katherine ralfe the waste pickers of durban
TRANSCRIPT
Katherine Ralfe
The Waste Pickers of Durban: A case study of three buyback centres
October 2007
Submitted in partial fulfilment of the requirement of the degree of Master of Town
and Regional Planning.
Supervised by Professor Peter Robinson , School of Architecture Planning and
Housing.

Unless stated specifically to the contrary in this text, this thesis is my own original
work
Katherine Ralfe
Acknowledgements
I would like to thank the following people, without which the completion of this work
would not be possible:
Professor Peter Robinson for his comments, support, and encouragement through
this process.
The lecturing staff in the town and regional planning department, especially Nancy
for encouraging me to finish and offering input.
Brenda and George Dunn, who helped with the translation during the fieldwork
phase.
Michele McLean for her help and advice.
The Waste Minimisation and Recycling department of Durban Solid Waste for
providing access to the buyback centres and for their support of this study.
My friends for putting up with my constant whining about the dissertation, and for still
wanting to hang out with me even though I avoided their calls during the months
when I was writing.
Mies for cheering me up and dragging me away from my work all too often.
My family, for their love and constant support through this whole process, and for
helping me with the final editing.
And, finally to the waste pickers who agreed to take part in this study. Their stories
saddened me, and inspired me at the same time. I have nothing but respect for
these individuals.
Abstract
The informal sector in South Africa has experienced phenomenal growth since the
end of Apartheid, and in Durban this has been no different. Due to the growth in
unemployment, many have turned to the informal sector in order to find a way to
survive and meet basic needs. Waste picking is one area of the informal economy
where there is relative ease of entry, as limited start up capital is needed to go into
business.
This research sought to gain a better understanding of the waste pickers operating in
Durban, their socio-economic characteristics , earnings, and their working conditions.
The research also aimed to determine the linkages between informal recycling and
the formal recycling industries, as well as the relationship between waste pickers and
the local authorities.
Three different buyback centres for recyclable material were chosen in order to gain
access to waste pickers, and 20 questionnaires were conducted at each of these
centres. Due to a lack of information as to the total population of waste pickers in
Durban, this sample cannot be considered representative of all waste pickers in
Durban. Rather, it presented a benchmark against which future larger studies can be
measured.
It was found that the waste pickers were fairly evenly divided according to gender,
and that education levels were generally low with a large portion of the sample never
having gone to school. Nearly all the waste pickers fell into the economically active
population of 16-65, and most had migrated to Durban in search of a job.
The majority of the waste pickers worked at least a standard working week, if not
longer. Metal and cardboard were found to be the items of choice for collection.
Nearly all the waste pickers transported their material by hand or by trolley.
The study determined that waste picking cannot be considered a form of transitional
employment. While the majority of the sample clearly expressed a wish to move to a
different job, nearly all the respondents had been involved in waste picking for a year
or longer. It is also an occupation entered into not by choice, but in order to survive.
It is clearly a last resort for many of the individuals involved. The waste pickers in this
study were found to earn, on average, very little.
The differences in gender noted in this study were also startling. The men were
found to have better means of transportation of materials (such as trolleys). Men
were found to support smaller households, and earn more than the women, and
more women were found to be living in very poor households than men.
The relationship between the waste pickers and the local authorities was found to be
a fairly indifferent one, and the waste pickers appeared to have limited contact with
government officials.
Considering the links between formal recycling and waste picking, this study
supports the Marxist view of the informal economy, finding that the waste pickers in
this study were clearly linked to the formal sector, and that their activities were
subordinate to and dependent on the formal sector recycling companies.
Table of contents
Chapter 1: Introduction
1.1. Background to the study
1.2.The key questions that will be addressed in this research
1.3.Outline of the content
Chapter 2: Urban waste management and the informal sector
2.1. Introduction
2.2. Environmental Sustainability and recycling
2.3. Urban Waste management
2.3.1 . The Developing World Context
2.3.2. Urban Solid Waste Management and Recycling in South
Africa and Durban
2.3.2.1. Legislation
2.3.2.2. Recycling Environment in South Africa
Paper and Cardboard
Cans
Metal
Plastics
Glass
Other materials
2.3.2.3. Durban Solid waste policy
2.4. The urban informal sector
2.4.1. Defining the Urban Informal Sector
2.4.1.1. Economic Dualism
2.4.1.2. Criticisms of Economic Dualism
2.4.2. The Causes of the Informal Sector
2.4.3. Gender and the informal sector
2.4.4. The informal sector in South Africa
2.4.5. The informal sector in Durban
2.5. Urban Poverty and vulnerability
1
1
3
4
6
6
6
8
8
11
11
14
16
17
18
18
21
22
22
25
25
26
28
32
35
37
39
42
2.6. Conclusion
Chapter 3: The Informal Recycling Industry
3.1 Introduction
3.2. Organisational structure
3.2.1. Types of Informal collectors
3.2.2. Organisational structure within informal collection
3.2.3. Informal! Formal sector linkages
3.3. Characteristics of the pickers
3.3.1. Gender
3.3.2. Age
3.3.3. Education
3.3.4. Dependents
3.3.5. Migration
3.3.6. Transitional Employment
3.4. Working Conditions
3.4.1. Hours worked
3.4.2. Problems faced
3.4.3. Material transportation
3.4.4. Areas for collection
3.4.5. Items Picked
3.5. Earnings, poverty and vUlnerability
3.6. Benefit to city
3.7. Attitudes towards informal recycling
3.8. Conclusion
Chapter 4: Methodology
4.1. Introduction
4.2. Research Design
4.3. The study area
4.3.1. Brook Street
4.3.2. Reclamation
44
45
45
45
46
48
50
51
51
52
53
53
53
54
54
54
55
57
58
59
60
63
65
71
72
72
72
75
75
78
4.3.3. Eskom 80
4.4. Research Tools Used 82
4.5. Sampling 84
4.6. Fieldwork 85
4.6.1. The Pilot Study 85
4.6.2. Data Collection 87
4.7. Data Analysis 88
4.8. Conclusion 89
Chapter 5: Results and discussion 90
5.1. Introduction 90
5.2. Socio-economic characteristics of the collectors 90
5.2.1. Gender 90
5.2.2. Race 91
5.2.3. Education levels 91
5.2.4. Home language 93
5.2.5. Age 94
5.2.6. Migration 96
5.3. Employment analysis 102
5.3.1. Previous Employment 102
5.3.2. Transitional employment 105
5.3.3. Time spent working 115
5.3.4. Materials collected 119
5.3.5. Material transportation 122
5.3.6. Collection Areas 126
5.3.7. Problems encountered 132
5.3.8. Likes and dislikes about the industry 137
5.4. Earnings and poverty 141
5.4.1. Earnings 141
5.4.2. Other sources of income 150
5.4.3. Dependents and sole breadwinner 1525.4.4. Poverty 153
5.5. Relationship with the municipality 155
5.6. Formal I informal sector linkages
5.7. Theoretical Implications
Chapter 6: Conclusion
6.1. Summary of the research
6.2. Recommendations arising from this research
6.3. Issues for further research
6.4. Concluding Remarks
References
Appendix 1: Questionnaire for the waste pickers
158
161
163
163
169
173
174
175
182
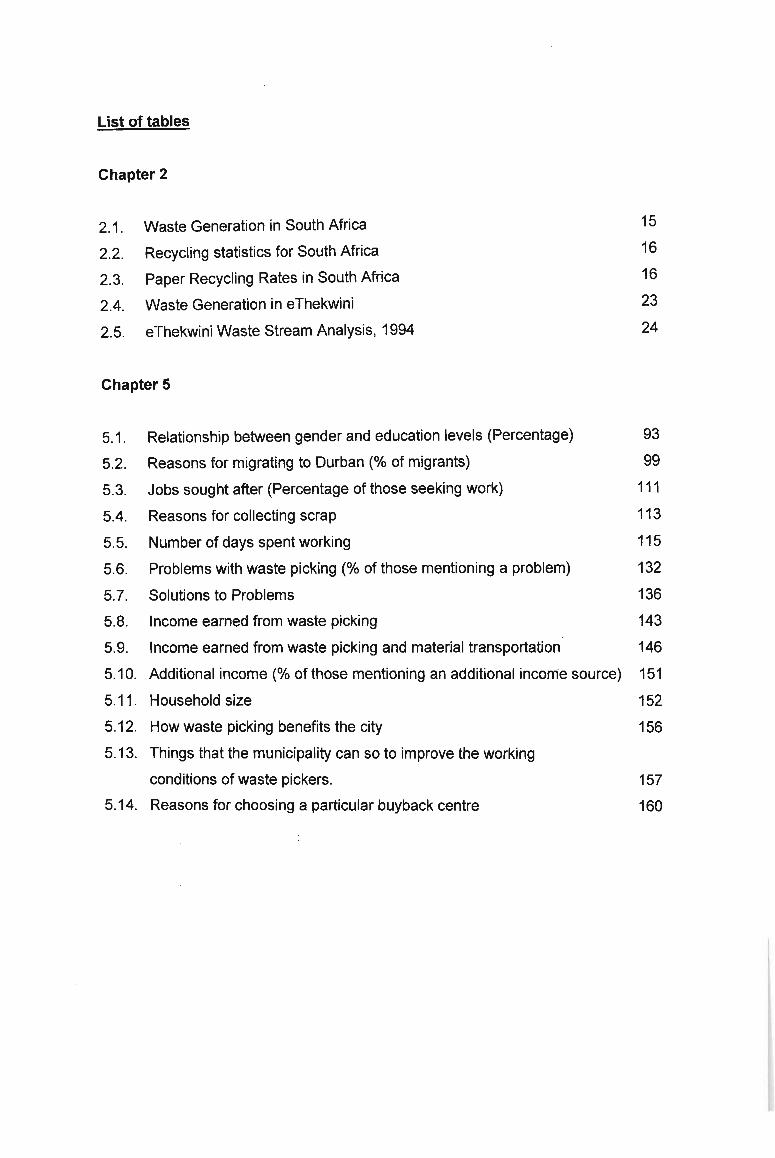
List of tables
Chapter 2
2.1. Waste Generation in South Africa
2.2. Recycling statistics for South Africa
2.3. Paper Recycling Rates in South Africa
2.4. Waste Generation in eThekwini
2.5. eThekwini Waste Stream Analysis, 1994
Chapter 5
15
16
16
23
24
5.1.
5.2 .
5.3.
5.4.
5.5.
5.6.
5.7.
5.8.
5.9.
5.10.
5.11.
5.12.
5.13.
5.14.
Relationship between gender and education levels (Percentage)
Reasons for migrating to Durban (% of migrants)
Jobs sought after (Percentage of those seeking work)
Reasons for collecting scrap
Number of days spent working
Problems with waste picking (% of those mentioning a problem)
Solutions to Problems
Income earned from waste picking
Income earned from waste picking and material transportation
Additional income (% of those mentioning an additional income source)
Household size
How waste picking benefits the city
Things that the municipality can so to improve the working
conditions of waste pickers.
Reasons for choosing a particular buyback centre
93
99
111
113
115
132
136
143
146
151
152
156
157
160
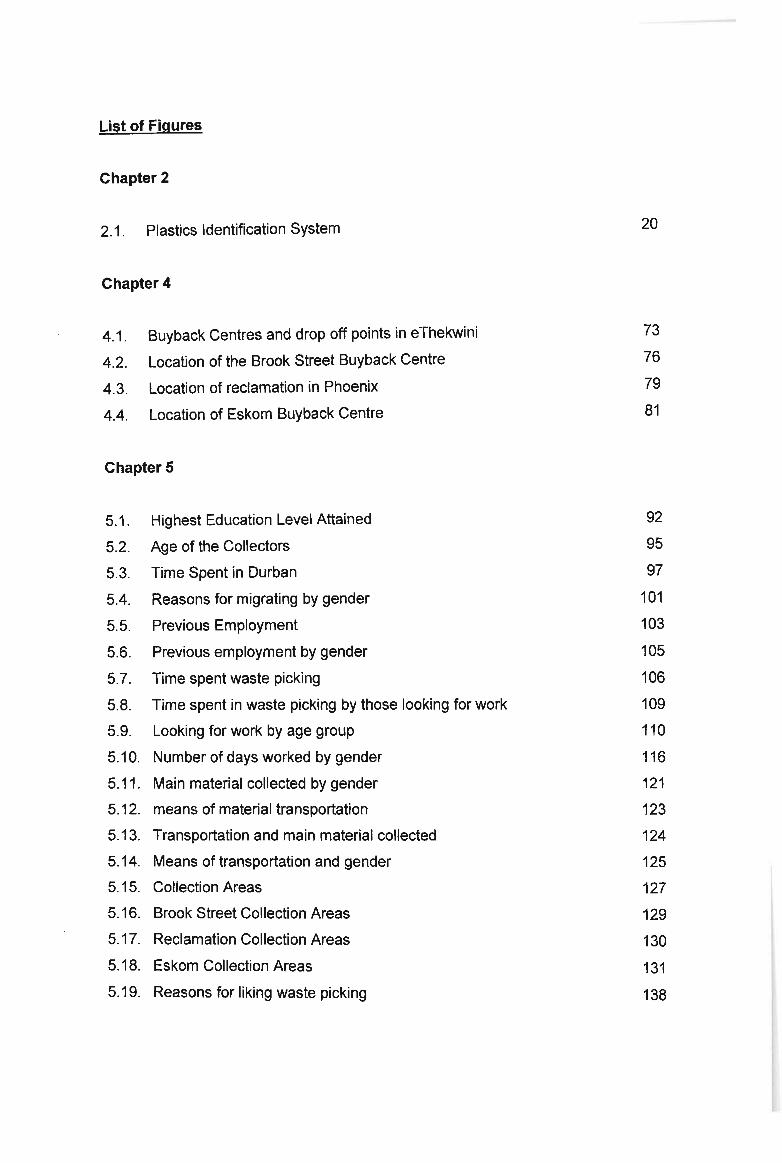
List of Figures
Chapter 2
2.1. Plastics Identification System
Chapter 4
4.1. Buyback Centres and drop off points in eThekwini
4.2. Location of the Brook Street Buyback Centre
4.3. Location of reclamation in Phoenix
4.4. Location of Eskom Buyback Centre
Chapter 5
20
73
76
79
81
5.1.
5.2.
5.3.
5.4.
5.5.
5.6.
5.7.
5.8.
5.9.
5.10.
5.11.
5.12.
5.13.
5.14.
5.15.
5.16.
5.17 .
5.18.
5.19.
Highest Education Level Attained
Age of the Collectors
Time Spent in Durban
Reasons for migrating by gender
Previous Employment
Previous employment by gender
Time spent waste picking
Time spent in waste picking by those looking for work
Looking for work by age group
Number of days worked by gender
Main material collected by gender
means of material transportation
Transportation and main material collected
Means of transportation and gender
Collection Areas
Brook Street Collection Areas
Reclamation Collection Areas
Eskom Collection Areas
Reasons for liking waste picking
92
95
97
101
103
105
106
109
110
116
121
123
124
125
127
129
130
131
138

5.20. Frequency graph showing income
5.21. Income from waste picking by gender
5.22. Income earned and main material collected
5.23. Hours worked and income from waste picking
5.24. Income and days worked per week
142
145
146
149
150
Chapter 1: Introduction
1.1. Background to the Study
Durban, South Africa is a city of stark differences. Years of repressive rule under
colonialism and later under Apartheid afforded white South Africans economic
opportunities, at the expense of other racial groups. In addition to this, the separate
policies put in place by the government manifested themselves in the cityscape, as
different race groups were allocated segregated areas within the city, and forced to
live there. Apartheid ended in 1994, when the new democratically elected
government came to power. This gave many South Africans hope that the
inequalities, both in terms of race as well as income distribution, would be
addressed. However, the neo-liberal economic policies adopted by the new
government, as well as the shift towards participation in the global economy, has
resulted in high unemployment, poverty, and growing inequality.
Against a backdrop of high unemployment, the phenomenal growth that has been
experienced in the informal sector since democracy is expected. Lund and Skinner
point out that while 'Apartheid legislation limited the range of goods that could be
sold, blocked the formation of companies by black people, and set up an array of
bureaucratic processes that discouraged the registration of small-scale economic
activity' (2003: 3), with the end of apartheid these problems have been overcome.
However, changing legislation, coupled with the high unemployment rate have aided
the recent growth experienced within the informal sector, and currently it is estimated
that 'between 25% and 30% of South Africans who are presently working, operate in
the informal economy' (Lund and Skinner, 2003: 3). In Durban, it is estimated that
'only 1 in 3 economically active people in Durban are employed in the formal sector'
(Durban Unicity's Economic Development Department in Lund and Skinner, 2003:
5). While the informal sector is clearly an important source of livelihood for many
individuals, there appears to be little understanding of the people involved in this
sector, their particular life circumstances, and the links between their work and the
formal sector (Skinner, 2006: 125).
Recycling is an industry that is growing at a rapid pace, due to diminishing
environmental resources. In the context of many third world countries, a lively
informal sector has sprung up around this industry. In some countries, it is multi
layered and material passes through many hands before finally reaching the formal
sector recycling companies (see, for example, Van Beukering et ai, 1996, Hayami et
ai, 2006). At the bottom of the informal recycling hierarchy are the waste pickers.
These individuals have limited equipment and capital, and sort through waste in
order to extract recyclable material. Some of these individuals operate on landfill
sites, while others roam the city scavenging for material.
Waste picking is one activity in the informal sector where there is a relative ease of
entry. While street trading is the most common informal activity in Durban (Lund and
Skinner, 2003: 4), it also requires a fair amount of start up capital, as well as access
to a trading space and basic services. With waste picking, no start up capital,
equipment, or space is needed. Waste pickers can start collecting materials at any
time, and can then take them to one of the buyback centres managed by Durban
Solid Waste, or to one of the numerous scrap dealers in order to exchange the
material for money. All that is really needed is knowledge of where to take material to
be exchanged. Considering the ease of entry into this sector, one would expect it to
be a refuge for those desperate for money to survive, and those living in a situation
of extreme poverty and hardship, unable to find work in any other sector. Waste
pickers form the bottom of the informal recycling hierarchy, which will be elaborated
on in chapter 3.
This study is motivated by a desire to understand the socio-economic situation of
waste pickers in Durban, and to shed some light on a group of people who are often
marginalised and looked down upon by society because of the nature of their work.
Academic conversation on the informal recycling industry has tended to focus on the
organisational structure and the linkages to the formal sector (see, for example,
Birkbeck, 1979, Van Beukering et ai, 1996, Hayami et ai, 2006). However, as the
natural environment has become a greater concern in recent years, some of the
literature has pointed to the environmental benefit of waste picking, and the informal
recycling industry in general. The socio-economic situation and the life
2
circumstances of the waste pickers has also been elaborated on, however, only
three studies could be found that relate specifically to waste picking in Durban.
DeKock (1986a and 1986b) conducted research into a group of waste pickers
operating on a landfill site in Durban, and McLean (2000a and 2000b) firstly looked
at a group of 20 waste pickers selling back material to a buyback centre in Durban,
and secondly at a group of waste pickers scavenging in the Glenwood area of
Durban. All of these studies elaborated on the socio-economic circumstances of the
waste pickers. These studies present a useful benchmark against which to compare
the current study. However, this research will not only consider the socio-economic
characteristics of the collectors, but will also discuss the links between the formal
and informal recycling industries.
1.2. The key questions that will be addressed in this research
The general aim of this research is to gain a more accurate understanding of those
participating in waste picking in Durban. This has been done by conducting
interviews at three different buyback centres within Durban. While there are a total of
6 buyback centres in Durban that are run by Durban Solid Waste, as well as many
private recycling companies that buy waste from those involved in informal recycling,
three of these were chosen as locations for this study. Interviews were conducted at
each of these locations.
The research addresses a number of different issues within informal recycling.
Firstly, as already stated, the research aims to determine the socio-economic
characteristics of the waste pickers. This includes elaborating on trends such as
education levels amongst collectors, gender, age, and home language. This
facilitates a greater understanding of the types of people who participate in waste
picking.
The research also aims to analyze the working conditions of the waste pickers, and
the process of waste picking. It was also an objective to understand the types of
materials picked, the time these individuals spend working, how they transport the
recyclable goods around, the areas in which they collect material, as well as the
problems that they encounter in their particular line of work.
3
Attention is also be paid to the levels of earnings of these individuals in order to
determine whether waste picking can be considered a viable livelihood strategy. This
either proves or disproves the contention that waste pickers live in a state of poverty
and are vulnerable. This research gives an indication as to the amount of money
made from waste picking, and other sources of income of those involved in waste
picking.
The relationship between waste pickers and other interest groups is discussed.
Specifically, the way in which the waste pickers view the local authorities is
elaborated on. The research also aims to determine ways in which the local
authorities can better support the informal recycling sector in general, and the way in
which they can intervene and aid the activity of waste picking.
Finally, the research also focuses on determining the relationship between formal
sector recycling and waste picking. Academic conversation has suggested that
waste pickers are nothing more than disguised wage workers (See, for example,
Birkbeck, 1979 and Wilson, 1998) for formal recycling companies, but they do not
get the security of a stable wage and other benefits that come with formal
employment. This research explores this idea further, and elaborates on the
relationship between formal sector recycling and waste picking.
1.3. Outline of the Content
This dissertation has been divided into 6 chapters. Chapter 1 offers an introduction
to the topic, as well as the need for a study of this kind. The specific aims and
questions to be addressed in this research have been elaborated on, while an
indication has been given concerning the academic conversation surrounding this
topic.
Chapter 2 discusses the literature informing this study. The chapter is divided into 4
separate parts. Firstly, environmental sustainability and recycling are discussed;
thereafter, Urban Solid Waste Management is focused on, and the developing world
as well as South African context. Thirdly, the urban informal sector is elaborated on.
4
Theoretical approaches to the informal sector, as well as the informal sector in South
Africa and Durban is discussed, as informal recycling falls within the urban informal
sector. Fourthly, the concept of urban poverty and vulnerability is given attention, as
waste pickers are generally viewed as a poor and marginalised group, so a greater
understanding of these issues is vital.
Chapter 3 focuses on literature relating specifically to the informal recycling sector
and this is discussed in detail. The organisational structure of the informal recycling
sector, the characteristics of the waste pickers, and attitudes towards informal sector
recycling are expanded upon.
Chapter 4 outlines the methodology used in this research. The design of the
research, the study areas, as well as the research tools used is discussed. The
fieldwork is elaborated on, as well as the way in which the data was analysed.
Chapter 5 presents the results of the questionnaire conducted with the informal
recyclers, as well as a discussion of the findings. The chapter is divided into 6 parts.
Firstly, the socio-economic characteristics of the waste pickers are elaborated on.
Thereafter, their working conditions are discussed in detail. Following this, their
earnings are focused on, and waste picking as a viable livelihood strategy is
discussed. The relationship between the waste pickers and the municipality is then
elaborated on, followed by the linkages between the waste pickers and the formal
recycling industry. Thereafter, the results of this study will be related to the theory
and conceptual approaches relating to the informal sector.
Chapter 6 concludes this thesis, and sums up the main findings of this research.
Where possible, suggestions and recommendations as to how the municipality can
better support the informal recycling sector are given. The overall findings of this
research are contrasted with the literature.
5
Chapter 2: Urban Waste Management and the Informal Sector
2.1. Introduction
This chapter provides an overview of the literature that informs, and can be applied
to this study. Initially, the idea of recycling is explained and it is shown how this
activity fits into the broader context of environmental sustainability. Issues of waste
management and the importance of recycling as an environmentally friendly activity
are elaborated on. The literature relating to the informal sector is then discussed,
and a background to the operations of the urban informal sector in developing
countries is offered, as informal collecting and recycling falls within this sector.
Attention is paid to theory relating to the urban informal sector. Each of these bodies
of literature is discussed in turn, and related to this particular study.
2.2. Environmental Sustainability and Recycling
In recent years, the issues of a growing world population, and diminishing natural
resources has led to increased concern over the quality of our natural environment.
The increased pressure that development has put on our planet has led to the
adoption of the notion of sustainable development as a :way in which the
environment can be protected, without impacting upon economic growth.
Sustainable development can be defined as development that 'meets the needs of
the present without compromising the ability of future generations to meet their own
needs' (Brundlandt commission in Platt et al 1994: 10). Reference is made to both
the concept of inter-generational equity (considering future generations), as well as
intra-generational equity (equality within a generation).
The idea of sustainability has also been applied to the urban context. The increase in
environmental consciousness has led to an increase in the levels of recycling
worldwide, to slow the rate of resource use. According to Platt, et al. (1994), there
are two different types of urban sustainability. The first considers conservation, and
'protection and restoration of the remaining biological phenomena and processes
within the community itself' (1994: 10), and the second is concerned with limiting the
environmental impact of the region on the surrounding land, water and atmospheric
6
resources. Recycling falls into the second type of urban sustainability, as does
energy conservation and more efficient transportation.
Recycling can be defined as 'the process undertaken.in the recovery and re-use of
materials which no longer have any value to the original owner and which would
have been disposed of' (Parkin, 1995: 5). This is not to be confused with waste
minimization, which is defined as 'any activity that is undertaken to prevent or reduce
the volume and/or environmental impact of waste that is generated, treated, stored
or disposed of (DEAT, 1999a in DEAT, 2005: 10). If one considers the value of
recyclable materials, 'the general rule is: the further upstream [in the waste process],
the better' (Bartone 1986: 39 in Rogerson 2001: 250).
Van Beukering et al point out that the industry surrounding recycling is different in
the 1st and 3rd world environments. While waste prevention may be an appropriate
strategy for countries with high consumption levels, a waste reduction strategy will
not be that applicable to developing countries, where excessive consumption is not
that much of an issue (Van Beukering et al 1996: 2).
The types of recycling strategies and the motivation behind recycling also differ
between the developing and developed world. While environmental concern is the
primary driver of the recycling industry in many cities in the developed world, in the
developing world one often finds 'an informal sector that exists in parallel with the
formal waste collection authorities' (Van Beukering et al 1996: 2). According to
Furedy, the distinction between formal and informal recycling activities is what
officials recognise as a part of the solid waste management system, as 'parallel
activities that are usually regarded as undesirable and often, illegal' (Furedy, 1990 in
Tevera, 1994: 22). One World Bank official described the informal recycling industry
as 'a fact of life' (Bartone, 1986: 38 in Rogerson, 2001: 247) in much of the
developing world. The sector is guided by market forces and supports many
individuals trying to etch out a living in the cities. As Wilson et al argue, 'The degree
to which a particular material is recycled [in the informal recycling sector] depends on
income levels, the existence of local and national markets, need for secondary raw
materials, levels of financial and regulatory governmental intervention, prices of
7
virgin materials, international trade in secondary raw materials and relevant treaties'
(2006: 5).
2.3. Urban Waste management
2.3.1. The Developing World Context
Urban waste management is important to consider, as it ultimately determines the
environment in which recycling, and more specifically informal recycling, exists.
Cities generate large amounts of waste that need to be dealt with. In developing
countries, the pace of urbanisation is rapid and this leads to cities demanding more
resources, and ultimately generating more waste. Solid waste management systems
in developing countries 'are often poorly run and operate to low standards. They can
be unreliable, provide inadequate coverage and may conflict with other urban
services' (Wilson et ai, 2006: 2). This is generally caused by a lack of funds and
capacity. Because of this, it is estimated that only 50% of waste generated in cities in
developing countries is collected by the local authorities (Cointreau, 1991 in Van
Beukering et ai, 1996: 2). This has opened a gap for 'legions of men, women, and
children who make a living from the recovery, sorting and selling of retrievable items
of solid waste' (Beall, 1997: 70 in Rogerson, 2001: 247).
Baud et al (2001) argue that urban solid waste management in developing countries
is concerned with two main things. Firstly, public sector reform of the municipal
waste management system (which could come in the form of privitisation, or public I
private partnerships), and secondly, 'concern for sustainable development in the
urban context' (Baud et ai, 2001: 3). They identify four different key players in the
context of urban solid waste management in developing countries: the public sector;
the private sector, made up of 'large and small registered enterprises carrying out
collection, transport, disposal and recycling' (Baud et ai, 2001: 5); the informal
sector, made up of 'waste pickers, itinerant buyers, traders in waste materials and
non-registered small-scale enterprises' (Baud et ai, 2001: 5); and local community
and its representatives, made up of non-governmental organizations, and community
based organizations. NGOs and CBOs can be classified further into two different
groups, namely, those who are socially orientated, whose 'primary concern is the
8
humane one of the welfare/empowerment of informal waste workers' (Furedy, 1997:
144), or those who are environmentally orientated, whose 'primary concern is to
make an impact on nuisances and hazards of poor waste management through
community cooperation, which may entail the organization of waste recovery and
recycling' (Furedy, 1997: 144).
These different actors interrelate to form the solid waste management environment
within the majority of developing countries. However, 'little attention is given to the
potential of small-scale, private operators and community-based organizations
(CBO's) removing solid waste informally from residential areas. Local authorities
prefer to link up with formal enterprises' (Baud et ai, 2001: 4). Informal enterprises,
while sometimes acknowledged, are often not included in policy.
A number of general trends in the solid waste management systems in developing
countries have been identified. Furedy (1997) identified eight different trends. They
are as follows:
• Waste picking, or informal collection has increased
• Direct buying of recyclables in certain countries has decreased, thus so have
habits of separating at the source.
• technical changes in waste collection has inhibited informal recovery and
increased picking at landfills
• Conventional approaches to solid waste management have become
unsustainable in many developing countries, resulting in an inability of
authorities to cope.
• Internationally, waste reduction and recycling are now accepted as 'bedrock
principles in all waste management' (Furedy, 1997: 143).
• The public are now more aware of the health risks of poor waste
management.
• 'There are attempts to coordinate official, private and community-based
activities in urban services to increase access for basic needs' (Furedy, 1997:
143).
• Issues of waste management increasingly are the focus of the international
environmental agenda.
9
While all of these trends may not apply to every developing country, they generally
point out the environment in which solid waste management policy is formulated in a
developing world context.
lrnprovinq solid waste management in developing countries is vital in order to
achieve sustainability. Solid waste management systems need to address both
intergenerational equity and intra-generational equity in order to be effective. Baud et
al (2001) argue that intergenerational equity can be improved through minimizing
waste produced, maximizing reuse and recycling, and disposing of the remaining
waste in a controlled fashion so as 'not to exceed the absorption capacity of local
sinks' (2001: 5). This view is supported by Tevera (1994), who asserts that 'Waste
recycling activities are also justified on both economic and environmental grounds
because they help save resources, protect the environment, and contribute to
sustainable development' (1994: 24).
From the point of view of intra-generational equity, effective solid waste management
can have an impact on this. According to Baud et al management systems need to
consider 'meeting human needs [and] several economic, social and public health
goals need to be included' (2001: 5). Allowing informal collectors to make a living
contributes to intra-generational equity. Wilson, et al support this view, arguing that
'over the last 20 years, there has been growing recognition of the economic, social
and environmental benefits of the informal sector in waste management' (2006: 9).
Solid waste management clearly has an environmental impact, as discussed above,
as well as a social impact. The social impact is evident if one considers the hundreds
of thousands of informal sector waste workers around the world whose livelihoods
are intrinsically linked to waste disposal, collection, and policy. Thus, it can be
argued that what is needed in the developing world context is an integrated
approach, which incorporates both social and environmental goals. Furedy described
this as 'an emerging movement for reform of conventional approaches to municipal
solid waste management in Southern cities' (1997: 142). This integrated approach
must include both conventional as well as informal activities, it should have 'among
its primary aims, waste reduction and the facilitation of recycling' (Furedy, 1997:
143). In addition to this, the integrated approach calls for a variety of stakeholders to
10
have a say in the formulation of policy, and a compromise between the goals of
social welfare, waste reduction and recovery, and effective waste management with
minimum handling.
Of particular interest to this study is the trend of a growing number of informal
collectors in developing world cities. This view is supported by Wilson et ai, who
point out that 'Insufficient collection, uncontrolled street collection points and
improper disposal in open dumps allow refuse to be readily available for informal
waste recycling through scavenging/waste picking' (Wilson et ai, 2006: 2). Although
waste picking is a reality in many cities in the developing world, there appears to be
reluctance on the part of local authorities to deal directly with the informal recycling
sector. Baud et al found that 'local authorities work together with large enterprises
and non-governmental organizations (NGOs), but refuse to deal directly with the
informal trade and recycling enterprises which cover large fractions of waste' (Baud
et ai, 2001: 3).
2.3.2. Urban Solid Waste Management and Recycling in South Africa and Durban
In line with global trends, recycling has increasingly become a concern in solid waste
management in South Africa. This section will first outline the policy and legislation
pertaining to waste management in South Africa, as well as general trends in
recycling and waste in the country as a whole. Thereafter, particular attention will be
paid to solid waste management and policy in Durban. Recycling in Durban will also
be elaborated on.
2.3.2.1 . Legislation
Prior to 1994, the only legislation that made mention of recycling was the
Environmental Conservation Act 73 of 1989. Part vi, section 24 which gives
regulations regarding waste management. Sub-section d and e state that the
minister may make regulations with regard to waste management concerning:
'd) The reduction of waste by:
i) modifications in the design and marketing ofproducts
ii) modifications in the manUfacturingprocess
11
iii) the use of alternative products
e) The utilization of waste by way of recovery, re-use or processing of waste'
(Government press, 1989).
After the change in government in 1994, a host of new legislation was passed. The
National Environmental Management Act (NEMA) was passed in 1998, and this
legislation made considerable mention of the concept of sustainable development.
Section 2 of the act contains the principles behind the legislation. and sub-section 3
states that 'development must be socially, environmentally and economically
sustainable' (Government Press, 1998). Sub-section 4(a) states that:
4(a) 'Sustainable development requires the consideration of all relevant
factors including the following:
ivy that waste is avoided, or where it cannot be altogether avoided,
minimised and re-used or recycled where possible and
otherwise disposed of in a reasonable manner; (Government
Press, 1998)
This legislation makes a more direct reference to recycling, and sets it within the
broader goal of sustainable development.
In March 2000, the white paper on integrated pollution and waste management for
South Africa was published in the government gazette. The white paper made direct
reference to the need to establish a culture of recycling and waste minimization in
South Africa. One of the objectives of the policy was 'To set targets to minimise
waste generation and pollution at source and promote . a hierarchy of waste
management practices, namely reduction of waste at source, reuse and recycling
with safe disposal as the last resort' (Government press, 2000: 18). An
acknowledgement of the lack of legislation and policy pertaining to recycling was
made in the white paper. It points out that in South Africa there is 'a general lack of
commitment to recycling. There is no legislation, policy or waste management
culture that promotes resource recovery or makes it financially viable' (Government
press, 2000: 24).
12
The white paper, and general discussion that it generated, resulted in the Draft
National Waste Management Bill. The bill states the importance of including
recycling in waste management strategies. Specifically, Part 5 of Chapter 3 of this
bill focuses on recovery, re-use, and recycling of waste. It includes 3 different sub
sections. Subsection 1 states that recycling must benefit the environment, and the
process must not use more natural resources than disposal. Subsection 2 outlines
the powers of the minister with regard to recycling. It states that:
(2) The Minister may, by notice in the Gazette, require any person or category of
persons to-
i. provide for the recovery, re-use or recycling ofproducts or components
ofa product manufactured or imported by that person; or
ii. a product to include a determined percentage of recycled material in a
product that is produced, imported or manufactured by that person or
category ofpersons. (Government Press, 2006).
Subsection 3 outlines gives powers to local municipalities, stating that the
municipality may enforce recyclinq on any person making use of the municipal
collection service.
This bill is currently up for comment, and will possibly be passed in the near future.
Thus, while the recycling business in South Africa may not change initially, the
legislation gives power to local authorities as well as national government to set the
climate regarding this activity, if they choose.
In addition to this, the department of environmental affairs and tourism has had
success in getting the key players in the waste management sector to reach
collective decisions on the way forward for recycling in South Africa. The first
National Waste Summit was held at Polokwane, to 'address the challenges facing
waste management in South Africa' (DEAT, 2005: 2). The need to reduce, reuse and
recycle was recognised at this convention. The goal emerging from this summit was
'to reduce waste generation and disposal by 50% and 25% respectively by 2012 and
develop a plan for zero waste by 2022' (DEAT, 2005: 3).
13
The Polokwane declaration, a statement of political intent, resulted from this summit.
This declaration outlines the commitments of government, civil society and the
business community to sustainable waste management (DEAT, 2005: 3). Recycling
will form a significant part of this strategy, if the goals of the Polokwane declaration
are to be realized. An objective of the declaration is to grow the recycling industry by
30% by 2012 (DEAT, 2005: 9).
2.3.2.2. Recycling Environment in South Africa
The legislation and policy pertaining to recycling in South Africa has been discussed
in detail .above. However, recycling in South Africa has historically been, and
continues to be, dominated by the private sector. In addition to this, the motivation
behind recycling is generally an economic, rather than environmental concern
(McLean, 1998: 1).
The South African government has recognized that in order to create better habitats,
partnerships with communities, non-government organizations, and other key
stakeholders need to be considered (Jones, 2003) . The idea that different groups
can be useful in managing living environments can be applied to informal recycling.
Waste pickers perform a role in waste minimization, despite the fact that they are
given little or no recognition for this by local government.
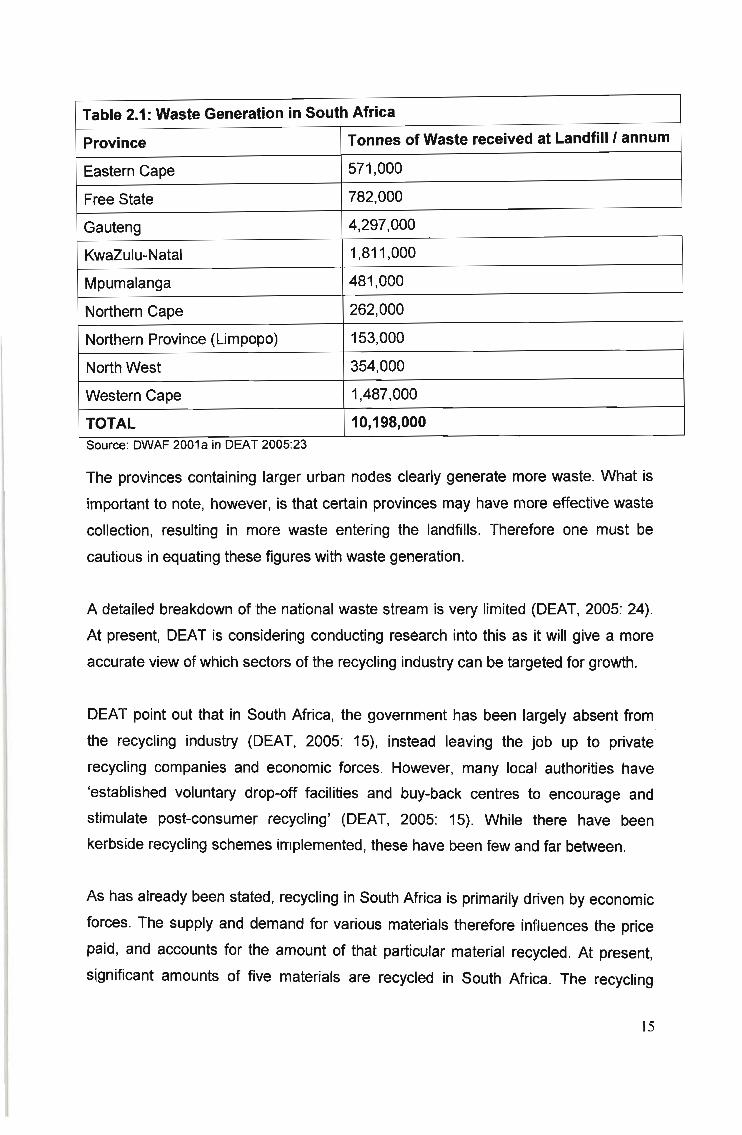
South Africa generates a substantial amount of waste, and there is significant scope
for an increase in recycling. The following table shows the waste generation figures
for South Africa as a whole, per province:
14
Source: DWAF 2001a In DEAT 2005:23
Table 2.1: Waste Generation in South Africa
Province Tonnes of Waste received at Landfilll annum
Eastern Cape 571,000
Free State 782,000
Gauteng 4,297,000
KwaZulu-Natal 1,811,000
Mpumalanga 481,000
Northern Cape 262,000
Northern Province (Limpopo) 153,000
North West 354,000
Western Cape 1,487,000
TOTAL 10,198,000
The provinces containing larger urban nodes clearly generate more waste. What is
important to note, however, is that certain provinces may have more effective waste
collection, resulting in more waste entering the landfills. Therefore one must be
cautious in equating these figures with waste generation.
A detailed breakdown of the national waste stream is very limited (DEAT, 2005: 24).
At present, DEAT is considering conducting research into this as it will give a more
accurate view of which sectors of the recycling industry can be targeted for growth.
DEAT point out that in South Africa, the government has been largely absent from
the recycling industry (DEAT, 2005: 15), instead leaving the job up to private
recycling companies and economic forces. However, many local authorities have
'established voluntary drop-off facilities and buy-back centres to encourage and
stimulate post-consumer recycling' (DEAT, 2005: 15). While there have been
kerbside recycling schemes implemented, these have been few and far between.
As has already been stated, recycling in South Africa is primarily driven by economic
forces. The supply and demand for various materials therefore influences the price
paid, and accounts for the amount of that particular material recycled. At present,
significant amounts of five materials are recycled in South Africa. The recycling
15
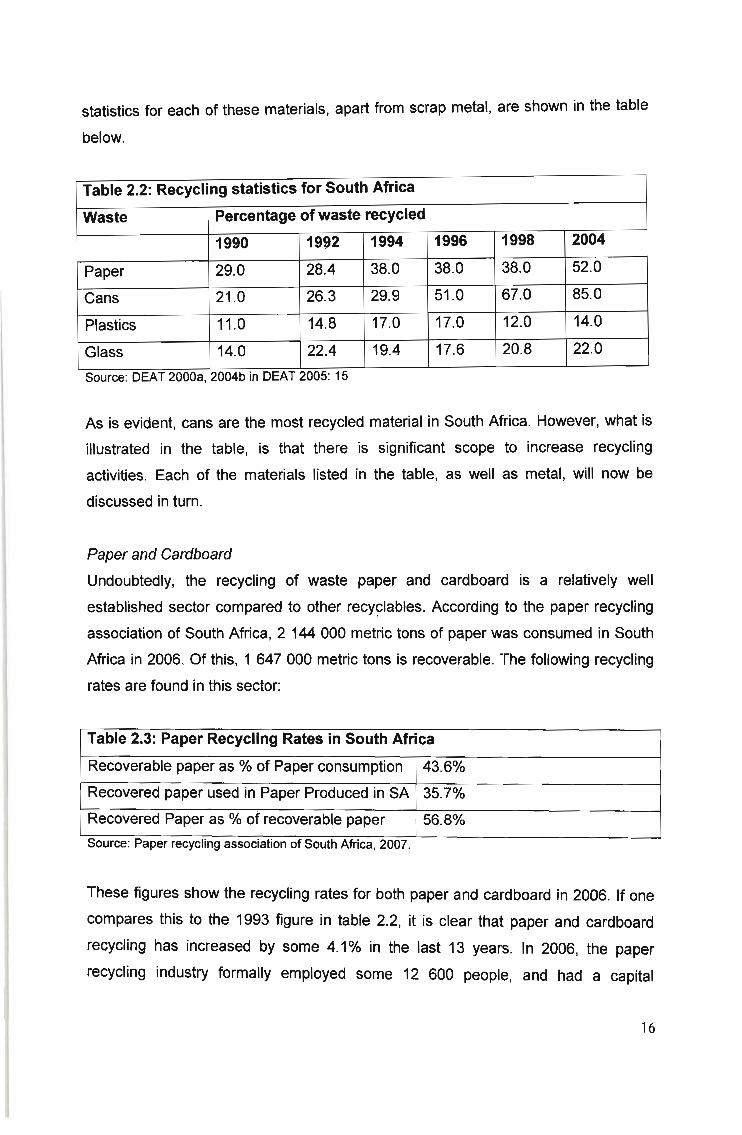
statistics for each of these materials, apart from scrap metal, are shown in the table
below.
Table 2.2: Recycling statistics for South Africa
Waste Percentage of waste recycled
1990 1992 1994 1996 1998 2004
Paper 29.0 28.4 38.0 38.0 38.0 52.0
Cans 21 .0 26.3 29.9 51.0 67.0 85.0
Plastics 11.0 14.8 17.0 17.0 12.0 14.0
Glass 14.0 22.4 19.4 17.6 20.8 22.0
Source : DEAT 2000a, 2004b In DEAT 2005: 15
As is evident, cans are the most recycled material in South Africa. However, what is
illustrated in the table, is that there is significant scope to increase recycling
activities. Each of the materials listed in the table, as well as metal, will now be
discussed in turn.
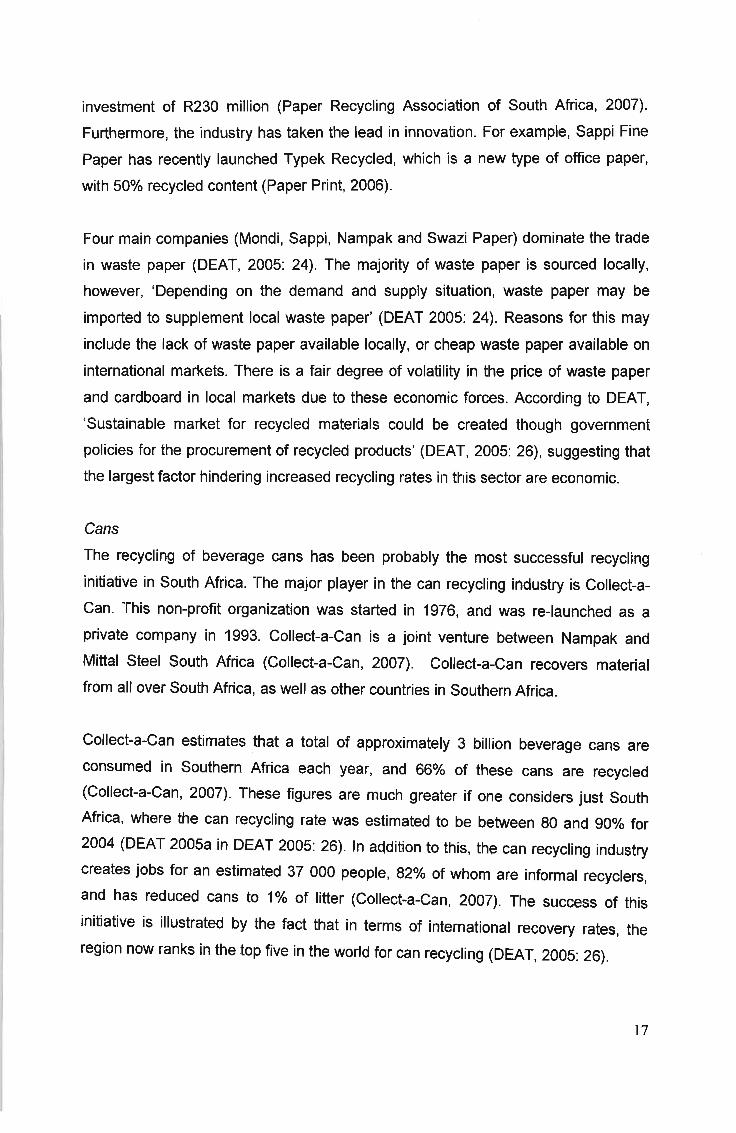
Paper and Cardboard
Undoubtedly, the recycling of waste paper and cardboard is a relatively well
established sector compared to other recyclables. According to the paper recycling
association of South Africa, 2 144 000 metric tons of paper was consumed in South
Africa in 2006. Of this, 1 647 000 metric tons is recoverable. The following recycling
rates are found in this sector:
Source: Paper recycling associatlon of South Africa , 2007 .
Table 2.3: Paper Recycling Rates in South Africa
Recoverable paper as % of Paper consumption 43.6%
Recovered paper used in Paper Produced in SA 35.7%
Recovered Paper as % of recoverable paper 56.8%. .
These figures show the recycling rates for both paper and cardboard in 2006. If one
compares this to the 1993 figure in table 2.2, it is clear that paper and cardboard
recycling has increased by some 4.1% in the last 13 years. In 2006, the paper
recycling industry formally employed some 12 600 people, and had a capital
16
investment of R230 million (Paper Recycling Association of South Africa, 2007).
Furthermore, the industry has taken the lead in innovation. For example, Sappi Fine
Paper has recently launched Typek Recycled, which is a new type of office paper,
with 50% recycled content (Paper Print, 2006).
Four main companies (Mondi, Sappi, Nampak and Swazi Paper) dominate the trade
in waste paper (DEAT, 2005: 24). The majority of waste paper is sourced locally,
however, 'Depending on the demand and supply situation, waste paper may be
imported to supplement local waste paper' (DEAT 2005: 24). Reasons for this may
include the lack of waste paper available locally, or cheap waste paper available on
international markets. There is a fair degree of volatility in the price of waste paper
and cardboard in local markets due to these economic forces. According to DEAT,
'Sustainable market for recycled materials could be created though government
policies for the procurement of recycled products' (DEAT, 2005: 26), suggesting that
the largest factor hindering increased recycling rates in this sector are economic.
Cans
The recycling of beverage cans has been probably the most successful recycling
initiative in South Africa. The major player in the can recycling industry is Collect-a
Can. This non-profit organization was started in 1976, and was re-launched as a
private company in 1993. Collect-a-Can is a joint venture between Nampak and
Mittal Steel South Africa (Collect-a-Can, 2007). Collect-a-Can recovers material
from all over South Africa, as well as other countries in Southern Africa.
Collect-a-Can estimates that a total of approximately 3 billion beverage cans are
consumed in Southern Africa each year, and 66% of these cans are recycled
(Collect-a-Can, 2007). These figures are much greater if one considers just South
Africa, where the can recycling rate was estimated to be between 80 and 90% for
2004 (DEAT 2005a in DEAT 2005: 26). In addition to this, the can recycling industry
creates jobs for an estimated 37 000 people, 82% of whom are informal recyclers,
and has reduced cans to 1% of litter (Collect-a-Can, 2007). The success of this
initiative is illustrated by the fact that in terms of international recovery rates, the
region now ranks in the top five in the world for can recycling (DEAT, 2005: 26).
17
Collect-a-Can has been extremely successful due to a number of reasons. However,
part of this success can be linked to its innovative collection system. Collect-a-can
also subsidise the collection system (DEAT 2005: 26), and an incentive is paid to
deliver the material directly to their branches (Collect-a-Can, 2007). The limited
number of players in the can recycling sector has meant that the price for cans has
enjoyed more stability than other recyclable goods. The price is fixed for a period of
about 18 months (DEAT 2005: 26).
Metal
Scrap metal is one of the more lucrative materials to recycle; however, prices differ
substantially according to the type of metal recovered. This category is split broadly
into ferrous metals, which are metals that contain iron, and non-ferrous metals, such
as aluminum, copper and zinc. Typically, this material is sold to commercial dealers
such as the Reclamation Group. According to DEAT, 'A company such as the
Reclamation Group recovers approximately 3,000,000 tonnes per annum of ferrous
metals and 93,000 tonnes per annum of non-ferrous metal' (DEAT 2005: 27).
One of the major problems faced by this industry is the fact that, due to the higher
prices paid for scrap metal, this sub-sector has experienced 'a high incidence of
trading stolen materials' (DEAT 2005: 27). For example, Telkom spends millions
each year replacing stolen copper wire.
Plastics
According to the Plastics Federation of South Africa, South Africa consumes a total
of 1 100 000 tonnes of plastic polymers in a year, while the local recycled material
consumption is estimated at 150 000 tonnes a year (Plastics Federation of South
Africa, 2007). This indicates a recovery rate of 13.6%. This figure is verified by table
2.2 on page 27, which estimated the recovery rate of plastics in South Africa to be
around 14%.
There are approximately 850 companies specializing in plastics conversion, and the
majority of these are small companies. In total, there are approximately 30 000
people employed in plastics conversion in South Africa (Plastics Federation of South
Africa, 2007).
18
Plastics recycling requires more care compared to other recyclables. This is due to
the fact that the different types of plastics need to be sorted for the recycling
process. The plastics federation of South Africa has divided the different types of
plastics into 7 different categories (Plastics Federation of South Africa, 2007). They
describe these as follows:
• Low density and linear low density polyethylene (pE-LD and PE-LLD) - A thin,
usually transparent packaging film. Examples include fresh and frozen
vegetable bags, and soft squeezable bottles.
• High density polyethylene (PE-HO) - This substance is mostly used for the
manufacture of strong, non-transparent bottles (such as household cleaning
agents). It is also used for the manufacturing of plastic buckets and basins.
• Polypropylene (PP) - materials such as coca-cola bottle caps, and firmer
forms of packaging are made from this.
• Polystyrene (PS) - This includes the white foam substance, used for
packaging. It also includes disposable containers and cutlery.
• Poly(vinyl chloride) (PVC) - This material is easily recyclable, and is usually a
clear plastic. Examples include fruit juice bottles, and cooking oil bottles.
• Poly(ethylene terephthalate) (PET) - The coca-cola type bottle is made from
this.
• Other - Plastics that do not fit into the categories above are grouped together.
These mostly include engineering type plastics (Plastics Federation of South
Africa, 2007).
In order to simplify the recycling process, and to ensure that the plastics are properly
separated, a system of identification is increasingly being used in South Africa. The
different symbols show the type of plastic. The logo is printed on the article in the
manufacturing process. Figure 2.1. shows these different logos.
19
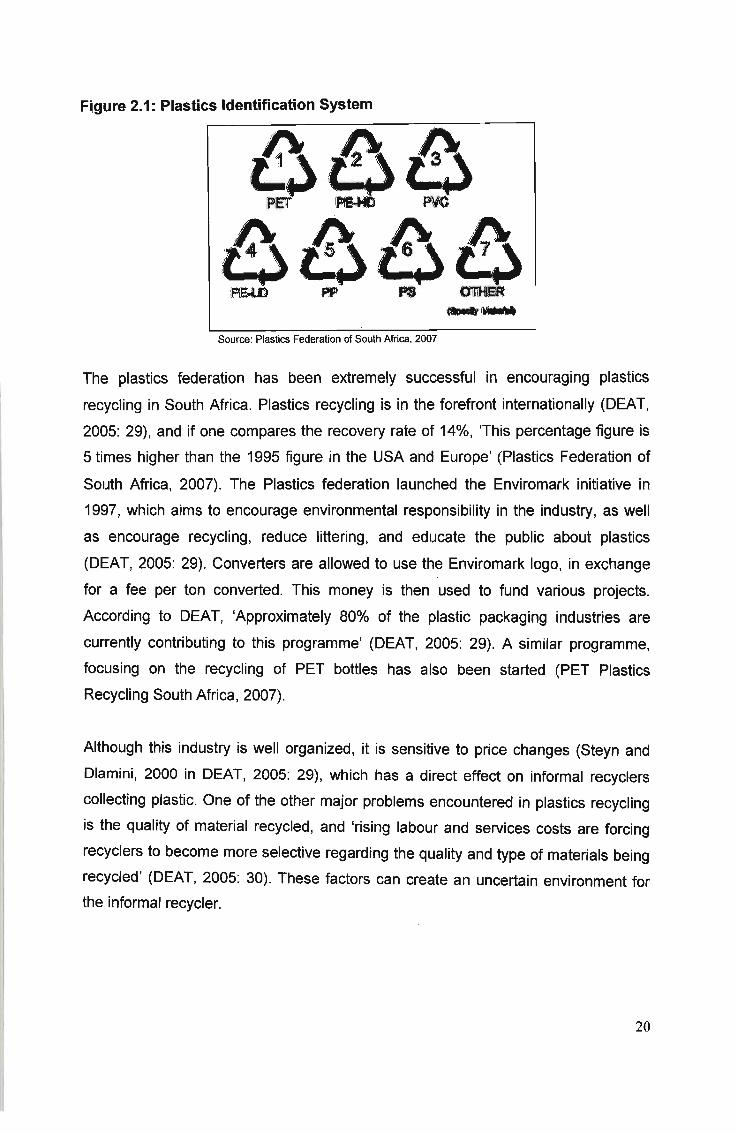
Figure 2.1: Plastics Identification System
O~~~~~~iP&U)PP IPa OtriJoiIeR....~
Source: Plastics Federation of South Africa, 2007
The plastics federation has been extremely successful in encouraging plastics
recycling in South Africa. Plastics recycling is in the forefront internationally (DEAT,
2005: 29), and if one compares the recovery rate of 14%, 'This percentage figure is
5 times higher than the 1995 figure in the USA and Europe' (Plastics Federation of
South Africa, 2007). The Plastics federation launched the Enviromark initiative in
1997, which aims to encourage environmental responsibility in the industry, as well
as encourage recycling, reduce littering, and educate the public about plastics
(DEAT, 2005: 29). Converters are allowed to use the Enviromark logo, in exchange
for a fee per ton converted. This money is then used to fund various projects.
According to DEAT, 'Approximately 80% of the plastic packaging industries are
currently contributing to this programme' (DEAT, 2005: 29). A similar programme,
focusing on the recycling of PET bottles has also been started (PET Plastics
Recycling South Africa, 2007).
Although this industry is well organized, it is sensitive to price changes (Steyn and
Dlamini, 2000 in DEAT, 2005: 29), which has a direct effect on informal recyclers
collecting plastic. One of the other major problems encountered in plastics recycling
is the quality of material recycled, and 'rising labour and services costs are forcing
recyclers to become more selective regarding the quality and type of materials being
recycled' (DEAT, 2005: 30). These factors can create an uncertain environment for
the informal recycler.
20
Glass
Glass recycling in South Africa has been less successful than other materials, due to
the fact that this is dominated by the glass recycling association (McLean, 1998: 4),
which is a joint initiative between Nampak and Consol glass. Currently, the glass
packaging industry produces sales of approximately 730 000 tonnes per annum, and
of this '105 000 tonnes (14%) is recovered and recycled' (Consol Glass, 2007).
However, this figure includes only the amount recycled by these two companies. The
total recycling rate for 2004, as indicated in table 2.2 was 22%. This figure compares
poorly with other countries, such as Britain (which recycles 45%), and the
Netherlands and Australia which recycle 91% and 50% respectively (National Drive,
2006).
Glass recycling can either involve the collection of bottles for reuse, cullet (crushed
glass), or broken glass (DEAT, 2005: 28). In 1999, 6.9% of recycled glass was
collected by informal recyclers. According to the Department of Environmental Affairs
and Tourism, 'The maximum amount of cullet that can be recycled at the current
levels of production is 175,000 Tonnes' (DEAT, 2005: 28). In 2002, there were a total
of 143 agents in South Africa collecting glass (DEAT, 2005: 28).
One of the major problems with glass recycling is the fact that the industry is run
under monopoly conditions. The glass recycling association (Nampak and Consol
glass), has by far the largest share of the market, and allegations of price fixing have
been made. According to the competition commission of South Africa, a complaint
has been laid against Consol Glass and Nampak for alleged collusion and price
fixing in the glass recycling market (Competition Complaints Commission of South
Africa, 2004).
Other problems with glass recycling occur in the collection phase. Glass needs to be
separated according to colour, and if there is contamination the whole load is
rejected (DEAT, 2005: 28). In addition to this, profit margins are not particularly high
in glass recycling (DEAT, 2005: 28), and large volumes need to be collected to make
it economically feasible. However, the national glass recycling association have
apparently 'set its sights on driving glass recycling levels up from the current 20% to
50% a year over the next five years (National Drive, 2006) .
21

Other materials
Other materials are also experiencing a growth in recycling. Materials such as
electronic waste, building rubble, tyres, textiles and organic waste can all be
recycled. Recently, Hewlett Packard has launched a return and recycle programme,
which has resulted in 6000 ink toner cartridges being recycled in 18 months (Ink
Cartridges Collected, 2006: 21). The government is also aiming to encourage the
recycling of tyres to a greater extent, by putting in place regulations for this sector
(The Road to Tyre Recovery, 2006: 26).
Despite these initiatives, at present the industry and market in these materials is not
as established as in the previous 5 materials mentioned. Generally, informal
collectors do not collect these materials due to the fact that most recycling centres
do not buy them. If some of these materials are collected, they are primarily for re
use.
2.3.2.3. Durban Solid waste policy
At present, Durban has six operational landfill sites. Four of these are general waste
sites, while 2 are 'Iow hazard eo-disposal sites' (eThekwini Municipality, 2007). In
addition to these, there are transfer sites as well as 15 garden refuse disposal sites
located around the city (eThekwini Municipality, 2007). One of the major issues
facing most large metropolitan areas, is diminishing landfill space. One way in which
to save landfill space is to increase the rate of recycling.
According to a report prepared by the Durban Municipality, In excess of 1.8 million
tonnes of waste was generated in 1996 in the Durban metropolitan area. Of this, 1.2
million tonnes is general or low hazard waste (Cities Environmental Report on the
Internet, 1999), the type of waste that could contain recyclable material.
A detailed waste analysis has not yet been conducted in eThekwini. However, the
eThekwini Integrated Waste Management Plan (2004) estimates that the total waste
landfilled in eThekwini composed of the following:
22
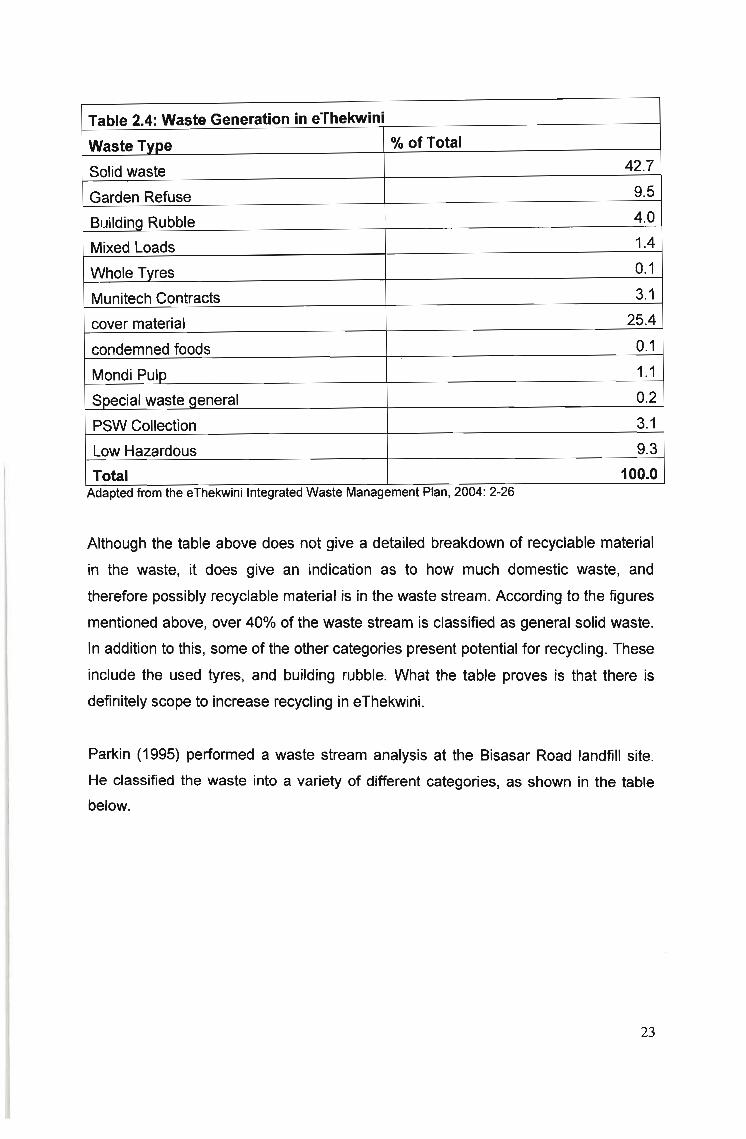
Adapted from the e'Ihekwinl Integrated Waste Management Plan, 2004: 2-26
Table 2.4: Waste Generation in eThekwini
Waste Type % of Total
Solid waste 42.7
Garden Refuse 9.5
Buildina Rubble 4.0
Mixed Loads 1.4
Whole Tvres 0.1
Munitech Contracts 3.1
cover material 25.4
condemned foods 0.1
Mondi Pulp 1.1
Special waste qeneral 0.2
PSW Collection 3.1
Low Hazardous 9.3
Total 100.0..
Although the table above does not give a detailed breakdown of recyclable material
in the waste, it does give an indication as to how much domestic waste, and
therefore possibly recyclable material is in the waste stream. According to the figures
mentioned above, over 40% of the waste stream is classified as general solid waste.
In addition to this, some of the other categories present potential for recycling . These
include the used tyres , and building rubble. What the table proves is that there is
definitely scope to increase recycling in eThekwini.
Parkin (1995) performed a waste stream analysis at the Bisasar Road landfill site.
He classified the waste into a variety of different categories, as shown in the table
below.
23
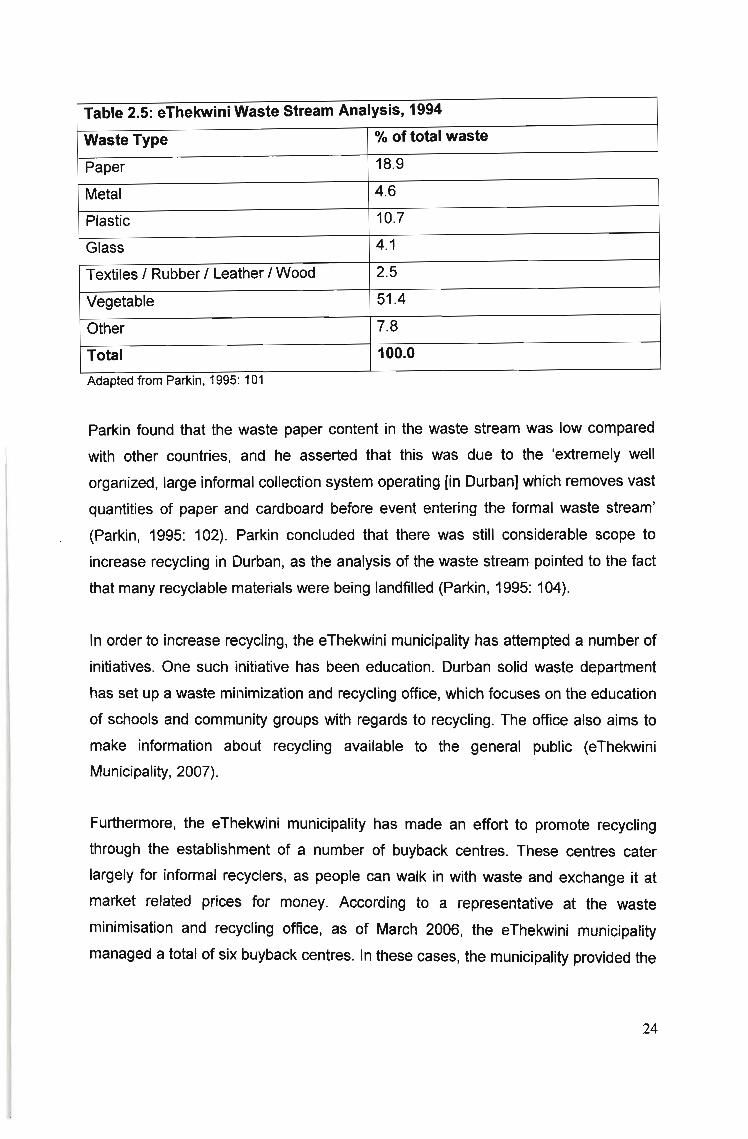
Adapted from Parkm, 1995: 101
Table 2.5: eThekwini Waste Stream Analysis, 1994
Waste Type % of total waste
Paper 18.9
Metal 4.6
Plastic 10.7
Glass 4.1
Textiles I Rubber I Leather I Wood 2.5
Vegetable 51.4
Other 7.8
Total 100.0
Parkin found that the waste paper content in the waste stream was low compared
with other countries, and he asserted that this was due to the 'extremely well
organized, large informal collection system operating [in Durban] which removes vast
quantities of paper and cardboard before event entering the formal waste stream'
(Parkin, 1995: 102). Parkin concluded that there was still considerable scope to
increase recycling in Durban, as the analysis of the waste stream pointed to the fact
that many recyclable materials were being landfilled (Parkin, 1995: 104).
In order to increase recycling, the eThekwini municipality has attempted a number of
initiatives. One such initiative has been education. Durban solid waste department
has set up a waste minimization and recycling office, which focuses on the education
of schools and community groups with regards to recycling. The office also aims to
make information about recycling available to the general public (eThekwini
Municipality, 2007).
Furthermore, the eThekwini municipality has made an effort to promote recycling
through the establishment of a number of buyback centres. These centres cater
largely for informal recycJers, as people can walk in with waste and exchange it at
market related prices for money. According to a representative at the waste
minimisation and recycling office, as of March 2006, the eThekwini municipality
managed a total of six buyback centres. In these cases, the municipality provided the
24
space for the facility as well as start up capital, for the site manager. Each centr&
specifies which materials they collect. In total, these buyback centres collect
approximately 468 tonnes of recyclables in a month (email from the waste
minimisation and recycling office of Durban Solid Waste, March 2006).
In addition to these buyback centres, the municipality also operate a number of
community drop off points. These sites offer communities an opportunity to separate
their waste, and drop it off in provided bins. They differ from buyback centres in that
no financial incentive is offered. As of March 2006, the municipality managed a total
of 17 community drop off sites. Sites tend to differ as to which materials they collect.
In total, these drop off points collect approximately 156 tonnes of recyclables in a
month (email from the waste minimisation and recycling office of Durban Solid
Waste, March 2006).
While community drop off points and buyback centres represent a large amount of
the total material recycled in Durban, it is important to remember that the private
sector also accounts for large volumes of recyclable material. Businesses, as well as
informal collectors may sell back their recyclable material to companies such as the
Reclamation Group and other private companies. The above should therefore not
serve as an indication as to the total amount recycled in Durban.
2.4. The urban informal sector
2.4.1. Defining the Urban Informal Sector
The informal recycling industry touched on above exists within a large sector of the
urban economy known as the informal sector. Defining this sector has been the
subject of much debate, and tends to differ according to countries, as well as school
of thought. Statistics South Africa defines the informal sector as follows:
'The informal sector consists of those businesses that are not registered in
any way. They are generally small in nature and are seldom run from
business premises. Instead, they are run from homes, street pavements or
other informal arrangements' (stats SA, 2004: xxvii in Skinner, 2006: 127).
25
Portes, Castells and Benton (1989) argue that the informal sector is 'a common
sense notion' (1989: 11), and 'a process of income-generation characterized by one
central feature: it is unregulated by institutions of society, in a legal and social
environment in which similar activities are regulated' (1989: 12). As Bernabe points
out there is 'no consensus over what constitutes the informal sector worldwide',
(2002: 5), and according to Bromley (1990), 'From its very origins in the early 1970s,
the concept of the informal sector has been beset by definitional problems' (1990:
335).
The term "informal sector" first appeared in the 1970s. This was a time of crisis in
development theory, as many of the accelerated growth strategies put forward had
failed. Increased population growth as well as rural to urban migration led to the
rapid increase of the urban population in many third world countries. Employment
creation was exceeded by the growth in the labour force. What became evident was
that people were not 'unemployed' in the narrow sense. Rather, they were 'engaged
in a multitude of small-scale unregistered, unmeasured and largely unregulated
"informal" activities' (Bernabe, 2002: 7). As May and Stavrou point out, 'once it was
accepted that there existed a group of urban dwellers who were unemployed,
poverty stricken and politically docile and whose existence was not temporary,
analysts began to investigate their lifestyle more closely to see how this group
survived' (May and Stavrou, 1989: 2). Theorists attempted to explain the
phenomenon of the informal sector, and this ultimately led to different conceptual
approaches.
2.4.1.1. Economic Dualism
This school of thought sees the economy as being divided into two distinct sectors,
namely the formal sector and the informal sector. Each is seen to have different
characteristics, and function under different conditions. The informal sector was
viewed as 'autonomous and an economy in its own right' (Bromley, 1990: 336). The
earlier definitions relating to the informal sector subscribed to this line of thought.
One of the earliest definitions of the informal sector subscribed to this view. Hart,
who conducted research into Informal income opportunities in Accra, Ghana argued
26
that 'the distinction between formal and informal income opportunities is based
essentially on that between wage-earning and self-employment' (Hart, 1973: 68).
Commenting on Keith Hart's definition, Bromley notes that, 'For Hart, informal
income opportunities were ways for the poor to get by when neither corporations nor
the government could provide sufficient employment for the expanding population'
(Bromley, 1990: 335). Dne of the criticisms of Hart's definition is that it precludes 'the
possibility of workers being employed by informal sector operators' (Davies, 1979: 88
in De Kock, 1987: 10).
The international labour organization (ILD) also expanded on the dualist
interpretation of the informal sector, in their 1972 Kenya Report. The ILD theorists
'suggested there existed a marginal, poor, "informal" sector of the urban economy,
which produced goods and created employment and income for the poorest of the
poor' (ILD 1972 in Bernabe 2002: 7). According to the lLD, the informal sector could
be defined using seven distinct criteria (Bromley, 1990: 336). These criteria were as
follows:
• easeof entry
• Reliance on indigenous resources
• Family ownership of enterprises
• Small scale of operation
• Labour intensive and adapted technology
• Skills acquired outside the formal school system
• Unregulated and competitive markets (lLD, 1972 in De Kock, 1987:
11).
The ILD saw 'small-scale industrial, handicraft, and repair establishments as the
core of the informal sector and the priority for government support' (Bromley, 1990:
336). Bernabe points out that while Hart (1973) defines the informal sector in terms
of the individual, focusing on wage-earnings for the formal sector employee, and
self-employment for those in the informal sector, the ILD definition focuses on units
or enterprises (Bernabe, 2002: 7), and describes means of production.
Some scholars argued that this dualistic interpretation of the informal sector is
informed by western experience. According to Gerry, 'The 1930s' depression in
27
Western economies had supported the contention that the persistence of a small,
apparently independent sphere of the economy provided two essential components
for future growth' (Gerry, 1987: 107). Thus, those who are involved in the informal
economy are seen as people who are structurally unemployed, and the informal
sector thus provides work for these individuals. Secondly, it is believed that once the
economy in question does take off, the informal sector will provide 'a launch pad for
would-be entrepreneurs' (Gerry, 1987: 107). This influenced the policies of those
following the dualism school of thought.
Those who took a dualistic position on the informal economy argue for policies to
support the urban informal sector, which is seen as an important tool for poverty
alleviation. While certain policy approaches have been put in place for the formal
sector, those taking a dualist position argue that different policies need to be put in
place for the informal sector. Government deregulation (in the form of abolishing
policies that discriminated against small enterprises) is encouraged combined with
government intervention in areas such as training, access to credit, and marketing
(Gerry, 1987: 109). The ILO's position is essentially reformist, and is 'aimed at
achieving income transfers to benefit the poor, without prejudicing too much of the
pre-existing capitalist basis for economic growth' (Gerry, 1987: 109).
Although the Hart definition and the ILO approach are the most common dualist
definitions, others offer alternative interpretations. For example, PREALC, the ILO's
World Employment Programme in Latin America sees the informal sector as 'a
marginal unprotected sector of the economy in which people survive' (Bernabe,
2002: 8). The PREALC definition focuses on income and employment rather than
units (such as in the case of the ILO definition). Other dualist approaches have
defined the informal sector 'vis a vis "state protection'" (Bernabe, 2002: 8). These
dualist interpretations argue that while formal sector activities have the benefit of
government support in terms of import protection and access to credit, those working
in the informal sector have to survive entirely on their own.
2.4.1.2. Criticisms of Economic Dualism
28
Early work on the informal sector almost entirely centres around ideas of economic
dualism, however, this has been criticized by some. As Bromley argues, the
approach of economic dualism leads to the classification of all activities into either
the formal sector or the informal sector, causing 'a great lack of clarity as to what
else exists apart from these two sectors and how to classify anything that does not fit
into the definition' (Bromley, 1978b in De Kock, 1987: 12). The debate surrounding
economic dualism focuses on classification, and draws attention away from the more
important issue of identifying the underlying causes that result in the informal sector.
As Gerry pointed out, the dualistic discourse 'avoids any discussion of the economic
structure as a whole and the conditions underlying the relations between
characteristically different production processes co-existing in the urban national and
international economy' (Gerry, 1978: 1149 in De Kock, 1987: 13). Thus, many
scholars then turned their attention to explaining the phenomenon of the informal
sector, rather than classifying and defining it.
A Marxist critique of the informal sector debate emerged in the 1970s. Marxists
argue that formal and informal sector activities are not separate and independent,
but rather 'parts of one overall capitalist system in which informal activities are
subordinate to, and dependent on, the formal sector' (Bernabe, 2002: 9). This school
of thought points to an explanation of the existence of the informal sector, as well as
rejecting previous definitions. As Gerry points out, 'they saw the economic activities
of the nonwaged urban poor as constituting a subordinate petty commodity form of
production coexisting with a dominant capitalist mode of production' (Gerry, 1987:
112). The existence of these petty commodity producers (or those involved in the
"informal sector") benefits capital in two ways. Firstly, their presence means that
there is a large supply of labour eager to enter into formal sector employment. This
puts downward pressure on urban wage levels, keeping them low and enabling
capital to benefit. Secondly, capital also benefits from the cheap goods and services
available in the informal sector.
Marxists argue that those employed in the so-called 'informal sector' are little more
than 'disguised wage workers indirectly exploited in particular through the
subcontracting system' (Gerry, 1987: 112). In many cases, capital would not be able
to function without the goods and services of these petty commodity producers.
29
Capital thus gains the benefits of these services and goods from petty commodity
producers without offering the benefits and protection of formal employment.
According to Marxists, the state facilitates this relationship between petty commodity
production and capital, as well as perpetuates poverty. They argue that 'the poverty
found in the informal sector [is] due to its relations with capitalist production and
distribution and with a state that furnished conditions propitious for capital
accumulation' (Gerry, 1987: 111). Thus, government policies aimed at supporting the
informal sector are believed to transform both the small proprietor and his or her eo
workers into disguised wage workers serving the interests of capitalist growth (Gerry,
1987: 113).
This view was promoted by Birkbeck (1979), who conducted a study into the informal
recycling sector in Cali, Columbia. Birkbeck found that garbage pickers worked for
the recycling factories, but were not employed by them. The garbage pickers were
responsible for large amounts of waste paper, but remained poor because of the
economic forces in operation. Birkbeck noted that 'rather than view the picker as a
vagrant who should really be working in a factory, we should see him as a worker
who is part of an industrial system' (Birkbeck, 1979: 161). Birkbeck also pointed out
that the garbage picker was involved in the occupation for survival reasons, due to
the lack of economic opportunities available to him or her (Birkbeck, 1979: 161).
This Marxist view of the informal sector is also supported by Wilson, who looked at
three different groups of informal workers: street vendors, brick makers, and garbage
pickers. She found that they are not 'part of a traditional sector divorced from the
modern sector...Rather, they retail products manufactured in the formal capitalist
sector (in the case of street vendors) or provide inputs consumed by that sector (in
the case of garbage pickers and brick makers)' (Wilson, 1998: 114). These activities
are 'intimately connected to the capitalist system and facilitate the generation of
greater profits within that system' (Wilson, 1998: 114). Ultimately, she concludes that
the workers in the groups she studied are directly and indirectly used by capitalist
firms, and the workers subsidize the capitalist system as a whole (Wilson, 1998:
114).
30
Within the Marxist framework, scholars have considered the relationship between the
capital and petty commodity producers. As Bromley notes, most scholars have
rejected the concept of dualism and have adopted a 'dominance - dependence type
formulation' (Bromley, 1990: 336) where the informal and formal sector are seen to
be interdependent. Portes, Castells and Benton suggest that there are at least three
different types of informal activities. These activities vary in their linkages to the
formal economy, as well as in their dependence on it. The first are subsistence
activities, which are 'required for sheer survival' (Portes et ai, 1989: 300). Secondly,
there are those activities that interlock and are subordinate to formal sector activities,
and thirdly, there are those activities that 'offer potential for autonomous growth'
(Portes et ai, 1989: 300). An example of this would be a situation where 'one begins
to work informally in order to learn a profession' (Capecchi, 1989: 211).
Bromley and Gerry also expand on the idea of an informal to formal continuum of
employment. They suggest that casual, or "informal" work, could be grouped into
four different categories (Bromley and Gerry, 1979). Short~term wage work describes
a situation in which an individual is 'paid and contracted by the day, week, month or
season' (1979: 5). Thus, while the worker is contracted by law, the worker receives
none of the benefits afforded to formal wage workers. Secondly, there are those who
operate as disguised wage workers. This group is distinguished by the fact that 'a
firm, or group of firms regularly and directly appropriates part of the product of a
person's work without that person legally being an employee of the firm or group of
firms' (Bromley and Gerry, 1979: 6). The third category of casual work is dependent
work. In this situation, 'the worker is not in wage-work or in disguised wage work but
is dependent upon one or more large enterprises. The dependence can be in the
form of credit, supply of material, equipment, or premises' (Bromley and Gerry, 1979:
6). Bromley and Gerry offer the example of a taxi driver, who rents a vehicle in order
to run his business (Bromley and Gerry, 1979: 6). The last type of casual work
identified by Bromley and Gerry is true self-employment. In this case, 'a person
works independently, obtaining an income without engaging in wage-working,
disguised wage-working, or dependent working' (Bromley and Gerry, 1979: 6). A
characteristic of true self employment is having a choice of suppliers, and owning the
means of production.
31
The idea of an informal-formal economy continuum is supported by Lund and
Skinner (2003). They point out that there is no clear line separating informal and
formal economic activities, and 'there are few informal operators who are not linked
(either by supply of inputs or demand for goods or services) into the formal economy'
(2003: 2). Skinner (2006) suggests that 'There is increasing consensus in
development literature that rather than viewing informal activities as part of a
separate sector they should be viewed as part of the entire economy which has
formal and informal ends' (2006: 128). Lund and Skinner also point out that since the
late 80s, there has been a trend to consider sectors within the informal economy,
and an emphasis has been placed on approaching the informal economy on an
industry-by-industry basis (Lund and Skinner, 2003: 3, Skinner, 2006: 128)
Portes, Castells and Benton (1989), and Bromley and Gerry (1979) argue that there
are linkages between the formal and informal sectors, and the extent of dependence
on the formal economy differs according to the type of casual work done. The idea of
a continuum of work from informal to formal contradicts the dualist model, which
proposes that the formal and informal spheres of the economy are separate.
However, others argue that the concept of dualism does not 'necessarily deny the
presence of interdependence' (Sethuraman, 1981 in Bernabe, 2002: 10), and that
the concept of dualism provides a way in which to classify activities, but these
activities need not be viewed as independent.
2.4.2. The Causes of the Informal Sector
While some have sought to define, and explain the informal sector conceptually,
others have turned their attention to the underlying causes which result in the
informal economy. It appears that these arguments can roughly be grouped into two
categories: those who believe that the informal sector is a result of poverty, or arises
out of a need for individuals to survive; and those who believe that the informal
economy is a result of heavy state bureaucracy and excess regulation (Bernabe,
2002: 11).
A common idea, put forward by those arguing for reformist policies, and emanating
from the dualist school of thought, is that the informal economy is a result of the
32
economic restructuring that took place in the 1970s (Portes, Castells, Benton 1989:
27). People were left with little or no job prospects in the formal sector, and the
informal sector became an area in which this large group of "unemployed" people
sought refuge. Poverty and desperation is what drove people to find employment
opportunities in the informal sector.
Marxists argue that the informal sector is a result of petty commodity producers
being forced into the informal sector due to lack of opportunities in the formal sector.
As discussed in section 2.4.1.2, Marxists argue that informal workers are kept in their
position by capital and the state and that those involved in the informal sector are not
there by choice. Poverty and a need to survive, caused by capital, is thus the main
cause of the informal sector.
Portes, Castells, and Benton point out that unionization can also be held partly
responsible for the extent of the informal sector (1989: 28). A powerful union means
that a large group of unemployed people will have less of an impact on the urban
wage rate, and despite the fact that labour supply is high, there will be little
downward pressure on the wage rate. This is the case in South Africa, where labour
is organized and as a result unit labour costs are high compared to countries at a
similar stage of development. This, in turn, has discouraged investment in labour
intensive industries, resulting in a high unemployment rate and a growing informal
sector.
The above arguments, although emanating from different schools of thought and
conceptual angles, both argue that 'activities are undertaken as an alternative to
open unemployment since, in the absence of social security benefits, individuals
cannot afford to be unemployed' (Souza and Tokman, 1976: 355-356 in Bernabe,
2002: 11). This view is supported by the PREALC approach discussed above, which
stresses the survivalist nature of the informal sector.
While many argue that poverty and a need to survive is ultimately responsible for the
informal sector, others point out that the informal sector may be nothing more than a
response to a bureaucratic and over regulatory state. This legalist view is put forward
by Hernando De Soto, who argues that underdevelopment and the informal sector
33
was a result of a mercantilist system, which the government abuses to its own
advantage. As Bromley explains, Desoto argues that 'informality is...a mass
response to mindless, pompous bureaucracy and to the manipulations of the
economic system by vested interest groups' (Bromley, 1990: 331). Informal sector
workers are argued to have shown 'tremendous initiative and entrepreneurial
dynamism by finding "informal" means of production and reproduction ...that fall
outside the governments "planned", "regulated," and "managed" economy' (Bromley,
1990: 330 - 331).
Those agreeing with this legalist view argue for policies embracing the informal
sector, and viewing it rather as a path to development. De Soto and his followers
point out that what is needed is 'deregulation, decriminalization, and accelerated
legalization' (Bromley, 1990: 332). Commenting on development in Peru, De Soto
points out that capitalism is not the problem, but rather the absence of it (De Soto,
1986 in Tsoeu, 2003: 22). The 'free market' is essentially blocked by bureaucratic
processes and red tape, resulting in informal sector workers turning their backs on
this process, exercising their own power, and ignoring a legal system that is
unreasonable.
Other examples of how state policy and regulation can affect the informal sector are
put forward by Portes, Castells, and Benton (1989). They suggest that the growth of
the informal economy could be somewhat attributed to 'the state's regulation of the
economy, both in terms of taxes and social legislation' (1989: 28). This is slightly
different from De Soto's idea, as rather than growing out of excessive bureaucracy,
growth in the informal sector can be at least partially attributed to firms wishing to
escape the welfare state. Another reason for growth in the informal economy put
forward by Portes, Castells, and Benton is the increase in international competition.
As cheaper goods flood local markets, local firms cannot compete at the legislated
wage rate. They must decide either to 'close down their plants or move them
underground' (Portes et ai, 1989: 28).
However, it is likely that the informal economy cannot be explained by one factor
alone. Rather, the informal economy is likely to be caused by a combination of the
above factors. In addition to this, there has been an acknowledgement in recent
34
years, of the need to consider the informal economy sectorally (Skinner, 2006: 128).
For example, factors causing informality in the textile industry may be different to the
factors causing the informal recycling industry. In addition to this, Gerry points out
that policies and interest in the informal sector have 'tended to wax and wane
according to the cycle of boom and slump in the national and international economy
alike' (1987: 100). Gerry argues that it is necessary to understand the historical
context and the trends in development theory in order to understand the approaches
towards the informal sector.
2.4.3. Gender in Informal Sector
Gender relations within the informal economy deserve special mention, as they are
often unequal, exploitative, and have been given little attention in the literature.
According to Wilson, 'Although many studies of the informal economy tend to be
gender-blind, being male or female affects one's movements, possibilities, and
career trajectories in the informal sector' (1998: 105).
Women can be involved in the informal economy either independently, or as workers
in a family business or other business. However, 'Women heads of household,
abandoned, separated, or widowed, more often depend on their informal sector work
for the majority of household income' (Wilson, 1998: 105). Therefore, these
individuals are less likely to be involved independently in the informal sector, and are
more likely to be reliant on it for survival.
Women involved independently in the informal sector face many obstacles. Skinner
(2006) conducted a study of those working in the informal economy in Durban. She
found that women were less likely to employ others, with 76 percent of the one
person enterprises interviewed owned by women (2006: 133). Overall, Skinner found
that 'men were more likely to employ others, are better off and have more assets, all
of which facilitates accessing services' (2006: 145). This lack of assets and contacts
was also confirmed by Wilson, who found that 'women who work independently of
their husbands are disadvantaged in setting up micro enterprises such as sewing
workshops or street vending stalls by their lesser access to capital and to the skills
35
needed for buying and marketing' (Rakowski, 1987; Lycette and White, 1988 in
Wilson, 1998: 105).
While women who operate independently in the informal sector may be exploited,
those who work in a family business may also face exploitation. Wilson offers an
example of women working in the informal sector in Mexico. She points out that
gender ideology in Mexico prescribes that it is shameful for a wife to work, as her
husband should be able to support her, and secondly, it undermines the ability of the
male household head to control their wives movements (1998: 115). 'To maintain the
appearance of males' fulfilling their ideal roles as head of household, both women
and men may consciously hide women's labour contributions to the family economy'
(Melhus, 1993 in Wilson, 1998: 115). Women are therefore exploited further, as their
contribution to the economy is not recognized, and this practice reinforces the view
of women as the subordinate sex, dependent on males for their survival.
There has been an attempt on the part of some non-governmental organizations
(NGO's) to create organizations that support women within the informal sector, and
give them a voice. One such example is the Self-employed Women's Union (SEWU)
that was started in Durban in the mid 1990's. In 1995, SEWU met for a workshop to
discuss the place of women within the informal sector. The workshop showed the
subordinate position of women within the informal sector, confirming that women can
mainly be found in the lower-income selling activities. Participants pointed out that
'once one kind of trading activity becomes more profitable, we find men taking over
that type of activity' (SEWU, 1995: 12).
The workshop also touched on the issue of organization within the urban informal
sector. Although there are many organizations that can be found, these do not tend
to draw a distinction between workers and employers. Therefore, these
'organizations 'tend to represent in practice the interests of the most powerful
entrepreneurs at the upper end of their particular sector' (SEWU, 1995: 13). For
example, the African Council of Hawkers and Informal Businesses is a membership
based organization that supposedly makes certain products and services available to
their constituencies, at a price. There is no legal control over the body ensuring that
they operate in a fair manner. Furthermore, the organization has an 80% women
36
membership, and an 100% male leadership (SEWU, 1995: 14). The lack of
representation of women, as well as the fact that the most powerful individuals
involved in the informal sector are disproportionally represented, further points to the
inferior status of women in this sector, as well as society as a whole.
2.4.4. Informal sector in South Africa
Informal recycling falls within the informal economy as a whole. It is therefore
important to have an understanding of how the informal sector functions in South
Africa, the policy approaches towards it, and the historical context in which it
developed.
Apartheid had a significant effect on the development of the informal economy in
South Africa. According to Lund and Skinner, 'Apartheid legislation limited the range
of goods that could be sold, blocked the formation of companies by black people,
and set up an array of bureaucratic processes that discouraged the registration of
small-scale economic activity' (2003: 3). This legacy still remains today. Due to
apartheid, as well as a relatively strong formal sector, the informal sector in South
Africa is less prominent than in other developing countries (Lund and Skinner, 2003:
3). In November 2003, 'President Thabo Mbeki introduced the idea of there being a
"first and "second" economy in South Africa' (Skinner, 2006: 125). This "second
economy", as defined by the government is 'mainly informal, marginalized, unskilled
economy, populated by the unemployed and those unemployable in the formal
sector' (ANC Today, 2003 in Skinner, 2006: 125). It appears, from these statements,
that the South African government views the lack of skills as the main cause of
unemployment, and the reason that individuals enter this sector.
While many positive changes have been made since South Africa became a
democracy, unemployment, one of the major contributors to poverty, has increased.
One of the areas in which there has actually been a growth in employment has been
the informal sector (Skinner, 2006: 125, McLean 2000b: 10). However, the size of
this sector is difficult to estimate. Recent research suggests that 'between 25% and
30% of South Africans who are presently working, operate in the informal economy'
(Devey et ai, 2003a in Lund and Skinner, 2003: 3). The inequality in the informal
37
sector with regards to gender has also been researched, and the 2001 Labour Force
Survey found that there are more women working in the informal sector than in the
formal sector (StatsSA 2001b in Lund and Skinner, 2003: 4). While men still
dominate in both the informal and formal sectors, the gender disparity in the informal
sector is not as large as in the formal sector (2001 labour force survey in Lund and
Skinner, 2003: 3). Statistics South Africa has also found that the wholesale and retail
sectors dominate the informal sector in South Africa (Stats SA in Lund and Skinner,
2006: 4), with 'just over half of all informal workers located in this sector' (Lund and
Skinner, 2003: 4). The informal economy is said to contribute 'between 8-12 percent
to gross domestic product' (Budlender, Buwembo, Chobokoane and Shabalala in
Skinner, 2006: 127). This is clearly a substantial amount and has fuelled a renewed
interest in the informal sector on the part of government.
The informal sector in South Africa falls under the jurisdiction of different government
departments. At a national level, the Department of Trade and Industry is
responsible for 'growing small businesses, including informal enterprises' (Skinner,
2006: 126), while the Department of Labour is responsible for providing training
services to both formal and informal enterprises. Local government also has an
important role to play in 'shaping the environment that those working in the informal
economy operate' (Skinner, 2006: 126).
While the government has an influence on the regulatory environment surrounding
informal work, many other factors influence the investment climate for the informal
economy. Lund and Skinner (2003), elaborate on these. The regulatory environment
has an impact on informal sector work. The regulatory environment includes
legislation, taxes, and registration and licensing. While labour legislation has little
effect on informal sector work, municipal by-laws can have a significant impact on
the informal economy, by designating where people are allowed to trade. While
many people believe that the "decision" to operate informally is motivated by tax
evasion, Lund and Skinner point out that '90.6% of those working in the informal
economy reported monthly earnings of R2500 or below' (Lund and Skinner, 2003: 8),
This is well below the tax threshold. With regards to registration and licensing, Lund
and Skinner argue that the process is complicated and costly, and is even more
difficult if one is foreign (Lund and Skinner, 2003:10). They also suggest that the
38
informal economy is affected by the institutional environment. They stress the
importance of including the informal sector in the decision making process.
While the regulatory and institutional environments have a huge impact on the ability
of the informal sector to function, the access to services and infrastructure are
important factors affecting growth in the informal economy. Lund and Skinner
elaborate on the different services offered to informal sector workers, including
access to training, markets, and financial services and insurance. They point out that
while the department of labour has been tasked with providing training to workers,
this has not reached significantly into the informal sector (Lund and Skinner, 2003:
13). Although the informal sector is involved in the local economy, 'There is no
evidence to indicate that any of those working in the informal economy in South
Africa are successfully accessing international markets' (2003: 16), and access to
finance and insurance in the informal sector, a factor critical to business growth, is
still underdeveloped (2003: 18). Infrastructure requirements are similar in both the
formal and informal economies, 'They both need secure space...which comes with a
known and reliably delivered set of services (lighting, water, toilets, garbage removal,
security, storage)' (2003: 20). Sites range from a complete set of services, to none
whatsoever.
Another huge factor impacting on the informal sector is crime. This factor not only
has an impact on shaping the business environment in the informal sector, but also
impacts on the formal sector, as well as each and every South African. Lund points
out that 'in a survey of over 500 traders operating in Durban 41% of women traders
and 33% of men traders reported that theft and criminal violence was the biggest
obstacle faced by their business' (Lund, 1998: 31 in Lund and Skinner, 2003: 21).
While some of these factors influencing the informal sector do not have that much of
an effect on the informal recycling sector, it is important to point out the contextual
position of the informal economy in South Africa as a whole, so as to gain an
understanding of the conditions under which it functions.
2.4.5. Informal Sector in Durban
39
While section 2.4.4 above elaborated on the informal sector in South Africa, it is
important to consider how the sector functions in Durban, the area in which this
current study is located. Historically, the development of the informal sector has
been hampered by apartheid legislation, and the "move on laws" which prohibited
street traders from occupying one spot for longer than half an hour (Lund and
Skinner, 2003: 6). These laws were relaxed towards the end of apartheid, and now
street trading and other informal activities are very much a part of the urban
landscape in Durban. In 1996, when the new South African constitution came into
effect, local government were given 'a new range of tasks, one of which was the
promotion of local economic development' (Lund and Skinner, 2003: 4). The informal
sector, clearly a sector providing employment to many, had therefore to be
considered and accommodated by local government.
According to current estimates, 'only one in three economically active people in
Durban are employed in the formal sector' (Durban Unicity's Economic Development
Department in Lund and Skinner, 2003: 5). The informal sector therefore provides a
livelihood for many individuals in Durban. Skinner (2006) conducted a survey on
informal economy workers in Durban. She conducted 507 interviews, and gathered
information as to the socio-economic characteristics of the participants, as well as
their working conditions.
Skinner found that 'Six in ten informal enterprises reported earning R1000 or less'
(Skinner, 2006: 135). Very few of the businesses interviewed earned more than
R5000 a month. Considering household income, just over one in ten respondents
reported that they were living in households with an income of between R5001 and
R10000 a month. Nearly a third claimed to be living in households with a monthly
income of between R2001 and R5000, while 'One in four respondents reported liVing
in very poor households - living in households whose totally monthly income is
between zero and R1000' (Skinner, 2006: 129). According to Potgieter, (2002: 61)
the Household subsistence level for Durban for September 2001 was R1914.97
(Potgieter, 2002: 61 in Skinner, 2006: 129). Over half the respondents in Skinner's
survey lived in households with incomes below this level. Informal workers in Durban
were found to have 'large numbers of people dependent on their income' (Skinner,
2006: 129). Skinner found that in 40% of cases the interviewee was the only income
40
earner in the house, and in 45% of cases there was just one other income earner in
the house (Skinner, 2006: 129).
The survey confirmed that 'the informal economy absorbs the unemployed and those
who have been retrenched' (Skinner, 2006: 130), and it was also found that the skills
that were gained in formal sector work were not necessarily being used in the
informal sector. In addition to this, the research found that only 26% of the
businesses surveyed were established before 1990 (Skinner, 2006: 130), pointing to
the growth of the informal sector after apartheid restrictions were abolished (Skinner,
2006: 130).
Skinner's survey also pointed to linkages between the formal and informal sectors,
and found that backward linkages into the formal economy were stronger than
forward linkages. Backward linkages into the formal economy were found to exist in
the form of informal workers relying on formal establishments for supplies and raw
materials. Six in every ten enterprise owners identified medium to large enterprises
as a source for supplies. Forward linkages into the formal economy were found to be
less strong than this. 'Only 26 respondents (5%) said they sold to other informal
enterprises. Fifteen enterprise owners (3%) reported that they sold to formal
enterprises and only 11 owners (2%) said they sold to middlemen or agents'
(Skinner, 2006: 133).
Skinner's survey also touched on the working environment of the people interviewed,
as well as their ability to access services and support. She found that 'Over half - 56
percent - of the enterprise owners interviewed, reported that they had one or more
person working with them' (Skinner, 2006: 133). In terms of access to business
support, Skinner found that few informal sector workers had been able to access
this. Of those interviewed, only 4% had been able to obtain a bank loan, while 14%
had attempted to get credit (Skinner, 2006: 138). Among reasons for not getting
loans, 'collateral requirements, complicated procedures and banks not being
interested in this kind of business' (2006: 138) were given. Lack of access to training
was also pointed out in this survey, as 88% of respondents indicated that they had
never received help through training or any other assistance programme (Skinner,
2006: 139). However, '57 percent of respondents report[ed] lack of funds and credit
41
as a major problem' (Skinner, 2006: 140), while only 14% identified lack of training
as a problem.
Crime was also indicated to be a factor effecting informal sector workers, with 16%
of those interviewed reporting that their business had been a victim of crime in 2001
(Skinner, 2006: 134). However, 'it appears as if crime was not as big an issue in the
informal economy in Durban as it was in the formal economy' (Skinner, 2006: 134).
The research surrounding the informal sector in Durban appears to focus
predominately on street trading, as this is the main informal activity in the city. While
the above study did not appear to include those involved in the informal recycling
industry, the findings are a useful comparison against which this study can be
measured.
2.5. Urban Poverty and vulnerability
The informal sector and those working informally in Durban have been elaborated on
above in section 2.4.5. As stated, many of the individuals operating in this sector are
not there by choice, and make barely enough to survive. The majority of this group of
people thus live in a state of poverty and can therefore be considered vulnerable.
Discussing urban poverty is therefore crucial in terms of understanding their living
circumstances.
Poverty has been defined in a number of different ways, but is commonly defined as
the 'inability of individuals, households, or entire communities to command sufficient
resources to satisfy a socially acceptable minimum standard of living' (May, 1998 in
Mclntosh, 2004: 3). It is a concept that is often defined in quantitative terms (for
example, the World Bank classifies those who survive on less than 1 US dollar a
day, poor). However, poverty means more than simply a lack of resources in
monetary terms. New techniques to define poverty have highlighted 'how the poor
define poverty in multidimensional ways that encompass self-respect, autonomy,
access to land, and so on, rather than income alone' (Mcllwaine, 2003: 114). This is
amplified by lack of choices, and marginalization from society. Rakodi argues that
'key features of poverty are a high degree of exposure and susceptibility to the risk of
42
crises, stress, and shocks, and little capacity to recover quickly from them' (Rakodi,
2002: 14)
Research has generally confirmed the relationship between being poor and working
in the informal economy (See, for example, Skinner 2006 and McLean 2000b). As
Skinner (2006) points out, 'Supporting those in the informal economy thus becomes
an important poverty alleviation task' (2006: 146). Many studies conducted into the
informal recycling industry confirm these findings. Wilson et al describe the garbage
pickers as the 'poorest of the urban poor' (2006: 27). Tevera (1994), and Medina
(2001) both point out that while poverty is an important reason for waste picking, it is
not the only one. Resource scarcity can also drive the informal recycling industry.
Those involved in the informal recycling industry are not only poor; they are also
vulnerable to specific risks. While poverty considers the material conditions and
access to resources by an individual, vulnerability broadens this to include a number
of other factors that impact on an individual's life. Waiters states that 'urban
vulnerability can not only be defined by material conditions: definitions must be
broadened to include issues of powerlessness, voicelessness, unemployment,
capacity and access to resources' (Waiters, 2002: 2), while McLean notes that
vulnerability suggests that 'an individual, a household or a community is at risk,
being unable to plan or cope in times of crisis' (McLean 2000b: 10). Vulnerability is
also influenced by the prevailing social, economic, environmental, and political
conditions (McLean 2000b: 10). Wilson et al point to the lack of choice for individuals
who are vulnerable, suggesting that this hampers them from entering more
conventional occupations (Wilson et ai, 2006: 7).
Although informal recycling can help those involved reduce their vulnerability,
through providing an income, it also increases their vulnerability by subjecting them
to risks. Rouse (2006) conducted a study into waste pickers at the Jam Chakro site
in Karachi, and found that the waste was heavily soiled and carried a high risk of
infection by the time it arrived at the landfill. The informal recyclers were therefore
subjected to a health risk, adding to their vulnerability. Waiters (2002) conducted a
study into the waste pickers working at the Bisasar Road landfill site in Durban and, ,found that the pickers were exposed to a number of risks. These include the
43
possibility of landslides, the risk of being run over by a compactor or other vehicle,
and the possibility of being cut by sharp objects on the landfill (Strachan, pers
comm., 08-09-99 in Waiters, 2002). However, the pickers on the landfill claim these
risks are of little consequence, possibly because 'pickers are afraid to admit to some
of the dangers since this may give DSW [Durban Solid Waste] cause to refuse them
access to the site' (Waiters, 2002: 8) and 'because these are accepted as the day to
day hazards that can be avoided if one is careful' (respondent, 6-03-2000 in Waiters,
2002: 8). This suggests that the pickers suffer further vulnerability, as they lack job
security and are concerned that they may be not allowed on to the landfill to work.
2.6. Conclusion
This chapter has outlined some of the literature informing this study. Understanding
environmental sustainability and urban waste management in the developing world
context is vital, as the informal recycling industry is a part of this system, and
ultimately adds to environmental sustainability, helping to reduce the ecological
footprint of the city in question. Similarly, understanding solid waste management
and the recycling environment in South Africa and specifically in Durban is
necessary as this also forms the environment in which informal recycling occurs. The
literature surrounding the origins, causes, and conceptual approaches towards the
informal sector provides a theoretical lens through which the results of this study
may be viewed. Informal recycling is an informal activity, and therefore an
understanding of this theory is necessary. Many studies about the informal sector,
and the informal recycling sector have shown the participants in these fields to be
poor. An understanding of the literature relating to urban poverty and vulnerability is
therefore necessary.
While the literature presented in this chapter has provided information as to the
environment in which informal recycling exists, it has not focussed specifically on the
informal recycling industry. This is discussed in detail in the next chapter.
44
Chapter 3: The Informal Recycling Industry
3.1. Introduction
In many countries, an informal recycling industry runs parallel with the formal waste
collection system. The sector is extremely important in a number of developing
countries, where 'the informal sector...directly provides a waste collection service in
areas where there is no formal municipal system in place' (Wilson et ai, 2006: 3).
Informal recycling has been defined as 'the activity involved in the collection and
disposal of culturally-defined waste materials, whether the activity be done directly
for subsistence (food, clothing, and artefacts), for exchange, for sale, or for wages
or, as is sometimes the case, for some combination of these' (Blincow, 1986: 97 in
Tevera, 1994: 22)
Research into the informal recycling industry originally focused on 'how the urban
poor were eking a living at the periphery of the formal economy' (Tevera, 1994: 21),
as well as the relationship between informal collectors and the formal recycling
companies (see for example, Birkbeck, 1979). More recently, attention has turned to
the social aspects of informal collecting, and the characteristics of the participants in
this line of work. In this chapter, attention will be paid to literature relating to the
different aspects of informal collection, ranging from the organizational structure of
informal collection systems, to the socio-economic characteristics of the garbage
pickers. Literature which discusses the working environment of the pickers, as well
as government policy and attitudes towards informal collection will also be given
attention.
3.2. Organisational Structure
The word "informal" is somewhat misleading, as research into informal recycling has
found the industry to be highly orqanized, both between collectors, as well as
between informal collectors and formal recycling companies (Van Beukering, 1996,
Hayami et ai, 2006). As Rogerson points out, 'Scavengers present only one element
in the numbers of entrepreneurs that link to waste management... [and there]...exists
a recognizable recycling chain beginning from the urban household or the small
45
urban factory, running through networks of informal scavengers to groups of
"middlemen", in terms of dealers and buyers, who in turn sell to more formalized
recycling operations' (Rogerson, 2001: 249). Understanding the linkages within the
informal recycling industry, as well as between the formal and informal recycling
industries is important, as 'the way the informal recycling activities are organized has
important consequences for income generation, working conditions and social status'
(Wilson et ai, 2006: 4). The organization of the industry thus has an effect on the
economic characteristics, and working environments of the participants.
3.2.1. Types of informal collectors
Wilson et al note that in cities where informal collection runs parallel with formal
collection, four main categories of informal recyclers exist. The extent to which these
different categories are represented will differ according to location 'depending on
where and how material recovery takes place' (Wilson et ai, 2006: 2), however,
Wilson et al argue that generally the following four categories of collectors can be
found:
1. Itinerant waste buyers: These are 'waste collectors who often go from door to
door, collecting sorted dry recyclable materials from households' (2006: 2).
They then buy the material and transport it to a recycling shop or buyback
centre.
2. Street waste picking: These individuals sort to recover 'secondary raw
materials... from mixed waste thrown on the streets or from communal bins
before collection' (2006: 2)
3. Municipal waste collection crew: 'Secondary raw materials are recovered from
vehicles transporting MSW to disposal sites' (2006: 2).
4. Waste picking from dumps: 'Waste pickers/scavengers sort through wastes
prior to being covered....This is often associated with communities that live in
shacks, built from waste construction materials, on or near the dump' (2006:
2).
Using this framework presented by Wilson et al (2006), each category of informal
collector is elaborated on, and examples used to demonstrate how each group adds
to informal recycling as a whole. Thereafter, organizational structures within the
46
informal recycling industry are elaborated on. Following this, the linkages between
formal sector recycling and informal recycling are then discussed.
Itinerant waste buyers are considered to be higher up in the informal recycling
industry than waste pickers. Extensive research has been done on the well
organized informal recycling sector in India. Van Beukering et al (1996) found that
this group of door to door buyers were slightly better off than the waste pickers, who
sort through waste for recyclables. Hayami et al point out that waste collectors and
itinerant waste buyers form the bottom of the informal recycling hierarchy, as 'both
earn their livelihood by selling collected waste to higher level traders' (Hayami et ai,
2006: 42). The main distinguishing characteristic between itinerant waste buyers and
waste pickers, is the access to capital. Itinerant waste buyers need capital to
purchase waste. In addition to this, itinerant waste buyers were found to collect
larger volumes of waste, and thus have different transportation methods to the waste
pickers (Hayami et ai, 2006: 48). Hayami et al also found this group to be slightly
better off financially than the waste pickers.
Street waste pickers make up a large portion of informal recyclers in Durban. Their
work consists of those going through waste in public areas to extract recyclable
material. Often, this is done on waste collection days, before the municipal service
collects the waste. Generally, this group of people scavenge in particular areas,
close to buyback centres that are known to them. Occasionally, a picker may have
an agreement with a business or factory to collect their waste material. Pickers differ
from itinerant buyers in that they do not pay for the recyclable material which they
collect.
Some extraction of recyclable materials occur while waste is being transported. The
municipal waste collection crew may extract material in order to supplement their
income. According to Wilson et ai, this practice is widespread in a number of
countries such as Mexico, Columbia, Thailand, and the Philippines (Wilson et ai,
2006: 2).
Waste picking off landfills is very popular in developing countries around the world.
While most of the time the authorities or management of the landfill view picking in a
47
negative light, at many dump sites it is tolerated. However, this group are often at
odds with the authorities, and this makes for a precarious and insecure working
environment (see, for example, Waiters, 2002, and De Kock, 1987).
Rouse conducted a study into waste picking at the Jam Chakro site in Karachi, and
found that waste pickers operate in a highly organized manner. The informal
landlord, known as a vadera, 'lets plots of land of the landfill site to individual waste
pickers for around Rs 50/month. Waste pickers then pay truck drivers around Rs.
50/truck to dump waste on their particular plot' (Rouse, 2006: 4). The pickers then
burn the waste and extract the recyclable material (metal). This is then taken back to
workers homes where the 'women and children sort them into different categories.'
(Rouse, 2006: 5).
3.2.2. Organisational structure within informal collection
As already pointed out, in most countries the informal recycling industry is highly
organised and there is a clear hierarchy in place. This hierarchy cannot be ignored
by policy makers and government officials who wish to intervene in this sector.
Furedy points out that the government funded "cash for trash" project in Manila, the
Philippians, attempted to buy-pass the traditional junk dealers, and the project failed
for this reason (Furedy, 1997: 148). In a study conducted on the informal sector and
waste paper recovery in Bombay, Van Beukering et al (1996) found that the
participants were well organised and that the links with the formal sector were well
established. They found that in Bombay, there appears to be a definite hierarchy
through which the collection of waste paper works. Bottom of the scale are the waste
pickers. This is followed by the Itinerant waste buyers (IBWs). The waste collected
by these two groups then goes to a buyer, who buys the waste from them,
accumulates it, and sells it to a wholesaler (Van Beukering et ai, 1996). The main
difference between the wholesaler and the buyer is that the wholesaler specialises in
one material, and deals in much larger volumes than the buyer. The wholesaler then
deals directly with the recycling company. Each particular segment of this process
has its own issues and organisational characteristics, some of which have been
discussed above. The informal recycling industry was found to have a similar
organizational structure in Delhi, according to a study done by Hayami et al (2006).
48
Baud et al (2001) conducted research into partnerships in solid waste management
in various locations. They found that in Chennai (Madras), India, relations exist
between waste pickers, itinerant buyers, and dealers. The main driving force behind
this partnership is profit. According to Baud et ai, 'Waste pickers collect materials,
which they sell to dealers. The pickers also receive other benefits (free medical
treatment), gunny bags, and gifts in kind or cash' (Baud et ai, 2001: 7). Dealers were
also found to foster a relationship with itinerant waste buyers.
This also represents a way in which an individual can move up in the informal
recycling industry, and progress from a picker, to a itinerant waste buyer, to a buyer
and so on. Both the study done by Van Beukering et al (1996), as well as the study
conducted by Hayami et al (2006) found that income and education levels increased
as one progressed up the hierarchy. Studies have also proved that as one moves up
the hierarchy in the informal recycling industry, the participants increase in status,
and are generally more established in the business (Van Beukering et al 1996).
However, while the study conducted by Van Beukering et al (1996) in Bombay
suggests that it is possible to progress to better positions within the informal
recycling industry, the study conducted by Hayami et al (2006) suggests that this is
extremely difficult for the waste pickers working in Delhi.
Some scholars have also pointed to a lack of organization within the informal
recycling industry. Tevera conducted research into informal collectors working on a
dump in Gaborone. He found scavenging activities at the dump to be unsystematic,
with significant aspects of activities being at 'the level of disorganization and the
numerous fights for waste' (Tevera, 1994: 28). As Wilson et al point out, 'As a
general rule, the less organized the informal recycling sector is, the less the people
involved are capable of adding value to the secondary raw materials they collect,
and the more vulnerable they are to exploitation from intermediate dealers' (Wilson
et ai, 2006: 4). Rogerson supports this finding, pointing out that in Africa 'the majority
of informal sector resource entrepreneurs are poorly organized and often exist in
highly exploitative arrangements in relation to both middlemen and recycling
companies' (Rogerson, 2001: 254). As material moves up the informal recycling
49
hierarchy, the greater value it possesses. It is clear that those at the bottom of the
informal recycling hierarchy are poor.
A possible way in which to decrease the exploitation of waste pickers would be to
form a type of organisation. McLean conducted research into the informal recycling
industry in Durban, and asked a question of the waste pickers as to whether they
were in favour of starting some kind of organization. The majority of the collectors
said that they didn't want an organization, because they couldn't trust each other.
Theft of materials between collectors is found to be common. However, some
believed 'an association would give them a voice, which would ultimately be
advantageous to all collectors' (McLean, 2000b: 19).
3.2.3. Informal I formal sector linkages
Informal recycling is intricately linked to the formal recycling sector. The formal
recycling sector has the means to convert the material back to a useable product,
and thus is almost entirely responsible for the demand in recyclable material. The
linkages between informal recycling and formal recycling are therefore not only
present, but in most cases they are necessary to keep the informal recycling sector
functioning. The informal recycling industry is thus largely dependent on the formal
recycling industry, however, it is less clear as to how dependent the formal recycling
industry is on material from informal collection. This will differ according to location.
Backward linkages into the formal economy are common in the informal recycling
industry. Some collectors rely on particular factories or shops to get recyclable
material, for example cardboard, and the majority of these places let the collectors
take their recyclable material for free. However, McLean documented one instance
where a waste picker working in the Durban CBD was 'allowed access to the
cardboard of a storekeeper, only after she had swept the pavement outside the shop'
(McLean, 2000b: 6). In some cases, the collector becomes an itinerant waste buyer,
and purchases the waste for a fee (Hayami et ai, 2006). This indicates a backward
linkage into the formal economy. However, many collectors do not buy waste, and
therefore backward linkages into the formal economy are relatively weak.
50
Forward linkages into the formal economy are common. Nearly all informally
collected recyclable material reaches a formal sector recycling firm, and the literature
confirms this (see Hayami, 2006, McLean 2000b, Rouse, 2006, DeKock, 1986).
However, there is some evidence to suggest forward linkages into the informal
sector in some places. Tevera, in a study of garbage pickers working on a landfill in
Gaborone, found that 'unlike the situation elsewhere in third world cities, where
dump scavenging activities are an important source of materials for the formal
recycling industry, in Gaborone only 2-10% of the weight of the recovered material
went to recycling companies while the remainder was used by waste pickers or went
to the informal sector' (Tevera, 1994: 29).
The extent to which the formal recycling sector relies on the informal recycling sector
differs according to location. Chris Birkbeck conducted one of the first pieces of
research into waste pickers in Cali, Columbia. He argued that the pickers are
responsible for large quantities of waste paper that is used for recycling, but they will
remain poor because of the economic forces in operation. 'Rather than view the
picker as a vagrant who should really be working in a factory, we should see him as
a worker who is part of an industrial system' (Birkbeck, 1979: 161). In essence,
Birkbeck points out that the pickers work for the factories, but are not employed by
them. They are disguised wage workers, who are needed by the factories.
This study is particularly focussed on street waste pickers, as opposed to other
groups within the informal recycling industry. The remainder of the literature
presented in this chapter therefore relates specifically to this group of people.
3.3. Characteristics of the waste pickers
3.3.1. Gender
The waste pickers form the lowest rung on the informal recycling industry ladder (see
Van Beukering 1996, and De Kock, 1986). However, it is unclear as to which gender
is dominant in this activity. Hayami et al (2006) found that most pickers were male
with large families to support. Other studies that report more male pickers than
females include Medina (2001 and 1998), and Birkbeck (1979). McLean (2000b),
51
who conducted a study into waste pickers working on the streets of Durban, found
that 75 percent of the collectors that she interviewed were male.
However, other studies suggest that waste picking is dominated by women. Waiters
conducted a study into the waste pickers operating on the Bisasar Road landfill site
in Durban. She found that most of the waste pickers were women; however, they
were not represented properly in consultations with landfill managers (Waiters, 2002:
9). Tevera, who also conducted a study into dump site waste pickers in Gaborone,
found that 'as many as 61.3% of the waste pickers interviewed were women'
(Tevera, 1994: 25). Medina, in a study on the informal recycling industry in Laredo
and Nuevo Laredo, found that although the men working on the landfill site
outnumbered women, this was only marginal. Medina suggests the greater
proportion of women working in dumpsite scavenging could be due to the fact that
they do not have to move around large distances to collect material, and because of
this they can bring their children with them to work (Medina, 1998: 115). This may be
a reason why waste picking on landfills appears to have a greater proportion of
women participants than street waste picking.
3.3.2. Age
The average age of a participant in waste picking differs according to the different
studies conducted. According to McLean, the majority of the participants interviewed
in her study conducted in Durban, were between the ages of 31 and 60 years of age
(McLean, 2000b). However, in the case of the Bombay waste paper industry, a
number of pickers were found to be children, with 18% of respondents found to be
15 years or younger (Van Beukering et al 1996: 13). The high levels of involvement
of children is confirmed by Rogerson (2001: 248), and Birkbeck (1979: 167), while
Wilson et al point out that 'Family organized activities are common in dump
scavenging and in situations where waste collection is provided by the informal
sector' (2006: 4). Tevera, in his study conducted on a garbage dump in Gaborone,
found that '57.3% of all the waste pickers were in the 20-40 years age group while as
many as 18.7% were 19 years old or younger' (Tevera, 1994: 25).
52
3.3.3. Education
The majority of studies reveal that education levels are low amongst waste pickers
and informal collectors. As Rouse points out, 'most are uneducated and do not have,
and may not be able to afford to gain, skills necessary for other jobs' (Rouse, 2006:
6). These findings are supported by Birkbeck (1979), Tevera (1994), and Medina
(1998). As one moves up the informal recycling hierarchy, the education levels and
status of the average participant have been found to increase (See Hayami, 2006,
Van Beukering, 1996).
3.3.4. Dependents
The majority of studies suggest that waste pickers support others with their income,
or in some cases add to the family income. Hayami et al (2006) found that the
majority of pickers support large families, while McLean (2000b) found that 80% of
the collectors interviewed have dependents. These findings are also supported by
Waiters who points out that 'often it is only temporary work and garbage picking that
must feed, clothe and educate families of between 2 and 10 people' (Waiters, 2002:
6). Tevera found that 'The number of dependents varied from 1 to 9 although the 1 to
4 category dominated with 48% of the total... Only 18.7% of the pickers mentioned
that they did not have any dependents' (Tevera, 1994: 26).
3.3.5. Migration
Waste picking is a sector that appears to be dominated by migrants and newcomers
to cities. Hayami et al (2006) and Van Beukering (1996) found that the itinerant
collectors, and waste pickers, were mostly migrants from rural areas. These findings
were further validated by a study done by McLean (2000a) in Durban. McLean
interviewed ~ number of collectors operating in Durban, and selling their recycled
materials to a buy-back centre located in the central business district. Only one of
the 20 collectors interviewed was from Durban originally. In another study done by
McLean, in which collectors operating in the Berea / Glenwood area of Durban were
interviewed, it was found that over 80 percent of the collectors interviewed were from
rural areas (McLean 2000b: 12). The prevalence of migrants in this area of work has
53
also been confirmed by a number of other studies (see Rouse, 2006, Wilson et ai,
2006, and Medina 1998 and 2001).
3.3.6. Transitional employment
The relative ease of entry into this sector of the informal economy suggests that it is
a place for those desperate for employment, and may well serve as a type of
transitional employment, before the waste picker finds a better job (see Birkbeck
1979, Rogerson, 2001). However, 'whilst it is clear that people can and do move into
and out of garbage collection...there are also those people who work in garbage
picking for long periods of time' (Birkbeck, 1979: 169). McLean found that 'most
collectors (55%) had been involved in collection activities for 1-2 years...AII intimated
that they had originally come to Durban in search of employment, which had not
been forthcoming' (McLean, 2000b: 13). Medina found that the number of years
spent in the industry depended on the type of picker. He found that dumpsite
scavengers had been collecting for 4.6 years on average, and street waste pickers
for 3.9 years on average (Medina, 1998: 114). Medina also found that 56.3% of the
dumpsite pickers, and 100% of the street waste pickers had previous work
experience (Medina, 1998: 14). He concludes that 'street scavenging constitutes a
source of extra income, a transitional activity, and when the [waste pickers] discover
that it is not lucrative, they switch to some other pursuit' (Medina, 1998: 116). In
contrast to these studies, Tevera found that 'dump scavenging in Gaborone is a
survivalist activity that is perused mainly by seasoned urban dwellers' (Tevera, 1994:
27).
3.4. Working Conditions
3.4.1. Hours worked
The time that waste pickers spend working differs according to the different studies.
McLean found that the majority of the Durban collectors who she interviewed 'spent
either five (weekdays), six or seven days collecting' (McLean, 2000b: 14), and
earnings increased according to days worked.
54
Hours worked can be very different for those waste pickers operating on dump sites,
as this group of people are often dependent on when the authorities allow them
access, and when the municipal collection vehicles arrive (see Tevera, 1994, and
Waiters, 2002). However, DeKock, in a study conducted on waste pickers operating
on a landfill in Durban, where the pickers were less regulated, found that the majority
of the waste pickers she interviewed (71%) worked between 7 and 10 hours a day
(DeKock, 1986a: 124).
3.4.2. Problems faced
Waste pickers are faced with very difficult working conditions. The majority of studies
show that this group is often at odds with the local authorities and the police (See, for
example, Rouse, 2006, Medina, 1998, and Rogerson, 2001). In Durban, during the
study conducted by De Kock (1986 and 1987), the apartheid legislation was still in
operation, which insisted that black people in the cities have a pass stating that they
worked in the city, and for whom they worked. The waste pickers were often
harassed as they did not have this necessary documentation. In a more recent
study, McLean found that waste pickers in Durban feel that they are not recognized,
and that they consider themselves somehow 'frowned upon by local authorities'
(McLean, 2000a: 4).
The literature suggests that harassment from the local authorities affects both
genders. However, in Bombay, Van Beukering et al (1996) found that it was only the
male informal collectors who reported being harassed by the police. In contrast to
this, Eerd suggests that 'female scavengers in particular may be considered easy
sexual targets' (Eerd, 1996 in Wilson et ai, 2006: 7).
Waste pickers operating on municipal dump sites have been found to be even more
at odds with the local authorities than waste pickers operating on the streets, and are
often faced with the constant threat of being prohibited from picking (see, for
example, Waiters, 2002). This may suggest why Tevera found that none of the waste
pickers operating on the Gaborone dump whom he interviewed wanted scavenging
activities to be formalized (Tevera, 1994: 29). Tevera suggests that 'recovery should
55
be allowed to continue but under regulated conditions' (Tevera, 1994: 31), where
pickers are confined to certain areas and issued with protective clothing.
One of the greatest risks to which waste pickers are exposed on a daily basis, is a
risk to their health, and a number of studies have pointed this out (see, for example,
Medina, 1998 and Tevera, 1994). This health risk is increased by the lack of
protective clothing and proper equipment. According to Wilson et ai, 'Studies have
shown that respiratory and dermatological problems, eye infections and low life
expectancy are common' (Wilson et ai, 2006: 7). However, other studies have shown
that waste pickers may have better health than unemployed people living in the
same settlement. It could be argued that 'working with waste may be less detrimental
to health than not having a financial means to survive' (Wilson et ai, 2006: 8).
Informal collection and waste picking has been shown in some cases not only to
pose a health risk to the participants in this industry, but also to public health in
general. In a study on the habitats for mosquito larva in solid waste containers,
Mazine et al (1996) found that the informal recycling industry has an impact on this.
Some home owners were found to leave recyclable material aside for an informal
collector, who in some cases did not return for some months. Consequently, the
material is stored for the collector, and in the process becomes a larval container
habitat for mosquitoes. In some cases, the informal collector stores materials in their
backyards or in adjacent lots until they have enough to sell, 'a practice that provides
habitats not only to mosquitoes but also rodents, cockroaches and scorpions'
(Mazine et ai, 1996: 12).
In addition to dealing with health risks, and harassment by the police and authorities,
waste pickers often find themselves at odds with home owners, as well as
stigmatized by the general public. Many waste pickers search through domestic
waste left on the street for collection by the authorities, and occasionally home
owners object to this. McLean reported that only one of the collectors that she
interviewed had been chased by a property owner (McLean, 2000b: 19), and Mazine
et at found that two of the home owners who they interviewed accused waste pickers
of going through their domestic waste, and in the process spreading the contents 'all
over in front of their houses' (Mazine et al, 1996: 9).
56
A further problem faced by waste pickers is conflict with other waste pickers. McLean
found that nearly every collector whom she interviewed indicated that they had had
goods stolen in the past by another collector (McLean, 2000b: 19). The fierce
competition for material is intensified between pickers who operate on landfill sites.
Tevera alluded to this, commenting that 'it was common to see men, boys and
women pushing one another violently as they scrambled for waste' (Tevera, 1994:
28) on the Gaborone dump. A large portion (48%) of the pickers that he interviewed
mentioned that 'they wanted the Gaborone city council to impose law and order at
the dump' (Tevera, 1994: 29). Waiters, in a study on the pickers operating at the
Bisasar Road Landfill site in Durban found that many pickers faced the threat of
violence from other pickers, and were intimidated on a regular basis (Waiters, 2002).
A range of other difficulties are also faced by waste pickers on a reqular basis. Often,
pickers have to travel long distances to get to centres where they can sell their
material, and often they have to take the price offered at the nearest buyback centre,
irrespective of whether or not they are being exploited. The situation can be even
worse for dumpsite scavengers, who are often visited by only one middleman who
buys the recyclable material and transports it to town. This problem is elaborated on
by Medina, who found that, 'Dumpsite scavengers face a monopsonistic market
(market where only one buyer exists, as opposed to a monopoly, where there is only
one seller), and thus get lower prices than in the competitive market in town'
(Medina, 1998: 115). Medina found that the price offered by middlemen buying
material at the dumpsite was 25% lower than the prices offered in town. In addition
to this, waste pickers are also very much at the mercy of the elements, as rain or bad
weather can affect their work, thereby reducing their income (Rouse, 2006: 6).
3.4.3. Material transportation
Means of transportation has a direct effect on the amount of recyclable material that
can be collected, and is thus directly linked to the income potential of a waste picker.
The majority of waste pickers are forced to carry their material to a buyback centre
by hand. In a study on can collectors operating in Nuevo Laredo, Mexico and
Laredo, Texas, Medina found that 'most street collectors must roam through several
57
neighbourhoods on foot, carrying a sack or a plastic bag containing the cans'
(Medina, 1998: 116). Some collectors have access to a trolley, or cart, which
enables them to collect more material and to move around with greater ease.
McLean found that 'Trolley-owners earned more despite working fewer days, and
needed to operate in one area only' (McLean, 2000b: 15). Other collectors sell to a
middleman who will pick up the material from them. This is often the situation in
dump scavenging (See De Kock, 1987, and Wilson, 1998). However, McLean
(2000b) found that a portion of her sample operated in Durban's central business
district, and sold their material to a paper agent with a vehicle.
Some studies point to gender inequality in terms of access to transportation of
materials. Commenting on a study she conducted on the garbage pickers operating
on a landfill in Mexicali, Wilson found that, 'most families employed in the dump own
pick-up trucks. Women heads of household do not, nor do women who work at the
dump while their husbands work elsewhere' (Wilson, 1998: 109). These women are
forced to sell to middlemen, at a lower price. McLean (2000b) found that the majority
of trolley owners interviewed were men, while the women were more likely to
transport the recyclable material on their head.
3.4.4. Areas for collection
While Dumpsite waste pickers clearly operate in one particular location, street waste
pickers have to walk various areas to look for recyclable material. Birkbeck found
that 'the garbage picker recuperates mainly from domestic waste and secondarily
from some commercial establishments and the occasional small-scale industry'
(Birkbeck, 1979: 166). Medina found that the commercial/downtown areas of
Laredo (Texas), and Nuevo Laredo (Mexico) were particularly active areas for
scavenging, probably due to the vast numbers of people who pass through these
areas (Medina, 1998: 114). Most of the street scavengers interviewed were found to
follow a particular route every day (Medina, 1998: 116).
McLean interviewed a number of street scavengers operating in the Durban suburb
of Glenwood. She found that the garbage pickers were not territorial, and '90%
indicated that collecting was done on a "first-come-first-served" basis' (McLean,
58
2000b: 19). The remainder (10%) had an "understanding" with a store keeper who
kept their recyclable material aside for them. McLean also pointed out that 'for seven
(35%) of collectors, Glenwood was their first collection area; they had not collected
elsewhere' (McLean, 2000b: 14).
3.4.5. Items Picked
Items picked by the informal collectors appear to be anything perceived to be of
value, and as Mazine et al point out, there are 'differing community perceptions as to
what constitutes refuse' (Mazine et ai, 1996: 1). Waste pickers are out to maximise
their earnings, and 'potential profit margin is the main selection criteria for targeting
materials, although this also depends on accessibility, convenience, ease of
transporting and handling' (Wilson et aI, 2006: 5). Common items picked and sold to
recyclers include glass, scrap metal, plastic, paper, and cardboard. Metal has the
highest value of these items, and pickers occasionally burn waste to extract the
metal (see Rouse, 2006 and Van Beukering 1996). However, this has a negative
impact on the environment as it results in air pollution.
Other items have also been documented in the literature as being scavenged by
informal collectors. Bones, textiles, and discarded reusable items are such examples
(Medina, 2001, Wilson 1998). Tevera (1994) found that many of the waste pickers
operating on a landfill in Gaborone were extracting foodstuffs and other reusable
items. Some of the foodstuffs were then resold, or consumed by the pickers and their
families (Tevera, 1994: 28). In Indonesia, waste pickers have been found to collect
asphalt drums, which are then recycled into kerosene stoves (Bubel 1990 in
Rogerson 2001: 251).
Items that are recovered by South African informal collectors appear to be in line
with international trends. Cardboard, newspaper and other paper, cans, glass,
plastics, and scrap metals were all found to be collected (McLean 2000b, 2000a,
Waiters, 2002). In her study on the informal collectors operating in the Glenwood
area of Durban, McLean found that cardboard was the most popular item collected,
and that women generally collected all forms of paper. Scrap metal was also found
to be a popular item collected, with nearly all the males interviewed collecting this
59
item (McLean, 2000b). McLean also pointed out that of the people she interviewed,
'not a single collector recovered plastic or glass' (McLean, 2000b: 17). The reasons
given for this include the low selling price for these materials (50%); the scarcity of
these commodities (30%); or the collectors were 'unaware that these materials could
be traded (15%)' (McLean, 2000b: 17). In addition to traded recyclable material,
other items of perceived value, such as clothing and household goods were also
found to be collected, and sixteen (80%) of the collectors interviewed indicated that
they removed food from domestic refuse bags (McLean, 2000b: 18). Those that
collected only one type of recyclable material were also found to earn considerably
less than those collecting at least two commodities (McLean, 2000b: 17)
A clear gender divide in terms of types of materials collected exists amongst Durban
waste pickers. Men appear to have access to trolleys which enables them to collect
more lucrative items such as scrap metal. As McLean argues, items collected could
be linked to transport (McLean, 2000b: 23).
3.5. Earnings, Poverty and vulnerability
All studies agreed that waste pickers earn very little (see for example De Kock 1986,
Van Beukering 1996, McLean 2000a and 2000b, Rouse, 2006). In the study
conducted in Delhi, Hayami et al found that waste pickers earn below the minimum
wage, while itinerant waste buyers earn slightly above the minimum wage (Hayami
et al 2006: 49). However, the majority of these people had a number of dependents
to support. If one considers the households that these waste pickers are supporting,
it is clear that poverty prevails. Hayami et al found that 'using one US dollar in
purchasing power parity (PPP) as a poverty line, 17 per cent of the pickers were
found to be poor' (Hayami et ai, 2006: 51). However, according to the poverty line
set by the Indian Planning Commission (which uses estimates between $1 and $2
PPP a day), 88 % of the pickers were found to be poor.
Wilson et al point to the Jack of choice offered to waste pickers, stating that 'Informal
waste recycling is carried out by poor and marginalized social groups who resort to
scavenging/waste picking for income generation and some even for everyday
survival' (Wilson et ai, 2006: 2). The majority of studies point out that 'It alternative
60
employment opportunities and associated wages were higher, scavenging would be
less financially attractive' (Porter, 2002 in Wilson et ai, 2006: 6). Not only are wages
in waste picking generally low, but they are variable. This puts the picker under
constant stress, and denies him or her assurance of a stable income.
There has also been research into whether or not informal recycling is a
supplementary form of income, or the sole source of income for participants. It
appears that the literature is divided on this point. Medina conducted a study into
scavenging in America, and found that 'scavenging constitutes a source of cash for
disabled or old individuals with low incomes' (Medina, 2001: 236), and it
supplements other incomes. However, the USA is a country where the
unemployment rate is low, and so are poverty levels. Waste pickers have access to
other economic opportunities, as opposed to waste pickers in less developed
countries.
Garbage picking in developing countries is often the sole source of income for a
household. Waiters found that 90% of the waste pickers that she interviewed who
were operating on the Bisasar Road landfill site in Durban had no other sources of
income (Waiters, 2002: 6). She concluded that there was a 'Strong reliance on
garbage picking not only as a supplement to other earnings, but as the sole source
of income' (2002: 6). This finding is supported by others (see DeKock, 1986 and
Medina, 1998).
In contrast to this, Tevera (1994) found that the majority of the pickers that he
interviewed operating on a landfill site in Gaborone, used waste picking as a way in
which to supplement their income, rather than their sole source of income.
'Scavenging activities bring earnings that are a small fraction of the wages earned by
unskilled people in the city, such as housemaids and gardeners' (Tevera, 1994: 27).
The majority of the scavenging taking place on this landfill was not for recyclable
materials to sell, but rather for reusable items. About a third of the waste pickers
interviewed indicated that they derived no income from scavenging, and this group
'primarily scavenged for 'edible foods and usable household items' (Tevera, 1994:
27).
61
While there is general consensus that the income earned by garbage pickers is low,
some studies suggest that garbage pickers are not in complete abject poverty.
Medina found that waste pickers working on a dumpsite on the Mexican I US border
earned '225% the minimum wage that formal sector employees and factory workers
earn[ed]' (Medina, 1998: 115). Street waste pickers operating on the border were
found only to earn 64% of the minimum wage, substantially less than dumpsite
pickers. However, the majority of the street waste pickers were using garbage
picking to supplement their income. Itinerant waste buyers operating in Nuevo
Laredo and Laredo were found to earn in one day what minimum wage employees
make in a week (Medina, 1998: 116).
Wilson, who did a study in 1989-1990 on the garbage pickers operating on a landfill
in Mexicali, found that garbage pickers need not be the poorest of the poor. She
gave the example of a Mexicali family who work on the landfill three to four days a
week for 7 to 8 hours daily, and gather 3 tons of cardboard in a week. They were
able to earn 'more than three times as much as two formal-sector workers could earn
working six days a week for minimum wage. They did not have benefits, however, of
medical insurance or pension plans' (Wilson, 1998: 110).
Birkbeck (1979) also found that the waste pickers interviewed earned reasonably _
on a par with the governments minimum wage. However, they were denied the
benefits of formal employment, for example, social security and medical insurance.
In addition they were under the psychological stress of a variable income, and
unstable working conditions. As McLean points out, fluctuating prices have a
profound effect on waste pickers and "a decrease ofa few cents per kilogram has an
incredible impact on the lives of many thousands of collectors and their dependents'
(McLean, 1998: 4).
A major factor affecting the income earned by informal collectors is the price paid for
recyclable material. Due to the fact that a large quantity of material needs to be
collected in order to earn a reasonable amount, transporting this material becomes
an issue. Often, collectors are forced to sell to the agent who is closest to them,
irrespective of the price offered. The variations in price between agents can also be
62
large. McLean found that one agent operating in the Congella area of Durban was
'paying 8-10c more per kilogram than other agents' (McLean, 2000b: 16).
Some studies have gathered information as to the living conditions of waste pickers.
McLean found that many collectors lived in informal shelters, and earned barely
enough to cover theirfood and accommodation (McLean, 2000b: 20). Rouse points
out that an aspect of the poverty faced by informal collectors is their lack of access to
assets. Poor housing is one aspect of this, low saving and a lack of access to credit
is another (Rouse, 2006: 6).
There also appear to be relationships between aspects of the waste pickers' working
conditions and their earnings. Both the study by De Kock (1986 and 1987) and Van
Beukering (1996) showed that there was little correlation between hours worked, and
earnings made, as well age and earnings. De Kock (1986 and 1987) also found that
there was no correlation between education level, gender, and earnings. Both
studies found that experience in garbage picking has no impact on earnings. Picking
has also been revealed to be a survival strategy. Collectors engage in this type of
activity to meet basic needs. It is also believed that waste pickers perceive their
occupation to be a temporary activity.
3.6. The benefit of informal recycling
The studies done on the informal recycling sector have proved that this sector is
beneficial to the city, as it has the twofold impact of significantly reducing waste, and
providing a livelihood for the marginalised of society (Hayami et ai, 2006). In some
places, the informal recycling industry is responsible for the recycling of large
amounts of waste. Rogerson gives some examples of this, stating that, 'for urban
Indonesia, it has been suggested that the activities of informal pickers and
scavengers are responsible for reducing refuse quantities by roughly one-third'
(Rogerson, 2001: 249), and 'In west African research it has been estimated that as
much as 10 percent of domestic wastes are recovered from an already poor solid
waste stream' (Rogerson, 2001: 250). However, the informal recycling sector in
Durban seems to do less in terms of reducing the amount of waste landfilled, and
63
'According to DSW calculations picking amassed to less than 0.6% of the total
amount of waste coming in' (Strachan pers comm., 08-09-99 in Waiters, 2002: 8).
A major benefit of the informal recycling industry is that it provides a livelihood for
many of the urban poor. In comparison with other sectors within the informal
economy, there is relative ease of entry. For example, '5000 informal entrepreneurs
are involved in scavenging from Calcutta's main garbage dump, 25000 people
obtained a livelihood from the wastes of Malina's Smokey Mountain and a further
60000 are dependent upon these wastes for securing their basic needs' (Furedy
1989, in Rogerson 2001: 248). The informal recycling industry in Karachi 'provides
employment for more than 55000 families' (URC, 2001 in Rouse, 2006: 2).
However, the extent to which the informal recycling industry provides a livelihood for
people and accounts for recycling differs according to location. Tevera estimated that
only about 5% of the solid waste deposited at the official dump in Gaborone is
'consumed or used by the waste pickers' (Tevera, 1994: 29), while only 'about 150 to
200 people are almost permanently involved in waste scavenging at the city's only
official dump. The figure increases to 400 to 600 if the irregular waste pickers...are
included' (Tevera, 1994: 25). This is far fewer people than those working on the Jam
Chakro waste site in Karachi (Rouse, 2006: 5), or on Malina'a Smokey mountain
(Rouse, 2006: 2)
In addition to the obvious environmental and poverty alleviation aspects of waste
picking, local government can also gain much from the informal recycling industry. In
countries where solid waste collection is under resourced, informal collection can aid
the municipality by reducing the volumes that need to be collected and landfilled.
These economic benefits are achieved at no direct cost to tax payers (Wilson et ai,
2006: 6). Medina (1998), in his study on informal collection in the cities of Laredo
and Nuevo Laredo, estimate that collectors are saving the cities approximately
$2750 each month. Medina points out that only 85% of the waste generated in
Nuevo Laredo, Mexico, is collected. Informal collection operates in areas that are not
served by the municipality and 'collectors charge a fee for picking up the residents'
garbage which they transport in horse carts' (Medina, 1998: 111). In research done
on the informal collectors of Durban, McLean (2000a and 2000b) found that this
64
group of people were not aware of the importance of their work from an
environmental point of view, but did concede that their work resulted in a cleaner
city.
In addition to the above benefits of informal collection, the formal recycling industry
clearly benefits from informal recycling. Informal recycling provides 'a steady, reliable
supply of secondary raw materials for local manufacturing industry which can replace
more expensive imported raw materials. This also stimulates the manufacture of low
cost, affordable products made from recycled materials' (Wilson et ai, 2006: 6).
Those taking a Marxist approach to the field of informal recycling argue that garbage
pickers are in fact disguised wage workers for large capitalist recycling companies,
who benefit from a supply of recyclable material from a group to which, Marxists
argue, they afford no benefits or security. This view of the informal economy has
been discussed in detail in section 2.4.1.2.
3.7. Attitudes towards informal recycling
The response of various groups to the informal recycling industry is interesting, and
deserves mention as the way in which waste pickers are viewed by society and
government ultimately has an effect on the environment in which they work. Local
authorities often view the informal recycling sector as 'backward, unhygienic and
generally incompatible with a modern waste management system' (Wilson et ai,
2006: 2). Response by local authorities to informal recycling can range from
'repression and benign tolerance to, in a small number of cases, the promotion of
informal waste recycling' (Furedy 1992b in Rogerson 2001: 250).
There are some examples of government supporting and acknOWledging the informal
recycling sector. According to Furedy, in Indonesia there has been an
acknOWledgment of the work that waste pickers do, and the Indonesian president at
the time (President Suharto) referred to them as 'a self-reliant brigade who deserve
public respect and should not be treated as tramps' (Suharto in Furedy, 1997: 150).
In addition to the support from national government, the mayor of Surabaya was also
'dedicated to understanding the street people of the city and able to influence public
65
attitudes' (Furedy, 1997: 151). A project called "Mitra Pasukan Kuning" (friends of the
yellow troupe) was founded. This was la loose association of waste pickers that had
7110 registered members by 1991' (Furedy, 1997: 151). The main objective of this
programme was to improve the lives of the waste pickers. Volunteers worked with
the association to issue identity cards, organize picking areas, prevent police
harassment, and facilitate greater access to social services such as health care
(Furedy, 1997: 151). Some of the members of the friends of the yellow troupe formed
a cooperative savings society, with the help of a local businessman (Furedy, 1997:
151).
Baud et al (2001) analysed partnerships in solid waste management in three
different third world cities. They found that in most cases 'the local authorities work
together with large enterprises and non-governmental organizations (NGOs), but
refuse to deal directly with the informal trade and recycling enterprises which cover
large fractions of waste' (Baud et ai, 2001: 3). However, they point out that there are
some examples of positive government interaction with the informal recycling sector.
A partnership between large-scale enterprises, the local authorities, and small-scale
enterprises was identified in Manila, the Philippians. A private company was
employed to design new landfills, and the informal dealers and itinerant buyers were
'encouraged to organize co-operatives for collection, street sweeping, and recycling'
(Baud et ai, 2001: 6). Baud et al also pointed to a partnership between local
authorities, NGOs, and waste pickers in Madras, India. The local council gave four
NGOs funds to set a programme where street children were recruited to clean and
maintain streets. They were paid wages, and their income was increased by selling
recyclable material (Baud et ai, 2001: 7).
Another example of local government supporting the informal recycling sector can be
found in Curitiba, Brazil. In addition to encouraging household separation of
recyclable material at the source (Rabinovitch, 1992: 68), the government has also
implemented a successful "purchase of garbage" programme. In poorer areas of
Curitiba, residents are encouraged to sell their bags of garbage in exchange for bus
tickets and food (Rabinovitch, 1992: 68).
66
While there are a few examples of government promotion and encouragement in
informal recycling, this is rarely the case. Often, local authorities try to repress
informal recycling and waste picking. However, in some cases the government opts
to tolerate the sector, and ignore the work that it does. This often occurs in places
where waste picking is already an established practice. Tevera (1994) offers an
example of this. Waste pickers who operate at the Gaborone landfill site have
unrestricted entry, and there are no regulations with which the waste pickers have to
comply (Tevera, 1994: 25). The local authority 'tolerates dump waste pickers but is
quite unsympathetic towards them' (Tevera, 1994: 30), furthermore, they view the
waste pickers as something of an embarrassment. The Gaborone authorities
realised that 'repressing scavenging activities without providing alternative
employment opportunities would be a futile exercise' (Tevera, 1994: 30). This
attitude has been echoed in other parts of the world.
Another example of tolerance, versus repression or promotion of the informal
recycling industry, is offered by Waiters, who conducted research into waste picking
on the Bisasar Road landfill site in Durban. In 1994, controlled picking was
introduced, which marked the 'beginning of attempts to phase waste picking out or at
least control and regulate picking' (Waiters, 2002: 5). In the beginning pickers had
access to a designated area of the landfill most of the day, but this was no longer
allowed after July 1999, due to accidents and disorderly behaviour on the part of the
pickers. 'At present pickers can only pick from a transfer site within the landfill.
Pickers are allowed onto the site once landfill operations have ceased' (Waiters,
2002: 5). While waste picking is considered undesirable at Bisasar road, it is still
tolerated. Conflict exists between the landfill management and the waste pickers,
-and waste picking itself is a contravention of the landfill permit (Waiters, 2002: 5).
The practice of waste picking is tolerated to a certain degree, but the long term view
of the landfill managers is that waste picking should be phased out.
Repression of waste picking activities is common, and 'in most third world cities
waste pickers usually are a source of embarrassment to officials who often attempt
to stop their activities when overseas delegations are visiting' (Tevera, 1994: 22).
Other reasons for the repression of waste picking could be the view on the part of
authorities that it is problematic for pUblic health. In Africa, there are few examples
67
of support for this sector because of, 'policy intervention or of attempts to integrate
informal waste recovery into a national solid waste management system' (Rogerson,
2001: 254).
Repression of informal recycling is not only common in third world cities.
Governments in first world cities can also be hostile to waste picking activities.
Medina (2001) discusses the problem of individuals who steal the recyclable material
that households leave out for the local authorities to collect, in cities where there is a
curbside collection scheme. 'The thieves, known as paper poachers, steal the
newspapers placed at curbside before being picked up by city crews' (Medina, 2001:
234), and cost the city millions of dollars. Because of this, '220 cities and 33 counties
in Southern California have recycling programmes with anti-scavenging provisions'
(Lacey, 1994 in Medina, 2001: 234).
Another example of repression of informal recycling on the part of the local
authorities is the way in which the waste pickers operating at Jam Chakro landfill in
Karachi are treated. Rouse (2006) conducted research into waste picking at this
landfill site. Within weeks of the landfill site opening, it had been taken over by waste
pickers. One man 'designated himself as an informal landlord' (Rouse, 2006: 4), and
he rents out plots of land on the landfill to individual pickers. The privately owned
trucks bring the waste to the landfill, and although they are supposed to dump the
waste in areas designated by the local authority, waste pickers pay the truck drivers
to dump the waste on their particular plot (Rouse, 2006: 4). The waste is so
contaminated that the waste pickers are only able to extract the recyclable material
(glass and metal) by burning the waste. However, this has degraded the air quality
(Rouse, 2006: 4). This has an effect on the waste pickers and there families, who
live in informal housing on the landfill, as well as the residents from nearby
settlements, who are complain about the air quality (Rouse, 2006: 7).
The local authorities are in constant conflict with the waste pickers liVing and working
at Jam Chakro. As one municipal official commented, 'by appearance and conditions
these people are very poor, but they are not the poor...Even if you offered them your
job, they would refuse. It is in their habit and in their nature to pick waste. They also
like liVing in slums' (Municipal official in Rouse, 2006: 6). The local authorities would
68

like to see the end of waste picking at Jam Chakro, and they have tried in the past to
take steps in that direction. The authorities have attempted to evict people, but the
pickers turned violent (Rouse, 2006: 7). The authorities then tried to extinguish the
burning waste, but again the pickers turned violent (Rouse, 2006: 7). The authorities
then attempted to block the trucks from dumping waste on the pickers' plots, but this
was unsuccessful. The police were also brought in to stop the payoffs to truck
drivers, and to ensure that trucks transport the waste to designated areas. However,
the police were eventually withdrawn because they were found to be receiving
payoffs from the informal landlord as well as the truck drivers (Rouse, 2006: 8).
Medina (1998) conducted research into the scavengers operating on the US I
Mexican border in Laredo (US) and Nuevo Laredo (Mexico). He found that the
attitudes of the two local authorities towards informal recycling differed greatly. The
US officials consider the scavengers to be 'part of the cityscape' (Medina, 1998:
113), and their activities are tolerated even though there is no formal agreement in
place (Medina, 1998: 113). In contrast, the Mexican officials are far more hostile
towards the waste pickers and 'Nuevo Laredo ordinances prohibit scavenging on the
street and impose fines' (Medina, 1998: 113). This has resulted in the waste pickers
being forced to operate late at night, or early in the morning in order to avoid police
harassment (Medina, 1998: 113). The main reason for the ban on street waste
picking is because the city doesn't want to give tourists a 'bad impression' (Medina,
1998: 113).
While the attitudes of local authorities towards waste picking are generally fairly
negative, these attitudes can change, and can either become more supportive or
more restrictive. An example of this is offered by Medina, who points out that in the
late 19th
century in New York, America, waste pickers were paid to go through waste
to extract material, and they also got to keep what they extracted (Medina, 2001:
232). The attitude of the authorities changed in 1878, when the city halted payments
to the waste pickers, but still allowed them to pick for nothing. From 1882 onwards
the waste pickers were made to pay for the privilege of going through waste
(Medina, 2001: 232). The above example illustrates changing attitudes on the part
of the local authority. Originally, the local authority clearly welcomed waste picking
69
and saw the benefits of the work. However, this attitude changed, as did the policies
towards waste picking.
Non-Governmental Organisations (NGOs) have done positive work with the informal
recycling industry. It has received attention, due to its benefits, both in reducing
poverty, as well as being an environmentally friendly activity. Furedy (1997)
discusses one of these examples, of Manila in the Philippians. An NGO set up a
recycling project in Metro Manila, and attempted to incorporate the local junk
dealers. Attention was paid to the hierarchy and organisation of the informal
recycling sector. The focus of the project was on 'gaining cooperation of
neighbourhood waste dealers in employing door-to-door buyers (eco-aides)' (Furedy,
1997: 148). The eco-aides were given identification cards, and the project also
attempted to mobilize 'the support of households for separation and sale; and aiding
the dealers in technical and business development' (Furedy, 1997: 148). The project
grew to incorporate 25000 households, and employed 200 eco-aides. No support
has come from the local authorities in this project (Furedy, 1997: 149). Besides
driving the project, the NGO also aids in organising routes and territories for the
collectors (Baud et ai, 2001).
Another example of NGO work in the field of informal recycling is discussed by
Rogerson (2001). The Self-employed Women's Association in Ahmedabad, India,
have assisted women in this trade. The union has focussed on aiding the women in
developing alternative skills 'in waste gathering and sorting and dealing with clean
waste paper rather than merely picking up scraps' (Furedy 1990 in Rogerson, 2001:
252). Baud et al (2001)·also points out that a significant relationship exists between
waste pickers and a cornmunlty based organisation (CBO) operating in Chennai
(Madras), India. The CBO made sure the community waste containers were
maintained, and waste pickers were employed to keep the streets clean. They were
issued with protective equipment and paid a salary. The households in the area paid
a minimum amount for this service (Baud et ai, 2001).
The attitude of the private sector and the general public also has an impact on the
environment in which informal recyclers work. There are some examples of a
positive relationship between informal recyclers and the public. McLean points out
70
that some of the storekeepers in the areas in which the informal recyclers whom she
interviewed operate already separate out the items of value for the collectors
(McLean, 2000b: 18). Mazine et al found that many of the residents interviewed in a
community in Marilia, Brazil, had positive impressions of the informal collectors
operating in the area. Many knew them by name, and saved material of value for
them (Mazine et ai, 1996: 9).
The attitude of both local government and NGOs has a significant impact on the
environment in which informal recyclers work. As Wilson et al point out, 'Perhaps the
greatest challenge is to shift the perception and attitudes, particularly of local officials
and also of the general public, towards those involved in informal waste recycling'
(Wilson et ai, 2006: 9). Creating organisations of pickers, increasing door to door
collection, encouraging household separation of waste, and working with the informal
recycling sector rather than against it is needed. McLean found that many of the
pickers whom she interviewed would have welcomed some recognition of their work
by government, and 'a number of collectors (55%) believed that this recognition
might result in some form of assistance or sponsorship, such as the provision of a
trolley' (McLean, 2000b: 19). The private sector can also aid or hinder the work of
informal collectors, by either separating out their recyclable material for collectors, or
denying them access to their waste.
3.8. Conclusion
This section has elaborated on the informal recycling in detail. The organisational
structure, and the different interest groups within the informal recycling industry have
been given attention. As this study is concerned with street waste pickers, the socio
economic characteristics of this group have been discussed. In addition to this, the
literature relating to the working environment and earnings of those involved in waste
picking has been given attention, as has the interactions between waste pickers and
various interest groups such as the local authorities and NGOs.
This literature will be useful, as it will be compared against the outcomes of the
current study. The methodology followed is discussed in detail in the next chapter,
and the findings of this study are presented in chapter 5.
71
Chapter 4: Research Methodology
4.1. Introduction
This chapter elaborates on the research process undertaken in this study. Firstly, the
design of the study is discussed, as well as the different buyback centres chosen for
the research. Following this, the tools used to carry out the research, as well as the
sampling plan is expanded on. The fieldwork that has been conducted, and the way
in which the data has been collected and analysed will then be reported on.
4.2. Research Design
The overall aim of this research is to gain a more accurate understanding of those
involved in waste picking in Durban. The research aims to elaborate on the socio
economic characteristics of Durban waste pickers, as well as their working
conditions. The earnings of the waste pickers is also be analysed in order to
determine whether or not these individuals live in a state of poverty. In addition to
this, attention is paid to the relationship between waste pickers and other groups,
such as the general public and the local municipality. The links between the waste
pickers and the formal sector recycling companies is also be analysed. The research
was therefore designed with the broad aim to gain a better understanding of the
informal recycling industry, and the waste pickers participating in this study. This
study aims to be an in-depth analysis or case study of one particular sector of
informal recycling, which is waste picking.
In order to address these questions, waste pickers were interviewed, and have
supplied information about their lives, and work. In order to gain access to the waste
pickers, the various buyback centres in Durban have been considered, as informal
collectors are most likely to be found in these places, selling back material.
Contact was made with the eThekwini Municipality in Durban, and they provided
information about the various buyback centres that the municipality manages. In
total, there are 23 buyback / community drop off centres under municipal
72
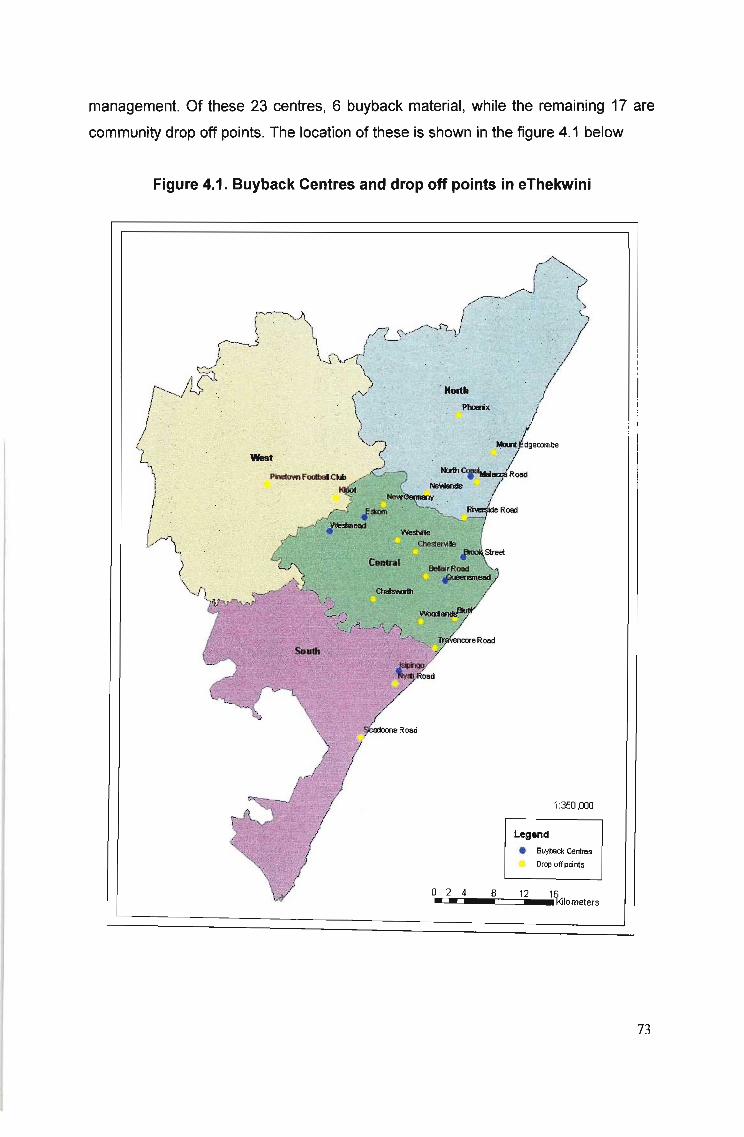
management. Of these 23 centres, 6 buyback material, while the remaining 17 are
community drop off points. The location of these is shown in the figure 4.1 below
Figure 4.1. Buyback Centres and drop off points in eThekwini
1:350rm
o 2 4.M 8
Legendo BlI)'UlCk Centres
Drep off pants
12
73
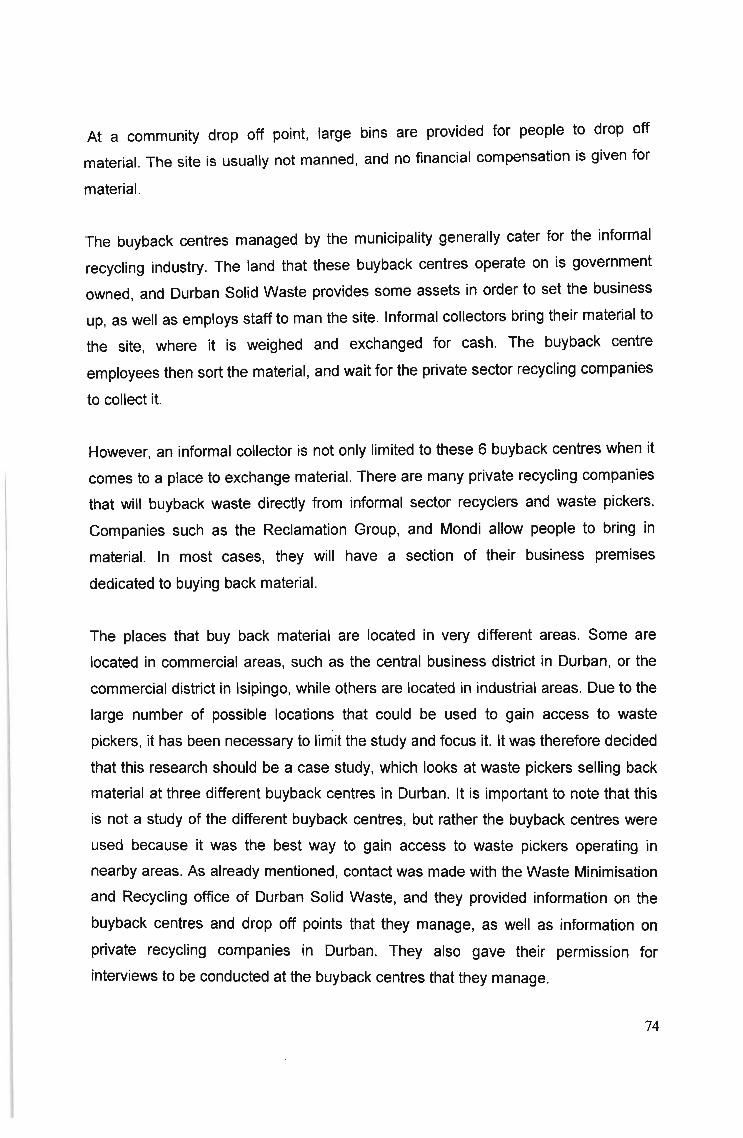
At a community drop off point, large bins are provided for people to drop off
material. The site is usually not manned, and no financial compensation is given for
material.
The buyback centres managed by the municipality generally cater for the informal
recycling industry. The land that these buyback centres operate on is government
owned, and Durban Solid Waste provides some assets in order to set the business
up, as well as employs staff to man the site. Informal collectors bring their material to
the site, where it is weighed and exchanged for cash. The buyback centre
employees then sort the material, and wait for the private sector recycling companies
to collect it.
However, an informal collector is not only limited to these 6 buyback centres when it
comes to a place to exchange material. There are many private recycling companies
that will buyback waste directly from informal sector recyclers and waste pickers.
Companies such as the Reclamation Group, and Mondi allow people to bring in
material. In most cases, they will have a section of their business premises
dedicated to buying back material.
The places that buy back material are located in very different areas. Some are
located in commercial areas, such as the central business district in Durban, or the
commercial district in Isipingo, while others are located in industrial areas. Due to the
large number of possible locations that could be used to gain access to waste
pickers, it has been necessary to limit the study and focus it. It was therefore decided
that this research should be a case study, which looks at waste pickers selling back
material at three different buyback centres in Durban. It is important to note that this
is not a study of the different buyback centres, but rather the buyback centres were
used because it was the best way to gain access to waste pickers operating in
nearby areas. As already mentioned, contact was madewith the Waste Minimisation
and Recycling office of Durban Solid Waste, and they provided information on the
buyback centres and drop off points that they manage, as well as information on
private recycling companies in Durban. They also gave their permission for
interviews to be conducted at the buyback centres that they manage.
74
Initially, only one buyback centre (Brook Street) was chosen for the study . However,
the fieldwork revealed that while the buyback centre dealt with relatively large
quantities of recyclable material everyday, it had a core group of waste pickers who
worked and sold back material on a daily basis. These regular waste pickers were all
interviewed, and the sample was too small to be of significance. The study was
therefore extended, and waste pickers selling material at two other buyback centres
were then interviewed. These two buyback centres were Eskom Buyback Centre
(managed by the municipality), and Reclamation, a private recycling company with a
branch in Phoenix.
4.3. The Study Area
The following three buyback centres were chosen as locations for this study . Each
will be discussed in turn.
4.3.1. Brook Street Buyback Centre
Brook Street Buyback Centre is located in the central business district in Durban in,
the Warwick Junction area. The area in which it is located has an array of formal
shops, as well as informal traders selling goods on the pavement. There is a taxi
rank located near the buyback centre, and the area is very busy during the day with
many people passing through. Figure 4.2 shows the location of Brook Street
Buyback Centre.
75
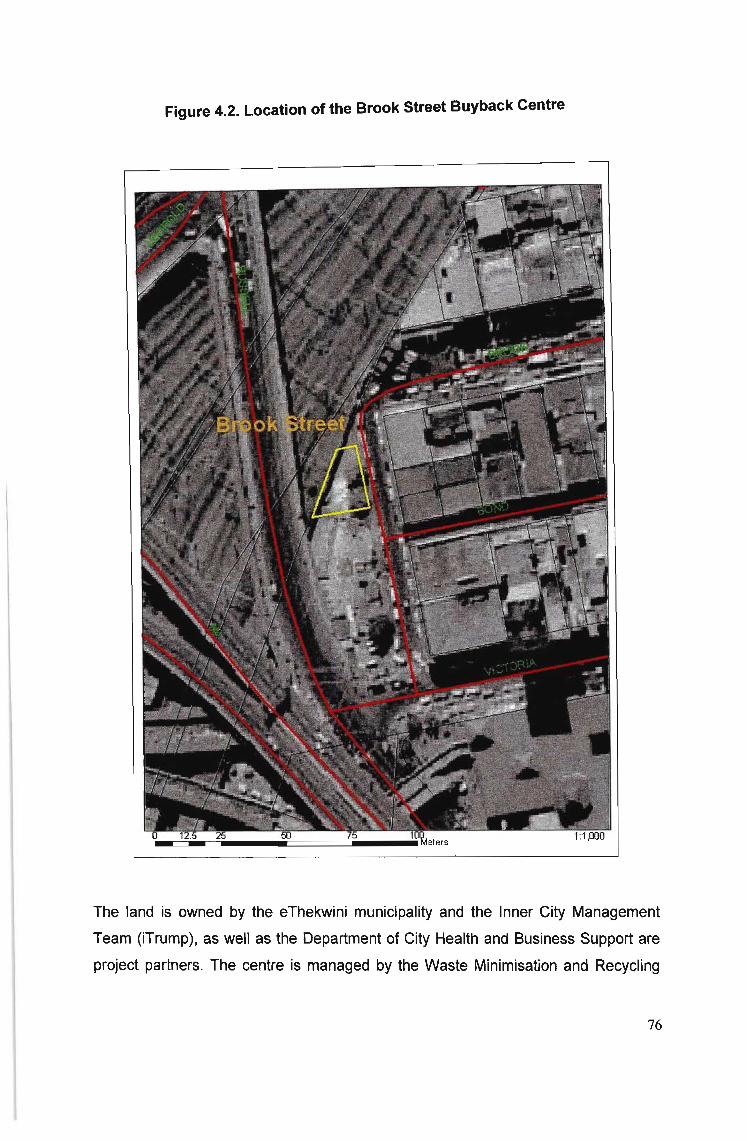
Figure 4.2. Location of the Brook Street Buyback Centre
The land is owned by the eThekwini municipality and the Inner City Management
Team (iTrump), as well as the Department of City Health and Business Support are
project partners. The centre is managed by the Waste Minimisation and Recycling
76
office of Durban Solid Waste. The management has officially employed two
individuals to run the buyback centre, although, there are occasionally other
individuals helping with the sorting of material. However, it is unclear as to who pays
these individuals, and whether they work for cash, kind, or for free.
In addition to staffing the buyback centre, the Durban Solid Waste also provides the
buyback centre with necessary equipment, including an office container, a scale, two
Mondi trolleys, containers for material, as well as signage for the centre. In total, the
buyback centre covers an area of approximately 350 square-metres. The buyback
centre has been in operation since 2000, and collects a monthly volume of
approximately 25 tonnes of all types of recyclables. A private recycling company
(Lindisiwe Recyclers) collects the metal, while the cardboard is collected by Mondi.
The buyback centre deals in a number of different materials, including cardboard,
paper, metal and cans. However, the two most common materials sold back to the
buyback centre are metal and cardboard. The price offered for cardboard at the time
of research (September 2006) was 10c a Kg, while the price for metal differed
according to the type. These are as follows:
• Copper - R20 a Kg
• Stainless Steel - R9 a Kg
• Aluminium - R7 a Kg
• Other metal - RO.75 a Kg
Clearly, the type of metal collected will have a great effect on the earning potential of
informal collectors.
Research at the Brook Street Buyback Centre was conducted in September 2006,
and the buyback centre was closed towards the end of the year. The reasons for this
are not known. At present the land still remains vacant.
77
4.3.2. The Reclamation Group
The Reclamation Group is a large private recycling company, with branches all over
South Africa. The group has over 60 facilities, and employs in excess of 2500
employees (Reclamation Group, 2007b). In KwaZulu-Natal the Reclamation Group
has a total of 18 branches. The company deals mostly with larger formal companies
selling back waste, however, they do buy material from the informal sector. The
Phoenix branch was chosen as a study area, as a representative from Reclamation
said that this has a large number of waste pickers selling back material, and there
are specific facilities for this. The location of the Reclamation branch in Phoenix is
shown in figure 4.3 below.
78
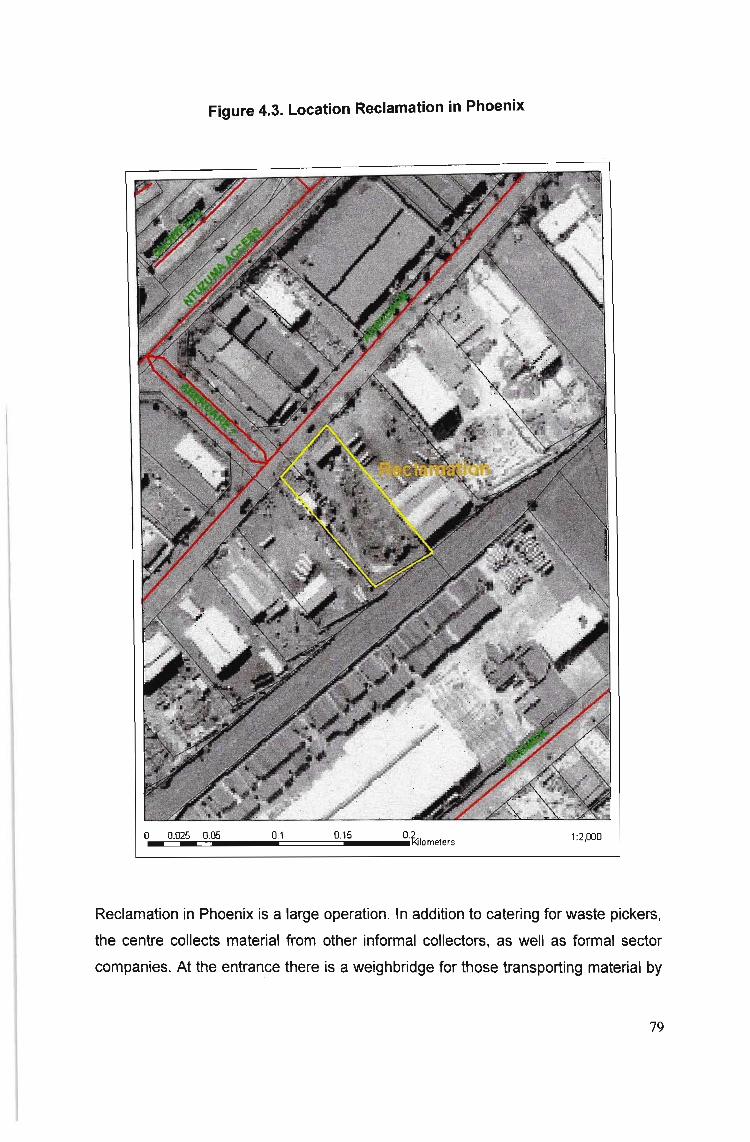
Figure 4.3. Location Reclamation in Phoenix
o 0.025 0.05- - 0.1 0.15 0.2Rilomete rs 1:2,000
Reclamation in Phoenix is a large operation. In addition to catering for waste pickers,
the centre collects material from other informal collectors, as well as formal sector
companies. At the entrance there is a weighbridge for those transporting material by
79
motor vehicle. There is also another section for waste pickers, who bring in their
material either by hand or trolley, and get it weighed on a large scale. The company
employs a number of people to sort the waste and work at the recycling centre. This
is generally a much larger establishment than either of the municipality managed
buyback centres, and there is far more activity in terms of people dropping off
material.
Reclamation deals with a range of recyclable material, including glass, rubber, scrap
metal, plastic, paper, and cardboard (Reclamation Group, 2007b). However, the
common items sold back by waste pickers are cardboard and scrap metal. The price
for cardboard is only 10c a Kg. According to a Reclamation representative, the price
had just been dropped at the time of research (February 2007) due to an oversupply
of scrap cardboard.
4.3.3. Eskom Buyback Centre
Eskom buyback centre is also managed by the Waste Minimisation and Recycling
office of Durban Solid Waste, but unlike Brook Street the buyback centre is located
in a light industrial area, and is surrounded by factories. The project has been
running since the end of 2004, and has also received sponsorship from the
Department of Environmental Affairs and Tourism. Three individuals have been
employed by management to run the buyback centre. Figure 4.4 below shows the
location of Eskom Road Buyback centre.
80
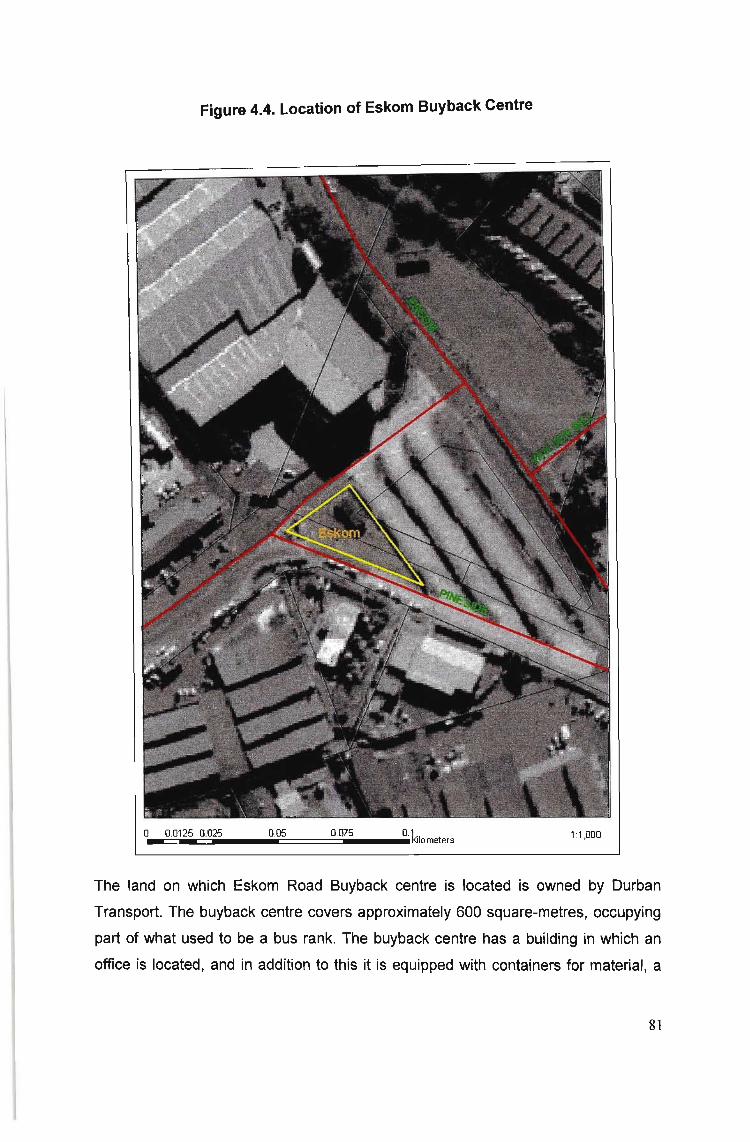
Figure 4.4. Location of Eskom Buyback Centre
o 0.0125 0.025- - 0.05 0.075 1:1,000
The land on which Eskom Road Buyback centre is located is owned by Durban
Transport. The buyback centre covers approximately 600 square-metres, occupying
part of what used to be a bus rank. The buyback centre has a building in which an
office is located, and in addition to this it is equipped with containers for material, a
81

scale, and signage boards. According to Durban Solid Waste, the Eskom Road
Buyback centre was opened at the end of 2004, and collects a monthly volume of
approximately 35 tons of recyclables.
The Buyback Centre collects a number of different materials, including cans, plastic,
glass, cardboard and paper. They do not collect scrap metal because according to
the manager, this requires a permit. Plastic appears to be the material that the
buyback centre trades in the most. At the time of research (February 2007) the
buyback centre offered 15c a Kg for cardboard and paper. The price paid for plastic
differs according to the type of plastic, however, most waste pickers did not have the
time to sort the plastic. Most are therefore paid a general rate of R1 a Kg. According
to the manager at Eskom, the price paid for glass is the rate set by the glass
recycling company, at 20c a Kg.
The Eskom buyback centre operates in a very different way from the Brook Street
buyback centre. While Brook Street caters almost exclusively for waste pickers,
Eskom deals mainly with people further up the informal recycling hierarchy, including
itinerant buyers, middlemen, and those with businesses in waste removal. The
centre deals almost entirely in plastic, and employs between 15 and 20 informal
workers each day to sort the plastic. The centre appears to be more of a transfer
point. As collectors drop off material, it is sorted and stacked, and then taken away
by another buyer, or a hired truck which then takes it to a formal recycling company.
4.4. Research Tools Used
A structured questionnaire was used to interview a number of waste pickers in order
to gain information about their lives, and their work. The researcher also gained
insight into the informal recycling industry through observation.
The questionnaire (see appendix 1) was conducted with the waste pickers at each of
the buyback centres discussed above. It was designed to be as brief as possible,
because 'if too many questions are asked, the respondent tends to become tired or
bored, with the result that those questions appearing towards the end of the
questionnaire are either left unanswered or answered without much care' (Behr,
82
1988: 157). The questionnaire was generally introspective in design, and asked
waste pickers information about their lives as well as their attitudes and opinions
about certain issues.
The questionnaire was semi-structured in nature, and had a range of open ended
and closed ended questions. Both of these types of questions have definite
advantages and disadvantages. Closed ended questions make the information
collected easy to deal with from a statistical and analytic point of view, but also could
have the effect of limiting the respondent (Behr, 1988: 157). The opposite can be
said of open ended questions.
A total of 32 questions were asked, and it was anticipated to take approximately 10
minutes of a respondents' time to answer. Waste pickers are essentially in business
for themselves, so it was seen as unreasonable to ask for more of their time,
considering this could have an impact on income. According to Behr, 'the
questionnaire should start with simple factual questions which can be answered
without much difficulty. Complex or awkward questions should come towards the
end' (Behr, 1988: 157). This advice was followed in the design of this questionnaire.
The questions towards the beginning of the questionnaire were generally close
ended, or required short answers. Questions that looked for attitudes and opinions
were towards the end of the questionnaire. Care was taken to ensure that the
questions were as unambiguous as possible.
The advantages of using a questionnaire as a research tool are many. Firstly, they
can be administered to a large number of people, and the way in which the
information must be analysed is generally clear (Bertram, 2003: 84). It also 'enables
the researcher to standardize the questions asked and to control the amount of
information that respondents will supply' (Bertram, 2003: 85).
However, there are also some disadvantages and restrictions to using a
questionnaire that need to be noted. Firstly, there is the problem of a non-response.
This results in bias in the data collected, and the researcher must be aware that
those refusing to participate can negatively affect the validity of the study. The
researcher must therefore consider how the findings would have differed, had more
83
people responded (Behr, 1988: 162). 'Generally speaking, a response rate of less
than 70% lacks validity' (Behr, 1988: 162).
In addition to the serious problem of non-response, there are other disadvantages to
using a questionnaire, which arise from the actual interview process. As Bertram
points out, 'respondents may not understand the questions asked or may give the
answer that he or she thinks the researcher wants to hear' (Bertram, 2003: 85).
In the case of this particular research, language appeared to be a barrier, with most
of the respondents not being first language English speakers. This was anticipated
by the researcher prior to fieldwork. In order to overcome this problem, an interpreter
/ research assistant was employed to help in the fieldwork. The research assistant
has a background in interviewing people for questionnaires, and is fluent in English,
IsiZulu and able to communicate in IsiXhosa.
4.5. Sampling
In order to determine a representative sample of waste pickers, one has to consider
the entire population of waste pickers in Durban. As Cohen and Manion point out,
'the researcher must obtain the minimum sample size that will accurately represent
the population under survey' (Cohen and Manion in Behr, 1988: 13). In this case,
the researcher would have had to have details as to the number of waste pickers
operating in the Durban area, or the waste picking population of Durban. This
information is unavailable, as research into the informal recycling industry in Durban
is limited.
While there is no information available as to the overall number of waste pickers
operating in Durban, there is information available on where waste pickers take their
collected material to exchange it for money. As discussed above, there are a total of
6 buyback centres run by the municipality, as well as many others run by private
sector companies. Initially, it was decided to choose only one buyback centre (Brook
Street) and use it as a case study. However, it soon became clear that there are not
enough waste pickers selling material to the buyback centre, and while 20
questionnaires were completed, this was hardly enough to perform a statistical
84
analysis on. It was therefore decided to choose two other buyback centres, and to
conduct 20 questionnaires at each of these, resulting in a total sample of 60
questionnaires., The three buyback centres chosen have been discussed in detail
above. They were selected because of their differences: Brook Street is located in a
busy commercial area, Eskom is in an industrial area, while Reclamation is a private
recycling company.
As mentioned above, a sample of 20 questionnaires were completed at each
buyback centre. The sampling method used was incidental sampling. In both of the
cases of Brook Street and Eskom, nearly the entire population of waste pickers
selling back material at these locations were interviewed. Reclamation was far
busier, and therefore the proportion of the population of waste pickers using
Reclamation interviewed is unclear.
Due to the lack of knowledge, both of the waste picking population of Durban, and
the population selling back material at each buyback centre, sampling in this study
has been very difficult. This study can therefore not be considered to be
representative of waste pickers operating in Durban as a whole, but must rather be
viewed as three separate case studies. In the analysis, the results for the entire
sample of 60 will be elaborated on, and the results from each buyback centre
compared. Thus, this research can be used as a benchmark against which future,
larger studies can be measured.
4.6. Fieldwork
4.6.1. The Pilot Study
In order to test that the questionnaire would elicit valid results and was
unambiguous, a pilot study was carried out. This was conducted at the Brook Street
Buyback Centre in early September 2006. The questionnaire was found to work fairly
well, and the response rate was also high as the waste pickers seemed happy to
give up their time to answer the questions. Not one waste picker declined being
interviewed.
85
A total of 5 pilot questionnaires were completed. The pilot questionnaire was found
to take on average about 10 minutes to complete, and consisted of a total of 28
questions. An interpreter I research assistance was present at all times during the
fieldwork. She is fluent is both English and IsiZulu, and is also able to communicate
in IsiXhosa.
A number of issues arose from the pilot study, which made it possible to determine
which questions needed rephrasing, and what needed to be added. It was found that
some important socio-economic questions had been left out in the pilot
questionnaire, such as age and home language. A further two questions were
added, the first asking that if the respondent collected more than one type of material
which material he or she collected the most of, and the second (Question 32 - See
Appendix 1) asked about what the municipality could do to improve the working
conditions of the waste pickers.
A number of questions were also rephrased to facilitate clarity. For example, instead
of asking how many people live in the household, this was rephrased to ask how
many people the respondent supported financially. This question aimed to gain an
understanding of how many individuals survived off the income from waste picking.
Similarly, a question that previously read 'Apart form collecting recyclable materials,
do you do any other work to get money?' was replaced with a question that asked
whether the respondent got money from any other sources. This was done because
grants, pensions and government support also provide additional income to the
household. A question asking the about other sources of income, and how much
they amounted to was also included.
A number of other questions were also expanded to be clearer. For example, instead
of asking the waste picker why they collect scrap, the question was rephrased to ask
the respondent why they collected scrap instead of doing other types of work. The
aim of this was to determine the extent to which waste pickers were in the line of
work by choice, and whether other opportunities were available to them. A question
asking the waste picker why they used a particular buyback centre, rather than
elsewhere was also included. This will help in considering informal and formal sector
linkages.
86
4.6.2. The Data Collection
The data collection commenced on the completion of the pilot study, in mid
September 2006. At this stage, it was still anticipated that 60 questionnaires would
be completed at Brook Street, and the study would focus entirely on this buyback
centre.
After a week administering questionnaires at the buyback centre, it was clear that a
sample of 60 questionnaires was not feasible. Nearly all of the 20 questionnaires
completed at Brook Street were done so in the first two days of fieldwork. After this,
the majority of waste pickers selling back waste to Brook Street regularly had been
interviewed, and it was clear that a sample of 60 was unrealistic. It as therefore
decided, as explained above, to choose two other buyback centres and to complete
20 questionnaires at each of them. The response rate at Brook Street was 100%,
with not one waste picker refusing to be interviewed.
In February 2007 it was decided to use the Eskom Buyback Centre as another
location in which to gain access to waste pickers. However, a similar problem to the
Brook Street Buyback Centre was experienced, as the buyback centre had a small
group of waste pickers who regularly dropped off material. In total, a week was spent
at the Eskom buyback centre. Due to the fact that the researcher was finding it
difficult to complete a sample of 20, the manager of the buyback centre offered his
knowledge of waste picking in the area. One afternoon, during the week that was
spent at Eskom, the manager took the researcher around the industrial area of New
Germany. He introduced the researcher to a number of waste pickers operating in
the area, who sometimes sell waste back to Eskom. These waste pickers, however,
also sometimes rely on a middleman to transport their material to the buyback
centre. Again, the response rate was high, with every picker consenting to an
interview.
The Reclamation Group was approached last, as this is a private company, and
permission was needed to conduct the questionnaires. Once this was acquired
research commenced. The data was gathered in February 2007. In contrast to the
87
other two study areas, Reclamation has a large number of waste pickers selling back
waste at a constant rate. There was no shortage of people to interview, and
therefore it only took 2 days to gather the necessary sample. The response rate was
slightly lower at Reclamation, with one waste picker refusing to be interviewed,
because he was in a hurry. Due to the high number of waste pickers using the
Reclamation Group to drop off waste, a much smaller part of this population was
sampled in this study. While it can be assumed through spending a week at Brook
Street and Eskom respectively that a large portion, if not all, of the population using
these two buyback centres was interviewed, the same cannot be said for
Reclamation. As no information exists as to the number of waste pickers selling
material to Reclamation on a regular basis, it is impossible to say what portion of the
population who use this buyback centre was sampled. One can only assume, that
due to the fact that it took a relatively short amount of time to collect the sample of
20, and based on how busy the buyback centre was at the time of research, that only
a fraction of the population has been captured in this sample of 20.
4.7. Data Analysis
The quantitative data gathered from the questionnaire went through a process of
post coding (for open-ended questions), data punching, and analysis. The majority of
the questions were analyzed to determine percentage profiles of responses. Where
appropriate, a more detailed statistical analysis was performed. Some cross
tabulations were done. For example, it was of interest to see if there was a
correlation between earnings, and different variables, such as gender, age, and
education levels. Overall, the data was analyzed to determine the demographic and
economic profile of a typical participant in the industry. Questions relating to attitudes
and opinions were post coded, and then responses were grouped and reported on.
4.8. Conclusion
This chapter has discussed the design of this research, as well as the three buyback
centres used as study areas. The way in which these centres operate, and the
conditions at each have been touched upon. The main research tool used in this
study was a questionnaire, both with open ended and closed ended questions. After
88

the pilot study, a total sample of 60 questionnaires were administered at the three
different buyback centres.
The data has been analysed in detail in chapter 5, in order to describe the socio
economic characteristics of the waste pickers, as well as their working conditions,
earnings, relationship with the municipality, and links with the formal sector.
89
Chapter 5: Results and Discussion
5.1. Introduction
In this chapter, the results of this study will be elaborated on and discussed in detail.
Findings relating to each buyback centre, as well as the sample as a whole will be
reported, and in each case, these results will be related back to the relevant
literature. Firstly, the socio-economic characteristics of the waste pickers interviewed
will be discussed. Thereafter, the working environment and working conditions of the
waste pickers will be focussed on in greater detail. An analysis of the earnings of the
waste pickers will then be presented, followed by a discussion of the waste pickers'
relationship with the local authorities, and the formal sector.
5.2. Socio-economic characteristics of the waste pickers
5.2.1. Gender
The entire sample was generally quite evenly divided according to gender, with 57%
of the sample being male, and 43% of the sample being female. However, the divide
in gender appeared to be quite great at the different buyback centres. Seventy five
percent of the waste pickers interviewed at Eskom were women, while 85% of the
people interviewed at the Reclamation Group were men. Brook Street had a more
even breakdown according to gender, with 60% of the sample being male, and the
remaining 40% being female.
This gender difference at the different buyback centres could be due to the types of
materials that were sold back at these different locations. At Eskom, plastics and
cardboard were mainly dealt with, while at Reclamation the majority of the waste
pickers were selling back metal. It appeared that more men were involved in metal
collection than women, who tended to specialize in plastics or cardboard.
There is no consensus in the literature as to which gender dominates waste picking.
Some studies, such as Birkbeck (1979), Hayami (2006), and Medina (2001), found
the profession to be dominated by men, while other studies, such as Tevera (1994),
90
and Waiters (2002), found women to dominate. McLean (2000b), in a study
conducted in Durban, found that three quarters of the waste pickers she interviewed
were male. While this study showed that men outnumbered women, it was not by a
large margin.
5.2.2. Race
Nearly the entire sample was black (95%), with the remaining 5% being of Indian
decent. The large representation of black people in the sample is an indication of
historic disadvantages.
5.2.3. Education Levels
Respondents were asked to state their highest level of education, and apart form
one individual who said she was attending night school, none of those interviewed
were still in the education system. Overall, a quarter of the respondents indicated
that they had never been to school, while about a third (34%) reported that they had
completed primary school education. Another third (33%) claimed to have some high
school education, while 8% reported that they had completed their matric, this was
the maximum education level reported to have been achieved. None of the
respondents had gone on to study further. The average education level reached by
the waste pickers was found to be some primary school education, grade 4 to grade
7. The graph below shows the education levels at each particular buyback centre.
91
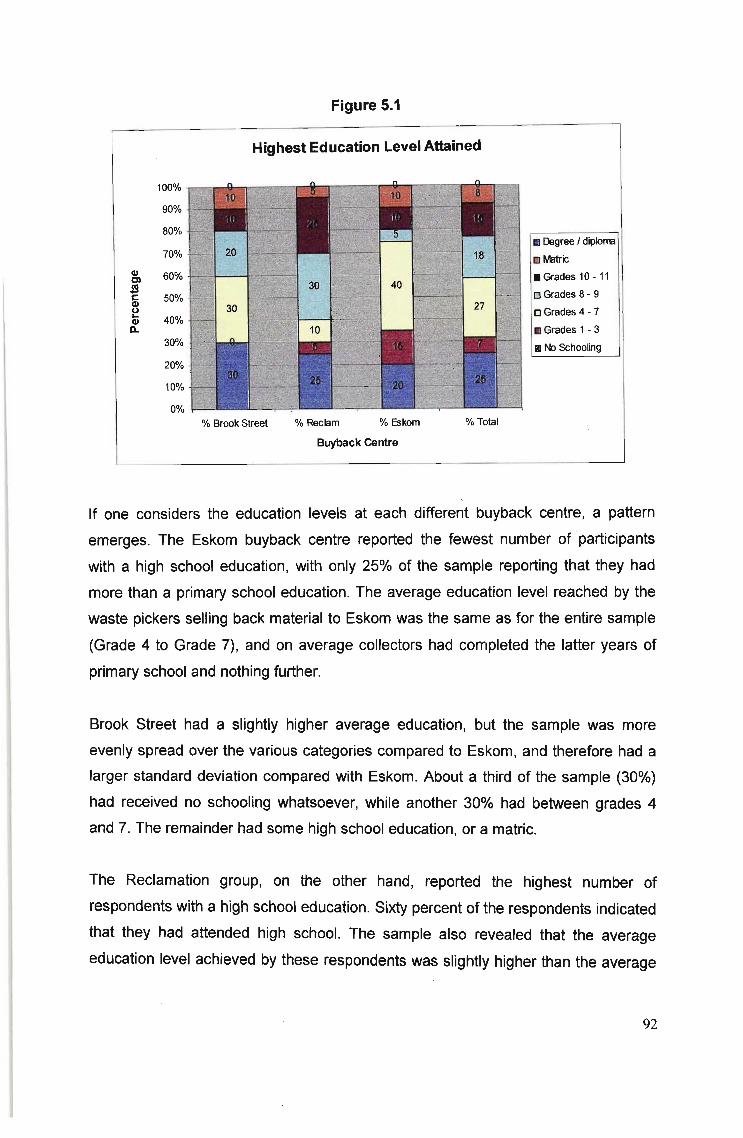
Figure 5.1
Highest Education Level Attained
100%
90%
80%
70%
Gl 60%C'lSs:: 50%Gl~
40%GlQ.
30%
20%
10%
0%
% Brook Street % Reclam % Eskom
11 Degree I diplorm
ClMltric
11 Grades 10 - 11
o Grades 8 - 9
o Grades 4-7
11 Grades 1 - 3
ClNo SChooling
% Total
Buyback centre
If one considers the education levels at each different buyback centre, a pattern
emerges. The Eskom buyback centre reported the fewest number of participants
with a high school education, with only 25% of the sample reporting that they had
more than a primary school education. The average education level reached by the
waste pickers selling back material to Eskom was the same as for the entire sample
(Grade 4 to Grade 7), and on average collectors had completed the latter years of
primary school and nothing further.
Brook Street had a slightly higher average education, but the sample was more
evenly spread over the various categories compared to Eskom, and therefore had a
larger standard deviation compared with Eskom. About a third of the sample (30%)
had received no schooling whatsoever, while another 30% had between grades 4
and 7. The remainder had some high school education, or a matric.
The Reclamation group, on the other hand, reported the highest number of
respondents with a high school education. Sixty percent of the respondents indicated
that they had attended high school. The sample also revealed that the average
education level achieved by these respondents was slightly higher than the average
92
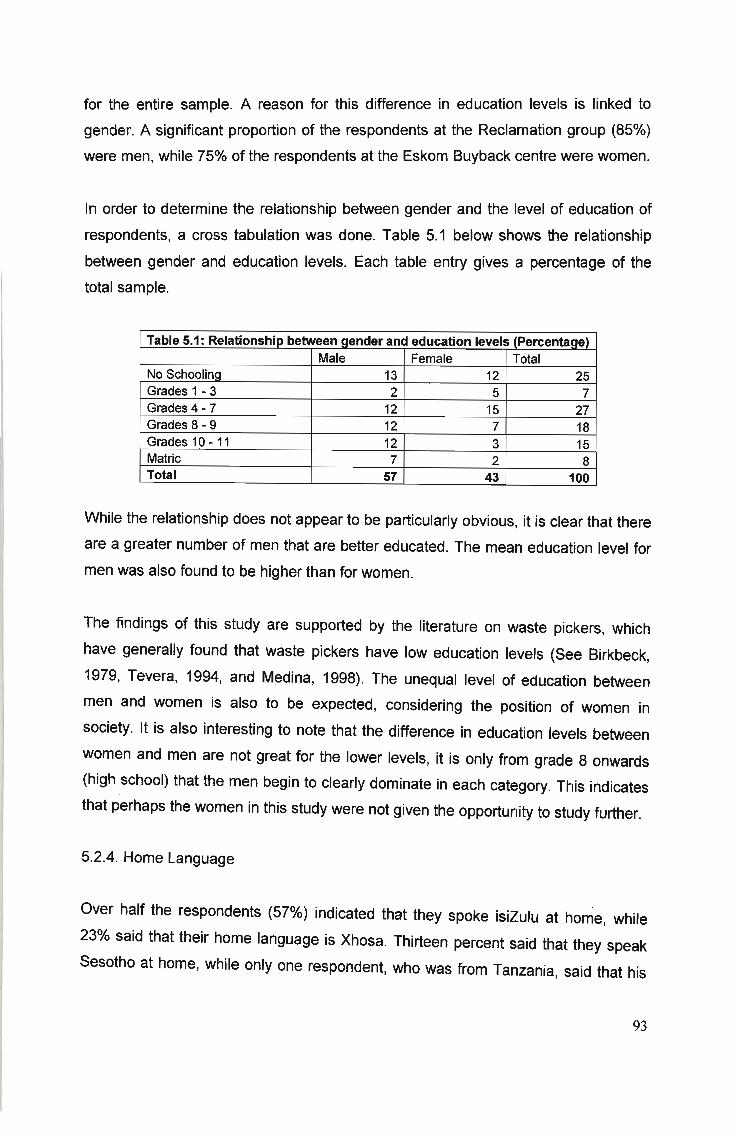
for the entire sample. A reason for this difference in education levels is linked to
gender. A significant proportion of the respondents at the Reclamation group (85%)
were men, while 75% of the respondents at the Eskom Buyback centre were women.
In order to determine the relationship between gender and the level of education of
respondents, a cross tabulation was done. Table 5.1 below shows the relationship
between gender and education levels. Each table entry gives a percentage of the
total sample.
Table 5.1: Relationship between aender and education levels tPercentaae)Male Female Total
No Schoolina 13 12 25Grades 1 - 3 2 5 7Grades 4 - 7 12 15 27Grades 8 - 9 12 7 18Grades 10 - 11 12 3 15Matric 7 2 8Total 57 43 100
While the relationship does not appear to be particularly obvious, it is clear that there
are a greater number of men that are better educated. The mean education level for
men was also found to be higher than for women.
The findings of this study are supported by the literature on waste pickers, which
have generally found that waste pickers have low education levels (See Birkbeck,
1979, Tevera, 1994, and Medina, 1998). The unequal level of education between
men and women is also to be expected, considering the position of women in
society. It is also interesting to note that the difference in education levels between
women and men are not great for the lower levels, it is only from grade 8 onwards
(high school) that the men begin to clearly dominate in each category. This indicates
that perhaps the women in this study were not given the opportunity to study further.
5.2.4. Home Language
Over half the respondents (57%) indicated that they spoke isiZulu at home, while
23% said that their home language is Xhosa. Thirteen percent said that they speak
Sesotho at home, while only one respondent, who was from Tanzania, said that his
93
first language was Swahili. Another 3 respondents (5% of the sample) said that
English was their home language.
The individual buyback centres were generally in line with the above trends, although
a higher proportion of Sesotho speaking people were found at the Eskom Buyback
centre (35% of those interviewed at Eskom).
The high number of IsiZulu speaking people can be expected, as it is the main
language in the province in which Durban is located. It is also most spoken language
in South Africa (Statistics South Africa, 2001). Similarly, it is also not surprising that
there are a large number of Xhosa speaking people (23% of the total sample)
operating as informal recyclers. Many of these individuals would have come from
rural areas in the Eastern Cape to seek job opportunities in Durban. Xhosa is also
the second most spoken language in South Africa (Statistics South Africa, 2001).
5.2.5. Age
The average age of the total sample was 42 years of age. The oldest participant was
85 years old, and the youngest 17. The range in age was therefore 68 years. The
mode, or most common response was 52 years of age, whilst the sample had a
median of 41.5 years. If one considers the economically active population (those
between the ages of 16 and 65 years), 95% of the sample fell in this group, whilst
five percent of the sample were over the age of 65. Only 7% of the waste pickers fell
in the 16 to 20 age category, while the category with the most number of
respondents (28%) was the 51 to 64 age group. The standard deviation in age was
14.6. Figure 5.2 below shows the different age categories of respondents.
94
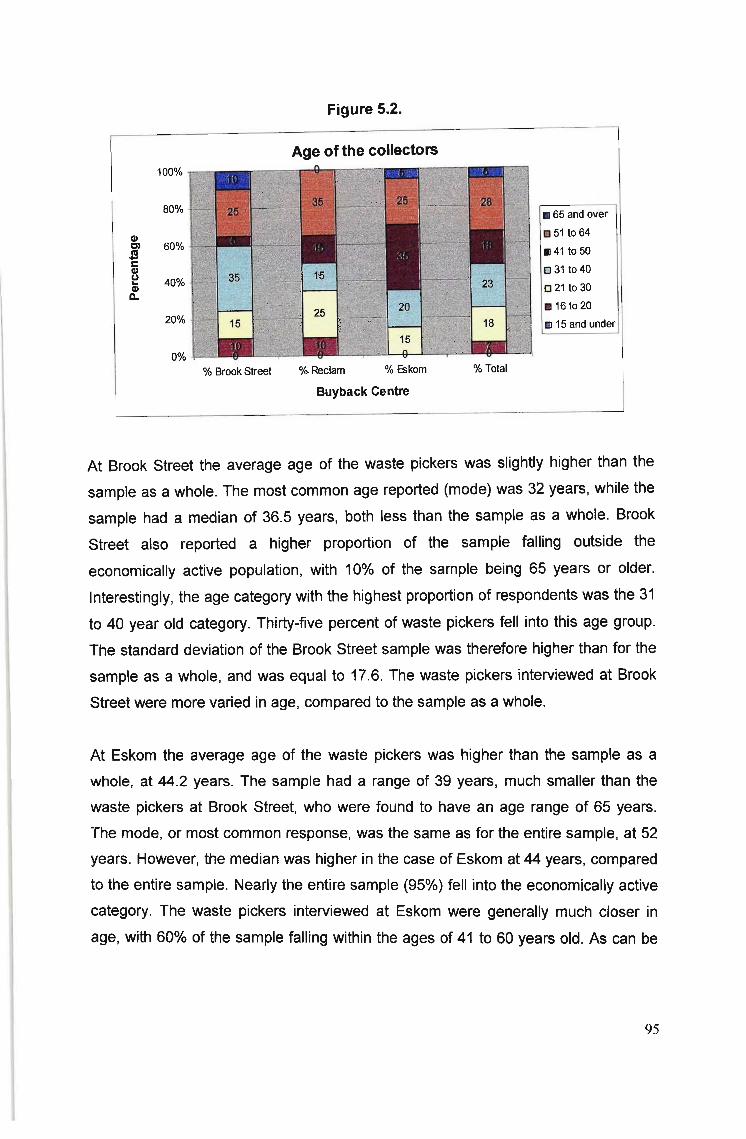
Figure 5.2.
Age of the collectors100%
80%
60%
40%
20%
0%
% BrookStreet % Reclam % Eskom % Total
1i1 65 and over
851 to 64
1141 to 50
031 to 40
021 to 30
11 16 to 20
!<I 15 and under
Buyback Centre
At Brook Street the average age of the waste pickers was slightly higher than the
sample as a whole. The most common age reported (mode) was 32 years, while the
sample had a median of 36.5 years, both less than the sample as a whole. Brook
Street also reported a higher proportion of the sample falling outside the
economically active population, with 10% of the sample being 65 years or older.
Interestingly, the age category with the highest proportion of respondents was the 31
to 40 year old category. Thirty-five percent of waste pickers fell into this age group.
The standard deviation of the Brook Street sample was therefore higher than for the
sample as a whole, and was equal to 17.6. The waste pickers interviewed at Brook
Street were more varied in age, compared to the sample as a whole.
At Eskom the average age of the waste pickers was higher than the sample as a
whole, at 44.2 years. The sample had a range of 39 years, much smaller than the
waste pickers at Brook Street, who were found to have an age range of 65 years.
The mode, or most common response, was the same as for the entire sample, at 52
years. However, the median was higher in the case of Eskom at 44 years, compared
to the entire sample. Nearly the entire sample (95%) fell into the economically active
category. The waste pickers interviewed at Eskom were generally much closer in
age, with 60% of the sample falling within the ages of 41 to 60 years old. As can be
95
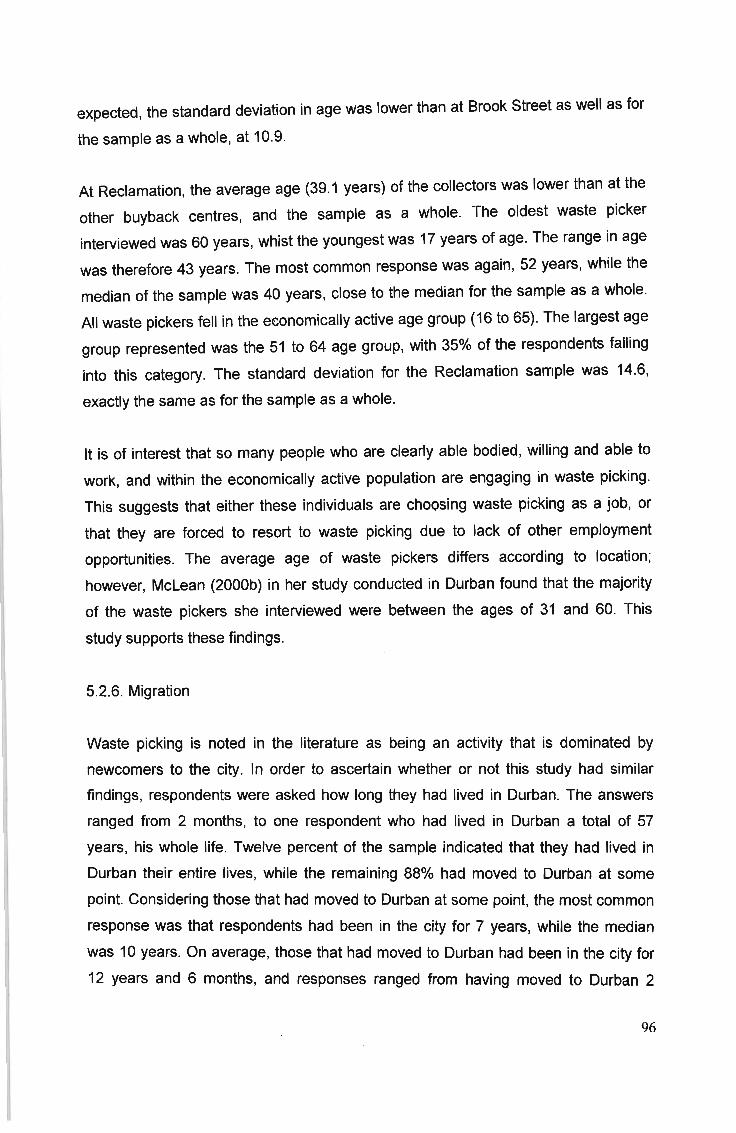
expected, the standard deviation in age was lower than at Brook Street as well as for
the sample as a whole, at 10.9.
At Reclamation, the average age (39.1 years) of the collectors was lower than at the
other buyback centres, and the sample as a whole. The oldest waste picker
interviewed was 60 years, whist the youngest was 17 years of age. The range in age
was therefore 43 years. The most common response was again, 52 years, while the
median of the sample was 40 years, close to the median for the sample as a whole.
All waste pickers fell in the economically active age group (16 to 65). The largest age
group represented was the 51 to 64 age group, with 35% of the respondents falling
into this category. The standard deviation for the Reclamation sample was 14.6,
exactly the same as for the sample as a whole.
It is of interest that so many people who are clearly able bodied, willing and able to
work, and within the economically active population are engaging in waste picking.
This suggests that either these individuals are choosing waste picking as a job, or
that they are forced to resort to waste picking due to lack of other employment
opportunities. The average age of waste pickers differs according to location;
however, McLean (2000b) in her study conducted in Durban found that the majority
of the waste pickers she interviewed were between the ages of 31 and 60. This
study supports these findings.
5.2.6. Migration
Waste picking is noted in the literature as being an activity that is dominated by
newcomers to the city. In order to ascertain whether or not this study had similar
findings, respondents were asked how long they had lived in Durban. The answers
ranged from 2 months, to one respondent who had lived in Durban a total of 57
years, his whole life. Twelve percent of the sample indicated that they had lived in
Durban their entire lives, while the remaining 88% had moved to Durban at some
point. Considering those that had moved to Durban at some point, the most common
response was that respondents had been in the city for 7 years, while the median
was 10 years. On average, those that had moved to Durban had been in the city for
12 years and 6 months, and responses ranged from having moved to Durban 2
96
months ago, to 42 years ago. The sample (excluding those that were born in
Durban) had a standard deviation of 10.3. If one groups the time spent living in
Durban into categories, it is clear that over 75% of the collectors interviewed have
lived in Durban for longer than 5 years. Only 3% of the total sample indicated that
they had been in Durban less than a year. This is shown in figure 5.3 below.
Figure 5.3
Time spent in Durban
100%
90%CIl 80%Q.E 70%Cl!
Cl) 60%...0 50%CIlCl 40%J9c 30%CIlu~ 20%CIl
D..10%
0%% Brook Street % Reclam % Eskom
o don't live in Durban
m all my life
l!l more than 21 years
m 16-20 years and 11 months
011-15 years and 11 months
o 6-10 years and 11 months
III 1-5 years and 11 months
m less than a year
% Total
Time spent in Durban
At Brook Street, not one of the respondents said that they had been born in Durban,
all had migrated to the city. However, one respondent, when asked how long he had
lived in Durban, replied that he did not live in Durban. This was due to the fact that
he travelled long distances to get to the city, and would travel home to a nearby rural
area regularly. He was therefore omitted from the analysis. Of the remaining 19
respondents, the most common response as to how long they had been living in the
city was the same as for the sample as a whole, at 7 years, while the average time
spent living in Durban was 9 years and 11 months, lower than that of the entire
sample. The standard deviation was much lower than for the entire sample, at 6.3,
as was the range of responses. If one groups time spent in Durban into categories,
40% of the sample said that they had been in Durban for 6 to 10 years. Eighty
percent of the sample indicated that they had been in Durban longer than 5 years,
while all of the respondents had been in Durban longer than a year.
97
At Eskom, 3 out of the 20 waste pickers interviewed (15%) indicated that they were
born in Durban. Of those that had migrated to Durban, the most common response
was that they had been in the city for 10 years. On average, the waste pickers that
had migrated to Durban had been in the city for 14 years and 3 months, significantly
more than the average for the entire sample. The respondent that had been in
Durban the shortest amount of time indicated that he had only lived in Durban 2
years, while the maximum time lived in Durban for those that had migrated here was
33 years. The standard deviation considering time spent in Durban for those that had
moved here was 9.8, marginally lower that of the entire sample. If one groups time
lived in Durban, the groups with the highest number of respondents were those that
had been in Durban between a year and 5 years and 11 months (20%), and those
that had been in Durban 16 to 20 years and 11 months (20%). Eighty percent of the
sample indicated that they had been in Durban longer than 5 years, while all of the
respondents had been in Durban longer than a year.
If one looks at the responses from the Reclamation Group, 20% indicated that they
had lived in Durban their entire lives. Of those that had migrated to the city, the most
common number of years spent in Durban were 7, with 15% pointing out that they
had been in Durban for this length of time. Those that had migrated to the city had
been in Durban for an average of 13 years and 8 months, higher than the average
for the entire sample. Reponses ranged from having been in Durban for 2 months, to
having migrated here 42 years ago. The standard deviation for those that had
migrated to Durban was 14, higher than the standard deviation for the entire sample,
indicating that the time spent in Durban varied to a greater extent between the waste
pickers at this buyback centre. Twenty five percent of the total sample indicated that
they had migrated to Durban more than 21 years ago. However, 25% of the total
sample also indicated that they had been in Durban for less than 5 years and 11
months, while 10% indicated that they had been in Durban for less than a year.
Between the buyback centres, it appears that collectors operating at the Reclamation
group had the highest number of new entrants to the city, and the highest number of
collectors (20%) who have lived in Durban all their lives.
According to the literature, waste picking is an occupation that is often dominated by
migrants and new comers to the city (see, for example, Hayami et ai, 2006, Van
98
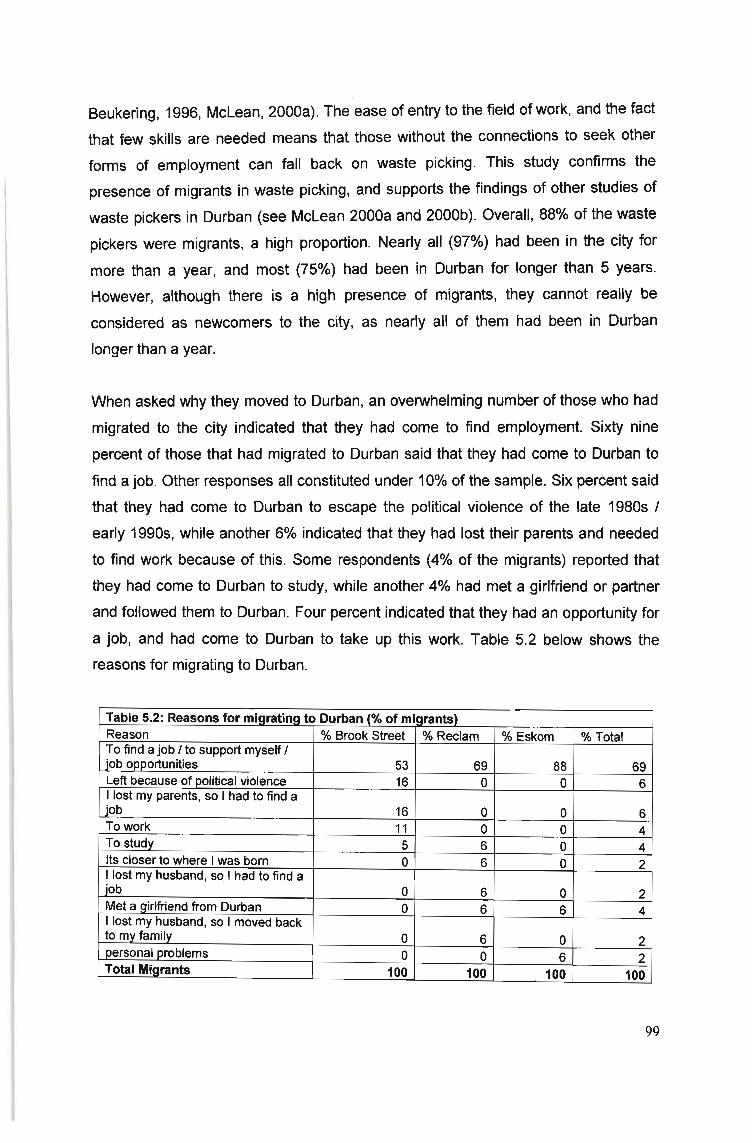
Beukering, 1996, McLean, 2000a). The ease of entry to the field of work, and the fact
that few skills are needed means that those without the connections to seek other
forms of employment can fall back on waste picking. This study confirms the
presence of migrants in waste picking, and supports the findings of other studies of
waste pickers in Durban (see McLean 2000a and 2000b). Overall, 88% of the waste
pickers were migrants, a high proportion. Nearly all (97%) had been in the city for
more than a year, and most (75%) had been in Durban for longer than 5 years.
However, although there is a high presence of migrants, they cannot really be
considered as newcomers to the city, as nearly all of them had been in Durban
longer than a year.
When asked why they moved to Durban, an overwhelming number of those who had
migrated to the city indicated that they had come to find employment. Sixty nine
percent of those that had migrated to Durban said that they had come to Durban to
find a job. Other responses all constituted under 10% of the sample. Six percent said
that they had come to Durban to escape the political violence of the late 1980s I
early 1990s, while another 6% indicated that they had lost their parents and needed
to find work because of this. Some respondents (4% of the migrants) reported that
they had come to Durban to study, while another 4% had met a girlfriend or partner
and followed them to Durban. Four percent indicated that they had an opportunity for
a job, and had come to Durban to take up this work. Table 5.2 below shows the
reasons for migrating to Durban.
Table 5.2: Reasons for mlqratlnu to Durban (% of mlqrants)Reason % Brook Street % Reclam % Eskom % TotalTo find a job I to support myself Ijob opportunities 53 69 88 69Left because of eolitical violence 16 0 0 6I lost my parents, so I had to find ajob 16 0 0 6To work 11 0 0 4To study 5 6 0 4Its closer to where I was born 0 6 0 2I lost my husband, so I had to find ajob 0 6 0 2Met a girlfriend from Durban 0 6 6 4I lost my husband, so I moved backto my family 0 6 0 2personal eroblems 0 0 6 2Total Migrants 100 100 100 100
99
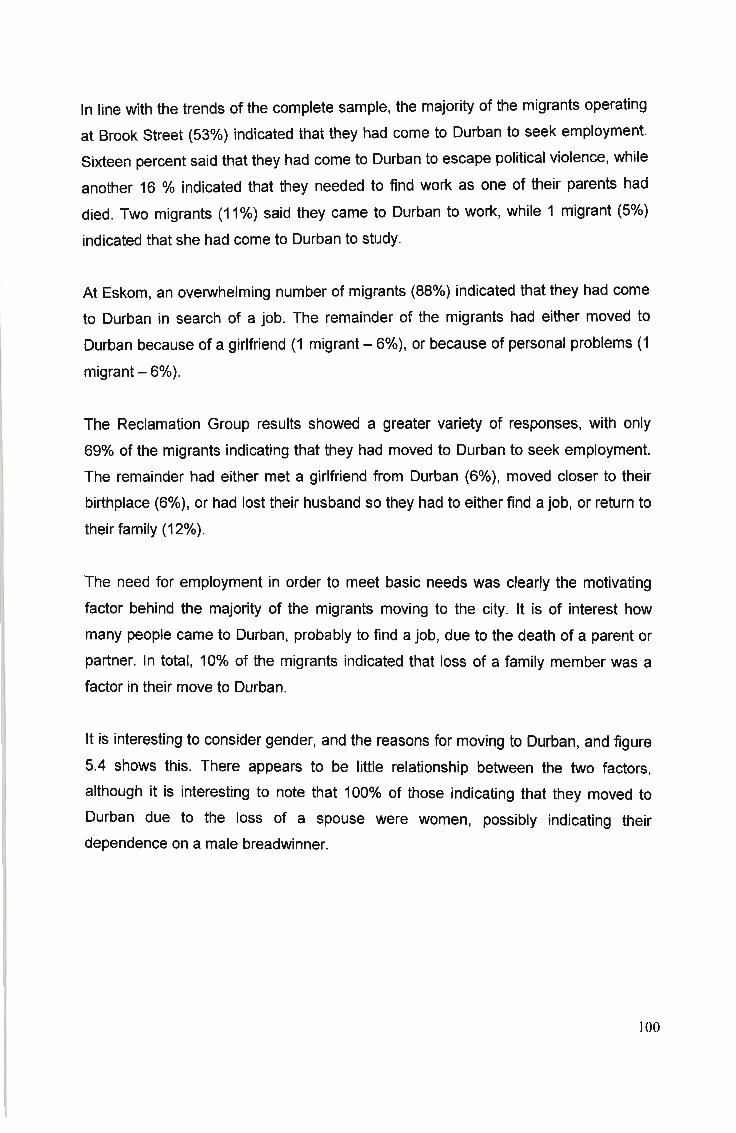
In line with the trends of the complete sample, the majority of the migrants operating
at Brook Street (53%) indicated that they had come to Durban to seek employment.
Sixteen percent said that they had come to Durban to escape political violence, while
another 16 % indicated that they needed to find work as one of their parents had
died. Two migrants (11%) said they came to Durban to work, while 1 migrant (5%)
indicated that she had come to Durban to study.
At Eskom, an overwhelming number of migrants (88%) indicated that they had come
to Durban in search of a job. The remainder of the migrants had either moved to
Durban because of a girlfriend (1 migrant - 6%), or because of personal problems (1
migrant - 6%).
The Reclamation Group results showed a greater variety of responses, with only
69% of the migrants indicating that they had moved to Durban to seek employment.
The remainder had either met a girlfriend from Durban (6%), moved closer to their
birthplace (6%), or had lost their husband so they had to either find a job, or return to
their family (12%).
The need for employment in order to meet basic needs was clearly the motivating
factor behind the majority of the migrants moving to the city. It is of interest how
many people came to Durban, probably to find a job, due to the death of a parent or
partner. In total, 10% of the migrants indicated that loss of a family member was a
factor in their move to Durban.
It is interesting to consider gender, and the reasons for moving to Durban, and figure
5.4 shows this. There appears to be little relationship between the two factors,
although it is interesting to note that 100% of those indicating that they moved to
Durban due to the loss of a spouse were women, possibly indicating their
dependence on a male breadwinner.
100
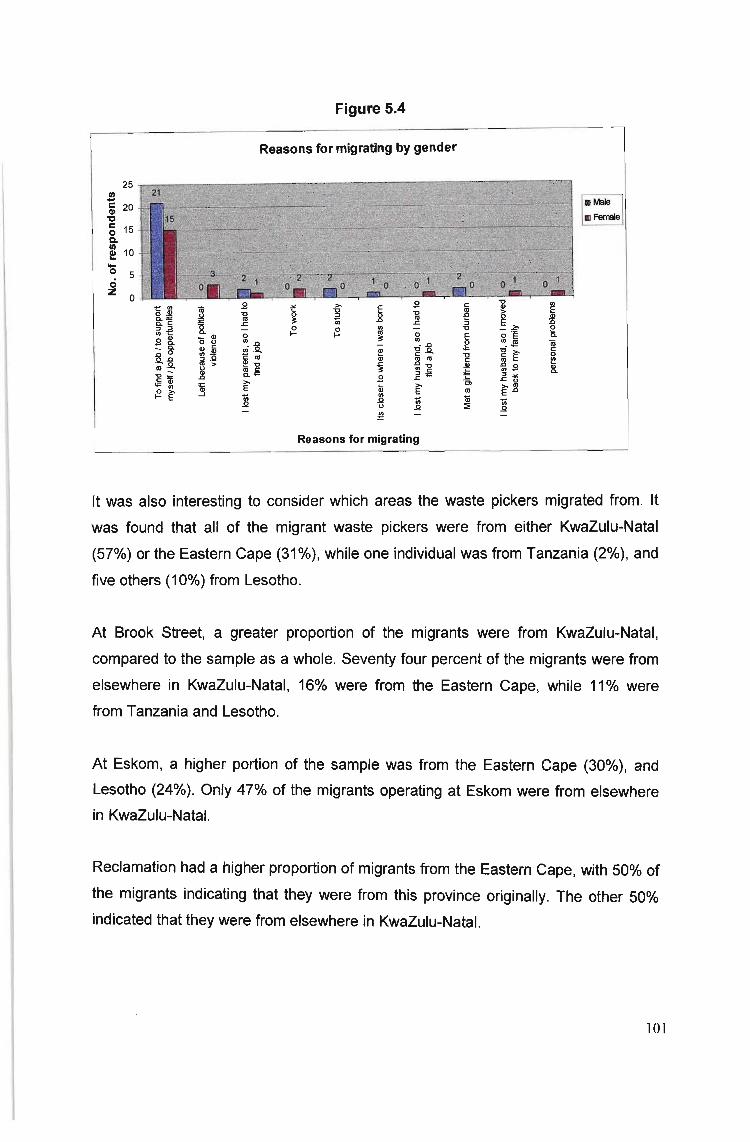
Figure 5.4
Reasons for migrating by gender
25
J!l; 20'l:J
~ 15Cl.
! 10...o 5oZ 0
t:: '"0.Sl~~:::J :::JlIlt::o III_0._0..0 00.0
'm ~
"""~ ~
~E
ro.Il .
i- IIIo UIII c",.Sl:::J .2.. >
~
~
B
"..s:-o"'.0
-E- ';'~"~.E
><
~oI-
s-,
":::J0;oI-
-o'"• .0" 0C .. ..-g".E,§E~
'"E.Sl.0
[roco'"~
III Male
III Female
Reasons for migrating
It was also interesting to consider which areas the waste pickers migrated from. It
was found that all of the migrant waste pickers were from either KwaZulu-Natal
(57%) or the Eastern Cape (31%), while one individual was from Tanzania (2%), and
five others (10%) from Lesotho.
At Brook Street, a greater proportion of the migrants were from KwaZulu-Natal,
compared to the sample as a whole. Seventy four percent of the migrants were from
elsewhere in KwaZulu-Natal, 16% were from the Eastern Cape, while 11% were
from Tanzania and Lesotho.
At Eskom, a higher portion of the sample was from the Eastern Cape (30%), and
Lesotho (24%). Only 47% of the migrants operating at Eskom were from elsewhere
in KwaZulu-Natal.
Reclamation had a higher proportion of migrants from the Eastern Cape, with 50% of
the migrants indicating that they were from this province originally. The other 50%
indicated that they were from elsewhere in KwaZulu-Natal.
101
These results can be expected, as the majority of respondents came from either
KwaZulu-Natal, or the Eastern Cape. The Eastern Cape is relatively close to
KwaZulu-Natal, and there are fewer employment opportunities within that province.
This is a possible reason as to why migrants chose Durban, one of the largest cities
in South Africa, to migrate to. Lesotho is also relatively close by, bordering northern
KwaZulu-Natal. Durban probably would have been the closest large city in which to
seek employment opportunities. While there was no specific question asking
migrants whether they came from urban or rural areas, this was determined during
the fieldwork. The majority of the migrants came from rural areas. This finding is
supported by the literature on waste picking, where it is widely reported that rural
migrants can be found in this type of work (See McLean 2000a and 2000b, Hayami
et ai, 2006, and Van Beukering, 1996).
5.3. Employment Analysis
5.3.1. Previous Employment
When asked what their previous type of employment was, only 12% of the total
sample replied that they had never worked before. A portion of the sample (18%)
indicated that they had worked previously in a factory, or in an industrial
environment. Seventeen percent of the collectors responded that they had previously
worked as domestic workers or cleaners, while 15% indicated that they had worked
previously in the informal sector either owning their own business, or working for
somebody else with an informal business. Examples given included selling fruit and
vegetables, working in an informal butchery, or running a Spaza Shop or Tuckshop.
Thirteen percent of the sample pointed out that they had previously been involved in
a trade. Examples given included painting, welding, plastering, carpentry, plumbing,
or mechanics. Figure 5.5 shows the breakdown in previous employment types for
each buyback centre, as well as for the sample as a whole.
102
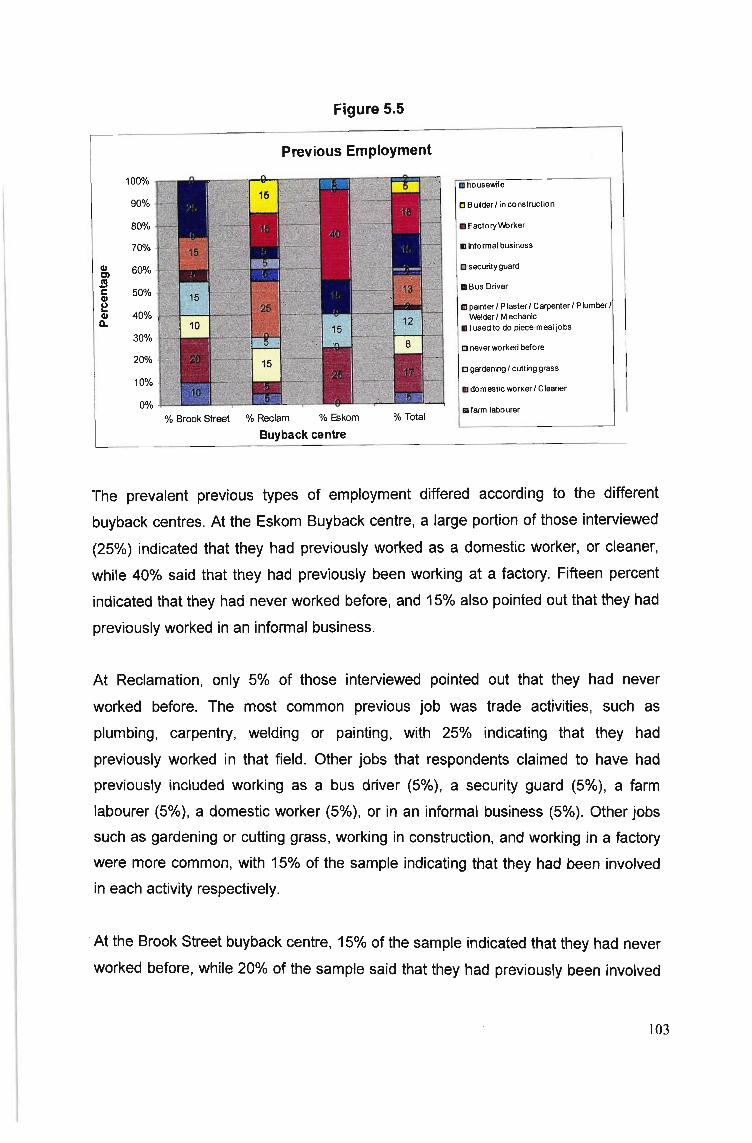
Figure 5.5
Previous Employment
100%
90%
80%
70%
CII 60%C)
Se 50%Cl)
~40%Cl)
a..30%
20%
10%
0%
% Brook Street % Reclam % Eskom % Total
m housewife
C Builder I in construction
11FactoryW,rker
11Informal business
C security guard
IDBus Driver
C painter I Plaster I Carpenter I P lumber IW3lder I Mechanic
II I used to do piece-mea l jobs
C never worked befo re
C gardening I cutt ing grass
III domestic worker I Cleaner
C farm labourer
Buyback centre
The prevalent previous types of employment differed according to the different
buyback centres. At the Eskom Buyback centre, a large portion of those interviewed
(25%) indicated that they had previously worked as a domestic worker, or cleaner,
while 40% said that they had previously been working at a factory. Fifteen percent
indicated that they had never worked before, and 15% also pointed out that they had
previously worked in an informal business.
At Reclamation, only 5% of those interviewed pointed out that they had never
worked before. The most common previous job was trade activities, such as
plumbing, carpentry, welding or painting, with 25% indicating that they had
previously worked in that field. Other jobs that respondents claimed to have had
previously included working as a bus driver (5%), a security guard (5%), a farm
labourer (5%), a domestic worker (5%), or in an informal business (5%). Other jobs
such as gardening or cutting grass, working in construction, and working in a factory
were more common, with 15% of the sample indicating that they had been involved
in each activity respectively.
.At the Brook Street buyback centre, 15% of the sample indicated that they had never
worked before, while 20% of the sample said that they had previously been involved
103
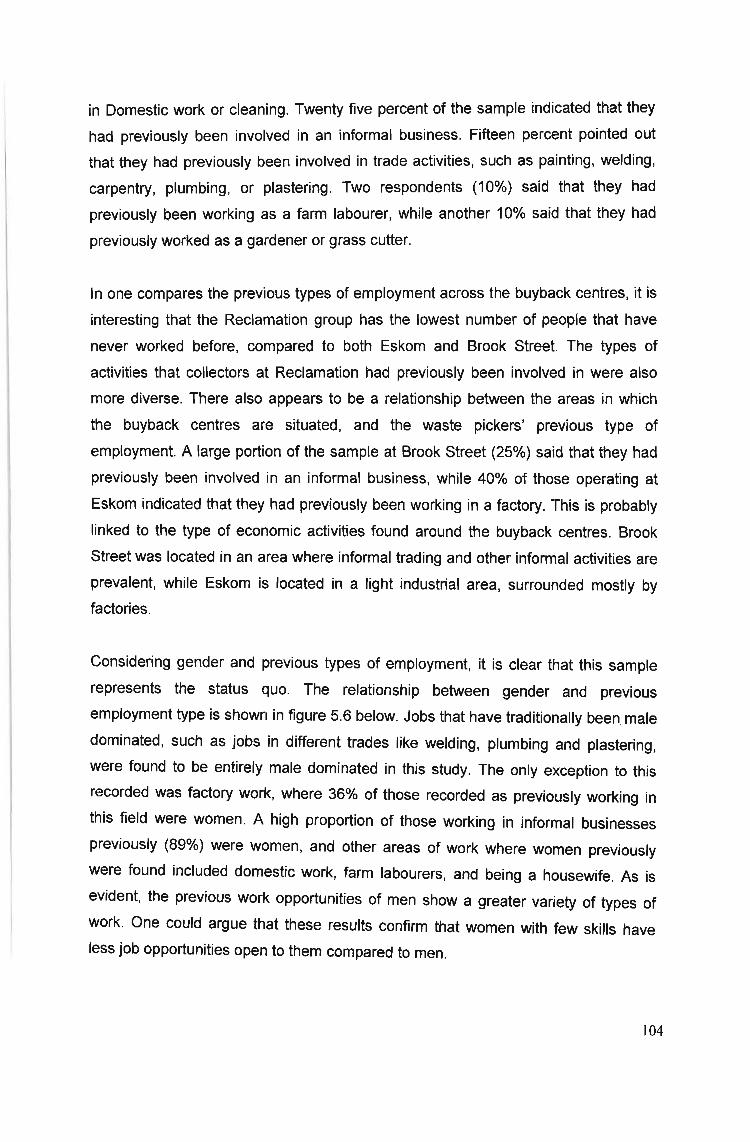
in Domestic work or cleaning. Twenty five percent of the sample indicated that they
had previously been involved in an informal business. Fifteen percent pointed out
that they had previously been involved in trade activities, such as painting, welding,
carpentry, plumbing, or plastering. Two respondents (10%) said that they had
previously been working as a farm labourer, while another 10% said that they had
previously worked as a gardener or grass cutter.
In one compares the previous types of employment across the buyback centres, it is
interesting that the Reclamation group has the lowest number of people that have
never worked before, compared to both Eskom and Brook Street. The types of
activities that collectors at Reclamation had previously been involved in were also
more diverse. There also appears to be a relationship between the areas in which
the buyback centres are situated, and the waste pickers' previous type of
employment. A large portion of the sample at Brook Street (25%) said that they had
previously been involved in an informal business, while 40% of those operating at
Eskom indicated that they had previously been working in a factory. This is probably
linked to the type of economic activities found around the buyback centres. Brook
Street was located in an area where informal trading and other informal activities are
prevalent, while Eskom is located in a light industrial area, surrounded mostly by
factories.
Considering gender and previous types of employment, it is clear that this sample
represents the status quo. The relationship between gender and previous
employment type is shown in figure 5.6 below. Jobs that have traditionally been male
dominated, such as jobs in different trades like welding, plumbing and plastering,
were found to be entirely male dominated in this study. The only exception to this
recorded was factory work, where 36% of those recorded as previously working in
this field were women. A high proportion of those working in informal businesses
previously (89%) were women, and other areas of work where women previously
were found included domestic work, farm labourers, and being a housewife. As is
evident, the previous work opportunities of men show a greater variety of types of
work. One could argue that these results confirm that women with few skills have
less job opportunities open to them compared to men.
104
Figure 5.6
PreviousEmployement by gender
!l 10c 9Cl> 8-g 7o 6go 5;;, 4_ 3
o 2ci 1z 0
CL '" ::J - -., tn '" 5" -n '" "'"0 '" Cl> C '" C Cl> 0- '" ~
0
3 a. < '" -~ '" o (')CL ~
~Cl> !; 3 Qg: Cl> CL
~:.0 ~ Cl>
::J
" "- .ff !!!. -c "go s· 0 < ~'"0 s;:3-u ~ '" <:T ~ S ·
" ;;} g: g- ('j)fJ w C s 0 (')0 ;;- Cl> (') Cl> '" '" ;;} 0;;} c CL "' -" ::T :::: ro a. s
~ i;lCD· g:~ = <:T (') ~~:::. et:i"
~ '"'"Cl> o !!Co c3 (')0 '" iii CL", "'.CD ;;; Cl> Cl> ~ 0~-.,
::J'" '" !!!. _ Cl>::J '" ::J~ ~
PreviousEmployment
~~
The results of this study confirm that skills gained in the formal sector are not being
used in the informal sector. Only one respondent claimed to have been previously
employed in the recycling field. This particular individual said that he had worked at
the Reclamation Group branch in another town (Matatile) , but was now working as a
waste picker in Durban. This is similar to the findings of Skinner, who interviewed
informal sector workers in Durban's central business district, and found that the skills
learnt in the formal sector were not necessarily being used in the informal sector
(Skinner , 2006: 130).
5.3.2. Transitional employment
In order to determine whether waste picking is indeed a transitional form of
employment, which individuals enter into until a better work opportunity comes up, it
was necessary to ask the waste pickers interviewed how long they had been
collecting scrap. Responses ranged from 1 day to 40 years, and the average time
spent in waste picking was 6 years and 7 months. The answer given most often
(mode) was 5 years, and the median was also 5 years. If one groups the results into
categories , 22% of the respondents indicated that they had been working as a waste
picker for a year or less. The two categories with the most number of respondents
was the between 4 and 6 years category, and the 11 to 20 years category, both of
105
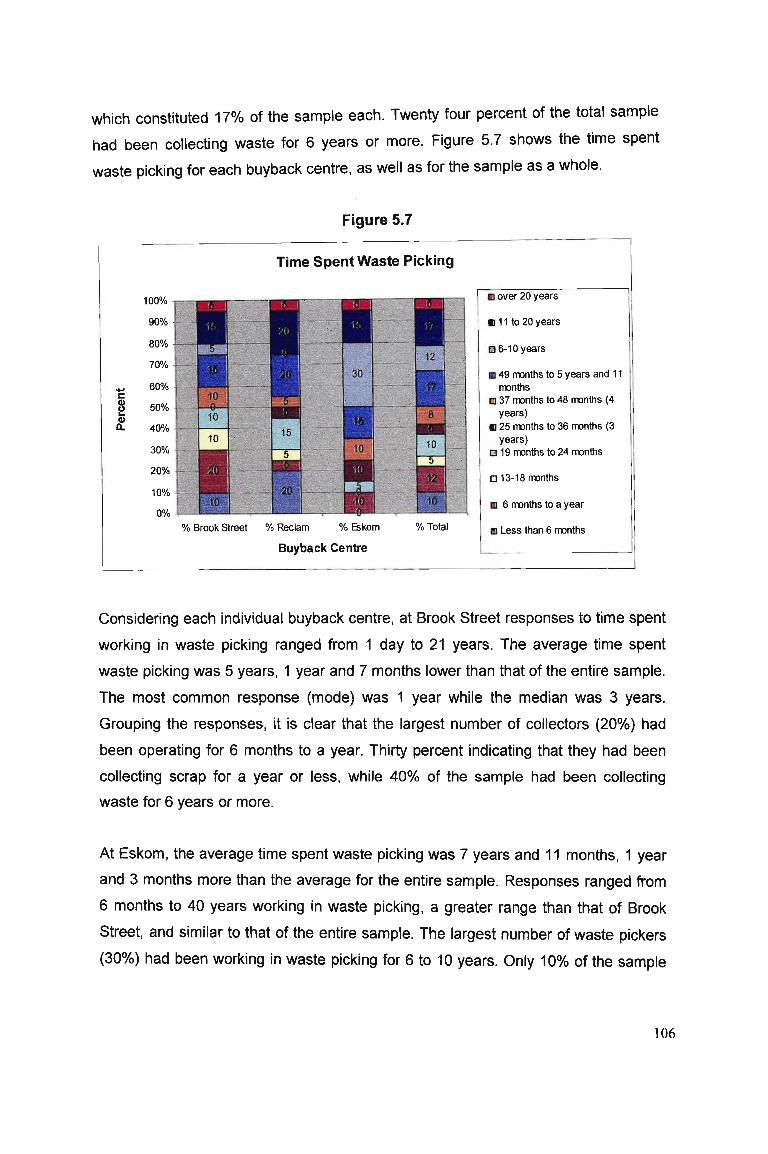
which constituted 17% of the sample each. Twenty four percent of the total sample
had been collecting waste for 6 years or more. Figure 5.7 shows the time spent
waste picking for each buyback centre, as well as for the sample as a whole.
Figure 5.7
Time Spent Waste Picking
100%
90%
80%
70%
- 60%eQ)
50%u...Q)0- 40%
30%
20%
10%
0%
% Brook Street % Reclam % Eskom
IDover 20 years
1111 to 20 years
El 6-10 years
11 49 rmnths to 5 years and 11rmnths
Cl37 rmnths to 48 rmnths (4years)
11 25 rmnths to 36 rmnths (3years)
El 19 rmnths to 24 rmnths
El 13-18 rmnths
ID 6 rmnths to a year
% Total m Less than 6 rmnths
Buyback Centre
Considering each individual buyback centre, at Brook Street responses to time spent
working in waste picking ranged from 1 day to 21 years. The average time spent
waste picking was 5 years, 1 year and 7 months lower than that of the entire sample.
The most common response (mode) was 1 year while the median was 3 years.
Grouping the responses, it is clear that the largest number of collectors (20%) had
been operating for 6 months to a year. Thirty percent indicating that they had been
collecting scrap for a year or less, while 40% of the sample had been collecting
waste for 6 years or more.
At Eskom, the average time spent waste picking was 7 years and 11 months, 1 year
and 3 months more than the average for the entire sample. Responses ranged from
6 months to 40 years working in waste picking, a greater range than that of Brook
Street, and similar to that of the entire sample. The largest number of waste pickers
(30%) had been working in waste picking for 6 to 10 years. Only 10% of the sample
106
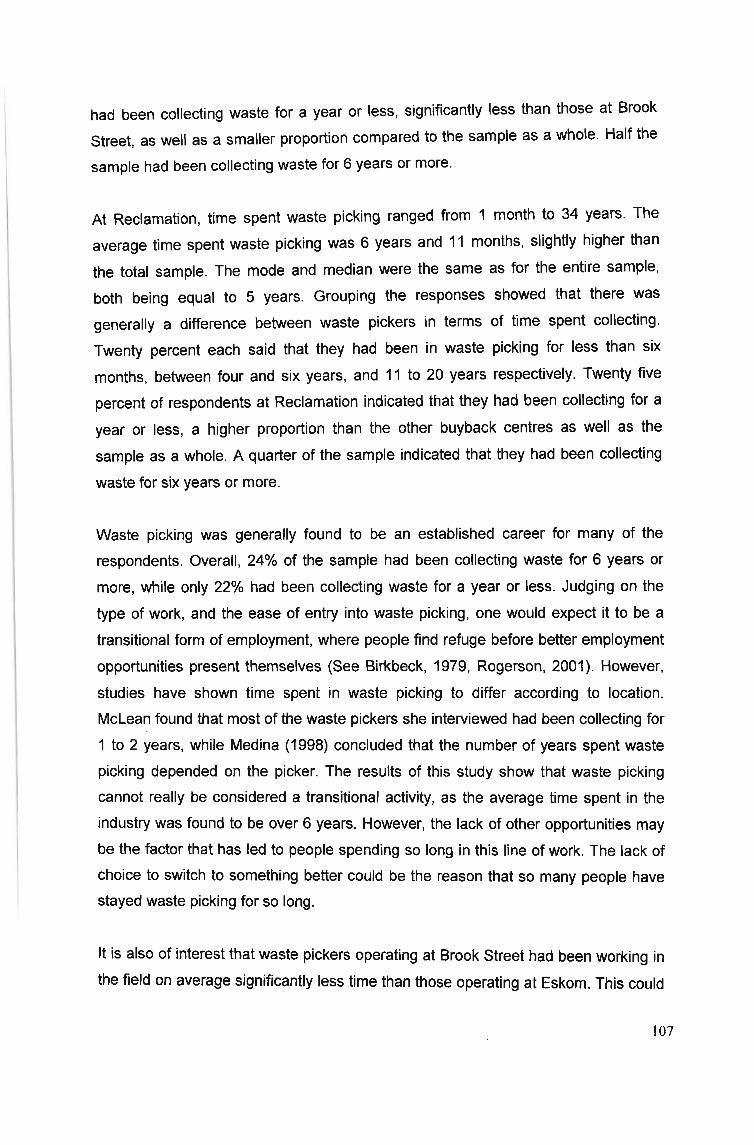
had been collecting waste for a year or less, significantly less than those at Brook
Street, as well as a smaller proportion compared to the sample as a whole. Half the
sample had been collecting waste for 6 years or more.
At Reclamation, time spent waste picking ranged from 1 month to 34 years. The
average time spent waste picking was 6 years and 11 months, slightly higher than
the total sample. The mode and median were the same as for the entire sample,
both being equal to 5 years. Grouping the responses showed that there was
generally a difference between waste pickers in terms of time spent collecting.
Twenty percent each said that they had been in waste picking for less than six
months, between four and six years, and 11 to 20 years respectively. Twenty five
percent of respondents at Reclamation indicated that they had been collecting for a
year or less, a higher proportion than the other buyback centres as well as the
sample as a whole. A quarter of the sample indicated that they had been collecting
waste for six years or more.
Waste picking was generally found to be an established career for many of the
respondents. Overall, 24% of the sample had been collecting waste for 6 years or
more, while only 22% had been collecting waste for a year or less. Judging on the
type of work, and the ease of entry into waste picking, one would expect it to be a
transitional form of employment, where people find refuge before better employment
opportunities present themselves (See Birkbeck, 1979, Rogerson, 2001). However,
studies have shown time spent in waste picking to differ according to location.
McLean found that most of the waste pickers she interviewed had been collecting for
1 to 2 years, while Medina (1998) concluded that the number of years spent waste
picking depended on the picker. The results of this study show that waste picking
cannot really be considered a transitional activity, as the average time spent in the
industry was found to be over 6 years. However, the lack of other opportunities may
be the factor that has led to people spending so long in this line of work. The lack of
choice to switch to something better could be the reason that so many people have
stayed waste picking for so long.
It is also of interest that waste pickers operating at Brook Street had been working in
the field on average significantly less time than those operating at Eskom. This could
107
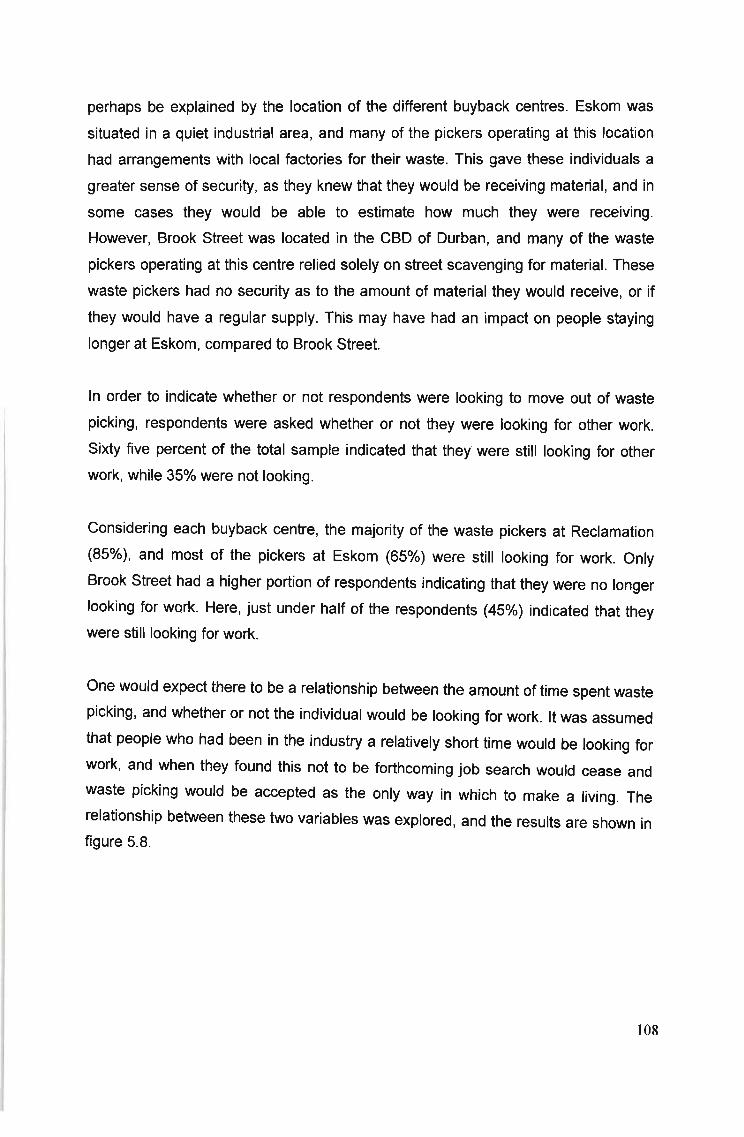
perhaps be explained by the location of the different buyback centres. Eskom was
situated in a quiet industrial area, and many of the pickers operating at this location
had arrangements with local factories for their waste. This gave these individuals a
greater sense of security, as they knew that they would be receiving material, and in
some cases they would be able to estimate how much they were receiving.
However, Brook Street was located in the CBD of Durban, and many of the waste
pickers operating at this centre relied solely on street scavenging for material. These
waste pickers had no security as to the amount of material they would receive, or if
they would have a regular supply. This may have had an impact on people staying
longer at Eskom, compared to Brook Street.
In order to indicate whether or not respondents were looking to move out of waste
picking, respondents were asked whether or not they were looking for other work.
Sixty five percent of the total sample indicated that they were still looking for other
work, while 35% were not looking.
Considering each buyback centre, the majority of the waste pickers at Reclamation
(85%), and most of the pickers at Eskom (65%) were still looking for work. Only
Brook Street had a higher portion of respondents indicating that they were no longer
looking for work. Here, just under half of the respondents (45%) indicated that they
were still looking for work.
One would expect there to be a relationship between the amount of time spent waste
picking, and whether or not the individual would be looking for work. It was assumed
that people who had been in the industry a relatively short time would be looking for
work, and when they found this not to be forthcoming job search would cease and
waste picking would be accepted as the only way in which to make a living. The
relationship between these two variables was explored, and the results are shown in
figure 5.8.
108
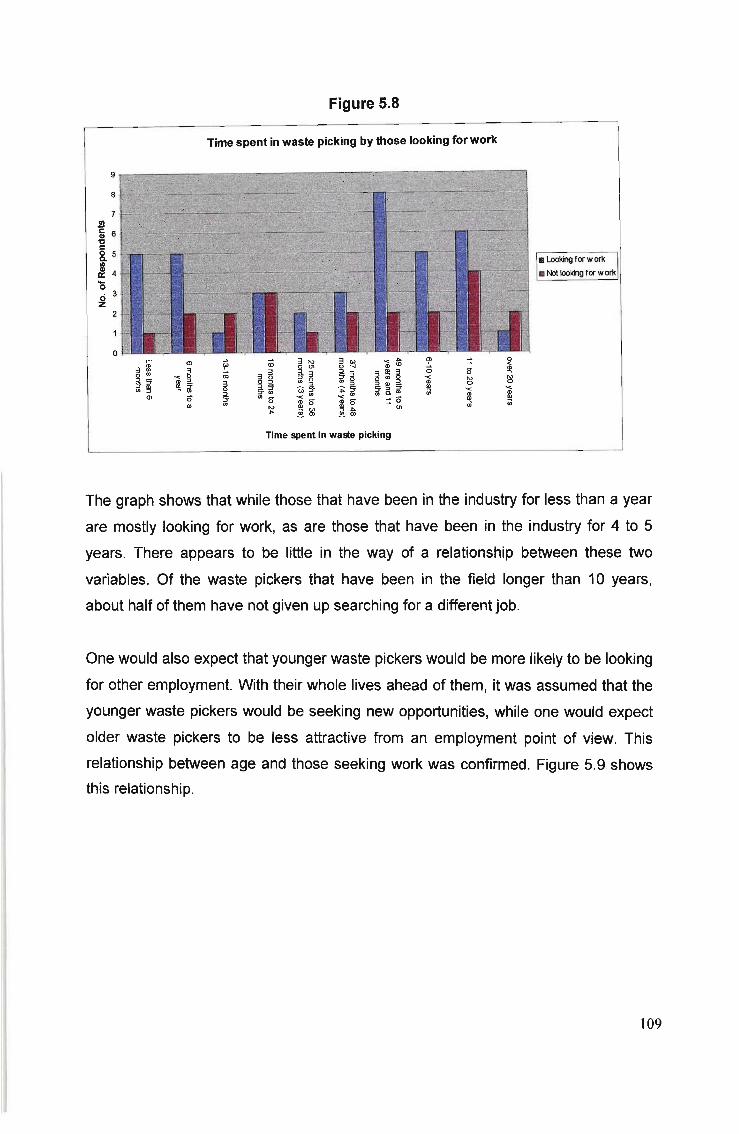
Figure 5.8
Time spent in waste picking by those looking for work
9
8
J!la; 6"CC
8. 5..~ 4
'0. 3o ,z
2
0r: ClCD
3 ., 30
.,'< 0
" - CD "_::T9'::Tlll !!l., " .,
Cl 0III
co 3 '" 3 '" -e A 'i' :::: 0so <0 en 0 ..., CD 0 !!l3 a 3 a 3 3 ~ a 0
3 0 ::To ~g 0 -e ro ro0 " ., " ::J Ql a CD 0 0
~i (;J =r "j;;=r 9',,::T III -c -e., 0. ., ;;; CD CD., '< ., '< ., III
0 CD 0 CD 0 :::0 !!l ;;;'" ~&l !!l A en .,A
~'"
Time spent in waste picking
El looking for work
III Nollooking for w ork
The graph shows that while those that have been in the industry for less than a year
are mostly looking for work, as are those that have been in the industry for 4 to 5
years. There appears to be little in the way of a relationship between these two
variables. Of the waste pickers that have been in the field longer than 10 years,
about half of them have not given up searching for a different job.
One would also expect that younger waste pickers would be more likely to be looking
for other employment. With their whole lives ahead of them, it was assumed that the
younger waste pickers would be seeking new opportunities, while one would expect
older waste pickers to be less attractive from an employment point of view. This
relationship between age and those seeking work was confirmed. Figure 5.9 shows
this relationship.
109
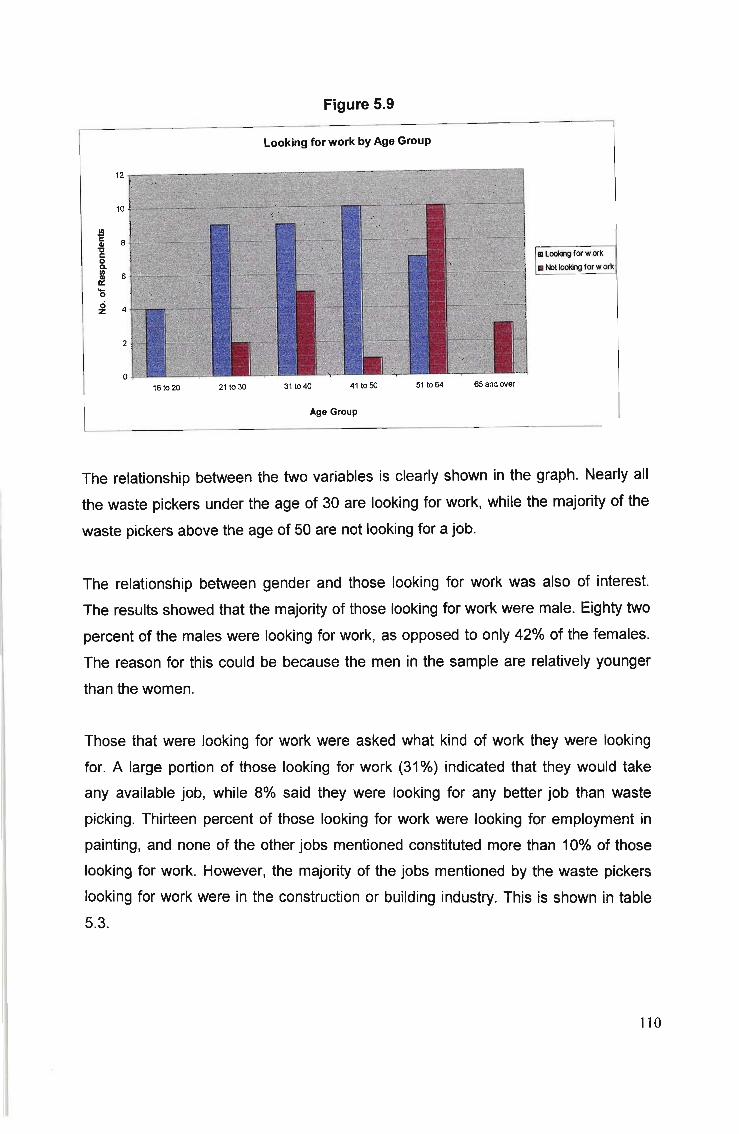
Figure 5.9
Looking for work by Age Group
12
10
.l!l; 8'tlr:::oCl.
Xl 60::o~ 4
2
o
IIILookingfor wark
mNot lookingfor w ork
16 to 20 21 to 30 31 to 40 41 to 50 511064 65 and over
Age Group
The relationship between the two variables is clearly shown in the graph. Nearly all
the waste pickers under the age of 30 are looking for work, while the majority of the
waste pickers above the age of 50 are not looking for a job.
The relationship between gender and those looking for work was also of interest.
The results showed that the majority of those looking for work were male. Eighty two
percent of the males were looking for work, as opposed to only 42% of the females.
The reason for this could be because the men in the sample are relatively younger
than the women.
Those that were looking for work were asked what kind of work they were looking
for. A large portion of those looking for work (31%) indicated that they would take
any available job, while 8% said they were looking for any better job than waste
picking. Thirteen percent of those looking for work were looking for employment in
painting, and none of the other jobs mentioned constituted more than 10% of those
looking for work. However, the majority of the jobs mentioned by the waste pickers
looking for work were in the construction or building industry. This is shown in table
5.3.
110
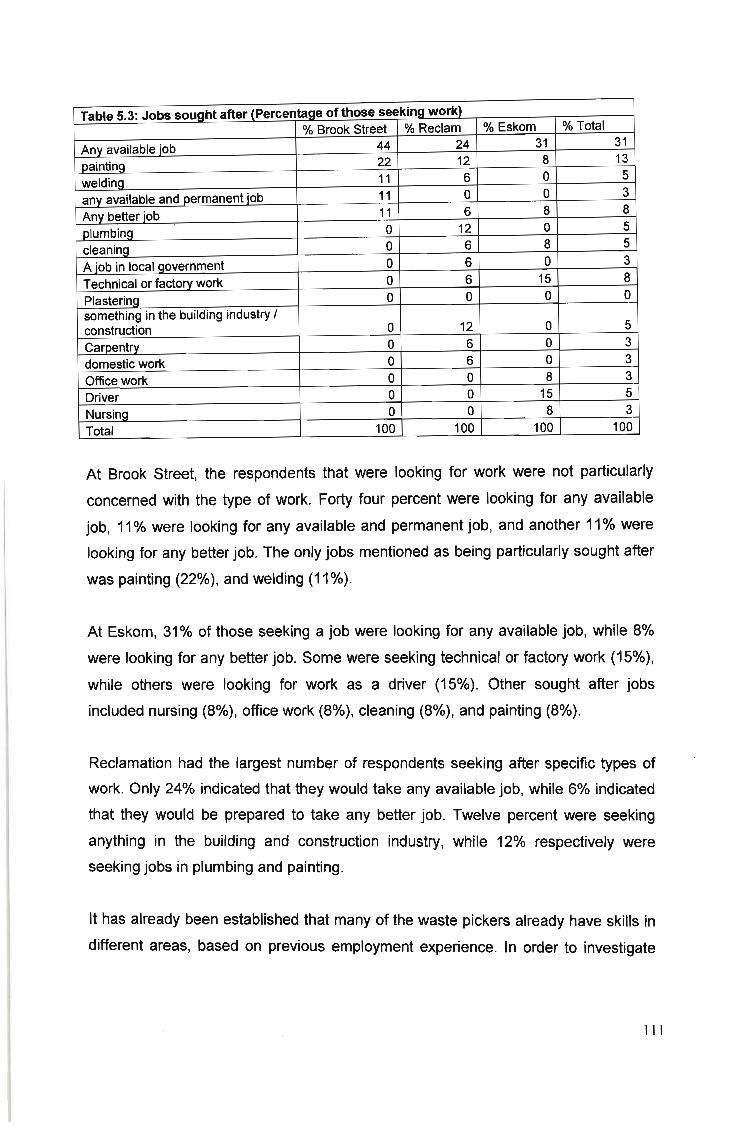
Table 5.3: Jobs sought after (Percentage of those seeking work)% Brook Street % Reclam % Eskom % Total
Any available job 44 24 31 31painting 22 12 8 13weldinq 11 6 0 5any available and permanent iob 11 0 0 3Any better lob 11 6 8 8plumbino 0 12 0 5cleaning 0 6 8 5A job in local government 0 6 0 3Technical or factory work 0 6 15 8Plasterino 0 0 0 0something in the bUilding industry I
12 0 5construction 0Carpentry 0 6 0 3domestic work 0 6 0 3Office work 0 0 8 3Driver 0 0 15 5Nurslnq 0 0 8 3Total 100 100 100 100
At Brook Street, the respondents that were looking for work were not particularly
concerned with the type of work. Forty four percent were looking for any available
job, 11% were looking for any available and permanent job, and another 11% were
looking for any better job. The only jobs mentioned as being particularly sought after
was painting (22%), and welding (11%).
At Eskom, 31 % of those seeking a job were looking for any available job, while 8%
were looking for any better job. Some were seeking technical or factory work (15%),
while others were looking for work as a driver (15%). Other sought after jobs
included nursing (8%), office work (8%), cleaning (8%), and painting (8%).
Reclamation had the largest number of respondents seeking after specific types of
work. Only 24% indicated that they would take any available job, while 6% indicated
that they would be prepared to take any better job. Twelve percent were seeking
anything in the building and construction industry, while 12% respectively were
seeking jobs in plumbing and painting.
It has already been established that many of the waste pickers already have skills in
different areas, based on previous employment experience. In order to investigate
111
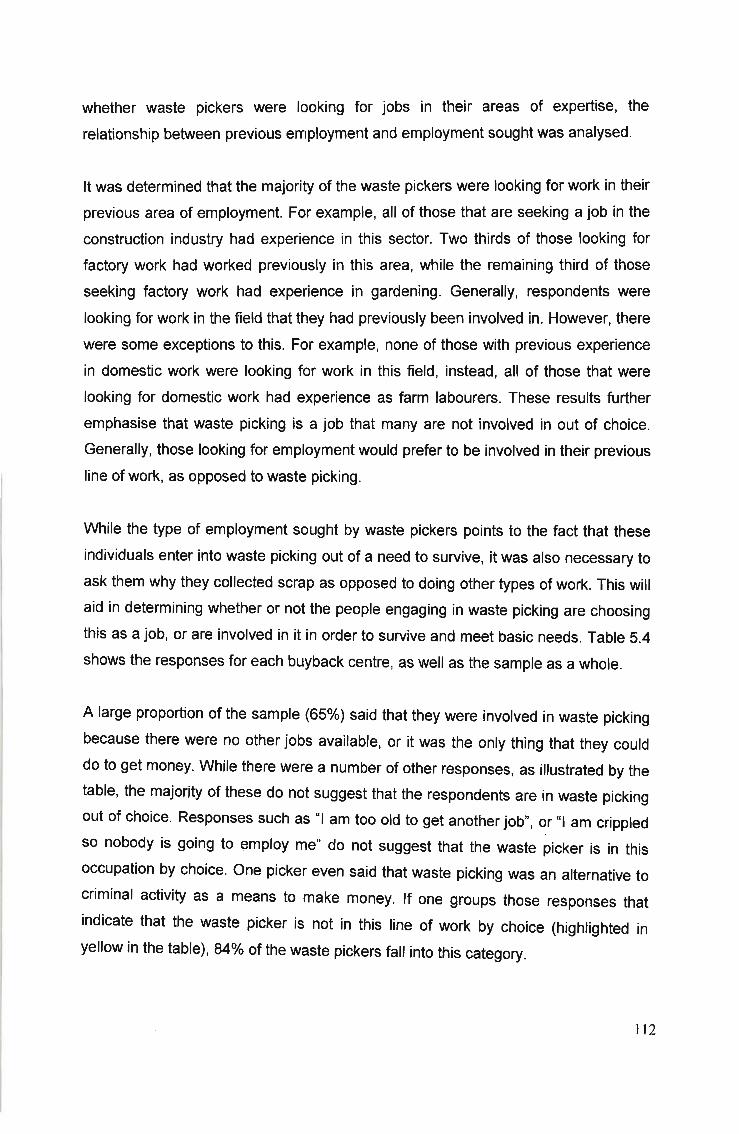
whether waste pickers were looking for jobs in their areas of expertise, the
relationship between previous employment and employment sought was analysed.
It was determined that the majority of the waste pickers were looking for work in their
previous area of employment. For example, all of those that are seeking a job in the
construction industry had experience in this sector. Two thirds of those looking for
factory work had worked previously in this area, while the remaining third of those
seeking factory work had experience in gardening. Generally, respondents were
looking for work in the field that they had previously been involved in. However, there
were some exceptions to this. For example, none of those with previous experience
in domestic work were looking for work in this field, instead, all of those that were
looking for domestic work had experience as farm labourers. These results further
emphasise that waste picking is a job that many are not involved in out of choice.
Generally, those looking for employment would prefer to be involved in their previous
line of work, as opposed to waste picking.
While the type of employment sought by waste pickers points to the fact that these
individuals enter into waste picking out of a need to survive, it was also necessary to
ask them why they collected scrap as opposed to doing other types of work. This will
aid in determining whether or not the people engaging in waste picking are choosing
this as a job, or are involved in it in order to survive and meet basic needs. Table 5.4
shows the responses for each buyback centre, as well as the sample as a whole.
A large proportion of the sample (65%) said that they were involved in waste picking
because there were no other jobs available, or it was the only thing that they could
do to get money. While there were a number of other responses, as illustrated by the
table, the majority of these do not suggest that the respondents are in waste picking
out of choice. Responses such as "I am too old to get another job", or "I am crippled
so nobody is going to employ me" do not suggest that the waste picker is in this
occupation by choice. One picker even said that waste picking was an alternative to
criminal activity as a means to make money. If one groups those responses that
indicate that the waste picker is not in this line of work by choice (highlighted in
yellow in the table), 84% of the waste pickers fall into this category.
112
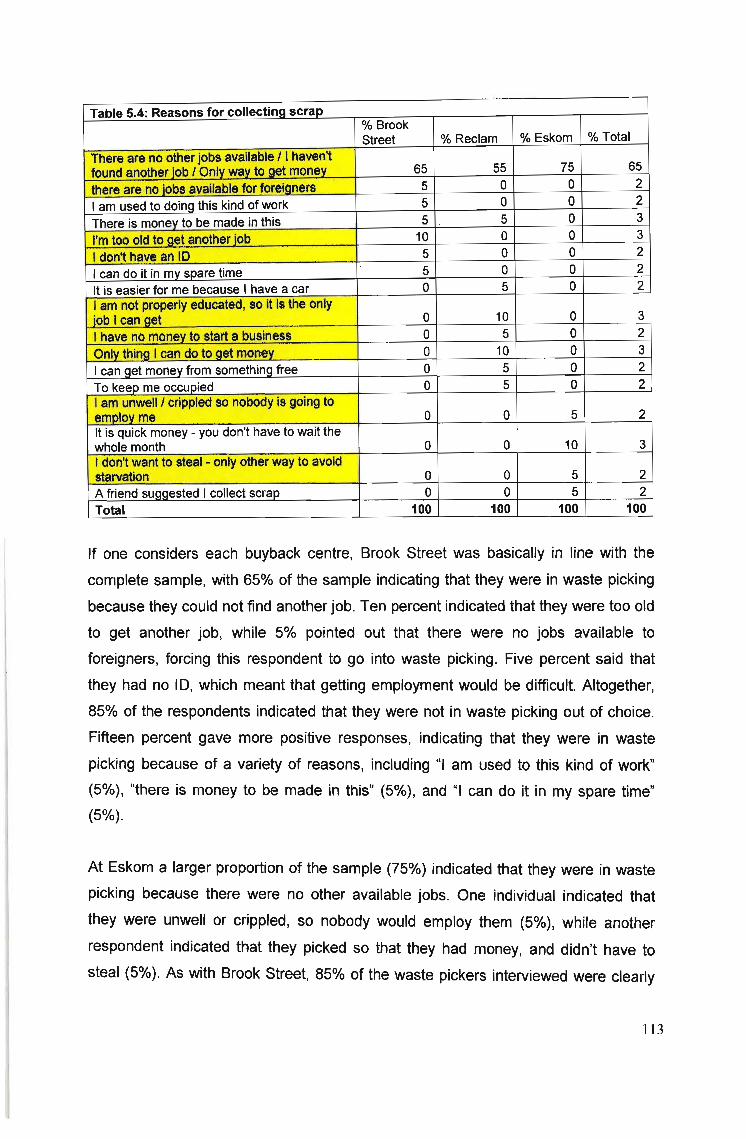
Table 5.4: Reasons for collecting scrap% BrookStreet % Reclam % Eskom % Total
There are no other jobs available 1I haven't65 55 75 65found another job I Only way to get money
there are no jobs available for foreigners 5 0 0 2I am used to doil!g this kind of work 5 0 0 2There is money to be made in this 5 5 0 3I'm too old to get another lob 10 0 0 3I don't have an ID 5 0 0 2I can do it in my spare time 5 0 0 2It is easier for me because I have a car 0 5 0 2I am not properly educated, so it is the only
10 0 3job I can get 0I have no money to start a business 0 5 0 2Only thing I can do to Qetmoney 0 10 0 3I can qet money from something free 0 5 0 2To keep me oc~ed 0 5 0 2I am unwell I crippled so nobody is going to
5 2employ me 0 0It is quick money - you don't have to wait the
0 10 3whole month 0I don't want to steal - only other way to avoidstarvation 0 0 5 2A friend suggested I collect scrap 0 0 5 2Total 100 100 100 100
If one considers each buyback centre, Brook Street was basically in line with the
complete sample, with 65% of the sample indicating that they were in waste picking
because they could not find another job. Ten percent indicated that they were too old
to get another job, while 5% pointed out that there were no jobs available to
foreigners, forcing this respondent to go into waste picking. Five percent said that
they had no ID, which meant that getting employment would be difficult. Altogether,
85% of the respondents indicated that they were not in waste picking out of choice.
Fifteen percent gave more positive responses, indicating that they were in waste
picking because of a variety of reasons, including "I am used to this kind of work"
(5%), "there is money to be made in this" (5%), and "I can do it in my spare time"
(5%).
At Eskom a larger proportion of the sample (75%) indicated that they were in waste
picking because there were no other available jobs. One individual indicated that
they were unwell or crippled, so nobody would employ them (5%), while another
respondent indicated that they picked so that they had money, and didn't have to
steal (5%). As with Brook Street, 85% of the waste pickers interviewed were clearly
113

not in the field of work out of choice. Other responses were more positive, with 10%
of the sample indicating that they were in waste picking because of the quick money,
as pickers are paid as soon as they exchange material. One respondent (5%) said
that they were in waste picking because a friend suggested they collect scrap.
At Reclamation, 55% of the sample indicated that they were in waste picking
because there were no other jobs available. However, many other responses pointed
to the fact that waste pickers were not in this line of work out of choice. Ten percent
of the sample indicated that they were not educated, so they could not get another
job, while another 10% said it was the only thing they could do to get money. Five
percent said that they were in waste picking because they had no money to start a
business. Altogether, 80% of the sample at Reclamation was not in waste picking by
choice. Others gave different responses, which indicated possible choice of job.
These included responses such as "there is money to be made in this", "it is easy for
me because I have access to a car", "I can get money from something free", and "it
keeps me occupied". All of these responses constituted 5% each of the total sample.
While some responses clearly indicate that the waste picker is not in this line of work
by choice, other responses are positive about the work. However, this does not
necessarily mean that these waste pickers chose this type of work. It could mean
that they have accepted it as part of their existence, and have chosen to be positive
about it.
The literature on waste picking suggests that waste picking provides work for those
desperate for employment, who cannot find work in the formal sector of the
economy. These individuals do not have capital or assets to start a business, either
formal or informal. As Wilson et al point out, 'Inability to enter more conventional
occupations and the resulting absence of real choice needs to be recognized'
(Wilson et ai, 2006: 7). This study confirms this, showing that the majority of the
waste pickers interviewed were in this type of work because there were no better
jobs available to them. Waste picking is a means to survive for the majority of the
individuals interviewed.
114
5.3.3. Time spent working
Respondents were asked how many days they spent collecting scrap. One
respondent replied that he did not know as it was his first day working, and this
respondent was therefore omitted from the analysis, resulting in a total sample of 59
respondents. The average number of days per week spent collecting scrap was 5.5,
or 5 and a half days. The most common response was 5 days, and the median was
also 5 days. Responses ranged from 7 days collecting scrap, to only 2 days. The
standard deviation of the sample was low, at 1.1. The grouped responses are shown
in table 5.5. As is clear, nearly half (42%) indicated that they worked 5 days a week.
Table 5.5: Number of days spent workingNo. of Davs a week % Brook Street % Reclam % Eskom % Total
1 0 0 0 02 0 5 0 23 11 5 0 54 0 5 0 25 16 40 70 426 74 20 0 317 0 25 30 19
Total 100 100 100 100
Considering each buyback centre, responses at Brook Street ranged from 6 days
spent working, to three days. On average, respondents spent 5.5 days working,
exactly the same as the results for the entire sample. The mode and median of the
Brook street sample was slightly higher than that of the sample as a whole, at 6 for
both. The sample at Brook Street was clustered to a greater extent around the mean,
compared to the sample as a whole. The standard deviation was therefore lower
than the entire sample, at 1.0. Looking at the way in which the responses can be
grouped, 74% indicated that they work for 6 days a week, significantly more than the
sample as a whole.
At Eskom, the responses were far less varied, and responses were either 5 days
spent working, or 7 days spent working. The average number of days spent working
for those selling material to Eskom was 5.6, slightly higher than the sample as a
whole. The most frequent response was the same as for the sample as a whole, at 5
days a week. The median was also the same as for the sample as a whole, at 5
115
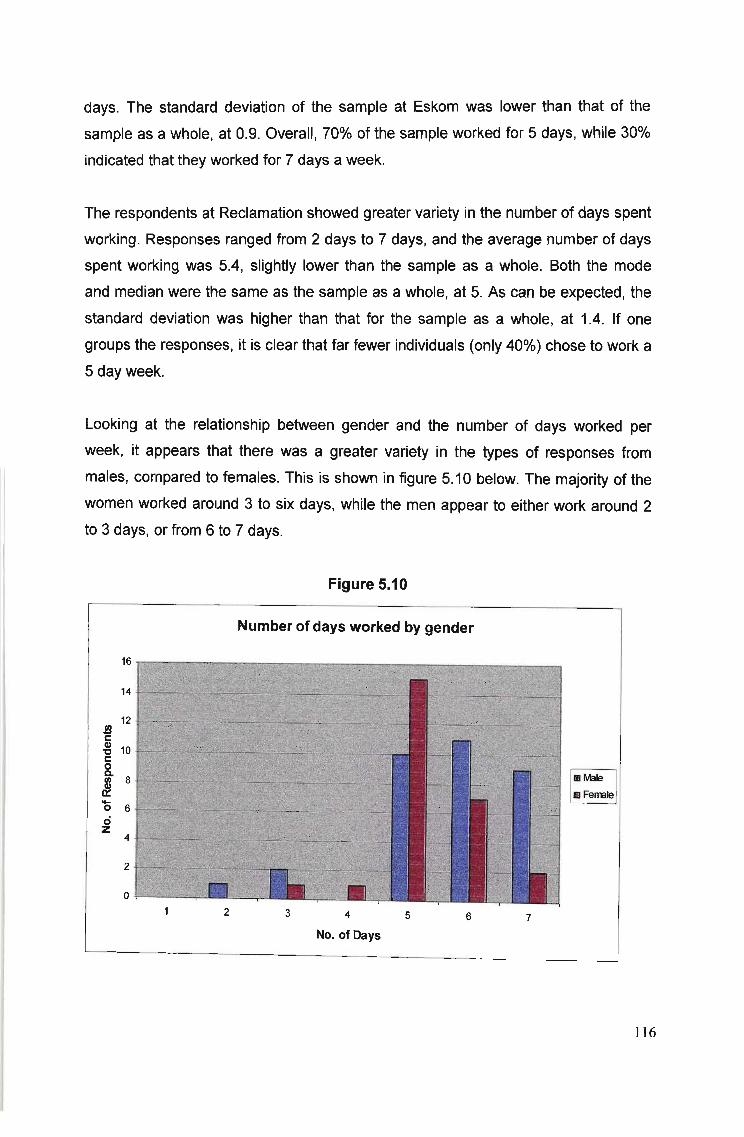
days. The standard deviation of the sample at Eskom was lower than that of the
sample as a whole, at 0.9. Overall, 70% of the sample worked for 5 days, while 30%
indicated that they worked for 7 days a week.
The respondents at Reclamation showed greater variety in the number of days spent
working. Responses ranged from 2 days to 7 days, and the average number of days
spent working was 5.4, slightly lower than the sample as a whole. Both the mode
and median were the same as the sample as a whole, at 5. As can be expected, the
standard deviation was higher than that for the sample as a whole, at 1.4. If one
groups the responses, it is clear that far fewer individuals (only 40%) chose to work a
5 day week.
Looking at the relationship between gender and the number of days worked per
week, it appears that there was a greater variety in the types of responses from
males, compared to females. This is shown in figure 5.10 below. The majority of the
women worked around 3 to six days, while the men appear to either work around 2
to 3 days, or from 6 to 7 days.
Figure 5.10
Number of days worked by gender
16
14
12sc:~ 10c:oli' 8~'0 6ciZ
4
2
o2 3 4
No. of Days
5 6 7
116
It is clear that the majority of the waste pickers worked a normal working week in
terms of the number of days spent working (mode =5). These finding are supported
by McLean, who found that the majority of the waste pickers she interviewed worked
for either 5, 6, or 7 days collecting. However, it is important to also consider the
hours worked per day.
Respondents were asked how many hours a day, on average, they worked. Only
one respondent said that he did not know how many hours a day he worked, as it
was his first day working. He was therefore omitted from the sample, resulting in a
total sample of 59 respondents. The average number of hours worked per day by
waste pickers was 7.9 hours, close to a complete working day of 8 hours. Reponses
ranged from those that spent 2 hours a day working, to those that worked for 13
hours. The most common response was an 8 hour working day, and the median was
also 8 hours. The standard deviation of the sample was 2.6. If one groups the
responses, 17% of the sample indicated that they worked for 8 hours a day, while
15% said they worked for 10 hours. Fourteen percent said that they worked for 9
hours a day. Nearly half the sample (46%) indicated that they worked more than 8
hours a day, more than a standard working day.
At Brook Street the individual who pointed out it was his first day working was
omitted from the analysis for how many hours worked per day. For the remainder,
the average number of hours worked per day was 7.6, slightly less than the sample
as a whole. Responses ranged from 2 hours work per day, to 12 hours per day. The
most common response for number of hours worked per day was 11, significantly
higher than the average for the sample. The median was closer to the average, at 8
hours. The standard deviation was therefore higher than for the sample as a whole,
at 3.2. Grouping the responses, a large portion (21%) indicated that they worked for
11 hours a day, while 16% each indicated that they worked for 10 hours or 8 hours
respectively. Overall, 42% of the sample indicated that they worked more than an 8
hour day, slightly less than for the sample as a whole.
Considering Eskom, responses ranged from those that worked a 5 hour day, to
those that worked 11 hours a day. On average, waste pickers operating at Eskom
worked for 8.6 hours, significantly more than the average for the sample as a whole.
117
The most common response to how many hours worked per day was 8 hours or 9
hours, while the median was 9 hours. Both the median and mode were relatively
close to the average indicating a low standard deviation. The standard deviation was
found to be 1.6, significantly lower than for the sample as a whole. Grouping the
responses, 25% indicated that they worked for 9 hours a day, while another 25%
indicated they worked for 8 hours a day. Twenty percent of the sample said that they
worked for 10 hours a day, while 60% indicated that they worked for longer than 8
hours a day, significantly higher than for the sample as a whole.
At Reclamation, on average the waste pickers reported working for 7.4 hours a day,
slightly lower than for the sample as a whole. The most common response was
surprisingly high, at 9 hours, while the median was closer to the average, at 7.25
hours. The maximum number of hours worked was 13, while the minimum was 3.
The standard deviation of the Reclamation sample was slightly higher than for the
sample as a whole, at 2.7. Grouping the responses, 15% of the sample indicated
that they worked for 9 hours a day, while 10% each indicated that they worked for 3
hours, 5 hours, 6 hours, 7 hours, 8 hours, and 10 hours respectively. Overall, only
35% of those working at Reclamation indicated that thy worked more than an 8 hour
day, less than that of the entire sample as well the other buyback centres.
Overall, it appears that the waste pickers operating at Eskom worked the hardest,
averaging higher than the other buyback centres for both the number of days
worked, as well as the hours worked per day. Waste pickers operating at
Reclamation were found, on average to work the least amount of days per week and
hours per day compared to the other buyback centres.
When one compares the number of days worked per week to the number of hours
worked per day, there appears to be no relationship between these variables. Some
of those working less than 3 days a week worked for between 11 and 13 hours a
week, while some only worked for 6.5 hours a day.
What these results prove is that in general, waste pickers clearly work long hours,
many of them putting in more than a standard working day, and some working up to
thirteen hours to collect material. Waste pickers, essentially are in business for
118
themselves and are not bound by specific working hours. However, waste pickers
operating on dump sites in contrast are often dependent on when the authorities will
allow them to pick (see Waiters, 2002, and Tevera, 1994). For street waste pickers,
such as the participants in this study, these constraints are not in place.
5.3.4. Materials collected
Respondents were asked if they collected any of the following types of material:
Paper, cardboard, plastics, glass, cans, or metal. These are the main materials
recycled in South Africa . For the sample as a whole, it was found that the item most
popular for collection was metal. Sixty seven percent of respondents indicated that
they collected metal, which is not surprising considering it is the commodity that
fetches the greatest price for recycling. Sixty two percent of the sample indicated that
they collected cardboard, while only 37% said that they collected plastics. Cans and
paper fetched 17% and 18% respectively, while only 8% of the total sample indicated
that they collected glass. Fifty two percent of the sample indicated that they only
focussed on one material, while 23% said that they collected two materials. Three
percent indicated that they collected three materials, while 21% collected 4 or more
materials.
Waste pickers were also asked to indicate, in cases where they collected more than
one material, which material they collected the most of. This allowed the researcher
to determine which material the waste picker focussed on. Overall, 52% of the entire
sample focussed on metal as the main material for collection, while 40% focussed on
cardboard. Seven percent collected the mostly plastics , while only 2% collected
primarily paper.
At Brook Street, collectors seemed to specialise in two materials. Sixty five percent
of the sample indicated that they collected cardboard , while 60% said that they
collected metal. Not one waste picker collected plastics, glass, or cans, but 5%
indicated that they collected paper. Most waste pickers at Brook Street (70%)
focussed on collecting one material, while 30% collected two types of materials.
Overall, waste pickers at Brook Street tended to focus their efforts on metal (50% of
119
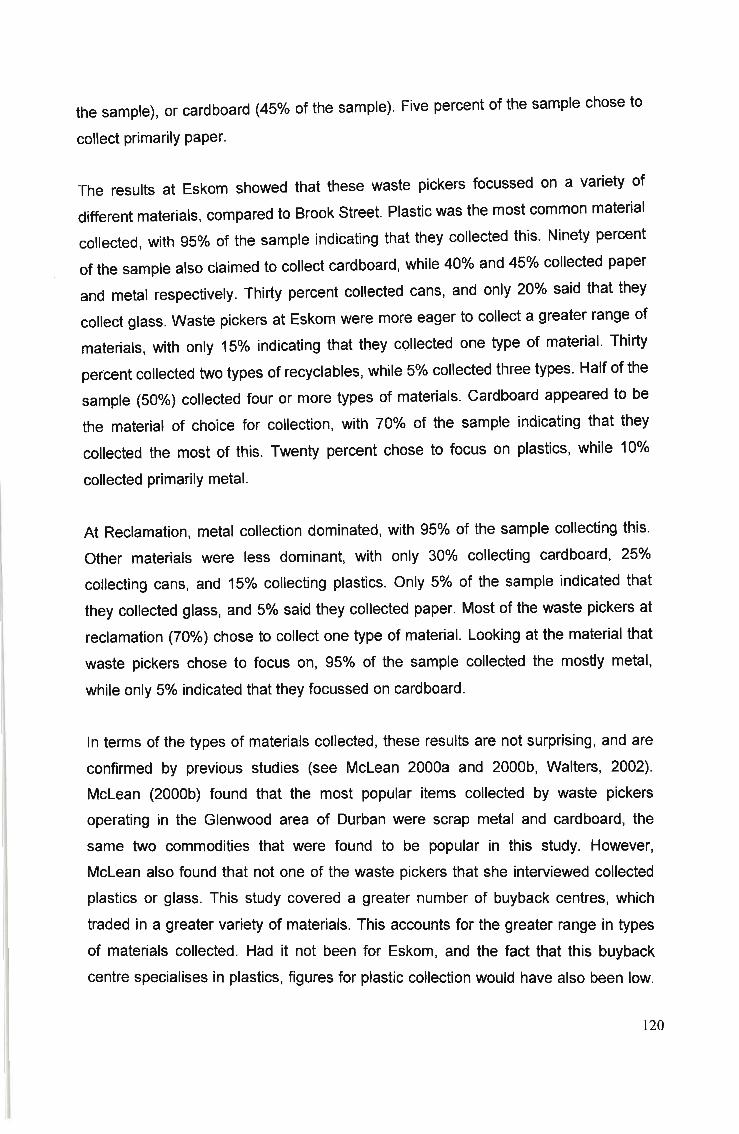
the sample), or cardboard (45% of the sample). Five percent of the sample chose to
collect primarily paper.
The results at Eskom showed that these waste pickers focussed on a variety of
different materials, compared to Brook Street. Plastic was the most common material
collected, with 95% of the sample indicating that they collected this. Ninety percent
of the sample also claimed to collect cardboard, while 40% and 45% collected paper
and metal respectively. Thirty percent collected cans, and only 20% said that they
collect glass. Waste pickers at Eskom were more eager to collect a greater range of
materials, with only 15% indicating that they collected one type of material. Thirty
percent collected two types of recyclables, while 5% collected three types. Half of the
sample (50%) collected four or more types of materials. Cardboard appeared to be
the material of choice for collection, with 70% of the sample indicating that they
collected the most of this. Twenty percent chose to focus on plastics, while 10%
collected primarily metal.
At Reclamation, metal collection dominated, with 95% of the sample collecting this.
Other materials were less dominant, with only 30% collecting cardboard, 25%
collecting cans, and 15% collecting plastics. Only 5% of the sample indicated that
they collected glass, and 5% said they collected paper. Most of the waste pickers at
reclamation (70%) chose to collect one type of material. Looking at the material that
waste pickers chose to focus on, 95% of the sample collected the mostly metal,
while only 5% indicated that they focussed on cardboard.
In terms of the types of materials collected, these results are not surprising, and are
confirmed by previous studies (see McLean 2000a and 2000b, Waiters, 2002).
McLean (2000b) found that the most popular items collected by waste pickers
operating in the Glenwood area of Durban were scrap metal and cardboard, the
same two commodities that were found to be popular in this study. However,
McLean also found that not one of the waste pickers that she interviewed collected
plastics or glass. This study covered a greater number of buyback centres, which
traded in a greater variety of materials. This accounts for the greater range in types
of materials collected. Had it not been for Eskom, and the fact that this buyback
centre specialises in plastics, figures for plastic collection would have also been low.
120
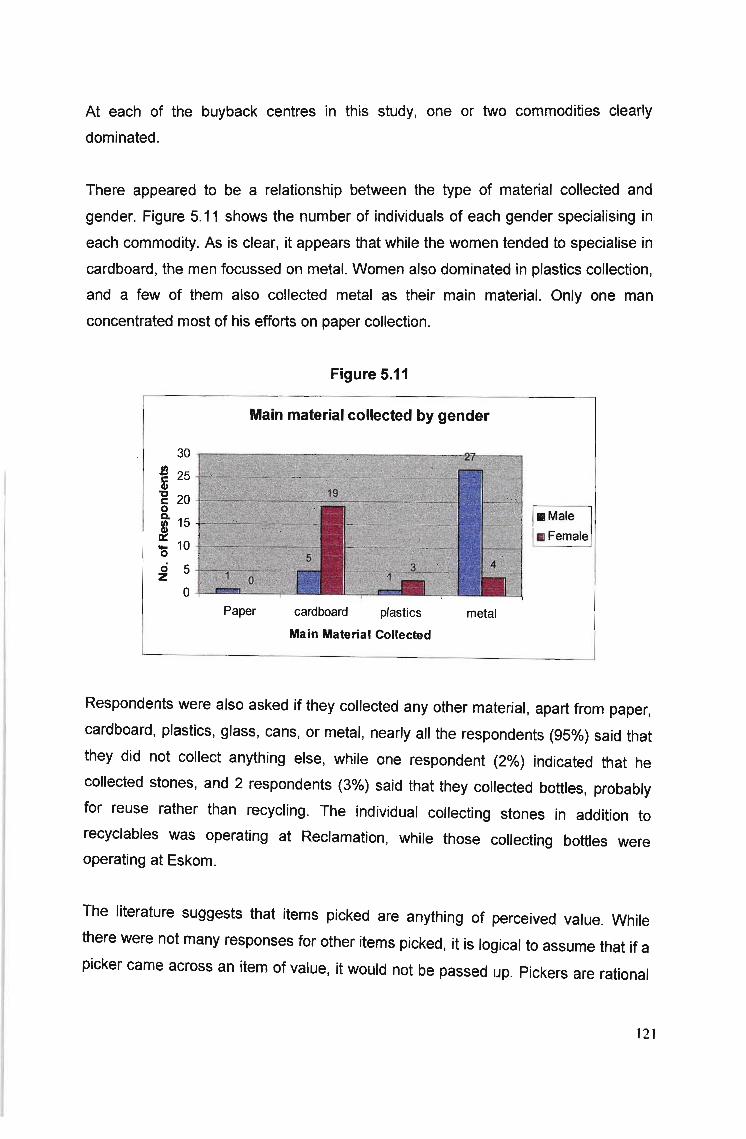
At each of the buyback centres in this study, one or two commodities clearly
dominated.
There appeared to be a relationship between the type of material collected and
gender. Figure 5.11 shows the number of individuals of each gender specialising in
each commodity. As is clear, it appears that while the women tended to specialise in
cardboard, the men focussed on metal. Women also dominated in plastics collection,
and a few of them also collected metal as their main material. Only one man
concentrated most of his efforts on paper collection.
Figure 5.11
Main material collected by gender
30
~ 25Q)s 20o~ 15~'0 10
ci 5zo
mMale
mJ Female
Paper cardboard plastics
Main Material Collected
metal
Respondents were also asked if they collected any other material, apart from paper,
cardboard, plastics, glass, cans, or metal, nearly all the respondents (95%) said that
they did not collect anything else, while one respondent (2%) indicated that he
collected stones, and 2 respondents (3%) said that they collected bottles, probably
for reuse rather than recycling. The individual collecting stones in addition to
recyclables was operating at Reclamation, while those collecting bottles were
operating at Eskom.
The literature suggests that items picked are anything of perceived value. While
there were not many responses for other items picked, it is logical to assume that if a
picker came across an item of value, it would not be passed up. Pickers are rational
121
economic actors, and if they come across an item that can be used or sold, it is likely
that they will take it. However, the waste pickers in this study were rather
commenting on items that they collected regularly, rather than items that they came
across occasionally.
5.3.5. Material transportation
In waste picking, the volume of material collected determines the waste pickers'
income. Intrinsically linked to this, is the means of transportation available to the
waste picker to move volumes of material. A more convenient form of transportation
for material will allow the waste picker to cover a wider area, and to collect greater
volumes of material. This will give the waste picker the potential to earn a greater
income. Respondents were asked how they usually transported the material they
collected to the buyback centre. About a third of the sample (33%) indicated that
they used a shopping cart, or a trolley of some description, while 30% had their
material collected by a middleman with a van, truck, or car. These individuals were
operating in New Germany, near Eskom buyback centre. Thirteen percent of the
sample carried the material on their heads to the buyback centre, while 8% carried
the material by hand. Five percent of the waste pickers interviewed had their own car
Or van to transport the materials. All other responses constituted less than 5% of the
total sample. The different responses for each buyback centre, as well as the sample
as a whole are shown in figure 5.12.
122
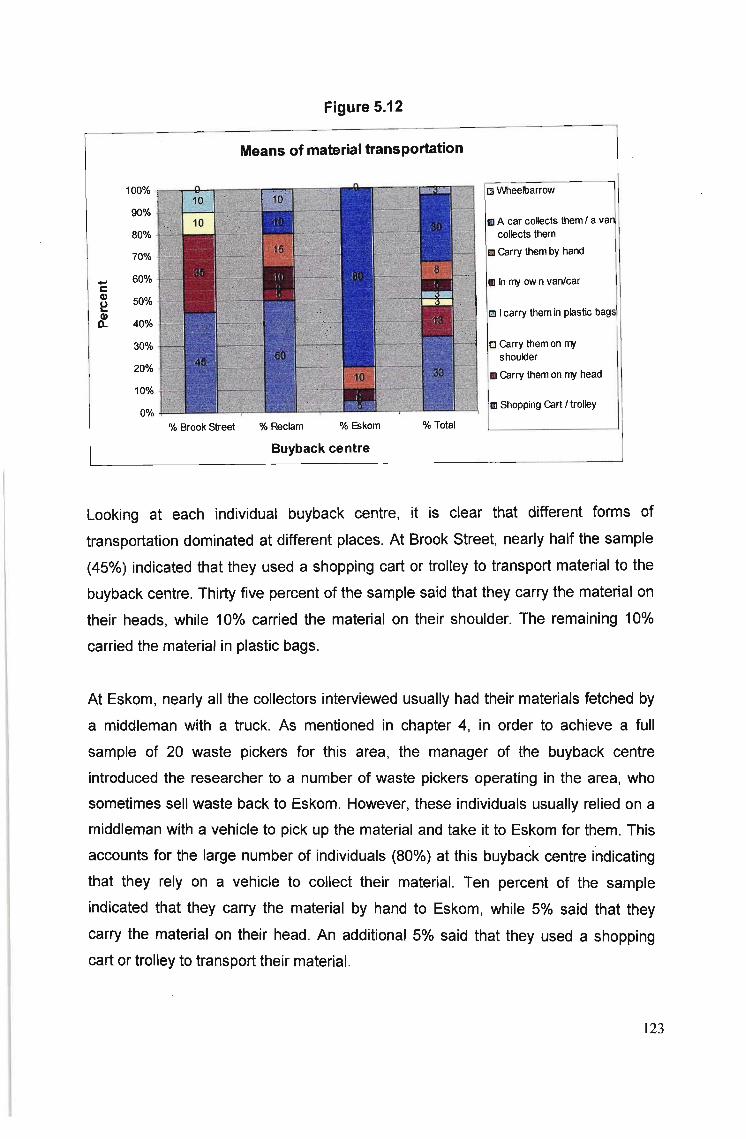
Figure 5.12
Means of material transportation
100%
90%
80%
70%
- 60%c(I)
50%~(I)
40%Q.
30%
20%
10%
0%% Brook Street % Reclam
mA car collects them I a vacollects them
m Carry them by hand
m Icarry them in plastic bags
o Carry them on mj
shoulder
III Carry them on mj head
m Shopping Cart I trolley
% Eskom % Total
Buyback centre
looking at each individual buyback centre, it is clear that different forms of
transportation dominated at different places. At Brook Street, nearly half the sample
(45%) indicated that they used a shopping cart or trolley to transport material to the
buyback centre. Thirty five percent of the sample said that they carry the material on
their heads, while 10% carried the material on their shoulder. The remaining 10%
carried the material in plastic bags.
At Eskom, nearly all the collectors interviewed usually had their materials fetched by
a middleman with a truck. As mentioned in chapter 4, in order to achieve a full
sample of 20 waste pickers for this area, the manager of the buyback centre
introduced the researcher to a number of waste pickers operating in the area, who
sometimes sell waste back to Eskom. However, these individuals usually relied on a
middleman with a vehicle to pick up the material and take it to Eskom for them. This
accounts for the large number of individuals (80%) at this buyback centre indicating
that they rely on a vehicle to collect their material. Ten percent of the sample
indicated that they carry the material by hand to Eskom, while 5% said .that they
carry the material on their head. An additional 5% said that they used a shopping
cart or trolley to transport their material.
123
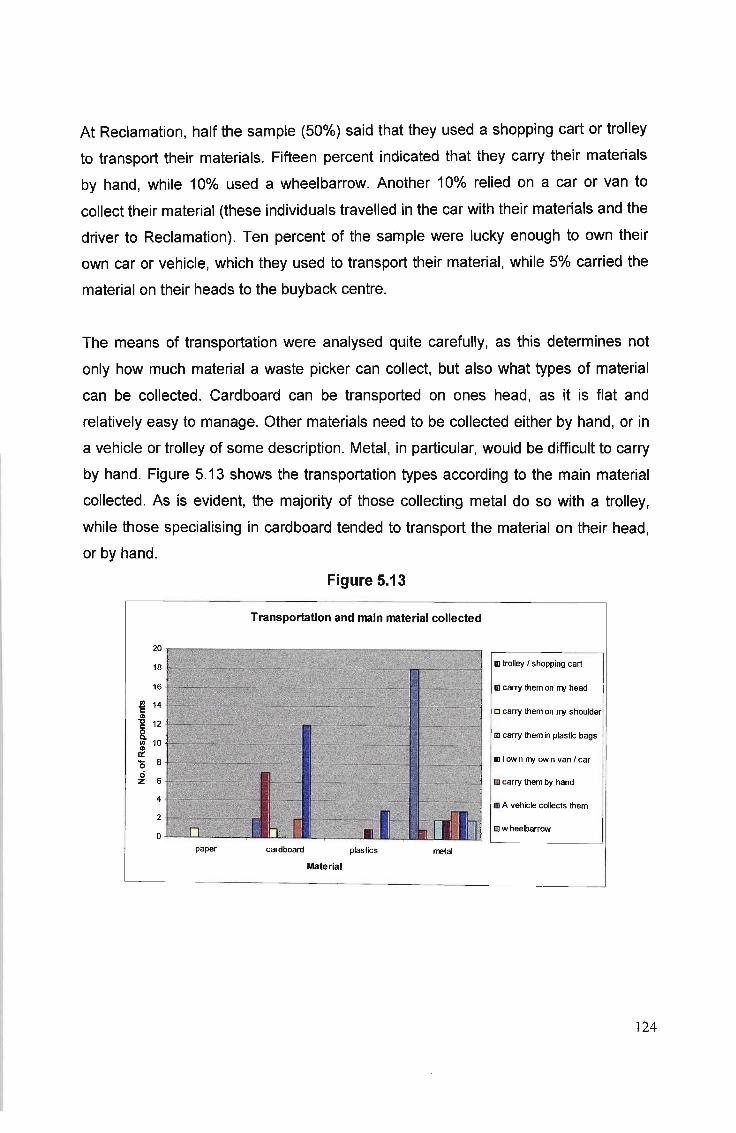
At Reclamation, half the sample (50%) said that they used a shopping cart or trolley
to transport their materials. Fifteen percent indicated that they carry their materials
by hand, while 10% used a wheelbarrow. Another 10% relied on a car or van to
collect their material (these individuals travelled in the carwith their materials and the
driver to Reclamation). Ten percent of the sample were lucky enough to own their
own car or vehicle, which they used to transport their material, while 5% carried the
material on their heads to the buyback centre.
The means of transportation were analysed quite carefully, as this determines not
only how much material a waste picker can collect, but also what types of material
can be collected. Cardboard can be transported on ones head, as it is flat and
relatively easy to manage. Other materials need to be collected either by hand, or in
a vehicle or trolley of some description. Metal, in particular, would be difficult to carry
by hand. Figure 5.13 shows the transportation types according to the main material
collected. As is evident, the majority of those collecting metal do so with a trolley,
while those specialising in cardboard tended to transport the material on their head,
or by hand.
Figure 5.13
Transportation and main material collected
20
18
16
~ 14e'g 12
8.:g 10~
'0 8
0Z 6
4
2
0
paper cardboard
Material
plastics metal
m trolley I shopping cart
IiJcarry them on myhead
[J carry them on myshoulder
[J carry them in plastic bags
till own myown van I car
1lIcarry them by hand
tIl A vehicle collects them
[J wheelbarrow
124
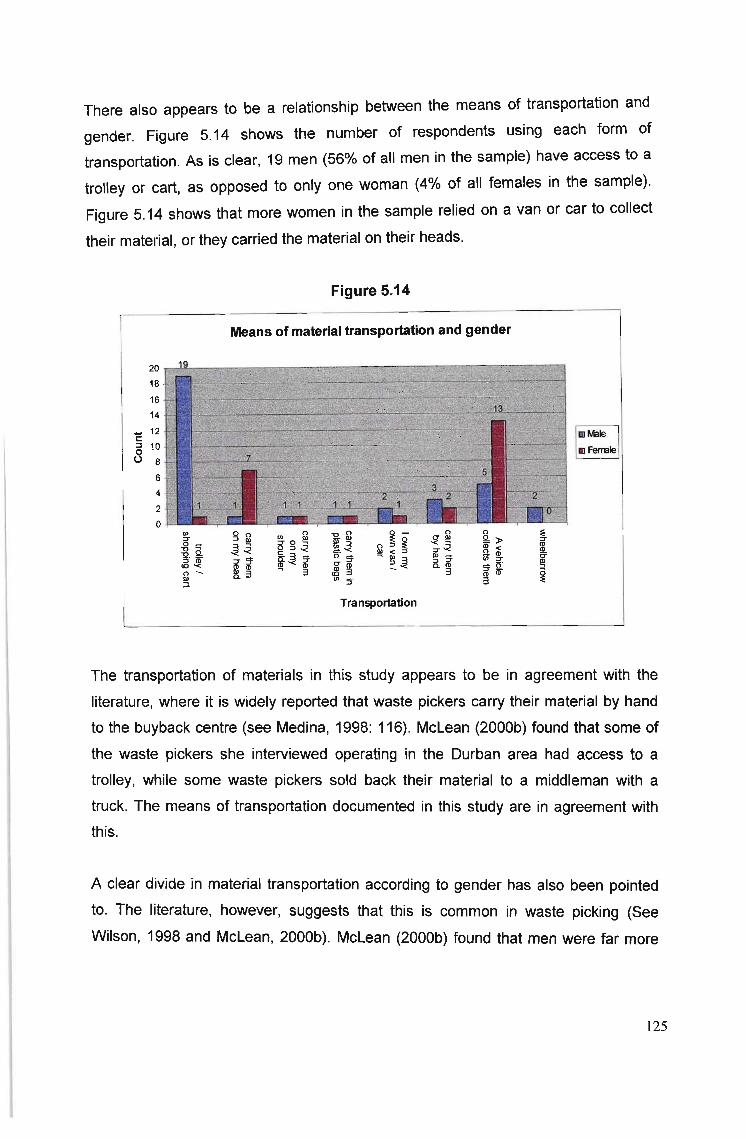
There also appears to be a relationship between the means of transportation and
gender. Figure 5.14 shows the number of respondents using each form of
transportation. As is clear, 19 men (56% of all men in the sample) have access to a
trolley or cart, as opposed to only one woman (4% of all females in the sample).
Figure 5.14 shows that more women in the sample relied on a van or car to collect
their material, or they carried the material on their heads.
Figure 5.14
Means of material transportation and gender
20
18
16
14
... 12c:g 10o 8
6
4
2
o'":To _
"t:l ~
"t:lQ.5 " CD
<0 -c(") Ql~
Transportation
og~/ll <U/ll'" :T- erffim3
I m ~le IIJ Ferrale
The transportation of materials in this study appears to be in agreement with the
literature, where it is widely reported that waste pickers carry their material by hand
to the buyback centre (see Medina, 1998: 116). McLean (2000b) found that some of
the waste pickers she interviewed operating in the Durban area had access to a
trolley, while some waste pickers sold back their material to a middleman with a
truck. The means of transportation documented in this study are in agreement with
this.
A clear divide in material transportation according to gender has also been pointed
to. The literature, however, suggests that this is common in waste picking (See
Wilson, 1998 and McLean, 2000b). McLean (2000b) found that men were far more
125
likely to have access to a trolley to transport their material, while women were more
likely to carry material on their heads.
The idea that a waste picker can move up in the informal recycling hierarchy is linked
to their means of transportation. Reclamation (2007a), suggest that a waste picker
can with time, improve their means of transportation, and expand their business. In
order to test this theory, the relationship between the time spent waste picking and
the means of material transportation was explored. Waste pickers who had been in
the business longer would be expected to have better means of material
transportation. However, this was found not to be the case. There was little
relationship found between these two variables. Those owning their own vehicle
were found to be involved in waste picking on average for 2.6 years, while those
owning a trolley or cart were found to be involved in waste picking for 6.5 years on
average. The highest number of trolley owners was found amongst those oparafinq
for 11 to 20 years, and those operating for less than 6 months. In short, there was no
relationship between transportation and time spent in waste picking. Clearly, the
waste pickers in this study have not been able to improve their transoortetion with
time. This is more than likely due to the fact that earnings are low, and there is
probably little disposable income left to save in order to buy a trolley or a car.
5.3.6. Collection Areas
Respondents were asked in which areas they usually collect material. This was done
in order to gain a sense of how far the waste pickers travelled for material, as well as
whether the waste pickers were territorial. The areas reported by the waste pickers
are shown in the figure 5.15.
126
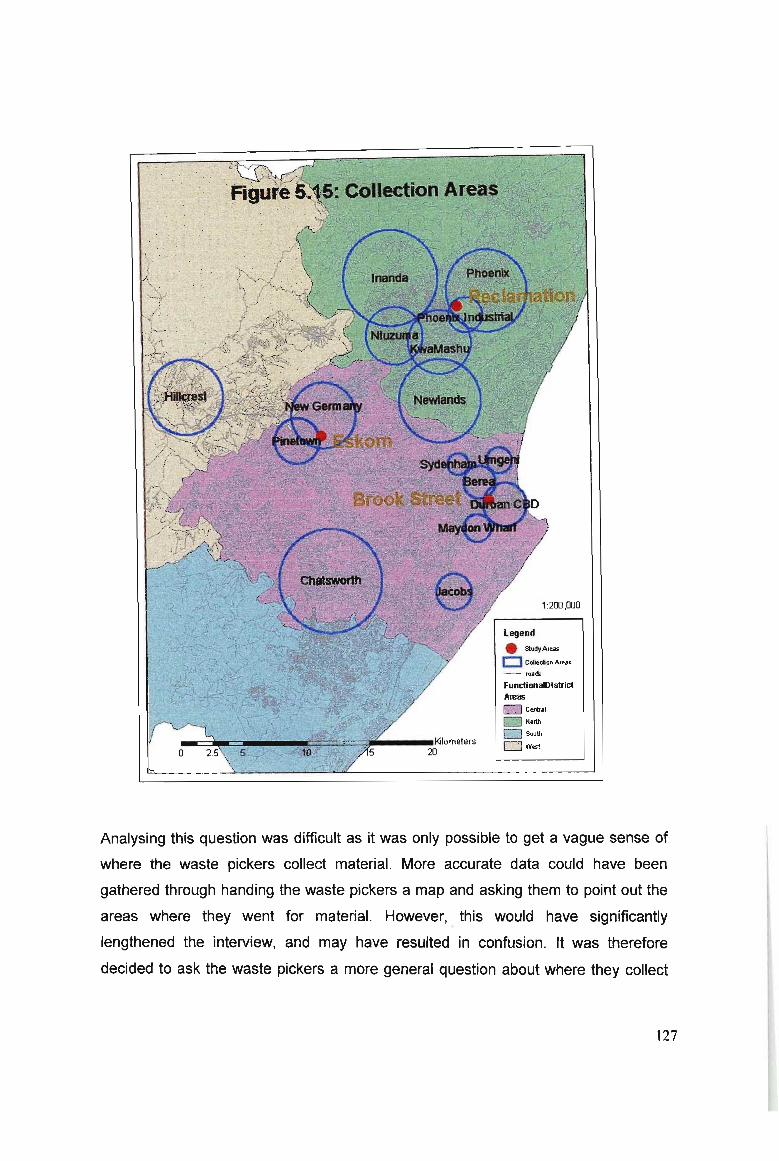
"'__Kilometers20
1:200 ,000
legend
_ Study Areas
o Coll@cli onAfeas
- roads:
Funct ionalOistrictAreas
~ C_. I
~ N.rtl\
~ South
~Wesl
Analysing this question was difficult as it was only possible to get a vague sense of
where the waste pickers collect material. More accurate data could have been
gathered through handing the waste pickers a map and asking them to point out the
areas where they went for material. However, . this would have significantly
lengthened the interview, and may have resulted in confusion. It was therefore
decided to ask the waste pickers a more general question about where they collect
127
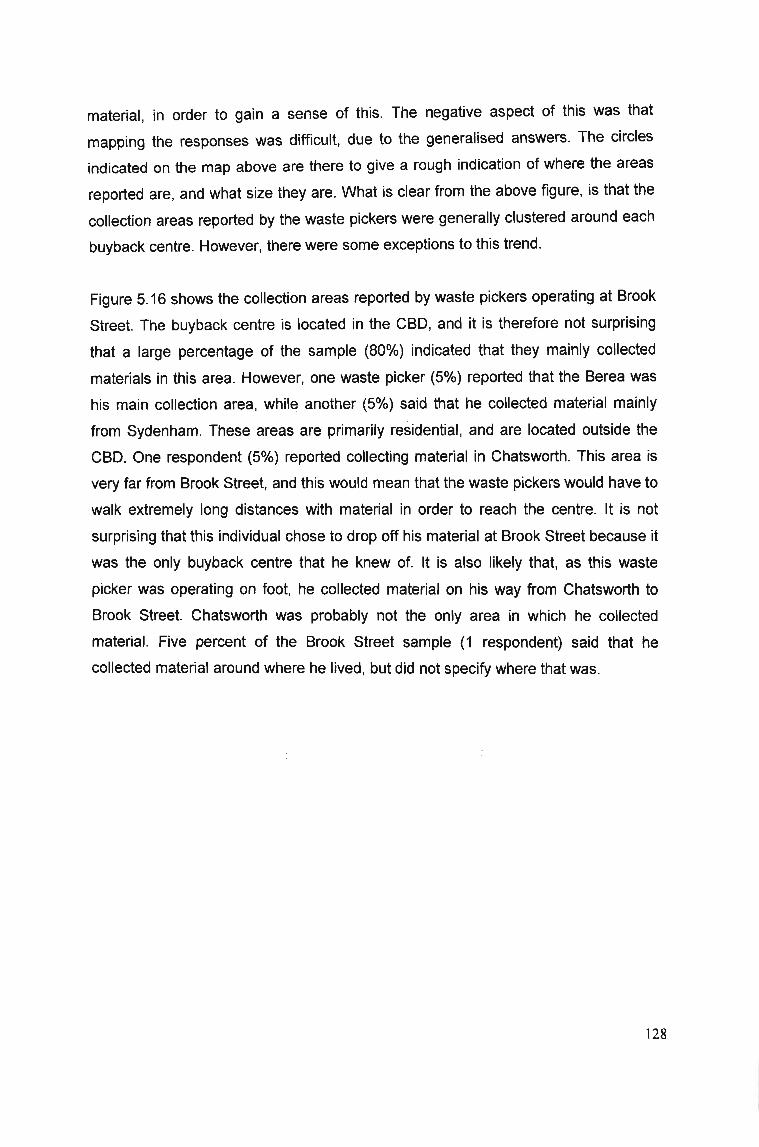
material, in order to gain a sense of this. The negative aspect of this was that
mapping the responses was difficult, due to the generalised answers. The circles
indicated on the map above are there to give a rough indication of where the areas
reported are, and what size they are. What is clear from the above figure, is that the
collection areas reported by the waste pickers were generally clustered around each
buyback centre. However, there were some exceptions to this trend.
Figure 5.16 shows the collection areas reported by waste pickers operating at Brook
Street. The buyback centre is located in the CBD, and it is therefore not surprising
that a large percentage of the sample (80%) indicated that they mainly collected
materials in this area. However, one waste picker (5%) reported that the Berea was
his main collection area, while another (5%) said that he collected material mainly
from Sydenham. These areas are primarily residential, and are located outside the
CBD. One respondent (5%) reported collecting material in Chatsworth. This area is
very far from Brook Street, and this would mean that the waste pickers would have to
walk extremely long distances with material in order to reach the centre. It is not
surprising that this individual chose to drop off his material at Brook Street because it
was the only buyback centre that he knew of. It is also likely that, as this waste
picker was operating on foot, he collected material on his way from Chatsworth to
Brook Street. Chatsworth was probably not the only area in which he collected
material. Five percent of the Brook Street sample (1 respondent) said that he
collected material around where he lived, but did not specify where that was.
128
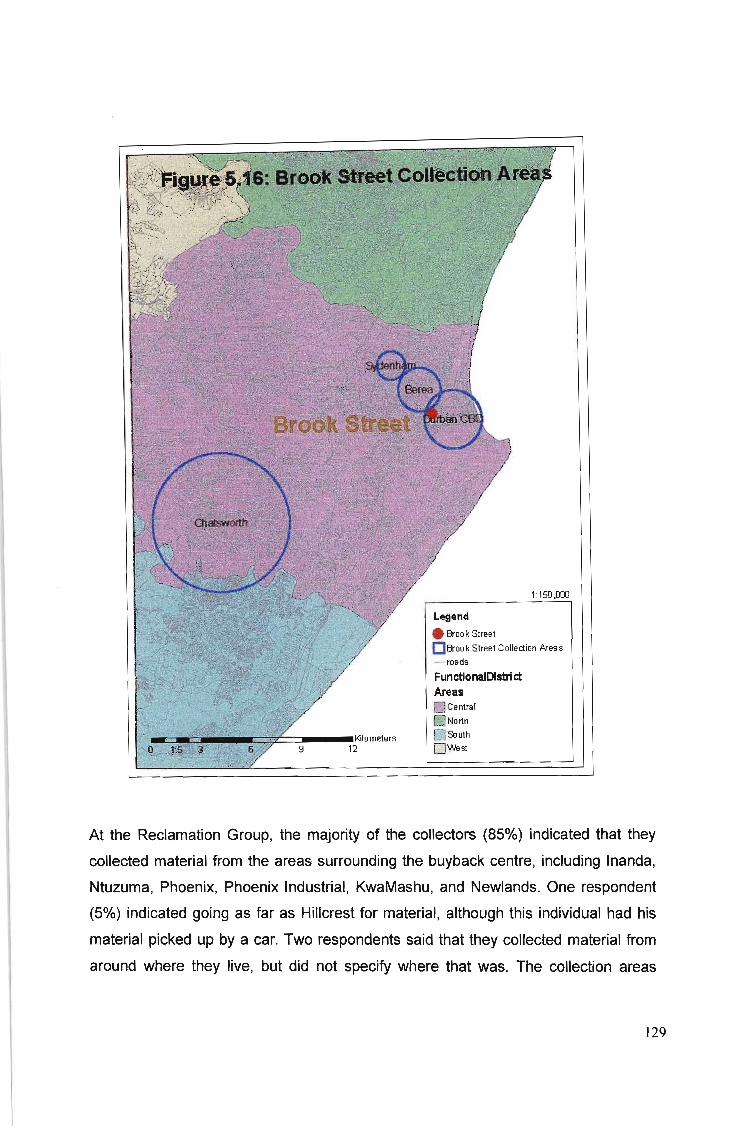
===-__Kilometers12
1:150,000
Legend
etBrook Street
D Brook Street Collection Areas- roads
FunctionalDistrietAreas!illCentral
IYJNorthlBiJ South
f.ZEj West
At the Reclamation Group, the majority of the collectors (85%) indicated that they
collected material from the areas surrounding the buyback centre, including Inanda,
Ntuzuma, Phoenix, Phoenix Industrial, KwaMashu, and Newlands. One respondent
(5%) indicated going as far as Hillcrest for material, although this individual had his
material picked up by a car. Two respondents said that they collected material from
around where they live, but did not specify where that was, The collection areas
129
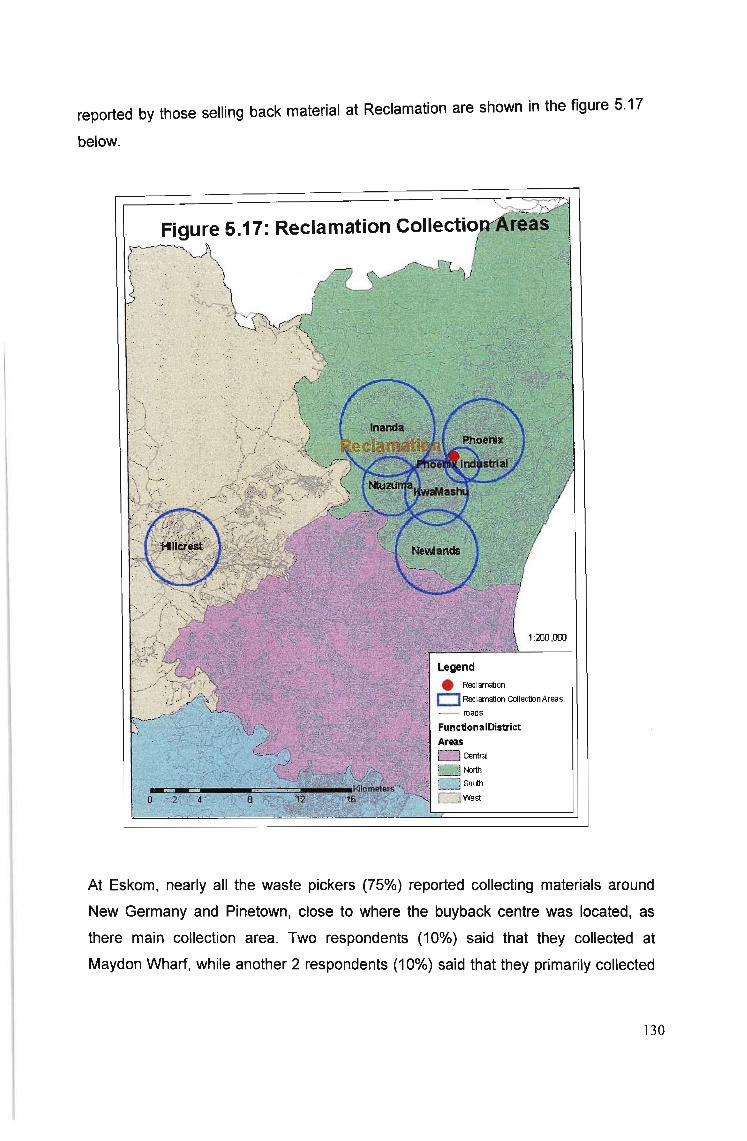
reported by those selling back material at Reclamation are shown in the figure 5.17
below.
Figure 5.17: Reclamation Collectio
1:200,000
Legend• Reclamation
o Reclamation CollecoonAreas
- roads
FunctionalDistrictAreas&1*,,;.) central
North
South
West
At Eskom, nearly all the waste pickers (75%) reported collecting materials around
New Germany and Pinetown, close to where the buyback centre was located, as
there main collection area. Two respondents (10%) said that they collected at
Maydon Wharf, while another 2 respondents (10%) said that they primarily collected
130
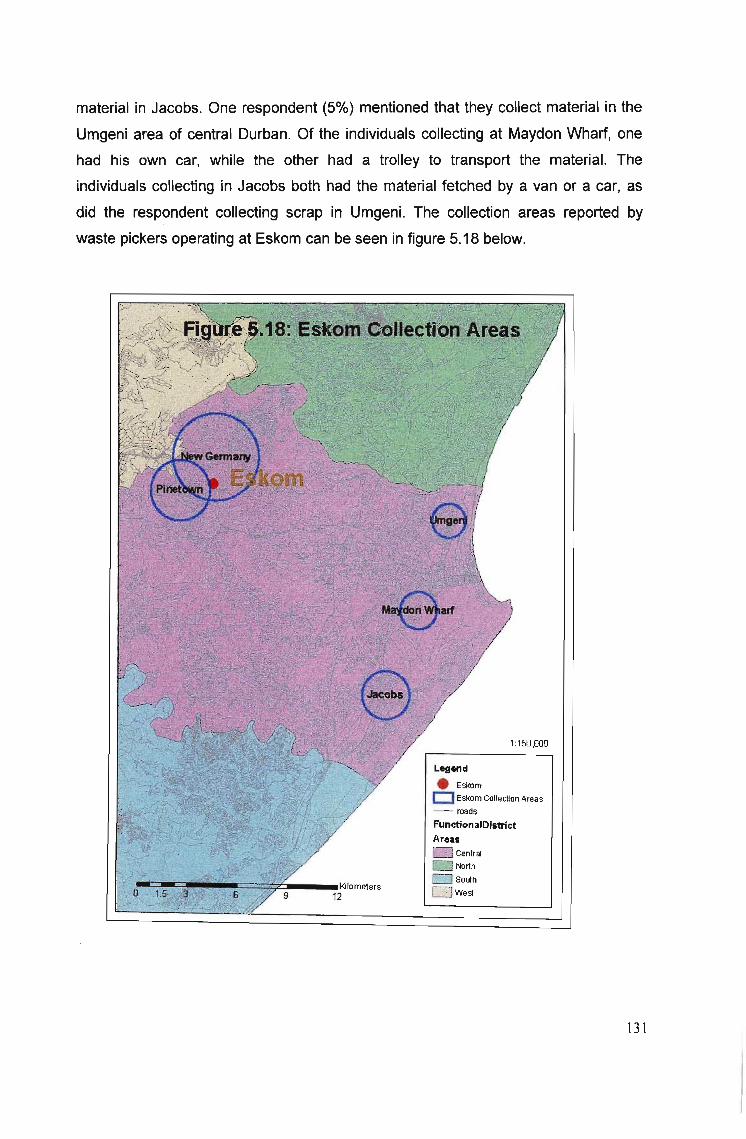
material in Jacobs. One respondent (5%) mentioned that they collect material in the
Umgeni area of central Durban. Of the individuals collecting at Maydon Wharf, one
had his own car, while the other had a trolley to transport the material. The
individuals collecting in Jacobs both had the material fetched by a van or a car, as
did the respondent collecting scrap in Umgeni. The collection areas reported by
waste pickers operating at Eskom can be seen in figure 5.18 below.
:;z::. Kilamelers
12
1:150,000
Legend
• Eskomo Eskom Collection Areas
--. roads
FunctionalDistrict
Areas
g Central
~North
South
West
131
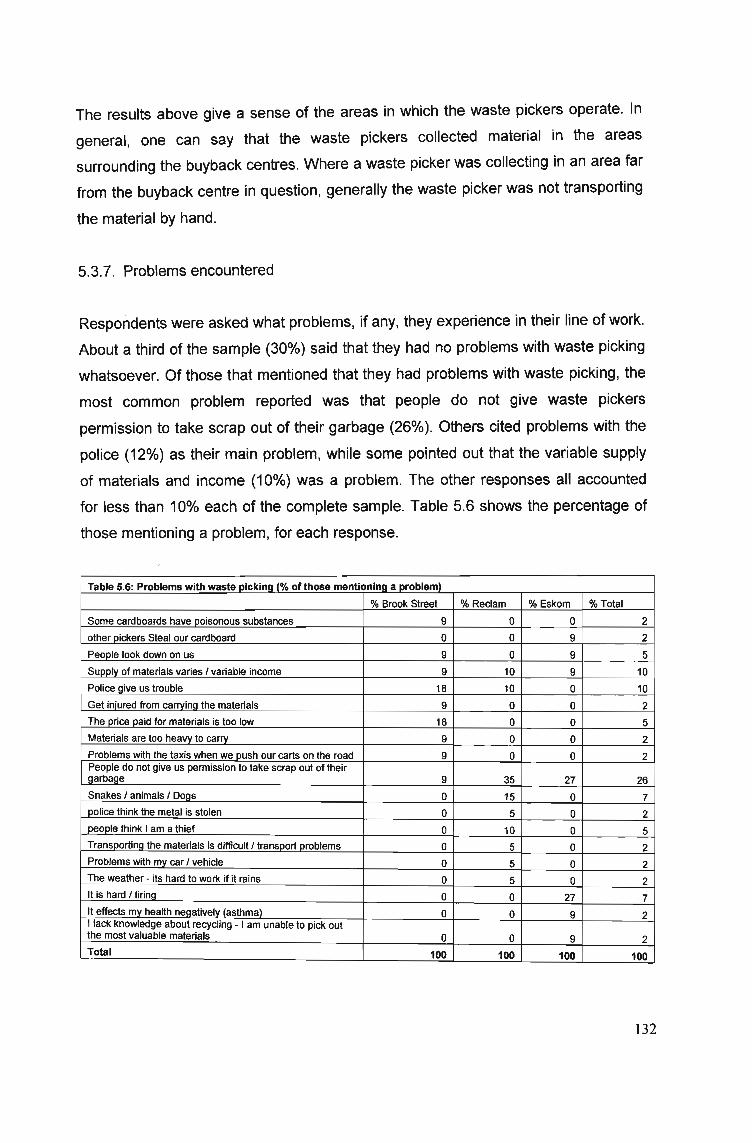
The results above give a sense of the areas in which the waste pickers operate. In
general, one can say that the waste pickers collected material in the areas
surrounding the buyback centres. Where a waste picker was collecting in an area far
from the buyback centre in question, generally the waste picker was not transporting
the material by hand.
5.3.7. Problems encountered
Respondents were asked what problems, if any, they experience in their line of work.
About a third of the sample (30%) said that they had no problems with waste picking
whatsoever. Of those that mentioned that they had problems with waste picking, the
most common problem reported was that people do not give waste pickers
permission to take scrap out of their garbage (26%). Others cited problems with the
police (12%) as their main problem, while some pointed out that the variable supply
of materials and income (10%) was a problem. The other responses all accounted
for less than 10% each of the complete sample. Table 5.6 shows the percentage of
those mentioning a problem, for each response.
Table 5.6: Problems with waste Dlckina (% of those mentionina a probleml
% Brook Street % Reclam % Eskom % Total
Some cardboards have poisonous substances 9 0 0 2
other oickers Steal our cardboard 0 0 9 2
People look down on us 9 0 9 5
Supply of materials varies I variable income 9 10 9 10
Police aive us trouble 18 10 0 10
Get iniured from carrvinq the materials 9 0 0 2
The price paid for materials is too low 18 0 0 5
Materials are too neavv to carry 9 0 0 2
Problems with the taxis when we push our carts on the road 9 0 0 2People do not give us permission to take scrap out of theirsaroace 9 35 27 26
Snakes I animals I DOllS 0 15 0 7police think the metal is stolen 0 5 0 2people think I am a thief 0 10 0 5Transoortina the materials is difficult I transport problems 0 5 0 2Problems with my car I vehicle 0 5 0 2The weathe r - its hard to work if it rains 0 5 0 2It is hard I tirina 0 0 27 7It effects my health neqativelv (asthma) 0 0 9 2I lack knowledge about recycling - I am unable to pick outthe most valuable materials 0 0 9 2Total 100 100 100 100
132
At Brook Street nearly half (45%) of the sample indicated that they had no problems
whatsoever. Of those that stated that they had problems with waste picking, the two
main problems pointed out was the police giving pickers trouble (18%), and the price
paid for materials was too low (18%). Brook Street was situated in the central
business district in Durban, with a more visible police presence. This may account
for the greater number of respondents pointing out police harassment as a problem.
Other problems included people looking down on the waste pickers because of their
work (9%), the variable supply of materials or variable income from waste picking
(9%), and having to carry heavy materials (9%). Due to the fact that Brook Street is
in the CBD, there is a lot of vehicle traffic around the buyback centre. This is possibly
a reason why 9% of those mentioning problems with waste picking pointed out that
they have problems with the taxis when they push their carts on the road. Another
9% indicated that home owners give them trouble, when they try to pick scrap from
their garbage.
At Eskom, 45% of the sample indicated that they had no problems whatsoever with
waste picking. Of those that pointed out that they had a problem, 27% stated that
their main problem was that people do not give them permission to take scrap out of
their garbage, while another 27% mentioned that the work was hard or tiring. Other
responses included that waste picking affected their health negatively (9%), while
9% responded that they lack knowledge about recycling, and so they are unable to
pick the most valuable materials. Nine percent pointed out that that the variable
income and the inconsistent supply of materials was a problem, while an additional
9% said that the stealing of materials between pickers was a problem. Nine percent
also stated that they had a problem with the fact that they were looked down on by
people, because of their work.
In contrast to Eskom and Brook Street, every single waste picker interviewed at
Reclamation said that they had problems with their work. The main problem stated
was that people do not give the waste pickers permission to take scrap out of their
garbage (35%), while 15% said that animals gave them trouble, such as home
owners' dogs, or snakes in the garbage. Ten percent pointed to an inconsistent
supply of materials and a variable income as being a problem, and another 10% said
that the police gave them trouble. An additional 10% indicated that people thought
133
that they were a thief. The remaining responses constituted less than 10% each of
the sample for Reclamation.
One of the major problems pointed out by the waste pickers were problems that
involved interactions with other people, such as the police or homeowners. Many
waste pickers reported that people did not allow them to take material from their
garbage, or thought they were thieves. Some also reported having problems with the
police, or being looked down on because of waste picking for money. The problem
with home owners could be solved if the public had a better understanding of the
work that waste pickers do, why they do it, and if they were aware that waste pickers
are not criminals but rather than a group of vulnerable individuals engaging in this
activity in order to survive.
If one considers problems in waste picking according to gender, it appears that the
males interviewed have fewer problems in this line of work, with 32% of all males in
the sample indicating that they have no problems with waste picking, as opposed to
27% of the females. More men than women cited problems with the police as an
issue, while more women than men mentioned that the work is hard or tiring, and the
materials are heavy to carry.
The literature on waste picking has suggested that there are a number of common
problems faced in this line of work. Many studies have suggested that waste pickers
are often at odds with the police and the local authorities (Rouse, 2006, Medina,
1998). In this study, some waste pickers reported problems with the police (9% of
the total sample); however, no waste picker reported having a problem with the local
authorities specifically. McLean found that many of the Durban waste pickers she
interviewed felt 'frowned upon by local authorities' (McLean, 2000a: 4), but apart
from interactions with police, this was not confirmed in this study.
An additional problem with waste picking has been reported to be the health risk
related to this type of work (Wilson, 2006, Medina, 1998). The lack of protective
clothing and proper equipment means that the picker may be in contact with hazard
substances, or sharp objects. In this study, health risks were not pointed out as a
major problem by the waste pickers interviewed. Only 6% of the total sample
134
indicated that waste picking negatively affected their health. One picker claimed that
the cardboard collected had poisonous substances on it, while another picker said
that waste picking gave her health problems. This waste picker was operating at
Eskom, an industrial area, and it could be that the air quality in this area was the
problem, rather than the material collected or the process of collection. Another
respondent indicated that he got injured from carrying the materials.
Much of the literature suggests that waste pickers are often harassed by home
owners (see McLean 2000b: 19, Mazine et al, 1996: 9), and stigmatised by the
general public. In this study, two respondents pointed out that people think they are
thieves, while another 2 respondents said that people look down on them for waste
picking. Eleven respondents (18% of the total sample) said that their major problem
was the fact that people did not give them permission to take scrap out of their
garbage. The results of this study are clearly in agreement with the literature on
waste picking in this regard.
McLean (2000b) found that every waste picker she interviewed had had goods
stolen by other waste pickers. This study found that this was brought up as a
problem by only one waste picker, and was not a significant problem for most waste
pickers.
Other waste pickers suggested that there was a problem with transportation, and
moving the materials around. Only one individual mentioned this as his main
problem with waste picking. In addition to this, waste pickers are faced with a
monopsonisticmarket, with usually one buyer situated close to the area of collection.
Waste pickers are not faced with a great amount of choice as to who to sell their
material to. Another problem mentioned in the literature is that waste pickers are
often at the mercy of the elements, and their income can therefore be effected by
bad weather (Rouse, 2006: 6). In this study, only one individual pointed out that the
weather was a problem.
Respondents were asked what could be done to solve the problems with waste
picking that they had mentioned. Thirty percent of the sample had not mentioned any
problems, and therefore put forward no solutions, while 12% said that they were not
135
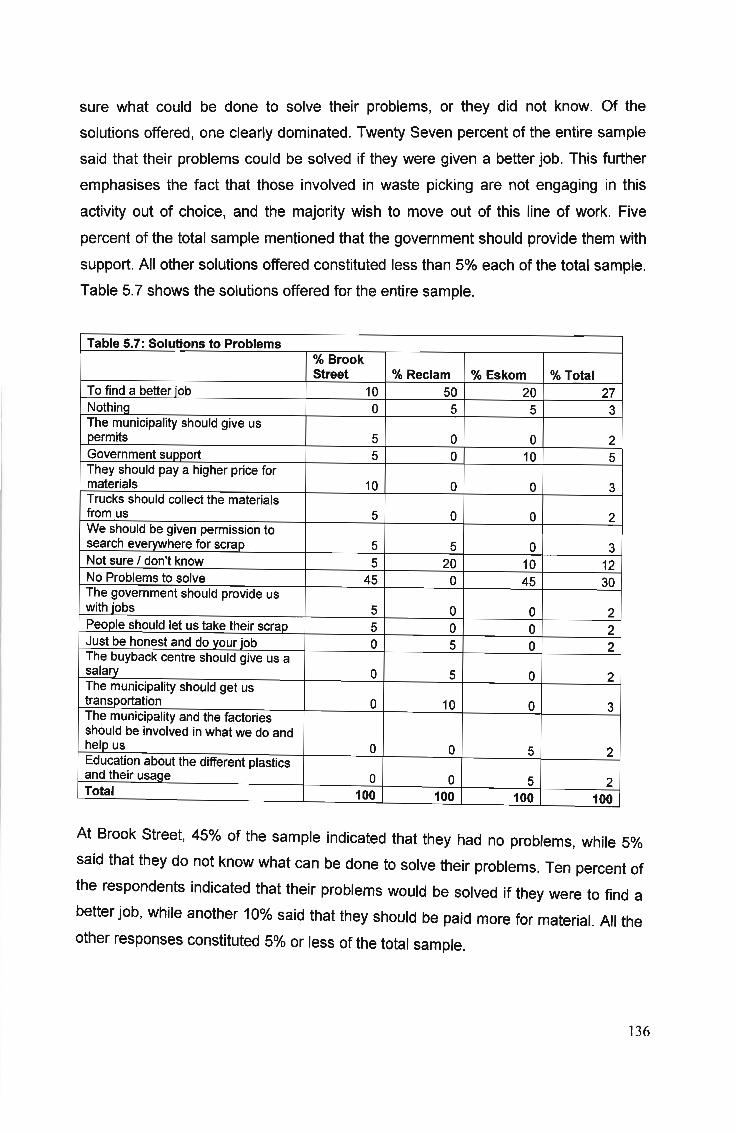
sure what could be done to solve their problems, or they did not know. Of the
solutions offered, one clearly dominated. Twenty Seven percent of the entire sample
said that their problems could be solved if they were given a better job. This further
emphasises the fact that those involved in waste picking are not engaging in this
activity out of choice, and the majority wish to move out of this line of work. Five
percent of the total sample mentioned that the government should provide them with
support. All other solutions offered constituted less than 5% each of the total sample.
Table 5.7 shows the solutions offered for the entire sample.
Table 5.7: Solutions to Problems% BrookStreet % Reclam % Eskom % Total
To find a better lob 10 50 20 27Nothinq 0 5 5 3The municipality should give uspermits 5 0 0 2Government support 5 0 10 5They should pay a higher price formaterials 10 0 0 3Trucks should collect the materialsfrom us 5 0 0 2We should be given permission tosearch evervwhere for scrap 5 5 0 3Not sure I don't know 5 20 10 12No Problems to solve 45 0 45 30The government should provide uswith lobs 5 0 0 2People should let us take their scrap 5 0 0 2Just be honest and do your lob 0 5 0 2The buyback centre should give us asalarv 0 5 0 2The municipality should get ustransportation 0 10 0 3The municipality and the factoriesshould be involved in what we do andhelp us 0 0 5 2Education about the different plasticsand their usaoe 0 0 5 2Total 100 100 100 100
At Brook Street, 45% of the sample indicated that they had no problems, while 5%
said that they do not know what can be done to solve their problems. Ten percent of
the respondents indicated that their problems would be solved if they were to find a
better job, while another 10% said that they should be paid more for material. All the
other responses constituted 5% or less of the total sample.
136
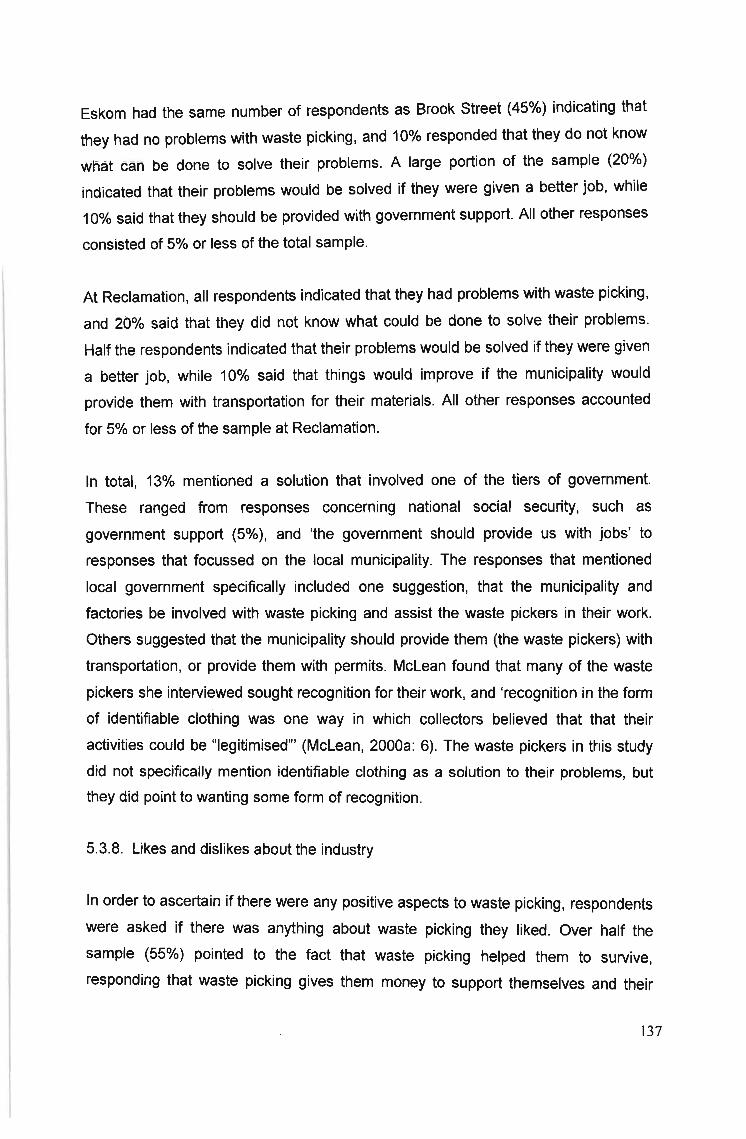
Eskom had the same number of respondents as Brook Street (45%) indicating that
they had no problems with waste picking, and 10% responded that they do not know
what can be done to solve their problems. A large portion of the sample (20%)
indicated that their problems would be solved if they were given a better job, while
10% said that they should be provided with government support. All other responses
consisted of 5% or less of the total sample.
At Reclamation, all respondents indicated that they had problems with waste picking,
and 20% said that they did not know what could be done to solve their problems.
Half the respondents indicated that their problems would be solved if they were given
a better job, while 10% said that things would improve if the municipality would
provide them with transportation for their materials. All other responses accounted
for 5% or less of the sample at Reclamation.
In total, 13% mentioned a solution that involved one of the tiers of government.
These ranged from responses concerning national social security, such as
government support (5%), and 'the government should provide us with jobs' to
responses that focussed on the local municipality. The responses that mentioned
local government specifically included one suggestion, that the municipality and
factories be involved with waste picking and assist the waste pickers in their work.
Others suggested that the municipality should provide them (the waste pickers) with
transportation, or provide them with permits. McLean found that many of the waste
pickers she interviewed sought recognition for their work, and 'recognition in the form
of identifiable clothing was one way in which collectors believed that that their
activities could be "legitimised'" (McLean, 2000a: 6). The waste pickers in this study
did not specifically mention identifiable clothing as a solution to their problems, but
they did point to wanting some form of recognition.
5.3.8. Likes and dislikes about the industry
In order to ascertain if there were any positive aspects to waste picking, respondents
were asked if there was anything about waste picking they liked. Over half the
sample (55%) pointed to the fact that waste picking helped them to survive,
responding that waste picking gives them money to support themselves and their
137
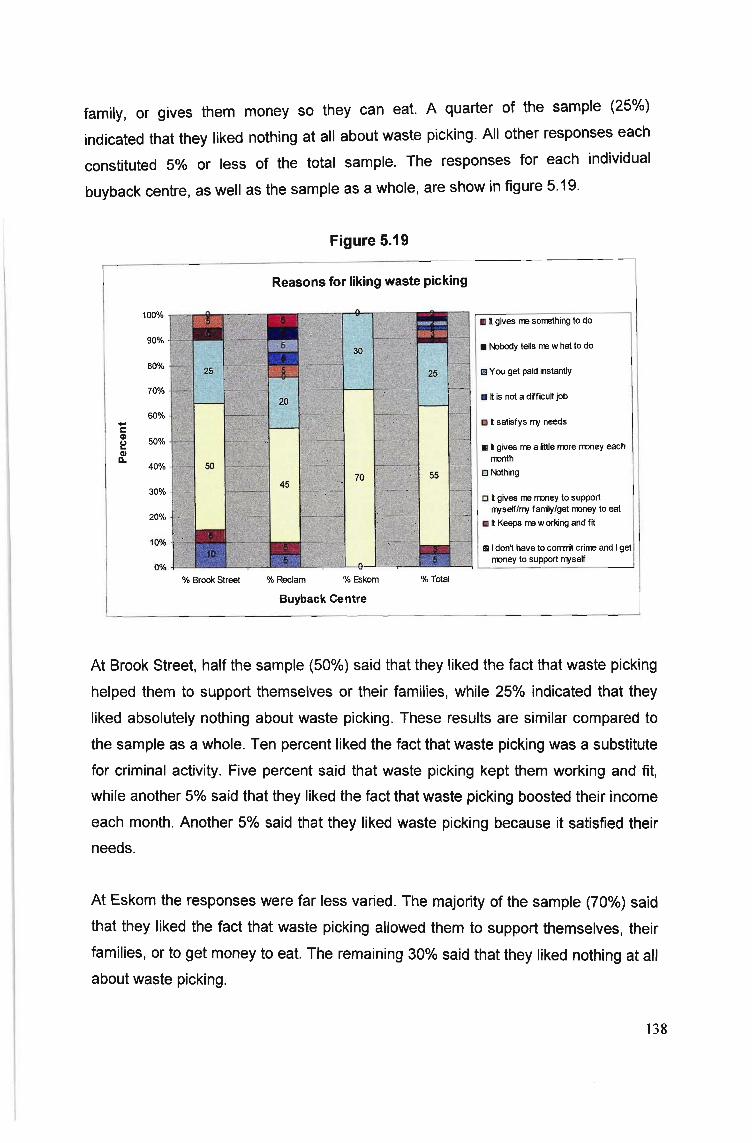
family, or gives them money so they can eat. A quarter of the sample (25%)
indicated that they liked nothing at all about waste picking. All other responses each
constituted 5% or less of the total sample. The responses for each individual
buyback centre, as well as the sample as a whole, are show in figure 5.19.
Figure 5.19
Reasons for liking waste picking
100%
90%
80%
70%
60%..cQl
50%~Ql11.
40%
30%
20%
10%
0%
% Brook Street % Reclam
III ttgives rre sorreth ing to do
11 Nobody tells rre w hat to do
13You get paid instantly
[] tt satisfys my needs
11I gives rre a little more money eachmonth
o Nothing
o I gives rre money to supportmyseW/my famly/gel money to eat
III tt Keeps rre working and f~
GIIdon't have to cormit cr irre and Igetmoney to support myseW
% Eskom % Total
Buyback Centre
At Brook Street, half the sample (50%) said that they liked the fact that waste picking
helped them to support themselves or their families, while 25% indicated that they
liked absolutely nothing about waste picking. These results are similar compared to
the sample as a whole. Ten percent liked the fact that waste picking was a substitute
for criminal activity. Five percent said that waste picking kept them working and fit,
while another 5% said that they liked the fact that waste picking boosted their income
each month. Another 5% said that they liked waste picking because it satisfied their
needs.
At Eskom the responses were far less varied. The majority of the sample (70%) said
that they liked the fact that waste picking allowed them to support themselves, their
families, or to get money to eat. The remaining 30% said that they liked nothing at all
about waste picking.
138
At Reclamation the responses were more varied than at the other buyback centres.
Only 45% indicated that they liked the fact that waste picking gave them money to
support themselves, their families, or to eat, while only 20% said that they liked
nothing at all about waste picking. The other responses were varied, with 5%
pointing out that waste picking was a substitute to crime, while another 5% said that
waste picking kept them working and fit. Five percent also said they liked the fact
that waste picking is not a difficult job, while an additional 5% said that waste picking
satisfied their needs. One individual (5%) liked the fact that you get paid instantly,
while another 5% liked being his own boss, pointing out that nobody tells you what to
do in this line of work. Five percent (one respondent) said that he liked waste picking
as it gave him something to do, and kept him occupied.
While these results point to a range of different things that respondents enjoy about
waste picking, the majority only liked the fact that waste picking was a means for
them to survive, while the second largest category were those that liked nothing at all
about waste picking. This further strengthens the point that waste picking is a
survivalist activity, which people do not enter into by choice. It is not a desirable job
according to the majority of the respondents in this study.
Respondents were also asked what they disliked about waste picking. About a third
of the sample (33%) indicated that they had no problems whatsoever with waste
picking, while 12% said that they disliked the variable income, or that it was
sometimes hard to find material. Another 12% said that they disliked the low income
from waste picking. Seven percent said that they disliked the work because it was
hard and tiring, while another 7% said that the materials were heavy to carry. Seven
percent also pointed out stigmatization from the general public as a dislike, saying
that sometimes people look down on them or think they are crazy for doing waste
picking. Other dislikes mentioned each accounted for 5% of the total sample or less.
At Brook Street 30% of the sample said that they did not dislike anything about
waste picking, while 20% said that the materials were heavy to carry. Twenty percent
pointed to the stigmatisation associated with waste picking, saying that people look
down on them or think they are crazy for doing waste picking, and another 5% said
139
that they disliked the fact that people thought they were a thieves because of the
work they do. Ten percent of respondents said that waste picking didn't give them
enough money to meet their needs, while another 10% pointed to the inconsistent
supply of materials, or the variable income as being a dislike. Five percent cited the
dirtiness of the work as being a dislike, while an additional 5% said that they found
the work hard or tiring.
At Eskom, a higher number of respondents (35%) indicated that they had no dislikes
with waste picking, compared to Brook Street. Fifteen percent pointed out that it was
hard or tiring, while another 15% indicated that they didn't like the low income earned
from waste picking. Ten percent cited an inconsistent supply of material and a
variable income as a dislike, while an additional 10% disliked the long distances that
have to be covered to find material. Five percent said that they disliked the weather
disturbing their work, while another 5% disliked the fact that if one gets injured then
one cannot work and therefore earn money. Five percent felt that people thought
they were a thief, and disliked this, while an additional 5% disliked everything about
waste picking.
At Reclamation, 35% of the sample indicated that they did not dislike anything about
waste picking, while 15% indicated that they disliked the variable supply of material
and inconsistent income. Another 15% pointed to a health risk associated with waste
picking, pointing out that they dislike it when they get cut by the metal they are
collecting. Ten percent said they disliked that waste picking made them dirty, while
another 10% said that they disliked the low income earned from waste picking. Five
percent said they disliked that sometimes people would ask for money in exchange
for garbage, while another 5% disliked waste picking because it affected ones health
negatively. Five percent also disliked that if one gets injured one cannot work.
It is interesting that a third of the sample had no dislikes with waste picking.
Considering the nature of the work, and the fact that all the evidence points to waste
picking being an activity which people enter in order to survive, not out of a matter of
choice, one would expect the waste pickers interviewed to have pointed out many
more dislikes with the industry. This is perhaps due to the fact that while the waste
pickers have not chosen this job out of choice, they choose not to complain about it
140
or be negative. Looking at the likes and dislikes stated together, it appears that 13
respondents (22% of the total sample) stated that the only thing they liked about
waste picking is that it helped them to survive, and they disliked nothing about the
job. This points to the fact that while the waste pickers choose not to be negative
about their work, there is no pretence as to why they are waste picking. It is simply a
matter of survival. Considering the difference in gender and the problems mentioned,
women had fewer dislikes with waste picking, with 41% of the women in the total
sample said that they disliked nothing about waste picking, as opposed to 23% of the
men.
5.4. Earnings and Poverty
5.4.1. Earnings
Respondents were asked how much, on average, they made per week from
collecting scrap specifically. Two individuals have been left out of this analysis. One
individual did not want to give his weekly income, while the other respondent
indicated that he did not know yet, as he had only been working for one day.
Responses ranged from R5 a week to R3000 a week. On average, the waste pickers
interviewed were found to earn R270 a week from collecting scrap, with the highest
number of waste pickers interviewed earning R50 a week. The median was found to
be R150, while the standard deviation was 420. The standard deviation for this
question was very high, showing that the sample was indeed abnormal. This is
illustrated in the frequency graph (figure 5.20) below. However, as mentioned in
chapter 4, the purpose of this study is to present findings relating to a group of waste
pickers, rather than make generalisations about the entire population of waste
pickers operating in Durban. The standard deviation is mentioned here to show the
large variety in responses received, and in order to compare this between the
different buyback centres.
141
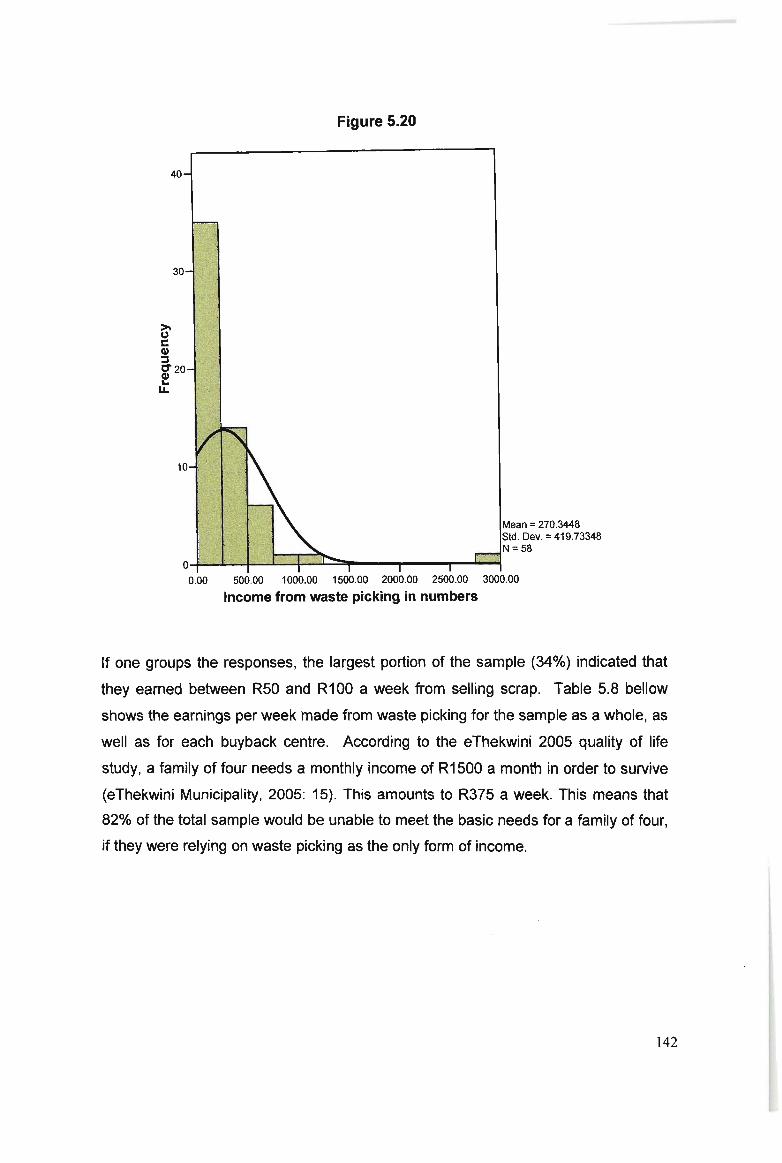
Figure 5.20
40
30
>.oe(I):sC" 20~u..
Mean =270.3448Std. Dev. =419.73348
~~••~~~~,....._..,..__.,--~~N=58
500.00 1000.00 1500.00 2000.00 2500.00 3000.00
Income from waste picking in numbers
If one groups the responses, the largest portion of the sample (34%) indicated that
they earned between R50 and R100 a week from selling scrap. Table 5.8 bellow
shows the earnings per week made from waste picking for the sample as a whole, as
well as for each buyback centre. According to the eThekwini 2005 quality of life
study, a family of four needs a monthly income of R1500 a month in order to survive
(eThekwini Municipality, 2005: 15). This amounts to R375 a week. This means that
82% of the total sample would be unable to meet the basic needs for a family of four,
if they were relying on waste picking as the only form of income.
142
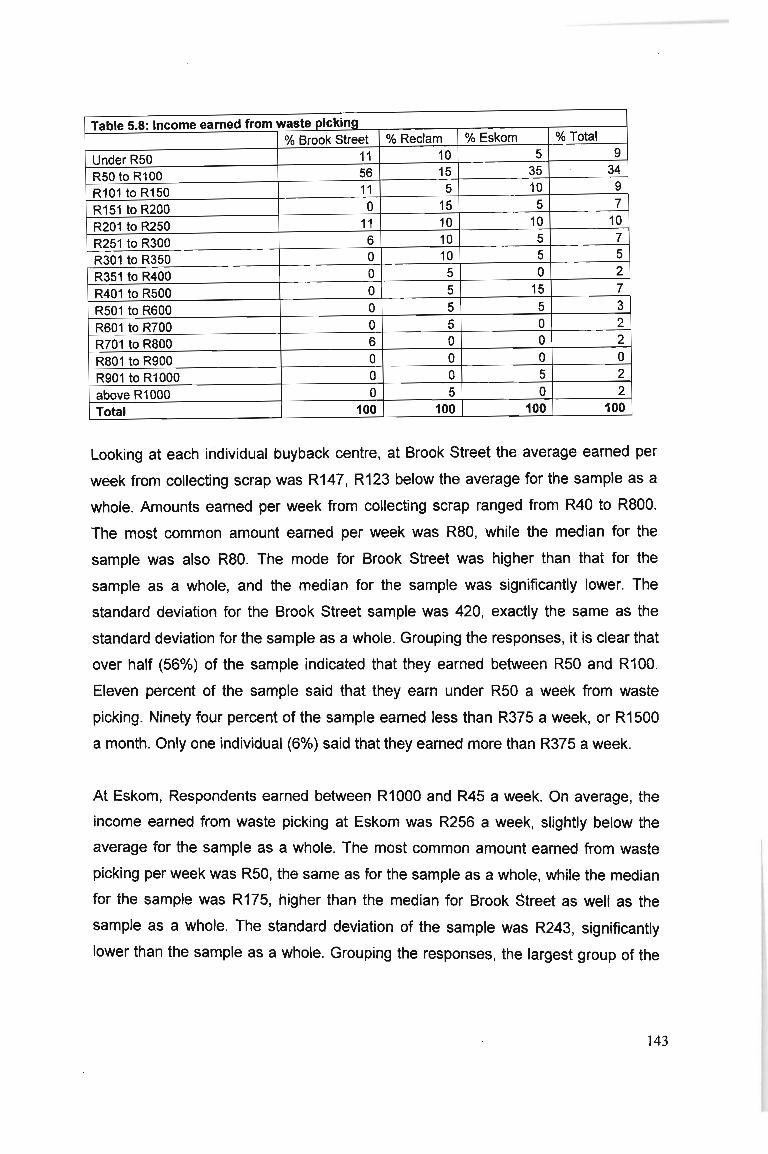
Table 5.8: Income earned from waste picking% Brook Street % Reclam % Eskom % Total
Under R50 11 10 5 9R50 to R100 56 15 35 34R101 to R150 11 5 10 9R151 to R200 0 15 5 7R201 to R250 11 10 10 10R251 to R300 6 10 5 7R301 to R350 0 10 5 5R351 to R400 0 5 0 2R401 to R500 0 5 15 7R501 to R600 0 5 5 3R601 to R700 0 5 0 2R701 to R800 6 0 0 2R801 to R900 0 0 0 0R901 to R1000 0 0 5 2above R1000 0 5 0 2Total 100 100 100 100
Looking at each individual buyback centre, at Brook Street the average earned per
week from collecting scrap was R147, R123 below the average for the sample as a
whole. Amounts earned per week from collecting scrap ranged from R40 to R800.
The most common amount earned per week was R80, while the median for the
sample was also R80. The mode for Brook Street was higher than that for the
sample as a whole, and the median for the sample was significantly lower. The
standard deviation for the Brook Street sample was 420, exactly the same as the
standard deviation for the sample as a whole. Grouping the responses, it is clear that
over half (56%) of the sample indicated that they earned between R50 and R100.
Eleven percent of the sample said that they earn under R50 a week from waste
picking. Ninety four percent of the sample earned less than R375 a week, or R1500
a month. Only one individual (6%) said that they earned more than R375 a week.
At Eskom, Respc;mdents earned between R1000 and R45 a week. On average, the
income earned from waste picking at Eskom was R256 a week, slightly below the
average for the sample as a whole. The most common amount earned from waste
picking per week was R50, the same as for the sample as a whole, while the median
for the sample was R175, higher than the median for Brook Street as well as the
sample as a whole. The standard deviation of the sample was R243, significantly
lower than the sample as a whole. Grouping the responses, the largest group of the
143
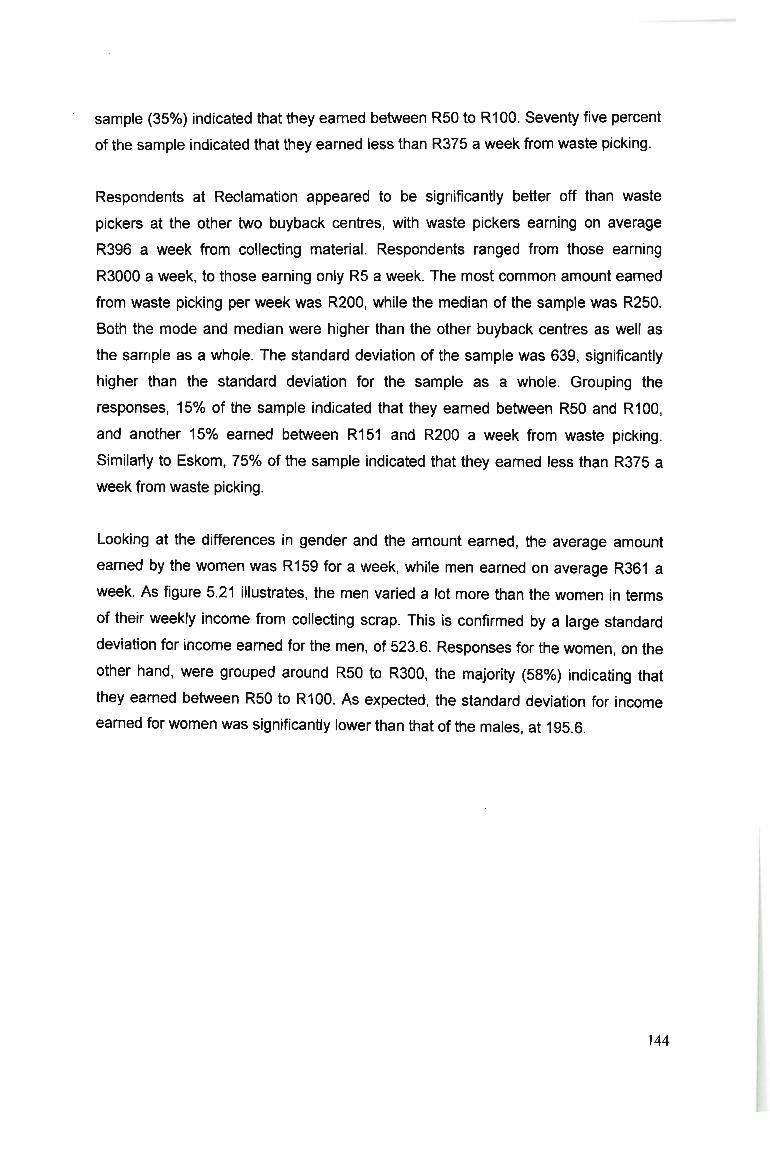
sample (35%) indicated that they earned between R50 to R100. Seventy five percent
of the sample indicated that they earned less than R375 a week from waste picking.
Respondents at Reclamation appeared to be significantly better off than waste
pickers at the other two buyback centres, with waste pickers earning on average
R396 a week from collecting material. Respondents ranged from those earning
R3000 a week, to those earning only R5 a week. The most common amount earned
from waste picking per week was R200, while the median of the sample was R250.
Both the mode and median were higher than the other buyback centres as well as
the sample as a whole. The standard deviation of the sample was 639, significantly
higher than the standard deviation for the sample as a whole. Grouping the
responses, 15% of the sample indicated that they earned between R50 and R100,
and another 15% earned between R151 and R200 a week from waste picking.
Similarly to Eskom, 75% of the sample indicated that they earned less than R375 a
week from waste picking.
Looking at the differences in gender and the amount earned, the average amount
earned by the women was R159 for a week, while men earned on average R361 a
week. As figure 5.21 illustrates, the men varied a lot more than the women in terms
of their weekly income from collecting scrap. This is confirmed by a large standard
deviation for income earned for the men, of 523.6. Responses for the women, on the
other hand, were grouped around R50 to R300, the majority (58%) indicating that
they earned between R50 to R100. As expected, the standard deviation for income
earned for women was significantly lower than that of the males, at 195.6.
144
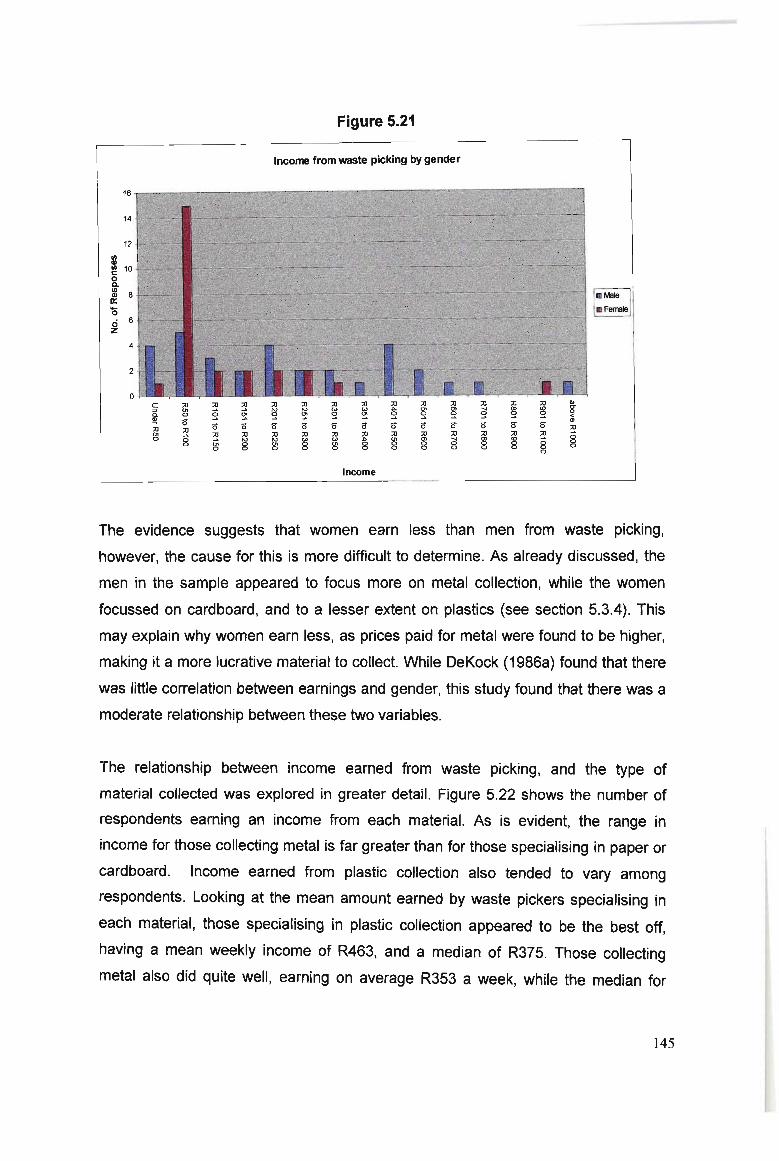
Figure 5.21
Income from waste picking by gender
16
14
12
IIIQl~ 10oCl.
:ll 80:'0cl 6Z
4
2
c ;0 ;0 ~;0 ;0 ;0 ;0 ;0 ;0 ;0 ;0 ;0 ;0 III
:> '" ~to '" c.> c.> ... '" '" .... (Xl <D sc, 0 ~ ~ ~ s ~ ~ ~ ~ ~ s s <
!!l 6" 6" 6"ID
6" 6" 6" 6" 6" 6" 6" 6" 6" 6" ;0;0 ;0;0 ;0 ;0 ;0 ;0 ;0 ;0 ;0 ;0 ~ 0'" 8
;0 ;00 '" re c.> c.> ... o. '" .... ce <D
'" 8 '" 8 er 8 8 8 0 8 0 0 80 0 00 0 00
Income
III Male
III Ferrale
The evidence suggests that women earn less than men from waste picking,
however, the cause for this is more difficult to determine. As already discussed, the
men in the sample appeared to focus more on metal collection, while the women
focussed on cardboard, and to a lesser extent on plastics (see section 5.3.4). This
may explain why women earn less, as prices paid for metal were found to be higher,
making it a more lucrative material to collect. While DeKock (1986a) found that there
was little correlation between earnings and gender, this study found that there was a
moderate relationship between these two variables.
The relationship between income earned from waste picking, and the type of
material collected was explored in greater detail. Figure 5.22 shows the number of
respondents earning an income from each material. As is evident, the range in
income for those collecting metal is far greater than for those specialising in paper or
cardboard. Income earned from plastic collection also tended to vary among
respondents. Looking at the mean amount earned by waste pickers specialising in
each material, those specialising in plastic collection appeared to be the best off,
having a mean weekly income of R463, and a median of R375. Those collecting
metal also did quite well, earning on average R353 a week, while the median for
145
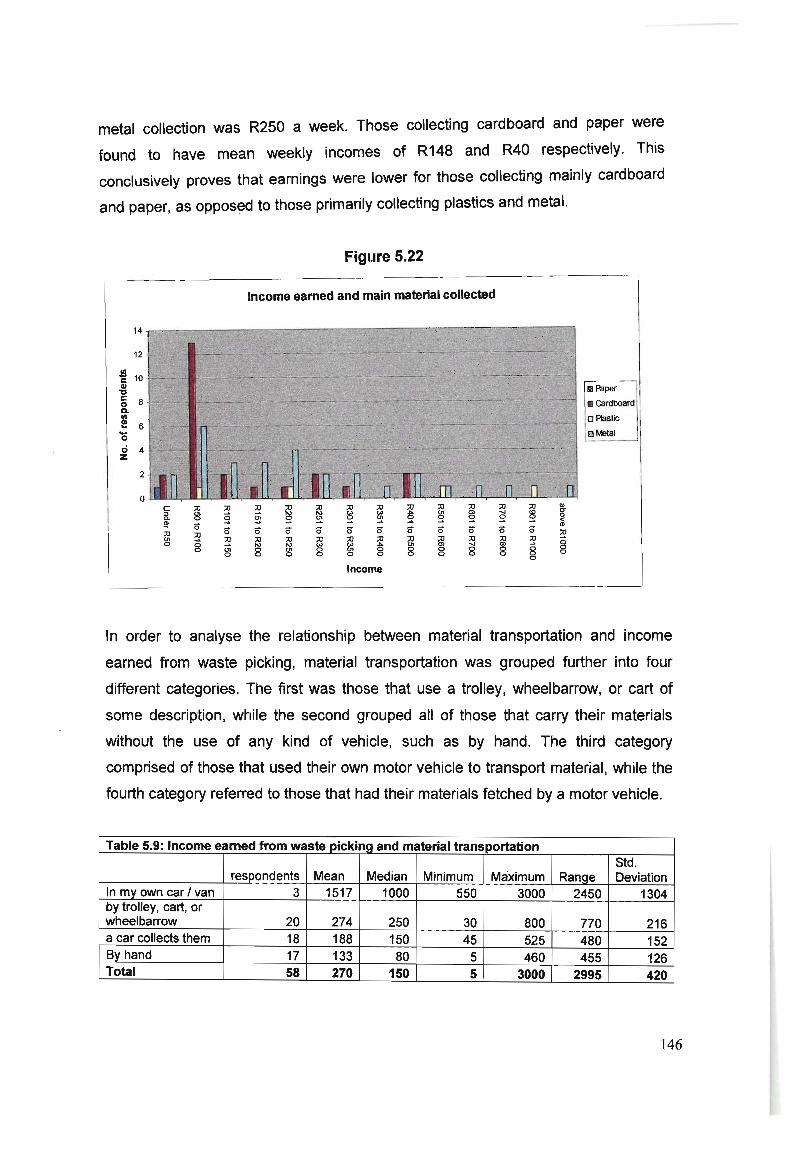
metal collection was R250 a week. Those collecting cardboard and paper were
found to have mean weekly incomes of R148 and R40 respectively. This
conclusively proves that earnings were lower for those collecting mainly cardboard
and paper, as opposed to those primarily collecting plastics and metal.
Figure 5.22
Income eamed and main material collected
14
12
~ 10Gl
"S 8e,III
! 6ocl 4Z
2
o;0 ;0 ~'"0 ~ ~s s s~ ~
;00 '"0 '" 0
0 0
;0 ;0 ;0 ;0 ;0 ;0
~ '" ~ '" .... '"~ ~ ~ ~
s s 0 s s s;0 ;0 ;0 ;0 ;0 ;0
'" '" '" .... '" Cl
'" 0 '" 0 8 00 0 0 0 0
Income
;0 ;0 ;0 IIICl ..., CD 0-
~ ~ ~0<
S- S- s (I)
;0 ;0 ~~..., Cl> 0
0 0 0 00 0 0 0
0
In order to analyse the relationship between material transportation and income
earned from waste picking, material transportation was grouped further into four
different categories. The first was those that use a trolley, wheelbarrow, or cart of
some description, while the second grouped all of those that carry their materials
without the use of any kind of vehicle, such as by hand. The third category
comprised of those that used their own motor vehicle to transport material, while the
fourth category referred to those that had their materials fetched by a motor vehicle.
Table 5.9: Income earned from waste pickina and material transportationStd.
respondents Mean Median Minimum Maximum RanQe DeviationIn mv own car I van 3 1517 1000 550 3000 2450 1304by trolley, cart, orwheelbarrow 20 274 250 30 800 770 216a car collects them 18 188 150 45 525 480 152Bv hand 17 133 80 5 460 455 126Total 58 270 150 5 3000 2995 420
146
As can be expected, those owning a motor vehicle made far more on average than
the other waste pickers. All earned above R500 a week from waste picking, and the
average amount earned for this group was R1517 a week. The next best off were
those using a trolley or cart to transport material. These individuals earned, on
average, R274 a week. However, there was a range of responses in this category,
with waste pickers earning between R30 and R800. The median for those using a
trolley was R250. Those who had their materials fetched for them by a motor vehicle
earned, on average, R188 a week, and the median for this group was R150. Waste
pickers who had their materials collected for them earned between R45 and R525 a
week from scrap. The group that was the worse off was without a doubt those that
transported their materials by hand, carried it on their head, their shoulder, or in a
sack. These individuals were found to earn only R133 a week on average, with the
median being R80. Responses ranged in this category from only R5, to R460.
The above proves that income earned from waste picking is without a doubt linked to
the ease of transportation of materials. Income decreased as the ease of material
transportation decreased. Earlier it was pointed out that male waste pickers have
better access to trolleys and carts for collection (see section 5.3.5). This enables
them to specialise in metal collection, which means that they have the ability to earn,
on average, more than women in this line of work. Better means of material
transportation not only gives the individual waste picker more time to look for
material in his or her place of choice, but it also allows for materials such as metal,
which are difficult to scavenge by hand, to be collected.
Considering education levels and the income made from waste picking, it appears
that there is a slight correlation between these two variables. Looking at each
extreme, those that had a matric earned more, on average, than others. Nearly all
the respondents with a matric earned above R500 a week from waste picking,
however, one individual with a matric earned less than R50 a week. Those with
grades 10 to 11 were found to earn R313 a week on average, less than those with a
matric, but more than the average for the sample as a whole. Considering this trend,
one would expect the income earned from waste picking to decrease as education
levels decreased. However, there was found to be little relationship between income
and those with less than a grade 10 education. These results are supported by
147
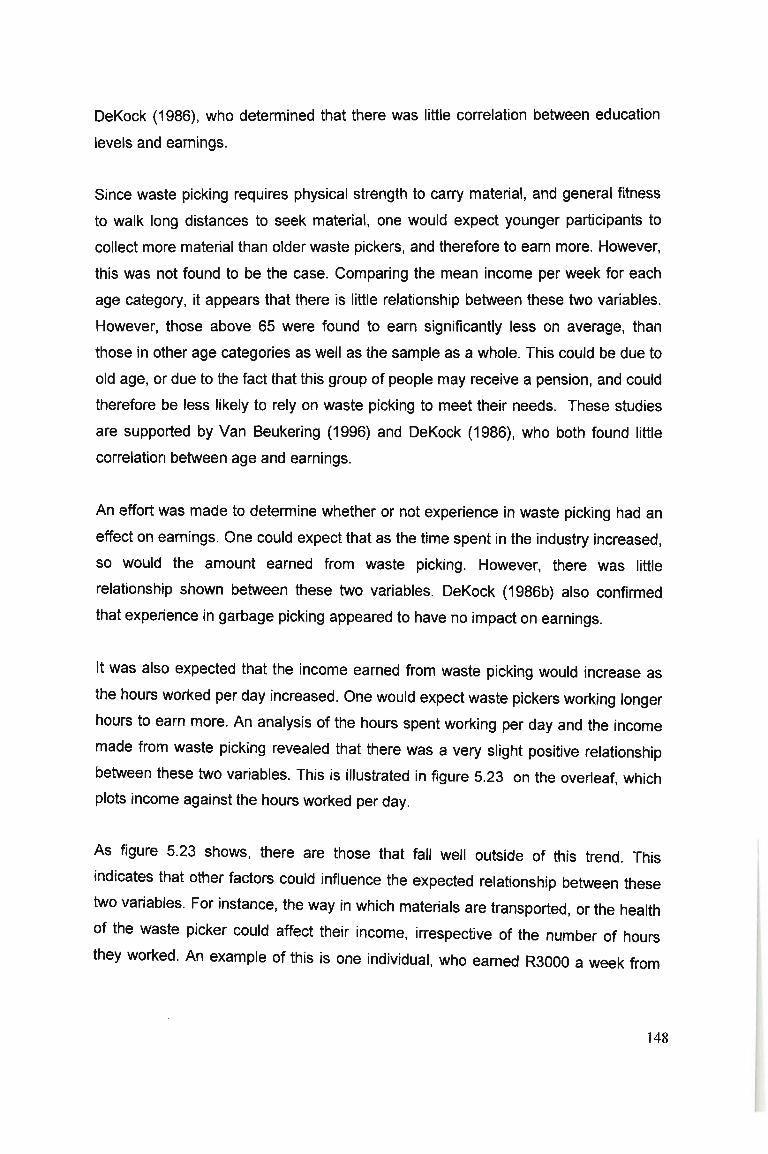
DeKock (1986), who determined that there was little correlation between education
levels and earnings.
Since waste picking requires physical strength to carry material, and general fitness
to walk long distances to seek material, one would expect younger participants to
collect more material than older waste pickers, and therefore to earn more. However,
this was not found to be the case. Comparing the mean income per week for each
age category, it appears that there is little relationship between these two variables.
However, those above 65 were found to earn significantly less on average, than
those in other age categories as well as the sample as a whole. This could be due to
old age, or due to the fact that this group of people may receive a pension, and could
therefore be less likely to rely on waste picking to meet their needs. These studies
are supported by Van Beukering (1996) and DeKock (1986), who both found little
correlation between age and earnings.
An effort was made to determine whether or not experience in waste picking had an
effect on earnings. One could expect that as the time spent in the industry increased,
so would the amount earned from waste picking. However, there was little
relationship shown between these two variables. DeKock (1986b) also confirmed
that experience in garbage picking appeared to have no impact on earnings.
It was also expected that the income earned from waste picking would increase as
the hours worked per day increased. One would expect waste pickers working longer
hours to earn more. An analysis of the hours spent working per day and the income
made from waste picking revealed that there was a very slight positive relationship
between these two variables. This is illustrated in figure 5.23 on the overleaf, which
plots income against the hours worked per day.
As figure 5.23 shows, there are those that fall well outside of this trend. This
indicates that other factors could influence the expected relationship between these
two variables. For instance, the way in which materials are transported, or the health
of the waste picker could affect their income, irrespective of the number of hours
they worked. An example of this is one individual, who earned R3000 a week from
148
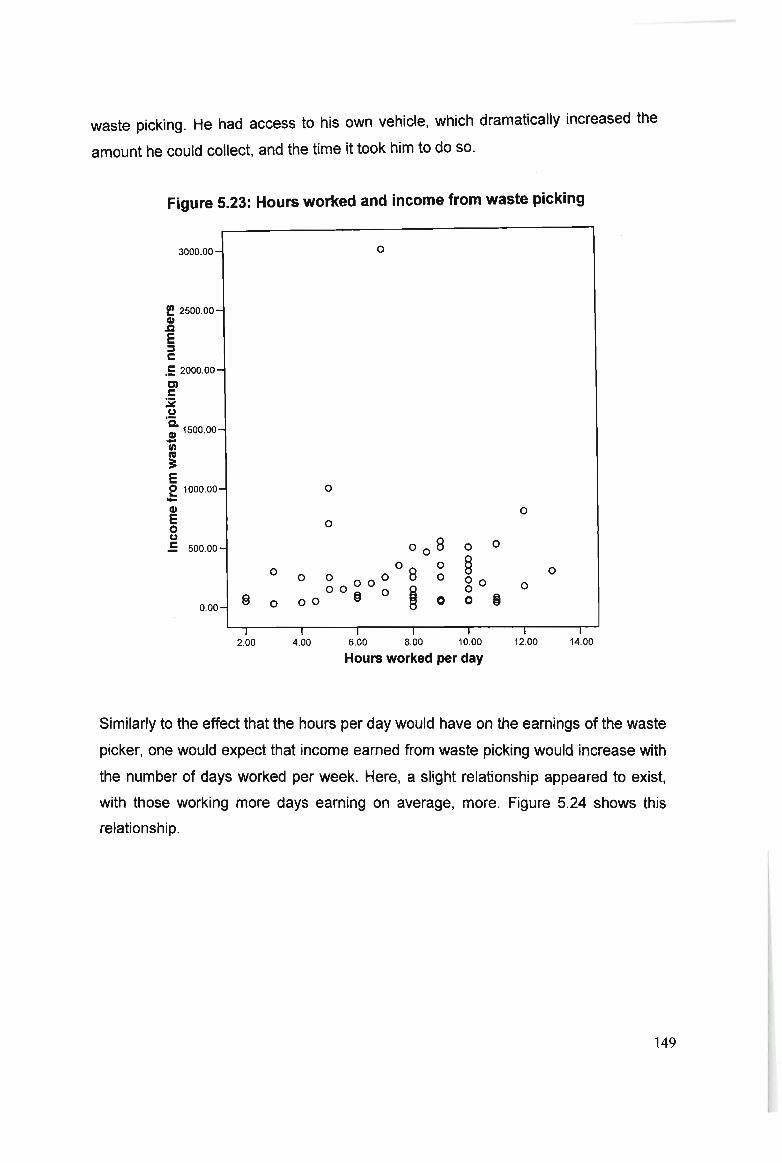
waste picking. He had access to his own vehicle, which dramatically increased the
amount he could collect , and the time it took him to do so.
Figure5.23: Hours worked and income from waste picking
3000 .00- o
o
o
f 2500.00CDJ:lE=c.S: 2000.00C)c:i2u'Q.
CD 1500 .00-111;E.g 1000 .00-
CDEou.5 500 .00-
0.00- 8
o
o
o
00 8o 0
o 0 000 8 0OOA 0 ~
00 ~ Cl 0
o 0
§go 0o t:)
o
I2.00
I
4.00I I I
6.00 8.00 10.00
Hours worked per day
I12.00
I14.00
Similarly to the effect that the hours per day would have on the earnings of the waste
picker, one would expect that income earned from waste picking would increase with
the number of days worked per week. Here, a slight relationship appeared to exist,
with those working more days earning on average, more. Figure 5.24 shows this
relationship.
149
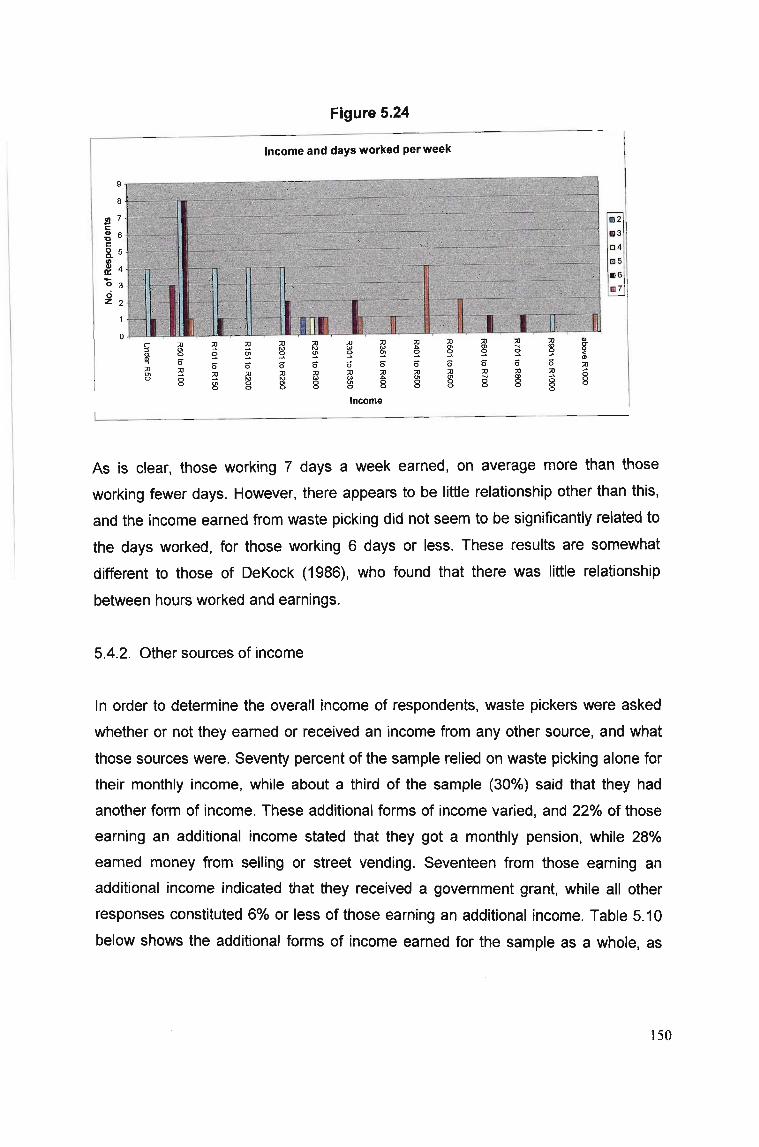
Figure 5.24
Income and days worked per week
9
8
.l!l 7c.g 6c8. 5..~ 4
a 3oZ 2
o3! 3! ;0 ;0 ;0 ;0 ;0 ;0 ;0 ;0 ;0
'" '" '" '" ... '" a> ...~s ~ ~ ~ ~ ~ s ~ s ~
6" 6" 6" 6" 6" 6" 6" 6" 6" 6" 6"
3! ;0 ;0 ;0 ;0 ;0 ;0 ;0 ;0 ;0 ;0
re ro '" '" ... '" a> ... 0> §'" 0 '" 0 '" 0 0 8 8 80 0 0 0 0 0 0
Income
As is clear, those working 7 days a week earned, on average more than those
working fewer days. However, there appears to be little relationship other than this,
and the income earned from waste picking did not seem to be significantly related to
the days worked, for those working 6 days or less. These results are somewhat
different to those of DeKock (1986), who found that there was little relationship
between hours worked and earnings.
5.4.2. Other sources of income
In order to determine the overall income of respondents. waste pickers were asked
whether or not they earned or received an income from any other source, and what
those sources were. Seventy percent of the sample relied on waste picking alone for
their monthly income, while about a third of the sample (30%) said that they had
another form of income. These additional forms of income varied. and 22% of those
earning an additional income stated that they got a monthly pension, while 28%
earned money from selling or street vending. Seventeen from those earning an
additional income indicated that they received a government grant, while all other
responses constituted 6% or less of those earning an additional income. Table 5.10
below shows the additional forms of income earned for the sample as a whole, as
150
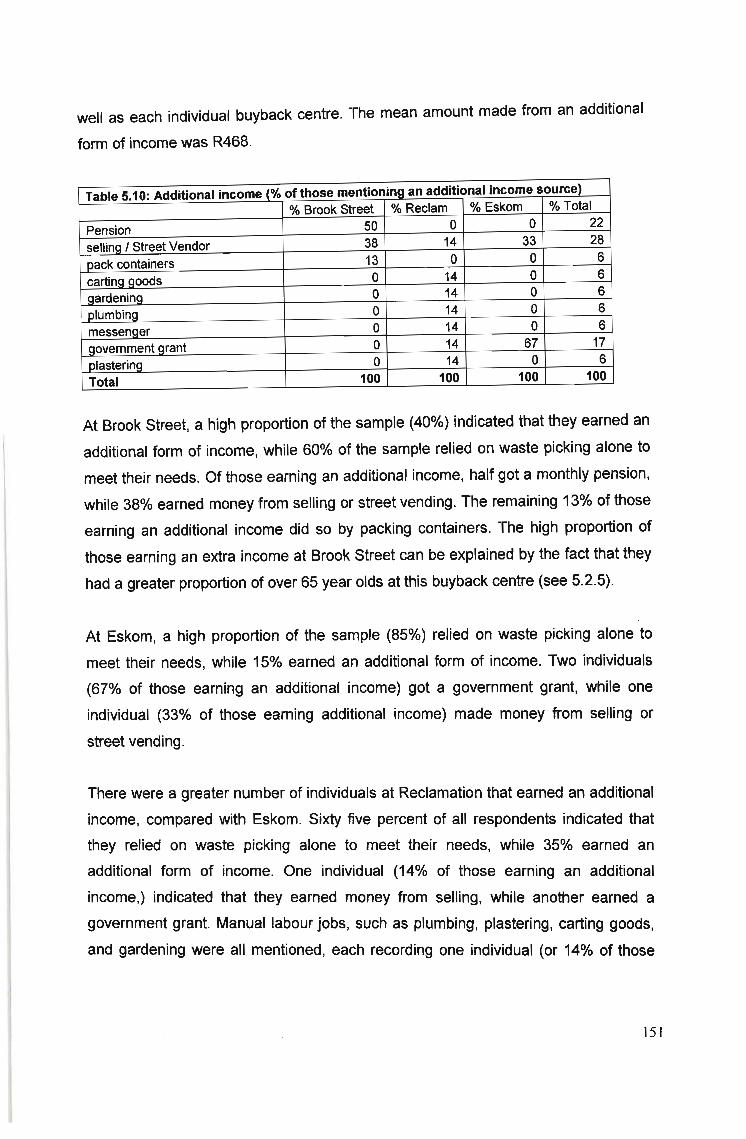
well as each individual buyback centre. The mean amount made from an additional
form of income was R468.
Table 5.10: Additional income (% of those mentionina an additional income source)% Brook Street % Reclam % Eskom % Total
Pension 50 0 0 22sellino I Street Vendor 38 14 33 28pack containers 13 0 0 6carting aoods 0 14 0 6oardenina 0 14 0 6plumbina 0 14 0 6messenoer 0 14 0 6aovernment orant 0 14 67 17olasterino 0 14 0 6Total 100 100 100 100
At Brook Street, a high proportion of the sample (40%) indicated that they earned an
additional form of income, while 60% of the sample relied on waste picking alone to
meet their needs. Of those earning an additional income, half got a monthly pension,
while 38% earned money from selling or street vending. The remaining 13% of those
earning an additional income did so by packing containers. The high proportion of
those earning an extra income at Brook Street can be explained by the fact that they
had a greater proportion of over 65 year olds at this buyback centre (see 5.2.5).
At Eskom, a high proportion of the sample (85%) relied on waste picking alone to
meet their needs, while 15% earned an additional form of income. Two individuals
(67% of those earning an additional income) got a government grant, while one
individual (33% of those earning additional income) made money from selling or
street vending.
There were a greater number of individuals at Reclamation that earned an additional
income, compared with Eskom. Sixty five percent of all respondents indicated that
they relied on waste picking alone to meet their needs, while 35% earned an
additional form of income. One individual (14% of those earning an additional
income,) indicated that they earned money from selling, while another earned a
government grant. Manual labour jobs, such as plumbing, plastering, carting goods,
and gardening were all mentioned, each recording one individual (or 14% of those
151
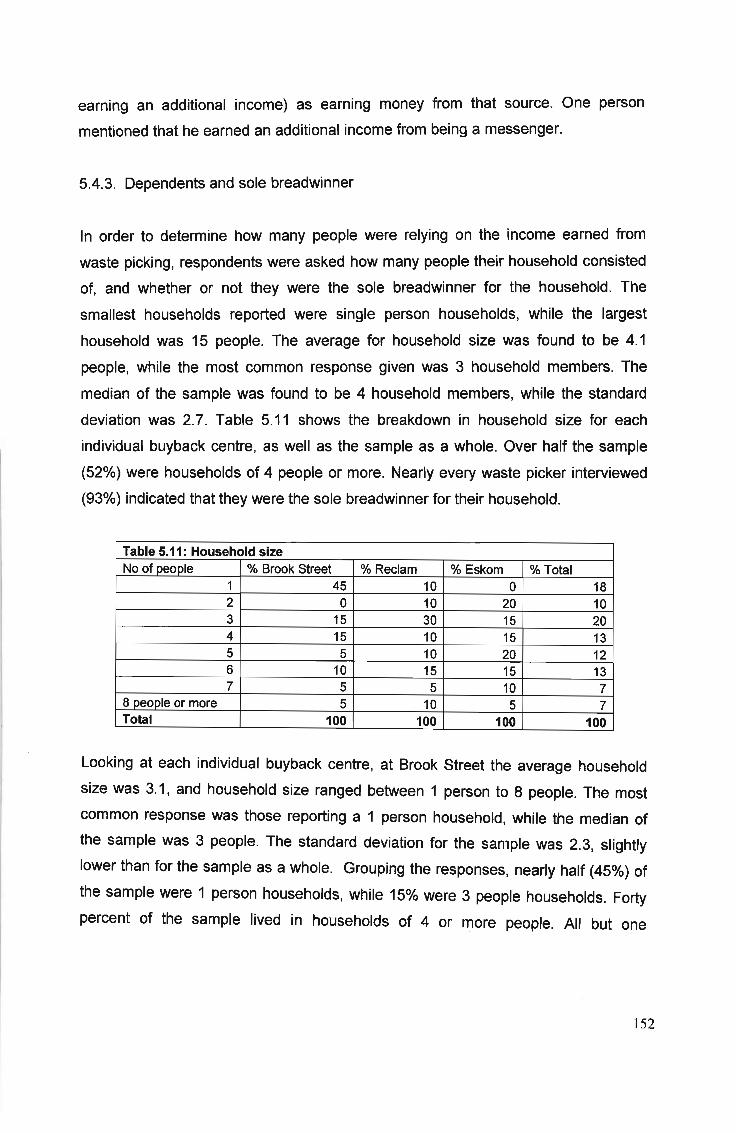
earning an additional income) as earning money from that source. One person
mentioned that he earned an additional income from being a messenger.
5.4.3. Dependents and sole breadwinner
In order to determine how many people were relying on the income earned from
waste picking, respondents were asked how many people their household consisted
of, and whether or not they were the sole breadwinner for the household. The
smallest households reported were single person households, while the largest
household was 15 people. The average for household size was found to be 4.1
people, while the most common response given was 3 household members. The
median of the sample was found to be 4 household members, while the standard
deviation was 2.7. Table 5.11 shows the breakdown in household size for each
individual buyback centre, as well as the sample as a whole. Over half the sample
(52%) were households of 4 people or more. Nearly every waste picker interviewed
(93%) indicated that they were the sole breadwinner for their household.
Table 5.11: Household sizeNo of people % Brook Street % Reclam % Eskom % Total
1 45 10 0 182 0 10 20 103 15 30 15 204 15 10 15 135 5 10 20 126 10 15 15 137 5 5 10 7
8 people or more 5 10 5 7Total 100 100 100 100
Looking at each individual buyback centre, at Brook Street the average household
size was 3.1, and household size ranged between 1 person to 8 people. The most
common response was those reporting a 1 person household, while the median of
the sample was 3 people. The standard deviation for the sample was 2.3, slightly
lower than for the sample as a whole. Grouping the responses, nearly half (45%) of
the sample were 1 person households, while 15% were 3 people households. Forty
percent of the sample lived in households of 4 or more people. All but one
152
respondent (95% of the sample) said that they were the sole breadwinner for their
household.
Considering Eskom, there seemed to be a greater variety in household size
compared with Brook Street. Household size ranged from two people to eleven
people, with the average household size being 4.6 people. The most common
household size reported was 2 people, and the median of the sample was 4.5. The
standard deviation was 2.2, slightly lower than for the sample as a whole. Grouping
the responses, it is clear that the greatest proportion of the sample (20%) lived in 2
person households, or in 5 person households (20%). Sixty five percent of the
sample lived in a household which consisted of 4 or more people. All but one
respondent (95%) indicated that they were the sole breadwinner for their household.
At Reclamation, household size ranged from one person households to households
consisting of 15 people. The average household size was 4.6 people, while the most
people responded that they lived in households consisting of 3 people. The median
for the sample was 3.5 people, while the standard deviation was 3.3, significantly
higher than for the sample as a whole. Grouping the responses, the highest
proportion of the sample (30%) indicated that they lived in 3 person households. Half
the sample lived in households of 4 or more people. Nearly every respondent (90%)
indicated that they were the sole breadwinner for their household.
Considering the number of people supported by the waste picker by gender, it is
clear that on average, men support fewer people with their earnings than the women
in the sample. The average household size for males was 3.8, while the average
household size for women was higher, at 4.5. The median household size for women
was 4, as opposed to 3 for the men. All the females said that they were the sole
breadwinner for the household, as opposed to 88% of the men. Twelve percent of
the men had another breadwinner living in their household.
5.4.4. Poverty
In order to analyse whether waste pickers can be considered poor, one has to look
both at their total income, whether or not they are the only breadwinner in the house,
153
and how many people they support on their income. The benchmark for poverty
used here is the income level pointed out in the 2005 eThekwini quality of life study,
where it stated that a family of 4 would need a monthly income of R1500 to survive
(eThekwini Municipality, 2005: 15). This translates into R94 a week per person.
Total income for each waste picker was considered. This was done by adding the
income from waste picking to any additional income that the waste picker may earn.
Excluded from this analysis was one waste picker who refused to answer the
question, and another waste picker who was unable to give his monthly income, as it
was his first day working. This resulted in a total sample of 58 respondents. It was
found that 67% earned a total income of less than R375 a week (R1500 a month).
However, this did not give an accurate representation of whether of not these
individuals were living below the poverty line stated above, as household size has
not been taken into account.
Total income for each waste picker was divided by the household size, to determine
how much was available for each household member. It was found that 62% of all
the waste pickers interviewed lived in households where each individual member
had less than R94 a week to survive. Every single one of these waste pickers were
the sole breadwinners for their households. These 36 waste pickers (or 62% of the
sample) are clearly living below the survival level set for eThekwini, and can
therefore be considered very poor.
Of those considered to be living in very poor households, 16 of them were men and
20 were women. This means that 76% of females in the entire sample can be
considered to be living in very poor households, as opposed to only 47% of the
males in this study. This further highlights the differences in terms of gender pointed
out throughout the analysis. The male waste pickers clearly have better access to
transportation of materials, which allows them to collect more lucrative scrap such as
metal. They therefore earn more, and also have, on average, fewer dependents than
the women in this study.
These findings are in agreement with the literature that exists on waste picking.
While some studies have found that waste pickers earn minimum wage, or in some
154
cases above this, the majority have concluded that waste pickers earn very little and
are usually on, or below the minimum wage (see for example Van Beukering, 1996,
Hayami, 2006, Rouse, 2006). This study has confirmed that the majority of the
individuals interviewed relied solely on waste picking to meet their needs. This
finding is supported by a number of studies (see, for example, McLean 2000b, and
DeKock, 1986a).
While some studies have pointed to the fact that garbage pickers may not be the
poorest of the poor, they are faced with other factors that make them vulnerable.
These factors include working conditions that may negatively affect their health, as
well as the psychological stress of a variable income and no benefits for the work
that they do (see, for example, Wilson, 1998: 110). These factors have an impact on
the waste pickers' quality of life.
5.5. Relationship with the municipality
An aim of this study was to determine how waste pickers viewed the municipality,
and to consider how the local authorities can improve the working conditions of the
waste pickers. This was explored through two different questions. The first asked
whether or not the waste pickers felt that their work benefited the city, and if so how
it benefited the city. This was asked to determine whether or not the waste pickers
viewed their work as valuable to the municipality. The second asked what the waste
pickers thought the municipality could do to better their working conditions.
When asked whether or not the waste pickers believed their work benefited the city,
the majority (86%) thought that it did. The largest portion of the sample (82%)
indicated that they thought their work removed dirt, cleaned the city, reduced litter, or
kept the city clean. The responses are shown in table 5.12 below:
155
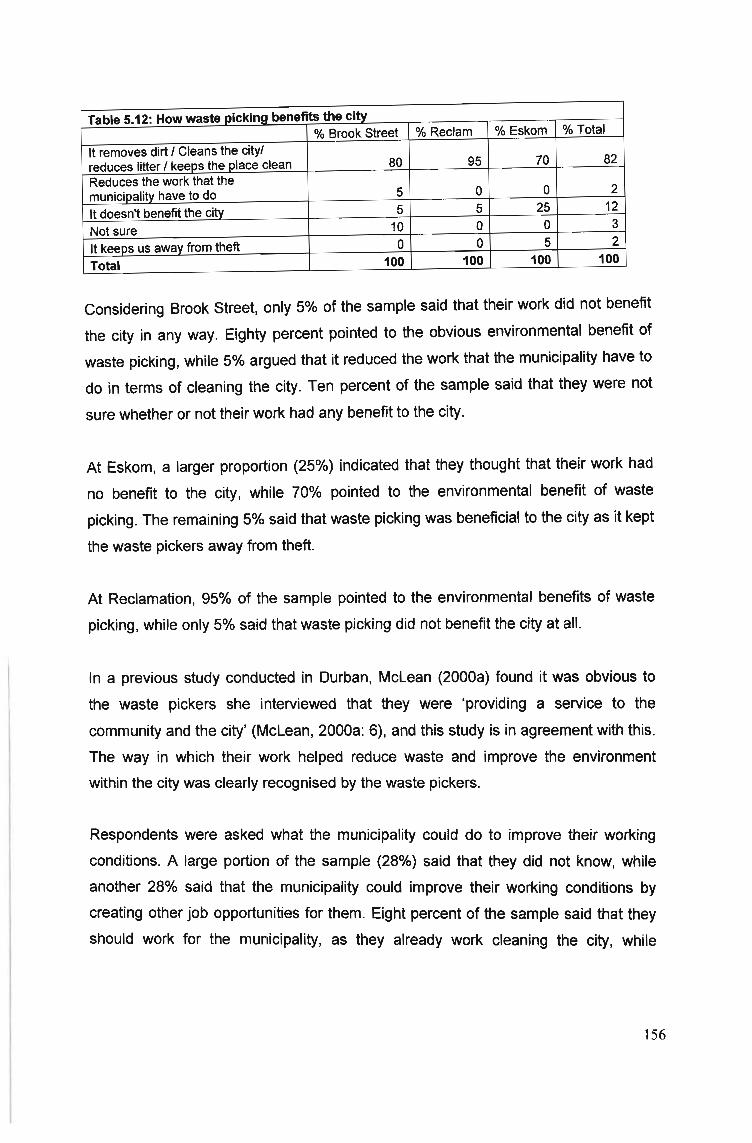
Table 5.12: How waste picking benefits the city% Brook Street % Reclam % Eskom % Total
It removes dirt! Cleans the city!70 82reduces litter! keeps the place clean 80 95
Reduces the work that the2municipality have to do 5 0 0
It doesn't benefit the city 5 5 25 12Not sure 10 0 0 3It keeps us away from theft 0 0 5 2Total 100 100 100 100
Considering Brook Street, only 5% of the sample said that their work did not benefit
the city in any way. Eighty percent pointed to the obvious environmental benefit of
waste picking, while 5% argued that it reduced the work that the municipality have to
do in terms of cleaning the city. Ten percent of the sample said that they were not
sure whether or not their work had any benefit to the city.
At Eskom, a larger proportion (25%) indicated that they thought that their work had
no benefit to the city, while 70% pointed to the environmental benefit of waste
picking. The remaining 5% said that waste picking was beneficial to the city as it kept
the waste pickers away from theft.
At Reclamation, 95% of the sample pointed to the environmental benefits of waste
picking, while only 5% said that waste picking did not benefit the city at all.
In a previous sfudy conducted in Durban, McLean (2000a) found it was obvious to
the waste pickers she interviewed that they were 'providing a service to the
community and the city' (McLean, 2000a: 6), and this study is in agreement with this.
The way in which their work helped reduce waste and improve the environment
within the city was clearly recognised by the waste pickers.
Respondents were asked what the municipality could do to improve their working
conditions. A large portion of the sample (28%) said that they did not know, while
another 28% said that the municipality could improve their working conditions by
creating other job opportunities for them. Eight percent of the sample said that they
should work for the municipality, as they already work cleaning the city, while
156
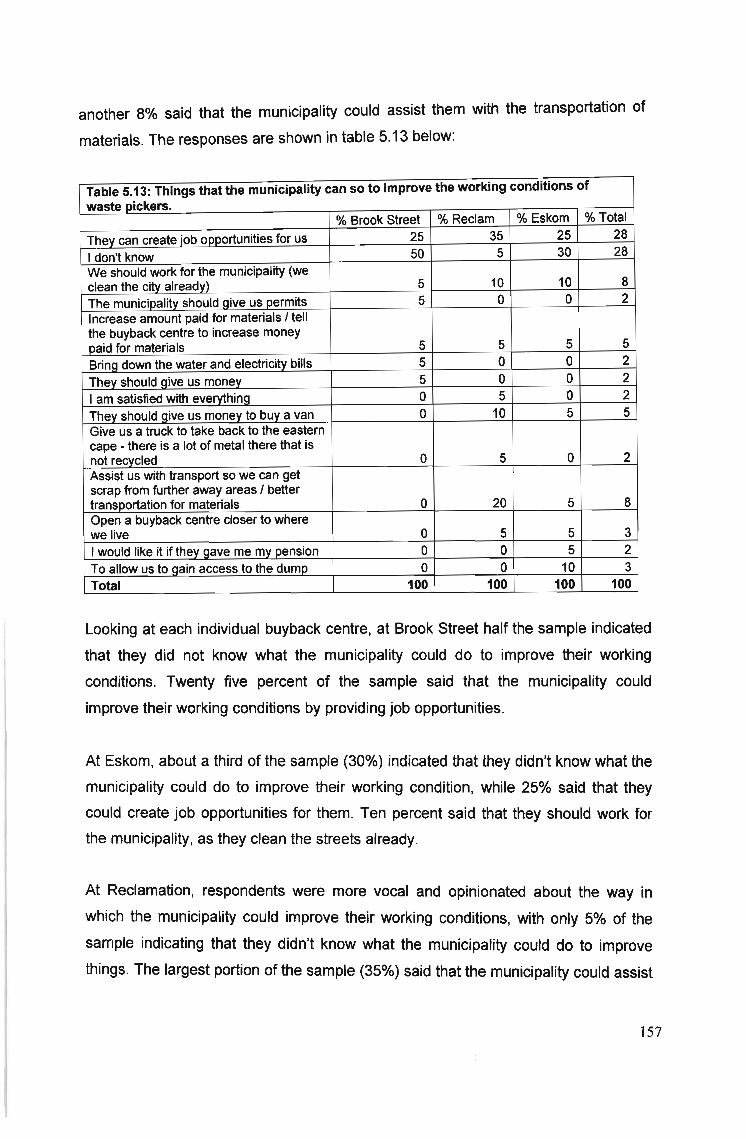
another 8% said that the municipality could assist them with the transportation of
materials. The responses are shown in table 5.13 below:
Table 5.13: Things that the municipality can so to improve the working conditions ofwaste pickers.
% Brook Street % Reclam % Eskom % Total
They can create iob opportunities for us 25 35 25 28
I don't know 50 5 30 28We should work for the municipality (we
10 8clean the city alreadv) 5 10
The municipalitv should aive us permits 5 0 0 2Increase amount paid for materials I tellthe buyback centre to increase money
5 5 5paid for materials 5Bring down the water and electricity bills 5 0 0 2They should aive us money 5 0 0 2I am satisfied with evervthina 0 5 0 2They should aive us money to buy a van 0 10 5 5Give us a truck to take back to the easterncape - there is a lot of metal there that is
0 2not recycled 0 5Assist us with transport so we can getscrap from further away areas I better
8transportation for materials 0 20 5Open a buyback centre closer to wherewe live 0 5 5 3I would like it if thev aave me my pension 0 0 5 2To allow us to aain access to the dump 0 0 10 3Total 100 100 100 100
Looking at each individual buyback centre, at Brook Street half the sample indicated
that they did not know what the municipality could do to improve their working
conditions. Twenty five percent of the sample said that the municipality could
improve their working conditions by providing job opportunities.
At Eskom, about a third of the sample (30%) indicated that they didn't know what the
municipality could do to improve their working condition, while 25% said that they
could create job opportunities for them. Ten percent said that they should work for
the municipality, as they clean the streets already.
At Reclamation, respondents were more vocal and opinionated about the way in
which the municipality could improve their working conditions, with only 5% of the
sample indicating that they didn't know what the municipality could do to improve
things. The largest portion of the sample (35%) said that the municipality could assist
157
them by providing job opportunities, while 20% said that the municipality could assist
them with the transportation of materials. Ten percent said that they should work for
the municipality, as they clean the streets already, while another 10% argued that
the"municipality should give them money to buy a van to transport materials.
Some responses implied that waste pickers would like some form of assistance with
the transportation of their materials. In essence , the amount of material that a picker
can transpcr; dictgt~s hQW mych he or she will.mgK~, SQ it is hardly ~u.rprisjng thatthis was pointed out as an area where the municipality could provide assistance.
Also of interest are the responses that implied that waste pickers would like more
recognition for the work that they do, and more support from the municipality.
Responses such as "We should work for the municipality (we clean the city already)"
and "The municipality should give us permits", or "the municipality should allow us to
gain access to the dump" all point to this. The large number of individuals that said
that the municipality should provide job opportunities further emphasises the fact that
waste picking is, for most, not an activity entered into by choice.
5.6. Formal I informal sector linkages
An aim of this study was to explore the linkages between formal sector and informal
sector r~cycling . 60th forward and backward linkages into the f~rmal economy needto be analysed in order to fully understand the relationship between the two.
In contrast to other informal activities, backward linkages into the formal economy
are not very strong. This is because waste picking requires very little, or no start up
capital. Any individual can pick waste off the street and sell it back to a buyback
centre. However, many individuals (30%.) had a trolley to transport their materials.
No question was asked concerning the origin of these trolleys . whether or not the
waste pickers bought them from an informal or formal business, or built the trolleys
themselves . However, through observation it was determined that the different
trolleys were all fairly unique, indicating that they were probably homemade.
F-orward linkages into the formal economy were found to be much stronger. In the
case of thos~ s~lIing back material to Reclamation, th~ mat~rial went d.ir~ctly to a
158
formal recycling company and the material was sorted and dealt with on site. Brook
Street was owned and managed by the government, however, a formal recycling
company collected the material. Eskom was also owned and managed by the
government, but the individuals in charge at this buyback centre acted more like
middlemen. They were not employed by anyone recycling company, but they bought
back material from waste pickers, sorted it, and arranged for it to go on to other
formal recycling companies.
Ultimately, nearly all the material the waste pickers collected found its way to the
formal recycling industry, as they had the means to process the material and recycle
it. Waste pickers are clearly dependent on the formal recycling sector, as they
provide the demand for materials. Without the formal recycling sector, the waste
pickers would not be able to earn an income. However, the extent to which the
formal recycling sector is dependent on the waste pickers is far more difficult to
determine. Many formal recycling companies rely on other formal sector industries to
sell back material, rather than on informal recycling. The informal recycling sector is
relatively small in South Africa, compared to other developing countries, while the
economy and manufacturing are well developed. Waste pickers are clearly more
dependent on the formal recycling sector than the formal recycling sector is on the
waste pickers. The relationship is an unequal one, and waste pickers are even more
vulnerable because of this.
The point of convergence for informal and formal sector recyclers is the buyback
centre, therefore it was necessary to ask why waste pickers choose to use a
particular buyback centre, as opposed to going elsewhere. It was also important to
establish whether the waste .pickers had any special arrangement with a particular
buyback centre, or whether they acted as rational economic actors, going where the
price was best or to the buyback centre that was most convenient.
The reasons for choosing a particular buyback centre are shown in table 5.14 below.
The largest portion of the sample (67%) pointed out that the buyback centre they had
chosen was the closest and most convenient, while 15% indicated that the buyback
centre they were at was the only one they knew. All other responses constituted less
than 10% of the total sample.
159
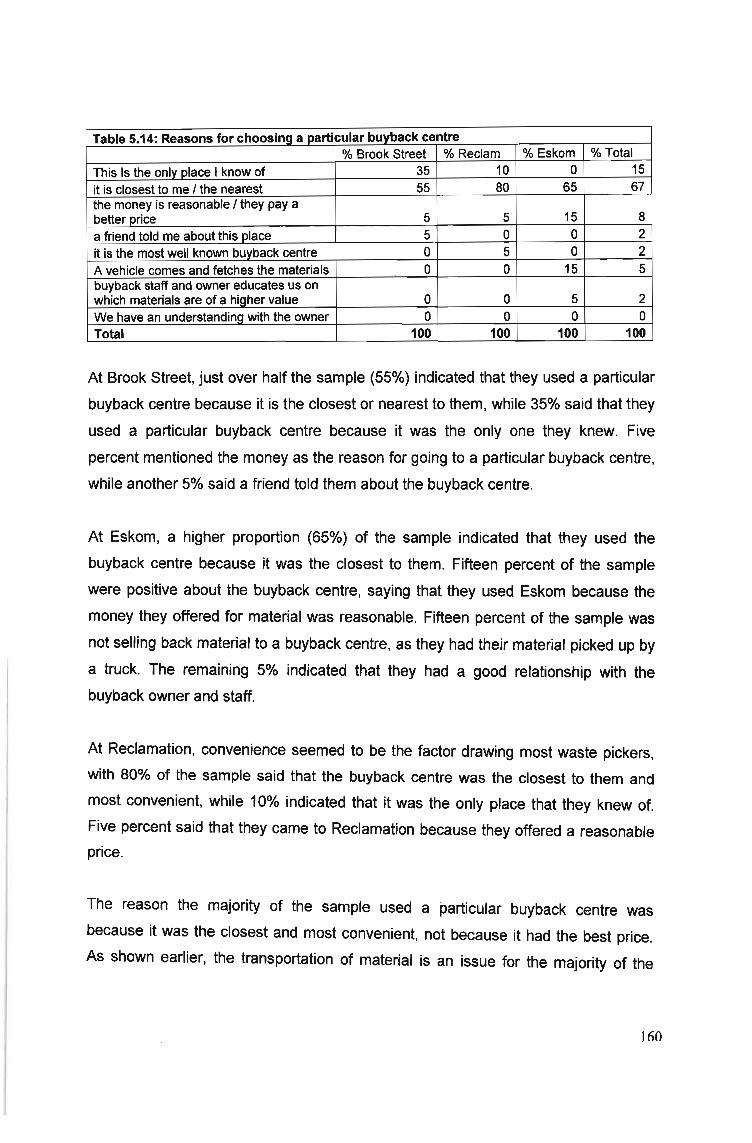
Table 5.14: Reasons for choosina a particular buyback centre% Brook Street % Reclam % Eskom % Total
This Is the onlv olace I know of 35 10 0 15it is closest to me I the nearest 55 80 65 67the money is reasonable I they pay a
5 5 15 8better oricea friend told me about this place 5 0 0 2it is the most well known buvback centre 0 5 0 2A vehicle comes and fetches the materials 0 0 15 5buyback staff and owner educates us on
0 5 2which materials are of a higher value 0We have an understandinq with the owner 0 0 0 0Total 100 100 100 100
At Brook Street, just over half the sample (55%) indicated that they used a particular
buyback centre because it is the closest or nearest to them, while 35% said that they
used a particular buyback centre because it was the only one they knew. Five
percent mentioned the money as the reason for going to a particular buyback centre,
while another 5% said a friend told them about the buyback centre.
At Eskom, a higher proportion (65%) of the sample indicated that they used the
buyback centre because it was the closest to them. Fifteen percent of the sample
were positive about the buyback centre, saying that they used Eskom because the
money they offered for material was reasonable. Fifteen percent of the sample was
not selling back material to a buyback centre, as they had their material picked up by
a truck. The remaining 5% indicated that they had a good relationship with the
buyback owner and staff.
At Reclamation, convenience seemed to be the factor drawing most waste pickers,
with 80% of the sample said that the buyback centre was the closest to them and
most convenient, while 10% indicated that it was the only place that they knew of.
Five percent said that they came to Reclamation because they offered a reasonableprice.
The reason the majority of the sample used a particular buyback centre was
because it was the closest and most convenient, not because it had the best price.
As shown earlier, the transportation of material is an issue for the majority of the
160
waste pickers. This explains why many of them choose to go to the closest buyback
centre. The time and effort it takes to transport material means that waste pickers
are left with little choice other than to sell back their material to the closest centre.
5.7. Theoretical Implications
As already discussed, the informal recycling sector has clear linkages with the formal
recycling industry. While backward linkages into the formal economy are less
prevalent, forward linkages are strong and unequal. The demand for recyclable
material comes from the formal recycling sector, and while the waste pickers are
dependent on this demand for their survival, it is unlikely that the formal recycling
companies are dependent on the waste pickers to the same extent. The links
between informal and formal recycling are clear, proving that a dualistic
interpretation of the informal recycling sector is, in this case, invalid. The two sectors
are clearly linked and interdependent, even though the relationship is unequal.
If one takes a Marxist view of the informal recycling industry, one would expect
informal recycling not to be separate and autonomous, but rather 'parts of one
overall capitalist system in which informal activities are subordinate to, and
dependent on, the formal sector' (Bemabe, 2002: 9). Marxists argue that the
existence of the urban informal sector places downward pressure on urban wage
levels, and capital also benefits from a supply of cheap good and services. The
informal sector workers are viewed as little more than disguised wage workers,
denied of the benefits and security from formal employment.
Applying a Marxist view to the results of this study, it is clear that the formal recycling
companies benefit from goods (in this case recyclable material) from the waste
pickers. However, it is unlikely that the presence of the informal sector and the
unemployed has a significant effect on the urban wage levels. In South Africa,
protective labour legislation, and the presence of strong trade unions have resulted
in a high unemployment rate, and relatively high unit labour costs compared to other
developing countries elsewhere in the world (Poswell, 2002: 19). Despite the fact
that there are many who are not formally employed, urban wage levels have not
161
been affected to a great extent because of this. One could argue that few are
employed, at the expense of many.
While capital undoubtedly benefits from the material collected by the waste pickers in
this study, the extent to which they are dependent on informal recycling is unclear.
The relatively well developed manufacturing industry in Durban provides many
recycling companies with their waste, and this accounts for most of their material
collected. Despite this, the waste pickers clearly provide a constant supply of
material to the formal sector recycling companies, and can be considered to be
working for them. As shown above, the majority of the waste pickers are forced to
use only one buyback centre, as it is close to them and convenient. Most work a
normal working week or longer collecting scrap. In essence they rely on the formal
sector for their income. One can view the waste pickers in this study as ultimately
working for formal recycling companies, or as disguised wage workers. This study is
in agreement with previous studies on this point, such as Birkbeck (1979), and
Wilson (1998).
162
Chapter 6: Conclusion
6.1. Summary of this research
The purpose of this research has been to answer a number of questions about
informal collection in Durban. Three buyback centres for recyclable material were
chosen in order to gain access to waste pickers, and 20 questionnaires were
conducted at three different buyback centres in the Durban area. Questions
focussed on the socio-economic characteristics of the waste pickers, their working
conditions, as well as their earnings and their relationship to other interest groups
such as the formal recycling industry, and the local authorities.
In terms of socio-economic characteristics, the waste pickers were fairly evenly
divided according to gender lines, nearly all of them were black, indicative of the
unequal past in South Africa. Education levels were found to be low, with a quarter of
the total sample never having gone to school. The remainder indicated that they had
some schooling, although the level of education achieved was found to be low with
only 8% of the sample having actually finished school and obtained a matric. The
mean education level for the males in the sample was found to be higher than the
females. Over half the sample (57%) was found to speak IsiZulu at home, followed
by IsiXhosa and Sesotho. This is to be expected as IsiZulu is the main language
spoken in KwaZulu-Natal, while IsiXhosa and Sesotho are prevalent in the areas
bordering KwaZulu-Natal. Nearly all of the waste pickers interviewed (95%) fell within
the economically active age category of 16 to 65, while the average age was found
to be 42 years.
The majority of the waste pickers interviewed were found to be migrants to Durban
(88%), and the majority of the migrants were not newcomers to the city, as 75% of
them had moved here 5 years ago or more. Nearly all of the migrants had come to
Durban to seek employment. Most of the migrants came from rural areas elsewhere
in KwaZulu-Natal, the nearby Eastern Cape province, or the adjacent country of
Lesotho.
163
In terms of the working conditions of the waste pickers, it was found that 88% of the
sample had worked before entering waste picking as an occupation. This study was
in agreement with previous research (see Skinner 2006: 130), that skills learnt in the
formal sector were not necessarily being used in the informal sector. The men were
found to have held a greater range of jobs previously, while the women were
involved in jobs such as domestic work and selling goods informally.
It was found that waste picking cannot be considered a form of transitional
employment, as many of the participants had been in the field for a long period of
time, with 78% of the sample involved in waste picking for a year or longer. Despite
this, a large portion of the sample (65%) were still looking for work. There was also
found to be little relationship between the amount of time spent waste picking and
whether or not the respondents were looking for work. This suggests that although
the participants have been in waste picking for a long period of time, this is probably
out of necessity rather than choice, as many of them are still looking for other forms
of work. Younger waste pickers were found to be more likely to be looking for
employment. The majority of those looking for work were looking for a job in a field
where they had previous experience. When asked why they were involved in waste
picking, 84% of the respondents cited a reason that led one to believe that they took
up waste picking in order to survive. The absence of choice for these individuals
needs to be recognised (Wilson, 2006: 7); as waste pickers have generally not
entered this field for any other reason other than necessity.
The majority of waste pickers were found to work hard, most working a five day
week, and some longer. A large portion of the sample (46%) indicated that they
worked more than an 8 hour working day. Metal and cardboard were found to be the
items of choice for collection, with 52% focussing on metal collection mainly, and
40% focusing primarily on cardboard collection. Metal collection was found to be
dominated by males, while cardboard collection was dominated by females.
The waste pickers were found to transport the materials by different means, ranging
from the use of a middleman with a vehicle, transporting the material in their own
car, in a trolley, or by hand. About a third had access to a trolley, while about another
third had the material fetched from them by a middleman. Twenty eight percent
164
carried the material themselves to the buyback centre. Only 5% owned their own
vehicle which they used to transport material. There was a relationship between the
type of material collected and the type of transportation, with most of those collecting
metal doing so using a trolley, and those collecting cardboard tended to carry it on
their head. Men were more likely to have access to a trolley, while women were
more likely to have the material collected by a middleman, or to carry the material on
their heads to the buyback centre.
Despite the type of work, about a third of the waste pickers (33%) had no problems
with the job. Of those who mentioned problems in the job, the majority pointed out
interactions with homeowners, the police, or the general public as problematic. When
asked what could be done to solve these problems, an overwhelming number of
respondents indicated that if they were offered a better job, their problems could be
solved. When asked what they liked about waste picking, 55% pointed to the fact
that it helped them to survive, while 25% said they liked nothing about waste picking
at all. This further emphasises the undesirable nature of this work.
The waste pickers in this study were found to earn very little, 82% of the sample
earned less than R375 a week, or R1500 a month. Nearly all the waste pickers
(70%) relied on waste picking as their only form of income, and 93% of those
interviewed were the sole breadwinners in their households, most of which consisted
of around 4 people. A total of 62% of those interviewed were found to be living in
very poor households, below the poverty line set by the 2005 eThekwini Quality of
Life Study (2005: 15). The results of this study suggest that, on average, the men
interviewed earned more than the women, and the women were also found to
support larger households. Seventy six percent of the women were found to be living
in households below the poverty line, as opposed to only 47% of the males
interviewed.
Other differences in earnings were established, with those focussing on cardboard
and paper earning less than those focussing on plastics or metal. It was also found
that as the ease of transportation of materials increased, so did the earnings of the
waste picker. More male waste pickers had access to trolleys for collection than
female waste pickers, and this could be a reason for the males in this study earning,
165
on average, more than the females interviewed. Experience in waste picking was
found to have little effect on the amount earned, as did education levels and age,
although the pensioners in the sample were found to earn less from waste picking
than other age groups. There was a slight positive relationship between the hours
worked per day and earnings.
The study also considered the relationship between the municipality and the waste
pickers, and ways in which the local authorities could support waste picking. Nearly
all the waste pickers interviewed (86%) considered that their work benefited the city.
Despite this, a large portion of the waste pickers (28%) said that they did not know
what the municipality could do to improve their work conditions. Another 28% said
that the municipality could aid the waste pickers by providing job opportunities. This
further emphasises that waste pickers collect scrap out of necessity, as many would
gladly switch to another job if given the opportunity.
The waste pickers interviewed seemed to have a fairly indifferent relationship with
the local authorities. Not many waste pickers mentioned interactions with the local
authorities as a problem, although a percentage (18%) mentioned that the police
sometimes gave them trouble. When asked what could be done to solve their
problems, only 13% mentioned a solution that involved one of the tiers of
government. While some waste pickers pointed out that the municipality could aid in
their work by providing transport, not many waste pickers gave specific suggestions
as to how the municipality could proactively aid in their work. Perhaps the fact that
waste picking is not as large an occupation in Durban as it is in other developing
countries has impacted on this relationship between the local authorities and the
waste pickers.
The relationship between formal sector recycling and informal recycling was also
analysed. Backward linkages into the formal economy were not found to be very
strong. Waste picking needs little or no start up capital, and therefore the waste
pickers have not had to rely on inputs or supplies from the formal sector. Forward
linkages into the formal economy were found to be far stronger, as formal recycling
companies provide the demand for recyclable material, which they then buyback and
process. The waste pickers were therefore found to be dependent on the formal
166
recycling companies in this regard; however, the formal recycling companies are not
dependent on the waste pickers to the same degree, as the formal sector recycling
companies get much of their material from other formal sector companies. The
relationship between the formal recycling companies and the waste pickers is an
unequal one, and it leaves the waste picker vulnerable. The idea of the formal
recycling sector, as separate and autonomous, as the theory of economic dualism
(discussed in section 2.4.4.1) would suggest, is clearly rejected and disproved by the
results of this study.
This study was found to support the Marxist view of the informal economy. The
informal and formal recycling industries are clearly linked through backwards and
forward linkages, as described above. In this case, the informal recycling industry is
dependent on, and subordinate to, the formal sector recycling companies. Although
the presence of the informal sector does not necessarily put a large amount of
pressure on urban wage levels, due to the presence of strong trade unions and
protective labour legislation, the formal recycling sector clearly benefits from the
work that the waste pickers do. This study supports the findings of Birkbeck (1979)
and Wilson (1998), both of whom concluded that the waste pickers they interviewed
were actually working for the formal recycling companies, but were not employed by
them.
In this study, it was found that many pickers were forced to use one buyback centre,
as it was close and convenient, or it was the only one that they knew of. There was
therefore little choice available to the waste picker. Most of the individuals in this
study then worked at least a standard working week collecting scrap, which they in
turn sold to one buyback centre. In essence, these individuals worked for the
buyback centres in this study, or the formal recycling companies. However, they are
afforded none of the benefits of formal sector employment.
While waste picking clearly aids in facilitating greater profits on behalf of the formal
sector recycling companies, it is unclear as to the extent that the formal recycling
companies rely on the materials provided by waste pickers. This is perhaps an issue
that could be looked at more closely in further research. As mentioned previously,
Durban is a city with a relatively well developed waste collection system and
167
manufacturing sector. Companies such as Reclamation probably collect more
material from formal sector companies selling material back to them, than they
collect from the informal recycling sector.
Birkbeck (1979) suggested that the waste pickers that he interviewed were likely to
stay poor, due to the economic forces in operation. This study supports this view, as
few opportunities for improving their economic situation are available to the waste
pickers in this study. Reclamation suggest that through hard work, a waste picker
can in turn invest in better means of transportation, and therefore begin to make
greater profits (Reclamation 2007a: 31). This entrepreneurial view of waste picking is
not the reality on the ground. This study found that there was no relationship
between the amount of time spent in the field of waste picking, and the means of
transportation for materials. It is unlikely that the majority of the waste pickers, who
are often living on or below the poverty line, will be able to save the large amount of
money needed for a motor vehicle. In addition to this, the unstable price of
recyclable material is likely to have a major effect on the ability of waste pickers to
improve their lot. In February 2007, when research was conducted at Reclamation,
the price of cardboard had dropped in a matter of days from 15 cents a Kg, to only
10c a Kg. This 50% decrease in price has a major effect on the income of a waste
picker specialising in this commodity. Saving to invest in better means of
transportation is severely hampered by the volatility in price.
Birkbeck (1979) also suggests that the waste picker could improve his or her lot by
unionising. Together, the waste pickers could argue for fairer prices for recyclable
material, or at the least greater price stability. However, the nature of the work
makes any sort of networking difficult. In addition to this, the waste pickers are in
competition for material, which may also hamper the formation of an organisation.
Even if an organisation of some description was a possibility, it is unlikely that the .
waste pickers would have much influence on the price of materials. As mentioned
previously, the relationship between the informal recycling industry and the formal
recycling industry is an unequal one, and while waste pickers are dependent on the
formal recycling industry to create a demand for material, the formal recycling
industry is not dependent on material supplied from the waste pickers to the same
extent.
168
This study confirms the fact that waste pickers are not typically entrepreneurs who
enter into the field by choice, because they see an economic opportunity that they
wish to exploit; but rather they are individuals who are forced into this work because
there is nothing else available to them. It is desperation to survive alone that appears
to drive waste picking in Durban.
6.2. Recommendations arising from this research
The waste pickers interviewed in this study do not have many opportunities open to
them to better their lot in life. As mentioned previously, the waste pickers in this
study are likely to stay poor due to the economic forces in operation, if nothing
significant changes with regards to their working conditions. Two entities could
possibly change the working conditions of the waste pickers. The first are the formal
recycling companies. However, as discussed above, the formal recycling industry
benefits from the material that the waste pickers provide, without having to formally
employ them. It is therefore unlikely that this group will change their behaviour, as
the current arrangement is to their benefit. However, in the unlikely event that they
would wish to alter the working conditions of the waste pickers, some suggestions
are presented below.
The second entity that could possibly change the working environment for the waste
pickers would be the local authorities. Waste picking has environmental benefits, as
well as providing employment for many. In the context of rapid urbanisation,
diminishing natural resources, and high unemployment, informal recycling deserves
more attention. The suggestions below, if taken up, could go a long way in changing
the working environment of the waste pickers.
These suggestions are as follows:
• Provide the waste pickers with identification cards, and some form of
identifiable clothing.
Although the municipality has already provided six buyback centres, it could do
more to support the informal recycling sector. The waste pickers interviewed in
169
this study gave some examples of this. Some mentioned that the municipality
could give them permits, so that people are aware of the work they are doing,
and will allow them to extract recyclable material from their domestic refuse
without harassment. The issue of stigmatisation was noted in this research, and
some of the waste pickers interviewed cited this as a problem with, or dislike of,
the work. Recognition on the part of the local authority may go a long way
towards reducing the stigmatisation that the waste pickers feel, and may aid in
gaining the cooperation of the public. The municipality, or perhaps even the
private recycling companies, could provide the waste pickers with some form of
identifiable clothing, and I or identification cards.
• Initiate the formation of an organisation of waste pickers
Innovative ways of dealing with the reality of the informal recycling sector could
be applied in the case of Durban. Forming some kind of organisation for the
waste pickers would be a useful, as has been established in places like Surabaya
Indonesia (see Furedy, 1997: 151). An organisation could aid in organising
picking areas, and there is also an opportunity to involve local communities in
residential areas. If the community knew that their waste was being sorted,
collected and recycled by a waste picker on a regular basis they may see the
environmental, and poverty alleviation benefits of supporting informal collection.
They may then be more willing to sort their waste, making it easier for the waste
pickers to collect. It is unlikely that private sector recycling companies would take
the initiative in this area, as they have nothing to gain from the formation of an
organisation of waste pickers. Organisation may also result in waste pickers
having an influence on prices paid for recyclable goods. It is more likely that the
task of forming an organisation of waste pickers would be left up to the local
authority, NGOs, or the waste pickers themselves.
• Aiding waste pickers to acquire better market information
The majority of waste pickers interviewed in this study were found to use one
buyback centre, irrespective of the price they offered relative to other buyback
centres. Taking the price of cardboard, for example, at Eskom the price was 15c
a Kg, and at Reclamation and Brook Street it was 10c a Kg. In general, the price
170
difference between buyback centres tended to differ. The waste pickers
interviewed had no way of knowing what the best prevailing market price for
material actually was, as the majority relied on one buyback centre. If the flow of
information was better, waste pickers would be able to make more informed
choices about where to sell back their material, or what other buyback centres
are paying for material. The issue of transportation would still play a role in a
waste picker choosing a particular buyback centre, however, waste pickers would
be more informed about the prevailing market price for goods. Cellular
communication could be used to inform waste pickers of changes in prices at
various buyback centres, via an SMS database. This would give the waste
pickers more information on the prevailing market conditions, enabling them to
make more informed choices. This idea goes hand in hand with the formation of
an organisation, discussed above. Again, this solution is not likely to be
supported by large recycling companies. However, the municipality and NGOs
could perhaps consider this once an organisation has been formed.
• ImprOVing the means of transportation
A way in which waste pickers could increase their incomes, would be if they had
access to better means of transportation. The trolleys and carts that the waste
pickers in this study were using varied in size and origin. Some were old
shopping trolleys, while others had built their own carts. It is of interest that the
buyback centres have not attempted to aid the collectors in getting better means
of transportation, as it is directly linked to the volumes of material that waste
pickers can collect. The buyback centres could provide trolleys to collectors who
do not have one at a subsidized rate, or, they could rent trolleys out at a nominal
rate.
Improving transportation to the extent that waste pickers may be able to use a
vehicle may be more difficult. It is unlikely that any of the waste pickers in this
study, many of whom barely make enough to survive, will be able to save for a
motor vehicle. The local authorities could possibly buy used vehicles, which they
could then rent to the waste pickers at a nominal daily rate. However, the waste
pickers would have to have a drivers licence to operate a vehicle. Obtaining this
would be a significant hurdle for waste pickers to overcome, especially as time
171
taken off work means loss of income for the waste picker. In addition to this, the
better educated waste pickers would be more likely to take advantage of this, at
the expense of those with little or no education.
Private sector recycling companies may find this idea attractive, as it has
implications for the amount of material that they can buy from the waste pickers,
and therefore the amount of profit that they can make.
• Issue waste pickers with protective clothing
Some of the waste pickers interviewed in this study (15%) pointed to a health risk
associated with waste picking, mentioning that they dislike it when they get cut by
the metal they are collecting. A way that this could be solved would be to provide
the waste pickers with protective clothing. This is an initiative that could come
from either the private sector or the municipality, as it is likely to result in waste
pickers collecting more recyclable material.
• Waste Education
Encouraging households to engage in source separation could greatly improve
the working conditions of the waste pickers, and minimise the health risk
associated with waste picking. The municipality has many lines of communication
with its ratepayers and are in a good position to encourage households to
separate at source, and leave the material on the pavement for the waste pickers
to collect. However, this idea would work best in conjunction with an organisation
as discussed above, where collection routes for waste pickers could be organised
to ensure that the sorted material does in fact get collected.
In addition to educating households on source separation, the waste pickers
should also receive training. Plastics, for example, are complicated to identify and
sort, as there are several different types. Metals, too, require identification and
separation. Furthermore, there are also different prices offered for different
materials. Educating the waste pickers on which are the most lucrative materials,
and how to identify them will have an impact on the income that they are able to
earn.
172
Without help from the municipality waste pickers are likely to stay poor, and continue
living on or below the poverty line. The ideas above present a way in which the
municipality, or formal recycling companies if they wish, could aid the waste pickers
in advancing in their I work. It is unlikely that the private recycling companies will
change their behaviour significantly, as there is little financial incentive to do so.
Innovation on behalf of the local authorities in terms of working with the informal
recycling industry is needed.
6.3. Possibilities for further Research
While some ideas as to how to improve the quality of life for those involved in waste
picking have been presented above, there is no doubt that policy makers will be
more willing to support the informal recycling industry if they are clear on exactly how
large it is, how many people it employs, and the extent to which it diverts waste from
landfills. A detailed study, such as that done by Van Beukering et al (1996) in
Bombay, is needed to establish how many waste pickers actually operate in Durban,
how much waste collectively they are responsible for recycling, and the economic
and environmental benefit of the industry as a whole. Such a study will be a major
undertaking, but it will aid policy makers in gaining a deeper understanding of the
participants in this industry, as well as the extent to which it benefits the city.
Furthermore, research should be conducted on the scope of recycling in Durban. An
analysis of the waste stream is necessary, as is an understanding of the extent to
which this activity can be grown further. Environmental resources are diminishing at
a rapid ate, and recycling will have to grow as a result. Possible growth trends in the
industry, and how these can be exploited to maximise employment and include the
informal recycling industry, should be looked at in greater detail.
This stUdy has given a glimpse as to how some of the waste pickers in Durban live
and conduct their work. While questions were asked relating to how the municipality
can possibly improve their working conditions, this was very brief. Focus groups and
more in-depth interviews should be conducted with the waste pickers in order to go
173
into more detail as to how the waste pickers feel the local authorities could aid in
supporting their work.
6.4. Concluding Remarks
The main research questions posed in chapter 1 have been answered. The socio
economic characteristics and the working conditions of the waste pickers in this
study have been elaborated on in detail, while their relationship with the municipality,
as well as the links between the formal and informal recycling sectors has been
discussed. This research is in agreement with the majority of the literature on waste
picking, that has found the individuals involved in this activity to be poor, earning
very little. In addition to this, the literature suggests that waste pickers are little more
than disguised wage workers, subsidising the formal recycling companies with none
of the benefits associated with formal employment. This study is also in agreement
with this.
The waste pickers that were interviewed in this research deserve respect from the
public, and acknowledgement from the municipality. In a city where unemployment is
high, these individuals should be commended on finding an innovative,
environmentally friendly way in which to make a living. Further research should look
more closely at the size and extent of the informal recycling industry in Durban, as
this information will ultimately guide policy makers and perhaps encourage further
interest in what is potentially an industry that can be used, both for poverty alleviation
and sustainable waste management.
174
References
Baud, I. Grafakos, S. Hordijk, M. Post, J. (2001). Quality of Life and Alliances in Solid
Waste Management. Cities, 18(1),3-12.
Behr, A. (1988). Empirical Research Methods for the Social Sciences, second
Edition. Butterworths, Durban .
Bernabe, S. (2002) . Informal Employment in Countries in Transition: A conceptual
framework. CASE paper 56. Centre for Analysis of Social Exclusion, LSE.
Bertram, C. (2003). Understanding Research: Learner Guide and Reader. School of
Education, Training and Development, University of KwaZulu-Natal ,
Pietermaritzburg.
Birkbeck, C. (1979). Chapter 8: Garbage, Industry, and the 'Vultures' of Cali,
Colombia. In Casual Work and Poverty in Third World Cities, Bromley, Rand Gerry,
C (Eds). John Wiley & Sons, Surry, Great Britain.
Bromley, R. and Gerry, C. (1979). Chapter 1: Who are the casual poor? In Casual
Work and Poverty in Third World Cities, Bromley, Rand Gerry, C (Eds). John WHey
& Sons , Surry , Great Britain.
Bromley , R. (1990). A New Path to Development? The Significance and Impact of
Hernando De Soto 's Ideas on Underdevelopment, Production, and Reproduction.
Economic Geography, 66(4),328-348.
Capecchi, A. (1989). Chapter 10: The Informal Economy and the Development of
Flexible Specialization in Emilia-Romagna, in The Informal Economy: Studies in
Less Developed Countries, Portes, A, Castells, M, Benton, L (Eds), John Hopkins
University Press, Baltimore, Maryland USA.
175
Cities Environmental Report on the Internet. (1999). Durban Metro State of the
Environment and Development :1999. [27 March 2007]
<http://www.ceroi.netfreports/durban/issues/waste/recycle.htm>
Collect-a-Can. (2007). Collect-a-Can. [20 March 2007]
<http://www.collectacan.co.za>
Competition Commission of South Africa (2004). MEDIA RELEASE NO 23 OF 2004,
11 NOVEMBER 2004: The Competition Commission Refers A Complaint Against
Consol And Nampak To The Tribunal For Alleged Collusion. [22 March 2007]
<http://www.compcom.co.za/resources/Media%20Releases/Media%20Releases%20
2004/Med ia%20re lease%20Consol%20and%20Nampak%2011%20NOV%2004%20
final.doc >
Consol Glass. (2007). Glass Recycling: An Industry Perspective. [22 March 2007]
<http://www.consol.co.za>
De Kock, R. (1986). Garbage picking as a strategy for survival. Development Studies
Unit. Centre for applied social sciences, University of Natal, Durban.
De Kock, R. (1987). Garbage Picking as a Strategy for Survival: A Case Study of a
Sub-sector of the Informal Sector, Unpublished Masters Thesis, University of Natal,
Durban.
Department of Environmental Affairs and Tourism (DEAT). (2005). National Waste
management Strategy Implementation South Africa: Recycling. Annexure H: Waste
Stream Analysis and Prioritisation for recycling. Report Number 12/9/6. [4 April
2007] < http://wis .octoplus .co.za/documents/234.pdf>
eThekwini Municipality. (2004). eThekwini Integrated Waste Management Plan. [28
March 2007] <http://www.durban.gov.za/durban/services/services/dsw/docs/2004
08-31 000001 - eThekwini IWMP.PDF/>
176
eThekwini Municipality (2005). eQuality of Life: 2005. [4 April 2007]
<http://www.durban.gov.za/durban/government/munadmin/mediaIpublications/golifel
gof>
eThekwini Municipality (2007). Solid Waste and Cleansing. [27 March 2007]
<http://www.durban.gov.za>
Furedy, C. (1997). Socio-Environmental Initiatives in Solid Waste Management in
Southern Cities: Developing International Comparisons. Journal of Public Health,
27(2), 142-156.
Gerry, C. (1987). Developing Economies and the Informal Sector in Historical
Perspective. Annals of the American Academy of Political Science, 493, 100-119
Hart, K. (1973). Income Opportunities and Urban Employment in Ghana. The Journal
of Modem African Studies, 11(1), 61-89.
Hayami, Y, Dikshit, A, Mishra, S. (2006). Waste Pickers and Collectors in Delhi:
Urban Poverty and Environment in an Urban Informal Sector. Journal of
Development Studies, 42(1),41-69.
Hicks, D. (1993). Reviewed Works: Scavengers, Recyclers, and Solutions for Solid
Waste Management in Indonesia. By Daniel T. Sicular. The Journal ofAsian Studies,
52(1),223-224.
Ink Cartridges Collected. (August 2006). Risk Management. p21.
Jones, K. (2003). Partnerships for better liVing environments (No. 0-620-29507-4):
Built Environment Support Group, Pietermaritzburg, South Africa.
Lund, F. Skinner, C. (2003). The Investment Climate for the Informal Economy: A
Case of Durban, South Africa. Background Paper for the 2005 World Development
Report. [7 April 2007]
<http://www .wiego.org/papers/2005/unifem/21 lund skinner SA durban case stud
YJ2Qf>
177
May, J, Stavrou, S. (1989). The informal sector: Socio-economic dynamics and
growth in the greater Durban metropolitan region: Centre for social and development
studies, University of Natal, Durban.
Mazine, C. Macoris, M. Andrighetti, M. Yasumaro, S. Silva, M. Nelson, M. Winch, P.
(1996). Disposable containers as larval habitats for Aedes aegypti in a city with
regular refuse collection: A study in Marilia, Sao Paulo State, Brazil. Acta Tropica,
62(1), 1-13.
Mcllwaine, C, Moser, C. (2003). Poverty, Violence and livelihood in urban Columbia
and Guatemala. Progress in Development Studies, 3(2), 113-130.
Mclntosh, A. (2004). Attacking Poverty in South Africa: Mclntosh Xaba and
Associates.
McLean, M. (2000a). A personal profile of some of the informal collectors in central
Durban - a case study. Society in Transition, 31(1), 1-9.
McLean, M. (2000b). Informal Collection: A matter of survival amongst the urban
vulnerable. Africanus 30(2), 8-26.
McLean, M. (1998). The pros and cons of recycling in South Africa: A personal
Perspective. Unpublished paper.
Medina, M. (1998). Border scavenging: a case study of aluminium recycling in
Laredo, TX and Nuevo Laredo, Mexico. Resources, Conservation and Recycling 23,
107-126.
Medina, M. (2001). Scavenging in America: back to the future? Resources,
Conservation and Recycling, 31(3),229-240.
Metal Recyclers Association of South Africa. (2007). Metal recycling Association of
South Africa. [22 March 2007] <http://www.mra.co.za>
178
National Drive to Promote Glass Recycling (7 April 2006). Business Day, pg 10.
Paper Print & Packaging: Sappi proud of recycling first. (20 July 2006). The Star, pg
8.
Paper recycling association of South Africa. (2007). Paper Recycling Statistics. [19
March 2007] <http://www.prasa.co.za/statistics.html>
Parkin, J. (1995). A recycling overview: Using Durban as a case study, Unpublished
Masters Thesis, University of Natal, Durban.
PET Plastics Recycling South Africa. (2007). What is PET? [22 March 2007]
<http://www.petco.co.za/>
Plastics Federation of South Africa. (2007). Industry Info. [22 March 2007]
<http://www.plasticsinfo.co.za/>
Platt, R, Rowntree, R, Pamela, M (eds). (1994). The Ecological City. University of
Massachusetts Press, Massachusetts, USA.
Portes, A, Castells, M, Benton, L. (1989). Chapter 1: Overview, in The Informal
Economy: Studies in Less Developed Countries, Portes, A, Castells, M, Benton, L
(eds), John Hopkins University Press, Baltimore, Maryland USA.
Poswell, L. (2002). The Post-Apartheid South African Labour Market: A Status
Report. Development Policy Research Unit, University of Cape Town.
Rabinovitch, J. (1992). Curitiba: Towards Sustainable Urban Development.
Environment and Urbanisation. 4 (2), 62-73.
Rakodi, C. (2002). Chapter 1: A Livelihoods Approach - Conceptual Issues and
Definitions, in Urban Livelihoods: A People Centred Approach to Reducing Poverty,
179
Rakodi, C and L1oyd-Jones, T (eds), Earthscan Publications, London, United
Kingdom.
Reclamation Group. (2007a). Case Study 4. [14 April 2007].
<http://www.ifc,org/ifcextlenviro.nsf/AtlachmentsByTitle/p SI PromiseofPrivateEquit
y CS4/$FILE/Case+Study+4.pdf>
Reclamation Group. (2007b) Company History and profile [6 July 2007]
<htl p:llwww.reclam.co.za/>
Republic of South Africa. (1989). Environmental Conservation Act 73 of 1989.
Government Press
Republic of South Africa. (1998), National Environmental Management Act 107 of
1998. Government Press.
Republic of South Africa. (2000). White paper on integrated pollution and waste
management. Government Press.
Republic of South Africa. (2006). Draft national Environmental management: Waste
Management Bill. Government Press.
Rogerson, C. (2001). The waste sector and informal entrepreneurship in developing
world cities. Urban Forum, 247-259.
Rouse, J. (2006). Seeking common ground for people: Livelihoods, governance and
waste. Habitat International, 30(4), 741-753.
Self-Employed Women's Union (SEWU). (1995). Workshop on organizing the
informal sector in Southern Africa, La Mercy Hotel, La Mercy, KwaZulu-Natal, South
Africa.
Skinner, C. (2006). Falling through the Policy Gaps? Evidence from the Informal
Economy in Durban, South Africa. Urban Forum, 17(2), 125-148
180
Statistics South Africa. (2001). Census 2001. [30 April 2007]
<http://www.statssa.gov.za/census01/htmIlC2001Interactive.asp>
Tevera, D. (1994). Dump Scavenging in Gaborone, Botswana: Anachronism or
Refuge Occupation of the Poor? Geografiska Annaler. Series B, Human Geography,
76(1), 21-32.
The road to tyre recovery, reuse, retread and recycling. (September 2006). Risk
Management. Pg 26.
Tsoeu, R. (2003). Street traders, regulation and development in the eThekwini
Unicity : an assessment of the new informal economy policy. Unpublished Masters
Thesis, University of Natal, Durban.
Van Beukering, P. Schoon, E., Mani, A. (1996) The Informal Sector and waste paper
recovery in Bombay. Creed working paper series no. 5. International Institute for
Environment and Development.
Waiters, J. (2002). Landfill Picking: A partnership to reduce vulnerability?
Unpublished paper.
Wilson, D. Velis, C and Cheeseman, C. (2006). Role of informal sector recycling in
waste management in developing countries. Habitat International, 30(4),'797-808.
Wilson, T. (1998). Approaches to Understanding the Position of Women Workers in
the Informal Sector. Latin American Perspectives, 25(2), 105-119.
181

Appendix 1: Questionnaire for the waste pickers
Name of respondent (optional), _Date interviewed _
11. Gender I Male IFemale
2. RaceBlack 1White 2Indian 3Coloured 4
3. Please State vour hlqhest level of education attained
14. What is your home language?
15. How old are IOU?
16. How long have IOU been collecUng scrap?
17. What was lour previous !lJle of emplolment?
la. How manl people do IOU support IInancialll?
110. How long have IOU lived in Durban?
111. Whl did IOU move to Durban?
12. Where did vou live before YOU movedto Durban?
2
182

13. Apart from collecting recyclable materials, do you get money from any othersources?Yes I 1 I No 12
I Go to 14 I I Go to 15
14. What are these other sources of income, and how much do you get from them permonth?Source Amounta.b.c.d.
15. How much do you make per week from collecting scrap?
16. How many days a week do you work collecting scrap?
17. How many hours a day do you work collecting scrap?
18. Do you collect any of the following types of materials?Yes No
Paper 1 2Cardboard 1 2Plastics 1 2Glass 1 2Cans 1 2Metal 1 2
19. If you collect more than one type of material, which material do you collect the mostof?
20. Apart from the materials listed in question 16 above, what other things do youcollect?
21. How do yOU transport the materials to their next location?
22. In which areas do you normally collect materials?
183

23. What problems, if any, do you experience in this type of work?
24. What do you think can be done to solve these problems?
125. What do you like about this type 01work?
26. What do you dislike about this type of work?
27. Do you think that your work helps the city? If so, how?
No 2
29. If so, what type of work are you looking for?
30. Why do yOU collect scrap instead of doina other types of work?
31. Why do you choose to drop your material off at this buyback centre (here) insteadof a different buvback centre?
32. What do yOU think the municipality can do to improve your working conditions?
184