kannan govindaraj 2020 - university of twente research
TRANSCRIPT

QUANTIFYING TRANSCRIPTIONAL DYNAMICS BY TF-FRAP
Kannan Govindaraj
2020
ii
Graduation Committee:
prof. dr. Jennifer L. Herek (Chairman) University of Twente
prof. dr. Marcel Karperien (Promotor) University of Twente
dr. ing. Janine N. Post (Co-Promotor) University of Twente
prof. dr. M.M.A.E. Mireille Claessens University of Twente
prof. dr. Armagan Koçer University of Twente
prof. dr. Alessandra Cambi Radboud MC
prof. dr. Anna Akhmanov Utrecht University
dr. Roberto Narcisi Erasmus MC
dr. Andre J. van Wijnen Mayo Clinic, USA
Quantifying transcriptional dynamics by TF-FRAP
Kannan Govindaraj, 2020
PhD Thesis, University of Twente, Enschede, The Netherlands
The work in this PhD thesis was performed in the department of Developmental BioEngineering within the TechMed Centre, and the Faculty of Science and Technology of the University of Twente, The Netherlands.
The research was funded by ReumaNederland and the printing of this thesis is partially supported by Dutch Society for Matrix Biology (NVMB).
©Kannan Govindaraj, 2020. All rights reserved. No parts of this thesis may be reproduced, stored in a retrieval system or transmitted in any form or by any means without permission of the author.
Printed by Gildeprint, Enschede, The Netherlands.
ISBN: 978-90-365-5076-5
DOI: 10.3990/1.9789036550765
iii
QUANTIFYING TRANSCRIPTIONAL DYNAMICS BY TF-FRAP
DISSERTATION
to obtain
the degree of doctor at the University of Twente, on the authority of the rector magnificus,
prof. dr. T.T.M. Palstra on account of the decision of the Doctorate Board,
to be publicly defended on Friday, November 20, 2020, at 12:45
by
Kannan Govindaraj
Born on April 3, 1986 in Tiruchirappalli, Tamilnadu, India.

iv
This dissertation has been approved by
Promotor: prof. dr. H.B.J Karperien (University of Twente)
Co-promotor: dr. J.N. Post (University of Twente)
v
Summary
Transcription factors are DNA binding proteins, upon binding, they can regulate the expression of their target genes. SOX9 and RUNX2 are the master transcription factors of cartilage and bone development, respectively. They play crucial role in the progression of osteoarthritis (OA). Mapping the signaling mechanisms that regulate these transcription factors will help to understand OA pathophysiology at the molecular level. However, studying the activity of transcription factors in live cells at the protein level is a challenging task, due to the lack of suitable methods. Currently, the transcription factor activity is studied indirectly by measuring the expression of their target genes or proteins, by biochemical/molecular biology methods, which are not suitable for live cells. Moreover, these indirect methods yield very poor spatiotemporal resolution of transcription factor activity. Higher spatiotemporal resolution capturing the immediate changes to the activity of transcription factors would help us to understand their secondary interactions with other proteins in response to external stimulation. To bridge the gap, we developed a biophysical method, Transcription Factor – Fluorescence Recovery After Photobleaching (TF-FRAP) and studied the transcriptional dynamics of SOX9 and RUNX2 in human primary chondrocytes (hPCs) and in proliferating and differentiating mesenchymal stem cells (hMSCs).
In this thesis, we describe: i) the method of TF-FRAP, from experimental pre-conditions to detailed protocol and data analysis; ii) the changes in the TF-FRAP rates can be the direct readout of SOX9 transcriptional activity, and we cross-verified TF-FRAP readings by quantifying SOX9 target gene expression by qPCR and chromatin immunoprecipitation (ChIP); iii) the changes to SOX9 dynamics in healthy, preserved and OA hPCs as measured by TF-FRAP and mapped a few external factors that regulate SOX9 activity in hPCs, iv) the changes to SOX9 and RUNX2 dynamics at the subpopulation level in proliferating and multi-lineage differentiating hMSCs, to understand chondrocyte development and hypertrophy.
In addition to quantifying transcriptional dynamics, this thesis presents several novel applications of TF-FRAP, including predicting the differentiation potential of a donor towards a particular lineage, defining the number of subpopulations in a heterogenic population of cells, relationship between spatial arrangement of transcription factors and their dynamics.
vi
Samenvatting
Transcriptiefactoren zijn DNA bindende eiwitten. Wanneer ze binden, kunnen ze de expressie van hun doelwitgenen reguleren. SOX9 en RUNX2 zijn de meester transcriptiefactoren van respectievelijk kraakbeen,- en botontwikkeling. Ze spelen een cruciale rol in de progressie van osteoarthritis (OA). Het in kaart brengen van signaleringsmechanismes die deze transcriptiefactoren reguleren zal helpen met het begrijpen van OA pathofysiologie op het moleculaire niveau. Het bestuderen van de activiteit van transcriptiefactoren in levende cellen op het eiwit niveau is echter een uitdagende taak, door een gebrek aan geschikte methodes. Op dit moment wordt transcriptiefactoractiviteit indirect bestudeerd door de expressie van hun doelwitgenen of door eiwitten te meten met behulp van biochemische/moleculair biologische methodes, welke niet geschikt zijn voor levende cellen. Daarnaast leveren deze indirecte methodes zeer matige ruimtelijk-temporele resolutie van transcriptiefactoractiviteit. Een hogere ruimtelijk-temporele resolutie die onmiddellijke veranderingen in de activiteit van transcriptiefactoren vastlegt zou ons helpen bij het begrijpen van hun secundaire interacties met andere eiwitten als reactie op externe stimulatie. Om de kloof te overbruggen, hebben we een biofysische methode ontwikkeld, Transcription Factor – Fluorescence Recovery After Photobleaching (TF-FRAP), en hebben we de transcriptionele dynamiek van SOX9 en RUNX2 onderzocht in humane primaire chondrocyten (hPCs) en in prolifererende en differentiërende mesenchymale stamcellen (hMSCs).
In deze thesis beschrijven we i) de methode van TF-FRAP, van experimentele pre-condities tot een gedetailleerd protocol en data analyse; ii) de veranderingen in de TF-FRAP snelheden kunnen een directe meetmethode zijn voor SOX9 transcriptionele activiteit, en we hebben TF-FRAP metingen kruislings geverifieerd door het kwantificeren van SOX9 doelwitgen expressie met qPCR en chromatine-immunoprecipitatie (ChIP); iii) de veranderingen in SOX9 dynamiek in gezonde, geconserveerde en OA hPCs en we hebben een paar externe factoren in kaart gebracht die SOX9 activiteit reguleren in hPCs, iv) de veranderingen in SOX9 en RUNX2 dynamiek op het subpopulatie niveau in prolifererende en multilineage differentiërende hMSCs.
In aanvulling op het kwantificeren van transcriptie dynamiek, presenteert deze thesis ook verscheidene nieuwe applicaties van TF-FRAP, inclusief het voorspellen van het differentiatiepotentiaal van een donor richting een bepaalde lijn, het definiëren van het aantal subpopulaties in een heterogene celpopulatie, het verband tussen ruimtelijke ordening van transcriptiefactoren en hun dynamiek.
vii
Contents
Summary/Samenvatting v/vi
Chapter 1 General Introduction
1
Chapter 2 Using FRAP to quantify changes in transcription factor dynamics after cell stimulation: Cell culture, FRAP, data analysis and visualization
11
Chapter 3 Changes in Fluorescence Recovery After Photobleaching (FRAP) as an indicator of SOX9 transcription factor activity
41
Chapter 4 Dissecting SOX9 protein dynamics reveals its differential regulation among healthy, preserved and osteoarthritic chondrocytes
69
Chapter 5 Mapping SOX9 transcriptional dynamics during chondro-, osteo- and adipogenic differentiation of human mesenchymal stem cells
123
Chapter 6 Mapping RUNX2 transcriptional dynamics during chondro-, osteo- and adipogenic differentiation of human mesenchymal stem cells
167
Chapter 7 Reflection and outlook
205
Tamil summary
217
Acknowledgements
221
Biography
225
Scientific Output 227
viii
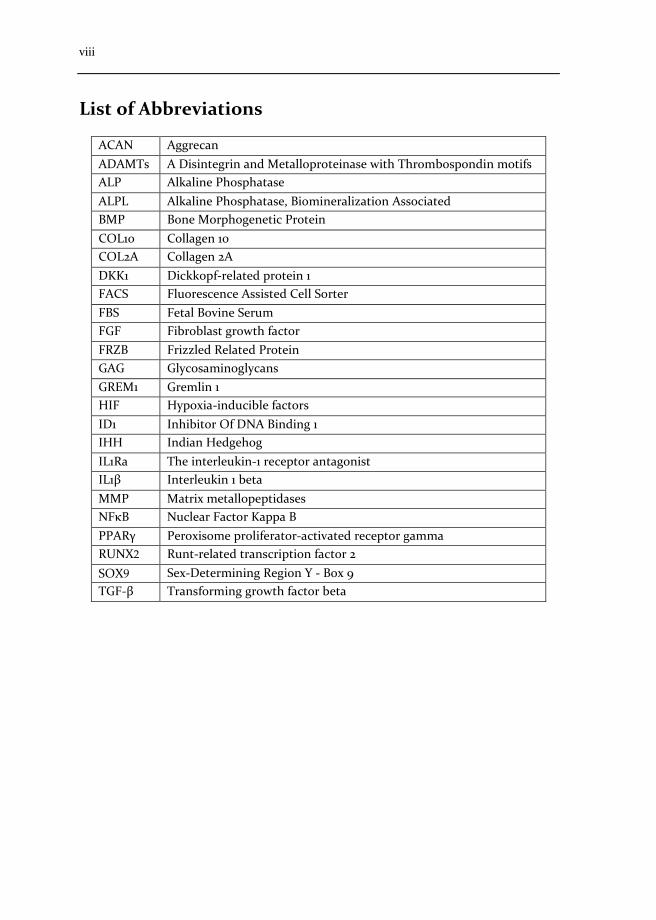
List of Abbreviations
ACAN Aggrecan ADAMTs A Disintegrin and Metalloproteinase with Thrombospondin motifs ALP Alkaline Phosphatase ALPL Alkaline Phosphatase, Biomineralization Associated BMP Bone Morphogenetic Protein COL10 Collagen 10 COL2A Collagen 2A DKK1 Dickkopf-related protein 1 FACS Fluorescence Assisted Cell Sorter FBS Fetal Bovine Serum FGF Fibroblast growth factor FRZB Frizzled Related Protein GAG Glycosaminoglycans GREM1 Gremlin 1 HIF Hypoxia-inducible factors ID1 Inhibitor Of DNA Binding 1 IHH Indian Hedgehog IL1Ra The interleukin-1 receptor antagonist IL1β Interleukin 1 beta MMP Matrix metallopeptidases NFκB Nuclear Factor Kappa B PPARγ Peroxisome proliferator-activated receptor gamma RUNX2 Runt-related transcription factor 2 SOX9 Sex-Determining Region Y - Box 9 TGF-β Transforming growth factor beta

1 Introduction and motivation
2 | Chapter 1
1
2
3
4
5
6
7
8
1.1 Introduction
1.1.1 Transcription Factors
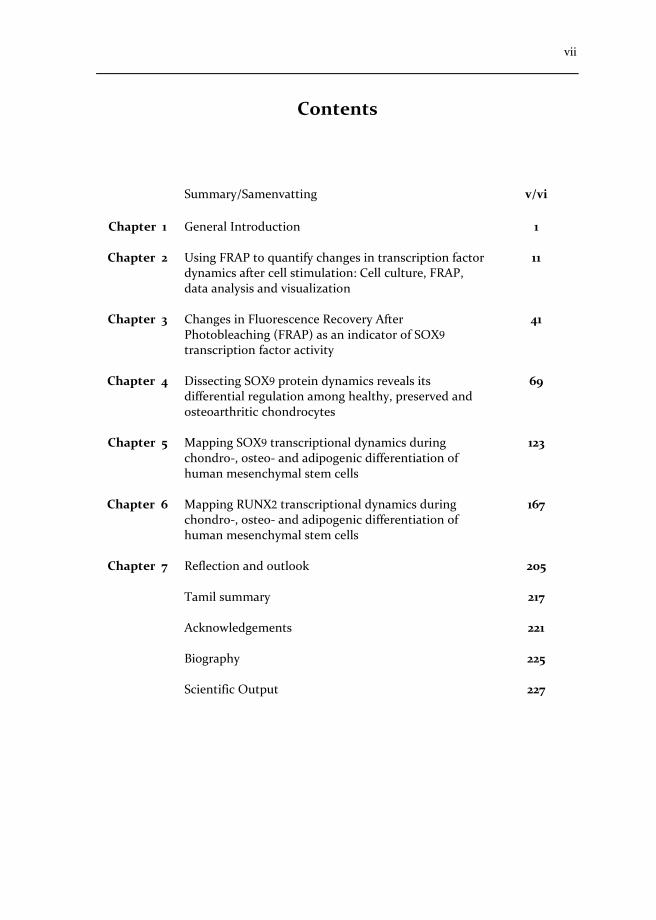
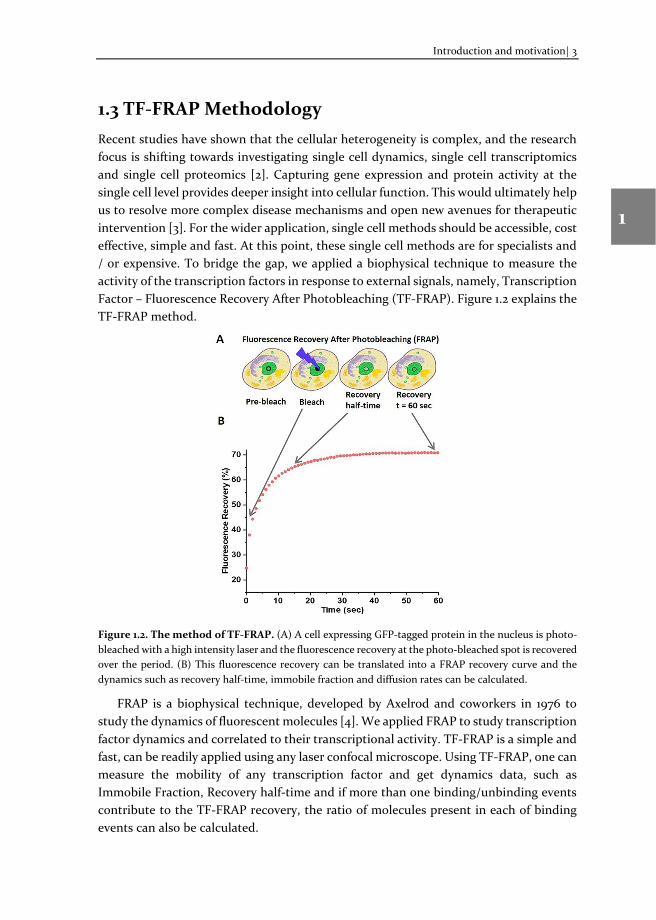
Transcription factors are DNA binding proteins that regulate the transcription of a set of genes. Transcription factors form complexes with other proteins and co-factors to exert their function [1]. Transcription factors within a cell can be found in three states: 1. Bound to DNA, 2. Bound to a protein complex, 3. Freely mobile without any complex. Transcription factors that are bound to DNA are relatively immobile as compared to transcription factors in their unbound state. If these transcription factors are bound to a protein complex, their mobility can be slower, depending on the complex size and transient interactions. Figure 1.1 explains this principle.
Figure 1.1. Mobility of the cartilage transcription factor (SOX9) in different states. An unbound transcription factor is highly mobile, while a transcription factor bound to other co-factors is comparatively less mobile, but as it is not bound to DNA, it is transcriptionally inactive. A transcription factor that is transcriptionally active, is bound to DNA, possibly with functional co-factors, is relatively immobile.
1.2 Motivation Traditionally, the activity of a transcription factors was studied using indirect, static methods, such as qPCR, immunofluorescence and western blot. Although they are robust methods, the results lack the spatiotemporal resolution of protein activity in real-time. Moreover, in these methods, cells with diverse transcriptomes and proteomes are lysed together and processed for the experiment, giving little information about the gene expression and protein activity at the single cell level.
Introduction and motivation| 3
1
2
3
4
5
6
7
8
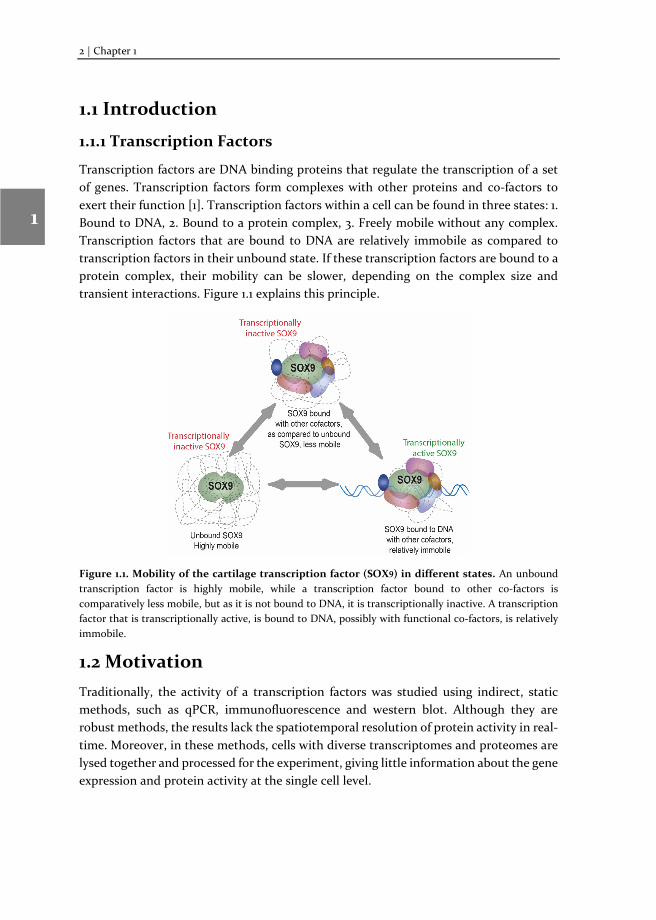
1.3 TF-FRAP Methodology Recent studies have shown that the cellular heterogeneity is complex, and the research focus is shifting towards investigating single cell dynamics, single cell transcriptomics and single cell proteomics [2]. Capturing gene expression and protein activity at the single cell level provides deeper insight into cellular function. This would ultimately help us to resolve more complex disease mechanisms and open new avenues for therapeutic intervention [3]. For the wider application, single cell methods should be accessible, cost effective, simple and fast. At this point, these single cell methods are for specialists and / or expensive. To bridge the gap, we applied a biophysical technique to measure the activity of the transcription factors in response to external signals, namely, Transcription Factor – Fluorescence Recovery After Photobleaching (TF-FRAP). Figure 1.2 explains the TF-FRAP method.
Figure 1.2. The method of TF-FRAP. (A) A cell expressing GFP-tagged protein in the nucleus is photo-bleached with a high intensity laser and the fluorescence recovery at the photo-bleached spot is recovered over the period. (B) This fluorescence recovery can be translated into a FRAP recovery curve and the dynamics such as recovery half-time, immobile fraction and diffusion rates can be calculated.
FRAP is a biophysical technique, developed by Axelrod and coworkers in 1976 to study the dynamics of fluorescent molecules [4]. We applied FRAP to study transcription factor dynamics and correlated to their transcriptional activity. TF-FRAP is a simple and fast, can be readily applied using any laser confocal microscope. Using TF-FRAP, one can measure the mobility of any transcription factor and get dynamics data, such as Immobile Fraction, Recovery half-time and if more than one binding/unbinding events contribute to the TF-FRAP recovery, the ratio of molecules present in each of binding events can also be calculated.
4 | Chapter 1
1
2
3
4
5
6
7
8
1.3.1 Hypothesis: TF-FRAP methodology
We hypothesized that the mobility of the transcription factors is dependent on their molecular state, i.e., freely mobile (unbound), bound to a protein complex and bound to DNA. These changes in molecular states can be measured by TF-FRAP and are correlated to their transcriptional activity.
1.4 Osteoarthritis (OA) pathology
1.4.1 What is OA?
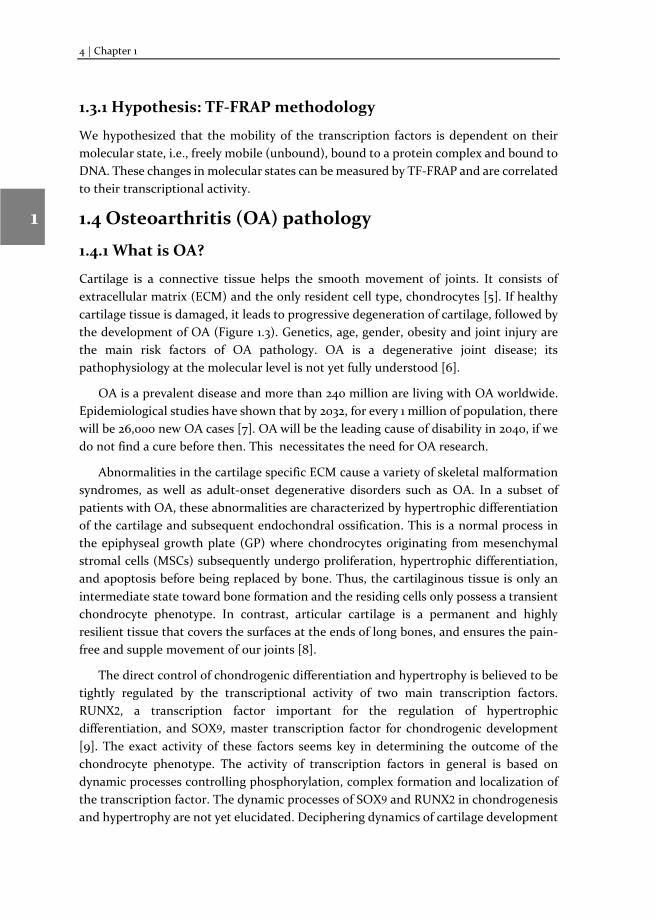
Cartilage is a connective tissue helps the smooth movement of joints. It consists of extracellular matrix (ECM) and the only resident cell type, chondrocytes [5]. If healthy cartilage tissue is damaged, it leads to progressive degeneration of cartilage, followed by the development of OA (Figure 1.3). Genetics, age, gender, obesity and joint injury are the main risk factors of OA pathology. OA is a degenerative joint disease; its pathophysiology at the molecular level is not yet fully understood [6].
OA is a prevalent disease and more than 240 million are living with OA worldwide. Epidemiological studies have shown that by 2032, for every 1 million of population, there will be 26,000 new OA cases [7]. OA will be the leading cause of disability in 2040, if we do not find a cure before then. This necessitates the need for OA research.
Abnormalities in the cartilage specific ECM cause a variety of skeletal malformation syndromes, as well as adult-onset degenerative disorders such as OA. In a subset of patients with OA, these abnormalities are characterized by hypertrophic differentiation of the cartilage and subsequent endochondral ossification. This is a normal process in the epiphyseal growth plate (GP) where chondrocytes originating from mesenchymal stromal cells (MSCs) subsequently undergo proliferation, hypertrophic differentiation, and apoptosis before being replaced by bone. Thus, the cartilaginous tissue is only an intermediate state toward bone formation and the residing cells only possess a transient chondrocyte phenotype. In contrast, articular cartilage is a permanent and highly resilient tissue that covers the surfaces at the ends of long bones, and ensures the pain-free and supple movement of our joints [8].
The direct control of chondrogenic differentiation and hypertrophy is believed to be tightly regulated by the transcriptional activity of two main transcription factors. RUNX2, a transcription factor important for the regulation of hypertrophic differentiation, and SOX9, master transcription factor for chondrogenic development [9]. The exact activity of these factors seems key in determining the outcome of the chondrocyte phenotype. The activity of transcription factors in general is based on dynamic processes controlling phosphorylation, complex formation and localization of the transcription factor. The dynamic processes of SOX9 and RUNX2 in chondrogenesis and hypertrophy are not yet elucidated. Deciphering dynamics of cartilage development
Introduction and motivation| 5
1
2
3
4
5
6
7
8
enables us to control transition from SOX9 to RUNX2 to avoid transition towards hypertrophy in articular cartilage. In this thesis, we have studied SOX9 and RUNX2 dynamics in human primary chondrocytes and in differentiating mesenchymal stem cells.
Figure 1.3. Schematic representation of healthy and OA joint. Healthy joint with intact cartilage enables smooth movement of joints. Damaged cartilage in the OA joint restrains the smooth movement [15].
1.4.2 SOX9
SOX9 is the master regulator of cartilage development and homeostasis. It interacts with SOX5, SOX6 and several other transcriptional regulators during cartilage development. SOX9 directly regulates the expression of cartilage matrix genes, such as COL2A and ACAN, which make-up more than 90% of the cartilage ECM proteins. Cartilage-specific mutation of SOX9 resulted in cartilage malformation in mice. Mutation of the SOX9 gene in human causes campomelic dysplasia. It is known that its expression and activity decreases during OA pathophysiology (reviewed in [9-11]). Given the master role of SOX9 cartilage homeostasis and disease, mapping the factors regulating SOX9 activity is necessary to understand the pathophysiology of osteoarthritis.
1.4.3 RUNX2
RUNX2 plays a master role in bone development and it is significantly upregulated during hypertrophic differentiation of articular chondrocytes and development of OA. During hypertrophic differentiation, it upregulates the expression of COL10, MMP13 and ADAMTs. COL10 is a much stiffer collagen and does not allow the supple movement of the joints and promotes tissue calcification [12]. MMP13 and ADAMTs degrade cartilage ECM and destabilize cartilage tissue. In a subset of OA patients, bony outgrowths in the joint is reported, and RUNX2 plays important role in this. In addition, RUNX2 activates
6 | Chapter 1
1
2
3
4
5
6
7
8
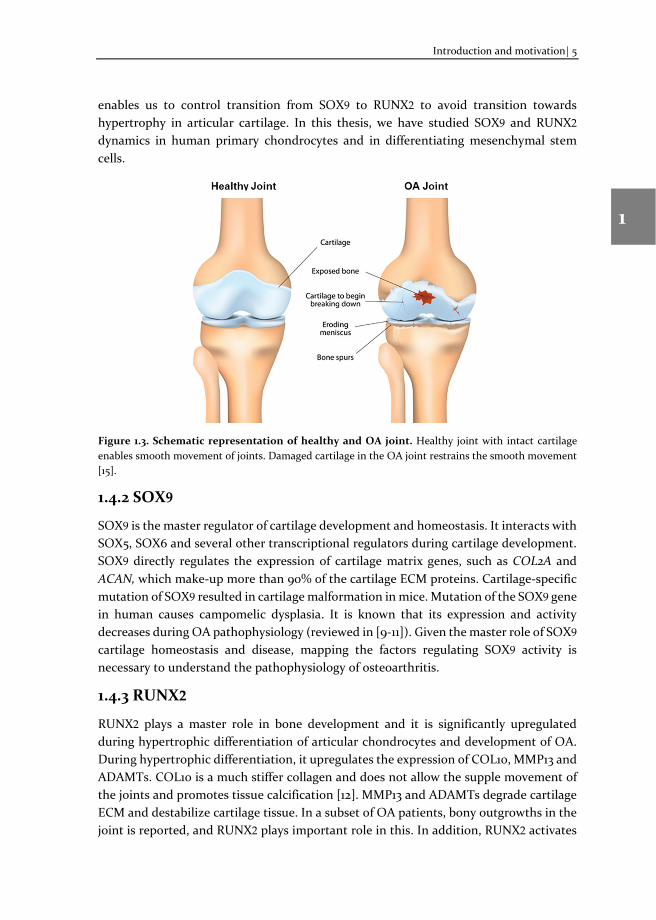
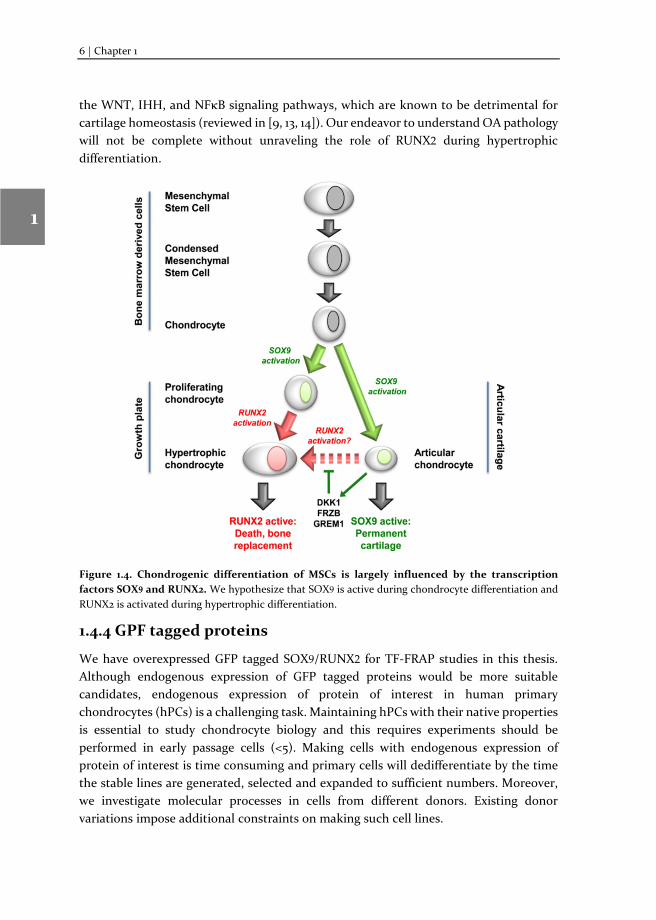
the WNT, IHH, and NFκB signaling pathways, which are known to be detrimental for cartilage homeostasis (reviewed in [9, 13, 14]). Our endeavor to understand OA pathology will not be complete without unraveling the role of RUNX2 during hypertrophic differentiation.
Figure 1.4. Chondrogenic differentiation of MSCs is largely influenced by the transcription factors SOX9 and RUNX2. We hypothesize that SOX9 is active during chondrocyte differentiation and RUNX2 is activated during hypertrophic differentiation.
1.4.4 GPF tagged proteins
We have overexpressed GFP tagged SOX9/RUNX2 for TF-FRAP studies in this thesis. Although endogenous expression of GFP tagged proteins would be more suitable candidates, endogenous expression of protein of interest in human primary chondrocytes (hPCs) is a challenging task. Maintaining hPCs with their native properties is essential to study chondrocyte biology and this requires experiments should be performed in early passage cells (<5). Making cells with endogenous expression of protein of interest is time consuming and primary cells will dedifferentiate by the time the stable lines are generated, selected and expanded to sufficient numbers. Moreover, we investigate molecular processes in cells from different donors. Existing donor variations impose additional constraints on making such cell lines.
Introduction and motivation| 7
1
2
3
4
5
6
7
8
1.4.5 Hypothesis: OA pathology
We hypothesized that the dynamics of SOX9 and RUNX2 are dependent on the disease state of chondrocytes. SOX9 mobility will be lower (higher activity) in healthy chondrocytes and higher (lower activity) in OA chondrocytes. RUNX2 mobility will be higher in healthy chondrocytes and lower in OA chondrocytes. External signaling factors can positively or negatively influence their activity and thus mobility.
1.5 Thesis Outline Fundamental knowledge on cartilage homeostasis and OA pathology is a key to develop therapeutic strategies. Since SOX9 is one of the master transcription factors in cartilage homeostasis and RUNX2 is activated during hypertrophic differentiation, we studied their signaling mechanism in OA pathology.
The aims of this thesis are: (i) to develop the TF-FRAP method, which helps in direct readout of the activity of transcription factors, (ii) mapping the factors regulating SOX9 transcriptional activity in healthy and OA chondrocytes using TF-FRAP, (iii) to study SOX9 and RUNX2 dynamics during chondro-, osteo- and adipogenic differentiation of hMSCs using TF-FRAP.
This chapter, chapter 1 outlines the background knowledge about transcription factors, TF-FRAP methodology and osteoarthritis.
In chapter 2, we explain the TF-FRAP method. Using the Nikon A1 confocal as an example, we have given a step-by-step protocol explaining how to perform TF-FRAP. We have also covered pre-conditions of FRAP, cell stimulation, sample preparation, useful tips and tricks, troubleshooting, data analysis and visualization. This would help any researcher without background knowledge about the technique to familiarize and set up the TF-FRAP experiment.
In chapter 3, we applied the TF-FRAP method to measure SOX9 dynamics in the chondrogenic cell line C-20/A4 and correlated its changes to its transcriptional activity. We stimulated the cells with the cytokines BMP7, WNT3a and IL1β, and showed that the SOX9 dynamics change in response to external stimuli on a short time scale (<20 mins). Using chromatin immunoprecipitation (ChIP), we cross validated our FRAP results. Quantification of mRNA expression by qPCR showed a correlation between gene expression and SOX9 dynamics.
To understand the molecular mechanism involved in OA pathophysiology, we applied TF-FRAP to study SOX9 transcriptional activity in human primary chondrocytes (hPCs) in response to external stimuli. TF-FRAP captured a striking difference in SOX9 dynamics among healthy, preserved (healthy looking region of OA joint) and OA hPCs. In addition, TF-FRAP also identified presence of two cell populations in hPCs within a donor. These cell populations displayed distinct SOX9 dynamics. Surprisingly, these
8 | Chapter 1
1
2
3
4
5
6
7
8
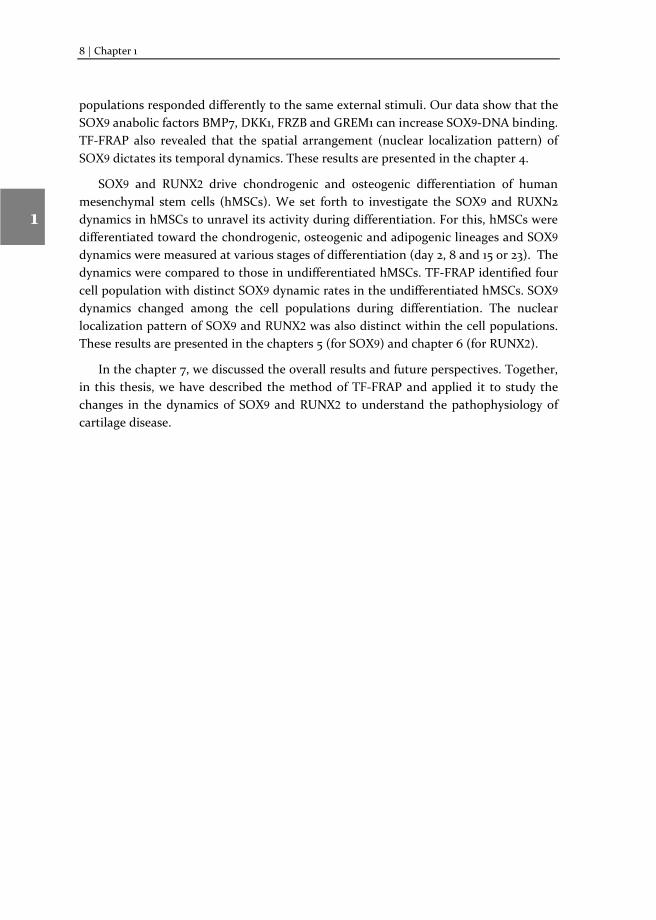
populations responded differently to the same external stimuli. Our data show that the SOX9 anabolic factors BMP7, DKK1, FRZB and GREM1 can increase SOX9-DNA binding. TF-FRAP also revealed that the spatial arrangement (nuclear localization pattern) of SOX9 dictates its temporal dynamics. These results are presented in the chapter 4.
SOX9 and RUNX2 drive chondrogenic and osteogenic differentiation of human mesenchymal stem cells (hMSCs). We set forth to investigate the SOX9 and RUXN2 dynamics in hMSCs to unravel its activity during differentiation. For this, hMSCs were differentiated toward the chondrogenic, osteogenic and adipogenic lineages and SOX9 dynamics were measured at various stages of differentiation (day 2, 8 and 15 or 23). The dynamics were compared to those in undifferentiated hMSCs. TF-FRAP identified four cell population with distinct SOX9 dynamic rates in the undifferentiated hMSCs. SOX9 dynamics changed among the cell populations during differentiation. The nuclear localization pattern of SOX9 and RUNX2 was also distinct within the cell populations. These results are presented in the chapters 5 (for SOX9) and chapter 6 (for RUNX2).
In the chapter 7, we discussed the overall results and future perspectives. Together, in this thesis, we have described the method of TF-FRAP and applied it to study the changes in the dynamics of SOX9 and RUNX2 to understand the pathophysiology of cartilage disease.
Introduction and motivation| 9
1
2
3
4
5
6
7
8
References 1. Spitz, F. & Furlong, E. E. (2012) Transcription factors: from enhancer binding to developmental control, Nat Rev Genet. 13, 613-26.
2. Altschuler, S. J. & Wu, L. F. (2010) Cellular Heterogeneity: Do Differences Make a Difference?, Cell. 141, 559-563.
3. Spiller, D. G., Wood, C. D., Rand, D. A. & White, M. R. H. (2010) Measurement of single-cell dynamics, Nature. 465, 736-745.
4. Axelrod, D., Koppel, D. E., Schlessinger, J., Elson, E. & Webb, A. W. (1976) Mobility measurement by analysis of fluorescence photobleaching recovery kinetics, Biophys J. 16, 1055-1069.
5. Chiara, G. & Ranieri, C. (2009) Cartilage and Bone Extracellular Matrix, Current Pharmaceutical Design. 15, 1334-1348.
6. Palazzo, C., Nguyen, C., Lefevre-Colau, M.-M., Rannou, F. & Poiraudeau, S. (2016) Risk factors and burden of osteoarthritis, Annals of Physical and Rehabilitation Medicine. 59, 134-138.
7. Turkiewicz, A., Petersson, I. F., Bjork, J., Hawker, G., Dahlberg, L. E., Lohmander, L. S. & Englund, M. (2014) Current and future impact of osteoarthritis on health care: a population-based study with projections to year 2032, Osteoarthritis and cartilage /OARS, Osteoarthritis Research Society. 22, 1826-32.
8. Hollander, A. P., Dickinson, S. C. & Kafienah, W. (2010) Stem Cells and Cartilage Development: Complexities of a Simple Tissue, STEM CELLS. 28, 1992-1996.
9. Zhou, G., Zheng, Q., Engin, F., Munivez, E., Chen, Y., Sebald, E., Krakow, D. & Lee, B. (2006) Dominance of SOX9 function over RUNX2 during skeletogenesis, Proceedings of the National Academy of Sciences. 103, 19004.
10. Lefebvre, V. & Dvir-Ginzberg, M. (2017) SOX9 and the many facets of its regulation in the chondrocyte lineage, Connective Tissue Research. 58, 2-14.
11. Nishimura, R., Hata, K., Takahata, Y., Murakami, T., Nakamura, E. & Yagi, H. (2017) Regulation of Cartilage Development and Diseases by Transcription Factors, J Bone Metab. 24, 147-153.
12. Aigner, T., Reichenberger, E., Bertling, W., Kirsch, T., Stoss, H. & von der Mark, K. (1993) Type X collagen expression in osteoarthritic and rheumatoid articular cartilage, Virchows Arch B Cell Pathol Incl Mol Pathol. 63, 205-11.
13. Chen, D., Kim, D. J., Shen, J., Zou, Z. & O'Keefe, R. J. (2019) Runx2 plays a central role in Osteoarthritis development, Journal of Orthopaedic Translation. 23, 132-139
14. Eames, B. F., Sharpe, P. T. & Helms, J. A. (2004) Hierarchy revealed in the specification of three skeletal fates by Sox9 and Runx2, Dev Biol. 274, 188-200.
15. https://www.msk.org.au/osteoarthritis-knee

2 Using FRAP to quantify changes in
transcription factor dynamics after cell stimulation: Cell culture, FRAP, data analysis
and visualization
Abstract Here we show how to measure the mobility of transcription factors using Fluorescence Recovery After Photobleaching (FRAP). Transcription factors are DNA binding proteins that, upon binding to specific DNA motifs, regulate transcription of their target genes. FRAP is a simple, fast and cost-effective method, and is a widely used quantitative method to measure the dynamics of fluorescently labelled molecules in solution, membranes and inside living cells. Dynamics, specified by the immobile fraction, recovery half-time, diffusion co-efficient, and ratio of molecules contributing to different phases of FRAP recovery, can be quantified by FRAP. This can be of useful to understand their function in gene regulation. This tutorial is intended to familiarize the reader with the FRAP procedure to quantify transcription factor dynamics using a standard confocal microscope and analysis using MATLAB. This article will guide the reader through the preconditions of FRAP, and a detailed and step-by-step procedure of preparing cells, bleaching protocol, data analysis in MATLAB, and visualization of the FRAP data.
Kannan Govindaraj and Janine N. Post
Book Chapter: Methods Molecular Biology, Vol. 2221, p109-139, Osteoporosis and Osteoarthritis. Editors: Andre J. van Wijnen and Marina S. Ganshina.
DOI: doi.org/10.1007/978-1-0716-0989-7_9
Corrigendum: In the published version, we used a term ‘Diffusion constant (D)’, and we have used more correct term ‘Diffusion co-efficient (D)’ in this chapter.
12| Chapter 2
2
3
4
5
6
7
8
2.1 Introduction Fluorescence Recovery After Photobleaching (FRAP) is a biophysical technique, developed in the late 1970s by Axelrod et al. [1]. FRAP has been successfully applied to study the mobility of fluorescent molecules in solution. The discovery of green fluorescent protein (GFP [2]) and subsequent advances in imaging technologies further extended the scope of FRAP to study protein and lipid mobility in live cells. FRAP can be used to study the mobility of fluorescently labeled proteins, lipids and molecules in 2D structures (e.g. the plasma membrane) and in 3D structures (e.g. nuclei and cytoplasm) [3]. However, appropriate FRAP models resembling actual reaction kinetics within the system – 2D or 3D – under investigation should be used to interpret the data [4].
Transcription factors play a key role in the regulation of gene expression, and their binding to DNA precedes its activity. There are numerous theories describing the mechanism of transcription factor activity, reviewed in [5]. Despite many conflicting and consenting theories on their functional mechanism [6], the quantity of transcription factors bound to DNA, affinity, and duration of binding seem to be the major contributing factors in exerting their activity, which could be either transcriptional activation or repression [5, 7]. Thus, quantifying transcription factor dynamics will yield useful information on their transcriptional activity.
In this tutorial, we will explain when and how FRAP can be used to measure transcription factor dynamics. We describe the FRAP protocol from pre-conditions of FRAP, such as required materials and preparatory work, tips and tricks, to data analysis and visualization. We will discuss how to stimulate cells to study transcription factor dynamics in response to external factors [8], as we have done in our studies. To guide the reader through the FRAP procedure, we explain FRAP terminologies, models for fitting FRAP data, data analysis using ImageJ (FIJI), MATLAB (MathWorks®) and data visualization using OriginPro® (OriginLab®) software. Additionally, we added a step-by-step protocol to perform a FRAP experiment using a NIKON confocal microscope as an online supplement.
2.1.1 Different methods for measuring protein dynamics
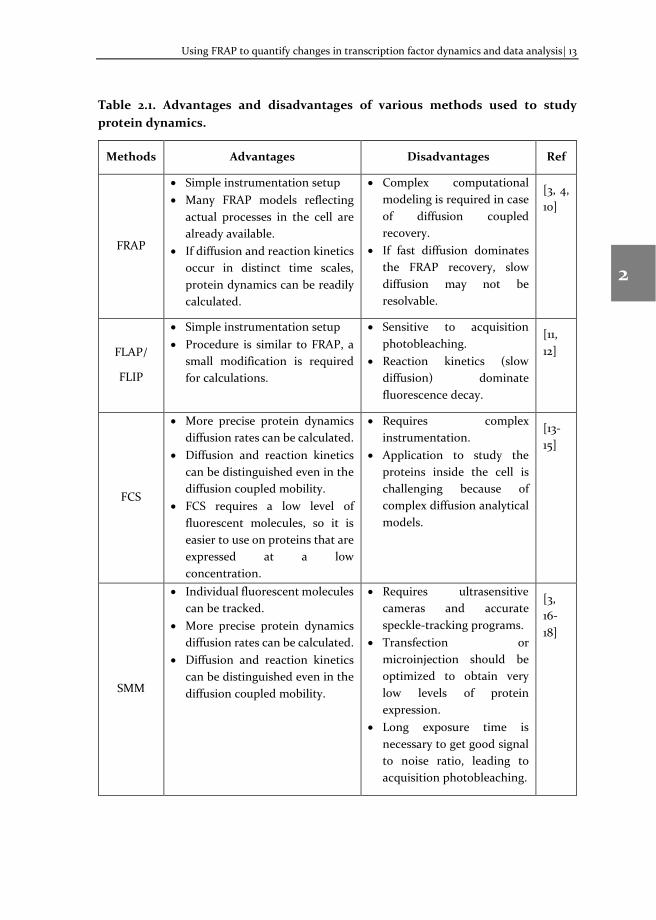
FRAP is a widely used method to study the protein dynamics in live cells due to its simple setup in a laser confocal microscope. Other methods, such as FLAP (Fluorescence Loss After Photoactivation), FLIP (Fluorescence Loss In Photobleaching), FCS (Fluorescence Correlation Spectroscopy), SMM (Single Molecule Microscopy) are also used to study protein kinetics [3]. These methods have their own advantages and disadvantages, as described in Table 2.1.
Using FRAP to quantify changes in transcription factor dynamics and data analysis| 13
2
3
4
5
6
7
8
Table 2.1. Advantages and disadvantages of various methods used to study protein dynamics.
Methods Advantages Disadvantages Ref
FRAP
• Simple instrumentation setup • Many FRAP models reflecting
actual processes in the cell are already available.
• If diffusion and reaction kinetics occur in distinct time scales, protein dynamics can be readily calculated.
• Complex computational modeling is required in case of diffusion coupled recovery.
• If fast diffusion dominates the FRAP recovery, slow diffusion may not be resolvable.
[3, 4, 10]
FLAP/
FLIP
• Simple instrumentation setup • Procedure is similar to FRAP, a
small modification is required for calculations.
• Sensitive to acquisition photobleaching.
• Reaction kinetics (slow diffusion) dominate fluorescence decay.
[11, 12]
FCS
• More precise protein dynamics diffusion rates can be calculated.
• Diffusion and reaction kinetics can be distinguished even in the diffusion coupled mobility.
• FCS requires a low level of fluorescent molecules, so it is easier to use on proteins that are expressed at a low concentration.
• Requires complex instrumentation.
• Application to study the proteins inside the cell is challenging because of complex diffusion analytical models.
[13-15]
SMM
• Individual fluorescent molecules can be tracked.
• More precise protein dynamics diffusion rates can be calculated.
• Diffusion and reaction kinetics can be distinguished even in the diffusion coupled mobility.
• Requires ultrasensitive cameras and accurate speckle-tracking programs.
• Transfection or microinjection should be optimized to obtain very low levels of protein expression.
• Long exposure time is necessary to get good signal to noise ratio, leading to acquisition photobleaching.
[3, 16-18]
14| Chapter 2
2
3
4
5
6
7
8
2.1.2 When to use FRAP
FRAP can be used to study the signaling mechanism or to map the factors that regulate a cellular process, such as the activity of transcription factors. For this, cells must be transfected with a fluorescent fusion protein, thus the protein of interest tagged with a fluorescent protein. The choice of transfection method depends on the cell type and the protein of interest. It is recommended to make a stably transfected cell line using for example CRISPR/Cas9 [9], if a cell line (which properties are not affected by passage number) is used in the study, or if overexpression of the protein of interest is toxic to the cells. This helps to study the protein of interest at the native expression levels and helps to avoid the transfection step every time before FRAP. If using primary cells or cells which tend to (de)differentiate over a number of passages, transient transfection would be the best option. If the cells are easy to transfect, lipid mediated transfection may be used. Retroviral or other viral mediated transfection can be used for hard to transfect cells. N.B. check local safety regulations, since in most countries the use of viruses is only allowed in labs with the correct biosafety levels, which is then also true for the location of the microscope (BSL-2 in the USA, MLII in the Netherlands). We do not have a confocal microscope in our MLII lab, so we cannot use viral induction for our FRAP experiments.
Since the cells with which we work, human Primary Chondrocytes (hPCs) and human Mesenchymal Stem cells (hMSCs), tend to dedifferentiate over a number of passages, we used lipid mediated transient transfection. In these primary cells, we were able to achieve at least a transfection efficiency of 20% (see method). For training purposes, we use the immortalized C-20/A4 cell line.
2.1.3 FRAP Principle
In FRAP a small region of interest (ROI, can be circular, square or rectangular) is photobleached with a high intensity laser and the fluorescent recovery is monitored in that ROI in a given time scale (from seconds to minutes). Post-bleach imaging duration and frame-rate is determined based on the mobility of the molecule of interest. The higher the mobility, the lower the imaging time, the higher the frame rate. For example, if the mobility of a transcription is relatively high, with a stable plateau reached within a minute, fluorescence recovery can be recorded for 60 sec, at a speed of 4 frames per second (fps). Before photobleaching, a number of pre-bleach images (usually ~10) are recorded for normalization of the fluorescence recovery. This process can be translated into a graph.
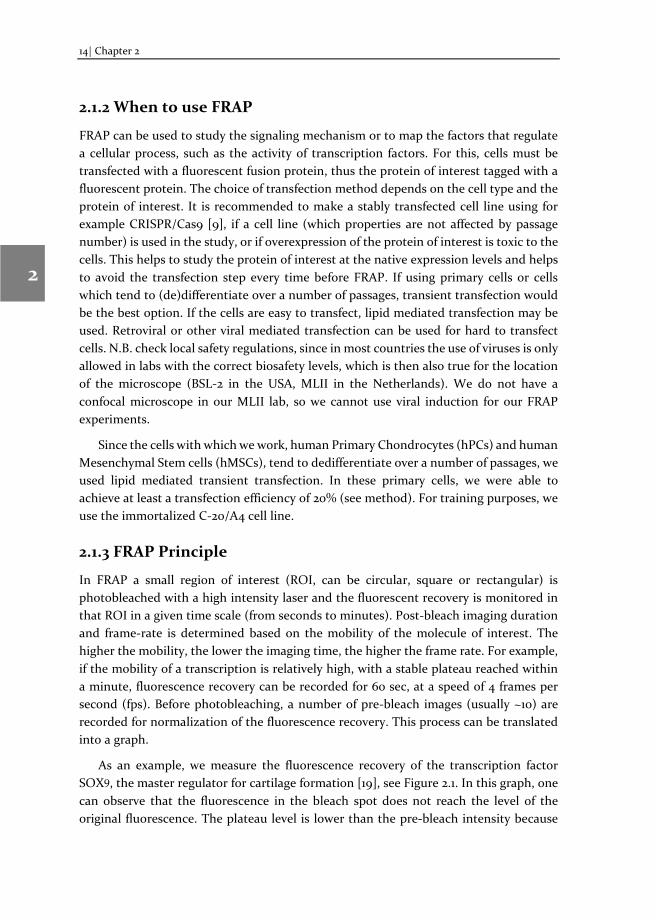
As an example, we measure the fluorescence recovery of the transcription factor SOX9, the master regulator for cartilage formation [19], see Figure 2.1. In this graph, one can observe that the fluorescence in the bleach spot does not reach the level of the original fluorescence. The plateau level is lower than the pre-bleach intensity because
Using FRAP to quantify changes in transcription factor dynamics and data analysis| 15
2
3
4
5
6
7
8
some of the FRAP-bleached molecules are immobile within the region of interest that is bleached. Because of their immobility, they do not contribute to the recovery, while at the same time occupying binding sites for incoming unbleached proteins. We therefore name the fraction of molecules that contributes to the recovery the ‘mobile fraction’ and the one that does not contribute the ‘immobile fraction’.
Figure 2.1. Fluorescence recovery curve of SOX9-mGFP. The fluorescence intensity is normalized to 100%. The immobile fraction and recovery half-time are indicated (red dotted lines).
2.1.4 Mapping signal transduction pathways regulating transcription factor mobility
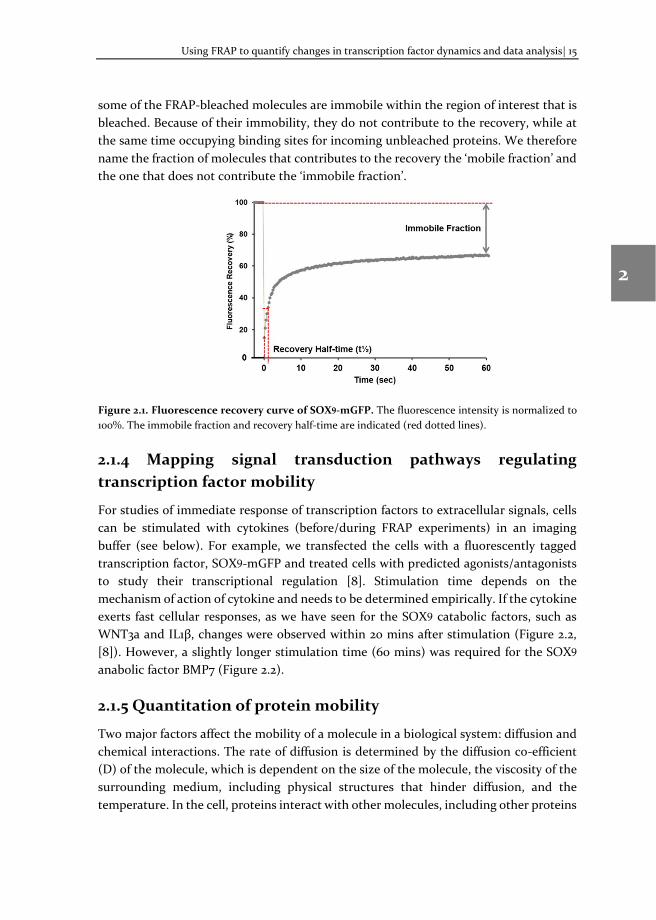
For studies of immediate response of transcription factors to extracellular signals, cells can be stimulated with cytokines (before/during FRAP experiments) in an imaging buffer (see below). For example, we transfected the cells with a fluorescently tagged transcription factor, SOX9-mGFP and treated cells with predicted agonists/antagonists to study their transcriptional regulation [8]. Stimulation time depends on the mechanism of action of cytokine and needs to be determined empirically. If the cytokine exerts fast cellular responses, as we have seen for the SOX9 catabolic factors, such as WNT3a and IL1β, changes were observed within 20 mins after stimulation (Figure 2.2, [8]). However, a slightly longer stimulation time (60 mins) was required for the SOX9 anabolic factor BMP7 (Figure 2.2).
2.1.5 Quantitation of protein mobility
Two major factors affect the mobility of a molecule in a biological system: diffusion and chemical interactions. The rate of diffusion is determined by the diffusion co-efficient (D) of the molecule, which is dependent on the size of the molecule, the viscosity of the surrounding medium, including physical structures that hinder diffusion, and the temperature. In the cell, proteins interact with other molecules, including other proteins
16| Chapter 2
2
3
4
5
6
7
8
and DNA/RNA. The binding constants of the molecular interactions, binding (kon) and dissociation (koff) with other molecules, will affect mobility of the protein of interest.
Protein kinetic data can be calculated from the FRAP measurements. This includes the fraction of immobile molecules (immobile fraction, IF), the recovery half-time (τ½, time it takes for the fluorescence to reach 50% of the final fluorescence), diffusion co-efficient (D), association (kon) and dissociation (koff) rates [20]. So, using FRAP, one can calculate the diffusion and reaction kinetics of any fluorescently labelled protein/lipid in a cell. If the molecular processes that contribute to the fluorescence recovery occur in distinct timescales, FRAP is a robust method to study the protein kinetics.
Figure 2.2. FRAP curves showing SOX9-mGFP mobility changes in C20/A4 cells after treatment with cytokines. Treatment of C20/A4 cells with WNT3a at 10 ng/ml increased SOX9-mGFP mobility at 20 mins (yellow curve) as compared to the control (blue curve). In contrast, BMP7 at 10 ng/ml did not change SOX9-mGFP mobility significantly at 20 mins (orange curve) as compared to the control. However, 100 ng/ml of BMP7 with 1 hr treatment decreased the SOX9-mGFP mobility significantly (grey curve). This indicates that concentration of cytokines and stimulation time varies among cytokines and should be determined empirically.
To calculate the protein kinetic data, different equations / models can be applied: i) chemical interaction model, ii) diffusion model, and iii) reaction-diffusion model. In the chemical interaction model, FRAP curves are fitted with an exponential equation with a single exponent:
𝐹𝐹(𝑡𝑡) = 𝑦𝑦0 + 𝐴𝐴(1 − 𝑒𝑒−𝑡𝑡/𝜏𝜏) (equation 1)
where y0 is the value of the fluorescent intensity at the first post-bleach frame, A is the amplitude of mobile population and τ is the time constant.
To calculate the half-time recovery of A,
Half-time to recover: 𝑡𝑡½ = ln(2) ∗ 𝜏𝜏 (equation 2)
Where t½ is the time-point at which 50% of the fluorescence is recovered, τ is the time constant.
Using FRAP to quantify changes in transcription factor dynamics and data analysis| 17
2
3
4
5
6
7
8
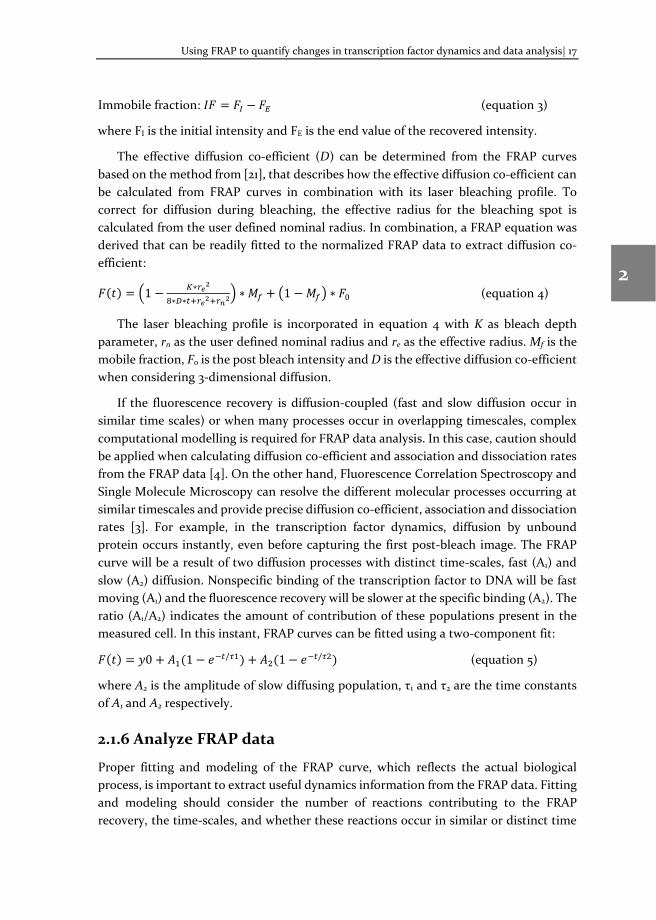
Immobile fraction: 𝐼𝐼𝐹𝐹 = 𝐹𝐹𝐼𝐼 − 𝐹𝐹𝐸𝐸 (equation 3)
where FI is the initial intensity and FE is the end value of the recovered intensity.
The effective diffusion co-efficient (D) can be determined from the FRAP curves based on the method from [21], that describes how the effective diffusion co-efficient can be calculated from FRAP curves in combination with its laser bleaching profile. To correct for diffusion during bleaching, the effective radius for the bleaching spot is calculated from the user defined nominal radius. In combination, a FRAP equation was derived that can be readily fitted to the normalized FRAP data to extract diffusion co-efficient:
𝐹𝐹(𝑡𝑡) = �1 − 𝐾𝐾∗𝑟𝑟𝑒𝑒2
8∗𝐷𝐷∗𝑡𝑡+𝑟𝑟𝑒𝑒2+𝑟𝑟𝑛𝑛2� ∗ 𝑀𝑀𝑓𝑓 + �1 −𝑀𝑀𝑓𝑓� ∗ 𝐹𝐹0 (equation 4)
The laser bleaching profile is incorporated in equation 4 with K as bleach depth parameter, rn as the user defined nominal radius and re as the effective radius. Mf is the mobile fraction, F0 is the post bleach intensity and D is the effective diffusion co-efficient when considering 3-dimensional diffusion.
If the fluorescence recovery is diffusion-coupled (fast and slow diffusion occur in similar time scales) or when many processes occur in overlapping timescales, complex computational modelling is required for FRAP data analysis. In this case, caution should be applied when calculating diffusion co-efficient and association and dissociation rates from the FRAP data [4]. On the other hand, Fluorescence Correlation Spectroscopy and Single Molecule Microscopy can resolve the different molecular processes occurring at similar timescales and provide precise diffusion co-efficient, association and dissociation rates [3]. For example, in the transcription factor dynamics, diffusion by unbound protein occurs instantly, even before capturing the first post-bleach image. The FRAP curve will be a result of two diffusion processes with distinct time-scales, fast (A1) and slow (A2) diffusion. Nonspecific binding of the transcription factor to DNA will be fast moving (A1) and the fluorescence recovery will be slower at the specific binding (A2). The ratio (A1/A2) indicates the amount of contribution of these populations present in the measured cell. In this instant, FRAP curves can be fitted using a two-component fit:
𝐹𝐹(𝑡𝑡) = 𝑦𝑦0 + 𝐴𝐴1(1 − 𝑒𝑒−𝑡𝑡/𝜏𝜏1) + 𝐴𝐴2(1 − 𝑒𝑒−𝑡𝑡/𝜏𝜏2) (equation 5)
where A2 is the amplitude of slow diffusing population, τ1 and τ2 are the time constants of A1 and A2 respectively.
2.1.6 Analyze FRAP data
Proper fitting and modeling of the FRAP curve, which reflects the actual biological process, is important to extract useful dynamics information from the FRAP data. Fitting and modeling should consider the number of reactions contributing to the FRAP recovery, the time-scales, and whether these reactions occur in similar or distinct time
18| Chapter 2
2
3
4
5
6
7
8
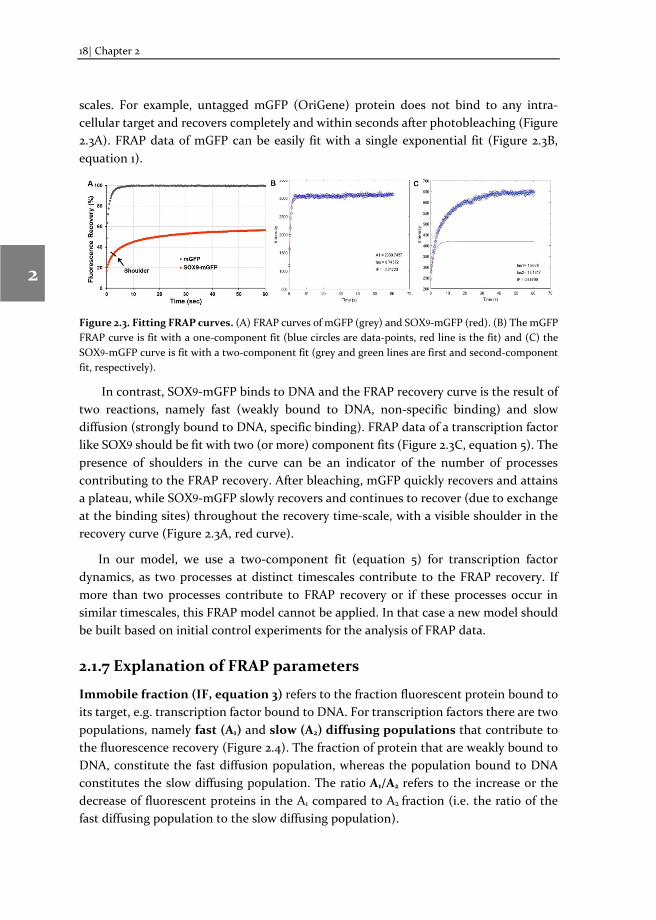
scales. For example, untagged mGFP (OriGene) protein does not bind to any intra-cellular target and recovers completely and within seconds after photobleaching (Figure 2.3A). FRAP data of mGFP can be easily fit with a single exponential fit (Figure 2.3B, equation 1).
Figure 2.3. Fitting FRAP curves. (A) FRAP curves of mGFP (grey) and SOX9-mGFP (red). (B) The mGFP FRAP curve is fit with a one-component fit (blue circles are data-points, red line is the fit) and (C) the SOX9-mGFP curve is fit with a two-component fit (grey and green lines are first and second-component fit, respectively).
In contrast, SOX9-mGFP binds to DNA and the FRAP recovery curve is the result of two reactions, namely fast (weakly bound to DNA, non-specific binding) and slow diffusion (strongly bound to DNA, specific binding). FRAP data of a transcription factor like SOX9 should be fit with two (or more) component fits (Figure 2.3C, equation 5). The presence of shoulders in the curve can be an indicator of the number of processes contributing to the FRAP recovery. After bleaching, mGFP quickly recovers and attains a plateau, while SOX9-mGFP slowly recovers and continues to recover (due to exchange at the binding sites) throughout the recovery time-scale, with a visible shoulder in the recovery curve (Figure 2.3A, red curve).
In our model, we use a two-component fit (equation 5) for transcription factor dynamics, as two processes at distinct timescales contribute to the FRAP recovery. If more than two processes contribute to FRAP recovery or if these processes occur in similar timescales, this FRAP model cannot be applied. In that case a new model should be built based on initial control experiments for the analysis of FRAP data.
2.1.7 Explanation of FRAP parameters
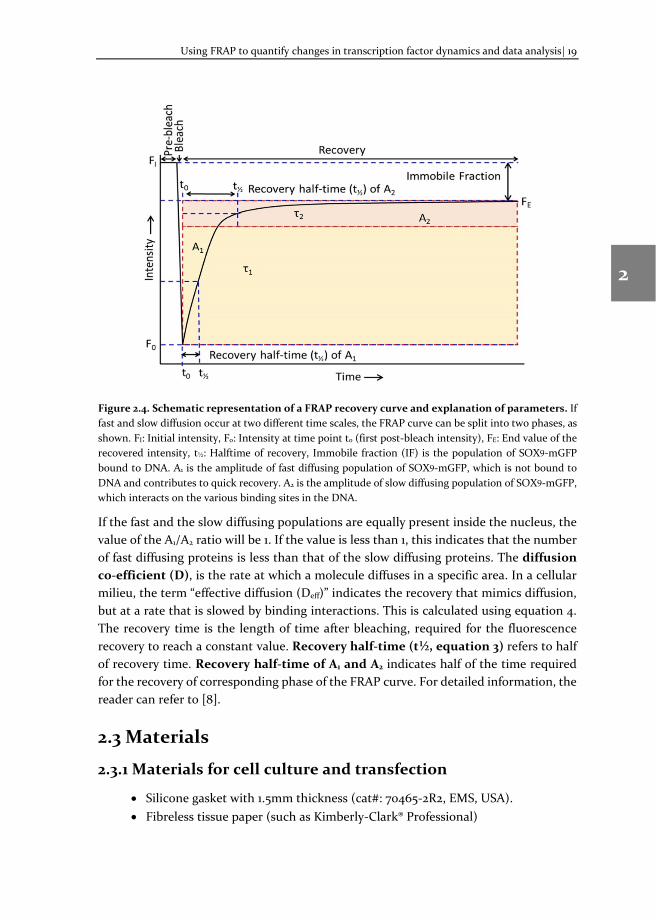
Immobile fraction (IF, equation 3) refers to the fraction fluorescent protein bound to its target, e.g. transcription factor bound to DNA. For transcription factors there are two populations, namely fast (A1) and slow (A2) diffusing populations that contribute to the fluorescence recovery (Figure 2.4). The fraction of protein that are weakly bound to DNA, constitute the fast diffusion population, whereas the population bound to DNA constitutes the slow diffusing population. The ratio A1/A2 refers to the increase or the decrease of fluorescent proteins in the A1 compared to A2 fraction (i.e. the ratio of the fast diffusing population to the slow diffusing population).
Using FRAP to quantify changes in transcription factor dynamics and data analysis| 19
2
3
4
5
6
7
8
Figure 2.4. Schematic representation of a FRAP recovery curve and explanation of parameters. If fast and slow diffusion occur at two different time scales, the FRAP curve can be split into two phases, as shown. FI: Initial intensity, F0: Intensity at time point t0 (first post-bleach intensity), FE: End value of the recovered intensity, t½: Halftime of recovery, Immobile fraction (IF) is the population of SOX9-mGFP bound to DNA. A1 is the amplitude of fast diffusing population of SOX9-mGFP, which is not bound to DNA and contributes to quick recovery. A2 is the amplitude of slow diffusing population of SOX9-mGFP, which interacts on the various binding sites in the DNA.
If the fast and the slow diffusing populations are equally present inside the nucleus, the value of the A1/A2 ratio will be 1. If the value is less than 1, this indicates that the number of fast diffusing proteins is less than that of the slow diffusing proteins. The diffusion co-efficient (D), is the rate at which a molecule diffuses in a specific area. In a cellular milieu, the term “effective diffusion (Deff)” indicates the recovery that mimics diffusion, but at a rate that is slowed by binding interactions. This is calculated using equation 4. The recovery time is the length of time after bleaching, required for the fluorescence recovery to reach a constant value. Recovery half-time (t½, equation 3) refers to half of recovery time. Recovery half-time of A1 and A2 indicates half of the time required for the recovery of corresponding phase of the FRAP curve. For detailed information, the reader can refer to [8].
2.3 Materials
2.3.1 Materials for cell culture and transfection
• Silicone gasket with 1.5mm thickness (cat#: 70465-2R2, EMS, USA). • Fibreless tissue paper (such as Kimberly-Clark® Professional)
20| Chapter 2
2
3
4
5
6
7
8
• 24-well plates • Microscopic cover glass (12 or 13mm, Ø) • Tweezers to lift the coverslip • Suitable transfection reagent
o Lipofectamine LTX with Plus reagent (cat. # 15338030, ThermoFisher scientific) (for C20/A4 cells and human primary chondrocytes). We used 1:1 (w/v) ratio of DNA and Plus reagent and 2:1 (v/v) ratio of Lipofectamine LTX to Plus reagent.
o Lipofectamine 3000 with P3000 reagent (cat. # L3000015, ThermoFisher scientific) (for hMSCs). We used 1:1.5 (w/v) ratio of DNA and P3000 reagent and 2:1 (v/w) ratio of Lipofectamine 3000 to DNA.
• Plasmid DNA encoding GFP-tagged protein of interest • Confocal microscope • Cells of interest • Proteins/cytokines for cell stimulation • Microscopic glass slide • Imaging buffer
2.3.2 Materials for FRAP
Imaging Buffer (Tyrode’s solution, see Note 1)
135 mM NaCl, 10 mM KCl, 0.4 mM MgCl2, 1 mM CaCl2, 10 mM HEPES, pH adjusted to 7.2, Imaging buffer with these components was filter sterilized and stored at -20°C. On the day of use, add 20 mM glucose and 0.1% BSA (final concentration after adding to the buffer). Alternatively, medium without phenol red can also be used as imaging media (see Note 2).
2.3.3 Confocal laser scanning microscope:
- Laser scanning confocal microscope (We used a Nikon A1 confocal microscope) with suitable laser lines for excitation of the fluorescent protein
- Option to maintain the physiological temperature, CO2 control.
2.3.4 Materials for FRAP analysis
- MATLAB with script (available on request), - ImageJ (for drift correction), - Alternatively, easyFRAP software can be used.
2.3.5 Materials for data visualization and statistical analysis.
- Data analysis and graphing software, we used Origin Pro (OriginLab®)
Using FRAP to quantify changes in transcription factor dynamics and data analysis| 21
2
3
4
5
6
7
8
2.4 Protocol
2.4.1 Cell culture and transfection
To study the cellular physiology, cells ideally should be maintained in their native state. For example, primary chondrocytes should maintain their chondrogenic potential during the experiments. To prevent dedifferentiation, expand the primary chondrocytes in physioxical (2.5-5% O2) conditions. Use low passage numbers (<4) and low population doubling levels (PDL <5). Culture the cells without antibiotics especially during and after transfection. We usually do not serum-starve the cells before FRAP experiments, unless we stimulate with growth factors.
Culturing with serum or serum-starvation: Depending on the nature of the study, cells can be cultured with or without serum. If the dynamics of protein under study is influenced by cell cycle, it would be appropriate to synchronize the cell cycle by serum starvation. Also, if the study is intended to investigate the long-time effect of an external growth factor/cytokine cells may need to be cultured without or with inactivated serum to avoid interference with the growth factors present in the serum.
2.4.2 Choice of the fluorophore
The fluorophore of choice should be irreversibly photo-bleachable at high intensity light and photo-stable at lower light intensities. The chosen fluorescent protein should not have dimerization, tetramerization or oligomerization properties. These properties will lead to complex formation and may impair the function of the protein of interest [22]. The fluorescent protein should also have a fast maturation time and be resistant to environmental changes, such as temperature, O2 and pH. We refer the readers to the following references to know more about selection of fluorescent proteins [23-25]. Fluorescent proteins such as mGFP, eGFP, mRFP and mCherry have been successfully used in FRAP experiments [26-28].
2.4.3 Transfection
FRAP can only be performed on fluorescently labeled molecules. For the study of transcription factors in primary cells, transient transfection is the easiest method of introducing a fluorescent fusion protein. At least 10-15% of transfection efficiency is required to image sufficient cells for FRAP. Optimization of seeding density, transfection reagent, plasmid DNA purification and time of transfection may be necessary. We transfected immortalized juvenile costal chondrocytes (C20/A4), human primary chondrocytes (hPCs) and human mesenchymal stem cells (hMSCs) at 70-80% confluent level and are able to achieve a minimum transfection efficiency of ~20%. To get a high transfection efficiency, use Opti-MEM (Invitrogen) medium (without serum and
22| Chapter 2
2
3
4
5
6
7
8
antibiotics) during transfection. After 2:00 – 4:00 hrs (depending on the cell type), replace this medium with normal culture medium (without antibiotics).
2.4.4 Cell stimulation
Cell stimulation time and concentration of cytokines/growth factors are other important factors to be considered. Stimulation time depends on the speed of cellular response, the concentration depends on the efficacy of the cytokine/growth factor, and both needed to be determined empirically. We stimulated C20/A4 cells [29] with different concentrations (1 ng/ml, 10 ng/ml and 200 ng/ml) of WNT3a and found that 10 ng/ml was the minimal concentration needed to destabilize SOX9-mGFP from DNA [8]. In contrast, BMP7 promoted DNA binding of SOX9-mGFP at 100ng/ml concentration and with a longer incubation time (Figure 2.2).
2.4.5 Preparing cells for FRAP
Day 1: Seed the cells on a sterile, microscopic glass coverslip (12 or 13 mm Ø) placed in a 24 well plate (see Note 3).
Day 2: Transfect the cells with the plasmid encoding the fluorescent protein of interest.
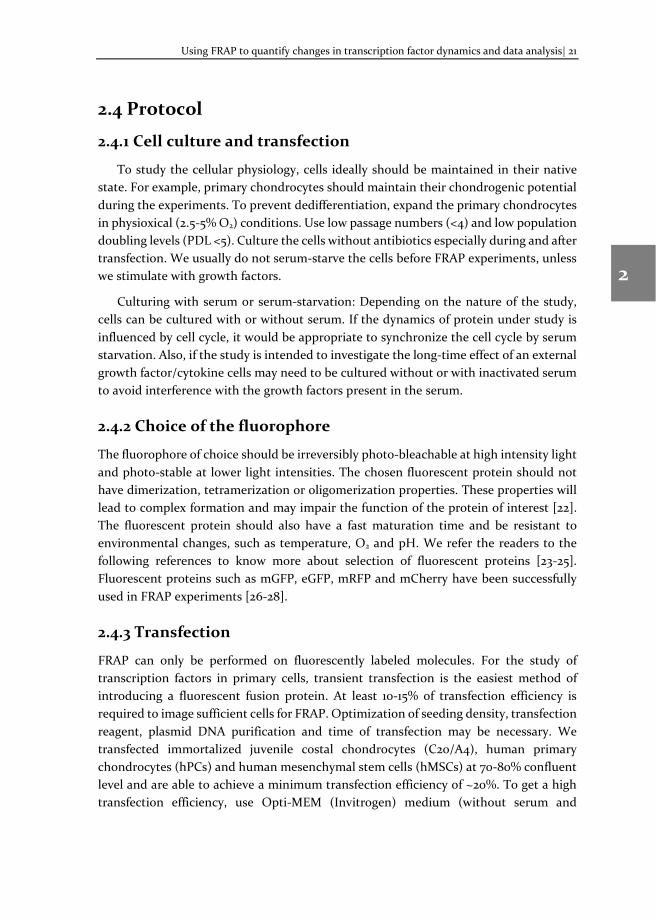
Day 3: Perform FRAP using the protocol below. For FRAP experiments, transfected cells grown on coverslip (on day 2) needs to be prepared in the following way (Figure 2.5).
1. Mount a silicone well divider (Electron Microscopy Sciences, USA with right well size) on to a microscopic glass slide (Figure 2.5A, see Note 4).
2. Fill the silicone well with imaging buffer (Figure 2.5B). 3. Place the coverslip in the middle of silicone well filled with imaging buffer, with
the transfected cells facing the imaging buffer (Figure 2.5C, see Note 5). 4. Excess water will be squeezed out and the coverslip will nicely mount on to the
silicone divider. Make sure that no air bubble is introduced in the buffer. If there is an air bubble, carefully remove the coverslip with the tweezer and start from step 1.
Once the coverslip with transfected cells is successfully mounted on to the silicone well, it is ready for FRAP. For this follow the FRAP protocol in 3.2.
2.4.6 FRAP
There is no standardized universal protocol for FRAP since the experimental design depends on bleaching and recovery characteristics of the fluorescent molecule under study. However, all FRAP experiments contain three phases, i.e., 1. Pre-bleach image acquisition, 2. Photo-bleaching and 3. Post-bleach image acquisition. For the FRAP dataset to be comparable across various conditions/treatments, keep the same parameters for all FRAP measurements.
Using FRAP to quantify changes in transcription factor dynamics and data analysis| 23
2
3
4
5
6
7
8
Figure 2.5. Preparation of the cells grown on coverslip for FRAP. (A) The silicone divider is mounted on to a microscopic glass slide. (B) Imaging buffer is filled in the silicone well. (C) Transfected cells grown on a coverslip is placed on the imaging buffer (cells are facing the imaging buffer).
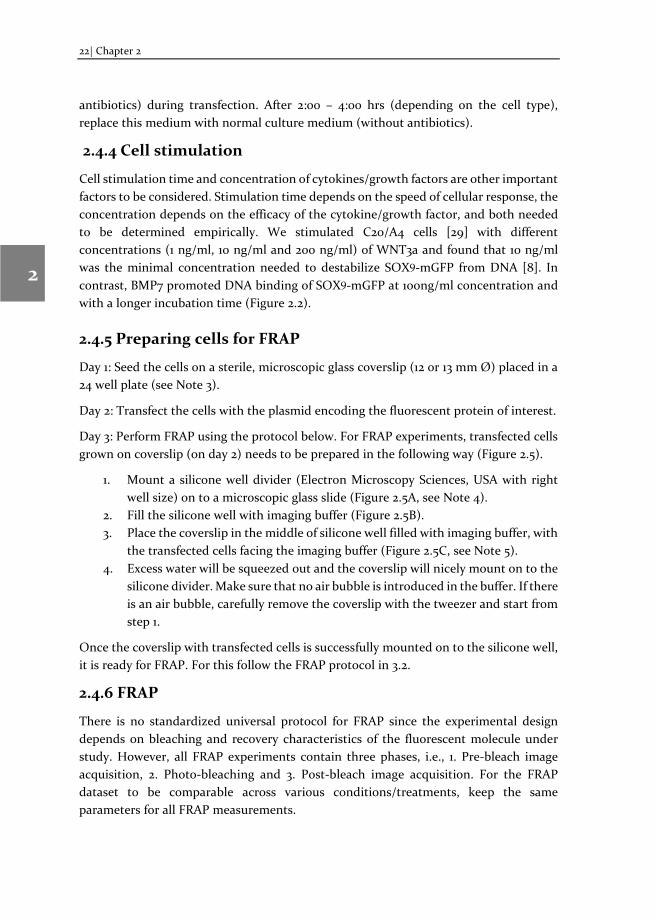
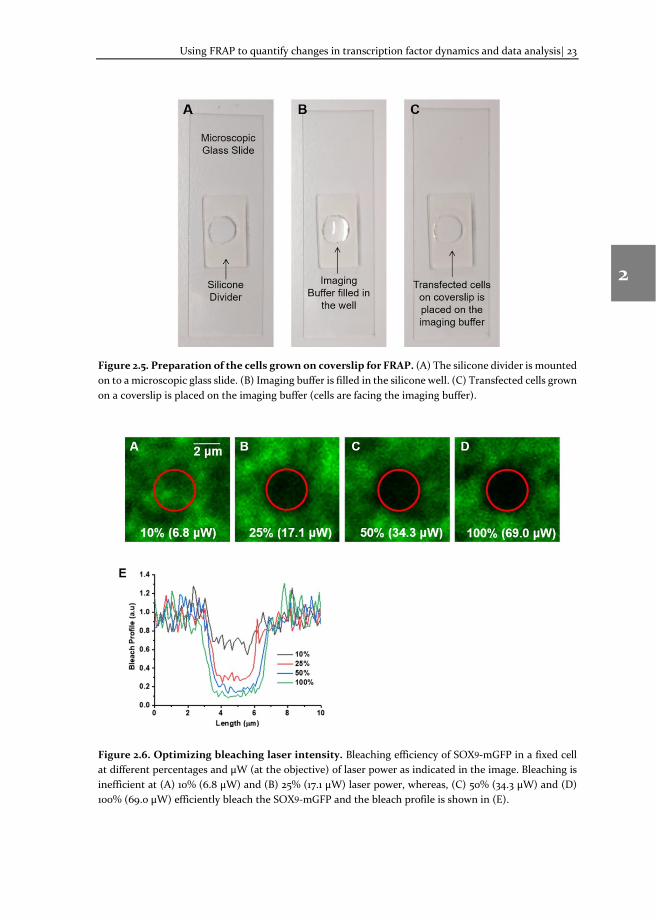
Figure 2.6. Optimizing bleaching laser intensity. Bleaching efficiency of SOX9-mGFP in a fixed cell at different percentages and μW (at the objective) of laser power as indicated in the image. Bleaching is inefficient at (A) 10% (6.8 μW) and (B) 25% (17.1 μW) laser power, whereas, (C) 50% (34.3 μW) and (D) 100% (69.0 μW) efficiently bleach the SOX9-mGFP and the bleach profile is shown in (E).
24| Chapter 2
2
3
4
5
6
7
8
1. Pre-bleach image acquisition: Pre-bleach images are used to normalize the fluorescence recovery data during analysis. Usually, 10 pre-bleach images are sufficient to get averaged pre-bleach intensity. However, if your fluorophore (such as mGFP) has a triplet state, in order to exclude the artefacts introduced by this triplet state of mGFP, more pre-bleach images (>25) are required. During analysis, use only the average intensity of last 10 pre-bleach images for normalization.
2. Photobleaching: Photobleaching should be instantaneous after the pre-bleach. A small region of interest (ROI) is photo-bleached with a high laser power. The laser used for the image acquisition can be used for photobleaching as well and the laser power needs to be determined empirically. Duration of bleaching and number of iterations of high-intensity laser pulse should be as low as possible to calculate accurate protein dynamics. Optimal bleaching parameters can be easily determined using a fixed cell (using 4% paraformaldehyde in PBS) expressing the same fluorescent protein (Figure 2.6). The following guidelines can be helpful:
i. Laser power: Usually, 25 – 100% laser power is used for photobleaching. Higher laser power enables faster bleaching, but is toxic to the cells [30]. It should be optimized to the minimum laser power needed to achieve complete photobleaching of the ROI (Figure 2.6).
ii. Size of the ROI: The size of the ROI is usually less than 10% of the total fluorescence distribution area. It also depends on the kinetics of the fluorescent molecule. A size of 1-2 μm (Ø) ROIs with higher magnification objectives (60x/100x) give a good signal to noise ratio (SNR). Smaller ROIs will increase the noise.
iii. Shape of the ROI: The ROI can be circular or a rectangle or a square. Again, this depends on the shape/distribution of the fluorescent protein. We use a circular ROI for nuclear proteins, such as transcription factors. However, the calculation formulae may need to be adjusted according to the shape of the ROI [31].
iv. Duration of bleaching: Ideally it should be as short as possible. v. Number of iterations: It is recommended to achieve complete
photobleaching in a single iteration. This is especially important when studying fast kinetics.
vi. Scan speed: The higher the scan speed, the faster the bleaching process. However, the bleaching can be inefficient.
3. Post-bleach image acquisition: Acquire sequence of images after photobleaching to monitor the dynamics of fluorescence recovery. The following acquisition guidelines can be used to resolve the dynamic range and good temporal resolution.
Using FRAP to quantify changes in transcription factor dynamics and data analysis| 25
2
3
4
5
6
7
8
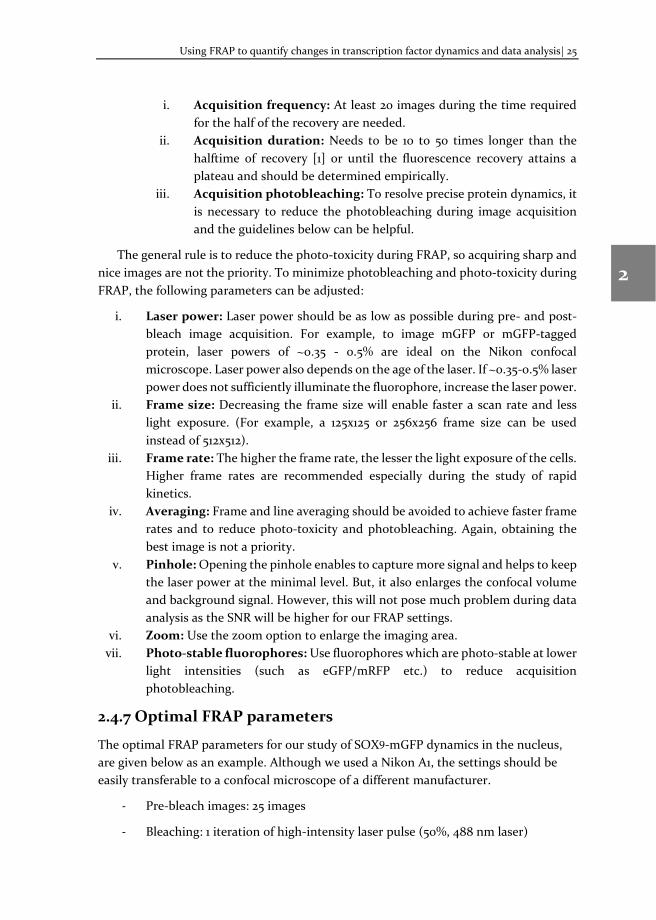
i. Acquisition frequency: At least 20 images during the time required for the half of the recovery are needed.
ii. Acquisition duration: Needs to be 10 to 50 times longer than the halftime of recovery [1] or until the fluorescence recovery attains a plateau and should be determined empirically.
iii. Acquisition photobleaching: To resolve precise protein dynamics, it is necessary to reduce the photobleaching during image acquisition and the guidelines below can be helpful.
The general rule is to reduce the photo-toxicity during FRAP, so acquiring sharp and nice images are not the priority. To minimize photobleaching and photo-toxicity during FRAP, the following parameters can be adjusted:
i. Laser power: Laser power should be as low as possible during pre- and post-bleach image acquisition. For example, to image mGFP or mGFP-tagged protein, laser powers of ~0.35 - 0.5% are ideal on the Nikon confocal microscope. Laser power also depends on the age of the laser. If ~0.35-0.5% laser power does not sufficiently illuminate the fluorophore, increase the laser power.
ii. Frame size: Decreasing the frame size will enable faster a scan rate and less light exposure. (For example, a 125x125 or 256x256 frame size can be used instead of 512x512).
iii. Frame rate: The higher the frame rate, the lesser the light exposure of the cells. Higher frame rates are recommended especially during the study of rapid kinetics.
iv. Averaging: Frame and line averaging should be avoided to achieve faster frame rates and to reduce photo-toxicity and photobleaching. Again, obtaining the best image is not a priority.
v. Pinhole: Opening the pinhole enables to capture more signal and helps to keep the laser power at the minimal level. But, it also enlarges the confocal volume and background signal. However, this will not pose much problem during data analysis as the SNR will be higher for our FRAP settings.
vi. Zoom: Use the zoom option to enlarge the imaging area. vii. Photo-stable fluorophores: Use fluorophores which are photo-stable at lower
light intensities (such as eGFP/mRFP etc.) to reduce acquisition photobleaching.
2.4.7 Optimal FRAP parameters
The optimal FRAP parameters for our study of SOX9-mGFP dynamics in the nucleus, are given below as an example. Although we used a Nikon A1, the settings should be easily transferable to a confocal microscope of a different manufacturer.
- Pre-bleach images: 25 images
- Bleaching: 1 iteration of high-intensity laser pulse (50%, 488 nm laser)
26| Chapter 2
2
3
4
5
6
7
8
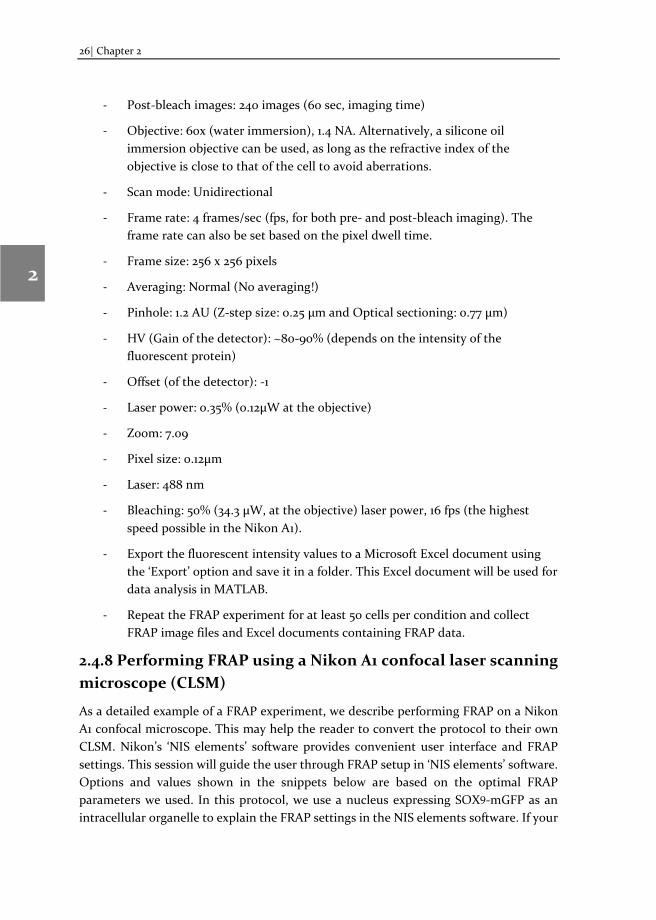
- Post-bleach images: 240 images (60 sec, imaging time)
- Objective: 60x (water immersion), 1.4 NA. Alternatively, a silicone oil immersion objective can be used, as long as the refractive index of the objective is close to that of the cell to avoid aberrations.
- Scan mode: Unidirectional
- Frame rate: 4 frames/sec (fps, for both pre- and post-bleach imaging). The frame rate can also be set based on the pixel dwell time.
- Frame size: 256 x 256 pixels
- Averaging: Normal (No averaging!)
- Pinhole: 1.2 AU (Z-step size: 0.25 μm and Optical sectioning: 0.77 μm)
- HV (Gain of the detector): ~80-90% (depends on the intensity of the fluorescent protein)
- Offset (of the detector): -1
- Laser power: 0.35% (0.12μW at the objective)
- Zoom: 7.09
- Pixel size: 0.12μm
- Laser: 488 nm
- Bleaching: 50% (34.3 μW, at the objective) laser power, 16 fps (the highest speed possible in the Nikon A1).
- Export the fluorescent intensity values to a Microsoft Excel document using the ‘Export’ option and save it in a folder. This Excel document will be used for data analysis in MATLAB.
- Repeat the FRAP experiment for at least 50 cells per condition and collect FRAP image files and Excel documents containing FRAP data.
2.4.8 Performing FRAP using a Nikon A1 confocal laser scanning microscope (CLSM)
As a detailed example of a FRAP experiment, we describe performing FRAP on a Nikon A1 confocal microscope. This may help the reader to convert the protocol to their own CLSM. Nikon’s ‘NIS elements’ software provides convenient user interface and FRAP settings. This session will guide the user through FRAP setup in ‘NIS elements’ software. Options and values shown in the snippets below are based on the optimal FRAP parameters we used. In this protocol, we use a nucleus expressing SOX9-mGFP as an intracellular organelle to explain the FRAP settings in the NIS elements software. If your
Using FRAP to quantify changes in transcription factor dynamics and data analysis| 27
2
3
4
5
6
7
8
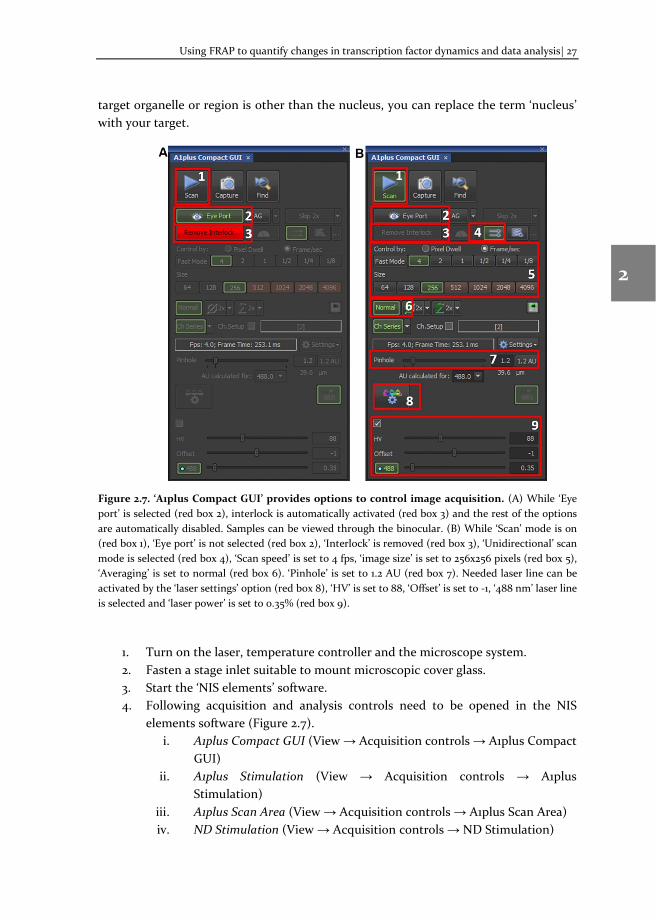
target organelle or region is other than the nucleus, you can replace the term ‘nucleus’ with your target.
Figure 2.7. ‘A1plus Compact GUI’ provides options to control image acquisition. (A) While ‘Eye port’ is selected (red box 2), interlock is automatically activated (red box 3) and the rest of the options are automatically disabled. Samples can be viewed through the binocular. (B) While ‘Scan’ mode is on (red box 1), ‘Eye port’ is not selected (red box 2), ‘Interlock’ is removed (red box 3), ‘Unidirectional’ scan mode is selected (red box 4), ‘Scan speed’ is set to 4 fps, ‘image size’ is set to 256x256 pixels (red box 5), ‘Averaging’ is set to normal (red box 6). ‘Pinhole’ is set to 1.2 AU (red box 7). Needed laser line can be activated by the ‘laser settings’ option (red box 8), ‘HV’ is set to 88, ‘Offset’ is set to -1, ‘488 nm’ laser line is selected and ‘laser power’ is set to 0.35% (red box 9).
1. Turn on the laser, temperature controller and the microscope system. 2. Fasten a stage inlet suitable to mount microscopic cover glass. 3. Start the ‘NIS elements’ software. 4. Following acquisition and analysis controls need to be opened in the NIS
elements software (Figure 2.7). i. A1plus Compact GUI (View → Acquisition controls → A1plus Compact
GUI) ii. A1plus Stimulation (View → Acquisition controls → A1plus
Stimulation) iii. A1plus Scan Area (View → Acquisition controls → A1plus Scan Area) iv. ND Stimulation (View → Acquisition controls → ND Stimulation)
28| Chapter 2
2
3
4
5
6
7
8
v. Ti Pad (View → Acquisition controls → Ti Pad) vi. Time Measurement (View → Analysis controls → Time Measurement)
5. ‘Ti Pad’ contains basic microscopic control options. Set the options as shown below to view the cells in the binocular.
i. Select ‘60x objective’ ii. Select the light path ‘E100’
iii. Select ‘EPI’ mode iv. Select ‘Shutters’ ‘ON v. Select ‘green filter’ (for GFP)
vi. Zoom option in the ‘Ti Pad’ is the optical zoom. Keep it at 1.00x in the ‘Ti Pad’ and in the microscope as well.
6. Set the parameters in the ‘A1plus Scan Area’ window, if necessary. Once the parameters are set, drag and position the scan area (red square) to the middle of the window and to confirm the position, right click on it (the red square will turn into green).
7. Place a drop of milliQ water on the 60x water objective and place the microscopic glass slide mounted with transfected cells. The glass slide should be placed in the inverted position, so that the microscopic coverslip is in contact with the objective.
8. Look through the ‘binocular’ and focus the cells using white light. Once the cells are focused, turn on the epi(fluorescent) light (white light can be turned off) and search for the transfected cells. Click the ‘EPI’ button to turn on/off the epi light in the ‘TiPad’ window. Following guidelines can be helpful to select the right cells for FRAP.
i. The transfected cell morphology should be normal. ii. Cells having extra weird fluorescent bodies should be avoided.
iii. Avoid cells expressing very low or very high levels of fluorescent proteins.
iv. For cells expressing optimal level of fluorescent proteins, ‘HV’ values would be ~85-90% (for above mentioned optimal FRAP parameters).
9. Position a nucleus (or other cellular region of interest) expressing fluorescent proteins in the center of the view area (when looking through the binocular).
10. Change the light path to ‘L100’ and turn on the ‘PFS’ in the ‘Ti Pad’ window. 11. Set the image acquisition parameters in ‘A1plus Compact GUI’ window, as shown
in the Figure 2.10. If ‘Remove Interlock’ button appears in ‘RED’, click on it, to remove interlock and turn on the ‘PFS’ in the ‘Ti Pad’ window.
12. Make sure that the correct laser is selected (for example, the 488 laser in case of GFP tagged protein) click on ‘Scan’ button (top left corner) in the ‘A1plus Compact GUI’ window. Once the first FRAP measurement is finished after starting NIS elements software, switching between ‘Eye’ and ‘Scan’ mode can be done in one click by ‘Eye Port’ button (Figure 2.7, red box 2).
Using FRAP to quantify changes in transcription factor dynamics and data analysis| 29
2
3
4
5
6
7
8
13. A new window showing the centered nucleus will appear. Focus may need to be slightly adjusted to bring the nucleus into focus.
14. Turn on ‘pixel saturation indicator’ and see if there are any saturated pixels in the nucleus (saturated pixels are shown as red dots by default). If saturated pixels appear, decrease HV values to reduce the number of saturated pixels (a few, <5 saturated pixels are allowed) and stop ‘Scan’ in the ‘A1plus Compact GUI’ window. A frozen window showing the desired nucleus will stay in the screen. (If the nucleus appears in the window, skip steps 15 and 16 and proceed to step 17).
15. If the nucleus does not appear in the window, the view area (step 6) or the scan area (step 9) might not be centered properly.
16. Another way to center the desired nucleus (expressing SOX9-mGFP) is to right click on the scan area (green square) and select the option ‘Scan full field of view’ in the ‘A1plus Scan Area’ window. The image acquisition parameters, such as frame rate, frame size and zoom will change. Again, set the zoom to 7.09 and scan area (red square) will appear again. Drag and position it around the nucleus of interest and right click on the red square to confirm the position (the red square will turn green). Adjust the image acquisition parameters to optimal conditions and click ‘Scan’ button in the ‘A1plus Compact GUI’ window and return to step 13.
17. Draw three ROIs in the frozen window. To draw ROIs, right click and drag inside the frozen window. Options to choose the ROI shape will appear on the frozen window and choose ‘Circular ROI’ option. The mouse pointer will turn into a ‘+’ sign, click and drag on the frozen window a red circular ROI will be drawn.
18. Right click on the ‘red ROI’ and click ‘ROI properties’ option. ‘ROI properties’ window will appear and set the ROI dimensions. After setting the values, close the ‘ROI properties’ window.
19. To draw two more ROIs, either repeat steps 17 and 18 or simply right click on the current ‘red ROI’ and select ‘Duplicate Selected ROIs’ option.
20. Assign a function to each ROI as mentioned in the order below. Click on a ROI to select it, to assign a function, right click on it, a window will appear, and select the function to be assigned. Keep the below order throughout the FRAP measurements, to get uniform datasets.
i. ‘Stimulation ROI’ (red, for FRAP measurements) ii. ‘Reference ROI’ (green, to measure the acquisition photobleaching)
iii. ‘Background ROI’ (blue, to measure the background signal 21. Once functions are assigned, ROIs in the frozen image will be labelled
accordingly and position the ROIs as per following guidelines. Position the ‘Stimulation ROI S1:1’ (red) in a representative region close to the center of the nucleus. Position the ‘Reference ROI R:2’ (green) as much as away from the
30| Chapter 2
2
3
4
5
6
7
8
stimulation ROI (but the fluorescent intensity levels should be identical to stimulation ROI). Position the ‘Background ROI B:3’ at the outside of the cell.
22. Set the bleaching parameters in ‘A1plus stimulation’ window. Select the appropriate laser (for example, 488 nm laser for GFP) for bleaching and set the intensity and the ‘Scan speed’ as optimized.
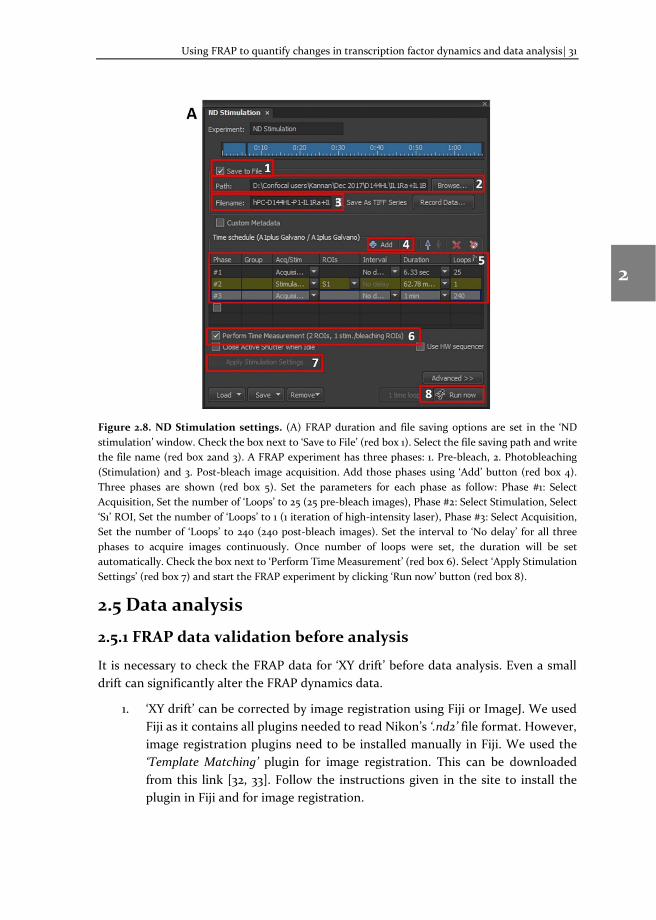
23. Set the FRAP duration and file saving options in ‘ND Stimulation’ window (Figure 2.8). Set the parameters as mentioned in the FRAP protocol. Follow the instructions in the figure legend to set the parameters and run the FRAP experiment. A new live window (with the ‘set file name’) acquiring series of images as set in ‘ND Stimulation’ will appear.
24. Once FRAP measurements are finished, fluorescent intensity values for all the three ROIs will be plotted against the function of time and will be displayed automatically in the ‘Time Measurement’ window.
25. Check the FRAP data shown in the ‘Time Measurement’ window for the following artifacts.
i. Acquisition photobleaching (green ROI) should be less than 10%. If it is more than 10% or any weird fluctuation is present, move the ‘Reference ROI’ to another location within the nucleus (but far from the ‘Stimulation ROI’) in the ‘FRAP image stack’.
ii. If the ROI is locked (fixed), right click on the ROI and select ‘Unlock Selected ROIs’ option. Once ROI is moved to another location, click the ‘Measure’ button in the ‘Time Measurement’ window. Repeat this step until the reference line is free of artifacts as mentioned in 25(i).
iii. There should be a proper FRAP recovery (red ROI) in the ‘Stimulation ROI’ intensity values. If there is no recovery and the intensity values appear flat after photobleaching, discard the data and check if the cells are healthy.
iv. Background intensity values ideally should be less than 50. If it is more than 50, move the ‘Background ROI’ to the outside of the cell and repeat the step (ii).
v. XY drift: if there is XY drift in the FRAP image stack, data can be used after drift correction (image registration, see Note 6).
vi. Z drift: If the FRAP images have Z drift, discard that FRAP measurement (see Note 7).
26. Export the fluorescent intensity values to a Microsoft Excel document using the ‘Export’ option and save it in a folder. This Excel document will be used for data analysis in MATLAB.
27. Repeat the FRAP experiment for at least 50 cells per condition and collect FRAP image files and Excel documents containing FRAP data.
Using FRAP to quantify changes in transcription factor dynamics and data analysis| 31
2
3
4
5
6
7
8
Figure 2.8. ND Stimulation settings. (A) FRAP duration and file saving options are set in the ‘ND stimulation’ window. Check the box next to ‘Save to File’ (red box 1). Select the file saving path and write the file name (red box 2and 3). A FRAP experiment has three phases: 1. Pre-bleach, 2. Photobleaching (Stimulation) and 3. Post-bleach image acquisition. Add those phases using ‘Add’ button (red box 4). Three phases are shown (red box 5). Set the parameters for each phase as follow: Phase #1: Select Acquisition, Set the number of ‘Loops’ to 25 (25 pre-bleach images), Phase #2: Select Stimulation, Select ‘S1’ ROI, Set the number of ‘Loops’ to 1 (1 iteration of high-intensity laser), Phase #3: Select Acquisition, Set the number of ‘Loops’ to 240 (240 post-bleach images). Set the interval to ‘No delay’ for all three phases to acquire images continuously. Once number of loops were set, the duration will be set automatically. Check the box next to ‘Perform Time Measurement’ (red box 6). Select ‘Apply Stimulation Settings’ (red box 7) and start the FRAP experiment by clicking ‘Run now’ button (red box 8).
2.5 Data analysis
2.5.1 FRAP data validation before analysis
It is necessary to check the FRAP data for ‘XY drift’ before data analysis. Even a small drift can significantly alter the FRAP dynamics data.
1. ‘XY drift’ can be corrected by image registration using Fiji or ImageJ. We used Fiji as it contains all plugins needed to read Nikon’s ‘.nd2’ file format. However, image registration plugins need to be installed manually in Fiji. We used the ‘Template Matching’ plugin for image registration. This can be downloaded from this link [32, 33]. Follow the instructions given in the site to install the plugin in Fiji and for image registration.
32| Chapter 2
2
3
4
5
6
7
8
2. After image registration, play the FRAP image stack in Fiji to check for the proper alignment. Still, if the alignment is not proper, discard this FRAP data.
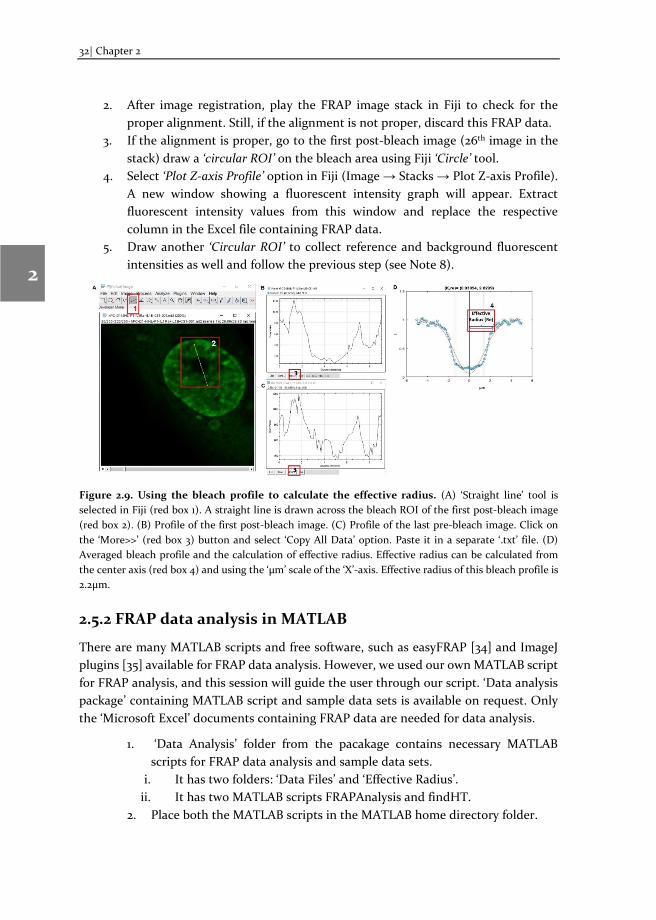
3. If the alignment is proper, go to the first post-bleach image (26th image in the stack) draw a ‘circular ROI’ on the bleach area using Fiji ‘Circle’ tool.
4. Select ‘Plot Z-axis Profile’ option in Fiji (Image → Stacks → Plot Z-axis Profile). A new window showing a fluorescent intensity graph will appear. Extract fluorescent intensity values from this window and replace the respective column in the Excel file containing FRAP data.
5. Draw another ‘Circular ROI’ to collect reference and background fluorescent intensities as well and follow the previous step (see Note 8).
Figure 2.9. Using the bleach profile to calculate the effective radius. (A) ‘Straight line’ tool is selected in Fiji (red box 1). A straight line is drawn across the bleach ROI of the first post-bleach image (red box 2). (B) Profile of the first post-bleach image. (C) Profile of the last pre-bleach image. Click on the ‘More>>’ (red box 3) button and select ‘Copy All Data’ option. Paste it in a separate ‘.txt’ file. (D) Averaged bleach profile and the calculation of effective radius. Effective radius can be calculated from the center axis (red box 4) and using the ‘μm’ scale of the ‘X’-axis. Effective radius of this bleach profile is 2.2μm.
2.5.2 FRAP data analysis in MATLAB
There are many MATLAB scripts and free software, such as easyFRAP [34] and ImageJ plugins [35] available for FRAP data analysis. However, we used our own MATLAB script for FRAP analysis, and this session will guide the user through our script. ‘Data analysis package’ containing MATLAB script and sample data sets is available on request. Only the ‘Microsoft Excel’ documents containing FRAP data are needed for data analysis.
1. ‘Data Analysis’ folder from the pacakage contains necessary MATLAB scripts for FRAP data analysis and sample data sets.
i. It has two folders: ‘Data Files’ and ‘Effective Radius’. ii. It has two MATLAB scripts FRAPAnalysis and findHT.
2. Place both the MATLAB scripts in the MATLAB home directory folder.
Using FRAP to quantify changes in transcription factor dynamics and data analysis| 33
2
3
4
5
6
7
8
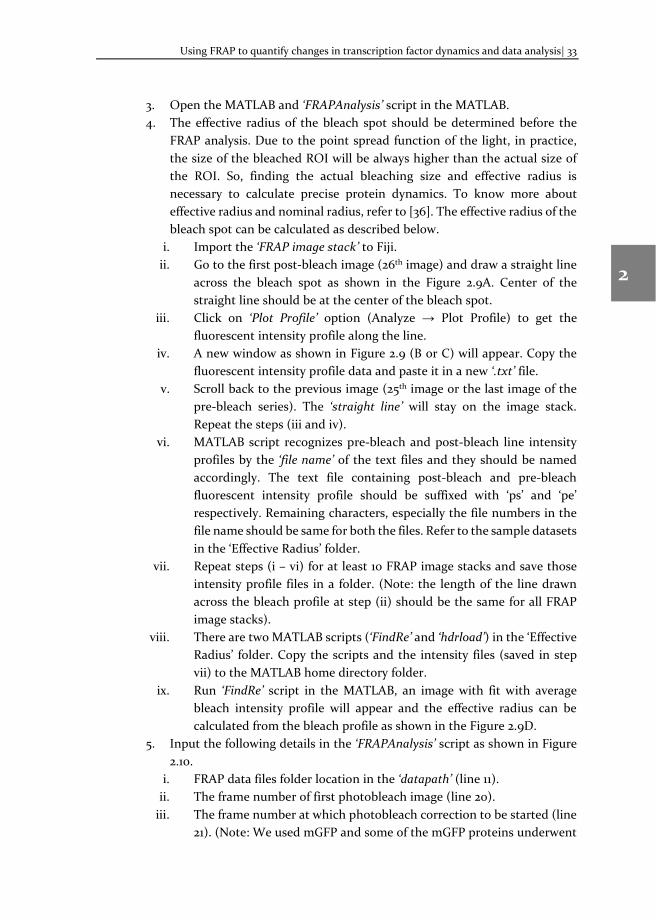
3. Open the MATLAB and ‘FRAPAnalysis’ script in the MATLAB. 4. The effective radius of the bleach spot should be determined before the
FRAP analysis. Due to the point spread function of the light, in practice, the size of the bleached ROI will be always higher than the actual size of the ROI. So, finding the actual bleaching size and effective radius is necessary to calculate precise protein dynamics. To know more about effective radius and nominal radius, refer to [36]. The effective radius of the bleach spot can be calculated as described below.
i. Import the ‘FRAP image stack’ to Fiji. ii. Go to the first post-bleach image (26th image) and draw a straight line
across the bleach spot as shown in the Figure 2.9A. Center of the straight line should be at the center of the bleach spot.
iii. Click on ‘Plot Profile’ option (Analyze → Plot Profile) to get the fluorescent intensity profile along the line.
iv. A new window as shown in Figure 2.9 (B or C) will appear. Copy the fluorescent intensity profile data and paste it in a new ‘.txt’ file.
v. Scroll back to the previous image (25th image or the last image of the pre-bleach series). The ‘straight line’ will stay on the image stack. Repeat the steps (iii and iv).
vi. MATLAB script recognizes pre-bleach and post-bleach line intensity profiles by the ‘file name’ of the text files and they should be named accordingly. The text file containing post-bleach and pre-bleach fluorescent intensity profile should be suffixed with ‘ps’ and ‘pe’ respectively. Remaining characters, especially the file numbers in the file name should be same for both the files. Refer to the sample datasets in the ‘Effective Radius’ folder.
vii. Repeat steps (i – vi) for at least 10 FRAP image stacks and save those intensity profile files in a folder. (Note: the length of the line drawn across the bleach profile at step (ii) should be the same for all FRAP image stacks).
viii. There are two MATLAB scripts (‘FindRe’ and ‘hdrload’) in the ‘Effective Radius’ folder. Copy the scripts and the intensity files (saved in step vii) to the MATLAB home directory folder.
ix. Run ‘FindRe’ script in the MATLAB, an image with fit with average bleach intensity profile will appear and the effective radius can be calculated from the bleach profile as shown in the Figure 2.9D.
5. Input the following details in the ‘FRAPAnalysis’ script as shown in Figure 2.10.
i. FRAP data files folder location in the ‘datapath’ (line 11). ii. The frame number of first photobleach image (line 20).
iii. The frame number at which photobleach correction to be started (line 21). (Note: We used mGFP and some of the mGFP proteins underwent
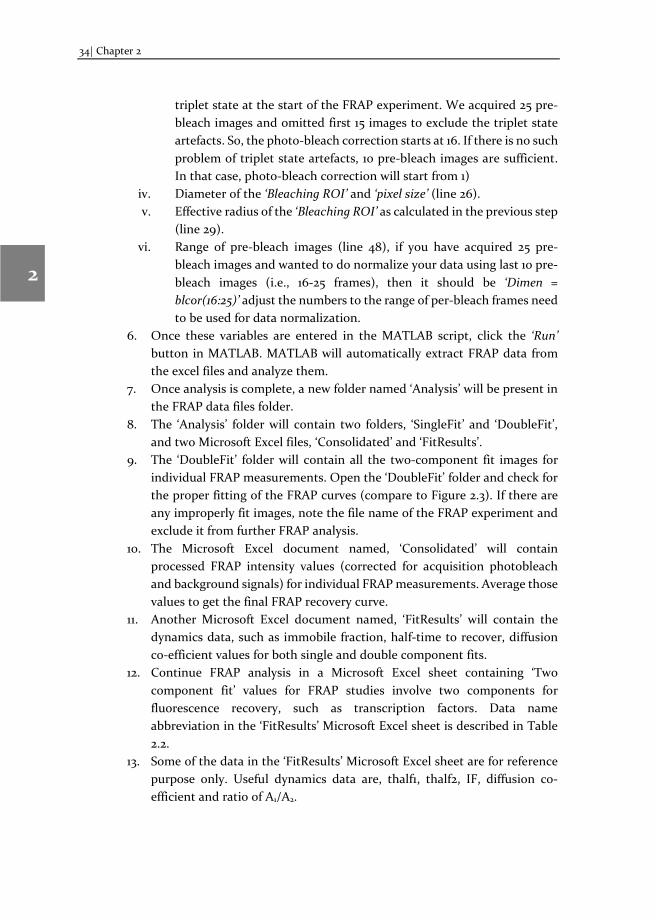
34| Chapter 2
2
3
4
5
6
7
8
triplet state at the start of the FRAP experiment. We acquired 25 pre-bleach images and omitted first 15 images to exclude the triplet state artefacts. So, the photo-bleach correction starts at 16. If there is no such problem of triplet state artefacts, 10 pre-bleach images are sufficient. In that case, photo-bleach correction will start from 1)
iv. Diameter of the ‘Bleaching ROI’ and ‘pixel size’ (line 26). v. Effective radius of the ‘Bleaching ROI’ as calculated in the previous step
(line 29). vi. Range of pre-bleach images (line 48), if you have acquired 25 pre-
bleach images and wanted to do normalize your data using last 10 pre-bleach images (i.e., 16-25 frames), then it should be ‘Dimen = blcor(16:25)’ adjust the numbers to the range of per-bleach frames need to be used for data normalization.
6. Once these variables are entered in the MATLAB script, click the ‘Run’ button in MATLAB. MATLAB will automatically extract FRAP data from the excel files and analyze them.
7. Once analysis is complete, a new folder named ‘Analysis’ will be present in the FRAP data files folder.
8. The ‘Analysis’ folder will contain two folders, ‘SingleFit’ and ‘DoubleFit’, and two Microsoft Excel files, ‘Consolidated’ and ‘FitResults’.
9. The ‘DoubleFit’ folder will contain all the two-component fit images for individual FRAP measurements. Open the ‘DoubleFit’ folder and check for the proper fitting of the FRAP curves (compare to Figure 2.3). If there are any improperly fit images, note the file name of the FRAP experiment and exclude it from further FRAP analysis.
10. The Microsoft Excel document named, ‘Consolidated’ will contain processed FRAP intensity values (corrected for acquisition photobleach and background signals) for individual FRAP measurements. Average those values to get the final FRAP recovery curve.
11. Another Microsoft Excel document named, ‘FitResults’ will contain the dynamics data, such as immobile fraction, half-time to recover, diffusion co-efficient values for both single and double component fits.
12. Continue FRAP analysis in a Microsoft Excel sheet containing ‘Two component fit’ values for FRAP studies involve two components for fluorescence recovery, such as transcription factors. Data name abbreviation in the ‘FitResults’ Microsoft Excel sheet is described in Table 2.2.
13. Some of the data in the ‘FitResults’ Microsoft Excel sheet are for reference purpose only. Useful dynamics data are, thalf1, thalf2, IF, diffusion co-efficient and ratio of A1/A2.
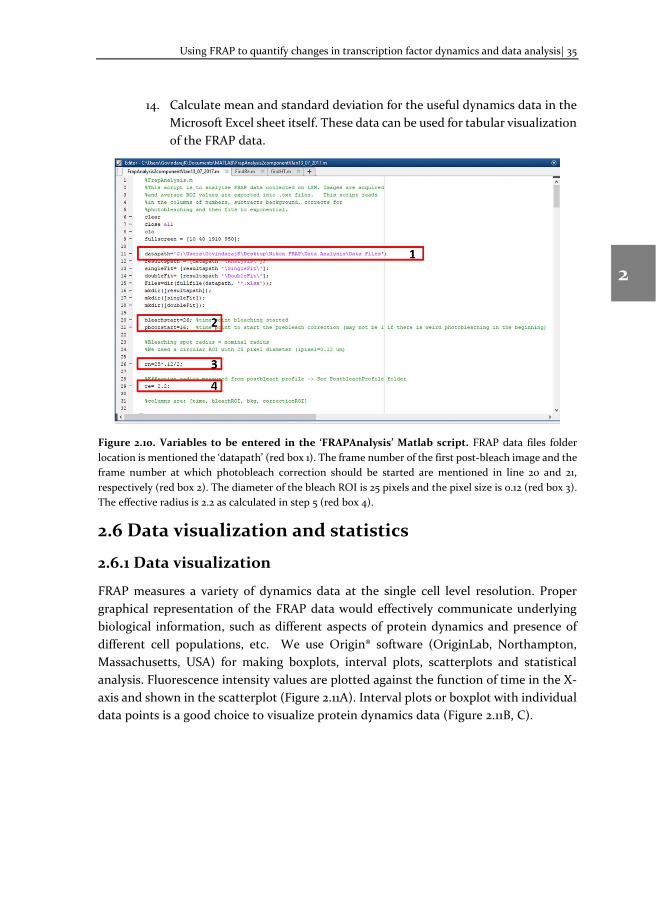
Using FRAP to quantify changes in transcription factor dynamics and data analysis| 35
2
3
4
5
6
7
8
14. Calculate mean and standard deviation for the useful dynamics data in the Microsoft Excel sheet itself. These data can be used for tabular visualization of the FRAP data.
Figure 2.10. Variables to be entered in the ‘FRAPAnalysis’ Matlab script. FRAP data files folder location is mentioned the ‘datapath’ (red box 1). The frame number of the first post-bleach image and the frame number at which photobleach correction should be started are mentioned in line 20 and 21, respectively (red box 2). The diameter of the bleach ROI is 25 pixels and the pixel size is 0.12 (red box 3). The effective radius is 2.2 as calculated in step 5 (red box 4).
2.6 Data visualization and statistics
2.6.1 Data visualization
FRAP measures a variety of dynamics data at the single cell level resolution. Proper graphical representation of the FRAP data would effectively communicate underlying biological information, such as different aspects of protein dynamics and presence of different cell populations, etc. We use Origin® software (OriginLab, Northampton, Massachusetts, USA) for making boxplots, interval plots, scatterplots and statistical analysis. Fluorescence intensity values are plotted against the function of time in the X-axis and shown in the scatterplot (Figure 2.11A). Interval plots or boxplot with individual data points is a good choice to visualize protein dynamics data (Figure 2.11B, C).
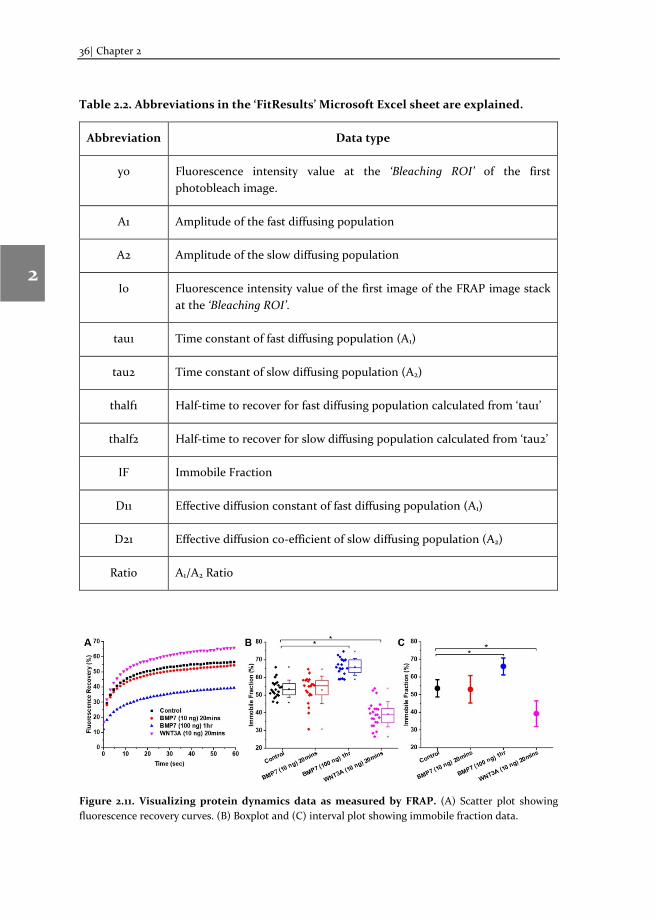
36| Chapter 2
2
3
4
5
6
7
8
Table 2.2. Abbreviations in the ‘FitResults’ Microsoft Excel sheet are explained.
Abbreviation Data type
y0 Fluorescence intensity value at the ‘Bleaching ROI’ of the first photobleach image.
A1 Amplitude of the fast diffusing population
A2 Amplitude of the slow diffusing population
I0 Fluorescence intensity value of the first image of the FRAP image stack at the ‘Bleaching ROI’.
tau1 Time constant of fast diffusing population (A1)
tau2 Time constant of slow diffusing population (A2)
thalf1 Half-time to recover for fast diffusing population calculated from ‘tau1’
thalf2 Half-time to recover for slow diffusing population calculated from ‘tau2’
IF Immobile Fraction
D11 Effective diffusion constant of fast diffusing population (A1)
D21 Effective diffusion co-efficient of slow diffusing population (A2)
Ratio A1/A2 Ratio
Figure 2.11. Visualizing protein dynamics data as measured by FRAP. (A) Scatter plot showing fluorescence recovery curves. (B) Boxplot and (C) interval plot showing immobile fraction data.
Using FRAP to quantify changes in transcription factor dynamics and data analysis| 37
2
3
4
5
6
7
8
2.6.2 Statistics
Our data does not show a normal distribution because of the cellular heterogeneity. We therefore used a Mann-Whitney U-test to calculate statistical significance.
2.7 Notes 1. Maintaining physiological pH and osmolarity during imaging is important to keep the
cells alive and normal. We used Tyrode’s solution [37] buffered with HEPES during imaging.
2. In case of using media without phenol red as imaging media, either CO2 supply or HEPES buffering is required during imaging. Avoid incubating cells (in well plates) in the imaging buffer in the CO2 incubator.
3. Wash the coverslips with ‘90% EtOH + 10% glacial acetic acid’ solution and rinse with 70% EtOH. Autoclave and keep sterile until use (Sec 2.2.1 day 1).
4. We used a silicone gasket with 1.5mm thickness (cat#: 70465-2R2, EMS, USA). We did cut the small circular well and made the circle slightly bigger to allow for a larger imaging area (Sec 2.2.1, Point 1)
5. Coverslips in the 24-well plates can be easily lifted using a 10 μl tip and a tweezer. Practice this mounting step before doing the procedure with cells. This step needs prior practice! Gently press the coverslip with a fibreless tissue paper (such as Kimberly-Clark® Professional, Sec 2.2.1, Point 3).
6. Check if the XY drift occurs with every FRAP measurement, if it occurs frequently, check whether the glass side with coverslip is properly mounted in the stage inlet. Also, if there is a XY drift, mark it in the corresponding Microsoft Excel file containing FRAP data. So that during data validation, corresponding FRAP image stack can be readily picked for image registration (Sec 3.1, Point 25.v)
7. If the ‘PFS’ is turned on, usually the Z drift will not occur (Sec 3.1, Point 26). 8. You can create shortcuts for ‘Template Matching’ and ‘Plot Z-axis profile’ options in the
Fiji (Plugins → Shortcuts → Add Shortcuts → Select preferred shortcut key and command). This will help to save time during data validation (Sec 3.2, Point 5).
38| Chapter 2
2
3
4
5
6
7
8
References 1. Axelrod, D., Koppel, D. E., Schlessinger, J., Elson, E. & Webb, A. W. (1976) Mobility measurement by analysis of fluorescence photobleaching recovery kinetics, Biophys J. 16, 1055-1069. 2. Tsien, R. Y. (1998) The green fluorescent protein, Annu Rev Biochem. 67, 509-544. 3. Fritzsche, M. & Charras, G. (2015) Dissecting protein reaction dynamics in living cells by fluorescence recovery after photobleaching, Nat Protoc. 10, 660-80. 4. Sprague, B. L. & McNally, J. G. (2005) FRAP analysis of binding: proper and fitting, Trends Cell Biol. 15, 84-91. 5. Pan, Y., Tsai, C.-J., Ma, B. & Nussinov, R. (2010) Mechanisms of transcription factor selectivity, Trends in Genetics. 26, 75-83. 6. Spivakov, M. (2014) Spurious transcription factor binding: non-functional or genetically redundant?, Bioessays. 36, 798-806. 7. Orphanides, G. & Reinberg, D. (2002) A Unified Theory of Gene Expression, Cell. 108, 439-451. 8. Govindaraj, K., Hendriks, J., Lidke, D. S., Karperien, M. & Post, J. N. (2019) Changes in Fluorescence Recovery After Photobleaching (FRAP) as an indicator of SOX9 transcription factor activity, Biochimica et Biophysica Acta (BBA) - Gene Regulatory Mechanisms. 1862, 107-117. 9. Jinek, M., Chylinski, K., Fonfara, I., Hauer, M., Doudna, J. A. & Charpentier, E. (2012) A Programmable Dual-RNA–Guided DNA Endonuclease in Adaptive Bacterial Immunity, Science. 337, 816. 10. Mueller, F., Mazza, D., Stasevich, T. J. & McNally, J. G. (2010) FRAP and kinetic modeling in the analysis of nuclear protein dynamics: what do we really know?, Curr Opin Cell Biol. 22, 403-11. 11. Beaudouin, J., Mora-Bermudez F Fau - Klee, T., Klee T Fau - Daigle, N., Daigle N Fau - Ellenberg, J. & Ellenberg, J. (2006) Dissecting the contribution of diffusion and interactions to the mobility of nuclear proteins, Biophys J. 15. 12. Fritzsche, M., Lewalle A Fau - Duke, T., Duke T Fau - Kruse, K., Kruse K Fau - Charras, G. & Charras, G. Analysis of turnover dynamics of the submembranous actin cortex. 24, 757-767. 13. Oh, D., Zidovska, A., Xu, Y. & Needleman, Daniel J. (2011) Development of Time-Integrated Multipoint Moment Analysis for Spatially Resolved Fluctuation Spectroscopy with High Time Resolution, Biophysical Journal. 101, 1546-1554. 14. Kim, S. A., Heinze, K. G. & Schwille, P. (2007) Fluorescence correlation spectroscopy in living cells, Nature Methods. 4, 963. 15. Herrick-Davis, K., Grinde, E., Cowan, A. & Mazurkiewicz, J. E. (2013) Fluorescence Correlation Spectroscopy Analysis of Serotonin, Adrenergic, Muscarinic, and Dopamine Receptor Dimerization: The Oligomer Number Puzzle, Molecular Pharmacology. 84, 630-642. 16. Mendoza, M. C., Besson S Fau - Danuser, G. & Danuser, G. Quantitative fluorescent speckle microscopy (QFSM) to measure actin dynamics. Unit 2.18. 17. Watanabe, N. Inside view of cell locomotion through single-molecule: fast F-/G-actin cycle and G-actin regulation of polymer restoration. 86, 62-83. 18. Watanabe, N. & Mitchison, T. J. Single-molecule speckle analysis of actin filament turnover in lamellipodia. 295, 1083-1086 19. Bi, W., Deng, J. M., Zhang, Z., Behringer, R. R. & de Crombrugghe, B. (1999) Sox9 is required for cartilage formation, Nature Genetics. 22, 85. 20. Rayan, G., Guet, J.-E., Taulier, N., Pincet, F. & Urbach, W. (2010) Recent Applications of Fluorescence Recovery after Photobleaching (FRAP) to Membrane Bio-Macromolecules, Sensors (Basel, Switzerland). 10, 5927-5948. 21. Blaney Davidson, E. N., Vitters, E. L., van Lent, P. L., van de Loo, F. A., van den Berg, W. B. & van der Kraan, P. M. (2007) Elevated extracellular matrix production and degradation upon bone morphogenetic protein-2 (BMP-2) stimulation point toward a role for BMP-2 in cartilage repair and remodeling, Arthritis Res Ther. 9, R102.
Using FRAP to quantify changes in transcription factor dynamics and data analysis| 39
2
3
4
5
6
7
8
22. Shaner, N. C., Patterson, G. H. & Davidson, M. W. (2007) Advances in fluorescent protein technology, Journal of Cell Science. 120, 4247. 23. Nagy, P., Vereb, G., Post, J. N., Friedländer, E. & Szölloősi, J. (2005) Novel Single Cell Fluorescence Approaches in the Investigation of Signaling at the Cellular Level in Biophysical Aspects of Transmembrane Signaling (Damjanovich, S., ed) pp. 33-70, Springer Berlin Heidelberg, Berlin, Heidelberg. 24. Zacharias, D. A., Violin, J. D., Newton, A. C. & Tsien, R. Y. (2002) Partitioning of Lipid-Modified Monomeric GFPs into Membrane Microdomains of Live Cells, Science. 296, 913. 25. Shaner, N. C., Steinbach, P. A. & Tsien, R. Y. (2005) A guide to choosing fluorescent proteins, Nature Methods. 2, 905. 26. Cardarelli, F., Tosti L Fau - Serresi, M., Serresi M Fau - Beltram, F., Beltram F Fau - Bizzarri, R. & Bizzarri, R. Fluorescent recovery after photobleaching (FRAP) analysis of nuclear export rates identifies intrinsic features of nucleocytoplasmic transport. 287, 5554-61 27. Wu, B., Piatkevich, K. D., Lionnet, T., Singer, R. H. & Verkhusha, V. V. (2011) Modern fluorescent proteins and imaging technologies to study gene expression, nuclear localization, and dynamics, Current opinion in cell biology. 23, 310-317. 28. Nissim-Rafinia, M. & Meshorer, E. (2011) Photobleaching Assays (FRAP & FLIP) to Measure Chromatin Protein Dynamics in Living Embryonic Stem Cells, Journal of Visualized Experiments : JoVE, 2696. 29. Goldring, M. B., Birkhead, J. R., Suen, L. F., Yamin, R., Mizuno, S., Glowacki, J., Arbiser, J. L. & Apperley, J. F. (1994) Interleukin-1 beta-modulated gene expression in immortalized human chondrocytes, J Clin Invest. 94, 2307-16. 30. Post, J. N., Lidke, K. A., Rieger, B. & Arndt-Jovin, D. J. (2005) One- and two-photon photoactivation of a paGFP-fusion protein in live Drosophila embryos, FEBS Letters. 579, 325-330. 31. Siggia, E. D., Lippincott-Schwartz, J. & Bekiranov, S. (2000) Diffusion in Inhomogeneous Media: Theory and Simulations Applied to Whole Cell Photobleach Recovery, Biophysical Journal. 79, 1761-1770. 32. Tseng, Q. (2011) Template Matching and Slice Alignment - ImageJ Plugins https://sitesgooglecom/site/qingzongtseng/template-matching-ij-plugin 33. Tseng, Q., Wang, I., Duchemin-Pelletier, E., Azioune, A., Carpi, N., Gao, J., Filhol, O., Piel, M., Théry, M. & Balland, M. (2011) A new micropatterning method of soft substrates reveals that different tumorigenic signals can promote or reduce cell contraction levels, Lab on a Chip. 11, 2231-2240. 34. Koulouras, G., Panagopoulos, A., Rapsomaniki, M. A., Giakoumakis, N. N., Taraviras, S. & Lygerou, Z. (2018) EasyFRAP-web: a web-based tool for the analysis of fluorescence recovery after photobleaching data, Nucleic acids research. 46, W467-W472. 35. Blumenthal, D., Goldstien, L., Edidin, M. & Gheber, L. A. (2015) Universal Approach to FRAP Analysis of Arbitrary Bleaching Patterns, Scientific Reports. 5, 11655. 36. Day, C. A., Kraft, L. J., Kang, M. & Kenworthy, A. K. (2012) Analysis of protein and lipid dynamics using confocal fluorescence recovery after photobleaching (FRAP), Current protocols in cytometry / editorial board, J Paul Robinson, managing editor [et al]. CHAPTER, Unit2.19. 37. Lidke, D. S., Nagy, P., Heintzmann, R., Arndt-Jovin, D. J., Post, J. N., Grecco, H. E., Jares-Erijman, E. A. & Jovin, T. M. (2004) Quantum dot ligands provide new insights into erbB/HER receptor–mediated signal transduction, Nature Biotechnology. 22, 198.

3 Changes in Fluorescence Recovery After
Photobleaching (FRAP) as an indicator of SOX9 transcription factor activity
Abstract
Cells respond to their environment via an intricate cellular signaling network, directing cell fate. Changes in cell fate are characterized by changes in gene transcription, dictated by (master) transcription factor activity. SOX9 is the master transcription factor for chondrocyte development. Its impaired function is implicated in osteoarthritis and growth disorders, such as dwarfism. However, the factors regulating SOX9 transcriptional activity are not yet fully mapped. Current methods to study transcription factor activity are indirect and largely limited to quantification of SOX9 target gene and protein expression levels after several hours or days of stimulation, leading to poor temporal resolution. We used Fluorescence Recovery After Photobleaching (FRAP) to study the mobility of SOX9 and correlated the changes in mobility to changes in its transcriptional activity by cross-validating with chromatin immunoprecipitation and qPCR. We show that using FRAP, we can quantify the changes in SOX9 mobility on short time scales as an indication of transcriptional activity, which correlated to changes of SOX9 DNA-binding and long-term target gene expression.
Kannan Govindaraj, Jan Hendriks, Diane S. Lidke, Marcel Karperien and Janine N. Post
Published: BBA - Gene Regulatory Mechanisms (2019), DOI:doi.org/10.1016/j.bbagrm.2018.11.001
42 | Chapter 3
1
2
3
4
5
6
7
8
3.1 Introduction
SOX9 is the master transcription factor of cartilage formation during the differentiation of mesenchymal stem cells into chondrocytes. SOX9 controls several processes during development, differentiation, disease and tissue homeostasis, and is under control of several signaling networks, including hedgehog, notch, wnt/β-catenin and TGF-β signaling. Its differential regulation is implicated in many diseases, including dwarfism and other growth disorders, and in cartilage pathophysiology, such as osteoarthritis (OA) [1].
The regulation of SOX9 transcriptional activity is not yet fully mapped. In contrast, SOX9 expression patterns have been described in many tissue types, such as pancreas, intestine, lung, liver, cartilage and testis etc [1, 2]. TGF-β, BMP7 and FGF positively regulate SOX9 activity, whereas WNT3a, IL1β and notch signaling negatively regulate its acitivity [3]. During OA, SOX9 activity and expression is reduced [4]. We have previously shown that loss of ACAN and COL2A1 expression precedes loss of SOX9 expression, indicating that during OA SOX9 activity is not solely reduced by a lack of SOX9 expression [5]. This indicates that there are factors regulating SOX9 protein activity. In this paper, we tested whether factors that are known to be differentially regulated in OA can directly influence SOX9 transcriptional activity. For this we chose a positive regulator of SOX9, BMP7, and two negative regulators of cartilage homeostasis, IL1β and WNT3a.
Cartilage development and homeostasis is traditionally measured in terms of expression of SOX9 and its target genes, collagen 2 and aggrecan, at the mRNA level. In chondrocytes, BMP7 stimulates SOX9 target genes and thereby the production of chondrocyte specific extracellular matrix genes such as proteoglycan and collagens [6-9] and is clinically approved for cartilage and bone tissue regeneration [10, 11]. WNT3a is a prototypical, well-characterized activator of the canonical WNT/β-catenin pathway [12], downregulates cartilage matix genes and has a well-documented role in osteoarthritis pathology [13, 14]. Among several pro-inflammatory cytokines, IL1β plays a keyrole in cartilage pathology [15]. IL1β is a potent inhibitor of the chondrocyte phenotype by downregulating SOX9, COL2A1 and ACAN mRNA expression [16, 17]. Although much is known about downstream regulation of SOX9 target gene expression, the upstream factors regulating SOX9 protein activity are not yet fully mapped.
Currently, the activity of SOX9 is studied indirectly and on the long-term, using qPCR, promotor reporter assays, western blot or immunofluorescence by measuring the target gene or protein expression levels and correlating this to the transcription factor activity [18]. However, these traditional methods have some limitations. For example, mRNA expression does not always result in subsequent protein expression and protein expression does not always correspond to protein activity [5]. Secondly, although these
Changes in Fluorescence Recovery After Photobleaching (FRAP) as an indicator of SOX9 activity| 43
1
2
3
4
5
6
7
8
methods provide effective qualitative and quantitative information on gene and protein expression, information on transcription factor dynamics and activity is limited. Thirdly, often hundreds to thousands of cells are used for these experiments, limiting the use of these methods for investigating transcription factor activity in rare tissue samples. These limitations necessitate the need of a new method that enables the study of the activity of transcription factors directly.
We used FRAP to study the real-time dynamics of SOX9 with spatiotemporal resolution in response to a variety of extracellular signals. We applied the principle that the mobility of nuclear receptors can be correlated to their activity level. In theory, an active transcription factor is transiently bound to DNA, rendering it relatively immobile, whereas an unbound transcription factor will be more highly mobile, and this can be quantified by FRAP. Although FRAP has already been used to study the mobility of transcription factors in steady-state situations, mobility was not previously correlated to changes in DNA binding and target gene expression levels in response to changes in the extracellular environment. Fluorescence Correlation Spectroscopy (FCS) and Single Molecule Microscopy (SMM) are other direct methods, which can probe transcription factor mobility. However, they require expensive and complex instrumentation and analysis methods [19].
Most methods currently applied to study the activity of transcription factors fail to capture the immediate changes of SOX9 activity following stimulation. To bridge this gap, we applied FRAP as a fast, relatively simple, less expensive and more direct method, to study the immediate changes of transcriptional activity in response to external stimuli. FRAP provides quantitative measures of protein dynamics, such as immobile fraction (IF, fraction bound to DNA), half-time to recover (t½), and the ratio of the fast diffusing population (unbound transcription factor) to slow diffusing population (interaction at the binding site) (A1/A2) of fluorescent moieties [19].
We measured SOX9 transcriptional activity by FRAP in the chondrocyte cell line C-20/A4 [20] both in the presence and absence of known regulators of SOX9, such as BMP7, WNT3a and IL1β. In this paper, we show that the stimulation of C-20/A4 cells by these factors immediately and directly changes SOX9 binding with DNA and transcriptional activity and that these changes can be detected in living single cells by FRAP.
3.2 Materials and methods
3.2.1 Plasmids
The vector expressing SOX9-mGFP was constructed by cloning mGFP (PS100040, Origene) with the C-terminal of wild type SOX9 (RC208944, Origene) using SgfI and MluI restriction sites. The correct reading frame of the fusion construct was verified by
44 | Chapter 3
1
2
3
4
5
6
7
8
sequencing. Non-dimerizing and non-DNA binding mutated SOX9-mGFP, A76E and W143R respectively, were generated from SOX9-mGFP by site-directed mutagenesis (210518, Agilent). Primer sequences used for site directed mutagenesis are specified in Table S3.2. Mutations were verified by sequencing.
3.2.2 Cell culture and Transfection
Immortalized human juvenile costal chondrocytes (C-20/A4 cells) [20] were cultured in DMEM (Invitrogen, USA) supplemented with 10% FBS (Sigma) without antibiotic at 37⁰C with 5% CO2. Cells were cultured on glass coverslips and transfected a day before FRAP measurements. Cells were plated in 24 well plate a day before transfection. Lipofectamine LTX with Plus Reagent (Invitrogen, USA) was used for transfection and the manufacturer’s protocol was followed.
3.2.3 Imaging Buffer
Imaging was performed in Tyrode’s buffer with freshly added 20 mM glucose (GIBCO) and 0.1% BSA (Sigma) [48]. Tyrode’s buffer is composed of 135 mM NaCl (Sigma), 10 mM KCl (Sigma), 0.4 mM MgCl2 (Sigma), 1 mM CaCl2 (Sigma), 10 mM HEPES (Acros organics), pH adjusted to 7.2, filter sterilized and stored at -20.
3.2.4 Cytokine/antagonist treatments
Cells were washed with Imaging buffer, and either WNT3a (R&D Systems, Minneapolis, USA) or IL1β (PeproTech, USA) was supplemented to the imaging buffer at a final concentration of 10 ng/ml, unless otherwise noted. FRAP was performed starting from 20 min after treatment, unless otherwise noted. The iNOS inhibitor 1400W (Cayman chemical, Michigan, USA) was added to the IL1β-treated cells after 20 min, at a final concentration of 100 µg/ml while maintaining the IL1β concentration. FRAP was performed after 20 min of 1400W addition. For BMP7 treatment, cells were incubated in 100 ng/ml of BMP7 (R&D Systems, Minneapolis, USA) for 1 hr.
3.2.5 Fluorescence Recovery After Photobleaching
Transiently transfected C-20/A4 cells grown on glass coverslips were maintained in imaging buffer with or without external factors. The FRAP measurement was performed in Nikon A1 laser scanning confocal microscope with 60X/1.2 NA water immersion objective, 488 nm Argon laser at 0.5% laser power during imaging and 1 iteration of 50% laser power during photo-bleaching (Nikon, Japan). The temperature was maintained at 37°C with an OkaLab temperature controller. For FRAP, a frame size of 256x256 pixels covering the whole nucleus was scanned at 4 frames/sec for 60 sec post-bleach. The pixel size was 0.12 μm. A representative circular region of 2.9 μm diameter was bleached with
Changes in Fluorescence Recovery After Photobleaching (FRAP) as an indicator of SOX9 activity| 45
1
2
3
4
5
6
7
8
one iteration (60 ms) of high intensity laser (50%). Twenty-five pre-bleach images were taken and the last 10 pre-bleach fluorescence intensity values were averaged to normalize the post-bleach fluorescence recovery curve. We performed FRAP experiments on at least 20 cells per condition and repeated experiments at least twice. Individual FRAP measurement curves were averaged to get a single FRAP curve. To assess the statistical significance between the conditions Mann-Whitney U tests were applied using Origin software.
3.2.6 Formulae used in our FRAP calculations
We used a previously described diffusion uncoupled, two-component method [26] and applied it to analyze wild-type and mutated SOX9-mGFP FRAP data. A single-component fit was used to analyze mGFP mobility.
Single component fit: 𝐹𝐹(𝑡𝑡) = 𝑦𝑦0 + 𝐴𝐴1(1 − 𝑒𝑒−𝑡𝑡/𝜏𝜏) (equation 1)
where F0 is the value of the fluorescent intensity at the first post-bleach frame, A1 is the amplitude of the fast diffusing population and τ is the time constant.
Two-component fit: 𝐹𝐹(𝑡𝑡) = 𝑦𝑦0 + 𝐴𝐴1(1 − 𝑒𝑒−𝑡𝑡/𝜏𝜏1) + 𝐴𝐴2(1 − 𝑒𝑒−𝑡𝑡/𝜏𝜏2) (equation 2)
where A2 is the amplitude of slow diffusing population, τ1 and τ2 are the time constants of A1 and A2 respectively.
Half-time to recover: 𝑡𝑡½ = ln(2) ∗ 𝜏𝜏 (equation 3)
Immobile fraction: 𝐼𝐼𝐹𝐹 = 𝐹𝐹𝐼𝐼 − 𝐹𝐹𝐸𝐸 (equation 4)
where FI is the initial intensity and FE is the end value of the recovered intensity.
We determined the effective diffusion constant for mGFP that shows a single component behavior. However, the initial diffusion after bleaching was faster than we could measure. Therefore, the post-bleach intensity and thus the effective diffusion constant were underestimated. To correct this, we determined the post bleaching intensity with GFP in fixed cells (on average, post-bleach I = 20% of pre-bleach I) and used this as an initial value in our fits.
3.2.7 Chromatin Immunoprecipitation (ChIP)
Cells were cultured in 10 cm plates, transfected with SOX9-mGFP and treated with WNT3a (10 ng/ml), BMP7 (100 ng/ml) and IL1β (10 ng/ml) for 1hr in serum free media. ChIP was carried out using an EZ-ChIP kit (Millipore, USA, Cat# 17-371), according to the manufacturer’s guidelines. A ChIP validated SOX9 antibody [26] (AB5535, EMD Millipore) was used at 1:500 dilution to pull out SOX9-DNA complexes. ChIP
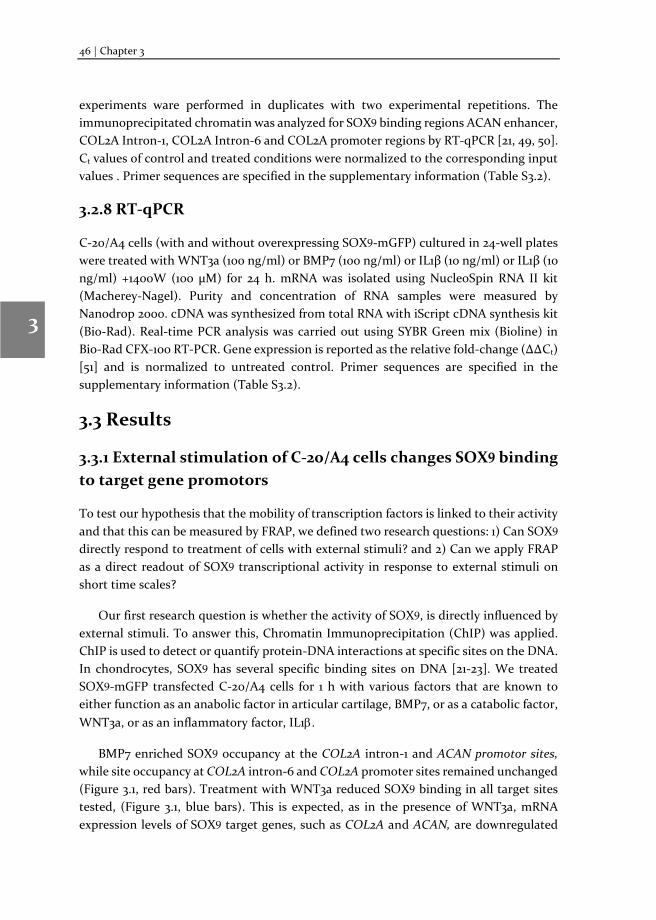
46 | Chapter 3
1
2
3
4
5
6
7
8
experiments ware performed in duplicates with two experimental repetitions. The immunoprecipitated chromatin was analyzed for SOX9 binding regions ACAN enhancer, COL2A Intron-1, COL2A Intron-6 and COL2A promoter regions by RT-qPCR [21, 49, 50]. Ct values of control and treated conditions were normalized to the corresponding input values . Primer sequences are specified in the supplementary information (Table S3.2).
3.2.8 RT-qPCR
C-20/A4 cells (with and without overexpressing SOX9-mGFP) cultured in 24-well plates were treated with WNT3a (100 ng/ml) or BMP7 (100 ng/ml) or IL1β (10 ng/ml) or IL1β (10 ng/ml) +1400W (100 µM) for 24 h. mRNA was isolated using NucleoSpin RNA II kit (Macherey-Nagel). Purity and concentration of RNA samples were measured by Nanodrop 2000. cDNA was synthesized from total RNA with iScript cDNA synthesis kit (Bio-Rad). Real-time PCR analysis was carried out using SYBR Green mix (Bioline) in Bio-Rad CFX-100 RT-PCR. Gene expression is reported as the relative fold-change (ΔΔCt) [51] and is normalized to untreated control. Primer sequences are specified in the supplementary information (Table S3.2).
3.3 Results
3.3.1 External stimulation of C-20/A4 cells changes SOX9 binding to target gene promotors
To test our hypothesis that the mobility of transcription factors is linked to their activity and that this can be measured by FRAP, we defined two research questions: 1) Can SOX9 directly respond to treatment of cells with external stimuli? and 2) Can we apply FRAP as a direct readout of SOX9 transcriptional activity in response to external stimuli on short time scales?
Our first research question is whether the activity of SOX9, is directly influenced by external stimuli. To answer this, Chromatin Immunoprecipitation (ChIP) was applied. ChIP is used to detect or quantify protein-DNA interactions at specific sites on the DNA. In chondrocytes, SOX9 has several specific binding sites on DNA [21-23]. We treated SOX9-mGFP transfected C-20/A4 cells for 1 h with various factors that are known to either function as an anabolic factor in articular cartilage, BMP7, or as a catabolic factor, WNT3a, or as an inflammatory factor, IL1β.
BMP7 enriched SOX9 occupancy at the COL2A intron-1 and ACAN promotor sites, while site occupancy at COL2A intron-6 and COL2A promoter sites remained unchanged (Figure 3.1, red bars). Treatment with WNT3a reduced SOX9 binding in all target sites tested, (Figure 3.1, blue bars). This is expected, as in the presence of WNT3a, mRNA expression levels of SOX9 target genes, such as COL2A and ACAN, are downregulated
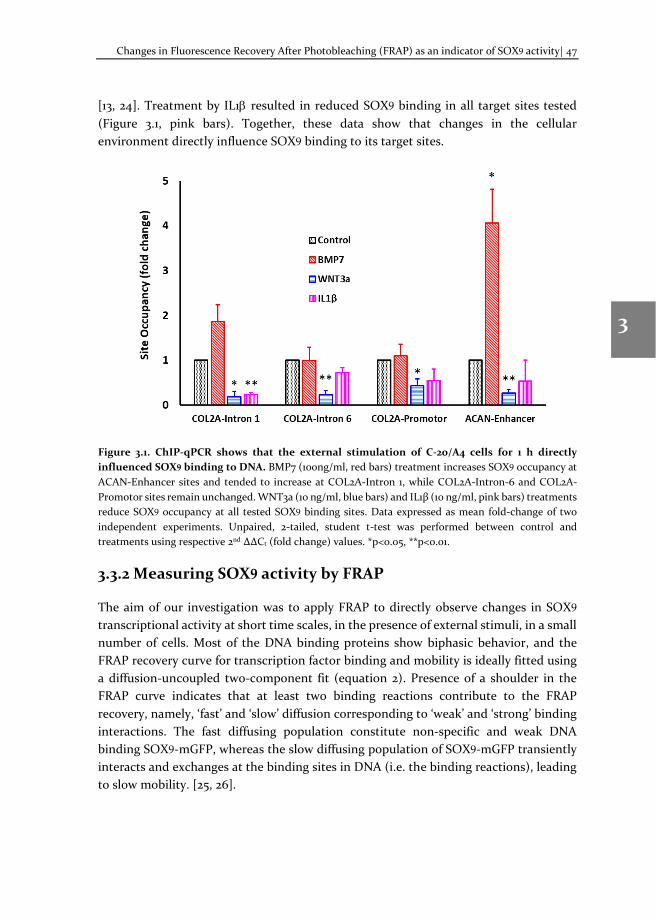
Changes in Fluorescence Recovery After Photobleaching (FRAP) as an indicator of SOX9 activity| 47
1
2
3
4
5
6
7
8
[13, 24]. Treatment by IL1β resulted in reduced SOX9 binding in all target sites tested (Figure 3.1, pink bars). Together, these data show that changes in the cellular environment directly influence SOX9 binding to its target sites.
Figure 3.1. ChIP-qPCR shows that the external stimulation of C-20/A4 cells for 1 h directly influenced SOX9 binding to DNA. BMP7 (100ng/ml, red bars) treatment increases SOX9 occupancy at ACAN-Enhancer sites and tended to increase at COL2A-Intron 1, while COL2A-Intron-6 and COL2A-Promotor sites remain unchanged. WNT3a (10 ng/ml, blue bars) and IL1β (10 ng/ml, pink bars) treatments reduce SOX9 occupancy at all tested SOX9 binding sites. Data expressed as mean fold-change of two independent experiments. Unpaired, 2-tailed, student t-test was performed between control and treatments using respective 2nd ΔΔCt (fold change) values. *p<0.05, **p<0.01.
3.3.2 Measuring SOX9 activity by FRAP
The aim of our investigation was to apply FRAP to directly observe changes in SOX9 transcriptional activity at short time scales, in the presence of external stimuli, in a small number of cells. Most of the DNA binding proteins show biphasic behavior, and the FRAP recovery curve for transcription factor binding and mobility is ideally fitted using a diffusion-uncoupled two-component fit (equation 2). Presence of a shoulder in the FRAP curve indicates that at least two binding reactions contribute to the FRAP recovery, namely, ‘fast’ and ‘slow’ diffusion corresponding to ‘weak’ and ‘strong’ binding interactions. The fast diffusing population constitute non-specific and weak DNA binding SOX9-mGFP, whereas the slow diffusing population of SOX9-mGFP transiently interacts and exchanges at the binding sites in DNA (i.e. the binding reactions), leading to slow mobility. [25, 26].
48 | Chapter 3
1
2
3
4
5
6
7
8
DNA binding proteins, such as transcription factors, move randomly inside the nucleus and bind to the DNA at random intervals. On average, proteins reside on DNA for a period of time (called the mean residence time) and dissociate and move to another binding site. Thus, the mobility of DNA binding proteins is determined by two factors: namely, the translational mobility between binding sites (fast diffusion, non-specific and weak DNA binding,) and the binding reactions (slow diffusion, specific and strong DNA binding,). SOX9-mGFP FRAP recovery curves were more accurately fit by two exponential fits (Figure S3.1. A, B), indicating there are at least two populations contributing to FRAP recovery, as shown for other proteins [26, 27]. Further, to ensure that the SOX9-mGFP FRAP recovery is diffusion-uncoupled, we did two simple tests. Both tests are based on the principle that diffusion is an extremely fast event and does not depend on the spatial scale. First, we did FRAP measurements with different bleach ROI size (2.9 μm, 4.7 μm, and 6.4 μm diameter) and observed almost no change in the FRAP curve (Figure S3.1. A) [25, 28]. Second, we measured the FRAP recovery at different locations of the bleach spot and found almost no change in the FRAP curve (Figure S3.1. B) [25, 27]. These two tests indicate that the SOX9-mGFP recovery is diffusion-uncoupled.
Explanation of FRAP parameters: The ratio A1/A2 refers to the increase or the decrease of fluorescent moieties in the A1 compared to A2 populations (i.e. the ratio of the fast diffusing population to the slow diffusing population). Recovery half-time (t½) of A1 and A2 refers to 50% of time required to achieve full recovery of fast and slow diffusing populations respectively. Speed of the recovery indicates the strength of the binding - higher the speed, lower the binding strength and vice versa [25]. In contrast, mGFP has no binding sites inside the cell and serves as a good internal control for unbound protein, as it very quickly recovers to 100% after photobleaching (Figure S3.2 and Table 3.1)
3.3.3 BMP-7 decreases SOX9 mobility
To investigate whether the increased DNA binding of SOX9 to its target sites correlated to a decrease in mobility, we performed FRAP on C-20/A4 cells that were transiently transfected with SOX9-mGFP. Cells were treated with BMP7 (100 ng/ml) for 1 hour and the changes in mobility such as the immobile fraction, the ratio of the fast diffusing population to the slow diffusing population and t½ of the SOX9-mGFP was compared to the untreated control. In the presence of BMP7, the SOX9-mGFP immobile fraction (IF) increased significantly from 53.6% to 65.7% (Figure 3.2). The increase in IF was accompanied by significantly longer t½ for both slow and fast diffusing populations of SOX9-mGFP. Ratio of the fast diffusing population is significantly decreased compared to the untreated control (Figure 3.2 and Table 3.1), indicating that a higher fraction of the SOX9 population is bound to DNA leading to increased SOX9 activity. This corresponds to the results of the ChIP assay.
Changes in Fluorescence Recovery After Photobleaching (FRAP) as an indicator of SOX9 activity| 49
1
2
3
4
5
6
7
8
3.3.4 WNT3a increased SOX9 mobility
We examined the role of WNT3a in regulating SOX9 mobility by FRAP. Treatment of C-20/A4 cells with 10 ng/ml of recombinant WNT3a for 20 min significantly reduced the SOX9-mGFP immobile fraction by 13% (Figure 3.3, blue boxes and Fable 3.1). Recovery half-time of the fast diffusing population of SOX9-mGFP changed significantly as compared to the control. However, neither the t½ of the slow diffusing population nor the ratio of the fast diffusing population changed significantly, compared to the untreated control (Figure 3.3 and Table 3.1). There was a significant difference of WNT3a treatment for all parameters as compared to the BMP7 treatment. This indicates that in the presence of WNT3a more SOX9-mGFP is destabilized from DNA, rendering the protein more mobile. However, an increased concentration of WNT3a (200 ng/ml) did not further increase the SOX9-mGFP mobile fraction (Figure S3.3).
3.3.5 IL1β increased SOX9 mobility, which was reversed by iNOS inhibition
We have not found any reports indicating that IL1β has an inhibitory role in SOX9 protein activity, however, we have previously found that IL1β exposure decreased expression of the SOX9 target genes COL2A1 and ACAN [29]. We hypothesized that IL1β decreases ACAN and COL2A1 expression by inhibiting SOX9 transcriptional activity and reducing SOX9 binding to DNA. SOX9-mGFP transfected C-20/A4 cells were treated with 10 ng/ml of recombinant IL1β for 20 min. This resulted in a decrease of the immobile fraction by 15%, which was similar to that found for WNT3a treatment (Figure 3.3, pink boxes, and Table 3.1). There was no significant difference in the recovery half-time of the slow and the fast diffusing populations compared to the untreated control. The ratio of the fast and slow diffusing populations did not change significantly as compared to control cells (Figure 3.3 and Table 3.1). Changes between BMP7 and WNT3a/IL1β treated conditions are significant for all parameters.
IL1β, and other pro-inflammatory cytokines, can activate iNOS (inducible Nitric Oxide Synthase) that stimulates nitric oxide (NO) production [30, 31]. It has been shown that in the presence of NO, the transcription factor NFκB binds more tightly to its target gene, thereby increasing the level of target gene expression. The role of NO in OA is well documented [32-34]. Animal experiments have shown that inhibiting iNOS results in a decrease in the expression of catabolic factors [35].
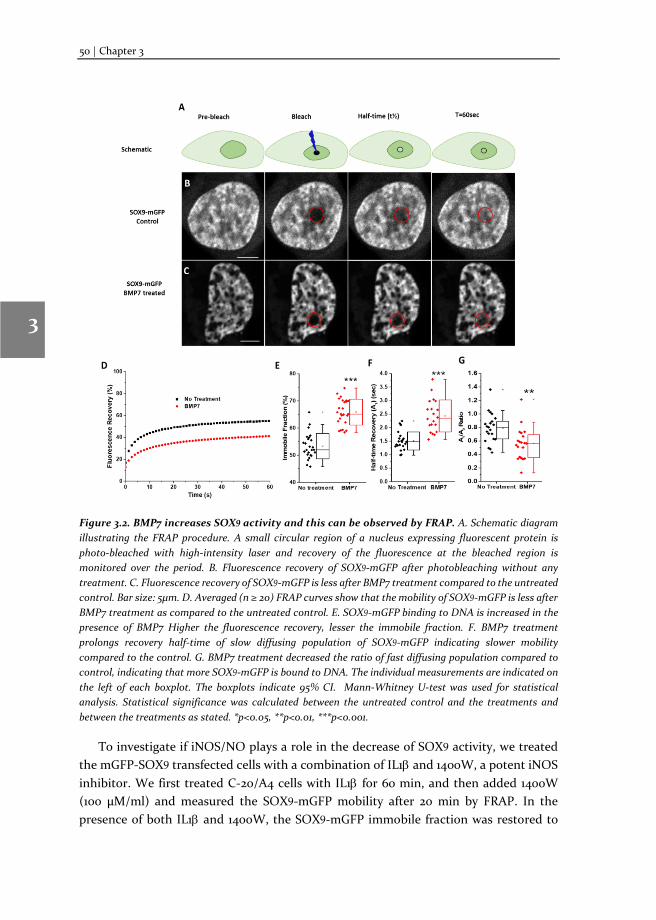
50 | Chapter 3
1
2
3
4
5
6
7
8
Figure 3.2. BMP7 increases SOX9 activity and this can be observed by FRAP. A. Schematic diagram illustrating the FRAP procedure. A small circular region of a nucleus expressing fluorescent protein is photo-bleached with high-intensity laser and recovery of the fluorescence at the bleached region is monitored over the period. B. Fluorescence recovery of SOX9-mGFP after photobleaching without any treatment. C. Fluorescence recovery of SOX9-mGFP is less after BMP7 treatment compared to the untreated control. Bar size: 5μm. D. Averaged (n ≥ 20) FRAP curves show that the mobility of SOX9-mGFP is less after BMP7 treatment as compared to the untreated control. E. SOX9-mGFP binding to DNA is increased in the presence of BMP7 Higher the fluorescence recovery, lesser the immobile fraction. F. BMP7 treatment prolongs recovery half-time of slow diffusing population of SOX9-mGFP indicating slower mobility compared to the control. G. BMP7 treatment decreased the ratio of fast diffusing population compared to control, indicating that more SOX9-mGFP is bound to DNA. The individual measurements are indicated on the left of each boxplot. The boxplots indicate 95% CI. Mann-Whitney U-test was used for statistical analysis. Statistical significance was calculated between the untreated control and the treatments and between the treatments as stated. *p<0.05, **p<0.01, ***p<0.001.
To investigate if iNOS/NO plays a role in the decrease of SOX9 activity, we treated the mGFP-SOX9 transfected cells with a combination of IL1β and 1400W, a potent iNOS inhibitor. We first treated C-20/A4 cells with IL1β for 60 min, and then added 1400W (100 µM/ml) and measured the SOX9-mGFP mobility after 20 min by FRAP. In the presence of both IL1β and 1400W, the SOX9-mGFP immobile fraction was restored to
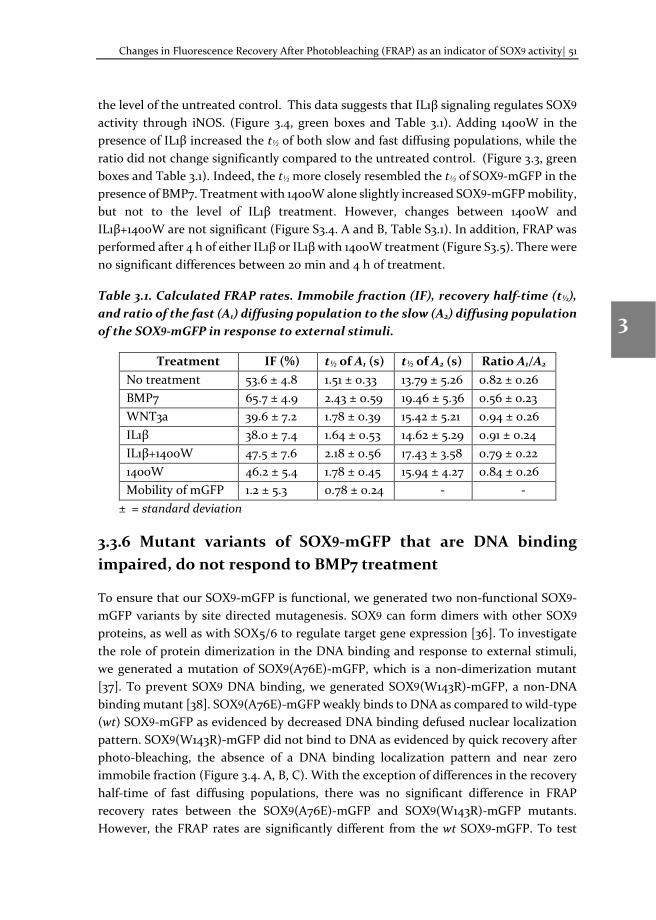
Changes in Fluorescence Recovery After Photobleaching (FRAP) as an indicator of SOX9 activity| 51
1
2
3
4
5
6
7
8
the level of the untreated control. This data suggests that IL1β signaling regulates SOX9 activity through iNOS. (Figure 3.4, green boxes and Table 3.1). Adding 1400W in the presence of IL1β increased the t½ of both slow and fast diffusing populations, while the ratio did not change significantly compared to the untreated control. (Figure 3.3, green boxes and Table 3.1). Indeed, the t½ more closely resembled the t½ of SOX9-mGFP in the presence of BMP7. Treatment with 1400W alone slightly increased SOX9-mGFP mobility, but not to the level of IL1β treatment. However, changes between 1400W and IL1β+1400W are not significant (Figure S3.4. A and B, Table S3.1). In addition, FRAP was performed after 4 h of either IL1β or IL1β with 1400W treatment (Figure S3.5). There were no significant differences between 20 min and 4 h of treatment.
Table 3.1. Calculated FRAP rates. Immobile fraction (IF), recovery half-time (t½), and ratio of the fast (A1) diffusing population to the slow (A2) diffusing population of the SOX9-mGFP in response to external stimuli.
± = standard deviation
3.3.6 Mutant variants of SOX9-mGFP that are DNA binding impaired, do not respond to BMP7 treatment
To ensure that our SOX9-mGFP is functional, we generated two non-functional SOX9-mGFP variants by site directed mutagenesis. SOX9 can form dimers with other SOX9 proteins, as well as with SOX5/6 to regulate target gene expression [36]. To investigate the role of protein dimerization in the DNA binding and response to external stimuli, we generated a mutation of SOX9(A76E)-mGFP, which is a non-dimerization mutant [37]. To prevent SOX9 DNA binding, we generated SOX9(W143R)-mGFP, a non-DNA binding mutant [38]. SOX9(A76E)-mGFP weakly binds to DNA as compared to wild-type (wt) SOX9-mGFP as evidenced by decreased DNA binding defused nuclear localization pattern. SOX9(W143R)-mGFP did not bind to DNA as evidenced by quick recovery after photo-bleaching, the absence of a DNA binding localization pattern and near zero immobile fraction (Figure 3.4. A, B, C). With the exception of differences in the recovery half-time of fast diffusing populations, there was no significant difference in FRAP recovery rates between the SOX9(A76E)-mGFP and SOX9(W143R)-mGFP mutants. However, the FRAP rates are significantly different from the wt SOX9-mGFP. To test
Treatment IF (%) t½ of A1 (s) t½ of A2 (s) Ratio A1/A2 No treatment 53.6 ± 4.8 1.51 ± 0.33 13.79 ± 5.26 0.82 ± 0.26 BMP7 65.7 ± 4.9 2.43 ± 0.59 19.46 ± 5.36 0.56 ± 0.23 WNT3a 39.6 ± 7.2 1.78 ± 0.39 15.42 ± 5.21 0.94 ± 0.26 IL1β 38.0 ± 7.4 1.64 ± 0.53 14.62 ± 5.29 0.91 ± 0.24 IL1β+1400W 47.5 ± 7.6 2.18 ± 0.56 17.43 ± 3.58 0.79 ± 0.22 1400W 46.2 ± 5.4 1.78 ± 0.45 15.94 ± 4.27 0.84 ± 0.26 Mobility of mGFP 1.2 ± 5.3 0.78 ± 0.24 - -
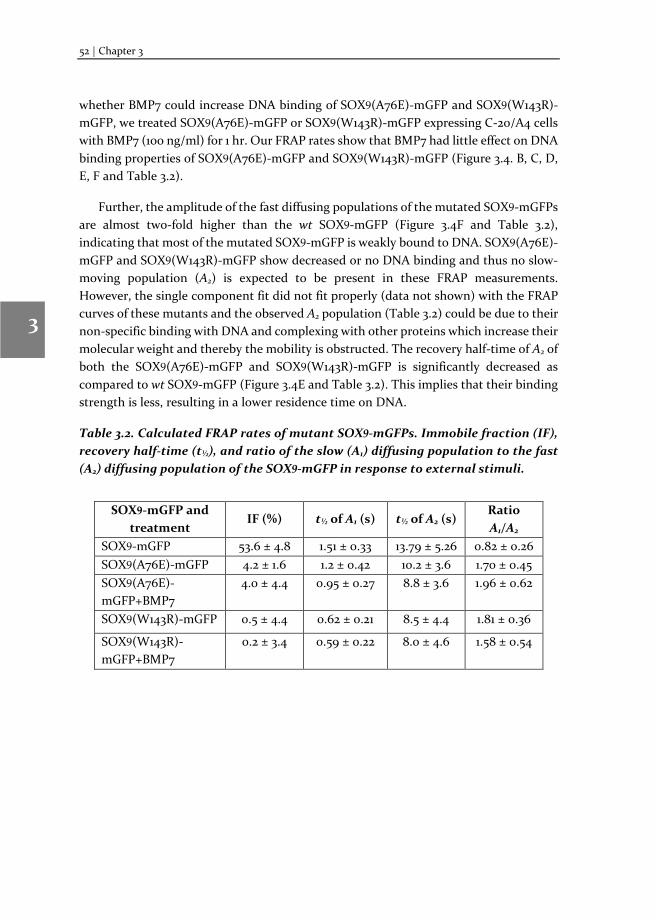
52 | Chapter 3
1
2
3
4
5
6
7
8
whether BMP7 could increase DNA binding of SOX9(A76E)-mGFP and SOX9(W143R)-mGFP, we treated SOX9(A76E)-mGFP or SOX9(W143R)-mGFP expressing C-20/A4 cells with BMP7 (100 ng/ml) for 1 hr. Our FRAP rates show that BMP7 had little effect on DNA binding properties of SOX9(A76E)-mGFP and SOX9(W143R)-mGFP (Figure 3.4. B, C, D, E, F and Table 3.2).
Further, the amplitude of the fast diffusing populations of the mutated SOX9-mGFPs are almost two-fold higher than the wt SOX9-mGFP (Figure 3.4F and Table 3.2), indicating that most of the mutated SOX9-mGFP is weakly bound to DNA. SOX9(A76E)-mGFP and SOX9(W143R)-mGFP show decreased or no DNA binding and thus no slow-moving population (A2) is expected to be present in these FRAP measurements. However, the single component fit did not fit properly (data not shown) with the FRAP curves of these mutants and the observed A2 population (Table 3.2) could be due to their non-specific binding with DNA and complexing with other proteins which increase their molecular weight and thereby the mobility is obstructed. The recovery half-time of A2 of both the SOX9(A76E)-mGFP and SOX9(W143R)-mGFP is significantly decreased as compared to wt SOX9-mGFP (Figure 3.4E and Table 3.2). This implies that their binding strength is less, resulting in a lower residence time on DNA.
Table 3.2. Calculated FRAP rates of mutant SOX9-mGFPs. Immobile fraction (IF), recovery half-time (t½), and ratio of the slow (A1) diffusing population to the fast (A2) diffusing population of the SOX9-mGFP in response to external stimuli.
SOX9-mGFP and treatment
IF (%) t½ of A1 (s) t½ of A2 (s) Ratio A1/A2
SOX9-mGFP 53.6 ± 4.8 1.51 ± 0.33 13.79 ± 5.26 0.82 ± 0.26 SOX9(A76E)-mGFP 4.2 ± 1.6 1.2 ± 0.42 10.2 ± 3.6 1.70 ± 0.45 SOX9(A76E)-mGFP+BMP7
4.0 ± 4.4 0.95 ± 0.27 8.8 ± 3.6 1.96 ± 0.62
SOX9(W143R)-mGFP 0.5 ± 4.4 0.62 ± 0.21 8.5 ± 4.4 1.81 ± 0.36
SOX9(W143R)-mGFP+BMP7
0.2 ± 3.4 0.59 ± 0.22 8.0 ± 4.6 1.58 ± 0.54
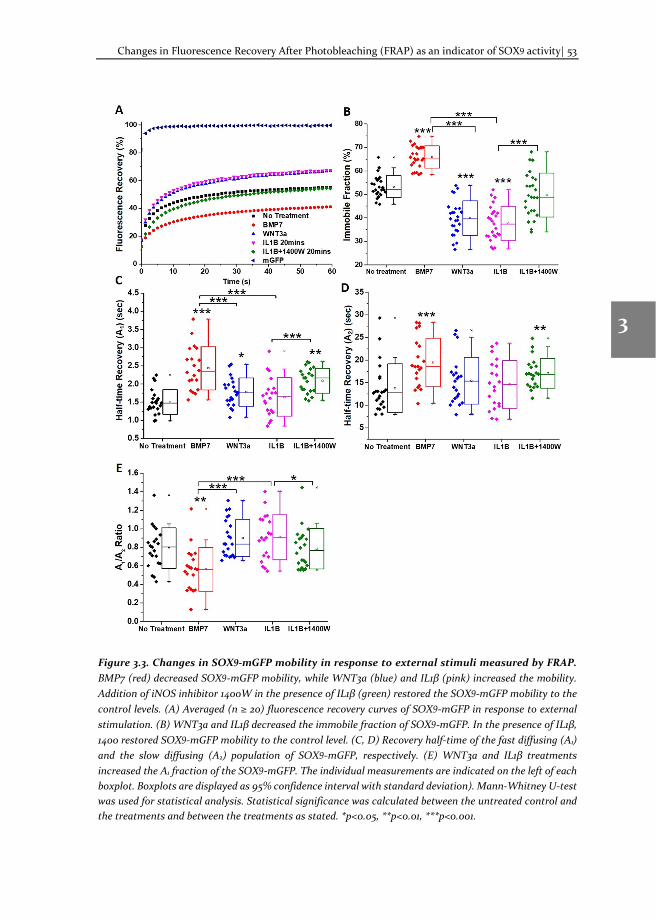
Changes in Fluorescence Recovery After Photobleaching (FRAP) as an indicator of SOX9 activity| 53
1
2
3
4
5
6
7
8
Figure 3.3. Changes in SOX9-mGFP mobility in response to external stimuli measured by FRAP. BMP7 (red) decreased SOX9-mGFP mobility, while WNT3a (blue) and IL1β (pink) increased the mobility. Addition of iNOS inhibitor 1400W in the presence of IL1β (green) restored the SOX9-mGFP mobility to the control levels. (A) Averaged (n ≥ 20) fluorescence recovery curves of SOX9-mGFP in response to external stimulation. (B) WNT3a and IL1β decreased the immobile fraction of SOX9-mGFP. In the presence of IL1β, 1400 restored SOX9-mGFP mobility to the control level. (C, D) Recovery half-time of the fast diffusing (A1) and the slow diffusing (A2) population of SOX9-mGFP, respectively. (E) WNT3a and IL1β treatments increased the A1 fraction of the SOX9-mGFP. The individual measurements are indicated on the left of each boxplot. Boxplots are displayed as 95% confidence interval with standard deviation). Mann-Whitney U-test was used for statistical analysis. Statistical significance was calculated between the untreated control and the treatments and between the treatments as stated. *p<0.05, **p<0.01, ***p<0.001.
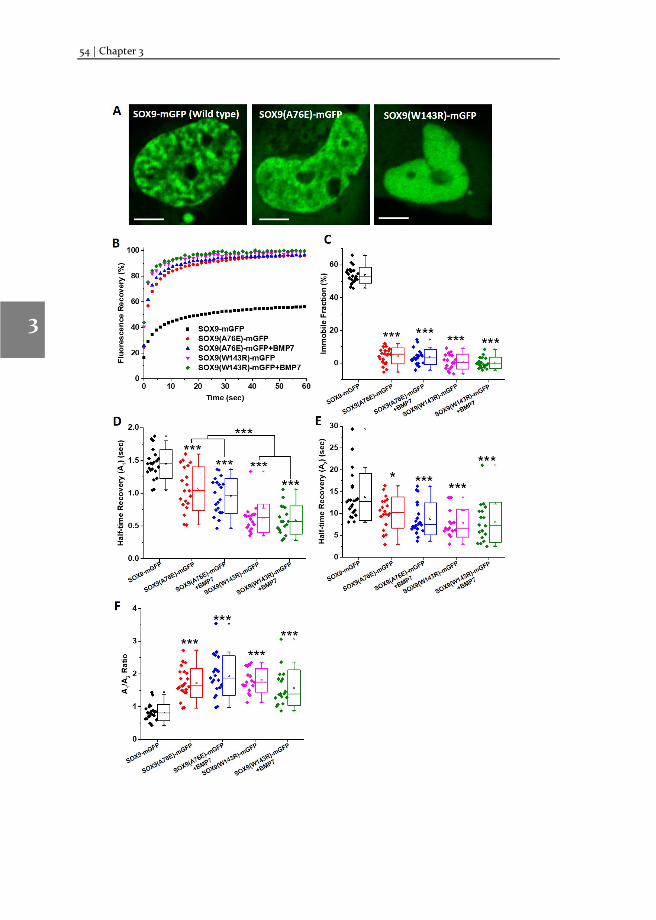
54 | Chapter 3
1
2
3
4
5
6
7
8
Changes in Fluorescence Recovery After Photobleaching (FRAP) as an indicator of SOX9 activity| 55
1
2
3
4
5
6
7
8
Figure 3.4. Mutant SOX9-mGFPs did not respond to BMP7 treatment. (A) Nuclear localization pattern of wt and mutant SOX9-mGFP. Highly patterned nuclear localization was observed in the wt SOX9-mGFP. Non-dimerizing mutant SOX9(A76E)-mGFP showed less patterned and more diffused localization pattern in the nucleus as compared to wt SOX9-mGFP. Non-DNA binding mutant SOX9(W143R)-GFP showed highly diffused nuclear localization pattern as compared to wt SOX9-mGFP. (B) Averaged FRAP recovery curves (n ≥ 20) show both the SOX9-mGFP mutants fully recover after photo-bleaching and results in near zero immobile fraction (C). (D) Recovery half-time of fast diffusing population of both the mutant SOX9-mGFPs is significantly decreased as compared to wt SOX9-mGFP. However, recovery half-time of SOX9(A76E)-mGFP is slightly higher than SOX9(W143R)-mGFP due to its weak DNA binding. (E) Recovery half-time of slow diffusing fraction of both the SOX9-mGFP mutants are significantly lower than the wt SOX9-mGFP. (F) Fast diffusing population of SOX9-mGFP is significantly higher in both the SOX9-mGFP mutants as compared to the wt SOX9-mGFP. BMP7 (100ng/ml) treatment did not increase the DNA binding of mutated SOX9-mGFPs. The individual measurements are indicated on the left of each boxplot. Boxplots are displayed as 95% confidence interval with standard deviation. Scale bar: 5μm. Mann-Whitney U-test was used for statistical analysis. Statistical significance was calculated between the wt and mutated SOX9-mGFP and between the mutants as stated. *p<0.05, ***p<0.001.
3.3.7 FRAP readings correlate with long-term gene expression levels
To evaluate whether the immediate effects of BMP7, WNT3a and IL1β on SOX9-mGFP mobility and DNA binding correlate to transcription of SOX9 target genes in the long term, we measured the target gene expression levels at 24 h after treatment. For each ligand, we tested a known target gene of its canonical pathway, as well as the SOX9 cartilage-specific target genes COL2A1 and ACAN.
BMP7 induced the expression of ACAN but not COL2A1. The expression of the BMP7 target gene ID1 increased in the presence of BMP7, while the hypertrophic markers SPP1 and ALPL were downregulated as compared to the control (Figure 3.5. A, red bars). The expression ACAN and COL2A1 were downregulated in the presence of WNT3a, while the WNT target AXIN2 was upregulated. The hypertrophic marker gene MMP13 [24] was upregulated in the presence of WNT3a (Figure 3.5. B, blue bars).
As expected, the presence of IL1β upregulated expression of the targets IL1β, while ACAN and COL2A1, were downregulated (Figure 3.5. C, pink bars). Addition of 1400W in the presence of IL1β restored SOX9 activity as evidenced by the upregulation of COL2A1 and ACAN. However, treatment with 1400W alone did not influence gene expression (Figure 3.5. C, brown bars).
To investigate the influence of SOX9-mGFP overexpression on its activity, we also quantified gene expression levels in response to BMP7, WNT3a and IL1β in C-20/A4 cells transfected with SOX9-mGFP. With slight differences that are possibly due to the overexpression of SOX9, these levels correlate with the gene expression patterns of non-transfected cells (Figure S3.6. A, B, C). Interestingly, SOX9 mRNA expression levels were
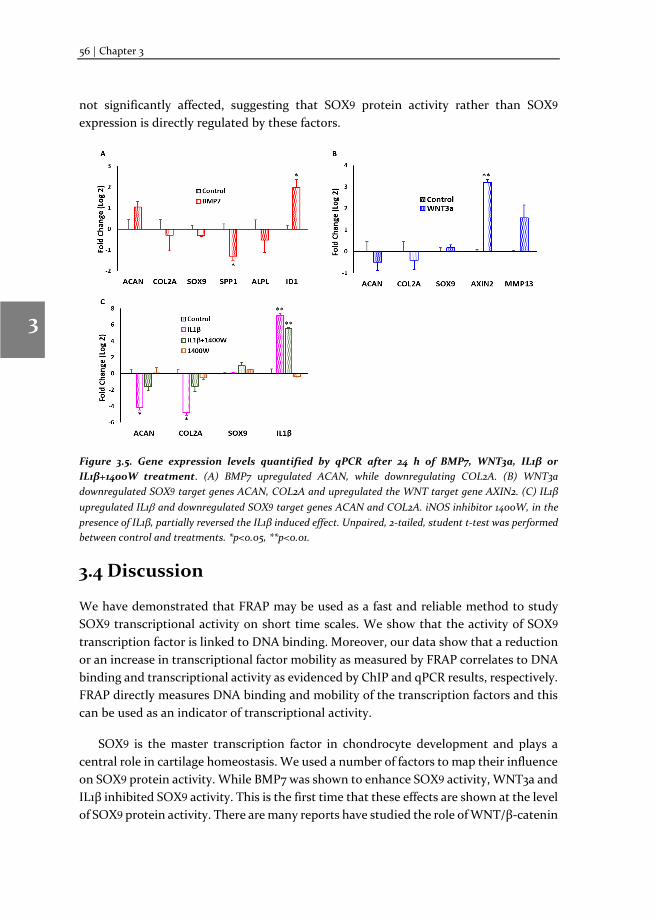
56 | Chapter 3
1
2
3
4
5
6
7
8
not significantly affected, suggesting that SOX9 protein activity rather than SOX9 expression is directly regulated by these factors.
Figure 3.5. Gene expression levels quantified by qPCR after 24 h of BMP7, WNT3a, IL1β or IL1β+1400W treatment. (A) BMP7 upregulated ACAN, while downregulating COL2A. (B) WNT3a downregulated SOX9 target genes ACAN, COL2A and upregulated the WNT target gene AXIN2. (C) IL1β upregulated IL1β and downregulated SOX9 target genes ACAN and COL2A. iNOS inhibitor 1400W, in the presence of IL1β, partially reversed the IL1β induced effect. Unpaired, 2-tailed, student t-test was performed between control and treatments. *p<0.05, **p<0.01.
3.4 Discussion
We have demonstrated that FRAP may be used as a fast and reliable method to study SOX9 transcriptional activity on short time scales. We show that the activity of SOX9 transcription factor is linked to DNA binding. Moreover, our data show that a reduction or an increase in transcriptional factor mobility as measured by FRAP correlates to DNA binding and transcriptional activity as evidenced by ChIP and qPCR results, respectively. FRAP directly measures DNA binding and mobility of the transcription factors and this can be used as an indicator of transcriptional activity.
SOX9 is the master transcription factor in chondrocyte development and plays a central role in cartilage homeostasis. We used a number of factors to map their influence on SOX9 protein activity. While BMP7 was shown to enhance SOX9 activity, WNT3a and IL1β inhibited SOX9 activity. This is the first time that these effects are shown at the level of SOX9 protein activity. There are many reports have studied the role of WNT/β-catenin
Changes in Fluorescence Recovery After Photobleaching (FRAP) as an indicator of SOX9 activity| 57
1
2
3
4
5
6
7
8
and IL1β signaling in SOX9 transcriptional activity by measuring SOX9 promotor activity (by luciferase assay) or mRNA or protein expression of SOX9 and/or its target genes after several hours of stimulation. However, none of these studies has directly investigated SOX9 protein activity in live cells in response to external stimulation due to unavailability of suitable methods. To our knowledge, this is the first report that the upstream signals have direct effect on SOX9 transcriptional activity on very short time scales (20 minutes to 1 hour after treatment), that results in changes in longtime target gene expression levels [18, 24, 39, 40]. Further, mapping of upstream factors regulating SOX9 activity in human primary chondrocytes (hPCs) is necessary to understand chondrocyte homeostasis and OA pathophysiology.
In studying SOX9 transcriptional activity by FRAP, we look for a percentage of change in immobile fractions in addition to change in the t½ of A1 and A2 and A1/A2 of the transcription factor. In a cellular milieu, the term “effective diffusion” indicates the recovery that mimics diffusion, but at a rate that is slowed by binding interactions [25] with other proteins and co-factors. One needs to take these latter factors into account only if they investigate protein diffusion kinetics. Another important factor would be translocation of the protein of interest from cytoplasm to nucleus or vice versa. Nuclear import happens at a time scale of minutes [41], thus this is especially important for FRAP studies with a duration from several minutes to hours [42, 43]. Cytoplasmic levels of SOX9-mGFP in C20/A4 cells were very less (<10%), compared to its nuclear localization level. This is highly unlikely that the nuclear import of SOX9-mGFP contributes to FRAP measurements with very short duration (60 sec).
We observed a significant decrease of SOX9 activity in the presence of WNT3a and IL1β, whereas, SOX9 activity was increased in the presence of BMP7 as evidenced by the decrease or increase in the immobile fraction. The ratio of the fast diffusing population versus the slow diffusing population (A1/A2) showed that the BMP7 treatment increased the slow diffusing SOX9-mGFP population, indicating more SOX9 molecules were bound to DNA. Whereas, WNT3a and IL1β treatments have increased the unbound population, indicating less SOX9 was bound to DNA, as compared to the untreated control.
WNT3a and IL1β treatments destabilized SOX9-mGFP from DNA and as expected, we found a higher mobility and thus lower immobile fractions, but longer t½ rates of SOX9-mGFP. However, the recovery kinetics of the transcription factor are highly dependent on the interactions with other transcription factors and co-factors following stimulation [25, 44]. In effect, higher (or lower) mobile fractions are not always associated with a shorter or longer t½. Significant differences in t½ between the treated conditions and/or the untreated conditions of the fast and the slow diffusing populations indicate the possible changes in intermolecular interactions with different treatments. For example, in the presence of IL1β, the iNOS inhibitor 1400W restored the SOX9-mGFP activity to the control levels, indicating that IL1β inhibits SOX9 transcriptional activity
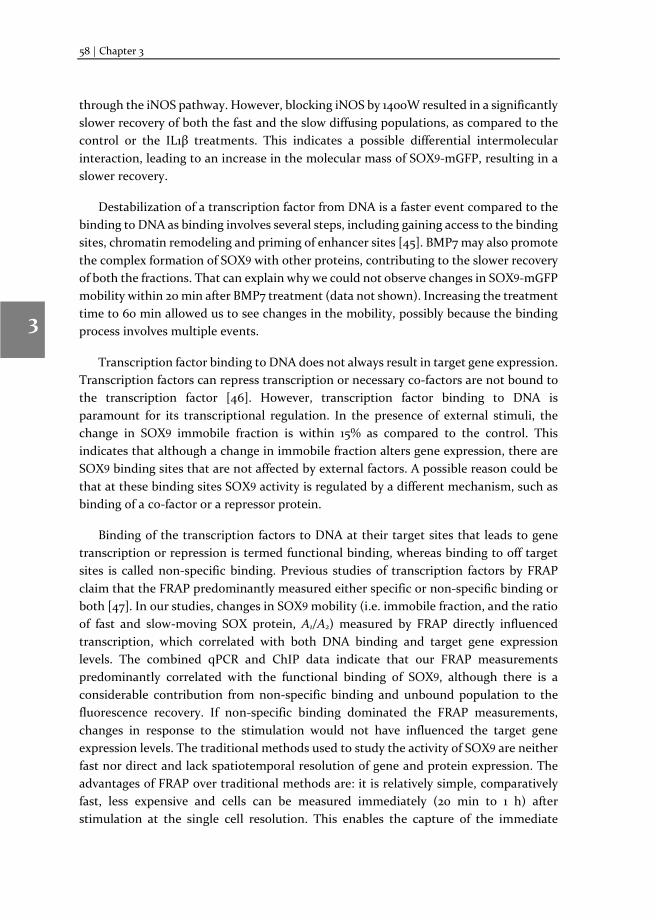
58 | Chapter 3
1
2
3
4
5
6
7
8
through the iNOS pathway. However, blocking iNOS by 1400W resulted in a significantly slower recovery of both the fast and the slow diffusing populations, as compared to the control or the IL1β treatments. This indicates a possible differential intermolecular interaction, leading to an increase in the molecular mass of SOX9-mGFP, resulting in a slower recovery.
Destabilization of a transcription factor from DNA is a faster event compared to the binding to DNA as binding involves several steps, including gaining access to the binding sites, chromatin remodeling and priming of enhancer sites [45]. BMP7 may also promote the complex formation of SOX9 with other proteins, contributing to the slower recovery of both the fractions. That can explain why we could not observe changes in SOX9-mGFP mobility within 20 min after BMP7 treatment (data not shown). Increasing the treatment time to 60 min allowed us to see changes in the mobility, possibly because the binding process involves multiple events.
Transcription factor binding to DNA does not always result in target gene expression. Transcription factors can repress transcription or necessary co-factors are not bound to the transcription factor [46]. However, transcription factor binding to DNA is paramount for its transcriptional regulation. In the presence of external stimuli, the change in SOX9 immobile fraction is within 15% as compared to the control. This indicates that although a change in immobile fraction alters gene expression, there are SOX9 binding sites that are not affected by external factors. A possible reason could be that at these binding sites SOX9 activity is regulated by a different mechanism, such as binding of a co-factor or a repressor protein.
Binding of the transcription factors to DNA at their target sites that leads to gene transcription or repression is termed functional binding, whereas binding to off target sites is called non-specific binding. Previous studies of transcription factors by FRAP claim that the FRAP predominantly measured either specific or non-specific binding or both [47]. In our studies, changes in SOX9 mobility (i.e. immobile fraction, and the ratio of fast and slow-moving SOX protein, A1/A2) measured by FRAP directly influenced transcription, which correlated with both DNA binding and target gene expression levels. The combined qPCR and ChIP data indicate that our FRAP measurements predominantly correlated with the functional binding of SOX9, although there is a considerable contribution from non-specific binding and unbound population to the fluorescence recovery. If non-specific binding dominated the FRAP measurements, changes in response to the stimulation would not have influenced the target gene expression levels. The traditional methods used to study the activity of SOX9 are neither fast nor direct and lack spatiotemporal resolution of gene and protein expression. The advantages of FRAP over traditional methods are: it is relatively simple, comparatively fast, less expensive and cells can be measured immediately (20 min to 1 h) after stimulation at the single cell resolution. This enables the capture of the immediate
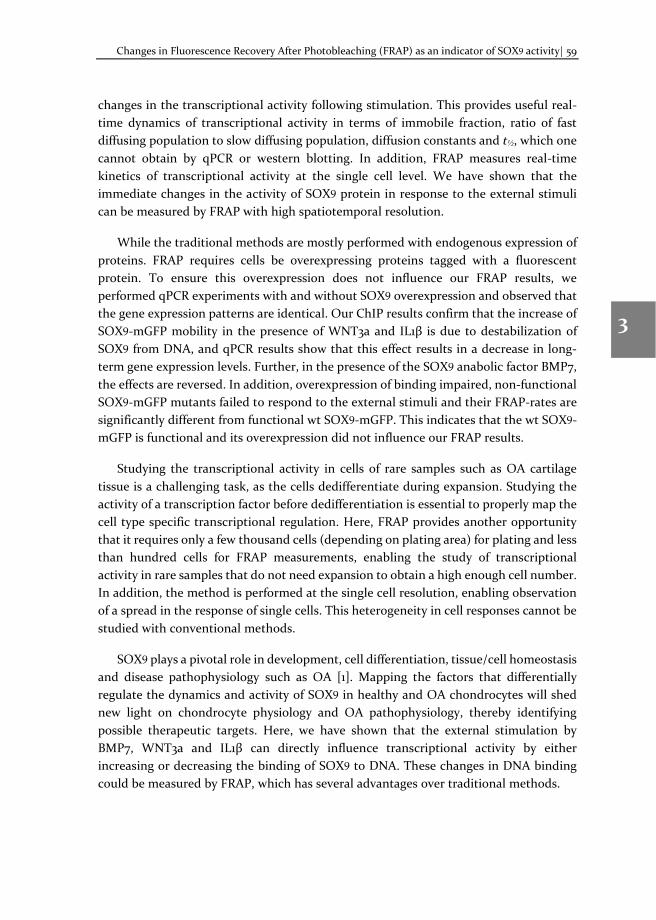
Changes in Fluorescence Recovery After Photobleaching (FRAP) as an indicator of SOX9 activity| 59
1
2
3
4
5
6
7
8
changes in the transcriptional activity following stimulation. This provides useful real-time dynamics of transcriptional activity in terms of immobile fraction, ratio of fast diffusing population to slow diffusing population, diffusion constants and t½, which one cannot obtain by qPCR or western blotting. In addition, FRAP measures real-time kinetics of transcriptional activity at the single cell level. We have shown that the immediate changes in the activity of SOX9 protein in response to the external stimuli can be measured by FRAP with high spatiotemporal resolution.
While the traditional methods are mostly performed with endogenous expression of proteins. FRAP requires cells be overexpressing proteins tagged with a fluorescent protein. To ensure this overexpression does not influence our FRAP results, we performed qPCR experiments with and without SOX9 overexpression and observed that the gene expression patterns are identical. Our ChIP results confirm that the increase of SOX9-mGFP mobility in the presence of WNT3a and IL1β is due to destabilization of SOX9 from DNA, and qPCR results show that this effect results in a decrease in long-term gene expression levels. Further, in the presence of the SOX9 anabolic factor BMP7, the effects are reversed. In addition, overexpression of binding impaired, non-functional SOX9-mGFP mutants failed to respond to the external stimuli and their FRAP-rates are significantly different from functional wt SOX9-mGFP. This indicates that the wt SOX9-mGFP is functional and its overexpression did not influence our FRAP results.
Studying the transcriptional activity in cells of rare samples such as OA cartilage tissue is a challenging task, as the cells dedifferentiate during expansion. Studying the activity of a transcription factor before dedifferentiation is essential to properly map the cell type specific transcriptional regulation. Here, FRAP provides another opportunity that it requires only a few thousand cells (depending on plating area) for plating and less than hundred cells for FRAP measurements, enabling the study of transcriptional activity in rare samples that do not need expansion to obtain a high enough cell number. In addition, the method is performed at the single cell resolution, enabling observation of a spread in the response of single cells. This heterogeneity in cell responses cannot be studied with conventional methods.
SOX9 plays a pivotal role in development, cell differentiation, tissue/cell homeostasis and disease pathophysiology such as OA [1]. Mapping the factors that differentially regulate the dynamics and activity of SOX9 in healthy and OA chondrocytes will shed new light on chondrocyte physiology and OA pathophysiology, thereby identifying possible therapeutic targets. Here, we have shown that the external stimulation by BMP7, WNT3a and IL1β can directly influence transcriptional activity by either increasing or decreasing the binding of SOX9 to DNA. These changes in DNA binding could be measured by FRAP, which has several advantages over traditional methods.
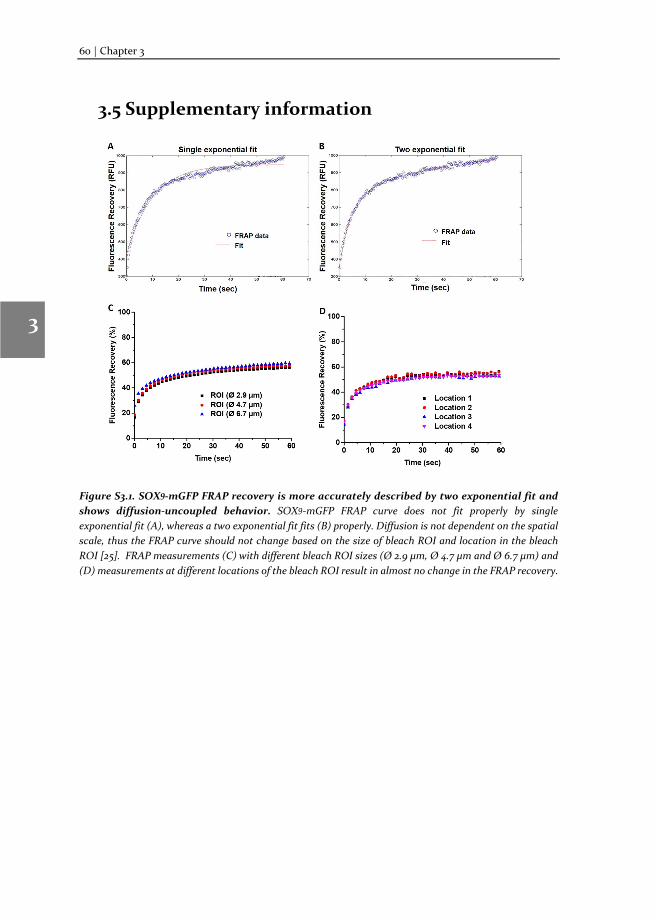
60 | Chapter 3
1
2
3
4
5
6
7
8
3.5 Supplementary information
Figure S3.1. SOX9-mGFP FRAP recovery is more accurately described by two exponential fit and shows diffusion-uncoupled behavior. SOX9-mGFP FRAP curve does not fit properly by single exponential fit (A), whereas a two exponential fit fits (B) properly. Diffusion is not dependent on the spatial scale, thus the FRAP curve should not change based on the size of bleach ROI and location in the bleach ROI [25]. FRAP measurements (C) with different bleach ROI sizes (Ø 2.9 µm, Ø 4.7 µm and Ø 6.7 µm) and (D) measurements at different locations of the bleach ROI result in almost no change in the FRAP recovery.
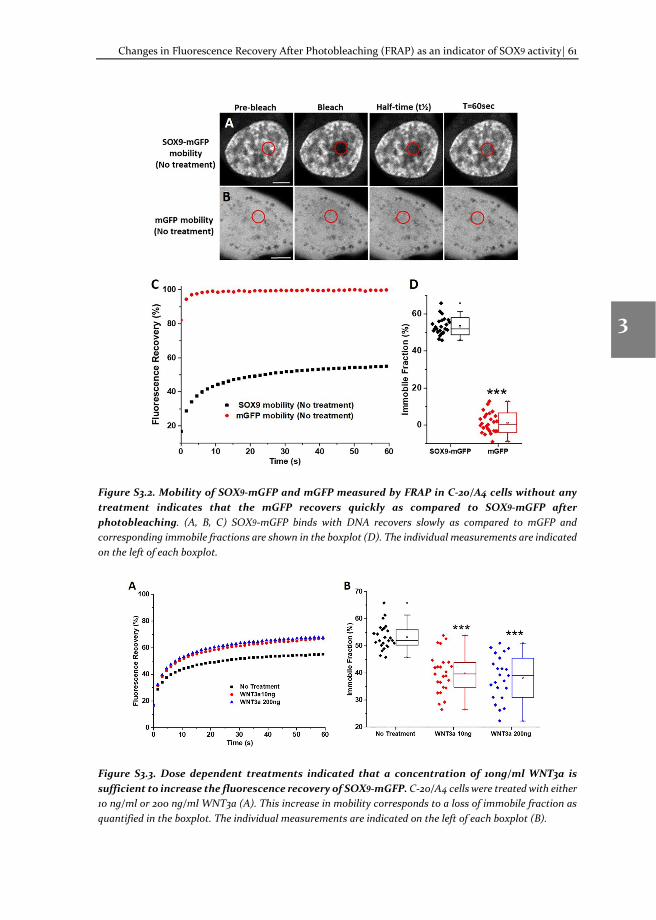
Changes in Fluorescence Recovery After Photobleaching (FRAP) as an indicator of SOX9 activity| 61
1
2
3
4
5
6
7
8
Figure S3.2. Mobility of SOX9-mGFP and mGFP measured by FRAP in C-20/A4 cells without any treatment indicates that the mGFP recovers quickly as compared to SOX9-mGFP after photobleaching. (A, B, C) SOX9-mGFP binds with DNA recovers slowly as compared to mGFP and corresponding immobile fractions are shown in the boxplot (D). The individual measurements are indicated on the left of each boxplot.
Figure S3.3. Dose dependent treatments indicated that a concentration of 10ng/ml WNT3a is sufficient to increase the fluorescence recovery of SOX9-mGFP. C-20/A4 cells were treated with either 10 ng/ml or 200 ng/ml WNT3a (A). This increase in mobility corresponds to a loss of immobile fraction as quantified in the boxplot. The individual measurements are indicated on the left of each boxplot (B).
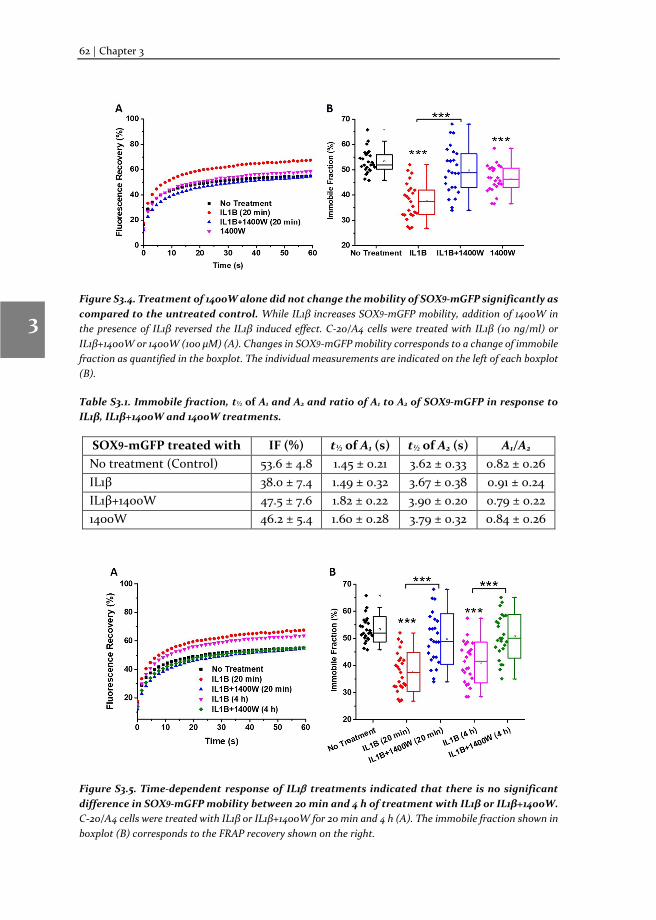
62 | Chapter 3
1
2
3
4
5
6
7
8
Figure S3.4. Treatment of 1400W alone did not change the mobility of SOX9-mGFP significantly as compared to the untreated control. While IL1β increases SOX9-mGFP mobility, addition of 1400W in the presence of IL1β reversed the IL1β induced effect. C-20/A4 cells were treated with IL1β (10 ng/ml) or IL1β+1400W or 1400W (100 μM) (A). Changes in SOX9-mGFP mobility corresponds to a change of immobile fraction as quantified in the boxplot. The individual measurements are indicated on the left of each boxplot (B).
Table S3.1. Immobile fraction, t½ of A1 and A2 and ratio of A1 to A2 of SOX9-mGFP in response to IL1β, IL1β+1400W and 1400W treatments.
Figure S3.5. Time-dependent response of IL1β treatments indicated that there is no significant difference in SOX9-mGFP mobility between 20 min and 4 h of treatment with IL1β or IL1β+1400W. C-20/A4 cells were treated with IL1β or IL1β+1400W for 20 min and 4 h (A). The immobile fraction shown in boxplot (B) corresponds to the FRAP recovery shown on the right.
SOX9-mGFP treated with IF (%) t½ of A1 (s) t½ of A2 (s) A1/A2 No treatment (Control) 53.6 ± 4.8 1.45 ± 0.21 3.62 ± 0.33 0.82 ± 0.26 IL1β 38.0 ± 7.4 1.49 ± 0.32 3.67 ± 0.38 0.91 ± 0.24 IL1β+1400W 47.5 ± 7.6 1.82 ± 0.22 3.90 ± 0.20 0.79 ± 0.22 1400W 46.2 ± 5.4 1.60 ± 0.28 3.79 ± 0.32 0.84 ± 0.26
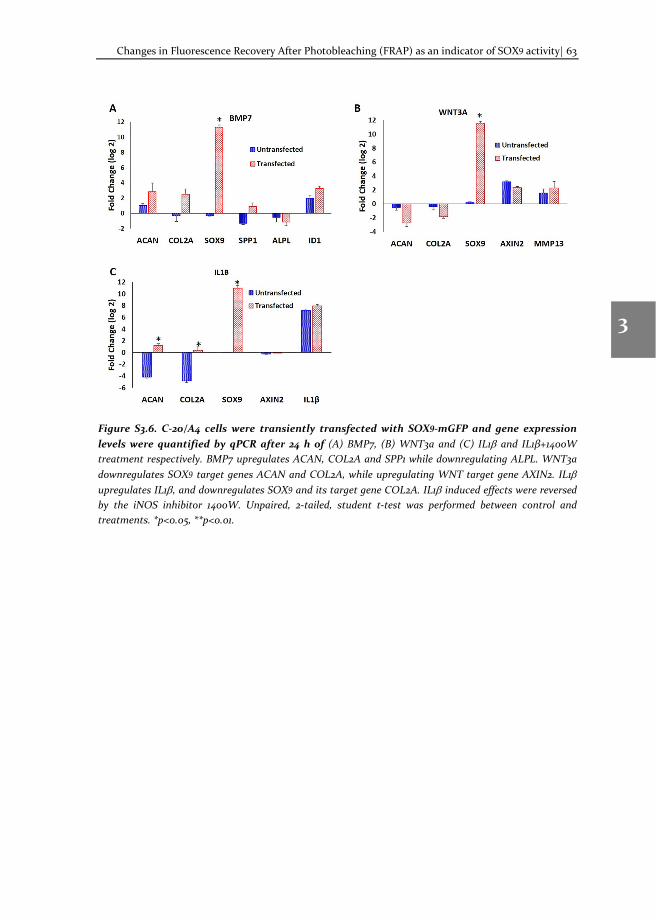
Changes in Fluorescence Recovery After Photobleaching (FRAP) as an indicator of SOX9 activity| 63
1
2
3
4
5
6
7
8
Figure S3.6. C-20/A4 cells were transiently transfected with SOX9-mGFP and gene expression levels were quantified by qPCR after 24 h of (A) BMP7, (B) WNT3a and (C) IL1β and IL1β+1400W treatment respectively. BMP7 upregulates ACAN, COL2A and SPP1 while downregulating ALPL. WNT3a downregulates SOX9 target genes ACAN and COL2A, while upregulating WNT target gene AXIN2. IL1β upregulates IL1β, and downregulates SOX9 and its target gene COL2A. IL1β induced effects were reversed by the iNOS inhibitor 1400W. Unpaired, 2-tailed, student t-test was performed between control and treatments. *p<0.05, **p<0.01.
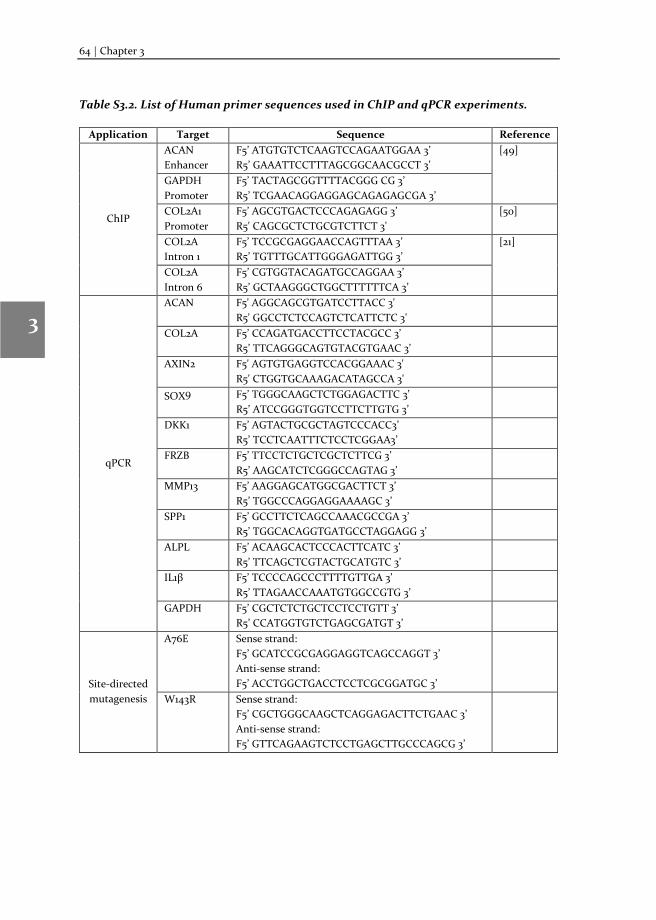
64 | Chapter 3
1
2
3
4
5
6
7
8
Table S3.2. List of Human primer sequences used in ChIP and qPCR experiments.
Application Target Sequence Reference
ChIP
ACAN Enhancer
F5’ ATGTGTCTCAAGTCCAGAATGGAA 3’ R5’ GAAATTCCTTTAGCGGCAACGCCT 3’
[49]
GAPDH Promoter
F5’ TACTAGCGGTTTTACGGG CG 3’ R5’ TCGAACAGGAGGAGCAGAGAGCGA 3’
COL2A1 Promoter
F5’ AGCGTGACTCCCAGAGAGG 3’ R5' CAGCGCTCTGCGTCTTCT 3'
[50]
COL2A Intron 1
F5’ TCCGCGAGGAACCAGTTTAA 3’ R5’ TGTTTGCATTGGGAGATTGG 3’
[21]
COL2A Intron 6
F5’ CGTGGTACAGATGCCAGGAA 3’ R5’ GCTAAGGGCTGGCTTTTTTCA 3’
qPCR
ACAN F5' AGGCAGCGTGATCCTTACC 3' R5' GGCCTCTCCAGTCTCATTCTC 3'
COL2A F5’ CCAGATGACCTTCCTACGCC 3’ R5’ TTCAGGGCAGTGTACGTGAAC 3’
AXIN2 F5' AGTGTGAGGTCCACGGAAAC 3' R5' CTGGTGCAAAGACATAGCCA 3'
SOX9 F5’ TGGGCAAGCTCTGGAGACTTC 3’ R5’ ATCCGGGTGGTCCTTCTTGTG 3’
DKK1 F5’ AGTACTGCGCTAGTCCCACC3’ R5’ TCCTCAATTTCTCCTCGGAA3’
FRZB F5’ TTCCTCTGCTCGCTCTTCG 3’ R5’ AAGCATCTCGGGCCAGTAG 3’
MMP13 F5’ AAGGAGCATGGCGACTTCT 3’ R5’ TGGCCCAGGAGGAAAAGC 3’
SPP1 F5’ GCCTTCTCAGCCAAACGCCGA 3’ R5’ TGGCACAGGTGATGCCTAGGAGG 3’
ALPL F5’ ACAAGCACTCCCACTTCATC 3’ R5’ TTCAGCTCGTACTGCATGTC 3’
IL1β F5’ TCCCCAGCCCTTTTGTTGA 3’ R5’ TTAGAACCAAATGTGGCCGTG 3’
GAPDH F5’ CGCTCTCTGCTCCTCCTGTT 3’ R5’ CCATGGTGTCTGAGCGATGT 3’
Site-directed mutagenesis
A76E Sense strand: F5’ GCATCCGCGAGGAGGTCAGCCAGGT 3’ Anti-sense strand: F5’ ACCTGGCTGACCTCCTCGCGGATGC 3’
W143R Sense strand: F5’ CGCTGGGCAAGCTCAGGAGACTTCTGAAC 3’ Anti-sense strand: F5’ GTTCAGAAGTCTCCTGAGCTTGCCCAGCG 3’
Changes in Fluorescence Recovery After Photobleaching (FRAP) as an indicator of SOX9 activity| 65
1
2
3
4
5
6
7
8
References
1. Jo, A., Denduluri, S., Zhang, B., Wang, Z., Yin, L., Yan, Z., Kang, R., Shi, L. L., Mok, J., Lee, M. J. & Haydon, R. C. (2014) The versatile functions of Sox9 in development, stem cells, and human diseases, Genes Dis. 1, 149-161. 2. Belo, J., Krishnamurthy, M., Oakie, A. & Wang, R. (2013) The Role of SOX9 Transcription Factor in Pancreatic and Duodenal Development, Stem Cells and Development. 22, 2935-2943. 3. Lefebvre, V. & Dvir-Ginzberg, M. (2017) SOX9 and the many facets of its regulation in the chondrocyte lineage, Connective Tissue Research. 58, 2-14. 4. Thoms, B. L., Dudek, K. A., Lafont, J. E. & Murphy, C. L. (2013) Hypoxia promotes the production and inhibits the destruction of human articular cartilage, Arthritis and rheumatism. 65, 1302-12. 5. Zhong, L., Huang, X., Karperien, M. & Post, J. N. (2016) Correlation between Gene Expression and Osteoarthritis Progression in Human, Int J Mol Sci. 17. 6. Minina, E., Kreschel, C., Naski, M. C., Ornitz, D. M. & Vortkamp, A. (2002) Interaction of FGF, Ihh/Pthlh, and BMP signaling integrates chondrocyte proliferation and hypertrophic differentiation, Dev Cell. 3, 439-449. 7. Klatte-Schulz, F., Giese, G., Differ, C., Minkwitz, S., Ruschke, K., Puts, R., Knaus, P. & Wildemann, B. (2016) An investigation of BMP-7 mediated alterations to BMP signalling components in human tenocyte-like cells, Sci Rep. 6, 29703. 8. Chubinskaya, S., Hurtig, M. & Rueger, D. C. (2007) OP-1/BMP-7 in cartilage repair, Int Orthop. 31, 773-81. 9. Zhou, J., Yu, G., Cao, C., Pang, J. & Chen, X. (2011) Bone morphogenetic protein-7 promotes chondrogenesis in human amniotic epithelial cells, Int Orthop. 35, 941-8. 10. Caron, M. M., Emans, P. J., Cremers, A., Surtel, D. A., Coolsen, M. M., van Rhijn, L. W. & Welting, T. J. (2013) Hypertrophic differentiation during chondrogenic differentiation of progenitor cells is stimulated by BMP-2 but suppressed by BMP-7, Osteoarthritis and cartilage / OARS, Osteoarthritis Research Society. 21, 604-13. 11. Bessa, P. C., Casal, M. & Reis, R. L. (2008) Bone morphogenetic proteins in tissue engineering: the road from the laboratory to the clinic, part I (basic concepts), J Tissue Eng Regen Med. 2, 1-13. 12. Shimizu, H., Julius, M. A., Giarre, M., Zheng, Z., Brown, A. M. C. & Kitajewski, J. (1997) Transformation by Wnt family proteins correlates with regulation of beta-catenin, Cell Growth Differ. 8(12), 1349-1358. 13. Ma, B., Landman, E. B., Miclea, R. L., Wit, J. M., Robanus-Maandag, E. C., Post, J. N. & Karperien, M. (2013) WNT signaling and cartilage: of mice and men, Calcified tissue international. 92, 399-411. 14. Sassi, N., Laadhar, L., Allouche, M., Achek, A., Kallel-Sellami, M., Makni, S., and Sellami, S. (2014) WNT signaling and chondrocytes: from cell fate determination to osteoarthritis physiopathology, Journal of Receptors and Signal Transduction. 34, 73-80. 15. Kobayashi, M., Squires, G. R., Mousa, A., Tanzer, M., Zukor, D. J., Antoniou, J., Feige, U. & Poole, A. R. (2005) Role of interleukin-1 and tumor necrosis factor alpha in matrix degradation of human osteoarthritic cartilage, Arthritis and rheumatism. 52, 128-35. 16. Kolettas, E., Muir, H. I., Barrett, J. C. & Hardingham, T. E. (2001) Chondrocyte phenotype and cell survival are regulated by culture conditions and by specific cytokines through the expression of Sox-9 transcription factor, Rheumatology. 40, 1146-1156. 17. Legendre, F., Dudhia, J., Pujol, J. P. & Bogdanowicz, P. (2003) JAK/STAT but not ERK1/ERK2 pathway mediates interleukin (IL)-6/soluble IL-6R down-regulation of Type II collagen, aggrecan core, and link protein transcription in articular chondrocytes. Association with a down-regulation of SOX9 expression, The Journal of biological chemistry. 278, 2903-12. 18. Kumar, D. & Lassar, A. B. (2009) The transcriptional activity of Sox9 in chondrocytes is regulated by RhoA signaling and actin polymerization, Mol Cell Biol. 29, 4262-73.
66 | Chapter 3
1
2
3
4
5
6
7
8
19. Fritzsche, M. & Charras, G. (2015) Dissecting protein reaction dynamics in living cells by fluorescence recovery after photobleaching, Nat Protoc. 10, 660-80. 20. Goldring, M. B., Birkhead, J. R., Suen, L. F., Yamin, R., Mizuno, S., Glowacki, J., Arbiser, J. L. & Apperley, J. F. (1994) Interleukin-1 beta-modulated gene expression in immortalized human chondrocytes, J Clin Invest. 94, 2307-16. 21. Oh, C. D., Maity, S. N., Lu, J. F., Zhang, J., Liang, S., Coustry, F., de Crombrugghe, B. & Yasuda, H. (2010) Identification of SOX9 interaction sites in the genome of chondrocytes, PloS one. 5, e10113. 22. Bridgewater, L. C., Lefebvre, V. & de Crombrugghe, B. (1998) Chondrocyte-specific enhancer elements in the Col11a2 gene resemble the Col2a1 tissue-specific enhancer., The Journal of biological chemistry. 273, 14998–15006. 23. Lefebvre, V., Huang, W., Harley, V. R., Goodfellow, P. N. & de Crombrugghe, B. (1997) SOX9 is a potent activator of the chondrocyte-specific enhancer of the pro alpha1(II) collagen gene, Molecular and Cellular Biology. 17, 2336-2346. 24. Nalesso, G., Sherwood, J., Bertrand, J., Pap, T., Ramachandran, M., De Bari, C., Pitzalis, C. & Dell'accio, F. (2011) WNT-3A modulates articular chondrocyte phenotype by activating both canonical and noncanonical pathways, J Cell Biol. 193, 551-64. 25. Sprague, B. L. & McNally, J. G. (2005) FRAP analysis of binding: proper and fitting, Trends Cell Biol. 15, 84-91. 26. Phair, R. D., Scaffidi, P., Elbi, C., Vecerová, J., Dey, A., Ozato, K., Brown, D. T., Hager, G., Bustin, M. & Misteli, T. (2004) Global Nature of Dynamic Protein-Chromatin Interactions In Vivo: Three-Dimensional Genome Scanning and Dynamic Interaction Networks of Chromatin Proteins, Molecular and Cellular Biology. 24, 6393-6402. 27. Phair, R. D., Gorski, S. A. & Misteli, T. (2003) Measurement of Dynamic Protein Binding to Chromatin In Vivo, Using Photobleaching Microscopy in Methods in Enzymology pp. 393-414, Academic Press. 28. Sprague, B. L., Pego, R. L., Stavreva, D. A. & McNally, J. G. (2004) Analysis of binding reactions by fluorescence recovery after photobleaching, Biophys J. 86, 3473-95. 29. Huang, X., Zhong, L., Hendriks, J., Post, J. N. & Karperien, M. (2019) Different response of human chondrocytes from healthy looking areas and damaged regions to IL1beta stimulation under different oxygen tension, J Orthop Res. 37, 84-93. 30. Abramson, S. B. (2008) Nitric oxide in inflammation and pain associated with osteoarthritis, Arthritis Research & Therapy. 10, S2-S2. 31. Rasheed, Z., Al-Shobaili, H. A., Rasheed, N., Mahmood, A. & Khan, M. I. (2016) MicroRNA-26a-5p regulates the expression of inducible nitric oxide synthase via activation of NF-kappaB pathway in human osteoarthritis chondrocytes, Arch Biochem Biophys. 594, 61-7. 32. Pelletier, J.-P., Martel-Pelletier, J. & Abramson, S. B. (2001) Osteoarthritis, an inflammatory disease: Potential implication for the selection of new therapeutic targets, Arthritis & Rheumatism. 44, 1237-1247. 33. Amin, A. R., Di Cesare, P. E., Vyas, P., Attur, M., Tzeng, E., Billiar, T. R., Stuchin, S. A. & Abramson, S. B. (1995) The expression and regulation of nitric oxide synthase in human osteoarthritis-affected chondrocytes: evidence for up-regulated neuronal nitric oxide synthase, J Exp Med. 182(6), 2097-102. 34. Ma, B., Zhong, L., van Blitterswijk, C. A., Post, J. N. & Karperien, M. (2013) T cell factor 4 is a pro-catabolic and apoptotic factor in human articular chondrocytes by potentiating nuclear factor kappaB signaling, The Journal of biological chemistry. 288, 17552-8. 35. Pelletier, J. P., Lascau-Coman, V., Jovanovic, D., Fernandes, J. C., Manning, P., Connor, J. R., Currie, M. G. & Martel-Pelletier, J. (1999) Selective inhibition of inducible nitric oxide synthase in experimental osteoarthritis is associated with reduction in tissue levels of catabolic factors, J Rheumatol. 26(9), 2002-2014. 36. Liu, C.-F. & Lefebvre, V. (2015) The transcription factors SOX9 and SOX5/SOX6 cooperate genome-wide through super-enhancers to drive chondrogenesis, Nucleic acids research. 43, 8183-8203.
Changes in Fluorescence Recovery After Photobleaching (FRAP) as an indicator of SOX9 activity| 67
1
2
3
4
5
6
7
8
37. Bernard, P., Tang, P., Liu, S., Dewing, P., Harley, V. R. & Vilain, E. (2003) Dimerization of SOX9 is required for chondrogenesis, but not for sex determination, Human Molecular Genetics. 12, 1755-1765. 38. Sock, E., Pagon, R. A., Keymolen, K., Lissens, W., Wegner, M. & Scherer, G. (2003) Loss of DNA-dependent dimerization of the transcription factor SOX9 as a cause for campomelic dysplasia, Human Molecular Genetics. 12, 1439-1447. 39. Sekiya, I., Tsuji, K., Koopman, P., Watanabe, H., Yamada, Y., Shinomiya, K., Nifuji, A. & Noda, M. (2000) SOX9 Enhances Aggrecan Gene Promoter/Enhancer Activity and Is Up-regulated by Retinoic Acid in a Cartilage-derived Cell Line, TC6, Journal of Biological Chemistry. 275, 10738-10744. 40. Blache, P., van de Wetering, M., Duluc, I., Domon, C., Berta, P., Freund, J. N., Clevers, H. & Jay, P. (2004) SOX9 is an intestine crypt transcription factor, is regulated by the Wnt pathway, and represses the CDX2 and MUC2 genes, J Cell Biol. 166, 37-47. 41. Lidke, D. S., Huang, F., Post, J. N., Rieger, B., Wilsbacher, J., Thomas, J. L., Pouysségur, J., Jovin, T. M. & Lenormand, P. (2010) ERK Nuclear Translocation Is Dimerization-independent but Controlled by the Rate of Phosphorylation, Journal of Biological Chemistry. 285, 3092-3102. 42. Han, F., Liang, P., Wang, F., Zeng, L. & Zhang, B. (2011) Automated Analysis of Time-Lapse Imaging of Nuclear Translocation by Retrospective Strategy and Its Application to STAT1 in HeLa Cells, PloS one. 6, e27454. 43. Cutler, A. A., Jackson, J. B., Corbett, A. H. & Pavlath, G. K. (2018) Non-equivalence of nuclear import among nuclei in multinucleated skeletal muscle cells, J Cell Sci. 131. 44. Farla, P., Hersmus, R., Trapman, J. & Houtsmuller, A. B. (2005) Antiandrogens prevent stable DNA-binding of the androgen receptor, J Cell Sci. 118, 4187-4198. 45. Shlyueva, D., Stampfel, G. & Stark, A. (2014) Transcriptional enhancers: from properties to genome-wide predictions, Nat Rev Genet. 15, 272-86. 46. Spivakov, M. (2014) Spurious transcription factor binding: non-functional or genetically redundant?, Bioessays. 36, 798-806. 47. Mueller, F., Stasevich, T. J., Mazza, D. & McNally, J. G. (2013) Quantifying transcription factor kinetics: At work or at play?, Critical Reviews in Biochemistry and Molecular Biology. 48, 492-514. 48. Lidke, D. S., Nagy, P., Heintzmann, R., Arndt-Jovin, D. J., Post, J. N., Grecco, H. E., Jares-Erijman, E. A. & Jovin, T. M. (2004) Quantum dot ligands provide new insights into erbB/HER receptor–mediated signal transduction, Nature Biotechnology. 22, 198. 49. Bar Oz, M., Kumar, A., Elayyan, J., Reich, E., Binyamin, M., Kandel, L., Liebergall, M., Steinmeyer, J., Lefebvre, V. & Dvir-Ginzberg, M. (2016) Acetylation reduces SOX9 nuclear entry and ACAN gene transactivation in human chondrocytes, Aging Cell. 15, 499-508. 50. Dvir-Ginzberg, M., Gagarina, V., Lee, E.-J. & Hall, D. J. (2008) Regulation of Cartilage-specific Gene Expression in Human Chondrocytes by SirT1 and Nicotinamide Phosphoribosyltransferase, The Journal of biological chemistry. 283, 36300-36310. 51. Chakrabarti, S. K., James, J. C. & Mirmira, R. G. (2002) Quantitative Assessment of Gene Targeting in Vitroand in Vivo by the Pancreatic Transcription Factor, Pdx1: IMPORTANCE OF CHROMATIN STRUCTURE IN DIRECTING PROMOTER BINDING, Journal of Biological Chemistry. 277, 13286-13293.

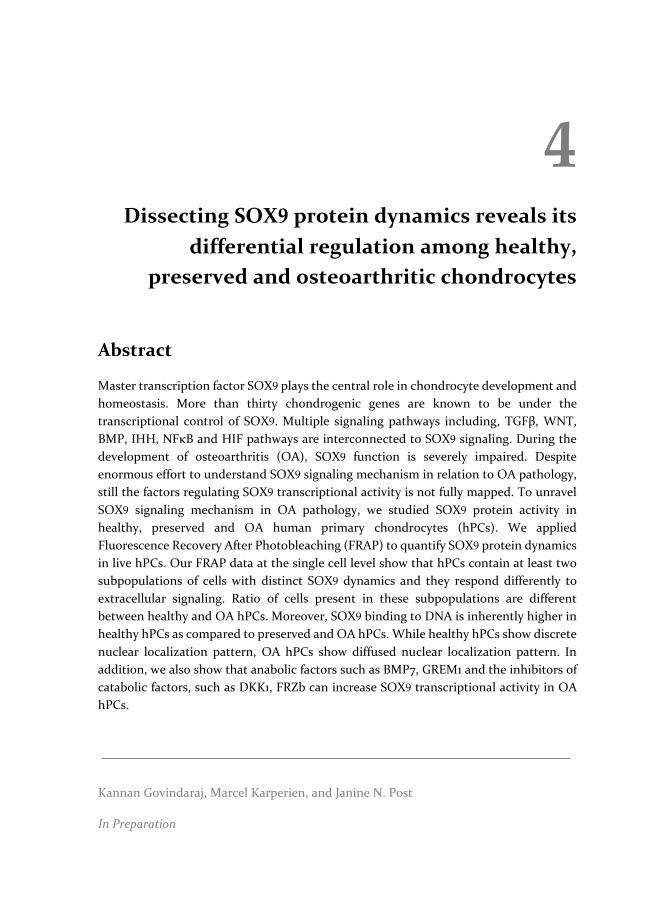
4 Dissecting SOX9 protein dynamics reveals its
differential regulation among healthy, preserved and osteoarthritic chondrocytes
Abstract
Master transcription factor SOX9 plays the central role in chondrocyte development and homeostasis. More than thirty chondrogenic genes are known to be under the transcriptional control of SOX9. Multiple signaling pathways including, TGFβ, WNT, BMP, IHH, NFκB and HIF pathways are interconnected to SOX9 signaling. During the development of osteoarthritis (OA), SOX9 function is severely impaired. Despite enormous effort to understand SOX9 signaling mechanism in relation to OA pathology, still the factors regulating SOX9 transcriptional activity is not fully mapped. To unravel SOX9 signaling mechanism in OA pathology, we studied SOX9 protein activity in healthy, preserved and OA human primary chondrocytes (hPCs). We applied Fluorescence Recovery After Photobleaching (FRAP) to quantify SOX9 protein dynamics in live hPCs. Our FRAP data at the single cell level show that hPCs contain at least two subpopulations of cells with distinct SOX9 dynamics and they respond differently to extracellular signaling. Ratio of cells present in these subpopulations are different between healthy and OA hPCs. Moreover, SOX9 binding to DNA is inherently higher in healthy hPCs as compared to preserved and OA hPCs. While healthy hPCs show discrete nuclear localization pattern, OA hPCs show diffused nuclear localization pattern. In addition, we also show that anabolic factors such as BMP7, GREM1 and the inhibitors of catabolic factors, such as DKK1, FRZb can increase SOX9 transcriptional activity in OA hPCs.
Kannan Govindaraj, Marcel Karperien, and Janine N. Post
In Preparation
70 | Chapter 4
1
2
3
4
5
6
7
8
4.1 Introduction
The transcription factor SOX9 is a DNA binding protein and a key player during embryonic development and skeletal formation. In the process of cartilage and bone formation, SOX9 plays an important role in mesenchymal stem cell condensation and chondrocyte differentiation [1]. Haploinsufficiency or mutations within and around the SOX9 genetic locus causes skeletal malformation. In addition, impaired SOX9 function is implicated in various diseases, such as osteoarthritis (OA), fibrosis, micrognathia, dwarfism, cancer, etc. [1, 2].
SOX9 plays a well-established role in OA pathophysiology. OA is a multifactorial, degenerative joint disease and its pathophysiology at the molecular level is yet unknown. During OA, extracellular matrix (ECM) in the cartilage tissue is degraded and its repair and regeneration capacity is limited. ECM is composed of collagens and proteoglycans (aggrecan with glycosaminoglycans). At the onset of OA, expression of these ECM genes is downregulated. In chondrocytes, SOX9 regulates the expression of many ECM genes, including COL2A and ACAN. SOX9 activity is upregulated in healthy (articular) chondrocytes and downregulated during hypertrophic differentiation [2-4].
Several signaling pathways, including the BMP7, WNT3A, IL1 and TGFβ pathways, have been studied extensively to understand the regulation of SOX9 target gene or protein expression in OA pathology. BMP7 is an anabolic factor in cartilage homeostasis and upregulates expression of ECM proteins, such as ACAN and COL2A [5]. WNT signaling is essential for chondrocyte differentiation and endochondral ossification. However, WNT activation is a driving factor of hypertrophic differentiation [6]. IL1β is expressed in OA onset and upregulates ECM degrading enzymes [7]. Both WNT and IL1β signaling play a key role in OA pathophysiology. Despite much knowledge on the regulation of SOX9 expression, the precise mechanism and the factors regulating its transcriptional activity are not yet fully understood [2].
SOX9 activity has been studied at the mRNA, protein and target gene expression levels. SOX9 protein is known to exist in several molecular states – phosphorylated [8], methylated [9] and acetylated [10] forms – and these states play a key role in its transcriptional activity [2]. Currently used methods for studying SOX9 protein activity are static, including western blot, immunofluorescence, EMSA, ChIP, etc., but these lack spatiotemporal resolution. We have previously shown that FRAP can be used as a reliable method to study SOX9 transcriptional activity at the protein level in C20/A4 cells [11].
In this study, using FRAP, we have investigated SOX9 dynamics in healthy, preserved and OA human primary articular chondrocytes (hPCs) in response to extra cellular stimulation. We show that at least two populations of cells are present in healthy, preserved and OA hPCs, and that they respond differently to external stimulation. Our
Dissecting SOX9 dynamics reveals its differential regulation among healthy, preserved & OA hPCs| 71
1
2
3
4
5
6
7
8
FRAP data with spatiotemporal resolution has also captured distinct nuclear localization patterns and dynamics of SOX9-mGFP among healthy, preserved and OA hPCs.
4.2 Materials and Methods
4.2.1 Cell Culture
Healthy hPCs without known OA were purchased from Articular Engineering, USA. Preserved (cells from visually less damaged cartilage tissue) and OA (cells from comparatively highly damaged cartilage tissue) hPCs were isolated from knee joints of patients undergoing joint replacement surgery [12]. Donor numbers mentioned in this manuscript and the corresponding donor numbers in our lab reference, along with OARSI score are mentioned in Table S4.1 (for our future reference). hPCs were cultured in chondrocyte proliferation media containing DMEM (Invitrogen), 10% FBS (Sigma), 20mM ascorbic acid-2-phosphate (Sigma) and non-essential amino acids, at 37⁰C with 5% CO2. hPCs were expanded and used within 4 passages / 4-5 population doublings.
4.2.2 Transfection
hPCs (40,000 cells) were plated in chondrocyte proliferation media on glass cover slips (12 mm, Ø) in a 24-well plate and transiently transfected with SOX9-mGFP. Lipofectamine LTX with Plus Reagent (Life Technologies) was used for the transfection of SOX9-mGFP and the manufacturer’s protocol was followed. Transfection mix was prepared in Opti-MEM. Plasmid (ng), Plus reagent and LTX (μl) ratio: 1:1:2. Cells were maintained in serum-free Opti-MEM during transfection for 3 hours and was replaced with proliferation media post-transfection.
4.2.3 Imaging Buffer
Imaging was performed in Tyrode’s buffer with freshly added 20 mM glucose (GIBCO) and 0.1% BSA (Sigma) [13]. Buffer composition: 135 mM NaCl (Sigma), 10 mM KCl (Sigma), 0.4 mM MgCl2 (Sigma), 1 mM CaCl2 (Sigma), 10 mM HEPES (Acros organics), pH: 7.2, filter sterilized and stored at -20⁰C.
4.2.4 Cytokines and Inhibitors treatments
Prior to FRAP measurements, hPCs were treated with either cytokines and/or inhibitors in the imaging buffer at concentrations indicated below. All cytokines were purchased from R&D systems, unless otherwise stated. For cytokines or inhibitor treatments: hPCs were kept in the imaging buffer containing cytokines/inhibitors for 20 min (60 min for BMP7) before FRAP measurements. For cytokines with inhibitors treatments: hPCs were
72 | Chapter 4
1
2
3
4
5
6
7
8
first treated with the inhibitors for 20 min and then cytokines were added to the imaging buffer incubated for another 20 min prior to FRAP measurements. Control (no treatment), BMP7 (100 ng/ml), IL1β (10 ng/ml; Peprotech), WNT3A (10 ng/ml), GREM1 (100 ng/ml), DKK1 (10 ng/ml), FRZB (10 ng/ml), IL1Ra (10 ng/ml; Sigma), 1400W (100 μM; Cayman Chemicals).
4.2.5 FRAP
hPCs with transiently expressing SOX9-mGFP were maintained in the imaging buffer, with or without cytokines and/or inhibitors during FRAP measurements. FRAP measurement was performed in Nikon A1 laser scanning confocal microscope with 60X/1.2 NA water immersion objective, 488 nm laser at 0.35% (0.12 μW at the objective) laser power. Temperature was maintained at 37°C with an OkaLab temperature controller. FRAP settings: frame size of 256x256 pixels, scan speed: 4 fps, scan time: 60 sec (post-bleach), pixel size: 0.12 μm, zoom size: 7.09. A representative circular region of 2.9 μm diameter was bleached with one iteration (60 ms) of 50% (34.3 μW) laser power. Twenty-five pre-bleach images were taken and the last 10 pre-bleach fluorescence intensity values were averaged to normalize the FRAP curve. N ≥ 40 cells per condition. MatlabTM was used to analyze the FRAP data and the script is available upon request. A diffusion uncoupled, two-component method was used to interpret our FRAP data as described previously [11].
4.2.6 Cluster analysis
Unsupervised hierarchical clustering was used to predict number of clusters present in the data using following algorithms; Distance type: Euclidean, Cluster method: Furthest neighbor and Find Clustroid: Sum of distances. Hierarchical clustering predicted at least two clusters in the data and the cluster centers were calculated in the predicted clusters. These cluster centers were used as input and K-means clustering was performed to further refine the cluster data analysis. Cells with very different FRAP rates, which did not fit to any of the clusters were considered outliers and excluded from the data analysis. Cluster analysis was performed using Origin® software.
4.2.7 Cell cycle synchronization
hPCs were seeded on glass coverslips in a 24-well plate in chondrocyte proliferation media. A day after, cells were washed and medium was replaced with chondrocyte proliferation media without FBS. After 24 hours, cells were washed and medium was replaced with chondrocyte proliferation media with FBS. Post synchronization, cells were analyzed at 3 time points, at 0 h (after 24 h FBS free media), 2 h (after 24 h FBS free media + 2 h with FBS media), 6 h (after 24 h FBS free media + 6 h with FBS media). In case, the cells were transfected with SOX9-mGFP, cells were maintained in chondrocyte
Dissecting SOX9 dynamics reveals its differential regulation among healthy, preserved & OA hPCs| 73
1
2
3
4
5
6
7
8
proliferation media with FBS for 6 h to allow cells to synthesize SOX9-mGFP followed by serum starvation for 24 hours and serum stimulation at the time points described above.
4.2.8 Immunofluorescence Staining
Cells grown on coverslips were fixed with freshly prepared 4% paraformaldehyde and washed 3x with ice cold PBS at 5 minute intervals and simultaneously permeabilized and blocked with 0.3% Triton-X-100 and 1% BSA in PBS for 15 mins. Cells were incubated with Rabbit anti-SOX9 antibody (Millipore) at 1:50 dilution in the blocking and permeabilization solution overnight at 4⁰C. Coverslip with cells were washed 3x with PBS at 5 minute intervals. Cells were incubated with goat anti-rabbit AF568 antibody (Abcam) at the dilution of 1:500 for 45 mins. Coverslip with cells were washed 3x with PBS at 5 minute intervals and mounted on to a microscopic glass side with VectaShield containing DAPI. Cells immuno-stained with SOX9 were imaged using a Nikon A1 confocal microscope with a 60x/1.2 NA water immersion objective.
4.2.9 Statistical analysis
Since FRAP data did not show normal distribution we applied the Mann-Whitney U-test to calculate significance using Origin® software. Statistical significance is calculated between the control and treated conditions. Paired, 2-tailed, student t-test was performed to calculate significance for qPCR data.
4.2.10 mRNA isolation and RT-qPCR
hPCs were plated on a 12-well plate, cytokines and inhibitors treatments were given for 24 h at the concentration indicated. For treatments with inhibitors and cytokines, cytokines were added after 1 h pre-treatment with the inhibitors and the 24 h time point was calculated from the time cytokines were added. mRNA was isolated using either the NucleoSpin RNA isolation kit (Macherey-Nagel) or TRIzolTM (Invitrogen) with linear acrylamide as a co-precipitant, according to the manufacturer’s protocol. Purity and concentration of RNA samples were measured by Nanodrop 2000. cDNA was synthesized using the iScript cDNA synthesis kit (Bio-Rad). Real-time PCR analysis was carried out using SYBR Green mix (Bioline) in a Bio-Rad CFX-96 RT-PCR. Gene expression is reported as the relative mRNA expression [14] and is normalized to untreated control and GAPDH. Primer sequences are specified in the supplementary information (Table S4.2).
74 | Chapter 4
1
2
3
4
5
6
7
8
4.3 Results
4.3.1 Explanation of FRAP parameters
A brief illustration of FRAP method is presented in the Figure S4.1, we refer the readers to [11] for more details. A schematic FRAP curve with calculations is presented in Figure S4.2. FRAP terminologies: Immobile Fraction (IF) is the fraction of SOX9-mGFP not recovered until the end of FRAP measurement. Recovery half-time (t½) of A1 and A2 denots half of the time required for fluorescence recovery of A1 and A2 populations respectively. A1/A2 is the ratio of A1 to A2 population.
4.3.2 SOX9 binding to DNA is lower in preserved and OA hPCs as compared to healthy hPCs
Impaired SOX9 function is implicated in OA pathology and to understand the changes in SOX9 activity during OA progression, we quantified SOX9-DNA binding by FRAP, in healthy, preserved and OA hPCs in the steady state (i.e. untreated cells in imaging buffer). Averaged FRAP curves of two healthy, six preserved and six OA donors (Figure 4.1A) show that the SOX9-mGFP mobility is lower (thus, higher DNA binding) in healthy hPCs as compared to preserved and OA hPCs. This resulted in significantly higher IF in healthy hPCs (60.9%) as compared to preserved (45.4%) and OA (45.1%) hPCs (Figure 4.1B and Table S4.3). The ratio of A1 to A2 was lower in healthy hPCs as compared to preserved and OA hPCs (Figure 4.1C and Table S4.3). T½ of A1 and A2 were significantly longer in healthy hPCs as compared to preserved and OA hPCs (Figure S4.3, 1D and Table S4.3). Our data indicated that there is no significant difference in the FRAP rates of SOX9 dynamics between preserved and OA hPCs. Averaged FRAP rates of individual donors are presented in Table S4.4. We performed further experiments in two healthy donors, three preserved and three OA donors.
4.3.3 Workflow data analysis
During data analysis, we observed a large spread in the data. To check if there were any clusters present, we performed an unsupervised hierarchical clustering, followed by K-means clustering, see methods for details. Workflow of the data analysis is illustrated in Figure S4.4.
4.3.4 Two population of cells present in hPCs
Hierarchical and K-means clustering indicated that there are at least two population of cells present in the hPCs (irrespective of their health state), each with distinct FRAP rates. Dendrograms of hierarchical clustering, 2D scatter plots of K-means clustering and FRAP recovery curves showing these two populations (in steady state) for all the donors
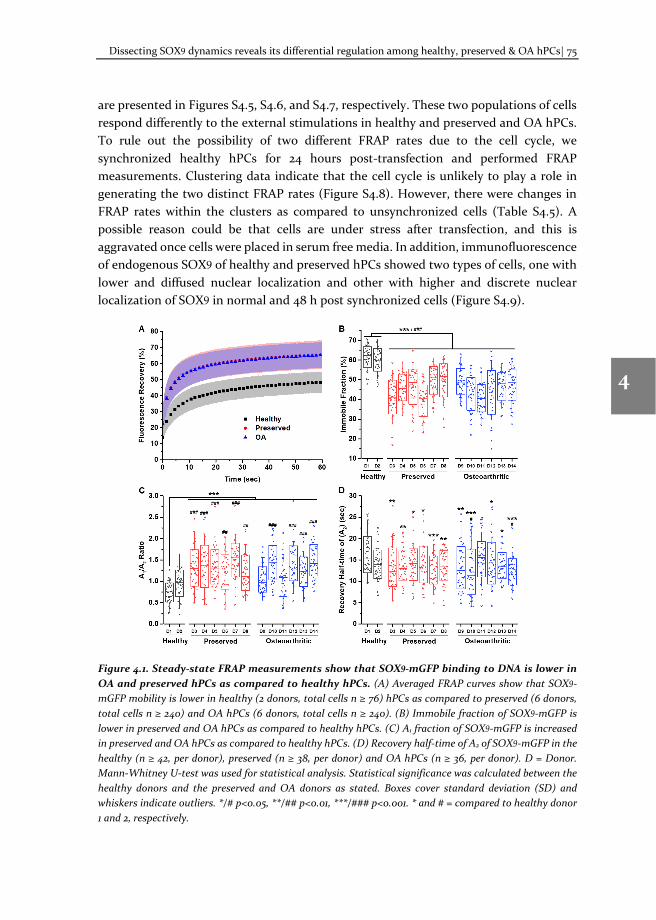
Dissecting SOX9 dynamics reveals its differential regulation among healthy, preserved & OA hPCs| 75
1
2
3
4
5
6
7
8
are presented in Figures S4.5, S4.6, and S4.7, respectively. These two populations of cells respond differently to the external stimulations in healthy and preserved and OA hPCs. To rule out the possibility of two different FRAP rates due to the cell cycle, we synchronized healthy hPCs for 24 hours post-transfection and performed FRAP measurements. Clustering data indicate that the cell cycle is unlikely to play a role in generating the two distinct FRAP rates (Figure S4.8). However, there were changes in FRAP rates within the clusters as compared to unsynchronized cells (Table S4.5). A possible reason could be that cells are under stress after transfection, and this is aggravated once cells were placed in serum free media. In addition, immunofluorescence of endogenous SOX9 of healthy and preserved hPCs showed two types of cells, one with lower and diffused nuclear localization and other with higher and discrete nuclear localization of SOX9 in normal and 48 h post synchronized cells (Figure S4.9).
Figure 4.1. Steady-state FRAP measurements show that SOX9-mGFP binding to DNA is lower in OA and preserved hPCs as compared to healthy hPCs. (A) Averaged FRAP curves show that SOX9-mGFP mobility is lower in healthy (2 donors, total cells n ≥ 76) hPCs as compared to preserved (6 donors, total cells n ≥ 240) and OA hPCs (6 donors, total cells n ≥ 240). (B) Immobile fraction of SOX9-mGFP is lower in preserved and OA hPCs as compared to healthy hPCs. (C) A1 fraction of SOX9-mGFP is increased in preserved and OA hPCs as compared to healthy hPCs. (D) Recovery half-time of A2 of SOX9-mGFP in the healthy (n ≥ 42, per donor), preserved (n ≥ 38, per donor) and OA hPCs (n ≥ 36, per donor). D = Donor. Mann-Whitney U-test was used for statistical analysis. Statistical significance was calculated between the healthy donors and the preserved and OA donors as stated. Boxes cover standard deviation (SD) and whiskers indicate outliers. */# p<0.05, **/## p<0.01, ***/### p<0.001. * and # = compared to healthy donor 1 and 2, respectively.
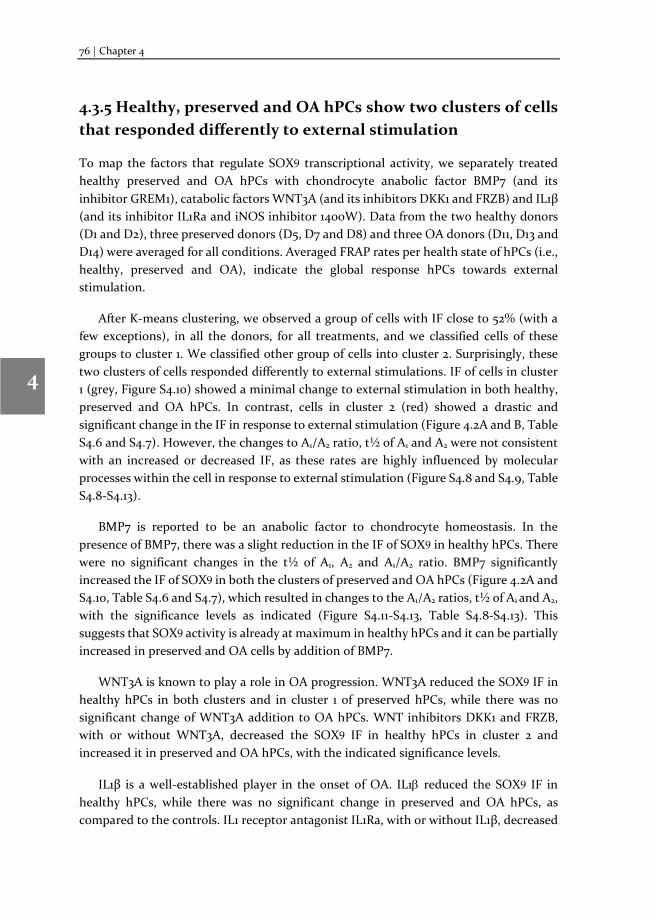
76 | Chapter 4
1
2
3
4
5
6
7
8
4.3.5 Healthy, preserved and OA hPCs show two clusters of cells that responded differently to external stimulation
To map the factors that regulate SOX9 transcriptional activity, we separately treated healthy preserved and OA hPCs with chondrocyte anabolic factor BMP7 (and its inhibitor GREM1), catabolic factors WNT3A (and its inhibitors DKK1 and FRZB) and IL1β (and its inhibitor IL1Ra and iNOS inhibitor 1400W). Data from the two healthy donors (D1 and D2), three preserved donors (D5, D7 and D8) and three OA donors (D11, D13 and D14) were averaged for all conditions. Averaged FRAP rates per health state of hPCs (i.e., healthy, preserved and OA), indicate the global response hPCs towards external stimulation.
After K-means clustering, we observed a group of cells with IF close to 52% (with a few exceptions), in all the donors, for all treatments, and we classified cells of these groups to cluster 1. We classified other group of cells into cluster 2. Surprisingly, these two clusters of cells responded differently to external stimulations. IF of cells in cluster 1 (grey, Figure S4.10) showed a minimal change to external stimulation in both healthy, preserved and OA hPCs. In contrast, cells in cluster 2 (red) showed a drastic and significant change in the IF in response to external stimulation (Figure 4.2A and B, Table S4.6 and S4.7). However, the changes to A1/A2 ratio, t½ of A1 and A2 were not consistent with an increased or decreased IF, as these rates are highly influenced by molecular processes within the cell in response to external stimulation (Figure S4.8 and S4.9, Table S4.8-S4.13).
BMP7 is reported to be an anabolic factor to chondrocyte homeostasis. In the presence of BMP7, there was a slight reduction in the IF of SOX9 in healthy hPCs. There were no significant changes in the t½ of A1, A2 and A1/A2 ratio. BMP7 significantly increased the IF of SOX9 in both the clusters of preserved and OA hPCs (Figure 4.2A and S4.10, Table S4.6 and S4.7), which resulted in changes to the A1/A2 ratios, t½ of A1 and A2, with the significance levels as indicated (Figure S4.11-S4.13, Table S4.8-S4.13). This suggests that SOX9 activity is already at maximum in healthy hPCs and it can be partially increased in preserved and OA cells by addition of BMP7.
WNT3A is known to play a role in OA progression. WNT3A reduced the SOX9 IF in healthy hPCs in both clusters and in cluster 1 of preserved hPCs, while there was no significant change of WNT3A addition to OA hPCs. WNT inhibitors DKK1 and FRZB, with or without WNT3A, decreased the SOX9 IF in healthy hPCs in cluster 2 and increased it in preserved and OA hPCs, with the indicated significance levels.
IL1β is a well-established player in the onset of OA. IL1β reduced the SOX9 IF in healthy hPCs, while there was no significant change in preserved and OA hPCs, as compared to the controls. IL1 receptor antagonist IL1Ra, with or without IL1β, decreased
Dissecting SOX9 dynamics reveals its differential regulation among healthy, preserved & OA hPCs| 77
1
2
3
4
5
6
7
8
the SOX9 IF in healthy hPCs of cluster 2 and increased the IF in cluster 1 and in OA hPCs of cluster 2, as compared to the controls, with the indicated significance levels. iNOS is reportedly very active in OA hPCs and induces Nitric oxide (NO) production. We asked whether inhibiting iNOS would increase SOX9 activity. 1400W, an iNOS inhibitor, with or without IL1β, decreased SOX9 IF in the cells of cluster 2 of healthy hPCs and increased it in cluster 1 (in 1400W+IL1β condition only) of healthy hPCs and cells in cluster 2 of OA hPCs (Figure 4.2C, Table S4.6 and S4.7).
To investigate if there is any difference in the ratio of cells present between these clusters of healthy preserved and OA donors, we calculated the number of cells present in the clusters 1 and 2. Interestingly, nearly equal amount of cells were present in both the clusters of healthy hPCs, while the ratio of cells in cluster 1 was higher in preserved and OA hPCs (Figure 4.2D). Number of cells in cluster 1 and 2 in individual donors are presented in Table S4.14. Donor variation is prevalent in OA hPCs isolated from patients [15, 16]. To account for the variation at the donor level, we looked into how individual donors respond to cytokines. This data is presented in supplemental Figures S4.14-S4.17 and Tables S4.15-S4.32.
4.3.6 SOX9 dynamics differentially regulated by signaling interplay
We compared how individual FRAP rates of SOX9-mGFP – IF, t½ and ratio of A1 to A2 – change in response to external stimulation in the cluster 2 of healthy and OA hPCs (data of preserved hPCs are omitted for simplicity). In healthy hPCs, IF (grey) was significantly decreased in response to all treatments and this resulted in an increase of ratio A1 fraction (green) of SOX9-mGFP with the indicated significance levels (Figure 4.3A). However, t½ of A2 (blue) significantly increased only in and 1400W+IL1β treated condition and t½ of A1 (red) significantly decreased in the following treatments, GREM1+BMP7, DKK1+FRZB, IL1Ra and 1400W.
In OA hPCs, IF and t½ of A1 and A2 of SOX9-mGFP significantly increased in BMP7 treated condition, while only t½ of A1 and A2 increased GREM1+BMP7 treated condition (Figure 4.3B). WNT3A decreased t½ of A1 and A2 of SOX9-mGFP, however WNT inhibitors DKK1+FRZB increased IF. IL1β significantly decreased the t½ of A1 and IL1Ra with or without IL1β and 1400W+IL1β increased SOX9 IF. These changes in individual FRAP rates in response to external stimulation also resulted in change of the shape of FRAP curves as shown in the Figures S4.18 and S4.19 and Fable S4.9, S4.11, S4.13 and S4.14.
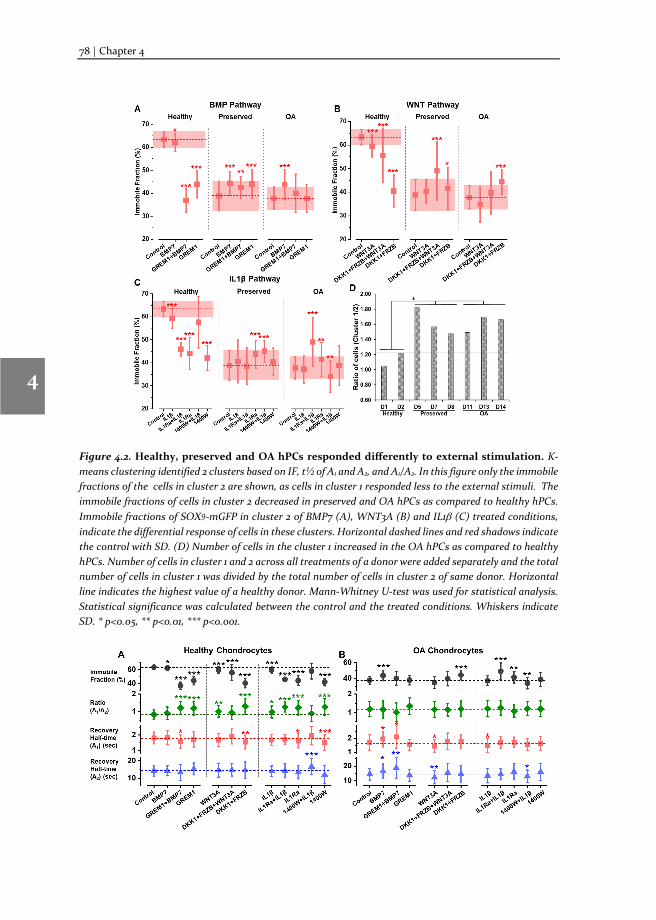
78 | Chapter 4
1
2
3
4
5
6
7
8
Figure 4.2. Healthy, preserved and OA hPCs responded differently to external stimulation. K-means clustering identified 2 clusters based on IF, t½ of A1 and A2, and A1/A2. In this figure only the immobile fractions of the cells in cluster 2 are shown, as cells in cluster 1 responded less to the external stimuli. The immobile fractions of cells in cluster 2 decreased in preserved and OA hPCs as compared to healthy hPCs. Immobile fractions of SOX9-mGFP in cluster 2 of BMP7 (A), WNT3A (B) and IL1β (C) treated conditions, indicate the differential response of cells in these clusters. Horizontal dashed lines and red shadows indicate the control with SD. (D) Number of cells in the cluster 1 increased in the OA hPCs as compared to healthy hPCs. Number of cells in cluster 1 and 2 across all treatments of a donor were added separately and the total number of cells in cluster 1 was divided by the total number of cells in cluster 2 of same donor. Horizontal line indicates the highest value of a healthy donor. Mann-Whitney U-test was used for statistical analysis. Statistical significance was calculated between the control and the treated conditions. Whiskers indicate SD. * p<0.05, ** p<0.01, *** p<0.001.
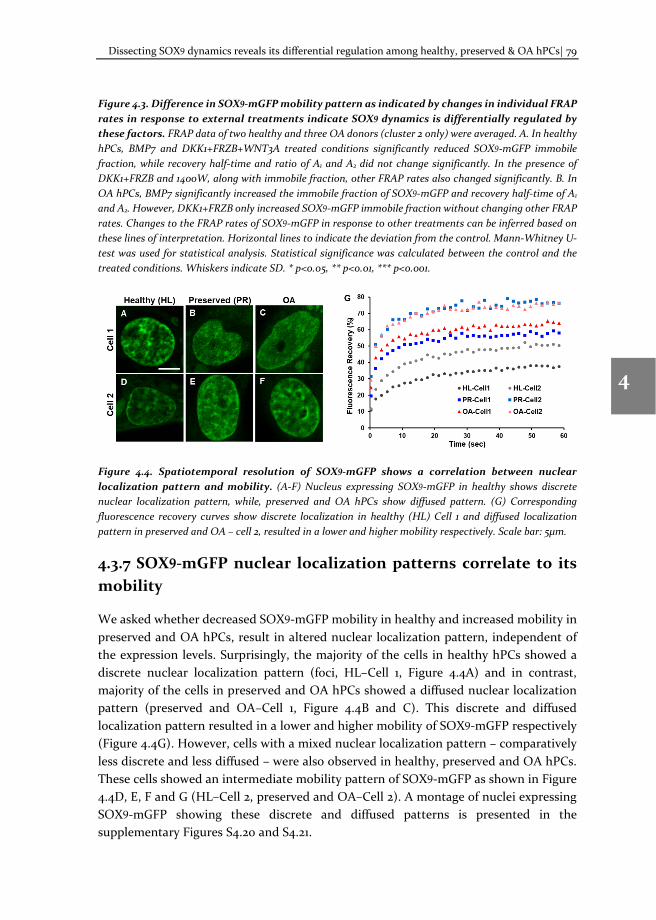
Dissecting SOX9 dynamics reveals its differential regulation among healthy, preserved & OA hPCs| 79
1
2
3
4
5
6
7
8
Figure 4.3. Difference in SOX9-mGFP mobility pattern as indicated by changes in individual FRAP rates in response to external treatments indicate SOX9 dynamics is differentially regulated by these factors. FRAP data of two healthy and three OA donors (cluster 2 only) were averaged. A. In healthy hPCs, BMP7 and DKK1+FRZB+WNT3A treated conditions significantly reduced SOX9-mGFP immobile fraction, while recovery half-time and ratio of A1 and A2 did not change significantly. In the presence of DKK1+FRZB and 1400W, along with immobile fraction, other FRAP rates also changed significantly. B. In OA hPCs, BMP7 significantly increased the immobile fraction of SOX9-mGFP and recovery half-time of A1 and A2. However, DKK1+FRZB only increased SOX9-mGFP immobile fraction without changing other FRAP rates. Changes to the FRAP rates of SOX9-mGFP in response to other treatments can be inferred based on these lines of interpretation. Horizontal lines to indicate the deviation from the control. Mann-Whitney U-test was used for statistical analysis. Statistical significance was calculated between the control and the treated conditions. Whiskers indicate SD. * p<0.05, ** p<0.01, *** p<0.001.
Figure 4.4. Spatiotemporal resolution of SOX9-mGFP shows a correlation between nuclear localization pattern and mobility. (A-F) Nucleus expressing SOX9-mGFP in healthy shows discrete nuclear localization pattern, while, preserved and OA hPCs show diffused pattern. (G) Corresponding fluorescence recovery curves show discrete localization in healthy (HL) Cell 1 and diffused localization pattern in preserved and OA – cell 2, resulted in a lower and higher mobility respectively. Scale bar: 5μm.
4.3.7 SOX9-mGFP nuclear localization patterns correlate to its mobility
We asked whether decreased SOX9-mGFP mobility in healthy and increased mobility in preserved and OA hPCs, result in altered nuclear localization pattern, independent of the expression levels. Surprisingly, the majority of the cells in healthy hPCs showed a discrete nuclear localization pattern (foci, HL–Cell 1, Figure 4.4A) and in contrast, majority of the cells in preserved and OA hPCs showed a diffused nuclear localization pattern (preserved and OA–Cell 1, Figure 4.4B and C). This discrete and diffused localization pattern resulted in a lower and higher mobility of SOX9-mGFP respectively (Figure 4.4G). However, cells with a mixed nuclear localization pattern – comparatively less discrete and less diffused – were also observed in healthy, preserved and OA hPCs. These cells showed an intermediate mobility pattern of SOX9-mGFP as shown in Figure 4.4D, E, F and G (HL–Cell 2, preserved and OA–Cell 2). A montage of nuclei expressing SOX9-mGFP showing these discrete and diffused patterns is presented in the supplementary Figures S4.20 and S4.21.
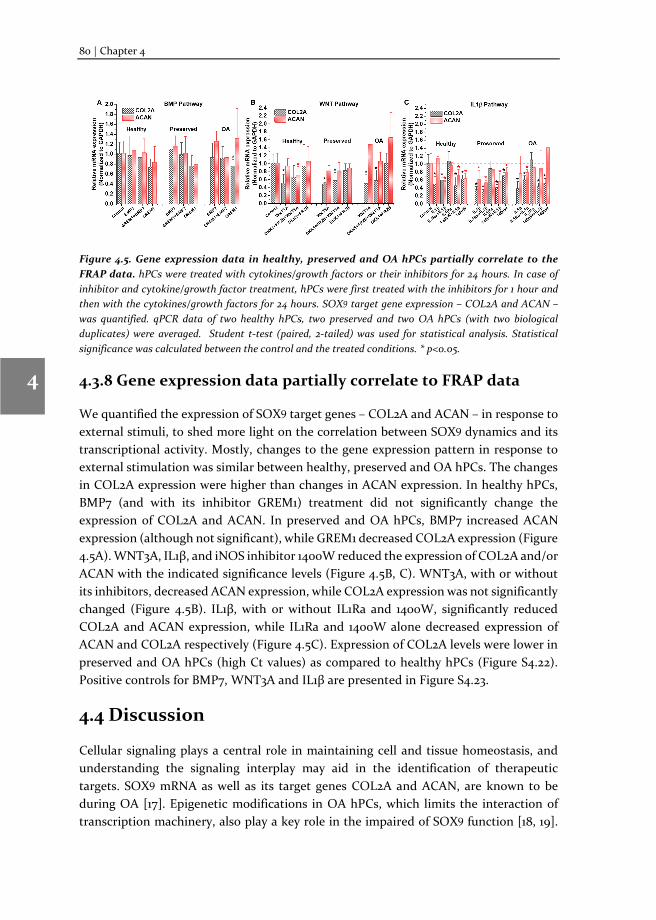
80 | Chapter 4
1
2
3
4
5
6
7
8
Figure 4.5. Gene expression data in healthy, preserved and OA hPCs partially correlate to the FRAP data. hPCs were treated with cytokines/growth factors or their inhibitors for 24 hours. In case of inhibitor and cytokine/growth factor treatment, hPCs were first treated with the inhibitors for 1 hour and then with the cytokines/growth factors for 24 hours. SOX9 target gene expression – COL2A and ACAN –was quantified. qPCR data of two healthy hPCs, two preserved and two OA hPCs (with two biological duplicates) were averaged. Student t-test (paired, 2-tailed) was used for statistical analysis. Statistical significance was calculated between the control and the treated conditions. * p<0.05.
4.3.8 Gene expression data partially correlate to FRAP data
We quantified the expression of SOX9 target genes – COL2A and ACAN – in response to external stimuli, to shed more light on the correlation between SOX9 dynamics and its transcriptional activity. Mostly, changes to the gene expression pattern in response to external stimulation was similar between healthy, preserved and OA hPCs. The changes in COL2A expression were higher than changes in ACAN expression. In healthy hPCs, BMP7 (and with its inhibitor GREM1) treatment did not significantly change the expression of COL2A and ACAN. In preserved and OA hPCs, BMP7 increased ACAN expression (although not significant), while GREM1 decreased COL2A expression (Figure 4.5A). WNT3A, IL1β, and iNOS inhibitor 1400W reduced the expression of COL2A and/or ACAN with the indicated significance levels (Figure 4.5B, C). WNT3A, with or without its inhibitors, decreased ACAN expression, while COL2A expression was not significantly changed (Figure 4.5B). IL1β, with or without IL1Ra and 1400W, significantly reduced COL2A and ACAN expression, while IL1Ra and 1400W alone decreased expression of ACAN and COL2A respectively (Figure 4.5C). Expression of COL2A levels were lower in preserved and OA hPCs (high Ct values) as compared to healthy hPCs (Figure S4.22). Positive controls for BMP7, WNT3A and IL1β are presented in Figure S4.23.
4.4 Discussion
Cellular signaling plays a central role in maintaining cell and tissue homeostasis, and understanding the signaling interplay may aid in the identification of therapeutic targets. SOX9 mRNA as well as its target genes COL2A and ACAN, are known to be during OA [17]. Epigenetic modifications in OA hPCs, which limits the interaction of transcription machinery, also play a key role in the impaired of SOX9 function [18, 19].
Dissecting SOX9 dynamics reveals its differential regulation among healthy, preserved & OA hPCs| 81
1
2
3
4
5
6
7
8
Our quantitative FRAP measurements indicate that the amount of SOX9 binding to DNA and its residence time on DNA is considerably reduced in preserved and OA hPCs as compared to healthy hPCs. This results in the increase of ratio of the fast moving fraction of SOX9-mGFP. Altered epigenetic modifications in OA hPCs – which either mask the binding sites of SOX9 in the DNA or change SOX9 molecular state – are likely one of the causes of reduced SOX9 transcriptional activity. Several reports indicate differences in gene expression profiles of hPCs isolated from minimally damaged areas (preserved) and highly damaged (OA) areas of OA knee joints [20, 21]. Our data indicate that SOX9-DNA binding is already reduced in hPCs isolated from both preserved and OA region of damaged joints when compared to hPCs isolated from healthy joints.
Chondrocytes are the only cell type present in cartilage tissue [22]. However, several recent reports claim the presence of more cell types in cartilage tissue (both in healthy and OA), including chondroprogenitors [23], mesenchymal progenitor cells [24] and dedifferentiated cells (only in expanded chondrocytes) [25]. To avoid dedifferentiation, we performed all FRAP experiments in lower passage cells (<P4) in all the donors. Mobility of SOX9-mGFP, measured in hPCs showed at least two distinct FRAP rates as identified by unsupervised hierarchical and K-means clustering, in healthy, preserved, and OA hPCs. This potentially indicates two differential SOX9 transcriptional activities within these two sub-populations of hPCs. Surprisingly, they differentially respond to growth factors in the microenvironment. BMP7, already used in an OA clinical trial [5], seems to enhance SOX9 binding to DNA in preserved and OA hPCs. WNT3A and IL1β – implicated in OA progression and known to reduce SOX9 transcriptional activity [11] – decrease SOX9-DNA binding in healthy hPCs and did not alter it in preserved and OA hPCs. This indicated that more SOX9 is bound to DNA in healthy hPCs and that this binding is affected by these catabolic factors, whereas OA hPCs were already exposed to these factors during OA progression and SOX9-DNA binding and activity is lower in these cells.
We have previously reported that the BMP inhibitor GREM1, and WNT inhibitors DKK1 and FRZB prevent hypertrophic differentiation and maintain articular chondrocyte phenotype[26]. Although they reduced SOX9 binding in healthy hPCs, they increased SOX9 binding in OA hPCs. IL1Ra, an inhibitor of IL1 receptor, also increased SOX9 binding in the OA hPCs. This indicates that the inhibitors of the catabolic factors will have a positive effect on the SOX9-DNA binding, and thus on its activity, in the OA hPCs. Differential response to the same growth factor/cytokine by donors sheds light on the extent of donor variation in OA. WNT, IL1 and iNOS inhibitors (1400W) either increased or decreased SOX9 binding in OA hPCs with a diverse donor variation. Increased level of active cell surface receptors or intracellular targets for these inhibitors may be the plausible cause for the activity of a particular pathway in the individual donors. This may also account for why some patients do not respond to OA treatments and indicate the potential need for the development of personalized therapy [27].
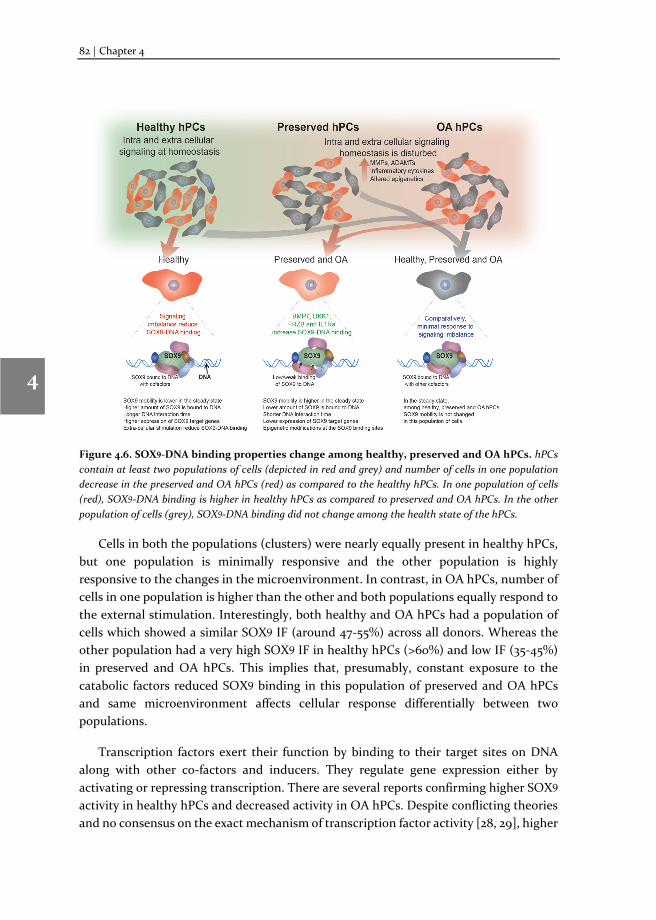
82 | Chapter 4
1
2
3
4
5
6
7
8
Figure 4.6. SOX9-DNA binding properties change among healthy, preserved and OA hPCs. hPCs contain at least two populations of cells (depicted in red and grey) and number of cells in one population decrease in the preserved and OA hPCs (red) as compared to the healthy hPCs. In one population of cells (red), SOX9-DNA binding is higher in healthy hPCs as compared to preserved and OA hPCs. In the other population of cells (grey), SOX9-DNA binding did not change among the health state of the hPCs.
Cells in both the populations (clusters) were nearly equally present in healthy hPCs, but one population is minimally responsive and the other population is highly responsive to the changes in the microenvironment. In contrast, in OA hPCs, number of cells in one population is higher than the other and both populations equally respond to the external stimulation. Interestingly, both healthy and OA hPCs had a population of cells which showed a similar SOX9 IF (around 47-55%) across all donors. Whereas the other population had a very high SOX9 IF in healthy hPCs (>60%) and low IF (35-45%) in preserved and OA hPCs. This implies that, presumably, constant exposure to the catabolic factors reduced SOX9 binding in this population of preserved and OA hPCs and same microenvironment affects cellular response differentially between two populations.
Transcription factors exert their function by binding to their target sites on DNA along with other co-factors and inducers. They regulate gene expression either by activating or repressing transcription. There are several reports confirming higher SOX9 activity in healthy hPCs and decreased activity in OA hPCs. Despite conflicting theories and no consensus on the exact mechanism of transcription factor activity [28, 29], higher
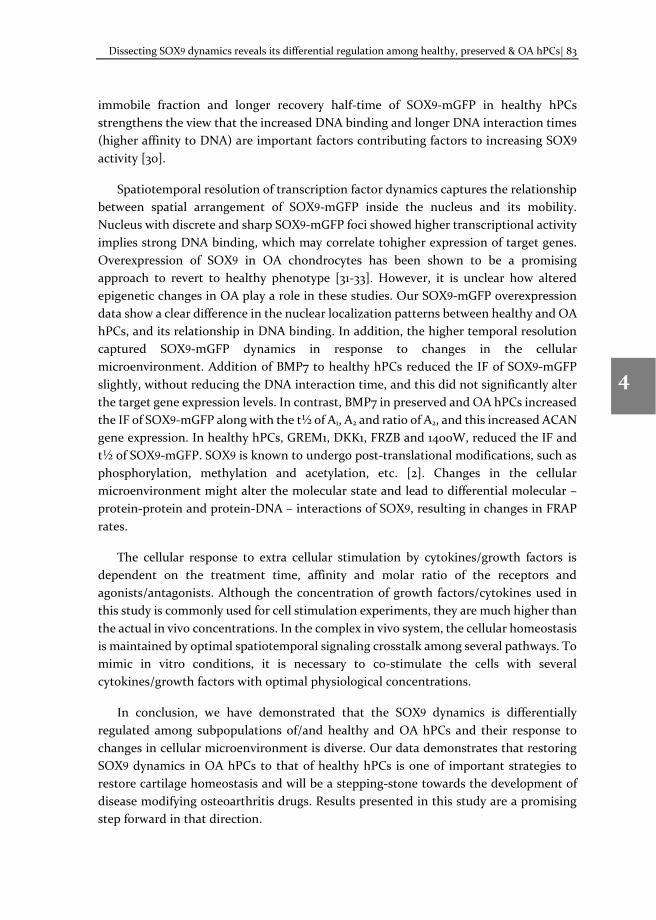
Dissecting SOX9 dynamics reveals its differential regulation among healthy, preserved & OA hPCs| 83
1
2
3
4
5
6
7
8
immobile fraction and longer recovery half-time of SOX9-mGFP in healthy hPCs strengthens the view that the increased DNA binding and longer DNA interaction times (higher affinity to DNA) are important factors contributing factors to increasing SOX9 activity [30].
Spatiotemporal resolution of transcription factor dynamics captures the relationship between spatial arrangement of SOX9-mGFP inside the nucleus and its mobility. Nucleus with discrete and sharp SOX9-mGFP foci showed higher transcriptional activity implies strong DNA binding, which may correlate tohigher expression of target genes. Overexpression of SOX9 in OA chondrocytes has been shown to be a promising approach to revert to healthy phenotype [31-33]. However, it is unclear how altered epigenetic changes in OA play a role in these studies. Our SOX9-mGFP overexpression data show a clear difference in the nuclear localization patterns between healthy and OA hPCs, and its relationship in DNA binding. In addition, the higher temporal resolution captured SOX9-mGFP dynamics in response to changes in the cellular microenvironment. Addition of BMP7 to healthy hPCs reduced the IF of SOX9-mGFP slightly, without reducing the DNA interaction time, and this did not significantly alter the target gene expression levels. In contrast, BMP7 in preserved and OA hPCs increased the IF of SOX9-mGFP along with the t½ of A1, A2 and ratio of A2, and this increased ACAN gene expression. In healthy hPCs, GREM1, DKK1, FRZB and 1400W, reduced the IF and t½ of SOX9-mGFP. SOX9 is known to undergo post-translational modifications, such as phosphorylation, methylation and acetylation, etc. [2]. Changes in the cellular microenvironment might alter the molecular state and lead to differential molecular – protein-protein and protein-DNA – interactions of SOX9, resulting in changes in FRAP rates.
The cellular response to extra cellular stimulation by cytokines/growth factors is dependent on the treatment time, affinity and molar ratio of the receptors and agonists/antagonists. Although the concentration of growth factors/cytokines used in this study is commonly used for cell stimulation experiments, they are much higher than the actual in vivo concentrations. In the complex in vivo system, the cellular homeostasis is maintained by optimal spatiotemporal signaling crosstalk among several pathways. To mimic in vitro conditions, it is necessary to co-stimulate the cells with several cytokines/growth factors with optimal physiological concentrations.
In conclusion, we have demonstrated that the SOX9 dynamics is differentially regulated among subpopulations of/and healthy and OA hPCs and their response to changes in cellular microenvironment is diverse. Our data demonstrates that restoring SOX9 dynamics in OA hPCs to that of healthy hPCs is one of important strategies to restore cartilage homeostasis and will be a stepping-stone towards the development of disease modifying osteoarthritis drugs. Results presented in this study are a promising step forward in that direction.
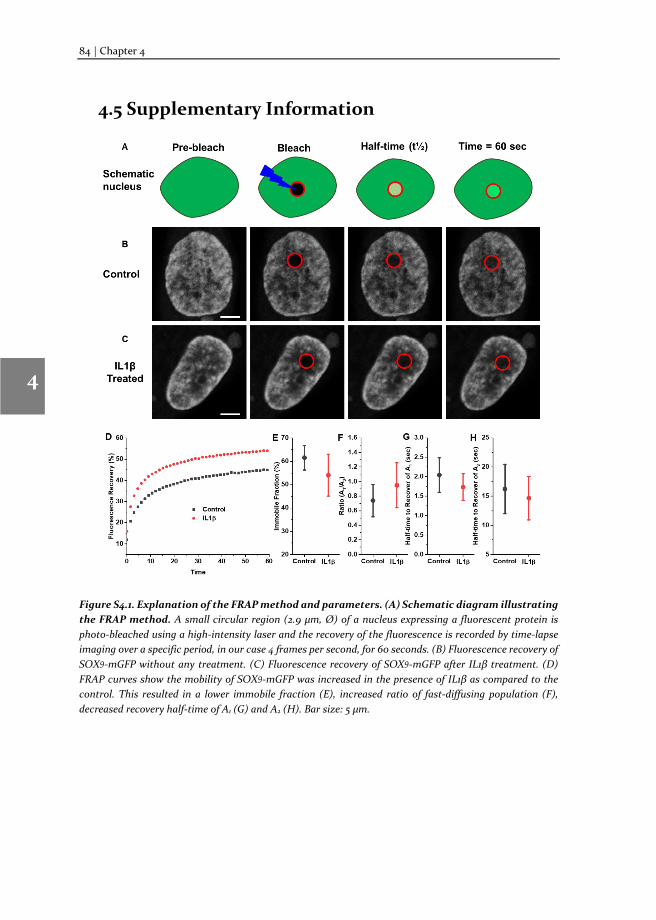
84 | Chapter 4
1
2
3
4
5
6
7
8
4.5 Supplementary Information
Figure S4.1. Explanation of the FRAP method and parameters. (A) Schematic diagram illustrating the FRAP method. A small circular region (2.9 μm, Ø) of a nucleus expressing a fluorescent protein is photo-bleached using a high-intensity laser and the recovery of the fluorescence is recorded by time-lapse imaging over a specific period, in our case 4 frames per second, for 60 seconds. (B) Fluorescence recovery of SOX9-mGFP without any treatment. (C) Fluorescence recovery of SOX9-mGFP after IL1β treatment. (D) FRAP curves show the mobility of SOX9-mGFP was increased in the presence of IL1β as compared to the control. This resulted in a lower immobile fraction (E), increased ratio of fast-diffusing population (F), decreased recovery half-time of A1 (G) and A2 (H). Bar size: 5 μm.
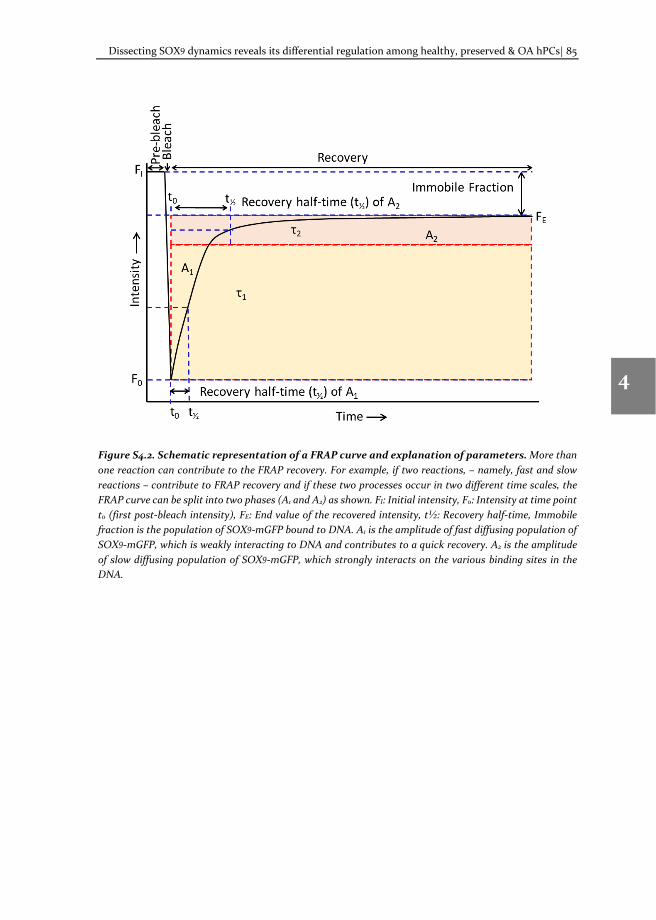
Dissecting SOX9 dynamics reveals its differential regulation among healthy, preserved & OA hPCs| 85
1
2
3
4
5
6
7
8
Figure S4.2. Schematic representation of a FRAP curve and explanation of parameters. More than one reaction can contribute to the FRAP recovery. For example, if two reactions, – namely, fast and slow reactions – contribute to FRAP recovery and if these two processes occur in two different time scales, the FRAP curve can be split into two phases (A1 and A2) as shown. FI: Initial intensity, F0: Intensity at time point t0 (first post-bleach intensity), FE: End value of the recovered intensity, t½: Recovery half-time, Immobile fraction is the population of SOX9-mGFP bound to DNA. A1 is the amplitude of fast diffusing population of SOX9-mGFP, which is weakly interacting to DNA and contributes to a quick recovery. A2 is the amplitude of slow diffusing population of SOX9-mGFP, which strongly interacts on the various binding sites in the DNA.
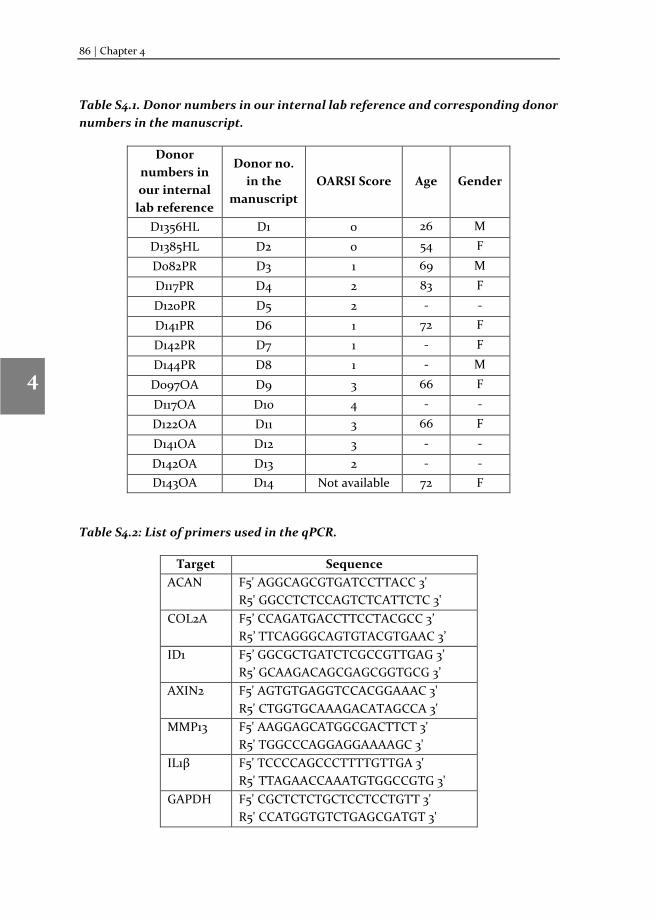
86 | Chapter 4
1
2
3
4
5
6
7
8
Table S4.1. Donor numbers in our internal lab reference and corresponding donor numbers in the manuscript.
Donor numbers in our internal
lab reference
Donor no. in the
manuscript OARSI Score Age Gender
D1356HL D1 0 26 M
D1385HL D2 0 54 F
D082PR D3 1 69 M
D117PR D4 2 83 F
D120PR D5 2 - -
D141PR D6 1 72 F
D142PR D7 1 - F
D144PR D8 1 - M
D097OA D9 3 66 F
D117OA D10 4 - -
D122OA D11 3 66 F
D141OA D12 3 - -
D142OA D13 2 - - D143OA D14 Not available 72 F
Table S4.2: List of primers used in the qPCR.
Target Sequence ACAN F5' AGGCAGCGTGATCCTTACC 3'
R5' GGCCTCTCCAGTCTCATTCTC 3' COL2A F5’ CCAGATGACCTTCCTACGCC 3’
R5’ TTCAGGGCAGTGTACGTGAAC 3’ ID1 F5’ GGCGCTGATCTCGCCGTTGAG 3’
R5’ GCAAGACAGCGAGCGGTGCG 3’ AXIN2 F5' AGTGTGAGGTCCACGGAAAC 3'
R5' CTGGTGCAAAGACATAGCCA 3' MMP13 F5' AAGGAGCATGGCGACTTCT 3'
R5' TGGCCCAGGAGGAAAAGC 3' IL1β F5' TCCCCAGCCCTTTTGTTGA 3'
R5' TTAGAACCAAATGTGGCCGTG 3' GAPDH F5' CGCTCTCTGCTCCTCCTGTT 3'
R5' CCATGGTGTCTGAGCGATGT 3'
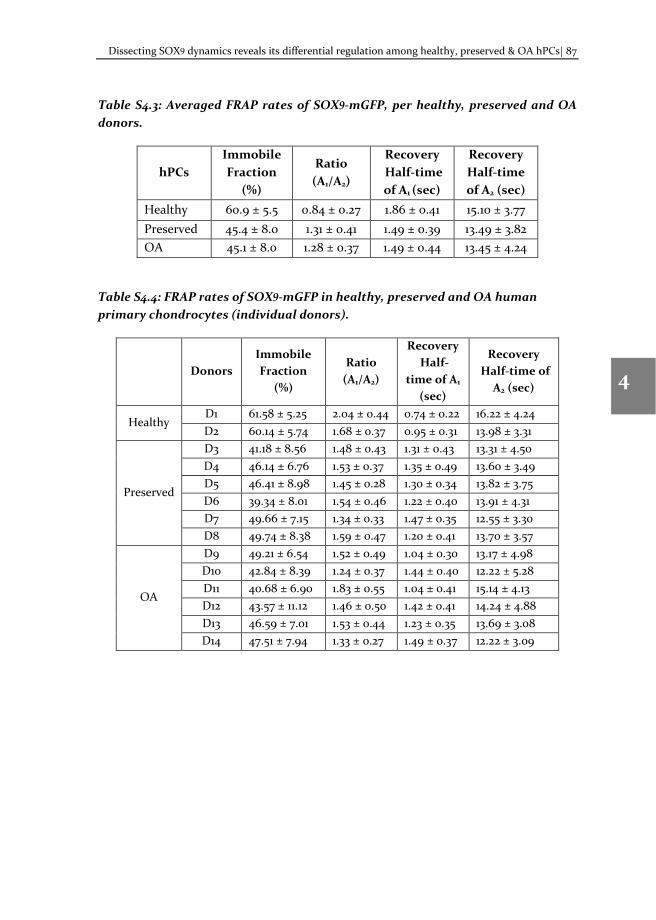
Dissecting SOX9 dynamics reveals its differential regulation among healthy, preserved & OA hPCs| 87
1
2
3
4
5
6
7
8
Table S4.3: Averaged FRAP rates of SOX9-mGFP, per healthy, preserved and OA donors.
hPCs Immobile Fraction
(%)
Ratio (A1/A2)
Recovery Half-time of A1 (sec)
Recovery Half-time of A2 (sec)
Healthy 60.9 ± 5.5 0.84 ± 0.27 1.86 ± 0.41 15.10 ± 3.77 Preserved 45.4 ± 8.0 1.31 ± 0.41 1.49 ± 0.39 13.49 ± 3.82 OA 45.1 ± 8.0 1.28 ± 0.37 1.49 ± 0.44 13.45 ± 4.24
Table S4.4: FRAP rates of SOX9-mGFP in healthy, preserved and OA human primary chondrocytes (individual donors).
Donors Immobile Fraction
(%)
Ratio (A1/A2)
Recovery Half-
time of A1 (sec)
Recovery Half-time of
A2 (sec)
Healthy D1 61.58 ± 5.25 2.04 ± 0.44 0.74 ± 0.22 16.22 ± 4.24 D2 60.14 ± 5.74 1.68 ± 0.37 0.95 ± 0.31 13.98 ± 3.31
Preserved
D3 41.18 ± 8.56 1.48 ± 0.43 1.31 ± 0.43 13.31 ± 4.50 D4 46.14 ± 6.76 1.53 ± 0.37 1.35 ± 0.49 13.60 ± 3.49 D5 46.41 ± 8.98 1.45 ± 0.28 1.30 ± 0.34 13.82 ± 3.75 D6 39.34 ± 8.01 1.54 ± 0.46 1.22 ± 0.40 13.91 ± 4.31 D7 49.66 ± 7.15 1.34 ± 0.33 1.47 ± 0.35 12.55 ± 3.30 D8 49.74 ± 8.38 1.59 ± 0.47 1.20 ± 0.41 13.70 ± 3.57
OA
D9 49.21 ± 6.54 1.52 ± 0.49 1.04 ± 0.30 13.17 ± 4.98 D10 42.84 ± 8.39 1.24 ± 0.37 1.44 ± 0.40 12.22 ± 5.28 D11 40.68 ± 6.90 1.83 ± 0.55 1.04 ± 0.41 15.14 ± 4.13 D12 43.57 ± 11.12 1.46 ± 0.50 1.42 ± 0.41 14.24 ± 4.88 D13 46.59 ± 7.01 1.53 ± 0.44 1.23 ± 0.35 13.69 ± 3.08 D14 47.51 ± 7.94 1.33 ± 0.27 1.49 ± 0.37 12.22 ± 3.09
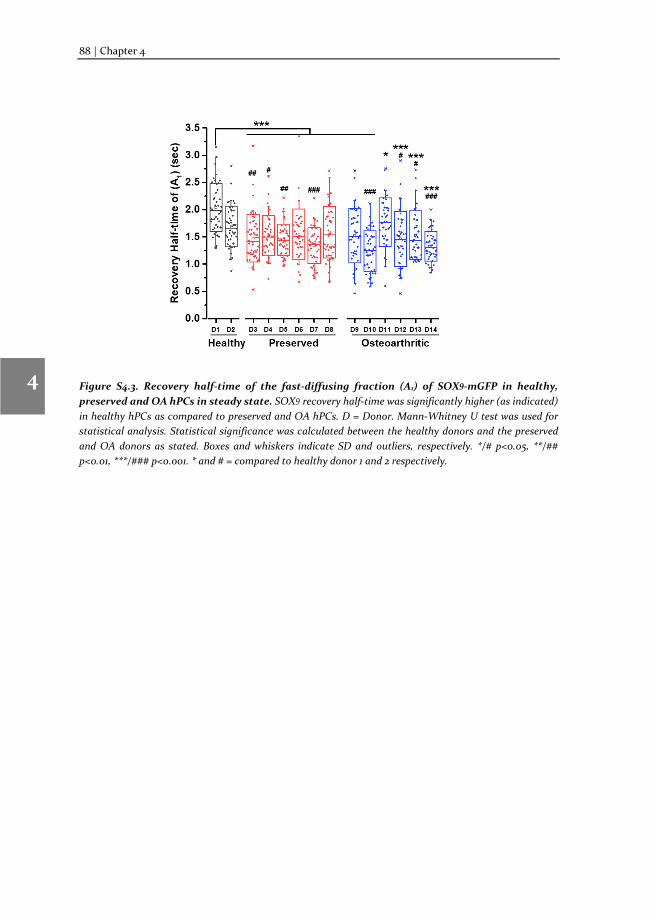
88 | Chapter 4
1
2
3
4
5
6
7
8
Figure S4.3. Recovery half-time of the fast-diffusing fraction (A1) of SOX9-mGFP in healthy, preserved and OA hPCs in steady state. SOX9 recovery half-time was significantly higher (as indicated) in healthy hPCs as compared to preserved and OA hPCs. D = Donor. Mann-Whitney U test was used for statistical analysis. Statistical significance was calculated between the healthy donors and the preserved and OA donors as stated. Boxes and whiskers indicate SD and outliers, respectively. */# p<0.05, **/## p<0.01, ***/### p<0.001. * and # = compared to healthy donor 1 and 2 respectively.
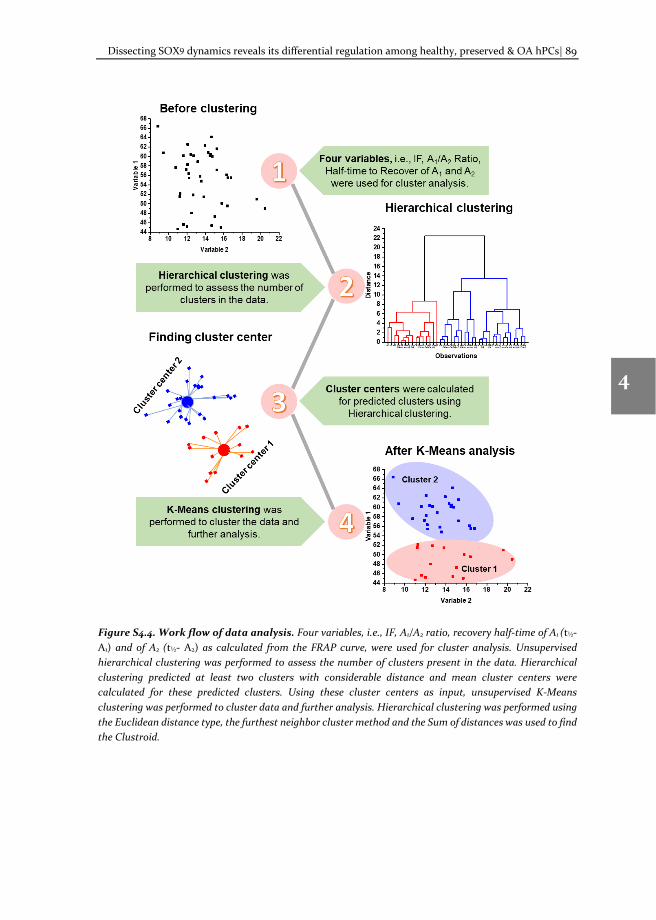
Dissecting SOX9 dynamics reveals its differential regulation among healthy, preserved & OA hPCs| 89
1
2
3
4
5
6
7
8
Figure S4.4. Work flow of data analysis. Four variables, i.e., IF, A1/A2 ratio, recovery half-time of A1 (t½- A1) and of A2 (t½- A2) as calculated from the FRAP curve, were used for cluster analysis. Unsupervised hierarchical clustering was performed to assess the number of clusters present in the data. Hierarchical clustering predicted at least two clusters with considerable distance and mean cluster centers were calculated for these predicted clusters. Using these cluster centers as input, unsupervised K-Means clustering was performed to cluster data and further analysis. Hierarchical clustering was performed using the Euclidean distance type, the furthest neighbor cluster method and the Sum of distances was used to find the Clustroid.
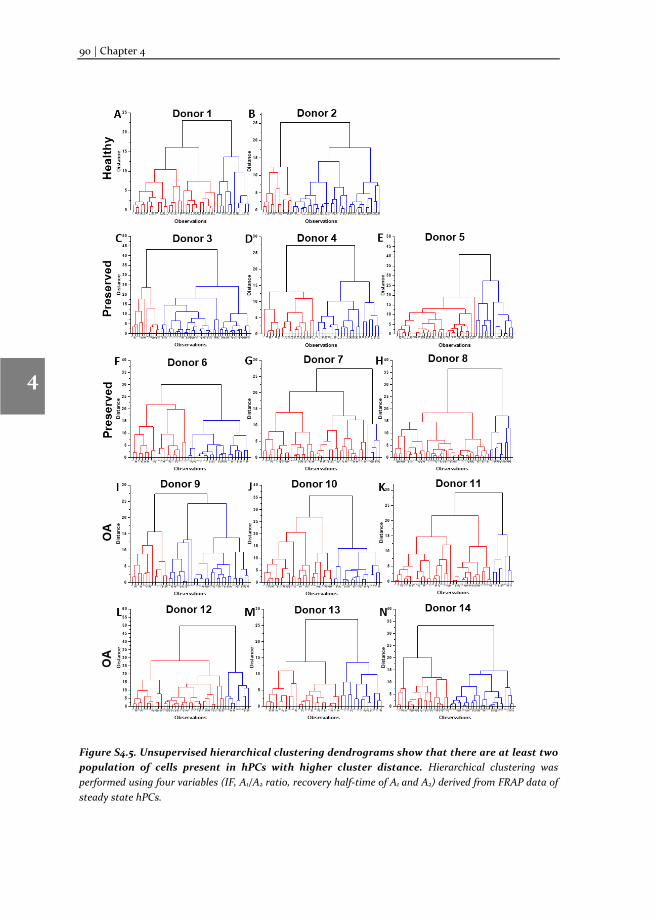
90 | Chapter 4
1
2
3
4
5
6
7
8
Figure S4.5. Unsupervised hierarchical clustering dendrograms show that there are at least two population of cells present in hPCs with higher cluster distance. Hierarchical clustering was performed using four variables (IF, A1/A2 ratio, recovery half-time of A1 and A2) derived from FRAP data of steady state hPCs.
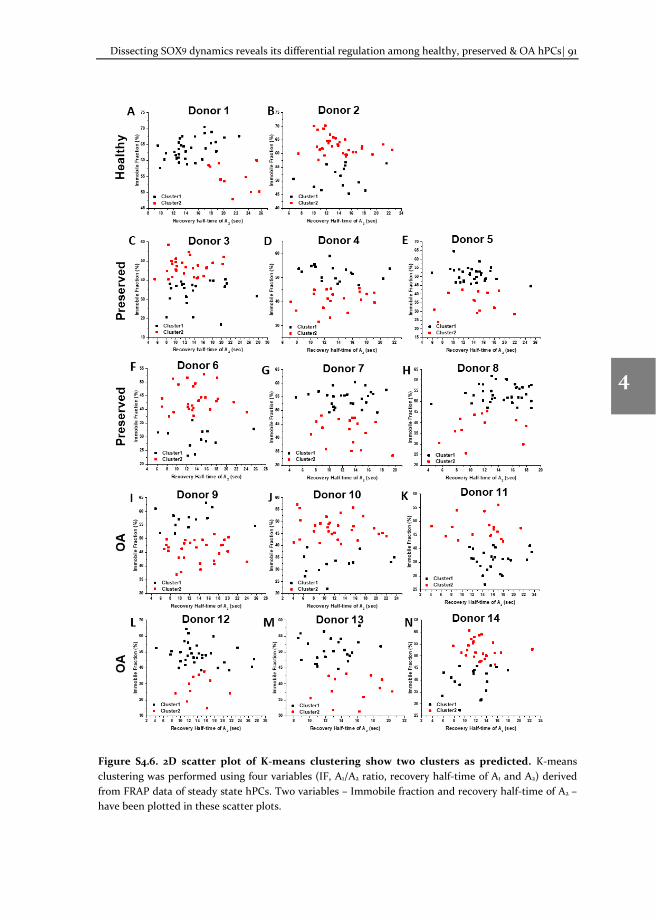
Dissecting SOX9 dynamics reveals its differential regulation among healthy, preserved & OA hPCs| 91
1
2
3
4
5
6
7
8
Figure S4.6. 2D scatter plot of K-means clustering show two clusters as predicted. K-means clustering was performed using four variables (IF, A1/A2 ratio, recovery half-time of A1 and A2) derived from FRAP data of steady state hPCs. Two variables – Immobile fraction and recovery half-time of A2 – have been plotted in these scatter plots.
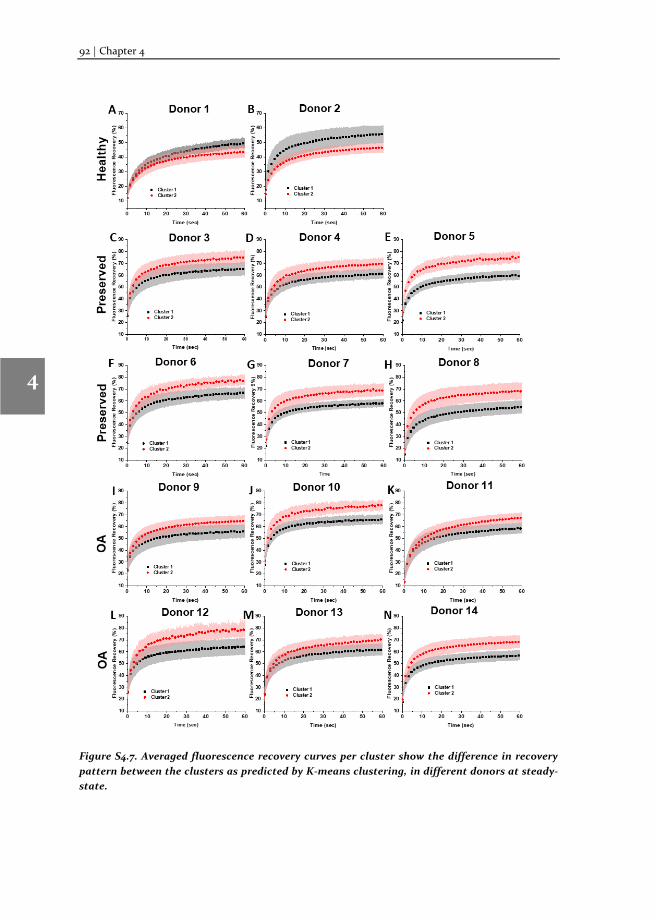
92 | Chapter 4
1
2
3
4
5
6
7
8
Figure S4.7. Averaged fluorescence recovery curves per cluster show the difference in recovery pattern between the clusters as predicted by K-means clustering, in different donors at steady-state.
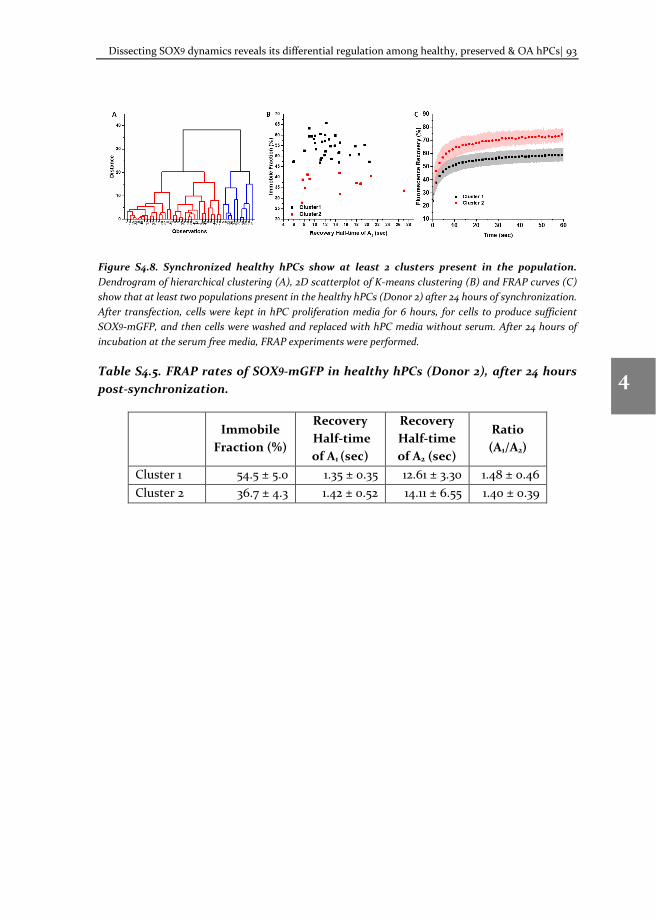
Dissecting SOX9 dynamics reveals its differential regulation among healthy, preserved & OA hPCs| 93
1
2
3
4
5
6
7
8
Figure S4.8. Synchronized healthy hPCs show at least 2 clusters present in the population. Dendrogram of hierarchical clustering (A), 2D scatterplot of K-means clustering (B) and FRAP curves (C) show that at least two populations present in the healthy hPCs (Donor 2) after 24 hours of synchronization. After transfection, cells were kept in hPC proliferation media for 6 hours, for cells to produce sufficient SOX9-mGFP, and then cells were washed and replaced with hPC media without serum. After 24 hours of incubation at the serum free media, FRAP experiments were performed.
Table S4.5. FRAP rates of SOX9-mGFP in healthy hPCs (Donor 2), after 24 hours post-synchronization.
Immobile Fraction (%)
Recovery Half-time of A1 (sec)
Recovery Half-time of A2 (sec)
Ratio (A1/A2)
Cluster 1 54.5 ± 5.0 1.35 ± 0.35 12.61 ± 3.30 1.48 ± 0.46 Cluster 2 36.7 ± 4.3 1.42 ± 0.52 14.11 ± 6.55 1.40 ± 0.39
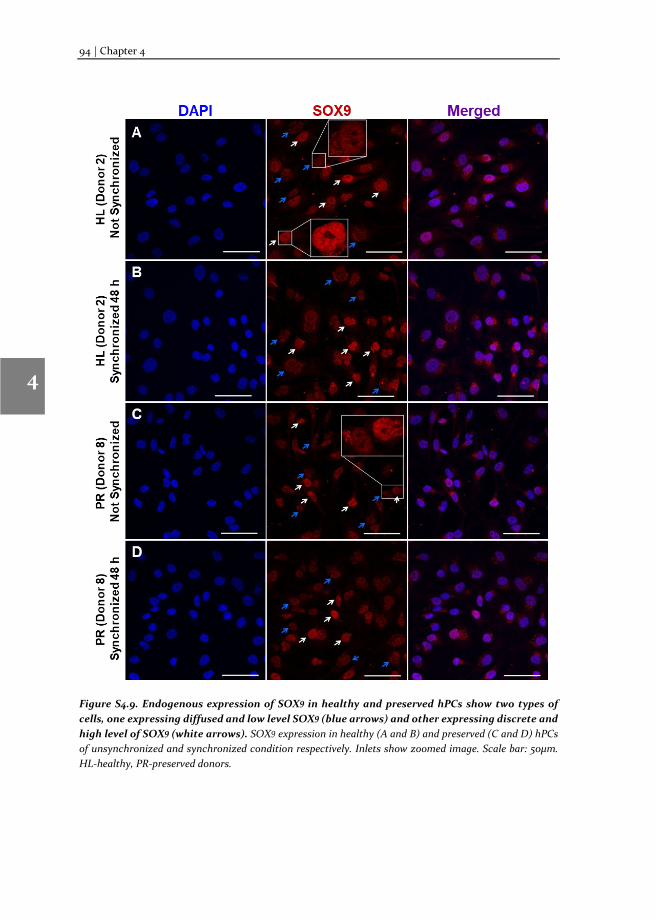
94 | Chapter 4
1
2
3
4
5
6
7
8
Figure S4.9. Endogenous expression of SOX9 in healthy and preserved hPCs show two types of cells, one expressing diffused and low level SOX9 (blue arrows) and other expressing discrete and high level of SOX9 (white arrows). SOX9 expression in healthy (A and B) and preserved (C and D) hPCs of unsynchronized and synchronized condition respectively. Inlets show zoomed image. Scale bar: 50μm. HL-healthy, PR-preserved donors.
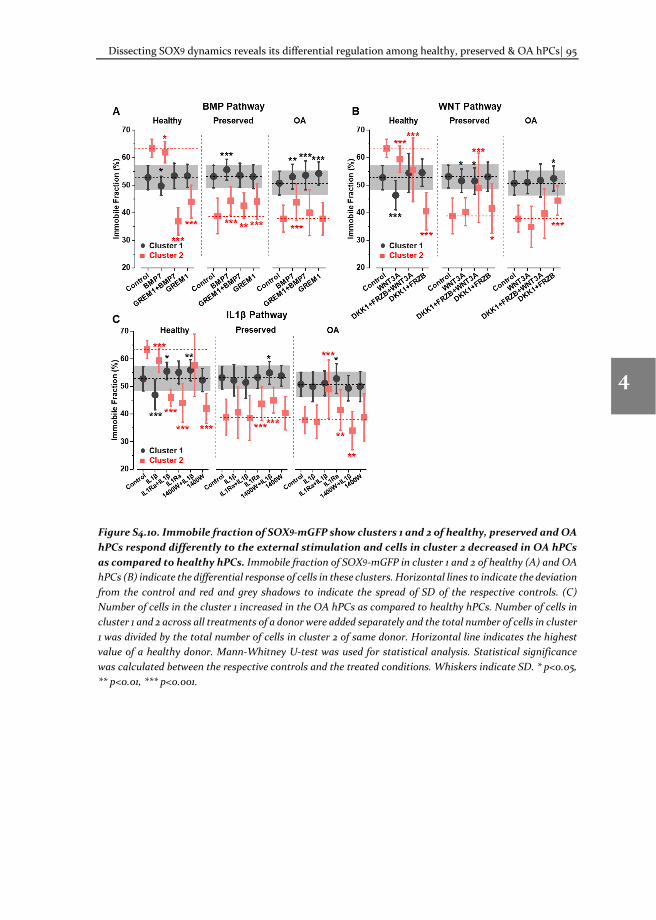
Dissecting SOX9 dynamics reveals its differential regulation among healthy, preserved & OA hPCs| 95
1
2
3
4
5
6
7
8
Figure S4.10. Immobile fraction of SOX9-mGFP show clusters 1 and 2 of healthy, preserved and OA hPCs respond differently to the external stimulation and cells in cluster 2 decreased in OA hPCs as compared to healthy hPCs. Immobile fraction of SOX9-mGFP in cluster 1 and 2 of healthy (A) and OA hPCs (B) indicate the differential response of cells in these clusters. Horizontal lines to indicate the deviation from the control and red and grey shadows to indicate the spread of SD of the respective controls. (C) Number of cells in the cluster 1 increased in the OA hPCs as compared to healthy hPCs. Number of cells in cluster 1 and 2 across all treatments of a donor were added separately and the total number of cells in cluster 1 was divided by the total number of cells in cluster 2 of same donor. Horizontal line indicates the highest value of a healthy donor. Mann-Whitney U-test was used for statistical analysis. Statistical significance was calculated between the respective controls and the treated conditions. Whiskers indicate SD. * p<0.05, ** p<0.01, *** p<0.001.
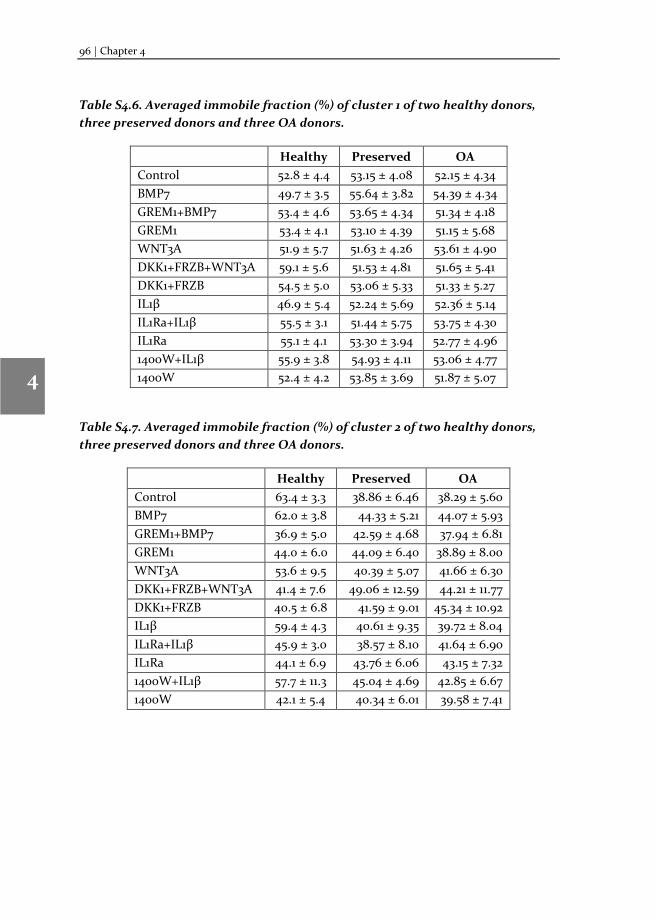
96 | Chapter 4
1
2
3
4
5
6
7
8
Table S4.6. Averaged immobile fraction (%) of cluster 1 of two healthy donors, three preserved donors and three OA donors.
Healthy Preserved OA Control 52.8 ± 4.4 53.15 ± 4.08 52.15 ± 4.34 BMP7 49.7 ± 3.5 55.64 ± 3.82 54.39 ± 4.34 GREM1+BMP7 53.4 ± 4.6 53.65 ± 4.34 51.34 ± 4.18 GREM1 53.4 ± 4.1 53.10 ± 4.39 51.15 ± 5.68 WNT3A 51.9 ± 5.7 51.63 ± 4.26 53.61 ± 4.90 DKK1+FRZB+WNT3A 59.1 ± 5.6 51.53 ± 4.81 51.65 ± 5.41 DKK1+FRZB 54.5 ± 5.0 53.06 ± 5.33 51.33 ± 5.27 IL1β 46.9 ± 5.4 52.24 ± 5.69 52.36 ± 5.14 IL1Ra+IL1β 55.5 ± 3.1 51.44 ± 5.75 53.75 ± 4.30 IL1Ra 55.1 ± 4.1 53.30 ± 3.94 52.77 ± 4.96 1400W+IL1β 55.9 ± 3.8 54.93 ± 4.11 53.06 ± 4.77 1400W 52.4 ± 4.2 53.85 ± 3.69 51.87 ± 5.07
Table S4.7. Averaged immobile fraction (%) of cluster 2 of two healthy donors, three preserved donors and three OA donors.
Healthy Preserved OA Control 63.4 ± 3.3 38.86 ± 6.46 38.29 ± 5.60 BMP7 62.0 ± 3.8 44.33 ± 5.21 44.07 ± 5.93 GREM1+BMP7 36.9 ± 5.0 42.59 ± 4.68 37.94 ± 6.81 GREM1 44.0 ± 6.0 44.09 ± 6.40 38.89 ± 8.00 WNT3A 53.6 ± 9.5 40.39 ± 5.07 41.66 ± 6.30 DKK1+FRZB+WNT3A 41.4 ± 7.6 49.06 ± 12.59 44.21 ± 11.77 DKK1+FRZB 40.5 ± 6.8 41.59 ± 9.01 45.34 ± 10.92 IL1β 59.4 ± 4.3 40.61 ± 9.35 39.72 ± 8.04 IL1Ra+IL1β 45.9 ± 3.0 38.57 ± 8.10 41.64 ± 6.90 IL1Ra 44.1 ± 6.9 43.76 ± 6.06 43.15 ± 7.32 1400W+IL1β 57.7 ± 11.3 45.04 ± 4.69 42.85 ± 6.67 1400W 42.1 ± 5.4 40.34 ± 6.01 39.58 ± 7.41
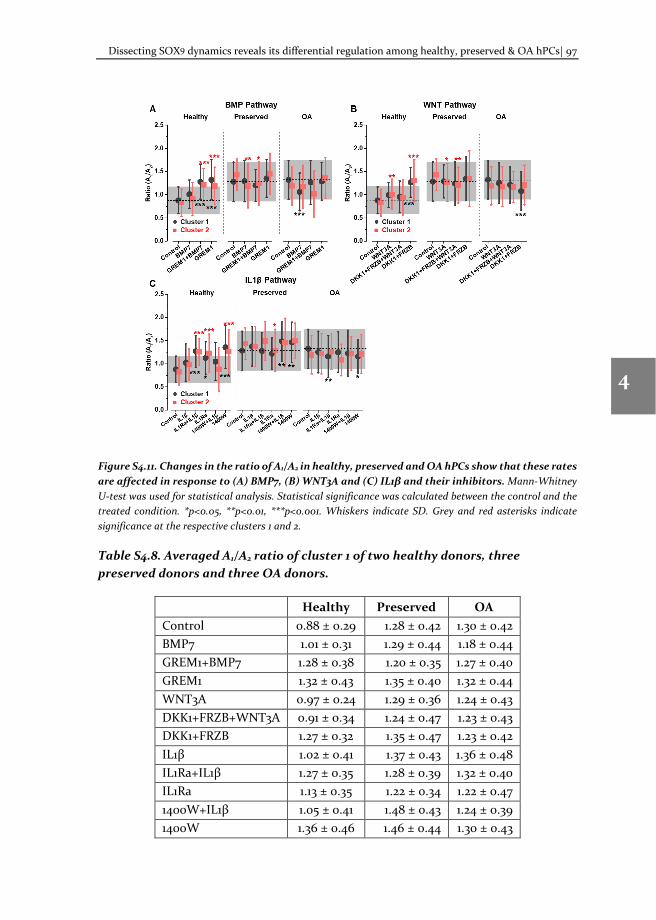
Dissecting SOX9 dynamics reveals its differential regulation among healthy, preserved & OA hPCs| 97
1
2
3
4
5
6
7
8
Figure S4.11. Changes in the ratio of A1/A2 in healthy, preserved and OA hPCs show that these rates are affected in response to (A) BMP7, (B) WNT3A and (C) IL1β and their inhibitors. Mann-Whitney U-test was used for statistical analysis. Statistical significance was calculated between the control and the treated condition. *p<0.05, **p<0.01, ***p<0.001. Whiskers indicate SD. Grey and red asterisks indicate significance at the respective clusters 1 and 2.
Table S4.8. Averaged A1/A2 ratio of cluster 1 of two healthy donors, three preserved donors and three OA donors.
Healthy Preserved OA Control 0.88 ± 0.29 1.28 ± 0.42 1.30 ± 0.42 BMP7 1.01 ± 0.31 1.29 ± 0.44 1.18 ± 0.44 GREM1+BMP7 1.28 ± 0.38 1.20 ± 0.35 1.27 ± 0.40 GREM1 1.32 ± 0.43 1.35 ± 0.40 1.32 ± 0.44 WNT3A 0.97 ± 0.24 1.29 ± 0.36 1.24 ± 0.43 DKK1+FRZB+WNT3A 0.91 ± 0.34 1.24 ± 0.47 1.23 ± 0.43 DKK1+FRZB 1.27 ± 0.32 1.35 ± 0.47 1.23 ± 0.42 IL1β 1.02 ± 0.41 1.37 ± 0.43 1.36 ± 0.48 IL1Ra+IL1β 1.27 ± 0.35 1.28 ± 0.39 1.32 ± 0.40 IL1Ra 1.13 ± 0.35 1.22 ± 0.34 1.22 ± 0.47 1400W+IL1β 1.05 ± 0.41 1.48 ± 0.43 1.24 ± 0.39 1400W 1.36 ± 0.46 1.46 ± 0.44 1.30 ± 0.43
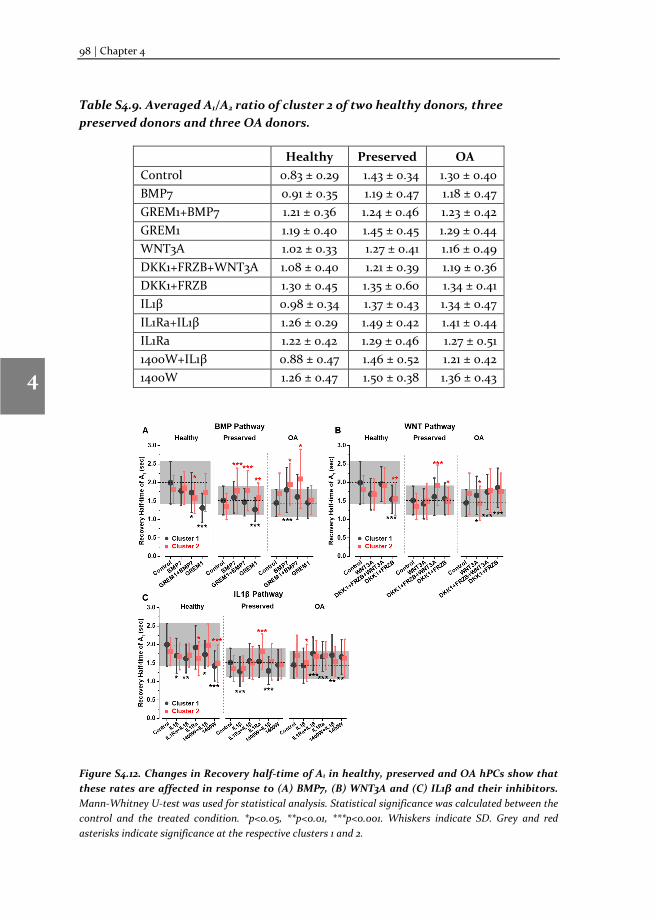
98 | Chapter 4
1
2
3
4
5
6
7
8
Table S4.9. Averaged A1/A2 ratio of cluster 2 of two healthy donors, three preserved donors and three OA donors.
Healthy Preserved OA Control 0.83 ± 0.29 1.43 ± 0.34 1.30 ± 0.40 BMP7 0.91 ± 0.35 1.19 ± 0.47 1.18 ± 0.47 GREM1+BMP7 1.21 ± 0.36 1.24 ± 0.46 1.23 ± 0.42 GREM1 1.19 ± 0.40 1.45 ± 0.45 1.29 ± 0.44 WNT3A 1.02 ± 0.33 1.27 ± 0.41 1.16 ± 0.49 DKK1+FRZB+WNT3A 1.08 ± 0.40 1.21 ± 0.39 1.19 ± 0.36 DKK1+FRZB 1.30 ± 0.45 1.35 ± 0.60 1.34 ± 0.41 IL1β 0.98 ± 0.34 1.37 ± 0.43 1.34 ± 0.47 IL1Ra+IL1β 1.26 ± 0.29 1.49 ± 0.42 1.41 ± 0.44 IL1Ra 1.22 ± 0.42 1.29 ± 0.46 1.27 ± 0.51 1400W+IL1β 0.88 ± 0.47 1.46 ± 0.52 1.21 ± 0.42 1400W 1.26 ± 0.47 1.50 ± 0.38 1.36 ± 0.43
Figure S4.12. Changes in Recovery half-time of A1 in healthy, preserved and OA hPCs show that these rates are affected in response to (A) BMP7, (B) WNT3A and (C) IL1β and their inhibitors. Mann-Whitney U-test was used for statistical analysis. Statistical significance was calculated between the control and the treated condition. *p<0.05, **p<0.01, ***p<0.001. Whiskers indicate SD. Grey and red asterisks indicate significance at the respective clusters 1 and 2.
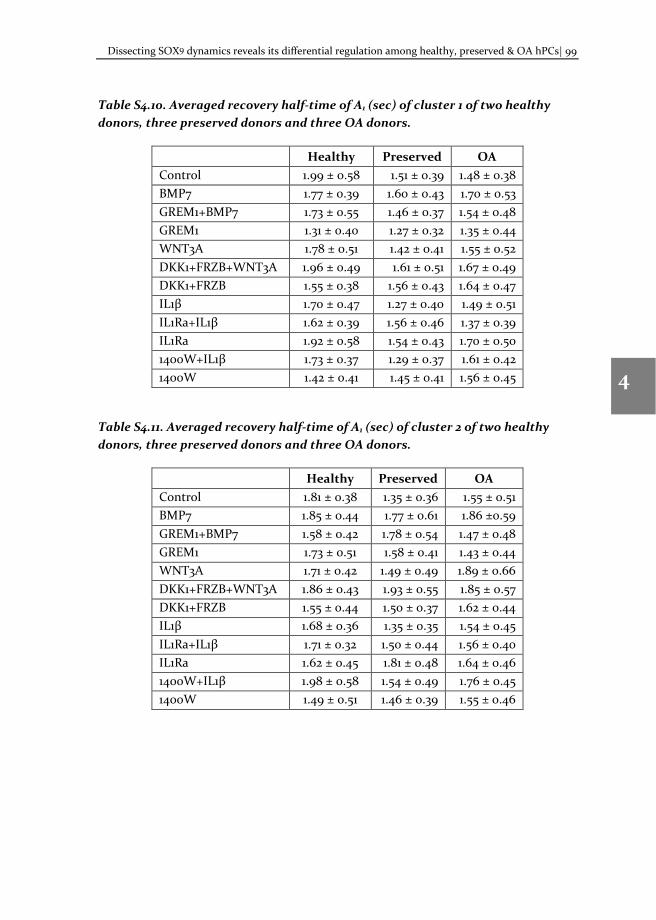
Dissecting SOX9 dynamics reveals its differential regulation among healthy, preserved & OA hPCs| 99
1
2
3
4
5
6
7
8
Table S4.10. Averaged recovery half-time of A1 (sec) of cluster 1 of two healthy donors, three preserved donors and three OA donors.
Healthy Preserved OA Control 1.99 ± 0.58 1.51 ± 0.39 1.48 ± 0.38 BMP7 1.77 ± 0.39 1.60 ± 0.43 1.70 ± 0.53 GREM1+BMP7 1.73 ± 0.55 1.46 ± 0.37 1.54 ± 0.48 GREM1 1.31 ± 0.40 1.27 ± 0.32 1.35 ± 0.44 WNT3A 1.78 ± 0.51 1.42 ± 0.41 1.55 ± 0.52 DKK1+FRZB+WNT3A 1.96 ± 0.49 1.61 ± 0.51 1.67 ± 0.49 DKK1+FRZB 1.55 ± 0.38 1.56 ± 0.43 1.64 ± 0.47 IL1β 1.70 ± 0.47 1.27 ± 0.40 1.49 ± 0.51 IL1Ra+IL1β 1.62 ± 0.39 1.56 ± 0.46 1.37 ± 0.39 IL1Ra 1.92 ± 0.58 1.54 ± 0.43 1.70 ± 0.50 1400W+IL1β 1.73 ± 0.37 1.29 ± 0.37 1.61 ± 0.42 1400W 1.42 ± 0.41 1.45 ± 0.41 1.56 ± 0.45
Table S4.11. Averaged recovery half-time of A1 (sec) of cluster 2 of two healthy donors, three preserved donors and three OA donors.
Healthy Preserved OA Control 1.81 ± 0.38 1.35 ± 0.36 1.55 ± 0.51 BMP7 1.85 ± 0.44 1.77 ± 0.61 1.86 ±0.59 GREM1+BMP7 1.58 ± 0.42 1.78 ± 0.54 1.47 ± 0.48 GREM1 1.73 ± 0.51 1.58 ± 0.41 1.43 ± 0.44 WNT3A 1.71 ± 0.42 1.49 ± 0.49 1.89 ± 0.66 DKK1+FRZB+WNT3A 1.86 ± 0.43 1.93 ± 0.55 1.85 ± 0.57 DKK1+FRZB 1.55 ± 0.44 1.50 ± 0.37 1.62 ± 0.44 IL1β 1.68 ± 0.36 1.35 ± 0.35 1.54 ± 0.45 IL1Ra+IL1β 1.71 ± 0.32 1.50 ± 0.44 1.56 ± 0.40 IL1Ra 1.62 ± 0.45 1.81 ± 0.48 1.64 ± 0.46 1400W+IL1β 1.98 ± 0.58 1.54 ± 0.49 1.76 ± 0.45 1400W 1.49 ± 0.51 1.46 ± 0.39 1.55 ± 0.46
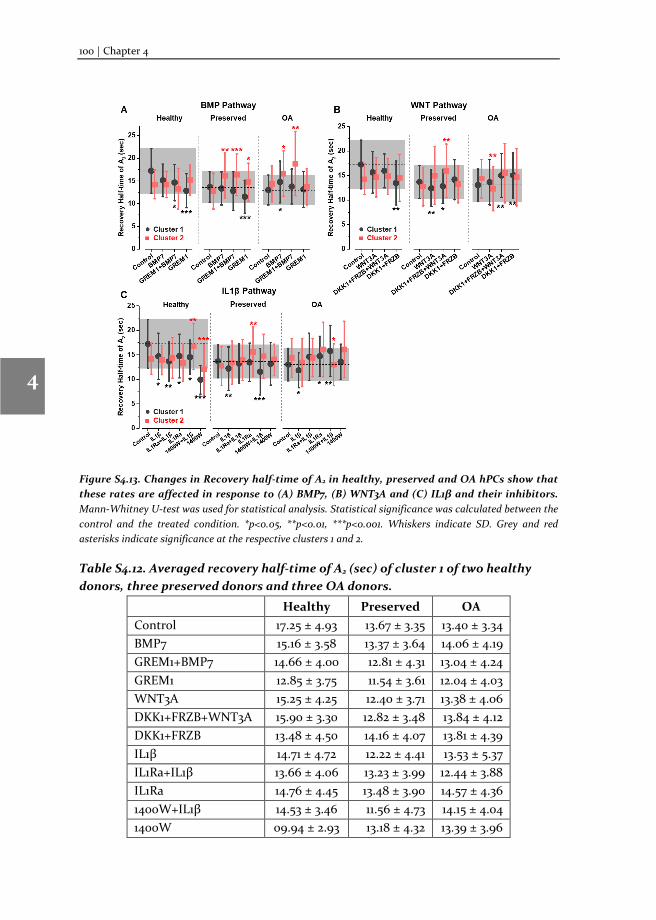
100 | Chapter 4
1
2
3
4
5
6
7
8
Figure S4.13. Changes in Recovery half-time of A2 in healthy, preserved and OA hPCs show that these rates are affected in response to (A) BMP7, (B) WNT3A and (C) IL1β and their inhibitors. Mann-Whitney U-test was used for statistical analysis. Statistical significance was calculated between the control and the treated condition. *p<0.05, **p<0.01, ***p<0.001. Whiskers indicate SD. Grey and red asterisks indicate significance at the respective clusters 1 and 2.
Table S4.12. Averaged recovery half-time of A2 (sec) of cluster 1 of two healthy donors, three preserved donors and three OA donors.
Healthy Preserved OA Control 17.25 ± 4.93 13.67 ± 3.35 13.40 ± 3.34 BMP7 15.16 ± 3.58 13.37 ± 3.64 14.06 ± 4.19 GREM1+BMP7 14.66 ± 4.00 12.81 ± 4.31 13.04 ± 4.24 GREM1 12.85 ± 3.75 11.54 ± 3.61 12.04 ± 4.03 WNT3A 15.25 ± 4.25 12.40 ± 3.71 13.38 ± 4.06 DKK1+FRZB+WNT3A 15.90 ± 3.30 12.82 ± 3.48 13.84 ± 4.12 DKK1+FRZB 13.48 ± 4.50 14.16 ± 4.07 13.81 ± 4.39 IL1β 14.71 ± 4.72 12.22 ± 4.41 13.53 ± 5.37 IL1Ra+IL1β 13.66 ± 4.06 13.23 ± 3.99 12.44 ± 3.88 IL1Ra 14.76 ± 4.45 13.48 ± 3.90 14.57 ± 4.36 1400W+IL1β 14.53 ± 3.46 11.56 ± 4.73 14.15 ± 4.04 1400W 09.94 ± 2.93 13.18 ± 4.32 13.39 ± 3.96
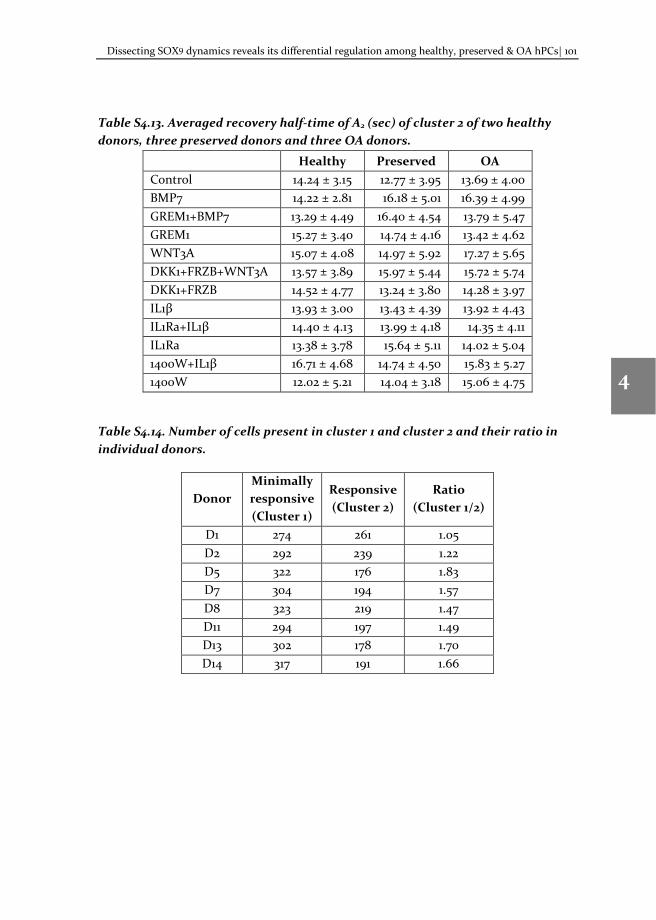
Dissecting SOX9 dynamics reveals its differential regulation among healthy, preserved & OA hPCs| 101
1
2
3
4
5
6
7
8
Table S4.13. Averaged recovery half-time of A2 (sec) of cluster 2 of two healthy donors, three preserved donors and three OA donors.
Healthy Preserved OA Control 14.24 ± 3.15 12.77 ± 3.95 13.69 ± 4.00 BMP7 14.22 ± 2.81 16.18 ± 5.01 16.39 ± 4.99 GREM1+BMP7 13.29 ± 4.49 16.40 ± 4.54 13.79 ± 5.47 GREM1 15.27 ± 3.40 14.74 ± 4.16 13.42 ± 4.62 WNT3A 15.07 ± 4.08 14.97 ± 5.92 17.27 ± 5.65 DKK1+FRZB+WNT3A 13.57 ± 3.89 15.97 ± 5.44 15.72 ± 5.74 DKK1+FRZB 14.52 ± 4.77 13.24 ± 3.80 14.28 ± 3.97 IL1β 13.93 ± 3.00 13.43 ± 4.39 13.92 ± 4.43 IL1Ra+IL1β 14.40 ± 4.13 13.99 ± 4.18 14.35 ± 4.11 IL1Ra 13.38 ± 3.78 15.64 ± 5.11 14.02 ± 5.04 1400W+IL1β 16.71 ± 4.68 14.74 ± 4.50 15.83 ± 5.27 1400W 12.02 ± 5.21 14.04 ± 3.18 15.06 ± 4.75
Table S4.14. Number of cells present in cluster 1 and cluster 2 and their ratio in individual donors.
Donor Minimally responsive (Cluster 1)
Responsive (Cluster 2)
Ratio (Cluster 1/2)
D1 274 261 1.05 D2 292 239 1.22 D5 322 176 1.83 D7 304 194 1.57 D8 323 219 1.47 D11 294 197 1.49 D13 302 178 1.70 D14 317 191 1.66
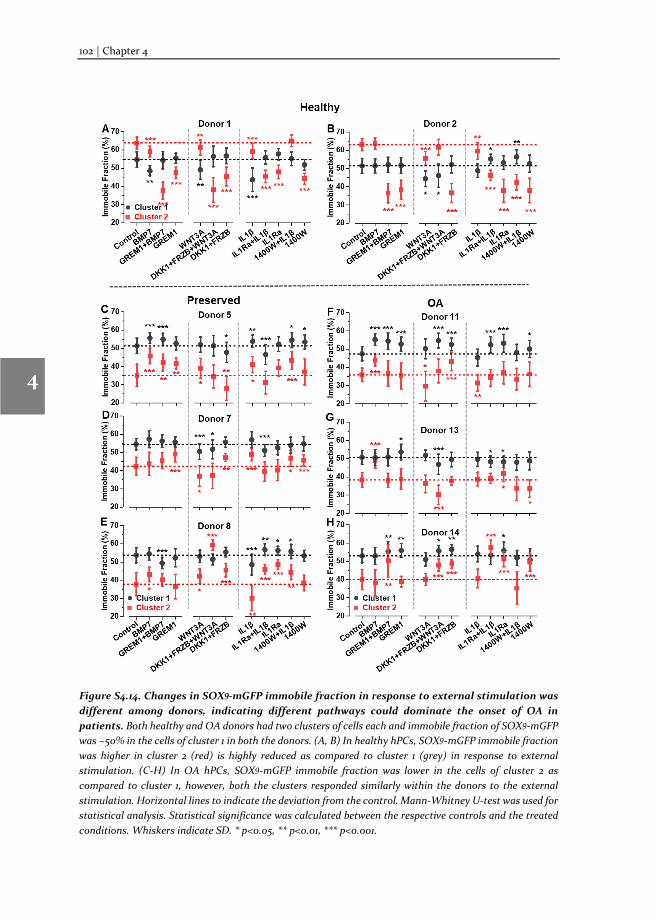
102 | Chapter 4
1
2
3
4
5
6
7
8
Figure S4.14. Changes in SOX9-mGFP immobile fraction in response to external stimulation was different among donors, indicating different pathways could dominate the onset of OA in patients. Both healthy and OA donors had two clusters of cells each and immobile fraction of SOX9-mGFP was ~50% in the cells of cluster 1 in both the donors. (A, B) In healthy hPCs, SOX9-mGFP immobile fraction was higher in cluster 2 (red) is highly reduced as compared to cluster 1 (grey) in response to external stimulation. (C-H) In OA hPCs, SOX9-mGFP immobile fraction was lower in the cells of cluster 2 as compared to cluster 1, however, both the clusters responded similarly within the donors to the external stimulation. Horizontal lines to indicate the deviation from the control. Mann-Whitney U-test was used for statistical analysis. Statistical significance was calculated between the respective controls and the treated conditions. Whiskers indicate SD. * p<0.05, ** p<0.01, *** p<0.001.
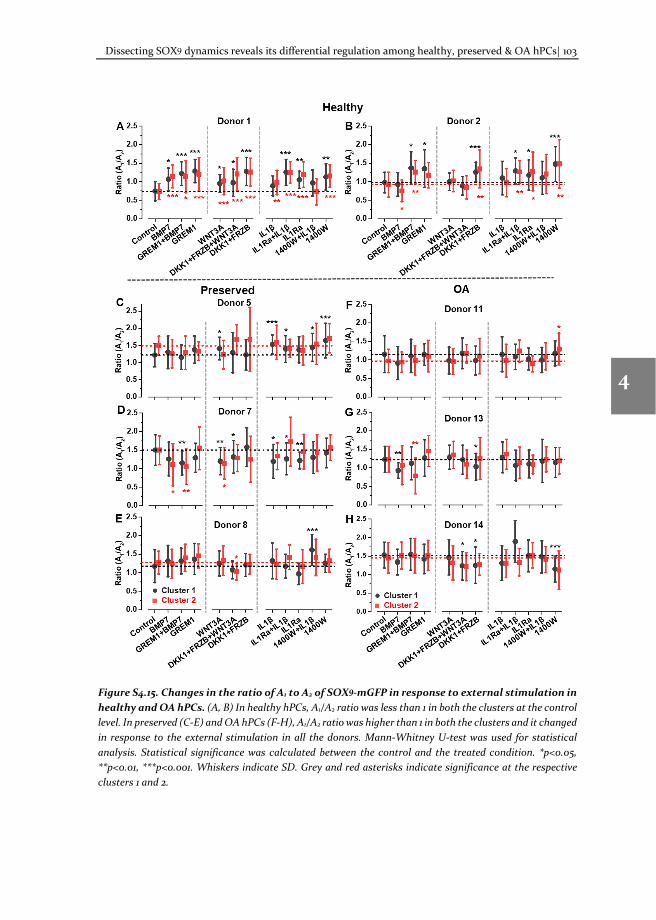
Dissecting SOX9 dynamics reveals its differential regulation among healthy, preserved & OA hPCs| 103
1
2
3
4
5
6
7
8
Figure S4.15. Changes in the ratio of A1 to A2 of SOX9-mGFP in response to external stimulation in healthy and OA hPCs. (A, B) In healthy hPCs, A1/A2 ratio was less than 1 in both the clusters at the control level. In preserved (C-E) and OA hPCs (F-H), A1/A2 ratio was higher than 1 in both the clusters and it changed in response to the external stimulation in all the donors. Mann-Whitney U-test was used for statistical analysis. Statistical significance was calculated between the control and the treated condition. *p<0.05, **p<0.01, ***p<0.001. Whiskers indicate SD. Grey and red asterisks indicate significance at the respective clusters 1 and 2.
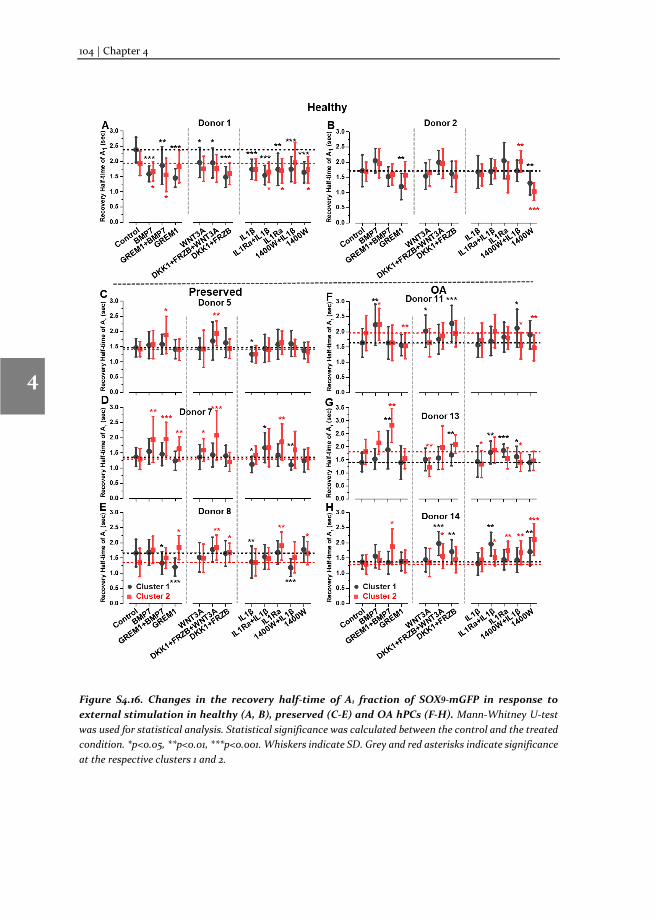
104 | Chapter 4
1
2
3
4
5
6
7
8
Figure S4.16. Changes in the recovery half-time of A1 fraction of SOX9-mGFP in response to external stimulation in healthy (A, B), preserved (C-E) and OA hPCs (F-H). Mann-Whitney U-test was used for statistical analysis. Statistical significance was calculated between the control and the treated condition. *p<0.05, **p<0.01, ***p<0.001. Whiskers indicate SD. Grey and red asterisks indicate significance at the respective clusters 1 and 2.
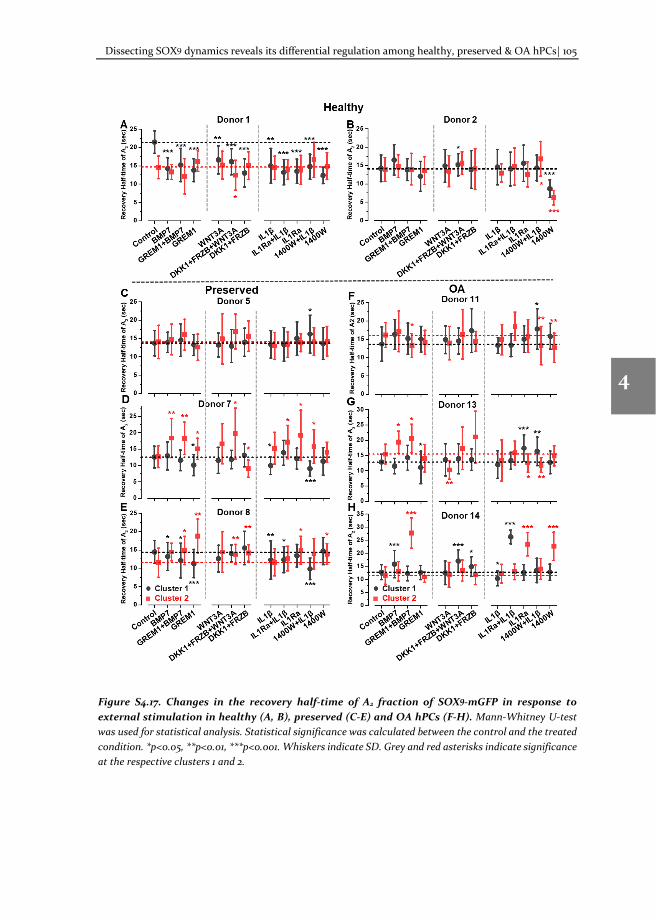
Dissecting SOX9 dynamics reveals its differential regulation among healthy, preserved & OA hPCs| 105
1
2
3
4
5
6
7
8
Figure S4.17. Changes in the recovery half-time of A2 fraction of SOX9-mGFP in response to external stimulation in healthy (A, B), preserved (C-E) and OA hPCs (F-H). Mann-Whitney U-test was used for statistical analysis. Statistical significance was calculated between the control and the treated condition. *p<0.05, **p<0.01, ***p<0.001. Whiskers indicate SD. Grey and red asterisks indicate significance at the respective clusters 1 and 2.
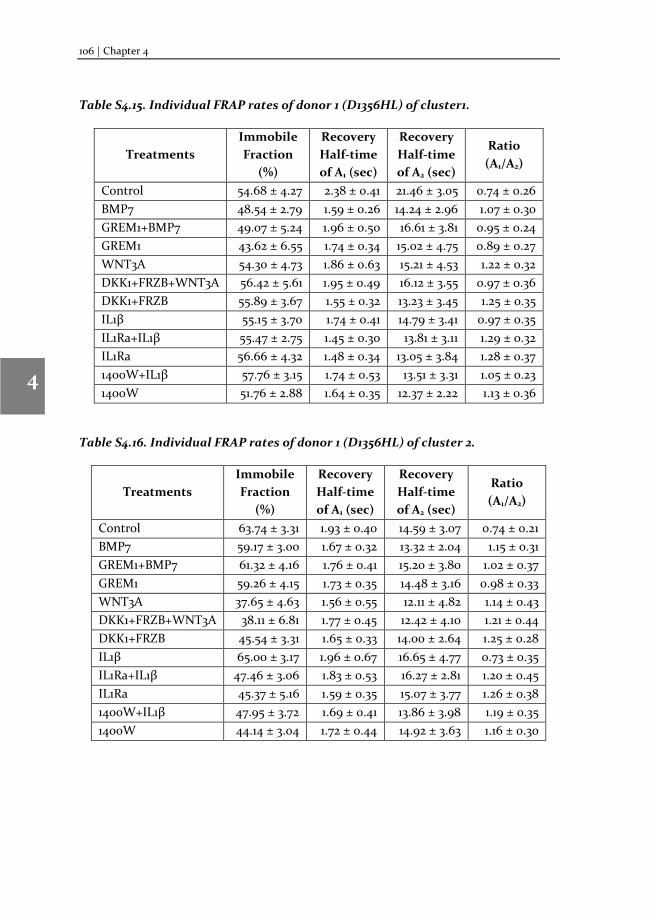
106 | Chapter 4
1
2
3
4
5
6
7
8
Table S4.15. Individual FRAP rates of donor 1 (D1356HL) of cluster1.
Treatments Immobile Fraction
(%)
Recovery Half-time of A1 (sec)
Recovery Half-time of A2 (sec)
Ratio (A1/A2)
Control 54.68 ± 4.27 2.38 ± 0.41 21.46 ± 3.05 0.74 ± 0.26 BMP7 48.54 ± 2.79 1.59 ± 0.26 14.24 ± 2.96 1.07 ± 0.30 GREM1+BMP7 49.07 ± 5.24 1.96 ± 0.50 16.61 ± 3.81 0.95 ± 0.24 GREM1 43.62 ± 6.55 1.74 ± 0.34 15.02 ± 4.75 0.89 ± 0.27 WNT3A 54.30 ± 4.73 1.86 ± 0.63 15.21 ± 4.53 1.22 ± 0.32 DKK1+FRZB+WNT3A 56.42 ± 5.61 1.95 ± 0.49 16.12 ± 3.55 0.97 ± 0.36 DKK1+FRZB 55.89 ± 3.67 1.55 ± 0.32 13.23 ± 3.45 1.25 ± 0.35 IL1β 55.15 ± 3.70 1.74 ± 0.41 14.79 ± 3.41 0.97 ± 0.35 IL1Ra+IL1β 55.47 ± 2.75 1.45 ± 0.30 13.81 ± 3.11 1.29 ± 0.32 IL1Ra 56.66 ± 4.32 1.48 ± 0.34 13.05 ± 3.84 1.28 ± 0.37 1400W+IL1β 57.76 ± 3.15 1.74 ± 0.53 13.51 ± 3.31 1.05 ± 0.23 1400W 51.76 ± 2.88 1.64 ± 0.35 12.37 ± 2.22 1.13 ± 0.36
Table S4.16. Individual FRAP rates of donor 1 (D1356HL) of cluster 2.
Treatments Immobile Fraction
(%)
Recovery Half-time of A1 (sec)
Recovery Half-time of A2 (sec)
Ratio (A1/A2)
Control 63.74 ± 3.31 1.93 ± 0.40 14.59 ± 3.07 0.74 ± 0.21 BMP7 59.17 ± 3.00 1.67 ± 0.32 13.32 ± 2.04 1.15 ± 0.31 GREM1+BMP7 61.32 ± 4.16 1.76 ± 0.41 15.20 ± 3.80 1.02 ± 0.37 GREM1 59.26 ± 4.15 1.73 ± 0.35 14.48 ± 3.16 0.98 ± 0.33 WNT3A 37.65 ± 4.63 1.56 ± 0.55 12.11 ± 4.82 1.14 ± 0.43 DKK1+FRZB+WNT3A 38.11 ± 6.81 1.77 ± 0.45 12.42 ± 4.10 1.21 ± 0.44 DKK1+FRZB 45.54 ± 3.31 1.65 ± 0.33 14.00 ± 2.64 1.25 ± 0.28 IL1β 65.00 ± 3.17 1.96 ± 0.67 16.65 ± 4.77 0.73 ± 0.35 IL1Ra+IL1β 47.46 ± 3.06 1.83 ± 0.53 16.27 ± 2.81 1.20 ± 0.45 IL1Ra 45.37 ± 5.16 1.59 ± 0.35 15.07 ± 3.77 1.26 ± 0.38 1400W+IL1β 47.95 ± 3.72 1.69 ± 0.41 13.86 ± 3.98 1.19 ± 0.35 1400W 44.14 ± 3.04 1.72 ± 0.44 14.92 ± 3.63 1.16 ± 0.30
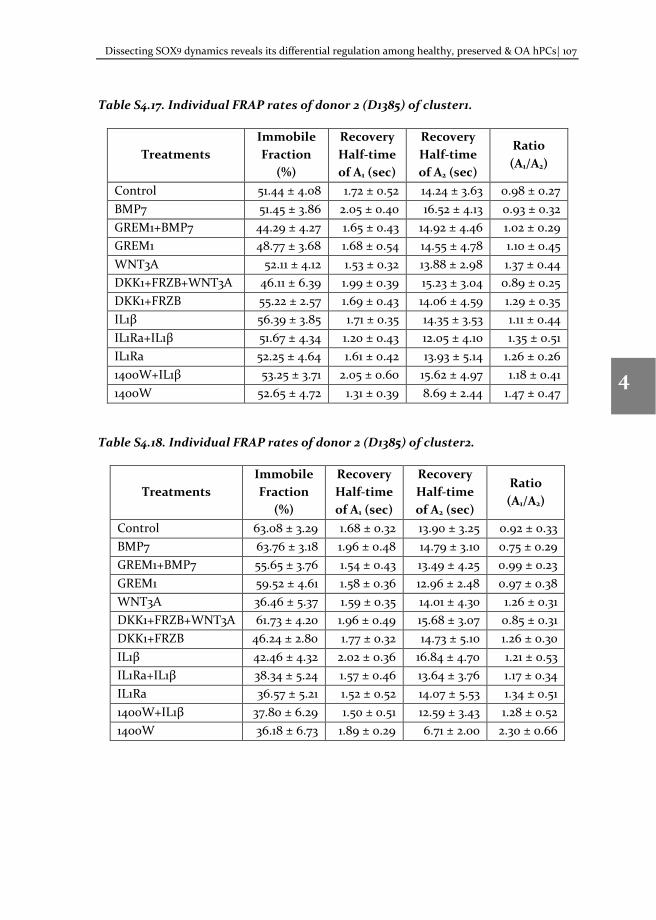
Dissecting SOX9 dynamics reveals its differential regulation among healthy, preserved & OA hPCs| 107
1
2
3
4
5
6
7
8
Table S4.17. Individual FRAP rates of donor 2 (D1385) of cluster1.
Treatments Immobile Fraction
(%)
Recovery Half-time of A1 (sec)
Recovery Half-time of A2 (sec)
Ratio (A1/A2)
Control 51.44 ± 4.08 1.72 ± 0.52 14.24 ± 3.63 0.98 ± 0.27 BMP7 51.45 ± 3.86 2.05 ± 0.40 16.52 ± 4.13 0.93 ± 0.32 GREM1+BMP7 44.29 ± 4.27 1.65 ± 0.43 14.92 ± 4.46 1.02 ± 0.29 GREM1 48.77 ± 3.68 1.68 ± 0.54 14.55 ± 4.78 1.10 ± 0.45 WNT3A 52.11 ± 4.12 1.53 ± 0.32 13.88 ± 2.98 1.37 ± 0.44 DKK1+FRZB+WNT3A 46.11 ± 6.39 1.99 ± 0.39 15.23 ± 3.04 0.89 ± 0.25 DKK1+FRZB 55.22 ± 2.57 1.69 ± 0.43 14.06 ± 4.59 1.29 ± 0.35 IL1β 56.39 ± 3.85 1.71 ± 0.35 14.35 ± 3.53 1.11 ± 0.44 IL1Ra+IL1β 51.67 ± 4.34 1.20 ± 0.43 12.05 ± 4.10 1.35 ± 0.51 IL1Ra 52.25 ± 4.64 1.61 ± 0.42 13.93 ± 5.14 1.26 ± 0.26 1400W+IL1β 53.25 ± 3.71 2.05 ± 0.60 15.62 ± 4.97 1.18 ± 0.41 1400W 52.65 ± 4.72 1.31 ± 0.39 8.69 ± 2.44 1.47 ± 0.47
Table S4.18. Individual FRAP rates of donor 2 (D1385) of cluster2.
Treatments Immobile Fraction
(%)
Recovery Half-time of A1 (sec)
Recovery Half-time of A2 (sec)
Ratio (A1/A2)
Control 63.08 ± 3.29 1.68 ± 0.32 13.90 ± 3.25 0.92 ± 0.33 BMP7 63.76 ± 3.18 1.96 ± 0.48 14.79 ± 3.10 0.75 ± 0.29 GREM1+BMP7 55.65 ± 3.76 1.54 ± 0.43 13.49 ± 4.25 0.99 ± 0.23 GREM1 59.52 ± 4.61 1.58 ± 0.36 12.96 ± 2.48 0.97 ± 0.38 WNT3A 36.46 ± 5.37 1.59 ± 0.35 14.01 ± 4.30 1.26 ± 0.31 DKK1+FRZB+WNT3A 61.73 ± 4.20 1.96 ± 0.49 15.68 ± 3.07 0.85 ± 0.31 DKK1+FRZB 46.24 ± 2.80 1.77 ± 0.32 14.73 ± 5.10 1.26 ± 0.30 IL1β 42.46 ± 4.32 2.02 ± 0.36 16.84 ± 4.70 1.21 ± 0.53 IL1Ra+IL1β 38.34 ± 5.24 1.57 ± 0.46 13.64 ± 3.76 1.17 ± 0.34 IL1Ra 36.57 ± 5.21 1.52 ± 0.52 14.07 ± 5.53 1.34 ± 0.51 1400W+IL1β 37.80 ± 6.29 1.50 ± 0.51 12.59 ± 3.43 1.28 ± 0.52 1400W 36.18 ± 6.73 1.89 ± 0.29 6.71 ± 2.00 2.30 ± 0.66
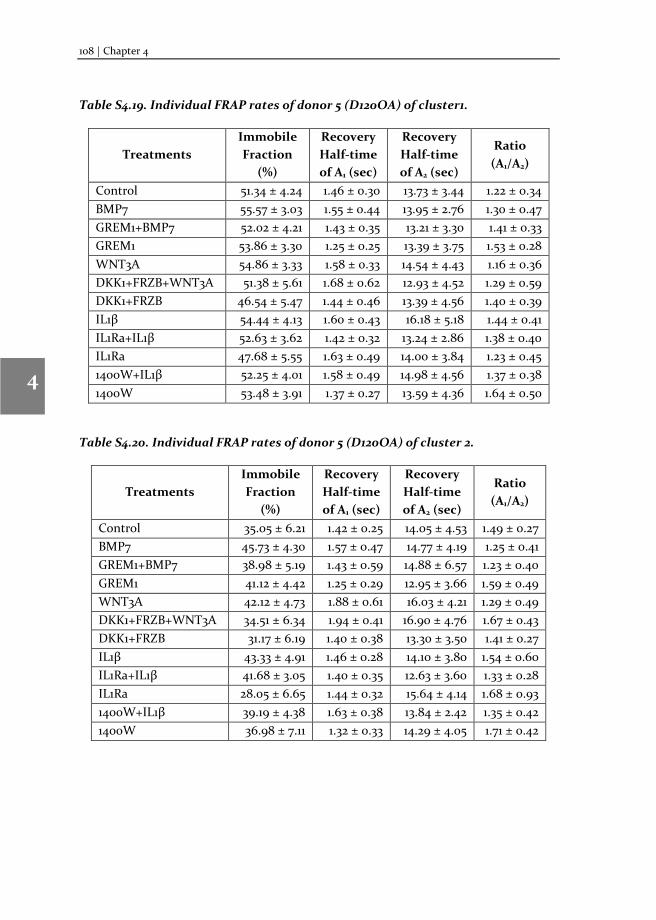
108 | Chapter 4
1
2
3
4
5
6
7
8
Table S4.19. Individual FRAP rates of donor 5 (D120OA) of cluster1.
Treatments Immobile Fraction
(%)
Recovery Half-time of A1 (sec)
Recovery Half-time of A2 (sec)
Ratio (A1/A2)
Control 51.34 ± 4.24 1.46 ± 0.30 13.73 ± 3.44 1.22 ± 0.34 BMP7 55.57 ± 3.03 1.55 ± 0.44 13.95 ± 2.76 1.30 ± 0.47 GREM1+BMP7 52.02 ± 4.21 1.43 ± 0.35 13.21 ± 3.30 1.41 ± 0.33 GREM1 53.86 ± 3.30 1.25 ± 0.25 13.39 ± 3.75 1.53 ± 0.28 WNT3A 54.86 ± 3.33 1.58 ± 0.33 14.54 ± 4.43 1.16 ± 0.36 DKK1+FRZB+WNT3A 51.38 ± 5.61 1.68 ± 0.62 12.93 ± 4.52 1.29 ± 0.59 DKK1+FRZB 46.54 ± 5.47 1.44 ± 0.46 13.39 ± 4.56 1.40 ± 0.39 IL1β 54.44 ± 4.13 1.60 ± 0.43 16.18 ± 5.18 1.44 ± 0.41 IL1Ra+IL1β 52.63 ± 3.62 1.42 ± 0.32 13.24 ± 2.86 1.38 ± 0.40 IL1Ra 47.68 ± 5.55 1.63 ± 0.49 14.00 ± 3.84 1.23 ± 0.45 1400W+IL1β 52.25 ± 4.01 1.58 ± 0.49 14.98 ± 4.56 1.37 ± 0.38 1400W 53.48 ± 3.91 1.37 ± 0.27 13.59 ± 4.36 1.64 ± 0.50
Table S4.20. Individual FRAP rates of donor 5 (D120OA) of cluster 2.
Treatments Immobile Fraction
(%)
Recovery Half-time of A1 (sec)
Recovery Half-time of A2 (sec)
Ratio (A1/A2)
Control 35.05 ± 6.21 1.42 ± 0.25 14.05 ± 4.53 1.49 ± 0.27 BMP7 45.73 ± 4.30 1.57 ± 0.47 14.77 ± 4.19 1.25 ± 0.41 GREM1+BMP7 38.98 ± 5.19 1.43 ± 0.59 14.88 ± 6.57 1.23 ± 0.40 GREM1 41.12 ± 4.42 1.25 ± 0.29 12.95 ± 3.66 1.59 ± 0.49 WNT3A 42.12 ± 4.73 1.88 ± 0.61 16.03 ± 4.21 1.29 ± 0.49 DKK1+FRZB+WNT3A 34.51 ± 6.34 1.94 ± 0.41 16.90 ± 4.76 1.67 ± 0.43 DKK1+FRZB 31.17 ± 6.19 1.40 ± 0.38 13.30 ± 3.50 1.41 ± 0.27 IL1β 43.33 ± 4.91 1.46 ± 0.28 14.10 ± 3.80 1.54 ± 0.60 IL1Ra+IL1β 41.68 ± 3.05 1.40 ± 0.35 12.63 ± 3.60 1.33 ± 0.28 IL1Ra 28.05 ± 6.65 1.44 ± 0.32 15.64 ± 4.14 1.68 ± 0.93 1400W+IL1β 39.19 ± 4.38 1.63 ± 0.38 13.84 ± 2.42 1.35 ± 0.42 1400W 36.98 ± 7.11 1.32 ± 0.33 14.29 ± 4.05 1.71 ± 0.42
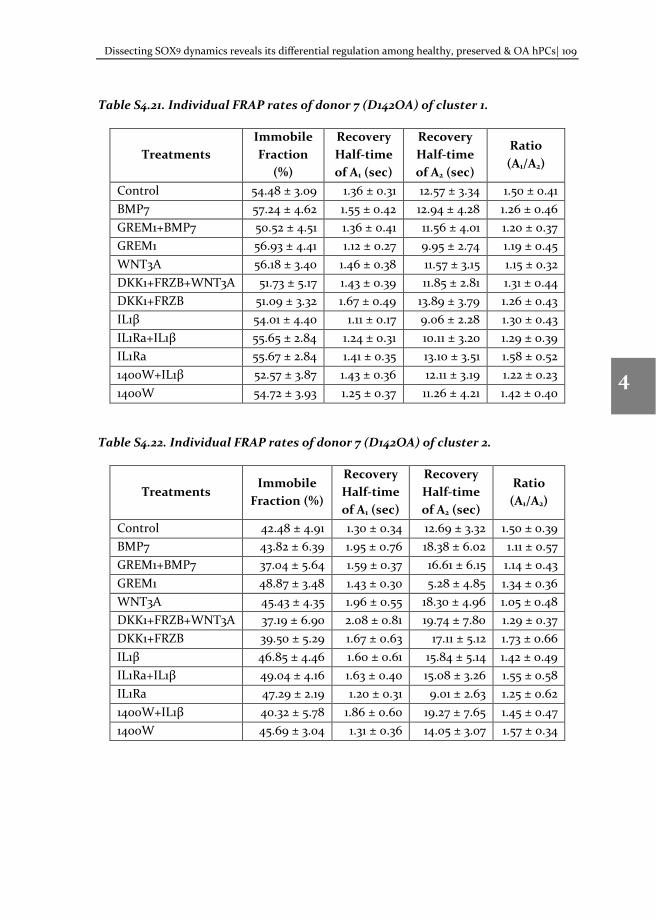
Dissecting SOX9 dynamics reveals its differential regulation among healthy, preserved & OA hPCs| 109
1
2
3
4
5
6
7
8
Table S4.21. Individual FRAP rates of donor 7 (D142OA) of cluster 1.
Treatments Immobile Fraction
(%)
Recovery Half-time of A1 (sec)
Recovery Half-time of A2 (sec)
Ratio (A1/A2)
Control 54.48 ± 3.09 1.36 ± 0.31 12.57 ± 3.34 1.50 ± 0.41 BMP7 57.24 ± 4.62 1.55 ± 0.42 12.94 ± 4.28 1.26 ± 0.46 GREM1+BMP7 50.52 ± 4.51 1.36 ± 0.41 11.56 ± 4.01 1.20 ± 0.37 GREM1 56.93 ± 4.41 1.12 ± 0.27 9.95 ± 2.74 1.19 ± 0.45 WNT3A 56.18 ± 3.40 1.46 ± 0.38 11.57 ± 3.15 1.15 ± 0.32 DKK1+FRZB+WNT3A 51.73 ± 5.17 1.43 ± 0.39 11.85 ± 2.81 1.31 ± 0.44 DKK1+FRZB 51.09 ± 3.32 1.67 ± 0.49 13.89 ± 3.79 1.26 ± 0.43 IL1β 54.01 ± 4.40 1.11 ± 0.17 9.06 ± 2.28 1.30 ± 0.43 IL1Ra+IL1β 55.65 ± 2.84 1.24 ± 0.31 10.11 ± 3.20 1.29 ± 0.39 IL1Ra 55.67 ± 2.84 1.41 ± 0.35 13.10 ± 3.51 1.58 ± 0.52 1400W+IL1β 52.57 ± 3.87 1.43 ± 0.36 12.11 ± 3.19 1.22 ± 0.23 1400W 54.72 ± 3.93 1.25 ± 0.37 11.26 ± 4.21 1.42 ± 0.40
Table S4.22. Individual FRAP rates of donor 7 (D142OA) of cluster 2.
Treatments Immobile
Fraction (%)
Recovery Half-time of A1 (sec)
Recovery Half-time of A2 (sec)
Ratio (A1/A2)
Control 42.48 ± 4.91 1.30 ± 0.34 12.69 ± 3.32 1.50 ± 0.39 BMP7 43.82 ± 6.39 1.95 ± 0.76 18.38 ± 6.02 1.11 ± 0.57 GREM1+BMP7 37.04 ± 5.64 1.59 ± 0.37 16.61 ± 6.15 1.14 ± 0.43 GREM1 48.87 ± 3.48 1.43 ± 0.30 5.28 ± 4.85 1.34 ± 0.36 WNT3A 45.43 ± 4.35 1.96 ± 0.55 18.30 ± 4.96 1.05 ± 0.48 DKK1+FRZB+WNT3A 37.19 ± 6.90 2.08 ± 0.81 19.74 ± 7.80 1.29 ± 0.37 DKK1+FRZB 39.50 ± 5.29 1.67 ± 0.63 17.11 ± 5.12 1.73 ± 0.66 IL1β 46.85 ± 4.46 1.60 ± 0.61 15.84 ± 5.14 1.42 ± 0.49 IL1Ra+IL1β 49.04 ± 4.16 1.63 ± 0.40 15.08 ± 3.26 1.55 ± 0.58 IL1Ra 47.29 ± 2.19 1.20 ± 0.31 9.01 ± 2.63 1.25 ± 0.62 1400W+IL1β 40.32 ± 5.78 1.86 ± 0.60 19.27 ± 7.65 1.45 ± 0.47 1400W 45.69 ± 3.04 1.31 ± 0.36 14.05 ± 3.07 1.57 ± 0.34
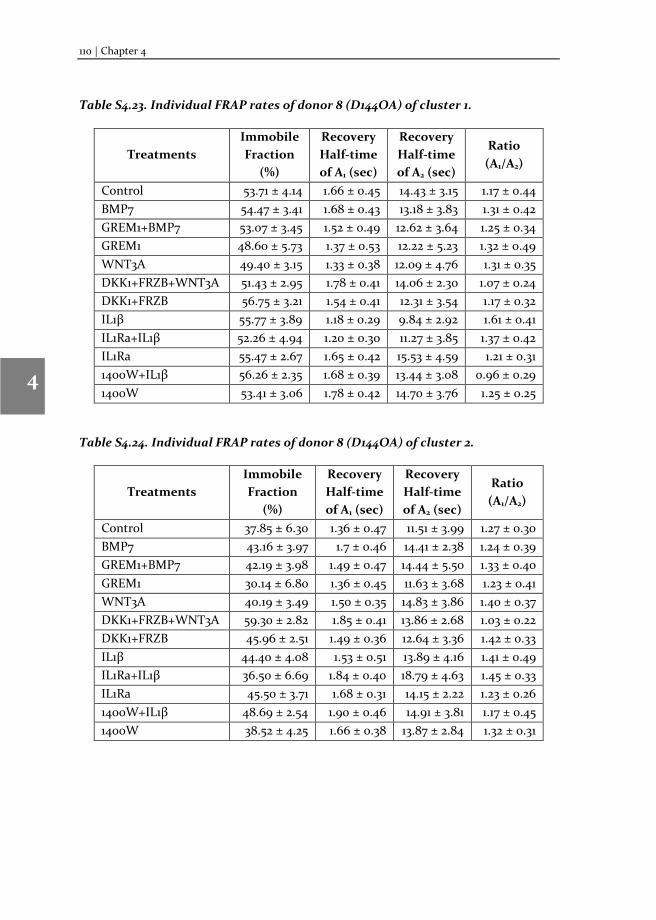
110 | Chapter 4
1
2
3
4
5
6
7
8
Table S4.23. Individual FRAP rates of donor 8 (D144OA) of cluster 1.
Treatments Immobile Fraction
(%)
Recovery Half-time of A1 (sec)
Recovery Half-time of A2 (sec)
Ratio (A1/A2)
Control 53.71 ± 4.14 1.66 ± 0.45 14.43 ± 3.15 1.17 ± 0.44 BMP7 54.47 ± 3.41 1.68 ± 0.43 13.18 ± 3.83 1.31 ± 0.42 GREM1+BMP7 53.07 ± 3.45 1.52 ± 0.49 12.62 ± 3.64 1.25 ± 0.34 GREM1 48.60 ± 5.73 1.37 ± 0.53 12.22 ± 5.23 1.32 ± 0.49 WNT3A 49.40 ± 3.15 1.33 ± 0.38 12.09 ± 4.76 1.31 ± 0.35 DKK1+FRZB+WNT3A 51.43 ± 2.95 1.78 ± 0.41 14.06 ± 2.30 1.07 ± 0.24 DKK1+FRZB 56.75 ± 3.21 1.54 ± 0.41 12.31 ± 3.54 1.17 ± 0.32 IL1β 55.77 ± 3.89 1.18 ± 0.29 9.84 ± 2.92 1.61 ± 0.41 IL1Ra+IL1β 52.26 ± 4.94 1.20 ± 0.30 11.27 ± 3.85 1.37 ± 0.42 IL1Ra 55.47 ± 2.67 1.65 ± 0.42 15.53 ± 4.59 1.21 ± 0.31 1400W+IL1β 56.26 ± 2.35 1.68 ± 0.39 13.44 ± 3.08 0.96 ± 0.29 1400W 53.41 ± 3.06 1.78 ± 0.42 14.70 ± 3.76 1.25 ± 0.25
Table S4.24. Individual FRAP rates of donor 8 (D144OA) of cluster 2.
Treatments Immobile Fraction
(%)
Recovery Half-time of A1 (sec)
Recovery Half-time of A2 (sec)
Ratio (A1/A2)
Control 37.85 ± 6.30 1.36 ± 0.47 11.51 ± 3.99 1.27 ± 0.30 BMP7 43.16 ± 3.97 1.7 ± 0.46 14.41 ± 2.38 1.24 ± 0.39 GREM1+BMP7 42.19 ± 3.98 1.49 ± 0.47 14.44 ± 5.50 1.33 ± 0.40 GREM1 30.14 ± 6.80 1.36 ± 0.45 11.63 ± 3.68 1.23 ± 0.41 WNT3A 40.19 ± 3.49 1.50 ± 0.35 14.83 ± 3.86 1.40 ± 0.37 DKK1+FRZB+WNT3A 59.30 ± 2.82 1.85 ± 0.41 13.86 ± 2.68 1.03 ± 0.22 DKK1+FRZB 45.96 ± 2.51 1.49 ± 0.36 12.64 ± 3.36 1.42 ± 0.33 IL1β 44.40 ± 4.08 1.53 ± 0.51 13.89 ± 4.16 1.41 ± 0.49 IL1Ra+IL1β 36.50 ± 6.69 1.84 ± 0.40 18.79 ± 4.63 1.45 ± 0.33 IL1Ra 45.50 ± 3.71 1.68 ± 0.31 14.15 ± 2.22 1.23 ± 0.26 1400W+IL1β 48.69 ± 2.54 1.90 ± 0.46 14.91 ± 3.81 1.17 ± 0.45 1400W 38.52 ± 4.25 1.66 ± 0.38 13.87 ± 2.84 1.32 ± 0.31

Dissecting SOX9 dynamics reveals its differential regulation among healthy, preserved & OA hPCs| 111
1
2
3
4
5
6
7
8
Table S4.25. Individual FRAP rates of donor 11 (D122OA) of cluster 1.
Treatments Immobile Fraction
(%)
Recovery Half-time of A1 (sec)
Recovery Half-time of A2 (sec)
Ratio (A1/A2)
Control 47.45 ± 3.89 1.64 ± 0.48 13.69 ± 4.67 1.15 ± 0.50 BMP7 55.26 ± 3.25 2.23 ± 0.68 16.35 ± 4.08 0.91 ± 0.45 GREM1+BMP7 50.21 ± 5.48 2.02 ± 0.53 14.85 ± 3.79 0.98 ± 0.36 GREM1 45.38 ± 4.66 1.56 ± 0.40 13.33 ± 2.17 1.15 ± 0.47 WNT3A 54.35 ± 4.50 1.63 ± 0.53 15.20 ± 4.25 1.11 ± 0.45 DKK1+FRZB+WNT3A 54.69 ± 4.00 1.76 ± 0.49 14.51 ± 3.57 1.18 ± 0.41 DKK1+FRZB 52.35 ± 4.44 1.70 ± 0.47 13.51 ± 3.15 1.09 ± 0.34 IL1β 48.15 ± 4.45 2.12 ± 0.63 17.81 ± 5.49 1.00 ± 0.34 IL1Ra+IL1β 52.66 ± 4.02 1.56 ± 0.35 15.03 ± 3.52 1.14 ± 0.29 IL1Ra 52.59 ± 3.43 2.27 ± 0.60 17.34 ± 5.97 0.98 ± 0.39 1400W+IL1β 53.25 ± 4.73 1.83 ± 0.46 15.01 ± 3.51 1.02 ± 0.34 1400W 50.05 ± 4.87 1.90 ± 0.49 15.79 ± 3.63 1.18 ± 0.30
Table S4.26. Individual FRAP rates of donor 11 (D122OA) of cluster 2.
Treatments Immobile Fraction
(%)
Recovery Half-time of A1 (sec)
Recovery Half-time of A2 (sec)
Ratio (A1/A2)
Control 35.89 ± 3.81 1.96 ± 0.58 16.16 ± 3.44 0.97 ± 0.32 BMP7 43.89 ± 3.09 2.25 ± 0.52 17.16 ± 5.54 0.94 ± 0.27 GREM1+BMP7 29.68 ± 8.09 1.64 ± 0.46 13.93 ± 4.58 0.95 ± 0.35 GREM1 31.50 ± 4.51 1.73 ± 0.57 14.89 ± 4.14 0.98 ± 0.44 WNT3A 36.71 ± 7.03 1.64 ± 0.59 13.30 ± 3.22 0.98 ± 0.39 DKK1+FRZB+WNT3A 38.06 ± 6.46 1.87 ± 0.44 16.37 ± 6.79 1.16 ± 0.24 DKK1+FRZB 34.29 ± 4.61 2.02 ± 0.55 18.56 ± 3.85 1.24 ± 0.30 IL1β 33.55 ± 5.87 1.54 ± 0.44 13.26 ± 5.21 1.09 ± 0.36 IL1Ra+IL1β 35.33 ± 7.14 1.54 ± 0.43 14.18 ± 3.28 1.10 ± 0.43 IL1Ra 43.24 ± 4.89 1.94 ± 0.43 14.43 ± 2.69 1.10 ± 0.48 1400W+IL1β 37.16 ± 6.59 1.80 ± 0.42 15.86 ± 3.99 0.89 ± 0.43 1400W 36.33 ± 6.18 1.47 ± 0.37 12.71 ± 4.50 1.29 ± 0.22
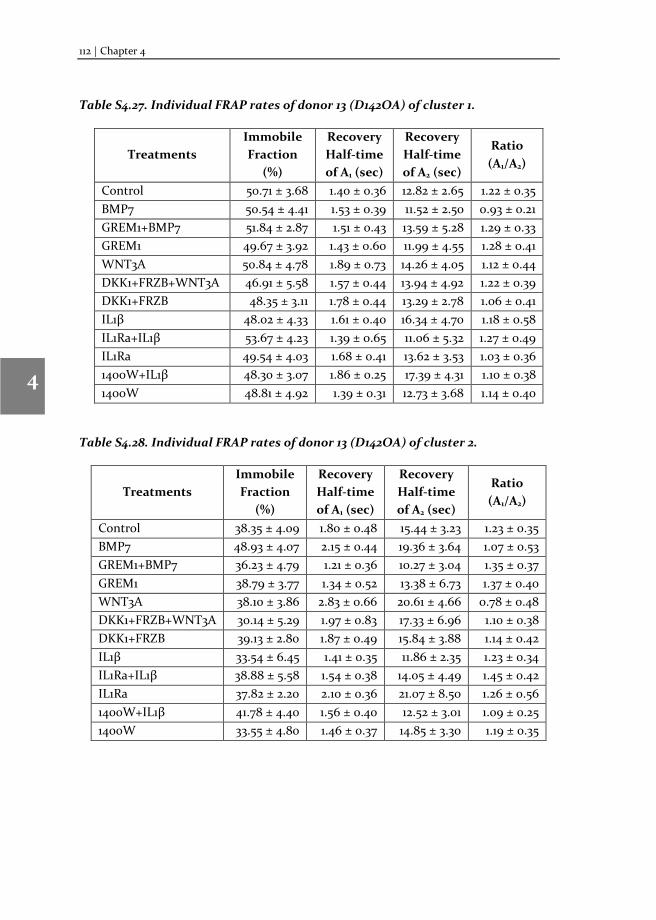
112 | Chapter 4
1
2
3
4
5
6
7
8
Table S4.27. Individual FRAP rates of donor 13 (D142OA) of cluster 1.
Treatments Immobile Fraction
(%)
Recovery Half-time of A1 (sec)
Recovery Half-time of A2 (sec)
Ratio (A1/A2)
Control 50.71 ± 3.68 1.40 ± 0.36 12.82 ± 2.65 1.22 ± 0.35 BMP7 50.54 ± 4.41 1.53 ± 0.39 11.52 ± 2.50 0.93 ± 0.21 GREM1+BMP7 51.84 ± 2.87 1.51 ± 0.43 13.59 ± 5.28 1.29 ± 0.33 GREM1 49.67 ± 3.92 1.43 ± 0.60 11.99 ± 4.55 1.28 ± 0.41 WNT3A 50.84 ± 4.78 1.89 ± 0.73 14.26 ± 4.05 1.12 ± 0.44 DKK1+FRZB+WNT3A 46.91 ± 5.58 1.57 ± 0.44 13.94 ± 4.92 1.22 ± 0.39 DKK1+FRZB 48.35 ± 3.11 1.78 ± 0.44 13.29 ± 2.78 1.06 ± 0.41 IL1β 48.02 ± 4.33 1.61 ± 0.40 16.34 ± 4.70 1.18 ± 0.58 IL1Ra+IL1β 53.67 ± 4.23 1.39 ± 0.65 11.06 ± 5.32 1.27 ± 0.49 IL1Ra 49.54 ± 4.03 1.68 ± 0.41 13.62 ± 3.53 1.03 ± 0.36 1400W+IL1β 48.30 ± 3.07 1.86 ± 0.25 17.39 ± 4.31 1.10 ± 0.38 1400W 48.81 ± 4.92 1.39 ± 0.31 12.73 ± 3.68 1.14 ± 0.40
Table S4.28. Individual FRAP rates of donor 13 (D142OA) of cluster 2.
Treatments Immobile Fraction
(%)
Recovery Half-time of A1 (sec)
Recovery Half-time of A2 (sec)
Ratio (A1/A2)
Control 38.35 ± 4.09 1.80 ± 0.48 15.44 ± 3.23 1.23 ± 0.35 BMP7 48.93 ± 4.07 2.15 ± 0.44 19.36 ± 3.64 1.07 ± 0.53 GREM1+BMP7 36.23 ± 4.79 1.21 ± 0.36 10.27 ± 3.04 1.35 ± 0.37 GREM1 38.79 ± 3.77 1.34 ± 0.52 13.38 ± 6.73 1.37 ± 0.40 WNT3A 38.10 ± 3.86 2.83 ± 0.66 20.61 ± 4.66 0.78 ± 0.48 DKK1+FRZB+WNT3A 30.14 ± 5.29 1.97 ± 0.83 17.33 ± 6.96 1.10 ± 0.38 DKK1+FRZB 39.13 ± 2.80 1.87 ± 0.49 15.84 ± 3.88 1.14 ± 0.42 IL1β 33.54 ± 6.45 1.41 ± 0.35 11.86 ± 2.35 1.23 ± 0.34 IL1Ra+IL1β 38.88 ± 5.58 1.54 ± 0.38 14.05 ± 4.49 1.45 ± 0.42 IL1Ra 37.82 ± 2.20 2.10 ± 0.36 21.07 ± 8.50 1.26 ± 0.56 1400W+IL1β 41.78 ± 4.40 1.56 ± 0.40 12.52 ± 3.01 1.09 ± 0.25 1400W 33.55 ± 4.80 1.46 ± 0.37 14.85 ± 3.30 1.19 ± 0.35
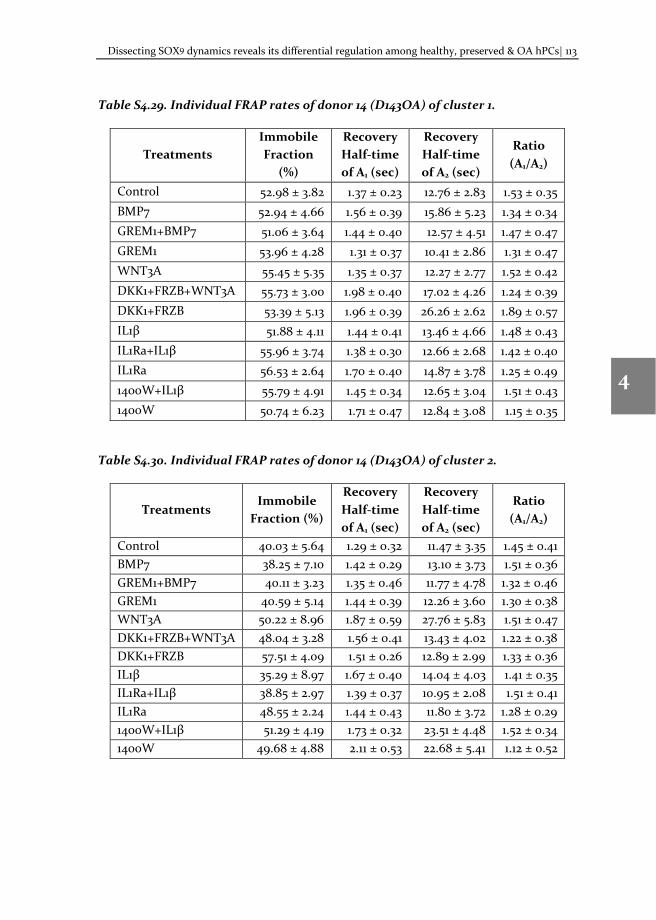
Dissecting SOX9 dynamics reveals its differential regulation among healthy, preserved & OA hPCs| 113
1
2
3
4
5
6
7
8
Table S4.29. Individual FRAP rates of donor 14 (D143OA) of cluster 1.
Treatments Immobile Fraction
(%)
Recovery Half-time of A1 (sec)
Recovery Half-time of A2 (sec)
Ratio (A1/A2)
Control 52.98 ± 3.82 1.37 ± 0.23 12.76 ± 2.83 1.53 ± 0.35 BMP7 52.94 ± 4.66 1.56 ± 0.39 15.86 ± 5.23 1.34 ± 0.34 GREM1+BMP7 51.06 ± 3.64 1.44 ± 0.40 12.57 ± 4.51 1.47 ± 0.47 GREM1 53.96 ± 4.28 1.31 ± 0.37 10.41 ± 2.86 1.31 ± 0.47 WNT3A 55.45 ± 5.35 1.35 ± 0.37 12.27 ± 2.77 1.52 ± 0.42 DKK1+FRZB+WNT3A 55.73 ± 3.00 1.98 ± 0.40 17.02 ± 4.26 1.24 ± 0.39 DKK1+FRZB 53.39 ± 5.13 1.96 ± 0.39 26.26 ± 2.62 1.89 ± 0.57 IL1β 51.88 ± 4.11 1.44 ± 0.41 13.46 ± 4.66 1.48 ± 0.43 IL1Ra+IL1β 55.96 ± 3.74 1.38 ± 0.30 12.66 ± 2.68 1.42 ± 0.40 IL1Ra 56.53 ± 2.64 1.70 ± 0.40 14.87 ± 3.78 1.25 ± 0.49 1400W+IL1β 55.79 ± 4.91 1.45 ± 0.34 12.65 ± 3.04 1.51 ± 0.43 1400W 50.74 ± 6.23 1.71 ± 0.47 12.84 ± 3.08 1.15 ± 0.35
Table S4.30. Individual FRAP rates of donor 14 (D143OA) of cluster 2.
Treatments Immobile
Fraction (%)
Recovery Half-time of A1 (sec)
Recovery Half-time of A2 (sec)
Ratio (A1/A2)
Control 40.03 ± 5.64 1.29 ± 0.32 11.47 ± 3.35 1.45 ± 0.41 BMP7 38.25 ± 7.10 1.42 ± 0.29 13.10 ± 3.73 1.51 ± 0.36 GREM1+BMP7 40.11 ± 3.23 1.35 ± 0.46 11.77 ± 4.78 1.32 ± 0.46 GREM1 40.59 ± 5.14 1.44 ± 0.39 12.26 ± 3.60 1.30 ± 0.38 WNT3A 50.22 ± 8.96 1.87 ± 0.59 27.76 ± 5.83 1.51 ± 0.47 DKK1+FRZB+WNT3A 48.04 ± 3.28 1.56 ± 0.41 13.43 ± 4.02 1.22 ± 0.38 DKK1+FRZB 57.51 ± 4.09 1.51 ± 0.26 12.89 ± 2.99 1.33 ± 0.36 IL1β 35.29 ± 8.97 1.67 ± 0.40 14.04 ± 4.03 1.41 ± 0.35 IL1Ra+IL1β 38.85 ± 2.97 1.39 ± 0.37 10.95 ± 2.08 1.51 ± 0.41 IL1Ra 48.55 ± 2.24 1.44 ± 0.43 11.80 ± 3.72 1.28 ± 0.29 1400W+IL1β 51.29 ± 4.19 1.73 ± 0.32 23.51 ± 4.48 1.52 ± 0.34 1400W 49.68 ± 4.88 2.11 ± 0.53 22.68 ± 5.41 1.12 ± 0.52
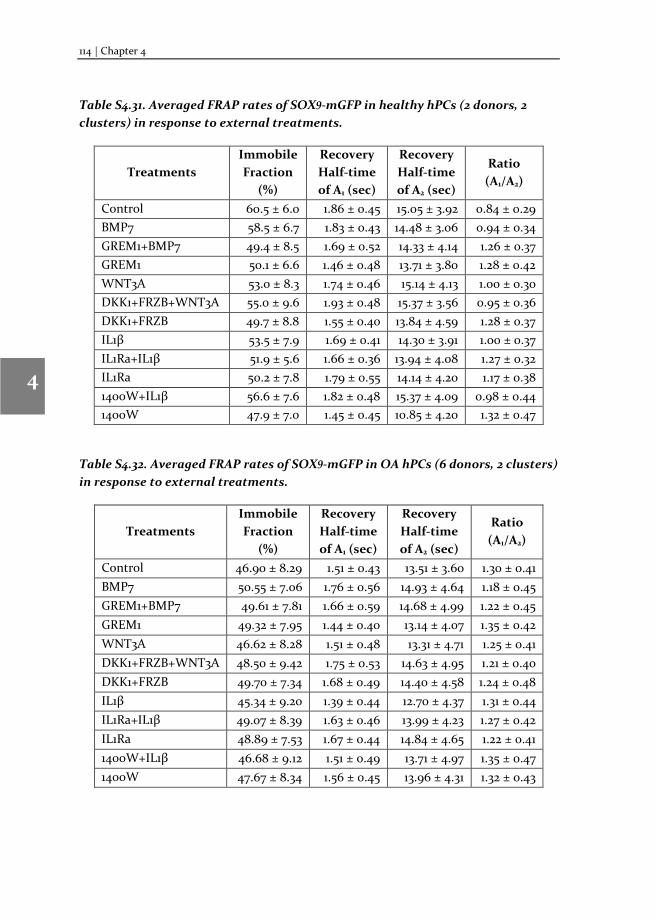
114 | Chapter 4
1
2
3
4
5
6
7
8
Table S4.31. Averaged FRAP rates of SOX9-mGFP in healthy hPCs (2 donors, 2 clusters) in response to external treatments.
Treatments Immobile Fraction
(%)
Recovery Half-time of A1 (sec)
Recovery Half-time of A2 (sec)
Ratio (A1/A2)
Control 60.5 ± 6.0 1.86 ± 0.45 15.05 ± 3.92 0.84 ± 0.29 BMP7 58.5 ± 6.7 1.83 ± 0.43 14.48 ± 3.06 0.94 ± 0.34 GREM1+BMP7 49.4 ± 8.5 1.69 ± 0.52 14.33 ± 4.14 1.26 ± 0.37 GREM1 50.1 ± 6.6 1.46 ± 0.48 13.71 ± 3.80 1.28 ± 0.42 WNT3A 53.0 ± 8.3 1.74 ± 0.46 15.14 ± 4.13 1.00 ± 0.30 DKK1+FRZB+WNT3A 55.0 ± 9.6 1.93 ± 0.48 15.37 ± 3.56 0.95 ± 0.36 DKK1+FRZB 49.7 ± 8.8 1.55 ± 0.40 13.84 ± 4.59 1.28 ± 0.37 IL1β 53.5 ± 7.9 1.69 ± 0.41 14.30 ± 3.91 1.00 ± 0.37 IL1Ra+IL1β 51.9 ± 5.6 1.66 ± 0.36 13.94 ± 4.08 1.27 ± 0.32 IL1Ra 50.2 ± 7.8 1.79 ± 0.55 14.14 ± 4.20 1.17 ± 0.38 1400W+IL1β 56.6 ± 7.6 1.82 ± 0.48 15.37 ± 4.09 0.98 ± 0.44 1400W 47.9 ± 7.0 1.45 ± 0.45 10.85 ± 4.20 1.32 ± 0.47
Table S4.32. Averaged FRAP rates of SOX9-mGFP in OA hPCs (6 donors, 2 clusters) in response to external treatments.
Treatments Immobile Fraction
(%)
Recovery Half-time of A1 (sec)
Recovery Half-time of A2 (sec)
Ratio (A1/A2)
Control 46.90 ± 8.29 1.51 ± 0.43 13.51 ± 3.60 1.30 ± 0.41 BMP7 50.55 ± 7.06 1.76 ± 0.56 14.93 ± 4.64 1.18 ± 0.45 GREM1+BMP7 49.61 ± 7.81 1.66 ± 0.59 14.68 ± 4.99 1.22 ± 0.45 GREM1 49.32 ± 7.95 1.44 ± 0.40 13.14 ± 4.07 1.35 ± 0.42 WNT3A 46.62 ± 8.28 1.51 ± 0.48 13.31 ± 4.71 1.25 ± 0.41 DKK1+FRZB+WNT3A 48.50 ± 9.42 1.75 ± 0.53 14.63 ± 4.95 1.21 ± 0.40 DKK1+FRZB 49.70 ± 7.34 1.68 ± 0.49 14.40 ± 4.58 1.24 ± 0.48 IL1β 45.34 ± 9.20 1.39 ± 0.44 12.70 ± 4.37 1.31 ± 0.44 IL1Ra+IL1β 49.07 ± 8.39 1.63 ± 0.46 13.99 ± 4.23 1.27 ± 0.42 IL1Ra 48.89 ± 7.53 1.67 ± 0.44 14.84 ± 4.65 1.22 ± 0.41 1400W+IL1β 46.68 ± 9.12 1.51 ± 0.49 13.71 ± 4.97 1.35 ± 0.47 1400W 47.67 ± 8.34 1.56 ± 0.45 13.96 ± 4.31 1.32 ± 0.43
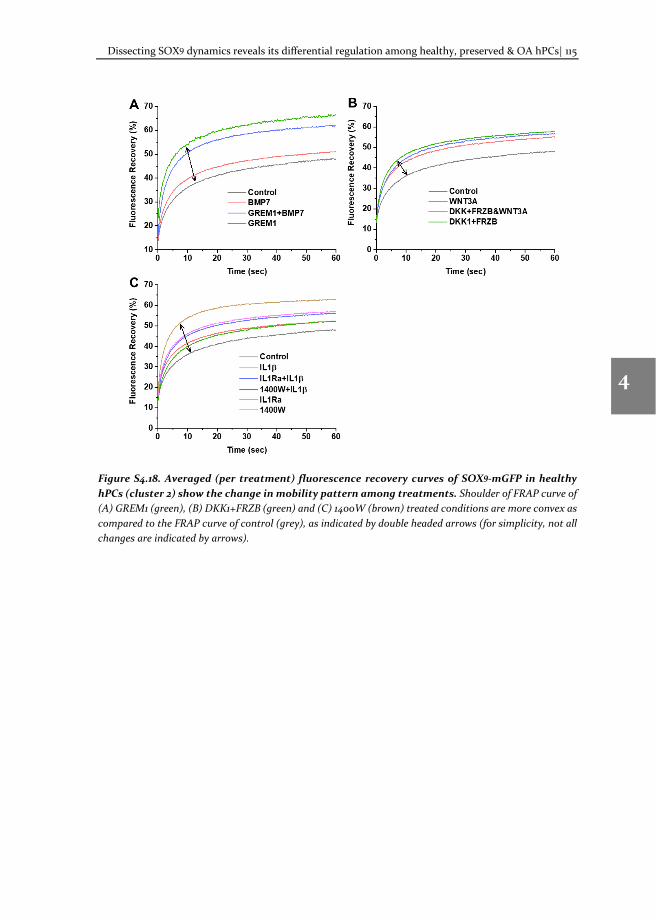
Dissecting SOX9 dynamics reveals its differential regulation among healthy, preserved & OA hPCs| 115
1
2
3
4
5
6
7
8
Figure S4.18. Averaged (per treatment) fluorescence recovery curves of SOX9-mGFP in healthy hPCs (cluster 2) show the change in mobility pattern among treatments. Shoulder of FRAP curve of (A) GREM1 (green), (B) DKK1+FRZB (green) and (C) 1400W (brown) treated conditions are more convex as compared to the FRAP curve of control (grey), as indicated by double headed arrows (for simplicity, not all changes are indicated by arrows).
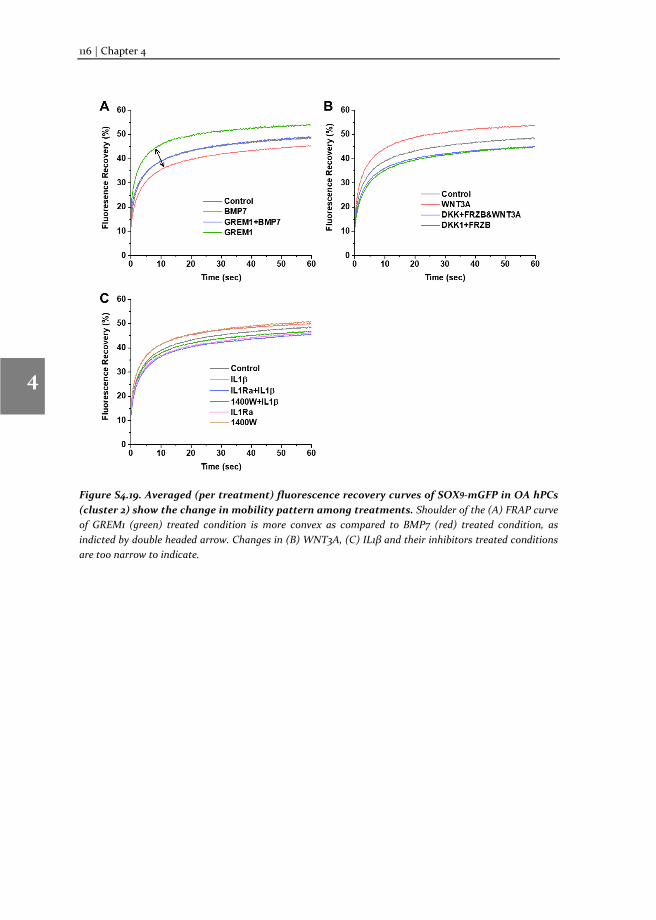
116 | Chapter 4
1
2
3
4
5
6
7
8
Figure S4.19. Averaged (per treatment) fluorescence recovery curves of SOX9-mGFP in OA hPCs (cluster 2) show the change in mobility pattern among treatments. Shoulder of the (A) FRAP curve of GREM1 (green) treated condition is more convex as compared to BMP7 (red) treated condition, as indicted by double headed arrow. Changes in (B) WNT3A, (C) IL1β and their inhibitors treated conditions are too narrow to indicate.
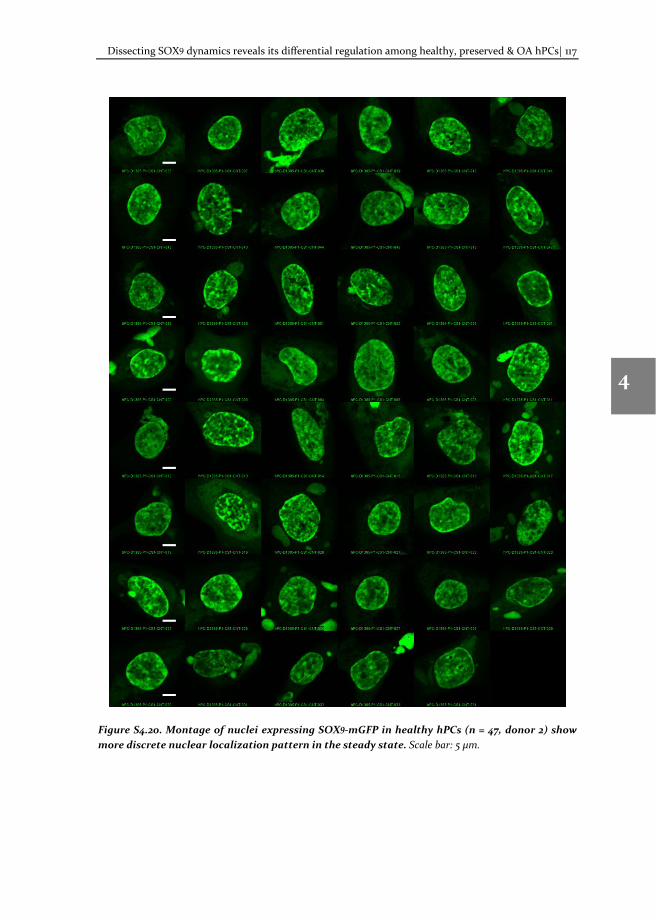
Dissecting SOX9 dynamics reveals its differential regulation among healthy, preserved & OA hPCs| 117
1
2
3
4
5
6
7
8
Figure S4.20. Montage of nuclei expressing SOX9-mGFP in healthy hPCs (n = 47, donor 2) show more discrete nuclear localization pattern in the steady state. Scale bar: 5 μm.
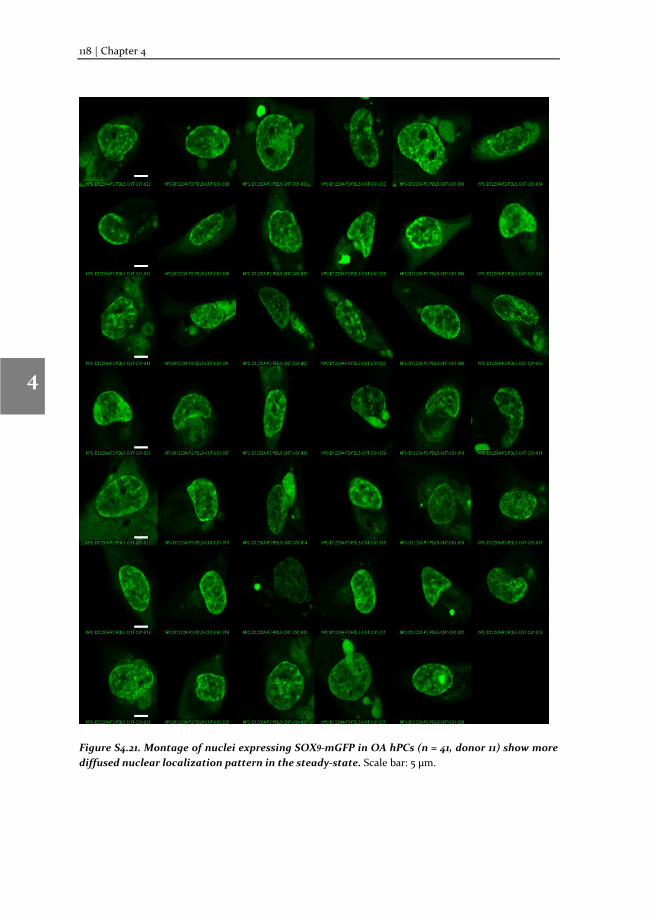
118 | Chapter 4
1
2
3
4
5
6
7
8
Figure S4.21. Montage of nuclei expressing SOX9-mGFP in OA hPCs (n = 41, donor 11) show more diffused nuclear localization pattern in the steady-state. Scale bar: 5 μm.
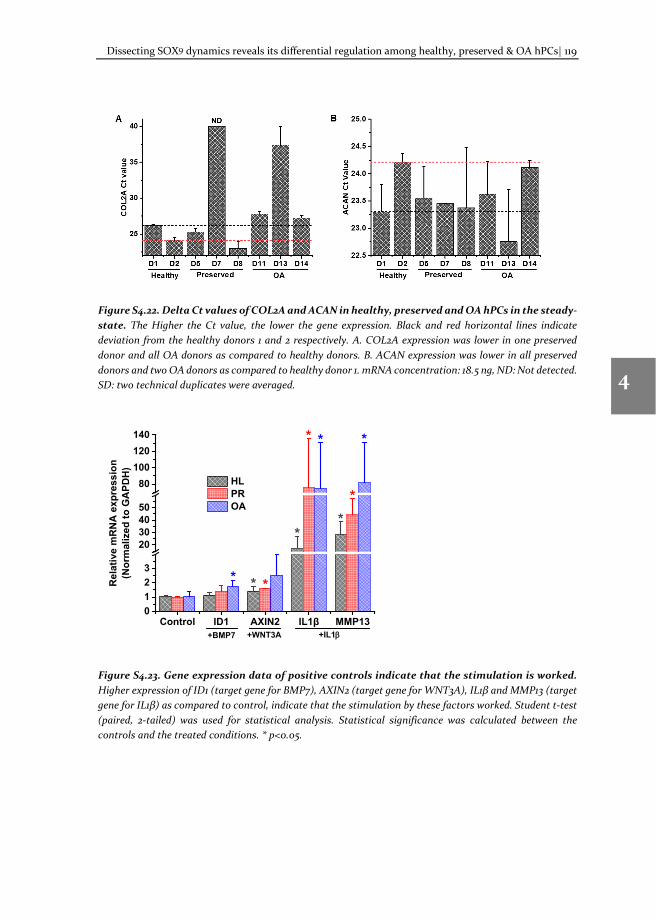
Dissecting SOX9 dynamics reveals its differential regulation among healthy, preserved & OA hPCs| 119
1
2
3
4
5
6
7
8
Figure S4.22. Delta Ct values of COL2A and ACAN in healthy, preserved and OA hPCs in the steady-state. The Higher the Ct value, the lower the gene expression. Black and red horizontal lines indicate deviation from the healthy donors 1 and 2 respectively. A. COL2A expression was lower in one preserved donor and all OA donors as compared to healthy donors. B. ACAN expression was lower in all preserved donors and two OA donors as compared to healthy donor 1. mRNA concentration: 18.5 ng, ND: Not detected. SD: two technical duplicates were averaged.
Figure S4.23. Gene expression data of positive controls indicate that the stimulation is worked. Higher expression of ID1 (target gene for BMP7), AXIN2 (target gene for WNT3A), IL1β and MMP13 (target gene for IL1β) as compared to control, indicate that the stimulation by these factors worked. Student t-test (paired, 2-tailed) was used for statistical analysis. Statistical significance was calculated between the controls and the treated conditions. * p<0.05.
Control ID1 AXIN2 IL1β MMP130123
20304050
80100120140
**
*
**
**
*
*Rel
ativ
e m
RN
A e
xpre
ssio
n(N
orm
aliz
ed to
GA
PDH
)
HL PR OA
+WNT3A+BMP7 +IL1β
120 | Chapter 4
1
2
3
4
5
6
7
8
References
1. Jo, A., Denduluri, S., Zhang, B., Wang, Z., Yin, L., Yan, Z., Kang, R., Shi, L. L., Mok, J., Lee, M. J. & Haydon, R. C. (2014) The versatile functions of Sox9 in development, stem cells, and human diseases, Genes Dis. 1, 149-161. 2. Lefebvre, V. & Dvir-Ginzberg, M. (2017) SOX9 and the many facets of its regulation in the chondrocyte lineage, Connective Tissue Research. 58, 2-14. 3. Chen, J. L., Duan, L., Zhu, W., Xiong, J. & Wang, D. (2014) Extracellular matrix production in vitro in cartilage tissue engineering, J Transl Med. 12:88. 4. Wang, J., Verdonk, P., Elewaut, D., Veys, E. M. & Verbruggen, G. (2003) Homeostasis of the extracellular matrix of normal and osteoarthritic human articular cartilage chondrocytes <em>in vitro</em>, Osteoarthritis and Cartilage. 11, 801-809. 5. Badlani, N., Oshima, Y., Healey, R., Coutts, R. & Amiel, D. (2009) Use of Bone Morphogenic Protein-7 as a Treatment for Osteoarthritis, Clinical Orthopaedics and Related Research®. 467, 3221-3229. 6. Dong, Y.-F., Soung, D. Y., Schwarz, E. M., O'Keefe, R. J. & Drissi, H. (2006) Wnt induction of chondrocyte hypertrophy through the Runx2 transcription factor, Journal of cellular physiology. 208, 77-86. 7. Daheshia, M. & Yao, J. Q. (2008) The Interleukin 1β Pathway in the Pathogenesis of Osteoarthritis, The Journal of Rheumatology. 35, 2306. 8. Huang, W., Chung, U.-i., Kronenberg, H. M. & de Crombrugghe, B. (2001) The chondrogenic transcription factor Sox9 is a target of signaling by the parathyroid hormone-related peptide in the growth plate of endochondral bones, Proceedings of the National Academy of Sciences. 98, 160. 9. Ito, T., Yadav, N., Lee, J., Furumatsu, T., Yamashita, S., Yoshida, K., Taniguchi, N., Hashimoto, M., Tsuchiya, M., Ozaki, T., Lotz, M., Bedford, M. T. & Asahara, H. (2009) Arginine methyltransferase CARM1/PRMT4 regulates endochondral ossification, BMC Developmental Biology. 9, 47. 10. Hattori, T., Coustry, F., Stephens, S., Eberspaecher, H., Takigawa, M., Yasuda, H. & de Crombrugghe, B. (2008) Transcriptional regulation of chondrogenesis by coactivator Tip60 via chromatin association with Sox9 and Sox5, Nucleic acids research. 36, 3011-3024. 11. Govindaraj, K., Hendriks, J., Lidke, D. S., Karperien, M. & Post, J. N. (2019) Changes in Fluorescence Recovery After Photobleaching (FRAP) as an indicator of SOX9 transcription factor activity, Biochimica et Biophysica Acta (BBA) - Gene Regulatory Mechanisms. 1862, 107-117. 12. Zhong, L., Schivo, S., Huang, X., Leijten, J., Karperien, M. & Post, N. J. (2017) Nitric Oxide Mediates Crosstalk between Interleukin 1β and WNT Signaling in Primary Human Chondrocytes by Reducing DKK1 and FRZB Expression, International Journal of Molecular Sciences. 18. 13. Lidke, D. S., Nagy, P., Heintzmann, R., Arndt-Jovin, D. J., Post, J. N., Grecco, H. E., Jares-Erijman, E. A. & Jovin, T. M. (2004) Quantum dot ligands provide new insights into erbB/HER receptor-mediated signal transduction, Nat Biotech. 22, 198-203. 14. Livak, K. J. & Schmittgen, T. D. (2001) Analysis of Relative Gene Expression Data Using Real-Time Quantitative PCR and the 2−ΔΔCT Method, Methods. 25, 402-408. 15. English, A., Corscadden, D., McGonagle, D., Jones, E. A., Henshaw, K., Emery, P. & Chapman, T. (2007) A comparative assessment of cartilage and joint fat pad as a potential source of cells for autologous therapy development in knee osteoarthritis, Rheumatology. 46, 1676-1683. 16. Martin, F., Lehmann, M., Sack, U. & Anderer, U. (2017) Featured Article: In vitro development of personalized cartilage microtissues uncovers an individualized differentiation capacity of human chondrocytes, Experimental Biology and Medicine. 242, 1746-1756. 17. Lee, J.-S. & Im, G.-I. (2011) SOX Trio Decrease in the Articular Cartilage with the Advancement of Osteoarthritis, Connective Tissue Research. 52, 496-502. 18. Kim, K.-I., Park, Y.-S. & Im, G.-I. (2013) Changes in the epigenetic status of the SOX-9 promoter in human osteoarthritic cartilage, Journal of Bone and Mineral Research. 28, 1050-1060.
Dissecting SOX9 dynamics reveals its differential regulation among healthy, preserved & OA hPCs| 121
1
2
3
4
5
6
7
8
19. Ramos, Y. F. M. & Meulenbelt, I. (2017) The role of epigenetics in osteoarthritis: current perspective, Current Opinion in Rheumatology. 29, 119-129. 20. Dell'Accio, F., De Bari, C., Eltawil, N. M., Vanhummelen, P. & Pitzalis, C. (2008) Identification of the molecular response of articular cartilage to injury, by microarray screening: Wnt-16 expression and signaling after injury and in osteoarthritis, Arthritis & Rheumatism. 58, 1410-1421. 21. Snelling, S., Rout, R., Davidson, R., Clark, I., Carr, A., Hulley, P. A. & Price, A. J. (2014) A gene expression study of normal and damaged cartilage in anteromedial gonarthrosis, a phenotype of osteoarthritis, Osteoarthritis and Cartilage. 22, 334-343. 22. Benedek, T. G. (2006) A history of the understanding of cartilage, Osteoarthritis and Cartilage. 14, 203-209. 23. Williams, R., Khan, I. M., Richardson, K., Nelson, L., McCarthy, H. E., Analbelsi, T., Singhrao, S. K., Dowthwaite, G. P., Jones, R. E., Baird, D. M., Lewis, H., Roberts, S., Shaw, H. M., Dudhia, J., Fairclough, J., Briggs, T. & Archer, C. W. (2010) Identification and Clonal Characterisation of a Progenitor Cell Sub-Population in Normal Human Articular Cartilage, PloS one. 5, e13246. 24. Alsalameh, S., Amin, R., Gemba, T. & Lotz, M. (2004) Identification of mesenchymal progenitor cells in normal and osteoarthritic human articular cartilage, Arthritis & Rheumatism. 50, 1522-1532. 25. Lin, Z., Fitzgerald, J. B., Xu, J., Willers, C., Wood, D., Grodzinsky, A. J. & Zheng, M. H. (2008) Gene expression profiles of human chondrocytes during passaged monolayer cultivation, Journal of Orthopaedic Research. 26, 1230-1237. 26. Leijten, J. C. H., Emons, J., Sticht, C., van Gool, S., Decker, E., Uitterlinden, A., Rappold, G., Hofman, A., Rivadeneira, F., Scherjon, S., Wit, J. M., van Meurs, J., van Blitterswijk, C. A. & Karperien, M. (2012) Gremlin 1, Frizzled-related protein, and Dkk-1 are key regulators of human articular cartilage homeostasis, Arthritis & Rheumatism. 64, 3302-3312. 27. Karsdal, M. A., Christiansen, C., Ladel, C., Henriksen, K., Kraus, V. B. & Bay-Jensen, A. C. (2014) Osteoarthritis – a case for personalized health care?, Osteoarthritis and Cartilage. 22, 7-16. 28. Spivakov, M. (2014) Spurious transcription factor binding: non-functional or genetically redundant?, Bioessays. 36, 798-806. 29. He, F., Buer, J., Zeng, A.-P. & Balling, R. (2007) Dynamic cumulative activity of transcription factors as a mechanism of quantitative gene regulation, Genome Biology. 8, R181. 30. Callegari, A., Sieben, C., Benke, A., Suter, D. M., Fierz, B., Mazza, D. & Manley, S. (2019) Single-molecule dynamics and genome-wide transcriptomics reveal that NF-kB (p65)-DNA binding times can be decoupled from transcriptional activation, PLOS Genetics. 15, e1007891. 31. Tao, K., Rey-Rico, A., Frisch, J., Venkatesan, J. K., Schmitt, G., Madry, H., Lin, J. & Cucchiarini, M. (2017) Effects of combined rAAV-mediated TGF-β and sox9 gene transfer and overexpression on the metabolic and chondrogenic activities in human bone marrow aspirates, Journal of Experimental Orthopaedics. 4, 4. 32. Rey-Rico, A., Venkatesan, J. K., Schmitt, G., Speicher-Mentges, S., Madry, H. & Cucchiarini, M. (2018) Effective Remodelling of Human Osteoarthritic Cartilage by sox9 Gene Transfer and Overexpression upon Delivery of rAAV Vectors in Polymeric Micelles, Molecular Pharmaceutics. 15, 2816-2826. 33. Tew, S. R., Li, Y., Pothacharoen, P., Tweats, L. M., Hawkins, R. E. & Hardingham, T. E. (2005) Retroviral transduction with SOX9 enhances re-expression of the chondrocyte phenotype in passaged osteoarthritic human articular chondrocytes, Osteoarthritis and Cartilage. 13, 80-89.

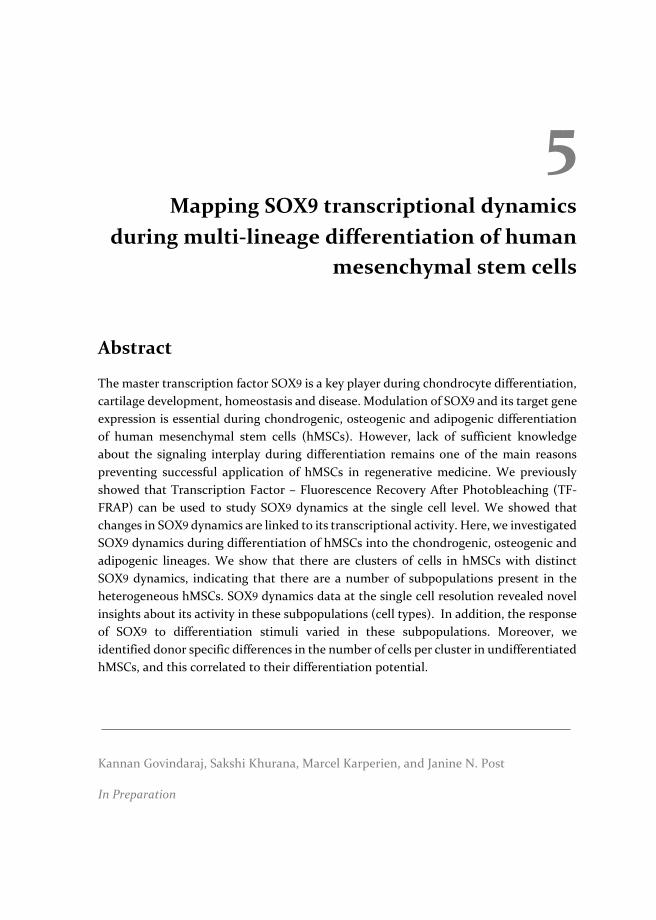
5 Mapping SOX9 transcriptional dynamics
during multi-lineage differentiation of human mesenchymal stem cells
Abstract
The master transcription factor SOX9 is a key player during chondrocyte differentiation, cartilage development, homeostasis and disease. Modulation of SOX9 and its target gene expression is essential during chondrogenic, osteogenic and adipogenic differentiation of human mesenchymal stem cells (hMSCs). However, lack of sufficient knowledge about the signaling interplay during differentiation remains one of the main reasons preventing successful application of hMSCs in regenerative medicine. We previously showed that Transcription Factor – Fluorescence Recovery After Photobleaching (TF-FRAP) can be used to study SOX9 dynamics at the single cell level. We showed that changes in SOX9 dynamics are linked to its transcriptional activity. Here, we investigated SOX9 dynamics during differentiation of hMSCs into the chondrogenic, osteogenic and adipogenic lineages. We show that there are clusters of cells in hMSCs with distinct SOX9 dynamics, indicating that there are a number of subpopulations present in the heterogeneous hMSCs. SOX9 dynamics data at the single cell resolution revealed novel insights about its activity in these subpopulations (cell types). In addition, the response of SOX9 to differentiation stimuli varied in these subpopulations. Moreover, we identified donor specific differences in the number of cells per cluster in undifferentiated hMSCs, and this correlated to their differentiation potential.
Kannan Govindaraj, Sakshi Khurana, Marcel Karperien, and Janine N. Post
In Preparation
124 | Chapter 5
1
2
3
4
5
6
7
8
5.1 Introduction
hMSCs are of great interest for regenerative therapy. Their potential to differentiate into chondrocytes, osteoblasts, and adipocytes substantiate therapeutic applications. hMSCs can be isolated from patients, can be differentiated in vitro and re-implanted in the patient body. Despite promising advances, clinical applications are largely unsuccessful due to several reasons, including sub-optimal differentiation and lack of sufficient knowledge about the signaling interplay, which is necessary to modulate the differentiation processes [1, 2].
Master transcription factors play a key role in orchestrating signaling cascade during differentiation. For example, SOX9 [3], RUNX2 [4] and PPARγ [5] are tightly regulated by the signaling interplay during chondrogenic, osteogenic and adipogenic differentiation of hMSCs, respectively. Although much is known about their collective mRNA and protein expression levels during various stages of differentiation, little is known about the real-time dynamics of these transcription factors [2]. Mapping real-time dynamics will help us to understand the response of transcription factors to changes in signaling network activities during the differentiation process. Given the complex hMSC heterogeneity within a donor and the large cell-cell variability, static gene and protein quantification methods do not yield the much-needed dynamic information about protein activity.
SOX9 is the master transcription factor for chondrocyte differentiation, cartilage development and homeostasis. SOX9 also plays a role in endochondral ossification and formation of growth plate [6]. In addition, SOX9 is involved in the development of testis and its mis-regulation is linked to various types of cancers including breast, prostate and chondrosarcoma [7]. Even a small change in SOX9 function during development will have profound impact in the function of skeletal system. Mutations in the SOX9 gene are known to cause campomelic dysplasia, a disease characteristic of cartilage and bone malformation [8]. SOX9 expression is increased during mesenchymal condensation and early chondrogenesis. SOX9 directly activates key chondrocyte genes aggrecan and type II collagen. Its expression is reduced or turned off during differentiation into other lineages [7].
In contrast, reduced SOX9 expression is linked to loss of cartilage homeostasis, incomplete MSC differentiation, and hypertrophy, etc. Therefore, others investigated methods for more efficient differentiation based on overexpression of SOX9 [9, 10]. Furthermore, SOX9 and its target gene expression levels are known to fluctuate during differentiation of hMSCs and are modulated in various differentiation lineages [11, 12]. However, signaling and transcriptional regulation of SOX9 and its target genes are not yet fully understood.
Mapping SOX9 transcriptional dynamics during multi-lineage differentiation of hMSCs| 125
1
2
3
4
5
6
7
8
We have previously shown that the average TF-FRAP rates correlate to DNA binding (ChIP assay) and transcriptional activity (gene expression analysis) [13]. However, these bulk measurements did not give sufficient information about SOX9 transcriptional activity in a time-resolved manner at the subpopulation level in a heterogenic cell population in, for example, MSCs.
Increased temporal resolution of SOX9 transcriptional activity will help us to understand more about the signaling interplay during differentiation. We applied our recently developed TF-FRAP to study the SOX9 dynamics in proliferating and differentiating hMSCs isolated from bone marrow. To understand SOX9 transcriptional activity during differentiation, we differentiated hMSCs into chondrogenic, osteogenic, and adipogenic lineage and measured SOX9 dynamics at day 0, 2, 8 and 15 or 23. TF-FRAP captured SOX9 dynamics with higher spatiotemporal resolution. Interestingly, our TF-FRAP revealed how SOX9 dynamics changed in various subpopulations of hMSCs during differentiation per lineage and time point.
5.2 Materials and Methods
5.2.1 Vector-plasmids
The vector expressing SOX9-mGFP was constructed by cloning mGFP (PS100040, Origene) with the C-terminal of wild type SOX9 (RC208944, Origene) using SgfI and MluI restriction sites. The correct reading frame of the fusion construct was verified by sequencing and its functionality was confirmed by mutation studies [13].
5.2.2 Cell Culture and Transfection
hMSCs were isolated from bone marrow from patients with no known musculoskeletal diseases. hMSCs were cultured in αMEM (22571-038, Gibco), supplemented with 10% FBS (F7524, Sigma), 200mM glutaMax (35050-38, gibco), 20 mM ascorbic acid 2 phosphate (AsAP, Sigma, A8960), 100 ng/ml bFGF (Neuromics, RP80001), and 100 U/ml of Penicillin-Streptomycin (15140122, gibco) at 37 ⁰C with 5% CO2. hMSCs were expanded and used within 4 passages.
C20/A4 cells were cultured in DMEM (Gibco, USA) with 10% FBS.
Human primary chondrocytes were cultured in chondrocyte proliferation media containing DMEM supplemented with 10% FBS, 20 mM ascorbic acid 2 phosphate (AsAP, Sigma, A8960), L-Proline (40 μg/ml) and non-essential amino acids, at 37 ⁰C with 5% CO2.
For transfection, cells were seeded on a sterile glass coverslip (40,000 per well) placed inside the well. Lipofectamine 3000 with P3000 Reagent (Life Technologies, USA) was
126 | Chapter 5
1
2
3
4
5
6
7
8
used for transfection of hMSCs and Lipofectamine LTX with Plus reagent was used for transfection of C20/A4 cells and hPCs and the manufacturer’s protocol was followed.
5.2.3 Cell synchronization
hMSCs were seeded on microscopic coverslip placed inside a 24-well plate in hMSC proliferation media. Next day, cells were transfected as described above and maintained in proliferation media with serum for about 8 hours to allow cells to produce SOX9-mGFP protein. For TF-FRAP: Transfected cells were maintained in serum free proliferation media 24 hours prior to TF-FRAP measurements. During TF-FRAP measurements, cells were maintained in the imaging buffer as described below. For imaging SOX9-mGFP nuclear localization pattern: for 24+0h time point, transfected cells were maintained in serum free proliferation media 24 hours prior to imaging. For 24+6h time point, post 24h of serum starvation, cell cycle was again started by replacing the media with proliferation media with serum. Cells were imaged 6h after the start of cell cycle, so the time point 24+6h. Cells in two different coverslips were used for 24+0h and 24h+6h time points study. During imaging, cells were maintained in the imaging buffer, at 37⁰C.
5.2.4 hMSCs differentiation
hMSCs were differentiated into chondrogenic, osteogenic and adipogenic lineages by culturing them in their respective differentiation media from day 0. Culture media was refreshed every 3 – 4 days. Chondrogenic differentiation medium: hMSCs (10,000 cells/cm2) were cultured in DMEM (Gibco) supplemented with 1% of Insulin-Transferrin-Selenium (ITS) mix (41400045, Gibco), 40 μg/ml of L-proline, 50 μg/ml of AsAP, 1% of sodium pyruvate (S8636, Sigma), 100 U/ml of Penicillin-Streptomycin, and freshly added TGFβ1 (10 ng/ml, 7754-BH, R&D Systems) and 10-7 M dexamethasone (Dex, D8893, Sigma). Osteogenic differentiation medium: hMSCs (1,000 cells/cm2) were cultured in αMEM supplemented with 10% FBS, 100 U/ml of Penicillin-Streptomycin, 200 mM GlutaMax, 50 μg/ml AsAP and freshly added Dex (10-8 M). Adipogenic differentiation medium: hMSCs (10,000 cells/cm2) were cultured in αMEM supplemented with 10% FBS, 100 U/ml of Penicillin-Streptomycin, 200 mM glutaMax, 50 μg/ml AsAP, freshly added Dex (10-6 M), 10 μg/ml Insulin (I9278, Sigma), 0.5 mM IBMX (I5879, Sigma) and 0.2 mM Indomethacin (57413, Sigma).
5.2.5 Imaging Buffer
Imaging was performed in Tyrode’s buffer with freshly added 20 mM glucose (Gibco) and 0.1% BSA (Sigma) [14]. Tyrode’s buffer is composed of 135 mM NaCl (Sigma), 10 mM KCl (Sigma), 0.4 mM MgCl2 (Sigma), 1 mM CaCl2 (Sigma), 10 mM HEPES (Acros organics), pH adjusted to 7.2, filter sterilized (0.2 μm) and stored at -20⁰C.
Mapping SOX9 transcriptional dynamics during multi-lineage differentiation of hMSCs| 127
1
2
3
4
5
6
7
8
5.2.6 Transcription factor-Fluorescence Recovery After Photobleaching
Proliferating or differentiating hMSCs were plated on poly-l-lysine (0.01%, Sigma), coated glass cover slips 2 days before transfection and were transiently transfected with SOX9-mGFP a day before of FRAP experiments. For chondrogenic differentiating cells, FBS was added to the chondrogenic medium for attachment of the cells to the coverslip. FRAP was performed at four time points, i.e., 0 day (proliferation), day 2, day 8 and day 15 or 23 for all the three lineages. Cells were maintained in imaging buffer during FRAP measurements and the mobility of transcription factors was measured at the steady-state (i.e. without other stimuli or FBS added). FRAP measurements were performed using a Nikon A1 laser scanning confocal microscope (Nikon, Japan) with a 60X/1.2 NA water immersion objective, 488 nm Argon laser at 0.35% (0.12 μW at the objective) laser power for SOX9-mGFP. The temperature was maintained at 37 ⁰C with an OkaLab temperature controller. A frame size of 256x256 pixels, covering the whole nucleus, was scanned. The pixel size was 0.12 μm. A representative circular region of 2.9 μm diameter was bleached with one iteration (60 ms) of 50% (34.3 μW) laser power. Twenty-five pre-bleach images were taken and the last 10 pre-bleach fluorescence intensity values were averaged to normalize the post-bleach fluorescence recovery curve. After bleaching, imaging was performed at 4 frames/sec for 60 sec post-bleach. FRAP experiments were performed on at least 40 cells per condition. To assess the statistical significance between the conditions Mann-Whitney U tests were applied using Origin® software. MatlabTM was used to analyze the FRAP data and the script is available upon request. A diffusion uncoupled, two-component method was used to interpret our FRAP results as mentioned in [13].
5.2.7 Clustering and statistical analysis
We applied unsupervised hierarchical clustering to cluster SOX9 dynamics data. TF-FRAP variables, such as Immobile Fraction (IF), Recovery half-time of A1 and A2 were used as input for cluster analysis. The following clustering parameters were used: Distance type: Euclidean, Cluster method: Furthest neighbor and Find Clustroid: Sum of distances. The distinct shapes of FRAP curves served as good references to identify and determine the number of clusters in our FRAP data. Clusters within a differentiation lineage at different time points that showed no significant difference (at P>=0.05, Mann-Whitney U-test) for at least two FRAP variables, were considered as same clusters, and were given the same letter/ identifier. OriginPro® (Origin Labs, USA) was used for clustering analysis.
128 | Chapter 5
1
2
3
4
5
6
7
8
5.2.8 Generation of heatmaps
For convenience, clusters as segregated by hierarchical clustering were reordered per time-point within the differentiation lineage in ascending order of immobile fraction values. All three FRAP variables, IF, recovery half-time (t ½ ) of A1 and t ½ of A2 , were normalized between 0 and 100. Within a variable, the lowest and highest values were set to 0 and 100 respectively. OriginPro® was used to make heat-maps.
5.2.9 Immunofluorescence
hMSCs cultured on microscopy coverslips were fixed for 10 min with freshly prepared 4% paraformaldehyde in PBS, pH7.2. Cells were washed with ice cold PBS, 3 times with 5 min interval. Cells were blocked and permeabilized for 15 mins with blocking solution containing 1 mg/ml BSA and 0.1% Triton X-100 in PBS. Cells were incubated with rabbit anti-human SOX9 primary antibody (AB5535, Millipore) in the blocking solution for 30 min at 37°C. Cells were washed with PBS, 3 times with 5 min intervals. Cells were incubated with goat anti-rabbit AF-568 antibody (ab175471, Abcam) in the blocking solution (with 0.05% Triton X-100) for 30 min at 37C. Cells were washed with PBS, 3 times with 5 min interval. Cell were stained with DAPI (1:100 dilution to 5 ng/ml) for 5 min in PBS. Cells were washed with PBS, 3 times with 5 min interval and mounted to microscopy glass side using Vecta shield mounting medium (company?). Cells were imaged using a Nikon A1 Confocal microscope with 60x water immersion objective with 1.2 NA.
5.2.10 Histology Staining
Differentiation of hMSCs into chondrogenic, osteogenic and adipogenic lineage is followed by Alcian blue, ALP and Oil Red O staining, respectively, at various time points. Alcian blue staining was used to stain GAG produced by chondrogenic differentiated hMSCs at day 0, day 2, day 8 and day 23. Cells were fixed with 10% buffered formalin (HT501128, Sigma) for 15 mins and washed twice with ice cold PBS. Cells were incubated with freshly prepared Alcian Blue 8GX (A3157, Sigma) staining solution (0.5% w/v in 1M HCl, pH 1.0) for 30 mins and the cells were rinsed with dH2O until the staining solution is washed off. ALP staining was used to stain alkaline phosphatase activity by osteogenic differentiated hMSCs at day 0, day 2, day 8 and day 14. ALP staining kit (S5L2-1KT, Sigma) was used for the staining and the manufacturer’s protocol was followed. Oil Red O staining was used to stain neutral triglycerides and lipids produced by adipogenic differentiated hMSCs at day 0, day 2, day 8 and day 23. Cells were fixed with 10% buffered formalin for 15 mins and washed twice with ice cold PBS and dH20. Cells were incubated in 60% isopropanol for 5 mins and then in freshly filtered Oil Red O staining solution for 5 mins and the cells were rinsed with dH2O until the staining solution was washed
Mapping SOX9 transcriptional dynamics during multi-lineage differentiation of hMSCs| 129
1
2
3
4
5
6
7
8
off (approximately 2 – 3 minutes). Cells were observed using a Nikon ECLIPSE TE300 microscope with 4x (0.13 NA) objective for all three staining.
5.2.11 mRNA isolation and RT-qPCR
Chondrogenic, osteogenic and adipogenic differentiating and proliferating hMSCs were separately cultured in a 12-well plate for different time points. Proliferating hMSCs were considered as 0 hr control and for differentiating cells, gene expression pattern was studied at three time-points: day 2, day 8 and day 15 or 23 (for all 3 lineages). mRNA was isolated using TRIzolTM (15596026, Invitrogen) and linear acrylamide as a co-precipitant, according to the manufacturer’s protocol. Purity and concentration of RNA samples were measured by Nanodrop 2000 (Thermo Fisher). cDNA was synthesized from total RNA with iScript cDNA synthesis kit (Bio-Rad). Real-time PCR analysis was carried out using SYBR Green mix (Bioline) in a Bio-Rad CFX-100 RT-qPCR. Gene expression is reported as the relative fold-change (ΔΔCt) [15] and is normalized to untreated proliferation control. Primer sequences are specified in the supplementary information (Table S5.1).
5.2.12 FACS
Osteogenically differentiating hMSCs were trypsinized on day 21 and washed with Flow Cytometry Staining Buffer (FCSB, FC001, R&D systems) for two times. Cells were re-suspended in 100 μl of FCSB and 1 μl of mouse anti-human CD10-PE (561002, BD Biosciences) and mouse anti-human CD92-AF647 (565316, BD Biosciences) antibodies were added and incubated for 45 mins at 4 ⁰C. Cells were washed with FCSB twice and re-suspended in 200 μl of FCSB sorted by FACS (BD FACSAria II). FACS sorted cells were seeded on a glass coverslip in the osteogenic differentiation medium. Cells were transfected with SOX9-mGFP plasmid on day 22 and FRAP was performed on the 23rd day of osteogenic differentiation.
5.3 Results
5.3.1 Interpretation of TF-FRAP results
We refer our readers to chapter 2 and 3 for the detailed explanation of TF-FRAP method and interpretation of data. In short: A higher immobile fraction (IF) and/or a longer recovery half-time of A2 (residence time) are the indicators of increased SOX9 transcriptional activity. Currently, there is no minimum cut-off value that defines the transcriptional output, but the values are always compared to those in other experimental conditions.
130 | Chapter 5
1
2
3
4
5
6
7
8
5.3.2 Cellular heterogeneity leads to diverse SOX9 mobility patterns
Transcriptional activity of SOX9 and its target gene expression are known to be dynamically regulated during the chondrogenic, osteogenic and adipogenic differentiation of hMSCs [9, 16]. SOX9 activity is known to increase during chondrogenesis and cartilage homeostasis [17] and down regulated during osteogenic and adipogenic differentiation. Since SOX9 binding to DNA precedes its transcriptional activity, we studied its DNA binding dynamics in proliferating and differentiating hMSCs. We expected SOX9 binding to DNA and recovery half-times will be increased during chondrogenic differentiation and decreased during osteogenic and adipogenic differentiation, as compared to the rates obtained in undifferentiated MSCs? Data obtained by averaging TF-FRAP values per time point did not yield any meaningful information, except that the averaged SOX9 mobility was increased during differentiation into any lineage (Figure S5.1). We observed diverse SOX9 mobility patterns in our TF-FRAP measurements. Since MSCs are known to be a heterogeneous population of cells [18], we hypothesized that there may be different clusters of cells. For this, we performed hierarchical cluster analysis.
Unsupervised hierarchical clustering showed the presence of at least four clusters with distinct mobility patterns in undifferentiated hMSCs (Figure 5.1A and Table 5.S2) as determined by immobile fraction and recovery half-times of SOX9. Cluster A had high IF and intermediate recovery half-times as compared to other clusters. Cluster B had high IF and low recovery half-times. Cluster C had intermediate IF and low recovery half-times. Cluster D had lower values for all three variables.
TF-FRAP curves of individual clusters and relationship between IF and recovery half-time of A2 are presented in Figure S5.2A-F. The percentage of cells per cluster is shown in Figure S5.8A and Table S5.2. To check whether these clusters in hMSCs are simply an integral property of any cell type, we measured the SOX9 dynamics in the C20/A4 cells and hPCs. TF-FRAP curves of SOX9 in the C20/A4 cells showed only one type of mobility pattern (Figure S5.3A), whereas hPCs showed two clusters with distinct mobility patterns (Figure S5.3B).
To rule out that the differential SOX9 dynamics patterns are due to various stages of the cell cycle, we performed FRAP measurements in undifferentiated hMSCs that were synchronized for 24 hours. Hierarchical clustering showed presence of at least four clusters in synchronized hMSCs as well (Figure S5.4). However, the number of cells per cluster was very different from those observed in unsynchronized hMSCs. This could be due to cell death during serum starvation and the number of cells that died per cluster could be different, depending on their metabolic state.
Mapping SOX9 transcriptional dynamics during multi-lineage differentiation of hMSCs| 131
1
2
3
4
5
6
7
8
Although the population-doubling time for hMSCs is known to be about 30 – 39h [19], we could synchronize only for 24h as transfected cells started to die after that. In addition, we observed differential SOX9 mobility patterns in chondrogenically differentiating hMSCs, where cell division is limited due to lack of nutrients. Moreover, the well-established fact that hMSCs is a heterogenic population of cells, indicate that the diverse SOX9 mobility patterns in hMSCs are due to its heterogenic cell population. Thus, we applied unsupervised hierarchical clustering to cluster cells in all time-points and differentiation lineages.
5.3.3 SOX9 residence time on DNA increases during chondrogenic differentiation
SOX9 activity is known to increase during chondrogenic differentiation of hMSCs as indicated by increased target gene expression [6]. To describe changes in SOX9 transcription dynamics, we measured its mobility by TF-FRAP during chondrogenic differentiation of hMSCs. SOX9 dynamics were measured at an early time point (day 2), at a middle time point (day 8) and at a later time point (day 15) and its mobility at those time points was compared with that of the undifferentiated hMSCs. After 15 days of chondrogenic differentiation cells were hard to transfect due to the presence of dense extracellular matrix around the cells. As this posed a possible transfection bias, by which some cells are transfected with higher efficiency than others, we used day 15 as the latest time-point.
During chondrogenic differentiation, we observed a total of 10 clusters (E-N) that were significantly different within. At day 2 and 15 of chondrogenic differentiation, we observed six clusters (Figure 5.1B and D) and five clusters at day 8 (Figure 5.1C) with distinct SOX9 dynamics. Interestingly, cluster D from the control group was present in all the three time-points of chondrogenic differentiation, indicating that at least one subpopulation of cells in hMSCs did not respond to the chondrogenic differentiation stimuli. Cluster H was present in all three differentiation time-points. Please note that the similarity of cluster D or H across time-points is not visible in the heat-maps, as the FRAP values were influenced in the normalization process by the appearance of new clusters. FRAP recovery curves of individual clusters and their relationship between IF and recovery half-time of A2 are presented in Figure S5.5A-F.
We expected increased SOX9 immobile fraction and longer recovery half times during chondrogenic differentiation as compared to undifferentiated hMSCs. We observed higher immobile fraction at day 2 and longer recovery half-times during day 8 and 15. Many of the new clusters that appeared in chondrogenically differentiating hMSCs showed a longer t-half of A2 (>12 sec) at day 15. Cluster M showed a t-half of A2 of more than 29 sec (Table S5.3). Our data show that during chondrogenic differentiation, the SOX9 dynamics changes differentially among the subpopulation of hMSCs.
132 | Chapter 5
1
2
3
4
5
6
7
8
Comparing SOX9 dynamics at individual cluster level revealed that the SOX9-DNA binding (IF) decreased in most clusters during chondrogenic differentiation as compared to undifferentiated hMSCs (Figure 5.1E and Table S5.3). Increased recovery half-times of SOX9 indicate longer residence times and active exchange of SOX9 on DNA. This is an indication that more chondrogenic genes under SOX9 control are differentially regulated during chondrogenic differentiation.
We confirmed the chondrogenic differentiation of hMSCs by Alcian blue staining (Figure 5.1F). The percentage of staining increased and visually correlated to the increase in differentiation at the later time-points. Increased immobility/lower diffusion times SOX9-DNA binding also correlated to increased COL2A gene expression (Figure S5.9A). The percentage of cells present per cluster during chondrogenic differentiation is presented in Figure S5.8B.
5.3.4 SOX9 binding and its residence time on DNA decreased during osteogenic differentiation
SOX9 activity is expected to be downregulated during osteogenic differentiation. Loebel et al. (2015) reported that SOX9 activity decreased (by means of decreased mRNA expression) during early stages (day 2 and 7) and is gradually increased at later stages (day 14 and 21) of osteogenic differentiation [20]. To further understand SOX9 protein activity during osteogenic differentiation, we studied SOX9 mobility during at day 2, 8 and 23 in osteogenically differentiating hMSCs. We observed 12 unique clusters (E – L) of SOX9 mobility patterns during osteogenic differentiation (Figure 25.A-D).
We expected lower SOX9-DNA binding and/or recovery half-times during osteogenic differentiation as compared to undifferentiated hMSCs. Comparing SOX9 dynamics data at the single cell level shows that the SOX9-DNA binding (IF) decreased in many clusters during osteogenic differentiation as compared to undifferentiated hMSCs (Figure 5.2E). SOX9 binding was higher at day 2 as compared to day 8 and 23. However, the IF was relatively lower (except for cluster I, day 8) in differentiating hMSCs as compared to the undifferentiated hMSCs (Figure 5.2E).
Recovery half-times increased at day 8 and 23 as compared to day 2 of osteogenic differentiation. Interestingly, during osteogenic differentiation, recovery half-times of SOX9 were shorter than what is observed in the various clusters in chondrogenic differentiation. These data suggest that during osteogenic differentiation, SOX9 activity may be lower as compared to its activity during chondrogenic differentiation. FRAP curves of individual clusters of osteogenic differentiation at different time-points and their relationship between IF and recovery half-time of A2 are presented in the Figure S5.6A-F.
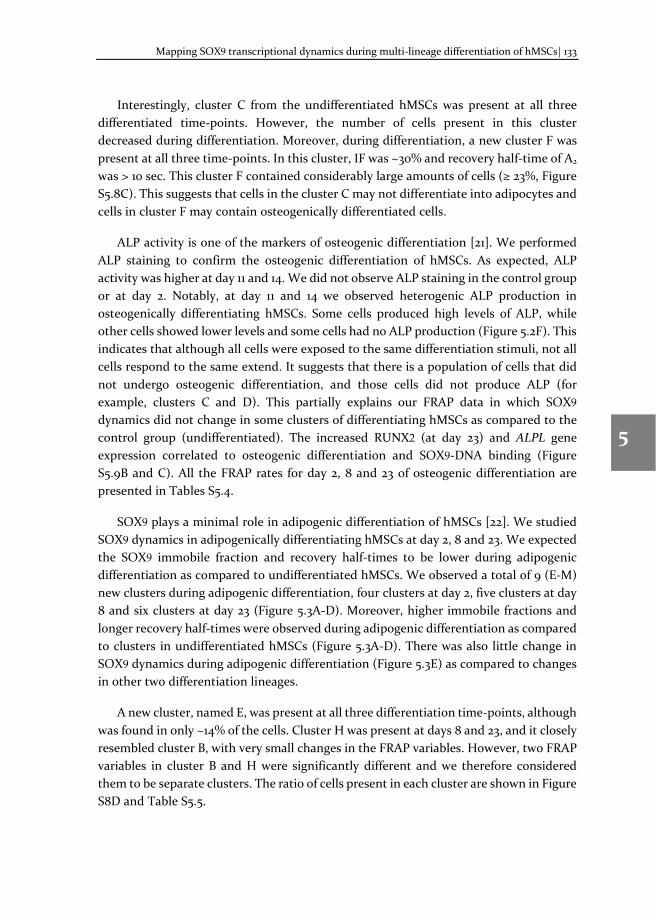
Mapping SOX9 transcriptional dynamics during multi-lineage differentiation of hMSCs| 133
1
2
3
4
5
6
7
8
Interestingly, cluster C from the undifferentiated hMSCs was present at all three differentiated time-points. However, the number of cells present in this cluster decreased during differentiation. Moreover, during differentiation, a new cluster F was present at all three time-points. In this cluster, IF was ~30% and recovery half-time of A2
was > 10 sec. This cluster F contained considerably large amounts of cells (≥ 23%, Figure S5.8C). This suggests that cells in the cluster C may not differentiate into adipocytes and cells in cluster F may contain osteogenically differentiated cells.
ALP activity is one of the markers of osteogenic differentiation [21]. We performed ALP staining to confirm the osteogenic differentiation of hMSCs. As expected, ALP activity was higher at day 11 and 14. We did not observe ALP staining in the control group or at day 2. Notably, at day 11 and 14 we observed heterogenic ALP production in osteogenically differentiating hMSCs. Some cells produced high levels of ALP, while other cells showed lower levels and some cells had no ALP production (Figure 5.2F). This indicates that although all cells were exposed to the same differentiation stimuli, not all cells respond to the same extend. It suggests that there is a population of cells that did not undergo osteogenic differentiation, and those cells did not produce ALP (for example, clusters C and D). This partially explains our FRAP data in which SOX9 dynamics did not change in some clusters of differentiating hMSCs as compared to the control group (undifferentiated). The increased RUNX2 (at day 23) and ALPL gene expression correlated to osteogenic differentiation and SOX9-DNA binding (Figure S5.9B and C). All the FRAP rates for day 2, 8 and 23 of osteogenic differentiation are presented in Tables S5.4.
SOX9 plays a minimal role in adipogenic differentiation of hMSCs [22]. We studied SOX9 dynamics in adipogenically differentiating hMSCs at day 2, 8 and 23. We expected the SOX9 immobile fraction and recovery half-times to be lower during adipogenic differentiation as compared to undifferentiated hMSCs. We observed a total of 9 (E-M) new clusters during adipogenic differentiation, four clusters at day 2, five clusters at day 8 and six clusters at day 23 (Figure 5.3A-D). Moreover, higher immobile fractions and longer recovery half-times were observed during adipogenic differentiation as compared to clusters in undifferentiated hMSCs (Figure 5.3A-D). There was also little change in SOX9 dynamics during adipogenic differentiation (Figure 5.3E) as compared to changes in other two differentiation lineages.
A new cluster, named E, was present at all three differentiation time-points, although was found in only ~14% of the cells. Cluster H was present at days 8 and 23, and it closely resembled cluster B, with very small changes in the FRAP variables. However, two FRAP variables in cluster B and H were significantly different and we therefore considered them to be separate clusters. The ratio of cells present in each cluster are shown in Figure S8D and Table S5.5.
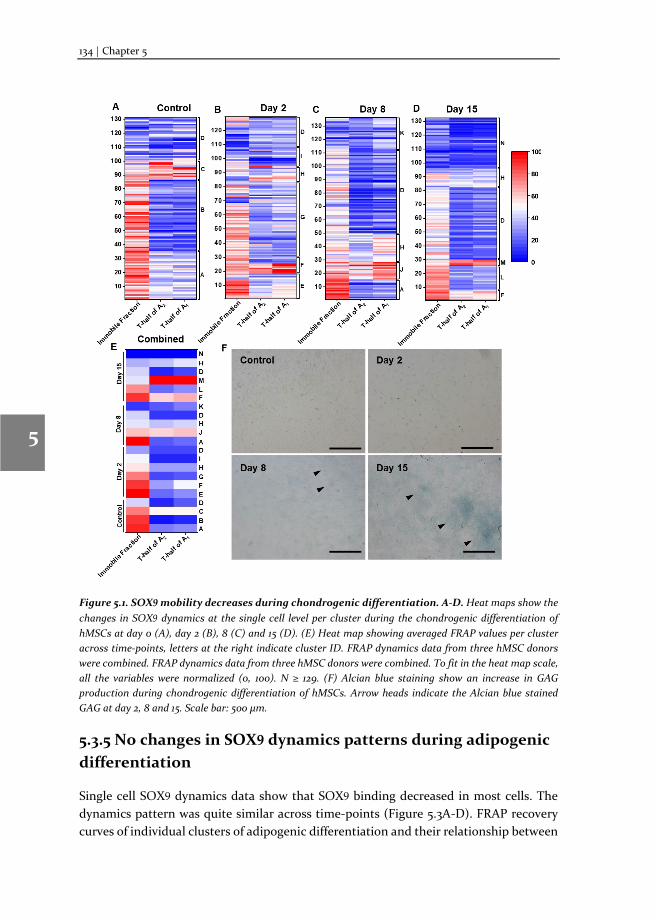
134 | Chapter 5
1
2
3
4
5
6
7
8
Figure 5.1. SOX9 mobility decreases during chondrogenic differentiation. A-D. Heat maps show the changes in SOX9 dynamics at the single cell level per cluster during the chondrogenic differentiation of hMSCs at day 0 (A), day 2 (B), 8 (C) and 15 (D). (E) Heat map showing averaged FRAP values per cluster across time-points, letters at the right indicate cluster ID. FRAP dynamics data from three hMSC donors were combined. FRAP dynamics data from three hMSC donors were combined. To fit in the heat map scale, all the variables were normalized (0, 100). N ≥ 129. (F) Alcian blue staining show an increase in GAG production during chondrogenic differentiation of hMSCs. Arrow heads indicate the Alcian blue stained GAG at day 2, 8 and 15. Scale bar: 500 μm.
5.3.5 No changes in SOX9 dynamics patterns during adipogenic differentiation
Single cell SOX9 dynamics data show that SOX9 binding decreased in most cells. The dynamics pattern was quite similar across time-points (Figure 5.3A-D). FRAP recovery curves of individual clusters of adipogenic differentiation and their relationship between
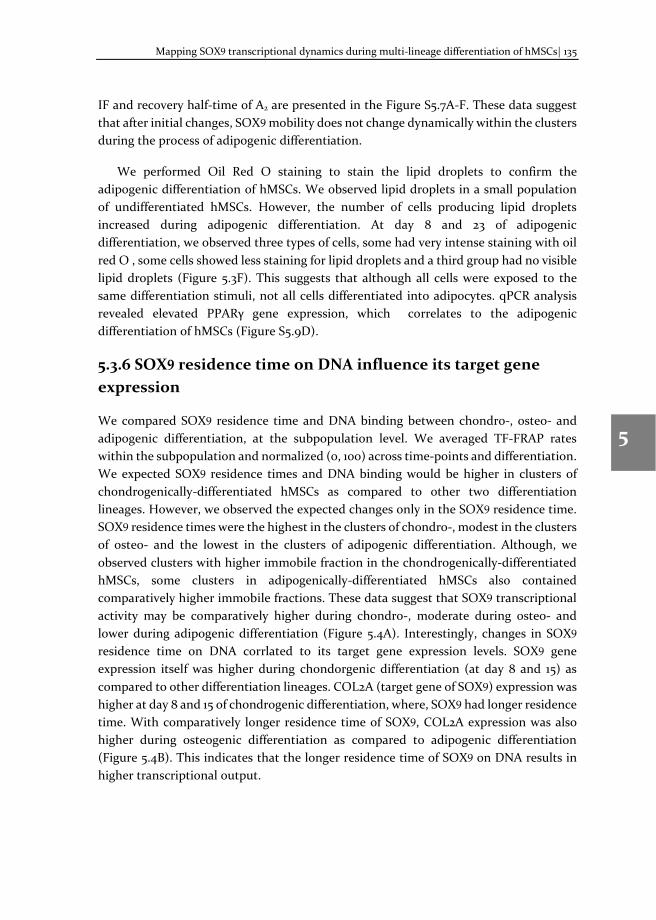
Mapping SOX9 transcriptional dynamics during multi-lineage differentiation of hMSCs| 135
1
2
3
4
5
6
7
8
IF and recovery half-time of A2 are presented in the Figure S5.7A-F. These data suggest that after initial changes, SOX9 mobility does not change dynamically within the clusters during the process of adipogenic differentiation.
We performed Oil Red O staining to stain the lipid droplets to confirm the adipogenic differentiation of hMSCs. We observed lipid droplets in a small population of undifferentiated hMSCs. However, the number of cells producing lipid droplets increased during adipogenic differentiation. At day 8 and 23 of adipogenic differentiation, we observed three types of cells, some had very intense staining with oil red O , some cells showed less staining for lipid droplets and a third group had no visible lipid droplets (Figure 5.3F). This suggests that although all cells were exposed to the same differentiation stimuli, not all cells differentiated into adipocytes. qPCR analysis revealed elevated PPARγ gene expression, which correlates to the adipogenic differentiation of hMSCs (Figure S5.9D).
5.3.6 SOX9 residence time on DNA influence its target gene expression
We compared SOX9 residence time and DNA binding between chondro-, osteo- and adipogenic differentiation, at the subpopulation level. We averaged TF-FRAP rates within the subpopulation and normalized (0, 100) across time-points and differentiation. We expected SOX9 residence times and DNA binding would be higher in clusters of chondrogenically-differentiated hMSCs as compared to other two differentiation lineages. However, we observed the expected changes only in the SOX9 residence time. SOX9 residence times were the highest in the clusters of chondro-, modest in the clusters of osteo- and the lowest in the clusters of adipogenic differentiation. Although, we observed clusters with higher immobile fraction in the chondrogenically-differentiated hMSCs, some clusters in adipogenically-differentiated hMSCs also contained comparatively higher immobile fractions. These data suggest that SOX9 transcriptional activity may be comparatively higher during chondro-, moderate during osteo- and lower during adipogenic differentiation (Figure 5.4A). Interestingly, changes in SOX9 residence time on DNA corrlated to its target gene expression levels. SOX9 gene expression itself was higher during chondorgenic differentiation (at day 8 and 15) as compared to other differentiation lineages. COL2A (target gene of SOX9) expression was higher at day 8 and 15 of chondrogenic differentiation, where, SOX9 had longer residence time. With comparatively longer residence time of SOX9, COL2A expression was also higher during osteogenic differentiation as compared to adipogenic differentiation (Figure 5.4B). This indicates that the longer residence time of SOX9 on DNA results in higher transcriptional output.
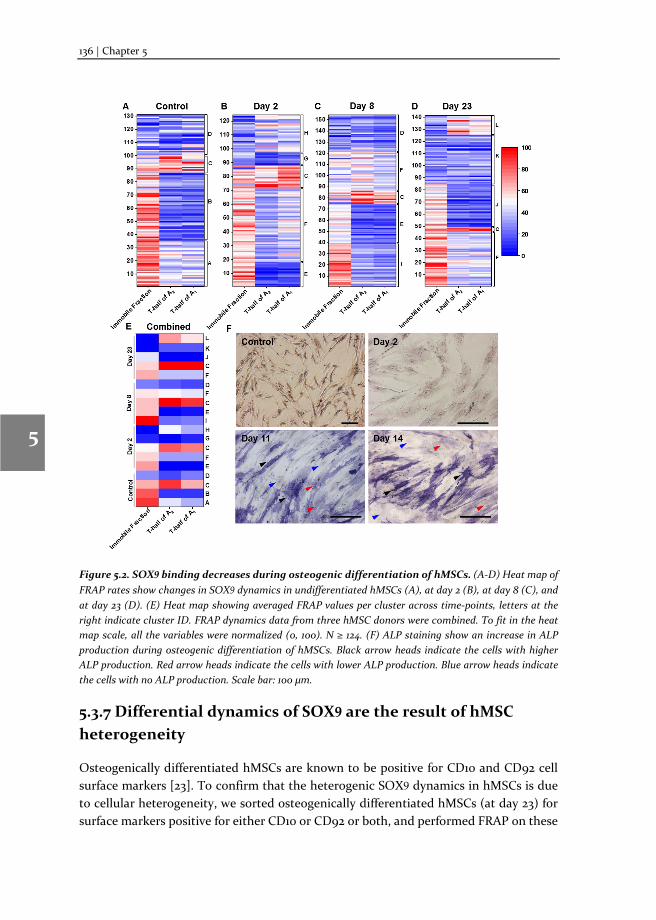
136 | Chapter 5
1
2
3
4
5
6
7
8
Figure 5.2. SOX9 binding decreases during osteogenic differentiation of hMSCs. (A-D) Heat map of FRAP rates show changes in SOX9 dynamics in undifferentiated hMSCs (A), at day 2 (B), at day 8 (C), and at day 23 (D). (E) Heat map showing averaged FRAP values per cluster across time-points, letters at the right indicate cluster ID. FRAP dynamics data from three hMSC donors were combined. To fit in the heat map scale, all the variables were normalized (0, 100). N ≥ 124. (F) ALP staining show an increase in ALP production during osteogenic differentiation of hMSCs. Black arrow heads indicate the cells with higher ALP production. Red arrow heads indicate the cells with lower ALP production. Blue arrow heads indicate the cells with no ALP production. Scale bar: 100 μm.
5.3.7 Differential dynamics of SOX9 are the result of hMSC heterogeneity
Osteogenically differentiated hMSCs are known to be positive for CD10 and CD92 cell surface markers [23]. To confirm that the heterogenic SOX9 dynamics in hMSCs is due to cellular heterogeneity, we sorted osteogenically differentiated hMSCs (at day 23) for surface markers positive for either CD10 or CD92 or both, and performed FRAP on these
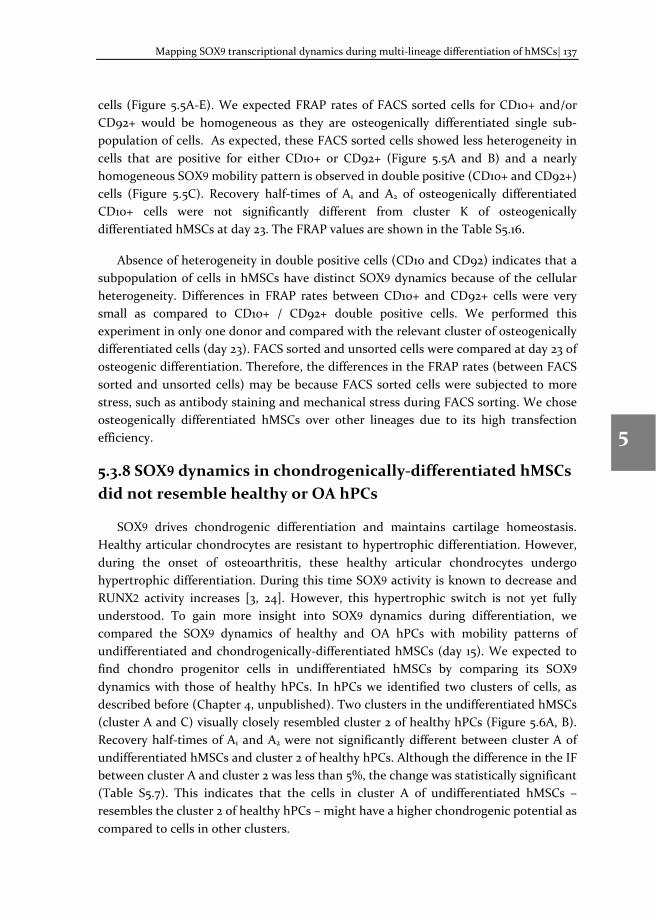
Mapping SOX9 transcriptional dynamics during multi-lineage differentiation of hMSCs| 137
1
2
3
4
5
6
7
8
cells (Figure 5.5A-E). We expected FRAP rates of FACS sorted cells for CD10+ and/or CD92+ would be homogeneous as they are osteogenically differentiated single sub-population of cells. As expected, these FACS sorted cells showed less heterogeneity in cells that are positive for either CD10+ or CD92+ (Figure 5.5A and B) and a nearly homogeneous SOX9 mobility pattern is observed in double positive (CD10+ and CD92+) cells (Figure 5.5C). Recovery half-times of A1 and A2 of osteogenically differentiated CD10+ cells were not significantly different from cluster K of osteogenically differentiated hMSCs at day 23. The FRAP values are shown in the Table S5.16.
Absence of heterogeneity in double positive cells (CD10 and CD92) indicates that a subpopulation of cells in hMSCs have distinct SOX9 dynamics because of the cellular heterogeneity. Differences in FRAP rates between CD10+ and CD92+ cells were very small as compared to CD10+ / CD92+ double positive cells. We performed this experiment in only one donor and compared with the relevant cluster of osteogenically differentiated cells (day 23). FACS sorted and unsorted cells were compared at day 23 of osteogenic differentiation. Therefore, the differences in the FRAP rates (between FACS sorted and unsorted cells) may be because FACS sorted cells were subjected to more stress, such as antibody staining and mechanical stress during FACS sorting. We chose osteogenically differentiated hMSCs over other lineages due to its high transfection efficiency.
5.3.8 SOX9 dynamics in chondrogenically-differentiated hMSCs did not resemble healthy or OA hPCs
SOX9 drives chondrogenic differentiation and maintains cartilage homeostasis. Healthy articular chondrocytes are resistant to hypertrophic differentiation. However, during the onset of osteoarthritis, these healthy articular chondrocytes undergo hypertrophic differentiation. During this time SOX9 activity is known to decrease and RUNX2 activity increases [3, 24]. However, this hypertrophic switch is not yet fully understood. To gain more insight into SOX9 dynamics during differentiation, we compared the SOX9 dynamics of healthy and OA hPCs with mobility patterns of undifferentiated and chondrogenically-differentiated hMSCs (day 15). We expected to find chondro progenitor cells in undifferentiated hMSCs by comparing its SOX9 dynamics with those of healthy hPCs. In hPCs we identified two clusters of cells, as described before (Chapter 4, unpublished). Two clusters in the undifferentiated hMSCs (cluster A and C) visually closely resembled cluster 2 of healthy hPCs (Figure 5.6A, B). Recovery half-times of A1 and A2 were not significantly different between cluster A of undifferentiated hMSCs and cluster 2 of healthy hPCs. Although the difference in the IF between cluster A and cluster 2 was less than 5%, the change was statistically significant (Table S5.7). This indicates that the cells in cluster A of undifferentiated hMSCs – resembles the cluster 2 of healthy hPCs – might have a higher chondrogenic potential as compared to cells in other clusters.
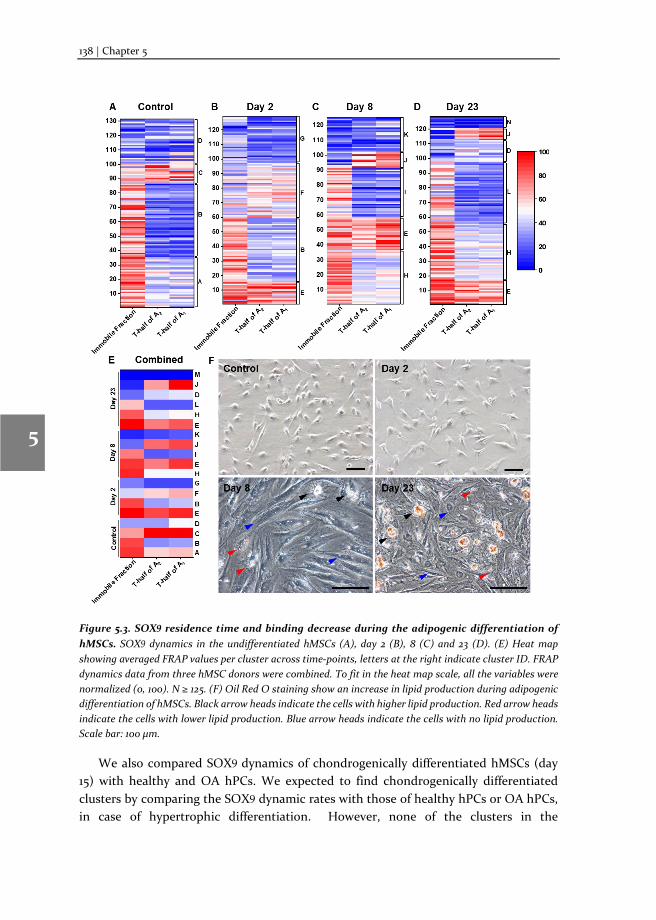
138 | Chapter 5
1
2
3
4
5
6
7
8
Figure 5.3. SOX9 residence time and binding decrease during the adipogenic differentiation of hMSCs. SOX9 dynamics in the undifferentiated hMSCs (A), day 2 (B), 8 (C) and 23 (D). (E) Heat map showing averaged FRAP values per cluster across time-points, letters at the right indicate cluster ID. FRAP dynamics data from three hMSC donors were combined. To fit in the heat map scale, all the variables were normalized (0, 100). N ≥ 125. (F) Oil Red O staining show an increase in lipid production during adipogenic differentiation of hMSCs. Black arrow heads indicate the cells with higher lipid production. Red arrow heads indicate the cells with lower lipid production. Blue arrow heads indicate the cells with no lipid production. Scale bar: 100 μm.
We also compared SOX9 dynamics of chondrogenically differentiated hMSCs (day 15) with healthy and OA hPCs. We expected to find chondrogenically differentiated clusters by comparing the SOX9 dynamic rates with those of healthy hPCs or OA hPCs, in case of hypertrophic differentiation. However, none of the clusters in the
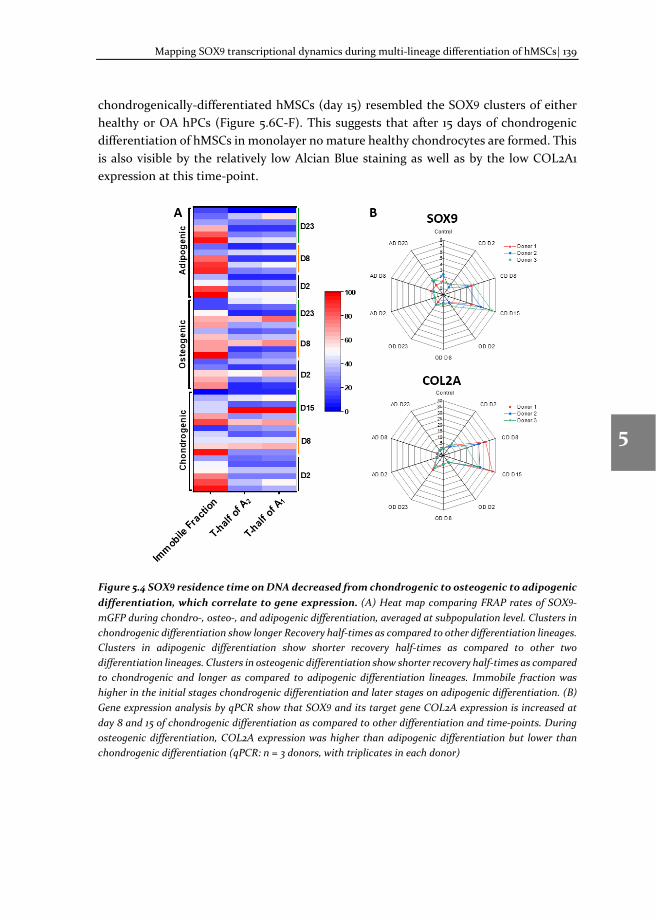
Mapping SOX9 transcriptional dynamics during multi-lineage differentiation of hMSCs| 139
1
2
3
4
5
6
7
8
chondrogenically-differentiated hMSCs (day 15) resembled the SOX9 clusters of either healthy or OA hPCs (Figure 5.6C-F). This suggests that after 15 days of chondrogenic differentiation of hMSCs in monolayer no mature healthy chondrocytes are formed. This is also visible by the relatively low Alcian Blue staining as well as by the low COL2A1 expression at this time-point.
Figure 5.4 SOX9 residence time on DNA decreased from chondrogenic to osteogenic to adipogenic differentiation, which correlate to gene expression. (A) Heat map comparing FRAP rates of SOX9-mGFP during chondro-, osteo-, and adipogenic differentiation, averaged at subpopulation level. Clusters in chondrogenic differentiation show longer Recovery half-times as compared to other differentiation lineages. Clusters in adipogenic differentiation show shorter recovery half-times as compared to other two differentiation lineages. Clusters in osteogenic differentiation show shorter recovery half-times as compared to chondrogenic and longer as compared to adipogenic differentiation lineages. Immobile fraction was higher in the initial stages chondrogenic differentiation and later stages on adipogenic differentiation. (B) Gene expression analysis by qPCR show that SOX9 and its target gene COL2A expression is increased at day 8 and 15 of chondrogenic differentiation as compared to other differentiation and time-points. During osteogenic differentiation, COL2A expression was higher than adipogenic differentiation but lower than chondrogenic differentiation (qPCR: n = 3 donors, with triplicates in each donor)
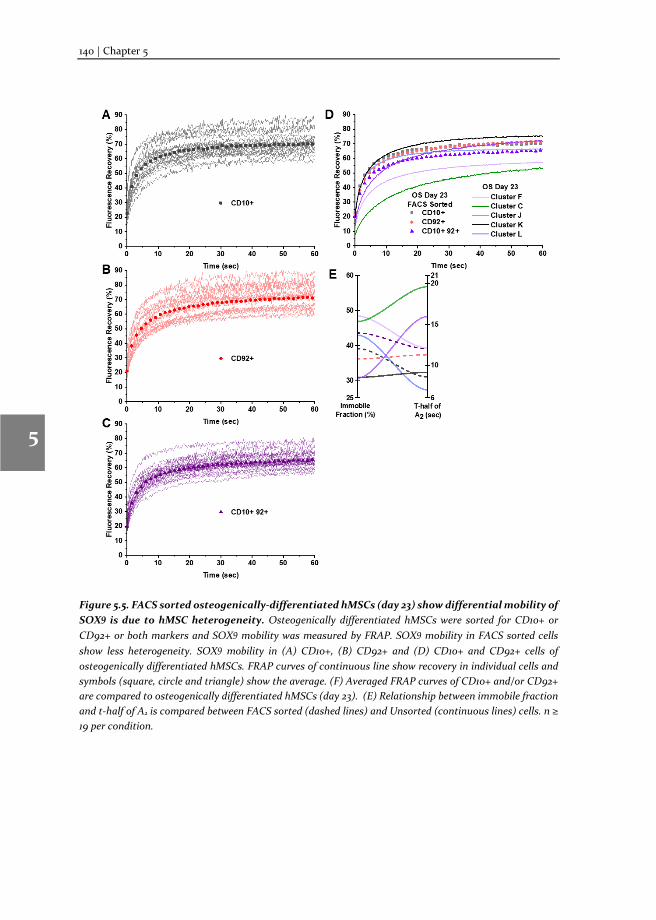
140 | Chapter 5
1
2
3
4
5
6
7
8
Figure 5.5. FACS sorted osteogenically-differentiated hMSCs (day 23) show differential mobility of SOX9 is due to hMSC heterogeneity. Osteogenically differentiated hMSCs were sorted for CD10+ or CD92+ or both markers and SOX9 mobility was measured by FRAP. SOX9 mobility in FACS sorted cells show less heterogeneity. SOX9 mobility in (A) CD10+, (B) CD92+ and (D) CD10+ and CD92+ cells of osteogenically differentiated hMSCs. FRAP curves of continuous line show recovery in individual cells and symbols (square, circle and triangle) show the average. (F) Averaged FRAP curves of CD10+ and/or CD92+ are compared to osteogenically differentiated hMSCs (day 23). (E) Relationship between immobile fraction and t-half of A2 is compared between FACS sorted (dashed lines) and Unsorted (continuous lines) cells. n ≥ 19 per condition.
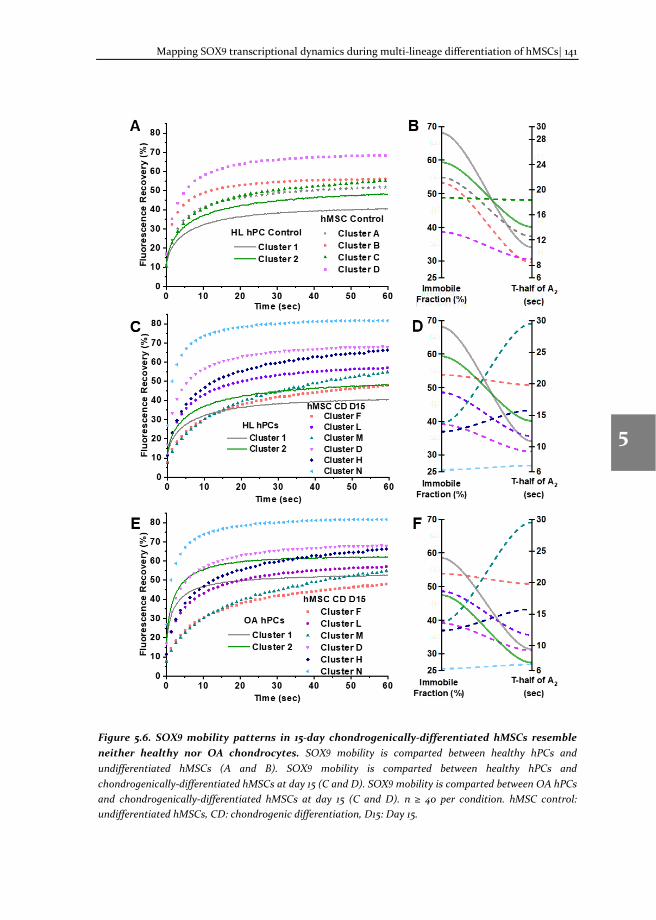
Mapping SOX9 transcriptional dynamics during multi-lineage differentiation of hMSCs| 141
1
2
3
4
5
6
7
8
Figure 5.6. SOX9 mobility patterns in 15-day chondrogenically-differentiated hMSCs resemble neither healthy nor OA chondrocytes. SOX9 mobility is comparted between healthy hPCs and undifferentiated hMSCs (A and B). SOX9 mobility is comparted between healthy hPCs and chondrogenically-differentiated hMSCs at day 15 (C and D). SOX9 mobility is comparted between OA hPCs and chondrogenically-differentiated hMSCs at day 15 (C and D). n ≥ 40 per condition. hMSC control: undifferentiated hMSCs, CD: chondrogenic differentiation, D15: Day 15.
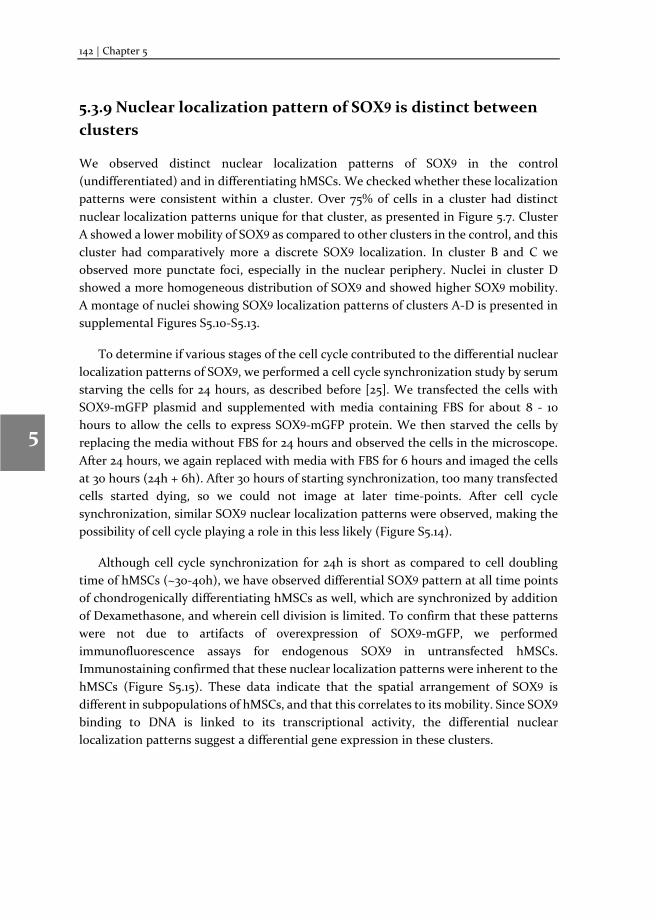
142 | Chapter 5
1
2
3
4
5
6
7
8
5.3.9 Nuclear localization pattern of SOX9 is distinct between clusters
We observed distinct nuclear localization patterns of SOX9 in the control (undifferentiated) and in differentiating hMSCs. We checked whether these localization patterns were consistent within a cluster. Over 75% of cells in a cluster had distinct nuclear localization patterns unique for that cluster, as presented in Figure 5.7. Cluster A showed a lower mobility of SOX9 as compared to other clusters in the control, and this cluster had comparatively more a discrete SOX9 localization. In cluster B and C we observed more punctate foci, especially in the nuclear periphery. Nuclei in cluster D showed a more homogeneous distribution of SOX9 and showed higher SOX9 mobility. A montage of nuclei showing SOX9 localization patterns of clusters A-D is presented in supplemental Figures S5.10-S5.13.
To determine if various stages of the cell cycle contributed to the differential nuclear localization patterns of SOX9, we performed a cell cycle synchronization study by serum starving the cells for 24 hours, as described before [25]. We transfected the cells with SOX9-mGFP plasmid and supplemented with media containing FBS for about 8 - 10 hours to allow the cells to express SOX9-mGFP protein. We then starved the cells by replacing the media without FBS for 24 hours and observed the cells in the microscope. After 24 hours, we again replaced with media with FBS for 6 hours and imaged the cells at 30 hours (24h + 6h). After 30 hours of starting synchronization, too many transfected cells started dying, so we could not image at later time-points. After cell cycle synchronization, similar SOX9 nuclear localization patterns were observed, making the possibility of cell cycle playing a role in this less likely (Figure S5.14).
Although cell cycle synchronization for 24h is short as compared to cell doubling time of hMSCs (~30-40h), we have observed differential SOX9 pattern at all time points of chondrogenically differentiating hMSCs as well, which are synchronized by addition of Dexamethasone, and wherein cell division is limited. To confirm that these patterns were not due to artifacts of overexpression of SOX9-mGFP, we performed immunofluorescence assays for endogenous SOX9 in untransfected hMSCs. Immunostaining confirmed that these nuclear localization patterns were inherent to the hMSCs (Figure S5.15). These data indicate that the spatial arrangement of SOX9 is different in subpopulations of hMSCs, and that this correlates to its mobility. Since SOX9 binding to DNA is linked to its transcriptional activity, the differential nuclear localization patterns suggest a differential gene expression in these clusters.
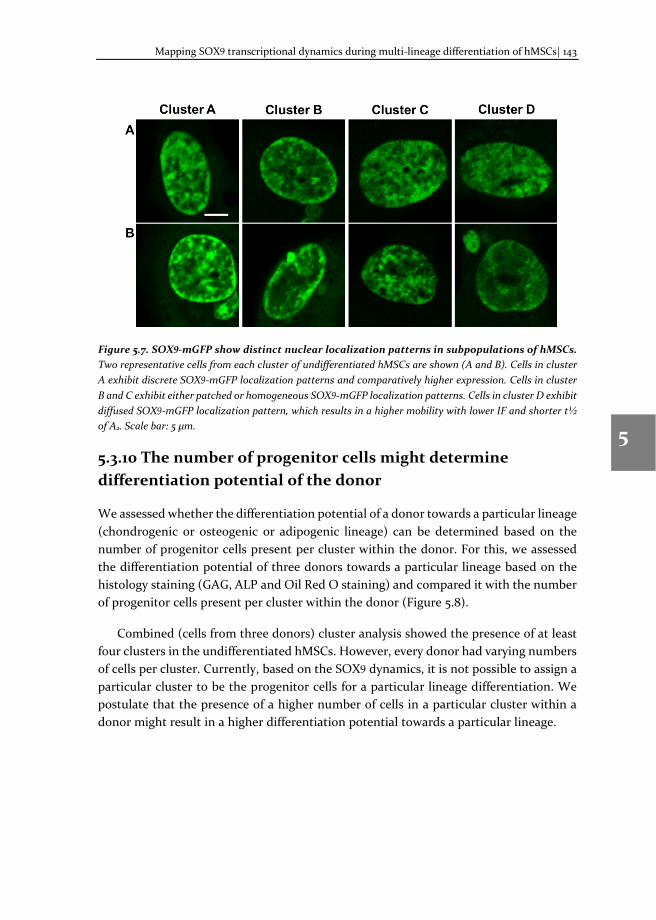
Mapping SOX9 transcriptional dynamics during multi-lineage differentiation of hMSCs| 143
1
2
3
4
5
6
7
8
Figure 5.7. SOX9-mGFP show distinct nuclear localization patterns in subpopulations of hMSCs. Two representative cells from each cluster of undifferentiated hMSCs are shown (A and B). Cells in cluster A exhibit discrete SOX9-mGFP localization patterns and comparatively higher expression. Cells in cluster B and C exhibit either patched or homogeneous SOX9-mGFP localization patterns. Cells in cluster D exhibit diffused SOX9-mGFP localization pattern, which results in a higher mobility with lower IF and shorter t½ of A2. Scale bar: 5 μm.
5.3.10 The number of progenitor cells might determine differentiation potential of the donor
We assessed whether the differentiation potential of a donor towards a particular lineage (chondrogenic or osteogenic or adipogenic lineage) can be determined based on the number of progenitor cells present per cluster within the donor. For this, we assessed the differentiation potential of three donors towards a particular lineage based on the histology staining (GAG, ALP and Oil Red O staining) and compared it with the number of progenitor cells present per cluster within the donor (Figure 5.8).
Combined (cells from three donors) cluster analysis showed the presence of at least four clusters in the undifferentiated hMSCs. However, every donor had varying numbers of cells per cluster. Currently, based on the SOX9 dynamics, it is not possible to assign a particular cluster to be the progenitor cells for a particular lineage differentiation. We postulate that the presence of a higher number of cells in a particular cluster within a donor might result in a higher differentiation potential towards a particular lineage.
144 | Chapter 5
1
2
3
4
5
6
7
8
Figure 5.8. Number of progenitor cells present per cluster in the undifferentiated hMSCs determine the differentiation potential of the donor. Stacked column chart at the right indicate the percentage of cells per cluster and the cluster ID is indicated at the left of the column chart. Donor 1 had considerable amount of cells in each cluster and showed moderate differentiation potential towards all lineage as compared to other donors. Donor 2 had more chondrogenic potential as compared to other two donors as evidenced by more GAG staining. This donor had 52% of cells in the cluster B, which had higher IF of SOX9. Donor 3 had more osteogenic and adipogenic potential as compared to other two donors as evidenced by more ALP and Oil Red O staining respectively. This donor had higher number of cells in the cluster B (38%) and D (36%), the later had lowest IF and shorter t-half of A2 of SOX9. Scale bar: 500 μm.
Interestingly, donor 1, which had a relatively even distribution of cells per cluster (20-30%) , showed a moderate differentiation potential towards all lineages. Donor 2, which had a higher number of cells (52%) in cluster B, had a higher chondrogenic potential than the other two donors (1 and 3). Cluster A contained the cells with lower SOX9 mobility, i.e., higher IF and longer t-half of A2. The lower mobility of SOX9 indicates a higher binding of SOX9 to DNA, which results in more target (chondrogenic) gene expression [13]. In contrast, donor 3 had a higher number of cells in two clusters B (38%) and D (36%), and showed a higher osteogenic and adipogenic potential as compared to the other two donors (1 and 2). Cluster D contained the cells with higher SOX9 mobility, i.e., a lower IF and a shorter t-half of A2. The higher mobility of SOX9 indicates a lower binding to DNA resulting in lower target gene expression. These data suggest that the number of cells per cluster may be indicative of the presence of different progenitor cells and thus indicative of the differentiation potential of the donor. However, due to the large donor variation more donors will need to be tested to confirm this finding.
Mapping SOX9 transcriptional dynamics during multi-lineage differentiation of hMSCs| 145
1
2
3
4
5
6
7
8
5.4 Discussion
hMSCs are a promising cell type for regenerative medicine, due to its multi lineage differentiation potential. However, lack of sufficient knowledge of the signaling interplay and the role of cellular heterogeneity during differentiation, prevent the successful application of hMSCs in regenerative therapy [2]. We have previously shown that the SOX9-DNA binding directly linked to its transcriptional activity. Higher immobile fractions or longer recovery half-times resulted in an increase of expression of its target genes [13]. Here, we show that SOX9 dynamics and coupled transcriptional activity is different among subpopulations of hMSCs and that TF-FRAP can be used to determine the number of subpopulations in heterogenic cells and possibly the differentiation potential of a donor.
SOX9 gene and protein expression is known to increase during chondrogenic differentiation [6] and decreases during osteogenic differentiation of hMSCs [20]. There are several reports stating that hMSCs are comprised of heterogenic cell populations that differ in molecular phenotype is [26-28]. However, these differentiation studies were performed in hMSCs in bulk experiments, with little information at the subpopulation level. Moreover, gene and protein expression alone does not reveal their activity. To our knowledge, we are the first to show the dynamic changes of SOX9 protein activity at the subpopulation level in the differentiating hMSCs at the single cell level. Changes in SOX9 dynamics were high among the clusters during chondrogenic and osteogenic differentiation, as compared to adipogenic differentiation. This is in line with previous reports that show that SOX9 plays a key role during chondrogenic and osteogenic differentiation, but a lesser role during adipogenic differentiation [22].
Previous reports have shown that longer residence time (recovery half-time) of transcription factors result in higher target gene expression [29, 30], and we have shown this specifically for SOX9 [13]. During chondro- and osteogenic differentiation, many clusters showed higher residence time at day 8 and 15 as compared to day 2, indicating higher SOX9 transcriptional activity. However, overall residence time was higher during chondrogenic differentiation as compared to osteogenic differentiation. Which resulted in a higher COL2A expression during chondro- and osteogenic differentiation as compared to undifferentiated and adipogenically differentiating hMSCs. This is in line with existing studies based on RUNX2/SOX9 mRNA expression [20]. During adipogenic differentiation, although SOX9-DNA binding was higher, residence times were much lower than seen in the cells differentiating towards the other two differentiation lineages. This suggests that there is less active exchange of SOX9 at its binding sites, which would result in lower transcriptional output. Gulyaeva et al (2018) has shown that inactivation of Sox9 is a prerequisite for adipogenesis [31].
146 | Chapter 5
1
2
3
4
5
6
7
8
During chondrogenic, osteogenic and adipogenic differentiation of hMSCs, at least one cluster had a comparatively low immobile fraction and a shorter recovery half-time of A2 in at least 10% of cells. In contrast, there were also new clusters with either a higher immobile fraction or longer recovery half-times of A2, or both. Notably, in every differentiation lineage, at least one other cluster did not respond to the differentiation stimuli. For example, cluster D during chondrogenic differentiation, cluster C during osteogenic differentiation and cluster B (at day 2) during adipogenic differentiation did not respond to differentiation stimuli. It is interesting to note that different subpopulations did not respond to a particular differentiation lineage, indicating subpopulations in undifferentiated hMSCs have commitment towards a particular lineage.
Varying levels of ALP and Oil Red O staining at the single cell level during osteo- and adipogenic differentiation, indicate that individual cells have varying degree of differentiation potential. Some cells show higher, some show moderate, while others show lower-to-none ALP/lipid droplet production. Cells with higher ALP/lipid production indicate that they had a higher osteogenic/adipogenic potential, and vice versa. The observation that there are cells that showed no ALP/lipid production, may be indicative of the lower-to-none osteogenic/adipogenic potential.
Differential SOX9 dynamics as measured by TF-FRAP in hMSCs (undifferentiated/differentiated) can also be explained by differential ALP and lipid production at the single cell level. Individual clusters have varying differentiation potential towards a particular lineage, which is determined by the activity and coupled dynamics of transcription factors. In a clonal selection study, Prins et al (2014) has shown that individual clones (derived from single cells of hMSCs) from the same donor had varying differentiation potentials towards a particular lineage differentiation [32]. Selective clones showed tri lineage (chondro-, osteo- and adipogenic), two lineage, one lineage, or no lineage differentiation potential. In another study, Leyva Leyva et al (2012) isolated two subpopulations (CD105+ and CD105–) from the same hMSC donor and showed that these populations had varying levels of osteogenic differentiation potential [33]. Our group has previously shown that differentiation potential is coupled to specific miRNA expression patterns [34]. These studies strengthen our data that the subpopulations – as determined by SOX9 dynamics and ALP/lipid production at the single cell level – have varying differentiation potentials towards a particular lineage.
Cluster analysis of SOX9 dynamics identified at least four subpopulations (cell types) in the undifferentiated hMSCs and four to six subpopulations in the differentiating hMSCs, independent of the lineage of differentiation. Interestingly, the percentage of cells present per cluster in the undifferentiated hMSCs were different among the donors. These donors also had varying differentiation potential towards a particular lineage. Donor 1 and 2 had more than 60% cells in clusters A and B, and showed comparatively
Mapping SOX9 transcriptional dynamics during multi-lineage differentiation of hMSCs| 147
1
2
3
4
5
6
7
8
moderate and higher chondrogenic potential, respectively. Cluster D, which contains cells with lower SOX9-DNA binding and residence time, contained a higher number of cells in donor 3 as compared to other donors and showed higher osteogenic and adipogenic potential. This might reflect the influence of the number of cells in a progenitor subpopulation to the differentiation potential of a donor towards a particular lineage. Previously, Prins et at (2014) suggested predicting the differentiation potential of a donor based on ALP production at day 15 [32].However, our TF-FRAP might provide a novel technique to determine the differentiation potential of a donor towards a particular lineage.
The SOX9 dynamics of cells in cluster A of undifferentiated hMSCs were similar to those of cells in cluster 2 of healthy hPCs, indicating that this cluster might have a higher chondrogenic potential. Many reports have shown that the chondrogenic differentiation of hMSCs in 2D culture is less efficient as compared to 3D culture [35, 36]. Moreover, in vitro chondrogenic differentiation of hMSCs mimic hypertrophic chondrocytes, which are unsuitable for clinical applications [37]. In line with previous reports, our data suggest that SOX9 dynamics in chondrogenically differentiated hMSCs more closely resemble those of hypertrophic hPCs.
One of the limitations of our study, may be that there are differences in transfection efficiency between different cell types in the heterogeneous population of MSCs. It is known that transfection efficiency can be different among various cell types [38]. One should be aware that our findings on the percentage of cells that are present per cluster, based on the SOX9 dynamics, may be slightly variable if the transfection efficiency is not same among the clusters.
SOX9 target gene expression is known to be different among various cell types [13, 39, 40]. It is also interesting to note that the comparison of SOX9 dynamics between C20/A4, hPCs and subpopulation of hMSCs indicates that the dynamics of the same transcription factor is different among different cell types and in different subpopulations of heterogenic cells. This supports our previous finding that the activity of a transcription factor is dependent on its dynamics [13]. The number of cell types/subpopulations present in the hMSCs are unknown [28]. Tedious and complicated single cell RNA sequencing is one of the ways to identify subpopulations [41]. TF-FRAP identified at least four subpopulations in hMSCs with distinct SOX9 dynamics in the undifferentiated hMSCs. Our finding that cells expressing a particular or combination of CD markers present more homogeneous SOX9 dynamics, suggests that TF-FRAP can be used to identify the number of subpopulations present in heterogenic cells, such as hMSCs. Simple TF-FRAP on a master transcription factor and subsequent cluster analysis might reveal the number of subpopulations present in any heterogenic population.
148 | Chapter 5
1
2
3
4
5
6
7
8
The higher spatio-temporal resolution of TF-FRAP as a technique, has shed more insight into correlation between the spatial arrangement of SOX9 in the nucleus and its corresponding dynamics. The distinct nuclear localization patterns of SOX9 in these subpopulations of hMSCs correlated to its differential dynamics pattern. It was a serendipitous observation that a transcription factor can localize differentially in the nucleus in the different subpopulations of hMSCs, and that this resulted in differential mobility patterns. Cells with strong SOX9 expression and/or discrete foci showed comparatively higher DNA binding and longer residence time and vice versa. The presence of discrete subnuclear foci of a transcription factor is known to show higher transcriptional output of target genes [42-44]. It is tempting to say that the cells that were present in cluster A, that had higher SOX9 DNA binding, a higher residence time of SOX9 coupled to discrete subnuclear foci, and that are similar to one of the clusters in hPCs, might be the chondro-progenitor cells.
Together, we have shown that subpopulations of hMSCs have differential SOX9 dynamics. SOX9 transcriptional activity is different among these subpopulations as evidenced by varying residence time, GAG/ALP/lipid droplet production and differential subnuclear localization patterns. TF-FRAP can prove to be a novel method to predict the number of subpopulations present in a heterogenic cells and predict the differentiation potential of a donor based on transcription factor dynamics.
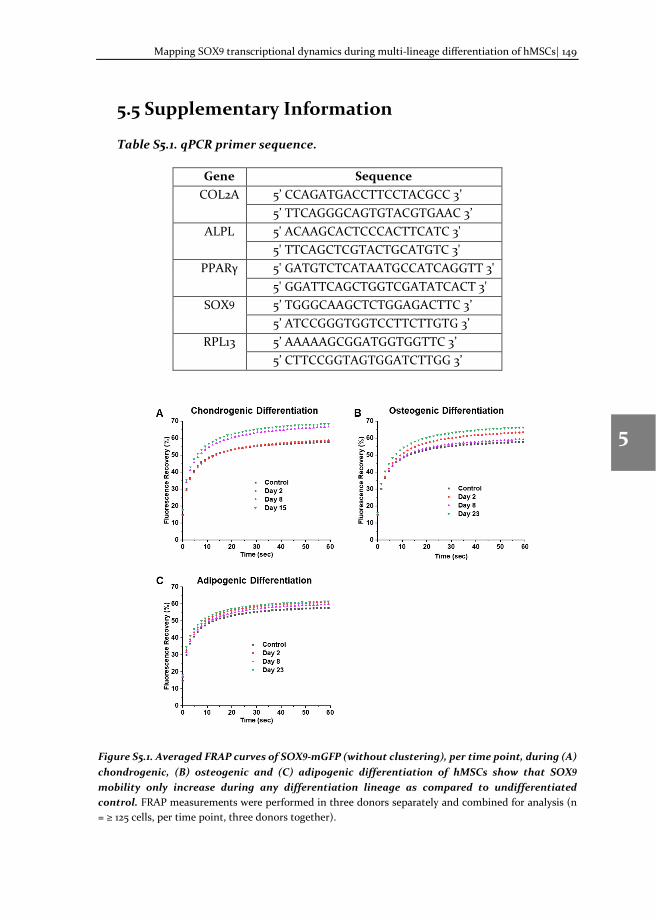
Mapping SOX9 transcriptional dynamics during multi-lineage differentiation of hMSCs| 149
1
2
3
4
5
6
7
8
5.5 Supplementary Information
Table S5.1. qPCR primer sequence.
Gene Sequence COL2A 5’ CCAGATGACCTTCCTACGCC 3’
5’ TTCAGGGCAGTGTACGTGAAC 3’ ALPL 5' ACAAGCACTCCCACTTCATC 3'
5' TTCAGCTCGTACTGCATGTC 3' PPARγ 5' GATGTCTCATAATGCCATCAGGTT 3'
5' GGATTCAGCTGGTCGATATCACT 3' SOX9 5’ TGGGCAAGCTCTGGAGACTTC 3’
5’ ATCCGGGTGGTCCTTCTTGTG 3’ RPL13 5’ AAAAAGCGGATGGTGGTTC 3’
5’ CTTCCGGTAGTGGATCTTGG 3’
Figure S5.1. Averaged FRAP curves of SOX9-mGFP (without clustering), per time point, during (A) chondrogenic, (B) osteogenic and (C) adipogenic differentiation of hMSCs show that SOX9 mobility only increase during any differentiation lineage as compared to undifferentiated control. FRAP measurements were performed in three donors separately and combined for analysis (n = ≥ 125 cells, per time point, three donors together).
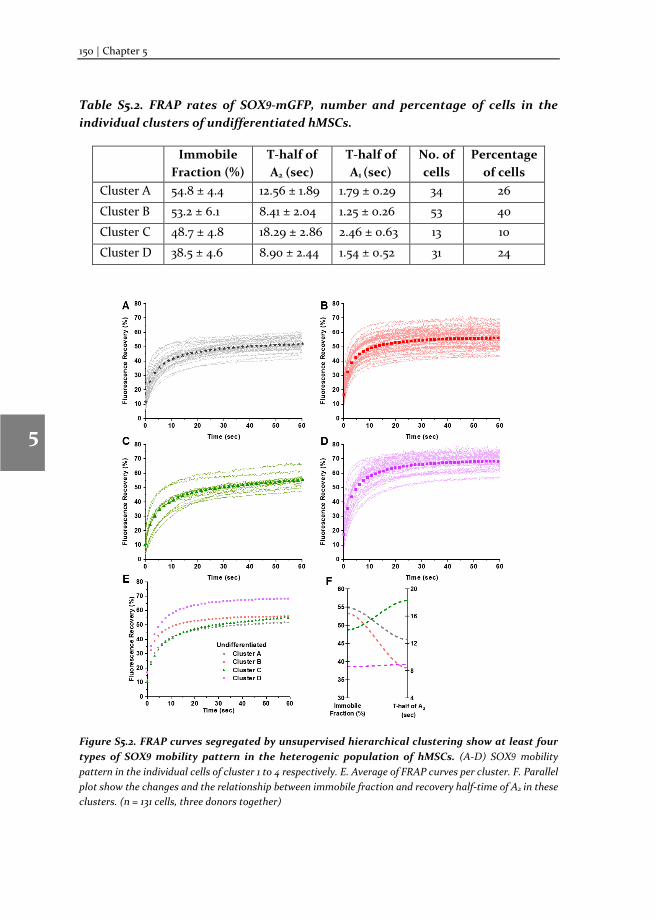
150 | Chapter 5
1
2
3
4
5
6
7
8
Table S5.2. FRAP rates of SOX9-mGFP, number and percentage of cells in the individual clusters of undifferentiated hMSCs.
Immobile
Fraction (%) T-half of A2 (sec)
T-half of A1 (sec)
No. of cells
Percentage of cells
Cluster A 54.8 ± 4.4 12.56 ± 1.89 1.79 ± 0.29 34 26
Cluster B 53.2 ± 6.1 8.41 ± 2.04 1.25 ± 0.26 53 40
Cluster C 48.7 ± 4.8 18.29 ± 2.86 2.46 ± 0.63 13 10
Cluster D 38.5 ± 4.6 8.90 ± 2.44 1.54 ± 0.52 31 24
Figure S5.2. FRAP curves segregated by unsupervised hierarchical clustering show at least four types of SOX9 mobility pattern in the heterogenic population of hMSCs. (A-D) SOX9 mobility pattern in the individual cells of cluster 1 to 4 respectively. E. Average of FRAP curves per cluster. F. Parallel plot show the changes and the relationship between immobile fraction and recovery half-time of A2 in these clusters. (n = 131 cells, three donors together)
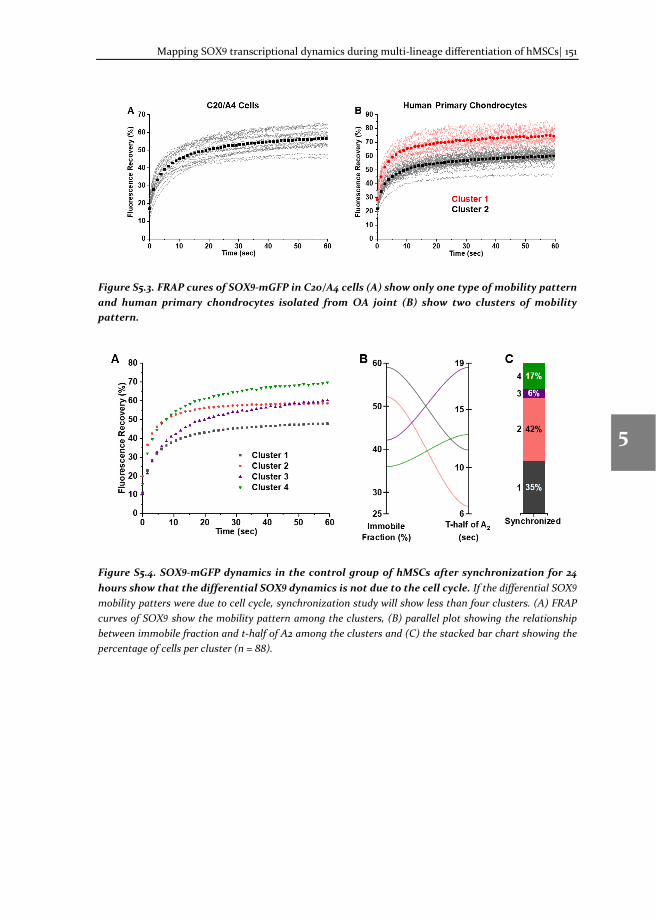
Mapping SOX9 transcriptional dynamics during multi-lineage differentiation of hMSCs| 151
1
2
3
4
5
6
7
8
Figure S5.3. FRAP cures of SOX9-mGFP in C20/A4 cells (A) show only one type of mobility pattern and human primary chondrocytes isolated from OA joint (B) show two clusters of mobility pattern.
Figure S5.4. SOX9-mGFP dynamics in the control group of hMSCs after synchronization for 24 hours show that the differential SOX9 dynamics is not due to the cell cycle. If the differential SOX9 mobility patters were due to cell cycle, synchronization study will show less than four clusters. (A) FRAP curves of SOX9 show the mobility pattern among the clusters, (B) parallel plot showing the relationship between immobile fraction and t-half of A2 among the clusters and (C) the stacked bar chart showing the percentage of cells per cluster (n = 88).
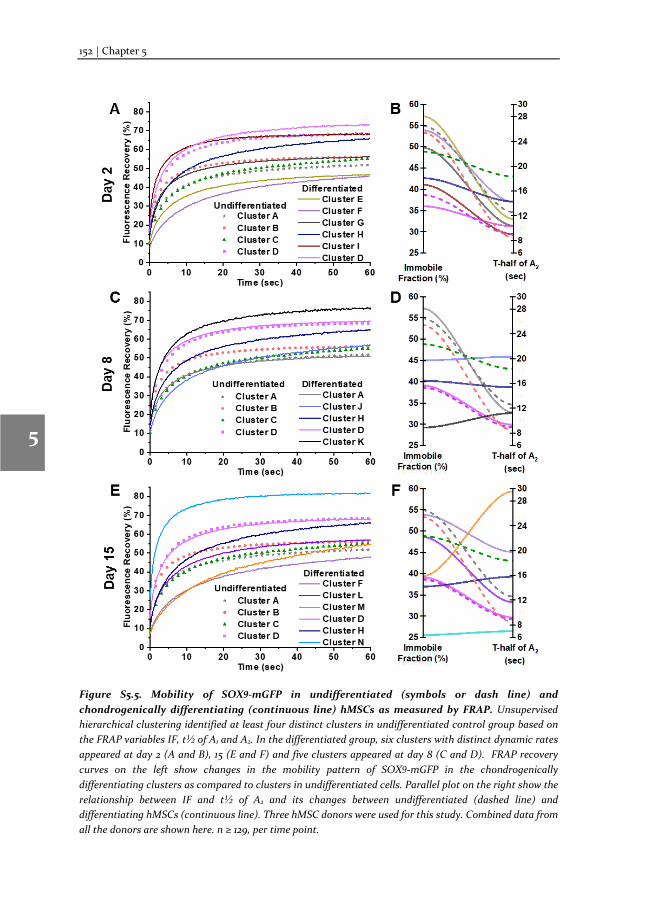
152 | Chapter 5
1
2
3
4
5
6
7
8
Figure S5.5. Mobility of SOX9-mGFP in undifferentiated (symbols or dash line) and chondrogenically differentiating (continuous line) hMSCs as measured by FRAP. Unsupervised hierarchical clustering identified at least four distinct clusters in undifferentiated control group based on the FRAP variables IF, t½ of A1 and A2. In the differentiated group, six clusters with distinct dynamic rates appeared at day 2 (A and B), 15 (E and F) and five clusters appeared at day 8 (C and D). FRAP recovery curves on the left show changes in the mobility pattern of SOX9-mGFP in the chondrogenically differentiating clusters as compared to clusters in undifferentiated cells. Parallel plot on the right show the relationship between IF and t½ of A2 and its changes between undifferentiated (dashed line) and differentiating hMSCs (continuous line). Three hMSC donors were used for this study. Combined data from all the donors are shown here. n ≥ 129, per time point.
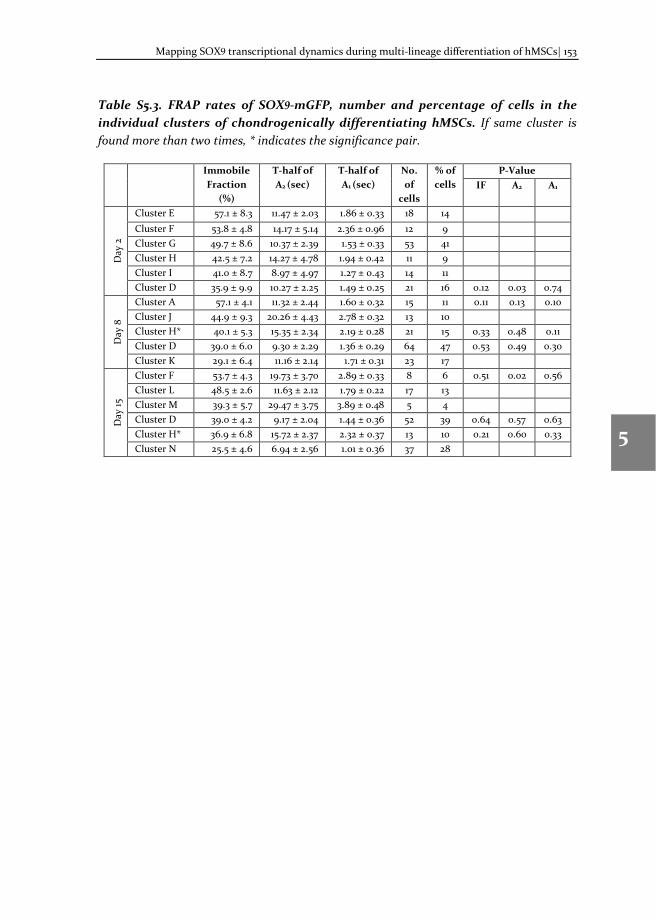
Mapping SOX9 transcriptional dynamics during multi-lineage differentiation of hMSCs| 153
1
2
3
4
5
6
7
8
Table S5.3. FRAP rates of SOX9-mGFP, number and percentage of cells in the individual clusters of chondrogenically differentiating hMSCs. If same cluster is found more than two times, * indicates the significance pair.
Immobile Fraction
(%)
T-half of A2 (sec)
T-half of A1 (sec)
No. of
cells
% of cells
P-Value IF A2 A1
Day
2
Cluster E 57.1 ± 8.3 11.47 ± 2.03 1.86 ± 0.33 18 14 Cluster F 53.8 ± 4.8 14.17 ± 5.14 2.36 ± 0.96 12 9 Cluster G 49.7 ± 8.6 10.37 ± 2.39 1.53 ± 0.33 53 41 Cluster H 42.5 ± 7.2 14.27 ± 4.78 1.94 ± 0.42 11 9 Cluster I 41.0 ± 8.7 8.97 ± 4.97 1.27 ± 0.43 14 11 Cluster D 35.9 ± 9.9 10.27 ± 2.25 1.49 ± 0.25 21 16 0.12 0.03 0.74
Day
8
Cluster A 57.1 ± 4.1 11.32 ± 2.44 1.60 ± 0.32 15 11 0.11 0.13 0.10 Cluster J 44.9 ± 9.3 20.26 ± 4.43 2.78 ± 0.32 13 10 Cluster H* 40.1 ± 5.3 15.35 ± 2.34 2.19 ± 0.28 21 15 0.33 0.48 0.11 Cluster D 39.0 ± 6.0 9.30 ± 2.29 1.36 ± 0.29 64 47 0.53 0.49 0.30 Cluster K 29.1 ± 6.4 11.16 ± 2.14 1.71 ± 0.31 23 17
Day
15
Cluster F 53.7 ± 4.3 19.73 ± 3.70 2.89 ± 0.33 8 6 0.51 0.02 0.56 Cluster L 48.5 ± 2.6 11.63 ± 2.12 1.79 ± 0.22 17 13 Cluster M 39.3 ± 5.7 29.47 ± 3.75 3.89 ± 0.48 5 4 Cluster D 39.0 ± 4.2 9.17 ± 2.04 1.44 ± 0.36 52 39 0.64 0.57 0.63 Cluster H* 36.9 ± 6.8 15.72 ± 2.37 2.32 ± 0.37 13 10 0.21 0.60 0.33 Cluster N 25.5 ± 4.6 6.94 ± 2.56 1.01 ± 0.36 37 28
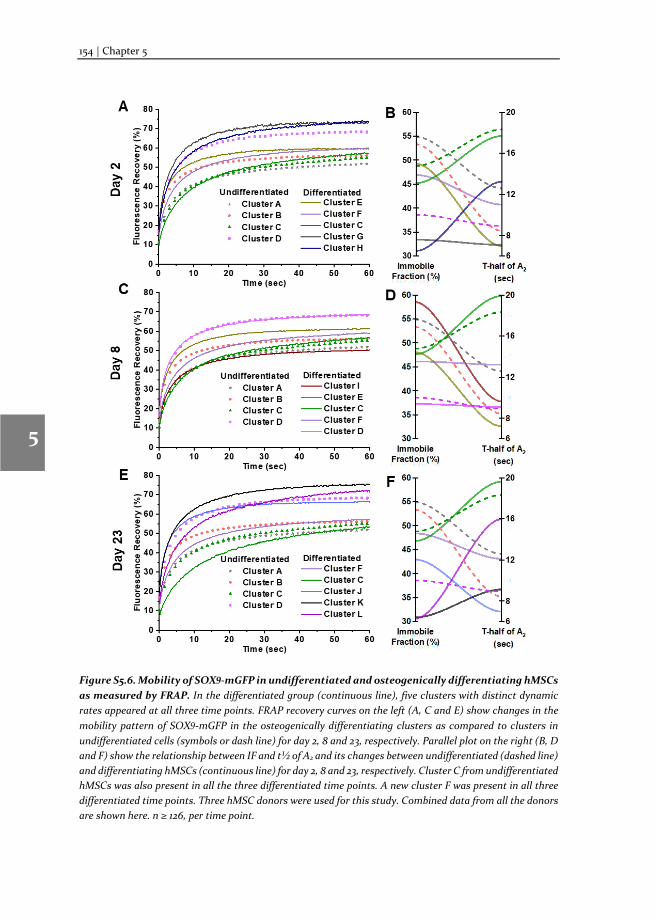
154 | Chapter 5
1
2
3
4
5
6
7
8
Figure S5.6. Mobility of SOX9-mGFP in undifferentiated and osteogenically differentiating hMSCs as measured by FRAP. In the differentiated group (continuous line), five clusters with distinct dynamic rates appeared at all three time points. FRAP recovery curves on the left (A, C and E) show changes in the mobility pattern of SOX9-mGFP in the osteogenically differentiating clusters as compared to clusters in undifferentiated cells (symbols or dash line) for day 2, 8 and 23, respectively. Parallel plot on the right (B, D and F) show the relationship between IF and t½ of A2 and its changes between undifferentiated (dashed line) and differentiating hMSCs (continuous line) for day 2, 8 and 23, respectively. Cluster C from undifferentiated hMSCs was also present in all the three differentiated time points. A new cluster F was present in all three differentiated time points. Three hMSC donors were used for this study. Combined data from all the donors are shown here. n ≥ 126, per time point.
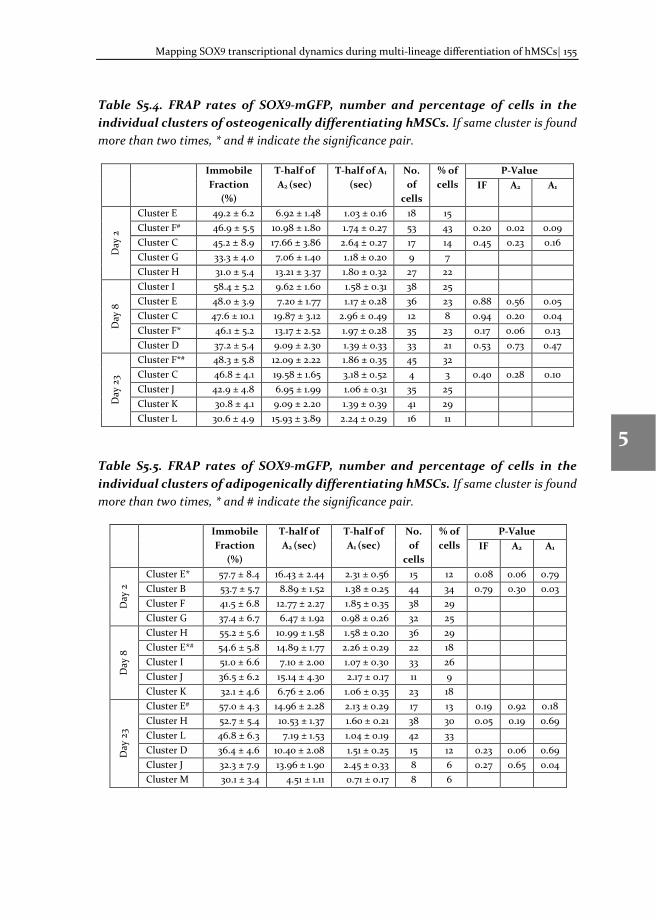
Mapping SOX9 transcriptional dynamics during multi-lineage differentiation of hMSCs| 155
1
2
3
4
5
6
7
8
Table S5.4. FRAP rates of SOX9-mGFP, number and percentage of cells in the individual clusters of osteogenically differentiating hMSCs. If same cluster is found more than two times, * and # indicate the significance pair.
Immobile Fraction
(%)
T-half of A2 (sec)
T-half of A1
(sec) No. of
cells
% of cells
P-Value IF A2 A1
Day
2
Cluster E 49.2 ± 6.2 6.92 ± 1.48 1.03 ± 0.16 18 15 Cluster F# 46.9 ± 5.5 10.98 ± 1.80 1.74 ± 0.27 53 43 0.20 0.02 0.09 Cluster C 45.2 ± 8.9 17.66 ± 3.86 2.64 ± 0.27 17 14 0.45 0.23 0.16 Cluster G 33.3 ± 4.0 7.06 ± 1.40 1.18 ± 0.20 9 7 Cluster H 31.0 ± 5.4 13.21 ± 3.37 1.80 ± 0.32 27 22
Day
8
Cluster I 58.4 ± 5.2 9.62 ± 1.60 1.58 ± 0.31 38 25 Cluster E 48.0 ± 3.9 7.20 ± 1.77 1.17 ± 0.28 36 23 0.88 0.56 0.05 Cluster C 47.6 ± 10.1 19.87 ± 3.12 2.96 ± 0.49 12 8 0.94 0.20 0.04 Cluster F* 46.1 ± 5.2 13.17 ± 2.52 1.97 ± 0.28 35 23 0.17 0.06 0.13 Cluster D 37.2 ± 5.4 9.09 ± 2.30 1.39 ± 0.33 33 21 0.53 0.73 0.47
Day
23
Cluster F*# 48.3 ± 5.8 12.09 ± 2.22 1.86 ± 0.35 45 32 Cluster C 46.8 ± 4.1 19.58 ± 1.65 3.18 ± 0.52 4 3 0.40 0.28 0.10 Cluster J 42.9 ± 4.8 6.95 ± 1.99 1.06 ± 0.31 35 25 Cluster K 30.8 ± 4.1 9.09 ± 2.20 1.39 ± 0.39 41 29 Cluster L 30.6 ± 4.9 15.93 ± 3.89 2.24 ± 0.29 16 11
Table S5.5. FRAP rates of SOX9-mGFP, number and percentage of cells in the individual clusters of adipogenically differentiating hMSCs. If same cluster is found more than two times, * and # indicate the significance pair.
Immobile Fraction
(%)
T-half of A2 (sec)
T-half of A1 (sec)
No. of
cells
% of cells
P-Value IF A2 A1
Day
2
Cluster E* 57.7 ± 8.4 16.43 ± 2.44 2.31 ± 0.56 15 12 0.08 0.06 0.79 Cluster B 53.7 ± 5.7 8.89 ± 1.52 1.38 ± 0.25 44 34 0.79 0.30 0.03 Cluster F 41.5 ± 6.8 12.77 ± 2.27 1.85 ± 0.35 38 29 Cluster G 37.4 ± 6.7 6.47 ± 1.92 0.98 ± 0.26 32 25
Day
8
Cluster H 55.2 ± 5.6 10.99 ± 1.58 1.58 ± 0.20 36 29 Cluster E*# 54.6 ± 5.8 14.89 ± 1.77 2.26 ± 0.29 22 18 Cluster I 51.0 ± 6.6 7.10 ± 2.00 1.07 ± 0.30 33 26 Cluster J 36.5 ± 6.2 15.14 ± 4.30 2.17 ± 0.17 11 9 Cluster K 32.1 ± 4.6 6.76 ± 2.06 1.06 ± 0.35 23 18
Day
23
Cluster E# 57.0 ± 4.3 14.96 ± 2.28 2.13 ± 0.29 17 13 0.19 0.92 0.18 Cluster H 52.7 ± 5.4 10.53 ± 1.37 1.60 ± 0.21 38 30 0.05 0.19 0.69 Cluster L 46.8 ± 6.3 7.19 ± 1.53 1.04 ± 0.19 42 33 Cluster D 36.4 ± 4.6 10.40 ± 2.08 1.51 ± 0.25 15 12 0.23 0.06 0.69 Cluster J 32.3 ± 7.9 13.96 ± 1.90 2.45 ± 0.33 8 6 0.27 0.65 0.04 Cluster M 30.1 ± 3.4 4.51 ± 1.11 0.71 ± 0.17 8 6
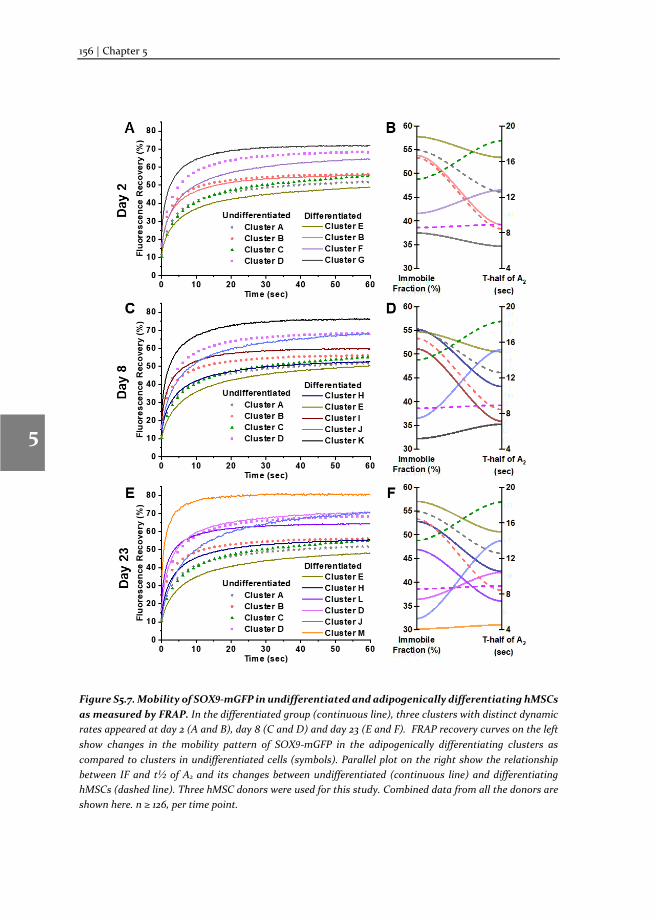
156 | Chapter 5
1
2
3
4
5
6
7
8
Figure S5.7. Mobility of SOX9-mGFP in undifferentiated and adipogenically differentiating hMSCs as measured by FRAP. In the differentiated group (continuous line), three clusters with distinct dynamic rates appeared at day 2 (A and B), day 8 (C and D) and day 23 (E and F). FRAP recovery curves on the left show changes in the mobility pattern of SOX9-mGFP in the adipogenically differentiating clusters as compared to clusters in undifferentiated cells (symbols). Parallel plot on the right show the relationship between IF and t½ of A2 and its changes between undifferentiated (continuous line) and differentiating hMSCs (dashed line). Three hMSC donors were used for this study. Combined data from all the donors are shown here. n ≥ 126, per time point.
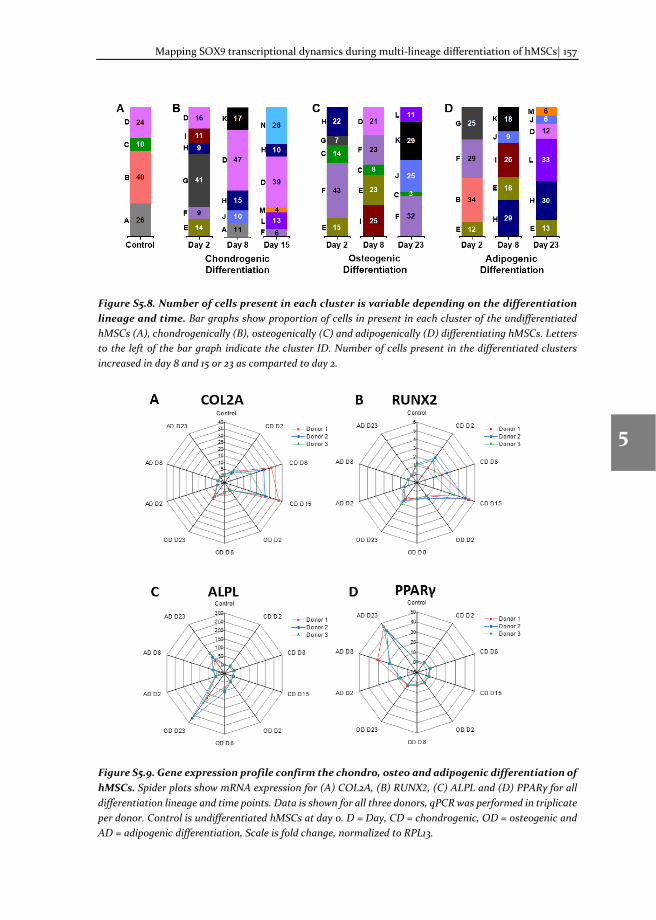
Mapping SOX9 transcriptional dynamics during multi-lineage differentiation of hMSCs| 157
1
2
3
4
5
6
7
8
Figure S5.8. Number of cells present in each cluster is variable depending on the differentiation lineage and time. Bar graphs show proportion of cells in present in each cluster of the undifferentiated hMSCs (A), chondrogenically (B), osteogenically (C) and adipogenically (D) differentiating hMSCs. Letters to the left of the bar graph indicate the cluster ID. Number of cells present in the differentiated clusters increased in day 8 and 15 or 23 as comparted to day 2.
Figure S5.9. Gene expression profile confirm the chondro, osteo and adipogenic differentiation of hMSCs. Spider plots show mRNA expression for (A) COL2A, (B) RUNX2, (C) ALPL and (D) PPARγ for all differentiation lineage and time points. Data is shown for all three donors, qPCR was performed in triplicate per donor. Control is undifferentiated hMSCs at day 0. D = Day, CD = chondrogenic, OD = osteogenic and AD = adipogenic differentiation, Scale is fold change, normalized to RPL13.
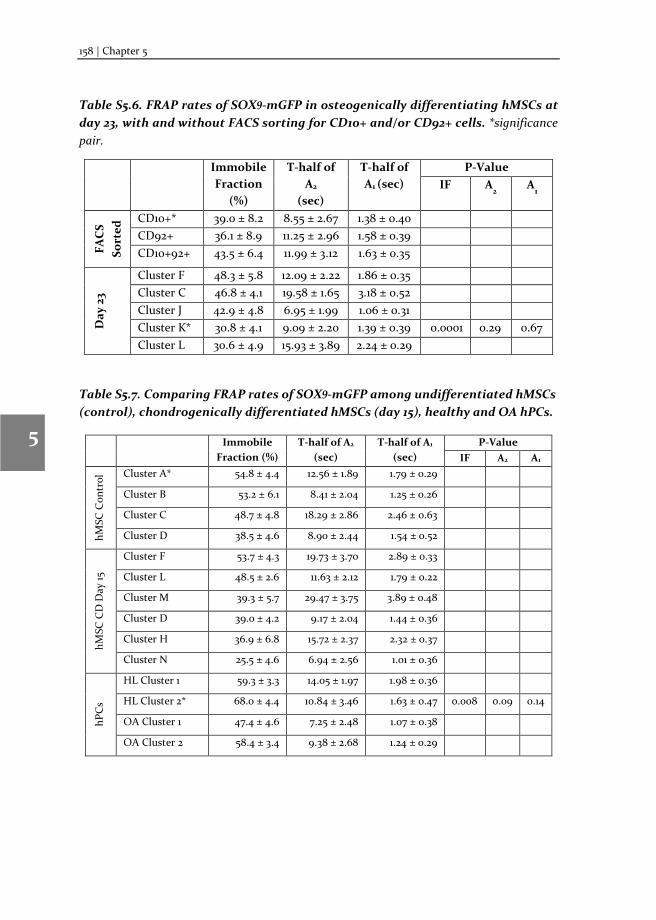
158 | Chapter 5
1
2
3
4
5
6
7
8
Table S5.6. FRAP rates of SOX9-mGFP in osteogenically differentiating hMSCs at day 23, with and without FACS sorting for CD10+ and/or CD92+ cells. *significance pair.
Table S5.7. Comparing FRAP rates of SOX9-mGFP among undifferentiated hMSCs (control), chondrogenically differentiated hMSCs (day 15), healthy and OA hPCs.
Immobile Fraction (%)
T-half of A2
(sec) T-half of A1
(sec) P-Value
IF A2 A1
hMSC
Con
trol
Cluster A* 54.8 ± 4.4 12.56 ± 1.89 1.79 ± 0.29
Cluster B 53.2 ± 6.1 8.41 ± 2.04 1.25 ± 0.26
Cluster C 48.7 ± 4.8 18.29 ± 2.86 2.46 ± 0.63
Cluster D 38.5 ± 4.6 8.90 ± 2.44 1.54 ± 0.52
hMSC
CD
Day
15
Cluster F 53.7 ± 4.3 19.73 ± 3.70 2.89 ± 0.33
Cluster L 48.5 ± 2.6 11.63 ± 2.12 1.79 ± 0.22
Cluster M 39.3 ± 5.7 29.47 ± 3.75 3.89 ± 0.48
Cluster D 39.0 ± 4.2 9.17 ± 2.04 1.44 ± 0.36
Cluster H 36.9 ± 6.8 15.72 ± 2.37 2.32 ± 0.37
Cluster N 25.5 ± 4.6 6.94 ± 2.56 1.01 ± 0.36
hPC
s
HL Cluster 1 59.3 ± 3.3 14.05 ± 1.97 1.98 ± 0.36
HL Cluster 2* 68.0 ± 4.4 10.84 ± 3.46 1.63 ± 0.47 0.008 0.09 0.14
OA Cluster 1 47.4 ± 4.6 7.25 ± 2.48 1.07 ± 0.38
OA Cluster 2 58.4 ± 3.4 9.38 ± 2.68 1.24 ± 0.29
Immobile Fraction
(%)
T-half of A2
(sec)
T-half of A1 (sec)
P-Value IF A
2 A
1
FAC
S So
rted
CD10+* 39.0 ± 8.2 8.55 ± 2.67 1.38 ± 0.40 CD92+ 36.1 ± 8.9 11.25 ± 2.96 1.58 ± 0.39
CD10+92+ 43.5 ± 6.4 11.99 ± 3.12 1.63 ± 0.35
Day
23
Cluster F 48.3 ± 5.8 12.09 ± 2.22 1.86 ± 0.35
Cluster C 46.8 ± 4.1 19.58 ± 1.65 3.18 ± 0.52
Cluster J 42.9 ± 4.8 6.95 ± 1.99 1.06 ± 0.31 Cluster K* 30.8 ± 4.1 9.09 ± 2.20 1.39 ± 0.39 0.0001 0.29 0.67 Cluster L 30.6 ± 4.9 15.93 ± 3.89 2.24 ± 0.29
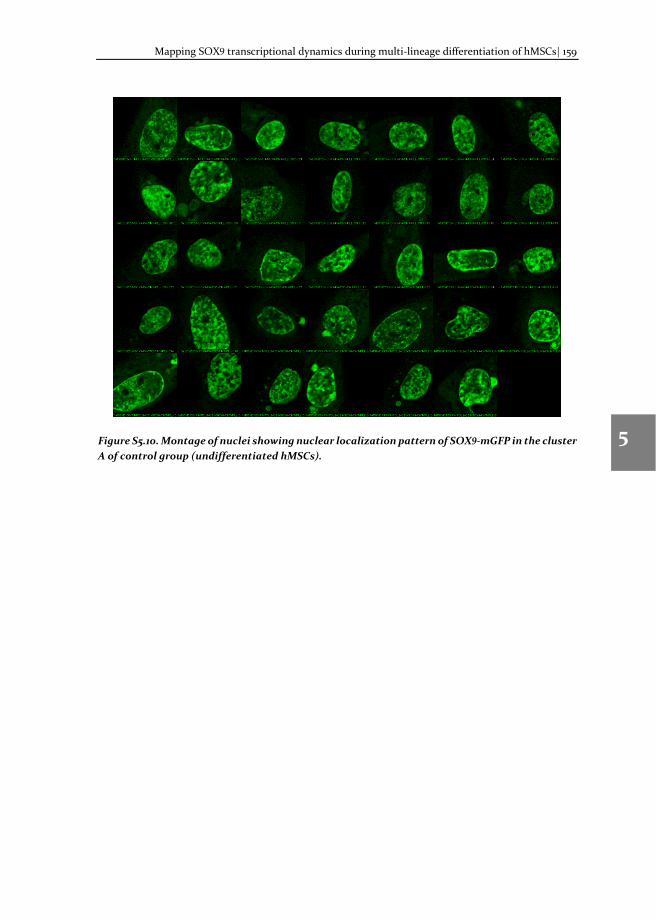
Mapping SOX9 transcriptional dynamics during multi-lineage differentiation of hMSCs| 159
1
2
3
4
5
6
7
8
Figure S5.10. Montage of nuclei showing nuclear localization pattern of SOX9-mGFP in the cluster A of control group (undifferentiated hMSCs).
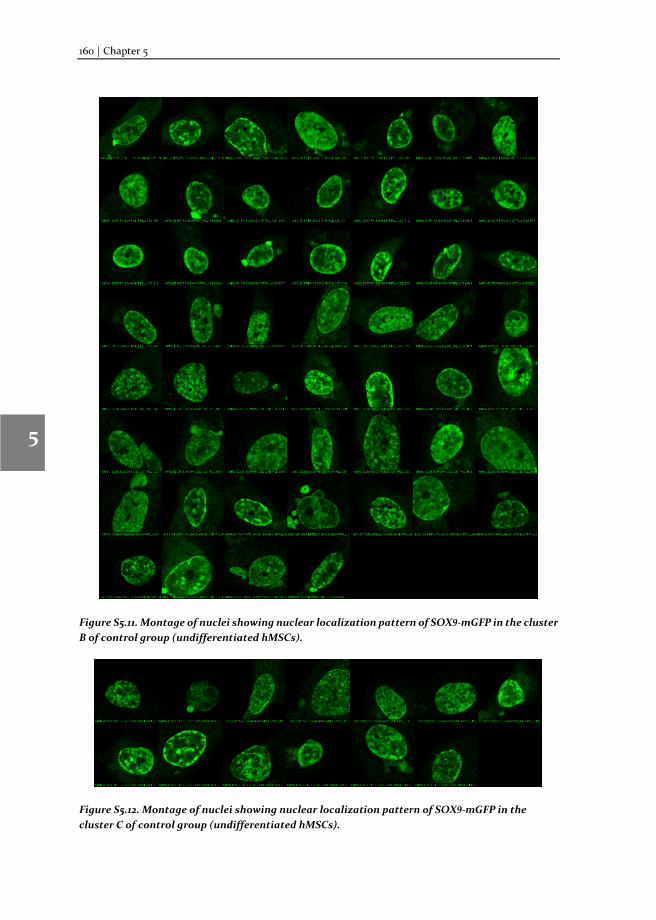
160 | Chapter 5
1
2
3
4
5
6
7
8
Figure S5.11. Montage of nuclei showing nuclear localization pattern of SOX9-mGFP in the cluster B of control group (undifferentiated hMSCs).
Figure S5.12. Montage of nuclei showing nuclear localization pattern of SOX9-mGFP in the cluster C of control group (undifferentiated hMSCs).
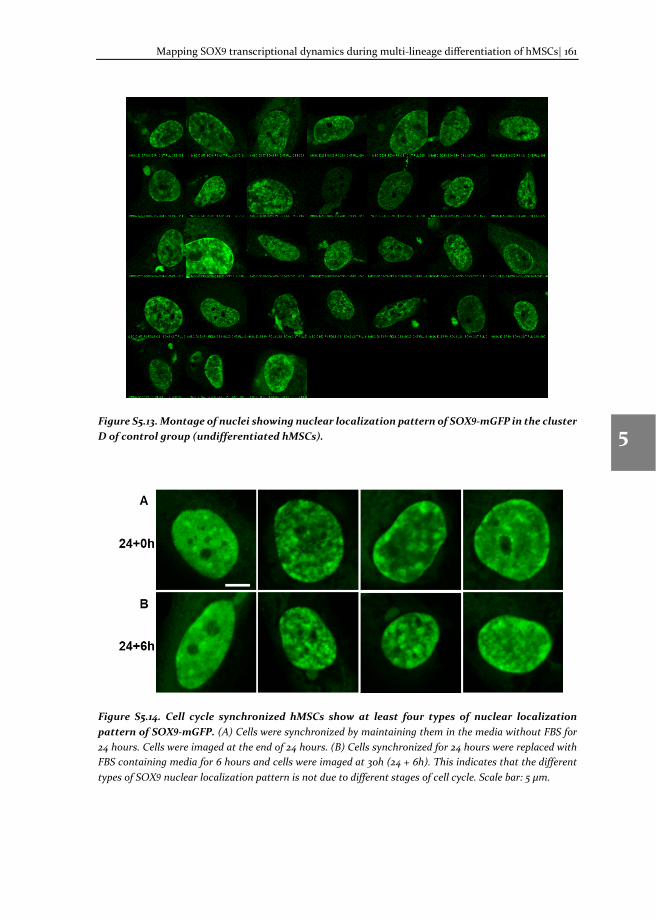
Mapping SOX9 transcriptional dynamics during multi-lineage differentiation of hMSCs| 161
1
2
3
4
5
6
7
8
Figure S5.13. Montage of nuclei showing nuclear localization pattern of SOX9-mGFP in the cluster D of control group (undifferentiated hMSCs).
Figure S5.14. Cell cycle synchronized hMSCs show at least four types of nuclear localization pattern of SOX9-mGFP. (A) Cells were synchronized by maintaining them in the media without FBS for 24 hours. Cells were imaged at the end of 24 hours. (B) Cells synchronized for 24 hours were replaced with FBS containing media for 6 hours and cells were imaged at 30h (24 + 6h). This indicates that the different types of SOX9 nuclear localization pattern is not due to different stages of cell cycle. Scale bar: 5 μm.
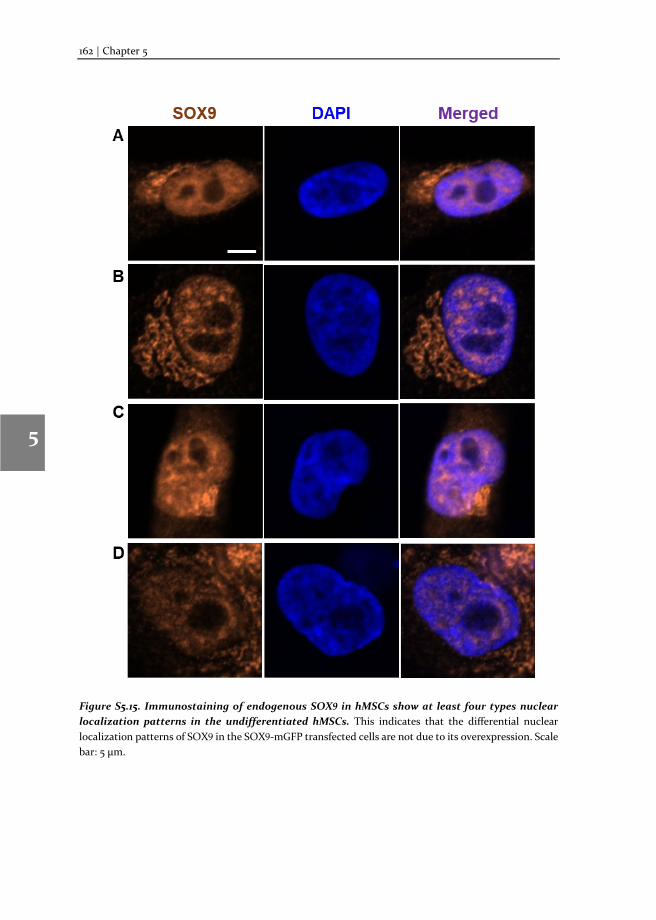
162 | Chapter 5
1
2
3
4
5
6
7
8
Figure S5.15. Immunostaining of endogenous SOX9 in hMSCs show at least four types nuclear localization patterns in the undifferentiated hMSCs. This indicates that the differential nuclear localization patterns of SOX9 in the SOX9-mGFP transfected cells are not due to its overexpression. Scale bar: 5 μm.
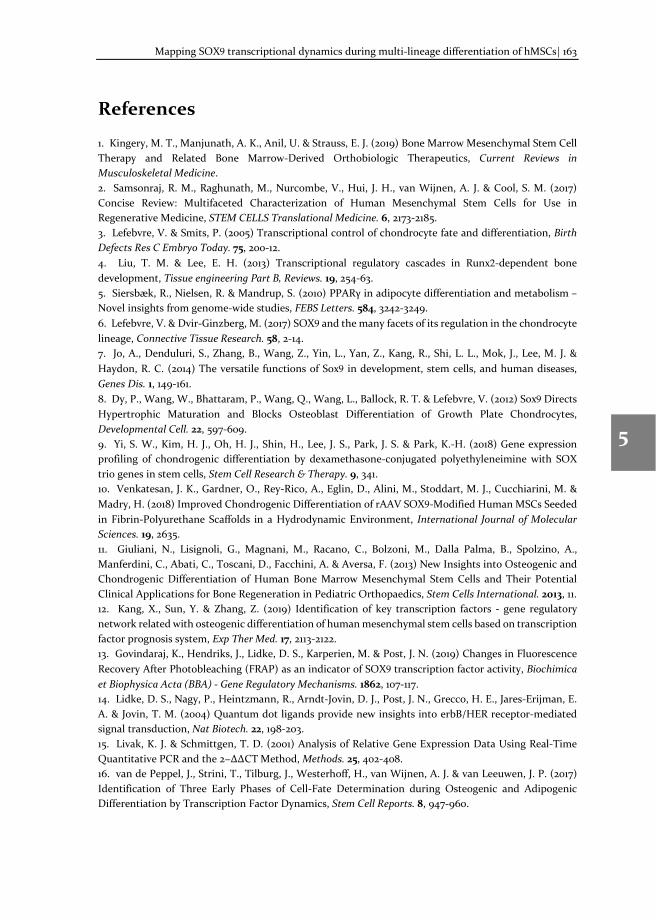
Mapping SOX9 transcriptional dynamics during multi-lineage differentiation of hMSCs| 163
1
2
3
4
5
6
7
8
References
1. Kingery, M. T., Manjunath, A. K., Anil, U. & Strauss, E. J. (2019) Bone Marrow Mesenchymal Stem Cell Therapy and Related Bone Marrow-Derived Orthobiologic Therapeutics, Current Reviews in Musculoskeletal Medicine. 2. Samsonraj, R. M., Raghunath, M., Nurcombe, V., Hui, J. H., van Wijnen, A. J. & Cool, S. M. (2017) Concise Review: Multifaceted Characterization of Human Mesenchymal Stem Cells for Use in Regenerative Medicine, STEM CELLS Translational Medicine. 6, 2173-2185. 3. Lefebvre, V. & Smits, P. (2005) Transcriptional control of chondrocyte fate and differentiation, Birth Defects Res C Embryo Today. 75, 200-12. 4. Liu, T. M. & Lee, E. H. (2013) Transcriptional regulatory cascades in Runx2-dependent bone development, Tissue engineering Part B, Reviews. 19, 254-63. 5. Siersbæk, R., Nielsen, R. & Mandrup, S. (2010) PPARγ in adipocyte differentiation and metabolism – Novel insights from genome-wide studies, FEBS Letters. 584, 3242-3249. 6. Lefebvre, V. & Dvir-Ginzberg, M. (2017) SOX9 and the many facets of its regulation in the chondrocyte lineage, Connective Tissue Research. 58, 2-14. 7. Jo, A., Denduluri, S., Zhang, B., Wang, Z., Yin, L., Yan, Z., Kang, R., Shi, L. L., Mok, J., Lee, M. J. & Haydon, R. C. (2014) The versatile functions of Sox9 in development, stem cells, and human diseases, Genes Dis. 1, 149-161. 8. Dy, P., Wang, W., Bhattaram, P., Wang, Q., Wang, L., Ballock, R. T. & Lefebvre, V. (2012) Sox9 Directs Hypertrophic Maturation and Blocks Osteoblast Differentiation of Growth Plate Chondrocytes, Developmental Cell. 22, 597-609. 9. Yi, S. W., Kim, H. J., Oh, H. J., Shin, H., Lee, J. S., Park, J. S. & Park, K.-H. (2018) Gene expression profiling of chondrogenic differentiation by dexamethasone-conjugated polyethyleneimine with SOX trio genes in stem cells, Stem Cell Research & Therapy. 9, 341. 10. Venkatesan, J. K., Gardner, O., Rey-Rico, A., Eglin, D., Alini, M., Stoddart, M. J., Cucchiarini, M. & Madry, H. (2018) Improved Chondrogenic Differentiation of rAAV SOX9-Modified Human MSCs Seeded in Fibrin-Polyurethane Scaffolds in a Hydrodynamic Environment, International Journal of Molecular Sciences. 19, 2635. 11. Giuliani, N., Lisignoli, G., Magnani, M., Racano, C., Bolzoni, M., Dalla Palma, B., Spolzino, A., Manferdini, C., Abati, C., Toscani, D., Facchini, A. & Aversa, F. (2013) New Insights into Osteogenic and Chondrogenic Differentiation of Human Bone Marrow Mesenchymal Stem Cells and Their Potential Clinical Applications for Bone Regeneration in Pediatric Orthopaedics, Stem Cells International. 2013, 11. 12. Kang, X., Sun, Y. & Zhang, Z. (2019) Identification of key transcription factors - gene regulatory network related with osteogenic differentiation of human mesenchymal stem cells based on transcription factor prognosis system, Exp Ther Med. 17, 2113-2122. 13. Govindaraj, K., Hendriks, J., Lidke, D. S., Karperien, M. & Post, J. N. (2019) Changes in Fluorescence Recovery After Photobleaching (FRAP) as an indicator of SOX9 transcription factor activity, Biochimica et Biophysica Acta (BBA) - Gene Regulatory Mechanisms. 1862, 107-117. 14. Lidke, D. S., Nagy, P., Heintzmann, R., Arndt-Jovin, D. J., Post, J. N., Grecco, H. E., Jares-Erijman, E. A. & Jovin, T. M. (2004) Quantum dot ligands provide new insights into erbB/HER receptor-mediated signal transduction, Nat Biotech. 22, 198-203. 15. Livak, K. J. & Schmittgen, T. D. (2001) Analysis of Relative Gene Expression Data Using Real-Time Quantitative PCR and the 2−ΔΔCT Method, Methods. 25, 402-408. 16. van de Peppel, J., Strini, T., Tilburg, J., Westerhoff, H., van Wijnen, A. J. & van Leeuwen, J. P. (2017) Identification of Three Early Phases of Cell-Fate Determination during Osteogenic and Adipogenic Differentiation by Transcription Factor Dynamics, Stem Cell Reports. 8, 947-960.
164 | Chapter 5
1
2
3
4
5
6
7
8
17. Bi, W., Deng, J. M., Zhang, Z., Behringer, R. R. & de Crombrugghe, B. (1999) Sox9 is required for cartilage formation, Nature Genetics. 22, 85. 18. Barilani, M., Palorini, R., Votta, G., Piras, R., Buono, G., Grassi, M., Bollati, V., Chiaradonna, F. & Lazzari, L. (2019) Central metabolism of functionally heterogeneous mesenchymal stromal cells, Scientific Reports. 9, 15420. 19. Naftali-Shani, N., Itzhaki-Alfia, A., Landa-Rouben, N., Kain, D., Holbova, R., Adutler-Lieber, S., Molotski, N., Asher, E., Grupper, A., Millet, E., Tessone, A., Winkler, E., Kastrup, J., Feinberg Micha, S., Zipori, D., Pevsner-Fischer, M., Raanani, E. & Leor, J. The Origin of Human Mesenchymal Stromal Cells Dictates Their Reparative Properties, Journal of the American Heart Association. 2, e000253. 20. Loebel, C., Czekanska, E. M., Bruderer, M., Salzmann, G., Alini, M. & Stoddart, M. J. (2014) In Vitro Osteogenic Potential of Human Mesenchymal Stem Cells Is Predicted by Runx2/Sox9 Ratio, Tissue Engineering Part A. 21, 115-123. 21. Wang, J.-j., Ye, F., Cheng, L.-j., Shi, Y.-j., Bao, J., Sun, H.-q., Wang, W., Zhang, P. & Bu, H. (2009) Osteogenic differentiation of mesenchymal stem cells promoted by overexpression of connective tissue growth factor, Journal of Zhejiang University SCIENCE B. 10, 355. 22. Wang, Y. & Sul, H. S. (2009) Pref-1 Regulates Mesenchymal Cell Commitment and Differentiation through Sox9, Cell Metabolism. 9, 287-302. 23. Granéli, C., Thorfve, A., Ruetschi, U., Brisby, H., Thomsen, P., Lindahl, A. & Karlsson, C. (2014) Novel markers of osteogenic and adipogenic differentiation of human bone marrow stromal cells identified using a quantitative proteomics approach, Stem Cell Research. 12, 153-165. 24. Caron, M. M., Emans, P. J., Cremers, A., Surtel, D. A., Coolsen, M. M., van Rhijn, L. W. & Welting, T. J. (2013) Hypertrophic differentiation during chondrogenic differentiation of progenitor cells is stimulated by BMP-2 but suppressed by BMP-7, Osteoarthritis and cartilage / OARS, Osteoarthritis Research Society. 21, 604-13. 25. Chen, M., Huang, J., Yang, X., Liu, B., Zhang, W., Huang, L., Deng, F., Ma, J., Bai, Y., Lu, R., Huang, B., Gao, Q., Zhuo, Y. & Ge, J. (2012) Serum Starvation Induced Cell Cycle Synchronization Facilitates Human Somatic Cells Reprogramming, PloS one. 7, e28203. 26. Post, S., Abdallah, B. M., Bentzon, J. F. & Kassem, M. (2008) Demonstration of the presence of independent pre-osteoblastic and pre-adipocytic cell populations in bone marrow-derived mesenchymal stem cells, Bone. 43, 32-39. 27. Larsen, K. H., Frederiksen, C. M., Burns, J. S., Abdallah, B. M. & Kassem, M. (2010) Identifying a molecular phenotype for bone marrow stromal cells with in vivo bone-forming capacity, Journal of Bone and Mineral Research. 25, 796-808. 28. Elsafadi, M., Manikandan, M., Atteya, M., Hashmi, J. A., Iqbal, Z., Aldahmash, A., Alfayez, M., Kassem, M. & Mahmood, A. (2016) Characterization of Cellular and Molecular Heterogeneity of Bone Marrow Stromal Cells, Stem Cells International. 2016, 18. 29. Morisaki, T., Müller, W. G., Golob, N., Mazza, D. & McNally, J. G. (2014) Single-molecule analysis of transcription factor binding at transcription sites in live cells, Nature Communications. 5, 4456. 30. Hipp, L., Beer, J., Kuchler, O., Reisser, M., Sinske, D., Michaelis, J., Gebhardt, J. C. M. & Knöll, B. (2019) Single-molecule imaging of the transcription factor SRF reveals prolonged chromatin-binding kinetics upon cell stimulation, Proceedings of the National Academy of Sciences. 116, 880. 31. Gulyaeva, O., Nguyen, H., Sambeat, A., Heydari, K. & Sul, H. S. (2018) Sox9-Meis1 Inactivation Is Required for Adipogenesis, Advancing Pref-1+ to PDGFRα+ Cells, Cell Reports. 25, 1002-1017.e4. 32. Prins, H.-J., Braat, A. K., Gawlitta, D., Dhert, W. J. A., Egan, D. A., Tijssen-Slump, E., Yuan, H., Coffer, P. J., Rozemuller, H. & Martens, A. C. (2014) In vitro induction of alkaline phosphatase levels predicts in vivo bone forming capacity of human bone marrow stromal cells, Stem Cell Research. 12, 428-440. 33. Leyva-Leyva, M., Barrera, L., López-Camarillo, C., Arriaga-Pizano, L., Orozco-Hoyuela, G., Carrillo-Casas, E. M., Calderón-Pérez, J., López-Díaz, A., Hernandez-Aguilar, F., González-Ramírez, R., Kawa, S., Chimal-Monroy, J. & Fuentes-Mera, L. (2012) Characterization of Mesenchymal Stem Cell Subpopulations
Mapping SOX9 transcriptional dynamics during multi-lineage differentiation of hMSCs| 165
1
2
3
4
5
6
7
8
from Human Amniotic Membrane with Dissimilar Osteoblastic Potential, Stem Cells and Development. 22, 1275-1287. 34. Georgi, N., Taipaleenmaki, H., Raiss, C. C., Groen, N., Portalska, K. J., van Blitterswijk, C., de Boer, J., Post, J. N., van Wijnen, A. J. & Karperien, M. (2015) MicroRNA Levels as Prognostic Markers for the Differentiation Potential of Human Mesenchymal Stromal Cell Donors, Stem Cells Dev. 24, 1946-55. 35. Yeung, P., Cheng, K. H., Yan, C. H. & Chan, B. P. (2019) Collagen microsphere based 3D culture system for human osteoarthritis chondrocytes (hOACs), Scientific Reports. 9, 12453. 36. Merceron, C., Portron, S., Masson, M., Lesoeur, J., Fellah, B. H., Gauthier, O., Geffroy, O., Weiss, P., Guicheux, J. & Vinatier, C. (2011) The Effect of Two- and Three-Dimensional Cell Culture on the Chondrogenic Potential of Human Adipose-Derived Mesenchymal Stem Cells after Subcutaneous Transplantation with an Injectable Hydrogel, Cell Transplantation. 20, 1575-1588. 37. Hubka, K. M., Dahlin, R. L., Meretoja, V. V., Kasper, F. K. & Mikos, A. G. (2014) Enhancing Chondrogenic Phenotype for Cartilage Tissue Engineering: Monoculture and Coculture of Articular Chondrocytes and Mesenchymal Stem Cells, Tissue Engineering Part B: Reviews. 20, 641-654. 38. Kim, T. K. & Eberwine, J. H. (2010) Mammalian cell transfection: the present and the future, Analytical and Bioanalytical Chemistry. 397, 3173-3178. 39. Zhong, L., Huang, X., Karperien, M. & Post, J. N. (2016) Correlation between Gene Expression and Osteoarthritis Progression in Human, Int J Mol Sci. 17. 40. Huang, X., Zhong, L., Hendriks, J., Post, J. N. & Karperien, M. (2018) Different response of human chondrocytes from healthy looking areas and damaged regions to IL1β stimulation under different oxygen tension, Journal of Orthopaedic Research. 0. 41. Hwang, B., Lee, J. H. & Bang, D. (2018) Single-cell RNA sequencing technologies and bioinformatics pipelines, Experimental & Molecular Medicine. 50, 96. 42. Wei, X., Samarabandu, J., Devdhar, R. S., Siegel, A. J., Acharya, R. & Berezney, R. (1998) Segregation of Transcription and Replication Sites Into Higher Order Domains, Science. 281, 1502. 43. Wei, X., Somanathan, S., Samarabandu, J. & Berezney, R. (1999) Three-Dimensional Visualization of Transcription Sites and Their Association with Splicing Factor–Rich Nuclear Speckles, Journal of Cell Biology. 146, 543-558. 44. Stein, G. S., van Wijnen, A. J., Stein, J. L., Lian, J. B., Montecino, M., Choi, J., Zaidi, K. & Javed, A. (2000) Intranuclear trafficking of transcription factors: implications for biological control, Journal of Cell Science. 113, 2527.

6 Mapping RUNX2 transcriptional dynamics
during multi-lineage differentiation of human
mesenchymal stem cells
Abstract
The multi-lineage differentiation capacity of human mesenchymal stem cells (hMSCs)
enables its potential for tissue engineering and regenerative medicine. Master
transcription factors play a key role during development, differentiation, homeostasis
and disease pathology. RUNX2 is the master transcription factor for bone development,
and it regulates several important signaling pathways during chondrogenic and
osteogenic differentiation of hMSCs. However, modulation of RUNX2 activity during
hMSC differentiation into various lineages is not yet fully described. We differentiated
hMSCs into chondro-, osteo-, and adipogenic lineages and studied RUNX2 protein
dynamics using Transcription Factor - Fluorescence Recovery After Photobleaching (TF-
FRAP) at different time points. The TF-FRAP method can capture the dynamic changes
of RUNX2 protein mobility at the single cell level resolution, and cluster analysis shows
how RUNX2 dynamics change at subpopulation level in proliferating and differentiating
hMSCs. In addition, TF-FRAP show that the RUNX2 dynamics is coupled to its nuclear
localization pattern. TF-FRAP can determine the differentiation potential of a donor
towards a particular lineage. Our data show that, although whole hMSC population is
exposed to differentiation stimuli, subpopulations in hMSCs show a differential response
to the same environmental cues.
Kannan Govindaraj, Sakshi Khurana, Marcel Karperien and Janine N. Post
In Preparation
168 | Chapter 6
1
2
3
4
5
6
7
8
6.1 Introduction
Human mesenchymal stem cells (hMSCs) are plastic, capable of self-renewal and multi-
lineage differentiation. hMSCs are of great interest in tissue engineering due to its
differentiation potential towards chondrogenic, osteogenic and adipogenic lineages.
Treating osteochondral defects with allogenic or patients’ own MSCs have shown
promising results [1]. Several strategies, including MSC injection in the joint and
implanting in vitro differentiated MSCs with or without supporting biomaterials, have
been investigated [2]. However, clinical translation of MSC-based therapies to treat
osteochondral defects are not successful due to the functional mismatch between
implanted hMSCs and chondrocytes or osteoblasts [3].
In vitro differentiation of hMSCs into chondrocytes results in either fibro cartilage or
hypertrophic differentiation, and is thus not suitable for the treatment of cartilage
defects. Osteogenic differentiated hMSCs lack the mechanical properties of osteoblasts,
thereby limiting successful bone implants [4]. Despite much progress, complete
knowledge of the signaling interplay during MSC differentiation into multiple lineages
is still lacking. Exploring the intra- and extracellular signaling network involved in MSC
differentiation will aid in advancing tissue-engineering strategies and expand our
knowledge in MSC lineage commitment [5].
The role of transcription factors is paramount in lineage commitment and
differentiation. RUNX2 [6], SOX9 [7] and PPARγ [8] are the master transcription factors
for osteoblast, chondrocyte, and adipocyte differentiation, respectively. RUNX2, the
master regulator of bone development, plays a key role in multiple signaling pathways
associated with bone development, including TGFβ, BMP and WNT [9, 10]. RUNX2
directly regulates the expression of extracellular protein, COL10A1, which is abundantly
present in the bone [11]. In addition, RUNX2 plays an essential role during chondrogenic
differentiation of hMSCs and hypertrophic differentiation of chondrocytes [12]. The role
of RUNX2 is minimal and its activity is inhibited during adipogenic differentiation of
hMSCs [8]. Although much is described about RUNX2 activity during various lineage
differentiation of hMSCs, its activity has been studied by quantifying target gene or
protein expression levels, using static methods such as, qPCR and western blot,
respectively. However, hMSCs are heterogenic and contain several subpopulations of
cells [13-15]. Studying the RUNX2 protein activity at the single cell level will help us to
understand how its transcriptional activity changes during differentiation at the
subpopulation level.
We have previously shown how SOX9 protein dynamics change among the
subpopulation of hMSCs during chondro-, osteo- and adipogenic differentiation
(Chapter 5). In this report, using TF-FRAP, we have studied how RUNX2 protein
dynamics changes during chondro-, osteo- and adipogenic differentiation of hMSCs.
Mapping RUNX2 transcriptional dynamics during multi-lineage differentiation of hMSCs | 169
1
2
3
4
5
6
7
8
6.2 Materials and Methods
6.2.1 Cell Culture and Transfection
hMSCs were isolated from bone marrow from patients with no known musculoskeletal
diseases. hMSCs were cultured in αMEM (22571-038, Gibco), supplemented with 10% FBS
(F7524, Sigma), 200mM glutaMax (35050-38, Gibco), 20mM ascorbic acid 2 phosphate
(AsAP, A8960, Sigma), 100 ng/ml bFGF (RP80001, Neuromics), and 100 U/ml of
Penicillin-Streptomycin (15140122, Gibco) at 37⁰C with 5% CO2. hMSCs were expanded
and used within 4 passages.
C20/A4 cells were cultured in DMEM (Gibco, USA) with 10% FBS.
Human primary chondrocytes were cultured in chondrocyte proliferation media
containing DMEM supplemented with 10% FBS, 20mM ascorbic acid 2 phosphate (AsAP,
A8960, Sigma), L-Proline (0.4 mM, P5607, Sigma) and non-essential amino acids
(11140050, Gibco) at 37⁰C with 5% CO2.
For transfection, cells were seeded on a sterile glass coverslip (40,000/well) placed
inside the well. eGFP-RUNX2 plasmid was kindly given by Gary S Stein [16].
Lipofectamine 3000 with P3000 Reagent (Life Technologies, USA) was used for
transfection of hMSCs and Lipofectamine LTX with Plus reagent was used for
transfection of C20/A4 cells and hPCs and the manufacturer’s protocol was followed.
6.2.2 Cell cycle synchronization
hMSCs were seeded on microscopic coverslip placed inside a 24-well plate in hMSC
proliferation media. Next day, cells were transfected as described above and maintained
in proliferation media with serum for about 8 hours to allow cells to produce eGFP-
RUNX2 protein. For TF-FRAP: Transfected cells were maintained in serum free
proliferation media 24 hours prior to TF-FRAP measurements. During TF-FRAP
measurements, cells were maintained in the imaging buffer as described below. For
imaging eGFP-RUNX2 nuclear localization pattern: for 24+0h time point, transfected
cells were maintained in serum free proliferation media 24 hours prior to imaging. For
24+6h time point, post 24h of serum starvation, cell cycle was again started by replacing
the media with proliferation media with serum. Cells were imaged 6h after the start of
cell cycle, so the time point 24+6h. Cells in two different coverslips were used for 24+0h
and 24h+6h time points study. During imaging, cells were maintained in the imaging
buffer, at 37⁰C.
170 | Chapter 6
1
2
3
4
5
6
7
8
6.2.3 hMSC differentiation
hMSCs were differentiated into chondrogenic, osteogenic and adipogenic lineages by
culturing them in the respective differentiation media from day 0. Culture media were
refreshed every 3 – 4 days.
Chondrogenic differentiation medium: hMSCs (5,000 cells/cm2) were cultured in
DMEM (Gibco) supplemented with 1% of Insulin-Transferrin-Selenium (ITS) mix
(41400045, Gibco), 40 μg/ml of L-proline, 50 μg/ml of AsAP, 1% of sodium pyruvate
(S8636, Sigma), 100 U/ml of Penicillin-Streptomycin, and freshly added TGFβ1 (10 ng/ml,
7754-BH, R&D Systems) and 10-7 M dexamethasone (Dex, D8893, Sigma).
Osteogenic differentiation medium: hMSCs (1,000 cells/cm2) were cultured in αMEM
supplemented with 10% FBS, 100 U/ml of Penicillin-Streptomycin, 200mM GlutaMax, 50
μg/ml AsAP and freshly added Dex (10-8 M).
Adipogenic differentiation medium: hMSCs (10,000 cells/cm2) were cultured in
αMEM supplemented with 10% FBS, 100 U/ml of Penicillin-Streptomycin, 200mM
glutaMax, 50 μg/ml AsAP, freshly added Dex (10-6 M), 10 μg/ml Insulin (I9278, Sigma),
0.5 mM IBMX (I5879, Sigma) and 0.2 mM Indomethacin (57413, Sigma).
6.2.4 Imaging Buffer
Imaging was performed in Tyrode’s buffer [17] with freshly added 20 mM glucose (Gibco)
and 0.1% BSA (Sigma). Tyrode’s buffer is composed of 135 mM NaCl (Sigma), 10 mM KCl
(Sigma), 0.4 mM MgCl2 (Sigma), 1 mM CaCl2 (Sigma), 10 mM HEPES (Acros organics),
pH adjusted to 7.2, filter sterilized (0.2 μm) and stored at -20⁰C.
6.2.5 Transcription Factor - Fluorescence Recovery After
Photobleaching
Proliferating or differentiating hMSCs were plated on poly-l-lysine (0.01%, Sigma),
coated glass cover slips 2 days before transfection and were transiently transfected with
eGFP-RUNX2 a day before FRAP experiments. Chondrogenically differentiating hMSCs
did not attach on the coverslip without serum in the differentiation media. So, only for
chondrogenic differentiation, serum was added to differentiation media, when we
reseeded cells on coverslips for TF-FRAP, again media was replaced without serum, once
the cells were attached. FRAP was performed at four time points, i.e., 0 day
(proliferation), day 2, day 8 and day 15 or 23, for all the three lineages. Cells were
maintained in imaging buffer during FRAP measurements and the mobility of
transcription factors was measured at the steady-state (i.e. without other stimuli or FBS
added). FRAP measurements were performed using a Nikon A1 laser scanning confocal
Mapping RUNX2 transcriptional dynamics during multi-lineage differentiation of hMSCs | 171
1
2
3
4
5
6
7
8
microscope (Nikon, Japan), with 60X/1.2 NA water immersion objective, 488 nm Argon
laser at 0.50% (0.12 μW at the objective) laser power for eGFP-RUNX2. The temperature
was maintained at 37⁰C with an OkaLab temperature controller. A frame size of 256x256
pixels covering the whole nucleus was scanned. The pixel size was 0.12 μm. A
representative circular region of 2.9 μm diameter was bleached with one iteration (60
ms) of 50% (34.3 μW) laser power. Twenty-five pre-bleach images were taken and the
last 10 pre-bleach fluorescence intensity values were averaged to normalize the post-
bleach fluorescence recovery curve. After bleaching, imaging was performed at 4
frames/sec for 60 sec post-bleach. FRAP experiments were performed on at least 40 cells
per condition. To assess the statistical significance between the conditions Mann-
Whitney U tests were applied using Origin® software. MatlabTM was used to analyze the
FRAP data and the script is available in appendix A. A diffusion uncoupled, two-
component method was used to interpret our FRAP results as mentioned in [18].
6.2.6 Clustering and statistical analysis
We applied unsupervised hierarchical clustering to cluster RUNX2 dynamics data. TF-
FRAP variables, such as Immobile Fraction, Recovery half-time of A1 and A2 were used as
input for cluster analysis. The following clustering parameters were used: Distance type:
Euclidean, Cluster method: Furthest neighbor, and Find Clustroid: Sum of distances. The
distinct shapes of FRAP curves served as good references to identify and determine the
number of clusters in our FRAP data. In some cases, two clusters as segregated by
unsupervised hierarchical clustering, had very close similarity with negligible differences
(statistically insignificant) in the FRAP rates. Therefore, those clusters were combined
and considered one cluster. Clusters within a differentiation lineage at different time
points that showed no significant difference (at P>=0.05, Mann-Whitney U-test) for at
least two FRAP variables, were considered as same clusters, and were given the same
cluster name/identifier. OriginPro® (Origin Labs, USA) was used for clustering analysis.
6.2.7 Generation of heat-map
For convenience, clusters as segregated by hierarchical clustering were reordered per
time-point within the differentiation lineage in the ascending order of immobile fraction
values. All three FRAP variables, IF, recovery half-time (t ½ ) of A1 and t ½ of A2 were
normalized between 0 and 100. Within a variable, the lowest and highest values were set
to 0 and 100 respectively. OriginPro® was used to make heat-maps.
6.2.8 Immunofluorescence
hMSCs cultured on microscopy coverslips were fixed for 10 min with freshly prepared
4% Paraformaldehyde in PBS, pH7.2. Cells were washed with ice cold PBS, 3 times with
5 min interval. Cells were blocked and permeabilized for 15 mins with blocking solution
172 | Chapter 6
1
2
3
4
5
6
7
8
containing 1 mg/ml BSA and 0.1% Triton X-100 in PBS. Cells were incubated with mouse
anti-human RUNX2 primary antibody (ab76956, Abcam) in the blocking solution for 30
min at 37⁰C. Cells were washed with PBS, 3 times with 5 min intervals. Cells were
incubated with goat anti-mouse AF-647 antibody (A-21235, Invitrogen) in the blocking
solution (with 0.05% Triton X-100) for 30 min at 37⁰C. Cells were washed with PBS, 3
times with 5 min interval. Cell were stained with DAPI (1:100 dilution to 5 ng/ml) for 5
min in PBS. Cells were washed with PBS, 3 times with 5 min interval and mounted to
microscopy glass side using Vecta shield mounting medium (Vector Laboratories). Cells
were imaged using a Nikon A1 Confocal microscope with 60x water immersion objective
with 1.2 NA.
6.2.9 Histological Staining
Differentiation of hMSCs into chondrogenic, osteogenic and adipogenic lineage is
followed by Alcian blue, ALP and Oil Red O staining, respectively, at various time points.
Alcian blue staining was used to stain GAG produced by chondrogenic differentiated
hMSCs at day 0, day 2, day 8 and day 23. Cells were fixed with 10% buffered formalin
(HT501128, Sigma) for 15 mins and washed twice with ice cold PBS. Cells were incubated
with freshly prepared Alcian Blue 8GX (A3157, Sigma) staining solution (0.5% w/v in 1M
HCl, pH 1.0) for 30 mins and the cells were rinsed with dH2O until the staining solution
is washed off. ALP staining was used to stain alkaline phosphatase activity by osteogenic
differentiated hMSCs at day 0, day 2, day 8 and day 14. ALP staining kit (S5L2-1KT, Sigma)
was used for the staining and the manufacturer’s protocol was followed. Oil Red O
staining was used to stain neutral triglycerides and lipids produced by adipogenic
differentiated hMSCs at day 0, day 2, day 8 and day 23. Cells were fixed with 10% buffered
formalin for 15 mins and washed twice with ice cold PBS and dH20. Cells were incubated
in 60% isopropanol for 5 mins and then in freshly filtered Oil Red O staining solution
for 5 mins and the cells were rinsed with dH2O until the staining solution was washed
off. Cells were observed using a Nikon ECLIPSE TE300 microscope with 4x (0.13 NA)
objective for all the three staining.
6.3 Results
6.3.1 Interpretation of TF-FRAP data
TF-FRAP data is interpreted by applying an appropriate model, representing actual
events contributing to fluorescence recovery. An optimal TF-FRAP model is based on
the number of events and time-scale in which the event occurs. In case of transcription
factors, three types of events are possible, i.e., unbound transcription factors freely
moving (diffusing) inside the nucleus, transcription factors weakly bound to DNA (fast
moving) and strongly bound/exchanging at its binding site on DNA (slow moving) [19].
Diffusion is an extremely fast event, which occurs even before capturing the first post-
Mapping RUNX2 transcriptional dynamics during multi-lineage differentiation of hMSCs | 173
1
2
3
4
5
6
7
8
bleach image and therefore is not included in the model. A diffusion uncoupled, two-
component fit method is one of the models suitable for interpreting the TF-FRAP data.
In this model, the first component indicates the fast moving (A1) fraction, the second
component indicates the slow moving (A2) fraction of transcription factors, and these
two events occur in distinct time-scales [20]. Dynamic rates of a transcription factor,
such as recovery half-times, diffusion constants of A1 and A2 and Immobile Fraction (IF)
can be calculated from the TF-FRAP curve. For detailed information, we refer the readers
to [18-20] We have previously shown that SOX9 binding to DNA determines its
transcriptional activity [18]. Higher immobile fraction (DNA binding) of SOX9 and or
longer recovery half-time of A2 increased its target gene expression and vice versa.
6.3.2 Cellular heterogeneity leads to diverse RUNX2 mobility
patterns
RUNX2 transcriptional activity and its target genes expression levels are known to be
dynamically regulated during various lineage differentiation [21]. Since the activity of a
transcription factor is coupled to its dynamics [18], to understand RUNX2 activity, we
measured changes in RUNX2 mobility during chondro-, osteo- and adipogenic
differentiation of hMSCs. RUNX2 activity is known to change dynamically during hMSC
differentiation (reviewed in [11]). For example, RUNX2 activity increased during
osteogenic [10] and initial stages of chondrogenic differentiation [22], while it decreased
during adipogenic differentiation [23]. Although these studies were based on RUNX2
expression and/or its target gene or protein expression levels, we expected changes in
RUNX2 protein dynamics in line with these reports. However, data analysis by averaging
FRAP values per time point did not yield any useful information, except that the RUNX2
mobility increased during hMSC differentiation into any lineage (Figure S6.1).
Interestingly, we observed diverse mobility patterns of RUNX2 in proliferating and
differentiating hMSCs.
To gain more insight into RUNX2 transcriptional activity at the sub population level,
we clustered the FRAP data using an unsupervised hierarchical clustering method.
Cluster analysis revealed the presence of at least four clusters with distinct dynamic rates
in RUNX2 FRAP data in undifferentiated hMSCs (Figure S6.2 and Table S6.1). To check
whether these diverse mobility patterns are inherent property of any cell type, we
measured RUNX2 mobility in the C20/A4 cell line and in human primary chondrocytes.
Diversity of RUNX2 mobility was lower in the C20/A4 cells, whereas we observed at least
two clusters with distinct mobility patterns in hPCs (Figure S6.3).
To rule out the possibility of cell cycle playing a role in generating the diverse
mobility patterns, we measured RUNX2 mobility in 24-h cell cycle synchronized hMSCs.
We observed four clusters in the synchronized hMSCs (Figure S6.4). The hMSC doubling
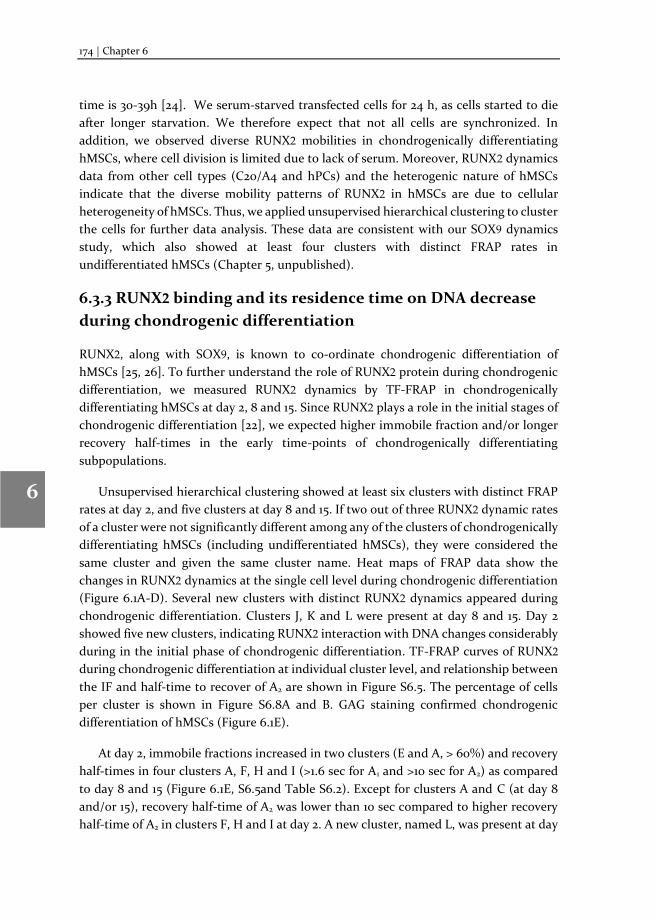
174 | Chapter 6
1
2
3
4
5
6
7
8
time is 30-39h [24]. We serum-starved transfected cells for 24 h, as cells started to die
after longer starvation. We therefore expect that not all cells are synchronized. In
addition, we observed diverse RUNX2 mobilities in chondrogenically differentiating
hMSCs, where cell division is limited due to lack of serum. Moreover, RUNX2 dynamics
data from other cell types (C20/A4 and hPCs) and the heterogenic nature of hMSCs
indicate that the diverse mobility patterns of RUNX2 in hMSCs are due to cellular
heterogeneity of hMSCs. Thus, we applied unsupervised hierarchical clustering to cluster
the cells for further data analysis. These data are consistent with our SOX9 dynamics
study, which also showed at least four clusters with distinct FRAP rates in
undifferentiated hMSCs (Chapter 5, unpublished).
6.3.3 RUNX2 binding and its residence time on DNA decrease
during chondrogenic differentiation
RUNX2, along with SOX9, is known to co-ordinate chondrogenic differentiation of
hMSCs [25, 26]. To further understand the role of RUNX2 protein during chondrogenic
differentiation, we measured RUNX2 dynamics by TF-FRAP in chondrogenically
differentiating hMSCs at day 2, 8 and 15. Since RUNX2 plays a role in the initial stages of
chondrogenic differentiation [22], we expected higher immobile fraction and/or longer
recovery half-times in the early time-points of chondrogenically differentiating
subpopulations.
Unsupervised hierarchical clustering showed at least six clusters with distinct FRAP
rates at day 2, and five clusters at day 8 and 15. If two out of three RUNX2 dynamic rates
of a cluster were not significantly different among any of the clusters of chondrogenically
differentiating hMSCs (including undifferentiated hMSCs), they were considered the
same cluster and given the same cluster name. Heat maps of FRAP data show the
changes in RUNX2 dynamics at the single cell level during chondrogenic differentiation
(Figure 6.1A-D). Several new clusters with distinct RUNX2 dynamics appeared during
chondrogenic differentiation. Clusters J, K and L were present at day 8 and 15. Day 2
showed five new clusters, indicating RUNX2 interaction with DNA changes considerably
during in the initial phase of chondrogenic differentiation. TF-FRAP curves of RUNX2
during chondrogenic differentiation at individual cluster level, and relationship between
the IF and half-time to recover of A2 are shown in Figure S6.5. The percentage of cells
per cluster is shown in Figure S6.8A and B. GAG staining confirmed chondrogenic
differentiation of hMSCs (Figure 6.1E).
At day 2, immobile fractions increased in two clusters (E and A, > 60%) and recovery
half-times in four clusters A, F, H and I (>1.6 sec for A1 and >10 sec for A2) as compared
to day 8 and 15 (Figure 6.1E, S6.5and Table S6.2). Except for clusters A and C (at day 8
and/or 15), recovery half-time of A2 was lower than 10 sec compared to higher recovery
half-time of A2 in clusters F, H and I at day 2. A new cluster, named L, was present at day
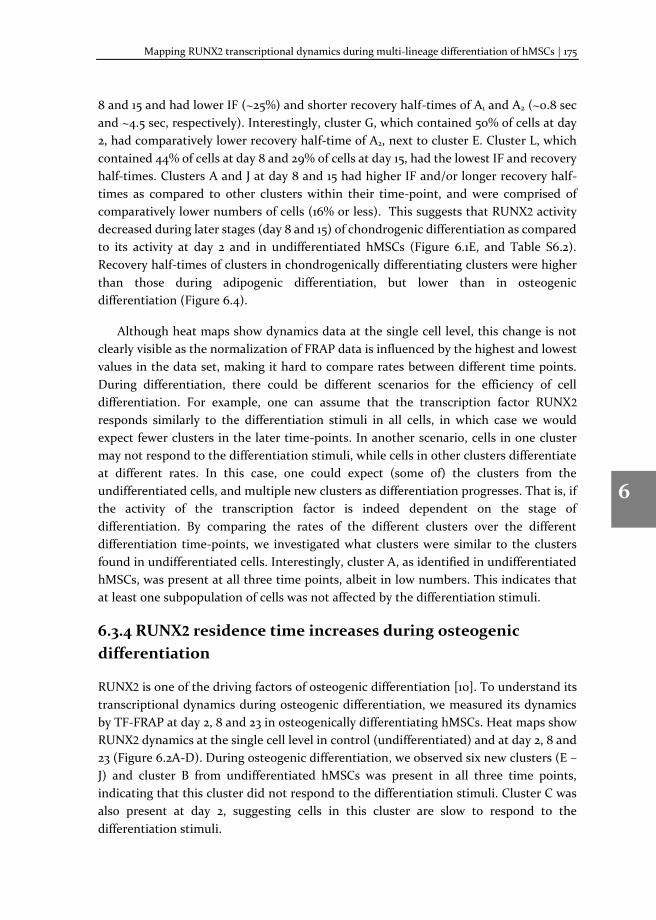
Mapping RUNX2 transcriptional dynamics during multi-lineage differentiation of hMSCs | 175
1
2
3
4
5
6
7
8
8 and 15 and had lower IF (~25%) and shorter recovery half-times of A1 and A2 (~0.8 sec
and ~4.5 sec, respectively). Interestingly, cluster G, which contained 50% of cells at day
2, had comparatively lower recovery half-time of A2, next to cluster E. Cluster L, which
contained 44% of cells at day 8 and 29% of cells at day 15, had the lowest IF and recovery
half-times. Clusters A and J at day 8 and 15 had higher IF and/or longer recovery half-
times as compared to other clusters within their time-point, and were comprised of
comparatively lower numbers of cells (16% or less). This suggests that RUNX2 activity
decreased during later stages (day 8 and 15) of chondrogenic differentiation as compared
to its activity at day 2 and in undifferentiated hMSCs (Figure 6.1E, and Table S6.2).
Recovery half-times of clusters in chondrogenically differentiating clusters were higher
than those during adipogenic differentiation, but lower than in osteogenic
differentiation (Figure 6.4).
Although heat maps show dynamics data at the single cell level, this change is not
clearly visible as the normalization of FRAP data is influenced by the highest and lowest
values in the data set, making it hard to compare rates between different time points.
During differentiation, there could be different scenarios for the efficiency of cell
differentiation. For example, one can assume that the transcription factor RUNX2
responds similarly to the differentiation stimuli in all cells, in which case we would
expect fewer clusters in the later time-points. In another scenario, cells in one cluster
may not respond to the differentiation stimuli, while cells in other clusters differentiate
at different rates. In this case, one could expect (some of) the clusters from the
undifferentiated cells, and multiple new clusters as differentiation progresses. That is, if
the activity of the transcription factor is indeed dependent on the stage of
differentiation. By comparing the rates of the different clusters over the different
differentiation time-points, we investigated what clusters were similar to the clusters
found in undifferentiated cells. Interestingly, cluster A, as identified in undifferentiated
hMSCs, was present at all three time points, albeit in low numbers. This indicates that
at least one subpopulation of cells was not affected by the differentiation stimuli.
6.3.4 RUNX2 residence time increases during osteogenic
differentiation
RUNX2 is one of the driving factors of osteogenic differentiation [10]. To understand its
transcriptional dynamics during osteogenic differentiation, we measured its dynamics
by TF-FRAP at day 2, 8 and 23 in osteogenically differentiating hMSCs. Heat maps show
RUNX2 dynamics at the single cell level in control (undifferentiated) and at day 2, 8 and
23 (Figure 6.2A-D). During osteogenic differentiation, we observed six new clusters (E –
J) and cluster B from undifferentiated hMSCs was present in all three time points,
indicating that this cluster did not respond to the differentiation stimuli. Cluster C was
also present at day 2, suggesting cells in this cluster are slow to respond to the
differentiation stimuli.
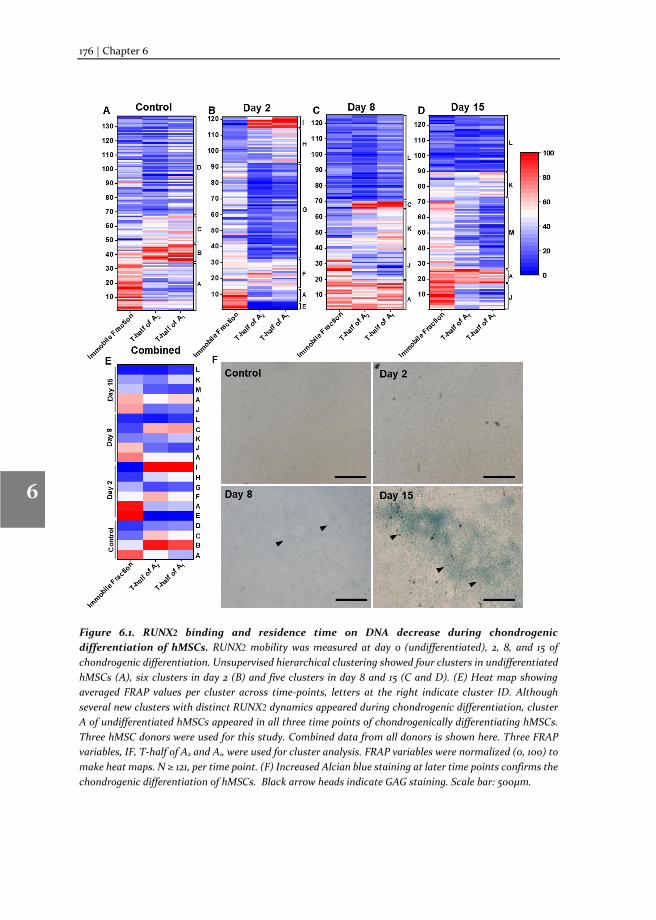
176 | Chapter 6
1
2
3
4
5
6
7
8
Figure 6.1. RUNX2 binding and residence time on DNA decrease during chondrogenic
differentiation of hMSCs. RUNX2 mobility was measured at day 0 (undifferentiated), 2, 8, and 15 of
chondrogenic differentiation. Unsupervised hierarchical clustering showed four clusters in undifferentiated
hMSCs (A), six clusters in day 2 (B) and five clusters in day 8 and 15 (C and D). (E) Heat map showing
averaged FRAP values per cluster across time-points, letters at the right indicate cluster ID. Although
several new clusters with distinct RUNX2 dynamics appeared during chondrogenic differentiation, cluster
A of undifferentiated hMSCs appeared in all three time points of chondrogenically differentiating hMSCs.
Three hMSC donors were used for this study. Combined data from all donors is shown here. Three FRAP
variables, IF, T-half of A2 and A1, were used for cluster analysis. FRAP variables were normalized (0, 100) to
make heat maps. N ≥ 121, per time point. (F) Increased Alcian blue staining at later time points confirms the
chondrogenic differentiation of hMSCs. Black arrow heads indicate GAG staining. Scale bar: 500μm.
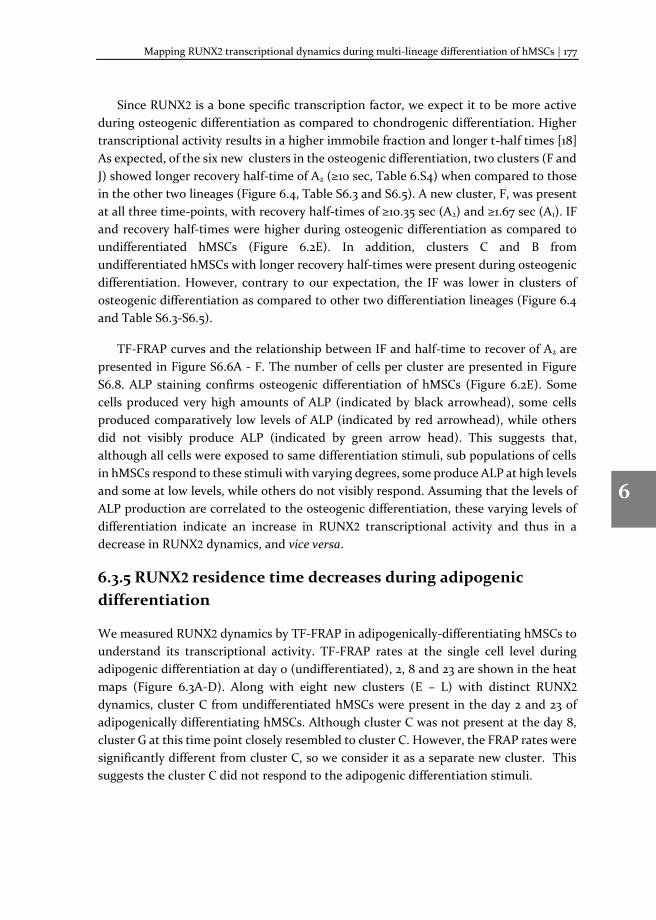
Mapping RUNX2 transcriptional dynamics during multi-lineage differentiation of hMSCs | 177
1
2
3
4
5
6
7
8
Since RUNX2 is a bone specific transcription factor, we expect it to be more active
during osteogenic differentiation as compared to chondrogenic differentiation. Higher
transcriptional activity results in a higher immobile fraction and longer t-half times [18]
As expected, of the six new clusters in the osteogenic differentiation, two clusters (F and
J) showed longer recovery half-time of A2 (≥10 sec, Table 6.S4) when compared to those
in the other two lineages (Figure 6.4, Table S6.3 and S6.5). A new cluster, F, was present
at all three time-points, with recovery half-times of ≥10.35 sec (A2) and ≥1.67 sec (A1). IF
and recovery half-times were higher during osteogenic differentiation as compared to
undifferentiated hMSCs (Figure 6.2E). In addition, clusters C and B from
undifferentiated hMSCs with longer recovery half-times were present during osteogenic
differentiation. However, contrary to our expectation, the IF was lower in clusters of
osteogenic differentiation as compared to other two differentiation lineages (Figure 6.4
and Table S6.3-S6.5).
TF-FRAP curves and the relationship between IF and half-time to recover of A2 are
presented in Figure S6.6A - F. The number of cells per cluster are presented in Figure
S6.8. ALP staining confirms osteogenic differentiation of hMSCs (Figure 6.2E). Some
cells produced very high amounts of ALP (indicated by black arrowhead), some cells
produced comparatively low levels of ALP (indicated by red arrowhead), while others
did not visibly produce ALP (indicated by green arrow head). This suggests that,
although all cells were exposed to same differentiation stimuli, sub populations of cells
in hMSCs respond to these stimuli with varying degrees, some produce ALP at high levels
and some at low levels, while others do not visibly respond. Assuming that the levels of
ALP production are correlated to the osteogenic differentiation, these varying levels of
differentiation indicate an increase in RUNX2 transcriptional activity and thus in a
decrease in RUNX2 dynamics, and vice versa.
6.3.5 RUNX2 residence time decreases during adipogenic
differentiation
We measured RUNX2 dynamics by TF-FRAP in adipogenically-differentiating hMSCs to
understand its transcriptional activity. TF-FRAP rates at the single cell level during
adipogenic differentiation at day 0 (undifferentiated), 2, 8 and 23 are shown in the heat
maps (Figure 6.3A-D). Along with eight new clusters (E – L) with distinct RUNX2
dynamics, cluster C from undifferentiated hMSCs were present in the day 2 and 23 of
adipogenically differentiating hMSCs. Although cluster C was not present at the day 8,
cluster G at this time point closely resembled to cluster C. However, the FRAP rates were
significantly different from cluster C, so we consider it as a separate new cluster. This
suggests the cluster C did not respond to the adipogenic differentiation stimuli.
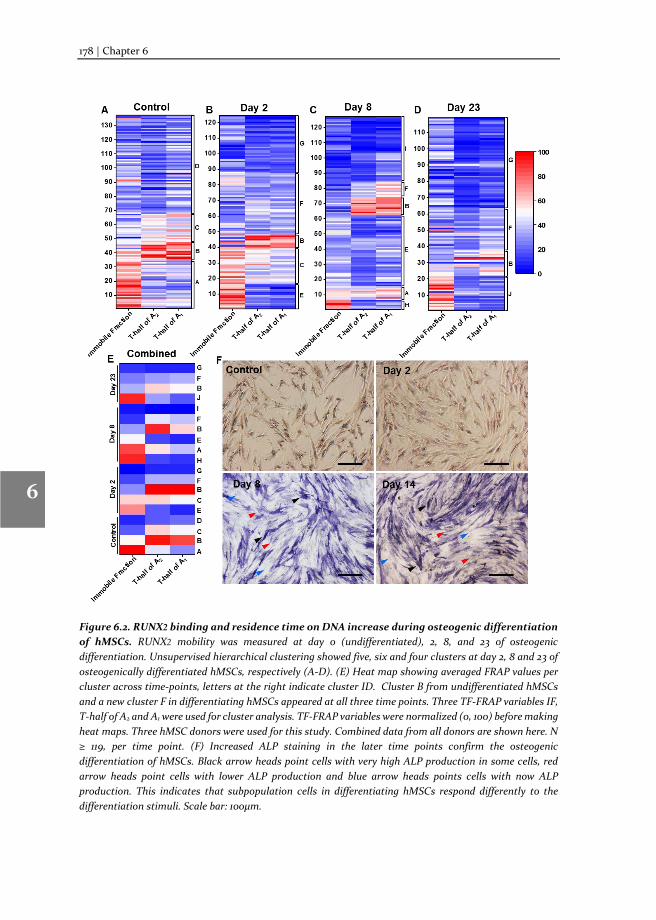
178 | Chapter 6
1
2
3
4
5
6
7
8
Figure 6.2. RUNX2 binding and residence time on DNA increase during osteogenic differentiation
of hMSCs. RUNX2 mobility was measured at day 0 (undifferentiated), 2, 8, and 23 of osteogenic
differentiation. Unsupervised hierarchical clustering showed five, six and four clusters at day 2, 8 and 23 of
osteogenically differentiated hMSCs, respectively (A-D). (E) Heat map showing averaged FRAP values per
cluster across time-points, letters at the right indicate cluster ID. Cluster B from undifferentiated hMSCs
and a new cluster F in differentiating hMSCs appeared at all three time points. Three TF-FRAP variables IF,
T-half of A2 and A1 were used for cluster analysis. TF-FRAP variables were normalized (0, 100) before making
heat maps. Three hMSC donors were used for this study. Combined data from all donors are shown here. N
≥ 119, per time point. (F) Increased ALP staining in the later time points confirm the osteogenic
differentiation of hMSCs. Black arrow heads point cells with very high ALP production in some cells, red
arrow heads point cells with lower ALP production and blue arrow heads points cells with now ALP
production. This indicates that subpopulation cells in differentiating hMSCs respond differently to the
differentiation stimuli. Scale bar: 100μm.
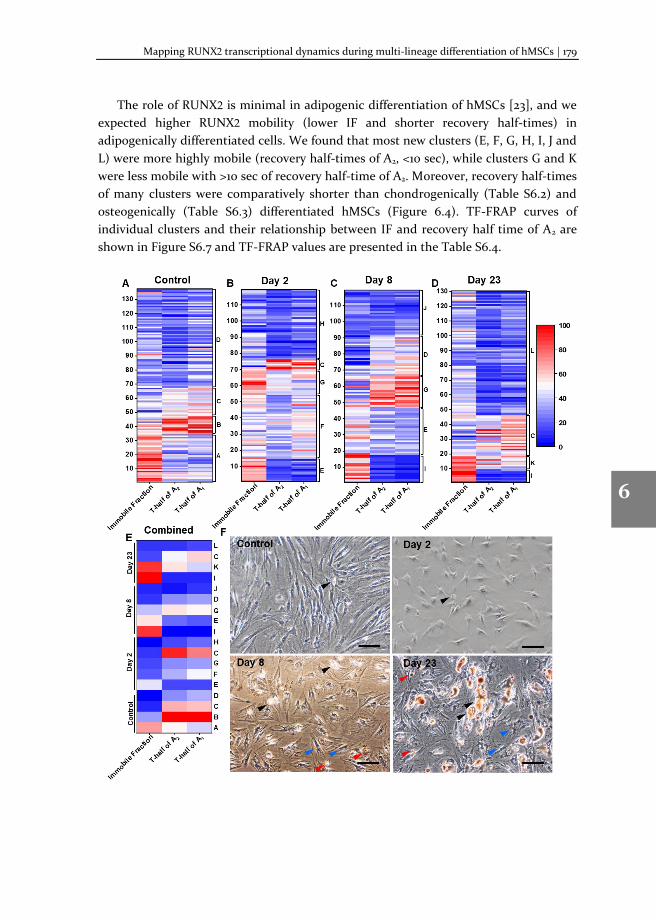
Mapping RUNX2 transcriptional dynamics during multi-lineage differentiation of hMSCs | 179
1
2
3
4
5
6
7
8
The role of RUNX2 is minimal in adipogenic differentiation of hMSCs [23], and we
expected higher RUNX2 mobility (lower IF and shorter recovery half-times) in
adipogenically differentiated cells. We found that most new clusters (E, F, G, H, I, J and
L) were more highly mobile (recovery half-times of A2, <10 sec), while clusters G and K
were less mobile with >10 sec of recovery half-time of A2. Moreover, recovery half-times
of many clusters were comparatively shorter than chondrogenically (Table S6.2) and
osteogenically (Table S6.3) differentiated hMSCs (Figure 6.4). TF-FRAP curves of
individual clusters and their relationship between IF and recovery half time of A2 are
shown in Figure S6.7 and TF-FRAP values are presented in the Table S6.4.
180 | Chapter 6
1
2
3
4
5
6
7
8
Figure 6.3. RUNX2 residence time on DNA decreases during adipogenic differentiation of hMSCs.
eGFP-RUNX2 mobility was measured at day 0 (undifferentiated), 2, 8, and 23 of adipogenic differentiation.
Unsupervised hierarchical clustering showed five clusters at day 2 and 8 and four clusters at day 23 in
adipogenically-differentiated hMSCs. Along with several new clusters, clusters C or D from undifferentiated
hMSCs also appeared during the adipogenic differentiation. (E) Heat map showing averaged FRAP values
per cluster across time-points, letters at the right indicate the cluster ID. Three FRAP variables, IF, T-half
of A2 and A1, were used for cluster analysis. FRAP variables were normalized (0, 100) before making heat
maps. Three hMSC donors were used for this study. Combined data from all donors are shown here. N ≥ 119,
per time point. (F) Increased Oil Red O staining over time points confirm adipogenic differentiation of
hMSCs. Black arrow heads indicate the cells with very high lipid production, red arrow heads indicate cells
with lower lipid production and blue arrow heads indicate cells with no lipid production. This indicates
subpopulation of cells in differentiating hMSCs do not respond similarly to the differentiation stimuli. Scale
bar: 100μm.
The percentage of cells per cluster are shown in Figure S6.8D. Interestingly, clusters
H, J and L (of day 2, 8 and 23, respectively), which contained comparatively higher
percentage of cells within their time points, showed comparatively lower IF (≤ 33%) and
shorter recovery half-times of A2 (≤ 5.68 sec) and A1 (≤ 0.96 sec, Table S6.4). This suggests
RUNX2-DNA binding (IF) and its residence time (recovery half-times) were drastically
reduced during adipogenic differentiation (Figure 6.1E). Cluster I (of day 8 and 23) had
higher immobile fractions (≤ 65%), but lower recovery half-times of A2 (≤4.38 sec) and
A1 (≤0.56 sec), indicating little active exchange of RUNX2 with DNA (Table S6.4).
Oil Red O staining at day 8 and 23 show varied degrees of oil droplets among
adipogenically differentiating cells (Figure 6.3E). Some cells contained very high amount
of lipid droplets (indicated by black arrow heads) and some cells with low lipid droplets
(indicated by red arrow heads) and some cells without any lipid droplets (indicated by
green arrow heads). These data again suggest that, although all cells were exposed to
same differentiation stimuli, sub population of cells respond differently resulting in
distinct RUNX2 dynamics.
6.3.6 RUNX2 residence time correlate to its target gene
expression levels
We compared RUNX2 residence time and DNA binding between chondro-, osteo- and
adipogenic differentiation, at the subpopulation level. We averaged TF-FRAP rates
within the subpopulation and normalized (0, 100) across time-points and differentiation.
We expected RUNX2 residence times and DNA binding would be higher in clusters of
osteogenically-differentiated hMSCs as compared to other two differentiation lineages.
However, we observed the expected changes only in the RUNX2 residence time. RUNX2
residence times were the highest in the clusters of osteo- and chondrogenic
differentiation and the lower in the clusters of adipogenic differentiation. Although, we
observed clusters with higher immobile fraction in the chondrogenically-differentiated
hMSCs, some clusters in adipogenically-differentiated hMSCs also contained
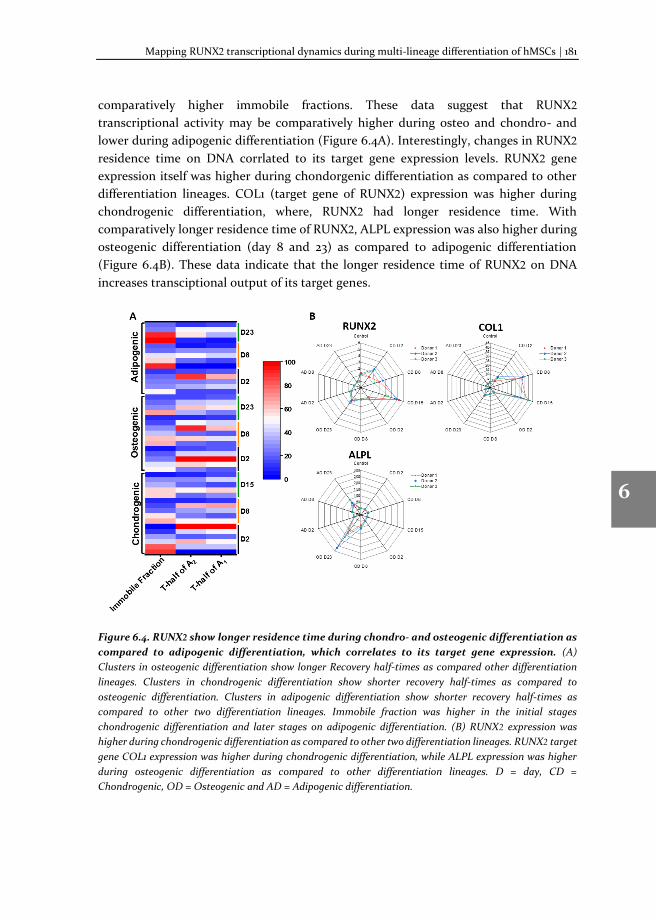
Mapping RUNX2 transcriptional dynamics during multi-lineage differentiation of hMSCs | 181
1
2
3
4
5
6
7
8
comparatively higher immobile fractions. These data suggest that RUNX2
transcriptional activity may be comparatively higher during osteo and chondro- and
lower during adipogenic differentiation (Figure 6.4A). Interestingly, changes in RUNX2
residence time on DNA corrlated to its target gene expression levels. RUNX2 gene
expression itself was higher during chondorgenic differentiation as compared to other
differentiation lineages. COL1 (target gene of RUNX2) expression was higher during
chondrogenic differentiation, where, RUNX2 had longer residence time. With
comparatively longer residence time of RUNX2, ALPL expression was also higher during
osteogenic differentiation (day 8 and 23) as compared to adipogenic differentiation
(Figure 6.4B). These data indicate that the longer residence time of RUNX2 on DNA
increases transciptional output of its target genes.
Figure 6.4. RUNX2 show longer residence time during chondro- and osteogenic differentiation as
compared to adipogenic differentiation, which correlates to its target gene expression. (A)
Clusters in osteogenic differentiation show longer Recovery half-times as compared other differentiation
lineages. Clusters in chondrogenic differentiation show shorter recovery half-times as compared to
osteogenic differentiation. Clusters in adipogenic differentiation show shorter recovery half-times as
compared to other two differentiation lineages. Immobile fraction was higher in the initial stages
chondrogenic differentiation and later stages on adipogenic differentiation. (B) RUNX2 expression was
higher during chondrogenic differentiation as compared to other two differentiation lineages. RUNX2 target
gene COL1 expression was higher during chondrogenic differentiation, while ALPL expression was higher
during osteogenic differentiation as compared to other differentiation lineages. D = day, CD =
Chondrogenic, OD = Osteogenic and AD = Adipogenic differentiation.
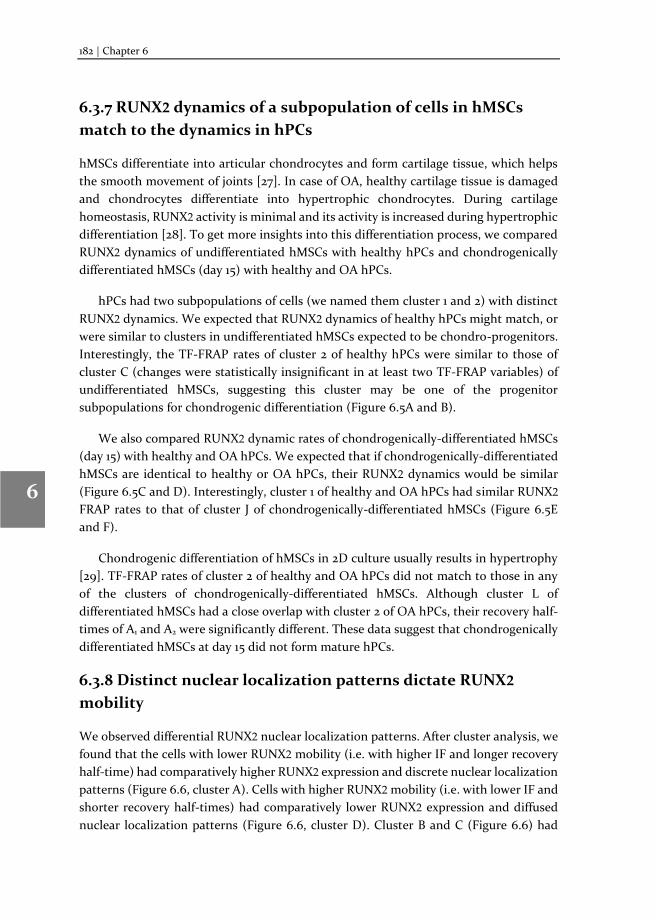
182 | Chapter 6
1
2
3
4
5
6
7
8
6.3.7 RUNX2 dynamics of a subpopulation of cells in hMSCs
match to the dynamics in hPCs
hMSCs differentiate into articular chondrocytes and form cartilage tissue, which helps
the smooth movement of joints [27]. In case of OA, healthy cartilage tissue is damaged
and chondrocytes differentiate into hypertrophic chondrocytes. During cartilage
homeostasis, RUNX2 activity is minimal and its activity is increased during hypertrophic
differentiation [28]. To get more insights into this differentiation process, we compared
RUNX2 dynamics of undifferentiated hMSCs with healthy hPCs and chondrogenically
differentiated hMSCs (day 15) with healthy and OA hPCs.
hPCs had two subpopulations of cells (we named them cluster 1 and 2) with distinct
RUNX2 dynamics. We expected that RUNX2 dynamics of healthy hPCs might match, or
were similar to clusters in undifferentiated hMSCs expected to be chondro-progenitors.
Interestingly, the TF-FRAP rates of cluster 2 of healthy hPCs were similar to those of
cluster C (changes were statistically insignificant in at least two TF-FRAP variables) of
undifferentiated hMSCs, suggesting this cluster may be one of the progenitor
subpopulations for chondrogenic differentiation (Figure 6.5A and B).
We also compared RUNX2 dynamic rates of chondrogenically-differentiated hMSCs
(day 15) with healthy and OA hPCs. We expected that if chondrogenically-differentiated
hMSCs are identical to healthy or OA hPCs, their RUNX2 dynamics would be similar
(Figure 6.5C and D). Interestingly, cluster 1 of healthy and OA hPCs had similar RUNX2
FRAP rates to that of cluster J of chondrogenically-differentiated hMSCs (Figure 6.5E
and F).
Chondrogenic differentiation of hMSCs in 2D culture usually results in hypertrophy
[29]. TF-FRAP rates of cluster 2 of healthy and OA hPCs did not match to those in any
of the clusters of chondrogenically-differentiated hMSCs. Although cluster L of
differentiated hMSCs had a close overlap with cluster 2 of OA hPCs, their recovery half-
times of A1 and A2 were significantly different. These data suggest that chondrogenically
differentiated hMSCs at day 15 did not form mature hPCs.
6.3.8 Distinct nuclear localization patterns dictate RUNX2
mobility
We observed differential RUNX2 nuclear localization patterns. After cluster analysis, we
found that the cells with lower RUNX2 mobility (i.e. with higher IF and longer recovery
half-time) had comparatively higher RUNX2 expression and discrete nuclear localization
patterns (Figure 6.6, cluster A). Cells with higher RUNX2 mobility (i.e. with lower IF and
shorter recovery half-times) had comparatively lower RUNX2 expression and diffused
nuclear localization patterns (Figure 6.6, cluster D). Cluster B and C (Figure 6.6) had
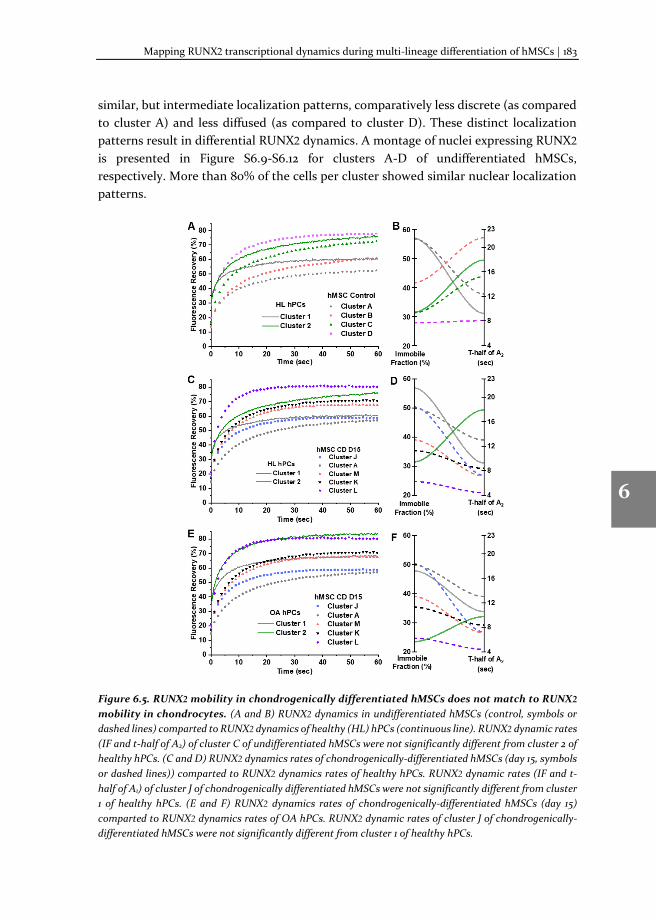
Mapping RUNX2 transcriptional dynamics during multi-lineage differentiation of hMSCs | 183
1
2
3
4
5
6
7
8
similar, but intermediate localization patterns, comparatively less discrete (as compared
to cluster A) and less diffused (as compared to cluster D). These distinct localization
patterns result in differential RUNX2 dynamics. A montage of nuclei expressing RUNX2
is presented in Figure S6.9-S6.12 for clusters A-D of undifferentiated hMSCs,
respectively. More than 80% of the cells per cluster showed similar nuclear localization
patterns.
Figure 6.5. RUNX2 mobility in chondrogenically differentiated hMSCs does not match to RUNX2
mobility in chondrocytes. (A and B) RUNX2 dynamics in undifferentiated hMSCs (control, symbols or
dashed lines) comparted to RUNX2 dynamics of healthy (HL) hPCs (continuous line). RUNX2 dynamic rates
(IF and t-half of A2) of cluster C of undifferentiated hMSCs were not significantly different from cluster 2 of
healthy hPCs. (C and D) RUNX2 dynamics rates of chondrogenically-differentiated hMSCs (day 15, symbols
or dashed lines)) comparted to RUNX2 dynamics rates of healthy hPCs. RUNX2 dynamic rates (IF and t-
half of A1) of cluster J of chondrogenically differentiated hMSCs were not significantly different from cluster
1 of healthy hPCs. (E and F) RUNX2 dynamics rates of chondrogenically-differentiated hMSCs (day 15)
comparted to RUNX2 dynamics rates of OA hPCs. RUNX2 dynamic rates of cluster J of chondrogenically-
differentiated hMSCs were not significantly different from cluster 1 of healthy hPCs.
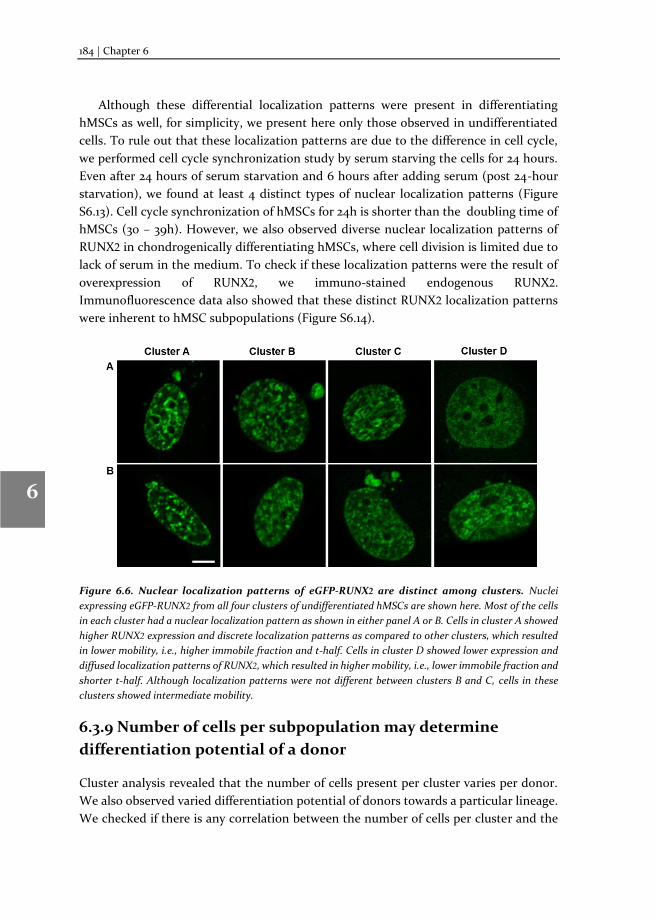
184 | Chapter 6
1
2
3
4
5
6
7
8
Although these differential localization patterns were present in differentiating
hMSCs as well, for simplicity, we present here only those observed in undifferentiated
cells. To rule out that these localization patterns are due to the difference in cell cycle,
we performed cell cycle synchronization study by serum starving the cells for 24 hours.
Even after 24 hours of serum starvation and 6 hours after adding serum (post 24-hour
starvation), we found at least 4 distinct types of nuclear localization patterns (Figure
S6.13). Cell cycle synchronization of hMSCs for 24h is shorter than the doubling time of
hMSCs (30 – 39h). However, we also observed diverse nuclear localization patterns of
RUNX2 in chondrogenically differentiating hMSCs, where cell division is limited due to
lack of serum in the medium. To check if these localization patterns were the result of
overexpression of RUNX2, we immuno-stained endogenous RUNX2.
Immunofluorescence data also showed that these distinct RUNX2 localization patterns
were inherent to hMSC subpopulations (Figure S6.14).
Figure 6.6. Nuclear localization patterns of eGFP-RUNX2 are distinct among clusters. Nuclei
expressing eGFP-RUNX2 from all four clusters of undifferentiated hMSCs are shown here. Most of the cells
in each cluster had a nuclear localization pattern as shown in either panel A or B. Cells in cluster A showed
higher RUNX2 expression and discrete localization patterns as compared to other clusters, which resulted
in lower mobility, i.e., higher immobile fraction and t-half. Cells in cluster D showed lower expression and
diffused localization patterns of RUNX2, which resulted in higher mobility, i.e., lower immobile fraction and
shorter t-half. Although localization patterns were not different between clusters B and C, cells in these
clusters showed intermediate mobility.
6.3.9 Number of cells per subpopulation may determine
differentiation potential of a donor
Cluster analysis revealed that the number of cells present per cluster varies per donor.
We also observed varied differentiation potential of donors towards a particular lineage.
We checked if there is any correlation between the number of cells per cluster and the
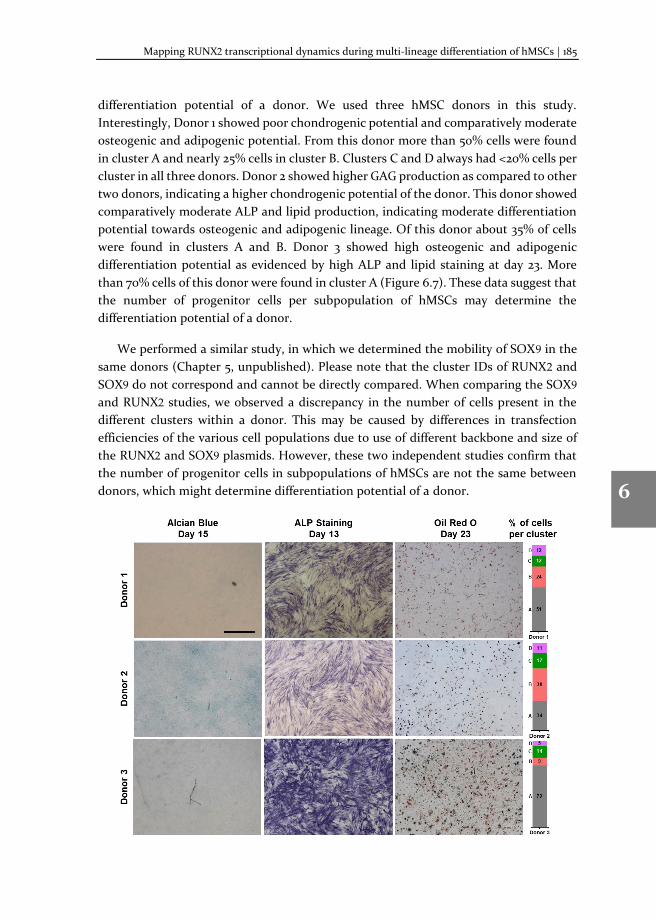
Mapping RUNX2 transcriptional dynamics during multi-lineage differentiation of hMSCs | 185
1
2
3
4
5
6
7
8
differentiation potential of a donor. We used three hMSC donors in this study.
Interestingly, Donor 1 showed poor chondrogenic potential and comparatively moderate
osteogenic and adipogenic potential. From this donor more than 50% cells were found
in cluster A and nearly 25% cells in cluster B. Clusters C and D always had <20% cells per
cluster in all three donors. Donor 2 showed higher GAG production as compared to other
two donors, indicating a higher chondrogenic potential of the donor. This donor showed
comparatively moderate ALP and lipid production, indicating moderate differentiation
potential towards osteogenic and adipogenic lineage. Of this donor about 35% of cells
were found in clusters A and B. Donor 3 showed high osteogenic and adipogenic
differentiation potential as evidenced by high ALP and lipid staining at day 23. More
than 70% cells of this donor were found in cluster A (Figure 6.7). These data suggest that
the number of progenitor cells per subpopulation of hMSCs may determine the
differentiation potential of a donor.
We performed a similar study, in which we determined the mobility of SOX9 in the
same donors (Chapter 5, unpublished). Please note that the cluster IDs of RUNX2 and
SOX9 do not correspond and cannot be directly compared. When comparing the SOX9
and RUNX2 studies, we observed a discrepancy in the number of cells present in the
different clusters within a donor. This may be caused by differences in transfection
efficiencies of the various cell populations due to use of different backbone and size of
the RUNX2 and SOX9 plasmids. However, these two independent studies confirm that
the number of progenitor cells in subpopulations of hMSCs are not the same between
donors, which might determine differentiation potential of a donor.
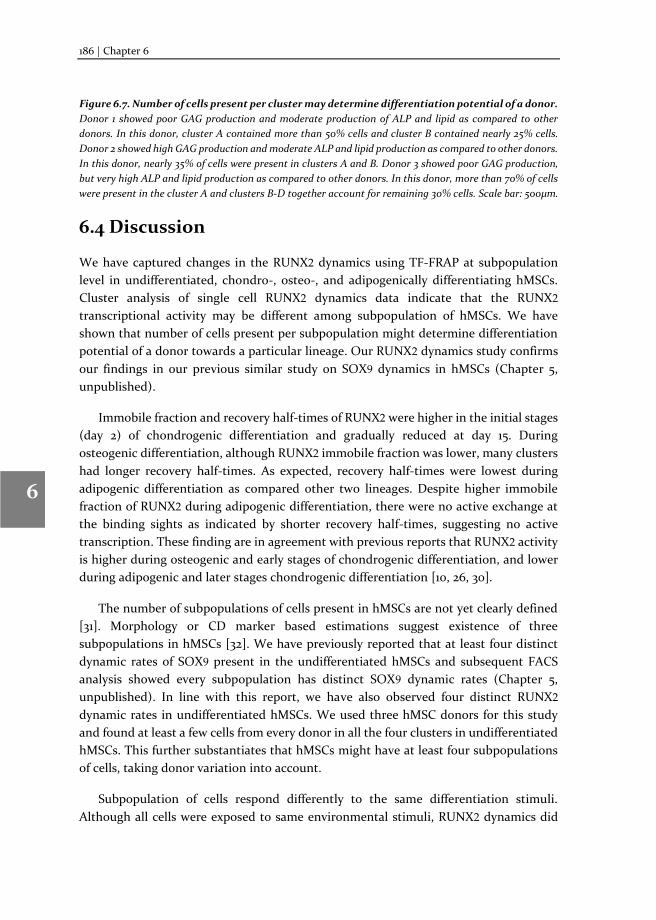
186 | Chapter 6
1
2
3
4
5
6
7
8
Figure 6.7. Number of cells present per cluster may determine differentiation potential of a donor.
Donor 1 showed poor GAG production and moderate production of ALP and lipid as compared to other
donors. In this donor, cluster A contained more than 50% cells and cluster B contained nearly 25% cells.
Donor 2 showed high GAG production and moderate ALP and lipid production as compared to other donors.
In this donor, nearly 35% of cells were present in clusters A and B. Donor 3 showed poor GAG production,
but very high ALP and lipid production as compared to other donors. In this donor, more than 70% of cells
were present in the cluster A and clusters B-D together account for remaining 30% cells. Scale bar: 500μm.
6.4 Discussion
We have captured changes in the RUNX2 dynamics using TF-FRAP at subpopulation
level in undifferentiated, chondro-, osteo-, and adipogenically differentiating hMSCs.
Cluster analysis of single cell RUNX2 dynamics data indicate that the RUNX2
transcriptional activity may be different among subpopulation of hMSCs. We have
shown that number of cells present per subpopulation might determine differentiation
potential of a donor towards a particular lineage. Our RUNX2 dynamics study confirms
our findings in our previous similar study on SOX9 dynamics in hMSCs (Chapter 5,
unpublished).
Immobile fraction and recovery half-times of RUNX2 were higher in the initial stages
(day 2) of chondrogenic differentiation and gradually reduced at day 15. During
osteogenic differentiation, although RUNX2 immobile fraction was lower, many clusters
had longer recovery half-times. As expected, recovery half-times were lowest during
adipogenic differentiation as compared other two lineages. Despite higher immobile
fraction of RUNX2 during adipogenic differentiation, there were no active exchange at
the binding sights as indicated by shorter recovery half-times, suggesting no active
transcription. These finding are in agreement with previous reports that RUNX2 activity
is higher during osteogenic and early stages of chondrogenic differentiation, and lower
during adipogenic and later stages chondrogenic differentiation [10, 26, 30].
The number of subpopulations of cells present in hMSCs are not yet clearly defined
[31]. Morphology or CD marker based estimations suggest existence of three
subpopulations in hMSCs [32]. We have previously reported that at least four distinct
dynamic rates of SOX9 present in the undifferentiated hMSCs and subsequent FACS
analysis showed every subpopulation has distinct SOX9 dynamic rates (Chapter 5,
unpublished). In line with this report, we have also observed four distinct RUNX2
dynamic rates in undifferentiated hMSCs. We used three hMSC donors for this study
and found at least a few cells from every donor in all the four clusters in undifferentiated
hMSCs. This further substantiates that hMSCs might have at least four subpopulations
of cells, taking donor variation into account.
Subpopulation of cells respond differently to the same differentiation stimuli.
Although all cells were exposed to same environmental stimuli, RUNX2 dynamics did
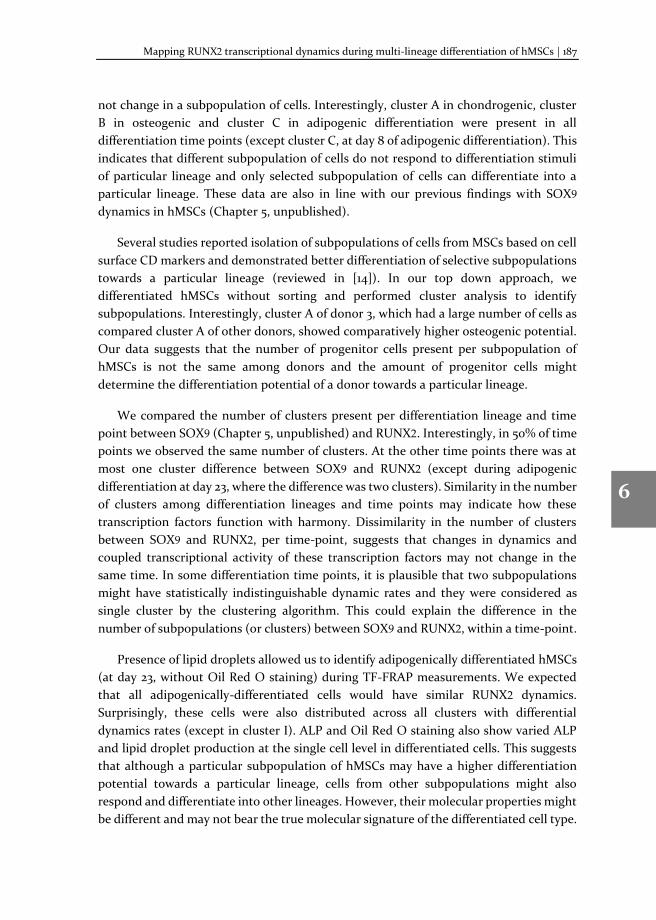
Mapping RUNX2 transcriptional dynamics during multi-lineage differentiation of hMSCs | 187
1
2
3
4
5
6
7
8
not change in a subpopulation of cells. Interestingly, cluster A in chondrogenic, cluster
B in osteogenic and cluster C in adipogenic differentiation were present in all
differentiation time points (except cluster C, at day 8 of adipogenic differentiation). This
indicates that different subpopulation of cells do not respond to differentiation stimuli
of particular lineage and only selected subpopulation of cells can differentiate into a
particular lineage. These data are also in line with our previous findings with SOX9
dynamics in hMSCs (Chapter 5, unpublished).
Several studies reported isolation of subpopulations of cells from MSCs based on cell
surface CD markers and demonstrated better differentiation of selective subpopulations
towards a particular lineage (reviewed in [14]). In our top down approach, we
differentiated hMSCs without sorting and performed cluster analysis to identify
subpopulations. Interestingly, cluster A of donor 3, which had a large number of cells as
compared cluster A of other donors, showed comparatively higher osteogenic potential.
Our data suggests that the number of progenitor cells present per subpopulation of
hMSCs is not the same among donors and the amount of progenitor cells might
determine the differentiation potential of a donor towards a particular lineage.
We compared the number of clusters present per differentiation lineage and time
point between SOX9 (Chapter 5, unpublished) and RUNX2. Interestingly, in 50% of time
points we observed the same number of clusters. At the other time points there was at
most one cluster difference between SOX9 and RUNX2 (except during adipogenic
differentiation at day 23, where the difference was two clusters). Similarity in the number
of clusters among differentiation lineages and time points may indicate how these
transcription factors function with harmony. Dissimilarity in the number of clusters
between SOX9 and RUNX2, per time-point, suggests that changes in dynamics and
coupled transcriptional activity of these transcription factors may not change in the
same time. In some differentiation time points, it is plausible that two subpopulations
might have statistically indistinguishable dynamic rates and they were considered as
single cluster by the clustering algorithm. This could explain the difference in the
number of subpopulations (or clusters) between SOX9 and RUNX2, within a time-point.
Presence of lipid droplets allowed us to identify adipogenically differentiated hMSCs
(at day 23, without Oil Red O staining) during TF-FRAP measurements. We expected
that all adipogenically-differentiated cells would have similar RUNX2 dynamics.
Surprisingly, these cells were also distributed across all clusters with differential
dynamics rates (except in cluster I). ALP and Oil Red O staining also show varied ALP
and lipid droplet production at the single cell level in differentiated cells. This suggests
that although a particular subpopulation of hMSCs may have a higher differentiation
potential towards a particular lineage, cells from other subpopulations might also
respond and differentiate into other lineages. However, their molecular properties might
be different and may not bear the true molecular signature of the differentiated cell type.
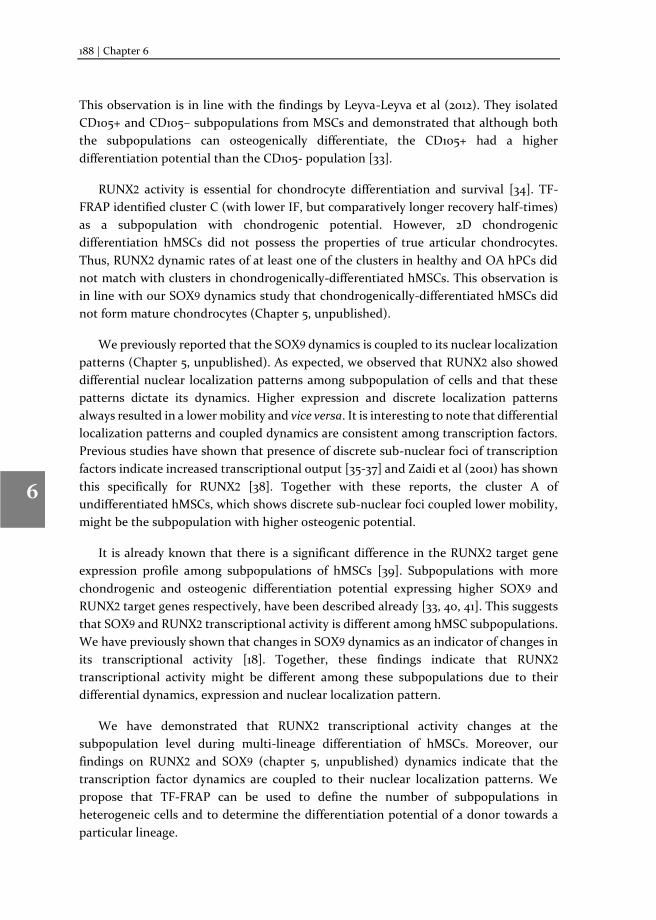
188 | Chapter 6
1
2
3
4
5
6
7
8
This observation is in line with the findings by Leyva-Leyva et al (2012). They isolated
CD105+ and CD105– subpopulations from MSCs and demonstrated that although both
the subpopulations can osteogenically differentiate, the CD105+ had a higher
differentiation potential than the CD105- population [33].
RUNX2 activity is essential for chondrocyte differentiation and survival [34]. TF-
FRAP identified cluster C (with lower IF, but comparatively longer recovery half-times)
as a subpopulation with chondrogenic potential. However, 2D chondrogenic
differentiation hMSCs did not possess the properties of true articular chondrocytes.
Thus, RUNX2 dynamic rates of at least one of the clusters in healthy and OA hPCs did
not match with clusters in chondrogenically-differentiated hMSCs. This observation is
in line with our SOX9 dynamics study that chondrogenically-differentiated hMSCs did
not form mature chondrocytes (Chapter 5, unpublished).
We previously reported that the SOX9 dynamics is coupled to its nuclear localization
patterns (Chapter 5, unpublished). As expected, we observed that RUNX2 also showed
differential nuclear localization patterns among subpopulation of cells and that these
patterns dictate its dynamics. Higher expression and discrete localization patterns
always resulted in a lower mobility and vice versa. It is interesting to note that differential
localization patterns and coupled dynamics are consistent among transcription factors.
Previous studies have shown that presence of discrete sub-nuclear foci of transcription
factors indicate increased transcriptional output [35-37] and Zaidi et al (2001) has shown
this specifically for RUNX2 [38]. Together with these reports, the cluster A of
undifferentiated hMSCs, which shows discrete sub-nuclear foci coupled lower mobility,
might be the subpopulation with higher osteogenic potential.
It is already known that there is a significant difference in the RUNX2 target gene
expression profile among subpopulations of hMSCs [39]. Subpopulations with more
chondrogenic and osteogenic differentiation potential expressing higher SOX9 and
RUNX2 target genes respectively, have been described already [33, 40, 41]. This suggests
that SOX9 and RUNX2 transcriptional activity is different among hMSC subpopulations.
We have previously shown that changes in SOX9 dynamics as an indicator of changes in
its transcriptional activity [18]. Together, these findings indicate that RUNX2
transcriptional activity might be different among these subpopulations due to their
differential dynamics, expression and nuclear localization pattern.
We have demonstrated that RUNX2 transcriptional activity changes at the
subpopulation level during multi-lineage differentiation of hMSCs. Moreover, our
findings on RUNX2 and SOX9 (chapter 5, unpublished) dynamics indicate that the
transcription factor dynamics are coupled to their nuclear localization patterns. We
propose that TF-FRAP can be used to define the number of subpopulations in
heterogeneic cells and to determine the differentiation potential of a donor towards a
particular lineage.
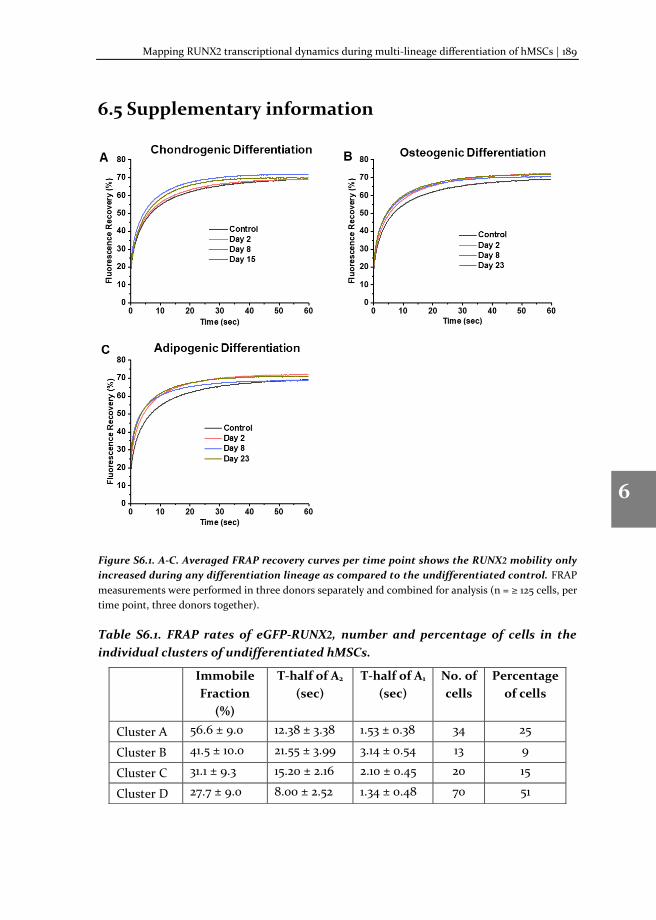
Mapping RUNX2 transcriptional dynamics during multi-lineage differentiation of hMSCs | 189
1
2
3
4
5
6
7
8
6.5 Supplementary information
Figure S6.1. A-C. Averaged FRAP recovery curves per time point shows the RUNX2 mobility only
increased during any differentiation lineage as compared to the undifferentiated control. FRAP
measurements were performed in three donors separately and combined for analysis (n = ≥ 125 cells, per
time point, three donors together).
Table S6.1. FRAP rates of eGFP-RUNX2, number and percentage of cells in the
individual clusters of undifferentiated hMSCs.
Immobile
Fraction
(%)
T-half of A2
(sec)
T-half of A1
(sec)
No. of
cells
Percentage
of cells
Cluster A 56.6 ± 9.0 12.38 ± 3.38 1.53 ± 0.38 34 25
Cluster B 41.5 ± 10.0 21.55 ± 3.99 3.14 ± 0.54 13 9
Cluster C 31.1 ± 9.3 15.20 ± 2.16 2.10 ± 0.45 20 15
Cluster D 27.7 ± 9.0 8.00 ± 2.52 1.34 ± 0.48 70 51
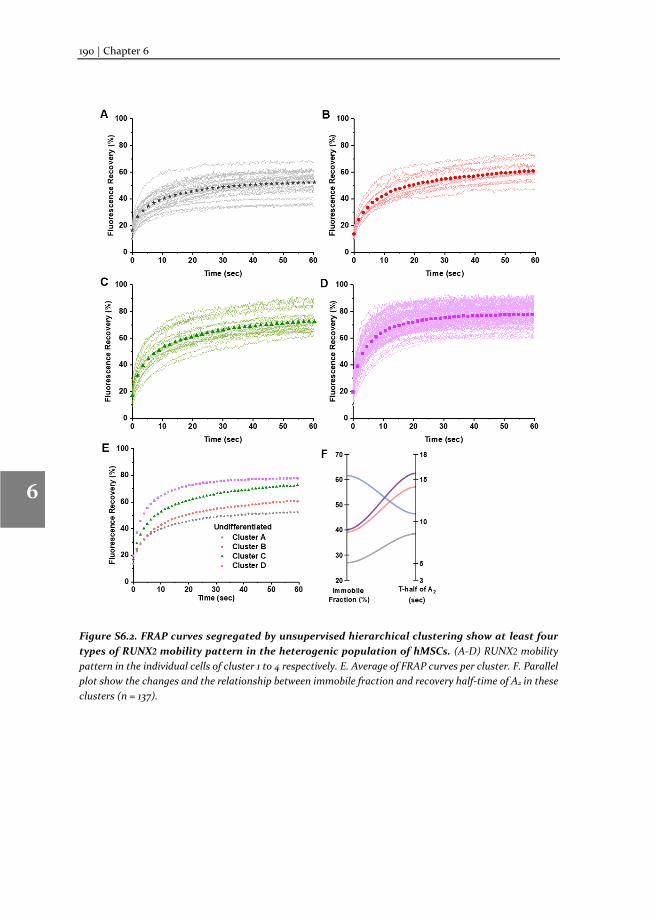
190 | Chapter 6
1
2
3
4
5
6
7
8
Figure S6.2. FRAP curves segregated by unsupervised hierarchical clustering show at least four
types of RUNX2 mobility pattern in the heterogenic population of hMSCs. (A-D) RUNX2 mobility
pattern in the individual cells of cluster 1 to 4 respectively. E. Average of FRAP curves per cluster. F. Parallel
plot show the changes and the relationship between immobile fraction and recovery half-time of A2 in these
clusters (n = 137).
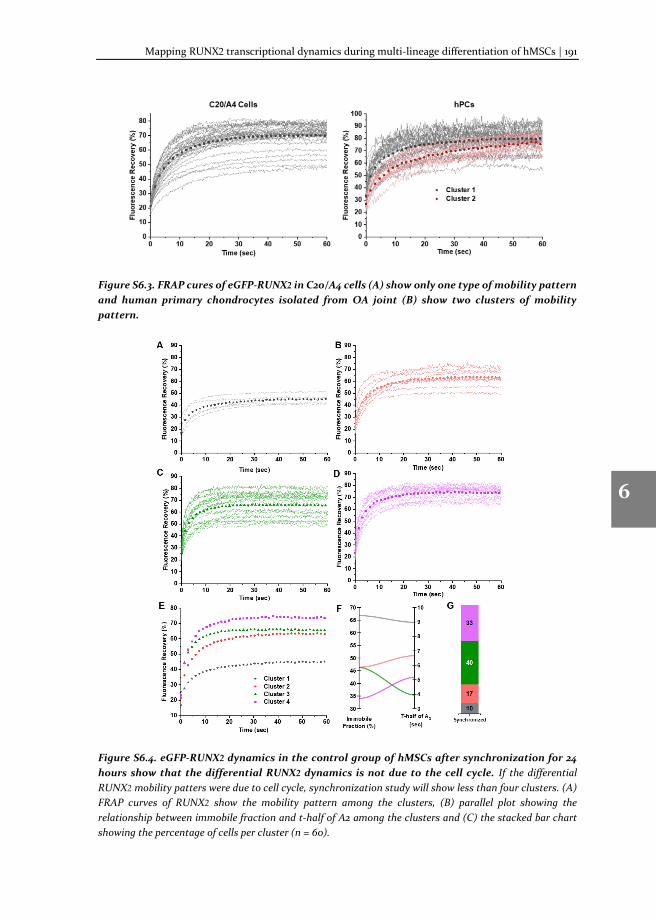
Mapping RUNX2 transcriptional dynamics during multi-lineage differentiation of hMSCs | 191
1
2
3
4
5
6
7
8
Figure S6.3. FRAP cures of eGFP-RUNX2 in C20/A4 cells (A) show only one type of mobility pattern
and human primary chondrocytes isolated from OA joint (B) show two clusters of mobility
pattern.
Figure S6.4. eGFP-RUNX2 dynamics in the control group of hMSCs after synchronization for 24
hours show that the differential RUNX2 dynamics is not due to the cell cycle. If the differential
RUNX2 mobility patters were due to cell cycle, synchronization study will show less than four clusters. (A)
FRAP curves of RUNX2 show the mobility pattern among the clusters, (B) parallel plot showing the
relationship between immobile fraction and t-half of A2 among the clusters and (C) the stacked bar chart
showing the percentage of cells per cluster (n = 60).
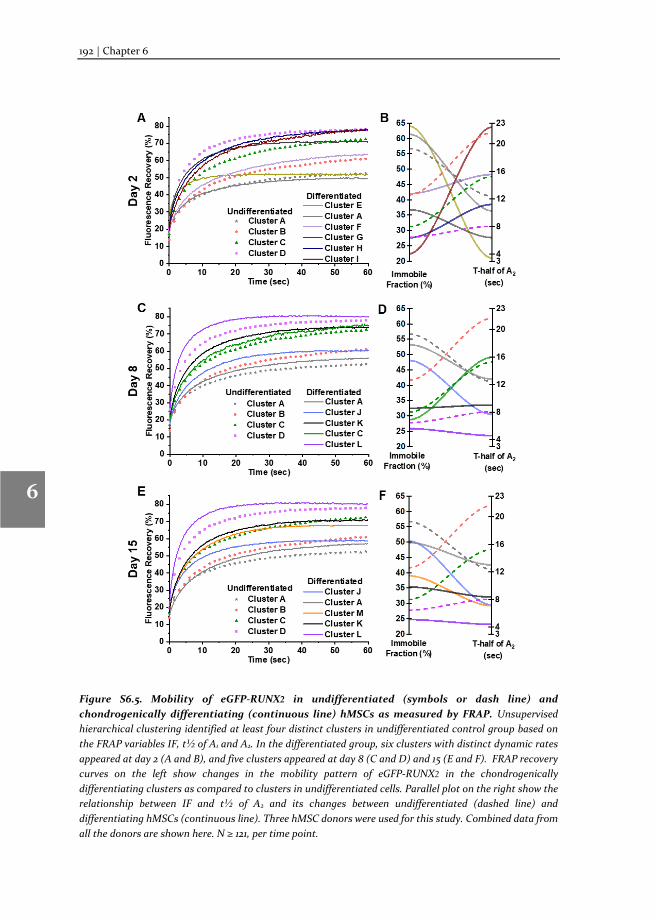
192 | Chapter 6
1
2
3
4
5
6
7
8
Figure S6.5. Mobility of eGFP-RUNX2 in undifferentiated (symbols or dash line) and
chondrogenically differentiating (continuous line) hMSCs as measured by FRAP. Unsupervised
hierarchical clustering identified at least four distinct clusters in undifferentiated control group based on
the FRAP variables IF, t½ of A1 and A2. In the differentiated group, six clusters with distinct dynamic rates
appeared at day 2 (A and B), and five clusters appeared at day 8 (C and D) and 15 (E and F). FRAP recovery
curves on the left show changes in the mobility pattern of eGFP-RUNX2 in the chondrogenically
differentiating clusters as compared to clusters in undifferentiated cells. Parallel plot on the right show the
relationship between IF and t½ of A2 and its changes between undifferentiated (dashed line) and
differentiating hMSCs (continuous line). Three hMSC donors were used for this study. Combined data from
all the donors are shown here. N ≥ 121, per time point.
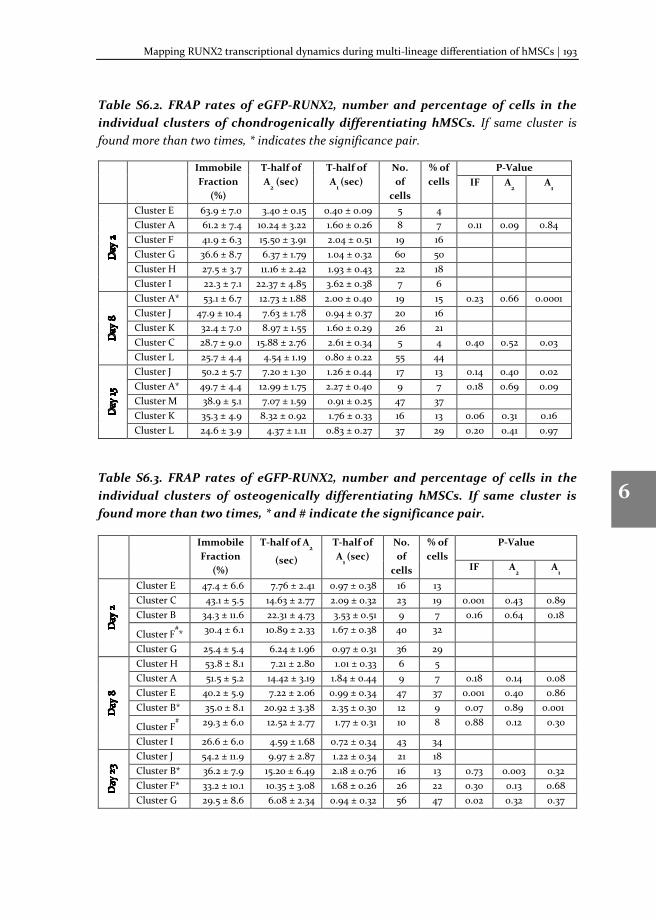
Mapping RUNX2 transcriptional dynamics during multi-lineage differentiation of hMSCs | 193
1
2
3
4
5
6
7
8
Table S6.2. FRAP rates of eGFP-RUNX2, number and percentage of cells in the
individual clusters of chondrogenically differentiating hMSCs. If same cluster is
found more than two times, * indicates the significance pair.
Table S6.3. FRAP rates of eGFP-RUNX2, number and percentage of cells in the
individual clusters of osteogenically differentiating hMSCs. If same cluster is
found more than two times, * and # indicate the significance pair.
Immobile
Fraction
(%)
T-half of
A2 (sec)
T-half of
A1 (sec)
No.
of
cells
% of
cells
P-Value
IF A2 A
1
Cluster E 63.9 ± 7.0 3.40 ± 0.15 0.40 ± 0.09 5 4
Cluster A 61.2 ± 7.4 10.24 ± 3.22 1.60 ± 0.26 8 7 0.11 0.09 0.84
Cluster F 41.9 ± 6.3 15.50 ± 3.91 2.04 ± 0.51 19 16
Cluster G 36.6 ± 8.7 6.37 ± 1.79 1.04 ± 0.32 60 50
Cluster H 27.5 ± 3.7 11.16 ± 2.42 1.93 ± 0.43 22 18
Cluster I 22.3 ± 7.1 22.37 ± 4.85 3.62 ± 0.38 7 6
Cluster A* 53.1 ± 6.7 12.73 ± 1.88 2.00 ± 0.40 19 15 0.23 0.66 0.0001
Cluster J 47.9 ± 10.4 7.63 ± 1.78 0.94 ± 0.37 20 16
Cluster K 32.4 ± 7.0 8.97 ± 1.55 1.60 ± 0.29 26 21
Cluster C 28.7 ± 9.0 15.88 ± 2.76 2.61 ± 0.34 5 4 0.40 0.52 0.03
Cluster L 25.7 ± 4.4 4.54 ± 1.19 0.80 ± 0.22 55 44
Cluster J 50.2 ± 5.7 7.20 ± 1.30 1.26 ± 0.44 17 13 0.14 0.40 0.02
Cluster A* 49.7 ± 4.4 12.99 ± 1.75 2.27 ± 0.40 9 7 0.18 0.69 0.09
Cluster M 38.9 ± 5.1 7.07 ± 1.59 0.91 ± 0.25 47 37
Cluster K 35.3 ± 4.9 8.32 ± 0.92 1.76 ± 0.33 16 13 0.06 0.31 0.16
Cluster L 24.6 ± 3.9 4.37 ± 1.11 0.83 ± 0.27 37 29 0.20 0.41 0.97
Immobile
Fraction
(%)
T-half of A2
(sec)
T-half of
A1 (sec)
No.
of
cells
% of
cells
P-Value
IF A2 A
1
Cluster E 47.4 ± 6.6 7.76 ± 2.41 0.97 ± 0.38 16 13
Cluster C 43.1 ± 5.5 14.63 ± 2.77 2.09 ± 0.32 23 19 0.001 0.43 0.89
Cluster B 34.3 ± 11.6 22.31 ± 4.73 3.53 ± 0.51 9 7 0.16 0.64 0.18
Cluster F#* 30.4 ± 6.1 10.89 ± 2.33 1.67 ± 0.38 40 32
Cluster G 25.4 ± 5.4 6.24 ± 1.96 0.97 ± 0.31 36 29
Cluster H 53.8 ± 8.1 7.21 ± 2.80 1.01 ± 0.33 6 5
Cluster A 51.5 ± 5.2 14.42 ± 3.19 1.84 ± 0.44 9 7 0.18 0.14 0.08
Cluster E 40.2 ± 5.9 7.22 ± 2.06 0.99 ± 0.34 47 37 0.001 0.40 0.86
Cluster B* 35.0 ± 8.1 20.92 ± 3.38 2.35 ± 0.30 12 9 0.07 0.89 0.001
Cluster F# 29.3 ± 6.0 12.52 ± 2.77 1.77 ± 0.31 10 8 0.88 0.12 0.30
Cluster I 26.6 ± 6.0 4.59 ± 1.68 0.72 ± 0.34 43 34
Cluster J 54.2 ± 11.9 9.97 ± 2.87 1.22 ± 0.34 21 18
Cluster B* 36.2 ± 7.9 15.20 ± 6.49 2.18 ± 0.76 16 13 0.73 0.003 0.32
Cluster F* 33.2 ± 10.1 10.35 ± 3.08 1.68 ± 0.26 26 22 0.30 0.13 0.68
Cluster G 29.5 ± 8.6 6.08 ± 2.34 0.94 ± 0.32 56 47 0.02 0.32 0.37
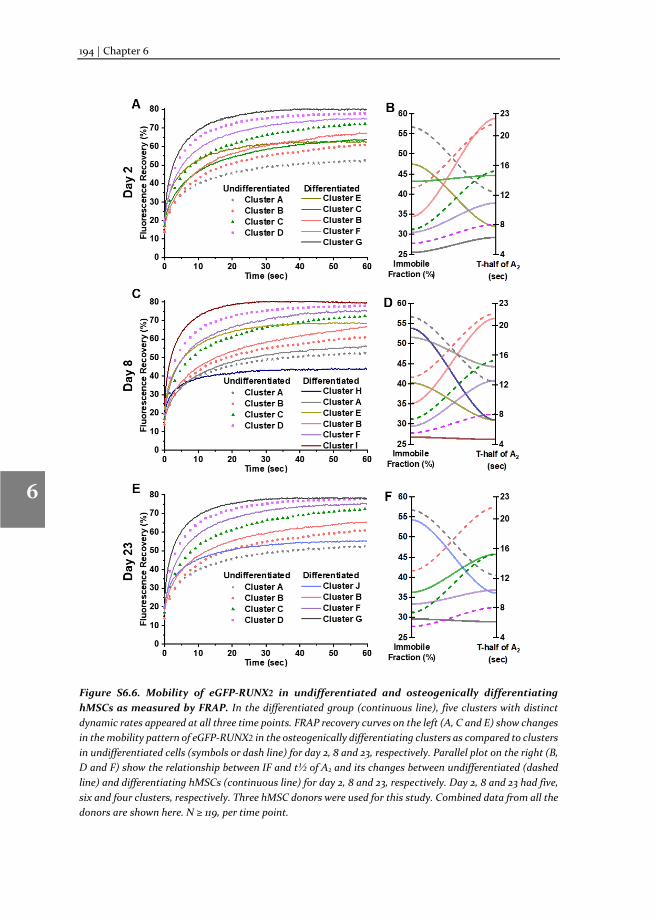
194 | Chapter 6
1
2
3
4
5
6
7
8
Figure S6.6. Mobility of eGFP-RUNX2 in undifferentiated and osteogenically differentiating
hMSCs as measured by FRAP. In the differentiated group (continuous line), five clusters with distinct
dynamic rates appeared at all three time points. FRAP recovery curves on the left (A, C and E) show changes
in the mobility pattern of eGFP-RUNX2 in the osteogenically differentiating clusters as compared to clusters
in undifferentiated cells (symbols or dash line) for day 2, 8 and 23, respectively. Parallel plot on the right (B,
D and F) show the relationship between IF and t½ of A2 and its changes between undifferentiated (dashed
line) and differentiating hMSCs (continuous line) for day 2, 8 and 23, respectively. Day 2, 8 and 23 had five,
six and four clusters, respectively. Three hMSC donors were used for this study. Combined data from all the
donors are shown here. N ≥ 119, per time point.
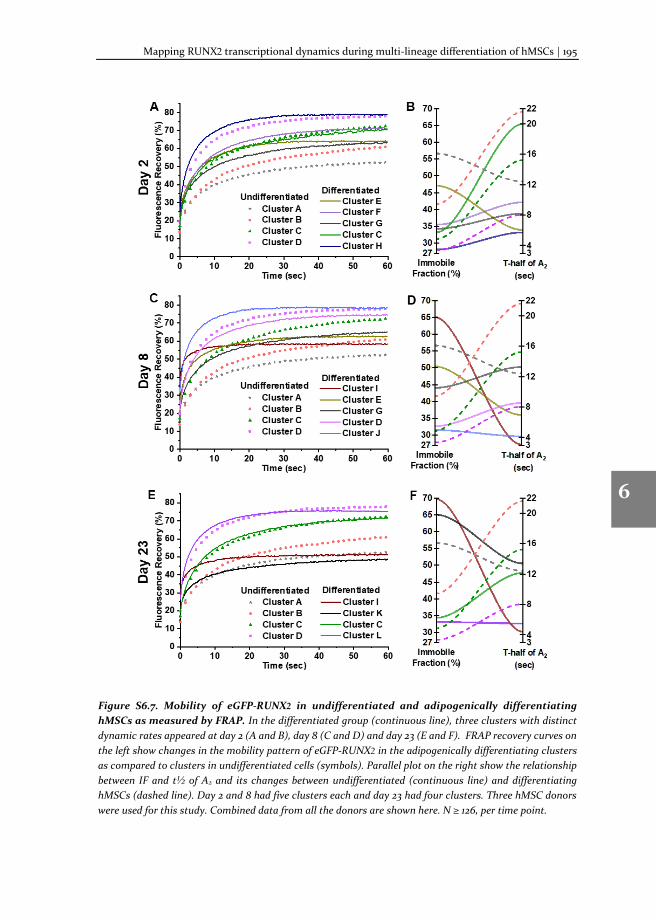
Mapping RUNX2 transcriptional dynamics during multi-lineage differentiation of hMSCs | 195
1
2
3
4
5
6
7
8
Figure S6.7. Mobility of eGFP-RUNX2 in undifferentiated and adipogenically differentiating
hMSCs as measured by FRAP. In the differentiated group (continuous line), three clusters with distinct
dynamic rates appeared at day 2 (A and B), day 8 (C and D) and day 23 (E and F). FRAP recovery curves on
the left show changes in the mobility pattern of eGFP-RUNX2 in the adipogenically differentiating clusters
as compared to clusters in undifferentiated cells (symbols). Parallel plot on the right show the relationship
between IF and t½ of A2 and its changes between undifferentiated (continuous line) and differentiating
hMSCs (dashed line). Day 2 and 8 had five clusters each and day 23 had four clusters. Three hMSC donors
were used for this study. Combined data from all the donors are shown here. N ≥ 126, per time point.
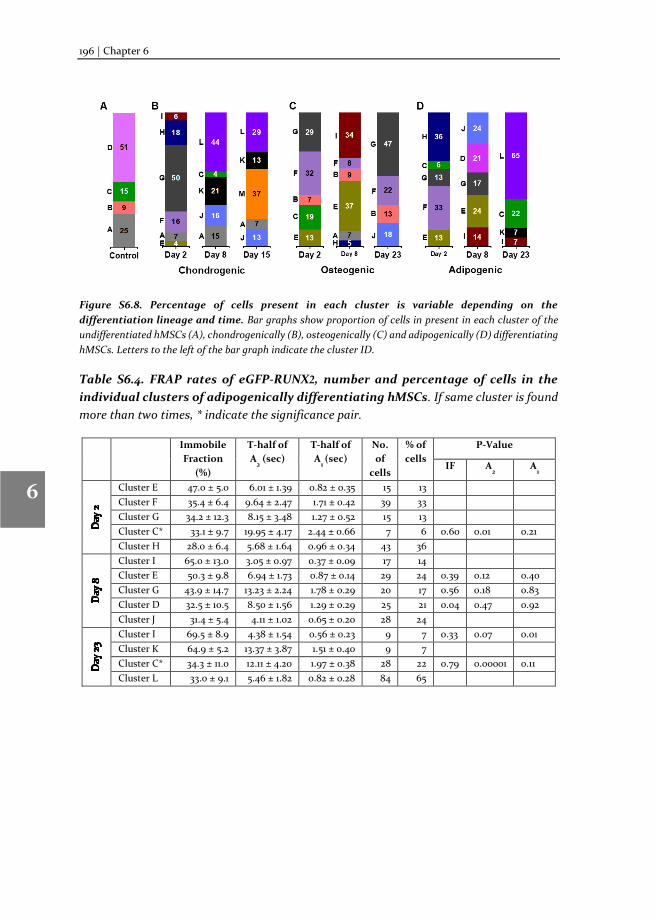
196 | Chapter 6
1
2
3
4
5
6
7
8
Figure S6.8. Percentage of cells present in each cluster is variable depending on the
differentiation lineage and time. Bar graphs show proportion of cells in present in each cluster of the
undifferentiated hMSCs (A), chondrogenically (B), osteogenically (C) and adipogenically (D) differentiating
hMSCs. Letters to the left of the bar graph indicate the cluster ID.
Table S6.4. FRAP rates of eGFP-RUNX2, number and percentage of cells in the
individual clusters of adipogenically differentiating hMSCs. If same cluster is found
more than two times, * indicate the significance pair.
Immobile
Fraction
(%)
T-half of
A2 (sec)
T-half of
A1 (sec)
No.
of
cells
% of
cells
P-Value
IF A2 A
1
Cluster E 47.0 ± 5.0 6.01 ± 1.39 0.82 ± 0.35 15 13
Cluster F 35.4 ± 6.4 9.64 ± 2.47 1.71 ± 0.42 39 33
Cluster G 34.2 ± 12.3 8.15 ± 3.48 1.27 ± 0.52 15 13
Cluster C* 33.1 ± 9.7 19.95 ± 4.17 2.44 ± 0.66 7 6 0.60 0.01 0.21
Cluster H 28.0 ± 6.4 5.68 ± 1.64 0.96 ± 0.34 43 36
Cluster I 65.0 ± 13.0 3.05 ± 0.97 0.37 ± 0.09 17 14
Cluster E 50.3 ± 9.8 6.94 ± 1.73 0.87 ± 0.14 29 24 0.39 0.12 0.40
Cluster G 43.9 ± 14.7 13.23 ± 2.24 1.78 ± 0.29 20 17 0.56 0.18 0.83
Cluster D 32.5 ± 10.5 8.50 ± 1.56 1.29 ± 0.29 25 21 0.04 0.47 0.92
Cluster J 31.4 ± 5.4 4.11 ± 1.02 0.65 ± 0.20 28 24
Cluster I 69.5 ± 8.9 4.38 ± 1.54 0.56 ± 0.23 9 7 0.33 0.07 0.01
Cluster K 64.9 ± 5.2 13.37 ± 3.87 1.51 ± 0.40 9 7
Cluster C* 34.3 ± 11.0 12.11 ± 4.20 1.97 ± 0.38 28 22 0.79 0.00001 0.11
Cluster L 33.0 ± 9.1 5.46 ± 1.82 0.82 ± 0.28 84 65
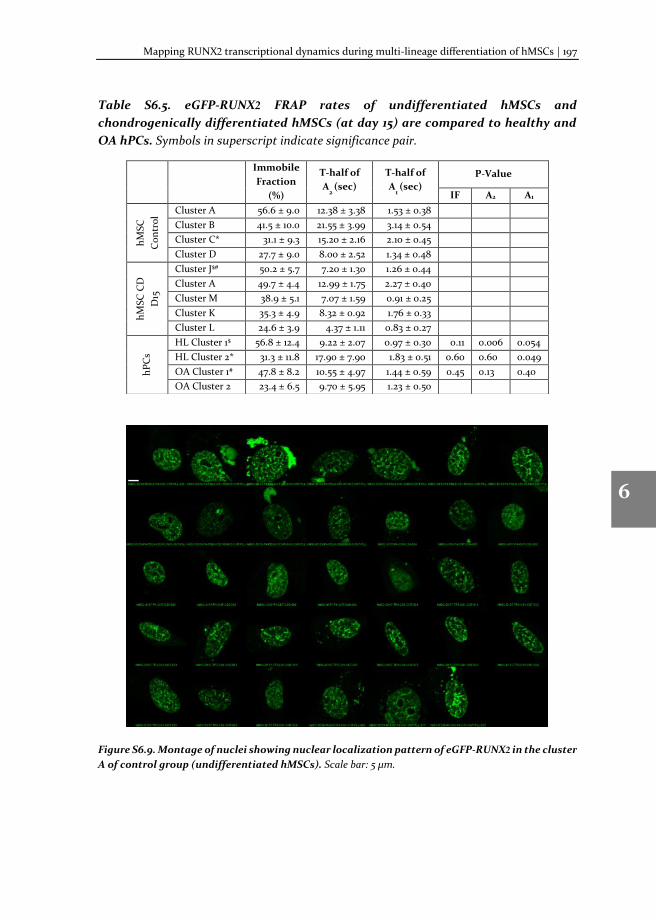
Mapping RUNX2 transcriptional dynamics during multi-lineage differentiation of hMSCs | 197
1
2
3
4
5
6
7
8
Table S6.5. eGFP-RUNX2 FRAP rates of undifferentiated hMSCs and
chondrogenically differentiated hMSCs (at day 15) are compared to healthy and
OA hPCs. Symbols in superscript indicate significance pair.
Figure S6.9. Montage of nuclei showing nuclear localization pattern of eGFP-RUNX2 in the cluster
A of control group (undifferentiated hMSCs). Scale bar: 5 μm.
Immobile
Fraction
(%)
T-half of
A2 (sec)
T-half of
A1 (sec)
P-Value
IF A2 A1
hM
SC
Co
ntr
ol
Cluster A 56.6 ± 9.0 12.38 ± 3.38 1.53 ± 0.38 Cluster B 41.5 ± 10.0 21.55 ± 3.99 3.14 ± 0.54 Cluster C* 31.1 ± 9.3 15.20 ± 2.16 2.10 ± 0.45 Cluster D 27.7 ± 9.0 8.00 ± 2.52 1.34 ± 0.48
hM
SC C
D
D15
Cluster J$# 50.2 ± 5.7 7.20 ± 1.30 1.26 ± 0.44
Cluster A 49.7 ± 4.4 12.99 ± 1.75 2.27 ± 0.40
Cluster M 38.9 ± 5.1 7.07 ± 1.59 0.91 ± 0.25
Cluster K 35.3 ± 4.9 8.32 ± 0.92 1.76 ± 0.33
Cluster L 24.6 ± 3.9 4.37 ± 1.11 0.83 ± 0.27
hP
Cs
HL Cluster 1$ 56.8 ± 12.4 9.22 ± 2.07 0.97 ± 0.30 0.11 0.006 0.054
HL Cluster 2* 31.3 ± 11.8 17.90 ± 7.90 1.83 ± 0.51 0.60 0.60 0.049
OA Cluster 1# 47.8 ± 8.2 10.55 ± 4.97 1.44 ± 0.59 0.45 0.13 0.40
OA Cluster 2 23.4 ± 6.5 9.70 ± 5.95 1.23 ± 0.50
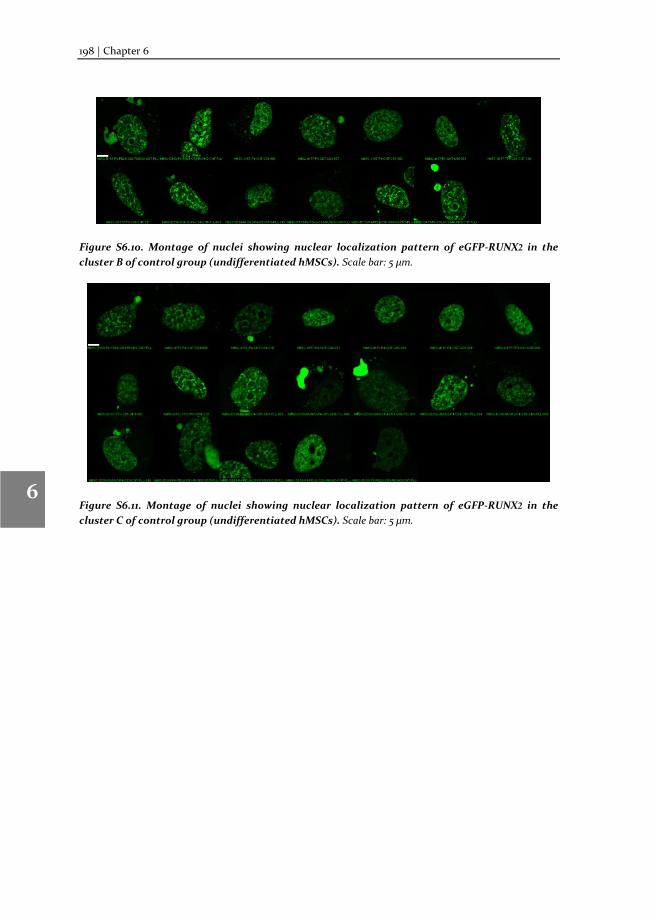
198 | Chapter 6
1
2
3
4
5
6
7
8
Figure S6.10. Montage of nuclei showing nuclear localization pattern of eGFP-RUNX2 in the
cluster B of control group (undifferentiated hMSCs). Scale bar: 5 μm.
Figure S6.11. Montage of nuclei showing nuclear localization pattern of eGFP-RUNX2 in the
cluster C of control group (undifferentiated hMSCs). Scale bar: 5 μm.
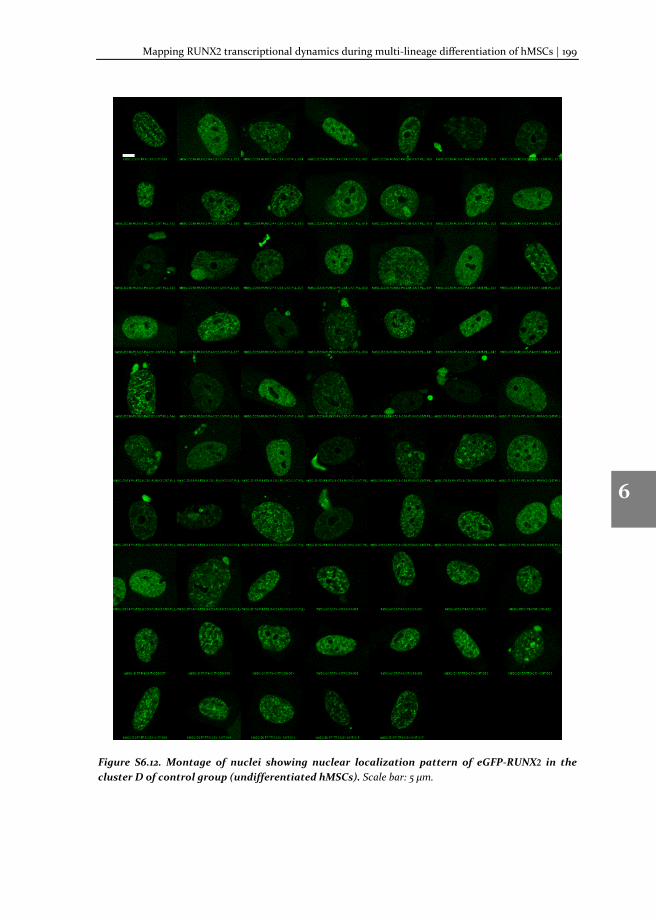
Mapping RUNX2 transcriptional dynamics during multi-lineage differentiation of hMSCs | 199
1
2
3
4
5
6
7
8
Figure S6.12. Montage of nuclei showing nuclear localization pattern of eGFP-RUNX2 in the
cluster D of control group (undifferentiated hMSCs). Scale bar: 5 μm.
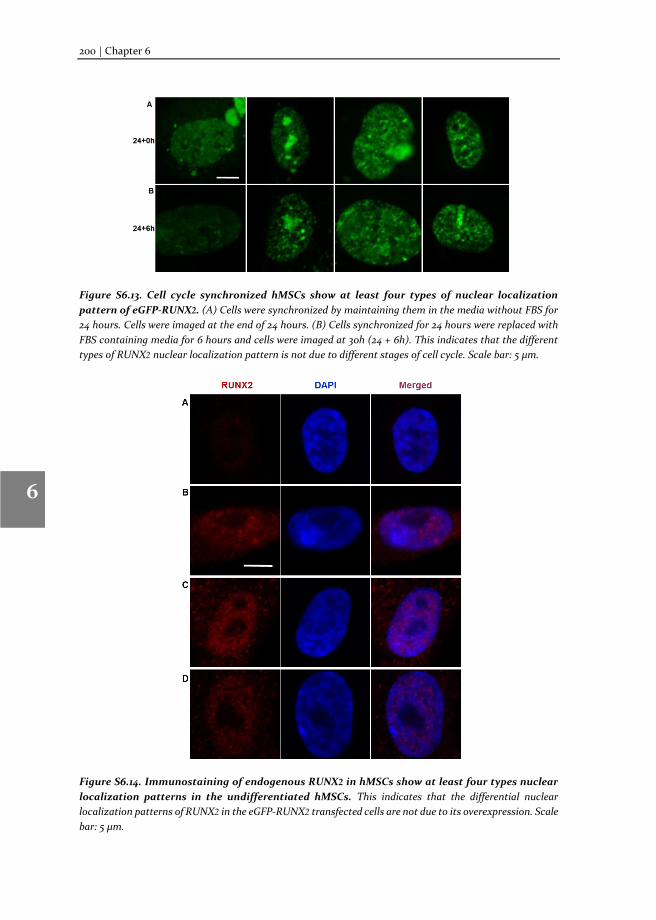
200 | Chapter 6
1
2
3
4
5
6
7
8
Figure S6.13. Cell cycle synchronized hMSCs show at least four types of nuclear localization
pattern of eGFP-RUNX2. (A) Cells were synchronized by maintaining them in the media without FBS for
24 hours. Cells were imaged at the end of 24 hours. (B) Cells synchronized for 24 hours were replaced with
FBS containing media for 6 hours and cells were imaged at 30h (24 + 6h). This indicates that the different
types of RUNX2 nuclear localization pattern is not due to different stages of cell cycle. Scale bar: 5 μm.
Figure S6.14. Immunostaining of endogenous RUNX2 in hMSCs show at least four types nuclear
localization patterns in the undifferentiated hMSCs. This indicates that the differential nuclear
localization patterns of RUNX2 in the eGFP-RUNX2 transfected cells are not due to its overexpression. Scale
bar: 5 μm.
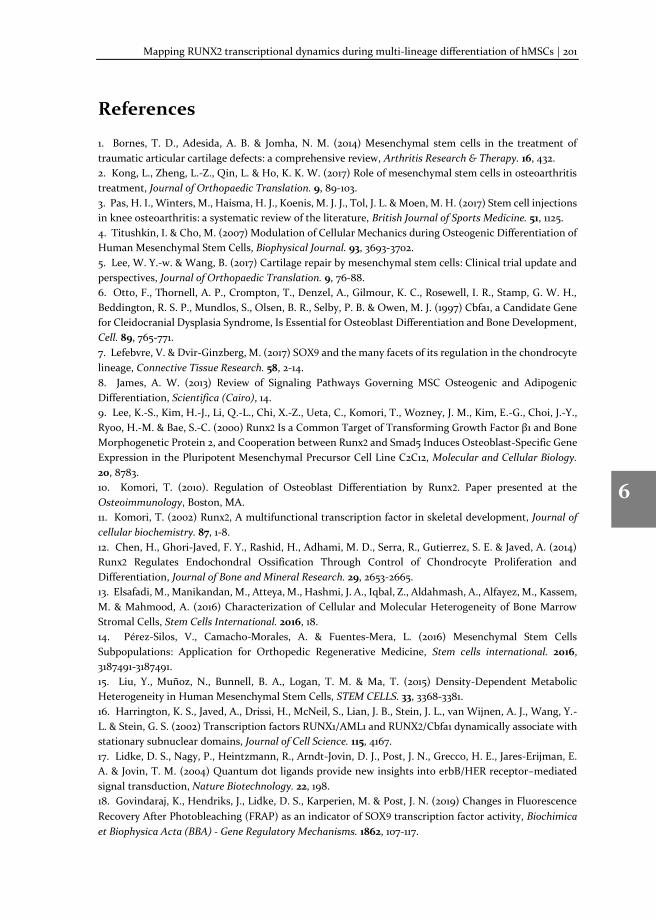
Mapping RUNX2 transcriptional dynamics during multi-lineage differentiation of hMSCs | 201
1
2
3
4
5
6
7
8
References
1. Bornes, T. D., Adesida, A. B. & Jomha, N. M. (2014) Mesenchymal stem cells in the treatment of
traumatic articular cartilage defects: a comprehensive review, Arthritis Research & Therapy. 16, 432.
2. Kong, L., Zheng, L.-Z., Qin, L. & Ho, K. K. W. (2017) Role of mesenchymal stem cells in osteoarthritis
treatment, Journal of Orthopaedic Translation. 9, 89-103.
3. Pas, H. I., Winters, M., Haisma, H. J., Koenis, M. J. J., Tol, J. L. & Moen, M. H. (2017) Stem cell injections
in knee osteoarthritis: a systematic review of the literature, British Journal of Sports Medicine. 51, 1125.
4. Titushkin, I. & Cho, M. (2007) Modulation of Cellular Mechanics during Osteogenic Differentiation of
Human Mesenchymal Stem Cells, Biophysical Journal. 93, 3693-3702.
5. Lee, W. Y.-w. & Wang, B. (2017) Cartilage repair by mesenchymal stem cells: Clinical trial update and
perspectives, Journal of Orthopaedic Translation. 9, 76-88.
6. Otto, F., Thornell, A. P., Crompton, T., Denzel, A., Gilmour, K. C., Rosewell, I. R., Stamp, G. W. H.,
Beddington, R. S. P., Mundlos, S., Olsen, B. R., Selby, P. B. & Owen, M. J. (1997) Cbfa1, a Candidate Gene
for Cleidocranial Dysplasia Syndrome, Is Essential for Osteoblast Differentiation and Bone Development,
Cell. 89, 765-771.
7. Lefebvre, V. & Dvir-Ginzberg, M. (2017) SOX9 and the many facets of its regulation in the chondrocyte
lineage, Connective Tissue Research. 58, 2-14.
8. James, A. W. (2013) Review of Signaling Pathways Governing MSC Osteogenic and Adipogenic
Differentiation, Scientifica (Cairo), 14.
9. Lee, K.-S., Kim, H.-J., Li, Q.-L., Chi, X.-Z., Ueta, C., Komori, T., Wozney, J. M., Kim, E.-G., Choi, J.-Y.,
Ryoo, H.-M. & Bae, S.-C. (2000) Runx2 Is a Common Target of Transforming Growth Factor β1 and Bone
Morphogenetic Protein 2, and Cooperation between Runx2 and Smad5 Induces Osteoblast-Specific Gene
Expression in the Pluripotent Mesenchymal Precursor Cell Line C2C12, Molecular and Cellular Biology.
20, 8783.
10. Komori, T. (2010). Regulation of Osteoblast Differentiation by Runx2. Paper presented at the
Osteoimmunology, Boston, MA.
11. Komori, T. (2002) Runx2, A multifunctional transcription factor in skeletal development, Journal of
cellular biochemistry. 87, 1-8.
12. Chen, H., Ghori-Javed, F. Y., Rashid, H., Adhami, M. D., Serra, R., Gutierrez, S. E. & Javed, A. (2014)
Runx2 Regulates Endochondral Ossification Through Control of Chondrocyte Proliferation and
Differentiation, Journal of Bone and Mineral Research. 29, 2653-2665.
13. Elsafadi, M., Manikandan, M., Atteya, M., Hashmi, J. A., Iqbal, Z., Aldahmash, A., Alfayez, M., Kassem,
M. & Mahmood, A. (2016) Characterization of Cellular and Molecular Heterogeneity of Bone Marrow
Stromal Cells, Stem Cells International. 2016, 18.
14. Pérez-Silos, V., Camacho-Morales, A. & Fuentes-Mera, L. (2016) Mesenchymal Stem Cells
Subpopulations: Application for Orthopedic Regenerative Medicine, Stem cells international. 2016,
3187491-3187491.
15. Liu, Y., Muñoz, N., Bunnell, B. A., Logan, T. M. & Ma, T. (2015) Density-Dependent Metabolic
Heterogeneity in Human Mesenchymal Stem Cells, STEM CELLS. 33, 3368-3381.
16. Harrington, K. S., Javed, A., Drissi, H., McNeil, S., Lian, J. B., Stein, J. L., van Wijnen, A. J., Wang, Y.-
L. & Stein, G. S. (2002) Transcription factors RUNX1/AML1 and RUNX2/Cbfa1 dynamically associate with
stationary subnuclear domains, Journal of Cell Science. 115, 4167.
17. Lidke, D. S., Nagy, P., Heintzmann, R., Arndt-Jovin, D. J., Post, J. N., Grecco, H. E., Jares-Erijman, E.
A. & Jovin, T. M. (2004) Quantum dot ligands provide new insights into erbB/HER receptor–mediated
signal transduction, Nature Biotechnology. 22, 198.
18. Govindaraj, K., Hendriks, J., Lidke, D. S., Karperien, M. & Post, J. N. (2019) Changes in Fluorescence
Recovery After Photobleaching (FRAP) as an indicator of SOX9 transcription factor activity, Biochimica
et Biophysica Acta (BBA) - Gene Regulatory Mechanisms. 1862, 107-117.
202 | Chapter 6
1
2
3
4
5
6
7
8
19. Phair, R. D., Gorski, S. A. & Misteli, T. (2003) Measurement of Dynamic Protein Binding to Chromatin
In Vivo, Using Photobleaching Microscopy in Methods in Enzymology pp. 393-414, Academic Press.
20. Phair, R. D., Scaffidi, P., Elbi, C., Vecerová, J., Dey, A., Ozato, K., Brown, D. T., Hager, G., Bustin, M.
& Misteli, T. (2004) Global Nature of Dynamic Protein-Chromatin Interactions In Vivo: Three-
Dimensional Genome Scanning and Dynamic Interaction Networks of Chromatin Proteins, Molecular
and Cellular Biology. 24, 6393-6402.
21. van de Peppel, J., Strini, T., Tilburg, J., Westerhoff, H., van Wijnen, A. J. & van Leeuwen, J. P. (2017)
Identification of Three Early Phases of Cell-Fate Determination during Osteogenic and Adipogenic
Differentiation by Transcription Factor Dynamics, Stem Cell Reports. 8, 947-960.
22. Akiyama, H., Kanno, T., Ito, H., Terry, A., Neil, J., Ito, Y. & Nakamura, T. (1999) Positive and negative
regulation of chondrogenesis by splice variants of PEBP2αA/CBFα1 in clonal mouse EC cells, ATDC5,
Journal of cellular physiology. 181, 169-178.
23. Ge, C., Cawthorn, W. P., Li, Y., Zhao, G., MacDougald, O. A. & Franceschi, R. T. (2016) Reciprocal
Control of Osteogenic and Adipogenic Differentiation by ERK/MAP Kinase Phosphorylation of Runx2
and PPARγ Transcription Factors, Journal of cellular physiology. 231, 587-596.
24. Naftali‐Shani, N., Itzhaki‐Alfia, A., Landa‐Rouben, N., Kain, D., Holbova, R., Adutler‐Lieber, S.,
Molotski, N., Asher, E., Grupper, A., Millet, E., Tessone, A., Winkler, E., Kastrup, J., Feinberg Micha, S.,
Zipori, D., Pevsner‐Fischer, M., Raanani, E. & Leor, J. The Origin of Human Mesenchymal Stromal Cells
Dictates Their Reparative Properties, Journal of the American Heart Association. 2, e000253.
25. Tanne, Y., Tanimoto, K., Tanaka, N., Ueki, M., Lin, Y. Y., Ohkuma, S., Kamiya, T., Tanaka, E. & Tanne,
K. (2008) Expression and activity of Runx2 mediated by hyaluronan during chondrocyte differentiation,
Archives of Oral Biology. 53, 478-487.
26. Enomoto, H., Furuichi, T., Zanma, A., Yamana, K., Yoshida, C., Sumitani, S., Yamamoto, H., Enomoto-
Iwamoto, M., Iwamoto, M. & Komori, T. (2004) Runx2 deficiency in chondrocytes causes adipogenic
changes in vitro, Journal of Cell Science. 117, 417.
27. Hollander, A. P., Dickinson, S. C. & Kafienah, W. (2010) Stem Cells and Cartilage Development:
Complexities of a Simple Tissue, STEM CELLS. 28, 1992-1996.
28. Ashkavand, Z., Malekinejad, H. & Vishwanath, B. S. (2013) The pathophysiology of osteoarthritis,
Journal of Pharmacy Research. 7, 132-138.
29. Chen, S., Fu, P., Cong, R., Wu, H. & Pei, M. (2015) Strategies to minimize hypertrophy in cartilage
engineering and regeneration, Genes & Diseases. 2, 76-95.
30. Fujita, T., Azuma, Y., Fukuyama, R., Hattori, Y., Yoshida, C., Koida, M., Ogita, K. & Komori, T. (2004)
Runx2 induces osteoblast and chondrocyte differentiation and enhances their migration by coupling with
PI3K-Akt signaling, Journal of Cell Biology. 166, 85-95.
31. Wilson, A., Hodgson-Garms, M., Frith, J. E. & Genever, P. (2019) Multiplicity of Mesenchymal Stromal
Cells: Finding the Right Route to Therapy, Frontiers in Immunology. 10, 1112.
32. Haasters, F., Prall, W. C., Anz, D., Bourquin, C., Pautke, C., Endres, S., Mutschler, W., Docheva, D. &
Schieker, M. (2009) Morphological and immunocytochemical characteristics indicate the yield of early
progenitors and represent a quality control for human mesenchymal stem cell culturing, Journal of
Anatomy. 214, 759-767.
33. Leyva-Leyva, M., Barrera, L., López-Camarillo, C., Arriaga-Pizano, L., Orozco-Hoyuela, G., Carrillo-
Casas, E. M., Calderón-Pérez, J., López-Díaz, A., Hernandez-Aguilar, F., González-Ramírez, R., Kawa, S.,
Chimal-Monroy, J. & Fuentes-Mera, L. (2012) Characterization of Mesenchymal Stem Cell Subpopulations
from Human Amniotic Membrane with Dissimilar Osteoblastic Potential, Stem Cells and Development.
22, 1275-1287.
34. Chen, H., Chen, H., Ghori-Javed, F. Y., Rashid, H., Serra, R., Gutierrez, S. E. & Javed, A. (2011)
Chondrocyte-Specific Regulatory Activity of Runx2 Is Essential for Survival and Skeletal Development,
Cells Tissues Organs. 194, 161-165.
Mapping RUNX2 transcriptional dynamics during multi-lineage differentiation of hMSCs | 203
1
2
3
4
5
6
7
8
35. Wei, X., Somanathan, S., Samarabandu, J. & Berezney, R. (1999) Three-Dimensional Visualization of
Transcription Sites and Their Association with Splicing Factor–Rich Nuclear Speckles, Journal of Cell
Biology. 146, 543-558.
36. Wei, X., Samarabandu, J., Devdhar, R. S., Siegel, A. J., Acharya, R. & Berezney, R. (1998) Segregation
of Transcription and Replication Sites Into Higher Order Domains, Science. 281, 1502.
37. Stein, G. S., van Wijnen, A. J., Stein, J. L., Lian, J. B., Montecino, M., Choi, J., Zaidi, K. & Javed, A.
(2000) Intranuclear trafficking of transcription factors: implications for biological control, Journal of Cell
Science. 113, 2527.
38. Zaidi, S. K., Javed, A., Choi, J.-Y., van Wijnen, A. J., Stein, J. L., Lian, J. B. & Stein, G. S. (2001) A specific
targeting signal directs Runx2/Cbfa1 to subnuclear domains and contributes to transactivation of the
osteocalcin gene, Journal of Cell Science. 114, 3093.
39. König, M. A., Canepa, D. D., Cadosch, D., Casanova, E., Heinzelmann, M., Rittirsch, D., Plecko, M.,
Hemmi, S., Simmen, H.-P., Cinelli, P. & Wanner, G. A. (2016) Direct transplantation of native pericytes
from adipose tissue: A new perspective to stimulate healing in critical size bone defects, Cytotherapy. 18,
41-52.
40. Pruszak, J., Ludwig, W., Blak, A., Alavian, K. & Isacson, O. (2009) CD15, CD24, and CD29 Define a
Surface Biomarker Code for Neural Lineage Differentiation of Stem Cells, STEM CELLS. 27, 2928-2940.
41. McCarthy, H. E., Bara, J. J., Brakspear, K., Singhrao, S. K. & Archer, C. W. (2012) The comparison of
equine articular cartilage progenitor cells and bone marrow-derived stromal cells as potential cell sources
for cartilage repair in the horse, The Veterinary Journal. 192, 345-351.

7 Reflection and Outlook
Abstract
Cellular organization and function at the molecular level is intrinsically complex. Proteins, which are encoded in the DNA, are the key functional units of a cell. A mammalian cell contains approximately 25,000 – 35,000 proteins and the expression of every protein is regulated by transcription factors. Transcription factors play a key role in the temporal regulation of mRNA expression, which can subsequently be translated into proteins. Transcription factor dysfunction is implicated in many diseases, such as in osteoarthritis (OA), cancer, autoimmune disease, diabetes, cardiovascular diseases etc. Mapping the spatiotemporal regulation of transcription factor activity in health and disease may help us to understand the disease mechanism and to identify therapeutic targets. For example, understanding when and how a transcription factor is activated or inhibited in health and disease would help us to modulate its activity in the diseases by introducing targeted drugs. Despite much progress in the past decades in exploring the disease mechanism at the molecular level, studies on the spatiotemporal regulation of transcription factor activity remain scarce due to technological and methodological limitations. In this thesis, we successfully applied FRAP to study transcription factor dynamics and developed TF-FRAP technique to study the activity of the transcription factor. Using TF-FRAP, to map the factors regulating SOX9 activity, we studied its dynamics in human primary chondrocytes (hPCs). To understand chondrocyte development and hypertrophy, we studied SOX9 and RUNX2 dynamics in proliferating and multi-lineage differentiating mesenchymal stem cells (hMSCs).
206 | Chapter 7
1
2
3
4
5
6
7
8
7.1 Gene and transcription factors
Transcription factors are gene regulatory proteins, their DNA binding precedes their transcriptional activity. Human genome encodes >1600 transcription factors and they tightly control the expression of every single gene in a cell. Most of the genes have their own control regions, namely, promotor and enhancer sequences in the DNA. The promotor region is always present in the upstream of transcription start site, while an enhancer region can be present in multiple locations, including upstream or downstream of the gene or within the intronic (non-coding) region of the gene or several kilo base pairs away from the gene [1]. There are hundreds and thousands of binding sites present for each transcription factor within the genome, with varying binding affinity to DNA. For example, SOX9 has >27,000 binding sites in mice rib chondrocytes [2]. However, strong binding of transcription factors – yet transient, ranging from a few seconds to minutes – on the gene regulatory region is necessary for a successful transcriptional output.
7.2 Transcription factor activity
Transcription factors are dynamic, their activity determines their mobility [3]. Transcription factors never function alone, they form complex with other proteins and co-factors to exert their function. Based on their function, transcription factors can be broadly classified into either activators or repressors, i.e., they either activate or repress gene expression. In other cases, even if a transcription factor is bound to DNA, a binding partner (co-factor) might be required or a repressor protein already bound to the transcription complex may need to be dissociated to initiate the gene transcription. Moreover, transcription factors may have multiple (differential) binding partners, which determine their mode of function [1, 4]. Complexity in transcription factor function is one of the reasons that the previous studies attempted to correlate transcription factor binding and their residence time on DNA to target gene expression yielded conflicting results [5]. Currently, transcription factor activity is studied using indirect methods by quantifying its target gene/protein expression, which yield poor spatiotemporal resolution and not suitable for live cells.
Our interest is to understand osteoarthritis (OA) pathophysiology to identify possible therapeutic targets. Function of SOX9 – the master transcription factor of chondrocyte development and homeostasis – is known to be heavily impaired during OA development [6]. We wanted to develop a method, which can directly measure the activity of SOX9 protein in live cells with a higher spatiotemporal resolution. By applying that method, we wanted to map the factors, which regulate SOX9 transcriptional activity. We applied FRAP to quantify the dynamics of SOX9 in C-20/A4 cells, as it is simple, fast and accessible to any lab with a confocal microscope. In chapter three, we show that FRAP captures immediate changes to SOX9 dynamics (<20 mins) in response
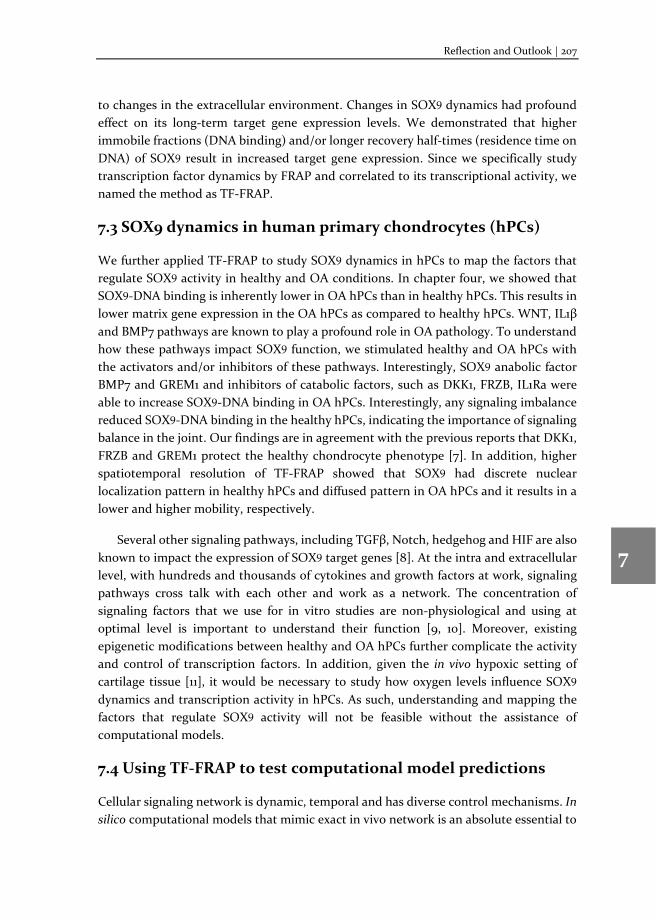
Reflection and Outlook | 207
1
2
3
4
5
6
7
8
to changes in the extracellular environment. Changes in SOX9 dynamics had profound effect on its long-term target gene expression levels. We demonstrated that higher immobile fractions (DNA binding) and/or longer recovery half-times (residence time on DNA) of SOX9 result in increased target gene expression. Since we specifically study transcription factor dynamics by FRAP and correlated to its transcriptional activity, we named the method as TF-FRAP.
7.3 SOX9 dynamics in human primary chondrocytes (hPCs)
We further applied TF-FRAP to study SOX9 dynamics in hPCs to map the factors that regulate SOX9 activity in healthy and OA conditions. In chapter four, we showed that SOX9-DNA binding is inherently lower in OA hPCs than in healthy hPCs. This results in lower matrix gene expression in the OA hPCs as compared to healthy hPCs. WNT, IL1β and BMP7 pathways are known to play a profound role in OA pathology. To understand how these pathways impact SOX9 function, we stimulated healthy and OA hPCs with the activators and/or inhibitors of these pathways. Interestingly, SOX9 anabolic factor BMP7 and GREM1 and inhibitors of catabolic factors, such as DKK1, FRZB, IL1Ra were able to increase SOX9-DNA binding in OA hPCs. Interestingly, any signaling imbalance reduced SOX9-DNA binding in the healthy hPCs, indicating the importance of signaling balance in the joint. Our findings are in agreement with the previous reports that DKK1, FRZB and GREM1 protect the healthy chondrocyte phenotype [7]. In addition, higher spatiotemporal resolution of TF-FRAP showed that SOX9 had discrete nuclear localization pattern in healthy hPCs and diffused pattern in OA hPCs and it results in a lower and higher mobility, respectively.
Several other signaling pathways, including TGFβ, Notch, hedgehog and HIF are also known to impact the expression of SOX9 target genes [8]. At the intra and extracellular level, with hundreds and thousands of cytokines and growth factors at work, signaling pathways cross talk with each other and work as a network. The concentration of signaling factors that we use for in vitro studies are non-physiological and using at optimal level is important to understand their function [9, 10]. Moreover, existing epigenetic modifications between healthy and OA hPCs further complicate the activity and control of transcription factors. In addition, given the in vivo hypoxic setting of cartilage tissue [11], it would be necessary to study how oxygen levels influence SOX9 dynamics and transcription activity in hPCs. As such, understanding and mapping the factors that regulate SOX9 activity will not be feasible without the assistance of computational models.
7.4 Using TF-FRAP to test computational model predictions
Cellular signaling network is dynamic, temporal and has diverse control mechanisms. In silico computational models that mimic exact in vivo network is an absolute essential to
208 | Chapter 7
1
2
3
4
5
6
7
8
understand biological networks. A suitable computational model should be able to store cellular network, tunable and dynamic upon stimulation. Such models will also be helpful to predict cellular outcome when we perturb the system.
Our group had previously developed a computational tool called Analysis of Networks with Interactive Modeling, ANIMO [12]. ANIMO can be used to predict combinations and concentrations of signaling molecules to mimic in vivo signaling and to study their effect on any signaling network (Figure 7.1). In addition, the model can analyze temporal signaling dynamics of large signaling network involving hundreds of molecules. ANIMO can analyze signaling networks constructed based on available literature data and predict previously unknown hidden interactions. However, these model predictions need to be validated by wet lab experiments. In one such study, we built Executable CHOndrocyte (ECHO) model, upon activation of in silico signaling nodes, it can switch the cell fate between SOX9+ and RUNX2+ state, to indicate growth plate phenotype and hypertrophic phenotype, respectively. Since SOX9 and RUNX2 are the transcription factors, we applied TF-FRAP to validate model predictions. Although the model prediction and validation is not part of this thesis, interesting findings of this study can be found here [13].
7.5 SOX9 and RUNX2 dynamics in hMSCs
During development, hMSCs differentiate into chondrocytes and osteoblasts, which form cartilage and bone tissue, respectively. Proliferation of terminally differentiated chondrocytes in cartilage is limited, however, hypertrophic differentiation is a normal phenomenon in the growth plate chondrocytes during bone formation. During the development of OA, chondrocytes in damaged cartilage tissue undergo hypertrophic differentiation. Since SOX9 and RUNX2 are the master transcription factors of cartilage and bone development, we studied their transcriptional dynamics in hMSCs to understand the hypertrophic switch. To start with, we applied TF-FRAP to study SOX9 and RUNX2 dynamics in proliferating and differentiating hMSCs.
Our studies on SOX9 and RUNX2 dynamics during the differentiation of hMSCs into chondro-, osteo- and adipogenic lineages showed diversity of SOX9 and RUNX2 mobility within heterogenic cells. Although we are not closer in understating the hypertrophic switch, our findings in chapter five and six show how SOX9 and RUNX2 transcriptional dynamics change during differentiation across lineages. In addition, we have shown that the subpopulations in hMSCs respond differently to the same differentiation stimulation. Interestingly, some subpopulations did not respond to the differentiation stimuli. Cluster analysis of SOX9 and RUNX2 dynamics and correlated histology staining indicated that the subpopulations of hMSCs might have varying differentiation potential towards particular lineage. To our knowledge, this is the first ever transcription factor dynamics study at the subpopulation level in proliferating and differentiating hMSCs. In
Reflection and Outlook | 209
1
2
3
4
5
6
7
8
addition, mapping transcription factor dynamics during differentiation is essential to understand temporal activity of transcription factors during development.
7.5.1 Relationship between immobile fraction and recovery half-times
Changes to the TF-FRAP rates due to intramolecular interaction should also be further studied. Despite a correlation between immobile fraction, recovery half-times and target gene expression levels, in some cases of external stimulation, we have observed an inverse correlation between immobile fraction and the recovery half-times. Although TF-FRAP measurements on SOX9 dynamics in hPCs reflect its transcriptional activity (Chapter 4), there are discrepancies in our hMSC differentiation studies. For example, SOX9 immobile fraction was highest in adipogenically differentiating hMSCs as compared to chondro- and osteogenic differentiation (Chapter 5). However, recovery half-times of SOX9 were longer in chondro- and osteogenic differentiation, which resulted in a higher transcriptional output. Our studies on RUNX2 dynamics in hMSCs are also indicated that the recovery half-times may be the important predictor of its transcriptional activity (Chapter 6). Differential intramolecular interactions in the binding partners of transcription factor complexes in response to the external stimulations determine the transcription factor mobility. Although, these changes of molecular weight of the transcription factor complexes are reflected in the shape of TF-FRAP curve, these changes are hard to interpret now, as we do not have information on what exactly contribute to the changes in the dynamics.
7.5.2 Determining differentiation potential of hMSCs
We postulate that the differentiation potential of an hMSC donor into a particular lineage can be determined by TF-FRAP. Currently the differentiation potential of an hMSC donor is determined by histology staining after at least 15 days of differentiation [14]. Early determination differentiation potential of a donor will help us to quickly identify right donor for hMSC-based treatments in musculoskeletal diseases. Our studies on SOX9 and RUNX2 dynamics in hMSCs identified at least four subpopulations in the undifferentiated hMSCs. The number of cells present per subpopulation (cluster) was different among the donors. Interestingly, of the three donors, one had high tendency towards chondrogenic, other one towards adipogenic and third one towards osteogenic differentiation. However, we performed experiments only in three donors, repeating the measurements in more donors would shed light on this novel application of TF-FRAP to determine the differentiation potential of a donor. Moreover, based on the transcription factor mobility pattern, it would be necessary to construct a reference library correlated to the particular lineage differentiation potential of a donor. By comparing the percentage of cells present per mobility group with the reference library will enable us to predict the differentiation potential of a donor within a few days.
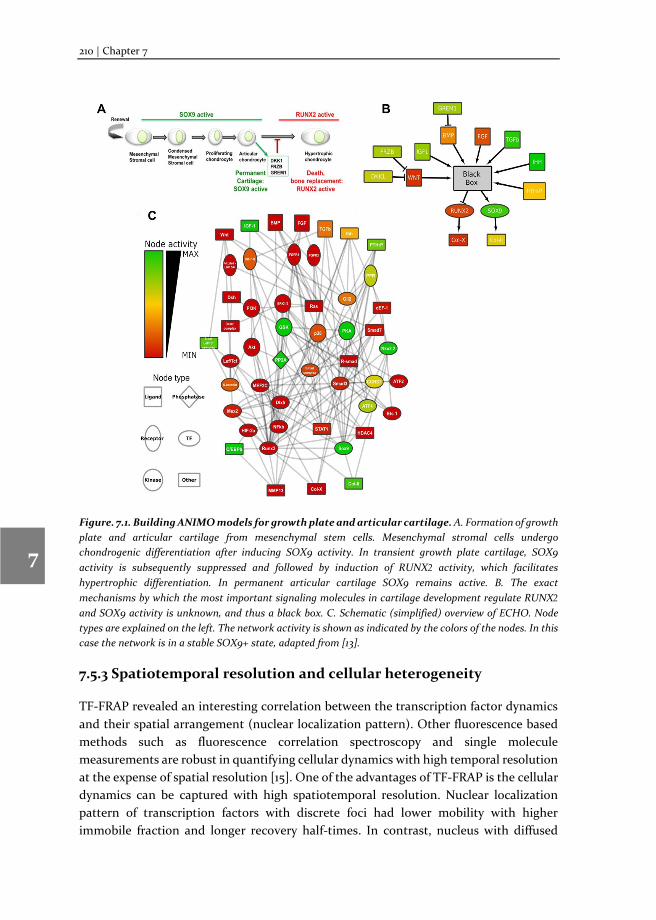
210 | Chapter 7
1
2
3
4
5
6
7
8
Figure. 7.1. Building ANIMO models for growth plate and articular cartilage. A. Formation of growth plate and articular cartilage from mesenchymal stem cells. Mesenchymal stromal cells undergo chondrogenic differentiation after inducing SOX9 activity. In transient growth plate cartilage, SOX9 activity is subsequently suppressed and followed by induction of RUNX2 activity, which facilitates hypertrophic differentiation. In permanent articular cartilage SOX9 remains active. B. The exact mechanisms by which the most important signaling molecules in cartilage development regulate RUNX2 and SOX9 activity is unknown, and thus a black box. C. Schematic (simplified) overview of ECHO. Node types are explained on the left. The network activity is shown as indicated by the colors of the nodes. In this case the network is in a stable SOX9+ state, adapted from [13].
7.5.3 Spatiotemporal resolution and cellular heterogeneity
TF-FRAP revealed an interesting correlation between the transcription factor dynamics and their spatial arrangement (nuclear localization pattern). Other fluorescence based methods such as fluorescence correlation spectroscopy and single molecule measurements are robust in quantifying cellular dynamics with high temporal resolution at the expense of spatial resolution [15]. One of the advantages of TF-FRAP is the cellular dynamics can be captured with high spatiotemporal resolution. Nuclear localization pattern of transcription factors with discrete foci had lower mobility with higher immobile fraction and longer recovery half-times. In contrast, nucleus with diffused
Reflection and Outlook | 211
1
2
3
4
5
6
7
8
localization pattern had higher mobility with lower immobile fraction and shorter recovery half-times. We observed at least two types of cells in the hPCs with distinct dynamic and nuclear localization pattern of SOX9. This is in line with previous reports of cellular heterogeneity in the cartilage [16]. We observed at least three distinct nuclear localization patterns of SOX9 and RUNX2 in undifferentiated hMSCs. To our knowledge, this is the first ever report that transcription factor dynamics is coupled to its nuclear localization pattern.
7.5.4 TF-FRAP as a novel tool to determine the number of subpopulations in heterogenic cells
hMSCs are known for their heterogeneity, however, exact number of cell types are not yet known. Although, known cell surface CD markers can sort subpopulations, it does not help to determine the number of subpopulations present in heterogenic populations [17]. TF-FRAP studies on SOX9 and RUNX2 dynamics revealed at least four distinct dynamics and nuclear localization patterns of these transcription factors in the undifferentiated hMSCs. Every cell type has their own signature of proteome [18]. Since the protein expression in a cell is tightly controlled by the transcription factors and their activity is determined by their dynamics, we postulate that their distinct dynamics pattern can be used to identify the number of cell types (subpopulations) present in a heterogenic cell type. Notably, SOX9 dynamics was homogeneous in a subpopulation of hMSCs positive for both CD10 and CD92 surface markers. Studying the dynamics of two or more tissue specific master transcription factors by TF-FRAP and subsequent cluster analysis would reveal the number of cell types present in the heterogenic population. In this thesis, we have shown this principle only in two cell types (hPCs and hMSCs). However, studies on other heterogenic cells and their master transcription factors would be necessary to strengthen the hypothesis. If it is proven in other cell types and transcription factors, TF-FRAP would be one of the easiest ways to determine the degree of cellular heterogeneity in a heterogenic pool of cells. Currently, only the complex single cell RNA sequencing method can identify the cellular heterogeneity at the molecular level [19, 20]. Identifying subpopulations based on metabolic density has also been proposed, however, it still requires dense experiments [21].
Further research into mapping SOX9 and RUNX2 transcriptional activity at the subpopulation level during differentiation will expand our knowledge in chondrocyte differentiation and cartilage development at the molecular level. This knowledge is essential to precisely control in vitro differentiation, which is useful for clinical applications. In addition, this would help us to develop functional biomaterials for cartilage defects and to identify therapeutic targets to cure cartilage defects.
212 | Chapter 7
1
2
3
4
5
6
7
8
7.6 Conclusion
We have developed TF-FRAP method, which may be used as a direct readout of the activity of a transcription factor. We applied TF-FRAP to quantify SOX9 dynamics in OA disease pathophysiology and demonstrated its differential activity between healthy and OA hPCs. Further, we have studied SOX9 and RUNX2 dynamics in chondro-, osteo- and adipogenically differentiating hMSCs and revealed novel insights about the transcription factor dynamics during differentiation. In addition to investigating transcription factor activity in disease pathology, this thesis also presents novel applications of TF-FRAP, such as defining number of subpopulations in heterogenic cells, predicting differentiation potential of a donor, correlation between spatial arrangement of transcription factors and their dynamics.
Reflection and Outlook | 213
1
2
3
4
5
6
7
8
References
1. Lambert, S. A., Jolma, A., Campitelli, L. F., Das, P. K., Yin, Y., Albu, M., Chen, X., Taipale, J., Hughes, T. R. & Weirauch, M. T. (2018) The Human Transcription Factors, Cell. 172, 650-665. 2. Ohba, S., He, X., Hojo, H. & McMahon, A. P. (2015) Distinct Transcriptional Programs Underlie Sox9 Regulation of the Mammalian Chondrocyte, Cell Rep. 12, 229-43. 3. Govindaraj, K., Hendriks, J., Lidke, D. S., Karperien, M. & Post, J. N. (2019) Changes in Fluorescence Recovery After Photobleaching (FRAP) as an indicator of SOX9 transcription factor activity, Biochimica et Biophysica Acta (BBA) - Gene Regulatory Mechanisms. 1862, 107-117. 4. Holwerda, S. J. & de Laat, W. (2013) CTCF: the protein, the binding partners, the binding sites and their chromatin loops, Philos Trans R Soc Lond B Biol Sci. 368, 20120369. 5. Spivakov, M. (2014) Spurious transcription factor binding: non-functional or genetically redundant?, Bioessays. 36, 798-806. 6. Bi, W., Deng, J. M., Zhang, Z., Behringer, R. R. & de Crombrugghe, B. (1999) Sox9 is required for cartilage formation, Nature Genetics. 22, 85. 7. Leijten, J. C. H., Emons, J., Sticht, C., van Gool, S., Decker, E., Uitterlinden, A., Rappold, G., Hofman, A., Rivadeneira, F., Scherjon, S., Wit, J. M., van Meurs, J., van Blitterswijk, C. A. & Karperien, M. (2012) Gremlin 1, Frizzled-related protein, and Dkk-1 are key regulators of human articular cartilage homeostasis, Arthritis & Rheumatism. 64, 3302-3312. 8. Jo, A., Denduluri, S., Zhang, B., Wang, Z., Yin, L., Yan, Z., Kang, R., Shi, L. L., Mok, J., Lee, M. J. & Haydon, R. C. (2014) The versatile functions of Sox9 in development, stem cells, and human diseases, Genes Dis. 1, 149-161. 9. van der Kraan, P. M. (2017) The changing role of TGFβ in healthy, ageing and osteoarthritic joints, Nature Reviews Rheumatology. 13, 155-163. 10. Hlavacek, W. S., Faeder, J. R., Blinov, M. L., Perelson, A. S. & Goldstein, B. (2003) The complexity of complexes in signal transduction, Biotechnology and Bioengineering. 84, 783-794. 11. Lafont, J. E. (2010) Lack of oxygen in articular cartilage: consequences for chondrocyte biology, International Journal of Experimental Pathology. 91, 99-106. 12. Schivo, S., Scholma, J., Wanders, B., Camacho, R. A. U., Vet, P. E. v. d., Karperien, M., Langerak, R., Pol, J. v. d. & Post, J. N. (2014) Modeling Biological Pathway Dynamics With Timed Automata, IEEE Journal of Biomedical and Health Informatics. 18, 832-839. 13. Schivo, S., Khurana, S., Govindaraj, K., Scholma, J., Kerkhofs, J., Zhong, L., Huang, X., van de Pol, J., Langerak, R., van Wijnen, A. J., Geris, L., Karperien, M. & Post, J. N. (2020) ECHO, the executable CHOndrocyte: A computational model to study articular chondrocytes in health and disease, Cellular Signalling. 68, 109471. 14. Kang, J.-M., Rajangam, T., Rhie, J.-W. & Kim, S.-H. (2020) Characterization of cell signaling, morphology, and differentiation potential of human mesenchymal stem cells based on cell adhesion mechanism, Journal of cellular physiology. n/a. 15. Moerner, W. E. & Fromm, D. P. (2003) Methods of single-molecule fluorescence spectroscopy and microscopy, Review of Scientific Instruments. 74, 3597. 16. Williams, R., Khan, I. M., Richardson, K., Nelson, L., McCarthy, H. E., Analbelsi, T., Singhrao, S. K., Dowthwaite, G. P., Jones, R. E., Baird, D. M., Lewis, H., Roberts, S., Shaw, H. M., Dudhia, J., Fairclough, J., Briggs, T. & Archer, C. W. (2010) Identification and Clonal Characterisation of a Progenitor Cell Sub-Population in Normal Human Articular Cartilage, PloS one. 5, e13246. 17. Perez-Silos, V., Camacho-Morales, A. & Fuentes-Mera, L. (2016) Mesenchymal Stem Cells Subpopulations: Application for Orthopedic Regenerative Medicine, Stem Cells Int. 2016, 3187491. 18. Becker, L., Liu, N.-C., Averill, M. M., Yuan, W., Pamir, N., Peng, Y., Irwin, A. D., Fu, X., Bornfeldt, K. E. & Heinecke, J. W. (2012) Unique Proteomic Signatures Distinguish Macrophages and Dendritic Cells, PloS one. 7, e33297.
214 | Chapter 7
1
2
3
4
5
6
7
8
19. Wang, Y., Hoinka, J. & Przytycka, T. M. (2019) Subpopulation Detection and Their Comparative Analysis across Single-Cell Experiments with scPopCorn, Cell Systems. 8, 506-513.e5. 20. Kharchenko, P. V., Silberstein, L. & Scadden, D. T. (2014) Bayesian approach to single-cell differential expression analysis, Nature Methods. 11, 740-742. 21. Liu, Y., Muñoz, N., Bunnell, B. A., Logan, T. M. & Ma, T. (2015) Density-Dependent Metabolic Heterogeneity in Human Mesenchymal Stem Cells, STEM CELLS. 33, 3368-3381.
Reflection and Outlook | 215
1
2
3
4
5
6
7
8
Highlights of this thesis
Development of TF-FRAP method to study the activity of the transcription factor.
Method of TF-FRAP: A systematic protocol, sample preparation, data analysis and interpretation methods.
We have shown transcription factor dynamics can change in a short time (<20 mins) in response to external factors.
SOX9 transcriptional activity – coupled to its binding and residence time on DNA – is different between healthy and OA hPCs and quantified by TF-FRAP.
TF-FRAP identified at least two subpopulations of cells in hPCs (within a donor) and they respond differently to same external stimuli.
Healthy and OA hPCs differentially respond to same extracellular stimulation. TF-FRAP – a novel tool to determine the number of subpopulation of cells in a
heterogenic cell type (such as hMSC) based on transcription factor dynamics. Undifferentiated hMSCs appeared to contain at least four subpopulation of cells
with distinct transcription factor (SOX9 and RUNX2) dynamics. Higher spatiotemporal resolution of TF-FRAP identifies a correlation between
nuclear localization pattern and transcription factor dynamics. SOX9 and RUNX2 dynamics and coupled transcriptional activity changes at
subpopulation level during the chondro-, osteo- and adipogenic differentiation of hMSCs.
Subpopulation of cells respond differently to same extracellular signal. Predicting differentiation potential of an hMSC donor towards a particular
lineage using TF-FRAP.

ஆய்வுச்சுருக்கம்
மூட்டுவலி (Osteoarthritis) – அறிமுகம்
நமது ைகக்கால்கைள அைசப்பதற்கும் மடக்குவதற்கும் மூட்டு அவசியமானதாகும். மூட்டு என்பது
இரண்டு நீண்ட எலும்புகள் ஒன்ைறெயான்று சந்திக்கும் இடமாகும். எலும்புகளின் நீண்ட முைனகைள
கார்டிேலஜ் (Cartilage) என்ற மிருதுவான ெவண்ைம நிற தைச மூடியிருக்கும். நமது மூட்டுகள்
உராய்வின்றி சுமூகமாக இயங்குவதற்கு இந்த கார்டிேலஜ் தைசகேள உதவுகின்றன. இந்த தைச
ேசதமைடயும்ெபாழுது osteoarthritis என்ற மூட்டுவலி உண்டாகிறது. இந்த தைசயானது ஒருவர்
வயதாவதினாேலா, விபத்து அல்லது மூட்டில் பலத்த அடிபடுவதினாேலா ேசதமாகலாம்.
ைகக்கால்களில் ஏற்படும் மூட்டுவலியானது (Osteoarthritis), உடல் பருமன், பாலினம், மூட்டுக்காயம்,
மரபுவழி என பல காரணங்களால் வருகிறது. இந்த கார்டிேலஜ் தைச மூட்டுவலியால்
அவதிபடுபவர்களுக்கு ெதாடர்ந்து மற்றவர்கைளப்ேபால பல இடங்களுக்கு நடந்துெசல்லுதல் அல்லது
பயணப்படுதல் என்பது சவாலானதாகும். தற்ேபாைதக்கு மூட்டுவலிைய முழுைமயாக குணப்படுத்த
சிகிச்ைச முைறகள் இல்ைல. வலி நிவாரணிைய எடுத்துக்ெகாண்டு மூட்டுவலியின் அளைவக்
கட்டுக்குள் ைவத்துக்ெகாள்ள முடியும். மூட்டு மிக ேமாசமாக ேதய்ந்துவிட்டது அல்லது
பாதிக்கப்பட்டுவிட்டது என்றால் அதிகபட்சமாக மூட்டுமாற்று அறுைவசிகிச்ைச ெசய்துக்ெகாள்ளலாம்.
அறுைவசிகிச்ைச ெசலவு மற்றும் பின்விைளவுகள் காரணமாக பலரும் இைத ெசய்ய தயாராக
இல்ைல.
மூட்டுவலிைய குணப்படுத்தக்கூடிய மருத்துவ சிகிச்ைசகைளக் கண்டுபிடிக்க உலெகங்கிலும் பல
ஆய்வு நிைலயங்களில் ஆராய்ச்சிகள் கடந்த பல தைலமுைறகளாக நடந்துெகாண்டுதான்
இருக்கின்றன. ஆனாலும், இன்னும் குணப்படுத்தக்கூடிய சிகிச்ைச முைறகள்
கண்டுபிடிக்கபடாததற்கான ஒரு முக்கிய காரணம் மூலக்கூறு அளவில் இந்த ேநாய் முற்றுவதற்கான
முழுைமயான காரணங்கள் கண்டறியப்படாமல் இருப்பேத. எனது இந்த ஆராய்ச்சி புத்தகம் ேநாய்
முற்றுவதற்கான காரணங்கைளக் கண்டுபிடிப்பதில் ஒரு சிறிய படிக்கல்லாகும்.
ெசல்கள் – அறிமுகம்
ெசல் என்பது ஒரு உயிரின் அடிப்பைட அலகாகும். நமது உடல் பல ேகாடிக்கணக்கான ெசல்களால்
ஆனது. ஒவ்ெவாரு ெசல்லும் சரியாக ெசயல்படுவதற்கு புரதங்கள் மிக அவசியம், அைவகைள
அந்தந்த ெசல்கேள உற்பத்தி ெசய்கின்றன. ஒவ்ெவாரு ெசல்லிலும் உள்ள DNA எனப்படும்
மரபுப்ெபாருளானது, இந்த புரதங்களுக்கான குறியாக்கங்கைள (encode) ெகாண்டுள்ளன, அைவ ஜீன்
(gene) என்று அைழக்கப்படுகின்றன. நமது ெசல்களில் உள்ள DNA சுமார் 35,000-க்கும் அதிகமான
புரதங்களுக்கான ஜீன்கைளக் ெகாண்டுள்ளதாக் கருதப்படுகிறது. எல்லா புரதங்களும் எல்லா
ெசல்களிலும் உற்பத்தி ெசய்யப்படுவதில்ைல. ஒவ்ெவாரு ெசல்லும் அதன் பணி மற்றும்
அைமவிடத்திற்கு தக்கவாறு சில குறிப்பிட்ட புரதங்கைள, குறிப்பிட்ட அளவில் உற்பத்தி ெசய்கின்றன.
ஒரு குறிப்பிட்ட ெசல்லில், எந்ெதந்த புரதங்கள், எந்த அளவில் உற்பத்தி ெசய்யப்பட ேவண்டும்
என்பைத பல காரணிகள் தீர்மானித்தாலும், படிெயடுக்கும் காரணிகள் (Transcription factors) அதில் முக்கிய
பங்கு வகிக்கின்றன. இந்த படிெயடுக்கும் காரணிகளும் ஒரு வைக புரதங்கேள.
படிெயடுத்தல் அறிமுகம்
நமது DNA-வில் உள்ள ஒவ்ெவாரு ஜீனும் ஒரு புரதத்ைத உருவாக்குவதற்கான குறியாக்கங்கைளக்
ெகாண்டுள்ளது என்று ெசால்லலாம். ஜீனிலிருந்து ஒரு புரதம் உற்பத்தி ெசய்யப்படுவதற்கு இரண்டு படி
218 | ஆய்வுச்சுருக்கம்
நிைலகள் உள்ளன, அைவ: 1. படிெயடுத்தல், 2. ெமாழிமாற்றம். படிெயடுத்தல் என்பது ஜீனில் உள்ள
குறியாக்கங்களிலிருந்து தூது RNA உற்பத்தி ெசய்யப்படுவைதக் குறிக்கிறது. இந்த ெசயலில்
படிெயடுக்கும் காரணிகள் மிக முக்கிய பங்காற்றுகின்றன. தற்ேபாது இந்த தூது RNA-க்கள் அந்த
குறிப்பிட்ட புரதத்துக்கான குறியாக்கங்கைளக் ெகாண்டிருக்கும். இரண்டாவதாக, இந்த தூது RNA-
க்களில் உள்ள குறியாக்கங்கள் இைரேபாேசாம் என்ற உட்ெபாருளினால் படிக்கப்பட்டு புரங்கள்
உற்பத்தி ெசய்யப்படுவது ெமாழியாக்கம் என்று அைழக்கப்படுகிறது.
படிெயடுக்கும் காரணிகள் ெசயல்படும் விதம்
நமது ெசல்களில் நூற்றுக்கணக்கான படிெயடுக்கும் காரணிகள் உள்ளன. ஒரு குறிப்பிட்ட
படிெயடுக்கும் காரணியானது, பல ஜீன்களின் படிெயடுக்கும் நிகழ்ைவ கட்டுப்படுத்தக்கூடும். அைவ
படிெயடுத்தலில் ஈடுபடும் மற்ற காரணிகளுடன் இைணந்து, ஒரு குறிப்பிட்ட ஜீனின் கட்டுப்பாட்டு
பகுதியில் பதிந்து அந்த புரதத்ைத உற்பத்தி ெசய்ய உதவும் தூது RNA உற்பத்திைய ஒழுங்குபடுத்தும்.
ஒரு படிெயடுக்கும் காரணியானது ெசயல்பட நமது ெசல்லில் உள்ள DNA-வில் பதியேவண்டியது
அவசியமாகும். ஒேர படிெயடுக்கும் காரணியானது ஒரு ெசல்லில் ஆயிரக்கணக்கில் காணப்படும். சில
DNA-வில் பதிந்து தனது பணிைய ெசய்துக்ெகாண்டிருக்கும், எஞ்சிய படிெயடுக்கும் காரணிகள்
உட்கருக்குள் மிக ேவகமாக சுற்றிக்ெகாண்டிருக்கும். இப்படி சுற்றிக்ெகாண்டிருக்கும் படிெயடுக்கும்
காரணிகள் அச்சமயத்தில் படிெயடுக்கும் ெசயலில் ஈடுபடவில்ைல என்று ெசால்லலாம்.
SOX9 மற்றும் RUNX2 படிெயடுக்கும் காரணிகள்:
SOX9 மற்றும் RUNX2 என்ற படிெயடுக்கும் காரணிகளானது முைறேய கார்டிேலசு மற்றும் எலும்பு
தைசகளின் சமனிைலயான ெசயல்பாட்டிற்கு மிகவும் அவசியமானைவயாகும். ேசதமைடந்த மூட்டில்
இந்த இரண்டு படிெயடுக்கும் காரணிகளின் ெசயல்பாடுகளும் பாதிக்கப்படிருப்பது ஏற்கனேவ
கண்டறியப்பட்டுள்ளது. ஆேராக்கியமான கார்டிேலசு தைசகளில் SOX9 ெசயல்பாடு அதிகமாகவும்
RUNX2 ெசயல்பாடு குைறவாகவும் இருக்கும். பாதிப்புக்குள்ளான கார்டிேலசு தைசகளில் அைவகளின்
ெசயல்பாடு அப்படிேய ேநெரதிராக இருக்கும். ஆனாலும், மூலக்கூறு அளவில் அைவகள்
பாதிக்கப்படுவதற்கான காரணங்கள் என்ன என்பது இன்னும் கண்டறியப்படவில்ைல.
TF-FRAP முைறைம:
ெசல்லின் உட்கருவினுள் காணப்படும் இந்த படிெயடுக்கும் புரதங்களின் நகர்ைவ அளவிட
உடெனாளிர்த் (Fluorescence) தன்ைமைய ைமயமாகக்ெகாண்ட பல முைறகள் இருந்தாலும், நான் “ஒளி-
அைனத்தலுக்கு பிந்ைதய உடெனாளிர் மீட்சி” (FRAP) என்ற முைறைய பயன்படுத்திேனன்.
இந்தமுைறயில் ஒரு குறிப்பிட்ட அைலநீல (488) ஒளிக்குட்படுத்தினால் மட்டுேம பச்ைச நிறத்தில்
உடெனாளிரும் (Green Fluorescence Protein, GFP) புரதத்ைத SOX9 மற்றும் RUNX2 ஆகிய படிெயடுக்கும்
புரதங்களுடன் தனித்தனிேய இைணத்துவிட்ேடாம். ஒேர ேநரத்தில் இந்த இரண்டு புரதங்களில்
ஏேதனும் ஒன்று மட்டுேம ெசல்லினுள் ெசலுத்தப்படும். இப்ெபாழுது, எங்ெகல்லாம் பச்ைச நிற
உடெனாளிரும் புரத்தத்ைதக் காண்கிேறாேமா அங்ெகல்லாம் SOX9-GFP அல்லது GFP-RUNX2 புரதம்
காணப்படும். இந்த புரதங்கள் ெசல்லின் உட்கரு முழுவதும் நிரம்பியிருக்கும் 488 அைல நீளமுள்ள
ஒளிைய ெசலுத்தினால் இந்த புரதங்கள் பச்ைச நிறத்தில் உட்கரு முழுவதும் உடெனாளிரும்.
உட்கருவின் ஒரு சிறுபகுதியில் மிக அதிக சக்தியுைடய ஒளிைய மிகக்குறுகிய காலத்திற்கு (1
வினாடிக்கும் குைறவாக) ெசலுத்தும்ெபாழுது, அந்த பகுதியில் உள்ள புரதங்கள் தங்கள் உடெனாளிர்த்
தன்ைமைய இழக்கும். அைத சுற்றியுள்ள பகுதிகளிலுள்ள உடெனாளிர்த் தன்ைமைய இழக்காத
புரதங்கள் உடெனாளிர்த் தன்ைமைய இழந்த புரதங்கள் உள்ள பகுதிக்குள் நுைழயும். அைவகள்
நுைழயும் ேவகத்ைத உடெனாளிர் நுண்ேணாக்கியின் (Fluorescence Microscope) மூலம் அளவிடமுடியும்.
ஆய்வுச்சுருக்கம் | 219
ஏற்கனேவ குறிப்பிட்டபடி, படிெயடுக்கும் காரணிகளின் ெசயல்பாட்டிற்கு DNA-வில் உள்ள ஜீன்களின்
கட்டுப்பாட்டுப் பகுதிகளின் மீது பதியேவண்டியது அவசியமாகும். படிெயடுக்கும் புரதங்கள்
அதிகளவில் DNA-மீது பதிந்திருந்தால் உட்கருக்குள் அைவகள் மிக ெமதுவாக நகரும். மாறாக, அந்த
புரதங்கள் ெசயல்படாமல் DNA மீது பதியாமல் உட்கருக்குள் சுற்றிக்ெகாண்டிருந்தால் ஒப்பீட்டளவில் மிக
ேவகமாக நகரும்.
கருதுேகாள் (Hypothesis):
எனது ஆராய்ச்சிக்கு இரண்டு கருதுேகாள்கைள எடுத்துக்ெகாண்ேடன். முதலாவது, படிெயடுக்கும்
புரதங்கள் உட்கருக்குள் மூன்று நிைலகளில் இருக்கக்கூடும். 1. சில படிெயடுக்கும் புரதங்கள், DNA-மீது
பதியாமல் ெசயலற்ற நிைலயில் மிக ேவகமாக சுற்றிக்ெகாண்டிருக்கும். 2. சில DNA-மீது பதியாமல்,
ஆனால் மற்ற புரதங்களுடன் கூட்டாக இைணந்து உட்கருக்குள் வலம் வரும். 3. சில DNA-மீது பதிந்து
மிக ெமதுவாக நகரும் ெசயல்பாட்டில் உள்ள புரதங்கள். படிெயடுக்கும் புரதங்களின் ெசயல்படு
தன்ைமைய, உட்கருக்குள் அைவகள் நகரும் ேவகத்ைத அடிப்பைடயாக ைவத்து TF-FRAP
முைறைமைய பயன்படுத்தி அளவிடலாம் என்பது முதல் கருதுேகாள்.
இரண்டாவதாக, மூட்டுபகுதியில் இருக்கும் கார்டிேலசு தைசயின் சமனிைலயான ெசயல்பாட்டிற்கு
SOX9 பணி மிகவும் அவசியம் என்பதால், ஆேராக்கியமான ெசல்களில் அைவகளின் நகர்வு ேவகம்
குைறவாவும், பாதிக்கப்பட்ட ெசல்களின் அைவகளின் நகர்வுேவகம் ேவகமாகவும் இருக்கும் என
அனுமானித்ேதாம். RUNX2-வின் ெசயல்பாடு அப்படிேய ேநெரதிராக இருக்கும் எனவும்
அனுமானித்ேதாம். இது இரண்டாவது கருதுேகாள்.
ஆராய்ச்சி முடிவுகள்:
இந்த ஆய்வு புத்தகத்தின் மூன்றாவது அத்தியாயத்தில், முதல் கருதுேகாைள TF-FRAP, RT-qPCR மற்றும்
Chromatin-Immunoprecipitation ஆகிய ேசாதைனகைள பயன்படுத்தி ஆய்வுப்பூர்வமாக நிரூபித்திருக்கிேறாம்.
BMP7 என்ற புரதமானது கார்டிேலசு தைசயின் சமனிைலயான ெசயல்பாட்டிற்கு உதவுகிறது. இந்த
புரதத்ைத படிம ஊடகத்தில் (Imaging media) ேசர்த்து SOX9 புரதம் உட்கருவினுள் நகரும் ேவகத்ைத
அளவிட்டெபாழுது, அதன் நகர்வு ேவகம் குைறவாக இருந்தது. இது SOX9 ெசயல்பாடு
அதிகரித்திருப்பைதக் காட்டுகிறது. ேமலும், WNT3a மற்றும் IL1β ேபான்ற புரதங்கள் ேசதமைடந்த
கார்டிேலசு தைசயில் அதிகம் உற்பத்தி ெசய்யப்படுவது கண்டறியப்பட்டுள்ளது. இந்த புரதங்கைள
தனித்தனிேய படிமஊடகத்தில் ேசர்த்தெபாழுது SOX9 நகர்வு ேவகம் அதிகரித்தது. இது இந்த புரதங்கள்
SOX9 ெசயல்பாட்ைட குைறக்கின்றன என்பைத சுட்டிக்காட்டுகின்றன.
நான்காவது அத்தியாயத்தில், ஆேராக்கியமான கார்டிேலசு தைச மற்றும் ேசதமைடந்த கார்டிேலசு
தைசக்கிைடேய SOX9 புரதத்தின் ெசயல்பாடு எப்படி ேவறுபடுகிறது என்பைத கண்டறிந்துள்ேளாம்.
ஆேராக்கியமான கார்டிேலசு தைசயிலிருந்து பிரித்ெதடுக்கப்பட்ட ெசல்கைள ஒப்பிடுைகயில்,
ேசதமைடந்த தைசயிலிருந்து பிரித்ெதடுக்கப்பட்ட ெசல்களில் SOX9 நகர்வு ேவகம் அதிகமாக இருந்தது.
இது ேசதமைடந்த கார்டிேலசு தைசகளில் SOX9 ெசயல்பாடு குைறந்திருப்பைதக் காட்டுகிறது. ேமலும்,
ேசதமைடந்த ெசல்களில் BMP7, DKK1, FRZb மற்றும் IL1Ra ேபான்ற புரதங்கள் SOX9 ெசயல்பாட்ைட
அதிகரித்தைதயும் கண்டறிந்ேதாம். ஆேராக்கியமான ெசல்களில் SOX9 அதிக அளவில் ெதளிவான
திட்டுகளாக DNA முழுவாதும் பதிந்திருந்தது. ஆனால், ேசதமைடந்த ெசல்களில் SOX9 ெதளிவான
திட்டுகளாக இல்லாமல், உட்கரு முழுவதும் ஊடுருவி இருந்தது.
ஐந்தாவது மற்றும் ஆறாவது அத்தியாயங்களில் முைறேய எலும்பு மச்ைச இைணப்பு
உயிரணுக்களில் (bone marrow stem cells) SOX9 மற்றும் RUNX2 புரதங்களின் நகர்ைவ
ஆய்வுெசய்திருக்கிேறாம். இைணப்பு உயிரணுக்கைள கார்டிேலசு ெசல்களாக (Chondrocytes), எலும்பு
220 | ஆய்வுச்சுருக்கம்
ெசல்களாக (Osteoblasts) மற்றும் ெகாழுப்பு ெசல்களாக (Adipocytes) ேவற்றுைமயாக்கம் ெசய்து, அதில் SOX9
மற்றும் RUNX2 படிெயடுக்கும் காரணிகளின் ெசயல்பாடுகள் எப்படி ேவறுபடுகின்றன என்பைத
கண்டறிந்ேதாம். TF-FRAP முைறைமைய பயன்படுத்தி SOX9 மற்றும் RUNX2 புரதங்களின் நகர்ைவக்
கணிப்பதன் மூலம் ஒரு ெகாைடயாளரின் இைணப்பு உயிரணுக்கள் எந்த வைக ெசல்களாக
(காரிடிேலசு, எலும்பு அல்லது ெகாழுப்பு ெசல்களில்) நன்றாக ேவற்றுைமயாக்கம் ஆகிறது என்பைதக்
கண்டறிய முடியும். உட்கருவில் இந்த படிெயடுக்கும் புரதங்கள் பதிந்திருக்கும் அைமப்பிற்கும்
அைவகளின் நகர்வுக்கும் ெதாடர்பிருப்பைதக் கண்டறிந்துள்ேளாம். எல்லா ெசல்களும்
ேவற்றுைமயாக்கும் காரணிகளும் ஒருேபால விைனயாற்றுவதில்ைல என்பைத கண்டறிந்ேதாம்.
இறுதியாக, இந்த ஆய்வுப்புத்தகத்தில், TF-FRAP முைறையப்பற்றியும் அைத ஒரு நுண்ேணாக்கியில்
எப்படி ெசய்யலாம் என்பைதயும் நுணுக்கமாக விளக்கியிருக்கிேறாம். ேமலும், படிெயடுக்கும்
புரதங்களின் நகர்வுக்கும் அதன் ெசயல்பாட்டிற்குமுள்ளத் ெதாடர்ைப விளக்கியிருக்கிேறாம்.

Acknowledgements| 221
Acknowledgements
Unending laboratory experiments, innumerable dimensions of data analysis, routine of sleepless nights and countless excuses of writing thesis (applies only to my wife, though) have ended. Finally, joyful and ever-longing day of finishing my thesis has arrived (after multiple deferment of three months deadline!). I thank my God Almighty for strengthening me to finish this work. I would like to thank all my colleagues and friends, who were part of this journey.
I would like to thank my supervisor Janine for offering me this PhD position at DBE. Janine, you have been great inspiration to me, without your constant encouragement and support, this thesis would not have been possible. I particularly appreciated your open door scientific discussions, motivation, flexibility, freedom and cheerfulness. I am immensely thankful for your unconditional helping spirit, both scientifically and personally. I hope now you can do your rowing without thinking about my thesis.
I would like to thank my promotor Marcel for all your scientific inputs, discussions, freedom and encouragements during my PhD.
Jeroen Leijten, you have been always inspirational to me. Your discussions during DBE meeting were helpful. You helped me for the extension of my PhD contract when I was in a desperate need and application of successful ReumaNederlands grant, in which, I am currently employed as a post-doc. Thanks for all your help.
Moreover, I would like to thank prof. dr. Mireille Claessens, prof. dr. Armagan Koçer, prof. dr. Alessandra Cambi, prof. dr. Anna Akhmanov, dr. Roberto Narcisi, dr. Andre J. van Wijnen my for being part of my graduation committee.
Jacqueline, you are kind and always ready to help. Often, I wondered how it is possible to be this polite and helpful with loads of responsibilities. Definitely, every DBE-er will cherish you!
Ine and Irene, thanks for your help in Nikon confocal microscope and BioNano lab. Your offices were always open for my queries. Kirsten, thank you for your help in biochemistry and microbiology lab. Christian, thanks for your help in FACS machine.
Piet, Lilliana and Severine thank you for your inputs during DBE meetings. I would like to thank my colleagues, Tom, thanks for your cheerfulness, take some fresh air apart from your relentless work, even your microgels needed air (in-air). Jan, curves of our data almost looked similar, I bet the statistics would have failed to find significance, but I’m sure that we did different work! Thanks for fixing Matlab scripts. I’m pleased to have you as one of my paranymphs. Leilei and Xiaobin, we had nice chats and dinner together, I always wanted to learn Chinese from you, but never happened (honestly, none of us

222 | Acknowledgements
had time!). Elahe Hadavi thank you for the chocolates! Thanks Lisanne Karbaat for the home made sambals, we liked them. Corina, thanks for the cheerful moments! Thank you Michelle, Carlo, Melvin, Malin, Marieke, Nuno, Rong, Maurice, Mustafa, Salwa, Sanne, Alma, Castro, Barbara, Bram, Francisca and Lissane Morshuis for your help in the labs and discussions. My officemates, Elaheh Jooybar, Brenda, Bas, Yao Fu, Sarah, Lin Chen and Lin Zhong, thanks for sharing the office and chats. Ingrid, thank you for all your administrative work and pointing to right people throughout my PhD.
My bachelor students, Laura, Max, Jeroen and Karl, thank you for being part of my PhD thesis and thank you Janneke for assigning them to me. Maik, once you were my bachelor student, I am happy to have you as one of my paranymphs.
I would like to thank ReumaNederland for the funding and OCON for supplying patient knee joins for chondrocyte isolation.
Friends from other departments, Praneeth, Francis, Prasanna, Deepti, Rolf, Yusuf, Nazim, Fabian, Jiena Zhang, Priyanka, Hasib, Pinak and Keerthi thank you for making my PhD days colorful.
I would like to thank Dr. Marshal Dhayal and Dr. Gopal Pande from CCMB, Hyderabad, for their help in my research career.
Maurice and Ingrid, thank you for picking me from Hengelo railway station as I arrived in the Netherlands for the first time, thank you for accommodating me, I enjoyed the food and stay in your house! I would like to thank the members of ICF-Enschede. Paul van Dijk and Mieke your spiritual support, hospitality and help to the new comers are commendable. Rev. Josine thank you for your trips to Taize. Renji brother and Mini sister, thank you for prayer meetings and hosting me in your house. My fellow brothers and sisters, Lijun, Junia, Maria, Femi, Kwame, Caroline, Cathrine, Sheeba, Issac, Ioana, Alen, Benjamin, Rivka, Faith, Eric, Jienna, Stephen Emmanuel, Stephen Nalli, Jan Marten, Dink, Somto, Arnold, Hans and Jan thanks for your support during my stay in Enschede. Let the Lord bless you all abundantly!
My sweet heart Sakshi, could not forget our video calls before our marriage! You arrived in my life during the middle of my PhD journey and helped me to complete my thesis! Without your help, fifth and sixth chapters of this thesis would not be possible. Your constant help and encouragement is part of this thesis. Because of my thesis work, many times you had to miss me. In spite of our busy research work, you also brought our loving daughter Stuti (ஸ்துதி) to our life! When you raced to deliver Stuti, I raced to deliver my thesis, but you succeeded! Now, you are a PhD student, wish you success with your own PhD thesis!

Acknowledgements| 223
I would like to thank all my family members. அம்மா, அப்பா உங்கள் ெதாடர்ச்சியான ஊக்கத்திற்கும், ெஜபங்களுக்கும் நன்றி. எனது ஆராய்ச்சி படிப்பில் உங்கள் உதவியும் கரிசைனயும் இன்றியைமயாதது. எனது ஆராய்ச்சி படிப்பு முடிந்ததில் ெபருமகிழ்ச்சி அைடவீர்கள் என்பது எனக்கு ெதரியும். நான் விரும்பியபடி என்ைன கல்லூரி படிப்பு வைர படிக்கைவத்து, என்ைன ெநதர்லாந்து வைர அனுப்பி ைவத்ததில் உங்கள் தியாகங்கள் அதிகம். கல்லூரி நாட்களில் எனக்காக அதிகாைலயில் எழுந்து உணைவ ஆயத்தம் ெசய்துெகாடுத்து, உங்கள் ேவைலையயும் கவனித்ததில் நீங்கள் பட்ட கஷ்டங்கள் அதிகம். ேதவன்தாேம உங்கைள ஆசீர்வதிப்பாராக! சக்தி, அனிதா, தானிேயல், உங்கள் ெதாடர்ச்சியான ஊக்கங்களுக்கு நன்றி. ேமலும், எனது உறவினர்கள் அைனவருக்கும் நன்றி.
ரிச்சர்ட் அண்ணன், பத்மா அக்கா, ரீத்து, நீத்து, ேநசராஜன் அண்ணன், பிரிசில்லா அக்கா, சீகன், சீமா உங்கள் ெஜபங்களுக்கும் உற்சாகத்திற்கும் நன்றி. சீலி ஆசிரிைய, ேஜன் ஆசிரிைய மற்றும் எனது ஞாயிறு பள்ளி ஆசிரியர்களின் உதவியும் மறக்க இயலாது. திருெசல்வம் சேகாதரர், ராணி அம்மா, அம்பிகா மற்றும் முழு குடும்பத்தினருக்கும் நன்றிகள் பல. எனக்காக ெஜபித்த வாகனிங்கன் தமிழ் திருச்சைபயினருக்கும் நன்றி.
ெதாடர்ந்து ஊக்கம் அளித்த ேபராயர் ஹீபர் கல்லூரி முதல்வர், முைன. பால் தயாபரன் ஐயா அவர்களுக்கும், முைன. வேயாலட் தயாபரன் அம்மா அவர்களுக்கும், விலங்கியல் துைற தைலவர், முைன. சுதா பிரிசில்லா அவர்களுக்கும் நன்றி. முைன. ெசல்வம் ஐயா (ஓய்வு) மற்றும் முைன. பால்ராஜ் ஐயா (மேலசியா) அவர்கள் ெசய்த உதவிகளும், தந்த ஊக்கமும் அதிகம்.
I would like to thank Amit, Margaret and Anant for their prayer support during my PhD research. Amit you visited Netherlands for a week, that turned out to be fruitful, looking forward to welcome you here. I thank mother and father-in-law, Gargi for their encouragements.
I would like to thank members of EHOW church, especially, Mathews uncle, Vijay Kumar uncle, Revathi Kumar uncle, Samuel Uncle, Bibu brother, Kathleen aunty and their families for their support and prayer.
- Kannan Govindaraj –

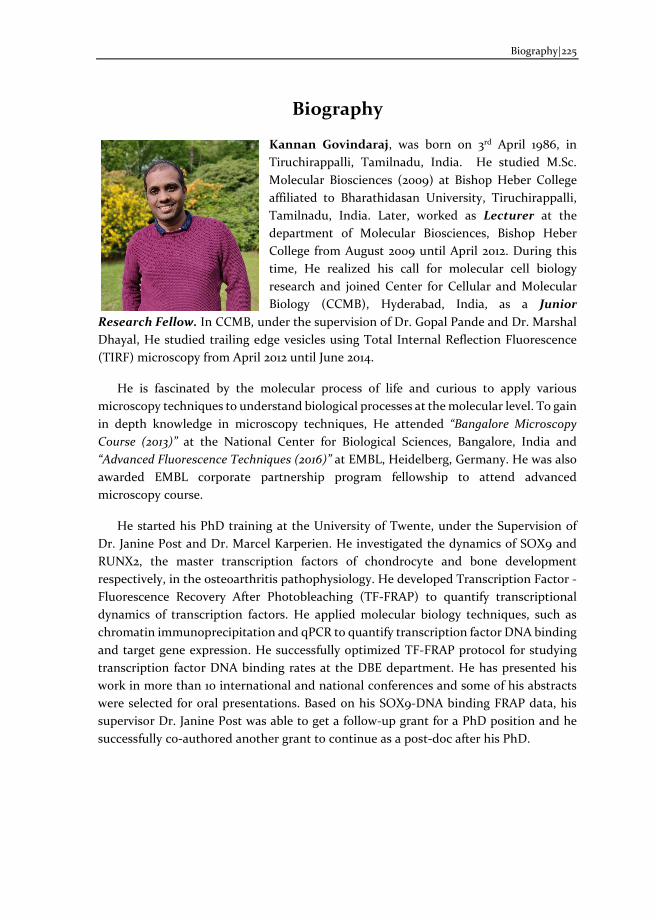
Biography|225
Biography
Kannan Govindaraj, was born on 3rd April 1986, in Tiruchirappalli, Tamilnadu, India. He studied M.Sc. Molecular Biosciences (2009) at Bishop Heber College affiliated to Bharathidasan University, Tiruchirappalli, Tamilnadu, India. Later, worked as Lecturer at the department of Molecular Biosciences, Bishop Heber College from August 2009 until April 2012. During this time, He realized his call for molecular cell biology research and joined Center for Cellular and Molecular Biology (CCMB), Hyderabad, India, as a Junior
Research Fellow. In CCMB, under the supervision of Dr. Gopal Pande and Dr. Marshal Dhayal, He studied trailing edge vesicles using Total Internal Reflection Fluorescence (TIRF) microscopy from April 2012 until June 2014.
He is fascinated by the molecular process of life and curious to apply various microscopy techniques to understand biological processes at the molecular level. To gain in depth knowledge in microscopy techniques, He attended “Bangalore Microscopy Course (2013)” at the National Center for Biological Sciences, Bangalore, India and “Advanced Fluorescence Techniques (2016)” at EMBL, Heidelberg, Germany. He was also awarded EMBL corporate partnership program fellowship to attend advanced microscopy course.
He started his PhD training at the University of Twente, under the Supervision of Dr. Janine Post and Dr. Marcel Karperien. He investigated the dynamics of SOX9 and RUNX2, the master transcription factors of chondrocyte and bone development respectively, in the osteoarthritis pathophysiology. He developed Transcription Factor - Fluorescence Recovery After Photobleaching (TF-FRAP) to quantify transcriptional dynamics of transcription factors. He applied molecular biology techniques, such as chromatin immunoprecipitation and qPCR to quantify transcription factor DNA binding and target gene expression. He successfully optimized TF-FRAP protocol for studying transcription factor DNA binding rates at the DBE department. He has presented his work in more than 10 international and national conferences and some of his abstracts were selected for oral presentations. Based on his SOX9-DNA binding FRAP data, his supervisor Dr. Janine Post was able to get a follow-up grant for a PhD position and he successfully co-authored another grant to continue as a post-doc after his PhD.

Scientific output| 227
Scientific Output
Peer-reviewed papers
1. Govindaraj, K., Hendriks, J., Lidke, D. S., Karperien, M. and Post, J. N. (2019) Changes in Fluorescence Recovery After Photobleaching (FRAP) as an indicator of SOX9 transcription factor activity, Biochimica et Biophysica Acta (BBA) - Gene Regulatory Mechanisms. 1862, 107-117.
2. Schivo, S., Khurana, S., Govindaraj, K., Scholma, J., Kerkhofs, J., Zhong, L., Huang, X., van de Pol, J., Langerak, R., van Wijnen, A. J., Geris, L., Karperien, M. and Post, J. N. (2020) ECHO, the executable CHOndrocyte: A computational model to study articular chondrocytes in health and disease, Cellular Signalling. 68, 109471.
3. Trinadh, M., Govindaraj, K., Santosh, V., Dhayal, M. and Sainath, A. V. S. (2016) Synthesis of PEO-based di-block glycopolymers at various pendant spacer lengths of glucose moiety and their in-vitro biocompatibility with MC3T3 osteoblast cells, Designed Monomers and Polymers. 19, 24-33.
4. Trinadh, M., Govindaraj, K., Rajasekhar, T., Dhayal, M. and Sainath, A. V. S. (2015) Synthesis and characterization of poly(ethylene oxide)-based glycopolymers and their biocompatibility with osteoblast cells, Polymer International. 64, 795-803.
5. Trinadh, M., Kannan, G., Rajasekhar, T., Sesha Sainath, A. V. and Dhayal, M. (2014) Synthesis of glycopolymers at various pendant spacer lengths of glucose moiety and their effects on adhesion, viability and proliferation of osteoblast cells, RSC Advances. 4, 37400-37410.
-- In Progress --
6. Govindaraj, K., Karperien, M. and Post, J. N. (2019) Dissecting SOX9 protein dynamics reveals its differential regulation among healthy, preserved and osteoarthritic chondrocytes, Under preparation.
7. Govindaraj, K., Khurana, S., Karperien, M. and Post, J. N. Mapping SOX9 transcriptional dynamics during chondro-, osteo- and adipogenic differentiation of human mesenchymal stem cells, Under preparation.
8. Govindaraj, K., Khurana, S., Karperien, M. and Post, J. N. Mapping RUNX2 transcriptional dynamics during chondro-, osteo- and adipogenic differentiation of human mesenchymal stem cells, Under preparation.
Book Chapters
1. Govindaraj, K. and Post, J. N. (2021) Using FRAP to Quantify Changes in Transcription Factor Dynamics After Cell Stimulation: Cell Culture, FRAP, Data Analysis, and Visualization in Osteoporosis and Osteoarthritis (van Wijnen, A. J. & Ganshina, M. S., eds) pp. 109-139, Springer US, New York, NY.
228 | Scientific output
Oral Presentations
1. Govindaraj, K., Khurana, S., Karperien, M. and Post, J. N. TF-FRAP determines transcription dynamics, heterogeneity and differentiation potential of stem cells, Dutch Biophysics, 2020, NL.
2. Govindaraj, K., Khurana, S., Karperien, M. and Post, J. N. Dissecting SOX9 dynamics to decode matrix biology in osteoarthritis, NVMB, 2019, Lunteren, NL.
3. Govindaraj, K., Khurana, S., Karperien, M. and Post, J. N. RUNX2 and SOX9 protein mobility correlates to osteogenic and chondrogenic differentiation of hMSCs, NVMB, 2018, Lunteren, NL.
4. Govindaraj, K., Karperien, M. and Post, J. N. Understanding Osteoarthritis pathophysiology by FRAPing SOX9, EMBL Microscopy course, 2016, Heidelberg, DE. Awarded EMBL CPP fellowship (fee waiver).
5. Govindaraj, K., Karperien, M. and Post, J. N. Decoding Matrix Biology by FRAPing SOX9, NVMB, 2016, Lunteren, NL.
6. Govindaraj, K., Karperien, M. and Post, J. N. WNT blows your SOX off, MIRA day, 2016, Enschede, NL.
Poster Presentations
1. Govindaraj, K., Karperien, M. and Post, J. N. Mapping the network regulating transcription factor activity and dynamics by TF-FRAP, FEBS 2021, Ljubliana, Slovenia.
2. Govindaraj, K., Karperien, M. and Post, J. N. Identifying sub population of cells in human primary chondrocytes by measuring SOX9 dynamics by FRAP, Seeing is Believing, 2019, EMBL, Heidelberg, DE.
3. Govindaraj, K., Karperien, M. and Post, J. N. Single cell SOX9 dynamics reveals its differential DNA binding in subpopulations of human chondrocytes. OARSI 2020, Published in Osteoarthritis and Cartilage, DOI: doi.org/10.1016/j.joca.2020.02.131.
4. Govindaraj, K., Karperien, M. and Post, J. N. Changes in SOX9 and RUNX2 protein activity correlate to the health state of human primary chondrocytes, OARSI 2019, Published in Osteoarthritis and Cartilage, DOI: doi.org/10.1016/j.joca.2019.02.292. Toronto, Canada.
5. Govindaraj, K., Khurana, S., Karperien, M. and Post, J. N. Dancing transcription factors: SOX9 and RUNX2 mobility correlates to their activity, Dutch Biophysics, 2018, Veldhoven, NL.
Scientific output| 229
6. Khurana, S., Govindaraj, K., Karperien, M. and Post, J. N. RUNX2 and SOX9 protein mobility correlates to osteogenic and chondrogenic differentiation of mesenchymal stem cells, Published in Osteoarthritis and Cartilage, DOI:10.1016/j.joca.2018.02.239. OARSI 2018, Liverpool, UK
7. Govindaraj, K., Khurana, S., Karperien, M. and Post, J. N. SOX9 transcriptional activity is differentially regulated in healthy and osteoarthritic chondrocytes, OARSI 2018, Published in Osteoarthritis and Cartilage. Liverpool, UK
8. Govindaraj, K., Karperien, M. and Post, J. N. Development of a tool for direct read-out of cell responses to environmental changes, TERMIS 2017, Davos, Switzerland.
9. Govindaraj, K., Karperien, M. and Post, J. N. Mapping the network regulating transcription factor activity by FRAP, Seeing is Believing, 2017, EMBL, Heidelberg, DE. Selected for a Flash Talk.
10. Khurana, S., Govindaraj, K., Karperien, M. and Post, J. N. FRAP to investigate differential RUNX2 transcriptional activity in proliferating and differentiating Mesenchymal Stem Cells, Seeing is Believing, 2017, EMBL, Heidelberg, DE.
11. Govindaraj, K., Karperien, M. and Post, J. N. IL1β may initiate cartilage degradation by activating WNT signaling in chondrocytes, NVMB, 2017, Lunteren, NL.
12. Govindaraj, K., Karperien, M. and Post, J. N. SOX9 transcriptional activity is dependent on the chondrocyte health state and is directly regulated by WNT3A, IL1β and BMP7, Published in Osteoarthritis and Cartilage. DOI: doi.org/10.1016/j.joca.2017.02.285, OARSI 2017, Las Vegas, USA, Selected to be presented in the breakfast poster tour.
13. Govindaraj, K., Karperien, M. and Post, J. N. WNT blows your SOX off, Dutch Biophysics 2016, Veldhoven, NL.
14. Govindaraj, K., Karperien, M. and Post, J. N. Dancing Transcription Factors: What makes SOX9 to move? OARSI 2016, Amsterdam, NL, Published in Osteoarthritis and Cartilage. DOI: doi.org/10.1016/j.joca.2016.01.339
15. Govindaraj, K., Karperien, M. and Post, J. N. Determination of RUNX2 and SOX9 transcriptional activity by FRAP, Seeing is Believing, 2015, EMBL, Heidelberg, DE.
16. Govindaraj, K., Dhayal, M., and Pande, G., A Study of Trailing edge vesicles in Osteoblast Cells, Bangalore Microscopy course 2013, NCBS, Bangalore, IN.
230 | Scientific output
Grants and Awards
1. Reumafonds grant for a two-year post-doc position “Investigating the role of molecular crowding in osteoarthritis pathophysiology”. Grant value: €158.000, Role: Co-author.
2. Awarded EMBL Corporate Partnership Programme (CPP) Fellowship in the form of Registration fee waiver (€400) to attend Advanced Fluorescence Techniques course, EMBL, Heidelberg, DE.
3. BioNano Lab voucher (2015) to use confocal microscopy facility in MESA+ institute. Role: lead author. Grant value: €4000.
4. FEBS Young Scientist Forum (YSF) Grant to attend FEBS YSF meeting (1 – 4 July 2021) at Lovran, Croatia and FEBS congress (4 – 9 July 2021) at Ljubljana, Slovenia. Registration fee waiver and travel grant. Grant value: about €1500.

