journal of science and technological researches - jstr
TRANSCRIPT
© JSTR All rights reserved
Vol. 3 Issue No.3, July-September 2021 e-ISSN 2456-7701
Journal of Science and Technological ResearchesOrigin of Innovation
“together we can and we will make a difference”
A STUDY ON WATER QUALITY STATUS OF SHIVNA RIVER,MANDSAUR, WITH RESPECT TO ITS CONSERVATION
AND MANAGEMENTSubrata Pani
Environmental Research Laboratory, Environmental Planning & Co-ordination Organization, Paryavaran Parisar, E-5 Arera Colony, Bhopal-462016.
Email:[email protected]
Date of Received 10 August, 2021
Date of Revised 25 August, 2021
Date of Acceptance 10 September, 2021
Date of Publication 30 September, 2021
DOI : https://doi.org/10.51514/JSTR.3.3.2021.14-32
Subrata Pani e-ISSN 2456-7701 Journal of Science and Technological Researches (JSTR) Vol. 3 Issue No.3, July-September 2021
*Author for correspondence © JSTR All rights reserved
(14)
A STUDY ON WATER QUALITY STATUS OF SHIVNA RIVER, MANDSAUR, WITH RESPECT TO ITS CONSERVATION
AND MANAGEMENT
Subrata Pani
Environmental Research Laboratory, Environmental Planning & Co-ordination Organization, Paryavaran Parisar, E-5 Arera Colony, Bhopal-462016.
Email:[email protected]
ABSTRACT
Present study was done to assess the impact of various anthropogenic and natural factors on water quality of Shivna River which is one of the most important rivers of Mandsaur district of Madhya Pradesh of central India. Water samples were collected from 9 stations of the river stretching a distance of about 10 Km within Mandsaur town in two seasons during the period 2019. The study depicts that the river is grossly polluted due to inflow of sewage through Bugaliya Nalla besides accumulation of both autochthonous and allocthonous materials in the river bed from Mandsaur Town over the years.
Keywords: Anthropogenic, natural factor, river, pollution, autochthonous and allocthonous materials
INTRODUCTION Water bodies have been the most exploited natural
resources, since man strode the earth. Rapid increase of industrialization, urbanization, and population explosion in last few decades have caused a dramatic increase in the demand for water, as well as significant deteriorations in water quality throughout the world (Pani et al 2014). Environment pollution is a worldwide problem and its potential to influence the health of human populations is great. Pollution often reaches its most serious proportions especially in densely settled urban-industrial centers of more developed countries. Hence the significance of environmental factors with respect to pollution as well as to the health and well-being of human populations is increasingly apparent. Water pollution is a major problem of whole world. This is the biggest problem that affects the health of human, animals and plants. In India majority of the rivers and other water bodies have become a victim of pollution due to the aforesaid factors. Madhya Pradesh though very rich with number of interstate rivers, dams, reservoirs and lakes, unfortunately witnessing the problem of pollution due to unplanned planning and their overexploitation, inflow of city sewage, agricultural and industrial wastes. Number of rivers like Parvati, Shipra, Kahn has become victims of pollution due to various anthropogenic activities. River Shivna of Mandsaur district which is one of the major rivers in the state has been subjected to serious water quality
deterioration (Shyam Lal et al 2018). Therefore considering the above facts in mind assessment of water quality of the river has been carried out so as to understand the existing water quality scenario vis-a-vis environmental problems. The objective is to suggest appropriate mitigative measures for restoration of water quality as well as biodiversity of the important river. 1.1 Description of the Study Area
The present study area is located within the Latitudes 23º 32' to 24º 15' N and Longitudes 74º 47' E to 75º 22' E (Survey of India, Toposheet No 46 I/13 and 14, 46 M/ 1, 2 and 5, 45 L/ 16, 45 P/4, 7 and 8 on the scale of 1: 50,000, Figure -1). The River originates from the Sevna village, (230 42’30.6” N: 740 48’ 91.4” E) at an elevation of about 524 m. in Pratapgarh District of Rajasthan, It is the main tributary of Chambal River, which extends over 103.4 km covering parts of Madhya Pradesh and Rajasthan, the River Basin covers a total area of 3361.52 sq. km. The study area constitutes a part of Malwa Plateau of the Deccan Volcanic Province (Deepali et al 1911). 1.2 Environmental Problems
Shivna River is the life line of Mandsaur town as this river plays important role in social, religioustic, cultural activities of Mandsaur town besides providing potable water to the city dwellers. The river has become a severe victim of both natural and anthropogenic problems. The catchment area within
Subrata Pani e-ISSN 2456-7701 Journal of Science and Technological Researches (JSTR) Vol. 3 Issue No.3, July-September 2021
(15)
the city limit is densely polluted and inflow of untreated sewage, dumping of solid wastes directly in the river has resulted in severe deterioration of water quality. The irregular flow of river has resulted in accumulation of nutrient from biodegradable materials as well as silt which have accelerated proliferation of algal mass, thereafter further degrading the water quality.
The major Environmental Problems of the River are:-
Inflow of sewage Dumping of Solid waste Siltation from the eroded banks Weed infestation Anthropogenic activities Poor Biodiversity
MATERIALS AND METHODS 2.1 Methods Used for Collection of Water and Wastewater
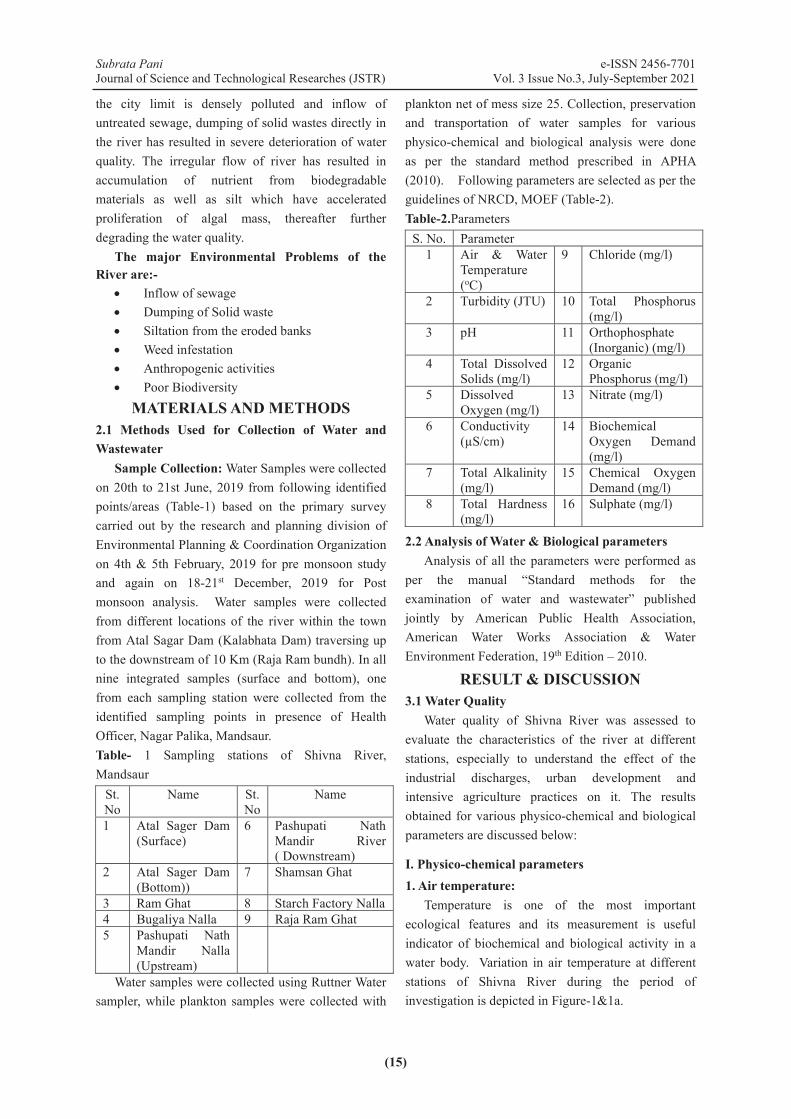
Sample Collection: Water Samples were collected on 20th to 21st June, 2019 from following identified points/areas (Table-1) based on the primary survey carried out by the research and planning division of Environmental Planning & Coordination Organization on 4th & 5th February, 2019 for pre monsoon study and again on 18-21st December, 2019 for Post monsoon analysis. Water samples were collected from different locations of the river within the town from Atal Sagar Dam (Kalabhata Dam) traversing up to the downstream of 10 Km (Raja Ram bundh). In all nine integrated samples (surface and bottom), one from each sampling station were collected from the identified sampling points in presence of Health Officer, Nagar Palika, Mandsaur. Table- 1 Sampling stations of Shivna River, Mandsaur
Water samples were collected using Ruttner Water sampler, while plankton samples were collected with
plankton net of mess size 25. Collection, preservation and transportation of water samples for various physico-chemical and biological analysis were done as per the standard method prescribed in APHA (2010). Following parameters are selected as per the guidelines of NRCD, MOEF (Table-2). Table-2.Parameters
S. No. Parameter 1 Air & Water
Temperature (oC)
9 Chloride (mg/l)
2 Turbidity (JTU) 10 Total Phosphorus (mg/l)
3 pH 11 Orthophosphate (Inorganic) (mg/l)
4 Total Dissolved Solids (mg/l)
12 Organic Phosphorus (mg/l)
5 Dissolved Oxygen (mg/l)
13 Nitrate (mg/l)
6 Conductivity (μS/cm)
14 Biochemical Oxygen Demand (mg/l)
7 Total Alkalinity (mg/l)
15 Chemical Oxygen Demand (mg/l)
8 Total Hardness (mg/l)
16 Sulphate (mg/l)
2.2 Analysis of Water & Biological parameters Analysis of all the parameters were performed as
per the manual “Standard methods for the examination of water and wastewater” published jointly by American Public Health Association, American Water Works Association & Water Environment Federation, 19th Edition – 2010.
RESULT & DISCUSSION 3.1 Water Quality
Water quality of Shivna River was assessed to evaluate the characteristics of the river at different stations, especially to understand the effect of the industrial discharges, urban development and intensive agriculture practices on it. The results obtained for various physico-chemical and biological parameters are discussed below:
I. Physico-chemical parameters
1. Air temperature: Temperature is one of the most important
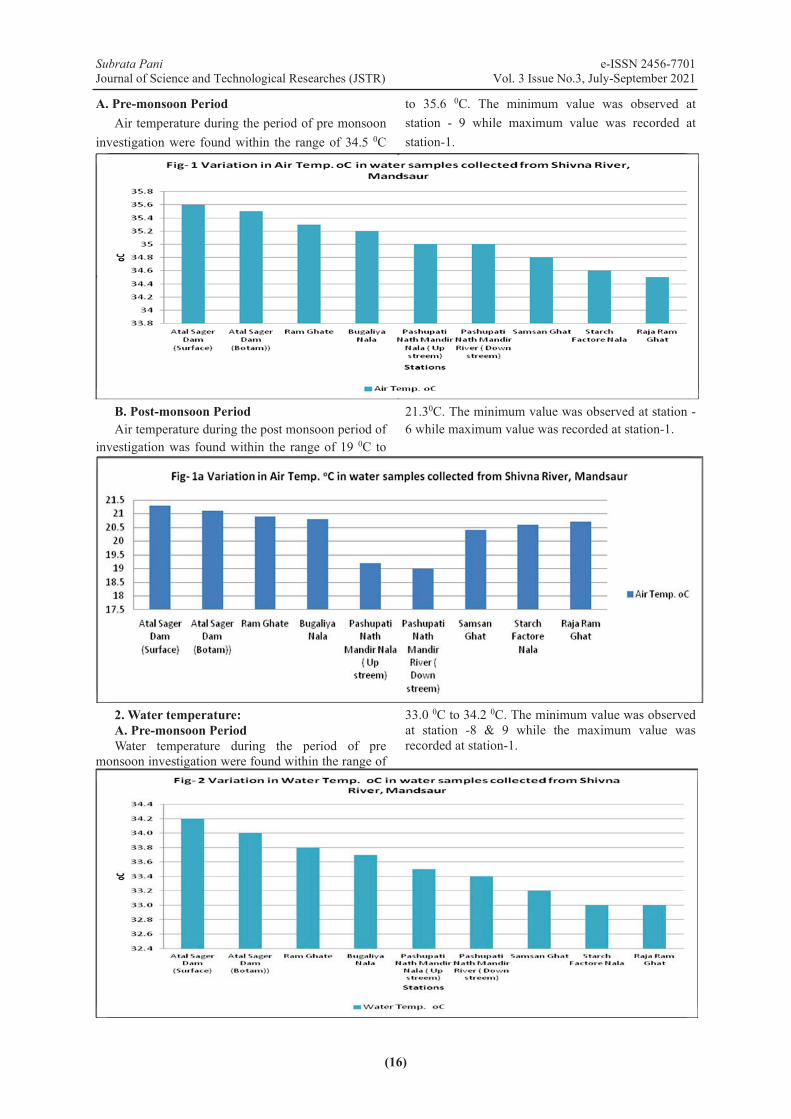
ecological features and its measurement is useful indicator of biochemical and biological activity in a water body. Variation in air temperature at different stations of Shivna River during the period of investigation is depicted in Figure-1&1a.
St. No
Name St. No
Name
1 Atal Sager Dam (Surface)
6 Pashupati Nath Mandir River ( Downstream)
2 Atal Sager Dam (Bottom))
7 Shamsan Ghat
3 Ram Ghat 8 Starch Factory Nalla 4 Bugaliya Nalla 9 Raja Ram Ghat 5 Pashupati Nath
Mandir Nalla (Upstream)
Subrata Pani e-ISSN 2456-7701Journal of Science and Technological Researches (JSTR) Vol. 3 Issue No.3, July-September 2021
(16)
A. Pre-monsoon PeriodAir temperature during the period of pre monsoon
investigation were found within the range of 34.5 0C
to 35.6 0C. The minimum value was observed at station - 9 while maximum value was recorded at station-1.
B. Post-monsoon PeriodAir temperature during the post monsoon period of
investigation was found within the range of 19 0C to
21.30C. The minimum value was observed at station -6 while maximum value was recorded at station-1.
2. Water temperature:A. Pre-monsoon PeriodWater temperature during the period of pre
monsoon investigation were found within the range of
33.0 0C to 34.2 0C. The minimum value was observed at station -8 & 9 while the maximum value was recorded at station-1.
g g
Subrata Pani e-ISSN 2456-7701Journal of Science and Technological Researches (JSTR) Vol. 3 Issue No.3, July-September 2021
(17)
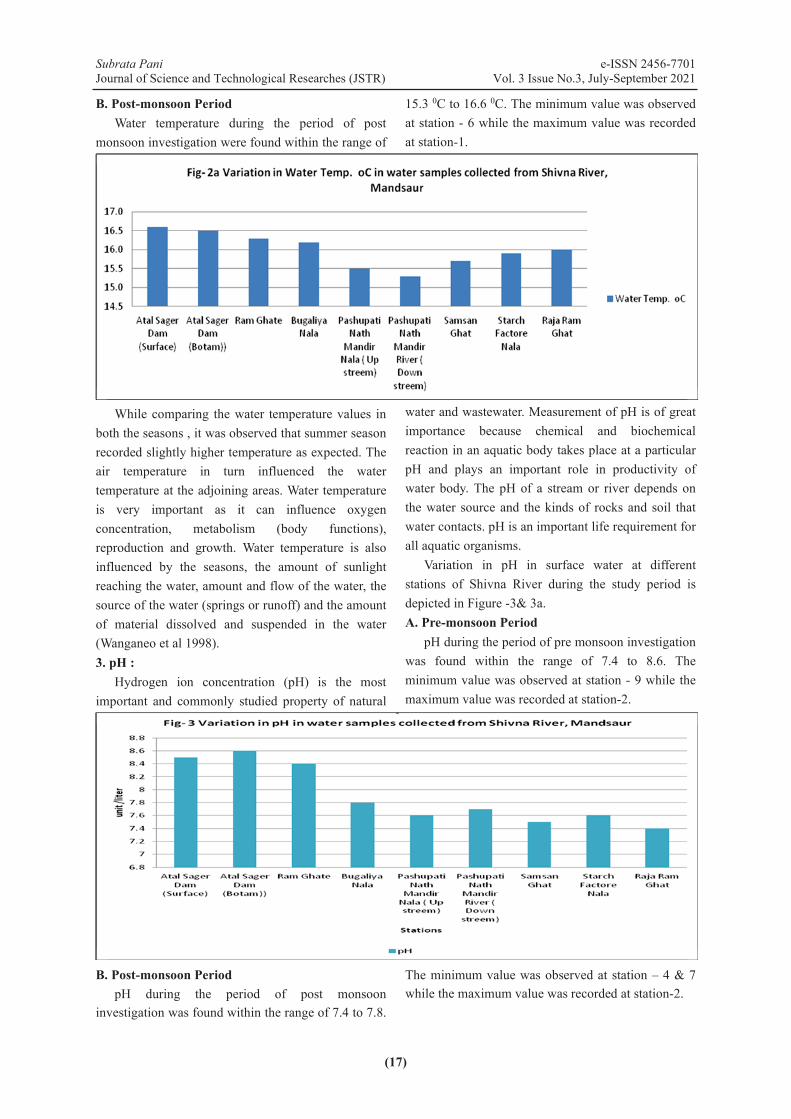
B. Post-monsoon PeriodWater temperature during the period of post
monsoon investigation were found within the range of
15.3 0C to 16.6 0C. The minimum value was observed at station - 6 while the maximum value was recorded at station-1.
While comparing the water temperature values in both the seasons , it was observed that summer season recorded slightly higher temperature as expected. The air temperature in turn influenced the watertemperature at the adjoining areas. Water temperature is very important as it can influence oxygen concentration, metabolism (body functions), reproduction and growth. Water temperature is also influenced by the seasons, the amount of sunlight reaching the water, amount and flow of the water, the source of the water (springs or runoff) and the amount of material dissolved and suspended in the water (Wanganeo et al 1998).3. pH :
Hydrogen ion concentration (pH) is the most important and commonly studied property of natural
water and wastewater. Measurement of pH is of great importance because chemical and biochemical reaction in an aquatic body takes place at a particular pH and plays an important role in productivity of water body. The pH of a stream or river depends on the water source and the kinds of rocks and soil that water contacts. pH is an important life requirement for all aquatic organisms.
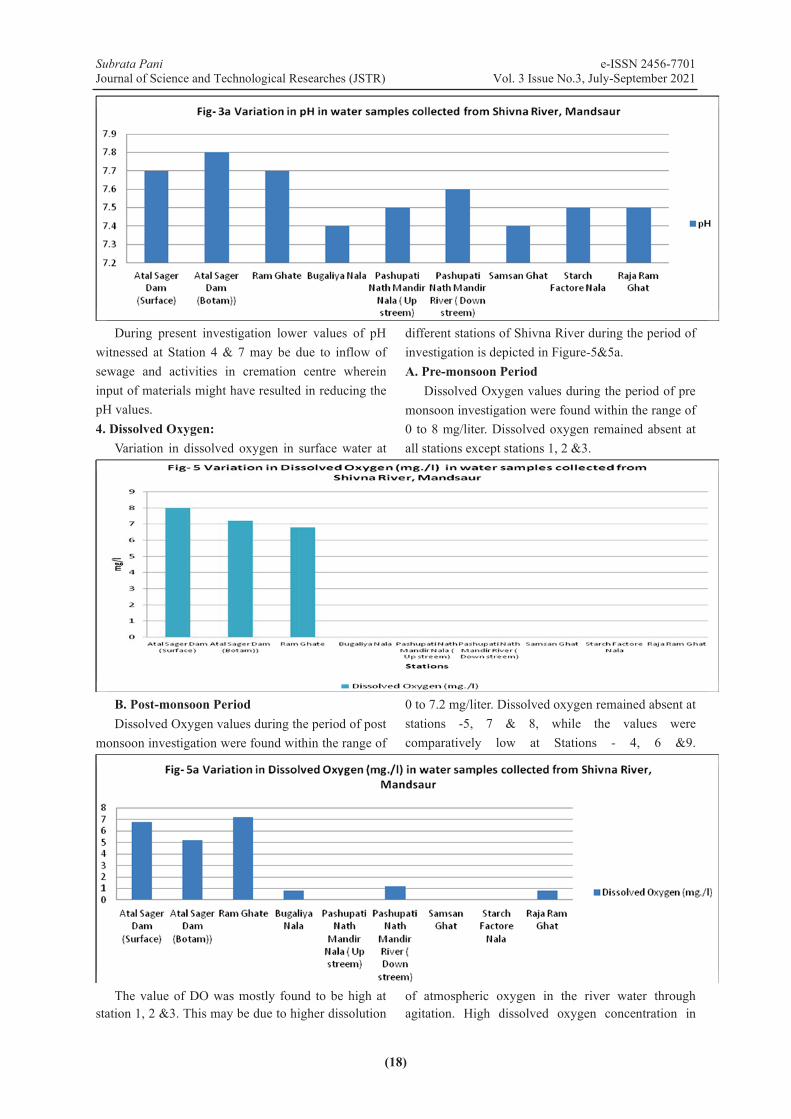
Variation in pH in surface water at different stations of Shivna River during the study period is depicted in Figure -3& 3a.A. Pre-monsoon Period
pH during the period of pre monsoon investigation was found within the range of 7.4 to 8.6. The minimum value was observed at station - 9 while the maximum value was recorded at station-2.
B. Post-monsoon PeriodpH during the period of post monsoon
investigation was found within the range of 7.4 to 7.8.
The minimum value was observed at station – 4 & 7 while the maximum value was recorded at station-2.
Subrata Pani e-ISSN 2456-7701Journal of Science and Technological Researches (JSTR) Vol. 3 Issue No.3, July-September 2021
(18)
During present investigation lower values of pH witnessed at Station 4 & 7 may be due to inflow of sewage and activities in cremation centre wherein input of materials might have resulted in reducing the pH values. 4. Dissolved Oxygen:
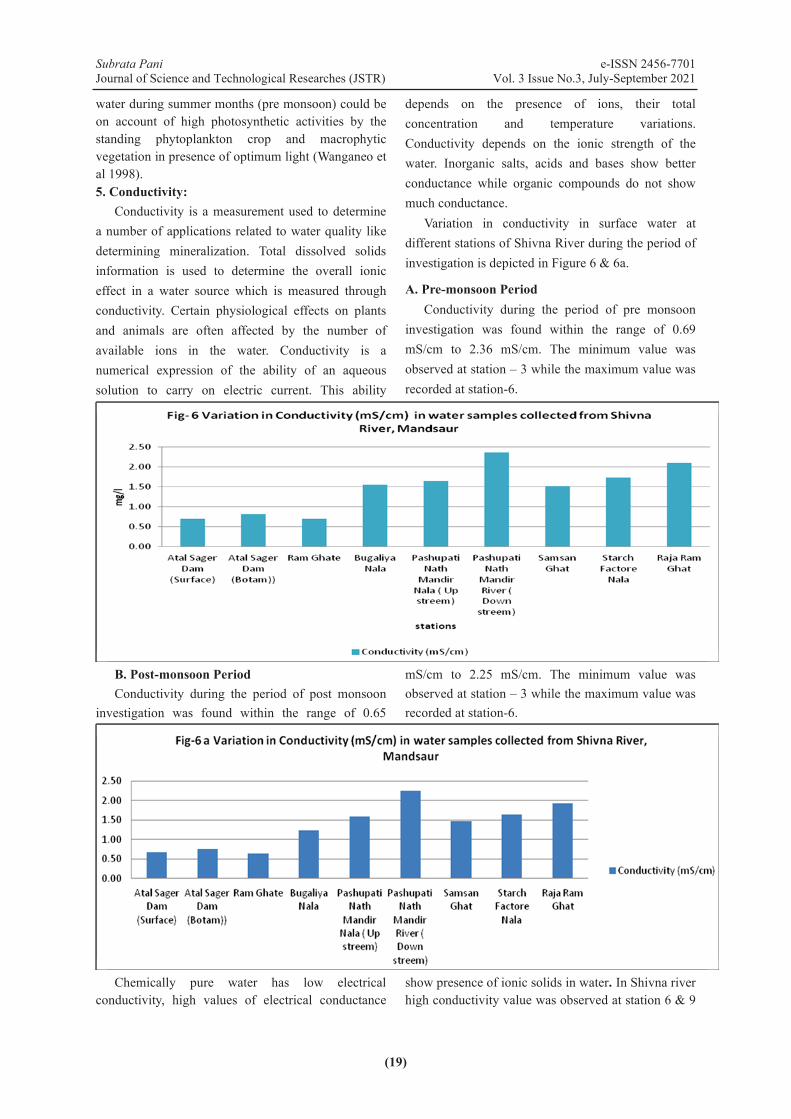
Variation in dissolved oxygen in surface water at
different stations of Shivna River during the period of investigation is depicted in Figure-5&5a. A. Pre-monsoon Period
Dissolved Oxygen values during the period of pre monsoon investigation were found within the range of 0 to 8 mg/liter. Dissolved oxygen remained absent at all stations except stations 1, 2 &3.
B. Post-monsoon PeriodDissolved Oxygen values during the period of post
monsoon investigation were found within the range of
0 to 7.2 mg/liter. Dissolved oxygen remained absent at stations -5, 7 & 8, while the values were comparatively low at Stations - 4, 6 &9.
The value of DO was mostly found to be high at station 1, 2 &3. This may be due to higher dissolution
of atmospheric oxygen in the river water through agitation. High dissolved oxygen concentration in
Subrata Pani e-ISSN 2456-7701Journal of Science and Technological Researches (JSTR) Vol. 3 Issue No.3, July-September 2021
(19)
water during summer months (pre monsoon) could be on account of high photosynthetic activities by the standing phytoplankton crop and macrophytic vegetation in presence of optimum light (Wanganeo et al 1998).5. Conductivity:
Conductivity is a measurement used to determine a number of applications related to water quality like determining mineralization. Total dissolved solids information is used to determine the overall ionic effect in a water source which is measured through conductivity. Certain physiological effects on plants and animals are often affected by the number of available ions in the water. Conductivity is a numerical expression of the ability of an aqueous solution to carry on electric current. This ability
depends on the presence of ions, their total concentration and temperature variations. Conductivity depends on the ionic strength of the water. Inorganic salts, acids and bases show better conductance while organic compounds do not show much conductance.
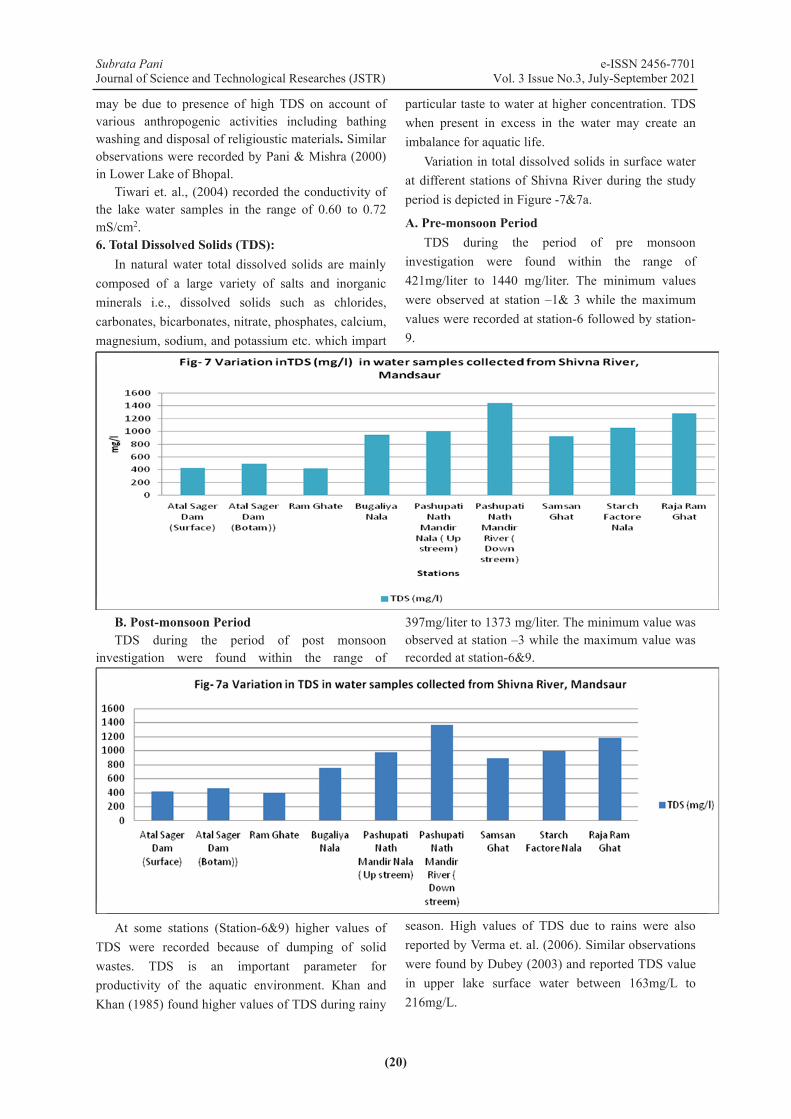
Variation in conductivity in surface water at different stations of Shivna River during the period of investigation is depicted in Figure 6 & 6a.
A. Pre-monsoon PeriodConductivity during the period of pre monsoon
investigation was found within the range of 0.69 mS/cm to 2.36 mS/cm. The minimum value was observed at station – 3 while the maximum value was recorded at station-6.
B. Post-monsoon PeriodConductivity during the period of post monsoon
investigation was found within the range of 0.65
mS/cm to 2.25 mS/cm. The minimum value was observed at station – 3 while the maximum value was recorded at station-6.
Chemically pure water has low electrical conductivity, high values of electrical conductance
show presence of ionic solids in water. In Shivna river high conductivity value was observed at station 6 & 9
Subrata Pani e-ISSN 2456-7701Journal of Science and Technological Researches (JSTR) Vol. 3 Issue No.3, July-September 2021
(20)
may be due to presence of high TDS on account of various anthropogenic activities including bathing washing and disposal of religioustic materials. Similar observations were recorded by Pani & Mishra (2000) in Lower Lake of Bhopal.
Tiwari et. al., (2004) recorded the conductivity of the lake water samples in the range of 0.60 to 0.72 mS/cm2. 6. Total Dissolved Solids (TDS):
In natural water total dissolved solids are mainly composed of a large variety of salts and inorganic minerals i.e., dissolved solids such as chlorides, carbonates, bicarbonates, nitrate, phosphates, calcium, magnesium, sodium, and potassium etc. which impart
particular taste to water at higher concentration. TDS when present in excess in the water may create an imbalance for aquatic life.
Variation in total dissolved solids in surface water at different stations of Shivna River during the study period is depicted in Figure -7&7a.
A. Pre-monsoon PeriodTDS during the period of pre monsoon
investigation were found within the range of 421mg/liter to 1440 mg/liter. The minimum values were observed at station –1& 3 while the maximum values were recorded at station-6 followed by station-9.
B. Post-monsoon PeriodTDS during the period of post monsoon
investigation were found within the range of
397mg/liter to 1373 mg/liter. The minimum value was observed at station –3 while the maximum value was recorded at station-6&9.
At some stations (Station-6&9) higher values of TDS were recorded because of dumping of solid wastes. TDS is an important parameter for productivity of the aquatic environment. Khan and Khan (1985) found higher values of TDS during rainy
season. High values of TDS due to rains were also reported by Verma et. al. (2006). Similar observations were found by Dubey (2003) and reported TDS value in upper lake surface water between 163mg/L to 216mg/L.
Subrata Pani e-ISSN 2456-7701Journal of Science and Technological Researches (JSTR) Vol. 3 Issue No.3, July-September 2021
(21)
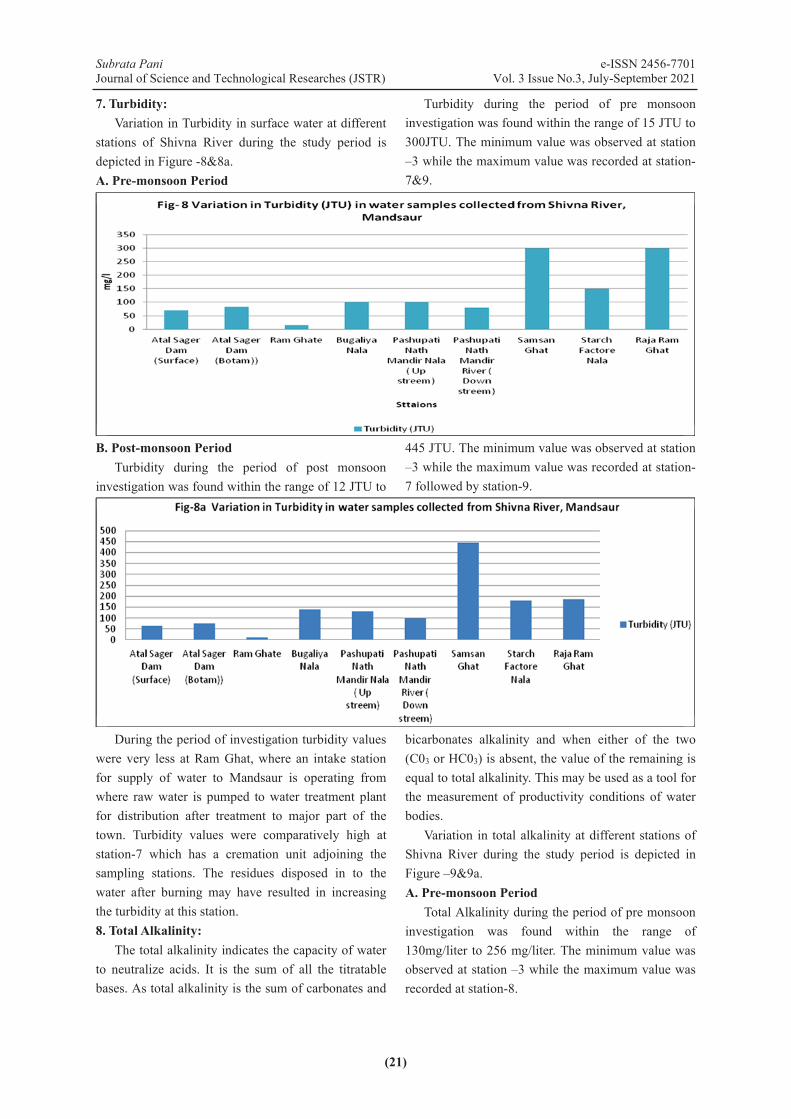
7. Turbidity:Variation in Turbidity in surface water at different
stations of Shivna River during the study period is depicted in Figure -8&8a.A. Pre-monsoon Period
Turbidity during the period of pre monsooninvestigation was found within the range of 15 JTU to 300JTU. The minimum value was observed at station –3 while the maximum value was recorded at station-7&9.
B. Post-monsoon PeriodTurbidity during the period of post monsoon
investigation was found within the range of 12 JTU to
445 JTU. The minimum value was observed at station –3 while the maximum value was recorded at station-7 followed by station-9.
During the period of investigation turbidity values were very less at Ram Ghat, where an intake stationfor supply of water to Mandsaur is operating from where raw water is pumped to water treatment plant for distribution after treatment to major part of the town. Turbidity values were comparatively high at station-7 which has a cremation unit adjoining the sampling stations. The residues disposed in to the water after burning may have resulted in increasing the turbidity at this station.8. Total Alkalinity:
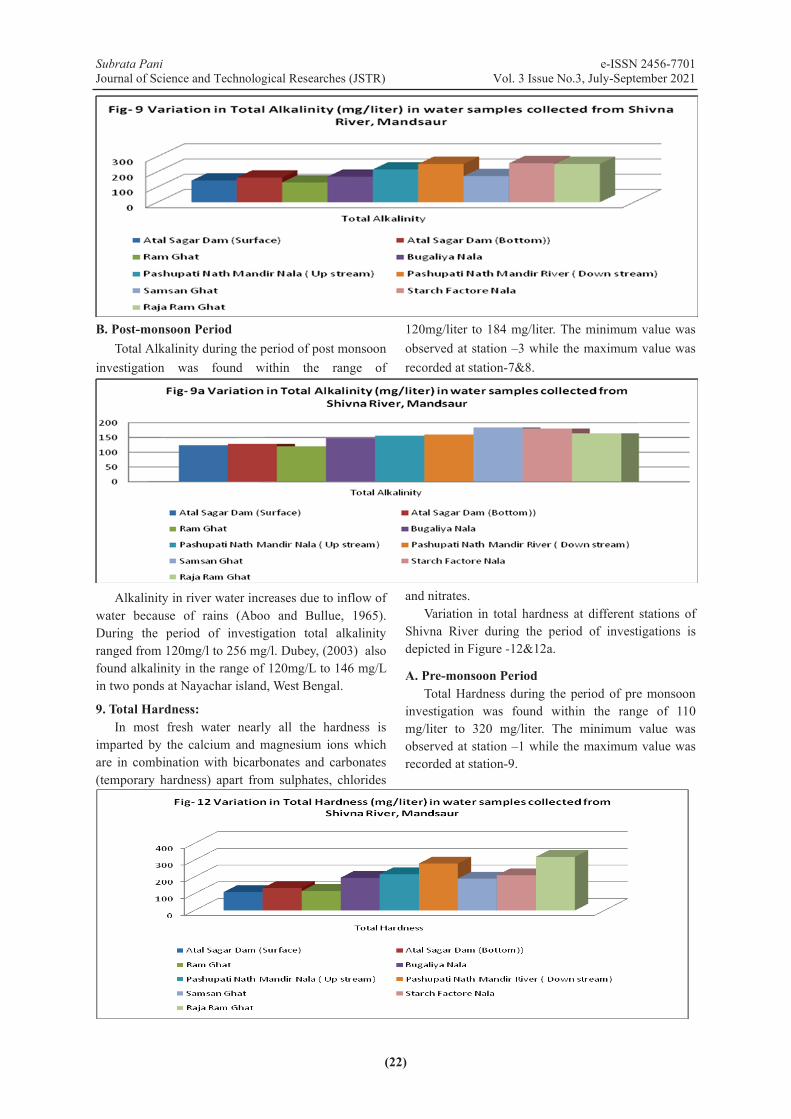
The total alkalinity indicates the capacity of water to neutralize acids. It is the sum of all the titratable bases. As total alkalinity is the sum of carbonates and
bicarbonates alkalinity and when either of the two (C03 or HC03) is absent, the value of the remaining is equal to total alkalinity. This may be used as a tool for the measurement of productivity conditions of water bodies.
Variation in total alkalinity at different stations of Shivna River during the study period is depicted in Figure –9&9a.A. Pre-monsoon Period
Total Alkalinity during the period of pre monsooninvestigation was found within the range of 130mg/liter to 256 mg/liter. The minimum value was observed at station –3 while the maximum value was recorded at station-8.
Subrata Pani e-ISSN 2456-7701Journal of Science and Technological Researches (JSTR) Vol. 3 Issue No.3, July-September 2021
(22)
B. Post-monsoon PeriodTotal Alkalinity during the period of post monsoon
investigation was found within the range of
120mg/liter to 184 mg/liter. The minimum value was observed at station –3 while the maximum value was recorded at station-7&8.
Alkalinity in river water increases due to inflow of water because of rains (Aboo and Bullue, 1965). During the period of investigation total alkalinity ranged from 120mg/l to 256 mg/l. Dubey, (2003) also found alkalinity in the range of 120mg/L to 146 mg/L in two ponds at Nayachar island, West Bengal.
9. Total Hardness:In most fresh water nearly all the hardness is
imparted by the calcium and magnesium ions which are in combination with bicarbonates and carbonates (temporary hardness) apart from sulphates, chlorides
and nitrates.Variation in total hardness at different stations of
Shivna River during the period of investigations is depicted in Figure -12&12a.
A. Pre-monsoon PeriodTotal Hardness during the period of pre monsoon
investigation was found within the range of 110 mg/liter to 320 mg/liter. The minimum value was observed at station –1 while the maximum value was recorded at station-9.
Subrata Pani e-ISSN 2456-7701Journal of Science and Technological Researches (JSTR) Vol. 3 Issue No.3, July-September 2021
(23)
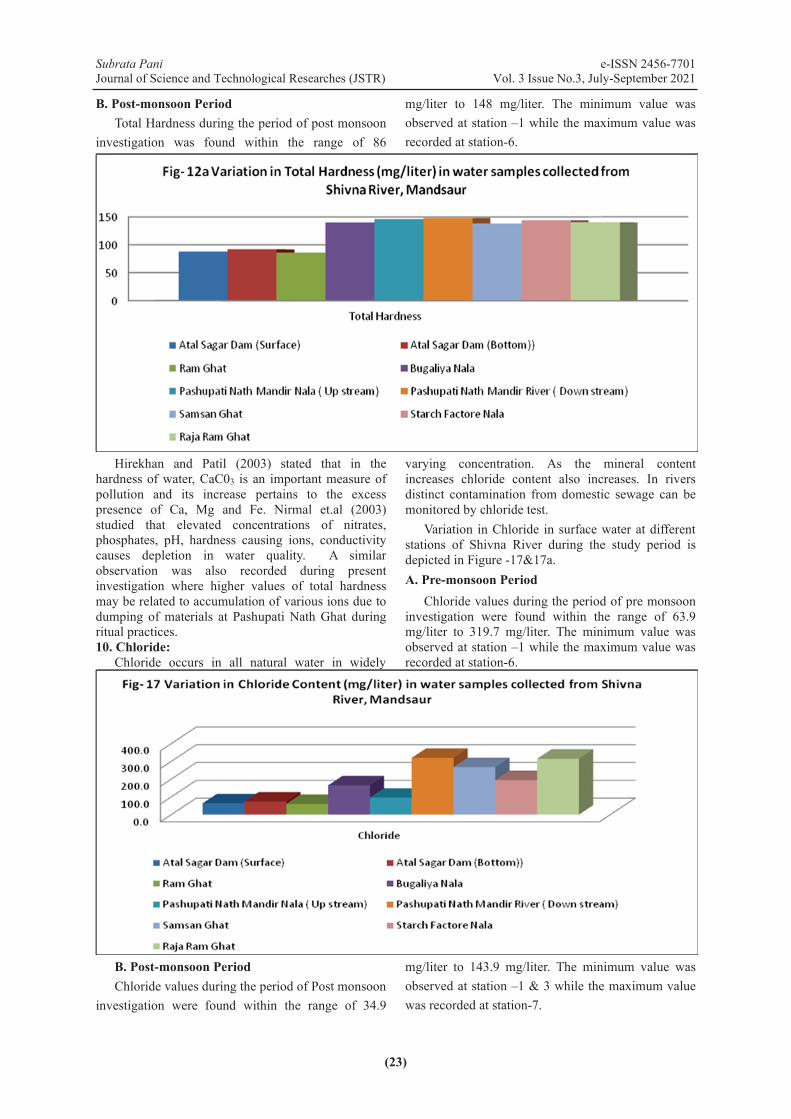
B. Post-monsoon PeriodTotal Hardness during the period of post monsoon
investigation was found within the range of 86
mg/liter to 148 mg/liter. The minimum value was observed at station –1 while the maximum value was recorded at station-6.
Hirekhan and Patil (2003) stated that in the hardness of water, CaC03 is an important measure of pollution and its increase pertains to the excess presence of Ca, Mg and Fe. Nirmal et.al (2003) studied that elevated concentrations of nitrates, phosphates, pH, hardness causing ions, conductivity causes depletion in water quality. A similar observation was also recorded during present investigation where higher values of total hardness may be related to accumulation of various ions due to dumping of materials at Pashupati Nath Ghat during ritual practices. 10. Chloride:
Chloride occurs in all natural water in widely
varying concentration. As the mineral content increases chloride content also increases. In rivers distinct contamination from domestic sewage can be monitored by chloride test.
Variation in Chloride in surface water at different stations of Shivna River during the study period is depicted in Figure -17&17a.A. Pre-monsoon Period
Chloride values during the period of pre monsooninvestigation were found within the range of 63.9 mg/liter to 319.7 mg/liter. The minimum value was observed at station –1 while the maximum value was recorded at station-6.y
B. Post-monsoon PeriodChloride values during the period of Post monsoon
investigation were found within the range of 34.9
mg/liter to 143.9 mg/liter. The minimum value was observed at station –1 & 3 while the maximum value was recorded at station-7.
Subrata Pani e-ISSN 2456-7701Journal of Science and Technological Researches (JSTR) Vol. 3 Issue No.3, July-September 2021
(24)
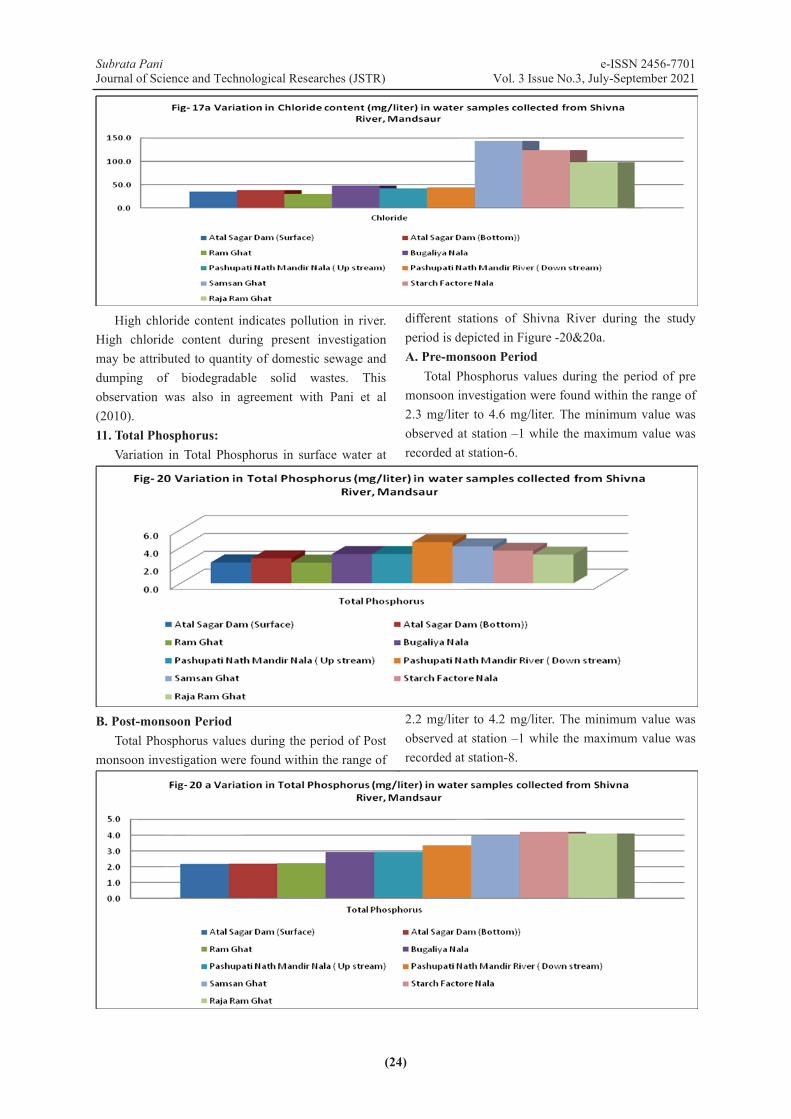
High chloride content indicates pollution in river. High chloride content during present investigation may be attributed to quantity of domestic sewage and dumping of biodegradable solid wastes. This observation was also in agreement with Pani et al (2010). 11. Total Phosphorus:
Variation in Total Phosphorus in surface water at
different stations of Shivna River during the study period is depicted in Figure -20&20a.A. Pre-monsoon Period
Total Phosphorus values during the period of pre monsoon investigation were found within the range of 2.3 mg/liter to 4.6 mg/liter. The minimum value was observed at station –1 while the maximum value was recorded at station-6.
B. Post-monsoon PeriodTotal Phosphorus values during the period of Post
monsoon investigation were found within the range of
2.2 mg/liter to 4.2 mg/liter. The minimum value was observed at station –1 while the maximum value was recorded at station-8.
Subrata Pani e-ISSN 2456-7701Journal of Science and Technological Researches (JSTR) Vol. 3 Issue No.3, July-September 2021
(25)
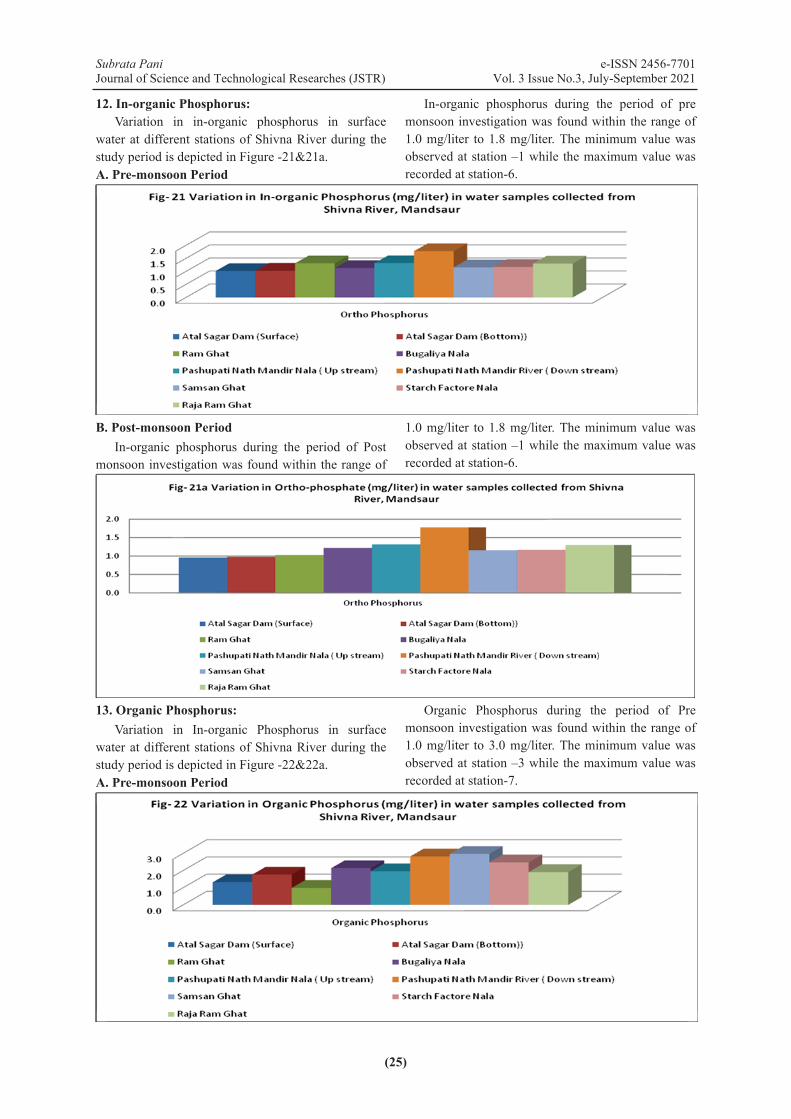
12. In-organic Phosphorus:Variation in in-organic phosphorus in surface
water at different stations of Shivna River during the study period is depicted in Figure -21&21a.A. Pre-monsoon Period
In-organic phosphorus during the period of pre monsoon investigation was found within the range of 1.0 mg/liter to 1.8 mg/liter. The minimum value was observed at station –1 while the maximum value was recorded at station-6.
B. Post-monsoon PeriodIn-organic phosphorus during the period of Post
monsoon investigation was found within the range of
1.0 mg/liter to 1.8 mg/liter. The minimum value was observed at station –1 while the maximum value was recorded at station-6.
13. Organic Phosphorus: Variation in In-organic Phosphorus in surface
water at different stations of Shivna River during the study period is depicted in Figure -22&22a.A. Pre-monsoon Period
Organic Phosphorus during the period of Pre monsoon investigation was found within the range of 1.0 mg/liter to 3.0 mg/liter. The minimum value was observed at station –3 while the maximum value was recorded at station-7.
Subrata Pani e-ISSN 2456-7701Journal of Science and Technological Researches (JSTR) Vol. 3 Issue No.3, July-September 2021
(26)
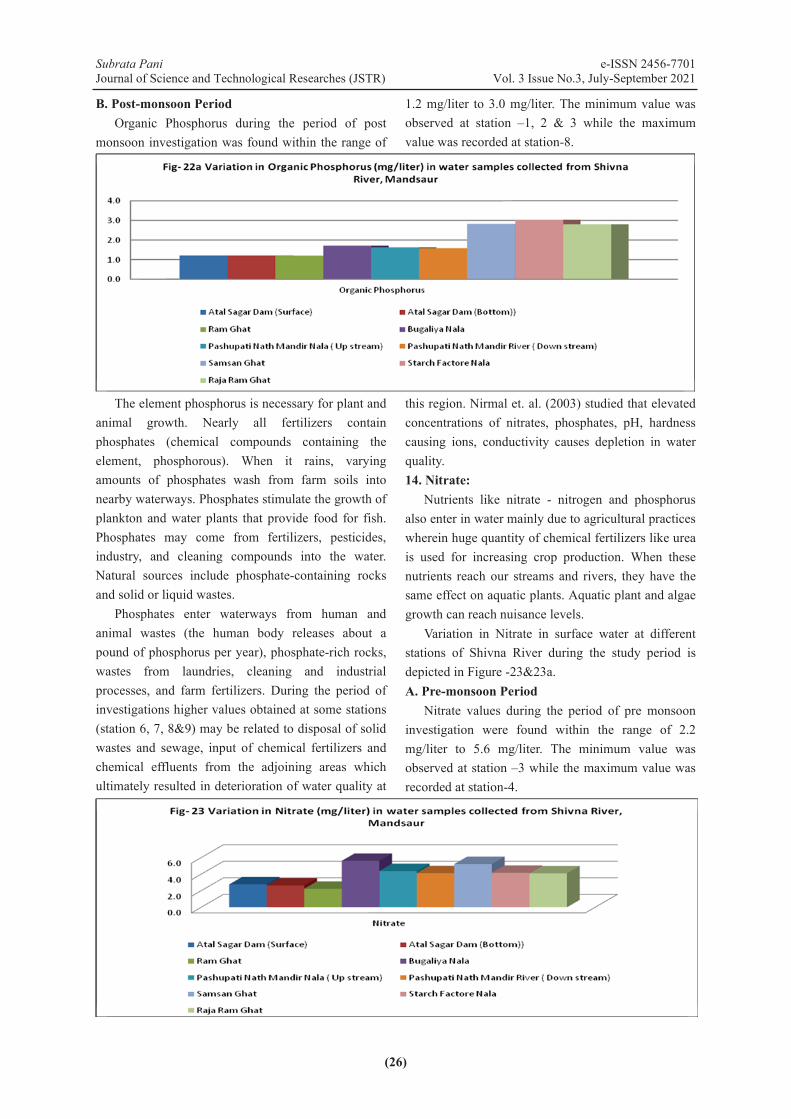
B. Post-monsoon PeriodOrganic Phosphorus during the period of post
monsoon investigation was found within the range of
1.2 mg/liter to 3.0 mg/liter. The minimum value was observed at station –1, 2 & 3 while the maximum value was recorded at station-8.
The element phosphorus is necessary for plant and animal growth. Nearly all fertilizers contain phosphates (chemical compounds containing the element, phosphorous). When it rains, varying amounts of phosphates wash from farm soils into nearby waterways. Phosphates stimulate the growth of plankton and water plants that provide food for fish. Phosphates may come from fertilizers, pesticides, industry, and cleaning compounds into the water. Natural sources include phosphate-containing rocks and solid or liquid wastes.
Phosphates enter waterways from human and animal wastes (the human body releases about a pound of phosphorus per year), phosphate-rich rocks, wastes from laundries, cleaning and industrial processes, and farm fertilizers. During the period of investigations higher values obtained at some stations (station 6, 7, 8&9) may be related to disposal of solid wastes and sewage, input of chemical fertilizers and chemical effluents from the adjoining areas which ultimately resulted in deterioration of water quality at
this region. Nirmal et. al. (2003) studied that elevated concentrations of nitrates, phosphates, pH, hardness causing ions, conductivity causes depletion in water quality. 14. Nitrate:
Nutrients like nitrate - nitrogen and phosphorus also enter in water mainly due to agricultural practices wherein huge quantity of chemical fertilizers like urea is used for increasing crop production. When these nutrients reach our streams and rivers, they have the same effect on aquatic plants. Aquatic plant and algae growth can reach nuisance levels.
Variation in Nitrate in surface water at different stations of Shivna River during the study period is depicted in Figure -23&23a.A. Pre-monsoon Period
Nitrate values during the period of pre monsooninvestigation were found within the range of 2.2 mg/liter to 5.6 mg/liter. The minimum value was observed at station –3 while the maximum value was recorded at station-4.
Subrata Pani e-ISSN 2456-7701Journal of Science and Technological Researches (JSTR) Vol. 3 Issue No.3, July-September 2021
(27)
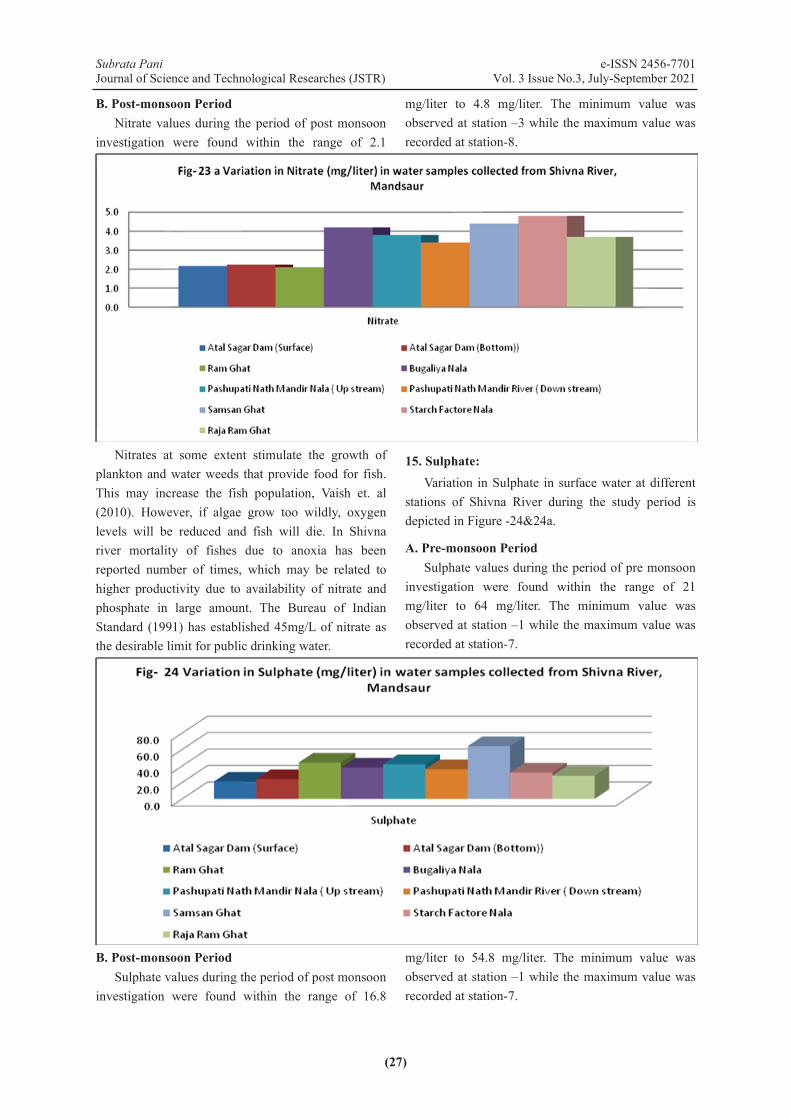
B. Post-monsoon PeriodNitrate values during the period of post monsoon
investigation were found within the range of 2.1
mg/liter to 4.8 mg/liter. The minimum value was observed at station –3 while the maximum value was recorded at station-8.
Nitrates at some extent stimulate the growth of plankton and water weeds that provide food for fish. This may increase the fish population, Vaish et. al (2010). However, if algae grow too wildly, oxygen levels will be reduced and fish will die. In Shivna river mortality of fishes due to anoxia has been reported number of times, which may be related to higher productivity due to availability of nitrate and phosphate in large amount. The Bureau of Indian Standard (1991) has established 45mg/L of nitrate as the desirable limit for public drinking water.
15. Sulphate:Variation in Sulphate in surface water at different
stations of Shivna River during the study period is depicted in Figure -24&24a.
A. Pre-monsoon PeriodSulphate values during the period of pre monsoon
investigation were found within the range of 21 mg/liter to 64 mg/liter. The minimum value was observed at station –1 while the maximum value was recorded at station-7.
B. Post-monsoon PeriodSulphate values during the period of post monsoon
investigation were found within the range of 16.8
mg/liter to 54.8 mg/liter. The minimum value was observed at station –1 while the maximum value was recorded at station-7.
Subrata Pani e-ISSN 2456-7701Journal of Science and Technological Researches (JSTR) Vol. 3 Issue No.3, July-September 2021
(28)
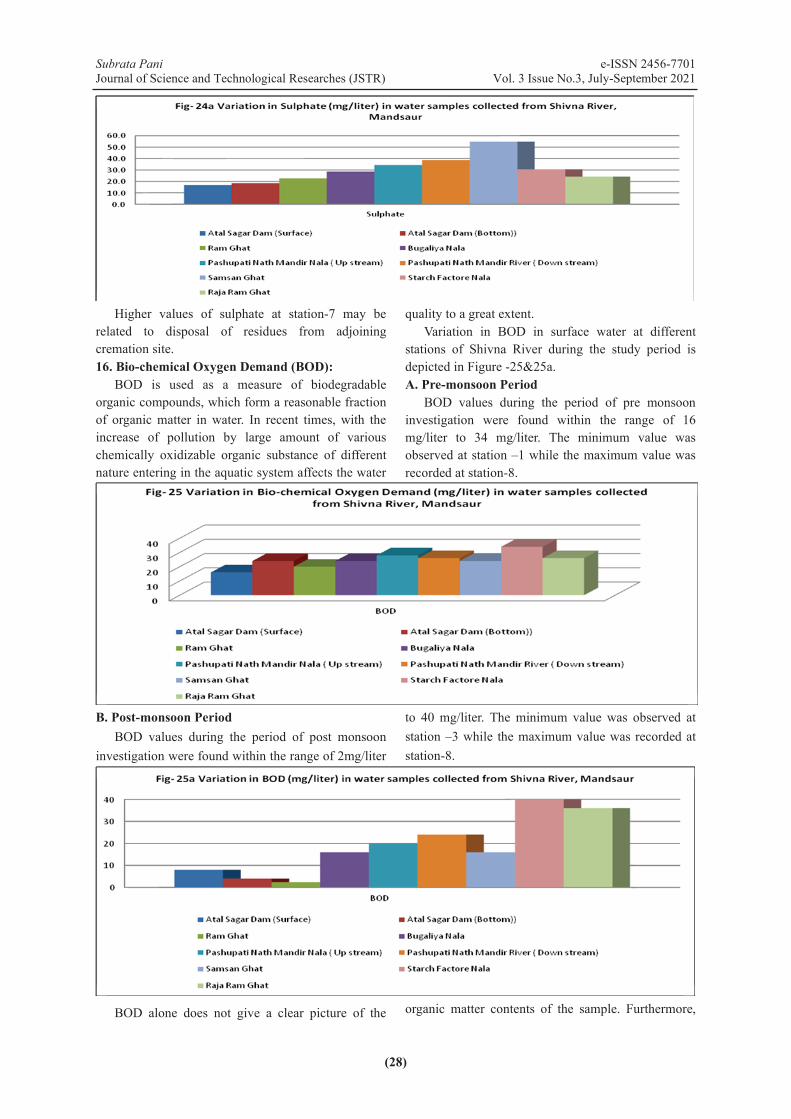
Higher values of sulphate at station-7 may be related to disposal of residues from adjoining cremation site.16. Bio-chemical Oxygen Demand (BOD):
BOD is used as a measure of biodegradable organic compounds, which form a reasonable fraction of organic matter in water. In recent times, with the increase of pollution by large amount of various chemically oxidizable organic substance of different nature entering in the aquatic system affects the water
quality to a great extent. Variation in BOD in surface water at different
stations of Shivna River during the study period is depicted in Figure -25&25a.A. Pre-monsoon Period
BOD values during the period of pre monsooninvestigation were found within the range of 16 mg/liter to 34 mg/liter. The minimum value was observed at station –1 while the maximum value was recorded at station-8.
B. Post-monsoon PeriodBOD values during the period of post monsoon
investigation were found within the range of 2mg/liter
to 40 mg/liter. The minimum value was observed at station –3 while the maximum value was recorded at station-8.
BOD alone does not give a clear picture of the organic matter contents of the sample. Furthermore,
Subrata Pani e-ISSN 2456-7701Journal of Science and Technological Researches (JSTR) Vol. 3 Issue No.3, July-September 2021
(29)
the presence of various toxicants in the samples may severely affect the validity of the BOD test. Hence, COD is considered to be a better estimate of the organic matter, which needs no sophistication and is time savings. However, COD i.e., the oxygen consumed (OC) does not differentiate the stable organic matter from the unstable form. Therefore, the COD values are not directly comparable to that of BOD, furthermore, some cyclic organic compounds are not oxidized; whereas, on the other hand many inorganic compounds like nitrates, sulphides and reduced metal ions get oxidized. Samples containing chlorides more than 2 g/l, the chloride ions are oxidized to chlorine giving erroneous results. Despite
these limitations COD is still an important parameter for estimate the carbonaceous fraction of the organic matter much closer to the actual amounts.17. Chemical Oxygen Demand:
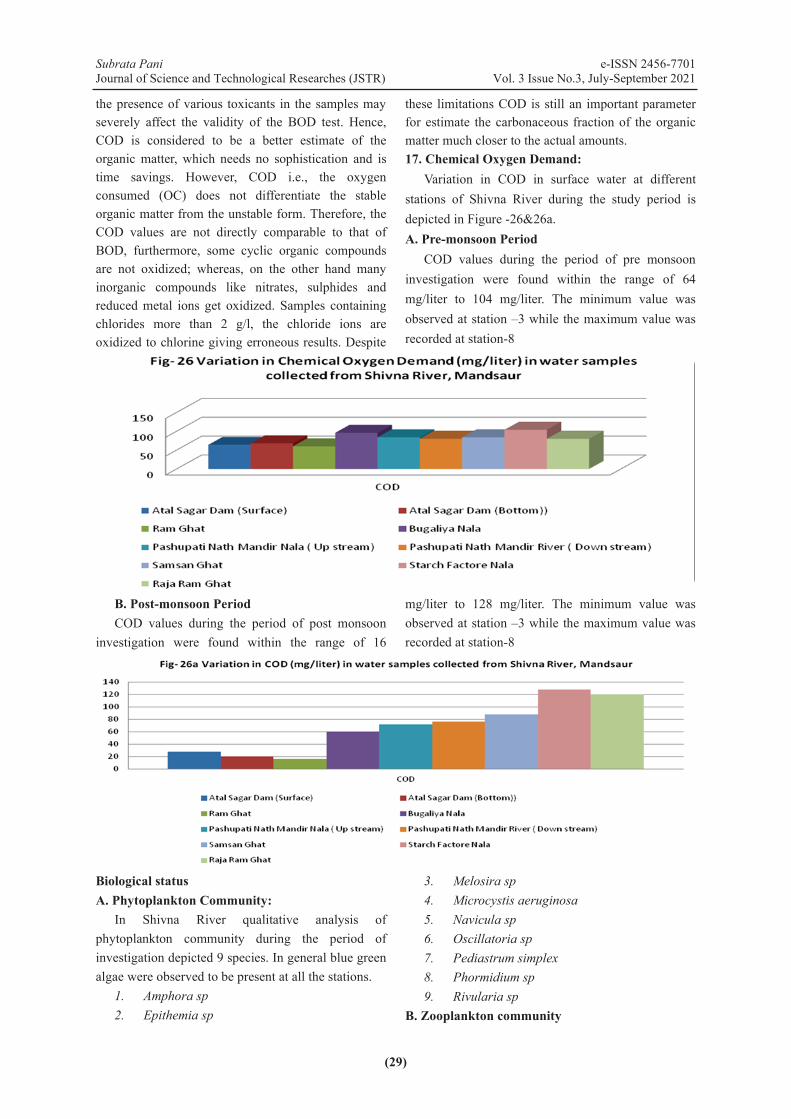
Variation in COD in surface water at different stations of Shivna River during the study period is depicted in Figure -26&26a.A. Pre-monsoon Period
COD values during the period of pre monsooninvestigation were found within the range of 64 mg/liter to 104 mg/liter. The minimum value was observed at station –3 while the maximum value was recorded at station-8
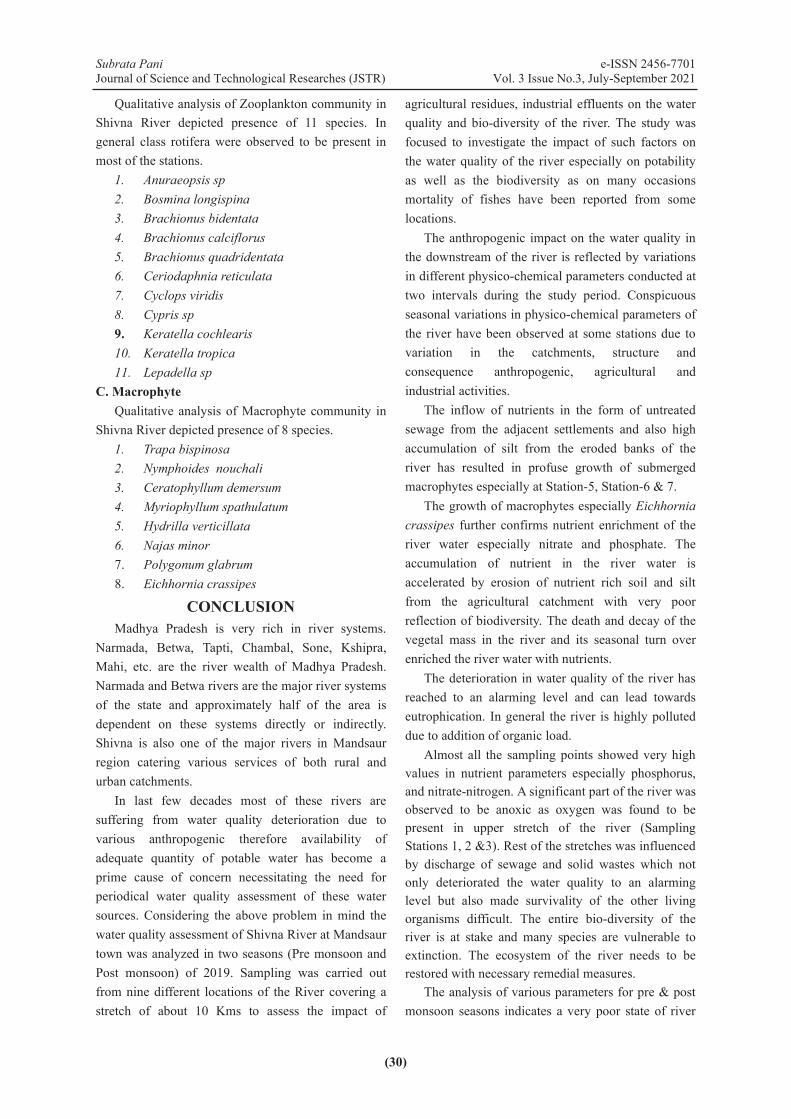
B. Post-monsoon PeriodCOD values during the period of post monsoon
investigation were found within the range of 16
mg/liter to 128 mg/liter. The minimum value was observed at station –3 while the maximum value was recorded at station-8
Biological statusA. Phytoplankton Community:
In Shivna River qualitative analysis of phytoplankton community during the period of investigation depicted 9 species. In general blue green algae were observed to be present at all the stations.
1. Amphora sp2. Epithemia sp
3. Melosira sp4. Microcystis aeruginosa5. Navicula sp6. Oscillatoria sp7. Pediastrum simplex8. Phormidium sp 9. Rivularia sp
B. Zooplankton community
Subrata Pani e-ISSN 2456-7701 Journal of Science and Technological Researches (JSTR) Vol. 3 Issue No.3, July-September 2021
(30)
Qualitative analysis of Zooplankton community in Shivna River depicted presence of 11 species. In general class rotifera were observed to be present in most of the stations.
1. Anuraeopsis sp 2. Bosmina longispina 3. Brachionus bidentata 4. Brachionus calciflorus 5. Brachionus quadridentata 6. Ceriodaphnia reticulata 7. Cyclops viridis 8. Cypris sp 9. Keratella cochlearis 10. Keratella tropica 11. Lepadella sp
C. Macrophyte Qualitative analysis of Macrophyte community in
Shivna River depicted presence of 8 species. 1. Trapa bispinosa 2. Nymphoides nouchali 3. Ceratophyllum demersum 4. Myriophyllum spathulatum 5. Hydrilla verticillata 6. Najas minor 7. Polygonum glabrum 8. Eichhornia crassipes
CONCLUSION Madhya Pradesh is very rich in river systems.
Narmada, Betwa, Tapti, Chambal, Sone, Kshipra, Mahi, etc. are the river wealth of Madhya Pradesh. Narmada and Betwa rivers are the major river systems of the state and approximately half of the area is dependent on these systems directly or indirectly. Shivna is also one of the major rivers in Mandsaur region catering various services of both rural and urban catchments.
In last few decades most of these rivers are suffering from water quality deterioration due to various anthropogenic therefore availability of adequate quantity of potable water has become a prime cause of concern necessitating the need for periodical water quality assessment of these water sources. Considering the above problem in mind the water quality assessment of Shivna River at Mandsaur town was analyzed in two seasons (Pre monsoon and Post monsoon) of 2019. Sampling was carried out from nine different locations of the River covering a stretch of about 10 Kms to assess the impact of
agricultural residues, industrial effluents on the water quality and bio-diversity of the river. The study was focused to investigate the impact of such factors on the water quality of the river especially on potability as well as the biodiversity as on many occasions mortality of fishes have been reported from some locations.
The anthropogenic impact on the water quality in the downstream of the river is reflected by variations in different physico-chemical parameters conducted at two intervals during the study period. Conspicuous seasonal variations in physico-chemical parameters of the river have been observed at some stations due to variation in the catchments, structure and consequence anthropogenic, agricultural and industrial activities.
The inflow of nutrients in the form of untreated sewage from the adjacent settlements and also high accumulation of silt from the eroded banks of the river has resulted in profuse growth of submerged macrophytes especially at Station-5, Station-6 & 7.
The growth of macrophytes especially Eichhornia crassipes further confirms nutrient enrichment of the river water especially nitrate and phosphate. The accumulation of nutrient in the river water is accelerated by erosion of nutrient rich soil and silt from the agricultural catchment with very poor reflection of biodiversity. The death and decay of the vegetal mass in the river and its seasonal turn over enriched the river water with nutrients.
The deterioration in water quality of the river has reached to an alarming level and can lead towards eutrophication. In general the river is highly polluted due to addition of organic load.
Almost all the sampling points showed very high values in nutrient parameters especially phosphorus, and nitrate-nitrogen. A significant part of the river was observed to be anoxic as oxygen was found to be present in upper stretch of the river (Sampling Stations 1, 2 &3). Rest of the stretches was influenced by discharge of sewage and solid wastes which not only deteriorated the water quality to an alarming level but also made survivality of the other living organisms difficult. The entire bio-diversity of the river is at stake and many species are vulnerable to extinction. The ecosystem of the river needs to be restored with necessary remedial measures.
The analysis of various parameters for pre & post monsoon seasons indicates a very poor state of river
Subrata Pani e-ISSN 2456-7701 Journal of Science and Technological Researches (JSTR) Vol. 3 Issue No.3, July-September 2021
(31)
water quality. The quality of water at different stations of Shivna River has been observed to be highly variable with poor diversity of phytoplankton, zooplankton and macrophytes. The river water in general was observed to have very higher concentration of nutrients like nitrate and phosphate at Bugaliya Nalla, near Pashupati Nath Temple, Samsan Ghat stations. The quality of water observed to be deteriorated at these stations possibly due to accumulation of nutrients received in the form of sewage from the adjoining residential areas mainly through Bugaliya Nalla. In addition to this the inflow of nutrient through silts as a result of intensive agricultural practices probably another important factor in increasing the nutrient concentration in these locations of the river.
The main observations based on selected limnological parameters during the period of study can be concluded as follows: Total dissolved solids were recorded very
high at cremation Ghat due to dispose of ashes and other solid waste during both the season.
Water quality at sampling stations -1 and -2 observed to be better in comparison to rest of the stations, as higher values of dissolved oxygen were recorded in these two stations. This could be due to less exposure of the catchments to human activities.
Lower concentration of dissolved oxygen recorded at stations - 4, 5 & 6 onwards may be due to inflow of domestic sewage mainly through Bugaliya Nalla as these sampling stations are situated amidst densely populated area.
Higher values recorded for total hardness and total alkalinity at sampling station-3, 4 &5 may be due to joining of hardness causing ions and salts through surface runoff especially during rainy season.
Nutrients such as nitrate, phosphate were also recorded very high during post monsoon season especially at sampling station-4, 5, 6 & 7. This may be because of accumulation through surface runoff from agricultural fields in catchment areas.
The biological characteristics of the Shivna River depicted poor biodiversity with wide variation in both flora and fauna at different stations. Significant variations in biological diversity at different stretches of the river were observed
during the entire period of investigation. The river in general depicted a poor representation of various micro and macro flora and fauna of aquatic community. The present study affirms that in last few decades
the river has witnessed the adversity of the nature like irregular rain fall as well as growing anthropogenic pressure like inflow of sewage, dumping of solid wastes , establishment of industries without effective wastewater treatment facilities in the fringe area and withdrawal of excessive water for irrigation etc. These factors ultimately resulted in reducing the carrying capacity of the river with irregular flow. The water quality of the river as a result has deteriorated at many places because of the combination of these factors. In future if the inflow of untreated industrial effluents and agricultural waste continues, the quality of river may further get deteriorated to an alarming level and higher accumulation of nutrients at few places could be detrimental for the ecological sustainability in the river. Suggestion and recommendations
On the basis of the study following suggestions and recommendations are proposed. Adequate measures should be taken for ensuring
maximum availability of water from its catchment during monsoon by widening and deepening the river and also the inflow channel like Bugaliya joining the river. The illegal drawl of water should also be regulated.
Periodical De-silting and De-weeding operation should be conducted to remove the excess silt and weeds.
The bank and fringe areas of the river should be protected from erosion by afforestation and landscaping.
Industries situated near the Shivna River are polluting the river with starch, chemicals and other pollutants, so, the discharge from these industries should be treated before their disposal.
Entry of domestic sewage should be prevented and disposal of solid wastes into the river especially from the Temple areas should be strictly prohibited.
Idol immersion is also reported to be taking place at some places of the river; this should be diverted by providing alternative Ghats.
Subrata Pani e-ISSN 2456-7701 Journal of Science and Technological Researches (JSTR) Vol. 3 Issue No.3, July-September 2021
(32)
Organic farming should be promoted in the agricultural fields situated in the catchment area of the river.
Animal intervention should be stopped to prevent the pollution from animal origin.
Vehicle washing was also observed at some places which cause oil and grease pollution to the river. So, this should be stopped.
Washing and bathing activities should also be restricted to prevent the soap and detergent pollution.
Regular water quality monitoring and other measures should be taken care of to assess the pollution level and sources of pollution in the river.
On the basis of above suggestions and recommendations, better conservation and management plan can be formulated for the Shivna River and other similar type of water resources which will help the policy makers to develop a self sustainable long run plans for the conservation plans of aquatic resources.
ACKNOWLEDGEMENT: The research team of EPCO is grateful to
Executive Director, Environmental Planning and Coordination Organization, Collector, Mandsaur, CMO and other Municipal Officials of Mandsaur for providing assistance and other support in conducting this study.
REFERENCES [1]. Aboo, K.M. and Bullue, K.R. (1965)
Investigation on the pollution of upper lake and its suitability as a source of water supply. CEPHERI project report, 1-29.
[2]. APHA (2010) American Public Health Association, American Water Works Association & Water Environment Federation, 19th Edition – 2010.
[3]. Bureau of Indian Standard (1991), Indian Standard Drinking Water- Specification, https://law.resource.org/pub/in/bis/S06/is.10500.1991.pdf
[4]. Deepali Amb, Rachna Modi, M.S.Sharma, Vipul Sharma and Kuldeep Singh Gour (2011), Water Quality of Reservoir in Mandsaur District, Madhya Pradesh, , Current World Environment, Vol. 6(1), 173-176 (2011).
[5]. Dubey, N. (2003) A comparative status of quality of drinking water of Bhopal city Filtration plants and ground water with special reference to heavy metals and organ chemical, Ph.D. Thesis, Barkatullah Uni., Bhopal.
[6]. Hirekhan, K.N. and Patil, M.R. (2003) Ground water quality for irrigation purposes around iron ore mining area, Goa, Indian Journal of environmental protection, 23 (11), 1239-1243.
[7]. Nirmal, J.I., Bhatt, I., Kumar, R. and Patel, M. (2003) physicochemical properties of ground water in and around Anand district.IJEP.23 (11), 1248-1253.
[8]. Pani, S., Mishra S.M., (2000) Impact of Hydraulic detention on water quality characteristics of Tropical wetland (Lower lake: Pankaj Shrivastava ed. Environmental Pollution and its Management ABS Publication, New Delhi.)
[9]. Shyam Lal Bamniya, Pramendra Dev, Vinita Kulshreshtha (2018), RecentlygeologicalstudyofShivnariverbasin,northwesternregion,MadhyaPradesh,India , National Journal of Multidisciplinary Research and Development, https: // www.researchgate.net / publication / 326655010.
[10]. Subrata Pani, Amit Dubey and M.R. Khan (2014) Decadal Variation in Micro flora and Fauna in 10 Water Bodies of Bhopal, Madhya Pradesh, Current World Environment, Vol. 9(1), 137-144 (2014), ISSN: 0973-4929, Online ISSN: 2320-803. 2014
[11]. Tiwari, D., (2004) Pollution potential of the wastes polluting river Pandu. J. Nature Environment and Pollution Technology, Vol.3, No.2, pp 219-224.
[12]. Vaish, D., Singh, R.K. and Bajpai, A. (2010) Assessment of water quality of Betwa River (M.P.), India, Pollution Research, 29 (2), 305-307.
[13]. Wanganeo A., S.Pani & R, Wanganeo (1998), Summer dissolved oxygen regime in a tropical Vindhyan lake in relation to its conservation strategy Bionature, vol. 9 - 1998