journal of athletic training - nata |
TRANSCRIPT

Jo
urn
al o
f A
th
le
tic T
ra
in
in
gV
olu
me
46 #
2, P
ag
es 1
13–224
Ma
rch
- A
pril 2
011
AD TO COME
Official Publication of the National Athletic Trainers’ Association
Journal of Athletic Training
Volume 46 Number 2 March-April 2011
Hip-Abductor Strengthening for Patellofemoral Pain Syndrome
Heat-Illness Screening Instrument
Work–Family Conflicts in Secondary School Athletic Trainers
Prevention of Pediatric Overuse Injuries


Journal of Athletic Traininghttp://www.journalofathletictraining.org
Volume 46, Number 2, March–April 2011
Editor-in-ChiefChristopher D. Ingersoll, PhD, ATC, FNATA, FACSM
Central Michigan University
Section Editors
Prevention and Risk Identification
Douglas J. Casa, PhD, ATC, FNATA, FACSMUniversity of Connecticut
Jennifer M. Hootman, PhD, ATC, FNATA, FACSMCenters for Disease Control and Prevention
Darin A. Padua, PhD, ATCUniversity of North Carolina at Chapel Hill
Pathology, Physiology, and Biodynamics
Mitchell L. Cordova, PhD, ATC, FNATA, FACSMUniversity of North Carolina at Charlotte
J. Ty Hopkins, PhD, ATC, FNATA, FACSMBrigham Young University
Mark A. Merrick, PhD, ATCOhio State University
Sandra J. Shultz, PhD, ATC, FNATA, FACSMUniversity of North Carolina at Greensboro
Examination, Treatment, and Rehabilitation
Paul A. Borsa, PhD, ATC, FACSMUniversity of Florida
Kevin M. Guskiewicz, PhD, ATC, FNATA, FACSMUniversity of North Carolina at Chapel Hill
Jay Hertel, PhD, ATC, FNATA, FACSMUniversity of Virginia
Administration, ProfessionalDevelopment, and Pedagogy
Michael S. Ferrara, PhD, ATC, FNATAUniversity of Georgia
William A. Pitney, EdD, ATC, FNATANorthern Illinois University
Senior Associate Editor
Craig R. Denegar, PhD, ATC, PT, FNATAUniversity of Connecticut
Clinical Applications Editor
Peggy Houglum, PhD, ATC, PTDuquesne University
Statistical Consultants
Bruce M. Gansneder, PhDUniversity of Virginia
Stephen W. Marshall, PhDUniversity of North Carolina at Chapel Hill
Richard Tandy, PhDUniversity of Nevada-Las Vegas
Consulting Editors
Kenneth L. Knight, PhD, ATC, FNATA, FACSMBrigham Young University
David H. Perrin, PhD, ATC, FACSMUniversity of North Carolina at Greensboro
Clint Thompson, MA, ATCSeattle, WA
Managing Editor
Leslie E. Neistadt, ELS
Editorial AssistantDennise Brogdon
Official publication of the followingassociations:National Athletic Trainers’ AssociationTaiwan Athletic Trainers’ SocietyJapan Athletic Trainers’ Organization
Indexes: Currently indexed in MEDLINE, PubMed Central, Focus on Sports Science & Medicine (ISI: Institute for Scientific Information), Research AlertTH (ISI: Institute for Scientific Information),
Physical Education Index, SPORT Discus (SIRC: Sport Information Resource Centre, Canada), CINAHL (Cumulative Index to Nursing & Allied Health Literature), AMED (Allied and Alternative
Medicine Database), PsycINFO (American Psychological Association), EMBASE (Elsevier Science), Science Citation Index, Current Contents/Clinical Medicine, Science Citation Index Expanded
(SciSearch), Journal Citation Reports/Science Edition, Biological Abstracts, and BIOSIS Previews.
The Journal of Athletic Training (ISSN 1062-6050) is published bimonthly ($267 for 1-year institutional subscription; $303 foreign) by the National Athletic Trainers’ Association, Inc, 2952 Stemmons
Freeway, Dallas, TX 75247. Periodicals postage paid at Dallas, TX, and at additional mailing offices. Claims for copies lost in the mail must be received within 90 days (180 days foreign) of the issue
date to ensure replacement at no charge.
POSTMASTER: Send address changes to Journal of Athletic Training, c/o NATA, 2952 Stemmons Freeway, Dallas, TX 75247. CHANGE OF ADDRESS: Request for address change must be
received 30 days prior to date of issue with which it is to take effect. Duplicate copies cannot be sent to replace those undelivered as a result of failure to send advance notice. ADVERTISING:
Although advertising is screened, acceptance of the advertisement does not imply NATA endorsement of the product or the views expressed. Rates available upon request. The views and opinions in
the Journal of Athletic Training are those of the authors and are not necessarily of the National Athletic Trainers’ Association, Inc.
Copyright 2011 by the National Athletic Trainers’ Association, Inc. All rights reserved. Printed in the United States. The Journal of Athletic Training is printed on paper that meets the requirements of
ANSI/NISO Z39.48-1992 (Permanence of Paper).
Journal of Athletic Training 113
Editorial Board
Lawrence E. Armstrong, PhD, FACSM
University of Connecticut
Christopher M. Bailey, PhD
Case Medical Center
Michael F. Bergeron, PhD
Sanford USD Medical Center
David R. Black, PhD, MPH, CHES
Purdue University
J. Troy Blackburn, PhD, ATC
University of North Carolina at ChapelHill
Steven P. Broglio, PhD, ATC
The University of Illinois at Urbana-Champaign
Robert C. Cantu, MD
Emerson Hospital
Thomas A. Cappaert, PhD, ATC,CSCS, CES
Central Michigan University
Christopher R. Carcia, PhD, PT
Duquesne University
Shane V. Caswell, PhD, ATC
George Mason University
Joseph F. Clark, PhD, ATC
University of Cincinnati
Michael W. Collins, PhD
University of Pittsburgh
R. Dawn Comstock, PhD
The Research Institute at NationwideChildren’s Hospital
Tracey Covassin, PhD, ATC
Michigan State University
Carrie L. Docherty, PhD, ATC
Indiana University
Michael G. Dolan, MA, ATC, CSCS
Canisius College
David O. Draper, EdD, ATC, FNATA
Brigham Young University
Zeevi Dvir, PhD
Tel Aviv University, Israel
Jennifer E. Earl, PhD, ATC
University of Wisconsin-Milwaukee
Kyle Ebersole, PhD, ATC
University of Wisconsin-Milwaukee
Todd A. Evans, PhD, ATC
University of Northern Iowa
Reed Ferber, PhD, ATC, CAT(C)
University of Calgary, Canada
Sandra Fowkes Godek, PhD, ATC
West Chester University
Julie M. Fritz, PhD, PT, ATC
University of Utah
Trenton E. Gould, PhD, ATCThe University of Southern Mississippi
Phillip A. Gribble, PhD, ATCThe University of Toledo
Joseph M. Hart, PhD, ATCUniversity of Virginia
Jolene Henning, EdD, ATCUniversity of North Carolina at
Greensboro
Lee Herrington, PhD, MSc, MCSPUniversity of Salford
Mark Hoffman, PhD, ATCOregon State University
Tricia J. Hubbard, PhD, ATCUniversity of North Carolina at Charlotte
Mary Lloyd Ireland, MDKentucky Sports Medicine Clinic
Lennart D. Johns, PhD, ATCQuinnipiac University
Daniel A. Judelson, PhDCalifornia State University-Fullerton
Thomas W. Kaminski, PhD, ATC, FNATAUniversity of Delaware
D. Casey Kerrigan, MD, MSUniversity of Virginia
Sarah B. Knowles, PhD, MPHPalo Alto Medical Foundation Research
Institute
Michael C. Koester, MD, ATCSlocum Center for Orthopedics and
Sports Medicine, Eugene, OR
John E. Kovaleski, PhD, ATCUniversity of South Alabama
Carl G. Mattacola, PhD, ATC, FNATAUniversity of Kentucky
Malissa Martin, EdD, ATCCollege of Mount St Joseph
Stephanie M. Mazerolle, PhD, ATCUniversity of Connecticut
Michael McCrea, PhDWaukesha Memorial Hospital
Edward G. McFarland, MDJohns Hopkins University
Thomas J. McLoughlin, PhDThe University of Toledo
Joseph B. Myers, PhD, ATCUniversity of North Carolina at Chapel Hill
John Nyland, EdD,PT, SCS,ATC,CSCSUniversity of Louisville
James A. Onate, PhD, ATCThe Ohio State University
Riann M. Palmieri-Smith, PhD, ATCUniversity of Michigan
Kimberly S. Peer, EdD, ATCKent State University
Scott G. Piland, PhD, ATC
University of Southern Mississippi
Christopher M. Powers, PhD, PT
University of Southern California
Margot Putukian, MD
Princeton University
Richard Ray, EdD, ATC
Hope College
Bryan L. Riemann, PhD, ATC
Armstrong Atlantic State University
William A. Romani, PhD, PT, ATC
MedStar Research Institute
Scott E. Ross, PhD, ATC
Virginia Commonwealth University
Mack D Rubley, PhD, LAT, ATC,
CSCS*D
University of Nevada, Las Vegas
Susan Saliba, PhD, PT, ATC
University of Virginia
Eric L. Sauers, PhD, ATC, CSCS, FNATA
Arizona School of Health Sciences
Randy J. Schmitz, PhD, ATC
University of North Carolina at Greensboro
Michael R. Sitler, EdD, ATC, FNATA
Temple University
Chad Starkey, PhD, ATC, FNATA
Ohio University
Erik E. Swartz, PhD, ATC
University of New Hampshire
Paula Sammarone Turocy, EdD, ATC
Duquesne University
Timothy L. Uhl, PhD, PT, ATC, FNATA
University of Kentucky
Tamara C. Valovich McLeod, PhD,
ATC, CSCS
Arizona School of Health Sciences
Willem van Mechelen, MD, PhD
VU University Medical Center,
Netherlands
Stacy E. Walker, PhD, ATC
Ball State University
Gary B. Wilkerson, EdD, ATC, FNATA
University of Tennessee, Chattanooga
Jonathan E. Wingo, PhD
University of Alabama
John L. Woodard, PhD
Wayne State University
Susan W. Yeargin, PhD, ATC
Indiana State University
114 Volume 46 N Number 2 N April 2011

Journal of Athletic TrainingOfficial Publication of the National Athletic Trainers’ Association, Inc Volume 46, Number 2, March–April 2011
Original Research
Clinical Studies
The Assessment of Airway Maneuvers and Interventions in University Canadian Football, Ice Hockey,and Soccer PlayersJ. Scott Delaney, MDCM; Ammar Al-Kashmiri, MD; Penny-Jane Baylis, MBBS; Tracy Troutman, PT;Mahmood Aljufaili, MD; Jose A. Correa, PhD . . . . . . . . . . . . . . . . . . . . . . . . . . . . . . . . . . . . . . . . . . . . . . . . . . 117
Arthrometric Measurement of Ankle-Complex Motion: Normative ValuesNeil A. Schwarz, MS; John E. Kovaleski, PhD, ATC; Robert J. Heitman, EdD; Larry R. Gurchiek, DA, ATC;Coral Gubler-Hanna, PhD, PT, ATC . . . . . . . . . . . . . . . . . . . . . . . . . . . . . . . . . . . . . . . . . . . . . . . . . . . . . . . . . 126
Chronic Ankle Instability: Evolution of the ModelClaire E. Hiller, PhD; Sharon L. Kilbreath, PhD; Kathryn M. Refshauge, PhD . . . . . . . . . . . . . . . . . . . . . . . . . . . 133
Changes in Knee Biomechanics After a Hip-Abductor Strengthening Protocol for Runners With PatellofemoralPain SyndromeReed Ferber, PhD, ATC, CAT(C); Karen D. Kendall, MKin, CAT(C); Lindsay Farr . . . . . . . . . . . . . . . . . . . . . . . 142
Interday Reliability of Peak Muscular Power Outputs on an Isotonic Dynamometer and Assessment of ActiveTrunk Control Using the Chop and Lift TestsThomas G. Palmer, MSEd, ATC, CSCS; Timothy L. Uhl, PhD, PT, ATC, FNATA . . . . . . . . . . . . . . . . . . . . . . . 150
Scapular-Muscle Performance: Two Training Programs in Adolescent SwimmersAnnemie Van de Velde, PT; Kristof De Mey, PT; Annelies Maenhout, PT; Patrick Calders, PhD;Ann M. Cools, PhD, PT . . . . . . . . . . . . . . . . . . . . . . . . . . . . . . . . . . . . . . . . . . . . . . . . . . . . . . . . . . . . . . . . . . 160
CommentaryChristopher R. Carcia, PhD, PT, SCS, OCS . . . . . . . . . . . . . . . . . . . . . . . . . . . . . . . . . . . . . . . . . . . . . . . . . . 168
Authors’ ReplyAnnemie Van de Velde, PT; Kristof De Mey, PT; Annelies Maenhout, PT; Patrick Calders, PhD;Ann M. Cools, PhD, PT . . . . . . . . . . . . . . . . . . . . . . . . . . . . . . . . . . . . . . . . . . . . . . . . . . . . . . . . . . . . . . . . 169
Balance Performance With a Cognitive Task: A Continuation of the Dual-Task Testing ParadigmJacob E. Resch, PhD, ATC; Bryson May, MS; Phillip D. Tomporowski, PhD; Michael S. Ferrara, PhD, ATC, FNATA 170
Development of a Heat-Illness Screening Instrument Using the Delphi Panel TechniqueLindsey E. Eberman, PhD, LAT, ATC; Michelle A. Cleary, PhD, ATC . . . . . . . . . . . . . . . . . . . . . . . . . . . . . . . . . 176
Observational Studies
Work–Family Conflict Among Athletic Trainers in the Secondary School SettingWilliam A. Pitney, EdD, ATC, FNATA; Stephanie M. Mazerolle, PhD, ATC; Kelly D. Pagnotta, MA, ATC . . . . . 185
Assessing Strategies to Manage Work and Life Balance of Athletic Trainers Working in the NationalCollegiate Athletic Association Division I SettingStephanie M. Mazerolle, PhD, ATC; William A. Pitney, EdD, ATC, FNATA; Douglas J. Casa, PhD, ATC,FNATA, FACSM; Kelly D. Pagnotta, MA, ATC . . . . . . . . . . . . . . . . . . . . . . . . . . . . . . . . . . . . . . . . . . . . . . . . 194
Position StatementNational Athletic Trainers’ Association Position Statement: Prevention of Pediatric Overuse InjuriesTamara C. Valovich McLeod, PhD, ATC; Laura C. Decoster, ATC; Keith J. Loud, MDCM, MSc;Lyle J. Micheli, MD; J. Terry Parker, PhD, ATC; Michelle A. Sandrey, PhD, ATC; Christopher White, MS, ATC . . . . 206
DepartmentsThank You to Guest Reviewers . . . . . . . . . . . . . . . . . . . . . . . . . . . . . . . . . . . . . . . . . . . . . . . . . . . . . . . . . . . . . . 221

CEU QuizThe CEU quiz for the March–April 2011 issue
(Volume 46, Number 2) of the
Journal of Athletic Training will be located
online at www.nata.org/quizcenter
34th Annual Undergraduate Student Writing ContestAll materials must be received on or before March 1, 2012
The electronic file is to be submitted to [email protected] and hard copy materials mailed to
NATA Undergraduate Student Writing Contest
Attention: Holly McCauley
2952 Stemmons Freeway
Dallas, TX 75247
Details of the contest are located at
http://www.nata.org/deloss-brubaker-student-writing-award
For questions about the contest, contact Dr Lori Dewald, EdD, ATC, CHES, F-AAHE,
.
116 Volume 46 N Number 2 N April 2011

The Assessment of Airway Maneuvers andInterventions in University Canadian Football,Ice Hockey, and Soccer Players
J. Scott Delaney, MDCM*; Ammar Al-Kashmiri, MD�; Penny-Jane Baylis,MBBS*; Tracy Troutman, PT*; Mahmood Aljufaili, MD`; Jose A. Correa, PhD‰
*McGill Sport Medicine Clinic and Department of Emergency Medicine, McGill University Health Centre, Montreal, QC,Canada; 3Emergency Department, Khoula Hospital, Muscat, Oman; 4Accident & Emergency Department, RoyalHospital, Muscat, Oman; 1Department of Mathematics and Statistics, McGill University, Montreal, QC, Canada
Context: Managing an airway in an unconscious athlete is alifesaving skill that may be made more difficult by the recentchanges in protective equipment. Different airway maneuversand techniques may be required to help ventilate an uncon-scious athlete who is wearing full protective equipment.
Objective: To assess the effectiveness of different airwaymaneuvers with football, ice hockey, and soccer playerswearing full protective equipment.
Design: Crossover study.Setting: University sports medicine clinic.Patients or Other Participants: A total of 146 university
varsity athletes, consisting of 62 football, 45 ice hockey, and 39soccer players.
Intervention(s): Athletes were assessed for different airwayand physical characteristics. Three investigators then evaluated theeffectiveness of different bag-valve-mask (BVM) ventilation tech-niques in supine athletes who were wearing protective equipmentwhile inline cervical spine immobilization was maintained.
Main Outcome Measure(s): The effectiveness of 1-personBVM ventilation (1-BVM), 2-person BVM ventilation (2-BVM),and inline immobilization and ventilation (IIV) was judged byeach investigator for each athlete using a 4-point rating scale.
Results: All forms of ventilation were least difficult in soccerplayers and most difficult in football players. When comparedwith 1-BVM, both 2-BVM and IIV were deemed more effectiveby all investigators for all athletes. Interference from the helmetand stabilizer were common reasons for difficult ventilation infootball and ice hockey players.
Conclusions: Sports medicine professionals should prac-tice and be comfortable with different ventilation techniques forathletes wearing full equipment. The use of a new ventila-tion technique, termed inline immobilization and ventilation, maybe beneficial, especially when the number of responders islimited.
Key Words: emergency management, ventilation, resusci-tation
Key Points
N Control of a patient’s compromised airway may be affected by factors such as the sport and protective equipment, numberof people able to assist, individuals’ experience with different airway techniques and equipment, and physical attributesand size of the clinician.
N Sports medicine professionals should be familiar with more than one basic airway maneuver; in general, 2-person bag-valve-mask ventilation or inline immobilization and ventilation may be more effective than 1-person bag-mask-valveventilation.
N Inline immobilization and ventilation may be preferable to 1-person bag-valve-mask ventilation when the clinician is tall or2 people are not available.
Maintaining an airway and assisting breathing inan athlete wearing protective equipment who hasbecome obtunded or unconscious is a challeng-
ing yet essential skill for any health care professionalcovering sporting events. Available options include simpleairway procedures such as a jaw-thrust maneuver; place-ment of an oral airway to improve ventilation; adjunctiveairway devices, such as a bag-valve-mask (BVM), laryngealmask airway, or Combitube (Kendall Sheridan, Argyle,NY); and, finally, definitive airway control with endotra-cheal intubation.1–3 In an unconscious athlete, maintainingan adequate airway and assisting ventilation is a time-sensitive but often difficult procedure that is potentiallylifesaving.
Immobilization of the cervical spine often complicatesairway management in an injured athlete because thecervical spine is ideally splinted in a neutral position. Thisis most often accomplished by positioning someone at thehead of the supine athlete to hold the helmet or head in aneutral (inline) position. Unfortunately, this necessaryprocedure allows for less access to the airway, with lessphysical space for the athletic trainer or physician tomaintain or control the airway at the head of the athlete. Infootball and ice hockey players, the helmet and shoulderpads are typically left in place to maintain neutral cervicalspine alignment. If the helmet is removed, the head andneck usually fall into an extended position,4–10 possiblyfurther complicating an existing cervical spine injury.11 As
Journal of Athletic Training 2011;46(2):117–125g by the National Athletic Trainers’ Association, Incwww.nata.org/jat
original research
Journal of Athletic Training 117
such, most experts agree that when a football or ice hockeyplayer has sustained a possible cervical spine injury, eitherthe helmet should be left in place while the face mask orvisor is removed2,3,12–17 or both helmet and shoulder padsshould be removed simultaneously.3
As technology advances, sport equipment evolves.Recently, football and ice hockey helmets have becomelarger in an effort to provide more protection.18,19 Theouter shells of many helmets now extend to cover more ofthe face and jaw area, often obscuring the angle of themandible. Inflatable bladders near the ears and side of theface inside newer football helmets allow for better fit andprotection, but they are not easy to remove and caninterfere with access to the angle of the mandible. Access tothe angle of the mandible is important because most rescueairway maneuvers involve pulling the mandible anteriorlyby the angle to allow for better airflow and ventilation.Shoulder pads also have been getting larger, sometimesencroaching on the jaw and neck area of an unconscioussupine athlete. All of these changes may adversely affectairway management in the obtunded or unconsciousathlete.
To our knowledge, we are the first to assess theeffectiveness and practicality of different basic airwaymaneuvers in football, ice hockey, and soccer players whowere wearing full protective equipment for their respectivesports. By being aware of the potential hurdles tosuccessful airway management in athletes and by havingdifferent BVM options, the sports medicine professionalwill be better prepared and will increase the chance ofsurvival for the athlete.
METHODS
McGill University has men’s and women’s varsity soccerteams, men’s and women’s varsity ice hockey teams, and amen’s varsity football team. Different airway proceduresand devices were tested in healthy volunteers from these 5teams. Protective equipment around the head and neckarea in soccer is minimal, so we decided that soccer playerswould function as a control group. This study wasapproved by the Ethics Review Board of the McGillUniversity School of Medicine.
We collected consent and baseline information includingage, height, mass, and sex from the volunteers. Athleteswere excluded if they had experienced a head or neck injuryprecluding active participation with the team; had recent orcurrent symptoms indicating an upper or lower respiratorytract infection (eg, fever, sore throat, rhinorrhea, cough,shortness of breath, increased sputum production); hadactive oral or labial lesions or injuries (eg, canker, coldsores); or had eaten a meal within 120 minutes of the study.Noninvasive measures of specific airway characteristicsoften used to predict ease or difficulty in airway control,described in detail elsewhere,20–23 were taken. Theseincluded a Mallampati score (from 1 to 4), which assessesthe posterior pharyngeal structures visualized with maxi-mal mouth opening. A high Mallampati score (class 4) isassociated with more difficult ventilation and endotrachealintubation.24 Also assessed were the size of oral opening(ability to insert 3 of the athlete’s own fingers between theteeth), hyomental distance (ability to accommodate at least3 finger breadths between the hyoid bone and the mentum),
and upper lip test (ability to place the lower teeth overupper lip), all of which, when present, predict easierventilation and endotracheal intubation.25 The presence ofa beard or moustache, overbite, or false teeth was alsoassessed because any of these can also affect ventilationeffectiveness. These baseline characteristics and airwaymeasurements provide information on the sample studiedand may allow for comparisons with participants in futureairway studies.
After the airway assessment was completed, athletes infull protective sports equipment were placed in a supineposition on their field of play: a FieldTurf (Calhoun, GA)surface for soccer and football and the ice or hallwaybeside the ice surface for ice hockey. Data collectionwas usually done during or after practices, so thatvolunteers were in their own equipment and as sweaty asthey might be during a game situation. The onlysubstitution to the athletes’ own protective equipmentwas that football players were asked to select and wear aproperly fitting Riddell Revolution (Elyria, OH) helmetwith the face mask already removed, whereas the icehockey players were asked to select and wear a properlyfitting Bauer (Mississauga, ON, Canada) helmet with theface mask/visor already removed. Although the usualstandard of care for helmeted athletes with a possiblecervical spine injury is to leave the chin strap in place, weundid or removed the chin straps because they interferewith access to the angle of the mandible and properplacement of the facial mask of the BVM device. Thesupine athlete then had his or her head and cervical spineimmobilized by a physician, athletic trainer, or athletictherapist experienced with cervical immobilization. Toensure as uniform a cervical spine immobilization tech-nique as possible, the most senior athletic trainer or athletictherapist involved with the sports teams reviewed thetechnique before the study. The physician, athletic trainer,or athletic therapist immobilized the head and cervicalspine in the standard kneeling position at the head of theathlete by grasping both sides of the head or helmet,allowing himself or herself to stay at the top of the head orslightly off to the side.
The different BVM situations were assessed by 3investigators with different clinical experiences and phys-ical attributes. Investigator A (height 5 170 cm, mass 575 kg) was a recent male graduate in emergency medicine.Investigator B (height 5 166 cm, mass 5 62 kg) was afemale athletic therapist with more than 15 years’ experi-ence covering football and ice hockey. Investigator C(height 5 185 cm, mass 5 95 kg) was a male emergencyand sports medicine physician with more than 13 years’work experience. We felt that having 3 individuals withdifferent airway experiences and physical attributes wouldhelp to imitate the range of experiences and sizes of sportsmedicine professionals called upon to maintain airways inemergency situations.
Three BVM ventilation positions were assessed in asupine athlete with his or her head and neck maintained ina neutral position by a physician, athletic trainer, orathletic therapist. The positions were as follows:
a) One-person BVM ventilation (1-BVM). Each investiga-
tor attempted to place the BVM device in proper
position by himself or herself. This involves holding the
118 Volume 46 N Number 2 N April 2011
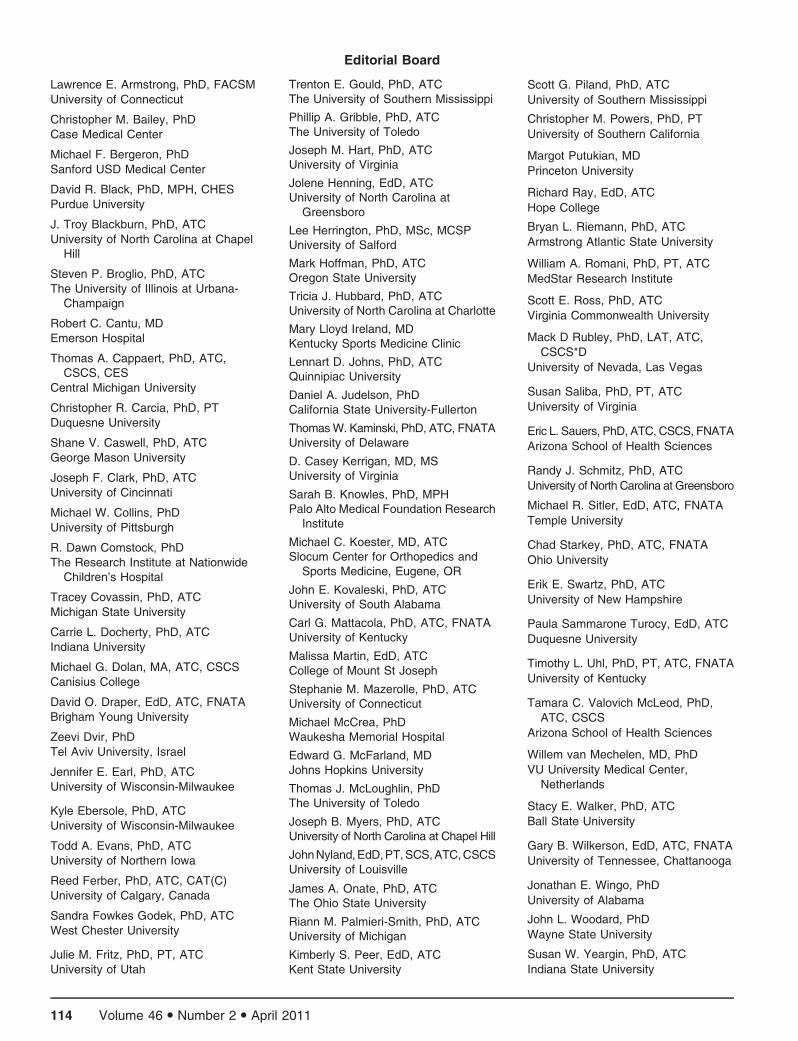
jaw, usually at the angle of the mandible with one hand,
and thrusting it forward while holding the BVM device
over the mouth with the same hand (usually the left).
The other hand (usually the right) is typically used to
pump the bag (Figure 1). However, the bag was not
pumped in this study.
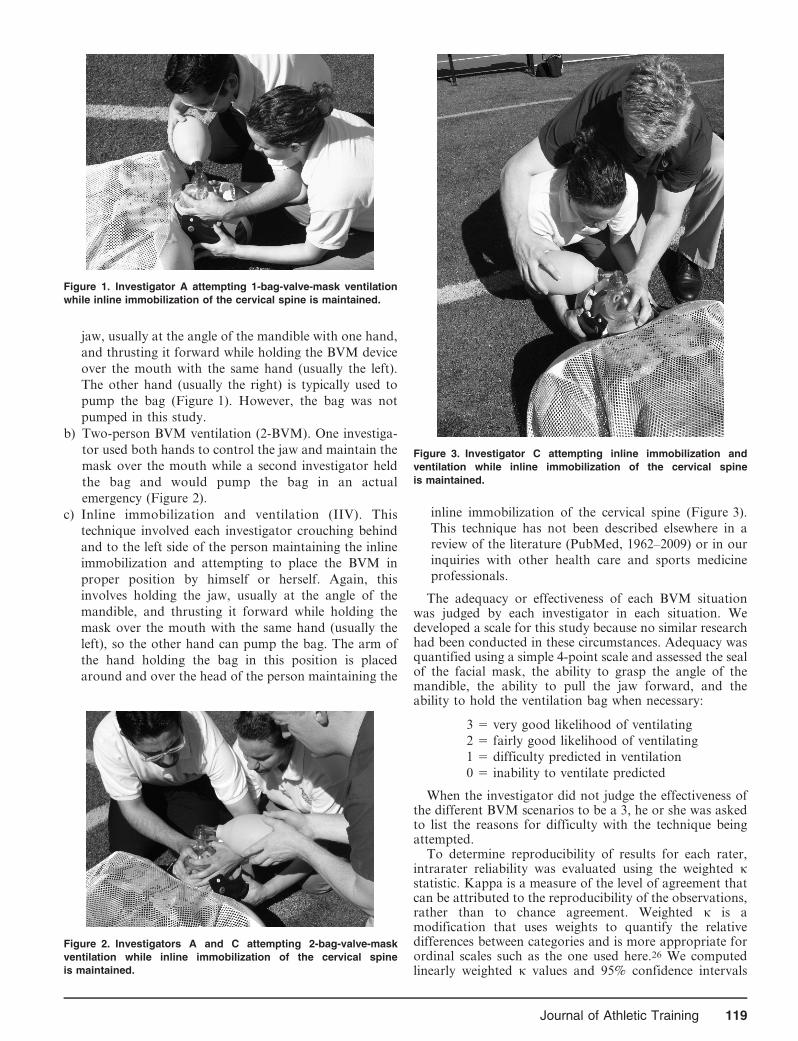
b) Two-person BVM ventilation (2-BVM). One investiga-
tor used both hands to control the jaw and maintain the
mask over the mouth while a second investigator held
the bag and would pump the bag in an actual
emergency (Figure 2).
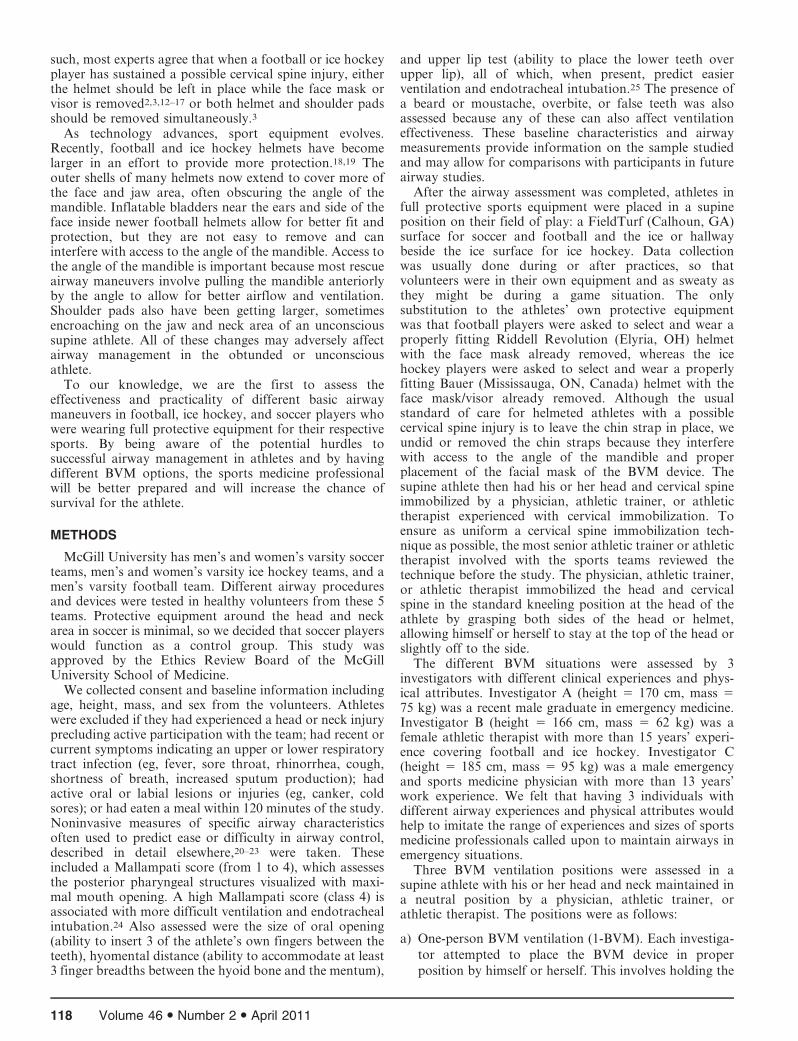
c) Inline immobilization and ventilation (IIV). This
technique involved each investigator crouching behind
and to the left side of the person maintaining the inline
immobilization and attempting to place the BVM in
proper position by himself or herself. Again, this
involves holding the jaw, usually at the angle of the
mandible, and thrusting it forward while holding the
mask over the mouth with the same hand (usually the
left), so the other hand can pump the bag. The arm of
the hand holding the bag in this position is placed
around and over the head of the person maintaining the
inline immobilization of the cervical spine (Figure 3).
This technique has not been described elsewhere in areview of the literature (PubMed, 1962–2009) or in our
inquiries with other health care and sports medicine
professionals.
The adequacy or effectiveness of each BVM situationwas judged by each investigator in each situation. Wedeveloped a scale for this study because no similar researchhad been conducted in these circumstances. Adequacy wasquantified using a simple 4-point scale and assessed the sealof the facial mask, the ability to grasp the angle of themandible, the ability to pull the jaw forward, and theability to hold the ventilation bag when necessary:
3 5 very good likelihood of ventilating
2 5 fairly good likelihood of ventilating
1 5 difficulty predicted in ventilation
0 5 inability to ventilate predicted
When the investigator did not judge the effectiveness ofthe different BVM scenarios to be a 3, he or she was askedto list the reasons for difficulty with the technique beingattempted.
To determine reproducibility of results for each rater,intrarater reliability was evaluated using the weighted kstatistic. Kappa is a measure of the level of agreement thatcan be attributed to the reproducibility of the observations,rather than to chance agreement. Weighted k is amodification that uses weights to quantify the relativedifferences between categories and is more appropriate forordinal scales such as the one used here.26 We computedlinearly weighted k values and 95% confidence intervals
Figure 1. Investigator A attempting 1-bag-valve-mask ventilation
while inline immobilization of the cervical spine is maintained.
Figure 2. Investigators A and C attempting 2-bag-valve-mask
ventilation while inline immobilization of the cervical spine
is maintained.
Figure 3. Investigator C attempting inline immobilization and
ventilation while inline immobilization of the cervical spine
is maintained.
Journal of Athletic Training 119

using the approach and FORTRAN program of Mielke etal27 for each scale and rater by sport on a subset ofrandomly selected athletes. Each athlete was assessed 3times by the same practitioner. The results for the weightedk values are listed in the Appendix and show substantialagreement or higher.28 In all instances, we observed goodagreement; the few disagreements involved a 1-pointdifference. We know,28 however, that k can sometimes beunreliable when complete agreement is observed or a raredisagreement occurs within a set of nearly identical values
because k depends on the prevalence of each category.Thus, k may not be reliable for these rare observations.This situation occurred in our data when, within aparticular scale and rater, all value points were identical,or identical save for one. In order to provide a picture ofthe reproducibility of the scales within each rater when thisoccurred, we report percentage agreement values and 95%confidence intervals. All descriptive statistics were com-puted using SAS software (version 9.2; SAS Institute Inc,Cary, NC).
Table 2. Combined Investigators’ and Individual Investigator’s Assessments of 1-Person Bag-Valve-Mask Ventilation Airway Maneuvera
Sport Investigator(s)
Technique Assessment (4-Point Scale)b
0 1 2 3
Football Combined 2 59 98 27
A 0 9 46 7
B 2 9 31 20
C 0 41 21 0
Ice hockey Combined 0 8 75 52
A 0 2 19 24
B 0 4 22 19
C 0 2 34 9
Soccer Combined 0 0 19 98
A 0 0 6 33
B 0 0 5 34
C 0 0 8 31
a Each investigator attempted each maneuver once, so the total attempts were 186 for football, 135 for ice hockey, and 117 attempts for soccer.b Scoring: 3 5 very good likelihood of ventilating, 2 5 fairly good likelihood of ventilating, 1 5 difficulty predicted in ventilation, 0 5 inability to
ventilate predicted.
Table 1. Player and Airway Characteristics
Characteristic
Sport
Football (n 5 62) Ice Hockey (n 5 45) Soccer (n 5 39)
Age, y 20.4 6 1.7 21.6 6 2.0 19.9 6 2.0
Height, cm 181.0 6 13 173.6 6 11.9 171.4 6 11.8
Mass, kg 95.0 6 16.5 78.5 6 12.4 69.8 6 8.9
Males, n (%) 62 (100.0) 26 (57.8) 20 (51.3)
Female, n (%) 0 (0.0) 19 (42.2) 19 (48.7)
Mallampati score, n (%)
1 36 (58.1) 20 (45.5)a 17 (43.6)
2 15 (24.2) 14 (31.8)a 9 (23.1)
3 6 (9.7) 9 (20.5)a 9 (23.1)
4 5 (8.1) 1 (2.3)a 4 (10.3)
Hyomental distance, n (%)
,3 fingers 1 (1.6) 9 (20.5)a 7 (17.9)
$3 fingers 61 (98.4) 35 (79.5)a 32 (82.1)
Mouth opening, n (%)
,3 fingers 0 (0.0) 2 (4.6)a 1 (2.6)
Upper lip test, n (%)
Favorable 42 (67.7) 33 (75.0)a 31 (79.5)
Unfavorable 20 (32.3) 11 (25.0)a 8 (20.5)
Facial hair, n (%)
Absent 31 (50.0) 39 (88.6)a 30 (76.9)
Present (eg, beard, goatee) 31 (50.0) 5 (11.4)a 9 (23.1)
Dentition, n (%)
Normal 50 (80.7) 34 (79.1)b 35 (89.7)
Abnormal (eg, buck teeth, false
teeth) 12 (19.3) 9 (20.9)b 4 (10.3)
a Data missing for 2 athletes.b Data missing for 1 athlete.
120 Volume 46 N Number 2 N April 2011
RESULTS
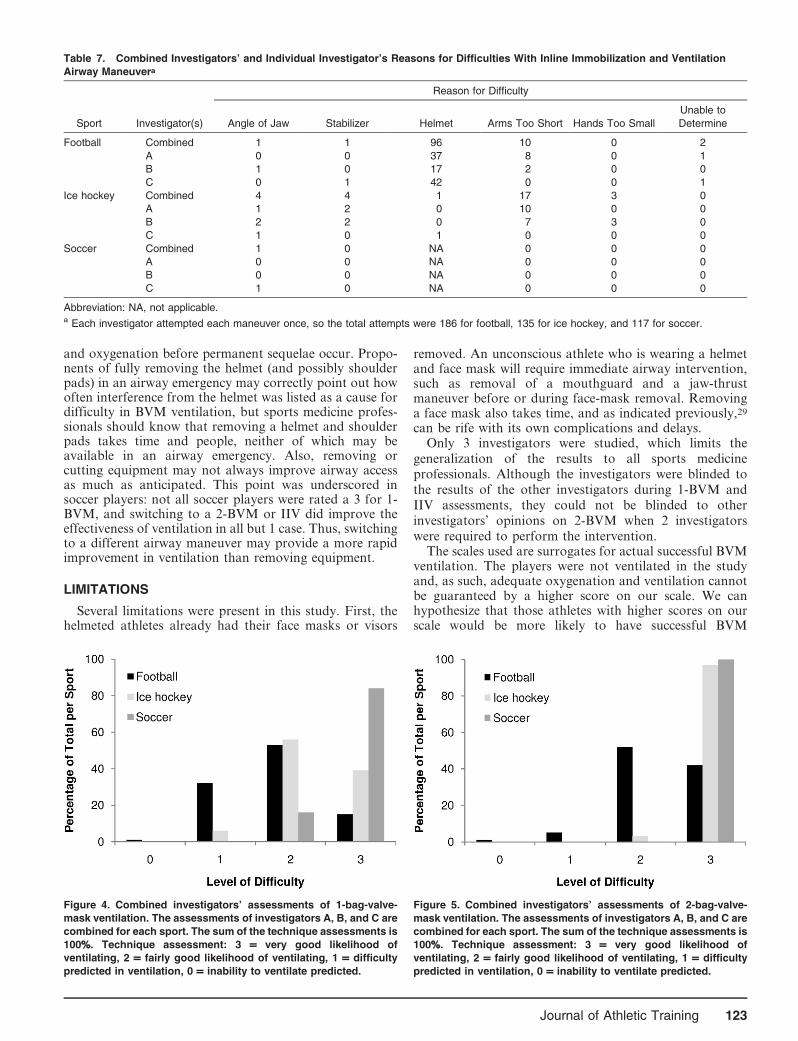
At the beginning of the 2007 season, there were 74 footballplayers, 52 ice hockey players, and 44 soccer players on thevarsity teams. Due to absences on the days of recruitmentand attrition, 62 athletes were fully recruited for football, 45for ice hockey, and 39 for soccer. Their baseline and airwaycharacteristics are listed in Table 1. Combined and individ-ual investigator assessments of difficulty of each airwaymaneuver are listed in Tables 2 through 4. Combinedinvestigator assessments of the different airway maneuversas a percentage of the total for each sport are shown inFigures 4 through 6. Difficulties for each situation are listedin Tables 5 through 7.
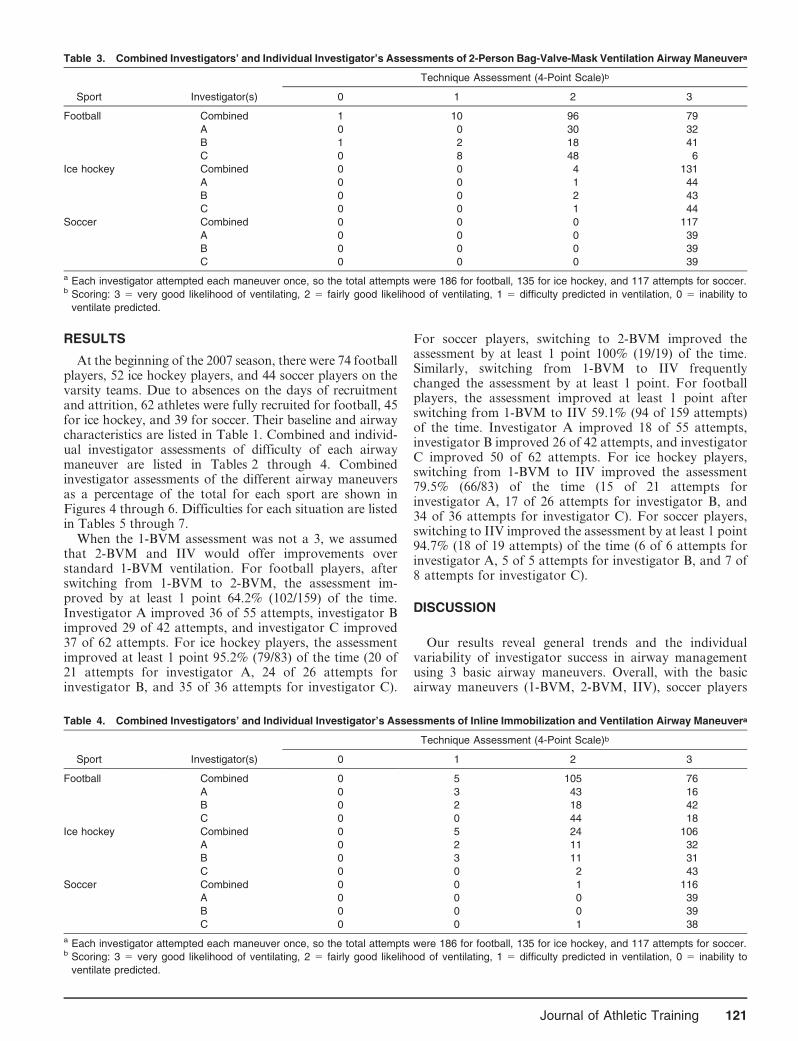
When the 1-BVM assessment was not a 3, we assumedthat 2-BVM and IIV would offer improvements overstandard 1-BVM ventilation. For football players, afterswitching from 1-BVM to 2-BVM, the assessment im-proved by at least 1 point 64.2% (102/159) of the time.Investigator A improved 36 of 55 attempts, investigator Bimproved 29 of 42 attempts, and investigator C improved37 of 62 attempts. For ice hockey players, the assessmentimproved at least 1 point 95.2% (79/83) of the time (20 of21 attempts for investigator A, 24 of 26 attempts forinvestigator B, and 35 of 36 attempts for investigator C).
For soccer players, switching to 2-BVM improved theassessment by at least 1 point 100% (19/19) of the time.Similarly, switching from 1-BVM to IIV frequentlychanged the assessment by at least 1 point. For footballplayers, the assessment improved at least 1 point afterswitching from 1-BVM to IIV 59.1% (94 of 159 attempts)of the time. Investigator A improved 18 of 55 attempts,investigator B improved 26 of 42 attempts, and investigatorC improved 50 of 62 attempts. For ice hockey players,switching from 1-BVM to IIV improved the assessment79.5% (66/83) of the time (15 of 21 attempts forinvestigator A, 17 of 26 attempts for investigator B, and34 of 36 attempts for investigator C). For soccer players,switching to IIV improved the assessment by at least 1 point94.7% (18 of 19 attempts) of the time (6 of 6 attempts forinvestigator A, 5 of 5 attempts for investigator B, and 7 of8 attempts for investigator C).
DISCUSSION
Our results reveal general trends and the individualvariability of investigator success in airway managementusing 3 basic airway maneuvers. Overall, with the basicairway maneuvers (1-BVM, 2-BVM, IIV), soccer players
Table 3. Combined Investigators’ and Individual Investigator’s Assessments of 2-Person Bag-Valve-Mask Ventilation Airway Maneuvera
Sport Investigator(s)
Technique Assessment (4-Point Scale)b
0 1 2 3
Football Combined 1 10 96 79
A 0 0 30 32
B 1 2 18 41
C 0 8 48 6
Ice hockey Combined 0 0 4 131
A 0 0 1 44
B 0 0 2 43
C 0 0 1 44
Soccer Combined 0 0 0 117
A 0 0 0 39
B 0 0 0 39
C 0 0 0 39
a Each investigator attempted each maneuver once, so the total attempts were 186 for football, 135 for ice hockey, and 117 attempts for soccer.b Scoring: 3 5 very good likelihood of ventilating, 2 5 fairly good likelihood of ventilating, 1 5 difficulty predicted in ventilation, 0 5 inability to
ventilate predicted.
Table 4. Combined Investigators’ and Individual Investigator’s Assessments of Inline Immobilization and Ventilation Airway Maneuvera
Sport Investigator(s)
Technique Assessment (4-Point Scale)b
0 1 2 3
Football Combined 0 5 105 76
A 0 3 43 16
B 0 2 18 42
C 0 0 44 18
Ice hockey Combined 0 5 24 106
A 0 2 11 32
B 0 3 11 31
C 0 0 2 43
Soccer Combined 0 0 1 116
A 0 0 0 39
B 0 0 0 39
C 0 0 1 38
a Each investigator attempted each maneuver once, so the total attempts were 186 for football, 135 for ice hockey, and 117 attempts for soccer.b Scoring: 3 5 very good likelihood of ventilating, 2 5 fairly good likelihood of ventilating, 1 5 difficulty predicted in ventilation, 0 5 inability to
ventilate predicted.
Journal of Athletic Training 121
were the least difficult to ventilate. Although ice hockeyplayers were more difficult to ventilate than soccer players,football players were the most difficult for all 3 investiga-tors to ventilate. In all sports and for all investigators,switching from 1-BVM to 2-BVM or IIV usually improvedthe assessment of airway maneuvers (Figures 4 through 6).
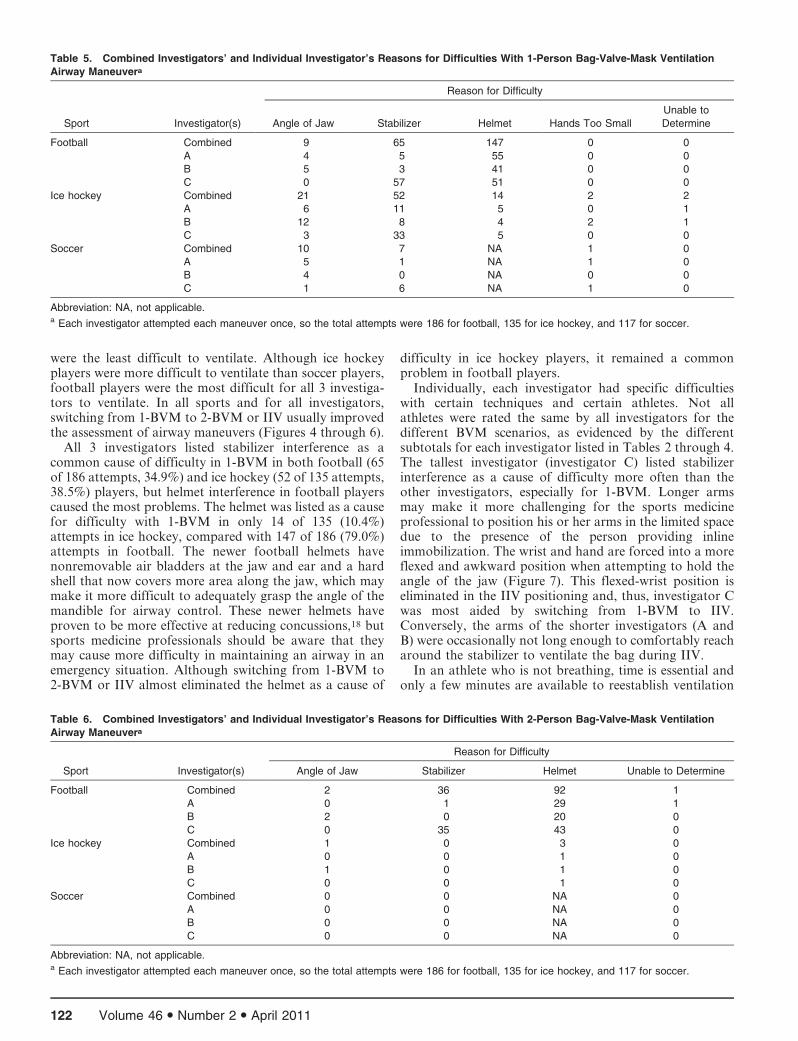
All 3 investigators listed stabilizer interference as acommon cause of difficulty in 1-BVM in both football (65of 186 attempts, 34.9%) and ice hockey (52 of 135 attempts,38.5%) players, but helmet interference in football playerscaused the most problems. The helmet was listed as a causefor difficulty with 1-BVM in only 14 of 135 (10.4%)attempts in ice hockey, compared with 147 of 186 (79.0%)attempts in football. The newer football helmets havenonremovable air bladders at the jaw and ear and a hardshell that now covers more area along the jaw, which maymake it more difficult to adequately grasp the angle of themandible for airway control. These newer helmets haveproven to be more effective at reducing concussions,18 butsports medicine professionals should be aware that theymay cause more difficulty in maintaining an airway in anemergency situation. Although switching from 1-BVM to2-BVM or IIV almost eliminated the helmet as a cause of
difficulty in ice hockey players, it remained a commonproblem in football players.
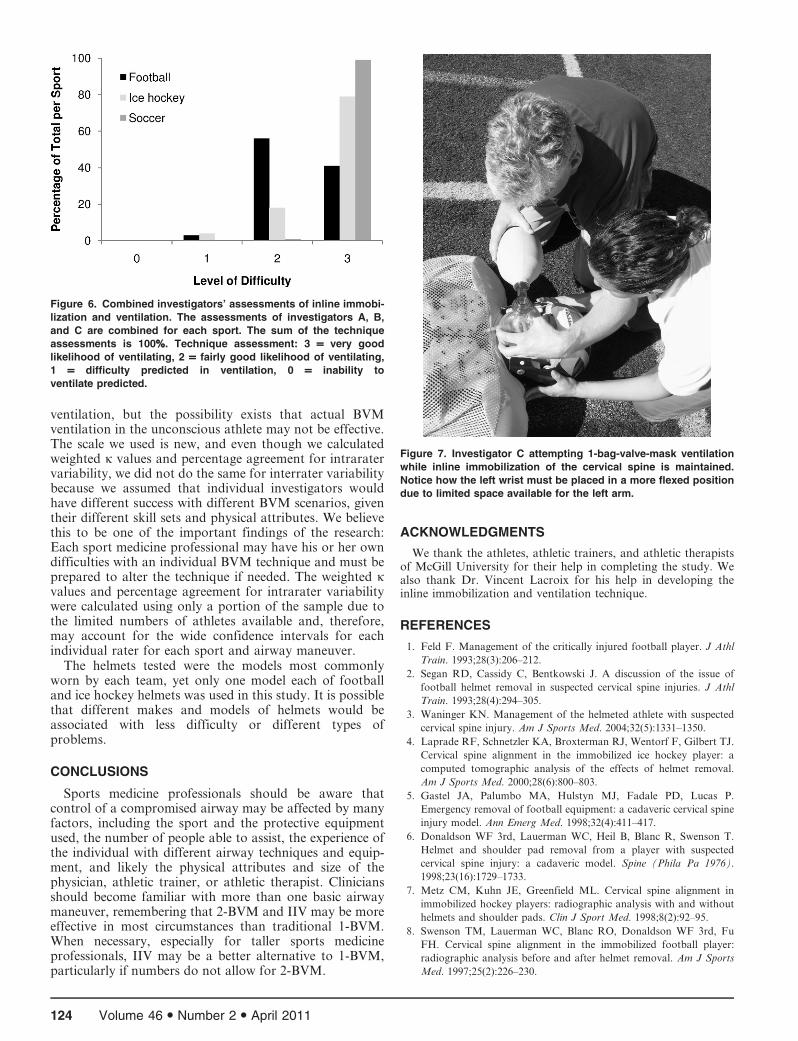
Individually, each investigator had specific difficultieswith certain techniques and certain athletes. Not allathletes were rated the same by all investigators for thedifferent BVM scenarios, as evidenced by the differentsubtotals for each investigator listed in Tables 2 through 4.The tallest investigator (investigator C) listed stabilizerinterference as a cause of difficulty more often than theother investigators, especially for 1-BVM. Longer armsmay make it more challenging for the sports medicineprofessional to position his or her arms in the limited spacedue to the presence of the person providing inlineimmobilization. The wrist and hand are forced into a moreflexed and awkward position when attempting to hold theangle of the jaw (Figure 7). This flexed-wrist position iseliminated in the IIV positioning and, thus, investigator Cwas most aided by switching from 1-BVM to IIV.Conversely, the arms of the shorter investigators (A andB) were occasionally not long enough to comfortably reacharound the stabilizer to ventilate the bag during IIV.
In an athlete who is not breathing, time is essential andonly a few minutes are available to reestablish ventilation
Table 5. Combined Investigators’ and Individual Investigator’s Reasons for Difficulties With 1-Person Bag-Valve-Mask Ventilation
Airway Maneuvera
Sport Investigator(s)
Reason for Difficulty
Angle of Jaw Stabilizer Helmet Hands Too Small
Unable to
Determine
Football Combined 9 65 147 0 0
A 4 5 55 0 0
B 5 3 41 0 0
C 0 57 51 0 0
Ice hockey Combined 21 52 14 2 2
A 6 11 5 0 1
B 12 8 4 2 1
C 3 33 5 0 0
Soccer Combined 10 7 NA 1 0
A 5 1 NA 1 0
B 4 0 NA 0 0
C 1 6 NA 1 0
Abbreviation: NA, not applicable.a Each investigator attempted each maneuver once, so the total attempts were 186 for football, 135 for ice hockey, and 117 for soccer.
Table 6. Combined Investigators’ and Individual Investigator’s Reasons for Difficulties With 2-Person Bag-Valve-Mask Ventilation
Airway Maneuvera
Sport Investigator(s)
Reason for Difficulty
Angle of Jaw Stabilizer Helmet Unable to Determine
Football Combined 2 36 92 1
A 0 1 29 1
B 2 0 20 0
C 0 35 43 0
Ice hockey Combined 1 0 3 0
A 0 0 1 0
B 1 0 1 0
C 0 0 1 0
Soccer Combined 0 0 NA 0
A 0 0 NA 0
B 0 0 NA 0
C 0 0 NA 0
Abbreviation: NA, not applicable.a Each investigator attempted each maneuver once, so the total attempts were 186 for football, 135 for ice hockey, and 117 for soccer.
122 Volume 46 N Number 2 N April 2011
and oxygenation before permanent sequelae occur. Propo-nents of fully removing the helmet (and possibly shoulderpads) in an airway emergency may correctly point out howoften interference from the helmet was listed as a cause fordifficulty in BVM ventilation, but sports medicine profes-sionals should know that removing a helmet and shoulderpads takes time and people, neither of which may beavailable in an airway emergency. Also, removing orcutting equipment may not always improve airway accessas much as anticipated. This point was underscored insoccer players: not all soccer players were rated a 3 for 1-BVM, and switching to a 2-BVM or IIV did improve theeffectiveness of ventilation in all but 1 case. Thus, switchingto a different airway maneuver may provide a more rapidimprovement in ventilation than removing equipment.
LIMITATIONS
Several limitations were present in this study. First, thehelmeted athletes already had their face masks or visors
removed. An unconscious athlete who is wearing a helmetand face mask will require immediate airway intervention,such as removal of a mouthguard and a jaw-thrustmaneuver before or during face-mask removal. Removinga face mask also takes time, and as indicated previously,29
can be rife with its own complications and delays.Only 3 investigators were studied, which limits the
generalization of the results to all sports medicineprofessionals. Although the investigators were blinded tothe results of the other investigators during 1-BVM andIIV assessments, they could not be blinded to otherinvestigators’ opinions on 2-BVM when 2 investigatorswere required to perform the intervention.
The scales used are surrogates for actual successful BVMventilation. The players were not ventilated in the studyand, as such, adequate oxygenation and ventilation cannotbe guaranteed by a higher score on our scale. We canhypothesize that those athletes with higher scores on ourscale would be more likely to have successful BVM
Table 7. Combined Investigators’ and Individual Investigator’s Reasons for Difficulties With Inline Immobilization and Ventilation
Airway Maneuvera
Sport Investigator(s)
Reason for Difficulty
Angle of Jaw Stabilizer Helmet Arms Too Short Hands Too Small
Unable to
Determine
Football Combined 1 1 96 10 0 2
A 0 0 37 8 0 1
B 1 0 17 2 0 0
C 0 1 42 0 0 1
Ice hockey Combined 4 4 1 17 3 0
A 1 2 0 10 0 0
B 2 2 0 7 3 0
C 1 0 1 0 0 0
Soccer Combined 1 0 NA 0 0 0
A 0 0 NA 0 0 0
B 0 0 NA 0 0 0
C 1 0 NA 0 0 0
Abbreviation: NA, not applicable.a Each investigator attempted each maneuver once, so the total attempts were 186 for football, 135 for ice hockey, and 117 for soccer.
Figure 4. Combined investigators’ assessments of 1-bag-valve-
mask ventilation. The assessments of investigators A, B, and C are
combined for each sport. The sum of the technique assessments is
100%%. Technique assessment: 3 = very good likelihood of
ventilating, 2 = fairly good likelihood of ventilating, 1 = difficulty
predicted in ventilation, 0 = inability to ventilate predicted.
Figure 5. Combined investigators’ assessments of 2-bag-valve-
mask ventilation. The assessments of investigators A, B, and C are
combined for each sport. The sum of the technique assessments is
100%%. Technique assessment: 3 = very good likelihood of
ventilating, 2 = fairly good likelihood of ventilating, 1 = difficulty
predicted in ventilation, 0 = inability to ventilate predicted.
Journal of Athletic Training 123
ventilation, but the possibility exists that actual BVMventilation in the unconscious athlete may not be effective.The scale we used is new, and even though we calculatedweighted k values and percentage agreement for intraratervariability, we did not do the same for interrater variabilitybecause we assumed that individual investigators wouldhave different success with different BVM scenarios, giventheir different skill sets and physical attributes. We believethis to be one of the important findings of the research:Each sport medicine professional may have his or her owndifficulties with an individual BVM technique and must beprepared to alter the technique if needed. The weighted kvalues and percentage agreement for intrarater variabilitywere calculated using only a portion of the sample due tothe limited numbers of athletes available and, therefore,may account for the wide confidence intervals for eachindividual rater for each sport and airway maneuver.
The helmets tested were the models most commonlyworn by each team, yet only one model each of footballand ice hockey helmets was used in this study. It is possiblethat different makes and models of helmets would beassociated with less difficulty or different types ofproblems.
CONCLUSIONS
Sports medicine professionals should be aware thatcontrol of a compromised airway may be affected by manyfactors, including the sport and the protective equipmentused, the number of people able to assist, the experience ofthe individual with different airway techniques and equip-ment, and likely the physical attributes and size of thephysician, athletic trainer, or athletic therapist. Cliniciansshould become familiar with more than one basic airwaymaneuver, remembering that 2-BVM and IIV may be moreeffective in most circumstances than traditional 1-BVM.When necessary, especially for taller sports medicineprofessionals, IIV may be a better alternative to 1-BVM,particularly if numbers do not allow for 2-BVM.
ACKNOWLEDGMENTS
We thank the athletes, athletic trainers, and athletic therapistsof McGill University for their help in completing the study. Wealso thank Dr. Vincent Lacroix for his help in developing theinline immobilization and ventilation technique.
REFERENCES
1. Feld F. Management of the critically injured football player. J Athl
Train. 1993;28(3):206–212.
2. Segan RD, Cassidy C, Bentkowski J. A discussion of the issue of
football helmet removal in suspected cervical spine injuries. J Athl
Train. 1993;28(4):294–305.
3. Waninger KN. Management of the helmeted athlete with suspected
cervical spine injury. Am J Sports Med. 2004;32(5):1331–1350.
4. Laprade RF, Schnetzler KA, Broxterman RJ, Wentorf F, Gilbert TJ.
Cervical spine alignment in the immobilized ice hockey player: a
computed tomographic analysis of the effects of helmet removal.
Am J Sports Med. 2000;28(6):800–803.
5. Gastel JA, Palumbo MA, Hulstyn MJ, Fadale PD, Lucas P.
Emergency removal of football equipment: a cadaveric cervical spine
injury model. Ann Emerg Med. 1998;32(4):411–417.
6. Donaldson WF 3rd, Lauerman WC, Heil B, Blanc R, Swenson T.
Helmet and shoulder pad removal from a player with suspected
cervical spine injury: a cadaveric model. Spine (Phila Pa 1976).
1998;23(16):1729–1733.
7. Metz CM, Kuhn JE, Greenfield ML. Cervical spine alignment in
immobilized hockey players: radiographic analysis with and without
helmets and shoulder pads. Clin J Sport Med. 1998;8(2):92–95.
8. Swenson TM, Lauerman WC, Blanc RO, Donaldson WF 3rd, Fu
FH. Cervical spine alignment in the immobilized football player:
radiographic analysis before and after helmet removal. Am J Sports
Med. 1997;25(2):226–230.
Figure 6. Combined investigators’ assessments of inline immobi-
lization and ventilation. The assessments of investigators A, B,
and C are combined for each sport. The sum of the technique
assessments is 100%%. Technique assessment: 3 = very good
likelihood of ventilating, 2 = fairly good likelihood of ventilating,
1 = difficulty predicted in ventilation, 0 = inability to
ventilate predicted.
Figure 7. Investigator C attempting 1-bag-valve-mask ventilation
while inline immobilization of the cervical spine is maintained.
Notice how the left wrist must be placed in a more flexed position
due to limited space available for the left arm.
124 Volume 46 N Number 2 N April 2011
9. Palumbo MA, Hulstyn MJ, Fadale PD, O’Brien T, Shall L. The effect
of protective football equipment on alignment of the injured cervical
spine: radiographic analysis in a cadaveric model. Am J Sports Med.
1996;24(4):446–453.
10. Prinsen RK, Syrotuik DG, Reid DC. Position of the cervical
vertebrae during helmet removal and cervical collar application in
football and hockey. Clin J Sport Med. 1995;5(3):155–161.
11. Laun RA, Lignitz E, Haase N, Latta LL, Ekkernkamp A, Richter D.
Mobility of unstable fractures of the odontoid during helmet removal:
a biomechanical study [in German]. Unfallchirurg. 2002;105(12):
1092–1096.
12. Owsley HK. Helmet removal in athletics: the ‘‘big debate.’’ Emerg
Med Serv. 2005;34(5):73–77.
13. Sanchez AR 2nd, Sugalski MT, LaPrade RF. Field-side and
prehospital management of the spine-injured athlete. Curr Sports
Med Rep. 2005;4(1):50–55.
14. Ellis D, Ellis J. Face mask removal in the spine-injured football
player: a review. Emerg Med Serv. 2002;31(10):175–178.
15. Kleiner DM, Pollak AN, McAdam C. Helmet hazards: do’s & don’ts
of football helmet removal. JEMS. 2001;26(7):36–44, 46–48.
16. Waninger KN. On-field management of potential cervical spine injury
in helmeted football players: leave the helmet on! Clin J Sport Med.
1998;8(2):124–129.
17. Waninger KN, Richards JG, Pan WT, Shay AR, Shindle MK. An
evaluation of head movement in backboard-immobilized helmeted
football, lacrosse, and ice hockey players. Clin J Sport Med.
2001;11(2):82–86.
18. Viano DC, Pellman EJ, Withnall C, Shewchenko N. Concussion in
professional football: performance of newer helmets in reconstructed
game impacts, part 13. Neurosurgery. 2006;59(3):591–606.
19. Collins M, Lovell MR, Iverson GL, Ide T, Maroon J. Examining
concussion rates and return to play in high school football players
wearing newer helmet technology: a three-year prospective cohort
study. Neurosurgery. 2006;58(2):275–286.
20. Eberhart LH, Arndt C, Cierpka T, Schwanekamp J, Wulf H,
Putzke C. The reliability and validity of the upper lip bite test
compared with the Mallampati classification to predict difficult
laryngoscopy: an external prospective evaluation. Anesth Analg.
2005;101(1):284–289.
21. Lee A, Fan LT, Gin T, Karmakar MK, Ngan Kee WD. A sys-
tematic review (meta-analysis) of the accuracy of the Mallampati
tests to predict the difficult airway. Anesth Analg. 2006;102(6):
1867–1878.
22. Reed MJ, Dunn MJ, McKeown DW. Can an airway assessment score
predict difficulty at intubation in the emergency department? Emerg
Med J. 2005;22(9):99–102.
23. Khan ZH, Arbabi S. The reliability and validity of the upper lip bite
test compared with the Mallampati classification to predict difficult
laryngoscopy. Anesth Analg. 2006;103(2):497.
24. Kheterpal S, Han R, Tremper KK, et al. Incidence and predictors of
difficult and impossible mask ventilation. Anesthesiology. 2006;105(5):
885–891.
25. Langeron O, Masso E, Huraux C, et al. Prediction of difficult mask
ventilation. Anesthesiology. 2000;92(5):1229–1236.
26. Cohen J. Weighted kappa: nominal scale agreement with provision
for scaled disagreement or partial credit. Psychol Bull. 1968;70(4):
213–220.
27. Mielke PW Jr, Berry KJ, Johnston JE. The exact variance of weighted
kappa with multiple raters. Psychol Rep. 2007;101(2):655–660.
28. Viera AJ, Garrett JM. Understanding interobserver agreement: the
kappa statistic. Fam Med. 2005;37(5):360–363.
29. Copeland AJ, Decoster LC, Swartz EE, Gattie ER, Gale SD.
Combined tool approach is 100% successful for emergency football
face mask removal. Clin J Sport Med. 2007;17(6):452–457.
Address correspondence to J. Scott Delaney, MDCM, McGill Sport Medicine Clinic, 475 Pine Avenue West, Montreal, Quebec, CanadaH2W 1S4. Address e-mail to [email protected].
Appendix. Intrarater Weighted k Values and Percentage of Agreement for the Airway Maneuvers (95% Confidence Intervals)a
Airway Maneuver Investigator Football (n 5 11)b Hockey (n 5 9)b Soccer (n 5 10)b
1-person bag-valve-mask A 0.72 (0.46, 0.98) 0.79 (0.50, 1.0) 0.85 (0.48, 1.0)
B 0.84 (0.57, 1.0) 0.74 (0.46, 1.0) 0.69 (0.33, 1.0)
C 0.83 (0.56, 1.0) 0.90 (0.60, 1.0) 0.81 (0.44, 1.0)
2-person bag-valve-mask A 0.80 (0.51, 1.0) 0.67 (0.29, 1.0) 0.93c (0.79, 0.98)
B 0.76 (0.47, 1.0) 0.65 (0.26, 1.0) 0.93c (0.79, 0.98)
C 0.88 (0.56, 1.0) 0.84 (0.45, 1.0) 0.93c (0.79, 0.98)
Inline immobilization and
ventilation
A 0.72 (0.42, 1.0) 0.74 (0.40, 1.0) 1.0c (0.89, 1.0)
B 0.78 (0.46, 1.0) 0.73 (0.39, 1.0) 0.93c (0.79, 0.98)
C 0.77 (0.42, 1.0) 0.81 (0.42, 1.0) 1.0c (0.89, 1.0)
a Interpretation of weighted k is as follows28: ,0, less than chance agreement; 0.01–0.20, slight agreement; 0.21–0.40, fair agreement; 0.41–0.60,
moderate agreement; 0.61–0.80, substantial agreement; 0.81–0.99, almost-perfect agreement; 1.0, perfect agreement.b The number of athletes in each group is a subset of randomly selected athletes from the larger groups. These subsets were used to calculate
intrarater reliability.c Total agreement occurred for each individual rater (rating 5 3) and one instance of 1-point disagreement for each rater (rating 5 2). Kappa
returned no value due to the very small prevalence of the ratings of 0, 1, and 2. In these instances, average percentage of agreement was used.
Journal of Athletic Training 125
Arthrometric Measurement of Ankle-Complex Motion:Normative Values
Neil A. Schwarz, MS; John E. Kovaleski, PhD, ATC; Robert J. Heitman, EdD;Larry R. Gurchiek, DA, ATC; Coral Gubler-Hanna, PhD, PT, ATC
Department of Health & Physical Education, University of South Alabama, Mobile. Mr Schwarz is now at theDepartment of Health, Human Performance, and Recreation, Baylor University, Waco, TX.
Context: Valid and reliable measurements of ankle-complexmotion have been reported using the Hollis Ankle Arthrometer.No published normative data of ankle-complex motion obtainedfrom ankle arthrometry are available for use as a reference forclinical decision making.
Objective: To describe the distribution variables of ankle-complex motion in uninjured ankles and to establish normativereference values for use in research and to assist in clinicaldecision making.
Design: Descriptive laboratory study.Setting: University research laboratory.Patients or Other Participants: Both ankles of 50 men and
50 women (age 5 21.78 6 2.0 years [range, 19–25 years]) weretested.
Intervention(s): Each ankle underwent anteroposterior(AP) and inversion-eversion (I-E) loading using an anklearthrometer.
Main Outcome Measure(s): Recorded anterior, posterior,and total AP displacement (millimeters) at 125 N and inversion,eversion, and total I-E rotation (degrees) at 4 Nm.
Results: Women had greater ankle-complex motion for allvariables except for posterior displacement. Total AP displacementof the ankle complex was 18.79 6 4.1 mm for women and 16.70 64.8 mm for men (U 5 3742.5, P , .01). Total I-E rotation of the anklecomplex was 42.106 6 9.06 for women and 34.136 6 10.16 for men(U 5 2807, P , .001). All variables were normally distributed exceptfor anterior displacement, inversion rotation, eversion rotation, andtotal I-E rotation in the women’s ankles and eversion rotation in themen’s ankles; these variables were skewed positively.
Conclusions: Our study increases the available database onankle-complex motion, and it forms the basis of norm-referencedclinical comparisons and the basis on which quantitativedefinitions of ankle pathologic conditions can be developed.
Key Words: normal distribution, flexibility
Key Points
N This study increases the available database on ankle-complex motion and forms the basis of norm-referenced clinicalcomparisons.
N Women had greater ankle range of motion than men, and all of the range-of-motion variables measured were normallydistributed except for anterior displacement, inversion rotation, eversion rotation, and total inversion-eversion rotation,which showed a higher incidence toward hypermobility.
N Our findings are clinically important because they will assist in the clinical decision-making process, enabling comparisonsto be made with individual patient data and enabling quantitative definitions of ankle conditions to be developed.
Instrumented ankle arthrometry allows the examiner toquantify ligamentous laxity in lieu of manual exami-nation.1–3 Valid and reliable measurements of the
combined motions within the talocrural and subtalar joints(ankle complex) have been investigated fully and reportedusing the Hollis Ankle Arthrometer (Blue Bay Research,Inc, Navarre, FL).3–6 Consisting of a 6-degrees-of-freedomspatial kinematic linkage, this device is described as asuitable evaluation tool that quantifies the anteroposterior(AP) load displacement and inversion-eversion (I-E)rotational characteristics of the ankle complex.3,4,7
The Hollis Ankle Arthrometer has been used in a varietyof clinical and research settings involving college-agedathletes and participants less than 25 years of age.Researchers have applied this type of arthrometricassessment in studies to biomechanically assess ankle-complex laxity in vivo and in vitro,3,4,8 identify ankleinstability after injury,9–13 investigate the effects of sex andathletic status on ankle-complex laxity,14 identify the
relationship between ankle and knee ligamentous laxityand generalized joint laxity,15 investigate the effects ofbalance training on gait in patients with chronic ankleinstability,13 investigate the effects of limb dominance onankle laxity,4 and assess the effectiveness of ankle taping.16
One limitation of using the Hollis Ankle Arthrometerand of using instrumented ankle arthrometry in general isthat relatively small sample sizes have been reported andno normative data are available for comparison andreference.9–14 Kovaleski et al4 investigated total APdisplacement and I-E rotation between the dominant andnondominant ankles in a group of 41 male and femaleparticipants (age 5 23.8 6 4.4 years). Bilateral anklecomparisons showed no differences in ankle-complexlaxity, and they reported mean total AP displacement of18.47 6 5.1 mm for the dominant ankle and 17.51 65.4 mm for the nondominant ankle. They also reportedmean total I-E rotation of 46.196 6 12.26 for the dominantankle and 47.386 6 14.36 for the nondominant ankle. The
Journal of Athletic Training 2011;46(2):126–132g by the National Athletic Trainers’ Association, Incwww.nata.org/jat
original research
126 Volume 46 N Number 2 N April 2011
relatively large SDs indicated sizable variations in APdisplacement and I-E rotation measurements in theuninjured ankle. To establish normative data for ankle-complex motion, adequate sample size is important todescribe the resulting distribution and to ensure confidencethat the theoretical distribution fitted to the data hasminimal error associated with it.
Given the importance of having normative valuesagainst which clinical findings can be compared, thepurpose of our study was to describe the distributionvariables of ankle-complex motion in uninjured ankles andto establish normative reference values for use in researchand to assist in clinical decision making.
METHODS
Participants
Participants included 50 men (age 5 21.9 6 2.1 years,height 5 178.2 6 7.4 cm, mass 5 86.9 6 21.1 kg) and 50women (age 5 21.7 6 2.0 years, height 5 165.1 6 7.9 cm,mass 5 65.7 6 11.1 kg) from 19 to 25 years of age (21.78 62.0 years). Ninety-three participants were right-leg domi-nant, and 7 were left-leg dominant. The dominant leg wasdefined operationally as the leg used to kick a ball. None ofthe participants had a history of lower extremity injury,including ankle sprain. Before testing, all participantsprovided written informed consent, and the university’sinstitutional review board approved the study.
Participants completed the Foot and Ankle OutcomeScore (FAOS) questionnaire to gauge self-reported anklefunction.17 The FAOS is a subjective self-report of anklefunction in daily activities, sports, and recreation that isdivided into 5 subscales. A normalized score (100indicating no problems and 0 indicating extreme problems)was calculated for each subscale. The results of the FAOSsurvey showed the FAOS subscale mean scores rangedfrom 95.2 6 10.5 to 99.1 6 3.0, which implied that theankles included in our study were free of problemsassociated with ankle dysfunction.
Instrumentation
Instrumented measurement of ankle-complex motionwas conducted using the Hollis Ankle Arthrometer.7 Thearthrometer consists of a spatial kinematic linkage, anadjustable plate fixed to the foot, a load-measuring handleattached to the footplate through which the load is applied,and a reference pad attached to the tibia.3,4 Anklearthrometry is a method for assessing either translatorydisplacement or angular motion of the foot in relation tothe leg that results from the combined motions within thetalocrural and subtalar joints. The spatial kinematiclinkage is a 6-degrees-of-freedom electrogoniometer thatmeasures applied forces and moments and the resultanttranslations and rotations of the ankle complex.2,7 Thearthrometer spatial linkage connected the tibial pad to thefootplate and measured the motion of the footplate relativeto the tibial pad. Ankle-flexion angle was measured fromthe plantar surface of the foot relative to the anterior tibiaand was determined by the 6-degrees-of-freedom electro-goniometer within the instrumented linkage. An Inspiron1525 computer (Dell Inc, Round Rock, TX) with ananalog-to-digital converter (National Instruments Corp,
Austin, TX) was used to simultaneously record andcalculate the data. The resulting AP displacement (milli-meters) and I-E rotation (degrees of range of motion) alongwith the corresponding AP load and I-E torque wererecorded. We used a custom software program written inLabVIEW (National Instruments) for collection andreduction of the data.
Procedures
Testing and participant positioning replicated previouslyreported methods.4,5,9 Individuals participated in 1 testingsession and both ankles underwent 3 trials each of AP andI-E loading. To minimize variation, the arthrometer waspositioned on all participants in a similar manner for alltests, and the same examiner (N.A.S.) performed all tests.
Each participant was positioned supine on a firm tablewith the knee in 106 to 206 of knee flexion and the footextended over the edge of the table. A restraining strapattached to support bars under the table was securedaround the distal lower leg approximately 1 cm above themalleoli and then tightened to prevent lower leg movementduring testing. The examiner placed the bottom of the footonto the footplate and secured the foot using heel anddorsal clamps. The heel clamp prevented the device fromrotating on the calcaneus, and the dorsal clamp secured thefoot to the footplate. The tibial reference pad then waspositioned approximately 5 cm above the malleoli andsecured to the lower leg with an elastic strap.
The ankle was positioned at zero AP load and zero I-Emoment at a neutral (06) flexion angle, which was definedas the measurement reference position.2,4 The other degreesof freedom (internal-external, medial-lateral, and proxi-mal-distal) also were maintained at their zero-load neutralposition. Thus, the measurement reference position repre-sented zero moment and force loads. This angle wasmeasured from the plantar surface of the foot relative tothe anterior tibia and determined by the 6-degrees-of-freedom electrogoniometer within the instrumented link-age. Anteroposterior loading, I-E torque, and the flexionangle were applied through the load handle in line with thefootplate. Each trial involved reciprocal movements fromthe zero load to the maximum load. For the AP trial, theankles were loaded to 6125 N with both anterior andposterior forces. Starting at the reference position, anteriorloading was applied first; posterior loading, second. TotalAP displacement of the ankle complex (millimeters) wasrecorded along with the loads. Anterior motion was definedas the displacement produced in response to the loadchanging from 0 to 125 N. Posterior motion was defined asthe displacement produced in response to a load changingfrom 0 to 2125 N. Total AP displacement was defined asthe change produced in response to a load varying from2125 to 125 N. For I-E rotation, the ankles were loaded to64 Nm with both inversion and eversion torque. Startingat the neutral reference position, inversion loading wasapplied first; eversion loading, second. Rotation of theankle complex was recorded along with the torque.Inversion rotation was defined as the angular displacementproduced in response to a torque changing from 0 to 4 Nm.Eversion rotation was defined as the angular displacementproduced in response to a torque changing from 0 to24 Nm. Total I-E rotation was defined as the angular-
Journal of Athletic Training 127
displacement change produced in response to a torquevarying from 24 to 4 Nm. By observing the computermonitor, the examiner visualized the applied load to obtainmaximum AP displacement and I-E rotation.
Test order was assigned randomly between right and leftankles. After the ankle measurements were obtained, thedevice was removed, and the testing procedure wasrepeated on the contralateral ankle.
Statistical Analysis
Anterior, posterior, and total AP displacement at 125 Nand inversion, eversion, and total I-E rotation at 4 Nmwere used as outcome measures. Descriptive data for allvariables were expressed as the mean (6SD) score, medianscore, SE score, range of scores, and 95% confidenceinterval. The dominant and nondominant ankle-complexmotion data from each of the 100 participants were firsttested for normality. Normality of distribution wasinvestigated using the Kolmogorov-Smirnov test withLilliefors correction. If a finding of the Kolmogorov-Smirnov test was significant, normality of distribution wasfurther investigated for that finding by examining the zscores for skewness and kurtosis. If the z scores forskewness and kurtosis of the variable were from +2.00 to22.00, the finding was considered to be normallydistributed. If the z score for skewness of a finding wasoutside the +2.00 to 22.00 range, the finding was describedas positively or negatively skewed. If the z score forkurtosis of a finding was outside the +2.00 to 22.00 range,the finding was described as leptokurtic or platykurtic.
Limb-dominance data determined to be normallydistributed were analyzed using the paired-samples t testto identify any side-related difference between observa-tions. Data determined not to be normally distributed wereanalyzed using the Wilcoxon test. Sex data determined tobe normally distributed were analyzed using the indepen-dent-samples t test to examine differences between men andwomen. Data determined not to be normally distributedwere analyzed using the Mann-Whitney U test. Effect sizewas determined using the Cohen d.18 The a level was set apriori at .05. All statistical analyses were performed withSPSS software (version 17.0; SPSS Inc, Chicago, IL).
RESULTS
Limb Dominance
The findings of the Kolmogorov-Smirnov test weresignificant for total AP displacement of the dominant ankle(D 5 0.096, P 5 .02), total AP displacement of thenondominant ankle (D 5 0.093, P 5 .03), and inversionrotation of the dominant ankle (D 5 0.093, P 5 .03).Examination of the z scores for skewness and kurtosisshowed normal distribution for total AP displacement ofthe dominant ankle (skewness 5 0.33, SE 5 0.24; kurtosis5 20.57, SE 5 0.48) and total AP displacement of thenondominant ankle (skewness 5 0.14, SE 5 0.24; kurtosis5 20.40, SE 5 0.48). The z scores for inversion rotation ofthe dominant ankle (skewness 5 0.68, SE 5 0.24; kurtosis5 0.43, SE 5 0.48) showed that this variable was positivelyskewed. Results indicated that all variables were normallydistributed except for inversion rotation of the dominantankle.
Bilateral comparisons revealed greater dominant thannondominant ankle-complex motion for total AP displace-ment (dominant 5 19.23 6 4.37 mm, nondominant 516.26 6 4.28 mm; t99 5 6.43, P , .01, Cohen d 5 .68),posterior displacement (dominant 5 9.64 6 2.50 mm,nondominant 5 7.30 6 2.43 mm; t99 5 6.78, P , .01,Cohen d 5 .95), and eversion rotation (dominant 5 15.646
6 4.926, nondominant 5 14.576 6 4.836; t99 5 3.44, P ,.01, Cohen d 5 .22). Greater inversion rotation was foundfor nondominant than for dominant ankle-complex motion(dominant 5 22.166 6 6.756, nondominant 5 23.856 66.606; Z 5 23.5, P 5 .01, Cohen d 5 .25).
No differences were found between the dominant andnondominant ankles for anterior displacement (dominant5 9.58 6 2.99 mm, nondominant 5 8.96 6 3.15 mm; t99 51.9, P 5 .06, Cohen d 5 .20) and total I-E rotation(dominant 5 37.806 6 10.446, nondominant 5 38.446 610.266; t99 5 21.22, P , .22, Cohen d 5 .06). Small effectsizes were found for 4 of the 6 variables and were notconsidered clinically important; thus, the data from bothankles were pooled for all subsequent analyses.
Sex Differences
Ankle-complex motion values in the male population of100 ankles are shown in Table 1. The findings of theKolmogorov-Smirnov test were significant for total I-E(D 5 0.097, P 5 .02) and eversion (D 5 0.145, P 5 .01)rotation. Examination of the z scores showed normaldistribution for total I-E rotation (skewness 5 0.28, SE 50.24; kurtosis 5 20.78, SE 5 0.48) and positive skewnessfor eversion rotation (skewness 5 0.64, SE 5 0.24; kurtosis5 20.30, SE 5 0.48). Examination of frequency distribu-tions for total AP displacement and total I-E rotation andtheir corresponding histograms graphically showed thedistribution around the mean (Figures 1 and 2).
Ankle-complex motion values in the female populationof 100 ankles are displayed in Table 2. The findings of theKolmogorov-Smirnov test were significant for all thevariables except posterior displacement. Examination of zscores showed normal distribution for total AP displace-ment (D 5 0.113, P 5 .01; skewness 5 0.47, SE 5 0.24;kurtosis 5 20.36, SE 5 0.48); positive skewness foranterior displacement (D 5 0.090, P 5 .04; skewness 50.75, SE 5 0.24; kurtosis 5 0.85, SE 5 0.48), inversion (D5 0.120, P 5 .01; skewness 5 0.67, SE 5 0.24; kurtosis 520.05, SE 5 0.48), and total I-E rotation (D 5 0.121, P 5.01; skewness 5 0.64, SE 5 0.24; kurtosis 5 20.29, SE 50.48); and positive skewness and leptokurtosis for eversionrotation (D 5 0.109, P 5 .01; skewness 5 1.07, SE 5 0.24;kurtosis 5 1.47, SE 5 0.48). Examination of frequencydistributions for total AP displacement and total I-Erotation and their corresponding histograms graphicallyshowed the distribution around the mean (Figures 3 and4).
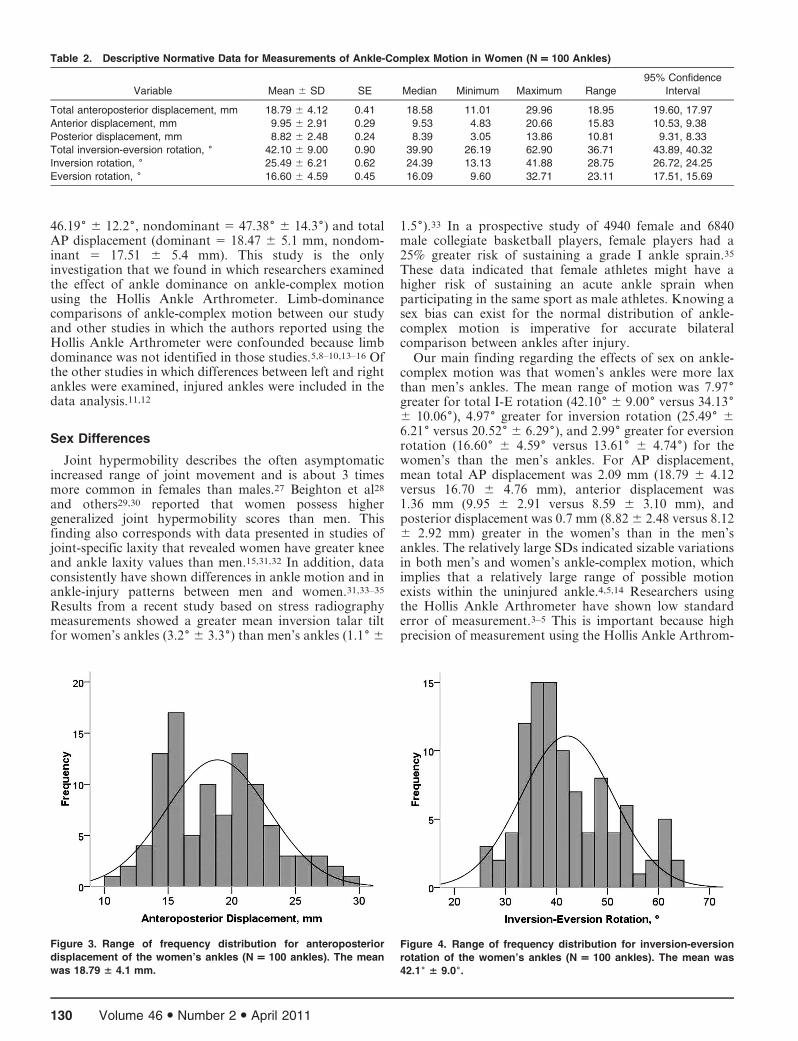
The women’s ankles had greater motion than the men’sankles for all variables except posterior displacement(women’s ankle motion 5 8.82 6 2.5 mm, men’s anklemotion 5 8.12 6 2.9 mm; t198 5 21.83, P 5 .07). Meantotal AP displacement of the women’s ankles was 18.79 64.1 mm and of the men’s ankles was 16.70 6 4.8 mm (t198
5 23.306, P , .01). Anterior displacement was 9.95 62.9 mm for the women’s ankles and 8.59 6 3.1 mm for the
128 Volume 46 N Number 2 N April 2011
men’s ankles (U 5 3708.5, P 5 .002). The mean total I-Erotation of the women’s ankles was 42.106 6 9.06 and ofthe men’s ankles was 34.136 6 10.16 (U 5 2807, P , .001).Inversion rotation was 25.496 6 6.26 for the women’sankles and 20.526 6 6.36 for the men’s ankles (U 5 2800.5,P , .001). Eversion rotation was 16.606 6 4.66 for thewomen’s ankles and 13.616 6 4.76 for the men’s ankles (U5 3117, P , .001).
DISCUSSION
Instrumented ankle arthrometry was introduced in 1999as an assessment tool to provide objective and quantifi-able assessment of ankle-complex motion.4 Other au-thors3,5,6,8–16 have reported the advantages of this proce-dure for detecting ankle ligamentous laxity after injury. Weperformed this study to characterize the normal magnitudeof physiologic ankle-complex motion in a population ofuninjured ankles measured with the Hollis Ankle Ar-thrometer.
Limb Dominance
From a clinical perspective, assessment of ankle-complexmotion should be made bilaterally and, when possible,against established normative data.19 This is especiallyimportant when testing an individual’s functional statusafter ligamentous and capsular injury. Thus, knowing ifankle-complex motion between ankles in the same individ-
ual differs is imperative for accurate diagnosis. To date,few investigators have quantified differences in theuninjured ankle complex for right and left or dominantand nondominant motion,4,20,21 primarily because areliable and repeatable method for quantifying ankle-complex motion has been unavailable.22–24 Our data are farmore comprehensive than the data that normally are usedto evaluate ankle-complex motion, except when researchersuse a device similar to the Hollis Ankle Arthrometer as anevaluation tool.
Examination of the effect sizes for the variablesquantifying ankle-complex motion confirmed that within-subjects differences between the dominant and nondomi-nant ankles were, on average, small and, therefore, notclinically important.18,25,26 These findings of symmetrywere consistent with previous reports of the mechanicallaxity characteristics of the ankle complex betweenlegs.4,20,21 Based on data obtained using 3-dimensionalkinematics, Stefanyshyn and Engsberg20 determined thatranges of motion for inversion, eversion, and total I-E werenot different between the right and left legs in participantswith no history of ankle injury. Siegler et al21 noted nodifferences for inversion, eversion, or total I-E rotationcomparisons of left and right ankles. They reported theaverage range of motion from paired-ankles data as 21.766 3.86 for eversion, 20.06 6 4.86 for inversion, and 42.06 64.26 for total I-E rotation. In uninjured ankles, Kovaleskiet al4 found no differences between dominant andnondominant ankles for total I-E rotation (dominant 5
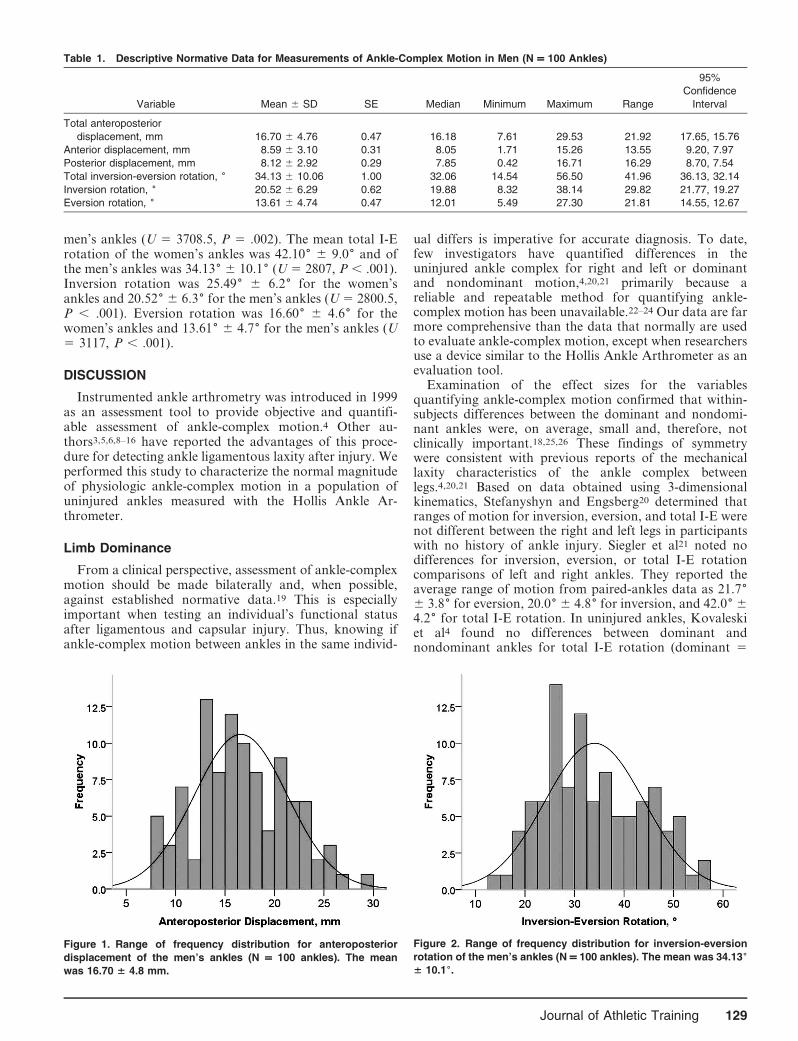
Table 1. Descriptive Normative Data for Measurements of Ankle-Complex Motion in Men (N = 100 Ankles)
Variable Mean 6 SD SE Median Minimum Maximum Range
95%
Confidence
Interval
Total anteroposterior
displacement, mm 16.70 6 4.76 0.47 16.18 7.61 29.53 21.92 17.65, 15.76
Anterior displacement, mm 8.59 6 3.10 0.31 8.05 1.71 15.26 13.55 9.20, 7.97
Posterior displacement, mm 8.12 6 2.92 0.29 7.85 0.42 16.71 16.29 8.70, 7.54
Total inversion-eversion rotation, 6 34.13 6 10.06 1.00 32.06 14.54 56.50 41.96 36.13, 32.14
Inversion rotation, 6 20.52 6 6.29 0.62 19.88 8.32 38.14 29.82 21.77, 19.27
Eversion rotation, 6 13.61 6 4.74 0.47 12.01 5.49 27.30 21.81 14.55, 12.67
Figure 1. Range of frequency distribution for anteroposterior
displacement of the men’s ankles (N = 100 ankles). The mean
was 16.70 6 4.8 mm.
Figure 2. Range of frequency distribution for inversion-eversion
rotation of the men’s ankles (N = 100 ankles). The mean was 34.136
6 10.16.
Journal of Athletic Training 129
46.196 6 12.26, nondominant 5 47.386 6 14.36) and totalAP displacement (dominant 5 18.47 6 5.1 mm, nondom-inant 5 17.51 6 5.4 mm). This study is the onlyinvestigation that we found in which researchers examinedthe effect of ankle dominance on ankle-complex motionusing the Hollis Ankle Arthrometer. Limb-dominancecomparisons of ankle-complex motion between our studyand other studies in which the authors reported using theHollis Ankle Arthrometer were confounded because limbdominance was not identified in those studies.5,8–10,13–16 Ofthe other studies in which differences between left and rightankles were examined, injured ankles were included in thedata analysis.11,12
Sex Differences
Joint hypermobility describes the often asymptomaticincreased range of joint movement and is about 3 timesmore common in females than males.27 Beighton et al28
and others29,30 reported that women possess highergeneralized joint hypermobility scores than men. Thisfinding also corresponds with data presented in studies ofjoint-specific laxity that revealed women have greater kneeand ankle laxity values than men.15,31,32 In addition, dataconsistently have shown differences in ankle motion and inankle-injury patterns between men and women.31,33–35
Results from a recent study based on stress radiographymeasurements showed a greater mean inversion talar tiltfor women’s ankles (3.26 6 3.36) than men’s ankles (1.16 6
1.56).33 In a prospective study of 4940 female and 6840male collegiate basketball players, female players had a25% greater risk of sustaining a grade I ankle sprain.35
These data indicated that female athletes might have ahigher risk of sustaining an acute ankle sprain whenparticipating in the same sport as male athletes. Knowing asex bias can exist for the normal distribution of ankle-complex motion is imperative for accurate bilateralcomparison between ankles after injury.
Our main finding regarding the effects of sex on ankle-complex motion was that women’s ankles were more laxthan men’s ankles. The mean range of motion was 7.976greater for total I-E rotation (42.106 6 9.006 versus 34.1366 10.066), 4.976 greater for inversion rotation (25.496 66.216 versus 20.526 6 6.296), and 2.996 greater for eversionrotation (16.606 6 4.596 versus 13.616 6 4.746) for thewomen’s than the men’s ankles. For AP displacement,mean total AP displacement was 2.09 mm (18.79 6 4.12versus 16.70 6 4.76 mm), anterior displacement was1.36 mm (9.95 6 2.91 versus 8.59 6 3.10 mm), andposterior displacement was 0.7 mm (8.82 6 2.48 versus 8.126 2.92 mm) greater in the women’s than in the men’sankles. The relatively large SDs indicated sizable variationsin both men’s and women’s ankle-complex motion, whichimplies that a relatively large range of possible motionexists within the uninjured ankle.4,5,14 Researchers usingthe Hollis Ankle Arthrometer have shown low standarderror of measurement.3–5 This is important because highprecision of measurement using the Hollis Ankle Arthrom-
Table 2. Descriptive Normative Data for Measurements of Ankle-Complex Motion in Women (N = 100 Ankles)
Variable Mean 6 SD SE Median Minimum Maximum Range
95% Confidence
Interval
Total anteroposterior displacement, mm 18.79 6 4.12 0.41 18.58 11.01 29.96 18.95 19.60, 17.97
Anterior displacement, mm 9.95 6 2.91 0.29 9.53 4.83 20.66 15.83 10.53, 9.38
Posterior displacement, mm 8.82 6 2.48 0.24 8.39 3.05 13.86 10.81 9.31, 8.33
Total inversion-eversion rotation, 6 42.10 6 9.00 0.90 39.90 26.19 62.90 36.71 43.89, 40.32
Inversion rotation, 6 25.49 6 6.21 0.62 24.39 13.13 41.88 28.75 26.72, 24.25
Eversion rotation, 6 16.60 6 4.59 0.45 16.09 9.60 32.71 23.11 17.51, 15.69
Figure 3. Range of frequency distribution for anteroposterior
displacement of the women’s ankles (N = 100 ankles). The mean
was 18.79 6 4.1 mm.
Figure 4. Range of frequency distribution for inversion-eversion
rotation of the women’s ankles (N = 100 ankles). The mean was
42.16 6 9.06.
130 Volume 46 N Number 2 N April 2011
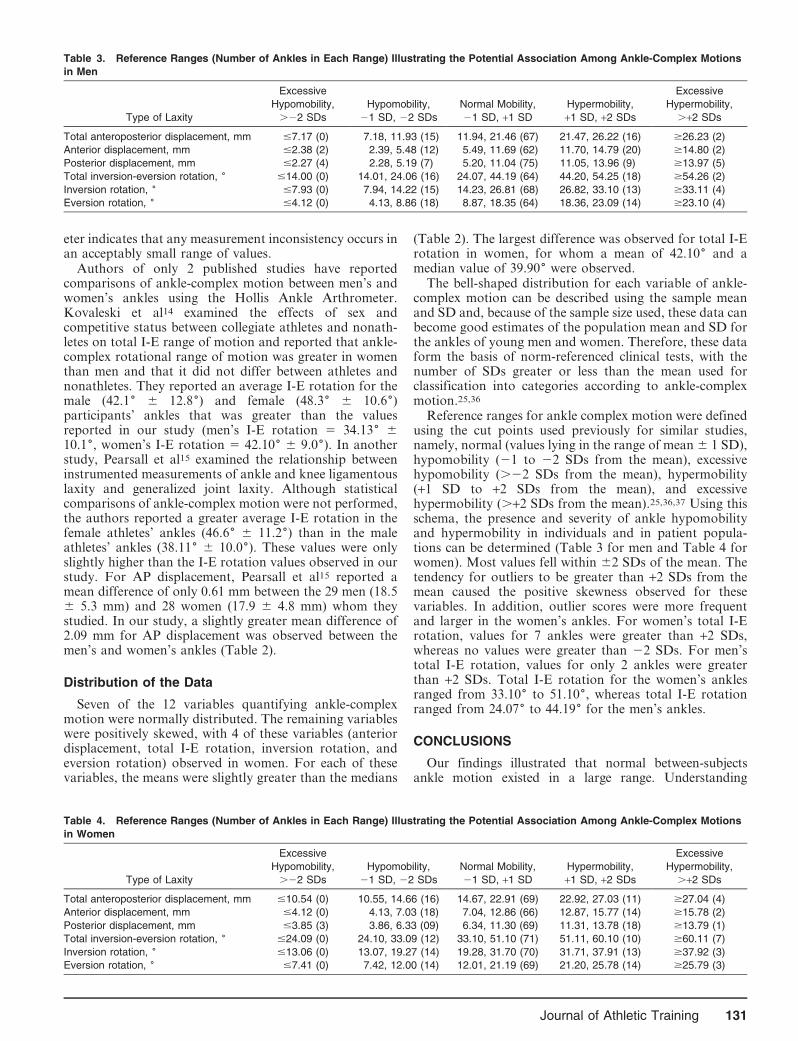
eter indicates that any measurement inconsistency occurs inan acceptably small range of values.
Authors of only 2 published studies have reportedcomparisons of ankle-complex motion between men’s andwomen’s ankles using the Hollis Ankle Arthrometer.Kovaleski et al14 examined the effects of sex andcompetitive status between collegiate athletes and nonath-letes on total I-E range of motion and reported that ankle-complex rotational range of motion was greater in womenthan men and that it did not differ between athletes andnonathletes. They reported an average I-E rotation for themale (42.16 6 12.86) and female (48.36 6 10.66)participants’ ankles that was greater than the valuesreported in our study (men’s I-E rotation 5 34.136 610.16, women’s I-E rotation 5 42.106 6 9.06). In anotherstudy, Pearsall et al15 examined the relationship betweeninstrumented measurements of ankle and knee ligamentouslaxity and generalized joint laxity. Although statisticalcomparisons of ankle-complex motion were not performed,the authors reported a greater average I-E rotation in thefemale athletes’ ankles (46.66 6 11.26) than in the maleathletes’ ankles (38.116 6 10.06). These values were onlyslightly higher than the I-E rotation values observed in ourstudy. For AP displacement, Pearsall et al15 reported amean difference of only 0.61 mm between the 29 men (18.56 5.3 mm) and 28 women (17.9 6 4.8 mm) whom theystudied. In our study, a slightly greater mean difference of2.09 mm for AP displacement was observed between themen’s and women’s ankles (Table 2).
Distribution of the Data
Seven of the 12 variables quantifying ankle-complexmotion were normally distributed. The remaining variableswere positively skewed, with 4 of these variables (anteriordisplacement, total I-E rotation, inversion rotation, andeversion rotation) observed in women. For each of thesevariables, the means were slightly greater than the medians
(Table 2). The largest difference was observed for total I-Erotation in women, for whom a mean of 42.106 and amedian value of 39.906 were observed.
The bell-shaped distribution for each variable of ankle-complex motion can be described using the sample meanand SD and, because of the sample size used, these data canbecome good estimates of the population mean and SD forthe ankles of young men and women. Therefore, these dataform the basis of norm-referenced clinical tests, with thenumber of SDs greater or less than the mean used forclassification into categories according to ankle-complexmotion.25,36
Reference ranges for ankle complex motion were definedusing the cut points used previously for similar studies,namely, normal (values lying in the range of mean 6 1 SD),hypomobility (21 to 22 SDs from the mean), excessivehypomobility (.22 SDs from the mean), hypermobility(+1 SD to +2 SDs from the mean), and excessivehypermobility (.+2 SDs from the mean).25,36,37 Using thisschema, the presence and severity of ankle hypomobilityand hypermobility in individuals and in patient popula-tions can be determined (Table 3 for men and Table 4 forwomen). Most values fell within 62 SDs of the mean. Thetendency for outliers to be greater than +2 SDs from themean caused the positive skewness observed for thesevariables. In addition, outlier scores were more frequentand larger in the women’s ankles. For women’s total I-Erotation, values for 7 ankles were greater than +2 SDs,whereas no values were greater than 22 SDs. For men’stotal I-E rotation, values for only 2 ankles were greaterthan +2 SDs. Total I-E rotation for the women’s anklesranged from 33.106 to 51.106, whereas total I-E rotationranged from 24.076 to 44.196 for the men’s ankles.
CONCLUSIONS
Our findings illustrated that normal between-subjectsankle motion existed in a large range. Understanding
Table 3. Reference Ranges (Number of Ankles in Each Range) Illustrating the Potential Association Among Ankle-Complex Motions
in Men
Type of Laxity
Excessive
Hypomobility,
.22 SDs
Hypomobility,
21 SD, 22 SDs
Normal Mobility,
21 SD, +1 SD
Hypermobility,
+1 SD, +2 SDs
Excessive
Hypermobility,
.+2 SDs
Total anteroposterior displacement, mm #7.17 (0) 7.18, 11.93 (15) 11.94, 21.46 (67) 21.47, 26.22 (16) $26.23 (2)
Anterior displacement, mm #2.38 (2) 2.39, 5.48 (12) 5.49, 11.69 (62) 11.70, 14.79 (20) $14.80 (2)
Posterior displacement, mm #2.27 (4) 2.28, 5.19 (7) 5.20, 11.04 (75) 11.05, 13.96 (9) $13.97 (5)
Total inversion-eversion rotation, 6 #14.00 (0) 14.01, 24.06 (16) 24.07, 44.19 (64) 44.20, 54.25 (18) $54.26 (2)
Inversion rotation, 6 #7.93 (0) 7.94, 14.22 (15) 14.23, 26.81 (68) 26.82, 33.10 (13) $33.11 (4)
Eversion rotation, 6 #4.12 (0) 4.13, 8.86 (18) 8.87, 18.35 (64) 18.36, 23.09 (14) $23.10 (4)
Table 4. Reference Ranges (Number of Ankles in Each Range) Illustrating the Potential Association Among Ankle-Complex Motions
in Women
Type of Laxity
Excessive
Hypomobility,
.22 SDs
Hypomobility,
21 SD, 22 SDs
Normal Mobility,
21 SD, +1 SD
Hypermobility,
+1 SD, +2 SDs
Excessive
Hypermobility,
.+2 SDs
Total anteroposterior displacement, mm #10.54 (0) 10.55, 14.66 (16) 14.67, 22.91 (69) 22.92, 27.03 (11) $27.04 (4)
Anterior displacement, mm #4.12 (0) 4.13, 7.03 (18) 7.04, 12.86 (66) 12.87, 15.77 (14) $15.78 (2)
Posterior displacement, mm #3.85 (3) 3.86, 6.33 (09) 6.34, 11.30 (69) 11.31, 13.78 (18) $13.79 (1)
Total inversion-eversion rotation, 6 #24.09 (0) 24.10, 33.09 (12) 33.10, 51.10 (71) 51.11, 60.10 (10) $60.11 (7)
Inversion rotation, 6 #13.06 (0) 13.07, 19.27 (14) 19.28, 31.70 (70) 31.71, 37.91 (13) $37.92 (3)
Eversion rotation, 6 #7.41 (0) 7.42, 12.00 (14) 12.01, 21.19 (69) 21.20, 25.78 (14) $25.79 (3)
Journal of Athletic Training 131
normalcy is important for determining excessive motion(laxity) after injury, the need for treatment interventions, andthe efficacy of treatment. Important distinctions in ankle-complex motion were noted by sex. Because ankle-complexmotion was, on average, greater in women than in men, therange of motion in the normal reference range, along withhypermobility and excessive hypermobility, needs to beconsidered and set at a higher reference value in women thanin men when clinicians contemplate intervention. In thefuture, researchers should focus on identifying differences inankle-complex motion among athletes and individuals ofdifferent ages. Researchers also should study whether ankle-complex motion greater or less than the normal referencerange affects incidence of ankle injury so that appropriateinjury-prevention initiatives can be developed.
REFERENCES
1. Siegler S, Lapointe S, Nobilini R, Berman AT. A six-degrees-of-
freedom instrumented linkage for measuring the flexibility charac-
teristics of the ankle joint complex. J Biomech. 1996;29(7):943–947.
2. Hollis JM, Blasier RD, Flahiff CM. Simulated lateral ankle
ligamentous injury: change in ankle stability. Am J Sports Med.
1995;23(6):672–677.
3. Kovaleski JE, Hollis J, Heitman RJ, Gurchiek LR, Pearsall AW 4th.
Assessment of ankle-subtalar-joint-complex laxity using an instru-
mented ankle arthrometer: an experimental cadaveric investigation.
J Athl Train. 2002;37(4):467–474.
4. Kovaleski JE, Gurchiek LR, Heitman RJ, Hollis JM, Pearsall AW
4th. Instrumented measurement of anteroposterior and inversion-
eversion laxity of the normal ankle joint complex. Foot Ankle Int.
1999;20(12):808–814.
5. Hubbard TJ, Kovaleski JE, Kaminski TW. Reliability of intratester
and intertester measurements derived from an instrumented ankle
arthrometer. J Sport Rehabil. 2003;12(3):208–220.
6. Heitman RJ, Kovaleski JE, Gilley WF, Gurchiek LR. Application of
generalizability theory in estimating the reliability of ankle laxity
measurements [abstract]. J Athl Train. 2006;41(suppl 2):S17.
7. Hollis JM, inventor. Ankle laxity measurement system. US patent
5,402,800. April 4, 1995.
8. Kovaleski JE, Norrell PM, Heitman RJ, Hollis JM, Pearsall AW.
Knee and ankle position, anterior drawer laxity, and stiffness of the
ankle complex. J Athl Train. 2008;43(3):242–248.
9. Hubbard TJ, Kaminski TW, Vander Griend RA, Kovaleski JE.
Quantitative assessment of mechanical laxity in the functionally
unstable ankle. Med Sci Sports Exerc. 2004;36(5):760–766.
10. Hubbard TJ, Kramer LC, Denegar CR, Hertel J. Correlations among
multiple measures of functional and mechanical instability in subjects
with chronic ankle instability. J Athl Train. 2007;42(3):361–366.
11. Hubbard TJ, Kramer LC, Denegar CR, Hertel J. Contributing factors
to chronic ankle instability. Foot Ankle Int. 2007;28(3):343–354.
12. Hubbard TJ. Ligament laxity following inversion injury with and
without chronic ankle instability. Foot Ankle Int. 2008;29(3):305–311.
13. McKeon PO, Paolini G, Ingersoll CD, et al. Effects of balance
training on gait parameters in patients with chronic ankle instability:
a randomized controlled trial. Clin Rehabil. 2009;23(7):609–621.
14. Kovaleski JE, Hollis MJ, Norrell PM, Vicory JR, Heitman RJ. Sex
and competitive status in ankle inversion-eversion range of motion of
college students. Percept Mot Skills. 2004;99(3, pt 2):1257–1262.
15. Pearsall AW, Kovaleski JE, Heitman RJ, Gurchiek LR, Hollis JM.
The relationships between instrumented measurements of ankle and
knee ligamentous laxity and generalized joint laxity. J Sports Med
Phys Fitness. 2006;46(1):104–110.
16. Wilkerson GB, Kovaleski JE, Meyer M, Stawiz C. Effects of the
subtalar sling ankle taping technique on combined talocrural-subtalar
joint motions. Foot Ankle Int. 2005;26(3):239–246.
17. Roos EM, Brandsson MD, Karlsson J. Validation of the Foot and
Ankle Outcome Score for ankle ligament reconstruction. Foot Ankle
Int. 2001;22(10):788–794.
18. Cohen J. Statistical Power Analysis for Behavioral Sciences. 2nd ed.
Hillsdale, NJ: Lawrence Erlbaum Assoc; 1988:145–178.
19. Starkey C, Brown SD, Ryan JL. Examination of Orthopedic and
Athletic Injuries. 3rd ed. Philadelphia, PA: FA Davis Co; 2010.
20. Stefanyshyn D, Engsberg JR. Right to left differences in the ankle
joint complex range of motion. Med Sci Sports Exerc.
1994;26(5):551–555.
21. Siegler S, Wang D, Plasha E, Berman AT. Technique for in vivo
measurement of the three-dimensional kinematics and laxity charac-
teristics of the ankle joint complex. J Orthop Res. 1994;12(3):421–431.
22. Frost SC, Amendola A. Is stress radiography necessary in the
diagnosis of acute or chronic ankle instability? Clin J Sport Med.
1999;9(1):40–45.
23. Fujii T, Luo ZP, Kitaoka HB, An KN. The manual stress test may
not be sufficient to differentiate ankle ligament injuries. Clin Biomech
(Bristol, Avon). 2000;15(8):619–623.
24. Martin DE, Kaplan PA, Kahler DM, Dussault R, Randolph BJ.
Retrospective evaluation of graded stress examination of the ankle.
Clin Orthop Relat Res. 1996;328:165–170.
25. Moseley AM, Crosbie J, Adams R. Normative data for passive ankle
plantarflexion-dorsiflexion flexibility. Clin Biomech (Bristol, Avon).
2001;16(6):514–521.
26. Welkowitz J, Ewen RB, Cohen J. Introductory Statistics for the
Behavioral Sciences. 5th ed. Orlando, FL: Harcourt Brace College
Publishers; 2000.
27. Hakim A, Grahame R. Joint hypermobility. Best Pract Res Clin
Rheumatol. 2003;17(6):989–1004.
28. Beighton P, Solomon L, Soskolne C. Articular mobility in an African
population. Ann Rheum Dis. 1973;32(5):413–418.
29. Remvig L, Jensen DV, Ward RC. Epidemiology of general joint
hypermobility and basis for the proposed criteria for benign joint
hypermobility syndrome: review of the literature. J Rheumatol.
2007;34(4):804–809.
30. Jansson A, Saartok T, Werner S, Renstrom P. General joint laxity in
1845 Swedish school children of different ages: age- and gender-
specific distributions. Acta Paediatr. 2004;93(9):1202–1206.
31. Beynnon BD, Bernstein IM, Belisle A, et al. The effect of estradiol
and progesterone on knee and ankle joint laxity. Am J Sports Med.
2005;33(9):1298–1304.
32. Rozzi SL, Lephart SM, Gear WS, Fu FH. Knee joint laxity and
neuromuscular characteristics of male and female soccer and
basketball players. Am J Sports Med. 1999;27(3):312–319.
33. Wilkerson RD, Mason MA. Differences in men’s and women’s mean
ankle ligamentous laxity. Iowa Orthop J. 2000;20:46–48.
34. Hootman JM, Dick R, Agel J. Epidemiology of collegiate injuries for
15 sports: summary and recommendations for injury prevention
initiatives. J Athl Train. 2007;42(2):311–319.
35. Hosea TM, Carey CC, Harrer MF. The gender issue: epidemiology of
ankle injuries in athletes who participate in basketball. Clin Orthop
Relat Res. 2000;372:45–49.
36. Redmond AC, Crane YZ, Menz HB. Normative values for the Foot
Posture Index. J Foot Ankle Res. 2008;1(1):6.
37. Ekstrand J, Gillquist J. The frequency of muscle tightness and injuries
in soccer players. Am J Sports Med. 1982;10(2):75–78.
Address correspondence to Neil A. Schwarz, MS, Department of Health, Human Performance, and Recreation, Baylor University, OneBear Place #97313, Waco, TX 76798-7313. Address e-mail to [email protected].
132 Volume 46 N Number 2 N April 2011
Chronic Ankle Instability: Evolution of the Model
Claire E. Hiller, PhD; Sharon L. Kilbreath, PhD; Kathryn M. Refshauge, PhD
Faculty of Health Sciences, University of Sydney, New South Wales, Australia
Context: The Hertel model of chronic ankle instability (CAI)is commonly used in research but may not be sufficientlycomprehensive. Mechanical instability and functional instabilityare considered part of a continuum, and recurrent sprain occurswhen both conditions are present. A modification of the Hertelmodel is proposed whereby these 3 components can existindependently or in combination.
Objective: To examine the fit of data from people with CAI to2 CAI models and to explore whether the different subgroupsdisplay impairments when compared with a control group.
Design: Cross-sectional study.Patients or Other Participants: Community-dwelling adults
and adolescent dancers were recruited: 137 ankles with anklesprain for objective 1 and 81 with CAI and 43 controls forobjective 2.
Intervention(s): Two balance tasks and time to recover froman inversion perturbation were assessed to determine if thesubgroups demonstrated impairments when compared with acontrol group (objective 2).
Main Outcome Measure(s): For objective 1 (fit to the 2models), outcomes were Cumberland Ankle Instability Toolscore, anterior drawer test results, and number of sprains. For
objective 2, outcomes were 2 balance tasks (number of foot liftsin 30 seconds, ability to balance on the ball of the foot) and timeto recover from an inversion perturbation. The Cohen d wascalculated to compare each subgroup with the control group.
Results: A total of 56.5% of ankles (n 5 61) fit the Hertelmodel, whereas all ankles (n 5 108) fit the proposed model. Inthe proposed model, 42.6% of ankles were classified asperceived instability, 30.5% as recurrent sprain and perceivedinstability, and 26.9% as among the remaining groups. All CAIsubgroups performed more poorly on the balance and inversion-perturbation tasks than the control group. Subgroups withperceived instability had greater impairment in single-legstance, whereas participants with recurrent sprain performedmore poorly than the other subgroups when balancing on theball of the foot. Only individuals with hypomobility appearedunimpaired when recovering from an inversion perturbation.
Conclusions: The new model of CAI is supported by theavailable data. Perceived instability alone and in combinationcharacterized the majority of participants. Several impairmentsdistinguished the sprain groups from the control group.
Key Words: ankle injuries, joint instability, postural balance,recurrent ankle sprains
Key Points
N The proposed new model of chronic ankle instability is supported by data from previous studies and the current study.More subgroups are identified than in previous models, with perceived instability as a common link.
N On balance tests, all groups with chronic ankle instability performed more poorly than control groups.N The model will allow the development of specific injury-rehabilitation and injury-prevention programs for subgroups of
chronic ankle instability.
Ankle sprains are very common not only in thesporting population1 but also in the generalcommunity.2 Although the acute symptoms of
ankle sprain resolve quickly, many people report persistingproblems, such as pain and instability.3 Chronic ankleinstability (CAI) is one of the most common of theseresidual problems3 and has been defined as ‘‘repetitivebouts of lateral ankle instability resulting in numerousankle sprains.’’4 Despite the high prevalence of CAI, itremains a phenomenon that is poorly understood byresearchers and clinicians alike. This has resulted ininconsistencies in terminology, definitions, and in hypoth-eses about impairments,4 relationships among the impair-ments,5 and the relative contributions of the impairmentsto activity limitations and participation restrictions.
The World Health Organization has classified the effectsof disease in terms of impairments, which refer to problemsin body structure or function; activity limitations, whichrefer to difficulties in execution of activities; and partici-pation restrictions, which refer to changes in life situations,often involving a physical component (International
Classification of Functioning, Disability, and Health).6
Impairments associated with CAI include increased liga-mentous laxity and proprioceptive deficits. Activity limi-tations affect the execution of activities such as walking orjumping.7 Participation restrictions as a consequence ofCAI can include cessation of sport or occupationalinvolvement.
Inconsistencies in CAI research may be explained, inpart, by the common assumption that CAI is ahomogeneous condition. That is, it is often assumed thatall cases of CAI arise from the same injury and developthe same impairments, leading to a consistent relationshipbetween impairments and activity limitations. This as-sumption likely explains the conflicting results frominvestigations of CAI. If CAI is a heterogeneous conditionthat includes several homogeneous subgroups, conflictingreports of impairments, activity limitations, and partici-pation restrictions may reflect researchers’ recruitment ofeither an idiosyncratically determined subgroup or aheterogeneous population, thereby ‘‘washing out’’ signif-icant findings.
Journal of Athletic Training 2011;46(2):133–141g by the National Athletic Trainers’ Association, Incwww.nata.org/jat
original research
Journal of Athletic Training 133
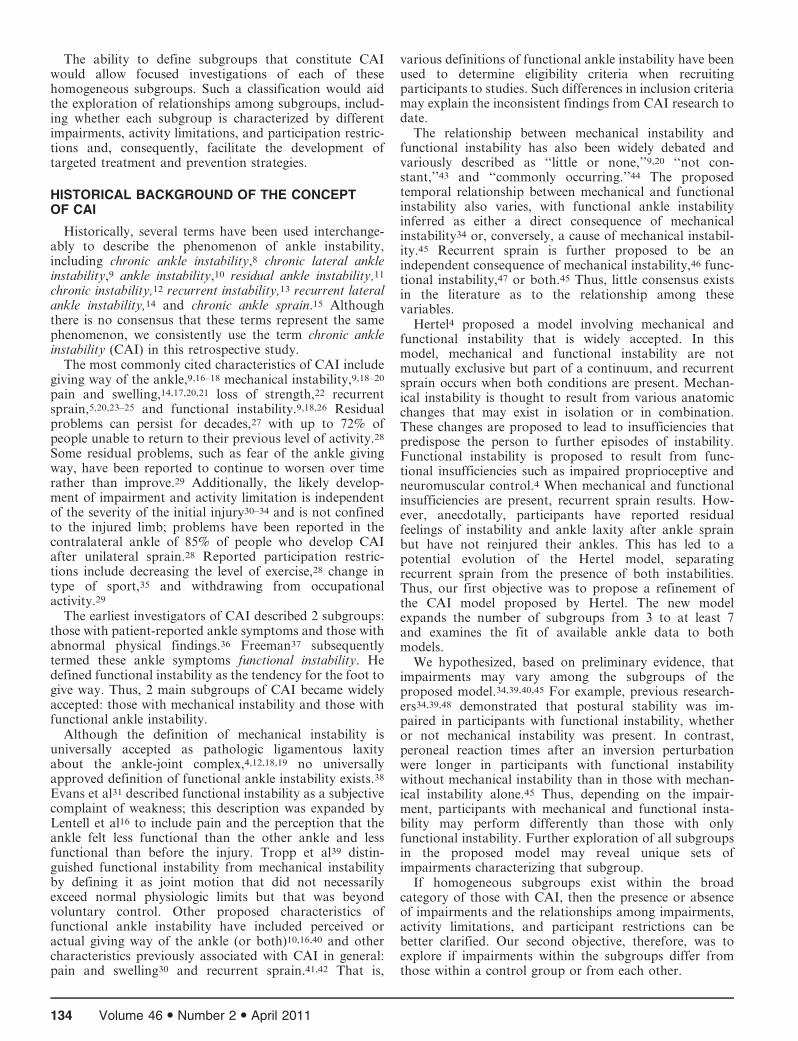
The ability to define subgroups that constitute CAIwould allow focused investigations of each of thesehomogeneous subgroups. Such a classification would aidthe exploration of relationships among subgroups, includ-ing whether each subgroup is characterized by differentimpairments, activity limitations, and participation restric-tions and, consequently, facilitate the development oftargeted treatment and prevention strategies.
HISTORICAL BACKGROUND OF THE CONCEPTOF CAI
Historically, several terms have been used interchange-ably to describe the phenomenon of ankle instability,including chronic ankle instability,8 chronic lateral ankleinstability,9 ankle instability,10 residual ankle instability,11
chronic instability,12 recurrent instability,13 recurrent lateralankle instability,14 and chronic ankle sprain.15 Althoughthere is no consensus that these terms represent the samephenomenon, we consistently use the term chronic ankleinstability (CAI) in this retrospective study.
The most commonly cited characteristics of CAI includegiving way of the ankle,9,16–18 mechanical instability,9,18–20
pain and swelling,14,17,20,21 loss of strength,22 recurrentsprain,5,20,23–25 and functional instability.9,18,26 Residualproblems can persist for decades,27 with up to 72% ofpeople unable to return to their previous level of activity.28
Some residual problems, such as fear of the ankle givingway, have been reported to continue to worsen over timerather than improve.29 Additionally, the likely develop-ment of impairment and activity limitation is independentof the severity of the initial injury30–34 and is not confinedto the injured limb; problems have been reported in thecontralateral ankle of 85% of people who develop CAIafter unilateral sprain.28 Reported participation restric-tions include decreasing the level of exercise,28 change intype of sport,35 and withdrawing from occupationalactivity.29
The earliest investigators of CAI described 2 subgroups:those with patient-reported ankle symptoms and those withabnormal physical findings.36 Freeman37 subsequentlytermed these ankle symptoms functional instability. Hedefined functional instability as the tendency for the foot togive way. Thus, 2 main subgroups of CAI became widelyaccepted: those with mechanical instability and those withfunctional ankle instability.
Although the definition of mechanical instability isuniversally accepted as pathologic ligamentous laxityabout the ankle-joint complex,4,12,18,19 no universallyapproved definition of functional ankle instability exists.38
Evans et al31 described functional instability as a subjectivecomplaint of weakness; this description was expanded byLentell et al16 to include pain and the perception that theankle felt less functional than the other ankle and lessfunctional than before the injury. Tropp et al39 distin-guished functional instability from mechanical instabilityby defining it as joint motion that did not necessarilyexceed normal physiologic limits but that was beyondvoluntary control. Other proposed characteristics offunctional ankle instability have included perceived oractual giving way of the ankle (or both)10,16,40 and othercharacteristics previously associated with CAI in general:pain and swelling30 and recurrent sprain.41,42 That is,
various definitions of functional ankle instability have beenused to determine eligibility criteria when recruitingparticipants to studies. Such differences in inclusion criteriamay explain the inconsistent findings from CAI research todate.
The relationship between mechanical instability andfunctional instability has also been widely debated andvariously described as ‘‘little or none,’’9,20 ‘‘not con-stant,’’43 and ‘‘commonly occurring.’’44 The proposedtemporal relationship between mechanical and functionalinstability also varies, with functional ankle instabilityinferred as either a direct consequence of mechanicalinstability34 or, conversely, a cause of mechanical instabil-ity.45 Recurrent sprain is further proposed to be anindependent consequence of mechanical instability,46 func-tional instability,47 or both.45 Thus, little consensus existsin the literature as to the relationship among thesevariables.
Hertel4 proposed a model involving mechanical andfunctional instability that is widely accepted. In thismodel, mechanical and functional instability are notmutually exclusive but part of a continuum, and recurrentsprain occurs when both conditions are present. Mechan-ical instability is thought to result from various anatomicchanges that may exist in isolation or in combination.These changes are proposed to lead to insufficiencies thatpredispose the person to further episodes of instability.Functional instability is proposed to result from func-tional insufficiencies such as impaired proprioceptive andneuromuscular control.4 When mechanical and functionalinsufficiencies are present, recurrent sprain results. How-ever, anecdotally, participants have reported residualfeelings of instability and ankle laxity after ankle sprainbut have not reinjured their ankles. This has led to apotential evolution of the Hertel model, separatingrecurrent sprain from the presence of both instabilities.Thus, our first objective was to propose a refinement ofthe CAI model proposed by Hertel. The new modelexpands the number of subgroups from 3 to at least 7and examines the fit of available ankle data to bothmodels.
We hypothesized, based on preliminary evidence, thatimpairments may vary among the subgroups of theproposed model.34,39,40,45 For example, previous research-ers34,39,48 demonstrated that postural stability was im-paired in participants with functional instability, whetheror not mechanical instability was present. In contrast,peroneal reaction times after an inversion perturbationwere longer in participants with functional instabilitywithout mechanical instability than in those with mechan-ical instability alone.45 Thus, depending on the impair-ment, participants with mechanical and functional insta-bility may perform differently than those with onlyfunctional instability. Further exploration of all subgroupsin the proposed model may reveal unique sets ofimpairments characterizing that subgroup.
If homogeneous subgroups exist within the broadcategory of those with CAI, then the presence or absenceof impairments and the relationships among impairments,activity limitations, and participant restrictions can bebetter clarified. Our second objective, therefore, was toexplore if impairments within the subgroups differ fromthose within a control group or from each other.
134 Volume 46 N Number 2 N April 2011
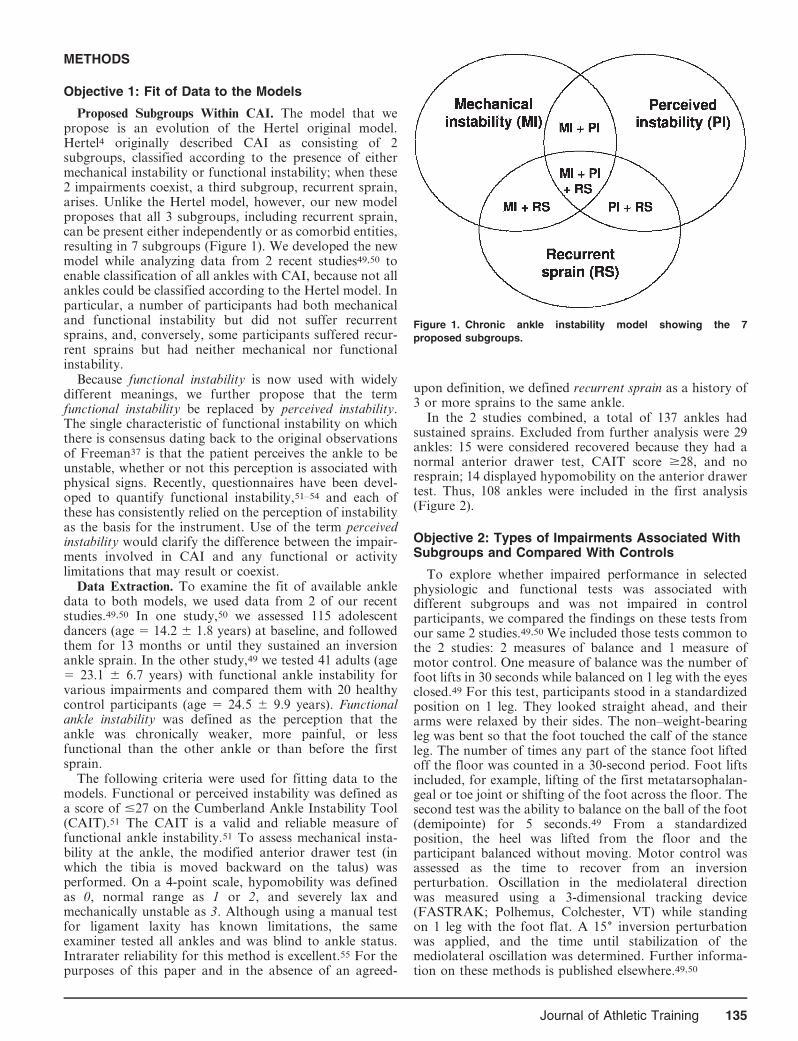
METHODS
Objective 1: Fit of Data to the Models
Proposed Subgroups Within CAI. The model that wepropose is an evolution of the Hertel original model.Hertel4 originally described CAI as consisting of 2subgroups, classified according to the presence of eithermechanical instability or functional instability; when these2 impairments coexist, a third subgroup, recurrent sprain,arises. Unlike the Hertel model, however, our new modelproposes that all 3 subgroups, including recurrent sprain,can be present either independently or as comorbid entities,resulting in 7 subgroups (Figure 1). We developed the newmodel while analyzing data from 2 recent studies49,50 toenable classification of all ankles with CAI, because not allankles could be classified according to the Hertel model. Inparticular, a number of participants had both mechanicaland functional instability but did not suffer recurrentsprains, and, conversely, some participants suffered recur-rent sprains but had neither mechanical nor functionalinstability.
Because functional instability is now used with widelydifferent meanings, we further propose that the termfunctional instability be replaced by perceived instability.The single characteristic of functional instability on whichthere is consensus dating back to the original observationsof Freeman37 is that the patient perceives the ankle to beunstable, whether or not this perception is associated withphysical signs. Recently, questionnaires have been devel-oped to quantify functional instability,51–54 and each ofthese has consistently relied on the perception of instabilityas the basis for the instrument. Use of the term perceivedinstability would clarify the difference between the impair-ments involved in CAI and any functional or activitylimitations that may result or coexist.
Data Extraction. To examine the fit of available ankledata to both models, we used data from 2 of our recentstudies.49,50 In one study,50 we assessed 115 adolescentdancers (age 5 14.2 6 1.8 years) at baseline, and followedthem for 13 months or until they sustained an inversionankle sprain. In the other study,49 we tested 41 adults (age5 23.1 6 6.7 years) with functional ankle instability forvarious impairments and compared them with 20 healthycontrol participants (age 5 24.5 6 9.9 years). Functionalankle instability was defined as the perception that theankle was chronically weaker, more painful, or lessfunctional than the other ankle or than before the firstsprain.
The following criteria were used for fitting data to themodels. Functional or perceived instability was defined asa score of #27 on the Cumberland Ankle Instability Tool(CAIT).51 The CAIT is a valid and reliable measure offunctional ankle instability.51 To assess mechanical insta-bility at the ankle, the modified anterior drawer test (inwhich the tibia is moved backward on the talus) wasperformed. On a 4-point scale, hypomobility was definedas 0, normal range as 1 or 2, and severely lax andmechanically unstable as 3. Although using a manual testfor ligament laxity has known limitations, the sameexaminer tested all ankles and was blind to ankle status.Intrarater reliability for this method is excellent.55 For thepurposes of this paper and in the absence of an agreed-
upon definition, we defined recurrent sprain as a history of3 or more sprains to the same ankle.
In the 2 studies combined, a total of 137 ankles hadsustained sprains. Excluded from further analysis were 29ankles: 15 were considered recovered because they had anormal anterior drawer test, CAIT score $28, and noresprain; 14 displayed hypomobility on the anterior drawertest. Thus, 108 ankles were included in the first analysis(Figure 2).
Objective 2: Types of Impairments Associated WithSubgroups and Compared With Controls
To explore whether impaired performance in selectedphysiologic and functional tests was associated withdifferent subgroups and was not impaired in controlparticipants, we compared the findings on these tests fromour same 2 studies.49,50 We included those tests common tothe 2 studies: 2 measures of balance and 1 measure ofmotor control. One measure of balance was the number offoot lifts in 30 seconds while balanced on 1 leg with the eyesclosed.49 For this test, participants stood in a standardizedposition on 1 leg. They looked straight ahead, and theirarms were relaxed by their sides. The non–weight-bearingleg was bent so that the foot touched the calf of the stanceleg. The number of times any part of the stance foot liftedoff the floor was counted in a 30-second period. Foot liftsincluded, for example, lifting of the first metatarsophalan-geal or toe joint or shifting of the foot across the floor. Thesecond test was the ability to balance on the ball of the foot(demipointe) for 5 seconds.49 From a standardizedposition, the heel was lifted from the floor and theparticipant balanced without moving. Motor control wasassessed as the time to recover from an inversionperturbation. Oscillation in the mediolateral directionwas measured using a 3-dimensional tracking device(FASTRAK; Polhemus, Colchester, VT) while standingon 1 leg with the foot flat. A 156 inversion perturbationwas applied, and the time until stabilization of themediolateral oscillation was determined. Further informa-tion on these methods is published elsewhere.49,50
Figure 1. Chronic ankle instability model showing the 7
proposed subgroups.
Journal of Athletic Training 135
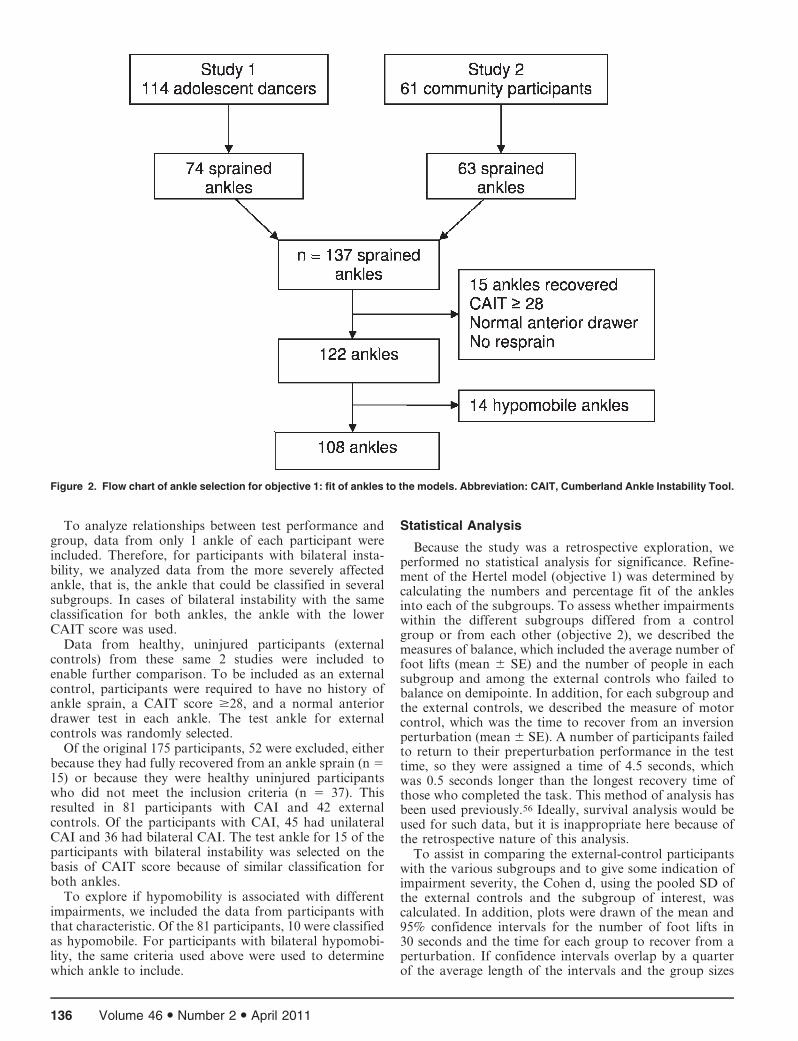
To analyze relationships between test performance andgroup, data from only 1 ankle of each participant wereincluded. Therefore, for participants with bilateral insta-bility, we analyzed data from the more severely affectedankle, that is, the ankle that could be classified in severalsubgroups. In cases of bilateral instability with the sameclassification for both ankles, the ankle with the lowerCAIT score was used.
Data from healthy, uninjured participants (externalcontrols) from these same 2 studies were included toenable further comparison. To be included as an externalcontrol, participants were required to have no history ofankle sprain, a CAIT score $28, and a normal anteriordrawer test in each ankle. The test ankle for externalcontrols was randomly selected.
Of the original 175 participants, 52 were excluded, eitherbecause they had fully recovered from an ankle sprain (n 515) or because they were healthy uninjured participantswho did not meet the inclusion criteria (n 5 37). Thisresulted in 81 participants with CAI and 42 externalcontrols. Of the participants with CAI, 45 had unilateralCAI and 36 had bilateral CAI. The test ankle for 15 of theparticipants with bilateral instability was selected on thebasis of CAIT score because of similar classification forboth ankles.
To explore if hypomobility is associated with differentimpairments, we included the data from participants withthat characteristic. Of the 81 participants, 10 were classifiedas hypomobile. For participants with bilateral hypomobi-lity, the same criteria used above were used to determinewhich ankle to include.
Statistical Analysis
Because the study was a retrospective exploration, weperformed no statistical analysis for significance. Refine-ment of the Hertel model (objective 1) was determined bycalculating the numbers and percentage fit of the anklesinto each of the subgroups. To assess whether impairmentswithin the different subgroups differed from a controlgroup or from each other (objective 2), we described themeasures of balance, which included the average number offoot lifts (mean 6 SE) and the number of people in eachsubgroup and among the external controls who failed tobalance on demipointe. In addition, for each subgroup andthe external controls, we described the measure of motorcontrol, which was the time to recover from an inversionperturbation (mean 6 SE). A number of participants failedto return to their preperturbation performance in the testtime, so they were assigned a time of 4.5 seconds, whichwas 0.5 seconds longer than the longest recovery time ofthose who completed the task. This method of analysis hasbeen used previously.56 Ideally, survival analysis would beused for such data, but it is inappropriate here because ofthe retrospective nature of this analysis.
To assist in comparing the external-control participantswith the various subgroups and to give some indication ofimpairment severity, the Cohen d, using the pooled SD ofthe external controls and the subgroup of interest, wascalculated. In addition, plots were drawn of the mean and95% confidence intervals for the number of foot lifts in30 seconds and the time for each group to recover from aperturbation. If confidence intervals overlap by a quarterof the average length of the intervals and the group sizes
Figure 2. Flow chart of ankle selection for objective 1: fit of ankles to the models. Abbreviation: CAIT, Cumberland Ankle Instability Tool.
136 Volume 46 N Number 2 N April 2011

are greater than 10, then this is an indication that the Pvalue would be close to .05.57
RESULTS
Objective 1: Fit of Data to the Models
In the first analysis (n 5 108 ankles), 61 ankles (56.5%)fit the Hertel model and 47 ankles did not (Figure 3). Datafrom all 108 ankles fit the new proposed model with highfidelity for each subgroup. The percentage fit for theproposed subgroups was perceived instability, 42.6%;perceived instability and recurrent sprain, 30.5%; perceivedand mechanical instability and recurrent sprain, 11.1%;mechanical and perceived instability, 9.3%; mechanicalinstability, 2.8%; recurrent sprain, 2.8%; and mechanicalinstability and recurrent sprain, 0.9%.
Objective 2: Level of Impairments Within DifferentSubgroups Compared With Control Group
The second analysis of 81 participants suggested that allsubgroups were impaired on at least 1 measure comparedwith external controls: that is, they experienced more
failures in the demipointe perturbation test, had more footlifts in the single-leg–stance test, and took longer to recoverfrom a perturbation (Table; Figures 4 and 5). However,impairment severity varied. We could not further explore 3subgroups (mechanical instability, recurrent sprain, andmechanical instability plus recurrent sprain) because eachcell contained too few participants.
Performance in the foot-lifts test of balance wasimpaired in all subgroups compared with external controls,although the hypomobility group appeared to be lessimpaired. In contrast, performance in the balancing-on-demipointe test indicated that participants with recurrentsprain in combination with mechanical or perceivedinstability (or both) performed more poorly than partici-pants with perceived instability with or without mechanicalinstability and the hypomobility group. The level ofimpaired performance was similar for the test of recoveryfrom a perturbation among the tested subgroups except forthe hypomobility group, which appeared to be unimpairedcompared with the external controls.
DISCUSSION
Fit of the New Model
The good data fit from our 2 recent studies to the newmodel gives preliminary support to the proposed 7subgroups of CAI. The original concept of subgroupsbased on mechanical instability, perceived instability, andrecurrent sprain remains the same, but we propose thateach of these, including those with recurrent sprain, canexist independently or in combination. The data fitdemonstrated that it is possible to have mechanicalinstability and perceived instability without experiencingrecurrent sprain. Previously, this would not have beenexpected. It should be noted, however, that the numericvalues within each cell should not be taken as an indicationof the expected prevalence of the different subgroups; theymerely indicate that all data from the presented studies fitthe model and that subgroups appear to exist. The numericvalues noted here reflect the recruitment criteria for the 2studies. Prevalence of each subgroup should therefore betested in future research.
Exploring possible associations of different subgroupswith different impairments indicates some potential trends.For example, all groups with perceived instability hadgreater impairment on the foot-lifts test of balance than thehypomobility group. The presence of recurrent sprainappeared to make it more likely that a person could notbalance on demipointe when compared with subgroupswithout recurrent sprain. Finally, perceived instabilityalone or in combination appeared to be associated with alonger time to recover from an inversion perturbation thanwas demonstrated by either external controls or partici-pants with ankle hypomobility.
Perceived instability appears to lead to the same degreeof impairment as recurrent sprain in some tests, whereasthe presence of hypomobility may modulate some effects.Chronic ankle instability has often been defined as thepresence of recurrent sprain,4 with or without perceivedinstability.54,58,59 However, 52% of participants in thecurrent study had perceived instability without recurrentsprain. It may be that the feeling of instability is the most
Figure 3. Fit of the ankle data to the Hertel4 model (A) and the new
model (B). A total of 47 ankles did not fit the Hertel model.
Journal of Athletic Training 137
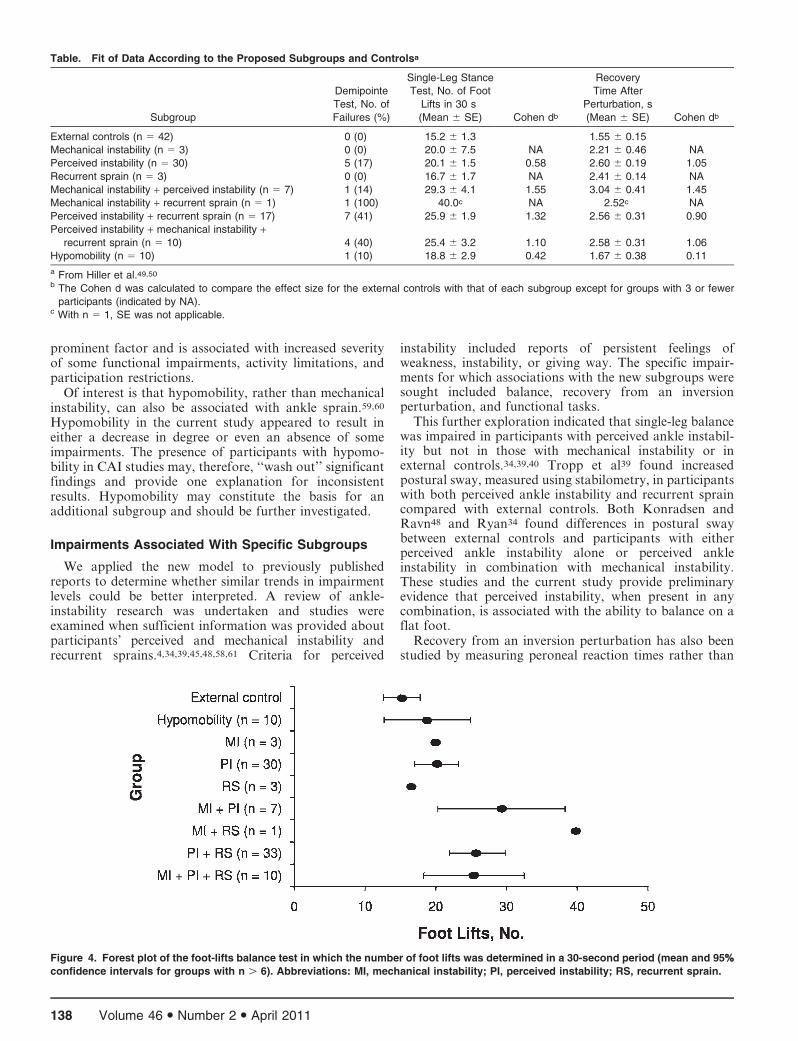
prominent factor and is associated with increased severityof some functional impairments, activity limitations, andparticipation restrictions.
Of interest is that hypomobility, rather than mechanicalinstability, can also be associated with ankle sprain.59,60
Hypomobility in the current study appeared to result ineither a decrease in degree or even an absence of someimpairments. The presence of participants with hypomo-bility in CAI studies may, therefore, ‘‘wash out’’ significantfindings and provide one explanation for inconsistentresults. Hypomobility may constitute the basis for anadditional subgroup and should be further investigated.
Impairments Associated With Specific Subgroups
We applied the new model to previously publishedreports to determine whether similar trends in impairmentlevels could be better interpreted. A review of ankle-instability research was undertaken and studies wereexamined when sufficient information was provided aboutparticipants’ perceived and mechanical instability andrecurrent sprains.4,34,39,45,48,58,61 Criteria for perceived
instability included reports of persistent feelings ofweakness, instability, or giving way. The specific impair-ments for which associations with the new subgroups weresought included balance, recovery from an inversionperturbation, and functional tasks.
This further exploration indicated that single-leg balancewas impaired in participants with perceived ankle instabil-ity but not in those with mechanical instability or inexternal controls.34,39,40 Tropp et al39 found increasedpostural sway, measured using stabilometry, in participantswith both perceived ankle instability and recurrent spraincompared with external controls. Both Konradsen andRavn48 and Ryan34 found differences in postural swaybetween external controls and participants with eitherperceived ankle instability alone or perceived ankleinstability in combination with mechanical instability.These studies and the current study provide preliminaryevidence that perceived instability, when present in anycombination, is associated with the ability to balance on aflat foot.
Recovery from an inversion perturbation has also beenstudied by measuring peroneal reaction times rather than
Table. Fit of Data According to the Proposed Subgroups and Controlsa
Subgroup
Demipointe
Test, No. of
Failures (%)
Single-Leg Stance
Test, No. of Foot
Lifts in 30 s
(Mean 6 SE) Cohen db
Recovery
Time After
Perturbation, s
(Mean 6 SE) Cohen db
External controls (n 5 42) 0 (0) 15.2 6 1.3 1.55 6 0.15
Mechanical instability (n 5 3) 0 (0) 20.0 6 7.5 NA 2.21 6 0.46 NA
Perceived instability (n 5 30) 5 (17) 20.1 6 1.5 0.58 2.60 6 0.19 1.05
Recurrent sprain (n 5 3) 0 (0) 16.7 6 1.7 NA 2.41 6 0.14 NA
Mechanical instability + perceived instability (n 5 7) 1 (14) 29.3 6 4.1 1.55 3.04 6 0.41 1.45
Mechanical instability + recurrent sprain (n 5 1) 1 (100) 40.0c NA 2.52c NA
Perceived instability + recurrent sprain (n 5 17) 7 (41) 25.9 6 1.9 1.32 2.56 6 0.31 0.90
Perceived instability + mechanical instability +recurrent sprain (n 5 10) 4 (40) 25.4 6 3.2 1.10 2.58 6 0.31 1.06
Hypomobility (n 5 10) 1 (10) 18.8 6 2.9 0.42 1.67 6 0.38 0.11
a From Hiller et al.49,50
b The Cohen d was calculated to compare the effect size for the external controls with that of each subgroup except for groups with 3 or fewer
participants (indicated by NA).c With n 5 1, SE was not applicable.
Figure 4. Forest plot of the foot-lifts balance test in which the number of foot lifts was determined in a 30-second period (mean and 95%%
confidence intervals for groups with n . 6). Abbreviations: MI, mechanical instability; PI, perceived instability; RS, recurrent sprain.
138 Volume 46 N Number 2 N April 2011

the protocol we used. Peroneal latency times were similarfor external controls and participants with either mechan-ical instability alone61 or mechanical instability combinedwith recurrent sprain.45 In contrast, latency times werelonger for participants with perceived ankle instabilitycombined with either recurrent sprain or mechanicalinstability than for external controls.40,45,48 Again, theperceived instability appears to mediate the impairment.
In contrast, in an investigation58 of ankle motion duringfunctional tasks, patterns of motion were altered inparticipants with mechanical instability combined withperceived instability but not in either those with perceivedinstability alone or those who had recovered. In this study,mechanical instability appeared to be a mediating factor.Repeated episodes of giving way or recurrent sprain wereinclusion criteria, so it would have been illuminating todivide both the mechanical and functional instabilitygroups into those with and without recurrent sprain.
Taken together, these findings provide preliminaryevidence for different associations or levels of impairmentwith different subgroups. However, although the newmodel provides preliminary evidence for the proposedsubgroups within CAI, it does not resolve all issues. Asingle test of mechanical instability may not comprehen-sively detect pathologic laxity of all ankle ligaments. Forexample, Hubbard et al62 found no correlation amongvarious tests of mechanical instability in participants withCAI. The tests investigated were fibular position usingfluoroscopy, instrumented ankle laxity in 3 directions, andtalar hypomobility. Yet in a related study, anterior andinversion laxity were the factors most predictive of CAIgroup membership,5 and, therefore, we suggest that at leastthese 2 directions be considered when assessing mechanicalinstability.
The definition of recurrent sprain also varies widelyacross studies. A review of the literature shows thatdefinitions of recurrent sprain range from 2 to 8 previoussprains, with various time requirements since the lastsprain. It is also unclear whether a lifetime history of 3sprains separated by a number of years results in the sameimpairments or activity limitations as a recent history of 3sprains separated by weeks or months. Finally, giving way
of the ankle is often used as an inclusion criterion forstudies of CAI. Because giving way can be either perceivedor actual, we do not know if it belongs in the current modelas part of perceived instability, as a recurrent sprain thatdoes not have a physical response, or as a uniquelydifferent subgroup.
A further interesting question is whether increasingseverity of CAI is reflected in a hierarchy in the subgroups.Intuitively, we would expect that people in a subgroup withmore components to be more seriously limited in activityand participation than those with only a single component,but this possibility requires further investigation.
Limitations
The present study had a number of limitations. Testingthe model by fitting the data retrospectively means thatalthough all subgroups can be shown to exist, the testingwas limited to a single common test for mechanical andperceived instability and recurrent sprain. In particular,mechanical instability was tested only in the anterior-posterior plane using clinical tests (ie, manual testing),although instrumented arthrometry or radiographic mea-sures in at least 2 planes is likely to be more accurate. Themodel requires validation with a separate group ofparticipants. In addition, research for which participantsare recruited using a broad definition of CAI and across awide range of ages and activity levels would provide abetter indication of subgroup prevalence. Specifically, sucha study would determine whether it is possible for aparticipant to have recurrent sprain without mechanical orperceived instability. The retrospective nature of ourexploration of impairments also limited the numbers andtypes of impairment that could be included and thestatistical analysis.
Future Directions
To further our understanding of the impairments,activity limitations, and participation restrictions associat-ed with CAI, we recommend that future authors describeparticipants using validated measurements of those vari-ables that define the subgroups in both the original and
Figure 5. Forest plot of the time to recover from an inversion perturbation (mean and 95%% confidence intervals for groups with n . 6).
Abbreviations: MI, mechanical instability; PI, perceived instability; RS, recurrent sprain.
Journal of Athletic Training 139
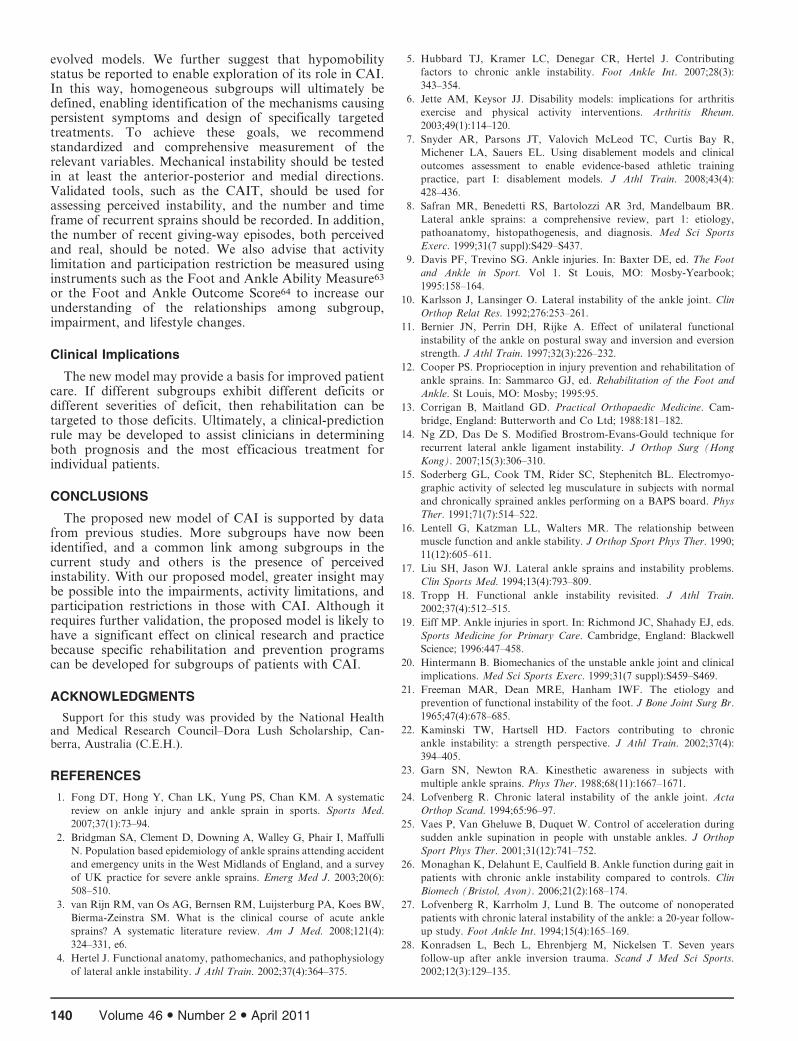
evolved models. We further suggest that hypomobilitystatus be reported to enable exploration of its role in CAI.In this way, homogeneous subgroups will ultimately bedefined, enabling identification of the mechanisms causingpersistent symptoms and design of specifically targetedtreatments. To achieve these goals, we recommendstandardized and comprehensive measurement of therelevant variables. Mechanical instability should be testedin at least the anterior-posterior and medial directions.Validated tools, such as the CAIT, should be used forassessing perceived instability, and the number and timeframe of recurrent sprains should be recorded. In addition,the number of recent giving-way episodes, both perceivedand real, should be noted. We also advise that activitylimitation and participation restriction be measured usinginstruments such as the Foot and Ankle Ability Measure63
or the Foot and Ankle Outcome Score64 to increase ourunderstanding of the relationships among subgroup,impairment, and lifestyle changes.
Clinical Implications
The new model may provide a basis for improved patientcare. If different subgroups exhibit different deficits ordifferent severities of deficit, then rehabilitation can betargeted to those deficits. Ultimately, a clinical-predictionrule may be developed to assist clinicians in determiningboth prognosis and the most efficacious treatment forindividual patients.
CONCLUSIONS
The proposed new model of CAI is supported by datafrom previous studies. More subgroups have now beenidentified, and a common link among subgroups in thecurrent study and others is the presence of perceivedinstability. With our proposed model, greater insight maybe possible into the impairments, activity limitations, andparticipation restrictions in those with CAI. Although itrequires further validation, the proposed model is likely tohave a significant effect on clinical research and practicebecause specific rehabilitation and prevention programscan be developed for subgroups of patients with CAI.
ACKNOWLEDGMENTS
Support for this study was provided by the National Healthand Medical Research Council–Dora Lush Scholarship, Can-berra, Australia (C.E.H.).
REFERENCES
1. Fong DT, Hong Y, Chan LK, Yung PS, Chan KM. A systematic
review on ankle injury and ankle sprain in sports. Sports Med.
2007;37(1):73–94.
2. Bridgman SA, Clement D, Downing A, Walley G, Phair I, Maffulli
N. Population based epidemiology of ankle sprains attending accident
and emergency units in the West Midlands of England, and a survey
of UK practice for severe ankle sprains. Emerg Med J. 2003;20(6):
508–510.
3. van Rijn RM, van Os AG, Bernsen RM, Luijsterburg PA, Koes BW,
Bierma-Zeinstra SM. What is the clinical course of acute ankle
sprains? A systematic literature review. Am J Med. 2008;121(4):
324–331, e6.
4. Hertel J. Functional anatomy, pathomechanics, and pathophysiology
of lateral ankle instability. J Athl Train. 2002;37(4):364–375.
5. Hubbard TJ, Kramer LC, Denegar CR, Hertel J. Contributing
factors to chronic ankle instability. Foot Ankle Int. 2007;28(3):
343–354.
6. Jette AM, Keysor JJ. Disability models: implications for arthritis
exercise and physical activity interventions. Arthritis Rheum.
2003;49(1):114–120.
7. Snyder AR, Parsons JT, Valovich McLeod TC, Curtis Bay R,
Michener LA, Sauers EL. Using disablement models and clinical
outcomes assessment to enable evidence-based athletic training
practice, part I: disablement models. J Athl Train. 2008;43(4):
428–436.
8. Safran MR, Benedetti RS, Bartolozzi AR 3rd, Mandelbaum BR.
Lateral ankle sprains: a comprehensive review, part 1: etiology,
pathoanatomy, histopathogenesis, and diagnosis. Med Sci Sports
Exerc. 1999;31(7 suppl):S429–S437.
9. Davis PF, Trevino SG. Ankle injuries. In: Baxter DE, ed. The Foot
and Ankle in Sport. Vol 1. St Louis, MO: Mosby-Yearbook;
1995:158–164.
10. Karlsson J, Lansinger O. Lateral instability of the ankle joint. Clin
Orthop Relat Res. 1992;276:253–261.
11. Bernier JN, Perrin DH, Rijke A. Effect of unilateral functional
instability of the ankle on postural sway and inversion and eversion
strength. J Athl Train. 1997;32(3):226–232.
12. Cooper PS. Proprioception in injury prevention and rehabilitation of
ankle sprains. In: Sammarco GJ, ed. Rehabilitation of the Foot and
Ankle. St Louis, MO: Mosby; 1995:95.
13. Corrigan B, Maitland GD. Practical Orthopaedic Medicine. Cam-
bridge, England: Butterworth and Co Ltd; 1988:181–182.
14. Ng ZD, Das De S. Modified Brostrom-Evans-Gould technique for
recurrent lateral ankle ligament instability. J Orthop Surg (Hong
Kong). 2007;15(3):306–310.
15. Soderberg GL, Cook TM, Rider SC, Stephenitch BL. Electromyo-
graphic activity of selected leg musculature in subjects with normal
and chronically sprained ankles performing on a BAPS board. Phys
Ther. 1991;71(7):514–522.
16. Lentell G, Katzman LL, Walters MR. The relationship between
muscle function and ankle stability. J Orthop Sport Phys Ther. 1990;
11(12):605–611.
17. Liu SH, Jason WJ. Lateral ankle sprains and instability problems.
Clin Sports Med. 1994;13(4):793–809.
18. Tropp H. Functional ankle instability revisited. J Athl Train.
2002;37(4):512–515.
19. Eiff MP. Ankle injuries in sport. In: Richmond JC, Shahady EJ, eds.
Sports Medicine for Primary Care. Cambridge, England: Blackwell
Science; 1996:447–458.
20. Hintermann B. Biomechanics of the unstable ankle joint and clinical
implications. Med Sci Sports Exerc. 1999;31(7 suppl):S459–S469.
21. Freeman MAR, Dean MRE, Hanham IWF. The etiology and
prevention of functional instability of the foot. J Bone Joint Surg Br.
1965;47(4):678–685.
22. Kaminski TW, Hartsell HD. Factors contributing to chronic
ankle instability: a strength perspective. J Athl Train. 2002;37(4):
394–405.
23. Garn SN, Newton RA. Kinesthetic awareness in subjects with
multiple ankle sprains. Phys Ther. 1988;68(11):1667–1671.
24. Lofvenberg R. Chronic lateral instability of the ankle joint. Acta
Orthop Scand. 1994;65:96–97.
25. Vaes P, Van Gheluwe B, Duquet W. Control of acceleration during
sudden ankle supination in people with unstable ankles. J Orthop
Sport Phys Ther. 2001;31(12):741–752.
26. Monaghan K, Delahunt E, Caulfield B. Ankle function during gait in
patients with chronic ankle instability compared to controls. Clin
Biomech (Bristol, Avon). 2006;21(2):168–174.
27. Lofvenberg R, Karrholm J, Lund B. The outcome of nonoperated
patients with chronic lateral instability of the ankle: a 20-year follow-
up study. Foot Ankle Int. 1994;15(4):165–169.
28. Konradsen L, Bech L, Ehrenbjerg M, Nickelsen T. Seven years
follow-up after ankle inversion trauma. Scand J Med Sci Sports.
2002;12(3):129–135.
140 Volume 46 N Number 2 N April 2011
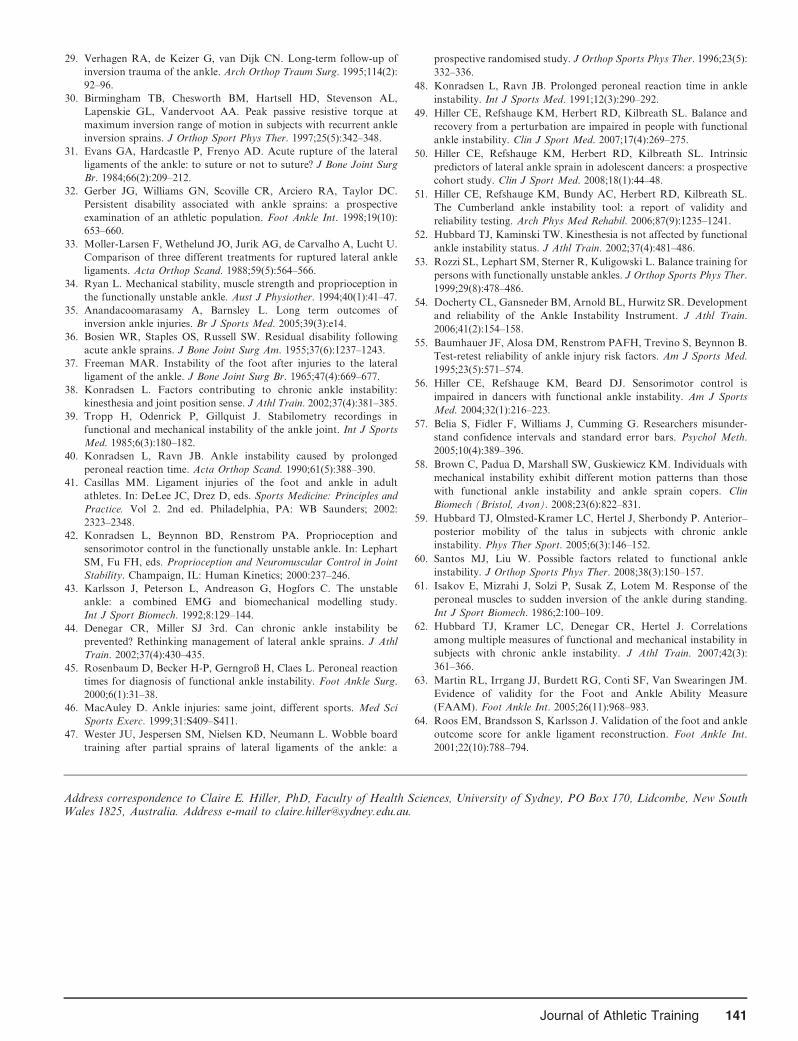
29. Verhagen RA, de Keizer G, van Dijk CN. Long-term follow-up of
inversion trauma of the ankle. Arch Orthop Traum Surg. 1995;114(2):
92–96.
30. Birmingham TB, Chesworth BM, Hartsell HD, Stevenson AL,
Lapenskie GL, Vandervoot AA. Peak passive resistive torque at
maximum inversion range of motion in subjects with recurrent ankle
inversion sprains. J Orthop Sport Phys Ther. 1997;25(5):342–348.
31. Evans GA, Hardcastle P, Frenyo AD. Acute rupture of the lateral
ligaments of the ankle: to suture or not to suture? J Bone Joint Surg
Br. 1984;66(2):209–212.
32. Gerber JG, Williams GN, Scoville CR, Arciero RA, Taylor DC.
Persistent disability associated with ankle sprains: a prospective
examination of an athletic population. Foot Ankle Int. 1998;19(10):
653–660.
33. Moller-Larsen F, Wethelund JO, Jurik AG, de Carvalho A, Lucht U.
Comparison of three different treatments for ruptured lateral ankle
ligaments. Acta Orthop Scand. 1988;59(5):564–566.
34. Ryan L. Mechanical stability, muscle strength and proprioception in
the functionally unstable ankle. Aust J Physiother. 1994;40(1):41–47.
35. Anandacoomarasamy A, Barnsley L. Long term outcomes of
inversion ankle injuries. Br J Sports Med. 2005;39(3):e14.
36. Bosien WR, Staples OS, Russell SW. Residual disability following
acute ankle sprains. J Bone Joint Surg Am. 1955;37(6):1237–1243.
37. Freeman MAR. Instability of the foot after injuries to the lateral
ligament of the ankle. J Bone Joint Surg Br. 1965;47(4):669–677.
38. Konradsen L. Factors contributing to chronic ankle instability:
kinesthesia and joint position sense. J Athl Train. 2002;37(4):381–385.
39. Tropp H, Odenrick P, Gillquist J. Stabilometry recordings in
functional and mechanical instability of the ankle joint. Int J Sports
Med. 1985;6(3):180–182.
40. Konradsen L, Ravn JB. Ankle instability caused by prolonged
peroneal reaction time. Acta Orthop Scand. 1990;61(5):388–390.
41. Casillas MM. Ligament injuries of the foot and ankle in adult
athletes. In: DeLee JC, Drez D, eds. Sports Medicine: Principles and
Practice. Vol 2. 2nd ed. Philadelphia, PA: WB Saunders; 2002:
2323–2348.
42. Konradsen L, Beynnon BD, Renstrom PA. Proprioception and
sensorimotor control in the functionally unstable ankle. In: Lephart
SM, Fu FH, eds. Proprioception and Neuromuscular Control in Joint
Stability. Champaign, IL: Human Kinetics; 2000:237–246.
43. Karlsson J, Peterson L, Andreason G, Hogfors C. The unstable
ankle: a combined EMG and biomechanical modelling study.
Int J Sport Biomech. 1992;8:129–144.
44. Denegar CR, Miller SJ 3rd. Can chronic ankle instability be
prevented? Rethinking management of lateral ankle sprains. J Athl
Train. 2002;37(4):430–435.
45. Rosenbaum D, Becker H-P, Gerngroß H, Claes L. Peroneal reaction
times for diagnosis of functional ankle instability. Foot Ankle Surg.
2000;6(1):31–38.
46. MacAuley D. Ankle injuries: same joint, different sports. Med Sci
Sports Exerc. 1999;31:S409–S411.
47. Wester JU, Jespersen SM, Nielsen KD, Neumann L. Wobble board
training after partial sprains of lateral ligaments of the ankle: a
prospective randomised study. J Orthop Sports Phys Ther. 1996;23(5):
332–336.
48. Konradsen L, Ravn JB. Prolonged peroneal reaction time in ankle
instability. Int J Sports Med. 1991;12(3):290–292.
49. Hiller CE, Refshauge KM, Herbert RD, Kilbreath SL. Balance and
recovery from a perturbation are impaired in people with functional
ankle instability. Clin J Sport Med. 2007;17(4):269–275.
50. Hiller CE, Refshauge KM, Herbert RD, Kilbreath SL. Intrinsic
predictors of lateral ankle sprain in adolescent dancers: a prospective
cohort study. Clin J Sport Med. 2008;18(1):44–48.
51. Hiller CE, Refshauge KM, Bundy AC, Herbert RD, Kilbreath SL.
The Cumberland ankle instability tool: a report of validity and
reliability testing. Arch Phys Med Rehabil. 2006;87(9):1235–1241.
52. Hubbard TJ, Kaminski TW. Kinesthesia is not affected by functional
ankle instability status. J Athl Train. 2002;37(4):481–486.
53. Rozzi SL, Lephart SM, Sterner R, Kuligowski L. Balance training for
persons with functionally unstable ankles. J Orthop Sports Phys Ther.
1999;29(8):478–486.
54. Docherty CL, Gansneder BM, Arnold BL, Hurwitz SR. Development
and reliability of the Ankle Instability Instrument. J Athl Train.
2006;41(2):154–158.
55. Baumhauer JF, Alosa DM, Renstrom PAFH, Trevino S, Beynnon B.
Test-retest reliability of ankle injury risk factors. Am J Sports Med.
1995;23(5):571–574.
56. Hiller CE, Refshauge KM, Beard DJ. Sensorimotor control is
impaired in dancers with functional ankle instability. Am J Sports
Med. 2004;32(1):216–223.
57. Belia S, Fidler F, Williams J, Cumming G. Researchers misunder-
stand confidence intervals and standard error bars. Psychol Meth.
2005;10(4):389–396.
58. Brown C, Padua D, Marshall SW, Guskiewicz KM. Individuals with
mechanical instability exhibit different motion patterns than those
with functional ankle instability and ankle sprain copers. Clin
Biomech (Bristol, Avon). 2008;23(6):822–831.
59. Hubbard TJ, Olmsted-Kramer LC, Hertel J, Sherbondy P. Anterior–
posterior mobility of the talus in subjects with chronic ankle
instability. Phys Ther Sport. 2005;6(3):146–152.
60. Santos MJ, Liu W. Possible factors related to functional ankle
instability. J Orthop Sports Phys Ther. 2008;38(3):150–157.
61. Isakov E, Mizrahi J, Solzi P, Susak Z, Lotem M. Response of the
peroneal muscles to sudden inversion of the ankle during standing.
Int J Sport Biomech. 1986;2:100–109.
62. Hubbard TJ, Kramer LC, Denegar CR, Hertel J. Correlations
among multiple measures of functional and mechanical instability in
subjects with chronic ankle instability. J Athl Train. 2007;42(3):
361–366.
63. Martin RL, Irrgang JJ, Burdett RG, Conti SF, Van Swearingen JM.
Evidence of validity for the Foot and Ankle Ability Measure
(FAAM). Foot Ankle Int. 2005;26(11):968–983.
64. Roos EM, Brandsson S, Karlsson J. Validation of the foot and ankle
outcome score for ankle ligament reconstruction. Foot Ankle Int.
2001;22(10):788–794.
Address correspondence to Claire E. Hiller, PhD, Faculty of Health Sciences, University of Sydney, PO Box 170, Lidcombe, New SouthWales 1825, Australia. Address e-mail to [email protected].
Journal of Athletic Training 141

Changes in Knee Biomechanics After a Hip-AbductorStrengthening Protocol for Runners WithPatellofemoral Pain Syndrome
Reed Ferber, PhD, ATC, CAT(C)*`�; Karen D. Kendall, MKin, CAT(C)*�;Lindsay Farr*
*Faculty of Kinesiology, 3Running Injury Clinic, and 4Faculty of Nursing, University of Calgary, AB, Canada
Context: Very few authors have investigated the relationshipbetween hip-abductor muscle strength and frontal-plane kneemechanics during running.
Objective: To investigate this relationship using a 3-weekhip-abductor muscle-strengthening program to identify changesin strength, pain, and biomechanics in runners with patellofem-oral pain syndrome (PFPS).
Design: Cohort study.Setting: University-based clinical research laboratory.Patients or Other Participants: Fifteen individuals (5 men,
10 women) with PFPS and 10 individuals without PFPS (4 men,6 women) participated.
Intervention(s): The patients with PFPS completed a 3-week hip-abductor strengthening protocol; control participantsdid not.
Main Outcome Measure(s): The dependent variables ofinterest were maximal isometric hip-abductor muscle strength,
2-dimensional peak knee genu valgum angle, and stride-to-stride knee-joint variability. All measures were recorded atbaseline and 3 weeks later. Between-groups differences werecompared using repeated-measures analyses of variance.
Results: At baseline, the PFPS group exhibited reducedstrength, no difference in peak genu valgum angle, andincreased stride-to-stride knee-joint variability compared withthe control group. After the 3-week protocol, the PFPS groupdemonstrated increased strength, less pain, no change in peakgenu valgum angle, and reduced stride-to-stride knee-jointvariability compared with baseline.
Conclusions: A 3-week hip-abductor muscle-strengtheningprotocol was effective in increasing muscle strength anddecreasing pain and stride-to-stride knee-joint variability inindividuals with PFPS. However, concomitant changes in peakknee genu valgum angle were not observed.
Key Words: gait, hip muscles, anterior knee pain
Key Points
N After a 3-week hip-abduction strengthening program, patients with patellofemoral pain syndrome increased musclestrength and displayed decreases in both pain and stride-to-stride knee-joint variability. No changes were noted in peakknee genu valgum.
N Stride-to-stride knee-joint variability may be a better indicator of injury rehabilitation than are peak angles.N Hip-abductor muscle strengthening should be incorporated into patellofemoral pain syndrome rehabilitation protocols.
Anumber of authors1–7 have hypothesized that aprimary contributing factor to patellofemoral painsyndrome (PFPS) is weakness of the hip-abductor
musculature. The hip-abductor muscles have been theo-rized1–9 to eccentrically control hip adduction and, thus,knee genu valgum angle during the stance phase ofrunning. A greater genu valgum angle (or increase in thedynamic Q-angle) has been purported2,3,5,8–12 to increasepatellofemoral contact pressure and to lead to PFPS.However, very few researchers have investigated therelationship between hip-abductor muscle strength andfrontal-plane knee mechanics.
Willson and Davis11 reported that compared withcontrols, patients with PFPS exhibited greater hip adduc-tion during single-leg squats, running, and repetitive single-leg jumps, and they attributed the atypical frontal-planemechanics to weakness of the hip-abductor musculature.However, measures of hip-abductor strength were notcollected. Other authors7–10,13 have also reported similarfindings, with PFPS patients demonstrating greater hip
adduction, knee genu valgum, or reduced strength of thehip-abductor musculature (or all of these) than do healthypeople. Yet these studies mainly investigated each variablein isolation and did not directly address the relationshipbetween hip-abductor muscle strength and knee genuvalgum angle.
Few experts have examined the relationship betweenhip-abductor muscle strength and knee mechanics andhow gains or reductions in strength may affect frontal-plane knee mechanics. Bolgla et al7 measured hip-abductor strength and knee and hip kinematics andreported that those with PFPS exhibited reduced hip-abductor muscle strength but no differences in knee genuvalgum angle during stair descent compared with thecontrol group. Similar to Bolgla et al,7 Dierks et al2
reported reduced hip-abductor muscle strength in bothPFPS patients and the control group after a prolongedand exhaustive run. However, in contrast to the findingsof Bolgla et al,7 the PFPS patients in this study exhibitedan increase in peak hip adduction, a component of the
Journal of Athletic Training 2011;46(2):142–149g by the National Athletic Trainers’ Association, Incwww.nata.org/jat
original research
142 Volume 46 N Number 2 N April 2011
knee genu valgum angle, over the course of the run,compared with healthy runners. Recently, Snyder et al14
reported that after a 6-week hip strengthening protocol,healthy female runners exhibited a 13% gain in abductorstrength, but the hip-adduction angle during runningincreased by 1.46, contrary to their hypotheses and theresults of previous studies. Moreover, to date, no authorshave specifically tested whether improvements in musclestrength would lead to a reduced peak knee genu valgumangle for runners with PFPS. Thus, based on theconflicting results of these studies, further investigationinto the relationship between hip-abductor musclestrength and knee mechanics is warranted. In light ofthese contradictory findings in the literature, it may beworthwhile to examine the relationship between hip-abductor muscle strength and knee mechanics using amore novel approach.
Previous authors15–21 have suggested that movementvariability may be an important consideration with respectto injury prevention and rehabilitation. However, one mustfirst define movement variability. When a motion isperformed repeatedly, as in the stride-to-stride patterninvolved in running, and even when the goal of the motionremains constant, the exhibited kinematic movementpattern varies among strides.17 The overall movement goalof running would be an example of global variability, whichhas been defined as a combination of between-limbs orwithin-limb kinematic patterns for the purpose of amovement goal or, for example, in response to balanceperturbations. In contrast, local variability has been definedas the coupling or relative angles between joints orsegments.15
Stride-to-stride variability in joint movement patternsduring locomotion can be both beneficial and harmfuldepending on the global or local variability measure used.For example, increased stride-to-stride variability in stridelength18 and stride time,19 both measures of globalvariability, have been associated with an increased risk offalling. With respect to local variability, in 2009 Drewes etal20 reported less coordinated rearfoot-shank segmentalcoupling in those with chronic ankle instability, andMcKeon et al21 observed a decrease in rearfoot-shanksegmental coupling variability in individuals with chronicankle instability after a 4-week balance-training program.Miller et al17 suggested that during running, tibia-rearfootand rearfoot-thigh segmental coupling variability wasreduced, but knee-rearfoot coupling variability was in-creased in runners with a history of iliotibial bandsyndrome, compared with healthy individuals. Finally,Hamill et al15 noted less variability in lower extremitymovement patterns during running in patients with PFPScompared with healthy people. Thus, although there issome discrepancy in the literature, most researchers havereported that reduced variability is associated withrunning-related injuries, such as PFPS, and increasedvariability of movement appears to be necessary to allowfor flexibility in gait mechanics in response to unexpectedperturbations.
The purpose of our experiment was to investigate therelationship between hip-abductor muscle strength andfrontal-plane knee mechanics. We sought to assess thisrelationship by using a 3-week hip-abductor muscle-strengthening protocol to measure potential changes in
strength, pain, and biomechanics in patients with PFPS.We operationally defined local, within-limb movementvariability and quantified it as the change in knee-jointfrontal-plane kinematic patterns across 10 consecutivefootfalls (herein called stride-to-stride knee-joint variabili-ty). We hypothesized that at baseline, PFPS patients wouldexhibit reduced hip-abductor muscle strength, greater peakknee genu valgum angle, and decreased stride-to-strideknee-joint variability compared with the control group.After the 3-week rehabilitation protocol, we hypothesizedthat hip-abductor muscle strength would increase, painwould decrease, peak knee genu valgum angle woulddecrease, and stride-to-stride knee-joint variability wouldincrease over baseline measures.
METHODS
Participants
We conducted an a priori sample-size power analysis(b 5 .20, a 5 .05; desired effect size 5 0.66) using varia-bility in hip-abductor strength and knee genu valgum dataobtained from pilot data and relevant literature.8,11,14,22
Based on this analysis, a minimum of 10 to 13 participantsper group were needed to adequately power the studybased on the variables of interest. Specifically, 10individuals were needed to adequately detect differencesin hip-abductor strength,11,14 and at least 13 people wereneeded to adequately detect differences in peak knee genuvalgum angle,8,14,22 either compared with the control groupor after a strengthening protocol. Each participant signeda consent form approved by the University of CalgaryConjoint Health Research Ethics Board, which alsoapproved the study.
All participants were active recreational athletes run-ning at least 30 minutes per day a minimum of 3 days perweek. The PFPS group consisted of 5 men and 10 women(age 5 35.2 6 12.2 years, height 5 1.65 6 0.34 m, mass5 69.1 6 11.6 kg). The control group consisted of 4 menand 6 women (age 5 29.9 6 8.3 years, height 5 1.73 60.41 m, mass 5 73.1 6 15.7 kg). The control volunteerswere pain free at the time of testing, had no history oforthopaedic surgery, had not sustained a musculoskeletalinjury in the past year, and did not meet any of theexclusion criteria.
The PFPS participants presented to the clinic and wereassessed by the same certified athletic trainer for exclusioncriteria. Exclusion criteria were consistent with those ofBoling et al12 and included unilateral symptoms present formore than 2 months, self-reported clinical evidence of otherknee conditions, history of knee surgery, self-reportedhistory of patellar dislocations or subluxations, or currentsignificant injury affecting other lower extremity joints.The PFPS injury assessment was also based on that ofBoling et al12 and included anterior or retropatellar kneepain, with a severity of at least 3 on a 10-cm visualanalogue scale (VAS), during at least 2 of the followingactivities and within the past week: (1) ascending anddescending stairs, (2) hopping and running, (3) squatting orkneeling, and (4) prolonged sitting. The PFPS individualsalso had to exhibit insidious onset of symptoms unrelatedto trauma, pain with compression of the patella, and painon palpation of patellar facets.
Journal of Athletic Training 143
Procedures
Retroreflective markers were used to measure 2-dimen-sional (2-D) knee frontal-plane biomechanical motion. Themarkers were secured to hook-and-loop straps that weretightly wrapped around the thigh and shank to minimizemovement artifact and along a line between the ischialtuberosity and the middle of the popliteal fossa andbetween the middle of the popliteal fossa and the Achillestendon to represent the long axes of the femur and shank,respectively (Figure 1). After collecting a 1-second standingcalibration trial, volunteers performed dynamic trials inwhich they ran on a treadmill (model TR 4500, Star Trac,Irvine, CA) for 20 seconds (approximately 30 footfalls) at aspeed of 2.55 m/s. We chose this speed because previousauthors2,11,15–17,23 have reported using similar overgroundand treadmill speeds. A 2-minute warm-up period providedtime for accommodation to the treadmill and speed and toachieve a steady state of comfortable running before the20 seconds of data were collected. All participants werefamiliar with treadmill running. The middle 10 consecutivefootfalls were selected and analyzed from the symptomaticlimb for the PFPS group and from the dominant limb forthe control group.
Strength of the hip-abductor muscles was measured withthe side-lying volunteer exerting a maximal isometriccontraction for 5 seconds in 306 of hip abduction and 56
of hip extension.24 A force dynamometer (model 01163manual muscle tester; Lafayette Instrument, Lafayette, IN)was used to measure force output. The dynamometer wasplaced immediately proximal to the lateral malleolus, andparticipants applied a maximal isometric force against anonelastic strap for the ‘‘make’’ test method of strengthtesting.3 An initial familiarization trial was performedbefore the average of 3 trials was recorded; all trials werewithin a coefficient of variation of 10%. Body weight wasmeasured using a standard digital scale, and force valueswere normalized to a percentage of body weight. Pain wasmeasured using a 10-cm VAS. All measurements weretaken at baseline and at 3 weeks for both the control andPFPS volunteers.
Rehabilitation Protocol
All PFPS patients were given a 3-week hip-abductormuscle-strengthening protocol consisting of 2 exercises(Figure 2). These exercises were to be performed using a 5-ft (1.52-m) piece of Resist-A-Band (Donovan Industries,Inc, Tampa, FL) for 3 sets of 10 repetitions of eachexercise, for each leg, daily over the course of the 3 weeks.The patients were instructed to move the involved limboutward for 2 seconds and inward for 2 seconds and toexercise both limbs using this common therapeuticprotocol because the contralateral limb also benefits fromthe exercise.25 All PFPS patients returned after 7 to 10 daysfor a follow-up to log exercise program adherence and tohave their exercise technique checked. If the sets andrepetitions were being performed too easily, a piece of bandoffering greater resistance was provided. The PFPSparticipants were asked to refrain from any therapeutictreatments other than the 2 exercises, and all volunteerswere encouraged to continue with their regular runningschedule at their discretion. It is important to note that all
PFPS patients were running on a regular basis at the timeof data collection.
Data Collection and Analysis
Pain was measured using a VAS in which 0 indicated nopain and 10 indicated the most pain imaginable. The PFPSparticipants were asked to place a dash along the 10-cmline to indicate the average amount of pain experiencedduring the past week while running.
Kinematic data were collected using a 60-Hz camera(model GL2; Canon Canada Inc, Mississauga, ON,Canada). For all data collection, the camera was placed1.2 m above the ground and 1.7 m away from the middle ofthe treadmill. A digital inclinometer (model 360; Smart-Tool Technology, Inc, Oklahoma City, OK) ensured thatthe camera lens was oriented parallel to the frontal plane ofthe laboratory and the participant and perpendicular to thetreadmill platform. Raw marker trajectory data werefiltered with a second-order, low-pass Butterworth filterat 10 Hz. Vicon Motus software (version 9.2; C-Motion,Inc, Rockville, MD) was used to digitize the markers andfilter and to calculate 2-D angles. The kinematic data wereanalyzed for the stance phase and normalized to 101 datapoints. The stance phase was determined using kinematicmarker data, with initial contact identified using a velocity-based algorithm applied to the posterior calcaneus, and
Figure 1. Retroreflective marker placement used for kinematic
data collection.
144 Volume 46 N Number 2 N April 2011
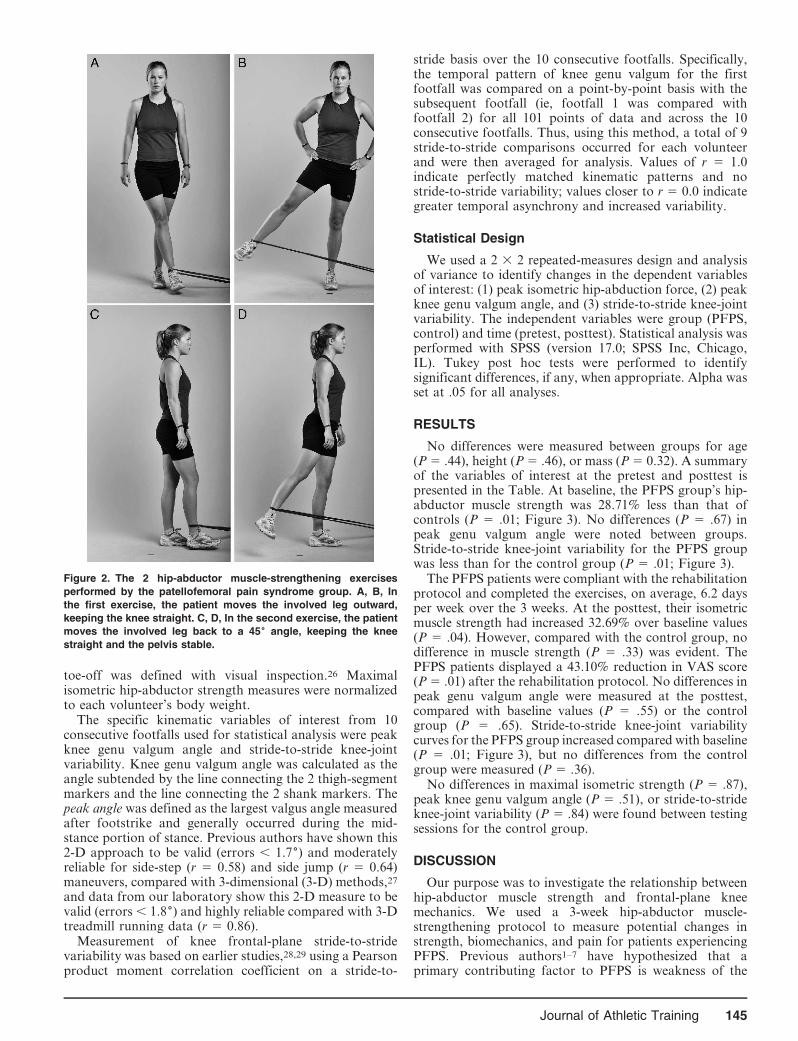
toe-off was defined with visual inspection.26 Maximalisometric hip-abductor strength measures were normalizedto each volunteer’s body weight.
The specific kinematic variables of interest from 10consecutive footfalls used for statistical analysis were peakknee genu valgum angle and stride-to-stride knee-jointvariability. Knee genu valgum angle was calculated as theangle subtended by the line connecting the 2 thigh-segmentmarkers and the line connecting the 2 shank markers. Thepeak angle was defined as the largest valgus angle measuredafter footstrike and generally occurred during the mid-stance portion of stance. Previous authors have shown this2-D approach to be valid (errors , 1.76) and moderatelyreliable for side-step (r 5 0.58) and side jump (r 5 0.64)maneuvers, compared with 3-dimensional (3-D) methods,27
and data from our laboratory show this 2-D measure to bevalid (errors , 1.86) and highly reliable compared with 3-Dtreadmill running data (r 5 0.86).
Measurement of knee frontal-plane stride-to-stridevariability was based on earlier studies,28,29 using a Pearsonproduct moment correlation coefficient on a stride-to-
stride basis over the 10 consecutive footfalls. Specifically,the temporal pattern of knee genu valgum for the firstfootfall was compared on a point-by-point basis with thesubsequent footfall (ie, footfall 1 was compared withfootfall 2) for all 101 points of data and across the 10consecutive footfalls. Thus, using this method, a total of 9stride-to-stride comparisons occurred for each volunteerand were then averaged for analysis. Values of r 5 1.0indicate perfectly matched kinematic patterns and nostride-to-stride variability; values closer to r 5 0.0 indicategreater temporal asynchrony and increased variability.
Statistical Design
We used a 2 3 2 repeated-measures design and analysisof variance to identify changes in the dependent variablesof interest: (1) peak isometric hip-abduction force, (2) peakknee genu valgum angle, and (3) stride-to-stride knee-jointvariability. The independent variables were group (PFPS,control) and time (pretest, posttest). Statistical analysis wasperformed with SPSS (version 17.0; SPSS Inc, Chicago,IL). Tukey post hoc tests were performed to identifysignificant differences, if any, when appropriate. Alpha wasset at .05 for all analyses.
RESULTS
No differences were measured between groups for age(P 5 .44), height (P 5 .46), or mass (P 5 0.32). A summaryof the variables of interest at the pretest and posttest ispresented in the Table. At baseline, the PFPS group’s hip-abductor muscle strength was 28.71% less than that ofcontrols (P 5 .01; Figure 3). No differences (P 5 .67) inpeak genu valgum angle were noted between groups.Stride-to-stride knee-joint variability for the PFPS groupwas less than for the control group (P 5 .01; Figure 3).
The PFPS patients were compliant with the rehabilitationprotocol and completed the exercises, on average, 6.2 daysper week over the 3 weeks. At the posttest, their isometricmuscle strength had increased 32.69% over baseline values(P 5 .04). However, compared with the control group, nodifference in muscle strength (P 5 .33) was evident. ThePFPS patients displayed a 43.10% reduction in VAS score(P 5 .01) after the rehabilitation protocol. No differences inpeak genu valgum angle were measured at the posttest,compared with baseline values (P 5 .55) or the controlgroup (P 5 .65). Stride-to-stride knee-joint variabilitycurves for the PFPS group increased compared with baseline(P 5 .01; Figure 3), but no differences from the controlgroup were measured (P 5 .36).
No differences in maximal isometric strength (P 5 .87),peak knee genu valgum angle (P 5 .51), or stride-to-strideknee-joint variability (P 5 .84) were found between testingsessions for the control group.
DISCUSSION
Our purpose was to investigate the relationship betweenhip-abductor muscle strength and frontal-plane kneemechanics. We used a 3-week hip-abductor muscle-strengthening protocol to measure potential changes instrength, biomechanics, and pain for patients experiencingPFPS. Previous authors1–7 have hypothesized that aprimary contributing factor to PFPS is weakness of the
Figure 2. The 2 hip-abductor muscle-strengthening exercises
performed by the patellofemoral pain syndrome group. A, B, In
the first exercise, the patient moves the involved leg outward,
keeping the knee straight. C, D, In the second exercise, the patient
moves the involved leg back to a 456 angle, keeping the knee
straight and the pelvis stable.
Journal of Athletic Training 145

hip musculature, including the abductors. However, fewresearchers have directly investigated this possibility.
In support of the first hypothesis, the PFPS patientsexhibited 28.71% reduced maximal isometric hip-abductormuscle strength at baseline, compared with the controlgroup. These results are similar to those of several otherstudies1–9,12,15–18 involving PFPS patients and indicate thatweakness of the hip abductors may play a key role in thedevelopment of PFPS. We also hypothesized that over the3-week rehabilitation protocol, hip-abductor musclestrength would increase. In support of this hypothesis,PFPS patients exhibited an average 32.69% improvementin strength. Authors of earlier strengthening stud-ies6,14,30–32 reported 13% to 51% increases in hip-abductorstrength after rehabilitation protocols that ranged from 6to 14 weeks in length. Thus, the increase in abductorstrength reported in the current study is comparable withprevious findings.
We hypothesized that over the 3-week rehabilitationprotocol, the level of pain experienced by the PFPSpatients would decrease. In support of this hypothesis,the level of pain for 14 of the 15 patients decreased 40%over the course of the study. These results are in agreementwith those of previous studies1–9,12,15–18 whose authors alsosuggested that hip-abductor muscle weakness is a contrib-uting factor in the development and treatment of PFPS andshould be targeted in its treatment. An asset of ourinvestigation is that the rehabilitation protocol consisted ofexercises intended solely to increase the strength of the hipabductors. Thus, these results provide further evidence thathip-abductor muscle-strengthening exercises should beconsidered for preventing musculoskeletal injury andtreating PFPS.
Tyler et al32 examined the benefits of a hip-strengtheningprogram on 35 patients diagnosed with PFPS. Allvolunteers participated in a 6-week intervention thatconsisted primarily of hip-strengthening exercises. Hipstrength improved in 66% of the PFPS patients, which isconsistent with our results. Based on a minimum decreaseof 1.5 cm in the VAS scores, 21 patients (26 knees) had asuccessful outcome and 14 patients (17 knees) had anunsuccessful outcome. Interestingly, and in contrast to ourresults, these authors32 reported that, based on their
statistical analysis, improvement in hip-abduction strengthwas unrelated to PFPS pain and treatment outcome. Thus,other muscles in addition to the hip abductors may beimportant in treating PFPS.31,32 Future studies involving amore comprehensive hip muscle-strengthening protocol arenecessary to answer this question.
In such a short period of time, improvements in musclestrength are largely attributable to changes in neuromus-cular activation of muscles and not to changes in muscle-fiber composition or hypertrophy.33,34 Previous au-thors33,34 have shown that after 10 or 14 days of dailystrengthening, an increased number of motor units arerecruited, concomitant with greater maximal voluntarycontraction. These results support the notion that neuraladaptation, not hip-abductor muscle-fiber hypertrophy,was primarily responsible for the increased strengthexhibited by the PFPS participants after only 3 weeks ofmuscle strengthening.
Similar to earlier researchers,2,3,8,9,11 we hypothesizedthat reduced hip-abductor muscle strength would result ina greater peak knee genu valgum angle when running and,thus, would contribute to the development of PFPS,because the hip abductors would not be able to adequatelycontrol hip adduction via eccentric contraction. However,no differences in peak knee genu valgum angle weremeasured between groups or across time.
To date, few investigators2,6,7,14 have evaluated therelationship between hip-abductor muscle strength andknee kinematics. Our findings are similar to those of Bolglaet al,7 who reported that 18 patients with PFPS had hipweakness but did not demonstrate altered hip or kneekinematics while descending stairs, compared with acontrol group. Yet our results contrast with those ofMascal et al.6 In their case study, the participant whounderwent a biomechanical assessment after a 14-weekstrengthening protocol demonstrated improved hipstrength and reduced hip adduction (a component of kneegenu valgum) during a step-down maneuver, comparedwith baseline values. Our findings also contrast with thoseof Dierks et al,2 who reported an inverse relationshipbetween decreased hip-abductor muscle strength andincreased hip adduction at the beginning and end of aprolonged run for PFPS patients.
Table. Variables of Interest for the Control and Patellofemoral Pain Syndrome Groups
Variable
Control Group Patellofemoral Pain Syndrome Group
Pretraining Posttraining Pretraining Posttraining
Mean 6 SD
95%
Confidence
Interval Mean 6 SD
95%
Confidence
Interval Mean 6 SD
95%
Confidence
Interval Mean 6 SD
95%
Confidence
Interval
Abductor muscle
strength, % of
body weight 18.11 6 3.89 15.15, 21.07 18.49 6 2.99 15.76, 21.22 12.91 6 4.12a 9.89, 15.93 17.13 6 3.08b 14.37, 19.89
Genu valgum, 6 2.67 6 1.19 0.40, 4.94 3.1 6 1.02 0.88, 5.32 3.71 6 1.38 1.39, 6.03 3.05 6 1.34 0.74, 5.36
Consecutive
footfall
variability, r 0.81 6 0.17 0.75, 0.87 0.83 6 0.15 0.78, 0.88 0.39 6 0.11a 0.35, 0.43 0.79 6 0.13b 0.75, 0.83
Visual analogue
scale pain
score, cm 5.80 6 2.10 5.10, 6.50 3.30 6 1.90b 2.67, 3.93
a Value reduced compared with control group (P , .05).b Value increased compared with prerehabilitation values (P , .05).
146 Volume 46 N Number 2 N April 2011
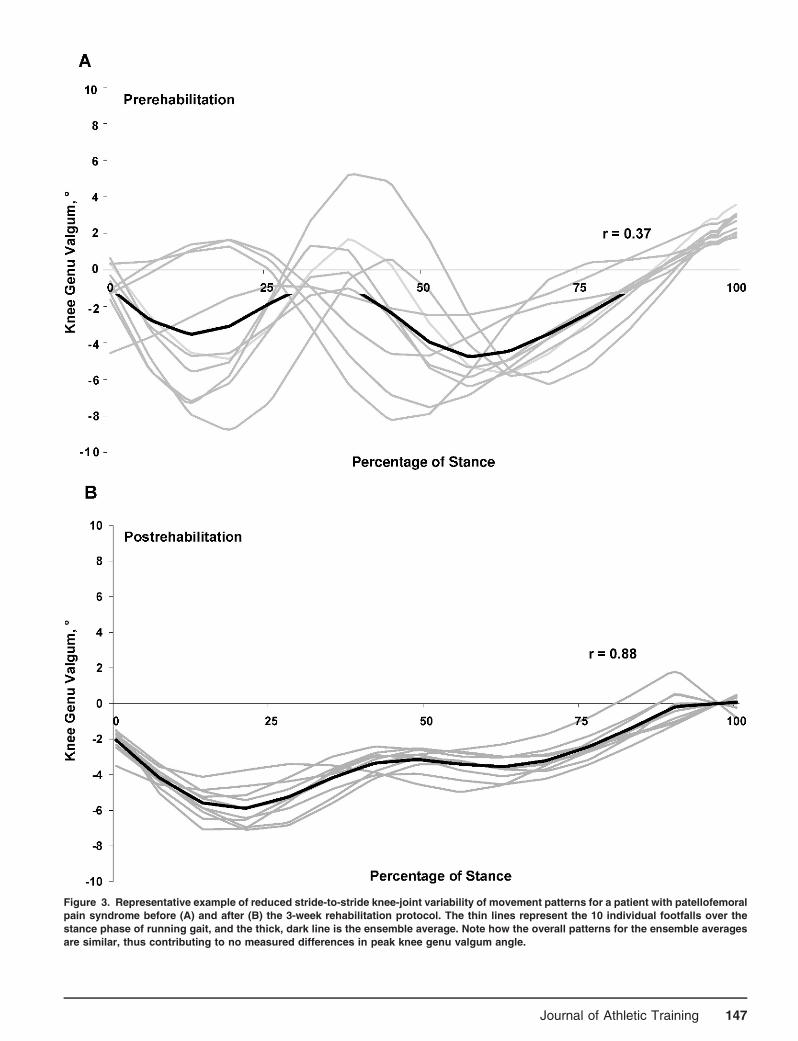
Figure 3. Representative example of reduced stride-to-stride knee-joint variability of movement patterns for a patient with patellofemoral
pain syndrome before (A) and after (B) the 3-week rehabilitation protocol. The thin lines represent the 10 individual footfalls over the
stance phase of running gait, and the thick, dark line is the ensemble average. Note how the overall patterns for the ensemble averages
are similar, thus contributing to no measured differences in peak knee genu valgum angle.
Journal of Athletic Training 147
The single-subject design and stair-descent method usedby Mascal et al6 make comparison of their results with oursdifficult. We measured 2-D knee genu valgum angle, whichis a combination of thigh adduction and shank abduction.Thus, comparison with studies of 3-D angles is challenging.In addition, Dierks et al2 used a fatigue protocol todetermine the association between hip-abductor musclestrength and mechanics, whereas we used a muscle-strengthening protocol. Future studies are thereforenecessary to help resolve these conflicting data.
Based on the PFPS data reported by Hamill et al15 andothers, we hypothesized that over the 3-week rehabilitationprotocol, stride-to-stride knee-joint variability would in-crease as pain-free status and more typical movementpatterns were restored. However, at baseline we measureda marked increase in variability for the PFPS groupcompared with the control group. Moreover, we measuredreductions in stride-to-stride knee-joint variability after thestrengthening protocol.
Inspection of Figure 3 reveals that the PFPS groupadopted a more consistent stride-to-stride kinematicpattern after the rehabilitation protocol. From a clinicalperspective, it is reasonable to assume that restoring a moreconsistent and predictable movement pattern, concomitantwith increased muscle strength and reduced pain, would beexpected after such an exercise regime. By providing theknee joint with more consistent (ie, less variable) movementpatterns on a stride-to-stride basis, it is possible that a moreoptimal environment is established, allowing for tissuehealing and pain resolution. Additional clinical studies arenecessary to answer these questions.
It is important to compare the methods used by Hamillet al15 with ours. They investigated intersegment couplingvariability, whereas we assessed variability within a singlejoint. They theorized that increased movement variabilityfrom 2 lower extremity segments represents a healthypopulation and is necessary to help prevent injury. Thistheory can still be applied to our results because increasedintersegmental coupling between the shank and thigh mayhave produced our observed reduction in single-jointmotion. More research will address this question.
At the posttest, compared with their baseline values, all15 PFPS patients increased muscle strength and demon-strated at least a 4-cm (33%) VAS drop in pain; in fact, 4patients were pain free at 3 weeks. Reduced stride-to-strideknee-joint variability was seen in 13 of 15 patients. At theend of the study, we provided all patients with a morecomprehensive rehabilitation program, including recom-mendations for stretching and strengthening exercises thatfocused on the low back, hip, knee, and ankle musculature.Anecdotally, we followed up after an additional 3 weeks ofrehabilitation and learned that all patients were pain freeand had returned to their preinjury running regimes.
Several limitations of this study are apparent. First, thebiomechanical measures used a 2-D camera system, andknee motion occurs in 3 dimensions. Thus, using a 3-Dmotion system would provide more comprehensive dataregarding the changes in pelvic and lower limb mechanicsthat occur as a result of muscle strengthening. However,previous authors27 have shown this 2-D approach to bevalid and moderately reliable for side-step and side-jumpmaneuvers, and data from our laboratory show this 2-Dmeasure to be valid and highly reliable compared with 3-D
measures during treadmill running. The control groupexhibited no change in peak knee genu valgum angle overthe 3 weeks, results similar to those of earlier investiga-tions.7,14,22 For example, Snyder et al14 reported 0.46 and1.46 changes in knee-abduction and hip-adduction excur-sion values, respectively, after a 6-week strengtheningprotocol. Moreover, the 0.666 and 0.436 differences wemeasured for the PFPS and control groups, respectively,are similar to those reported by Ferber et al,22 whoinvestigated 3-D kinematics for test-retest reliability inhealthy runners. These authors reported mean differencesof 0.646 in peak knee adduction and 1.646 in peak hipadduction over 2 days. Thus, even though we used a 2-Danalysis, our results are comparable with those of previous3-D studies.
Second, because we had a standard camera placementand did not position it at a specific height from the groundrelative to the participant’s height or knee location (orboth), perspective error was a possibility. However, ourvolunteers were all of the same approximate height, andgiven that our day-to-day values were similar to those of anearlier investigation,22 we are confident that this concernwas minimized. Next, the investigator was aware of theparticipant’s group allocation (PFPS or control), and onlythe PFPS group performed the exercises, perhaps leadingto bias during testing and analysis. However, using astandardized protocol for data collection and analysis foreach measure reduced this bias. Also, future researchinvolving a PFPS group that did not perform the exerciseswould be helpful to better understand how the exercisesand subsequent increases in hip-abductor muscle strengthinfluenced movement mechanics. In addition, the groupswere not matched for number of participants or sex.However, no differences in age, height, or mass weremeasured between the groups, and all study participantswere recreational runners, indicating that the groups weresimilar. The volunteers performed a simple running taskthat lasted a relatively brief period of time, and all ran atthe same speed. This procedure may not have beenstrenuous enough to reveal changes in lower extremitymechanics, so future studies involving running to fatigue,similar to the protocol of Dierks et al,2 may be beneficial.Furthermore, the running speed chosen was a comfortablepace for all participants and was similar to their ownregular running paces on a treadmill and compared withprevious studies. Next, the number of patients and lengthof the rehabilitation protocol were limited. A study with alarger control population matched for age, sex, mass, andmileage or a longer and more comprehensive rehabilitationprotocol (or both) may reveal different results, especiallywith respect to changes in knee genu valgum mechanics.Lastly, we measured isometric muscle-force output, whichis not a direct measure of hip-abductor muscle strength anddoes not necessarily reflect the dynamic concentric andeccentric muscle contractions involved in running.
CONCLUSIONS
A 3-week hip-abductor muscle-strengthening protocolwas effective in increasing muscle strength and decreasingthe level of pain and stride-to-stride knee-joint variabilityin individuals with PFPS. These results also indicate thatstride-to-stride knee-joint variability may be a better
148 Volume 46 N Number 2 N April 2011
indicator of injury rehabilitation progression than are peakangles. Finally, incorporating hip-abductor muscle-strengthening into PFPS rehabilitation protocols is impor-tant.
ACKNOWLEDGMENTS
This study was supported in part by the Alberta HeritageFoundation for Medical Research, the Workers’ CompensationBoard of Alberta Meredith Graduate Fellowship, and theUniversity of Calgary Undergraduate Student Research Program.We thank Treny Sasyniuk for her administrative and logisticalassistance. Fitter-First supplied all Resist-A-Bands used in thisstudy, and we are grateful for their support.
REFERENCES
1. Cichanowski HR, Schmitt JS, Johnson RJ, Niemuth PE. Hip strength
in collegiate female athletes with patellofemoral pain. Med Sci Sports
Exerc. 2007;39(8):1227–1232.
2. Dierks TA, Manal KT, Hamill J, Davis IS. Proximal and distal
influences on hip and knee kinematics in runners with patellofemoral
pain during a prolonged run. J Orthop Sports Phys Ther. 2008;38(8):
448–456.
3. Ireland ML, Willson JD, Ballantyne BT, Davis IM. Hip strength in
females with and without patellofemoral pain. J Orthop Sports Phys
Ther. 2003;33(11):671–676.
4. Robinson RL, Nee RJ. Analysis of hip strength in females seeking
physical therapy treatment for unilateral patellofemoral pain
syndrome. J Orthop Sports Phys Ther. 2007;37(5):232–238.
5. Willson JD, Davis IS. Utility of the frontal plane projection angle in
females with patellofemoral pain. J Orthop Sports Phys Ther.
2008;38(10):606–615.
6. Mascal CL, Landel R, Powers C. Management of patellofemoral pain
targeting hip, pelvis, and trunk muscle function: 2 case reports.
J Orthop Sports Phys Ther. 2003;33(11):647–660.
7. Bolgla LA, Malone TR, Umberger BR, Uhl TL. Hip strength and hip
and knee kinematics during stair descent in females with and without
patellofemoral pain syndrome. J Orthop Sports Phys Ther. 2008;
38(1):12–18.
8. Ferber R, Davis IM, Williams DS III. Gender differences in lower
extremity mechanics during running. Clin Biomech (Bristol, Avon).
2003;18(4):350–357.
9. Powers CM. The influence of altered lower-extremity kinematics on
patellofemoral joint dysfunction: a theoretical perspective. J Orthop
Sports Phys Ther. 2003;33(11):639–646.
10. Niemuth PE, Johnson RJ, Myers MJ, Thieman TJ. Hip muscle
weakness and overuse injuries in recreational runners. Clin J Sport
Med. 2005;15(1):14–21.
11. Willson JD, Davis IS. Lower extremity mechanics of females with and
without patellofemoral pain across activities with progressively
greater task demands. Clin Biomech (Bristol, Avon). 2008;23(2):
203–211.
12. Boling MC, Bolgla LA, Mattacola CG, Uhl TL, Hosey RG.
Outcomes of a weight-bearing rehabilitation program for patients
diagnosed with patellofemoral pain syndrome. Arch Phys Med
Rehabil. 2006;87(11):1428–1435.
13. Moss RI, Devita P, Dawson ML. A biomechanical analysis of
patellofemoral stress syndrome. J Athl Train. 1992;27(1):64–69.
14. Snyder KR, Earl JE, O’Connor KM, Ebersole KT. Resistance
training is accompanied by increases in hip strength and changes in
lower extremity biomechanics during running. Clin Biomech (Bristol,
Avon). 2009;24(1):26–34.
15. Hamill J, van Emmerik RE, Heiderscheit BC, Li L. A dynamical
systems approach to lower extremity running injuries. Clin Biomech
(Bristol, Avon). 1999;14(5):297–308.
16. Heiderscheit BC, Hamill J, van Emmerik RE. Q-angle influences on
the variability of lower extremity coordination during running. Med
Sci Sports Exerc. 1999;31(9):1313–1319.
17. Miller RH, Meardon SA, Derrick TR, Gillette JC. Continuous
relative phase variability during an exhaustive run in runners with a
history of iliotibial band syndrome. J Appl Biomech. 2008;24(3):
262–270.
18. Nakamura T, Meguro K, Sasaki H. Relationship between falls and
stride length variability in senile dementia of the Alzheimer type.
Gerontology. 1996;42(2):108–113.
19. Hausdorff JM, Rios DA, Edelberg HK. Gait variability and fall risk
in community-living older adults: a 1-year prospective study. Arch
Phys Med Rehabil. 2001;82(8):1050–1056.
20. Drewes LK, McKeon PO, Paolini G, et al. Altered ankle kinematics
and shank-rear-foot coupling in those with chronic ankle instability.
J Sport Rehabil. 2009;18(3):375–388.
21. McKeon PO, Paolini G, Ingersoll CD, et al. Effects of balance
training on gait parameters in patients with chronic ankle instability:
a randomized controlled trial. Clin Rehabil. 2009;23(7):609–621.
22. Ferber R, McClay Davis I, Williams DS III, Laughton C. A
comparison of within- and between-day reliability of discrete 3-D
lower extremity variables in runners. J Orthop Res. 2002;20(6):
1139–1145.
23. Ferber R, Sheerin K, Kendall KD. Measurement error of rearfoot
kinematics during running between a 100Hz and 30Hz camera. Int
Sportsmed J. 2009;10(3):152–162.
24. Piva SR, Fitzgerald K, Irrgang JJ, et al. Reliability of measures of
impairments associated with patellofemoral pain syndrome. BMC
Musculoskeletal Disord. 2006;31(7):33.
25. Earl JE. Gluteus medius activity during three variations of isometric
single-leg stance. J Sport Rehabil. 2005;14(1):1–11.
26. Zeni JA Jr, Richards JG, Higginson JS. Two simple methods for
determining gait events during treadmill and overground walking
using kinematic data. Gait Posture. 2008;27(4):710–714.
27. McLean SG, Walker K, Ford KR, Myer GD, Hewett TE, Van den
Bogert AJ. Evaluation of a two dimensional analysis method as a
screening and evaluation tool for anterior cruciate ligament injury.
Br J Sports Med. 2005;39(6):355–362.
28. Derrick TR, Bates BT, Dufek JS. Evaluation of time-series data sets
using the Pearson product-moment correlation coefficient. Med Sci
Sports Exerc. 1994;26(7):919–928.
29. Ferber R, Osternig LR, Woollacott MH, Wasielewski NJ, Lee JH.
Bilateral accommodations to anterior cruciate ligament deficiency
and surgery. Clin Biomech (Bristol, Avon). 2004;19(2):136–144.
30. Fredricson M, Cookingham CL, Chaudhari AM, Dowdell BC,
Oestreicher N, Sahrmann SA. Hip abductor weakness in runners with
iliotibial band syndrome. Clin J Sport Med. 2000;10(3):169–175.
31. Nakagawa TH, Muniz TB, Baldon Rde M, Dias Maciel C, de
Menezes Reiff RB, Serrao FV. The effect of additional strengthening
of hip abductor and lateral rotator muscles in patellofemoral pain
syndrome: a randomized controlled pilot study. Clin Rehabil.
2008;22(12):1051–1060.
32. Tyler TF, Nicholas SJ, Mullaney MJ, McHugh MP. The role of hip
muscle function in the treatment of patellofemoral pain syndrome.
Am J Sports Med. 2006;34(4):630–636.
33. Akima H, Takahashi H, Kuno SY, et al. Early phase adaptations of
muscle use and strength to isokinetic training. Med Sci Sports Exerc.
1999;31(4):588–594.
34. Patten C, Kamen G, Rowland DM. Adaptations in maximal motor
unit discharge rate to strength training in young and older adults.
Muscle Nerve. 2001;24(4):542–550.
Address correspondence to Reed Ferber, PhD, ATC, CAT(C), Faculty of Kinesiology, 2500 University Drive Northwest, University ofCalgary, Calgary, AB, Canada T2N 1N4. Address e-mail to [email protected].
Journal of Athletic Training 149

Interday Reliability of Peak Muscular Power Outputson an Isotonic Dynamometer and Assessment ofActive Trunk Control Using the Chop and Lift Tests
Thomas G. Palmer, MSEd, ATC, CSCS*�; Timothy L. Uhl, PhD, PT, ATC,FNATA*
Departments of *Rehabilitation Science and 3Kinesiology and Health Promotion, University of Kentucky, Lexington
Context: Assessment techniques used to measure function-al tasks involving active trunk control are restricted to linearmovements that lack the explosive movements and dynamictasks associated with activities of daily living and sport. Reliableclinical methods used to assess the diagonal and ballisticmovements about the trunk are lacking.
Objective: To assess the interday reliability of peak muscu-lar power outputs while participants performed diagonal chopand lift tests and maintained a stable trunk.
Design: Controlled laboratory study.Setting: University research laboratory.Patients or Other Participants: Eighteen healthy individu-
als (10 men and 8 women; age 5 32 6 11 years, height 5 1686 12 cm, mass 5 80 6 19 kg) from the general populationparticipated.
Intervention(s): Participants performed 2 power tests (chop,lift) using an isotonic dynamometer and 3 endurance tests(Biering-Sørensen, side-plank left, side-plank right) to assessactive trunk control. Testing was performed on 3 different daysseparated by at least 1 week. Reliability was compared between
days 1 and 2 and between days 2 and 3. Correlations betweenthe power and endurance tests were evaluated to determine thedegree of similarity.
Main Outcome Measure(s): Peak muscular power out-puts (watts) derived from a 1-repetition maximum protocol forthe chop and lift tests were collected for both the right and leftsides.
Results: Intraclass correlation coefficients for peak muscularpower were highly reliable for the chop (range, 0.87–0.98), lift(range, 0.83–0.96), and endurance (range, 0.80–0.98) testsbetween test sessions. The correlations between the powerassessments and the Biering-Sørensen test (r range, 20.008 to0.017) were low. The side-plank tests were moderatelycorrelated with the chop (r range, 0.528–0.590) and the lift(r range, 0.359–0.467) tests.
Conclusions: The diagonal chop and lift power protocolgenerated reliable data and appears to be a dynamic test thatsimulates functional tasks, which require dynamic trunk control.
Key Words: trunk stability, anaerobic peak muscular power,assessment, diagonal movement patterns
Key Points
N Peak muscular power outputs (measured in watts) obtained from the chop and lift tests were highly reliable acrossdifferent test days separated by at least 1 week.
N The chop and lift tests were novel but reliable measurements for dynamic, multiplanar functional activities that have low tomoderate correlation with traditional muscular endurance tests, indicating that these tests provide unique informationabout function compared with traditional measures.
N Performing diagonal power movements about a stable trunk can offer clinicians alternate tests that simulate activities ofdaily living and sport in a dynamic nature.
Functional tasks in activities of daily living and sportrequire some dynamic trunk activity.1,2 The trunkmusculature absorbs, produces, and transports
multidirectional forces to and from the upper and lowerextremities by maintaining a balance of stability andmobility.3–5 The importance of maintaining and control-ling different positions of the trunk during physical activityhas been well established in the functional performanceand injury literature.6–12 Researchers have hypothesizedthat deficits in muscular capabilities (power, strength,endurance) and motor control (amplitude, timing) lead topoor trunk stabilization and can alter performance orincrease injury susceptibility.10,13–17 As a result, severaldifferent assessment techniques have emerged to evaluatetrunk musculature. Unfortunately, most of these assess-
ment techniques focus on muscular endurance tasks andevaluate static postures18–20 or linear movements.21 Re-cently, investigators22,23 identified muscular power as acritical element in the development and evaluation ofproximal stability for dynamic trunk activity. Powermovements, such as lifting a heavy bag of pet food outof the car or throwing or kicking a ball, rely on a proximalfoundation.5,24,25 Some researchers16,17 consider diagonaland forceful movement patterns that simulate motionsassociated with activities of daily living or sport to be morefunctionally appropriate in assessing the capabilities of thetrunk stabilizers. To date, limited reliable assessment testsare available to evaluate active trunk control with diagonaland forceful movements similar to activities of daily livingand sport.
Journal of Athletic Training 2011;46(2):150–159g by the National Athletic Trainers’ Association, Incwww.nata.org/jat
original research
150 Volume 46 N Number 2 N April 2011
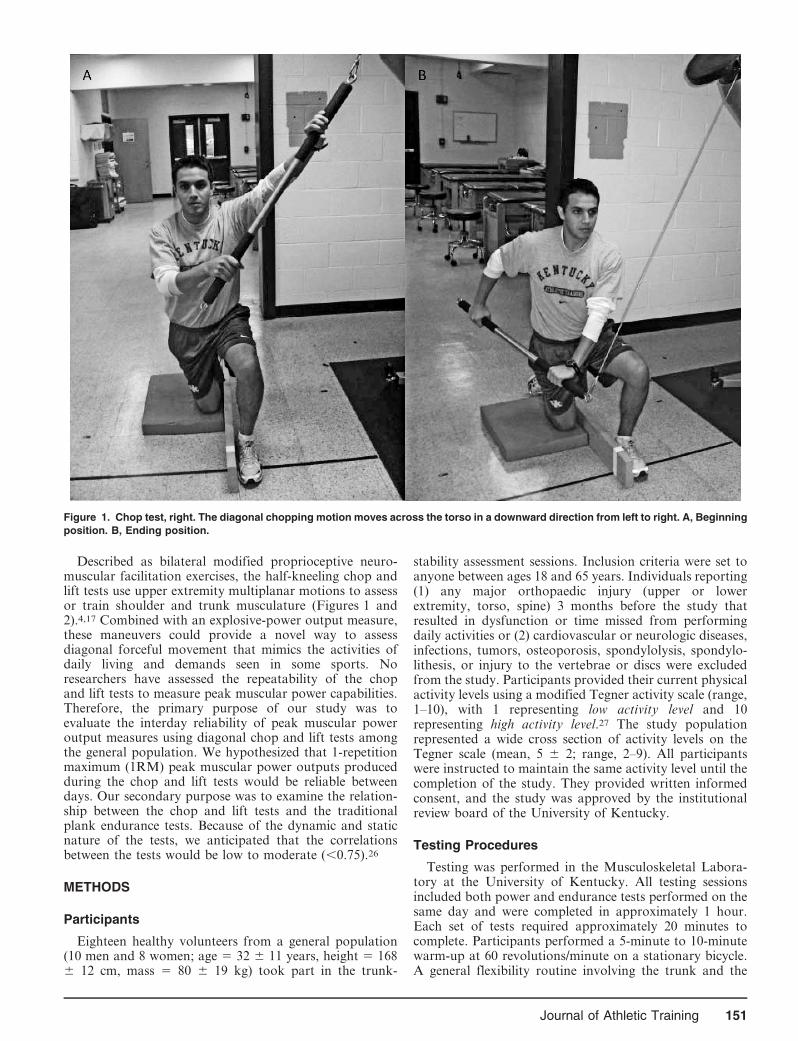
Described as bilateral modified proprioceptive neuro-muscular facilitation exercises, the half-kneeling chop andlift tests use upper extremity multiplanar motions to assessor train shoulder and trunk musculature (Figures 1 and2).4,17 Combined with an explosive-power output measure,these maneuvers could provide a novel way to assessdiagonal forceful movement that mimics the activities ofdaily living and demands seen in some sports. Noresearchers have assessed the repeatability of the chopand lift tests to measure peak muscular power capabilities.Therefore, the primary purpose of our study was toevaluate the interday reliability of peak muscular poweroutput measures using diagonal chop and lift tests amongthe general population. We hypothesized that 1-repetitionmaximum (1RM) peak muscular power outputs producedduring the chop and lift tests would be reliable betweendays. Our secondary purpose was to examine the relation-ship between the chop and lift tests and the traditionalplank endurance tests. Because of the dynamic and staticnature of the tests, we anticipated that the correlationsbetween the tests would be low to moderate (,0.75).26
METHODS
Participants
Eighteen healthy volunteers from a general population(10 men and 8 women; age 5 32 6 11 years, height 5 1686 12 cm, mass 5 80 6 19 kg) took part in the trunk-
stability assessment sessions. Inclusion criteria were set toanyone between ages 18 and 65 years. Individuals reporting(1) any major orthopaedic injury (upper or lowerextremity, torso, spine) 3 months before the study thatresulted in dysfunction or time missed from performingdaily activities or (2) cardiovascular or neurologic diseases,infections, tumors, osteoporosis, spondylolysis, spondylo-lithesis, or injury to the vertebrae or discs were excludedfrom the study. Participants provided their current physicalactivity levels using a modified Tegner activity scale (range,1–10), with 1 representing low activity level and 10representing high activity level.27 The study populationrepresented a wide cross section of activity levels on theTegner scale (mean, 5 6 2; range, 2–9). All participantswere instructed to maintain the same activity level until thecompletion of the study. They provided written informedconsent, and the study was approved by the institutionalreview board of the University of Kentucky.
Testing Procedures
Testing was performed in the Musculoskeletal Labora-tory at the University of Kentucky. All testing sessionsincluded both power and endurance tests performed on thesame day and were completed in approximately 1 hour.Each set of tests required approximately 20 minutes tocomplete. Participants performed a 5-minute to 10-minutewarm-up at 60 revolutions/minute on a stationary bicycle.A general flexibility routine involving the trunk and the
Figure 1. Chop test, right. The diagonal chopping motion moves across the torso in a downward direction from left to right. A, Beginning
position. B, Ending position.
Journal of Athletic Training 151
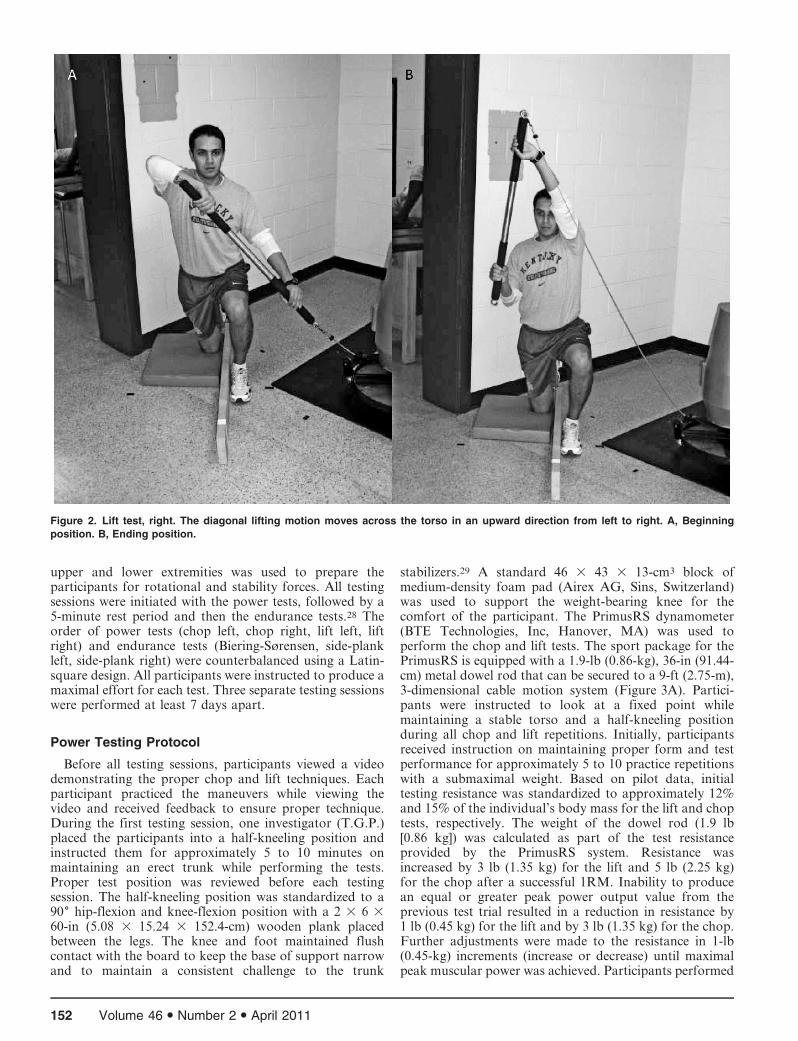
upper and lower extremities was used to prepare theparticipants for rotational and stability forces. All testingsessions were initiated with the power tests, followed by a5-minute rest period and then the endurance tests.28 Theorder of power tests (chop left, chop right, lift left, liftright) and endurance tests (Biering-Sørensen, side-plankleft, side-plank right) were counterbalanced using a Latin-square design. All participants were instructed to produce amaximal effort for each test. Three separate testing sessionswere performed at least 7 days apart.
Power Testing Protocol
Before all testing sessions, participants viewed a videodemonstrating the proper chop and lift techniques. Eachparticipant practiced the maneuvers while viewing thevideo and received feedback to ensure proper technique.During the first testing session, one investigator (T.G.P.)placed the participants into a half-kneeling position andinstructed them for approximately 5 to 10 minutes onmaintaining an erect trunk while performing the tests.Proper test position was reviewed before each testingsession. The half-kneeling position was standardized to a906 hip-flexion and knee-flexion position with a 2 3 6 360-in (5.08 3 15.24 3 152.4-cm) wooden plank placedbetween the legs. The knee and foot maintained flushcontact with the board to keep the base of support narrowand to maintain a consistent challenge to the trunk
stabilizers.29 A standard 46 3 43 3 13-cm3 block ofmedium-density foam pad (Airex AG, Sins, Switzerland)was used to support the weight-bearing knee for thecomfort of the participant. The PrimusRS dynamometer(BTE Technologies, Inc, Hanover, MA) was used toperform the chop and lift tests. The sport package for thePrimusRS is equipped with a 1.9-lb (0.86-kg), 36-in (91.44-cm) metal dowel rod that can be secured to a 9-ft (2.75-m),3-dimensional cable motion system (Figure 3A). Partici-pants were instructed to look at a fixed point whilemaintaining a stable torso and a half-kneeling positionduring all chop and lift repetitions. Initially, participantsreceived instruction on maintaining proper form and testperformance for approximately 5 to 10 practice repetitionswith a submaximal weight. Based on pilot data, initialtesting resistance was standardized to approximately 12%and 15% of the individual’s body mass for the lift and choptests, respectively. The weight of the dowel rod (1.9 lb[0.86 kg]) was calculated as part of the test resistanceprovided by the PrimusRS system. Resistance wasincreased by 3 lb (1.35 kg) for the lift and 5 lb (2.25 kg)for the chop after a successful 1RM. Inability to producean equal or greater peak power output value from theprevious test trial resulted in a reduction in resistance by1 lb (0.45 kg) for the lift and by 3 lb (1.35 kg) for the chop.Further adjustments were made to the resistance in 1-lb(0.45-kg) increments (increase or decrease) until maximalpeak muscular power was achieved. Participants performed
Figure 2. Lift test, right. The diagonal lifting motion moves across the torso in an upward direction from left to right. A, Beginning
position. B, Ending position.
152 Volume 46 N Number 2 N April 2011
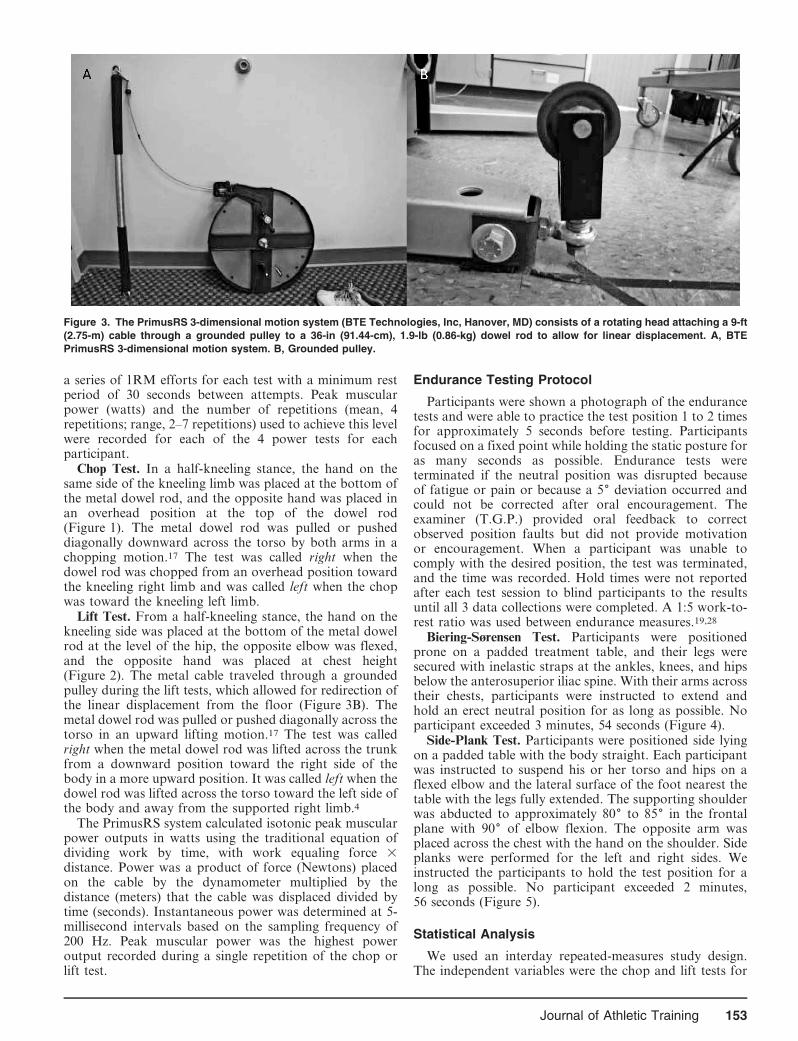
a series of 1RM efforts for each test with a minimum restperiod of 30 seconds between attempts. Peak muscularpower (watts) and the number of repetitions (mean, 4repetitions; range, 2–7 repetitions) used to achieve this levelwere recorded for each of the 4 power tests for eachparticipant.
Chop Test. In a half-kneeling stance, the hand on thesame side of the kneeling limb was placed at the bottom ofthe metal dowel rod, and the opposite hand was placed inan overhead position at the top of the dowel rod(Figure 1). The metal dowel rod was pulled or pusheddiagonally downward across the torso by both arms in achopping motion.17 The test was called right when thedowel rod was chopped from an overhead position towardthe kneeling right limb and was called left when the chopwas toward the kneeling left limb.
Lift Test. From a half-kneeling stance, the hand on thekneeling side was placed at the bottom of the metal dowelrod at the level of the hip, the opposite elbow was flexed,and the opposite hand was placed at chest height(Figure 2). The metal cable traveled through a groundedpulley during the lift tests, which allowed for redirection ofthe linear displacement from the floor (Figure 3B). Themetal dowel rod was pulled or pushed diagonally across thetorso in an upward lifting motion.17 The test was calledright when the metal dowel rod was lifted across the trunkfrom a downward position toward the right side of thebody in a more upward position. It was called left when thedowel rod was lifted across the torso toward the left side ofthe body and away from the supported right limb.4
The PrimusRS system calculated isotonic peak muscularpower outputs in watts using the traditional equation ofdividing work by time, with work equaling force 3distance. Power was a product of force (Newtons) placedon the cable by the dynamometer multiplied by thedistance (meters) that the cable was displaced divided bytime (seconds). Instantaneous power was determined at 5-millisecond intervals based on the sampling frequency of200 Hz. Peak muscular power was the highest poweroutput recorded during a single repetition of the chop orlift test.
Endurance Testing Protocol
Participants were shown a photograph of the endurancetests and were able to practice the test position 1 to 2 timesfor approximately 5 seconds before testing. Participantsfocused on a fixed point while holding the static posture foras many seconds as possible. Endurance tests wereterminated if the neutral position was disrupted becauseof fatigue or pain or because a 56 deviation occurred andcould not be corrected after oral encouragement. Theexaminer (T.G.P.) provided oral feedback to correctobserved position faults but did not provide motivationor encouragement. When a participant was unable tocomply with the desired position, the test was terminated,and the time was recorded. Hold times were not reportedafter each test session to blind participants to the resultsuntil all 3 data collections were completed. A 1:5 work-to-rest ratio was used between endurance measures.19,28
Biering-Sørensen Test. Participants were positionedprone on a padded treatment table, and their legs weresecured with inelastic straps at the ankles, knees, and hipsbelow the anterosuperior iliac spine. With their arms acrosstheir chests, participants were instructed to extend andhold an erect neutral position for as long as possible. Noparticipant exceeded 3 minutes, 54 seconds (Figure 4).
Side-Plank Test. Participants were positioned side lyingon a padded table with the body straight. Each participantwas instructed to suspend his or her torso and hips on aflexed elbow and the lateral surface of the foot nearest thetable with the legs fully extended. The supporting shoulderwas abducted to approximately 806 to 856 in the frontalplane with 906 of elbow flexion. The opposite arm wasplaced across the chest with the hand on the shoulder. Sideplanks were performed for the left and right sides. Weinstructed the participants to hold the test position for along as possible. No participant exceeded 2 minutes,56 seconds (Figure 5).
Statistical Analysis
We used an interday repeated-measures study design.The independent variables were the chop and lift tests for
Figure 3. The PrimusRS 3-dimensional motion system (BTE Technologies, Inc, Hanover, MD) consists of a rotating head attaching a 9-ft
(2.75-m) cable through a grounded pulley to a 36-in (91.44-cm), 1.9-lb (0.86-kg) dowel rod to allow for linear displacement. A, BTE
PrimusRS 3-dimensional motion system. B, Grounded pulley.
Journal of Athletic Training 153

Figure 4. Biering-Sørensen isometric endurance test. Participants were instructed to stabilize and maintain an erect torso with their legs
secured to a treatment table.
Figure 5. Side-plank isometric endurance test performed to the left side. The erect torso and lumbopelvic area were supported over the
elbow and the feet. During performance, a visual target was provided to help the participant maintain focus and balance.
154 Volume 46 N Number 2 N April 2011
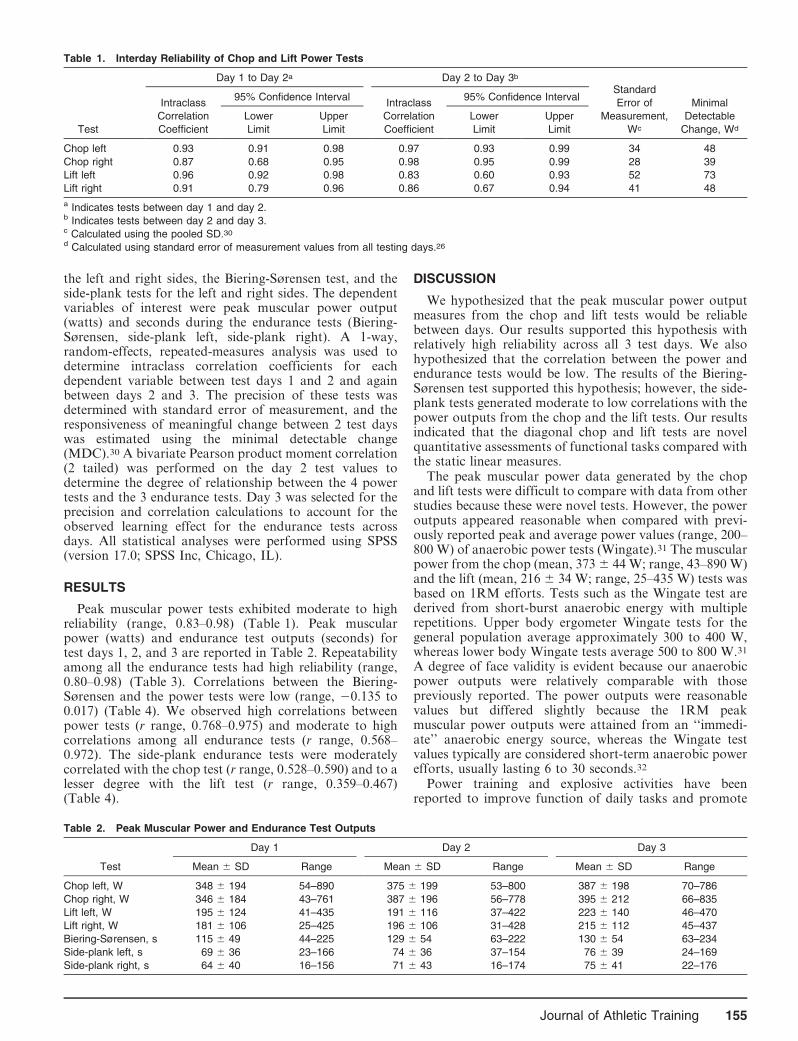
the left and right sides, the Biering-Sørensen test, and theside-plank tests for the left and right sides. The dependentvariables of interest were peak muscular power output(watts) and seconds during the endurance tests (Biering-Sørensen, side-plank left, side-plank right). A 1-way,random-effects, repeated-measures analysis was used todetermine intraclass correlation coefficients for eachdependent variable between test days 1 and 2 and againbetween days 2 and 3. The precision of these tests wasdetermined with standard error of measurement, and theresponsiveness of meaningful change between 2 test dayswas estimated using the minimal detectable change(MDC).30 A bivariate Pearson product moment correlation(2 tailed) was performed on the day 2 test values todetermine the degree of relationship between the 4 powertests and the 3 endurance tests. Day 3 was selected for theprecision and correlation calculations to account for theobserved learning effect for the endurance tests acrossdays. All statistical analyses were performed using SPSS(version 17.0; SPSS Inc, Chicago, IL).
RESULTS
Peak muscular power tests exhibited moderate to highreliability (range, 0.83–0.98) (Table 1). Peak muscularpower (watts) and endurance test outputs (seconds) fortest days 1, 2, and 3 are reported in Table 2. Repeatabilityamong all the endurance tests had high reliability (range,0.80–0.98) (Table 3). Correlations between the Biering-Sørensen and the power tests were low (range, 20.135 to0.017) (Table 4). We observed high correlations betweenpower tests (r range, 0.768–0.975) and moderate to highcorrelations among all endurance tests (r range, 0.568–0.972). The side-plank endurance tests were moderatelycorrelated with the chop test (r range, 0.528–0.590) and to alesser degree with the lift test (r range, 0.359–0.467)(Table 4).
DISCUSSION
We hypothesized that the peak muscular power outputmeasures from the chop and lift tests would be reliablebetween days. Our results supported this hypothesis withrelatively high reliability across all 3 test days. We alsohypothesized that the correlation between the power andendurance tests would be low. The results of the Biering-Sørensen test supported this hypothesis; however, the side-plank tests generated moderate to low correlations with thepower outputs from the chop and the lift tests. Our resultsindicated that the diagonal chop and lift tests are novelquantitative assessments of functional tasks compared withthe static linear measures.
The peak muscular power data generated by the chopand lift tests were difficult to compare with data from otherstudies because these were novel tests. However, the poweroutputs appeared reasonable when compared with previ-ously reported peak and average power values (range, 200–800 W) of anaerobic power tests (Wingate).31 The muscularpower from the chop (mean, 373 6 44 W; range, 43–890 W)and the lift (mean, 216 6 34 W; range, 25–435 W) tests wasbased on 1RM efforts. Tests such as the Wingate test arederived from short-burst anaerobic energy with multiplerepetitions. Upper body ergometer Wingate tests for thegeneral population average approximately 300 to 400 W,whereas lower body Wingate tests average 500 to 800 W.31
A degree of face validity is evident because our anaerobicpower outputs were relatively comparable with thosepreviously reported. The power outputs were reasonablevalues but differed slightly because the 1RM peakmuscular power outputs were attained from an ‘‘immedi-ate’’ anaerobic energy source, whereas the Wingate testvalues typically are considered short-term anaerobic powerefforts, usually lasting 6 to 30 seconds.32
Power training and explosive activities have beenreported to improve function of daily tasks and promote
Table 1. Interday Reliability of Chop and Lift Power Tests
Test
Day 1 to Day 2a Day 2 to Day 3b
Standard
Error of
Measurement,
Wc
Minimal
Detectable
Change, Wd
Intraclass
Correlation
Coefficient
95% Confidence IntervalIntraclass
Correlation
Coefficient
95% Confidence Interval
Lower
Limit
Upper
Limit
Lower
Limit
Upper
Limit
Chop left 0.93 0.91 0.98 0.97 0.93 0.99 34 48
Chop right 0.87 0.68 0.95 0.98 0.95 0.99 28 39
Lift left 0.96 0.92 0.98 0.83 0.60 0.93 52 73
Lift right 0.91 0.79 0.96 0.86 0.67 0.94 41 48
a Indicates tests between day 1 and day 2.b Indicates tests between day 2 and day 3.c Calculated using the pooled SD.30
d Calculated using standard error of measurement values from all testing days.26
Table 2. Peak Muscular Power and Endurance Test Outputs
Test
Day 1 Day 2 Day 3
Mean 6 SD Range Mean 6 SD Range Mean 6 SD Range
Chop left, W 348 6 194 54–890 375 6 199 53–800 387 6 198 70–786
Chop right, W 346 6 184 43–761 387 6 196 56–778 395 6 212 66–835
Lift left, W 195 6 124 41–435 191 6 116 37–422 223 6 140 46–470
Lift right, W 181 6 106 25–425 196 6 106 31–428 215 6 112 45–437
Biering-Sørensen, s 115 6 49 44–225 129 6 54 63–222 130 6 54 63–234
Side-plank left, s 69 6 36 23–166 74 6 36 37–154 76 6 39 24–169
Side-plank right, s 64 6 40 16–156 71 6 43 16–174 75 6 41 22–176
Journal of Athletic Training 155

muscle hypertrophy at a more efficient rate than does slow-velocity resistance training.33–37 Activities that producehigher force at high velocities at the distal segments(kicking, throwing, landing) depend on moments createdin the proximal segments.24,25,38 Therefore, it is reasonableto combine diagonal patterns using the extremities with a1RM protocol to determine the power capacity of theupper extremity and trunk functioning together. Severalauthors14,22,25,29,39,40 have recognized the importance ofactive trunk control during power movements but have notfully explored the use of peak muscular power and trunkcontrol. These results indicate that the dynamic power testmight be a reliable method with which to further explorethese systems and how they change in response to injury ortraining.
Nesser et al41 and Nesser and Lee42 studied thecorrelation between power performance measures and teststhat challenge dynamic trunk activity. In both studies, theauthors reported very low to moderate correlations (rrange, 0.099–0.6) between trunk muscular measures(planks, trunk flexion-extension repetitions) and powerperformance measures (20-yd [18.3-m] and 40-yd [36.6-m]sprints, vertical jump) among football players and femalesoccer players.41,42 They concluded the assessment testsused had very little to do with athletic performancemeasures in these sports and the assessment techniquesused possibly were not specific enough to evaluate athleticperformance.41,42 The measures used in these studies wereprimarily static linear tests and static muscular-endurancetests and not explosive anaerobic tasks commonly associ-ated with sport performance. The low to moderatecorrelations (r range, 0.099–0.6) between the static/lineartests and sport performance measures were similar to thecorrelations between the power and endurance assessment
tests used in our study (r range, 20.008 to 0.590). Ourresults offer further evidence that trunk stability duringdynamic arm movements might function along a muscularperformance continuum (power–strength–endurance), assuggested by McGill et al.22 The moderate correlationsbetween the power and side-plank tests (r range, 0.359–0.590) revealed that approximately 33% of the variance isexplained by the static measures. The fact that approxi-mately 66% of the variance is unexplained between thesemeasures indicates that the chop and lift protocol mightprovide another method with which to further investigateactivities of daily living and sport by requiring the distalextremities to exert a maximal effort on a stable proximalbase.
Recently, McGill et al22 hypothesized that the hip andtrunk stabilizers can develop sport-specific anaerobiccapabilities that assist in the performance of explosivetasks. Some authors22,23,29,40,43,44 have suggested thesemuscular characteristics are directly related to sportspecificity, the bioenergetics of an individual, and therange of motion needed to successfully complete a giventask. McGill et al22 evaluated electromyography of thelumbopelvic-trunk musculature along a stability continu-um and concluded that different levels of trunk muscularactivation and stiffness are required for different activitiesand should be trained according to the mobility andstability needs of a specific task. In addition, traditionallinear and static measures commonly used for patients withlow back conditions or lower levels of trunk stabilizationlikely are less appropriate for monitoring trunk control athigher levels of activity.3,45 Therefore, clinicians shouldconsider assessing dynamic trunk control on a continuumthat progresses from low to high levels of muscular activity.The chop and lift tests might be good alternative tests when
Table 3. Interday Reliability of Muscular Endurance Tests
Test
Day 1 to Day 2a Day 2 to Day 3b
Standard
Error of
Measurement,
sc,d
Minimal
Detectable
Change, sc,e
Intraclass
Correlation
Coefficient
95% Confidence IntervalIntraclass
Correlation
Coefficient
95% Confidence Interval
Lower
Limit
Upper
Limit
Lower
Limit
Upper
Limit
Biering-Sørensen 0.80 0.65 0.97 0.98 0.95 0.99 7 10
Side-plank left 0.89 0.81 0.97 0.96 0.91 0.98 7 10
Side-plank right 0.91 0.80 0.97 0.98 0.95 0.99 6 8
a Indicates tests between day 1 and day 2.b Indicates tests between day 2 and day 3.c Time in seconds is the average amount of seconds for each endurance test for all sessions.d Calculated using the pooled SD.30
e Calculated using standard error of measurement values from all testing days.26
Table 4. Bivariate Pearson Product Moment Correlation Coefficients (P Values) for Day 3 of Testing
Test
Endurance Test Power Test
Biering-Sørensen Side-Plank Left Side-Plank Right Chop Left Chop Right Lift Left Lift Right
Biering-Sørensen 1a 0.615 (.007b) 0.568 (.01b) 20.027 (.92) 0.017 (.95) 20.008 (.97) 20.135 (.59)
Side-plank left 1a 0.972 (,.001b) 0.528 (.02b) 0.547 (.03b) 0.451 (.06) 0.367 (.13)
Side-plank right 1a 0.584 (.01b) 0.590 (.01b) 0.467 (.05) 0.359 (.14)
Chop left 1a 0.975 (,.001b) 0.768 (,.001b) 0.860 (,.001b)
Chop right 1a 0.783 (,.001b) 0.857 (,.001b)
Lift left 1a 0.769 (,.001b)
Lift right 1a
a Indicates perfect correlation.b Indicates difference (P , .05).
156 Volume 46 N Number 2 N April 2011
assessing movements involving the trunk. The combinationof ballistic arm movements and the narrow base of supportin the half-kneeling stance creates a different state fromthat associated with the static plank test, which offers analternative challenge to the proximal stabilizers.23,29 Sport-specific training and assessments have been implementedfor decades; these tests might provide another method toevaluate active extremity and trunk function. Furtherresearch is needed to investigate the performance capabil-ities as they pertain to specific tasks that require muscularpower rather than muscular endurance.
Muscular endurance characteristics of the hip and trunkstabilizers traditionally have been recognized as primarycontributors in maintaining a stable lumbopelvic area.6,8,11
As a result, the Biering-Sørensen and side-plank tests havebecome 2 of the most common clinical tests used to assessthe isometric endurance capabilities of the hip and trunkmusculature to identify individuals with potential dysfunc-tion.18,19,46 Therefore, we investigated the relationshipbetween the traditional measures and a novel test withthe expectation that the correlation between them would below, per our hypothesis. The moderate correlation (r range,0.359–0.590; P range, .01–.14) between the side-plank testsand the power maneuvers indicated that both testschallenge the lateral stabilizers (oblique musculature,transverse abdominus) but conceivably through the useof different muscle bioenergetics.22,46 Although not quan-tified in our study, the correlations between the chop testand the side-plank tests are likely due to similarities in themuscular activation of the lateral trunk and abdominalobliques necessary to complete these movements.47 Thelow to moderate correlations between the differentassessment protocols support the divergent validity of thepower test outputs. Both the power and enduranceassessment protocols appear to be measuring differentcharacteristics, perhaps on a performance continuum.22
Diagonal movements, such as those used in the chop andlift tests, are likely to promote sequential muscle activationon multiple planes between the proximal and distal bodysegments. The muscular endurance tests tend to isolate aselect group of muscles while functioning on a singleplane.1,16,17,20,25 The erector spine, gluteal, or hamstringsmuscles have been reported20 to be active predominantlyduring a supine-plank position and Biering-Sørensen proneposition. The anterior musculatures of the torso and pelvisare active predominately during a prone-plank position,whereas the lateral trunk stabilizers are isolated with theside-plank positions.20,47–49 The trunk stabilizers seldomlyare isolated in this manner22; rather, they functioncollectively on multiple planes to provide different degreesof stability and mobility.50–52 As such, researchers39,48,53–55
have reported that static and 1-dimensional muscularendurance tests are poorly correlated with tasks associatedwith daily function and sport. In part, this is likely due tothe limited multidimensional and diagonal movementscommonly used in sport. McGill et al22 identified thepotential importance of incorporating diagonal movementpatterns because greater electromyographic peak torqueactivation among a variety of trunk musculature wasevident when compared with linear stability tasks. Fur-thermore, the use of diagonal movement patterns has beenreported16 to promote a balance between agonist andantagonist muscle activation of multiple muscle groups.
Thus, diagonal movement patterns of the extremitiesshould be considered because they promote a comprehen-sive integration of active trunk stability on multiple planes.The results of our study provide a foundation for furtherinvestigations involving diagonal movements and func-tional tasks.
To have clinical meaningfulness, a new clinical test needsto demonstrate high reliability, validity, and responsivenessto change.30 The primary purpose of our study was toevaluate interday reliability of peak muscular outputmeasures using diagonal chop and lift tests; the reliabilitywas found to be good to excellent (intraclass correlationcoefficient range, 0.83–0.98). However, a gradual increasein the peak power outputs from day 1 to day 3 for eachtesting session indicated that learning might have beenoccurring (Table 2). In previous studies,18,19 investigatorshave identified a learning effect between testing sessions formuscular endurance tests involving the trunk and pelvicmusculature. Based on our study and previous reports, wesuggest that a familiarization period be included. At least1 day of testing or training is recommended to ensure thatmeasurable changes are true and are not due to learning.48
We did not specifically evaluate responsiveness becauseit would have required either an intervention or 2 separatepopulations. However, the calculation of standard error ofmeasurement and MDC describes the potential change thatwould be needed to determine a true change in perfor-mance (Tables 1 and 2). The MDC values represent theminimal amount of change necessary to determine a truechange has occurred beyond the measurement error. Theaverage MDCs for the 4 power tests were about 20% oftheir respective mean values. An approximate increase inperformance of 20% would represent a meaningful clinicalchange for the power tests. This percentage is similar tothat found with traditional static measures within a generalpopulation.18 This percentage of change seems reasonablebecause other measures, such as numeric pain rating scales,require a 2 out of 10 change to indicate a meaningfulchange.56
The initial test resistance of 12% and 15% body mass forthe lift and chop tests, respectively, appears to be arelatively good recommendation when testing the generalpopulation for 1RM. The average number of repetitionsneeded to reach maximal peak power outputs was 3 for thelift tests and 4 for the chop tests. Testing resistance that iscloser to an individual’s 1RM makes the testing processmore efficient.57 Although not different, a trend of moretrials for the chop test was evident among participantsscoring ‘‘high’’ (.7) on the Tegner activity scale. Ourresults indicated that individuals with a higher activity levelor those competing in sport might benefit from using ahigher starting resistance, such as 20% to 25% of the totalbody mass, especially with the chop test.
Limitations
Although the values gained from the chop and lift testswere reliable and attainable in approximately 30 minutes(mean 5 26 6 3.9 minutes), the test techniques did havesome limitations. The diagonal patterns required theparticipant to create forceful movements of the upperbody while maintaining a stable proximal base from a half-kneeling position. This required individuals to have
Journal of Athletic Training 157
adequate upper body strength and coordination to performthese movements. It is impossible to not consider thecontributions made by the upper extremity to the testingprocedure and, therefore, the contribution to the peakpower generated. This test does not isolate the specifictrunk musculature but evaluates contributions of dynamictrunk control while an individual performs a functionaltask with the lower and upper extremity as a single forcefulunit. The lift motion is a slightly awkward movement;compared with the chop test, it requires more time topractice, to instruct the participant in use, and to completetesting. Improvements in the testing protocol might beneeded to refine the overall efficiency of the assessmenttechniques.
CONCLUSIONS
The chop and lift tests performed on the PrimusRSdynamometer provided repeatable measures of poweroutput from week to week in the general population. Thisnovel test appeared to measure a different construct thanmuscular endurance because correlations with the Biering-Sørensen and side-plank tests were low to moderate. Thefrequent use of power movements on multiple planes inathletics and in daily tasks requires clinicians andresearchers to identify testing techniques that evaluatethese effects. We believe the chop and lift 1RM protocolhas good potential to serve this purpose because it appearsto measure functional tasks that require dynamic trunkcontrol. Further testing and modification of this protocolmight provide additional evidence to support the potentialroles that muscular power might play during specificactivities.
ACKNOWLEDGMENTS
Dr Uhl is on the Research Advisor Committee for BTETechnologies, Inc (Hanover, MD). A portion of the results (datafor 12 participants) was included in a poster presentation at theCanadian Academy of Sport and Exercise Medicine Conference,June 4–7, 2009, in Vancouver, BC, Canada.
REFERENCES
1. Hirashima M, Kadota H, Sakurai S, Kudo K, Ohtsuki T. Sequential
muscle activity and its functional role in the upper extremity and
trunk during overarm throwing. J Sports Sci. 2002;20(4):301–310.
2. Putman CA. Sequential motions of body segments in striking and
throwing skills: descriptions and explanations. J Biomech. 1993;
26(suppl 1):125–135.
3. Comerford MJ, Mottram SL. Functional stability re-training:
principles and strategies for managing mechanical dysfunction. Man
Ther. 2001;6(1):3–14.
4. Cook G, Fields K. Functional training for the torso. Strength Cond J.
1997;19(2):14–19.
5. Kibler WB, Press J, Sciascia A. The role of core stability in athletic
function. Sports Med. 2006;36(3):189–198.
6. Cholewicki J, McGill SM. Mechanical stability of the in vivo lumbar
spine: implications for injury and chronic low back pain. Clin
Biomech (Bristol, Avon). 1996;11(1):1–15.
7. Comerford MJ, Mottram SL. Movement and stability dysfunction:
contemporary developments. Man Ther. 2001;6(1):15–26.
8. Hewett TE, Torg JS, Boden BP. Video analysis of trunk and knee
motion during non-contact anterior cruciate ligament injury in female
athletes: lateral trunk and knee abduction motion are combined
components of the injury mechanism. Br J Sports Med. 2009;43(6):
417–422.
9. Hodges PW, Richardson CA. Inefficient muscular stabilization of the
lumbar spine associated with low back pain: a motor control
evaluation of transversus abdominis. Spine (Phila Pa 1976). 1996;
21(22):2640–2650.
10. Ford KD, Myer GD, Hewett TE. Increased trunk motion in female
athletes compared to males during single leg landing [abstract]. Med
Sci Sports Exerc. 2007;39(5):S70.
11. Myer GD, Chu DA, Brent JL, Hewett TE. Trunk and hip control
neuromuscular training for the prevention of knee joint injury. Clin
Sports Med. 2008;27(3):425–428.
12. Myer GD, Ford KR, Barber Foss KD, Liu C, Nick TG, Hewett TE.
The relationship of hamstrings and quadriceps strength to anterior
cruciate ligament injury in female athletes. Clin J Sport Med.
2009;19(1):3–8.
13. Borghuis J, Hof AL, Lemmink KA. The importance of sensory-motor
control in providing core stability: implications for measurement and
training. Sports Med. 2008;38(11):893–916.
14. Leetun DT, Ireland ML, Willson JD, Ballantyne BT, Davis IM. Core
stability measures as risk factors for lower extremity injury in athletes.
Med Sci Sports Exerc. 2004;36(6):926–934.
15. Stodden DF, Campbell BM, Moyer TM. Comparison of trunk
kinematics in trunk training exercises and throwing. J Strength Cond
Res. 2008;22(1):112–118.
16. Voss DE. Proprioceptive neuromuscular facilitation. Am J Phys Med.
1967;46(1):838–899.
17. Voight ML, Hoogenboom BJ, Cook G. The chop and lift
reconsidered: integrating neuromuscular principles into orthopedic
and sports rehabilitation. North Am J Sports Phys Ther. 2008;3(3):
151–159.
18. Biering-Sørensen F. Physical measurements as risk indicators for low-
back trouble over a one-year period. Spine (Phila Pa 1976). 1984;
9(2):106–119.
19. Latimer J, Maher CG, Refshauge K, Colaco I. The reliability and
validity of the Biering-Sorensen test in asymptomatic subjects and
subjects reporting current or previous nonspecific low back pain.
Spine (Phila Pa 1976). 1999;24(20):2085–2090.
20. Schellenberg KL, Lang JM, Chan KM, Burnham RS. A clinical tool
for office assessment of lumbar spine stabilization endurance: prone
and supine bridge maneuvers. Am J Phys Med Rehabil. 2007;86(5):
380–386.
21. Mayer T, Gatchel R, Betancur J, Bovasso E. Trunk muscle endurance
measurement: isometric contrasted to isokinetic testing in normal
subjects. Spine (Phila Pa 1976). 1995;20(8):920–927.
22. McGill SM, Karpowicz A, Fenwick CM. Ballistic abdominal
exercises: muscle activation patterns during three activities along
the stability/mobility continuum. J Strength Cond Res. 2009;23(3):
898–905.
23. Willardson JM. Core stability training for healthy athletes: a diffe-
rent paradigm for fitness professionals. Strength Cond J. 2007;29(6):
42–49.
24. Kibler WB, McMullen J, Uhl T. Shoulder rehabilitation strategies,
guidelines, and practice. Oper Tech Sports Med. 2000;8(4):258–
267.
25. McMullen J, Uhl TL. A kinetic chain approach for shoulder
rehabilitation. J Athl Train. 2000;35(3):329–337.
26. Portney LGW, Portney M, Gross L, Watkins MP. Foundations of
Clinical Research: Applications to Practice. 2nd ed. Upper Saddle
River, NJ: Prentice Hall; 1999.
27. Briggs KK, Lysholm J, Tegner Y, Rodkey WG, Kocher MS,
Steadman JR. The reliability, validity, and responsiveness of the
Lysholm score and Tegner activity scale for anterior cruciate ligament
injuries of the knee: 25 years later. Am J Sports Med. 2009;37(5):
890–897.
28. Yates JW, Kearney JT, Noland MP, Felts WM. Recovery of dynamic
muscular endurance. Eur J Appl Physiol Occup Physiol. 1987;56(6):
662–667.
29. Hansen K, Cronin J. Training loads for the development of lower
body muscular power during squatting movements. Strength Cond J.
2009;31(3):17–33.
158 Volume 46 N Number 2 N April 2011
30. Haley SM, Fragala-Pinkham MA. Interpreting change scores of tests
and measures used in physical therapy. Phys Ther. 2006;86(5):
735–743.
31. Hoffman J. Norms for Fitness, Performance, and Health. Champaign,
IL: Human Kinetics; 2006.
32. McArdle WD, Katch FI, Katch VL. Exercise Physiology: Energy
Nutrition and Human Performance. 6th ed. Baltimore, MD: Lippin-
cott Williams & Wilkins; 2007.
33. Cowley PM, Fitzgerald S, Sottung K, Swensen T. Age, weight, and
the front abdominal power test as predictors of isokinetic trunk
strength and work in young men and women. J Strength Cond Res.
2009;23(3):915–925.
34. Coyle EF, Feiring DC, Rotkis TC, et al. Specificity of power
improvements through slow and fast isokinetic training. J Appl
Physiol. 1981;51(6):1437–1442.
35. Earles DR, Judge JO, Gunnarsson OT. Velocity training induces
power-specific adaptations in highly functioning older adults. Arch
Phys Med Rehabil. 2001;82(7):872–878.
36. Lesmes GR, Costill DL, Coyle EF, Fink WJ. Muscle strength and
power changes during maximal isokinetic training. Med Sci Sports.
1978;10(4):266–269.
37. Nogueira W, Gentil P, Mello SN, Oliveira RJ, Bezerra AJ, Bottaro
M. Effects of power training on muscle thickness of older men.
Int J Sports Med. 2009;30(3):200–204.
38. Zazulak BT, Hewett TE, Reeves NP, Goldberg B, Cholewicki J.
Deficits in neuromuscular control of the trunk predict knee injury
risk: a prospective biomechanical-epidemiologic study. Am J Sports
Med. 2007;35(7):1123–1130.
39. Cowley PM, Swensen TC. Development and reliability of two core
stability field tests. J Strength Cond Res. 2008;22(2):619–624.
40. Popadic Gacesa JZ, Barak OF, Grujic NG. Maximal anaerobic
power test in athletes of different sport disciplines. J Strength Cond
Res. 2009;23(3):751–755.
41. Nesser TW, Huxel KC, Tincher JL, Okada T. The relationship
between core stability and performance in Division I football players.
J Strength Cond Res. 2008;22(6):1750–1754.
42. Nesser TW, Lee WL. The relationship between core strength
performance in Division I female soccer players. J Exerc Physiol
Online. 2009;12(2):21–28.
43. Willardson JM. Core stability training: applications to sports
conditioning programs. J Strength Cond Res. 2007;21(3):979–985.
44. McGill SM, McDermott A, Fenwick CM. Comparison of different
strongman events: trunk muscle activation and lumbar spine motion,
load, and stiffness. J Strength Cond Res. 2009;23(4):1148–1161.
45. Hibbs AE, Thompson KG, French D, Wrigley A, Spears I.
Optimizing performance by improving core stability and core
strength. Sports Med. 2008;38(12):995–1008.
46. McGill SM, Childs A, Liebenson C. Endurance times for low back
stabilization exercises: clinical targets for testing and training from a
normal database. Arch Phys Med Rehabil. 1999;80(8):941–944.
47. Juker D, McGill S, Kropf P, Steffen T. Quantitative intramuscular
myoelectric activity of lumbar portions of psoas and the abdominal
wall during a wide variety of tasks. Med Sci Sports Exerc.
1998;30(2):301–310.
48. Stevens VK, Bouche KG, Mahieu NN, Cambier DC, Vanderstraeten
GG, Danneels LA. Reliability of a functional clinical test battery
evaluating postural control, proprioception and trunk muscle activity.
Am J Phys Med Rehabil. 2006;85(9):727–736.
49. Stevens VK, Coorevits PL, Bouche KG, Mahieu NN, Vanderstraeten
GG, Danneels LA. The influence of specific training on trunk muscle
recruitment patterns in healthy subjects during stabilization exercises.
Man Ther. 2007;12(3):271–279.
50. Bergmark A. Stability of the lumbar spine: a study in mechanical
engineering. Acta Orthop Scand Suppl. 1989;230:1–54.
51. Cholewicki J, Panjabi MM, Khachatryan A. Stabilizing function of
trunk flexor-extensor muscles around a neutral spine posture. Spine
(Phila Pa 1976). 1997;22(19):2207–2212.
52. Panjabi MM. The stabilizing system of the spine: part I. Function,
dysfunction, adaptation, and enhancement. J Spinal Disord. 1992;
5(4):383–389.
53. Keller A, Hellesnes J, Brox JI. Reliability of the isokinetic trunk
extensor test, Biering-Sørensen test, and Astrand bicycle test:
assessment of intraclass correlation coefficient and critical difference
in patients with chronic low back pain and healthy individuals. Spine
(Phila Pa 1976). 2001;26(7):771–777.
54. Liemohn WP, Baumgartner TA, Gagnon LH. Measuring core
stability. J Strength Cond Res. 2005;19(3):583–586.
55. Willson JD, Dougherty CP, Ireland ML, Davis IM. Core stability and
its relationship to lower extremity function and injury. J Am Acad
Orthop Surg. 2005;13(5):316–325.
56. Cleland JA, Childs JD, Fritz JM, Whitman JM, Eberhart SL.
Development of a clinical prediction rule for guiding treatment of a
subgroup of patients with neck pain: use of thoracic spine mani-
pulation, exercise, and patient education. Phys Ther. 2007;87(1):
9–23.
57. Baechle TR, Earle RW, National Strength and Conditioning
Association. Essentials of Strength and Conditioning. 3rd ed.
Champaign, IL: Human Kinetics; 2008.
Address correspondence to Thomas G. Palmer, MSEd, ATC, CSCS, Northern Kentucky University, Nunn Drive, 108 Albright HealthCenter, Highland Heights, KY 41048. Address e-mail to [email protected].
Journal of Athletic Training 159
Scapular-Muscle Performance: Two TrainingPrograms in Adolescent Swimmers
Annemie Van de Velde, PT*; Kristof De Mey, PT�; Annelies Maenhout, PT�;Patrick Calders, PhD*; Ann M. Cools, PhD, PT�
*Arteveldehogeschool Ghent, Belgium; 3Ghent University, Belgium
Context: Swimming requires well-balanced scapular-muscleperformance. An additional strength-training program for theshoulders is pursued by swimmers, but whether these muscle-training programs need to be generic or specific for enduranceor strength is unknown.
Objective: To evaluate isokinetic scapular-muscle perfor-mance in a population of adolescent swimmers and to comparethe results of training programs designed for strength or muscleendurance.
Design: Controlled laboratory study.Setting: University human research laboratory.Patients or Other Participants: Eighteen adolescent swim-
mers.Intervention(s): Each participant pursued a 12-week scap-
ular-training program designed to improve either musclestrength or muscle endurance.
Main Outcome Measure(s): Bilateral peak force, fatigueindex, and protraction/retraction strength ratios before and afterthe scapular-training program.
Results: Scapular protraction/retraction ratios were slightlyhigher than 1 (dominant side 5 1.08, nondominant side 5 1.25,P 5 .006). Side-to-side differences in retraction strength wereapparent both before and after the training program (P 5 .03 andP 5.05, respectively). After the training program, maximalprotraction (P , .05) and retraction (P , .01) strength improvedon the nondominant side. Peak force and fatigue index were notdifferent between the training groups. The fatigue indexes forprotraction on both sides (P , .05) and retraction on the non-dominant side (P 5 .009) were higher after the training program.
Conclusions: We describe the scapular-muscle character-istics of a group of adolescent swimmers. Both muscle-strengthand muscle-endurance programs improved absolute musclestrength. Neither of the strength programs had a positive effecton scapular-muscle endurance. Our results may be valuable forcoaches and physiotherapists when they are designing exerciseprograms for swimmers.
Key Words: upper extremity, strength training, endurancetraining, athletes
Key Points
N We describe sport-specific adaptations regarding scapular-muscle performance in adolescent swimmers. Increasedprotraction strength and side-to-side differences were observed.
N In these athletes, both strength-training and muscle-endurance programs improved scapular-muscle strength, but neitherprogram improved scapular-muscle endurance.
N Addressing muscle imbalances and asymmetry may be important to preventing injury in adolescent swimmers.
Swimming is a demanding sport, especially withrespect to the shoulder joint. Shoulder injuriesfrequently occur in swimming athletes: 47% to 80%
of all competitive swimmers reported shoulder injuriesduring their sport careers.1–3 Swimming requires manysequential repetitive movements, with little opportunity forrest. An elite swimmer performs approximately 2500shoulder revolutions during each training session. Conse-quently, sufficient upper limb muscle endurance andstrength are necessary in these athletes.
The scapular muscles have an important function inswimming.4–6 Electromyographic stroke analysis showsthat the serratus anterior muscle has the leading function,4
being continuously active throughout the stroke andpositioning the scapula for hand entry, hand exit, andpulling the body over the arm. As a result, the serratusanterior may be susceptible to fatigue. An appropriateupward rotation of the scapula is necessary to avoidimpingement during the swimming stroke. Considering thecooperation between the serratus anterior and lower
trapezius muscles in scapular upward rotation,7 the lowertrapezius is also of importance in swimming.5,6
The function of the scapular muscles in swimming hasalready been examined by several authors.5,6 In 2004, Su etal6 compared isometric strength values of the scapularmuscles in swimmers before and after a single swim session.Serratus anterior and upper trapezius strength decreasedby 14% and 13%, respectively. Fatigue of the scapularmuscles may influence other factors, such as muscle activityand kinematics. A few researchers8,9 examined the effect ofserratus anterior fatigue on muscle-activation timing andscapular kinematics. After a fatigue protocol for theserratus anterior, muscle activation was greater in theupper trapezius, which can compensate for serratusanterior fatigue. The scapular kinematics after serratusanterior fatigue were characterized by decreased posteriortilting and increased internal rotation. Alterations in bothmuscle activation and scapular kinematics may contributeto shoulder injuries, including subacromial impingementsyndrome and glenohumeral joint instability.10–12 In
Journal of Athletic Training 2011;46(2):160–167g by the National Athletic Trainers’ Association, Incwww.nata.org/jat
original research
160 Volume 46 N Number 2 N April 2011

patients with subacromial impingement, decreased serratusanterior activity and increased anterior tipping and internalrotation were found.12
Because of the increased need for muscle endurance andthe considerable risk for shoulder injuries, swimmers maybenefit from a specific shoulder-training program. How-ever, evidence about the most effective way of training (forinstance, muscle-strength versus muscle-endurance train-ing) is lacking. In the literature, strength programs havefocused primarily on the glenohumeral muscles and onmaximal strength to improve sport performance.13–17 Onegroup18 examined the effect of a functional strengthprogram, with selected exercises for the rotator cuff andserratus anterior, on the incidence of shoulder pain. Forthe serratus anterior only, an endurance program (3 setsuntil exhaustion) was followed; for the other muscles, 3 setsof 10 repetitions were completed. However, in the strengthevaluation, only maximal strength was measured. Anendurance-specific measurement, such as the fatigue index(FI), was not investigated. Thus, no conclusions aboutmuscle endurance could be made. With respect to theavailable literature on strength training in swimmers,whether programs should focus on maximal strength oron muscle endurance is unknown.
We had several goals for our study. First, we evaluatedthe isokinetic muscle performance of the scapular musclesin adolescent swimmers by assessing peak force and the FIduring an isokinetic protraction-retraction protocol. Sec-ond, we compared muscle strength and muscle endurancebefore and after a strength- or endurance-training programin order to determine whether shoulder muscle-trainingprograms in swimmers need to be specific for musclestrength or endurance. Third, we measured side-to-sidedifferences in strength before and after the trainingprogram. To our knowledge, this investigation has neverbeen performed before in adolescent swimmers.
METHODS
Participants
A total of 18 adolescent swimmers (11 females, 7 males)participated in our study. All athletes were members of thesame swimming club and had 4 to 6 training sessions everyweek with a mean session duration of 2 hours. The age ofparticipants was 14.7 6 1.3 years; participant height was165.2 6 8.3 cm, and mass was 50.06 6 9.13 kg. Twoswimmers were left handed; the others were right handed.All athletes breathed on both sides while swimming.Exclusion criteria were cervical or thoracic conditions,previous shoulder surgery, or shoulder pain that interferedwith swim training. None of the swimmers experienced anyshoulder pain during the 12-week test period. Beforeparticipating in this study, the swimmers and their parentssigned informed consent documents. This study wasapproved by the ethical committee of Ghent University.
Design
This study was a 2-group, randomized design withrepeated measures. Between the 2 strength and endurancemeasurements, the volunteers followed a scapular-trainingschedule of 3 times per week for 12 weeks. The trainingprogram was completed before the athletes started swim
training each day. All athletes participated in their normalswim practices and races.
Isokinetic Protraction-Retraction Strength Evaluation
Isokinetic testing is considered the ‘‘gold standard’’ interms of objectively evaluating an athlete’s strength.19–22
Cools et al20,21 developed a reliable isokinetic protraction-retraction protocol (intraclass correlation coefficient 50.88–0.77) in healthy volunteers that was used successfullyin athletes.
All isokinetic tests were performed using an isokineticdynamometer (System 3; Biodex Medical Systems, Inc,Shirley, NY). For isokinetic strength measurement of thescapular muscles, we used the closed chain attachment,which was fixed horizontally to the dynamometer. Wefollowed the same testing procedures and testing positionsdescribed by Cools et al.20,21 Each swimmer performed 2isokinetic tests on both sides, the first test at a linear speedof 12.2 cm/s (5 repetitions at an angular velocity of 606/s)and the second test at 36.6 cm/s (40 repetitions at anangular velocity of 1806/s). The resting period between testswas 10 seconds. The first test determined maximal strength,and the second test evaluated muscle endurance. The teststarted in a maximal retracted position, and participantswere instructed to perform maximal protractions followedby retraction movements over the total range of motion.Because movement took place in the horizontal plane,gravity correction was not performed. Before starting datacollection, each volunteer performed 5 familiarizationtrials. During the test, the swimmers were given onlyverbal encouragement and no visual feedback from thecomputer screen. The testing sequence was the same forboth groups and both sets of measurements.
Scapular-Training Program
Swimmers were randomly allocated to either the muscle-strength group or the muscle-endurance group. Thetraining program was supervised by a physiotherapistand completed in a gym room near the swimming pool.Exercises were the same for both groups, but trainingweights and number of repetitions were different so that wecould focus on either muscle strength or muscle endurance.Each session consisted of 4 exercises, the first 2 of whichwere designed to reinforce the serratus anterior muscle andremaining 2 of which were designed for the entire trapeziusmuscle.23–25 The schedule was designed to train bothmuscle groups alternately and was the same for bothgroups and sessions. We selected the exercises based onprevious experimental studies.23–26 If possible, exerciseswere performed in the lying position rather than in thestanding or sitting position because the supine and pronepositions are more sport specific for swimmers. The firstexercise (Figure 1) was a variant of the dynamic hugmovement,23 which can be described as horizontal flexionof the humerus, starting at 606 of elevation. The swimmercrossed his or her hands while holding an elastic exerciseband. Next, the swimmer performed scapular protractionby moving the hands away from each other. Different-colored exercise bands were used to determine the mostsuitable amount of resistance. In the second exercise(Figure 2), the swimmer performed an elbow push-up.24
With both elbows flexed to 906 and upper extremity weight
Journal of Athletic Training 161
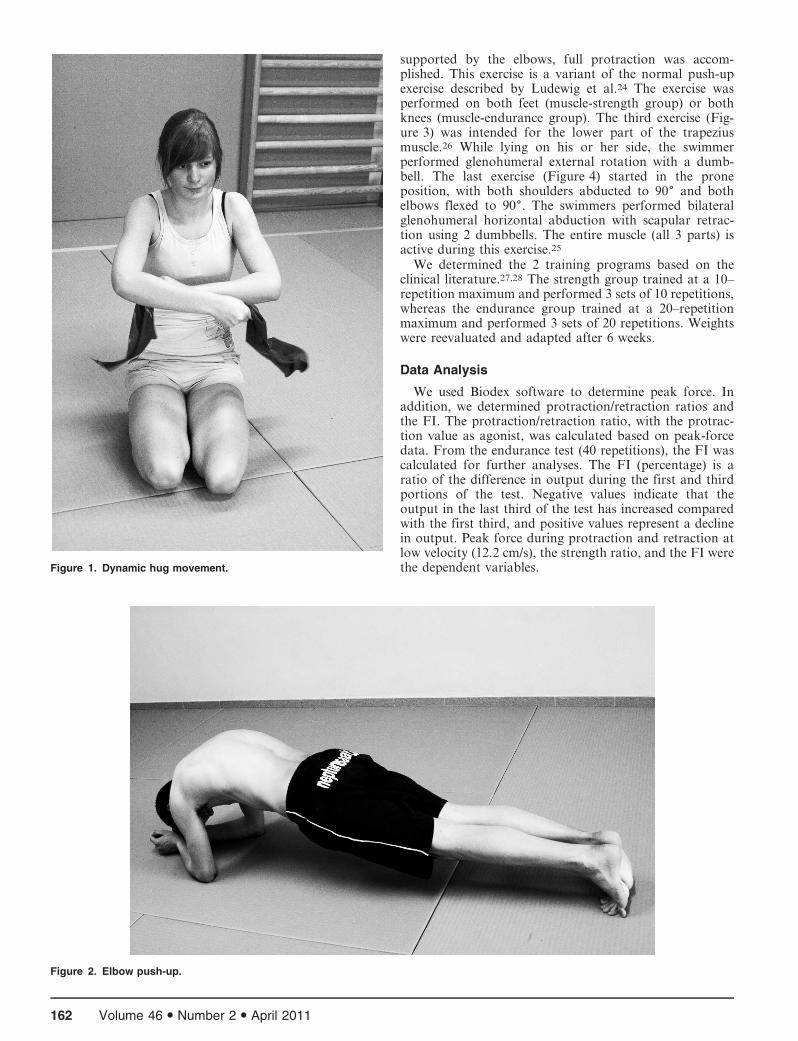
supported by the elbows, full protraction was accom-plished. This exercise is a variant of the normal push-upexercise described by Ludewig et al.24 The exercise wasperformed on both feet (muscle-strength group) or bothknees (muscle-endurance group). The third exercise (Fig-ure 3) was intended for the lower part of the trapeziusmuscle.26 While lying on his or her side, the swimmerperformed glenohumeral external rotation with a dumb-bell. The last exercise (Figure 4) started in the proneposition, with both shoulders abducted to 906 and bothelbows flexed to 906. The swimmers performed bilateralglenohumeral horizontal abduction with scapular retrac-tion using 2 dumbbells. The entire muscle (all 3 parts) isactive during this exercise.25
We determined the 2 training programs based on theclinical literature.27,28 The strength group trained at a 10–repetition maximum and performed 3 sets of 10 repetitions,whereas the endurance group trained at a 20–repetitionmaximum and performed 3 sets of 20 repetitions. Weightswere reevaluated and adapted after 6 weeks.
Data Analysis
We used Biodex software to determine peak force. Inaddition, we determined protraction/retraction ratios andthe FI. The protraction/retraction ratio, with the protrac-tion value as agonist, was calculated based on peak-forcedata. From the endurance test (40 repetitions), the FI wascalculated for further analyses. The FI (percentage) is aratio of the difference in output during the first and thirdportions of the test. Negative values indicate that theoutput in the last third of the test has increased comparedwith the first third, and positive values represent a declinein output. Peak force during protraction and retraction atlow velocity (12.2 cm/s), the strength ratio, and the FI werethe dependent variables.Figure 1. Dynamic hug movement.
Figure 2. Elbow push-up.
162 Volume 46 N Number 2 N April 2011

We used the Shapiro-Wilcoxon test to control datadistribution. In this study, all data were normallydistributed with equal variances, so parametric tests wereappropriate for further analyses. To analyze anthropomet-ric group differences, an independent t test with a 5 .05was used. No age, mass, or height differences betweengroups were noted (all P values . .05).
We used a general linear model (GLM) 3-way analysis ofvariance (ANOVA) with repeated-measures design forstatistical analysis. The within-subjects factors were time(pretest, posttest) and side (dominant, nondominant).Group (muscle strength or muscle endurance) was thebetween-subjects factor. We were interested in interactioneffects of time and group, as well as main effects. In thepresence of a significant interaction, post hoc Bonferronit tests were performed. In this study, a was set at .05, andthe corrected a was set at .025. All statistical analyses wereperformed with SPSS (version 15.0; SPSS Inc, Chicago,IL). Power analysis of the strength and endurance valueswas calculated at 67%.
RESULTS
Peak Force
Descriptive data and results from the post hoc Bonfer-roni adjustments for peak force regarding time (pretrainingversus posttraining), group (strength versus muscle endur-ance), side (dominant versus nondominant), and bothmovement directions (protraction and retraction) aresummarized in Table 1.
The GLM 3-way ANOVA for repeated measuresrevealed no triple interaction effect for time 3 side 3group for protraction or retraction peak force. Further-more, we found no 2-way interaction effects for group(time 3 group or side 3 group) for protraction or
retraction peak force. Finally, none of the between-subjectstests for group were significant for protraction (P 5 .60) orretraction (P 5 .50) peak forces. These results indicate nosignificant effect of training group.
Figure 3. External glenohumeral rotation.
Figure 4. Horizontal abduction with scapular retraction.
Journal of Athletic Training 163
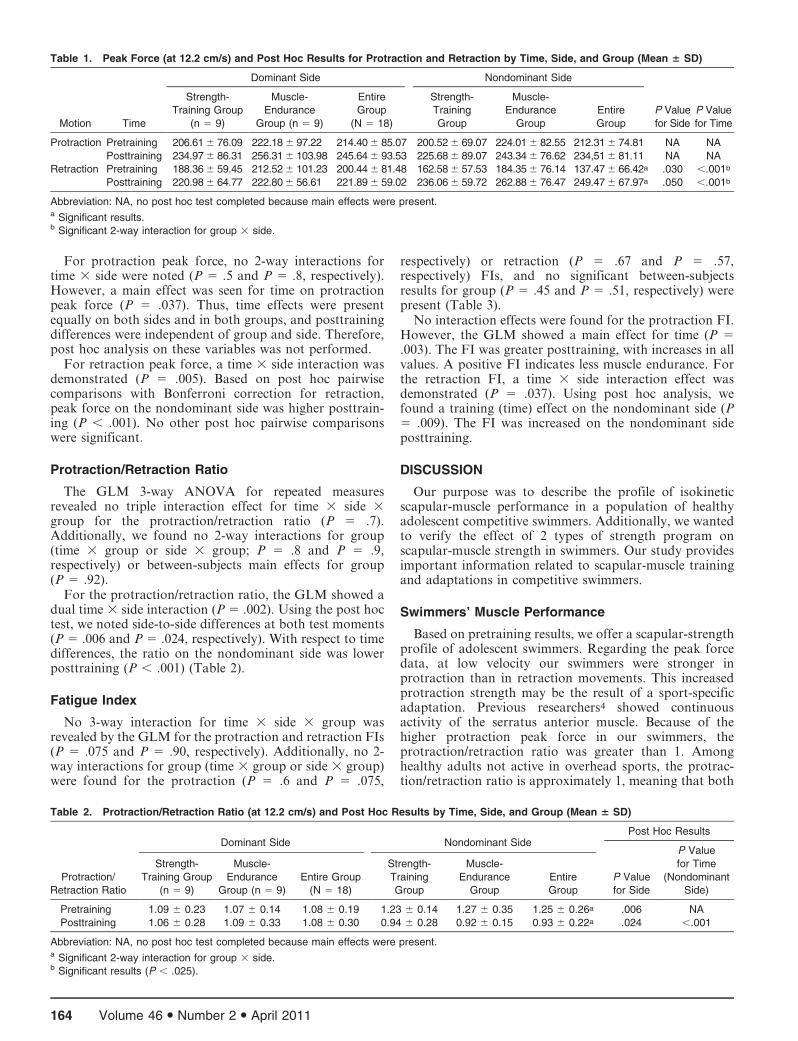
For protraction peak force, no 2-way interactions fortime 3 side were noted (P 5 .5 and P 5 .8, respectively).However, a main effect was seen for time on protractionpeak force (P 5 .037). Thus, time effects were presentequally on both sides and in both groups, and posttrainingdifferences were independent of group and side. Therefore,post hoc analysis on these variables was not performed.
For retraction peak force, a time 3 side interaction wasdemonstrated (P 5 .005). Based on post hoc pairwisecomparisons with Bonferroni correction for retraction,peak force on the nondominant side was higher posttrain-ing (P , .001). No other post hoc pairwise comparisonswere significant.
Protraction/Retraction Ratio
The GLM 3-way ANOVA for repeated measuresrevealed no triple interaction effect for time 3 side 3group for the protraction/retraction ratio (P 5 .7).Additionally, we found no 2-way interactions for group(time 3 group or side 3 group; P 5 .8 and P 5 .9,respectively) or between-subjects main effects for group(P 5 .92).
For the protraction/retraction ratio, the GLM showed adual time 3 side interaction (P 5 .002). Using the post hoctest, we noted side-to-side differences at both test moments(P 5 .006 and P 5 .024, respectively). With respect to timedifferences, the ratio on the nondominant side was lowerposttraining (P , .001) (Table 2).
Fatigue Index
No 3-way interaction for time 3 side 3 group wasrevealed by the GLM for the protraction and retraction FIs(P 5 .075 and P 5 .90, respectively). Additionally, no 2-way interactions for group (time 3 group or side 3 group)were found for the protraction (P 5 .6 and P 5 .075,
respectively) or retraction (P 5 .67 and P 5 .57,respectively) FIs, and no significant between-subjectsresults for group (P 5 .45 and P 5 .51, respectively) werepresent (Table 3).
No interaction effects were found for the protraction FI.However, the GLM showed a main effect for time (P 5.003). The FI was greater posttraining, with increases in allvalues. A positive FI indicates less muscle endurance. Forthe retraction FI, a time 3 side interaction effect wasdemonstrated (P 5 .037). Using post hoc analysis, wefound a training (time) effect on the nondominant side (P5 .009). The FI was increased on the nondominant sideposttraining.
DISCUSSION
Our purpose was to describe the profile of isokineticscapular-muscle performance in a population of healthyadolescent competitive swimmers. Additionally, we wantedto verify the effect of 2 types of strength program onscapular-muscle strength in swimmers. Our study providesimportant information related to scapular-muscle trainingand adaptations in competitive swimmers.
Swimmers’ Muscle Performance
Based on pretraining results, we offer a scapular-strengthprofile of adolescent swimmers. Regarding the peak forcedata, at low velocity our swimmers were stronger inprotraction than in retraction movements. This increasedprotraction strength may be the result of a sport-specificadaptation. Previous researchers4 showed continuousactivity of the serratus anterior muscle. Because of thehigher protraction peak force in our swimmers, theprotraction/retraction ratio was greater than 1. Amonghealthy adults not active in overhead sports, the protrac-tion/retraction ratio is approximately 1, meaning that both
Table 1. Peak Force (at 12.2 cm/s) and Post Hoc Results for Protraction and Retraction by Time, Side, and Group (Mean 6 SD)
Motion Time
Dominant Side Nondominant Side
P Value
for Side
P Value
for Time
Strength-
Training Group
(n 5 9)
Muscle-
Endurance
Group (n 5 9)
Entire
Group
(N 5 18)
Strength-
Training
Group
Muscle-
Endurance
Group
Entire
Group
Protraction Pretraining 206.61 6 76.09 222.18 6 97.22 214.40 6 85.07 200.52 6 69.07 224.01 6 82.55 212.31 6 74.81 NA NA
Posttraining 234.97 6 86.31 256.31 6 103.98 245.64 6 93.53 225.68 6 89.07 243.34 6 76.62 234,51 6 81.11 NA NA
Retraction Pretraining 188.36 6 59.45 212.52 6 101.23 200.44 6 81.48 162.58 6 57.53 184.35 6 76.14 137.47 6 66.42a .030 ,.001b
Posttraining 220.98 6 64.77 222.80 6 56.61 221.89 6 59.02 236.06 6 59.72 262.88 6 76.47 249.47 6 67.97a .050 ,.001b
Abbreviation: NA, no post hoc test completed because main effects were present.a Significant results.b Significant 2-way interaction for group 3 side.
Table 2. Protraction/Retraction Ratio (at 12.2 cm/s) and Post Hoc Results by Time, Side, and Group (Mean 6 SD)
Protraction/
Retraction Ratio
Dominant Side Nondominant SidePost Hoc Results
Strength-
Training Group
(n 5 9)
Muscle-
Endurance
Group (n 5 9)
Entire Group
(N 5 18)
Strength-
Training
Group
Muscle-
Endurance
Group
Entire
Group
P Value
for Side
P Value
for Time
(Nondominant
Side)
Pretraining 1.09 6 0.23 1.07 6 0.14 1.08 6 0.19 1.23 6 0.14 1.27 6 0.35 1.25 6 0.26a .006 NA
Posttraining 1.06 6 0.28 1.09 6 0.33 1.08 6 0.30 0.94 6 0.28 0.92 6 0.15 0.93 6 0.22a .024 ,.001
Abbreviation: NA, no post hoc test completed because main effects were present.a Significant 2-way interaction for group 3 side.b Significant results (P , .025).
164 Volume 46 N Number 2 N April 2011
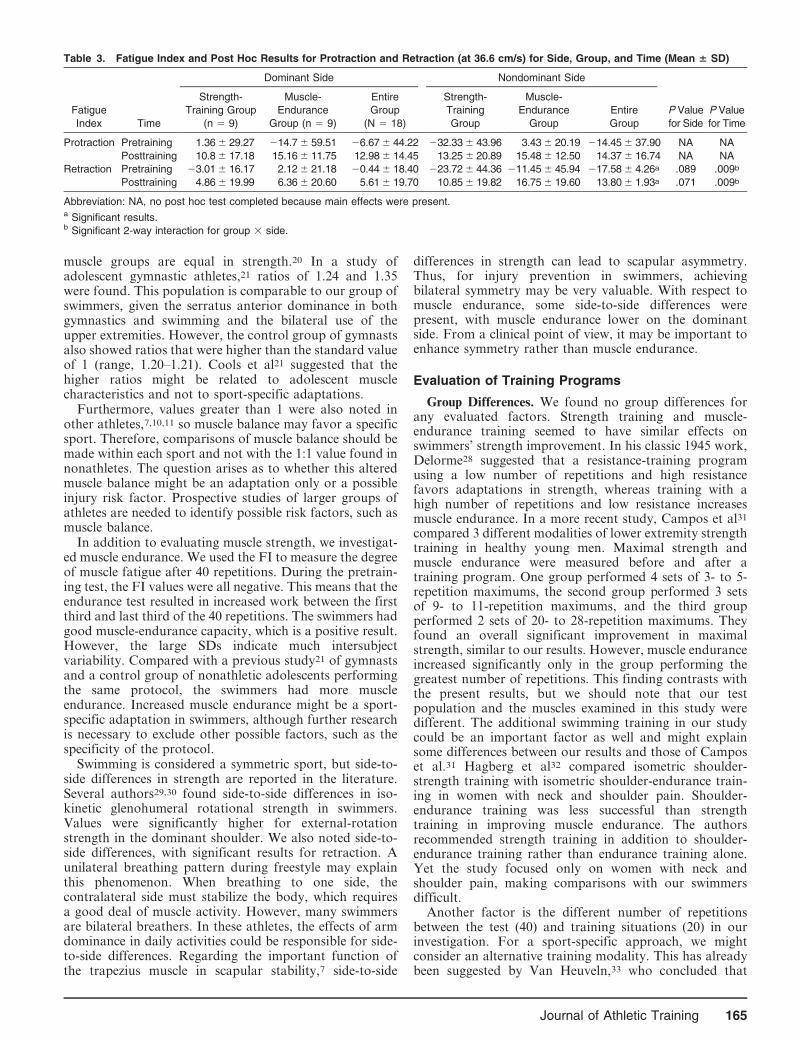
muscle groups are equal in strength.20 In a study ofadolescent gymnastic athletes,21 ratios of 1.24 and 1.35were found. This population is comparable to our group ofswimmers, given the serratus anterior dominance in bothgymnastics and swimming and the bilateral use of theupper extremities. However, the control group of gymnastsalso showed ratios that were higher than the standard valueof 1 (range, 1.20–1.21). Cools et al21 suggested that thehigher ratios might be related to adolescent musclecharacteristics and not to sport-specific adaptations.
Furthermore, values greater than 1 were also noted inother athletes,7,10,11 so muscle balance may favor a specificsport. Therefore, comparisons of muscle balance should bemade within each sport and not with the 1:1 value found innonathletes. The question arises as to whether this alteredmuscle balance might be an adaptation only or a possibleinjury risk factor. Prospective studies of larger groups ofathletes are needed to identify possible risk factors, such asmuscle balance.
In addition to evaluating muscle strength, we investigat-ed muscle endurance. We used the FI to measure the degreeof muscle fatigue after 40 repetitions. During the pretrain-ing test, the FI values were all negative. This means that theendurance test resulted in increased work between the firstthird and last third of the 40 repetitions. The swimmers hadgood muscle-endurance capacity, which is a positive result.However, the large SDs indicate much intersubjectvariability. Compared with a previous study21 of gymnastsand a control group of nonathletic adolescents performingthe same protocol, the swimmers had more muscleendurance. Increased muscle endurance might be a sport-specific adaptation in swimmers, although further researchis necessary to exclude other possible factors, such as thespecificity of the protocol.
Swimming is considered a symmetric sport, but side-to-side differences in strength are reported in the literature.Several authors29,30 found side-to-side differences in iso-kinetic glenohumeral rotational strength in swimmers.Values were significantly higher for external-rotationstrength in the dominant shoulder. We also noted side-to-side differences, with significant results for retraction. Aunilateral breathing pattern during freestyle may explainthis phenomenon. When breathing to one side, thecontralateral side must stabilize the body, which requiresa good deal of muscle activity. However, many swimmersare bilateral breathers. In these athletes, the effects of armdominance in daily activities could be responsible for side-to-side differences. Regarding the important function ofthe trapezius muscle in scapular stability,7 side-to-side
differences in strength can lead to scapular asymmetry.Thus, for injury prevention in swimmers, achievingbilateral symmetry may be very valuable. With respect tomuscle endurance, some side-to-side differences werepresent, with muscle endurance lower on the dominantside. From a clinical point of view, it may be important toenhance symmetry rather than muscle endurance.
Evaluation of Training Programs
Group Differences. We found no group differences forany evaluated factors. Strength training and muscle-endurance training seemed to have similar effects onswimmers’ strength improvement. In his classic 1945 work,Delorme28 suggested that a resistance-training programusing a low number of repetitions and high resistancefavors adaptations in strength, whereas training with ahigh number of repetitions and low resistance increasesmuscle endurance. In a more recent study, Campos et al31
compared 3 different modalities of lower extremity strengthtraining in healthy young men. Maximal strength andmuscle endurance were measured before and after atraining program. One group performed 4 sets of 3- to 5-repetition maximums, the second group performed 3 setsof 9- to 11-repetition maximums, and the third groupperformed 2 sets of 20- to 28-repetition maximums. Theyfound an overall significant improvement in maximalstrength, similar to our results. However, muscle enduranceincreased significantly only in the group performing thegreatest number of repetitions. This finding contrasts withthe present results, but we should note that our testpopulation and the muscles examined in this study weredifferent. The additional swimming training in our studycould be an important factor as well and might explainsome differences between our results and those of Camposet al.31 Hagberg et al32 compared isometric shoulder-strength training with isometric shoulder-endurance train-ing in women with neck and shoulder pain. Shoulder-endurance training was less successful than strengthtraining in improving muscle endurance. The authorsrecommended strength training in addition to shoulder-endurance training rather than endurance training alone.Yet the study focused only on women with neck andshoulder pain, making comparisons with our swimmersdifficult.
Another factor is the different number of repetitionsbetween the test (40) and training situations (20) in ourinvestigation. For a sport-specific approach, we mightconsider an alternative training modality. This has alreadybeen suggested by Van Heuveln,33 who concluded that
Table 3. Fatigue Index and Post Hoc Results for Protraction and Retraction (at 36.6 cm/s) for Side, Group, and Time (Mean 6 SD)
Fatigue
Index Time
Dominant Side Nondominant Side
P Value
for Side
P Value
for Time
Strength-
Training Group
(n 5 9)
Muscle-
Endurance
Group (n 5 9)
Entire
Group
(N 5 18)
Strength-
Training
Group
Muscle-
Endurance
Group
Entire
Group
Protraction Pretraining 1.36 6 29.27 214.7 6 59.51 26.67 6 44.22 232.33 6 43.96 3.43 6 20.19 214.45 6 37.90 NA NA
Posttraining 10.8 6 17.18 15.16 6 11.75 12.98 6 14.45 13.25 6 20.89 15.48 6 12.50 14.37 6 16.74 NA NA
Retraction Pretraining 23.01 6 16.17 2.12 6 21.18 20.44 6 18.40 223.72 6 44.36 211.45 6 45.94 217.58 6 4.26a .089 .009b
Posttraining 4.86 6 19.99 6.36 6 20.60 5.61 6 19.70 10.85 6 19.82 16.75 6 19.60 13.80 6 1.93a .071 .009b
Abbreviation: NA, no post hoc test completed because main effects were present.a Significant results.b Significant 2-way interaction for group 3 side.
Journal of Athletic Training 165
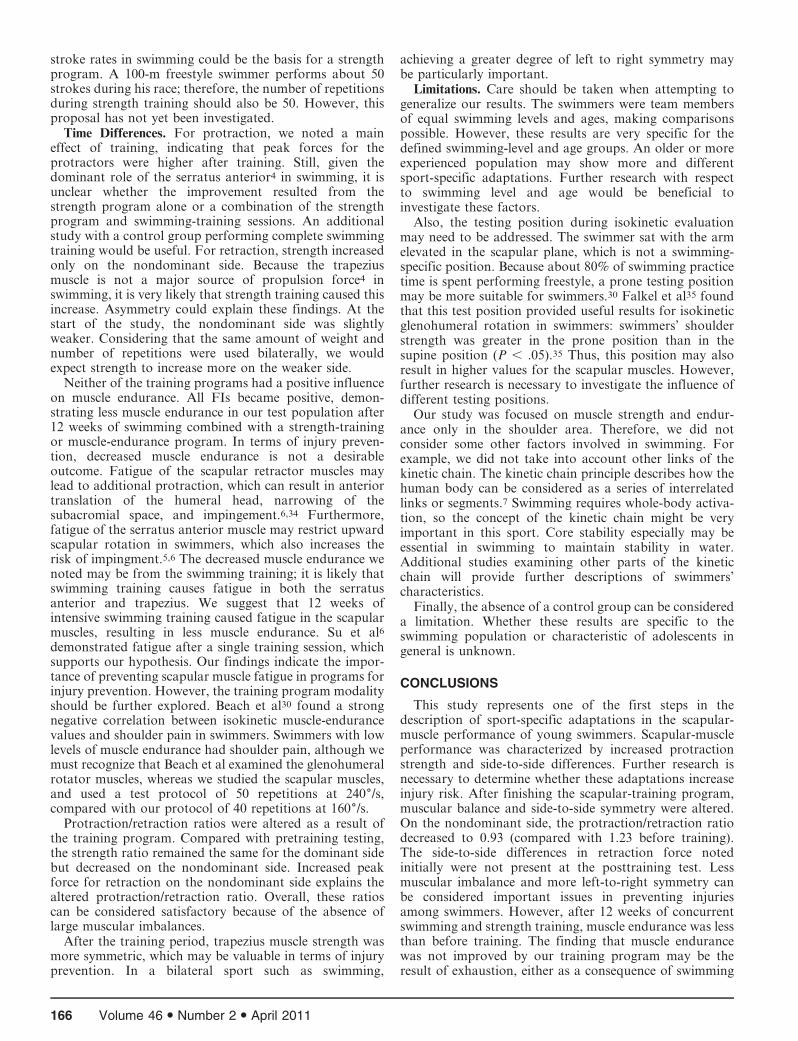
stroke rates in swimming could be the basis for a strengthprogram. A 100-m freestyle swimmer performs about 50strokes during his race; therefore, the number of repetitionsduring strength training should also be 50. However, thisproposal has not yet been investigated.
Time Differences. For protraction, we noted a maineffect of training, indicating that peak forces for theprotractors were higher after training. Still, given thedominant role of the serratus anterior4 in swimming, it isunclear whether the improvement resulted from thestrength program alone or a combination of the strengthprogram and swimming-training sessions. An additionalstudy with a control group performing complete swimmingtraining would be useful. For retraction, strength increasedonly on the nondominant side. Because the trapeziusmuscle is not a major source of propulsion force4 inswimming, it is very likely that strength training caused thisincrease. Asymmetry could explain these findings. At thestart of the study, the nondominant side was slightlyweaker. Considering that the same amount of weight andnumber of repetitions were used bilaterally, we wouldexpect strength to increase more on the weaker side.
Neither of the training programs had a positive influenceon muscle endurance. All FIs became positive, demon-strating less muscle endurance in our test population after12 weeks of swimming combined with a strength-trainingor muscle-endurance program. In terms of injury preven-tion, decreased muscle endurance is not a desirableoutcome. Fatigue of the scapular retractor muscles maylead to additional protraction, which can result in anteriortranslation of the humeral head, narrowing of thesubacromial space, and impingement.6,34 Furthermore,fatigue of the serratus anterior muscle may restrict upwardscapular rotation in swimmers, which also increases therisk of impingment.5,6 The decreased muscle endurance wenoted may be from the swimming training; it is likely thatswimming training causes fatigue in both the serratusanterior and trapezius. We suggest that 12 weeks ofintensive swimming training caused fatigue in the scapularmuscles, resulting in less muscle endurance. Su et al6
demonstrated fatigue after a single training session, whichsupports our hypothesis. Our findings indicate the impor-tance of preventing scapular muscle fatigue in programs forinjury prevention. However, the training program modalityshould be further explored. Beach et al30 found a strongnegative correlation between isokinetic muscle-endurancevalues and shoulder pain in swimmers. Swimmers with lowlevels of muscle endurance had shoulder pain, although wemust recognize that Beach et al examined the glenohumeralrotator muscles, whereas we studied the scapular muscles,and used a test protocol of 50 repetitions at 2406/s,compared with our protocol of 40 repetitions at 1606/s.
Protraction/retraction ratios were altered as a result ofthe training program. Compared with pretraining testing,the strength ratio remained the same for the dominant sidebut decreased on the nondominant side. Increased peakforce for retraction on the nondominant side explains thealtered protraction/retraction ratio. Overall, these ratioscan be considered satisfactory because of the absence oflarge muscular imbalances.
After the training period, trapezius muscle strength wasmore symmetric, which may be valuable in terms of injuryprevention. In a bilateral sport such as swimming,
achieving a greater degree of left to right symmetry maybe particularly important.
Limitations. Care should be taken when attempting togeneralize our results. The swimmers were team membersof equal swimming levels and ages, making comparisonspossible. However, these results are very specific for thedefined swimming-level and age groups. An older or moreexperienced population may show more and differentsport-specific adaptations. Further research with respectto swimming level and age would be beneficial toinvestigate these factors.
Also, the testing position during isokinetic evaluationmay need to be addressed. The swimmer sat with the armelevated in the scapular plane, which is not a swimming-specific position. Because about 80% of swimming practicetime is spent performing freestyle, a prone testing positionmay be more suitable for swimmers.30 Falkel et al35 foundthat this test position provided useful results for isokineticglenohumeral rotation in swimmers: swimmers’ shoulderstrength was greater in the prone position than in thesupine position (P , .05).35 Thus, this position may alsoresult in higher values for the scapular muscles. However,further research is necessary to investigate the influence ofdifferent testing positions.
Our study was focused on muscle strength and endur-ance only in the shoulder area. Therefore, we did notconsider some other factors involved in swimming. Forexample, we did not take into account other links of thekinetic chain. The kinetic chain principle describes how thehuman body can be considered as a series of interrelatedlinks or segments.7 Swimming requires whole-body activa-tion, so the concept of the kinetic chain might be veryimportant in this sport. Core stability especially may beessential in swimming to maintain stability in water.Additional studies examining other parts of the kineticchain will provide further descriptions of swimmers’characteristics.
Finally, the absence of a control group can be considereda limitation. Whether these results are specific to theswimming population or characteristic of adolescents ingeneral is unknown.
CONCLUSIONS
This study represents one of the first steps in thedescription of sport-specific adaptations in the scapular-muscle performance of young swimmers. Scapular-muscleperformance was characterized by increased protractionstrength and side-to-side differences. Further research isnecessary to determine whether these adaptations increaseinjury risk. After finishing the scapular-training program,muscular balance and side-to-side symmetry were altered.On the nondominant side, the protraction/retraction ratiodecreased to 0.93 (compared with 1.23 before training).The side-to-side differences in retraction force notedinitially were not present at the posttraining test. Lessmuscular imbalance and more left-to-right symmetry canbe considered important issues in preventing injuriesamong swimmers. However, after 12 weeks of concurrentswimming and strength training, muscle endurance was lessthan before training. The finding that muscle endurancewas not improved by our training program may be theresult of exhaustion, either as a consequence of swimming
166 Volume 46 N Number 2 N April 2011
training itself or in combination with strength training.Collecting more information concerning sport-specificadaptations in swimmers is the first goal in furtherresearch.
ACKNOWLEDGMENTS
We thank the swimmers and coaches of swimming club KZNAfor their enthusiasm and effort during the training period.
REFERENCES
1. Allegrucci M, Whitney SL, Irrgang JJ. Clinical implications of
secondary impingement of the shoulder in freestyle swimmers.
J Orthop Sports Phys Ther. 1994;20(6):307–318.
2. Bak K, Fauno P. Clinical findings in competitive swimmers with
shoulder pain. Am J Sports Med. 1997;25(2):254–260.
3. Pink M, Perry J, Browne A, Scovazzo ML, Kerrigan J. The normal
shoulder during freestyle swimming: an electromyographic cinemat-
ographic analysis of twelve muscles. Am J Sports Med. 1991;
19(6):569–576.
4. Pink MM, Tibone JE. The painful shoulder in the swimming athlete.
Orthop Clin North Am. 2000;31(2):247–261.
5. Crotty NM, Smith J. Alterations in scapular position with fatigue: a
study in swimmers. Clin J Sport Med. 2000;10(4):251–258.
6. Su KP, Johnson MP, Gracely EJ, Karduna AR. Scapular rotation in
swimming with and without impingement syndrome: practice effects.
Med Sci Sports Exerc. 2004;36(7):1117–1123.
7. Kibler WB. The role of the scapula in athletic shoulder function.
Am J Sports Med. 1998;26(2):325–337.
8. Borstad JD, Szucs K, Navalgund A. Scapula kinematic alterations
following a modified push-up plus task. Hum Mov Sci. 2009;
28(6):738–751.
9. Szucs K, Navalgund A, Borstad JD. Scapular muscle activation and
co-activation following a fatigue task. Med Biol Eng Comput.
2009;47(5):487–495.
10. Burkhart SS, Morgan CD, Kibler WB. Shoulder injuries in overhead
athletes: the ‘‘dead arm’’ revisited. Clin Sports Med. 2000;19(1):
125–158.
11. Burkhart SS, Morgan CD, Kibler WB. The disabled throwing
shoulder: spectrum of pathology, part 3. The SICK scapula, scapular
dyskinesis, the kinetic chain, and rehabilitation. Arthroscopy. 2003;
19(6):641–661.
12. Ludewig PM, Cook TM. Alterations in shoulder kinematics and
associated muscle activity in people with symptoms of shoulder
impingement. Phys Ther. 2000;80(3):276–291.
13. Davies E. Effect of weight training on speed in swimming. Phys Educ.
1959;17(3):193–199.
14. Girold S, Maurin D, Dugue B, Chatard JC, Millet C. Effects of dry-
land vs. resisted- and assisted-sprint exercises on swimming sprint
performances. J Strength Cond Res. 2007;21(2):599–605.
15. Sharp P, Costill DL, Troup PJ. Muscle strength and sprint swimming.
In: Garrett WE, Kirkendall DT, eds. Exercise and Sport Science.
Philadelphia, PA: Lippincott; 1980:895–904.
16. Tanaka H, Costill DL, Thomas R, Fink WJ, Widrick JJ. Dry-land
resistance training for competitive swimming. Med Sci Sports Exerc.
1993;25(8):592–599.
17. Toussaint HM, Vervoorn K. Effects of specific high resistance
training in the water on competitive swimmers. Int J Sports Med.
1990;11(3):228–233.
18. Swanik KA, Swanik CB, Lephart SM, Huxel K. The effect of
functional training on the incidence of shoulder pain and strength in
intercollegiate swimmers. J Sport Rehabil. 2002;11(2):140–154.
19. Dvir Z. Isokinetics Muscle Testing: Interpretation and Clinical
Applications. Philadelphia, PA: Churchill Livingstone; 1995:171–193.
20. Cools AM, Witvrouw EE, Danneels LA, Vanderstraeten GG,
Cambier DC. Test-retest reproducibility of concentric strength values
for shoulder girdle protraction and retraction using the Biodex
isokinetic dynamometer. Isokinet Exerc Sci. 2002;10(3):129–136.
21. Cools AM, Geerooms E, Van den Berghe DF, Cambier DC,
Witvrouw EE. Isokinetic scapular muscle performance in young elite
gymnasts. J Athl Train. 2007;42(4):458–463.
22. Ellenbecker TS, Davies GJ. The application of isokinetics in testing
and rehabilitation of the shoulder complex. J Athl Train. 2000;35(3):
338–350.
23. Decker MJ, Hintermeister RA, Faber KJ, Hawkins RJ. Serratus
anterior muscle activity during selected rehabilitation exercises.
Am J Sports Med. 1999;27(6):784–791.
24. Ludewig PM, Hoff MS, Osowski EE, Meschke SA, Rundquist PJ.
Relative balance of serratus anterior and upper trapezius muscle
activity during push-up exercises. Am J Sports Med. 2004;32(2):
484–493.
25. Moseley JB Jr, Jobe FW, Pink M, Perry J, Tibone J. EMG analysis of
the scapular muscles during a shoulder rehabilitation program.
Am J Sports Med. 1992;20(2):128–134.
26. Cools AM, Dewitte V, Lanszweert F, et al. Rehabilitation of scapular
muscle balance: which exercises to prescribe? Am J Sports Med.
2007;35(10):1744–1751.
27. Bird SP, Tarpenning KM, Marino FE. Designing resistance training
programmes to enhance muscular fitness: a review of the acute
programme variables. Sports Med. 2005;35(10):841–851.
28. Delorme TL. Restoration of muscle power by heavy resistance
exercises. J Bone Joint Surg Am. 1945;27:645–667.
29. Gozlan G, Bensoussan L, Coudreuse JM, et al. Isokinetic dynamom-
eter measurement of shoulder rotational strength in healthy elite
athletes (swimming, volley-ball, tennis): comparison between domi-
nant and non-dominant shoulder. Ann Readapt Med Phys. 2006;
49(1):8–15.
30. Beach ML, Whitney SL, Dickoff-Hofmann SA. Relationship of
shoulder flexibility, strength, and endurance to shoulder pain in
competitive swimmers. J Orthop Sports Phys Ther. 1992;16(6):
262–268.
31. Campos GE, Luecke TJ, Wendeln HK, et al. Muscular adaptations in
response to three different resistance-training regimens: specificity of
repetition maximum training zones. Eur J Appl Physiol. 2002;88(1–
2):50–60.
32. Hagberg M, Harms-Ringdahl K, Nisell R, Hjelm EW. Rehabilitation
of neck-shoulder pain in women industrial workers: a randomized
trial comparing isometric shoulder endurance training with isometric
shoulder strength training. Arch Phys Med Rehabil. 2000;81(8):
1051–1058.
33. Van Heuveln G. Krachttraining voor zwemmers. Ned Tijdschrift
Krachttrain. 2007;16:5–8.
34. Yanai T, Hay JG. Shoulder impingement in front-crawl swimming, I:
a method to identify impingement. Med Sci Sports Exerc. 2000;32(1):
21–29.
35. Falkel JE, Murphy TC, Murray TF. Prone positioning for testing
shoulder internal and external rotation on the Cybex isokinetic
dynamometer. J Orthop Sports Phys Ther. 1987;8(7):368–370.
Address correspondence to Annemie Van de Velde, PT, University Hospital Ghent, Department of Rehabilitation Sciences andPhysiotherapy, De Pintelaan 185, 2B3, B9000 Ghent, Belgium. Address e-mail to [email protected].
Journal of Athletic Training 167

COMMENTARY
COMMENTARY
Christopher R. Carcia, PhD, PT, SCS, OCS
Department of Physical Therapy, John G. Rangos Sr. Schoolof Health Sciences, Duquesne University, Pittsburgh, PA
I would like to commend the authors on their work. Thisstudy to a large extent mirrored the published work byCools et al,1 albeit in a different population. Unique to thepresent work, however, is the investigation of 2 types oftraining programs on muscle-performance characteristicsin adolescent swimmers. Specifically, after isokineticpretesting of the scapular protractors and retractors,swimmers performed a supervised program of eitherstrength training or endurance training for 12 weeks,followed by a posttest. The authors did not identifydifferences in muscle performance between groups afterthe intervention for any of the dependent measures.Furthermore, the authors reported that muscle endurance,as a function of the fatigue index (FI), decreased betweenthe 2 measures.
Identifying differences between groups and amongmultiple interventions is influenced by several factors,including variance among the groups, sample size, andthe effect size(s) of the intervention(s).2 In this study, theauthors acknowledge that intersubject variance (largeSDs) may have contributed to the inability to detect adifference between groups in isokinetic muscle perfor-mance measures after the intervention programs. Al-though this may be a contributing factor, it is my opinionthat the inability to identify group differences wasminimally influenced by this factor. Additionally, eventhough the group sizes were small, larger group sizes inthis situation would likely have done very little to increasethe chance of identifying a statistical, let alone clinicallyimportant, difference between groups. The underlyingreason the authors were unable to detect differencesbetween groups was probably a function of the similar-ities in intervention programs. This statistical informationcould have been ascertained by performing a prospectivepilot study. Armed with the information from an a prioripilot study, the authors could have calculated the samplesize necessary to identify a statistical difference or realizedthat the training programs were so similar that furtherpursuit of the study was not likely to demonstratedifferences. Arguably, there are times when identifyingno differences between interventions is clinically impor-tant. In these cases, when the investigators expect to findno difference, it becomes even more critical to conduct apower analysis. At this juncture, given that neither a pilotstudy nor power analysis was performed, it would have
been helpful to the reader had the authors reported theactual effect sizes (g2).
With regard to muscle endurance, participants per-formed a fatigue test (40 repetitions at 1806/s) before andafter the training programs. During the pretest, the authorsfound a negative FI, which indicates that work increasedwhen the data from the last third of the fatigue protocolwere compared with those of the first third. The authorsreported, ‘‘The swimmers had good muscle-endurancecapacity, which is a positive result.’’ During the posttest,however, the authors found a positive FI, indicating thatwork decreased when the last third of the fatigue protocolwas compared with the first third. The authors interpretedthis result as signifying that the swimmers had less muscle-endurance capacity after training. They theorized thatswimming in conjunction with the training program mayhave created a situation involving overtraining. Theyattempted to substantiate their findings by citing the workof Su et al,3 who observed decreased muscular enduranceafter an acute bout of swimming. Although it is possiblethat the swimmers became overtrained during the 12-weekstudy, this logic would not explain the results of their FIs.Overtrained or not, the participants’ ability to generateforce should have been greater at the onset (ie, during thefirst third of the fatigue protocol) and less during the finalphase (ie, during the last third of the protocol). Su et al3 dididentify a decrease in shoulder force production after anacute bout of swimming, reinforcing the fact that theability to generate force decreases after a period of acuteexertion. The factor that most likely explains the negativeFI is simply a learning effect. The authors cite reliabilitydata related to the Biodex for the motions of protractionand retraction,4 but these data were not specific to thefaster speed at which the fatigue test was conducted.Although the participants performed a brief (5-trial)familiarization session, this was obviously insufficient.The data from the present study indicate that during thepretest, the participants learned how to use the device;hence, force readings were greater in the last third of thetest than in the first third. They retained this experience,and I believe that the posttest data are valid. However, Idisagree with the interpretation of the posttest data andsuggest that these data are consistent with a normal fatiguetest, as shown in other similar work.1
Despite these weaknesses, the strength of the currentstudy is the descriptive muscle-performance data inadolescent swimmers. These data are of potential value toresearchers and clinicians who work with this population.
Journal of Athletic Training 2011;46(2):168–169g by the National Athletic Trainers’ Association, Incwww.nata.org/jat
168 Volume 46 N Number 2 N April 2011
REFERENCES
1. Cools AM, Geerooms E, Van den Berghe DF, Cambier DC, Witvrouw
EE. Isokinetic scapular muscle performance in young elite gymnasts.
J Athl Train. 2007;42(4):458–463.
2. Portney LG, Watkins MP. Foundations of Clinical Research: Applications
to Practice. 2nd ed. Upper Saddle River, NJ: Prentice-Hall Inc, 2000.
3. Su KP, Johnson MP, Gracely EJ, Karduna AR. Scapular rotation in
swimming with and without impingement syndrome: practice effects.
Med Sci Sports Exerc. 2004;36(7):1117–1123.
4. Cools AM, Witvrouw EE, Danneels LA, Vanderstraeten GG, Cambier
DC. Test-retest reproducibility of concentric strength values for
shoulder girdle protraction and retraction using the Biodex isokinetic
dynamometer. Isokinet Exerc Sci. 2002;10(3):129–136.
Address correspondence to Christopher R. Carcia, PhD, PT, SCS, OCS, Department of Physical Therapy, John G. Rangos Sr. School ofHealth Sciences, Duquesne University, Pittsburgh, PA 15282. Address e-mail to [email protected].
Journal of Athletic Training 169

AUTHORS’ REPLY
We agree with Dr Carcia’s commentary and thank himfor his valuable and useful observations.
Annemie Van de Velde, PTPatrick Calders, PhD
University Hospital GhentGhent, Belgium
email: [email protected]
Kristof De Mey, PTAnnelies Maenhout, PT
Ann M. Cools, PhD, PTGhent University
Ghent, Belgium
Journal of Athletic Training 169
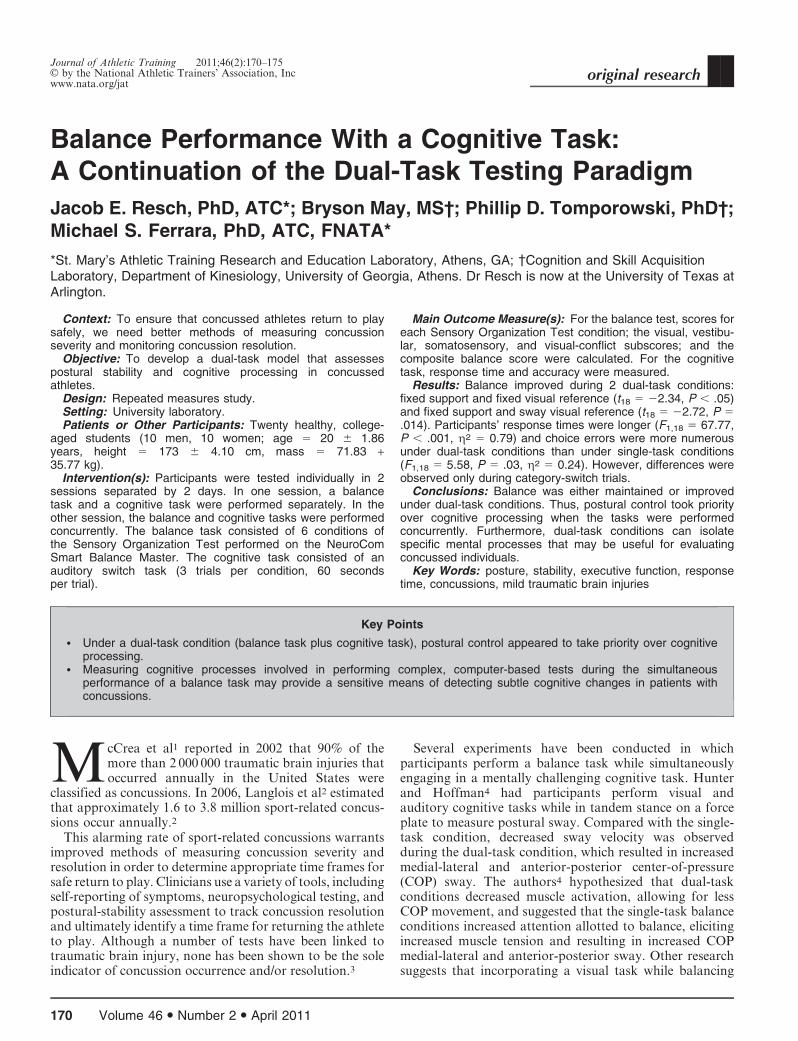
Balance Performance With a Cognitive Task:A Continuation of the Dual-Task Testing Paradigm
Jacob E. Resch, PhD, ATC*; Bryson May, MS�; Phillip D. Tomporowski, PhD�;Michael S. Ferrara, PhD, ATC, FNATA*
*St. Mary’s Athletic Training Research and Education Laboratory, Athens, GA; 3Cognition and Skill AcquisitionLaboratory, Department of Kinesiology, University of Georgia, Athens. Dr Resch is now at the University of Texas atArlington.
Context: To ensure that concussed athletes return to playsafely, we need better methods of measuring concussionseverity and monitoring concussion resolution.
Objective: To develop a dual-task model that assessespostural stability and cognitive processing in concussedathletes.
Design: Repeated measures study.Setting: University laboratory.Patients or Other Participants: Twenty healthy, college-
aged students (10 men, 10 women; age 5 20 6 1.86years, height 5 173 6 4.10 cm, mass 5 71.83 +35.77 kg).
Intervention(s): Participants were tested individually in 2sessions separated by 2 days. In one session, a balancetask and a cognitive task were performed separately. In theother session, the balance and cognitive tasks were performedconcurrently. The balance task consisted of 6 conditions ofthe Sensory Organization Test performed on the NeuroComSmart Balance Master. The cognitive task consisted of anauditory switch task (3 trials per condition, 60 secondsper trial).
Main Outcome Measure(s): For the balance test, scores foreach Sensory Organization Test condition; the visual, vestibu-lar, somatosensory, and visual-conflict subscores; and thecomposite balance score were calculated. For the cognitivetask, response time and accuracy were measured.
Results: Balance improved during 2 dual-task conditions:fixed support and fixed visual reference (t18 5 22.34, P , .05)and fixed support and sway visual reference (t18 5 22.72, P 5.014). Participants’ response times were longer (F1,18 5 67.77,P , .001, g2 5 0.79) and choice errors were more numerousunder dual-task conditions than under single-task conditions(F1,18 5 5.58, P 5 .03, g2 5 0.24). However, differences wereobserved only during category-switch trials.
Conclusions: Balance was either maintained or improvedunder dual-task conditions. Thus, postural control took priorityover cognitive processing when the tasks were performedconcurrently. Furthermore, dual-task conditions can isolatespecific mental processes that may be useful for evaluatingconcussed individuals.
Key Words: posture, stability, executive function, responsetime, concussions, mild traumatic brain injuries
Key Points
N Under a dual-task condition (balance task plus cognitive task), postural control appeared to take priority over cognitiveprocessing.
N Measuring cognitive processes involved in performing complex, computer-based tests during the simultaneousperformance of a balance task may provide a sensitive means of detecting subtle cognitive changes in patients withconcussions.
McCrea et al1 reported in 2002 that 90% of themore than 2 000 000 traumatic brain injuries thatoccurred annually in the United States were
classified as concussions. In 2006, Langlois et al2 estimatedthat approximately 1.6 to 3.8 million sport-related concus-sions occur annually.2
This alarming rate of sport-related concussions warrantsimproved methods of measuring concussion severity andresolution in order to determine appropriate time frames forsafe return to play. Clinicians use a variety of tools, includingself-reporting of symptoms, neuropsychological testing, andpostural-stability assessment to track concussion resolutionand ultimately identify a time frame for returning the athleteto play. Although a number of tests have been linked totraumatic brain injury, none has been shown to be the soleindicator of concussion occurrence and/or resolution.3
Several experiments have been conducted in whichparticipants perform a balance task while simultaneouslyengaging in a mentally challenging cognitive task. Hunterand Hoffman4 had participants perform visual andauditory cognitive tasks while in tandem stance on a forceplate to measure postural sway. Compared with the single-task condition, decreased sway velocity was observedduring the dual-task condition, which resulted in increasedmedial-lateral and anterior-posterior center-of-pressure(COP) sway. The authors4 hypothesized that dual-taskconditions decreased muscle activation, allowing for lessCOP movement, and suggested that the single-task balanceconditions increased attention allotted to balance, elicitingincreased muscle tension and resulting in increased COPmedial-lateral and anterior-posterior sway. Other researchsuggests that incorporating a visual task while balancing
Journal of Athletic Training 2011;46(2):170–175g by the National Athletic Trainers’ Association, Incwww.nata.org/jat
original research
170 Volume 46 N Number 2 N April 2011
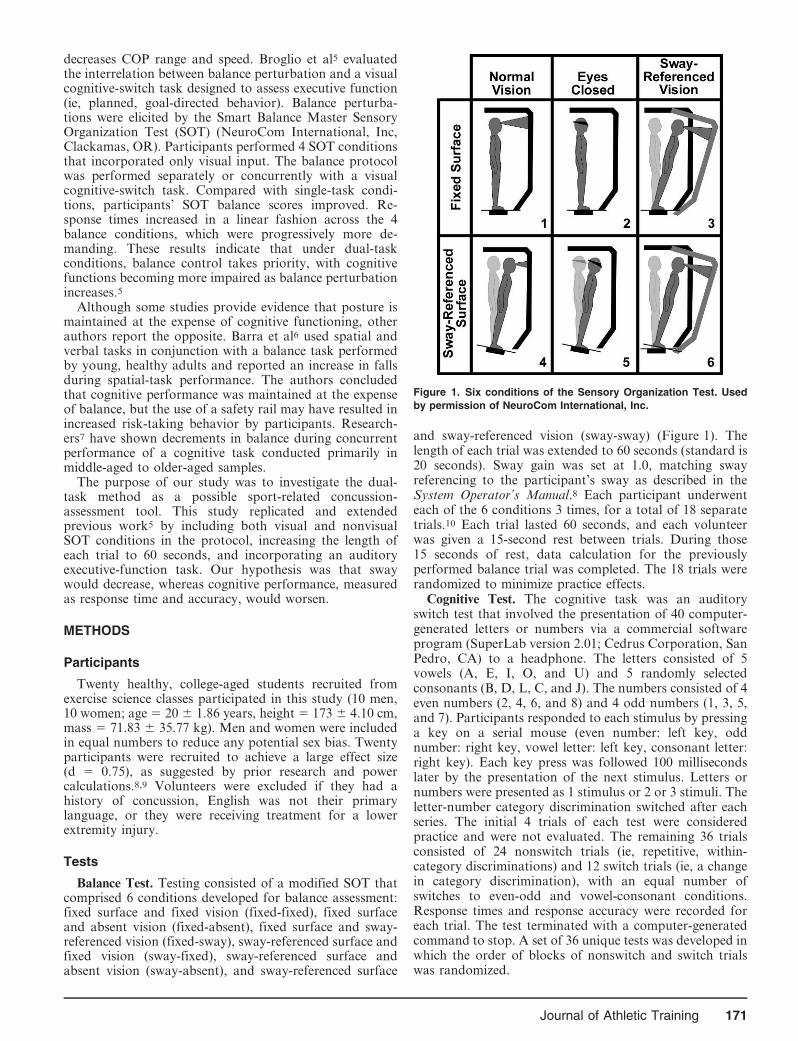
decreases COP range and speed. Broglio et al5 evaluatedthe interrelation between balance perturbation and a visualcognitive-switch task designed to assess executive function(ie, planned, goal-directed behavior). Balance perturba-tions were elicited by the Smart Balance Master SensoryOrganization Test (SOT) (NeuroCom International, Inc,Clackamas, OR). Participants performed 4 SOT conditionsthat incorporated only visual input. The balance protocolwas performed separately or concurrently with a visualcognitive-switch task. Compared with single-task condi-tions, participants’ SOT balance scores improved. Re-sponse times increased in a linear fashion across the 4balance conditions, which were progressively more de-manding. These results indicate that under dual-taskconditions, balance control takes priority, with cognitivefunctions becoming more impaired as balance perturbationincreases.5
Although some studies provide evidence that posture ismaintained at the expense of cognitive functioning, otherauthors report the opposite. Barra et al6 used spatial andverbal tasks in conjunction with a balance task performedby young, healthy adults and reported an increase in fallsduring spatial-task performance. The authors concludedthat cognitive performance was maintained at the expenseof balance, but the use of a safety rail may have resulted inincreased risk-taking behavior by participants. Research-ers7 have shown decrements in balance during concurrentperformance of a cognitive task conducted primarily inmiddle-aged to older-aged samples.
The purpose of our study was to investigate the dual-task method as a possible sport-related concussion-assessment tool. This study replicated and extendedprevious work5 by including both visual and nonvisualSOT conditions in the protocol, increasing the length ofeach trial to 60 seconds, and incorporating an auditoryexecutive-function task. Our hypothesis was that swaywould decrease, whereas cognitive performance, measuredas response time and accuracy, would worsen.
METHODS
Participants
Twenty healthy, college-aged students recruited fromexercise science classes participated in this study (10 men,10 women; age 5 20 6 1.86 years, height 5 173 6 4.10 cm,mass 5 71.83 6 35.77 kg). Men and women were includedin equal numbers to reduce any potential sex bias. Twentyparticipants were recruited to achieve a large effect size(d 5 0.75), as suggested by prior research and powercalculations.8,9 Volunteers were excluded if they had ahistory of concussion, English was not their primarylanguage, or they were receiving treatment for a lowerextremity injury.
Tests
Balance Test. Testing consisted of a modified SOT thatcomprised 6 conditions developed for balance assessment:fixed surface and fixed vision (fixed-fixed), fixed surfaceand absent vision (fixed-absent), fixed surface and sway-referenced vision (fixed-sway), sway-referenced surface andfixed vision (sway-fixed), sway-referenced surface andabsent vision (sway-absent), and sway-referenced surface
and sway-referenced vision (sway-sway) (Figure 1). Thelength of each trial was extended to 60 seconds (standard is20 seconds). Sway gain was set at 1.0, matching swayreferencing to the participant’s sway as described in theSystem Operator’s Manual.8 Each participant underwenteach of the 6 conditions 3 times, for a total of 18 separatetrials.10 Each trial lasted 60 seconds, and each volunteerwas given a 15-second rest between trials. During those15 seconds of rest, data calculation for the previouslyperformed balance trial was completed. The 18 trials wererandomized to minimize practice effects.
Cognitive Test. The cognitive task was an auditoryswitch test that involved the presentation of 40 computer-generated letters or numbers via a commercial softwareprogram (SuperLab version 2.01; Cedrus Corporation, SanPedro, CA) to a headphone. The letters consisted of 5vowels (A, E, I, O, and U) and 5 randomly selectedconsonants (B, D, L, C, and J). The numbers consisted of 4even numbers (2, 4, 6, and 8) and 4 odd numbers (1, 3, 5,and 7). Participants responded to each stimulus by pressinga key on a serial mouse (even number: left key, oddnumber: right key, vowel letter: left key, consonant letter:right key). Each key press was followed 100 millisecondslater by the presentation of the next stimulus. Letters ornumbers were presented as 1 stimulus or 2 or 3 stimuli. Theletter-number category discrimination switched after eachseries. The initial 4 trials of each test were consideredpractice and were not evaluated. The remaining 36 trialsconsisted of 24 nonswitch trials (ie, repetitive, within-category discriminations) and 12 switch trials (ie, a changein category discrimination), with an equal number ofswitches to even-odd and vowel-consonant conditions.Response times and response accuracy were recorded foreach trial. The test terminated with a computer-generatedcommand to stop. A set of 36 unique tests was developed inwhich the order of blocks of nonswitch and switch trialswas randomized.
Figure 1. Six conditions of the Sensory Organization Test. Used
by permission of NeuroCom International, Inc.
Journal of Athletic Training 171

Each participant was trained to perform the auditoryswitch task in 5 phases. Initially, the task was described tothe participant, who stood next to a computer station. Heor she was directed to attend to a chart at eye level thatdescribed the correct stimulus-condition and mouse-keyresponse pairings. Next, the volunteer donned a set ofheadphones, was instructed to hold the mouse in the righthand with both arms at the side, and was then asked tomonitor a series of 15 letters and numbers stimuli presentedevery 500 milliseconds (adjusting the loudness of thestimuli to the preferred level via a volume-adjustment dialon the headphone cord). The participant was directed tolisten to a series of 30 numbers and to discriminate betweeneven and odd numbers with the appropriate mouse-keypress. A series of 30 letters was presented and theparticipant was asked to discriminate between vowels andconsonants with the appropriate key press. Finally, he orshe was told that both letters and numbers were going to bepresented and to respond as quickly and accurately aspossible. Stimuli consisted of 120 letters or numbers, whichwere repeated in series lengths of 1, 2, or 3 and thenswitched from one category to the other. There were 80nonswitch and 40 switch trials, with an equal number ofswitches to even-odd and vowel-consonant conditions.
Procedures
Participants read and signed a consent form approved bythe institutional review board, which also approved thestudy, and completed a brief questionnaire of self-reporteddemographics. Testing consisted of 2 sessions separated by48 to 72 hours, performed at the same time of day. Duringsession 1, each participant was familiarized with thebalance and cognitive protocol by completing truncatedversions of the full tests. For the balance task, participantscompleted 10 seconds of 1 trial of all 6 conditions. For thecognitive task, participants completed shortened versionsof both the nonswitch and switch tasks.
The balance test was conducted by trained researchersusing the Smart Balance Master (NeuroCom) in concertwith the Data Acquisition Toolkit (version 2.0; Neuro-Com). The latter portion of the first session consisted of 1of 2 scenarios: in the first, the cognitive and balance taskswere performed separately (single task); in the second, thecognitive and balance tasks were performed concurrently(dual task). The unused protocol, either single task or dualtask, was used for the second testing session. Sessions 1 and2 were counterbalanced across participants. The single-taskand dual-task conditions were delivered by 1 and 2investigators, respectively. For the single-task balancecondition, volunteers were provided the same instructionsas given in the practice session, that is, to respond to thecognitive stimuli as quickly and accurately as possible.After initiation of data collection, no verbal cues weregiven. Data were collected for the eighteen 60-second trials.After completion of the balance task, the participant wasasked to step out of the device and prepare for thecognitive task. The dual-task session began with instruc-tions. After confirming that the participant understood theprocedure, testing began with a volume-adjustment trialand a 120-trial practice test, which was administered to theparticipant while he or she was standing next to thecomputer station. The participant was then instructed to
step on the platform and to perform the cognitive test whilemaintaining balance under 6 test conditions. Each balanceand cognitive test began simultaneously. Each participantfinished the cognitive test before completing the balancetrial.
Data Analysis
Balance Assessment. The initial 5 and final 20 secondswere discarded from data analysis to limit extraneous andbetween-subjects variability associated with the beginningand completion of the dual-task protocol. Scores for eachSOT condition; visual, vestibular, somatosensory, andvisual-conflict subscores; and a composite balance scorewere calculated from data obtained during the remaining35-second period in which dual-task conditions were ineffect. Scores were derived as described in the SystemOperator’s Manual.8 We used paired t tests to assessdifferences between scores obtained from the single-taskand dual-task protocols for condition; visual, vestibular,somatosensory, and visual-conflict; and composite ratioscores. The data obtained from 1 male participant wereexcluded from analyses due to extreme SOT scores, whichwere below the normative data provided by NeuroCom forboth the single-task and dual-task protocols. The exclusionof this participant did not affect the overall power of thestudy.11
Cognitive Assessment. Cognitive test performance wasassessed by evaluating each participant’s response time(RT) and response accuracy to stimuli presented on trialsimmediately before a category switch (nonswitch trials)and to stimuli presented immediately after a categoryswitch (switch trials). Participants’ RTs and proportion ofresponse errors were averaged over 3 successive testsperformed under the single-task condition and 3 testsperformed under each of the 6 dual-task conditions. TheRT scores and response errors were analyzed separately viaa within-subjects 2 (trial type: nonswitch, switch) 3 2 (testcondition: single task, dual task) 3 6 (balance conditions)analysis of variance. All data were analyzed using SPSS(version 15.0; SPSS Inc, Chicago, IL). Sample size wasestimated using a large effect size (d 5 0.80) frompreviously related research.4
RESULTS
Balance Assessment
Differences in balance scores were noted between 2 ofthe 6 conditions. Scores were higher under during the dual-task fixed-fixed (t18 5 22.35, P 5 .030) and fixed-sway(t18 5 22.72, P 5 .014) conditions. Condition, subscore,and composite means and SDs for the 35-second assess-ment of balance during single-task and dual-task condi-tions are provided in the Table.
Cognitive Assessment
Response times were longer for switch trials thannonswitch trials under both single-task and dual-taskconditions (F1,18 5 67.77, P # .001, g2 5 0.79). Aninteraction was noted for response time between trial type(nonswitch versus switch) and test condition (single taskversus dual task) (F1,18 5 5.084, P 5 .037, g2 5 0.22). As
172 Volume 46 N Number 2 N April 2011

seen in Figure 2, RT during dual-task conditions waslonger than during single-task conditions but only forswitch trials. Analyses of response errors yielded maineffects for trial type (F1,18 5 5.58, P 5 .03, g2 5 0.24),which were qualified by a trial type 3 test-conditioninteraction (F1,18 5 8.35, P 5 .01, g2 5 0.32). As shown inFigure 3, participants made more errors during dual-taskconditions but only on switch trials.
DISCUSSION
The purpose of our study was to investigate the effects ofintroducing visual and nonvisual conditions of the SOT inconjunction with an auditory cognitive task on balance andcognitive performance. Our results confirmed and extendedthe findings obtained by Broglio et al,5 which indicatedthat balance would be maintained at the expense ofcognitive function with regard to both RT and errors.
Similar to prior researchers,4,5,7,12 we found that youngadults’ postural stability increased during the fixed-fixedand fixed-sway conditions and remained unchanged duringthe remainder of the balance conditions. With respect tothe cognitive task, we observed a concomitant increase inRT and number of errors with increasing difficulty of thebalance task.
A physiologic explanation of our findings is that cerebralprocessing during dual-task conditions apparently modifieshow the central nervous system controls postural stability.Under normal conditions, balance is controlled viaintegration of sensory information provided by the visual,vestibular, and somatosensory systems.5,13 Input based onlimb positioning is transmitted to the basal ganglia. Thissignal is integrated with planned actions developed in thepremotor cortex and supplementary motor cortex in thecerebellum. The descending pathway continues via alphamotor neurons, which innervate skeletal muscle, allowing
Figure 2. Reaction time for single-task and dual-task methods for 6 balance conditions: (1) fixed surface, fixed vision; (2) fixed surface,
absent vision; (3) fixed surface, sway-referenced vision; (4) sway-referenced surface, fixed vision; (5) sway-referenced surface, absent
vision; (6) sway-referenced surface, sway-referenced vision.
Table. Balance-Task Condition Scores, Subscores, and Composite Scores (Mean 6 SD)a
Balance Condition Balance Test Only
Dual Task
(Balance Test + Cognitive Test)
1 (fixed surface, fixed vision) 89.5 6 6.0 91.6 6 3.4b
2 (fixed surface, absent vision) 86.0 6 5.3 88.0 6 3.2
3 (fixed surface, sway-referenced vision) 84.1 6 9.5 89.7 6 4.2c
4 (sway-referenced surface, fixed vision) 85.2 6 7.8 85.2 6 5.4
5 (sway-referenced surface, absent vision) 72.7 6 9.5 73.9 6 7.4
6 (sway-referenced surface, sway-referenced vision) 71.5 6 10.5 71.7 6 7.0
Visual 95.0 6 9.4 92.5 6 4.5
Vestibular 81.0 6 11.1 80.3 6 7.8
Somatosensory 96.5 6 8.4 95.7 6 2.4
Visual conflict 99.4 6 9.7 100.2 6 5.1
Composite score 91.4 6 5.7 93.2 6 3.5
a The range of possible scores is 0 to 100.b P , .05.c P # .05.
Journal of Athletic Training 173
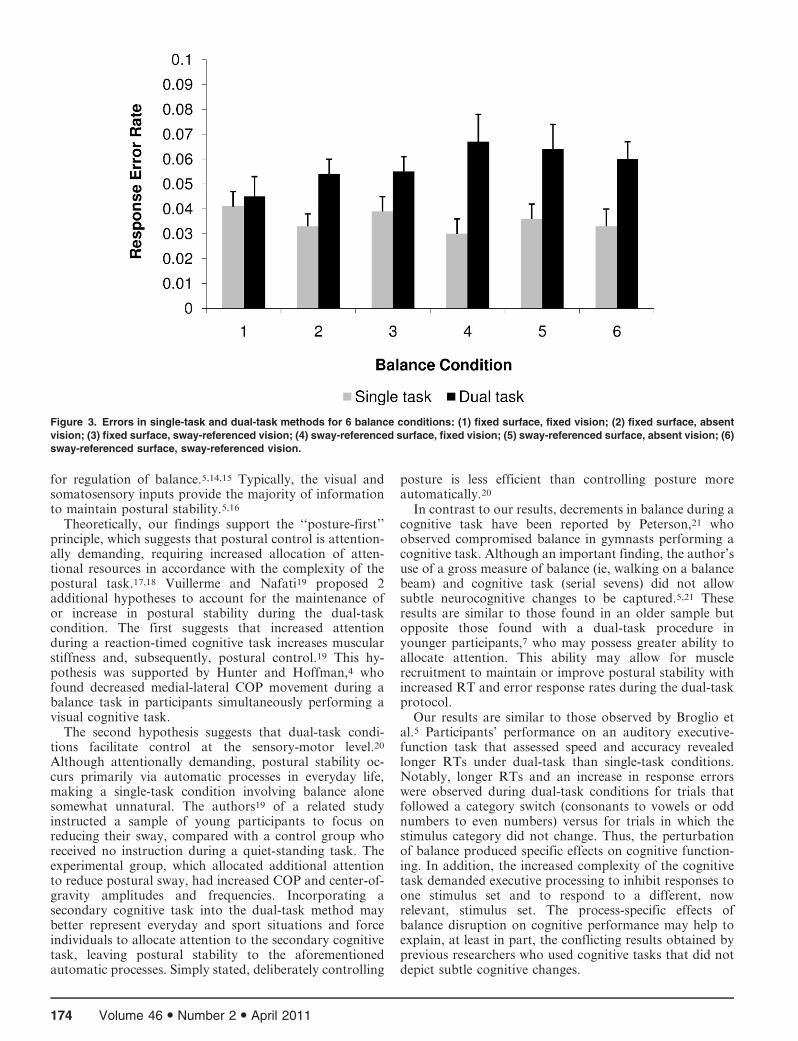
for regulation of balance.5,14,15 Typically, the visual andsomatosensory inputs provide the majority of informationto maintain postural stability.5,16
Theoretically, our findings support the ‘‘posture-first’’principle, which suggests that postural control is attention-ally demanding, requiring increased allocation of atten-tional resources in accordance with the complexity of thepostural task.17,18 Vuillerme and Nafati19 proposed 2additional hypotheses to account for the maintenance ofor increase in postural stability during the dual-taskcondition. The first suggests that increased attentionduring a reaction-timed cognitive task increases muscularstiffness and, subsequently, postural control.19 This hy-pothesis was supported by Hunter and Hoffman,4 whofound decreased medial-lateral COP movement during abalance task in participants simultaneously performing avisual cognitive task.
The second hypothesis suggests that dual-task condi-tions facilitate control at the sensory-motor level.20
Although attentionally demanding, postural stability oc-curs primarily via automatic processes in everyday life,making a single-task condition involving balance alonesomewhat unnatural. The authors19 of a related studyinstructed a sample of young participants to focus onreducing their sway, compared with a control group whoreceived no instruction during a quiet-standing task. Theexperimental group, which allocated additional attentionto reduce postural sway, had increased COP and center-of-gravity amplitudes and frequencies. Incorporating asecondary cognitive task into the dual-task method maybetter represent everyday and sport situations and forceindividuals to allocate attention to the secondary cognitivetask, leaving postural stability to the aforementionedautomatic processes. Simply stated, deliberately controlling
posture is less efficient than controlling posture moreautomatically.20
In contrast to our results, decrements in balance during acognitive task have been reported by Peterson,21 whoobserved compromised balance in gymnasts performing acognitive task. Although an important finding, the author’suse of a gross measure of balance (ie, walking on a balancebeam) and cognitive task (serial sevens) did not allowsubtle neurocognitive changes to be captured.5,21 Theseresults are similar to those found in an older sample butopposite those found with a dual-task procedure inyounger participants,7 who may possess greater ability toallocate attention. This ability may allow for musclerecruitment to maintain or improve postural stability withincreased RT and error response rates during the dual-taskprotocol.
Our results are similar to those observed by Broglio etal.5 Participants’ performance on an auditory executive-function task that assessed speed and accuracy revealedlonger RTs under dual-task than single-task conditions.Notably, longer RTs and an increase in response errorswere observed during dual-task conditions for trials thatfollowed a category switch (consonants to vowels or oddnumbers to even numbers) versus for trials in which thestimulus category did not change. Thus, the perturbationof balance produced specific effects on cognitive function-ing. In addition, the increased complexity of the cognitivetask demanded executive processing to inhibit responses toone stimulus set and to respond to a different, nowrelevant, stimulus set. The process-specific effects ofbalance disruption on cognitive performance may help toexplain, at least in part, the conflicting results obtained byprevious researchers who used cognitive tasks that did notdepict subtle cognitive changes.
Figure 3. Errors in single-task and dual-task methods for 6 balance conditions: (1) fixed surface, fixed vision; (2) fixed surface, absent
vision; (3) fixed surface, sway-referenced vision; (4) sway-referenced surface, fixed vision; (5) sway-referenced surface, absent vision; (6)
sway-referenced surface, sway-referenced vision.
174 Volume 46 N Number 2 N April 2011
One limitation of this investigation was our study of ahealthy sample to determine whether cognitive deficitsexisted in a nonconcussed state and to evaluate the dual-tasking model as a possible concussion-assessment test.Further research regarding this dual-task condition proto-col will include a concussed sample for comparison. Otherlimitations were participant motivation and frustrationduring completion of the cognitive task. Although partic-ipant compliance and effort were considered good,extraneous variables such as these can only be controlledto a certain extent.
Our results are particularly important for researchersinterested in assessing the effects of concussion on athletes’cognitive function. Currently, no single evaluative test candetermine the effect of a concussion on cognitive functionand help clinicians make return-to-play decisions. Therelationships among self-reported symptoms, computerizedneuropsychological testing, and postural stability are welldocumented in the concussion literature. When deliveredseparately, these tools have demonstrated sensitivities of68%, 79%, and 62%, respectively; when delivered together,greater than 90% sensitivity was achieved.22 Althoughthese results are encouraging, not all clinicians have accessto these tests due to financial constraints and limitedavailability of the professional support needed to properlyevaluate such tests.
The results of the present study suggest that measures ofcognitive processes involved in performing complexcomputer-based tests while concurrently performing abalance task may provide a sensitive means of detectingsubtle cognitive changes in a young, healthy sample.Although our findings show promise as an alternate toolfor concussion assessment, continued research on aconcussed sample is imperative before we implement thisprotocol in the management of concussion. Like any toolused for clinical decision making, each evaluative toolsuggested to help in the management of sport-relatedconcussion must meet the stringent criteria of thelaboratory setting before being used in clinical prac-tice.9,23,24 Our methods may be more academic andlaboratory based, but the results provide meaningfulcontributions to aid in the development of a more clinicallybased tool. A novel tool that incorporates both a motorand a cognitive task to detect deficiencies associated withsport-related concussion may prove to be both time- andcost-effective for the clinician.
REFERENCES
1. McCrea M, Kelly JP, Randolph C, Cisler R, Berger L. Immediate
neurocognitive effects of concussion. Neurosurgery. 2002;50(5):
1032–1042.
2. Langlois JA, Rutland-Brown W, Wald MM. The epidemiology of
traumatic brain injury: a brief overview. J Head Trauma Rehabil.
2006;21(5):375–378.
3. Broglio SP, Macciocchi SN, Ferrara MS. Neurocognitive perfor-
mance of concussed athletes when symptom free. J Athl Train.
2007;42(4):504–508.
4. Hunter MC, Hoffman MA. Postural control: visual and cognitive
manipulations. Gait Posture. 2001;13(10):41–48.
5. Broglio SP, Tomporowski PD, Ferrara MS. Balance performance
with a cognitive task: a dual-task paradigm. Med Sci Sports Exerc.
2005;37(4):689–695.
6. Barra J, Bray A, Sahni V, Golding JF, Gresty MA. Increasing
cognitive load with increasing balance challenge: recipe for catastro-
phe. Exp Brain Res. 2006;174(4):734–745.
7. Shumway-Cook A, Woollacott M. Attentional demands and postural
control: the effect of sensory context. J Gerontol A Biol Sci Med Sci.
2000;55(1):M10–M16.
8. NeuroCom International, Inc. NeuroCom System Operator’s Manual.
8th ed. Clackamas, OR: NeuroCom International, Inc; 2001:PO-
1–PO-10.
9. McCrory P, Meeuwisse W, Johnston K, et al. Consensus statement on
concussion in sport: the 3rd International Conference on Concussion
in Sport held in Zurich, November 2008. J Athl Train. 2009;44(4):
434–448.
10. May B, Tomporowski PD, Ferrara M. Effects of backpack load on
balance and decisional processes. Mil Med. 2009;174(12):1308–1312.
11. Maxwell SE, Delaney HD. Designing Experiments and Analyzing
Data. 2nd ed. Mahweh, NJ: Lawrence Erlbaum Associates; 2004:641.
12. Rankin JK, Woollacott MH, Shumway-Cook A, Brown LA.
Cognitive influences on postural stability: a neuromuscular analysis
in young and older adults. J Gerontol Biol Sci Med Sci. 2000;
55(3):M112–M119.
13. Vuillerme N, Nougier V. Attentional demand for regulating postural
sway: the effect of expertise in gymnastics. Brain Res Bull. 2004;
63(12):161–165.
14. Riemann BL, Guskiewicz KM. Effects of mild head injury on
postural stability as measured through clinical balance testing. J Athl
Train. 2000;35(1):19–25.
15. Martin JH. Neuroanatomy: Text and Atlas. 2nd ed. Stamford, CT:
Appleton & Lange; 1996:323–348.
16. Guskiewicz KM. Postural stability assessment following concussion:
one piece of the puzzle. Clin J Sport Med. 2001;11(3):182–189.
17. Andersson G, Hagman J, Talianzadeh R, Svedberg A, Larsen HC.
Effect of cognitive load on postural control. Brain Res Bull. 2002;
58(1):135–139.
18. Kerr B, Condon SM, McDonald LA. Cognitive spatial processing
and the regulation of posture. J Exp Psychol Hum Percept Perform.
1985;11(5):617–622.
19. Vuillerme N, Nafati G. How attentional focus on body sway affects
postural control during quiet standing. Psychol Res. 2007;71(2):
192–200.
20. Vuillerme N, Nougier V, Teasdale N. Effects of a reaction time task
on postural control in humans. Neurosci Lett. 2000;291(2):77–80.
21. Peterson C. Development and Use of the Multi-Task Head Injury
Assessment Test in Athletes with Concussions [dissertation]. Athens:
University of Georgia; 2002.
22. Broglio SP, Macciochi SN, Ferrara MS. Sensitivity of the concussion
assessment battery. Neurosurgery. 2007;60(6):1050–1058.
23. Guskiewicz KM, Perrin DH, Gansneder BM. Effect of mild head
injury on postural stability in athletes. J Athl Train. 1996;31(4):
300–306.
24. Lovell MR, Collins MW. Neuropsychological assessment of the
college football player. J Head Trauma Rehabil. 1998;13(2):9–26.
Address correspondence to Jacob E. Resch, PhD, ATC, University of Texas at Arlington, Department of Kinesiology, 113 MaverickActivities Center, Arlington, TX 76019. Address e-mail to [email protected].
Journal of Athletic Training 175

Development of a Heat-Illness Screening InstrumentUsing the Delphi Panel Technique
Lindsey E. Eberman, PhD, LAT, ATC; Michelle A. Cleary, PhD, ATC
Florida International University, Miami. Dr Eberman is now at the Department of Applied Medicine and Rehabilitation,Indiana State University, Terre Haute. Dr Cleary is now at the Department of Kinesiology and Rehabilitation Science,University of Hawai’i at Manoa, Honolulu, HI.
Context: Exertional heat illness (EHI) is the third leadingcause of death among athletes, but with preparticipationscreening, risk factors can be identified, and some EHIs canbe prevented.
Objective: To establish content validity of the Heat IllnessIndex Score (HIIS), a 10-item screening instrument designed toidentify athletes at risk for EHI during a preparticipationexamination.
Design: Delphi study.Setting: The Delphi technique included semistructured face-
to-face or telephone interviews and included electronic ques-tionnaires administered via e-mail.
Patients or Other Participants: Six individuals with exten-sive research experience and/or clinical expertise in EHIparticipated as expert panelists.
Main Outcome Measure(s): We used a Delphi paneltechnique (3 rounds) to evaluate the HIIS with the consensusof expert opinions. For round 1, we conducted face-to-faceinterviews with the panelists. For round 2, we solicited panelists’feedback of the transcribed data to ensure trustworthiness, thenprovided the participants with the revised HIIS and a question-
naire eliciting their levels of agreement for each revision fromthe previous round on a visual analog scale (11.4 cm) withextreme indicators of strongly disagree and strongly agree. Wecalculated the mean and SD for each revision and acceptedwhen the mean was greater than 7.6 cm (agree) and the SD stillpermitted a positive response (.5.7 cm), suggesting consen-sus. For round 3, we instructed participants to indicate theirlevels of agreement with each final, revised item and their levelsof agreement with the entire instrument on a 4-point Likert scale(1 5 strongly disagree, 4 5 strongly agree).
Results: In round 1, panelists supported all 10 items butrequested various revisions. In round 2, 16.3% (7 of 43)revisions were rejected, and 2 revisions were modified. In round3, 100% of panelists reported agreeing (n 5 3 of 6) or stronglyagreeing (n 5 3 of 6) with the final instrument.
Conclusions: Panelists were able to achieve consensus andvalidated the content of the HIIS, as well as the instrument itself.Implementation and further analysis are necessary to effectivelyidentify the diagnostic accuracy of the HIIS.
Key Words: Heat Illness Index Score, preparticipationphysical examination, exertional heat illnesses, risk assessment
Key Points
N Using the Delphi panel technique, we established content validity of the Heat Illness Index Score instrument with 3 roundsof panelist consensus.
N The Heat Illness Index Score instrument needs more revision and needs implementation to establish diagnostic accuracyand clinical usefulness.
Exertional heat stroke is the third leading cause ofdeath in the United States among high schoolathletes,1 and, with effort to reduce risk factors,
many heat illnesses can be prevented.2–4 Screening athletesduring preparticipation physical examinations (PPEs) canhelp health care professionals identify predisposing factorsof exertional heat illnesses (EHIs). Using the PPE toidentify patients at risk for EHI can provide the athletictrainer (AT) with information about predisposing condi-tions that might not otherwise be disclosed.5,6 Subsequentaction to reduce these risks is an essential component of theprevention process. Typically, the PPE includes anevaluation of general medical considerations and ortho-paedic injuries; however, ATs would be better equipped toprevent injury and illness with more information about anyprevious history of cardiovascular, respiratory, and heatillnesses.5–7
The recognition of inherent risk factors can helppractitioners make sound clinical decisions when extrinsic
risk factors can inhibit safe participation. Extrinsic riskfactors include exercising in warm or hot, humid environ-mental conditions; wearing protective equipment; havinginappropriate work-to-rest ratios; or having insufficientaccess to water and shade.2 The intrinsic risk factors forEHI include history of EHI; poor cardiovascular andphysical fitness (and accompanying obesity); inadequateheat acclimatization; dehydration or electrolyte imbalance;recent febrile illness; sleep deprivation; a ‘‘never give up’’ or‘‘warrior’’ mentality; a high level of motivation orzealousness; and use of questionable drugs, herbs, orsupplements.3,4 These intrinsic risk factors of EHI can beidentified during the PPE, but most examinations areinadequate to obtain enough information to identifyindividuals at risk. Current research supports extendingthe length of the PPE to include more indicators forcardiovascular, respiratory, and general medical condi-tions, including EHI.5–11 Expanding the PPE would allowpractitioners to identify at-risk athletes and likely would
Journal of Athletic Training 2011;46(2):176–184g by the National Athletic Trainers’ Association, Incwww.nata.org/jat
original research
176 Volume 46 N Number 2 N April 2011
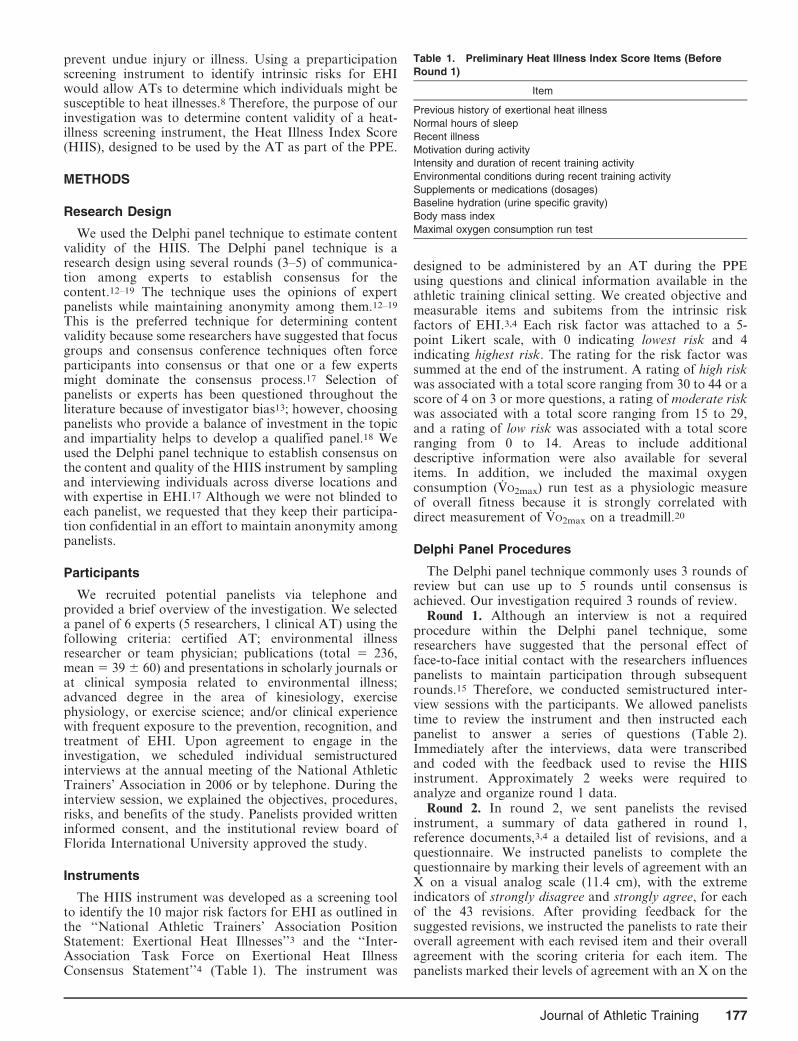
prevent undue injury or illness. Using a preparticipationscreening instrument to identify intrinsic risks for EHIwould allow ATs to determine which individuals might besusceptible to heat illnesses.8 Therefore, the purpose of ourinvestigation was to determine content validity of a heat-illness screening instrument, the Heat Illness Index Score(HIIS), designed to be used by the AT as part of the PPE.
METHODS
Research Design
We used the Delphi panel technique to estimate contentvalidity of the HIIS. The Delphi panel technique is aresearch design using several rounds (3–5) of communica-tion among experts to establish consensus for thecontent.12–19 The technique uses the opinions of expertpanelists while maintaining anonymity among them.12–19
This is the preferred technique for determining contentvalidity because some researchers have suggested that focusgroups and consensus conference techniques often forceparticipants into consensus or that one or a few expertsmight dominate the consensus process.17 Selection ofpanelists or experts has been questioned throughout theliterature because of investigator bias13; however, choosingpanelists who provide a balance of investment in the topicand impartiality helps to develop a qualified panel.18 Weused the Delphi panel technique to establish consensus onthe content and quality of the HIIS instrument by samplingand interviewing individuals across diverse locations andwith expertise in EHI.17 Although we were not blinded toeach panelist, we requested that they keep their participa-tion confidential in an effort to maintain anonymity amongpanelists.
Participants
We recruited potential panelists via telephone andprovided a brief overview of the investigation. We selecteda panel of 6 experts (5 researchers, 1 clinical AT) using thefollowing criteria: certified AT; environmental illnessresearcher or team physician; publications (total 5 236,mean 5 39 6 60) and presentations in scholarly journals orat clinical symposia related to environmental illness;advanced degree in the area of kinesiology, exercisephysiology, or exercise science; and/or clinical experiencewith frequent exposure to the prevention, recognition, andtreatment of EHI. Upon agreement to engage in theinvestigation, we scheduled individual semistructuredinterviews at the annual meeting of the National AthleticTrainers’ Association in 2006 or by telephone. During theinterview session, we explained the objectives, procedures,risks, and benefits of the study. Panelists provided writteninformed consent, and the institutional review board ofFlorida International University approved the study.
Instruments
The HIIS instrument was developed as a screening toolto identify the 10 major risk factors for EHI as outlined inthe ‘‘National Athletic Trainers’ Association PositionStatement: Exertional Heat Illnesses’’3 and the ‘‘Inter-Association Task Force on Exertional Heat IllnessConsensus Statement’’4 (Table 1). The instrument was
designed to be administered by an AT during the PPEusing questions and clinical information available in theathletic training clinical setting. We created objective andmeasurable items and subitems from the intrinsic riskfactors of EHI.3,4 Each risk factor was attached to a 5-point Likert scale, with 0 indicating lowest risk and 4indicating highest risk. The rating for the risk factor wassummed at the end of the instrument. A rating of high riskwas associated with a total score ranging from 30 to 44 or ascore of 4 on 3 or more questions, a rating of moderate riskwas associated with a total score ranging from 15 to 29,and a rating of low risk was associated with a total scoreranging from 0 to 14. Areas to include additionaldescriptive information were also available for severalitems. In addition, we included the maximal oxygenconsumption (VO2max) run test as a physiologic measureof overall fitness because it is strongly correlated withdirect measurement of VO2max on a treadmill.20
Delphi Panel Procedures
The Delphi panel technique commonly uses 3 rounds ofreview but can use up to 5 rounds until consensus isachieved. Our investigation required 3 rounds of review.
Round 1. Although an interview is not a requiredprocedure within the Delphi panel technique, someresearchers have suggested that the personal effect offace-to-face initial contact with the researchers influencespanelists to maintain participation through subsequentrounds.15 Therefore, we conducted semistructured inter-view sessions with the participants. We allowed paneliststime to review the instrument and then instructed eachpanelist to answer a series of questions (Table 2).Immediately after the interviews, data were transcribedand coded with the feedback used to revise the HIISinstrument. Approximately 2 weeks were required toanalyze and organize round 1 data.
Round 2. In round 2, we sent panelists the revisedinstrument, a summary of data gathered in round 1,reference documents,3,4 a detailed list of revisions, and aquestionnaire. We instructed panelists to complete thequestionnaire by marking their levels of agreement with anX on a visual analog scale (11.4 cm), with the extremeindicators of strongly disagree and strongly agree, for eachof the 43 revisions. After providing feedback for thesuggested revisions, we instructed the panelists to rate theiroverall agreement with each revised item and their overallagreement with the scoring criteria for each item. Thepanelists marked their levels of agreement with an X on the
Table 1. Preliminary Heat Illness Index Score Items (Before
Round 1)
Item
Previous history of exertional heat illness
Normal hours of sleep
Recent illness
Motivation during activity
Intensity and duration of recent training activity
Environmental conditions during recent training activity
Supplements or medications (dosages)
Baseline hydration (urine specific gravity)
Body mass index
Maximal oxygen consumption run test
Journal of Athletic Training 177
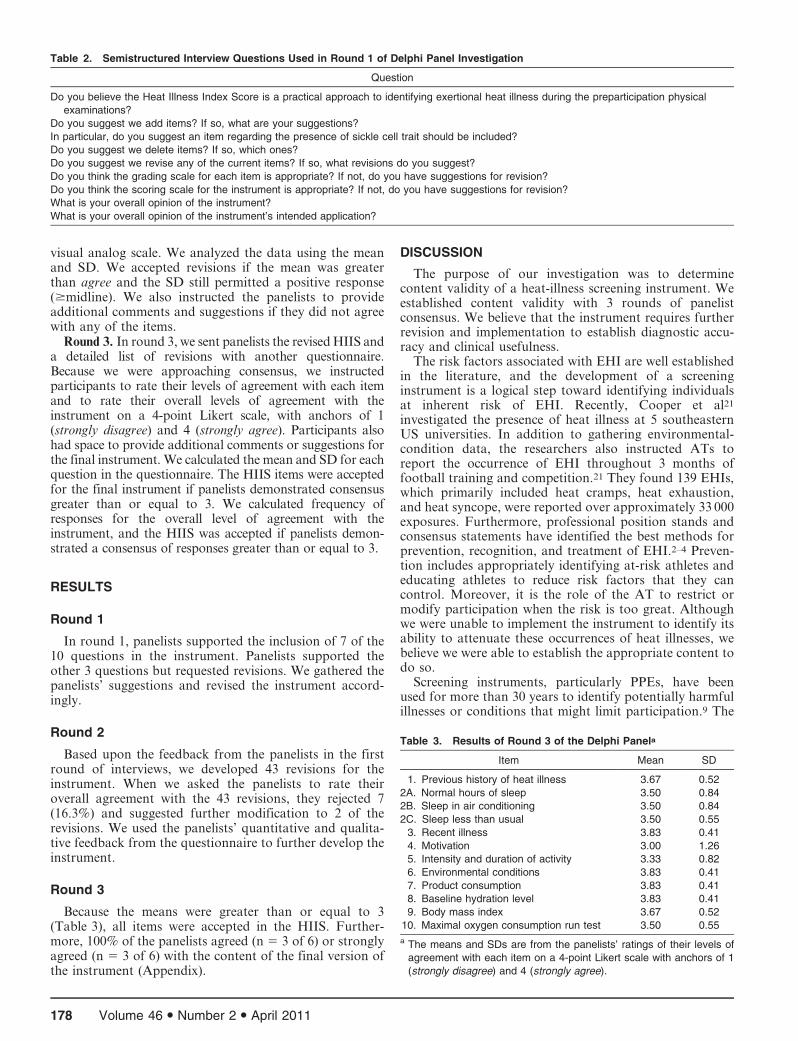
visual analog scale. We analyzed the data using the meanand SD. We accepted revisions if the mean was greaterthan agree and the SD still permitted a positive response($midline). We also instructed the panelists to provideadditional comments and suggestions if they did not agreewith any of the items.
Round 3. In round 3, we sent panelists the revised HIIS anda detailed list of revisions with another questionnaire.Because we were approaching consensus, we instructedparticipants to rate their levels of agreement with each itemand to rate their overall levels of agreement with theinstrument on a 4-point Likert scale, with anchors of 1(strongly disagree) and 4 (strongly agree). Participants alsohad space to provide additional comments or suggestions forthe final instrument. We calculated the mean and SD for eachquestion in the questionnaire. The HIIS items were acceptedfor the final instrument if panelists demonstrated consensusgreater than or equal to 3. We calculated frequency ofresponses for the overall level of agreement with theinstrument, and the HIIS was accepted if panelists demon-strated a consensus of responses greater than or equal to 3.
RESULTS
Round 1
In round 1, panelists supported the inclusion of 7 of the10 questions in the instrument. Panelists supported theother 3 questions but requested revisions. We gathered thepanelists’ suggestions and revised the instrument accord-ingly.
Round 2
Based upon the feedback from the panelists in the firstround of interviews, we developed 43 revisions for theinstrument. When we asked the panelists to rate theiroverall agreement with the 43 revisions, they rejected 7(16.3%) and suggested further modification to 2 of therevisions. We used the panelists’ quantitative and qualita-tive feedback from the questionnaire to further develop theinstrument.
Round 3
Because the means were greater than or equal to 3(Table 3), all items were accepted in the HIIS. Further-more, 100% of the panelists agreed (n 5 3 of 6) or stronglyagreed (n 5 3 of 6) with the content of the final version ofthe instrument (Appendix).
DISCUSSION
The purpose of our investigation was to determinecontent validity of a heat-illness screening instrument. Weestablished content validity with 3 rounds of panelistconsensus. We believe that the instrument requires furtherrevision and implementation to establish diagnostic accu-racy and clinical usefulness.
The risk factors associated with EHI are well establishedin the literature, and the development of a screeninginstrument is a logical step toward identifying individualsat inherent risk of EHI. Recently, Cooper et al21
investigated the presence of heat illness at 5 southeasternUS universities. In addition to gathering environmental-condition data, the researchers also instructed ATs toreport the occurrence of EHI throughout 3 months offootball training and competition.21 They found 139 EHIs,which primarily included heat cramps, heat exhaustion,and heat syncope, were reported over approximately 33 000exposures. Furthermore, professional position stands andconsensus statements have identified the best methods forprevention, recognition, and treatment of EHI.2–4 Preven-tion includes appropriately identifying at-risk athletes andeducating athletes to reduce risk factors that they cancontrol. Moreover, it is the role of the AT to restrict ormodify participation when the risk is too great. Althoughwe were unable to implement the instrument to identify itsability to attenuate these occurrences of heat illnesses, webelieve we were able to establish the appropriate content todo so.
Screening instruments, particularly PPEs, have beenused for more than 30 years to identify potentially harmfulillnesses or conditions that might limit participation.9 The
Table 3. Results of Round 3 of the Delphi Panela
Item Mean SD
1. Previous history of heat illness 3.67 0.52
2A. Normal hours of sleep 3.50 0.84
2B. Sleep in air conditioning 3.50 0.84
2C. Sleep less than usual 3.50 0.55
3. Recent illness 3.83 0.41
4. Motivation 3.00 1.26
5. Intensity and duration of activity 3.33 0.82
6. Environmental conditions 3.83 0.41
7. Product consumption 3.83 0.41
8. Baseline hydration level 3.83 0.41
9. Body mass index 3.67 0.52
10. Maximal oxygen consumption run test 3.50 0.55
a The means and SDs are from the panelists’ ratings of their levels of
agreement with each item on a 4-point Likert scale with anchors of 1
(strongly disagree) and 4 (strongly agree).
Table 2. Semistructured Interview Questions Used in Round 1 of Delphi Panel Investigation
Question
Do you believe the Heat Illness Index Score is a practical approach to identifying exertional heat illness during the preparticipation physical
examinations?
Do you suggest we add items? If so, what are your suggestions?
In particular, do you suggest an item regarding the presence of sickle cell trait should be included?
Do you suggest we delete items? If so, which ones?
Do you suggest we revise any of the current items? If so, what revisions do you suggest?
Do you think the grading scale for each item is appropriate? If not, do you have suggestions for revision?
Do you think the scoring scale for the instrument is appropriate? If not, do you have suggestions for revision?
What is your overall opinion of the instrument?
What is your overall opinion of the instrument’s intended application?
178 Volume 46 N Number 2 N April 2011
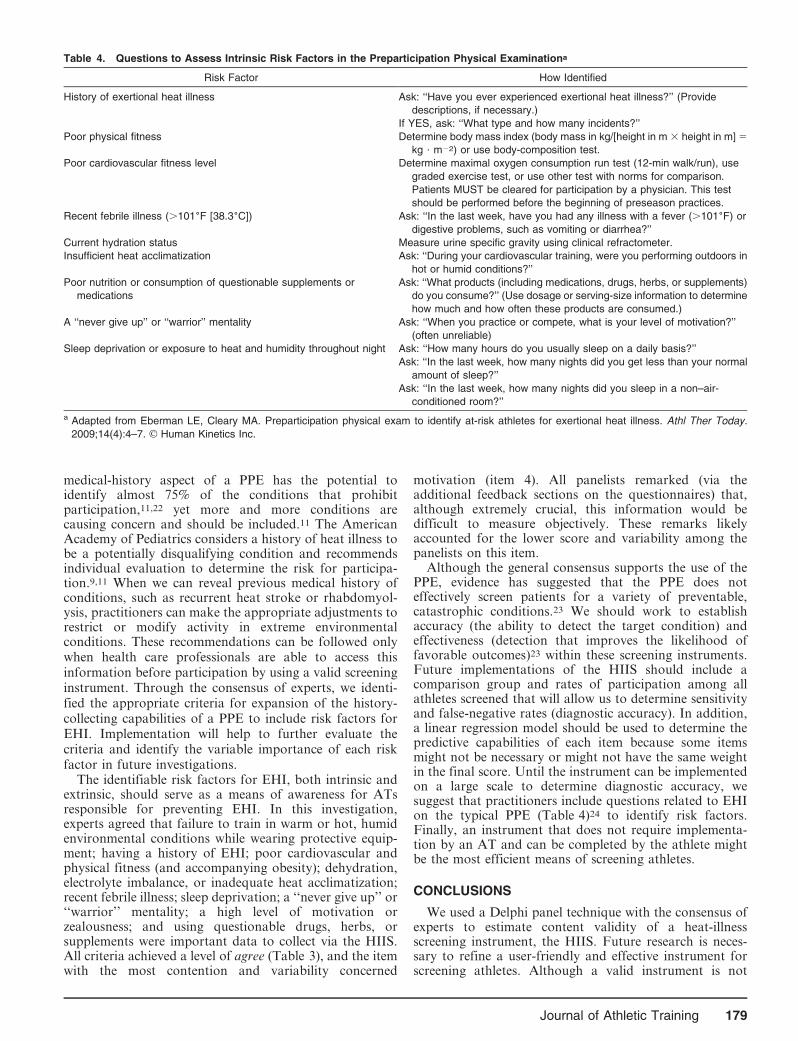
medical-history aspect of a PPE has the potential toidentify almost 75% of the conditions that prohibitparticipation,11,22 yet more and more conditions arecausing concern and should be included.11 The AmericanAcademy of Pediatrics considers a history of heat illness tobe a potentially disqualifying condition and recommendsindividual evaluation to determine the risk for participa-tion.9,11 When we can reveal previous medical history ofconditions, such as recurrent heat stroke or rhabdomyol-ysis, practitioners can make the appropriate adjustments torestrict or modify activity in extreme environmentalconditions. These recommendations can be followed onlywhen health care professionals are able to access thisinformation before participation by using a valid screeninginstrument. Through the consensus of experts, we identi-fied the appropriate criteria for expansion of the history-collecting capabilities of a PPE to include risk factors forEHI. Implementation will help to further evaluate thecriteria and identify the variable importance of each riskfactor in future investigations.
The identifiable risk factors for EHI, both intrinsic andextrinsic, should serve as a means of awareness for ATsresponsible for preventing EHI. In this investigation,experts agreed that failure to train in warm or hot, humidenvironmental conditions while wearing protective equip-ment; having a history of EHI; poor cardiovascular andphysical fitness (and accompanying obesity); dehydration,electrolyte imbalance, or inadequate heat acclimatization;recent febrile illness; sleep deprivation; a ‘‘never give up’’ or‘‘warrior’’ mentality; a high level of motivation orzealousness; and using questionable drugs, herbs, orsupplements were important data to collect via the HIIS.All criteria achieved a level of agree (Table 3), and the itemwith the most contention and variability concerned
motivation (item 4). All panelists remarked (via theadditional feedback sections on the questionnaires) that,although extremely crucial, this information would bedifficult to measure objectively. These remarks likelyaccounted for the lower score and variability among thepanelists on this item.
Although the general consensus supports the use of thePPE, evidence has suggested that the PPE does noteffectively screen patients for a variety of preventable,catastrophic conditions.23 We should work to establishaccuracy (the ability to detect the target condition) andeffectiveness (detection that improves the likelihood offavorable outcomes)23 within these screening instruments.Future implementations of the HIIS should include acomparison group and rates of participation among allathletes screened that will allow us to determine sensitivityand false-negative rates (diagnostic accuracy). In addition,a linear regression model should be used to determine thepredictive capabilities of each item because some itemsmight not be necessary or might not have the same weightin the final score. Until the instrument can be implementedon a large scale to determine diagnostic accuracy, wesuggest that practitioners include questions related to EHIon the typical PPE (Table 4)24 to identify risk factors.Finally, an instrument that does not require implementa-tion by an AT and can be completed by the athlete mightbe the most efficient means of screening athletes.
CONCLUSIONS
We used a Delphi panel technique with the consensus ofexperts to estimate content validity of a heat-illnessscreening instrument, the HIIS. Future research is neces-sary to refine a user-friendly and effective instrument forscreening athletes. Although a valid instrument is not
Table 4. Questions to Assess Intrinsic Risk Factors in the Preparticipation Physical Examinationa
Risk Factor How Identified
History of exertional heat illness Ask: ‘‘Have you ever experienced exertional heat illness?’’ (Provide
descriptions, if necessary.)
If YES, ask: ‘‘What type and how many incidents?’’
Poor physical fitness Determine body mass index (body mass in kg/[height in m 3 height in m] 5
kg ? m22) or use body-composition test.
Poor cardiovascular fitness level Determine maximal oxygen consumption run test (12-min walk/run), use
graded exercise test, or use other test with norms for comparison.
Patients MUST be cleared for participation by a physician. This test
should be performed before the beginning of preseason practices.
Recent febrile illness (.1016F [38.36C]) Ask: ‘‘In the last week, have you had any illness with a fever (.1016F) or
digestive problems, such as vomiting or diarrhea?’’
Current hydration status Measure urine specific gravity using clinical refractometer.
Insufficient heat acclimatization Ask: ‘‘During your cardiovascular training, were you performing outdoors in
hot or humid conditions?’’
Poor nutrition or consumption of questionable supplements or
medications
Ask: ‘‘What products (including medications, drugs, herbs, or supplements)
do you consume?’’ (Use dosage or serving-size information to determine
how much and how often these products are consumed.)
A ‘‘never give up’’ or ‘‘warrior’’ mentality Ask: ‘‘When you practice or compete, what is your level of motivation?’’
(often unreliable)
Sleep deprivation or exposure to heat and humidity throughout night Ask: ‘‘How many hours do you usually sleep on a daily basis?’’
Ask: ‘‘In the last week, how many nights did you get less than your normal
amount of sleep?’’
Ask: ‘‘In the last week, how many nights did you sleep in a non–air-
conditioned room?’’
a Adapted from Eberman LE, Cleary MA. Preparticipation physical exam to identify at-risk athletes for exertional heat illness. Athl Ther Today.
2009;14(4):4–7. g Human Kinetics Inc.
Journal of Athletic Training 179
finalized yet, we suggest that practitioners ask questionsrelated to EHI risk factors during the PPE until aninstrument with strong diagnostic accuracy is available.Furthermore, we invite feedback from those using the HIISin clinical practice.
REFERENCES
1. Coris EE, Ramirez AM, Van Durme DJ. Heat illness in athletes: the
dangerous combination of heat, humidity and exercise. Sports Med.
2004;34(1):9–16.
2. American College of Sports Medicine, Armstrong LE, Casa DJ, et al.
American College of Sports Medicine position stand: exertional heat
illness during training and competition. Med Sci Sports Exerc.
2007;39(3):556–572.
3. Binkley HM, Beckett J, Casa DJ, Kleiner DM, Plummer PE.
National Athletic Trainers’ Association position statement: exertional
heat illnesses. J Athl Train. 2002;37(3):329–343.
4. Casa DJ, Almquist J, Anderson S, et al. Inter-Association Task Force
on Exertional Heat Illness consensus statement. NATA News. June
2003:24–29.
5. Cromer BA, McLean SC, Heald FP. A critical review of compre-
hensive health screening in adolescents. J Adolesc Health. 1992;
13(suppl 2):1S–65S.
6. Glover DW, Maron BJ. Profile of preparticipation cardiovascular
screening for high school athletes. JAMA. 1998;279(22):1817–1819.
7. Goldberg B, Saraniti A, Witman P, Gavin M, Nicholas JA. Pre-
participation sports assessment: an objective evaluation. Pediatrics.
1980;66(5):736–745.
8. American Academy of Family Physicians, American Academy of
Pediatrics, American Medical Society for Sports Medicine, American
Orthopaedic Society for Sports Medicine, American Osteopathic
Academy of Sports Medicine. The Preparticipation Physical Evalua-
tion. 2nd ed. Minneapolis, MN: McGraw-Hill; 1997.
9. Lombardo JA, Badolato SK. The preparticipation physical exami-
nation. Clin Cornerstone. 2001;3(5):10–25.
10. Mick TM, Dimeff RJ. What kind of physical examination does a
young athlete need before participating in sports? Cleve Clin J Med.
2004;71(7):587–597.
11. Rice SG; American Academy of Pediatrics Council on Sports
Medicine and Fitness. Medical conditions affecting sports participa-
tion. Pediatrics. 2008;121(4):841–848.
12. Keeney S, Hasson F, McKenna HP. Consulting the oracle: ten lessons
from using the Delphi technique in nursing research. J Adv Nurs.
2006;53(2):205–212.
13. Keeney S, Hasson F, McKenna HP. A critical review of the Delphi
technique as a research methodology for nursing. Int J Nurs Stud.
2001;38(2):195–200.
14. Landeta J. Current validity of the Delphi method in social sciences.
Technol Forecast Soc Change. 2006;73(5):467–482.
15. McKenna HP. The Delphi technique: a worthwhile research
approach for nursing? J Adv Nurs. 1994;19(6):1221–1225.
16. Rowe G, Wright G. The Delphi technique as a forecasting tool: issues
and analysis. Int J Forecast. 1999;15(4):353–375.
17. Jairath N, Weinstein J. The Delphi methodology (part one): a useful
administrative approach. Can J Nurs Admin. 1994;7(3):29–42.
18. Goodman CM. The Delphi technique: a critique. J Adv Nurs.
1987;12(6):729–734.
19. Gall MD, Gall JP, Borg WR. Educational Research: An Introduction.
7th ed. Boston, MA: Pearson Education Inc; 2003:460.
20. Grant S, Corbett K, Amjad AM, Wilson J, Aitchison T. A
comparison of methods of predicting maximum oxygen uptake.
Br J Sports Med. 1995;29(3):147–152.
21. Cooper ER, Ferrara MS, Broglio SP. Exertional heat illness and
environmental conditions during a single football season in the
Southeast. J Athl Train. 2006;41(3):332–336.
22. Risser WL, Hoffman HM, Bellah GG Jr. Frequency of preparticipa-
tion sports examinations in secondary school athletes: are the
University Interscholastic League guidelines appropriate? Tex Med.
1985;81(7):35–39.
23. Carek PJ, Mainous A 3rd. The preparticipation physical examination
for athletics: a systematic review of current recommendations. BMJ.
2003;327(7418):E170–E173. http://www.bmj.com/content/327/7418/
E170.full. Accessed August 27, 2010.
24. Eberman LE, Cleary MA. Preparticipation physical exam to identify
at-risk athletes for exertional heat illness. Athl Ther Today.
2009;14(4):4–7.
25. Borg G. Perceived exertion as an indicator of somatic stress.
Scand J Rehabil Med. 1970;2(2):92–98.
Address correspondence to Lindsey E. Eberman, PhD, LAT, ATC, Department of Applied Medicine and Rehabilitation, 567 N 5th Street,SS 257, Indiana State University, Terre Haute, IN. Address e-mail to [email protected].
180 Volume 46 N Number 2 N April 2011

Journal of Athletic Training 181

182 Volume 46 N Number 2 N April 2011

Journal of Athletic Training 183

Appendix. Final Heat Illness Screening Instrument
Abbreviations: ATC, certified athletic trainer; EMT, emergency medical technician; USG, urine specific gravity;VO2max, maximal oxygen consumption.
Reference for Borg scale: Borg.25
Manufacturers: Ritalin (Novartis International AG, Basel, Switzerland); Red Bull (Red Bull North America, SantaMonica, CA).
184 Volume 46 N Number 2 N April 2011
Work–Family Conflict Among Athletic Trainers in theSecondary School Setting
William A. Pitney, EdD, ATC, FNATA*; Stephanie M. Mazerolle, PhD, ATC�;Kelly D. Pagnotta, MA, ATC�
*Northern Illinois University, DeKalb; 3University of Connecticut, Storrs
Context: Work–family conflict (WFC) negatively affects aprofessional’s ability to function at work or home.
Objective: To examine perceptions of and contributingfactors to WFC among secondary school athletic trainers.
Design: Sequential explanatory mixed-methods study.Setting: Secondary school.Patients or Other Participants: From a random sample of
1325 individuals selected from the National Athletic Trainers’Association Member Services database, 415 individuals (203women, 212 men; age 5 36.8 6 9.3 years) provided usableonline survey data. Fourteen individuals participated in follow-upinterviews.
Intervention(s): Online WFC questionnaire followed by in-depth phone interviews.
Main Outcome Measure(s): Descriptive statistics wereobtained to examine perceived WFC. Pearson product momentcorrelations were calculated to examine the relationshipbetween work hours, total athletic training staff, and number ofchildren and WFC score. We performed analysis of variance toexamine differences between the independent variables of sexand control over work schedule and the dependent variable ofWFC score. The a priori a was set at P # .05. Qualitative datawere analyzed using inductive content analysis. Multiple-analyst
triangulation and member checks established trustworthiness ofthe qualitative data.
Results: Mean WFC scores were 23.97 6 7.78 for scale 1(family defined as having a partner or spouse with or withoutchildren) and 23.17 6 7.69 for scale 2 (family defined asindividuals, including parents, siblings, grandparents, and anyother close relatives, involved in one’s life), indicatingmoderate perceived WFC. A significant relationship was foundbetween the average hours of work per week and WFCscores: those with less scheduling control experienced moreWFC. Two dimensions emerged from the qualitative methodsthat relate to how WFC is mitigated in the secondary schoolenvironment: (1) organizational—having colleagues and ad-ministration that understood the role demands and allowed formodifications in schedule and personal time and (2) personal—taking time for oneself and having a family that understandsthe work demands of an athletic trainer resulted in reducedperceived WFC.
Conclusions: A large number of work hours per week andlack of control over work schedules affected the perceived levelof WFC.
Key Words: work–family interface, work–family balance, roleconflict
Key Points
N Work–family conflict is experienced by athletic trainers in the secondary school setting, regardless of sex, family situation,or the number of children.
N Organizational support from administrators and coaches was perceived to help balance work and family obligations.N Taking time for oneself and having a family that understands the athletic trainer’s work demands also reduced work–family
conflict.
Work–family balance has been documented in theliterature1–3 to be an important retention factorfor those individuals employed in the sport
industry (eg, coaches, athletic trainers [ATs]). Capel1
reported the lack of personal and family time as a reasonto leave the athletic training profession, a concern echoedby the findings of a Women in Athletic TrainingCommittee survey.4 In examining retention factors amongcollegiate coaches and administrators, Pastore et al2 notedthat they were more likely to remain in their currentpositions as a result of the fulfillment of work–familybalance. Although the work–family interface has becomeincreasingly popular among scholars, until recently, limitedattention has been given to the construct for thoseprofessionals working within the sport industry.5–7
Researchers have begun to examine work–family conflict(WFC) within the coaching profession5–7; however, there is
a modest amount of WFC within the athletic trainingprofession.8–11 Furthermore, the occurrence of WFC hasonly been examined within the collegiate setting,8–11 andthe findings may not be transferable to all clinical settings.At the initiation of this study (March 2009), 14.5% of allNational Athletic Trainers’ Association (NATA) membersprovided athletic training services to secondary schoolseither directly or through outreach programs, making itone of the larger clinical settings for employment.12
Additionally, the American Medical Association13 andthe NATA14,15 have developed official and summarystatements, respectively, that encourage all schools withsporting programs, including secondary schools, to haveadequate athletic medical personnel (full-time ATs) onstaff. Moreover, with states such as New Jersey promotinglegislation to mandate onsite medical coverage by an AT,the number of ATs working in that clinical setting will only
Journal of Athletic Training 2011;46(2):185–193g by the National Athletic Trainers’ Association, Incwww.nata.org/jat
original research
Journal of Athletic Training 185

increase.13–15 Thus, investigating issues such as WFC thatcan negatively affect the professional role is warranted inthe secondary school setting.
Long work hours have been documented as a primarycontributing factor to the occurrence of WFC withinseveral professions,16,17 including coaching6 and athletictraining.8–10 Other factors, such as control over workschedules8,9 and flexibility in work schedules,5,7–9 havebeen identified as mediators for individuals managing theirprofessional and personal lives. The work–family interfaceis complex, and scholars5,6 have suggested that it must beexamined via a multilevel framework that includesorganizational factors (eg, work hours, scheduling),individual factors (eg, personality, values), and sociocul-tural factors (eg, society views, gender roles). The purposeof our study, therefore, was twofold. First, we sought toexplore the existence of WFC among ATs working in thesecondary school setting and to identify those factors thatcontribute to their WFC in this setting. Second, we wantedto gain insight and understanding as to those factors thatmitigate WFC in the secondary school setting. Thefollowing questions guided our investigation:
1. To what extent do ATs in the high school setting
perceive WFC?
2. Is there a connection between the level of WFC and
various demographic variables (eg, sex, marital status,
family-unit size)?
3. Does the high school work environment influence the
occurrence of WFC?
4. What factors are perceived to mitigate the occurrence of
WFC?
METHODS
A sequential, explanatory, mixed-methods design18 with2 phases was used for this study. This design allows theresearchers to collect and analyze data quantitatively andthen follow up with qualitative information to not onlygain additional insight but also to confirm or disconfirmthe study’s findings.18 Phase I involved a cross-sectionalsurvey of ATs in the secondary school setting to quantifytheir perceptions of WFC. Phase II involved collectingqualitative data from a purposeful sample of participantswho completed phase I and served as a means to bothconfirm the phase I findings and investigate how ATs atthe secondary level manage responsibilities in both theirpersonal and professional lives. The study receivedinstitutional review board approval from Northern IllinoisUniversity and the University of Connecticut before datacollection began.
Participants and Procedures
Phase I consisted of an online survey. The NATAMember Services Department provided a randomized listof 1325 e-mail addresses of secondary school NATAmembers whose primary work setting was secondaryschool; 1303 e-mails were deliverable. An initial e-mailinvitation containing the survey Internet link was sent tothese individuals. A total of 440 ATs (33.7%) volunteeredto participate and accessed the online survey; of these, 415surveys were usable for data analysis.
At the conclusion of the WFC survey, interestedindividuals were invited to participate in phase II of thestudy, which involved confidential telephone interviewsrelated to experience with WFC. Participants interested inthe qualitative aspect of the study were instructed toprovide confidential contact information (phone numberand preferred time of day to be reached) to members of theresearch team. Because more individuals were interested inphase II than could be included, participants wererandomly selected; we used data saturation to guide thetotal number of participants. Selected individuals werecontacted with a consent form; once we received theconsent form, we scheduled a formal interview andconducted it using a semistructured interview guide(Appendix). Table 1 provides a breakdown of the partic-ipants’ demographic data.
Instrumentation
The online survey consisted of 2 sections. The firstsection contained 15 items pertaining to general demo-graphic characteristics such as age, sex, years of experience,hours worked, and marital status. The second sectioncontained two 5-item scales evaluating one’s perceived level
Table 1. Participants’ Demographic Data (N = 415)
Demographic Characteristic n (%)
Sex
Female 203 (48.9)
Male 212 (51.1)
Highest degree obtained
Bachelor’s 160 (38.6)
Master’s 248 (59.8)
Doctorate 4 (0.9)
Not specified 3 (0.7)
Current job situation
Full time 338 (81.4)
Part time 62 (14.9)
Clinical outreach 11 (2.7)
Not specified 4 (1.0)
Family situation
Married or partnered 270 (65.1)
Single, never married or partnered 90 (21.7)
Living with significant other 34 (8.2)
Divorced 16 (3.9)
Not specified 5 (1.1)
Children?
Yes 231 (55.7)
No 183 (44.1)
Not specified 1 (0.2)
National Athletic Trainers’ Association District
1 30 (7.2)
2 86 (20.7)
3 59 (14.2)
4 60 (14.5)
5 20 (4.8)
6 46 (11.1)
7 35 (8.4)
8 30 (7.2)
9 27 (6.5)
10 18 (4.3)
Not specified 4 (1.0)
186 Volume 46 N Number 2 N April 2011

of WFC based upon current family status. Scale 1 definedfamily as having a partner or spouse with or withoutchildren; scale 2 defined family as those individuals,including parents, siblings, grandparents, and any otherclose relatives, involved in one’s life. Participants had theoption to answer one scale or both scales, depending upontheir family situation.
The survey, which was developed and validated byNetemeyer et al19 and Mazerolle et al10 in separatepopulation groups, is scored along a 7-point Likert scaleranging from 1 (strongly disagree) to 7 (strongly agree).The 5 WFC items (Table 2) have previously demonstrat-ed adequate internal consistency with a Cronbach a of0.88 for working professionals19 and of 0.89 for ATs.10
Each 5-item scale was summed to provide a measure ofWFC. With the current data, our verification of theinstrument’s reliability revealed a Cronbach a of 0.954for scale 1 (family defined as having a partner or spousewith or without children) and 0.937 for scale 2 (familydefined as those individuals, including parents, siblings,grandparents, and any other close relatives, involved inone’s life).
The semistructured interview guide was based on thestudy’s purpose and research questions, as well aspreexisting literature on WFC in the athletic trainingprofession8–11 and sport industry.5–7 All of the questionswere constructed using the open-ended format to encour-age reflection and discussion regarding the participant’sexperiences. We selected the semistructured format becauseit provided methodologic rigor but also allowed usflexibility in the event an unexpected theme emerged fromdata collection.20,21 Furthermore, when more than oneresearcher is involved in data collection, a semistructuredinterview format allows for consistency in collectionmethods as well as the production of reliable data.22
Before data collection, the interview guide was shared with2 social science researchers to ensure the questions wereappropriate and reflected our study’s purpose. Feedbackwas digested by the researchers, and changes and edits weremade to enhance the clarity and flow of the interviewguide.
Data Analysis
We analyzed our quantitative data using SPSS (version16.0; SPSS Inc, Chicago, IL). Participants’ demographicdata were analyzed with descriptive statistics, includingmeans, SDs, frequencies, and percentages. Level of WFC
was examined with descriptive statistics, specifically meanresponses to each question and the corresponding SD. Thesummed response to the 5 WFC items in each scaleprovides a measure of the extent to which WFC permeatedthe work–home interface of the ATs.
To examine the relationship between the level of WFCand the demographic variables of average work hours perweek, total number of athletic training staff in workcontext, and number of children in one’s care, weconducted a Pearson product moment correlation, withthe a priori a level set at P # .05. An analysis of variancewith the a level set a priori at P # .05 was conducted toexamine whether a difference existed between the indepen-dent variables of control over work schedule, sex, havingchildren, and having a flexible work schedule and thedependent variable of WFC score.
The qualitative data obtained in phase II were analyzedusing an inductive content analysis, paralleling the basic, orgeneric, approach described by Merriam.20 The processinvolves first examining the content of the interviewtranscripts and identifying concepts related to the researchquestions and purpose. These concepts were tagged with aconceptual label to capture their meaning. The conceptuallabels, or codes, were then examined and thematized. Onceemergent themes were generated from the data, each themewas compared and contrasted for the purposes ofidentifying whether higher-order and lower-order themeswere evident. Trustworthiness of the qualitative findingswas established using member checks and multiple-analysttriangulation, 2 strategies that are effective in establishingtrustworthiness when combined.23 Member checks, acritical step for establishing credibility,20 were performedusing interpretative verification.23 Seven randomly selectedparticipants were invited to examine the qualitativeresearch findings and to verify that the findings werereasonable based on the information provided in theinterviews. Of the 7 individuals invited, 6 responded andverified the qualitative results. Two researchers indepen-dently followed the aforementioned steps in data analysisto ensure that the results were interpreted accurately(multiple-analyst triangulation).23 The researchers dis-cussed findings and agreed upon the final themes beforesharing the results with the participants.
RESULTS
Of the respondents, 203 (48.9%) were women and 212(51.1%) were men. The participants were 37 6 9 years old
Table 2. Work–Family Conflict Measuresa
Scale 1 Scale 2
n Mean 6 SD n Mean
The demands of my work interfere with my personal and family life 337 4.88 6 1.70 411 4.82 6 1.66
The amount of time my job requires makes it difficult to fulfill my family responsibilities 337 4.51 6 1.68 411 4.33 6 1.66
Things I want to do at home do not get done because of the demands of my job 337 4.72 6 1.73 411 4.63 6 1.81
Due to work related duties, I have to make changes to my plans for family activities or
miss out on family-related activities 337 5.15 6 1.66 411 5.14 6 1.65
There is a conflict between my job and commitment to those responsibilities and the
responsibilities I have to my family 337 4.67 6 1.69 411 4.35 6 1.72
a Scale 1 defined family as having a partner or spouse with or without children. Scale 2 defined family as those individuals, including parents,
siblings, grandparents, and any other close relatives, involved in one’s life. Individuals could answer either scale or both scales, depending upon
their current family situation. Each instrument was a 7-point Likert scale with 1 5 strongly disagree through 7 5 strongly agree.
Journal of Athletic Training 187
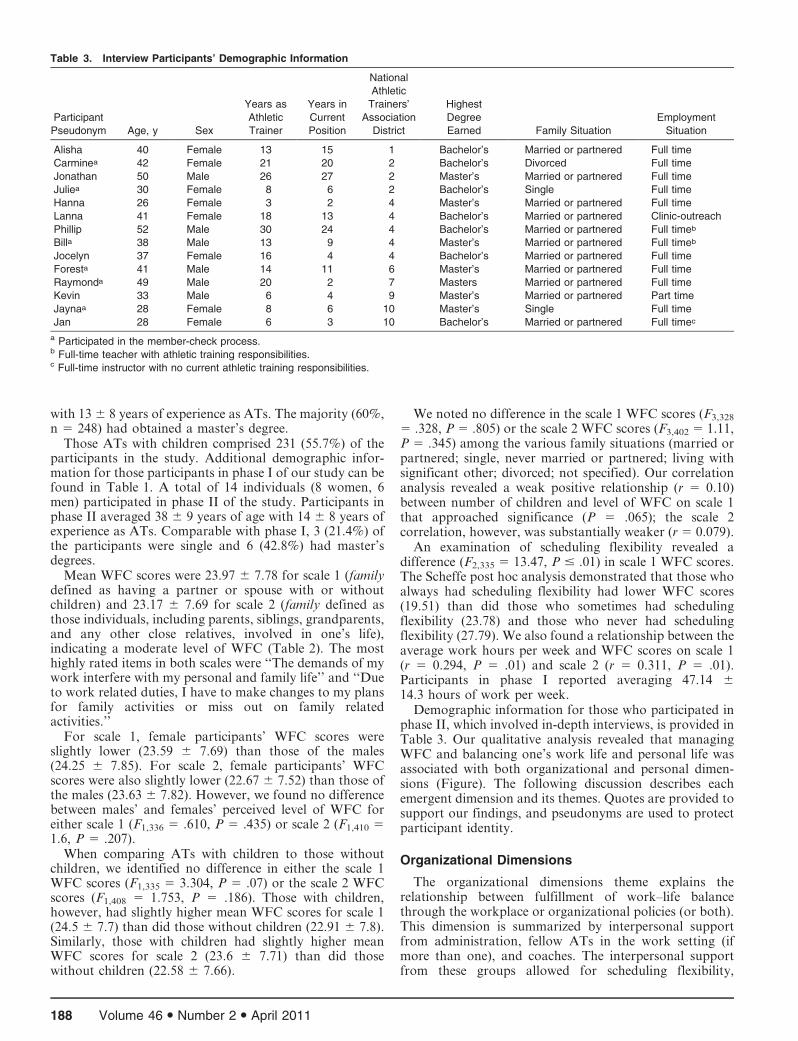
with 13 6 8 years of experience as ATs. The majority (60%,n 5 248) had obtained a master’s degree.
Those ATs with children comprised 231 (55.7%) of theparticipants in the study. Additional demographic infor-mation for those participants in phase I of our study can befound in Table 1. A total of 14 individuals (8 women, 6men) participated in phase II of the study. Participants inphase II averaged 38 6 9 years of age with 14 6 8 years ofexperience as ATs. Comparable with phase I, 3 (21.4%) ofthe participants were single and 6 (42.8%) had master’sdegrees.
Mean WFC scores were 23.97 6 7.78 for scale 1 (familydefined as having a partner or spouse with or withoutchildren) and 23.17 6 7.69 for scale 2 (family defined asthose individuals, including parents, siblings, grandparents,and any other close relatives, involved in one’s life),indicating a moderate level of WFC (Table 2). The mosthighly rated items in both scales were ‘‘The demands of mywork interfere with my personal and family life’’ and ‘‘Dueto work related duties, I have to make changes to my plansfor family activities or miss out on family relatedactivities.’’
For scale 1, female participants’ WFC scores wereslightly lower (23.59 6 7.69) than those of the males(24.25 6 7.85). For scale 2, female participants’ WFCscores were also slightly lower (22.67 6 7.52) than those ofthe males (23.63 6 7.82). However, we found no differencebetween males’ and females’ perceived level of WFC foreither scale 1 (F1,336 5 .610, P 5 .435) or scale 2 (F1,410 51.6, P 5 .207).
When comparing ATs with children to those withoutchildren, we identified no difference in either the scale 1WFC scores (F1,335 5 3.304, P 5 .07) or the scale 2 WFCscores (F1,408 5 1.753, P 5 .186). Those with children,however, had slightly higher mean WFC scores for scale 1(24.5 6 7.7) than did those without children (22.91 6 7.8).Similarly, those with children had slightly higher meanWFC scores for scale 2 (23.6 6 7.71) than did thosewithout children (22.58 6 7.66).
We noted no difference in the scale 1 WFC scores (F3,328
5 .328, P 5 .805) or the scale 2 WFC scores (F3,402 5 1.11,P 5 .345) among the various family situations (married orpartnered; single, never married or partnered; living withsignificant other; divorced; not specified). Our correlationanalysis revealed a weak positive relationship (r 5 0.10)between number of children and level of WFC on scale 1that approached significance (P 5 .065); the scale 2correlation, however, was substantially weaker (r 5 0.079).
An examination of scheduling flexibility revealed adifference (F2,335 5 13.47, P # .01) in scale 1 WFC scores.The Scheffe post hoc analysis demonstrated that those whoalways had scheduling flexibility had lower WFC scores(19.51) than did those who sometimes had schedulingflexibility (23.78) and those who never had schedulingflexibility (27.79). We also found a relationship between theaverage work hours per week and WFC scores on scale 1(r 5 0.294, P 5 .01) and scale 2 (r 5 0.311, P 5 .01).Participants in phase I reported averaging 47.14 614.3 hours of work per week.
Demographic information for those who participated inphase II, which involved in-depth interviews, is provided inTable 3. Our qualitative analysis revealed that managingWFC and balancing one’s work life and personal life wasassociated with both organizational and personal dimen-sions (Figure). The following discussion describes eachemergent dimension and its themes. Quotes are provided tosupport our findings, and pseudonyms are used to protectparticipant identity.
Organizational Dimensions
The organizational dimensions theme explains therelationship between fulfillment of work–life balancethrough the workplace or organizational policies (or both).This dimension is summarized by interpersonal supportfrom administration, fellow ATs in the work setting (ifmore than one), and coaches. The interpersonal supportfrom these groups allowed for scheduling flexibility,
Table 3. Interview Participants’ Demographic Information
Participant
Pseudonym Age, y Sex
Years as
Athletic
Trainer
Years in
Current
Position
National
Athletic
Trainers’
Association
District
Highest
Degree
Earned Family Situation
Employment
Situation
Alisha 40 Female 13 15 1 Bachelor’s Married or partnered Full time
Carminea 42 Female 21 20 2 Bachelor’s Divorced Full time
Jonathan 50 Male 26 27 2 Master’s Married or partnered Full time
Juliea 30 Female 8 6 2 Bachelor’s Single Full time
Hanna 26 Female 3 2 4 Master’s Married or partnered Full time
Lanna 41 Female 18 13 4 Bachelor’s Married or partnered Clinic-outreach
Phillip 52 Male 30 24 4 Bachelor’s Married or partnered Full timeb
Billa 38 Male 13 9 4 Master’s Married or partnered Full timeb
Jocelyn 37 Female 16 4 4 Bachelor’s Married or partnered Full time
Foresta 41 Male 14 11 6 Master’s Married or partnered Full time
Raymonda 49 Male 20 2 7 Masters Married or partnered Full time
Kevin 33 Male 6 4 9 Master’s Married or partnered Part time
Jaynaa 28 Female 8 6 10 Master’s Single Full time
Jan 28 Female 6 3 10 Bachelor’s Married or partnered Full timec
a Participated in the member-check process.b Full-time teacher with athletic training responsibilities.c Full-time instructor with no current athletic training responsibilities.
188 Volume 46 N Number 2 N April 2011
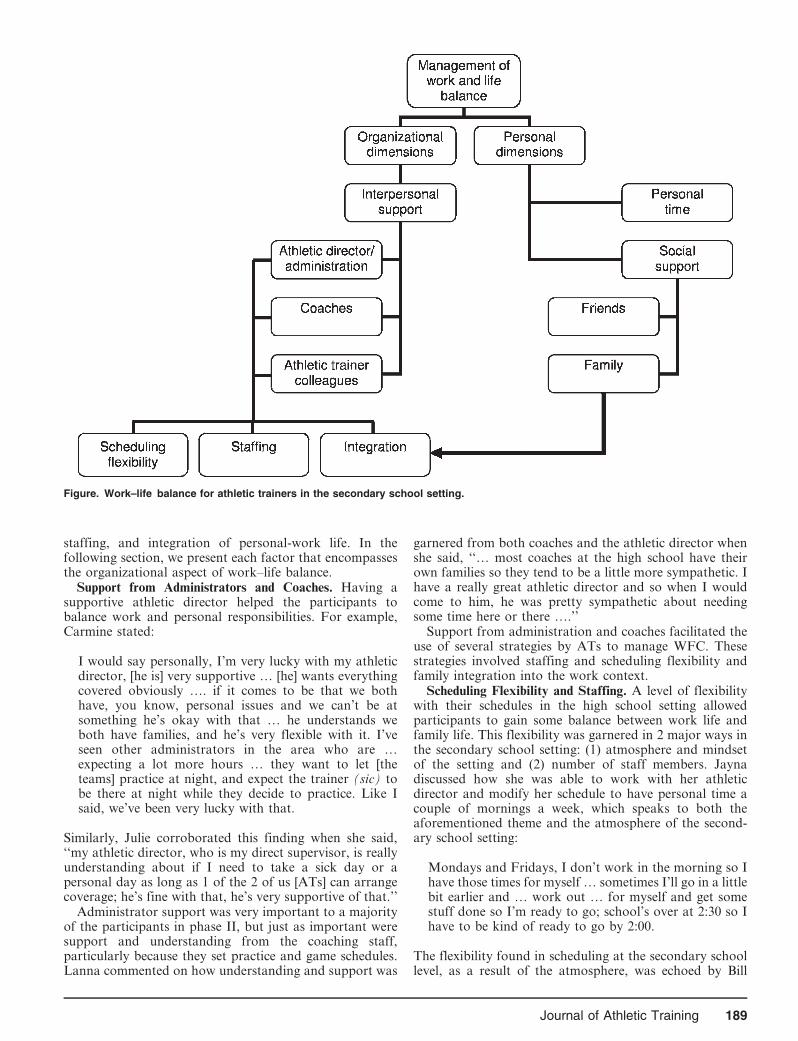
staffing, and integration of personal-work life. In thefollowing section, we present each factor that encompassesthe organizational aspect of work–life balance.
Support from Administrators and Coaches. Having asupportive athletic director helped the participants tobalance work and personal responsibilities. For example,Carmine stated:
I would say personally, I’m very lucky with my athleticdirector, [he is] very supportive … [he] wants everythingcovered obviously …. if it comes to be that we bothhave, you know, personal issues and we can’t be atsomething he’s okay with that … he understands weboth have families, and he’s very flexible with it. I’veseen other administrators in the area who are …expecting a lot more hours … they want to let [theteams] practice at night, and expect the trainer (sic) tobe there at night while they decide to practice. Like Isaid, we’ve been very lucky with that.
Similarly, Julie corroborated this finding when she said,‘‘my athletic director, who is my direct supervisor, is reallyunderstanding about if I need to take a sick day or apersonal day as long as 1 of the 2 of us [ATs] can arrangecoverage; he’s fine with that, he’s very supportive of that.’’
Administrator support was very important to a majorityof the participants in phase II, but just as important weresupport and understanding from the coaching staff,particularly because they set practice and game schedules.Lanna commented on how understanding and support was
garnered from both coaches and the athletic director whenshe said, ‘‘… most coaches at the high school have theirown families so they tend to be a little more sympathetic. Ihave a really great athletic director and so when I wouldcome to him, he was pretty sympathetic about needingsome time here or there ….’’
Support from administration and coaches facilitated theuse of several strategies by ATs to manage WFC. Thesestrategies involved staffing and scheduling flexibility andfamily integration into the work context.
Scheduling Flexibility and Staffing. A level of flexibilitywith their schedules in the high school setting allowedparticipants to gain some balance between work life andfamily life. This flexibility was garnered in 2 major ways inthe secondary school setting: (1) atmosphere and mindsetof the setting and (2) number of staff members. Jaynadiscussed how she was able to work with her athleticdirector and modify her schedule to have personal time acouple of mornings a week, which speaks to both theaforementioned theme and the atmosphere of the second-ary school setting:
Mondays and Fridays, I don’t work in the morning so Ihave those times for myself … sometimes I’ll go in a littlebit earlier and … work out … for myself and get somestuff done so I’m ready to go; school’s over at 2:30 so Ihave to be kind of ready to go by 2:00.
The flexibility found in scheduling at the secondary schoollevel, as a result of the atmosphere, was echoed by Bill
Figure. Work–life balance for athletic trainers in the secondary school setting.
Journal of Athletic Training 189
when he stated, ‘‘I like the fact that at the high school level… I seem to have some control over my hours still,although not as much as I like to at times, but I still canhave pretty flexible hours if I need.’’
For those participants with a second team member, workscheduling flexibility was improved and more realistic thanfor those without an additional staff member. Carminediscussed the improvements in his life balance when hisadministration added a second AT:
Oh, it’s night and day; it’s amazing! I mean, having doneit all [myself] for about 12 years and being the soleprovider and trying to be everything to these athletesbecause they’re so used to it—you know, to be at everyevent and be there every single day, well or sick …. Thedifference of hiring a second person and having that[scheduling] option is you know, like, irreplaceable. Youknow with my kids, now, if one of our kids is sick, he haskids as well, you know, we call each other, we don’t haveto call anybody else, you know, we call each other andsay ‘‘Look, so and so is sick; I can’t be in today,’’ or‘‘I’m going to be late,’’ or ‘‘I need to, you know,chaperone this,’’ or ‘‘go to the doctor,’’ or, you know, soyah, it’s been amazing. It’s a huge difference.
Another participant, Forest, discussed the level of sched-uling flexibility that comes with having additional staffversus working in isolation. He articulated that this ‘‘is myfirst time to have an assistant and it’s been kind of neat tobe able to walk away and say, hey I want to go do this andyou got it. So for the last 2 years, it’s been that way ….’’
Family Integration. The concept of family integrationwas mainly discussed by ATs with families and was definedfor this group as the opportunity to incorporate familytime into the workday. When supported by administrationand coaches, ATs can bring family members, such aschildren, to practice or game coverage and interact withand care for them. For example, Jonathan stated, ‘‘whenmy kids were in elementary school, they literally walkedfrom their elementary school 5 blocks to [my school] andspent the afternoon in the [athletic] training room. If theygot their homework done quickly enough, they were able togo out and sit and watch games [with me].’’
Family integration into the work context requiredsupport not only from administration and coaches butalso from the family. Forest explained how his wife wasinstrumental in transporting his children to the school to bewith him: ‘‘My wife is very supportive of me. I get my kidsup here for, like, pregame meal before football games orbasketball games or [they] come see me and we’ll eat dinnertogether before I go back to work ….’’
Personal Dimensions
Personal dimensions refer to those factors that allowedthe secondary school AT to meet personal interests andobligations that were not dependent on or provided withinthe workplace. These factors included making time duringthe day for personal responsibilities and social supportfrom both family and friends.
Address Personal Time. Participants explained that tobalance work life and family life, you must be sure toaddress personal needs by ensuring you have time for
yourself. When asked what advice she would give to thoseworking in the secondary school setting to lessen WFC,Jayna stated: ‘‘You have to learn to say no. You can’t be[at the school] all the time. Now, when we have days off I’mnot there all the time … you just have to say ‘no’ and youhave to kind of watch out for yourself because noteverybody will.’’ Jocelyn supported this by saying ‘‘…take time out for yourself because, when I first got started,it was just all about athletic training and then, now Irealized if you have the time off you may as well take itbecause it’s meant for yourself to have that.’’
Social Support. Obtaining social support from bothfamily and friends was a key factor in balancing work andpersonal time. For example, Jocelyn explained how herhusband helps to manage caregiving at home when she isbusy with her role: ‘‘he just kind of picks up the slack duringfootball so whatever I don’t get done, he just kind of picksup and does it.’’ Raymond explained how he receivedsupport from his wife to balance home responsibilities: ‘‘Iwouldn’t be able to [balance work and home life] withouther. She runs the work in the house, she takes care of thedetails, she just tells me when to show up—and I do.’’
Social support was not only related to helping and/orcovering specific family roles but also to obtaining a levelof understanding from one’s spouse or partner. Forexample, when asked how he was able to balance workand family life, Forest explained that it comes from a highlevel of understanding of the profession that his wife has:
I think [for] most of it my work comes first, and my wifeis very understanding of that. She’s been very support-ive. I mean she gets frustrated at times, but she’s beenwith me since in high school, so I mean she’s beenaround athletic training from the get go and sheunderstands the hours and understands that we’re notgoing to get paid a whole lot, but we’re going to be okay,but she’s been very supportive of what I do.
Friends also provided social support and understandingto ATs in this study. For example, Julie stated ‘‘… myfriends are pretty understanding and because I don’t haveto come in to work until usually between 11:00 and 12:00,sometimes we get together for breakfast or an early lunch… or if I’m not working in an evening, we might gettogether then.’’
DISCUSSION
The purpose of our study was to gain a betterunderstanding of WFC within the secondary schoolsetting. Specifically, we hoped to discover what factors, ifany, lead to WFC for this group and what, if anything, canbe done to improve life balance for the secondary schoolAT. Overall, we found that, as is the case for ATs in thecollegiate setting, WFC can occur, but through supportnetworks, which encompass work and home, a balancedlifestyle is feasible for the secondary school AT.
Regardless of sex, family situation, or number ofchildren, participants in the current study experiencedmoderate levels of WFC. These results corroborateprevious WFC research8 that found that ATs working inthe National Collegiate Athletic Association Division Isetting experienced WFC regardless of sex or family status.
190 Volume 46 N Number 2 N April 2011
However, this finding was not substantiated by previousstudies24,25 on other working professionals. Those workingprofessionals, particularly women with young children,experienced more WFC,24,25 yet for our group of ATs,those demographic factors were not an influence.
A multitude of factors could explain this finding, but themost logical centers on the age of the data. Much of the sexand family status data were collected in the 1990s and maynot fully illustrate the current dynamic in the workplace orat home. Furthermore, the customary roles of breadwinnerand homemaker are no longer associated with traditionalgender roles; many males are beginning to assume more ofa role in household duties, thus possibly explaining the lackof gender differences.26
The ATs in the current study who had more control overtheir work schedules reported less WFC than did thosewithout that degree of control; this finding was verified bythe qualitative data analysis. This result also authenticatesthe work of previous researchers,8 who noted that lack ofscheduling flexibility and control over work schedule werecontributing factors to WFC among both ATs and coachesworking in the Division I setting.5–7 Distinct, however,from the collegiate setting, the secondary school settingappears to provide the AT with more flexibility andcontrol. On many occasions, the phase II participantsindicated that the flexibility afforded by the secondaryschool setting allowed them to meet personal and familyresponsibilities when necessary. This is consistent withorganizational research7,10,27 demonstrating that providingflexible time to working professionals reduced experiencesof WFC.
Mazerolle et al8 also found that the hours worked toaddress job responsibilities were an antecedent of WFC.Similarly, we identified a positive relationship between thehours worked per week and WFC scores. Hours per weekaddressing athletic training obligations was a key qualita-tive finding related to role conflict in a study28 examiningrole strain among dual-position ATs and physical educa-tors in the secondary school setting. Moreover, Pitney etal28 found that hours worked per week in athletic trainingwas the only predictor of total role strain. In a separatestudy investigating the professional commitment of theAT, Pitney29 showed that secondary school ATs took timeto rejuvenate or handle the hours worked and made sure totake time away from their work-related responsibilities,indicating that hours worked had the potential to affect theATs’ quality of life or commitment to their positions.
The current study revealed how various aspects of thesecondary school organization can mitigate perceivedWFC. Participants explained that perceived support fromadministration and coaches was critical in balancing theirwork-related responsibilities and their personal lives. Inmost instances, the balance was achieved by modifying thework schedule, integrating family into the work context, oraddressing staffing issues. In the sport context, Dixon andSagas7 found that organizational support reduced WFC.Similarly, ATs working in the secondary school settingwho had support from administration tended to have lessperceived role strain.28 Participants in phase II of our studyidentified the support they received from the administra-tion and coaches as rather ‘‘family friendly,’’ meaning thatthe ATs could integrate their families into the work settingand take time to address personal needs that arose. In a
recent work–life balance study, Mazerolle30 identifiedintegration as a strategy used by ATs working in thecollegiate setting; integration has been suggested previouslynot only for the collegiate setting10,31 but also for otherworking professionals as a means by which to reduceWFC.26 These findings underscore the importance of anorganizational support structure that values family-friend-ly policies as a way to reduce WFC.
Our participants discussed the need to create or maintainpersonal time so that they could take care of themselves ortheir families, or both. Setting boundaries to carve out timefor oneself to limit the consuming nature of a particularprofessional role has been implicated as an important aspectof maintaining professional commitment29 and reducingrole strain.28 In a study of professional commitment amongATs working in the secondary school setting,29 participantsexplained the necessity of having adequate time away froma role to care for oneself and emotionally recharge. Pitney etal28 found that ATs who proactively worked with admin-istrators and coaches to make clear what they had time todo tended to perceive less role strain. Setting boundariesand prioritizing roles and responsibilities are often recom-mended by work–life scholars and experts32 and are easilyaccomplished by saying ‘‘no,’’ calling on coworkers, andapplying integration.30 As in the collegiate setting, having acoworker (or several coworkers) with whom to share workresponsibilities allowed the secondary school AT to achievea balance and assume some control over the work schedule.Interestingly, however, the concept of integration, whichhas been previously recommended for the collegiate AT,took on a different meaning at the secondary school level.For the collegiate AT, integration meant taking the ‘‘downtime’’ during the workday to exercise, do laundry, or spendtime with a spouse. The secondary school level provided amore traditional family-friendly environment, allowing theAT to interact with his or her children while working.Regardless of the setting, establishing boundaries andpriorities appears to allow the AT to achieve a balancedlifestyle.
Implications, Limitations, and Future Directions
Our findings demonstrate that WFC is experienced byATs in the secondary school setting, regardless of sex,family situation, or number of children. These resultsconfirm previous WFC results among ATs. Organizationalsupport from administrators and coaches was perceived tohelp ATs to balance work and family obligations, allowingfor scheduling flexibility and coverage by other staff, aswell as family integration into the secondary schoolcontext. Organizational leaders in the secondary schoolsetting who wish to reduce WFC among their staffs shouldconsider creating family-friendly policies and exploringtheir staff’s perceptions of the level of support they receive.Additionally, considering the expansion of staff andallowing for scheduling flexibility are advised, as ismonitoring the hours worked per week by ATs in thesecondary school setting.
Athletic trainers in the secondary school setting areadvised to further develop interpersonal skills in order tonegotiate with administrators regarding modifications ofschedules, personal time release, and family integrationinto the work setting in order to mitigate WFC.
Journal of Athletic Training 191

Our study cannot be generalized to all athletic trainingsettings. For those ATs working in a clinical outreachsetting, the influences of WFC may be much different.Although we included some participants who wereemployed in the clinical outreach setting, our purposewas not to examine workplace differences or the influenceof dual responsibilities. Future researchers should investi-gate differences among those ATs employed directly in thesecondary school setting versus those employed in theclinical outreach setting.
A one-time, cross-sectional survey has its own limita-tions, in that we were not able to obtain a fullunderstanding of WFC influences over the course of anindividual’s career or even over a 1-year period. Longitu-dinal research is warranted to further understand theinfluences that career progression and changes in familystatus have on perceived WFC.
REFERENCES
1. Capel SA. Attrition of athletic trainers. Athl Train J Natl Athl Train
Assoc. 1990;25(1):34–39.
2. Pastore DL, Inglis S, Danylchuk KE. Retention factors in coaching
and athletic management: differences by gender, position, and
geographic location. J Sport Soc Issues. 1996;20(4):427–441.
3. Pastore DL. Male and female coaches of women’s athletic teams:
reasons for entering and leaving the profession. J Sport Manage.
1991;5(2):128–143.
4. Women in Athletic Training Committee. Survey of men and women
in athletic training. http://www.nata.org/committees/wat/survey/htm.
Accessed April 26, 2004.
5. Dixon MA, Bruening JE. Perspectives on work–family conflict in
sport: an integrated approach. Sport Manage Rev. 2005;8(3):227–253.
6. Dixon MA, Bruening JE. Work–family conflict in coaching, I: a top-
down perspective. J Sport Manage. 2007;21(3):377–406.
7. Dixon MA, Sagas M. The relationship between organizational
support, work–family conflict, and the job-life satisfaction of
university coaches. Res Q Exerc Sport. 2007;78(3):236–247.
8. Mazerolle SM, Bruening JE, Casa DJ. Work–family conflict, part I:
antecedents of work–family conflict in National Collegiate Athletic
Association Division I-A certified athletic trainers. J Athl Train.
2008;43(5):505–512.
9. Mazerolle SM, Bruening JE. Sources of work–family conflict among
certified athletic trainers, part I. Athl Ther Today. 2006;11(5):33–35.
10. Mazerolle SM, Bruening JE, Casa DJ, Burton LJ. Work–family
conflict, part II: job and life satisfaction in National Collegiate
Athletic Association Division I-A certified athletic trainers. J Athl
Train. 2008;43(5):513–522.
11. Milazzo SA, Miller TW, Bruening JE, Faghri PD. A survey of
Division I-A athletic trainers on bidirectional work–family conflict
and its relation to job satisfaction [abstract]. J Athl Train. 2006;
41(suppl 2):S73.
12. National Athletic Trainers’ Association. Membership statistics. http://
www.nata.org/members1/documents/membstats/2009%2003.htm. Ac-
cessed April 29, 2010.
13. American Medical Association. Official statement on guidelines for
medical coverage for secondary schools. http://www.nata.org/
members1/canworc/ss/ama_recommendation.pdf. Accessed Septem-
ber 7, 2007.
14. National Athletic Trainers’ Association. Official statement on second-
ary schools. http://www.nata.org/statements/official/secondaryschool.
pdf. Accessed September 7, 2007.
15. Almquist J, McLeod Valovich TC, Cavanna A, et al. Summary
statement: appropriate medical coverage for the secondary school-
aged athlete. J Athl Train. 2008;43(4):416–427.
16. Frone MR, Yardley JK, Markel KS. Developing and testing an
integrative model of the work–family interface. J Voc Behav.
1997;50(2):145–167.
17. Major VS, Klein KJ, Ehrhart MG. Work time, work interference with
family, and psychological distress. J Appl Psychol. 2002;87(3):
427–436.
18. Creswell JW. Research Design: Qualitative, Quantitative, and Mixed
Methods Approaches. 2nd ed. Thousand Oaks, CA: Sage; 2003:16–19.
19. Netemeyer RG, Boles JS, McMurrian R. Development and
validation of work–family conflict and family-work conflict scales.
J Appl Psychol. 1996;81(4):400–410.
20. Merriam SB. Qualitative Research and Case Study Applications in
Education. 2nd ed. San Francisco, CA: Jossey-Bass; 1998:11, 12, 74,
204.
21. Creswell JW. Qualitative Inquiry and Research Design: Choosing
Among Five Approaches. 2nd ed. Thousand Oaks, CA: Sage; 2007.
22. Seidman I. Interviewing as Qualitative Research: A Guide for
Researchers in Education and the Social Sciences. 3rd ed. New York,
NY: Teachers College Press; 2006.
23. Pitney WA, Parker J. Qualitative Research in Physical Activity and the
Health Professions. Champaign, IL: Human Kinetics; 2009:63–65.
24. Duxbury L, Higgins C, Lee C. Work–family conflict: a comparison
by gender, family type, and perceived control. J Fam Issues. 1994;
15(3):449–466.
25. Greenhaus JH, Beutell NJ. Sources of conflict between work and
family roles. Acad Manage Rev. 1985;10(1):76–88.
26. Rapoport R, Bailyn L, Fletcher J, Pruitt B. Beyond Work–Family
Balance. San Francisco, CA: Jossey-Bass; 2002:26–28.
27. Babin BJ, Boles JS. The effects of perceived co-worker involvement
and supervisor support on service provider roles stress, performance
and job satisfaction. J Retailing. 1996;72(1):57–75.
28. Pitney WA, Stuart ME, Parker J. Role strain among dual position
physical educators and athletic trainers working in the high school
setting. Phys Educ. 2008;65(3):157–168.
29. Pitney WA. A qualitative examination of professional role commit-
ment among athletic trainers working in the secondary school setting.
J Athl Train. 2010;45(2):198–204.
30. Mazerolle SM. Enhancing work and life balance in athletic training.
Paper presented at: 62nd annual meeting of the Eastern Athletic
Trainers’ Association Convention; January 8–11, 2010; Boston, MA.
31. Mazerolle SM, Bruening JE. Work–family conflict, part 2: how
athletic trainers can ease it. Athl Ther Today. 2006;11(6):47–49.
32. Robinson J. Work to Live. New York, NY: Berkeley Publishing
Group; 2003.
Appendix. Interview Guide.
1. Please provide some information about your profes-
sional career.
2. Have you ever worked in another clinical setting besides
the high school setting? What is so appealing about the
high school setting for you compared to other clinical
settings?
3. Describe the balance between your personal life and
your work life.
4. Have you experienced challenges finding a balancebetween your personal and professional life?
N If so, share an instance when you have faced thischallenge.
N If not, what has allowed you to maintain this
balance?
5. Discuss if working in the high school setting provides a
suitable working environment to achieve a balancebetween your work and home life.
6. How does your administration (HS AD)/supervisors
(clinic) help or hinder in finding a balance between work
and home?
192 Volume 46 N Number 2 N April 2011

7. In what way have co-workers helped or hindered your
ability to maintain life balance?
8. In what way has your spouse/partner helped or hindered
your ability to maintain life balance?
9. How do you and your spouse/partner divide the labor/home responsibilities?
10. If a new athletic trainer was just about to enter this
work setting, what advice would you give him/her to
help them maintain a balanced life?
Abbreviation: HS AD indicates high school athleticdirector.
Address correspondence to William A. Pitney, EdD, ATC, FNATA, Department of Kinesiology & Physical Education, Northern IllinoisUniversity, DeKalb, IL 60115. Address e-mail to [email protected].
Journal of Athletic Training 193
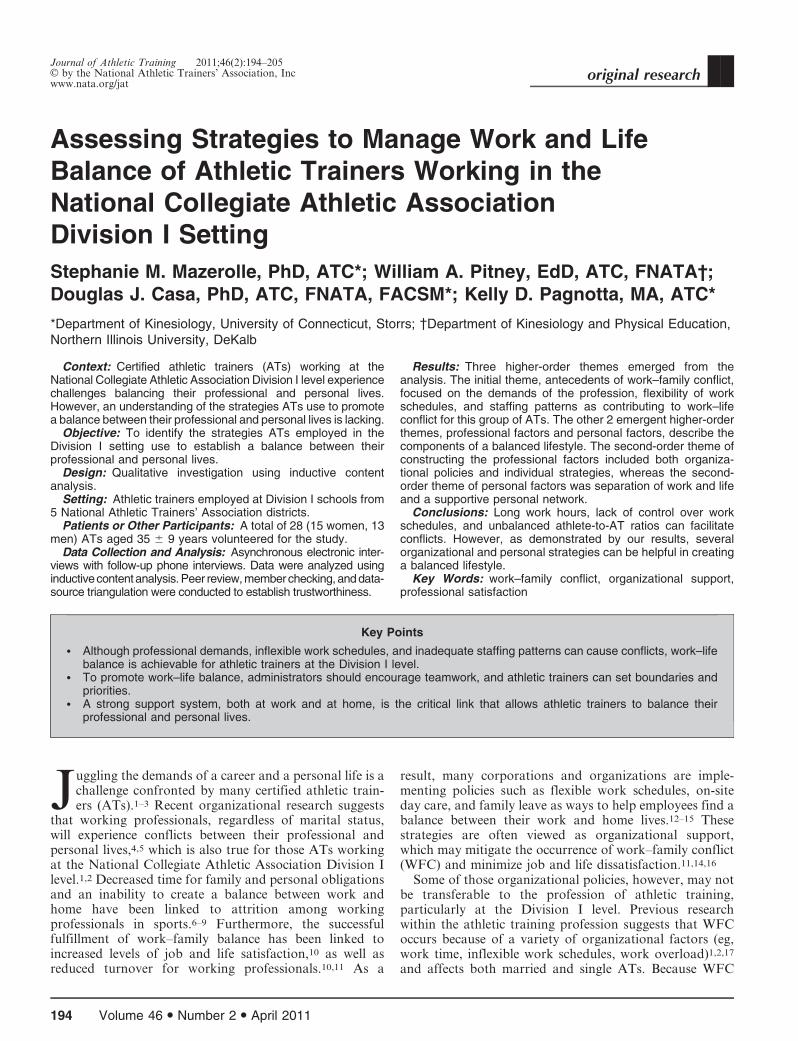
Assessing Strategies to Manage Work and LifeBalance of Athletic Trainers Working in theNational Collegiate Athletic AssociationDivision I Setting
Stephanie M. Mazerolle, PhD, ATC*; William A. Pitney, EdD, ATC, FNATA�;Douglas J. Casa, PhD, ATC, FNATA, FACSM*; Kelly D. Pagnotta, MA, ATC*
*Department of Kinesiology, University of Connecticut, Storrs; 3Department of Kinesiology and Physical Education,Northern Illinois University, DeKalb
Context: Certified athletic trainers (ATs) working at theNational Collegiate Athletic Association Division I level experiencechallenges balancing their professional and personal lives.However, an understanding of the strategies ATs use to promotea balance between their professional and personal lives is lacking.
Objective: To identify the strategies ATs employed in theDivision I setting use to establish a balance between theirprofessional and personal lives.
Design: Qualitative investigation using inductive contentanalysis.
Setting: Athletic trainers employed at Division I schools from5 National Athletic Trainers’ Association districts.
Patients or Other Participants: A total of 28 (15 women, 13men) ATs aged 35 6 9 years volunteered for the study.
Data Collection and Analysis: Asynchronous electronic inter-views with follow-up phone interviews. Data were analyzed usinginductivecontentanalysis. Peer review, member checking, and data-source triangulation were conducted to establish trustworthiness.
Results: Three higher-order themes emerged from theanalysis. The initial theme, antecedents of work–family conflict,focused on the demands of the profession, flexibility of workschedules, and staffing patterns as contributing to work–lifeconflict for this group of ATs. The other 2 emergent higher-orderthemes, professional factors and personal factors, describe thecomponents of a balanced lifestyle. The second-order theme ofconstructing the professional factors included both organiza-tional policies and individual strategies, whereas the second-order theme of personal factors was separation of work and lifeand a supportive personal network.
Conclusions: Long work hours, lack of control over workschedules, and unbalanced athlete-to-AT ratios can facilitateconflicts. However, as demonstrated by our results, severalorganizational and personal strategies can be helpful in creatinga balanced lifestyle.
Key Words: work–family conflict, organizational support,professional satisfaction
Key Points
N Although professional demands, inflexible work schedules, and inadequate staffing patterns can cause conflicts, work–lifebalance is achievable for athletic trainers at the Division I level.
N To promote work–life balance, administrators should encourage teamwork, and athletic trainers can set boundaries andpriorities.
N A strong support system, both at work and at home, is the critical link that allows athletic trainers to balance theirprofessional and personal lives.
Juggling the demands of a career and a personal life is achallenge confronted by many certified athletic train-ers (ATs).1–3 Recent organizational research suggests
that working professionals, regardless of marital status,will experience conflicts between their professional andpersonal lives,4,5 which is also true for those ATs workingat the National Collegiate Athletic Association Division Ilevel.1,2 Decreased time for family and personal obligationsand an inability to create a balance between work andhome have been linked to attrition among workingprofessionals in sports.6–9 Furthermore, the successfulfulfillment of work–family balance has been linked toincreased levels of job and life satisfaction,10 as well asreduced turnover for working professionals.10,11 As a
result, many corporations and organizations are imple-menting policies such as flexible work schedules, on-siteday care, and family leave as ways to help employees find abalance between their work and home lives.12–15 Thesestrategies are often viewed as organizational support,which may mitigate the occurrence of work–family conflict(WFC) and minimize job and life dissatisfaction.11,14,16
Some of those organizational policies, however, may notbe transferable to the profession of athletic training,particularly at the Division I level. Previous researchwithin the athletic training profession suggests that WFCoccurs because of a variety of organizational factors (eg,work time, inflexible work schedules, work overload)1,2,17
and affects both married and single ATs. Because WFC
Journal of Athletic Training 2011;46(2):194–205g by the National Athletic Trainers’ Association, Incwww.nata.org/jat
original research
194 Volume 46 N Number 2 N April 2011
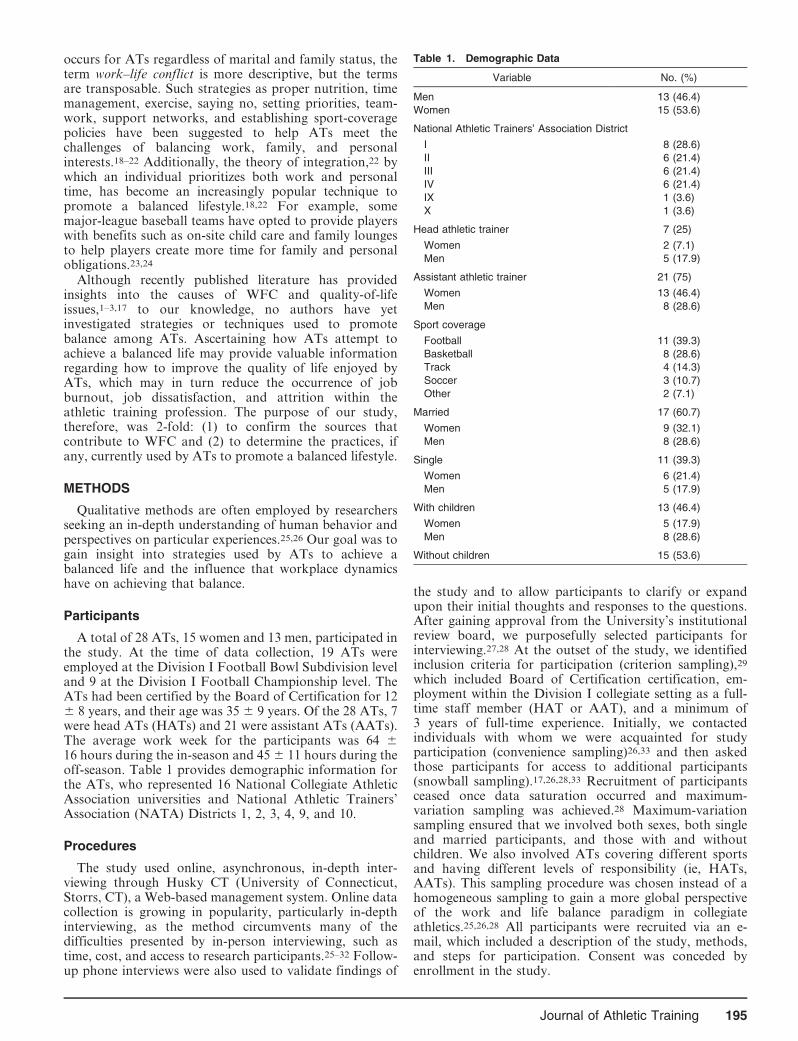
occurs for ATs regardless of marital and family status, theterm work–life conflict is more descriptive, but the termsare transposable. Such strategies as proper nutrition, timemanagement, exercise, saying no, setting priorities, team-work, support networks, and establishing sport-coveragepolicies have been suggested to help ATs meet thechallenges of balancing work, family, and personalinterests.18–22 Additionally, the theory of integration,22 bywhich an individual prioritizes both work and personaltime, has become an increasingly popular technique topromote a balanced lifestyle.18,22 For example, somemajor-league baseball teams have opted to provide playerswith benefits such as on-site child care and family loungesto help players create more time for family and personalobligations.23,24
Although recently published literature has providedinsights into the causes of WFC and quality-of-lifeissues,1–3,17 to our knowledge, no authors have yetinvestigated strategies or techniques used to promotebalance among ATs. Ascertaining how ATs attempt toachieve a balanced life may provide valuable informationregarding how to improve the quality of life enjoyed byATs, which may in turn reduce the occurrence of jobburnout, job dissatisfaction, and attrition within theathletic training profession. The purpose of our study,therefore, was 2-fold: (1) to confirm the sources thatcontribute to WFC and (2) to determine the practices, ifany, currently used by ATs to promote a balanced lifestyle.
METHODS
Qualitative methods are often employed by researchersseeking an in-depth understanding of human behavior andperspectives on particular experiences.25,26 Our goal was togain insight into strategies used by ATs to achieve abalanced life and the influence that workplace dynamicshave on achieving that balance.
Participants
A total of 28 ATs, 15 women and 13 men, participated inthe study. At the time of data collection, 19 ATs wereemployed at the Division I Football Bowl Subdivision leveland 9 at the Division I Football Championship level. TheATs had been certified by the Board of Certification for 126 8 years, and their age was 35 6 9 years. Of the 28 ATs, 7were head ATs (HATs) and 21 were assistant ATs (AATs).The average work week for the participants was 64 616 hours during the in-season and 45 6 11 hours during theoff-season. Table 1 provides demographic information forthe ATs, who represented 16 National Collegiate AthleticAssociation universities and National Athletic Trainers’Association (NATA) Districts 1, 2, 3, 4, 9, and 10.
Procedures
The study used online, asynchronous, in-depth inter-viewing through Husky CT (University of Connecticut,Storrs, CT), a Web-based management system. Online datacollection is growing in popularity, particularly in-depthinterviewing, as the method circumvents many of thedifficulties presented by in-person interviewing, such astime, cost, and access to research participants.25–32 Follow-up phone interviews were also used to validate findings of
the study and to allow participants to clarify or expandupon their initial thoughts and responses to the questions.After gaining approval from the University’s institutionalreview board, we purposefully selected participants forinterviewing.27,28 At the outset of the study, we identifiedinclusion criteria for participation (criterion sampling),29
which included Board of Certification certification, em-ployment within the Division I collegiate setting as a full-time staff member (HAT or AAT), and a minimum of3 years of full-time experience. Initially, we contactedindividuals with whom we were acquainted for studyparticipation (convenience sampling)26,33 and then askedthose participants for access to additional participants(snowball sampling).17,26,28,33 Recruitment of participantsceased once data saturation occurred and maximum-variation sampling was achieved.28 Maximum-variationsampling ensured that we involved both sexes, both singleand married participants, and those with and withoutchildren. We also involved ATs covering different sportsand having different levels of responsibility (ie, HATs,AATs). This sampling procedure was chosen instead of ahomogeneous sampling to gain a more global perspectiveof the work and life balance paradigm in collegiateathletics.25,26,28 All participants were recruited via an e-mail, which included a description of the study, methods,and steps for participation. Consent was conceded byenrollment in the study.
Table 1. Demographic Data
Variable No. (%)
Men 13 (46.4)
Women 15 (53.6)
National Athletic Trainers’ Association District
I 8 (28.6)
II 6 (21.4)
III 6 (21.4)
IV 6 (21.4)
IX 1 (3.6)
X 1 (3.6)
Head athletic trainer 7 (25)
Women 2 (7.1)
Men 5 (17.9)
Assistant athletic trainer 21 (75)
Women 13 (46.4)
Men 8 (28.6)
Sport coverage
Football 11 (39.3)
Basketball 8 (28.6)
Track 4 (14.3)
Soccer 3 (10.7)
Other 2 (7.1)
Married 17 (60.7)
Women 9 (32.1)
Men 8 (28.6)
Single 11 (39.3)
Women 6 (21.4)
Men 5 (17.9)
With children 13 (46.4)
Women 5 (17.9)
Men 8 (28.6)
Without children 15 (53.6)
Journal of Athletic Training 195
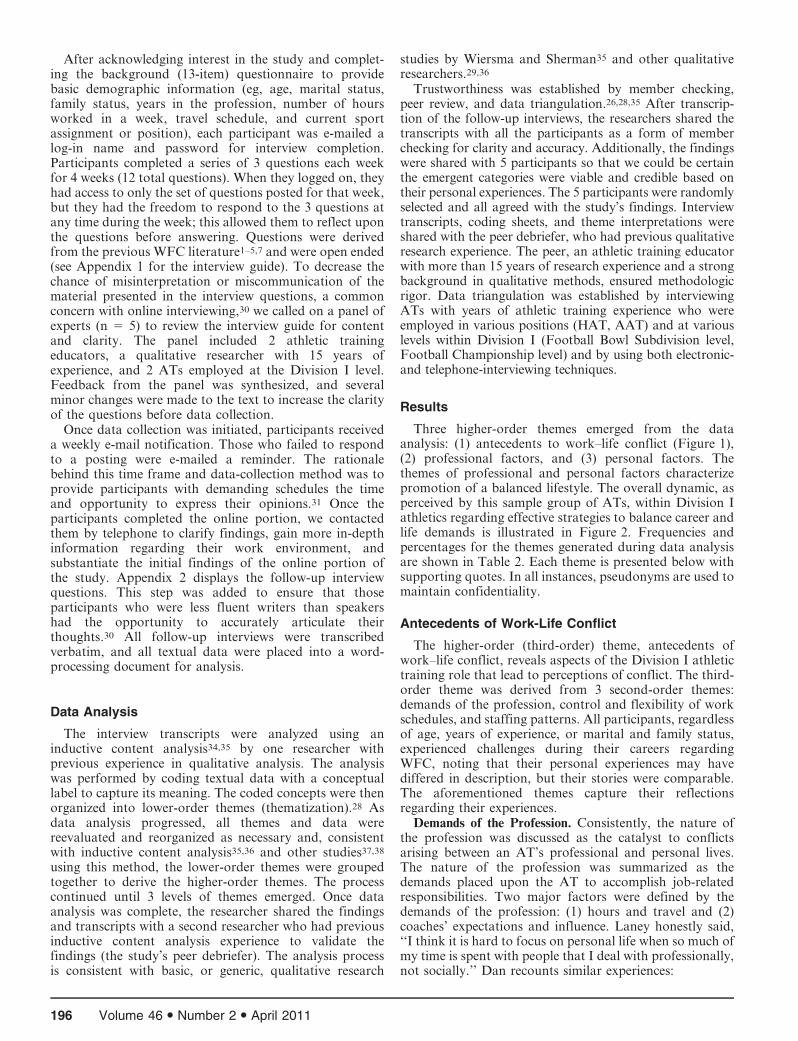
After acknowledging interest in the study and complet-ing the background (13-item) questionnaire to providebasic demographic information (eg, age, marital status,family status, years in the profession, number of hoursworked in a week, travel schedule, and current sportassignment or position), each participant was e-mailed alog-in name and password for interview completion.Participants completed a series of 3 questions each weekfor 4 weeks (12 total questions). When they logged on, theyhad access to only the set of questions posted for that week,but they had the freedom to respond to the 3 questions atany time during the week; this allowed them to reflect uponthe questions before answering. Questions were derivedfrom the previous WFC literature1–5,7 and were open ended(see Appendix 1 for the interview guide). To decrease thechance of misinterpretation or miscommunication of thematerial presented in the interview questions, a commonconcern with online interviewing,30 we called on a panel ofexperts (n 5 5) to review the interview guide for contentand clarity. The panel included 2 athletic trainingeducators, a qualitative researcher with 15 years ofexperience, and 2 ATs employed at the Division I level.Feedback from the panel was synthesized, and severalminor changes were made to the text to increase the clarityof the questions before data collection.
Once data collection was initiated, participants receiveda weekly e-mail notification. Those who failed to respondto a posting were e-mailed a reminder. The rationalebehind this time frame and data-collection method was toprovide participants with demanding schedules the timeand opportunity to express their opinions.31 Once theparticipants completed the online portion, we contactedthem by telephone to clarify findings, gain more in-depthinformation regarding their work environment, andsubstantiate the initial findings of the online portion ofthe study. Appendix 2 displays the follow-up interviewquestions. This step was added to ensure that thoseparticipants who were less fluent writers than speakershad the opportunity to accurately articulate theirthoughts.30 All follow-up interviews were transcribedverbatim, and all textual data were placed into a word-processing document for analysis.
Data Analysis
The interview transcripts were analyzed using aninductive content analysis34,35 by one researcher withprevious experience in qualitative analysis. The analysiswas performed by coding textual data with a conceptuallabel to capture its meaning. The coded concepts were thenorganized into lower-order themes (thematization).28 Asdata analysis progressed, all themes and data werereevaluated and reorganized as necessary and, consistentwith inductive content analysis35,36 and other studies37,38
using this method, the lower-order themes were groupedtogether to derive the higher-order themes. The processcontinued until 3 levels of themes emerged. Once dataanalysis was complete, the researcher shared the findingsand transcripts with a second researcher who had previousinductive content analysis experience to validate thefindings (the study’s peer debriefer). The analysis processis consistent with basic, or generic, qualitative research
studies by Wiersma and Sherman35 and other qualitativeresearchers.29,36
Trustworthiness was established by member checking,peer review, and data triangulation.26,28,35 After transcrip-tion of the follow-up interviews, the researchers shared thetranscripts with all the participants as a form of memberchecking for clarity and accuracy. Additionally, the findingswere shared with 5 participants so that we could be certainthe emergent categories were viable and credible based ontheir personal experiences. The 5 participants were randomlyselected and all agreed with the study’s findings. Interviewtranscripts, coding sheets, and theme interpretations wereshared with the peer debriefer, who had previous qualitativeresearch experience. The peer, an athletic training educatorwith more than 15 years of research experience and a strongbackground in qualitative methods, ensured methodologicrigor. Data triangulation was established by interviewingATs with years of athletic training experience who wereemployed in various positions (HAT, AAT) and at variouslevels within Division I (Football Bowl Subdivision level,Football Championship level) and by using both electronic-and telephone-interviewing techniques.
Results
Three higher-order themes emerged from the dataanalysis: (1) antecedents to work–life conflict (Figure 1),(2) professional factors, and (3) personal factors. Thethemes of professional and personal factors characterizepromotion of a balanced lifestyle. The overall dynamic, asperceived by this sample group of ATs, within Division Iathletics regarding effective strategies to balance career andlife demands is illustrated in Figure 2. Frequencies andpercentages for the themes generated during data analysisare shown in Table 2. Each theme is presented below withsupporting quotes. In all instances, pseudonyms are used tomaintain confidentiality.
Antecedents of Work-Life Conflict
The higher-order (third-order) theme, antecedents ofwork–life conflict, reveals aspects of the Division I athletictraining role that lead to perceptions of conflict. The third-order theme was derived from 3 second-order themes:demands of the profession, control and flexibility of workschedules, and staffing patterns. All participants, regardlessof age, years of experience, or marital and family status,experienced challenges during their careers regardingWFC, noting that their personal experiences may havediffered in description, but their stories were comparable.The aforementioned themes capture their reflectionsregarding their experiences.
Demands of the Profession. Consistently, the nature ofthe profession was discussed as the catalyst to conflictsarising between an AT’s professional and personal lives.The nature of the profession was summarized as thedemands placed upon the AT to accomplish job-relatedresponsibilities. Two major factors were defined by thedemands of the profession: (1) hours and travel and (2)coaches’ expectations and influence. Laney honestly said,‘‘I think it is hard to focus on personal life when so much ofmy time is spent with people that I deal with professionally,not socially.’’ Dan recounts similar experiences:
196 Volume 46 N Number 2 N April 2011

I work so many hours that I don’t have time to do thethings that I like to do. I don’t have the time to see myfamily and often miss holidays and family events. Iwould even go long periods of time without seeingfriends that I didn’t work with.
Brianna discussed how the long work hours affected herability to connect with others outside the workplace:
I have experienced challenges finding a balance betweenmy personal and professional life. First it is important torealize the time constraints and travel requirements withbeing a Division I AT. I feel the most difficult thing forme personally to do is meet people outside of work in thearea that I live.
Emma reflected on the chaos traveling causes to herwork–life balance:
Weekend after weekend of traveling can become verytaxing. I never feel that I have any time for myself duringthe season. It becomes hard to keep up with simple dailythings like grocery shopping, laundry, or correspondingwith loved ones.
Kara summed it up by asking the question, ‘‘How do Ihave the same energy for my husband I have for my jobafter a 13-hour day?’’
Several ATs mentioned the role of the coaching staff inallowing them to maintain a balanced lifestyle. Ultimately,the coach determines practice and game schedules. ManyATs felt that the coaches’ expectations and the last-minutechanges made to schedules created (or potentially created)conflicts. Milly, while commenting on what she couldchange about her current position, said, ‘‘I would like to
see more coaches with their athletic trainers work as a teamand work with their schedules. The coach needs tounderstand the sacrifice they’re [the ATs] making attimes.’’ Scott talked about the evolution of daily practicesand the expectations of the coaching staff for the AT to bepresent. ‘‘I know coaches who want coverage no matter thetime. I have had coaches want practice at 6 AM and thenagain at 8 PM and expect medical coverage.’’ Jen discussedthe coach’s ability to change practice schedules as the mostproblematic factor:
Ultimately, if I could change something [that would helpme manage more effectively], I would like to have morecontrol over what the practice schedule is and notchanging a planned practice time [it is the biggest thingthat affects your day-to-day activities].
The role of the coach, specifically, including his or hercontrol over practice schedules and expectations of theirstaff members, was discussed as an impediment to lifebalancing for ATs. As shown in Figure 1, the coach’sexpectations and control over work schedules can directlyaffect an AT’s ability to manage professional and personaltime.
Control and Flexibility of Work Schedules. Many ATsdiscussed the lack of control or the inflexibility of workschedules as the source of conflicts in managing theirpersonal responsibilities. Scott stated, ‘‘Ultimately, I thinkif we had a little more control over scheduling instead ofalways having to be reactive, it would help in the job we do[and minimize the number of conflicts I personally have].’’Harrietta discussed the sacrifices she has made personallyto meet her job-related responsibilities and the effect of notdetermining her own schedule: ‘‘If coach schedules practiceor there is a game—I’m there. I have no control over the
Figure 1. Sources of work–life conflict.
Journal of Athletic Training 197
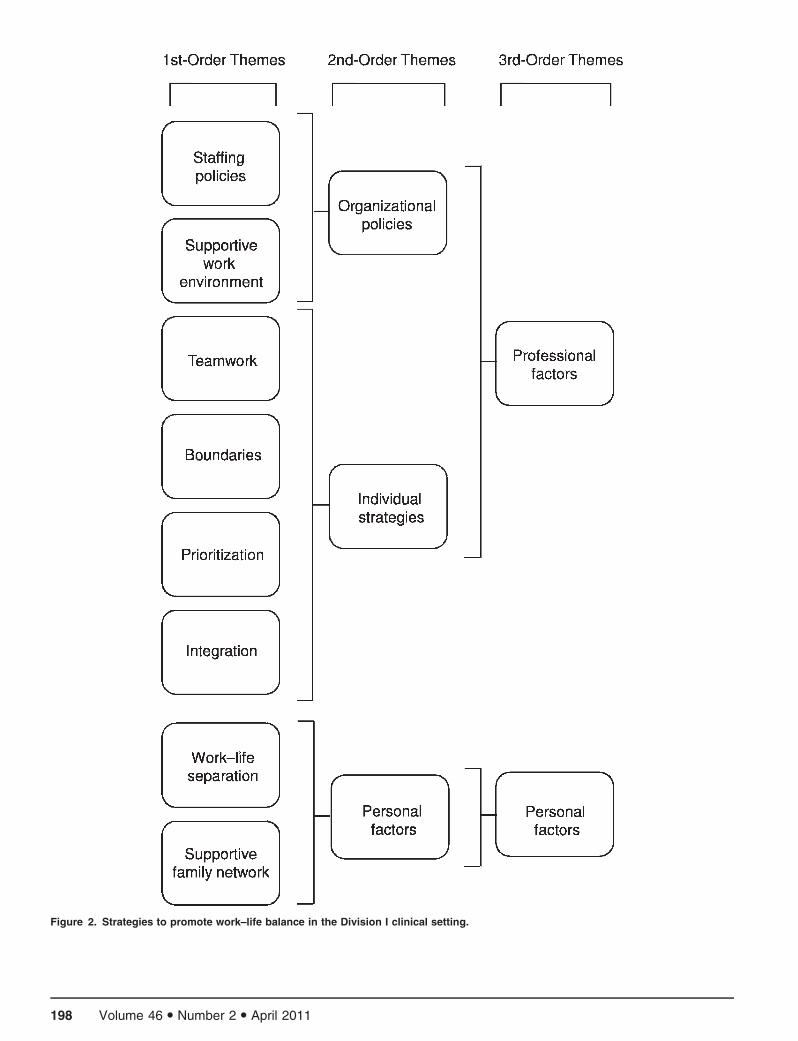
Figure 2. Strategies to promote work–life balance in the Division I clinical setting.
198 Volume 46 N Number 2 N April 2011
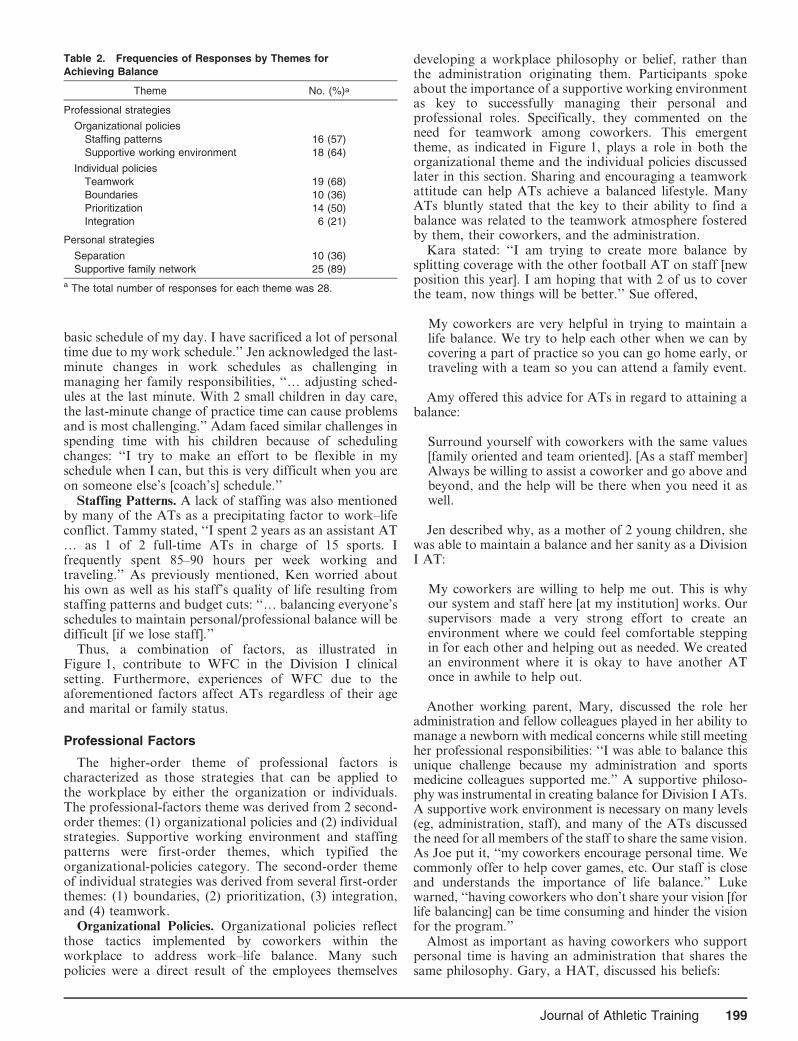
basic schedule of my day. I have sacrificed a lot of personaltime due to my work schedule.’’ Jen acknowledged the last-minute changes in work schedules as challenging inmanaging her family responsibilities, ‘‘… adjusting sched-ules at the last minute. With 2 small children in day care,the last-minute change of practice time can cause problemsand is most challenging.’’ Adam faced similar challenges inspending time with his children because of schedulingchanges: ‘‘I try to make an effort to be flexible in myschedule when I can, but this is very difficult when you areon someone else’s [coach’s] schedule.’’
Staffing Patterns. A lack of staffing was also mentionedby many of the ATs as a precipitating factor to work–lifeconflict. Tammy stated, ‘‘I spent 2 years as an assistant AT… as 1 of 2 full-time ATs in charge of 15 sports. Ifrequently spent 85–90 hours per week working andtraveling.’’ As previously mentioned, Ken worried abouthis own as well as his staff’s quality of life resulting fromstaffing patterns and budget cuts: ‘‘… balancing everyone’sschedules to maintain personal/professional balance will bedifficult [if we lose staff].’’
Thus, a combination of factors, as illustrated inFigure 1, contribute to WFC in the Division I clinicalsetting. Furthermore, experiences of WFC due to theaforementioned factors affect ATs regardless of their ageand marital or family status.
Professional Factors
The higher-order theme of professional factors ischaracterized as those strategies that can be applied tothe workplace by either the organization or individuals.The professional-factors theme was derived from 2 second-order themes: (1) organizational policies and (2) individualstrategies. Supportive working environment and staffingpatterns were first-order themes, which typified theorganizational-policies category. The second-order themeof individual strategies was derived from several first-orderthemes: (1) boundaries, (2) prioritization, (3) integration,and (4) teamwork.
Organizational Policies. Organizational policies reflectthose tactics implemented by coworkers within theworkplace to address work–life balance. Many suchpolicies were a direct result of the employees themselves
developing a workplace philosophy or belief, rather thanthe administration originating them. Participants spokeabout the importance of a supportive working environmentas key to successfully managing their personal andprofessional roles. Specifically, they commented on theneed for teamwork among coworkers. This emergenttheme, as indicated in Figure 1, plays a role in both theorganizational theme and the individual policies discussedlater in this section. Sharing and encouraging a teamworkattitude can help ATs achieve a balanced lifestyle. ManyATs bluntly stated that the key to their ability to find abalance was related to the teamwork atmosphere fosteredby them, their coworkers, and the administration.
Kara stated: ‘‘I am trying to create more balance bysplitting coverage with the other football AT on staff [newposition this year]. I am hoping that with 2 of us to coverthe team, now things will be better.’’ Sue offered,
My coworkers are very helpful in trying to maintain alife balance. We try to help each other when we can bycovering a part of practice so you can go home early, ortraveling with a team so you can attend a family event.
Amy offered this advice for ATs in regard to attaining abalance:
Surround yourself with coworkers with the same values[family oriented and team oriented]. [As a staff member]Always be willing to assist a coworker and go above andbeyond, and the help will be there when you need it aswell.
Jen described why, as a mother of 2 young children, shewas able to maintain a balance and her sanity as a DivisionI AT:
My coworkers are willing to help me out. This is whyour system and staff here [at my institution] works. Oursupervisors made a very strong effort to create anenvironment where we could feel comfortable steppingin for each other and helping out as needed. We createdan environment where it is okay to have another ATonce in awhile to help out.
Another working parent, Mary, discussed the role heradministration and fellow colleagues played in her ability tomanage a newborn with medical concerns while still meetingher professional responsibilities: ‘‘I was able to balance thisunique challenge because my administration and sportsmedicine colleagues supported me.’’ A supportive philoso-phy was instrumental in creating balance for Division I ATs.A supportive work environment is necessary on many levels(eg, administration, staff), and many of the ATs discussedthe need for all members of the staff to share the same vision.As Joe put it, ‘‘my coworkers encourage personal time. Wecommonly offer to help cover games, etc. Our staff is closeand understands the importance of life balance.’’ Lukewarned, ‘‘having coworkers who don’t share your vision [forlife balancing] can be time consuming and hinder the visionfor the program.’’
Almost as important as having coworkers who supportpersonal time is having an administration that shares thesame philosophy. Gary, a HAT, discussed his beliefs:
Table 2. Frequencies of Responses by Themes for
Achieving Balance
Theme No. (%)a
Professional strategies
Organizational policies
Staffing patterns 16 (57)
Supportive working environment 18 (64)
Individual policies
Teamwork 19 (68)
Boundaries 10 (36)
Prioritization 14 (50)
Integration 6 (21)
Personal strategies
Separation 10 (36)
Supportive family network 25 (89)
a The total number of responses for each theme was 28.
Journal of Athletic Training 199
I have worked hard to establish an atmosphere thatallows and encourages us to work together and to coverfor each other when possible. I never want my staff tofeel like they cannot do something because they don’thave coverage or help.
Another HAT, Scott, described his goal of establishing aworking model that encouraged and allowed his staff moreof a balance: ‘‘I think we’re getting closer to it here [abalance]. It’s been one of the goals [we’ve/I’ve had].’’ Millyvocalized the importance of administrative support forsuccessful life balancing:
It starts with our boss. He certainly and definitivelyunderstands the need for space in our personal life andtried to accommodate our needs. He encourages us totake time off from work as needed for personal reasonsand does not give us a hard time about it. Heunderstands if we have desires to visit family or havedoctor’s appointments.
One caveat that did arise regarding a supportive,cohesive work environment fostered by both coworkersand administrators (HATs, athletic directors) was nottaking advantage of those accommodations or of theflexible time made possible by coworkers. Amy summed itby stating, ‘‘I don’t take advantage and use family as anexcuse.’’ Mike reiterated, ‘‘my coworkers have always letme have the option of going home and taking care of mypersonal obligations, but I also do not take advantage ofthis opportunity.’’
The number of staff members was another criticalcomponent to meeting personal obligations and finding abalance; that is, the sports medicine staff must be largeenough to support a teamwork working environment.Jackson discussed the philosophy of his staff by saying,‘‘we do a tremendous job (5 full-time and 5 GAs [graduateassistants]) of supporting each other when personal issuesarise.’’ Denise stated, ‘‘The administration has supportedour department [mission for more personal time] withhiring of additional personnel.’’ Another reflected on aprevious position in which a lack of staff contributed to animbalance within her life. Tammy said, ‘‘my biggestchallenge before [at my former school] was an imbalancewith staff-to-patient ratios. At my current institution, wehave a rather large staff. One of the greatest benefits of ourlarge staff is that people are willing to assist if someonerequires help.’’ Jake honestly felt that the foundation for abalanced lifestyle at the Division I level was linked tostaffing: ‘‘providing enough support staff [to adequatelycover and handle responsibilities].’’ Sue concurred, stating‘‘I think more staff [would increase personal time].Oftentimes you do not have one sport assignment, youget multiple ones. That is what makes the hours so long.’’One HAT felt he was able to help his staff the most in thelast year because he had enough staff to adequately coverall practices and lifting sessions. Scott acknowledged, ‘‘that[allowing staff to have the time off] only comes when youhave the amount of people you need. We have gotten very,very close to that here.’’ Ken, another HAT, contemplatedthe negative effect the loss of staff members could have onwork–life balance, ‘‘Should we lose position(s), balancingeveryone’s schedules to maintain personal/professional
balance will be difficult while maintaining the same levelof care.’’
Individual Policies. Individual policies were specificstrategies addressed by many of the ATs regarding theirattempts to establish a balanced lifestyle. Many of thediscussions focused on the service-oriented nature of theprofession as a precipitating factor for conflicts. To avoidconflicts and allow for more personal time, many ATsdiscussed setting boundaries. Bruce declared, ‘‘set bound-aries and stick to them [this will help to achieve] thatbalance that we all strive to get.’’ Kara, while articulatingadvice to new ATs, said, ‘‘set your boundaries early. Letyour student-athletes and coaches know what are accept-able things to call you about during evenings and weekends[and what are not].’’ Kim talked about using workschedules as a way to establish boundaries and a routine,which in turn helped her create a balance. ‘‘Establishingrules and daily rehab/treatment time frames for athletesand coaches to follow has been an effective way for me tohave a schedule where I know when I can expect downtime.’’ Others discussed using the word no as a method toestablishing boundaries and a way to enjoy a morebalanced lifestyle. Amy stated, ‘‘learn how to say no, butdon’t overuse the word. Only say no when your work–lifebalance, relationship, or family will be affected.’’ Millyagreed:
… concerning schedules and learning to value my time, Ihave learned to say no to things. If athletes need to beevaluated, I used [to] drop everything the minute theycalled. Now, I will have them wait for me.
Adam said, ‘‘don’t be afraid to say NO.’’ By establishingboundaries, such as setting treatment hours, saying no, orhaving specific call times, an AT can effectively do the jobwhile still having a personal life.
Another common tactic used by the ATs was prioriti-zation, or setting daily priorities. More often, it involvedsetting aside time for themselves during the day toaccomplish personal tasks or obligations. Randy discussedusing his lunch break as a way to fit in a workout: ‘‘… formyself, I exercise. I try to do it every weekday at lunch.This gives me time to rest and recover.’’ Brianna echoed thevalue of using exercise as a stress-reduction and recoverytechnique: ‘‘Probably the most important thing I do [tomaintain a balanced lifestyle] is I work out every day. It isthe one thing I can do every day that is completely andutterly for me and no one else.’’ Mike stressed making timefor yourself, regardless of the activity, ‘‘… make sure todesignate some time for yourself. Do something that youfind as an outlet, and get away from work.’’ Concurringwith many of the ATs, Sue summarized finding a balancethrough prioritization: ‘‘I try to maintain a balance byprioritizing. I find that being able to put the things that areimportant to you first helps it from keeping you fromgetting absorbed by another aspect.’’ Others mentioned thereality of not prioritizing the time for themselves because ofwork-related obligations. Kara frankly stated, ‘‘if there is aconflict, then the personal side [my time] is what getsthrown out the window.’’
The concept of integration was discussed only by thoseATs with families and was seen as an effective tool tocreating a balanced lifestyle and increasing family contact
200 Volume 46 N Number 2 N April 2011
time. Scott said, ‘‘I try to include my daughters in as manywork-related things as possible.’’ Amy described thefamily-friendly environment at her institution: ‘‘There arekids all over our department, at intermittent times. No onetakes advantage of it, everyone gets their jobs done, andeveryone is exposed to less stress because they have thealternative to have their child with them at work if needbe.’’ Rachel attributed her ability to manage her children’sschedules with her work schedules to integration:
When my children were younger, I would bring them towork with me on Sundays. We only had a few hours oftreatments at that time [and it was a way to spend timewith them and meet my work obligations].
Personal Factors
Personal factors were operationalized as strategies orcircumstances used by the AT outside of the workplace.This higher-order theme consisted of 2 lower-order themes:(1) supportive family network and (2) work–life separation.Frequently, the ATs discussed and stressed the importanceof their personal social networks, which included non-ATfriends, spouses, peers, and family members (eg, parents,siblings, husband, children). Jackson stated, ‘‘My wifeunderstands what I do and knows how my schedule (orlack of a consistent one) varies. The short version is myfamily accepts what I do for my career.’’ Jen echoed thissentiment: ‘‘I am fortunate to have a very understandinghusband.’’ Harrietta acknowledged the encouragement shereceived from her family, which allowed her to manage herresponsibilities more effectively:
My family helps me maintain my life balance. Theyunderstand the importance of my job and the amount oftime that… job takes. All in all, my family never makesme feel guilty about my life balance (or lack of balance).
Kara talked about her family’s understanding withregard to scheduling of events and family gatherings:
My family has learned to schedule around the footballseason, since I don’t get a day off from August toDecember. This helps with the work–life balance so thatI don’t miss as many family gatherings.
A balanced lifestyle was very important to all partici-pants, and many were able to achieve that balancemore effectively through the support of their social net-works.
Another frequent comment made by the ATs addressedseparating their professional and personal lives. Jakebluntly stated, ‘‘Leave work at work.’’ Taber’s commentswere consistent with this recommendation. He noted thatthe most important element in finding a balance was to‘‘leave all of the issues and problems from work at work.’’Milly reflected upon her struggles with finding a balanceand openly confessed not wanting her work to consumeher. She found balance by
not bringing work home [with me]. At the end of theday, if there is an individual injured, an exercise I need to
make, or an evaluation I need to do better, I wait untilthe next day, when I am at work to do these things.
Making a clear distinction between work and personallife can help some ATs reduce the stress and challengesassociated with this balance.
DISCUSSION
The impetus for this study came from data transcriptionand analysis from a previous study examining WFC amongDivision I ATs.1,7 The purpose of that study was to determinewhether WFC was occurring within the profession of athletictraining and what effect it had upon such constructs as joband life satisfaction, job burnout, and job retention.1,7
Through the data-collection process, specifically throughthe one-on-one interviews, it became clear that many of theparticipants were experiencing a certain level of WFC. Severalcommented on methods to combat the conflicts they wereexperiencing because of the demands of their positions. Manyencouraged future researchers to examine the practices beingused to promote a family-friendly work environment withinathletic training. Also highlighting this need for furtherinvestigation has been the increase in articles within theathletic training literature. Since 2005, Athletic TherapyToday has published 4 separate articles2,18–20 and devotedan entire section to elements related to work and familybalance and quality of life for ATs.19–21 Several of the articlesfocused on suggested practices to help promote a balancedlifestyle for an AT and, although many of the recommenda-tions are practical, they may not completely depict thesituation (eg, clinical settings). Currently, a majority of theresearch examining successful policies focused primarily onthe traditional employment sector, with little attention tonontraditional employment settings in which the work day isnot 9 AM to 5 PM.
Beyond the suggestions of study participants to conductthis line of research, the need for investigation surroundingorganizational policies and personal strategies for thepromotion of work and family life balance lies in itsdocumented consequences. In separate meta-analyses,Kossek and Ozeki16 and Allen et al38 found that inaddition to life and job dissatisfaction, employees experi-encing WFC were also experiencing job burnout, thoughtsof leaving their positions or careers entirely, and a host ofother non–work-related variables such as depression andmarital dissatisfaction. Although neither study includedATs, the occurrence of WFC has been documented in theprofession,1–3,7 and its negative effect was much strongerfor ATs than for other working professionals7; therefore,investigating strategies and policies to help promote abalanced life is crucial.
Sources of WFC
We identified several antecedents of WFC, includingdemands of the profession, control and flexibility of work,and staffing patterns. These findings corroborate those ofprevious researchers1,2 who characterized organizationalfactors such as work hours, travel, and work schedules asmajor catalysts to WFC that are reported to have anegative influence on quality of life in this population.17
Although WFC has been proposed to arise because ofmyriad factors,13 for ATs in this study, the catalysts were
Journal of Athletic Training 201
grounded in the organizational structure of the workplace.This is not surprising, because athletic training is oftencharacterized as a ‘‘time-intensive occupation,’’40,41 adescription linked to higher reported levels ofWFC.1,7,42–44 Long work hours and travel are not uniqueto the athletic training profession; however, the lack ofcontrol over work schedules, coaches’ demands andexpectations, and inadequate staffing patterns are distinc-tive to the profession. Lack of control over work schedulesand inadequate staffing patterns have been associated withWFC within the Division I clinical settings in the past.1,2
These particular issues have not been associated with WFCin other professions, perhaps because of popular strategiessuch as flexible work schedules, flex time, and jobsharing5,12,14,45,46; when these strategies are used appropri-ately, scheduling and staffing concerns no longer contrib-ute to WFC.
Another factor that directly influenced control overwork schedules was the role of the coaching staff.Understandably, last-minute changes regarding workschedules can affect an individual’s ability to manage hisor her personal life, and an AT is no exception. Again,organizational culture and work scheduling has beenheavily associated with WFC,12,13 and those employeeswho have control, or the perception of control, over theirwork schedules report less WFC than those who do not.15
Balancing Work and Family: Professional Strategies
For participants in this study, 2 distinct avenues wereavailable for achieving balance: organizational policies andindividual workplace strategies. Many of the anecdotalsuggestions within the athletic training literature werecomparable with our findings.18–20 On an individual levelwithin the workplace, the need to establish boundaries withcoaches and athletes was necessary for many of the ATs tomaintain work–life balance. The reality is an AT employedat the interscholastic level will never enjoy a typicalworkday schedule; however, once the workday is complete,the focus should be on personal interests or domestic careobligations and not additional work responsibilities, whichcan often wait until the next day. Many strategies toestablish boundaries in the workplace exist, but asdocumented in the aforementioned results and in editorialsby Scriber and Alderman19 and Mensch and Wham,20 theuse of the word no is a highly effective method. Being ateam player, which is another key to successful fulfillmentof work–life balance, does not always mean that an AT hasto say yes to every additional responsibility or last-minuteschedule change. Joe Robinson, a life-balancing expert,encourages the use of the word no to establish work and lifeboundaries and guarantees its success.47
Almost as important as establishing workplace bound-aries is setting priorities. Setting priorities, defined by thisgroup of ATs as setting aside time during the day for non–work-related activities such as exercising, going to lunchwith a friend, or doing laundry, have been recommendedby several experts in life balancing47,48 and addressed byseveral keynote speakers at the NATA Annual Meetingand Clinical Symposia.48,49 Instituting priorities canempower individuals, providing them with more controlover their personal and professional responsibilities andschedules. Such control is key to fulfillment of work–life
balance,15 which is associated with a more productive,committed worker, reduced attrition in the workplace, andbolstered teamwork among staff members.10,45
Teamwork was especially important for this group ofATs in sustaining a balanced life. Regardless of marital orfamily status, ATs were able to have a sense of balancebecause of the teamwork culture. On many occasions, ATswere able to attend a child’s recital, personal doctor’sappointment, or wedding because a fellow AT was able tocover. A strong support system that includes coworkers hasbeen mentioned previously as necessary to promoting lifebalance in athletic training, particularly for female ATs.22
Furthermore, HATs and administrators should encourageteamwork among staff members because it provides a senseof organizational support, a critical link to improving workand life balance.11,16,42,45
The theory of integration, which has been suggested as atactic promoting work–family balance,18,50 was alsoreported by several of the married ATs as an effectiveway to address last-minute changes or child-care emergen-cies and even as a way to increase the amount of time spentwith family. When appropriate, the ability to includefamily in the workplace environment can ease the stressesrelated to WFC. Integration may also be of value for otherATs, regardless of their marital or family status. As withprioritizing personal time regardless of the time of day,using integration to offset lulls or changes in schedules canhelp an AT achieve a balance. For example, an AT maychoose to go for a run, do laundry, or have lunch with afriend during ‘‘working’’ hours when he or she does nothave taping duties to complete, rehabilitation programs tooversee, or practice to cover. Although at work, the AT ischoosing to use this period of time for personal activitiesand, as noted earlier, setting priorities can help anindividual to find a sense of balance. A direct correlationexisted between an increase in ‘‘me’’ time and achievementof balance.19 Similarly, in a recent study44 of professionalrole commitment, ATs identified time for rejuvenation as acritical aspect of maintaining their commitment over anextended period of time. A period of rejuvenation not onlywas time away from the day-to-day role of the AT but alsoprovided time to address personal needs.
Personal Strategies
Finding a balance between their personal and professionallives is unquestionably essential for the ATs in this study, andthe basis for achievement is a personal support network(Table 2). Relying on family, friends, and coworkers hasbeen cited as a key component in fulfilling work and lifebalance.22,50 Similarly, in an editorial addressing the personaland professional satisfaction of ATs, family support washighlighted as instrumental in attaining a balanced lifestyle.21
On an individual basis, support was defined in a variety ofways, but it was typically described as the understanding andflexibility of friends and family regarding the nature of theAT’s professional demands and responsibilities. Many of thestatements made by the participants in this study echoedthose of Kaiser,21 who emphasized the need for time awayfrom the workplace and the need for ATs to surroundthemselves with those who can empathize with the uniquejob responsibilities of an AT. Our findings relate to previous
202 Volume 46 N Number 2 N April 2011
research44 in ATs that underscored the role of networks toobtain social support and succeed in one’s work role.
We are not suggesting that an AT’s spouse’s career is lessimportant than the AT’s career, but it seemed necessary formany of the married ATs to have a spouse with a moreflexible work schedule to accommodate the workingdemands of the AT. Future researchers may investigate theinfluence of a spouse’s career on work–life balance as well asthe overall life satisfaction of the AT. Just as a supportiveorganizational culture affords an employee the ability toattend to family and personal responsibilities, a supportivefamily network allows the AT to adapt and handle the longwork hours and lack of control over work schedules. Asscholars continue to investigate effective policies for fulfill-ment of work–life balance, the influence of supportive familynetworks outside the workplace should also be studiedbecause of the current paucity of literature on the topic.
The theory of separation, although becoming lesspopular in the literature,50 appears to provide ATs withan effective strategy in reducing the influence of work ontheir personal lives. At the core, the theory of separationviews work and life as distinct, independent spheresbetween which individuals attempt to create a distinctdivision.50 Separation, an unfavorable term for manywork–life scholars,43,48,50 suggests that work is not partof life; however, for this group of working professionals, itappeared to provide the necessary relief from the pressuresand stresses placed upon them in the workplace. Further-more, the mindset of separation may allow ATs to increaseboth career and personal-life satisfaction by not allowingthem to negatively influence one another. Several of theATs attributed their sense of balance to time spent withfamily or on leisure activities and focusing all their energywhile at home with their families, rather than on workissues or responsibilities, a strategy also discussed byKaiser.21 The theory of separation for this group of ATsmay be defined more loosely: that working individualsshould concentrate their energies on a specific aspect oftheir lives (eg, working or spending time with family)instead of trying to multitask or allowing responsibilities tospill over from one realm into the other. Furthermore, theemphasis should be on the quality of work or taskcompletion, rather than on the time spent performing thespecific activity. Ultimately, a balanced lifestyle is in theeye of the beholder (balance is defined differently by eachperson), and the hope is that once a balance is achieved,contentment or personal satisfaction follows.
Limitations
The strategies and policies resulting from this study maynot be transferable to all clinical settings because they comefrom a small (although random) sample. Additionally, thesuggestions and thoughts of the participants in this currentstudy may not reflect those of all ATs practicing clinically, butthese personal experiences form a foundation for under-standing successful practices used to reduce the occurrenceof WFC and to achieve work–life balance. This was anexploratory study used to investigate a more global picturewithin the Division I setting; therefore, future inquiries shouldbe more focused on specific samples (with respect to sex ormarital status, for example) within this setting.
Implications
Intuitively, every working professional at some juncturein his or her life struggles with finding a balance, but giventhe unique job responsibilities of an AT, the struggles arelikely to be exacerbated or prolonged. Fortunately, thisgroup of ATs demonstrated that with hard work,communication, and support, attaining a balance ispossible within the Division I clinical settings. AlthoughWFC is prevalent in athletic training, as evident by ourreported results and previous AT literature,1–3,17 and willcontinue to occur, several organizational policies andpersonal strategies can be implemented to help reduceconflicts that may arise. When integrated, the strategies canhelp the AT to achieve a balance between professional andpersonal lives. We encourage ATs to strongly consider thestrategies presented in this manuscript and recommendselecting life-balancing techniques that meet the individualAT’s professional and personal goals and needs. Further-more, the results generated can assist the AT individually,the sports medicine department collectively, and theNATA globally. At any stage of their careers, ATs canlearn to set boundaries and understand at times it isacceptable to ‘‘just say no,’’ especially if their personalsatisfaction or family time may be affected. Also, ATsshould remember to take time for themselves by beinginvolved with outside interests; doing so will help topromote a sense of balance and encourage a more positiveoutlook on life. Teamwork among coworkers should besupported at all levels, including by the individual, HATs,and administrators. This strategy by far, along with havinga strong support network, was most important in givingATs the ability to manage their career demands andpersonal responsibilities. Athletic administrators andHATs should also explore possibilities to allow ATs tohave more control over their schedules. Flexible workingschedules and control over one’s work schedule areeffective strategies to help employees meet their responsi-bilities both at work and at home.4,5 Flexible workschedules in the athletic training environment may bemore structured (eg, choosing a particular time of day toaccomplish tasks, rather than working from home) than inother working environments but can still allow the AT toaccomplish nonwork tasks on certain days.
In its strategic plan,51 the NATA indicated the need foran increase in members’ personal and professional satis-faction. To move one step closer, the NATA needs toinvestigate ways to enforce the recommendations of theTask Force to Establish Appropriate Medical Coverage forIntercollegiate Athletics52 regarding appropriate medicalcoverage for intercollegiate athletics. Falling short of therecommendations, as many departments do, is often theimpetus for WFC within this population. Moreover, theNATA should encourage and support teamwork and jobsharing (interchangeability of staffing) within sportsmedicine departments. Inevitably, these accommodationswill be the most important elements in helping ATs toachieve a balanced lifestyle, particular in the currenteconomic climate. Job sharing or interchangeability ofstaff members simply means that each member of thesports medicine staff is qualified to provide medical carefor an athlete, regardless of his or her specific sportassignment, and can do so when necessary. Futureresearch, particularly focusing on the influence of staffing
Journal of Athletic Training 203
shortages, family-friendly working environments, andorganizational support on WFC within athletic training,is necessary. Furthermore, although we studied a stratifiedsample of participants, future authors should study a morehomogeneous sample to characterize demographic catego-ries such as single ATs, women versus men ATs, marriedATs, and married ATs with children.
ACKNOWLEDGMENTS
We thank the athletic trainers who participated in the studyand the Eastern Athletic Trainers’ Association for funding thisproject.
REFERENCES
1. Mazerolle SM, Bruening JE, Casa DJ. Work–family conflict, part I:
Antecedents of work–family conflict in National Collegiate Athletic
Association Division I-A certified athletic trainers. J Athl Train.
2008;43(5):505–512.
2. Mazerolle SM, Bruening JE. Sources of work–family conflict among
certified athletic trainers, part I. Athl Ther Today. 2006;11(5):33–35.
3. Milazzo SA, Miller TW, Bruening JE, Faghri PD. A survey of
Division I-A athletic trainers on bidirectional work–family conflict
and its relation to job satisfaction [abstract]. J Athl Train.
2006;41(suppl 2):S73.
4. Boles JS, Howard GW, Howard-Donofrio H. An investigation into
the inter-relationships of work–family conflict, family-work conflict
and work satisfaction. J Manage Issues. 2001;13(3):376–390.
5. Babin BJ, Boles JS. The effects of perceived co-worker involvement
and supervisor support on service provider roles stress, performance
and job satisfaction. J Retail. 1996;72(1):57–76.
6. Capel SA. Attrition of athletic trainers. Athl Train J Natl Athl Train
Assoc. 1990;25(1):34–39.
7. Mazerolle SM, Bruening JE, Casa DJ, Burton LJ. Work-family
conflict, part II: job and life satisfaction in National Collegiate
Athletic Association Division I-A certified athletic trainers. J Athl
Train. 2008;43(5):513–522.
8. Pastore DL. Male and female coaches of women’s athletic teams:
reasons for entering and leaving the profession. J Sport Manage.
1991;5(2):128–143.
9. Pastore DL, Inglis S, Danylchuk KE. Retention factors in coaching
and athletic management: differences by gender, position, and
geographic location. J Sport Soc Issues. 1996;20(4):427–441.
10. Carlson DS, Kacmar KM. Work–family conflict in the organization:
do life role values make a difference? J Manage. 2000;26(5):
1031–1054.
11. Thompson CA, Beauvais LL, Lyness KS. When work–family benefits
are not enough: the influence of work–family culture on benefit
utilization, organizational attachment, and work–family conflict.
J Voc Beh. 1999;54(3):392–415.
12. Dixon MA, Bruening JE. Work–family conflict in coaching, I: a top-
down perspective. J Sport Manage. 2007;21(3):377–406.
13. Dixon MA, Bruening JE. Perspectives on work–family conflict in
sport: an integrated approach. Sport Manage Rev. 2005;8(3):227–253.
14. Dixon MA, Sagas M. The relationship between organizational
support, work–family conflict, and the job-life satisfaction of
university coaches. Res Q Exerc Sport. 2007;78(3):236–247.
15. Thomas LT, Ganster DC. Impact of family-supportive work
variables on work–family conflict and strain: a control perspective.
J Appl Psychol. 1995;80(1):6–15.
16. Kossek EE, Ozeki C. Work–family conflict, policies, and the job-life
satisfaction relationship: a review and directions for organizational
behavior-human resources research. J Appl Psychol. 1998;83(2):
139–149.
17. Pitney WA. Organizational influences and quality-of-life issues
during the professional socialization of certified athletic trainers
working in the National Collegiate Athletic Association Division I
setting. J Athl Train. 2006;41(2):189–195.
18. Mazerolle SM, Bruening JE. Work-family conflict, part II: how
athletic trainers can ease it. Athl Ther Today. 2006;11(6):47–49.
19. Scriber KC, Alderman MH. The challenge of balancing our
professional and personal lives. Athl Ther Today. 2005;10(6):14–17.
20. Mensch J, Wham G. It’s a quality-of-life issue. Athl Ther Today.
2005;10(1):34–35.
21. Kaiser DA. Finding satisfaction as an athletic trainer. Athl Ther
Today. 2005;10(6):18–24.
22. Rice L, Gilbert W, Bloom G. Strategies used by Division I female
athletic trainers to balance family and career demands [abstract].
J Athl Train. 2001;36(suppl 2):S73.
23. Dixon MA, Bruening JE, Mazerolle SM, Davis A, Crowder J,
Lorsbach M. Work–family conflict in professional baseball players:
perceptions, influences, and consequences. Nine. 2006;14(2):
80–101.
24. Gmlech G, San Antonio PM. Baseball wives: gender and the work of
baseball. J Contemp Ethnogr. 2001;30(3):335–356.
25. Denzin NK, Lincoln YS. Handbook of Qualitative Research. 2nd ed.
Thousand Oaks, CA: Sage; 2000.
26. Creswell JW. Qualititative Inquiry and Research Design: Choosing
Among Five Approaches. 2nd ed. Thousand Oaks, CA: Sage;
2007:118–119.
27. Patton MQ. Practical Evaluation. Newbury Park, CA: Sage; 1990.
28. Pitney WA, Parker J. Qualitative Research in Physical Activity and the
Health Professions. Champaign, IL: Human Kinetics; 2009:42.
29. Maxwell JA. Qualitative Research Design: An Interactive Approach.
Thousand Oaks, CA: Sage; 1996.
30. Meho LI. E-mail interviewing in qualitative research: a method-
ological discussion. J Am Soc Info Sci Technol. 2006;57(10):1284–
1295.
31. Burton LJ, Bruening JE. Technology and method intersect in the
online focus group. Quest. 2003;55(4):315–327.
32. Strauss AL, Corbin JM. Basics of Qualitative Research: Grounded
Theory Procedures and Techniques. Newbury Park, CA: Sage; 1990.
33. Creswell JW. Educational Research: Planning, Conducting, and
Evaluating Quantitative and Qualitative Research. 2nd ed. Upper
Saddle River, NJ: Pearson Merrill Prentice Hall; 2004:51–55.
34. Patton MQ. Qualitative Research and Evaluation Methods. 2nd ed.
Newbury Park, CA: Sage; 1990.
35. Wiersma LD, Sherman CP. Volunteer youth sport coaches’ perspec-
tives of coaching education/certification and parental codes of
conduct. Res Q Exerc Sport. 2005;76(3):324–338.
36. Gilson TA, Chow CM, Ewing ME. Using goal orientations to
understand motivation in strength training. J Strength Cond Res.
2008;22(4):1169–1175.
37. Gould D, Finch LM, Jackson SA. Coping strategies used by national
champion figure skaters. Res Q Exerc Sport. 1993;64(4):453–468.
38. Allen TD, Herst DEL, Bruck CS, Sutton M. Consequences associated
with work-to-family conflict: a review and agenda for future research.
J Occup Health Psychol. 2000;5(2):278–308.
39. Pitney WA. The professional socialization of certified athletic trainers
in high school settings: a grounded theory investigation. J Athl Train.
2002;7(3):286–292.
40. Staurowsky E, Scriber K. An analysis of selected factors that affect
the work lives of athletic trainers employed in accredited educational
program. J Athl Train. 1998;33(3):244–248.
41. Bacharach SB, Bamberger P, Conley S. Work-home conflict among
nurses and engineers: mediating the impact of role stress on burnout
and satisfaction at work. J Organ Behav. 1991;12(1):39–53.
42. Pitney WA, Stuart ME, Parker J. Role strain among dual position
physical educators and athletic trainers in the high school setting.
Phys Educ. 2008;65(3):157–168.
43. Pitney WA. A qualitative examination of professional role commit-
ment among athletic trainers working in the secondary school setting.
J Athl Train. 2010;45(2):198–204.
44. O’Driscoll MP, Ilgen DR, Hildreth K. Time devoted to job and off-
job activities, interrole conflict, and affective experiences. J Appl
Psychol. 1992;77(3):272–279.
204 Volume 46 N Number 2 N April 2011
45. Duxbury L, Higgins C, Lee C. Work-family conflict: a comparison by
gender, family type, and perceived control. J Fam Issues. 1994;15(3):
449–466.
46. Robinson J. Work to Live. New York, NY: Berkeley Publishing
Group; 2003.
47. Clark SC. Work-family border theory: a new theory of work/family
balance. Hum Relat. 2000;53(6):747–770.
48. Woodruff L. Johnson and Johnson keynote speaker. Paper presented
at: 59th National Athletic Trainers’ Association Annual Meeting and
Clinical Symposia; June 19, 2008; St Louis, MO.
49. Carroll K. Johnson and Johnson keynote speaker. Paper presented at:
56th National Athletic Trainers’ Association Annual Meeting and
Clinical Symposia; June 15, 2006; Atlanta, GA.
50. Rapoport R, Bailyn L, Fletcher J, Pruitt B. Beyond Work– Family
Balance. San Francisco, CA: Jossey-Bass; 2002:23–25.
51. Becker-Doyle E. NATA sees future in updated strategic plan. J Athl
Train. 2003;38(3):192–193.
52. Appropriate medical coverage of intercollegiate athletics. National
Athletic Trainers’ Association Web site. http://www.nata.org/appropriate-
medical-coverage-intercollegiate-athletics. Accessed September 15, 2010.
Appendix 1. Semistructured Interview Guide
Appendix 2. Follow-Up Interview Questions
Address correspondence to Stephanie M. Mazerolle, PhD, ATC, University of Connecticut, 2095 Hillside Road, U-1110, Storrs, CT06269-1110. Address e-mail to [email protected].
1. Could you give me a little bit of background about your professional career and what made you pursue a position in
the collegiate setting?
2. Describe an ideal working environment in athletic training? Is it obtainable in your current work environment or
another work setting?
3. What do you feel is, or has been, your greatest challenge as an athletic trainer?
4. Reflect on the challenges that you have faced and describe what you have done to effectively deal with those
challenges.
5. How important is a balanced lifestyle to you? Please describe to me, if it is, how you are able to maintain a balancebetween your professional and personal life?
6. Have you experienced challenges finding a balance between your personal and professional life? If so, share an
instance when you have faced this challenge.
7. What factors have contributed to the challenge? If not, why haven’t you had challenges?
8. In what way have coworkers helped or hindered your ability to maintain life balance?
9. In what way has your administration helped or hindered these challenges?
10. How does your family (support system) help or hinder in these challenges?
11. Discuss if working in the athletic training profession provides a suitable working environment to achieve a balance.12. If a new athletic trainer was just about to enter this work setting, what advice would you give him/her to help them
maintain a balanced life?
1. If you could change anything about the intercollegiate setting that you work in, what would it be? Why?
2. Have your expectations/understanding of the job changed since your early years in the profession?
3. Reflect upon your thoughts of maintaining a balance when you first entered the profession. How does it compare to
now? Has it changed? If so, how?
4. If you are having a hard time finding a balance in your life, why do you continue to work in that setting?
Journal of Athletic Training 205
National Athletic Trainers’ Association PositionStatement: Prevention of Pediatric Overuse Injuries
Tamara C. Valovich McLeod, PhD, ATC*; Laura C. Decoster, ATC�;Keith J. Loud, MDCM, MSc`; Lyle J. Micheli, MD‰; J. Terry Parker, PhD, ATCI;Michelle A. Sandrey, PhD, ATC"; Christopher White, MS, ATC#
*Athletic Training Program, A.T. Still University, Mesa, AZ; 3New Hampshire Musculoskeletal Institute, Manchester,NH; 4Section of General Academic Pediatrics, Dartmouth-Hitchcock Medical Center, Lebanon, NH; 1Division ofSports Medicine, Children’s Hospital, Boston, MA; IGwinnett Soccer Association, Lilburn, GA; "Graduate AthleticTraining Program, West Virginia University, Morgantown; #Brophy College Preparatory School, Phoenix, AZ
Objective: To provide certified athletic trainers, physicians,and other health care professionals with recommendations onbest practices for the prevention of overuse sports injuries inpediatric athletes (aged 6–18 years).
Background: Participation in sports by the pediatric popula-tion has grown tremendously over the years. Although thehealth benefits of participation in competitive and recreationalathletic events are numerous, one adverse consequence issport-related injury. Overuse or repetitive trauma injuriesrepresent approximately 50% of all pediatric sport-related
injuries. It is speculated that more than half of these injuriesmay be preventable with simple approaches.
Recommendations: Recommendations are provided basedon current evidence regarding pediatric injury surveillance,identification of risk factors for injury, preparticipation physicalexaminations, proper supervision and education (coaching andmedical), sport alterations, training and conditioning programs,and delayed specialization.
Key Words: adolescents, children, chronic injuries, micro-trauma, growth, development
Overuse injuries in the pediatric population representa significant health care concern. Some reports andclinical observations1,2 indicate that 50% of pedi-
atric patients present to sports medicine clinics for chronicinjuries. In addition to their costs (direct and indirectmedical expenditures), these injuries also result in lostparticipation time, numerous physician visits, and lengthyand often recurring rehabilitation.3–5 Furthermore, athleteswho sustain recurrent overuse injuries may stop partici-pating in sports and recreational activities, thus potentiallyadding to the already increasing number of sedentaryindividuals and the obesity epidemic.
In the pediatric population, overuse injuries can includegrowth-related disorders and those resulting from repeat-ed microtrauma.6 Growth-related disorders include Os-good-Schlatter disease, Sever disease, and other apophy-seal injuries. Overuse injuries resulting from repetitivemicrotrauma and chronic submaximal loading of tissuesinclude stress fractures, similar to those described in adultathletes.6 However, overlap exists between broad classifi-cations; some growth-related disorders may occur insedentary children but much less often than in theiractive peers.6 Regardless of the cause, these injuries canresult in significant pain and disability. Although littleresearch has identified causative factors for overuseinjuries in children and adolescents, these injuries maybe caused by training errors, improper technique,excessive sports training, inadequate rest, muscle weak-ness and imbalances, and early specialization.6–10 Morethan half of all reported overuse injuries are speculated to
be preventable,5 but few empirical data support thisstatistic.
The purpose of this position statement is to providecertified athletic trainers, physicians, and other health careprofessionals with current best practice recommendationsregarding the prevention of overuse injuries in pediatricathletes, including children (aged 6–12 years) and adoles-cents (aged 13–18 years).11 Even though specific age rangeshave been identified, it is important to note that theoccurrence of puberty, followed by skeletal maturity, is afar more important marker of maturity than chronologicage when managing pediatric overuse injuries. In particu-lar, this position statement will provide recommendationsbased on current evidence (Table 1) pertaining to injurysurveillance (eg, incidence, prevalence), identification ofrisk factors for injury, preparticipation physical examina-tions (PPEs), proper supervision and education (coachingand medical), sport alterations, training and conditioningprograms, and delayed specialization.
RECOMMENDATIONS
Injury Surveillance
1. Research should be devoted to improved understand-
ing of the prevalence, incidence, and economic cost of
overuse injuries among pediatric athletes in the United
States and should focus on prevention and treatment
of these overuse injuries.12,13 Evidence Category: C
Journal of Athletic Training 2011;46(2):206–220g by the National Athletic Trainers’ Association, Incwww.nata.org/jat
position statement
206 Volume 46 N Number 2 N April 2011
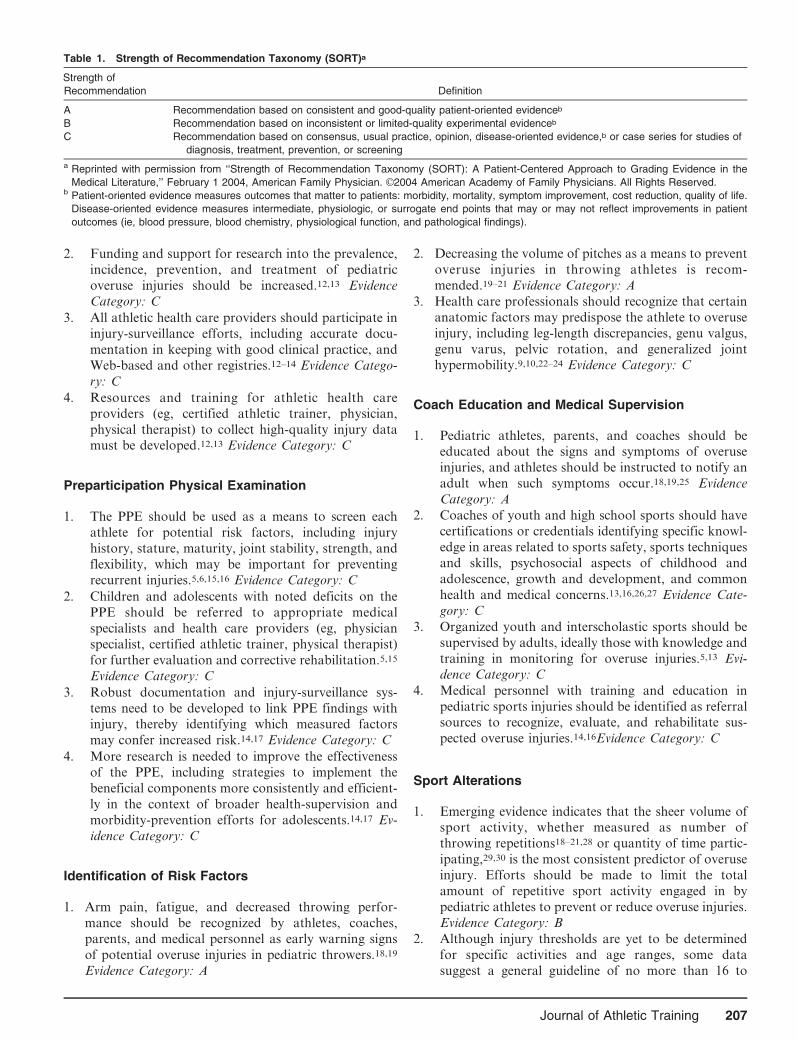
2. Funding and support for research into the prevalence,
incidence, prevention, and treatment of pediatric
overuse injuries should be increased.12,13 Evidence
Category: C
3. All athletic health care providers should participate in
injury-surveillance efforts, including accurate docu-
mentation in keeping with good clinical practice, and
Web-based and other registries.12–14 Evidence Catego-
ry: C
4. Resources and training for athletic health care
providers (eg, certified athletic trainer, physician,
physical therapist) to collect high-quality injury datamust be developed.12,13 Evidence Category: C
Preparticipation Physical Examination
1. The PPE should be used as a means to screen each
athlete for potential risk factors, including injury
history, stature, maturity, joint stability, strength, and
flexibility, which may be important for preventingrecurrent injuries.5,6,15,16 Evidence Category: C
2. Children and adolescents with noted deficits on the
PPE should be referred to appropriate medical
specialists and health care providers (eg, physician
specialist, certified athletic trainer, physical therapist)
for further evaluation and corrective rehabilitation.5,15
Evidence Category: C
3. Robust documentation and injury-surveillance sys-
tems need to be developed to link PPE findings withinjury, thereby identifying which measured factors
may confer increased risk.14,17 Evidence Category: C
4. More research is needed to improve the effectiveness
of the PPE, including strategies to implement the
beneficial components more consistently and efficient-
ly in the context of broader health-supervision and
morbidity-prevention efforts for adolescents.14,17 Ev-
idence Category: C
Identification of Risk Factors
1. Arm pain, fatigue, and decreased throwing perfor-
mance should be recognized by athletes, coaches,
parents, and medical personnel as early warning signs
of potential overuse injuries in pediatric throwers.18,19
Evidence Category: A
2. Decreasing the volume of pitches as a means to prevent
overuse injuries in throwing athletes is recom-
mended.19–21 Evidence Category: A
3. Health care professionals should recognize that certain
anatomic factors may predispose the athlete to overuse
injury, including leg-length discrepancies, genu valgus,
genu varus, pelvic rotation, and generalized jointhypermobility.9,10,22–24 Evidence Category: C
Coach Education and Medical Supervision
1. Pediatric athletes, parents, and coaches should beeducated about the signs and symptoms of overuse
injuries, and athletes should be instructed to notify an
adult when such symptoms occur.18,19,25 Evidence
Category: A
2. Coaches of youth and high school sports should have
certifications or credentials identifying specific knowl-
edge in areas related to sports safety, sports techniques
and skills, psychosocial aspects of childhood and
adolescence, growth and development, and common
health and medical concerns.13,16,26,27 Evidence Cate-
gory: C
3. Organized youth and interscholastic sports should be
supervised by adults, ideally those with knowledge and
training in monitoring for overuse injuries.5,13 Evi-
dence Category: C
4. Medical personnel with training and education in
pediatric sports injuries should be identified as referralsources to recognize, evaluate, and rehabilitate sus-
pected overuse injuries.14,16Evidence Category: C
Sport Alterations
1. Emerging evidence indicates that the sheer volume ofsport activity, whether measured as number of
throwing repetitions18–21,28 or quantity of time partic-
ipating,29,30 is the most consistent predictor of overuse
injury. Efforts should be made to limit the total
amount of repetitive sport activity engaged in by
pediatric athletes to prevent or reduce overuse injuries.
Evidence Category: B
2. Although injury thresholds are yet to be determined
for specific activities and age ranges, some data
suggest a general guideline of no more than 16 to
Table 1. Strength of Recommendation Taxonomy (SORT)a
Strength of
Recommendation Definition
A Recommendation based on consistent and good-quality patient-oriented evidenceb
B Recommendation based on inconsistent or limited-quality experimental evidenceb
C Recommendation based on consensus, usual practice, opinion, disease-oriented evidence,b or case series for studies of
diagnosis, treatment, prevention, or screening
a Reprinted with permission from ‘‘Strength of Recommendation Taxonomy (SORT): A Patient-Centered Approach to Grading Evidence in the
Medical Literature,’’ February 1 2004, American Family Physician. g2004 American Academy of Family Physicians. All Rights Reserved.b Patient-oriented evidence measures outcomes that matter to patients: morbidity, mortality, symptom improvement, cost reduction, quality of life.
Disease-oriented evidence measures intermediate, physiologic, or surrogate end points that may or may not reflect improvements in patient
outcomes (ie, blood pressure, blood chemistry, physiological function, and pathological findings).
Journal of Athletic Training 207

20 hours per week of vigorous physical activity by
pediatric athletes.30 Evidence Category: B
3. Alterations or modifications to the existing rules for
adult sports may help to prevent overuse injuries in
pediatric athletes and should be considered by coaches
and administrators for sports in which youth rules are
lacking.5,13,31 Evidence Category: C
4. Adults should ensure that pediatric athletes play only 1
overhead throwing sport at a time, avoid playing that
sport year-round, and use caution when combining
pitching with other demanding throwing positions (eg,
pitch 1 day and catch the next day) to ensure adequate
time for recovery.7,28,32 Evidence Category: C
5. Parents and coaches should restrict the use of breaking
pitches in order to prevent pitching-related arm
injuries.20 If an individual pitcher can throw breaking
pitches on a limited basis and remain symptom free,
then it may be allowed; however, if the use of this pitch
precedes the development of any throwing-related
symptoms, it should be immediately terminated and
the athlete should seek medical attention. Evidence
Category: C
6. Pitching limits should be established for players 9 to
14 years old: full-effort throwing (ie, in competition)
should be limited to 75 pitches per game, 600 pitches
per season, and 2000 to 3000 pitches per year.20,33
Evidence Category: B
7. Pitchers between 15 and 18 years of age should throw
no more than 90 pitches per game and pitch no more
than 2 games per week.21,33Evidence Category: C
Training and Conditioning Programs
1. Preseason and in-season preventive training programs
focusing on neuromuscular control, balance, coordi-
nation, flexibility, and strengthening of the lower
extremities are advocated for reducing overuse injury
risk, especially among pediatric athletes with a
previous history of injury.34–36 Evidence Category: A
2. All pediatric athletes should begin participating in a
general fitness program, emphasizing endurance,
flexibility, and strengthening, at least 2 months before
the sport season starts.5,9,37,38 Evidence Category: C
3. Pediatric athletes should have at least 1 to 2 days off
per week from competitive practices, competitions,
and sport-specific training.12,31 Coaches and adminis-
trators should consider these required days off when
organizing season schedules. Evidence Category: C
4. Pediatric athletes should participate on only 1 team of
the same sport per season when participation on 2 or
more teams of the same sport (eg, high school and
club) would involve practices or games (or both) more
than 5 days per week.31 Evidence Category: C
5. Progression of training intensity, load, time, and
distance should only increase by 10% each week to
allow for adequate adaptation and to avoid over-
load.5,31 Evidence Category: C
6. After injury or delayed time without throwing,
pediatric throwing athletes should pursue a gradual
return-to-throwing program over several weeks before
beginning or resuming full throwing activities.7,32
Evidence Category: C
Delayed Specialization
1. Pediatric athletes should be encouraged to participate
in multiple sports and recreational activities through-
out the year to enhance general fitness and aid in motor
development.5,13 Evidence Category: C
2. Pediatric athletes should take time off between sport
seasons and 2 to 3 nonconsecutive months away from a
specific sport if they participate in that sport year-
round.31 Evidence Category: C
3. Pediatric athletes who participate in simultaneous (eg,
involvement in high school and club sports at the same
time) or consecutive seasons of the same sport should
follow the recommended guidelines with respect to the
cumulative amount of time or pitches over the year.31
Evidence Category: C
BACKGROUND AND LITERATURE REVIEW
Repetitive stress on the musculoskeletal system withoutadequate and appropriate preparation and rest can resultin chronic or overuse injuries in athletes of any age. Inchildren and adolescents, this fact is complicated by thegrowth process, which can result in a unique set of injuriesamong pediatric athletes. Growth-related injuries mostfrequently affect the epiphyseal plates, where long bonegrowth occurs, and the apophyses, which serve as the bonyattachments for musculotendinous units.6 Compression isusually responsible for epiphyseal injuries, whereas repeat-ed tension or traction forces injure the apophyses.39
Differences in growth rates between the epiphyses andapophyses and between bone and muscle tissue are factorsin apophyseal injury risk. These different growth rates maylead to relative myotendinous inflexibility and increasedtraction forces on the apophyses, contributing to tractionapophyseal injuries.40,41 In throwers, repetitive microtrau-ma can lead to further bony insult, resulting in capitellarosteochondritis dissecans, a localized lesion of uncertaincause that involves the separation of articular cartilage andsubchondral bone.42,43 Although most cases of osteochon-dritis dissecans resolve without consequence, lesions thatdo not heal after surgical intervention or a period ofreduced repetitive impact loading may be responsible forfuture sequelae, including degenerative changes.44
Growth-center injuries may have long-term physicalconsequences and affect normal growth and develop-ment.16,40 However, little high-quality evidence supportsor refutes this suggestion. In a systematic review45 ofrepetitive loading in gymnasts, females were at risk forstress-related injuries of the distal radius, including distalradial physeal arrest, but the lower-quality evidence ofmost of the included studies limited the strength ofconclusions regarding whether physeal injury can inhibitradial growth. In a more recent systematic review,16 12
208 Volume 46 N Number 2 N April 2011

studies of baseball pitchers (3 case series, 9 case studies)with acute or chronic physeal injuries related to organizedsport were analyzed. Stress-related changes were reportedin all studies, including physeal widening in 8 reports,osteochondritis and radiographic widening of the proximalhumeral growth plate in 2 reports, and humeral physis in 1report.16 Most of these patients improved with rest andwere able to return to baseball, although some did notcontinue to pitch.
Data from lower extremity physeal injury studies werealso extracted for review. Ten studies16 of lower extremityphyseal injury revealed that these injuries occurred mainlyin runners, but soccer, tennis, baseball (catcher), andgymnastics athletes also showed radiographic changes ofphyseal widening. Among the 17 studies (11 case reports, 6case series) of physeal injury in gymnasts, traumaticphyseal arrest was described in 1, stress changes or frac-tures in 6, physeal widening in 5, and premature growth-plate closure in 5. In the 8 cross-sectional gymnasticsstudies reviewed, a distal physeal stress reaction was notedon radiographs from 10% to 85% of the athletes. Althoughthe authors concluded that stress-related physeal injuries inpediatric athletes often resolve without growth complica-tion after adequate rest and rehabilitation,16 prospective,randomized studies must be performed to provide strongerevidence before clinicians should relax their vigilanceconcerning the potential for growth disturbance.
An estimated 50% of overuse injuries in physically activechildren and adolescents may be preventable.5 Theprevention of pediatric overuse injuries requires a compre-hensive, multidimensional approach that includes (1)improved injury surveillance (ie, improved understandingof epidemiology), (2) identification of risk factors forinjury, (3) thorough PPEs, (4) proper supervision andeducation (both coaching and medical), (5) sport alter-ations, (6) improved training and conditioning programs,and (7) delayed specialization. This preventive approachhas been advocated by several prominent sports and healthcare organizations, including the American College ofSports Medicine,5 the World Health Organization andInternational Federation of Sports Medicine,13 the Amer-ican Academy of Pediatrics,31 and the InternationalOlympic Committee.12
Injury Surveillance
Before implementing any new prevention strategies oraiming to improve injury management, we must haveadequate studies of epidemiology and a good understand-ing of the risk factors for pediatric overuse injuries.15 Theliterature regarding the epidemiology of overuse injuries inpediatric athletes is scarce at best, particularly the literatureconcerning American children.
However, the epidemiology of chronic injuries has beeninvestigated in several international studies. In a 2003Japanese study,46 the authors reviewed 196 stress fractures(125 males, 71 females) among 10 726 patients over a 10-year period. The average age of those with stress fractureswas 20.1 years (range, 10–46 years), with 42.6% of patientsbetween the ages of 15 and 19 years. The location of thestress fracture was somewhat specific to sport: theolecranon in baseball players, ribs in rowers, and tibialshaft stress fractures in ballet dancers, runners, and tennis,
basketball, and volleyball players. Basketball players alsosustained stress fractures to the metatarsals, whereas trackathletes and soccer players incurred stress fractures to thetibial shaft and pubic bone. The authors concluded thatstress fractures were common in high-functioning adoles-cent athletes, with similar proportions among male andfemale athletes. In another Japanese study29 of stressfractures in 208 athletes under the age of 20 years, theresearchers found that the peak age of occurrence was16 years, the most frequent site was the tibial shaft, andbasketball was the sport most commonly associated withstress fractures. A 2006 retrospective study47 of stressfractures among 25 juveniles demonstrated that the age ofonset was 12.9 6 4.3 years (range, 3–17 years) and the tibiawas most often affected (48%, n 5 13), followed by themetatarsals (18.5%, n 5 5). Using data from the HighSchool Report Injuries Online (RIO) injury surveillancesystem, Fernandez et al48 reported that 4350 athleticinjuries occurred among athletes participating in 9 highschool sports during 1 academic year. Although theseauthors did not focus solely on overuse injuries, they notedthat 53% (n 5 2298) of these injuries were to the lowerextremity; 2% of these injuries were classified as tendinitisand 1.3% as stress fractures. Specific investigations of theepidemiology of overuse injuries are warranted in the highschool population.
Although studies on the general prevalence of pediatricoveruse injuries are lacking, investigators have addressedthe sport-specific prevalence of overuse injuries. Du-bravcic-Simunjak et al2 retrospectively surveyed 469 elitejunior figure skaters in Croatia, with 42% of female skatersand 45% of male skaters self-reporting an overuse injury atsome point in their skating careers. In female singles iceskaters, the most frequent injury was a stress fracture(approximately 20%), followed by patellar tendinitis(14.9%). Male singles ice skaters were more likely toexperience jumper’s knee (16%), followed by Osgood-Schlatter disease (14.2%). Maffulli et al49 reported onoveruse injuries of the elbow among elite gymnasts in theUnited Kingdom and found that 12 elbows of 8 patients(aged 11–15 years) displayed a spectrum of radiologicabnormalities, including olecranon physis widening andepiphyseal fragmentation.
In a recent investigation of Norwegian soccer players,the rates of overuse injuries were 0.2 (95% confidenceinterval [CI] 5 0.1, 0.4) and 0.4 (95% CI 5 0.0, 0.8) per1000 player-hours in 6- to 12-year-old boys and girls,respectively.50 An increase in the incidence of overuseinjuries was noted in an older cohort (13–16 years old) ofboys (0.7, 95% CI 5 0.4, 1.0) and girls (0.7, 95% CI 5 0.3,1.1) per 1000 player-hours, with the relative risk (RR) ofoveruse injury calculated as 2.9 (95% CI 5 1.3, 6.4) and 1.7(95% CI 5 0.6, 5.5) in older boys and girls, respectively.50
In addition, 87% of the reported overuse injuries resultedin time loss from soccer that ranged from 1 to more than21 days. Similarly, LeGall et al51 investigated the incidenceof soccer-related injuries in elite French youth players andfound that those younger than age 14 had more injuriesduring training sessions (ie, practices) and more growth-related overuse injuries, whereas older athletes more oftensustained injuries during games. Overuse injuries account-ed for 17.2% of all injuries and were mainly classified astendinopathies (n 5 108, 9.4%), osteochondroses (n 5 72,
Journal of Athletic Training 209
6.3%), or other overuse (n 5 19, 1.6%). In a follow-upstudy of adolescent female soccer athletes over 8 seasons,overuse injuries accounted for 13.4% of all injuries.52
We need to better understand the prevalence, incidence,and economic impact of overuse injuries among pediatricathletes in the United States. Although few data arecurrently available about overuse injuries, the more than7.5 million young people who participate in interscholasticsports53 and millions of others who participate in youthsports programs across the country represent a very largeat-risk population worthy of the expenditure of time,effort, money, and improved surveillance by clinicians andresearchers alike.
Preparticipation Physical Examination
A consensus has emerged that the PPE, as defined byseveral leading medical and allied health specialty societies,is the primary means of identifying at-risk athletes andinitiating preventive measures.5,6,14,15,17 The main objec-tives of the PPE are to detect life-threatening or disablingmedical or musculoskeletal conditions and to screenathletes for medical or musculoskeletal conditions thatmay predispose them to injury or illness.17 In the context ofthis position statement, the history and musculoskeletalexamination are important in detecting and possiblypreventing overuse injuries. Additional information onother aspects of the PPE can be obtained from thePreparticipation Physical Evaluation monograph.17
The history portion of the PPE should be used torecognize previous injuries and other possible signs ofovertraining. Many overuse injuries can be identified fromthe answers provided in the history component.17 Further-more, a history of stress fractures or chronic or recurringmusculoskeletal injuries may be associated with nutritionalinsufficiencies, which should be investigated as needed.17
The physical examination of the musculoskeletal systemshould include evaluation of the athlete’s physical statureand maturity (Tanner stage) and any deficits in strengthand flexibility.5,17 In addition, the stability, symmetry, andrange of motion of all joints and the relative symmetry,strength, and flexibility of all major muscle groups shouldbe evaluated. These musculoskeletal assessments includerange-of-motion tests, manual muscle tests, joint stresstests, flexibility tests, and balance tests, compared bilater-ally. The Preparticipation Physical Evaluation17 describesthe general 14-point musculoskeletal screening examina-tion as an acceptable approach to evaluate the musculo-skeletal system in athletes who are asymptomatic andwithout a history of previous injury. If the athlete describesa previous injury in the history portion or pain or positivefindings are noted on the general screening examination, amore thorough joint-specific examination should beconducted.17 Ideally, a biomechanical assessment orfunctional screening test(s) should be incorporated toevaluate overall posture, gait mechanics, core stability,and functional strength.54 This may include either a singlefunctional screening test, such as the overhead squat test,55
or a series of tasks56 to identify abnormal movementpatterns. However, these tasks have yet to be validated inthe pediatric population. Any deficits or concerns shouldbe discussed with the athlete and parent, along withrecommendations for correcting these deficits, including
referral to a physician specialist, athletic trainer, orphysical therapist if needed.5,14,15 Future researchersshould focus on improving aspects of the musculoskeletalhistory, validating the general 14-point musculoskeletalscreening examination and incorporating additionalscreening tests as possible predictors of overuse injuries.
A well-designed PPE can serve as a screening processfrom which prevention mechanisms can be developed.57
This process should be simple to administer and reliableand should use a combination of anthropometric andbiomechanical measures to identify risk factors. Unfortu-nately, the PPE is often incompletely and inconsistentlydelivered. In most states, the PPE is mandated for highschool athletes, but it is often not a requirement for thoseparticipating in club-based or youth sports. Requiredelements in the history and physical examination varywidely and are often not consistent with published nationalguidelines.58 The Preparticipation Physical Evaluation17
suggests that the ideal location for the PPE is within theathlete’s primary care physician’s office; however, itacknowledges other approaches, including the coordinatedmedical team examination and, although not recom-mended, the locker room-based examination. As aconsequence of the lack of mandates, many adolescentsseek their PPEs with a variety of providers and may bediverted from a medical ‘‘home,’’ where they can receiveongoing health immunizations and screening for thecommon psychosocial morbidities of adolescence.59 Thelack of continuity also precludes connection with therehabilitative follow-up deemed essential to injury preven-tion.60
Finally, the PPE may not be able to meet criteria for anappropriate screening process, even if implemented per-fectly, because it is neither sensitive nor specific enough toadequately detect the life-threatening medical conditionsthat are so exceedingly rare60 or, in its current state, predictthe potential for overuse injuries. Furthermore, as notedthroughout this position statement, the evidence base islacking as to which historical, anthropometric, andbiomechanical findings confer increased musculoskeletalinjury risk and which may be amenable to preventiveinterventions.
Identification of Risk Factors
Little rigorous research has been conducted to investi-gate potential risk factors for overuse injuries in pediatricathletes. Table 2 lists a number of suspected growth-relatedintrinsic and extrinsic risk factors for overuse injuries,although these classifications and listings of risk factors areprimarily based on anecdotal evidence.9,61
One group10 attempted to identify accident-prone andoveruse-prone profiles in young adults by prospectivelyinvestigating the effects of numerous physical and psycho-social characteristics on the rate of acute and overuseinjuries. They developed an overuse-injury–prone profilefor both males and females, which included physicalfactors such as a lack of stability (eg, decreased staticstrength coupled with laxity), muscle tightness, malalign-ment, more explosive strength, and large body size (ie,height and mass), and psychological traits including degreeof carefulness, dedication, vitality, and sociability (Ta-ble 3).10 Many of these characteristics (eg, anatomical
210 Volume 46 N Number 2 N April 2011
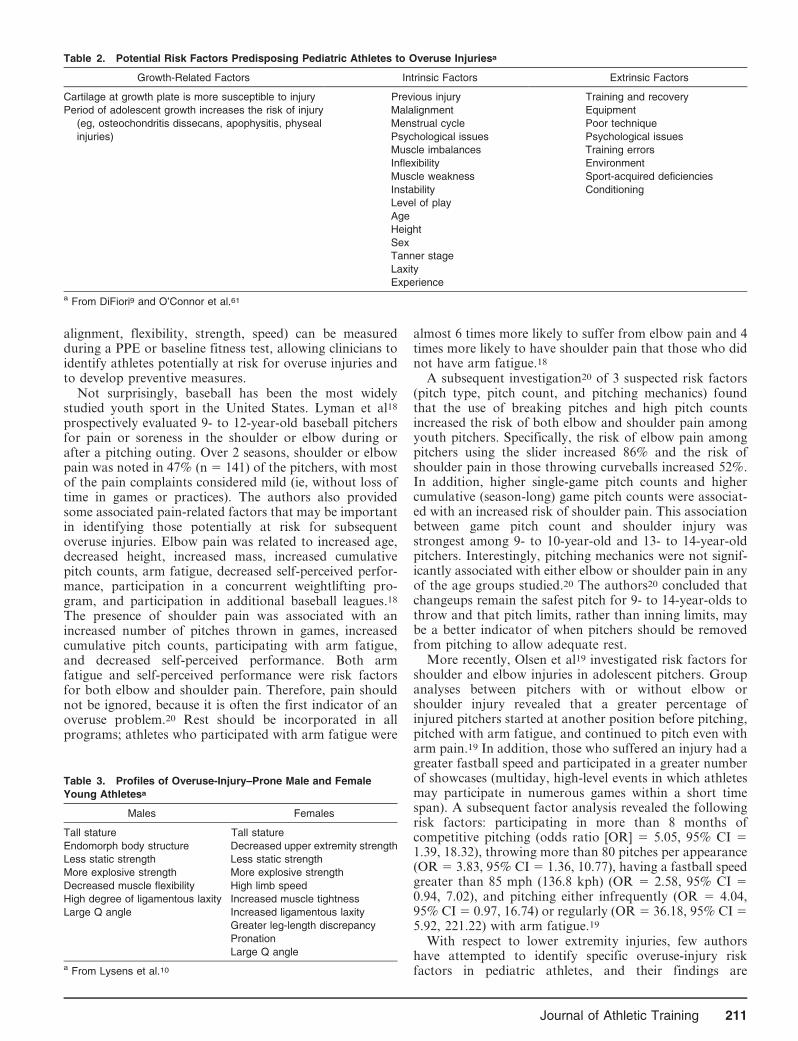
alignment, flexibility, strength, speed) can be measuredduring a PPE or baseline fitness test, allowing clinicians toidentify athletes potentially at risk for overuse injuries andto develop preventive measures.
Not surprisingly, baseball has been the most widelystudied youth sport in the United States. Lyman et al18
prospectively evaluated 9- to 12-year-old baseball pitchersfor pain or soreness in the shoulder or elbow during orafter a pitching outing. Over 2 seasons, shoulder or elbowpain was noted in 47% (n 5 141) of the pitchers, with mostof the pain complaints considered mild (ie, without loss oftime in games or practices). The authors also providedsome associated pain-related factors that may be importantin identifying those potentially at risk for subsequentoveruse injuries. Elbow pain was related to increased age,decreased height, increased mass, increased cumulativepitch counts, arm fatigue, decreased self-perceived perfor-mance, participation in a concurrent weightlifting pro-gram, and participation in additional baseball leagues.18
The presence of shoulder pain was associated with anincreased number of pitches thrown in games, increasedcumulative pitch counts, participating with arm fatigue,and decreased self-perceived performance. Both armfatigue and self-perceived performance were risk factorsfor both elbow and shoulder pain. Therefore, pain shouldnot be ignored, because it is often the first indicator of anoveruse problem.20 Rest should be incorporated in allprograms; athletes who participated with arm fatigue were
almost 6 times more likely to suffer from elbow pain and 4times more likely to have shoulder pain that those who didnot have arm fatigue.18
A subsequent investigation20 of 3 suspected risk factors(pitch type, pitch count, and pitching mechanics) foundthat the use of breaking pitches and high pitch countsincreased the risk of both elbow and shoulder pain amongyouth pitchers. Specifically, the risk of elbow pain amongpitchers using the slider increased 86% and the risk ofshoulder pain in those throwing curveballs increased 52%.In addition, higher single-game pitch counts and highercumulative (season-long) game pitch counts were associat-ed with an increased risk of shoulder pain. This associationbetween game pitch count and shoulder injury wasstrongest among 9- to 10-year-old and 13- to 14-year-oldpitchers. Interestingly, pitching mechanics were not signif-icantly associated with either elbow or shoulder pain in anyof the age groups studied.20 The authors20 concluded thatchangeups remain the safest pitch for 9- to 14-year-olds tothrow and that pitch limits, rather than inning limits, maybe a better indicator of when pitchers should be removedfrom pitching to allow adequate rest.
More recently, Olsen et al19 investigated risk factors forshoulder and elbow injuries in adolescent pitchers. Groupanalyses between pitchers with or without elbow orshoulder injury revealed that a greater percentage ofinjured pitchers started at another position before pitching,pitched with arm fatigue, and continued to pitch even witharm pain.19 In addition, those who suffered an injury had agreater fastball speed and participated in a greater numberof showcases (multiday, high-level events in which athletesmay participate in numerous games within a short timespan). A subsequent factor analysis revealed the followingrisk factors: participating in more than 8 months ofcompetitive pitching (odds ratio [OR] 5 5.05, 95% CI 51.39, 18.32), throwing more than 80 pitches per appearance(OR 5 3.83, 95% CI 5 1.36, 10.77), having a fastball speedgreater than 85 mph (136.8 kph) (OR 5 2.58, 95% CI 50.94, 7.02), and pitching either infrequently (OR 5 4.04,95% CI 5 0.97, 16.74) or regularly (OR 5 36.18, 95% CI 55.92, 221.22) with arm fatigue.19
With respect to lower extremity injuries, few authorshave attempted to identify specific overuse-injury riskfactors in pediatric athletes, and their findings are
Table 2. Potential Risk Factors Predisposing Pediatric Athletes to Overuse Injuriesa
Growth-Related Factors Intrinsic Factors Extrinsic Factors
Cartilage at growth plate is more susceptible to injury
Period of adolescent growth increases the risk of injury
(eg, osteochondritis dissecans, apophysitis, physeal
injuries)
Previous injury
Malalignment
Menstrual cycle
Psychological issues
Muscle imbalances
Inflexibility
Muscle weakness
Instability
Level of play
Age
Height
Sex
Tanner stage
Laxity
Experience
Training and recovery
Equipment
Poor technique
Psychological issues
Training errors
Environment
Sport-acquired deficiencies
Conditioning
a From DiFiori9 and O’Connor et al.61
Table 3. Profiles of Overuse-Injury–Prone Male and Female
Young Athletesa
Males Females
Tall stature
Endomorph body structure
Less static strength
More explosive strength
Decreased muscle flexibility
High degree of ligamentous laxity
Large Q angle
Tall stature
Decreased upper extremity strength
Less static strength
More explosive strength
High limb speed
Increased muscle tightness
Increased ligamentous laxity
Greater leg-length discrepancy
Pronation
Large Q angle
a From Lysens et al.10
Journal of Athletic Training 211
inconclusive. These studies are limited to research onmedial tibial stress syndrome (MTSS) and stress frac-tures.30,62,63 In 2 investigations of risk factors for MTSS inhigh school cross-country runners, predictive variablesdiffered.62,63 One group62 found that athletes with MTSShad a greater navicular drop (6.6 mm) than those who wereasymptomatic (3.6 mm) and that the combination ofnavicular drop and sex accurately predicted 78% of MTSScases. However, resting calcaneal position, tibiofemoralvarum, and gastrocnemius length (ie, tightness) were notpredictive. A subsequent investigation63 revealed that sexand body mass index were predictors of MTSS, with thelatter being the only predictor when controlling fororthotic use. Additionally, compared with those withoutan injury history, high school cross-country runners with ahistory of previous injury were 2 times more likely to reportMTSS (OR 5 2.18, 95% CI 5 0.07, 6.4) and 3 times morelikely to use orthotics (OR 5 3.0, 95% CI 5 0.09, 9.4).63
Correlates of stress fractures in a general population offemale adolescents have also been researched and, althoughage had the strongest association with a stress-fracturehistory (27% to 29% increased odds for each year beyondage 11), participation in more than 16 hours per week ofvigorous activity (OR 5 1.88, 95% CI 5 1.18, 3.03) and inhigh-impact physical activity, such as basketball, soccer,volleyball, running, tennis, or cheerleading (OR 5 1.06,95% CI 5 1.03, 1.10), was also related to stress-fracturehistory.30 They reported a slight (but nonsignificant)increased risk for stress fracture in the most sedentarygirls, a reminder that participation in impact-loadingphysical activity is important in this population becauseof its positive effects on bone mineral density.30
In a subsequent clinic-based study of adolescent femaleathletes, only family history of osteoporosis or osteopeniawas associated with stress fracture (OR 5 2.96, 95% CI 51.36, 6.45).64 However, in neither adolescent athleteinvestigation was stress fracture associated with irregularmenstrual periods, as has been demonstrated in adultwomen athletes and military recruits.65 In combination,these investigations may begin to identify safe thresholdsfor participation in vigorous physical activity (16–20 h/wk).They also suggest that risk stratification must incorporateboth intrinsic (eg, inherited skeletal quality) and extrinsic(eg, training volume) factors. Another area of focusconcerning risk factors has been generalized joint hyper-mobility, which is characterized by mobility of multiplejoints beyond the normal range of motion. Communityprevalence of generalized joint hypermobility appears todepend on age, sex, and race, with reports ranging from 2%(adult Caucasian males) to 57% (African females of mixedages).66 A considerable number of studies of rheumatologyand pediatric clinic-based populations appear to demon-strate relationships between generalized joint hypermobil-ity and insidious-onset arthralgia and fibromyalgia.67–75
Yet prospective studies of nonclinic populations are at bestinconclusive as to whether joint hypermobility increasesinjury risk.
In a prospective study23 of 17-year-old military recruits,those with hypermobility had more injuries during bootcamp than those who were not hypermobile. Anotherprospective study24 of youngsters 6 to 14 years olddemonstrated that children with hypermobile joints hadmore complaints of joint pain than nonhypermobile
children. A retrospective study76 of pediatric (aged 6–16 years) netball players in Australia showed thathypermobility was associated with an increased prevalenceof self-reported injuries. In another small retrospectivestudy77 including children and adults, more injuries werereported by hypermobile ballet dancers than by theirnonhypermobile counterparts. In an attempt to describeoveruse-prone profiles of young adults, Lysens et al10
reported that males and females with weak muscles, poorflexibility, and hypermobility may be at increased risk foroveruse injuries.
Alternately, several prospective studies of mixed (childand adult) or adult athletic populations do not support theconclusion that joint hypermobility is related to injury risk.A prospective study78 of netball players aged 15 to 36 yearsdemonstrated no differences in injuries based on hyper-mobility status. Studies of National Collegiate AthleticAssociation lacrosse players79 and professional soccerplayers80 also have indicated no differences in injuriesbased on hypermobility status. Finally, a retrospectivestudy81 of female gymnasts aged 10 to 21 years found norelationship between hypermobility status and reportedhistory of injuries.
Screening for generalized joint hypermobility is relativelyeasy using the methods first proposed by Carter andWilkinson82 and later modified by Beighton and Horan.83
This multijoint active range-of-motion screening procedureis widely accepted (Table 4). Incorporating this screeninginto the PPE might add only a few minutes to eachassessment, but its use should depend upon the time, cost,and level of experience of the examiner administering thePPE.
Proper Supervision and Education
Organizations sponsoring interscholastic or club-basedathletics in which pediatric athletes participate have theresponsibility to ensure adequate coaching and medicalsupervision.5,13,14 Proper supervision by coaches andenforcement of the rules of the sport (which includesadequate education of both coaches and officials) mayserve as a means to decrease overuse injury risk in this agegroup.9,15,50 For example, Little League Baseball providespitch-count regulation (Appendix A), tracking sheet(Appendix B), and pitching eligibility forms, all of whichare easily accessible to youth baseball coaches. Theguidelines mandating pitch-count limits are adapted fromscientific evidence and are updated frequently as newresearch emerges.84 Moreover, proper medical supervisionat competitions and practices may allow for earlyrecognition of overuse injuries in the beginning stages topermit proper evaluation, referral, and rehabilitationbefore they result in time lost from participation.14,15
Education of all athletes, parents, coaches, and officialsregarding overuse injuries and preventive mechanisms isadvocated. Athletes, parents, and coaches should all haveknowledge of general signs and symptoms of overuse,including but not limited to a gradual onset of pain, painpresenting as an ache, no history of direct injury, stiffnessor aching after or during training or competition,increasing periods of time for pain to resolve, pointtenderness, visible swelling, missed training sessions as aresult of the pain or injury, and a problem that persists.25
212 Volume 46 N Number 2 N April 2011
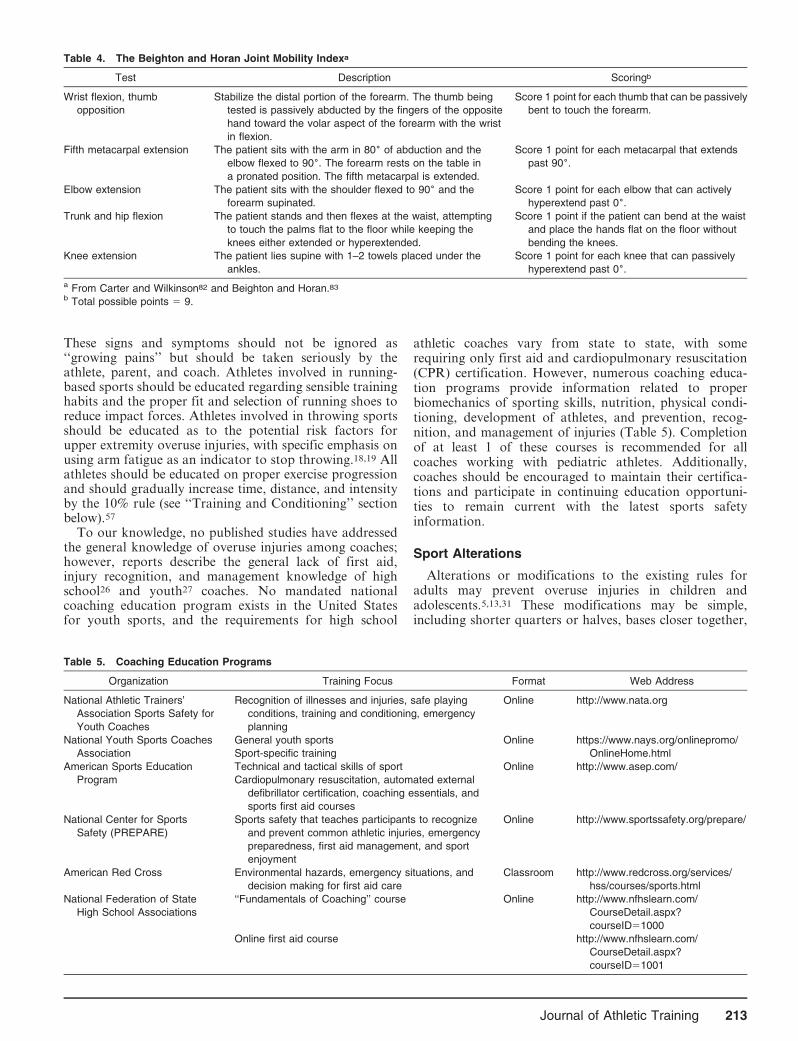
These signs and symptoms should not be ignored as‘‘growing pains’’ but should be taken seriously by theathlete, parent, and coach. Athletes involved in running-based sports should be educated regarding sensible traininghabits and the proper fit and selection of running shoes toreduce impact forces. Athletes involved in throwing sportsshould be educated as to the potential risk factors forupper extremity overuse injuries, with specific emphasis onusing arm fatigue as an indicator to stop throwing.18,19 Allathletes should be educated on proper exercise progressionand should gradually increase time, distance, and intensityby the 10% rule (see ‘‘Training and Conditioning’’ sectionbelow).57
To our knowledge, no published studies have addressedthe general knowledge of overuse injuries among coaches;however, reports describe the general lack of first aid,injury recognition, and management knowledge of highschool26 and youth27 coaches. No mandated nationalcoaching education program exists in the United Statesfor youth sports, and the requirements for high school
athletic coaches vary from state to state, with somerequiring only first aid and cardiopulmonary resuscitation(CPR) certification. However, numerous coaching educa-tion programs provide information related to properbiomechanics of sporting skills, nutrition, physical condi-tioning, development of athletes, and prevention, recog-nition, and management of injuries (Table 5). Completionof at least 1 of these courses is recommended for allcoaches working with pediatric athletes. Additionally,coaches should be encouraged to maintain their certifica-tions and participate in continuing education opportuni-ties to remain current with the latest sports safetyinformation.
Sport Alterations
Alterations or modifications to the existing rules foradults may prevent overuse injuries in children andadolescents.5,13,31 These modifications may be simple,including shorter quarters or halves, bases closer together,
Table 4. The Beighton and Horan Joint Mobility Indexa
Test Description Scoringb
Wrist flexion, thumb
opposition
Stabilize the distal portion of the forearm. The thumb being
tested is passively abducted by the fingers of the opposite
hand toward the volar aspect of the forearm with the wrist
in flexion.
Score 1 point for each thumb that can be passively
bent to touch the forearm.
Fifth metacarpal extension The patient sits with the arm in 806 of abduction and the
elbow flexed to 906. The forearm rests on the table in
a pronated position. The fifth metacarpal is extended.
Score 1 point for each metacarpal that extends
past 906.
Elbow extension The patient sits with the shoulder flexed to 906 and the
forearm supinated.
Score 1 point for each elbow that can actively
hyperextend past 06.
Trunk and hip flexion The patient stands and then flexes at the waist, attempting
to touch the palms flat to the floor while keeping the
knees either extended or hyperextended.
Score 1 point if the patient can bend at the waist
and place the hands flat on the floor without
bending the knees.
Knee extension The patient lies supine with 1–2 towels placed under the
ankles.
Score 1 point for each knee that can passively
hyperextend past 06.
a From Carter and Wilkinson82 and Beighton and Horan.83
b Total possible points 5 9.
Table 5. Coaching Education Programs
Organization Training Focus Format Web Address
National Athletic Trainers’
Association Sports Safety for
Youth Coaches
Recognition of illnesses and injuries, safe playing
conditions, training and conditioning, emergency
planning
Online http://www.nata.org
National Youth Sports Coaches
Association
General youth sports Online https://www.nays.org/onlinepromo/
OnlineHome.htmlSport-specific training
American Sports Education
Program
Technical and tactical skills of sport Online http://www.asep.com/
Cardiopulmonary resuscitation, automated external
defibrillator certification, coaching essentials, and
sports first aid courses
National Center for Sports
Safety (PREPARE)
Sports safety that teaches participants to recognize
and prevent common athletic injuries, emergency
preparedness, first aid management, and sport
enjoyment
Online http://www.sportssafety.org/prepare/
American Red Cross Environmental hazards, emergency situations, and
decision making for first aid care
Classroom http://www.redcross.org/services/
hss/courses/sports.html
National Federation of State
High School Associations
‘‘Fundamentals of Coaching’’ course Online http://www.nfhslearn.com/
CourseDetail.aspx?
courseID51000
Online first aid course http://www.nfhslearn.com/
CourseDetail.aspx?
courseID51001
Journal of Athletic Training 213
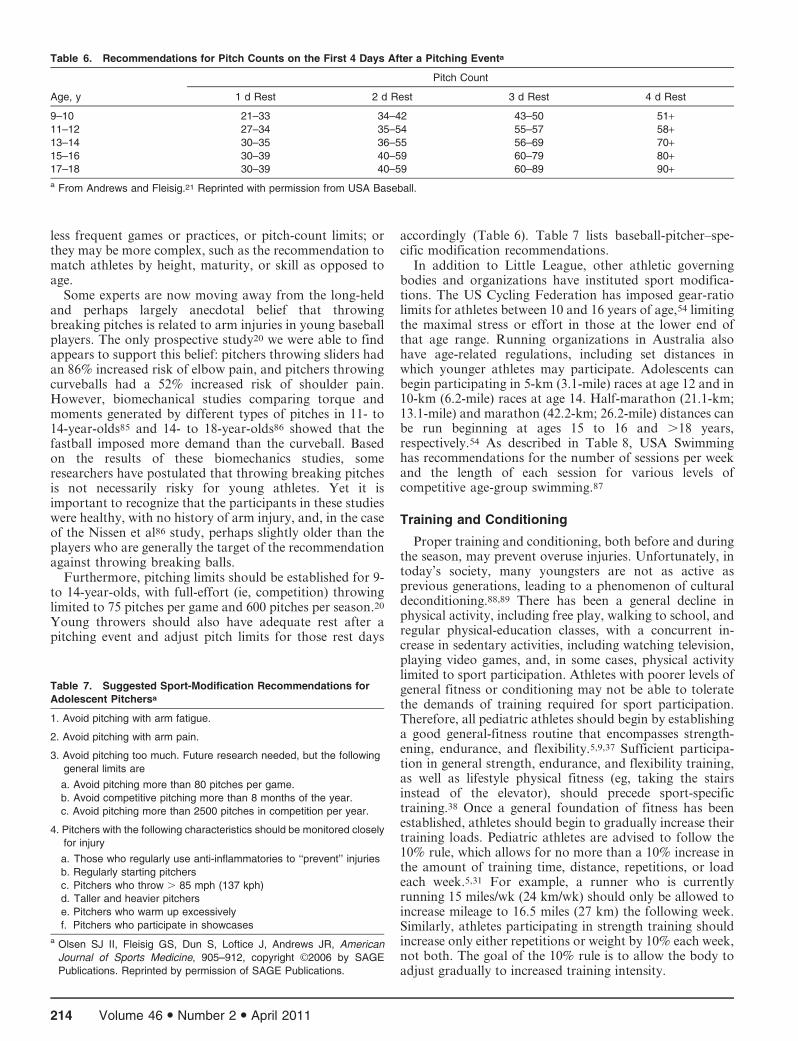
less frequent games or practices, or pitch-count limits; orthey may be more complex, such as the recommendation tomatch athletes by height, maturity, or skill as opposed toage.
Some experts are now moving away from the long-heldand perhaps largely anecdotal belief that throwingbreaking pitches is related to arm injuries in young baseballplayers. The only prospective study20 we were able to findappears to support this belief: pitchers throwing sliders hadan 86% increased risk of elbow pain, and pitchers throwingcurveballs had a 52% increased risk of shoulder pain.However, biomechanical studies comparing torque andmoments generated by different types of pitches in 11- to14-year-olds85 and 14- to 18-year-olds86 showed that thefastball imposed more demand than the curveball. Basedon the results of these biomechanics studies, someresearchers have postulated that throwing breaking pitchesis not necessarily risky for young athletes. Yet it isimportant to recognize that the participants in these studieswere healthy, with no history of arm injury, and, in the caseof the Nissen et al86 study, perhaps slightly older than theplayers who are generally the target of the recommendationagainst throwing breaking balls.
Furthermore, pitching limits should be established for 9-to 14-year-olds, with full-effort (ie, competition) throwinglimited to 75 pitches per game and 600 pitches per season.20
Young throwers should also have adequate rest after apitching event and adjust pitch limits for those rest days
accordingly (Table 6). Table 7 lists baseball-pitcher–spe-cific modification recommendations.
In addition to Little League, other athletic governingbodies and organizations have instituted sport modifica-tions. The US Cycling Federation has imposed gear-ratiolimits for athletes between 10 and 16 years of age,54 limitingthe maximal stress or effort in those at the lower end ofthat age range. Running organizations in Australia alsohave age-related regulations, including set distances inwhich younger athletes may participate. Adolescents canbegin participating in 5-km (3.1-mile) races at age 12 and in10-km (6.2-mile) races at age 14. Half-marathon (21.1-km;13.1-mile) and marathon (42.2-km; 26.2-mile) distances canbe run beginning at ages 15 to 16 and .18 years,respectively.54 As described in Table 8, USA Swimminghas recommendations for the number of sessions per weekand the length of each session for various levels ofcompetitive age-group swimming.87
Training and Conditioning
Proper training and conditioning, both before and duringthe season, may prevent overuse injuries. Unfortunately, intoday’s society, many youngsters are not as active asprevious generations, leading to a phenomenon of culturaldeconditioning.88,89 There has been a general decline inphysical activity, including free play, walking to school, andregular physical-education classes, with a concurrent in-crease in sedentary activities, including watching television,playing video games, and, in some cases, physical activitylimited to sport participation. Athletes with poorer levels ofgeneral fitness or conditioning may not be able to toleratethe demands of training required for sport participation.Therefore, all pediatric athletes should begin by establishinga good general-fitness routine that encompasses strength-ening, endurance, and flexibility.5,9,37 Sufficient participa-tion in general strength, endurance, and flexibility training,as well as lifestyle physical fitness (eg, taking the stairsinstead of the elevator), should precede sport-specifictraining.38 Once a general foundation of fitness has beenestablished, athletes should begin to gradually increase theirtraining loads. Pediatric athletes are advised to follow the10% rule, which allows for no more than a 10% increase inthe amount of training time, distance, repetitions, or loadeach week.5,31 For example, a runner who is currentlyrunning 15 miles/wk (24 km/wk) should only be allowed toincrease mileage to 16.5 miles (27 km) the following week.Similarly, athletes participating in strength training shouldincrease only either repetitions or weight by 10% each week,not both. The goal of the 10% rule is to allow the body toadjust gradually to increased training intensity.
Table 6. Recommendations for Pitch Counts on the First 4 Days After a Pitching Eventa
Age, y
Pitch Count
1 d Rest 2 d Rest 3 d Rest 4 d Rest
9–10 21–33 34–42 43–50 51+11–12 27–34 35–54 55–57 58+13–14 30–35 36–55 56–69 70+15–16 30–39 40–59 60–79 80+17–18 30–39 40–59 60–89 90+a From Andrews and Fleisig.21 Reprinted with permission from USA Baseball.
Table 7. Suggested Sport-Modification Recommendations for
Adolescent Pitchersa
1. Avoid pitching with arm fatigue.
2. Avoid pitching with arm pain.
3. Avoid pitching too much. Future research needed, but the following
general limits are
a. Avoid pitching more than 80 pitches per game.
b. Avoid competitive pitching more than 8 months of the year.
c. Avoid pitching more than 2500 pitches in competition per year.
4. Pitchers with the following characteristics should be monitored closely
for injury
a. Those who regularly use anti-inflammatories to ‘‘prevent’’ injuries
b. Regularly starting pitchers
c. Pitchers who throw . 85 mph (137 kph)
d. Taller and heavier pitchers
e. Pitchers who warm up excessively
f. Pitchers who participate in showcases
a Olsen SJ II, Fleisig GS, Dun S, Loftice J, Andrews JR, American
Journal of Sports Medicine, 905–912, copyright g2006 by SAGE
Publications. Reprinted by permission of SAGE Publications.
214 Volume 46 N Number 2 N April 2011

More recently, preventive training programs have beentargeted specifically at the pediatric athlete. Although theprimary focus of many of these programs has often beenfor the prevention of noncontact anterior cruciate ligamentinjuries, several authors34–36 have also investigated whetheroveruse-injury risk could be reduced among programparticipants. In a prospective study of a structured warm-up program including technique training, neuromuscularcontrol, and balance and strengthening exercises, Olsen etal36 reported that participants had a reduction in overallinjuries (RR 5 0.49, 95% CI 5 0.36, 0.68), lower limbinjuries (RR 5 0.51, 95% CI 5 0.36, 0.74), and overuseinjuries (RR 5 0.43, 95% CI 5 0.25, 0.75). Similarly, aprogram that focused on educating and training coaches toincorporate an overall-prevention mentality (consisting ofimproved warm-up, cool-down, taping unstable ankles,rehabilitation, promoting fair play, and a set of 10 exercisesdesigned to improve joint stability, flexibility, strength,coordination, reaction time, and endurance) resulted in areduction in both total injuries (0.76 6 0.89 versus 1.18 61.04, P , .01) and overuse injuries (0.26 6 0.48 versus 0.446 0.65, P , .05) per player-year.35 Specific to physicallyactive adolescents, a 6-month, home-based balance-train-ing program resulted in improvements in both static anddynamic balance among program participants.34 However,because of the limited number of injuries reported, noconclusions regarding the effectiveness of the program onreducing injuries could be drawn. Still, a clinicallyimportant difference was noted in self-reported injuries:program participants reported 3 (95% CI 5 5, 35) injuriesper 100 adolescents, compared with 17 (95% CI 5 3, 24) inthe control groups. Interestingly, the program was moreeffective in reducing injuries among those adolescents whoreported sustaining an injury in the previous year,90 thushighlighting the need to identify injury history through athorough PPE. In general, programs that are successful inreducing the risk of overuse injuries among pediatricathletes seem to include strengthening, neuromuscular
control, flexibility exercises, balance, and technique train-ing.
Delayed Specialization
One of the more controversial areas with respect topediatric overuse injuries deals with the early specializationof athletes participating in the same sport year-round froma young age. Although little evidence-based researchdemonstrates that this practice has negative consequenceson physical growth or psychological outcomes, manyclinicians and health care organizations have advocatedfor diversity in sport participation or delayed specializa-tion.5,9,91,92,93 It is theorized that participation in only 1sport can result in increased risk for repetitive microtraumaand overuse5 or that multisport athletes who do not obtainadequate rest between daily activities or between seasonsand those who participate in 2 or more sports thatemphasize the same body part are at higher risk foroveruse injuries than those in multiple sports with differentemphases.31
Young athletes who participate in a variety of sportstend to have fewer injuries and play longer, therebymaintaining a higher level of physical activity than thosewho specialize before puberty.92 In addition to thepotential for repetitive microtrauma and overuse injury,specialization in 1 sport may be associated with nutritionaland sleep inadequacies, psychological or socializationissues, and ultimately burnout. These problems might beavoided with a balanced lifestyle and a strong supportsystem made up of parents, friends, coaches, and healthcare providers.12
CONCLUSIONS
The major objective in managing repetitive or traininginjuries in athletes of any age should be to determine riskfactors for injury and identify steps to prevent theoccurrence of these injuries. Knowledge is growing about
Table 8. Developmental Progression for Pediatric Swimmersa
Level Category Commitment
1 Sport preparation: ages 6–9 y 2–3 sessions/wk
30–60 min/session
2 Basic skill development: ages 8–11 y 2–4 sessions/wk
30–60 min/session
Encourage other activities, sports
Intrasquad or low-pressure competition
3 Basic training development: ages 11–14 y 4–6 sessions/wk
60–90 min/session
Year-round participation
Encourage other activities, sports while understanding the need to meet
attendance expectations
4 Progressive training: ages 13–18 y 6–10 sessions/wk
90–120 min/session
Year-round competition
Including long-course (50-m pool-length) competition
Commit to swimming
Shorter breaks to minimize deterioration of aerobic base
5 Advanced training: age 14 y and older 8–10 sessions/wk
90–120 min/session
Year-round
High commitment level
Short breaks to minimize deterioration of aerobic base
a Reprinted with permission from USA Swimming.87
Journal of Athletic Training 215
risk factors for the occurrence of both acute traumaticinjuries and repetitive microtrauma overuse injuries inadults, particularly in such activities as military training,work activities, and sports. However, too little is knownabout risk factors for overuse injury in pediatric athletes.
Injury surveillance in young athletes should be improvedto record the occurrence of injury and the determination ofassociated risk factors, as well as epidemiologic data (eg,age, sex, height, mass, and, if possible, Tanner stage).Epidemiologic studies in specific environments in pediatricpopulations would add greatly to the understanding of therisk associated with particular sport activities, thusproviding a foundation for future studies of preventionand treatment efficacy.
ACKNOWLEDGMENTS
We gratefully acknowledge the efforts of Michael C. Koester,MD, ATC; Laura Purcell, MD; Angela Smith, MD; and thePronouncements Committee in the preparation of this document.
DISCLAIMER
The NATA publishes its position statements as a service topromote the awareness of certain issues to its members. Theinformation contained in the position statement is neitherexhaustive not exclusive to all circumstances or individuals.Variables such as institutional human resource guidelines, state orfederal statutes, rules, or regulations, as well as regionalenvironmental conditions, may impact the relevance and imple-mentation of these recommendations. The NATA advises itsmembers and others to carefully and independently consider eachof the recommendations (including the applicability of same toany particular circumstance or individual). The position state-ment should not be relied upon as an independent basis for carebut rather as a resource available to NATA members or others.Moreover, no opinion is expressed herein regarding the quality ofcare that adheres to or differs from NATA’s position statements.The NATA reserves the right to rescind or modify its positionstatements at any time.
REFERENCES
1. Watkins J, Peabody P. Sports injuries in children and adolescents
treated at a sports injury clinic. J Sports Med Phys Fitness. 1996;
36(1):43–48.
2. Dubravcic-Simunjak S, Pecina M, Kuipers H, Moran J, Haspl M.
The incidence of injuries in elite junior figure skaters. Am J Sports
Med. 2003;31(4):511–517.
3. Patel DR, Nelson TL. Sports injuries in adolescents. Med Clin North
Am. 2000;84(4):983–1007, viii.
4. Stanitski CL. Management of sports injuries in children and
adolescents. Orthop Clin North Am. 1988;19(4):689–698.
5. American College of Sports Medicine. Current comment from the
American College of Sports Medicine: the prevention of sport injuries
of children and adolescents. Med Sci Sports Exerc. 1993;25(8 suppl):1–7.
6. Dalton SE. Overuse injuries in adolescent athletes. Sports Med.
1992;13(1):58–70.
7. Cassas KJ, Cassettari-Wayhs A. Childhood and adolescent sports-
related overuse injuries. Am Fam Physician. 2006;73(6):1014–1022.
8. American Academy of Pediatrics. Injuries in youth soccer: a subject
review. Committee on Sports Medicine and Fitness. Pediatrics.
2000;105(3, pt 1):659–661.
9. DiFiori JP. Overuse injuries in young athletes: an overview. Athl Ther
Today. 2002;7(6):25.
10. Lysens RJ, Ostyn MS, VandenAuweele Y, Lefevre J, Vuylsteke M,
Renson L. The accident-prone and overuse-prone profiles of the
young athlete. Am J Sports Med. 1989;17(5):612–619.
11. Behrman RE, Kliegman R, Nelson WE. Nelson Textbook of
Pediatrics. 15th ed. Philadelphia, PA: WB Saunders; 1996.
12. Mountjoy M, Armstrong N, Bizzini L, et al. IOC consensus statement
on training the elite child athlete. Clin J Sport Med. 2008;18(2):
122–123.
13. Federation Internationale de Medecine du Sport/World Health
Organization Ad Hoc Committee on Sports and Children. Sports
and children: consensus statement on organized sports for children.
Bull World Health Organ. 1998;76(5):445–447.
14. Almquist J, Valovich McLeod TC, Cavanna A, et al. Summary
statement: appropriate medical care for the secondary school-aged
athlete. J Athl Train. 2008;43(4):416–427.
15. Hergenroeder AC. Prevention of sports injuries. Pediatrics. 1998;
101(6):1057–1063.
16. Caine D, DiFiori J, Maffulli N. Physeal injuries in children’s and
youth sports: reasons for concern? Br J Sports Med. 2006;40(9):
749–760.
17. Preparticipation Physical Evaluation Working Group. Preparticipa-
tion Physical Evaluation. 4th ed. Grove Village, IL: American
Academy of Pediatrics; 2010.
18. Lyman S, Fleisig GS, Waterbor JW, et al. Longitudinal study of
elbow and shoulder pain in youth baseball pitchers. Med Sci Sports
Exerc. 2001;33(11):1803–1810.
19. Olsen SJ 2nd, Fleisig GS, Dun S, Loftice J, Andrews JR. Risk factors
for shoulder and elbow injuries in adolescent baseball pitchers.
Am J Sports Med. 2006;34(6):905–912.
20. Lyman S, Fleisig GS, Andrews JR, Osinski ED. Effect of pitch type,
pitch count, and pitching mechanics on risk of elbow and shoulder
pain in youth baseball pitchers. Am J Sports Med. 2002;30(4):
463–468.
21. Andrews JR, Fleisig G. How many pitches should I allow my child to
throw? USA Baseball News. April 1996:5.
22. Klemp P, Stevens JE, Isaacs S. A hypermobility study in ballet
dancers. J Rheumatol. 1984;11(5):692–696.
23. Acasuso Diaz M, Collantes Estevez E, Sanchez Guijo P. Joint
hyperlaxity and musculoligamentous lesions: study of a population of
homogeneous age, sex and physical exertion. Br J Rheumatol.
1993;32(2):120–122.
24. Gedalia A, Press J. Articular symptoms in hypermobile schoolchil-
dren: a prospective study. J Pediatr. 1991;119(6):944–946.
25. Hodson A. Too much too soon? The risk of ‘‘overuse’’ injuries in
young football players. J Bodyw Mov Ther. 1999;3(2):85–91.
26. Ransone J, Dunn-Bennett LR. Assessment of first-aid knowledge and
decision making of high school athletic coaches. J Athl Train.
1999;34(3):267–271.
27. Valovich McLeod TC, McGaugh JW, Boquiren ML, Bay RC. Youth
sports coaches do not have adequate knowledge regarding first-
aid and injury prevention. Appl Res Coach Athlet Ann. 2008;23:
130–146.
28. Carson WG Jr, Gasser SI. Little Leaguer’s shoulder: a report of 23
cases. Am J Sports Med. 1998;26(4):575–580.
29. Ohta-Fukushima M, Mutoh Y, Takasugi S, Iwata H, Ishii S.
Characteristics of stress fractures in young athletes under 20 years.
J Sports Med Phys Fitness. 2002;42(2):198–206.
30. Loud KJ, Gordon CM, Micheli LJ, Field AE. Correlates of stress
fractures among preadolescent and adolescent girls. Pediatrics.
2005;115(4):e399–e406.
31. Brenner JS. American Academy of Pediatrics Council on Sports
Medicine and Fitness. Overuse injuries, overtraining, and burnout in
child adolescent athletes. Pediatrics. 2007;119(6):1242–1245.
32. Benjamin HJ, Briner WW Jr. Little league elbow. Clin J Sport Med.
2005;15(1):37–40.
33. American Sports Medicine Institute. Factors related to arm pain in
youth baseball pitchers. http://www.asmi.org/asmiweb/research/
youthbaseball.htm. Accessed February 21, 2009.
34. Emery CA, Cassidy JD, Klassen TP, Rosychuk RJ, Rowe BH.
Effectiveness of a home-based balance-training program in reducing
sports-related injuries among healthy adolescents: a cluster random-
ized controlled trial. CMAJ. 2005;172(6):749–754.
216 Volume 46 N Number 2 N April 2011
35. Junge A, Rosch D, Peterson L, Graf-Baumann T, Dvorak J.
Prevention of soccer injuries: a prospective intervention study in
youth amateur players. Am J Sports Med. 2002;30(5):652–659.
36. Olsen OE, Myklebust G, Engebretsen L, Holme I, Bahr R. Exercises
to prevent lower limb injuries in youth sports: cluster randomised
controlled trial. BMJ. 2005;330(7489):449.
37. Flynn JM, Lou JE, Ganley TJ. Prevention of sports injuries in
children. Curr Opin Pediatr. 2002;14(6):719–722.
38. Faigenbaum AD, Micheli LJ. Preseason conditioning for the
preadolescent athlete. Pediatr Ann. 2000;29(3):156–161.
39. Micheli LJ, Fehlandt AF Jr. Overuse injuries to tendons and
apophyses in children and adolescents. Clin Sports Med. 1992;11(4):
713–726.
40. Gerrard DF. Overuse injury and growing bones: the young athlete at
risk. Br J Sports Med. 1993;27(1):14–18.
41. Outerbridge AR, Micheli LJ. Overuse injuries in the young athlete.
Clin Sports Med. 1995;14(3):503–516.
42. Stubbs MJ, Field LD, Savoie FH 3rd. Osteochondritis dissecans of
the elbow. Clin Sports Med. 2001;20(1):1–9.
43. Kocher MS, Tucker R, Ganley TJ, Flynn JM. Management of
osteochondritis dissecans of the knee: current concepts review.
Am J Sports Med. 2006;34(7):1181–1191.
44. Twyman RS, Desai K, Aichroth PM. Osteochondritis dissecans of the
knee: a long-term study. J Bone Joint Surg Br. 1991;73(3):461–464.
45. Caine D, Howe W, Ross W, Bergman G. Does repetitive physical
loading inhibit radial growth in female gymnasts? Clin J Sport Med.
1997;7(4):302–308.
46. Iwamoto J, Takeda T. Stress fractures in athletes: review of 196 cases.
J Orthop Sci. 2003;8(3):273–278.
47. Niemeyer P, Weinberg A, Schmitt H, Kreuz PC, Ewerbeck V, Kasten
P. Stress fractures in the juvenile skeletal system. Intl J Sports Med.
2006;27(3):242–249.
48. Fernandez WG, Yard EE, Comstock RD. Epidemiology of lower
extremity injuries among U.S. high school athletes. Acad Emerg Med.
2007;14(7):641–645.
49. Maffulli N, Chan D, Aldridge MJ. Overuse injuries of the olecranon
in young gymnasts. J Bone Joint Surg Br. 1992;74(2):305–308.
50. Froholdt A, Olsen OE, Bahr R. Low risk of injuries among children
playing organized soccer: a prospective cohort study. Am J Sports
Med. 2009;37(6):1155–1160.
51. Le Gall F, Carling C, Reilly T, Vandewalle H, Church J, Rochcongar
P. Incidence of injuries in elite French youth soccer players: a 10-
season study. Am J Sports Med. 2006;34(6):928–938.
52. Le Gall F, Carling C, Reilly T. Injuries in young elite female soccer
players: an 8-season prospective study. Am J Sports Med. 2008;36(2):
276–284.
53. National Federation of State High School Associations. 2009–2010
high school athletics participation survey. http://www.nfhs.org/
content.aspx?id53282&linkidentifier5id&itemid53282. Accessed
October 7, 2010.
54. Pearce PZ. Prehabilitation: preparing young athletes for sports. Curr
Sports Med Rep. 2006;5(3):155–160.
55. Hirth C. Clinical movement analysis to identify muscle imbalances
and guide exercise. Athl Ther Today. 2007;12(4):10–14.
56. Kiesel K, Plisky PJ, Voight ML. Can serious injury in professional
football be predicted by a preseason functional movement screen.
North Am J Sport Phys Ther. 2007;2(3):147–158.
57. Hreljac A. Etiology, prevention, and early intervention of overuse
injuries in runners: a biomechanical perspective. Phys Med Rehabil
Clin N Am. 2005;16(3):651–667, vi.
58. Rausch CM, Phillips GC. Adherence to guidelines for cardiovascular
screening in current high school preparticipation evaluation forms.
J Pediatr. 2009;155(4):584–586.
59. Krowchuk DP, Krowchuk HV, Hunter DM, et al. Parents’
knowledge of the purposes and content of preparticipation physical
examinations. Arch Pediatr Adolesc Med. 1995;149(6):653–657.
60. Bundy DG, Feudtner C. Preparticipation physical evaluations for
high school athletes: time for a new game plan. Ambul Pediatr.
2004;4(3):260–263.
61. O’Connor FG, Howard TM, Fieseler CM, Nirschl RP. Managing
overuse injuries: a systematic approach. Phys Sportsmed. 1997;25(5):
88–113.
62. Bennett JE, Reinking MF, Pluemer B, Pentel A, Seaton M, Killian C.
Factors contributing to the development of medial tibial stress
syndrome in high school runners. J Orthop Sports Phys Ther. 2001;
31(9):504–510.
63. Plisky MS, Rauh MJ, Heiderscheit B, Underwood FB, Tank RT.
Medial tibial stress syndrome in high school cross-country runners:
incidence and risk factors. J Orthop Sports Phys Ther. 2007;37(2):
40–47.
64. Loud KJ, Micheli LJ, Bristol S, Austin SB, Gordon CM. Family
history predicts stress fracture in active female adolescents. Pediatrics.
2007;120(2):e364–e372.
65. Bennell K, Matheson G, Meeuwisse W, Brukner P. Risk factors for
stress fractures. Sports Med. 1999;28(2):91–122.
66. Remvig L, Jensen DV, Ward RC. Epidemiology of general joint
hypermobility and basis for the proposed criteria for benign joint
hypermobility syndrome: review of the literature. J Rheumatol.
2007;34(4):804–809.
67. Acasuso-Diaz M, Collantes-Estevez E. Joint hypermobility in
patients with fibromyalgia syndrome. Arthritis Care Res. 1998;11(1):
39–42.
68. Adib N, Davies K, Grahame R, Woo P, Murray KJ. Joint
hypermobility syndrome in childhood: a not so benign multisystem
disorder? Rheumatology (Oxford). 2005;44(6):744–750.
69. Arroyo IL, Brewer EJ, Giannini EH. Arthritis/arthralgia and
hypermobility of the joints in schoolchildren. J Rheumatol. 1988;
15(6):978–980.
70. Gedalia A, Person DA, Brewer EJ Jr, Giannini EH. Hypermobility of
the joints in juvenile episodic arthritis/arthralgia. J Pediatr. 1985;
107(6):873–876.
71. Gedalia A, Press J, Klein M, Buskila D. Joint hypermobility and
fibromyalgia in schoolchildren. Ann Rheum Dis. 1993;52(7):494–
496.
72. Hoppmann RA. Instrumental musicians’ hazards. Occup Med.
2001;16(4):619–631, iv–v.
73. Hudson N, Fitzcharles MA, Cohen M, Starr MR, Esdaile JM. The
association of soft-tissue rheumatism and hypermobility. Br J
Rheumatol. 1998;37(4):382–386.
74. Hudson N, Starr MR, Esdaile JM, Fitzcharles MA. Diagnostic
associations with hypermobility in rheumatology patients. Br J
Rheumatol. 1995;34(12):1157–1161.
75. Ofluoglu D, Gunduz OH, Kul-Panza E, Guven Z. Hypermobility in
women with fibromyalgia syndrome. Clin Rheumatol. 2006;25(3):
291–293.
76. Smith R, Damodaran AK, Swaminathan S, Campbell R, Barnsley L.
Hypermobility and sports injuries in junior netball players. Br J Sports
Med. 2005;39(9):628–631.
77. Klemp P, Learmonth ID. Hypermobility and injuries in a profes-
sional ballet company. Br J Sports Med. 1984;18(3):143–148.
78. Hopper DM, Hopper JL, Elliott BC. Do selected kinanthropometric
and performance variables predict injuries in female netball players?
J Sports Sci. 1995;13(3):213–222.
79. Decoster LC, Bernier JN, Lindsay RH, Vailas JC. Generalized joint
hypermobility and its relationship to injury patterns among NCAA
lacrosse players. J Athl Train. 1999;34(2):99–105.
80. Collinge R, Simmonds JV. Hypermobility, injury rate and rehabil-
itation in a professional football squad: a preliminary study. Phys
Ther Sport. 2009;10(3):91–96.
81. Steele VA, White JA. Injury prediction in female gymnasts. Br J Sports
Med. 1986;20(1):31–33.
82. Carter C, Wilkinson J. Persistent joint laxity and congenital
dislocation of the hip. J Bone Joint Surg Br. 1964;46:40–45.
83. Beighton P, Horan F. Orthopaedic aspects of the Ehlers-Danlos
syndrome. J Bone Joint Surg Br. 1969;51(3):444–453.
84. Little League Baseball. Protecting young pitching arms. http://www.
littleleague.org/Assets/old_assets/media/Pitch_Count_Publication_2008.
pdf. Accessed October 27, 2010.
Journal of Athletic Training 217
85. Dun S, Loftice J, Fleisig GS, Kingsley D, Andrews JR. A
biomechanical comparison of youth baseball pitches: is the curveball
potentially harmful? Am J Sports Med. 2008;36(4):686–692.
86. Nissen CW, Westwell M, Ounpuu S, Patel M, Solomito M, Tate J. A
biomechanical comparison of the fastball and curveball in adolescent
baseball pitchers. Am J Sports Med. 2009;37(8):1492–1498.
87. USA Swimming. Organization and administration, part 3: organizing
the wet side. In: Foundations of Coaching. Colorado Springs, CO:
USA Swimming; 2007:1–4.
88. Gill TJt, Micheli LJ. The immature athlete: common injuries and
overuse syndromes of the elbow and wrist. Clin Sports Med. 1996;
15(2):401–423.
89. Micheli LJ, Klein JD. Sports injuries in children and adolescents.
Br J Sports Med. 1991;25(1):6–9.
90. Emery CA. Risk factors for injury in child and adolescent sport: a
systematic review of the literature. Clin J Sport Med.
2003;13(4):256–268.
91. Micheli LJ, Glassman R, Klein M. The prevention of sports injuries
in children. Clin Sports Med. 2000;19(4):821–834, ix.
92. American Academy of Pediatrics Committee on Sports Medicine and
Fitness. Intensive training and sports specialization in young athletes.
Pediatrics. 2000;106(1, pt 1):154–157.
93. American Orthopaedic Society for Sports Medicine. Stop sports
injuries. http://www.sportsmed.org/stop. Accessed December 15, 2010.
Address correspondence to Tamara C. Valovich McLeod, PhD, ATC, Athletic Training Program, A.T. Still University, 5850 E. StillCircle, Mesa, AZ 85206. Address e-mail to [email protected].
218 Volume 46 N Number 2 N April 2011

Ap
pen
dix
A.
Lit
tle
Leag
ue
Pit
ch
Co
un
tT
racker.
Fo
rmp
rovid
ed
by
Lit
tle
Leag
ue
Inte
rnati
on
al,
Wil
liam
sp
ort
,P
A.
Journal of Athletic Training 219
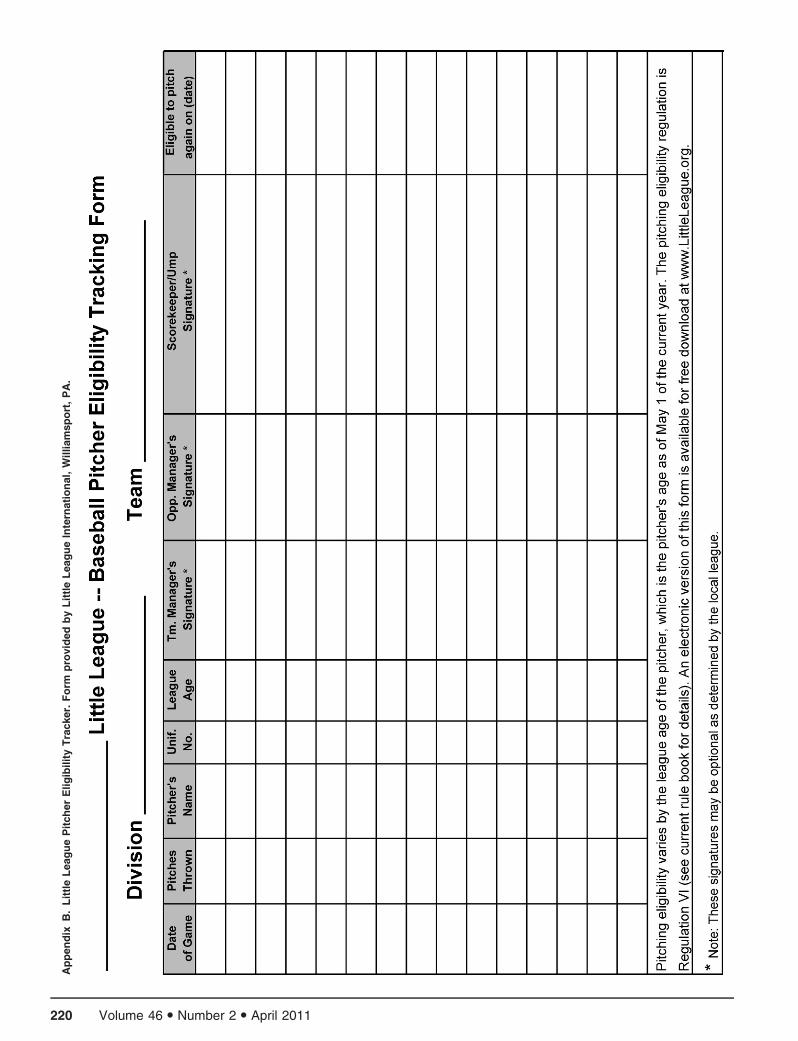
Ap
pen
dix
B.
Lit
tle
Leag
ue
Pit
ch
er
Eli
gib
ilit
yT
racker.
Fo
rmp
rovid
ed
by
Lit
tle
Leag
ue
Inte
rnati
on
al,
Wil
liam
sp
ort
,P
A.
220 Volume 46 N Number 2 N April 2011
We thank our 2010 Manuscript Reviewers for their hard work and dedication. We also recognize retiring Editorial Board
member A. Louise Fincher, EdD, ATC, for her years of service.
John P. Abt, PhD, ATC
Jon Almquist, ATC
Jatin P. Ambegaonkar, PhD, OT,ATC, CSCS
Naoko Aminaka, PhD, ATC
J. C. Andersen, PhD, PT, LAT, ATC,
SCS
Scott Anderson, ATC
Philip Anloague, DHSc, PT, OCS,
MTC
Kirk J. Armstrong, EdD, ATC
William J. Armstrong, PhD
Brent L. Arnold, PhD, ATC
Patricia A. Aronson, PhD, ATC
Tricia M. Austin, PhD, PT, ATC
Klaus Bak, MD
Robert J. Baker, MD, PhD, ATC
Kim D. Barber Foss, MS, ATC
Mary D. Barnum, EdD, ATC
William B. Barr, PhD
Mary J. Barron, PhD, ATC
David M. Bazett-Jones, MS, ATC
Glenn Beachy, MS, ATC
David G. Behm, PhD
David R. Bell, PhD, ATC
Anne Benjaminse, MS
David C. Berry, PhD, ATC
Max Bertman, MS
Michael J. Bey, PhD
Kyle D. Bickel, MD, FACS
Mark Bishop, PhD, PT
Leanne Bisset, PhD, MPhty (Sports
Physiotherapy), MPhty (Musculo-
skeletal Physiotherapy), BPhty
Turner A. Blackburn, Jr, MEd, PT,
ATC
Dale F. Blair, MS, ATC, CSCS
Christopher M. Bleakley, PhD
Joseph Bleiberg, PhD
Kellie H. Bliven, PhD, ATC
Lori A. Bolgla, PhD, PT, ATC
Michelle C. Boling, PhD, ATC
Leslie J. Bonci, MPH, RD, LDN
John D. Borstad, PhD, PT
Brian L. Bowyer, MD
Jim Brenner, PhD, ATC
Dustin J. Briggs, MS, ATC, CSCS
Timothy J. Brindle, PhD, PT, ATC
Cathleen N. Brown, PhD, ATC
Lee E. Brown, EdD, CSCS*D,
FNSCA, FACSM
Sara D. Brown, MS, ATC
Peter H. Brubaker, PhD
Jody B. Brucker, PhD, ATC
Kirk Brumels, PhD, ATC
Jason Brumitt, MSPT, ATC, CSCS,
SCS
Michael E. Brunet, II, PhD, ATC
Shawna L. Bryant, ATC
Patricia A. Buchanan, PhD, PT, ATC,GCFT
Bernadette D. Buckley, PhD, ATC
Thomas A. Buckley, EdD
William E. Buckley, PhD, MBA, ATC
Jackie Buell, PhD, RD, ATC, CSSD
Timothy A. Butterfield, PhD, ATC
Kenneth L. Cameron, PhD, ATC,CSCS
William D. Carr, PhD
Amanda M. Caswell, PhD, ATC
Pamela S. Chally, PhD
Scott W. Cheatham, DPT, ATC,CSCS, PES
Samuel Cheuvront, PhD
Jacek Cholewicki, PhD
Daniel J. Cipriani, PhD, PT
Michelle A. Cleary, PhD, ATC
J. Richard Coast, PhD
Stephen C. Cobb, PhD, ATC
Jared W. Coburn, PhD, CSCS
Darryl J. Cochrane, MPhEd
Christy L. Collins, MA
Marisa A. Colston, PhD, ATC
Matthew J. Comeau, PhD, LAT,
ATC, CSCS
John Cone, MS, CSCS
Chad Cook, PhD, MBA, PT, OCS
Bud Cooper, EdD, ATC, CSCS
Mark W. Cornwall, PhD, PT, CPed
Nelson Cortes, PhD, ATC
Garrett F. Coughlan, PhD, PT
Ron Courson, ATC, PT
Kathie Courtney, PhD, ATC
Joel T. Cramer, PhD, CSCS*D,
NSCA-CPT*D
Lynn A. Darby, PhD
George J. Davies, DPT, MEd, PT,
LAT, ATC, CSCS, SCS, FAPTA
Louis De Beaumont, PhD
Sarah J. De la Motte, PhD, ATC
Michael J. Decker, PhD
Laura C. Decoster, ATC
Eamonn Delahunt, PhD, BSc
(Physiotherapy)
J. Scott Delaney, MD
Julie DeMartini, MA
Timothy J. Demchak, PhD, ATC
Mike T. Diede, PhD, ATC
Michael R. Dillon, MA, ATC, CSCS,
EMT-1
Lindsay J. DiStefano, PhD, ATC
John Dixon, PhD
Scott T. Doberstein, MS, LAT, ATC,
CSCS
Thomas M. Dodge, PhD, ATC, CSCS
Jennifer L. Doherty-Restrepo, PhD,
ATC
David C. Dome, MD, MS, ATC
Thomas P. Dompier, PhD, ATC
Abbey Dondanville, EdD, ATC
Geoffrey Dover, PhD, CAT(C), ATC
Matthew Doyle, ATC
Jeffrey B. Driban, PhD, ATC, CSCS
Joshua M. Drouin, PhD, ATC
Jacques Duysens, PhD
Priscilla M. Dwelly, MS, ATC
David Ebaugh, PhD, PT
Lindsey E. Eberman, PhD, ATC
Ruben Echemendia, PhD
Todd Ellenbecker, DPT, MS, SCS,
OCS, CSCS
Carolyn Emery, PhD
Holly Emmanuel, MS, ATC
Marcia E. Epler, PhD, PT, ATC
Mia L. Erickson, EdD, PT, ATC,
CHT
Rafael Escamilla, PhD, PT
J. B. Feland, PhD, PT
Francis X. Feld, MEd, MS, CRNA,
ATC, NREMT-P
Daniel Ferris, PhD
Kelly A. Fiala, PhD, ATC
Kevin R. Ford, PhD
Danny T. Foster, PhD, ATC
Andrew Franklyn-Miller, MBBS
Jamie L. Frye, PhD, ATC
Matthew J. Gage, PhD, ATC
thank you to guest reviewers
Journal of Athletic Training 221
Daniel Gagnon, MSc
Matthew S. Ganio, PhD
Fredrick A. Gardin, PhD, ATC
Alison M. Gardiner-Shires, PhD,
ATC
J. C. Garrison, PhD, PT, ATC, SCS
Paul R. Geisler, EdD, ATC
Peter G. Gerbino, MD
Simon Gianotti, PhD
Mark H. Gibson, MS, MSEd, PT,ATC
A. Tucker Gleason, PhD
Benjamin Goerger, MS, ATC
Scott B. Going, PhD
Alli Gokeler, MS
Grace M. Golden, PhD, ATC, CSCS
Ashley Goodman, PhD, LAT, ATC,CPed
Megan D. Granquist, PhD, ATC
Richard Greenwald, PhD
Lori D. Greenwood, PhD, LAT, ATC
Chris M. Gregory, PhD, PT, ATC
Matt Greig, PhD
Nicole Grigg, PhD
Terry L. Grindstaff, PhD, PT, ATC,
SCS, CSCS
Michael T. Gross, PhD, PT
Jayd M. Grossman, MEd, ATC
Paul Grutter, MD
Dawn T. Gulick, PhD, PT, ATC,
CSCS
A. Burke Gurney, PhD, PT, OCS
Gregory M. Gutierrez, PhD
Sheri A. Hale, PhD, PT, ATC
Robert R. Hammill, MS, ATC
Jennifer Jordan Hamson-Utley, PhD,
LAT, ATC
Karrie L. Hamstra-Wright, PhD,
ATC
Laura L. Harris, PhD, ATC
Blain Harrison, MEd, MSAT
Erin Hartigan, DPT, PhD, PT, OCS
Laura A. Hartman, MS, ATC, CSCS
Hans Haverkamp, PhD
Bradley T. Hayes, PhD, ATC
Bryan Heiderscheidt, PhD, PT
Timothy J. Henry, PhD, ATC
Valerie W. Herzog, EdD, LAT, ATC
Michael Higgins, PhD, ATC
Rachel A. Hildebrand, MEd, ATC
Claire E. Hiller, PhD
Sue Hillman, ATC, PT
Matthew C. Hoch, MS, ATC
Anthony J. House, MS, ATC
Terry J. Housh, PhD
Jennifer S. Howard, MS, ATC
Warren B. Howe, MD
Michael Hudson, PhD
Robert A. Huggins, MEd, ATC
Brian J. Hughes, EdD, ATC/R
Christopher J. Hughes, PhD, PT,
OCS, CSCS
Tamerah N. Hunt, PhD, ATC, CSCS
Wendy Hurd, PhD, PT
Jeffrey C. Ives, PhD
Cale A. Jacobs, PhD, ATC
Ollie Jay, PhD
Stephanie Jevas, PhD, ATC
Evan C. Johnson, MA
Alan P. Jung, PhD
Lisa S. Jutte, PhD, ATC
Leamor Kahanov, EdD, LAT, ATC
David M. Kahler, MD
Edward J. Kane, PhD, PT, ATC
Gregory M. Karst, PhD, PT
Jeffrey K. Kawaguchi, PhD, ATC
George A. Kelley, DA, FACSM
Michael D. Kennedy, PhD
Glen P. Kenny, PhD
Thomas W. Kernozek, PhD
Robert D. Kersey, PhD, ATC
Kyle Kiesel, PhD, ATC, CSCS
Marjorie A. King, PhD, PT, ATC
David Klossner, PhD, ATC
Joanne C. Klossner, PhD, LAT, ATC
Joseph Knapik, ScD
Adam C. Knight, PhD, ATC
Dennis W. Koch, PhD
Peter M. Koehneke, MS, ATC
Roger O. Kollock, MA, ATC, CSCS
Jeff G. Konin, PhD, PT, ATC
Suzanne M. Konz, PhD, ATC
Lauren C. Kramer, PhD, ATC
Jake Krong, MS
Tron Krosshaug, PhD
Jennifer Kruger, PhD
Kristen L. Kucera, PhD, LAT, ATC
Anthony S. Kulas, PhD, LAT, ATC
Matthew R. Kutz, PhD, ATC
Kathleen M. Laquale, PhD, LATC,
LDN
Kevin G. Laudner, PhD, ATC
Christine Lawless, MD, MBA,FACC, CAQSM
Deidre Leaver-Dunn, PhD, ATC
Elaine C. Lee, PhD
Jason K. Lee, PhD
Sae Yong Lee, PhD, ATC
James E. Leone, PhD, LAT, ATC,
CSCS*D, CHES
Scott M. Lephart, PhD, ATC
Larry J. Leverenz, PhD, ATC
Shelley W. Linens, PhD, ATC
Rebecca M. Lopez, PhD, ATC, CSCS
Dan Lorenz, DPT, PT, ATC, CSCS
Keith J. Loud, MD, FAAP
Janice K. Loudon, PhD, PT, ATC
James M. Lynch, MD, ATC
Stephen N. Macciocchi, PhD, ABPP
Jill A. Manners, MS, MPT
Sarah Manspeaker, MSEd, ATC
Pedro J. Marin, PhD
Brendon P. McDermott, MS, ATC
Michael McElroy, MS, LAT, ATC,
CSCS
Adrian McGoldrick, MD
Melanie L. McGrath, PhD, ATC
Nancy C. McGrath, MS, RD
Timothy A. McGuine, PhD, ATC
Patrick O. McKeon, PhD, ATC
Mary K. McLendon, MS, ATC
Todd A. McLoda, PhD, ATC
Jennifer M. Medina McKeon, PhD,
ATC, CSCS
Mark Melnyk, PhD
Christopher Mendias, PhD, ATC
James M. Mensch, PhD, ATC
John A. Mercer, PhD
Barbara Meyer, PhD
David A. Middlemas, EdD, MA,
ATC
Jason P. Mihalik, PhD, CAT(C), ATC
Katya Mileva, PhD
John P. Miller, PhD, ATC
Kevin C. Miller, PhD, ATC, CSCS
Michael G. Miller, EdD, ATC
Kody Moffatt, MD, MS, ATC,
FAAP
Dani M. Moffit, PhD, ATC
Monique Mokha, PhD, ATC
Melissa M. Montgomery, MA, ATC
Dylan Morrissey, PhD
Martin Mrazik, PhD
Gregory D. Myer, MS
Peter J. Neibert, PhD
Katherine R. Newsham, PhD, ATC
Anh-Dung Nguyen, PhD, ATC
Andrew W. Nichols, MD
Jen Nickelson, PhD, RD
Brian Noehren, PhD, PT
Marc Norcross, MA, ATC
Susan A. Norkus, PhD, ATC
Andrew J. Notebaert, PhD
Daniel P. O’Connor, PhD
Francis O’Connor, MD
thank you to guest reviewers
222 Volume 46 N Number 2 N April 2011
Denise L. O’Rand, PhD, ATC
Gretchen D. Oliver, PhD, ATC
Jeffrey A. Oster, DPM
Sakiko Oyama, MS, ATC
Riann M. Palmieri-Smith, PhD, ATC
Evangelos Pappas, PhD, PT, OCSJeffrey Parr, MS, ATC
Craig Payne, Dip Pod NZ, MPH
Jodi Pelegrin, DO, MS, ATC
Sally A. Perkins, MS, ATC
Connie Peterson, PhD, ATC
Meredith Petschauer, PhD, ATC
Ronald Pfeiffer, EdD, ATC
Kate R. Pfile, PhD, ATCBrian G. Pietrosimone, PhD, ATC
Alexander M. Pinto, MS, ATC
Phillip Plisky, DSc, PT, ATC/L, OCS,
CSCS
John W. Powell, PhD, ATC
Michael E. Powers, PhD, ATC
James C. Puffer, MD
Laura Purcell, MDJames M. Rankin, PhD, ATC
Jack Ransone, PhD, ATC
Mitchell J. Rauh, PhD, PT, MPH,
FACSM
Jacquelene Raymond, PhD
Jonathan Reeser, MD, PhD
Johna K. Register-Mihalik, PhD,
ATCMichael P. Reiman, DPT, ATC, OCS,
SCS, FAAOMPT, CSCS
Mark F. Reinking, PhD, PT, ATC,
SCS
Jake E. Resch, MS, ATC
Valerie Rich, PhD, ATC, CSCS,
WEMT-B
Megan E. Rittler, PhD, ATCRichard H. Robinson, PhD
Susan L. Rozzi, PhD, ATC
Edward J. Ryan, MS, ATC
Bradley W. Sage, MSEd, ATC
Scott R. Sailor, EdD, ATC
Matthew E. Sailors, MEd, PT, ATC
Michelle A. Sandrey, PhD, ATC
Lindsay D. Sauer, PhD, ATC
Melissa A. Schiff, MD, MPH
Laura Schmitt, PhD, PT
Sarah Schultz, PhD, ATCAaron Sciascia, MS, ATC
Jason S. Scibek, PhD, ATC
Jeff G. Seegmiller, EdD, ATC
Matthew K. Seeley, PhD, ATC
JoEllen M. Sefton, PhD, ATC, CMT
Amee L. Seitz, PhD, DPT, OCS
Timothy C. Sell, PhD, PT
Ellen Shanley, PT, OCS, CSCSSue Shapiro, EdD, ATC
Brenda J. Shields, MS
Yohei Shimokochi, PhD, ATC
Jeffrey J. Shultz, MD
Jeremy Sibold, EdD, ATC
Julie A. Siegmund, MEd, LAT, ATC,
CSCS
Susan M. Sigward, PhD, PT, ATCCarrie Silkman, MSEd, ATC
Peter Sinclair, PhD
Angela Smith, MD
Joseph H. Smith, MS, ATC, CSCS
Kelli R. Snyder, MS, ATC
Barry Spiering, PhD
David J. Stearne, PhD, ATC
Rebecca Stearns, MA, ATCSue Stevens, EdD, ATC
Christopher Stickley, PhD, ATC
Jennifer A. Stone, MS, ATC
Marcus B. Stone, PhD, ATC
Stephen J. Straub, PhD, ATC
Jennifer R. Street, MS, ATC
Janine Stubbs, PhD
Dai Sugimoto, MS, ATC, CSCSThomas M. Susco, DPT, MEd, ATC
Charles B. Swanik, PhD, ATC
Kathleen A. Swanik, PhD, ATC
Kimberly Szucs, OTR/L
Charles A. Thigpen, PhD, PT, ATC
Abbey Thomas, PhD, ATC
Jim Thornton, MS, ATC
Ryan T. Tierney, PhD, ATC
Mark D. Tillman, PhD, CSCS
Toni M. Torres-McGehee, PhD, ATC
Tim Tourville, PhD, ATC
Johanna Tran, MD
Patricia M. Tripp, PhD, LAT, ATC,
CSCS
Cynthia A. Trowbridge, PhD, LAT,
ATC, CSCS
Kavin K. Tsang, PhD, ATC
Lori W. Turner, PhD, RD
Giampietro Vairo, MS, ATC
Marta Van Loan, PhD
Bonnie L. Van Lunen, PhD, ATC
Evert Verhagen, PhD
Larry Verity, PhD
Jeff Volek, PhD
Stella L. Volpe, PhD, RD, LDN,
FACSM
Stacy E. Walker, PhD, ATC
Hsing-Kuo Wang, PhD
Noah J. Wasielewski, PhD, ATC,
CSCS
Craig A. Wassinger, PhD, PT
Tim Watson, PhD
Heather E. Webb, PhD, ATC
Kathryn Webster, PhD, ATC
Erik A. Wikstrom, PhD, ATC
Jackson E. Winters, DDS
Andrew P. Winterstein, PhD, ATC
Cynthia J. Wright, MEd, ATC
Linda M. Yamamoto, PhD
Jingzhen Yang, PhD, MPH
Ian Young, DSc, PT, OCS, SCS, Cert
MDT
Bohdanna T. Zazulak, DPT, MS,OCS
Brian Zeller, PhD, ATC
Eric Zemper, PhD
Steven M. Zinder, PhD, ATC
thank you to guest reviewers
Journal of Athletic Training 223