journal of asian scientific research
TRANSCRIPT
Journal of Asian Scientific Research, 2013, 3(7):698-714
698
AN ANALYSIS OF TURKISH HIGH SCHOOL STUDENTS’ PERFORMANCE
ON CONCEPTUAL, ALGORITHMIC AND GRAPHICAL PHYSICS PROBLEMS
Mehmet Altan KURNAZ
Assist. Prof., Faculty of Education, Kastamonu University, Kastamonu, Turkey
ABSTRACT
The aim of this study was to investigate performances of high school students regarding the
conceptual, algorithmic and graphical physics questions by comparatively. The study was carried
out with participant of 68 students. Data of the study was gathered with 15 open-ended questions.
The results of the study showed that students performed better on the algorithmic and conceptual
questions than the graphical questions. It was concluded that students’ competence in each
question types may be affected from ratio of question types asked in university entrance
examinations.
Keywords: Conceptual questions, Algorithmic questions, Graphical questions
INTRODUCTION
Just like other lessons, physics subjects in schools possess an unsettled quality, in terms of teaching
and learning of contents and objectives. High school physics contents generally reflects the
simplified and (or) reduced version of the physics subjects in college. Researchers in the field of
education agree upon that the ultimate goal of the high school curriculum should not be considered
only as training physicians. The content of high school physics lessons is expected to train
individuals, who can generate solutions and make decisions when they encounter with problems,
which involve the society (National Education Standards., 1993). In this sense, the primary
objective of the recently-structured physics curricula in Turkey is to train productive and creative
individuals who have internalized the fact that physics is a discipline that is derived from the real
life, and who can explain the meaning of the basic concepts of physics accurately and solve
problems (MEB, 2007). However, high school students in Turkey are required for university
entrance to be successful in the exam of Transition to Higher Education (THE) and Undergraduate
Placement Exam (UPE), which do not include any open-ended questions that allow to assess
students’ understandings of the physics concepts and to evaluate their solut ion processes rather
than the final product. THE and UPE examinations include questions from the subjects of core
lessons, including physics, that are taught in high school.
Journal of Asian Scientific Research
journal homepage: http://aessweb.com/journal-detail.php?id=5003
Journal of Asian Scientific Research, 2013, 3(7):698-714
699
Some studies, which investigated the effects of these examinations, present interesting results.
Özden (2010) indicates that students’ performance (scores) in these exams affect their choices of
profession. Other studies (Ayvacı, 2010; Baştürk, 2011) emphasize that these examinations have
an effect on the instruction approaches of teachers. In his study, Ayvacı (2010) attracts attention to
the fact that teachers worry that teaching environments that were grounded on conceptual learning
will not be compatible with concepts of THE and UPE examinations. (Baştürk, 2011) states that
teachers, during their instruction, attach importance to the exercises with short and practical
solutions in their lessons, since the students are required to answer the questions within a limited
time during the university entrance examinations. Having similar reasons, Ates and Cataloglu
(2007) state that a great number of teachers highlight the algorithmic questions, similar to the ones
in the examinations, that needs a numerical answer and that do not inquire explanations. As a
consequence, THE and UPE inevitably change classroom instruction and urge students to study
with an intensive tempo and practice a lot of questions in order to successful in the examinations.
There are explicitly some questions to be asked right here: Is it sufficient for achievement to
practice a lot of questions? To what extent does solving a lot of questions actualize/develop the
conceptual learning? To what extent does solving a lot of algorithmic (and multiple-choice)
questions develop the conceptual learning? Kim and Pak (2002) compared the conceptual
perceptions of students who solve a lot of physics questions (an average of 1500 questions) with
their skills of applying the physics formulas and mathematical operations. The results that were
obtained by researchers showed that while students who solve a lot of physics questions do not
have difficulty in using the physics formulas and mathematical operations, they have difficulties in
conceptual learning. A typical study that was performed with college students in Turkey revealed
that (Kurnaz, 2007) students are able to solve the questions with the help of algebraic equations;
however, they have limited information about the truth, in other words the physics laws behind
their solution. Moreover, he also indicates that students solve an algorithmic question by using the
formula that is compatible with the concepts in the question (e.g. the problem has the initial
velocity, acceleration and displacement, and the final velocity is asked. Then the velocity formula
without time shall be used); however, they are unable or have difficulty to explain the physics law
behind the formula they apply. Mazur (1996) expresses that even though students have the skills of
recalling the formulas and solving the questions in his physics lessons, they were found insufficient
in terms of conceptual questions. A further discussion is made by Maloney (1994). He thinks that
novice students try the formula and equations in order to find the unknown for the solution. In case
of failure, they try to apply the next formula and equation they remember without considering the
reason of the failure.
In some studies, the relation between the algorithmic understanding and conceptual understanding
is discussed in relation with whether the students are algorithmic or conceptual problem solvers. In
comparison of achievement of students regarding conceptual and algorithmic questions, the first
study was conducted by Nurrenbern and Pickering (1987) who investigated the relationship
between algorithmic problem solving and having the knowledge of the basic concepts behind these
problems. Then, some other studies (e.g. (Nakhleh, 1993; Nakhleh and Mitchell, 1993; Kim and
Journal of Asian Scientific Research, 2013, 3(7):698-714
700
Pak, 2002; Erkan, 2011) attempted to determine whether the students are conceptual problem
solvers or algorithmic problem solvers. The frequently-used instrument in these studies includes
two questions about the same subject, one of which requires the conceptual understanding and the
other requires algorithmic skills (e.g. (Nurrenbern and Pickering, 1987; Sawrey, 1990; Nakhleh,
1993; Nakhleh and Mitchell, 1993; Lin et al., 1996; Mason et al., 1997). In some of the well-
known studies that were performed within this framework, Nurrenbern and Pickering (1987)
determined that 65 % of students gave correct answers to the algorithmic questions, 35 % gave
correct answers to conceptual questions; and Nakhleh (1993) determined that 85 % of students
gave correct answers to algorithmic questions and 49 % gave correct answers to conceptual
questions. Moreover, studies also reveal that outstanding achievement in algorithmic questions
does not warrant the conceptual understanding (Mazur, 1996; McDermott, 2001; Kim and Pak,
2002; Redish, 2005; Kurnaz, 2007; Ateş, 2008; Erkan, 2011).
Some researchers take part in the discussion of conceptual and algorithmic understanding by
emphasizing the importance of graphical understanding, as well. Graphics have such properties that
they can ease the reflection of relations between the variables being examined for the solution of
problems (Beichner, 1994; Ates and Stevens, 2003; Sağlam Arslan, 2009). Moreover, drawing
and/or interpreting graphics are among actions that will be presented by students in the process of
acting like scientists who were examining, analyzing, accomplishing and reporting (Roth, 2004;
Bowen and Roth, 2005). Additionally, since graphics are frequently used in social information
networks (such as TV, newspaper and internet), everyone is expected to have the skill of explaining
the meaning of graphics (Tairab and Khalaf Al-Naqbi, 2004; Kekule, 2008). Van Dyke and White
(2004) state that graphical interpretation will support the abstract thinking skills of students. In
addition, since different graphic representations could be used for different purposes, it is suggested
to have the skill of selecting the convenient graphical representation for an information set that is
given (Kosslyn, 1985). Additionally, within the context of physics lessons, graphics are also used
to explain the results of tests that are performed in laboratories. Thus, graphics could also be
considered a communication medium between teacher-student and student-student.
Just like other lessons, physics teaching/learning also attaches a great importance to reading,
forming and interpreting graphics. However, a number of studies express that students have
common deficiencies in terms of forming and interpreting graphics (McDermott et al., 1987;
Beichner, 1994; Berg and Smith, 1994; Ates and Stevens, 2003; Kekule, 2008; Sağlam Arslan,
2009). For example, in his two-stage study that was previously performed with 480 and then with
700 students, Kekule (2008) emphasizes the fact that students describe graphics as the outline or
picture of reality. Berg and Smith (1994) also reported that students perceive graphics as a picture,
instead of a symbolic depiction of knowledge. Sağlam Arslan (2009) conducted their study with a
total of 243 students from different level of education (high school students, undergraduate and
graduate students). The researcher states that students from different education level have a great
difficulty in using graphics for the purpose of analyzing the relation between different variables and
thereby, they cannot realize the graphical depiction of the information. However, it is known that
Journal of Asian Scientific Research, 2013, 3(7):698-714
701
information is frequently illustrated with graphical representations in many school books. As a
matter of fact, most of the standard examinations are developed in such a way to involve the skills
of reading, forming and interpreting graphics (Forster, 2004). Similarly, examining the question
types in THE and UPE examinations in Turkey, it is seen that the questions are not only conceptual
and algorithmic; they involve graphical questions as well. The studies comparing students’
performances on graphical, conceptual and algorithmic questions were very few in number
compared to the ones focusing on the students’ performances on conceptual and algorithmic
questions (Coştu, 2007; Coştu, 2010). Especially, when considering the importance of graphics
within the context of physics lessons and school books and question types in THE and UPE
examinations, it is believed that the research of the relationship among graphical, conceptual and
algorithmic question performances is also important.
To this end, the objective of this study is to compare the performances of students regarding the
conceptual, algorithmic and graphical physics questions and determine the differences, if exists.
METHODOLOGY
Case study was used as the research method in this study. The case that is examined within the
scope of the study involves the performances of students at conceptual, algorithmic and graphical
physics questions.
Study Group
The study group was consisted of a total of 68 high school students in a city in the Black Sea region
of Turkey. A criterion-based purposive sampling strategy was applied in forming of the study
group. The criteria for selection were for all students to be in the twelve-grade and to have a score
four or five (out of five) in physics lesson. The reason of selecting the study group from the
students with high grades was to control the deviations that would be caused by unsuccessful
students during the performance comparison.
Instrument
In line with the aims, this study used an achievement test consisted of question sets, which involve
conceptual, graphical and algorithmic questions on the same subject. The achievement test involves
15 questions on four subjects and the questions were prepared by using different physics school
books and question banks. In the achievement test, students were also asked about what kind of
questions they preferred (at what kind of questions they felt more successful). The prepared
questions were examined and approved by a field expert who studies in the field of physics and
three physics teachers, in terms of its understandability and practicability. A pilot application of the
achievement test conducted with 24 students, and its understandability was found sufficient. All of
the questions are open-ended, and their features are given in Table 1.
Journal of Asian Scientific Research, 2013, 3(7):698-714
702
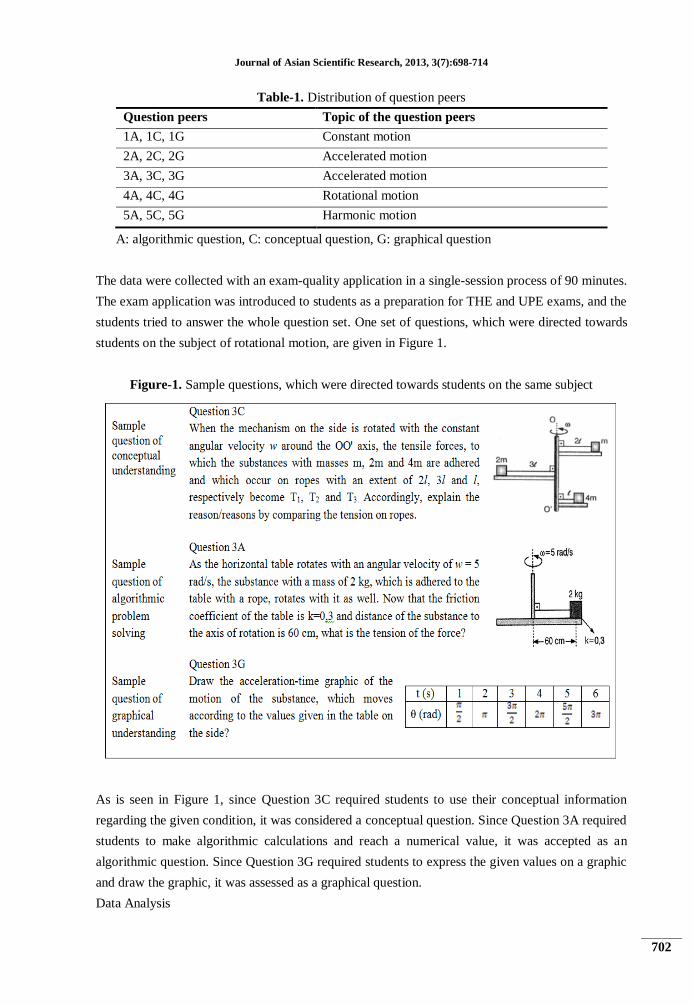
Table-1. Distribution of question peers
Question peers Topic of the question peers
1A, 1C, 1G Constant motion
2A, 2C, 2G Accelerated motion
3A, 3C, 3G Accelerated motion
4A, 4C, 4G Rotational motion
5A, 5C, 5G Harmonic motion
A: algorithmic question, C: conceptual question, G: graphical question
The data were collected with an exam-quality application in a single-session process of 90 minutes.
The exam application was introduced to students as a preparation for THE and UPE exams, and the
students tried to answer the whole question set. One set of questions, which were directed towards
students on the subject of rotational motion, are given in Figure 1.
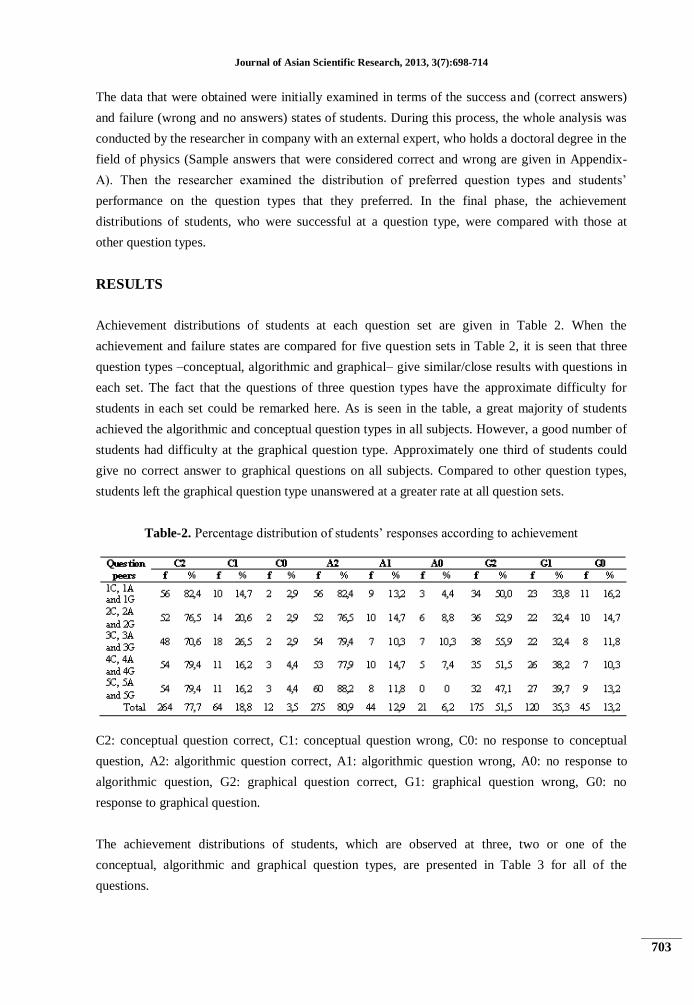
Figure-1. Sample questions, which were directed towards students on the same subject
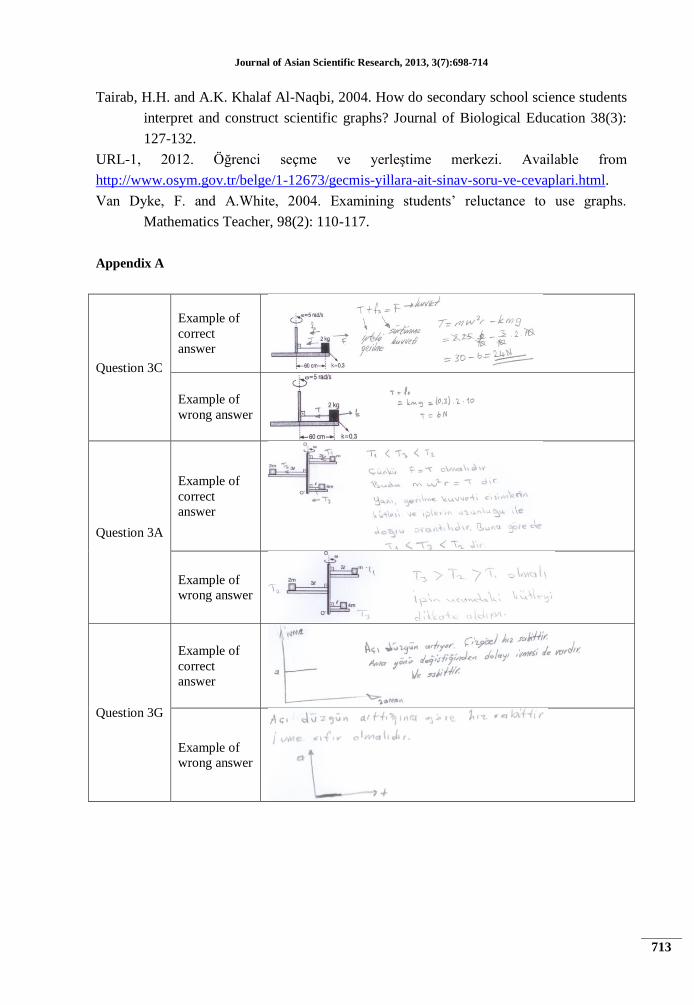
As is seen in Figure 1, since Question 3C required students to use their conceptual information
regarding the given condition, it was considered a conceptual question. Since Question 3A required
students to make algorithmic calculations and reach a numerical value, it was accepted as an
algorithmic question. Since Question 3G required students to express the given values on a graphic
and draw the graphic, it was assessed as a graphical question.
Data Analysis
Journal of Asian Scientific Research, 2013, 3(7):698-714
703
The data that were obtained were initially examined in terms of the success and (correct answers)
and failure (wrong and no answers) states of students. During this process, the whole analysis was
conducted by the researcher in company with an external expert, who holds a doctoral degree in the
field of physics (Sample answers that were considered correct and wrong are given in Appendix-
A). Then the researcher examined the distribution of preferred question types and students’
performance on the question types that they preferred. In the final phase, the achievement
distributions of students, who were successful at a question type, were compared with those at
other question types.
RESULTS
Achievement distributions of students at each question set are given in Table 2. When the
achievement and failure states are compared for five question sets in Table 2, it is seen that three
question types –conceptual, algorithmic and graphical– give similar/close results with questions in
each set. The fact that the questions of three question types have the approximate difficulty for
students in each set could be remarked here. As is seen in the table, a great majority of students
achieved the algorithmic and conceptual question types in all subjects. However, a good number of
students had difficulty at the graphical question type. Approximately one third of students could
give no correct answer to graphical questions on all subjects. Compared to other question types,
students left the graphical question type unanswered at a greater rate at all question sets.
Table-2. Percentage distribution of students’ responses according to achievement
C2: conceptual question correct, C1: conceptual question wrong, C0: no response to conceptual
question, A2: algorithmic question correct, A1: algorithmic question wrong, A0: no response to
algorithmic question, G2: graphical question correct, G1: graphical question wrong, G0: no
response to graphical question.
The achievement distributions of students, which are observed at three, two or one of the
conceptual, algorithmic and graphical question types, are presented in Table 3 for all of the
questions.
Journal of Asian Scientific Research, 2013, 3(7):698-714
704
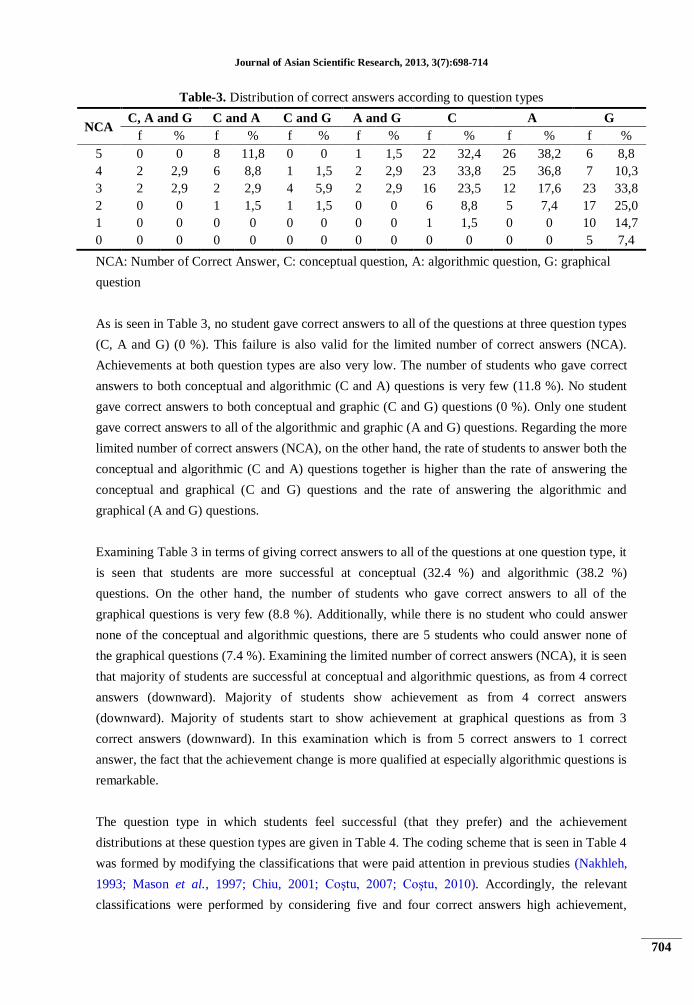
Table-3. Distribution of correct answers according to question types
NCA C, A and G C and A C and G A and G C A G
f % f % f % f % f % f % f %
5 0 0 8 11,8 0 0 1 1,5 22 32,4 26 38,2 6 8,8
4 2 2,9 6 8,8 1 1,5 2 2,9 23 33,8 25 36,8 7 10,3
3 2 2,9 2 2,9 4 5,9 2 2,9 16 23,5 12 17,6 23 33,8
2 0 0 1 1,5 1 1,5 0 0 6 8,8 5 7,4 17 25,0
1 0 0 0 0 0 0 0 0 1 1,5 0 0 10 14,7
0 0 0 0 0 0 0 0 0 0 0 0 0 5 7,4
NCA: Number of Correct Answer, C: conceptual question, A: algorithmic question, G: graphical
question
As is seen in Table 3, no student gave correct answers to all of the questions at three question types
(C, A and G) (0 %). This failure is also valid for the limited number of correct answers (NCA).
Achievements at both question types are also very low. The number of students who gave correct
answers to both conceptual and algorithmic (C and A) questions is very few (11.8 %). No student
gave correct answers to both conceptual and graphic (C and G) questions (0 %). Only one student
gave correct answers to all of the algorithmic and graphic (A and G) questions. Regarding the more
limited number of correct answers (NCA), on the other hand, the rate of students to answer both the
conceptual and algorithmic (C and A) questions together is higher than the rate of answering the
conceptual and graphical (C and G) questions and the rate of answering the algorithmic and
graphical (A and G) questions.
Examining Table 3 in terms of giving correct answers to all of the questions at one question type, it
is seen that students are more successful at conceptual (32.4 %) and algorithmic (38.2 %)
questions. On the other hand, the number of students who gave correct answers to all of the
graphical questions is very few (8.8 %). Additionally, while there is no student who could answer
none of the conceptual and algorithmic questions, there are 5 students who could answer none of
the graphical questions (7.4 %). Examining the limited number of correct answers (NCA), it is seen
that majority of students are successful at conceptual and algorithmic questions, as from 4 correct
answers (downward). Majority of students show achievement as from 4 correct answers
(downward). Majority of students start to show achievement at graphical questions as from 3
correct answers (downward). In this examination which is from 5 correct answers to 1 correct
answer, the fact that the achievement change is more qualified at especially algorithmic questions is
remarkable.
The question type in which students feel successful (that they prefer) and the achievement
distributions at these question types are given in Table 4. The coding scheme that is seen in Table 4
was formed by modifying the classifications that were paid attention in previous studies (Nakhleh,
1993; Mason et al., 1997; Chiu, 2001; Coştu, 2007; Coştu, 2010). Accordingly, the relevant
classifications were performed by considering five and four correct answers high achievement,
Journal of Asian Scientific Research, 2013, 3(7):698-714
705
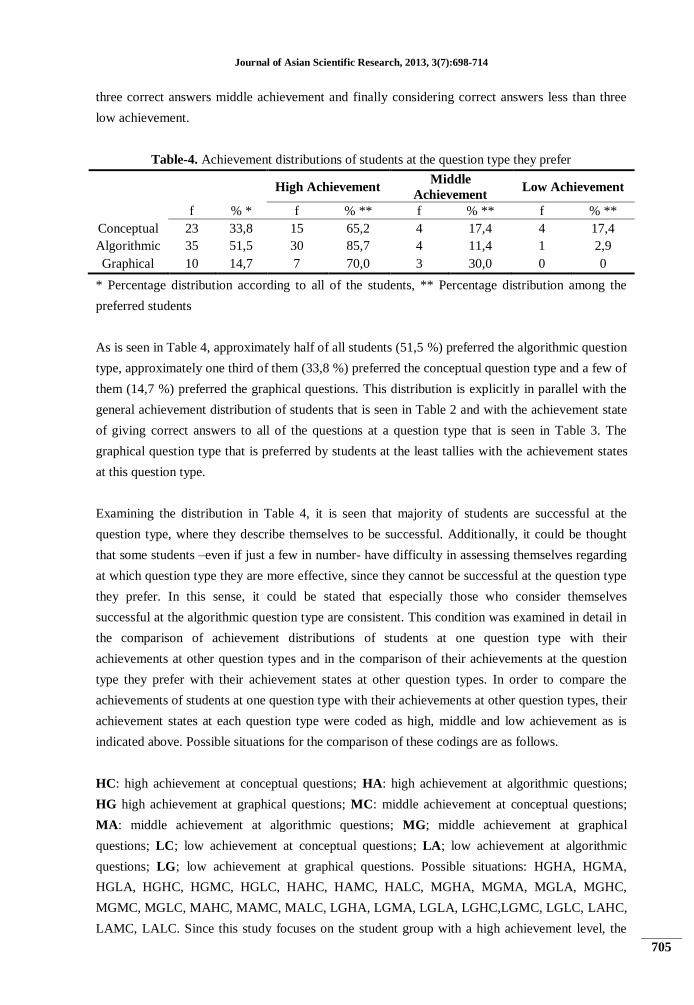
three correct answers middle achievement and finally considering correct answers less than three
low achievement.
Table-4. Achievement distributions of students at the question type they prefer
High Achievement Middle
Achievement Low Achievement
f % * f % ** f % ** f % **
Conceptual 23 33,8 15 65,2 4 17,4 4 17,4
Algorithmic 35 51,5 30 85,7 4 11,4 1 2,9
Graphical 10 14,7 7 70,0 3 30,0 0 0
* Percentage distribution according to all of the students, ** Percentage distribution among the
preferred students
As is seen in Table 4, approximately half of all students (51,5 %) preferred the algorithmic question
type, approximately one third of them (33,8 %) preferred the conceptual question type and a few of
them (14,7 %) preferred the graphical questions. This distribution is explicitly in parallel with the
general achievement distribution of students that is seen in Table 2 and with the achievement state
of giving correct answers to all of the questions at a question type that is seen in Table 3. The
graphical question type that is preferred by students at the least tallies with the achievement states
at this question type.
Examining the distribution in Table 4, it is seen that majority of students are successful at the
question type, where they describe themselves to be successful. Additionally, it could be thought
that some students –even if just a few in number- have difficulty in assessing themselves regarding
at which question type they are more effective, since they cannot be successful at the question type
they prefer. In this sense, it could be stated that especially those who consider themselves
successful at the algorithmic question type are consistent. This condition was examined in detail in
the comparison of achievement distributions of students at one question type with their
achievements at other question types and in the comparison of their achievements at the question
type they prefer with their achievement states at other question types. In order to compare the
achievements of students at one question type with their achievements at other question types, their
achievement states at each question type were coded as high, middle and low achievement as is
indicated above. Possible situations for the comparison of these codings are as follows.
HC: high achievement at conceptual questions; HA: high achievement at algorithmic questions;
HG high achievement at graphical questions; MC: middle achievement at conceptual questions;
MA: middle achievement at algorithmic questions; MG; middle achievement at graphical
questions; LC; low achievement at conceptual questions; LA; low achievement at algorithmic
questions; LG; low achievement at graphical questions. Possible situations: HGHA, HGMA,
HGLA, HGHC, HGMC, HGLC, HAHC, HAMC, HALC, MGHA, MGMA, MGLA, MGHC,
MGMC, MGLC, MAHC, MAMC, MALC, LGHA, LGMA, LGLA, LGHC,LGMC, LGLC, LAHC,
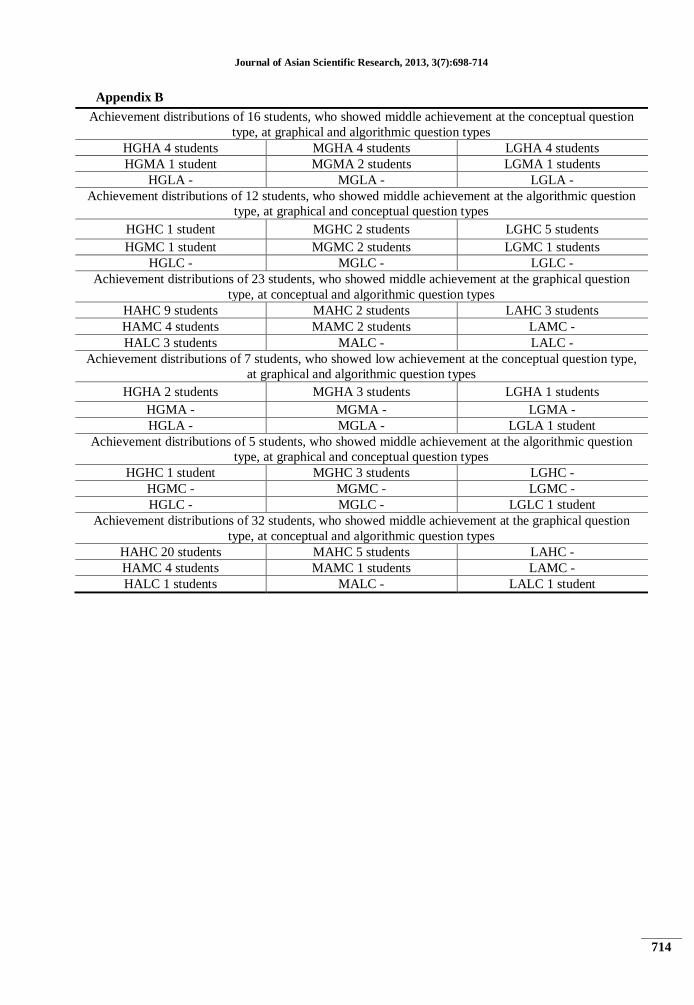
LAMC, LALC. Since this study focuses on the student group with a high achievement level, the
Journal of Asian Scientific Research, 2013, 3(7):698-714
706
comparison of these students with their achievement states at conceptual, algorithmic and graphical
question types is given below. Findings regarding other comparisons are presented in Appendix-B.
Since those who gave 5 and 4 correct answers are considered together in this classification in order
to determine the students with overachievement, the distribution that is presented in Table 3 for 5
or 4 correct answers is required to be rearranged according to the achievement classification, which
is presented in Table 4. The distribution, which occurs when the distribution that is presented in
Table 3 for 5 or 4 correct answers is rearranged according to the achievement classification in
Table 4, becomes as follows: The number of students who gave 5 or 4 correct answers at three
questions types is 4 (5,9 %). The number of students who gave 5 or 4 correct answers at two of
conceptual and algorithmic (C and A) questions is 33 (48,5 %). The number of students who gave 5
or 4 correct answers at two of conceptual and graphical (C and G) questions is 6 (8,8 %). The
number of students who gave 5 or 4 correct answers at two of algorithmic and graphical (A and G)
questions is 10 (14,7 %). Finally, the number of students who gave 5 or 4 correct answers at
conceptual questions is 45 (66,2 %). The number of students who gave 5 or 4 correct answers at
algorithmic questions is 51 (75 %). The number of students who gave 5 or 4 correct answers at
graphical questions is 13 (19,1 %).
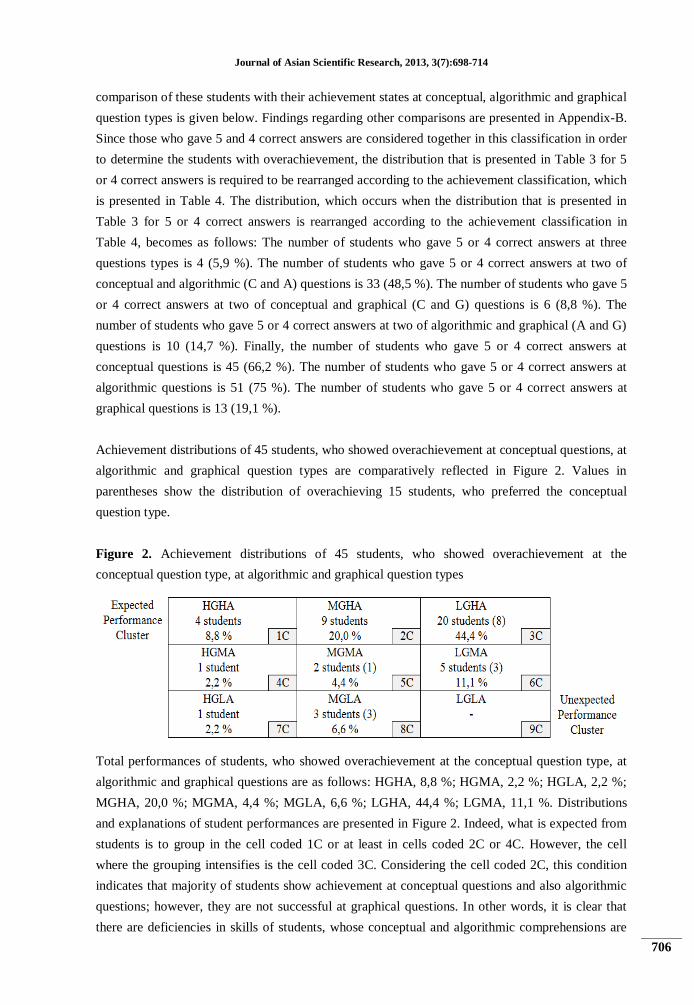
Achievement distributions of 45 students, who showed overachievement at conceptual questions, at
algorithmic and graphical question types are comparatively reflected in Figure 2. Values in
parentheses show the distribution of overachieving 15 students, who preferred the conceptual
question type.
Figure 2. Achievement distributions of 45 students, who showed overachievement at the
conceptual question type, at algorithmic and graphical question types
Total performances of students, who showed overachievement at the conceptual question type, at
algorithmic and graphical questions are as follows: HGHA, 8,8 %; HGMA, 2,2 %; HGLA, 2,2 %;
MGHA, 20,0 %; MGMA, 4,4 %; MGLA, 6,6 %; LGHA, 44,4 %; LGMA, 11,1 %. Distributions
and explanations of student performances are presented in Figure 2. Indeed, what is expected from
students is to group in the cell coded 1C or at least in cells coded 2C or 4C. However, the cell
where the grouping intensifies is the cell coded 3C. Considering the cell coded 2C, this condition
indicates that majority of students show achievement at conceptual questions and also algorithmic
questions; however, they are not successful at graphical questions. In other words, it is clear that
there are deficiencies in skills of students, whose conceptual and algorithmic comprehensions are
Journal of Asian Scientific Research, 2013, 3(7):698-714
707
considered high, regarding the formation and interpretation of graphics. Moreover, 8 out of 20
students who are grouped in the cell coded 3C are also the students that prefer the conceptual
question type. Thus, it could be stated that there is a relation between the self-confidence and
achievements of these students at conceptual questions and their achievements at algorithmic
questions. As a matter of fact, 12 out of 20 students preferred the algorithmic questions and showed
overachievement at both conceptual and algorithmic questions (see, Figure 3 cell 3A). On the other
hand, it should be remarked that some of the students who preferred conceptual questions are
grouped in the cells 5C, 6C and 8C (a total of 7 students). Even though it could be asserted that
students obtained the conceptual learning and gained self-confidence at conceptual questions, the
required achievement could not be depicted at algorithmic and graphical questions. Indeed, the fact
that they preferred conceptual questions could be interpreted in such a way that they well know that
they cannot be successful enough at algorithmic and graphical questions.
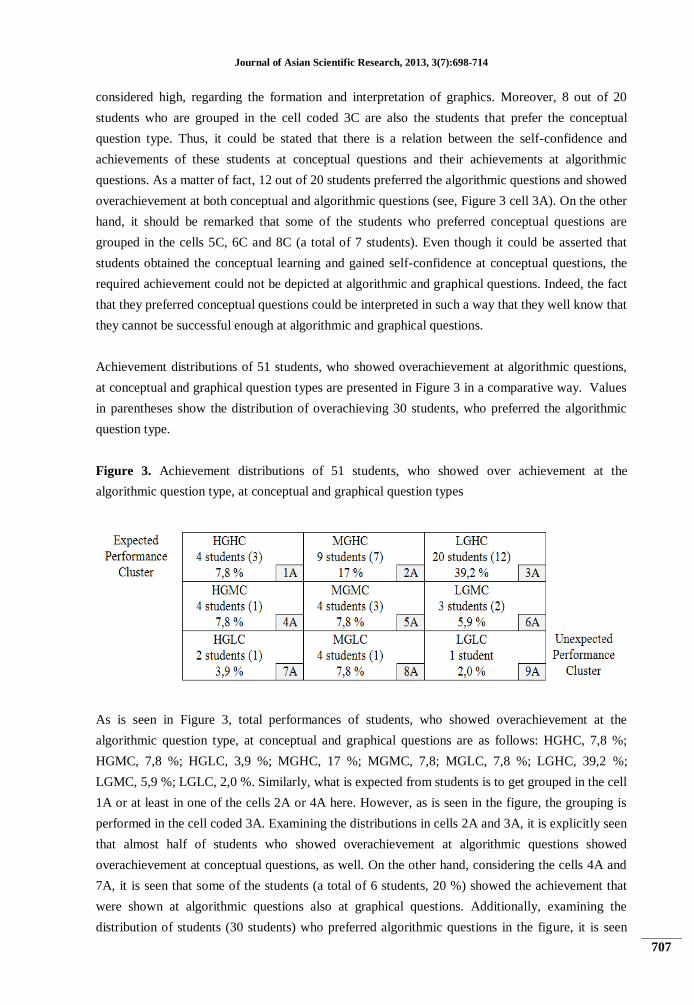
Achievement distributions of 51 students, who showed overachievement at algorithmic questions,
at conceptual and graphical question types are presented in Figure 3 in a comparative way. Values
in parentheses show the distribution of overachieving 30 students, who preferred the algorithmic
question type.
Figure 3. Achievement distributions of 51 students, who showed over achievement at the
algorithmic question type, at conceptual and graphical question types
As is seen in Figure 3, total performances of students, who showed overachievement at the
algorithmic question type, at conceptual and graphical questions are as follows: HGHC, 7,8 %;
HGMC, 7,8 %; HGLC, 3,9 %; MGHC, 17 %; MGMC, 7,8; MGLC, 7,8 %; LGHC, 39,2 %;
LGMC, 5,9 %; LGLC, 2,0 %. Similarly, what is expected from students is to get grouped in the cell
1A or at least in one of the cells 2A or 4A here. However, as is seen in the figure, the grouping is
performed in the cell coded 3A. Examining the distributions in cells 2A and 3A, it is explicitly seen
that almost half of students who showed overachievement at algorithmic questions showed
overachievement at conceptual questions, as well. On the other hand, considering the cells 4A and
7A, it is seen that some of the students (a total of 6 students, 20 %) showed the achievement that
were shown at algorithmic questions also at graphical questions. Additionally, examining the
distribution of students (30 students) who preferred algorithmic questions in the figure, it is seen
Journal of Asian Scientific Research, 2013, 3(7):698-714
708
that majority of them (a total of 19 students, 63 %) are in the cells 2A and 3A. From this point of
view, it could be asserted that majority of students who preferred algorithmic questions have high
levels of conceptual understandings.
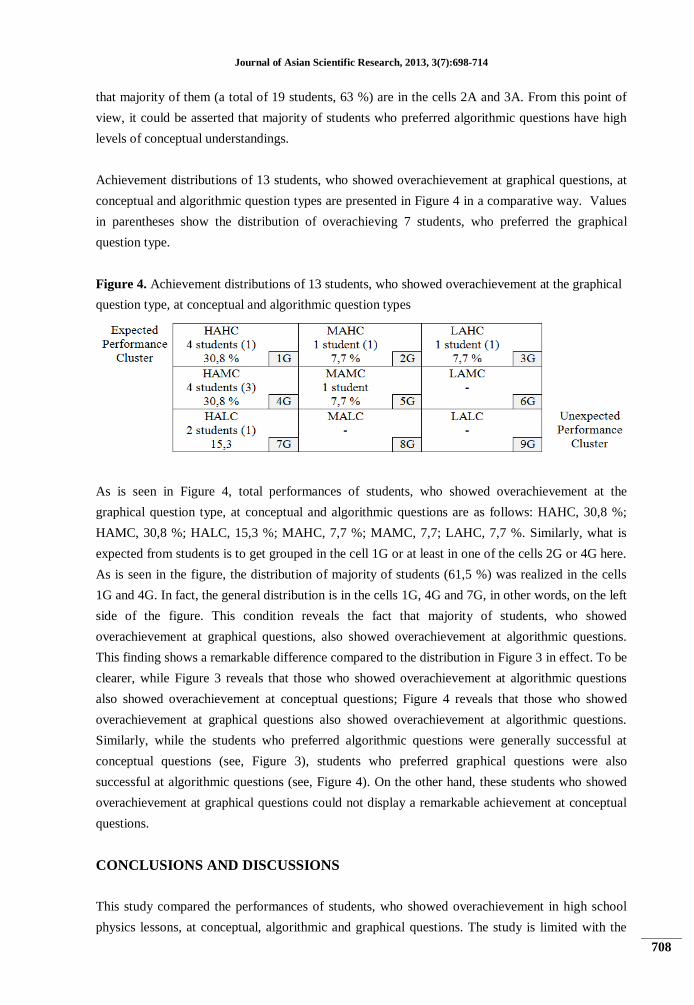
Achievement distributions of 13 students, who showed overachievement at graphical questions, at
conceptual and algorithmic question types are presented in Figure 4 in a comparative way. Values
in parentheses show the distribution of overachieving 7 students, who preferred the graphical
question type.
Figure 4. Achievement distributions of 13 students, who showed overachievement at the graphical
question type, at conceptual and algorithmic question types
As is seen in Figure 4, total performances of students, who showed overachievement at the
graphical question type, at conceptual and algorithmic questions are as follows: HAHC, 30,8 %;
HAMC, 30,8 %; HALC, 15,3 %; MAHC, 7,7 %; MAMC, 7,7; LAHC, 7,7 %. Similarly, what is
expected from students is to get grouped in the cell 1G or at least in one of the cells 2G or 4G here.
As is seen in the figure, the distribution of majority of students (61,5 %) was realized in the cells
1G and 4G. In fact, the general distribution is in the cells 1G, 4G and 7G, in other words, on the left
side of the figure. This condition reveals the fact that majority of students, who showed
overachievement at graphical questions, also showed overachievement at algorithmic questions.
This finding shows a remarkable difference compared to the distribution in Figure 3 in effect. To be
clearer, while Figure 3 reveals that those who showed overachievement at algorithmic questions
also showed overachievement at conceptual questions; Figure 4 reveals that those who showed
overachievement at graphical questions also showed overachievement at algorithmic questions.
Similarly, while the students who preferred algorithmic questions were generally successful at
conceptual questions (see, Figure 3), students who preferred graphical questions were also
successful at algorithmic questions (see, Figure 4). On the other hand, these students who showed
overachievement at graphical questions could not display a remarkable achievement at conceptual
questions.
CONCLUSIONS AND DISCUSSIONS
This study compared the performances of students, who showed overachievement in high school
physics lessons, at conceptual, algorithmic and graphical questions. The study is limited with the

Journal of Asian Scientific Research, 2013, 3(7):698-714
709
examination of performance of successful students on the achievement test. Analyzing achievement
states of students, who showed high performance at a question type during practices, at other
question types is another limitation of the current study.
Among the results of the study was that students performed better on the algorithmic and
conceptual questions than the graphical questions. Moreover, algorithmic questions were the most
preferred question types by students. In addition, the students who prefer algorithmic questions
were found more successful than those who prefer other questions. One could make a general
assumption from these findings that students tended to select algorithmic questions and showed a
better performance. According to the results of the study, the performances that are shown by
students for conceptual questions were also high. While these results do not entirely correspond to
the results of some other studies (e.g. (Nurrenbern and Pickering, 1987; Nakhleh, 1993; Coştu,
2007; Coştu, 2010), they are partially in line with the results of some others (e.g. (Lin et al., 1996;
Erkan, 2011). For instance, being similar to this study, Lin et al. (1996) determined that there was
not a significant difference between conceptual and algorithmic performances of students.
Similarly, Erkan (2011), who worked with pre-service chemistry teachers in Turkey, investigated
performances of pre-service teachers in conceptual and algorithmic questions and determined that
there was not a significant difference between them. Erkan (2011) also compared the performances
of pre-service teachers at conceptual, algorithmic and graphical questions and determined that the
achievement was in favor of conceptual questions. Moreover, Coştu (2007) presented that eleventh-
grade students performed better conceptual chemistry questions than algorithmic and graphical
chemistry questions. In another study (Coştu, 2010) that was performed with the twelfth grade
students, algorithmic questions were the only question types that students performed high. The
results of (Coştu, 2007; Coştu, 2010) and Erkan (2011) that are related with student performances
at graphical questions show a parallelism with the results that were obtained in this study since
students’ performance on graphical questions were found enough in none of them. Based on the
scores obtained from the achievement test, this study revealed students’ difficulty in graphical
questions. This result is consistent with the results of many different studies, which assert that
students have issues with graphical questions/operations (McKenzie and Pandilla, 1986; Erkan,
2011). Within the scope of this study, the fact that students have higher general performances at
algorithmic and conceptual questions could be based on different reasons. The first and major
contributing factor can be considered as the content and question style of THE and UPE
examinations. Examining the total 178 physics questions that have been asked in THE and UPE
during last five years, it is seen that 83 of the questions are conceptual, 85 of them are algorithmic
and 10 are graphical (URL-1, 2012) It could be thought that the types of questions that have been
asked recently affect the performances of students at algorithmic, graphical and conceptual
questions in a positive or negative way. In other words, students could be expected to be motivated
more towards the question types that are include more in the examinations. Moreover, this
motivation might cause for students to practice more on these question types. Another factor could
be the fact that teachers prefer algorithmic questions in their lessons since it is emphasized that in
Turkey, the development of graphical skills is ignored (Kağan-Temiz and Tan, 2009) and
Journal of Asian Scientific Research, 2013, 3(7):698-714
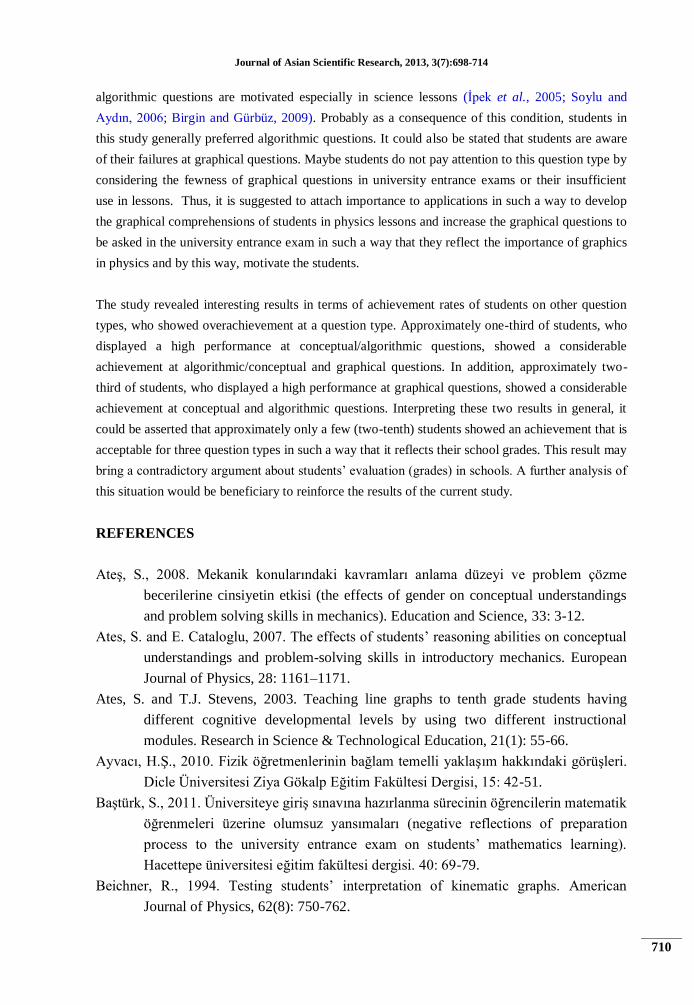
710
algorithmic questions are motivated especially in science lessons (İpek et al., 2005; Soylu and
Aydın, 2006; Birgin and Gürbüz, 2009). Probably as a consequence of this condition, students in
this study generally preferred algorithmic questions. It could also be stated that students are aware
of their failures at graphical questions. Maybe students do not pay attention to this question type by
considering the fewness of graphical questions in university entrance exams or their insufficient
use in lessons. Thus, it is suggested to attach importance to applications in such a way to develop
the graphical comprehensions of students in physics lessons and increase the graphical questions to
be asked in the university entrance exam in such a way that they reflect the importance of graphics
in physics and by this way, motivate the students.
The study revealed interesting results in terms of achievement rates of students on other question
types, who showed overachievement at a question type. Approximately one-third of students, who
displayed a high performance at conceptual/algorithmic questions, showed a considerable
achievement at algorithmic/conceptual and graphical questions. In addition, approximately two-
third of students, who displayed a high performance at graphical questions, showed a considerable
achievement at conceptual and algorithmic questions. Interpreting these two results in general, it
could be asserted that approximately only a few (two-tenth) students showed an achievement that is
acceptable for three question types in such a way that it reflects their school grades. This result may
bring a contradictory argument about students’ evaluation (grades) in schools. A further analysis of
this situation would be beneficiary to reinforce the results of the current study.
REFERENCES
Ateş, S., 2008. Mekanik konularındaki kavramları anlama düzeyi ve problem çözme
becerilerine cinsiyetin etkisi (the effects of gender on conceptual understandings
and problem solving skills in mechanics). Education and Science, 33: 3-12.
Ates, S. and E. Cataloglu, 2007. The effects of students’ reasoning abilities on conceptual
understandings and problem-solving skills in introductory mechanics. European
Journal of Physics, 28: 1161–1171.
Ates, S. and T.J. Stevens, 2003. Teaching line graphs to tenth grade students having
different cognitive developmental levels by using two different instructional
modules. Research in Science & Technological Education, 21(1): 55-66.
Ayvacı, H.Ş., 2010. Fizik öğretmenlerinin bağlam temelli yaklaşım hakkındaki görüşleri.
Dicle Üniversitesi Ziya Gökalp Eğitim Fakültesi Dergisi, 15: 42-51.
Baştürk, S., 2011. Üniversiteye giriş sınavına hazırlanma sürecinin öğrencilerin matematik
öğrenmeleri üzerine olumsuz yansımaları (negative reflections of preparation
process to the university entrance exam on students’ mathematics learning).
Hacettepe üniversitesi eğitim fakültesi dergisi. 40: 69-79.
Beichner, R., 1994. Testing students’ interpretation of kinematic graphs. American
Journal of Physics, 62(8): 750-762.
Journal of Asian Scientific Research, 2013, 3(7):698-714
711
Berg, C. and P. Smith, 1994. Assessing students’ abilities to construct and interpret line
graphs: Disparities between multiple-choice and free responses instruments.
Science Education, 78(6): 527-554.
Birgin, O. and R. Gürbüz, 2009. İlköğretim ii. Kademe öğrencilerinin rasyonel sayilar
konusundaki işlemsel ve kavramsal bilgi düzeylerinin incelenmesi. Uludağ
Üniversitesi Eğitim Fakültesi Dergisi, 22(2): 529-550.
Bowen, G.M. and W.M. Roth, 2005. Data and graph interpretation practices among
preservice science teachers. Journal of Research in Science Teaching, 42(10):
1063–1088.
Chiu, M. H., 2001. Algorithmic problem solving and conceptual understanding of
chemistry by students at a local high school in Taiwan. Proc Nat Sci Council,
ROC (D), 11(1): 20–38.
Coştu, B., 2007. Comparison of students’ performance on algorithmic, conceptual and
graphical chemistry gas problems. Journal of Science Education and Technology,
16(5): 379-386.
Coştu, B., 2010. Algorithmic, conceptual and graphical chemistry problems: A revisited
study. Asian Journal of Chemistry, 22(8): 6013-6025.
Erkan, E.N., 2011. Kimya öğretmen adaylarının işlemsel, kavramsal ve grafiksel
sorulardaki başarılarının karşılaştırılması. Yayınlanmamış yüksek lisans tezi,
eğitim bilimleri enstitüsü, dokuz eylül üniversitesi, İzmir.
Forster, P.A., 2004. Graphing in physics: Processes and sources of error in tertiary
entrance examinations in western australia. Research in Science Education, 34:
239–226.
İpek, A.S., C. Işık and M. Albayrak, 2005. Sınıf öğretmeni adaylarının kesir işlemleri
konusundaki kavramsal performansları. Kazım Karabekir Eğitim Fakültesi
Dergisi, 1: 537-547.
Kağan-Temiz, B. and M. Tan, 2009. Lise 1. Sınıf öğrencilerinin grafik yorumlama
becerileri (the abilities of first grade students to interpret the graphs at high
school). Ahmet Kelesoglu Education Faculty (AKEF) Journal, 28: 31-43.
Kekule, M., 2008. Graphs in physics education. GIREP 2008 Conference Physics
Curriculum Design, Development and Validation, August 18-22, Nicosia, Cyprus.
Kim, E. and S.J. Pak, 2002. Students do not overcome conceptual difficulties after solving
1000 traditional problems. American Association of Physics Teachers, 70(7): 759-
765.
Kosslyn, S.M., 1985. Graphing and human information processing. Journal of American
Statistical Association, 80: 499–512.
Kurnaz M. A., 2011. Enerji Konusunda Model Tabanlı Öğrenme Yaklaşımına Göre
Tasarlanan Öğrenme Ortamlarının Zihinsel Model Gelişimine Etkisi.
Yayınlanmamış Doktora Tezi, Karadeniz Teknik Üniversitesi, Trabzon, Türkiye.

Journal of Asian Scientific Research, 2013, 3(7):698-714
712
Lin, Q., P. Kirsch and R. Turner, 1996. Numeric and conceptual understanding of general
chemistry at a minority institution. Journal of Chemical Education, 73(10): 1003–
1005.
Maloney, D.P., 1994. Research on problem solving. New York: Macmillan.
Mason, D.S., D.F. Shell and F.E. Crawley, 1997. Differences in problem solving
nonscience majors in introductory chemistry on paired algorithmic-conceptual
problems. Journal of Research in Science Teaching, 34(9): 905–923.
Mazur, E., 1996. Peer instruction: A users’ manual. Upper Saddle River, NJ: Prentice
Hall.
McDermott, L.C., 2001. Oersted medal lecture 2001: Physics education research‐the key
to students learning. American Journal of Physics, 69: 1127-1137.
McDermott, L.C., M.L. Rosenquist and E.H. van Zee, 1987. Students’ difficulties in
connecting graphs and physics: Examples from kinematics. American Journal of
Physics, 55(6): 503-513.
McKenzie, D. and M. Pandilla, 1986. The construction and validation of the test of
graphing in science (togs). Journal of Research in Science Teaching, 23(7): 571-
579.
MEB, 2007. Ortaöğretim 9. Sınıf fizik dersi öğretim programı, TTKB, Ankara.
Nakhleh, M.B., 1993. Are our students conceptual thinkers or algorithmic problem
solvers? Journal of Chemical Education, 70(1): 52-55.
Nakhleh, M.B. and R.C. Mitchell, 1993. Concept learning versus problem solving: There
is a difference. Journal of Chemical Education, 70(3): 190-192.
National Education Standards., 1993. National education standards: Observe, interact,
change, learn. Washington, DC: National Academic Press.
Nurrenbern, S.C. and M. Pickering, 1987. Concept learning versus problem solving: Is
there a difference? Journal of Chemical Education, 64: 508-510.
Özden, M., 2010. Kimya öğretiminde okul ve dershane eğitiminin karşılaştırılması:
Malatya ili örneği. Türk Eğitim Bilimleri Dergisi, 8(2): 397-416.
Redish, E.F., 2005. Changing student ways of knowing: What should our students learn in
a physics class?, world view on physics education in 2005: Focusing on change,
delhi. Available from http://www.physics.umd.edu/perg/papers/redish/index.html.
Roth, W.M., 2004. Emergence of graphing practices in scientific research. Journal of
Cognition and Culture, 4: 595–627.
Sağlam Arslan, A., 2009. Cross-grade comparison of students’ understanding of energy
concepts. Journal of Science Education and Technology, 19(3): 303-313.
Sawrey, B.A., 1990. Concept learning versus problem solving: Revisited. Journal of
Chemical Education, 67(3): 253–254.
Soylu, Y. and S. Aydın, 2006. Matematik derslerinde kavramsal ve işlemsel öğrenmenin
dengelenmesinin önemi üzerine bir çalışma. Erzincan Eğitim Fakültesi Dergisi,
8(2): 83-95.
Journal of Asian Scientific Research, 2013, 3(7):698-714
713
Tairab, H.H. and A.K. Khalaf Al-Naqbi, 2004. How do secondary school science students
interpret and construct scientific graphs? Journal of Biological Education 38(3):
127-132.
URL-1, 2012. Öğrenci seçme ve yerleştime merkezi. Available from
http://www.osym.gov.tr/belge/1-12673/gecmis-yillara-ait-sinav-soru-ve-cevaplari.html.
Van Dyke, F. and A.White, 2004. Examining students’ reluctance to use graphs.
Mathematics Teacher, 98(2): 110-117.
Appendix A
Question 3C
Example of
correct
answer
Example of
wrong answer
Question 3A
Example of
correct
answer
Example of
wrong answer
Question 3G
Example of
correct
answer
Example of
wrong answer
Journal of Asian Scientific Research, 2013, 3(7):698-714
714
Appendix B
Achievement distributions of 16 students, who showed middle achievement at the conceptual question
type, at graphical and algorithmic question types
HGHA 4 students MGHA 4 students LGHA 4 students
HGMA 1 student MGMA 2 students LGMA 1 students
HGLA - MGLA - LGLA -
Achievement distributions of 12 students, who showed middle achievement at the algorithmic question
type, at graphical and conceptual question types
HGHC 1 student MGHC 2 students LGHC 5 students
HGMC 1 student MGMC 2 students LGMC 1 students
HGLC - MGLC - LGLC -
Achievement distributions of 23 students, who showed middle achievement at the graphical question
type, at conceptual and algorithmic question types
HAHC 9 students MAHC 2 students LAHC 3 students
HAMC 4 students MAMC 2 students LAMC -
HALC 3 students MALC - LALC -
Achievement distributions of 7 students, who showed low achievement at the conceptual question type,
at graphical and algorithmic question types
HGHA 2 students MGHA 3 students LGHA 1 students
HGMA - MGMA - LGMA -
HGLA - MGLA - LGLA 1 student
Achievement distributions of 5 students, who showed middle achievement at the algorithmic question
type, at graphical and conceptual question types
HGHC 1 student MGHC 3 students LGHC -
HGMC - MGMC - LGMC -
HGLC - MGLC - LGLC 1 student
Achievement distributions of 32 students, who showed middle achievement at the graphical question
type, at conceptual and algorithmic question types
HAHC 20 students MAHC 5 students LAHC -
HAMC 4 students MAMC 1 students LAMC -
HALC 1 students MALC - LALC 1 student