john-r-hauser.pdf - copyright royalty board
TRANSCRIPT
Before theUNITED STATES COPYRIGHT ROYALTY JUDGES
THE LIBRARY OF CONGRESSWashington, D.C.
In the Matter of
DETERMINATION OF ROYALTY RATES FOR DIGITAL PERFORMANCE IN SOUND RECORDINGS AND EPHEMERAL RECORDINGS (WEB IV)
)))) Docket No. 14-CRB-0001-WR ) (2016-2020))))
REBUTTAL TESTIMONY OF JOHN R. HAUSER, SC.D.
FEBRUARY 23, 2015
i
Table of Contents
I. INTRODUCTION ................................................................................................................. 1
A. Qualifications................................................................................................................... 1
B. Assignment ...................................................................................................................... 3
II. SUMMARY OF OPINIONS................................................................................................. 4
III. CASE BACKGROUND ........................................................................................................ 6
A. Royalty Determination Proceedings ................................................................................ 6
B. Overview of the McFadden Survey ................................................................................. 7
1. Incentive Alignment in the McFadden Survey................................................................ 8
2. Conjoint Task in the McFadden Survey........................................................................ 10
3. Music Streaming Questions in the McFadden Survey .................................................. 13
IV. DESIGN AND DEVELOPMENT OF PROFESSOR MCFADDEN’S SURVEY......... 14
V. THE RESULTS OF PROFESSOR MCFADDEN’S LIMITED PRETEST, CONFUSING FEATURE DESCRIPTIONS, AND HIGH DROP-OUT RATES INDICATE THE SURVEY INSTRUMENT LIKELY PROVIDED DATA THAT WERE NOT RELIABLE ................................................................................................... 18
A. Confusing Feature Descriptions..................................................................................... 18
B. Feature Descriptions Allowing Varied and Substantially Distinct Interpretations........ 21
C. Professor McFadden’s Final Feature Definitions and Incentive Alignment Were Not Tested ............................................................................................................................ 23
D. Professor McFadden’s Pretest Appears To Have Indicated that Respondents Had Trouble Understanding Key Aspects of the Survey...................................................... 26
E. High Drop-out Rate of Respondents in the McFadden Survey ..................................... 27
VI. ASSESSING PROFESSOR MCFADDEN’S SURVEY INSTRUMENT USING AN EVALUATIVE QUALITATIVE STUDY ........................................................................ 28
A. Professor McFadden’s Incentive Alignment Was Confusing........................................ 33
1. Professor McFadden’s Incentive Alignment Did Not Account for Common Pitfalls of Incentive Alignment ...................................................................................................... 34
2. Professor McFadden’s Incentive Alignment Did Not Properly Align the Choices of Respondents .................................................................................................................. 40
B. Professor McFadden’s Survey Features Were Unclear and Allowed for Extensive Variation in Respondent Interpretation of Features ...................................................... 44

ii
1. Playlist Method ............................................................................................................. 45
2. On-Demand Track Selection......................................................................................... 51
3. Offline Listening ........................................................................................................... 54
4. Mobile Device Streaming.............................................................................................. 56
5. Skip Limits .................................................................................................................... 59
6. Available Library Size .................................................................................................. 60
7. Advertising .................................................................................................................... 63
8. Most Qualitative Study Respondents Indicated at Least Some Confusion About Professor McFadden’s Feature Definitions................................................................... 65
C. A Review of Videotapes Revealed Even Greater Confusion about Professor McFadden’s Survey....................................................................................................... 66
D. Professor McFadden’s Brand Controls Likely Did Not Achieve the Effect Desired by Professor McFadden...................................................................................................... 70
E. Professor McFadden’s Willingness-to-Pay Values Are Likely Unreliable Because the Underlying Data Are Not Reliable. Thus, Professor Rubinfeld Cannot Rely upon Professor McFadden’s Survey to Justify His Assumptions .......................................... 73
1
I. INTRODUCTION
A. Qualifications
1. I am the Kirin Professor of Marketing at the Massachusetts Institute of Technology
(“MIT”) Sloan School of Management. The principal focus of my research and
teaching at MIT has been in the areas of marketing management, new product and
service development, consumer satisfaction, marketing research, research
methodology, and competitive marketing strategy. My research includes the
evaluation of consumer decision-making, product and service development,
customized communications designed around customers’ cognitive styles, and
determination of relative feature preferences and implicit product valuations. I have
conducted research on consumer products and services in intellectual property and
false advertising in multiple industries, including satellite and online radio and
music services as well as online retail, fashion, and luxury goods. I have evaluated
the factors that influence consumer purchasing decisions, consumer preferences, and
consumer impressions in a variety of matters related to pricing, distribution, and
advertising. I have testified about the use of conjoint analysis to measure
consumers’ willingness to pay for and willingness to buy product and service
features.
2. I have testified on matters related to my research, which includes retail products and
luxury goods. My testimony history includes, but is not limited to, matters on behalf
of SiriusXM, Dish Network, Tivo, WE Woman’s Entertainment, Louis Vuitton,
Apple Inc., Microsoft, Johnson & Johnson, and Procter & Gamble. My testimony in
these matters has addressed trademark infringement, patent infringement, and false
advertising, among other issues. In addition, I provide strategic market-research-
based consulting to numerous consumer products, technology/software, and durable
goods manufacturers, including American Airlines, Johnson & Johnson, IBM,
Procter & Gamble, Fidelity Investments, Pacific Gas & Electric Company, Ford
Motor Company, General Motors, and Chrysler.
3. I have served as Editor-in-chief of Marketing Science and have held senior editorial
positions with Management Science, the Journal of Marketing Research, and the
2
Journal of Product Innovation Management. I have received numerous awards for
excellence in research and teaching in marketing and was recognized by the
American Marketing Association with the Paul D. Converse Award for “outstanding
contributions to marketing scholarship.”1 In 2001, I received the Parlin Award,
which is a “preeminent national honor . . .[awarded for] outstanding leadership and
sustained impact on advancing the evolving profession of marketing research over
an extended period of time,” according to the American Marketing Association.2 In
2011, I received the Churchill Lifetime Achievement Award of the American
Marketing Association for contributions to marketing research. In 2013, I was
awarded the Buck Weaver Award by the Institute for Operations Research and the
Management Sciences (“INFORMS”) Society of Marketing Science (“ISMS”), for
lifetime contributions to the theory and practice of marketing science.3 I am a
Fellow of INFORMS and an Inaugural Fellow of the ISMS. I am President of the
ISMS. I have also served as a Trustee of the Marketing Science Institute.
4. I am the co-author of two textbooks, Design and Marketing of New Products and
Essentials of New Product Management, as well as more than 80 articles and
papers, including articles on various methods used to determine the importance of
product features in consumer decision-making. I have developed market research
techniques that enable marketing researchers, experts, and managers to predict the
value of individual features in both existing and hypothetical products. These
methods have been employed numerous times by academic researchers, as well as
1 “The Paul D. Converse Awards,” American Marketing Association,
https://archive.ama.org/Archive/ Community/ARC/Pages/Career/Awards/Converse.aspx (lastvisited on Feb. 15, 2015).
2 “Parlin Award 2010,” American Marketing Association,https://www.ama.org/AboutAMA/Pages/Parlin-Award.aspx (last visited on Feb. 16, 2015).
3 “Buck Weaver Award,” INFORMS, https://www.informs.org/Recognize-Excellence/ Community-Prizes-and-Awards/Marketing-Science-Society/Buck-Weaver-Award (lastvisited on Feb. 15, 2015).

3
practitioners from major international corporations. Many of these papers have been
recognized with national and international awards.4
5. My curriculum vitae is attached as Appendix A, and my testimony at deposition or
trial within the last five years is attached as Appendix B.
B. Assignment
6. I was asked by counsel for the National Association of Broadcasters and
iHeartMedia to review and comment on the Testimony of Professor Daniel L.
McFadden in the matter of Determination of Rates and Terms for Digital
Performance in Sound Recordings and Ephemeral Recordings (Web IV).5 In
particular, I have been asked to assess the scientific validity of Professor
McFadden’s survey methodology, design, and results.
7. Part of the work for this investigation was performed under my direction by others
at Analysis Group, Inc. (“AG”), an economic and litigation consulting firm
headquartered in Boston, Massachusetts, as well as Applied Marketing Science
(“AMS”), a market research and consulting firm.6 My rate of compensation is $950
4 Olivier Toubia, John R. Hauser & Duncan I. Simester,“Polyhedral Methods for Adaptive
Choice-Based Conjoint Analysis,” Journal of Marketing Research, Vol. 41 (1), Feb. 2004, at116-31; Michael Yee, Ely Dahan, John R. Hauser & James Orlin,“Greedoid-Based Non-compensatory Two-Stage Consideration-then-Choice Inference,” Marketing Science, Vol. 26(4), (2007) at 532-49.; Olivier Toubia, Duncan I. Simester, John R. Hauser & Ely Dahan Fast Polyhedral Adaptive Conjoint Estimation, Marketing Science, Vol. 22 (3), (2003), at 273-303; Ely Dahan & John R. Hauser The Virtual Customer, Journal of Product Innovation Management, Vol. 19 (5), (2002), at 332-54; Olivier Toubia, John R. Hauser & Rosanna Garcia Probabilistic Polyhedral Methods for Adaptive Choice-Based Conjoint Analysis: Theory and Application, Marketing Science, Vol. 26 (5), (2007), at 596-610.
5 Testimony of Daniel L. McFadden, In the Matter of Determination of Rates and Terms for Digital Performance in Sound Recordings and Ephemeral Recordings (Web IV), No. 14-CRB-0001-WR, Oct. 6, 2014 ( “McFadden Testimony”).
6 See Applied Marketing Science overview. http://ams-inc.com/overview-main (last visited Feb. 15, 2015). In 1989 I helped to found AMS and I retain a small amount of stock in AMS. I do not receive compensation from AMS that is directly related to this survey, nor do I participate in day-to-day management decisions. I am listed on their website as “consultant/co-founder.” I avoided speaking directly to the interviewers in this study to maintain a double-blind protocol. However, I did review the interviews to ensure that my instructions were implemented appropriately.
4
per hour. In addition, I receive compensation based on the professional fees of AG.
No compensation is contingent on the nature of my findings or on the outcome of
this litigation. Hourly rates for other staff at AG working on this matter range from
$270 to $625 per hour, depending upon the level and experience of the staff
involved.
8. Appendix C contains a list of materials relied upon in this report. I reserve the right
to continue my evaluation of the studies cited in this report and may conduct
additional research. My conclusions and opinions may be updated if additional
information is made available.
II. SUMMARY OF OPINIONS
9. Professor McFadden’s survey data are not reliable.
10. Professor McFadden’s survey relied on complicated feature descriptions that were
long, overlapping, and jargon-heavy. These descriptions were prone to confusion
and heterogeneous interpretation and required careful evaluation of respondent
understanding; an evaluation which Professor McFadden failed to implement.
11. Professor McFadden’s high dropout rate between Part A and Part B of the study
suggests that respondents found his study burdensome and/or confusing.
12. Professor McFadden attempted to implement incentive alignment, but he was not
successful in encouraging respondents to think hard and accurately and to answer
questions in a manner that reflected their true preferences. A thorough evaluative
qualitative research study of target respondents, that I performed to test the
understanding of target respondents, indicates that an unacceptable three-quarters of
these qualitative study participants found Professor McFadden’s incentive alignment
language confusing. In some instances, my qualitative study respondents explained
how they would adapt their answers to match their misunderstandings of the
instructions.
13. My qualitative study of the feature descriptions also indicates that the vast majority
of my study respondents were confused by one or more of Professor McFadden’s
feature definitions.
5
a. An analysis of interview transcripts reveals that 68 percent of my qualitative
study participants explicitly acknowledged confusion or provided interpretations
of one or more features or feature levels inconsistent with Professor McFadden’s
definitions.7 For example, 60 percent of study respondents were unable to
accurately characterize the meaning of a playlist generated by a tastemaker.
b. An evaluation of the video tapes of my qualitative interviews reveals an even
greater rate of confusion. Respondent intonation, facial expression, and body
language as well as responses to probing questions revealed confusion about
many of the features about which Professor McFadden attempted to measure
preferences. In fact, with this additional information, blind coders assessed that
confusion related to specific features ranged from 11 percent for the most well-
understood feature to 87 percent for the most confusingly presented feature. For
example, with the additional information provided through visual and auditory
cues, coders found 85 percent of qualitative study respondents were confused by
the tastemaker playlist generation description.
c. Respondents had varied and meaningfully distinct interpretations of Professor
McFadden’s feature levels, which prevents one from mapping Professor
McFadden’s results to actual services in the manner used by Professor Daniel
Rubinfeld. For example, while respondents generally understood that 1.5 to 3
minutes of commercial breaks per hour would mean that an advertisement or
advertisements would occur periodically during an hour of otherwise free
listening, there were six separate interpretations for how those 1.5 to 3 minutes
of advertisements would occur.
The rate of respondent confusion found through my qualitative study of Professor
McFadden’s survey instrument undermines any conclusions drawn by Professor McFadden
based on his respondents’ answers. The results of the qualitative study reveal widely-varied
interpretations of features and feature levels, making it exceptionally difficult, if not 7 Only 17 respondents understood all seven of Professor McFadden’s feature descriptions.
The remaining 36 out of the total 53 respondents did not understand at least one of his feature descriptions. I use the term “feature” throughout this Testimony while Professor McFadden appears to use “feature” and “attribute” interchangeably.

6
impossible, to map the results to actual services in order to evaluate actual service values
based on differentiated features. The confusing incentive-alignment language means that
Professor McFadden cannot interpret respondents’ reactions to the survey to be consistent
with choices respondents would make with respect to real music services. The survey
language — and specifically the incentive alignment language — appears to have caused
demand artifacts,8 which altered respondents’ choices, making them explicitly inconsistent
with actual consumer valuations of the features of music services. The overall confusion
rate found in my study of Professor McFadden’s survey instrument demonstrates that the
data cannot be used in a scientific or reliable manner and that interpretations based on the
data cannot be relied upon in this matter.
III. CASE BACKGROUND
A. Royalty Determination Proceedings
14. SoundExchange presented its Royalty Rate Proposal for eligible nonsubscription
transmissions, transmissions made by a new subscription service, and ephemeral
recordings for the period between 2016 and 2020 for commercial webcasters in
October 2014.9 In this submission, SoundExchange argues that “the market data
supports a ‘greater-of’ rate structure that includes a minimum per performance rate
and a percentage of the revenues of the service.”10
8 In his seminal paper from 1975, Sawyer describes demand artifact to “include all aspects of
the experiment which cause the subject to perceive, interpret, and act upon what he believes is expected or desired of him by the experimenter. According to the author, “[t]he effects of demand artifacts pose important threats to both internal and external validity.” See Alan G. Sawyer Demand Artifacts in Laboratory Experiments in Consumer Research, Journal of Consumer Research, Vol. 1 (4), (1975), at 20-30. An example of a demand artifact would be a respondent who chooses a higher priced product in a survey compared to the real world because she thinks that the interviewer expects the respondent to spend a certain amount of money. See, for example, Section VI.A of this report.
9 Introductory Memorandum to the Written Direct Statement of SoundExchange, Inc. at 1, In the Matter of Determination of Rates and Terms for Digital Performance in Sound Recordings and Ephemeral Recordings (Web IV), No. 14-CRB-0001-WR, Oct. 7, 2014, fromhere on “SoundExchange Introductory Memorandum.”
10 Id. at 3.
7
15. As part of its written direct statement submitted to the Copyright Royalty Judges,
SoundExchange engaged economist Professor Daniel L. Rubinfeld to estimate the
proposed royalty rates based on other license agreements between certain “on-
demand” services and certain record labels, adjusted for differences between “on-
demand” services that underlie those agreements and those services of statutory
webcasters.11 As part of his evaluation of the adjustments that he asserts are needed
to adjust the benchmark from the royalty rates found in agreements for “on-
demand” services as a basis for rates for statutory services, Professor Rubinfeld
relied upon a conjoint survey conducted by Professor Daniel McFadden. Based on
these survey data, Professor Rubinfeld “summed the average willingness to pay for
various attributes — no advertising, on-demand listening, mobile service, playlist
formation, catalog size, etc. — for hypothetical interactive and statutory services.”12
According to his calculations, he found “an interactivity ratio of 1.90,” which
Professor Rubinfeld asserts “indicates that the assumed interactivity ratio of 2.0
[which Professor Rubinfeld uses to adjust the on-demand service agreement rates] is
conservative.”13
B. Overview of the McFadden Survey
16. Professor McFadden conducted a “two-part” online survey “to perform an analysis
of consumer demand for internet music streaming services” and “to estimate the
relative value that consumers place on certain attributes commonly offered by music
streaming services.”14 Professor McFadden conducted his survey as an online study,
using YouGov®, a service with a prescreened online panel, the members of which
are paid for participation in surveys via a point system. Specifically, the survey was
11 Id. at 2-3.12 Corrected Testimony of Daniel L. Rubinfeld at 52. In the Matter of Determination of Royalty
Rates and Terms for Ephemeral Recording and Digital Performance of Sound Recordings (Web IV), No. 14-CRB-0001-WR, Oct. 6, 2014 (“Rubinfeld Testimony”).
13 Id.14 McFadden Testimony at 2.
8
conducted in two parts that were separated by at least two to three days.15 The first
part of the survey (“Part A”) included background questions about music streaming
habits, as well as screener questions to target “a population of the U.S. population
over the age of 13 with exclusions for respondents with household members who
were employed by an online streaming music service, a record company or other
owner of copyrighted music, or a marketing research firm.”16 After Part A,
respondents were asked to spend two to three days experimenting with streaming
music services, such as Spotify and Pandora, to familiarize themselves with the
features available.17
17. The second part of the survey (“Part B”) included a description of Professor
McFadden’s “incentive alignment;” a conjoint choice-task section, which included
definitions for key music streaming service features and a series of choice tasks
during which respondents were requested to choose their preferred music streaming
service repeatedly from different offerings; and a final section with questions on
respondents’ usage of music streaming services.
1. Incentive Alignment in the McFadden Survey
18. Professor McFadden’s survey used a method called incentive alignment to ensure
that, in Professor McFadden’s words, his survey subjects were “careful and truthful
in responding.”18 With respect to this incentive alignment, Professor McFadden
further explained that “[i]n conjoint surveys, it is important to align the respondent’s
incentives with incentives they would face in the actual market to ensure they
accurately reveal their preferences.”19 Based on this objective to accurately reveal
preferences, Professor McFadden’s survey described its specific incentive to
respondents as follows:
15 Id. at 16.16 Id. at 11.17 Id. at 16.18 Id. at 4.19 Id. at 14.
9
We offer you an incentive to participate in this survey. Here’s how it works.You will be shown 15 sets of choices of streaming music plans and you willbe asked to choose your preferred plan within each set. One of the choices ineach set will be a free plan.
We will use a computer algorithm to understand your preferences for streaming music services. We will give you a gift that has a dollar value of$30 in total. Based on your streaming music preferences in this survey, we willselect a music streaming service among the ones currently available and givethat to you, deducting its actual cost from the $30. Then we will give you theremaining amount as a VISA gift card.
For example, suppose that your preferred service costs $10 a month. Then, wewill give you this service plus the remaining amount of $20 ($30 minus $10) asa VISA gift card. If this service is actually worth more to you than $10 amonth, then you are better off with the service and the $20 VISA gift card thanyou would be with a $30 gift card. Of course, if the service is actually worthless to you than $10 a month, then you are worse off with the service and a$20 gift card than with a $30 gift card. Everyone will get at least $15 in VISAgift cards.
To guarantee that you get a streaming service that is worth more to you thanits cost, try to weigh service features and costs carefully and accurately sothat the choices you indicate tell us whether various features of streamingservice plans are truly worth their cost.
In order to be eligible to receive the incentive, you must complete the survey within one hour of starting it. You will be prevented from moving through thequestions too quickly and, if it appears that you are answering questions atrandom, you will not be eligible for the incentive.Please press the forward arrow to start the survey20
19. Incentive alignment for conjoint analysis is used increasingly in the marketing
literature. The goal of incentive alignment comprises three components: “the
respondents believe (1) it is in their best interests to think hard and tell the truth; (2)
it is, as much as feasible, in their best interests to do so; and (3) there is no way, that
is obvious to the respondents, they can improve their welfare by ‘cheating.’”21 To be
successful, however, a respondent must understand the incentive-alignment
20 Id. at App. B, B-vii (emphasis in original).21 Ding, Min, et al., “Unstructured Direct Elicitation of Decision Rules,” Journal of Marketing
Research, February 2011, pp. 116-127 at p. 120.
10
instructions, the instructions must be complete on all important elements, and they
must reflect how choices are made among real music services. If the incentive-
alignment instructions fail any of these criteria, then they can do more harm than
good.
20. In addition to the general overview of the incentive alignment, Professor McFadden
also provided respondents an example of how the actual cost of a currently available
music streaming service can be deducted from the total gift amount. The example
instructs respondents to think through how much the music streaming services
displayed in the choice exercises are actually worth to them: “If this service is
actually worth more to you than $10 a month, then you are better off with the
service and the $20 VISA gift card than you would be with a $30 gift card.”22
Although it is natural to provide an example, this particular example is worded in a
manner that asks his respondents directly to generate a willingness-to-pay for music
services. Respondents generate this willingness to pay even though, as Professor
McFadden acknowledged, sampled survey respondents “choose the free version [of
the music service] decisively over the paid version” when asked which services they
used at the time they answered questions in Part A of his study.22 Thus, Professor
McFadden’s instructions likely induced a demand artifact that undermined the
reliability of any measures of willingness-to-pay estimates that might be inferred
from the survey.
2. Conjoint Task in the McFadden Survey
21. After introducing respondents to the incentive alignment, Professor McFadden
provided respondents with names and definitions of features common to music
streaming services, introductory instructions, and 15 choice tasks evaluating
different potential music streaming services. Professor McFadden “focused on those
22 McFadden Testimony at 17. “When there is a free and paid version of the same platform,
consumers choose the free version decisively over the paid version.” This result ranges from 86-95 percent, but varies by platform: 86 percent of Spotify users used the free version, 88 percent of Slacker users, 92 percent of Songza users, 93 percent of Pandora users, 95 percent of last.fm users, and 95 percent of Rdio users.

11
features not available under the statutory license”23 in order to elicit respondents’
willingness to pay for certain features of music streaming services.
22. First, Professor McFadden provided a page that listed seven of the features
(excluding price) that would be offered in the choice tasks, along with definitions
for each feature, stating “the following definitions may be helpful.” The eighth
feature, price, was not defined on this page. In most cases, the feature names on the
definitions page differed from the feature names that were displayed to respondents
in the actual choice screens, which means that respondents not only had to process
two names for select features, but also had to invest cognitive effort if they wanted
to reconcile the remembered feature names mentioned in the feature explanation
section of the survey with the feature names shown during the conjoint task. The
features Professor McFadden defined are: (1) “Playlist generation method” (playlist
method in the choice tasks), (2) “Features available for streaming to a computer”
(on-demand track selection in the choice tasks), (3) “Ability to listen offline”
(offline listening in the choice tasks), (4) “Features available for streaming to mobile
devices” (mobile device streaming in the choice tasks), (5) “Ability to skip songs”
(skip limits in the choice tasks), (6) “Library size” (available library size in the
choice tasks), and (7) “Advertising” (also advertising in the choice tasks).24
23. Professor McFadden does not include brand as a feature in each choice task. He
states that his design “controlled for consumers’ valuation of brand—Spotify,
Pandora, or an unknown brand” by separating the choice tasks into three sets of five
choice tasks each. His survey presented brand prompts prior to the actual choice
screens.25 Specifically, following the feature definition screen, Professor McFadden
provided the following introductory instructions:
Assume that [Pandora/Spotify/one or more new services] is currently offering the plans on the following screens. Please review these plans and answer the questions that follow. If you currently have a plan with Pandora, all of your playlists, radio station, ratings and other settings will be preserved if you switch
23 Id. at 7.24 Id. at App. B, B-viii – B-ix.25 Id. at 10.
12
to a different plan.26 Assume that any features that are not described are the same for all plans.27
24. The choice tasks were broken into three sets of five choice tasks, each with a new
introductory screen varying the brand defined as “[Pandora/Spotify/one or more
new services].” The order in which the brand sets occurred was randomized by
Professor McFadden. Professor McFadden’s testimony does not provide any further
information on how he accounted for this brand control in his analyses.
25. Following the introduction, respondents were presented with 15 choice tasks. At the
top of each choice task an instruction read: “Assume that a streaming music
provider is currently offering the 3 plans shown below.” Below this instruction, a
grid displayed four columns with the following headers: Features, Plan A, Plan B,
and Plan C.28 The “Features” column contained the shortened names for the features
defined in the definition page. Each column was associated with the same brand —
which was not displayed but defined in the instructions — and contained different
options for these features. At the bottom, respondents were asked: “Among the 3
plans shown, which plan do you most prefer?”
26. The order in which the features were presented was randomized by Professor
McFadden across each respondent. The feature levels themselves were varied
subject to certain constraints. Every choice task included a free option on the far left
hand side.29 No feature available in the free plan could be unavailable or worse in a
26 In the absence of any detailed screenshots from Professor McFadden’s materials relied upon,
I assumed for my qualitative study that the instruction “If you currently have a plan with Pandora…” is updated with Spotify or the generic “new service” based on the brand set that is rotated for each respondent. Id. at App. B, B-viii.
27 Id. at App. B, B-ix.28 “If the respondent was a current subscriber to Pandora or Spotify, their current plan was
included in each of that brand’s choice sets and was indicated as such” Id. at. 9.29 “The first plan displayed in the conjoint table was always a zero subscription price (“free”)
alternative, followed by two plans with positive subscription prices, with the lower-priced plan displayed in the middle column and the more expensive plan displayed in the final column. The experimental design ensured that the quality of these plans increased along with the price. This ordering mimicked the convenient lowest-to-highest price ordering that
13
more expensive plan. Professor McFadden “respected natural restrictions on feature
combinations.”30 For instance, he notes that, “a plan could not have offline listening
features, which require a mobile device, without also having the capability of
listening to the service on such a device.”31 (The reverse was not true: a plan could
include mobile streaming options but not offer offline listening.)
3. Music Streaming Questions in the McFadden Survey
27. After the final choice task in the conjoint choice exercise was completed, Professor
McFadden’s survey asked four more questions related to music streaming services.
The first two questions assessed the duration and extent of respondents’ music
listening on Pandora and on Spotify. The third question assessed respondents’
likelihood of signing up for their favorite plan of all the paid plans in the choice
exercise, if it were offered to them. The final question of the survey assessed
respondents’ likelihood of signing up for their favorite plan of all free plans in the
choice exercise, if it were offered to them.32 Professor McFadden reports with
respect to the likelihood of subscribing to a free service that “most individuals
responded that they were somewhat or very likely to use a free service.”33
28. In the discussions that follow, I first discuss best practices for survey design and
development, and then evaluate Professor McFadden’s survey with respect to these
practices. I then describe the methodology that I used to evaluate the reliability of
consumers often encounter in sales materials produced by firms to help consumers easily compare products” Id. at 10-11.
30 Id. at. 9.31 Id.32 The four questions that Professor McFadden asked were: (1) “During the past two days, how
much (if at all) did you listen to music on Pandora?”; (2) “During the past two days, how much (if at all) did you listen to music on Spotify?”; (3) “We have asked you about many versions of paid music streaming services in this survey. If your favorite paid plan were to be offered, how likely would you be to sign up for this plan?”; and (4) “We have asked you about many versions of free music streaming services in this survey. If your favorite free plan were to be offered, how likely would you be to sign up for this plan?” Id. at App. B., B-ix, B-x).
33 Id. at 19.
14
Professor McFadden’s survey instrument and the implications of that evaluation for
the reliability and relevance of Professor McFadden’s survey for opinions in this
case.
IV. DESIGN AND DEVELOPMENT OF PROFESSOR MCFADDEN’S SURVEY
29. The basic survey methodology that Professor McFadden used is called conjoint
analysis. Conjoint analysis was introduced in marketing in 1971 and is widely used
by academics and practitioners to evaluate consumer preferences, forecast consumer
response to new products, and determine the value that consumers place on
features.34 Conjoint analysis methods vary, but, if the survey is designed well and
implemented well, most methods lead to reliable estimates. However, the analysis of
the data, and any interpretation based on the analysis, presupposes that the survey is
understood by consumers. Feature valuations are only reliable if consumers
understand the features as described and defined in the survey. My own empirical
research in this case indicates that respondents to Professor McFadden’s survey
understood neither the incentive alignment instructions nor the feature definitions
sufficiently to complete the questionnaire in a reliable and consistent manner. As a
consequence, the results from Professor McFadden’s survey are unreliable and
invalid.
30. In designing and implementing a survey, it is important to follow standard scientific
methods to ensure the reliability and validity of the data collected by the survey. If
the data are flawed, biased, or cannot be interpreted precisely, conclusions based on
the survey have to be carefully scrutinized, and, if based on unreliable data sources
such as a fundamentally confusing survey, need to be rejected. To assure that the
survey data themselves are reliable, it is critical to adopt the guidelines set forth by
market research scientists for surveys conducted for academic, commercial, and
litigation purposes. Professor McFadden appears to agree with this premise and
states: “The conditions under which conjoint analysis surveys have proven most
consistently reliable are when product features and levels considered in the 34 Id. at 4.
15
elicitations are complete, clear, and realistic.”35 He discusses some of the key design
characteristics of a scientifically reliable study in his expert testimony, including,
among other things, appropriate sample selection, use of a double-blind design, and
the rotation of answer options. Professor McFadden followed some of these
prescribed design procedures in the development of his survey instrument but
ignored others. Critically, despite conducting a limited pilot study, he did not
explore critical aspects of his survey and, hence, did not identify key areas of
confusion among consumers, which render his survey data unreliable.
31. Critical survey design elements that were implemented by Professor McFadden are:
(1) A blind design to ensure respondents’ objectivity was not affected by knowledge
of the survey’s sponsor and/or purpose of the survey;36 (2) Introductory/screener
questions to help to identify members of the target population of the survey and
determine whether respondents meet the criteria (i.e., “qualify”) for inclusion;37 and
(3) Rotation of answer options to avoid order effects.38
32. The McFadden Testimony also discussed another element of survey design:
pretests. Professor McFadden refers to his pretest interviews as a pilot survey.
Pretests are useful in accurately designing surveys in both academia and litigation
cases, particularly when the survey instrument is complex, as in the case of
Professor McFadden’s study. Pretests can be particularly important when the survey
relies on industry specific terms or jargon which may not be understood by target
respondents. A carefully conducted pretest informs the researcher whether a survey
is well-constructed and provides the basic elements to produce reliable data.
33. As Shari Diamond points out in her guide to survey research in litigation, “[t]exts on
survey research generally recommend pretests as a way to increase the likelihood
35 Id. at 4.36 Id. at 13.37 Id. at App. B, B-iv – B-vi.38 Id. at 14.

16
that questions are clear and unambiguous.”39 For example, questionnaires must use
language that respondents find easy to understand. If the questions of interest are
ambiguous or otherwise unclear, the results of the survey are likely to be distorted
due to guessing or misunderstanding on the part of the respondent. In order to
prevent such misunderstandings, to the extent possible prior to administering the
final survey, it is important to evaluate (or “pretest”) the proposed series of
questions with a small sample of “the same type of respondents who would be
eligible to participate in the full-scale survey.”40 Such pretests can also help to
assess the potential for demand artifacts (including those related to guessing the
purpose and sponsor of the study or artificially focusing on constructed willingness-
to-pay) and recall issues, and to ensure that all survey questions were understood as
intended.41
34. Professor McFadden conducted a limited pretest, which consisted of a pilot survey
combined with a very small percentage of follow-up interviews. Specifically, he
provided his survey to 52 respondents; 22 of whom agreed to be contacted with
follow-up questions. Ultimately, nine out of the 22 contacted respondents responded
to a phone interview after a certain time after the survey.42 Thus, Professor
McFadden had no information on comments that could have been made by over 80
percent of the pretest respondents. It is possible that the non-response could have
been driven by confusion or difficulty in answering the survey’s questions.
39 Diamond, Shari S., “Reference Guide on Survey Research,” in Reference Manual on
Scientific Evidence, Third Edition, Federal Judicial Center, 2011, pp. 229-276, at p. 248.40 Diamond, Shari S., “Reference Guide on Survey Research,” in Reference Manual on
Scientific Evidence, Third Edition, Federal Judicial Center, 2011, pp. 229-276, at p. 249.41 Diamond, Shari S., “Reference Guide on Survey Research,” in Reference Manual on
Scientific Evidence, Third Edition, Federal Judicial Center, 2011, pp. 229-276, at pp. 247-248.
42 For a very simple survey with non-ambiguous, relatively easy-to-understand content, a relatively small number of pretest candidates may suffice if none of the candidates indicates difficulties with understanding the survey and its instructions. However, in this case, Professor McFadden interviewed only a small percentage of the number of pilot respondents to his pilot.
17
According to Professor McFadden’s summary of his pretest, interviewers discussed
with these nine respondents (1) whether the respondents “understood the choice
tasks generally;” (2) “whether there were any attributes that they considered
important that they had not been asked about;” (3) whether they were familiar with
music streaming services; (4) and whether they became “bored with the presentation
of the choice tasks or found the survey too lengthy.”43 It is notable that Professor
McFadden does not state explicitly that the respondents understood the features of
the music services or that they understood the incentive-alignment instructions.
Professor McFadden did not provide detailed information on follow-up questions,
answers, or comments that were part of the interview with the nine respondents.44
35. According to his testimony, Professor McFadden “simplified the description and
number of levels of the playlist attributes and simplified the language about
incentives.”45 One can assume such changes were in response to respondents
experiencing trouble understanding the playlist feature and the incentive alignment.
Professor McFadden provides no evidence, however, that his changes to the survey
were pretested or that the changes were sufficient to remove respondent confusion.
My qualitative study suggests that the changes were not adequate and that there
remained substantial confusion among respondents.
43 McFadden Testimony at 15.44 Pretest interviews need not be recorded. The survey expert can prepare a summary of what
was learned from the pretests and what changes were made as a result. However, the survey expert should be able to defend the pretest and be confident that, were someone else to do a parallel and unbiased pretest, the auditing researcher would not find confusion.
45 McFadden Testimony at 15-16. Based on information provided by Professor McFadden, he also made substantial edits to the language of the on-demand track selection and mobile device streaming definitions as well as minor edits to all feature definitions and the names of the features as listed on the definitions page. See “Pilot Survey Questions,” SNDEX0018484.txt.

18
V. THE RESULTS OF PROFESSOR MCFADDEN’S LIMITED PRETEST, CONFUSING FEATURE DESCRIPTIONS, AND HIGH DROP-OUT RATES INDICATE THE SURVEY INSTRUMENT LIKELY PROVIDED DATA THAT WERE NOT RELIABLE
A. Confusing Feature Descriptions
36. When reviewing Professor McFadden’s survey implementation, I discovered that
several of his features were described using potentially hard-to-understand
language, were referred to inconsistently throughout the survey, appeared to be
partially overlapping in their descriptions, or were potentially incomplete. Such
feature descriptions may have caused confusion for respondents or left substantial
room for interpretation.
37. While some of Professor McFadden’s features were generally self-explanatory,
other features were complicated and described in potentially difficult-to-understand
language. For example, Professor McFadden’s description of the playlist method is
relatively brief but uses terms and ideas that may be unfamiliar to average
consumers. Such terms include “curated,” “music tastemakers,” and “computer
algorithm.”46 These terms are industry-specific terms that may seem easy to
understand to someone who has carefully evaluated service options and features, or
studied streaming music services, but may be beyond the vocabulary of a casual
streaming user. I assessed Professor McFadden’s description of playlist method
using the Flesch Reading Ease scale and the Flesch-Kincaid Grade Level. These
metrics are commonly relied upon to assess the readability of a fragment of text or a
document.47 Professor McFadden’s passage on music tastemakers scores a 13.2 on
the Flesch Reading Ease scale. This result is concerning, as a score below 30 on the
Flesch Reading Ease scale indicates that the text fragment is best understood by
university graduates, which means that individuals with a lower education level are
less likely to understand and comprehend the same text. That same passage on
music tastemakers scores a 21.1 on the Flesch-Kincaid Grade Level, a measure that
46 McFadden Testimony, Appendix B, p. B-viii.47 Zamanian, Mostafa and Pooneh Heydari, “Readability of Texts: State of the Art,” Theory and
Practice in Language Studies, 2(1), January 2012, pp. 43-53, at p. 44.
19
relates readability to a particular US grade level; a score of 21 indicates a level of
difficulty of the 21st grade (equivalent to graduate education). Although language
complexity and complex instructions do not make a survey per se unreliable, it is a
cause for concern and normally indicates the need for a thorough pretest of the
survey to establish ease of understanding among typical survey respondents. If only
a small fraction of the target population can comprehend descriptions that are
crucial to understanding the survey and, more specifically, the valuation of a feature
in a conjoint analysis, then the results from the conjoint study are likely to be
unreliable. The preferences of respondents cannot be reliably assessed if the
respondents do not understand the feature for which their preferences are intended
to be measured.
38. Another reason for concern is that Professor McFadden referred to features
inconsistently throughout the survey. Professor McFadden defined all features in the
introductory screens, but referred to these features during the choice tasks by using a
shorthand that was not defined as part of the overall definitions.48,49 In some cases,
this shorthand could be tied back to the definitions easily (e.g., “library size” vs.
“available library size”), but in others the undefined shorthand could have caused
additional confusion or bias for respondents. The feature “ability to skip tracks” on
the definitions page is listed as “skip limits” on the choice tasks. This changes the
framing of the feature from a positive connotation (an ability to skip) to a negative
connotation (a limit to the ability to skip). Such framing could affect the valuation
of this feature.50
48 Unless otherwise noted, throughout this report, I will refer to features using the shorthand
versions from the choice task screens.49 Sometimes feature descriptions are long or presented with videos, animations, or pictures. In
this case, the survey may use a shorthand (or icons) to represent the features. The shorthand simplifies the choice screens. However, whenever shorthand is used, the shorthand must be explained to the respondent and pretests must ensure that the respondent can reliably interpret the choice screens using the shorthand. In such cases, it is common to make it easy for the respondent to refer back to the original descriptions at any point in the survey.
50 Tversky, Amos and Daniel Kahneman, “The Framing of Decisions and the Psychology of Choice,” Science, Vol. 211(4481), 1981, pp. 453-458, at p. 456. “Outcomes are commonly
20
39. Other features had little relationship between their names: for example, “features
available for streaming to a computer” as defined on the definitions page is referred
to as “on-demand track selection” in the choice tasks. This name is so different from
the name in the definitions that it may be very difficult for respondents to relate the
two concepts. Moreover, the ability to select tracks on demand is only one of the
possible options of this feature. In fact, Professor McFadden sets “album, artist, and
song selection on demand” as the highest-priced level for this feature in his choice
tasks, thus framing it as the premium option. Referring to the feature broadly as “on-
demand track selection” rather than the more neutral “features available for
streaming to a computer” reinforces the premium character and potentially changes
the valuation of the feature, potentially biasing responses in favor of that level of
functionality relative to neutrally named features.
40. Aside from concerns regarding the framing of features, the existence of two names
means additional cognitive load for respondents. A potential consequence of
additional cognitive load and cognitive depletion may, in fact, be frustration, lack of
attention, and the tendency to abandon the survey. If some respondents abandon the
survey because they find the features confusing, such abandonment could skew the
sample towards people who are more expert and enthusiastic about the topic at
hand. Such respondents could very well value these features differently than non-
expert, less enthusiastic respondents. Confusion, and potentially increased cognitive
effort, can also lead to changes in choice behavior. For example, respondents may
spend less time trading off features and instead make very quick, superficial choices
that do not reflect their true underlying preferences.
41. In addition, some features had similar and/or overlapping options. For example, the
features on-demand track selection and mobile device streaming displayed very
similar options. Both features included options for “playlists generated by the
service” and “album, artist, and song selection on demand.” This is liable to cause
perceived as positive or negative in relation to a reference outcome that is judged neutral. Variations of the reference point can therefore determine whether a given outcome is evaluated as a gain or as a loss.” In other words, according to the authors, specific framing can potentially “reverse the preference order between options.”
21
confusion. The mere similarity between these different features could have caused
significant confusion among respondents and may have led them to mix up features
during their trade-off and product evaluation process, which, in turn, would affect
the estimation of the value of these features using a statistical model. Not only did
these features have overlapping options, but both features offered the option
“playlists generated by the service,” which itself potentially overlaps with the
playlist method feature. Professor McFadden did not specify or clarify whether these
playlists were generated in the same manner as specified in the playlist method
feature for any given plan. Respondents could interpret the vague feature
descriptions in many different ways, making it virtually impossible to compare any
willingness to pay estimates among features or among respondents.
B. Feature Descriptions Allowing Varied and Substantially Distinct
Interpretations
42. Other feature descriptions potentially suffered from a lack of specificity that could
affect the value placed on the feature by respondents. If this happened, the lack of
specificity would make any interpretation of results unreliable in the context of real
music streaming services. For example, features such as offline listening were
described as simple yes/no features without further details on potentially important
feature levels that are inherent to the feature and cannot be considered self-
explanatory. For example, it likely matters whether the ability to listen to songs
offline during a flight includes 20, 100, or 1,000 songs.
43. Moreover, Professor McFadden’s Testimony notes that offline listening is only
applicable when using a mobile device,51 but this is never specified in any feature
descriptions or instructions in his survey instrument. His respondents were not
informed of this restriction, and may have tried to reconcile the feature with their
computer-based streaming behavior.
51 McFadden Testimony at 9.

22
44. In addition, even features that did seem self-explanatory at the first glance were
missing a depth of information that is likely necessary for consumers’ decision-
making processes. Consider, for example, the “feature” of having to listen to
advertising. For some respondents, the possibility to listen to 1.5 to 3 minutes of ads
per hour in 2 blocks is much less burdensome than being interrupted 10 times for a
total of 1.5 to 3 minutes; for others, the relationship might be reversed.
Consequently, the feature 1.5 to 3 minutes of ads per hour is likely to generate very
different utilities across consumers for two reasons. Similarly, consider different
interpretations of the word “tastemaker.” If a consumer is encouraged to interpret a
tastemaker to be a celebrity such as Beyoncé, the respondent may receive value
from the fact that the respondent can participate in the celebrity’s taste. If, however,
the same respondent is encouraged to interpret a tastemaker as an unspecified
person who works at the streaming service, the respondent may perceive a different
value because the respondent does not participate in the celebrity’s taste. One
cannot know which interpretation the respondent had in mind: Without knowledge
of which respondents interpreted tastemaker either way, it is not possible to reliably
estimate respondents’ valuations and match their preferences to the actual features
in the marketplace. Perhaps the survey was relying on terms of art that are known in
an industry, but there is no reason that consumers would be experts in such terms of
art. Consumers rely on their own language, which is why good survey practice
requires a survey designer to first determine the words and phrases that consumers
use to describe features and then use those words and phrases in the same manner in
the survey.52
45. For people who interpret the feature in (almost) the exact same way, Professor
McFadden can determine to what extent their preferences, and therefore their
underlying feature valuations, differ from one another. Professor McFadden’s
statistical model relies on determining the true variation in feature valuations among
consumers, provided that the premise of a singular interpretation of the feature or
feature level holds true. If, however, respondents interpret features or feature levels 52 Payne, Stanley L., The Art of Asking Questions, Princeton University Press, 1980.
23
differently, then the estimates of feature valuation, and the manner in which such
valuation vary among consumers, is confounded with differing interpretations of the
meanings of features. Such confounding renders the statistical model unreliable. The
statistical model cannot determine whether the variation in utilities is caused by true
preference differences or simply by distinct interpretations of the feature definition.
When there are distinct interpretations of a feature, the estimated feature valuation
might be more strongly driven by differences in the interpretation of features rather
than by valuations of those features.53
C. Professor McFadden’s Final Feature Definitions and Incentive
Alignment Were Not Tested
46. If respondents indicate significant problems with a survey in a pretest, then it is best
practices to modify the survey and retest the survey. When problems are significant,
it may be useful to continue pretesting until respondents no longer indicate any
noteworthy problems with the survey. Professor McFadden found problems,
attempted corrections, but did not pretest his corrections.
47. Based on a review of his production materials, Professor McFadden altered the
definitions of every single feature in his study, changed the names of all but one of
his features, and changed both the language and the mechanism of the incentive
alignment between the end of his pretest and the actual launch of his survey. In his
testimony, Professor McFadden does not explain these substantial changes.
48. Professor McFadden claims that he “simplified the description and number of levels
of the playlist attributes and simplified the language about incentives.”54 An
example of what he may have meant by simplification is the playlist method feature.
After his pretest, Professor McFadden apparently reduced the three elements in his
feature levels to two elements, dropping “playlists customized by your votes and
53 Slight variations in interpretations of feature descriptions should be expected and can be
considered measurement noise. When there is slight variation, the results from the statistical models should not be affected in a substantial manner. If, however, the variation is substantial, then the statistical estimates cannot be interpreted reliably.
54 McFadden Testimony at 15-16.

24
preferences of users with similar tastes, or playlists customized using your votes and
song attributes” in favor of “[playlists] generated by a computer algorithm
customized by the user’s preferences or feedback (often provided by ‘like’ or
‘dislike’ votes).” As my qualitative study of Professor McFadden’s survey
instrument demonstrates, the resulting change did not eliminate substantial
confusion.
49. While attempting to simplify the incentive alignment language, Professor McFadden
actually added substantial content to his description of the incentive alignment. The
pilot version of his incentive alignment was much shorter and, rather than
suggesting the respondent would receive a customized plan, instead claimed that the
respondent would randomly be selected to receive “one of two gifts: (1) a $30 VISA
gift card or (2) a $30 gift card to one of several possible popular music streaming
services. [The respondent’s] streaming music preferences [would] determine the
chance that [the respondent would] receive each of the two gifts.”55 This incentive
structure is different from the incentive alignment presented in his final survey,
which involves deducting the cost of a selected music streaming service gift card
from a second gift card with a cash value. Professor McFadden also added the
example of a hypothetical respondent whose “preferred service costs $10 a month”56
after conducting his limited pretest. This new example included the accompanying
discussion of whether the respondent did or did not value the service more than $10
and, thus, whether they would or would not be better off with the deal than with a
$30 VISA gift card. This language is technical and includes economic concepts like
willingness-to-pay and evaluating but-for options. Without careful wording and
55 “We will choose at random between one of two gifts: (1) a $30 VISA gift card, or (2) a $30
gift card to one of several possible popular music streaming services. Your streaming music preferences will determine the chance that you receive each of the two gifts” (“Pilot Survey Questions,” SNDEX0018484.txt).
56 McFadden Testimony, App. B, B-vii.
25
extensive pretesting, such concepts may be difficult to explain to typical survey
respondents.57
50. In addition to the changes that Professor McFadden explicitly mentioned in his
testimony, he also changed the names of all of the features except for advertising,
without changing the names in the accompanying choice tasks. In his pilot survey,
the feature names on Professor McFadden’s definitions page matched the names in
his choice tasks, but in his final survey most of these names were not matched.
51. Finally, Professor McFadden added or altered language in all of his remaining
feature descriptions. In some cases the changes were minor: for offline listening, he
changed the name from “offline listening” to “ability to listen offline” and the
definition from “users can download and listen to a selection of the service’s music
when internet access is unavailable” to “ability to download and listen to a selection
of the service’s music when internet access is unavailable.” In other cases, the
changes were more substantial. He changed the name of “on-demand track
selection” to “features available for streaming to a computer” and completely
reworked the definition, adding a new sentence and altering the existing sentence
substantially. The pilot survey definition was “Users can select a particular track
(songs) to hear on-demand, users can listen to an entire album on-demand, and users
can create their own playlists.” The new definition starts with a new sentence and
alters the language to the existing sentence: “Using desktop software or a web
interface from a computer, users may be able to access playlists generated by the
57 In addition to a number of other changes, Professor McFadden added two complete
paragraphs: “For example, suppose that your preferred service costs $10 a month. Then, we will give you this service plus the remaining amount of $20 ($30 minus $10) as a VISA giftcard. If this service is actually worth more to you than $10 a month, then you are better off with the service and the $20 VISA gift card than you would be with a $30 gift card. Of course, if the service is actually worth less to you than $10 a month, then you are worse off with the service and a $20 gift card than with a $30 gift card. Everyone will get at least $15 in VISA gift cards.
To guarantee that you get a streaming service that is worth more to you than its cost, try to weigh service features and costs carefully and accurately so that the choices you indicate tell us whether various features of streaming service plans are truly worth their cost.” See McFadden Testimony, App. B, B-vii, and “Pilot Survey Questions,” SNDEX0018484.txt.
26
streaming service and/or play specific tracks ‘on demand.’ With ‘on demand’
features, users can listen to particular tracks (songs) or an entire album on request
and users can create their own playlists.”58
52. Professor McFadden made substantial changes to his feature definitions and
incentive alignment process and language, all of which are crucial aspects of his
survey. In cases with complex instructions and language, with such extensive
changes following a pretest, it is best practice to re-test the survey to assess whether
the new language is understandable to respondents. I have seen no evidence that
Professor McFadden has done such retesting.
D. Professor McFadden’s Pretest Appears To Have Indicated that Respondents Had Trouble Understanding Key Aspects of the Survey
53. Of the 52 respondents who took Professor McFadden’s pilot survey, almost 60
percent did not wish to be re-contacted. Ultimately, less than 20 percent of his pilot
respondents were interviewed as part of his pretest. It is possible that these self-
selected interviewed respondents were exactly the respondents who were less bored
with the survey than those who refused further contact. If this were the case, then
one cannot project to the universe of survey respondents any statements that the
respondents were not bored with the survey.59 A more appropriate methodology for
recruiting pretest participants is to formally invite people to participate in a pretest
process before they embark on the pilot study. Such an approach would avoid
potentially-systematic nonresponse bias that arises from attempting to contact
respondents after the pretest.
54. Given the large number of changes that Professor McFadden implemented
following his pilot study, even these respondents who agreed to be contacted must
have indicated sufficient difficulty with the survey to prompt these changes to the
survey.
58 See McFadden Testimony, App. B, B-viii, and “Pilot Survey Questions,”
SNDEX0018484.txt.59 Olson, Kristen M., “Survey Participation, Nonresponse Bias, Measurement Error Bias, and
Total Bias,” Public Opinion Quarterly, 70(5), 2006, pp. 737-758.
27
55. None of the evidence provided by Professor McFadden after his pilot study
addresses potentially fundamental issues of survey construction, such as the difficult
and likely confusion-inducing language describing the incentive alignment and
feature characteristics.
E. High Drop-out Rate of Respondents in the McFadden Survey
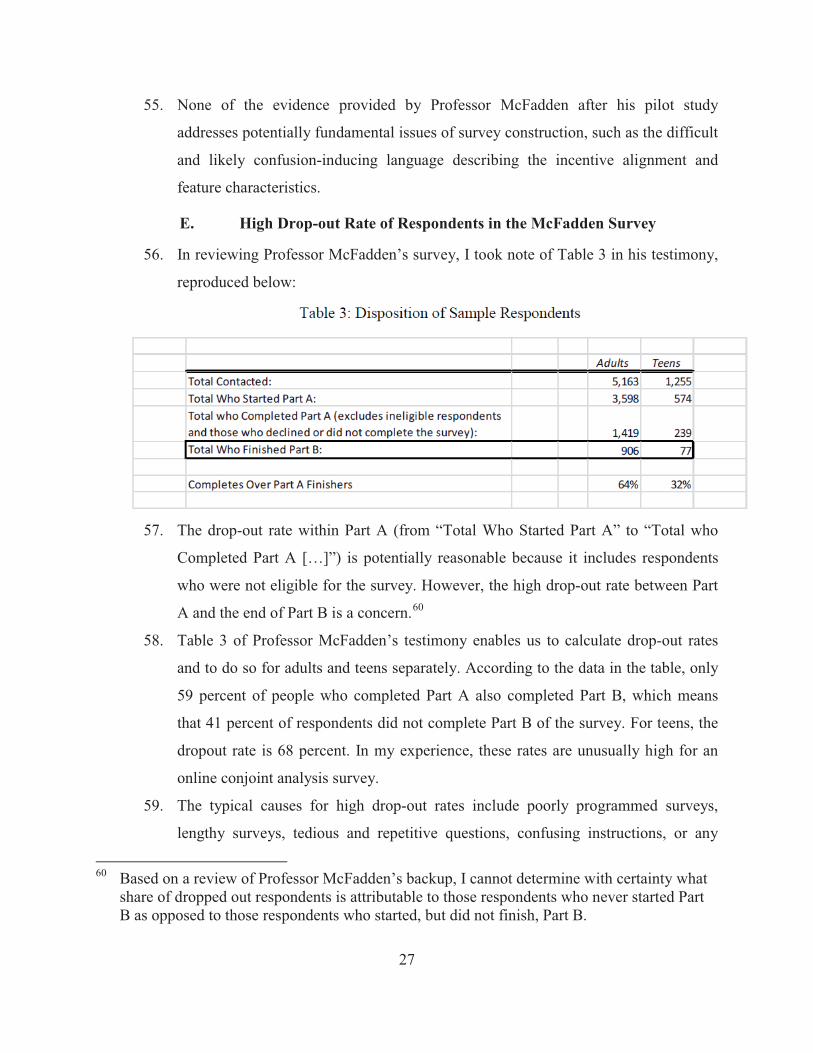
56. In reviewing Professor McFadden’s survey, I took note of Table 3 in his testimony,
reproduced below:
57. The drop-out rate within Part A (from “Total Who Started Part A” to “Total who
Completed Part A […]”) is potentially reasonable because it includes respondents
who were not eligible for the survey. However, the high drop-out rate between Part
A and the end of Part B is a concern.60
58. Table 3 of Professor McFadden’s testimony enables us to calculate drop-out rates
and to do so for adults and teens separately. According to the data in the table, only
59 percent of people who completed Part A also completed Part B, which means
that 41 percent of respondents did not complete Part B of the survey. For teens, the
dropout rate is 68 percent. In my experience, these rates are unusually high for an
online conjoint analysis survey.
59. The typical causes for high drop-out rates include poorly programmed surveys,
lengthy surveys, tedious and repetitive questions, confusing instructions, or any
60 Based on a review of Professor McFadden’s backup, I cannot determine with certainty what
share of dropped out respondents is attributable to those respondents who never started Part B as opposed to those respondents who started, but did not finish, Part B.

28
difficulties that increase cognitive load to a point where respondents would rather
abandon the survey than finish it.61 The high drop-out rates in Professor
McFadden’s survey suggest that one or more of these problems occurred. In best
practice, a carefully conducted pretest should have identified any problems that
were causing the high drop-out rates. The pretest should have led to changes in the
survey to reduce drop-out rates. If respondents are dropping out because they do not
understand the feature descriptions and/or the incentive-alignment instructions, then
the survey completers are a self-selected sample that does not represent the
population of music-streaming consumers. My qualitative study, akin to a more
complete pretest, of Professor McFadden’s survey demonstrates that there was a
substantial amount of confusion, which is consistent with the high dropout rates
observed in Professor McFadden’s survey.
VI. ASSESSING PROFESSOR MCFADDEN’S SURVEY INSTRUMENT USING AN EVALUATIVE QUALITATIVE STUDY60. To better understand whether and to what extent respondents were confused by, or
did not understand, Professor McFadden’s survey, I conducted a thorough
evaluative qualitative study of the survey instructions and questions using
videotaped in-person interviews (See Exhibits 1.a and 1.b for examples).62 At my
direction, an experienced, professional marketing research firm, Applied Marketing
Science (“AMS”), presented Professor McFadden’s survey questions to a set of 53
respondents in the Boston Metro region and Denver, CO. I replicated Professor
McFadden’s survey questions using standard online methods because survey
computer code was not provided by Professor McFadden.63 My qualitative study
61 Diamond, Shari S., “Reference Guide on Survey Research,” in Reference Manual on
Scientific Evidence, Third Edition, Federal Judicial Center, 2011, pp. 229-276, at pp. 245-246.
62 All videotapes and associated interview transcripts are included in my production materials.63 Under my guidance, AMS replicated Professor McFadden’s survey based on Appendix B in
the McFadden Testimony, and a mock-up or screenshot of one choice exercise as displayed on p. 10 of the McFadden Testimony. I did not receive any materials with further detail on the construction of Professor McFadden’s survey. It is my understanding that Counsel for

29
respondents, who were selected using the same screening criteria as Professor
McFadden’s respondents, took Part A of the survey on a computer at their home and
took Part B on a computer on-site. They were then interviewed by double-blind
interviewers on-site according to a qualitative research questionnaire that I designed
(included as Appendix D). More specifically, respondents were asked about their
understanding of the gift-card incentive (incentive alignment), their understanding
of the various features in the survey, and their ease or difficulty in navigating the
survey. Unlike in Professor McFadden’s pretest, where he was only able to
interview a small portion of his test respondents, I was able to interview all of the 53
participants who took Part B of Professor McFadden’s study as part of my
qualitative study, avoiding any potential drop-out bias in responses.64
61. My qualitative study followed Professor McFadden’s survey methodology as
closely as feasible: it included Professor McFadden’s original screening survey, the
two-to-three day waiting period, and a full replication of his “Part B” survey,
including the conjoint choice tasks. Screenshots of my replication are included as
Appendix E. At my direction, AMS worked with Fieldwork, a market research firm
that specializes in recruiting and provides interview facilities,65 to interview 53
respondents who finished the first portion of Professor McFadden’s survey and then
came to research facilities for the second portion of the survey. Of these 53
qualitative study candidates, 29 came to Waltham (near Boston) and 24 came to
Denver. Similar to Professor McFadden’s YouGov® panel, these respondents were
SoundExchange indicated that all materials necessary to replicate Professor McFadden’s survey had been provided as part of their production.
64 11 additional respondents started Part A of Professor McFadden’s survey in connection with my qualitative study. These respondents did not participate in Part B and were not interviewed.
65 Fieldwork’s rigorous recruiting process includes quality checks such as constant database updates, tracking for participation and undesirable respondents, extensively trainingrecruiters for high recruiting integrity, careful screening processes, commitment to the MRA standards of ethics in data collection, and numerous other techniques to ensure a high quality of recruited respondents. For further information, see “Fieldwork Recruiting,” http://www.fieldwork.com/recruiting, (last visited on Feb. 15, 2015).
30
pre-screened and reimbursed for their time. Because this study asked people to visit
the interview facility, respondents were offered $100 in compensation for their time
and efforts, in addition to the $30 gift-card incentive offered by Professor
McFadden’s survey.66
62. My qualitative study respondents took Part B of the online survey on laptop
computers provided by AMS at the interview site, with interviewers following along
on a separate laptop synchronized to the first. The interviewer was provided with a
script of questions and instructions for how to conduct the interview.
63. It is important when conducting qualitative research to ensure that research be done
carefully and in an unbiased manner. I took several measures to ensure that this was
the case for my qualitative study. Following standard scientific protocol, my
qualitative study was conducted as a double-blind study: AMS provided six
experienced interviewers who were not informed of the purpose of the qualitative
study, and instead were instructed to “pretest” a general market research survey.
Supervisors to the interviewers were similarly kept blind to the purpose, the
sponsor, and the litigation parties involved in this case in order to avoid any demand
artifacts. Similar to the interviewers conducting the study, recruited qualitative study
candidates were informed that they were participating in a general market research
survey. The interview script was carefully constructed to include double-sided
questions that did not suggest a correct or preferred answer (e.g., “Do you
understand or do you not understand…”). Interviewers were instructed not to
provide confirming responses such as “correct” or “yes” after respondents answered
questions and to assure respondents that there were no right or wrong answers.
64. When asked about features, instructions, or the choice tasks in the replicated survey,
study respondents were allowed to go back to prior pages of the questionnaire by
using the back button in the web browser. Therefore, qualitative study respondents
had the opportunity to reflect on a question — and the survey — before making 66 It is standard practice to provide monetary incentive to respond to surveys, aside from any
incentive alignment. Professor McFadden’s YouGov® survey also provided monetary reward in the form of YouGov® “points” which can be redeemed for gift cards or merchandise.
31
statements to the interviewer. The advantage of this method is twofold. First, the
qualitative study respondents were given the time to literally “re-view” details of the
survey, providing them time to digest the information. Second, this method puts an
emphasis on providing true thoughts rather than on remembering correctly.
65. The transcripts and videos of my qualitative study interviews are considered
qualitative data. There is a long tradition in marketing and other social sciences of
analyzing qualitative data and, as a result, methodologies have been developed to
assure independent and unbiased analyses of qualitative data.
First, qualitative data require human judgment. Information is
communicated by the qualitative study respondents by their words
expressed in an open-ended (non-categorical) manner. Information is also
expressed by intonation, facial expression, and body language. Thus, we
need human “judges” to interpret, or at least categorize, the data.
Second, neither I nor Professor McFadden are blind to the hypotheses of
the “pretest.” Thus, we need the judges to be independent and blind to the
hypotheses of the study.
Third, it is the nature of qualitative data that some quotes can be “cherry-
picked” out of context. We must take steps to prevent such cherry-picking.
The independent-judging methodology provides the means to identify
representative quotes. Specifically, after the judges establish categories of
responses and assign respondent responses to those categories, we can
choose examples in the categories to illustrate the categorization as long as
we also report how often respondent responses fall into these categories.
For example, if 60 percent of respondent responses fall into category “A,”
we can reasonably give an example quote from that category and indicate
that the quote is typical of 60 percent of respondents. By the same token, if
only one percent of respondent responses fall into category “B,” we, as
research scientists, can provide the quote from the 1 percent of
respondents, but we must be careful to not represent the quote as applying
to a larger fraction or to respondents in general.
32
Thus, following scientific procedures from the social sciences, I implemented a
double-blind, independent judges methodology. Although I personally reviewed
representative videos to assure that the interviewers and judges followed the
instructions I set forth scientifically, the assignment of respondent responses to
categories is based on the result of the judging methodology rather than my not-
blind-to-the-hypotheses judgments. These steps assure that I have not biased the
results in any way.
66. Under my instruction, temporary and permanent employees at Analysis Group, who
were blind to my assignment in this case as a rebuttal expert and to the
sponsor/author of the underlying survey instrument, were asked to review the videos
and transcripts from my qualitative study. Two blind-to-the-purpose coders were
asked to review the transcripts for all 53 respondents and group similar responses
together. For any given feature, the coders separately reviewed all answers to
probing questions on the meaning of the feature and created categories based on the
different ways the respondents understood the feature. If all respondents understood
in the same way, only one category would be created. If, however, at least one
respondent interpreted the feature substantially differently from the other
respondents, there would be two or more categories of response. No instruction was
given regarding the “correct” number of categories. Based on the objective of
focusing on the verbatim answers in order to allow for reasonable grouping,
wherever possible, responses were put into categories. A respondent who indicated
an element of confusion after several probing questions could still be placed into a
category of a correct definition if his verbatim answers contained recognizable
thoughts that reflected the intended meaning of Professor McFadden’s definitions.
67. My qualitative study determined that the overall methodology of a conjoint study
(i.e., the choice tasks) was clear to respondents and generally well-suited to evaluate
consumer preferences. For example, one respondent stated:

33
A: I like that it had all three plans laid out, and it had different amounts of prices.67
Another respondent answered:Q: How easy or difficult did you find this exercise to answer?A: Easy. . .It’s simply laid out, so it’s easy to read all of it.68
A third respondent reflected the same opinion:Q: How easy or difficult did you find this exercise to answer?A: It was pretty easy. . .The plans are laid out very well. Very easy to compare
the three. That made it simple, just interpretive comparing.69
68. My qualitative study also determined, however, that many of Professor McFadden’s
feature descriptions were confusing to survey respondents and that only a small
fraction of respondents understood the incentive alignment instructions.
A. Professor McFadden’s Incentive Alignment Was Confusing
69. Professor McFadden states that he introduced an incentive alignment in his survey
because “it is important to align the respondent’s incentives with incentives they
would face in the actual market to ensure they accurately reveal their preferences.”70
Incentive alignment is increasingly common when employing a conjoint survey,
when feasible and when the instructions are understood by the respondents.71 I have
used incentive-aligned conjoint-analysis surveys in both my academic and
consulting research. I am quite aware of both the advantages of incentive alignment
and the challenges of identifying careful phrasing that aligns incentives for ordinary
consumers.
67 Combined transcripts from qualitative research interviews conducted by Applied Marketing
Science on January 14-15, 2015, from here on “Transcripts,” p. 17, Alexandra F.68 Transcripts, p. 74, Bradley K.69 Transcripts, p. 135, Chad H.70 McFadden Testimony at 14.71 Min Ding, An Incentive-Aligned Mechanism for Conjoint Analysis, Journal of Marketing
Research, Vol. 44, (2007), pp. 214–23, at 215.

34
1. Professor McFadden’s Incentive Alignment Did Not Account for Common Pitfalls of Incentive Alignment
70. Incentive alignment is an increasingly common addition to conjoint analyses in
certain settings, particularly when the product or service tested can be believably
custom-tailored to a respondent’s preferences. If, however, respondents
misunderstand or misinterpret the incentive offered to them, inaccuracies can be
increased, potentially rendering the study unreliable. If incentive alignment causes
confusion and/or causes the respondent to make choices that systematically deviate
from the choices the respondent would have made in the marketplace, then it can be
counterproductive. Therefore, it is important for a researcher to pretest the incentive
alignment carefully and, if confusion appears to exist, to reword the incentive
alignment instructions until there are no signs of confusion and no
counterproductive incentives that encourage respondents to deviate from their true
preferences.
71. In implementing his incentive alignment, Professor McFadden cites a seminal paper
on incentive alignment in conjoint analysis, “An Incentive-Aligned Mechanism for
Conjoint Analysis” by Min Ding to support incentive alignment.72, 73 Nonetheless,
Professor McFadden’s survey does not account for many of the specific warnings
and potential pitfalls discussed in Ding’s paper. In the following paragraphs I
discuss some of these warnings and potential pitfalls.
72. Believability. Properly constructed incentive alignment mimics real world decisions
by convincing respondents that their choices in the survey have real consequences.
Respondents are promised a gift that is customized to their preferences based on the
choices they make in the survey: in this way, the choices respondents make have a
clear and direct consequence. Ding offered respondents an iPod along with a
customized “package” of accessories. These accessories were all available on the
72 McFadden Testimony at 14. Min Ding, An Incentive-Aligned Mechanism for Conjoint
Analysis, Journal of Marketing Research, Vol. 44, (2007), pp. 214–23, at 215.73 I have co-authored papers with Min Ding in which we used incentive alignment. I have
discussed the challenges of incentive-alignment at length with Min Ding.
35
Apple website and were often sold in different package bundles.74 Thus, the idea of
receiving one’s personal custom bundle was believable and helped the incentive
alignment to work. Professor McFadden’s incentive, however, is not as easily
customizable. He did not pretest to establish whether or not respondents, customized
based on their answers to the survey, believed that their favorite music streaming
service could be identified from among existing services.
73. Professor McFadden also instructed respondents to assume that, if they are a current
subscriber, “all of [their] playlists, radio station, ratings and other settings will be
preserved if [they] switch to a different plan.”75 This is a reasonable assumption if
respondents switch within services; however, if their choices indicate a preference
for a service to which they do not currently subscribe, they may not believe that
these preferences would transfer. 76
74. Familiarity. In order to reasonably answer a survey, respondents must be familiar
with the product features at issue. If they are too familiar with the products, they
may disregard instructions given to them or overwrite them with their own outside
knowledge. Ding specifically chooses a newly launched iPod Shuffle product to test
his incentive alignment in order to avoid this potential familiarity bias.77 Professor
McFadden does not account for the issue of familiarity being dominant enough to
overwrite his feature descriptions. My qualitative study, however, provides
numerous examples where respondents interpret features either differently than
intended by Professor McFadden or supplement their understanding with their own
feature details as based on their own experiences with Spotify or Pandora. For
74 Min Ding, An Incentive-Aligned Mechanism for Conjoint Analysis, Journal of Marketing
Research, Vol. 44, 214–23, (2007), at 217.75 McFadden Testimony at App. B, B-viii.76 One respondent said, “I thought it meant that my playlists or my radio stations on Pandora
would show up and then I would go from there, but I don’t think that’s what it’s saying. […] I think it would have been a little more helpful to clarify if I’m going to be logging into my Pandora account, or it’s just going to be as an example.” (Transcripts, p. 448, Julianna J.)
77 Min Ding, An Incentive-Aligned Mechanism for Conjoint Analysis, Journal of Marketing Research, Vol. 44, 214–23, (2007), at 217.

36
example, because Professor McFadden did not specify the details of advertising,
such as how often advertisement blocks occur, several respondents based their
understanding of this feature on their previous experiences with different music
streaming services:Q: How many blocks of advertisements did you assume to be played when you
read “1.5 to 3 minute of ads per hour”? A: I figured that would be at least 15 seconds an ad, so if they did one ad at a
time, then—I think it was 30 seconds for Spotify, though—not Spotify, Pandora. I’m going to say a good ad is 15 seconds. Four a minute, 6 every minute and a half, so it’d be 6 to 12.78
Or:Q: Could you tell me in your own words what it means when there are 1.5 to 3
minutes of ads per hour? A: One and a half to 3 minutes of ads per hour seems pretty small, when an
hour is 60 minutes. That’s a very small fraction of an hour. I wouldn’t find that—I’m not sure if that’s currently what Pandora does, since I’ve used Pandora for years. Here and there, having a 30-second ad—that’s just like five to ten, if they’re 30 seconds. I think I did my math wrong. One to five minutes, I don’t think that’s—yeah, five, six ads, that doesn’t bother me in an hour. It’s such a small fraction.79
75. As I will discuss in more detail in Section VI.E of this report, any substantial
deviations from the intended meaning of the features create unreliable data that
yield invalid statistical results.
76. Endowment. Incentive alignment attempts to mimic real world choices, but
respondents are faced with a minor windfall in the form of their payment, or as
Professor McFadden puts it, their “gift.”80 Ding notes that this may create a situation
in which respondents “behave differently than they would in real life because of this
potential gain.”81 This limitation is difficult to avoid in any incentive aligned study,
and, in some cases, does not compromise incentive alignment. However, because of
the endowment effect any specific incentive alignment must be carefully pretested
78 Transcripts, p. 242, Edward B.79 Transcripts, p. 110, Brian G.80 McFadden Testimony at 14.81 Ding, Min, “An Incentive-Aligned Mechanism for Conjoint Analysis,” Journal of Marketing
Research, Vol. 44, 2007, pp. 214–223, at p. 222.

37
before implementation. My study of Professor McFadden’s incentive alignment
language indicates that some of the respondents used the windfall to choose services
that were not free, while stating that they would prefer a free service under normal
circumstances.82 For example:Q: If you were presented with these options and had to spend your own money,
would you choose the same options? A: No, I would actually choose different options. It’s your money, so you want
something that is actually worth spending. You want something that doesn’t have, like you get unlimited tracks in there and stuff. It just depends on what kind of plans they have on there.83
77. It appears that these respondents are affected by a demand artifact; that is, they
attempt to please the researcher and mimic the choices of the person who has a real
budget of $30 and makes choices accordingly. Another respondent volunteered,
unprompted:A: Maybe I should just pretend like I have money to have better answers. Q: There’s no right or wrong. A: I know, but I feel bad because it [sic] not that it’s a bad plan. It’s because
I’m broke.84
78. Professor McFadden’s incentive alignment may cause at least some respondents to
reveal preferences contrary to the preferences they would display if they were using
their own money to choose among music-streaming services.
79. Difficulty with Understanding. Ding notes that an incentive alignment mechanism
could have unforeseen consequences if it is poorly understood by survey
respondents. For respondents who display confusion regarding their “gift,” the
incentive alignment may cause them to act according to their perceptions of the
survey’s hypotheses rather than their true preferences. My study showed that very
few respondents understood the incentive alignment language.
82 In response to the question “If you were presented with these options and had to spend your
own money, would you choose the same options?” seven respondents answered “no” or “probably not,” according to blind coders who were asked to review the videotapes.
83 Transcripts, p. 542, Lidia S.84 Transcripts, p. 796, Toni V.

38
80. Professor’s McFadden’s incentive alignment description may induce some
respondents to perceive a lock-in effect associated with his gift. Signing respondents
up for monthly service is not as simple as a one-time transaction because it creates
potential further transaction costs such as time and effort to cancel the service. In
the same vein, receiving a gift card for a streaming service is not the same as
receiving a tangible good because respondents would have to sign up for the service,
potentially investing learning time and experiencing other externalities, such as the
potential burden created by the data streaming onto a mobile device. The latter
could be important if the respondent has a capped data plan. Professor McFadden’s
instructions do not clarify how the gift will address these issues; hence the
respondents will make a variety of their own, unobserved, assumptions and take
these factors in consideration. For example, in my qualitative study of the
McFadden survey, one respondent expressed concern about the effort required to
customize preferences:A: Another thing, as I’m thinking about feedback on the gift card thing, I don’t
want to do it per month. The gift card, in my mind, that idea of a month, I’m not going to continue on it, but I want to do it because it’s going to take a long time to set up my preferences and decide what music I want to listen to and all of those things.85
In the same vein, another respondent clearly showed concern with respect to lock-
in:A. When I did the assignment and I was going through Pandora, I would’ve had
to put in a credit card according to what I read and if I did it. I’m saying, how many times in my life have I accepted something for a 30-day trial, where if I don’t cancel it, all of a sudden… [sic].86
Another respondent expressed confusion about how the gift card mechanism would
work, given that streaming services are priced on a monthly basis:Q: With respect to the music streaming service gift mentioned on the prior
screen, in your own words could you tell me what that particular gift comprises?
A: It’s a $30 gift card, and deducted from that is the cost of the streaming music that I would want. I would get the remainder as cash on the gift card. What
85 Transcripts, p. 170, Daniel D.86 Transcripts, p. 229, Edward B.
39
was confusing to me is that—because typically, these are per month, so it’s essentially just the first month.87
81. Relatedly, Professor McFadden assumes that the option of a streaming service gift-
card has value to respondents, but I see evidence that respondents did not value this
service specific gift-card option and focused exclusively on the monetary reward.
For example, one respondent admitted at the outset: A. I don’t know what questions you’re going to ask me, but I would take the
cash instead of signing up for a subscription service, if that’s what you’re asking me.88
When asked about their expected gifts, other respondents ignored the music
streaming gift card. One respondent stated:Q: How did you interpret it? A: That we would be given a $30 gift card. Q: In your words, what do you expect your personal gift to include? A: Money.89
If there is no incremental value associated with the option of a service related gift-
card, one has to assume that the incentive alignment cannot work as intended and
respondents are, at best, no more likely to “accurately reveal their preferences” than
without the attempted incentive alignment.90
82. I tested Professor McFadden’s revised and final language in my qualitative study
with 53 respondents. The qualitative study indicated clearly that Professor
McFadden’s incentive alignment was confusing to respondents. At a minimum,
Professor McFadden’s attempt at incentive alignment did not achieve its desired
goal. Likely, the confusion caused by Professor McFadden’s attempt at incentive
alignment caused respondents to make choices in the conjoint exercise differently
from how they would have chosen among real music-streaming services. Such
confusion renders the answers to the conjoint-analysis survey unreliable.
87 Transcripts, p. 184, Delia P.88 Transcripts, p. 620, Nicole M.89 Transcripts, p. 34, Alicia R.90 McFadden Testimony at 14.
40
2. Professor McFadden’s Incentive Alignment Did Not Properly Align the Choices of Respondents
83. Respondents in my qualitative study were asked a number of questions regarding
the incentive alignment in order to gauge whether the respondents understood what
they would be getting and how their choices could impact their compensation. After
reading the screen describing the incentive alignment, respondents were asked: (1)
“With respect to the music streaming service gift mentioned on the prior screen, in
your own words, could you tell me what the particular gift comprises?” (2) “In your
own words, what do you expect your personal gift to include?” and (3) “Is there any
additional information or different words or phrases that would help you better
understand the instructions?” Additionally, after answering the first choice task,
respondents were asked: (1) “Do you think or do you not think that the question
below the table with streaming plans relates to the gift mentioned earlier in the
survey?” (2) “How does this question relate to the gift mentioned earlier in the
survey?” and (3) “How does this question relate to your total compensation for
taking this survey?”
84. As discussed in Paragraph 66 above, two coders, who were blind to the case, any
hypotheses, and to the sponsor of the study being tested, reviewed these videos and
transcripts and coded the respondents’ answers.91
85. The results are attached as Exhibit 2. Out of 53 respondents, only nine (17 percent)
appeared to understand the incentive alignment at a sufficient level for the incentive
to result in respondents “accurately reveal[ing] their preferences” for a real music
streaming service through their choices in the survey. These 17 percent of
respondents were able to describe the relationship between the VISA gift card and
91 Coding and coding reconciliation were done on a rolling basis. Blind coders discussed and
refined classifications for each response by each qualitative study respondent after transcripts were reviewed independently. When coders were unable to evaluate the consistency of a response with Professor McFadden’s intended definitions, the definitions and responses were reviewed with staff at Analysis Group to confirm their understanding of Professor McFadden’s definitions. After these reviews, the coders conducted the final reconciliation of the transcription classifications between themselves.
41
the streaming music service gift card and relate it to their choices in the survey. For
instance, one respondent stated:Q: How does this question relate to that $30 gift? How would you say it?A: Of the $30 gift, a proportion of that will go towards the plan that it
ultimately chooses for you, or that I choose.92
Another respondent explained his understanding of the survey instructions:Q: Could you tell me in your own words what the survey is asking you to do?A: From what I got out of it, it’s asking me to take a survey, and in the survey,
read questions on different music streaming websites. Since most websites have a monthly fee, depending on how I answered the question, you guys are going to use an algorithm through the computer to decide what music streaming website I would prefer the most.
It seems as though the incentive to do this is I would get a gift card that would be worth the monthly payments of the website or the streaming website. Depending on how I choose my questions depends on how much money I would get on a gift card for—it’s like $10 a month or something like that for a couple of months. If it appears that I’m answering questions at random or going too fast or not doing a thorough job of answering the questions, I won’t get anything at all.93
86. These statements show some understanding of both the relationship between the two
gift cards and that the study respondents’ choices in the survey would affect how the
$30 would be allocated between a complimentary service and the residual value on
the VISA gift card. However, even among some respondents classified as
understanding the incentive alignment, there was notable confusion regarding the
mechanism of plan choice. For example, one respondent believed he would
explicitly choose the music streaming service that he would receive as a gift rather
than the results of his answers determining which service would be the best one for
him:Q: How does this question relate to the gift mentioned earlier in the survey? A: The survey asked us that we would choose a streaming provider later, and I
assumed that these are possibly plans from the later survey [sic].94
92 Transcripts, p. 135, Chad H.93 Transcripts, p. 149, Christopher N.94 Transcripts, p. 392, Jacob K.
42
87. The remaining respondents misunderstood the incentive alignment, in varying ways.
Five respondents (9 percent) did not acknowledge the presence of the incentive
alignment at all, focusing on the $100 interview payment as their compensation.95
The remaining 39 respondents (74 percent) acknowledged the presence of the
incentive alignment instructions but fundamentally did not understand the concept.
Within this category, there was substantial heterogeneity of understanding. Nine
respondents explicitly acknowledged that they did not comprehend the instructions,
two thought they were simply receiving a $30 gift card, ten discussed that the
amount of the streaming service would be subtracted from the VISA gift card but
did not indicate awareness that they would also receive the streaming service gift
card, four interpreted the gift to be only the music streaming service without
reference to a VISA gift card, nine understood the gift card language but could not
relate it to their survey choices, and five otherwise misunderstood the mechanism.
88. These varied interpretations of the incentive alignment may lead to different
answers to the choice tasks and thus may render the entire conjoint analysis
unreliable. Professor McFadden, however, collected no data that would enable him
to identify how these interpretations would have influenced the choice tasks
specifically. Broadly, there are four possible responses:
First, respondents may have completely disregarded the incentive alignment in
making their choices. Five respondents appear to have explicitly ignored the
incentive alignment. These respondents may have made the same choices they
would have absent the incentive alignment screen. For such respondents,
Professor McFadden did not achieve any greater accuracy by including the
incentive alignment.
Second, respondents may have reacted unpredictably in the face of confusion.
Because these respondents recall reading the screen, but do not comprehend it,
they may not fully disregard the incentive alignment and even try to reconcile it 95 Although the interview payment can be considered a reward that is, in principle, similar to
the point rewards in a consumer panel and this phenomenon may not have occurred in the on-line study, I do not include these respondents in my count of confused respondents related to incentive alignment.

43
throughout the choice exercise. As a consequence, these respondents likely
behaved in unpredictable ways that are not externally valid.
Third, some respondents may have chosen music streaming services that were
specifically disconnected from their preferences. Choices by these respondents
may have been driven by confusion, the aforementioned windfall effect, or the
demand artifacts that encouraged them to overvalue music streaming services. I
see evidence of these effects throughout the interviews, and consider such
choices to be unreliable.
Fourth, some respondents may have specifically acted according to their
misinterpretation of the incentive alignment. For example, respondents who
believed they were receiving only the remaining value, without the streaming
service component, may have systematically chosen free plans in order to
maximize their payout. Likewise, respondents who believed they were only
receiving the music streaming component but not a residual value may have
systematically chosen more expensive plans because they saw no consequence
to choosing the expensive plan. Either type of respondent was likely to choose
to make choices that do not reflect their true preferences.
89. At the end of my qualitative study, interviewers posed the question, “If you were
presented with these options and had to spend your own money, would you choose
the same options?” This one-sided question is purposefully biased toward a “yes”
answer in which the respondent indicates he or she would be incentive aligned.
Despite this bias, seven respondents (13 percent) stated that they would not, or
would probably not, have chosen the same options. These respondents had varying
levels of understanding of the incentive alignment, as established early in the
qualitative study. In fact, two respondents were coded as understanding the
alignment and, despite this understanding, still admitted that they did not make
choices that were aligned with their preferences. Notably, given the confusion found
with respect to feature definitions, it is unclear whether any of the respondents
would have selected a real music-streaming service which matched his or her choice
tasks.

44
B. Professor McFadden’s Survey Features Were Unclear and Allowed for Extensive Variation in Respondent Interpretation of Features
90. As discussed in Section V of my report, my review of Professor McFadden’s
descriptions of the music-streaming features indicated that many descriptions were
potentially confusing to respondents. In my qualitative study, I sought to answer two
questions about respondent understanding: (1) Were respondents confused, or were
they not confused, by the features? and (2) Did respondents understand, or did they
not understand, the features in the same way as other respondents? Both of these
aspects of understanding or misunderstanding are important to determining whether
we can interpret Professor McFadden’s results as reliable. Confusion can lead to
unpredictable and unreliable decision-making in choice tasks. Differences of
interpretation complicate the calculation of the valuation of features: the choices
that respondents make will differ depending on their interpretation of the feature,
but the calculation of the valuations of the features (partworths) assumes that all
respondents are responding to the same interpretations of the features.
91. To test whether respondents in Professor McFadden’s survey correctly interpreted
the feature descriptions, respondents in my qualitative interviews were directly
asked to explain the features in the survey in their own words. In some cases, a
feature definition may be easy to parrot back to an interviewer, and it may sound as
if the respondent understood the definition, but in fact was simply exercising recall.
To distinguish simple verbal recall versus understanding, respondents were probed
on the depth of their understanding of the features.
92. A summary of the results of the qualitative study is attached as Exhibit 3. This
summary is based on the more-conservative coding of the qualitative data in which
the judges based their categorizations on only the verbal statements. I discuss later
more-comprehensive judging in which judges also use non-verbal cues.
93. The effectiveness and clarity of feature descriptions varies across Professor
McFadden’s seven features. Some features are clearly defined and well understood
by participants. For example, all respondents to my qualitative study were able to
explain skip limits. When probed they were appropriately able to distinguish skip
limits for songs from skipping advertisements, another common feature in online
45
streaming. Other features, such as mobile device streaming or offline listening,
seemed clearly defined at the high level, but when qualitative study respondents
were probed on how they would use the feature, it became clear that their
understanding of these features was superficial. Finally, some features were poorly
understood by the respondents. More than half of respondents (60 percent) in my
qualitative study were unable to correctly interpret playlist method.
94. In this section I discuss the results of my qualitative study for each of the seven
features tested by Professor McFadden, assessing both the number of correct
interpretations as in Exhibit 3, as well as the variety of different correct and
incorrect interpretations based on a review of transcribed interviews. These results
are based on the more-conservative coding that did not include non-verbal cues.
1. Playlist Method
95. Professor McFadden describes playlist method (listed as “playlist generation
method” in the definitions) as follows: “Playlists offered to a user can either be
curated by music tastemakers (such as Beyoncé or Rolling Stone Magazine) or
generated by a computer algorithm customized by the user’s preferences or
feedback (often provided by ‘like’ or ‘dislike’ votes).”96 The feature can take on
three possible levels: (1) “Curated by music tastemakers”; (2) “Generated by a
computer algorithm customized by your preferences”; and (3) “Curated by music
tastemakers; Generated by a computer algorithm customized by your preferences,”
where the latter option is on a second line in the choice table. Thus, all choices
include one of the playlist generation methods, while more expensive plans may
allow for both.
96. Both the terms “music tastemaker” and “computer algorithm” are potentially
confusing terms of art. Moreover, unless target respondents have a common
understanding based on their experience with real music-streaming services, both
descriptions are vague to respondents and lead to varied interpretations by
96 McFadden Testimony at App. B, B-viii.
46
respondents. Thus, any estimation of the valuation of the feature is ambiguous and
cannot be averaged over respondents.
97. To determine whether respondents understood these terms, respondents were asked
about this feature in three separate questions: (1) “Could you tell me in your own
words what the term playlist method means to you?”; (2) “Could you tell me in your
own words what it means when the playlist is curated by music tastemakers?”; and
(3) “Could you tell me in your own words what the term generated by a computer
algorithm customized by your own preferences means to you?” Respondents were
also asked to define “curate,” “tastemaker,” “computer algorithm,” and
“customized” as well as whether the service(s) they had tested over the testing
period used these methods.
98. Exhibits 4.a and 4.b show the results of these questions. For clarity, the two levels
of playlist method were broken out into separate questions. Exhibit 4.a shows the
results for “playlists curated by music tastemakers.” Specifically, answers to the
question “Could you tell me in your own words what the term tastemaker means to
you?” were coded. This coding reports a conservative estimate of understanding of
“playlists curated by music tastemakers” by focusing on the definition of the term
“tastemaker” and assuming that respondents who could explain tastemaker would
also be able to explain what playlists curated by a tastemaker entailed. In total, 21
respondents (40 percent) interpreted music tastemakers correctly as either celebrities
or music experts who created the playlists.97 On the other hand, 60 percent of
respondents could not correctly identify music tastemakers. These 32 respondents
had wide-ranging interpretations of the meaning: three acknowledged that they did
97 One respondent said, “Tastemaker means key influencer, somebody who is leading by
example. You want to follow them, maybe.” (Transcripts, p. 172, Daniel D.)
Another respondent said, “That people who have the job to look at taste in music would choose—work for the company and choose those music for people. […] To generate the taste in music, like something that takes your input and makes a taste out of it.” (Transcripts, p. 747, Steven S.)

47
not understand or could not explain music tastemakers,98 three thought the
tastemakers were other users,99 seven thought they themselves were the
tastemakers,100 eight understood another person was involved but considered it to be
an unspecified person generating playlists based on this unspecified person’s
preferences,101 three thought experts custom-tailored playlists for the user,102 two
98 One respondent stated, “I don’t know. Tastemaker. Again, somebody—I don’t know. Going
along the lines of whatever genre, whatever music that you’re into, they give you along the lines of the same concept or the same ideas. I have no idea.” (Transcripts, p. 256, Elizabeth V.)
Another gave a number of possible definitions, concluding with “I’m not really sure”: “Tastemaker would be someone that you looked up to that maybe has similar taste or views as you. If your friends like it, I would probably like it also. [...] It could be, if you’re following a certain artist like Bruno Mars. If Bruno Mars likes this, perhaps you would like it also. That’s another thing that it could be. I’m really not sure.” (Transcripts, p. 288, Frank B.)
99 One respondent said, “I guess just another user. I’m not really sure.” (Transcripts, p. 777, Thomas W.)
Another said, “The tastemakers are the people that are actually using the—Spotify.” (Transcripts, p. 203, Donna C.)
100 One respondent stated, “Almost exactly what that means to me is it means that it is—it’s whatever I like that I can pick from their—make my own playlist. What I like, my taste versus their taste.” (Transcripts, p. 566, Manuel R.)
Another respondent stated, “I would think that that means musical preferences that you have. If you like a little bit of rap, a little bit of Pavarotti, that’s your taste. You’re a tastemaker. […] Taste, preferences, what you prefer to listen to.” (Transcripts, p. 625, Nicole M.)
101 One respondent said, “Tastemaker, a group of things put together by people that like it ordon’t like it. Something that they personally like.” (Transcripts, p. 91, Brandon R.)
Another respondent said, “Somebody with a taste for that type of music making the playlist for it.” (Transcripts, p. 379, Iman D.)
102 One respondent stated, “It was one thing that you—a tastemaker, I would say, is something that makes a playlist based on what it appears your taste in music is, what your preference is.” (Transcripts, p. 189, Delia P.)
Another respondent stated, “Tastemaker would probably be someone that analyzes what stuff you like to listen to and knows where to find other music that’s similar.” (Transcripts, p. 437, Jordan P.)

48
mixed up tastemakers with computer algorithms,103 and six respondents had even
more varied responses that could not be broadly categorized.104
99. As I mentioned earlier in Paragraph 48, Professor McFadden edited the description
of the playlist method substantially. Specifically, Professor McFadden removed an
entire element to the feature: “playlists customized using your votes and preferences
of users with similar tastes.” Exhibit 4.a shows why this change is problematic. A
number of respondents believed other users, themselves, or an unspecified person to
be the tastemaker. In other words, three of the categories identified by blind coders
relate to this deleted feature and contradict Professor McFadden’s updated definition
of music tastemakers.105 Had Professor McFadden retested his survey after these
substantial modifications of his feature descriptions, he likely would have been able
to identify this problem. Exhibit 4.b shows the results for playlists “generated by a
computer algorithm customized by your own preferences.” In this case, 42
qualitative study respondents (79 percent) understood this aspect of the feature,
although even within this group there were different interpretations of how the 103 One respondent said, “Tastemaker means the computer algorithm memorizing the bands and
music you like. […] The computer saves your preferences, and instead of you always having to look up the songs of the same band, it just kind of shows you the options and the songs of the band.” (Transcripts, p. 24, Alex S.)
Another respondent said, “Once again, going back to maybe based off the recent music that you listened to. It just puts all of the music that they think that you would like into that.” (Transcripts, p. 122, Celine A.)
104 One respondent said, “Tastemaker means to me that there’s a certain—that there’s an idea of what goes with what. If a person’s taste in music is classical, these are things that they will like. That’s what I think of when I think of tastemaker.” (Transcripts, p. 107, Brian G.)
Another respondent said, “In the song venue, it would be certain choices people are making that they want to enjoy. […] It’s an auditory thing. It’s what you—it’s like on weekends, when I’m scuttlebutting around, I might have on country or Motown from the ‘70s, because it’s kind of upbeat and whatever. At night, my choices, they’re not that. They’re easy listening, whether be instrumental or just songs that are mindless that I don’t have to think about.” (Transcripts, p. 504, Kristin C.)
105 In Exhibit 3.a, these categories appear as: (1) “Respondents who believed that playlists were generated by other users,” (2) “Respondents who believed that playlists were generated by themselves,” and (3) “Respondents who believed that playlists were generated by an unspecified person’s preferences.”
49
algorithm functioned with varying degrees of accuracy. Twelve respondents thought
the algorithm suggested similar songs based on the user’s selection of a genre or
artist,106 fifteen thought the algorithm suggested similar songs based on feedback
(i.e., the thumbs-up, thumbs-down mechanism Professor McFadden intended),107
and fifteen thought the algorithm suggested songs based on the user’s prior listening
history.108 Additionally, eleven respondents substantially misunderstood the
computer algorithm: two respondents acknowledged that they could not explain the
concept;109 three misinterpreted what an “algorithm” meant;110 four believed they
106 One respondent stated, “Made by a computer algorithm means that you pick the genre and it
just customizes it and plays whatever song. If I pick rock, they play Ozzy Osbourne, Rolling Stones, but the other one means that you pick the songs and it just plays it over and over again. It shuffles it.” (Transcripts, p. 24, Alex S.)
Another respondent stated, “That would mean I go in and I pick—it tries to pick off my likes that I’ve shown it, so I’ll go in and I’ll pick artists, genre, whatever, and it will interpret what that means, and then pull some of its own also.” (Transcripts, p. 471, Kelly B.)
107 One respondent said, “To me, that makes me think of when it has like the thumbs-up or thumbs-down part on it, and it tells you—they get an idea of the song that you like, to play more of those or to play less of the songs that you don’t like. […] Whether or not you like or dislike. The thumbs-up is that you like it; thumbs-down is that you don’t like that song. Then, they try to skip that song if you still have skips, I think, or they just know that, and next timethey won’t play that particular song. Sometimes they do. I’ve seen that they do songs similar to it.” (Transcripts, p. 8, Alexandra F.)
Another respondent said, “There is an equation somewhere that is taking what you like and don’t like and is then coming up with music based on those preferences, but it’s all based on a mathematical equation.” (Transcripts, p. 593, Molly S.)
108 One respondent stated, “That’s cool, yeah. I think that computer takes all of my choices that I listened to—like last night. I’m sure when I go back in there if it’s going to pop up with, ‘This is what you enjoyed. Would you like the computer to store that information?’ Then you can either keep it as your playlist or change it up.” (Transcripts, p. 504, Kristin C.)
Another respondent stated, “Your computer will notice that you’re doing something over and over again and find a common, and then try to help you out and give you options if you like this, you like this, don’t like it.” (Transcripts, p. 316, Hackeem A.)
109 One respondent simply said, “I’m not sure.” (Transcripts, p. 580, Michael B.)
Another respondent said, “No, I don’t. […] I’m assuming it has to do something with the computer. I’m not really good with computers.” (Transcripts, p. 761, Tanya R.)
110 One respondent stated, “I would think that if you go into a computer and then you would just organize it the way you want it, it would be easier.” (Transcripts, pp. 38, Alicia R.)
50
could generate the playlist themselves;111 and two believed that the algorithm
selected songs based on any of their online history including activity outside of the
service.112
100. In total, combining these two exhibits, 21 people (40 percent) understood how
playlists were generated,113 21 (40 percent) understood the computer algorithm
piece but misunderstood the music tastemaker piece,114 and 11 (21 percent) did not
Another respondent stated, “Generated by a computer algorithm is it’ll pull other like media files together. […] The computer is doing it. If I just pull my own preferences, I’m just picking songs that I like instead of the computer.” (Transcripts, p. 625, Nicole M.)
111 One respondent said, “It’s you looking for your own music. The music that you pick is the ones that you get. It’s not picked by other people.” (Transcripts, p. 122, Celine A.)
Another respondent said, “You could pick your own songs and put them into categories, like under your albums, artists, your favorite playlists, songs, yeah.” (Transcripts, p. 423, Joe R.)
112 One respondent stated, “I feel like that would mean through your searches of the computer, that music stored on your website would use your searches to create a playlist that you like. […] Through your past searches of any music streaming website or of YouTube or anything like that. Or looking up lyrics of a song or a song artist, buying concert tickets, stuff like that. I feel like the computer would use that to create something.” (Transcripts, p. 302, Giana B.)
Another respondent said, “The program would follow the artists or songs that I’m listening to, and based upon that information I may provide to them when I log in to their site, or if they link into my social media sites, you get a little better feel as to who I am. My age, my demographics, the type of music I like, and even political views. With all of those tidbits of information, customize a playlist they believe would best suit me.” (Transcripts, p. 288, Frank B.)
113 For example, one respondent who understood both concepts of a music tastemaker and a computer algorithm explained a music tastemaker as: “A person who has a taste in a certain kind of thing—an art maker or a tastemaker, a cook, a chef. […] They have a specialty in what they are doing. They know a lot about sharing it with others.” And a music-selecting computer algorithm as: “It uses what you’ve done in the past to let you know what you want in the future. […] It takes songs that you listen to and makes—it takes songs that you’ve been listening to and gives you more that it thinks you would like.” (Transcripts, p. 395, Jacob K.)
114 For example, although this respondent understood what a computer algorithm was (“It would be, basically, there’s a set computer process that it goes through. It uses your likes and dislikes and changes the music based on what you like or dislike, but there’s no human involvement; it’s just done with a computer.”), he misunderstood the concept of a music tastemaker (“It would be basically if I’m listening to a type of music and it’s something that I like the best, I would try to choose what I think that other people are going to like that’s going to be similar to what I like.”). (Transcripts, p. 77, Bradley K.)

51
understand music tastemakers or computer algorithms.115 (No one understood music
tastemakers but not computer algorithms.)
101. The low level of understanding of the playlist method is consistent with the
discussion earlier in this report. The playlist method feature was described using
complex language, including industry-specific jargon. This was also one of the
features for which Professor McFadden substantially adjusted the language
following his pretest, which means he identified problems but did not test the
changes.
102. Respondent understanding of this feature is arguably critical to the reliability of
Professor McFadden’s survey. Not only is playlist method given its own feature
with various levels, but “playlists generated by the service” is a level available in
both the on-demand track selection and mobile device streaming features.
Confusion and misinterpretation with respect to the playlist method feature could
easily contaminate both of these other features, because they include similar
language and overlapping concepts.
2. On-Demand Track Selection
103. Professor McFadden describes on-demand track selection (listed as “features
available for streaming to a computer” in the definitions) as follows: “Using desktop
software or a web interface from a computer, users may be able to access playlists
generated by the streaming service and/or play specific tracks ‘on demand.’ With
‘on demand’ features, users can listen to particular tracks (songs) or an entire album
on request and users can create their own playlists.”
104. The feature can take on two possible levels: (1) “Playlists generated by the service”
and (2) “Playlists generated by the service. Album, artist, and song selection on
115 For example, this respondent did not understand either concept of a music tastemaker
(“Tastemaker? Again, it’s probably what my tastes are in music, my likes and dislikes, my likes in listening in various categories of music.”) or a computer algorithm (“Computer-generated? […] I would think it—but I can’t see how, because they would just be able to change the tune of the music for you. […] Like being able to actually disc jockey your own music. […] That you’re actually being able to do your playlist and the mode, the pace of the tunes.”). (Transcripts, p. 717-718, Steve M.)

52
demand” where the latter option is on a second line in the choice table. All choices
include the option to listen to playlists that are “generated by the service,” while
more expensive plans may also allow for on-demand track selection.
105. Notably, the on-demand track selection feature definition does not specify how the
playlists are being generated by the service; Professor McFadden’s survey leaves it
to the respondent to guess at how the playlists were generated. Respondents may use
outside knowledge to make that guess or may compare this feature to the playlist
method options (“curated by music tastemaker” or “generated by a computer
algorithm”) and assume a connection between the two. Doing so is particularly
problematic for the reliability of the survey because 60 percent of respondents failed
to understand the playlist method options. Respondents may carry their
misunderstanding from the playlist feature into the streaming feature.
106. Qualitative study respondents were asked to define on-demand track selection in
two separate questions: (1) “Could you tell me in your own words what the term on-
demand track selection means to you?” and (2) “Could you tell me in your own
words what it means when there are playlists generated by the service and album,
artist, and song selection on demand?”
107. The results of the second qualitative question regarding the specific feature option
of “playlists generated by the service and album, artist, and song selection on
demand” showed substantial confusion among qualitative study respondents. It was
unclear, however, from a review of the interview transcripts whether this confusion
was driven primarily by the description of the feature option itself or by the length
and complexity of the qualitative question. Thus, responses to this question were not
analyzed; instead, I focused on the responses to the first question defining on-
demand track selection.
108. The results for the on-demand track selection feature are included in Exhibit 5.
Although respondents may have had trouble interpreting how the service would
select playlists, the majority of respondents (49 respondents, 92 percent) correctly
interpreted that the feature on-demand track selection meant that the respondents
could select and listen to any song they wanted. For example:

53
Q: Moving on, can you tell me in your own words what the term “on-demand track selection” means to you?
A: To me, that means that I can search for a specific song and play that specific song that I want to listen to.
Q: Could you elaborate on that just a little bit?A: That means that if there was a specific country song I wanted to listen to, I
could go into that music system. I could type it in. They would bring up the songs for me, and I would be able to play that specific song that I wanted to listen to without having to go through a whole playlist, without having to skip through a bunch of songs until I got to that one. It would just be I would be able to listen to that one song that I was looking for.116
And:Q: Could you tell me in your own words what the term “on-demand track
selection” means to you?A: I choose when I want and what I want.Q: Can you tell me a little bit more about that?A: On demand would give me options, and I choose which song I want to listen
to when I want to listen to it. It’s on my demand, personal demand. It’s not what they are putting out there and giving to me. It’s my choice, and it’s when I wanted to use it. 117
109. Four people misinterpreted the concept of on-demand track selection: one person
could not explain it in her own words;118 one person believed he had to purchase the
songs in order to play them;119 and two people believed that the music streaming
service selected the songs,120 rather than the user.
116 Transcripts, p. 14, Alexandra F.117 Transcripts, p. 614, Nancy M.118 “It’s using a music streaming website to—I opened the tab and now I can’t remember. […]
To be honest, I couldn’t really tell you because that’s not one of the things I focus on, and it doesn’t really matter to me, I guess.” (Transcripts, p. 308, Giana B.)
119 “I think that’s just all the ones you can purchase or buy.” (Transcripts, p. 674, Samuel H.)120 “That you are not choosing it, they are.” (Transcripts, p. 43, Alicia R.)
And: “On-demand track selection, to me, is, like I said, if it notices that you like a certain brand or a certain genre, it’s just going to continue to give you things like that.” (Transcripts, p. 321, Hackeem A.)

54
3. Offline Listening
110. Professor McFadden describes offline listening (listed as “ability to listen offline” in
the definitions): “Users can download and listen to a selection of the service’s music
when internet access is unavailable.” The feature can take on two levels: “Not
available” or “Yes.”121
111. This feature description references “a selection” of the music database, but gives no
further instructions about how much music a user could expect to have access to
offline.
112. Qualitative study respondents were asked “Could you tell me in your own words
how you use the offline listening feature.” Qualitative study respondents were also
probed on their assumptions about the number of songs that would be available
offline in four questions:
1. “Could you tell me in your own words to how many albums you can listen offline?”
2. “Could you tell me in your own words to how many artists you can listen offline?”
3. “Could you tell me in your own words to how many songs you can listen offline?”
4. “While making your choices in this survey, how many songs did you assume offline listening would include?”
Qualitative study respondents were also asked about the importance of this
information: “Could you tell me whether or not it matters to you to have a certain
amount of songs available for offline listening?”
113. The results for this feature can be seen in Exhibit 6. For this feature, 40 respondents
(85 percent) properly understood what offline listening meant. For example:Q: Now that you’ve made some more choices, we’d like to learn how you
interpreted the various options. Could you tell me in your own words what the term “offline listening” means to you?
121 In Professor McFadden’s Table 1, which includes his feature descriptions and the levels, the
second level of offline listening is listed as “Available.” However, in his screenshot of an example choice task in Appendix B, p. B-ix, this is listed as “Yes.” In my qualitative study I used the screenshot in Appendix B in order to replicate Professor McFadden’s survey instrument.

55
A: Sure. If I’m in an area where I don’t have Wi-Fi access the information is stored on whatever device I’ve been using, and I can listen to it without being connected to the Internet.
[…]Q: Could you tell me in your own words to how many albums you can listen
offline? […]A: I would believe that would be based upon the number of songs that I have
previously selected. I don’t believe I would have access to the internal library of 20 million, or 1 million songs. It would be based on songs that I’ve selected added to the playlist that I would be able to listen to offline.
Q: Why do you say that? A: Storage. A million songs, titles, albums, whatever, would be huge capacity.
I’m guessing storage on my device, if I only have 64 gigs, 120 gigs, or whatever it might be, that at some point I’m going to run out of space.122
Even within these qualitative study respondents classified by coders as “correct,”
four participants believed they could listen to the entire database of songs offline,
something that Professor McFadden’s definition directly contradicts.123
114. An additional seven qualitative study respondents misunderstood the concept of
offline listening in varying ways: one respondent could not explain offline listening
in his own words;124 two respondents conflated offline listening with listening on
mobile devices;125 one respondent believed offline listening referred to listening on
122 Transcripts, pp. 292-293, Frank B.123 For example:
Q: Could you tell me in your own words to how many songs you can listen to offline? A: I would say as many as you want, I would think.Q: While making your choices in this survey, how many songs did you assume offline
listening would include? A: Like I said, I think it would probably be all those songs you want when you’re online.(Transcripts, pp. 427-428, Joe R.)
124 “If you’re saying online listening, you’re talking about the computer. Offline listening would be some other form, without using the Internet. I don’t know how that would work. I don’t really understand what offline means, I guess. [...] I’m unclear on what offline is, so I don’t know.” (Transcripts, p. 414, James H.)
125 “Yes, it’s when you can stream music from your computer at home onto your MP3 player or your mobile device.” (Transcripts, p. 209, Donna C.)
56
the computer using other tabs or browser windows;126 and one respondent believed
offline listening meant that he did not have to sign in to the service.127 Two
respondents demonstrated that they did not understand offline listening, but their
answers did not fall into an obvious category.128
4. Mobile Device Streaming
115. Professor McFadden describes mobile device streaming (listed as “Features
available for streaming to mobile devices” in the definitions) as follows: “Users may
be able to use the music streaming service on mobile devices, such as phones and
tablets. The music streaming service may limit the features that are available on
mobile devices. Users may be able to access playlists generated by the streaming
service, pick the artist or album but hear tracks in a random order, and/or play
specific tracks ‘on demand.’ With ‘on demand’ features, users can listen to
particular tracks (songs) or an entire album on request and users can create their
own playlists.”
126 “You don’t have to be on the actual site when you hear it. You can still be doing work on
your computer” (Transcripts, p. 722, Steve M.)127 Specifically, the respondent stated:
Q: Could you tell me in your own words what the term “offline listening” means to you?A: When you’re not logged in, or to a general service, or if you don’t have one, you can just
go onto the website and stream its music.[…]Q: While making your choices in this survey, how many songs did you assume offline
listening would include?A: I was under the impression all—all of the songs.(Transcripts, pp. 320-321, Hackeem A.)
128 A review of these transcripts suggests that both unclassified respondents believe that offline listening means that services are not available when a device is not connected to Wi-Fi or cellular service. One respondent said, “If you’re not on your mobile device’s data you could not listen to that music.” (Transcripts, p. 307, Giana B.)
Another respondent said, “I kind of feel like that means if you’re able to listen to it in certain places. You’d be able to listen to it whenever, in other places you wouldn’t be able to.” (Transcripts, p. 539, Lidia S.)
57
116. This feature can take on four levels: (1) “Not available,” (2) “Playlists generated by
the service,” (3) “Playlists generated by the service. Albums and artists chosen by
you, but tracks are played in a random order,” and (4) “Playlists generated by the
service. Album, artist, and song selection on demand.”
117. These feature descriptions do not specify how playlists are generated. Moreover, the
feature descriptions overlap significantly with the descriptions for computer
streaming.
118. Qualitative study respondents were asked two questions about mobile streaming: (1)
“Could you tell me in your own words what the term mobile device streaming
means to you?” (2) “Could you tell me in your own words what it means when
mobile device streaming offers playlists generated by the service and album, artist,
and song selection on demand?”
119. Exhibit 7 shows the results for mobile device streaming. The majority of qualitative
study respondents (51 or 96 percent) were able to correctly explain the concept of
mobile device streaming. For example, most qualitative study respondents answered
similarly to the following:
It means to me whether you can stream it to your MP3 player or your
iPhone or your Android.129
120. When probed on the meaning of one of the levels of the feature “playlists generated
by the service and album, artist, and song selection on demand,” however, this
apparent understanding fell apart. Respondents appeared taken aback or
overwhelmed by the lengthy question used in my qualitative study. The question
“Could you tell me in your own words what it means when mobile device streaming
offers playlists generated by the service and album, artist, and song selection on
demand?” is indeed complex, but it is simply a repetition of a feature level
definition used by Professor McFadden. Only 29 respondents (55 percent)
understood both aspects of the feature level;130 13 respondents (25 percent) were
129 Transcripts, p. 202, Donna C.130 One respondent explained both feature levels as: “Generated by the service would be similar
to listening to a radio station where they pick the music. You pick what type of radio station
58
able to explain one aspect of the level but not the other;131 and 9 respondents (17
percent) misinterpreted or could not explain either feature levels in this context.132
121. This is a case where the concept of a mobile device is deceptively simple: mobile
devices are ubiquitous and it is not surprising that respondents can explain what
they are. When probed further, however, it becomes clear that many qualitative
study respondents do not understand the feature mobile device streaming as
intended by Professor McFadden.
you want to hear, what type of music selection. The playlist on demand was the other one? […] Let’s say I wanted to hear all The Beatles, then it would pick The Beatles albums, or if I had a particular album that I wanted to hear, this one particular album. The difference also became whether they randomly mixed the album or if it came out just as the album had been.” (Transcripts, p. 519, Leanne G.)
131 One respondent understood “playlists generated by the service” but not “album, artist, and song selection on demand”:
A: Playlist generated—what did you say? By the computer?Q: Generated by the service.A: For whatever reason they put together a grouping of songs in a list, and just for instance,
I was supposed to listen to Spotify. That’s what they do. You say you want to listen to country or whatever and it says “Country Gold” and then there’s 20 or 30 songs and those are the songs that they’ve decided what should go in there, as opposed to…
Q: It was playlist generated by the service and album, artist, and song selection on demand.A: Okay, so that’s just if you like a particular artist, you pop that in and out comes some
songs. It seems like still the service selects which ones you get to do, if it’s the album or the artist and it’s separate from the song. It’s just song.(Transcripts, p. 188, Delia P.)
Another respondent understood “album, artist, and song selection on demand” but not “playlists generated by the service”: “Playlist is, if you like a song, you could add it to a playlist, and you can go back and play that playlist where—what was the second one? […]That’s like if you want to hear a certain artist at that moment; you can just go there and they have all of the songs that artist would sing, and you can listen to it on demand right then and there.” (Transcripts, pp. 640-641, Rebecca C.)
132 One respondent said, “It’ll do a lot of artists—we’ll use Celine Dion as an example. It’ll pick similar artists that are in her category to play just to create a station. Just picking artists in that genre—or Metallica, and it will pull a bunch of other heavy metal artists.” (Transcripts, p. 624, Nicole M.)

59
5. Skip Limits
122. Professor McFadden describes skip limits (listed as the “ability to skip songs” in the
definitions) as follows: “Users can skip tracks (songs) that they do not want to hear
and continue to the next track.” The feature can take on two possible levels: “Limit
of 6 skips per hour” and “Unlimited ability to skip tracks.”133 My qualitative study
respondents were asked “Could you tell me in your own words what the term skip
limits means to you?” and “Could you tell me in your own words what it means
when there is a limit of 6 skips per hour?”
123. In some online streaming services, such as Pandora, users can skip an advertisement
after listening to it for some period of time. Professor McFadden’s definition of skip
limits specifies that the limit applies to skipping tracks or songs, but the title “skip
limits” is not necessarily evocative of this. In order to address this issue,
respondents were also asked “Could you tell me whether or not skipping as
mentioned in the survey allows you to skip over advertisements?”
124. Results for the skip limits feature are included in Exhibit 8. For this feature, using
conservative coding, 100 percent of respondents understood and could explain what
skip limits meant. A typical response was:Skip limits is how many times I can skip. Skips would just be how many times a song comes up or any song comes up that I don’t want listen to, that I’d be able to just skip it and go onto the next song—how many times I’m allowed to do that or not allowed to do that.
Additionally, when probed, no respondents were confused by the relationship
between skipping songs and skipping advertisements. Many respondents were not
aware of the ability to skip advertising134, but, among those who were aware of this
133 In Professor McFadden’s Table 1, which includes his feature descriptions and the levels, the
first level of skip limits is listed as “Up to 6 skips per hour.” However, in his screenshot of an example choice task in Appendix B, p. B-ix, this is listed as “Limit of 6 skips per hour.” In my qualitative study I used the screenshot in Appendix B in order to replicate Professor McFadden’s survey instrument.
134 One respondent said, “Skip limits means if you’re not liking that selection, you can only do that—whatever the limit is. Up to six times is what was mentioned here a lot. After you reach that limit, it won’t let you skip anymore. [...] I don’t believe it does let you skip the advertisements.” (Transcripts, p. 413, James H.)

60
potential feature, all were able to distinguish advertising-skipping from song-
skipping.135
125. Of note, the understanding of the skip limits feature indicates that respondents to my
qualitative study were capable of giving clear and accurate answers to well-defined
features. Moreover, when faced with a potentially complicating question regarding
skipping advertising, the participants responded appropriately and distinguished
song skipping from advertising skipping. The 100 percent understanding of the skip
limit feature is evidence that my qualitative study does not itself contain a demand
artifact. The confusion identified by conservative coding, as identified through the
qualitative research, can be reliably interpreted as being caused by Professor
McFadden’s survey instrument. Thus, when qualitative study respondents were
unable to explain other concepts in their own words or indicated confusion,
respondent reactions were due to actual confusion with the features and not due to
any artifact of being questioned on the features. When presented with features that
the qualitative study respondents understood, respondents answered accurately and
confidently.
6. Available Library Size
126. Professor McFadden describes available library size (listed as “Library size” in the
definitions and “music library size” in Table 1) as follows: “The number of tracks
(songs) available in the service’s database.” The feature can take on four levels: “1
Another respondent said, “It means skipping a song. That’s what I would think it means. I can skip six songs. […] As mentioned in the survey, I didn’t see that you could skip it, but I did try to skip ads and I couldn’t. I would say you can’t, but it didn’t say whether you could.” (Transcripts, pp. 242-243, Edward B.)
135 “Based on the plans, it’s been based on an hour block and the number of times you can skip through a song within a playlist, so not really like fast-forwarding or rewind, but skipping the entire song as a whole and moving onto another song. [….] No, it didn’t say that, but I do like the option of—for example, on YouTube when you’re playing a video, you usually remove the ad itself, maybe 30 seconds or a minute, usually five seconds in you have the option to skip the ad. It did not clearly say that within the survey.” (Transcripts, p. 459, Juliana J.)
61
million songs,” “10 million songs,” “20 million songs,” and “More than 20 million
songs.”
127. Qualitative study respondents were asked: “Could you tell me in your own words
what the term available library size means to you?” and “Could you tell me in your
own words what it means when the available library size is 20 million songs?”
128. Exhibit 9 shows the results for this feature: 33 respondents (62 percent) understood
available library size. For example:Q: Now that you’ve made some choices, we would like to learn how you
interpreted the various options. Could you tell me in your own words what the term “available library size” means to you?
A: The available library size would be how many songs the company has that you could possibly listen to.
Q: Could you tell me a little bit more about that?A: That the library size would be—if it was smaller, it wouldn’t have as many
songs in each genre. If you wanted to listen to something that was more off the beaten path, you might not be able to find it, whereas top 40 is going to be easy to find. That early punk track from the early ‘70s, you might not catch that one. That’s what it makes me think of. It makes me think that there were some limitations to—if there’s a small library size, there’s going to be some limitations to what you will and will not be able to find. For me personally, I like to find lots of new things, things I haven’t been exposed to before. Again, that’s my personal preference, and a smaller library would mean that I’m probably going to get repeated content, repeated songs.
Q: Could you tell me in your own words what it means when the available library size is 20 million songs?
A: Twenty million songs sounds like a lot of songs. That sounds like an amazing amount of songs available. There’s probably international artists, as well as U.S. artists, that if you heard about a great band from Japan, you could actually find them in there. Twenty million sounds really great, especially when it’s compared to the 1 million. You’re like, well, that’s a lot less. There’s 19 million more songs the other way.136
The remaining respondents either misinterpreted the feature (32 percent) or gave
answers too vague to categorize (6 percent). There were many types of
misinterpretation: 15 respondents thought that available library size had some 136 Transcripts, p. 106, Brian G.
Another respondent said, “The options of the songs that you’re going to be able to be selecting. It’s like 1 million, only 1 million songs you can choose from here all the time versus 20 million, like one of the other ones was. […] There’s a lot of songs to choose from.” (Transcripts, pp. 49-50, Ariana D.)

62
relationship to the number of songs the user could store, either on the cloud via the
service (6 respondents),137 download on their personal computer (3 respondents),138
or with unspecified storage location (6 respondents).139 Additionally, two
respondents thought that available library size was genre-specific, such that a
library size of 10 million songs would include 10 million songs per genre. For
example:Q: Now that you’ve made some choices, I want to learn how you interpreted
some of the various options. Could you tell me in your own words what the term “available library size” means to you?
A: How many songs are in each genre. Q: Could you tell me in your own words what it means when the available
library size is 20 million songs?
137 One respondent stated, “How much music you would be able to listen to. […] If you would
be able to save music, and they’d only allow you a certain amount to save for you.” (Transcripts, p. 533, Lidia S.)
138 For example:
Q: Could you tell me in your own words what it means when the available library size is 20 million songs?
A: That means that you’d be able to get 20 million songs in there. Q: What do you mean by you can get them? A: You have to download them. (Transcripts, p. 36, Alicia R.)
139 For example:
Q: Now that you’ve made some choices, I’d like to learn how you interpreted some of the various options. Could you tell me in your own words what the term “available library size” means to you?
A: As many songs as you want.Q: Tell me why you say that.A: Usually your library is where you keep your songs, and unlimited library size, so yeah.Q: Could you tell me in your own words what it means when the available library size is 20
million songs?A: That is the limit. You cannot have more than 20 million songs. (Transcripts, p. 315, Hackeem A.)
63
A: I feel that would mean there’s 20 million songs in each genre. They could be repeated songs through each genre, because I know that several songs dofall into different categories. They probably mean that.140
129. On its face, one would expect available library size to be an easy-to-understand
feature. The amount of confusion only reinforces the importance of pretesting
language, even on features that may seem self-explanatory to the author of the
survey.
7. Advertising
130. Professor McFadden describes advertising as follows: “Plans may be ad-free or may
have advertising breaks in between tracks.” The feature can take on two levels: “1.5
to 3 minutes of ads per hour” or “No ads.” This feature description does not
distinguish whether it is possible to listen to these ads in one block, or whether they
will be spread throughout the hour. Respondents were asked “Could you tell me in
your own words what the term advertising means to you?” as well as questions to
probe the frequency expected of these advertising breaks.
131. Exhibit 10 shows the results for this feature. All respondents were able to explain
the concept of advertising. A typical response was:To me, advertising is when a song finishes and you’re stuck with 30 seconds of listening to some ad about something that you probably don’t want to listen to. 141
132. However, there was substantial heterogeneity with respect to how often the
qualitative study respondents expected to hear ads. Expectations of the number of
times users would be interrupted by advertisements per hour ranged from once per
hour (2 respondents)142 to 12 or more times per hour (2 respondents.)143 A large
140 Transcripts, p. 301, Giana B.141 Transcripts, p. 10, Alexandra F.142 For example:
Q: Could you tell me in your own words how many commercial breaks you’d expect these 1.5 to 3 minutes of ads per hour to occur in?
A: Every hour. Q: How many blocks of advertisements did you assume to be played when you read “1.5 to 3
minutes of ads per hour”?
64
number of respondents (62 percent) expected 2 to 5 interruptions per hour,144 while
another substantial group (19 percent) thought it would be closer to 6 to 12
interruptions.145 In this case, respondents completed a vague description of a feature
with their own varied experiences and expectations. For example:Q: Can you tell me in your own words what it means when there are one and a
half to three minutes of ads per hour?A: Over the course of an hour, probably one and a half to three minutes’ worth
of ads will be either spread out throughout that hour in between songs, or—Spotify will say, “Watch this video and get an hour for free.” You can opt to watch a longer advertisement for the next 30 minutes advertisement-free. You can watch it all up front, I guess. You could do it in a chunk.146
133. Because it is possible that respondents value this feature differently depending upon
the number of interruptions per hour, Professor McFadden cannot combine these
varied respondent understandings for the purpose of analysis or opinions. I see
evidence of these different valuations in qualitative study respondents’ answers.
One respondent said:A: I would rather listen to it for three minutes and just get it over with than it
interrupting you.147
In contrast, another respondent said: A: I would probably prefer if it was shorter blocks, just because it’s only 30
seconds away from your music or whatever at a time.148
[…]A: One. (Transcripts, p. 397, Jacob K.)
143 One respondent said, “Those ads are short, so I would say, if they’re going to do one every two minutes, you’re going to do thirty. I would say probably 60. Probably 60 to 90 quick ads.” (Transcripts, p. 644, Rebecca C.)
144 One respondent stated, “They generally don’t like to put a whole bunch of ads together, so I’m assuming that’s probably three or four blocks.” (Transcripts, p. 735, Steven J.)
145 One respondent stated, “That kind of depends on the commercials. Sometimes they’re 15 seconds; sometimes they’re at least 30 seconds. It depends on what it is. […] At least ten.” (Transcripts, p. 26, Alex S.)
146 Transcripts, p. 141, Chad H.147 Transcripts, p. 275, Eric R.148 Transcripts, p. 440, Jordan P.
65
8. Most Qualitative Study Respondents Indicated at Least Some Confusion About Professor McFadden’s Feature Definitions
134. The preceding paragraphs document considerable heterogeneity in the manner in
which respondents interpret features. Different interpretations among respondents
undermine any analyses of the data and undermine any interpretations and opinions
based on those analyses. A common interpretation of feature descriptions is critical
because the calculation of partworths and creation of estimated valuations of
features depends on that common understanding of the features. If two distinct
groups of respondents interpret features differently, they may systematically value
these features differently. Because Professor McFadden has no way of knowing
which respondents interpreted the features which way, he cannot reliably combine
respondent answers into a single analysis to obtain reliable valuations of the features
(or a probability distribution of those valuations as is the output of Hierarchical
Bayes analysis).
135. The preceding paragraphs also document that many qualitative study respondents
were confused by key feature descriptions in Professor McFadden’s survey.
Because of this confusion, any analyses of the answers to Professor McFadden’s
survey would lead to unreliable estimates of partworths and of the valuations that
respondents place on the features. Professor McFadden has no way of knowing
which respondents were confused; he cannot simply eliminate the confused
respondents from his analyses to concentrate only on respondents who were not
confused.
136. On many features, the level of confusion raises well above any noise levels that
could reasonably be handled with a “zero-mean error term.” The assumption of a
zero-mean error term is an assumption that there is no bias, just “white” noise, in the
respondent’s answers. The assumption is violated if the confusion leads to biases or
if the confusion leads to systematic and unobservable differences among
respondents. If this assumption is violated, then the statistical analysis of the data
from Professor McFadden’s survey is not valid. Even if a zero-mean term could be
assumed, which it cannot be, confusion would increase the magnitude of the error
and substantially increase any reported precision of the estimates. With less
66
precision, results put forth as statistically relevant may not be statistically relevant
and certainly cannot be claimed to be statistically relevant.149 Because several
features were interpreted by blind coders as having substantial variation in their
meaning, the level of confusion raises well above the noise levels mentioned above.
Taking into account that a number of interpretations for some features not only
showed such variation, but were also frequently far off Professor McFadden’s
intended meaning, the coding of the qualitative research indicates that there was
likely substantial confusion amongst respondents to Professor McFadden’s study.
C. A Review of Videotapes Revealed Even Greater Confusion aboutProfessor McFadden’s Survey
137. The coding discussed in the prior section was based on the respondents’ verbal
responses. Although the discussion above showed likely confusion in respondents’
understanding of the features, it is conservative (favors Professor McFadden’s
survey) because it does not take into account any confusion that is expressed by
respondents’ non-verbal cues such as intonation, facial expression, and body
language. To assess whether the non-verbal cues indicated increased confusion or
whether non-verbal cues suggested less confusion, the video recordings of the
qualitative interviews were also evaluated by two blind judges.
138. In the coding of video recordings, two blind-to-the-purpose coders were asked to
review the videos recordings of all 53 respondents and to assess the respondents’
understanding of certain features and aspects of the survey using intonation, facial
expression, and body language as well as the verbal responses. The coders were
provided with the qualitative study interview script (Appendix D), a guide for
coding which included the feature definitions provided by Professor McFadden
(Appendix F), a screenshot of Professor McFadden’s survey (Table 2 in his
testimony), and an Excel file template. Each coder was asked to watch each video
149 In classical statistics, statistically relevant would translate directly to statistically significant
at some level of significance, say the 0.05 level. In Bayesian statistics, the interpretations are somewhat different in that we refer to the posterior distribution of the estimates. However, in either interpretation, this level of confusion means that any precision is grossly overstated.
67
and, for selected questions in the interview script, assess whether the respondent did
or did not understand the feature being described. For each question for which the
coders assessed understanding, respondents were graded on a five point scale: (1)
understands; (2) probably understands or somewhat understands; (3) unsure/unclear;
(4) probably does not understand or does not completely understand; and (5) does
not understand. Although numbers are used in the prior sentence, such numbering
was avoided with the scale for the coders, so as not to indicate that one end of the
scale was preferable to the other.
139. Unlike the first set of coding, which focused exclusively on interpreting the
transcribed answers, this video coding assessed qualitative study respondents on two
levels: (1) correct or incorrect interpretation of the feature on the basis of Professor
McFadden’s definitions (similar to the prior coding);150 and (2) certainty and
confidence in response (assessed via intonation, facial expression, gesture, and
wording.) Thus, a respondent who provided a confident, correct answer would be
classified as “understands” while a respondent who provided a confident, incorrect
answer would be classified as “does not understand.” A respondent who expressed
confusion or uncertainty (by saying “I guess?” or “I’m not sure” or via gestures or
intonation), but gave an answer that was correct or mostly correct would be
classified as “probably or somewhat understands” while a respondent who
expressed confusion and gave a mostly incorrect answer would be classified as
“probably does not understand or does not completely understand.” A respondent
who expressed confusion and could not answer the question or answered it entirely
incorrectly would be classified as “does not understand.” “Unclear/unsure” was
150 Coders were provided with the definitions page from Professor McFadden’s survey (App. B,
B-viii) as well as accompanying verbal instructions. Coders were told to consider only these definitions, without regard to any outside information they might have about music streaming features. Coders met regularly with staff at Analysis Group to confirm their understanding of the features.
68
reserved for rare cases where the coders were unable to determine the respondents’
understanding.151
140. Exhibit 11 shows the results of the video-recording coding related to confusion.
These results are generally consistent with my results, above in Section VI.B, but
reveal less overall understanding.152 In the case of transcript-based feature
interpretation, coders grouped all respondents into categories according to the
content of their responses, regardless of confusion. Therefore, the feature
interpretation coding discussed above was conservative: all qualitative study
respondents were given the benefit of the doubt regarding their understanding
regardless of intonation, facial expression, and body language. In the video-
recording coding, coders classified qualitative study respondents as not
understanding a feature when the coders observed confusion expressed through
intonation, facial expression, and body language.
151 For questions on music streaming features, only two respondents were coded as
“Unsure/Unclear”: one respondent for music tastemakers and another respondent for advertising.
152 In total, 361 responses were coded using both methods: there were 371 total responses (53 participants x 7 features). Six were excluded due to interviewer error and four due to unclear responses. Of these 361 responses, all but 4 of the responses were coded consistently between the two methods. 69 percent were coded identically between both methods (“understands” and “correct interpretation” or “does not understand” and “incorrect interpretation”). An additional 30 percent of responses revealed additional confusion when visual and verbal cues were considered. This result is consistent with the expectation that the holistic video coding would identify more confusion compared to the transcript coding method. Only four responses about specific features were categorized such that the video coding judged a response as “understands” or “probably understands,” while the transcript categorization judged the response as “incorrect interpretation.”
I carefully reviewed the video recordings and transcripts for the 1 percent of responses which were coded inconsistently between the two methods. The small number (approximately 1 percent) of discrepancies is understandable, likely expected noise, and certainly does notcause any concern with the reliability of either the coding of the verbal responses or the coding of video recordings.
69
141. Because of the 99 percent consistency, for the vast majority of respondents, any
respondents classified as “understanding” in this exhibit are a subset of those
respondents who were classified as having the correct interpretation in the prior
exhibits.
142. For example, when asked to define available library size the following respondent
was classified as “correct” in the first coding using the transcripts and “probably
does not understand” in the second based on the raw videotape:Q: Could you tell me in your own words what it means when the available
library size is 20 million songs? A: That you could have up to 20 songs. [sic] Or to choose from? Q: Maybe I ought to repeat the question.[Moderator repeats question.] A: You have the option to add up to 20 million songs? Q: There are no right or wrong answers. A: That’s my choice, that you have the 20 million songs, you have the option to
down—you can’t download them, but put them in you—I don’t know how you word it. Choose from.153
It is clear to the coders from the video recording that this respondent is confused by
the term. But, ultimately, she gives an answer that is close to correct and, thus, was
classified as correct in Exhibit 9, because the classification was based solely on the
transcript.
143. There are higher levels of confusion found by judges who relied on video recordings
than by judges who relied on verbal transcripts only. Thus, the transcript coding
underlying Exhibits 3-10 was conservative. The video-recording coding reinforces
the high level of confusion experienced by respondents when they attempted to
answer Professor McFadden’s survey. This high level of confusion renders the data
obtained from Professor McFadden’s survey unreliable and not indicative of
respondents’ true preferences for features of music-streaming services. Any
estimates of feature valuations obtained by Professor McFadden and used by
Professor Rubinfeld are, by implication, unreliable and not indicative of
respondent’s valuations. 153 Transcripts, p. 606, Nancy M.
70
D. Professor McFadden’s Brand Controls Likely Did Not Achieve the Effect Desired by Professor McFadden
144. Professor McFadden attempted to control for brand by varying the brand that
respondents were told to keep in mind for each of three sets of choice tasks: Although brand is not an attribute listed in Table 1, I controlled for consumers’ valuation of brand—Spotify, Pandora, or an unknown brand—as follows. The respondent was presented with: (i) five choice sets in which s/he was required to choose among hypothetical (or actual) Spotify products; (ii) five choice sets in which s/he was required to choose among hypothetical (or actual) Pandora products, and (iii) five choice sets in which s/he was required to choose among hypothetical products of an unnamed brand. The order that these sets were presented was randomized across respondents.154
145. Professor McFadden presents no further information about how his branded results
compare to his non-branded results. In my qualitative study, after each of the sets of
five questions, respondents were asked “was there or wasn’t there a brand
associated with your last five choices?” Respondents answered “no,”155 referenced
the same brand across all three sets of choice tasks,156 or attempted to compare the
choice sets to brands they were aware of in the real world,157 often without making
any reference to the introductory screen that sought to induce the brand variation.
This screen did not register with respondents. As a result, Professor McFadden’s
survey did not control for a brand effect in the manner in which it was intended.
154 McFadden Testimony at 10.155 One respondent said the following after being asked whether their choices related to a brand:
“No, I wouldn’t say so. […] No, no brand. […] No, no brand.” (Transcripts, pp. 22, 26, 28, Alex S.)
156 One respondent said, “You mean a provider, like Spotify or Pandora? […] Probably Spotify. […] Probably Spotify. […] Yeah, it reminded me of Spotify.” (Transcripts, pp. 775, 778, 781, Thomas W.)
157 One respondent said, “[…] Rhapsody, Pandora, Spotify [...] I noticed that some of them I could identify what they were, by the description. There are some major differences.” (Transcripts, p. 564, Manuel R.)
Another respondent said, “I guess it’s kind of like Pandora in a way, or Spotify.” (Transcripts, p. 435, Jordan P.)
Another said, “I go a lot with Pandora, so I kind of was comparing it to that.” (Transcripts, p. 49, Ariana D.)

71
Moreover, respondents would repeatedly mention brands without prompting while
thinking through their choices.158
146. Additionally, when features were unclear, as they often were, respondents may have
overwritten the instructions using their personal knowledge.159 Such personal
knowledge varied among respondents and Professor McFadden has no way in his
analysis to account for this variation in personal knowledge. Critically, because the
effective brand anchor is not observed in Professor McFadden’s survey and because
personal knowledge varies among respondents, then, if the features in the conjoint
survey have different meanings for different brands, Professor McFadden cannot
combine these disparate respondents into a single analysis.
147. For example, consider the “playlists curated by music tastemakers” feature level.
Both Spotify and Pandora offer playlists curated by music tastemakers, but the
features are markedly different from each other. Spotify allows users to “follow” 158 For example:
Q: Please describe why you chose the option that you chose. A: I chose plan A based on skips. That was the ultimate thing, because I know sometimes when I’m in certain moods, I just want to skip the regular songs, and I just want to listen to one specific song. If I was to listen to Pandora and that was the plan, I would’ve just picked that one, because no matter which plan I picked, I was only allowed to skip six songs per hour.(Transcripts, p. 3, Alexandra F.)
“I notice that the words ‘random order’ are put in here with Spotify, which is something I noticed, too. That’s something that my son has brought up, that with Pandora, a lot of times, you end up having the same artists in a row, which doesn’t faze me, but I know that it’s—it’s interesting how they would put that in there. That is something that would cue me in that it was Spotify. A random order is something that seems to be a big push for them.” (Transcripts, p. 612, Nancy M.)
159 For example:Q: When it says on there “mobile device streaming,” when it says “playlists generated by the service,” could you tell me what that means?A: Assuming for Pandora, because that’s just what I thought of, the like and dislike, how it generates your playlist. It tries to put songs in categories, and then what categories you like or dislike, it tries to give you those kinds of songs.(Transcripts, p. 668, Samuel H.)
72
other users, including celebrities, and listen to their playlists, whereas Pandora
offers official playlists generated by non-celebrity experts.160 This is prone to cause
different interpretations among respondents, depending on the service with which
they are more familiar, making an interpretation of Professor McFadden’s statistical
analyses difficult, if not impossible.
148. One respondent, who identified herself as a Pandora user, described her
understanding based on her experiences with Pandora:Q: Could you tell me in your own terms what the term “tastemaker” means to
you? A: A tastemaker, I guess, is somebody that does a lot of research on music and
would pick out what songs they think that I would like based on what topic of music I want to listen to.
Q: What do you mean by that? Tastemaker—maybe flesh it out a little bit more. How would that end up working out?
A: I see it as that’s computer-generated. If I went to Pandora and I clicked I wanted country music, that they would just give me a whole list of songs to listen based on—if I picked the top 40 songs of country music right now, it would just bring it up automatically, that I wouldn’t really have a say in that. It was just that’s the topic that I picked, so that brought up a bunch of songs for me.161
Meanwhile, a Spotify user focused her answer differently:Q: Could you tell me in your own words what it means when the playlist is
curated by music tastemakers? A: You know something? I don’t know what it means, and I’ve always wanted to
know what it means. I’m assuming that—I’m going to use Spotify for example because it just seems more relevant to all of these questions. What was the question again?
[Moderator repeats question.] A: The tastemakers are the people that are actually using the—Spotify. May I
use that example?162
160 “FAQs: Why should my playlist be private while I am curating?” Spotify.com,
http://www.spotifyartists.com/faq/#why-do-i-need-to-uncheck-the-option-to-make-playlists-public, (last visited Feb. 16, 2015); “Pandora Unveils Billboard Advertising Unit Featuring Lexus,” Pandora.com, October 20, 2011, http://investor.pandora.com/phoenix.zhtml?c=227956&p=irolnewsArticle&ID=1619467,(last visited Feb. 16, 2015).
161 Transcript, p. 7, Alexandra F.162 Transcript, p. 203, Donna C.
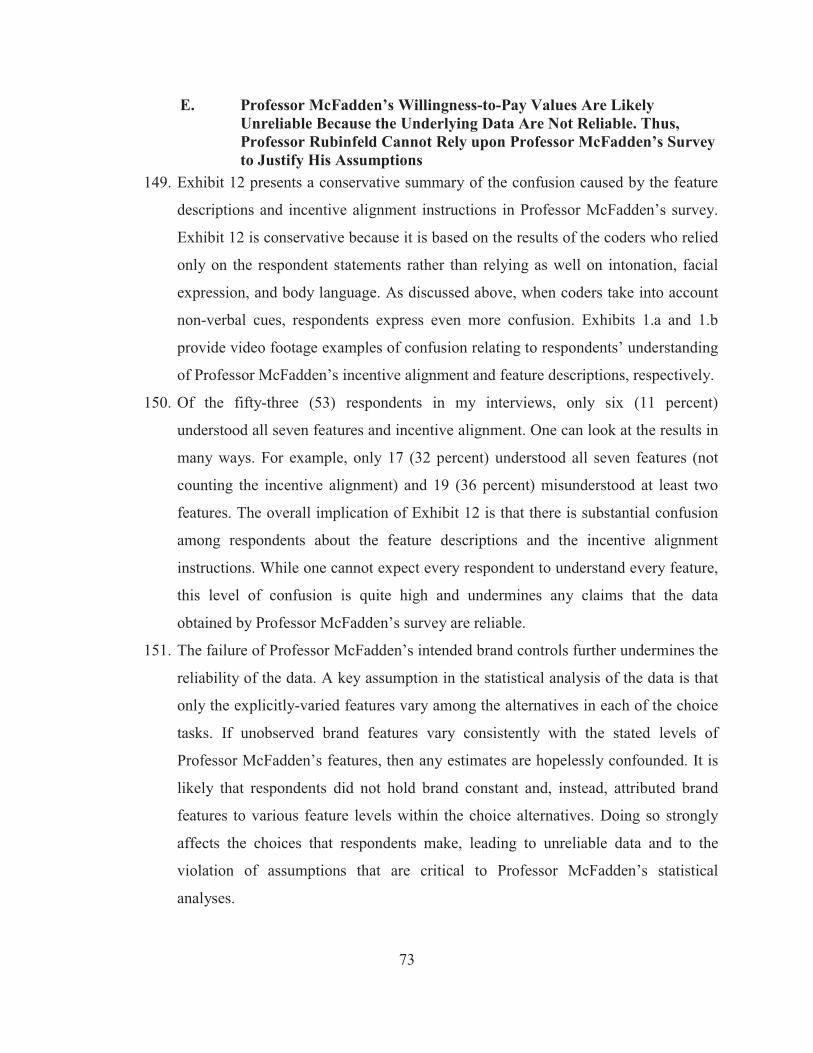
73
E. Professor McFadden’s Willingness-to-Pay Values Are Likely Unreliable Because the Underlying Data Are Not Reliable. Thus, Professor Rubinfeld Cannot Rely upon Professor McFadden’s Survey to Justify His Assumptions
149. Exhibit 12 presents a conservative summary of the confusion caused by the feature
descriptions and incentive alignment instructions in Professor McFadden’s survey.
Exhibit 12 is conservative because it is based on the results of the coders who relied
only on the respondent statements rather than relying as well on intonation, facial
expression, and body language. As discussed above, when coders take into account
non-verbal cues, respondents express even more confusion. Exhibits 1.a and 1.b
provide video footage examples of confusion relating to respondents’ understanding
of Professor McFadden’s incentive alignment and feature descriptions, respectively.
150. Of the fifty-three (53) respondents in my interviews, only six (11 percent)
understood all seven features and incentive alignment. One can look at the results in
many ways. For example, only 17 (32 percent) understood all seven features (not
counting the incentive alignment) and 19 (36 percent) misunderstood at least two
features. The overall implication of Exhibit 12 is that there is substantial confusion
among respondents about the feature descriptions and the incentive alignment
instructions. While one cannot expect every respondent to understand every feature,
this level of confusion is quite high and undermines any claims that the data
obtained by Professor McFadden’s survey are reliable.
151. The failure of Professor McFadden’s intended brand controls further undermines the
reliability of the data. A key assumption in the statistical analysis of the data is that
only the explicitly-varied features vary among the alternatives in each of the choice
tasks. If unobserved brand features vary consistently with the stated levels of
Professor McFadden’s features, then any estimates are hopelessly confounded. It is
likely that respondents did not hold brand constant and, instead, attributed brand
features to various feature levels within the choice alternatives. Doing so strongly
affects the choices that respondents make, leading to unreliable data and to the
violation of assumptions that are critical to Professor McFadden’s statistical
analyses.
74
152. Because the underlying data are unreliable, any statistical summaries of the data,
including the calculations of partworths from the data, are unreliable. Even if the
data were reliable, which they are not, respondents vary considerably in how they
interpret the feature descriptions. A reported valuation for a feature, say offline
listening, is combining “apples and oranges,” that is, the valuation is combining
many different respondent interpretations into a single summary. Because Professor
McFadden’s analyses can identify neither which respondents have which
interpretations nor how the differing interpretations affect the partworth, it is not
appropriate to assume that the average interpretation is the same as that assumed by
Professor McFadden. This variation undermines assumptions about “error terms”
that are critical to the estimation and the interpretation of the results.
153. Because the data upon which Professor McFadden relies are unreliable and, by
implications, the statistical analyses are unreliable, the reported valuations of the
music-streaming features are unreliable. Thus, any ratios calculated by Professor
Rubinfeld based on Professor McFadden’s analyses are themselves unreliable.
154. Professor McFadden focuses his estimates on three non-statutory features of music
streaming: on-demand track selection (which he calculates as the combined effect
from both computer and mobile on-demand options), offline listening, and skip
limits.163 He then compares the values for these features to the values he calculates
for “other features” that are “available to both statutory webcasters and streaming
services that have directly negotiated licenses,” which I will refer to as statutory
features. Professor McFadden estimates that “45% = (3.89/(4.16+3.89+0.60)) of the
value to future consumers is attributable to the non-statutory features.”.164 Professor
Rubinfeld makes a similar calculation, asserting that “these calculations result in an
163 McFadden Testimony at 25-26.164 McFadden Testimony at 24-28. In Figure 4 of his testimony, Professor McFadden lists three
non-statutory features: On demand (desktop and mobile), Offline listening, and Unlimited skips. He also denotes six “other features” and associated feature levels that are available to both statutory webcasters and streaming services with directly negotiated licenses: Free plan, Playlist from tastemakers to algorithm, Catalog from 1M to 20M, Current plan, No advertising, and Addition of mobile services.

75
interactivity ratio of 1.9.”165 This estimate is highly unreliable. As the qualitative
research demonstrates, the confusion among respondents is so high that any
estimates based on the data from Professor McFadden’s survey are likely to be
biased substantially and in an unknown and unknowable direction.
155. The calculated ratio can be substantially smaller or substantially larger, even if only
one feature in the survey would indicate substantial confusion. For example, if the
valuation for offline listening is biased upwards, then the calculated interactivity
ratio mentioned above would be inflated; if it is biased downward, the ratio would
be deflated. However, the problems with the calculated ratio are far more severe
than that. Wrongly estimating the valuation of one feature will affect the valuations
of other features, especially when feature descriptions are very similar and when
respondents mix up features during the choice task because of evident overlap in
meaning. In addition, when multiple features are affected by confusion, it is literally
impossible to reconstruct how features affect one another during the choice exercise
and how the valuations for each feature are affected. The only conclusion that can
be drawn is that true consumer preferences were not reliably assessed by the
McFadden survey and that the bias from the incentive alignment and the feature
descriptions appears to affect the valuations of all features.
165 Rubinfeld Testimony at 52.

76
I declare under penalty of perjury that the foregoing is true and correct.
____________________________ February 23, 2015
John R. Hauser Date

Exhibit 1.a
Please see disk attached for video

Exhibit 1.b
Please see disk attached for video
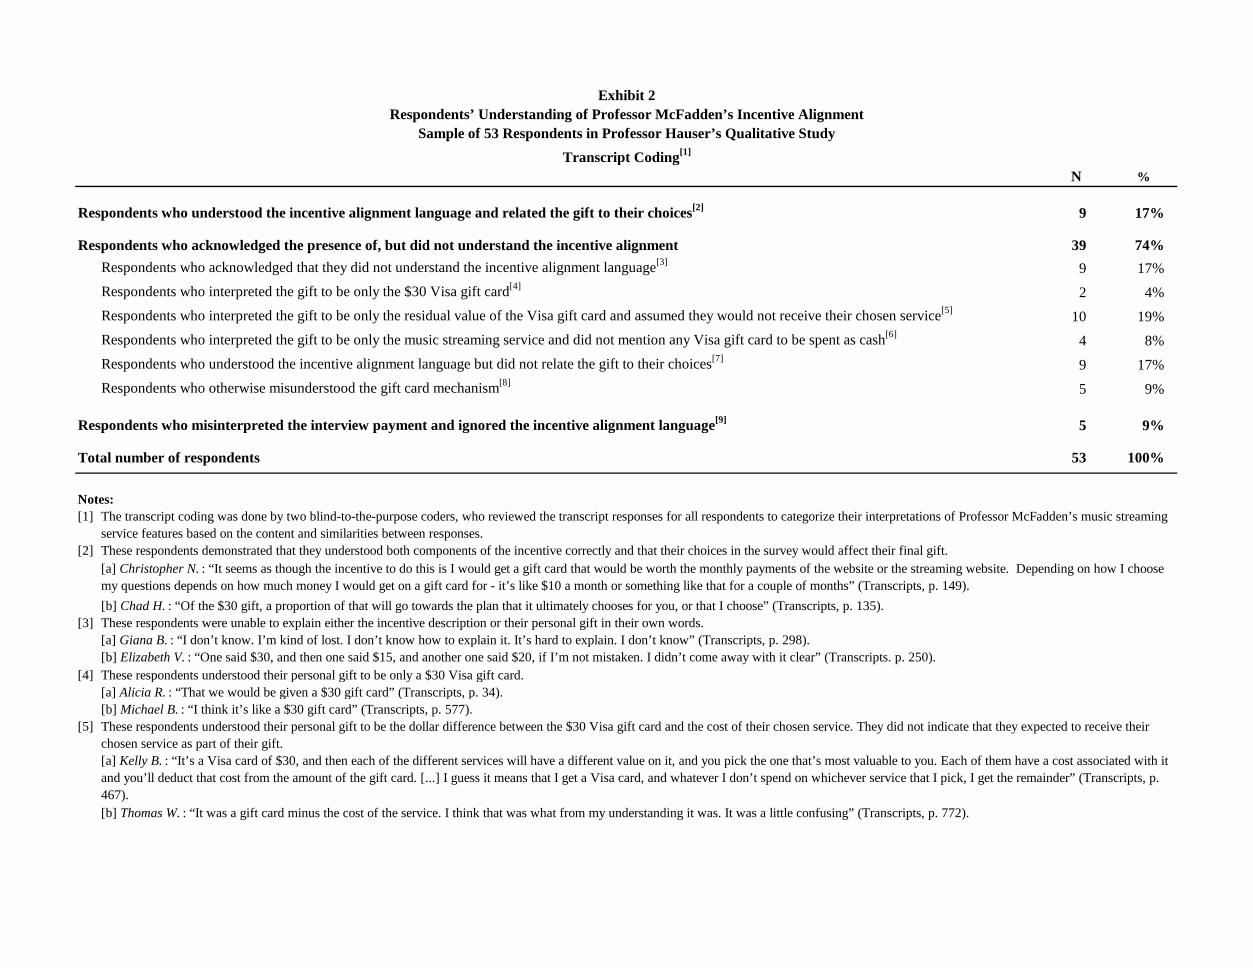
Exhibit 2Respondents’ Understanding of Professor McFadden’s Incentive Alignment
Sample of 53 Respondents in Professor Hauser’s Qualitative StudyTranscript Coding[1]
N %
Respondents who understood the incentive alignment language and related the gift to their choices[2] 9 17%
Respondents who acknowledged the presence of, but did not understand the incentive alignment 39 74% Respondents who acknowledged that they did not understand the incentive alignment language[3]
9 17%
Respondents who interpreted the gift to be only the $30 Visa gift card[4]2 4%
Respondents who interpreted the gift to be only the residual value of the Visa gift card and assumed they would not receive their chosen service[5]10 19%
Respondents who interpreted the gift to be only the music streaming service and did not mention any Visa gift card to be spent as cash[6]4 8%
Respondents who understood the incentive alignment language but did not relate the gift to their choices[7]9 17%
Respondents who otherwise misunderstood the gift card mechanism[8]5 9%
Respondents who misinterpreted the interview payment and ignored the incentive alignment language[9] 5 9%
Total number of respondents 53 100%
Notes:[1]
[2]
[b] Chad H. : “Of the $30 gift, a proportion of that will go towards the plan that it ultimately chooses for you, or that I choose” (Transcripts, p. 135).[3]
[a] Giana B. : “I don’t know. I’m kind of lost. I don’t know how to explain it. It’s hard to explain. I don’t know” (Transcripts, p. 298).[b] Elizabeth V. : “One said $30, and then one said $15, and another one said $20, if I’m not mistaken. I didn’t come away with it clear” (Transcripts. p. 250).
[4] These respondents understood their personal gift to be only a $30 Visa gift card.[a] Alicia R. : “That we would be given a $30 gift card” (Transcripts, p. 34).[b] Michael B. : “I think it’s like a $30 gift card” (Transcripts, p. 577).
[5]
The transcript coding was done by two blind-to-the-purpose coders, who reviewed the transcript responses for all respondents to categorize their interpretations of Professor McFadden’s music streaming service features based on the content and similarities between responses.
These respondents were unable to explain either the incentive description or their personal gift in their own words.
These respondents demonstrated that they understood both components of the incentive correctly and that their choices in the survey would affect their final gift.[a] Christopher N. : “It seems as though the incentive to do this is I would get a gift card that would be worth the monthly payments of the website or the streaming website. Depending on how I choose my questions depends on how much money I would get on a gift card for - it’s like $10 a month or something like that for a couple of months” (Transcripts, p. 149).
These respondents understood their personal gift to be the dollar difference between the $30 Visa gift card and the cost of their chosen service. They did not indicate that they expected to receive their chosen service as part of their gift.[a] Kelly B. : “It’s a Visa card of $30, and then each of the different services will have a different value on it, and you pick the one that’s most valuable to you. Each of them have a cost associated with it and you’ll deduct that cost from the amount of the gift card. [...] I guess it means that I get a Visa card, and whatever I don’t spend on whichever service that I pick, I get the remainder” (Transcripts, p. 467).[b] Thomas W. : “It was a gift card minus the cost of the service. I think that was what from my understanding it was. It was a little confusing” (Transcripts, p. 772).
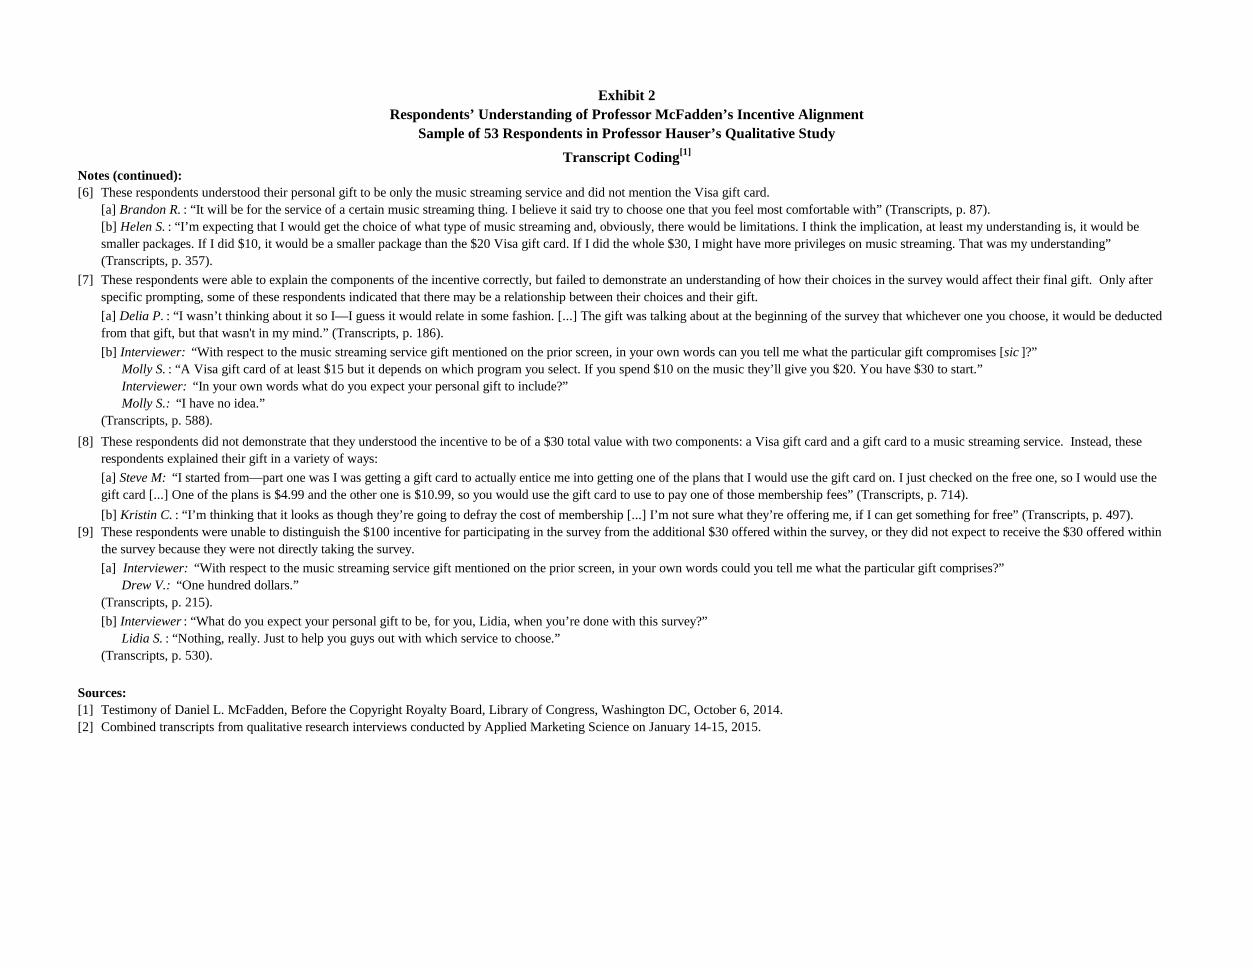
Exhibit 2Respondents’ Understanding of Professor McFadden’s Incentive Alignment
Sample of 53 Respondents in Professor Hauser’s Qualitative StudyTranscript Coding[1]
Notes (continued):[6] These respondents understood their personal gift to be only the music streaming service and did not mention the Visa gift card.
[7]
[8]
[9]
[b] Interviewer : “What do you expect your personal gift to be, for you, Lidia, when you’re done with this survey?” Lidia S. : “Nothing, really. Just to help you guys out with which service to choose.”(Transcripts, p. 530).
Sources:[1] Testimony of Daniel L. McFadden, Before the Copyright Royalty Board, Library of Congress, Washington DC, October 6, 2014.[2] Combined transcripts from qualitative research interviews conducted by Applied Marketing Science on January 14-15, 2015.
[a] Interviewer: “With respect to the music streaming service gift mentioned on the prior screen, in your own words could you tell me what the particular gift comprises?” Drew V.: “One hundred dollars.”(Transcripts, p. 215).
These respondents did not demonstrate that they understood the incentive to be of a $30 total value with two components: a Visa gift card and a gift card to a music streaming service. Instead, these respondents explained their gift in a variety of ways:
These respondents were able to explain the components of the incentive correctly, but failed to demonstrate an understanding of how their choices in the survey would affect their final gift. Only after specific prompting, some of these respondents indicated that there may be a relationship between their choices and their gift.
These respondents were unable to distinguish the $100 incentive for participating in the survey from the additional $30 offered within the survey, or they did not expect to receive the $30 offered within the survey because they were not directly taking the survey.
[b] Interviewer: “With respect to the music streaming service gift mentioned on the prior screen, in your own words can you tell me what the particular gift compromises [sic ]?” Molly S. : “A Visa gift card of at least $15 but it depends on which program you select. If you spend $10 on the music they’ll give you $20. You have $30 to start.” Interviewer: “In your own words what do you expect your personal gift to include?” Molly S.: “I have no idea.”(Transcripts, p. 588).
[a] Steve M: “I started from—part one was I was getting a gift card to actually entice me into getting one of the plans that I would use the gift card on. I just checked on the free one, so I would use the gift card [...] One of the plans is $4.99 and the other one is $10.99, so you would use the gift card to use to pay one of those membership fees” (Transcripts, p. 714).
[a] Brandon R. : “It will be for the service of a certain music streaming thing. I believe it said try to choose one that you feel most comfortable with” (Transcripts, p. 87).[b] Helen S. : “I’m expecting that I would get the choice of what type of music streaming and, obviously, there would be limitations. I think the implication, at least my understanding is, it would be smaller packages. If I did $10, it would be a smaller package than the $20 Visa gift card. If I did the whole $30, I might have more privileges on music streaming. That was my understanding” (Transcripts, p. 357).
[b] Kristin C. : “I’m thinking that it looks as though they’re going to defray the cost of membership [...] I’m not sure what they’re offering me, if I can get something for free” (Transcripts, p. 497).
[a] Delia P. : “I wasn’t thinking about it so I—I guess it would relate in some fashion. [...] The gift was talking about at the beginning of the survey that whichever one you choose, it would be deducted from that gift, but that wasn't in my mind.” (Transcripts, p. 186).

Exhibit 3Respondents’ Interpretations of Professor McFadden’s Music Streaming Feature Descriptions
Sample of 53 Respondents in Professor Hauser’s Qualitative StudyTranscript Coding[1]
N % N % N %
Playlist Method[2]21 40% 32 60% 53 100%
Curated by Music Tastemakers 21 40% 32 60% 53 100%Generated by a Computer Algorithm 42 79% 11 21% 53 100%
On-Demand Track Selection 49 92% 4 8% 53 100%
Offline Listening[3]40 85% 7 15% 47 100%
Mobile Device Streaming 51 96% 2 4% 53 100%Skip Limits 53 100% 0 0% 53 100%
Available Library Size[4]33 66% 17 34% 50 100%
Advertising 53 100% 0 0% 53 100%
Notes:[1]
[2]
[3] Six respondents were asked about “offline licensing” rather than “offline listening.” These respondents are not included in the table above.
[4]
Sources:[1] Testimony of Daniel L. McFadden Before the Copyright Royalty Board, Library of Congress, Washington DC, October 6, 2014.
[2] Combined transcripts from qualitative research interviews conducted by Applied Marketing Science on January 14-15, 2015.
Three respondents did not explain available library size sufficiently to determine understanding. These respondents are not included in the table above, unlike in Exhibit 9, where these respondents appear in a separate category.
Respondents with a Correct Interpretation
Respondents with an Incorrect Interpretation
Total Respondents
The transcript coding was done by two blind-to-the-purpose coders, who reviewed the transcript responses for all respondents to categorize their interpretations of Professor McFadden’s music streaming service features based on the content and similarities between responses.To assess Professor McFadden’s music streaming service feature of playlist method , responses were coded according to the respondents’ understanding of the underlying levels: “curated by music tastemakers” and “generated by a computer algorithm.” For the purpose of this exhibit, the transcript coding for respondents’ understanding of these two levels were combined. Respondents who had a correct interpretation of both the concept of a music tastemaker and a computer algorithm were categorized as having a “Correct Interpretation.” If they had an incorrect interpretation of either concept, they were categorized as having an “Incorrect Interpretation.”
Feature Descriptions

Exhibit 4.aRespondents’ Understanding of Professor McFadden’s Description of Music Streaming Service Features
Sample of 53 Respondents in Professor Hauser’s Qualitative Study Playlist Method: Music Tastemakers
Transcript Coding[1]
N %
21 40%
Respondents who believed that playlists were generated by celebrities[2] 4 8%
Respondents who believed that playlists were generated by music experts[3] 17 32%
32 60% Respondents who acknowledged that they did not understand the concept of a tastemaker[4] 3 6%
Respondents who believed that playlists were generated by other users[5] 3 6%
Respondents who believed that playlists were generated by themselves[6] 7 13%
Respondents who believed that playlists were generated by an unspecified person’s preferences[7] 8 15%
Respondents who believed that playlists were custom-tailored for them by music experts[8] 3 6%
Respondents who believed that playlists were generated by a computer algorithm[9] 2 4%
Respondents who otherwise misunderstood the concept of a tastemaker[10] 6 11%
53 100%
Notes:[1]
[2] These respondents understood the term tastemaker to mean celebrities.
[3]
[b] Chad H. : “Someone who is well versed in matching your tastes. That is a funny term” (Transcripts, p. 139).
Responses to “Could you tell me in your own words what the term tastemaker means to you?”
Respondents who interpreted tastemakers to be celebrities or music experts who create playlists
Respondents who had other interpretations of tastemakers, signaling their misunderstanding of the feature
Total number of respondents
[a] Steven J. : “That means that somebody, like Beyoncé—whoever that is. I know who she is, but somebody like Beyoncé has decided that—it says—I don’t know if she knows anything about Motown, but when Beyoncé says, ‘Here’s my Motown playlist.’ She’s the person that picks which particular files goes into the Motown bucket. [...] Somebody who is suppose [sic ] to be an authority” (Transcripts, p. 732).
[a] Nancy M. : “Someone obviously who’s knowledgeable in the music industry and watches patterns and realizes that if you like one band, you might possibly like another one. They study patterns and put them all together to give you options that you don’t realize that you have” (Transcripts, p. 607).
These respondents understood the term tastemaker to mean music experts who specialize in selecting songs for playlists.
[b] Toni V. : “Like I said before, I think it’s playlists or options for listening to music based on either what the computer thinks or the program thinks the person who is using the streaming music personal is—or tastemaker is somebody that is a professional rock star, rock and roll music player, or whatever” (Transcripts, p. 800).
The transcript coding was done by two blind-to-the-purpose coders, who reviewed the transcript responses for all respondents to categorize their interpretations of Professor McFadden’s music streaming service features based on the content and similarities between responses.

Exhibit 4.aRespondents’ Understanding of Professor McFadden’s Description of Music Streaming Service Features
Sample of 53 Respondents in Professor Hauser’s Qualitative Study Playlist Method: Music Tastemakers
Transcript Coding[1]
Notes (continued):[4]
[5] These respondents understood the term tastemaker to mean other users of the music streaming service.
[b] Donna C. : “The tastemakers are the people that are actually using the—Spotify” (Transcripts, p. 203).
[6] These respondents understood the term tastemaker to mean themselves.
[7]
[8]
[9]
[10]
Sources:[1] Testimony of Daniel L. McFadden Before the Copyright Royalty Board, Library of Congress, Washington DC, October 6, 2014.
[2] Combined transcripts from qualitative research interviews conducted by Applied Marketing Science on January 14-15, 2015.
[a] Brian G.: “Tastemaker means to me that there’s a certain—that there’s an idea of what goes with what. If a person’s taste in music is classical, these are things that they will like. That’s what I think of when I think of tastemaker” (Transcripts, p. 107).
These respondents understood the term tastemaker to mean an unspecified person that selects songs that are similar to each other.
[b] Kristin C. : “In the song venue, it would be certain choices people are making that they want to enjoy. [...] It’s an auditory thing. It’s what you—it’s like on weekends, when I’m scuttlebutting around, I might have on country or Motown from the ‘70s, because it’s kind of upbeat and whatever. At night, my choices, they’re not that. They’re easy listening, whether be instrumental or just songs that are mindless that I don’t have to think about” (Transcripts, p. 504).
[b] Jordan P. : “Tastemaker would probably be someone that analyzes what stuff you like to listen to and knows where to find other music that’s similar” (Transcripts, p. 437).
[b] Frank B. : “Tastemaker would be someone that you looked up to that maybe has similar taste or views as you. If your friends like it, I would probably like it also. [...] It could be, if you’re following a certain artist like Bruno Mars. If Bruno Mars likes this, perhaps you would like it also. That’s another thing that it could be. I’m really not sure” (Transcripts, p. 288).
[a] Delia P. : “It was one thing that you—a tastemaker, I would say, is something that makes a playlist based on what it appears your taste in music is, what your preference is” (Transcripts, p. 189).
These respondents understood the term tastemaker to mean music experts who create customized playlists based on the users’ tastes.
These respondents had other interpretations of the term tastemaker.
[b] Celine A. : “Once again, going back to maybe based off the recent music that you listened to. It just puts all of the music that they think that you would like into that” (Transcripts, p. 122).
[a] Brandon R. : “Tastemaker, a group of things put together by people that like it or don’t like it. Something that they personally like” (Transcripts, p. 91).
[b] Iman D. : “Somebody with a taste for that type of music making the playlist for it” (Transcripts, p. 379).
These respondents understood the term tastemaker to mean a computer algorithm which selected songs for a playlist based on the user’s song preferences.
[a] Thomas W. : “I guess just another user. I’m not really sure” (Transcripts, p. 777).
[a] Manuel R. : “Almost exactly what that means to me is it means that it is—it’s whatever I like that I can pick from their—make my own playlist. What I like, my taste versus their taste” (Transcripts, p. 566).[b] Nicole M. : “I would think that that means musical preferences that you have. If you like a little bit of rap, a little bit of Pavarotti, that’s your taste. You’re a tastemaker. Taste, preferences, what you prefer to listen to” (Transcripts, p. 625).
These respondents acknowledged that they did not understand the term tastemaker.
[a] Elizabeth V. : “I don’t know. Tastemaker. Again, somebody—I don’t know. Going along the lines of whatever genre, whatever music that you’re into, they give you along the lines of the same concept or the same ideas. I have no idea” (Transcripts, p. 256).
[a] Alex S. : “Tastemaker means the computer algorithm memorizing the bands and music you like. [...] The computer saves your preferences, and instead of you always having to look up the songs of the same band, it just kind of shows you the options and the songs of the band” (Transcripts, p. 24).

Exhibit 4.bRespondents’ Understanding of Professor McFadden’s Description of Music Streaming Service Features
Sample of 53 Respondents in Professor Hauser’s Qualitative Study Playlist Method: Generated by a Computer Algorithm
Transcript Coding[1]
N %
42 79% Based on the user’s selection of a genre or artist, the computer algorithm suggests similar songs[2] 12 23%
Based on the user’s feedback, the computer algorithm suggests similar songs[3] 15 28%
Based on the user’s previous music listening history, the computer algorithm suggests similar songs[4] 15 28%
11 21% Respondents who acknowledged that they did not understand how a computer algorithm could generate a playlist[5] 2 4%
Respondents who did not appear to understand the term “algorithm”[6] 3 6%
Respondents who believed that they generated the playlist[7] 4 8%
Respondents who believed that the computer algorithm selects songs based on any of the user’s online activities[8] 2 4%
53 100%
Notes:[1]
[2]
[3]
Responses to “Could you tell me in your own words what the term generated by a computer algorithm customized by your own preferences means to you?”
Respondents with a definition for computer algorithm generated playlists
Respondents who did not understand the concept of a music selecting computer algorithm
Total number of respondents
[a] Alex S. : “Made by a computer algorithm means that you pick the genre and it just customizes it and plays whatever song. If I pick rock, they play Ozzy Osbourne, Rolling Stones, but the other one means that you pick the songs and it just plays it over and over again. It shuffles it” (Transcripts, p. 24).
The transcript coding was done by two blind-to-the-purpose coders, who reviewed the transcript responses for all respondents to categorize their interpretations of Professor McFadden’s music streaming service features based on the content and similarities between responses.
[b] Molly S. : “There is an equation somewhere that is taking what you like and don’t like and is then coming up with music based on those preferences, but it’s all based on a mathematical equation” (Transcripts, p. 593).
These respondents believed that computer algorithms generate playlists based on the user’s selection of a genre or artist.
[a] Alexandra F. : “To me, that makes me think of when it has like the thumbs-up or thumbs-down part on it, and it tells you—they get an idea of the song that you like, to play more of those or to play less of the songs that you don’t like. [...] Whether or not you like or dislike. The thumbs-up is that you like it; thumbs-down is that you don’t like that song. Then, they try to skip that song if you still have skips, I think, or they just know that, and next time they won’t play that particular song. Sometimes they do. I’ve seen that they do songs similar to it” (Transcripts, p. 8).
[b] Kelly B. : “That would mean I go in and I pick—it tries to pick off my likes that I’ve shown it, so I’ll go in and I’ll pick artists, genre, whatever, and it will interpret what that means, and then pull some of its own also” (Transcripts, p. 471).These respondents believed that computer algorithms generate playlists based on the user’s active “likes” and “dislikes” of currently playing songs.

Exhibit 4.bRespondents’ Understanding of Professor McFadden’s Description of Music Streaming Service Features
Sample of 53 Respondents in Professor Hauser’s Qualitative Study Playlist Method: Generated by a Computer Algorithm
Transcript Coding[1]
Notes (continued):[4]
[5]
[6] These respondents did not understand the term algorithm as a way in which the computer selected songs for the user.
[7] These respondents understood the term “computer algorithm” to mean themselves.
[8]
Sources:[1] Testimony of Daniel L. McFadden Before the Copyright Royalty Board, Library of Congress, Washington DC, October 6, 2014.
[2] Combined transcripts from qualitative research interviews conducted by Applied Marketing Science on January 14-15, 2015.
[a] Giana B. : “I feel like that would mean through your searches of the computer, that music stored on your website would use your searches to create a playlist that you like. [...] Through your past searches of any music streaming website or of YouTube or anything like that. Or looking up lyrics of a song or a song artist, buying concert tickets, stuff like that. I feel like the computer would use that to create something” (Transcripts, p. 302).
These respondents acknowledged that they did not understand what a computer algorithm was nor how it could generate a playlist.
[b] Frank B. : “The program would follow the artists or songs that I’m listening to, and based upon that information I may provide to them when I log in to their site, or if they link into my social media sites, you get a little better feel as to who I am. My age, my demographics, the type of music I like, and even political views. With all of those tidbits of information, customize a playlist they believe would best suit me” (Transcripts, p. 288).
These respondents believed that computer algorithms generate playlists based on the user’s listening history within the music streaming service.
[a] Celine A. : “It’s you looking for your own music. The music that you pick is the ones that you get. It’s not picked by other people” (Transcripts, p. 122).
[b] Joe R. : “You could pick your own songs and put them into categories, like under your albums, artists, your favorite playlists, songs, yeah” (Transcripts, p. 423).
[a] Steve M. : “Computer-generated? [...] I would think it—but I can’t see how, because they would just be able to change the tune of the music for you. [...] Like being able to actually disc jockey your own music. [...] That you’re actually being able to do your playlist and the mode, the pace of the tunes” (Transcripts, p. 719).
[a] Kristin C. : “That’s cool, yeah. I think that computer takes all of my choices that I listened to—like last night. I’m sure when I go back in there if it’s going to pop up with, ‘This is what you enjoyed. Would you like the computer to store that information?’ Then you can either keep it as your playlist or change it up” (Transcripts, p. 504).
[a] Michael B. : “I’m not sure” (Transcripts, p. 580).
[b] Tanya R. : “No, I don’t. […] I’m assuming it has to do something with the computer. I’m not really good with computers” (Transcripts, p. 761).
[b] Hackeem A. : “Your computer will notice that you’re doing something over and over again and find a common, and then try to help you out and give you options if you like this, you like this, don’t like it” (Transcripts, p. 316).
[b] Nicole M. : “Generated by a computer algorithm is it’ll pull other like media files together. […] The computer is doing it. If I just pull my own preferences, I’m just picking songs that I like instead of the computer” (Transcripts, p. 625),
These respondents believed that computer algorithms generate playlists by accessing both the user’s information that the user provided to the music streaming service and publicly available information on other websites.
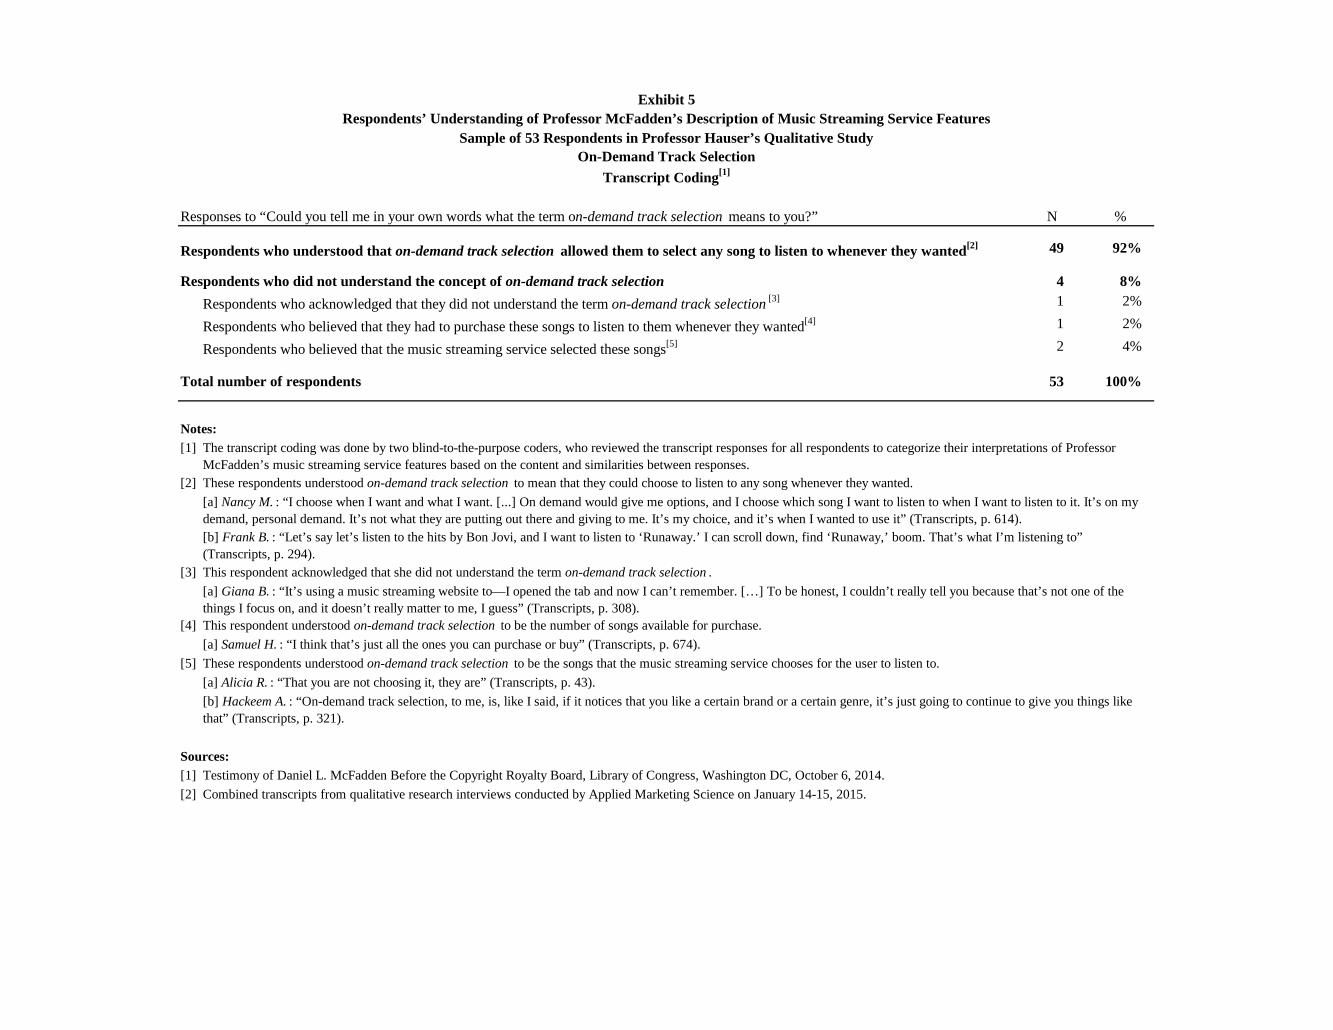
Exhibit 5Respondents’ Understanding of Professor McFadden’s Description of Music Streaming Service Features
Sample of 53 Respondents in Professor Hauser’s Qualitative StudyOn-Demand Track Selection
Transcript Coding[1]
N %
49 92%
4 8% Respondents who acknowledged that they did not understand the term on-demand track selection [3] 1 2%
Respondents who believed that they had to purchase these songs to listen to them whenever they wanted[4] 1 2%
Respondents who believed that the music streaming service selected these songs[5] 2 4%
53 100%
Notes:[1]
[2]
[3]
[4]
[5]
Sources:[1] Testimony of Daniel L. McFadden Before the Copyright Royalty Board, Library of Congress, Washington DC, October 6, 2014.
[2] Combined transcripts from qualitative research interviews conducted by Applied Marketing Science on January 14-15, 2015.
[b] Frank B. : “Let’s say let’s listen to the hits by Bon Jovi, and I want to listen to ‘Runaway.’ I can scroll down, find ‘Runaway,’ boom. That’s what I’m listening to” (Transcripts, p. 294).
Responses to “Could you tell me in your own words what the term on-demand track selection means to you?”
These respondents understood on-demand track selection to be the songs that the music streaming service chooses for the user to listen to.
[a] Alicia R. : “That you are not choosing it, they are” (Transcripts, p. 43).
[b] Hackeem A. : “On-demand track selection, to me, is, like I said, if it notices that you like a certain brand or a certain genre, it’s just going to continue to give you things like that” (Transcripts, p. 321).
This respondent acknowledged that she did not understand the term on-demand track selection .
[a] Giana B. : “It’s using a music streaming website to—I opened the tab and now I can’t remember. […] To be honest, I couldn’t really tell you because that’s not one of the things I focus on, and it doesn’t really matter to me, I guess” (Transcripts, p. 308).This respondent understood on-demand track selection to be the number of songs available for purchase.
[a] Samuel H. : “I think that’s just all the ones you can purchase or buy” (Transcripts, p. 674).
Respondents who understood that on-demand track selection allowed them to select any song to listen to whenever they wanted[2]
Respondents who did not understand the concept of on-demand track selection
Total number of respondents
These respondents understood on-demand track selection to mean that they could choose to listen to any song whenever they wanted.
[a] Nancy M. : “I choose when I want and what I want. [...] On demand would give me options, and I choose which song I want to listen to when I want to listen to it. It’s on my demand, personal demand. It’s not what they are putting out there and giving to me. It’s my choice, and it’s when I wanted to use it” (Transcripts, p. 614).
The transcript coding was done by two blind-to-the-purpose coders, who reviewed the transcript responses for all respondents to categorize their interpretations of Professor McFadden’s music streaming service features based on the content and similarities between responses.

Exhibit 6Respondents’ Understanding of Professor McFadden’s Description of Music Streaming Service Features
Sample of 53 Respondents in Professor Hauser’s Qualitative Study Offline Listening
Transcript Coding[1]
N %
40 85%
7 15% Respondents who acknowledged that they did not understand the term offline listening [3] 1 2%
Respondents who believed that offline listening was the ability to listen to music on their mobile devices[4] 2 4%
Respondents who believed that they could listen to music while using other programs or applications[5] 1 2%
Respondents who believed that they could listen to music without logging into their music streaming service account[6] 1 2%
Respondents who otherwise misunderstood the concept of offline listening [7] 2 4%
47 100%
6
Notes:[1]
[2]
[3]
[4]
[b] Alicia R. : “Being able to listen to it on your phone. […] Just on your app” (Transcripts, p. 42).
[b] Daniel D. : “Offline means you can download it and you don’t have to be connected to the Internet in any way” (Transcripts, p. 178).
This respondent acknowledged that he did not understand what “offline” meant.
[a] James H. : “If you’re saying online listening, you’re talking about the computer. Offline listening would be some other form, without using the Internet. I don’t know how that would work. I don’t really understand what offline means, I guess. [...] I’m unclear on what offline is, so I don’t know” (Transcripts, p. 414).These respondents believed that the concept of offline listening was the same as concept of mobile device streaming . One of these respondents believed that she would be able to access all of the songs available in the music streaming service’s database through offline listening. [a] Donna C. : “Yes, it’s when you can stream music from your computer at home onto your MP3 player or your mobile device” (Transcripts, p. 209).
[a] Elizabeth V. : “That you don’t have to be on Wi-Fi to listen to the music that you downloaded and saved. If you’re traveling in an airplane you can listen to the music, as well” (Transcripts, p. 261).
Responses to “Could you tell me in your own words what the term offline listening means to you?”
Respondents who understood that they could listen to music without Internet access[2]
Respondents who did not understand the concept of offline listening
Total number of respondents
These respondents understood the concept of offline listening . Four of these respondents believed that they would be able to access all of the songs available in the music streaming service’s database through offline listening.
Respondents excluded due to interviewer error[8]
The transcript coding was done by two blind-to-the-purpose coders, who reviewed the transcript responses for all respondents to categorize their interpretations of Professor McFadden’s music streaming service features based on the content and similarities between responses.
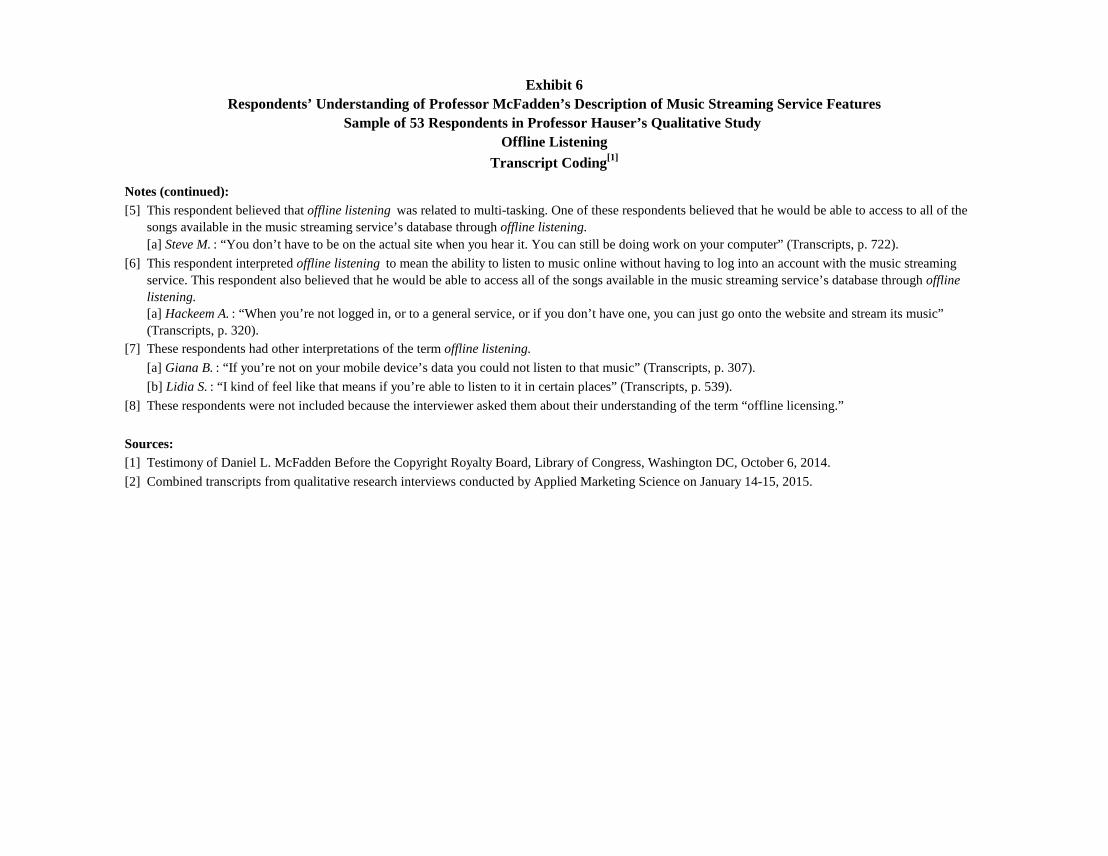
Exhibit 6Respondents’ Understanding of Professor McFadden’s Description of Music Streaming Service Features
Sample of 53 Respondents in Professor Hauser’s Qualitative Study Offline Listening
Transcript Coding[1]
Notes (continued):[5]
[6]
[7]
[8]
Sources:[1] Testimony of Daniel L. McFadden Before the Copyright Royalty Board, Library of Congress, Washington DC, October 6, 2014.
[2] Combined transcripts from qualitative research interviews conducted by Applied Marketing Science on January 14-15, 2015.
[a] Giana B. : “If you’re not on your mobile device’s data you could not listen to that music” (Transcripts, p. 307).
[b] Lidia S. : “I kind of feel like that means if you’re able to listen to it in certain places” (Transcripts, p. 539).
These respondents were not included because the interviewer asked them about their understanding of the term “offline licensing.”
These respondents had other interpretations of the term offline listening.
This respondent believed that offline listening was related to multi-tasking. One of these respondents believed that he would be able to access to all of the songs available in the music streaming service’s database through offline listening. [a] Steve M. : “You don’t have to be on the actual site when you hear it. You can still be doing work on your computer” (Transcripts, p. 722).
This respondent interpreted offline listening to mean the ability to listen to music online without having to log into an account with the music streaming service. This respondent also believed that he would be able to access all of the songs available in the music streaming service’s database through offline listening. [a] Hackeem A. : “When you’re not logged in, or to a general service, or if you don’t have one, you can just go onto the website and stream its music” (Transcripts, p. 320).

Exhibit 7Respondents’ Understanding of Professor McFadden’s Description of Music Streaming Service Features
Sample of 53 Respondents in Professor Hauser’s Qualitative Study Mobile Device Streaming
Transcript Coding[1]
N %
51 96%In conjunction with mobile device streaming,… Respondents who understood both “playlists generated by the service” and “album, artist, and song selection on demand”[2] 29 55%
Respondents who understood “playlist generated by the service” but did not understand “album, artist, and song selection on demand”[3] 7 13%
Respondents who understood “album, artist, and song selection on demand” but did not understand “playlist generated by the service”[4] 6 11%
Respondents who did not understand either “playlists generated by the service” or “album, artist, and song selection on demand”[5] 9 17%
2 4%
53 100%
Notes:[1]
[2]
[3]
[b] Drew V. : “Playlist part would mean that you can have it just stream a particular genre automatically. The artist selection means you can go down and pick whatever artist and listen to a full album, or a particular track, or whatever” (Transcripts, p. 218).These respondents understood mobile device streaming together with “playlists generated by the service,” but misinterpreted or did not explain what they understood by the term “album, artist, and song selection on demand.”[a] Delia P. : “For whatever reason they put together a grouping of songs in a list, and just for instance, I was supposed to listen to Spotify. That’s what they do. You say you want to listen to country or whatever and it says ‘Country Gold’ and then there’s 20 or 30 songs and those are the songs that they’ve decided what should go in there, [...] that’s just if you like a particular artist, you pop that in and out comes some songs. It seems like still the service selects which ones you get to do, if it’s the album or the artist and it’s separate from the song. It’s just song” (Transcripts, p. 188).[b] Samuel H. : “Assuming for Pandora, because that’s just what I thought of, the like and dislike, how it generates your playlist. It tries to put songs in categories, and then what categories you like or dislike, it tries to give you those kinds of songs. [...] Pretty much also that’s Pandora, where you can type in the artist and it has his own station” (Transcripts, p. 668).
[a] Alexandra F. : “That would be like picking the category. If I wanted to listen to country music, it would bring up whatever country music topic they wanted. It would also let me pick a song that I wanted to listen to and would let me play that as well” (Transcripts, p. 6).
Responses to “Could you tell me in your own words what the term mobile device streaming means to you?” and “Could you tell me in your own words what it means when mobile device streaming offers playlists generated by the service and album, artist, and song selection on demand ?”
Respondents who understood that they could listen to music through an application on a mobile device
Respondents who did not understand or did not explain clearly the concept of mobile device streaming [6]
Total number of respondents
These respondents understood the concept of mobile device streaming together with both “playlists generated by the service” and “album, artist, and song selection on demand.”
The transcript coding was done by two blind-to-the-purpose coders, who reviewed the transcript responses for all respondents to categorize their interpretations of Professor McFadden’s music streaming service features based on the content and similarities between responses.

Exhibit 7Respondents’ Understanding of Professor McFadden’s Description of Music Streaming Service Features
Sample of 53 Respondents in Professor Hauser’s Qualitative Study Mobile Device Streaming
Transcript Coding[1]
Notes (continued):[4]
[5]
[6] These respondents did not understand or did not explain clearly the concept of mobile device streaming .
Sources:[1] Testimony of Daniel L. McFadden Before the Copyright Royalty Board, Library of Congress, Washington DC, October 6, 2014.
[2] Combined transcripts from qualitative research interviews conducted by Applied Marketing Science on January 14-15, 2015.
[b] Lidia S. : “I’m not sure. […] I think that’s where it allowed you how many tracks to skip” (Transcripts, p. 533).
These respondents understood mobile device streaming together with “album, artist, and song selection on demand,” but misinterpreted or did not explain what they understood by the term “playlists generated by the service.”[a] Rebecca C. : “Yep. Playlist is, if you like a song, you could add it to a playlist, and you can go back and play that playlist where—what was the second one? [...] That’s like if you want to hear a certain artist at that moment; you can just go there and they have all of the songs that artist would sing, and you can listen to it on demand right then and there” (Transcripts, pp. 640-641).[b] Kevin H. : “All I can think of is on demand means maybe voice-activated to be able to just play the songs that you want and add to your playlists. Available through, again, a phone or a tablet” (Transcripts, p. 485).These respondents understood mobile device streaming , but did not understand either “playlists generated by the service” or “album, artist, and song selection on demand.”[a] Steve M. : “Through your cell phone, you have access to stream through your phone. [...] I would assume that it means that the phone—actually, to me, it would mean the supplier, the make of the phone, has some sort of deal, like when iTunes or somebody was putting that Bon Jovi music on people’s phones without them actually ordering it, that it’s similar to that. That’s what it makes me think of” (Transcripts, p. 717).[b] Tanya R. : “Apps for the music. […] I’m not sure how to answer that one, either” (Transcripts, p. 760).
[a] Blake B. : “It’s where you play the music. If it’s not in your house, you can’t listen to it unless you have—unless it’s offline instead of online. [...] If you were in your house you’d be able to listen to it, but if you went outside it wouldn’t be as strong of a connection” (Transcripts, p. 63).

Exhibit 8Respondents’ Understanding of Professor McFadden’s Description of Music Streaming Service Features
Sample of 53 Respondents in Professor Hauser’s Qualitative Study Skip Limits
Transcript Coding[1]
N %
53 100% Respondents who understood skip limits and, when probed, distinguished it from skipping ads[2] 53 100%
Respondents who understood skip limits and, when probed, could not distinguish it from skipping ads 0 0%
53 100%
Notes:[1]
[2]
Sources:[1] Testimony of Daniel L. McFadden Before the Copyright Royalty Board, Library of Congress, Washington DC, October 6, 2014.
[2] Combined transcripts from qualitative research interviews conducted by Applied Marketing Science on January 14-15, 2015.
[b] James H. : “Skip limits means if you’re not liking that selection, you can only do that—whatever the limit is. Up to six times is what was mentioned here a lot. After you reach that limit, it won’t let you skip anymore. [...] I don’t believe it does let you skip the advertisements” (Transcripts, p. 413).
Responses to “Could you tell me in your own words what the term skip limits means to you?” and “Could you tell me whether or not skipping as mentioned in the survey allows you to skip over advertisements?”
Respondents who understood the term skip limits to refer to the number of songs that the user could skip over
Total number of respondents
These respondents understood the concept of skip limits and understood that this applied to songs and not advertisements.
[a] Brian G. : “Skip limits, to me, means that you’re limited in when a song comes on that you can say, oh, I don’t want to listen to this, and move to the next track that the service is going to give you. [...] I believe it said song skipping. It just meant that you could skip to the next song, but you can’t skip the ads” (Transcripts, p. 111).
The transcript coding was done by two blind-to-the-purpose coders, who reviewed the transcript responses for all respondents to categorize their interpretations of Professor McFadden’s music streaming service features based on the content and similarities between responses.

Exhibit 9Respondents’ Understanding of Professor McFadden’s Description of Music Streaming Service Features
Sample of 53 Respondents in Professor Hauser’s Qualitative Study Available Library SizeTranscript Coding[1]
N %
33 62%
17 32% Respondents who understood available library size to mean the total number of songs the user could store on the service[2] 6 11%
Respondents who understood available library size to mean the total number of songs the user can download from the service[3] 3 6%
Respondents who understood available library size to mean the total memory space available for the user to save songs[4] 6 11%
Respondents who understood available library size to mean the number of songs available in each music genre[5] 2 4%
3 6%
53 100%
Notes:[1]
[2]
[3]
[4]
[5]
Responses to “Could you tell me in your own words what the term available library size means to you?”
[b] Brandon R. : “It’s the amount of songs you’re available to have on your certain playlist or on your device” (Transcripts, p. 89).
[a] Alex S. : “Any type of songs you can download onto your app or account—a limit. […] It means I can download 20 million songs if you felt like it” (Transcripts, p. 23).
[b] Rebecca C. : “That I would think it would be how many songs could be downloaded and available for you to use or have just to play over if you wanted” (Transcripts, p. 640).
Respondents who understood available library size to mean the total number of songs available for the user to access through streaming[1]
Respondents who did not understand the concept of available library size
Total number of respondents
[a] Juliana J. : “The term ‘library size’ is how much, how big the pool of music is available to you as a consumer” (Transcripts, p. 453).
[b] James H. : “Available library size means how many songs and what access you have to them. […] Basically, it’s just a number driven if it’s referring to the 10 million, or 20 million” (Transcripts, p. 409).
[a] Christopher N. : “It just means how much space is available for you to store your music. If you’re a huge music junkie, you’d probably want to have the 20 million spaces for 20 million songs library” (Transcripts, p. 153).
These respondents interpreted the term available library size to mean the total number of songs available in the service’s database for the user to access.
These respondents interpreted the term available library size to mean the total number of songs that the user would be able to store in the service, for example, through saving songs to a playlist.
These respondents interpreted the term available library size to mean the total number of songs that the user would be able to download from the service to their own devices.
The transcript coding was done by two blind-to-the-purpose coders, who reviewed the transcript responses for all respondents to categorize their interpretations of Professor McFadden’s music streaming service features based on the content and similarities between responses.
Respondents whose explanation of the term available library size was insufficient to determine understanding[6]
These respondents interpreted the term available library size to mean the total memory space available for the user to store their music. These participants did not specify whether this space was hosted by the service or available on their own devices.[a] Kevin H. : “Just the size given to you. I would think total space where a number of songs can fit into that total space. All songs are different and lengths of song. I just assume that you have a total size you can fit all your songs into, and your libraries into. [...] That it will hold up to 20 million songs regardless of the actual space” (Transcripts, pp. 484-485).[b] Edward B. : “Available library size means how much space has been allocated, whether it’s in a cloud for things online or how much space you’re going to need on your computer” (Transcripts, p. 238).

Exhibit 9Respondents’ Understanding of Professor McFadden’s Description of Music Streaming Service Features
Sample of 53 Respondents in Professor Hauser’s Qualitative Study Available Library SizeTranscript Coding[1]
Notes (continued):[6]
[7]
Sources:[1] Testimony of Daniel L. McFadden Before the Copyright Royalty Board, Library of Congress, Washington DC, October 6, 2014.
[2] Combined transcripts from qualitative research interviews conducted by Applied Marketing Science on January 14-15, 2015.
[a] Giana B. : “How many songs are in each genre. I feel that would mean there’s 20 million songs in each genre. [...] They could be repeated songs through each genre, because I know that several songs do fall into different categories. They probably mean that” (Transcripts, p. 301).
These respondents interpreted the term available library size to mean the number of songs available in each music genre.
[c] Helen S. : “That’s as many songs as you can store, I would imagine. I have two interpretations. I thought it was possibly that you could have that many in a library of songs, that you’re categorizing songs, if you’re having playlists and things like that. Or if that’s what’s available, that they actually have a library of 20 million songs that you could choose from” (Transcripts, p. 360).
These respondents did not explain the term available library size clearly.
[a] Celine A. : “You can have as much songs as you want. For example, the one million—you could have up to one million songs” (Transcripts. p. 121).
[b] Tanya R. : “How many, I guess, artists that you can have on your app. [...] Different, I don’t know how you say it, genres. [...] I guess it just means 20 million songs. It can be from a variety of different—it could be gospel, it could be rock, alternative; you could just have a variety of songs” (Transcripts, p. 760).
[b] Steven J. : “When you click on a playlist; for example, if you say I want 1960s Oldies. That one database has a million songs in it. Another one has two million. It’s the scope, I guess” (Transcripts, p. 731).

Exhibit 10Respondents’ Understanding of Professor McFadden’s Description of Music Streaming Service Features
Sample of 53 Respondents in Professor Hauser’s Qualitative Study Advertising
Transcript Coding[1]
N %
53 100% Respondents who expected 1.5 to 3 minutes of advertisements to interrupt their music listening once per hour[3] 2 4%
Respondents who expected 1.5 to 3 minutes of advertisements to interrupt their music listening 2 to 5 times per hour[4] 33 62%
Respondents who expected 1.5 to 3 minutes of advertisements to interrupt their music listening 6 to 12 times per hour[5] 10 19%
Respondents who expected 1.5 to 3 minutes of advertisements to interrupt their music listening 12 or more times per hour[6] 2 4%
Respondents who did not specify how many advertisement interruptions per hour they expected[7] 2 4%
Respondents who acknowledged that they did not know how many advertisement interruptions per hour to expect[8] 4 8%
53 100%
Notes:[1]
[2] All participants understood the concept of advertising.[3]
[4]
[5]
[b] Alex S. : “At least ten” (Transcripts, p. 815).
Responses to “Could you tell me in your own words how many commercial breaks you expect these 1.5 to 3 minutes of ads per hour to occur in?” and “How many blocks of advertisements did you assume to be played when you read ‘1.5 to 3 minute of ads per hour ’?”
Respondents’ understanding of advertising frequency[2]
Total number of participants
These respondents expected that they would experience one interruption per hour.
[a] Thomas W. : “Once per hour” (Transcripts, p. 779).
[b] Jacob K. : “Every hour” (Transcripts, p. 397).
These respondents expected that they would experience two to five interruptions per hour.
[a] Ariana D. : “Probably, at least three to four” (Transcripts, p. 52).
[b] Steven J. : “They generally don’t like to put a whole bunch of ads together, so I’m assuming that’s probably three or four blocks” (Transcripts, p. 735).
These respondents expected that they would experience six to 12 interruptions per hour.
[a] Linda S. : “Nine” (Transcripts, p. 552).
The transcript coding was done by two blind-to-the-purpose coders, who reviewed the transcript responses for all respondents to categorize their interpretations of Professor McFadden’s music streaming service features based on the content and similarities between responses.
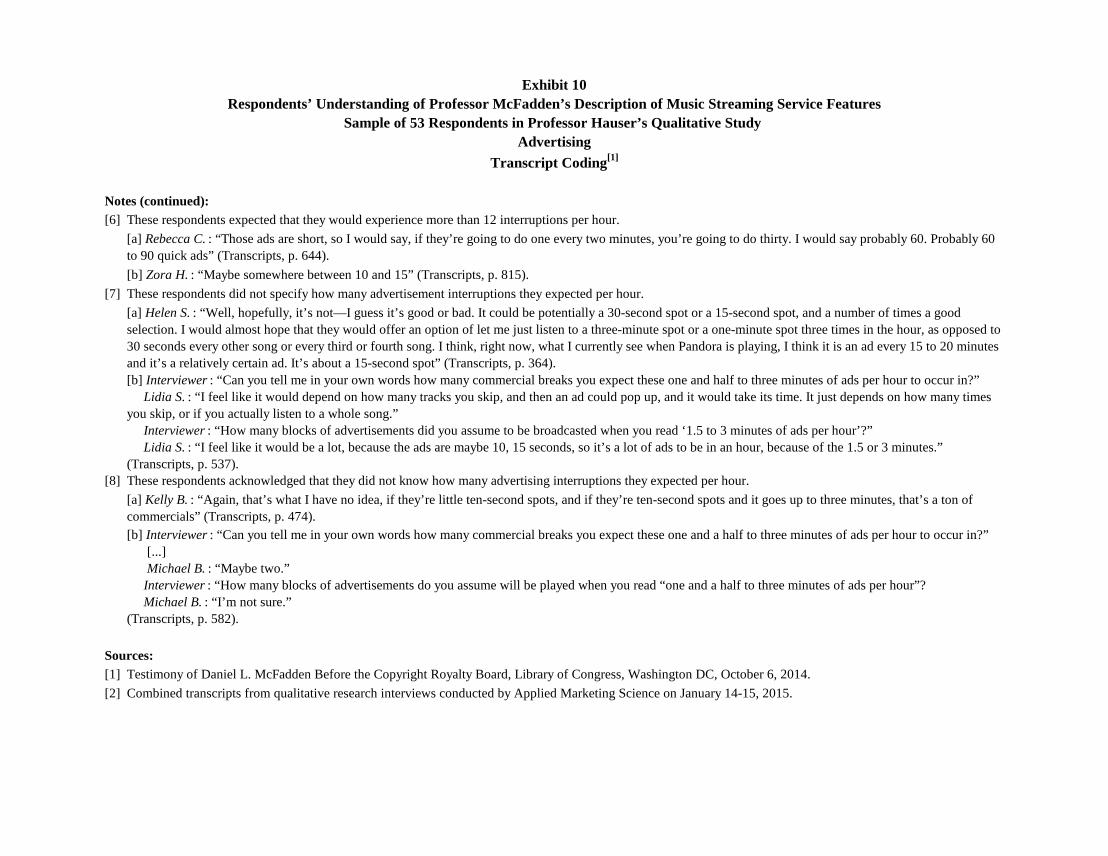
Exhibit 10Respondents’ Understanding of Professor McFadden’s Description of Music Streaming Service Features
Sample of 53 Respondents in Professor Hauser’s Qualitative Study Advertising
Transcript Coding[1]
Notes (continued):[6]
[7]
[8]
Sources:[1] Testimony of Daniel L. McFadden Before the Copyright Royalty Board, Library of Congress, Washington DC, October 6, 2014.
[2] Combined transcripts from qualitative research interviews conducted by Applied Marketing Science on January 14-15, 2015.
These respondents acknowledged that they did not know how many advertising interruptions they expected per hour.
[a] Kelly B. : “Again, that’s what I have no idea, if they’re little ten-second spots, and if they’re ten-second spots and it goes up to three minutes, that’s a ton of commercials” (Transcripts, p. 474).[b] Interviewer : “Can you tell me in your own words how many commercial breaks you expect these one and a half to three minutes of ads per hour to occur in?” [...] Michael B. : “Maybe two.” Interviewer : “How many blocks of advertisements do you assume will be played when you read “one and a half to three minutes of ads per hour”? Michael B. : “I’m not sure.”(Transcripts, p. 582).
These respondents expected that they would experience more than 12 interruptions per hour.
[a] Rebecca C. : “Those ads are short, so I would say, if they’re going to do one every two minutes, you’re going to do thirty. I would say probably 60. Probably 60 to 90 quick ads” (Transcripts, p. 644).
[b] Zora H. : “Maybe somewhere between 10 and 15” (Transcripts, p. 815).
These respondents did not specify how many advertisement interruptions they expected per hour.
[a] Helen S. : “Well, hopefully, it’s not—I guess it’s good or bad. It could be potentially a 30-second spot or a 15-second spot, and a number of times a good selection. I would almost hope that they would offer an option of let me just listen to a three-minute spot or a one-minute spot three times in the hour, as opposed to 30 seconds every other song or every third or fourth song. I think, right now, what I currently see when Pandora is playing, I think it is an ad every 15 to 20 minutes and it’s a relatively certain ad. It’s about a 15-second spot” (Transcripts, p. 364).[b] Interviewer : “Can you tell me in your own words how many commercial breaks you expect these one and half to three minutes of ads per hour to occur in?” Lidia S. : “I feel like it would depend on how many tracks you skip, and then an ad could pop up, and it would take its time. It just depends on how many times you skip, or if you actually listen to a whole song.” Interviewer : “How many blocks of advertisements did you assume to be broadcasted when you read ‘1.5 to 3 minutes of ads per hour’?” Lidia S. : “I feel like it would be a lot, because the ads are maybe 10, 15 seconds, so it’s a lot of ads to be in an hour, because of the 1.5 or 3 minutes.”(Transcripts, p. 537).
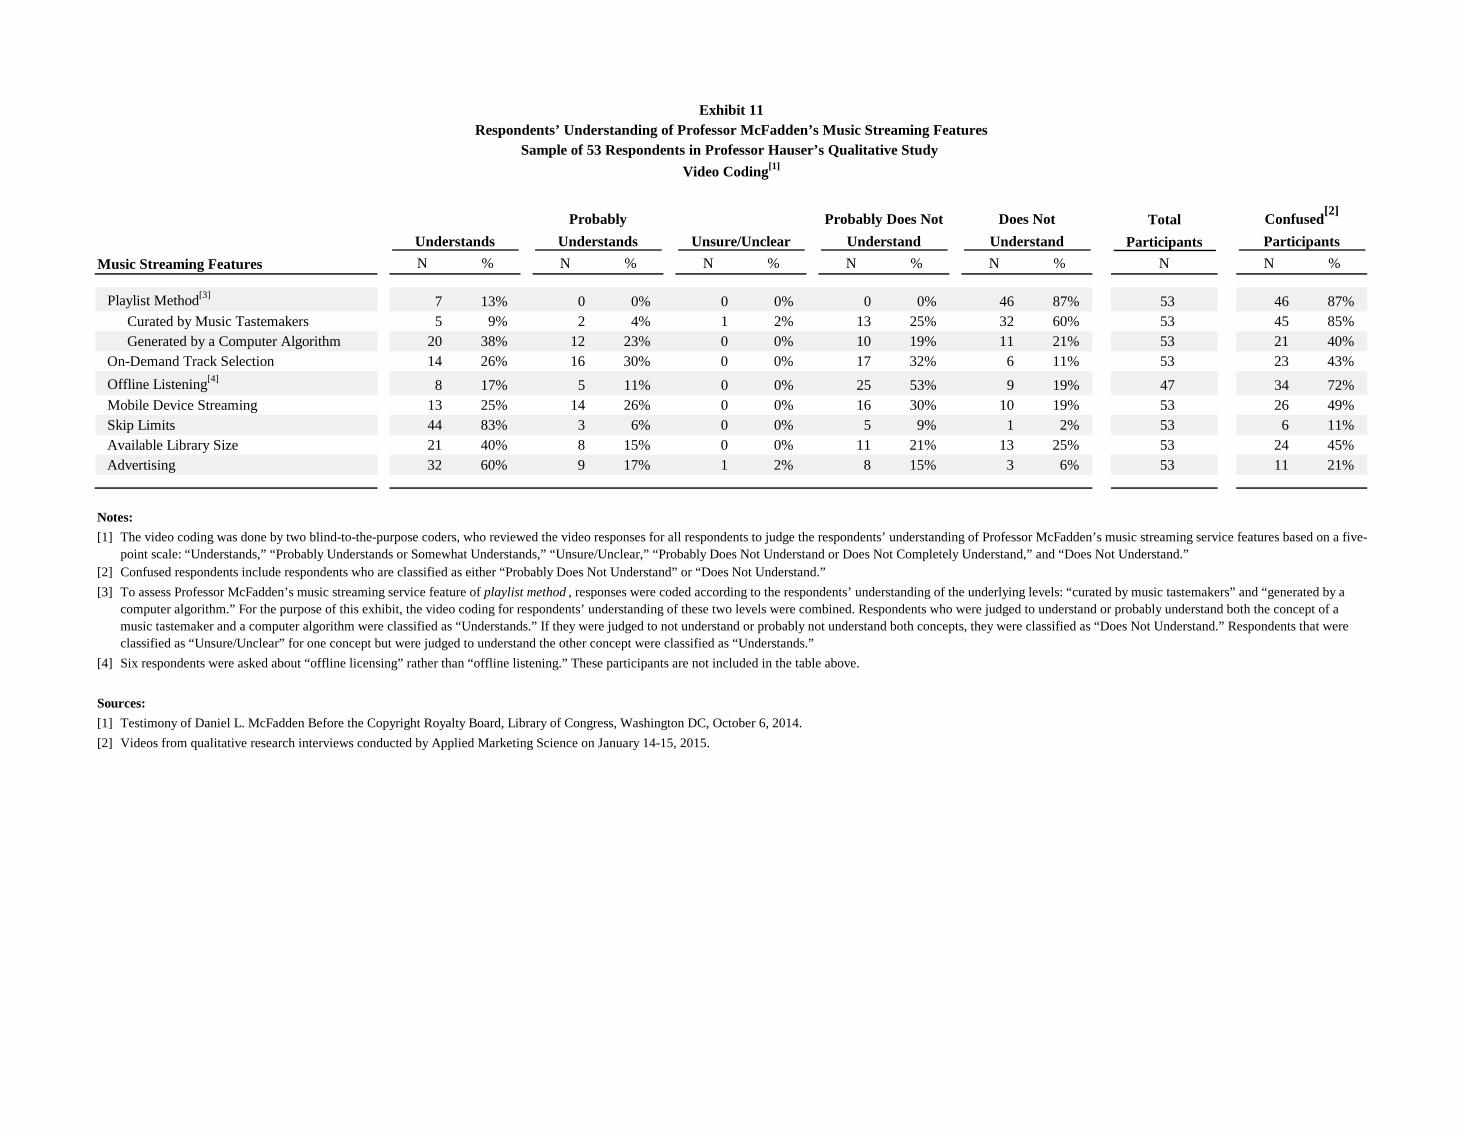
Exhibit 11Respondents’ Understanding of Professor McFadden’s Music Streaming Features
Sample of 53 Respondents in Professor Hauser’s Qualitative Study Video Coding[1]
Total Participants
N % N % N % N % N % N N %
Playlist Method[3]7 13% 0 0% 0 0% 0 0% 46 87% 53 46 87%
Curated by Music Tastemakers 5 9% 2 4% 1 2% 13 25% 32 60% 53 45 85%Generated by a Computer Algorithm 20 38% 12 23% 0 0% 10 19% 11 21% 53 21 40%
On-Demand Track Selection 14 26% 16 30% 0 0% 17 32% 6 11% 53 23 43%
Offline Listening[4]8 17% 5 11% 0 0% 25 53% 9 19% 47 34 72%
Mobile Device Streaming 13 25% 14 26% 0 0% 16 30% 10 19% 53 26 49%Skip Limits 44 83% 3 6% 0 0% 5 9% 1 2% 53 6 11%Available Library Size 21 40% 8 15% 0 0% 11 21% 13 25% 53 24 45%Advertising 32 60% 9 17% 1 2% 8 15% 3 6% 53 11 21%
Notes:[1]
[2] Confused respondents include respondents who are classified as either “Probably Does Not Understand” or “Does Not Understand.”
[3]
[4] Six respondents were asked about “offline licensing” rather than “offline listening.” These participants are not included in the table above.
Sources:[1] Testimony of Daniel L. McFadden Before the Copyright Royalty Board, Library of Congress, Washington DC, October 6, 2014.
[2] Videos from qualitative research interviews conducted by Applied Marketing Science on January 14-15, 2015.
The video coding was done by two blind-to-the-purpose coders, who reviewed the video responses for all respondents to judge the respondents’ understanding of Professor McFadden’s music streaming service features based on a five-point scale: “Understands,” “Probably Understands or Somewhat Understands,” “Unsure/Unclear,” “Probably Does Not Understand or Does Not Completely Understand,” and “Does Not Understand.”
To assess Professor McFadden’s music streaming service feature of playlist method , responses were coded according to the respondents’ understanding of the underlying levels: “curated by music tastemakers” and “generated by a computer algorithm.” For the purpose of this exhibit, the video coding for respondents’ understanding of these two levels were combined. Respondents who were judged to understand or probably understand both the concept of a music tastemaker and a computer algorithm were classified as “Understands.” If they were judged to not understand or probably not understand both concepts, they were classified as “Does Not Understand.” Respondents that were classified as “Unsure/Unclear” for one concept but were judged to understand the other concept were classified as “Understands.”
Probably Does Not Understand
Does Not Understand
Confused[2]
ParticipantsMusic Streaming Features
UnderstandsProbably
Understands Unsure/Unclear

Sample of 53 Respondents in Professor Hauser’s Qualitative Study
Correct Interpretation of Incentive Alignment
Incorrect Interpretation of Incentive Alignment
IgnoredIncentive Alignment
6 10 12 13 21 13 10 0 10 3 00 0 00 0 0
9 39 5
[1]
[2]
[3]
[4]
Notes:
2 of 71 of 7
Total
Six respondents were asked about “offline licensing” rather than “offline listening.” Unlike in Exhibits 3, 6, and 11 where these respondents are excluded, here these respondents are included and counted as having a correct interpretation of offline listening. Five of these respondents had an incorrect interpretation of the incentive alignment. Of these, one understood all seven features, three understood six of the seven features, and one understood five of the seven features. The sixth respondent ignored the incentive alignment but understood all seven features.
To assess Professor McFadden’s music streaming service feature of playlist method , responses were coded according to the respondents’ understanding of the underlying levels: “curated by music tastemakers” and “generated by a computer algorithm.” For the purpose of this exhibit, the transcript coding for respondents’ understanding of these two levels were combined. Respondents who had a correct interpretation of both the concept of a music tastemaker and a computer algorithm were categorized as having a “Correct Interpretation.” If they had an incorrect interpretation of either concept, they were categorized as having an “Incorrect Interpretation.”
The transcript coding was done by two blind-to-the-purpose coders, who reviewed the transcript responses for all respondents to categorize their interpretations of Professor McFadden's music streaming service features based on the content and similarities between responses.The seven features included are playlist method , on-demand track selection , offline listening , mobile device streaming , skip limits , available library size , and advertising.
Exhibit 12Count of Respondents Who Correctly Identified Varying Numbers of Music Streaming Features
By Correct and Incorrect Incentive Alignment InterpretationTranscript Coding[1]
3 of 7
7 of 76 of 75 of 74 of 7
Number of Features[2]
Correctly Interpreted
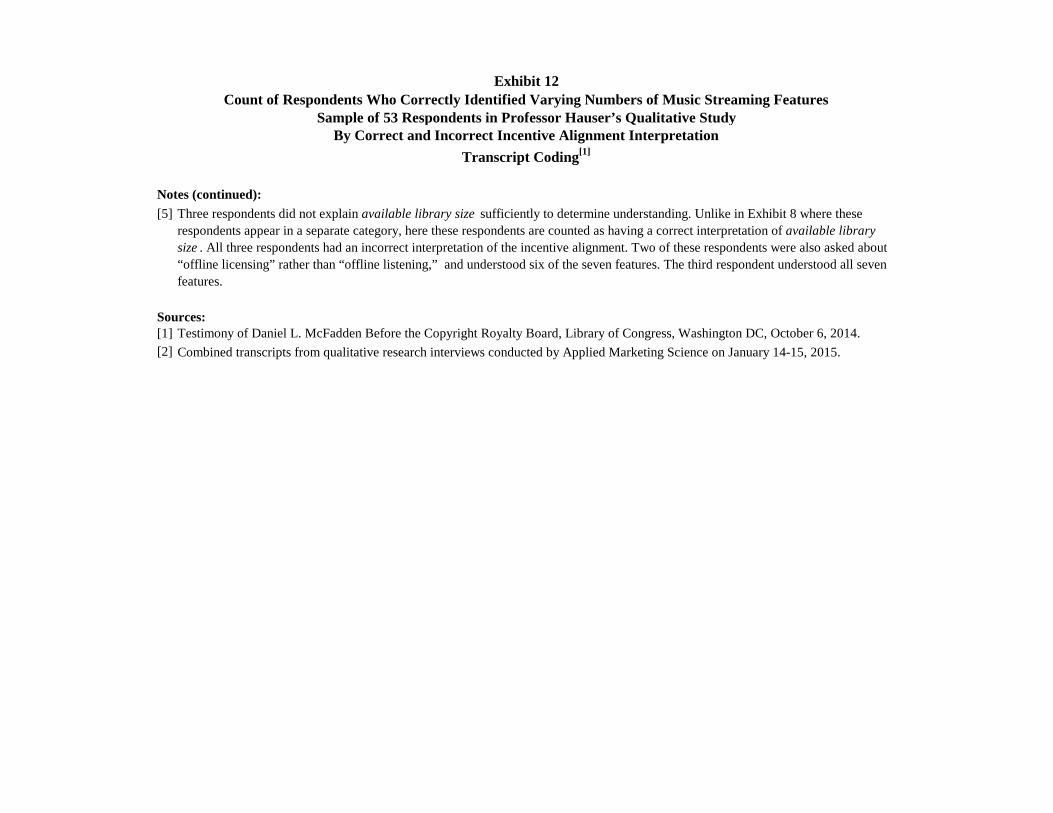
Sample of 53 Respondents in Professor Hauser’s Qualitative Study
Exhibit 12Count of Respondents Who Correctly Identified Varying Numbers of Music Streaming Features
By Correct and Incorrect Incentive Alignment InterpretationTranscript Coding[1]
Notes (continued):[5]
Sources:[1]
[2] Combined transcripts from qualitative research interviews conducted by Applied Marketing Science on January 14-15, 2015.
Testimony of Daniel L. McFadden Before the Copyright Royalty Board, Library of Congress, Washington DC, October 6, 2014.
Three respondents did not explain available library size sufficiently to determine understanding. Unlike in Exhibit 8 where these respondents appear in a separate category, here these respondents are counted as having a correct interpretation of available library size . All three respondents had an incorrect interpretation of the incentive alignment. Two of these respondents were also asked about “offline licensing” rather than “offline listening,” and understood six of the seven features. The third respondent understood all seven features.

APPENDIX A
ACADEMIC VITA
A-1
ACADEMIC VITA (long version, public)
John R. Hauser
Address
MIT Sloan School of Management
Massachusetts Institute of Technology, E62-538
Cambridge, Massachusetts 02142
(617) 253-2929
[email protected]; web.mit.edu/hauser/www
mitsloan.mit.edu/faculty-and-research/academic-groups/marketing/
Education
Sc.D. M.I.T., 1975, Operations Research Dissertation: "A Normative Methodology for Predicting Consumer Response to
Design Decisions: Issues, Models, Theory and Use.”
Advisor: John D. C. Little. Committee members: Glen L. Urban and Moshe Ben-Akiva.
S.M. M.I.T., 1973, Civil Engineering (Transportation Systems Division)
S.M. M.I.T., 1973, Electrical Engineering
S.B. M.I.T., 1973, Electrical Engineering
Joint Thesis (S.M.'s and S.B.): "An Efficient Method to Predict the Impacts of Operating Decisions for
Conventional Bus Systems." Advisor: Nigel Wilson.
Lifetime Achievement Awards
Buck Weaver Award 2013, INFORMS Society of Marketing Science (ISMS).This award recognizes lifetime contributions to
the theory and practice of marketing science.
Parlin Award 2001, The American Marketing Association describes this award as “the oldest and most distinguished award
in the marketing research field.”
Converse Award 1996, the American Marketing Association, for “outstanding contributions to the development of the
science of marketing.”
Churchill Award 2011, the American Marketing Association, Market Research Special Interest Group, for “Lifetime
achievement in the academic study of marketing research.”
Fellow of the Institute for Operations Research and Management Science (INFORMS)
Inaugural Fellow of the INFORMS Society of Marketing Science (ISMS)
Highly Cited Researcher (ISI Web of Science), Since 2006.
Awards for Published Papers
INFORMS Society of Marketing Science ISMS Long Term Impact Award, 2012, Finalist
(formerly The Institute ISMS Long Term Impact Award, 2011, Finalist
of Management Science) John D.C. Little Best-paper Award, 2009, Finalist
John D.C. Little Best-paper Award, 2003, First Place
John D.C. Little Best-paper Award, 1998, Finalist
John D.C. Little Best-paper Award, 1994, Finalist

A-2
John D.C. Little Best-paper Award, 1993, First Place
John D.C. Little Best-paper Award, 1990, Honorable Mention
Best paper in Marketing Sciences Literature, 1984, Honorable mention.
Best Paper in Marketing Sciences Literature, 1983, First Place.
Best Paper in Marketing Sciences Literature, 1982, First Place.
Two published articles were cited in 2007 as one of “the top 20 marketing
science articles in the past 25 years.
American Marketing Association: Explor Award (Leadership is on-line market research), 2004, First-Place
Finalist, Paul Green Award for contributions to marketing research, 2004
MSI Award for Most Significant Contribution to Practice of Marketing in 1996.
Finalist, O'dell Award for best paper in the Journal of Marketing Research,
published in 1986, awarded in 1991.
One of the top 50 most prolific marketing scholars (top journals) in the last 25
years (1982-2006). Total articles, rate of publication, and author-adjusted rate.
Product Development Management Assoc. Best Paper Award, Finalist, 2003.
Best Paper Award, Finalist, 2002.
One of ten most-cited papers in the Journal of Product Innovation Management.
One of the top articles in educational citations in the last twenty years.
European Marketing Academy Best Paper in IJRM, Finalist, 2014
Sawtooth Software Conference Best Presentation and Paper, 2006; Runner-up, 2008.
European Society of Marketing Research Best Paper at Rome conference, September 1984.
Emerald Management Reviews 2010 Citation of Excellence (top 50 of 15,000 published papers in 2009)
Doctoral Consortia Faculty American Marketing Association, 1979, 1984, 1985, 1986, 1988, 1989, 1991,
1993, 1995, 1997, 1998, 2001, 2003, 2004, 2005, 2006, 2007, 2008, 2009, 2012,
2013, 2014.
INFORMS Society of Marketing Science, 2002 (founding member), 2003, 2004,
2012, 2014.
European Marketing Academy, 1985
Awards, Teaching
MIT Sloan School of Management: Nominated for Excellence in Teaching Award 2000, 2007, 2008.
Named "Outstanding Faculty" by Business Week Guide to the Best Business
Schools (1995).
Excellence in Teaching Award 1994 (Awarded by the Master's Student class).
Awards for Thesis Supervision
American Marketing Association (Ph.D.): Winner John Howard Dissertation Award (2010, Matt Selove, Committee)
Co-winner John Howard Dissertation Award (2005, Olivier Toubia)
1st Place (1981, Ken Wisniewski)
Honorable Mention (1979, Patricia Simmie).
INFORMS (Ph.D.) Winner of the Frank Bass Award (2004, Olivier Toubia, awarded 2005)
Winner of the Frank Bass Award (1989, Abbie Griffin, awarded 1995)
A-3
MIT Sloan School of Management (Ph.D.): 1st Place (1987, Peter Fader)
MIT Sloan School of Management (Master's): 1st Place (1991, Jon Silver and John Thompson)
1st Place (1983, Steve Gaskin)
Honorable Mention (1982, Larry Kahn).
Awards, Other
Who’s Who in America Since 1997
Who’s Who in Management Science Since 2000
Who’s Who in Economics Since 2003
Who’s Who in Finance and Business Since 2009
Harvard Business School: Marvin Bower Fellow, 1987 - 1988.
National Science Foundation Fellowship: 1971 - 1974.
M.I.T.: National Scholar, 1967 - 1971.
Honor Societies: Tau Beta Pi, Eta Kappa Nu, Sigma Xi
Directorships, Trustee, Advisory Board
1988 – Present Founder, Principal, Board Member, Applied Marketing Science, Inc.
March 2003 – July 2009 Trustee, Marketing Science Institute
Academic Appointments
January 1989 - Present: Kirin Professor of Marketing
MIT Sloan School of Management
Massachusetts Institute of Technology
Cambridge, Massachusetts 02142
July 2010 – June 2011 Head, Marketing Group
July 2005 – June 2009: Area Head, Management Science Area
July 1988 – June 2003: Head, Marketing Group
September 1993 - May 2000: co-Director, International Center for Research on the Management of Technology
September 1997 - May 2000: Research Director, Center for Innovation in Product Development
June 2001 – June 2006: Virtual Customer Initiative Leader, Center for Innovation in Product Development
July 1984 - January 1989: Professor of Management Science
MIT Sloan School of Management
Massachusetts Institute of Technology
Cambridge, Massachusetts 02142

A-4
July 1987 - June 1988: Marvin Bower Fellow
Harvard Business School
Harvard University
Cambridge, Massachusetts 02163
March 1985 - May 1985: Visiting Lecturer
European Institute of Business Administration
Fontainebleau, FRANCE
September 1980 - June 1984: Associate Professor of Management Science
MIT Sloan School of Management
Massachusetts Institute of Technology
Cambridge, Massachusetts 02142
September 1975 - August 1980: Assistant Professor of Marketing and of Transportation
(granted tenure and promoted in 1980)
Graduate School of Management and Transportation Center
Northwestern University
Evanston, Illinois 60201
Teaching Interests
Marketing Management, New Product and Service Development, Competitive Marketing Strategy, Marketing
Models, Measurement and Marketing Research, Research Methodology, Marketing Analytics.
Research Interests
Consumer decision measurement: conjoint analysis, non-compensatory methods, adaptive methods, machine-
learning methods, strategic importance of accuracy. Product forecasting: information acceleration, really-new
products, incentive-aligned games. Consumer behavior: cognitive simplicity in decision making and in dynamic
models, theory-based models, vivid stimuli. Morphing: website, banner, product assortment. Voice of the customer
methods, defensive and competitive strategy, new product development, experimental and quasi-experimental
methods.
Texts
Urban, Glen L. and John R. Hauser, Design and Marketing of New Products, Prentice-Hall, Second Edition 1993.
A comprehensive text that integrates advanced, state-of-the-art techniques to provide graduate-level students and
marketing professionals with an understanding of the techniques and an operating ability to design, test, and
implement new products and services.
This text has been honored by being selected for both the Prentice-Hall International Series in Management and the
Series in Marketing. It has been adopted at a number of major universities. In a 1988 survey it was identified the
1980 version as the most widely used new product textbook at the graduate level.
The revision includes new material on designing for quality, reduced cycle times, prelaunch forecasting, quality
improvement, defensive and competitive strategy, value mapping, the integration of marketing and engineering, new
issues of organization, customer satisfaction, and new international examples. It is available in Korean and is being
translated into Japanese and Chinese. We stopped revising the text when Glen Urban became Dean of the MIT Sloan
School and I became editor of Marketing Science. Many current texts draw heavily from our material.
Third most cited work in the Journal of Product Innovation, 1984-2004. (Cited May 2010.)
Urban, Glen L., John R. Hauser, and Niki Dholakia, Essentials of New Product Management, Prentice Hall, 1986.
This is an undergraduate textbook which presents the essential concepts but written for a non-technical audience. It
A-5
has been translated to Japanese and has sold well in Japan.
Hauser, John R. and Glen L. Urban, From Little’s Law to Marketing Science: A Festschrift in Honor of John D.C. Little, MIT
Press, Cambridge, MA, 2015.
Hauser, John R., Applying Marketing Management: Four Simulations, Scientific Press, 1986.
This mini-text and software package contains four tutorial exercises for marketing management concepts. With this
package students learn positioning, competitive strategy, new product development, and life cycle forecasting while
using the personal computer to simulate marketing management problems. A detailed instructor's manual and
transparency masters are also available. It is available in Japanese.
Hauser, John R., ENTERPRISE: An Integrating Management Exercise, Scientific Press, 1989.
This mini-text and software package contains a comprehensive competitive simulation. Students compete in six
markets by making marketing and production decisions. A detailed instructor's manual and administrative software
is also available. It is available in Japanese.
Journal Editor
Marketing Science, Editor-in-Chief for volumes 8, 9, 10, 11, 12, and 13 (1989-1994). Four issues per year including
periodic editorials and journal management. Processed about 120 new papers per year. Special Editor for issues on
the Theory and Practice of Marketing (2014) and Big Data (2015).
Journal Publications (Almost all available for download at web.mit.edu/hauser/www.)
Citations Reports: January 2015 Google Scholar; 18,171 citations and an H-index of 49 from
http://scholar.google.com/citations?user=N6s8mO4AAAAJ&hl=en. ISI Web of Science (automated, January 2015):
4,184 citations with an H-index of 32. Not included in automatic ISI report: Design and Marketing of New Products
(407 2E, 265 1E, 24 UG) Defensive Marketing Strategies (204), Testing Competitive Market Structures (80).
Application of Defender (43), Dynamic Markov Application (28). Revised total of 5,235; revised ISI H-index of 35.
Lin, Song, Juanjuan Zhang, and John R. Hauser (2014), “Learning from Experience, Simply,” Marketing Science, 34, 1,
(January-February), 1-19.
Hauser, John R., Guilherme Liberali , and Glen L. Urban (2014), “Website Morphing 2.0: Switching Costs, Partial
Exposure, Random Exit, and When to Morph,” Management Science, 60, 6, (June), 1594–1616.
Hauser, John R. (2014), “Consideration-Set Heuristics,” Journal of Business Research, 67 (8), 1688-1699.
Urban, Glen L., Guilherme Liberali, Erin MacDonald, Robert Bordley, and John R. Hauser (2014), “Morphing Banner
Advertisements,” Marketing Science, 33, 1.
Hauser, John R., Songting Dong, and Min Ding (2014), “ Self-Reflection and Articulated Consumer Preferences,”
Journal of Product Innovation Management, 31, 1, 17-32.
Liberali, Guilherme, Glen L. Urban, and John R. Hauser (2013), “ Competitive Information, Trust, Brand
Consideration, and Sales: Two Field Experiments ” International Journal for Research in Marketing, 30, 2, (June),
101-113.
Finalist, IJRM Best Paper Award, 2014.
Dzyabura, Daria and John R. Hauser (2011), “Active Machine Learning for Consideration Heuristics,” Marketing
Science, 30, 5, (September-October), 801-819.
A-6
Hauser, John R. (2011), “A Marketing Science Perspective on Recognition-Based Heuristics (and the Fast and Frugal
Paradigm),” Judgment and Decision Making, 6, 5, (July), 396-408.
Ding, Min, John Hauser, Songting Dong, Daria Dzyabura, Zhilin Yang, Chenting Su, and Steven Gaskin (2011),
“Unstructured Direct Elicitation of Decision Rules,” Journal of Marketing Research, 48, (February), 116-127.
Hauser, John R., Olivier Toubia, Theodoros Evgeniou, Daria Dzyabura, and Rene Befurt (2010), “Cognitive Simplicity
and Consideration Sets,” Journal of Marketing Research, 47, (June), 485-496.
Urban, Glen L., John R. Hauser, Guilherme Liberali, Michael Braun, and Fareena Sultan (2009), “Morph the Web to
Build Empathy, Trust, and Sales,” Sloan Management Review, 50, 4, (Summer), 53-61.
Hauser, John R., Glen L. Urban, Guilherme Liberali, and Michael Braun (2009), “Website Morphing,” Marketing
Science., 28, 2, (March-April), 202-224. Lead article with commentaries by Andrew Gelman, John Gittins, and Hal
Varian. Includes rejoinder.
Finalist, John D. C. Little Award for Best Article in the Marketing Sciences Literature, 2009.
2010 Emerald Management Reviews Citation of Excellence for one of best articles published in the top 400
business and management journals in 2009. (Top 50 of 15,000 articles.)
Toubia, Olivier, John R. Hauser and Rosanna Garcia (2007), “Probabilistic Polyhedral Methods for Adaptive Choice-
Based Conjoint Analysis: Theory and Application,” Marketing Science, 26, 5, (September-October), 596-610.
Co-winner, American Marketing Association, John Howard Dissertation Award, 2005
Yee, Michael, Ely Dahan, John Hauser, and James Orlin (2007), “Greedoid-Based Non-compensatory Two-Stage
Consideration-then-Choice Inference,” Marketing Science, 26, 4, (July-August), 532-549.
First Place, American Marketing Association Explor Award, 2004
Toubia, Olivier and John R. Hauser (2007), “On Managerial Efficient Designs,” Marketing Science, 26, 6, (November-
December), 851-858.
Garcia, Rosanna, Paul Rummel, and John R. Hauser (2007), “Validating Agent-Based Marketing Models Using
Conjoint-Analysis,” Journal of Business Research, 60, 8, (August), 848-857.
Hauser, John R., Gerald Tellis, and Abbie Griffin (2006), “Research on Innovation: A Review and Agenda for
Marketing Science,” Marketing Science, 25, 6, (November-December), 687-717.
Cited by Thomson Reuters’ Essential Science Indicators as a Fast Breaking Paper in Economics and Business
in April 2009.
Cited in 2014 by the International Journal of Research in Marketing as one of the top 10 impactful articles
published in Marketing Science during 2004-2012..
Hauser, John R. and Olivier Toubia (2005), “The Impact of Utility Balance and Endogeneity in Conjoint Analysis,”
Marketing Science, 24, 3, (Summer), 498-507.
Glen L. Urban and John R. Hauser (2004), “’Listening-In’ to Find and Explore New Combinations of Customer Needs,”
Journal of Marketing, 68, (April), 72-87.

A-7
Toubia, Olivier, John R. Hauser, and Duncan Simester (2004), “Polyhedral Methods for Adaptive Choice-based
Conjoint Analysis,” Journal of Marketing Research, 41, 1, (February), 116-131.
Finalist, Paul Green Award for contributions to the practice of marketing research.
Toubia, Olivier, Duncan I. Simester, John R. Hauser, and Ely Dahan (2003), “Fast Polyhedral Adaptive Conjoint
Estimation,” Marketing Science, 22, 3, (Summer), 273-303.
First Place, John D. C. Little Award for Best Article in the Marketing Sciences Literature, 2003
First Place, Frank M. Bass Award for Best Article Based on a Dissertation, 2005.
Finalist, INFORMS Society for Marketing Science Long Term Impact Award, 2011
Finalist, INFORMS Society for Marketing Science Long Term Impact Award, 2012
Dahan, Ely and John R. Hauser (2002), “The Virtual Customer,” Journal of Product Innovation Management, 19, 5,
(September), 332-354.
Finalist, PDMA Best Paper Award in 2003.
Hauser, John R. (2001), "Metrics Thermostat," Journal of Product Innovation Management, 18, 3. (May), 134-153.
Finalist PDMA Best Paper Award in 2002.
Cited by the PDMA in 2007 as one of the top articles in the last twenty years in educational citations.
Simester, Duncan I, John R. Hauser, Birger Wernerfelt, and Roland Rust (2000), "Implementing Quality Improvement
Programs Designed to Enhance Customer Satisfaction: Quasi-experiments in the United States and Spain," Journal of
Marketing Research, 37, 1, (February), 102-112.
Hauser, John R. (1998), "Research, Development, and Engineering Metrics." Management Science, 44, 12,
December, 1670-1689.
Hauser, John R. and Gerry Katz (1998), “Metrics: You Are What You Measure!.” European Management Journal, 16,
5, (October), 516-528. Highlighted in “A Round-up of Important Articles from Business Periodicals,” in Mastering
Management Review published by the Financial Times.
Hauser, John R., Duncan I. Simester, and Birger Wernerfelt (1997), "Side Payments in Marketing," Marketing Science,
16, 3, 246-255.
Finalist, John D. C. Little Award for Best Article in the Marketing Sciences Literature, 1997.
Urban, Glen L., John R. Hauser, William J. Qualls, Bruce D. Weinberg, Jonathan D. Bohlmann and Roberta A. Chicos
(1997), "Validation and Lessons from the Field: Applications of Information Acceleration," Journal of Marketing
Research, 34, 1, (February), 143-153.
Hauser, John R. and Florian Zettelmeyer (1997), “Metrics to Evaluate R,D&E,” Research Technology Management, 40,
4, (July-August), 32-38.
Griffin, Abbie, and John R. Hauser (1996), "Integrating Mechanisms for Marketing and R&D," Journal of Product
Innovation Management, 13, 3, (May), 191-215.
One of ten most-cited papers in the Journal of Product Innovation Management (JPIM 24, 3, 2007, p.209)

A-8
Hauser, John R., Duncan I. Simester, and Birger Wernerfelt (1996), "Internal Customers and Internal Suppliers," Journal
of Marketing Research, 33, 3, (August), 268-280.
Urban, Glen L., Bruce Weinberg and John R. Hauser (1996), "Premarket Forecasting of Really-New Products," Journal
of Marketing, 60,1, (January), 47-60. Abstracted in the Journal of Financial Abstracts, 2, 23A, (June) 1995.
1996 MSI Award for the most significant contribution to the advancement of the practice of marketing.
Hauser, John R., Duncan I. Simester, and Birger Wernerfelt (1994), "Customer Satisfaction Incentives," Marketing
Science, 13, 4, (Fall), 327-350.
Finalist, John D. C. Little Award for Best Article in the Marketing Sciences Literature, 1994.
Hauser, John R., Glen L. Urban, and Bruce Weinberg (1993), "How Consumers Allocate their Time When
Searching for Information," Journal of Marketing Research,30, 4, (November), 452-466.
Hauser, John R. (1993), "How Puritan Bennett Used the House of Quality," Sloan Management Review, 34, 3,
(Spring), 61-70. Reprinted in Taiwan Philips News (in Chinese), 23, 1, (Feb), 1994.
Griffin, Abbie and John R. Hauser (1993), "The Voice of the Customer," Marketing Science, 12, 1, (Winter), 1-27.
First-place, John D. C. Little Award for Best Article in Marketing Sciences Literature, 1993.
First Place, Frank M. Bass Award for Best Article Based on a Dissertation, 1995.
Cited in 2007 by the INFORMS Society of Marketing Science as one “of the top 20 marketing science
articles in the past 25 years.
Cited in 2014 by the International Journal of Research in Marketing as one of the top 10 academically
most impactful marketing science papers.
Griffin, Abbie and John R. Hauser (1992), "Patterns of Communication Among Marketing, Engineering, and
Manufacturing -- A Comparison between Two New Product Teams," Management Science, 38, 3, (March), 360-
373.
One of the 500 most-cited articles in the first 50 years of Management Science.
Urban, Glen. L., John. R. Hauser, and John. H. Roberts (1990), "Prelaunch Forecasting of New Automobiles:
Models and Implementation," Management Science, 36, 4, (April), 401-421. Reprinted in Modeling for
Management, Vol. 1, George P. Richardson, ed., Dartmouth Publishing Co., Hampshire England.
INFORMS (TIMS) Finalist, Best Article in Marketing Science Literature, 1990.
Hauser, John R. and Birger Wernerfelt (1990), "An Evaluation Cost Model of Consideration Sets," Journal of
Consumer Research, 16, (March), 393-408.
Hauser, John R. and Birger Wernerfelt (1989), "The Competitive Implications of Relevant-Set/Response Analysis,"
Journal of Marketing Research, 26, 4, (November), 391-405.
Hauser, John R. and Don Clausing (1988), "The House of Quality," Harvard Business Review, 66, 3, (May-June),
63-73. Reprinted in The Product Development Challenge, Kim B. Clark and Steven C. Wheelwright, eds., Harvard
Business Review Book, Boston MA 1995. Reprinted in IEEE Engineering Management Review, 24, 1, Spring
1996. Translated into German and published in Hermann Simon and Christian Homburg (1998),
Kunderzufriedenheit, (Druck and Buchbinder, Hubert & Co.: Gottingen, Germany).
Fader, Peter and John R. Hauser (1988), "Implicit Coalitions in a Generalized Prisoner's Dilemma," Journal of
Conflict Resolution, 32, 3, (September), 553-582.
A-9
Hauser, John R. (1988), "Competitive Price and Positioning Strategies," Marketing Science, 7, 1, (Winter), 76-91.
Hauser, John R. (1986), "Agendas and Consumer Choice," Journal of Marketing Research, 2 , 3, (August), 199-212.
(Includes unpublished appendix containing "Proofs of Theorems and Other Results." ) Reprinted in Gregory S.
Carpenter, Rashi Glazer, and Kent Nakamota (1997), Readings on Market-Driving Strategies, Towards a New
Theory of Competitive Advantage, (Reading, MA: Addison-Wesley Longman ,Inc.)
Finalist, 1991 American Marketing Associations O'dell Award for Best Paper in JMR (5-year lag)
Hauser, John R. and Glen L. Urban (1986), "Value Priority Hypotheses for Consumer Budget Plans," Journal of
Consumer Research, 12, 4, (March), 446-462.
Eliashberg, Jehoshua and John R. Hauser (1985), "A Measurement Error Approach for Modeling Consumer Risk
Preference," Management Science, 31, 1, (January), 1-25.
Hauser, John R., and Steven P. Gaskin (1984), "Application of the `DEFENDER' Consumer Model," Marketing
Science, 3, 4, (Fall), 327-351. Reprinted (in French) in Recherche et Applications on Marketing, Vol. 1, April 1986,
pp. 59-92.
Urban, Glen L., P. L. Johnson and John R. Hauser (1984), "Testing Competitive Market Structures," Marketing
Science, 3, 2, (Spring), 83-112.
INFORMS (TIMS) Finalist, Best Article in Marketing Science Literature, 1984.
Hauser, John R. (1984), "Consumer Research to Focus R&D Projects" Journal of Product Innovation Management,
1, 2, (January), 70.84.
Hauser, John R., and Steven M. Shugan (1983), "Defensive Marketing Strategy," Marketing Science, 2, 4, (Fall),
319-360.
INFORMS (TIMS) Best Article in Marketing Science Literature, 1983.
Cited in 2007 by the INFORMS Society of Marketing Science as one “of the top 20 marketing science
articles in the past 25 years.
Republished in 2008 as one of eight “classic” articles in Marketing Science.
Cited in 2014 by the International Journal of Research in Marketing as one of the top 10 academically
most impactful marketing science papers.
Hauser, John R., and Kenneth J. Wisniewski (1982), "Application Predictive Test, and Strategy Implications of a
Dynamic Model of Consumer Response," Marketing Science, 1, 2, (Spring), 143-179.
Hauser, John R., and Kenneth J. Wisniewski (1982), "Dynamic Analysis of Consumer Response to Marketing
Strategies," Management Science, 28, 5, (May), 455-486.
INFORMS (TIMS) Best Article in Marketing Science Literature, 1982.
Tybout, Alice M. and John R. Hauser (1981), "A Marketing Audit Using a Conceptual Model of Consumer
Behavior: Application and Evaluation," Journal of Marketing, 45, 3, (Summer), 81-101.
Hauser, John R., and Patricia Simmie (1981), "Profit Maximizing Perceptual Positions: An Integrated Theory for the
Selection of Product Features and Price," Management Science, 27, 2, (January), 33-56.

A-10
One of the 500 most-cited articles in the first 50 years of Management Science.
Hauser, John R., Frank S. Koppelman and Alice M. Tybout (1981), "Consumer-Oriented Transportation Service
Planning: "Consumer Analysis and Strategies," Applications of Management Science, 1, 91-138.
Hauser, John R., and Steven M. Shugan (1980), "Intensity Measures of Consumer Preference," Operation Research,
28, 2, (March-April), 278-320.
Hauser, John R., and Frank S. Koppelman (1979), "Alternative Perceptual Mapping Techniques: Relative Accuracy
and Usefulness, Journal of Marketing Research, 16, 4, (November), 495-506.
Hauser, John R., and Glen L. Urban (1979), "Assessment of Attribute Importances and Consumer Utility Functions:
von Neumann-Morgenstern Theory Applied to Consumer Behavior," Journal of Consumer Research, 5, (March),
251-262.
Koppelman, Frank S. and John R. Hauser (1979), "Destination Choice Behavior for Non-Grocery Shopping Trips,"
Transportation Research Record, 673, 157-165.
Hauser, John R. (1978), "Consumer Preference Axioms: Behavioral Postulates for Describing and Predicting
Stochastic Choice," Management Science, 24, 13, (September), 1331-1341.
Hauser, John R. (1978), "Testing the Accuracy, Usefulness and Significance of Probabilistic Models: An
Information Theoretic Approach," Operations Research, 26, 3, (May-June), 406-421.
Hauser, John R. and Glen L. Urban (1977), "A Normative Methodology for Modeling Consumer Response to
Innovation," Operations Research, 25, 4. (July-August), 579-619.
Published Notes and Commentaries
Sunil Gupta, Dominique Hanssens, John Hauser, Donald Lehmann, and Bernd Schmitt (2014), “Theory and Practice
in Marketing Special Section in Marketing Science,” Marketing Science, 33, 1.
Chintagunta, Pradeep, Dominique Hanssens, John R. Hauser, Jagmohan Singh Raju, Kannan Srinivasan, and
Richard Staelin (2013), “Marketing Science: A Strategic Review,” Marketing Science, 33, 1, (January-February).
Hauser, John R. (2011), “New Developments in Product-Line Optimization,” International Journal on Research in
Marketing, 28, 26-27. Commentary on papers by Michalek, Ebbes, Adigüzel, Feinberg, and Papalambros,
“Enhancing Marketing with Engineering,” and Tsafarakis, Marinakis, and Matsatsinis, “Particle Swarm
Optimization for Optimal Product Line Design.”
Hauser, John R. (2011), “Paul E. Green: An Applications’ Guru,” in Vithala Rao, Ed., Paul Green’s Legends
Volume: Conjoint Analysis Applications, (Newbury Park, CA: Sage Publications). Forthcoming.
Hauser, John R. (2011), “Perspectives on Paul E. Green,” in V. Srinivasan, Ed., Paul Green’s Contributions to
Conjoint Analysis – Early Years, (Newbury Park, CA: Sage Publications). Forthcoming.
Hauser, John R. and Steven M. Shugan (2007), “Comments on ‘Defensive Marketing Strategy,’” Marketing Science,
27, 1, (January-February), 85-87.
Rangaswamy, Arvind , Jim Cochran, Tülin Erdem, John R. Hauser, and Robert J. Meyer (2007), “Editor-in-Chief
Search Committee Report: The Digital Future is Here,” Marketing Science, 27, 1, (January-February), 1-3.
Hauser, John R. (2006), “Twenty-Five Years of Eclectic Growth in Marketing Science,” Marketing Science (invited
commentary), 25, 6, (November-December), 557-558.

A-11
Hauser, John R., Greg Allenby, Frederic H. Murphy, Jagmohan Raju, Richard Staelin, and Joel Steckel (2005),
“Marketing Science – Growth and Evolution,” Marketing Science, 24, 1, (Winter), 1-2, invited editorial.
Hauser, John R., Scott Carr, Barbara Kahn, James Hess, and Richard Staelin (2002), "Marketing Science: A Strong
Franchise with a Bright Future," Marketing Science, 21, 1, (Winter), invited editorial.
Hauser, John R. (1984), "Price Theory and the Role of Marketing Science," Journal of Business, Vol. 57, No. 1,
(January), S65-S72.
Hauser, John R. (1980), "Comments on 'Econometric Models of Probabilistic Choice Among Products'," Journal of
Business, 53, 3, Part 2, (July 1980), S31-S34.
Papers in Edited Volumes and/or Proceedings
Selove, Matthew and John R. Hauser (2010), “How Does Incorporating Price Competition into Market Simulators
Affect Product Design Decisions?,” Proceedings of the Sawtooth Software Conference, Newport Beach, CA, Oct 6-
8, 2010.
Hauser, John R. and Glen L. Urban (2009), “Profile of John D. C. Little,” in Saul I. Gass and Arjang A. Assad eds.
Profiles in Operations Research, (New York, NY: Springer).
Ding, Min, Steven Gaskin, and John Hauser (2009), “A Critical Review of Non-compensatory and Compensatory
Models of Consideration-Set Decisions,” 2009 Sawtooth Software Conference Proceedings, Delray, FL, March 23-
27, 2009, 207-232.
Runner-up, Best Paper at Sawtooth Software Conference, 2009.
Gaskin, Steven, Theodoros Evgeniou, Daniel Bailiff, John Hauser (2007), “Two-Stage Models: Identifying Non-
Compensatory Heuristics for the Consideration Set then Adaptive Polyhedral Methods Within the Consideration
Set,” Proceedings of the Sawtooth Software Conference in Santa Rosa, CA, October 17-19, 2007.
Hauser, John R. and Ely Dahan (2010), “New Product Development,” in Rajiv Grover, Ed., Essentials of Marketing
Management, (Englewood Cliffs, NJ: Prentice Hall), forthcoming January 2011.
Toubia, Olivier, Theodoros Evgeniou, and John Hauser (2007), “Optimization-Based and Machine-Learning
Methods for Conjoint Analysis: Estimation and Question Design,” in Anders Gustafsson, Andreas Herrmann and
Frank Huber, Eds, Conjoint Measurement: Methods and Applications, 4E, (New York, NY: Springer). 231-258.
Hauser, John R., Ely Dahan, Michael Yee, and James Orlin (2006), ““Must Have” Aspects vs. Tradeoff Aspects in
Models of Customer Decisions,” Proceedings of the Sawtooth Software Conference in Del Ray Beach, FL, March
29-31, 2006
Best Paper at the Sawtooth Software Conference, 2006.
Hauser, John R. and Vithala Rao (2004), “Conjoint Analysis, Related Modeling, and Applications,” Advances in Market
Research and Modeling: Progress and Prospects,, Jerry Wind and Paul Green, Eds., (Boston, MA: Kluwer Academic
Publishers), 141-168.
Dahan, Ely and John R. Hauser (2003), "Product Management: New Product Development and Launching," Handbook
of Marketing, Barton Weitz and Robin Wensley, Eds, Sage Press, (June), 179-222.
Hauser, John R. (1997), “The Role of Mathematical Models in the Study of Product Development,” Proceedings of the
14th Paul D. Converse Awards Conference, University of Illinois, Champaign-Urbana, IL, 72-90.
A-12
Swanson, Derby A. and John R. Hauser (1995), "The Voice of the Customer: How Can You Be Sure You Know
What Customers Really Want?," Proceedings of the 1st Pacific Rim Symposium of Quality Function Deployment,
MacQuarie University, NSW Australia, February 15-17.
Little, John D. C., Leonard M. Lodish, John R. Hauser, and Glen L. Urban (1993), "Comment on `Marketing
Science's Pilgrimage to the Ivory Tower' by Hermann Simon," in Research Traditions in Marketing, Gary L. Lilien,
Bernard Pras, and Gilles Laurent, eds, (Kluwer), 45-51.
Hauser, John R. (1986), "Theory and Application of Defensive Strategy" in The Economics of Strategic Planning,
Lacy G. Thomas, ed., (Lexington Books, D. C. Heath & Co.: Lexington, MA), 113-140. Reprinted by the Marketing
Science Institute.
Hauser, John R. (1985), "The Coming revolution in Marketing Theory," in R. Russell, ed., Marketing in an
Electronic Age, (Harvard Business School Press: Boston, MA), 344-363.
Hauser, John R. and Glen L. Urban (1984), "Consumer Durables: Actual Budgets Compared to Value Priority
Model - Preliminary Results and Managerial Implications," Proceedings of the ESOMAR-Congress, Rome, Italy,
(September). (Awarded Best Paper at Conference).
Hauser, John R., John H. Roberts and Glen L. Urban (1983), "Forecasting Sales of a New Consumer Durable: A
Prelaunch Modeling and Measurement Methodology," Advances and Practices of Marketing Science, Fred S.
Zufryden, ed., (The Institute of Management Science: Providence, RI), 115-128.
Hauser, John R., and Glen L. Urban (1982), "Prelaunch Forecasting of New Consumer Durables: Ideas on a
Consumer Value-Priority Model," in A. D. Shocker and R. Srivastava, eds., Analytic Approaches to Product and
Market Planning, Vol. 2, (Marketing Science Institute: Cambridge Massachusetts), 276-296.
Hauser, John R. (1982), "Comments on 'A Survey of Experimental Market Mechanisms for Classical
Environments'," Research in Marketing, Supplement 1: Choice Models for Buyer Behavior, L. McAlister, ed., (JAI
Press: Greenwich, CT), Spring, 49-56.
Hauser, John R. (1981), "Comments on 'Violations of Regularity and the Similarity Hypothesis by Adding
Asymmetrically Dominated Alternatives to the Choice Set'," Proceedings of the Special Conference on Choice
Theory, Joel Huber, ed., (Duke University: Durham, NC), June.
Hauser, John R., and Frank S. Koppelman (1979), "An Empirical Comparison of Techniques to Model Consumer
Perceptions and Preferences," in A. D. Shocker, ed., Analytic Approaches to Product and Marketing Planning,
(Marketing Science Institute: Cambridge, Massachusetts), 216-238.
Tybout, Alice M., John R. Hauser, and Frank S. Koppelman (1977), "Consumer-Oriented Transportation Planning:
An Integrated Methodology for Modeling Consumer Perceptions, Preferences and Behavior," Advances in
Consumer Research, Vol. 5, (Chicago, Illinois), October.
Hauser, John R. and Steven M. Shugan (1977), "Extended Conjoint Analysis with Intensity Measures and Computer
Assisted Interviews: Applications to Telecommunications and Travel, " Advances in Consumer Research, Vol. 5,
(Chicago, Illinois), October.
Hauser, John R. and Frank S. Koppelman (1977), "Designing Transportation Services: A Marketing Approach."
Proceedings of the Transportation Research Forum, (Atlanta, GA), October, 638-652.
Hauser, John R. and Peter R. Stopher (1976), "Choosing an Objective Function Based on Modeling Consumer
Perceptions and Preferences," Proceedings of the International Conference on Cybernetics and Society,
(Washington, D.C.), November, 26-31.
A-13
Magazine Articles
Hauser, John R., Abbie Griffin, and Steve Gaskin (2011), “The House of Quality,” Wiley International
Encyclopedia of Marketing, (Chichester, West Sussex UK: John Wiley & Sons, Ltd.).
Abbie Griffin, Steve Gaskin, Robert Klein, Gerry Katz, and John R. Hauser (2009), “The Voice of the Customer,”
Wiley International Encyclopedia of Marketing, (Chichester, West Sussex UK: John Wiley & Sons, Ltd.).
Hauser, John R. (2002), “Marketing Makes a Difference,” Marketing Management, (January/February), 11, 1, 46-
47.
Hauser, John R. (2000), “Going Overboard on Platforms,” AMS Voices, 8.
Hauser, John R. (1997), “The Problem with Pinball,” AMS Voices, 4.
Hauser, John R. (1996), "You Are What You Measure," AMS Voices, 1.
Hauser, John R. (1995), "Internal Customers," Insight, 4, 1.
Hauser, John R. (1994), "Quality Function Deployment," Marketing Encyclopedia for the Year 2000, Jeffrey
Heilbrunn, ed., American Marketing Association, Chicago, IL, 60606.
Hauser, John R. (1993), "Are Customer-Satisfaction Programs Profitable?, Insight, 3.
Hauser, John R. (1988), "Customer Driven Engineering," Design News, (July 18), p. 50.
Hauser, John R. and Robert L. Klein (1988), "Without Good Research, Quality is a Shot in the Dark," Marketing
News, Vol. 22, No. 1, January 4. Page 1.
Hauser, John R. (1986), "`Defender' Helps Mature Brands Ward off New Foes," Marketing Educator, 5, 3, (Fall), 5.
Working Papers
Selove, Matthew and John R. Hauser (2011), “The Strategic Importance of Accuracy in Conjoint Design,” (Cambridge,
MA: MIT Sloan School of Management), July.
Ding, Min, John R. Hauser, and Lixin Huang (2013), “Sleuthing Game,” draft working paper, (Cambridge, MA: MIT
Sloan School of Management).
Classic Working Papers (Support published papers with additional information)
Braun, Michael, Clarence Lee, Glen L. Urban, and John R. Hauser (2009), “Does Matching Website Characteristics to
Cognitive Styles Increase Online Sales?,” (Cambridge, MA: MIT Sloan School of Management).
Zettelmeyer, Florian and John R. Hauser (1995), "Metrics to Evaluate R&D Groups: Phase I, Qualitative
Interviews," Working Paper, International Center for Research on the Management of Technology, MIT,
Cambridge, MA, 02142.
Hauser, John R. (1991), "Comparison of Importance Measurement Methodologies and their Relationship to
Consumer Satisfaction," (Cambridge, MA: MIT Sloan School of Management).
Research in Progress
Pretests and implementation of the sleuth game.
A-14
Field application and test of website morphing.
The effect of vivid stimuli in conjoint analysis.
Exploration vs. exploitation in retailer coupons.
Research Reports (not otherwise listed)
Hauser, John R. (1996), “R&D Metrics: An Annotated Bibliography,” ICRMOT Working Paper, M.I.T., Cambridge,
MA 02142. (June) Also available as a Marketing Science Institute Working Paper (November).
Hauser, John R. and Greg Cirmak (1987), "Consumer Driven Engineering for the CHEK Automobiles," Information
Resources, Inc. Report to General Motors, Inc. Details the results of a major study on consumer perceptions and
preferences of luxury automobiles. April.
Hauser, John R. (1983), "Critique of Market Studies for Cellular Radio Telephone:. Affidavits before the FCC
evaluating market studies, June and September.
Hauser, John R. (1983), "Forecasts of Demand and Cellular Radio Telephone,: Affidavits before the FCC for five
major and nine minor markets. June and April.
Hauser, John R., and J. Bertan (1982), "Auto Show Interviews," Internal Report to Buick Division of General
Motors, June.
Hauser, John R., and Kenneth J. Wisniewski (1981), "Monitoring the Implementation of Innovative Transportation
Services, Phase I: Final Report," Technical Report to the Urban Mass Transit Administration, Research Grant IL-11-
0012, May.
Hauser, John R. and Kenneth J. Wisniewski (1979), "Consumer Analysis for General Travel Destinations,"
Technical Report, Transportation Center, Northwestern University, March.
Hauser, John R. and Steven M. Shugan (1978), "Designing and Building a Market Research Information System,"
Technical Report, Transportation Center, Northwestern University, February.
Hauser, John R. (1978), "Forecasting and Influencing the Adoption of Technological Innovations," Technical
Report, Transportation Center, Northwestern University, October.
Hauser, John R., Alice M. Tybout and Frank S. Koppelman (1978), "Consumer-Oriented Transportation Services
Planning: The Development and Implementation of a Questionnaire to Determine Consumer Wants and Needs,"
Technical Report, Transportation Center, Northwestern University, October.
Tybout, Alice M., Frank S. Koppelman and John R. Hauser (1977), "Consumer Views of Transportation in
Evanston: A Report Based on Focus Group Interviews," Technical Report, Transportation Center, Northwestern
University, June.
Koppelman, Frank S., John R. Hauser and Alice M. Tybout (1977), "Preliminary Analysis of Perceptions,
Preferences, Beliefs and Usage of Transportation Services for Travel to Downtown Evanston," Technical, Report,
Transportation Center, Northwestern University, May.
Hauser, John R. (1977), "Results of the Focus Group Interviews for Shared Ride Auto Transit," Cambridge
Systematics Consultant's Report, May.
Hauser, John R. (1976), "Report on the Applicability of Attitudinal research for Improving the Effectiveness of
Transportation Demand Models," Position Paper commissioned by Cambridge Systematics, Inc., April.
A-15
Wilson, Nigel, R. W. Weissberg and John R. Hauser (1976), "Advanced Dial-a-Ride Algorithms--Final Report,"
M.I.T. Department of Civil Engineering Technical Report, April.
Hauser, John R., et al. (1974), "The Chemung County Transit Survey." Volunteers in Technical Assistance (a
division of VISTA) publication for Chemung County, NY, June. (Includes analysis of transportation options based
on the results of the survey designed and implemented by the technical team.)
Hauser, John R. (1974), "A Cost Model for RTS (Rochester, NY) Conventional Bus Routes," M.I.T., Department of
Civil Engineering Report, January.
Hauser, John R. (1973), "An Efficient Model for Planning Bus Routes in Communities with Populations Between
20,000 and 250,000," M.I.T., Operations Research Center Working Paper OR-029-993, November.
Research Grants
July 2007 – June 2008 Understanding Non-compensatory Decision Making for Consideration
Decisions (under Consortium with MIT Center for eBusiness and General
Motors, Inc.)
June 2000 – May 2006 Center for Innovation in Product Development, MIT, Initiative Leader, Virtual
Customer.
January 2001 – May 2002 eBusiness Center at MIT. Design and Delivery of Online Promotions. (with
John Little, Duncan Simester, and Glen Urban).
January 1997 – May 2000 Center for Innovation in Product Development, Engineering Research Center
Grant from the National Science Foundation. Research Director. In addition,
research grants for non-monetary incentives, procurement metrics, and virtual
customer methods.
June 1999 – May 2000 “Metrics Thermostat,” International Center for Research on the Management of
Technology (Principal Investigator).
June 1999- May 2001 “New Product Metrics at Ford and the US Navy,” Center for Innovation in
Product Development
June 1999- May 2001 “Lean Sustainment Metrics at the USAF,” Lean Sustainment Initiative at MIT
June 1994 - May 1999 "Metrics to Value R&D," International Center for Research on the Management
of Technology (Principal Investigator). General topic. Detailed proposals were
for various aspects of the problem.
June 1991 - May 1994 "Customer Needs, Customer Satisfaction, Sales, and Profit: Providing the Right
Incentives to Engineering and R&D," International Center for Research on the
Management of Technology (co-Principal Investigator with Birger Wernerfelt)
January 1990 - June 1992 "Information Acceleration and Preproduction Forecasting of New Autos, Phases
I and II." General Motors Electric Vehicle Project. (Associate)
December 1988 - June 1990 "Improved Methodologies to Measure Consumer Needs," Procter & Gamble
Company. (Principal Investigator)
September 1981 - December 1985 "Prelaunch Forecasting System for New Consumer Durables and Its
Applications to Auto Purchases," General Motors, Buick Division (co-Principal
Investigator with Glen L. Urban).
A-16
January 1981 - May 1981 "Marketing Approaches in Travel Demand," United Parcel Service Grant
(Faculty Advisor).
January 1979 - August 1980 "Monitoring the Implementation of Innovative Public Transportation Services"
from University Research Program of the Urban Mass Transportation
Administration (Principal Investigator).
July 1975 - September 1977 "Consumer-Oriented Transportation Service Planning." from the Program of
University Research, U.S. Department of Transportation (Faculty Associate).
September 1977 - January 1978 "Consumer-oriented Transportation Service: Modification and Evaluation" from
Program of University Research, USDOT (Faculty Associate).
May 1976 - September 1978 "Enhancement of Communications with a Small Scientific Community Using
Slow-Scan Televideo Terminals and Voice-Grade Telephone Lines" from the
National Science Foundation (Faculty Associate).
January 1976 - December 1976 "A Method for Assessing Pricing and Structural Changes on Transport Mode
Use," U.S. Department of Transportation (Faculty Associate).
September 1976 - June 1977 "Prediction of Urban Recreational Demand" from the National Science
Foundation (Faculty Consultant).
Invited Lectures (Outside the MIT Sloan School)
Carnegie Mellon University, April 10, 2015, “Learning from Experience, Simply.”
University of North Carolina, Kenan-Flagler Business School, Marketing Department. March 7, 2014. “Learning
from Experience, Simply.”
Marketing Science Institute, November 2012, “Panel Discussion: Perspectives on Big Data from Marketing
Scholars,” Cambridge, MA.
Wharton School, University of Pennsylvania, April 2009, “Website Morphing”
Max Planck Institute for Human Development, Center for Adaptive Behavior and Cognition, Summer Institute on
Bounded Rationality in Psychology and Economics, August 2006, “Greedoid-Based Non-Compensatory
Consider-then-Choice Inference.”
Northwestern University, Evanston, IL, April 2006, “Greedoid-based Non-compensatory Inference.”
University of Michigan, Seminar Series, October 2004, “Table Stakes: Non-compensatory Consideration-then-
Choice Inference.”
Management Roundtable Special Conference on “Taking the Voice of the Customer to the Next Level,” Boston,
MA October 2004, “The Virtual Customer.”
Marketing Science Institute Research Generation Conference, Atlanta, GA, May 2004, “New Products/Innovation,”
(with Gerry Tellis).
Marketing Science Institute Conference on Emerging Approaches for Successful Innovation, Chicago, IL, May
2003, "'Listening-In' to Find Unmet Customer Needs and Solutions."
University of California at Los Angeles, "Polyhedral CBC (and other fun stuff), February 2003

A-17
New York University, "Polyhedral Methods," March 2003.
Industrial Liaison Program – Research Directors' Conference, April 2002, "The Virtual Customer."
University of Maryland, "Polyhedral Methods for Conjoint Analysis," March 2002.
Marketing Science Institute Trustees Meeting on Marketing Outside the Silo, Boston, MA, April 2002, "Challenges
and Visions for Marketing's Role in Product Development Processes."
Managing Corporate Innovation -- ILP Symposium celebrating ten years of Management of Technology Research at
MIT. “Dealing with the Virtual Customer: Fast Web-based Customer Input.” April 2001
Epoch Foundation, Cambridge, MA, October 2000, “The Virtual Customer.”
Yale University Research Seminar in Marketing, New Haven, CN, March 2000, "Metrics Thermostat."
Analysis Group Economics Seminar, Boston, MA, December 1999, "The Use of Marketing Research in Litigation."
Also New York, NY, March 2000 and Washington, D. C., March 2002.
Boston Chapter of the Society for Concurrent Engineering, Waltham, MA, October 1999, "Metrics Thermostat."
University of Michigan DuPont Distinguished Speakers’ Series, Ann Arbor, MI, March 1998, “New Product
Metrics.”
Kirin Brewery Co. Limited, Tokyo, JAPAN, December 1998, “You Are What You Measure!” and “Scientific
Studies of the Voice of the Customer.”
NEC Corporation, Tokyo, JAPA, December 1998, “Scientific Studies of the Voice of the Customer.”
University of California at Los Angeles, Los Angeles, CA, February 1997, “Research, Development, and
Engineering Metrics”
Stanford University, Stanford, CA, December 1996, “Metrics to Value R,D&E”
University of California at Los Angeles, Los Angeles, CA, February 1997, “Research, Development, and Engineering
Metrics”
Duke University, Durham, NC, "Internal Customers and Internal Suppliers," Nov. 1995.
University of Minnesota, Minneapolis, MN, "Voice of the Customer," "Internal Customers and Captive Suppliers,"
May 1995.
Winter Retreat, University of Florida, Gainesville, FL, "Internal Customers and Captive Suppliers," December 1993.
Product Development Association - Boston, "Design and Marketing of New Products II: Advances in Product
Development Management over the Last 13 Years," May 1993.
3M, Minneapolis, MN, "Incentives to Encourage a Long-term Perspective and a Customer Focus," Workshop on
"Towards a World-class Research, Development, and Engineering Organization," November 1992.
Baxter Health Care, Orange County, CA, "The Voice of the Customer," August 1992.
TIMS College on the Practice of Management Science (New Directions in Management Science), Cambridge, MA:
"The Voice of the Customer," October 1991.
IBM, Inc., Boca Raton, FL: "Voice of the Customer for Performance Graphics," May 1991.

A-18
Kirin Brewery Company, Ltd. Tokyo, JAPAN: "New Product Development" and "Customer Satisfaction and
Customer Needs," April 1991.
American Iron and Steel Institute, Detroit, MI: "Satisfying the Customer -- Technical Issues," February 1991.
Warner Lambert, Inc., Mountain Laurel, PA: "Communication Among R&D and Marketing," October 1990.
Digital Equipment Corporation, Maynard, MA: "Voice of the Customer," May 1990.
Life Insurance Marketing and Research Association, Inc.: 31st Research Planning Conference, Boston, MA, "The
House of Quality." June 1989.
University of Illinois: "Customer Driven Engineering." April, 1988.
Marketing Science Institute and IBM Thornwood Educational Facility: Quality through Customer Driven
Engineering." April, 1988.
Harvard Business School: "Customer Driven Engineering: Integrating Marketing and Engineering." February, 1988.
Vanderbilt University: "Competitive Price and Advertising Strategies" and "Customer Driven Engineering."
October, 1988.
Columbia University: "Price, Positioning, and Advertising Games: To Equilibrate of Not, Does it Pay to be Smart?"
May, 1987.
New York Marketing Modelers' Club: "Would You Really Rather Have a Buick?: Prelaunch Forecasting of New
Automobiles," May 1987.
M.I.T. Applied Economics: "Competitive Product Selection and Advertising Models." April, 1987.
Northwestern University: "Agendas and Consumer Choice," August, 1986.
AMA Faculty Consortium on Marketing Strategy at the University Tennessee, Knoxville. "Defender: Analyses for
Competitive Strategy," July, 1986.
Ohio State University: "Defensive and Competitive Strategy." May, 1986.
Boston University: "Research in Competitive Strategy." November, 1985.
Midwest Electronics Association, Minneapolis, MN: "New Products for High-Tech Firms." October, 1985.
University of Pennsylvania: "Agendas and Consumer Choice," August, 1985.
Herstein Institute, Vienna Austria: "Competitive Strategy," May, 1985.
Cadbury-Schweppes, Birmingham, England: "New Product Development and Defensive Strategy." May, 1985.
Rhone-Poulenc and Aluminum Pechiney, Paris, France: "New Product Development." April, 1985.
University of Michigan: "Defensive and Competitive Strategy." February, 1985.
Marketing Science Institute Special Mini-Conference: "Defensive Marketing Strategies for Consumer Firms."
September 1983.
A-19
University of Chicago, Graduate School of Business, Chicago, IL. "Agendas and Consumer Choice," May 1984.
European Institute for Business Administration (INSEAD), Fontainebleau, FRANCE. "Agendas and Consumer
Choice," June 1984.
University of Connecticut. "Defensive Marketing: Theory, Measurement, and Models," April, 1983.
University of Osaka, JAPAN "Defensive Marketing: Theory, Measurement, and Models," August, 1983.
Kao Soap, Ltd., Tokyo, JAPAN: "Defensive Marketing," August, 1983.
Johnson & Johnson, K. K., Tokyo, JAPAN: "Defensive Marketing," August, 1983.
Analog Devices, Inc., Norwood, MA. "New Product Development," May, 1982.
University of Rochester Research Seminar, "Prelaunch Forecasting of New Consumer Durables," April 1982.
Frito-Lay R & D Laboratory, Dallas, TX, "Marketing and R & D for New Products," October 1981.
University of California at Los Angels Research Seminar, "Defensive Marketing Strategies," July, 1981.
Purdue University Research Seminar, "Product Realization," October 1979.
Stanford University Research Seminar, "Product Realization," October 1979.
Elrick and Lavidge, Inc., Chicago, Illinois, "Product Realization," October 1979.
Booz, Allen and Hamilton, Inc., Chicago, Illinois, "New Service Planning for Hospitals," April 1979.
Cornell University Research Seminar, "Intensity Measures of Consumer Preference," February 1979.
University of Rochester Research Seminar, "Product Realization: Synthesis of Marketing and Economic Theory,"
December 1978.
Region VI Center of Health Planning, New Orleans, LA, "Finding the Linkage Through Marketing,: August 1978.
Nebraska Hospital Association, Kearney, NE, "Hospital Marketing Surveys," May 1978.
Executive Development Group, Waterloo Management Education Centre, Toronto, Ontario, Canada, "Designing
New Industrial Products," February 1978.
Academic Update, Xavier University Graduate Program in Hospital and Health Administration, Cincinnati, OH,
"Designing Hospital Services: A Marketing Approach," October 1977.
The Hospital Marketing Workshop, Ireland Educational Corporation, Chicago, Illinois, "Analyzing the Hospital
Markets," January 1977 and May 1977.
Association for College Unions - International, 1976 Fall Conference in Green Bay, WI, Keynote Speech -
"Designing Successful Services: A Marketing Approach," October 1976.
University of Chicago, Graduate School of Business, Research Seminar, "Testing Probabilistic Models," April 1976.
Council for the Advancement and Support of Education, Conference on Marketing Alumni Program, New York,
NY, Keynote Speech, February 1976.
A-20
Presentations at Professional Meetings (No published proceedings, some co-presented or presented by co-author[s]*)
INFORMS Marketing Science Conference, Baltimore MD, June 2015. Songting Dong, John Hauser*, Min Ding,
Lixin Huang, and Holger Dietrich, “The Sleuth Game: Predicting Consumer Response to as-yet-unspecified Product
Features for Really New Products.”
AMA/Sheth Foundation Doctoral Consortium, Northwestern University, Evanston, IL, June 2014, “Bridging
Empircs and Practice.”
INFORMS Marketing Science Consortium, Emory University, Atlanta GA, June 2014, “Learning from Experience
Simply.”
AMA Summer Educators’ Conference, San Francisco, CA, August 1-3, 2014. Guilherme Liberali,* Hauser, John R.,
and Glen L. Urban “Recent Advances in Morphing Theory: Challenges and Opportunities for Research."
INFORMS Marketing Science Conference, Atlanta, GA, June 2014. Aliaa Atwi* and John R. Hauser, “Exploration
vs. Exploitation in Rapid Coupon Personalization.”
AMA Sheth Foundation Doctoral Consortium 2013, University of Michigan, Ann Arbor, MI, June 6-9. “Managing
Your Career (as a Marketing Academic).”
AMA Summer Educators’ Conference, Boston MA August 9-11, 2013. Panel on “Academic Integrity in the
Publication Process” with Robert Meyer, Richard Lusch, John Hauser.*
10th Marketing Dynamics Conference, The University of North Carolina at Chapel Hill, May 30 – June 1, 2013.
Song Lin*, Juanjuan Zhang, and John Hauser, “Learning from Experience, Simply.”
Joint Statistical Meetings 2013, Montreal, Ontario, August 2013. Song Lin*, Juanjuan Zhang, and John Hauser,
“Learning from Experience, Simply.”
2012 AMA Sheth Foundation Doctoral Consortium, Foster School of Business, University of Washington, June
2012, Panel: 10 Steps to Successful Publishing.
INFORMS Marketing Science Conference, Boston, MA, June 2012.
• Song Lin*, Juanjuan Zhang, and John R. Hauser, “Learning from Experience, Simply.”
• Glen L. Urban, Guilherme Liberali, Erin MacDonald, Robert Bordley, and John R. Hauser*, “Morphing Banner
Advertising”
• Matt Selove* and John R. Hauser, “The Strategic Importance of Accuracy in Conjoint Design.”
• Panel: Research Opportunities at the Marketing/Operations Interface
The 2012 Theory & Practice in Marketing (TPM) Conference on Marketing Strategy, Harvard University, Boston,
MA. May 2-3, 2012. Glen L. Urban, Guilherme Liberali, Erin MacDonald, Robert Bordley, and John R. Hauser*,
“Morphing Banner Advertising.”
New England Marketing Conference, Cambridge, MA, October 28, 2011. Gui Liberali, Glen L. Urban and John R.
Hauser*, “ Providing Unbiased Competitive Information to Encourage Trust, Consideration, and Sales: Two Field
Experiments.”
Yale School of Management, Center for Customer Insight, The Customer Insights Conference, New Haven, CT,
May 12-14, 2011. John R. Hauser and Matthew Selove*, “The Strategic Importance of Accuracy in the Relative
Quality of Conjoint Analysis.”
INFORMS Marketing Science Conference, Cologne, Germany, June 2010 (*indicates primary presenter if not me)
• Liberali, Guilherme*, John R. Hauser, and Glen L. Urban, “Optimal Time-to-Morph and Cognitive Costs of
Morphing.”
A-21
• Liberali, Guilherme, Glen L. Urban, and John R. Hauser, “Do Competitive Test Drives and Product Brochures
Improve Sales?”
• Urban, Glen L.*, Jong Moon Kim, Erin MacDonald, John R. Hauser and Daria Dzyabura, “Developing
Consideration Rules for Durable Goods Markets.”
2010 Advanced Research Techniques Forum, San Francisco, CA, June 6-9, 2010, “Unstructured Direct Elicitation
of Non-compensatory and Compensatory Decision Rules,” with Min Ding, Songting Dong*, Daria Dzyabura (listed
as Silinskaia), Zhilin Yang, Chenting Su, and Steven Gaskin.
2009 AMA Sheth Foundation Doctoral Consortium, J. Mack Robinson College of Business, Georgia State
University, June 2009. E-Commerce and Digital Marketing Topics.
INFORMS Marketing Science Conference, Ann Arbor, MI, June 2009 (* indicates primary presenter if not me)
• “An Empirical Test of Incentive-Compatible Direct Elicitation of Heuristic Decision Rules for Consideration
and Choice,” with Min Ding, Songting Dong, Daria Dzyabura, Zhilin Yang, Chenting Su, and Steven Gaskin
• “Adaptive Profile Evaluation to Identify Heuristic Decision Rules in “Large” and Challenging Experimental
Designs,” with Daria Dzyabura (formerly Silinskaia)* and Glen L. Urban..
• “Morphing Websites in the Presence of Switching Costs,” with Guilherme Liberali* and Glen L. Urban.
• “Continuous-Time Markov-Process with Misclassification: Modeling and Application to Auto Marketing,”
with Glen L. Urban* and Guilherme Liberali.
• “An Incentive-Aligned Sleuthing Game For Survey Research,” with Min Ding*
• “Would You Consider a Buick Even if It Were #1 in JD Power?” with Erin MacDonald* and Glen Urban
• “Cognitive Simplicity and Consideration Sets,” with Rene Befurt*, Daria Dzyabura, Olivier Toubia, and
Theodoros Evgeniou
• “John D. C. Little, a Pioneer in Marketing Science (Festschrift paper),” with Glen L. Urban
INFORMS Marketing Science Conference, Vancouver, B.C., June 2008 (* indicates primary presenter if not me)
• “Cognitive Styles and Website Design,” with Michael Braun, Glen L. Urban, and Clarence Lee.
• Modeling Cognitive Complexity to Predict Consideration Sets,” with Daria Dzyabura (formerly Silinskaia)*,
Theodoros Evgeniou, Olivier Toubia, and Rene Befurt.
• “Morphing Websites to Match Individual Cognitive Styles,” with Michael Braun*, Glen L. Urban, and
Guilherme Liberali
Sawtooth Software Conference, Delray, FL, March 2009, “A Critical Review of Non-compensatory and
Compensatory Models of Consideration-Set Decisions,” with Min Ding and Steven Gaskin
AMA Doctoral Consortium, Robert J. Trulaske, Sr. College of Business, University of Missouri, June 2007,
“Looking Ahead: Directions for Scholarly Research in Marketing” and “Building Teaching Effectiveness:
Stimulating Student Interest.”
Sawtooth Software Conference, Santa Rosa, CA, October 2007, “Two-Stage Models: Identifying Non-
Compensatory Heuristics for the Consideration Set then Adaptive Polyhedral Methods Within the Consideration
Set,” with Steven Gaskin, Theodoros Evgeniou, Daniel Bailiff.
AMA Advance Research Technologies Forum, Sante Fe, New Mexico, June 2007, “Two-Stage Models: Identifying
Non-Compensatory Heuristics for the Consideration Set then Adaptive Polyhedral Methods Within the
Consideration Set,” with Steven Gaskin, Theodoros Evgeniou, and Daniel Bailiff.
AMA Doctoral Consortium, W. P. Carey School of Business, Arizona State University, May 2007, “Consideration
The New Battlefield in Product Development.”
Agent-based Models of Market Dynamics and Consumer Behaviour, University of Surrey, Guildford, UK, January
2006, “Co-opetition for the Diffusion of Resistant Innovations: A Case Study in the Global Wine Industry using an
Agent-based Model.” with Rosanna Garcia. Also presented at the American Marketing Association’s Advanced
A-22
Research Techniques (ART) Forum in June 2006 at Monterrey CA.
AMA Doctoral Consortium, University of Maryland, College Park, MD, July 2006, “Creating Value: Products and
Brands.”
Marketing Science Conference, University of Pittsburgh, Pittsburgh, PA, June 2006, “A Truth-telling Sleuthing
Game for Survey Research,” with Min Ding.
Marketing Science Conference, University of Pittsburgh, Pittsburgh, PA, June 2006, On Managerially Efficient
Experimental Designs,: with Olivier Toubia.
Sawtooth Software Conference on Conjoint Analysis, Delray Beach, FL, March 2006, “Must Have” Aspects vs.
Tradeoff Aspects in Models of Customer Decisions,” with Michael Yee, James Orlin, Ely Dahan.
AMA Doctoral Consortium, University of Connecticut, Storrs CT, June 2005, “The Virtual Customer.”
Marketing Science Conference, Emory, Atlanta, GA, June 2005, “Direct, Nonparametric Product Optimization
Using Interactive Genetic Algorithms,” with Kamal Malek and Kevin Karty.
Marketing Science Conference, Emory, Atlanta, GA, June 2005, “Non-Deterministic Polyhedral Methods for
Adaptive Choice-Based Conjoint Analysis: Application to the Diffusion of the New Wine Cork,” with Olivier
Toubia and Rosanna Garcia.
Marketing Science Conference, Emory, Atlanta, GA, June 2005, “Greedoid-Based Non-compensatory Two-Stage
Consideration-then-Choice Inference,” with Michael Yee, Jim Orlin, and Ely Dahan.
Marketing Science Doctoral Consortium, Rotterdam, The Netherlands, June 2004, “Research that Has Impact.”
Marketing Science Conference, Rotterdam, The Netherlands, June 2004, “Improving Choice-Based Polyhedral
Methods by Taking Response Error into Account,” with Olivier Toubia.
Marketing Science Conference, Rotterdam, The Netherlands, June 2004, “The Dream Versus Reality of CRM,” with
Glen L. Urban, Eric Bradlow, and, Mahesh Kumar.
Marketing Science Conference, Rotterdam, The Netherlands, June 2004, “Non-compensatory Consideration-then-
Choice Adaptive Conjoint Analysis,” with Michael Yee and James Orlin.
AMA Doctoral Consortium, Texas A&M University, College Station, TX, June 2004, "Virtual Customer Initiative."
AMA Advanced Research Techniques Forum, June 2004, “Conjoint Adaptive Ranking Database System
(CARDS),” with Ely Dahan, James Orlin, and Michael Yee.
AMA Doctoral Consortium, University of Minnesota, Minneapolis, MN, June 2003, "The Review Process."
Marketing Science Doctoral Consortium, University of Maryland, June 2003, “Roots of Marketing Science
Thought,” with John Little.
Marketing Science Conference, University of Maryland, June 12-15, 2003, "Individual-level Adaptation of Choice-
Based Conjoint Questions: More Efficient Questions and More Accurate Estimation," (with Olivier Toubia and
Duncan Simester).
Marketing Science Conference, University of Alberta, Canada, June 28, 2002, "Configurators, Utility Balance, and
Managerial Use," (with Duncan Simester and Olivier Toubia).
Marketing Science Doctoral Consortium, University of Alberta, Canada, "Helping Managers Structure and Make
Decisions," June 27, 2002. (Founding Consortium).

A-23
Marketing Science Conference, University of Alberta, Canada, June 28, 2002, "Adaptive Choice-Based Conjoint
Analysis with Polyhedral Methods," (with Duncan Simester and Olivier Toubia*).
Advances in Marketing Research and Modeling: The Academic and Industry Impact of Paul E. Green, Wharton,
Philadelphia, PA, May 2002, "New Methods of Data Collection and Estimation Using Polyhedral Estimation
Techniques."
Production and Operations Management Society (POMS) Conference 2002 - High Tech POM, San Francisco, CA,
April 2002, "The Virtual Customer," (with Ely Dahan*).
Product Development Association (PDMA) International Research Conference, Santa Clara, CA, October 2001,
"The Virtual Customer," (with Ely Dahan*).
New England Marketing Conference, Cambridge, MA, September 2002, "Fast Polyhedral Adaptive Conjoint
Estimation," (with Ely Dahan, Duncan Simester, and Olivier Toubia).
Marketing Science Conference, Wiesbaden, Germany, July 2001, "Empirical Test of Web-based Conjoint Analysis
Including ACA, Efficient Fixed Designs, Polyhedral Methods, and Hybrid Methods," (with Ely Dahan, Duncan
Simester, and Olivier Toubia*)
Marketing Science Conference, Wiesbaden, Germany, July 2001, "Evaluation of Fast Polyhedral Adaptive Conjoint
Estimation," (with Duncan Simester and Olivier Toubia).
The 12th Annual Advanced Research Techniques Forum, Amelia Island, Florida, June 2001, "The Virtual
Customer: Communication, Conceptualization, and Computation," (with Ely Dahan*).
AMA Doctoral Consortium, University of Miami, June 2001, "Role of Technology in Marketing."
Marketing Science Conference, UCLA, June 2000, "Applications of the Metrics Thermostat."
Marketing Science Conference, UCLA, June 2000, "The Virtual Customer." (with Ely Dahan and Duncan Simester).
Marketing Science Institute Marketing Metrics Workshop, Washington, D.C. October 1999, "Metrics for New
Product Development: Making Agency Theory Practical," Plenary Speaker.
Marketing Science Conference, Syracuse, NY, May 1999, “Balancing Customer Input, Speed to Market, and
Reduced Cost in New Product Development: What is the Most Profitable Strategy”
ICRMOT Conference on Technology Alliances and New Product Development: A Cross-cultural Perspective,
Mishima, JAPAN, December 1998, “You Are What You Measure!”
AMA Doctoral Consortium, Athens, Georgia, August 1998, “Quantitative Advances in Marketing Models.”
AMA Winter Educators’ Conference, Austin, TX, February 1998 (Plenary Speaker), “New Challenges in the
Marketing-Product Development Interface.”
AMA Doctoral Consortium, Cincinnati OH, August 1997, "Working with Industry."
Marketing Science Conference, Berkeley CA, March 1997, “Cultivating Technological Managers for Customer
Expertise.”
Marketing Science Institute Conference on Interfunctional Interfaces: The Management of Corporate Fault Zones, Palo
Alto, CA, December 1996, “Multi-Stage Modeling of R&D/Marketing Interfaces in New Product Development.”

A-24
Marketing Science Conference, Berkeley CA, March 1997, “Cultivating Technological Managers for Customer
Expertise.”
Envisioning the Future on Internet Marketing: Research and Strategy Implications, M.I.T., September 1996, “Agents and
Intermediaries: Roles, Trust, and Value.”
"Can R&D be Evaluated on Market-Driven Criteria?," (with Florian Zettelmeyer). Marketing Science Conference,
University of Florida, Gainesville, March 1996
"Information Acceleration," (with Glen Urban, William Qualls, Bruce Weinberg, Jon Bohlmann, and Roberta
Chicos). Wharton Conference on Innovation in Product Development, Philadelphia, PA, May 1995.
"Metrics by Which Managers Evaluate R&D Groups," (with Florian Zettelmeyer). Association of Consumer
Research, Boston, MA, October 1994.
"Satisfying the Internal Customer," (with Birger Wernerfelt and Duncan Simester) Marketing Science Conference,
University of Arizona, Tucson, AZ, March 1994.
"Customer-Satisfaction Based Incentive Systems," AMA Educator's Conference, Boston, MA, August 1993.
"Marketing in the 1990s: Emerging Issues," AMA Doctoral Consortium, University of Illinois, August 1993.
"Quality Function Deployment and the Voice of the Customer," Pharmaceutical Management Science Association,
Phoenix AZ, May 1993.
"In a World of Active Time-constrained Customers, How Can a Firm be the Great Communicator," (with Birger
Wernerfelt), Marketing Science Conference, Washington University, St. Louis, MO, March 1993.
"Customer Needs, Customer Satisfaction, Sales, and Profit," (with Birger Wernerfelt, Ronit Bodner, and Duncan
Simester), ORSA/TIMS Joint National Conference, San Francisco, CA, November 1992.
"Customer Satisfaction and Employee Rewards," (with Birger Wernerfelt, Ronit Bodner, and Duncan Semester),
Marketing Science Conference, London, England, June 1992.
"Information Acceleration and Preproduction Forecasting of Electric Autos," (with Glen L. Urban and Bruce
Weinberg), Marketing Science Conference, London, England, June 1992.
"The Voice of the Customer and Customer Satisfaction," ORSA/TIMS Joint National Meeting, Anaheim, CA,
October 1991.
"Modeling Marketing Phenomena," AMA Doctoral Consortium, University of Southern Calif. August 1991.
"Relationship of Satisfaction to Customer Needs and to Market Share," 1st Congress on Customer Satisfaction and
Market-Driven Quality, American Marketing Association, Orlando FL, May 1991.
"Time Flies When You're Having Fun: How Consumers Allocate Their Time When Evaluating Products" (with
Bruce Weinberg, Glen Urban, and Miguel Villas-Boas), Marketing Science Conference, Wilmington, DL, March
1991.
"Information Acceleration and Preproduction Forecasting of New Autos," (with Glen Urban, and Bruce Weinberg),
Marketing Science Conference, Wilmington, DL, March 1991.
"Beyond Quality Function Deployment," ORSA/TIMS Joint National Meeting, Philadelphia, PA October 1990.
(Conference-wide Tutorial)
A-25
"Competitive Marketing Strategies," Operations Research 1990 (Osterreichische Gesellschaft fur Operations
Research), Vienna, Austria, August 1990. (Invited Speaker)
"New Product Development: A Quantitative Analysis of Interfunctional Communication" (with Abbie Griffin),
Marketing Science Conference, Urbana, IL, March 1990.
"Integrated Product Development: New Methodological Developments" (with Abbie Griffin), Marketing Science
Conference, Durham, N.C., March 1989.
"Customer Driven Engineering" (with Gregory Cirmak and Robert Klein), ORSA/TIMS Joint National Meeting,
Washington, D.C., April 1988.
"Competitive Advertising and Pricing in Duopolies" (with Birger Wernerfelt), Marketing Science Conference,
Seattle, Washington, March 1988.
"Customer Driven Engineering" (with Abbie Griffin), Marketing Science Conference, Seattle, Washington, March
1988.
"Customer Needs," Visions of Design Practices for the Future, Newton, MA, October 1987.
"Effective Strategies in Oligopoly" (with Peter Fader), ORSA/TIMS Joint National Meeting, Miami Beach, Florida,
November 1986.
"Competitive Strategy Contest: Result and Analysis" (with Peter Fader), Marketing Science Conference, Dallas, TX,
March 1986.
"The PC As a Tool to Teach Complex Marketing Science Concepts," Marketing Science Conference, Dallas, TX,
March 1986.
"The Coming Revolution in Marketing Theory," Plenary Speaker, European Marketing Conference, Bielefeld, West
Germany. April 1985.
"Defensive Strategy" Confer. on Economics of the Firm, Universite de Paris X, Nanterre, France, April 1985.
"Competitive Marketing Strategies" Marketing Science Conference, Nashville, Tennessee, March 1985.
"Developing New Product Management: Past Progress, Current Efforts, Current Needs" (Panel) Marketing Science
Conference, Nashville, Tennessee, March 1985.
"Testing Competitive Marketing Structures: Theory and Applications" (with Glen Urban) ORSA/TIMS Joint
National Meeting, Dallas, TX November 1984.
"Competitive Strategy," ORSA/TIMS Joint National Meeting, Dallas, Texas, November 1984.
"Forecasting Automobile Sales: An Application of a Value Priority Algorithm," (with Glen Urban), John Roberts
and John Dabels), TIMS XXVI International Meeting, Copenhagen, Denmark, June 1984.
"Consumer Durables: The Actual Consumer Budgets Compared to the Value Priority Model," (with Glen Urban),
Marketing Science Conference, Chicago, Illinois, March 1984.
"Defensive Strategy Models: Application and Predictive Text," (with Steven Gaskin, and Karl Irons) ORSA/TIMS
Joint National Meeting, Orlando, Florida, November 1983.
"New Product Research: Focus on Defensive strategies," Roundtable Program, ORSA/TIMS Joint National
Meeting, Orlando, FL, November 1983.

A-26
"Intensity of Preference," (with Steven Shugan) ORSA/TIMS Joint National meeting, San Diego, CA, October
1982.
"Measurement Error Theories for von Neumann-Morgenstern Utility Functions," (with Jehoshua Eliashberg)
ORSA/TIMS Joint National Meeting, San Diego, CA, October 1982.
"Consumer Preference Models: Axioms and Statistics," ORSA/TIMS Joint National Meeting, Houston, Texas,
October 1981.
"Economic Models of Consumer Behavior," (panel discussion), ORSA/TIMS Joint National Meeting, Houston,
Texas, October 1981.
"Defensive Marketing Strategies, Part II," (with Steven Shugan), ORSA/TIMS Joint National Meeting, Houston,
Texas, October 1981.
"Agendas and Choice Probabilities," (with Amos Tversky), Association of Consumer Research, St. Louis, Missouri,
October 1981, and Special Conference on Choice Theory, Durham, North Carolina , June 1981.
"Strategic Response to Competitive New Products," (with Steven Shugan), ORSA/TIMS Joint National Meeting,
Toronto, Ontario, Canada, May 1981.
"Applications of a Dynamic Semi-Markov Model of Consumer Choice," (with Ken Wisniewski), ORSA/TIMS Joint
National Meeting, Colorado Springs, Colorado, November 1980.
"Models of Consumer Behavior," (panel discussion), ORSA/TIMS joint National Meetings, Colorado Springs,
Colorado, November 1980.
"Dynamic Semi-Markov Models of Consumer Behavior," (with Ken Wisniewski) TIMS International Conference
on Marketing, Paris, June 1980.
"Profit Maximizing Perceptual Positioning," (with Patricia Simmie) TIMS International Conference on Marketing,
Paris, June 1980.
"An Error Theory for von Neumann-Morgenstern Utility Assessment," (with Jehoshua Eliashberg), ORSA/TIMS
Joint National Meeting, Washington, D.C., May 1980.
"Defender: Defensive Strategies Against New Products" (with Steven Shugan), ORSA/TIMS Second Special
Interest Conference on Marketing Measurement and Analysis, Austin, Texas, March 1980.
"Adaptive Control of New Product Launches," (with Ken Wisniewski), ORSA/TIMS Joint National Meeting,
Milwaukee, Wisconsin, October 1979.
"The Value of Up-front Research in New Products," (with Glen Urban), TIMS International Meeting, Honolulu,
Hawaii, June 1979.
"Methods for Computing Probabilities of Choice," (with Steven Shugan), TIMS International Meeting, Honolulu,
Hawaii, June 1979.
"Forecasting and Improving the Adoption of New High Technology Products," (with Pat Lyon), ORSA/TIMS Joint
National Meeting, New Orleans, Louisiana, May 1979.
"A Methodology for Product Realization: Multi-method Procedures," (with Patricia Simmie), ORSA/TIMS Joint
National Meeting, Los Angeles, California, November 1978.

A-27
"Searching for Marketing Segments" (with Ken Wisniewski), ORSA/TIMS Joint National Meeting, New York, New
York, May 1978.
"P.A.R.I.S.: An Interactive Market Research System," (with Steven Shugan), ORSA/TIMS Joint National Meeting,
New York, New York, May 1978.
"Extended Conjoint Analysis," (with Steven Shugan), ORSA/TIMS Joint National Meeting, Atlanta, Georgia,
November 1977.
"Consumer Preference Functions: Theory, Measurement, Estimation , and Application," (with Steven Shugan),
ORSA/TIMS Joint National Meeting, Atlanta, Georgia, November 1977.
"Measuring Consumer Preferences for Health Care Plans," (with Glen Urban), ORSA/TIMS Joint National Meeting,
San Francisco, California, May 1977.
"Improved Transportation Design with Consumer Response Models: An AMTRAK Example" (with Frank
Koppelman), ORSA/TIMS Joint National Meeting, Miami, Florida, November 1976.
"A Comparison of Statistical and Direct Multiattribute Utility Assessment Procedures," (with Glen Urban),
ORSA/TIMS Joint National Meeting, Las Vegas, Nevada, November 1985.
"Measuring Consumer Preferences: An Axiomization for Describing Choice," ORSA/TIMS Joint National Meeting,
Las Vegas, Nevada, November 1975.
"Modeling Consumer Response to Innovations," (1) Milwaukee Chapter of ORSA/TIMS, November 1985; (2)
Chicago Chapter of ORSA/TIMS, December 1975.
"Modeling Decisions of Choice Among Finite Alternatives: Applications to Marketing and to Transportation
Demand Theory," ORSA/TIMS Joint National Meeting, San Juan, Puerto, Rico, October 1974.
"An Efficient Model for Planning Bus Routes in Medium Sized Communities," ORSA/TIMS Joint National
Meeting, San Diego, CA, November 1973.
Professional Affiliations
The Institute for Operations Research and Management Science
American Marketing Association
Product Development and Management Association, Certified New Product Development Professional
Professional Services
President, INFORMS Society of Marketing Science (January 2014 –December 2015). President-elect (a board
position, January 2012 – December 2013).
Secretary, INFORMS Society of Marketing (January 2002 – December 2005). Founding Officer.
Advisory Council, INFORMS College of Marketing (1994 - 2002)
Council of The Institute of Management Sciences (1987 - 1989)
Associate Editor for Marketing, Management Science, (1980 - 1981)
Department Editor for Marketing, Management Science, (1982 - 1988)

A-28
Editor-in-Chief, Marketing Science, (1989 - 1994)
Editor, Special Issue on Big Data, Marketing Science, 2015. Associate Editor, Special Issue on the Theory and
Practice of Marketing, Marketing Science, 2014.
Editorial Advisory Board, Sloan Management Review (2000-2002).
Associate Editor, Journal of Marketing Research (April 2006 – June 2009). First time in journal history that
Associate Editors had been appointed.
Senior Advisory Board, Journal of Marketing Research (July 2009 – 2014). First time such an advisory board was
formed.
Advisory Board, Marketing Science (2010 – 2014).
Advisory Board, Journal of Product Innovation Management (2011 – 2014)
Emeritus Editorial Board, Marketing Science (includes active reviewing of papers).
Editorial Boards, Marketing Science, (1980 – 1988, Editor 1989-1995, 2003- 2008, including acting Area Editor),
Journal of Product Innovation Management (1997 - 2010), Journal of Marketing (2005- 2008, outstanding reviewer
2006), European Management Journal (advisory, 1998 - 2002), International Journal for Research in Marketing
(2007 – 2014).
Reviewer: Advances in Consumer Research, Applications in Management Science, European Journal of Research in
Marketing, Journal of the Academy of Marketing Science, Journal of Consumer Research, Journal of Marketing,
Journal of Marketing Research, Journal of Mathematical Psychology, Journal of Product Innovation Management,
Management Science, Marketing Science, Operations Research, Review of Marketing, Sloan Management Review,
Transportation Research Record, Transportation Science, AMA Dissertation Prize, AMA Educators' Conference,
American Institute of Decision Sciences Dissertation Prize, Nicholson Dissertation Prize, Marketing Science
Institute Dissertation Award, Product Development Management Association Dissertation Prize, Prentice-Hall
Books, National Science Foundation.
Conference Chairman: Conference Chair, Profitable Customer-Driven Organizations: Developing the Blueprint,
Management Roundtable, May 1994.
Segment Chairman: Yale School of Management, Center for Customer Insight, The Customer Insights Conference,
New Haven, CT. May 12-14, 2011. New Product Innovations.
Non-traditional Models of Consumer Preference and Choice, Adaptive Preference and Estimation,
Optimizing Product Design and Customer Targeting, Obtaining Information From or About
Consumers (Atlanta, GA, 2005, co-chair four sessions)
TIMS International Meeting, Copenhagen, Denmark, June 1984 (two sessions).
TIMS College of Marketing, Houston, Texas, October 1981 (twelve sessions).
TIMS College of Marketing, Milwaukee, Wisconsin, October 1979 (five sessions).
American Marketing Association Educator's Conference, Chicago, Illinois, August 1978, (three
sessions).
INFORMS Marketing Science Conference, Atlanta GA, June 2005 (four sessions)

A-29
Session Chairman: INFORMS (Previously named ORSA or TIMS)
Virtual Customer Initiative (Rotterdam, The Netherlands, 2004)
New Approaches to Mapping (University of Maryland, 2003)
The Virtual Customer (University of Alberta, Canada 2002)
The Virtual Customer (Wiesbaden, Germany 2001)
Building Competitive Advantage Through Product Quality and R&D (Gainesville, FL 1996)
Customer Satisfaction and Its Role in Global Competition (San Francisco, CA 1992)
Competitive R&D (Washington, D.C., April 1988)
Competitive Marketing Strategy, (St. Louis, Michigan, November 1987)
Competition in Multiattributed Spaces (Atlanta, Georgia, November 1985).
Marketing: Consumer Measurement (Copenhagen, Denmark, June 1984)
Marketing: Dynamic Structures (Copenhagen, Denmark, June 1984)
Product Policy (Orlando, Florida, November 1983)
Product Policy (San Diego, California, October 1982)
New Product Introduction and Defense in Competitive Environments, (Detroit, Michigan, April
1982)
New Product and Product Policy Models, (Houston, Texas, October 1981)
New Product Models (Toronto, Ontario, Canada, May 1981)
Models of Consumer Behavior (Colorado Springs, Colorado, November 1980)
New Product Realization and Selection (Los Angeles, California, November 1978).
Session Chairman: Association of Consumer Research
Mathematical Theories of Consumer Behavior (St. Louis, Missouri, October 1981)
Committee Memberships
Editor Selection Committee, Marketing Science, INFORMS College of Marketing, 2001 (chair), 2004 (chair), 2007.
Editor Selection Committee, Journal of Marketing Research, American Marketing Association, 1999.
Conference Steering Committee, Duke Invitational Symposium on Choice Modeling and Behavior, June 1993.
Editor Selection Committee, Management Science, TIMS.
Founding Committee for Marketing Science, TIMS College of Marketing, (1979 - 1982).
Management Science Roundtable, TIMS, (1982 - 1988)
A-30
Marketing Strategy Steering Committee, Marketing Science Institute, (1983 - 1984).
Organizing Committee for Conference on Economics of the Firm, April 1985, Universite de Paris X Nanterre.
Organizing Committee for 1985 Conference in Bielefeld, West Germany, European Marketing Academy.
Publications Committee (1980 - 1982), Operations Society of America.
Scientific Committee for 1986 Conference in Helsinki, Finland.
Student Affairs Committee (1978 - 1979), Operations Society of America.
Litigation Consulting (on behalf of, *deposition testimony, †court, commission, or arbitration testimony, for public vita,
current cases with pending reports are not listed)
ABC, Inc., American Broadcasting Company, Inc., and Disney Enterprises, Inc., Plaintiffs, v. Dish Network L.L.C.
and Dish Network Corp., (Preliminary Injunction)
Alcatel-Lucent USA Inc. v. Amazon.com, Inc. et al. (Patent Infringement)* †
Allergan, Inc. Engagement. (Off-label Prescriptions)
American Express Travel Related Services, Inc. v. Visa USA, Inc., et. al.* (Evaluation of marketing research)
In Re American Express Anti-Steering Rules Antitrust Litigation (II)* (Evaluation of marketing research)
American Multi-Cinema, Inc. v. American Movie Classics Company, Inc., et. al. (Confusion)
Amway v. Procter & Gamble (Damages)*
Apple, Inc. v. Samsung Electronics Company, Ltd, et al.** †† (Patent infringement, two cases, 1846, 630)
Atlantic Recording Corporation, et. al. v. XM Satellite Radio, Inc. (Copyright infringement).
Axcan Scandipharm, Inc. V. Global Pharmaceuticals And Impax Laboratories, Inc. (False Advertising)
Berlex v. Biogen, Inc. (Damages)*
Blue Mountain Arts, Susan Polis Schutz, and Stephen Schutz v. Hallmark Card, Inc. (Trade Dress)
James And Lisa Camenson, et al.; v. Milgard Manufacturing Inc., et. al. (Class action)
CBS Corporation, CBS Broadcasting Inc., CBS Studios Inc., and Survivor Productions, LLC. v. and DISH Network
Corporation, DISH Network L.L.C. (damages).
Comm-Tract Corp. v. Northern Telecom, Inc. (Advice only)
Computer Aid, Inc. v. Hewlett Packard (damages)*
Creative Laboratories, Inc. v. Apple Computer, Inc. (Intellectual Property)
CTC Communications Corporation v. Bell Atlantic Corporation (Damages)
Curt Schlesinger and Peter Lore, on behalf themselves and the Certified Class, Plaintiffs, v. Ticketmaster* (Class
action, false advertising, confusion)
Dayna Craft, et al. v. Philip Morris Companies, Inc. and Philip Morris Inc. (Class Action).*
Eagle Harbor Holdings LLC, and Mediustech LLC, v. Ford Motor Company (Patent infringement).
EPD v. Curtis (Product Confusion)†
Fox Broadcasting Company, Inc., Twentieth Century Fox Film Corp., and Fox Television Holdings. Inc., Plaintiffs,

A-31
v. Dish Network L.L.C. and Dish Network Corp., (Preliminary Injunction, Damages)*
Stephen S. Gallagher, et. al. v. State Farm Mutual Automobile Insurance Company, et al. (Class Action)
Geico v. Google and Overture Services (Yahoo), Inc. (Trademark Infringement)
Gillette v. S. C. Johnson (Patent Infringement)
Gyrodata, Inc. v. Atlantic Inertial Systems Inc (“AIS”), et al. (consulting expert)
Heublein vs. Seagrams and Gallo (Liability)
Hewlett-Packard, Inc. v. Factory Mutual Insurance Company (Insurance Coverage)*
IMS Health Incorporated v. Symphony Health Solutions Corporation, Source Healthcare Analytics, LLC, and
ImpactRx, Inc., C.A. No. 1:13-cv-2071-GMS (D. Del.). (Patent infringement, technical expert.)
Intel v. Advanced Micro Devices (Damages)*
J. B. D. L. Corp. d/b/a, Beckett Apothecary v. Wyeth-Ayerst Laboratories, Inc. and American Home Products
Corporation, (Class Action)
Jerry Jacobs, et. al. v. Osmose Inc., et. al. (Class Action)*
Jay Kordich, et. al. v. Salton Maxim Housewares, Inc., et. al. (Trademark)†
In RE J.P. Morgan Chase Cash Balance Litigation (Class Action)*
Lending Tree, Inc. v. The Gator Corporation (Intellectual Property)
Lotus v. Borland (Damages)*
Luciano F. Paone v. Microsoft Corporation (Patent Infringement)*.
Louis Vuitton Malletier, S. A. v. Hyundai Motor America (Trademark Infringement)*
Marvin Lumber and Cedar Company v. PPG Industries, Inc., et. al. (Survey Design)
MasterCard International, Inc. v. First National Bank of Omaha (Product Confusion)*
Mayo Foundation v. Mayo Health Facilities (Product Confusion)†
Mead Johnson Nutritionals v. unnamed party (False Advertising)
Merck & Co. (Lanham Act Advice)
Michael Kors (USA), Inc. and Michael Kors, L.L.C. v. Costco Wholesale Corporation, Civil Action No. 13-CV-
4832, the United States District Court Southern District of New York. (Damages)*
In Re Microsoft Corporation Antitrust Litigation (Multi-district Litigation)*
Millennium Laboratories, Inc. v. Ameritox, Ltd. (False Advertising)
Pacific Bell Telephone Company in New Regulatory Framework Review of Customer Satisfaction before the
California Public Utility Commission†
Pfizer Consumer Healthcare (Lanham Act Advice)
Playtex v. Procter & Gamble (Claims Substantiation)*†
Procter & Gamble v. Amway (Liability and Damages)*†
Procter & Gamble v. Haugan, et. al. (Liability and Damages)†
Putnum Fund Trustees, (Investment Fraud, advice on market research)
Ram Broadcasting, Inc. (Cellular Telephone Filings)
RealPlayer, Inc. v. Microsoft Corporation (Anti-trust)
A-32
Roberts et. al. v. Enterprise Rent-a-Car Company of Boston, Inc. (Class Action)
The Republic of Columbia v. Diageo North America, et al. (Anti-trust)
St. Clair Intellectual Property Consultants, Inc. v. Research in Motion, Ltd. and General Imaging Co. (Patent
infringement)
Barbara Schwab, et. al. v. Philip Morris, USA (Class Action)*
SoundExhange, Inc. vs. Sirius Satellite Radio, Inc. and XM Satellite Radio, Inc.: In the Matter of Adjustment of
Rates and Terms for Preexisting Subscription Services and Satellite Digital Radio Services. 2007*†.
2012†*
State of Colorado, et. al. v. Warner Chilcott Holdings Company III, Ltd., et. al. (Anti-trust)*
State of Florida and Plaintiff States Antitrust Litigation for Disposable Contact Lenses (Survey Analysis)†
Stipic, et. al. v. Behr Process Corporation and Masco International (Class Action)*
Straumann Company v. Lifecore Biomedical, Inc. (Product Confusion)*
Sun Microsystems, Inc. v. Microsoft Corporation (Anti-trust)
Tivo, Inc. v. Echostar Communications Corporation, et. al*
Tropicana Products, Inc. v. Vero Beach Groves, Inc. (Lanham Act)† (Declaration accepted as court testimony.)
Wal-Mart Stores, Inc (and other retailers) v. Mastercard International, Inc. (Liability and Damages, Anti-trust)*
We Media, Inc. v. We: Women’s Entertainment, LLC. (Product Confusion)*
Marketing, Marketing Research, and Product Development Consulting
American Home Foods, Inc.; American Airlines; American Hospital Supply Corporation; Analog Devices, Inc;
Andersen Consulting, Inc. (Accenture), Applied Marketing Science, Inc.; A.T.&T.; Avon; Barton-Aschmann
Associates; Baxter Cardiovascular Group, Booz Allen Hamilton, Inc., Cambridge Systematics, Inc.; Chrysler, LLC;
Colgate-Palmolive; Costello Associates, Inc.; Economics’ Laboratories, Inc.; Elrick and Lavidge, Inc.; Evanston
Hospital; Evanston, Illinois and Schaumburg, Illinois (Transportation Planning); Fiat Chrysler Automobiles, Fidelity
Investments; Ford Motor Company; French's Inc., G.D. Searle, Inc.; General Foods, Inc.; General Motors, Inc.,
Buick Division, Chevrolet Division, Marketing and Product Planning; Gillette; IBM, Inc.; Information Resources,
Inc.; Intel, Inc., Johnson & Johnson; Kodak; Macromedia, Inc., Management Decision Systems, Inc.; M/A/R/C, Inc.;
Merck, Inc., Navistar International, Inc.; Pacific Gas and Electric Company, Pepsi-Cola, Inc.; Polaroid; Procter &
Gamble Company; Product Genesis, Inc.; RAM Broadcasting, Inc.; Regional Transportation Authority; Richardson-
Vicks, Inc.; Southern Company Services, Inc.; Time-Life Books; Volunteers in Technical Assistance, and Wyeth-
Ayerst Laboratories, Inc. Co-founder, principal, and board member, Applied Marketing Science, Inc., Advisory
Board (former), Affinnova, Inc.
M.I.T. or MIT Sloan Committee Work
Associated Faculty Committee to Review the Organizational Learning Center (MIT Sloan), 1995.
Building Committee for the E51 Expansion, MIT Sloan, 1992, Ad Hoc.

A-33
Center for Innovation in Product Development
Leader, Virtual Customer Initiative, 2000 - 2006
Research Director, 1997 – 2000
Center for Transportation Studies, 1981 - 1982.
Master of Science in Transportation Committee.
Committee on the Masters in Analytics, 2014-2015.
Committee on the Undergraduate Program, 2003 – 2005.
Committee to Investigate Sloan-Logo Research Notes (MIT Sloan, chair), 2001-2002.
Dean’s Consultation Committee (MIT Sloan), 2008-2009.
Dean Search Committee (MIT Sloan), 1993.
Executive Educational Programs Committee (MIT Sloan), 1983 – 1985, 1998-1999, 2007.
Faculty Admissions Committee, 2004-2009.
Faculty Council (MIT Sloan), 1999.
International Center on Research for the Management of Technology (MIT Sloan).
Co-Director, (1993 - 2000).
Joint Steering Committee (1990 - 1993).
Management Science Area, MIT Sloan School of Management.
Area Head, (2005- 2009).
Chairman of Subcommittee on Peer Group Comparisons, (1981 - 1982).
Committee on Management Science Curriculum Redesign, (1982 - 1983).
Marketing Group Head (1986, 1988 – 2003, 2010-2011).
Management of Technology Program Committee (MIT Sloan), (2001- 2003).
Master's Program Committee, MIT Sloan, (1980 – 1987, 2007 – 2014).
Subcommittee on Fellowship Awards (2014-2015)
Ad hoc committee to develop a Marketing, Operations and Strategy Track (2011-2012).
A-34
Chairman: Subcommittee On Placement, (1981 - 1982).
Core Curriculum Implementation Committee (1992-1994).
Core Curriculum Reassessment Committee (1991-1992).
Subcommittee on Admissions, Special Consideration, (2007 – 2009).
Subcommittee on Course Ratings (2011).
Subcommittee on Entrepreneurship and Innovation Evaluation (Chair, 2008).
Subcommittee on the Management Science Core, (1982 - 1983).
Subcommittee on Tracks (2008-2009).
Subcommittee on Strategy Curriculum (2009).
MIT Sloan Committee on Educational Technology, 2004 – 2006.
Operations Research Center
Admissions Committee, (1981 - 1982).
Associated Faculty (1980 – 2000).
Operations Research Committee (2001- 2003).
President's Committee (1984).
Organization Committee for the New MIT Sloan Building, E62, (2007- 2009).
Personnel and Policy Committee, MIT Sloan (Executive Committee, 2005 – 2009, 2013-2014).
Chair of ad hoc committees for reappointment, promotion, and tenure (1983 - 2014).
Member of ad hoc committees for reappointment, promotion, and tenure (1981 - 2014).
Sloan Appreciation Awards Committee (2013-2014)
Symposium Director, Marketing Center, MIT Sloan School, M.I.T., (1981 - 1982).
Zannetos Dissertation Award Committee, MIT Sloan, (1981-82, 1996-97, chair 1997-1998).
M.I.T. Subjects Taught (often multiple sections)
15.810, Marketing Management (Core) Spring 1990, 1991, 1992, 1993, 1994, 1995, 1997, 1998, 1999, 2001,
2004, 2005. 2006. Fall 1999, 2006, 2007, 2008, 2011, 2012, 2013,
2014.
(Teaching awards listed on page 2 of vita.)
15.812, Marketing Management (UG) Fall 1981, 1982, 1984, 1985, 1986. Spring 1981, 1984, 2006.
15.813, Marketing Management in Public Sector Fall 1980.
A-35
15.814, Marketing Mgmt (Mgmt of Technology) Fall 1988, 1993, 1999, 2001.
15.820, Advanced Marketing Management Spring 1990
15.828, New Product Development Spring 1981, 1982, 1989; Fall 1982, 1984; 1985.
15.838, Ph.D. Seminar (Various Topics) Spring 1986, 1997, 2002, 2006, 2011, 2013, 2014, 2015.
15.839, Marketing and Statistics Workshop Spring 1982; Fall 1982, 1984.
15.TH4. Thesis Project on Competitive Strategy Spring 1985, 1986.
Summer Session, ILP, and External Executive
A.T.&T Course on New Product Development, 1986.
European Institute for Business Administration (INSEAD) European Marketing Programme, 1985.
Greater Boston Area Executive Program, 1982, 1983.
M.I.T. Civil Engineering, Demand Theory, 1980, 1981, and 1982.
M.I.T. ILP, Marketing Strategy and Models in the Information age, 1983.
M.I.T., Management of R&D, 1989, 1990, 1991, 1992, 1993, 1994. 1995, 1996, 1997, 1998, 1999.
M.I.T. Marketing Science Symposium, 1981, 1982, 1983, 1984, 1985, 1986, 1987, 1988.
M.I.T./M.I.P. Executive Program, 1992.
M.I.T. New Product Development, 1997.
Pedagogical Developments.
In 2012, I redesigned the core curriculum in marketing to reflect new developments in marketing analytics, big data,
and new media.
In 1990 and 1991, Prof. John D. C. Little and I redesigned the core curriculum in Marketing Management and taught
the course to the entire Master's class.
In the 1991-1992 I was part of a committee of six faculty members that redesigned the core curriculum at the Sloan
School. I supervised the voice-of-the-customer analyses of students and recruiters and encouraged the committee to
design a program that these customers would find exciting. The new core was implemented in the 1993-1994
academic year. Student satisfaction increased significantly.
Teaching Notes
Note on Defensive Marketing Strategy (2005, for 15.810, Marketing Management)
Note on Product Development (213, for 15.810, Marketing Management)
Note on the Voice of the Customer (2013, for 15.810, Marketing Management)
Note on Consumer Behavior (2013, for 15.810, Marketing Management)
A-36
Note on Life Cycle Diffusion Models (2005, for 15.810, Marketing Management)
Note on Engineering Product Design (2006, for 15.810, Marketing Management)
Note on Conjoint Analysis (2013, for 15.810, Marketing Management)
M.I.T. Thesis Supervision
(a) MIT Sloan School of Management, Master's Theses
Hafiz Adamjee (joint with John Scaife), "The Face of the Customer: The Use of Multimedia in Quality Function
Deployment," - (1993). This product was subsequently commercialized and was a finalist for the New Media
Invision 1994 Multimedia award at COMDEX/Spring '94.
Ramay Akras, "Competitive Strategy in the Marketing of Small DDP Computers: an Analysis of Emerging Price
and Product Position Patterns," - (1986).
Frederic Amerson, "Strategic Marketing Simulation: Improvements to the Enterprise Integrating Exercise," -
(1989).
Sébastien Andrivet (Sloan Fellows Program), “Customer research, customer-driven design, and business strategy in
Massively Multiplayer Online Games,” – (2007)
Andrew Anagnos (joint with Karen Van Kirk), "A Framework for Analyzing Quality in the News Media," - (1991)
Allen Aerni, "Measurement of Customer Satisfaction," - (1994).
Joel Berez, "An Investigation of Decision Hierarchies" - (1981).
Harel Beit-on, "Competitive Strategy for Small Business Jet Aircraft," - (1985).
Willy Biberstein (SDM Program), "Framework for Customer Interaction Throughout the Automotive Product
Development Process," (February 2002).
Andre Borschberg (joint with Webb Elkins), "Defensive Marketing Strategy: Its Application to a financial Decision
Support System" - Reader (1983).
Philippe Bosquet, "European Airline Deregulation: Defining Air France's Strategy for the 1990's," - Reader (1989)
Jill A. Christians, (joint with Cheryl M. Duckworth), "Expectations and Customer Satisfaction: A Market Research
Study for Plimoth Plantation," Reader (1994).
Poh-Kian Chua (MOT Program), “R,D&E Metrics: Shaping the Outcomes of Your R,D&E Investment,” – (1998).
Leslie K. Cooper, "The Structure of Recruiter Needs at the Sloan School of Management: A Quantitative
Assessment," - (1992).
Teruyuki Daino (Sloan Fellows Program), “How a Leading Company Can Overcome a Competitive Challenge: A
Case Study of Anheuser-Busch Company.” – (1998).
Laura E. Donohue, "Software Product Development: An Application of the Integration of R&D and Marketing via
Quality Function Deployment" - (1990)
Cheryl M. Duckworth (joint with Jill A. Christians), "Expectations and Customer Satisfaction: A Market Research
Study for Plimoth Plantation," Reader (1994).

A-37
Webb Elkins (joint with Andre Borschberg), "Defensive Marketing Strategy: Its Application to a Financial Decision
Support System" - Reader (1983).
Rasheed El-Moslimany (LFM Program), "Getting Value from the Value Chain: Comfort Choice," Co-Advisor.
(June 2002)
Merve Ergez (Master of Science in Management Studies), Strategic Scent Selection: A Marketing Research Study
for Olivita Brand,” (June 2014).
Julio Faura (MOT Program), "Contribution to Web-based Conjoint Analysis for Market Research," (2000).
Richard Feldman, "Decision Support Systems for Forecasting Communications in the Home," - Reader (1985).
Anders T. Fornander, "The Continuing Operating System Battle in the Personal Computer Industry," - Reader
(1994).
Carl Frank (MOT Program), "Metrics Thermostat for Strategic Priorities in Military System Acquisition Projects,"
(2000).
Mihaela Fulga, "Competitive Pricing and Positioning Strategies in the Dating Service Market," - (1986).
Steven P. Gaskin, "Defender: Test and Application of a Defensive Marketing Model" - (1986). 1st Place, Brooks
Award.
Peter N. Goettler, "A Pre-market Forecasting Model of New Consumer Durables: Development and Application," -
Reader (1986).
Patti N. Goldberger, "Competitive Strategy in the Market for Running Shoes," - (1985).
Akhil Gupta, "The Personal Computer Industry: Economic and Market Influences on Product Positioning
Strategies," - (1986).
Michael Halloran (joint with Marc Silver), "Defensive Marketing Strategy: Empirical Applications" - (1983).
Carla Heaton, "Competitive Strategy in the Facsimile Market," - (1985).
Judith Hee, "Determining Manufacturer's Coupon Strategies" - Reader (1981).
Jonathan E. Higginson, “Understanding Dependencies in Research and Development at the Charles Stark Draper
Laboratory.” - (1997).
Scott D. Hill, "Correlation of Core Competencies with Market-Driven or Self-Guided Research," - (1995).
Dan Isaacs, "Competitive Pricing and Positioning Strategies in the Imported Beer Marketing," - (1986).
Francois Jacques, "Marketing Strategies in Innovative Industries: The Case of Package/Document Delivery
Services," - Co-Advisor (1985).
Lawrence Kahn, "Competitive Positioning: A Study of Recruiter's and Employer's Perceptions of the Sloan School
of Management" - (1982). Honorable mention Brooke's Thesis Prize.
D. Darcy Kay, "Competitive Strategy for Anti-arthritic Drugs" - (1985).
Young Joo Kim (MOT Program), “R&D Management Applications of The Dynamic Metrics Framework” – (1998)
A-38
Sidney A. Kriger, "The Effect of Quality Function Deployment on Communications of the New Product
Development Teams," - (1989)
Yasuke Kume, "New Marketing Strategy of Telecommunications in Japan" - Reader (1981).
Elvind Lange, "Measuring Market Response to Marketing Mix Variables Using Dynamic Modeling and Its
Implications for Brand Strategy" - Reader (1981).
Stephen P. Langhans, "Defensive Marketing Strategy: A Consumer Semi-Durable Case Example" - (1983).
In-Kyu Lee, "Evaluating System for the Upstream Center of R&D for being Market-Oriented in a Consumer
Electronics Company," - (1995).
Michael Leslie (joint with Joel Wachtler), "A Methodology for Making International Marketing Mix Decisions," -
Reader (1985).
Kit Mee Lim, "Competitive Strategy among Companies Offering Credit Cards," - Reader (1985).
James A. Lutz, "Competitive Marketing Strategy in the CAD Marketplace," - (1985).
Larry D. Lyons, "Forecasting the Impact of Competitive Entries on Sales of a New Consumer Durable" - Reader
(1984).
Arpita Majundar (SDM Program), "Strategic Metrics for Product Development at Ford Motor Company," - (2000).
Catherine E. Manion, "A Survey of Customer Satisfaction Incentive Systems for Salespersons," - (1993).
Maureen E. Matamoros, "Information Overload," – Reader (1986).
Meghan McArdle (LFM Program), "Internet-based Rapid Customer Feedback for Design Feature Tradeoff
Analysis," – co-Advisor (2000)
Fernando Motta, "Competitive Strategy Among Panamanian Banks," - (1985).
Neil Novich, "Price and Promotion Analysis Using Scanner Data" - Reader (1981).
Kenji Nozaki, "Marketing and Technology Strategy for the Japanese Architectural Design Company," - (1989).
Seiji Nozawa, “Voice of the Customer Analysis in the Japanese Beer Market.” - (1997).
Minho Park (MOT Program), “R&D Matrix at LG Electronics.” - (1997)
Stephen Pearse, "Production and Sales Forecasting: A Case Study and Analysis" - Reader (1982).
Ning P. Peng, "An Exploration of the Impact and Success of Customer Satisfaction Programs," - (1994).
Homer Pien (MOT Program), “Competitive Advantage through Successful Management of R&D.” - (1997)
Susan B. Poulin, "Defensive Strategy in the Automatic Test Equipment Industry" (1984).
Jill W. Roberts, "MBA Recruiters' Needs: Voice of the Customer Analysis," - (1992).
Lisa Gayle Ross, "A Voice of the Customer Analysis of M.B.A. Schools: The Student Segment," - (1992). Lisa
was a runner-up for the George Hay Brown Marketing Scholar of the Year in 1992.
A-39
Tamaki Sano, “Strategy for Kirin as a Global Brand” – (2009) Sloan Fellow.
John Scaife (joint with Hafiz Adamjee), "The Face of the Customer: The Use of Multimedia in Quality Function
Deployment," - (1993). See award listed under Adamjee.
Paul E. Schoidtz, "Advertising, Price, and Positioning Equilibria," - (1986).
Hongmei Shang, "A Simulation Analysis of Optimal Task Assignment for Growing Managers from R&D Labs," –
(February 2000).
Rosemarie Shield, "Competitive Pricing and Positioning Strategies in the Chromatographic Instruments Market," - ,
(1986).
Jon Silver (joint with John C. Thompson, Jr.), "Beta-binomial Analysis of Customer Needs -- Channels for Personal
Computers," - (1991). 1st Prize, Brooks Award.
Marc Silver (joint with Michael Halloran), "Defensive Marketing Strategy: Empirical Applications" - (1983).
Lisa Silverman, "An Application of New Product Growth Modeling to Automobile Introductions" - (1982).
Sheryl Sligh, "An Assessment of the Analog Modem Market," - (1991).
Jamie Smith, "Industrial Buying Process of Pension Funds for Real Estate," - (1982).
Yoshihito Takahashi (MOT), "Analysis of Strategy in an Ethical Drug Industry," – Reader ( 2000).
Genevieve Tchang, "A Methodology for Planning and Evaluating External Relations at Business Schools" - Reader
(1982).
John C. Thompson, Jr. (joint with Jon Silver), "Beta-binomial Analysis of Customer Needs -- Channels for Personal
Computers," - (1991). 1st Place, Brooks Award.
V. Mullin Traynor, "The Dissemination and Adoption of New Technology: Control Data's Computer-Based
Training System, Plato, and the Electric Utilities" - (1982).
Karen Van Kirk (joint with Andrew Anagnos), "A Framework for Analyzing Quality in the News Media," - (1991)
Joel Wachtler (joint with Michael Leslie), "A Methodology for Making International Marketing Mix Decisions," -
Reader (1985).
Tamao Watanabe, "Customer Analysis of the U.S. Cardiovascular Drug Market: Focusing on Physician's Drug
Choice" - (1991)
Stephen L. Weise, "Expert Decision Support Systems for Marketing Management," – Reader (1986).
Nancy Werner, "Competitive Price and Positioning in the Integrated Office Automation Systems Market" - (1986).
Julie Wherry, “Pre-Test Marketing: Its Current State in the Consumer Goods Industry and Its Effect on Determining
a Networked Good.” - (2006).
Ali Yalcin, "The Potentials and Limitations of Customer Satisfaction Indices in Captive Customer-Supplier
Environments," - (1995)
Sandra Yie, "The Core Curriculum at Sloan: Establishing a Hierarchy of Needs," - (1992).

A-40
Judy Young, "Responsive Marketing Strategy at AT&T" - (1982).
(b) Aeronautics S.M. Theses
Keith Russell (LSI), "Reengineering Metrics Systems for Aircraft Sustainment Teams: A Metrics Thermostat for
Use in Strategic Priority Management," (February 2001).
(c) Electrical Engineering, S.B. and M.Eng. Theses
Chan, Christine W. Y. (M. Eng), “Measuring Non-Monetary Incentives Using Conjoint Analysis,” Co-Advisor
(1999).
Emily Hui (M.Eng.), "Application of Polyhedral Conjoint Analysis to the Design of Sloan's Executive Education
Programs." June 2003.
Brian T. Miller (S. B.), "A Verification of Price Equilibria Based on Non-Zero Conjectural Variation," (1986).
(d) Mechanical Engineering, Master’s Theses
Burt D. LaFountain, “An Empirical Exploration of Metrics for Product Development Teams” – (1999)
Tina Savage, “The Virtual Customer: A Distributed Methodology for Linking Product Design and Customer
Preferences.” Co-Advisor (1998).
(e) Operations Research Center, Master’s Theses
Jeffrey Moffit (ORC), " Applying the Metrics Thermostat to Naval Acquisitions for Improving the Total Ownership
Cost – Effectiveness of New Systems," (2001)
Olivier Toubia (ORC), "Interior-point Methods Applied to Internet Conjoint Analysis," (February 2001), Co-
Advisor.
(f) Urban Studies, Master's Theses
Marijoan Bull, "Affirmative Fair Housing Marketing" - Committee Member (1982).
Barry Cosgrove, "Marketing Analysis for the Brockton Area Transportation Authority" – Committee Member
(1981).
(g) Sloan School of Management, Ph.D. Theses
Makoto Abe, "A Marketing Mix Model Developed from Single Source Data: A Semiparametric Approach."
Committee member (August 1991). Abe is on the faculty at the University of Tokyo.
Daria Dzyabura, “Essays on Machine Learning in Marketing (tentative title),” Chairman (June 2012). Dzyabura is
now on the faculty at New York University.
Peter Fader, "Effective Strategies in Oligopolies," Chairman (February 1987). Sloan School of Management,
Zannetos Prize, 1st Place. Fader is on the faculty at the University of Pennsylvania.
Fred Feinberg, "Pulsing Policies for Aggregate Advertising Models" Committee Member (August 1988). Feinberg
is on the faculty of the University of Michigan.
Dave Godes, " Friend or Foe?: The Relationship Between Learning and Incentives and two additional essays in
marketing," (June 2000), Committee Member. Primary advisor on listed essay. Zannetos Prize, 1st Place. Godes is
on the faculty of the University of Maryland.

A-41
Abbie Griffin, "Functionally Integrated New Product Development: Improving the Product Development Process
Through Linking Marketing and Technology Development," Chairman. (June 1989). Griffin is on the faculty at the
University of Utah and was editor of Journal of Product Innovation Management from 1997-2003 Frank Bass
Dissertation Award (INFORMS).
Gurumurthy Kalyanaram, "Empirical Modeling of the Dynamics of the Order of Entry Effect on Market Share, Trial
Penetration and Repeat Purchases for Frequently Purchased Consumer Goods," Committee Member (March 1989).
G. K. was on the faculty at the University of Texas, Dallas.
Eriko Kitazawa, "Customer Satisfaction at Japanese Utility Franchises," Committee Member (1996).
Eleanor (Nell) Putnam-Farr, “The Effects of Framing on Enrollment and Participation – Field Experiments Using
Different Recruitment Language.” expected June 2015. Putnam-Farr will begin a post doc at Yale in July 2015.
John H. Roberts, "A Multiattributed Utility Diffusion Model: Theory and Application to the Prelaunch Forecasting
of Autos". Committee Member (February 1984). Roberts is on the faculty at the London Business School.
Matt Selove, “The Strategic Importance of Accuracy in Conjoint Design,” Committee Member (June 2010). Selove
is on the faculty at the University of Southern California. John Howard Dissertation Award (AMA), 2010.
Duncan I. Simester, "Analytical Essays on Marketing," Committee Member, (June 1993). Sloan School of
Management, Zannetos Prize, Honorable Mention. Simester is on the faculty of M.I.T.
Olivier Toubia, “New Approaches to Idea Generation and Consumer Input in the Product Development Process,”
(June 2004). Toubia is on the faculty of Columbia University. Frank M. Bass Dissertation Award (INFORMS),
2005, John Howard Dissertation Award (AMA), 2005.
Miguel Villas-Boas, "On Promotions and Advertising Policies: A Strategic Approach." Committee member
(February 1991). Villas-Boas is on the faculty at the University of California, Berkeley.
Bruce Weinberg, "An Information-Acceleration-Based Methodology for Developing Preproduction Forecasts for
Durable Goods: Design, Development, and Initial Validation." Committee Member. (August 1992). Weinberg was
on the faculty at Boston University.
Florian Zettelmeyer, “Three Essays on Strategic and Organizational Uses of Information in Marketing.” Committee
Member. Zettelmeyer is on the faculty of Northwestern University.
(h) Civil Engineering, Ph.D. Thesis
Karla Karash (Ph.D.), "An Application of the Lens Model in Measuring Retail Attractiveness and the Effects of
Transportation Programs" - Committee Member (August 1983). Karash was at the MBTA.
(i) Electrical Engineering and Computer Science, Ph.D. Thesis
Atwi, Aliaa, “Exploration vs. Exploitation in Rapid Coupon Personalization.” PhD in Electrical Engineering and
Computer Science, Chair, (expected June 2016)..
(j) Mechanical Engineering, Ph.D. Thesis
Javier Gonzalez-Zugasti (Mechanical Engineering, Ph.D.), "Models for Product Family Design and Selection,"
(June 2000), Committee Member.
(k) Operations Research Center, Ph.D. Thesis
A-42
Yee, Michael (Operations Research, Ph.D.), “Inferring Non-Compensatory Choice Heuristics,” (June 2006), Co-
Advisor. Yee is at MIT’s Lincoln Laboratories.
Northwestern University Ph.D. Thesis Supervision (1975 - 1980 Academic Years)
Steven M. Shugan, "A Descriptive Stochastic Preference Theory and Dynamic Optimization: Applications Toward
Predicting Consumer Choice' Chairman (September 1977). Shugan is on the faculty at the University of Florida and
was editor of Marketing Science for six years.
Patricia Simmie, "Product Realization: Theory, Models, and Application" - Chairman (June 1979), American
Marketing Association Dissertation Prize, Honorable Mention. Simmie was at York University.
Ken J. Wisniewski, "A Semi-Markov Theory of Consumer Response: New Theoretical Properties, Simulation
Testing, and Empirical Application" Chairman (June 1981). American Marketing Association Dissertation Prize,
First Place. Wisniewski was on the University of Chicago.

APPENDIX B
EXPERT TESTIMONY

B-1
John R. Hauser
Expert Testimony
Fox Broadcasting Company, Inc. v. Dish Network LLC, Civil Action No. 12-04536-DMB-SHx, United States
District Court for the Central District of California. Deposition testimony, December 15, 2014.
Michael Kors, Inc. v. Costco Wholesale Corporation, Civil Action No. 13-CV-4832, United States District Court
for the Southern District of New York. Deposition testimony, June 9, 2014.
Apple Inc. v. Samsung Electronics Co. Ltd. et al., Case No. 12-CV-00630, United States District Court for the
Northern District of California San Jose Division. Deposition testimony, September 27, 2013. Trial Testimony,
April 8, 2014.
In Re American Express Anti-Steering Rules Antitrust Litigation (II), United States District Court for the Eastern
District of New York, Master File No. 11-MD-02221 (NGG)(RER). Deposition testimony, August 12, 2013.
Apple Inc. v. Samsung Electronics Co. Ltd. et al., Case No. 11-CV-01846-LHK, United States District Court
Northern District of California San Jose Division. Deposition testimony, April 27, 2012. Trial Testimony, August
10, 2012. Deposition Testimony, November 29, 2012. Trial Testimony, November 14, 2013.
In the Matter of Determination of Rates and Terms for Preexisting Subscriptions and Satellite Digital Audio
Radio Services, Docket No. 2011-1 CRB PSS/Satellite II, Before the Copyright Royalty Judges, Library of
Congress. Deposition testimony, March 2, 2012. Trial testimony June 12, 2012.
Alcatel Lucent, Inc. v. Amazon.Com, Inc. et al., Civil Docket No. 6:09-CV-422. United States District Court for
the Eastern District of Texas Tyler Division, Deposition testimony, June 3, 2011, Trial testimony, October 13,
2011.
Luciano F. Paone v. Microsoft Corporation, Case No. CV-07-2973, United States District Court for the Eastern
District of New York. Deposition Testimony, September 23, 2011.
Louis Vuitton Malletier v. Hyundai Motor America, Case Number 10-CIV-1611-PKC, United States District
Court for the Southern District of New York. Deposition testimony, May 6, 2011.
Curt Schlesinger, et al. v. Ticketmaster, Case No. BC30456, Superior Court of the State of California for the
County of Los Angeles. Deposition testimony, November 19, 2010.
St. Claire Intellectual Property Consultants, Inc. v. Research In Motion LTD., et al., Research In Motion
Corporation, Civil Action No. 08-371-JJF-LPS, United States District Court for the District of Delaware.
Deposition testimony, February 26, 2010.
Dayna Craft, et al. v. Philip Morris Companies, Inc. and Philip Morris Inc., Case No. 002-00406-02, Division No.
6, Missouri Circuit Court, Twenty-Second Judicial Circuit (City of St. Louis). Deposition testimony, November
11-12, 2009.
Playtex Products, Inc. v. The Procter & Gamble Company, Case No. 08 Civ. 1532 (WHP). Deposition testimony,
February 25, 2009. Trial testimony, March 19, 2009.

B-2
In Re J.P. Morgan Chase Cash Balance Litigation, Master File No. 06. Div. 0732 (HB), United States District
Court for the Southern District of New York. Deposition testimony, December 10, 2008.

APPENDIX C MATERIALS RELIED UPON

C-1
Court Documents
“Introductory Memorandum to the Written Direct Statement of SoundExchange, Inc.,” In Re: Determination of Royalty Rates and Terms for Ephemeral Recording and Digital Performance of Sound Recordings (Web IV) Before the United States Copyright Royalty Judges, Library of Congress, Washington, D.C., Docket No. 14-CRB-0001-WR, October 7, 2014.
Testimony of Daniel L. McFadden, In Re: Determination of Rates and Terms for Digital Performance in Sound Recordings and Ephemeral Recordings (WEB IV) Before the Copyright Royalty Judges, Library of Congress, Washington D.C., Docket No. 14-CRB-0001-WR, October 6, 2014 and Backup Documents.
Testimony of Daniel L. Rubinfeld, In Re: Determination of Rates and Terms for Ephemeral Recording and Digital Performance of Sound Recordings (WEB IV) Before the United States Copyright Royalty Judges, Library of Congress, Washington D.C., Docket No. 14-CRB-0001-WR, October 6, 2014.
Academic Literature
Diamond, Shari S., “Reference Guide on Survey Research,” in Reference Manual on Scientific Evidence, Third Edition, Federal Judicial Center, 2011, pp. 229-276.
Ding, Min, John R. Hauser, Songting Dong, Daria Dzyabura, Zhilin Yang, Chenting Su, and Steven P. Gaskin, “Unstructured Direct Elicitation of Decision Rules,” Journal of Marketing Research, 48(1) February 2011, pp. 116-127.
Ding, Min, “An Incentive-Aligned Mechanism for Conjoint Analysis,” Journal of Marketing Research, 44(2), May 2007, pp. 214–223.
Olson, Kristen M., “Survey Participation, Nonresponse Bias, Measurement Error Bias, and Total Bias,” Public Opinion Quarterly, 70(5), 2006, pp. 737-758.
Payne, Stanley L., The Art of Asking Questions, Princeton University Press, 1980.
Sawyer, Alan G., “Demand Artifacts in Laboratory Experiments in Consumer Research”, Journal of Consumer Research, 1(4), 1975, pp. 20-30.
Tversky, Amos and Daniel Kahneman, “The Framing of Decisions and the Psychology of Choice,” Science, 211(4481), 1981, pp. 453-458.
Zamanian, Mostafa and Pooneh Heydari, “Readability of Texts: State of the Art,” Theory and Practice in Language Studies, 2(1), January 2012, pp. 43-53.
Other Publicly Available Sources
“Applied Marketing Science Overview,” http://ams-inc.com/overview-main, visited February 15, 2015.
C-2
“Buck Weaver Award,” INFORMS, 2014, https://www.informs.org/Recognize-Excellence/ Community-Prizes-and-Awards/Marketing-Science-Society/Buck-Weaver-Award, visited February 15, 2015.
“FAQs: Why should my playlist be private while I am curating?” Spotify.com, http://www.spotifyartists.com/faq/#why-do-i-need-to-uncheck-the-option-to-make-playlists-public, visited February 16, 2015.
“Fieldwork Recruiting,” http://www.fieldwork.com/recruiting, visited on February 15, 2015.
“Pandora Unveils Billboard Advertising Unit Featuring Lexus,” Pandora.com, October 20, 2011, http://investor.pandora.com/phoenix.zhtml?c=227956&p=irolnewsArticle&ID=1619467, visited February 16, 2015.
“Parlin Award 2010,” American Marketing Association, 2015, https://www.ama.org/AboutAMA/Pages/Parlin-Award.aspx, visited February 16, 2015.
“The Paul D. Converse Awards,” American Marketing Association, 2014, https://archive.ama.org/Archive/ Community/ARC/Pages/Career/Awards/Converse.aspx, visited February 15, 2015.
Other Sources
Combined transcripts from qualitative research interviews conducted by Applied Marketing Science on January 14-15, 2015.
AppliedMarketingScience_409BO15-Music_Jan14th-1pm-Daniel.avi
AppliedMarketingScience_409BO15-Music_Jan14th-2pm-Donna.avi
AppliedMarketingScience_409BO15-Music_Jan14th-2pm-Linda.avi
AppliedMarketingScience_409BO15-Music_Jan14th-3pm-Steven.avi
AppliedMarketingScience_409BO15-Music_Jan14th-3pm-Toni.avi
AppliedMarketingScience_409BO15-Music_Jan14th-5pm-Giana.avi
AppliedMarketingScience_409BO15-Music_Jan14th-9am-Elizabeth.avi
AppliedMarketingScience_409BO15-Music_Jan14th-9am-Kristin.avi
AppliedMarketingScience_409BO15-Music_Jan14th-10am-Ariana.avi
AppliedMarketingScience_409BO15-Music_Jan14th-10am-Edward.avi
AppliedMarketingScience_409BO15-Music_Jan14th-11am-Alexandra.avi
AppliedMarketingScience_409BO15-Music_Jan14th-11am-Leanne.avi
AppliedMarketingScience_409BO15-Music_Jan14th-alex-4pm.avi
AppliedMarketingScience_409BO15-Music_Jan14th-Hackeem.avi
AppliedMarketingScience_409BO15-Music_Jan15th-1pm-Brian.avi

C-3
AppliedMarketingScience_409BO15-Music_Jan15th-1pm-Zora.avi
AppliedMarketingScience_409BO15-Music_Jan15th-2pm-Christopher.avi
AppliedMarketingScience_409BO15-Music_Jan15th-2pm-Rebecca.avi
AppliedMarketingScience_409BO15-Music_Jan15th-4pm-Joe.avi
AppliedMarketingScience_409BO15-Music_Jan15th-4pm-Michael.avi
AppliedMarketingScience_409BO15-Music_Jan15th-5pm-Sameul.avi
AppliedMarketingScience_409BO15-Music_Jan15th-9am-Juliana.avi
AppliedMarketingScience_409BO15-Music_Jan15th-9am-Kevin.avi
AppliedMarketingScience_409BO15-Music_Jan15th-10am-Nancy.avi
AppliedMarketingScience_409BO15-Music_Jan15th-10am-Thomas.avi
AppliedMarketingScience_409BO15-Music_Jan15th-11am-Kelly.avi
AppliedMarketingScience_409BO15-Music_Jan15th-330pm-Blake.avi
AppliedMarketingScience_409BO15-Music_Jan15th-Rebecca-5pm.avi
Fieldwork-Network_529de15_AliciaR-11am-1-15-15.avi
Fieldwork-Network_529de15_BradleyK-1pm-1-15-15.avi
Fieldwork-Network_529de15_brandonR-5pm-1-14-14.avi
Fieldwork-Network_529de15_CelineA-3pm-1-14-15.avi
Fieldwork-Network_529de15_ChadV-10am-1-14-15.avi
Fieldwork-Network_529de15_DeliaP-5pm-1-15-15.avi
Fieldwork-Network_529de15_DrewH-10am-1-14-15.avi
Fieldwork-Network_529de15_EricR-3pm-1-14-15.avi
Fieldwork-Network_529de15_frankB-2pm-1-14-14.avi
Fieldwork-Network_529de15_Hannahc-2pm-1-14-15.avi
Fieldwork-Network_529de15_HaydenC-3pm-1-15-15.avi
Fieldwork-Network_529de15_HelenS-2pm-1-15-15.avi
Fieldwork-Network_529de15_ImanD-11am-1-14-15.avi
Fieldwork-Network_529de15_JacobK-4pm-1-15-15.avi
Fieldwork-Network_529de15_JamesH-9am-1-15-15.avi
Fieldwork-Network_529de15_JordanP-2pm-1-15-15.avi
Fieldwork-Network_529de15_LidiaS-4pm-1-14-15.avi
Fieldwork-Network_529de15_ManuelR-1pm-1-14-15.avi

C-4
Fieldwork-Network_529de15_MollyS-10am-1-15-15.avi
Fieldwork-Network_529de15_NicoleM-11am-1-14-15.avi
Fieldwork-Network_529de15_SelenaM-4pm-1-14-15.avi
Fieldwork-Network_529de15_SherryM-9am-1-14-15.avi
Fieldwork-Network_529de15_Stevens-5pm-1-14-15.avi
Fieldwork-Network_529de15_TanyaR-1pm-1-14-15.avi

APPENDIX D
QUALITATIVE STUDY QUESTIONNAIRE

D-1
QUALITATIVE STUDY QUESTIONNAIRE FOR “PART 2 SURVEY”
Quota: n=50 who have qualified for Phase II of the Music Streaming Survey
Section 1: Introduction to Interview
[Note to moderator: The respondent will review the material on a single page of the web survey and fill-in any required responses. Allow the respondent to click “NEXT” when s/he is ready. After the respondent clicks on the “NEXT” button to move on to the next page of the web survey, you will ask the respondent a series of follow-up questions. Direct the respondent to face you so that you can talk face-to-face. During the discussion, the respondent is allowed to go back to the web survey to review or look up information. This action should not be encouraged or discouraged. It should happen at the discretion of the respondent as if the respondent were taking the survey on his or her own. Once the discussion is completed, instruct the respondent to continue with the web survey.] [Below are examples of general probing questions that can be asked throughout the discussion in the case that the respondent hesitates or indicates confusion through statements, body language, or facial expressions.
What did you mean by that? [or] Why did you say that?
Why? [or] Anything else? [or] What else?
I noticed you hesitated before you answered – what were you thinking about?]
Techniques to avoid: Please do not lead respondents via confirmatory remarks such as “Got it,” “Clearly!,” “Right,” etc. [Moderator to read out loud:] Today we would like you to provide us comments on a survey about streaming music. Thank you for your willingness to participate in our study. Your answers will be kept confidential. The results of this study will not be used to try to sell you anything. This interview should take about 30 minutes to 1 hour to complete. You will use this computer to take the survey. After you answer questions on the computer screen, click the “NEXT” button to move to the next screen. At this point, I may ask you a few follow-up questions. During this time, you can ask me questions or make comments. It is helpful for us to understand what you are thinking when you are answering the survey questions. Feel free to “think out loud.” The responses you give to these questions are very important to us. When you are ready to get started, please turn to your screen and begin.
Section 2: Introduction Section of the Survey
Introduction (Incentive alignment) Please read the following screen and let me know when you are done.

D-2
[Instruct the respondent to click the “NEXT” button on the screen whenever (s)he feels ready to continue to the next screen of the web survey.]
Q.1. Could you tell me in your own words what the survey is asking you to do? How would you say it yourself? [If respondent indicates confusion over a particular word or phrase, do not try to explain. Simply respond] Thank you, we will note that.
Q.2. With respect to the music streaming service gift mentioned on the prior screen, in your own words, could you tell me what the particular gift comprises?
Q.3. [ONLY if respondent does not describe the particular gift that [s]he expects, ask:] In your words, what do you expect your personal gift to include?
Q.4. [ONLY if respondent indicates confusion over a particular word or phrase, or if respondent indicates that there was not enough information, ask:] Is there any additional information or different words or phrases that would help you better understand the instructions?

D-3
Feature descriptions table Please read the following screen and click the “NEXT” button when you are ready.
Q.5. [ONLY if respondent indicates confusion over a particular word or phrase while thinking aloud or directly asks for clarification, or if respondent indicates that there was not enough information, ask:] What is your understanding of the word…?
a. Is there any additional information or different words or phrases that would help you understand the instructions better?

D-4
Section 3: Conjoint Choice Screens
Introduction screen to conjoint task including mentions of brand (first of three screens throughout the choice exercise) Please read the following screen.
Q.6. [ONLY if respondent indicates confusion over a particular word or phrase while thinking aloud or directly asks for clarification, or if respondent indicates that there was not enough information, ask:] What is your understanding of the word…?
a. Is there any additional information or different words or phrases that would help you understand the instructions better?
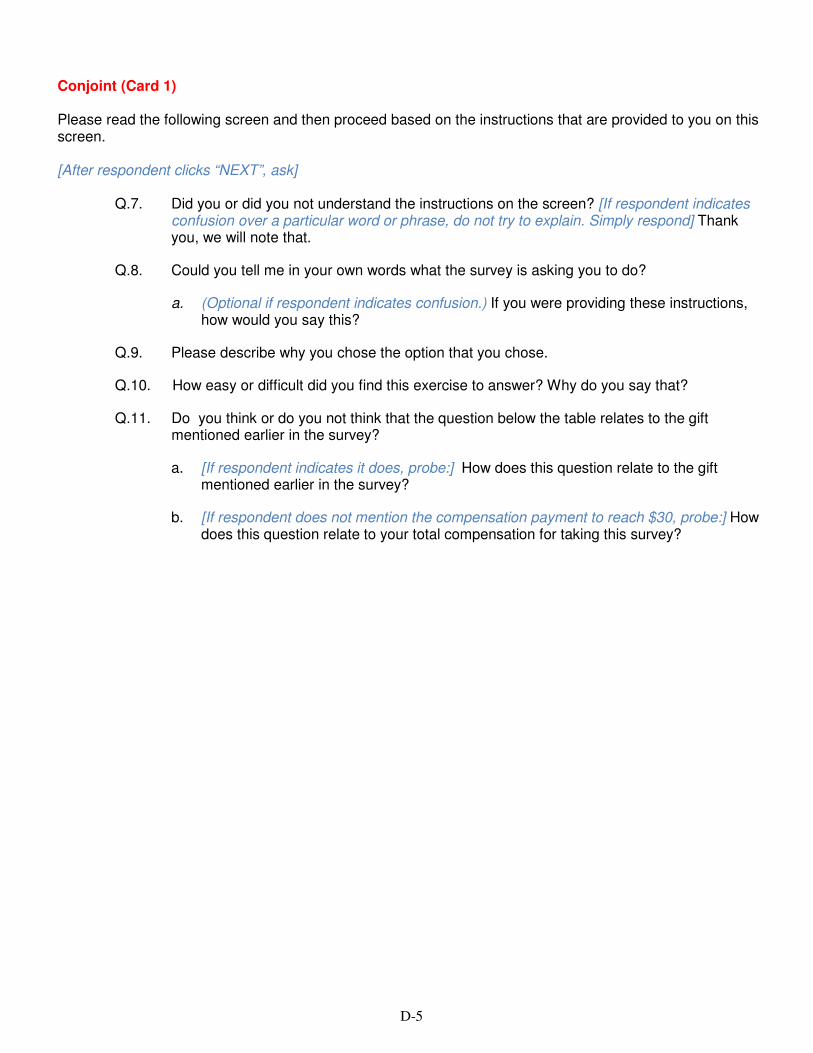
D-5
Conjoint (Card 1) Please read the following screen and then proceed based on the instructions that are provided to you on this screen. [After respondent clicks “NEXT”, ask]
Q.7. Did you or did you not understand the instructions on the screen? [If respondent indicates confusion over a particular word or phrase, do not try to explain. Simply respond] Thank you, we will note that.
Q.8. Could you tell me in your own words what the survey is asking you to do?
a. (Optional if respondent indicates confusion.) If you were providing these instructions, how would you say this?
Q.9. Please describe why you chose the option that you chose.
Q.10. How easy or difficult did you find this exercise to answer? Why do you say that?
Q.11. Do you think or do you not think that the question below the table relates to the gift mentioned earlier in the survey?
a. [If respondent indicates it does, probe:] How does this question relate to the gift mentioned earlier in the survey?
b. [If respondent does not mention the compensation payment to reach $30, probe:] How does this question relate to your total compensation for taking this survey?
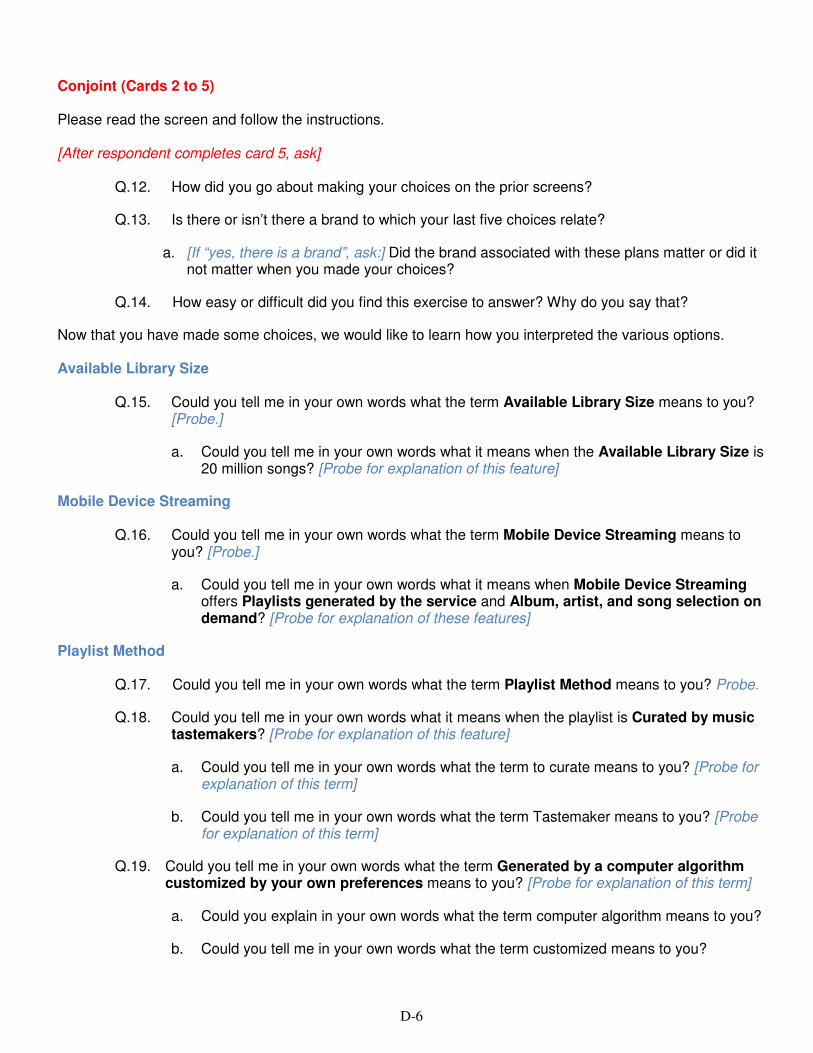
D-6
Conjoint (Cards 2 to 5) Please read the screen and follow the instructions. [After respondent completes card 5, ask]
Q.12. How did you go about making your choices on the prior screens?
Q.13. Is there or isn’t there a brand to which your last five choices relate?
a. [If “yes, there is a brand”, ask:] Did the brand associated with these plans matter or did it not matter when you made your choices?
Q.14. How easy or difficult did you find this exercise to answer? Why do you say that?
Now that you have made some choices, we would like to learn how you interpreted the various options. Available Library Size
Q.15. Could you tell me in your own words what the term Available Library Size means to you? [Probe.]
a. Could you tell me in your own words what it means when the Available Library Size is 20 million songs? [Probe for explanation of this feature]
Mobile Device Streaming
Q.16. Could you tell me in your own words what the term Mobile Device Streaming means to you? [Probe.]
a. Could you tell me in your own words what it means when Mobile Device Streaming offers Playlists generated by the service and Album, artist, and song selection on demand? [Probe for explanation of these features]
Playlist Method
Q.17. Could you tell me in your own words what the term Playlist Method means to you? Probe.
Q.18. Could you tell me in your own words what it means when the playlist is Curated by music tastemakers? [Probe for explanation of this feature]
a. Could you tell me in your own words what the term to curate means to you? [Probe for explanation of this term]
b. Could you tell me in your own words what the term Tastemaker means to you? [Probe for explanation of this term]
Q.19. Could you tell me in your own words what the term Generated by a computer algorithm customized by your own preferences means to you? [Probe for explanation of this term]
a. Could you explain in your own words what the term computer algorithm means to you?
b. Could you tell me in your own words what the term customized means to you?

D-7
c. Could you tell me whether or not the service that you have tested during the last few days
i. Uses computer algorithms?
ii. Uses customizations?
iii. Accounts for your preferences?

D-8
Conjoint Intro 2 (after Card 5) Please read the screen and follow the instructions. [After respondent completes Conjoint Intro 2, ask]
Q.20. [ONLY if respondent indicates confusion over a particular word or phrase while thinking aloud or directly asks for clarification, or if respondent indicates that there was not enough information, ask:] What is your understanding of the word…?
a. Is there any additional information or different words or phrases that would help you understand the instructions better?
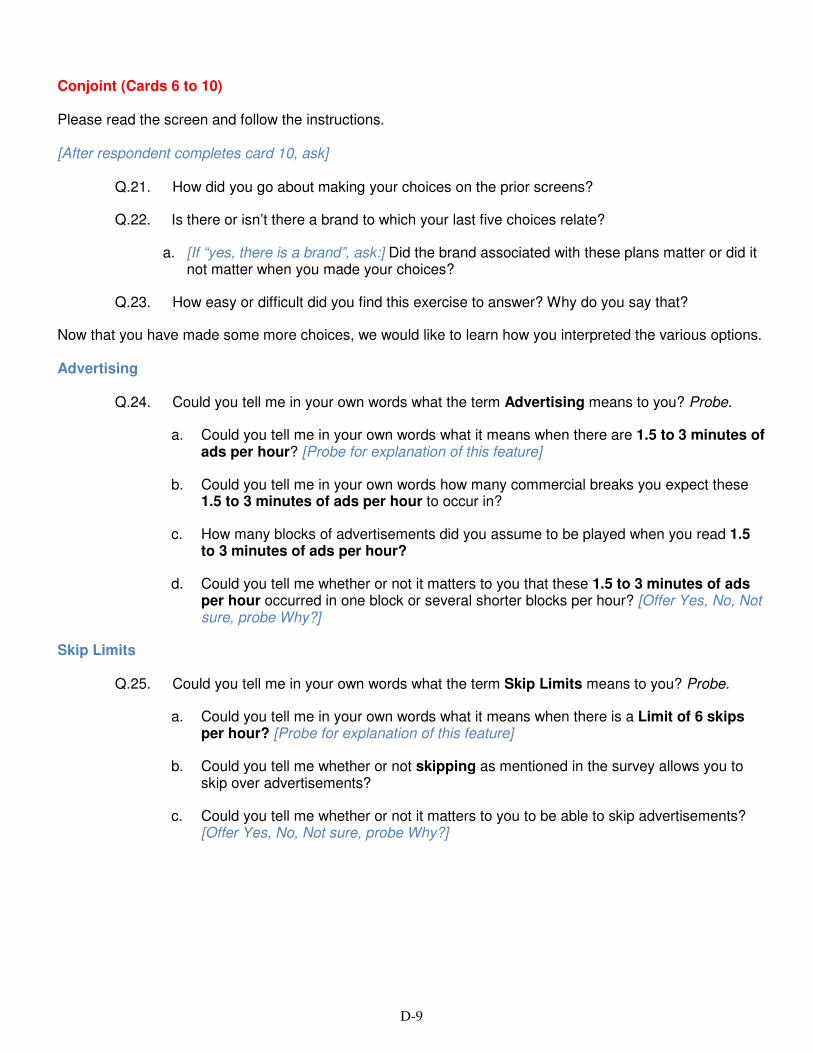
D-9
Conjoint (Cards 6 to 10) Please read the screen and follow the instructions. [After respondent completes card 10, ask]
Q.21. How did you go about making your choices on the prior screens?
Q.22. Is there or isn’t there a brand to which your last five choices relate?
a. [If “yes, there is a brand”, ask:] Did the brand associated with these plans matter or did it not matter when you made your choices?
Q.23. How easy or difficult did you find this exercise to answer? Why do you say that?
Now that you have made some more choices, we would like to learn how you interpreted the various options. Advertising
Q.24. Could you tell me in your own words what the term Advertising means to you? Probe.
a. Could you tell me in your own words what it means when there are 1.5 to 3 minutes of ads per hour? [Probe for explanation of this feature]
b. Could you tell me in your own words how many commercial breaks you expect these 1.5 to 3 minutes of ads per hour to occur in?
c. How many blocks of advertisements did you assume to be played when you read 1.5 to 3 minutes of ads per hour?
d. Could you tell me whether or not it matters to you that these 1.5 to 3 minutes of ads per hour occurred in one block or several shorter blocks per hour? [Offer Yes, No, Not sure, probe Why?]
Skip Limits
Q.25. Could you tell me in your own words what the term Skip Limits means to you? Probe.
a. Could you tell me in your own words what it means when there is a Limit of 6 skips per hour? [Probe for explanation of this feature]
b. Could you tell me whether or not skipping as mentioned in the survey allows you to skip over advertisements?
c. Could you tell me whether or not it matters to you to be able to skip advertisements? [Offer Yes, No, Not sure, probe Why?]

D-10
Conjoint Intro 3 (after Card 10) Please read the screen and follow the instructions. [After respondent completes Conjoint Intro 3, ask]
Q.26. [ONLY if respondent indicates confusion over a particular word or phrase while thinking aloud or directly asks for clarification, or if respondent indicates that there was not enough information, ask:] What is your understanding of the word…?
a. Is there any additional information or different words or phrases that would help you understand the instructions better?
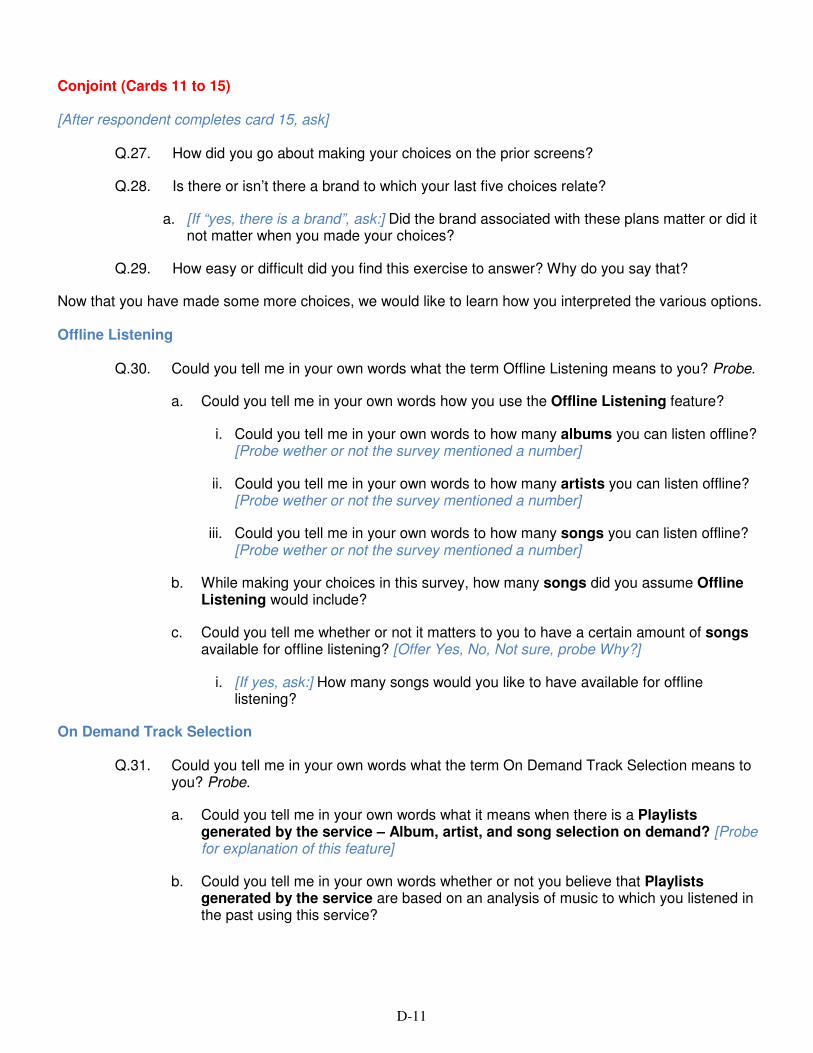
D-11
Conjoint (Cards 11 to 15) [After respondent completes card 15, ask]
Q.27. How did you go about making your choices on the prior screens?
Q.28. Is there or isn’t there a brand to which your last five choices relate?
a. [If “yes, there is a brand”, ask:] Did the brand associated with these plans matter or did it not matter when you made your choices?
Q.29. How easy or difficult did you find this exercise to answer? Why do you say that?
Now that you have made some more choices, we would like to learn how you interpreted the various options. Offline Listening
Q.30. Could you tell me in your own words what the term Offline Listening means to you? Probe.
a. Could you tell me in your own words how you use the Offline Listening feature?
i. Could you tell me in your own words to how many albums you can listen offline? [Probe wether or not the survey mentioned a number]
ii. Could you tell me in your own words to how many artists you can listen offline? [Probe wether or not the survey mentioned a number]
iii. Could you tell me in your own words to how many songs you can listen offline? [Probe wether or not the survey mentioned a number]
b. While making your choices in this survey, how many songs did you assume Offline Listening would include?
c. Could you tell me whether or not it matters to you to have a certain amount of songs available for offline listening? [Offer Yes, No, Not sure, probe Why?]
i. [If yes, ask:] How many songs would you like to have available for offline listening?
On Demand Track Selection
Q.31. Could you tell me in your own words what the term On Demand Track Selection means to you? Probe.
a. Could you tell me in your own words what it means when there is a Playlists generated by the service – Album, artist, and song selection on demand? [Probe for explanation of this feature]
b. Could you tell me in your own words whether or not you believe that Playlists generated by the service are based on an analysis of music to which you listened in the past using this service?

D-12
c. Could you tell me whether or not it matters to you to be able to influence playlists through music to which you listened in the past using this service? [Offer Yes, No, Not sure, probe Why?]
d. Could you tell me in your own words whether or not you assumed that Album, artist, and song selection on demand are restricted to the offered playlists or whether they can be chosen from the service’s complete library? [Probe for explanation of this feature]
e. Could you tell me whether or not it matters to you to be able to select Album, artist, and song selection on demand from the service’s complete library? [Offer Yes, No, Not sure, probe Why?]
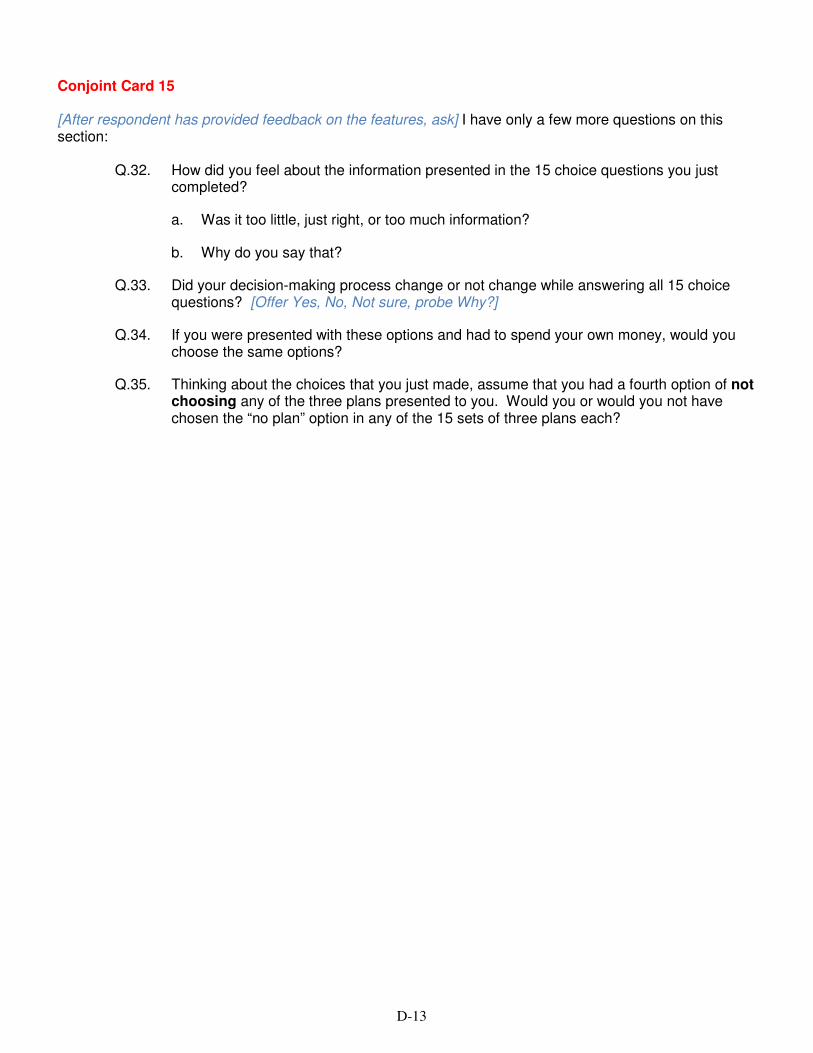
D-13
Conjoint Card 15 [After respondent has provided feedback on the features, ask] I have only a few more questions on this section:
Q.32. How did you feel about the information presented in the 15 choice questions you just completed?
a. Was it too little, just right, or too much information?
b. Why do you say that?
Q.33. Did your decision-making process change or not change while answering all 15 choice questions? [Offer Yes, No, Not sure, probe Why?]
Q.34. If you were presented with these options and had to spend your own money, would you choose the same options?
Q.35. Thinking about the choices that you just made, assume that you had a fourth option of not choosing any of the three plans presented to you. Would you or would you not have chosen the “no plan” option in any of the 15 sets of three plans each?

D-14
Section 4: Close out
Proceed through the final question block in the web survey: Can you please continue with the survey. Close Out Discussion Questions: Thank you for completing the survey on the screen. I have a few more follow-up questions before we wrap up.
Q.36. How easy or difficult did you find the survey? Why do you say that?
Q.37. Did you or did not understand the explanations of features in the survey? Why do you say that?
Q.38. Were you or were you not able to navigate the survey? Why do you say that?
Q.39. Was there or wasn’t there anything in the survey that made you think that you should answer one way or the other? Why do you say that?
Q.40. Did you or did you not think the plan options shown in each choice question were realistic? Why do you say that?
Q.41. What do you think is the purpose of this study?
Q.42. Is there anything else you would like to add?
Thank you for your time and sharing your thoughts with us today.

APPENDIX E
REPLICATION SURVEY
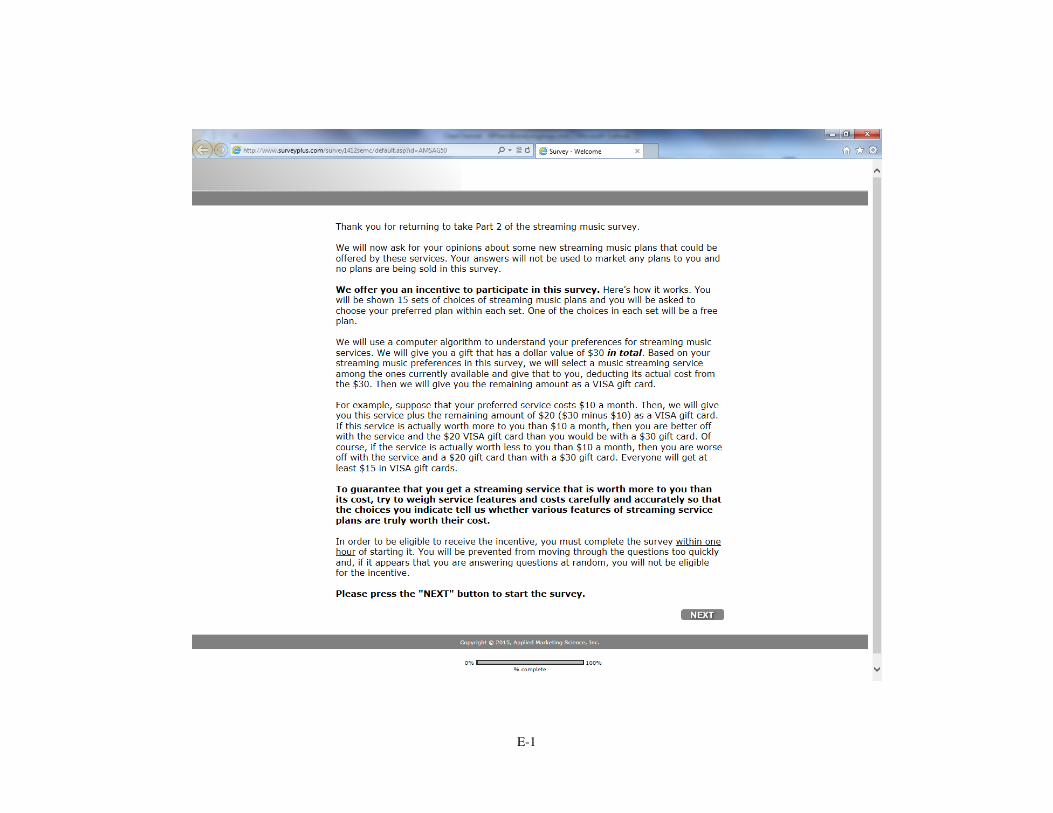
E-1

E-2

E-3
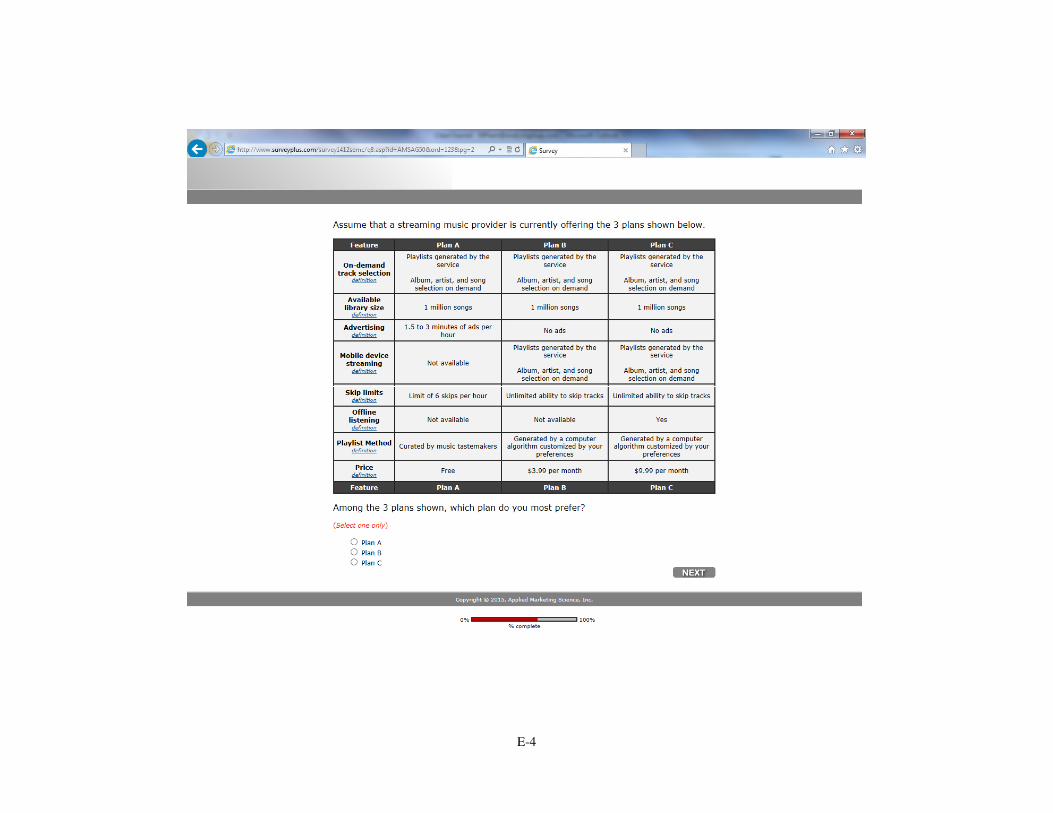
E-4

E-5

E-6
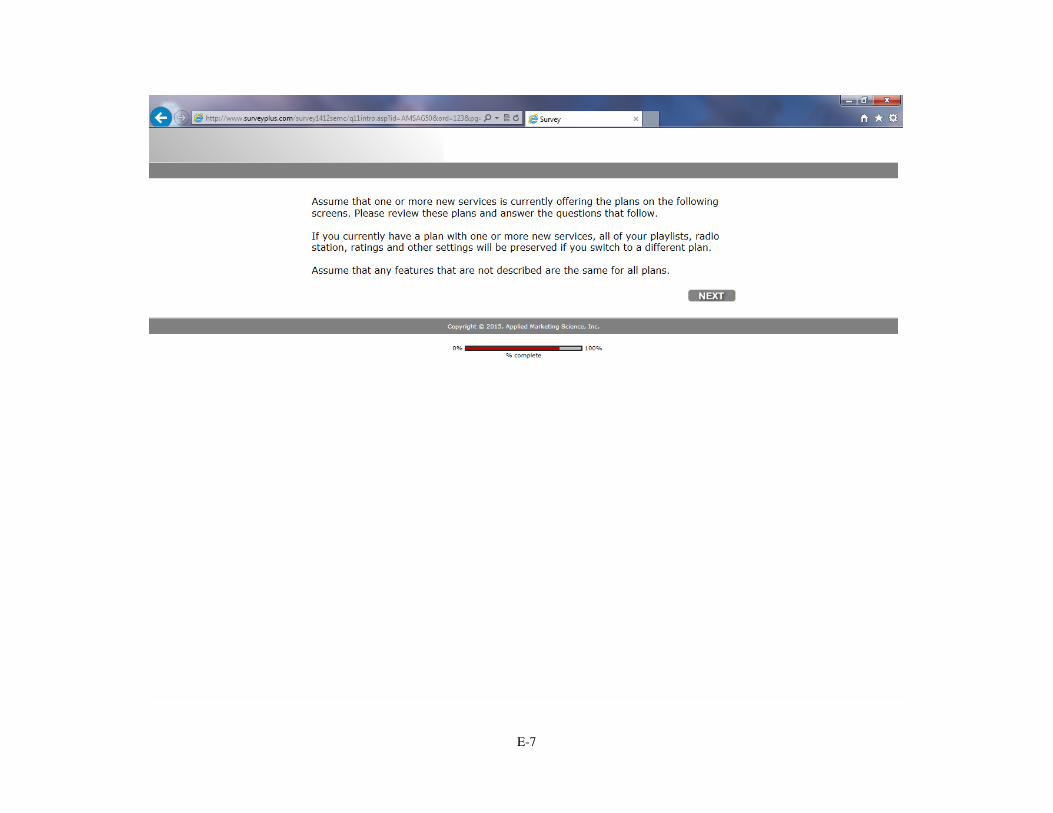
E-7

E-8
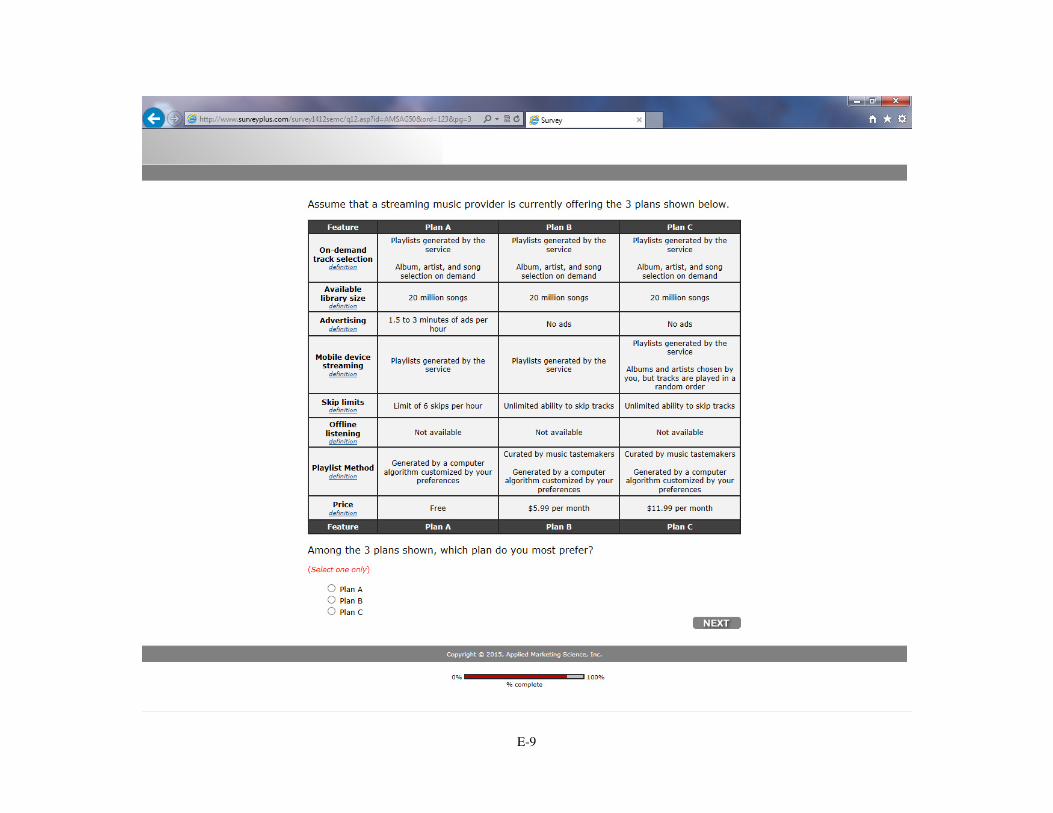
E-9
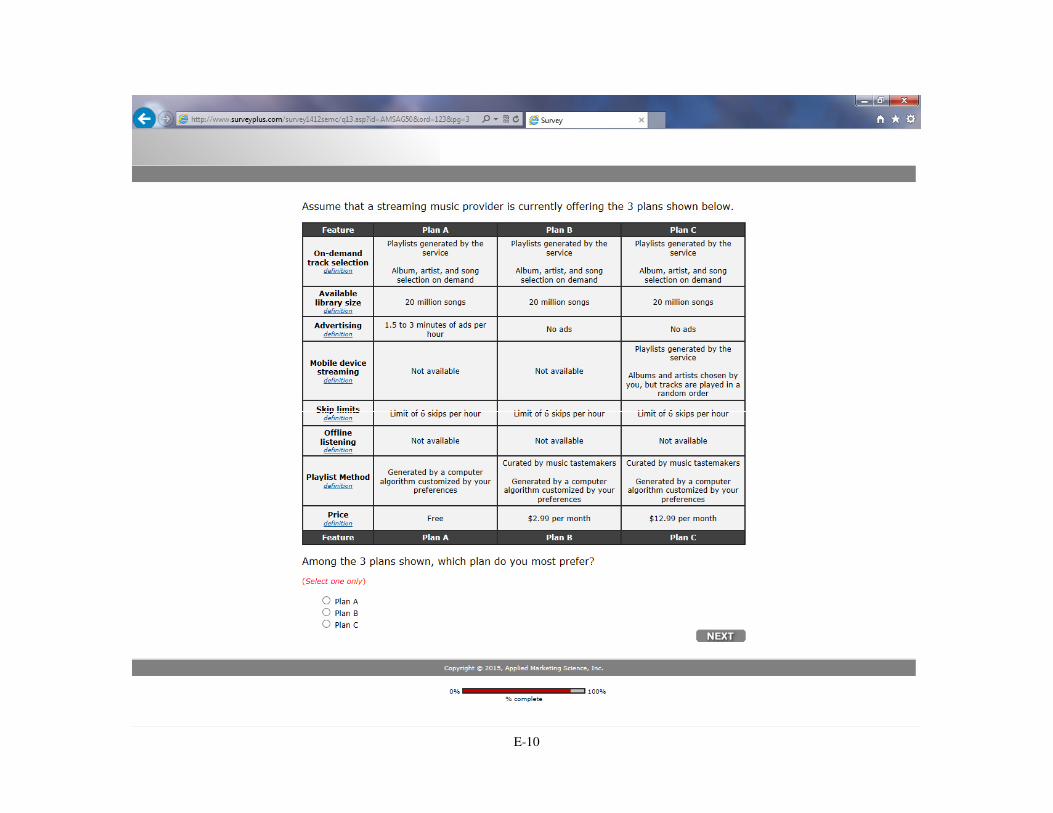
E-10

E-11
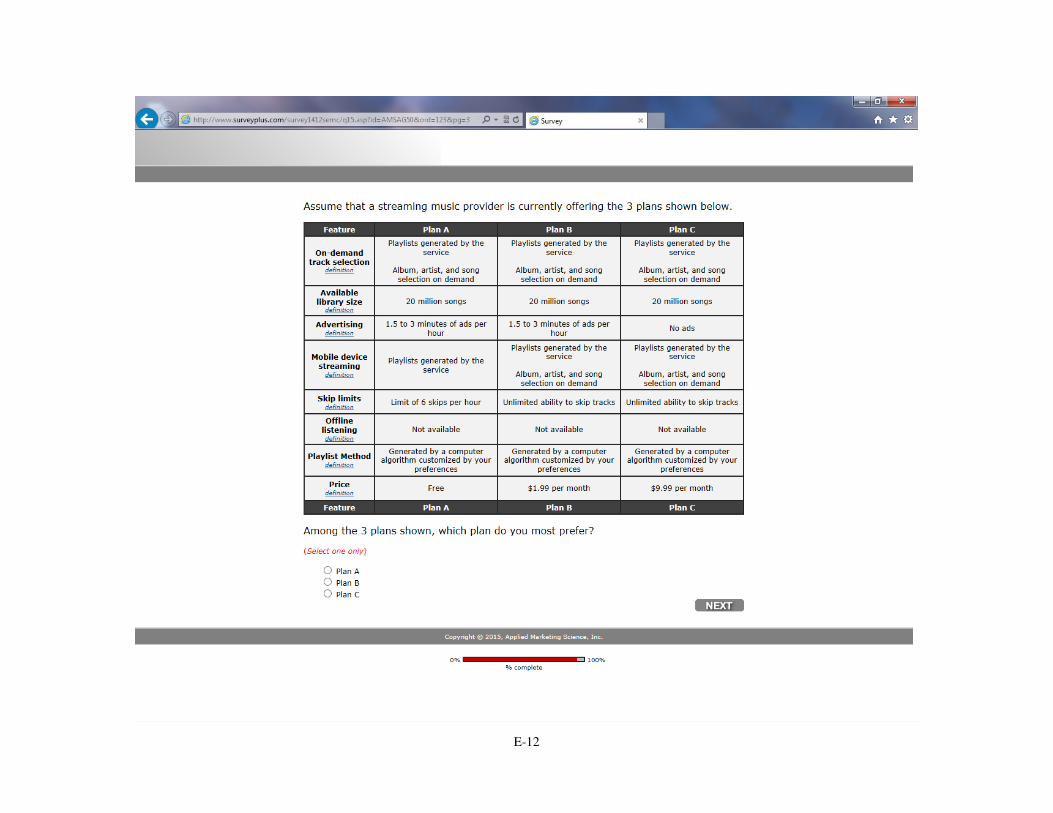
E-12
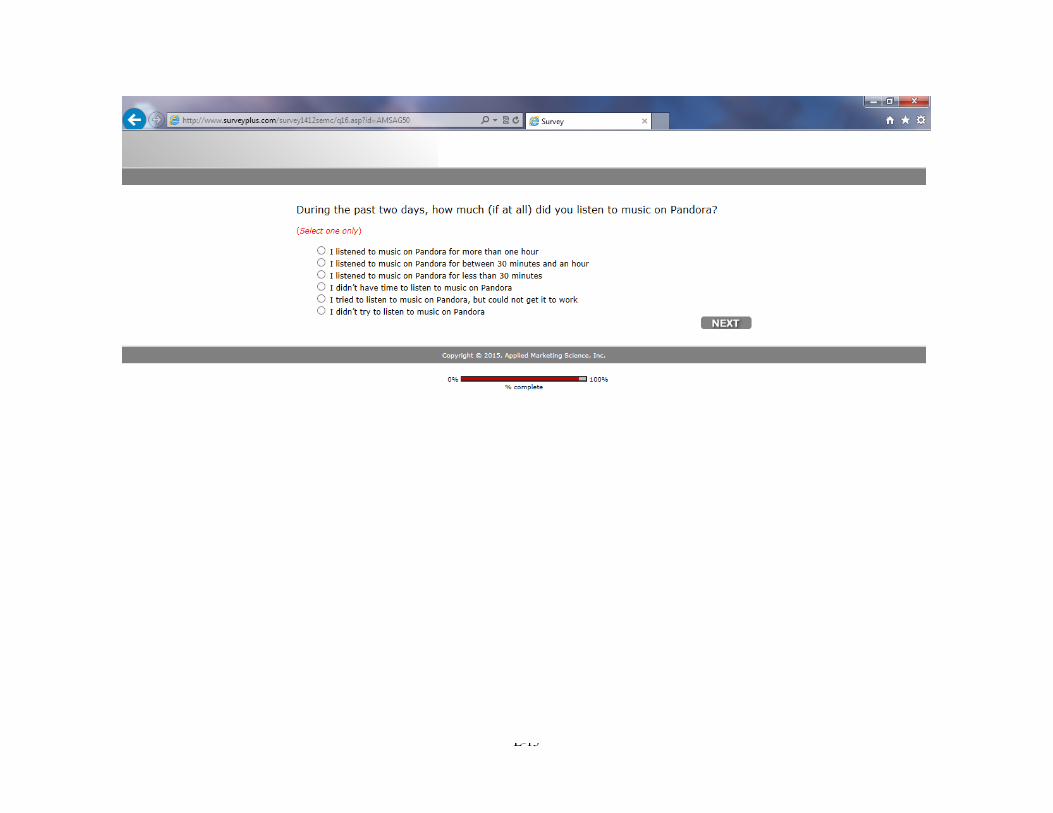
E-13
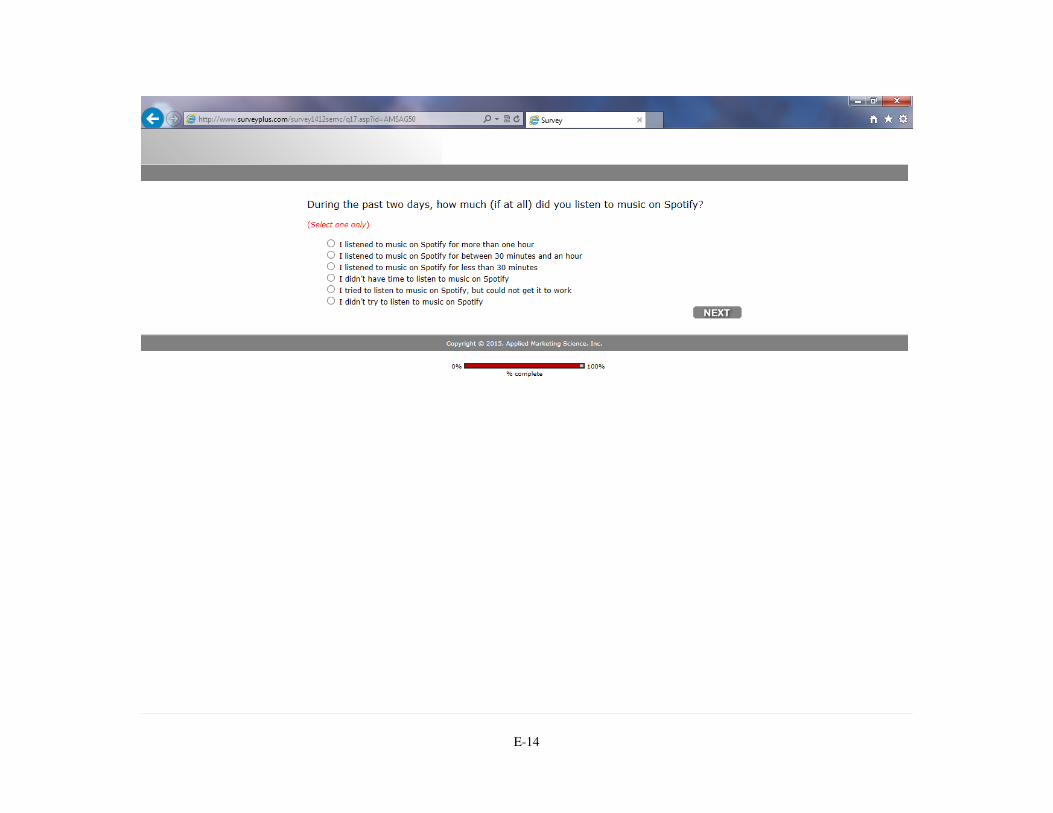
E-14

E-15
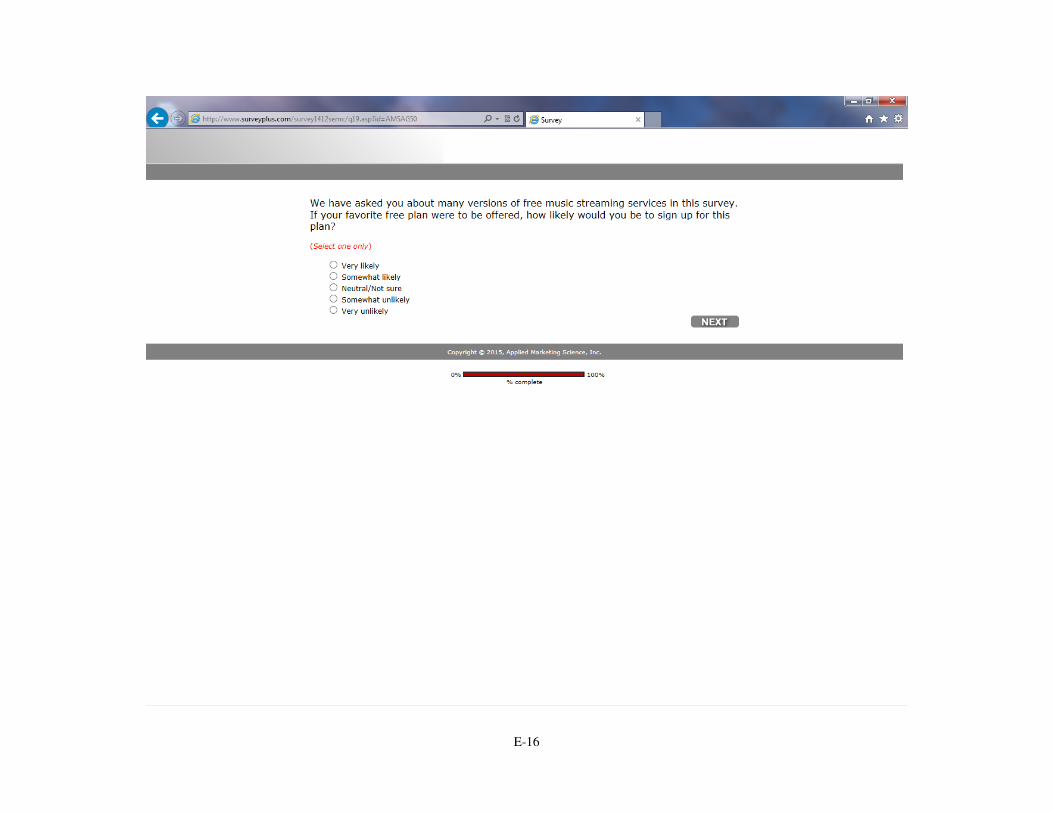
E-16

E-17

APPENDIX F
GUIDE FOR BLIND-TO-THE-PURPOSE CODERS
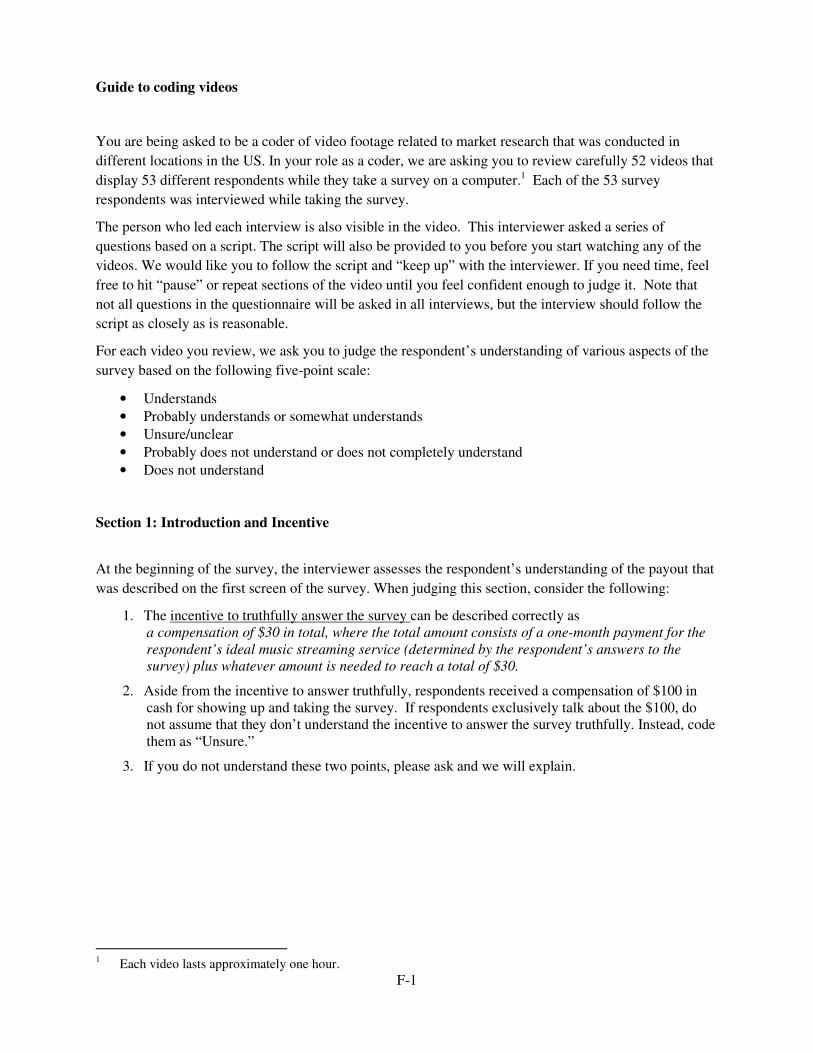
F-1
Guide to coding videos
You are being asked to be a coder of video footage related to market research that was conducted in
different locations in the US. In your role as a coder, we are asking you to review carefully 52 videos that
display 53 different respondents while they take a survey on a computer.1 Each of the 53 survey
respondents was interviewed while taking the survey.
The person who led each interview is also visible in the video. This interviewer asked a series of
questions based on a script. The script will also be provided to you before you start watching any of the
videos. We would like you to follow the script and “keep up” with the interviewer. If you need time, feel
free to hit “pause” or repeat sections of the video until you feel confident enough to judge it. Note that
not all questions in the questionnaire will be asked in all interviews, but the interview should follow the
script as closely as is reasonable.
For each video you review, we ask you to judge the respondent’s understanding of various aspects of the
survey based on the following five-point scale:
• Understands
• Probably understands or somewhat understands
• Unsure/unclear
• Probably does not understand or does not completely understand
• Does not understand
Section 1: Introduction and Incentive
At the beginning of the survey, the interviewer assesses the respondent’s understanding of the payout that
was described on the first screen of the survey. When judging this section, consider the following:
1. The incentive to truthfully answer the survey can be described correctly as
a compensation of $30 in total, where the total amount consists of a one-month payment for the respondent’s ideal music streaming service (determined by the respondent’s answers to the survey) plus whatever amount is needed to reach a total of $30.
2. Aside from the incentive to answer truthfully, respondents received a compensation of $100 in
cash for showing up and taking the survey. If respondents exclusively talk about the $100, do
not assume that they don’t understand the incentive to answer the survey truthfully. Instead, code
them as “Unsure.”
3. If you do not understand these two points, please ask and we will explain.
1 Each video lasts approximately one hour.

F-2
A. Given what you have seen in the video, are you under the impression that the respondent does or does
not understand how her/his incentive to answer the survey truthfully is described in the screen
(Questions 1-4 in interview script)?
• Understands
• Probably understands or somewhat understands
• Unsure/unclear
• Probably does not understand or does not completely understand
• Does not understand
Section 2: Conjoint Choice Task 1
The interviewer now takes the respondent through a series of tasks where they can choose among music
streaming services, based on different sets of features. You are asked to review the video and determine
whether the respondent understands or does not understand these features. Please ensure that you
understand the features, in order to determine this. If you don’t understand the features, ask and we will
explain.
The features are defined as follows:
Playlist generation method
Playlists offered to a user can either be curated by music tastemakers (such as Beyoncé or Rolling Stone
Magazine) or generated by a computer algorithm customized by the user's preferences or feedback (often
provided by “like” or “dislike” votes).
Features available for streaming to a computer
Using desktop software or a web interface from a computer, users may be able to access playlists
generated by the streaming service and/or play specific tracks “on demand.” With “on demand” features,
users can listen to particular tracks (songs) or an entire album on request and users can create their own
playlists.
Ability to listen offline
Users can download and listen to a selection of the service's music when internet access is unavailable.
Features available for streaming to mobile devices
Users may be able to use the music streaming service on mobile devices, such as phones and tablets. The
music streaming service may limit the features that are available on mobile devices. Users may be able to
access playlists generated by the streaming service, pick the artist or album but hear tracks in a random
order, and/or play specific tracks “on demand.” With “on demand” features, users can listen to particular
tracks (songs) or an entire album on request and users can create their own play lists.
Ability to skip songs
Users can skip tracks (songs) that they do not want to hear and continue to the next track.
Library size
The number of tracks (songs) available in the service’s database
Advertising
Plans may be ad-free or may have advertising breaks in between tracks

F-3
B. Given what you have seen in the video, are you under the impression that the respondent does or does
not understand the survey instructions (Questions 7-10 in interview script)?
• Understands
• Probably understands or somewhat understands
• Unsure/unclear
• Probably does not understand or does not completely understand
• Does not understand

F-4
Section 3: Conjoint Choice Tasks 2-5
C. Given what you have seen in the video, are you under the impression that the respondent does or does
not understand the feature “Available Library Size” (Question 15 in interview script)?
• Understands
• Probably understands or somewhat understands
• Unsure/unclear
• Probably does not understand or does not completely understand
• Does not understand
D. Given what you have seen in the video, are you under the impression that the respondent does or does
not understand the feature “Mobile Device Streaming” (Question 16 in interview script)?
• Understands
• Probably understands or somewhat understands
• Unsure/unclear
• Probably does not understand or does not completely understand
• Does not understand
E. Given what you have seen in the video, are you under the impression that the respondent does or does
not understand the feature “Playlist Method” (Question 17 in interview script)?
• Understands
• Probably understands or somewhat understands
• Unsure/unclear
• Probably does not understand or does not completely understand
• Does not understand
F. Given what you have seen in the video, are you under the impression that the respondent does or does
not understand the feature “curated by music tastemakers” (Question 18 in interview script)?
• Understands
• Probably understands or somewhat understands
• Unsure/unclear
• Probably does not understand or does not completely understand
• Does not understand
G. Given what you have seen in the video, are you under the impression that the respondent does or does
not understand the feature “generated by a computer algorithm customized by your own preferences”
(Question 19 in interview script)?
• Understands
• Probably understands or somewhat understands
• Unsure/unclear
• Probably does not understand or does not completely understand
• Does not understand

F-5
Section 4: Conjoint Choice Tasks 6-10
H. Given what you have seen in the video, are you under the impression that the respondent does or does
not understand the feature “advertising” (Question 24 in interview script)?
• Understands
• Probably understands or somewhat understands
• Unsure/unclear
• Probably does not understand or does not completely understand
• Does not understand
I. Given what you have seen in the video, are you under the impression that the respondent does or does
not understand the feature “skip limits” (Question 25 in interview script)?
• Understands
• Probably understands or somewhat understands
• Unsure/unclear
• Probably does not understand or does not completely understand
• Does not understand
Section 5: Conjoint Choice Tasks 11-15
J. Given what you have seen in the video, are you under the impression that the respondent does or does
not understand the feature “offline listening” (Question 30 in interview script)?
• Understands
• Probably understands or somewhat understands
• Unsure/unclear
• Probably does not understand or does not completely understand
• Does not understand
K. Given what you have seen in the video, are you under the impression that the respondent does or does
not understand the feature “on demand track selection” (Question 31 in interview script)?
• Understands
• Probably understands or somewhat understands
• Unsure/unclear
• Probably does not understand or does not completely understand
• Does not understand
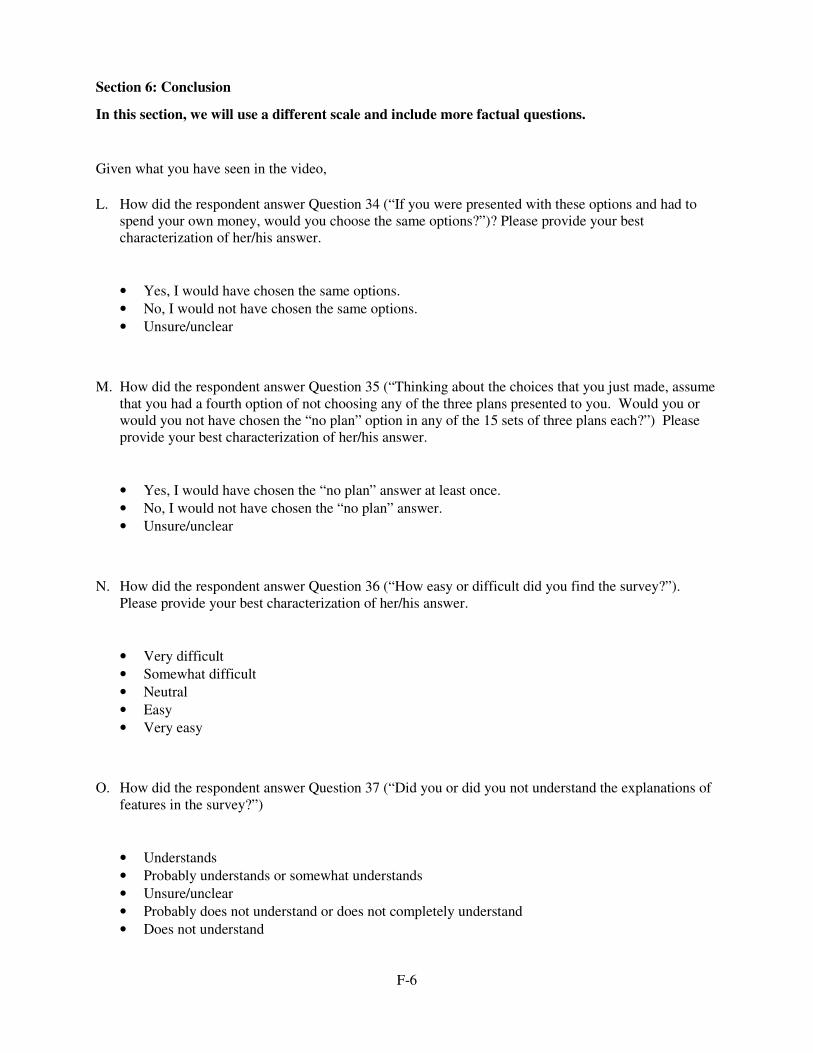
F-6
Section 6: Conclusion
In this section, we will use a different scale and include more factual questions.
Given what you have seen in the video,
L. How did the respondent answer Question 34 (“If you were presented with these options and had to
spend your own money, would you choose the same options?”)? Please provide your best
characterization of her/his answer.
• Yes, I would have chosen the same options.
• No, I would not have chosen the same options.
• Unsure/unclear
M. How did the respondent answer Question 35 (“Thinking about the choices that you just made, assume
that you had a fourth option of not choosing any of the three plans presented to you. Would you or
would you not have chosen the “no plan” option in any of the 15 sets of three plans each?”) Please
provide your best characterization of her/his answer.
• Yes, I would have chosen the “no plan” answer at least once.
• No, I would not have chosen the “no plan” answer.
• Unsure/unclear
N. How did the respondent answer Question 36 (“How easy or difficult did you find the survey?”).
Please provide your best characterization of her/his answer.
• Very difficult
• Somewhat difficult
• Neutral
• Easy
• Very easy
O. How did the respondent answer Question 37 (“Did you or did you not understand the explanations of
features in the survey?”)
• Understands
• Probably understands or somewhat understands
• Unsure/unclear
• Probably does not understand or does not completely understand
• Does not understand