java culture inc. - efs solutions for business
TRANSCRIPT
Java Culture Inc.
Business Plan 1234 West Broadway
Vancouver, BC
January 2012
Table of Contents
Page 1
1.0 Executive Summary ......................................................................................................................... 1
Chart: Highlights ............................................................................................................................. 1
1.1 Objectives .................................................................................................................................... 2
1.2 Mission ......................................................................................................................................... 2
1.3 Keys to Success ........................................................................................................................... 2
2.0 Company Summary ......................................................................................................................... 2
2.1 Company Ownership .................................................................................................................... 2
2.2 Startup Summary ......................................................................................................................... 3
Table: Startup ................................................................................................................................. 4
Table: Startup Funding ................................................................................................................... 4
3.0 Products ........................................................................................................................................... 5
4.0 Market Analysis Summary ................................................................................................................ 5
4.1 Market Segmentation ................................................................................................................... 5
Chart: Market Analysis ................................................................................................................... 6
Table: Market Analysis ................................................................................................................... 6
4.2 Target Market Segment Strategy .................................................................................................. 6
4.3 Industry Analysis .......................................................................................................................... 7
4.3.1 Competition and Buying Patterns .......................................................................................... 7
5.0 Strategy and Implementation Summary ........................................................................................... 7
5.1 Competitive Edge ......................................................................................................................... 7
5.2 Sales Strategy .............................................................................................................................. 8
5.2.1 Sales Forecast ...................................................................................................................... 8
Chart: Sales Monthly .................................................................................................................. 8
Table: Sales Forecast ................................................................................................................. 9
6.0 Management Summary .................................................................................................................... 9
6.1 Personnel Plan ........................................................................................................................... 10
Table: Personnel .......................................................................................................................... 10
7.0 Financial Plan ................................................................................................................................ 10
7.1 Important Assumptions ............................................................................................................... 10
Table: General Assumptions ........................................................................................................ 10
7.2 Break-even Analysis ................................................................................................................... 10
Table: Break-even Analysis .......................................................................................................... 10
7.3 Projected Cash Flow .................................................................................................................. 11
Chart: Cash Flow Year One ......................................................................................................... 11
Table: Cash Flow ......................................................................................................................... 11
7.4 Projected Profit and Loss ........................................................................................................... 12
Table: Profit and Loss .................................................................................................................. 12

Table of Contents
Page 2
7.5 Projected Balance Sheet ............................................................................................................ 13
7.6 Business Ratios ......................................................................................................................... 14
Table: Ratios ................................................................................................................................ 14
Table: Sales Forecast Year One ............................................................................................................ 1
Table: Personnel Year One .................................................................................................................... 1
Table: General Assumptions Year One .................................................................................................. 1
Table: Profit and Loss Year One ............................................................................................................ 2
Table: Cash Flow Year One ................................................................................................................... 3
Table: Balance Sheet Year One ............................................................................................................. 4
Java Culture
Page 1
1.0 Executive Summary
Java Culture coffee bar is determined to become a daily necessity for local coffee addicts, a
place to dream of as you try to escape the daily stresses of life and just a comfortable place to
meet your friends or to read a book, all in one. With the growing demand for high-quality
gourmet coffee and excellent service, Java Culture will capitalise on its proximity to the
University of British Columbia campus to build a core group of repeat customers. Java Culture
will offer its customers the best-prepared coffee in the area that will be complimented with
pastries, as well as free books that its patrons can read to enjoy their visit.
The company will operate a 2,300 square foot coffee bar within walking distance from the UBC
campus. The owners have secured this location through a five-year lease with an option for
extending. They have also provided $140,000 of the required $170,000 start-up funds. The remaining capital will be obtained through Vancity Credit Union commercial loans.
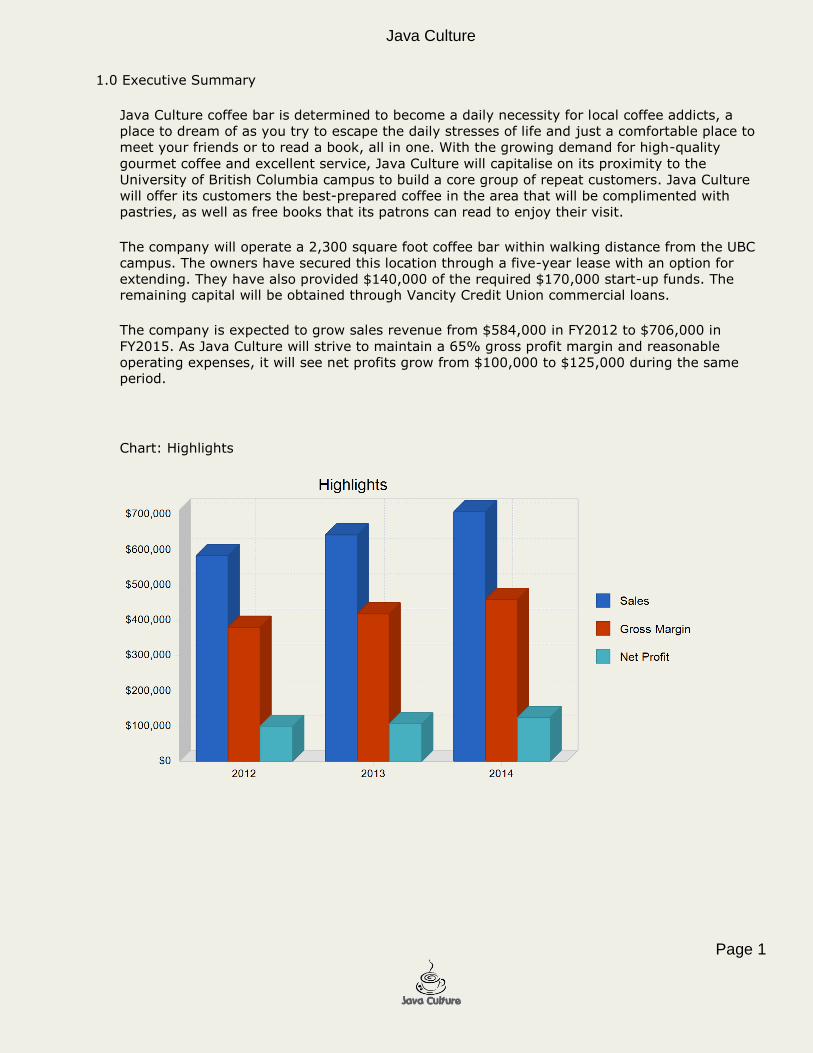
The company is expected to grow sales revenue from $584,000 in FY2012 to $706,000 in
FY2015. As Java Culture will strive to maintain a 65% gross profit margin and reasonable
operating expenses, it will see net profits grow from $100,000 to $125,000 during the same period.
Chart: Highlights

Java Culture
Page 2
1.1 Objectives
Java Culture's targets for the first year of operations are:
Become selected as the "Best New Coffee Bar in the UBC area" by the local restaurant
guide.
Turn in profits from the first month of operations. Maintain a 65% gross margin.
1.2 Mission
Java Culture will make its best effort to create a unique place where customers can socialise
with each other in a comfortable and relaxing environment while enjoying the best-brewed
coffee or espresso and pastries in town. We will be in the business of helping our customers to
relieve their daily stresses by providing peace of mind through great ambience, convenient
location, friendly customer service, and products of consistently high quality. Java Culture will
invest its profits to increase the employee satisfaction while providing solid return to its
shareholders.
1.3 Keys to Success
The keys to success will be:
Store design that will be both visually attractive to customers, and designed for fast and
efficient operations.
Employee training to ensure the best coffee preparation techniques.
Marketing strategies aimed to build a solid base of loyal customers, as well as to maximise the sales of high margin products, such as espresso drinks.
2.0 Company Summary
Java Culture Inc, a Vancouver BC corporation, sells coffee, other beverages and snacks in its
2,300 square feet premium coffee bar located near the University of BC campus. Java Culture's
major investors are Arthur Garfield and James Polk who cumulatively own over 70% of the
company. The start-up loss of the company is assumed in the amount of $27,680.
2.1 Company Ownership
Java Culture Inc. is registered as a corporation in the province of BC. Arthur Garfield owns 51%
of the company. His cousin, James Polk, as well as Megan Flanigan and Todd Barkley hold minority stakes in Java Culture Inc.
Java Culture
Page 3
2.2 Startup Summary
The start-up expenses include:
Legal costs for obtaining licenses and permits as well as the accounting services totalling
$1,300.
Marketing promotion costs for the grand opening of Java Culture in the amount of $3,500
and as well as flyer printing (2,000 flyers at $0.04 per copy) for the total sum of $3,580.
Consultants fees of $3,000 paid to ABC Espresso Services for help with setting up the coffee
bar.
Insurance (general liability, workers' compensation and property casualty) coverage at a
total premium of $2,400.
Pre-paid rent expenses for one month at $1.76 per square feet in the total amount of
$4,400.
Premises remodelling in the amount of $10,000.
Other start-up expenses including stationery ($500) and phone and utility deposits
($2,500).
The required start-up assets of $142,320 include:
Operating capital in the total amount of $67,123, which includes employees and owner's
salaries of $23,900 for the first two months and cash reserves for the first three months of
operation (approximately $14,400 per month).
Start-up inventory of $16,027, which includes:
o Coffee beans (12 regular brands and five decaffeinated brands) - $6,000
o Coffee filters, baked goods, salads, sandwiches, tea, beverages, etc. - $7,900
o Retail supplies (napkins, coffee bags, cleaning, etc.) - $1,840
o Office supplies - $287
Equipment for the total amount of $59,170:
o Espresso machine - $6,000
o Coffee maker - $900
o Coffee grinder - $200
o Food service equipment (microwave, toasters, dishwasher, refrigerator, blender,
etc.) - $18,000
o Storage hardware (bins, utensil rack, shelves, food case) - $3,720
o Counter area equipment (counter top, sink, ice machine, etc.) - $9,500
o Serving area equipment (plates, glasses, flatware) - $3,000
o Store equipment (cash register, security, ventilation, signage) - $13,750
o Office equipment (PC, fax/printer, phone, furniture, file cabinets) - $3,600 o Other miscellaneous expenses - $500
Funding for the company comes from two primary sources--owners' investments and bank
loans. Two principal owners, Arthur Garfield and James Polk, have contributed $70,000 and
$30,000 respectively. All other investors have contributed $40,000, which brings the total
investments to $140,000. The remaining $30,000 needed to cover the start-up expenses and
assets came from the two bank loans--a one-year loan in the amount of $10,000 and a long-
term (five years) loan of $20,000. Both loans were secured through the Vancity Credit Union.
Thus, total start-up loss is assumed in the amount of $27,680.
Java Culture
Page 4
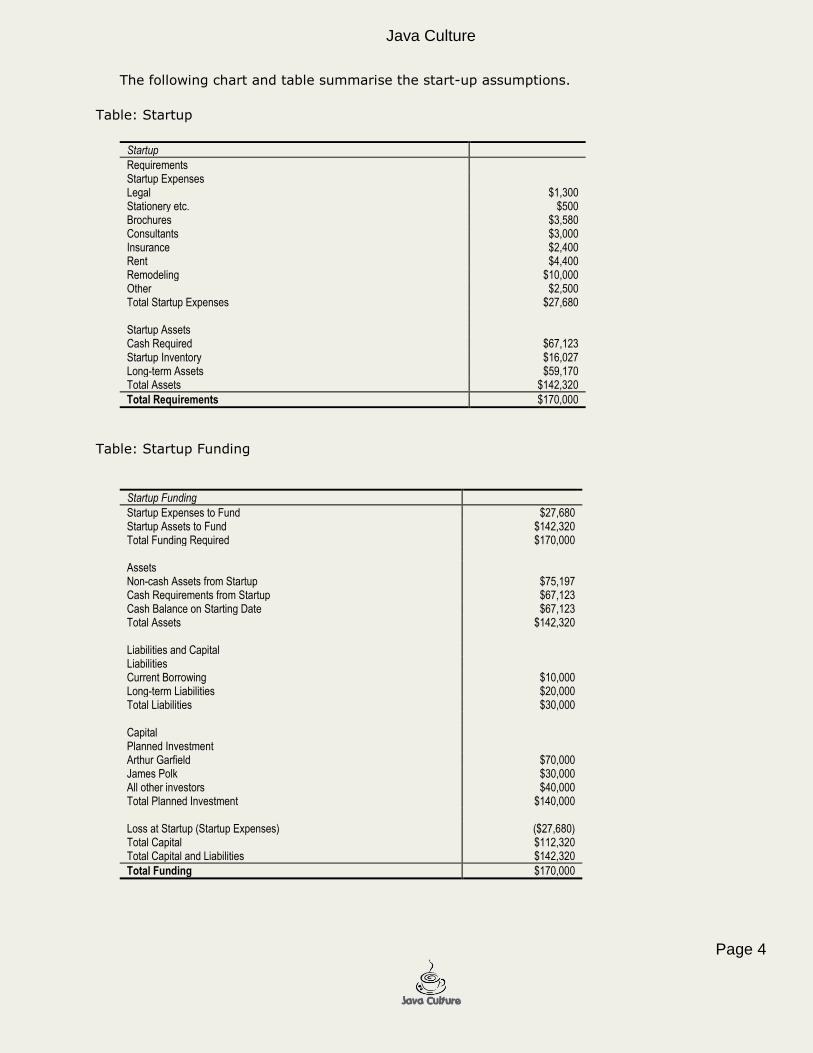
The following chart and table summarise the start-up assumptions.
Table: Startup
Startup
Requirements Startup Expenses Legal $1,300 Stationery etc. $500 Brochures $3,580 Consultants $3,000 Insurance $2,400 Rent $4,400 Remodeling $10,000 Other $2,500 Total Startup Expenses $27,680
Startup Assets Cash Required $67,123 Startup Inventory $16,027 Long-term Assets $59,170 Total Assets $142,320
Total Requirements $170,000
Table: Startup Funding
Startup Funding
Startup Expenses to Fund $27,680 Startup Assets to Fund $142,320 Total Funding Required $170,000
Assets Non-cash Assets from Startup $75,197 Cash Requirements from Startup $67,123 Cash Balance on Starting Date $67,123 Total Assets $142,320
Liabilities and Capital Liabilities Current Borrowing $10,000 Long-term Liabilities $20,000 Total Liabilities $30,000
Capital Planned Investment Arthur Garfield $70,000 James Polk $30,000 All other investors $40,000 Total Planned Investment $140,000
Loss at Startup (Startup Expenses) ($27,680) Total Capital $112,320 Total Capital and Liabilities $142,320
Total Funding $170,000

Java Culture
Page 5
3.0 Products
Java Culture will offer its customers the best-tasting coffee beverages in the UBC area. This will
be achieved by using high-quality ingredients and strictly following preparation guidelines. The
store layout, menu listings and marketing activities will be focused on maximising the sales of
higher margin espresso drinks. Along with the espresso drinks, brewed coffee and teas, as well
as some refreshment beverages, will be sold in the coffee bar. Java Culture will also offer its
clients pastries, small salads and sandwiches. For the gourmet clientele that prefers to prepare
its coffee at home, Java Culture will also be selling coffee beans.
The menu offerings will be supplemented by free books and magazines that customers can read inside the coffee bar.
4.0 Market Analysis Summary
British Columbia coffee consumption has shown steady growth, with gourmet coffee having the
strongest growth. Coffee drinkers in the Province are among the most demanding. They favour
well-brewed gourmet coffee drinks and demand great service. Vancouver BC with its liberal and
outgoing populace and long rainy winter has traditionally been a great place for coffee
establishments. Java Culture will strive to build a loyal customer base by offering a great
tasting coffee in a relaxing environment of its coffee bar located close to the bustling University
of British Columbia campus.
4.1 Market Segmentation
Java Culture will focus its marketing activities on reaching the University students and faculty,
people working in offices located close to the coffee bar and on sophisticated teenagers. Our
market research shows that these are the customer groups that are most likely to buy gourmet
coffee products. Since gourmet coffee consumption is universal across different income
categories and mostly depends on the level of higher education, proximity to the UBC campus
will provide access to the targeted customer audience.
The chart and table below outline the total market potential (in number of customers) of
gourmet coffee drinkers in the UBC area.

Java Culture
Page 6
Chart: Market Analysis
Table: Market Analysis
Market Analysis
2012 2013 2014 2015 2016 Potential Customers Growth CAGR Students and Faculty 2% 18,000 18,360 18,727 19,102 19,484 2.00% Teenagers 1% 3,000 3,030 3,060 3,091 3,122 1.00% Office workers 2% 8,000 8,160 8,323 8,489 8,659 2.00% Other 0% 5,000 5,000 5,000 5,000 5,000 0.00%
Total 1.63% 34,000 34,550 35,110 35,682 36,265 1.63%
4.2 Target Market Segment Strategy
Java Culture will cater to people who want to get their daily cup of great-tasting coffee in a
relaxing atmosphere. Such customers vary in age, although our location close to the University
campus means that most of our clientele will be college students and faculty. Our market
research shows that these are discerning customers that gravitate towards better tasting
coffee. Furthermore, a lot of college students consider coffee bars to be a convenient studying
or meeting location, where they can read or meet with peers without the necessity to pay cover
charges. For us, this will provide a unique possibility for building a loyal client base.

Java Culture
Page 7
4.3 Industry Analysis
Coffee consumption has shown a steady 2.5% growth rate in Canada over the last decade. In
2010, total sales of coffee were approximately $750 million with gourmet coffee representing
33% (or $250 million) of that. The retail coffee industry is flourishing in Greater Vancouver. The
local climate, with a long rainy season, is very conducive for the consumption of hot non-
alcoholic beverages. At the same time, hot, dry summers drive people into cafes to order iced
drinks. Further, coffee has really become a part of the lifestyle in Greater Vancouver. Its
discerning coffee drinkers are in favour of well-prepared, strong coffee-based beverages, which they can consume in a relaxing environment.
4.3.1 Competition and Buying Patterns
Competition
According to a 2010 study, the UBC area had 125 established snack & non-alcoholic beverage
bars with total sales of $42 million. Among other establishments that offer coffee drinks to their
customers are most of Vancouver's limited and full-service restaurants. Java Culture's direct
competitors will be other coffee bars located near the University of British Columbia campus.
These include Starbucks, Tim Horton's, The UBC Bookstore, and other foodservice
establishments that offer coffee. Starbucks will definitely be one of the major competitors
because of its strong financial position and established marketing and operational practices.
However, despite Starbuck's entrenched market position, many customers favour smaller,
independent establishments that offer a cosy atmosphere and good coffee at affordable
prices. We estimate that Starbucks holds approximately 35% market share in that
neighbourhood, Tim Horton's appeals to 25% of customers, The UBC Bookstore caters to
another 10%, with the remaining market share split among other establishments. Java Culture
will position itself as a unique coffee bar that offers not only the best tasting coffee and pastries
but also provides a home-like, cosy and comfortable environment, which established corporate
establishments lack. We will cater to customers' bodies and minds, which will help us grow our market share in this competitive market.
Buying Patterns
The major reason for the customers to return to a specific coffee bar is a great tasting coffee,
quick service and pleasant atmosphere. Although, as stated before, coffee consumption is
uniform across different income segments, Java Culture will price its product offerings
competitively. We strongly believe that selling coffee with a great service in a lovely setting will
help us build a strong base of loyal clientele.
5.0 Strategy and Implementation Summary
Java Culture's marketing strategy will be focused on getting new customers, retaining the
existing customers, getting customers to spend more and come back more often. Establishing a
loyal customer base is of paramount importance since such customer core will not only generate most of the sales but also will provide favourable referrals.
5.1 Competitive Edge
Java Culture will position itself as a unique coffee bar where its patrons can not only enjoy a
cup of perfectly brewed coffee but also spend their time in an ambient environment.
Comfortable sofas and chairs, dimmed light and quiet relaxing music will help the customers to relax from daily stresses and will differentiate Java Culture from incumbent competitors.

Java Culture
Page 8
5.2 Sales Strategy
Java Culture baristas will handle the sales transactions. To speed up the customer service, at
least two employees will be servicing clients--while one employee will be preparing the
customer's order, the other one will be taking care of the sales transaction. All sales data
logged on the point-of-sale terminal will be later analysed for marketing purposes.
In order to build up its client base, Java Culture will use banners and fliers, utilise customer
referrals and cross-promotions with other businesses in the community. At the same time,
customer retention programs will be used to make sure the customers are coming back and
spending more at the coffee bar.
5.2.1 Sales Forecast
Food costs are assumed at 25% for coffee beverages and 50% for retail beans and pastries.
Proximity to the University campus will dictate certain sales seasonality with revenues slightly
decreasing during the school vacation periods.
The chart and table below outline our projected sales forecast for the next three years.
Chart: Sales Monthly
Java Culture
Page 9
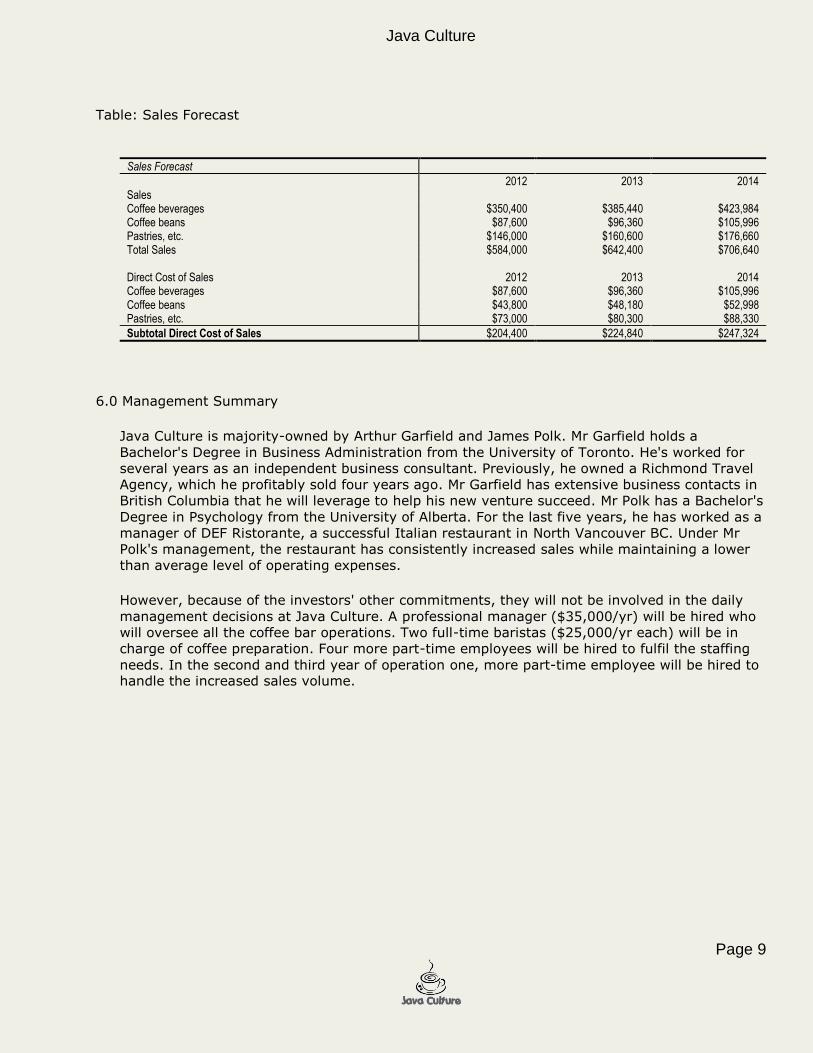
Table: Sales Forecast
Sales Forecast
2012 2013 2014 Sales Coffee beverages $350,400 $385,440 $423,984 Coffee beans $87,600 $96,360 $105,996 Pastries, etc. $146,000 $160,600 $176,660 Total Sales $584,000 $642,400 $706,640
Direct Cost of Sales 2012 2013 2014 Coffee beverages $87,600 $96,360 $105,996 Coffee beans $43,800 $48,180 $52,998 Pastries, etc. $73,000 $80,300 $88,330
Subtotal Direct Cost of Sales $204,400 $224,840 $247,324
6.0 Management Summary
Java Culture is majority-owned by Arthur Garfield and James Polk. Mr Garfield holds a
Bachelor's Degree in Business Administration from the University of Toronto. He's worked for
several years as an independent business consultant. Previously, he owned a Richmond Travel
Agency, which he profitably sold four years ago. Mr Garfield has extensive business contacts in
British Columbia that he will leverage to help his new venture succeed. Mr Polk has a Bachelor's
Degree in Psychology from the University of Alberta. For the last five years, he has worked as a
manager of DEF Ristorante, a successful Italian restaurant in North Vancouver BC. Under Mr
Polk's management, the restaurant has consistently increased sales while maintaining a lower
than average level of operating expenses.
However, because of the investors' other commitments, they will not be involved in the daily
management decisions at Java Culture. A professional manager ($35,000/yr) will be hired who
will oversee all the coffee bar operations. Two full-time baristas ($25,000/yr each) will be in
charge of coffee preparation. Four more part-time employees will be hired to fulfil the staffing
needs. In the second and third year of operation one, more part-time employee will be hired to handle the increased sales volume.
Java Culture
Page 10
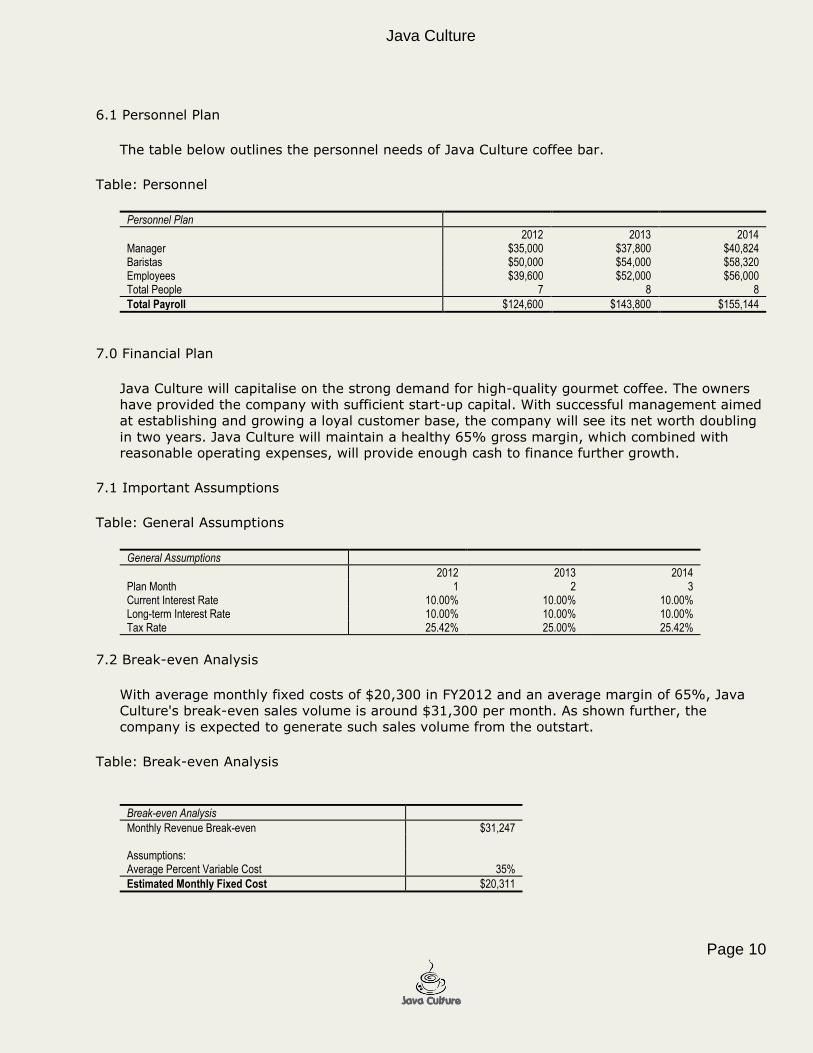
6.1 Personnel Plan
The table below outlines the personnel needs of Java Culture coffee bar.
Table: Personnel
Personnel Plan
2012 2013 2014 Manager $35,000 $37,800 $40,824 Baristas $50,000 $54,000 $58,320 Employees $39,600 $52,000 $56,000 Total People 7 8 8
Total Payroll $124,600 $143,800 $155,144
7.0 Financial Plan
Java Culture will capitalise on the strong demand for high-quality gourmet coffee. The owners
have provided the company with sufficient start-up capital. With successful management aimed
at establishing and growing a loyal customer base, the company will see its net worth doubling
in two years. Java Culture will maintain a healthy 65% gross margin, which combined with reasonable operating expenses, will provide enough cash to finance further growth.
7.1 Important Assumptions
Table: General Assumptions
General Assumptions
2012 2013 2014 Plan Month 1 2 3 Current Interest Rate 10.00% 10.00% 10.00% Long-term Interest Rate 10.00% 10.00% 10.00% Tax Rate 25.42% 25.00% 25.42%
7.2 Break-even Analysis
With average monthly fixed costs of $20,300 in FY2012 and an average margin of 65%, Java
Culture's break-even sales volume is around $31,300 per month. As shown further, the
company is expected to generate such sales volume from the outstart.
Table: Break-even Analysis
Break-even Analysis
Monthly Revenue Break-even $31,247
Assumptions: Average Percent Variable Cost 35%
Estimated Monthly Fixed Cost $20,311
Java Culture
Page 11
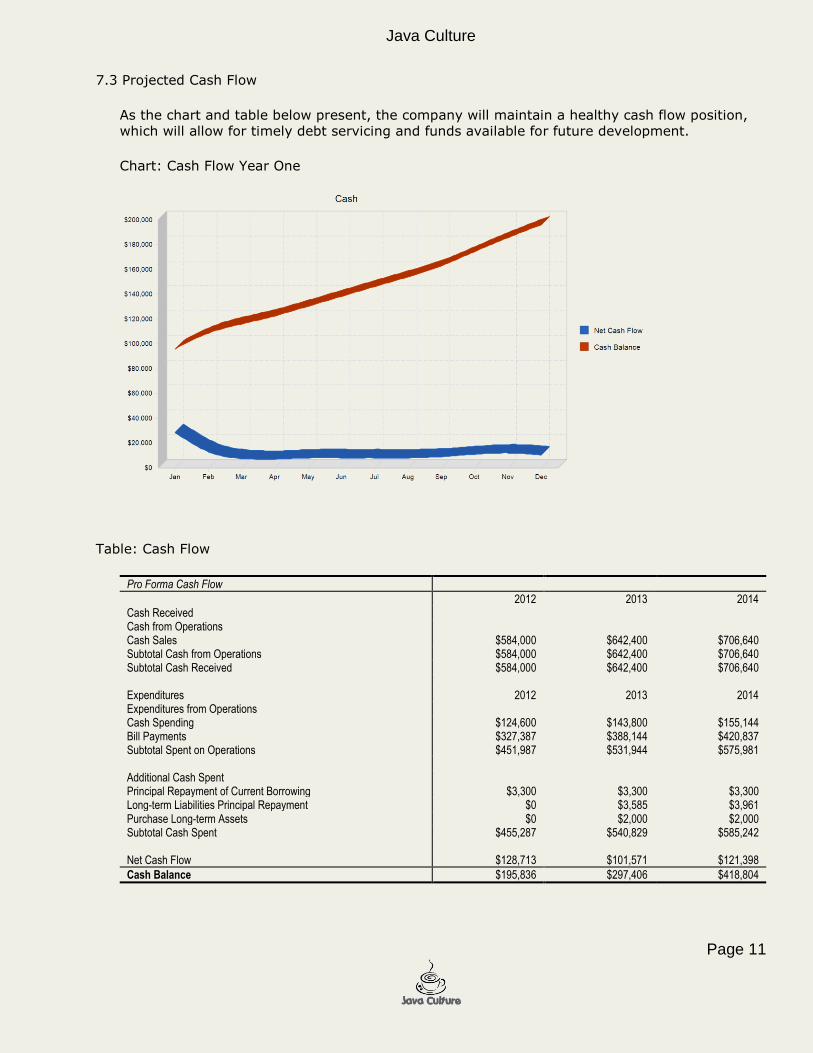
7.3 Projected Cash Flow
As the chart and table below present, the company will maintain a healthy cash flow position, which will allow for timely debt servicing and funds available for future development.
Chart: Cash Flow Year One
Table: Cash Flow
Pro Forma Cash Flow
2012 2013 2014 Cash Received Cash from Operations Cash Sales $584,000 $642,400 $706,640 Subtotal Cash from Operations $584,000 $642,400 $706,640 Subtotal Cash Received $584,000 $642,400 $706,640
Expenditures 2012 2013 2014 Expenditures from Operations Cash Spending $124,600 $143,800 $155,144 Bill Payments $327,387 $388,144 $420,837 Subtotal Spent on Operations $451,987 $531,944 $575,981
Additional Cash Spent Principal Repayment of Current Borrowing $3,300 $3,300 $3,300 Long-term Liabilities Principal Repayment $0 $3,585 $3,961 Purchase Long-term Assets $0 $2,000 $2,000 Subtotal Cash Spent $455,287 $540,829 $585,242
Net Cash Flow $128,713 $101,571 $121,398
Cash Balance $195,836 $297,406 $418,804
Java Culture
Page 12
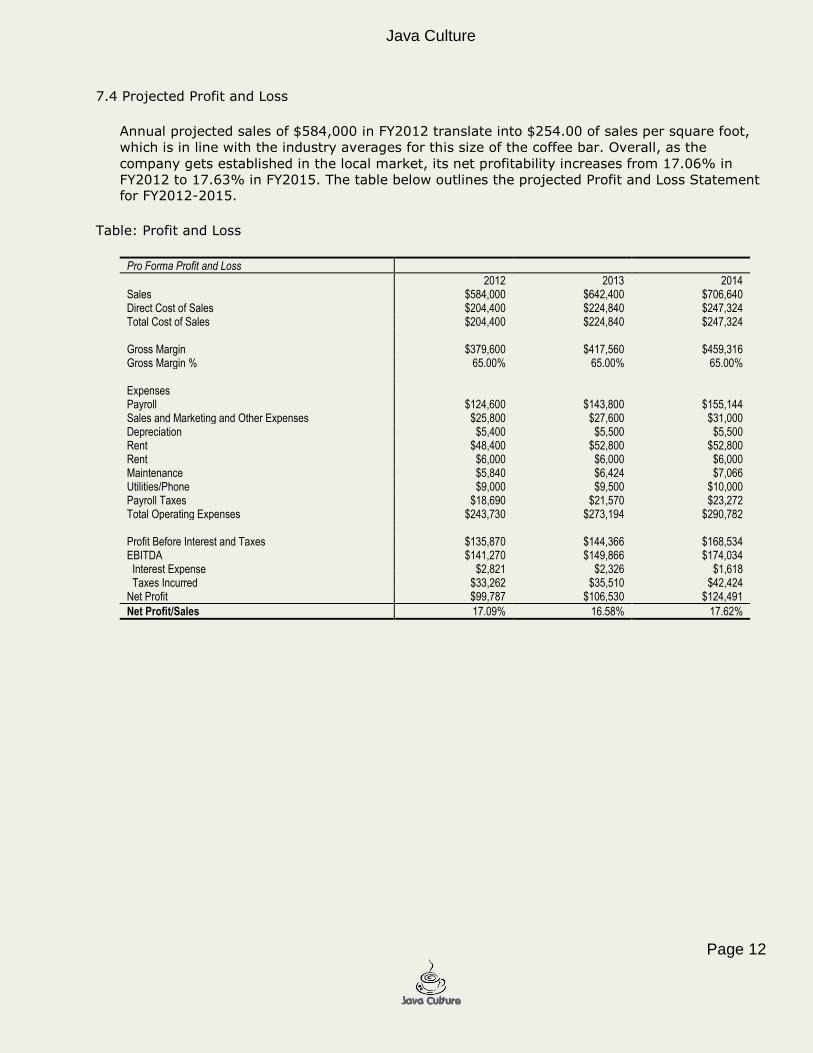
7.4 Projected Profit and Loss
Annual projected sales of $584,000 in FY2012 translate into $254.00 of sales per square foot,
which is in line with the industry averages for this size of the coffee bar. Overall, as the
company gets established in the local market, its net profitability increases from 17.06% in
FY2012 to 17.63% in FY2015. The table below outlines the projected Profit and Loss Statement for FY2012-2015.
Table: Profit and Loss
Pro Forma Profit and Loss
2012 2013 2014 Sales $584,000 $642,400 $706,640 Direct Cost of Sales $204,400 $224,840 $247,324 Total Cost of Sales $204,400 $224,840 $247,324
Gross Margin $379,600 $417,560 $459,316 Gross Margin % 65.00% 65.00% 65.00%
Expenses Payroll $124,600 $143,800 $155,144 Sales and Marketing and Other Expenses $25,800 $27,600 $31,000 Depreciation $5,400 $5,500 $5,500 Rent $48,400 $52,800 $52,800 Rent $6,000 $6,000 $6,000 Maintenance $5,840 $6,424 $7,066 Utilities/Phone $9,000 $9,500 $10,000 Payroll Taxes $18,690 $21,570 $23,272 Total Operating Expenses $243,730 $273,194 $290,782
Profit Before Interest and Taxes $135,870 $144,366 $168,534 EBITDA $141,270 $149,866 $174,034 Interest Expense $2,821 $2,326 $1,618 Taxes Incurred $33,262 $35,510 $42,424 Net Profit $99,787 $106,530 $124,491
Net Profit/Sales 17.09% 16.58% 17.62%
Java Culture
Page 13
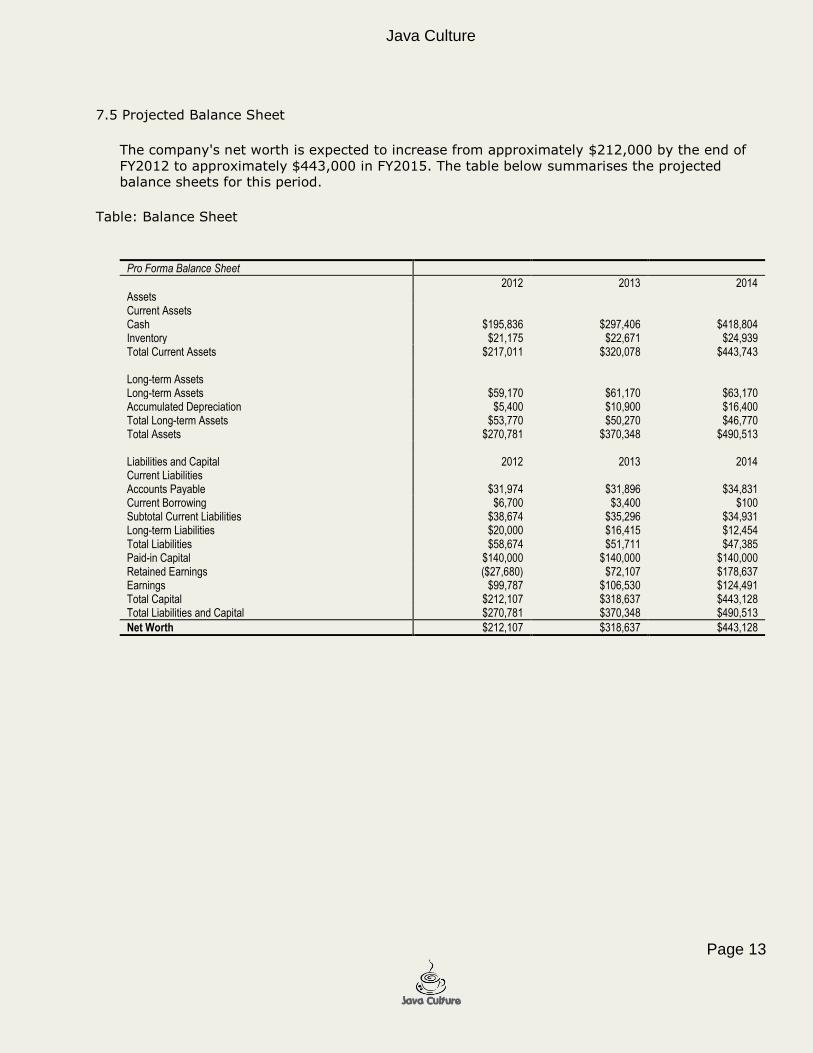
7.5 Projected Balance Sheet
The company's net worth is expected to increase from approximately $212,000 by the end of
FY2012 to approximately $443,000 in FY2015. The table below summarises the projected balance sheets for this period.
Table: Balance Sheet
Pro Forma Balance Sheet
2012 2013 2014 Assets Current Assets Cash $195,836 $297,406 $418,804 Inventory $21,175 $22,671 $24,939 Total Current Assets $217,011 $320,078 $443,743
Long-term Assets Long-term Assets $59,170 $61,170 $63,170 Accumulated Depreciation $5,400 $10,900 $16,400 Total Long-term Assets $53,770 $50,270 $46,770 Total Assets $270,781 $370,348 $490,513
Liabilities and Capital 2012 2013 2014 Current Liabilities Accounts Payable $31,974 $31,896 $34,831 Current Borrowing $6,700 $3,400 $100 Subtotal Current Liabilities $38,674 $35,296 $34,931 Long-term Liabilities $20,000 $16,415 $12,454 Total Liabilities $58,674 $51,711 $47,385 Paid-in Capital $140,000 $140,000 $140,000 Retained Earnings ($27,680) $72,107 $178,637 Earnings $99,787 $106,530 $124,491 Total Capital $212,107 $318,637 $443,128 Total Liabilities and Capital $270,781 $370,348 $490,513
Net Worth $212,107 $318,637 $443,128
Java Culture
Page 14
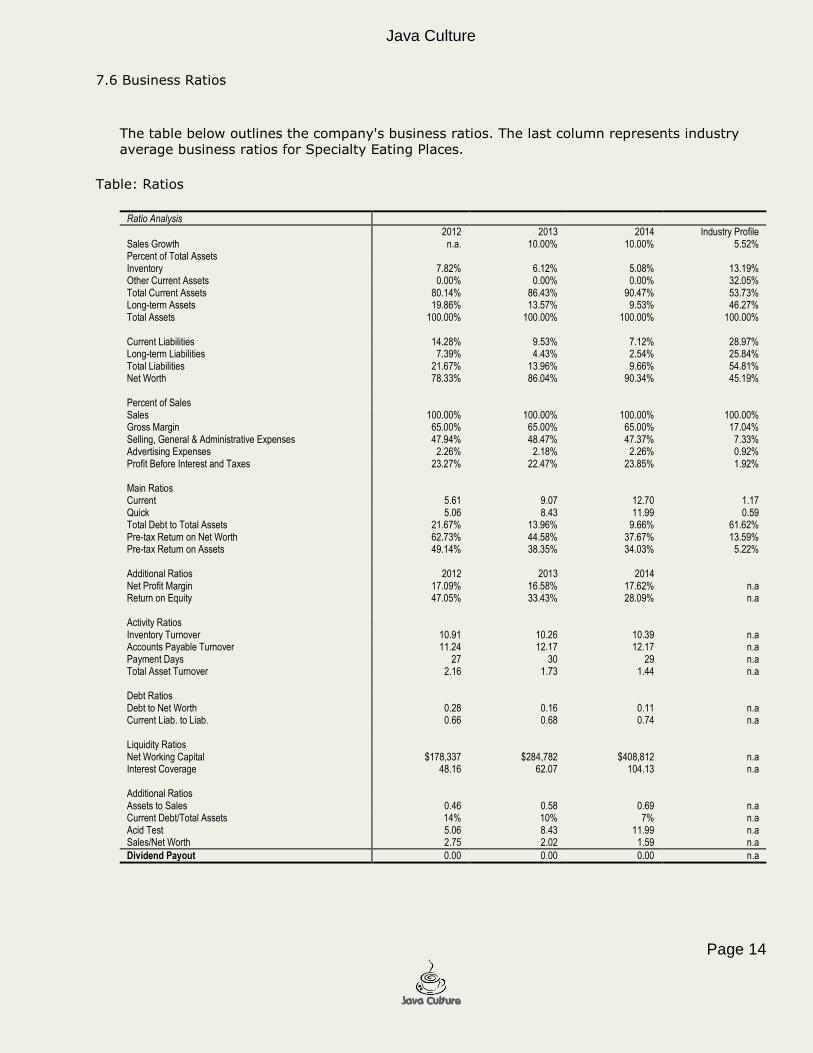
7.6 Business Ratios
The table below outlines the company's business ratios. The last column represents industry average business ratios for Specialty Eating Places.
Table: Ratios
Ratio Analysis
2012 2013 2014 Industry Profile Sales Growth n.a. 10.00% 10.00% 5.52% Percent of Total Assets Inventory 7.82% 6.12% 5.08% 13.19% Other Current Assets 0.00% 0.00% 0.00% 32.05% Total Current Assets 80.14% 86.43% 90.47% 53.73% Long-term Assets 19.86% 13.57% 9.53% 46.27% Total Assets 100.00% 100.00% 100.00% 100.00%
Current Liabilities 14.28% 9.53% 7.12% 28.97% Long-term Liabilities 7.39% 4.43% 2.54% 25.84% Total Liabilities 21.67% 13.96% 9.66% 54.81% Net Worth 78.33% 86.04% 90.34% 45.19%
Percent of Sales Sales 100.00% 100.00% 100.00% 100.00% Gross Margin 65.00% 65.00% 65.00% 17.04% Selling, General & Administrative Expenses 47.94% 48.47% 47.37% 7.33% Advertising Expenses 2.26% 2.18% 2.26% 0.92% Profit Before Interest and Taxes 23.27% 22.47% 23.85% 1.92%
Main Ratios Current 5.61 9.07 12.70 1.17 Quick 5.06 8.43 11.99 0.59 Total Debt to Total Assets 21.67% 13.96% 9.66% 61.62% Pre-tax Return on Net Worth 62.73% 44.58% 37.67% 13.59% Pre-tax Return on Assets 49.14% 38.35% 34.03% 5.22%
Additional Ratios 2012 2013 2014 Net Profit Margin 17.09% 16.58% 17.62% n.a Return on Equity 47.05% 33.43% 28.09% n.a
Activity Ratios Inventory Turnover 10.91 10.26 10.39 n.a Accounts Payable Turnover 11.24 12.17 12.17 n.a Payment Days 27 30 29 n.a Total Asset Turnover 2.16 1.73 1.44 n.a
Debt Ratios Debt to Net Worth 0.28 0.16 0.11 n.a Current Liab. to Liab. 0.66 0.68 0.74 n.a
Liquidity Ratios Net Working Capital $178,337 $284,782 $408,812 n.a Interest Coverage 48.16 62.07 104.13 n.a
Additional Ratios Assets to Sales 0.46 0.58 0.69 n.a Current Debt/Total Assets 14% 10% 7% n.a Acid Test 5.06 8.43 11.99 n.a Sales/Net Worth 2.75 2.02 1.59 n.a
Dividend Payout 0.00 0.00 0.00 n.a
Appendix
Page 1
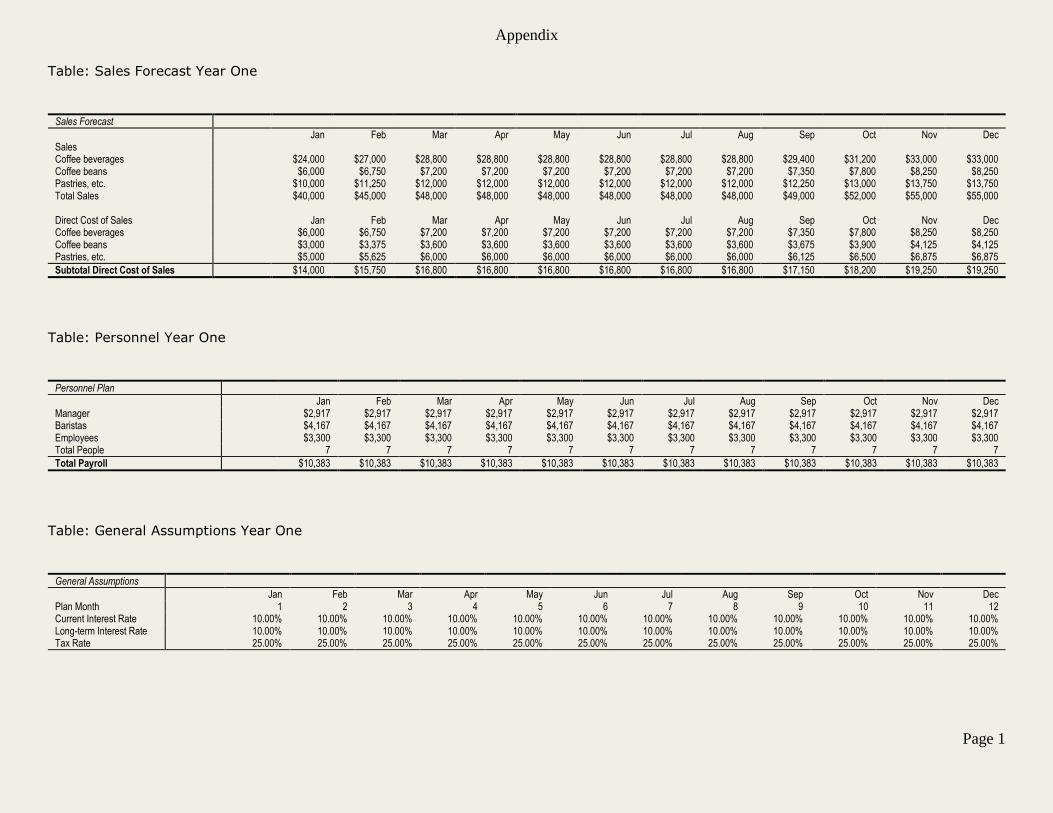
Table: Sales Forecast Year One
Sales Forecast
Jan Feb Mar Apr May Jun Jul Aug Sep Oct Nov Dec Sales Coffee beverages $24,000 $27,000 $28,800 $28,800 $28,800 $28,800 $28,800 $28,800 $29,400 $31,200 $33,000 $33,000 Coffee beans $6,000 $6,750 $7,200 $7,200 $7,200 $7,200 $7,200 $7,200 $7,350 $7,800 $8,250 $8,250 Pastries, etc. $10,000 $11,250 $12,000 $12,000 $12,000 $12,000 $12,000 $12,000 $12,250 $13,000 $13,750 $13,750 Total Sales $40,000 $45,000 $48,000 $48,000 $48,000 $48,000 $48,000 $48,000 $49,000 $52,000 $55,000 $55,000
Direct Cost of Sales Jan Feb Mar Apr May Jun Jul Aug Sep Oct Nov Dec Coffee beverages $6,000 $6,750 $7,200 $7,200 $7,200 $7,200 $7,200 $7,200 $7,350 $7,800 $8,250 $8,250 Coffee beans $3,000 $3,375 $3,600 $3,600 $3,600 $3,600 $3,600 $3,600 $3,675 $3,900 $4,125 $4,125 Pastries, etc. $5,000 $5,625 $6,000 $6,000 $6,000 $6,000 $6,000 $6,000 $6,125 $6,500 $6,875 $6,875
Subtotal Direct Cost of Sales $14,000 $15,750 $16,800 $16,800 $16,800 $16,800 $16,800 $16,800 $17,150 $18,200 $19,250 $19,250
Table: Personnel Year One
Personnel Plan
Jan Feb Mar Apr May Jun Jul Aug Sep Oct Nov Dec Manager $2,917 $2,917 $2,917 $2,917 $2,917 $2,917 $2,917 $2,917 $2,917 $2,917 $2,917 $2,917 Baristas $4,167 $4,167 $4,167 $4,167 $4,167 $4,167 $4,167 $4,167 $4,167 $4,167 $4,167 $4,167 Employees $3,300 $3,300 $3,300 $3,300 $3,300 $3,300 $3,300 $3,300 $3,300 $3,300 $3,300 $3,300 Total People 7 7 7 7 7 7 7 7 7 7 7 7
Total Payroll $10,383 $10,383 $10,383 $10,383 $10,383 $10,383 $10,383 $10,383 $10,383 $10,383 $10,383 $10,383
Table: General Assumptions Year One
General Assumptions
Jan Feb Mar Apr May Jun Jul Aug Sep Oct Nov Dec Plan Month 1 2 3 4 5 6 7 8 9 10 11 12 Current Interest Rate 10.00% 10.00% 10.00% 10.00% 10.00% 10.00% 10.00% 10.00% 10.00% 10.00% 10.00% 10.00% Long-term Interest Rate 10.00% 10.00% 10.00% 10.00% 10.00% 10.00% 10.00% 10.00% 10.00% 10.00% 10.00% 10.00% Tax Rate 25.00% 25.00% 25.00% 25.00% 25.00% 25.00% 25.00% 25.00% 25.00% 25.00% 25.00% 25.00%
Appendix
Page 2
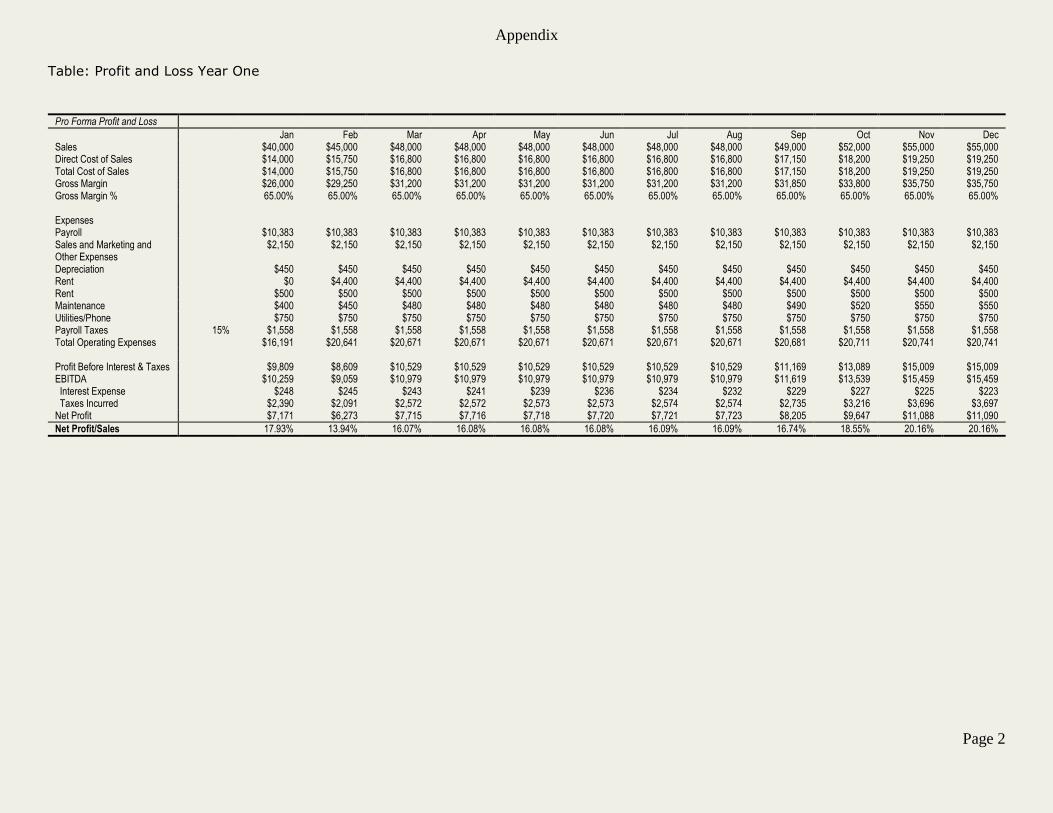
Table: Profit and Loss Year One
Pro Forma Profit and Loss
Jan Feb Mar Apr May Jun Jul Aug Sep Oct Nov Dec Sales $40,000 $45,000 $48,000 $48,000 $48,000 $48,000 $48,000 $48,000 $49,000 $52,000 $55,000 $55,000 Direct Cost of Sales $14,000 $15,750 $16,800 $16,800 $16,800 $16,800 $16,800 $16,800 $17,150 $18,200 $19,250 $19,250 Total Cost of Sales $14,000 $15,750 $16,800 $16,800 $16,800 $16,800 $16,800 $16,800 $17,150 $18,200 $19,250 $19,250 Gross Margin $26,000 $29,250 $31,200 $31,200 $31,200 $31,200 $31,200 $31,200 $31,850 $33,800 $35,750 $35,750 Gross Margin % 65.00% 65.00% 65.00% 65.00% 65.00% 65.00% 65.00% 65.00% 65.00% 65.00% 65.00% 65.00%
Expenses Payroll $10,383 $10,383 $10,383 $10,383 $10,383 $10,383 $10,383 $10,383 $10,383 $10,383 $10,383 $10,383 Sales and Marketing and Other Expenses
$2,150 $2,150 $2,150 $2,150 $2,150 $2,150 $2,150 $2,150 $2,150 $2,150 $2,150 $2,150
Depreciation $450 $450 $450 $450 $450 $450 $450 $450 $450 $450 $450 $450 Rent $0 $4,400 $4,400 $4,400 $4,400 $4,400 $4,400 $4,400 $4,400 $4,400 $4,400 $4,400 Rent $500 $500 $500 $500 $500 $500 $500 $500 $500 $500 $500 $500 Maintenance $400 $450 $480 $480 $480 $480 $480 $480 $490 $520 $550 $550 Utilities/Phone $750 $750 $750 $750 $750 $750 $750 $750 $750 $750 $750 $750 Payroll Taxes 15% $1,558 $1,558 $1,558 $1,558 $1,558 $1,558 $1,558 $1,558 $1,558 $1,558 $1,558 $1,558 Total Operating Expenses $16,191 $20,641 $20,671 $20,671 $20,671 $20,671 $20,671 $20,671 $20,681 $20,711 $20,741 $20,741
Profit Before Interest & Taxes $9,809 $8,609 $10,529 $10,529 $10,529 $10,529 $10,529 $10,529 $11,169 $13,089 $15,009 $15,009 EBITDA $10,259 $9,059 $10,979 $10,979 $10,979 $10,979 $10,979 $10,979 $11,619 $13,539 $15,459 $15,459 Interest Expense $248 $245 $243 $241 $239 $236 $234 $232 $229 $227 $225 $223 Taxes Incurred $2,390 $2,091 $2,572 $2,572 $2,573 $2,573 $2,574 $2,574 $2,735 $3,216 $3,696 $3,697 Net Profit $7,171 $6,273 $7,715 $7,716 $7,718 $7,720 $7,721 $7,723 $8,205 $9,647 $11,088 $11,090
Net Profit/Sales 17.93% 13.94% 16.07% 16.08% 16.08% 16.08% 16.09% 16.09% 16.74% 18.55% 20.16% 20.16%

Appendix
Page 3
Table: Cash Flow Year One
Pro Forma Cash Flow
Jan Feb Mar Apr May Jun Jul Aug Sep Oct Nov Dec Cash Received Cash from Operations Cash Sales $40,000 $45,000 $48,000 $48,000 $48,000 $48,000 $48,000 $48,000 $49,000 $52,000 $55,000 $55,000 Subtotal Cash from Operations $40,000 $45,000 $48,000 $48,000 $48,000 $48,000 $48,000 $48,000 $49,000 $52,000 $55,000 $55,000
Additional Cash Received Subtotal Cash Received $40,000 $45,000 $48,000 $48,000 $48,000 $48,000 $48,000 $48,000 $49,000 $52,000 $55,000 $55,000
Expenditures Jan Feb Mar Apr May Jun Jul Aug Sep Oct Nov Dec Expenditures from Operations Cash Spending $10,383 $10,383 $10,383 $10,383 $10,383 $10,383 $10,383 $10,383 $10,383 $10,383 $10,383 $10,383 Bill Payments $712 $21,650 $29,845 $30,569 $29,450 $29,449 $29,447 $29,445 $29,474 $30,424 $32,727 $34,195 Subtotal Spent on Operations $11,096 $32,034 $40,228 $40,952 $39,834 $39,832 $39,830 $39,829 $39,857 $40,808 $43,110 $44,578
Additional Cash Spent Principal Repayment of Current Borrowing
$275 $275 $275 $275 $275 $275 $275 $275 $275 $275 $275 $275
Subtotal Cash Spent $11,371 $32,309 $40,503 $41,227 $40,109 $40,107 $40,105 $40,104 $40,132 $41,083 $43,385 $44,853 Net Cash Flow $28,629 $12,691 $7,497 $6,773 $7,891 $7,893 $7,895 $7,896 $8,868 $10,917 $11,615 $10,147
Cash Balance $95,752 $108,444 $115,940 $122,713 $130,605 $138,498 $146,393 $154,289 $163,157 $174,074 $185,689 $195,836
Appendix
Page 4
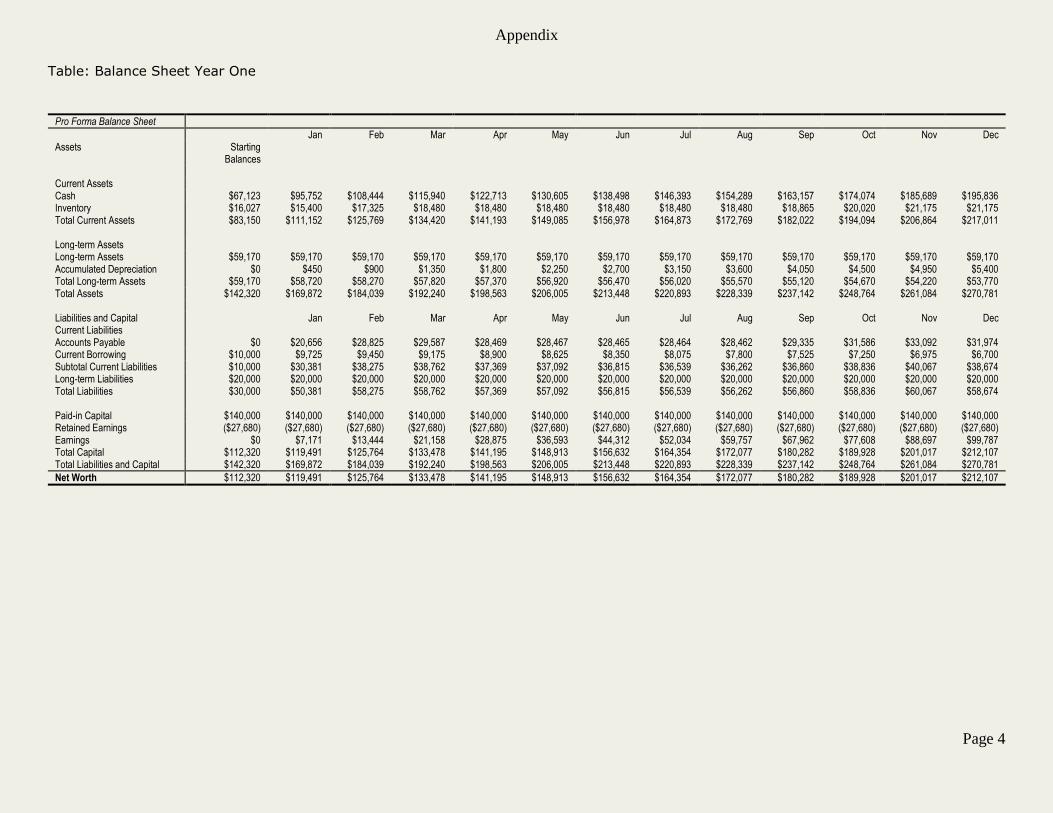
Table: Balance Sheet Year One
Pro Forma Balance Sheet
Jan Feb Mar Apr May Jun Jul Aug Sep Oct Nov Dec Assets Starting
Balances
Current Assets Cash $67,123 $95,752 $108,444 $115,940 $122,713 $130,605 $138,498 $146,393 $154,289 $163,157 $174,074 $185,689 $195,836 Inventory $16,027 $15,400 $17,325 $18,480 $18,480 $18,480 $18,480 $18,480 $18,480 $18,865 $20,020 $21,175 $21,175 Total Current Assets $83,150 $111,152 $125,769 $134,420 $141,193 $149,085 $156,978 $164,873 $172,769 $182,022 $194,094 $206,864 $217,011
Long-term Assets Long-term Assets $59,170 $59,170 $59,170 $59,170 $59,170 $59,170 $59,170 $59,170 $59,170 $59,170 $59,170 $59,170 $59,170 Accumulated Depreciation $0 $450 $900 $1,350 $1,800 $2,250 $2,700 $3,150 $3,600 $4,050 $4,500 $4,950 $5,400 Total Long-term Assets $59,170 $58,720 $58,270 $57,820 $57,370 $56,920 $56,470 $56,020 $55,570 $55,120 $54,670 $54,220 $53,770 Total Assets $142,320 $169,872 $184,039 $192,240 $198,563 $206,005 $213,448 $220,893 $228,339 $237,142 $248,764 $261,084 $270,781
Liabilities and Capital Jan Feb Mar Apr May Jun Jul Aug Sep Oct Nov Dec Current Liabilities Accounts Payable $0 $20,656 $28,825 $29,587 $28,469 $28,467 $28,465 $28,464 $28,462 $29,335 $31,586 $33,092 $31,974 Current Borrowing $10,000 $9,725 $9,450 $9,175 $8,900 $8,625 $8,350 $8,075 $7,800 $7,525 $7,250 $6,975 $6,700 Subtotal Current Liabilities $10,000 $30,381 $38,275 $38,762 $37,369 $37,092 $36,815 $36,539 $36,262 $36,860 $38,836 $40,067 $38,674 Long-term Liabilities $20,000 $20,000 $20,000 $20,000 $20,000 $20,000 $20,000 $20,000 $20,000 $20,000 $20,000 $20,000 $20,000 Total Liabilities $30,000 $50,381 $58,275 $58,762 $57,369 $57,092 $56,815 $56,539 $56,262 $56,860 $58,836 $60,067 $58,674
Paid-in Capital $140,000 $140,000 $140,000 $140,000 $140,000 $140,000 $140,000 $140,000 $140,000 $140,000 $140,000 $140,000 $140,000 Retained Earnings ($27,680) ($27,680) ($27,680) ($27,680) ($27,680) ($27,680) ($27,680) ($27,680) ($27,680) ($27,680) ($27,680) ($27,680) ($27,680) Earnings $0 $7,171 $13,444 $21,158 $28,875 $36,593 $44,312 $52,034 $59,757 $67,962 $77,608 $88,697 $99,787 Total Capital $112,320 $119,491 $125,764 $133,478 $141,195 $148,913 $156,632 $164,354 $172,077 $180,282 $189,928 $201,017 $212,107 Total Liabilities and Capital $142,320 $169,872 $184,039 $192,240 $198,563 $206,005 $213,448 $220,893 $228,339 $237,142 $248,764 $261,084 $270,781
Net Worth $112,320 $119,491 $125,764 $133,478 $141,195 $148,913 $156,632 $164,354 $172,077 $180,282 $189,928 $201,017 $212,107