james miley - white rose etheses online
TRANSCRIPT
Characterising the gas and dust in
protoplanetary discs around Herbig stars
James Miley
University of Leeds
School of Physics & Astronomy
A thesis submitted for the degree of
Doctor of Philosophy
5 June, 2020

Declaration
The candidate confirms that the work submitted is his own, except
where work which has formed part of jointly authored publications
has been included. The contribution of the candidate and the other
authors to this work has been explicitly indicated below. The candi-
date confirms that appropriate credit has been given within the thesis
where reference has been made to the work of others.
Chapter 2 is based on the published article “Asymmetric mid-plane
gas in ALMA images of HD100546”. This work was published in vol-
ume 485 of Monthly Notices of the Royal Astronomical Society, pages
7239-752, May 2019. Co-authors were O. Panic, T.J. Haworth, I. Pas-
cucci, M. Wyatt, C. Clarke, A.M.S. Richards, T. Ratzka. This work is
based on data from ALMA project 2015.1.01600.S, P.I. O. Panic. T.J.
Haworth provided scripts for the calculation of disc gas mass. A. M.
S. Richards advised on the astrometric accuracy of ALMA imaging.
All co-authors contributed feedback on the manuscript and discussion
on the analysis.
Chapter 3 is based on the published article “Unlocking the secrets
of the midplane gas and dust distribution in the young hybrid disc
HD141569”. This work was published in volume 615 of Astronomy
&. Astrophysics, letter 10 in July 2018. Co-authors were O. Panic,
M. Wyatt and G. M. Kennedy. All co-authors contributed feedback
on the manuscript and discussion on the analysis.
This copy has been supplied on the understanding that it is copyright
material and that no quotation from the thesis may be published
without proper acknowledgement.

The right of James Maxwell Miley to be identified as Author of this
work has been asserted by James Maxwell Miley in accordance with
the Copyright, Designs and Patents Act 1988.

For Edwin Maxwell, who was guided by the stars.
Acknowledgements
First of all I would like to say a massive thank you to Olja Panic
for guiding, teaching and supporting me throughout years of PhD
study. From the very first days you’ve inspired me to be the best
researcher I can possibly be and I’ll forever be grateful for all the
time you’ve invested in me. Thank you also to my second supervisor
Rene Oudmaijer for wise words and support when it was needed.
Thank you to John Ilee, Tom Haworth and Richard Booth, each of
whom have provided expert technical knowledge and scientific insight.
I would have taken a lot longer to get here without vital contributions
and discussions from each of you at the right times. Thank you also
for setting the best example of what a scientist should be like.
A special thanks also to Tom Hartquist who throughout my seven
and a half years in Leeds has guided me through physics as a teacher,
a mentor and a friend. Thank you also to the School of Physics &
Astronomy, and to Leeds University Union for providing a home away
from home for all this time. I loved my time at Leeds.
I owe an enormous debt of gratitude to every single PhD student who
has been through room 9.64; for sharing food, films, football and an
awful lot of time in the Fenton. It has been a pleasure and a privilege
to know you all.
Gracias Alice Perez and Miguel Vioque for keeping the journey fun
and for being great friends. Part of me is still partying in Madrid. A
big mention to the other half of Disco Inferno and my disc-wife from
day one, Alice Booth, best of luck in Leiden!
Thank you especially to Abi Frost with whom over the past three
years I’ve shared all the highs and lows of a PhD, and of life. I hope
to share a great deal more of them with you in the future, wherever
that takes us.
Finally, I’m eternally grateful to my fantastic friends and family out-
side of the astrophysics bubble. To Sam, Ash and Meghan who be-
came my second family in Leeds, thank you for everything from drink-
ing cans of lager in university halls of residence, to Sunday dinners
and attempting to tackle the big bad world. To my friends for life
the boys from Hitchin, who despite going on to do great and amazing
things with their lives have still not changed one bit.
My greatest thanks are to Mum and Dad for consistent and unwaver-
ing support in every possible way, at every juncture of my life. I’m a
very lucky person and couldn’t have done this without you.
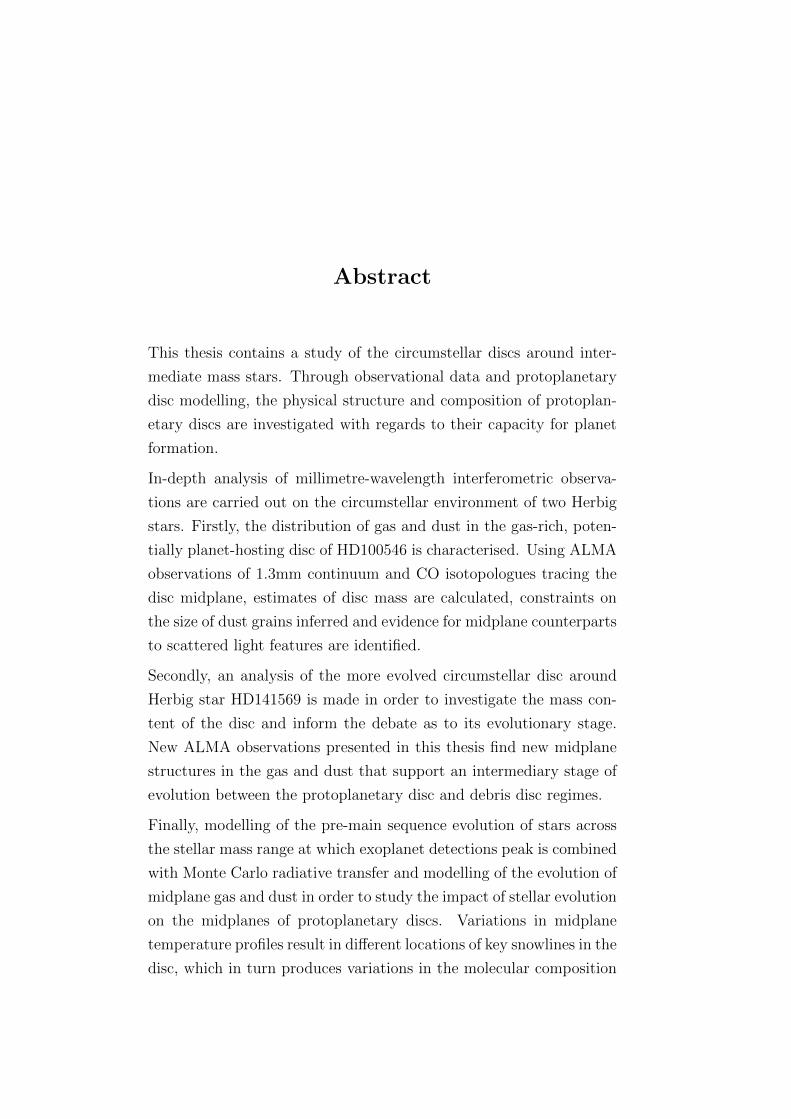
Abstract
This thesis contains a study of the circumstellar discs around inter-
mediate mass stars. Through observational data and protoplanetary
disc modelling, the physical structure and composition of protoplan-
etary discs are investigated with regards to their capacity for planet
formation.
In-depth analysis of millimetre-wavelength interferometric observa-
tions are carried out on the circumstellar environment of two Herbig
stars. Firstly, the distribution of gas and dust in the gas-rich, poten-
tially planet-hosting disc of HD100546 is characterised. Using ALMA
observations of 1.3mm continuum and CO isotopologues tracing the
disc midplane, estimates of disc mass are calculated, constraints on
the size of dust grains inferred and evidence for midplane counterparts
to scattered light features are identified.
Secondly, an analysis of the more evolved circumstellar disc around
Herbig star HD141569 is made in order to investigate the mass con-
tent of the disc and inform the debate as to its evolutionary stage.
New ALMA observations presented in this thesis find new midplane
structures in the gas and dust that support an intermediary stage of
evolution between the protoplanetary disc and debris disc regimes.
Finally, modelling of the pre-main sequence evolution of stars across
the stellar mass range at which exoplanet detections peak is combined
with Monte Carlo radiative transfer and modelling of the evolution of
midplane gas and dust in order to study the impact of stellar evolution
on the midplanes of protoplanetary discs. Variations in midplane
temperature profiles result in different locations of key snowlines in the
disc, which in turn produces variations in the molecular composition

of the local disc. The results quantify how snowline locations depend
on stellar luminosity evolution. This modelling procedure is applied
to the system of HR8799 in order to put constraints on the time and
location within the disc at which wide-orbit planets could have formed
based on their atmospheric C/O ratio. The results support an early
formation time, within around 1 Myr, for the carbon-rich exoplanet
HR8799b.
Abbreviations
ALMA Atacama Large Millimetre/Sub-millimetre Array
AO Adaptive Optics
APEX Atacama Pathfinder EXperiment
ARIEL Atmospheric Remote-sensing Infrared Exoplanet Large-survey
ATCA Australia Telescope Compact Array
au Astronomical Unit
CASA Common Astronomy Software Applications
ESA European Space Agency
ESO European Southern Observatory
EUV Extreme Ultra-Violet
FUV Far Ultra-Violet
FWHM Full-Width at Half-Maximum
HAeBe Herbig Ae/Be
HST Hubble Space Telescope
IR Infra-red
ISM Inter-Stellar Medium
JWST James Webb Space Telescope
MESA Modules for Experiments in Stellar Astrophysics
MIST MESA Isochrones and Stellar Tracks
MS Main Sequence
MYSO Massive Young Stellar Object
NASA National Aeronautics and Space Administration
NOEMA NOrthern Extended Millimeter Array
PA Position Angle
PdBI Plataue de Bure Interferometer
PMS Pre-Main Sequence
PSF Point Source Function
SED Spectral Energy Distribution
SKA Square Kilometre Array
SMA Sub-Millimetre Array
SPHERE Spectro-Polarimetric High- contrast Exoplanet REsearch instrument
VISIR VLT Imager and Spectrometer for mid-Infrared
VLA Very Large Array
VLT Very Large Telescope
YSO Young Stellar Object
ZAMS Zero Age Main Sequence
10
Contents
1 Introduction 1
1.1 Protoplanetary Discs . . . . . . . . . . . . . . . . . . . . . . . . . 2
1.1.1 Star formation . . . . . . . . . . . . . . . . . . . . . . . . 3
1.1.2 Observational evidence for protoplanetary discs . . . . . . 4
1.1.3 Protoplanetary disc structure . . . . . . . . . . . . . . . . 8
1.1.4 Results from observational surveys . . . . . . . . . . . . . 11
1.1.5 Gas in discs . . . . . . . . . . . . . . . . . . . . . . . . . . 12
1.1.6 Dust in discs . . . . . . . . . . . . . . . . . . . . . . . . . 16
1.2 Disc Evolution . . . . . . . . . . . . . . . . . . . . . . . . . . . . 23
1.2.1 Classical view of isolated low-mass star formation . . . . . 23
1.2.2 Transition Discs . . . . . . . . . . . . . . . . . . . . . . . . 26
1.2.3 Gaseous Debris Discs . . . . . . . . . . . . . . . . . . . . . 28
1.3 Herbig Stars . . . . . . . . . . . . . . . . . . . . . . . . . . . . . . 32
1.3.1 Discs around Herbig Stars . . . . . . . . . . . . . . . . . . 34
1.4 Methods . . . . . . . . . . . . . . . . . . . . . . . . . . . . . . . . 35
1.4.1 Millimetre Interferometry . . . . . . . . . . . . . . . . . . 35
1.4.2 Data reduction . . . . . . . . . . . . . . . . . . . . . . . . 37
1.4.3 Radiative Transfer Modelling . . . . . . . . . . . . . . . . 41
1.4.4 Midplane Evolution and Chemical Models . . . . . . . . . 43
2 Asymmetric midplane gas in ALMA images of HD 100546 45
2.1 Context . . . . . . . . . . . . . . . . . . . . . . . . . . . . . . . . 46
2.1.1 HD 100546 . . . . . . . . . . . . . . . . . . . . . . . . . . 46
2.1.2 Evidence for proto-planet(s) . . . . . . . . . . . . . . . . . 46
2.1.3 Structure in the disc . . . . . . . . . . . . . . . . . . . . . 47
11
CONTENTS
2.2 Observations & Data Reduction . . . . . . . . . . . . . . . . . . . 49
2.3 Results . . . . . . . . . . . . . . . . . . . . . . . . . . . . . . . . . 50
2.4 Analysis and Discussion . . . . . . . . . . . . . . . . . . . . . . . 56
2.4.1 Disc Mass . . . . . . . . . . . . . . . . . . . . . . . . . . . 56
2.4.2 Disc Asymmetry . . . . . . . . . . . . . . . . . . . . . . . 60
2.4.3 Asymmetry Analysis . . . . . . . . . . . . . . . . . . . . . 66
2.4.4 Radial Flux Profiles . . . . . . . . . . . . . . . . . . . . . 69
2.5 Conclusions . . . . . . . . . . . . . . . . . . . . . . . . . . . . . . 79
3 Unlocking the secrets of the midplane gas and dust distribution
in the young hybrid disc HD 141569 81
3.1 Context . . . . . . . . . . . . . . . . . . . . . . . . . . . . . . . . 82
3.2 Observations and results . . . . . . . . . . . . . . . . . . . . . . . 84
3.3 Discussion . . . . . . . . . . . . . . . . . . . . . . . . . . . . . . . 85
3.3.1 Dust emission . . . . . . . . . . . . . . . . . . . . . . . . . 85
3.3.2 Gas emission . . . . . . . . . . . . . . . . . . . . . . . . . 89
3.3.3 Nature of the disc . . . . . . . . . . . . . . . . . . . . . . . 94
3.3.4 Disc evolution . . . . . . . . . . . . . . . . . . . . . . . . . 95
3.4 Conclusions . . . . . . . . . . . . . . . . . . . . . . . . . . . . . . 99
4 The impact of pre-main sequence stellar evolution on midplane
snowline locations and C/O in planet forming discs 101
4.1 Context . . . . . . . . . . . . . . . . . . . . . . . . . . . . . . . . 102
4.2 Methods . . . . . . . . . . . . . . . . . . . . . . . . . . . . . . . . 105
4.2.1 Physical Modelling . . . . . . . . . . . . . . . . . . . . . . 105
4.2.2 Chemical model . . . . . . . . . . . . . . . . . . . . . . . . 108
4.3 Results . . . . . . . . . . . . . . . . . . . . . . . . . . . . . . . . . 108
4.3.1 Midplane temperature . . . . . . . . . . . . . . . . . . . . 108
4.3.2 Snowline locations . . . . . . . . . . . . . . . . . . . . . . 110
4.3.3 Disc Composition . . . . . . . . . . . . . . . . . . . . . . . 114
4.4 Discussion . . . . . . . . . . . . . . . . . . . . . . . . . . . . . . . 116
4.4.1 Application to HR8799 . . . . . . . . . . . . . . . . . . . . 116
4.4.2 Alternative chemistry model . . . . . . . . . . . . . . . . . 124
4.4.3 Implications for planet formation . . . . . . . . . . . . . . 125
12
CONTENTS
4.4.4 Implications for dust growth to pebble sizes . . . . . . . . 126
4.5 Conclusions . . . . . . . . . . . . . . . . . . . . . . . . . . . . . . 131
5 Conclusions 133
5.1 Summary . . . . . . . . . . . . . . . . . . . . . . . . . . . . . . . 134
5.2 Future work . . . . . . . . . . . . . . . . . . . . . . . . . . . . . . 139
5.2.1 Disc masses . . . . . . . . . . . . . . . . . . . . . . . . . . 139
5.2.2 Tracing spirals with gas line observations . . . . . . . . . . 140
5.2.3 HD141569 . . . . . . . . . . . . . . . . . . . . . . . . . . . 140
5.2.4 Connecting stellar & disc evolution . . . . . . . . . . . . . 142
References 187
13

CONTENTS
14
List of Figures
1.1 Examples of some of the first direct imaging of protoplanetary disc
with the HST. This HST image of protoplanetary discs in the Orion
nebula, with a magnified view of six discs appearing in silhouette
and displaying signs of evidence of photoevaporation from external
sources. Credit: NASA, ESA, M. Robberto (Space Telescope Sci-
ence Institute/ESA), the Hubble Space Telescope Orion Treasury
Project Team and L. Ricci (ESO) . . . . . . . . . . . . . . . . . . 5
1.2 Left: Near IR SPHERE/IRDIS DPI image of the disc HD 97048,
overlaid with the best fitting ellipses corresponding to ring (dashed
blue lines) and gaps (white lines). Image and fits from (Gin-
ski et al., 2016). Middle: Spiral arms revealed in the Ks band
VLT/NACO image of HD 135344B (Garufi et al., 2013) . Right:
Polarised light obsverd by SPHEER in the H band shows clumpy
spiral arms over a range of spatial scales in the disc AB Aur (Boc-
caletti et al., 2020). All images have their brightness scaled with
r2. . . . . . . . . . . . . . . . . . . . . . . . . . . . . . . . . . . . 6
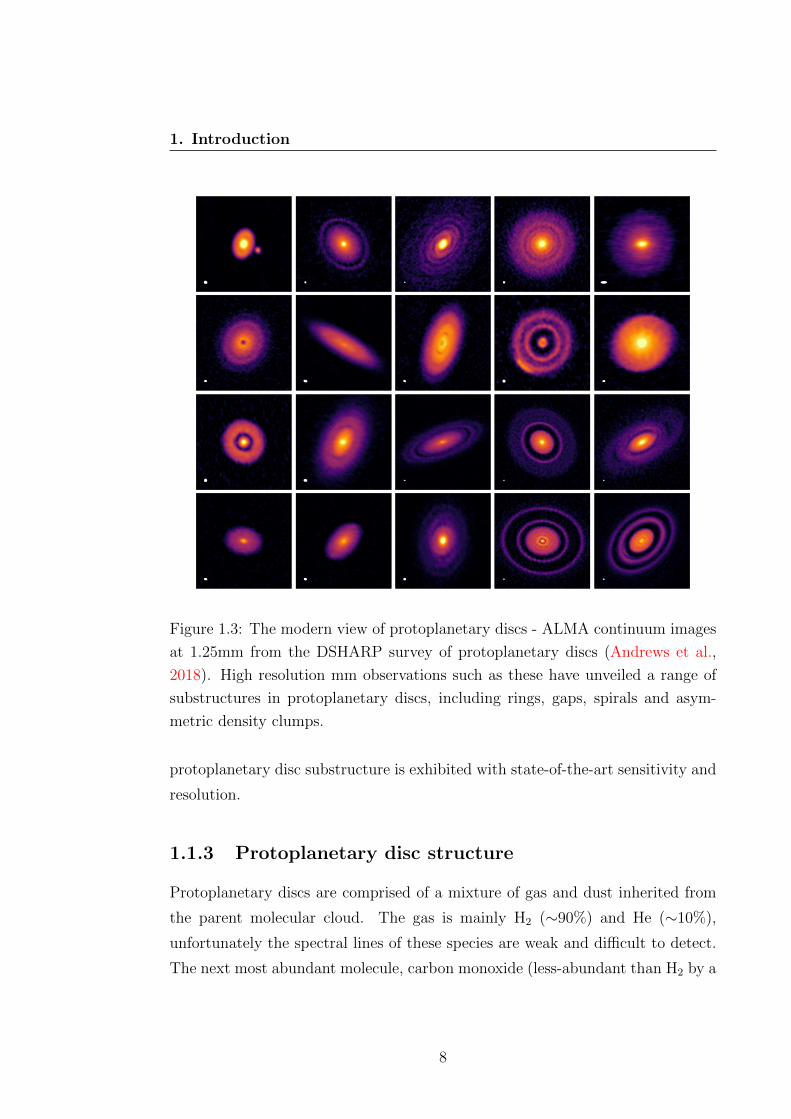
1.3 The modern view of protoplanetary discs - ALMA continuum im-
ages at 1.25mm from the DSHARP survey of protoplanetary discs
(Andrews et al., 2018). High resolution mm observations such
as these have unveiled a range of substructures in protoplanetary
discs, including rings, gaps, spirals and asymmetric density clumps. 8
15
LIST OF FIGURES
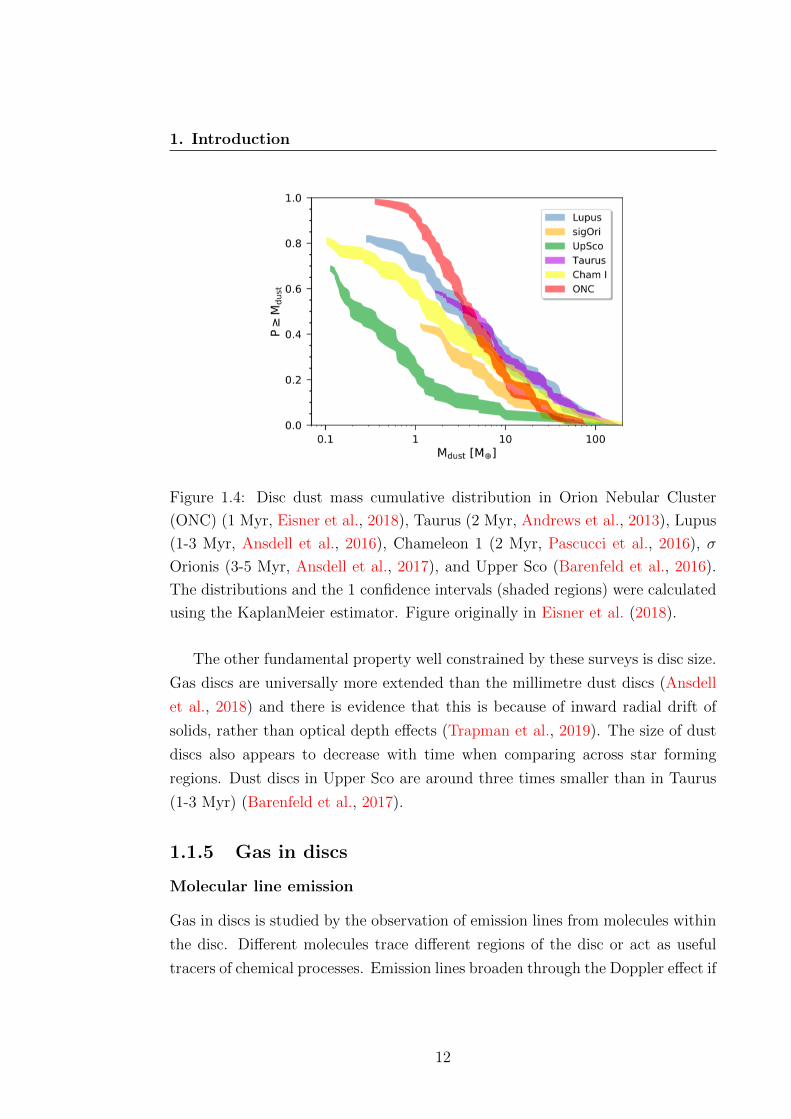
1.4 Disc dust mass cumulative distribution in Orion Nebular Cluster
(ONC) (1 Myr, Eisner et al., 2018), Taurus (2 Myr, Andrews et al.,
2013), Lupus (1-3 Myr, Ansdell et al., 2016), Chameleon 1 (2 Myr,
Pascucci et al., 2016), σ Orionis (3-5 Myr, Ansdell et al., 2017),
and Upper Sco (Barenfeld et al., 2016). The distributions and the
1 confidence intervals (shaded regions) were calculated using the
KaplanMeier estimator. Figure originally in Eisner et al. (2018). . 12
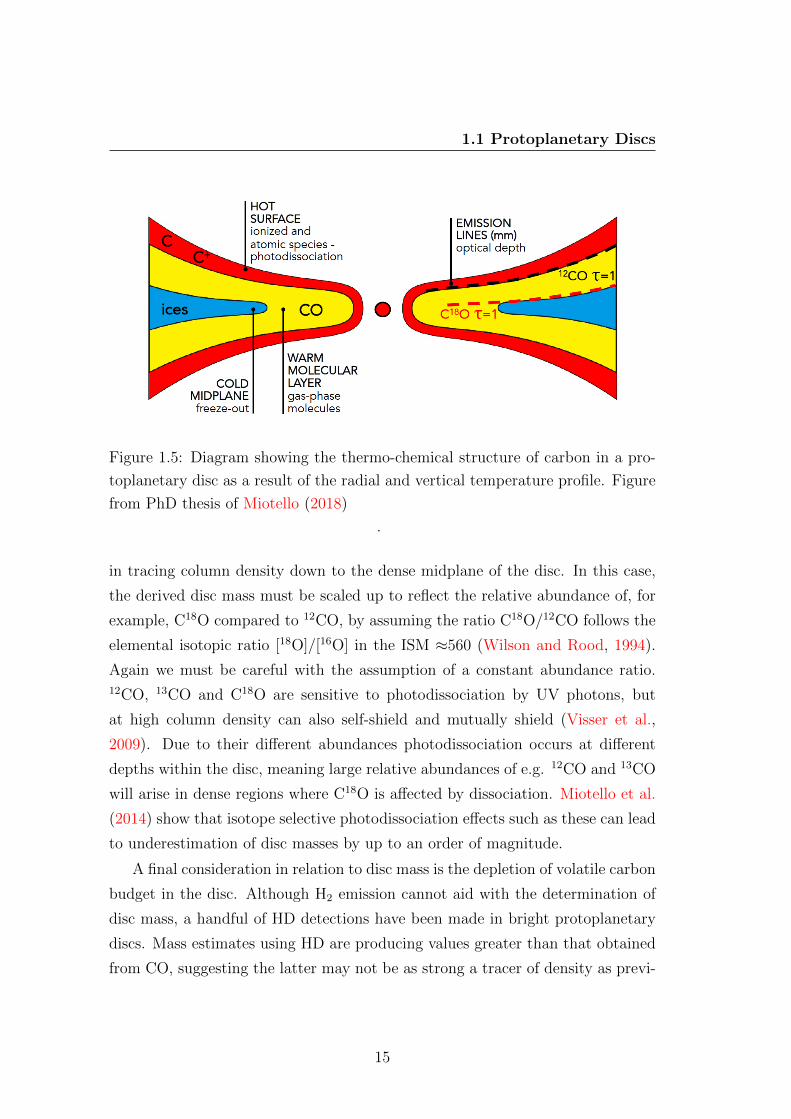
1.5 Diagram showing the thermo-chemical structure of carbon in a pro-
toplanetary disc as a result of the radial and vertical temperature
profile. Figure from PhD thesis of Miotello (2018) . . . . . . . . . 15
1.6 A diagram showing the cross section of a protoplanetary disc and
the regions of the disc that contribute to difference components of
the SED, from (Dullemond et al., 2007). . . . . . . . . . . . . . . 19
1.7 From Draine (2006). Lower panel: Opacity of amorphous silicate
spheres with size distribution dn/da ∝ a−3.5 for 3.5A≤ a ≤ amax.
Curves are labelled by amax. Upper panel: β ≡ d lnκ/d lnν for
selected amax; β(1mm)≤ 1 is found for amax ≥ 3mm. . . . . . . . 21
1.8 An illustration of the stages of star formation and disc evolution.
On the right is a sketch of the physical geometry of the system at
each stage, and the left is a typical spectral energy distribution at
each stage, where yellow represents the contribution from the star,
and red the contribution from the surrounding material. Figure
originally from Mulders (2013). . . . . . . . . . . . . . . . . . . . 24
1.9 ALMA image of the debris ring around Fomalhaut. This images
was produced though a mosaic of images observed at a wavelength
of 1.3mm. Image from (Macgregor et al., 2017) . . . . . . . . . . 26
1.10 Dust mass estimates made from sub-mm observations as function
of stellar age stars of spectral type A and B-type. Figure from
Wyatt et al. (2015), in original form from Panic et al. (2013).
Highlighted with blue squares are two Herbig discs: HD100546
and HD163296, two hybrid discs: HD141569 and HD21997, and
two debris discs: HR4796 and Beta Pic. . . . . . . . . . . . . . . . 29
16
LIST OF FIGURES
1.11 ALMA observations of dust continuum (top left) and CO gas ro-
tational emission from the β Pic disc, viewed here almost edge-on.
On the right hand side is a deprojection of the gas emission, re-
configured so as to give a pole-on view. Figure adapted from Dent
et al. (2014). . . . . . . . . . . . . . . . . . . . . . . . . . . . . . . 31
1.12 12CO rotational emission plotted against continuum emission in
two different ALMA wavelength bands for T Tauri, Herbig, debris
and hybrid discs. Binaries are plotted as open circles. Hybrid
discs lie above the general trend at both wavelengths. Figure from
Pericaud et al. (2017). . . . . . . . . . . . . . . . . . . . . . . . . 32
1.13 Pre-main sequence evolutionary tracks using the results of the
MIST project (Choi et al., 2016; Paxton et al., 2010) on a Hertzsprung-
Russel diagram. Tracks are plotted for a range of stellar masses
from 0.1–20 M�. Low mass stars descend vertically onto the main
sequence whereas high mass stars travel further horizontally on the
plot. The tracks are plotted until the point at which the star joins
the main sequence. . . . . . . . . . . . . . . . . . . . . . . . . . . 34
1.14 Demonstrating the importance of the sampling function and good
uv-space coverage. The panels show three synthetic images of Ja-
far the Leeds Lion generated using three different observing set
ups. In each row the configuration of antennas is shown on the
left, the uv coverage is shown in the middle and on the right is
the final ‘image’. The top row simulates a snapshot integration
with 50 antennas in a linear configuration. The second row uses
the same antenna configuration as the top row, but with a much
longer integration time that utilises the rotation of the Earth to
maximise uv coverage. The bottom row uses the ALMA extended
configuration with 50 antennas and a long integration time. Syn-
thetic observations visualised using Pynterferomter, available at:
www.jb.man.ac.uk/pynterferometer/ . . . . . . . . . . . . . . . . 38
17
LIST OF FIGURES
2.1 Previous multi-wavelength imaging of HD100546 on shorter spatial
scales within the ∼0.9 arcsec synthesized beam of the ALMA im-
ages presented here. Top left: Near-IR polarised scattered light
image created by Avenhaus et al. (2014), image shown is a Ks
filter PDI image of HD100546 annotated with detected features.
Green dots show the proposed locations of planets. Top right:
SPHERE/ZIMPOL Qφ polarized light image of HD 100546 at vis-
ible wavelengths from (Garufi et al., 2016). Bottom left: Sum of
GPI and MagAO imaging presented in (Follette et al., 2017) anno-
tated with identified features. Bottom right: Radio interferom-
etry image from data taken with ATCA at ∼7 mm and presented
in Wright et al. (2015). Contour levels are at 5, 7, 9, 11, 13, 15, 18,
21, 23, 25.7 times the RMS of 0.03 mJy/beam. The synthesized
beam is 0.200.18 arcsec. . . . . . . . . . . . . . . . . . . . . . . . 48
2.2 On the left is the contour map of the continuum emission, contours
increase in base 3 logarithms from 3σ to 729σ. Intensity weighted
velocity maps of the two isotopologue transitions are shown over-
laid with contours of the integrated line emission. For 13CO(2-1),
contours start at 3σ and rise in steps of 5σ to 78σ, for C18O(2-1)
contours start at 3σ, and rise in steps of 3σ up to 45σ. Dashed
contours are negative. Beam ellipses and a scale bar of 100 au are
shown in each image. North is up and West is right, dashed lines
follow the major and minor axis of the disc, assuming a position
angle of 144◦ and join at the stellar position given by GAIA. . . . 51
2.3 Overlaid contour maps of the isotopologue channels at system ve-
locity for determining disc position angle. Contours increase in
multiples of 3 from 3σ, where for individual channels, σ= 23 mJy kms−1
/beam for 13CO and 11 mJy kms−1 /beam for C18O. The dashed
black line represents the adopted minor axis corresponding to a
position angle of 144◦. . . . . . . . . . . . . . . . . . . . . . . . . 52
18
LIST OF FIGURES
2.4 Spectrum from the spectral windows centred on the CO isotopo-
logue lines. The C18O line flux densities have been multiplied by
a factor of 5 in order to make the profile easily visible in the plot.
The x axis is measured relative to the system velocity of 5.42 kms−1. 53
2.5 Dust mass calculated over a range of temperatures and maximum
grain sizes assuming optically thin emission measured at 1.3 mm. 57
2.6 The colour image shows the PSF deconvolved HST ACS image of
HD 100546 in the F435W band. Overlaid in white contours is the
integrated C18O (2-1) emission observed by ALMA, with contours
at (-2,2,3,4,5)×σ18, dashed lines are negative contours. Structures
in the scattered light image initially identified by Ardila et al.
(2007) are indicated with black ellipses. The black circle of radius
1.′′0 represents the HST coronograph. . . . . . . . . . . . . . . . . 61
2.7 Emission maps of 1.3mm continuum and C18O (2-1) with overlaid
dashed ellipses with a position angle of 144◦ and inclination of 43◦.
These correspond to rings with a deprojected radius of 100 au and
300 au. The star marks the GAIA position of HD 100546 on which
the ellipses are centered. Contours in the top panel range from (5-
75)×σ in steps of 10σ and in the bottom panel from (3-15)×σ in
steps of 2σ. Dashed contours are negative. High level contours
internal to the ellipse are omitted for clarity. . . . . . . . . . . . . 64
2.8 Slice are extracted from the emission maps of each tracer along
the minor axis. Solid lines show the slice towards the southwest,
dashed lines show the slice to the northwest. The horizontal purple
line indicates the rms measured in each image. . . . . . . . . . . 65
2.9 Calculated temperature, T+T∆T, required to produce the ob-
served variation in flux in segments of the disc from the C18O
moment 0 map, over a range of assumed midplane temperatures.
The dashed line indicates ∆T=0. . . . . . . . . . . . . . . . . . . 69
19
LIST OF FIGURES
2.10 Azimuthally averaged flux plotted against radius in green for both
the continuum and line emission. Grey lines show the averages
obtained for regions off-source (no emission). The shaded area
represents the 2σ level computed from these off-source averages.
Dotted black lines are least-squares fitted Gaussians to the flux
profiles. Horizontal black lines give the spatial scale corresponding
to the deprojected FWHM of the synthesized beam. . . . . . . . 70
2.11 Surface density profiles calculated form the radial profiles in Figure
2.10. The dotted line represents the surface density of the 1.3 mm
continuum image scaled up by a factor g/d=100. . . . . . . . . . . 72
2.12 The ratio 13CO/C18O is plotted against de-projected radius and
coloured in green, the calculated optical depth of C18O as a func-
tion of radius is plotted in purple. . . . . . . . . . . . . . . . . . . 74
2.13 Upper panel : Radially dependent spectral index, α, calculated
using ALMA continuum observations at 867 µm and 1.3 mm for
the disc of HD 100546. The upper and lower green lines give the
maximum and minimum curve considering flux calibration uncer-
tainties. The bar indicates a length of 50 au, approximately half
the beam width. Lower panel: Radially dependent opacity index,
β, over-plotted with horizontal lines that show the opacity cal-
culated by Draine (2006) for a dust population with amax of cm-
(dotted), mm- (dash-dot) and ISM grains (dashed), assuming a
grain size distribution of dn/da ∝ a−3.5. Where the lower-bound
curve crosses these lines, the area under the curve is coloured ac-
cording to the key. Error bars are propagated from noise in the
image (insets of Figure 2.10), and are barely visible. The x-axis is
shown up to 230 au, the detected size of the 867 µm disc (Walsh
et al., 2014a). . . . . . . . . . . . . . . . . . . . . . . . . . . . . . 75
2.14 Optical depth of the 1.3 mm emission as a function of de-projected
radius calculated for a range of maximum grain sizes (amax) in the
MRN grain size distribution. . . . . . . . . . . . . . . . . . . . . . 77
20
LIST OF FIGURES
2.15 βmm calculated using temperature profiles calculated with a power
law with varying T100. Horizontal lines are the same as in the lower
panel of Figure 2.13. . . . . . . . . . . . . . . . . . . . . . . . . . 78
3.1 SEDs of typical protoplanetary disc HD163296, the youngest hy-
brid disc HD141569 and 40Myr hybrid disc 49 Ceti. Fluxes have
been scaled to a distance from Earth of 100pc. Grey lines show
SEDs from radiative transfer models of HD141569 built using the
outer ring properties from Biller et al. (2015),and dust masses cal-
culated here. . . . . . . . . . . . . . . . . . . . . . . . . . . . . . . 83
3.2 Azimuthally averaged flux profile following the deprojection of
coordinates from the 1.3 mm image of HD 141569 (blue), 12CO
(green) and 13CO (red). Vertical black lines show the radial lo-
cations of rings identified in scattered light. Peak intensities for
1.3 mm continuum, 12CO and 13CO are 1.74 mJy/beam, 1.06 and
0.25 Jy km/s/beam respectively. Coloured dotted lines show NW
(upper) and SE (lower) cuts of the 12CO and 13CO maps along
the position angle of the 13CO peak. The shaded regions show
the variation of the profile when changing inclination of the source
by +/-10◦. Error bars are calculated as described in the text, the
coloured dashed lines represent the noise level after averaging for
each curve. . . . . . . . . . . . . . . . . . . . . . . . . . . . . . . . 86
3.3 13CO emission is shown in the colour map and contoured at levels
of (3,4,5,6)×σ13, with σ13=0.040 Jy km/s /beam. The red ellipses
show the position of the HST rings with parameters from Biller
et al. (2015). The black ellipse shows the location of the mm ring
detected in the 1.3 mm continuum image. . . . . . . . . . . . . . 88
3.4 Map of the optical depth of 12CO, the colour map is plotted for
regions of the disc where 13CO > 3σ13 is detected. Overlaid in
solid black contours of (10,20,30,40)×σ12 (σ12 = 0.064 Jy km/s
/beam) is the 12CO integrated intensity map convolved with the
larger beam and dashed black contours show 13CO as in Figure 3.3. 90
21
LIST OF FIGURES
3.5 Diagram showing observed structure in HD 141569. Greyscale
shows the 1.3mm continuum map. Overlaid is the previous detec-
tion of 13CO(2-1), with contours at (3,4,5,6)σ13,13CO(3-2) with
contours at (10,20,30,40)σ12 and the positions of rings identified
by ALMA and in scattered light (Biller et al., 2015; Perrot et al.,
2016). . . . . . . . . . . . . . . . . . . . . . . . . . . . . . . . . . 97
3.6 Azimuthally averaged profiles of the dust and the most optically
thin CO isotopologue observed by ALMA around three A type
stars. Dashed grey lines denote the positions of rings detected in
the system. For HD 141569 the profile of ALMA detected 12CO is
also plotted. Inset are images of the dust continuum at 1.3mm for
HD 141569 and 870µm for the other discs . The dashed line in the
HD 141569 image denotes position of the mm ring. Horizontal lines
represent the FWHM of the synthesising beam for each profile.
Total gas mass estimates are taken form the literature and assume
ISM abundances. . . . . . . . . . . . . . . . . . . . . . . . . . . . 98
4.1 Results of the stellar evolution models, following four stellar masses
for 10 Myr. Dotted lines mark the isochrones for selected timesteps
in the stellar evolution as labelled. . . . . . . . . . . . . . . . . . . 106
4.2 Snapshots of the midplane temperature as a function of radius
around stars of 0.5, 1, 2 and 3 M� at different stellar ages. Each
panel represents a different snapshot in time, each line represents
a disc around a different star as labelled in the key. . . . . . . . . 110
4.3 Midplane temperature as a function of radius at different times for
different M∗. Each panel shows a model with a different central
star (labelled in the bottom left corner) and each curve represents a
different time step, with the lightest colour representing the earliest
time. The arrow on each plot links the 4 curves in chronological
order. . . . . . . . . . . . . . . . . . . . . . . . . . . . . . . . . . 111
22
LIST OF FIGURES
4.4 Position of the CO (T=20K, left panel) and CO2 (T=47K, right
panel) snowlines in the disc midplane around stars of different mass
over a range of time steps. Each model has a total disc mass of
0.1 M�. Crosses show the positions of N2H+ rings, tracing the
CO snowline location of protoplanetary discs GM Aur, LkCa15,
DM Tau, HD163296 and TW Hydra. The disc temperatures for
each snowline are: GM Aur 24-28 K, LkCa15 21-25 K, DM Tau
13-18 K, HD163296 25 K and TW Hydra 17 K. . . . . . . . . . . 112
4.5 C/O in the gas (solid line) and solid phase (dotted line) for models
at 1 Myr with blue lines showing the model with a 0.5 M� host
star, and red lines showing a 3 M� host star. No drift or transport
are included in this instance. The gas phase line is plotted up to
the location of the CO snowline in the midplane, taken to be at
T=20K. Horizontal lines above the C/O curves denote the region
for which gas phase C/O=1 for each of the models and are colour
coded accordingly. . . . . . . . . . . . . . . . . . . . . . . . . . . 114
4.6 C/O in the gas (solid line) and solid phase (dotted line) for models
with a 3 M� host star and no drift or transport included. The
red lines show the model with stellar parameters at 1 Myr, the
black lines show the model at 5 Myr. The gas phase line is plotted
until the location of the CO snowline in the midplane, taken to be
at T=20 K. Horizontal lines above the curves denote the region
for which gas phase C/O=1 for each of the models and are colour
coded accordingly. . . . . . . . . . . . . . . . . . . . . . . . . . . 115
23
LIST OF FIGURES
4.7 The three elements of the HR8799 disc model. Left hand side:
Ratio of carbon to oxygen abundance in the gas phase (solid line)
and solid phase (dotted line) as a function of radius. Shaded ar-
eas mark the location of the giant planets in the HR8799 system,
black circles are plotted at the corresponding C/O retrieved for
their atmosphere. Each panel shows a different time step in the
evolution of the model as is labelled in the top right corner of each
panel. Timesteps are chosen to reflect key points as referred to
in the text. The gas phase C/O line is plotted up until the CO
snowline in the midplane, taken to be at 20K. Right hand side:
On the top is the evolution of T(R) in the model for a 1.5 M� star.
On the bottom is an HR diagram comparing the pre-MS evolution
of a 1.5 M� star to the evolutionary tracks in Figure 4.1. . . . . . 118
4.8 The proportion of material in the exoplanetary atmosphere that
originated as gas phase disc material, calculated using Equation
2 in order to reproduce the retrieved atmospheric C/H, O/H and
C/H for the exoplanet HR8799b. The data is plotted for all times
at which the CO snowline is radially exterior to the HR8799b’s
orbital radius. . . . . . . . . . . . . . . . . . . . . . . . . . . . . 123
4.9 Same as Figure 4.8 for the exoplanet HR8799c. . . . . . . . . . . 123
4.10 Alternative chemical model used as presented in Madhusudhan
et al. (2014) and used as ‘Case 1’ in Booth et al. (2017)) . . . . . 125
4.11 In each panel the maximum grain size is plotted as a function of
radius for disc models at different time steps. At each time step
the results are shown for disc models with different masses of host
star plotted as different colours. An indication of the results for
a model using stellar parameters that do not evolve, with values
adopted from 1 Myr, are plotted in grey. . . . . . . . . . . . . . . 128
4.12 Surface density profile as a result of dust evolution in disc models
with central stars of mass 0.5 and 3 M� for timesteps of 1 Myr. . 130
24
LIST OF FIGURES
5.1 Mass of currently detected exoplanets is plotted as a function of
the orbital period of the exoplanet. Data points are coloured by
the method used to detect the exoplanet as described by the key
on the right hand side. Direct imaging detects the exoplanets with
the lowest frequency, but is the only method by which planets
on wide orbits can be investigated. Data and plot from exoplan-
etarchive.ipac.caltech.edu, correct as of 19th February 2020. . . . 136
25

LIST OF FIGURES
26
Chapter 1
Introduction
1
1. Introduction
1.1 Protoplanetary Discs
Protoplanetary discs are the astrophysical environment in which exoplanets are
built and born. Comprised of gas and dust orbiting a young star, these discs
simultaneously feed the growing star and mark the beginning of the planet for-
mation process. Characterising these objects through observational evidence and
theoretical study reveals to astronomers the properties of the local environment
in which planet formation can take place. The physical structures of discs are
imprinted with the signatures of mechanisms for planet formation, the signs of
interactions with other nearby systems and clues as to the stage of evolution
the environment has reached. Astronomers can use these hints to reconstruct a
disc’s past in order to learn how much of an impact a planet can have in perturb-
ing the disc that hosts it, and to what extent the initial conditions in the local
environment dictate the properties of the planets that form there.
Remarkable progress has been made in both the theoretical and observational
efforts of the field, meaning that protoplanetary discs and the physics within them
can now be constrained with unprecedented detail. Meanwhile missions launched
to detect new worlds around distant stars provide a wealth of information on the
properties of exoplanets and the architecture of planetary systems. But there
is a long way still to go and many big questions still awaiting an answer. How
exactly do the discs we observe, and the planet formation mechanisms we define,
produce the ‘zoo’ of over 4000 exoplanets that have been detected?
This thesis explores the physical properties of discs around intermediate mass
stars at various stages of evolution through observations and disc modelling. In
the rest of Chapter 1 this thesis is put into context with the progress in the field
so far. Chapter 2 focuses on characterising the distribution of gas and dust in
a massive, gas-rich protoplanetary disc believed to be hosting embedded planets
through millimetre-wavelength interferometric observations. In Chapter 3 a sim-
ilar approach is applied to a disc showing a markedly different stage of evolution;
one that is more advanced and approaching the end of the protoplanetary disc
phase. In Chapter 4, radiative transfer modelling is combined with models of
pre-main sequence stellar evolution and with modelling of midplane evolution in
protoplanetary discs to explore why the discs hosted by intermediate mass stars
2
1.1 Protoplanetary Discs
differ from those around their lower mass counterparts. The impact of stellar
evolution on the conditions in the midplane are quantified and applied to the
system of intermediate mass star HR8799, host to four giant planets. In Chapter
5 the conclusions of this thesis are summarised and promising opportunities for
future work are discussed.
1.1.1 Star formation
Protoplanetary discs originate as a byproduct of the star formation process. In
order to understand how protoplanetary discs form, and to provide a context
within the wider cosmos, we must first understand the processes by which stars
are formed.
At the beginning are giant molecular clouds; massive (≥ 104 M�) dense regions
of 10-100pc in size. Molecular clouds obscure their inner regions from exterior
starlight leading to a very cool environment with temperatures of ∼10 K. In
order to form a star, these giant clouds must fragment into progressively smaller,
concentrated clumps of dense material.
Molecular clouds collapse due to gravity, and in doing so form dense clumps
(Williams et al., 2000) and elongated filamentary structures. The latter appears
to be ubiquitous in giant molecular clouds (GMCs) and can be seen in obser-
vations of gas (e.g. in Orion Bally et al., 1987) and dust (e.g. in the Gould
Belt Andre et al., 2010). These filaments have an average length of around 0.1pc
(Arzoumanian et al., 2014).
The densest filaments go on to form protostellar cores. Gravitational collapse
of a filament occurs when the mass per unit length exceeds the critical mass
of isothermal structure. The final collapse of a ‘pre-stellar’ core, with density of
around n∼ 104−105 cm−3, produces a protostellar object. Often stars are formed
in multiple systems, through the growth of two separate fragments from the same
molecular cloud, or through the fragmentation of a massive circum-primary disc
to form companions (e.g. simulations of protobinary systems by Bate, 2000).
The majority of stars are in multiple systems, massive stars in particular are
more likely to have companions (Raghavan et al., 2010, and references therein)
3
1. Introduction
and this has a significant influence on the future of a system. For example bi-
nary interaction dominate the evolution of higher mass stars (Sana et al., 2012)
and dynamical interactions between partners in a system can result in truncation
or complete dispersal of the circum-primary/circum-secondary discs. This thesis
focuses mainly on single star systems. Conservation of angular momentum in
the collapsing material leads to the formation of an accretion disc comprised of
gas and dust from the pre-stellar core, orbiting the protostar. The accretion disc
simultaneously feeds the central object and provides the environment in which
planet formation begins, and so its formation marks the birth of the ‘protoplan-
etary’ disc.
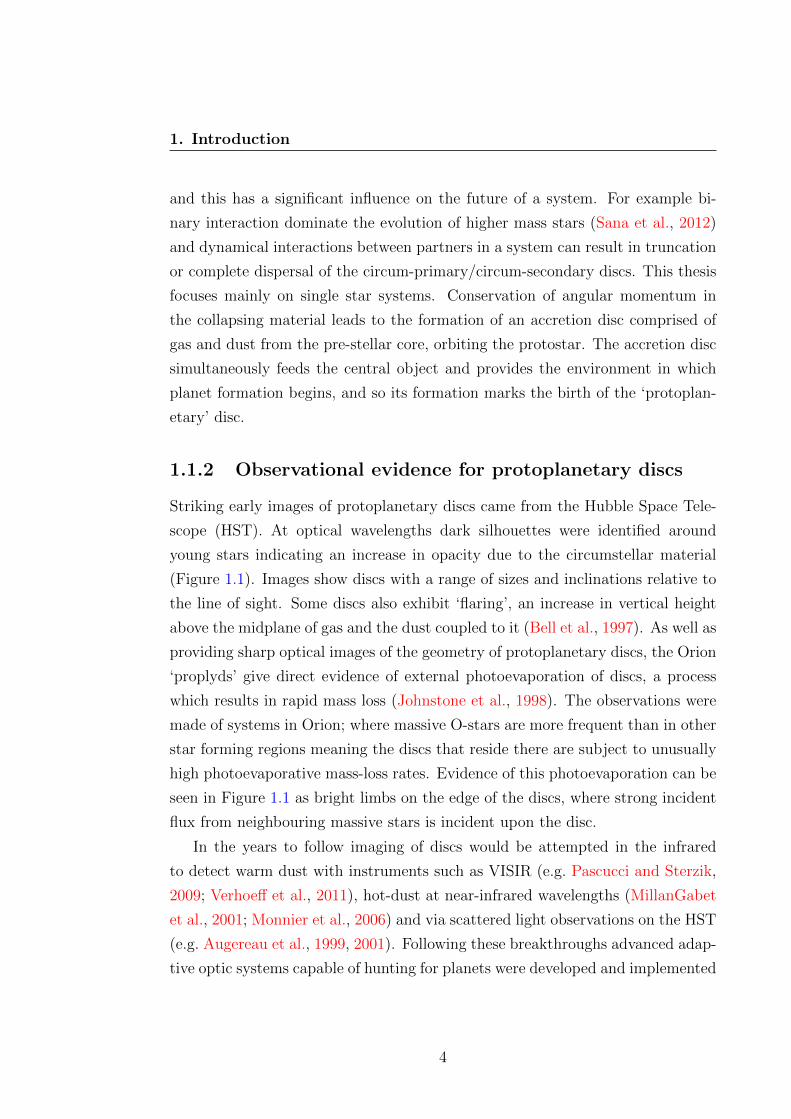
1.1.2 Observational evidence for protoplanetary discs
Striking early images of protoplanetary discs came from the Hubble Space Tele-
scope (HST). At optical wavelengths dark silhouettes were identified around
young stars indicating an increase in opacity due to the circumstellar material
(Figure 1.1). Images show discs with a range of sizes and inclinations relative to
the line of sight. Some discs also exhibit ‘flaring’, an increase in vertical height
above the midplane of gas and the dust coupled to it (Bell et al., 1997). As well as
providing sharp optical images of the geometry of protoplanetary discs, the Orion
‘proplyds’ give direct evidence of external photoevaporation of discs, a process
which results in rapid mass loss (Johnstone et al., 1998). The observations were
made of systems in Orion; where massive O-stars are more frequent than in other
star forming regions meaning the discs that reside there are subject to unusually
high photoevaporative mass-loss rates. Evidence of this photoevaporation can be
seen in Figure 1.1 as bright limbs on the edge of the discs, where strong incident
flux from neighbouring massive stars is incident upon the disc.
In the years to follow imaging of discs would be attempted in the infrared
to detect warm dust with instruments such as VISIR (e.g. Pascucci and Sterzik,
2009; Verhoeff et al., 2011), hot-dust at near-infrared wavelengths (MillanGabet
et al., 2001; Monnier et al., 2006) and via scattered light observations on the HST
(e.g. Augereau et al., 1999, 2001). Following these breakthroughs advanced adap-
tive optic systems capable of hunting for planets were developed and implemented
4
1.1 Protoplanetary Discs
Figure 1.1: Examples of some of the first direct imaging of protoplanetary disc
with the HST. This HST image of protoplanetary discs in the Orion nebula,
with a magnified view of six discs appearing in silhouette and displaying signs
of evidence of photoevaporation from external sources. Credit: NASA, ESA, M.
Robberto (Space Telescope Science Institute/ESA), the Hubble Space Telescope
Orion Treasury Project Team and L. Ricci (ESO)
on the Keck and Gemini telescopes (e.g. the four giant planets in HR8799, Marois
et al., 2008) and later with SPHERE on the VLT (e.g. two planets within the gap
of transition disc PDS 70, Haffert et al., 2019). With this observing technique
‘backlit’ images of protoplanetary discs are produced from light that has been
scattered or reflected into the line of site of the observer. Analysis of the im-
ages allows for characterisation of the inner dust disc in individual systems (e.g.
HD141569 with MagAO/GPI Follette et al., 2017) of for wider surveys as done in
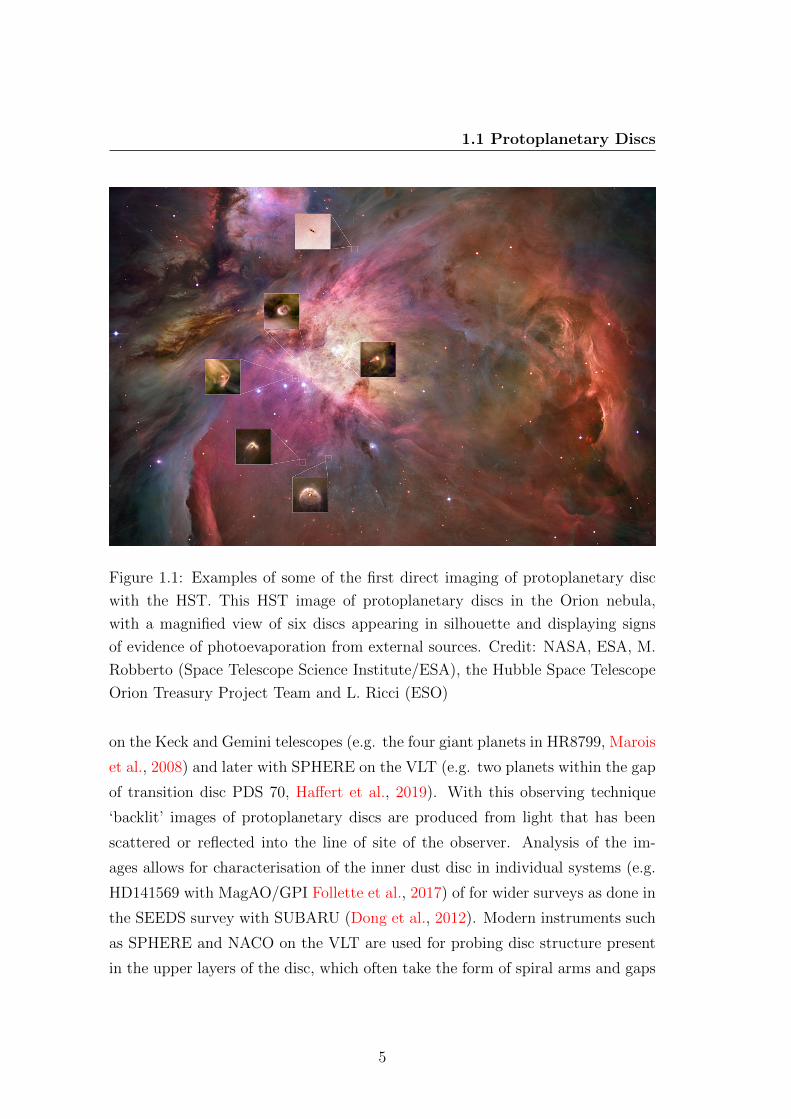
the SEEDS survey with SUBARU (Dong et al., 2012). Modern instruments such
as SPHERE and NACO on the VLT are used for probing disc structure present
in the upper layers of the disc, which often take the form of spiral arms and gaps
5
1. Introduction
Figure 1.2: Left: Near IR SPHERE/IRDIS DPI image of the disc HD 97048,
overlaid with the best fitting ellipses corresponding to ring (dashed blue lines)
and gaps (white lines). Image and fits from (Ginski et al., 2016). Middle: Spiral
arms revealed in the Ks band VLT/NACO image of HD 135344B (Garufi et al.,
2013) . Right: Polarised light obsverd by SPHEER in the H band shows clumpy
spiral arms over a range of spatial scales in the disc AB Aur (Boccaletti et al.,
2020). All images have their brightness scaled with r2.
in the disc as demonstrated in Figure 1.2. Boccaletti et al. (2020); Garufi et al.
(2013); Ginski et al. (2016).
Imaging of protoplanetary discs requires angular resolution only achieved by
a handful of leading modern day instruments, but evidence of circumstellar gas
and dust can also be found from analysing the photometry of a disc over a range
of wavelengths, known as its spectral energy distribution (SED). Infrared wave-
lengths are particularly useful for alerting observers to not only the presence of
protoplanetary discs, but also their structure (Dullemond and Dominik, 2004a;
Hillenbrand et al., 1992; Natta et al., 2001). Starlight absorbed by solid dust
grains is re-emitted at longer wavelengths, resulting in an excess of infrared (IR)
emission relative to the blackbody of the star. The presence of an IR excess in a
young star’s SED therefore provides indirect evidence of circumstellar material.
The greatest leap in observations of protoplanetary discs came through mil-
limetre interferometry (Section 1.4.1). Continuum emission at millimetre wave-
lengths traces thermal emission from cool dust that resides within the midplane
and in the outer regions of the disc. The midplane is a dense, sheltered environ-
ment that remains cool as a result of this shield from radiation. The midplane is
6
1.1 Protoplanetary Discs
also where giant planets are expected to form. Unlike observations made in the
infra-red, millimetre emission is usually optically thin meaning that variations
in the intensity of continuum emission from dust alerts observers to changes in
dust density within the disc. Millimetre emission therefore plays a vital role in
weighing protoplanetary discs (although not without uncertainties; see Section
1.1.6). A further benefit is that millimetre continuum emission originates mostly
from grains of around millimetre sizes, i.e. dust on the verge of becoming ‘peb-
bles’. Dust grains of this size are at a critical juncture in dust evolution and
planet formation models as they demonstrate that dust has grown significantly
from typical ISM grains of around micron sizes. Further growth beyond mm- or
cm-sizes is however very difficult due to fragmentation barriers and increasingly
rapid inward radial drift (Section 1.1.6). Confirming the location and structure
of millimetre grains in the disc is therefore crucial in characterising the potential
sites of planet formation. It is not just studies of dust that benefit from mm
wavelengths; low-level rotational transitions of key mass tracer carbon monoxide
and its less abundant isotopologues fall within millimetre wavelengths. This pro-
vides the opportunity to study the structure and temperature of gas in the disc
whilst simultaneously investigating the dust (Section 1.1.5).
Facilities such as Australia Telescope Compact Array (ATCA) in the southern
hemisphere and the Sub-Millimetre Array (SMA) and Plateau de Bure Interfer-
ometer (PdBI, later renamed NOEMA), in the northern hemisphere led the way
in producing interferometric images of continuum emission from dust and molec-
ular emission from gas in protoplanetary discs. The arrival of the Atacama Large
Millimetre Array (ALMA) provided unprecedented sensitivity and angular res-
olution at millimetre and sub-millimetre wavelengths. Protoplanetary discs can
be probed with incredible accuracy by sub-au angular resolution, and as a result
a wide range of sub-structures have been unveiled within discs including rings,
gaps, spirals and asymmetric density clumps. In fact, sub-structure within discs
appears to be ubiquitous amongst high resolution observations to date, especially
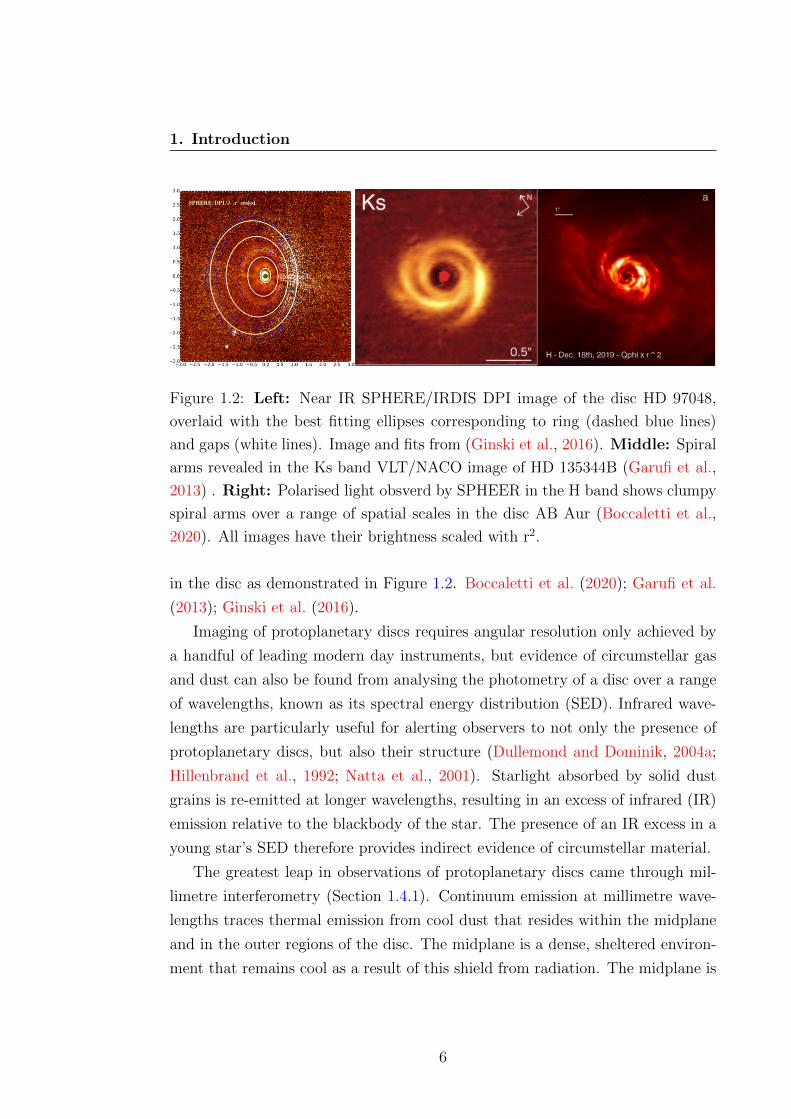
in the case of gaps and rings. Figure 1.3 shows 35 milliarcsecond resolution im-
ages from the ground-breaking Disk Substructures at High Angular Resolution
Project (DSHARP) survey (Andrews et al., 2018), in which the full range of
7
1. Introduction
Figure 1.3: The modern view of protoplanetary discs - ALMA continuum images
at 1.25mm from the DSHARP survey of protoplanetary discs (Andrews et al.,
2018). High resolution mm observations such as these have unveiled a range of
substructures in protoplanetary discs, including rings, gaps, spirals and asym-
metric density clumps.
protoplanetary disc substructure is exhibited with state-of-the-art sensitivity and
resolution.
1.1.3 Protoplanetary disc structure
Protoplanetary discs are comprised of a mixture of gas and dust inherited from
the parent molecular cloud. The gas is mainly H2 (∼90%) and He (∼10%),
unfortunately the spectral lines of these species are weak and difficult to detect.
The next most abundant molecule, carbon monoxide (less-abundant than H2 by a
8
1.1 Protoplanetary Discs
factor of ∼ 10,000 in the ISM), has numerous bright spectral lines over a range of
wavelengths making it the most useful astronomical tracer of density in molecular
clouds and protoplanetary discs.
Dust properties are deduced from observing spectral features of continuum
emission, particularly in the infrared. Dust in the ISM is mostly sub-micron
sized amorphous silicate grains enriched with elements including O, Fe, Mg, Ca
and Al, some crystalline silicates have also been observed in protoplanetary discs
(Kemper et al., 2004; Malfait et al., 1998). Millimetre observations can be used to
calculate opacities in the dust or protoplanetary discs (Isella et al., 2010; Natta
et al., 2006), which are strongly sensitive to grain composition and amax, the
largest grain size in the distribution (Draine, 2006).
Gas is far more abundant than dust in protoplanetary discs. Typically a
canonical ratio of gas to dust mass (g/d) of 100 is adopted based on values from
the ISM. This value does an adequate job in modelling of discs, however significant
evolution of dust and gas occurs over the lifetime of a disc and g/d is unlikely
to remain constant radially, or with time. The uncertainties in estimating total
disc mass from observations of gas and dust emission are significant (discussed in
Sections 1.1.5 and 1.1.6), and prevent a critical verification of this assumption.
Radial structure
Protoplanetary discs are first and foremost accretion discs feeding the central
star, and so to describe their structure we must consider the transport of angular
momentum through the disc. Lynden-Bell and Pringle (1974) were the first to
suggest that a viscous accretion disc could explain known properties of T Tauri
stars. Angular momentum transport in discs is assumed to be driven by turbu-
lence within the disc on length scales that are small in comparison to the disc
scale height. It is still somewhat of a puzzle as to what the specific physical ori-
gin of this turbulence is. However in order to proceed, many parametric models
adopt the Hartmann et al. (1998) description of viscosities in the disc as a time-
independent power law ν ∝ Rγ. Shakura and Sunyaev (1973) introduced a way
to write the ‘effective’ or turbulent viscosity as ν = αcsh still regularly utilised
to this day. This prescription allows for viscosity to be defined only in terms of
9
1. Introduction
the local disc quantities sound speed cs, scale height h and the dimensionless al-
pha parameter α, a constant which describes the efficiency of angular momentum
transport independent of a specific physical origin.
Building from these seminal works and the disc modelling that followed them,
Andrews et al. (2011) define a global surface density radial profile based on mil-
limetre observations of protoplanetary discs and modelling of their SEDs as
Σg = Σc
( RRc
)−γexp[−( R
Rc
)2−γ], (1.1)
where Σg is the surface density of the gas, Rc is a characteristic scaling radius
and Σc the surface density at that radius. This model includes a tapered expo-
nential decay in the outer disc, necessary for reproducing the extended gas and
dust emission regularly detected in outer regions (Hughes et al., 2008).
Vertical structure
The vertical profile of a protoplanetary disc is a balance between the vertical pres-
sure gradient in the gas, and the vertical component of gravity. This gravitational
component is a result of rotation around the central star, i.e. not the gravita-
tional field of the disc, which is assumed to be negligible unless Mdisc ≈ M∗ in
which case disc self-gravity leads to the disc becoming unstable to the formation
of spiral waves in the disc. Assuming the disc to be vertically isothermal and
that pressure in the midplane is defined by P = ρc2, this gives
1
ρ
dP
dz=c2
ρ
dρ
dz. (1.2)
The solution to Equation 1.2 for a thin disc z � r in Keplerian rotation gives
a vertical density profile of
ρ = ρ0e− z2
2h2 , (1.3)
where h is the disc scale height and ρ0 is the midplane density. The midplane
of a disc is dense, resulting in an increased optical depth to starlight meaning that
it becomes an obscured environment that cools to temperatures of around 20 K
10
1.1 Protoplanetary Discs
even at 10s of au. It is in this environment that giant planets are expected to form.
The ratio h/r increases with radius due to the flared disc surface; outer regions
are heated mainly through the capture and reprocessing of starlight from the
surface layers. Dust grains coupled to the gas are suspended vertically above the
midplane in a balance between gas pressure and gravity. The largest grains settle
towards the dense midplane of the disc (Dullemond and Dominik, 2004b). Close
to the inner wall of the disc temperature gradients are steeper and subsequently
viscous heating becomes a dominant factor in determining disc temperature. The
size of the regions over which viscous heating is significant varies depending on
the spectral type of the star and the disc properties, but typically does not stretch
much further than a few au.
An isothermal vertical temperature profile is often adopted in modelling fol-
lowing Chiang and Goldreich (1997), this approximation only holds for regions
close to the midplane, where heating from reprocessed starlight is negligible.
1.1.4 Results from observational surveys
High resolution observations with long integration times are useful in character-
ising individual discs to a great degree of accuracy such as those in Figure 1.3. In
order to determine fundamental properties of discs across statistically significant
sample sizes, a slightly different approach is required. Large demographic surveys
take snapshots of complete populations within known star forming regions to de-
termine fundamental properties of discs. Furthermore the different star forming
regions span a range in ages, and so comparisons between regions can also give
an indication as to expected trends in disc evolution.
One key property constrained in surveys such as these is disc mass. Typical
gas masses for the young discs in Lupus are < 1 MJ (Miotello et al., 2017),
whilst most dust masses range between 10−4 − 10−6 M�. Figure 1.4 compares
the disc dust mass cumulative distribution for star forming regions of different
ages. Between the ∼1 Myr Orion Nebular cluster and 5-10 Myr Upper Sco, dust
masses generally decrease as the discs evolve (See Section 1.2 for discussion of
disc evolution).
11
1. Introduction
Figure 1.4: Disc dust mass cumulative distribution in Orion Nebular Cluster
(ONC) (1 Myr, Eisner et al., 2018), Taurus (2 Myr, Andrews et al., 2013), Lupus
(1-3 Myr, Ansdell et al., 2016), Chameleon 1 (2 Myr, Pascucci et al., 2016), σ
Orionis (3-5 Myr, Ansdell et al., 2017), and Upper Sco (Barenfeld et al., 2016).
The distributions and the 1 confidence intervals (shaded regions) were calculated
using the KaplanMeier estimator. Figure originally in Eisner et al. (2018).
The other fundamental property well constrained by these surveys is disc size.
Gas discs are universally more extended than the millimetre dust discs (Ansdell
et al., 2018) and there is evidence that this is because of inward radial drift of
solids, rather than optical depth effects (Trapman et al., 2019). The size of dust
discs also appears to decrease with time when comparing across star forming
regions. Dust discs in Upper Sco are around three times smaller than in Taurus
(1-3 Myr) (Barenfeld et al., 2017).
1.1.5 Gas in discs
Molecular line emission
Gas in discs is studied by the observation of emission lines from molecules within
the disc. Different molecules trace different regions of the disc or act as useful
tracers of chemical processes. Emission lines broaden through the Doppler effect if
12
1.1 Protoplanetary Discs
the gas is moving along the line of sight of the observer, and as a result spectrally
resolved lines also provide kinematic information. In the case of protoplanetary
discs this can be used to constrain the inclination of the disc relative to the
observers line of sight and its position angle on the sky.
CO is an abundant molecule with well studied chemistry making it a useful
observational tool. It also has a number of less abundant isotopologues that
are readily detectable at similar frequencies. These species are useful tracers of
gas density structure and, through spectral resolution of their emission lines, gas
kinematics in the disc. CO is also the molecule most regularly used to make
estimates of disc mass; a property that is vital to observational and modelling
efforts in the field, but one that is still not accurately measured easily.
Mass estimates
The mass of gas in the disc can be estimated from observations by integrating the
flux received from a molecular emission line and then for an assumed temperature,
calculating how many molecules are required to produce such a flux. This is done
with Equation 1.4
Mgas =4π
hνu,l
Fu,l m d2
Au,l X, (1.4)
where Fu,l is the integrated line flux resulting from a transition from upper energy
level u to lower level l, νu,l is the rest frequency of the transition, d the distance to
the source, m is the mass of the CO molecule and Au,l is the appropriate Einstein
coefficient. Xu is the fractional population of the upper level, assuming that all
energy levels are populated through a Boltzmann distribution
Xu =Nu
Ntotal
=guZe
−EukTk , (1.5)
where gu is the degeneracy of level u, Eu is the energy of that level, Tk is the
kinetic (i.e. disc) temperature and Z is the partition function
Z =∑i
gi e−EikTk . (1.6)
13
1. Introduction
Equation 1.4 provides a direct method for computing disc mass which is not
dependent on any model. This method does however make a number of assump-
tions which introduce large uncertainties into the result it produces.
CO remains in the gas phase until its freezing temperature, which in a pro-
toplanetary disc is ≈20 K (Oberg et al., 2011) , meaning unlike other molecules
it remains in the gas phase for a large fraction of the protoplanetary disc’s radial
extent. At a certain radial separation from the host star, the midplane temper-
ature profile drops below this critical value. CO that is radially interior to the
so-called ‘snowline’ will remain in the gas phase whereas beyond the snowline CO
molecules stick to icy solid grains, a process known as ‘freeze-out’. As a result,
beyond the snowline any CO or CO isotopologues will not be detectable and so
the disc mass estimate is likely to be an underestimate. Molecules of the chosen
tracer can exist in various radial and vertical locations in the disc, and so local
disc temperature is unlikely to be the same across the whole emitting population.
In this thesis, the density tracers used for mass estimates are CO isotopologues
that are assumed to be tracing the column down to the midplane. In the cold,
dense midplane and in the outer disc (where a large proportion of disc mass is
stored) temperatures can drop to levels of around 20K. If temperature is any
lower than this, CO will be frozen out and undetectable. By assuming a minimum
temperature of 20 K, this method provides a firm lower limit on the estimate of
gas mass.
Figure 1.5 shows the regions of the disc in which carbon resides in different
forms. UV absorption lines of 12CO become optically thick at a column density
of 1015 cm−2 (van Dishoeck and Black, 1988), reached in the warm molecular
layers towards the surface of the disc as shown in Figure 1.5. In this case, the
optically thick 12CO emission is not useful for tracing density in the disc as the
observed emission originates only from a thin layer of the disc above the τ = 1
surface. This means that variations in the observed intensity can originate either
from variations in density or in temperature of the local disc in emitting regions.
The optical depth issues can be solved with observations of less abundant
CO isotopologues such as 13CO and C18O, because these species do not become
optically thick until much deeper in the disc, if at all. In discs with optically
thick 12CO emission, optically thin CO isotopologue emission is a powerful tool
14
1.1 Protoplanetary Discs
Figure 1.5: Diagram showing the thermo-chemical structure of carbon in a pro-
toplanetary disc as a result of the radial and vertical temperature profile. Figure
from PhD thesis of Miotello (2018)
.
in tracing column density down to the dense midplane of the disc. In this case,
the derived disc mass must be scaled up to reflect the relative abundance of, for
example, C18O compared to 12CO, by assuming the ratio C18O/12CO follows the
elemental isotopic ratio [18O]/[16O] in the ISM ≈560 (Wilson and Rood, 1994).
Again we must be careful with the assumption of a constant abundance ratio.12CO, 13CO and C18O are sensitive to photodissociation by UV photons, but
at high column density can also self-shield and mutually shield (Visser et al.,
2009). Due to their different abundances photodissociation occurs at different
depths within the disc, meaning large relative abundances of e.g. 12CO and 13CO
will arise in dense regions where C18O is affected by dissociation. Miotello et al.
(2014) show that isotope selective photodissociation effects such as these can lead
to underestimation of disc masses by up to an order of magnitude.
A final consideration in relation to disc mass is the depletion of volatile carbon
budget in the disc. Although H2 emission cannot aid with the determination of
disc mass, a handful of HD detections have been made in bright protoplanetary
discs. Mass estimates using HD are producing values greater than that obtained
from CO, suggesting the latter may not be as strong a tracer of density as previ-
15
1. Introduction
ously thought (Bergin et al., 2013; Favre et al., 2013; Kama et al., 2016). Removal
of carbon may occur through the conversion of CO into more complex molecules
(Yu et al., 2016), locked up in solids towards the midplane (Du et al., 2015) or
through depletion as a result of chemical evolution in the disc driven by X-rays
and cosmic rays (Eistrup et al., 2016).
1.1.6 Dust in discs
Radial Drift
Dust in protoplanetary discs orbits the central star in a Keplerian fashion. The
gas however is affected by a centrally peaked pressure gradient. Assuming vis-
cosity and magnetic fields to be negligible, in a stationary axisymmetric flow
where the star dominates the potential, the radial component of the momentum
equation gives
v2φ,gasr
=GM∗r2
+1
ρ
dP
dr, (1.7)
as given in (Armitage, 2009) where the second term on the right hand side
is negative, because pressure decreases with radius from the star for a centrally
peaked density profile such as in Equation 1.1. This means that gas will always
orbit at a slightly sub-Keplerian velocity, slower then the dust. This creates a
headwind for orbiting dust grains, decelerating their orbital velocity from Kep-
lerian and introducing a radial velocity that carries the dust grain towards the
central star in a process known as radial drift (Weidenschilling, 1977). Radial
drift results in a radial size-sorting of particles because the drag force increases
for grains of larger surface area. The smallest grains remain in the outer disc,
whereas larger grains approaching mm sizes drift inwards. Radial drift timescales
for particles in the outer regions of the disc (>100 au) are of order 105 years, how-
ever disc lifetimes are of order 106− 107 years, meaning the particles in the outer
disc should have already drifted onto the star.
Retention of large grains in the outer disc, or alternatively some form of
continuous replenishment, therefore seems to be essential in order to explain
the observational data (Birnstiel and Andrews, 2013; Klahr and Bodenheimer,
16
1.1 Protoplanetary Discs
2006). Local maxima in gas density due to pressure bumps can prevent radial
drift and create ideal locations for further growth of dust (Pinilla et al., 2012b;
Weidenschilling, 1977; Whipple, 1972). Massive planets capable of opening a
cavity in the gas distribution create a large pressure bump at the edge of the
orbit, resulting in radial dust traps that produce ring shaped dust accumulation
(2012a). All of the rings analysed in the high resolution ALMA observations in the
DSHARP survey are consistent with the predictions of dust trapping (Dullemond
et al., 2018). Pressure maxima can occur azimuthally as well as radially. If a
massive orbiting body causes a large perturbation, azimuthal dust traps can have
an influential role on the dust distribution in the disc, producing a crescent or
banana shaped dust structure. This theory has been successful in explaining the
highly asymmetric dust emission observed in IRS 48 (van der Marel et al., 2015).
Evidence of crescent-shaped dust asymmetries in systems such as V1247 Orionis
(Kraus et al., 2017) and HD135344B (Cazzoletti et al., 2018) point towards the
gravitational interaction of orbiting massive planets as the cause of the dust traps.
Radial drift can also be inhibited by magnetic dead-zones where turbulence and
angular momentum transport reduce to a minimum, allowing solid material and
planetary embryos to be efficiently trapped at the inner edge of the dead zone
(Dzyurkevich et al., 2010).
Dust evolution
Dust in the ISM is found with a grain size distribution that follows a power law,
dn/da ∝ a−p, (1.8)
a distribution described by a power law such as this with index p=3.5 is known
as an MRN power law, after the authors of the paper in which it was derived, and
describes a typical size distribution in interstellar grains (Mathis et al., 1977). The
index in Equation 1.8 changes as the dust population evolves, a flatter power law
means more of the mass in the total dust population is contained within the larger
grains. Dust grains orbiting in the disc stick together as a result of collisions. If
the collisional velocity in the disc is high, the grains can bounce off each other or
fragment into smaller grains (see Testi et al., 2014, and references therein).
17
1. Introduction
Models suggest the competing growth and fragmentation processes will settle
towards a steady state solution. The resulting distribution is usually a power-law
or broken power-law, which does not necessarily match the MRN distribution seen
in the ISM (Birnstiel et al., 2011). Growth of grains tends to lower p, whereas
fragmentation will re-introduce small particles and raise p.
Birnstiel et al. (2012) present a simple model comprised of just two popula-
tions: small grains that are well coupled to the gas and large grains that feel the
effects of radial drift and contain most of the dust mass. The results of the model
agree very well with the results of full simulations from dust evolution codes and
can describe the radial evolution of dust surface density and the evolution of
largest grain sizes (Birnstiel et al., 2012). This approach provides the basis for
much of the dust modelling in the field.
Continuum emission
We can probe dust content of a protoplanetary disc through observations of con-
tinuum emission from the dust. Solid grains emit as a blackbody, and as tem-
perature in protoplanetary discs decreases with radial separation from the star,
different regions of the disc will contribute to different parts of the SED as il-
lustrated in Figure 1.6. For example the inner wall of the protoplanetary disc
and the hottest regions closest to the star contribute at near-IR wavelengths,
whereas the outer disc and the cool, sheltered mid-plane contribute to millimetre
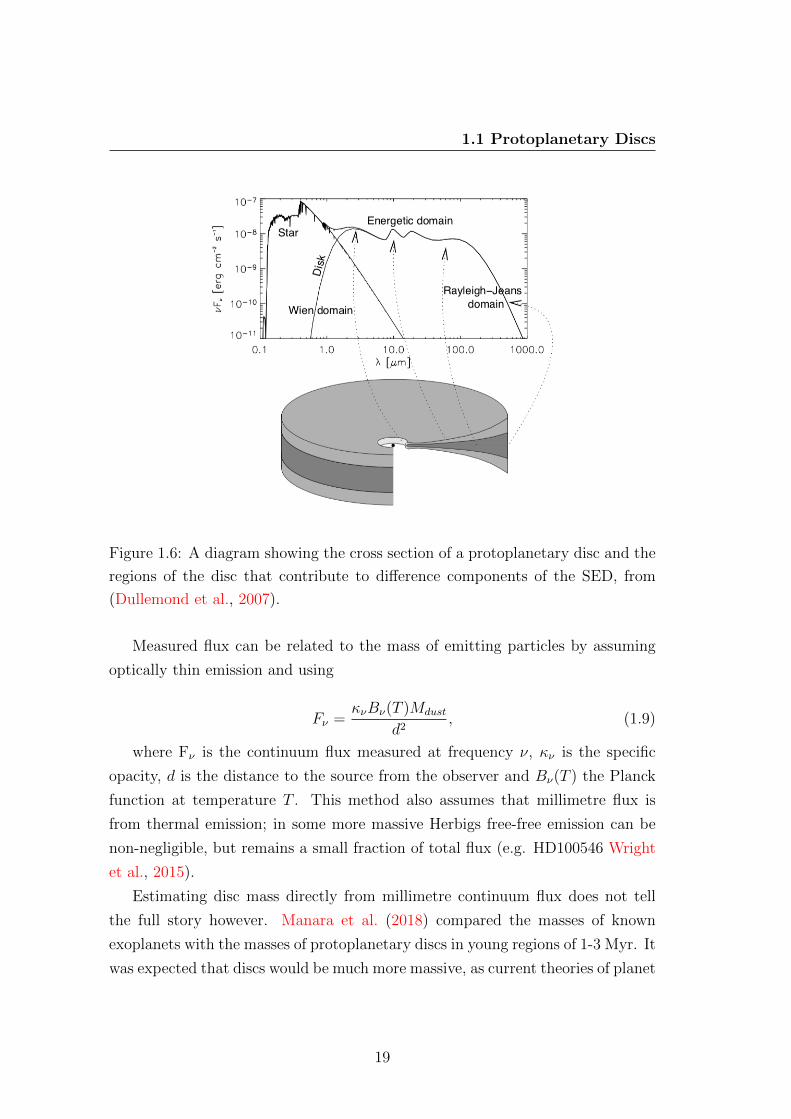
wavelengths.
Continuum emission also depends on particle size; millimetre continuum emis-
sion comes most efficiently from a narrow range of grain sizes between 1 mm and
1 cm (Takeuchi and Lin, 2005). If grains have grown beyond amax ≈ 3λ, where λ
is the wavelength of observation, they emit less efficiently (Draine, 2006).
Tracing mass
Continuum emission at mm-wavelengths is a diagnostic tool for tracing the coolest
dust in a protoplanetary disc, which is contained in the mid-plane and in the outer
disc, where the majority of solid mass is expected to be contained. This makes
millimetre fluxes the most useful for estimating disc mass.
18
1.1 Protoplanetary Discs
Figure 1.6: A diagram showing the cross section of a protoplanetary disc and the
regions of the disc that contribute to difference components of the SED, from
(Dullemond et al., 2007).
Measured flux can be related to the mass of emitting particles by assuming
optically thin emission and using
Fν =κνBν(T )Mdust
d2, (1.9)
where Fν is the continuum flux measured at frequency ν, κν is the specific
opacity, d is the distance to the source from the observer and Bν(T ) the Planck
function at temperature T . This method also assumes that millimetre flux is
from thermal emission; in some more massive Herbigs free-free emission can be
non-negligible, but remains a small fraction of total flux (e.g. HD100546 Wright
et al., 2015).
Estimating disc mass directly from millimetre continuum flux does not tell
the full story however. Manara et al. (2018) compared the masses of known
exoplanets with the masses of protoplanetary discs in young regions of 1-3 Myr. It
was expected that discs would be much more massive, as current theories of planet
19
1. Introduction
formation assert that it is not a particularly efficient process in terms of converting
disc material into planets. The authors found protoplanetary dust disc masses
to be lower, or at best comparable to, the amount of mass in heavy elements
in the exoplanetary systems discovered to date. Either disc dust masses are
systematically, significantly underestimated, or the cores of planets are forming
very quickly (0.1-1 Myr) and disc are continuously replenished throughout their
lifetime. In both scenarios, we are far from understanding the puzzle of solid
mass in discs.
The largest uncertainty in estimates made of dust mass using Equation 1.9,
and a likely source for the discrepancy highlighted by (Manara et al., 2018), is due
to the opacity term. Opacity has a power law dependence on frequency κν ∝ νβ
where β is the opacity spectral index β,
β(λ) ≡ d ln κ
d ln ν. (1.10)
In an optically thin disc under the Rayleigh-Jeans approximation, the opacity
index can be related to the spectral index by αmm = βmm + 2 (Draine, 2006) . At
millimetre wavelengths the dust being traced in the outer disc and midplane is
often cool enough that the Rayleigh-Jeans approximation does not apply. Draine
(2006) shows that in this case, for power law size distributions of dn/da ∝ a−p,
where a ≤ amax, 3 < p <4 and amax ≥ 3λobs, then
β ≈ (p− 3) βs, (1.11)
where βs is the opacity spectral index of solid material in the Rayleigh limit
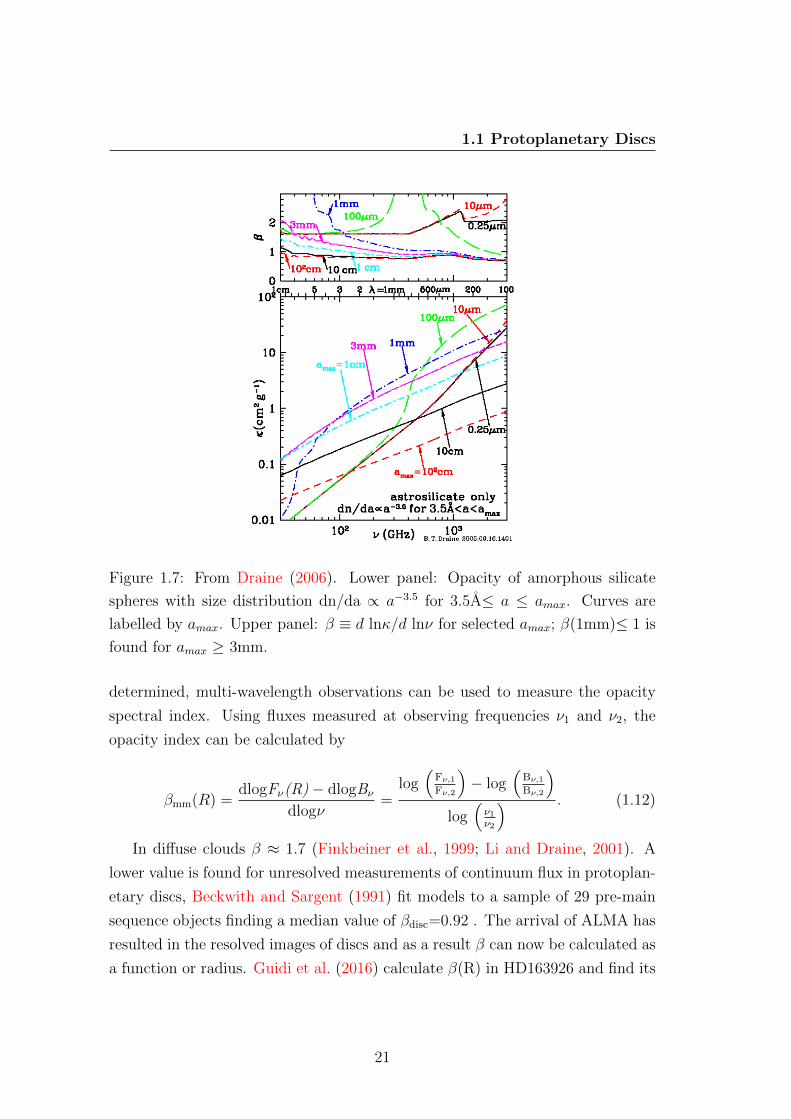
(Draine, 2003, 2006). Figure 1.7 shows calculations of the opacity of amorphous
spheres as a function of both frequency and the maximum grain size in the dust
distribution.
Figure 1.7 calculates κ and β for a single grain type, in a real disc the dust
will be a mixture of compositions in which optical constants, and as a result κ
will vary (e.g. carbonaceous grains, Jager et al., 1998).
At millimetre wavelengths it is clear that simplifications of opacity based on
the Rayleigh-Jeans approximation cannot be relied upon, and without robust in-
formation on the distribution and composition of dust grains, constraining opac-
ity is difficult observationally. However, even if the absolute opacity cannot be
20
1.1 Protoplanetary Discs
Figure 1.7: From Draine (2006). Lower panel: Opacity of amorphous silicate
spheres with size distribution dn/da ∝ a−3.5 for 3.5A≤ a ≤ amax. Curves are
labelled by amax. Upper panel: β ≡ d lnκ/d lnν for selected amax; β(1mm)≤ 1 is
found for amax ≥ 3mm.
determined, multi-wavelength observations can be used to measure the opacity
spectral index. Using fluxes measured at observing frequencies ν1 and ν2, the
opacity index can be calculated by
βmm(R) =dlogFν(R)− dlogBν
dlogν=
log(
Fν,1Fν,2
)− log
(Bν,1Bν,2
)log
(ν1ν2
) . (1.12)
In diffuse clouds β ≈ 1.7 (Finkbeiner et al., 1999; Li and Draine, 2001). A
lower value is found for unresolved measurements of continuum flux in protoplan-
etary discs, Beckwith and Sargent (1991) fit models to a sample of 29 pre-main
sequence objects finding a median value of βdisc=0.92 . The arrival of ALMA has
resulted in the resolved images of discs and as a result β can now be calculated as
a function or radius. Guidi et al. (2016) calculate β(R) in HD163926 and find its
21
1. Introduction
value to increase with radial separation from the star from ≈0.5 - 2.3. A radially
increasing β agrees with the predictions of size sorting by radial drift as larger
grains will give a lower value of β.
The most reliable dust mass estimates through Equation 1.9 will make a good
choice of T by constraining it through modelling of the dust disc. Alternatively
a minimum dust mass can be calculated by assuming all emitting dust is at a
low temperature representative of the outer disc or midplane (≈ 20 K). A good
estimate of κ can be made from Figure 1.7 using the observing frequency and an
estimate of amax in the dust distribution of the disc. All of the above assumes
optically thin emission, which is not necessarily the case, particularly in inner
regions where τ > 1 can be reached even at millimetre wavelengths.
Spectral index
The spectral index of emission from a protoplanetary disc shows the dependence
of flux on frequency.
α =d log Fνd log ν
(1.13)
The spectral index is related to the opacity index, and so is still affected by
the caveats described above. Variations in spectral index between different discs,
or indeed between different regions in a single disc, alert observers to differences
in the properties of the emitting solid material. Surveys of star forming regions
find that disc-averaged spectral indices can lie in the range 1.5 ≤ αmm ≤ 3.5
(Pinilla et al., 2014; Ricci et al., 2012). Using α and dust modelling to constrain
the index p of the dust grain size distribution can demonstrate the level of dust
evolution in a disc, offering insight as to the evolutionary state of the system (e.g.
in HD141569 White et al., 2018).
Radial drift and grain growth predict the largest solid particles to be concen-
trated toward the star, leaving the smaller ones behind. As emission brightness
is related to grain size we can therefore expect a variation in observed disc size
at different observing wavelengths, but also a variation in spectral index, αmm,
across the disc. Spatially resolved continuum images of discs at multiple wave-
lengths allow for a calculation of a position-dependent αmm, where, for optically
22
1.2 Disc Evolution
thin emission, Sν ∝ ναmm . If the size of grains in the disc varies with radius then
so will the spectral index. Guidi et al. (2016) find a spectral index that increases
radially 2.5 < α(R) < 3.9.
2D mapping of the spectral index from high-resolution images of protoplane-
tary discs can shows how α varies throughout the disc, which can be useful for
identifying local concentrations of, for example, large grains trapped in a pres-
sure trap (e.g. IRS 48; HD135344B, Cazzoletti et al., 2018; van der Marel et al.,
2015). Spectral index of the trapped dust can be used as a diagnostic tool for
exploring the properties of the vortex causing the trap, and the efficiency of the
dust trapping (Hammer et al., 2019).
1.2 Disc Evolution
1.2.1 Classical view of isolated low-mass star formation
Characterisation and modelling of a system’s SED gives a good first order ap-
proximation of a protoplanetary discs evolutionary state because the shape of
the SED is related to properties such as disc mass and the radial distribution
of gas and dust in the disc. Great care must be taken with SED modelling of
protoplanetary discs however; there is no unique solution to any individual SED.
Modelling of a disc’s emission includes a number of degenerate properties, the
effects of which are impossible to distinguish on the basis of photometry alone.
Nevertheless, broad conclusions can be drawn from the shape of an SED, in
particular from the form of the observed IR excess. As discussed at the beginning
of this chapter, protoplanetary discs initially result from the process of star for-
mation. Figure 1.8 shows the observational stages of protostar formation in the
evolutionary sequence proposed to explain the changes to their spectra known
as the ‘Lada Sequence’ (Adams et al., 1987; Lada, 1987). These epochs set the
context for disc evolution and provide useful points of reference for the processes
of disc evolution and planet formation.
The Class 0 stage represents the embedded processes of star formation de-
scribed in Section 1.1.1. The star is obscured from view by the cold material
which surrounds it, the latter produces cold blackbody emission at millimetre
23
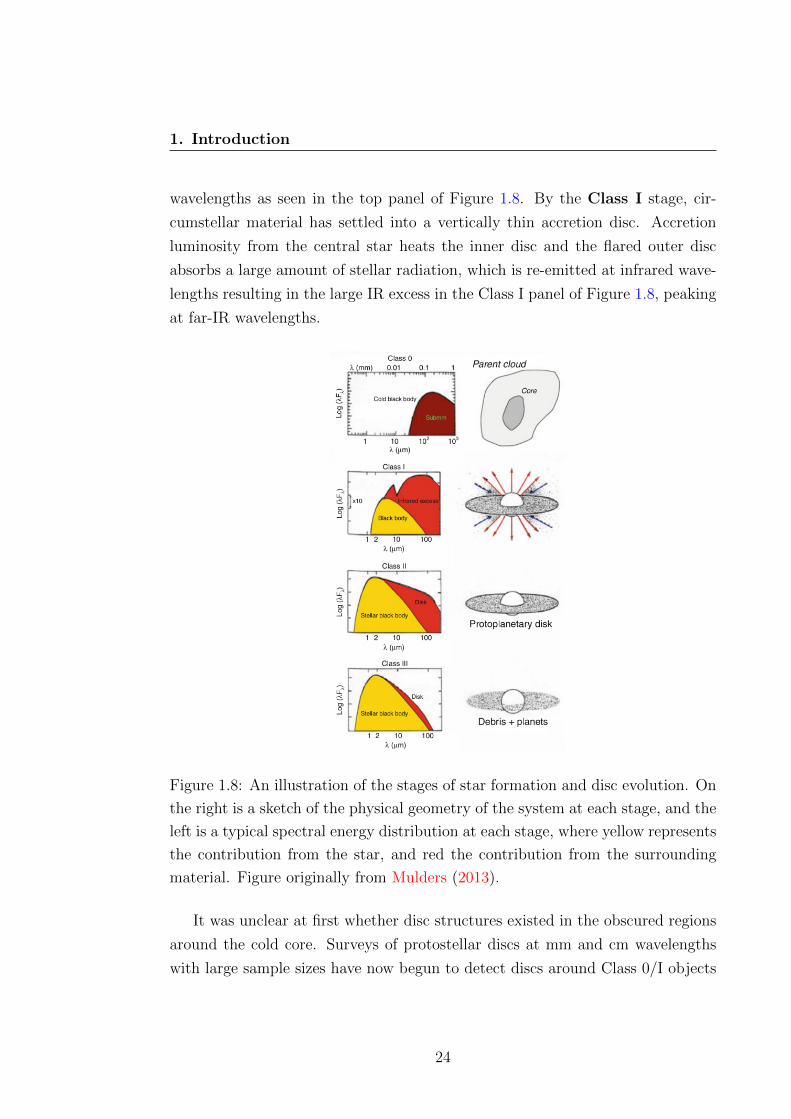
1. Introduction
wavelengths as seen in the top panel of Figure 1.8. By the Class I stage, cir-
cumstellar material has settled into a vertically thin accretion disc. Accretion
luminosity from the central star heats the inner disc and the flared outer disc
absorbs a large amount of stellar radiation, which is re-emitted at infrared wave-
lengths resulting in the large IR excess in the Class I panel of Figure 1.8, peaking
at far-IR wavelengths.
Figure 1.8: An illustration of the stages of star formation and disc evolution. On
the right is a sketch of the physical geometry of the system at each stage, and the
left is a typical spectral energy distribution at each stage, where yellow represents
the contribution from the star, and red the contribution from the surrounding
material. Figure originally from Mulders (2013).
It was unclear at first whether disc structures existed in the obscured regions
around the cold core. Surveys of protostellar discs at mm and cm wavelengths
with large sample sizes have now begun to detect discs around Class 0/I objects
24
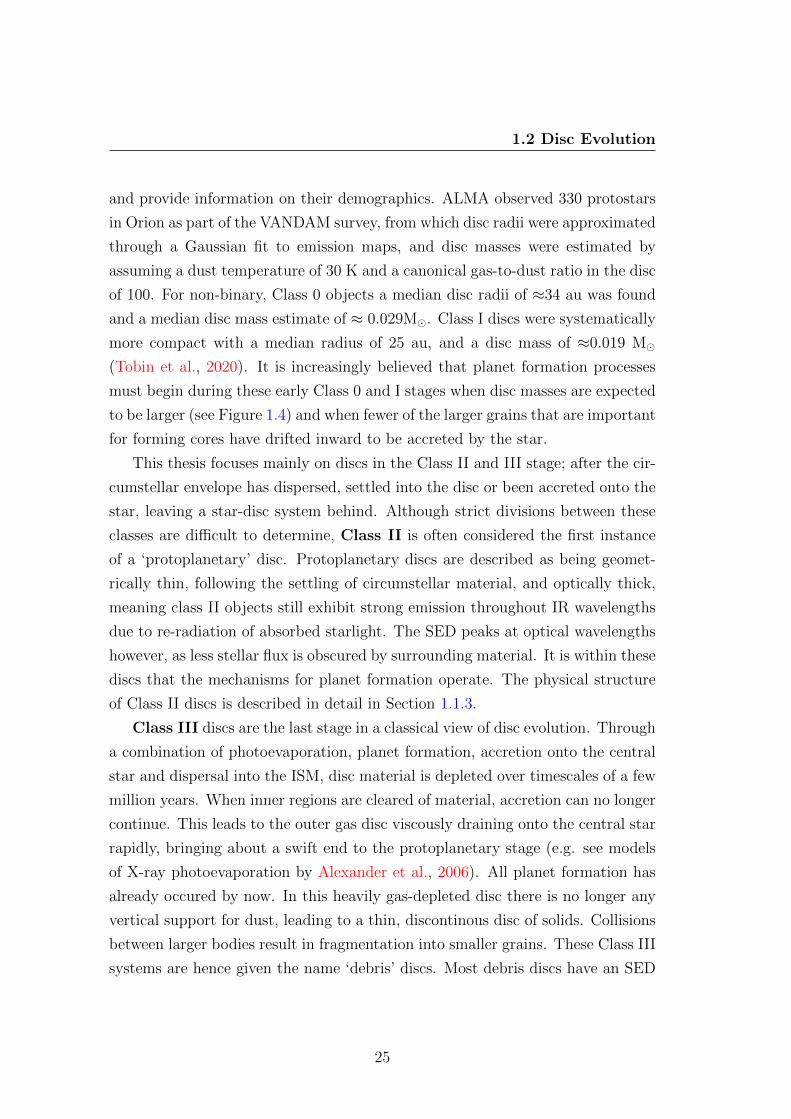
1.2 Disc Evolution
and provide information on their demographics. ALMA observed 330 protostars
in Orion as part of the VANDAM survey, from which disc radii were approximated
through a Gaussian fit to emission maps, and disc masses were estimated by
assuming a dust temperature of 30 K and a canonical gas-to-dust ratio in the disc
of 100. For non-binary, Class 0 objects a median disc radii of ≈34 au was found
and a median disc mass estimate of ≈ 0.029M�. Class I discs were systematically
more compact with a median radius of 25 au, and a disc mass of ≈0.019 M�
(Tobin et al., 2020). It is increasingly believed that planet formation processes
must begin during these early Class 0 and I stages when disc masses are expected
to be larger (see Figure 1.4) and when fewer of the larger grains that are important
for forming cores have drifted inward to be accreted by the star.
This thesis focuses mainly on discs in the Class II and III stage; after the cir-
cumstellar envelope has dispersed, settled into the disc or been accreted onto the
star, leaving a star-disc system behind. Although strict divisions between these
classes are difficult to determine, Class II is often considered the first instance
of a ‘protoplanetary’ disc. Protoplanetary discs are described as being geomet-
rically thin, following the settling of circumstellar material, and optically thick,
meaning class II objects still exhibit strong emission throughout IR wavelengths
due to re-radiation of absorbed starlight. The SED peaks at optical wavelengths
however, as less stellar flux is obscured by surrounding material. It is within these
discs that the mechanisms for planet formation operate. The physical structure
of Class II discs is described in detail in Section 1.1.3.
Class III discs are the last stage in a classical view of disc evolution. Through
a combination of photoevaporation, planet formation, accretion onto the central
star and dispersal into the ISM, disc material is depleted over timescales of a few
million years. When inner regions are cleared of material, accretion can no longer
continue. This leads to the outer gas disc viscously draining onto the central star
rapidly, bringing about a swift end to the protoplanetary stage (e.g. see models
of X-ray photoevaporation by Alexander et al., 2006). All planet formation has
already occured by now. In this heavily gas-depleted disc there is no longer any
vertical support for dust, leading to a thin, discontinous disc of solids. Collisions
between larger bodies result in fragmentation into smaller grains. These Class III
systems are hence given the name ‘debris’ discs. Most debris discs have an SED
25
1. Introduction
Figure 1.9: ALMA image of the debris ring around Fomalhaut. This images was
produced though a mosaic of images observed at a wavelength of 1.3mm. Image
from (Macgregor et al., 2017)
that can be described with emission at two different temperatures, which is likely
to suggest the presence of multiple rings/belts in a disc (Kennedy and Wyatt,
2014). This two-temperature structure may be analogous to the remaining disc
of the Solar System; comprised of the Asteroid belt and Edgeworth-Kuiper belt.
A two-temperature profile can in some instances be reproduced from a single belt
containing a variation in grain sizes due to the degeneracies in SED modelling.
As the mass of remaining disc material is low, debris discs are often faint and
have been difficult to detect in the past. Modern facilities are now capable of
detecting and even spatially resolving debris discs, confirming the proposed ring-
like structure as can be seen in the image of Fomalhaut in Figure 1.9 (MacGregor
et al., 2016).
1.2.2 Transition Discs
SED modelling of T Tauri stars helped to reveal the process by which class II
discs evolve into class III discs. So called “transition discs” were first identified
by Strom et al. (1989) and Skrutskie et al. (1990) as PMS stars hosting discs
26
1.2 Disc Evolution
with inner holes. The absence of dust towards inner regions was inferred from
a lack of IR excess in the SED even though a strong mid- and far- IR excess
was still present. This prediction was later confirmed by SMA imaging that
revealed discs with inner holes (e.g. Brown et al., 2009). Transition discs provided
significant observational evidence for evolutionary processes in protoplanetary
discs to occur from the inside-out, as opposed to a homogeneous depletion of
circumstellar material or the exterior photo evaporation of the Orion proplyds.
Some discs with inner gaps have been found to contain small dust components
interior to this gap at very short separation (e.g. HD100546 Panic et al., 2014),
and were labelled ‘pre-transition’ discs (Espaillat et al., 2007). As the nomencla-
ture suggests, initially these systems were thought to be showing a transitional
phase between a transition disc and a gas-poor, ringed debris disc.
Clearing of inner regions can be achieved through photoevaporation, planet
formation or dynamical influences of inner companions/exoplanets. A decrease in
near-IR flux can also be achieved if dust situated in the inner regions of the disc
has grown into larger bodies such as km-sized planetesimals, which emit at longer
wavelengths. In this case low optical depth at IR or mm observing wavelengths
can give the impression of a cleared gap.
Photoevaporation models for inner clearing are unable to reproduce the large
cavity sizes, accretion rates and disc masses observed in transition discs. Analysis
of 12 resolved transition disc cavities with the SMA by Andrews et al. (2011)
found dynamical clearing due to either low mass companions, giant planets on
long orbits, or young brown dwarfs to be the most likely explanation in order to fit
the observed disc density profiles. Within the dust gaps, gas is usually present but
with decreased surface density (Carmona et al., 2017). High resolution ALMA
imaging of 13CO and C18O revealed gas cavities within the dust cavities of four
transition discs, where the cavity in gas was up to three times smaller than that of
the dust (van der Marel et al., 2016). The observed structures agree with models
of planet-disc interactions in which giant planetary companions sculpt the inner
gap (van der Marel et al., 2016).
As a result of the growing library of high resolution ALMA data, gaps and
rings have become frequently observed structural features. Some transition discs
have been shown to consist of multiple dust rings (Fedele et al., 2018; van der Plas
27
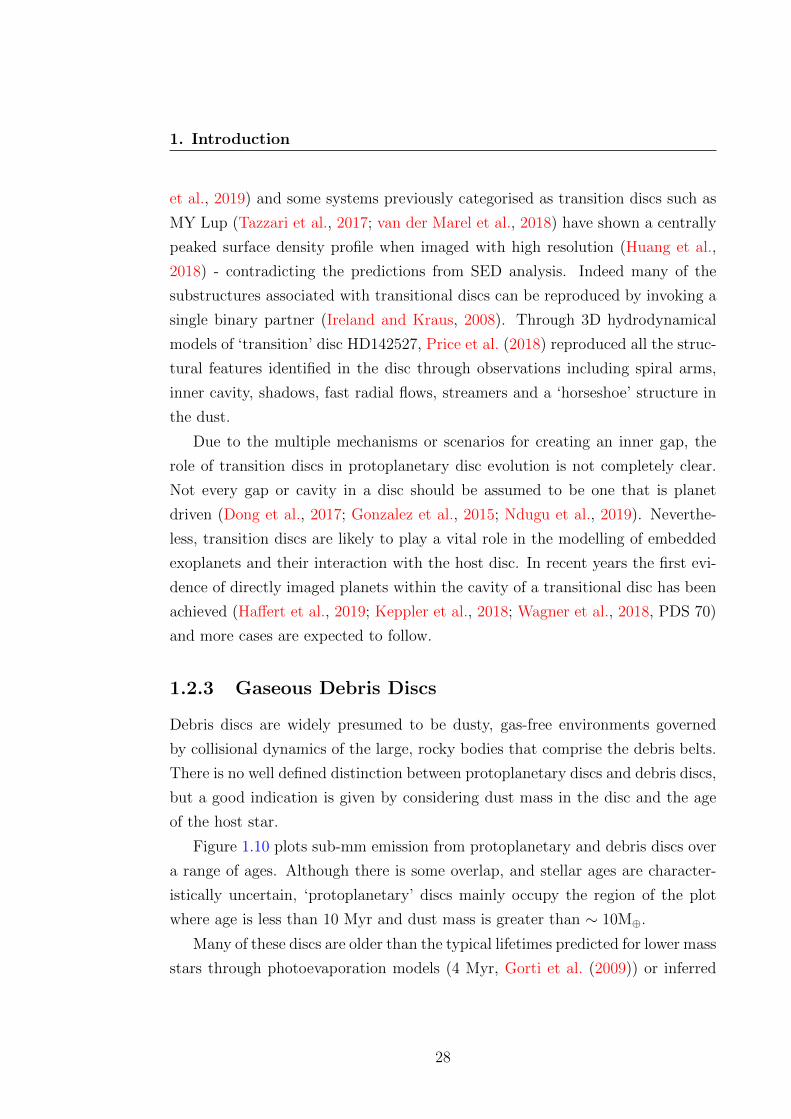
1. Introduction
et al., 2019) and some systems previously categorised as transition discs such as
MY Lup (Tazzari et al., 2017; van der Marel et al., 2018) have shown a centrally
peaked surface density profile when imaged with high resolution (Huang et al.,
2018) - contradicting the predictions from SED analysis. Indeed many of the
substructures associated with transitional discs can be reproduced by invoking a
single binary partner (Ireland and Kraus, 2008). Through 3D hydrodynamical
models of ‘transition’ disc HD142527, Price et al. (2018) reproduced all the struc-
tural features identified in the disc through observations including spiral arms,
inner cavity, shadows, fast radial flows, streamers and a ‘horseshoe’ structure in
the dust.
Due to the multiple mechanisms or scenarios for creating an inner gap, the
role of transition discs in protoplanetary disc evolution is not completely clear.
Not every gap or cavity in a disc should be assumed to be one that is planet
driven (Dong et al., 2017; Gonzalez et al., 2015; Ndugu et al., 2019). Neverthe-
less, transition discs are likely to play a vital role in the modelling of embedded
exoplanets and their interaction with the host disc. In recent years the first evi-
dence of directly imaged planets within the cavity of a transitional disc has been
achieved (Haffert et al., 2019; Keppler et al., 2018; Wagner et al., 2018, PDS 70)
and more cases are expected to follow.
1.2.3 Gaseous Debris Discs
Debris discs are widely presumed to be dusty, gas-free environments governed
by collisional dynamics of the large, rocky bodies that comprise the debris belts.
There is no well defined distinction between protoplanetary discs and debris discs,
but a good indication is given by considering dust mass in the disc and the age
of the host star.
Figure 1.10 plots sub-mm emission from protoplanetary and debris discs over
a range of ages. Although there is some overlap, and stellar ages are character-
istically uncertain, ‘protoplanetary’ discs mainly occupy the region of the plot
where age is less than 10 Myr and dust mass is greater than ∼ 10M⊕.
Many of these discs are older than the typical lifetimes predicted for lower mass
stars through photoevaporation models (4 Myr, Gorti et al. (2009)) or inferred
28
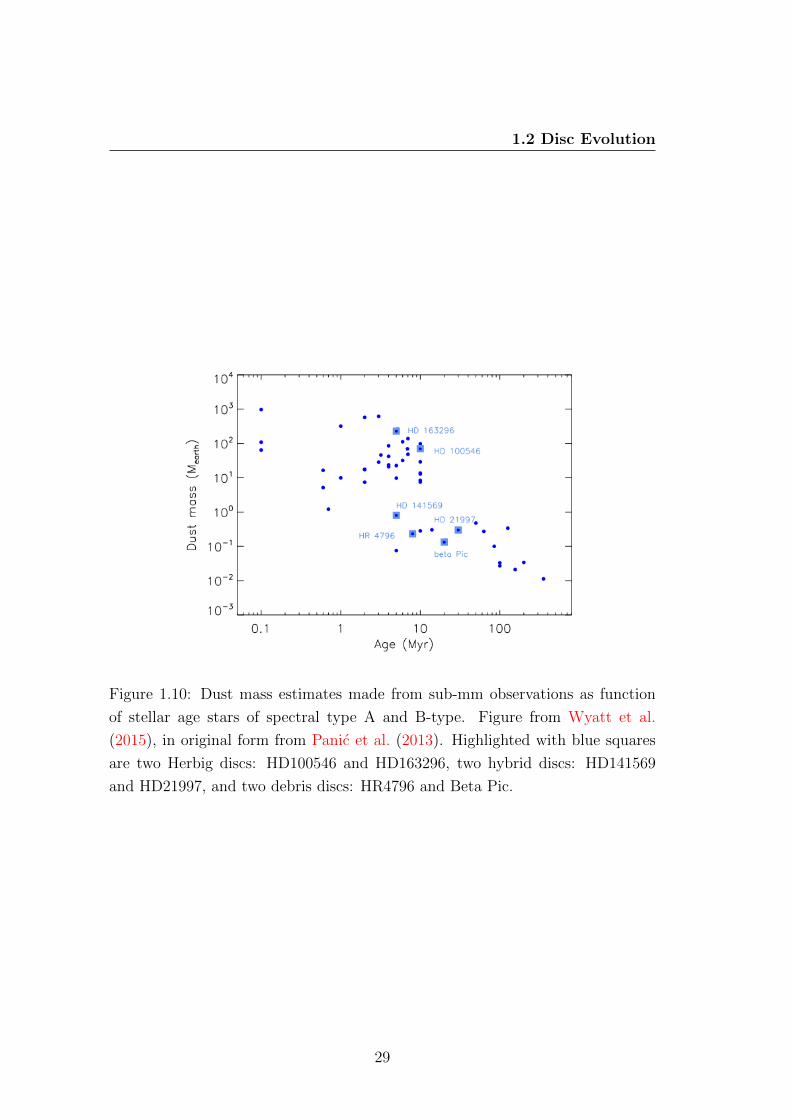
1.2 Disc Evolution
Figure 1.10: Dust mass estimates made from sub-mm observations as function
of stellar age stars of spectral type A and B-type. Figure from Wyatt et al.
(2015), in original form from Panic et al. (2013). Highlighted with blue squares
are two Herbig discs: HD100546 and HD163296, two hybrid discs: HD141569
and HD21997, and two debris discs: HR4796 and Beta Pic.
29
1. Introduction
from measurements of accretion (3 Myr, Fedele et al. (2010)). Near infrared
observations of star clusters by Haisch et al. (2001) found that half of the disc
population had lost their discs by 3 Myr, and virtually all had lost them by 6
Myr.
Observational evidence at millimetre wavelengths suggests that these lifetimes
are underestimates. Some of the brightest, and most well studied Herbig discs
are older than 4 Myr, yet maintain a strong C18O flux (e.g. HD97048 Panic et
al. (in prep), HD100546 Miley et al. (2019), HD163296 Boneberg et al. (2016)).
Even T Tauri disc TW Hydra is ∼8 Myr (Donaldson et al., 2016). There is not
yet a complete model of photoevaporation in Herbig disc to compare with.
Wyatt et al. (2015) proposed the distinction lies in the existence of large
quantities of primordial gas in the disc. Specifically, enough gas so that small
dust grains remain well coupled, so that the gas can damp collisions and suspend
grains vertically above the midplane.
However, recent observations have begun to detect significant amounts of
gas in systems previously categorised as debris discs. Analysing mm-wavelength
observations, Moor et al. (2017) found that 11 of the 16 discs in their sample of A
type had 12CO detections, and 3 of the 7 discs studies with ALMA observations
had optically thick 12CO emission; masking the true density through optical depth
effects. Less abundant molecular tracers are therefore crucial in making accurate
mass estimates from these discs, previously thought to be very gas poor. There
is now significant amounts of gas detected in over 16 ‘debris’ systems, a number
likely to rise as more ALMA observations are executed.
There are two leading theories as to how gas can remain at such late stages of
disc evolution. The first proposes that the gas we observe is of a secondary origin.
In a secondary scenario, after the primordial disc has dispersed collisions between
large, rocky planetesimals result in fragmentation and the release of any gas
that was trapped within them. This secondary generation of gas is immediately
vulnerable to photodissociation and it is believed that neutral carbon within the
inner disc plays an important role in shielding the CO to avoid its rapid removal
(Kral et al., 2019). A prime example of a secondary scenario is in debris disc β
Pic. Figure 1.11 shows the ALMA data in which CO gas was detected at the same
location as the planetesimal belt in the system, but only on one side of the disc.
30
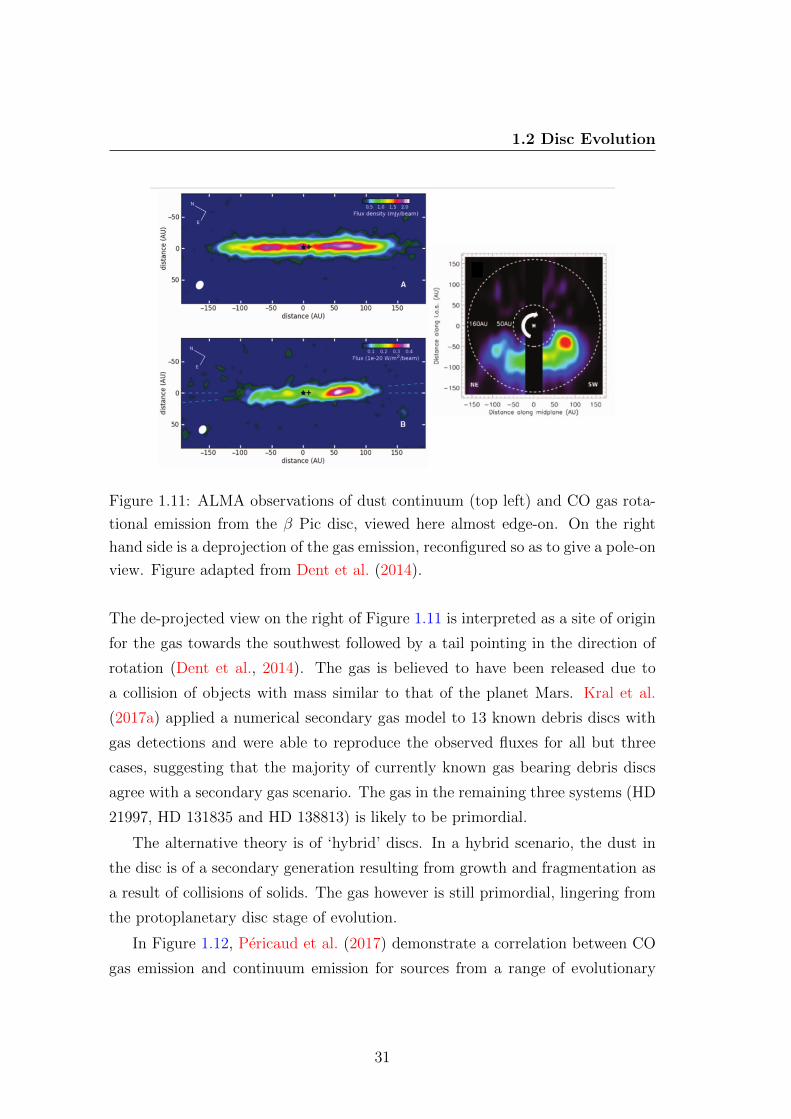
1.2 Disc Evolution
Figure 1.11: ALMA observations of dust continuum (top left) and CO gas rota-
tional emission from the β Pic disc, viewed here almost edge-on. On the right
hand side is a deprojection of the gas emission, reconfigured so as to give a pole-on
view. Figure adapted from Dent et al. (2014).
The de-projected view on the right of Figure 1.11 is interpreted as a site of origin
for the gas towards the southwest followed by a tail pointing in the direction of
rotation (Dent et al., 2014). The gas is believed to have been released due to
a collision of objects with mass similar to that of the planet Mars. Kral et al.
(2017a) applied a numerical secondary gas model to 13 known debris discs with
gas detections and were able to reproduce the observed fluxes for all but three
cases, suggesting that the majority of currently known gas bearing debris discs
agree with a secondary gas scenario. The gas in the remaining three systems (HD
21997, HD 131835 and HD 138813) is likely to be primordial.
The alternative theory is of ‘hybrid’ discs. In a hybrid scenario, the dust in
the disc is of a secondary generation resulting from growth and fragmentation as
a result of collisions of solids. The gas however is still primordial, lingering from
the protoplanetary disc stage of evolution.
In Figure 1.12, Pericaud et al. (2017) demonstrate a correlation between CO
gas emission and continuum emission for sources from a range of evolutionary
31
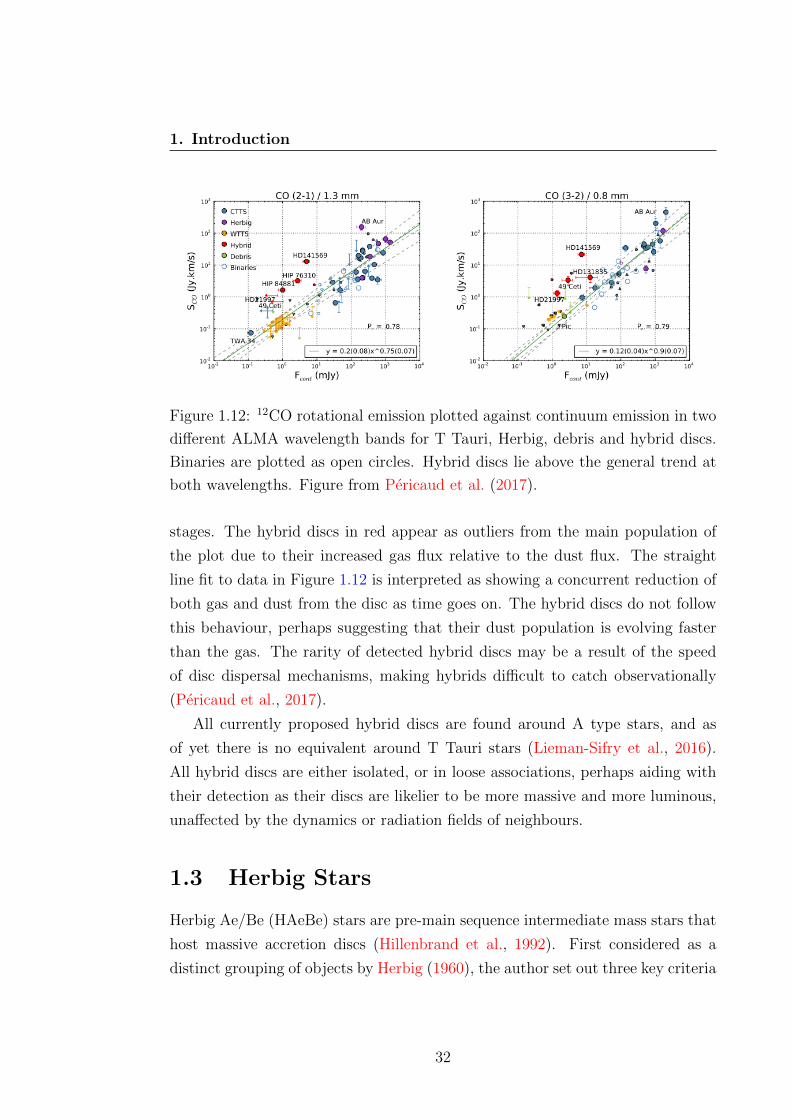
1. Introduction
Figure 1.12: 12CO rotational emission plotted against continuum emission in two
different ALMA wavelength bands for T Tauri, Herbig, debris and hybrid discs.
Binaries are plotted as open circles. Hybrid discs lie above the general trend at
both wavelengths. Figure from Pericaud et al. (2017).
stages. The hybrid discs in red appear as outliers from the main population of
the plot due to their increased gas flux relative to the dust flux. The straight
line fit to data in Figure 1.12 is interpreted as showing a concurrent reduction of
both gas and dust from the disc as time goes on. The hybrid discs do not follow
this behaviour, perhaps suggesting that their dust population is evolving faster
than the gas. The rarity of detected hybrid discs may be a result of the speed
of disc dispersal mechanisms, making hybrids difficult to catch observationally
(Pericaud et al., 2017).
All currently proposed hybrid discs are found around A type stars, and as
of yet there is no equivalent around T Tauri stars (Lieman-Sifry et al., 2016).
All hybrid discs are either isolated, or in loose associations, perhaps aiding with
their detection as their discs are likelier to be more massive and more luminous,
unaffected by the dynamics or radiation fields of neighbours.
1.3 Herbig Stars
Herbig Ae/Be (HAeBe) stars are pre-main sequence intermediate mass stars that
host massive accretion discs (Hillenbrand et al., 1992). First considered as a
distinct grouping of objects by Herbig (1960), the author set out three key criteria
32
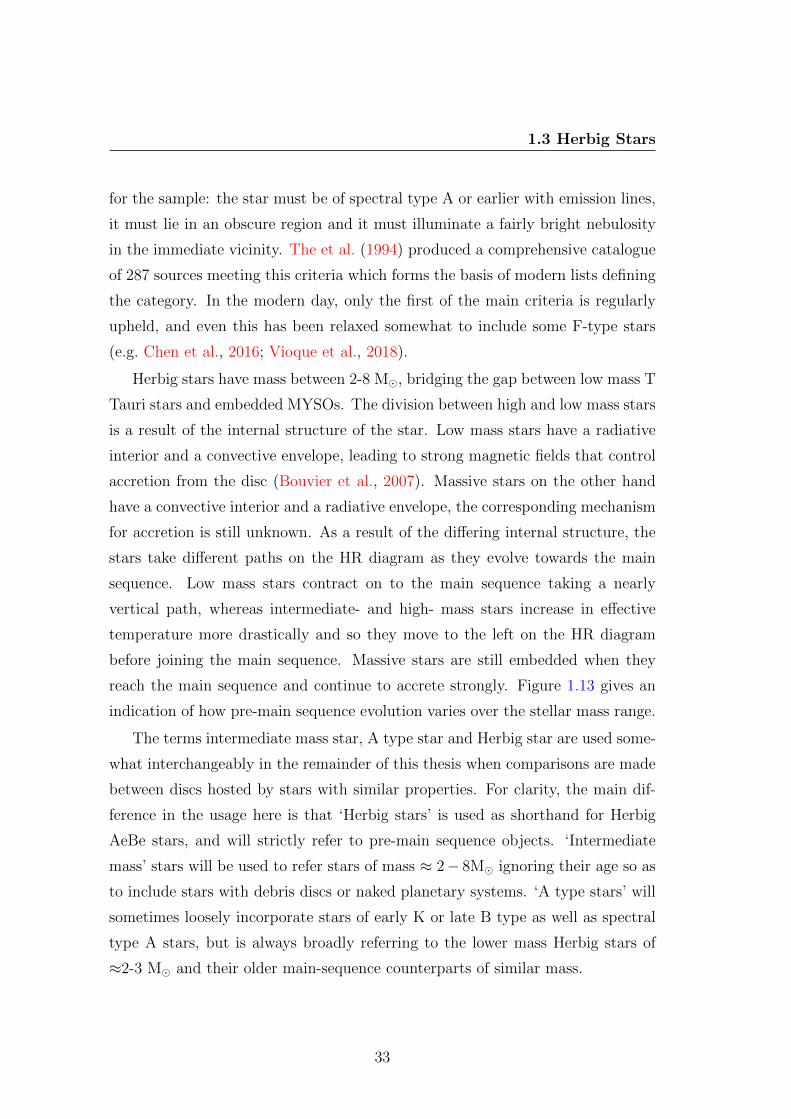
1.3 Herbig Stars
for the sample: the star must be of spectral type A or earlier with emission lines,
it must lie in an obscure region and it must illuminate a fairly bright nebulosity
in the immediate vicinity. The et al. (1994) produced a comprehensive catalogue
of 287 sources meeting this criteria which forms the basis of modern lists defining
the category. In the modern day, only the first of the main criteria is regularly
upheld, and even this has been relaxed somewhat to include some F-type stars
(e.g. Chen et al., 2016; Vioque et al., 2018).
Herbig stars have mass between 2-8 M�, bridging the gap between low mass T
Tauri stars and embedded MYSOs. The division between high and low mass stars
is a result of the internal structure of the star. Low mass stars have a radiative
interior and a convective envelope, leading to strong magnetic fields that control
accretion from the disc (Bouvier et al., 2007). Massive stars on the other hand
have a convective interior and a radiative envelope, the corresponding mechanism
for accretion is still unknown. As a result of the differing internal structure, the
stars take different paths on the HR diagram as they evolve towards the main
sequence. Low mass stars contract on to the main sequence taking a nearly
vertical path, whereas intermediate- and high- mass stars increase in effective
temperature more drastically and so they move to the left on the HR diagram
before joining the main sequence. Massive stars are still embedded when they
reach the main sequence and continue to accrete strongly. Figure 1.13 gives an
indication of how pre-main sequence evolution varies over the stellar mass range.
The terms intermediate mass star, A type star and Herbig star are used some-
what interchangeably in the remainder of this thesis when comparisons are made
between discs hosted by stars with similar properties. For clarity, the main dif-
ference in the usage here is that ‘Herbig stars’ is used as shorthand for Herbig
AeBe stars, and will strictly refer to pre-main sequence objects. ‘Intermediate
mass’ stars will be used to refer stars of mass ≈ 2− 8M� ignoring their age so as
to include stars with debris discs or naked planetary systems. ‘A type stars’ will
sometimes loosely incorporate stars of early K or late B type as well as spectral
type A stars, but is always broadly referring to the lower mass Herbig stars of
≈2-3 M� and their older main-sequence counterparts of similar mass.
33
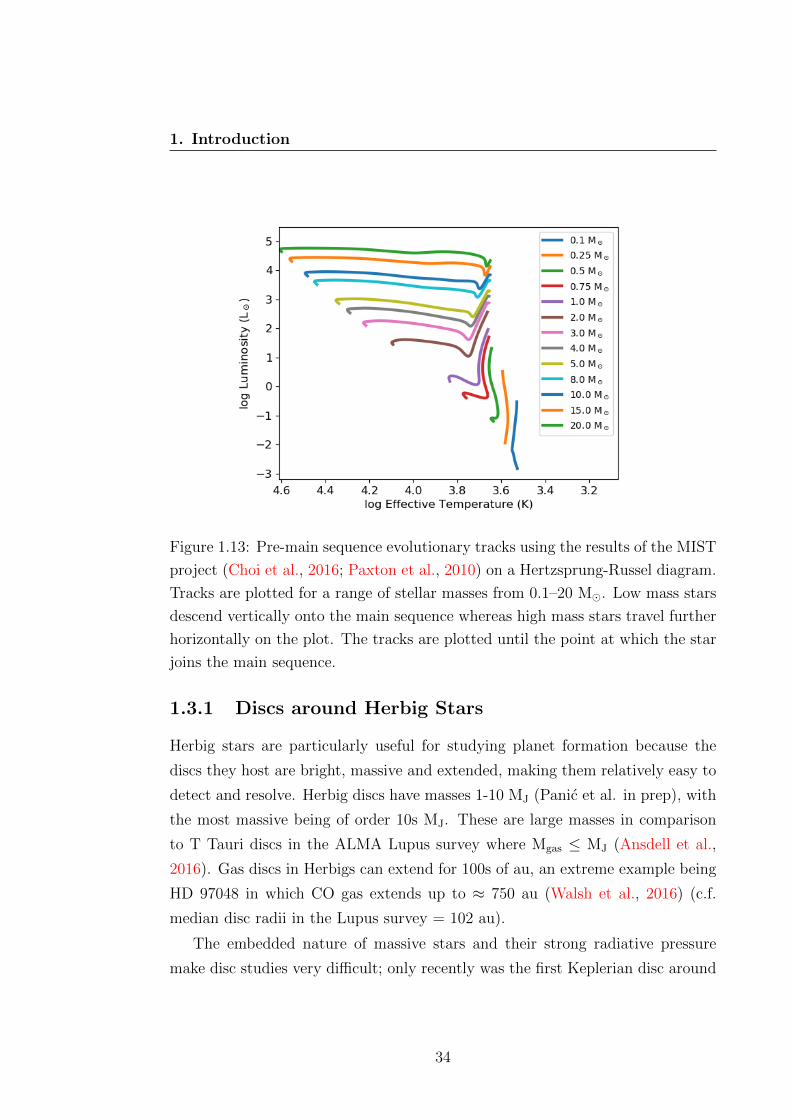
1. Introduction
Figure 1.13: Pre-main sequence evolutionary tracks using the results of the MIST
project (Choi et al., 2016; Paxton et al., 2010) on a Hertzsprung-Russel diagram.
Tracks are plotted for a range of stellar masses from 0.1–20 M�. Low mass stars
descend vertically onto the main sequence whereas high mass stars travel further
horizontally on the plot. The tracks are plotted until the point at which the star
joins the main sequence.
1.3.1 Discs around Herbig Stars
Herbig stars are particularly useful for studying planet formation because the
discs they host are bright, massive and extended, making them relatively easy to
detect and resolve. Herbig discs have masses 1-10 MJ (Panic et al. in prep), with
the most massive being of order 10s MJ. These are large masses in comparison
to T Tauri discs in the ALMA Lupus survey where Mgas ≤ MJ (Ansdell et al.,
2016). Gas discs in Herbigs can extend for 100s of au, an extreme example being
HD 97048 in which CO gas extends up to ≈ 750 au (Walsh et al., 2016) (c.f.
median disc radii in the Lupus survey = 102 au).
The embedded nature of massive stars and their strong radiative pressure
make disc studies very difficult; only recently was the first Keplerian disc around
34
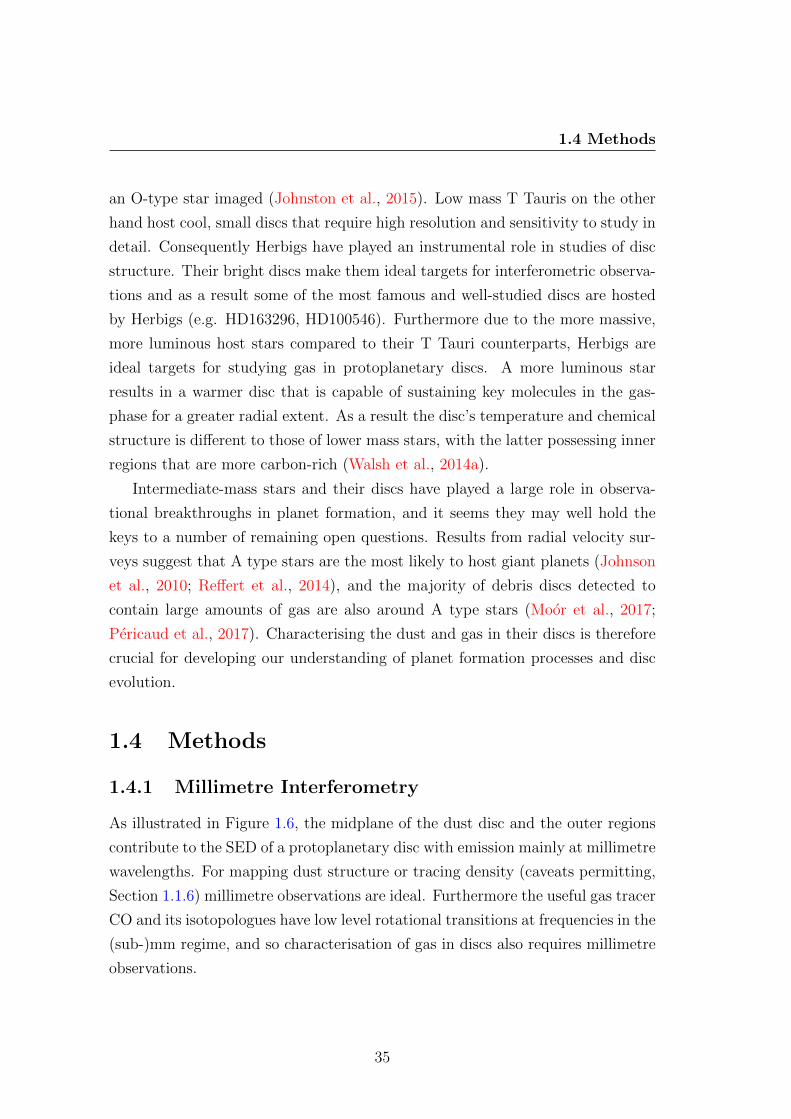
1.4 Methods
an O-type star imaged (Johnston et al., 2015). Low mass T Tauris on the other
hand host cool, small discs that require high resolution and sensitivity to study in
detail. Consequently Herbigs have played an instrumental role in studies of disc
structure. Their bright discs make them ideal targets for interferometric observa-
tions and as a result some of the most famous and well-studied discs are hosted
by Herbigs (e.g. HD163296, HD100546). Furthermore due to the more massive,
more luminous host stars compared to their T Tauri counterparts, Herbigs are
ideal targets for studying gas in protoplanetary discs. A more luminous star
results in a warmer disc that is capable of sustaining key molecules in the gas-
phase for a greater radial extent. As a result the disc’s temperature and chemical
structure is different to those of lower mass stars, with the latter possessing inner
regions that are more carbon-rich (Walsh et al., 2014a).
Intermediate-mass stars and their discs have played a large role in observa-
tional breakthroughs in planet formation, and it seems they may well hold the
keys to a number of remaining open questions. Results from radial velocity sur-
veys suggest that A type stars are the most likely to host giant planets (Johnson
et al., 2010; Reffert et al., 2014), and the majority of debris discs detected to
contain large amounts of gas are also around A type stars (Moor et al., 2017;
Pericaud et al., 2017). Characterising the dust and gas in their discs is therefore
crucial for developing our understanding of planet formation processes and disc
evolution.
1.4 Methods
1.4.1 Millimetre Interferometry
As illustrated in Figure 1.6, the midplane of the dust disc and the outer regions
contribute to the SED of a protoplanetary disc with emission mainly at millimetre
wavelengths. For mapping dust structure or tracing density (caveats permitting,
Section 1.1.6) millimetre observations are ideal. Furthermore the useful gas tracer
CO and its isotopologues have low level rotational transitions at frequencies in the
(sub-)mm regime, and so characterisation of gas in discs also requires millimetre
observations.
35
1. Introduction
Unfortunately, many promising objects are far away and difficult to spatially
resolve. Furthermore high spatial resolution is inversely proportional to observ-
ing wavelength, an inconvenience for millimetre continuum and molecular lines.
The solution to these problems is millimetre interferometry. This is where mul-
tiple antennas work in conjunction to simulate one large aperture. The angular
resolution of the array, rather than being dictated by the diameter of a single
antenna’s dish, is proportional to the maximum baseline between two antennas
in the array.
Rather than measuring brightness and position on the sky as in most other
forms of imaging, interferometry measures the interference pattern between two
apertures, measuring instead amplitude and phase. The brightness and position
that we see in the ‘image plane’ are related to the raw interferometric data, known
as visibilities V (u, v) following van Cittert-Zernicke theorem (Thompson et al.,
2017).
The fidelity of an image reconstructed from interferometric measurements,
i.e. the degree to which it is faithful to the original brightness distribution of
the source on the sky, is limited by ‘uv-coverage’. uv-coverage refers to how well
the Fourier transforms of the set of baselines for a particular array fills the uv
plane. The more baselines employed, the more baseline vectors a configuration
of antenna pairs covers, and the greater the coverage of the uv-plane for the
observation.
Long exposure times benefit observations in two ways. The first is that an
increased number of photons can be captured relative to a ‘snapshot’ observa-
tion, thereby improving the signal-to-noise ratio. The second relates to the uv
coverage; the rotation of the Earth during the period of observation means that
the position of the target source will change relative to the observing array, which
means a greater amount of uv space is covered. Increasing the number of antennas
in an array increases the number of baselines which will also improve uv coverage,
for example the Australia Telescope Compact Array (ATCA) observes at mm and
cm wavelengths using six antennas, which means it has 15 individual baselines
and relatively low uv-coverage. Whereas the Atacama Large Millimetre/sub-
millimetre Array (ALMA) observing with 50 antennas has 1225 baselines. ALMA
36
1.4 Methods
offers unprecedented uv-coverage at millimetre wavelengths, along with unprece-
dented angular resolution achieved through the maximum baseline of up to 16km.
A further consideration is the configuration in which the antennas are ar-
ranged. Antenna configuration is related to the uv coverage achieved and so
careful design of the antenna array can maximise uv coverage in observations to
improve fidelity as shown in Figure 1.14. A linear configuration of antennas in
the top panel of Figure 1.14 samples only a very specific part of the uv space
in one direction, and so the image represents a 1-dimensional projection of the
brightness distribution. The second row achieves much better uv coverage by
simulating a long integration time, thereby utilising the Earth’s rotation and
producing an image that resolves key features in the image which has become
recognisable. The final panel uses the ALMA extended configuration which was
designed to maximise angular resolution. Finer details in the image are recovered
and the image looks very similar to the brightness distribution of the science tar-
get, which in this case means that the image of Jafar the lion is very clear and
his main features can be easily identified and analysed.
1.4.2 Data reduction
The reduction of millimetre interferometric data can be broadly summed up by
the following sequence:
Calibrate V(u,v)Fourier Transform−→ Dirty beam & image
Deconvolution−→ Clean beam & image.
The first step is calibration of the observed visibilities, V (u, v). Calibration is
achieved by utilising observations of calibrator objects that were observed along-
side the science target. Flux is calibrated using an object of known magnitude at
millimetre wavelengths, often a bright quasar in the same region of sky as the sci-
ence target. Also required are real-time calibrations of phase in order to discern
the effects from the atmosphere with those originating from the target. Good
phase calibrators should be a point source as a true point source should have zero
phase in the visibilities. Phase calibration is the most important for final image
quality, removing atmospheric effects and variation with time throughout the ob-
servation. A final important step is the bandpass, or frequency, calibration which
37
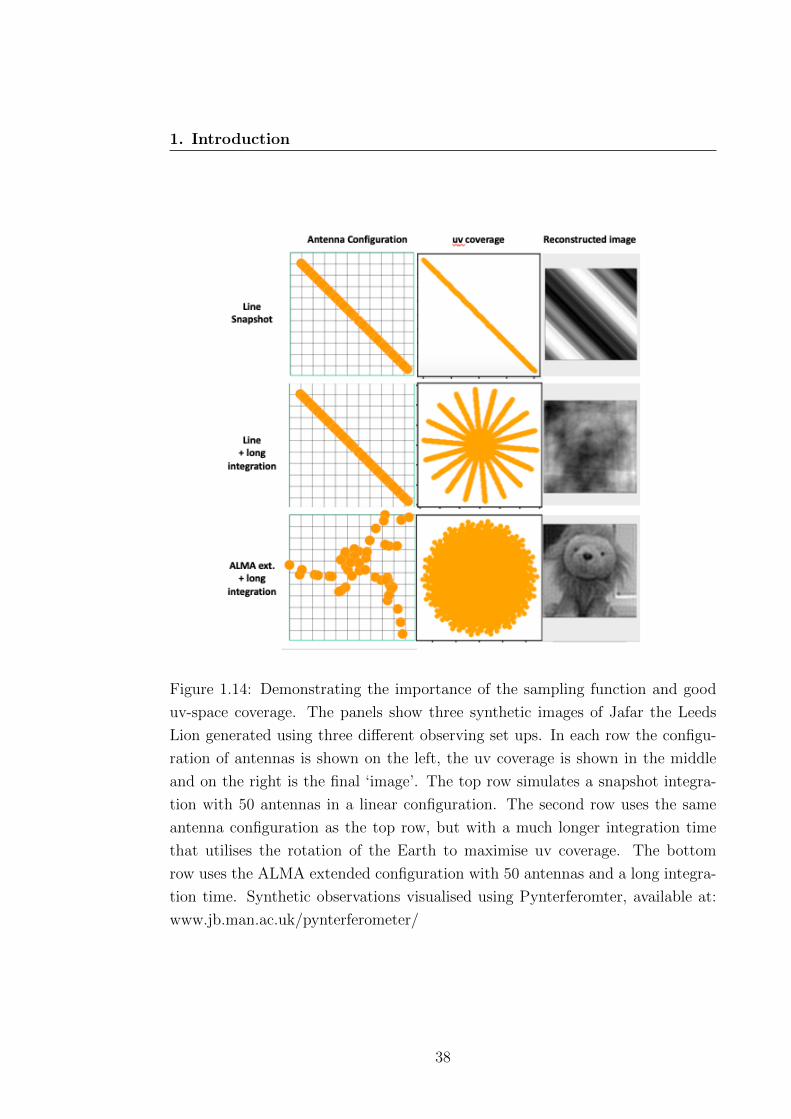
1. Introduction
Figure 1.14: Demonstrating the importance of the sampling function and good
uv-space coverage. The panels show three synthetic images of Jafar the Leeds
Lion generated using three different observing set ups. In each row the configu-
ration of antennas is shown on the left, the uv coverage is shown in the middle
and on the right is the final ‘image’. The top row simulates a snapshot integra-
tion with 50 antennas in a linear configuration. The second row uses the same
antenna configuration as the top row, but with a much longer integration time
that utilises the rotation of the Earth to maximise uv coverage. The bottom
row uses the ALMA extended configuration with 50 antennas and a long integra-
tion time. Synthetic observations visualised using Pynterferomter, available at:
www.jb.man.ac.uk/pynterferometer/
38
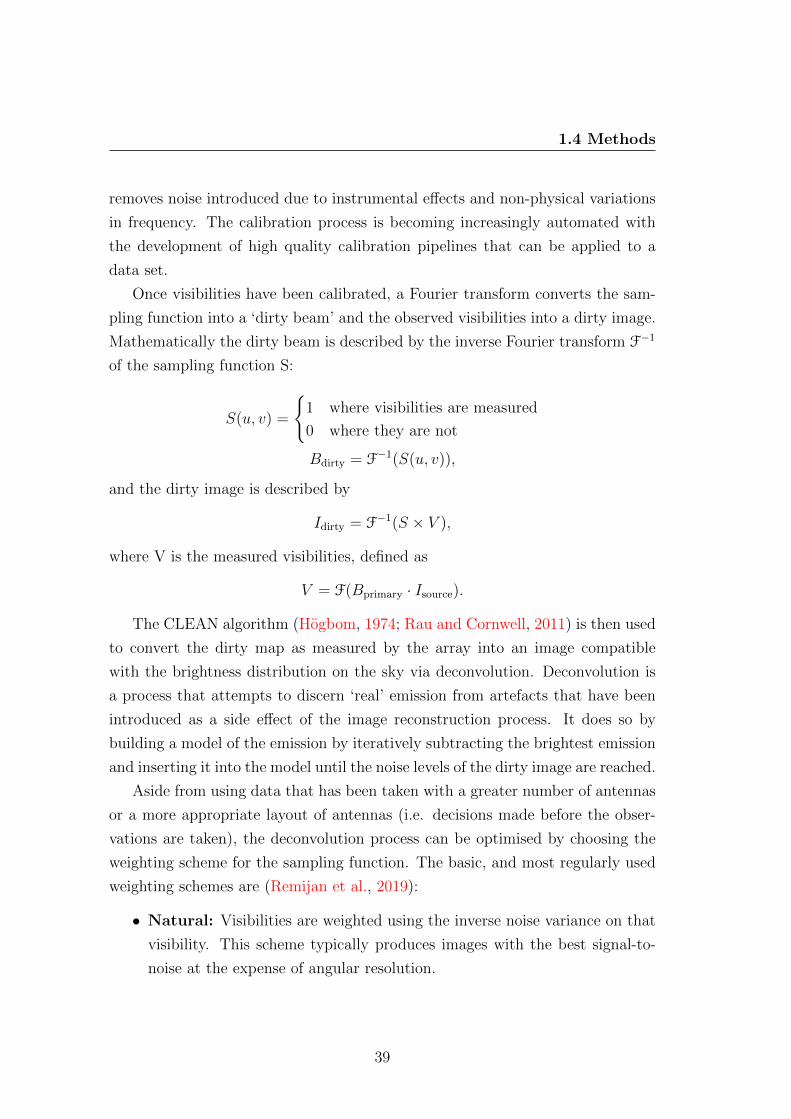
1.4 Methods
removes noise introduced due to instrumental effects and non-physical variations
in frequency. The calibration process is becoming increasingly automated with
the development of high quality calibration pipelines that can be applied to a
data set.
Once visibilities have been calibrated, a Fourier transform converts the sam-
pling function into a ‘dirty beam’ and the observed visibilities into a dirty image.
Mathematically the dirty beam is described by the inverse Fourier transform F−1
of the sampling function S:
S(u, v) =
{1 where visibilities are measured
0 where they are not
Bdirty = F−1(S(u, v)),
and the dirty image is described by
Idirty = F−1(S × V ),
where V is the measured visibilities, defined as
V = F(Bprimary · Isource).
The CLEAN algorithm (Hogbom, 1974; Rau and Cornwell, 2011) is then used
to convert the dirty map as measured by the array into an image compatible
with the brightness distribution on the sky via deconvolution. Deconvolution is
a process that attempts to discern ‘real’ emission from artefacts that have been
introduced as a side effect of the image reconstruction process. It does so by
building a model of the emission by iteratively subtracting the brightest emission
and inserting it into the model until the noise levels of the dirty image are reached.
Aside from using data that has been taken with a greater number of antennas
or a more appropriate layout of antennas (i.e. decisions made before the obser-
vations are taken), the deconvolution process can be optimised by choosing the
weighting scheme for the sampling function. The basic, and most regularly used
weighting schemes are (Remijan et al., 2019):
• Natural: Visibilities are weighted using the inverse noise variance on that
visibility. This scheme typically produces images with the best signal-to-
noise at the expense of angular resolution.
39
1. Introduction
• Uniform: Regrids the data in the uv plane, and then gives equal weighting
to all uv cells, increasing the contribution of visibilities that would be given
low weighting by the ‘natural’ scheme. This sharpens the angular resolution
of the final image and helps to reduce sidelobe artefacts, but in doing so
increases rms noise.
• Briggs: A flexible weighting scheme controlled by a robust parameter,
R, to achieve a trade-off between sensitivity and resolution. R=-2 gives a
result similar to ‘uniform’ weighting and R=2 is similar to ‘natural’. R=0.5
is regularly adopted as a useful compromise.
Line emission
Line emission occurs over much narrower frequency intervals than continuum
emission. Line profiles are best detected and characterised when using fine spec-
tral resolution (ALMA Cycle 7 channel widths could be as narrow as 3.8 kHz). An
important consideration in reducing data of molecular emission lines is removing
the contribution from continuum flux. If the line emission is not brighter than
the continuum within its frequency range, there will be no detection at all. By
fitting a polynomial to the continuum data, a model of the emission’s dependence
on frequency is created and subtracted from the spectral windows containing line
emission to leave behind only the emission from the line.
Self-calibration
As part of the deconvolution process, a model of the observed emission is built
by the CLEAN algorithm. If the source is bright enough, this model can be
used to calibrate the data and produce an image with increased signal to noise.
Self-calibration takes advantage of time averaging of the data and can be used
iteratively to continually improve signal to noise in the image (Pearson and Read-
head, 1984).
40
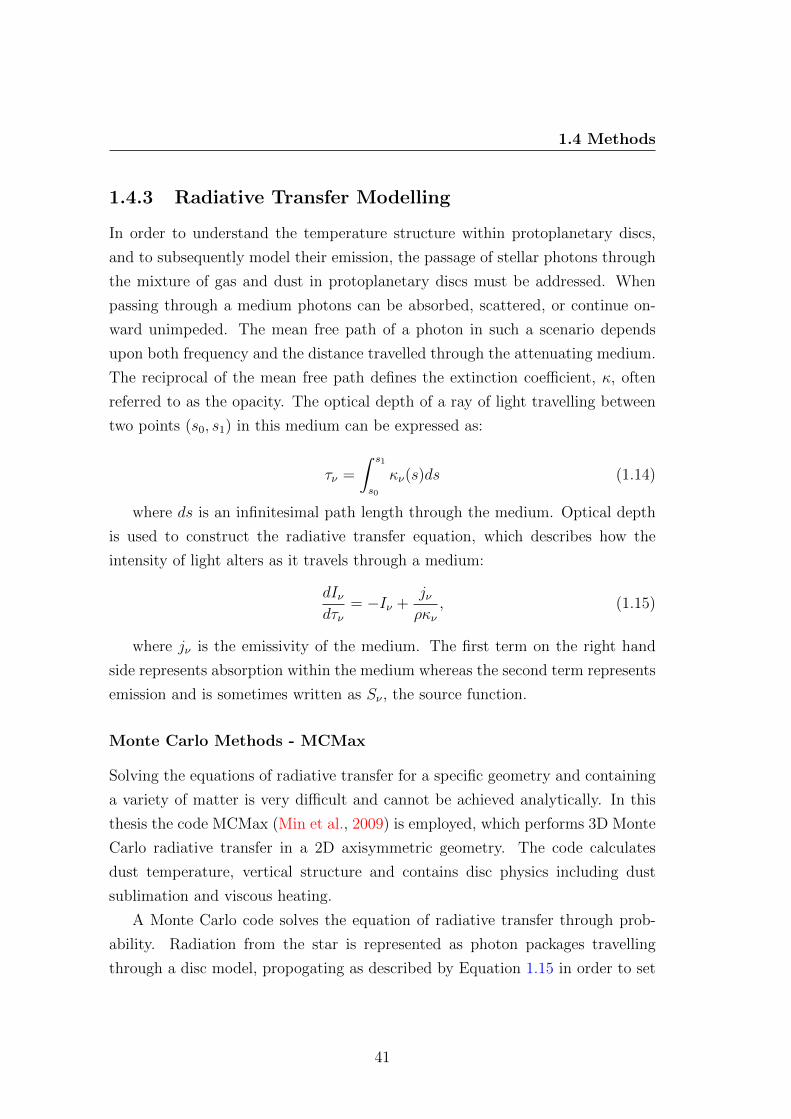
1.4 Methods
1.4.3 Radiative Transfer Modelling
In order to understand the temperature structure within protoplanetary discs,
and to subsequently model their emission, the passage of stellar photons through
the mixture of gas and dust in protoplanetary discs must be addressed. When
passing through a medium photons can be absorbed, scattered, or continue on-
ward unimpeded. The mean free path of a photon in such a scenario depends
upon both frequency and the distance travelled through the attenuating medium.
The reciprocal of the mean free path defines the extinction coefficient, κ, often
referred to as the opacity. The optical depth of a ray of light travelling between
two points (s0, s1) in this medium can be expressed as:
τν =
∫ s1
s0
κν(s)ds (1.14)
where ds is an infinitesimal path length through the medium. Optical depth
is used to construct the radiative transfer equation, which describes how the
intensity of light alters as it travels through a medium:
dIνdτν
= −Iν +jνρκν
, (1.15)
where jν is the emissivity of the medium. The first term on the right hand
side represents absorption within the medium whereas the second term represents
emission and is sometimes written as Sν , the source function.
Monte Carlo Methods - MCMax
Solving the equations of radiative transfer for a specific geometry and containing
a variety of matter is very difficult and cannot be achieved analytically. In this
thesis the code MCMax (Min et al., 2009) is employed, which performs 3D Monte
Carlo radiative transfer in a 2D axisymmetric geometry. The code calculates
dust temperature, vertical structure and contains disc physics including dust
sublimation and viscous heating.
A Monte Carlo code solves the equation of radiative transfer through prob-
ability. Radiation from the star is represented as photon packages travelling
through a disc model, propogating as described by Equation 1.15 in order to set
41
1. Introduction
the temperature. Photons take a random walk and at each grid cell they are
either absorbed, scattered or do not interact at all. Absorption of a photon adds
its energy to that of the grid cell, increasing its temperature. A new photon
with a spectrum corresponding to the temperature in the cell and the local dust
opacity is then emitted.
If the cell has absorbed and emitted before, then the new photon is emitted
with the difference spectrum between before and after the energy absorption,
this procedure is known as immediate temperature correction (Bjorkman and
Wood, 2001). The random walk of each photon continues from cell to cell until
the photon leaves the disc. When all photon packages have propagated through
the disc, the final temperature structure is been calculated. An infinite number
of photons would explore all possible paths and produce an exact temperature
structure. In reality stochastic errors on temperature occur in each cell, but
these errors can be reduced by increasing the number of photons used in the
calculations.
The vertical structure is then calculated iteratively, assuming the gas to be
in hydrostatic equilibrium and that the gas temperature is equal to the dust
temperature (a good approximation below the surface layer of the disc as shown
in modelling by Kamp and Dullemond, 2004). The initial structure is calculated
using Equation 1.3. The vertical structure of the dust is then calculated under
the influence of dust settling and turbulent mixing, which requires an update to
dust temperature. This dust temperature is in turn used to update the vertical
structure of the gas which is likely to deviate from the guess made with Equation
1.3, meaning the temperature and density structure in the disc are not currently
self-consistent. Dust temperature and vertical structure calculations of the dust
and gas are iterated until a self-consistent solution is converged upon.
The run time for a model increases with the number of photon packages used
and is proportional to τ 2. Certain models can therefore lead to significant com-
putational costs. MCMax includes two approximations that reduce the overall
run time and improve the calculated temperature structure in regions of high
optical depth. The first deals with regions of high optical depth, where photons
can have many interactions within a small region of the disc, using up a dis-
proportionate amount of computation time. This time can be reduced however
42
1.4 Methods
by treating all interactions with a single computational step using a modified
random walk (Fleck and Canfield, 1984). A second key optimisation improves
the accuracy of the temperature structure in regions of high optical depth where
photon statistics are low. In these environments energy transport occurs mainly
through radiative diffusion and so the issue can be solved using a partial diffusion
approximation. MCMax reduces the temperature in such regions by using the
diffusion equation from Wehrse et al. (2000) with the Monte Carlo temperature
immediately outside of the optically thick region as boundary conditions. This
reduces the number of photons requires to get an accurate midplane temperature
by orders of magnitude.
MCMax uses a multi-wavelength approach accounting for the full energy spec-
trum of photons leaving the disc, which leads to smoother predicted SEDs. The
formal solution to the radative transfer equation along the line of sight to the
disc can also be used to create a synthetic image of the disc at a given observing
wavelength.
1.4.4 Midplane Evolution and Chemical Models
In Chapter 4 midplane conditions are modelled by including the dominant physi-
cal mechanisms acting in this region of the disc. The disc evolution code presented
in (Booth et al., 2017) is employed to calculate the transport of gas and dust in
the disc in 1D. It combines viscous evolution of the gas with diffusion and radial
drift of solids. Dust evolution is calculated with a model containing two popula-
tions of dust: one of sub-micron sized ‘small’ grains that are well coupled to the
gas and a ‘large’ grain population where maximum grain size is determined by
the competition between growth and fragmentation processes following Birnstiel
et al. (2012). The total dust mass is dominated by the contribution from the
large grains, whereas the surface area is dominated by the small grains.
Temperature structure in the disc controls whether grains are icy or ice-free,
which in turn sets the collision velocity at which grains fragment, and determines
the state of volatiles in the midplane. In this thesis a simple chemical model is
applied in order to trace the abundance of major molecular carriers of carbon
and oxygen in both the gas and solid phase. The model adopted is that of Oberg
43
1. Introduction
et al. (2011), also implemented as ‘case 2’ in Booth et al. (2017); Madhusudhan
et al. (2014, 2017). It contains the major C-, N- and O- carrying species observed
in protoplanetary discs and giant exoplanet atmospheres; H2O, CO, CO2, NH3,
N2, silicates, refractory O components, organics and carbon grains. Initial solar
abundances are adopted: C/H= 2.7×10⁻⁴ , N/H= 6.8×10⁻⁵, O/H= 4.9×10⁻⁴,
and Si/H= 3.2×10⁻⁵ and the binding energies for the key molecules are the
same as those used by Piso et al. (2016) and Booth et al. (2017). Equilibrium
ice abundances are found by balancing thermal adsorption and desorption rates
in the midplane. Drift will act to alter the chemical abundances as a function
of radius, an assumption of our model is that chemical reactions act to restore
equilibrium abundances. Abundances of the gas and ice phase molecular species
are updated close to snowlines but the amount of material in carbon grains and
silicates is assumed to be constant (Booth et al., 2017).
44
Chapter 2
Asymmetric midplane gas in
ALMA images of HD 100546
45
2. Asymmetric midplane gas in ALMA images of HD 100546
2.1 Context
In this chapter new ALMA observations of the Herbig transition disc HD100546
are presented. These data include the first detection of C18O in the disc and the
first ALMA imaging at 1.3 mm, a crucial wavelength regime for tracing mass
in the outer disc and dense midplane in which a significant proportion of disc
mass resides. This system is investigated through characterisation of its gas and
dust emission. Estimates of mass in both the gas and dust are calculated in
order to assess the remaining planet-building budget within the disc. By utilising
observations at shorter wavelengths, the spectral index of disc emission is used to
constrain the maximum size to which dust grains have grown in the disc giving an
indication as to the state of the dust’s evolution. The detailed analysis of these
ALMA observations provide a valuable characterisation of a massive disc around
an intermediate mass, pre-main sequence star thought to be hosting embedded
planets within its disc.
2.1.1 HD 100546
This chapter focuses on a fascinating example of planet formation; the well-
studied disc around Herbig Ae/Be star HD 100546. The star is located at a
distance of 110pc (Lindegren et al., 2018) with a mass reported by van den Ancker
et al. (1997) of 2.4 M� from pre-main sequence (PMS) track fitting and more
recently 1.9 M� by Fairlamb et al. (2015) derived through X-shooter spectroscopy
and PARSEC PMS tracks (Bressan et al., 2012). Although previously thought
to be as old as ≥10Myr (van den Ancker et al., 1997), Fairlamb et al. (2015)
calculate an age for the star of 7.02±1.49 Myr and using the updated parallax
from GAIA data release 2, Vioque et al. (2018) find a younger age of 5.5+1.4−0.7 Myr.
2.1.2 Evidence for proto-planet(s)
The system has been long associated with active planet formation and so is well
studied. Direct imaging of a protoplanet has been claimed at ∼50 au via di-
rect imaging by Quanz et al. (2015) and there has been some evidence of an
46
2.1 Context
inner companion as well. This includes SED modelling and mid-IR interferome-
try (Mulders et al., 2013; Panic et al., 2014), ALMA observations (Walsh et al.,
2014a), near IR spectroscopy (Brittain et al., 2014, 2013) and a point source in
GEMINI Planet Imager (GPI) data at 10 au (Currie et al., 2015) supporting the
proposed planet at the inner disc wall. However this predicted companion has
alluded detection in more recent GPI and Magellan Adaptive Optics System ob-
servations by Follette et al. (2017). The position of the potential inner companion
coincides with the position of the rim of the inner gap at ∼ 11 ± 1 au, interior
to which is a small inner dust disc of ≤0.7 au (Panic et al., 2014) and a recently
detected bar-like structure reaching across the inner gap in both continuum and
Hα emission (Mendigutıa et al., 2017).
2.1.3 Structure in the disc
Observing with ATCA, 7mm continuum emission from HD100546 can be fit by
a Gaussian with FWHM between 50 and 60 au (Wright et al., 2015), and the
authors assert that grains in the disc are well-processed and have grown as large
as 5cm and possibly further. Walsh et al. (2014a) are able to detect a significant
amount of weak, extended continuum emission beyond this and find a best-fit
model for the dust in the uv plane comprised of two rings with a Gaussian pro-
file; one centred at 26 au with a FWHM of 21 au and one at 190 au with FWHM
75 au. Pineda et al. (2014) find that mm-sized grains are trapped within a similar
inner ring and note brightness asymmetries in the dust between the South-East
and North-West of the disc. All three of these studies at (sub-)millimetre wave-
lengths favour arguments of at least one giant planet orbiting within the disc. The
disc does not appear to be axi-symmetric; scattered light studies routinely ob-
serve multiple asymmetric features and spiral arms within the dust disc (Follette
et al., 2017; Garufi et al., 2016), including a ‘dark lane’ observed by Avenhaus
et al. (2014) in the same direction as the horse-shoe shaped asymmetry identified
in 7 mm images of (Wright et al., 2015). A selective summary of imaging of
HD100546 across the wavelength range is presented in Figure 2.1. The exact na-
ture of corresponding features at millimetre wavelengths has until now remained
largely undefined.
47
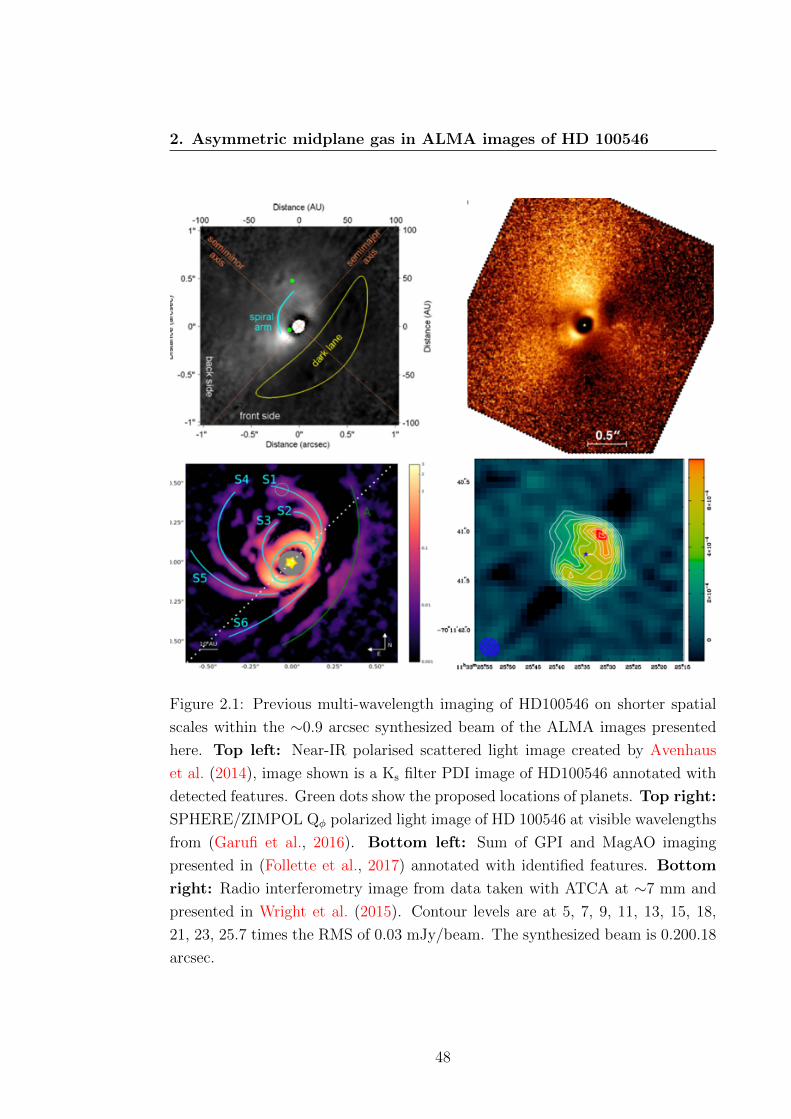
2. Asymmetric midplane gas in ALMA images of HD 100546
Figure 2.1: Previous multi-wavelength imaging of HD100546 on shorter spatial
scales within the ∼0.9 arcsec synthesized beam of the ALMA images presented
here. Top left: Near-IR polarised scattered light image created by Avenhaus
et al. (2014), image shown is a Ks filter PDI image of HD100546 annotated with
detected features. Green dots show the proposed locations of planets. Top right:
SPHERE/ZIMPOL Qφ polarized light image of HD 100546 at visible wavelengths
from (Garufi et al., 2016). Bottom left: Sum of GPI and MagAO imaging
presented in (Follette et al., 2017) annotated with identified features. Bottom
right: Radio interferometry image from data taken with ATCA at ∼7 mm and
presented in Wright et al. (2015). Contour levels are at 5, 7, 9, 11, 13, 15, 18,
21, 23, 25.7 times the RMS of 0.03 mJy/beam. The synthesized beam is 0.200.18
arcsec.
48
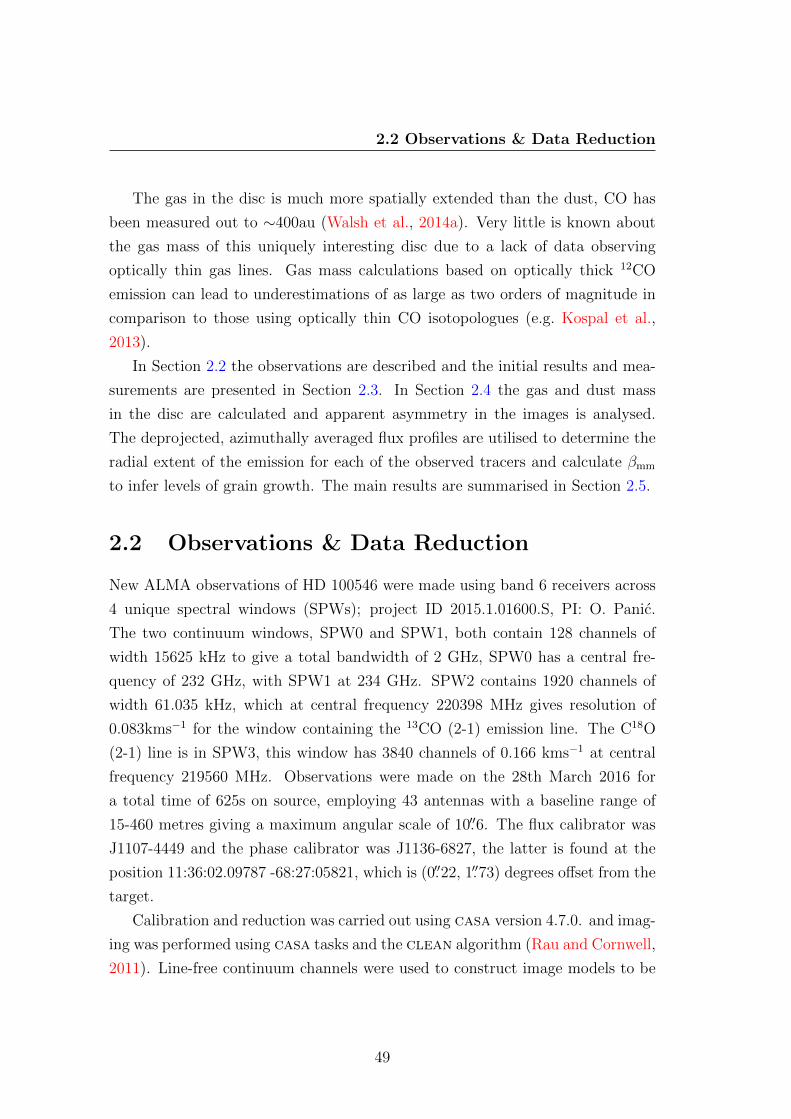
2.2 Observations & Data Reduction
The gas in the disc is much more spatially extended than the dust, CO has
been measured out to ∼400au (Walsh et al., 2014a). Very little is known about
the gas mass of this uniquely interesting disc due to a lack of data observing
optically thin gas lines. Gas mass calculations based on optically thick 12CO
emission can lead to underestimations of as large as two orders of magnitude in
comparison to those using optically thin CO isotopologues (e.g. Kospal et al.,
2013).
In Section 2.2 the observations are described and the initial results and mea-
surements are presented in Section 2.3. In Section 2.4 the gas and dust mass
in the disc are calculated and apparent asymmetry in the images is analysed.
The deprojected, azimuthally averaged flux profiles are utilised to determine the
radial extent of the emission for each of the observed tracers and calculate βmm
to infer levels of grain growth. The main results are summarised in Section 2.5.
2.2 Observations & Data Reduction
New ALMA observations of HD 100546 were made using band 6 receivers across
4 unique spectral windows (SPWs); project ID 2015.1.01600.S, PI: O. Panic.
The two continuum windows, SPW0 and SPW1, both contain 128 channels of
width 15625 kHz to give a total bandwidth of 2 GHz, SPW0 has a central fre-
quency of 232 GHz, with SPW1 at 234 GHz. SPW2 contains 1920 channels of
width 61.035 kHz, which at central frequency 220398 MHz gives resolution of
0.083kms−1 for the window containing the 13CO (2-1) emission line. The C18O
(2-1) line is in SPW3, this window has 3840 channels of 0.166 kms−1 at central
frequency 219560 MHz. Observations were made on the 28th March 2016 for
a total time of 625s on source, employing 43 antennas with a baseline range of
15-460 metres giving a maximum angular scale of 10.′′6. The flux calibrator was
J1107-4449 and the phase calibrator was J1136-6827, the latter is found at the
position 11:36:02.09787 -68:27:05821, which is (0.′′22, 1.′′73) degrees offset from the
target.
Calibration and reduction was carried out using casa version 4.7.0. and imag-
ing was performed using casa tasks and the clean algorithm (Rau and Cornwell,
2011). Line-free continuum channels were used to construct image models to be
49
2. Asymmetric midplane gas in ALMA images of HD 100546
used for self-calibration with reference antenna DA59 and the minimum solution
interval length for phase calibration. The resulting solutions were then applied
to all channels. After applying self-calibration, images were created with Briggs
weighting and robust=0.5, giving a synthesized beam of 1.′′05 x 0.′′77, P.A. = -160◦
for the continuum image. Source emission is contained within the inner third of
the primary beam and so primary beam correction was not applied to images.
Data cubes were created for the line emission by subtracting the continuum from
SPWs containing the line emission using casa task uvcontsub. Images of the
lines have beam sizes of 1.′′08 x 0.′′82, P.A. = -161◦ for 13CO and 1.′′10 x 0.′′83,
P.A. = -160◦ for C18O. Integrated intensity, from which fluxes are measured, and
intensity weighted velocity maps were created with casa task immoments by
summing all emission in channels containing significant (> 3σ) signal; in the case
of 13CO this corresponds to a range between -0.62 and 11.4 kms−1 and for C18O
between -2.0 and 10.8 kms−1.
In addition to the data presented here, archival cycle 0 ALMA observations
of HD 100546 in band 7 as described by Walsh et al. (2014a) are utilised (Project
ID: 2011.0.00863.S, PI: C. Walsh). This data is re-reduced and imaged, applying
self calibration as described above to obtain continuum emission observed at a
wavelength of 867µm. The cycle 0 data used J1147-6753 as a phase calibrator,
offset from the primary target by (1.′′2, 2.′′3). The continuum image has a syn-
thesized beam of dimensions 0.′′95 x 0.′′42, 38◦. The minimum baseline of 21 m
results in a maximum angular scale of 5.′′3.
2.3 Results
The integrated continuum flux in the 1.3 mm image of 492 mJy is measured with
an image rms of 0.5 mJy/beam. The 13CO (2-1) integrated flux is measured at
12.872 Jy kms−1 and the first detection of C18O in the disc gives an integrated flux
of 2.948 Jy kms−1 for the (2-1) transition, with rms noise 0.033 Jy/beam kms−1
and 0.027 Jy/beam kms−1 respectively. The 2σ contour reaches a maximum
separation of 2.′′5 in the 1.3 mm image, 3.′′6 in 13CO and 3.′′0 in C18O. Asymmetry
and the radial extent of the emission maps are thoroughly discussed in Section
2.4.2.
50
2.3 Results
Figure 2.2: On the left is the contour map of the continuum emission, contours
increase in base 3 logarithms from 3σ to 729σ. Intensity weighted velocity maps
of the two isotopologue transitions are shown overlaid with contours of the in-
tegrated line emission. For 13CO(2-1), contours start at 3σ and rise in steps of
5σ to 78σ, for C18O(2-1) contours start at 3σ, and rise in steps of 3σ up to 45σ.
Dashed contours are negative. Beam ellipses and a scale bar of 100 au are shown
in each image. North is up and West is right, dashed lines follow the major and
minor axis of the disc, assuming a position angle of 144◦ and join at the stellar
position given by GAIA.
To find a position angle for the disc, the data cubes from the CO isotopologue
emission are used to identify the minor axis of the disc by locating the channel
at the systemic velocity, vsys, of the source by eye, which can be identified by the
symmetry of the map as at vsys there will be no Doppler shifting. Channel maps
show the minor axis of 13CO in the channel at 5.51±0.08 kms−1 and for C18O
at 5.33±0.17 kms−1. An average of these two velocities is adopted as vsys from
this data set, giving 5.42±0.19 kms−1, shown in Figure 2.3 along with the minor
axis channel of each isotopologue. This average is consistent with the two vsys
determined from the channel maps within the uncertainties (which is assumed to
be represented by the channel widths). Figure 2.4 plots the observed spectrum
of each of the two lines. Both lines display a double peaked spectrum, where
each of the C18O peaks is broader than the peaks of 13CO. The mid-point of the13CO spectrum is consistent with the average vsys. The mid-point of the C18O
spectrum is harder to determine due to its shape. The local minimum at the
centre of the double peak profile is offset from the adopted vsys by 0.33 kms−1.
51
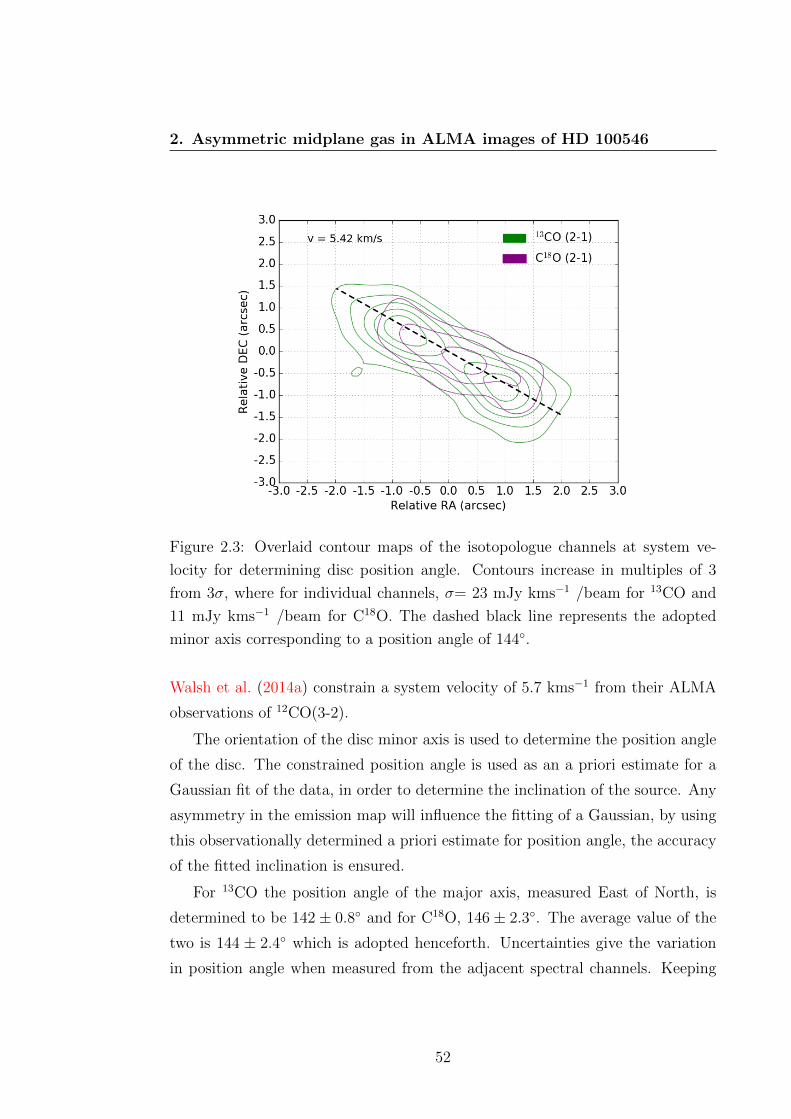
2. Asymmetric midplane gas in ALMA images of HD 100546
Figure 2.3: Overlaid contour maps of the isotopologue channels at system ve-
locity for determining disc position angle. Contours increase in multiples of 3
from 3σ, where for individual channels, σ= 23 mJy kms−1 /beam for 13CO and
11 mJy kms−1 /beam for C18O. The dashed black line represents the adopted
minor axis corresponding to a position angle of 144◦.
Walsh et al. (2014a) constrain a system velocity of 5.7 kms−1 from their ALMA
observations of 12CO(3-2).
The orientation of the disc minor axis is used to determine the position angle
of the disc. The constrained position angle is used as an a priori estimate for a
Gaussian fit of the data, in order to determine the inclination of the source. Any
asymmetry in the emission map will influence the fitting of a Gaussian, by using
this observationally determined a priori estimate for position angle, the accuracy
of the fitted inclination is ensured.
For 13CO the position angle of the major axis, measured East of North, is
determined to be 142 ± 0.8◦ and for C18O, 146 ± 2.3◦. The average value of the
two is 144 ± 2.4◦ which is adopted henceforth. Uncertainties give the variation
in position angle when measured from the adjacent spectral channels. Keeping
52
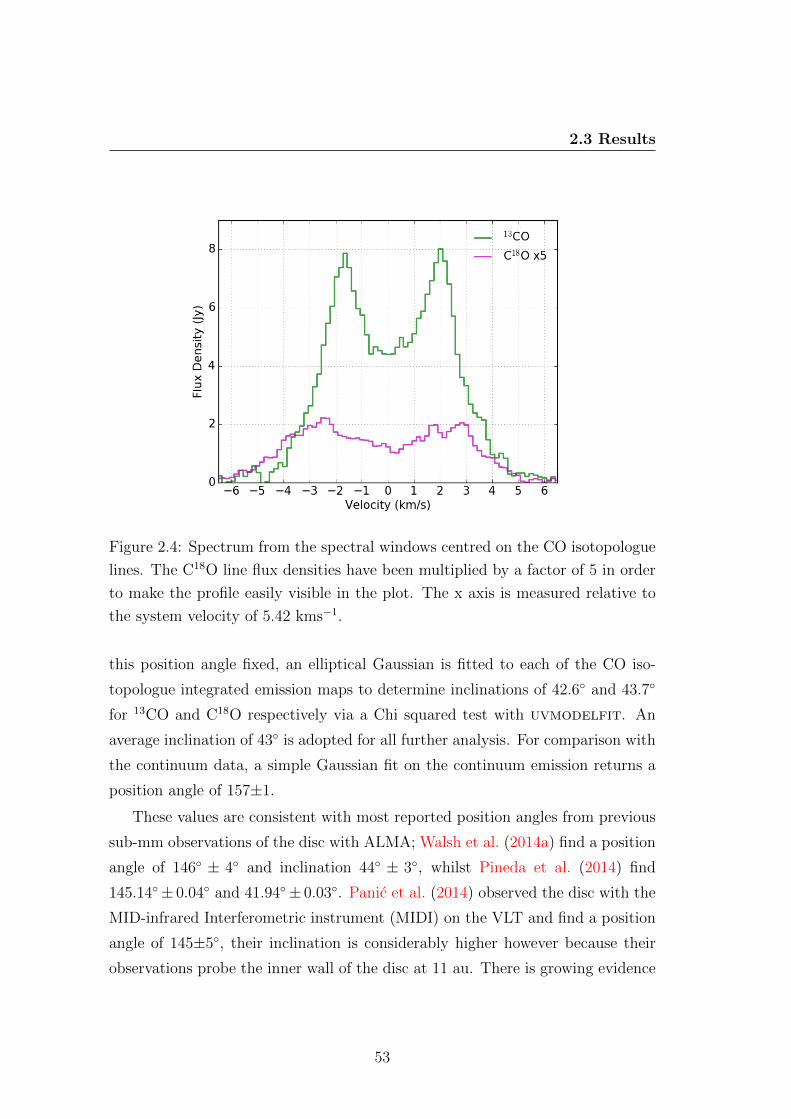
2.3 Results
Figure 2.4: Spectrum from the spectral windows centred on the CO isotopologue
lines. The C18O line flux densities have been multiplied by a factor of 5 in order
to make the profile easily visible in the plot. The x axis is measured relative to
the system velocity of 5.42 kms−1.
this position angle fixed, an elliptical Gaussian is fitted to each of the CO iso-
topologue integrated emission maps to determine inclinations of 42.6◦ and 43.7◦
for 13CO and C18O respectively via a Chi squared test with uvmodelfit. An
average inclination of 43◦ is adopted for all further analysis. For comparison with
the continuum data, a simple Gaussian fit on the continuum emission returns a
position angle of 157±1.
These values are consistent with most reported position angles from previous
sub-mm observations of the disc with ALMA; Walsh et al. (2014a) find a position
angle of 146◦ ± 4◦ and inclination 44◦ ± 3◦, whilst Pineda et al. (2014) find
145.14◦± 0.04◦ and 41.94◦± 0.03◦. Panic et al. (2014) observed the disc with the
MID-infrared Interferometric instrument (MIDI) on the VLT and find a position
angle of 145±5◦, their inclination is considerably higher however because their
observations probe the inner wall of the disc at 11 au. There is growing evidence
53
2. Asymmetric midplane gas in ALMA images of HD 100546
for a warp in the disc (Panic et al., 2010; Quillen, 2006; Walsh et al., 2017) which
would cause inclination to deviate radially.
Asymmetry in the 12CO line profile is detected in both APEX and ALMA
observations (Panic and Hogerheijde, 2009; Walsh et al., 2017). Images of the
ALMA observations of 12CO achieve a synthesizing beam of 0.′′92x0.′′38 (Pineda
et al., 2014). This asymmetry is not detected in the less abundant 13CO or C18O
lines, finding instead double-peaked line profiles symmetric to within uncertainties
(Figure 2.4). 12CO emission traces higher scale heights in the disc, meaning
that the asymmetry could be restricted to the upper vertical layers of the disc.
There already exists evidence for asymmetry of the disc surface in the scattered
light images that identify spiral arms and other structures (Ardila et al., 2007;
Avenhaus et al., 2014; Follette et al., 2017; Garufi et al., 2016). The APEX
observations have a larger beam and therefore the results may be affected by the
extended envelope of the disc as detected by scattered light as far as ∼ 1000 au
(Ardila et al., 2007; Grady et al., 2001).
The GAIA data release 2 (2018) position of HD 100546 was adjusted taking
into account proper motion between the dates of the ALMA and GAIA observa-
tions, giving a position of 11h33m25.3209s -70d11m41.2432s, within an accuracy
of (0.04, 0.05) mas (Lindegren et al., 2018). The centre of emission for each of
the tracers observed is found to be offset from this position.
Table 2.1 gives the coordinates of the centre of emission for the continuum
and CO isotopologues, accompanied by its offset from the GAIA coordinates.
A 2D Gaussian is fitted to the emission maps in Figure 2.2, the positions of
these fits are taken to be the centre of emission. A similar analysis is undertaken
here by fitting a uniform, elliptical disc geometry in the uv plane using CASA
task uvcontsub. This is repeated for each tracer, giving the position of the best-
fit disc model in Table 2.1. The benefit of uv-analysis is that it avoids being
misled by spurious artefacts that can be introduced into images during the image
reconstruction process. In each case the uv-fitted position is very similar to that
determined in the image plane. The uniform-disc fits give a position angle of 146◦
and inclination of 42◦, values which are within a few degrees of those constrained
above, and those from previous ALMA observations (Pineda et al., 2014; Walsh
et al., 2014a).
54
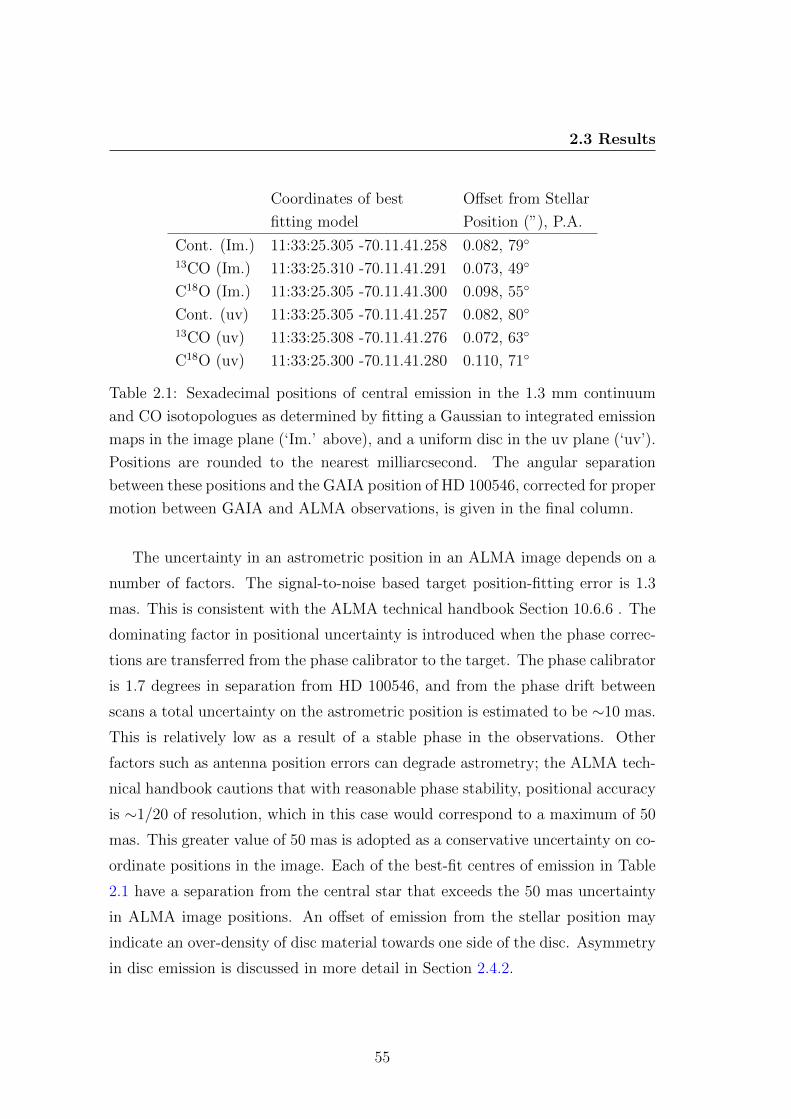
2.3 Results
Coordinates of best Offset from Stellar
fitting model Position (”), P.A.
Cont. (Im.) 11:33:25.305 -70.11.41.258 0.082, 79◦
13CO (Im.) 11:33:25.310 -70.11.41.291 0.073, 49◦
C18O (Im.) 11:33:25.305 -70.11.41.300 0.098, 55◦
Cont. (uv) 11:33:25.305 -70.11.41.257 0.082, 80◦
13CO (uv) 11:33:25.308 -70.11.41.276 0.072, 63◦
C18O (uv) 11:33:25.300 -70.11.41.280 0.110, 71◦
Table 2.1: Sexadecimal positions of central emission in the 1.3 mm continuum
and CO isotopologues as determined by fitting a Gaussian to integrated emission
maps in the image plane (‘Im.’ above), and a uniform disc in the uv plane (‘uv’).
Positions are rounded to the nearest milliarcsecond. The angular separation
between these positions and the GAIA position of HD 100546, corrected for proper
motion between GAIA and ALMA observations, is given in the final column.
The uncertainty in an astrometric position in an ALMA image depends on a
number of factors. The signal-to-noise based target position-fitting error is 1.3
mas. This is consistent with the ALMA technical handbook Section 10.6.6 . The
dominating factor in positional uncertainty is introduced when the phase correc-
tions are transferred from the phase calibrator to the target. The phase calibrator
is 1.7 degrees in separation from HD 100546, and from the phase drift between
scans a total uncertainty on the astrometric position is estimated to be ∼10 mas.
This is relatively low as a result of a stable phase in the observations. Other
factors such as antenna position errors can degrade astrometry; the ALMA tech-
nical handbook cautions that with reasonable phase stability, positional accuracy
is ∼1/20 of resolution, which in this case would correspond to a maximum of 50
mas. This greater value of 50 mas is adopted as a conservative uncertainty on co-
ordinate positions in the image. Each of the best-fit centres of emission in Table
2.1 have a separation from the central star that exceeds the 50 mas uncertainty
in ALMA image positions. An offset of emission from the stellar position may
indicate an over-density of disc material towards one side of the disc. Asymmetry
in disc emission is discussed in more detail in Section 2.4.2.
55
2. Asymmetric midplane gas in ALMA images of HD 100546
2.4 Analysis and Discussion
2.4.1 Disc Mass
Dust Mass
In order to estimate the mass of dust in the disc the flux within a 3σ contour of
the 1.3 mm continuum image is measured. The opacity depends on the maximum
grain size, for which there are only loose constraints in any individual protoplan-
etary discs. A minimum dust mass estimation can be made by assuming a dust
grain size distribution dn/da ∝ a−3.5 (Mathis et al., 1977). Assuming a maximum
grain size amax = 1 mm yields κ1.3mm = 1.15 cm2g−1 (Draine, 2006). Midplane
temperature of the dust is difficult to constrain from observations, however a firm
handle on the midplane disc mass can be found by assuming a sensible tempera-
ture range for this dense, cool environment, and so a temperature range of 20K –
40K is adopted here. In this transition disc, gas and dust are likely to be well cou-
pled, and our strong gas line detections suggest that the disc temperature must
be over the CO freeze-out temperature of ∼20 K. Herbigs host more luminous,
warmer discs than their T Tauri counterparts, and so the temperature is likely
to be above this 20 K lower bound. The upper bound is taken to be 40K. In the
radiative transfer models of A type stars by Panic and Min (2017), gas mass in
the disc must be increased by over two orders of magnitude to increase midplane
disc temperatures from 20 to 40 K at ∼40 au from the star, so this can safely be
considered as a generous upper limit.
The assumptions above give a minimum total dust mass of 4.1×10⁻⁴ M�
for T= 40 K, and 9.6×10⁻⁴ M� for T= 20 K. Figure 2.5 shows how this dust
mass can vary with midplane temperature or if the assumed level of grain growth
varies, thereby changing amax and the emissivity of the dust in turn. Between
amax= 1 mm and 10 mm, the most likely values in a protoplanetary disc at this
stage of evolution, the masses remain almost constant and are less sensitive to
temperature. This indicates that for reasonable assumptions of amax and midplane
temperature, the dust mass is ≈10−3 M�.
The mass range calculated is comparable with the estimate of Wright et al.
(2015) who employ the accretion disc models of d ’Alessio et al. (2005) to find
56
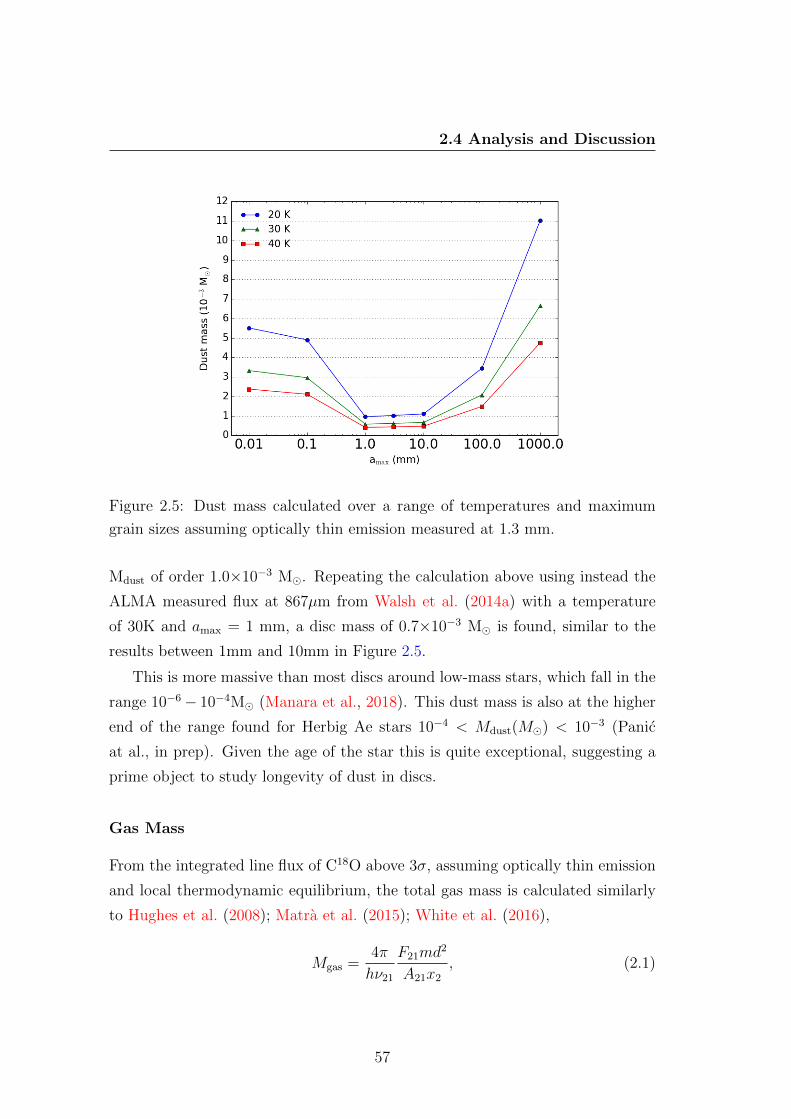
2.4 Analysis and Discussion
Figure 2.5: Dust mass calculated over a range of temperatures and maximum
grain sizes assuming optically thin emission measured at 1.3 mm.
Mdust of order 1.0×10⁻³ M�. Repeating the calculation above using instead the
ALMA measured flux at 867µm from Walsh et al. (2014a) with a temperature
of 30K and amax = 1 mm, a disc mass of 0.7×10⁻³ M� is found, similar to the
results between 1mm and 10mm in Figure 2.5.
This is more massive than most discs around low-mass stars, which fall in the
range 10−6− 10−4M� (Manara et al., 2018). This dust mass is also at the higher
end of the range found for Herbig Ae stars 10−4 < Mdust(M�) < 10−3 (Panic
at al., in prep). Given the age of the star this is quite exceptional, suggesting a
prime object to study longevity of dust in discs.
Gas Mass
From the integrated line flux of C18O above 3σ, assuming optically thin emission
and local thermodynamic equilibrium, the total gas mass is calculated similarly
to Hughes et al. (2008); Matra et al. (2015); White et al. (2016),
Mgas =4π
hν21
F21md2
A21x2, (2.1)
57
2. Asymmetric midplane gas in ALMA images of HD 100546
where F21 is the integrated line flux, ν21 is the rest frequency of the transition, d
the distance to the source, m is the mass of the CO molecule, A21 is the appro-
priate Einstein coefficient, and x is the fractional population of the upper level.
ISM fractional abundances for CO and its isotopologues are adopted, specifi-
cally CO/H2 ∼ 10−4, and the abundance of C18O relative to the main isotope
CO/C18O ∼ 550 (Wilson and Rood, 1994). A gas mass is calculated in this way
over a range of temperatures. The minimum gas mass was calculated with a tem-
perature of 20 K, giving a minimum disc gas mass of 0.018 M�. This estimated
gas mass is around 1% of the stellar mass, corresponding to around 18 Jupiter
masses. For comparison, in an ALMA survey of Lupus, most low-mass discs have
a gas disc mass of ≤ 10−3M�. In this case Ansdell et al. (2016) determine gas
mass using the 13CO and C18O measured flux for each disc and comparing to a
grid of models including isotope selective photo-dissociation. Such disc masses
are large even for Herbig stars, where the majority have discs within the range
(1-10)×10−3M� when calculated from midplane tracing CO isotopologues (Panic
at al., in prep). HD100546 therefore appears to still possess enough disc mass to
form Jupiter mass planets, a very significant amount for a disc that has reached
the transition disc stage of its evolution and shows detections of active planet
formation (Quanz et al., 2015).
The calculated gas mass assumes ISM abundances of C18O relative to CO.
Isotope-selective photodissociation can alter these ratios significantly in some
discs, which can lead to underestimates of disc mass by up to an order of mag-
nitude (Miotello et al., 2014). The CO line luminosities measured in this data
are unable to conclusively determine the extent of any isotope-selective photodis-
sociation when compared to the models of Miotello et al. (2016), and so our
calculation represents a lower limit. Carbon freeze-out beyond the snowline can
also result in low measured gas masses; T Tauri discs appear to have significant
levels of carbon freeze-out, for example in TW Hya (Schwarz et al., 2016). Herbig
discs such as HD 100546 on the other hand remain warmer for a greater radial
extent due to the more massive host star (Panic and Min, 2017). This pushes the
CO snowline to a greater radial separation allowing carbon to remain in the gas
phase for a greater radial extent of the disc. In the disc of HD 100546 freeze-out
58
2.4 Analysis and Discussion
is not expected to play a significant role; fitting physical-chemical models to ob-
servations, Kama et al. (2016) find that within the disc of TW Hydra, C and O
are strongly under-abundant, whereas in HD 100546, the depletion of gas-phase
carbon appears quite low, in part due to the relatively warm disc.
In light of the discussion above, our calculated gas estimate represents a firm
lower limit, but a very large one in comparison to other Herbig discs. The gas
mass estimated here is similar to that achieved through line modelling of another
bright Herbig disc, HD 163296 (Boneberg et al., 2016), and shows there is still
a large budget remaining in the disc for giant planet building in comparison to
discs that are in a more advanced stage of their evolution towards a debris disc,
e.g. HD 141569 (White et al., 2016).
Gas To Dust Ratio
Taking the dust mass calculated with T=20K and the minimum gas mass cal-
culated at the same temperature results in a calculated g/d for HD 100546 of ≈19. Low g/d (< 100) is observed in the majority of sources in recent surveys of
discs in star forming regions (Ansdell et al., 2016; Long et al., 2017). Studies of
individual Herbig discs suggest g/d is generally low in these larger, brighter discs
too (Boneberg et al., 2016; Meeus et al., 2010). The g/d affects disc evolution
because gas dynamics dominate the behaviour of the dust in gas-rich protoplan-
etary discs. The uncoupling of these two populations when gas densities drop
sufficiently low is a signpost for the transition to a debris disc.
Low observed g/d can mean a great amount of gas has been lost, or it can
be the result of carbon depletion in the disc through sequestration into large
icy bodies or the conversion of CO into more complex molecules. This ratio is
indicative only of regions within the CO snowline where freeze out is avoided. In
the similar Herbig disc HD 163296, the snowline is calculated to be at around 90
au (Qi et al., 2015), in cooler discs the snowline will be at a lesser separation, e.g.
TW Hydra, 30 au (Qi et al., 2013).
59
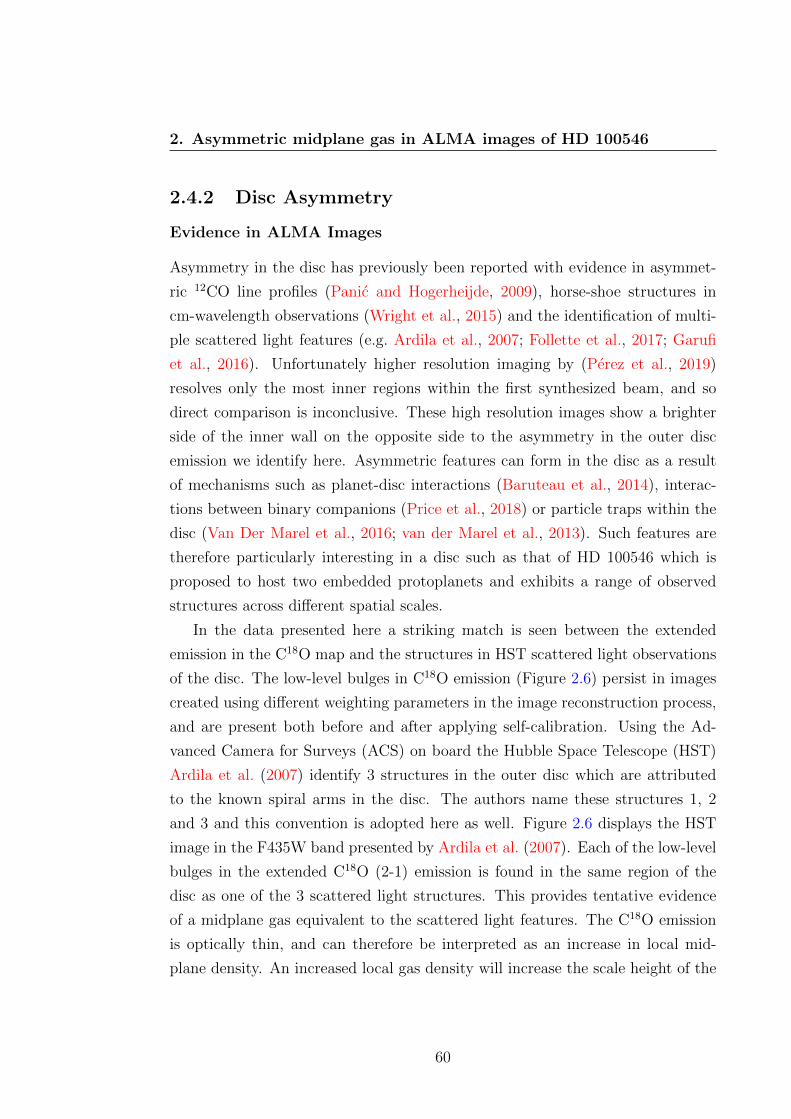
2. Asymmetric midplane gas in ALMA images of HD 100546
2.4.2 Disc Asymmetry
Evidence in ALMA Images
Asymmetry in the disc has previously been reported with evidence in asymmet-
ric 12CO line profiles (Panic and Hogerheijde, 2009), horse-shoe structures in
cm-wavelength observations (Wright et al., 2015) and the identification of multi-
ple scattered light features (e.g. Ardila et al., 2007; Follette et al., 2017; Garufi
et al., 2016). Unfortunately higher resolution imaging by (Perez et al., 2019)
resolves only the most inner regions within the first synthesized beam, and so
direct comparison is inconclusive. These high resolution images show a brighter
side of the inner wall on the opposite side to the asymmetry in the outer disc
emission we identify here. Asymmetric features can form in the disc as a result
of mechanisms such as planet-disc interactions (Baruteau et al., 2014), interac-
tions between binary companions (Price et al., 2018) or particle traps within the
disc (Van Der Marel et al., 2016; van der Marel et al., 2013). Such features are
therefore particularly interesting in a disc such as that of HD 100546 which is
proposed to host two embedded protoplanets and exhibits a range of observed
structures across different spatial scales.
In the data presented here a striking match is seen between the extended
emission in the C18O map and the structures in HST scattered light observations
of the disc. The low-level bulges in C18O emission (Figure 2.6) persist in images
created using different weighting parameters in the image reconstruction process,
and are present both before and after applying self-calibration. Using the Ad-
vanced Camera for Surveys (ACS) on board the Hubble Space Telescope (HST)
Ardila et al. (2007) identify 3 structures in the outer disc which are attributed
to the known spiral arms in the disc. The authors name these structures 1, 2
and 3 and this convention is adopted here as well. Figure 2.6 displays the HST
image in the F435W band presented by Ardila et al. (2007). Each of the low-level
bulges in the extended C18O (2-1) emission is found in the same region of the
disc as one of the 3 scattered light structures. This provides tentative evidence
of a midplane gas equivalent to the scattered light features. The C18O emission
is optically thin, and can therefore be interpreted as an increase in local mid-
plane density. An increased local gas density will increase the scale height of the
60
2.4 Analysis and Discussion
Figure 2.6: The colour image shows the PSF deconvolved HST ACS image of
HD 100546 in the F435W band. Overlaid in white contours is the integrated C18O
(2-1) emission observed by ALMA, with contours at (-2,2,3,4,5)×σ18, dashed lines
are negative contours. Structures in the scattered light image initially identified
by Ardila et al. (2007) are indicated with black ellipses. The black circle of radius
1.′′0 represents the HST coronograph.
disc, the subsequent elevation of small particles towards the scattering surface
will result in a stronger scattered light flux, as seen in the HST data. The C18O
emission bulges towards the outer disc may therefore be signalling the midplane
density features that correspond with the disc’s spiral arms. In this section a
general analysis is made of any observational evidence for asymmetry in the disc,
61
2. Asymmetric midplane gas in ALMA images of HD 100546
within the limits of the angular resolution of our ALMA observations.
In Section 2.3 the inclination and position angle of the disc is accurately
measured, both of which are very close to values derived from previous sub-
millimetre ALMA observations of the disc (Pineda et al., 2014; Walsh et al.,
2014a). This geometry is used to construct an ellipse with a semi-major axis
equivalent to 100 au in the disc. An initial visual assessment of asymmetry in
the disc is made by plotting this ellipse over the emission maps in Figure 2.2
centred at the stellar position. The midplane tracing 1.3 mm continuum and
C18O (2-1) emission in particular show evidence of an offset disc in Figure 2.7,
on scales larger than that the offsets listed in Table 2.1. In both panels high
level contours internal to the inner ellipse are omitted for clarity. Towards the
northwest in the panels of Figure 2.7, the 75σ contour (in the 1.3 mm image) and
the 15σ contour (C18O) overlap with the 100 au ellipse, whereas to the southeast
there is a significant offset. C18O in particular shows azimuthal asymmetry in
the outer disc, with low level emission extending much further out as previously
highlighted in Figure 2.6.
The largest asymmetry in the disc is along the minor axis (Figure 2.7) with the
brighter region found towards the position of Structure 2 in Figure 2.6. Evidence
for this also appears in Figure 2.8, which shows slices from the emission maps
taken along the minor axis in both directions, centered at the stellar position.
C18O (bottom panel) is brighter in the southwest for the majority of the disc,
and emission extends further by ∼0.′′3 in comparison to that in the northeast.
In the continuum (top panel) the southwest side is brighter than the northeast
throughout the disc. The greatest difference between the two sides is at an angular
separation of 0.′′7, where the southwest is brighter by 50σ. A low-level bump in
the continuum emission just beyond 2.′′0 occurs at the same radial location as the
extended C18O emission and scattered light emission in Figure 2.6. 13CO emission
(middle panel) is also brighter in the southwest for as far as ∼ 2.′′8, beyond which
the northeast of the disc is brighter.
Comparison to previously detected asymmetries in HD 100546
Figure 2.6 displays how the low-level, extended emission towards the edge of
the gas disc is spatially coincident with structures identified by Ardila et al.
62
2.4 Analysis and Discussion
(2007), potentially linking observed scattered light features with the midplane
gas above which the small, scattering grains are suspended. In other scattered
light observations, Avenhaus et al. (2014) see a dark lane that extends from
∼ 0.′′2 − 0.′′6 along the minor axis. The authors attribute this to effects due to
the polarised scattering function, rather than any physical feature in the disc.
However Wright et al. (2015) also observe an arc of millimetre emission in the
same direction, at the same separation as the scattered light dark lane, but not
quite as extended.
Mid-IR interferometry is able to resolve the inner disc, where asymmetry is
found close to the inner gap of the disc at 9 au (Panic et al., 2014). Features in
the inner disc can have a strong effect on the outer disc. For example there has
been recent evidence of warps from ALMA observations, e.g. this disc (Walsh
et al., 2017) and T Tauri star AA Tau (Loomis et al., 2017). A warp of the inner
disc can lead not only to shadowing of the outer disc but potentially even a break
of the disc into two distinct planes. Substructure can then develop as a result
of this geometry; a misaligned disc can result in shadows that create asymmetric
illumination of the disc, whilst a ‘broken’ disc can contain dust streamers that
cross gaps in the disc (Dutrey et al., 2014; Loomis et al., 2017). Recent very high
angular resolution (0.′′05) ALMA observations of the disc resolve the very inner
regions of the disc, revealing an asymmetric circumstellar ring in the continuum,
brightest towards the North East (Pineda et al., 2019). The authors attribute
this asymmetry to another scattered light spiral feature, this time identified by
SPHERE (Garufi et al., 2016), on angular scales much less than that of the
synthesized beam achieved in the observations presented here.
Many of these disc structures can arise through interactions with a central
companion as shown by 3D hydrodynamic simulations of the transition disc
HD 142527 (Price et al., 2018), this is particularly interesting in regard to any
asymmetries found in the HD 100546 disc when bearing in mind the evidence
found in recent years for a further companion at smaller separation.
63
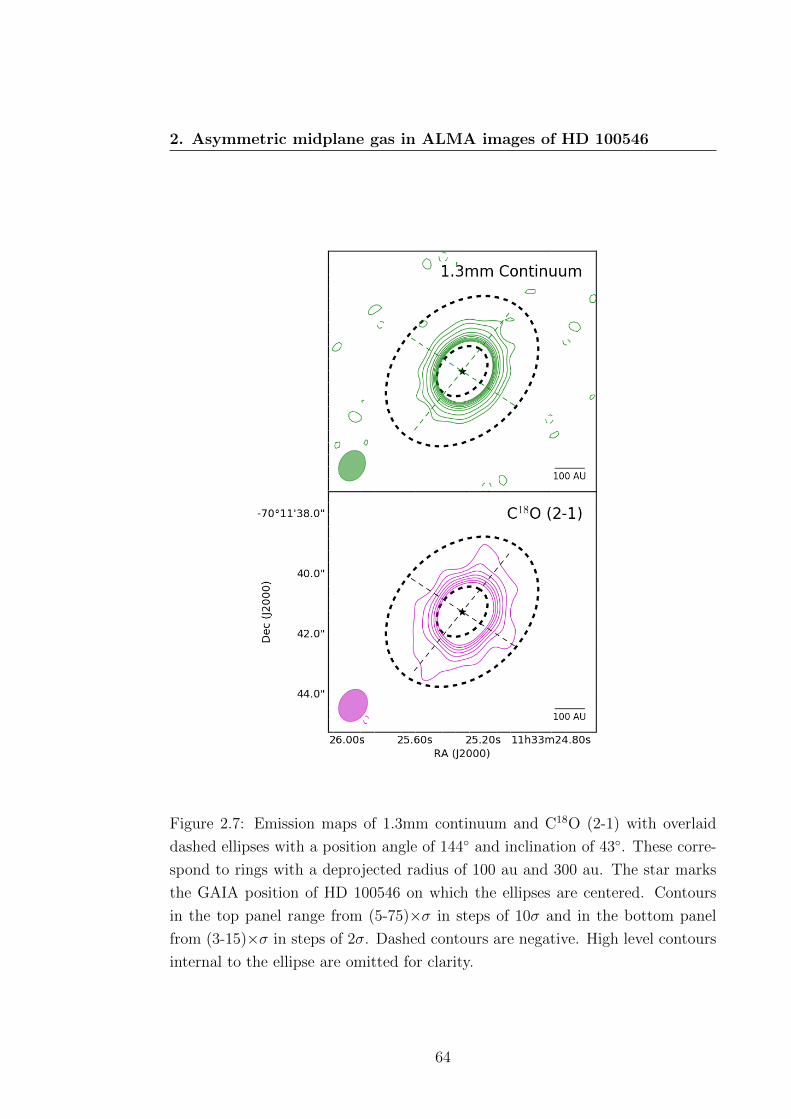
2. Asymmetric midplane gas in ALMA images of HD 100546
Figure 2.7: Emission maps of 1.3mm continuum and C18O (2-1) with overlaid
dashed ellipses with a position angle of 144◦ and inclination of 43◦. These corre-
spond to rings with a deprojected radius of 100 au and 300 au. The star marks
the GAIA position of HD 100546 on which the ellipses are centered. Contours
in the top panel range from (5-75)×σ in steps of 10σ and in the bottom panel
from (3-15)×σ in steps of 2σ. Dashed contours are negative. High level contours
internal to the ellipse are omitted for clarity.
64
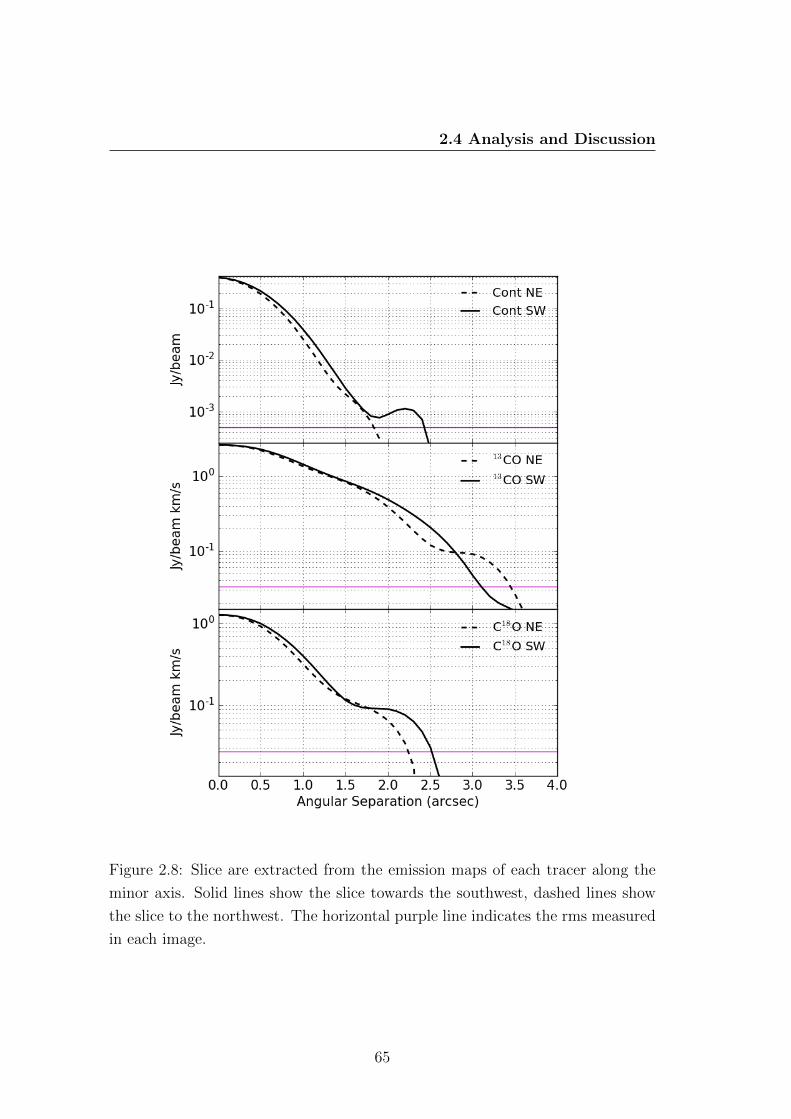
2.4 Analysis and Discussion
Figure 2.8: Slice are extracted from the emission maps of each tracer along the
minor axis. Solid lines show the slice towards the southwest, dashed lines show
the slice to the northwest. The horizontal purple line indicates the rms measured
in each image.
65
2. Asymmetric midplane gas in ALMA images of HD 100546
2.4.3 Asymmetry Analysis
Asymmetry in the surface brightness of the gas emission can occur from increased
temperature, increased density or a combination of the two.
In 3D hydrodynamic simulations, spiral arms launched by planets observed
at 1.3 mm have been shown to induce azimuthal variation in gas surface density
of approximately 50-60% (Juhasz and Rosotti, 2018), and should also be observ-
able in optically thin gas observations. In this scenario, a large spiral arm could
increase gas density locally, thereby elevating the scale height of micron-sized
grains to produce the scattered light features. Alternatively a local density in-
crease of 30% over a length scale approximately equal to the disc scale height is
enough to provide the conditions for dust trapping of larger particles in the outer
disc (Pinilla et al., 2012b). Another explanation for local increase in density is a
gravitationally unstable disc, where clumping occurs due to gravitational forces if
the free fall time scale is short compared to sound speed crossing time scales and
shearing time scales (Toomre, 1964). This is generally found in discs at an earlier
stage in their evolution whilst discs are still very massive (Mdisc/M? > 10%),
which is not the case here.
Brightness asymmetry can also result from varying temperature in the disc.
Azimuthal variation in disc temperature may result from an inner warp that
obscures sections of the disc or azimuthal variation of density.
Density Scenario
In this scenario it is assumed that the difference in observed brightness is due
solely to changes in gas density. The disc is bisected along the major axis and
then each half is divided into three 60◦ degree segments, the flux for each segment
is then summed. By calculating the brightness ratio between two segments on
opposite sides of the disc, the increase in surface density required to produce
the difference in flux can be readily calculated. The intensity of integrated line
emission is given by
I =hνAJ,J−1N(J)
4π, (2.2)
66
2.4 Analysis and Discussion
where AJ,J−1 is the Einstein coefficient for spontaneous emission from level J to
level J-1, and N(J) is the column density in a specific level. The intensity is
therefore proportional to the density of molecules in the N(J) level.
The largest brightness difference is between the two segments along the minor
axis; the southwest is brighter than the northeast by a factor of 1.10±0.15 .
The asymmetry identified in Section 2.4.2 is most obvious in the outer disc. The
brightness ratio of outer regions, summing only the emission beyond a deprojected
radius of 100 au is found to be 1.27±0.18 . The angular resolution of the current
observations limits comparisons of brightness across regions of the disc. Local
density increases on smaller scales can alert us to certain physical mechanisms in
the disc, some of which are discussed below.
Given the 1.′′0 resolution of the data, it is feasible that there are much larger
azimuthal density variations for a given radial separation that are diluted by the
beam. This might arise due to a local increase in density due to, for example, a
spiral arm. Ardila et al. (2007) associate the three structures in Figure 2.6 with
spiral arms, and it is towards each of these structures that the outer disc of C18O
emission seems least symmetric.
From this data the possibility of an unresolved vortex capable of trapping
particles at large separation in the HD 100546 disc cannot be ruled out, as the
observed density variation is similar to that predicted by Pinilla et al. (2012b).
High resolution data across multiple wavelengths would help to identify any such
feature (e.g. Cazzoletti et al., 2018). Such dust trapping vortices have not yet been
found at such a large radial separation from the host star however, as densities in
outer disc regions are typically not large enough to create the required pressure
jump.
Calculation of the Toomre parameter, Q, based on the radial profile of C18O
rules out gravitational instability in the disc. Assuming C18O traces total disc
mass, Q(R) for this disc reaches a minimum of 24 at 80 au confirming that the
disc is stable against gravitational collapse. However a clump in the outer disc
will experience relatively long orbital timescales, meaning it will take longer to
break up. Fragments of the disc that were previously unstable might linger at
the outer edges of the disc as they dissipate.
67
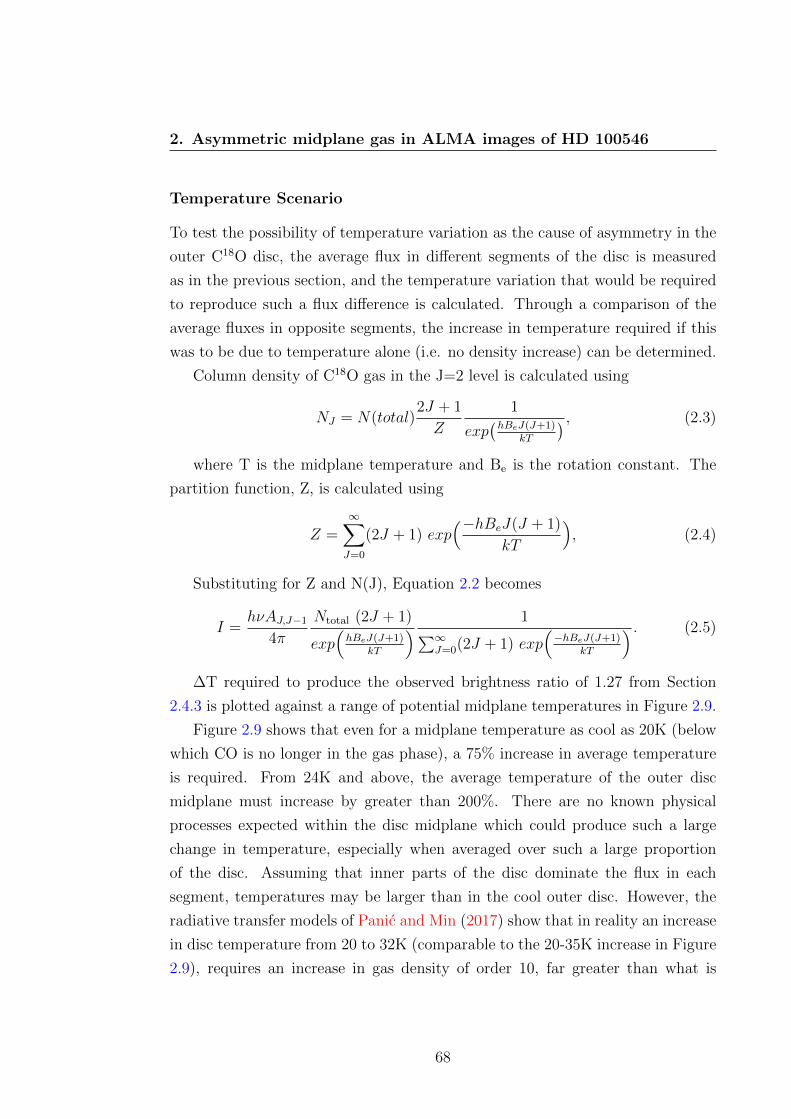
2. Asymmetric midplane gas in ALMA images of HD 100546
Temperature Scenario
To test the possibility of temperature variation as the cause of asymmetry in the
outer C18O disc, the average flux in different segments of the disc is measured
as in the previous section, and the temperature variation that would be required
to reproduce such a flux difference is calculated. Through a comparison of the
average fluxes in opposite segments, the increase in temperature required if this
was to be due to temperature alone (i.e. no density increase) can be determined.
Column density of C18O gas in the J=2 level is calculated using
NJ = N(total)2J + 1
Z
1
exp(hBeJ(J+1)
kT
) , (2.3)
where T is the midplane temperature and Be is the rotation constant. The
partition function, Z, is calculated using
Z =∞∑J=0
(2J + 1) exp(−hBeJ(J + 1)
kT
), (2.4)
Substituting for Z and N(J), Equation 2.2 becomes
I =hνAJ,J−1
4π
Ntotal (2J + 1)
exp(hBeJ(J+1)
kT
) 1∑∞J=0(2J + 1) exp
(−hBeJ(J+1)
kT
) . (2.5)
∆T required to produce the observed brightness ratio of 1.27 from Section
2.4.3 is plotted against a range of potential midplane temperatures in Figure 2.9.
Figure 2.9 shows that even for a midplane temperature as cool as 20K (below
which CO is no longer in the gas phase), a 75% increase in average temperature
is required. From 24K and above, the average temperature of the outer disc
midplane must increase by greater than 200%. There are no known physical
processes expected within the disc midplane which could produce such a large
change in temperature, especially when averaged over such a large proportion
of the disc. Assuming that inner parts of the disc dominate the flux in each
segment, temperatures may be larger than in the cool outer disc. However, the
radiative transfer models of Panic and Min (2017) show that in reality an increase
in disc temperature from 20 to 32K (comparable to the 20-35K increase in Figure
2.9), requires an increase in gas density of order 10, far greater than what is
68
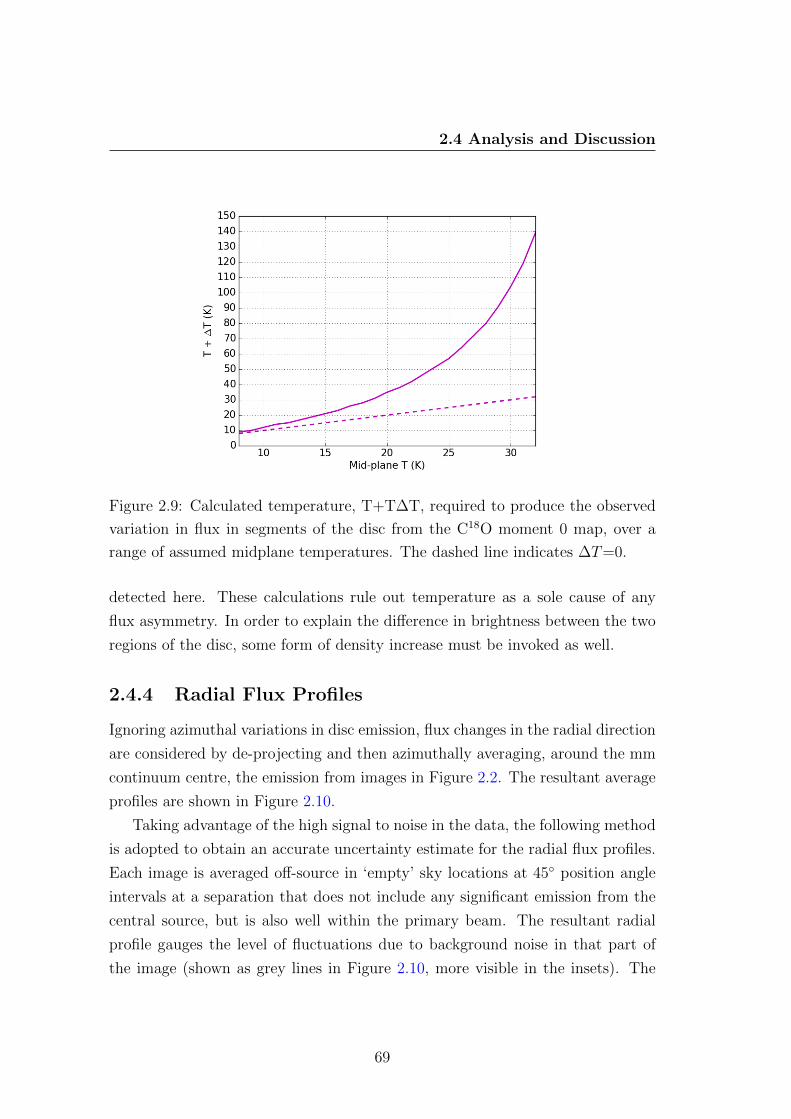
2.4 Analysis and Discussion
Figure 2.9: Calculated temperature, T+T∆T, required to produce the observed
variation in flux in segments of the disc from the C18O moment 0 map, over a
range of assumed midplane temperatures. The dashed line indicates ∆T=0.
detected here. These calculations rule out temperature as a sole cause of any
flux asymmetry. In order to explain the difference in brightness between the two
regions of the disc, some form of density increase must be invoked as well.
2.4.4 Radial Flux Profiles
Ignoring azimuthal variations in disc emission, flux changes in the radial direction
are considered by de-projecting and then azimuthally averaging, around the mm
continuum centre, the emission from images in Figure 2.2. The resultant average
profiles are shown in Figure 2.10.
Taking advantage of the high signal to noise in the data, the following method
is adopted to obtain an accurate uncertainty estimate for the radial flux profiles.
Each image is averaged off-source in ‘empty’ sky locations at 45◦ position angle
intervals at a separation that does not include any significant emission from the
central source, but is also well within the primary beam. The resultant radial
profile gauges the level of fluctuations due to background noise in that part of
the image (shown as grey lines in Figure 2.10, more visible in the insets). The
69
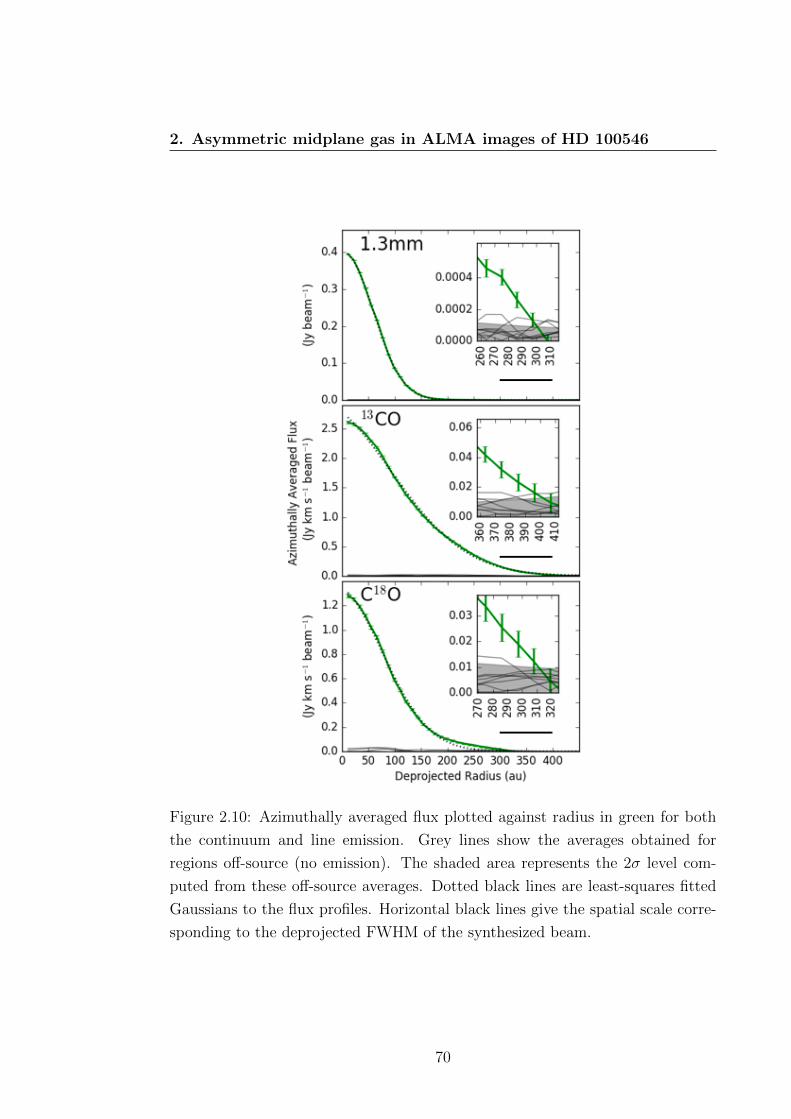
2. Asymmetric midplane gas in ALMA images of HD 100546
Figure 2.10: Azimuthally averaged flux plotted against radius in green for both
the continuum and line emission. Grey lines show the averages obtained for
regions off-source (no emission). The shaded area represents the 2σ level com-
puted from these off-source averages. Dotted black lines are least-squares fitted
Gaussians to the flux profiles. Horizontal black lines give the spatial scale corre-
sponding to the deprojected FWHM of the synthesized beam.
70
2.4 Analysis and Discussion
amplitudes of these fluctuations as a function of radius are fitted with polynomi-
als, the polynomials are then averaged over the different off-source locations. The
resulting final polynomial gives the average level of off-source fluctuations in the
image as a result of the azimuthal averaging process, which is used for error bars
on the average flux curve. This method also allows for a determination of average
outermost detection radius that does not rely on a pre-defined function or model;
taken to be the point at which the average flux becomes less than 2 times the
average noise fluctuations at that radius. In Figure 2.10 this corresponds to the
error bars reaching the grey shaded area.
Figure 2.10 plots the azimuthally averaged continuum flux and integrated
line emission against deprojected radius (using inclination=43◦ and PA=144◦ as
determined in Section 2.3). The 1.3 mm continuum is detected as far as an
average deprojected radial separation of 286±11 au. The 13CO profile shows us
that the gas in the disc is significantly more extended; detected as far out as
385±11 au, a comparable distance to the 390±20 au extent of 12CO in the disc
reported by Walsh et al. (2014a). The less abundant molecule C18O is detected
out to a shorter separation of 297±11 au.
A large amount of mass spread over large radial separations is important for
planet formation in the outer disc. Giant planets grow more massive in discs of
higher initial disc (gas) mass (Mordasini et al., 2012). Furthermore, population
synthesis models suggest that significant amounts of giant planets migrate into the
central star after formation (See review Mordasini, 2018). In order to survive,
some cores accrete late in the disc lifetime and grow as they migrate inward
(Baruteau et al., 2014). These results suggest the disc of HD 100546 is well
placed to support such late survivors, because a large amount of planet building
material (∼18 MJ) still exists over a large region of the disc (297 au outermost
detection of C18O). This is particularly relevant in the case of this disc, where a
proto-planet detection is claimed towards the outer disc at a radial separation of
∼50 au (Quanz et al., 2015).
The difference in the outer radius at which the discs are detected may be a true
physical difference, or could be a result of the different sensitivity between the
continuum and the line emission. In Figure 2.11 the surface density profile of each
tracer is plotted in order to assess how it changes with radial separation. Here
71
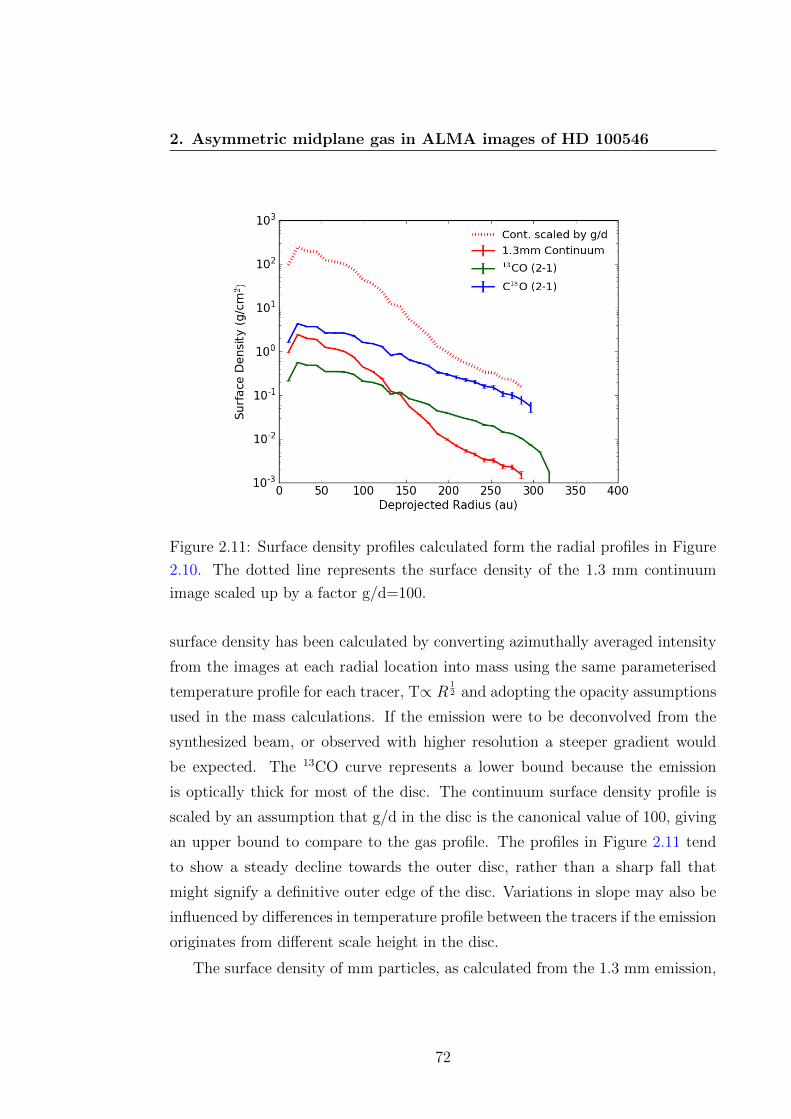
2. Asymmetric midplane gas in ALMA images of HD 100546
Figure 2.11: Surface density profiles calculated form the radial profiles in Figure
2.10. The dotted line represents the surface density of the 1.3 mm continuum
image scaled up by a factor g/d=100.
surface density has been calculated by converting azimuthally averaged intensity
from the images at each radial location into mass using the same parameterised
temperature profile for each tracer, T∝ R12 and adopting the opacity assumptions
used in the mass calculations. If the emission were to be deconvolved from the
synthesized beam, or observed with higher resolution a steeper gradient would
be expected. The 13CO curve represents a lower bound because the emission
is optically thick for most of the disc. The continuum surface density profile is
scaled by an assumption that g/d in the disc is the canonical value of 100, giving
an upper bound to compare to the gas profile. The profiles in Figure 2.11 tend
to show a steady decline towards the outer disc, rather than a sharp fall that
might signify a definitive outer edge of the disc. Variations in slope may also be
influenced by differences in temperature profile between the tracers if the emission
originates from different scale height in the disc.
The surface density of mm particles, as calculated from the 1.3 mm emission,
72
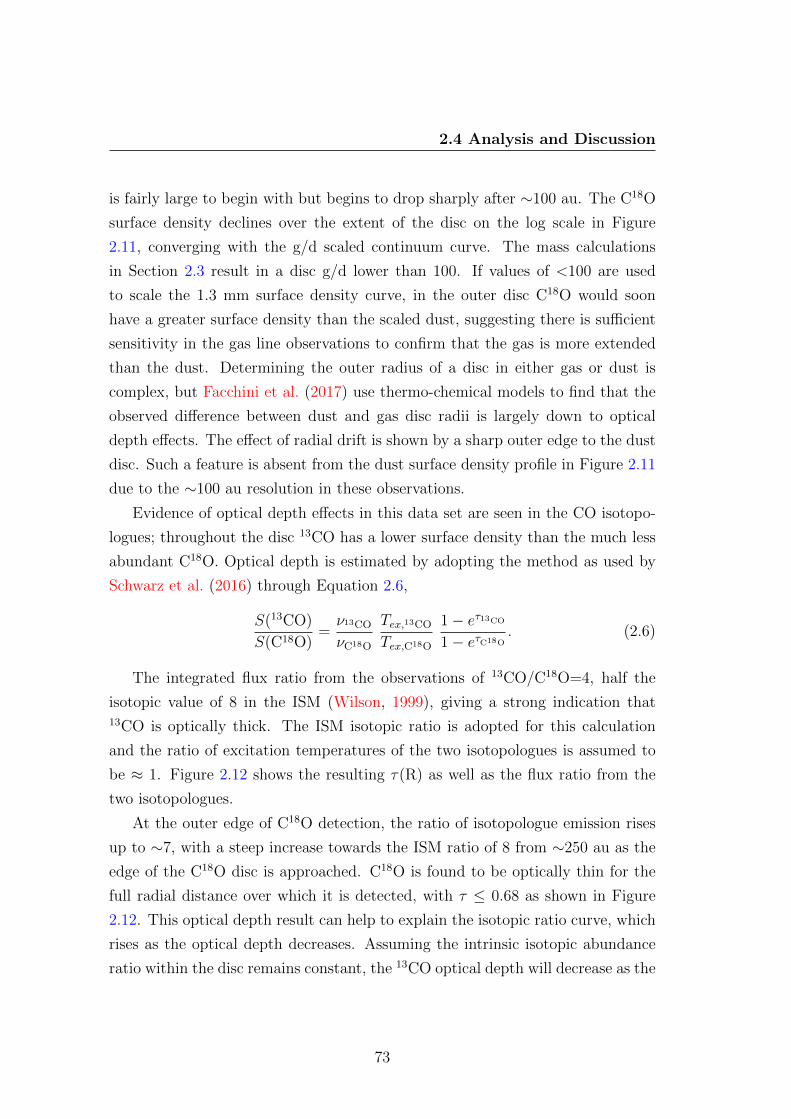
2.4 Analysis and Discussion
is fairly large to begin with but begins to drop sharply after ∼100 au. The C18O
surface density declines over the extent of the disc on the log scale in Figure
2.11, converging with the g/d scaled continuum curve. The mass calculations
in Section 2.3 result in a disc g/d lower than 100. If values of <100 are used
to scale the 1.3 mm surface density curve, in the outer disc C18O would soon
have a greater surface density than the scaled dust, suggesting there is sufficient
sensitivity in the gas line observations to confirm that the gas is more extended
than the dust. Determining the outer radius of a disc in either gas or dust is
complex, but Facchini et al. (2017) use thermo-chemical models to find that the
observed difference between dust and gas disc radii is largely down to optical
depth effects. The effect of radial drift is shown by a sharp outer edge to the dust
disc. Such a feature is absent from the dust surface density profile in Figure 2.11
due to the ∼100 au resolution in these observations.
Evidence of optical depth effects in this data set are seen in the CO isotopo-
logues; throughout the disc 13CO has a lower surface density than the much less
abundant C18O. Optical depth is estimated by adopting the method as used by
Schwarz et al. (2016) through Equation 2.6,
S(13CO)
S(C18O)=ν13CO
νC18O
Tex,13CO
Tex,C18O
1− eτ13CO
1− eτC18O. (2.6)
The integrated flux ratio from the observations of 13CO/C18O=4, half the
isotopic value of 8 in the ISM (Wilson, 1999), giving a strong indication that13CO is optically thick. The ISM isotopic ratio is adopted for this calculation
and the ratio of excitation temperatures of the two isotopologues is assumed to
be ≈ 1. Figure 2.12 shows the resulting τ(R) as well as the flux ratio from the
two isotopologues.
At the outer edge of C18O detection, the ratio of isotopologue emission rises
up to ∼7, with a steep increase towards the ISM ratio of 8 from ∼250 au as the
edge of the C18O disc is approached. C18O is found to be optically thin for the
full radial distance over which it is detected, with τ ≤ 0.68 as shown in Figure
2.12. This optical depth result can help to explain the isotopic ratio curve, which
rises as the optical depth decreases. Assuming the intrinsic isotopic abundance
ratio within the disc remains constant, the 13CO optical depth will decrease as the
73
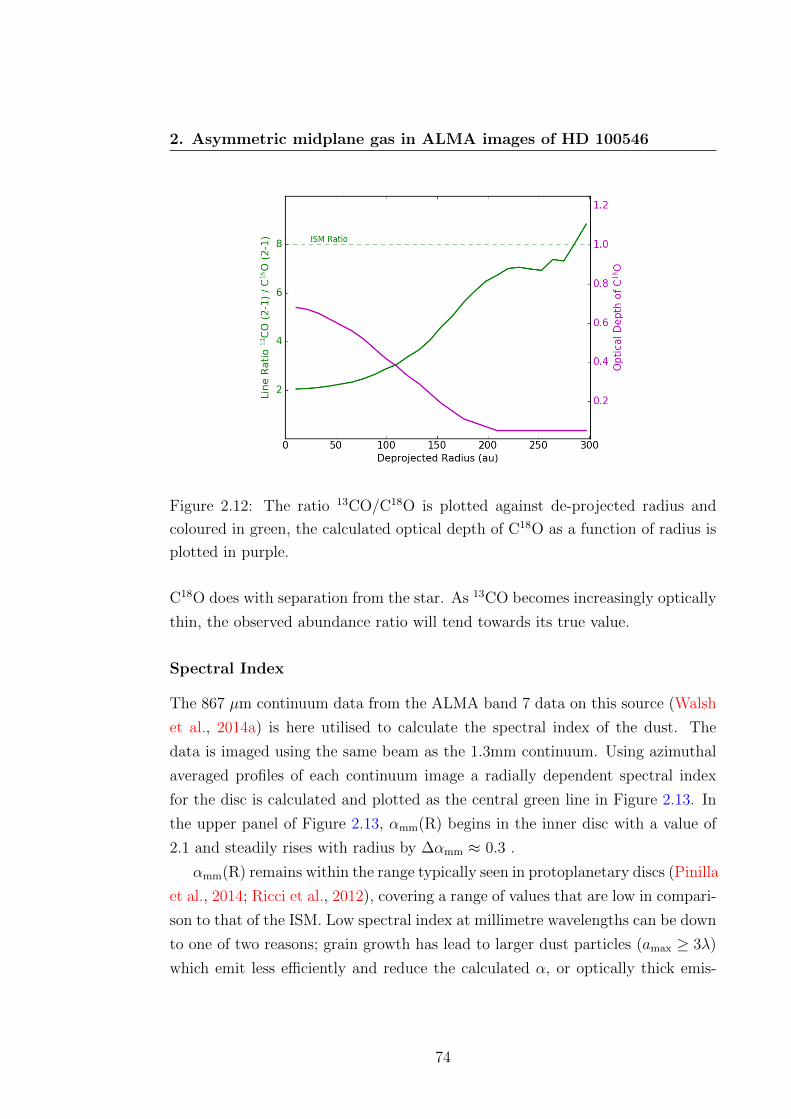
2. Asymmetric midplane gas in ALMA images of HD 100546
Figure 2.12: The ratio 13CO/C18O is plotted against de-projected radius and
coloured in green, the calculated optical depth of C18O as a function of radius is
plotted in purple.
C18O does with separation from the star. As 13CO becomes increasingly optically
thin, the observed abundance ratio will tend towards its true value.
Spectral Index
The 867 µm continuum data from the ALMA band 7 data on this source (Walsh
et al., 2014a) is here utilised to calculate the spectral index of the dust. The
data is imaged using the same beam as the 1.3mm continuum. Using azimuthal
averaged profiles of each continuum image a radially dependent spectral index
for the disc is calculated and plotted as the central green line in Figure 2.13. In
the upper panel of Figure 2.13, αmm(R) begins in the inner disc with a value of
2.1 and steadily rises with radius by ∆αmm ≈ 0.3 .
αmm(R) remains within the range typically seen in protoplanetary discs (Pinilla
et al., 2014; Ricci et al., 2012), covering a range of values that are low in compari-
son to that of the ISM. Low spectral index at millimetre wavelengths can be down
to one of two reasons; grain growth has lead to larger dust particles (amax ≥ 3λ)
which emit less efficiently and reduce the calculated α, or optically thick emis-
74
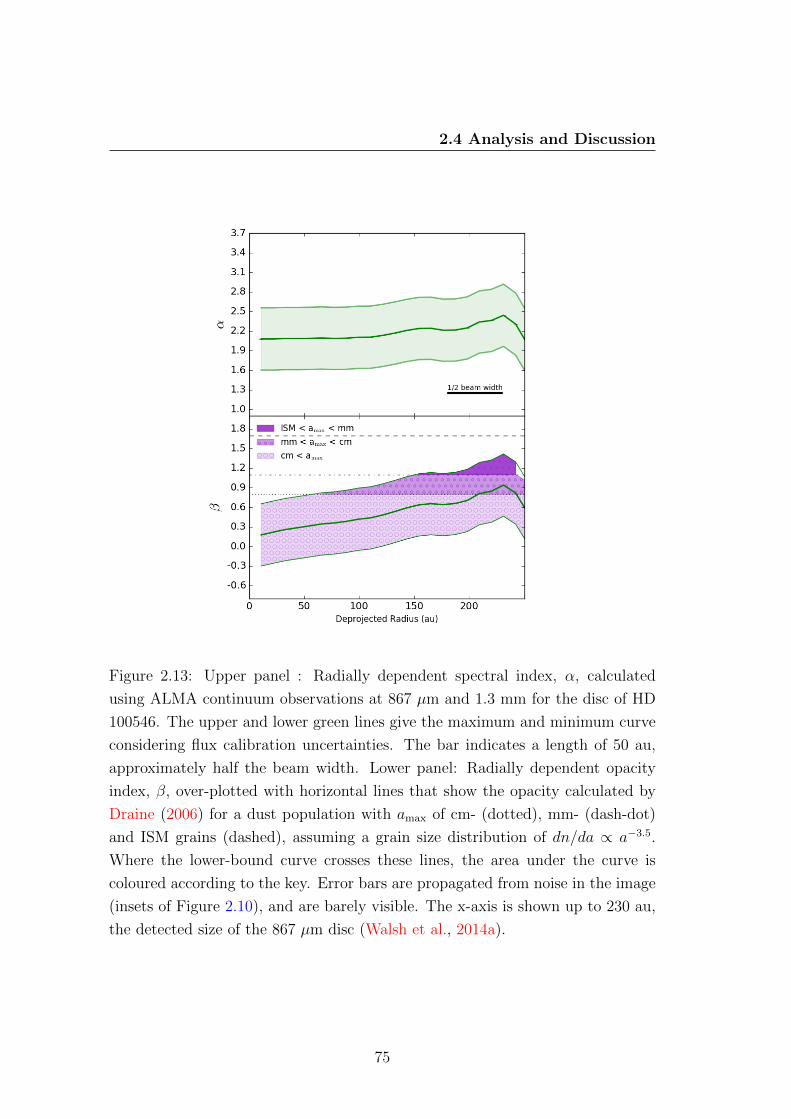
2.4 Analysis and Discussion
Figure 2.13: Upper panel : Radially dependent spectral index, α, calculated
using ALMA continuum observations at 867 µm and 1.3 mm for the disc of HD
100546. The upper and lower green lines give the maximum and minimum curve
considering flux calibration uncertainties. The bar indicates a length of 50 au,
approximately half the beam width. Lower panel: Radially dependent opacity
index, β, over-plotted with horizontal lines that show the opacity calculated by
Draine (2006) for a dust population with amax of cm- (dotted), mm- (dash-dot)
and ISM grains (dashed), assuming a grain size distribution of dn/da ∝ a−3.5.
Where the lower-bound curve crosses these lines, the area under the curve is
coloured according to the key. Error bars are propagated from noise in the image
(insets of Figure 2.10), and are barely visible. The x-axis is shown up to 230 au,
the detected size of the 867 µm disc (Walsh et al., 2014a).
75
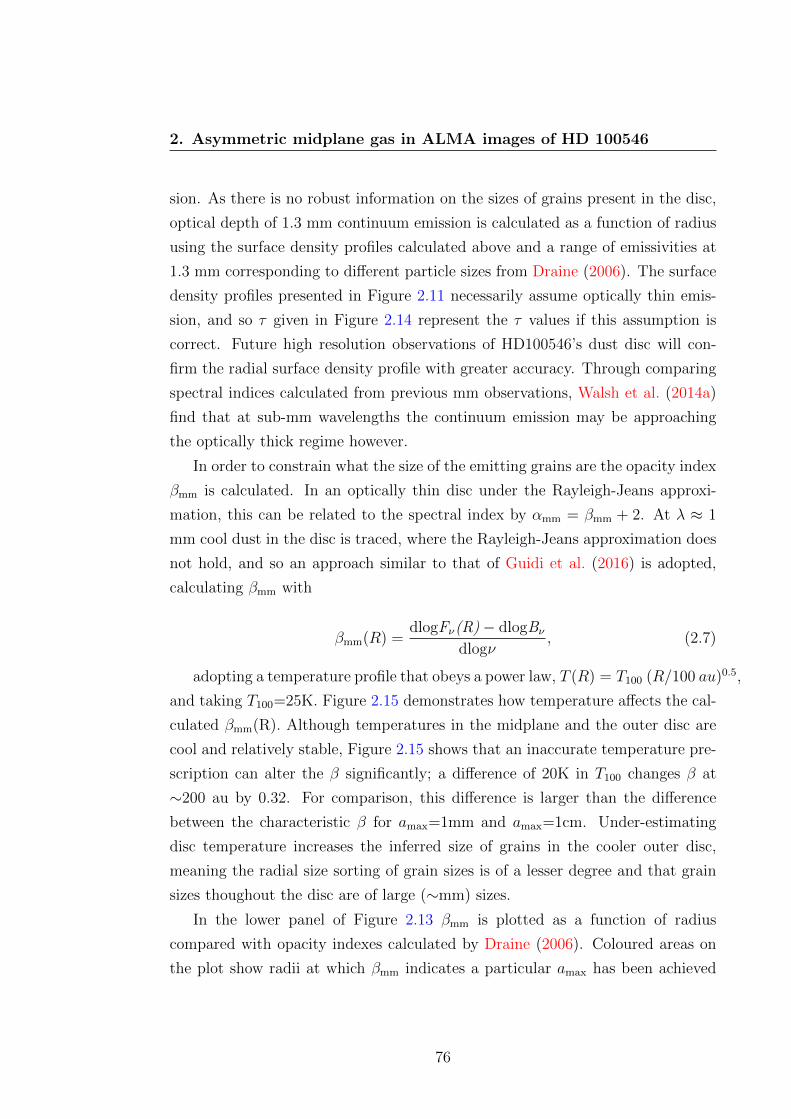
2. Asymmetric midplane gas in ALMA images of HD 100546
sion. As there is no robust information on the sizes of grains present in the disc,
optical depth of 1.3 mm continuum emission is calculated as a function of radius
using the surface density profiles calculated above and a range of emissivities at
1.3 mm corresponding to different particle sizes from Draine (2006). The surface
density profiles presented in Figure 2.11 necessarily assume optically thin emis-
sion, and so τ given in Figure 2.14 represent the τ values if this assumption is
correct. Future high resolution observations of HD100546’s dust disc will con-
firm the radial surface density profile with greater accuracy. Through comparing
spectral indices calculated from previous mm observations, Walsh et al. (2014a)
find that at sub-mm wavelengths the continuum emission may be approaching
the optically thick regime however.
In order to constrain what the size of the emitting grains are the opacity index
βmm is calculated. In an optically thin disc under the Rayleigh-Jeans approxi-
mation, this can be related to the spectral index by αmm = βmm + 2. At λ ≈ 1
mm cool dust in the disc is traced, where the Rayleigh-Jeans approximation does
not hold, and so an approach similar to that of Guidi et al. (2016) is adopted,
calculating βmm with
βmm(R) =dlogFν(R)− dlogBν
dlogν, (2.7)
adopting a temperature profile that obeys a power law, T (R) = T100 (R/100 au)0.5,
and taking T100=25K. Figure 2.15 demonstrates how temperature affects the cal-
culated βmm(R). Although temperatures in the midplane and the outer disc are
cool and relatively stable, Figure 2.15 shows that an inaccurate temperature pre-
scription can alter the β significantly; a difference of 20K in T100 changes β at
∼200 au by 0.32. For comparison, this difference is larger than the difference
between the characteristic β for amax=1mm and amax=1cm. Under-estimating
disc temperature increases the inferred size of grains in the cooler outer disc,
meaning the radial size sorting of grain sizes is of a lesser degree and that grain
sizes thoughout the disc are of large (∼mm) sizes.
In the lower panel of Figure 2.13 βmm is plotted as a function of radius
compared with opacity indexes calculated by Draine (2006). Coloured areas on
the plot show radii at which βmm indicates a particular amax has been achieved
76
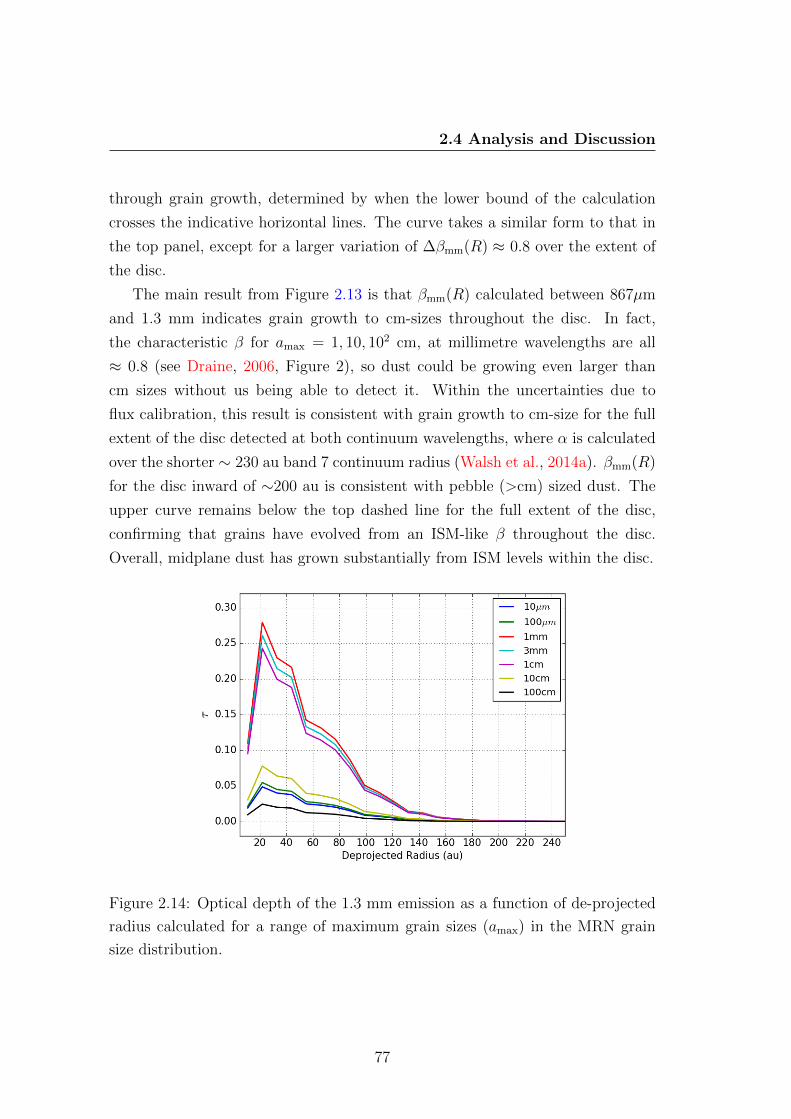
2.4 Analysis and Discussion
through grain growth, determined by when the lower bound of the calculation
crosses the indicative horizontal lines. The curve takes a similar form to that in
the top panel, except for a larger variation of ∆βmm(R) ≈ 0.8 over the extent of
the disc.
The main result from Figure 2.13 is that βmm(R) calculated between 867µm
and 1.3 mm indicates grain growth to cm-sizes throughout the disc. In fact,
the characteristic β for amax = 1, 10, 102 cm, at millimetre wavelengths are all
≈ 0.8 (see Draine, 2006, Figure 2), so dust could be growing even larger than
cm sizes without us being able to detect it. Within the uncertainties due to
flux calibration, this result is consistent with grain growth to cm-size for the full
extent of the disc detected at both continuum wavelengths, where α is calculated
over the shorter ∼ 230 au band 7 continuum radius (Walsh et al., 2014a). βmm(R)
for the disc inward of ∼200 au is consistent with pebble (>cm) sized dust. The
upper curve remains below the top dashed line for the full extent of the disc,
confirming that grains have evolved from an ISM-like β throughout the disc.
Overall, midplane dust has grown substantially from ISM levels within the disc.
Figure 2.14: Optical depth of the 1.3 mm emission as a function of de-projected
radius calculated for a range of maximum grain sizes (amax) in the MRN grain
size distribution.
77
2. Asymmetric midplane gas in ALMA images of HD 100546
Figure 2.15: βmm calculated using temperature profiles calculated with a power
law with varying T100. Horizontal lines are the same as in the lower panel of
Figure 2.13.
Radially increasing βmm in the outward direction has been predicted by dust
evolution models that include realistic coagulation and fragmentation (Birnstiel
et al., 2010; Brauer et al., 2008). Radially increasing β also agrees with past
studies that fit multi-wavelength observations with parametric models of discs
in the uv-plane, where only those with a radially increasing β could reproduce
observed emission (Banzatti et al., 2011; Perez et al., 2012; Tazzari et al., 2016;
Trotta et al., 2013).
Guidi et al. (2016) use high resolution data from ALMA and the VLA to ob-
servationally confirm a radially increasing dust opacity in the disc of intermediate
mass star HD 163296, a bright disc around a Herbig star that has been found to
have a series of dust-depleted rings (Isella et al., 2016). This is confirmed here
for HD 100546, adding further evidence for the prediction of Wright et al. (2015)
who suggest grains may have grown to at least 5 cm. Walsh et al. (2014a) com-
pare their measured flux with previous mm observations by Henning et al. (1994);
Wilner et al. (2003) in order to calculate disc-averaged β3mm−1mm=0.7-0.8, and
β1mm−870µm=-0.4, values that lie within the range found here over the extent of
78
2.5 Conclusions
the disc in Figure 2.13.
This analysis assumes that dust grains in the disc have a size distribution of
dn/da ∝ a−p, where p=3.5, an index typical of the ISM (Mathis et al., 1977)
that is canonically adopted when modelling discs. As grains grow, the overall
distribution of mass between grain sizes is likely to evolve. Birnstiel et al. (2011)
showed that when both coagulation and fragmentation are included within a disc
grain growth model, the size distribution will deviate from p=3.5; growth of grains
tends to lower p, whereas fragmentation will re-introduce small particles and raise
p. Draine (2006) demonstrates how β decreases with index p for a constant amax
in Figure 6 of that paper. ISM-like grains are expected at the outer edge of the
disc, yet this is not shown in Figure 2.13. Either these observations lack the
sensitivity to detect the full extent of the dust, or the dust in the disc would be
better suited to an alternative value of p. The latter would corroborate with the
results of Wright et al. (2015) when studying HD 100546, where the authors find
that only d ’Alessio et al. (2005) disc models with p=2.5 fit their data. Tighter
constraints could be achieved by comparing against an extensive grid of opacity
calculations at millimetre wavelengths over a range of p values.
2.5 Conclusions
New ALMA observations of the HD 100546 protoplanetary disc are presented
here including the first detection of C18O in the disc.
An integrated flux of 492 mJy is measured from the 1.3 mm continuum image.
An outer-most detection of the dust disc is determined at a radial separation
from the star of 290±10 au at 1.3 mm and the lower limit on dust disc mass was
calculated to be 4.1-9.6 ×10⁻⁴ M�.
Line emission is detected from CO isotopologue transitions 13CO (2-1) and
C18O (2-1). 13CO has an integrated flux of 12.872 Jy kms−1 and extends out
to 390±10 au, a size comparable with previous observations of 12CO in the disc.
The optically thinner, midplane tracing isotopologue C18O is detected for the
first time in the disc, giving an integrated flux of 2.948 Jy kms−1 with emission
detected as far as 300±10 au.
79
2. Asymmetric midplane gas in ALMA images of HD 100546
These detections correspond to a considerable gas mass of 0.018 M�, around
1% of the stellar mass. Freeze-out is not expected in this warm Herbig disc. If
carbon sequestration is efficient the total gas mass may be larger, but not lower, by
these calculations. The ALMA observations of continuum and CO isotopologue
emission presented here suggest the lower limit of the gas to dust ratio for the
HD 100546 disc is 19. This calculation assumes ISM abundances of C18O relative
to H2 in the disc and so the gas to dust ratio in the disc will be larger in the
event that C18O is significantly depleted relative to other species.
Low-level extended C18O emission is observed that is spatially coincident with
spiral arm structures identified in scattered light observations by the HST. The
extended C18O emission may be tracing the midplane density variation that cre-
ates the scattered light features. In each of the observed tracers, the disc is seen
to have a puzzling offset from the known stellar position of between ≈70-110
milliarcseconds.
Spectral index, αmm, is derived as a function of radius in the disc and rises
with separation from the star suggesting a decrease of maximum dust grain size
in the outward direction. The opacity index, βmm gives results consistent with
the growth of grains beyond mm-sizes throughout the disc, and to larger cm-sized
‘pebbles’ within ∼200 au. A shallower dust grain size distribution is the alter-
native explanation, suggesting a larger proportion of the solid mass is contained
within the largest grains in comparison to the ISM, or indeed optically thick dust
at 867µm.
80
Chapter 3
Unlocking the secrets of the
midplane gas and dust
distribution in the young hybrid
disc HD 141569
81
3. Unlocking the secrets of the midplane gas and dust distribution inthe young hybrid disc HD 141569
3.1 Context
Understanding the evolution from protoplanetary to debris discs (Dominik and
Dullemond, 2002; Wyatt et al., 2015) requires an understanding of their struc-
tures. How do the many gaps, dust traps and asymmetries seen in protoplanetary
discs evolve into dusty debris discs that typically host one or two rings, and what
is the role of gas in this process? The ‘hybrid’ discs (Pericaud et al., 2017), are
believed to probe this step in evolution because of detectable amounts of gas in
the disc despite otherwise appearing to have evolved beyond the protoplanetary
disc limit in dust mass. Whilst some molecular gas remains in the disc from the
protoplanetary stage, the dust in hybrids is of a second generation meaning it is
the product of dust evolution via grain growth and fragmentation processes.
In Chapter 2 there was evidence of large sized dust grains in transitional disc
HD 100546, suggesting a certain degree of evolution in the disc’s composition. But
what is the next stage? Herbig star HD 141569 hosts the only known hybrid disc
amongst pre-main sequence stars to date, a B9-A0 type, 5 Myr old star at a GAIA
distance of 111±1 pc (Lindegren et al., 2016; Weinberger et al., 2000)1. Its SED
and IR excess luminosity of 0.0084 (Sylvester et al., 1996) were the first indicators
of this unique status. Figure 3.1 shows that HD 141569 has an SED which appears
as a scaled-down version of a protoplanetary disc’s SED in the sense that it is
comprised by multiple radial (temperature) components. This is not the case
in known debris and hybrid discs as both these types show, at most, two radial
(temperature) components (e.g., 49 Ceti, HD 131835, Kennedy and Wyatt, 2014;
Moor et al., 2015; Roberge et al., 2013). Although its SED seems protoplanetary,
the disc dust mass of 0.7 M⊕ (Panic et al., 2013; Sandell et al., 2011) places
HD 141569 in between the protoplanetary and debris-disc regimes (Wyatt et al.,
2015). First detected by Dent et al. (2005), CO gas in the disc extends up to
200 au (Flaherty et al., 2016; White et al., 2016) and is nested inside the two
outermost rings detected by Hubble Space Telescope NICMOS at 234 and 388 au
(Augereau et al., 1999; Biller et al., 2015; Weinberger et al., 1999). Wide dusty
belts are more typically associated with debris discs. Reported gas masses for
1In this work all previously reported length scales are updated using the latest GAIA
distance for the source
82
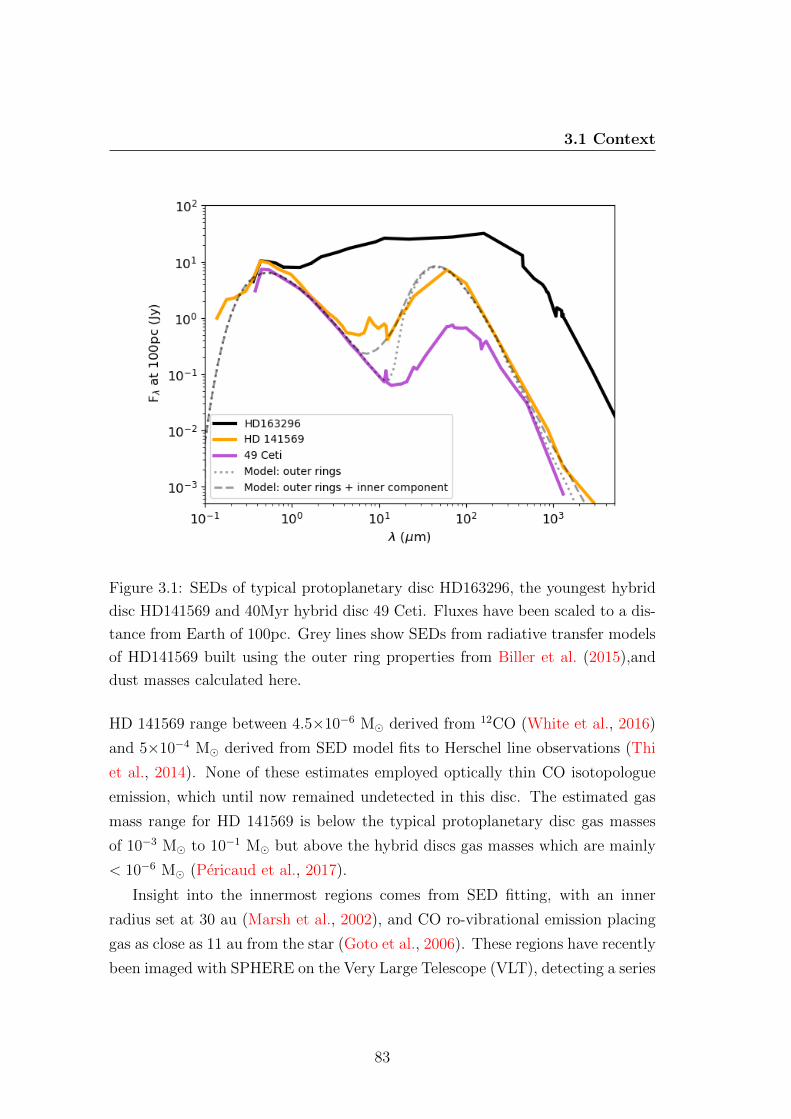
3.1 Context
Figure 3.1: SEDs of typical protoplanetary disc HD163296, the youngest hybrid
disc HD141569 and 40Myr hybrid disc 49 Ceti. Fluxes have been scaled to a dis-
tance from Earth of 100pc. Grey lines show SEDs from radiative transfer models
of HD141569 built using the outer ring properties from Biller et al. (2015),and
dust masses calculated here.
HD 141569 range between 4.5×10⁻⁶ M� derived from 12CO (White et al., 2016)
and 5×10⁻⁴ M� derived from SED model fits to Herschel line observations (Thi
et al., 2014). None of these estimates employed optically thin CO isotopologue
emission, which until now remained undetected in this disc. The estimated gas
mass range for HD 141569 is below the typical protoplanetary disc gas masses
of 10−3 M� to 10−1 M� but above the hybrid discs gas masses which are mainly
< 10−6 M� (Pericaud et al., 2017).
Insight into the innermost regions comes from SED fitting, with an inner
radius set at 30 au (Marsh et al., 2002), and CO ro-vibrational emission placing
gas as close as 11 au from the star (Goto et al., 2006). These regions have recently
been imaged with SPHERE on the Very Large Telescope (VLT), detecting a series
83
3. Unlocking the secrets of the midplane gas and dust distribution inthe young hybrid disc HD 141569
of concentric, but discontinuous, scattered light ‘ringlets’ at separations of 45, 61
and 89 au (Perrot et al., 2016). Inside these ringlets is a dust disc component
within 0.′′2, detected in 8.2µm imaging with the VLT’s VISIR instrument (Perrot
et al., 2016). A central, unresolved component of millimetre continuum emission
peaks at the stellar location (Marsh et al., 2002; White et al., 2018). Beyond
the gas-rich region are the two scattered light rings at 234 and 388 au, with
inclination and PA similar to that of the inner rings seen with SPHERE (Perrot
et al., 2016), but showing more complex structures and spirals, possibly due to
planets within the disc (Wyatt, 2005) or a fly-by (Reche et al., 2009).
Using new ALMA observations this chapter investigates to what extent the
midplane gas and dust of HD 141569 exhibit protoplanetary and debris disc
characteristics, in the context of increasing evidence for a hybrid class of discs.
3.2 Observations and results
ALMA observations in Band 6 were taken on 16th May 2016 (PI Panic, ID
2015.1.01600.S). 39 antennas of 12 m diameter were employed in a configuration
providing baseline lengths ranging from 16 m to 640 m. The velocity resolution
is 0.166 km/s for 13CO and 0.333 km/s for C18O, providing optimal sensitivity to
the tenuous and previously undetected midplane gas emission. The total effective
continuum bandwidth was 4 GHz. The data were flagged and calibrated follow-
ing the ALMA-pipeline data reduction. Titan was used as the flux calibrator,
J1550+0527 and J1733-1304 were used as the bandpass and phase calibrators
respectively. In addition to these new observations archival data from ALMA
Band 7 published by White et al. (2016) is also employed here, taking advan-
tage of the 12CO(3-2) observations. Using CASA 4.7.1, continuum emission is
subtracted from the uv plane. Images were created using the clean algorithm
(Rau and Cornwell, 2011); as no a priori knowledge of the distribution of 13CO,
or indeed of the dust emission at 1.3mm exists, a natural weighting is adopted
in image reconstruction in order to prioritise the collection of signal, rather than
the increased resolution that could be achieved with other baseline weightings.
This produced a synthesized beam size of 0.′′65 (72 au) for the continuum and
0.′′71 (79 au) for 13CO and C18O.
84
3.3 Discussion
Rms noise level in the continuum image is 0.11 mJy/beam, and in the 13CO
and C18O channel maps rms was 0.04 and 0.03 Jy km/s/beam respectively. In
the continuum imaging an unresolved point source of 1.7 mJy is detected. 13CO
does not show a firm detection in the individual channel maps, but the integrated
intensity map over the known range of velocities in which 12CO is seen (Flaherty
et al., 2016; White et al., 2016) shows a 6σ detection in 13CO. C18O is not detected
>3σ in either the channels or the integrated intensity map.
Azimuthal averaging was performed in radial bins of 0.′′12 for the 13CO and
1.3mm maps, and 0.′′15 for 12CO. Neither the strongly asymmetric 13CO nor
the unresolved central 1.3mm emission can provide reliable constraints on the
position angle and inclination of the disc, so for deprojection of coordinates the
values of the 12CO disc are adopted, PA=-9◦ and inclination=55◦ (White et al.,
2016). Figure 3.2 shows the averaged profiles. At 220 au a thin concentration of
millimetre grains is detected in a ring. 13CO(2-1) emission is detected as far as
220±10 au.
To derive uncertainties for the radial flux profile, azimuthal averaging is ap-
plied centered on emission-free regions of the image that are sufficiently far from
the central emission, yet within the primary beam of the observation. The mean
value across emission-free regions from different parts of the image gives a flux
profile that describes the background noise in the image as a result of the aver-
aging process. This method is more robust than simply taking the variation in
an elliptical bin and does not rely on any predefined disc models. The resultant
noise curves are shown in Figure 3.2 for each tracer. The outer belt is detected
at ∼6σmm in contiguous radial bins (comparing the 1.3 mm curve to the blue
dashed noise line), with a peak at 220±10 au.
3.3 Discussion
3.3.1 Dust emission
The comparison of the radial profile of 1.3 mm flux with the known disc structures
shows that some of the flux in the central unresolved component may be arising
from the rings detected by SPHERE (Perrot et al., 2016). A minimum dust
85
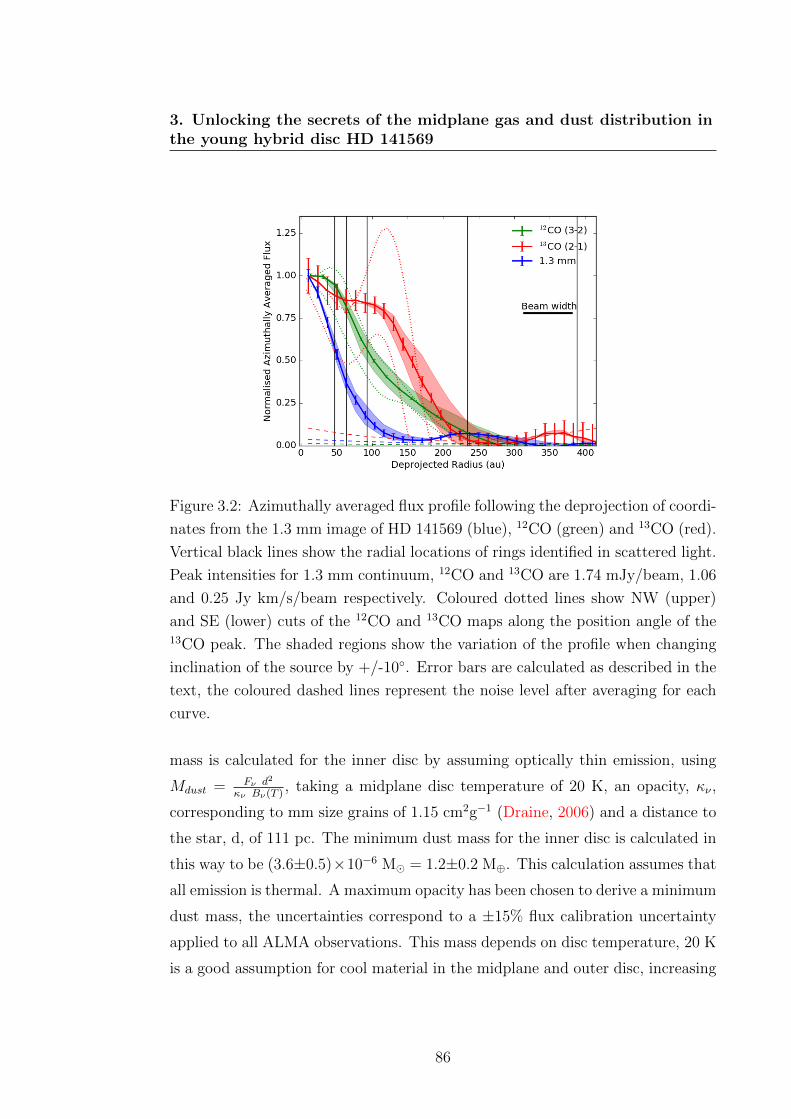
3. Unlocking the secrets of the midplane gas and dust distribution inthe young hybrid disc HD 141569
Figure 3.2: Azimuthally averaged flux profile following the deprojection of coordi-
nates from the 1.3 mm image of HD 141569 (blue), 12CO (green) and 13CO (red).
Vertical black lines show the radial locations of rings identified in scattered light.
Peak intensities for 1.3 mm continuum, 12CO and 13CO are 1.74 mJy/beam, 1.06
and 0.25 Jy km/s/beam respectively. Coloured dotted lines show NW (upper)
and SE (lower) cuts of the 12CO and 13CO maps along the position angle of the13CO peak. The shaded regions show the variation of the profile when changing
inclination of the source by +/-10◦. Error bars are calculated as described in the
text, the coloured dashed lines represent the noise level after averaging for each
curve.
mass is calculated for the inner disc by assuming optically thin emission, using
Mdust = Fν d2
κν Bν(T ), taking a midplane disc temperature of 20 K, an opacity, κν ,
corresponding to mm size grains of 1.15 cm2g−1 (Draine, 2006) and a distance to
the star, d, of 111 pc. The minimum dust mass for the inner disc is calculated in
this way to be (3.6±0.5)×10−6 M� = 1.2±0.2 M⊕. This calculation assumes that
all emission is thermal. A maximum opacity has been chosen to derive a minimum
dust mass, the uncertainties correspond to a ±15% flux calibration uncertainty
applied to all ALMA observations. This mass depends on disc temperature, 20 K
is a good assumption for cool material in the midplane and outer disc, increasing
86
3.3 Discussion
the assumed midplane temperature to 50 K would give a mass of 0.04 M⊕.
An alternative explanation for the origin of this flux may be free-free emission,
rather than thermal emission originating from rings of dust within the inner disc.
In fact, a typical mm contribution from free-free emission in Herbig discs at a
similar distance to HD 141569 is a few mJy (e.g., Wright et al., 2015), similar to
the 1.7 mJy integrated flux measured for the unresolved peak. Non-thermal, free-
free emission can be detected through a characteristically low spectral index, as
is seen towards inhomogeneous ultracompact Hii regions for example (de Muizon
et al., 1988; Rodrıguez et al., 1989). Optically thin free-free emission has spectral
slope ≈-0.1 above the break frequency with the value increasing as high as 2 at
shorter wavelength or higher optical depth (Condon and Ransom, 2016). This
value is considerably lower than that of thermal continuum emission in this regime
and so its effect may be seen in the spectral index. Protoplanetary discs typically
show αmm ≈ 2 − 3, transition discs tend to show slightly higher values than
this (Pinilla et al., 2014), whilst debris discs have αmm ≈ 2.5 − 3 (MacGregor
et al., 2016). ALMA (0.87mm and 2.9mm) and VLA (9mm) observations derive
a spectral index for the disc of αmm = 1.63 (MacGregor et al., 2016; White et al.,
2018), with which the 1.3 mm integrated flux of 1.8 mJy is consistent. αmm
calculated between ALMA observations at 870µm and 2.9 mm also give a steeper,
but still relatively low value of 1.81 (White et al., 2018). VLA observations show a
significant variability in the continuum flux of the disc, varying by a factor of two
to three on timescales of tens of minutes (White et al., 2018). Fluxes measured on
integration times shorter than the variability timescale may therefore only offer
a snapshot of flux emission. To make a conservative estimate of possible free-free
contribution, VLA flux of 54 µJy (MacGregor et al., 2016) can be extrapolated
using a characteristic spectral slope for optically thin free-free emission. From
this estimate the free-free flux at 1.3mm would be just 3% of the total integrated
flux measured, meaning the flux is predominantly thermal, potentially with small
free-free contribution of order 10s of µJy at most.
In Figure 3.2 there is an increase in flux which peaks at a deprojected radial
separation of 220±10 au. The ring is detected interior to the scattered light
ring at 234 au (Biller et al., 2015) as is demonstrated by the ellipses in Figure
3.3. Taking the flux from the peak of the ring in Figure 3.2 and assuming the
87
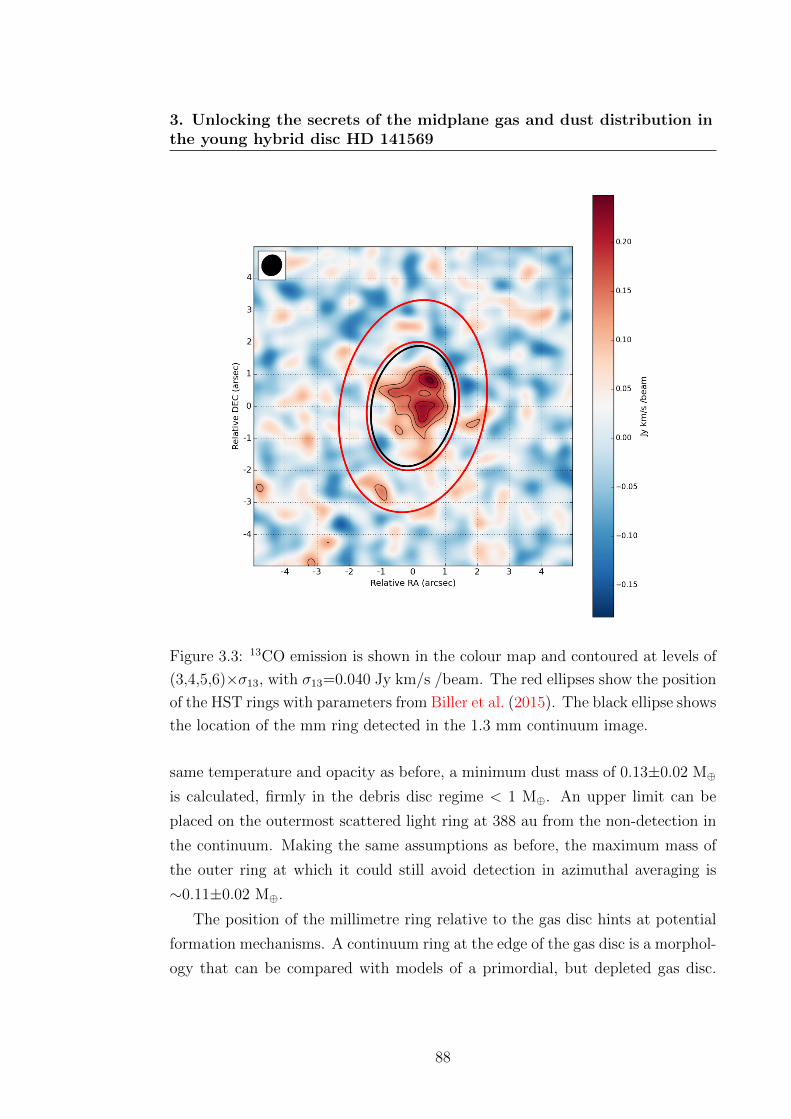
3. Unlocking the secrets of the midplane gas and dust distribution inthe young hybrid disc HD 141569
Figure 3.3: 13CO emission is shown in the colour map and contoured at levels of
(3,4,5,6)×σ13, with σ13=0.040 Jy km/s /beam. The red ellipses show the position
of the HST rings with parameters from Biller et al. (2015). The black ellipse shows
the location of the mm ring detected in the 1.3 mm continuum image.
same temperature and opacity as before, a minimum dust mass of 0.13±0.02 M⊕
is calculated, firmly in the debris disc regime < 1 M⊕. An upper limit can be
placed on the outermost scattered light ring at 388 au from the non-detection in
the continuum. Making the same assumptions as before, the maximum mass of
the outer ring at which it could still avoid detection in azimuthal averaging is
∼0.11±0.02 M⊕.
The position of the millimetre ring relative to the gas disc hints at potential
formation mechanisms. A continuum ring at the edge of the gas disc is a morphol-
ogy that can be compared with models of a primordial, but depleted gas disc.
88
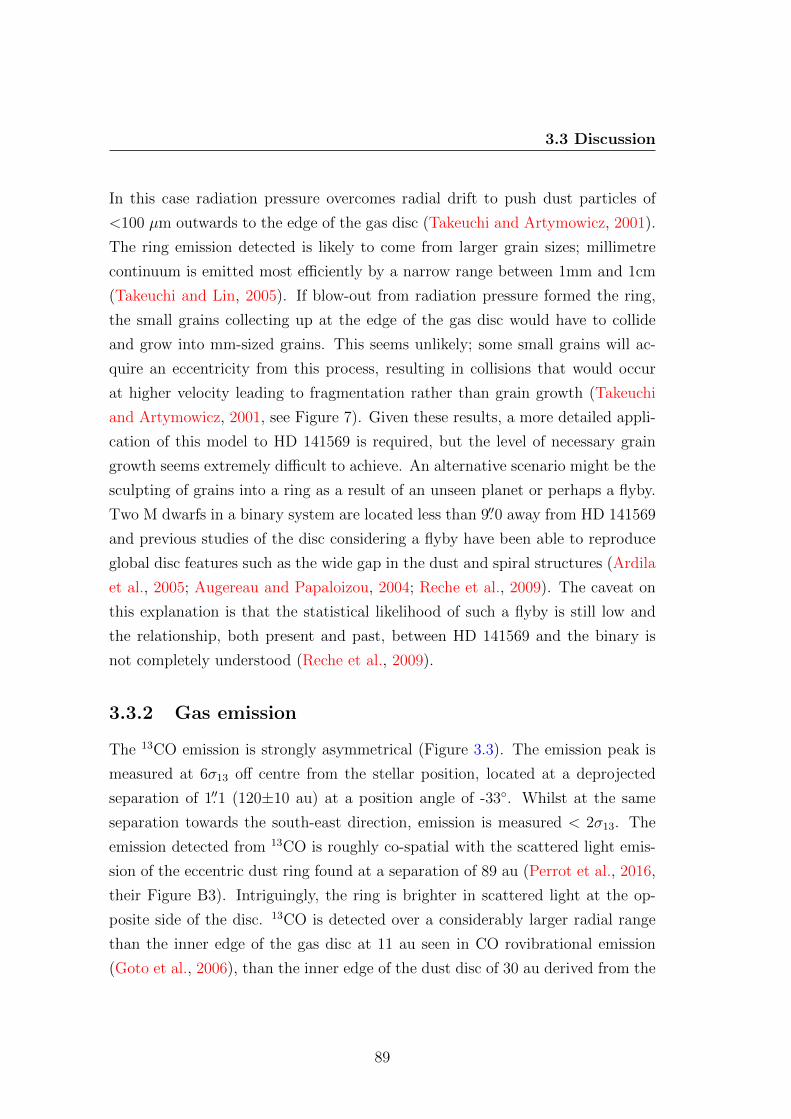
3.3 Discussion
In this case radiation pressure overcomes radial drift to push dust particles of
<100 µm outwards to the edge of the gas disc (Takeuchi and Artymowicz, 2001).
The ring emission detected is likely to come from larger grain sizes; millimetre
continuum is emitted most efficiently by a narrow range between 1mm and 1cm
(Takeuchi and Lin, 2005). If blow-out from radiation pressure formed the ring,
the small grains collecting up at the edge of the gas disc would have to collide
and grow into mm-sized grains. This seems unlikely; some small grains will ac-
quire an eccentricity from this process, resulting in collisions that would occur
at higher velocity leading to fragmentation rather than grain growth (Takeuchi
and Artymowicz, 2001, see Figure 7). Given these results, a more detailed appli-
cation of this model to HD 141569 is required, but the level of necessary grain
growth seems extremely difficult to achieve. An alternative scenario might be the
sculpting of grains into a ring as a result of an unseen planet or perhaps a flyby.
Two M dwarfs in a binary system are located less than 9.′′0 away from HD 141569
and previous studies of the disc considering a flyby have been able to reproduce
global disc features such as the wide gap in the dust and spiral structures (Ardila
et al., 2005; Augereau and Papaloizou, 2004; Reche et al., 2009). The caveat on
this explanation is that the statistical likelihood of such a flyby is still low and
the relationship, both present and past, between HD 141569 and the binary is
not completely understood (Reche et al., 2009).
3.3.2 Gas emission
The 13CO emission is strongly asymmetrical (Figure 3.3). The emission peak is
measured at 6σ13 off centre from the stellar position, located at a deprojected
separation of 1.′′1 (120±10 au) at a position angle of -33◦. Whilst at the same
separation towards the south-east direction, emission is measured < 2σ13. The
emission detected from 13CO is roughly co-spatial with the scattered light emis-
sion of the eccentric dust ring found at a separation of 89 au (Perrot et al., 2016,
their Figure B3). Intriguingly, the ring is brighter in scattered light at the op-
posite side of the disc. 13CO is detected over a considerably larger radial range
than the inner edge of the gas disc at 11 au seen in CO rovibrational emission
(Goto et al., 2006), than the inner edge of the dust disc of 30 au derived from the
89
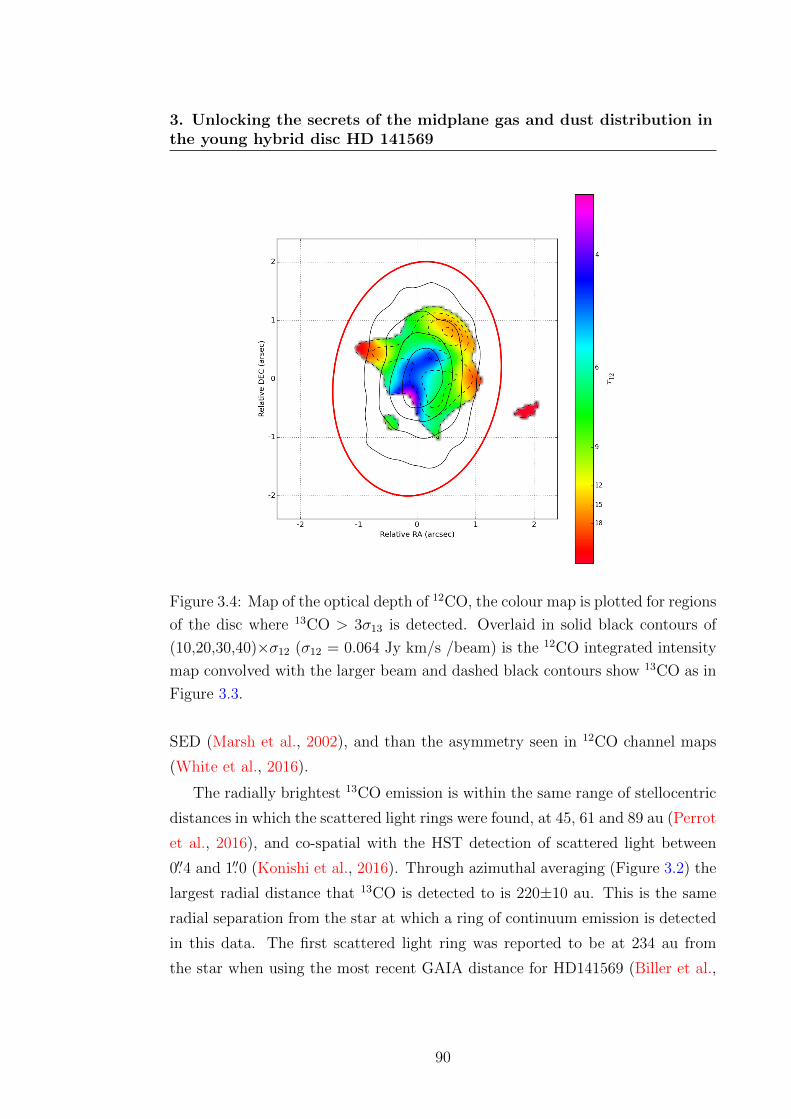
3. Unlocking the secrets of the midplane gas and dust distribution inthe young hybrid disc HD 141569
Figure 3.4: Map of the optical depth of 12CO, the colour map is plotted for regions
of the disc where 13CO > 3σ13 is detected. Overlaid in solid black contours of
(10,20,30,40)×σ12 (σ12 = 0.064 Jy km/s /beam) is the 12CO integrated intensity
map convolved with the larger beam and dashed black contours show 13CO as in
Figure 3.3.
SED (Marsh et al., 2002), and than the asymmetry seen in 12CO channel maps
(White et al., 2016).
The radially brightest 13CO emission is within the same range of stellocentric
distances in which the scattered light rings were found, at 45, 61 and 89 au (Perrot
et al., 2016), and co-spatial with the HST detection of scattered light between
0.′′4 and 1.′′0 (Konishi et al., 2016). Through azimuthal averaging (Figure 3.2) the
largest radial distance that 13CO is detected to is 220±10 au. This is the same
radial separation from the star at which a ring of continuum emission is detected
in this data. The first scattered light ring was reported to be at 234 au from
the star when using the most recent GAIA distance for HD141569 (Biller et al.,
90
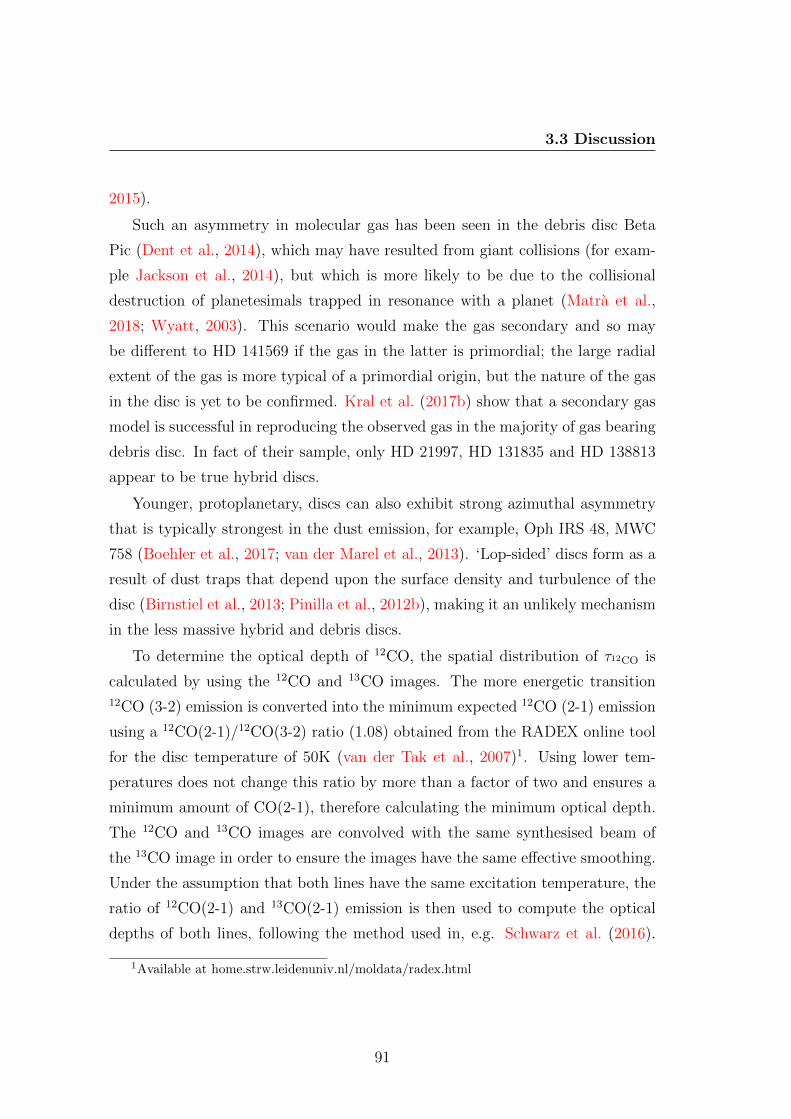
3.3 Discussion
2015).
Such an asymmetry in molecular gas has been seen in the debris disc Beta
Pic (Dent et al., 2014), which may have resulted from giant collisions (for exam-
ple Jackson et al., 2014), but which is more likely to be due to the collisional
destruction of planetesimals trapped in resonance with a planet (Matra et al.,
2018; Wyatt, 2003). This scenario would make the gas secondary and so may
be different to HD 141569 if the gas in the latter is primordial; the large radial
extent of the gas is more typical of a primordial origin, but the nature of the gas
in the disc is yet to be confirmed. Kral et al. (2017b) show that a secondary gas
model is successful in reproducing the observed gas in the majority of gas bearing
debris disc. In fact of their sample, only HD 21997, HD 131835 and HD 138813
appear to be true hybrid discs.
Younger, protoplanetary, discs can also exhibit strong azimuthal asymmetry
that is typically strongest in the dust emission, for example, Oph IRS 48, MWC
758 (Boehler et al., 2017; van der Marel et al., 2013). ‘Lop-sided’ discs form as a
result of dust traps that depend upon the surface density and turbulence of the
disc (Birnstiel et al., 2013; Pinilla et al., 2012b), making it an unlikely mechanism
in the less massive hybrid and debris discs.
To determine the optical depth of 12CO, the spatial distribution of τ12CO is
calculated by using the 12CO and 13CO images. The more energetic transition12CO (3-2) emission is converted into the minimum expected 12CO (2-1) emission
using a 12CO(2-1)/12CO(3-2) ratio (1.08) obtained from the RADEX online tool
for the disc temperature of 50K (van der Tak et al., 2007)1. Using lower tem-
peratures does not change this ratio by more than a factor of two and ensures a
minimum amount of CO(2-1), therefore calculating the minimum optical depth.
The 12CO and 13CO images are convolved with the same synthesised beam of
the 13CO image in order to ensure the images have the same effective smoothing.
Under the assumption that both lines have the same excitation temperature, the
ratio of 12CO(2-1) and 13CO(2-1) emission is then used to compute the optical
depths of both lines, following the method used in, e.g. Schwarz et al. (2016).
1Available at home.strw.leidenuniv.nl/moldata/radex.html
91
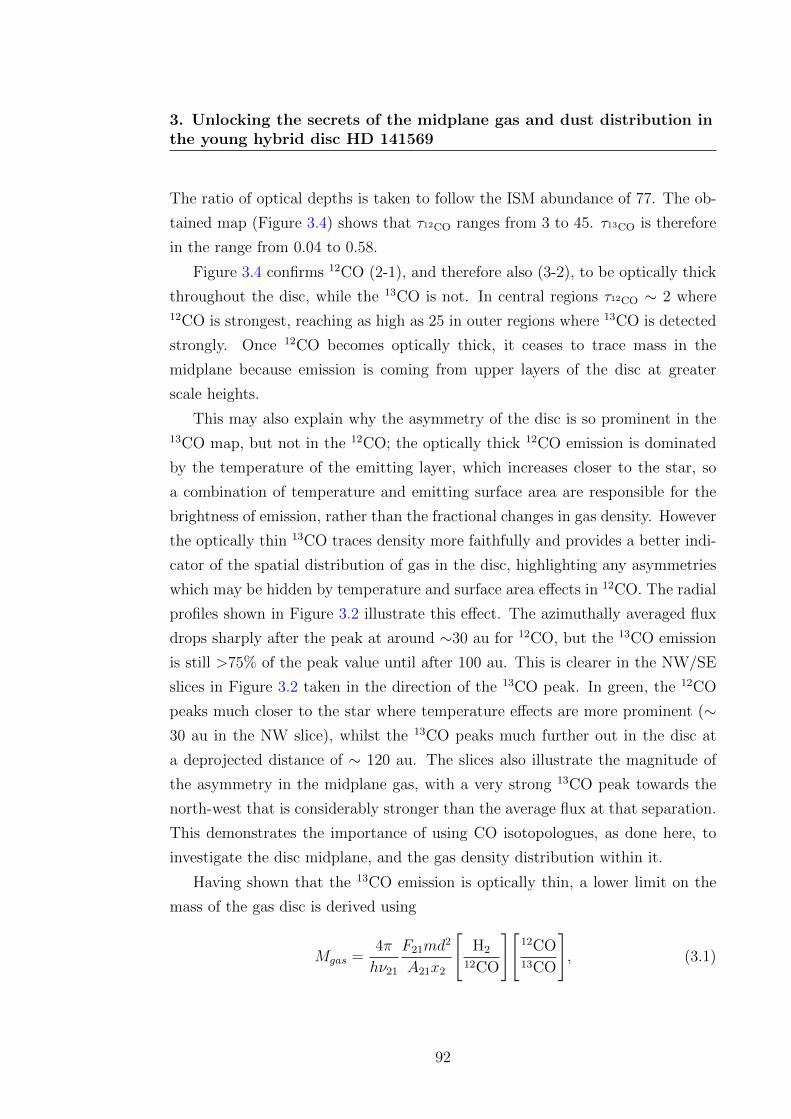
3. Unlocking the secrets of the midplane gas and dust distribution inthe young hybrid disc HD 141569
The ratio of optical depths is taken to follow the ISM abundance of 77. The ob-
tained map (Figure 3.4) shows that τ12CO ranges from 3 to 45. τ13CO is therefore
in the range from 0.04 to 0.58.
Figure 3.4 confirms 12CO (2-1), and therefore also (3-2), to be optically thick
throughout the disc, while the 13CO is not. In central regions τ12CO ∼ 2 where12CO is strongest, reaching as high as 25 in outer regions where 13CO is detected
strongly. Once 12CO becomes optically thick, it ceases to trace mass in the
midplane because emission is coming from upper layers of the disc at greater
scale heights.
This may also explain why the asymmetry of the disc is so prominent in the13CO map, but not in the 12CO; the optically thick 12CO emission is dominated
by the temperature of the emitting layer, which increases closer to the star, so
a combination of temperature and emitting surface area are responsible for the
brightness of emission, rather than the fractional changes in gas density. However
the optically thin 13CO traces density more faithfully and provides a better indi-
cator of the spatial distribution of gas in the disc, highlighting any asymmetries
which may be hidden by temperature and surface area effects in 12CO. The radial
profiles shown in Figure 3.2 illustrate this effect. The azimuthally averaged flux
drops sharply after the peak at around ∼30 au for 12CO, but the 13CO emission
is still >75% of the peak value until after 100 au. This is clearer in the NW/SE
slices in Figure 3.2 taken in the direction of the 13CO peak. In green, the 12CO
peaks much closer to the star where temperature effects are more prominent (∼30 au in the NW slice), whilst the 13CO peaks much further out in the disc at
a deprojected distance of ∼ 120 au. The slices also illustrate the magnitude of
the asymmetry in the midplane gas, with a very strong 13CO peak towards the
north-west that is considerably stronger than the average flux at that separation.
This demonstrates the importance of using CO isotopologues, as done here, to
investigate the disc midplane, and the gas density distribution within it.
Having shown that the 13CO emission is optically thin, a lower limit on the
mass of the gas disc is derived using
Mgas =4π
hν21
F21md2
A21x2
[H2
12CO
][12CO13CO
], (3.1)
92
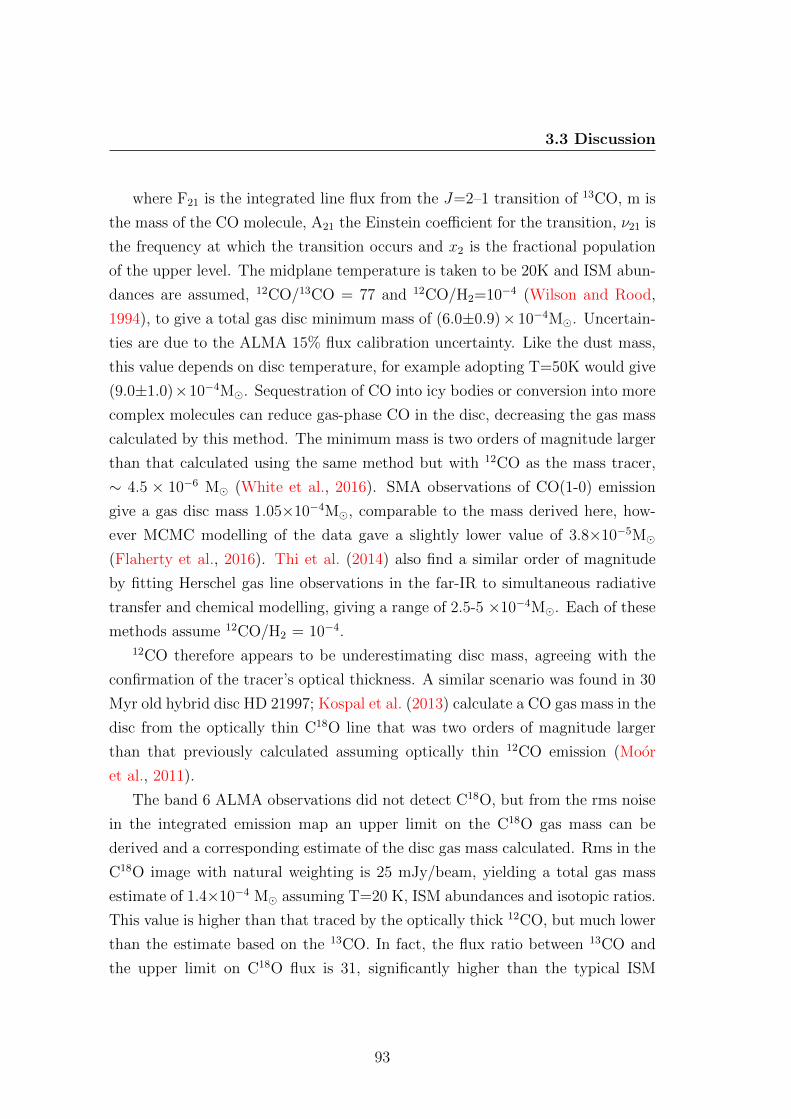
3.3 Discussion
where F21 is the integrated line flux from the J=2–1 transition of 13CO, m is
the mass of the CO molecule, A21 the Einstein coefficient for the transition, ν21 is
the frequency at which the transition occurs and x2 is the fractional population
of the upper level. The midplane temperature is taken to be 20K and ISM abun-
dances are assumed, 12CO/13CO = 77 and 12CO/H2=10−4 (Wilson and Rood,
1994), to give a total gas disc minimum mass of (6.0±0.9)× 10−4M�. Uncertain-
ties are due to the ALMA 15% flux calibration uncertainty. Like the dust mass,
this value depends on disc temperature, for example adopting T=50K would give
(9.0±1.0)×10−4M�. Sequestration of CO into icy bodies or conversion into more
complex molecules can reduce gas-phase CO in the disc, decreasing the gas mass
calculated by this method. The minimum mass is two orders of magnitude larger
than that calculated using the same method but with 12CO as the mass tracer,
∼ 4.5 × 10⁻⁶ M� (White et al., 2016). SMA observations of CO(1-0) emission
give a gas disc mass 1.05×10⁻⁴M�, comparable to the mass derived here, how-
ever MCMC modelling of the data gave a slightly lower value of 3.8×10⁻⁵M�
(Flaherty et al., 2016). Thi et al. (2014) also find a similar order of magnitude
by fitting Herschel gas line observations in the far-IR to simultaneous radiative
transfer and chemical modelling, giving a range of 2.5-5 ×10⁻⁴M�. Each of these
methods assume 12CO/H2 = 10−4.12CO therefore appears to be underestimating disc mass, agreeing with the
confirmation of the tracer’s optical thickness. A similar scenario was found in 30
Myr old hybrid disc HD 21997; Kospal et al. (2013) calculate a CO gas mass in the
disc from the optically thin C18O line that was two orders of magnitude larger
than that previously calculated assuming optically thin 12CO emission (Moor
et al., 2011).
The band 6 ALMA observations did not detect C18O, but from the rms noise
in the integrated emission map an upper limit on the C18O gas mass can be
derived and a corresponding estimate of the disc gas mass calculated. Rms in the
C18O image with natural weighting is 25 mJy/beam, yielding a total gas mass
estimate of 1.4×10⁻⁴ M� assuming T=20 K, ISM abundances and isotopic ratios.
This value is higher than that traced by the optically thick 12CO, but much lower
than the estimate based on the 13CO. In fact, the flux ratio between 13CO and
the upper limit on C18O flux is 31, significantly higher than the typical ISM
93
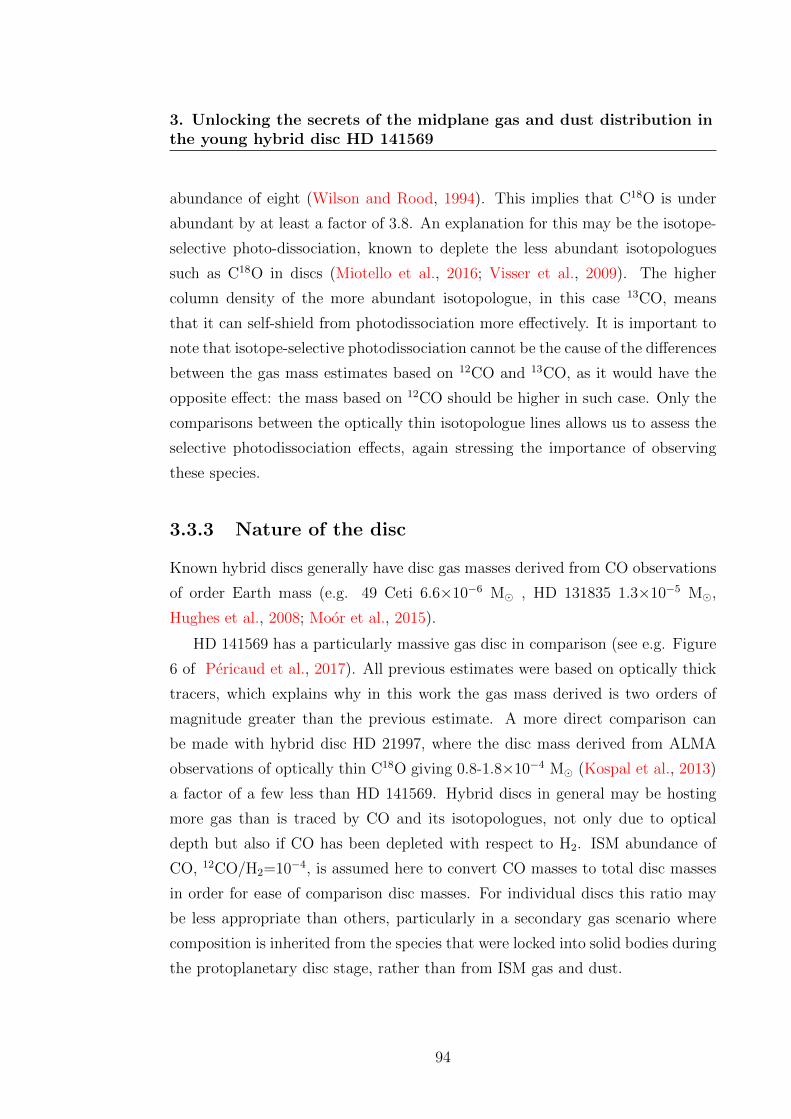
3. Unlocking the secrets of the midplane gas and dust distribution inthe young hybrid disc HD 141569
abundance of eight (Wilson and Rood, 1994). This implies that C18O is under
abundant by at least a factor of 3.8. An explanation for this may be the isotope-
selective photo-dissociation, known to deplete the less abundant isotopologues
such as C18O in discs (Miotello et al., 2016; Visser et al., 2009). The higher
column density of the more abundant isotopologue, in this case 13CO, means
that it can self-shield from photodissociation more effectively. It is important to
note that isotope-selective photodissociation cannot be the cause of the differences
between the gas mass estimates based on 12CO and 13CO, as it would have the
opposite effect: the mass based on 12CO should be higher in such case. Only the
comparisons between the optically thin isotopologue lines allows us to assess the
selective photodissociation effects, again stressing the importance of observing
these species.
3.3.3 Nature of the disc
Known hybrid discs generally have disc gas masses derived from CO observations
of order Earth mass (e.g. 49 Ceti 6.6×10⁻⁶ M� , HD 131835 1.3×10⁻⁵ M�,
Hughes et al., 2008; Moor et al., 2015).
HD 141569 has a particularly massive gas disc in comparison (see e.g. Figure
6 of Pericaud et al., 2017). All previous estimates were based on optically thick
tracers, which explains why in this work the gas mass derived is two orders of
magnitude greater than the previous estimate. A more direct comparison can
be made with hybrid disc HD 21997, where the disc mass derived from ALMA
observations of optically thin C18O giving 0.8-1.8×10⁻⁴ M� (Kospal et al., 2013)
a factor of a few less than HD 141569. Hybrid discs in general may be hosting
more gas than is traced by CO and its isotopologues, not only due to optical
depth but also if CO has been depleted with respect to H2. ISM abundance of
CO, 12CO/H2=10−4, is assumed here to convert CO masses to total disc masses
in order for ease of comparison disc masses. For individual discs this ratio may
be less appropriate than others, particularly in a secondary gas scenario where
composition is inherited from the species that were locked into solid bodies during
the protoplanetary disc stage, rather than from ISM gas and dust.
94
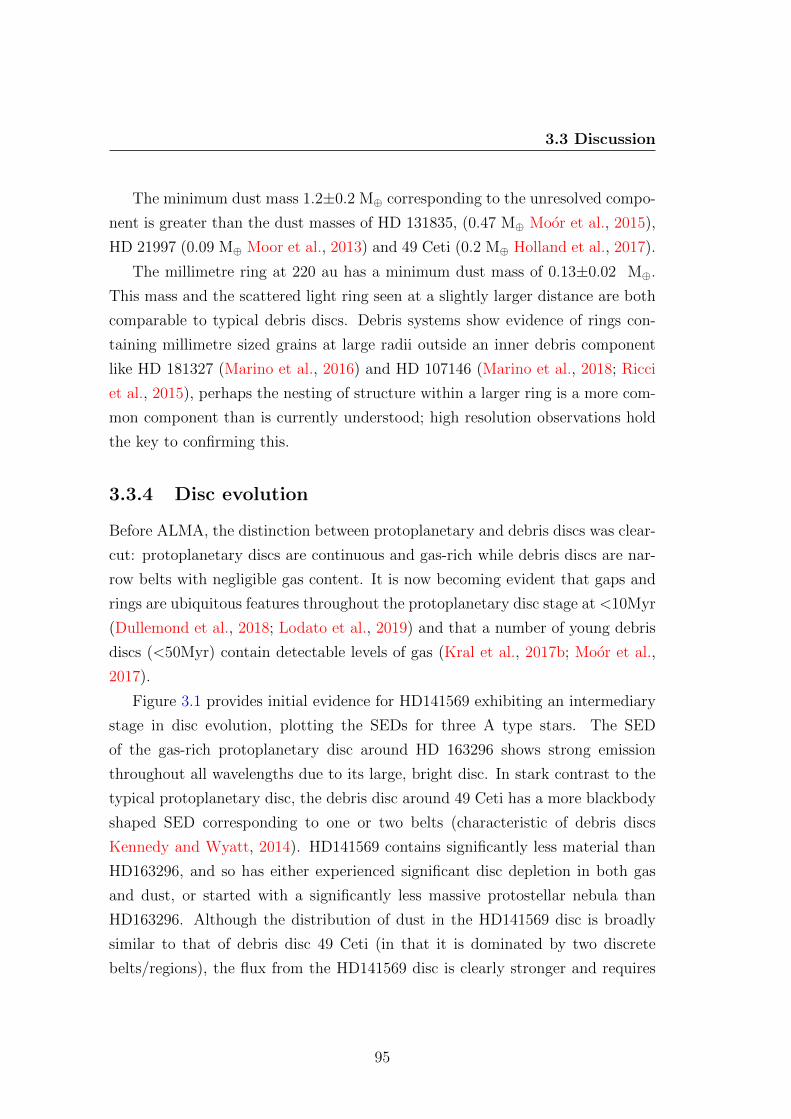
3.3 Discussion
The minimum dust mass 1.2±0.2 M⊕ corresponding to the unresolved compo-
nent is greater than the dust masses of HD 131835, (0.47 M⊕ Moor et al., 2015),
HD 21997 (0.09 M⊕ Moor et al., 2013) and 49 Ceti (0.2 M⊕ Holland et al., 2017).
The millimetre ring at 220 au has a minimum dust mass of 0.13±0.02 M⊕.
This mass and the scattered light ring seen at a slightly larger distance are both
comparable to typical debris discs. Debris systems show evidence of rings con-
taining millimetre sized grains at large radii outside an inner debris component
like HD 181327 (Marino et al., 2016) and HD 107146 (Marino et al., 2018; Ricci
et al., 2015), perhaps the nesting of structure within a larger ring is a more com-
mon component than is currently understood; high resolution observations hold
the key to confirming this.
3.3.4 Disc evolution
Before ALMA, the distinction between protoplanetary and debris discs was clear-
cut: protoplanetary discs are continuous and gas-rich while debris discs are nar-
row belts with negligible gas content. It is now becoming evident that gaps and
rings are ubiquitous features throughout the protoplanetary disc stage at <10Myr
(Dullemond et al., 2018; Lodato et al., 2019) and that a number of young debris
discs (<50Myr) contain detectable levels of gas (Kral et al., 2017b; Moor et al.,
2017).
Figure 3.1 provides initial evidence for HD141569 exhibiting an intermediary
stage in disc evolution, plotting the SEDs for three A type stars. The SED
of the gas-rich protoplanetary disc around HD 163296 shows strong emission
throughout all wavelengths due to its large, bright disc. In stark contrast to the
typical protoplanetary disc, the debris disc around 49 Ceti has a more blackbody
shaped SED corresponding to one or two belts (characteristic of debris discs
Kennedy and Wyatt, 2014). HD141569 contains significantly less material than
HD163296, and so has either experienced significant disc depletion in both gas
and dust, or started with a significantly less massive protostellar nebula than
HD163296. Although the distribution of dust in the HD141569 disc is broadly
similar to that of debris disc 49 Ceti (in that it is dominated by two discrete
belts/regions), the flux from the HD141569 disc is clearly stronger and requires
95
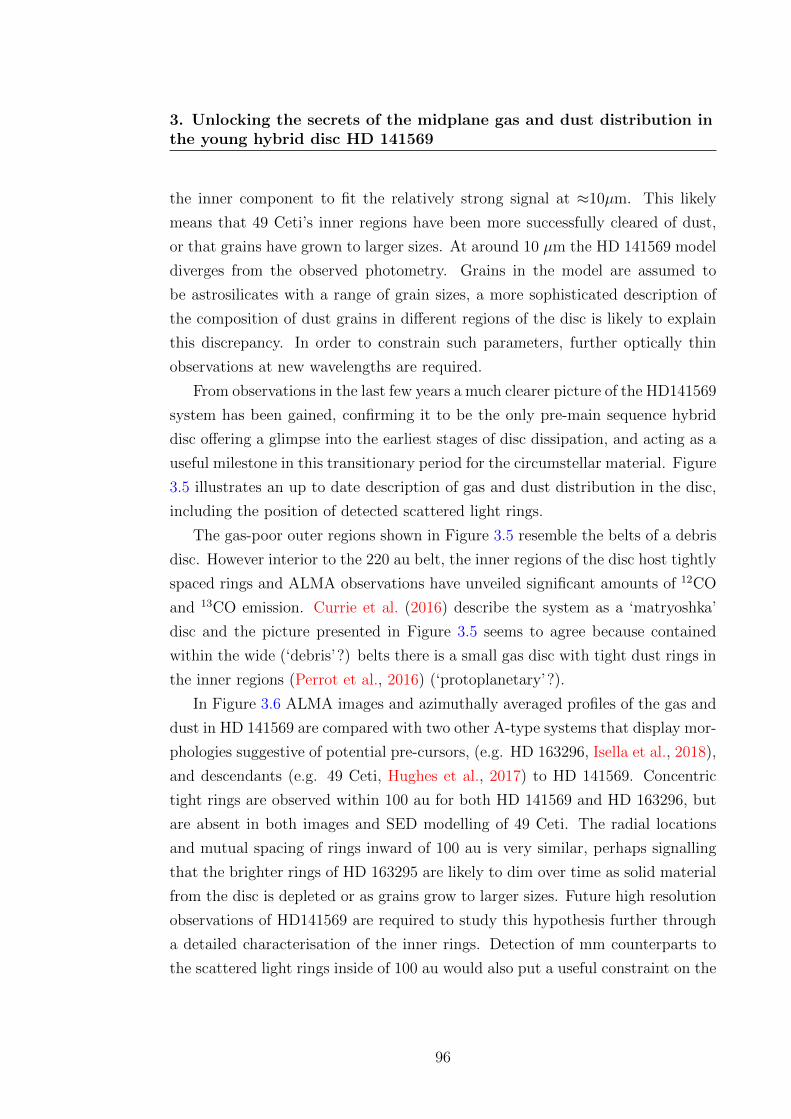
3. Unlocking the secrets of the midplane gas and dust distribution inthe young hybrid disc HD 141569
the inner component to fit the relatively strong signal at ≈10µm. This likely
means that 49 Ceti’s inner regions have been more successfully cleared of dust,
or that grains have grown to larger sizes. At around 10 µm the HD 141569 model
diverges from the observed photometry. Grains in the model are assumed to
be astrosilicates with a range of grain sizes, a more sophisticated description of
the composition of dust grains in different regions of the disc is likely to explain
this discrepancy. In order to constrain such parameters, further optically thin
observations at new wavelengths are required.
From observations in the last few years a much clearer picture of the HD141569
system has been gained, confirming it to be the only pre-main sequence hybrid
disc offering a glimpse into the earliest stages of disc dissipation, and acting as a
useful milestone in this transitionary period for the circumstellar material. Figure
3.5 illustrates an up to date description of gas and dust distribution in the disc,
including the position of detected scattered light rings.
The gas-poor outer regions shown in Figure 3.5 resemble the belts of a debris
disc. However interior to the 220 au belt, the inner regions of the disc host tightly
spaced rings and ALMA observations have unveiled significant amounts of 12CO
and 13CO emission. Currie et al. (2016) describe the system as a ‘matryoshka’
disc and the picture presented in Figure 3.5 seems to agree because contained
within the wide (‘debris’?) belts there is a small gas disc with tight dust rings in
the inner regions (Perrot et al., 2016) (‘protoplanetary’?).
In Figure 3.6 ALMA images and azimuthally averaged profiles of the gas and
dust in HD 141569 are compared with two other A-type systems that display mor-
phologies suggestive of potential pre-cursors, (e.g. HD 163296, Isella et al., 2018),
and descendants (e.g. 49 Ceti, Hughes et al., 2017) to HD 141569. Concentric
tight rings are observed within 100 au for both HD 141569 and HD 163296, but
are absent in both images and SED modelling of 49 Ceti. The radial locations
and mutual spacing of rings inward of 100 au is very similar, perhaps signalling
that the brighter rings of HD 163295 are likely to dim over time as solid material
from the disc is depleted or as grains grow to larger sizes. Future high resolution
observations of HD141569 are required to study this hypothesis further through
a detailed characterisation of the inner rings. Detection of mm counterparts to
the scattered light rings inside of 100 au would also put a useful constraint on the
96
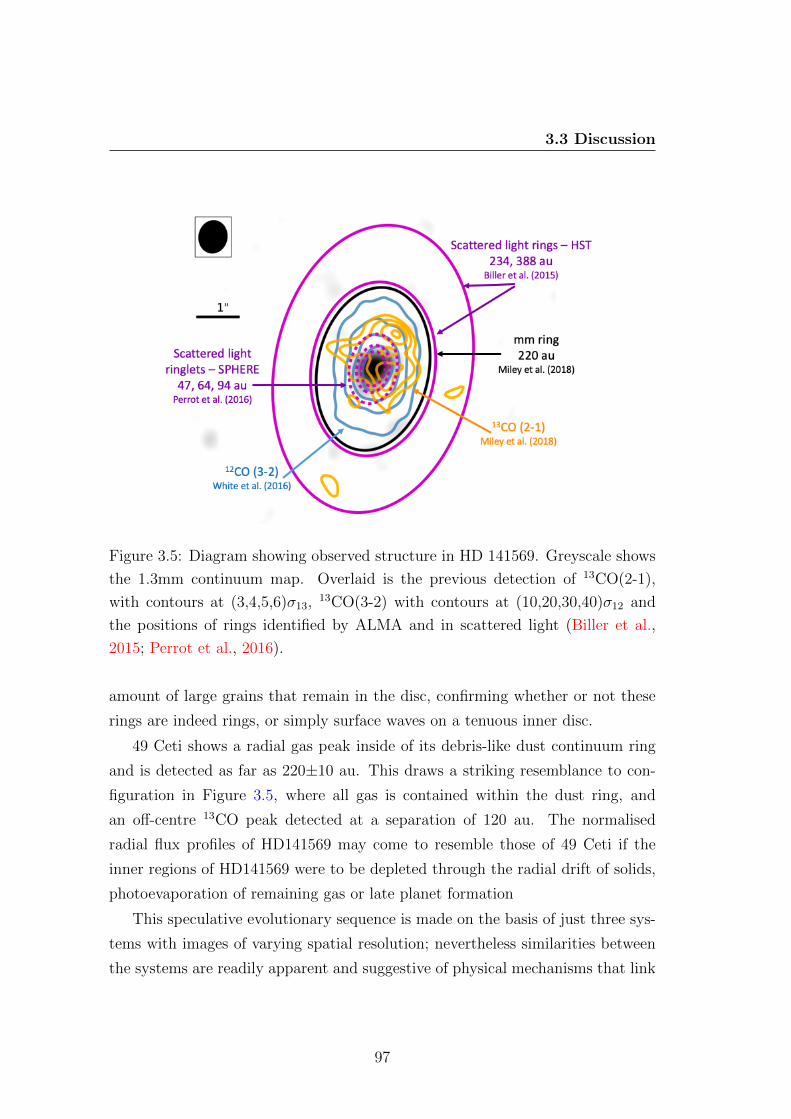
3.3 Discussion
Figure 3.5: Diagram showing observed structure in HD 141569. Greyscale shows
the 1.3mm continuum map. Overlaid is the previous detection of 13CO(2-1),
with contours at (3,4,5,6)σ13,13CO(3-2) with contours at (10,20,30,40)σ12 and
the positions of rings identified by ALMA and in scattered light (Biller et al.,
2015; Perrot et al., 2016).
amount of large grains that remain in the disc, confirming whether or not these
rings are indeed rings, or simply surface waves on a tenuous inner disc.
49 Ceti shows a radial gas peak inside of its debris-like dust continuum ring
and is detected as far as 220±10 au. This draws a striking resemblance to con-
figuration in Figure 3.5, where all gas is contained within the dust ring, and
an off-centre 13CO peak detected at a separation of 120 au. The normalised
radial flux profiles of HD141569 may come to resemble those of 49 Ceti if the
inner regions of HD141569 were to be depleted through the radial drift of solids,
photoevaporation of remaining gas or late planet formation
This speculative evolutionary sequence is made on the basis of just three sys-
tems with images of varying spatial resolution; nevertheless similarities between
the systems are readily apparent and suggestive of physical mechanisms that link
97
3. Unlocking the secrets of the midplane gas and dust distribution inthe young hybrid disc HD 141569
Figure 3.6: Azimuthally averaged profiles of the dust and the most optically thin
CO isotopologue observed by ALMA around three A type stars. Dashed grey
lines denote the positions of rings detected in the system. For HD 141569 the
profile of ALMA detected 12CO is also plotted. Inset are images of the dust
continuum at 1.3mm for HD 141569 and 870µm for the other discs . The dashed
line in the HD 141569 image denotes position of the mm ring. Horizontal lines
represent the FWHM of the synthesising beam for each profile. Total gas mass
estimates are taken form the literature and assume ISM abundances.
the stages. Future high sensitivity and high resolution observations of evolved,
gas-bearing debris discs are the key to determining how and when multiple rings
as seen in a protoplanetary disc are concentrated into debris-like belts, and how
the massive gas discs are dissipated.
Full characterisation of the inner regions of HD141569 is an important step
in achieving this goal. The inner regions within 100 au are yet to be probed
with precision at mm wavelength. The presence (or lack of) mid-plane counter-
parts to the concentric rings observed in scattered light (Perrot et al., 2016) and
confirmation of the spatial distribution of gas will give direct clues as to what
mechanisms are driving the disc dispersal. The likely candidates are perturbation
by embedded exoplanets, photoevaporation or accretion onto the central star.
98
3.4 Conclusions
3.4 Conclusions
An asymmetric distribution of midplane gas is detected in the young hybrid
disc HD 141569, traced by optically thin 13CO emission. In addition, a faint
mm ring of emission at 220±10 au is detected through azimuthal averaging of
the continuum image, providing a midplane counterpart to the ring detected in
scattered light, where these small dust grains originate. The minimum dust mass
in the ring is derived to be 0.13±0.02 M⊕, around 10% of the total flux from
the system. The bulk of the millimetre emission, which is known to be variable,
coincides with the location of the star and is unresolved placing an upper limit
on its radial extension of 72 au. This emission traces a minimum of 1.2±0.2 M⊕
of dust, but may have a free-free contribution of ≤3%. From these observations
an upper limit on mass of the outermost ring can be placed at 0.11±0.02 M⊕.
The gas disc is interior to this ring at 220 au. From the integrated 13CO flux
gas mass is derived to be (6.0±0.9)×10−4M�; a mass approximately two orders of
magnitude greater than that derived using 12CO. The reason for this is the high
optical depth of 12CO, rendering any gas mass value derived from its emission
a large underestimate. Non-detection of C18O shows that this isotopologue is
about four times less abundant than expected, based on the standard isotopic
ratio between 16O and 18O. Isotope-selective photodissociation is proposed as the
culprit.
New high sensitivity and high resolution images of HD141569 and of other
hybrid discs are the key to linking gas-rich, ringed protoplanetary discs with the
gas-poor, wide belts in debris discs through an evolutionary path.
99
3. Unlocking the secrets of the midplane gas and dust distribution inthe young hybrid disc HD 141569
100
Chapter 4
The impact of pre-main sequence
stellar evolution on midplane
snowline locations and C/O in
planet forming discs
101
4. The impact of pre-main sequence stellar evolution on midplanesnowline locations and C/O in planet forming discs
4.1 Context
The host star has a major influence on both the evolution of protoplanetary
discs and on the properties of the planetary systems that they go on to form.
Giant planets occur more frequently around more massive stars, specifically radial
velocity surveys find a peak in giant planet occurrence rate for a host stellar mass
of 1.9 M� (Johnson et al., 2010; Reffert et al., 2014). ALMA surveys of star
forming regions show that the mass of solids in protoplanetary discs also scales
with stellar mass (Mulders, 2018; Pascucci et al., 2016). This trend complies with
theoretical predictions; the core accretion scenario for planet formation predicts
more giant planets to be formed around higher mass stars (Ida and Lin, 2005;
Kennedy and Kenyon, 2008a). Furthermore planet population synthesis models
by Alibert et al. (2011) show that scaling disc mass with the mass of the stellar
host can explain the lack of high mass planets around 0.5 M� hosts and a lack of
short separation planets around stars with mass greater than 1.5 M�.
The central star determines the temperature structure within the disc it hosts.
More massive, more luminous stars result in a warmer disc, which is expected
to result in changes in the disc composition. Solids in the disc generally hold
a greater relative abundance of oxygen compared to the gas which is instead
relatively carbon-rich. Based on observations of gas and dust in discs, Oberg
et al. (2011) take the ratio of carbon to oxygen, C/O, in both the gas and solid
phase to be dictated by the location of snowlines for key molecular carriers of
oxygen and carbon. For example in their model the gas is most carbon-rich
between the CO2 and CO snowlines, because here the gas phase is dominated by
CO, leading to C/O∼1.
An exoplanet’s overall composition is inherited from the local disc at the time
of formation when material is accreted rapidly. Measurements of C/O and of
metallicity (e.g. C/H, O/H) in exoplanets can be used to connect the composi-
tion of the planet with the location of its formation, and the relative amounts
of oxygen-rich solids and carbon-rich gas this would have required. For example
Brewer et al. (2017) investigate C/O in hot Jupiters and find that super-stellar
C/O and sub-stellar O/H ratios suggest that some hot Jupiters form beyond the
102
4.1 Context
H2O snowline and migrate inward. The enrichment of the atmospheres of gi-
ant exoplanets is aided by radial drift in the disc, which acts to carry solids to
shorter radial separations from the star, doing so at a rate faster than depletion
due to chemical processes (Booth et al., 2017; Booth and Ilee, 2019; Krijt et al.,
2018). The inward drift of pebbles is also an effective mechanism for transport-
ing volatiles that are frozen onto grains towards the inner regions of the disc.
This causes a plume of volatile gas to build up at snowline locations, which vis-
cously spreads to enhance gas phase abundances of dominant molecular species
within their own snowlines (Booth and Ilee, 2019; Stammler et al., 2017). Exo-
planet atmospheric C/O may differ from the exoplanets overall composition due
to chemical effects within the atmosphere that are not taken into account by this
model (for a detailed description of factors affecting atmospheric chemistry see
review by Madhusudhan et al., 2016).
The formation of planets via gravitational instability on the other hand in-
volves the large scale collapse of a mixture of gas and dust. The compositions
of objects forming in this manner will likely reflect the stellar value (Madhusud-
han et al., 2014). However, thermal history and internal sedimentation in these
fragments can form objects with sub-stellar C/O (Ilee et al., 2017).
The temperature in the disc does not necessarily remain constant however,
meaning the snowline locations are not fixed to a particular radial distance from
the star. Low mass stars decrease in luminosity as they evolve towards the main
sequence meaning there is a decreased irradiating flux upon the disc. Intermediate
mass stars on the other hand, increase in effective temperature as they evolve
towards the main sequence, but do not experience as large a decrease in luminosity
as low mass stars, in fact after a few Myr their luminosity begins to increase again.
Due to this contrasting evolution of low-mass stars compared to intermediate
mass stars, Panic and Min (2017) infer different physical, and therefore chemical,
histories in the discs around low- and intermediate-mass stars. So without the
need to invoke any internal disc evolution, the temperature structure of the disc
can be expected to evolve alongside the luminosity of the host star, introducing a
temporal dependence for composition, in addition to the radial dependence from
Oberg et al. (2011). Every star must undergo this evolution, therefore every disc
must experience the repercussions to some extent.
103
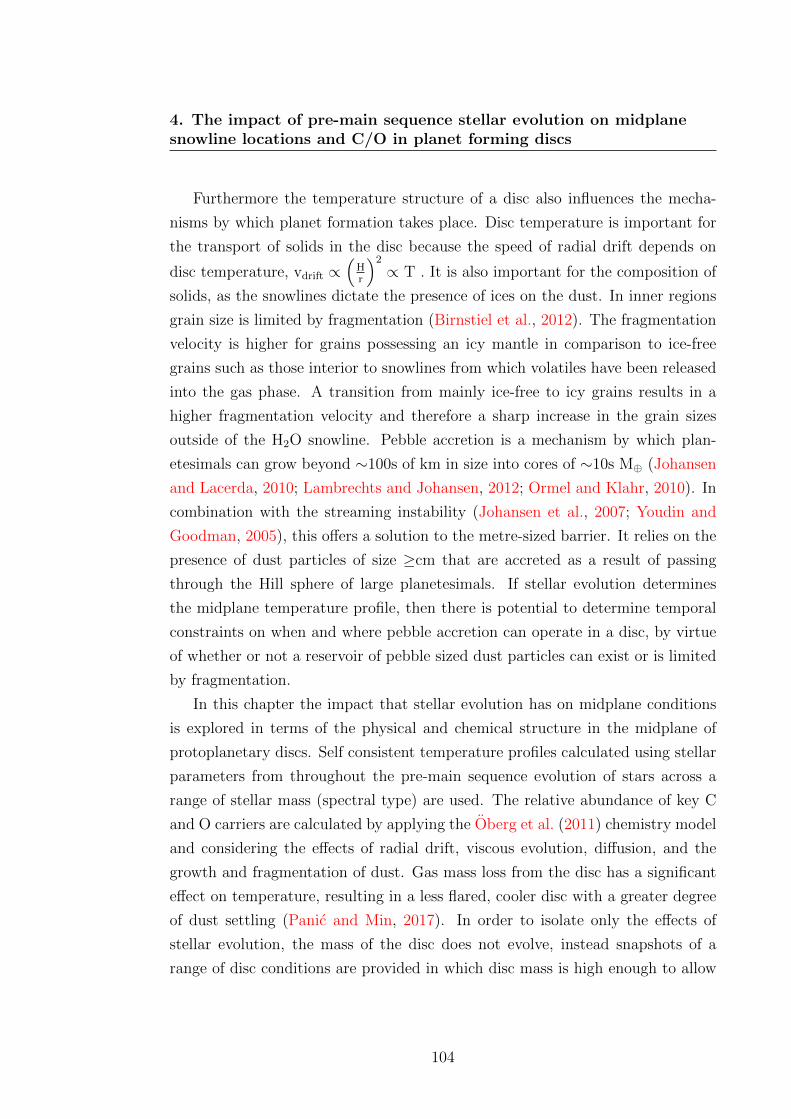
4. The impact of pre-main sequence stellar evolution on midplanesnowline locations and C/O in planet forming discs
Furthermore the temperature structure of a disc also influences the mecha-
nisms by which planet formation takes place. Disc temperature is important for
the transport of solids in the disc because the speed of radial drift depends on
disc temperature, vdrift ∝(
Hr
)2∝ T . It is also important for the composition of
solids, as the snowlines dictate the presence of ices on the dust. In inner regions
grain size is limited by fragmentation (Birnstiel et al., 2012). The fragmentation
velocity is higher for grains possessing an icy mantle in comparison to ice-free
grains such as those interior to snowlines from which volatiles have been released
into the gas phase. A transition from mainly ice-free to icy grains results in a
higher fragmentation velocity and therefore a sharp increase in the grain sizes
outside of the H2O snowline. Pebble accretion is a mechanism by which plan-
etesimals can grow beyond ∼100s of km in size into cores of ∼10s M⊕ (Johansen
and Lacerda, 2010; Lambrechts and Johansen, 2012; Ormel and Klahr, 2010). In
combination with the streaming instability (Johansen et al., 2007; Youdin and
Goodman, 2005), this offers a solution to the metre-sized barrier. It relies on the
presence of dust particles of size ≥cm that are accreted as a result of passing
through the Hill sphere of large planetesimals. If stellar evolution determines
the midplane temperature profile, then there is potential to determine temporal
constraints on when and where pebble accretion can operate in a disc, by virtue
of whether or not a reservoir of pebble sized dust particles can exist or is limited
by fragmentation.
In this chapter the impact that stellar evolution has on midplane conditions
is explored in terms of the physical and chemical structure in the midplane of
protoplanetary discs. Self consistent temperature profiles calculated using stellar
parameters from throughout the pre-main sequence evolution of stars across a
range of stellar mass (spectral type) are used. The relative abundance of key C
and O carriers are calculated by applying the Oberg et al. (2011) chemistry model
and considering the effects of radial drift, viscous evolution, diffusion, and the
growth and fragmentation of dust. Gas mass loss from the disc has a significant
effect on temperature, resulting in a less flared, cooler disc with a greater degree
of dust settling (Panic and Min, 2017). In order to isolate only the effects of
stellar evolution, the mass of the disc does not evolve, instead snapshots of a
range of disc conditions are provided in which disc mass is high enough to allow
104
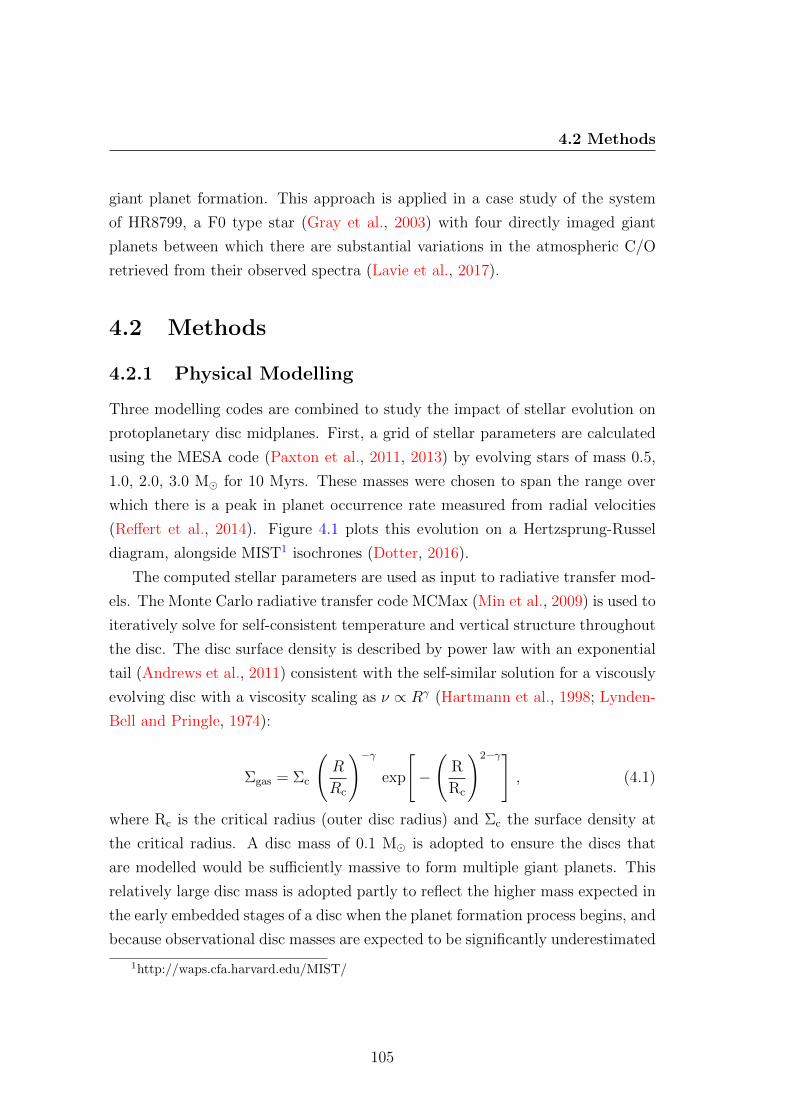
4.2 Methods
giant planet formation. This approach is applied in a case study of the system
of HR8799, a F0 type star (Gray et al., 2003) with four directly imaged giant
planets between which there are substantial variations in the atmospheric C/O
retrieved from their observed spectra (Lavie et al., 2017).
4.2 Methods
4.2.1 Physical Modelling
Three modelling codes are combined to study the impact of stellar evolution on
protoplanetary disc midplanes. First, a grid of stellar parameters are calculated
using the MESA code (Paxton et al., 2011, 2013) by evolving stars of mass 0.5,
1.0, 2.0, 3.0 M� for 10 Myrs. These masses were chosen to span the range over
which there is a peak in planet occurrence rate measured from radial velocities
(Reffert et al., 2014). Figure 4.1 plots this evolution on a Hertzsprung-Russel
diagram, alongside MIST1 isochrones (Dotter, 2016).
The computed stellar parameters are used as input to radiative transfer mod-
els. The Monte Carlo radiative transfer code MCMax (Min et al., 2009) is used to
iteratively solve for self-consistent temperature and vertical structure throughout
the disc. The disc surface density is described by power law with an exponential
tail (Andrews et al., 2011) consistent with the self-similar solution for a viscously
evolving disc with a viscosity scaling as ν ∝ Rγ (Hartmann et al., 1998; Lynden-
Bell and Pringle, 1974):
Σgas = Σc
(R
Rc
)−γexp
[−
(R
Rc
)2−γ], (4.1)
where Rc is the critical radius (outer disc radius) and Σc the surface density at
the critical radius. A disc mass of 0.1 M� is adopted to ensure the discs that
are modelled would be sufficiently massive to form multiple giant planets. This
relatively large disc mass is adopted partly to reflect the higher mass expected in
the early embedded stages of a disc when the planet formation process begins, and
because observational disc masses are expected to be significantly underestimated
1http://waps.cfa.harvard.edu/MIST/
105
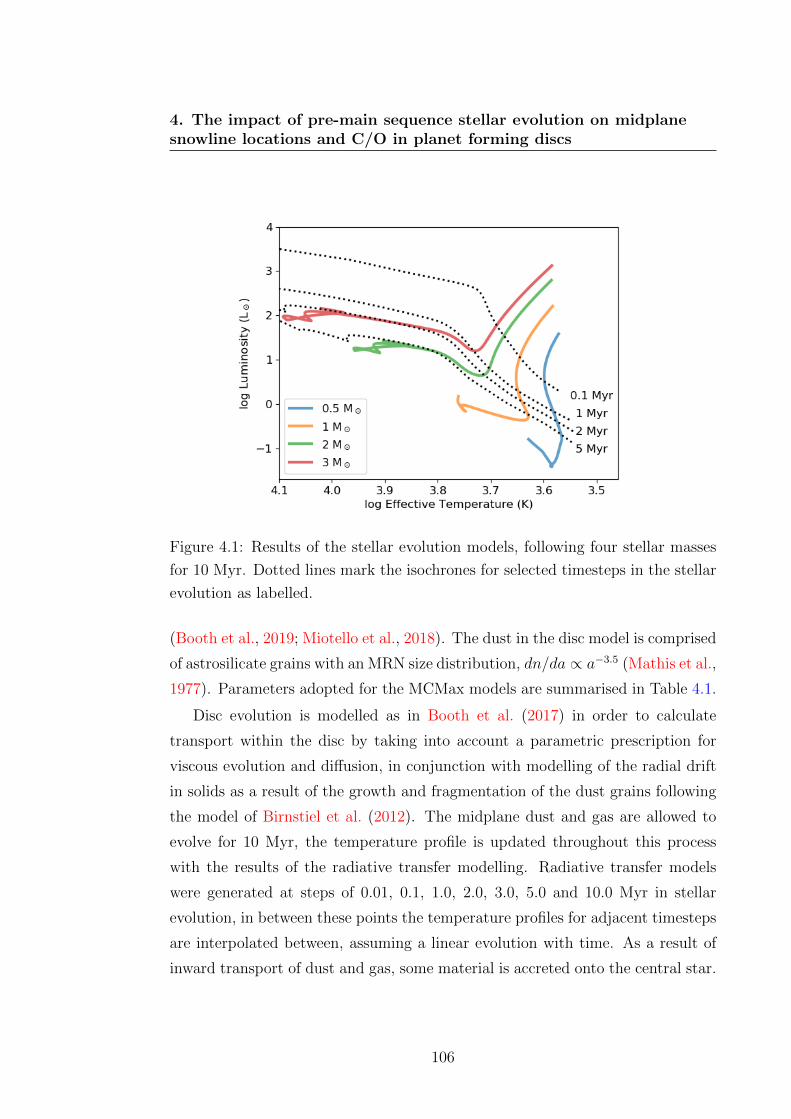
4. The impact of pre-main sequence stellar evolution on midplanesnowline locations and C/O in planet forming discs
Figure 4.1: Results of the stellar evolution models, following four stellar masses
for 10 Myr. Dotted lines mark the isochrones for selected timesteps in the stellar
evolution as labelled.
(Booth et al., 2019; Miotello et al., 2018). The dust in the disc model is comprised
of astrosilicate grains with an MRN size distribution, dn/da ∝ a−3.5 (Mathis et al.,
1977). Parameters adopted for the MCMax models are summarised in Table 4.1.
Disc evolution is modelled as in Booth et al. (2017) in order to calculate
transport within the disc by taking into account a parametric prescription for
viscous evolution and diffusion, in conjunction with modelling of the radial drift
in solids as a result of the growth and fragmentation of the dust grains following
the model of Birnstiel et al. (2012). The midplane dust and gas are allowed to
evolve for 10 Myr, the temperature profile is updated throughout this process
with the results of the radiative transfer modelling. Radiative transfer models
were generated at steps of 0.01, 0.1, 1.0, 2.0, 3.0, 5.0 and 10.0 Myr in stellar
evolution, in between these points the temperature profiles for adjacent timesteps
are interpolated between, assuming a linear evolution with time. As a result of
inward transport of dust and gas, some material is accreted onto the central star.
106
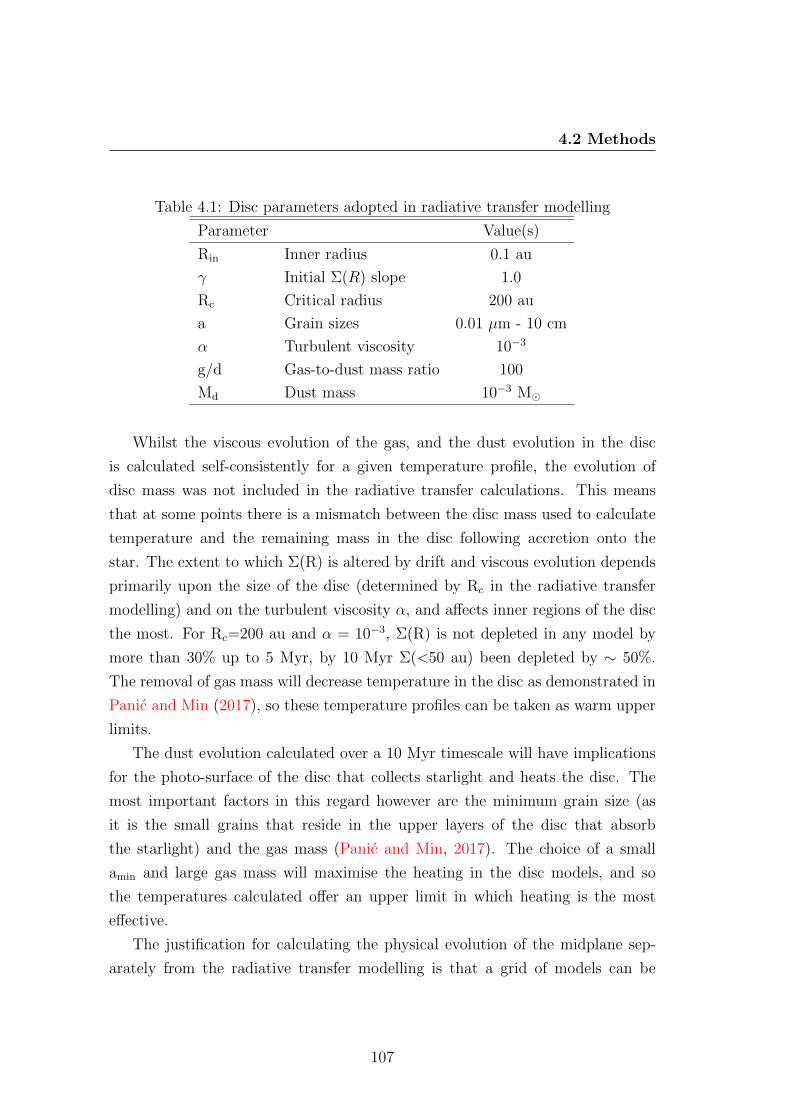
4.2 Methods
Table 4.1: Disc parameters adopted in radiative transfer modelling
Parameter Value(s)
Rin Inner radius 0.1 au
γ Initial Σ(R) slope 1.0
Rc Critical radius 200 au
a Grain sizes 0.01 µm - 10 cm
α Turbulent viscosity 10−3
g/d Gas-to-dust mass ratio 100
Md Dust mass 10−3 M�
Whilst the viscous evolution of the gas, and the dust evolution in the disc
is calculated self-consistently for a given temperature profile, the evolution of
disc mass was not included in the radiative transfer calculations. This means
that at some points there is a mismatch between the disc mass used to calculate
temperature and the remaining mass in the disc following accretion onto the
star. The extent to which Σ(R) is altered by drift and viscous evolution depends
primarily upon the size of the disc (determined by Rc in the radiative transfer
modelling) and on the turbulent viscosity α, and affects inner regions of the disc
the most. For Rc=200 au and α = 10−3, Σ(R) is not depleted in any model by
more than 30% up to 5 Myr, by 10 Myr Σ(<50 au) been depleted by ∼ 50%.
The removal of gas mass will decrease temperature in the disc as demonstrated in
Panic and Min (2017), so these temperature profiles can be taken as warm upper
limits.
The dust evolution calculated over a 10 Myr timescale will have implications
for the photo-surface of the disc that collects starlight and heats the disc. The
most important factors in this regard however are the minimum grain size (as
it is the small grains that reside in the upper layers of the disc that absorb
the starlight) and the gas mass (Panic and Min, 2017). The choice of a small
amin and large gas mass will maximise the heating in the disc models, and so
the temperatures calculated offer an upper limit in which heating is the most
effective.
The justification for calculating the physical evolution of the midplane sep-
arately from the radiative transfer modelling is that a grid of models can be
107
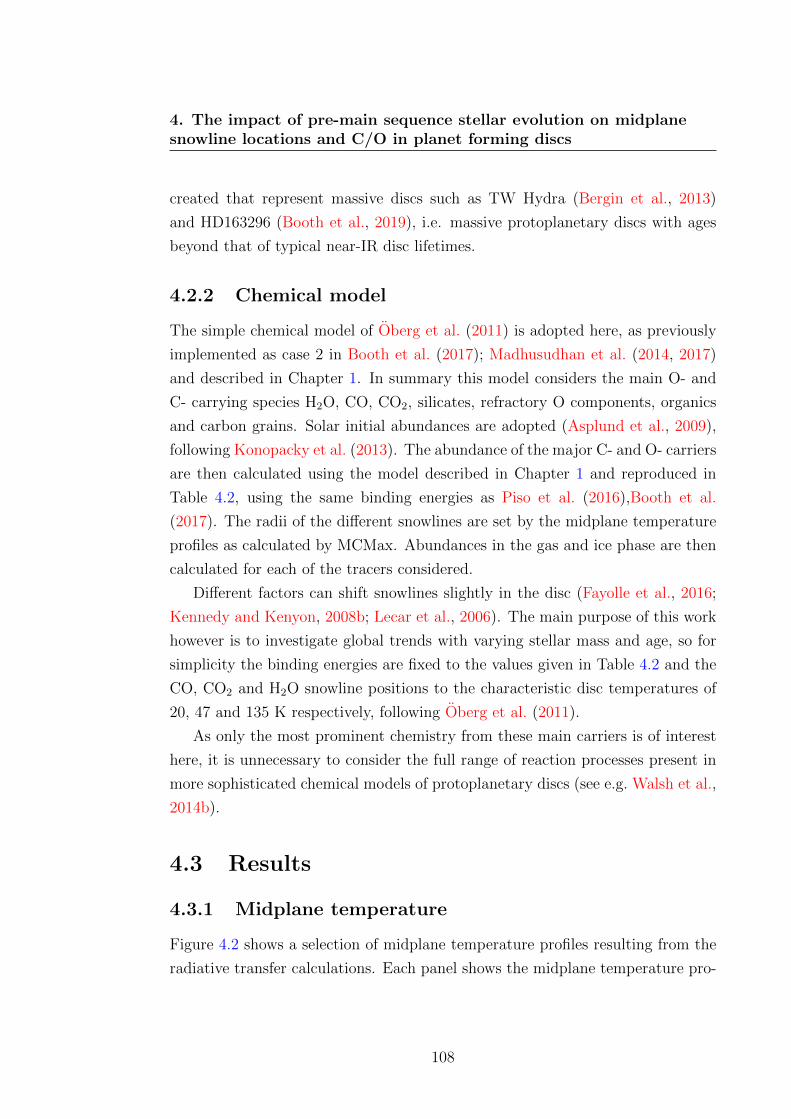
4. The impact of pre-main sequence stellar evolution on midplanesnowline locations and C/O in planet forming discs
created that represent massive discs such as TW Hydra (Bergin et al., 2013)
and HD163296 (Booth et al., 2019), i.e. massive protoplanetary discs with ages
beyond that of typical near-IR disc lifetimes.
4.2.2 Chemical model
The simple chemical model of Oberg et al. (2011) is adopted here, as previously
implemented as case 2 in Booth et al. (2017); Madhusudhan et al. (2014, 2017)
and described in Chapter 1. In summary this model considers the main O- and
C- carrying species H2O, CO, CO2, silicates, refractory O components, organics
and carbon grains. Solar initial abundances are adopted (Asplund et al., 2009),
following Konopacky et al. (2013). The abundance of the major C- and O- carriers
are then calculated using the model described in Chapter 1 and reproduced in
Table 4.2, using the same binding energies as Piso et al. (2016),Booth et al.
(2017). The radii of the different snowlines are set by the midplane temperature
profiles as calculated by MCMax. Abundances in the gas and ice phase are then
calculated for each of the tracers considered.
Different factors can shift snowlines slightly in the disc (Fayolle et al., 2016;
Kennedy and Kenyon, 2008b; Lecar et al., 2006). The main purpose of this work
however is to investigate global trends with varying stellar mass and age, so for
simplicity the binding energies are fixed to the values given in Table 4.2 and the
CO, CO2 and H2O snowline positions to the characteristic disc temperatures of
20, 47 and 135 K respectively, following Oberg et al. (2011).
As only the most prominent chemistry from these main carriers is of interest
here, it is unnecessary to consider the full range of reaction processes present in
more sophisticated chemical models of protoplanetary discs (see e.g. Walsh et al.,
2014b).
4.3 Results
4.3.1 Midplane temperature
Figure 4.2 shows a selection of midplane temperature profiles resulting from the
radiative transfer calculations. Each panel shows the midplane temperature pro-
108
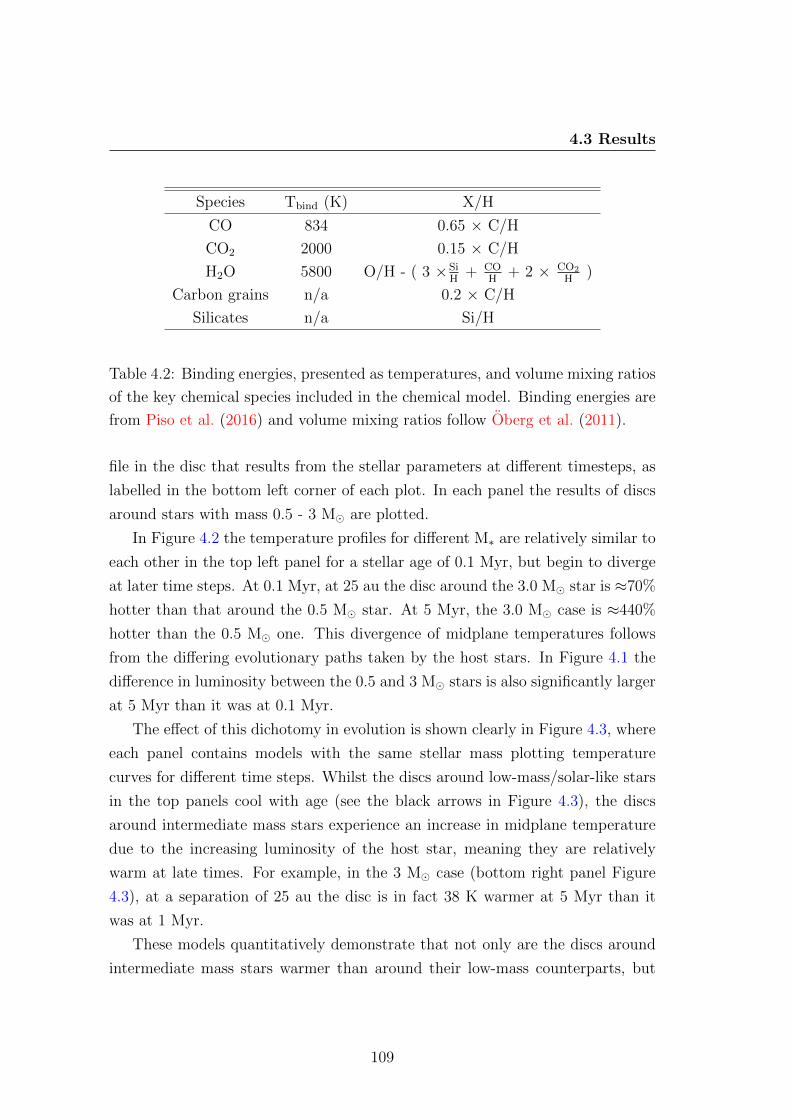
4.3 Results
Species Tbind (K) X/H
CO 834 0.65 × C/H
CO2 2000 0.15 × C/H
H2O 5800 O/H - ( 3 ×SiH
+ COH
+ 2 × CO2
H)
Carbon grains n/a 0.2 × C/H
Silicates n/a Si/H
Table 4.2: Binding energies, presented as temperatures, and volume mixing ratios
of the key chemical species included in the chemical model. Binding energies are
from Piso et al. (2016) and volume mixing ratios follow Oberg et al. (2011).
file in the disc that results from the stellar parameters at different timesteps, as
labelled in the bottom left corner of each plot. In each panel the results of discs
around stars with mass 0.5 - 3 M� are plotted.
In Figure 4.2 the temperature profiles for different M∗ are relatively similar to
each other in the top left panel for a stellar age of 0.1 Myr, but begin to diverge
at later time steps. At 0.1 Myr, at 25 au the disc around the 3.0 M� star is ≈70%
hotter than that around the 0.5 M� star. At 5 Myr, the 3.0 M� case is ≈440%
hotter than the 0.5 M� one. This divergence of midplane temperatures follows
from the differing evolutionary paths taken by the host stars. In Figure 4.1 the
difference in luminosity between the 0.5 and 3 M� stars is also significantly larger
at 5 Myr than it was at 0.1 Myr.
The effect of this dichotomy in evolution is shown clearly in Figure 4.3, where
each panel contains models with the same stellar mass plotting temperature
curves for different time steps. Whilst the discs around low-mass/solar-like stars
in the top panels cool with age (see the black arrows in Figure 4.3), the discs
around intermediate mass stars experience an increase in midplane temperature
due to the increasing luminosity of the host star, meaning they are relatively
warm at late times. For example, in the 3 M� case (bottom right panel Figure
4.3), at a separation of 25 au the disc is in fact 38 K warmer at 5 Myr than it
was at 1 Myr.
These models quantitatively demonstrate that not only are the discs around
intermediate mass stars warmer than around their low-mass counterparts, but
109
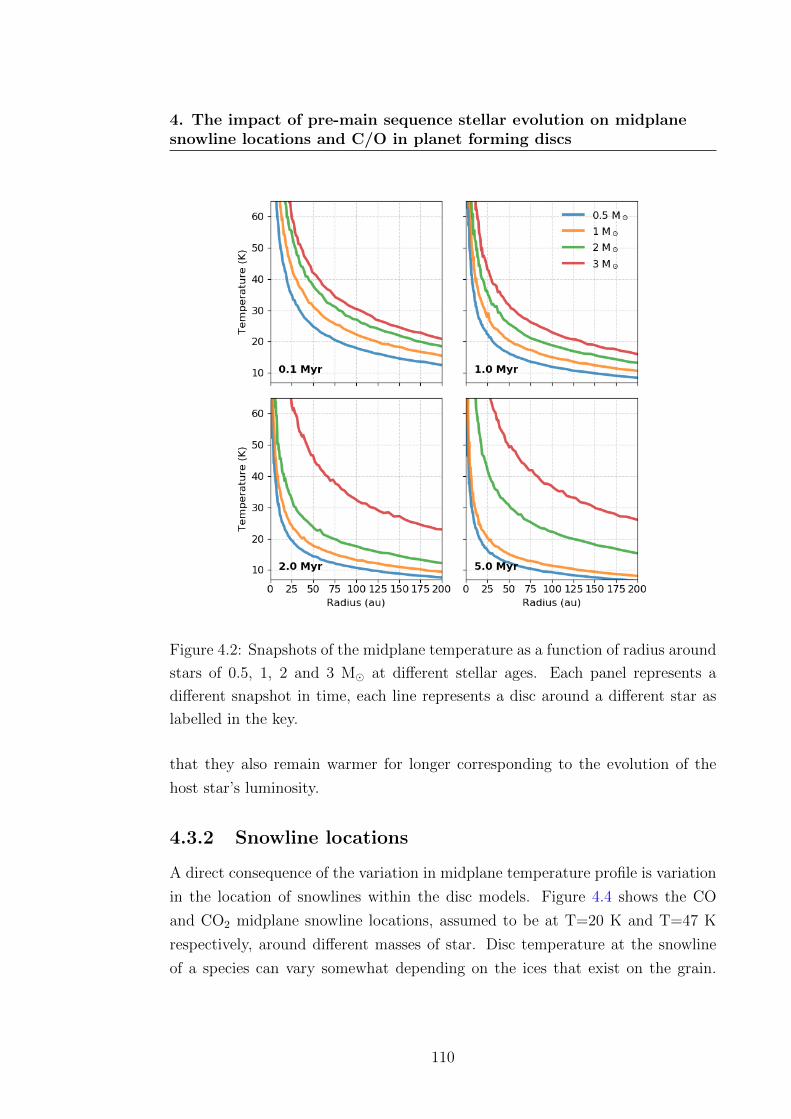
4. The impact of pre-main sequence stellar evolution on midplanesnowline locations and C/O in planet forming discs
Figure 4.2: Snapshots of the midplane temperature as a function of radius around
stars of 0.5, 1, 2 and 3 M� at different stellar ages. Each panel represents a
different snapshot in time, each line represents a disc around a different star as
labelled in the key.
that they also remain warmer for longer corresponding to the evolution of the
host star’s luminosity.
4.3.2 Snowline locations
A direct consequence of the variation in midplane temperature profile is variation
in the location of snowlines within the disc models. Figure 4.4 shows the CO
and CO2 midplane snowline locations, assumed to be at T=20 K and T=47 K
respectively, around different masses of star. Disc temperature at the snowline
of a species can vary somewhat depending on the ices that exist on the grain.
110
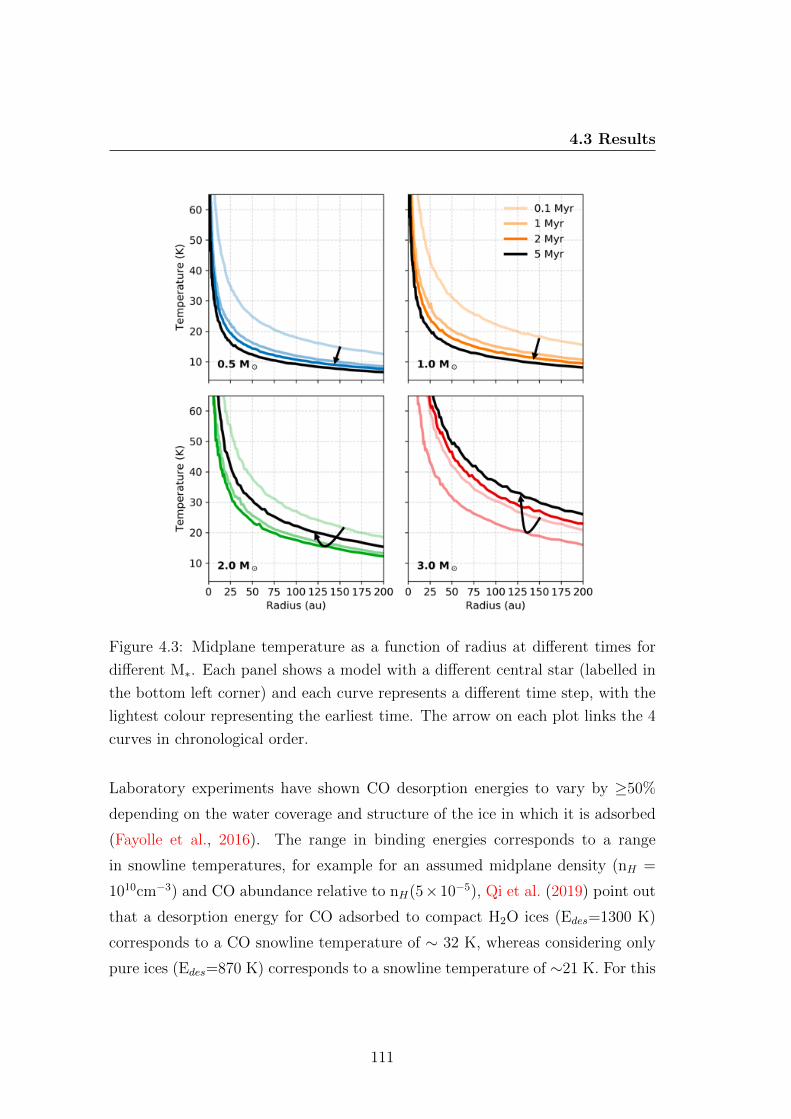
4.3 Results
Figure 4.3: Midplane temperature as a function of radius at different times for
different M∗. Each panel shows a model with a different central star (labelled in
the bottom left corner) and each curve represents a different time step, with the
lightest colour representing the earliest time. The arrow on each plot links the 4
curves in chronological order.
Laboratory experiments have shown CO desorption energies to vary by ≥50%
depending on the water coverage and structure of the ice in which it is adsorbed
(Fayolle et al., 2016). The range in binding energies corresponds to a range
in snowline temperatures, for example for an assumed midplane density (nH =
1010cm−3) and CO abundance relative to nH(5×10⁻⁵), Qi et al. (2019) point out
that a desorption energy for CO adsorbed to compact H2O ices (Edes=1300 K)
corresponds to a CO snowline temperature of ∼ 32 K, whereas considering only
pure ices (Edes=870 K) corresponds to a snowline temperature of ∼21 K. For this
111
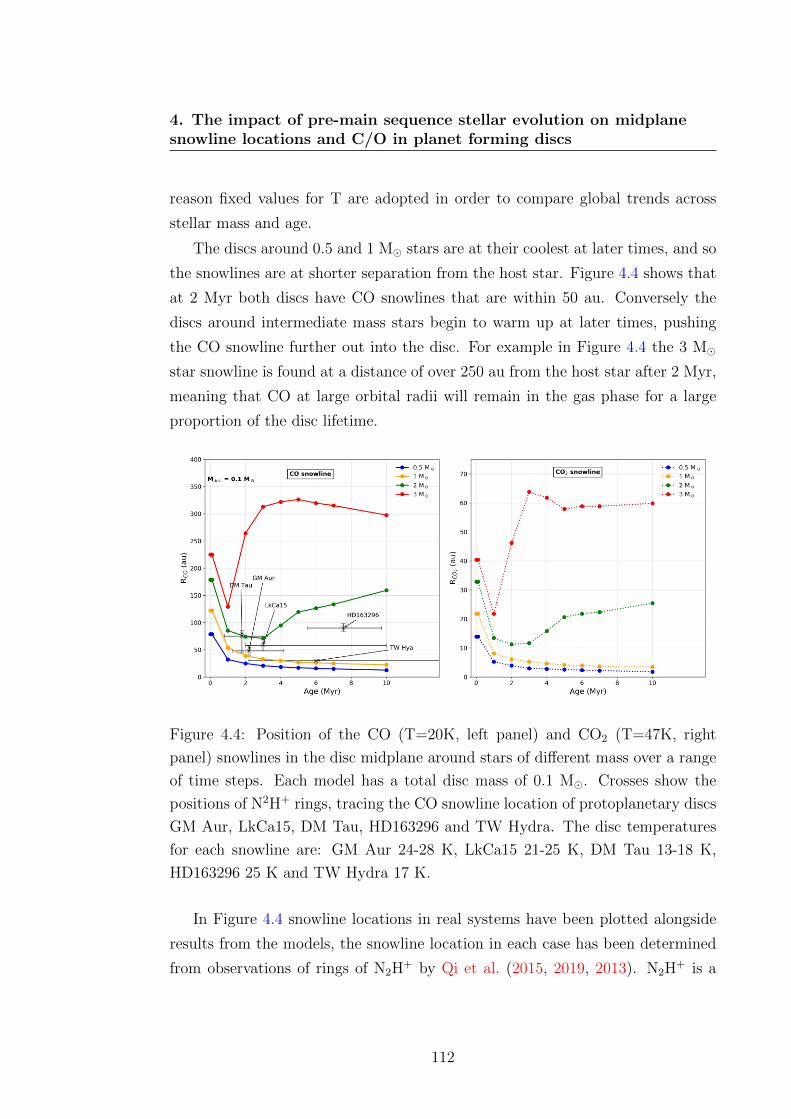
4. The impact of pre-main sequence stellar evolution on midplanesnowline locations and C/O in planet forming discs
reason fixed values for T are adopted in order to compare global trends across
stellar mass and age.
The discs around 0.5 and 1 M� stars are at their coolest at later times, and so
the snowlines are at shorter separation from the host star. Figure 4.4 shows that
at 2 Myr both discs have CO snowlines that are within 50 au. Conversely the
discs around intermediate mass stars begin to warm up at later times, pushing
the CO snowline further out into the disc. For example in Figure 4.4 the 3 M�
star snowline is found at a distance of over 250 au from the host star after 2 Myr,
meaning that CO at large orbital radii will remain in the gas phase for a large
proportion of the disc lifetime.
Figure 4.4: Position of the CO (T=20K, left panel) and CO2 (T=47K, right
panel) snowlines in the disc midplane around stars of different mass over a range
of time steps. Each model has a total disc mass of 0.1 M�. Crosses show the
positions of N2H+ rings, tracing the CO snowline location of protoplanetary discs
GM Aur, LkCa15, DM Tau, HD163296 and TW Hydra. The disc temperatures
for each snowline are: GM Aur 24-28 K, LkCa15 21-25 K, DM Tau 13-18 K,
HD163296 25 K and TW Hydra 17 K.
In Figure 4.4 snowline locations in real systems have been plotted alongside
results from the models, the snowline location in each case has been determined
from observations of rings of N2H+ by Qi et al. (2015, 2019, 2013). N2H
+ is a
112
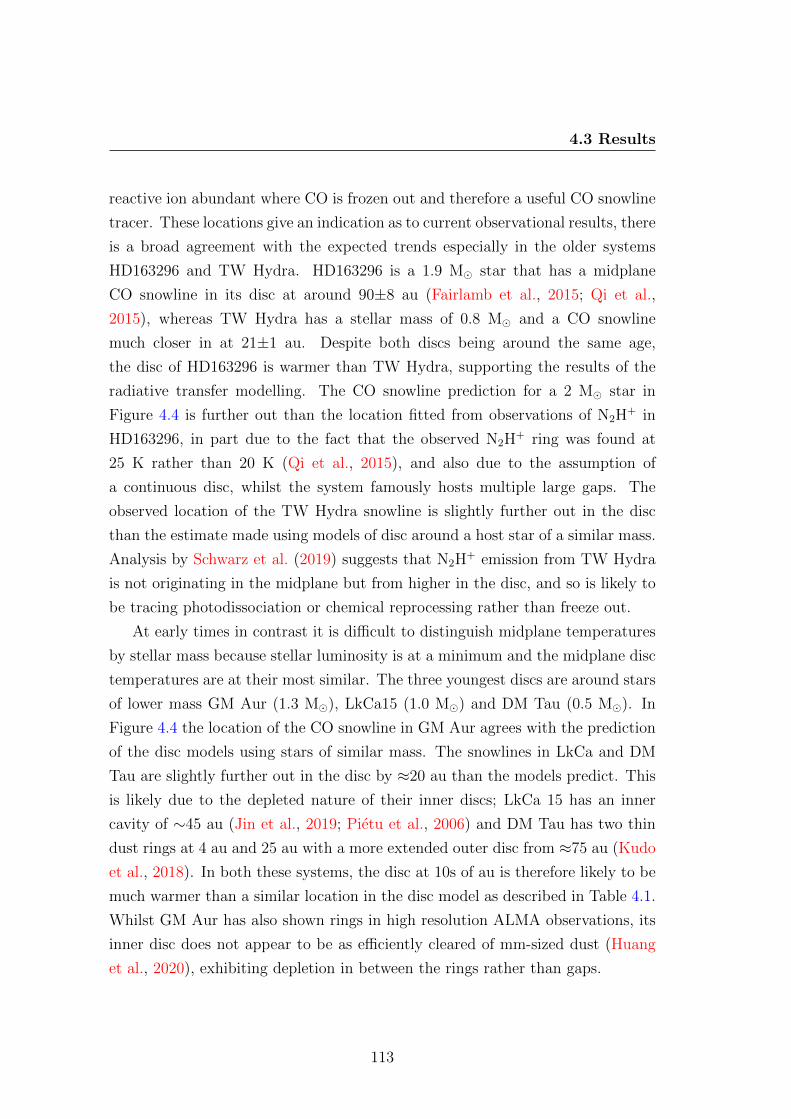
4.3 Results
reactive ion abundant where CO is frozen out and therefore a useful CO snowline
tracer. These locations give an indication as to current observational results, there
is a broad agreement with the expected trends especially in the older systems
HD163296 and TW Hydra. HD163296 is a 1.9 M� star that has a midplane
CO snowline in its disc at around 90±8 au (Fairlamb et al., 2015; Qi et al.,
2015), whereas TW Hydra has a stellar mass of 0.8 M� and a CO snowline
much closer in at 21±1 au. Despite both discs being around the same age,
the disc of HD163296 is warmer than TW Hydra, supporting the results of the
radiative transfer modelling. The CO snowline prediction for a 2 M� star in
Figure 4.4 is further out than the location fitted from observations of N2H+ in
HD163296, in part due to the fact that the observed N2H+ ring was found at
25 K rather than 20 K (Qi et al., 2015), and also due to the assumption of
a continuous disc, whilst the system famously hosts multiple large gaps. The
observed location of the TW Hydra snowline is slightly further out in the disc
than the estimate made using models of disc around a host star of a similar mass.
Analysis by Schwarz et al. (2019) suggests that N2H+ emission from TW Hydra
is not originating in the midplane but from higher in the disc, and so is likely to
be tracing photodissociation or chemical reprocessing rather than freeze out.
At early times in contrast it is difficult to distinguish midplane temperatures
by stellar mass because stellar luminosity is at a minimum and the midplane disc
temperatures are at their most similar. The three youngest discs are around stars
of lower mass GM Aur (1.3 M�), LkCa15 (1.0 M�) and DM Tau (0.5 M�). In
Figure 4.4 the location of the CO snowline in GM Aur agrees with the prediction
of the disc models using stars of similar mass. The snowlines in LkCa and DM
Tau are slightly further out in the disc by ≈20 au than the models predict. This
is likely due to the depleted nature of their inner discs; LkCa 15 has an inner
cavity of ∼45 au (Jin et al., 2019; Pietu et al., 2006) and DM Tau has two thin
dust rings at 4 au and 25 au with a more extended outer disc from ≈75 au (Kudo
et al., 2018). In both these systems, the disc at 10s of au is therefore likely to be
much warmer than a similar location in the disc model as described in Table 4.1.
Whilst GM Aur has also shown rings in high resolution ALMA observations, its
inner disc does not appear to be as efficiently cleared of mm-sized dust (Huang
et al., 2020), exhibiting depletion in between the rings rather than gaps.
113
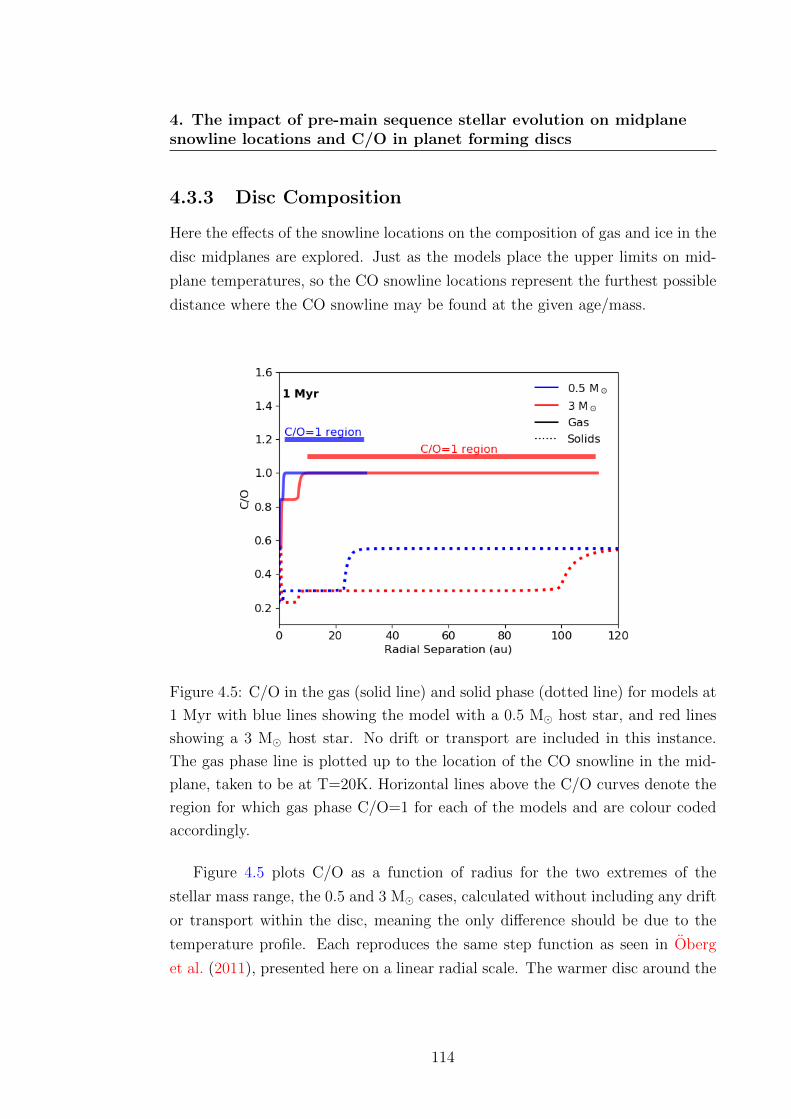
4. The impact of pre-main sequence stellar evolution on midplanesnowline locations and C/O in planet forming discs
4.3.3 Disc Composition
Here the effects of the snowline locations on the composition of gas and ice in the
disc midplanes are explored. Just as the models place the upper limits on mid-
plane temperatures, so the CO snowline locations represent the furthest possible
distance where the CO snowline may be found at the given age/mass.
Figure 4.5: C/O in the gas (solid line) and solid phase (dotted line) for models at
1 Myr with blue lines showing the model with a 0.5 M� host star, and red lines
showing a 3 M� host star. No drift or transport are included in this instance.
The gas phase line is plotted up to the location of the CO snowline in the mid-
plane, taken to be at T=20K. Horizontal lines above the C/O curves denote the
region for which gas phase C/O=1 for each of the models and are colour coded
accordingly.
Figure 4.5 plots C/O as a function of radius for the two extremes of the
stellar mass range, the 0.5 and 3 M� cases, calculated without including any drift
or transport within the disc, meaning the only difference should be due to the
temperature profile. Each reproduces the same step function as seen in Oberg
et al. (2011), presented here on a linear radial scale. The warmer disc around the
114
4.3 Results
3 M� star pushes both the CO and CO2 snowlines further out in the disc, leading
to a more extended region of maximum carbon enrichment in the gas phase (in
the model this is where C/O=1) in comparison to the disc around the 0.5 M�
star. Outwards of ∼30 au in Figure 4.5, the solids in the 0.5 M� case are much
more carbon enriched because all main carbon carriers are frozen out onto the
grains. In the warmer 3 M� case, the snowline is at ≈115 au in the disc and so
more carbon is in the gas phase, leaving solids with a lower value of C/O ≈ 0.3 .
Figure 4.6: C/O in the gas (solid line) and solid phase (dotted line) for models
with a 3 M� host star and no drift or transport included. The red lines show
the model with stellar parameters at 1 Myr, the black lines show the model at
5 Myr. The gas phase line is plotted until the location of the CO snowline in the
midplane, taken to be at T=20 K. Horizontal lines above the curves denote the
region for which gas phase C/O=1 for each of the models and are colour coded
accordingly.
Heating of the disc depends not only on the mass of the star, but the stage
of its evolution as well. In Figure 4.6 the same 1 Myr, 3 M� profile is plotted as
in Figure 4.5, but now compared to a model using stellar parameters at 5 Myr
115
4. The impact of pre-main sequence stellar evolution on midplanesnowline locations and C/O in planet forming discs
when the intermediate mass star’s luminosity is greater. In the 5 Myr case the
CO2 snowline is further out than in the 1 Myr case. As shown in Figure 4.6, this
results in a lower C/O ratio for the oxygen enriched solids up to 30 au in the
5 Myr case (dotted black line) compared to the 1 Myr case (red dotted line).
CO remains in the gas phase for the vast majority of the disc extent, with the
CO snowline found at over 400 au at 5 Myr. Figure 4.6 therefore makes it clear
that there is not only a radial dependence to be considered, but also a temporal
one. The CO and CO2 snowline locations will evolve with the disc temperature
profile resulting in changes to disc composition. The H2O snowline is always
at shorter separation from the central star, in some discs approaching the inner
regions where the disc is viscously heated rather than radiatively, and so it is not
necessarily expected that the H2O snowline will be affected in a similar manner
where this is true.
4.4 Discussion
4.4.1 Application to HR8799
The C/O in the gas and solid phases depends on both location within the disc
and time. Here the extent to which these results can explain variation in the
atmospheric C/O of giant planets within the same system is explored.
HR8799 is an F0 type star (Gray et al., 2003) that hosts four directly im-
aged giant planets in its system (Marois et al., 2008, 2010). The wide orbits and
large masses of the planets have proved difficult to model with current theories
of planet formation. Through spectroscopic analysis Sadakane (2006) find the
abundances of C and O in HR8799 to be consistent with solar values; log10C/H=
-3.57 and log10O/H= -3.31 (Asplund et al., 2009). In this section a disc model is
created specific to the stellar mass of HR8799 that includes stellar evolution, disc
transport and the chemical model following Oberg et al. (2011). The composition
of the model disc is then compared with the C/O determined for each of the four
exoplanets from their observed spectra by Lavie et al. (2017) using the atmo-
spheric retrieval code HELIOS. Properties of the four exoplanets are summarised
in Table 4.3.
116
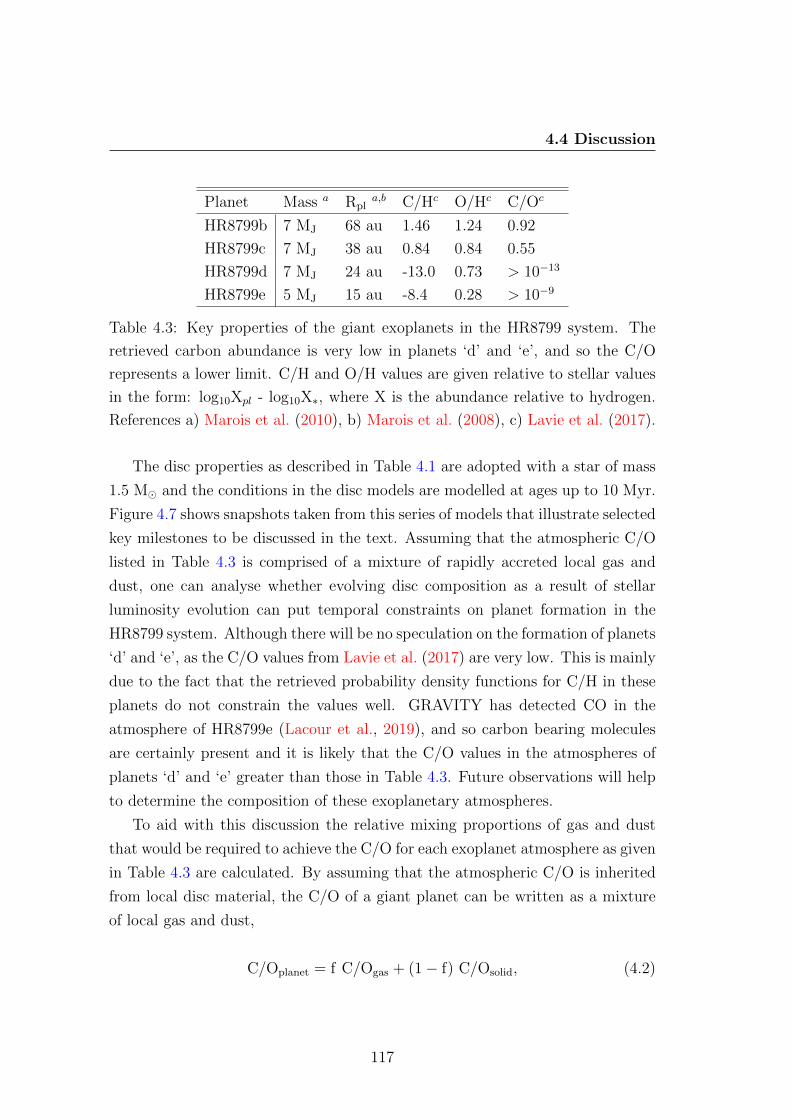
4.4 Discussion
Planet Mass a Rpla,b C/Hc O/Hc C/Oc
HR8799b 7 MJ 68 au 1.46 1.24 0.92
HR8799c 7 MJ 38 au 0.84 0.84 0.55
HR8799d 7 MJ 24 au -13.0 0.73 > 10−13
HR8799e 5 MJ 15 au -8.4 0.28 > 10−9
Table 4.3: Key properties of the giant exoplanets in the HR8799 system. The
retrieved carbon abundance is very low in planets ‘d’ and ‘e’, and so the C/O
represents a lower limit. C/H and O/H values are given relative to stellar values
in the form: log10Xpl - log10X∗, where X is the abundance relative to hydrogen.
References a) Marois et al. (2010), b) Marois et al. (2008), c) Lavie et al. (2017).
The disc properties as described in Table 4.1 are adopted with a star of mass
1.5 M� and the conditions in the disc models are modelled at ages up to 10 Myr.
Figure 4.7 shows snapshots taken from this series of models that illustrate selected
key milestones to be discussed in the text. Assuming that the atmospheric C/O
listed in Table 4.3 is comprised of a mixture of rapidly accreted local gas and
dust, one can analyse whether evolving disc composition as a result of stellar
luminosity evolution can put temporal constraints on planet formation in the
HR8799 system. Although there will be no speculation on the formation of planets
‘d’ and ‘e’, as the C/O values from Lavie et al. (2017) are very low. This is mainly
due to the fact that the retrieved probability density functions for C/H in these
planets do not constrain the values well. GRAVITY has detected CO in the
atmosphere of HR8799e (Lacour et al., 2019), and so carbon bearing molecules
are certainly present and it is likely that the C/O values in the atmospheres of
planets ‘d’ and ‘e’ greater than those in Table 4.3. Future observations will help
to determine the composition of these exoplanetary atmospheres.
To aid with this discussion the relative mixing proportions of gas and dust
that would be required to achieve the C/O for each exoplanet atmosphere as given
in Table 4.3 are calculated. By assuming that the atmospheric C/O is inherited
from local disc material, the C/O of a giant planet can be written as a mixture
of local gas and dust,
C/Oplanet = f C/Ogas + (1− f) C/Osolid, (4.2)
117
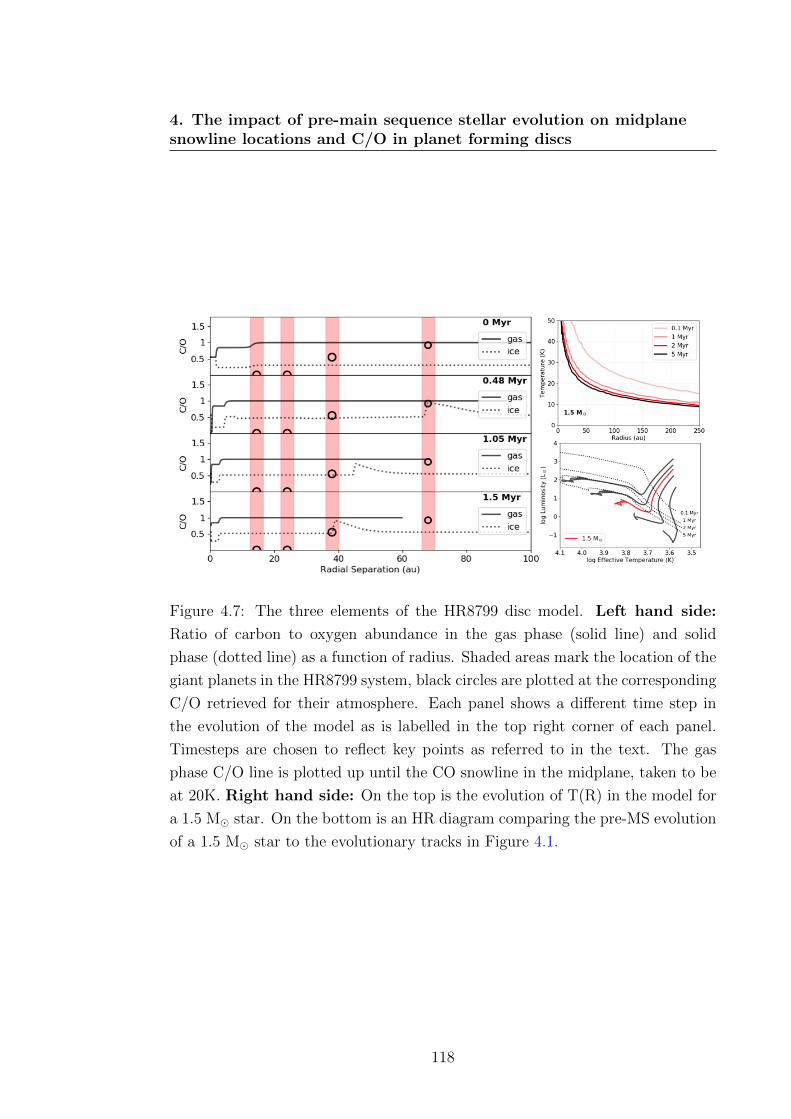
4. The impact of pre-main sequence stellar evolution on midplanesnowline locations and C/O in planet forming discs
Figure 4.7: The three elements of the HR8799 disc model. Left hand side:
Ratio of carbon to oxygen abundance in the gas phase (solid line) and solid
phase (dotted line) as a function of radius. Shaded areas mark the location of the
giant planets in the HR8799 system, black circles are plotted at the corresponding
C/O retrieved for their atmosphere. Each panel shows a different time step in
the evolution of the model as is labelled in the top right corner of each panel.
Timesteps are chosen to reflect key points as referred to in the text. The gas
phase C/O line is plotted up until the CO snowline in the midplane, taken to be
at 20K. Right hand side: On the top is the evolution of T(R) in the model for
a 1.5 M� star. On the bottom is an HR diagram comparing the pre-MS evolution
of a 1.5 M� star to the evolutionary tracks in Figure 4.1.
118
4.4 Discussion
where f is the fraction of material that is accreted to the planet that was originally
in the gas phase in the disc.
In Figure 4.7 selected snapshots are presented that show key time steps. On
the left-hand side are four panels showing C/O radial profiles for the HR8799
system. The black lines give the C/O in the solids and gas as labelled in the
legend, the coloured bars give the orbital radii of the 4 known giant planets, with
a circle plotted on the y-axis for each planet at the value corresponding to the
atmospheric C/O found by (Lavie et al., 2017) for each planet. On the right hand
side the midplane temperature profiles are given for different stages of the star’s
luminosity evolution (which can be compared to those in Figure 4.3). The path
of the 1.5 M� star across the HR diagram as calculated by the MESA stellar
modelling is shown in the bottom panel on the right hand side, with the tracks
of the 0.5, 1, 2 and 3 M� stars also plotted in grey.
In Figure 4.7, after 1.5 Myr, the evolution slows and the radial profile of C/O
in gas and dust is well defined. From these key epochs C/Ogas and C/Osolid can
be measured and used in Equation 4.2.
HR8799b
The main constraint that this modelling puts on the formation of carbon-rich
exoplanet HR8799b - the outermost planet in Figure 4.7 - is a result of the
displacement of the furthest radial location where the CO snowline may be located
at different ages. At a radial separation of 68 au HR8799 is interior to the CO
snowline position in all models up to the 1.05 Myr one, which is shown in Figure
4.7. Beyond the CO snowline, no major C or O carriers are in the gas phase. This
means that rapid gas accretion in this particular region during planet formation
will have no affect on the C/O ratio of any forming planet as the gas is mainly
H2, but it will affect the C/H ratio. HR8799b therefore must have accreted the
vast majority of its carbon and oxygen while still inside the C/O=1 region (inside
the CO snowline).
Using Equation 4.2, the amount of exoplanetary atmosphere that originated
in each of the gas and solid phases can be estimated using the relative amounts
of carbon and oxygen in the observed atmosphere and in the disc as calculated
119
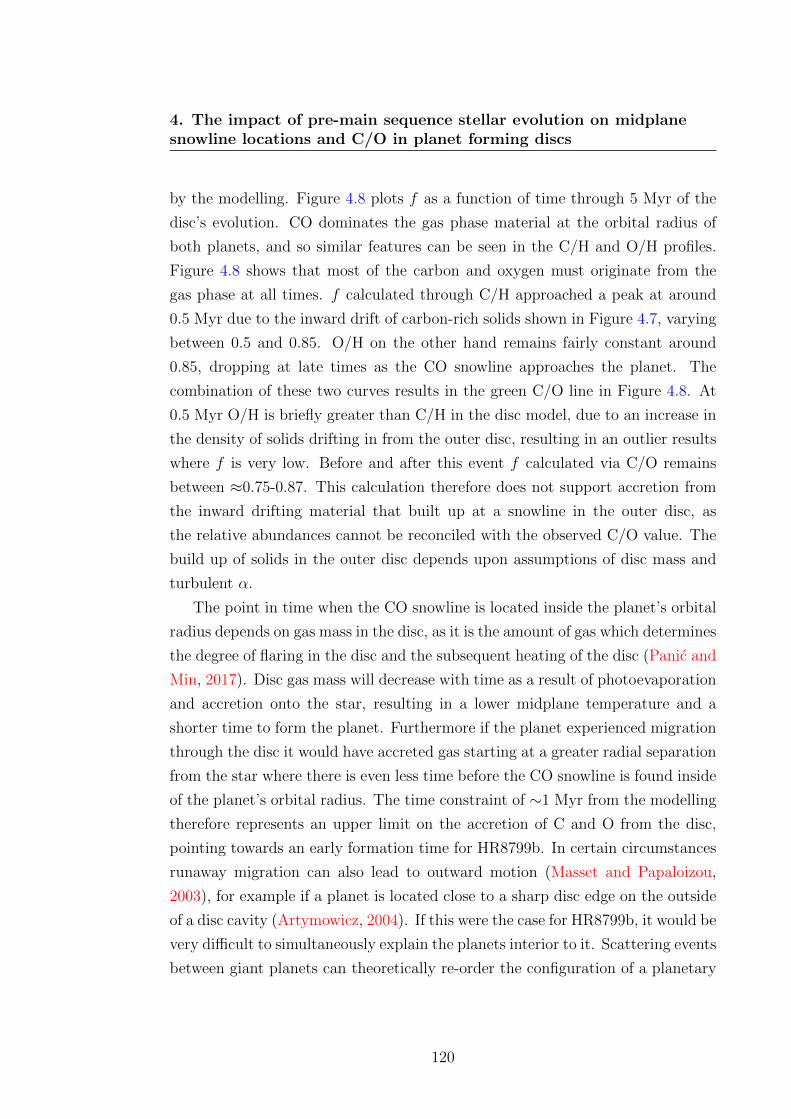
4. The impact of pre-main sequence stellar evolution on midplanesnowline locations and C/O in planet forming discs
by the modelling. Figure 4.8 plots f as a function of time through 5 Myr of the
disc’s evolution. CO dominates the gas phase material at the orbital radius of
both planets, and so similar features can be seen in the C/H and O/H profiles.
Figure 4.8 shows that most of the carbon and oxygen must originate from the
gas phase at all times. f calculated through C/H approached a peak at around
0.5 Myr due to the inward drift of carbon-rich solids shown in Figure 4.7, varying
between 0.5 and 0.85. O/H on the other hand remains fairly constant around
0.85, dropping at late times as the CO snowline approaches the planet. The
combination of these two curves results in the green C/O line in Figure 4.8. At
0.5 Myr O/H is briefly greater than C/H in the disc model, due to an increase in
the density of solids drifting in from the outer disc, resulting in an outlier results
where f is very low. Before and after this event f calculated via C/O remains
between ≈0.75-0.87. This calculation therefore does not support accretion from
the inward drifting material that built up at a snowline in the outer disc, as
the relative abundances cannot be reconciled with the observed C/O value. The
build up of solids in the outer disc depends upon assumptions of disc mass and
turbulent α.
The point in time when the CO snowline is located inside the planet’s orbital
radius depends on gas mass in the disc, as it is the amount of gas which determines
the degree of flaring in the disc and the subsequent heating of the disc (Panic and
Min, 2017). Disc gas mass will decrease with time as a result of photoevaporation
and accretion onto the star, resulting in a lower midplane temperature and a
shorter time to form the planet. Furthermore if the planet experienced migration
through the disc it would have accreted gas starting at a greater radial separation
from the star where there is even less time before the CO snowline is found inside
of the planet’s orbital radius. The time constraint of ∼1 Myr from the modelling
therefore represents an upper limit on the accretion of C and O from the disc,
pointing towards an early formation time for HR8799b. In certain circumstances
runaway migration can also lead to outward motion (Masset and Papaloizou,
2003), for example if a planet is located close to a sharp disc edge on the outside
of a disc cavity (Artymowicz, 2004). If this were the case for HR8799b, it would be
very difficult to simultaneously explain the planets interior to it. Scattering events
between giant planets can theoretically re-order the configuration of a planetary
120
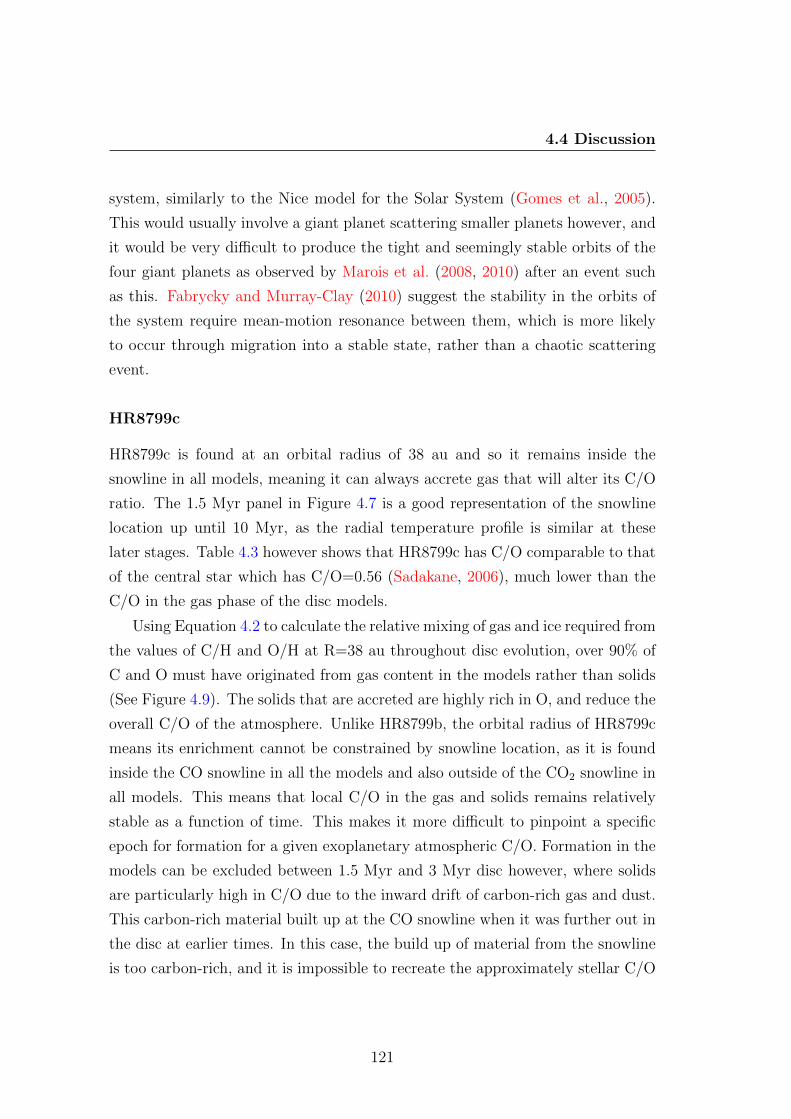
4.4 Discussion
system, similarly to the Nice model for the Solar System (Gomes et al., 2005).
This would usually involve a giant planet scattering smaller planets however, and
it would be very difficult to produce the tight and seemingly stable orbits of the
four giant planets as observed by Marois et al. (2008, 2010) after an event such
as this. Fabrycky and Murray-Clay (2010) suggest the stability in the orbits of
the system require mean-motion resonance between them, which is more likely
to occur through migration into a stable state, rather than a chaotic scattering
event.
HR8799c
HR8799c is found at an orbital radius of 38 au and so it remains inside the
snowline in all models, meaning it can always accrete gas that will alter its C/O
ratio. The 1.5 Myr panel in Figure 4.7 is a good representation of the snowline
location up until 10 Myr, as the radial temperature profile is similar at these
later stages. Table 4.3 however shows that HR8799c has C/O comparable to that
of the central star which has C/O=0.56 (Sadakane, 2006), much lower than the
C/O in the gas phase of the disc models.
Using Equation 4.2 to calculate the relative mixing of gas and ice required from
the values of C/H and O/H at R=38 au throughout disc evolution, over 90% of
C and O must have originated from gas content in the models rather than solids
(See Figure 4.9). The solids that are accreted are highly rich in O, and reduce the
overall C/O of the atmosphere. Unlike HR8799b, the orbital radius of HR8799c
means its enrichment cannot be constrained by snowline location, as it is found
inside the CO snowline in all the models and also outside of the CO2 snowline in
all models. This means that local C/O in the gas and solids remains relatively
stable as a function of time. This makes it more difficult to pinpoint a specific
epoch for formation for a given exoplanetary atmospheric C/O. Formation in the
models can be excluded between 1.5 Myr and 3 Myr disc however, where solids
are particularly high in C/O due to the inward drift of carbon-rich gas and dust.
This carbon-rich material built up at the CO snowline when it was further out in
the disc at earlier times. In this case, the build up of material from the snowline
is too carbon-rich, and it is impossible to recreate the approximately stellar C/O
121
4. The impact of pre-main sequence stellar evolution on midplanesnowline locations and C/O in planet forming discs
of HR8799c with this material (See Figure 4.9). The discrepancy may be alerting
us to significant chemical effects in the atmosphere, or to planet formation via
gravitational instability.
In order to achieve the approximately solar C/O of HR8799c in a region
of the disc with carbon-enriched gas, there must have been substantial oxygen
enrichment of the atmosphere through the accretion of solids. In our model,
radial drift and the subsequent inward transport of volatiles from the outer disc
are insufficient to achieve this.
A stellar C/O is seen in a number of hot Jupiters (e.g. 8 out of 9 planets
in the sample of Line et al., 2014). But unlike the hot Jupiters, HR8799c is
on a relatively wide orbit. Its approximately stellar C/O may be due to the
uncertainties in determining C/O of exoplanetary atmospheres from observed
spectra. Changes in C/O of an exoplanet’s atmosphere can also occur as part
of the formation process. If planet formation occurs via gravitational instability,
the C/O of a fragment can vary due to the sequestration of volatiles contained
within dust that settles towards the fragment core (Ilee et al., 2017) or due to
the accretion of planetesimals (Madhusudhan et al., 2014). Kratter et al. (2010)
identify a set of criteria to be met in order for any of the planets in HR8799 to
have formed via GI. For their proposed scenario, the authors require a formation
around the end of the Class I stage and beyond 40-70 au, with temperatures
colder than typical discs. These criteria are consistent with the constraints of an
early formation in the outer disc for HR8799b and the cooling of disc midplane
as a result of stellar evolution.
122
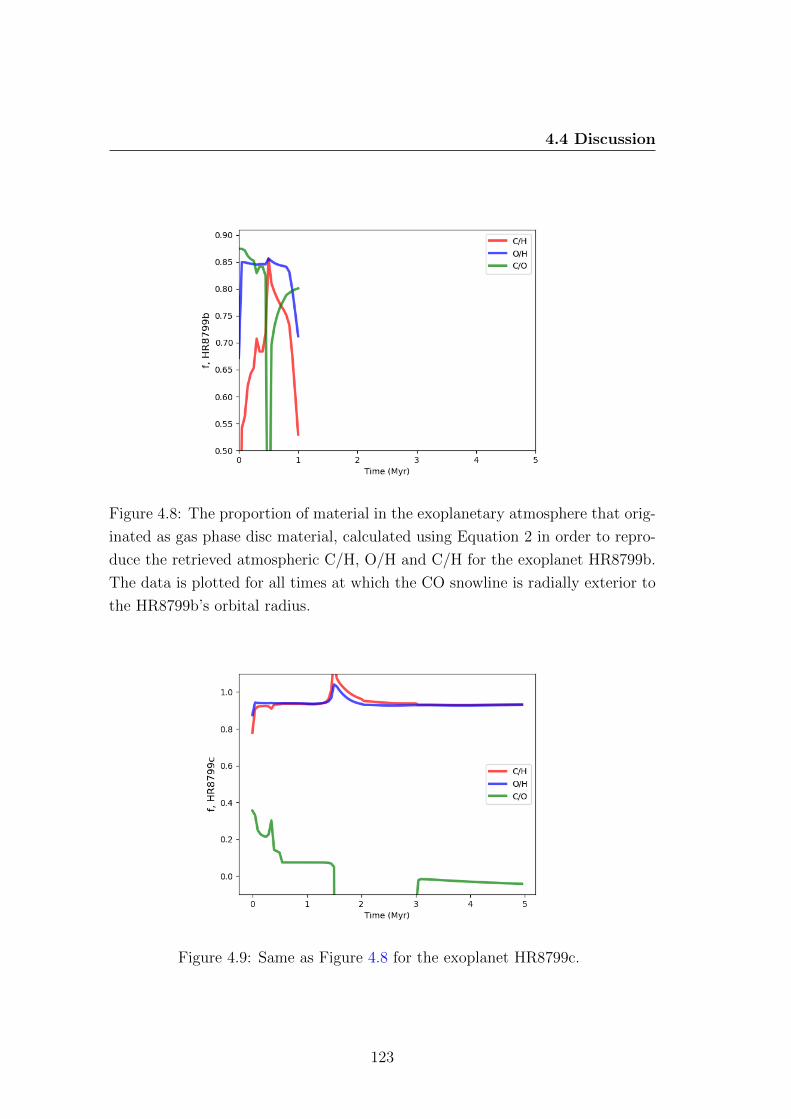
4.4 Discussion
Figure 4.8: The proportion of material in the exoplanetary atmosphere that orig-
inated as gas phase disc material, calculated using Equation 2 in order to repro-
duce the retrieved atmospheric C/H, O/H and C/H for the exoplanet HR8799b.
The data is plotted for all times at which the CO snowline is radially exterior to
the HR8799b’s orbital radius.
Figure 4.9: Same as Figure 4.8 for the exoplanet HR8799c.
123
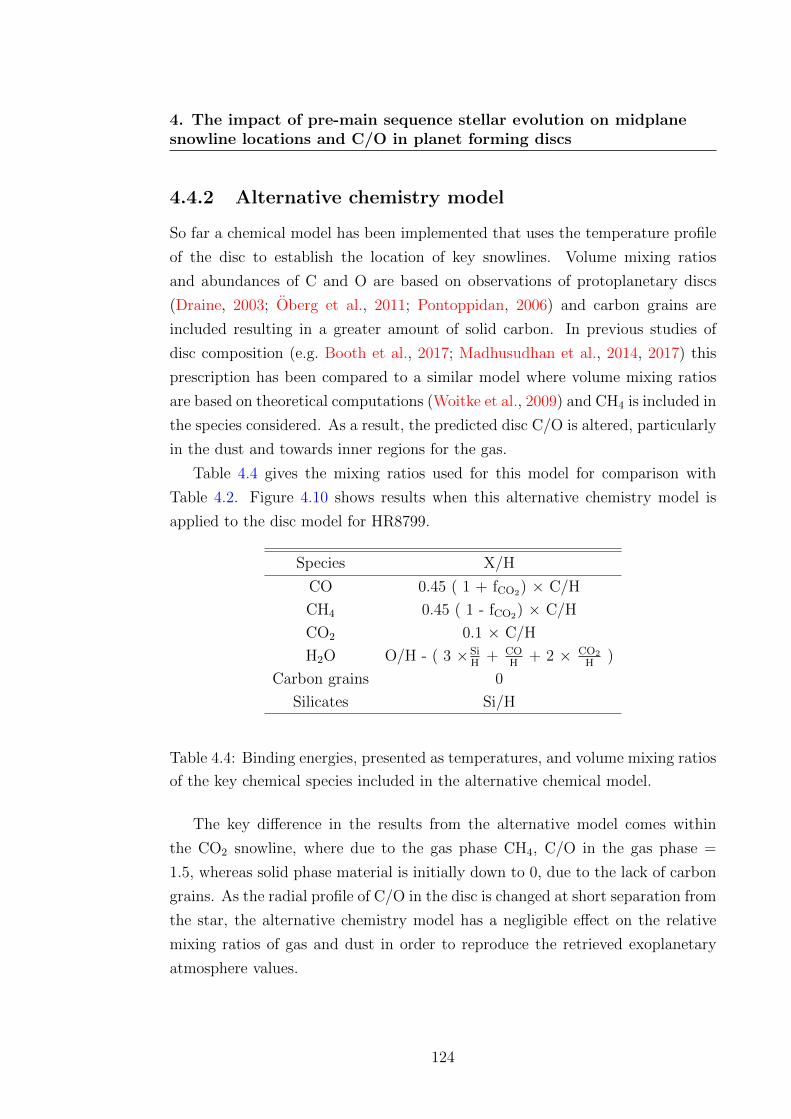
4. The impact of pre-main sequence stellar evolution on midplanesnowline locations and C/O in planet forming discs
4.4.2 Alternative chemistry model
So far a chemical model has been implemented that uses the temperature profile
of the disc to establish the location of key snowlines. Volume mixing ratios
and abundances of C and O are based on observations of protoplanetary discs
(Draine, 2003; Oberg et al., 2011; Pontoppidan, 2006) and carbon grains are
included resulting in a greater amount of solid carbon. In previous studies of
disc composition (e.g. Booth et al., 2017; Madhusudhan et al., 2014, 2017) this
prescription has been compared to a similar model where volume mixing ratios
are based on theoretical computations (Woitke et al., 2009) and CH4 is included in
the species considered. As a result, the predicted disc C/O is altered, particularly
in the dust and towards inner regions for the gas.
Table 4.4 gives the mixing ratios used for this model for comparison with
Table 4.2. Figure 4.10 shows results when this alternative chemistry model is
applied to the disc model for HR8799.
Species X/H
CO 0.45 ( 1 + fCO2) × C/H
CH4 0.45 ( 1 - fCO2) × C/H
CO2 0.1 × C/H
H2O O/H - ( 3 ×SiH
+ COH
+ 2 × CO2
H)
Carbon grains 0
Silicates Si/H
Table 4.4: Binding energies, presented as temperatures, and volume mixing ratios
of the key chemical species included in the alternative chemical model.
The key difference in the results from the alternative model comes within
the CO2 snowline, where due to the gas phase CH4, C/O in the gas phase =
1.5, whereas solid phase material is initially down to 0, due to the lack of carbon
grains. As the radial profile of C/O in the disc is changed at short separation from
the star, the alternative chemistry model has a negligible effect on the relative
mixing ratios of gas and dust in order to reproduce the retrieved exoplanetary
atmosphere values.
124
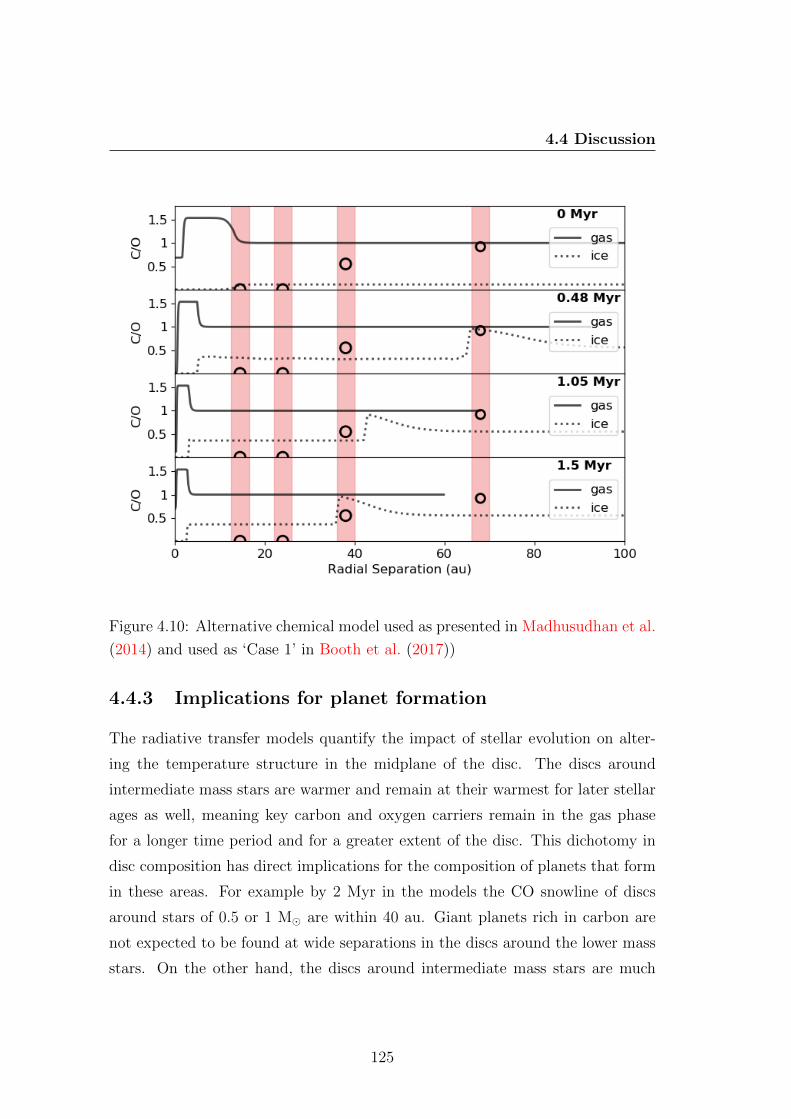
4.4 Discussion
Figure 4.10: Alternative chemical model used as presented in Madhusudhan et al.
(2014) and used as ‘Case 1’ in Booth et al. (2017))
4.4.3 Implications for planet formation
The radiative transfer models quantify the impact of stellar evolution on alter-
ing the temperature structure in the midplane of the disc. The discs around
intermediate mass stars are warmer and remain at their warmest for later stellar
ages as well, meaning key carbon and oxygen carriers remain in the gas phase
for a longer time period and for a greater extent of the disc. This dichotomy in
disc composition has direct implications for the composition of planets that form
in these areas. For example by 2 Myr in the models the CO snowline of discs
around stars of 0.5 or 1 M� are within 40 au. Giant planets rich in carbon are
not expected to be found at wide separations in the discs around the lower mass
stars. On the other hand, the discs around intermediate mass stars are much
125
4. The impact of pre-main sequence stellar evolution on midplanesnowline locations and C/O in planet forming discs
more likely to host carbon-rich giant planets on wider orbits because CO remains
in the gas for a much greater separation in the disc; over 250 au in the case of
the 3 M� star at >2 Myr.
By applying this modelling to the HR8799 system, constraints can be placed
on the period of time in which the bulk of C- and O- carrying molecules must
have been accreted by the two outer planets from the model disc. The position
of the CO snowline rules out the formation of HR8799b beyond 1 Myr. This
result assumes that atmospheric C/O reflects that of the initial disc material, but
chemical processes in the exoplanetary atmosphere will alter the observed ratio.
More precise predictions could be made by implementing a more sophisticated
chemical network and using species beyond the main C and O carriers as tracers
of atmospheric composition.
In this analysis in-situ formation of the giant planets in the system is con-
sidered. An evolving temperature structure will also impact upon migration
timescales of planets in the disc however, as migrational velocity of a planet in-
creases proportional to temperature. In discs that cool with time as a result of
stellar evolution, planets will migrate at a greater velocity at earlier times com-
pared to the velocity of a planet of equal mass at the same radial separation at
late times. In discs around intermediate mass stars that are warm at later times,
CO is present in the gas phase for a greater proportion of the disc, but any mi-
grating planets within the disc will do so with a greater velocity than at early
times in a cooler disc. If planet-driven gaps in the disc begin to overlap, and the
planets themselves are in mean-motion resonance then convergent migration can
occur (Kley, 2000), potentially helping to achieve mean motion resonances that
stabilise the orbits of the planets (Fabrycky and Murray-Clay, 2010).
4.4.4 Implications for dust growth to pebble sizes
In Section 4.4.1 the analysis of HR8799c suggested that significant enrichment by
solids could be required to explain the approximately solar C/O of the wide orbit
planet. The amount of solids accreted depends on the method of the planet’s
formation. Here we explore the impact of stellar evolution on the composition
of midplane dust, in particular we look to assess to what extent grain size in
126
4.4 Discussion
the disc is limited by the evolution of the star and whether this could prevent
pebble accretion in regions of the disc. In order for pebble accretion to be rapid,
pebbles have to make up a significant fraction for the gas giant core’s solid density
(Lambrechts and Johansen, 2012), and so they likely contribute significantly to
oxygen enrichment of the forming planet. Here we will define ‘pebbles’ as dust
grains with a ≥ 1 cm.
In Figure 4.11 results of dust evolution in our models are plotted as coloured
lines, the grey lines in the background show the results of modelling where the
stellar parameters remain constant but the dust is still allowed to evolve. As
expected an increase in grain size in the inner disc occurs due to changes in
fragmentation velocity, e.g. the sharp jumps at <2 au for all the models at
0.1 Myr (Figure 4.11).
Maximum grain size as a function of radius is similar among all models at
1 Myr, it is not until the divergence of midplane temperatures that a significant
effect is seen in outer regions. The threshold between icy and ice-free fragmen-
tation is pushed further into the disc as a result of the stellar evolution; this is
most clearly seen by comparing the red lines showing the 3 M� models at differ-
ent times in Figure 4.11. The extent to which stellar evolution is dictating this
location can be seen by comparing to the similar radial features of the grey lines
in the background.
In Figure 4.11 there are no pebbles present in the innermost regions of the
discs at 0.1 Myr, as the disc midplanes are relatively warm due to the luminous
young star. This is a short lived stage however, as stellar luminosity evolves
rapidly and the effects of radial drift start to take effect. The models of discs
around low mass stars at 1 and 2 Myr (blue and gold lines in Figure 4.11) host
pebbles out to 20-30 au. By 5 Myr the 0.5 and 1 M� models still host pebbles as
far as 10 au. These models show that pebbles reside in the inner disc (<10 au)
for at least 5 Myr and will be able to contribute towards core growth in these
regions. This is not the case in the discs around intermediate mass stars. The
1 Myr panel in Figure 4.11 shows that fragmentation limit in the 3 M� model
is found at 1 au, and is at 5 au in the 5 Myr panel. Due to rapid radial drift
and fragmentation in collisions any pebbles in these inner regions will be removed
from the disc quickly. Pebble sized grains are only efficiently removed from the
127
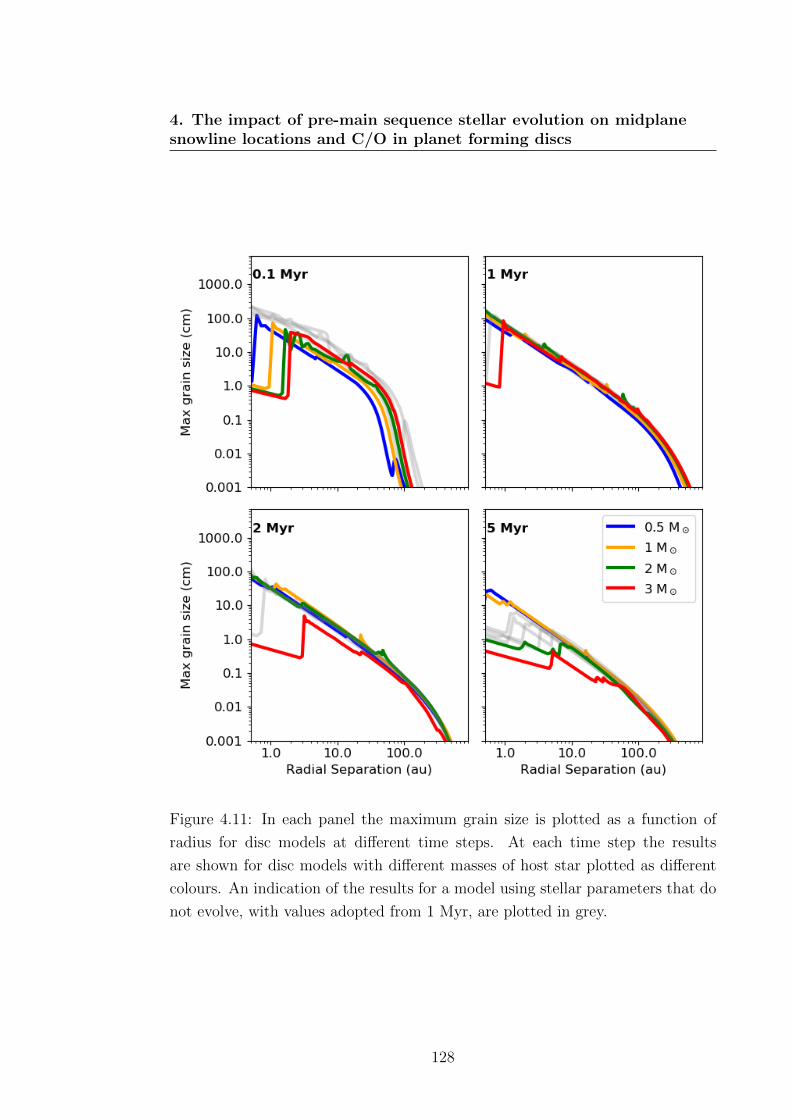
4. The impact of pre-main sequence stellar evolution on midplanesnowline locations and C/O in planet forming discs
Figure 4.11: In each panel the maximum grain size is plotted as a function of
radius for disc models at different time steps. At each time step the results
are shown for disc models with different masses of host star plotted as different
colours. An indication of the results for a model using stellar parameters that do
not evolve, with values adopted from 1 Myr, are plotted in grey.
128
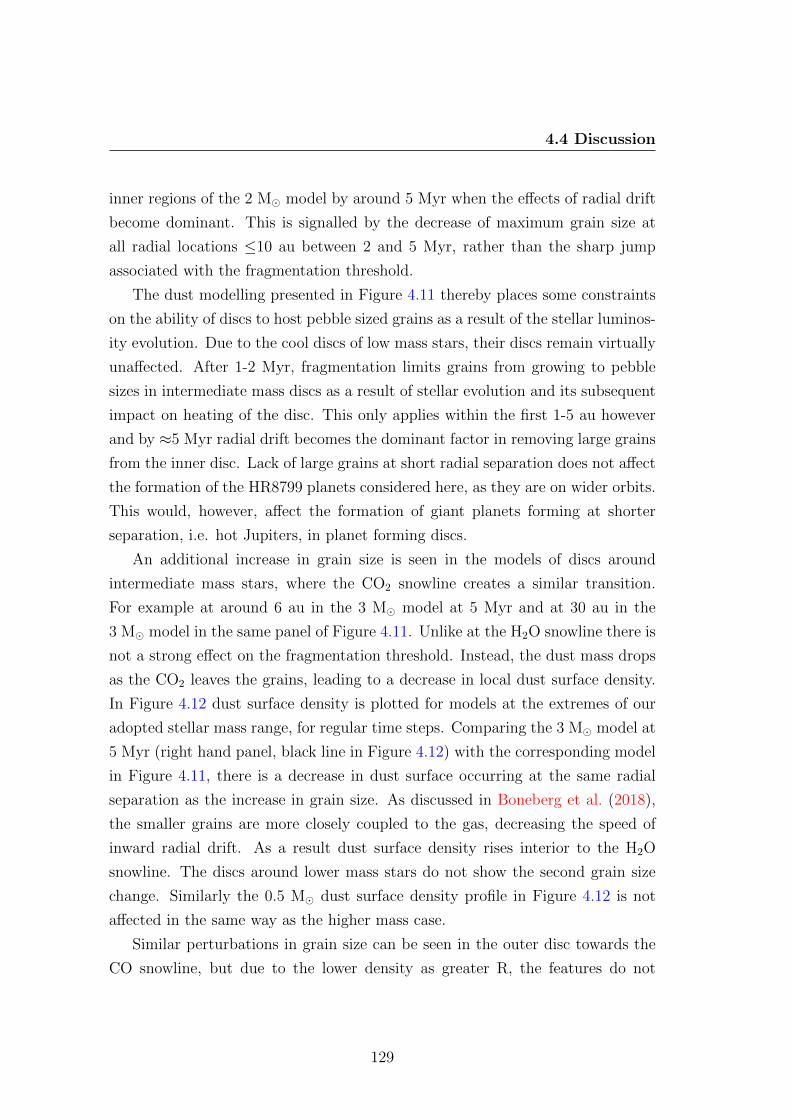
4.4 Discussion
inner regions of the 2 M� model by around 5 Myr when the effects of radial drift
become dominant. This is signalled by the decrease of maximum grain size at
all radial locations ≤10 au between 2 and 5 Myr, rather than the sharp jump
associated with the fragmentation threshold.
The dust modelling presented in Figure 4.11 thereby places some constraints
on the ability of discs to host pebble sized grains as a result of the stellar luminos-
ity evolution. Due to the cool discs of low mass stars, their discs remain virtually
unaffected. After 1-2 Myr, fragmentation limits grains from growing to pebble
sizes in intermediate mass discs as a result of stellar evolution and its subsequent
impact on heating of the disc. This only applies within the first 1-5 au however
and by ≈5 Myr radial drift becomes the dominant factor in removing large grains
from the inner disc. Lack of large grains at short radial separation does not affect
the formation of the HR8799 planets considered here, as they are on wider orbits.
This would, however, affect the formation of giant planets forming at shorter
separation, i.e. hot Jupiters, in planet forming discs.
An additional increase in grain size is seen in the models of discs around
intermediate mass stars, where the CO2 snowline creates a similar transition.
For example at around 6 au in the 3 M� model at 5 Myr and at 30 au in the
3 M� model in the same panel of Figure 4.11. Unlike at the H2O snowline there is
not a strong effect on the fragmentation threshold. Instead, the dust mass drops
as the CO2 leaves the grains, leading to a decrease in local dust surface density.
In Figure 4.12 dust surface density is plotted for models at the extremes of our
adopted stellar mass range, for regular time steps. Comparing the 3 M� model at
5 Myr (right hand panel, black line in Figure 4.12) with the corresponding model
in Figure 4.11, there is a decrease in dust surface occurring at the same radial
separation as the increase in grain size. As discussed in Boneberg et al. (2018),
the smaller grains are more closely coupled to the gas, decreasing the speed of
inward radial drift. As a result dust surface density rises interior to the H2O
snowline. The discs around lower mass stars do not show the second grain size
change. Similarly the 0.5 M� dust surface density profile in Figure 4.12 is not
affected in the same way as the higher mass case.
Similar perturbations in grain size can be seen in the outer disc towards the
CO snowline, but due to the lower density as greater R, the features do not
129
4. The impact of pre-main sequence stellar evolution on midplanesnowline locations and C/O in planet forming discs
persist and are smoothed out by transport processes. Additionally much of the
CO crossing the snowline is converted in to CO2 under the assumptions of our
chemical model, and so the inward flux of carbon is instead later released at the
CO2 snowline. Three small spikes can be seen on the red line in the 1 Myr panel
of Figure 4.11 corresponding to early snowline-induced disturbances. Transport
processes and the evolving snowline location in discs mean that there may be
some displacement between these radial features and the snowline itself for any
given time.
Figure 4.12: Surface density profile as a result of dust evolution in disc models
with central stars of mass 0.5 and 3 M� for timesteps of 1 Myr.
We do not include a prescription for dust trapping in our dust model, a
mechanism which acts to prevent the rapid removal of pebbles from the disc on
short timescales (Pinilla et al., 2012b). Accurate predictions of the timescales for
130
4.5 Conclusions
pebble removal in protoplanetary discs will require such considerations. Circular,
thin rings of dust that are consistent with dust trapping are common among high
resolution observations of bright protoplanetary discs (Dullemond et al., 2018).
It therefore seems that dust trapping mechanisms may also be common; further
imaging of large samples of discs that are capable of resolving dust rings are
necessary to confirm this.
The temporal constraints of our modelling suggest that the pre-main sequence
evolution of the host star could be used to identify when key snowline-dependant
planet formation mechanisms occur. For example numerical modelling by Schoo-
nenberg and Ormel (2017) shows that planetesimal formation by the streaming
instability is aided by the diffusion and condensation at the water snowline. Fur-
thermore snowlines may play an important role in the dust growth leading to
self-induced dust traps at the water or even CO snowlines (Vericel and Gonzalez,
2020). For a given proto-planet there will be a window of opportunity for pro-
cesses such as these to have taken place, the length of which depends upon the
spectral type of the star.
4.5 Conclusions
In this paper models of pre-main sequence stellar evolution across a range of
masses are combined with radiative transfer modelling of protoplanetary discs
to study the impact of stellar evolution on midplane temperature. The grid
of radiative transfer models quantify the change in temperature for continuous
discs of constant mass when irradiated by stars at different stages of their pre-
MS evolution. The consequences of these changes in midplane temperature are
discussed with specific attention to the composition of the disc and what this
means for the planets that form there. A summary of the main conclusions is
listed below.
• At ages >2Myr, stellar evolution of stars with mass >1.5M� diverges sig-
nificantly from that of the lower mass stars. The increase in luminosity
results in an increase in midplane temperature within the discs they host.
Disc models around intermediate mass stars are not only warmer than discs
131
4. The impact of pre-main sequence stellar evolution on midplanesnowline locations and C/O in planet forming discs
around low- or solar- mass stars, but they also remain at their warmest for
a greater duration of the stars’ pre-main sequence evolution.
• Applying this modelling procedure to the HR8799 system, it is found that
accretion of carbon and oxygen by exoplanet HR8799b must have occurred
at early times in the disc’s evolution whilst the planet was still inside the
CO snowline. A reliable, specific time constraint for any individual disc will
however require an accurate disc mass determination and a good estimate
of mass loss rate from the disc.
• Stellar evolution can limit growth of dust grains to pebble sizes in the first
few au for discs around intermediate mass stars, but only after a 1-2 Myr.
Radial drift is the most efficient mechanism at limiting growth to pebble
sized in the inner disc.
132

Chapter 5
Conclusions
133
5. Conclusions
5.1 Summary
Protoplanetary discs are the natal environment from which planets are formed,
and so the accurate characterisation of disc composition defines the basic building
blocks for planet formation. Meanwhile the mechanisms for planet formation
disturb this environment and leave imprints behind in the density distribution
of the disc. Study of disc structures can therefore give direct clues as to the
process by which planet formation occurs and on what drives protoplanetary disc
evolution.
This thesis characterises the gas and dust in discs around intermediate mass
stars. This was achieved through analysis of new ALMA observations of the discs
hosted by stars HD100546 and HD141569. Despite the similarity between the two
stars, the discs they host are markedly different because HD141569 demonstrates
a more advanced stage of disc evolution. Both discs were found to contain rela-
tively large amounts of gas for their respective evolutionary stages, despite ages
approaching what is currently considered to be the ‘typical’ disc lifetime. In
addition to analysis of observations, the conditions within long-lived discs were
explored further through modelling of protoplanetary disc midplanes and the
impact the evolution of the host star has on the properties of this part of the
disc. The results found direct implications for planet formation and led to con-
straints on the radial location and time of the formation of carbon-rich exoplanet
HR8799b; a directly imaged wide-orbit planet hosted by another intermediate
mass star. The three systems given specific attention in this thesis represent
three important epochs of protoplanetary disc evolution. Together, they tell the
story of protoplanetary disc evolution around intermediate mass stars. The anal-
ysis of imaging and modelling of these systems sets the scene for giant planet
formation in their discs.
Observations of the bright, gas-rich, planet forming disc around Herbig star
HD100546 proved the power of optically thin tracers in delving into the disc mid-
plane and in tracing the outer regions of the disc where the majority of mass is con-
tained. This method ultimately led to an estimated mass that places HD100546
in the top bracket of the most massive known discs around Herbig stars along with
134
5.1 Summary
systems such as HD97048 and HD163296. Discs like these must therefore have
a way of remaining massive significantly beyond disc lifetimes predicted by IR
statistics or photoevaporation models of discs around low mass stars. Examples
of massive, long-lived discs exist around some low mass stars as well, for example
the disc of TW Hydra. In order to explain giant planets on wide orbits (e.g. the
exoplanets of HR8799, Marois et al., 2008), observations of HD100546 and discs
similar to it will be the key as they are some of the few systems with sufficient
mass in the outer disc to support the formation of giant planets. Quantifying the
planet building budget in the outer disc for systems such as HD100546 and others
similar to it, is essential for confirming the capability of individual protoplanetary
discs to form giant planets on wide orbits, as well as their ability to do so at an
age beyond ‘typical’ disc lifetimes.
Studying the outer regions of protoplanetary discs via direct imaging is cur-
rently the only way in which to investigate giant planets on wide orbits. Modern
exoplanet detection methods are effective for exoplanets at short radial separation
(see Figure 5.1) or in systems where discs have dispersed. Identifying signatures
of embedded planets can be very difficult, and in the case of HD100546 has in-
volved much debate (Currie et al., 2017; Quanz et al., 2015, 2013; Rameau et al.,
2017). Millimetre wavelength observations with facilities such as ALMA are the
best way to characterise the coolest parts of the disc pertaining to the wide orbit
giants forming in the midplane and in the outer disc. It is here that the massive,
wide orbit planets detected by direct imaging originate, shown as blue stars in
Figure 5.1.
As well as investigating planet formation the observations analysed in this
thesis allow for detailed exploration of disc structures and the disc-embedded
mechanisms they could be alerting us to.
HD141569 provides a unique opportunity to study the end of the planet-
building phase and the subsequent dispersal of protoplanetary discs as they tran-
sition into the debris disc regime. In Chapter 3 observations probing midplane
gas and dust reveal a highly asymmetric distribution of 13CO. The 13CO emis-
sion in the ALMA observations presented here peaks at 120±10 au away from
the stellar position, and the main body of its emission lies in the same position
as rings located in scattered light. Analysis of the continuum emission also found
135
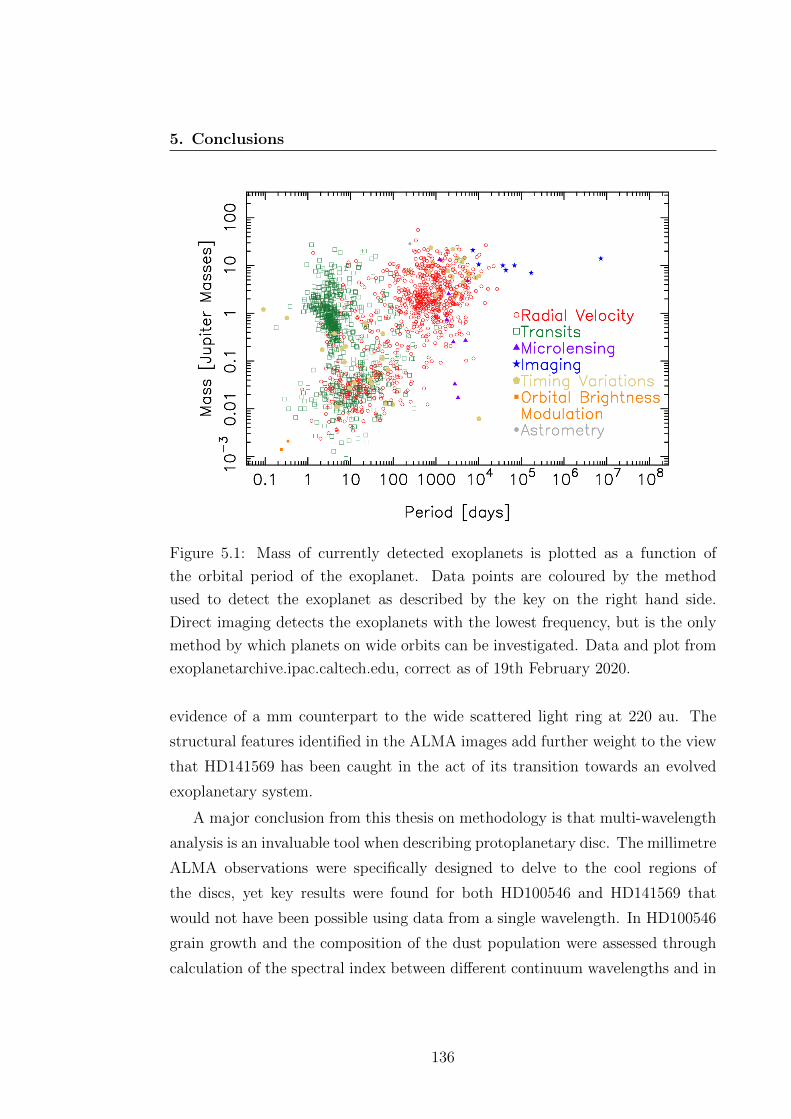
5. Conclusions
Figure 5.1: Mass of currently detected exoplanets is plotted as a function of
the orbital period of the exoplanet. Data points are coloured by the method
used to detect the exoplanet as described by the key on the right hand side.
Direct imaging detects the exoplanets with the lowest frequency, but is the only
method by which planets on wide orbits can be investigated. Data and plot from
exoplanetarchive.ipac.caltech.edu, correct as of 19th February 2020.
evidence of a mm counterpart to the wide scattered light ring at 220 au. The
structural features identified in the ALMA images add further weight to the view
that HD141569 has been caught in the act of its transition towards an evolved
exoplanetary system.
A major conclusion from this thesis on methodology is that multi-wavelength
analysis is an invaluable tool when describing protoplanetary disc. The millimetre
ALMA observations were specifically designed to delve to the cool regions of
the discs, yet key results were found for both HD100546 and HD141569 that
would not have been possible using data from a single wavelength. In HD100546
grain growth and the composition of the dust population were assessed through
calculation of the spectral index between different continuum wavelengths and in
136
5.1 Summary
HD141569 the optical depth of gas lines could be calculated to explain the wildly
different gas mass estimates made from ALMA observations. Furthermore both
studies utilise results from multiple observing techniques by comparing millimetre
interferometry to scattered light imaging that traces the surface layers of the
disc. Combining tracers of the midplane with those at greater vertical height
led to hints of spiral features in the outer disc of HD100546 and evidence for a
midplane counterpart to the wide ring at 220 au in HD141569. Throughout all
stages of disc evolution, the act of combining alternative observing modes from
a range of observational facilities is extremely powerful and adds greater depth
and understanding to structural analysis. Proof of this is clear when considering
HD141569; multiple data sets have provided the fascinating configuration of disc
structure as summarised in Figure 3.5. This has enabled greater scrutiny of the
disc’s evolutionary state and the nature of the gas it hosts. Circumstantially, the
asymmetric 13CO gas emission could be interpreted as the site of secondary gas
production originating from a planetesimal belt as seen in Beta Pic (Dent et al.,
2014). In this case the morphology of the clump is likely down to a combination
of elongation by the synthesising beam and spreading as a result of orbital motion
in the disc. On the other hand, gas mass in the disc is an order of magnitude
larger compared to that in systems that are consistent with models of secondary
gas (Kral et al., 2018). Furthermore HD141569 demonstrates the properties of
a hybrid disc as described by (Pericaud et al., 2017). It may be that the gas
is primordial, like that in HD100546, but unlike HD100546 the gas and dust in
the disc are being actively depleted or dispersed. The peak in 13CO intensity
that is separated from the star may in this case be a particularly dense region of
gas from a planet-driven spiral wake such as is observed in HD135344B (van der
Marel et al., 2016) or V1247 Orionis (Kraus et al., 2017). In the latter scenario
new observations that resolve the disc at scales of ∼ 10s au would be key in
verifying whether the gas asymmetry is linked to spiral arm features detected by
scattered light observations such as the arcs on the outer belts (Mawet et al.,
2017; Perrot et al., 2016).
Although it no longer holds sufficient mass to form new giant planets, the
density distribution in the remaining disc material of HD141569 will be shaped
and sculpted by any currently existing planets or by the mechanisms driving disc
137
5. Conclusions
depletion. As a result we can learn about the architecture of young planetary
systems through observations of systems such as this. As the only pre-main
sequence hybrid disc, HD141569 is the only known system that can exhibit to
observers ‘the beginning of the end’, and so it is also a crucial testing ground for
theories on the onset of disc dispersal.
Finally, Herbig stars bridge the gap between the low-mass and high-mass
regimes that show differing interior structure and stellar evolutionary paths from
each other. The discs hosted by A type stars are unusual in that they are the most
likely to host detected giant planets (Johnson et al., 2010; Reffert et al., 2014) and
most of the debris discs hosting surprisingly large amounts of gas are also around
A type stars (Moor et al., 2017; Pericaud et al., 2017). Furthermore discs around
Herbig stars are the brightest, most massive and some of the most well studied
protoplanetary discs in planet formation research. In Chapter 4 disc modelling
assesses how the variation in pre-main sequence evolution, across the stellar mass
range where giant exoplanet detection rates peak, affects the initial conditions
for planet formation in a massive protoplanetary disc. A dichotomy emerges
between the temperature evolution of discs around low- and intermediate-mass
stars in the density profile. As a result not only are discs around intermediate
mass star warmer, but they remain at their warmest for longer, and can even
heat up at late stages. A direct repercussion of this temperature evolution is the
fact that key snowlines can exist at different locations which in turn determine
the amount of carbon and oxygen that exists within the gas phase. This pro-
vides the perfect opportunity to draw a link between the wide orbit exoplanets
around intermediate mass stars and the properties of their natal disc. This the-
sis demonstrates that modelling of snowlines in discs around intermediate mass
stars can be used to determine much tighter radial constraints, and for the first
time temporal constraints, on a planet’s formation. With future instruments due
to provide a boost to the compositional characterisation of exoplanetary atmo-
spheres (see Section 5.2.4), the wide orbit planets forming in Herbig discs may
well provide the best opportunity to zoom in on the initial conditions of giant
planet formation, as it is these planets that are most effectively targeted by the
modelling procedure presented here. Potential extensions and improvements to
this modelling framework are discussed in the following section.
138
5.2 Future work
5.2 Future work
5.2.1 Disc masses
Total disc masses still remain uncertain in protoplanetary discs. The largest
uncertainty in calculating gas mass with the method adopted in the observational
studies in this thesis is the multiplicative factor used to scale the mass of the
chosen tracer to the mass of the entire disc. Doing so by abundance ratio in
the ISM assumes that no physical or chemical processes have altered this ratio
throughout the evolution of the disc, for example it does not take into account
the effects of isotope-selective photo dissociation. Physical-chemical modelling
by Kama et al. (2016) draws on detections of atomic carbon, a large range of CO
transitions and SED fitting to constrain parametric models to precisely estimate
mass in HD100546 and TW Hya. However such an approach requires a large
amount of observational data for individual discs and so can only be applied in
full to the best-studied systems. This application of this approach to large surveys
of discs in order to gain statistically significant results for a bulk population is
unfeasible for the time being.
Combining the estimates from multiple optically thin tracers is a sensible ap-
proach though. The best current candidates for observational mass tracers must
continue to be targeted, such as HD (Kama et al., 2016), C18O (Ansdell et al.,
2016) and less abundant CO isotopologues (Booth et al., 2019). Corresponding
mass estimates should then be made for different tracers within the same disc and
compared to establish where trends lie. For example, if in a large sample C18O
estimates were to habitually underestimate disc mass compared to estimates with
other tracers, it would indicate that isotope selective photo-dissociation, or per-
haps high optical depth, is a significant factor in a large proportion of the disc
population. Alternatively, HD transitions require relatively warm temperatures
and are difficult to observe, it may transpire that it is impossible to accurately
correct for the inability to trace the mass reservoirs in the midplane and outer
disc. Gas lines require greater sensitivity than continuum observations and so
gas in discs can sometimes be neglected in large surveys that require short inte-
gration times on each source. The result is that with a few exceptions (e.g. the
139
5. Conclusions
Lupus survey, Ansdell et al., 2016), we still do not have statistically significant
information on gas mass from across the star forming regions.
5.2.2 Tracing spirals with gas line observations
An interesting link with previously identified spiral structure features is found in
Chapter 2. One thing that ALMA observations do not seem to be proficiently
uncovering in protoplanetary discs is well defined structure in observations of
gas. Elias 2-27 shows two clear spiral arms (Perez et al., 2016), but it remains a
sole example of such a morphology despite the vast amount of disc observations
since then. Spirals on smaller scales thought to be driven by planets have been
identified through observations of dust in systems such as MWC 758 (Boehler
et al., 2017; Grady et al., 2012), HD142527 (Christiaens et al., 2014) and V1247
Orionis (Kraus et al., 2017). When categorising the morphologies identified in
scattered light images, Garufi et al. (2018) separate these cases from the wide,
asymmetric and relatively faint arms seen in ‘giant discs’ such as HD100546 and
HD34282 however. Imaging of gas density distribution in the outer disc with
greater angular resolution would provide important insight into systems such as
these. Firstly, structure can be better characterised on smaller length scales. But
also because an analogue of spiral structure in gas density would confirm the
spiral features as a change in local disc density, whereas a symmetric, structure-
free outer disc would suggest that the scattered light features are a surface wave
or simply clumps of dust density that might be interpreted as the remnants of a
broken ring (e.g. DoAr44, HD141569: Avenhaus et al., 2018; Perrot et al., 2016).
5.2.3 HD141569
As detailed in Chapter 3, the only known pre-main sequence hybrid disc HD141569
is uniquely placed as a case study in disc evolution as it appears to be exhibiting
the early stages of transforming from a ‘protoplanetary’ disc to a ‘debris’ disc.
There are a number of exciting new investigations that can be carried out to clar-
ify the key mechanisms driving this evolution. From an observational perspective,
the inner regions of the disc remain unresolved at millimetre wavelengths despite
being very well characterised in scattered light observations (e.g. with SPHERE
140
5.2 Future work
Perrot et al., 2016). Dispersal processes driven by planet formation or photoe-
vaporation are expected to occur from the inside out, and the inner 10s of au
in the disc is crucial to understanding how the disc is evolving. High resolution
observations of molecular emission lines and dust continuum at millimetre wave-
lengths will provide a view of the midplane in the inner regions of the disc, where
giant planets leave their detectable signatures. There are already observational
campaigns working towards this goal, including an ongoing ALMA large program
aiming to map the chemical structure in protoplanetary discs both vertically and
radially at 10 au scale, and a survey of hybrid and evolved Herbig discs aiming
to determine an inventory of the most important molecules in these evolved sys-
tems. In combination with existing observations from SPHERE that trace the
surface layers of the disc, new high resolution ALMA observations would finally
allow for a comprehensive description of inner regions to be obtained. Continuum
emission will confirm whether or not midplane analogues to the broken SPHERE
ringlets exist. Concentric rings may be formed through carving by an embedded
exoplanet (or exoplanets) however the HD141569 ringlets are also consistent with
the structures formed through the photoelectric instability (PEI) (Richert et al.,
2018). The inner disc morphology as a result of a gap-opening planet (e.g. Muley
et al., 2019) differs from the structures that form through scenarios involving PEI
(Castrejon et al., 2019). High resolution ALMA observations will be capable of
constraining key structural properties in the disc such as width, eccentricity and
mass within dust rings in order to distinguish between these scenarios. Further-
more molecular line observations with angular resolution of ∼10s of au will be
capable of unveiling the kinematic signatures of orbiting planets in the disc (e.g.
Pinte et al., 2018, 2019) or of a misaligned disc (e.g. Mayama et al., 2018).
In addition to new observational evidence, it must be established whether
the system is evolving due to universal mechanisms that would be expected in
any disc, or whether it’s apparent evolution has been accelerated by an interac-
tion/flyby in the past. Prior to the detection of molecular gas in the system, the
flyby scenario was investigated and shown to reproduce the large-scale properties
of the disc; namely spiral arms in the disc (Quillen et al., 2005), and since then we
have gained a much greater knowledge of the inner disc (within 200 au) and of gas
content in terms of mass and spatial distribution. New hydrodynamic modelling
141
5. Conclusions
can revisit the flyby scenario with these important updated constraints. If such
an event can explain the low disc mass, the truncation of the gas disc relative to
the dust distribution and the containment of detected gas within the inner dust
ring, then triggered evolution is the most likely cause, and HD141569 should be
considered a unique case of disc interaction. If not, the system is instead likely to
be a unique case study in disc evolution that is actively undergoing the dispersal
of gas and concentration of dust into debris-like rings whilst still on the pre-main
sequence. In this scenario, the high resolution ALMA observations of optically
thin molecular gas lines will be crucial in constraining more precisely the location
of gas in the disc. Observations with this level of sensitivity will also be able to
detect the presence of giant exoplanets capable of carving gaps, or misalignment
in the gas disc, through the kinematic signature in the gas lines (Pinte et al.,
2019; Walsh et al., 2017).
5.2.4 Connecting stellar & disc evolution
The modelling methods developed here are applied to the system of HR8799;
the only exoplanetary system for which C/O has been constrained for multiple
directly imaged giant planets in the outer disc. This is however only one system,
and may not be representative of all exoplanetary systems with giant planets.
A greater number of wide-separation planets to compare with is sorely needed.
Observations in the future with JWST and Ariel will provide spectroscopy of an
increased number of exoplanets from which C/O can be retrieved. The determi-
nation of composition indicators such as C/O ratios in exoplanetary atmospheres
are crucial to confirming the link between disc and planet. Due to the prolific
detection rates in radial velocity surveys, it is often hot Jupiters and other plan-
ets at short separation that are easily targeted. There would be great value in
doing the same for statistically significant numbers of wide orbit planets too,
particularly those around intermediate mass stars where snowlines exist at 10s
or 100s of au. In Chapter 4 an initial comparison of the calculated temperature
profiles with known N2H+ rings that trace the CO snowline position is made.
At the moment only a small number of these observations exist, and only in the
cases where N2H+ rings are thin and well-resolved can the snowline position be
142
5.2 Future work
constrained accurately (Qi et al., 2019). Observations of N2H+ across the stellar
mass range and for a range of ages would allow for the predictions of snowline
movement to be tested and potentially for the models to be calibrated to suit
observational data.
The methods presented here decouple radiative transfer calculations and disc
evolution in our modelling in order to study discs massive enough to form giant
planets up to 10 Myr. An intriguing further development would be to include a
prescription for simultaneous and consistent disc evolution alongside the stellar
evolution, as this will alter the density distribution within the disc and subse-
quently the temperature profile. Unfortunately most disc evolution codes result
in short disc lifetimes, due to either the efficiency of radial drift or of photoevapo-
ration. These shorter timescales disagree with observed evidence of massive discs
with ages ≥5 Myr, particularly those around Herbig stars (HD100546, HD163296,
TW Hya). Viscous evolution, disc dynamics and icy grain compositions have also
been shown to influence snowline positions and subsequently the C/N/O ratios
in the disc (Piso et al., 2015, 2016). Disc evolution, particularly at later stages is
influenced strongly by photoevaporation and so modelling will require a thorough
knowledge of photoevaporative rates across the stellar mass range. Current mod-
els including EUV, FUV and X-ray photoevaporation only exist for T Tauri stars
and not for their Herbig counterparts. The development of such models for inter-
mediate mass stars will provide an important step in this direction (Kunitomo et
al. in prep).
143

5. Conclusions
144
References
Adams, F. C., Lada, C. J., and Shu, F. H. (1987). Spectral Evolution of Young
Stellar Objects. The Astrophysical Journal, 312:788–806. 23
Alexander, R. D., Clarke, C. J., and Pringle, J. E. (2006). Photoevaporation of
protoplanetary discs I. Hydrodynamic models. Monthly Notices of the Royal
Astronomical Society, 369(1):216–228. 25
Alibert, Y., Mordasini, C., and Benz, W. (2011). Extrasolar planet population
synthesis III. Formation of planets around stars of different masses. Astronomy
& Astrophysics, 526:63. 102
Andre, P., Men’Shchikov, A., Bontemps, S., Konyves, V., Motte, F., Schneider,
N., Didelon, P., Minier, V., Saraceno, P., Ward-Thompson, D., Di Francesco, J.,
White, G., Molinari, S., Testi, L., Abergel, A., Griffin, M., Henning, T., Royer,
P., Merın, B., Vavrek, R., Attard, M., Arzoumanian, D., Wilson, C. D., Ade, P.,
Aussel, H., Baluteau, J. P., Benedettini, M., Bernard, J. P., Blommaert, J. A.,
Cambresy, L., Cox, P., Di Giorgio, A., Hargrave, P., Hennemann, M., Huang,
M., Kirk, J., Krause, O., Launhardt, R., Leeks, S., Le Pennec, J., Li, J. Z.,
Martin, P. G., Maury, A., Olofsson, G., Omont, A., Peretto, N., Pezzuto, S.,
Prusti, T., Roussel, H., Russeil, D., Sauvage, M., Sibthorpe, B., Sicilia-Aguilar,
A., Spinoglio, L., Waelkens, C., Woodcraft, A., and Zavagno, A. (2010). From
filamentary clouds to prestellar cores to the stellar IMF: Initial highlights from
the Herschel Gould Belt Survey. Astronomy and Astrophysics, 518(8):102. 3
Andrews, S. M., Rosenfeld, K. A., Kraus, A. L., and Wilner, D. J. (2013).
THE MASS DEPENDENCE BETWEEN PROTOPLANETARY DISKS AND
THEIR STELLAR HOSTS. The Astrophysical Journal, 771(2):129. 16, 12
145
REFERENCES
Andrews, S. M., Terrell, M., Tripathi, A., Ansdell, M., Williams, J. P., and
Wilner, D. J. (2018). Scaling Relations Associated with Millimeter Continuum
Sizes in Protoplanetary Disks. The Astrophysical Journal, 865(2):157. 15, 7, 8
Andrews, S. M., Wilner, D. J., Espaillat, C., Hughes, A. M., Dullemond, C. P.,
McClure, M. K., Qi, C., and Brown, J. M. (2011). Resolved images of large
cavities in protoplanetary transition disks. Astrophysical Journal, 732(1):42.
10, 27, 105
Ansdell, M., Williams, J. P., Manara, C. F., Miotello, A., Facchini, S., Van
Der Marel, N., Testi, L., and Van Dishoeck, E. F. (2017). An ALMA Survey
of Protoplanetary Disks in the σ Orionis Cluster. The Astronomical Journal,
153:240. 16, 12
Ansdell, M., Williams, J. P., Marel, N. v. d., Carpenter, J. M., Guidi, G., Hoger-
heijde, M., Mathews, G. S., Manara, C. F., Miotello, A., Natta, A., Oliveira,
I., Tazzari, M., Testi, L., van Dishoeck, E. F., and van Terwisga, S. E. (2016).
ALMA SURVEY OF LUPUS PROTOPLANETARY DISKS. I. DUST AND
GAS MASSES. ApJ, 828(1):46. 16, 12, 34, 58, 59, 139, 140
Ansdell, M., Williams, J. P., Trapman, L., van Terwisga, S. E., Facchini, S.,
Manara, C. F., van der Marel, N., Miotello, A., Tazzari, M., Hogerheijde, M.,
Guidi, G., Testi, L., and van Dishoeck, E. F. (2018). ALMA Survey of Lupus
Protoplanetary Disks II: Gas Disk Radii. The Astrophysical Journal, 859(1):21.
12
Ardila, D. R., Golimowski, D. A., Krist, J. E., Clampin, M., Ford, H. C., and
Illingworth, G. D. (2007). Hubble Space Telescope Advanced Camera for Sur-
veys Coronagraphic Observations of the Dust Surrounding HD 100546. ApJ,
665(1):512–534. 19, 54, 60, 61, 62, 67
Ardila, D. R., Lubow, S. H., Golimowski, D. A., Krist, J. E., Clampin, M., Ford,
H. C., Hartig, G. F., Illingworth, G. D., Bartko, F., BenItez, N., Blakeslee, J. P.,
Bouwens, R. J., Bradley, L. D., Broadhurst, T. J., Brown, R. A., Burrows, C. J.,
Cheng, E. S., Cross, N. J. G., Feldman, P. D., Franx, M., Goto, T., Gronwall,
C., Holden, B., Homeier, N., Infante, L., Kimble, R. A., Lesser, M. P., Martel,
146
REFERENCES
A. R., Menanteau, F., Meurer, G. R., Miley, G. K., Postman, M., Sirianni, M.,
Sparks, W. B., Tran, H. D., Tsvetanov, Z. I., White, R. L., Zheng, W., and
Zirm, A. W. (2005). A Dynamical Simulation of the Debris Disk around HD
141569A. ApJ, 627(2):986–1000. 89
Armitage, P. J. (2009). Astrophysics of Planet Formation. Cambridge University
Press, Cambridge. 16
Artymowicz, P. (2004). Debris disks and the formation of planets: a symposium
in memory of Fred Gillet ASP Conference Dynamics of Gaseous Disks with
Planets. In Debris disks and the formation of planets: a symposium in memory
of Fred Gillet, volume 324. 120
Arzoumanian, D., Andre, P., Peretto, N., and Konyves, V. (2014). Properties
of interstellar filaments as derived from herschel observations. In Astrophysics
and Space Science Proceedings, volume 36, pages 259–263. Springer, Cham. 3
Asplund, M., Grevesse, N., Sauval, A. J., and Scott, P. (2009). The Chemi-
cal Composition of the Sun. Annual Review of Astronomy and Astrophysics,
47(1):481–522. 108, 116
Augereau, J. C., Lagrange, A. M., Mouillet, D., and Menard, F. (1999).
HST/NICMOS2 observations of the HD 141569 A circumstellar disk. A&A,
350:51–54. 4, 82
Augereau, J. C., Lagrange, A. M., Mouillet, D., and Menard, F. (2001).
HST/NICMOS2 coronagraphic observations of the circumstellar environment
of three old PMS stars: HD 100546, SAO 206462 and MWC 480. Astronomy
& Astrophysics, 365(2):78–89. 4
Augereau, J. C. and Papaloizou, J. C. B. (2004). Structuring the HD 141569 A
circumstellar dust disk. A&A, 414(3):1153–1164. 89
Avenhaus, H., Quanz, S. P., Garufi, A., Perez, S., Casassus, S., Pinte, C., H-
M Bertrang, G., Caceres, C., Benisty, M., and Dominik, C. (2018). Disks
around T Tauri Stars with SPHERE (DARTTS-S). I. SPHERE/IRDIS Polari-
metric Imaging of Eight Prominent T Tauri Disks *. ApJ, 863(44). 140
147
REFERENCES
Avenhaus, H., Quanz, S. P., Meyer, M. R., Brittain, S. D., Carr, J. S., and Najita,
J. R. (2014). HD100546 MULTI-EPOCH SCATTERED LIGHT OBSERVA-
TIONS. ApJ, 790(1):56. 18, 47, 48, 54, 63
Bally, J., Langer, W. D., Stark, A. A., and Wilson, R. W. (1987). Filamentary
Structure in the Orion Molecular Cloud. The Astrophysical Journal, 45:45–49.
3
Banzatti, A., Testi, L., Isella, A., Natta, A., Neri, R., and Wilner, D. J. (2011).
Astronomy & Astrophysics New constraints on dust grain size and distri-
bution in CQ Tauri. A&A, 525. 78
Barenfeld, S. A., Carpenter, J. M., Ricci, L., and Isella, A. (2016). ALMA OB-
SERVATIONS OF CIRCUMSTELLAR DISKS IN THE UPPER SCORPIUS
OB ASSOCIATION. The Astrophysical Journal, 827(2):142. 16, 12
Barenfeld, S. A., Carpenter, J. M., Sargent, A. I., Isella, A., and Ricci, L. (2017).
Measurement of Circumstellar Disk Sizes in the Upper Scorpius OB Association
with ALMA. The Astrophysical Journal, 851:85. 12
Baruteau, C., Crida, A., Paardekooper, S.-J., Guilet, J., Bitsch, B., Nelson, R.,
Kley, W., and Papaloizou, J. (2014). Planet-Disc Interactions and Early Evo-
lution of Planetary Systems. In Henrik Beuther, Ralf S. Klessen, Cornelis
P. Dullemond, and Thomas Henning, editors, PPVI, pages 667–689. Univ.of
Arizona Press, Tucson. 60, 71
Bate, M. R. (2000). Predicting the properties of binary stellar systems: The
evolution of accreting protobinary systems. Monthly Notices of the Royal As-
tronomical Society, 314(1):33–53. 3
Beckwith, S. V. W. and Sargent, A. I. (1991). Particle emissivity in circumstellar
disks. The Astrophysical Journal, 381:250. 21
Bell, K. R., Cassen, P. M., Klahr, H. H., and Henning, T. (1997). THE STRUC-
TURE AND APPEARANCE OF PROTOSTELLAR ACCRETION DISKS :
LIMITS ON DISK FLARING. The Astrophysical Journal, 486:372–387. 4
148
REFERENCES
Bergin, E. A., Cleeves, L. I., Gorti, U., Zhang, K., Blake, G. A., Green, J. D.,
Andrews, S. M., Evans II, N. J., Henning, T., Oberg, K., Pontoppidan, K.,
Qi, C., Salyk, C., and van Dishoeck, E. F. (2013). An old disk still capable of
forming a planetary system. Nature, 493(7434):644–646. 16, 108
Biller, B. A., Liu, M. C., Rice, K., Wahhaj, Z., Nielsen, E., Hayward, T., Kuchner,
M. J., Close, L. M., Chun, M., Ftaclas, C., and Toomey, D. W. (2015). The
Gemini NICI Planet-Finding Campaign: asymmetries in the HD 141569 disc.
MNRAS, 450(4):4446–4457. 21, 22, 82, 83, 87, 88, 90, 97
Birnstiel, T. and Andrews, S. M. (2013). ON THE OUTER EDGES OF PRO-
TOPLANETARY DUST DISKS. ApJ, 780(2):153. 16
Birnstiel, T., Dullemond, C. P., and Pinilla, P. (2013). Lopsided dust rings in
transition disks. A&A, 550:L8. 91
Birnstiel, T., Klahr, H., and Ercolano, B. (2012). A simple model for the evolution
of the dust population in protoplanetary disks. Astronomy and Astrophysics,
539:A148. 18, 43, 104, 106
Birnstiel, T., Ormel, C. W., and Dullemond, C. P. (2011). Dust size distributions
in coagulation/fragmentation equilibrium: numerical solutions and analytical
fits. A&A, 525:A11. 18, 79
Birnstiel, T., Ricci, L., Trotta, F., Dullemond, C. P., Natta, A., Testi, L., Do-
minik, C., Henning, T., Ormel, C. W., and Zsom, A. (2010). Testing the theory
of grain growth and fragmentation by millimeter observations of protoplanetary
disks. A&A, 516:L14. 78
Bjorkman, J. E. and Wood, K. (2001). Radiative Equilibrium and Temperature
Correction in Monte Carlo Radiation Transfer. The Astrophysical Journal,
554(1):615–623. 42
Boccaletti, A., Di Folco, E., Pantin, E., Dutrey, A., Guilloteau, S., Tang, Y. W.,
Pietu, V., Habart, E., Milli, J., Beck, T. L., and Maire, A. L. (2020). Pos-
sible evidence of ongoing planet formation in AB Aurigae. A showcase of the
SPHERE/ALMA synergy. 15, 6
149
REFERENCES
Boehler, Y., Ricci, L., Weaver, E., Isella, A., Benisty, M., Carpenter, J., Grady,
C., Shen, B.-T., Tang, Y.-W., and Perez, L. (2017). The complex morphology
of the young disk MWC 758: Spirals and dust clumps around a large cavity.
ApJ, 853(2):162. 91, 140
Boneberg, D. M., Facchini, S., Clarke, C. J., Ilee, J. D., Booth, R. A., and
Bruderer, S. (2018). The extremely truncated circumstellar disc of V410 X-ray
1: A precursor to TRAPPIST-1? Monthly Notices of the Royal Astronomical
Society, 477(1):325–334. 129
Boneberg, D. M., Panic, O., Haworth, T. J., Clarke, C. J., and Min, M. (2016).
Determining the mid-plane conditions of circumstellar discs using gas and dust
modelling: a study of HD 163296. MNRAS, 461:385–401. 30, 59
Booth, A. S., Walsh, C., Ilee, J. D., Notsu, S., Qi, C., Nomura, H., and Akiyama,
E. (2019). The First Detection of 13 C 17 O in a Protoplanetary Disk: A
Robust Tracer of Disk Gas Mass. Astrophysical Journal Letters, 882:L31. 106,
108, 139
Booth, R. A., Clarke, C. J., Madhusudhan, N., and Ilee, J. D. (2017). Chemical
enrichment of giant planets and discs due to pebble drift. Monthly Notices of
the Royal Astronomical Society, 469(4):3994–4011. 24, 43, 44, 103, 106, 108,
124, 125
Booth, R. A. and Ilee, J. D. (2019). Planet-forming material in a protoplanetary
disc : the interplay between chemical evolution and pebble drift. Monthly
Notices of the Royal Astronomical Society, 487(3):3998–4011. 103
Bouvier, J., Alencar, S. H. P., Harries, T. J., Johns-Krull, C. M., and Ro-
manova, M. M. (2007). Magnetospheric Accretion in Classical T Tauri Stars.
In Reipurth, B., Jewitt, D., and Keil, K., editors, Protostars and Planets V,
pages 479–494. 33
Brauer, F., Dullemond, C. P., and Henning, T. (2008). Coagulation, fragmen-
tation and radial motion of solid particles in protoplanetary disks. A&A,
480(3):859–877. 78
150
REFERENCES
Bressan, A., Marigo, P., Girardi, L., Salasnich, B., Cero, C. D., Rubele, S., and
Nanni, A. (2012). PARSEC: stellar tracks and isochrones with the PAdova and
TRieste Stellar Evolution Code. MNRAS, 427:127–145. 46
Brewer, J. M., Fischer, D. A., and Madhusudhan, N. (2017). C/O AND O/H
RATIOS SUGGEST SOME HOT JUPITERS ORIGINATE BEYOND THE
SNOW LINE. The Astronomical Journal, 153(2):83. 102
Brittain, S. D., Carr, J. S., Najita, J. R., Quanz, S. P., and Meyer, M. R. (2014).
NIR SPECTROSCOPY OF THE HAeBe STAR HD 100546. III. FURTHER
EVIDENCE OF AN ORBITING COMPANION? ApJ, 791(2):136. 47
Brittain, S. D., Najita, J. R., Carr, J. S., Liskowsky, J., Troutman, M. R.,
and Doppmann, G. W. (2013). HIGH-RESOLUTION NEAR-INFRARED
SPECTROSCOPY OF HD 100546. II. ANALYSIS OF VARIABLE ROVI-
BRATIONAL CO EMISSION LINES. ApJ, 767:159. 47
Brown, J. M., Blake, G. A., Qi, C., Dullemond, C. P., Wilner, D. J., and Williams,
J. P. (2009). EVIDENCE FOR DUST CLEARING THROUGH RESOLVED
SUBMILLIMETER IMAGING. ApJ, 704(1):496–502. 27
Carmona, A., Thi, W. F., Kamp, I., Baruteau, C., Matter, A., Van Den Ancker,
M., Pinte, C., Kospal, A., Audard, M., Liebhart, A., Sicilia-Aguilar, A., Pinilla,
P., Regaly, Z., Gudel, M., Henning, T., Cieza, L. A., Baldovin-Saavedra, C.,
Meeus, G., and Eiroa, C. (2017). Astrophysics A gas density drop in the inner
6 AU of the transition disk around the Herbig Ae star HD 139614 Further
evidence for a giant planet inside the disk? A&A, 598:118. 27
Castrejon, A., Lyra, W., Richert, A. J. W., and Kuchner, M. (2019). Disentan-
gling Planets from Photoelectric Instability in Gas-rich Optically Thin Dusty
Disks. The Astrophysical Journal, 887(1):6. 141
Cazzoletti, P., van Dishoeck, E. F., Pinilla, P., Tazzari, M., Facchini, S., van der
Marel, N., Benisty, M., Garufi, A., and Perez, L. (2018). Evidence for a massive
dust-trapping vortex connected to spirals: a multi-wavelength analysis of the
HD˜135344B protoplanetary disk. Astronomy & Astrophysics, 619:A161. 17,
23, 67
151
REFERENCES
Chen, P., Shan, H., and Zhang, P. (2016). A new photometric study of Herbig
Ae/Be stars in the infrared. New Astronomy, 44:1–11. 33
Chiang, E. I. and Goldreich, P. (1997). Spectral Energy Distributions of T Tauri
Stars with Passive Circumstellar Disks. The Astrophysical Journal, 490(1):368–
376. 11
Choi, J., Dotter, A., Conroy, C., Cantiello, M., Paxton, B., and Johnson, B. D.
(2016). MESA ISOCHRONES AND STELLAR TRACKS (MIST). I. SOLAR-
SCALED MODELS. The Astrophysical Journal, 823(2):102. 17, 34
Christiaens, V., Casassus, S., Perez, S., van der Plas, G., and Menard, F. (2014).
SPIRAL ARMS IN THE DISK OF HD 142527 FROM CO EMISSION LINES
WITH ALMA. The Astrophysical Journal, 785(1):L12. 140
Condon, J. J. and Ransom, S. M. (2016). Essential Radio Astronomy. Princeton
University Press. 87
Currie, T., Brittain, S., Grady, C. A., Kenyon, S. J., and Muto, T. (2017).
Clarifying the Status of HD 100546 as Observed by the Gemini Planet Imager.
Research Notes of the AAS, 1(1):40. 135
Currie, T., Cloutier, R., Brittain, S., Grady, C., Burrows, A., Muto, T.,
Kenyon, S. J., and Kuchner, M. J. (2015). RESOLVING THE HD 100546
PROTOPLANETARY SYSTEM WITH THE GEMINI PLANET IMAGER:
EVIDENCE FOR MULTIPLE FORMING, ACCRETING PLANETS. ApJ,
814(2):L27. 47
Currie, T., Grady, C. A., Cloutier, R., Konishi, M., Stassun, K., Debes,
J., Marel, N. v. d., Muto, T., Jayawardhana, R., and Ratzka, T. (2016).
THE MATRYOSHKA DISK: KECK/NIRC2 DISCOVERY OF A SOLAR-
SYSTEM-SCALE, RADIALLY SEGREGATED RESIDUAL PROTOPLAN-
ETARY DISK AROUND HD 141569A. The Astrophysical Journal, 819(2):L26.
96
152
REFERENCES
d ’Alessio, P., Merın, B., Calvet, N., Hartmann, L., and Montesinos, B. (2005).
WWW DATABASE OF MODELS OF ACCRETION DISKS IRRADIATED
BY THE CENTRAL STAR. RMxAA, 41:61–67. 56, 79
de Muizon, M., Strom, R. G., Oort, M. J. A., Claas, J. J., and Braun, R. (1988).
G70.7+1.2: Supernova, nova, or stellar shell? A&A, 193(248-264). 87
Dent, W. R. F., Greaves, J. S., and Coulson, I. M. (2005). CO emission from
discs around isolated HAeBe and Vega-excess stars. MNRAS, 359(2):663–676.
82
Dent, W. R. F., Wyatt, M. C., Roberge, A., Augereau, J.-C., Casassus, S.,
Corder, S., Greaves, J. S., de Gregorio-Monsalvo, I., Hales, A., Jackson, A. P.,
Hughes, A. M., Lagrange, A.-M., Matthews, B., and Wilner, D. (2014). Molec-
ular gas clumps from the destruction of icy bodies in the $β$ Pictoris debris
disk. Science (80-. )., 343(6178):1490–1492. 17, 31, 91, 137
Dominik, C. and Dullemond, C. P. (2002). From Protoplanetary to Debris Disks.
In The Origin of Stars and Planets: The VLT View, pages 439–444. Springer-
Verlag, Berlin/Heidelberg. 82
Donaldson, J. K., Weinberger, A. J., Gagne, J., Faherty, J. K., Boss, A. P.,
and Keiser, S. A. (2016). NEW PARALLAXES AND A CONVERGENCE
ANALYSIS FOR THE TW Hya ASSOCIATION. The Astrophysical Journal,
833. 30
Dong, R., Li, S., Chiang, E., and Li, H. (2017). Multiple Disk Gaps and Rings
Generated by a Single Super-Earth. The Astrophysical Journal, 843(2):127. 28
Dong, R., Rafikov, R., Zhu, Z., Hartmann, L., Whitney, B., Brandt, T., Muto,
T., Hashimoto, J., Grady, C., Follette, K., Kuzuhara, M., Tanii, R., Knapp, R.,
Kudo, T., Kusakabe, N., Matsuo, T., Mcelwain, M. W., Miyama, S., Morino,
J.-I., Moro-Martin, A., Nishimura, T., Pyo, T.-S., Suto, H., Suzuki, R., Takami,
M., Takato, N., Terada, H., Tomono, D., Turner, E. L., Watanabe, M., Yamada,
T., Takami, H., Usuda, T., and Tamura, M. (2012). THE MISSING CAVITIES
153
REFERENCES
IN THE SEEDS POLARIZED SCATTERED LIGHT IMAGES OF TRANSI-
TIONAL PROTOPLANETARY DISKS: A GENERIC DISK MODEL. The
Astrophysical Journal, 750(16pp):161. 5
Dotter, A. (2016). MESA ISOCHRONES AND STELLAR TRACKS (MIST)
0: METHODS FOR THE CONSTRUCTION OF STELLAR ISOCHRONES.
The Astrophysical Journal Supplement Series, 222:8. 105
Draine, B. (2003). Interstellar Dust Grains. Annual Review of Astronomy and
Astrophysics, 41(1):241–289. 20, 124
Draine, B. T. (2006). On the Submillimeter Opacity of Protoplanetary Disks.
ApJ, 636:1114–1120. 16, 20, 9, 18, 21, 56, 75, 76, 77, 79, 86
Du, F., Bergin, E. A., and Hogerheijde, M. R. (2015). VOLATILE DEPLETION
IN THE TW HYDRAE DISK ATMOSPHERE. ApJL, 807:L32. 16
Dullemond, C. P., Birnstiel, T., Huang, J., Kurtovic, N. T., Andrews, S. M.,
Guzman, V. V., Perez, L. M., Isella, A., Zhu, Z., Benisty, M., Wilner, D. J.,
Bai, X.-N., Carpenter, J. M., Zhang, S., and Ricci, L. (2018). The Disk Sub-
structures at High Angular Resolution Project (DSHARP). VI. Dust Trapping
in Thin-ringed Protoplanetary Disks. ApJL, 869:L46. 17, 95, 131
Dullemond, C. P. and Dominik, C. (2004a). Flaring vs. self-shadowed disks: The
SEDs of Herbig Ae/Be stars. Astronomy and Astrophysics, 417(1):159–168. 6
Dullemond, C. P. and Dominik, C. (2004b). The effect of dust settling on the
appearance of protoplanetary disks. Astronomy and Astrophysics, 421(3):1075–
1086. 11
Dullemond, C. P., Hollenbach, D., Kamp, I., and D’Alessio, P. (2007). Models
of the Structure and Evolution of Protoplanetary Disks. In Protostars and
Planets V, page 555. 16, 19
Dutrey, A., Di Folco, E., Guilloteau, S., Boehler, Y., Bary, J., Beck, T., Beust,
H., Chapillon, E., Gueth, F., Hure, J.-M., Pierens, A., Pietu, V., Simon, M.,
and Tang, Y.-W. (2014). Possible planet formation in the young, low-mass,
multiple stellar system GG Tau A. Nature, 514(7524):600–602. 63
154
REFERENCES
Dzyurkevich, N., Flock, M., Turner, N. J., Klahr, H., and Henning, T. (2010).
Trapping solids at the inner edge of the dead zone: 3-D global MHD simula-
tions. A&A, 515:A70. 17
Eisner, J. A., Arce, H. G., Ballering, N. P., Bally, J., Andrews, S. M., Boyden,
R. D., Francesco, J. D., Fang, M., Johnstone, D., Kim, J. S., Mann, R. K.,
Matthews, B., Pascucci, I., Ricci, L., Sheehan, P. D., and Williams, J. P.
(2018). Protoplanetary Disk Properties in the Orion Nebula Cluster: Initial
Results from Deep, High-resolution ALMA Observations. The Astrophysical
Journal, 860(1):77. 16, 12
Eistrup, C., Walsh, C., and Van Dishoeck, E. F. (2016). Setting the volatile
composition of (exo)planet-building material: Does chemical evolution in disk
midplanes matter? Astronomy and Astrophysics, 595:A83. 16
Espaillat, C., Calvet, N., D’alessio, P., Hernandez, J., Qi, C., Hartmann, L.,
Furlan, E., and Watson, D. M. (2007). ON THE DIVERSITY OF THE TAU-
RUS TRANSITIONAL DISKS: UX TAU A & LK CA 15. Technical
report. 27
Fabrycky, D. C. and Murray-Clay, R. A. (2010). Stability of the directly imaged
multiplanet system HR 8799: Resonance and masses. Astrophysical Journal,
710(2):1408–1421. 121, 126
Facchini, S., Birnstiel, T., Bruderer, S., and Van Dishoeck, E. F. (2017). Different
dust and gas radial extents in protoplanetary disks: consistent models of grain
growth and CO emission. A&A, 605:16. 73
Fairlamb, J. R., Oudmaijer, R. D., Mendigutıa, I., Ilee, J. D., and van den Ancker,
M. E. (2015). A spectroscopic survey of Herbig Ae/Be stars with X-shooter
I. Stellar parameters and accretion rates. Monthly Notices of the Royal Astro-
nomical Society, 453(1):976–1001. 46, 113
Favre, C., Cleeves, L. I., Bergin, E. A., Qi, C., and Blake, G. A. (2013). A
SIGNIFICANTLY LOW CO ABUNDANCE TOWARD THE TW Hya PRO-
TOPLANETARY DISK: A PATH TO ACTIVE CARBON CHEMISTRY? The
Astrophysical Journal, 776(2):L38. 16
155
REFERENCES
Fayolle, E. C., Balfe, J., Loomis, R., Bergner, J., Graninger, D., Rajappan, M.,
and Oberg, K. I. (2016). N2 and CO desorption energies from water ice. The
Astrophysical Journal, 816(2):L28. 108, 111
Fedele, D., Tazzari, M., Booth, R., Testi, L., Clarke, C. J., Pascucci, I., Kospal,
A., Semenov, D., Bruderer, S., Henning, T., and Teague, R. (2018). ALMA
continuum observations of the protoplanetary disk AS 209 Evidence of multiple
gaps opened by a single planet. A&A, 610:A24. 27
Fedele, D., Van Den Ancker, M. E., Henning, T., Jayawardhana, R., and Oliveira,
J. M. (2010). Timescale of mass accretion in pre-main-sequence stars. A&A,
510:72. 30
Finkbeiner, D. P., Davis, M., and Schlegel, D. J. (1999). EXTRAPOLATION
OF GALACTIC DUST EMISSION AT 100 MICRONS TO COSMIC MI-
CROWAVE BACKGROUND RADIATION FREQUENCIES USING FIRAS.
THE ASTROPHYSICAL JOURNAL, 524:867–886. 21
Flaherty, K. M., Hughes, A. M., Andrews, S. M., Qi, C., Wilner, D. J., Boley,
A. C., White, J. A., Harney, W., and Zachary, J. (2016). RESOLVED CO
GAS INTERIOR TO THE DUST RINGS OF THE HD 141569 DISK. ApJ,
818(1):97. 82, 85, 93
Fleck, J. and Canfield, E. (1984). A random walk procedure for improving the
computational efficiency of the implicit Monte Carlo method for nonlinear ra-
diation transport. Journal of Computational Physics, 54(3):508–523. 43
Follette, K. B., Rameau, J., Dong, R., Pueyo, L., Close, L. M., Duchene, G., Fung,
J., Leonard, C., Macintosh, B., Males, J. R., Marois, C., Millar-Blanchaer,
M. A., Morzinski, K. M., Mullen, W., Perrin, M., Spiro, E., Wang, J., Ammons,
S. M., Bailey, V. P., Barman, T., Bulger, J., Chilcote, J., Cotten, T., De Rosa,
R. J., Doyon, R., Fitzgerald, M. P., Goodsell, S. J., Graham, J. R., Greenbaum,
A. Z., Hibon, P., Hung, L.-W., Ingraham, P., Kalas, P., Konopacky, Q., Larkin,
J. E., Maire, J., Marchis, F., Metchev, S., Nielsen, E. L., Oppenheimer, R.,
Palmer, D., Patience, J., Poyneer, L., Rajan, A., Rantakyro, F. T., Savransky,
D., Schneider, A. C., Sivaramakrishnan, A., Song, I., Soummer, R., Thomas,
156
REFERENCES
S., Vega, D., Wallace, J. K., Ward-Duong, K., Wiktorowicz, S., and Wolff,
S. (2017). Complex Spiral Structure in the HD 100546 Transitional Disk as
Revealed by GPI and MagAO. AJ, 153(6):264. 18, 5, 47, 48, 54, 60
Garufi, A., Benisty, M., Pinilla, P., Tazzari, M., Dominik, C., Ginski, C., Henning,
T., Kral, Q., Langlois, M., Menard, F., Stolker, T., Szulagyi, J., Villenave, M.,
and Van Der Plas, G. (2018). Evolution of protoplanetary disks from their
taxonomy in scattered light: Spirals, rings, cavities, and shadows. Astronomy
and Astrophysics, 620:94. 140
Garufi, A., Quanz, S. P., Avenhaus, H., Buenzli, E., Dominik, C., Meru, F.,
Meyer, M. R., Pinilla, P., Schmid, H. M., and Wolf, S. (2013). Small vs. large
dust grains in transitional disks: do different cavity sizes indicate a planet?
Astronomy & Astrophysics, 560:A105. 15, 6
Garufi, A., Quanz, S. P., Schmid, H. M., Mulders, G. D., Avenhaus, H., Boc-
caletti, A., Ginski, C., Langlois, M., Stolker, T., Augereau, J.-C., Benisty, M.,
Lopez, B., Dominik, C., Gratton, R., Henning, T., Janson, M., Menard, F.,
Meyer, M. R., Pinte, C., Sissa, E., Vigan, A., Zurlo, A., Bazzon, A., Buen-
zli, E., Bonnefoy, M., Brandner, W., Chauvin, G., Cheetham, A., Cudel, M.,
Desidera, S., Feldt, M., Galicher, R., Kasper, M., Lagrange, A.-M., Lannier,
J., Maire, A. L., Mesa, D., Mouillet, D., Peretti, S., Perrot, C., Salter, G., and
Wildi, F. (2016). The SPHERE view of the planet-forming disk around HD
100546. A&A, 588:A8. 18, 47, 48, 54, 60, 63
Ginski, C., Stolker, T., Pinilla, P., Dominik, C., Boccaletti, A., De Boer, J.,
Benisty, M., Biller, B., Feldt, M., Garufi, A., Keller, C. U., Kenworthy, M.,
Maire, A. L., Menard, F., Mesa, D., Milli, J., Min, M., Pinte, C., Quanz, S. P.,
Van Boekel, R., Bonnefoy, M., Chauvin, G., Desidera, S., Gratton, R., Girard,
J. H., Keppler, M., Kopytova, T., Lagrange, A. M., Langlois, M., Rouan, D.,
and Vigan, A. (2016). Direct detection of scattered light gaps in the transitional
disk around HD 97048 with VLT/SPHERE. Astronomy and Astrophysics, 595.
15, 6
157
REFERENCES
Gomes, R., Levison, H. F., Tsiganis, K., and Morbidelli, A. (2005). Origin of the
cataclysmic Late Heavy Bombardment period of the terrestrial planets. Nature,
435(7041):466–469. 121
Gonzalez, J.-F., Laibe, G., Maddison, S. T., Pinte, C., and Menard, F. (2015).
ALMA images of discs: are all gaps carved by planets? MNRAS, 454:36–40.
28
Gorti, U., Dullemond, C. P., and Hollenbach, D. (2009). TIME EVOLU-
TION OF VISCOUS CIRCUMSTELLAR DISKS DUE TO PHOTOEVAP-
ORATION BY FAR-ULTRAVIOLET, EXTREME-ULTRAVIOLET, AND X-
RAY RADIATION FROM THE CENTRAL STAR. The Astrophysical Jour-
nal, 705(2):1237–1251. 28
Goto, M., Usuda, T., Dullemond, C. P., Henning, T., Linz, H., Stecklum, B., and
Suto, H. (2006). Inner Rim of a Molecular Disk Spatially Resolved in Infrared
CO Emission Lines. ApJ, 652(1):758–762. 83, 89
Grady, C. A., Muto, T., Hashimoto, J., Fukagawa, M., Currie, T., and Biller,
B. (2012). SPIRAL ARMS IN THE ASYMMETRICALLY ILLUMINATED
DISK OF MWC 758 AND CONSTRAINTS ON GIANT PLANETS. The
Astrophysical Journal, 762(13pp). 140
Grady, C. A., Polomski, E. F., Henning, T., Stecklum, B., Woodgate, B. E.,
Telesco, C. M., Pina, R. K., Gull, T. R., Boggess, A., Bowers, C. W., Bruh-
weiler, F. C., Clampin, M., Danks, A. C., Green, R. F., Heap, S. R., Hutchings,
J. B., Jenkins, E. B., Joseph, C., Kaiser, M. E., Kimble, R. A., Kraemer, S.,
Lindler, D., Linsky, J. L., Maran, S. P., Moos, H. W., Plait, P., Roesler, F.,
Timothy, J. G., and Weistrop, D. (2001). The Disk and Environment of the
Herbig B[CLC]e[/CLC] Star HD 100546. AJ, 122(6):3396–3406. 54
Gray, R. O., Corbally, C. J., Garrison, R. F., Mcfadden, M. T., and Robin-
son, P. E. (2003). CONTRIBUTIONS TO THE NEARBY STARS (NSTARS)
PROJECT: SPECTROSCOPY OF STARS EARLIER THAN M0 WITHIN 40
PARSECS: THE NORTHERN SAMPLE. I. Astronomical Journal, 126:2048–
2059. 105, 116
158
REFERENCES
Guidi, G., Tazzari, M., Testi, L., de Gregorio-Monsalvo, I., Chandler, C. J.,
Perez, L., Isella, A., Natta, A., Ortolani, S., Hennings, T., Corder, S., Linz,
H., Andrews, S., Wilner, D., Ricci, L., Carpenter, J., Sargent, A., Mundy, L.,
Storm, S., Calvet, N., Dullemond, C., Greaves, J., Lazio, J., Deller, A., and
Kwon, W. (2016). Dust properties across the CO snowline in the HD 163296
disk from ALMA and VLA observations. A&A, 588:A112. 21, 23, 76, 78
Haffert, S. Y., Bohn, A. J., de Boer, J., Snellen, I. A., Brinchmann, J., Girard,
J. H., Keller, C. U., and Bacon, R. (2019). Two accreting protoplanets around
the young star PDS 70. 5, 28
Haisch, K. E., Lada, E. A., and Lada, C. J. (2001). Disk Frequencies and Lifetimes
in Young Clusters. The Astrophysical Journal, Volume 553, Issue 2, pp. L153-
L156., 553:L153–L156. 30
Hammer, M., Pinilla, P., Kratter, K. M., and Lin, M.-K. (2019). Observational
diagnostics of elongated planet-induced vortices with realistic planet formation
time-scales. MNRAS, 482:3609–3621. 23
Hartmann, L., Calvet, N., Gullbring, E., and D’Alessio, P. (1998). Accretion and
the Evolution of T Tauri Disks. The Astrophysical Journal, 495(1):385–400. 9,
105
Henning, T., Launhardt, R., Steinacker, J., and Thamm, E. (1994). Cold dust
around southern Herbig Ae/Be stars. A&A, 291:546. 78
Herbig, G. H. (1960). The Spectra of Be- and Ae-TYPE Stars Associated with
Nebulosity. The Astrophysical Journal Supplement Series, 4:337. 32
Hillenbrand, L. A., Strom, S. E., Vrba, F. J., and Keene, J. (1992). Herbig Ae/Be
stars - Intermediate-mass stars surrounded by massive circumstellar accretion
disks. The Astrophysical Journal, 397:613. 6, 32
Hogbom, J. A. (1974). Aperture Synthesis with a Non-Regular Distribution
of Interferometer Baselines. Astronomy and Astrophysics Supplement Series,
15:417. 39
159
REFERENCES
Holland, W. S., Matthews, B. C., Kennedy, G. M., Greaves, J. S., Wyatt, M. C.,
Booth, M., Bastien, P., Bryden, G., Butner, H., Chen, C. H., Chrysostomou,
A., Jenness, T., Kavelaars, . J., Lawler, S., Lestrade, J.-F., Marshall, J. P.,
Pani, O., Phillips, N., Serjeant, S., Schieven, G. H., Sibthorpe, B., Vican, L.,
Ward-Thompson, D., and Van Der Werf, P. (2017). SONS: The JCMT legacy
survey of debris discs in the submillimetre. MNRAS, 470:3606–3663. 95
Huang, J., Andrews, S. M., Dullemond, C. P., Isella, A., Perez, L. M., Guzman,
V. V., Oberg, K. I. ., Zhu, Z., Zhang, S., Bai, X.-N., Benisty, M., Birnstiel,
T., Carpenter, J. M., Hughes, A. M., Ricci, L., Weaver, E., and Wilner,
D. J. (2018). The Disk Substructures at High Angular Resolution Project
(DSHARP): II. Characteristics of Annular Substructures. ApJL, 869:L42. 28
Huang, J., Andrews, S. M., Dullemond, C. P., Oberg, K. I., Qi, C., Zhu, Z.,
Birnstiel, T., Carpenter, J. M., Isella, A., Macıas, E., McClure, M. K., Perez,
L. M., Teague, R., Wilner, D. J., and Zhang, S. (2020). A Multifrequency
ALMA Characterization of Substructures in the GM Aur Protoplanetary Disk.
The Astrophysical Journal, 891(1):48. 113
Hughes, A. M., Lieman-Sifry, J., Flaherty, K. M., Daley, C. M., Roberge, A.,
Kospal, ., Moor, A., Kamp, I., Wilner, D. J., Andrews, S. M., Kastner, J. H.,
and Abraham, P. (2017). Radial Surface Density Profiles of Gas and Dust in
the Debris Disk around 49 Ceti. The Astrophysical Journal, 839:86. 96
Hughes, A. M., Wilner, D. J., Kamp, I., and Hogerheijde, M. R. (2008). A Re-
solved Molecular Gas Disk around the Nearby A Star 49 Ceti. ApJ, 681(1):626–
635. 10, 57, 94
Ida, S. and Lin, D. N. C. (2005). Toward a Deterministic Model of Planetary For-
mation. III. Mass Distribution of ShortPeriod Planets around Stars of Various
Masses. The Astrophysical Journal, 626(2):1045–1060. 102
Ilee, J. D., Forgan, D. H., Evans, M. G., Hall, C., Booth, R., Clarke, C. J.,
Rice, W. K., Boley, A. C., Caselli, P., Hartquist, T. W., and Rawlings, J. M.
(2017). The chemistry of protoplanetary fragments formed via gravitational
160
REFERENCES
instabilities. Monthly Notices of the Royal Astronomical Society, 472(1):189–
204. 103, 122
Ireland, M. J. and Kraus, A. L. (2008). THE DISK AROUND CoKu TAURI/4:
CIRCUMBINARY, NOT TRANSITIONAL. The Astrophysical Journal,
678:59–62. 28
Isella, A., Carpenter, J. M., and Sargent, A. I. (2010). INVESTIGATING
PLANET FORMATION IN CIRCUMSTELLAR DISKS: CARMA OBSER-
VATIONS OF RY Tau AND DG Tau. The Astrophysical Journal, 714:1746–
1761. 9
Isella, A., Guidi, G., Testi, L., Liu, S., Li, H., Li, S., Weaver, E., Boehler, Y.,
Carperter, J. M., De Gregorio-Monsalvo, I., Manara, C. F., Natta, A., Perez,
L. M., Ricci, L., Sargent, A., Tazzari, M., and Turner 11, N. (2016). Ringed
Structures of the HD 163296 Protoplanetary Disk Revealed by ALMA. PRL,
117:251101. 78
Isella, A., Huang, J., Andrews, S. M., Dullemond, C. P., Birnstiel, T., Zhang,
S., Zhu, Z., Guzman, V. V., Perez, L. M., Bai, X.-N., Benisty, M., Carpenter,
J. M., Ricci, L., and Wilner, D. J. (2018). The Disk Substructures at High
Angular Resolution Project (DSHARP). IX. A High-definition Study of the
HD 163296 Planet-forming Disk. The Astrophysical Journal Letters, 869:L49.
96
Jackson, A. P., Wyatt, M. C., Bonsor, A., and Veras, D. (2014). Debris froms
giant impacts between planetary embryos at large orbital radii. MNRAS,
440(4):3757–3777. 91
Jager, C., Mutschke, H., and Henning, T. (1998). Optical properties of carbona-
ceous dust analogues. A&A, 332:291–299. 20
Jin, S., Isella, A., Huang, P., Li, S., Li, H., and Ji, J. (2019). New Constraints
on the Dust and Gas Distribution in the LkCa 15 Disk from ALMA. The
Astrophysical Journal, 881:108. 113
161
REFERENCES
Johansen, A. and Lacerda, P. (2010). Prograde rotation of protoplanets by ac-
cretion of pebbles in a gaseous environment. Monthly Notices of the Royal
Astronomical Society, 404(1):475–485. 104
Johansen, A., Oishi, J. S., Low, M. M. M., Klahr, H., Henning, T., and Youdin, A.
(2007). Rapid planetesimal formation in turbulent circumstellar disks. Nature,
448(7157):1022–1025. 104
Johnson, J. A., Aller, K. M., Howard, A. W., and Crepp, J. R. (2010). Giant
Planet Occurrence in the Stellar Mass-Metallicity Plane. Publications of the
Astronomical Society of the Pacific, 122(894):905–915. 35, 102, 138
Johnston, K. G., Robitaille, T. P., Beuther, H., Linz, H., Boley, P., Kuiper, R.,
Keto, E., Hoare, M. G., and Boekel, R. V. (2015). A KEPLERIAN-LIKE DISK
AROUND the FORMING O-TYPE STAR AFGL 4176. Astrophysical Journal
Letters, 813(1). 35
Johnstone, D., Hollenbach, D., and Bally, J. (1998). Photoevaporation of Disks
and Clumps by Nearby Massive Stars: Application to Disk Destruction in the
Orion Nebula. The Astrophysical Journal, 499(2):758–776. 4
Juhasz, A. and Rosotti, G. P. (2018). Spiral arms in thermally stratified proto-
planetary discs. MNRASL, 474(1):L32–L36. 66
Kama, M., Bruderer, S., Van Dishoeck, E. F., Hogerheijde, M., Folsom, C. P.,
Miotello, A., Fedele, D., Belloche, A., Gusten, R., and Wyrowski, F. (2016).
Volatile-carbon locking and release in protoplanetary disks A study of TW Hya
and HD 100546. A&A, 592:A83. 16, 59, 139
Kamp, I. and Dullemond, C. P. (2004). The gas temperature in the surface layers
of protoplanetary disks. ApJ, 615:991–999. 42
Kemper, F., Vriend, W. J., and Tielens, A. G. G. M. (2004). The Absence
of Crystalline Silicates in the Diffuse Interstellar Medium. The Astrophysical
Journal, 609(2):826–837. 9
162
REFERENCES
Kennedy, G. M. and Kenyon, S. J. (2008a). Planet Formation around Stars of
Various Masses: Hot SuperEarths. The Astrophysical Journal, 682(2):1264–
1276. 102
Kennedy, G. M. and Kenyon, S. J. (2008b). Planet Formation around Stars of
Various Masses: The Snow Line and the Frequency of Giant Planets. The
Astrophysical Journal, 673(1):502–512. 108
Kennedy, G. M. and Wyatt, M. C. (2014). Do two-temperature debris discs have
multiple belts? MNRAS, 444(4):3164–3182. 26, 82, 95
Keppler, M., Benisty, M., Muller, A., Henning, T., Van Boekel, R., Cantalloube,
F., Ginski, C., Van Holstein, R. G., Maire, A. L., Pohl, A., Samland, M., Aven-
haus, H., Baudino, J. L., Boccaletti, A., De Boer, J., Bonnefoy, M., Chauvin,
G., Desidera, S., Langlois, M., Lazzoni, C., Marleau, G. D., Mordasini, C.,
Pawellek, N., Stolker, T., Vigan, A., Zurlo, A., Birnstiel, T., Brandner, W.,
Feldt, M., Flock, M., Girard, J., Gratton, R., Hagelberg, J., Isella, A., Janson,
M., Juhasz, A., Kemmer, J., Kral, Q., Lagrange, A. M., Launhardt, R., Mat-
ter, A., Menard, F., Milli, J., Molliere, P., Olofsson, J., Perez, L., Pinilla, P.,
Pinte, C., Quanz, S. P., Schmidt, T., Udry, S., Wahhaj, Z., Williams, J. P.,
Buenzli, E., Cudel, M., Dominik, C., Galicher, R., Kasper, M., Lannier, J.,
Mesa, D., Mouillet, D., Peretti, S., Perrot, C., Salter, G., Sissa, E., Wildi, F.,
Abe, L., Antichi, J., Augereau, J. C., Baruffolo, A., Baudoz, P., Bazzon, A.,
Beuzit, J. L., Blanchard, P., Brems, S. S., Buey, T., De Caprio, V., Carbillet,
M., Carle, M., Cascone, E., Cheetham, A., Claudi, R., Costille, A., Delboulbe,
A., Dohlen, K., Fantinel, D., Feautrier, P., Fusco, T., Giro, E., Gluck, L., Gry,
C., Hubin, N., Hugot, E., Jaquet, M., Le Mignant, D., Llored, M., Madec, F.,
Magnard, Y., Martinez, P., Maurel, D., Meyer, M., Moller-Nilsson, O., Moulin,
T., Mugnier, L., Origne, A., Pavlov, A., Perret, D., Petit, C., Pragt, J., Puget,
P., Rabou, P., Ramos, J., Rigal, F., Rochat, S., Roelfsema, R., Rousset, G.,
Roux, A., Salasnich, B., Sauvage, J. F., Sevin, A., Soenke, C., Stadler, E.,
Suarez, M., Turatto, M., and Weber, L. (2018). Discovery of a planetary-mass
companion within the gap of the transition disk around PDS 70. Astronomy
and Astrophysics, 617. 28
163
REFERENCES
Klahr, H. and Bodenheimer, P. (2006). Formation of Giant Planets by Concurrent
Accretion of Solids and Gas inside an Anticyclonic Vortex. ApJ, 639(1):432–
440. 16
Kley, W. (2000). On the migration of a system of protoplanets. Monthly Notices
of the Royal Astronomical Society, 313(4):47–51. 126
Konishi, M., Grady, C. A., Schneider, G., Shibai, H., McElwain, M. W., Nesvold,
E. R., Kuchner, M. J., Carson, J., Debes, J. H., Gaspar, A., Henning, T. K.,
Hines, D. C., Hinz, P. M., Jang-Condell, H., Moro-Martin, A., Perrin, M.,
Rodigas, T. J., Serabyn, E., Silverstone, M. D., Stark, C. C., Tamura, M.,
Weinberger, A. J., and Wisniewski, J. P. (2016). DISCOVERY OF AN INNER
DISK COMPONENT AROUND HD 141569 A. ApJ, 818(2):L23. 90
Konopacky, Q. M., Barman, T. S., Macintosh, B. A., and Marois, C. (2013).
Detection of Carbon Monoxide and Water Absorption Lines in an Exoplanet
Atmosphere. Science, 339(6126):1398–1401. 108
Kospal, A., Moor, A., Juhasz, A., Abraham, P., Apai, D., Csengeri, T., Grady,
C. A., Henning, T., Hughes, A. M., Kiss, C., Pascucci, I., and Schmalzl, M.
(2013). ALMA OBSERVATIONS OF THE MOLECULAR GAS IN THE DE-
BRIS DISK OF THE 30 Myr OLD STAR HD 21997. Astrophysical Journal,
776(2):77. 49, 93, 94
Kral, Q., Marino, S., Wyatt, M. C., Kama, M., and Matra, L. (2018). Imaging
[CI] around HD 131835: reinterpreting young debris discs with protoplanetary
disc levels of CO gas as shielded secondary discs. Monthly Notices of the Royal
Astronomical Society, 000:1–23. 137
Kral, Q., Marino, S., Wyatt, M. C., Kama, M., and Matra, L. (2019). Imaging
[CI] around HD 131835: reinterpreting young debris discs with protoplanetary
disc levels of CO gas as shielded secondary discs. Monthly Notices of the Royal
Astronomical Society, 489(3):3670–3691. 30
Kral, Q., Matra, L., Wyatt, M. C., and Kennedy, G. M. (2017a). Predictions for
the secondary CO, C and O gas content of debris discs from the destruction of
164
REFERENCES
volatile-rich planetesimals. Monthly Notices of the Royal Astronomical Society,
469(1):521–550. 31
Kral, Q., Matra, L., Wyatt, M. C., and Kennedy, G. M. (2017b). Predictions for
the secondary CO, C and O gas content of debris discs from the destruction of
volatile-rich planetesimals. Monthly Notices of the Royal Astronomical Society,
469(1):521–550. 91, 95
Kratter, K. M., Murray-Clay, R. A., and Youdin, A. N. (2010). The runts of the
litter: Why planets formed through gravitational instability can only be failed
binary stars. Astrophysical Journal, 710(2):1375–1386. 122
Kraus, S., Kreplin, A., Fukagawa, M., Muto, T., Sitko, M. L., Young, A. K.,
Bate, M. R., Harries, T., Monnier, J. D., Willson, M., and Wisniewski, J.
(2017). Dust-trapping vortices and a potentially planet-triggered spiral wake
in the pre-transitional disk of V1247 Orionis. ApJL, 848:L11. 17, 137, 140
Krijt, S., Schwarz, K. R., Bergin, E. A., and Ciesla, F. J. (2018). Transport of
CO in Protoplanetary Disks: Consequences of Pebble Formation, Settling, and
Radial Drift. The Astrophysical Journal, 864(1):78. 103
Kudo, T., Hashimoto, J., Muto, T., Liu, H. B., Dong, R., Hasegawa, Y., Tsuk-
agoshi, T., and Konishi, M. (2018). A Spatially Resolved au-scale Inner Disk
around DM Tau. The Astrophysical Journal Letters, 868:L5. 113
Lacour, S., Nowak, M., Wang, J., Pfuhl, O., Eisenhauer, F., Abuter, R., Amorim,
A., Anugu, N., Benisty, M., Berger, J. P., Beust, H., Blind, N., Bonnefoy, M.,
Bonnet, H., Bourget, P., Brandner, W., Buron, A., Collin, C., Charnay, B.,
Chapron, F., Clenet, Y., Coude Du Foresto, V., De Zeeuw, P. T., Deen, C.,
Dembet, R., Dexter, J., Duvert, G., Eckart, A., Forster Schreiber, N. M.,
Fedou, P., Garcia, P., Garcia Lopez, R., Gao, F., Gendron, E., Genzel, R.,
Gillessen, S., Gordo, P., Greenbaum, A., Habibi, M., Haubois, X., Haußmann,
F., Henning, T., Hippler, S., Horrobin, M., Hubert, Z., Jimenez Rosales, A.,
Jocou, L., Kendrew, S., Kervella, P., Kolb, J., Lagrange, A. M., Lapeyrere,
V., Le Bouquin, J. B., Lena, P., Lippa, M., Lenzen, R., Maire, A. L., Molliere,
P., Ott, T., Paumard, T., Perraut, K., Perrin, G., Pueyo, L., Rabien, S.,
165
REFERENCES
Ramırez, A., Rau, C., Rodrıguez-Coira, G., Rousset, G., Sanchez-Bermudez, J.,
Scheithauer, S., Schuhler, N., Straub, O., Straubmeier, C., Sturm, E., Tacconi,
L. J., Vincent, F., Van Dishoeck, E. F., Von Fellenberg, S., Wank, I., Waisberg,
I., Widmann, F., Wieprecht, E., Wiest, M., Wiezorrek, E., Woillez, J., Yazici,
S., Ziegler, D., and Zins, G. (2019). First direct detection of an exoplanet by
optical interferometry: Astrometry and K -band spectroscopy of HR 8799 e.
Astronomy and Astrophysics, 623. 117
Lada, C. J. (1987). Proceedings of the International Astronomical Union: Preface.
In IAU Symposium, volume 115, page 1. Cambridge University Press. 23
Lambrechts, M. and Johansen, A. (2012). Rapid growth of gas-giant cores by
pebble accretion. Astronomy and Astrophysics, 544:32. 104, 127
Lavie, B., Mendonca, J. M., Mordasini, C., Malik, M., Bonnefoy, M., Demory,
B.-O., Oreshenko, M., Grimm, S. L., Ehrenreich, D., and Heng, K. (2017).
HELIOS-RETRIEVAL: An Open-source, Nested Sampling Atmospheric Re-
trieval Code; Application to the HR 8799 Exoplanets and Inferred Constraints
for Planet Formation. The Astronomical Journal, 154:91. 105, 116, 117, 119
Lecar, M., Podolak, M., Sasselov, D., and Chiang, E. (2006). On the Loca-
tion of the Snow Line in a Protoplanetary Disk. The Astrophysical Journal,
640(2):1115–1118. 108
Li, A. and Draine, B. T. (2001). Infrared Emission from Interstellar Dust. II. The
Diffuse Interstellar Medium. The Astrophysical Journal, 554(2):778–802. 21
Lieman-Sifry, J., Hughes, A. M., Carpenter, J. M., Gorti, U., Hales, A., and
Flaherty, K. M. (2016). DEBRIS DISKS IN THE SCORPIUSCENTAURUS
OB ASSOCIATION RESOLVED BY ALMA. ApJ, 828(1):25. 32
Lindegren, L., Hernandez, J., Bombrun, A., Klioner, S., Bastian, U., Ramos-
Lerate, M., de Torres, A., Steidelmuller, H., Stephenson, C., Hobbs, D.,
Lammers, U., Biermann, M., Geyer, R., Hilger, T., Michalik, D., Stampa,
U., McMillan, P., Castaneda, J., Clotet, M., Comoretto, G., Davidson, M.,
Fabricius, C., Gracia, G., Hambly, N., Hutton, A., Mora, A., Portell, J.,
166
REFERENCES
van Leeuwen, F., Abbas, U., Abreu, A., Altmann, M., Andrei, A., Anglada,
E., Balaguer-Nunez, L., Barache, C., Becciani, U., Bertone, S., Bianchi, L.,
Bouquillon, S., Bourda, G., Brusemeister, T., Bucciarelli, B., Busonero, D.,
Buzzi, R., Cancelliere, R., Carlucci, T., Charlot, P., Cheek, N., Crosta, M.,
Crowley, C., de Bruijne, J., de Felice, F., Drimmel, R., Esquej, P., Fienga, A.,
Fraile, E., Gai, M., Garralda, N., Gonzalez-Vidal, J., Guerra, R., Hauser, M.,
Hofmann, W., Holl, B., Jordan, S., Lattanzi, M., Lenhardt, H., Liao, S., Li-
cata, E., Lister, T., Loffler, W., Marchant, J., Martin-Fleitas, J.-M., Messineo,
R., Mignard, F., Morbidelli, R., Poggio, E., Riva, A., Rowell, N., Salguero, E.,
Sarasso, M., Sciacca, E., Siddiqui, H., Smart, R., Spagna, A., Steele, I., Taris,
F., Torra, J., van Elteren, A., van Reeven, W., and Vecchiato, A. (2018). Gaia
Data Release 2. A&A, 616:A2. 46, 54
Lindegren, L., Lammers, U., Bastian, U., Hernandez, J., Klioner, S., Hobbs, D.,
Bombrun, A., Michalik, D., Ramos-Lerate, M., Butkevich, A., Comoretto, G.,
Joliet, E., Holl, B., Hutton, A., Parsons, P., Steidelmuller, H., Abbas, U., Alt-
mann, M., Andrei, A., Anton, S., Bach, N., Barache, C., Becciani, U., Berthier,
J., Bianchi, L., Biermann, M., Bouquillon, S., Bourda, G., Brusemeister, T.,
Bucciarelli, B., Busonero, D., Carlucci, T., Castaneda, J., Charlot, P., Clotet,
M., Crosta, M., Davidson, M., de Felice, F., Drimmel, R., Fabricius, C., Fienga,
A., Figueras, F., Fraile, E., Gai, M., Garralda, N., Geyer, R., Gonzalez-Vidal,
J. J., Guerra, R., Hambly, N. C., Hauser, M., Jordan, S., Lattanzi, M. G.,
Lenhardt, H., Liao, S., Loffler, W., McMillan, P. J., Mignard, F., Mora, A.,
Morbidelli, R., Portell, J., Riva, A., Sarasso, M., Serraller, I., Siddiqui, H.,
Smart, R., Spagna, A., Stampa, U., Steele, I., Taris, F., Torra, J., van Reeven,
W., Vecchiato, A., Zschocke, S., de Bruijne, J., Gracia, G., Raison, F., Lis-
ter, T., Marchant, J., Messineo, R., Soffel, M., Osorio, J., de Torres, A., and
OMullane, W. (2016). Gaia Data Release 1. A&A, 595:A4. 82
Line, M. R., Knutson, H., Wolf, A. S., and Yung, Y. L. (2014). A systematic
retrieval analysis of secondary eclipse spectra. II. A uniform analysis of nine
planets and their C to O ratios. Astrophysical Journal, 783(2):70. 122
167
REFERENCES
Lodato, G., Dipierro, G., Ragusa, E., Long, F., Herczeg, G. J., Pascucci, I.,
Pinilla, P., Manara, C. F., Tazzari, M., Liu, Y., Mulders, G. D., Harsono, D.,
Boehler, Y., Menard, F., Johnstone, D., Salyk, C., Van Der Plas, G., Cabrit, S.,
Edwards, S., Fischer, W. J., Hendler, N., Nisini, B., Rigliaco, E., Avenhaus, H.,
Banzatti, A., and Gully-Santiago, M. (2019). The newborn planet population
emerging from ring-like structures in discs. MNRAS, 486:453–461. 95
Long, F., Herczeg, G. J., Pascucci, I., Drabek-Maunder, E., Mohanty, S., Testi,
L., Apai, D., Hendler, N., Henning, T., Manara, C. F., and Mulders, G. D.
(2017). An ALMA Survey of CO Isotopologue Emission from Protoplanetary
Disks in Chamaeleon I. ApJ, 844(2):99. 59
Loomis, R. A., Oberg, K. I., Andrews, S. M., and MacGregor, M. A. (2017). A
Multi-ringed, Modestly Inclined Protoplanetary Disk around AA Tau. ApJ,
840(1):23. 63
Lynden-Bell, D. and Pringle, J. E. (1974). The Evolution of Viscous Discs and
the Origin of the Nebular Variables. Monthly Notices of the Royal Astronomical
Society, 168(3):603–637. 9, 105
Macgregor, M. A., Matra, L., Kalas, P., Wilner, D. J., Pan, M., Kennedy, G. M.,
Wyatt, M. C., Duchene, G., Hughes, A. M., Rieke, G. H., Clampin, M., Fitzger-
ald, M. P., Graham, J. R., Holland, W. S., Panic, O., Shannon, A., and Su, K.
(2017). A Complete ALMA Map of the Fomalhaut Debris Disk. 16, 26
MacGregor, M. A., Wilner, D. J., Chandler, C., Ricci, L., Maddison, S. T.,
Cranmer, S. R., Andrews, S. M., Hughes, A. M., and Steele, A. (2016).
CONSTRAINTS ON PLANETESIMAL COLLISION MODELS IN DEBRIS
DISKS. ApJ, 823:79. 26, 87
Madhusudhan, N., Agundez, M., Moses, J. I., Hu, Y., Agundez, M., Moses, J. I.,
Org, J., and Hu, Y. (2016). Exoplanetary Atmospheres-Chemistry, Formation
Conditions, and Habitability. Space Sci Rev, 205:285–348. 103
Madhusudhan, N., Amin, M. A., and Kennedy, G. M. (2014). Towards Chem-
ical Constraints on Hot Jupiter Migration. Astrophysical Journal Letters,
794(1):L12. 24, 44, 103, 108, 122, 124, 125
168
REFERENCES
Madhusudhan, N., Bitsch, B., Johansen, A., and Eriksson, L. (2017). Atmo-
spheric signatures of giant exoplanet formation by pebble accretion. Monthly
Notices of the Royal Astronomical Society, 469(4):4102–4115. 44, 108, 124
Malfait, K., Waelkens, C., Waters, L. B. F. M., Vandenbussche, B., Huygen, E.,
and De Graauw, M. S. (1998). The spectrum of the young star HD 100546
observed with the Infrared Space Observatory. Astron. Astrophys, 332:25–28.
9
Manara, C. F., Morbidelli, A., and Guillot, T. (2018). Why do protoplanetary
disks appear not massive enough to form the known exoplanet population?
Astronomy and Astrophysics, 618:L3. 19, 20, 57
Marino, S., Carpenter, J., Wyatt, M. C., Booth, M., Casassus, S., Faramaz, V.,
Guzman, V., Hughes, A. M., Isella, A., Kennedy, G. M., Matra, L., Ricci, L.,
and Corder, S. (2018). A gap in the planetesimal disc around HD 107146 and
asymmetric warm dust emission revealed by ALMA. Monthly Notices of the
Royal Astronomical Society, 479(4):5423–5439. 95
Marino, S., Matra, L., Stark, C., Wyatt, M. C., Casassus, S., Kennedy, G.,
Rodriguez, D., Zuckerman, B., Perez, S., Dent, W. R. F., Kuchner, M., Hughes,
A. M., Schneider, G., Steele, A., Roberge, A., Donaldson, J., and Nesvold, E.
(2016). Exocometary gas in the HD 181327 debris ring. MNRAS, 460:2933–
2944. 95
Marois, C., Macintosh, B., Barman, T., Zuckerman, B., Song, I., Patience, J.,
Lafreniere, D., and Doyon, R. (2008). Direct imaging of multiple planets or-
biting the star HR 8799. Science, 322(5906):1348–1352. 5, 116, 117, 121, 135
Marois, C., Zuckerman, B., Konopacky, Q. M., Macintosh, B., and Barman, T.
(2010). Images of a fourth planet orbiting HR 8799. Nature, 468(7327):1080–
1083. 116, 117, 121
Marsh, K. A., Silverstone, M. D., Becklin, E. E., Koerner, D. W., Werner, M. W.,
Weinberger, A. J., and Ressler, M. E. (2002). MID-INFRARED IMAGES OF
THE DEBRIS DISK AROUND HD 141569. ApJ, 573:425–430. 83, 84, 90
169
REFERENCES
Masset, F. S. and Papaloizou, J. C. B. (2003). Runaway Migration and the
Formation of Hot Jupiters. The Astrophysical Journal, 588(1):494–508. 120
Mathis, J. S., Rumpl, W., and Nordsieck, K. H. (1977). THE SIZE DISTRIBU-
TION OF INTERSTELLAR GRAINS. Astrophysical Journal, 217:425–433.
17, 56, 79, 106
Matra, L., Marino, S., Kennedy, G. M., Wyatt, M. C., Oberg, K. I., and Wilner,
D. J. (2018). An Empirical Planetesimal Belt Radius-Stellar Luminosity Rela-
tion. ApJ, 859:72. 91
Matra, L., Panic, O., Wyatt, M. C., and Dent, W. R. F. (2015). CO mass upper
limits in the Fomalhaut ring - the importance of NLTE excitation in debris
discs and future prospects with ALMA. MNRAS, 447:3936–3947. 57
Mawet, D., Choquet, ., Absil, O., Huby, E., Bottom, M., Serabyn, E., Femenia,
B., Lebreton, J., Matthews, K., Gomez Gonzalez, C. A., Wertz, O., Carlo-
magno, B., Christiaens, V., Defrere, D., Delacroix, C., Forsberg, P., Habraken,
S., Jolivet, A., Karlsson, M., Milli, J., Pinte, C., Piron, P., Reggiani, M., Sur-
dej, J., and Vargas Catalan, E. (2017). CHARACTERIZATION OF THE
INNER DISK AROUND HD 141569 A FROM KECK/NIRC2 L-BAND VOR-
TEX CORONAGRAPHY. The Astronomical Journal, 153. 137
Mayama, S., Akiyama, E., Panic, O., Miley, J., Tsukagoshi, T., Muto, T., Dong,
R., de Leon, J., Mizuki, T., Oh, D., Hashimoto, J., Sai, J., Currie, T., Takami,
M., Grady, C. A., Hayashi, M., Tamura, M., and Inutsuka, S.-i. (2018). ALMA
Reveals a Misaligned Inner Gas Disk inside the Large Cavity of a Transitional
Disk. ApJ, 868(1):L3. 141
Meeus, G., Pinte, C., Woitke, P., Montesinos, B., Mendigutıa, I., Riviere-
Marichalar, P., Eiroa, C., Mathews, G. S., Vandenbussche, B., Howard, C. D.,
Roberge, A., Sandell, G., Duchene, G., Menard, F., Grady, C. A., Dent, W.
R. F., Kamp, I., Augereau, J. C., Thi, W. F., Tilling, I., Alacid, J. M., Andrews,
S., Ardila, D. R., Aresu, G., Barrado, D., Brittain, S., Ciardi, D. R., Danchi,
W., Fedele, D., de Gregorio-Monsalvo, I., Heras, A., Huelamo, N., Krivov, A.,
Lebreton, J., Liseau, R., Martin-Zaidi, C., Mora, A., Morales-Calderon, M.,
170
REFERENCES
Nomura, H., Pantin, E., Pascucci, I., Phillips, N., Podio, L., Poelman, D. R.,
Ramsay, S., Riaz, B., Rice, K., Solano, E., Walker, H., White, G. J., Williams,
J. P., Wright, G., and Collaboration, t. G. (2010). Gas in the protoplanetary
disc of HD 169142: Herschel’s view. A&A, 518(L124). 59
Mendigutıa, I., Oudmaijer, R. D., Garufi, A., Lumsden, S. L., Huelamo, N.,
Cheetham, A., De Wit, W. J., Norris, B., Olguin, F. A., and Tuthill, P.
(2017). The protoplanetary system HD 100546 in Hα polarized light from
SPHERE/ZIMPOL A bar-like structure across the disk gap? A&A, 608:A104.
47
Miley, J. M., Panic, O., Haworth, T. J., Pascucci, I., Wyatt, M., Clarke, C.,
Richards, A. M. S., and Ratzka, T. (2019). Asymmetric mid-plane gas in ALMA
images of HD 100546. Monthly Notices of the Royal Astronomical Society,
485(1):739–752. 30
MillanGabet, R., Schloerb, F. P., and Traub, W. A. (2001). Spatially Resolved
Circumstellar Structure of Herbig Ae/Be Stars in the NearInfrared. The As-
trophysical Journal, 546(1):358–381. 4
Min, M., Dullemond, C. P., Dominik, C., De Koter, A., and Hovenier, J. W.
(2009). Radiative transfer in very optically thick circumstellar disks. Astronomy
and Astrophysics, 497(1):155–166. 41, 105
Miotello, A. (2018). THE PUZZLE OF PROTOPLANETARY DISK MASSES.
PhD thesis. 16, 15
Miotello, A., Bruderer, S., and van Dishoeck, E. F. (2014). Protoplanetary disk
masses from CO isotopologue line emission. A&A, 572:A96. 15, 58
Miotello, A., Facchini, S., van Dishoeck, E. F., and Bruderer, S. (2018). Probing
the protoplanetary disk gas surface density distribution with 13 CO emission.
Astronomy & Astrophysics, 619:A113. 106
Miotello, A., van Dishoeck, E. F., Kama, M., and Bruderer, S. (2016). Determin-
ing protoplanetary disk gas masses from CO isotopologues line observations.
A&A, 594:A85. 58, 94
171
REFERENCES
Miotello, A., van Dishoeck, E. F., Williams, J. P., Ansdell, M., Guidi, G., Hoger-
heijde, M., Manara, C. F., Tazzari, M., Testi, L., van der Marel, N., and van
Terwisga, S. (2017). Lupus disks with faint CO isotopologues: low gas/dust or
high carbon depletion? A&A, 599:A113. 11
Monnier, J. D., Berger, J.-P., MillanGabet, R., Traub, W. A., Schloerb, F. P.,
Pedretti, E., Benisty, M., Carleton, N. P., Haguenauer, P., Kern, P., Labeye, P.,
Lacasse, M. G., Malbet, F., Perraut, K., Pearlman, M., and Zhao, M. (2006).
Few Skewed Disks Found in First ClosurePhase Survey of Herbig Ae/Be Stars.
The Astrophysical Journal, 647(1):444–463. 4
Moor, A., Abraham, P., Juhasz, A., Kiss, C., Pascucci, I., Kospal, ., Apai, D.,
Henning, T., Csengeri, T., and Grady, C. (2011). MOLECULAR GAS IN
YOUNG DEBRIS DISKS. ApJ, 740(1):L7. 93
Moor, A., Abraham, P., Kospal, A., Szabo, G. M., Apai, D., Balog, Z., Csen-
geri, T., Grady, C., Henning, T., Juhasz, A., Kiss, C., Pascucci, I., Szulagyi,
J., and Vavrek, R. (2013). A RESOLVED DEBRIS DISK AROUND THE
CANDIDATE PLANET-HOSTING STAR HD 95086. ApJ, 775(2):L51. 95
Moor, A., Cure, M., Kospal, A., Abraham, P., Csengeri, T., Eiroa, C., Gunawan,
D., Henning, T., Hughes, A. M., Juhasz, A., Pawellek, N., and Wyatt, M.
(2017). Molecular Gas in Debris Disks around Young A-type Stars. The As-
trophysical Journal, 849:123. 30, 35, 95, 138
Moor, A., Henning, T., Juhasz, A., Abraham, P., Balog, Z., Kospal, ., Pascucci,
I., Szabo, G. M., Vavrek, R., Cure, M., Csengeri, T., Grady, C., Gusten, R.,
and Kiss, C. (2015). DISCOVERY OF MOLECULAR GAS AROUND HD
131835 IN AN APEX MOLECULAR LINE SURVEY OF BRIGHT DEBRIS
DISKS. ApJ, 814(1):42. 82, 94, 95
Mordasini, C. (2018). Planetary Population Synthesis. In Deeg, H. J. and Bel-
monte, J. A., editors, Handbook of Exoplanets, pages 1–50. Springer Interna-
tional Publishing, Cham. 71
172
REFERENCES
Mordasini, C., Alibert, Y., Benz, W., Klahr, H., and Henning, T. (2012). Extra-
solar planet population synthesis IV. Correlations with disk metallicity, mass,
and lifetime. Astronomy & Astrophysics, 541:A97. 71
Mulders, G. D. (2013). Radiative transfer models of protoplanetary disks : theory
vs. observations. PhD thesis, Anton Pannekoek Institute for Astronomy (API).
16, 24
Mulders, G. D. (2018). Planet Populations as a Function of Stellar Properties.
In Deeg, H. J. and Belmonte, J. A., editors, Handbook of Exoplanets, pages
2009–2034. Springer, Cham. 102
Mulders, G. D., Paardekooper, S.-J., Panic, O., Dominik, C., van Boekel, R., and
Ratzka, T. (2013). Planet or Brown Dwarf? Inferring the Companion Mass
in HD 100546 from the Wall Shape using Mid-Infrared Interferometry. A&A,
557:A68. 47
Muley, D., Fung, J., and Van Der Marel, N. (2019). PDS 70: A Transition Disk
Sculpted by a Single Planet. The Astrophysical Journal Letters, 879:L2. 141
Natta, A., Prusti, T., Neri, R., Wooden, D., Grinin, V. P., and Mannings, V.
(2001). A reconsideration of disk properties in Herbig Ae stars. Astronomy
and Astrophysics, 371(1):186–197. 6
Natta, A., Testi, L., Calvet, N., Henning, T., Waters, R., and Wilner, D. (2006).
Dust in Proto-Planetary Disks: Properties and Evolution. University of Arizona
Press, Tucson. 9
Ndugu, N., Bitsch, B., and Jurua, E. (2019). Are the observed gaps in pro-
toplanetary discs caused by growing planets? Monthly Notices of the Royal
Astronomical Society, 488(3):3625–3633. 28
Oberg, K. I., Murray-Clay, R., and Bergin, E. A. (2011). The effects of snowlines
on C/O in planetary atmospheres. Astrophysical Journal Letters, 743(1):16.
14, 43, 102, 103, 104, 108, 109, 114, 116, 124
173
REFERENCES
Ormel, C. W. and Klahr, H. H. (2010). The effect of gas drag on the growth
of protoplanets: Analytical expressions for the accretion of small bodies in
laminar disks. Astronomy and Astrophysics, 520(5):43. 104
Panic, O. and Hogerheijde, M. R. (2009). Characterising discs around Herbig
Ae/Be stars through modelling of low-J 12CO lines. Astronomy and Astro-
physics, 508(2):707–716. 54, 60
Panic, O., Holland, W. S., Wyatt, M. C., Kennedy, G. M., Matthews, B. C.,
Lestrade, J. F., Sibthorpe, B., Greaves, J. S., Marshall, J. P., Phillips, N. M.,
and Tottle, J. (2013). First results of the SONS survey: submillimetre de-
tections of debris discs. Monthly Notices of the Royal Astronomical Society,
435:1037–1046. 16, 29, 82
Panic, O. and Min, M. (2017). Effects of disc mid-plane evolution on CO snowline
location. Monthly Notices of the Royal Astronomical Society, 467:1175–1185.
56, 58, 68, 103, 104, 107, 120
Panic, O., Ratzka, T., Mulders, G. D., Dominik, C., van Boekel, R., Henning, T.,
Jaffe, W., and Min, M. (2014). Resolving HD 100546 disc in the mid-infrared:
Small inner disc and asymmetry near the gap. Astronomy & Astrophysics,
562:A101. 27, 47, 53, 63
Panic, O., Van Dishoeck, E. F., Hogerheijde, M. R., Belloche, A., Gusten, R.,
Boland, W., and Baryshev, A. (2010). Observations of warm molecular gas
and kinematics in the disc around HD 100546. Astronomy and Astrophysics,
519(12). 54
Pascucci, I. and Sterzik, M. (2009). Evidence for disk photoevaporation driven
by the central star. Astrophysical Journal, 702(1):724–732. 4
Pascucci, I., Testi, L., Herczeg, G. J., Long, F., Manara, C. F., Hendler, N., Mul-
ders, G. D., Krijt, S., Ciesla, F., Henning, T., Mohanty, S., Drabek-Maunder,
E., Apai, D., Szucs, L., Sacco, G., and Olofsson, J. (2016). A STEEPER
THAN LINEAR DISK MASS-STELLAR MASS SCALING RELATION. The
Astrophysical Journal, 831. 16, 12, 102
174
REFERENCES
Paxton, B., Bildsten, L., Dotter, A., Herwig, F., Lesaffre, P., and Timmes, F.
(2010). Modules for Experiments in Stellar Astrophysics (MESA). The Astro-
physical Journal Supplement Series, 192(1):3. 17, 34
Paxton, B., Bildsten, L., Dotter, A., Herwig, F., Lesaffre, P., and Timmes, F.
(2011). Modules for Experiments in Stellar Astrophysics (MESA). Astrophys-
ical Journal, Supplement Series, 192(1):3. 105
Paxton, B., Cantiello, M., Arras, P., Bildsten, L., Brown, E. F., Dotter, A.,
Mankovich, C., Montgomery, M. H., Stello, D., Timmes, F. X., and Townsend,
R. (2013). Modules for Experiments in Stellar Astrophysics (MESA): Giant
Planets, Oscillations, Rotation, and Massive Stars. The Astrophysical Journal
Supplement Series, 208(1):4. 105
Pearson, T. J. and Readhead, A. C. S. (1984). Image Formation by Self-
Calibration in Radio Astronomy. Annual Review of Astronomy and Astro-
physics, 22(1):97–130. 40
Perez, L. M., Carpenter, J. M., Andrews, S. M., Ricci, L., Isella, A., Linz, H.,
Sargent, A. I., Wilner, D. J., Henning, T., Deller, A. T., Chandler, C. J.,
Dullemond, C. P., Lazio, J., Menten, K. M., Corder, S. A., Storm, S., Testi, L.,
Tazzari, M., Kwon, W., Calvet, N., Greaves, J. S., Harris, R. J., and Mundy,
L. G. (2016). Spiral density waves in a young protoplanetary disk. Science,
353(6307):1519–1521. 140
Perez, L. M., Carpenter, J. M., Chandler, C. J., Isella, A., Andrews, S. M., Ricci,
L., Calvet, N., Corder, S. A., Deller, A. T., Dullemond, C. P., Greaves, J. S.,
Harris, R. J., Henning, T., Kwon, W., Lazio, J., Linz, H., Mundy, L. G., Sar-
gent, A. I., Storm, S., Testi, L., and Wilner, D. J. (2012). CONSTRAINTS
ON THE RADIAL VARIATION OF GRAIN GROWTH IN THE AS 209 CIR-
CUMSTELLAR DISK. ApJ, 760(1):L17. 78
Perez, S., Casassus, S., Hales, A., Marino, S., Cheetham, A., Zurlo, A., Cieza,
L., Dong, R., Alarcon, F., Benıtez-Llambay, P., and Fomalont, E. (2019). Long
baseline observations of HD100546 with ALMA: a possible circumplanetary
disk detected in dust continuum and gas kinematics. 60
175
REFERENCES
Pericaud, J., Di Folco, E., Dutrey, A., Guilloteau, S., and Pietu, V. (2017).
The hybrid disks: a search and study to better understand evolution of disks.
Astronomy & Astrophysics, 600:A62. 17, 31, 32, 35, 82, 83, 94, 137, 138
Perrot, C., Boccaletti, A., Pantin, E., Augereau, J.-C., Lagrange, A.-M., Galicher,
R., Maire, A.-L., Mazoyer, J., Milli, J., Rousset, G., Gratton, R., Bonnefoy,
M., Brandner, W., Buenzli, E., Langlois, M., Lannier, J., Mesa, D., Peretti, S.,
Salter, G., Sissa, E., Chauvin, G., Desidera, S., Feldt, M., Vigan, A., Di Folco,
E., Dutrey, A., Pericaud, J., Baudoz, P., Benisty, M., De Boer, J., Garufi,
A., Girard, J. H., Menard, F., Olofsson, J., Quanz, S. P., Mouillet, D., Chris-
tiaens, V., Casassus, S., Beuzit, J.-L., Blanchard, P., Carle, M., Fusco, T.,
Giro, E., Hubin, N., Maurel, D., Moeller-Nilsson, O., Sevin, A., and Weber, L.
(2016). Discovery of concentric broken rings at sub-arcsec separations in the
HD 141569A gas-rich, debris disk with VLT/SPHERE. A&A, 590:L7. 22, 84,
85, 89, 90, 96, 97, 98, 137, 140, 141
Pietu, V., Dutrey, A., Guilloteau, S., Chapillon, E., and Pety, J. (2006). Resolving
the inner dust disks surrounding LkCa 15 and MWC 480 at mm wavelengths.
Astronomy and Astrophysics, 460(3). 113
Pineda, J. E., Quanz, S. P., Meru, F., Mulders, G. D., Meyer, M. R., Panic, O.,
and Avenhaus, H. (2014). Resolved images of the protoplanetary disk around
HD 100546 with ALMA. ApJL, 788. 47, 53, 54, 62
Pineda, J. E., Szulagyi, J., Quanz, S. P., van Dishoeck, E. F., Garufi, A., Meru,
F., Mulders, G. D., Testi, L., Meyer, M. R., and Reggiani, M. (2019). High-
resolution ALMA Observations of HD 100546: Asymmetric Circumstellar Ring
and Circumplanetary Disk Upper Limits. The Astrophysical Journal, 871(1):48.
63
Pinilla, P., Benisty, M., and Birnstiel, T. (2012a). Ring shaped dust accumulation
in transition disks. Astronomy & Astrophysics, 545:A81. 17
Pinilla, P., Benisty, M., Birnstiel, T., Ricci, L., Isella, A., Natta, A., Dullemond,
C. P., Quiroga-Nunez, L. H., Henning, T., and Testi, L. (2014). Millimetre
176
REFERENCES
spectral indices of transition disks and their relation to the cavity radius. As-
tronomy & Astrophysics, 564:A51. 22, 74, 87
Pinilla, P., Birnstiel, T., Ricci, L., Dullemond, C. P., Uribe, A. L., Testi, L., and
Natta, A. (2012b). Trapping dust particles in the outer regions of protoplane-
tary disks. A&A, 538:A114. 17, 66, 67, 91, 130
Pinte, C., Price, D. J., Menard, F., Duchene, G., Dent, W. R. F., Hill, T.,
De Gregorio-Monsalvo, I., Hales, A., and Mentiplay, D. (2018). Kinematic Ev-
idence for an Embedded Protoplanet in a Circumstellar Disk. The Astrophysical
Journal Letters, 860:L13. 141
Pinte, C., van der Plas, G., Menard, F., Price, D. J., Christiaens, V., Hill, T.,
Mentiplay, D., Ginski, C., Choquet, E., Boehler, Y., Duchene, G., Perez, S.,
and Casassus, S. (2019). Kinematic detection of a planet carving a gap in a
protoplanetary disk. 141, 142
Piso, A. M. A., Oberg, K. I., Birnstiel, T., and Murray-Clay, R. A. (2015). C/O
and snowline locations in protoplanetary disks: The effect of radial drift and
viscous gas accretion. Astrophysical Journal, 815(2). 143
Piso, A.-M. A., Pegues, J., and Oberg, K. I. (2016). The role of ice compositions
for snowlines and the C/N/O ratios in active disks. The Astrophysical Journal,
833(2):203. 44, 108, 109, 143
Pontoppidan, K. M. (2006). Spatial mapping of ices in the Ophiuchus-F core A
direct measurement of CO depletion and the formation of CO2. Astronomy
and Astrophysics, 453(3):47–50. 124
Price, D. J., Cuello, N., Pinte, C., Mentiplay, D., Casassus, S., Christiaens, V.,
Kennedy, G. M., Cuadra, J., Sebastian Perez, M., Marino, S., Armitage, P. J.,
Zurlo, A., Juhasz, A., Ragusa, E., Laibe, G., and Lodato, G. (2018). Circumbi-
nary, not transitional: on the spiral arms, cavity, shadows, fast radial flows,
streamers, and horseshoe in the HD 142527 disc. MNRAS, 477:1270–1284. 28,
60, 63
177
REFERENCES
Qi, C., Oberg, K. I., Andrews, S. M., Wilner, D. J., Bergin, E. A., Hughes,
A. M., Hogherheijde, M., and D’alessio, P. (2015). CHEMICAL IMAGING
OF THE CO SNOW LINE IN THE HD 163296 DISK. The Astrophysical
Journal, 813:128. 59, 112, 113
Qi, C., Oberg, K. I., Espaillat, C. C., Robinson, C. E., Andrews, S. M., Wilner,
D. J., Blake, G. A., Bergin, E. A., and Cleeves, L. I. (2019). Probing CO
and N 2 Snow Surfaces in Protoplanetary Disks with N 2 H + Emission. The
Astrophysical Journal, 882:160. 111, 112, 143
Qi, C., Oberg, K. I., and Wilner, D. J. (2013). H2CO and N2H+ in protoplanetary
disks: EVIDENCE for a CO-ice regulated chemistry. Astrophysical Journal,
765(1):34. 59, 112
Quanz, S. P., Amara, A., Meyer, M. R., Girard, J. H., Kenworthy, M. A., and
Kasper, M. (2015). CONFIRMATION AND CHARACTERIZATION OF THE
PROTOPLANET HD 100546 b - DIRECT EVIDENCE FOR GAS GIANT
PLANET FORMATION AT 50 AU. ApJ, 807(1):64. 46, 58, 71, 135
Quanz, S. P., Amara, A., Meyer, M. R., Kenworthy, M. A., Kasper, M., and
Girard, J. H. (2013). A young protoplanet candidate embedded in the circum-
stellar disk of HD100546. ApJL, 766(1):5. 135
Quillen, A. C. (2006). The Warped Circumstellar Disk of HD 100546. ApJ,
640(2):1078–1085. 54
Quillen, A. C., Varniere, P., Minchev, I., and Frank, A. (2005). DRIVING SPI-
RAL ARMS IN THE CIRCUMSTELLAR DISKS OF HD 100546 AND HD
141569A. The Astronomical Journal, 129:2481–2495. 141
Raghavan, D., Mcalister, H. A., Henry, T. J., Latham, D. W., Marcy, G. W.,
Mason, B. D., Gies, D. R., White, R. J., and Ten Brummelaar, T. A. (2010).
A SURVEY OF STELLAR FAMILIES: MULTIPLICITY OF SOLAR-TYPE
STARS. The Astrophysical Journal Supplement Series, 190:1–42. 3
178
REFERENCES
Rameau, J., Follette, K. B., Pueyo, L., Marois, C., Macintosh, B., Millar-
Blanchaer, M., Wang, J. J., Vega, D., Doyon, R., Lafreniere, D., Nielsen,
E. L., Bailey, V., Chilcote, J. K., Close, L. M., Esposito, T. M., Males, J. R.,
Metchev, S., Morzinski, K. M., Ruffio, J.-B., Wolff, S. G., Ammons, S. M., Bar-
man, T. S., Bulger, J., Cotten, T., De Rosa, R. J., Duchene, G., Fitzgerald,
M. P., Goodsell, S., Graham, J. R., Greenbaum, A. Z., Hibon, P., Hung, L.-
W., Ingraham, P., Kalas, P., Konopacky, Q., Larkin, J. E., Maire, J., Marchis,
F., Oppenheimer, R., Palmer, D., Patience, J., Perrin, M. D., Poyneer, L.,
Rajan, A., Rantakyro, F. T., Marley, M. S., Savransky, D., Schneider, A. C.,
Sivaramakrishnan, A., Song, I., Soummer, R., Thomas, S., Wallace, J. K.,
Ward-Duong, K., and Wiktorowicz, S. (2017). An Optical/Near-infrared In-
vestigation of HD 100546 b with the Gemini Planet Imager and MagAO. The
Astronomical Journal, 153:244–9. 135
Rau, U. and Cornwell, T. J. (2011). A multi-scale multi-frequency deconvolution
algorithm for synthesis imaging in radio interferometry. A&A, 532:A71. 39,
49, 84
Reche, R., Beust, H., and Augereau, J.-C. (2009). Investigating the flyby scenario
for the HD 141569 system. A&A, 493(2):661–669. 84, 89
Reffert, S., Bergmann, C., Quirrenbach, A., Trifonov, T., and Kunstler, A. (2014).
Precise Radial Velocities of Giant Stars VII. Occurrence Rate of Giant Extraso-
lar Planets as a Function of Mass and Metallicity. Astronomy & Astrophysics,
574:116. 35, 102, 105, 138
Remijan, A., Biggs, A., Cortes, P., A., Dent, B., Di Francesco, J., Fomalont, E.,
Hales, A., Kameno, S., Mason, B., Philips, N., Saini, K., Stoehr, F., Vilaro,
V. B., and Villard, E. (2019). ALMA Technical Handbook. Alma doc. edition.
39
Ricci, L., Carpenter, J. M., Fu, B., Hughes, A. M., Corder, S., and Isella, A.
(2015). ALMA OBSERVATIONS OF THE DEBRIS DISK AROUND THE
YOUNG SOLAR ANALOG HD 107146. ApJ, 798(2):124. 95
179
REFERENCES
Ricci, L., Trotta, F., Testi, L., Natta, A., Isella, A., and Wilner, D. J. (2012).
The effect of local optically thick regions in the long-wave emission of young
circumstellar disks. A&A, 540:A6. 22, 74
Richert, A. J. W., Lyra, W., and Kuchner, M. (2018). The interplay between
radiation pressure and the photoelectric instability in optically thin disks of
gas and dust. The Astrophysical Journal, 856:41. 141
Roberge, A., Kamp, I., Montesinos, B., Dent, W. R. F., Meeus, G., Donaldson,
J. K., Olofsson, J., Moor, A., Augereau, J.-C., Howard, C., Eiroa, C., Thi,
W.-F., Ardila, D. R., Sandell, G., and Woitke, P. (2013). HERSCHEL OB-
SERVATIONS OF GAS AND DUST IN THE UNUSUAL 49 Ceti DEBRIS
DISK. ApJ, 771(1):69. 82
Rodrıguez, L. F., Curiel, S., Moran, J. M., Mirabel, I. F., Roth, M., and Garay,
G. (1989). LARGE PROPER MOTIONS IN THE REMARKABLE TRIPLE
RADIO SOURCE IN SERPENS. Technical report. 87
Sadakane, K. (2006). λ Bootis-like abundances in the vega-like, γ doradus
type-pulsator HD 218396. Publications of the Astronomical Society of Japan,
58(6):1023–1032. 116, 121
Sana, H., De Mink, S. E., De Koter, A., Langer, N., Evans, C. J., Gieles, M., Gos-
set, E., Izzard, R. G., Le Bouquin, J. B., and Schneider, F. R. (2012). Binary
interaction dominates the evolution of massive stars. Science, 337(6093):444–
446. 4
Sandell, G., Weintraub, D. A., and Hamidouche, M. (2011). A SUBMILLIME-
TER MAPPING SURVEY OF HERBIG AeBe STARS. ApJ, 727(1):26. 82
Schoonenberg, D. and Ormel, C. W. (2017). Planetesimal formation near the
snowline: In or out? Astronomy and Astrophysics, 602:A21. 131
Schwarz, K. R., Bergin, E. A., Cleeves, L. I., Blake, G. A., Zhang, K., Oberg,
K. I., van Dishoeck, E. F., and Qi, C. (2016). THE RADIAL DISTRIBUTION
OF H 2 AND CO IN TW HYA AS REVEALED BY RESOLVED ALMA
OBSERVATIONS OF CO ISOTOPOLOGUES. ApJ, 823(2):91. 58, 73, 91
180
REFERENCES
Schwarz, K. R., Teague, R., and Bergin, E. A. (2019). Line Ratios Reveal N2H+
Emission Originates Above the Midplane in TW Hydrae. The Astrophysical
Journal, 881(2):L44. 113
Shakura, N. I. and Sunyaev, R. A. (1973). Astronomy and Astrophysics. Astron-
omy and Astrophysics, 24:337–355. 9
Skrutskie, M. F., Dutkevitch, D., Strom, S. E., Edwards, S., Strom, K. M., and
Shure, M. A. (1990). A sensitive 10-micron search for emission arising from
circumstellar dust associated with solar-type pre-main-sequence stars. The
Astronomical Journal, 99(4):1187. 26
Stammler, S. M., Birnstiel, T., Panic, O., Dullemond, C. P., and Dominik, C.
(2017). Redistribution of CO at the location of the CO ice line in evolving gas
and dust disks. Astronomy and Astrophysics, 600:140. 103
Strom, K. M., Strom, S. E., Edwards, S., Cabrit, S., and Skrutskie, M. F. (1989).
Circumstellar material associated with solar-type pre-main-sequence stars - A
possible constraint on the timescale for planet building. The Astronomical
Journal, 97:1451. 26
Sylvester, R. J., Skinner, C. J., Barlow, M. J., and Mannings, V. (1996). Op-
tical, infrared and millimetre-wave properties of Vega-like systems. MNRAS,
279(3):915–939. 82
Takeuchi, T. and Artymowicz, P. (2001). DUST MIGRATION AND MOR-
PHOLOGY IN OPTICALLY THIN CIRCUMSTELLAR GAS DISKS. ApJ,
557:990–1006. 89
Takeuchi, T. and Lin, D. N. C. (2005). Attenuation of Millimeter Emission from
Circumstellar Disks Induced by the Rapid Dust Accretion. ApJ, 623(1):482–
492. 18, 89
Tazzari, M., Testi, L., Ercolano, B., Natta, A., Isella, A., Chandler, C. J., Perez,
L. M., Andrews, S., Wilner, D. J., Ricci, L., Henning, T., Linz, H., Kwon,
W., Corder, S. A., Dullemond, C. P., Carpenter, J. M., Sargent, A. I., Mundy,
L., Storm, S., Calvet, N., Greaves, J. A., Lazio, J., and Deller, A. T. (2016).
181
REFERENCES
Multiwavelength analysis for interferometric (sub-)mm observations of proto-
planetary disks. A&A, 588:A53. 78
Tazzari, M., Testi, L., Natta, A., Ansdell, M., Carpenter, J., Guidi, G., Hogerhei-
jde, M., Manara, C. F., Miotello, A., Van Der Marel, N., Van Dishoeck, E. F.,
and Williams, J. P. (2017). Physical properties of dusty protoplanetary disks
in Lupus: evidence for viscous evolution? A&A, 606:88. 28
Testi, L., Birnstiel, T., Ricci, L., Andrews, S., Blum, J., Carpenter, J., Dominik,
C., Isella, A., Natta, A., Williams, J., and Wilner, D. (2014). Dust Evolution
in Protoplanetary Disks. Protostars and Planets VI, Henrik Beuther, Ralf S.
Klessen, Cornelis P. Dullemond, and Thomas Henning (eds.), University of
Arizona Press, Tucson, 914 pp., p.339-361, pages 339–361. 17
The, P. S., de Winter, D., and Perez, M. R. (1994). A new catalogue of members
and candidate members of the Herbig Ae/Be (HAEBE) stellar group. Astron-
omy & Astrophysics Supplement Series, 104:315–339. 33
Thi, W. F., Pinte, C., Pantin, E., Augereau, J. C., Meeus, G., Menard, F.,
Martin-Zaıdi, C., Woitke, P., Riviere-Marichalar, P., Kamp, I., Carmona, A.,
Sandell, G., Eiroa, C., Dent, W., Montesinos, B., Aresu, G., Meijerink, R.,
Spaans, M., White, G., Ardila, D., Lebreton, J., Mendigutıa, I., and Brittain,
S. (2014). Gas lines from the 5-Myr old optically thin disk around HD 141569A
Herschel observations and modeling. A&A, 561:A50. 83, 93
Thompson, A. R., Moran, J. M., and Swenson, G. W. (2017). Van CittertZernike
Theorem, Spatial Coherence, and Scattering. In Interferometry and Synthesis
in Radio Astronomy, pages 767–786. Springer, Cham. 36
Tobin, J. J., Sheehan, P. D., Megeath, S. T., Dıaz-Rodrıguez, A. K., Offner,
S. S. R., Murillo, N. M., van t Hoff, M. L. R., van Dishoeck, E. F., Osorio,
M., Anglada, G., Furlan, E., Stutz, A. M., Reynolds, N., Karnath, N., Fischer,
W. J., Persson, M., Looney, L. W., Li, Z.-Y., Stephens, I., Chandler, C. J., Cox,
E., Dunham, M. M., Tychoniec, ., Kama, M., Kratter, K., Kounkel, M., Mazur,
B., Maud, L., Patel, L., Perez, L., Sadavoy, S. I., Segura-Cox, D., Sharma, R.,
Stephenson, B., Watson, D. M., and Wyrowski, F. (2020). The VLA/ALMA
182
REFERENCES
Nascent Disk and Multiplicity (VANDAM) Survey of Orion Protostars. II. A
Statistical Characterization of Class 0 and Class I Protostellar Disks. The
Astrophysical Journal, 890(2):130. 25
Toomre, A. (1964). On The Gravitational Stability of a Disk of Stars. ApJ,
139:1217–1238. 66
Trapman, L., Facchini, S., Hogerheijde, M. R., van Dishoeck, E. F., and Brud-
erer, S. (2019). Gas versus dust sizes of protoplanetary discs: effects of dust
evolution. Astronomy & Astrophysics, 629:A79. 12
Trotta, F., Testi, L., Natta, A., Isella, A., and Ricci, L. (2013). Constraints on
the radial distribution of the dust properties in the CQ Tauri protoplanetary
disk. A&A, 558:A64. 78
van den Ancker, M. E., The, P. S., Tjin, H. R. E., Djie, A., Catala, C., De Winter,
D., Blondel, P. F. C., and Waters, L. B. F. M. (1997). Hipparcos data on Herbig
Ae/Be stars: an evolutionary scenario. A&A, 324:33–36. 46
Van Der Marel, N., Cazzoletti, P., Pinilla, P., and Garufi, A. (2016). VORTICES
AND SPIRALS IN THE HD 135344B TRANSITION DISK. ApJ, 823:178. 60
van der Marel, N., Pinilla, P., Tobin, J., Kempen, T. v., Andrews, S., Ricci, L.,
Birnstiel, T., Ataiee S., Pinilla P., Z. A. e. a., J., B. P., Sommeria, Baryshev
A. M., Hesper R., M. F. P. e. a., Birnstiel T., D. C. P., F., B., Birnstiel T., D.
C. P., P., P., Brauer F., D. C. P., T., H., Brown J. M., Rosenfeld K. A., A. S.
M. W. D. J., van Dishoeck E. F., Bruderer S., van der Marel N., v. D. E. F.,
van Kempen T. A., Casassus S., van der Plas G., M. S. P. e. a., T., D. B.,
Espaillat C., Muzerolle J., N. J. e. a. e. B. H. e. a., Flock M., Ruge J. P., D. N.
e. a., Follette K. B., Grady C. A., S. J. R. e. a., Fukagawa M., Tsukagoshi T.,
M. M. e. a., Fung J., S. J.-M., E., C., Geers V. C., Pontoppidan K. M., v. D. E.
F. e. a., Johansen A., Y. A., H., K., T., K. H. H., Henning, M.-K., L. W., Lin,
Marino S., P. S., S., C., Perez L. M., Isella A., C. J. M., J., C. C., Perez S.,
Casassus S., M. F. e. a., Pinilla P., Birnstiel T., R. L. e. a., Pinilla P., de Juan
Ovelar M., A. S. e. a., Raettig N., L. W., H., K., Rodmann J., Henning T., C.
C. J. M. L. G., J., W. D., Ubach C., Maddison S. T., W. C. M. e. a., van der
183
REFERENCES
Marel N., van Dishoeck E., B. S. e. a., van der Marel N., van Dishoeck E., B.
S. P. L. M., A., I., van der Marel N., van Dishoeck E. F., B. S. e. a., J., W. S.,
A., W. F. L. e. E., Windmark F., Birnstiel T., G. C. e. a., Zhang K., Isella A.,
C. J. M., A., B. G., M., Z. Z., and J., S. (2015). A CONCENTRATION OF
CENTIMETER-SIZED GRAINS IN THE OPHIUCHUS IRS 48 DUST TRAP.
Astrophysical Journal, 810(1):L7. 17, 23
van der Marel, N., van Dishoeck, E. F., Bruderer, S., Andrews, S. M., Pon-
toppidan, K. M., Herczeg, G. J., van Kempen, T., and Miotello, A. (2016).
Resolved gas cavities in transitional disks inferred from CO isotopologs with
ALMA. A&A, 585:A58. 27, 137
van der Marel, N., van Dishoeck, E. F., Bruderer, S., Birnstiel, T., Pinilla, P.,
Dullemond, C. P., van Kempen, T. A., Schmalzl, M., Brown, J. M., Herczeg,
G. J., Mathews, G. S., and Geers, V. (2013). A Major Asymmetric Dust Trap
in a Transition Disk. Science, 340(6137):1199–1202. 60, 91
van der Marel, N., Williams, J. P., Ansdell, M., Manara, C. F., Miotello, A.,
Tazzari, M., Testi, L., Hogerheijde, M., Bruderer, S., van Terwisga, S., and van
Dishoeck, E. F. (2018). New insights into the nature of transition disks from
a complete disk survey of the Lupus star forming region. The Astrophysical
Journal, 854(2):177. 28
van der Plas, G., Menard, F., Gonzalez, J. F., Perez, S., Rodet, L., Pinte, C.,
Cieza, L., Casassus, S., and Benisty, M. (2019). ALMA study of the HD 100453
AB system and the tidal interaction of the companion with the disk. Astronomy
& Astrophysics, 624:A33. 27
van der Tak, F. F. S., Black, J. H., Schoier, F. L., Jansen, D. J., and van Dishoeck,
E. F. (2007). A computer program for fast non-LTE analysis of interstellar line
spectra. A&A, 468(2):627–635. 91
van Dishoeck, E. F. and Black, J. H. (1988). The Photodissociation and Chem-
istry of Interstellar CO. The Astrophysical Journal, 334:771–802. 14
184
REFERENCES
Verhoeff, A. P., Min, M., Pantin, E., Waters, L. B., Tielens, A. G., Honda, M.,
Fujiwara, H., Bouwman, J., Van Boekel, R., Dougherty, S. M., De Koter, A.,
Dominik, C., and Mulders, G. D. (2011). The complex circumstellar environ-
ment of HD142527. Astronomy and Astrophysics, 528:91. 4
Vericel, A. and Gonzalez, J. F. (2020). Self-induced dust traps around snow lines
in protoplanetary discs. Monthly Notices of the Royal Astronomical Society,
492(1):210–222. 131
Vioque, M., Oudmaijer, R. D., Baines, D., Mendigutıa, I., and Perez-Martınez,
R. (2018). Gaia DR2 study of Herbig Ae/Be stars. A&A, 620:128. 33, 46
Visser, R., van Dishoeck, E. F., and Black, J. H. (2009). The photodissociation
and chemistry of CO isotopologues: applications to interstellar clouds and
circumstellar disks. A&A, 503(2):323–343. 15, 94
Wagner, K., Follete, K. B., Close, L. M., Apai, D., Gibbs, A., Keppler, M., Muller,
A., Henning, T., Kasper, M., Wu, Y.-L., Long, J., Males, J., Morzinski, K., and
Mcclure, M. (2018). Magellan Adaptive Optics Imaging of PDS 70: Measuring
the Mass Accretion Rate of a Young Giant Planet within a Gapped Disk. The
Astrophysical Journal Letters, 863:L8. 28
Walsh, C., Daley, C., Facchini, S., and Juhasz, A. (2017). Astronomy &
Astrophysics CO emission tracing a warp or radial flow within 100 au in the
HD 100546 protoplanetary disk. Astronomy & Astrophysics, 607:A114. 54, 63,
142
Walsh, C., Juhasz, A., Meeus, G., Dent, W. R. F., Maud, L. T., Aikawa, Y.,
Millar, T. J., and Nomura, H. (2016). ALMA REVEALS THE ANATOMY
OF THE mm-SIZED DUST AND MOLECULAR GAS IN THE HD 97048
DISK. Astrophysical Journal, 831:200. 34
Walsh, C., Juhasz, A., Pinilla, P., Harsono, D., Mathews, G. S., Dent, W. R. F.,
Hogerheijde, M. R., Birnstiel, T., Meeus, G., Nomura, H., Aikawa, Y., Millar,
T. J., and Sandell, G. (2014a). ALMA hints at the presence of two companions
in the disk around HD 100546. ApJL, 791:L6. 20, 35, 47, 49, 50, 52, 53, 54,
57, 62, 71, 74, 75, 76, 77, 78
185

REFERENCES
Walsh, C., Millar, T. J., Nomura, H., Herbst, E., Weaver, S. W., Aikawa, Y.,
Laas, J. C., and Vasyunin, A. I. (2014b). Complex organic molecules in proto-
planetary disks. Astronomy & Astrophysics, 563:33. 108
Wehrse, R., Baschek, B., and Von Waldenfels, W. (2000). The diffusion of radi-
ation in moving media I. Basic assumptions and formulae. Astron. Astrophys,
359:780–787. 43
Weidenschilling, S. J. (1977). Aerodynamics of solid bodies in the solar nebula.
Monthly Notices of the Royal Astronomical Society, 180:57–70. 16, 17
Weinberger, A. J., Becklin, E. E., Schneider, G., Smith, B. A., Lowrance, P. J.,
Silverstone, M. D., Zuckerman, B., and Terrile, R. J. (1999). THE CIRCUM-
STELLAR DISK OF HD 141569 IMAGED WITH NICMOS. ApJ, 525:53–56.
82
Weinberger, A. J., Rich, R. M., Becklin, E. E., Zuckerman, B., and Matthews, K.
(2000). Stellar Companions and the Age of HD 141569 and Its Circumstellar
Disk. ApJ, 544(2):937–943. 82
Whipple, F. L. (1972). On Certain Aerodynamic Processed for Asteroids and
Comets. In Elvius, A., editor, From Plasma to Planet, page 211, Saltsjobaden.
Wiley Interscience Division. 17
White, J. A., Boley, A. C., Hughes, A. M., Flaherty, K. M., Ford, E., Wilner, D.,
Corder, S., and Payne, M. (2016). ALMA OBSERVATIONS OF HD 141569s
CIRCUMSTELLAR DISK. Astrophysical Journal, 829(1):6. 57, 59, 82, 83, 84,
85, 90, 93
White, J. A., Boley, A. C., MacGregor, M. A., Hughes, A. M., and Wilner, D. J.
(2018). ALMA and VLA Observations of the HD 141569 System. MNRAS,
474:4500–4506. 22, 84, 87
Williams, J. P., Blitz, L., and Mckee, C. F. (2000). THE STRUCTURE AND
EVOLUTION OF MOLECULAR CLOUDS: FROM CLUMPS TO CORES
TO THE IMF. In Mannings, V., Boss, A. P., and Russell, S. S., editors, PPIV.
University of Arizona Press. 3
186
REFERENCES
Wilner, D. J., Bourke, T. L., Wright, C. M., Jørgensen, J. K., Van Dishoeck,
E. F., and Wong, T. (2003). DISKS AROUND THE YOUNG STARS TW
HYDRAE AND HD 100546 IMAGED AT 3.4 MILLIMETERS WITH THE
AUSTRALIA TELESCOPE COMPACT ARRAY. ApJ, 596:597. 78
Wilson, T. L. (1999). Isotopes in the interstellar medium and circumstellar en-
velopes. RPPh, 62(2):143–185. 73
Wilson, T. L. and Rood, R. T. (1994). Abundances in the Interstellar Medium.
ARA&A, 32(1):191–226. 15, 58, 93, 94
Woitke, P., Kamp, I., and F. Thi, W. (2009). Radiation thermo-chemical models
of protoplanetary disks: I. Hydrostatic disk structure and inner rim. Astronomy
and Astrophysics, 501(1):383–406. 124
Wright, C. M., Maddison, S. T., Wilner, D. J., Burton, M. G., Lommen, D.,
van Dishoeck, E. F., Pinilla, P., Bourke, T. L., Menard, F., and Walsh, C.
(2015). Resolving structure of the disc around HD100546 at 7 mm with ATCA.
MNRAS, 453(1):414–438. 18, 19, 47, 48, 56, 60, 63, 78, 79, 87
Wyatt, M. C. (2003). Resonant Trapping of Planetesimals by Planet Migra-
tion: Debris Disk Clumps and Vegas Similarity to the Solar System. ApJ,
598(2):1321–1340. 91
Wyatt, M. C. (2005). Spiral structure when setting up pericentre glow: possible
giant planets at hundreds of AU in the HD 141569 disk. A&A, 440(3):937–948.
84
Wyatt, M. C., Panic, O., Kennedy, G. M., and Matra, L. (2015). Five steps in
the evolution from protoplanetary to debris disk. ApASS, 357(2):103. 16, 29,
30, 82
Youdin, A. N. and Goodman, J. (2005). Streaming Instabilities in Protoplanetary
Disks. The Astrophysical Journal, 620(1):459–469. 104
Yu, M., Willacy, K., Dodson-Robinson, S. E., Turner, N. J., and Evans Ii, N. J.
(2016). PROBING PLANET FORMING ZONES WITH RARE CO ISO-
TOPOLOGUES. ApJ, 822:53. 16
187