it service management: process capability ... - core
TRANSCRIPT

IT SERVICE MANAGEMENT: PROCESS CAPABILITY,
PROCESS PERFORMANCE, AND BUSINESS
PERFORMANCE
A Thesis submitted by
Suren Behari
BS (UKZN), PGCert in e-Business (USQ), MBA (USQ)
For the award of
Doctor of Philosophy
2018

i
Abstract
As technology is at the core of almost every leading industry, organizations are
increasingly scrutinizing their Information Technology (IT) group’s performance so
that it is more in line with overall business performance and contributes to the
business’ bottom line. Many IT departments are not equipped to meet these increasing
IT service demands. They continue to operate as passive-reactive service providers,
utilizing antiquated methods that do not adequately provide the quality, real-time
solutions that organizations need to be competitive.
Organizations need efficient Information Technology Service Management (ITSM)
processes in order to cut costs, but ironically, in order to implement highly capable
processes, there are significant costs involved, both in terms of time and resources.
A potential way to achieve better performing and higher capable processes is to employ
methods to compare an organization’s processes against best-practice standards to
identify gaps and receive guidance to improve the processes. Many of the existing
methods require large investments.
Holding back progress towards best practice for financial benefit in the IT industry is
the reluctance of many IT organizations to embrace the business side (specifically
Service Portfolio Management and IT Financial Management) aspects of ITSM.
Service Portfolio Management (SPM) is used to manage investments in Service
Management across an organization, in terms of financial values. SPM enables
managers to assess the quality requirements and associated costs. IT Financial
Management aims to provide information on the IT assets and resources used to deliver
IT services. Providing a Service Portfolio and practicing IT Financial Management
requires a high level of maturity for an organization. It seems reasonable and logical
that the organization’s Chief Information Officer should be able to articulate and
justify the IT services provided, report the costs (by service) incurred in delivering
these services, and can communicate the demand for those services, that is, how they
are being consumed and projections on how they will be consumed in the future.
However, a major investment in terms of time and resources may be needed to
catalogue such information and report on it. The research problem that this paper
addresses is the lack of a pragmatic model and method that associates ITSM process

ii
maturity (process capability and performance) with financial performance for
organizations that lack mature ITSM processes.
Previous studies have reported on cost savings, but there is currently no measurement
model to associate ITSM maturity with financial profitability; which in turn prompts
the research question: How can the association of ITSM process capability and process
performance with financial performance of an organization be determined?
This research iteratively develops and applies a measurement model that presents a
pragmatic and cost-effective method to link ITSM process capability and process
performance with business performance by operationalizing Key Performance
Indicators (KPIs) to support Critical Success Factors (CSFs) and associating CSFs
with business risks to determine business performance.
This study employs a scholar-practitioner approach to changing/improving processes
using action research and an adaptation of the Keys to IT Service Management
Excellence Technique (KISMET) model to guide the process improvement initiative.
This technique leads to the second research question: How can the ITSM measurement
framework be demonstrated for CSI?
The research was based on a single case study of a global financial services firm
Company X that had implemented the ITIL® framework to improve the quality of its
IT services. The study found that the measurement framework developed can be used
as a starting point for self-improvement for businesses, identifying gaps in processes,
benchmarking within an organization as well as guiding an organization’s process
improvement efforts. The measurement model can be used to conduct What-If analyses
to model the impacts of future business decisions on KPIs and CSFs. The measurement
model presented in this study can be quickly implemented, adapted and evolved to
meet the organization’s needs. The research offers an example from which other
organizations can learn to measure their financial return on investment in ITSM
improvement.

iii
Certification of Thesis
This Thesis is entirely the work of Suren Behari except where otherwise
acknowledged. The work is original and has not previously been submitted for any
other award, except where acknowledged.
Principal Supervisor: ___________________
Professor Aileen Cater-Steel
Associate Supervisor: __________________
Professor Jeffrey Soar
Associate Supervisor: __________________
Dr Anup Shrestha
Student and supervisors signatures of endorsement are held at the University.

iv
Candidate’s Publication List
During the course of this research, the researcher contributed to a conference, book
chapter and co-authored a paper. The publication list follows.
Conference Proceedings
Behari, Suren and Cater-Steel, Aileen and Shrestha, Anup and Soar, Jeffrey (2016) A
measurement model to link process operational measures to risks associated with
attainment of business critical success factors. In: 6th International Engaged
Management Scholarship Conference. Available at SSRN:
https://ssrn.com/abstract=2866873, 9-10 September 2016, Paris.
Book Chapter
Behari, Suren and Cater-Steel, Aileen and Soar, Jeffrey (2016) Data Science and Big
Data Analytics in Financial Services: A Case Study. In: Handbook of Research on
Driving Competitive Advantage through Sustainable, Lean, and Disruptive
Innovation. IGI, pp. 396-423. ISBN 9781522501350
Co-Authored Papers
Shrestha, Anup and Cater-Steel, Aileen and Toleman, Mark and Rout, Terry and
Behari, Suren (2016) The issue of reliability in software mediated process
assessments. In: Software Process Improvement and Capability Determination 16th
International Conference, SPICE 2016, 9-10 June 2016, Dublin, Ireland.

v
Acknowledgements
I would like to acknowledge the assistance of the many people who provided help,
support, and encouragement, enabling me to complete this thesis. Being a distance
student has meant that I could not meet my supervisors in person as often as I would
have liked, yet all in their different ways have given me immeasurable support
throughout my research and writing.
I would particularly like to express my sincere appreciation to my principal supervisor
Professor Aileen Cater-Steel, who visited me in California to help me reign in the focus
of my thesis at a crucial time. Her supervision, guidance, patience, and continual
support has provided me with the direction and abilities to complete this thesis. I would
also like to thank my associate supervisors Professor Jeffrey Soar and Dr Anup
Shrestha. The support and encouragement they provided throughout the duration of
this research has been appreciated.
I am very grateful to the University’s industry partner Assessment Portal Pty Ltd. for
providing a software platform to conduct the surveys. Special thanks to Randy
Steinberg for granting approval to use his ITSM Metrics Modeling tool as a foundation
for the research. I thank the case study organization and participants for affording me
the opportunity to play the dual role of scholar and practitioner. I thank Ms Libby
Collett for her proofreading of my thesis that has enriched the composition of the
thesis.
I thank my sister Dr Kasturi Behari-Leak for being that pillar to lean on at times when
I strayed off the path. Despite being 10,000 miles away, she was available at odd hours
to offer her insightful knowledge. She has been my source of inspiration and unfailing
support throughout this journey. I will be forever grateful and indebted for her support.
The support provided by my family has been inestimable. My wife Claudia and
daughter Mira have kept me grounded throughout. I thank my wife Claudia in
particular, for without her support this research and thesis would not have been
achievable. I will be forever grateful and indebted for the sacrifices that Claudia has
made that have enabled me to spend the many hours over many years in the pursuit of
this research. This thesis is dedicated to my wife Claudia.

vi
Table of Contents
ABSTRACT ......................................................................................................................................... I
CERTIFICATION OF THESIS ............................................................................................................... III
CANDIDATE’S PUBLICATION LIST ..................................................................................................... IV
CONFERENCE PROCEEDINGS ..................................................................................................................... IV
BOOK CHAPTER ...................................................................................................................................... IV
CO-AUTHORED PAPERS ........................................................................................................................... IV
ACKNOWLEDGEMENTS .................................................................................................................... V
LIST OF FIGURES ............................................................................................................................. XII
LIST OF TABLES ............................................................................................................................... XV
CHAPTER 1 INTRODUCTION ............................................................................................................. 1
1.1 INTRODUCTION ............................................................................................................................. 1
1.2 BACKGROUND AND MOTIVATION ..................................................................................................... 2
1.3 RESEARCH PROBLEM, RESEARCH QUESTIONS, AND CONTRIBUTIONS ....................................................... 4
1.3.1 Expected Contribution to Theory, ITSM Literature, and Research Methodology ........... 6
1.3.2 Expected Contribution to ITSM Industry and Practice .................................................... 8
1.4 JUSTIFICATION OF THE RESEARCH ................................................................................................... 10
1.5 METHODOLOGY .......................................................................................................................... 11
1.6 DEFINITION OF KEY TERMS ........................................................................................................... 11
1.7 DELIMITATIONS OF SCOPE AND KEY ASSUMPTIONS ............................................................................ 15
1.8 STRUCTURE OF THESIS ................................................................................................................. 16
1.9 CHAPTER SUMMARY .................................................................................................................... 17
CHAPTER 2 LITERATURE REVIEW .................................................................................................... 18
2.1 INTRODUCTION ........................................................................................................................... 18
2.2 LITERATURE REVIEW STRATEGY ...................................................................................................... 19
2.3 LITERATURE REVIEW PROTOCOL .................................................................................................... 20
2.4 LITERATURE REVIEW FRAMEWORK ................................................................................................. 21
2.5 PARENT THEORIES ....................................................................................................................... 23
2.5.1 Agency Theory .............................................................................................................. 23
2.5.2 Strategic Alignment ...................................................................................................... 30
2.5.3 Resource-Based View and Knowledge-Based Theory ................................................... 33
2.5.4 Actor-Network Theory .................................................................................................. 34
2.6 FOCUS THEORIES ........................................................................................................................ 38

vii
2.6.1 ITSM Capability ............................................................................................................. 38
2.6.2 ITSM Performance ........................................................................................................ 45
2.6.3 Business Performance .................................................................................................. 50
2.7 CHAPTER SUMMARY .................................................................................................................... 61
CHAPTER 3 RESEARCH METHODOLOGY .......................................................................................... 63
3.1 INTRODUCTION ........................................................................................................................... 63
3.2 PHILOSOPHICAL WORLDVIEW ........................................................................................................ 64
3.2.1 Pragmatism .................................................................................................................. 65
3.3 RESEARCH ORIENTATION .............................................................................................................. 66
3.3.1 Epistemology ................................................................................................................ 66
3.3.2 Ontology ....................................................................................................................... 67
3.3.3 Axiology ........................................................................................................................ 68
3.4 RESEARCH DESIGN ...................................................................................................................... 69
3.4.1 Applied Research .......................................................................................................... 69
3.4.2 Case Study Research ..................................................................................................... 71
3.4.3 Mixed Methods ............................................................................................................. 73
3.4.4 Action Research ............................................................................................................ 74
3.5 RESEARCH APPROACH .................................................................................................................. 78
3.5.1 Definition of the Measurement Model ......................................................................... 78
3.5.2 Application of the Measurement Model ....................................................................... 79
3.6 CHAPTER SUMMARY .................................................................................................................... 85
CHAPTER 4 DESIGN OF THE BEHARI ITSM MEASUREMENT FRAMEWORK ...................................... 86
4.1 INTRODUCTION ........................................................................................................................... 86
4.2 THE DESIGN OF THE BEHARI ITSM MEASUREMENT FRAMEWORK ........................................................ 87
4.2.1 The ITSM Performance Pyramid ................................................................................... 87
4.2.2 The ITSM Measurement Model .................................................................................... 92
4.2.3 The Conceptual Model of the Behari ITSM Measurement Framework ........................ 94
4.3 DETAILS OF THE CONCEPTUAL MODEL CONSTRUCTS .......................................................................... 96
4.3.1 IT Level .......................................................................................................................... 96
4.3.2 Business and IT Level .................................................................................................... 98
4.3.3 Business Level ............................................................................................................... 99
4.4 CHAPTER SUMMARY .................................................................................................................. 100
CHAPTER 5 ACTION RESEARCH - CYCLE 1 (ARC1) .......................................................................... 101
5.1 INTRODUCTION ......................................................................................................................... 101
5.2 KISMET PHASE 1: CREATE A PROCESS IMPROVEMENT INFRASTRUCTURE ............................................. 104

viii
5.3 KISMET PHASE 2: ASSESS PROCESS CAPABILITY AND PERFORMANCE .................................................. 111
5.3.1 Process Capability Assessment ................................................................................... 111
5.3.2 Financial Measurement .............................................................................................. 127
5.3.3 Operationalizing the Behari ITSM Measurement Model ............................................ 135
5.4 KISMET PHASE 3: PLAN PROCESS IMPROVEMENT ACTION ................................................................ 157
5.4.1 Incident Management ................................................................................................ 157
5.4.2 Problem Management................................................................................................ 159
5.4.3 Change Management ................................................................................................. 161
5.5 KISMET PHASE 4: DESIGN PROCESS IMPROVEMENT GUIDELINES ....................................................... 161
5.6 KISMET PHASE 5: EXECUTE THE PROCESS IMPROVEMENT PLAN ........................................................ 162
5.6.1 Incident Management ................................................................................................ 162
5.6.2 Problem Management................................................................................................ 167
5.6.3 Change Management ................................................................................................. 169
5.7 KISMET PHASE 6: EVALUATE PROCESS IMPROVEMENT .................................................................... 169
5.7.1 Incident Management ................................................................................................ 170
5.7.2 Problem Management................................................................................................ 175
5.7.3 Change Management ................................................................................................. 176
5.8 KISMET PHASE 7 – CONTINUAL PROCESS IMPROVEMENT .................................................................. 176
5.8.1 Process Capability ....................................................................................................... 177
5.8.2 Process Performance .................................................................................................. 180
5.8.3 Market Events ............................................................................................................ 185
5.9 CHAPTER SUMMARY .................................................................................................................. 188
CHAPTER 6 ACTION RESEARCH - CYCLE 2 (ARC2) .......................................................................... 191
6.1 INTRODUCTION ......................................................................................................................... 191
6.2 KISMET PHASE 1: CREATE A PROCESS IMPROVEMENT INFRASTRUCTURE ............................................. 194
6.2.1 Reflection on creating a process improvement infrastructure ................................... 195
6.3 KISMET PHASE 2: ASSESS PROCESS CAPABILITY AND PERFORMANCE .................................................. 197
6.3.1 Process Capability Assessment ................................................................................... 197
6.3.2 Reflection on the process capability assessment results ............................................ 205
6.3.3 Financial Measurement .............................................................................................. 214
6.3.4 Operationalizing the Measurement Model ................................................................ 223
6.3.5 Reflection on operationalizing the measurement model ........................................... 238
6.4 KISMET PHASE 3: PLAN PROCESS IMPROVEMENT ACTION ................................................................ 281
6.4.1 Reflection on plan process improvement action ........................................................ 282
6.5 KISMET PHASE 4: DESIGN PROCESS IMPROVEMENT GUIDELINES ....................................................... 282
6.5.1 Reflection on design process improvement guidelines ............................................... 283
6.6 KISMET PHASE 5: EXECUTE THE PROCESS IMPROVEMENT PLAN ........................................................ 283

ix
6.6.1 Incident Management ................................................................................................ 283
6.6.2 Problem Management................................................................................................ 284
6.6.3 Change Management ................................................................................................. 284
6.6.4 Reflection on execute the process improvement plan ................................................ 285
6.7 KISMET PHASE 6: EVALUATE PROCESS IMPROVEMENT .................................................................... 285
6.7.1 Incident Management ................................................................................................ 285
6.7.2 Problem Management................................................................................................ 286
6.7.3 Change Management ................................................................................................. 286
6.7.4 Reflection on evaluate process improvement ............................................................ 286
6.8 FINAL REFLECTION .................................................................................................................... 287
6.8.1 Political Conditions ..................................................................................................... 287
6.8.2 Economic Factors ........................................................................................................ 294
6.8.3 Social Environment ..................................................................................................... 295
6.8.4 Technological Factors ................................................................................................. 295
6.8.5 Environmental Factors ................................................................................................ 296
6.8.6 Legal Environment ...................................................................................................... 298
6.9 CHAPTER SUMMARY .................................................................................................................. 299
CHAPTER 7 DISCUSSION ............................................................................................................... 301
7.1 INTRODUCTION ......................................................................................................................... 301
7.2 DISCUSSION APPROACH ............................................................................................................. 303
7.3 DISCUSSION ON FINDINGS RELATED TO RESEARCH QUESTION ONE ....................................................... 305
7.3.1 Process Capability ....................................................................................................... 305
7.3.2 Process Performance .................................................................................................. 307
7.3.3 Business Performance ................................................................................................ 314
7.3.4 Response to Research Question One .......................................................................... 319
7.4 DISCUSSION ON FINDINGS RELATED TO RESEARCH QUESTION TWO ...................................................... 325
7.4.1 Implementation of a method to demonstrate the ITSM Measurement Framework for
CSI 325
7.4.2 Structure of the method to achieve CSI ...................................................................... 327
7.4.3 Response to Research Question Two .......................................................................... 328
7.5 DISCUSSION ON SCHOLAR-PRACTITIONER APPROACH ....................................................................... 328
7.6 CHAPTER SUMMARY .................................................................................................................. 330
CHAPTER 8 CONCLUSION ............................................................................................................. 331
8.1 INTRODUCTION ......................................................................................................................... 331
8.2 SUMMARY OF THESIS ................................................................................................................. 332
8.3 CONTRIBUTION TO THEORY, ITSM LITERATURE, AND RESEARCH METHODOLOGY .................................. 335

x
8.3.1 Contribution to Underpinning Theories ...................................................................... 335
8.3.2 Contribution to ITSM Literature.................................................................................. 337
8.3.3 Contribution to Research Methodology ..................................................................... 338
8.4 CONTRIBUTION TO ITSM INDUSTRY AND PRACTICE ......................................................................... 339
8.5 LIMITATIONS AND AGENDA FOR FUTURE RESEARCH ......................................................................... 341
8.5.1 Literature Review........................................................................................................ 341
8.5.2 Methodology .............................................................................................................. 341
8.5.3 Process Capability ....................................................................................................... 344
8.5.4 Process Performance .................................................................................................. 345
8.5.5 Business Performance ................................................................................................ 346
8.6 CHAPTER SUMMARY .................................................................................................................. 347
ACKNOWLEDGEMENTS ................................................................................................................ 348
REFERENCES ................................................................................................................................. 349
LIST OF APPENDICES ..................................................................................................................... 386
APPENDIX A.1. LIST OF TERMS .............................................................................................................. 388
APPENDIX A.2. LITERATURE REVIEW SYSTEMATIC MAP ............................................................................. 398
APPENDIX B.1. ETHICS APPROVAL LETTER ............................................................................................... 410
APPENDIX B.2. COMPANY X APPROVAL LETTER ....................................................................................... 412
APPENDIX B.3. INTERVIEW/MEETING PARTICIPANT INFORMATION SHEET ..................................................... 413
APPENDIX B.4. INTERVIEW/MEETING CONSENT FORM .............................................................................. 416
APPENDIX B.5. FOCUS GROUP PARTICIPANT INFORMATION SHEET .............................................................. 417
APPENDIX B.6. FOCUS GROUP CONSENT FORM ....................................................................................... 419
APPENDIX B.7. STEINBERG’S CONSENT TO USE HIS ITSM METRICS MODELLING TOOL .................................... 420
APPENDIX C.1. PROCESS ASSESSMENT SURVEY INVITATION EMAIL ................................................................ 421
APPENDIX C.2. FOLLOW-UP EMAIL ........................................................................................................ 422
APPENDIX C.3. EMAIL TO EXTEND SURVEY DUE DATE ................................................................................. 423
APPENDIX C.4. FOCUS GROUP INVITATION EMAIL .................................................................................... 424
APPENDIX C.5. EMAIL COMMUNICATING PROCESS CAPABILITY RESULTS ....................................................... 425
APPENDIX C.6. INCIDENT MANAGEMENT SMPA PROCESS CAPABILITY ASSESSMENT REPORT WITH ACTION PLAN . 426
APPENDIX C.7. PROBLEM MANAGEMENT SMPA PROCESS CAPABILITY ASSESSMENT REPORT WITH ACTION PLAN . 438
APPENDIX C.8. CHANGE MANAGEMENT SMPA PROCESS CAPABILITY ASSESSMENT REPORT WITH ACTION PLAN .. 460
APPENDIX D.1. EMAIL COMMUNICATION OF PROCESS GUIDELINES .............................................................. 473
APPENDIX D.2. INCIDENT MANAGEMENT GUIDELINES ............................................................................... 474
APPENDIX D.3. PROBLEM MANAGEMENT GUIDELINES .............................................................................. 497
APPENDIX D.4. CHANGE MANAGEMENT GUIDELINES ................................................................................ 516
APPENDIX E.1. PROCESS ASSESSMENT SURVEY INVITATION EMAIL ............................................................... 527

xi
APPENDIX E.2. AUTO-GENERATED SURVEY INVITATION EMAIL ..................................................................... 528
APPENDIX E.3. AUTO-GENERATED SURVEY REMINDER EMAIL ...................................................................... 529
APPENDIX E.4. THANK YOU EMAIL ......................................................................................................... 530
APPENDIX E.5. FOCUS GROUP INVITATION EMAIL .................................................................................... 531
APPENDIX F.1. OPERATIONAL METRICS .................................................................................................. 532
APPENDIX F.2. KEY PERFORMANCE INDICATORS ....................................................................................... 532
APPENDIX F.3. CRITICAL SUCCESS FACTORS ............................................................................................. 533
APPENDIX F.4. BUSINESS RISKS ............................................................................................................. 533

xii
List of Figures
FIGURE 1-1 OVERVIEW OF CHAPTER 1 ........................................................................................................... 2
FIGURE 2-1 OVERVIEW OF CHAPTER 2 ......................................................................................................... 18
FIGURE 2-2 NUMBER OF JOURNAL ARTICLES AND CONFERENCE PAPERS .............................................................. 19
FIGURE 2-3 LITERATURE REVIEW FRAMEWORK .............................................................................................. 22
FIGURE 2-4 FORBES INSIGHTS SURVEY LIST OF MOST PREVALENT ITSM FRAMEWORKS (FORBES 2017) ................... 38
FIGURE 2-5 FRAMEWORK FOR EVALUATING RESEARCH ON THE BENEFITS OF IT INVESTMENTS (DEHNING &
RICHARDSON 2002) ........................................................................................................................ 50
FIGURE 3-1 OVERVIEW OF CHAPTER 3 ......................................................................................................... 63
FIGURE 3-2 THE INTERLINKED PRACTICES PROPOSED BY CRONHOLM AND GOLDKUHL (2004, P. 54)....................... 76
FIGURE 3-3 APPLICATION OF THE INTERLINKED PRACTICES ............................................................................... 77
FIGURE 3-4 A BASIC ACTION RESEARCH MODEL (COSTELLO 2003, P. 7) ............................................................. 84
FIGURE 4-1 OVERVIEW OF CHAPTER 4 ......................................................................................................... 86
FIGURE 4-2 SMART PERFORMANCE PYRAMID (ARTTO 1999, P. 6) ................................................................. 88
FIGURE 4-3 CONCEPTUAL MODEL OF THE ITSM PERFORMANCE PYRAMID ......................................................... 91
FIGURE 4-4 STEINBERG'S METRICS MODEL (STEINBERG 2013, P. 20) ............................................................... 92
FIGURE 4-5 BEHARI IT SERVICE MANAGEMENT MEASUREMENT FRAMEWORK ................................................... 95
FIGURE 5-1 OVERVIEW OF CHAPTER 5 ....................................................................................................... 102
FIGURE 5-2 ACTION RESEARCH CYCLE 1 TIMELINE ........................................................................................ 103
FIGURE 5-3 COMPANY X'S ORGANIZATIONAL CHART ................................................................................... 109
FIGURE 5-4 ASSESSMENT SURVEY RESULTS .................................................................................................. 115
FIGURE 5-5 INCIDENT MANAGEMENT PROCESS ASSESSMENT RESULTS ............................................................ 116
FIGURE 5-6 PROBLEM MANAGEMENT ASSESSMENT RESULTS ........................................................................ 116
FIGURE 5-7 CHANGE MANAGEMENT ASSESSMENT RESULTS .......................................................................... 117
FIGURE 5-8 ITSMP2 RISK LEVEL SCORECARD FOR INCIDENT MANAGEMENT ..................................................... 155
FIGURE 5-9 ITSMP2 RISK LEVEL SCORECARD FOR PROBLEM MANAGEMENT .................................................... 156
FIGURE 5-10 ITSMP2 RISK LEVEL SCORECARD FOR CHANGE MANAGEMENT .................................................... 156
FIGURE 5-11 PRIORITIZATION MATRIX (PHOTO BY RESEARCHER) .................................................................... 159
FIGURE 5-12 NUMBER OF INCIDENTS BY SUBTYPE FOR THE PERIOD 16 MAY 2016 TO 27 MAY 2016 .................. 163
FIGURE 5-13 FX CLOUDWATCH INTERFACE ................................................................................................ 164
FIGURE 5-14 INCIDENT MANAGEMENT DASHBOARD (MAY-OCT 2015) .......................................................... 166
FIGURE 5-15 INCIDENT MANAGEMENT PROCESS WORKFLOW ....................................................................... 166
FIGURE 5-16 BREAKDOWN OF INCIDENT SUBTYPE FOR CUSTOMER A .............................................................. 171
FIGURE 5-17 TOP 50% OF CUSTOMER A TICKETS ........................................................................................ 171
FIGURE 5-18 BREAKDOWN OF INCIDENT SUBTYPE FOR CUSTOMER B .............................................................. 172
FIGURE 5-19 TOP 50% OF CUSTOMER B TICKETS ......................................................................................... 173

xiii
FIGURE 5-20 TOTAL NUMBER OF INCIDENTS PER MONTH (MAY-OCT 2015) ................................................... 174
FIGURE 5-21 SEASONALITY OF NUMBER OF INCIDENTS PER BUSINESS UNIT ...................................................... 181
FIGURE 5-22 BREAKDOWN OF THE NUMBER OF BUSINESS SUPPORT LEVEL 1 INCIDENTS ..................................... 182
FIGURE 5-23 BREAKDOWN BY SERVICE COMPONENT FOR 28 JUNE 2015 ........................................................ 183
FIGURE 5-24 NUMBER OF INCIDENTS, PROBLEMS, AND CHANGES AROUND MAJOR SOFTWARE RELEASES (MAR 2014-
OCT 2015) .................................................................................................................................. 184
FIGURE 5-25 SEASONAL INFLUENCE ON TRADING VOLUME (MAY-OCT; 2012-2015)........................................ 185
FIGURE 5-26 CHART OF EUR/CHF (POPPLEWELL 2015) .............................................................................. 186
FIGURE 6-1 OVERVIEW OF CHAPTER 6 ....................................................................................................... 192
FIGURE 6-2 ACTION RESEARCH CYCLE 2 TIMELINE ........................................................................................ 193
FIGURE 6-3 CHANGE TO ORGANIZATIONAL STRUCTURE ................................................................................. 196
FIGURE 6-4 A COMPARISON OF THE NUMBER OF SMPA RECOMMENDATIONS BETWEEN ASSESSMENT 1 AND 2 FOR
INCIDENT MANAGEMENT ............................................................................................................... 208
FIGURE 6-5 A COMPARISON OF THE NUMBER OF SMPA RECOMMENDATIONS BETWEEN ASSESSMENT 1 AND 2 FOR
PROBLEM MANAGEMENT ............................................................................................................... 208
FIGURE 6-6 A COMPARISON OF THE NUMBER OF SMPA RECOMMENDATIONS BETWEEN ASSESSMENT 1 AND 2 FOR
CHANGE MANAGEMENT ................................................................................................................. 209
FIGURE 6-7 EMPLOYEE SALARIES IN CYCLE 1 VS. CYCLE 2................................................................................ 219
FIGURE 6-8 ITSMP2 RISK LEVEL SCORECARD FOR INCIDENT MANAGEMENT ..................................................... 237
FIGURE 6-9 ITSMP2 RISK LEVEL SCORECARD FOR PROBLEM MANAGEMENT .................................................... 237
FIGURE 6-10 ITSMP2 RISK LEVEL SCORECARD FOR CHANGE MANAGEMENT .................................................... 238
FIGURE 6-11 INCIDENT MANAGEMENT ITSMP2 RISK LEVEL SCORECARD FOR CYCLE 1 AND CYCLE 2 ..................... 239
FIGURE 6-12 PROBLEM MANAGEMENT ITSMP2 RISK LEVEL SCORECARD FOR CYCLE 1 AND CYCLE 2 ..................... 240
FIGURE 6-13 CHANGE MANAGEMENT ITSMP2 RISK LEVEL SCORECARD FOR CYCLE 1 AND CYCLE 2 ...................... 241
FIGURE 6-14 ZENDESK METRICS FOR NUMBER OF INCIDENTS .......................................................................... 249
FIGURE 6-15 ZENDESK METRICS FILTERS FOR NUMBER OF INCIDENTS ............................................................... 249
FIGURE 6-16 KPI WEIGHTED AVERAGE FORMULA ....................................................................................... 250
FIGURE 6-17 COMPARISON OF THE INCIDENT MANAGEMENT ITSMP2 ATTAINMENT BETWEEN CYCLE 1 AND CYCLE 2
.................................................................................................................................................. 278
FIGURE 6-18 COMPARISON OF THE PROBLEM MANAGEMENT ITSMP2 ATTAINMENT FOR CYCLE 1 AND CYCLE 2 ..... 279
FIGURE 6-19 COMPARISON OF THE CHANGE MANAGEMENT ITSMP2 ATTAINMENT FOR CYCLE 1 AND CYCLE 2 ....... 280
FIGURE 6-20 INCIDENTS AND CHANGES PER MILLION TRANSACTIONS FOR 3-MONTH PERIOD IN 2015 AND 2016 AT
COMPANY X ................................................................................................................................. 289
FIGURE 6-21 STOCK MARKET VOLATILITY ON THE US ELECTION NIGHT FROM CNN (2016) ............................... 290
FIGURE 6-22 THE US STOCK MARKET PERFORMANCE THE WEEK OF THE 2016 US ELECTIONS (CNN 2016) ......... 291
FIGURE 6-23 INCIDENTS AND CHANGES PER MILLION TRANSACTIONS FOR 3-MONTH PERIOD IN 2015 AND 2016 AT
COMPANY X ................................................................................................................................. 293

xiv
FIGURE 7-1 OVERVIEW OF CHAPTER 7 ....................................................................................................... 302
FIGURE 7-2 INCIDENTS AND CHANGES PER MILLION TRANSACTIONS FOR 3-MONTH PERIOD AROUND BREXIT AND THE
US 2016 PRESIDENTIAL ELECTIONS .................................................................................................. 311
FIGURE 7-3 THE VIX CHART FOR JUNE-AUGUST 2017 (MARKETWATCH 2017) ............................................... 312
FIGURE 7-4 VIX CHART SHOWING BIGGEST JUMP SINCE THE 2016 US ELECTION (MARKETWATCH 2017) ............ 312
FIGURE 7-5 A COMPARATIVE CHART OF GOLD AND THE JAPANESE YEN (THE ECONOMIC TIMES 2017) ................. 313
FIGURE 7-6 INCIDENTS AND CHANGES PER MILLION TRANSACTIONS FOR 3-MONTH PERIOD AUG-OCT 2016 AND 2017
.................................................................................................................................................. 314
FIGURE 7-7 TOTAL COST SAVINGS WHEN COMPARING THE LABOR COST OF PERFORMING PROCESSES IN CYCLE 1 WITH
CYCLE 2 ....................................................................................................................................... 316
FIGURE 7-8 ASSOCIATION OF PROCESS CAPABILITY, PROCESS PERFORMANCE AND FINANCIAL PERFORMANCE ....... 318
FIGURE 7-9 CHANGES MADE TO EACH COMPONENT OF THE STEINBERG ITSM METRICS MODELLING TOOL TO DEVELOP
THE ITSM3 .................................................................................................................................. 324
FIGURE 7-10 ACTION RESEARCH APPROACH USED IN THIS RESEARCH ............................................................... 327
FIGURE 8-1 OVERVIEW OF CHAPTER 8 ....................................................................................................... 332
xv
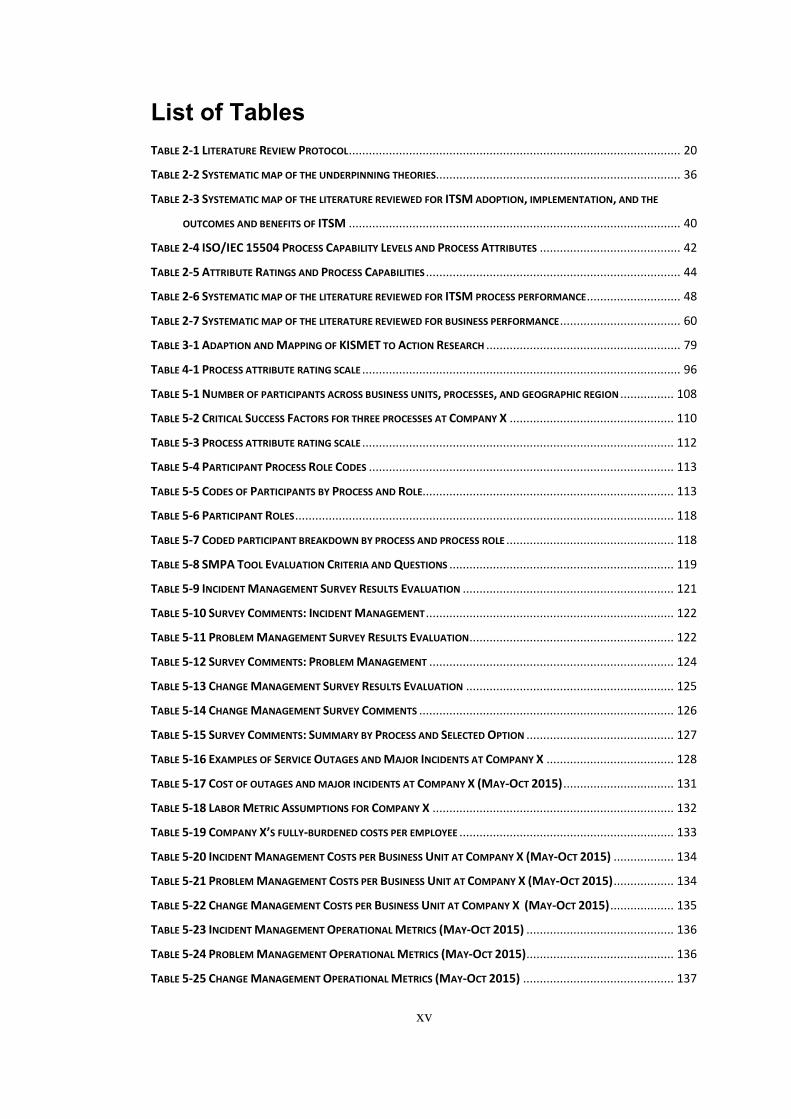
List of Tables
TABLE 2-1 LITERATURE REVIEW PROTOCOL ................................................................................................... 20
TABLE 2-2 SYSTEMATIC MAP OF THE UNDERPINNING THEORIES......................................................................... 36
TABLE 2-3 SYSTEMATIC MAP OF THE LITERATURE REVIEWED FOR ITSM ADOPTION, IMPLEMENTATION, AND THE
OUTCOMES AND BENEFITS OF ITSM ................................................................................................... 40
TABLE 2-4 ISO/IEC 15504 PROCESS CAPABILITY LEVELS AND PROCESS ATTRIBUTES .......................................... 42
TABLE 2-5 ATTRIBUTE RATINGS AND PROCESS CAPABILITIES ............................................................................ 44
TABLE 2-6 SYSTEMATIC MAP OF THE LITERATURE REVIEWED FOR ITSM PROCESS PERFORMANCE ............................ 48
TABLE 2-7 SYSTEMATIC MAP OF THE LITERATURE REVIEWED FOR BUSINESS PERFORMANCE .................................... 60
TABLE 3-1 ADAPTION AND MAPPING OF KISMET TO ACTION RESEARCH .......................................................... 79
TABLE 4-1 PROCESS ATTRIBUTE RATING SCALE ............................................................................................... 96
TABLE 5-1 NUMBER OF PARTICIPANTS ACROSS BUSINESS UNITS, PROCESSES, AND GEOGRAPHIC REGION ................ 108
TABLE 5-2 CRITICAL SUCCESS FACTORS FOR THREE PROCESSES AT COMPANY X ................................................. 110
TABLE 5-3 PROCESS ATTRIBUTE RATING SCALE ............................................................................................. 112
TABLE 5-4 PARTICIPANT PROCESS ROLE CODES ........................................................................................... 113
TABLE 5-5 CODES OF PARTICIPANTS BY PROCESS AND ROLE........................................................................... 113
TABLE 5-6 PARTICIPANT ROLES ................................................................................................................. 118
TABLE 5-7 CODED PARTICIPANT BREAKDOWN BY PROCESS AND PROCESS ROLE .................................................. 118
TABLE 5-8 SMPA TOOL EVALUATION CRITERIA AND QUESTIONS ................................................................... 119
TABLE 5-9 INCIDENT MANAGEMENT SURVEY RESULTS EVALUATION ............................................................... 121
TABLE 5-10 SURVEY COMMENTS: INCIDENT MANAGEMENT .......................................................................... 122
TABLE 5-11 PROBLEM MANAGEMENT SURVEY RESULTS EVALUATION ............................................................. 122
TABLE 5-12 SURVEY COMMENTS: PROBLEM MANAGEMENT ......................................................................... 124
TABLE 5-13 CHANGE MANAGEMENT SURVEY RESULTS EVALUATION .............................................................. 125
TABLE 5-14 CHANGE MANAGEMENT SURVEY COMMENTS ............................................................................ 126
TABLE 5-15 SURVEY COMMENTS: SUMMARY BY PROCESS AND SELECTED OPTION ............................................ 127
TABLE 5-16 EXAMPLES OF SERVICE OUTAGES AND MAJOR INCIDENTS AT COMPANY X ...................................... 128
TABLE 5-17 COST OF OUTAGES AND MAJOR INCIDENTS AT COMPANY X (MAY-OCT 2015) ................................. 131
TABLE 5-18 LABOR METRIC ASSUMPTIONS FOR COMPANY X ........................................................................ 132
TABLE 5-19 COMPANY X’S FULLY-BURDENED COSTS PER EMPLOYEE ................................................................ 133
TABLE 5-20 INCIDENT MANAGEMENT COSTS PER BUSINESS UNIT AT COMPANY X (MAY-OCT 2015) .................. 134
TABLE 5-21 PROBLEM MANAGEMENT COSTS PER BUSINESS UNIT AT COMPANY X (MAY-OCT 2015) .................. 134
TABLE 5-22 CHANGE MANAGEMENT COSTS PER BUSINESS UNIT AT COMPANY X (MAY-OCT 2015) ................... 135
TABLE 5-23 INCIDENT MANAGEMENT OPERATIONAL METRICS (MAY-OCT 2015) ............................................ 136
TABLE 5-24 PROBLEM MANAGEMENT OPERATIONAL METRICS (MAY-OCT 2015) ............................................ 136
TABLE 5-25 CHANGE MANAGEMENT OPERATIONAL METRICS (MAY-OCT 2015) ............................................. 137

xvi
TABLE 5-26 KEY PERFORMANCE INDICATORS FOR INCIDENT MANAGEMENT ..................................................... 138
TABLE 5-27 KEY PERFORMANCE INDICATORS FOR PROBLEM MANAGEMENT .................................................... 139
TABLE 5-28 KEY PERFORMANCE INDICATORS FOR CHANGE MANAGEMENT ...................................................... 140
TABLE 5-29 KPI THRESHOLD TARGETS, RESULTS, AND SCORES FOR INCIDENT MANAGEMENT ............................. 141
TABLE 5-30 KPI THRESHOLD TARGETS, RESULTS, AND SCORES FOR PROBLEM MANAGEMENT ............................ 142
TABLE 5-31 KPI THRESHOLD TARGETS, RESULTS, AND SCORES FOR CHANGE MANAGEMENT .............................. 143
TABLE 5-32 INCIDENT MANAGEMENT: MAPPING OF KPIS TO CSFS ................................................................ 145
TABLE 5-33 PROBLEM MANAGEMENT: MAPPING OF KPIS TO CSFS ............................................................... 146
TABLE 5-34 CHANGE MANAGEMENT: MAPPING OF KPIS TO CSFS ................................................................. 147
TABLE 5-35 INCIDENT MANAGEMENT: CSF ATTAINMENT AND CSF SCORES .................................................... 148
TABLE 5-36 PROBLEM MANAGEMENT: CSF ATTAINMENT AND CSF SCORES .................................................... 149
TABLE 5-37 CHANGE MANAGEMENT: CSF ATTAINMENT AND CSF SCORES ...................................................... 149
TABLE 5-38 INCIDENT MANAGEMENT: MAPPING OF OUTCOME RISKS TO CSF SCORES ...................................... 151
TABLE 5-39 PROBLEM MANAGEMENT: MAPPING OF OUTCOME RISKS TO CSF SCORES ..................................... 152
TABLE 5-40 CHANGE MANAGEMENT: MAPPING OF OUTCOME RISKS TO CSF SCORES ....................................... 153
TABLE 5-41 INCIDENT MANAGEMENT: ITSMP2 RISK LEVELS ......................................................................... 154
TABLE 5-42 PROBLEM MANAGEMENT: ITSMP2 RISK LEVELS ........................................................................ 154
TABLE 5-43 CHANGE MANAGEMENT: ITSMP2 RISK LEVELS .......................................................................... 154
TABLE 5-44 TOP 50% OF CUSTOMER A TICKETS .......................................................................................... 172
TABLE 5-45 TOP 50% OF CUSTOMER B TICKETS .......................................................................................... 173
TABLE 5-46 PROCESS ASSESSMENT RELIABILITY SCORES ............................................................................... 178
TABLE 5-47 DISTRIBUTION OF THE NUMBER OF PARTICIPANTS BY ORGANIZATION BUSINESS UNIT PER PROCESS ASSESSED
.................................................................................................................................................. 179
TABLE 5-48 EVENTS OF ISSUE A FOR 15 JANUARY 2015 ............................................................................... 187
TABLE 5-49 EVENTS OF ISSUE B FOR 15 JANUARY 2015 ............................................................................... 188
TABLE 6-1 NUMBER OF PARTICIPANTS ACROSS BUSINESS UNITS, PROCESSES, AND GEOGRAPHIC REGION ................ 194
TABLE 6-2 SUMMARY OF PROCESS CAPABILITY FOR ASSESSMENT 2.................................................................. 198
TABLE 6-3 CODED PARTICIPANT BREAKDOWN.............................................................................................. 199
TABLE 6-4 INCIDENT MANAGEMENT SURVEY RESULTS EVALUATION ............................................................... 201
TABLE 6-5 SURVEY COMMENTS: INCIDENT MANAGEMENT ............................................................................ 202
TABLE 6-6 SURVEY COMMENTS: PROBLEM MANAGEMENT ........................................................................... 203
TABLE 6-7 SURVEY COMMENTS: CHANGE MANAGEMENT ............................................................................. 204
TABLE 6-8 SURVEY COMMENTS: SUMMARY BY PROCESS AND SELECTED OPTION .............................................. 205
TABLE 6-9 COMPARISON OF PROCESS ATTRIBUTE RATINGS FOR ASSESSMENT 1 AND ASSESSMENT 2 ...................... 206
TABLE 6-10 AVERAGE RECOMMENDATION RATIO FOR THE THREE PROCESSES ................................................... 211
TABLE 6-11 A COMPARISON OF ASSESSMENT RELIABILITY SCORES FOR INCIDENT MANAGEMENT, PROBLEM
MANAGEMENT AND CHANGE MANAGEMENT .................................................................................... 213

xvii
TABLE 6-12 COST OF OUTAGES AND MAJOR INCIDENTS AT COMPANY X (MAY-OCT 2016) ................................. 214
TABLE 6-13 COMPANY X’S FULLY-BURDENED ANNUAL COSTS PER EMPLOYEE FOR SIX GROUPS OF STAFF ................ 216
TABLE 6-14 INCIDENT MANAGEMENT COSTS PER BUSINESS UNIT AT COMPANY X (MAY-OCT 2016) .................. 217
TABLE 6-15 PROBLEM MANAGEMENT COSTS PER BUSINESS UNIT AT COMPANY X (MAY-OCT 2016) .................. 217
TABLE 6-16 CHANGE MANAGEMENT COSTS PER BUSINESS UNIT AT COMPANY X (MAY-OCT 2016) ................... 218
TABLE 6-17 A COMPARISON OF EMPLOYEE ANNUAL SALARIES BY BUSINESS UNIT FOR CYCLE 1 AND 2 .................... 218
TABLE 6-18 NORMALIZED 2016 SALARIES USING CPI-W FOR 2015 & 2016 ................................................... 220
TABLE 6-19 INCIDENT MANAGEMENT COSTS PER BUSINESS UNIT AT COMPANY X ............................................ 221
TABLE 6-20 PROBLEM MANAGEMENT COSTS PER BUSINESS UNIT AT COMPANY X ............................................ 222
TABLE 6-21 CHANGE MANAGEMENT COSTS PER BUSINESS UNIT AT COMPANY X .............................................. 222
TABLE 6-22 NORMALIZED COSTS PER PROCESS FOR 2015 AND 2916 .............................................................. 223
TABLE 6-23 INCIDENT MANAGEMENT OPERATIONAL METRICS (MAY-OCT 2016) ............................................ 223
TABLE 6-24 PROBLEM MANAGEMENT OPERATIONAL METRICS (MAY-OCT 2016) ............................................ 224
TABLE 6-25 CHANGE MANAGEMENT OPERATIONAL METRICS (MAY-OCT 2016) ............................................. 224
TABLE 6-26 KPI THRESHOLD TARGETS, RESULTS, AND SCORES FOR INCIDENT MANAGEMENT ............................. 226
TABLE 6-27 KPI THRESHOLD TARGETS, RESULTS, AND SCORES FOR PROBLEM MANAGEMENT ............................ 228
TABLE 6-28 KPI THRESHOLD TARGETS, RESULTS, AND SCORES FOR CHANGE MANAGEMENT .............................. 229
TABLE 6-29 INCIDENT MANAGEMENT: CSF ATTAINMENT AND CSF SCORES .................................................... 231
TABLE 6-30 INCIDENT MANAGEMENT: MAPPING OF OUTCOME RISKS TO CSF SCORES ...................................... 233
TABLE 6-31 PROBLEM MANAGEMENT: MAPPING OF OUTCOME RISKS TO CSF SCORES ..................................... 234
TABLE 6-32 CHANGE MANAGEMENT: MAPPING OF OUTCOME RISKS TO CSF SCORES ....................................... 235
TABLE 6-33 INCIDENT MANAGEMENT: ITSMP2 RISK LEVELS ......................................................................... 236
TABLE 6-34 A COMPARISON OF INCIDENT MANAGEMENT KPI RESULTS BETWEEN CYCLE 1 AND CYCLE 2 ................ 243
TABLE 6-35 A COMPARISON OF INCIDENT MANAGEMENT CSF ATTAINMENT LEVELS FOR BETWEEN CYCLE 1 AND CYCLE 2
.................................................................................................................................................. 244
TABLE 6-36 A COMPARISON OF PROBLEM MANAGEMENT KPI RESULTS BETWEEN CYCLE 1 AND CYCLE 2 ............... 245
TABLE 6-37 A COMPARISON OF PROBLEM MANAGEMENT CSF ATTAINMENT LEVELS FOR BETWEEN CYCLE 1 AND CYCLE
2 ................................................................................................................................................ 246
TABLE 6-38 A COMPARISON OF CHANGE MANAGEMENT KPI RESULTS BETWEEN CYCLE 1 AND CYCLE 2 ................. 247
TABLE 6-39 A COMPARISON OF CHANGE MANAGEMENT CSF ATTAINMENT LEVELS FOR BETWEEN CYCLE 1 AND CYCLE 2
.................................................................................................................................................. 248
TABLE 6-40 A COMPARISON OF INCIDENT MANAGEMENT KPI RESULTS USING THE ENHANCED ITSM3 .................. 252
TABLE 6-41 A COMPARISON OF PROBLEM MANAGEMENT KPI RESULTS USING THE ENHANCED ITSM3 ................. 254
TABLE 6-42 A COMPARISON OF CHANGE MANAGEMENT KPI RESULTS USING THE ENHANCED ITSM3 ................... 256
TABLE 6-43 INCIDENT MANAGEMENT CSFS AND RELATED WEIGHTED KPIS ...................................................... 258
TABLE 6-44 PROBLEM MANAGEMENT CSFS AND RELATED WEIGHTED KPIS ..................................................... 260
TABLE 6-45 CHANGE MANAGEMENT CSFS AND RELATED WEIGHTED KPIS ....................................................... 262

xviii
TABLE 6-46 COMPARISON OF INCIDENT MANAGEMENT CSF ATTAINMENT LEVELS FOR CYCLE 1 AND CYCLE 2 USING THE
ENHANCED ITSM3 ......................................................................................................................... 264
TABLE 6-47 COMPARISON OF PROBLEM MANAGEMENT CSF ATTAINMENT LEVELS FOR CYCLE 1 AND CYCLE 2 USING THE
ENHANCED ITSM3 ......................................................................................................................... 265
TABLE 6-48 COMPARISON OF CHANGE MANAGEMENT CSF ATTAINMENT LEVELS FOR CYCLE 1 AND CYCLE 2 USING THE
ENHANCED ITSM3 ......................................................................................................................... 265
TABLE 6-49 WEIGHTED AVERAGE OF INCIDENT MANAGEMENT CSFS ASSOCIATED WITH BUSINESS RISKS ............... 267
TABLE 6-50 WEIGHTED AVERAGE OF PROBLEM MANAGEMENT CSFS ASSOCIATED WITH BUSINESS RISKS............... 268
TABLE 6-51 WEIGHTED AVERAGE OF CHANGE MANAGEMENT CSFS ASSOCIATED WITH BUSINESS RISKS ................ 269
TABLE 6-52 MAPPING OF THE NPLF SCALE TO BUSINESS RISK MITIGATION LEVELS ............................................. 270
TABLE 6-53 COMPARISON OF INCIDENT MANAGEMENT BUSINESS RISK LEVELS FOR CYCLE 1 AND CYCLE 2 .............. 270
TABLE 6-54 COMPARISON OF PROBLEM MANAGEMENT BUSINESS RISK LEVELS FOR CYCLE 1 AND CYCLE 2.............. 271
TABLE 6-55 COMPARISON OF CHANGE MANAGEMENT BUSINESS RISK LEVELS FOR CYCLE 1 AND CYCLE 2 ............... 272
TABLE 6-56 WEIGHTED AVERAGE OF INCIDENT MANAGEMENT BUSINESS RISK MITIGATION SCORES ASSOCIATED WITH
ITSMP2 DIMENSIONS .................................................................................................................... 273
TABLE 6-57 WEIGHTED AVERAGE OF PROBLEM MANAGEMENT BUSINESS RISK MITIGATION SCORES ASSOCIATED WITH
ITSMP2 DIMENSIONS .................................................................................................................... 274
TABLE 6-58 WEIGHTED AVERAGE OF CHANGE MANAGEMENT BUSINESS RISK MITIGATION SCORES ASSOCIATED WITH
ITSMP2 DIMENSIONS .................................................................................................................... 275
TABLE 6-59 COMPARISON OF INCIDENT MANAGEMENT ITSMP2 ATTAINMENT LEVELS FOR CYCLE 1 AND CYCLE 2 ... 276
TABLE 6-60 COMPARISON OF PROBLEM MANAGEMENT ITSMP2 ATTAINMENT LEVELS FOR CYCLE 1 AND CYCLE 2... 276
TABLE 6-61 COMPARISON OF CHANGE MANAGEMENT ITSMP2 ATTAINMENT LEVELS FOR CYCLE 1 AND CYCLE 2 .... 276
TABLE 6-62 MOST PROMINENT MARKET MOVERS WITH POSSIBLE REASONS AND MARKET IMPACT .......................... 291
TABLE 7-1 SUMMARY OF SIGNIFICANT REFLECTIONS AND THEIR OUTCOMES EXTRACTED FROM CHAPTERS 5 AND 6 .. 303
TABLE 7-2 TOTAL COST SAVINGS YEAR-OVER-YEAR ....................................................................................... 316
TABLE 7-3 COMPARISON OF PERFORMANCE KPI ACHIEVEMENT: CYCLE 1 & 2 .................................................. 317
TABLE 7-4 COMPARISON OF KPI PERFORMANCE FOR INCIDENT MANAGEMENT: CYCLE 1 & CYCLE 2 .................... 320
TABLE 7-5 INCIDENT MANAGEMENT CSF ATTAINMENT LEVELS: CYCLE 1 & CYCLE 2 .......................................... 320
TABLE 7-6 BUSINESS RISK MITIGATION LEVELS FOR THE ITSMP2 PRODUCTIVITY DIMENSION: CYCLE 1 & CYCLE 2 . 320
TABLE 7-7 ITSMP2 PRODUCTIVITY ATTAINMENT LEVELS ................................................................................ 321
TABLE 7-8 CHANGES MADE TO STEINBERG'S TOOL TO DEVELOP THE ITSM3 ...................................................... 322

CHAPTER 1 INTRODUCTION
1
CHAPTER 1 INTRODUCTION
1.1 Introduction
This research explores the association of IT Service Management (ITSM) Process
Capability, Process Performance, and Business Performance. This first chapter
introduces the research. The background and motivation to the research describe the
context of the research and the need for the study. The background includes the
description of ITIL® as the most widely accepted ITSM framework. The research
problem and the research questions are then stated followed by the justification for the
research in terms of contributions to knowledge and practice. The methodology for the
collection and analysis of data is provided next. The definition of key terms used in
the context of this research is provided, followed by the delimitations of scope and key
assumptions. This chapter concludes with a description of the overall structure of this
thesis.
This chapter is organized into nine sections. This section is an introduction to the first
chapter. The background and motivation of the research are provided in section 1.2.
The research problem and research questions are presented in section 1.3. Section 1.4
presents the contribution this research makes to theory and practice. The research
methodology is provided in section 1.5. Section 1.6 defines the key terms used in this
research. The delimitations of scope and the key assumptions of the study are presented
in section 1.7. Section 1.8 provides the overall structure of the thesis. The chapter
summary is provided in section 1.9.
An overview of the chapter is shown in Figure 1-1.

CHAPTER 1 INTRODUCTION
2
Figure 1-1 Overview of Chapter 1
1.2 Background and Motivation
Global IT spending for 2018 is projected to total $3.7 trillion versus the 2017 estimated
spending of $3.5 trillion (a 4.3% increase), according to a forecast by Gartner
Incorporated (Gartner 2017). The forecast foresees that enterprise software and IT
services will continue to exhibit strong growth, with IT spending on target to reach
$931 billion in 2017, and increase 5.3 percent in 2018 to reach $980 billion (Gartner
2017).
According to research by International Data Corporation (2017), industry spending on
IT products and services will continue to be led by financial services and
manufacturing, that together will generate around 30 percent of all IT revenues
CHAPTER 1 INTRODUCTION
3
throughout the forecast period of 2015 to 2020 as these industries invest in IT to
advance their digital transformation efforts (International Data Corporation 2017).
Academic research has shown that the cost of IT services can be as high as 60-90
percent of the total cost IT ownership (Addy 2007; Fleming 2005; Galup et al. 2009;
Orlov 2005).
IT Service providers can no longer afford to only focus on technology, but instead,
they now also have to consider the quality of the services they provide and their
relationship with customers (Van Bon 2007). Other issues within the field of ITSM are
that the cost of maintenance is too high, the speed of maintenance service is too slow
and that there is difficulty in managing the priority of change requests (Marrone et al.
2014).
Many organizations are increasingly dependent on IT which is considered to be a
critical enabler for transforming service industries (Chesbrough 2011; Huang, Wu &
Chen 2013). Organizations expect that both internal and external IT suppliers
continually improve the services provided (Galup et al. 2009; Pollard & Cater-Steel
2009) with a focus on customer service. IT Service Management (ITSM) focusses on
customers as a core strategy for improving the delivery of IT services (Winniford,
Conger & Erickson-Harris 2009). The benefits provided by ITSM can include an
improved IT service at a lower cost with a focus on service rather than technology
(Iden & Langeland 2010). ITSM is being increasingly implemented globally (Forbes
2017).
One ITSM framework often referred to as the best practice, is ITIL (Cannon 2011).
See §2.4.1.3 for more details on ITIL. The ITIL framework eventually led to the
creation of the international standard for ITSM: ISO/IEC 20000 (ISO/IEC 2011). Both
ITIL and ISO/IEC 20000 provide a process-oriented framework to implement ITSM
for organizations.
The latest version of the ITIL framework (known as ITIL 2011) includes Continual
Service Improvement (CSI) as a service lifecycle stage (OGC 2011b) that stresses the
importance of regularly evaluating processes to identify opportunities for
improvement in ITSM processes (Bernard 2012). The emphasis on continually
improving effectiveness and efficiency of IT processes and services through continual

CHAPTER 1 INTRODUCTION
4
assessment is in line with the concept of continual improvement adopted in ISO/IEC
20000 (Shrestha 2015).
The principal goal of CSI is to continually align and realign IT services to changes in
business practice by identifying and making appropriate improvements to ITSM
processes (Shrestha 2015). CSI is vital to the business to provide relevance and
responsiveness of IT services to customers, however, CSI activities are costly and
resource intensive (OGC 2011b), and in addition, process improvement programs may
be unsustainable over time if they are not effectively managed (Harkness, Kettinger &
Segars 1996; Khurshid & Bannerman 2014). To dynamically align IT services to
changes in business conditions and sustain process improvement projects,
organizations have employed techniques that involve a systematic measurement of
processes (Van Loon 2007).
A major challenge for organizations is to ensure that process improvement programs
are cost-effective, and that assessments of processes are transparent in order to provide
confidence in the assessment process and outcomes and to perform regular and
consistent process assessments for CSI (Shrestha 2015).
An initial scan of the literature on ITSM and financial benefits revealed that there were
no empirical studies that reported financial benefits from ITSM projects in actual
monetary value. There is little academic research on the potential impact of ITSM
processes to improve business performance and ultimately financial profitability
(Gacenga, Cater-Steel & Toleman 2010).
1.3 Research Problem, Research Questions, and Contributions
As technology is at the core of almost every leading industry, organizations are
increasingly scrutinizing their IT group’s performance so that it is more in line with
the overall business performance and contributes to the business’ bottom line
(Hinkelmann et al. 2016; Kappelman et al. 2016; Nicho & Khan 2017). Many IT
departments are not equipped to meet these increasing IT service demands (Cater-Steel
2009). They continue to operate as passive-reactive service providers, often utilizing

CHAPTER 1 INTRODUCTION
5
antiquated methods that do not adequately provide the quality, real-time solutions that
organizations need at present to be competitive (Cater-Steel 2009).
Organizations need efficient ITSM processes in order to cut costs, but ironically, in
order to implement highly capable processes, there are significant costs involved, both
in terms of time and resources (Hochstein, Tamm & Brenner 2005). One way to
achieve better performing and more capable processes is to employ methods to
compare an organization’s processes against best practices and standards to identify
gaps and receive guidance to improve the processes (Marrone et al. 2014).
One key issue reported in the industry is that most IT organizations have not yet
embraced the business side (specifically Service Portfolio Management and IT
Financial Management) aspects of ITSM (Steinberg 2013). Service Portfolio
Management is used to manage investments in service management across the
organization, in terms of financial values, that enables managers to assess the quality
requirements and associated costs (Kohlborn et al. 2009). IT Financial Management
aims to provide information on IT assets and resources used in delivering IT services
(OGC 2011e). Providing an optimal Service Portfolio and practicing IT Financial
Management requires a high level of maturity for an organization. It seems reasonable
and logical that the organization’s Chief Information Officer should be able to
articulate and justify the IT services provided, can report the costs (by service) to
deliver these services, and can communicate the demand for those services, that is,
how they are being consumed and will be consumed in the future. A major investment
in terms of time and resources may be needed to catalogue such information and report
on it.
The research problem that this study addresses is the lack of a pragmatic ITSM
Measurement Framework that can be used to associate ITSM process capability and
process performance with business performance. See §3.2.1 for a description of
pragmatism research philosophy and why it was chosen for this research.
Previous studies have reported cost savings (Cater-Steel, Tan & Toleman 2009a; Jäntti
et al. 2013; Pollard & Cater-Steel 2009) but there is apparently no measurement model

CHAPTER 1 INTRODUCTION
6
to associate ITSM process capability and process performance with financial
profitability which prompts the first research question:
RQ1. How can the association of ITSM process capability and process performance
with financial performance of an organization be determined?
The research develops and applies a measurement framework in iterative cycles to
present a pragmatic and cost-effective method that links ITSM process capability,
process performance, and financial performance by operationalizing Key Performance
Indicators (KPIs) that support Critical Success Factors (CSFs) and associating CSFs
with business risks to determine business financial performance (Behari et al. 2016).
In order to test the association of ITSM process capability and process performance
with business performance, a scholar-practitioner approach, based on action research
principles, was followed to plan and implement a process improvement project in the
case organization through active intervention. The outcome of the intervention is
addressed through RQ1.
RQ2 examines the research project through a different lens, and affords the
demonstration of how the intervention was conducted to answer RQ1. The Keys to IT
Service Management Excellence Technique (KISMET) model (Jäntti, Lahtela &
Kaukola 2010) was selected and justified to guide the application of the ITSM
Measurement Framework to illustrate the efficiency and effectiveness of the method
to achieve the outcomes. The output of RQ1 (the ITSM Measurement Framework)
serves as input to answer RQ2. Application and evaluation of the KISMET model leads
to the second research question:
RQ2. How can the ITSM measurement framework be demonstrated for CSI?
This exploratory study aims to develop and apply a pragmatic and cost-effective
measurement framework for ITSM to determine the association of ITSM process
capability and process performance with business financial performance, through a
systematic process improvement approach that is grounded in theory.
1.3.1 Expected Contribution to Theory, ITSM Literature, and Research Methodology

CHAPTER 1 INTRODUCTION
7
1.3.1.1 Expected Contribution to Underpinning Theories
Agency Theory
By using Agency Theory as a backdrop to this research, it is expected that this research
contributes to the problem of information asymmetry that is core to the principal-agent
problem. It is anticipated that through collaboration of business (principal) and IT
(agent) as well as the active intervention of the researcher, that this research informs
theory by demonstrating how the information asymmetry gap can be bridged for the
benefit of both the principal and agent.
Business-IT Alignment
It is expected that this research contributes to the literature on ITSM and Business-IT
alignment by the application of a previously empirically tested process improvement
framework to enable the alignment of business and IT. As a scholar-practitioner, the
researcher endeavors to translate the theoretical prescriptions of the framework by
using terminology more familiar in industry and practice.
Resource-Based View
This study draws on the resource-based view of the organization to demonstrate the
attributes of a firm’s IT capability and its relationship to organizational performance.
This study contributes to the growing body of literature linking IT and the resource-
based view and provides a framework for understanding how IT may be aptly viewed
as an organizational capability.
1.3.1.2 Expected Contribution to ITSM Literature
ITSM Adoption, Implementation, and Benefits
This research contributes to the ITSM literature on adoption, implementation and
benefits of ITSM, by providing empirical evidence of the tangible cost savings and
business risk mitigation by improving ITSM process capability and performance.
ITSM Capability
CHAPTER 1 INTRODUCTION
8
A contribution to the body of knowledge on process capability and process
assessments is expected from this research, by the use of a standards-based maturity
model and a transparent, efficient tool for process assessments.
ITSM Performance
By using a combination of CSFs and KPIs for the ITSM performance measurement, it
is anticipated that this research will contribute to the literature on using CSFs and KPIs
in IT performance measurement systems.
1.3.1.3 Expected Contribution to Research Methodology
Action Research
The use of action research in a real world environment (practice), using a process
improvement model to guide the cycles, is expected to contribute to research
methodology.
Actor-Network Theory
As an expected contribution to research methodology, the principles of ANT are
followed to address the principal-agent issue in the industry at a broad level, and the
business-IT alignment issue at the case study at a more specific level. ANT is
operationalized throughout the research, rather than used as a methodological lens, to
bridge the gap between IT and the business at the case organization. Through action
research and frequent intervention, the researcher aligns the interests of actors through
establishing a social and technological foundation for ITSM process improvement at
Company X.
1.3.2 Expected Contribution to ITSM Industry and Practice
A comprehensive and empirically validated conceptualization of the factors pertaining
to the association of process capability, process performance, and financial benefits is
presented. Although this research presents a measurement framework based on three
ITSM processes: incident management, problem management, and change
management, the model and method can be extended and adapted for any ITSM
process, as evidenced by Steinberg’s ITSM Metrics Model that consists of an Excel
Workbook with individual Worksheets for 13 of the 26 ITSM processes with at least

CHAPTER 1 INTRODUCTION
9
one from each ITIL lifecycle stage plus Service Desk and Workforce Worksheets. The
Worksheet presents an inventory of recommended operational metrics, KPIs, and
CSFs and the associated calculations for each one. The method of entering values for
operational metrics and tolerance thresholds is generic. The model then automatically
calculates the KPI values, compares them to the Tolerances and derives the KPI score.
Critical Success Factors (CSFs) are automatically calculated based on the KPI values,
Business Risk Mitigation levels are automatically calculated based on the derived CSF
scores and the scores for the ITSM Performance Pyramid are automatically calculated
based on the associated Business Risks.
The measurement framework designed and applied in this research project is expected
to contribute to practice by providing an efficient and cost-effective method and model
to identify opportunities to reduce costs and increase efficiency in ITSM processes that
can ultimately lead to increased competitiveness.
Practitioners can expect to use the framework as a means for organizational self-
improvement, to identify process gaps, to benchmark processes against best-practice
standards within an organization, as well as guide an organization’s improvement
efforts.
A practical measurement framework is developed to link ITSM process capability and
process performance with financial performance. The measurement framework may
be used to determine the effects on outcomes in a spreadsheet calculation through
systematic changes in the input. The measurement framework presented in this study
is designed so that it could be quickly implemented, adapted and evolved to meet the
any organization’s needs (see section 3.5.2 Table 3-1 and section 7.3.4.1 Table 7-8).
Practitioners can expect to drive continual service improvement by using the
framework for process capability assessment, process perfromance measurement and
financial measurement.
The practical contribution of the research is that it offers an example from which other
organizations can learn to measure their financial return on investment from ITSM
improvement projects. The research aims to provide an understanding of the potential
degree of financial benefits realizable due to process improvements. The application

CHAPTER 1 INTRODUCTION
10
of the model establishes the link between ITSM process capability, process
performance, and financial measures.
The next section justifies the research in terms of contribution to knowledge and
practice.
1.4 Justification of the Research
There is no single approach to IT Service Management and organizations employ a
variety of frameworks or processes to support their ITSM strategies. ITIL is the most
widespread approach followed by Business Process Framework (eTOM) and Control
Objectives for Information and Related Technologies (COBIT) (Forbes 2017).
Organizations that implement ITIL do so with an expectation that the organization will
benefit from its adoption. The expectations can be an improved IT service at a lower
cost (Iden & Langeland 2010), standardized IT services (Marrone & Kolbe 2011),
improved reliability and availability of IT services (Shang & Lin 2010), and cost
savings (Cater-Steel, Tan & Toleman 2009a; Jäntti et al. 2013; Pollard & Cater-Steel
2009).
Implementing ITSM is costly (Göbel, Cronholm & Seigerroth 2013), and may be
disruptive to an organization (Shang & Lin 2010), imposing business process changes
to meet organizational goals (Tan, Cater-Steel & Toleman 2009).
In order to cut costs and become more efficient in ITSM related work, organizations
need to use cost-effective methods to benchmark the organization’s processes against
standards to identify gaps and receive guidance to improve processes (Göbel,
Cronholm & Seigerroth 2013). Many of the existing methods require large investments
in time and resources, and there is a lack of a systematic approach to process
improvement (Göbel, Cronholm & Seigerroth 2013). The literature review confirmed
the lack of a pragmatic model and method that demonstrates the association of ITSM
process capability and process performance with business performance.
This research addresses the requirement for research into the development and
application of a cost-effective model and method to link ITSM process capability and

CHAPTER 1 INTRODUCTION
11
process performance with business performance and more specifically financial cost
savings.
This research also addresses the need for academic research to be applied to practice,
thus providing a rigor-relevance balance (Straub & Ang 2011) to propose a cost-
effective method, model and approach to improve ITSM processes.
1.5 Methodology
This section provides an overview of the methodology used to address the research
problem.
The exploratory study is a single-case study that follows a pragmatic research
approach, enabling methodological triangulation (Denzin 1970), to explore the
research problem. The case study method is well suited to this study as it allows rich
data collection on service management processes, people, services, tools, and
technologies. The case study approach is appropriate because this study focusses on
modern-day events in a natural setting, and there is no robust theoretical base for the
research (Yin 2013).
To enhance transferability, this case study uses methods such as surveys, interactive
interviews, focus group workshops, observation, and secondary data (personal and
official documents, physical data, and archived research data) to explore, describe and
explain a complex situation in a real-life context.
A scholar-practitioner (American Psychological Association 2007) approach, which is
similar to a participant-observer (Cochrane 1972) approach, was followed in this
research.
Definitions of key terms in the context of this research are provided in the next section.
1.6 Definition of Key Terms
Definitions adopted by researchers are often not uniform. Therefore, key terms that
could be controversial if not explicitly defined are presented in this section for an
understanding of the concepts and terminologies used in this research. The next section
defines terms used in this study that are categorized based on the concepts relevant to

CHAPTER 1 INTRODUCTION
12
the research questions. Appendix A.1 has a complete alphabetical listing of all terms
used in the context of this research.
Terms relating to RQ1: How can the association of ITSM process capability and
process performance with financial performance of an organization be determined?
business unit - A segment of the business that has its own plans, metrics, income, and
costs. Each business unit owns assets and uses these to create value for customers in
the form of goods and services (OGC 2011e).
capability - The ability of an organization, person, process, application, IT service or
other configuration item to carry out an activity. Capabilities are intangible assets of
an organization (OGC 2011e).
cost - The amount of money spent on a specific activity, IT service or business unit.
Costs consist of real cost (money), notional cost (such as people’s time) and
depreciation (Van Bon et al. 2008).
critical success factor (CSF) - Something that must happen if an IT service, process,
plan, project or other activity is to succeed (Rockart 1979).
first-line support - The first level in a hierarchy of support groups involved in the
resolution of incidents where each level contains more specialist skills or has more
time or other resources (OGC 2011d).
incident management - The process responsible for managing the lifecycle of all
incidents to ensure that normal service operation is restored as quickly as possible and
the business impact is minimized (OGC 2011d).
IT service - A service provided by an IT service provider that comprises a combination
of information technology, people and processes (OGC 2011b).
IT service management (ITSM) - The implementation and management of quality
IT services that meet the needs of the business that is performed by IT service providers
through an appropriate mix of people, process and information technology (OGC
2011b).

CHAPTER 1 INTRODUCTION
13
ITIL® - A set of best-practice publications for IT service management that provides
guidance on the provision of quality IT services and the processes, functions and other
capabilities needed to support them (OGC 2011b)
key performance indicator (KPI) - A metric that is used to help manage an IT
service, process, plan, project or other activity that is used to measure the achievement
of each critical success factor (OGC 2011a, 2011c).
metric - Something that is measured and reported to help manage a process, IT service
or activity (OGC 2011a).
operational - The lowest of three levels of planning and delivery (strategic, tactical,
operational) that include operational activities such as the day-to-day or short-term
planning or delivery of a business process or IT service management process (OGC
2011b).
operational cost - The cost resulting from running the IT services, which often
involves repeating payments – for example, staff costs, hardware maintenance and
electricity (OGC 2011b).
opportunity cost - A cost that represents the revenue that would have been generated
by using the resources in a different way (OGC 2011e).
performance - A measure of what is achieved or delivered by a system, person, team,
process or IT service (OGC 2011b).
process - A structured set of activities designed to accomplish a specific objective that
takes one or more defined inputs and turns them into defined outputs. A process may
define policies, standards, guidelines, activities and work instructions if they are
needed (Van Bon et al. 2008).
risk - A possible event that could cause harm or loss, or affect the ability to achieve
objectives that is measured by the probability of a threat, the vulnerability of the asset
to that threat, and the impact it would have if it occurred. Risk can also be defined as
uncertainty of outcome, and can be used in the context of measuring the probability of
positive outcomes as well as negative outcomes (Van Bon 2004).

CHAPTER 1 INTRODUCTION
14
second-line support – In ITIL Service Operation the second level in a hierarchy of
support groups involved in the resolution of incidents and investigation of problems
(OGC 2011d).
service - A means of delivering value to customers by facilitating outcomes customers
want to achieve without the ownership of specific costs and risks (Van Bon 2004).
service management - A set of specialized organizational capabilities for providing
value to customers in the form of services (Van Bon 2004).
Terms relating to RQ2: How can the ITSM measurement framework be demonstrated
for CSI?
Continual Service Improvement (CSI) - A stage in the lifecycle of a service.
Continual service improvement ensures that services are aligned with changing
business needs by identifying and implementing improvements to IT services that
support business processes (OGC 2011a).
ITSM Process Capability - The ability of an organization, person, process,
application, IT service or other configuration item to carry out an activity (OGC
2011e).
Process improvement – actions taken to change an organization’s processes so that
they can more effectively and/or efficiently meet the organization’s business goals
(ISO/IEC 2005).
KISMET – (Keys to IT Service Management and Effective Transition of Services) is
an ITSM process improvement model, coordinated as a research project by the
Software Engineering Research Unit of the Department of Computer Science at the
University of Kuopio at the University of Eastern Finland (Jäntti, Lahtela & Kaukola
2010).
Scholar-Practitioner - expresses an ideal of professional excellence grounded in
theory and research, informed by experiential knowledge, and motivated by personal
values (Distefano, Rudestam & Silverman 2004).
The next section describes the delimitations of the scope and key assumptions of this
study.

CHAPTER 1 INTRODUCTION
15
1.7 Delimitations of Scope and Key Assumptions
A limitation of the study is that it depends on a single case study examining a single
environment. A single case study sample limits generalizability (Myers 2008). The
research is expected to make a contribution to the field through drawing attention to
the details of processes and multiple stakeholder perspectives (Miles & Huberman
1994).
This study is limited to the extent that only the ITIL 2011 edition best practice
framework will be used. While other best practice methodologies and related
frameworks exist, such as the Microsoft Operations Framework or COBIT, this study
confines the scope to only ITIL as the selected case study drives this decision. This
may be seen as a limitation, as the outcome of the study may produce different results
if other best practice frameworks are used.
An additional limitation is that the study will only focus on three ITSM processes:
Incident, Problem and Change Management, as these are the processes currently
implemented at the case organization. Studies have reported that these three processes
are the most popular and are considered the highest priority (Marrone et al. 2014), as
they have the least number of organizational constraints (Shrestha et al. 2012).
The survey data collection uses a pre-existing instrument, the Software Mediated
Process Assessment (SMPA) tool (Shrestha 2015). This study used the SMPA tool for
the process capability assessment, primarily for its transparency and convenience. A
path for future research when using the SMPA approach is to further analyze the
reliability of the assessment results before determining the capability rating of a
process. The process attribute scores and corresponding capability level should be
considered in light of the reliability measures. This study did not analyze the
assessment reliability scores in detail but merely used the results at face value. Results
from other process assessment methods can be easily incorporated into the
measurement model by following the method outlined in Chapter 3.
This paper is based on a single case study for three ITSM processes. Using the
framework developed in this research, the approach can be easily extended to other
organizations and all ITSM processes. It might also be extended to work beyond ITSM
(see section 8.5.2.1 for further details and an example). Further research can be

CHAPTER 1 INTRODUCTION
16
undertaken to apply the framework in different industry sectors, using different tools
for data collection and methods to calculate financial measures.
As indicated by the literature review, further research can be conducted using standard
accounting measures and/or market measures to fit the model developed in this paper.
As a result of these efforts, improvements in the performance of IT groups should
contribute to overall business performance and profitability.
The overall structure of the thesis is presented in the next section.
1.8 Structure of Thesis
The structure of the thesis is based upon the recommendations of Perry (1998) and the
University of Southern Queensland PhD guidelines (USQ 2017). The language used
in this thesis is United States English, as the researcher is based in the United States.
The thesis comprises eight chapters. For ease of readability, the section mark § is used
to denote a chapter section of the document.
Chapter 1 (this chapter) provides the background and motivation to the research. The
research problem and research questions are presented with the justification of the
research. This chapter also includes the expected contributions to research and
practice, an overview of the methodology, key definitions, limitations of the research
and agenda for further research.
Chapter 2 consists of the review of the literature.
Chapter 3 presents the blueprint of the study, detailing the overall design and approach
that is underpinned by the research philosophy, epistemology and ontology. The
chapter also outlines the research method and the action research approach followed
in the study. A detailed description of the research orientation, ethical considerations,
trustworthiness and validity are also provided.
Chapter 4 presents the design of the ITSM measurement framework that demonstrates
the association of process capability and process performance with financial costs. The
conceptual model is described and applied to demonstrate how the components of the
model interact with each other.
CHAPTER 1 INTRODUCTION
17
Chapter 5 presents the details of the first cycle of the action research study using the
KISMET model as a guide. This chapter uses the model designed in chapter 4 to
generate the results.
Chapter 6 presents the details of the second cycle of the action research study. This
chapter uses and enhances the model designed in Chapter 4. The results of the first
action research cycle are compared to the results of the second cycle.
Chapter 7 presents a discussion of the research findings. This chapter provides a
critical examination of the research results with discussions based on the context of
the research method and reviewed literature. Discussions are structured around the
research questions with a reflection on research work conducted and the presentation
of key themes emerging from this research.
Chapter 8 summarizes the research findings and how this research addressed the
research problem. The contribution of research to the body of knowledge is discussed
and implications of the research to theory and practice are presented. Then, the
limitations of the research and directions for future research are presented.
1.9 Chapter Summary
This chapter laid the foundations for the thesis. The research background and
motivation were presented for an overall understanding of the research context. Then
the research problem and research questions were identified. Justification of the
research and the research methodology was then briefly introduced. Key definitions
and scope delimitations were provided before an outline of the thesis chapters. Upon
this groundwork, the thesis can proceed with a detailed description of the research.

CHAPTER 2 LITERATURE REVIEW
18
CHAPTER 2 LITERATURE REVIEW
2.1 Introduction
Chapter 1 introduced the research topic: IT Service Management: Process Capability,
Process Performance, and Business Performance. This chapter presents a review of
the academic literature and practitioner knowledge to support the research problem as
described in chapter 1. Section 2.1 introduces the chapter. Section 2.2 presents the
literature review strategy used in this research and section 2.3 provides the literature
review protocol. Section 2.4 presents the theoretical framework of the study and
section 2.5 discusses the theories specific to the research problem. Section 2.6
summarizes this chapter. Figure 2-1 illustrates an overview of chapter 2.
Figure 2-1 Overview of Chapter 2

CHAPTER 2 LITERATURE REVIEW
19
2.2 Literature Review Strategy
The literature review applied the Systematic Mapping (SM) methodology (Peersman
1996) as opposed to the Systematic Literature Review (SLR) (Cochrane 1972)
approach. This decision to utilize the SM method instead of an SLR is in line with the
views of Kitchenham et al. (2009).
Systematic mapping is a literature review methodology that has been neglected in
Information Technology research but is common in medical research but (Petersen et
al. 2008). A systematic mapping study delivers a structure of the type of research
studies and results that have been published by categorizing them and providing a
visual map of the results (Petersen et al. 2008). Systematic mapping requires less effort
than the SLR and allows the evidence in a domain to be mapped at a high level of
granularity. Systematic mapping studies have previously been recommended mainly
for research areas where there is a lack of relevant, high-quality primary studies
(Kitchenham & Charters 2007). The systematic map of the literature review forms the
basis for this chapter (see Appendix A.2).
The number of journal articles and conference papers selected for further analysis are
charted in Figure 2-2 showing their years of publication.
Figure 2-2 Number of journal articles and conference papers
The next section discusses the literature review protocol.

CHAPTER 2 LITERATURE REVIEW
20
2.3 Literature Review Protocol
The literature review protocol specifies the research questions being addressed,
methods used to perform the review, the search strategy, inclusion and exclusion
criteria, information to be obtained from each primary study, and the quality criteria
by which to evaluate each primary study. Table 2-1 presents the literature review
protocol used in this research.
Table 2-1 Literature Review Protocol
Literature Review
Criteria
Search Measures
Search Strategy Keyword searches in ITSM and performance
measurement domains. Searches performed on Google
Scholar, Association of Information Systems (AIS)
electronic library, Decision Sciences, ScienceDirect,
Elsevier, IEEE Xplore, SpringerLink.
Search Terms ITIL, IT Infrastructure Library, ITSM, IT service
management, ITIL maturity, ITSM maturity, ITIL
capability, ITSM capability, ITIL process assessments,
ITSM process assessments, ITSM performance
measurement, ITIL performance measurement, IT
service, ITIL metrics, ITSM metrics, ITSM benefits, ITIL
benefits, ITIL value, ITSM value, ITSM performance,
ITIL performance, IT performance, IS performance,
performance measurement design, performance
measurement frameworks, BSC, Balance scorecard,
Service management, Business-IT alignment, Strategic
alignment, IT and Resource-Based View, IT and
Knowledge-Based View, IT financial management, IT
financial measures
Quality criteria for
evaluating primary
study
Academic books, peer-reviewed journal articles,
conference papers, technical reports and electronic
articles.
Industry books, whitepapers, and reports.
Inclusion and
exclusion criteria
Included: Academic publications: books, peer-reviewed
journal articles and conference papers, and technical
reports. Industry publications: books, journal articles,
white papers and technical reports.
Excluded: opinion pieces.

CHAPTER 2 LITERATURE REVIEW
21
Using the literature review protocol presented in Table 2-1 a review was performed on
empirical and theoretical studies covering ITSM adoption, implementation, benefits,
process capability, process improvement and financial performance. Both academic
and industry publications were included. The review primarily used online searches of
bibliographic online databases and library catalogs. Literature searches were
performed on Google Scholar as well as the Association of Information Systems (AIS)
basket of eight journals (AIS 2011): European Journal of Information Systems (EJIS),
Information Systems Journal (ISJ), Information Systems Research (ISR), Journal of
AIS (JAIS), Journal of Information Technology (JIT), Journal of MIS (JMIS), Journal
of Strategic Information Systems (JSIS) and MIS Quarterly (MISQ). Literature
searches were also performed on AIS conferences, including International Conference
on Information Systems (ICIS), European Conference on Information Systems (ECIS),
Americas Conference on Information Systems (AMCIS), Pacific Asia Conference on
Information Systems (PACIS), Australasian Conference on Information Systems
(ACIS), and Hawaii International Conference on System Sciences (HICSS). The
articles retrieved in the search were reviewed and literature addressing ITSM benefits,
IS, ITIL and ITSM performance measurement were further analyzed Articles from
peer-reviewed academic publications were supplemented with industry press books,
white papers, and web pages.
The theoretical framework of the research is presented next.
2.4 Literature Review Framework
The review of empirical and theoretical studies progressed from general to specific
subject areas, as depicted by the hierarchical literature review framework in Figure
2-3. High-level components of the framework are represented in shades of blue, while
the green components represent the literature on IT and the orange components
represent the business focus of the literature review. The numbers show the relevant
sections in this chapter.

CHAPTER 2 LITERATURE REVIEW
22
Figure 2-3 Literature Review Framework
CHAPTER 2 LITERATURE REVIEW
23
Dichotomizing the research topic presents two main streams of literature: IT and
Business. The theory that glues these streams of literature is Agency Theory- IT being
the agent and business the principal. Based on the Agency theory, the literature review
narrowed the focus to Strategic Alignment Theory and Business-IT Alignment.
Working down the hierarchy from this level focusses the literature review on ITSM
Process Maturity and Business Performance, using the Resource-Based View as a
guide. Finally, all the lower levels of the hierarchical literature review framework
were guided by the Actor-Network Theory.
The next two major sections of this chapter (§2.5 and §2.6) provide a review of the
parent theories and focus theories. Theory in interpretive IS case studies can play
different roles, that can be used as an initial guide to design and data collection; as part
of an iterative process of data collection and analysis; and as a final product of the
research (Walsham 1995). The theory reviewed in §2.4 was used to create an initial
theoretical framework which takes account of previous knowledge to create a
theoretical basis to inform the topics and approach of the early empirical work. The
literature reviewed in §2.5 used theory as an iterative process of data collection and
analysis, with initial theories being expanded and revised.
2.5 Parent Theories
2.5.1 Agency Theory
As the backdrop to the literature review, Agency Theory (Eisenhardt 1989a) is a view
of corporate governance that endeavors to explain the shared behavior of principals
(who are typically owners of firms) and agents (the managers of those firms). This
theory mainly assumes that human beings are rationally bounded, self-interested and
risk-averse and given the opportunity, they will further their personal self-interests in
opposition to that of the firm, thus governance mechanisms should be introduced as a
measure to minimize these opportunities and align the interests of the agent to that of
the principal/firm through incentives (Aoki 2001; Christopher 2010; Eisenhardt 1989a;
Jensen & Meckling 1976). This application of a contractual lens (principal-agent) as a
primary unit of analysis has contributed to the current focus on decision-making rights,
input rights, and accountability measures. A number of best practice frameworks have
been created with the foundational goals of creating measures/processes to control,

CHAPTER 2 LITERATURE REVIEW
24
monitor and evaluate activity in the organization. The perceived view of IT governance
is that the outcomes or focus of these measures is to create strategic alignment, risk
management, performance management, delivery of business value through IT, as well
as capability management (Bardhan et al. 2010; De Haes & Van Grembergen 2004;
Luftman & McLean 2004; Papp 1999; Peppard & Breu 2003). Since IT governance is
a form of corporate governance, §2.4.1.1 reviews the literature on corporate
governance before the discussion on IT governance in § 2.4.1.2.
2.5.1.1 Corporate Governance
There has been increased scrutiny in the issue of corporate governance over the past
decade, focusing on improved transparency and accountability (Subramanian 2015).
The modern practice of corporate governance can be traced back to the 17th-century
Dutch Republic (Frentrop 2003; Gelderblom, De Jong & Jonker 2013; Lukomnik
2016), where, in 1609, the world’s first publically listed company, the Dutch East India
Company (Funnell & Robertson 2013), had a corporate governance dispute between
shareholders and directors (Mueller 2012). The seminal work of the legal scholars
Adolf Augustus Berle and Gardiner Means in the 1930s is pivotal to an understanding
of the changing role of modern corporations in society (Berle Jr & Means 1930).
The principal-agent problem was established in the 1980s as an approach to
understanding corporate governance (Fama & Jensen 1983), where a corporation is
seen as a series of contracts (Eisenhardt 1989a).
The 1990s saw an unprecedented rate of dismissals of CEOs of prominent US firms
such as Honeywell, IBM, Kmart and Kodak, by their board of directors, causing a
flurry of media attention at the time (Bianco & Lavelle 2000). According to Bianco
and Lavelle (2000), one-third of CEOs appointed at 450 major corporations lasted
three years or less. Additionally, one in four companies went through three or more
CEOs in the 1990s (Bianco & Lavelle 2000).
The issue of corporate governance was in the spotlight again in the early 2000s, when
the US firms Enron and MCI Inc. were at the center of corporate scandals. A US
federal law, Sarbanes-Oxley Act was passed in 2002 to regain public confidence in
corporate governance. Similarly, around the same time, the demise of Australia’s HIH

CHAPTER 2 LITERATURE REVIEW
25
Insurance and One.Tel led to the enactment of the Corporate Law Economic Reform
Program Act (CLERP 9) (Lee, J & Shailer 2008).
The term “corporate governance” may be defined as the relationship between owners
of corporations and the management they employ to run their companies on a day-to-
day basis for them. Since these owners are isolated from the daily activities of their
firms, the principal-agent issue arises between executive management (the “agent”)
that may have different interests and more information than shareholders (the
“principals”). Current interest in corporate governance is concerned with mitigation of
the conflicts of interests between stakeholders (Goergen 2012).
Corporate governance is concerned with minimizing costs and risks due to the isolation
of owners from hired management and with maximizing returns to owners using the
skills of employed management (Licker 2007). Current risks in corporate governance
include both legal and ethical issues, making investment returns complex and not
necessarily defined in monetary terms. This makes corporate governance a complex
process and, given the existence of the presumed gap between owners and managers,
and the specific knowledge needed in IT to understand the business value, IT
governance can be more complex to control, leading to the challenges of IT
governance. The next section discusses IT Governance.
2.5.1.2 IT Governance
IT governance is an integral subset discipline of corporate governance concerned with
IT performance and risk management. In a study by Licker (2007), the definition of IT
governance was presented by various researchers as:
“IT Governance is the strategic alignment of IT with the business such that
maximum business value is achieved through the development and
maintenance of effective IT control and accountability, performance
management and risk management” (Webb, Pollard & Ridley 2006, p. 7);
“… specifying the decision rights and accountability framework to encourage
desirable behaviors in using IT” (Weill & Ross 2004, p. 8);

CHAPTER 2 LITERATURE REVIEW
26
“the distribution of IT decision-making rights and responsibilities among
enterprise stakeholders, and the procedures and mechanisms for making and
monitoring strategic decisions regarding IT” (Peterson 2004, p. 7);
“control the formulation and implementation of IT strategy and in this way
ensure the fusion of business and IT” (De Haes & Van Grembergen 2004, p.
1).
Although definitions of IT governance vary, there has largely been a consensus in the
literature regarding the perceived purpose of IT governance: to ensure the best
utilization of IT resources for the purposes of achieving the business strategy and
furthering business objectives (Licker 2007).
According to Peterson (2004), governance is intended to mitigate IT challenges in
three ways: structural, process and relational. The first way refers to the structural
relationship of the IT function to the rest of the firm and focusses on strategic
alignment (Weill & Ross 2004). Good governance is intended to ensure the alignment
of the presumed IT interests of technical excellence and efficiency with those of the
firm at large. The next section reviews the literature on the three most dominant IT
governance models and best practice frameworks.
2.5.1.3 IT Governance Models/Best Practice Frameworks
Research in the field of IT governance has been underpinned and grounded by Agency
Theory (Jensen & Meckling 1976). The literature on IT Governance recognizes that
“effective governance” metrics are underpinned by the theoretical assumptions of
agency theory that encourage the widespread propagation of “best practice” models
and frameworks such as COBIT, ITIL and the Balanced Scorecard (BSC) (Masuku
2014). The three most influential IT governance models/frameworks, COBIT, ITIL,
and BSC are discussed next.
COBIT
The Control Objectives for Information and Related Technologies (COBIT®) best
practice framework incorporates many commonly accepted concepts and theories from
general management and academic IT literature (De Haes, Debreceny & Van
Grembergen 2013). COBIT is particularly influential in the IT governance, audit and
CHAPTER 2 LITERATURE REVIEW
27
compliance arena, informing much of how practitioners view, understand and
implement IT governance within their organizations (De Haes, Van Grembergen &
Debreceny 2013). This framework positions the IT governance objective as the
creation of stakeholder value, defined as “realizing benefits at an optimal resource cost
whilst optimizing risk” (ISACA 2012).
COBIT 5, the latest version of the framework, builds and expands on earlier versions
by integrating other major frameworks, standards and resources, including ISACA’s
Val IT and Risk IT, Information Technology Infrastructure Library (ITIL®) and
related standards from the International Organization for Standardization (ISO)
(ISACA 2017).
COBIT 5 claims to incorporate five principles that allow the firm to build an effective
governance and management framework based on a comprehensive set of seven
enablers that optimizes information and technology investment and use for the benefit
of stakeholders (ISACA 2017).
The COBIT 5 process capability model is grounded on the principle that there are
increasing levels of maturity of organizational governance and that an organization
can make changes to its processes and activities in order to progress in these levels
(Pasquini & Galiè 2013). COBIT 5 applies the international standard for process
assessment ISO/IEC 15504 to assess IT processes (Pasquini & Galiè 2013).
The study by Pasquini and Galiè (2013) recognized the COBIT 5 Process Capability
Model (based on ISO/IEC 15504) as a good approach to assess the “as-is” process
capability level, target the “to-be” maturity based on financial analyses and
opportunities that could result in improvements, and analyze the gap between “as-is”
and “to-be” to reach a desired level of capability for a given process.
ITIL
The genesis of ITIL comes from a response to the severe economic recession in the
late 1980s when the Central Computer and Telecommunications Agency (CCTA) in
the United Kingdom developed the Government Information Technology
Infrastructure Management framework in an attempt to reduce costs and better manage
IT service delivery (Sallé 2004). In the year 2000, the CCTA merged into the Office

CHAPTER 2 LITERATURE REVIEW
28
for Government Commerce (OGC), an independent office of the UK Treasury. In the
1990s, ITIL gained the support of the British Standards Institution and was extended
and adopted as BS 15000 (code of practice for IT service management) in 1995 (Cater-
Steel & Toleman 2008). The ITIL framework gained popularity worldwide through
the influence of the IT service management forum (itSMF) (Clacy & Jennings 2007;
Lahtela & Jäntti 2010).
Information Technology Infrastructure Library (ITIL®) is a documented set of best
practices and guidelines to implement ITSM. ITIL defines processes and functions
related to service strategy, service design, service transition, service operation and
continual service improvement (Glenfis-AG 2014). The ITIL 2011 edition, the latest
edition published by the British Office of Government Commerce in July 2011,
consists of five books: ITIL Service Strategy (OGC 2011e), ITIL Service Design
(OGC 2011c), ITIL Service Transition (OGC 2011f), ITIL Service Operation (OGC
2011d) and ITIL Continual Service Improvement (OGC 2011b).
ITSM is an evolving practice for implementing and managing quality IT services,
resources, and systems, to better align the delivery of IT services with the needs of the
business, with emphasis on benefits to customers, resulting in more capable and
proficient business processes and potentially beneficial cost cutting (Conger,
Winniford & Erickson-Harris 2008). ITSM “provides a framework to align IT
operations-related activities and the interactions of IT technical personnel with
business customer and user processes” (Galup et al. 2009, p. 125). The main objective
of ITSM is to improve IT services to satisfy business requirements and manage
infrastructure while increasing alignment between IT and organizational goals
(Masuku 2014).
ITIL is the most popular ITSM best practice framework (Forbes 2017), however, IT
organizations need an international standard to audit their ITSM processes (Jäntti et
al. 2013). ITIL underpins ISO/IEC 20000, the International Service Management
Standard family for IT service management, especially ISO/IEC 20000-1:2010 Part 1:
Service management system requirements and ISO/IEC 20000-2:2011 Part 2:
Guidance on the application of service management systems (Jäntti et al. 2013). The
IT service management process reference model (PRM) is defined in Part 4 of the
standard. (ISO/IEC 2010). ISO/IEC TS 15504-8:2012 process assessment model

CHAPTER 2 LITERATURE REVIEW
29
(ISO/IEC 2012) extends the PRM process definitions and defines Generic Practices,
Generic Resources and Generic Input/Outputs for evaluating the service management
process capability (Jäntti et al. 2013). In addition, Base Practices with Input and Output
Information Items are used as process performance indicators that introduce a Process
Maturity Framework (PMF). Recently, the ISO/IEC 15504 standard has been revised
and reorganized as a new series of the standard: the ISO/IEC 330xx series (ISO/IEC
2017).
Measurement in ITIL is divided into three components (OGC 2011b): Critical Success
Factors (CSFs) that reflect the organization’s goals for ITSM, Key Performance
Indicators (KPIs) that indicate the performance trend, and other metrics that enable
measurements in practice (Jäntti et al. 2013). The strength of ITIL has been attributed
to its activity-based process models and guidelines, and lists of critical success factors.
Balanced Scorecard
The Balanced Scorecard (BSC) is another widely adopted model for strategic
alignment. The BSC framework was introduced by Kaplan and Norton in the 1990s as
a framework of performance evaluation (Kaplan & Norton 1992). The BSC has been
used as a framework of IT evaluation since its introduction in the IT field, and later
used as a framework for IT Management, and IT Governance (Ahmad 2013). The
premise of this model is the integration of financial and non-financial measures,
arguing for the inclusion of measures concerning internal processes, the ability to
innovate, and customer satisfaction with the traditional evaluation of financial metrics
(Kaplan & Norton 1992). A system for business-IT alignment is provided to senior
management through the use of cascading balanced scorecards. Enablers for the IT
balanced scorecard include an IT development scorecard, and an IT operational
scorecard; the IT balanced scorecard then may become an enabler of a business-
balanced scorecard (Van Grembergen 2000).
The BSC is both a strategic measurement system and a strategic control system that is
used to align personal and departmental goals to business strategy, and assist
management to plan, execute and monitor business strategies (Kaplan & Norton 1996;
Norreklit 2000). The BSC model differentiates itself from other strategic measurement
systems in that it “includes outcome measures and the performance drivers of

CHAPTER 2 LITERATURE REVIEW
30
outcomes, linked together in cause-and-effect relationships” (Kaplan & Norton 1996,
p. 31). The purpose of the balanced scorecard is to align “the strategy expressed in the
actions actually undertaken to the strategy expressed in the plan” (Norreklit 2000, p.
69). This model inherently claims that financial measures represent past performance
whilst the drivers of future performance are the nonfinancial measures (Kaplan &
Norton 1996; Norreklit 2000).
The BSC model assumes that the suggested areas of measurement are linked by a
cause-and-effect relationship. Norreklit (2000) suggested that this assumption is
problematic, as it does not provide for a time lag dimension between the measures, as
required in cause-and-effect relationships. To investigate further, Norreklit (2000)
conducted an analysis of the BSC assumptions and concluded that “the balanced
scorecard makes invalid assumptions about causal relationships, leading to the
anticipation of performance indicators which are faulty, thus resulting in dysfunctional
organizational behavior and sub-optimized performance” (p. 75) and made the
argument that instead of being referred to as causal, the relationship between the
measurement areas is more likely to be one of interdependence (Norreklit 2000). In
addition, although the balanced scorecard attempts to integrate four important
performance perspectives in one simple and easy to use management report, the main
weakness of this approach is that it is primarily designed to provide senior managers
with an overall view of performance, thus making it inapplicable at the operational
level.
The next section moves down the hierarchical theoretical framework (Figure 2-3) to
review the literature on the link between IT and the business. §2.4.2 discusses the
Strategic Alignment Theory as the underpinning theory to Business-IT Alignment
which is reviewed in §2.4.2.1.
2.5.2 Strategic Alignment
This section introduces Strategic Alignment as the theoretical foundation for the
Business-IT Alignment focus of the study.
Rapid advanced development in IT technologies has stimulated new opportunities by
using technology strategically for business benefits (Galliers & Leidner 2014). The
alignment of IT strategies with business plans and business strategies to eventually

CHAPTER 2 LITERATURE REVIEW
31
implement them to improve productivity and competitiveness of the business requires
the efficient and effective use of IT (Luftman 2000). Strategic alignment is invaluable
to executives seeking to achieve alignment of their business and technology strategies
(Coleman & Papp 2006; Ward & Peppard 2002).
Strategic Alignment has been defined as the “Strategic Fit” & “Functional Integration”
among the four domains of business strategy, IT strategy, business infrastructure, and
IT infrastructure (Henderson & Venkatraman 1993), and similarly as “The degree to
which the IT mission, objectives and plans support and are supported by the business
mission, objectives, and plans” (Reich & Benbasat 1996, p. 55) and “applying
Information Technology (IT) in an appropriate and timely way, in harmony with
business strategies, goals and needs” (Luftman 2000, p. 14).
In the 1990s, Henderson and Venkatraman (1993) presented a systematic model, the
Strategic Alignment Model (SAM), that can enable the successful implementation of
business, technology, and infrastructure for improved alignment (Henderson &
Venkatraman 1993). The SAM framework recognizes that business success is
dependent on the harmony of business strategy, IT strategy, organizational
infrastructure and processes, and IT infrastructure and processes (Luftman 2004).
Based on the definition of Strategic Alignment by Henderson and Venkatraman
(1993), strategic alignment is a continuous process, ideally executed by a management
team working together and recognizing where the organization is strong and weak (and
why), developing action plans that leverage areas of strength, and building and
managing the four domains and the interrelationship between them. The strategic
alignment refers to the extent to which operational decisions within the firm are
consistent with the strategy, and the firm’s successful implementation of its strategy
to achieve its fundamental goals (Henderson & Venkatraman 1991, 1993; Luftman,
Lewis & Oldach 1993).
2.5.2.1 Business-IT Alignment
Stakeholders of organizations typically have different objectives, culture, and
incentives (Rahbar, Zeinolabedin & Afiati 2013). Business-IT alignment is the highly
sought-after state where businesses effectively use IT in a timely manner to achieve
business goals and strategies. The 2016-2017 Global CIO Survey from Deloitte LLP

CHAPTER 2 LITERATURE REVIEW
32
found that CIOs can drive business value by continually assessing and aligning IT
capabilities (Kark et al. 2017). The same survey found that the top IT capability
selected by respondents was the capacity to align IT activities with business strategy
and performance goals. About 75 percent of the CIOs surveyed said this capability was
essential to their success, including the CIO of a large US retailer, who stated that “The
difference between good and bad IT organizations is business alignment” (Kark et al.
2017).
Studies show that organizations with IT-enabled growth are not only positively
affected by economic impacts (e.g., increasing sales and decreasing expenditures)
(Alaeddini & Salekfard 2013), they can also achieve a better strategic match, a more
efficient IT architecture and more core competencies, as well as better decision-
making and faster competitive reactions (Rahbar, Zeinolabedin & Afiati 2013).
Scholars have proposed several definitions of business-IT alignment, of which the
more relevant are listed below:
Matching business requirements with relevant IT services (Tapia 2007);
Aligning the information systems capabilities with the business goals
(Chen 2008);
Applying IT in an appropriate and timely manner, in accordance with
existing business strategies, goals and needs (Luftman 2000);
The degree to which the IT applications, infrastructure, and organization
enable and support the business strategy and processes, including the
processes to realize this (Silvius 2008).
The best practices of ITIL support, enhance and prioritize the vital importance of
alignment between business and IT. The use of ITSM has influenced the alignment
and general interaction of the business and IT (Luftman, Papp & Brier 1999).
There is a possible positive effect on the performance of the business, competitive
advantage, and increased profitability, through business and IT alignment, since ITSM
has a direct impact on the strategic position of the business (Luftman & Ben-Zvi 2011).
The following section addresses the next level of the theoretical model, by providing
the theory that links ITSM Maturity to Business Performance.
CHAPTER 2 LITERATURE REVIEW
33
2.5.3 Resource-Based View and Knowledge-Based Theory
A theoretical framework that is often used in the field of information management and
other management fields is the Resource-Based View (RBV) of the firm (Wernerfelt
1984). RBV is deeply rooted in management strategy literature and proposes that
companies compete due to “unique” resources that are valuable, rare, difficult to
imitate, and non-substitutable by other resources (Barney 1991; Conner 1991; Schulze
1992). Furthermore, RBV posits that organizational resources are the source of
improved company performance and on-going competitive advantage (Wade &
Hulland 2004).
From the resource-based perspective, business is seen as a package of in-house,
strategically relevant resources. The organization is perceived as a bundle of assets
essential for the company to execute its strategy (Mills, Platts & Bourne 2003). The
strategically relevant resources employed, owned and controlled by the business form
the building blocks of competitive advantage of the firm. Accordingly, a company’s
performance is determined by its ownership or control of the exclusive, strategically
relevant resources needed to achieve its competitive advantage.
The RBV refers to resources such as physical (e.g., machines, plant, etc.), human (e.g.,
know-how), and organizational capital (e.g., the firm’s reputation) (Barney 1991). The
RBV sees knowledge as a generic source for sustainable competitiveness but fails to
realize the different types of knowledge-based capabilities such as acknowledging the
significance of human resources, competencies and intellectual capital for
competitiveness (Marrone 2010). Some researchers perceive that this constitutes a
weakness of the RBV since it does not emphasize sufficiently the importance of
learning and innovating in the firm, neither does it look at interfaces between
individuals. Particularly in service industries, the primary source of competitive
advantage is the continuous process of knowledge creation (Nonaka & Takeuchi
1995).
Using the resource-based view of the firm as a base, Grant (1996) proposed the
knowledge-based view of the firm (KBV), also known as the knowledge-based theory.
KBV is rooted in strategic management and extends the RBV of the firm.

CHAPTER 2 LITERATURE REVIEW
34
A company’s capabilities depend on both the tacit and explicit knowledge that exists
within the company. Operational capabilities are essential for a company’s existence
as they are required to produce products or deliver services and constitute a “must
have” set of know-how (Grant 2016). Dynamic capabilities are required for companies
to expand and adapt to the ever-changing environment (Eisenhardt & Martin 2000),
and to enable companies to improve or extend their existing strategy, resource base
and processes. Financial services organizations, like Company X, can be regarded as
knowledge-intensive organizations since they depend on the creation, capture,
transfer, and application of specialized knowledge in their core business processes
(Cuske et al. 2008).
IT Service Management frameworks, such as ITIL, are able to provide a positive
influence on knowledge transfer by prescribing policies, procedures, and tools that
serve as valuable enablers of knowledge generation and application (Marrone 2010).
These frameworks influence the IT organization’s resources and capabilities and
ultimately can lead to improvement of a firm’s competitive advantages (Marrone
2010).
The primary source of competitive advantage, specifically in the service industry, is
the continuous process of knowledge creation (Colurcio 2009; Nonaka & Takeuchi
1995). The sustainable growth of a firm requires continuous redevelopment of
knowledge-based resources and capabilities to be able to discover new business
opportunities (Saarenketo 2009). In most organizations, specialized knowledge is
distributed across different organization members, which causes a problem (Tsoukas
1996). §2.4.4 reviews literature on the Actor-Network Theory, the theory that was used
as a method to guide the research.
2.5.4 Actor-Network Theory
Actor-Network Theory (ANT) was pioneered by French sociologists through their
efforts to realize how scientific theories spread within scientific communities, become
entrenched in the community and are then taken for granted as a basis for further
scientific progress (Cater-Steel & McBride 2007). ANT was established by Michel
Callon and Bruno Latour (Callon & Latour 1981) during the course of the 1980s, and

CHAPTER 2 LITERATURE REVIEW
35
was later further developed by the authors and other scholars (Callon 1999; Latour
1999; Law 2009; Law & Hassard 1999).
A major problem in adopting and implementing a best practice framework, such as
ITIL, is convincing IT managers of the importance of ITIL and persuading executives
to invest in IT service management projects (Cater-Steel & McBride 2007). The
problems associated with ITIL adoption and technology adoption are not very different
as they both involve changes to practices, changes in organizational behavior and the
development of different attitudes and culture (Cater-Steel & McBride 2007).
The acceptance of IT service standards, and their entrenchment in organizations is a
social phenomenon, one of establishing social acceptance, of developing social
networks in which people’s interests are similar, and the message of ITIL becomes
part of everyone’s mindset. A positive view of ITIL leads to the acceptance of the
procedures as part of daily work lives, and people start to recommend its use to co-
workers.
ANT provides an explanatory framework to explore how a network of actors
communicate to align actor interests around the adoption and implementation of ITIL
- the establishment of a social and technological arrangement (Cater-Steel & McBride
2007). Establishing a standard requires the aligning of the interests of actors within the
network. Actors enroll others into the network, and as the interests of actors within the
network are aligned, the network becomes stable and the standards entrenched. ANT
suggests that the aligning of the interests of actors in the network involves the
translation of those interests into a common interest in adopting a framework such as
ITIL. This translation is achieved in the network through common definitions,
meanings, and inscriptions attached to the service activities. The actor-network must
first grow to reach a critical mass and then reach a state of stability. If the network
remains unstable, it can disappear as quickly as it emerges, and the standard becomes
obsolete. In order for stability to be established so that the standards become embedded
in work practices, the notion of irreversibility must be established (Cater-Steel &
McBride 2007).
According to ANT, standards adoption is not a just a technical process of writing the
procedures and getting people trained. It is primarily a social process by which groups

CHAPTER 2 LITERATURE REVIEW
36
of people come to share interests and adopt similar attitudes. For ITIL to be accepted
at any organization, it is these social processes that must be addressed first. It requires
that the social links between IT services and the rest of the firm are strong enough that
actor networks can be established and the message of ITIL transmitted so that people
are enrolled into an ITIL network. Their interests must be shown to be aligned with
the interests of the ITIL network. They must see that ITIL will help them achieve their
objectives.
The systematic map of the literature reviewed for the underpinning theories is
presented in Table 2-2 (below).
Table 2-2 Systematic map of the underpinning theories
Underpinning Theories
Researcher/Author
So
urc
e ITS
M B
est
Pra
ctic
e
Fra
mew
ork
s
IT G
ov
ern
an
ce &
Bu
sin
ess-
IT
Ali
gn
men
t
Res
ou
rce-
Ba
sed
Vie
w
Act
or-
Net
wo
rk T
heo
ry
Kashanchi, R. & Toland, J. (2006) JA
x
Marrone, M., & Kolbe, L. M. (2011) JA x
Rahbar, N., Zeinolabedin, N., & Afiati, S. (2013) JA
x
Silvius, A. (2008) JA
x
Weill, P., & Ross, J. W. (2004) JA
x
Peterson, R. (2004) JA
x
De Haes, S., & Van Grembergen, W. (2004) JA
x
Luftman, J. (2000) JA
x
Luftman, J., Papp, R., & Brier, T. (1999) JA
x
Luftman, J., & Ben-Zvi, T. (2011) JA
x
Jäntti, M., Rout, T., Wen, L., Heikkinen, S., & Cater-Steel, A.
(2013)
JA x
Conger, S., Winniford, M., & Erickson-Harris, L. (2008) JA x
Callon, M. (1999) JA
x
Latour, B. (1999) JA
x
Marrone, M. (2010) JA x
Wernerfelt, B. (1984) JA
x
Barney, J. (1991) JA
x
Conner, K. R. (1991) JA
x
Wade, M., & Hulland, J. (2004) JA
x
Mills, J., Platts, K., & Bourne, M. (2003) JA
x

CHAPTER 2 LITERATURE REVIEW
37
Underpinning Theories
Researcher/Author
So
urc
e ITS
M B
est
Pra
ctic
e
Fra
mew
ork
s
IT G
ov
ern
an
ce &
Bu
sin
ess-
IT
Ali
gn
men
t
Res
ou
rce-
Ba
sed
Vie
w
Act
or-
Net
wo
rk T
heo
ry
Grant, R. (1996) JA
x
Eisenhardt, K. M., & Martin, J. A. (2000) JA
x
Colurcio, M. (2009) JA
x
Saarenketo, S. e. a. (2009) JA
x
Tsoukas, H. (1996) JA
x
De Haes, S., Debreceny, R., & Van Grembergen, W. (2013) JA x
De Haes, S., Van Grembergen, W., & Debreceny, R. S. (2013) JA x
Galup, S. D., Dattero, R., Quan, J. J., & Conger, S. (2009) JA x
Masuku, S. (2014) JA x
Kaplan, R., & Norton, D. (1992) JA x
Kaplan, R., & Norton, D. (1996) JA x
Ahmad, M. (2009) JA x
Norreklit, H. (2000) JA x
Van Grembergen, W. (2000) CP x
Schulze, W. S. (1992) CP
x
Chen, H.-M. (2008) CP
x
Tapia, R. S. (2007) CP
x
Licker, P. (2007) CP
x
Webb, P., Pollard, C., & Ridley, G. (2006) CP
x
Duffy, K. P., & Denison, B. B. (2008) CP
x
Fraser, P., Moultrie, J., & Gregory, M. (2002) CP x
Pasquini, A., & Galiè, E. (2013) CP x
Cater-Steel, A., & McBride, N. (2007) CP x
Grant, R. (2002) B
x
Nonaka, I., & Takeuchi, H. (1995) B
x
Callon, M., & Latour, B. (1981) B
x
Law, J. (2009) B
x
Law, J., & Hassard, J. (1999) B
x
ISACA. (2012) IR x
Glenfis-AG. (2014) IR x
Cabinet Office (2011) IR x
Forbes. (2017) IR x
Count 17 15 14 6
Note. JA=Journal Article; CP=Conference Paper; B=Book; IR=Industry Resource.

CHAPTER 2 LITERATURE REVIEW
38
The next major section focusses on the body of knowledge that directly relates to the
research problem.
2.6 Focus Theories
2.6.1 ITSM Capability
2.6.1.1 ITSM Adoption, Implementation, and Benefits
The 2017 Forbes Insights survey on The State of ITSM (Forbes 2017) reported that
ITIL is the most popular ITSM framework. Of the 261 global senior executives
surveyed, 47 percent reported ITIL as the ITSM framework of choice. Figure 2-4
shows the list of most common ITSM frameworks from the Forbes Insights survey.
Figure 2-4 Forbes Insights survey list of most prevalent ITSM frameworks
(Forbes 2017)
The adoption, implementation, and benefits of ITSM and the ITIL framework has been
reported by numerous scholars across the globe, including the United States of
America (Galup et al. 2009; Pollard & Cater-Steel 2009), United Kingdom (Shwartz
et al. 2007), Germany (Egeler 2008), Australia (Cater-Steel, Tan & Toleman 2009a),
New Zealand (Potgieter, Botha & Lew 2005), China (Zhen & Xin-yu 2007), Malaysia
CHAPTER 2 LITERATURE REVIEW
39
(Ayat et al. 2009; Kanapathy & Khan 2012), Thailand (Lawkobkit 2008), and Norway
(Iden & Eikebrokk 2014; Iden & Langeland 2010).
In 2009 it was estimated that an ITSM framework was being used by around 45 percent
of US companies while 15 percent were planning its usage (Winniford, Conger &
Erickson-Harris 2009). In 2008, the IT Governance Institute estimated that ITIL had
the highest rate of adoption of 24 percent, followed by CobiT with an adoption rate of
14 percent (Marrone & Kolbe 2010). There is little empirical evidence of the possible
negative outcomes of ITSM adoption, given the research focus on benefits of the
adoption of ITSM. The studies by Gacenga, Cater-Steel and Toleman (2010)
acknowledged that this might present a one-sided view of the outcomes of ITSM
adoption and that information on costs, challenges and other risks need to be
incorporated into any cost-benefit analysis. Organizations have reported that
implementing ITIL to improve processes can change IT service management and
provide benefits to the business such as improved resource utilization, more timely
deliverables, improved communication with IT departments within the organization, a
reduction of server errors, elimination of redundant work and a decrease of rework,
and the justification of the cost of quality (Cater-Steel, Toleman & Tan 2006). It is
clear that many organizations are convinced of the positive impact of ITIL in
transforming IT service management.
ITSM frameworks, such as ITIL, are capable of having a positive impact on
knowledge transfer in organizations and influence the IT organization’s resources and
competences, and eventually lead to improvement of a business’s competitive
advantages (Grant 1996). The maturity of ITSM is directly related to the number of
realized benefits (Gacenga, Cater-Steel & Toleman 2010; Marrone & Kolbe 2010).
However, the benefits listed by Gacenga et al. mainly accrue to IT and not directly to
the general business. Previous empirical studies focused on process-specific benefits,
and not financial returns (Gacenga, Cater-Steel & Toleman 2010). Research to date
has not established the financial return on the investment of ITSM implementations.
Investment in ITSM processes requires that the benefits are justified economically, but
thus far, there has been little research on quantifying the benefits from ITSM
implementation. Customer satisfaction and operational performance improve with the
increase in ITIL framework activities. However, many organizations find it difficult

CHAPTER 2 LITERATURE REVIEW
40
to determine the tangible benefits from ITIL adoption (Cater-Steel, Toleman & Tan
2006).
The motivation to adopt ITIL may be due to legal compliance, a cost-saving measure,
risk management as a means to effectively satisfy customers (Cater-Steel, Tan &
Toleman 2009b).
The systematic map of the literature reviewed for ITSM adoption, implementation, and
the outcomes and benefits of ITSM are presented in Table 2-3 (below).
Table 2-3 Systematic map of the literature reviewed for ITSM adoption,
implementation, and the outcomes and benefits of ITSM
ITSM Process Capability
Researcher/Author So
urc
e
ITS
M A
do
pti
on
ITS
M O
utc
om
es a
nd
Ben
efit
s
ITS
M
Imp
lem
enta
tio
n
Pollard, C., & Cater-Steel, A. (2009) JA x
Marrone, M. (2010) JA x
Marrone, M., & Kolbe, L. M. (2010) JA
x
Egeler, M. (2008) JA
x
Marrone, M., & Kolbe, L. M. (2011) JA
x x
Gacenga, F., Cater-Steel, A., & Toleman, M. (2010) JA
x
Wan, S. H. C., & Chan, Y. H. (2008) JA
x
Cater-Steel, A. (2009) JA
x
Marrone, M., Gacenga, F., Cater-Steel, A., & Kolbe, L. (2014) JA
x
Kanapathy, K., & Khan, K. I. (2012) JA
x
Tan, W.-G., Cater-Steel, A., & Toleman, M. (2009) JA
x
Iden, J., & Eikebrokk, T. R. (2014) JA
x
Winniford, M., S. Conger, L. Erickson-Harris. (2009) JA
x
Suhonen, A., Heikkinen, S., Kurenniemi, M., & Jäntti, M. (2013) JA
x
Hochstein, A., Tamm, G., & Brenner, W. (2005) CP
x
Cater-Steel, A., Toleman, M., & Tan, W.-G. (2006) CP
x
Disterer, G. (2012) CP
x
Salling Pedersen, A., & Bjørn-Andersen, N. (2011) CP
x
Conger, S., Winniford, M., & Erickson-Harris, L. (2008) CP
x
Coelho, A. M., & Rupino da Cunha, P. (2009) CP
x
Flores, J., Rusu, L., & Johanneson, P. (2010) CP
x
Zajac, A., & Soja, P. (2012) CP
x

CHAPTER 2 LITERATURE REVIEW
41
de Espindola, R. S., Luciano, E. M., & Audy, J. L. N. (2009) CP
x
Count 2 11 11
Note. JA=Journal Article; CP=Conference Paper.
2.6.1.2 ITSM Maturity Models
Maturity models describe evolutionary levels of improvement in a specific process, or
domain, that organizations go through to become more mature (Mettler 2012). For
each level of maturity, maturity models typically provide a general description and
formally specify a number of specific characteristics along a set of well-defined
attributes (Fraser, Moultrie & Gregory 2002). ITSM maturity can be defined as the
extent to which “repeatable patterns of action” are defined, managed, measured,
controlled, and effective as a process (Paulk et al. 1993; Wulf, Winkler & Brenner
2015). As maturity models describe both the definition of organizational routines and
the performative perspective, they can also be used to describe the level of
organizational capability (Paulk et al. 1993).
Process maturity can be rolled-up to a domain level maturity by the use of staged logic
(i.e., certain processes need to be in place for a certain domain level), or continuous
logic (i.e., the domain-level maturity is reflected in the aggregate levels of process
maturity) (Wulf, Winkler & Brenner 2015). Maturity models can distinguish
themselves from each other by their specificity of their process prescriptions, as some
models define goals and attributes for each ITSM process individually, while others
only define generic attributes, which are applicable for all ITSM processes (Wulf,
Winkler & Brenner 2015). A third category of maturity models provides a combination
of generic and specific process goals and attributes (Wulf, Winkler & Brenner 2015).
One of the most commonly used general purpose process maturity evaluation
frameworks is the Capability Maturity Model (CMM) (Mesquida et al. 2012), which
was originally designed to measure maturity in the domain of software development
(Paulk et al. 1993). CMM is often referred to as the main framework, but its further
refined framework, Capability Maturity Model Integration (CMMI) is more frequently
used since some of the flaws of the original model have been eliminated in the latter.
An extension of CMMI, the Capability Maturity Model Integration for Services
(CMMI-SVC) has a specific focus on a set of processes required to manage service
provider organizations (CMMI Product Team 2011). COBIT, a framework with a

CHAPTER 2 LITERATURE REVIEW
42
focus on IT governance, defines a generic scale for the assessment of process maturity
and further provides control objectives for the individual COBIT processes (ISACA
2012). ISO/IEC 15504 (ISO/IEC 1998), initially referred to as the Software Process
Improvement and Capability Determination (SPICE) framework, is an international
standard for the assessment of processes. It can be applied for ITSM certification as
specified in the ISO/IEC 20000 standard (ISO/IEC 2010). ITIL (OGC 2011a) since
version 3 also provides some recommendations on how to assess the maturity of either
the individual service management processes or the entire ITSM domain.
In summary, all reviewed maturity models define generic process attributes. The six
generic process attributes specified by COBIT 5 (ISACA 2012) are compatible with
the CMMI-SVC (CMMI Product Team 2011) and SPICE (ISO/IEC 1998) maturity
models and in addition, cover specific goals and work products for ITSM processes.
2.6.1.3 ITSM Process Assessments
Process assessment is described in the literature as a series of steps targeted to compare
an organization’s everyday processes with reference processes that comprise typical
activities for the process at different capability levels (Barafort & Rousseau 2009b).
Process assessments are primarily conducted by organizations to benchmark results
against an international standard (Juran & Godfrey 1999). The international standard
for process assessment ISO/IEC 15504 suggests that process assessments can be used
for process improvement or to determine process capability (ISO/IEC 2005). The
primary goal of a process assessment is to provide guidance to improve processes
(Shrestha 2015).
Practitioner resources suggest that organizations prefer an easy, cost-effective and
timely process assessment mechanism that unveils a realistic indication of process
capability (Mainville 2014). This is particularly true for smaller organizations that are
undertaking their first experience with assessments (Juran & Godfrey 1999).
The ISO/IEC 15054 standard defines six process capability levels with nine process
attributes, as shown in
Table 2-4 (see below).
Table 2-4 ISO/IEC 15504 Process Capability Levels and Process Attributes

CHAPTER 2 LITERATURE REVIEW
43
Process Capability
Level
Process Attribute Outcome
CL0 - Incomplete
process
None The process is not practiced,
or it cannot fulfill its
objectives. At this level, the
process does not achieve its
objectives.
CL1 - Performed
process
PA1.1 Process Performance The process is performed
and achieves its objectives.
CL2 - Managed
process
PA2.1 Performance
Management
PA2.2 Work Product
Management
The process is managed
following a series of
activities such as planning,
monitoring and adjusting
activities. The outcomes are
established, controlled and
maintained.
CL3 - Established
process
PA3.1 Process Definition
PA3.2 Process Deployment
The process is formally
established following a
standard process that is
defined and deployed.
CL4 - Predictable
process
PA4.1 Process
Measurement
PA4.2 Process Control
The process is predictable
within a defined boundary
for measurement and
control.
CL5 - Optimizing
process
PA5.1 Process Innovation
PA5.2 Process
Optimization
The process follows
continuous optimization
journey through innovation
and optimization to achieve
current and projected
business goals.
At a more detailed level, each process attribute consists of one or more generic
practices, which are further expanded into indicators that provide criteria to assess
process capability in finer detail (ISO/IEC 2004).
The fulfillment of each process attribute is assessed on a four-point achievement
continuum (measurement scale): Not, Partially, Largely, Fully achieved (N-P-L-F).

CHAPTER 2 LITERATURE REVIEW
44
Achievement of a given Process Capability level requires the attributes for that level
to have been Fully or Largely achieved – and the attributes for all lower levels to be
Fully achieved. For example, achieving level 1 capability requires Attribute PA 1.1 to
be Fully or Largely achieved. Achieving level 2 requires both PA2.1 and PA2.2 to be
Fully or Largely achieved and PA1.1 to be Fully achieved. Achieving level 3 requires
both PA 3.1 and PA3.2 to be Fully or Largely achieved and PA1.1, 2.1 and 2.2 to be
Fully achieved, and so on for capability levels 4 and 5. Table 2-5 shows the
organization of process attributes into logical levels representing various process
capability levels and the requirements to reach a capability level.
Table 2-5 Attribute Ratings and Process Capabilities
Capability Level Process Attributes Rating
Capability Level 5 - Optimizing
PA 5.2 Continuous Optimization L /F PA 5.1 Process Innovation L /F
PA 4.1, PA 4.2 F PA 3.1, PA 3.2 F
PA 2.1, PA 2.2 F PA 1.1 F
Capability Level 4 - Predictable
PA 4.2 Process Control L /F
PA 4.1 Process Measurement L /F PA 3.1, PA 3.2 F PA 2.1, PA 2.2 F
PA 1.1 F
Capability Level 3 - Managed PA 3.2 Process Deployment L /F
PA 3.1 Process Definition L /F PA 2.1, PA 2.2 F
PA 1.1 F
Capability Level 2 - Managed PA 2.2 Work Product
Management
L /F
PA 2.1 Performance Management L /F
PA 1.1 F
Capability Level 1 - Performed PA 1.1 Process Performance L /F
Capability Level 0 - Incomplete

CHAPTER 2 LITERATURE REVIEW
45
2.6.2 ITSM Performance
2.6.2.1 Critical Success Factors
The evolution of CSF research can be traced back to management literature on
“success factors”, where, in a broad approach, Daniel (1961) focused on industry-
related CSFs that are relevant for any company in a particular industry (Daniel 1961).
This focus was later expanded by Anthony, Dearden and Vancil (1972), who
emphasized the need to adapt CSFs to both a company’s specific strategic objectives
and its particular managers (Anthony, Dearden & Vancil 1972).
The literature reviewed provided several definitions of CSF, but using the concepts of
Daniel (1961) and Anthony, Dearden and Vancil (1972), Rockart (1979) provides the
most frequently cited definition of CSF as “the limited number of areas in which
results, if they are satisfactory, will ensure successful competitive performance for the
organization” (Rockart 1979, p. 85). Consequently, Rockart (1979) stresses that these
particular areas of activity should be constantly and carefully managed by a company.
The critical success factor (CSF) method was originally established for an
organization’s alignment of IT design and strategic direction, to serve as a means for
identifying the key elements of an organization’s success (Aitken 2003).
Most organizations have a mission that is reflected in a company mission statement
and/or an elevator pitch. This mission echoes the company’s unique values and vision
that describes the organization’s purpose and direction (Caralli et al. 2004). Attaining
this mission involves the contribution and talent of the entire organization, by aligning
the goals and objectives of every employee of the organization with the company’s
mission. (Caralli et al. 2004). However, Caralli et al. (2004) believe that achieving
goals and objectives is not enough and that the organization must perform well in
strategic areas on a regular basis to achieve the company mission. These key areas that
are unique to the organization and the industry in which it competes can be defined as
the organization's critical success factors. (Caralli et al. 2004).
Previous research on CSF and ITIL have mainly focused on CSFs for the successful
adoption or implementation of ITIL (Cater-Steel & Tan 2005; Cater-Steel, Toleman &
Tan 2006; Hochstein, Tamm & Brenner 2005; Iden 2009; Iden & Langeland 2010;

CHAPTER 2 LITERATURE REVIEW
46
Pedersen et al. 2010; Pollard & Cater-Steel 2009; Tan, Cater-Steel & Toleman 2009).
None of these studies use CSFs as a measure of achieving business goals post
implementation of ITIL.
2.6.2.2 Key Performance Indicators
Key performance indicators (KPIs), also known as performance assessment indicators,
are vital indicators for measuring the effect and outcome of management (Wu & Chen
2012). KPIs “represent a set of measures focusing on the aspects of organizational
performance that are most critical for the current and future success of the
organization” (Baker 2002, p. 10). KPIs are comprised of quantified indicators that are
selected based on the design of an organization, as they can reflect the CSFs of the
organization (Kerr 2000). However, irrespective of the type of KPI selected, it must
harmonize with organizational goals, be objective and measurable (Kerr 2000).
KPIs are measures of specific organizational values or characteristics used to
determine whether an organization's goals and objectives are being achieved. They
reflect the CSFs, stakeholder requirements, and the organization’s expectations. The
organization’s goals need to be specific, measurable, attainable, relevant and time-
bound (SMART), in order for KPIs and their measures to be effective (Doran 1981).
A performance measure “is composed of a number and a unit of measure” (Birch 2000,
p. 5). The number gives us a magnitude (how much) and the unit gives the number a
meaning (what) (Birch 2000). Performance measures are always tied to a goal or an
objective. KPIs can use both financial and non-financial metrics, expressed as a
number, a ratio, a percentage, an index, a composite average or in a statistical context,
to measure CSFs (Kerr 2000). A KPI is, therefore, a metric that is linked to a pre-
determined target to determine if a CSF is achieved. Most often a KPI represents how
far a metric is above or below a pre-determined target (Kerr 2000).
For each CSF there must be one or more associated KPI(s) that provide the measure,
and a standard of performance or allowable variance from planned performance (Yang
2009). The key focus of a KPI is on the aspects of organizational performance that
require improvement or on the aspects that must be kept within a specified level to
ensure the success of the organization (Birch 2000).

CHAPTER 2 LITERATURE REVIEW
47
A significant reason for using KPIs as metrics in ITSM is to align business goals with
IT, to help achieve compliance requirements for business operations and to drive
operational implementation of IT strategically (Brooks 2006).
2.6.2.3 Performance Measurement
Performance measurement may be described as “the process of quantifying the
efficiency and effectiveness of action” (Neely 2005, p. 1229), and should be
considered in the broad sense of a term that “covers both overall economic and
operational aspects” (Tangen 2005, p. 40) including measures of productivity,
profitability and quality (Belkhamza 2012).
Gacenga (2013) recognized performance measurement challenges at both the
organizational level and IS/IT level. The frameworks and metrics identified in his work
to address the challenges at organizational level were: SERVQUAL (Parasuraman,
Zeithaml & Berry 1985), Sink and Tuttle model (Sink & Tuttle 1989), results and
determinants framework (Brignall et al. 1991), balanced scorecard (Kaplan & Norton
1992), performance pyramid (Lynch & Cross 1991) and the performance prism
(Neely, Adams & Kennerley 2002). Gacenga’s review of the literature on performance
measurement at the organizational level and in ITSM studies revealed that the BSC
was the most widely adopted framework of measure (Gacenga 2013).
At the IS/IT functional level Gacenga (2013) listed a number of approaches that have
been undertaken to overcome the challenges of performance measurement, for
example: IS success (Delone & McLean 2003), IS productivity (Dedrick, Gurbaxani
& Kraemer 2003; Weill 1992), IS quality (Chang & King 2005; Pitt, Watson & Kavan
1995), IS effectiveness (Scott 1995; Seddon, Graeser & Willcocks 2002) and IS
performance (Marchand & Raymond 2008; Saunders, C & Jones 1992; Son, Weitzel
& Laurent 2005; Van der Zee & de Jong 1999). Gacenga’s review of the IS/IT
performance literature conclude that the “BSC is useful at the IS level, and the IS BSC
can be used to link the IS level with the BSC at the organizational level” (Gacenga
2013, p. 31).
ITSM performance measurement is gaining interest (Belkhamza 2012), with recent
studies and publications investigating ITIL performance metrics (Barafort et al. 2005;
Brooks 2006; Steinberg 2013; Van Grembergen, De Haes & Amelinckx 2003), IT
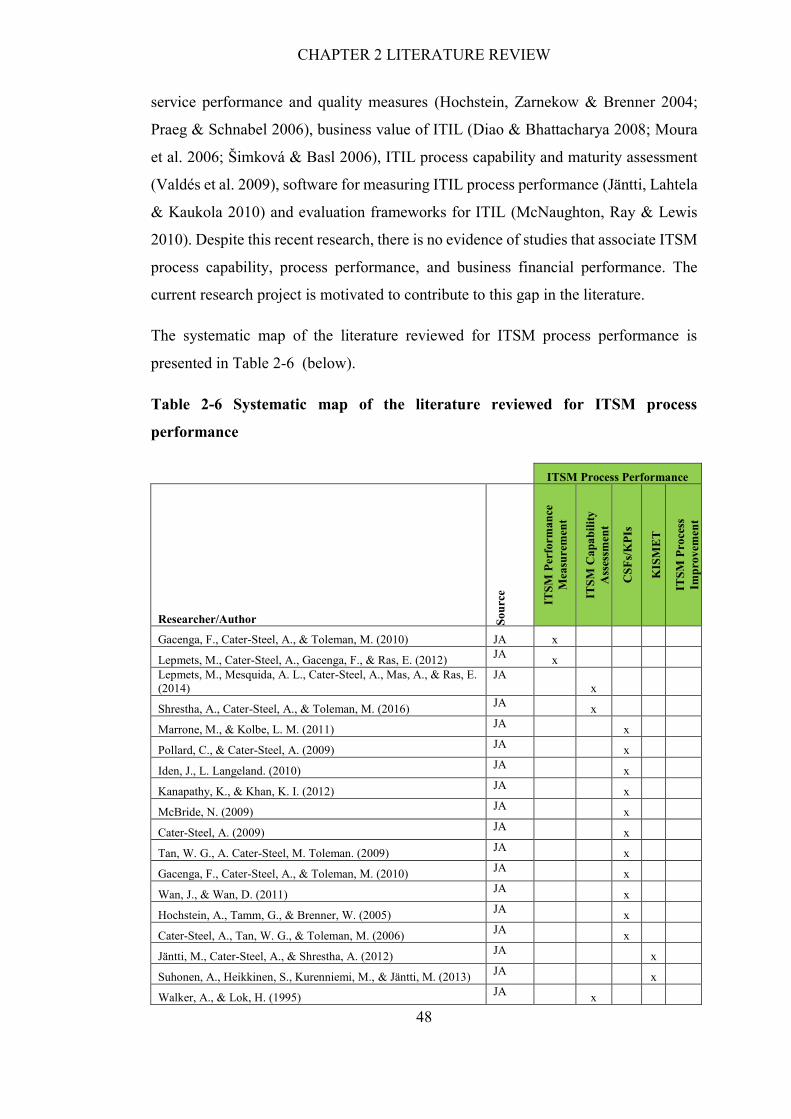
CHAPTER 2 LITERATURE REVIEW
48
service performance and quality measures (Hochstein, Zarnekow & Brenner 2004;
Praeg & Schnabel 2006), business value of ITIL (Diao & Bhattacharya 2008; Moura
et al. 2006; Šimková & Basl 2006), ITIL process capability and maturity assessment
(Valdés et al. 2009), software for measuring ITIL process performance (Jäntti, Lahtela
& Kaukola 2010) and evaluation frameworks for ITIL (McNaughton, Ray & Lewis
2010). Despite this recent research, there is no evidence of studies that associate ITSM
process capability, process performance, and business financial performance. The
current research project is motivated to contribute to this gap in the literature.
The systematic map of the literature reviewed for ITSM process performance is
presented in Table 2-6 (below).
Table 2-6 Systematic map of the literature reviewed for ITSM process
performance
ITSM Process Performance
Researcher/Author So
urc
e
ITS
M P
erfo
rman
ce
Mea
sure
men
t
ITS
M C
ap
ab
ilit
y
Ass
essm
ent
CS
Fs/
KP
Is
KIS
ME
T
ITS
M P
roce
ss
Imp
rov
emen
t
Gacenga, F., Cater-Steel, A., & Toleman, M. (2010) JA x
Lepmets, M., Cater-Steel, A., Gacenga, F., & Ras, E. (2012) JA
x Lepmets, M., Mesquida, A. L., Cater-Steel, A., Mas, A., & Ras, E.
(2014)
JA
x
Shrestha, A., Cater-Steel, A., & Toleman, M. (2016) JA
x
Marrone, M., & Kolbe, L. M. (2011) JA
x
Pollard, C., & Cater-Steel, A. (2009) JA
x
Iden, J., L. Langeland. (2010) JA
x
Kanapathy, K., & Khan, K. I. (2012) JA
x
McBride, N. (2009) JA
x
Cater-Steel, A. (2009) JA
x
Tan, W. G., A. Cater-Steel, M. Toleman. (2009) JA
x
Gacenga, F., Cater-Steel, A., & Toleman, M. (2010) JA
x
Wan, J., & Wan, D. (2011) JA
x
Hochstein, A., Tamm, G., & Brenner, W. (2005) JA
x
Cater-Steel, A., Tan, W. G., & Toleman, M. (2006) JA
x
Jäntti, M., Cater-Steel, A., & Shrestha, A. (2012) JA
x
Suhonen, A., Heikkinen, S., Kurenniemi, M., & Jäntti, M. (2013) JA
x
Walker, A., & Lok, H. (1995) JA
x
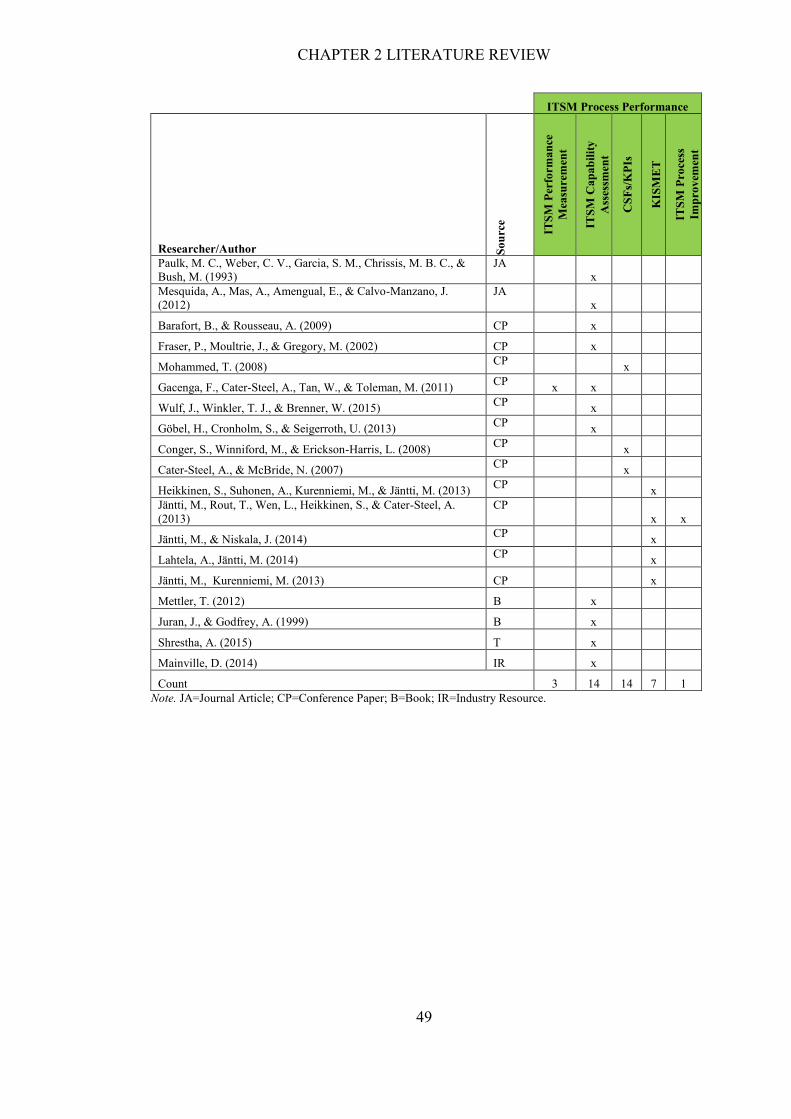
CHAPTER 2 LITERATURE REVIEW
49
ITSM Process Performance
Researcher/Author So
urc
e
ITS
M P
erfo
rman
ce
Mea
sure
men
t
ITS
M C
ap
ab
ilit
y
Ass
essm
ent
CS
Fs/
KP
Is
KIS
ME
T
ITS
M P
roce
ss
Imp
rov
emen
t
Paulk, M. C., Weber, C. V., Garcia, S. M., Chrissis, M. B. C., &
Bush, M. (1993)
JA
x Mesquida, A., Mas, A., Amengual, E., & Calvo-Manzano, J.
(2012)
JA
x
Barafort, B., & Rousseau, A. (2009) CP x
Fraser, P., Moultrie, J., & Gregory, M. (2002) CP x
Mohammed, T. (2008) CP
x
Gacenga, F., Cater-Steel, A., Tan, W., & Toleman, M. (2011) CP
x x
Wulf, J., Winkler, T. J., & Brenner, W. (2015) CP
x
Göbel, H., Cronholm, S., & Seigerroth, U. (2013) CP
x
Conger, S., Winniford, M., & Erickson-Harris, L. (2008) CP
x
Cater-Steel, A., & McBride, N. (2007) CP
x
Heikkinen, S., Suhonen, A., Kurenniemi, M., & Jäntti, M. (2013) CP
x Jäntti, M., Rout, T., Wen, L., Heikkinen, S., & Cater-Steel, A.
(2013)
CP
x x
Jäntti, M., & Niskala, J. (2014) CP
x
Lahtela, A., Jäntti, M. (2014) CP
x
Jäntti, M., Kurenniemi, M. (2013) CP x
Mettler, T. (2012) B x
Juran, J., & Godfrey, A. (1999) B x
Shrestha, A. (2015) T x
Mainville, D. (2014) IR x
Count 3 14 14 7 1
Note. JA=Journal Article; CP=Conference Paper; B=Book; IR=Industry Resource.
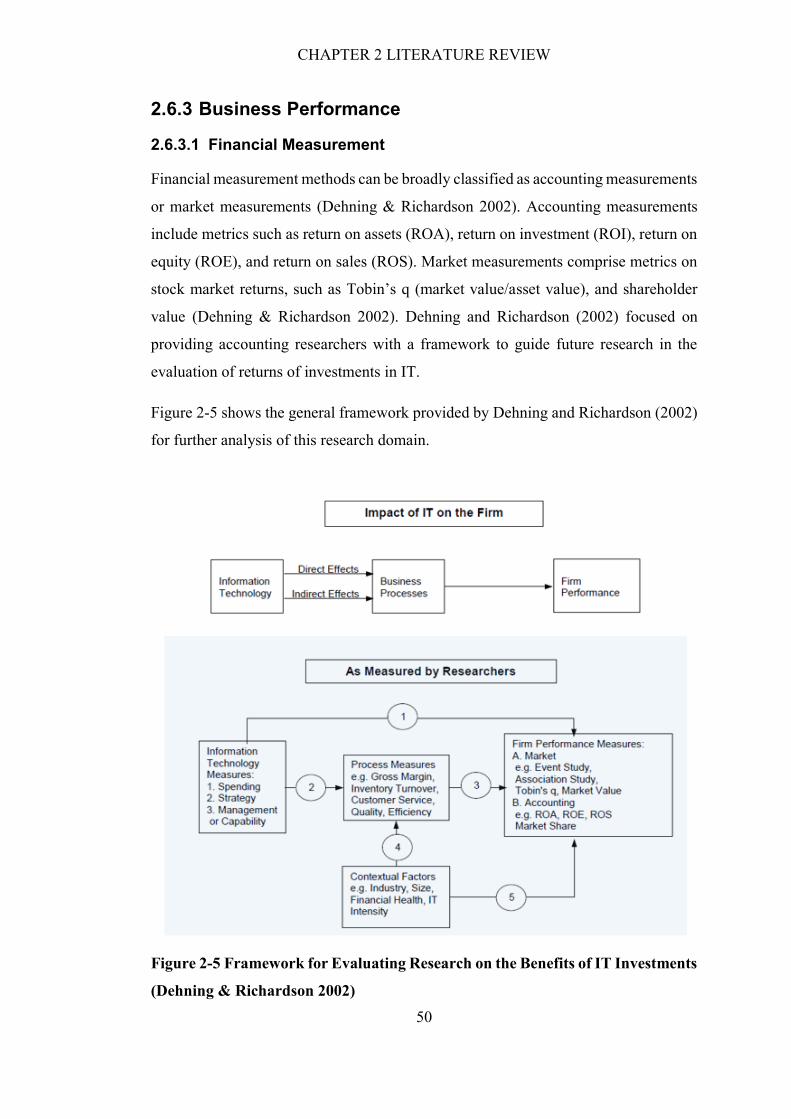
CHAPTER 2 LITERATURE REVIEW
50
2.6.3 Business Performance
2.6.3.1 Financial Measurement
Financial measurement methods can be broadly classified as accounting measurements
or market measurements (Dehning & Richardson 2002). Accounting measurements
include metrics such as return on assets (ROA), return on investment (ROI), return on
equity (ROE), and return on sales (ROS). Market measurements comprise metrics on
stock market returns, such as Tobin’s q (market value/asset value), and shareholder
value (Dehning & Richardson 2002). Dehning and Richardson (2002) focused on
providing accounting researchers with a framework to guide future research in the
evaluation of returns of investments in IT.
Figure 2-5 shows the general framework provided by Dehning and Richardson (2002)
for further analysis of this research domain.
Figure 2-5 Framework for Evaluating Research on the Benefits of IT Investments
(Dehning & Richardson 2002)

CHAPTER 2 LITERATURE REVIEW
51
The top section of Figure 2-5 shows that both the direct and indirect effects of IT on
business processes determine the overall performance of the firm. IT has a direct
and/or indirect effect on business processes, that determine the overall performance of
the firm (Dehning & Richardson 2002). Improving inventory management to reduce
inventory levels, inventory holding costs, waste, and spoilage is an example of a direct
effect of IT, while improving decision making utilizing information from a new IS that
was unavailable in a previous IS, is an example of an indirect effect of IT on business
processes (Dehning & Richardson 2002).
The lower shaded section of Figure 2-5 shows how researchers have measured IT,
business process/firm performance (Dehning & Richardson 2002). Previous
researchers have largely examined investments in IT in three ways: differences in the
amount of money spent on IT (IT spending), the type of IT purchased (IT strategy),
and how IT assets are managed (IT management/capability) (Dehning & Richardson
2002).
The framework presents three paths between IT and firm performance. Path 1 bypasses
the effect of IT on business process, representing a direct link between IT and the
firm’s overall performance (Dehning & Richardson 2002). In this line of research,
studies have measured a firm’s performance using Market measures or Accounting
measures (Dehning & Richardson 2002). Path 2 of the framework describes the
relation between IT and business process performance, with Business process
performance measures (Dehning & Richardson 2002). Path 3 shows how these process
measures integrate to determine overall firm performance (Dehning & Richardson
2002).
The link between IT and performance depends on other factors, which are referred to
as Contextual Factors in the framework (Dehning & Richardson 2002). Path 4 of the
framework presents the Contextual Factors that link business processes and firm
performance measures (Dehning & Richardson 2002). As shown in Figure 2-5, these
Contextual Factors affect business processes through Path 4 and overall firm
performance through Path 5 (Dehning & Richardson 2002).
In a case study research of three organizations that aimed to identify the effects of
business process redesign (BPR) projects, organizational and process level

CHAPTER 2 LITERATURE REVIEW
52
measurements were examined by Kohli and Hoadley (2006). Organizational level
measurements were identified as customer value, efficiency, and profitability, while
process oriented measurements comprised labor costs, cycle time, efficiency,
administrative expenses, responsiveness, resource usage, reporting, throughput, and
effectiveness (Kohli & Hoadley 2006).
The total cost of ownership (TCO) and real option valuation (ROV) was proposed by
Lei and Rawles (2003). Three primary categories of TCO costs were identified as
acquisition cost, control costs, and operation costs. Acquisition costs consist of the
hardware and software costs. Control costs include centralization and standardization
costs. Operation costs are made up of support, evaluation, installation, upgrade,
training, downtime, audit, and documentation costs. ‘Real option valuation’ considers
the options to defer, expand, contract, abandon, switch use, or alter a capital investment
(Lei & Rawles 2003). Although Lei and Rawles (2003) focused on using TCO and
ROV to address IT investment evaluation problems, they considered the acquisition,
control and operation costs in the development of the measurement model.
Identifying the related cost and time in business processes associated with ITSM
processes could assist in measuring the financial impact of ITSM processes and
business performance. The measurement process should be run as a project to gather
data within a period or apply a simulation model to generate the necessary
measurement data related to ITIL service management processes (Tiong, Cater-Steel
& Tan 2009).
The literature on financial measurements in ITSM focused mainly on accounting
measures related to costs of ITSM implementation. There is a need to address the issue
that scarce academic research has been conducted on the potential impact of ITSM
processes to improve business performance and ultimately financial profitability
(Gacenga, Cater-Steel & Toleman 2010).
2.6.3.2 Business Risks
Increasingly, risk management is viewed as a business driver, especially after the
implementation of the Sarbanes-Oxley Act, Basel II, and other more recent
regulations. Stakeholders have become much more concerned about risk, and
organizations are increasingly seeking a comprehensive risk control culture. Many are

CHAPTER 2 LITERATURE REVIEW
53
looking to Governance, Risk Management and Compliance (GRC) frameworks and
processes to effect improvement (Racz et al. 2010). The global financial crisis in 2008
unveiled the importance of risk management. New risk management standards have
been published since then, including the international standard, ISO 31000 ‘Risk
management – Principles and guidelines’ (ISO 2009).
The acronym GRC was first established in 2004 (Coopers 2004), and the popular
validated scientific definition is “GRC is an integrated, holistic approach to
organization-wide governance, risk, and compliance ensuring that an organization acts
ethically correct and in accordance with its risk appetite, internal policies, and external
regulations through the alignment of strategy, processes, technology, and people,
thereby improving efficiency and effectiveness” (Racz et al. 2010, p. 107).
Governance supports appropriate management decision-making by ensuring that the
information provided to executives is complete, accurate and timely, that controls are
in place to validate executive strategies and that executive directions are carried out
ethically and effectively (Tarantino 2008). Risk management identifies, analyses, and
addresses risks that can negatively affect the organization’s strategy and ability to
operate (Moeller 2011). Identified risks can be managed by mitigation, avoidance,
acceptance or risk sharing methods (Moeller 2011). Compliance addresses the
consistency in which the organization adheres to applicable regulations, laws, policies,
contracts, values, and strategies (Tarantino 2008).
There are a vast number of risks that may be identified, thus dealing with them may
seem overwhelming, but Enterprise Risk Management (ERM) can help better manage
risks by categorizing various risks into groups such as strategic, financial, operational,
hazard, external, internal, controllable, uncontrollable, financial, nonfinancial,
insurable and non-insurable (Sadgrove 2016).
To link risk performance to business performance, Sadgrove (2016) proposed an
alternative risk categorization:
1. Price risk. The risk that an increasing product or service offering supply or an
aggressive price reduction from competitors will force lower prices and consequently
lower profits.

CHAPTER 2 LITERATURE REVIEW
54
2. Market risk. The risk that customer preferences and demand might quickly change.
3. Credit risk. The risk of not meeting obligations, such as an entity that fails to settle
a legal obligation;
4. Operational risk. The risk of loss caused by inadequate or failed internal processes,
people, and technology, or from external events;
5. Strategic risk. The risk of poor performance resulting from poor strategy choices
and implementation.
6. Legal risk. This can be a mixture of risks. There is the financial risk that banks refer
to as liquidity risk from insufficient net positive cash flow or from exhausted capital
equity-raising or cash-borrowing capability. There is also a risk from litigation (e.g.,
in financial services, a lawsuit for losses due to poor financial advice) and from
compliance violations carrying regulatory authority penalties.
Specifically, in relation to ITSM, Steinberg (2013) proposed a similar categorization
of risks using the BSC as a guide:
Operational – how well the IT organization is delivering services on a daily
basis;
Capabilities – the capability of the IT organization to meet business needs;
Regulatory – how well the IT organization is operating in a manner that
protects it against regulatory risk for fines, penalties and audit issues;
Financial – how well the IT organization is managing and controlling costs as
well as protecting and enhancing revenue;
Customer – the customer view of the services being delivered (Steinberg 2013,
pp. 25-7).
2.6.3.3 Environmental Scanning
Environmental scanning entails the collection and use of information on events, trends,
and relationships in an organization's external environment (Choo & Auster 1993).
The knowledge gained from an environmental scan would support management
decisions in planning the organization's future course of action (Choo 2001).
Organizations scan the environment to understand the external forces of change better
CHAPTER 2 LITERATURE REVIEW
55
so that they may develop effective responses in order to circumvent surprises, gain
competitive advantage, identify threats and opportunities, mitigate risks, and improve
long-term and short-term planning (Sutton 1988).
The first notable study in the field of environmental scanning was performed by
Aguilar (1967). In his study, Aguilar refers to environmental scanning as:
“scanning for information about events and relationships in a company's outside
environment, the knowledge of which would assist top management in its task of
charting the company's future course of action” (Aguilar 1967, p. vii).
A similar perspective is shared by the majority of authors in this field, with agreement
that the main functions of environmental scanning are: to learn about events and trends
in the external environment; to establish relationships between them; to make sense of
the data; and to extract the main implications for decision making and strategy
development (Daft, Sormunen & Parks 1988; Fahey & King 1977; Keegan 1974;
Kefalas & Schoderbek 1973; Lenz & Engledow 1986; Stubbart 1982; Thomas, PS
1974).
The components most commonly referred to as comprising environmental scanning
are political, economic, social, and technological elements, well known as “PEST
analysis” (Aaker & Adler 1984; Fahey & Narayanan 1986; Johnson, G, Scholes &
Whittington 2011). An extension of the PEST analysis is the PESTLE or PESTEL
analysis that includes the two additional macroeconomic factors of Legal and
Environmental conditions (Ho 2014).
Company X is a foreign exchange service provider that is subject to the external
macroeconomic factors of the FX market. The Forex market is a truly global
marketplace with trillions of dollars of trades executed every day by buyers and sellers
from all over the globe (Bank of International Settlements 2016). The fact that foreign
exchange trading has become such a globalized activity means that the external
environment plays an even greater role in forex than ever before. In the context of this
research and the case study organization, the review of the literature on the external
factors that may affect Company X follows.
a) Political Conditions

CHAPTER 2 LITERATURE REVIEW
56
Political instability and government changes influence exchange rates. Political
turmoil and volatility can have a negative impact on a nation's economy (Blomberg &
Hess 1997).
Elections are events that occur in almost every democratic nation. They can pose a
large impact on the local currency. Frequent elections generally suggest political
instability to traders and analysts and normally stimulates higher volatility in the local
currency (Persson & Tabellini 1990). The value of a currency is affected if a country’s
government is changed, due to beliefs in changes of ideology and proposed monetary
or fiscal policies. Unexpected elections, generally due to corruption scandals or a non-
confidence vote, have the potential to cause chaos in the forex market (Rogoff 1996).
For example, chaos among citizens of a country may lead to civil conflict that may, in
turn, lead to higher political instability and economic uncertainty.
The impact of war is wide-scaled causing infrastructure damage that stifles a nation’s
short-term economic sustainability, which could cost governments as well as citizens
billions (Singh & Jun 1995). A major part of these funds needs to be borrowed. An
economy emaciated by war usually needs to be recovered with the aid of low-cost
capital, such as lower interest rates, that inevitably leads to the depreciation of the local
currency (Globerman et al. 2002). However, a war also provides potential advantages,
such as boosting a struggling economy, especially the manufacturing industry, if it is
involved to use its available resources on wartime production (Bennett & Green 1972).
The physical stability of a country, that is, the absence of war, conflict, social or
political upheaval, will affect the desirability and strength of its currency. The major
currencies belong to countries with political stability. Instability drives up demand for
US dollars as a safe haven investment.
b) Economic Factors
Economic factors include economic policy, distributed by governments and/or central
banks and economic conditions, generally exposed through economic reports, and
other economic indicators (Layton, Robinson & Tucker 2009).

CHAPTER 2 LITERATURE REVIEW
57
Economic policy encompasses government fiscal policy, that is, budget or spending
practices and monetary policy which is the means by which a government's central
bank influences the supply and “cost” of money (Layton, Robinson & Tucker 2009).
The widening of a nation’s government budget deficit or surpluses usually causes the
market to respond negatively, while the narrowing of budget deficits cause the market
to react positively, and the impact is revealed in the value of a nation’s currency
(Balladur 1999).
High levels of inflation typically cause a currency to lose value. High inflation usually
has a negative impact on currency because it decreases purchasing power (Balladur
1999). The demand for currency will strengthen if there is an expectation that short-
term interest rates will rise to balance inflation.
Gross Domestic Product (GDP), employment levels, Consumer Price Index (CPI),
industrial production reports, and retail sales are indicators of a robust economy
(Layton, Robinson & Tucker 2009). The healthier the outlook for a country is, the
stronger the desirability of their currency will be. In addition, when stocks and bonds
are offered with high rates of return the country’s currency demand will increase.
c) Social Environment
Illegal activity or fraud is the biggest risk for the retail forex trader (Cheung & Chinn
2001). Fraudulent activities include, but are not limited to, excessive commissions by
brokers, caused by customer account “churning”, high-pressure “boiler room”
campaigns, misrepresentation, and lucrative Ponzi schemes (Cheung & Chinn 2001).
There has been an increase in foreign currency fraud over the last few years. In
particular, retail forex traders have been victim to fraud (National Futures Association
2016).
The psychology of the market and the sensitivities of traders impact the foreign
exchange market in diverse ways (Payne 2003). Disturbing international events can
lead to a “flight to quality”, where assets are moved to an alleged “safe haven”.
Currencies will be in greater demand with higher pricing if perceived as stronger over
their weaker counterparts (Acharya & Pedersen 2005; Vayanos 2004). Traditional safe

CHAPTER 2 LITERATURE REVIEW
58
havens during economic uncertainty, include gold, the U.S. Dollar and Swiss Franc
(Acharya & Pedersen 2005).
The old finance market maxim “Buy the rumor, sell the fact” (Kadan, Michaely &
Moulton 2014), is applicable to the forex market. The maxim is the shift of a currency
price based on the news before the actual event, and an opposite reaction after the
occurrence of the event or action. This is often referred to as the market being
“oversold” or “overbought”, where investors center too much on the importance of
external events to forex rates (Cohen, L & Frazzini 2008), a cognitive bias known as
anchoring (Kahneman, D, Slovic & Tversky 1982).
The factors in exchange rate movements are either speculative forces, over-reaction to
news or bandwagon effects (Cheung & Chinn 1999). The bandwagon effect is a
psychological phenomenon in which people do something primarily because other
people are doing it, regardless of their own beliefs, which they may ignore or override
(Lai & Pauly 1992). The bandwagon effect has wide implications and often happens
by looking at trading recommendations of other people (Lai & Pauly 1992).
d) Technological Environment
Technological factors that have an impact on the forex industry include technology
infrastructure, such as the internet, software, and hardware. Technology has molded a
society that expects real-time results (Mullineux 2003).
Technological revolution, specifically the internet, has transformed the forex trading
industry by lowering costs, improving latency, and providing real-time access to news
and research (Economides 2001). The rate at which information is exchanged is of
paramount importance in the forex trading world as the lower the latency of
information, the faster the reaction times of market participants (Lyons 2002).
It has been argued by Mullineux (2003) that when analyzing the technological
environment as part of a PESTEL analysis, that there is often an affinity to focus on
technological advances in digital and internet-related areas, but it should also focus on
new approaches in manufacturing, materials advancements, and logistics.

CHAPTER 2 LITERATURE REVIEW
59
Mullineux (2003) acknowledged that technology is in constant flux, and as much as it
has greatly expanded the Forex market, any company that wants to maintain its market
edge must constantly be on the forefront of development.
e) Environmental Factors
Natural disasters have a catastrophic effect on the value of currencies. The
infrastructure and morale of a country can be severely harmed by natural disasters such
as earthquakes, tornadoes, floods, and hurricanes (Benson & Clay 2004).
A nation’s economic output can be severely limited by basic infrastructure damage.
The superfluous costs associated with the clean-up and rebuilding after a disaster,
affect government and private spending (Cavallo et al. 2013). The economic
uncertainty can lead to a decrease in consumer spending and loss of consumer
confidence (Fengler, Ihsan & Kaiser 2008).
Significant man-made disasters including nuclear, chemical plant and oil-rig
explosions; mining accidents; nuclear and terrorist bombings could unfavorably affect
the market’s economic and sentiment analysis for the nation, and therefore cause a fall
in the value of that nation’s currency (Barro 2009).
In 2011, the Triple Calamity in Japan in 2011 (an earthquake, a tsunami, and a nuclear
disaster), which delivered a brutal strike on the local economy and also influenced
global economy, is an example that proves what is stated above.
f) Legal Environment
The forex marketplace is mainly self-regulatory. Forex is an inter-bank market, where
international banks make trades with each other at a rate that they decide upon (Dale
1994).
The forex trading industry was unregulated before 2008. In 2008, the US government
appointed the Commodity Futures Trading Commission (CFTC) as the agency
responsible for regulating the forex industry, as it made the most sense because
currencies are considered commodities. At the same time, the National Futures
Association (NFA) became the policing institution of the forex industry. Regulation to

CHAPTER 2 LITERATURE REVIEW
60
control volatility in the industry and limit the losses to investors was passed in 2009
by the CFTC (Rex 2013).
The rampant growth of retail forex trading has led to increased regulation by the
CFTC. The CFTC has jurisdiction (under the US Commodity Exchange Act),
overleveraged forex transactions provided to retail investors in the United States
(Moran 1990). Retail customers are protected by the Act, as it only authorizes
regulated entities to act as counterparties for retail forex transactions, and it enforces
that all online forex dealers to the stringent financial standards enforced by the NFA
(Kapstein 1992).
The institutional forex sector also needs regulation, as these currency markets are
loosely regulated by local central banks and pose added risks to the retail investor.
Regulation of the institutional forex market can help improve on information
asymmetry and curb high currency volatility (Porter & Williams 2016). The regulation
of the retail forex market may have controlled incidents of fraudulent activity in that
sector, but non-regulation of the institutional forex market contributes significantly to
retail forex investors not being able to win in the market.
The systematic map of the literature reviewed for business performance is presented
in Table 2-7.
Table 2-7 Systematic map of the literature reviewed for business performance
Business
Performance
Researcher/Author So
urc
e
Bu
sin
ess
Met
rics
ITS
M F
ina
nci
al
Mea
sure
men
t
Smith, H. A., McKeen, J. D., & Street, C. (2004) JA x
Gacenga, F., Cater-Steel, A., & Toleman, M. (2010) JA x
Dehning, B., & Richardson, V. J. (2002) JA x
Kohli, R., & Hoadley, E. (2006) JA x
Tiong, C., Cater-Steel, A., & Tan, W.-G. (2009) JA x
Lei, K., & Rawles, P. T. (2003) CP x
Racz, N., Panitz, J. C., Amberg, M., Weippl, E., & Seufert, A. (2010) CP x
Tarantino, A. (2008) B x

CHAPTER 2 LITERATURE REVIEW
61
Business
Performance
Researcher/Author So
urc
e
Bu
sin
ess
Met
rics
ITS
M F
ina
nci
al
Mea
sure
men
t
Moeller, R. R. (2011) B x
Sadgrove, K. (2016) B x
Steinberg, R. A. (2013) B x
Coopers, P. (2004) IR x
Count 7 5
Note. JA=Journal Article; CP=Conference Paper; B=Book; IR=Industry Resource.
2.7 Chapter Summary
By dichotomizing the research topic into IT and the Business in Chapter 1, the
literature review followed a structured method, using a top-down approach to examine
the literature to logically synthesize studies around the underpinning Agency Theory.
Relationships across the lower level focus areas were identified and confirmed.
Previous empirical studies on ITSM adoption, implementation, and benefits focused
on process-specific benefits, and not financial benefits. Investment in ITSM processes
requires that the benefits are justified economically, but thus far, there has been little
research on quantifying the financial benefits from ITSM implementation.
The literature on ITSM process assessments confirms that the primary goal of a
process assessment is to provide guidance to improve processes. The international
standard for process assessment ISO/IEC 15504 suggests that process assessments can
be used for process improvement or to determine process capability. Practitioner
resources suggest that organizations favor an easy, cost-effective and timely process
assessment instrument that exposes an accurate indication of process capability.
Previous research on CSF and ITIL have mainly focused on CSFs for the successful
adoption or implementation of ITIL, while none of these studies use CSFs as a measure
of achieving business goals post implementation of ITIL. The literature showed that
an important goal for using KPIs as metrics in ITSM is to foster business-IT alignment,
to help achieve compliance requirements for business operations and to drive
operational implementation of IT strategically.
CHAPTER 2 LITERATURE REVIEW
62
Research in ITSM performance measurement is gaining interest with recent studies
and publications examining ITIL performance metrics, IT service performance and
quality measures, business value of ITIL, ITIL process capability and maturity
assessment, software for measuring ITIL process performance, and evaluation
frameworks for ITIL. Despite this recent research, there is no evidence of studies that
associate ITSM process capability, process performance, and business financial
performance.
The literature on financial measurements in ITSM focused mainly on accounting
measures related to costs of ITSM implementations. There is a need to address the
issue that scarce academic research has been conducted on the potential impact of
ITSM processes to improve business performance and ultimately financial
profitability.
The literature review revealed that there is a lack of theoretical and practical
knowledge around the development and use of a method and model to examine the
association of ITSM process capability and process performance with financial
performance. Furthermore, to date, there is no empirical evidence of applying a
pragmatic academic method and model as an ITSM process improvement tool.
The next chapter presents the research action plan as it relates to the research
philosophy, design, methods, and approach.

CHAPTER 3 RESEARCH METHODOLOGY
63
CHAPTER 3 RESEARCH METHODOLOGY
3.1 Introduction
Chapter 2 presented the theoretical foundation of this study, provided the context of
the research problem and demonstrated the need for the research. Chapter 2 also
revealed the existing gaps in academic research on links between ITSM process
maturity and business performance. The literature review demonstrated that there is
little academic research on the association of ITSM Process Capability and Process
Performance with Business Performance.
The aim of this chapter is to explain the research action plan as it relates to the research
philosophy, design, methods, and approach. Figure 3-1 illustrates an overview of
Chapter 3.
Figure 3-1 Overview of Chapter 3
Chapter 3 comprises six sections. Section 3.1 provides an introduction to the chapter.
Section 3.2 presents the researcher’s philosophical worldview, followed by a detailed
description of the research orientation in section 3.3. Ethical considerations,

CHAPTER 3 RESEARCH METHODOLOGY
64
trustworthiness, and validity are discussed in §3.3.3. A description of the research
design is provided in section 3.4, followed by the overall research approach in section
3.5. Section 3.5 also details the definition and the application of the measurement
framework. Finally, section 3.6 provides a summary and conclusion to this chapter.
3.2 Philosophical Worldview
In any research investigation, it is imperative that researchers are explicit about their
own views and assumptions (Schuh & Barab 2007). When researchers engage in
inquiry, they bring with them their own individual beliefs about knowledge, such as
what constitutes knowledge, what is intelligible and how we obtain knowledge (Carter
& New 2005). This is our paradigm, defined as the “basic belief system or worldview
that guides the investigator” (Guba & Lincoln 1994, p. 105). Although the paradigm
is the grounding that researchers work from, the researcher needs to critically
comprehend, make clear choices about, and be able to communicate one’s worldview
to the reader (Schuh & Barab 2007). The adoption of a research paradigm can be as
inimitable as the researcher adopting the paradigm (Schuh & Barab 2007).
Research methodology is a philosophical position or worldview that underpins and
informs the research style (Sapsford & Jupp 2006). Another interpretation of research
methodology is that it is the all-encompassing approach to the research design process
including theoretical grounding, data collection, and analysis (Creswell 2009). It
could, therefore, be inferred that the philosophical worldview of things is essential to
the meaning of research methodology. Research philosophy is concerned with the way
in which things are viewed in the world (Saunders, M, Lewis & Thornhill 2012; Yin
2009) and addresses the assumptions that underpin the research strategy and the
methods selected as part of a research paradigm. Research philosophies are steered by
different sets of assumptions which could be ontological, axiological or
epistemological, that influence the way in which the research process is identified
(Saunders, M, Lewis & Thornhill 2012). Many researchers choose to recognize these
multifaceted philosophical perspectives within the context of the two main traditions
of research inquiry, quantitative and qualitative research methods (Creswell 2009;
Saunders, M, Lewis & Thornhill 2012). From the above, it appears that these research
methods cannot be understood in isolation from the researcher’s stance of research

CHAPTER 3 RESEARCH METHODOLOGY
65
philosophy. The three major facets of thinking about research philosophy and the
suppositions as suggested by Creswell (2009), Yin (2009) and Saunders, M, Lewis and
Thornhill (2012) were considered in this research project.
3.2.1 Pragmatism
Pragmatism concerns thinking that choosing between one position (epistemology,
ontology, or axiology) or another is impractical in reality; and that the research
questions form the basis of which position to assume (Clark & Creswell 2011;
Saunders, M, Lewis & Thornhill 2012).
Three types of pragmatism that are important for IT research are functional
pragmatism (knowledge for action), referential pragmatism (knowledge about action),
and methodological pragmatism (knowledge through action) (Goldkuhl 2008a).
Methodological pragmatism is appropriate for this study as it involves more than just
observation for empirical data capture. Methodological pragmatism is based on
learning about the world through action (Kolb 2014). This type of pragmatism builds
on the idea of a planned intervention in the world to obtain knowledge as described by
Dewey (1938) through his notion of inquiry, to specifically apply and test different
approaches and policies. Dewey’s original notion of inquiry inspired approaches, e.g.
action science (Argyris, Putnam & McLain Smith 1985), development action inquiry
(Torbert 1999), pragmatic-systemic inquiry (Cronen 2001), practical inquiry
(Goldkuhl 2008a; Stevenson 2005) and pragmatic inquiry (Metcalfe 2008). A key
notion of inquiry is thus to construct knowledge in the interest of change and
improvement. Pragmatism is concerned with an influential view of knowledge; that it
is used in action for making a focused difference in practice. This study is concerned
with identifying changes to ITSM processes for improvement.
Action research adopts methodological pragmatism, however, one fundamental issue
in action research is the contribution to local practice (Goldkuhl 2008b). Pragmatic
research can be performed through action research (Baskerville & Myers 2004). In
such cases, there is a direct impact on engaged local practices. Pragmatist research
knowledge should also be valuable for practices external to the research ones
(Goldkuhl 2008a; Mathiassen 2002). It is vital to create knowledge and take actions to
enable knowledge transfer and knowledge use outside local practices. The role of local

CHAPTER 3 RESEARCH METHODOLOGY
66
intervention in pragmatism is that it is meaningful as a local improvement, but more
importantly, it is instrumental in creating knowledge that may be useful for local as
well as general practices (Goldkuhl 2012).
Pragmatism concerns itself with taking action and implementing change and the
relationship between knowledge obtained and action, making it suitable as a
foundation for research approaches that intervene in the world and not merely observe
from the outside. Pragmatism is an appropriate philosophy for this study because the
research involves intervention for organizational change (as in action research). The
emergent interest in action research and design research (Cole et al. 2005; Iivari &
Venable 2009; Järvinen 2007) makes it important to investigate pragmatism as a
potential paradigmatic base for exploring the impact of ITSM process maturity on
business performance.
The next section details the research orientation in terms of epistemology, ontology,
and axiology.
3.3 Research Orientation
Three sets of philosophical beliefs guide the choices regarding the research process:
ontology (reality), epistemology (knowledge), and axiology (ethics) (Creswell 2009;
Saunders, M, Lewis & Thornhill 2012; Yin 2009). These three sets of belief systems
are described and presented in relation to the conceptual and methodological concerns
of this study.
3.3.1 Epistemology
There are three epistemological orientations: research targeting explanation and
prediction; studies involving interpretation and understanding; and research seeking
intervention and change (Braa & Vidgen 1999). The first orientation positions itself
within positivism while the second within interpretivism. The third approach does not
have an apparent reference to a matching school of thought. Braa and Vidgen (1999)
referred to action research as an alternative for this epistemological orientation; they
discuss action and change-oriented research without explicitly locating it within a
pragmatic paradigm.

CHAPTER 3 RESEARCH METHODOLOGY
67
Action case research, proposed by Braa and Vidgen (1999) combines interpretive and
interventionary research. The link between change and interpretation has also been
identified by other scholars (Baskerville & Pries-Heje 1999). Action research
(Baskerville & Pries-Heje 1999) and variations such as action case research (Braa &
Vidgen 1999), grounded action research (Baskerville & Pries-Heje 1999) and
dialogical action research (Mårtensson & Lee 2004) all seem to include qualitative,
interpretive and pragmatist research orientations.
This research aligns well with the third epistemological orientation, intervention, and
change, as it involves intervention for organizational change. Changes to improve
ITSM processes are implemented, and ad hoc, as well as planned interventions, are
applied, as described in Chapter 4. The research also involves change and
interpretation.
3.3.2 Ontology
Actions and changes are at the core of a pragmatist ontology where social beings act
in a world of constant change (Blumer 1969). The “essence of society lies in an
ongoing process of action, not in a posited structure of relations” (Blumer 1969, p. 71).
Actions through guidance of purpose and knowledge are a way to change existence,
and therefore of critical importance in pragmatism. Goldkuhl (2012) posits that reason
and action change the world and that there is “an inseparable link between human
knowing and human action” (Goldkuhl 2012, p. 7).
Dewey defined the concept of inquiry as “the controlled or directed transformation of
an indeterminate situation into one that is so determinate in its constituents,
distinctions and relations as to convert the elements of original situation into a unified
whole” (1938, p. 108). This notion of inquiry is core to the belief system in pragmatic
research. Inquiry is perceived “as a natural part of life aimed at improving our
condition by adaptation accommodations in the world” (Cronen 2001, p. 14), meaning
that inquiry is an exploration into some part of reality that drives the creation of
knowledge for an organized change of this part of the reality.
This research is an exploration of a continually changing real-world situation that
involves reasoning, creating knowledge and change to improve the situation.

CHAPTER 3 RESEARCH METHODOLOGY
68
3.3.3 Axiology
This study considers the axiological features of ethics, values and trustworthiness to
address the issue of academic rigor in the research process.
Unlike with quantitative methods, where rigor is commonly taken for granted, Lincoln
and Guba (1985) explained that qualitative research requires a different approach to
rigor, referred to as trustworthiness. This refers to the level to which a reader can attain
confidence in the integrity, value, and worthwhileness of a qualitative study (Behari-
Leak 2015). This study uses a number of approaches to heighten transparency and
rigor and trustworthiness.
The combination of multiple methods and perspectives in a single study adds rigor,
breadth, and depth to any investigation (Denzin 2005). Data is solicited from various
sources as a means of cross-checking and to make the data trustworthy and worthwhile.
The different sources include different participants, different methods, and evidence
of previous research studies in ITSM.
Validity is ensured by a series of evidence (Yin 2003) to reinforce relations between
data and explanations offered. This study provides a chain of evidence to make all the
steps followed in the analysis process transparent and explicit. The validity concerns
in this study around the data generation and analysis are addressed through the linking
of the data, findings and research questions.
An issue with a case study approach is that the researcher may not be seen as an
objective and neutral observer if the researcher is professionally involved with the
case organization and academically embedded in ITSM. This study should not be seen
as being compromised by the participation of the researcher as the approaches to
ensure rigor discussed above are executed and upheld to counteract this. Given each
researcher’s individual and unique perceptions and interpretations of phenomena,
research is essentially biased to begin with, so there is no point in trying to “establish
validity” in any external or objective sense (Trochim & Donnelly 2007). Academic
rigor is applied to minimize the impact of any conscious or unconscious researcher
bias.

CHAPTER 3 RESEARCH METHODOLOGY
69
3.3.3.1 Research Ethics Considerations
To meet the ethical requirements of this study, consent was first obtained from the
CEO of Company X for approval to use the site as the case study, and then directly
from the participants. For the purposes of the practical research, permission was
granted by Company X to survey and interview staff for this project (see Appendix
B.2). Permission was also granted by the case organization to access internal systems
for data, documents, and archival records. Research data collection was undertaken
after ethics clearance was obtained from the USQ Human Research Ethics Committee,
on 23 October 2015 (Appendix B.1). The research aims were described to participants;
it was explained that the scope of participation was voluntary, and not binding; and
that the use of pseudonyms protected participants’ anonymity and confidentiality in
reports of their input.
The researcher’s pragmatic epistemological stance of intervention and change and
ontological orientation of this research being an exploratory study of a continually
changing real-world situation that involves reasoning, creating knowledge and change
to improve the situation, forms the basis of the research design. The overall research
design is presented next.
3.4 Research Design
This section describes and justifies the research design. The research design choices
are consistent with the scholar-practitioner approach to academic research
(Burkholder, Cox & Crawford 2016; DeLuca & Kock 2007; Goubil-Gambrell 1992).
The term scholar-practitioner “expresses an ideal of professional excellence grounded
in theory and research, informed by experiential knowledge, and motivated by
personal values” (Distefano, Rudestam & Silverman 2004, p. 393). Scholar-
practitioners have the opportunity to bring critical thinking and reflection into the work
arena in the form of action research (Scully-Russ, Lehner & Shuck 2013) and
appreciative inquiry (Tranfield & Denyer 2004). In this way, they can help leaders and
practitioners be more effective while contributing to the development of a dataset that
may contribute to theory (Suss 2015).
3.4.1 Applied Research
CHAPTER 3 RESEARCH METHODOLOGY
70
This study is applied research because it is concerned with finding an answer to a real
problem, for example, for companies that have adopted ITSM, the question of whether
ITSM process capability and process performance is associated with business
performance.
Applied research endeavors to advance and improve our understanding of a problem,
with the intent of contributing to the solution of that problem, while basic research, on
the other hand, focuses on expanding knowledge, i.e. to identify universal principles
that contribute to our understanding of how the world operates (Saunders, M, Lewis
& Thornhill 2012).
An applied research setting is used with a focus on the construct of effect. It is vital
that the outcome measures are valid and that they accurately measure the variables of
interest (Behari-Leak 2015). It is essential to measure multiple outcomes and to use
multiple measures to assess each construct fully. In contrast, basic research
concentrates on the construct of ‘cause’ (Bickman & Rog 2008). In laboratory studies,
the independent variable (cause) must be clearly elucidated and not confounded with
any other variables (Saunders, M, Lewis & Thornhill 2012).
Applied researchers are often faced with multiple questions to answer because they
frequently work in real-world settings, and because they often use multiple measures
of effects, they are more likely to use multiple research methods, often including both
quantitative and qualitative approaches (Bickman & Rog 2008). Although using
multiple methods may be necessary to address multiple questions, it is a strategy to
use triangulation on a difficult problem from several directions, thus offering
additional assurance to the study results (Bickman & Rog 2008).
Research validity is enhanced by bringing together different lines of evidence.
As described above, a trademark of applied research is the triangulation of methods
and measures to compensate for the fallibility of any single method or measure
(Bickman & Rog 2008). The validity of both qualitative and quantitative applied
research is enhanced by triangulation in data collection. The significance of
triangulation in qualitative research design, ethnography, and case study research are
emphasized by Yin (2011), Maxwell (2012), and Fetterman (2010). Likewise,

CHAPTER 3 RESEARCH METHODOLOGY
71
Bickman and Rog (2008) supported the use of multiple data collection methods in all
types of applied research.
Information systems is a highly applied field with robust vocational elements where a
combination of practice and theory is needed for usable and relevant knowledge to be
produced (Baskerville & Wood-Harper 1996).
3.4.2 Case Study Research
A case study examines a phenomenon in its natural setting, using multiple methods of
data collection to collect information from one or a few entities (people, groups or
organizations) (Benbasat 1984; Bonoma 1985; Kaplan 1986 ; Stone 1978; Yin 2013).
In a case study research the boundaries of the phenomenon are not clearly evident at
the outset of the research, and no experimental control or manipulation is used
(Benbasat 1984). The case study approach is appropriate because this study focusses
on modern-day events in a natural setting, and there is no sound theoretical base for
the research (Yin 2013).
The site selected for this case study is a global financial services company with over
200 employees, headquartered in North America, with offices worldwide. As the
findings contain commercially sensitive information, the identity of the company
cannot be revealed. In this research, it is referred to as Company X. Company X has
about 70 IT staff who attend to ITSM processes on a daily basis. Company X began to
scrutinize its IT group’s performance to ensure that it was in line with the overall
business performance and contributed to the business’ bottom line. Company X
embarked on implementing three of the 26 ITSM processes: Incident Management,
Problem Management, and Change Management, and was seeking to improve these
processes to lower costs, improve efficiency and offer higher service levels. The
business drivers for process improvement were service availability and reliability, and
continual improvement.
Company X was chosen for this research project because the company had recently
embarked on the implementation of ITSM processes, and needed to find out whether
investment in process improvement (capability and performance) actually resulted in
cost savings for the company. Moreover, it was convenient for Company X as the
researcher is a full-time employee of the company and it was cost-effective for the

CHAPTER 3 RESEARCH METHODOLOGY
72
company to have the researcher conduct the study without the need to hire a consultant.
As a global financial services company, Company X is exposed to a number of external
factors (as discussed in §6.8) that affected ITSM process capability and performance,
which influenced the results of the study, thus making the case organization an ideal
unit of analysis for this research project.
The focus of the study is guided by the specification of the unit of analysis. The unit
of analysis in IT research can be at the organizational, group or individual level
(Vessey, Ramesh & Glass 2002). The unit of analysis for this research is at the
organizational level, to explore the association of ITSM process capability and process
performance with business performance.
Case-study research is contingent on what one classifies as a case, which can be
defined as a person, a group, a program, an organization, a problem, or a body of
evidence (Rule & John 2011). The case has to be a case of something (Danermark,
Ekstrom & Jakobsen 2001); it is a particular instance of something that is part of a
larger group of instances. Company X as a site provides an instance of an IT Service
Provider for an “empirical enquiry to investigate a contemporary phenomenon [in this
case ITSM process improvement] within its real-life context, especially when the
boundaries between phenomenon and context are not clearly defined” (Yin 2003, p.
13).
The number of cases included in a research project is the key feature of the case study
research design. Case study research that includes multiple cases is said to be more
valid and generalizable, though there are instances where a single case is informative
(see e.g. (Lee, H et al. 1989)). Exploratory studies are mostly better served by single
cases, that is, where there is no previous theory. Multiple cases are desirable when the
purpose of the research is to describe phenomena, develop and test theories. The
purpose of this research is to explore, describe and explain a complex situation, and
act on the findings, rather than to test theories and discover general principles.
The exploratory study is a single-case study that will follow a pragmatic research
approach, enabling methodological triangulation (Denzin 1970), to explore the
research question. The case study method is well suited to this study as it allows rich
data collection on service management processes, people, services, tools, and

CHAPTER 3 RESEARCH METHODOLOGY
73
technologies. Eisenhardt (1989b, p. 534) has defined a case study as “a research
strategy which focuses on understanding the dynamics present in single settings”.
To enhance transferability, this case study uses qualitative data collection methods
such as interactive interviews, focus group workshops, participant observation, and
direct observation to explore, describe and explain a complex situation in a real-life
context. The diversity of research methods act as multiple sources and are useful in
case study design to triangulate the evidence and to make the data as robust as possible
(Rule & John 2011).
Instrument reliability is addressed to ensure that the questionnaire used to measure the
variables consistently measures what it is supposed to (Yin 2003). In order to develop
a highly credible study, the goals and aims of the investigation are described in detail.
Qualitative data will be gathered through several sampling strategies at different times
as well as with different participants. Three different methods (questionnaire,
interviews and focus groups) are used for the qualitative data collection. This data and
methodological triangulation ensure the rigor and credibility of the study. Validity
refers to whether the outcomes of the study are bound to the investigation. To ensure
internal validity, all data collected is documented, and verified by participants. All
interviews are recorded and transcribed. A pilot study is conducted to ensure that the
questions of the interviews and questionnaires are reviewed carefully, revised and
checked. The survey data collection method is based on the ISO/IEC 15504 standard
that has been validated through an international series of field tests (Cater-Steel,
Toleman & Rout 2006).
3.4.3 Mixed Methods
Quantitative and qualitative research methods are the two mainstream traditional
approaches in research methodology and philosophy (Creswell 2009). Their individual
ontological and epistemological grounding and disparate ideologies of research
conduct have given rise to the third research orientation – mixed methods.
The mixed methods approach to research is applied to combine the procedures,
methods, methodologies, and language of both quantitative and qualitative in a single
study (Johnson, RB & Onwuegbuzie 2004). While such an approach may be criticized
for mixing traditions embedded in dissimilar philosophical assumptions, it has been

CHAPTER 3 RESEARCH METHODOLOGY
74
accepted by the view that the use of research methods is justified by the research
questions that dictate the choice of such methods in order to guarantee obtaining the
answers to those questions (Cronholm & Hjalmarsson 2011; Onwuegbuzie & Leech
2006; Tashakkori & Teddlie 1998).
In mixed methods, the research questions are important as they serve as the foundation
of the entire research process, the choice of methods, the research design, the sampling
and sample, the tools for data collection and analysis (Bryman 2006; Johnson, RB &
Onwuegbuzie 2004; Morse et al. 2006; Onwuegbuzie & Leech 2006).
Data collection in mixed methods research involves combining quantitative and
qualitative approaches to data collection. The most widely used methods for data
collection in mixed methods research are questionnaires, interviews, focus groups,
observation, and secondary data (personal and official documents, physical data, and
archived research data) (Creswell 2009).
Pragmatism provides a set of assumptions about knowledge that underpins the mixed
methods approach, making it an ideal philosophical partner for the mixed methods
research approach. Being multifunction in nature, the pragmatic research approach
allows questions to be addressed that do not sit comfortably within a wholly
quantitative or qualitative approach to research design and methodology. Pragmatic
research approaches also perceive issues differently in different scenarios and allow
for different views and interpretation of the world.
The use of either quantitative or qualitative methods will not suffice to address the
research questions of this study, hence the rationale behind the choice of approach.
The pragmatic approach accentuates that several realities exist in any given proviso
and that the researcher’s choice of paradigm is dependent on the research question the
study is trying to solve (Saunders, M, Lewis & Thornhill 2012).
3.4.4 Action Research
Action research as a research methodology that exhibits the values of both qualitative
and quantitative methodologies was selected as the primary inquiry method for this
study. Action research aims to serve the overall alignment between ontology,
epistemology, methodology, and axiology of the overall study.

CHAPTER 3 RESEARCH METHODOLOGY
75
Action research pursues both action (change) and research (understanding) outcomes
(Dick 2002). The inclusion of action (change) in this research paradigm enables the
application of action research to management research in a real live organization
directly, in this case, Company X, as a problem-solving process in addition to a
research methodology.
Action research is an approach used in designing studies that pursue to inform and
influence practice. It is a specific orientation and purpose of inquiry rather than a
research methodology. Action research comprises a “family of approaches” that have
different orientations, yet reveal the characteristics that seek to “involve, empower and
improve” aspects of participants’ social world (Reason & Bradbury 2008).
This research followed the cyclical process of action research (McNiff 2013) using the
practice perspective suggested by Cronholm and Goldkuhl (2004). Research practice
and business practice interact with each other through action research, thus affording
the collaboration of two distinct practices that intersect to form the third practice, the
business change practice/empirical research practice (Cronholm & Goldkuhl 2004).
This third practice affords the direct participation of the researcher with the business,
that simultaneously generates new knowledge and theory for the research practice, and
generates business change to improve business practice (Cronholm & Goldkuhl 2004).
The action research performed in this study consists of the three interlinked practices
suggested by Cronholm and Goldkuhl (2004). This thesis and its research findings
comprise the theoretical research practice; the business change practice/empirical
research practice consists of the IT Service Management process improvement; and
the regular business practice is the case study organization performing IT Service
Management (Cronholm et al. 2011). Figure 3-2 shows the three interlinked practices.

CHAPTER 3 RESEARCH METHODOLOGY
76
Figure 3-2 The interlinked practices proposed by Cronholm and Goldkuhl (2004,
p. 54)
The links between the theoretical research practice and the business change
practice/empirical research practice consist of a research interest as input and
empirical data as output (Cronholm & Goldkuhl 2004). The links between the regular
business practice and business change practice/empirical theory practice consist of
change requests as input and change results as output (Cronholm & Goldkuhl 2004).
An illustration of the application of the interlinked practices proposed by Cronholm
and Goldkuhl (2004) is presented in Figure 3-3.

CHAPTER 3 RESEARCH METHODOLOGY
77
Figure 3-3 Application of the interlinked practices
This study employs a scholar-practitioner approach to changing/improving processes
to measure results for the benefit of the case study organization Company X. Action
research, defined as an approach employed by practitioners for improving practice as
part of the process of change, is appropriate. The research is context-bound and
participative. It is a continual learning process in which the researcher learns and also
shares the newly generated knowledge with those who may benefit from it (Koshy
2005).
Action research can be applied in five phases (Diagnose, Plan, Take action, Evaluate
action, and Reflect) (McNiff 2013). The method is highly pragmatic in nature
(Baskerville & Wood-Harper 1996) and rooted in practical action, produces highly
relevant research results, and aims to solve a direct problem situation while carefully
informing theory (Goldkuhl 2008a). To ensure the rigor of this action research, the
Keys to IT Service Management Excellence Technique (KISMET) model (Jäntti,
Cater-Steel & Shrestha 2012) is adapted and used as a process improvement
framework to achieve the goals of this action research study. The model supports
action research methods (Suhonen et al. 2013) and focusses on improving ITSM
practices. The model consists of the following seven phases: Create a process
improvement infrastructure, Perform a process assessment, Plan process improvement
actions, Improve/Implement the process based on ITSM practices, Deploy and
introduce the process, Evaluate process improvement and Continual process
improvement (Jäntti, Lahtela & Kaukola 2010).

CHAPTER 3 RESEARCH METHODOLOGY
78
The Design Science Research approach (Hevner et al. 2004) was considered for this
study, however, the Action Research method is more aligned with the epistemological
and ontological views of the research, and furthermore, the focus of the research is
more on exploring the association of ITSM Process Capability, Process Performance,
and Business Performance than on developing an artefact (Goldkuhl 2013).
The details of the research approach are described next.
3.5 Research Approach
The first research activity required the definition of a measurement model. The second
activity through direct participation followed the cyclic process of the action research
approach using the KISMET model as guidance, to systematically address process
improvements and measure financial benefits at two points in time. The KISMET
model was used to complement action research because action research was deemed
too theoretical for Company X to understand and execute on. KISMET offered a
common industry-familiar language that made it easy for both business managers and
IT personnel to understand without any issues of translation and misinterpretation. The
description of each phase of KISMET was practical, and that made it ideal for business
buy-in and process improvement execution. The research applies two cycles of action
research.
Appendix G details the research timeline.
3.5.1 Definition of the Measurement Model
The literature review presented in Chapter 2 failed to identify an empirically-tested
measurement model that links ITSM process capability and process performance to
business performance. The ITSM Metrics Modelling Tool proposed by Steinberg
(2013) comprises operational measures, process maturity measures, KPIs, CSFs, and
the BSC Scorecard.
Steinberg’s model was used as a starting point to define the measurement model, with
the objective of seeking an in-house practical fit-for-purpose model for Company X.
It was decided to extend Steinberg’s model to incorporate financial data. The
researcher initially contacted Steinberg by email on 20 November 2015 to obtain

CHAPTER 3 RESEARCH METHODOLOGY
79
approval to use his ITSM Metrics Modeling Tool, and then later on 10 October 2017
to confirm his approval (see Appendix B.7). Chapter 4 provides a detailed account of
the development of an ITSM Measurement Framework applied in this research project.
3.5.2 Application of the Measurement Model
To apply the model, two cycles of Action Research were undertaken to improve the
process capability and performance of Company X’s ITSM. These two cycles address
RQ2 by applying the KISMET (Jäntti, Lahtela & Kaukola 2010) model that had been
previously developed to structure process improvement in ITSM.
Previous studies that used KISMET and Action Research (Heikkinen et al. 2013; Jäntti
& Niskala 2014; Suhonen et al. 2013) show no evidence of an explicit mapping
between the steps of the KISMET model and Action Research phases. The KISMET
model was mapped to the Action Research phases and adapted to fit this study as
shown in Table 3-1.
Table 3-1 Adaption and Mapping of KISMET to Action Research
Action Research Phase KISMET Steps Adapted KISMET Model
Diagnose Create a process
improvement
infrastructure
Create a process
improvement infrastructure
Perform a process
assessment
Assess process capability
and performance
Plan Plan process
improvement action
Plan process improvement
action
Take Action Improve/implement the
process on the basis of
ITSM practices
Design process
improvement guidelines
Deploy and introduce the
process
Execute the process
improvement plan
CHAPTER 3 RESEARCH METHODOLOGY
80
Action Research Phase KISMET Steps Adapted KISMET Model
Evaluate Action Evaluate the
improvement of the
process
Evaluate process
improvement
Reflect Design continual process
/ service improvement
actions
Continual Process
Improvement
The adapted KISMET phases are described next.
3.5.2.1 KISMET Phase 1: Create a process improvement infrastructure
Action research and qualitative research require rigorous data collection and
documentation methods (Avison, Baskerville & Myers 2001; Miles & Huberman
1994). In this first phase of cycle 1, data is collected from multiple primary and
secondary sources (Myers 2008), using the most common methods for case study data
generation: questionnaires, interviews, focus groups and observation (Oates 2006).
Key assessment participants are identified and selected from five business units at
Company X. The target groups are purposefully sampled because they cover the
business and IT functions at Company X and are involved in the ITSM processes
selected.
The first phase of the KISMET model includes motivating business stakeholders to
ITSM, defining business strategy and goals for ITSM process improvement, selecting
and defining improvement targets, and identifying stakeholders who participate in the
process improvement. The Actor-Network Theory and literature on Business and IT
Alignment are used to guide this phase of KISMET.
3.5.2.2 KISMET Phase 2: Assess process capability and performance
The second phase includes identifying and selecting the ITSM processes to assess,
documenting the challenges in the current state of the process, identifying the key
recommendations for process improvement, identifying the tools that support the

CHAPTER 3 RESEARCH METHODOLOGY
81
process, and benchmarking the process with ITIL best practices and ISO/IEC 20000
requirements.
The output from phase 1 of KISMET serves as input to this phase. Based on the
business strategy and goals for ITSM improvement decided in phase 1, the appropriate
ITSM processes are selected to assess. The improvement targets defined in phase 1
expose the current state of processes and the challenges to be addressed. The key
concepts of the selected processes are identified and documented. The tools that
support the processes are identified. Process capability is benchmarked with ITIL best
practices and ISO/IEC 20000 requirements.
The literature review on process assessments helped guide the choice of method and
tool for the process capability measurement. The criteria for the choice is the
following:
1) The process assessment method needs to be transparent and aligned with a standard;
2) The assessment results need to be objective;
3) The data collection needs to be unobtrusive, reliable and repeatable.
The questionnaire data collection uses a Software-Mediated Process Assessment
(SMPA) approach (Shrestha et al. 2014) to enable the researcher and case study
organization to assess ITSM process capability. The four phases of the SMPA
approach include assessment preparation; assessment data collection via online
surveys; process capability measurement; and process improvement recommendations
reporting (Shrestha et al. 2014). The SMPA tool is supported by the international
standard for process assessment ISO/IEC 15504 (ISO/IEC 2012) and associated
assessment models.
The SMPA approach allocates online assessment questions to the survey participants,
via a browser-based software application, based on their role within each process:
process performers; process managers; and external process stakeholders. The Process
Assessment Model (PAM) for ITSM (ISO/IEC 2012) consists of a set of base practices
to achieve the process outcomes and a set of generic practices for process management
(CL2), standardization (CL3), quantitative measurement (CL4) and innovation (CL5)
of process capability (Shrestha et al. 2014). Although ISO/IEC 15504 provides for
CHAPTER 3 RESEARCH METHODOLOGY
82
capability levels from zero (incomplete) to five (optimizing), only questions relating
to level 1 (performed), level 2 (managed) and level 3 (established) of the SMPA tool
are used for all three processes, it was not considered likely by senior management at
the case study that process capability higher than level 3 would be evident.
The second part of the process assessment is the process performance measurement.
ITSM process performance is assessed based on Steinberg’s ITSM Metrics Modelling
Tool (Steinberg 2013). The model is built as a Microsoft Excel spreadsheet that
captures operational metrics, calculates KPIs from operational metrics, scores KPIs
depending on how they fall within specified tolerance levels, and calculates CSF risk
levels from the combinations of KPI results. The model maps the CSF attainment
scores to key areas of general business risk (outcome risks) and derives a Balanced
Scorecard from the average of the associated CSF performance levels for each process.
Financial measures for each of the selected process are calculated and documented for
the period being assessed.
The SMPA report, the outcome of the focus group session, the CSF Scorecard and the
financial measurement results form the basis for the guide to the process improvement
interviews.
3.5.2.3 KISMET Phase 3: Plan process improvement action
The plan process improvement action phase of KISMET includes the following steps:
analyze the challenges that have been identified, plan improvement actions, and
validate the challenges and improvement actions. A report is developed for each
process, detailing the survey results and proposing an action plan for each of the
report’s recommendation. The report also provides the CSFs agreed upon by the
business in the Create a Process Improvement Infrastructure phase, suggested
operational metrics and KPIs.
3.5.2.4 KISMET Phase 4: Design process improvement guidelines
The purpose of the design process improvement guidelines phase is to define and
document roles and responsibilities, actions, metrics, and relationships to other ITSM
processes.
CHAPTER 3 RESEARCH METHODOLOGY
83
Process managers create RACI (Responsible – Accountable – Consulted – Informed)
matrices (Cannon 2011) for each of the actions to improve processes. The proposed
actions are rationalized and detailed in collaboration with the process managers and
performers. The relationship amongst processes is identified and documented.
3.5.2.5 KISMET Phase 5: Execute the process improvement plan
Although the KISMET model calls for deploying an ITSM process in this phase, the
researcher adapted this phase to execute the process improvement plans. This phase
includes the following steps: communicate the action plan to all stakeholders, create
work instructions for how to improve the process in practice, encourage a positive
attitude to ITSM among the staff, increase the awareness of ITSM in the organization
through training, and organize ITSM workshops to clarify the ITSM process
interfaces.
3.5.2.6 KISMET Phase 6: Evaluate process improvement
The evaluate process improvement phase of the KISMET model involves collecting
feedback regarding an improved process, tools, and training, and conducting fine-
tuning if applicable. The evaluate action phase serves to review and reflect on the
improvement programs implemented and evaluate the outcomes of the process
improvement programs. The aim is to identify changes in each of the selected ITSM
process improvement areas, the effect on the processes, as well as the challenges that
occur during implementation of the changes, and to make suggestions for further
improvement. Detailed observation, monitoring, and recording enable the researcher
to assess the effect of the action or intervention and hence the effectiveness of the
proposed change. In addition to the planned observations, additional observations and
insights are recorded in a journal on a regular basis.
3.5.2.7 KISMET Phase 7: Continual Process Improvement
This phase of the action research cycle is primarily concerned with the critical
inspection of one’s own practice. Many authors propose graphic representations of
action research models in order to illustrate their views (Costello 2003).
At its most basic, action research can be viewed in terms of the processes outlined in
Figure 3-4.

CHAPTER 3 RESEARCH METHODOLOGY
84
Figure 3-4 A basic action research model (Costello 2003, p. 7)
This model was first introduced in the work of Kurt Lewin (1946) and has been cited
in several works on action research (for example, Avison et al. 1999; Costello 2003;
Dick 1993; McTaggart & Kemmis 1988; Mertler 2015).
Reflection, in relation to action research, is an activity that must be done at the end of
a particular action cycle (Mertler 2015). It is a vital step in the process since this is
where the researcher-practitioner reviews what has been done, determines its
effectiveness and makes decisions about potential changes for future implementations
of the project.
3.5.2.8 KISMET Cycle 2
The evaluate action phase of cycle 1 directly leads to the diagnose phase of cycle 2.
The diagnosing phase of cycle 2 uses the outcomes of the evaluate action phase of
cycle 1 to further diagnose what needs to be done to the process improvement plans
and the execution thereof. The effectiveness and applicability of the performance
metrics are re-evaluated at this stage. Process capability and performance are
reassessed. Qualitative and quantitative data are collected and analyzed in this phase.
The results of the qualitative study and the performance metrics are compared against
those from the diagnose phase from cycle 1. Another financial check is performed at
this stage to compare with the baseline results of Company X’s financial position, to
determine if the actions performed during the acting phase are associated with changes
in the financial results.

CHAPTER 3 RESEARCH METHODOLOGY
85
3.6 Chapter Summary
Chapter 3 provides the blueprint for the research study. The underlying research
philosophy, epistemology, and ontology, driven by the research questions, form the
basis for the overall research design and approach. The research design and approach
are underpinned by the research philosophy of pragmatism. The study is applied
research integrating mixed methods within a case study, following the action research
approach, to provide academic rigor and industry relevance.
Multiple methods that include surveys, focus groups, meetings, documents, software
repositories and observation are used to collect data. The multi-method approach,
driven by the research questions, offers data triangulation.
Action research was selected as the research approach and paradigm most suitable for
the nature of this study. Action research, through a cyclical process, follows both
action and research, thus fulfilling the need for this study to implement change and
obtain knowledge and understanding. The cyclical and spiralling nature of action
research aligns well with the continual process improvement program at the case study.
The KISMET model is used within the phases of action research to guide the research
activities and offer rigor to the study.

CHAPTER 4 DESIGN OF THE BEHARI ITSM MEASUREMENT FRAMEWORK
86
CHAPTER 4 DESIGN OF THE BEHARI ITSM MEASUREMENT FRAMEWORK
4.1 Introduction
Chapter 3 presented the blueprint of the study, detailing the overall design and
approach that is underpinned by the research philosophy, epistemology, ontology, and
axiology. Chapter 3 also outlined and justified the research method and the action
research approach followed in the study.
This chapter describes the design of the Behari ITSM Measurement Framework
(BITSMMF) and illustrates the linkage of ITSM process capability and process
performance to business financial performance.
Chapter 4 comprises four main sections. Section 4.1 provides an introduction to the
chapter. Section 4.2 details the components of the BITSMMF and presents the
conceptual model. Section 4.3 applies the conceptual model. Section 4.4 covers the
summary of the chapter and value of the model. Figure 4-1 illustrates an overview of
Chapter 4.
Figure 4-1 Overview of Chapter 4

CHAPTER 4 DESIGN OF THE BEHARI ITSM MEASUREMENT FRAMEWORK
87
4.2 The Design of the Behari ITSM Measurement Framework
The BITSMMF referred to as the Behari Framework going forward, consists of the
following two integrated components: ITSM Performance Pyramid (ITSMP2) and
ITSM Measurement Model (ITSM3).
The ITSM3 is an extension and adaption of the ITSM Metrics Model Tool proposed
by Steinberg (2013), while the ITSMP2 is based on the Performance Pyramid proposed
by Lynch and Cross (1991).
4.2.1 The ITSM Performance Pyramid
The Strategic Measurement and Reporting Technique (SMART) Performance
Pyramid, developed by Lynch and Cross (1991), comprises a hierarchical structure of
financial and non-financial performance measures across nine dimensions, that are
mapped onto the organization from corporate vision to individual objectives (Johnson,
S 2005). The Performance Pyramid was designed to serve as a management control
system of performance metrics to assist in the achievement of corporate vision by
cascading down through four levels. Figure 4-2 shows the SMART Performance
Pyramid developed by Lynch and Cross (1991).

CHAPTER 4 DESIGN OF THE BEHARI ITSM MEASUREMENT FRAMEWORK
88
Figure 4-2 SMART Performance Pyramid (Artto 1999, p. 6)
The SMART Performance Pyramid is an interrelated system of variables controlled at
different organizational levels. The pyramid contains four hierarchical levels of
measures and objectives that affect the organization’s external effectiveness and its
internal efficiency simultaneously while integrating the links between the corporate
strategy, strategic business units, and operations. The purpose of the pyramid is to link
an organization’s vision to its operation by decoding objectives from the top-down and
measures from bottom-up (Laitinen 2002; Tangen 2004).
The first level down from the corporate vision involves the setting of short-term
financial targets like cash flow and profitability and long-term goals for growth as well
as market position. Key market and financial measures are identified at this level of
the objectives, as ways of monitoring performance in achieving the vision. To attain
these market and financial objectives, the driving forces of customer satisfaction,
flexibility and productivity are also derived (Lynch & Cross 1991).
The next level down involves the day-to-day operational measures concerning
customer satisfaction, flexibility, and productivity.

CHAPTER 4 DESIGN OF THE BEHARI ITSM MEASUREMENT FRAMEWORK
89
Lastly, at the base of the pyramid, specific operational measures are derived from the
satisfaction, flexibility, and productivity measures at the third level. Here the objective
is to enhance quality and delivery performance and reduce cycle time and waste.
Individual departments can use the four key performance measures (quality, cycle
time, delivery and waste) on a daily basis (Striteska & Spickova 2012).
The strength of the SMART Performance Pyramid is that it draws together the
hierarchical view of business performance measurement with the business process
review (Neely et al. 2000). It also makes explicit the difference between measures that
are of interest to external stakeholders, such as customer satisfaction, quality and
delivery, and measures that are of interest within the business such as productivity,
cycle time and waste (Neely et al. 2000).
Lynch and Cross (1991) concluded that it was essential that the performance measures
chosen should:
link operations to strategic goals. It is vital that departments be aware of the
extent to which they contribute, separately and together, to achieve strategic
goals;
support decision-making at all levels of an organization by providing timely
and accurate information;
include strategic, operational, financial, and nonfinancial indicators;
measure the effectiveness of all processes and services;
measure efficiency regarding resource utilization within the organization;
include an appropriate mix of both quantitative and qualitative methods;
comprise an appropriate focus on both the long-term and short-term;
and be flexible and adaptable to an ever-changing business environment.
The SMART Performance Pyramid does not explicitly integrate the concept of
continual improvements; does not provide any mechanisms to identify key
performance indicators (Ghalayini, Noble & Crowe 1997); and has not been
empirically tested (Metawie & Gilman 2005). Moreover, stakeholders other than
customers and shareholders do not feature prominently in the SMART Performance

CHAPTER 4 DESIGN OF THE BEHARI ITSM MEASUREMENT FRAMEWORK
90
Pyramid (Neely, Adams & Kennerley 2002). It is necessary to ensure that measures
are included that relate to other stakeholders as well.
The research project is about continual process improvement, using CSFs and KPIs to
access process capability, process performance and business performance by involving
all stakeholders (operational, strategic and external stakeholders).
Supporters of the Performance Pyramid claim that it is superior to the BSC in two
ways:
It has a hierarchical structure, requiring business management to set objectives
for each level of the organization. The performance measures that emerge from
these objectives are specific and appropriate to each level.
It is process-focused – that is, it explicitly considers how processes combine to
achieve the organization’s goals. The measures interact horizontally, for
example cutting the production cycle time should shorten the delivery time.
They also interact vertically,– e.g., cutting the cycle time should also increase
productivity.
Another key feature of this model is its recognition that financial and nonfinancial
measures can support each other. For example, increased flexibility should improve a
company’s market position by meeting customers’ needs more effectively, while also
improving its financial performance by increasing revenues and reducing fixed costs.
The primary aim of the SMART Performance Pyramid is to connect through
organization’s strategy with its operations by translating objectives from the top down
and measures from the bottom up (Tangen, 2004). It attempts to integrate corporate
objectives with operational performance indicators, but does not provide any
mechanism to identify key performance indicators (Striteska & Spickova, 2012).
The SMART Performance Pyramid provides a good base for adaptation to the ITSM
Performance Pyramid, as the nine dimensions of the SMART Performance Pyramid
logically map to the hierarchal levels of the ITSM Performance Pyramid to provide a
holistic view of business performance. Moreover, the SMART Performance Pyramid
uses a bottom-up approach to measures that aligns well with Steinberg’s bottom-up
approach to operationalization the ITSM Metrics Model.

CHAPTER 4 DESIGN OF THE BEHARI ITSM MEASUREMENT FRAMEWORK
91
One of the drawbacks of the SMART Performance Pyramid is its tendency to focus on
two groups of stakeholders, i.e. shareholders and customers. It is necessary to ensure
that measures are included which relate to other stakeholders as well. This makes the
SMART Performance Pyramid an ideal candidate to enhance into the ITSM
Performance Pyramid to include all stakeholders across all the hierarchical levels.
The SMART Performance Pyramid fails to explicitly define linkages to other key
concepts in performance measurement, such as critical success factors (CSFs) and key
performance indicators (KPIs) (Watts & McNair-Connolly, 2012). The ITSM3 (as
described in section 4.2.3) will be used to provide the ITSM Performance Pyramid
with the CSF and KPI dimensions.
The SMART Performance Pyramid developed by Lynch and Cross (1991) was
adapted to comprise three levels of hierarchical objectives: Business Level, Business
and IT Level, and the IT Level, to meet the requirements of this research. The nine
dimensions of performance measurement are included and span all levels of the
organization. Figure 4-3 illustrates the conceptual model of the ITSM Performance
Pyramid.
Figure 4-3 Conceptual Model of the ITSM Performance Pyramid

CHAPTER 4 DESIGN OF THE BEHARI ITSM MEASUREMENT FRAMEWORK
92
4.2.2 The ITSM Measurement Model
The ITSM Metrics Model Tool was proposed by Steinberg (2013) as a measurement
model that uses several metrics’ categories that integrate into an overall metrics
framework. The model was designed around these categories interacting with each
other to translate observations and operational events into performance indicators that
can be used to determine the impacts of specific risks to make critical IT and business
management decisions. Figure 4-4 illustrates the measurement model Steinberg
proposed.
Figure 4-4 Steinberg's Metrics Model (Steinberg 2013, p. 20)
Steinberg’s ITSM Metrics Model Tool is a simple spreadsheet tool that can be used to
measure ITIL-related processes and used as a practical guide to demonstrate
operational metrics to be used and how these can be calculated into key performance
indicators (KPIs) and critical success factors (CSFs) that senior management
understands.
The model justifies an ITSM improvement initiative by modeling the desired, stated
target improvements expected to occur. Its purpose is to demonstrate the impacts and
effects of current ITSM practices.
The data flow within Steinberg’s model can be described using the metrics model
presented in Figure 4-4. Operational metrics are calculated into KPIs. KPI results will
fall into tolerance ranges. KPIs are then calculated into CSFs. CSFs are then used to
determine outcomes and presented in a dashboard format.
KPIs are metrics that indicate the performance level of an operation or process to
provide a foundation for pragmatic management decision-making. KPIs are calculated

CHAPTER 4 DESIGN OF THE BEHARI ITSM MEASUREMENT FRAMEWORK
93
or derived from one or more operational metric(s), which indicate whether one or more
CSF(s) are being met and fall within a target and acceptance range. CSFs are metrics
that represent key operational performance requirements to indicate the performance
of a process or an operation. CSFs are calculated or derived from one or more KPI(s)
and based on the performance of KPIs within tolerance levels. CSFs also indicate a
performance level. Dashboards represent the key metrics in a report or graphical
interface to indicate the success, at-risk status or failure of a business operation.
Dashboards are used to quickly assess the state of a business operation to prompt
timely action to correct operational deficiencies.
To apply Steinberg’s model, tolerance levels are recorded in the ITSM Metrics Model
Tool for each process to define acceptable and not acceptable KPI levels. For each
ITSM process, operational metrics are then entered with live data from ITSM process
reporting and other infrastructure measurements and observations. KPIs are then
derived from the above and coded green, yellow or red depending on how they fall
within the specified tolerance levels. CSF risk levels are then derived from
combinations of KPI results and color-coded green, yellow or red. Green indicates that
the KPI has met or bettered the success target, while a yellow color indicates that the
KPI is between the success and warning targets, and a red color indicates that the target
has not met the warning threshold that was set. Each process Balanced Scorecard is
then derived from combinations of Outcome Risks associated with the dimensions of
the Balanced Scorecard. The dashboards are derived from the average score of
Outcome Risks associated with the dimensions of the Balanced Scorecard. A process
Balanced Scorecard is presented as a radar chart showing each scorecard area
(Customer, Capability, Operational, Financial and Regulatory).
As mentioned in Chapter 2 § 2.4.1.3, the primary drawback of the BSC approach is
that it is mainly designed to provide senior management with an overall high-level
view of performance, and is thus not intended for the operations level (Ghalayini,
Noble & Crowe 1997). Further, Ghalayini, Noble and Crowe (1997) also argued that
the balanced scorecard is constructed as a monitoring and controlling tool rather than
an improvement tool. Furthermore, Neely et al. (2000) argued that although the
balanced scorecard is a valuable framework suggesting important areas in which
performance measures might be useful, it provides little guidance on how the

CHAPTER 4 DESIGN OF THE BEHARI ITSM MEASUREMENT FRAMEWORK
94
appropriate measures can be identified, introduced and ultimately used to manage the
business.
Although Steinberg’s model made a valuable contribution, one critical dimension is
missing: financial measures. Steinberg’s ITSM Metrics Model Tool was modified and
extended to fit this study, to address the research questions posed in §1.3. Steinberg’s
work was extended to propose the ITSM3 to include financial measures at all levels of
the model (Operational Metrics, KPIs, and CSFs). In addition, rather than use the
balanced scorecard approach Steinberg proposed, the model was extended to present
the performance measurement dimensions of the ITSM Performance Pyramid,
including costs and financial performance data.
4.2.3 The Conceptual Model of the Behari ITSM Measurement Framework
The integration of the components ITSM3 and ITSMP2 to form the Behari IT Service
Management Measurement Framework (BITSMMF) solves the two issues identified
in the SMART Performance Pyramid and Steinberg’s model. The inclusion of the
financial dimension from the ITSMP2 affords the extension of Steinberg’s model to
add financial measures to the ITSM Metrics Model Tool (see section 5.3.2 & section
6.3.3), and the integration with the ITSM3 provides a mechanism to identify key
performance indicators that the Performance Pyramid lacks (see section 5.3.3).
Figure 4-5 depicts the conceptual model of the Behari framework, a top-down model
of measurement and control developed to link process capability, performance and
financial profitability to KPIs, CSFs, and business risks. At the top business level, an
organization is concerned with the association of business risks with CSFs to derive
CSF scores to determine CSFs risks. At the middle level, both the business and IT are
involved with the ITSM function to derive KPIs that support the organization’s CSFs.
At the lower operational level, IT is focussed on the ITSM process metrics such as
process capability, process performance, and financial performance.
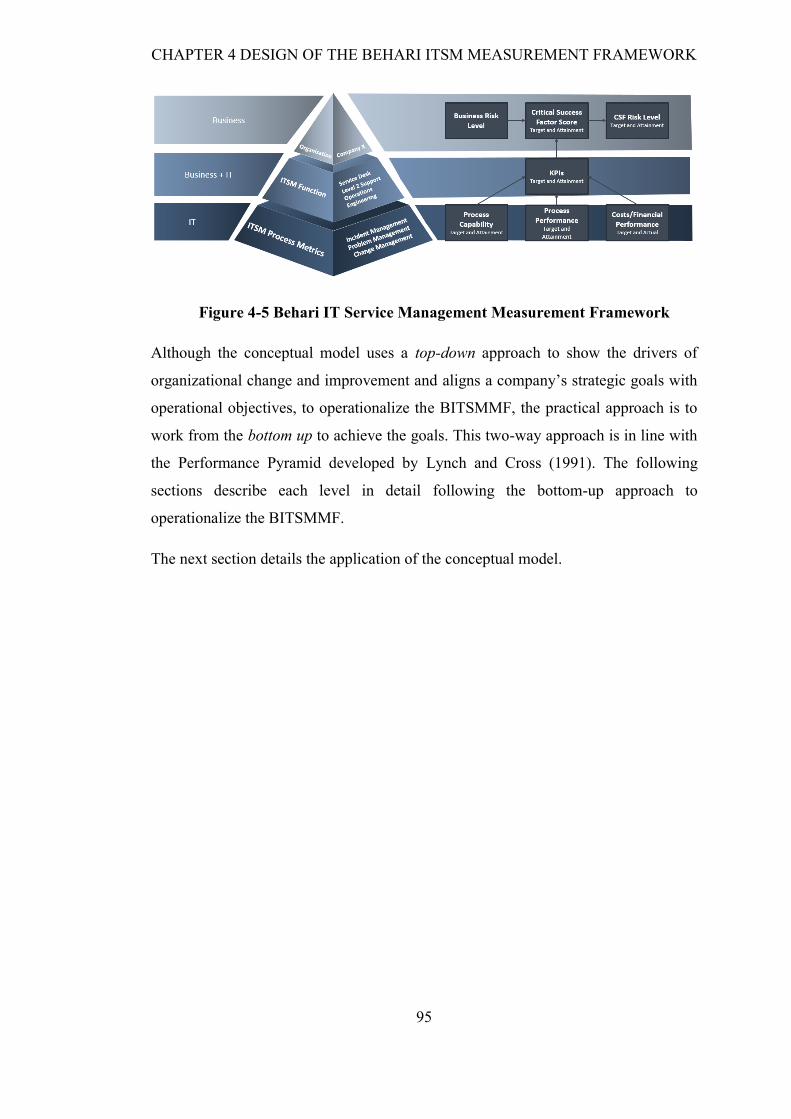
CHAPTER 4 DESIGN OF THE BEHARI ITSM MEASUREMENT FRAMEWORK
95
Figure 4-5 Behari IT Service Management Measurement Framework
Although the conceptual model uses a top-down approach to show the drivers of
organizational change and improvement and aligns a company’s strategic goals with
operational objectives, to operationalize the BITSMMF, the practical approach is to
work from the bottom up to achieve the goals. This two-way approach is in line with
the Performance Pyramid developed by Lynch and Cross (1991). The following
sections describe each level in detail following the bottom-up approach to
operationalize the BITSMMF.
The next section details the application of the conceptual model.

CHAPTER 4 DESIGN OF THE BEHARI ITSM MEASUREMENT FRAMEWORK
96
4.3 Details of the Conceptual Model Constructs
4.3.1 IT Level
Process Capability Measurement
An ITSM process assessment can be used to determine the level of maturity a process
has achieved. The level of ITSM maturity is incorporated into the ITSM3 to enable
process maturity to be linked to process performance and financial measures. It is
evident from the literature review (Chapter 2 §2.5.1.2) that a variety of ITSM maturity
evaluation frameworks are available to determine the level of maturity of an IT
process, for example, Capability Maturity Model Integration for Services (CMMI
Product Team 2011), COBIT (ISACA 2012), and ISO/IEC 15504 (ISO/IEC 1998).
Process assessment is defined as an activity that aims to compare the actual processes
performed in an organization with reference processes that include typical activities
for the process at different capability levels (Barafort & Rousseau 2009a). The ITSM3
uses the ISO/IEC 15504 international standard for process assessment (ISO/IEC 2012)
to measure process capability.
The SMPA approach to process assessment was used to measure the process
capability. Process attribute achievement ratings are calculated from the online survey
respondents by the software tool using the measurement framework of the ISO/IEC
15504 standard. The process capability score is based on the average rating of all
responses and uses the process attribute achievement scale as shown in
Table 4-1. The process capability level can then be derived from the attribute ratings.
Table 4-1 Process attribute rating scale
Fully There is certainty that process activities are
usually performed.
>85%-100%
Largely Process activities are performed in the majority
of cases.
>50%-85%
Partially Process activities are performed but not
frequently.
>15%-50%

CHAPTER 4 DESIGN OF THE BEHARI ITSM MEASUREMENT FRAMEWORK
97
Not Process activities are not or rarely performed. 0%-15%
Process Performance Measurement
Operational metrics are the basic observations of operation events for each ITSM
process that serve as a starting point for operationalizing the model and will be used
to calculate the KPIs for each of the processes. Operational metrics such as Number of
incident occurrences, Average incident response time, and Incident reopen rate are
sourced from the organization’s ITSM reporting tools, Human Resource systems,
observations and other infrastructure measurements.
Costs/Financial Performance
The ITSM3 includes financial measures: the cost of running a process and the cost of
process failures. Including these costs in the model establishes the association of
financial measures with ITSM capability and performance.
Process Costs
Process costs are the labor costs associated with running the ITSM process. Process
costs include additional costs the business incurs in addition to that paid to employees
for the work done. These additional costs are referred to as “on-costs” or “non-wage
labor costs” (Australian Bureau of Statistics 1993; OECD 2003).
Each process can be performed by multiple business units, and each business unit may
perform multiple processes.The cost of ITSM tools and training are included as on-
cost items. The number of staff in each business unit, and the proportion of time spent
working on each process is applied to calculate the total number of hours spent per
business unit per process. The total number of hours is multiplied by the hourly rate to
calculate the total cost per business unit per process according to the following
formulae:
Total hours spent on process (x) = [(annual available hours – annual leave hours)* assessment period *
% time spent on process per year] * total no. of staff per business unit
Annual fully-burdened cost per staff (z) = average (annual salary per staff member + annual on-cost per
staff member)

CHAPTER 4 DESIGN OF THE BEHARI ITSM MEASUREMENT FRAMEWORK
98
Labor Cost per Hour (y) = z / annual available hours
Labor Cost per Business Unit = x * y
Cost of IT Failures
IT failures can result in costs to the organization. These costs are associated with
specific processes directly related to the failure of IT services. These costs may include
fines, penalties, legal costs, loss of revenue and sales. Penalties for IT service failure
may be time-based and noted in service level agreements between the client and
service provider.
4.3.2 Business and IT Level
Key Performance Indicators
A key performance indicator (KPI) denotes a specific value or characteristic that is
measured to evaluate whether an organization's goals are being accomplished. KPIs
support the CSFs and take into account the needs of stakeholders and the
organization’s expectations. An organization’s KPIs need to be specific, measurable,
agreed upon, realistic, and time-based (SMART), to be effective. KPIs can use both
financial and non-financial metrics (Kerr 2000). KPIs are metrics that are used to
indicate the performance level of an operation or process. KPIs are used to provide a
foundation for actionable management decisions. While operational metrics are
generally historical in nature, KPIs are really the “metrics that matter” (Steinberg
2013).
KPIs are derived from one or more Operational Metric(s). The ITIL guidelines suggest
appropriate process KPIs to meet the organizational goals (Sharifi et al. 2009). The
ITSM3 also includes the process capability level, the cost of running the process and
other financial measures related to the process as KPIs.
Tolerance Thresholds and KPI Scoring
Tolerance thresholds represent upper and lower boundaries for acceptable KPI values
that should be set by the IT Service Manager and agreed by IT and Senior Business
Management. These thresholds are critical as they form the triggers for when
management needs to take action or make a key decision.

CHAPTER 4 DESIGN OF THE BEHARI ITSM MEASUREMENT FRAMEWORK
99
Each KPI should be associated with target and warning tolerance values. The target
value may be more or less than the warning value depending on the KPI being
measured. For some of the indicators (e.g., incident resolution rate), a higher value
indicates a positive value, whereas for others (e.g., number of incidents) a lower value
indicates a positive outcome. Traffic light indicators are commonly used in
measurement and status reports (Cokins 2009).
For each KPI target, the result is compared to the target and warning threshold to
deduce a KPI score. Steinberg used a three-point scale: 1 KPI result meets the target;
2 KPI results within the warning zone; 3 KPI results outside the warning zone.
Steinberg’s model then identifies the maximum score of the KPIs that are associated
with a CSF to score the CSF attainment.
4.3.3 Business Level
Critical Success Factor Scoring
CSFs scores are derived from one or more KPIs by comparing how those KPIs perform
within the tolerance range. A CSF is usually indicated with a performance level that
indicates the extent to which the CSF was achieved. Typically, this performance level
can be rated on a simple ordinal scale such as High, Medium or Low. According to
Steinberg (2013), a recommended approach to derive a CSF score is to model the
worst-case scenario. First, identify the KPIs that relate to the CSF and then rate the
CSF based on the highest (worst) value observed in any one of those KPIs.
Business Risks
Business risks (referred to as Outcome Risks in Steinberg’s model) are key indicators
of general business risk areas (Gewald & Hinz 2004; Steinberg 2013). Categories of
risk include operational, financial, regulatory, reputation, and security (Netter &
Poulsen 2003). Business risks are associated with CSFs that identify the success, at
risk or failure of CSFs. Business risk levels are used to quickly assess the level of risks
created by a process or by operational deficiencies. In short, business risks are the
events that the IT department is trying to protect against. Business risks may be
associated with one or more CSF(s). Business risk levels are determined by the highest
scoring CSF associated with the business risk.

CHAPTER 4 DESIGN OF THE BEHARI ITSM MEASUREMENT FRAMEWORK
100
ITSMP2 Risk Level Scorecard
The ITSMP2 Risk Level Scorecard is derived by using the average scores of only the
Business Risks associated with an ITSMP2 performance dimension. The results are
represented graphically as a radar chart to show the deviation from risk level targets.
4.4 Chapter Summary
This chapter presents the development and description of the Behari ITSM
Measurement Framework as a practical measurement framework to link ITSM process
capability and process performance to financial performance. The ITSM3 is designed
to facilitate What-If analyses to model the impacts of future business decisions on KPIs
and CSFs. This analysis can be achieved by increasing or decreasing the values of the
Operational indicators that may be related. The model may also be used for analytics,
for example, drilling down to more specific operational metrics. The model is designed
with flexibility to allow it to be easily adapted for any ITSM process to meet the
organization’s needs.
The ITSM3 provides a method to derive KPIs from operational metrics, link KPIs that
operationalize CSFs to applicable CSFs to achieve organizational goals, and to
associate business/outcome risks to these CSFs to ultimately determine the risks of
these CSFs. One of the aims of the model is to provide an understanding of the
potential degree of financial benefits realizable due to process improvements. The
application of the model uncovers the link between ITSM process capability and
performance and financial measures.

CHAPTER 5 ACTION RESEARCH CYCLE 1 (ARC1)
101
CHAPTER 5 ACTION RESEARCH - CYCLE 1 (ARC1)
5.1 Introduction
Chapter 4 presented the design of the Behari ITSM Measurement Model that
demonstrates the association of process capability and process performance to
financial costs. The conceptual model was described, and the details of how it can be
operationalized were provided to demonstrate how the components of the model
interact with each other.
This chapter aims to describe the events of the first cycle of the action research.
Chapter 6 describes the second cycle of the action research. Using the action research
approach, the researcher, through direct participation, followed a cyclic process to
systematically champion process improvements and measure financial benefit in the
case study organization Company X. The KISMET (Keys to IT Service Management
Excellence Technique) model (Jäntti et al. 2013) was used as a process improvement
guide to achieve the goals of this action research study. As detailed in Chapter 3 §3.4.4,
the action research cycle consists of the following five phases: Diagnose, Plan, Take
Action, Evaluate and Reflect (Baskerville & Wood-Harper 1996). The adapted
KISMET model, as described in Chapter 3 §3.5.2, consists of the following seven
activities: Create a process improvement infrastructure, Assess process capability and
performance, Plan process improvement action, Design process improvement
guidelines, Execute the process improvement plan, Evaluate process improvement and
Continual process improvement.
Chapter 5 comprises nine main sections. Section 5.1 provides an overview of the
chapter. The following seven sections are mapped directly to the seven phases of the
KISMET model and describe the specific activities of each phase. Section 5.2 details
the activities of the first phase (Create a process improvement infrastructure) of the
KISMET model. Section 5.3 walks through the second phase Assess process capability
and performance, followed by section 5.4 Plan process improvement action, and
section 5.5 the Design process improvement guidelines phase of KISMET. Section 5.6
details the activities of Execute the process improvement plan followed by section 5.7
Evaluate process improvement and section 5.8 Continual process improvement.

CHAPTER 5 ACTION RESEARCH CYCLE 1 (ARC1)
102
Finally, section 5.9 summarizes this chapter. Figure 5-1 shows the overview of Chapter
5.
Figure 5-1 Overview of Chapter 5
The timeline of activities for the first action research cycle is presented in Figure 5-2.

CHAPTER 5 ACTION RESEARCH CYCLE 1 (ARC1)
103
Figure 5-2 Action Research Cycle 1 Timeline

CHAPTER 5 ACTION RESEARCH CYCLE 1 (ARC1)
104
5.2 KISMET Phase 1: Create a process improvement infrastructure
The adoption of the ITIL framework requires organizational change. With any
organizational change comes challenges. One of the most difficult challenges to
overcome is to persuade people to conform to the new set of standards and align their
interests (Cater-Steel & McBride, 2007).
The research aim of this phase was to identify the primary problem(s) to be solved
through the action research project. For the management of Company X, the main
objective of this phase was to analyze the current state of ITSM processes to propose
improvement areas that align with the business strategy.
The first step in effecting change was to enroll actors or stakeholders at a senior level
at Company X to the interests of ITSM and service improvement.
A kickoff meeting was convened by the researcher on 23 February 2015 with the
executive staff of Company X to motivate the need for ITSM to improve processes
and to get buy-in. The meeting also served to introduce the research project and
emphasize the benefits of the study to the business. The company’s strategic goals for
ITSM process improvements were discussed and aligned with the company’s IT
objectives. The strategic goals of Company X were stated as:
To deliver high quality, reliable services that meet customer requirements;
To improve Process Performance / Service Levels; and
To build Engineering Team capabilities, such as efficiency, effectiveness, and
knowledge.
An important aim of the kickoff meeting was to develop a corporate mindset and
communication strategy on this new initiative of process improvement. The researcher
presented a condensed version of the research proposal with an emphasis on
measurable key milestones of the initiative, which helped strengthen the inscriptions
within the network and focus the meeting on the alignment of interests to establish a
common interest amongst executive staff.
CHAPTER 5 ACTION RESEARCH CYCLE 1 (ARC1)
105
Although there are a number of ITSM processes being performed at the case
organization, such as Incident Management, Problem Management, Change
Management, Release Management, Configuration Management, Availability
Management and Capacity Management, only three were observed to be performed
regularly with established workflows and policies: Incident Management, Problem
Management and Change Management. These three processes were chosen as the
focus of the CSI project at Company X. Company X’s senior management believed
that scrutinizing these three processes for possible improvement would have the
highest impact on meeting the business goals of the company. The choice is consistent
with the results of a cross-national study of ITIL adoption where it was found that
Incident Management, Problem Management, and Change Management were the top
three operational processes adopted by industry (Marrone et al. 2014).
The outcome of the kickoff meeting resulted in Company X’s Global Service
Initiative: the adoption of formal processes for Incident, Problem and Change
Management. The vision of this initiative was to provide a substantial level of
improvement for customers through the implementation of best practices in the
following areas:
Incident Management – improve in this process through application of ITSM
best practices;
Problem Management – implement problem management functions; and
Change Management – initiate the global change/request management
program.
The perceived anticipated benefits of this initiative were:
Reduced Case resolution times;
Increased first-call resolutions;
Improved team efficiencies;
Standardized Case documentation for improved knowledge transfer; and

CHAPTER 5 ACTION RESEARCH CYCLE 1 (ARC1)
106
Greater customer satisfaction.
The researcher identified three ITSM champions at the case organization as catalysts
to persuade other actors that it was in their interest to conform to a set of standards to
improve IT processes. The idea was to create a social network of people, standards,
and systems (Cater-Steel & McBride 2007).
The Global Service Initiative was planned as a cross-functional CSI project involving
six global teams: Business Support, Operations, Trading Solutions, Execution
Services, Engineering, and Program Management. The six global team leaders met and
agreed upon the development of a new framework for IT Service Management. The
Program Management Office (PMO) facilitated this meeting. As Director of
Engineering, the researcher represented the Engineering team. Specific improvements
to the global support organization and the implementation of ITSM best practices
across all business units were agreed upon. The goal was to develop rigorous,
repeatable and standardized processes that ultimately would be rolled-out across the
global IT support organization and would generate improved performance.
A subsequent meeting, facilitated by Company X’s PMO was held on 27 February
2015 with six process managers and five technical leads to review the current state of
processes. The workflow for each process was drawn on a whiteboard with issues and
challenges highlighted by participants. The analysis of the current state of processes
highlighted some critical issues:
Lack of one system to capture all issues;
An unacceptably high number of incidents were being categorized as most
critical;
Inconsistent communication channels;
Duplication of efforts across different business units;
Lack of prioritization of incidents;
Often the same issues continued to reoccur;
Too much time spent “chasing” for status updates; and
CHAPTER 5 ACTION RESEARCH CYCLE 1 (ARC1)
107
Unauthorized and unplanned changes were contributing to the excessive
number of incidents.
The process managers identified 67 key assessment participants selected across the
following six business units at Company X: Business Support, Operations, Trading
Solutions, Execution Services, Engineering, and Program Management. The target
business units were purposefully selected for the sample as they cover the business
and IT functions at Company X and are involved in all ITSM processes. The Business
Support unit consists of two tiers. Tier one functions as the service desk providing a
central point of contact for handling customer issues. Tier one support is the focal point
for customers reporting incidents and making service requests. Tier two staff handle
escalated issues from tier one staff and also serve as the interface to other ITSM
activities of Company X, such as problem management and change management. The
Operations unit is responsible for the deployment and maintenance of the
infrastructure and applications in the production data center and UAT (User
Acceptance Testing) environments. The Trading Solutions unit works with customers
to create custom deployment solutions. Execution Services is responsible for
maintaining a high level of trade execution quality for customers. This business unit
works closely with the business to analyze big data to craft trading strategies that best
fit a customer’s needs. Engineering is the unit that develops the FX cloud-based
software, fixes defects and works with the operations team as part of the DevOps
movement at Company X. The Program Management business unit manages several
projects simultaneously and provides Company X management with regular reports
on program status.
Some of the selected assessment participants were involved in multiple processes. The
numbers of participants in each business unit and process, as well as their geographical
dispersion, are listed in Table 5-1.
.

CHAPTER 5 ACTION RESEARCH CYCLE 1 (ARC1)
108
Table 5-1 Number of participants across business units, processes, and
geographic region
Organization
Business Unit
Change
Management
Incident
Management
Problem
Management
Geographic
Region
Business
Support
3 9 3 US, UK,
Singapore
Operations 12 12 0 US, India
Trading
Solutions
19 0 0 US, UK,
Singapore, India
Execution
Services
7 1 1 US
Engineering 0 0 14 US, India
Program
Management
4 4 3 US
Total 45 26 21
Figure 5-3 shows the organizational chart for Company X highlighting in yellow the
business units selected for the process capability assessment.

CHAPTER 5 ACTION RESEARCH CYCLE 1 (ARC1)
109
Figure 5-3 Company X's Organizational Chart

CHAPTER 5 ACTION RESEARCH CYCLE 1 (ARC1)
110
The researcher convened and facilitated a strategic planning meeting with process
managers to establish a set of five CSFs that align with Company X’s strategic business
goals. Table 5-2 shows the CSFs that were defined for each process.
Table 5-2 Critical Success Factors for three processes at Company X
Incident Management Problem Management Change Management
Quickly resolve
incidents
Minimize impact of
problems
Protect services when
making changes
Maintain IT service
quality
Reduce unplanned labor
spent on incidents
Make changes quickly
and accurately in line
with business needs
Improve IT and
business productivity
Improve quality of services
delivered
Make changes efficiently
and effectively
Effectively resolve
incidents
Effectively resolve
problems and errors
Utilize a repeatable
process for handling
changes
Cost savings Cost savings Cost savings
Company X used SugarCRM® (2015) to track incidents and problems and for general
customer support. SugarCRM is a customer relationship management (CRM) system
offered as a Web application for sales-force automation, marketing initiatives,
customer support and collaboration (SugarCRM 2015). Over the years, the
management of the system grew to be overly complex, so Company X migrated to
SalesForce® (2015) for customer relationship management and Zendesk® (2018) for
customer support. Zendesk manages the three selected ITSM processes. Zendesk®
(2018), a cloud-based customer service platform, was used for the data collection for
the quantitative part of the study. The software provides an analytic plugin module,
GoodData® (2015) that reports on the key performance metrics such as the number of
incidents reported, resolved, unresolved over a period, and escalated to problem
management. Also, Jira (Atlassian 2017) served as the bug tracking system for
incidents and problems. Jira is a Web-based software-as-a-service product that
provides bug tracking, issue tracking, and project management capabilities.
The next section details the second activity of the Kismet model.

CHAPTER 5 ACTION RESEARCH CYCLE 1 (ARC1)
111
5.3 KISMET Phase 2: Assess process capability and performance
As explained in Chapter 3 §3.5.2, the second activity of the KISMET model, Perform
a process assessment, was adapted to include both process capability assessment and
process performance assessment. The next section details the process capability
assessment.
5.3.1 Process Capability Assessment
From the literature review, it is evident that ITSM process assessments guide process
improvement and that transparently benchmarking process capabilities against an
international standard is worthwhile (Shrestha et al. 2014). Practitioner resources
suggest that organizations prefer an easy, cost-effective and timely process assessment
mechanism that unveils a realistic indication of process capability (Mainville 2014).
The Software-Mediated Process Assessment (SMPA) approach to process assessment
was chosen for this study, for its alignment with international standards, its
transparency and efficiency, and its ability to objectively measure feedback from
stakeholders (Shrestha et al. 2014). The SMPA approach uses online surveys for data
collection and a decision support system for analysis and reporting. The detailed
design of the SMPA approach is described in Shrestha et al. (2014). The SMPA
approach allocates assessment questions to the survey participants, via an online
interface, based on their role within each process: process performers; process
managers; and external process stakeholders. Questions are based on the process
assessment model (PAM) and sourced from an exemplar PAM for ITSM (ISO/IEC
15504 part 8). The PAM for ITSM (ISO/IEC 2012) consists of a set of base practices
to achieve the process outcomes and a set of generic practices for process management
(CL2), standardization (CL3), quantitative measurement (CL4) and innovation (CL5)
of process capability (Shrestha et al. 2014).
Process attribute achievement ratings are calculated from the online survey
respondents by the software tool using the measurement framework of the ISO/IEC
15504 standard. The process capability score is based on the average rating of all
responses and uses the process attribute achievement scale as shown in Table 5-3. The
process capability level can then be derived from the attribute ratings.
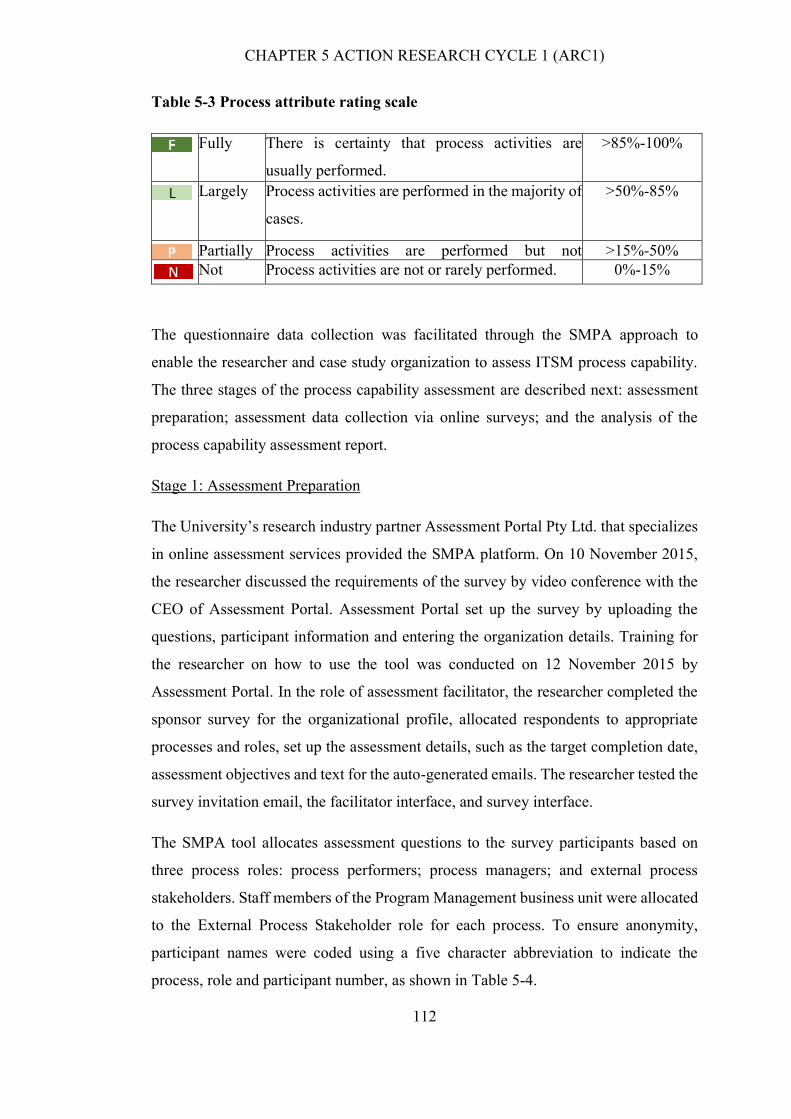
CHAPTER 5 ACTION RESEARCH CYCLE 1 (ARC1)
112
Table 5-3 Process attribute rating scale
Fully There is certainty that process activities are
usually performed.
>85%-100%
Largely Process activities are performed in the majority of
cases.
>50%-85%
Partially Process activities are performed but not
frequently.
>15%-50%
Not Process activities are not or rarely performed. 0%-15%
The questionnaire data collection was facilitated through the SMPA approach to
enable the researcher and case study organization to assess ITSM process capability.
The three stages of the process capability assessment are described next: assessment
preparation; assessment data collection via online surveys; and the analysis of the
process capability assessment report.
Stage 1: Assessment Preparation
The University’s research industry partner Assessment Portal Pty Ltd. that specializes
in online assessment services provided the SMPA platform. On 10 November 2015,
the researcher discussed the requirements of the survey by video conference with the
CEO of Assessment Portal. Assessment Portal set up the survey by uploading the
questions, participant information and entering the organization details. Training for
the researcher on how to use the tool was conducted on 12 November 2015 by
Assessment Portal. In the role of assessment facilitator, the researcher completed the
sponsor survey for the organizational profile, allocated respondents to appropriate
processes and roles, set up the assessment details, such as the target completion date,
assessment objectives and text for the auto-generated emails. The researcher tested the
survey invitation email, the facilitator interface, and survey interface.
The SMPA tool allocates assessment questions to the survey participants based on
three process roles: process performers; process managers; and external process
stakeholders. Staff members of the Program Management business unit were allocated
to the External Process Stakeholder role for each process. To ensure anonymity,
participant names were coded using a five character abbreviation to indicate the
process, role and participant number, as shown in Table 5-4.

CHAPTER 5 ACTION RESEARCH CYCLE 1 (ARC1)
113
Table 5-4 Participant Process Role Codes
Code Process Role Participant
Number IMPM Incident Management Process Manager 1-5
IMPP Incident Management Process Performer 1-19
IMPS Incident Management Process
Stakeholder
1-4
PMPM Problem Management Process Manager 1-3
PMPP Problem Management Process Performer 1-15
PMPS Problem Management Process
Stakeholder
1-3
CMPM Change Management Process Manager 1-5
CMPP Change Management Process Performer 1-37
CMPS Change Management Process
Stakeholder
1-4
Participant responses were coded as shown in Table 5-5.
Table 5-5 Codes of Participants by Process and Role
ITSM Process Process
Managers
Process
Performers
Process
Stakeholders
Count
Incident
Management
IMPM1-
IMPM5
IMPP1-
IMPP19
IMPS1-
IMPS4
28
Problem
Management
PMPM1-
PMPM3
PMPP1-
PMPP15
PMPS1-
PMPS3
21
Change
Management
CMPM1-
CMPM5
CMPP1-
CMPP37
CMPS1-
CMPS4
46
Total 13 71 11 95
Although ISO/IEC 15504 provides for process capability levels from zero
(incomplete) to five (optimizing), only questions relating to level 1 (performed), level
2 (managed) and level 3 (established) were used for all three processes. Company X
had recently implemented formal ITSM processes, and it was not considered likely
that process capability higher than level 3 would be evident.
Stage 2: Assessment Data Collection
Stakeholders identified in Phase 1 of the SMPA were initially contacted by email
(participant contact information is available in Company X’s Microsoft Outlook®
contacts) on 16 November 2015 to explain the research objective and solicit
participation in the assessment (see Appendix C.1). Later that day, an auto-generated
survey invitation email was sent to all participants, outlining the purpose of the survey,
CHAPTER 5 ACTION RESEARCH CYCLE 1 (ARC1)
114
requesting consent and providing a link to login to the SMPA tool. On 19 November
2015, an internal email using everyday business language was then sent to all
participants with a clearer explanation (see Appendix C.2). On 23 November 2015, an
email was sent to all participants to highlight the completion status of the survey at
that point in time and to encourage participants to complete the survey. On 25
November 2015, a progress report was sent to process managers to have them
encourage their team members to complete the survey by the deadline. An auto-
generated email was sent out to all participants on 28 November 2015 to remind
participants of the completion deadline of 30 November 2015. On the date of the
deadline, 80 percent of the surveys were completed. Since many participants were on
vacation during this period, it was decided to extend the close date of the survey to 5th
December 2015. The closing date was extended to 4 December 2015 and advised to
all participants (see Appendix C.3). All surveys were completed by the new deadline
of 4 December 2015.
The survey closed on the newly scheduled close date, and the process capability
assessment report was auto-generated by the Assessment Portal system.
Stage 3: Analysis of the Process Capability Assessment Report
The process capability assessment report was analyzed and discussed by the facilitator
and his research supervisors from 7th December 2015 to 17th December 2015.
The process capability assessment report presented the process attribute achievement
ratings and provided process improvement recommendations when any area of a
process demonstrated risk (a score of partial achievement or lower).
For each process, scores were calculated based on valid answers (responses of Fully,
Largely, Partially and Not) excluding Do not know and Do not understand responses.
A summary of the assessment survey results for all three processes is shown in Figure
5-4.
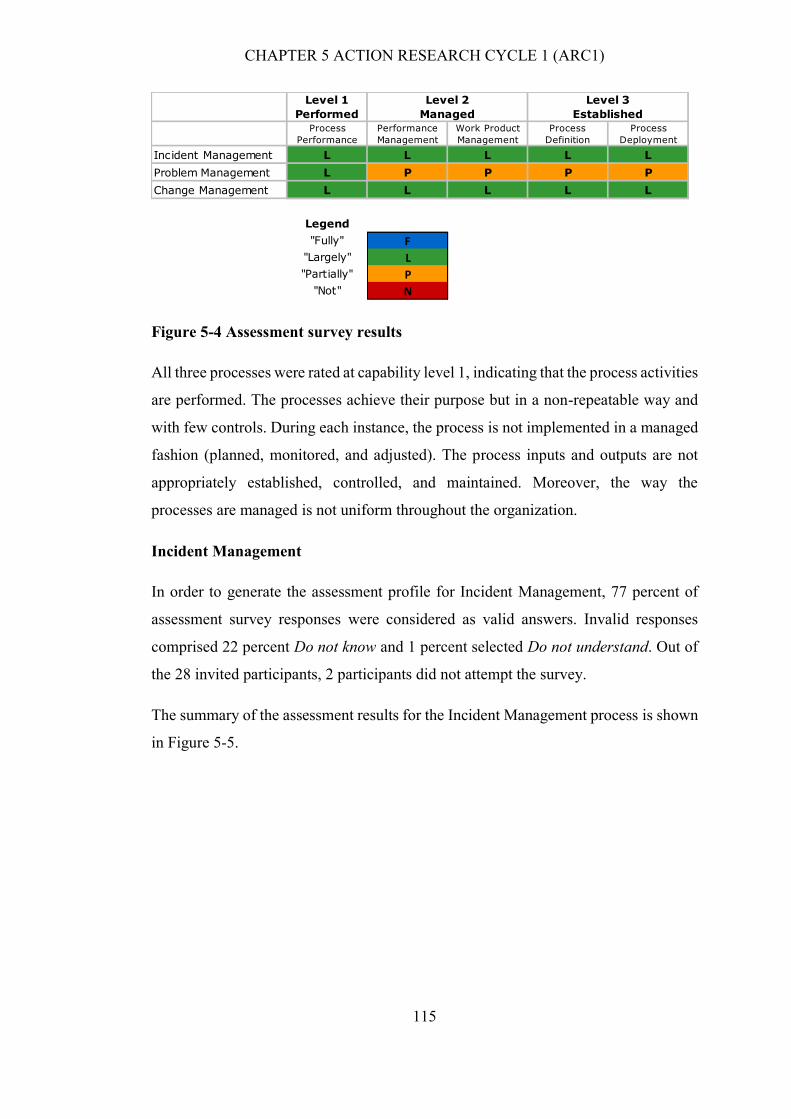
CHAPTER 5 ACTION RESEARCH CYCLE 1 (ARC1)
115
Figure 5-4 Assessment survey results
All three processes were rated at capability level 1, indicating that the process activities
are performed. The processes achieve their purpose but in a non-repeatable way and
with few controls. During each instance, the process is not implemented in a managed
fashion (planned, monitored, and adjusted). The process inputs and outputs are not
appropriately established, controlled, and maintained. Moreover, the way the
processes are managed is not uniform throughout the organization.
Incident Management
In order to generate the assessment profile for Incident Management, 77 percent of
assessment survey responses were considered as valid answers. Invalid responses
comprised 22 percent Do not know and 1 percent selected Do not understand. Out of
the 28 invited participants, 2 participants did not attempt the survey.
The summary of the assessment results for the Incident Management process is shown
in Figure 5-5.
Level 1
Performed
Process
Performance
Performance
Management
Work Product
Management
Process
Definition
Process
Deployment
Incident Management L L L L L
Problem Management L P P P P
Change Management L L L L L
Legend
"Fully" F
"Largely" L
"Partially" P
"Not" N
Level 2
Managed
Level 3
Established

CHAPTER 5 ACTION RESEARCH CYCLE 1 (ARC1)
116
Figure 5-5 Incident Management Process Assessment Results
Problem Management
Problem management had 84 percent valid assessment survey responses. Less than 1
percent of participants did not understand the question with 16 percent did not know
the answer to questions. All 21 invited survey participants completed the Problem
Management assessment.
The summary of the assessment results for the Problem Management process is shown
in Figure 5-6.
Figure 5-6 Problem Management Assessment Results
Change Management
In order to generate the assessment profile for Change Management, 80 percent of
assessment survey responses were considered. 29 percent of participants chose the Do
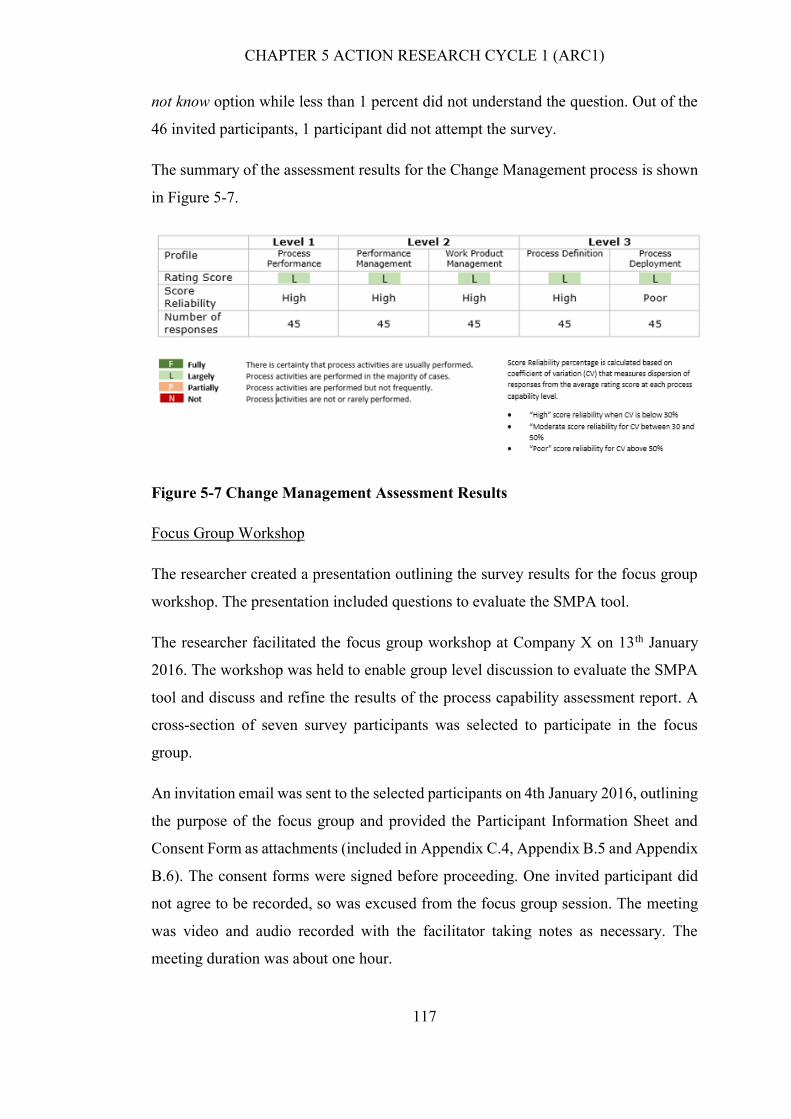
CHAPTER 5 ACTION RESEARCH CYCLE 1 (ARC1)
117
not know option while less than 1 percent did not understand the question. Out of the
46 invited participants, 1 participant did not attempt the survey.
The summary of the assessment results for the Change Management process is shown
in Figure 5-7.
Figure 5-7 Change Management Assessment Results
Focus Group Workshop
The researcher created a presentation outlining the survey results for the focus group
workshop. The presentation included questions to evaluate the SMPA tool.
The researcher facilitated the focus group workshop at Company X on 13th January
2016. The workshop was held to enable group level discussion to evaluate the SMPA
tool and discuss and refine the results of the process capability assessment report. A
cross-section of seven survey participants was selected to participate in the focus
group.
An invitation email was sent to the selected participants on 4th January 2016, outlining
the purpose of the focus group and provided the Participant Information Sheet and
Consent Form as attachments (included in Appendix C.4, Appendix B.5 and Appendix
B.6). The consent forms were signed before proceeding. One invited participant did
not agree to be recorded, so was excused from the focus group session. The meeting
was video and audio recorded with the facilitator taking notes as necessary. The
meeting duration was about one hour.

CHAPTER 5 ACTION RESEARCH CYCLE 1 (ARC1)
118
The workshop was conducted with a participant from each of the six business units
across all three ITSM processes to discuss the process capability results and triangulate
the data. Some participants played multiple roles across the three ITSM processes, as
shown in Table 5-6.
Table 5-6 Participant Roles
Participant Process Roles
Participant 1 IMPM1, PMPM1, CMPM1
Participant 2 IMPM2, CMPM2
Participant 3 IMPM3, CMPM3
Participant 4 IMPP1, CMPP1
Participant 5 IMPP2, PMPP2, CMPP2
Participant 6 PMPP1
Participant 7 IMPS1, PMPS1, CMPS1
The breakdown of the focus group participants by process and role is shown in Table
5-7.
Table 5-7 Coded participant breakdown by process and process role
ITSM Process Process Manager Process
Performer
Process
Stakeholder
Incident Management IMPM1-IMPM3 IMPP1 IMPS1
Problem Management PMPM1 PMPP1 PMPS1
Change Management CMPM1-CMPM3 CMPP1 CMPS1
The comments entered in the surveys were reviewed for specific details of perceptions
of process challenges. All responses to questions are detailed in the focus group
transcripts.
SMPA Tool Evaluation
In the workshop, an evaluation of the SMPA tool was conducted. Table 5-8 lists the
evaluation criteria, questions asked and sample responses.

CHAPTER 5 ACTION RESEARCH CYCLE 1 (ARC1)
119
Table 5-8 SMPA Tool Evaluation Criteria and Questions
Criterion Questions and Sample Responses
Usefulness How useful do you think it was to assess processes using online
surveys? IMPP1: “Speed of response.”
PMPP1: “It saved the progress, and whenever you came back
you can start from where you stopped.”
Comfort In your experience, how user-friendly was responding to the
online surveys?
IMPM1: “There were some bugs because of how you had your
survey set up for three levels versus five levels. I was asked to
click the Continue button to proceed to level 4, but there was no
Continue button.”
Efficiency Were there too many or not enough questions?
IMPS1: “And a lot of the questions seemed redundant. The
attention span is usually the first 5 minutes of taking the survey.”
Effectiveness Does asking direct questions in an online survey gather accurate
responses and make assessment results more visible?
IMPM1: “Your initial email you sent, it appeared as though the
answers were anonymous to everyone.”
Trust Is it more trustworthy to answer online surveys than interviews?
IMPS1: “I think this depends on the trust factors because we
need to know to what extent it is anonymous.”
Based on the evaluation questions, the workshop participants agreed on the following
points about the SMPA Tool:
- Online surveys are convenient;
- The survey contained too many questions – some were redundant;
- It would have been better to see all questions up front;
- The remaining time displayed is subjective – was not useful;
- Examples need to be more organization specific for better understanding of the
question;
- Attentive span was lost after a few minutes;

CHAPTER 5 ACTION RESEARCH CYCLE 1 (ARC1)
120
- Training in ITSM language is required for better quality of responses.
The discussion on the Assessment Survey results is summarized as follows:
- assessment results for Incident and Problem Management were as expected;
- Change Management results were a surprise (until the focus group participants
drilled deeper later);
- All participants thought that the measurement was reliable;
- There was interest in finding out why participants chose the Do not know
option;
- Communication was highlighted as being the primary problem at Company X
followed by the lack of training (in ITSM & Company X’s process workflow);
- There was much speculation around the Change Management assessment
results.
The comments staff entered in the survey were reviewed and found to be in line with
the workshop participants’ perceptions.
During the workshop, the survey results for each assessed process were evaluated with
probing questions using five criteria. Table 5-9 shows the survey results evaluation
criteria and probing questions for Incident Management as discussed in the workshop.

CHAPTER 5 ACTION RESEARCH CYCLE 1 (ARC1)
121
Table 5-9 Incident Management Survey Results Evaluation
Evaluation
Criteria
Probing Discussion
Questions
Summary of Responses
Communication Do you believe that the
information on Company
X’s Incident Management
Process was communicated
to all participants?
The focus group felt that
communication of the Incident
Management process was a
problem and that only the
Business Support business unit
had more insight into the process
than other business units.
Knowledge Do you believe that all
participants have sufficient
knowledge to understand
the questions?
The Change Management
process manager felt that only
the Business Support staff
members had the knowledge to
comprehend the questions.
Rating Score Why do you think the rating
score was ranked Largely
for all three capability
levels? That is, process
activities are performed in
the majority of cases.
The focus group felt that this is
true and expected as incidents
are dealt with by many people at
Company X.
Score
Reliability
Why do you think there is
high reliability of responses
across all three levels?
Most people feel that Incident
Management is the most mature
process.
Answer
Breakdown
Why do you think 22% of
participants chose the “Do
not know” answer?
Lack of communication of the
process.
The comments entered by Incident Management survey participants were reviewed
further. Table 5-10 shows the selected option for the related survey question, and the
comment entered.

CHAPTER 5 ACTION RESEARCH CYCLE 1 (ARC1)
122
Table 5-10 Survey Comments: Incident Management
Survey Question Selected
Option
Comment
Do you know if process inputs and
outputs are regularly reviewed?
P Depends on the urgency or
how important the
customer is. Do you know if process outcomes
are easily accessible? Do Not Know Maybe recorded in Jira or
somewhere, but not
everyone has access to
review. We only depend on
internal communication at
the moment. Do you know if the standard
process provides information to
implement multiple requirements?
Do Not Know If this process is
documented, it is not
disseminated to all team
members.
Problem Management
Table 5-11 shows the evaluation criteria and probing questions for Problem
Management as discussed in the workshop.
Table 5-11 Problem Management Survey Results Evaluation
Evaluation
Criteria
Probing Discussion Questions Summary of Responses
Communication Do you believe that the
information on Company X’s
Problem Management was
communicated to all participants?
The focus group felt that
there was a lack
communication of the
Problem Management
process and that only the
Engineering business units
had more insight into the
process than other business
units.

CHAPTER 5 ACTION RESEARCH CYCLE 1 (ARC1)
123
Evaluation
Criteria
Probing Discussion Questions Summary of Responses
Knowledge Do you believe that all
participants have sufficient
knowledge to understand the
questions?
The Problem Management
process manager felt that
only senior Engineering
staff members had the
knowledge to comprehend
the questions.
Rating Score Why do you think the rating score
was ranked Poor for capability
levels greater than 1? i.e., Process
activities are performed in the
majority of cases.
The focus group believed
that all groups did not have
an equal level of
knowledge of this process.
Score
Reliability
Why do you think there is Poor
reliability of responses for process
attribute 2.1 Performance
Management?
The group felt that there
was not enough awareness
of how to manage
performance and what it
meant by all business units.
Answer
Breakdown
Why do you think 16% of
participants chose the “Do not
know” answer?
Lack of communication of
the process.
The comments entered by Problem Management survey participants were reviewed.
Table 5-12 shows the selected option for the related survey question, and the comment
entered.

CHAPTER 5 ACTION RESEARCH CYCLE 1 (ARC1)
124
Table 5-12 Survey Comments: Problem Management
Question Selected
Option
Comment
Do you know if there is a good
organizational support to
effectively manage and perform
process activities?
P Support to fix the problems is
not there. Until that priority
(fixing issues vs. adding new
features) is changed this
whole process will continue
to be broken as far as the
customer is concerned. My
response is, “Yes, but in
reality, this would be a Yes –
only if you are deemed a
priority.”
Do you know if problems are
effectively resolved?
L If a stakeholder is aware
Do you know if stakeholders are
kept informed about the status
and progress of problem
resolution?
P based on priority
Change Management
Table 5-13 shows the evaluation criteria and probing questions for Change
Management as discussed in the workshop.
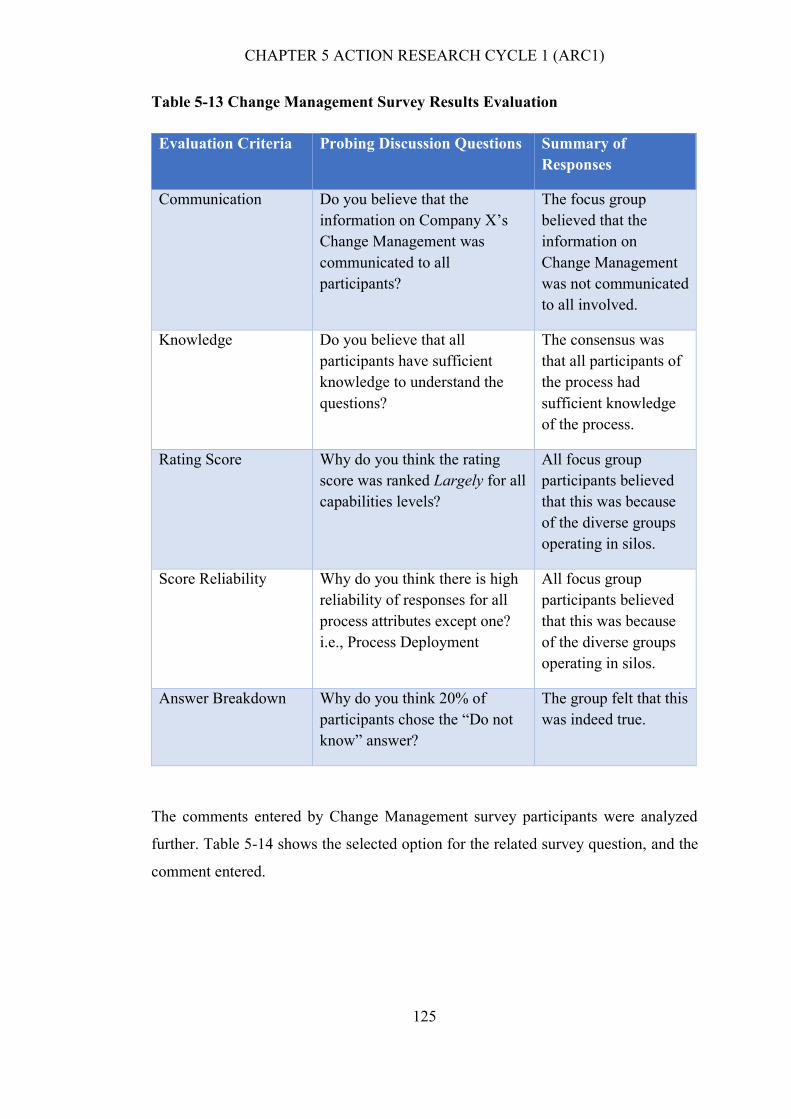
CHAPTER 5 ACTION RESEARCH CYCLE 1 (ARC1)
125
Table 5-13 Change Management Survey Results Evaluation
Evaluation Criteria Probing Discussion Questions Summary of
Responses
Communication Do you believe that the
information on Company X’s
Change Management was
communicated to all
participants?
The focus group
believed that the
information on
Change Management
was not communicated
to all involved.
Knowledge Do you believe that all
participants have sufficient
knowledge to understand the
questions?
The consensus was
that all participants of
the process had
sufficient knowledge
of the process.
Rating Score Why do you think the rating
score was ranked Largely for all
capabilities levels?
All focus group
participants believed
that this was because
of the diverse groups
operating in silos.
Score Reliability Why do you think there is high
reliability of responses for all
process attributes except one?
i.e., Process Deployment
All focus group
participants believed
that this was because
of the diverse groups
operating in silos.
Answer Breakdown Why do you think 20% of
participants chose the “Do not
know” answer?
The group felt that this
was indeed true.
The comments entered by Change Management survey participants were analyzed
further. Table 5-14 shows the selected option for the related survey question, and the
comment entered.
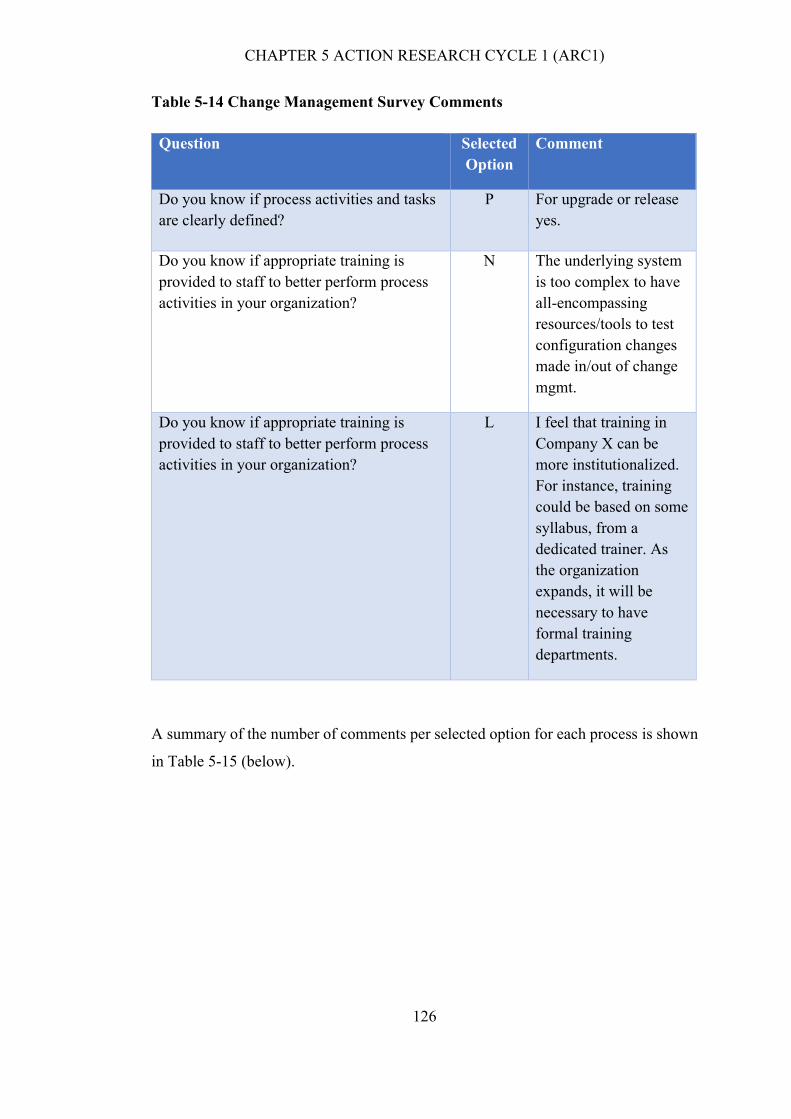
CHAPTER 5 ACTION RESEARCH CYCLE 1 (ARC1)
126
Table 5-14 Change Management Survey Comments
Question Selected
Option
Comment
Do you know if process activities and tasks
are clearly defined?
P For upgrade or release
yes.
Do you know if appropriate training is
provided to staff to better perform process
activities in your organization?
N The underlying system
is too complex to have
all-encompassing
resources/tools to test
configuration changes
made in/out of change
mgmt.
Do you know if appropriate training is
provided to staff to better perform process
activities in your organization?
L I feel that training in
Company X can be
more institutionalized.
For instance, training
could be based on some
syllabus, from a
dedicated trainer. As
the organization
expands, it will be
necessary to have
formal training
departments.
A summary of the number of comments per selected option for each process is shown
in Table 5-15 (below).

CHAPTER 5 ACTION RESEARCH CYCLE 1 (ARC1)
127
Table 5-15 Survey Comments: Summary by Process and Selected Option
Process
Selection Total
Comments
F L P N Don’t
Know
Incident
Management
2 3 2 0 3 10
Problem
Management
0 3 4 2 0 9
Change
Management
2 4 3 2 1 12
5.3.2 Financial Measurement
The KISMET model was enhanced to include financial measures as part of the process
performance assessment. Financial measures related to the three selected processes
were gathered.
Cost of Outages/Major Incidents
An outage or major incident at Company X is categorized into the following classes:
grid down, risk position, system down, inaccurate state, stuck rate, customer
connectivity issue, performance degradation and system issues with part of a customer
solution. Table 5-16 shows example symptoms of Service Outages and Major
Incidents at Company X.

CHAPTER 5 ACTION RESEARCH CYCLE 1 (ARC1)
128
Table 5-16 Examples of Service Outages and Major Incidents at Company X
Issue Description Criticality Potential Costs
Incurred
Grid down A Grid down situation is a
system-wide outage that
affects all customers. The
Business Support unit uses
all their resources to resolve
the problem and is also
required to escalate to
Engineering Managers and
the Executive Staff. Business
Support is responsible for
contacting key customers,
informing them of the
system-wide outage and they
inform the customer when
the issue is resolved. Once
the Grid has recovered,
Business Support informs
key customers that the
system is available and
apologizes for any
inconvenience.
Emergency
Critical
Average Loss in
Trading Volume for
the outage period
Wasted labor costs
Risk Position A risk position occurs when
a trade goes into a pending
state waiting for a response
from a provider. Customers
may have an open position
that they cannot close as the
market moves away from
them. Business Support
examines the Grid Monitors
and determines where the
Risk Positions are occurring.
They determine if it is
affecting a single or multiple
customers or single or
multiple liquidity providers.
The issue is escalated to
Operations informing them
to what the next steps are
with the problematic
Liquidity Provider(s).
Business Support would
contact the problematic
liquidity provider(s).
Emergency
Critical
Credit offered to
customers
Fines or penalties
Credit offered to
customers
Wasted labor costs

CHAPTER 5 ACTION RESEARCH CYCLE 1 (ARC1)
129
Issue Description Criticality Potential Costs
Incurred
System Down
(impacts
customer)
Business Support examines
the Grid Monitors and
narrows down which
Systems are affected. The
issue is escalated to
Operations, Trading
Solutions and Engineering.
Business Support contacts
key customers impacted by a
system outage. They inform
them that there is a system
outage and that they will
inform the customer when
the issue is resolved.
Once the issues are resolved,
Business Support informs the
customer(s) that the system
is available and apologizes
for any inconvenience. In
case an Incident Report is
required, Operations
provides the draft incident
report, and the Incident
Manager prepares the final
report.
Emergency
Critical
Average Loss in
Trading Volume for
the period the
system is down
Wasted labor costs
Inaccurate
state
(customer hits
EUR/USD,
but gets filled
with a
GBP/JPY
rate)
An example of this issue is
when a customer hits
EUR/USD, but gets filled
with a GBP/JPY rate.
Business Support first
examines the Grid Monitors
and narrows down the trades
affected. They then escalate
to Trading Solutions and
Engineering.
Emergency
Critical
Fines or penalties
Wasted labor costs
Stuck Rate This issue occurs when the
rate aggregation service fails
to include all incoming
liquidity provider rates in the
Volume Weighted Average
Price (VWAP). The risk is
that these old rates can be
traded on, that may lead to a
risk position for the trader.
Critical Credit offered to
customers
Wasted labor costs

CHAPTER 5 ACTION RESEARCH CYCLE 1 (ARC1)
130
Issue Description Criticality Potential Costs
Incurred
This issue is escalated to
Operations to restart liquidity
provider rate stream or
escalated to Trading
Solutions to investigate a
Broker/Order Adaptor.
Customer
Connectivity
issues
Issues with connectivity to
Company X’s Grid, either
from the trading application
or Application Programming
Interface (API).
These issues are escalated to
Operations and Trading
Solutions.
Critical Average Loss in
Trading Volume
Wasted labor costs
Noticeable
performance
degradation
impacting
customer
trading
This occurs when the virtual
machine for a customer fails
to run the garbage collection
and utilizes a high
percentage of memory.
This is escalated to
Operations and Trading
Solutions.
High Average Loss in
Trading Volume
Wasted labor costs
System issues
with a part of
customer
solution
These could range from
credit checks or inaccurate
configuration of a
component. These are
escalated to Operations.
High Average Loss in
Trading Volume
Wasted labor costs
The costs associated with outages and major incidents at Company X were calculated
as the sum of the average loss in trading volume for the outage period plus
payments/credit offered to customers.
Company X’s revenue model is based on earning a dollar amount per one million
dollars traded per customer. The dollar amount earned varies by customer and trading
volume ranges. For the six month period 1 May 2015 to 31 October 2015, there were
three major incidents and one outage at the case organization. As shown in Table 5-17
the cost of outages and major incidents at Company X during this period totaled
$17,370.

CHAPTER 5 ACTION RESEARCH CYCLE 1 (ARC1)
131
Table 5-17 Cost of outages and major incidents at Company X (May-Oct 2015)
Category Events Financial
Measure
Cost
Major
Incident
28/06/2015
21:05 Support received 200+
Risk Position alerts.
21:37 Customer A’s
connection was restored, and
trading resumed.
Average loss in
trading volume
32 minutes
$40,000,000 @
$5/million = $200
Credit offered
to customers
Risk Position =
$30,000
Credit Offered
@50% = $15,000
Major
Incident
26/07/2015
21:22 Email from Customer
B regarding connectivity
issues.
22:05 Application server
restarted, and Customer B
was able to connect.
Average loss in
trading volume
43 Minutes
$60,000,000 @
$7/million = $420
Outage 10/08/2015
06:15 Notification of a
connectivity issue from a
customer.
07:25 Issued identified as
related to the packet drop on
one of Company X’s Internet
Service Providers (ISPs).
07:52 Operations disabled all
routing via the affected ISP
and switched to alternate
ISP.
Average loss in
trading volume
1 hour 37 minutes
$300,000,000 @ an
average of $5/million
= $1,500
Major
Incident
29/10/2015
14:39 Customer C users were
unable to login to Portal, and
LP prices were refreshing
sporadically on the trading
UI.
Average loss in
trading volume
21 Minutes
$50,000,000 @
$5/million = $250

CHAPTER 5 ACTION RESEARCH CYCLE 1 (ARC1)
132
Category Events Financial
Measure
Cost
14:50 Operations observed
high load on one of Customer
C’s servers.
15: 00 Service restored and
prices resumed on the trading
UI.
Total cost of outages and major incidents $17,370
Process Costs
The calculations for the process costs are defined in Chapter 4 §4.3.1.
The labor assumptions applied to Company X are outlined in Table 5-18.
Table 5-18 Labor Metric Assumptions for Company X
Labor Assumption Detail Value
Available hours to
work per year
40 hours x 52 weeks 2,080 hours
Total leave hours per
year
15 days of vacation, 10 holidays and 5 days
of sick leave (30 days per year x 8 hours)
240 hours
Time period review 6 months 0.5 year
Company X’s annual costs in addition to an employee’s hourly wage include payroll
taxes, insurance, medical benefits, onsite lunch, equipment, software, supplies and
training costs.
Table 5-19 shows the calculations for Company X’s on-cost to calculate the fully-
burdened annual cost per employee. The business units are described in §5.2.1.

CHAPTER 5 ACTION RESEARCH CYCLE 1 (ARC1)
133
Table 5-19 Company X’s fully-burdened costs per employee
Cost Item Tier 1 Tier 2 Operations Engineering Trading Solutions Execution Services
Average annual salary $82,291 $100,625 $76,173 $131,585 $126,854 $118,367
Add: On-cost items:
Payroll taxes (8%) $6,583 $8,050 $6,094 $10,527 $10,148 $9,469
Insurance (5%) $4,115 $5,031 $3,809 $6,579 $6,343 $5,918
Medical benefits (1%) $823 $1,006 $762 $1,316 $1,269 $1,184
Onsite lunch $2,000 $2,000 $2,000 $2,000 $2,000 $2,000
Equipment $579 $550 $1,186 $1,650 $1,400 $685
Software licenses $1,200 $1,212 $1,750 $2,100 $1,200 $1,200
Supplies $100 $100 $150 $150 $150 $150
Training costs $0 $800 $1,500 $1,000 $500 $0
Total on-costs $15,400 $18,750 $17,250 $25,322 $23,010 $20,606
Total fully-burdened cost $97,691 $119,375 $93,423 $156,907 $149,864 $138,973

CHAPTER 5 ACTION RESEARCH CYCLE 1 (ARC1)
134
Table 5-20, Table 5-21 and Table 5-22 show the costs per business unit for each of the
processes after applying the formula described in §4.3.3.1.
Table 5-20 Incident Management Costs per Business Unit at Company X (May-
Oct 2015)
Business Unit Timea #
Staff
Hours Spent
on Incidents
Cost/Hour Total Cost
Support Tier 1 80% 7 5,152 $46.97 $241,989.44
Support Tier 2 30% 4 1,104 $57.39 $63,358.56
Operations 25% 13 2,990 $44.92 $134,310.80
Engineering 25% 14 3,220 $75.44 $242,916.80
Execution Services 40% 8 2,944 $72.05 $212,115.20
Trading Solutions 35% 19 6,118 $66.81 $408,743.58
Total cost of Incidents $1,303,434.38
a) Proportion of Time Spent on Incidents
Table 5-21 Problem Management Costs per Business Unit at Company X (May-
Oct 2015)
Business Unit Timea #
Staff
Hours Spent
on Problems
Cost/Hour Total Cost
Support Tier 1 5% 7 322 $46.97 $15,124.34
Support Tier 2 50% 4 1,840 $57.39 $105,597.60
Operations 50% 12 5,520 $44.92 $247,958.40
Engineering 50% 14 6,440 $75.44 $485,833.60
Execution
Services
10% 8 736 $72.05 $53,028.80
Trading
Solutions
20% 19 3,496 $66.81 $233,567.76
Total cost of Problems $1,141,110.50
a) Proportion of Time Spent on Problems
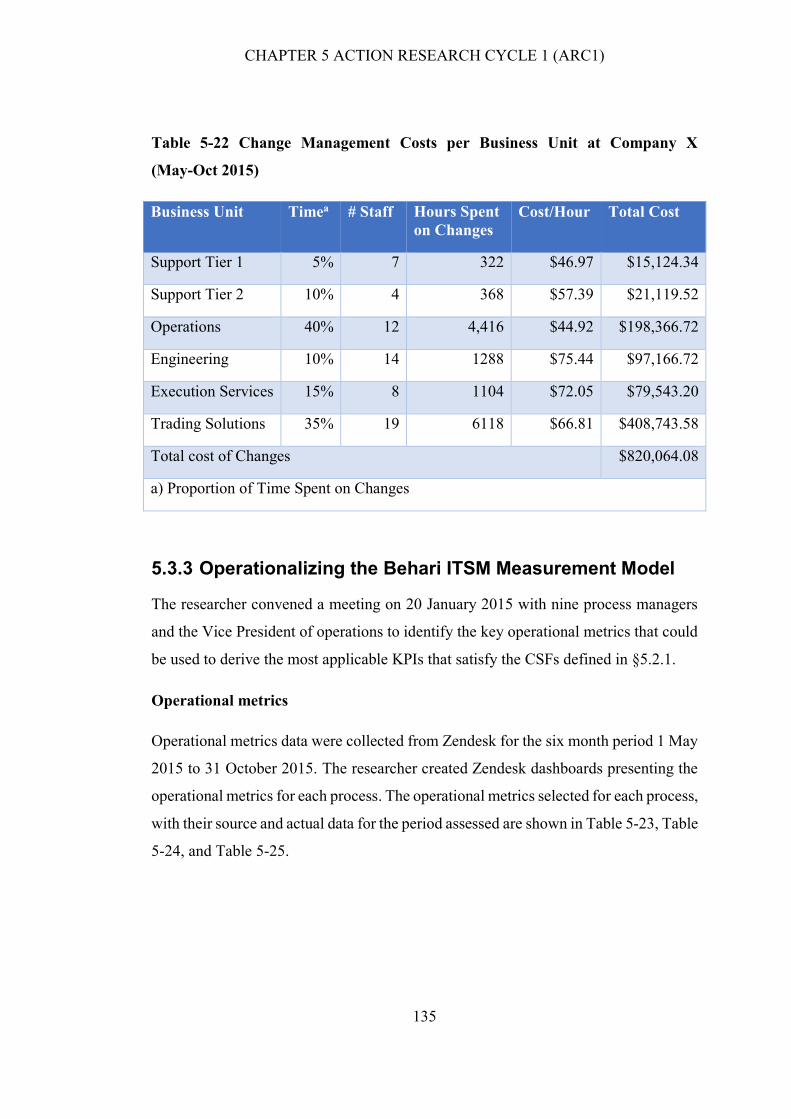
CHAPTER 5 ACTION RESEARCH CYCLE 1 (ARC1)
135
Table 5-22 Change Management Costs per Business Unit at Company X
(May-Oct 2015)
Business Unit Timea # Staff Hours Spent
on Changes
Cost/Hour Total Cost
Support Tier 1 5% 7 322 $46.97 $15,124.34
Support Tier 2 10% 4 368 $57.39 $21,119.52
Operations 40% 12 4,416 $44.92 $198,366.72
Engineering 10% 14 1288 $75.44 $97,166.72
Execution Services 15% 8 1104 $72.05 $79,543.20
Trading Solutions 35% 19 6118 $66.81 $408,743.58
Total cost of Changes $820,064.08
a) Proportion of Time Spent on Changes
5.3.3 Operationalizing the Behari ITSM Measurement Model
The researcher convened a meeting on 20 January 2015 with nine process managers
and the Vice President of operations to identify the key operational metrics that could
be used to derive the most applicable KPIs that satisfy the CSFs defined in §5.2.1.
Operational metrics
Operational metrics data were collected from Zendesk for the six month period 1 May
2015 to 31 October 2015. The researcher created Zendesk dashboards presenting the
operational metrics for each process. The operational metrics selected for each process,
with their source and actual data for the period assessed are shown in Table 5-23, Table
5-24, and Table 5-25.

CHAPTER 5 ACTION RESEARCH CYCLE 1 (ARC1)
136
Table 5-23 Incident Management Operational Metrics (May-Oct 2015)
Operational Metric Data Source Count Time in Hours
Total number of incidents Zendesk 10,171
Average time to resolve Severity 1
and Severity 2 incidents
Zendesk
52.2
Number of incidents resolved within
agreed service levels
Zendesk 3,377
Number of high severity/major incidents Zendesk 6,672
Number of incidents with customer impact Zendesk 3,371
Number of incidents reopened Zendesk 1,116
Average incident response time Zendesk
7.2
Average incident closure duration Zendesk 166.5
Incidents completed without escalation Zendesk 8,462
Total available time to work on incidents Zendesk
22,080
Total time spent resolving incidents Labor reports
8,000
Table 5-24 Problem Management Operational Metrics (May-Oct 2015)
Operational Metric Data Source Count Time in Hours
Number of repeat incidents Zendesk 2
Number of major problems Zendesk 8
Total number of incidents Zendesk 7
Total number of problems in pipeline Zendesk 83
Number of problems removed (error control) Zendesk 16
Number of known errors (root cause known and
workaround in place)
Zendesk 5
Number of problems reopened Zendesk 3
Number of problems with customer impact Zendesk 3
Average problem resolution time - severity 1 and 2
problems (hours)
Zendesk
664.5
Total available labor hours to work on problems Zendesk
1000
Total labor hours spent working on and coordinating
problems
Labor reports
200

CHAPTER 5 ACTION RESEARCH CYCLE 1 (ARC1)
137
Table 5-25 Change Management Operational Metrics (May-Oct 2015)
Operational Metric Data Source Count Time in Hours
Total changes in pipeline Zendesk 3,815
Total changes implemented Zendesk 125
Number of failed changes Zendesk 17
Number of emergency changes Zendesk 22
Number of unauthorized changes detected Zendesk 138
Number of changes rescheduled Zendesk 25
Average process time per change (hours) Zendesk
402
Number of changes resulting in incidents Zendesk 27
Total available labor hours to coordinate (not
implement) changes
Staffing
reports
49.1
Total labor hours spent coordinating changes
40
Key Performance Indicators
The researcher facilitated a meeting on the 21st January 2016 with a representative
from each of the business units (Business Support, Operations, Trading Solutions,
Execution Services, Engineering and Program Management), to discuss, select, and
agree upon KPIs. Suggested KPIs from ITIL guidelines were presented by the
researcher, and the most applicable KPIs that meet the organizational goals of
Company X were discussed in detail.
The list of KPIs and their meaning for each process as agreed by IT and the business
at Company X is shown below in Table 5-26, Table 5-27, and Table 5-28.
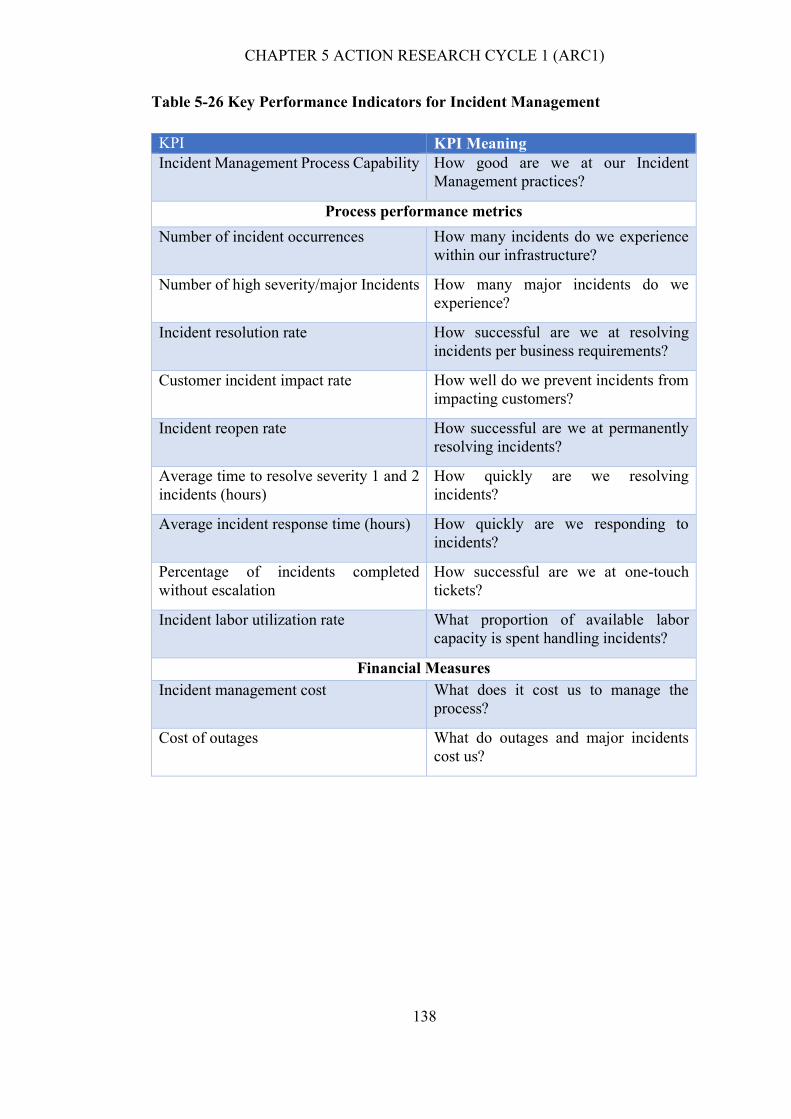
CHAPTER 5 ACTION RESEARCH CYCLE 1 (ARC1)
138
Table 5-26 Key Performance Indicators for Incident Management
KPI KPI Meaning
Incident Management Process Capability How good are we at our Incident
Management practices?
Process performance metrics
Number of incident occurrences How many incidents do we experience
within our infrastructure?
Number of high severity/major Incidents How many major incidents do we
experience?
Incident resolution rate How successful are we at resolving
incidents per business requirements?
Customer incident impact rate How well do we prevent incidents from
impacting customers?
Incident reopen rate How successful are we at permanently
resolving incidents?
Average time to resolve severity 1 and 2
incidents (hours)
How quickly are we resolving
incidents?
Average incident response time (hours) How quickly are we responding to
incidents?
Percentage of incidents completed
without escalation
How successful are we at one-touch
tickets?
Incident labor utilization rate What proportion of available labor
capacity is spent handling incidents?
Financial Measures
Incident management cost What does it cost us to manage the
process?
Cost of outages What do outages and major incidents
cost us?

CHAPTER 5 ACTION RESEARCH CYCLE 1 (ARC1)
139
Table 5-27 Key Performance Indicators for Problem Management
KPI KPI Meaning
Problem management process
capability
How good are our Problem Management
practices?
Process performance metrics
Incident repeat rate How effective are we at minimizing repeat
incidents?
Number of major problems How many major problems do we
experience?
Problem resolution rate What percentage of problems have we
eliminated?
Problem workaround rate For what percentage of problems do we
implement workarounds?
Problem reopen rate How successful are we at removing
problems permanently?
Customer impact rate How well are we keeping problems from
impacting customers?
Average problem resolution time -
severity 1 and 2 problems (hours)
How long does it take us to resolve
problems?
Problem labor utilization rate How much available labor capacity is spent
handling problems?
Financial Measures
Problem management cost What does it cost us to manage the process?
Cost of outages What do outages and major problems cost
us?

CHAPTER 5 ACTION RESEARCH CYCLE 1 (ARC1)
140
Table 5-28 Key Performance Indicators for Change Management
KPI KPI Meaning
Incident management process
capability
How good are our Change Management
practices?
Process performance metrics
Change efficiency rate How efficient are we at handling changes?
Change success rate How effective are we at handling changes?
Emergency change rate What percentage of changes are
emergencies?
Change reschedule rate How well do we implement changes on
schedule?
Average process time per change
(hours)
How long does the average change take?
Unauthorized change rate What percentage of changes bypass the
Change process?
Change incident rate How much available labor capacity is spent
handling changes?
Change labor workforce utilization How much available labor capacity is spent
handling problems?
Financial Measures Incident management cost What does it cost us to manage the process?
Cost of outages What do outages and major incidents cost
us?
Tolerance Thresholds and KPI Scoring
Based on the KPI method detailed in Chapter 4 §4.4.2, the KPI items, established
threshold targets, the desirable result (polarity), the calculations of the KPI results, and
the actual results for the case organization are shown below in Table 5-29,
Table 5-30 and Table 5-31 for incident management, problem management and change
management respectively. In these tables, the color of the KPI Result cell indicates the
level of achievement of the KPI. Green indicates that the KPI is being met, yellow
indicates that the KPI result is within the threshold and red indicates that the KPI is
not being met.
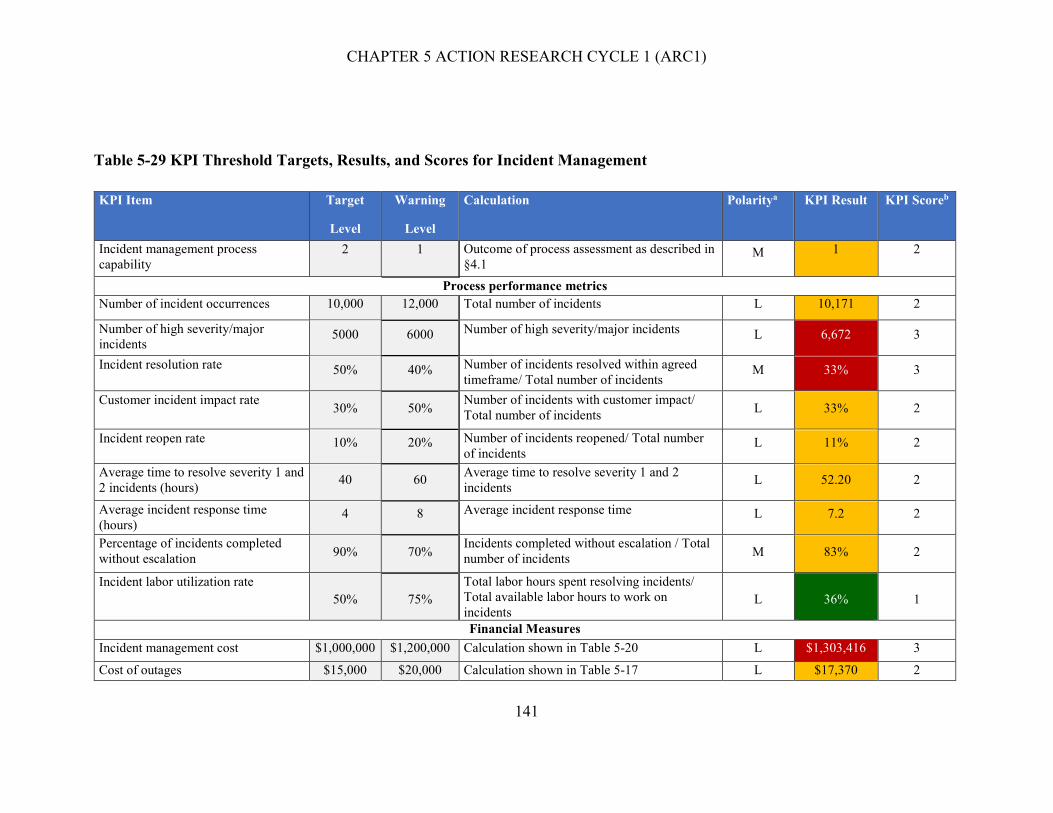
CHAPTER 5 ACTION RESEARCH CYCLE 1 (ARC1)
141
Table 5-29 KPI Threshold Targets, Results, and Scores for Incident Management
KPI Item Target
Level
Warning
Level
Calculation Polaritya KPI Result KPI Scoreb
Incident management process
capability
2 1 Outcome of process assessment as described in
§4.1 M 1 2
Process performance metrics
Number of incident occurrences 10,000 12,000 Total number of incidents L 10,171 2
Number of high severity/major
incidents 5000 6000 Number of high severity/major incidents L 6,672 3
Incident resolution rate 50% 40% Number of incidents resolved within agreed
timeframe/ Total number of incidents M 33% 3
Customer incident impact rate 30% 50%
Number of incidents with customer impact/
Total number of incidents L 33% 2
Incident reopen rate 10% 20% Number of incidents reopened/ Total number
of incidents L 11% 2
Average time to resolve severity 1 and
2 incidents (hours) 40 60
Average time to resolve severity 1 and 2
incidents L 52.20 2
Average incident response time
(hours) 4 8 Average incident response time L 7.2 2
Percentage of incidents completed
without escalation 90% 70%
Incidents completed without escalation / Total
number of incidents M 83% 2
Incident labor utilization rate
50% 75%
Total labor hours spent resolving incidents/
Total available labor hours to work on
incidents L 36% 1
Financial Measures
Incident management cost $1,000,000 $1,200,000 Calculation shown in Table 5-20 L $1,303,416 3
Cost of outages $15,000 $20,000 Calculation shown in Table 5-17 L $17,370 2

CHAPTER 5 ACTION RESEARCH CYCLE 1 (ARC1)
142
KPI Item Target
Level
Warning
Level
Calculation Polaritya KPI Result KPI Scoreb
Note:
a) Polarity: L indicates a lower value is desirable; M indicates a higher value is desirable
b) KPI score: 1 indicates KPI is met; 2 indicates a warning - KPI is within threshold; 3 indicates KPI is not met
Table 5-30 KPI Threshold Targets, Results, and Scores for Problem Management
KPI Item Target
Level
Warning
Level
Calculation Polaritya KPI Result KPI Scoreb
Problem management process capability level 2 1 Outcome of process assessment as
described in §4.1 M 1 2
Process performance metrics
Incident Repeat Rate 15% 20% Number of repeat incidents / Total
number of incidents L 28.57% 3
Number of Major Problems 10 12 Number of high severity and major
problems L 8 1
Problem Resolution Rate 90% 80% Number of problems removed(error
control) / Total number of problems M 19.3% 3
Problem Workaround Rate 30% 50% Number of known errors / Total number
of problems L
6% 1
Problem Reopen Rate 10% 20% Number of problems reopened / Total
number of problems L
3.6% 1
Customer Impact Rate 15% 20% Number of problems with customer
impact / Total number of problems L
0% 1

CHAPTER 5 ACTION RESEARCH CYCLE 1 (ARC1)
143
KPI Item Target
Level
Warning
Level
Calculation Polaritya KPI Result KPI Scoreb
Average Problem Resolution Time - Severity
1 and 2 Problems (Hours) 80 120 Average problem resolution time in hours L 664.5 3
Problem Labor Utilization Rate 50% 75%
Total labor hours spent working on and
coordinating problems / Total available
labor hours to work on problems L
20%
1
Financial Measures
Problem management cost $1,000,000 $1,200,000 Calculation shown in Table 5-21 L $1,141,073 2
Cost of outages $15,000 $20,000 Calculation shown in Table 5-17 L $17,370 2
Note:
a) Polarity: L indicates a lower value is desirable; M indicates a higher value is desirable
b) KPI score: 1 indicates KPI is met; 2 indicates a warning - KPI is within threshold; 3indicates KPI is not being met
Table 5-31 KPI Threshold Targets, Results, and Scores for Change Management
KPI Item Target
Level
Warning
Level
Calculation Polaritya KPI Result KPI Scoreb
Change management process capability
level
2 1 Outcome of process assessment as
described in §4.1 M 1 2
Process performance metrics
Change Efficiency Rate 80% 65% Total changes implemented / Total
changes in pipeline M 3.3% 3
Change Success Rate 80% 70% 1-(Number of failed changes / Total
changes implemented) M 86% 1
Emergency Change Rate 60% 80% Number of emergency changes / Total
changes in pipeline L 57.7% 1
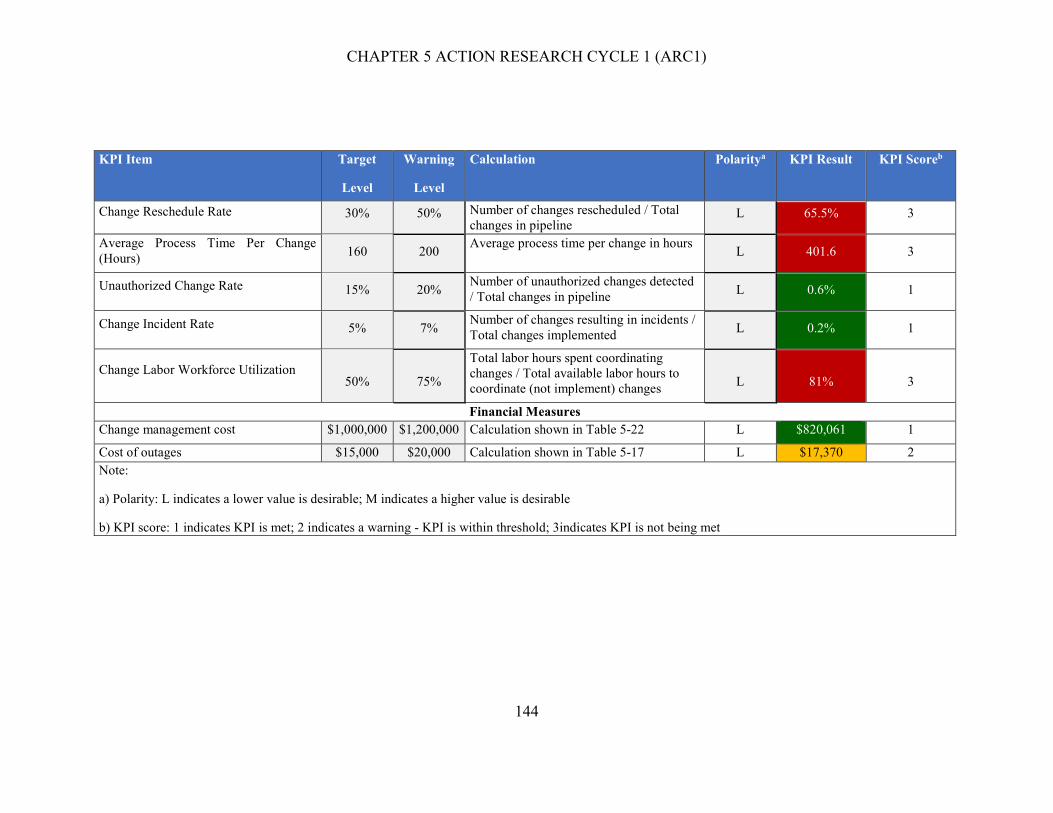
CHAPTER 5 ACTION RESEARCH CYCLE 1 (ARC1)
144
KPI Item Target
Level
Warning
Level
Calculation Polaritya KPI Result KPI Scoreb
Change Reschedule Rate 30% 50% Number of changes rescheduled / Total
changes in pipeline L 65.5% 3
Average Process Time Per Change
(Hours) 160 200
Average process time per change in hours L 401.6 3
Unauthorized Change Rate 15% 20% Number of unauthorized changes detected
/ Total changes in pipeline L 0.6% 1
Change Incident Rate 5% 7% Number of changes resulting in incidents /
Total changes implemented L 0.2% 1
Change Labor Workforce Utilization 50% 75%
Total labor hours spent coordinating
changes / Total available labor hours to
coordinate (not implement) changes L 81% 3
Financial Measures
Change management cost $1,000,000 $1,200,000 Calculation shown in Table 5-22 L $820,061 1
Cost of outages $15,000 $20,000 Calculation shown in Table 5-17 L $17,370 2
Note:
a) Polarity: L indicates a lower value is desirable; M indicates a higher value is desirable
b) KPI score: 1 indicates KPI is met; 2 indicates a warning - KPI is within threshold; 3indicates KPI is not being met

CHAPTER 5 ACTION RESEARCH CYCLE 1 (ARC1)
145
Linking KPIs to Critical Success Factors
An outcome of the kickoff meeting held on 23 February 2015 was the establishment
of two strategic CSFs: Improve IT and Business Productivity, and Maintain IT Service
Quality; and two tactical CSFs: Quickly Resolve Incidents, and Effectively Resolve
Incidents. The researcher included a fifth CSF of reducing costs as an outcome of a
process improvement initiative at the organization. CSF scores were derived from one
or more KPIs by comparing how those KPIs performed within the tolerance range.
Table 5-32, Table 5-33 and Table 5-34 show the KPIs associated with each CSF for
each of the three processes.
Table 5-32 Incident Management: Mapping of KPIs to CSFs
Critical Success Factor Associated Key Performance Indicator
Quickly Resolve Incidents Number of high severity/major incidents
Incident resolution rate
Incident reopen rate
Average problem resolution time - severity 1 and 2
problems (hours)
Percentage of Incidents completed without
escalation
Incident labor utilization rate
Incident management cost
Maintain IT Service
Quality
Number of high severity/major incidents
Customer incident impact rate
Average problem resolution time - severity 1 and 2
problems (hours)
Average incident response time
Incident labor utilization rate
Improve IT and Business
Productivity
Number of incident occurrences
Incident resolution rate
Incident reopen rate

CHAPTER 5 ACTION RESEARCH CYCLE 1 (ARC1)
146
Critical Success Factor Associated Key Performance Indicator
Average incident response time
Percentage of Incidents completed without
escalation
Incident management cost
Incident management process capability
Effectively Resolve
Incidents
Average problem resolution time - severity 1 and 2
problems (hours)
Percentage of Incidents completed without
escalation
Incident labor utilization rate
Incident management cost
Cost of major issues and outages
Cost Savings Number of high severity/major incidents
Incident resolution rate
Percentage of Incidents completed without
escalation
Incident labor utilization rate
Incident management cost
Cost of major issues and outages
Incident management process capability
Table 5-33 Problem Management: Mapping of KPIs to CSFs
Critical Success Factor Key Performance Indicator
Minimize Impact of
Problems (Reduce Incident
Frequency/Duration)
Incident repeat rate
Number of major problems
Problem workaround rate
Problem reopen rate
Average problem resolution time - severity 1 and 2
problems (hours)
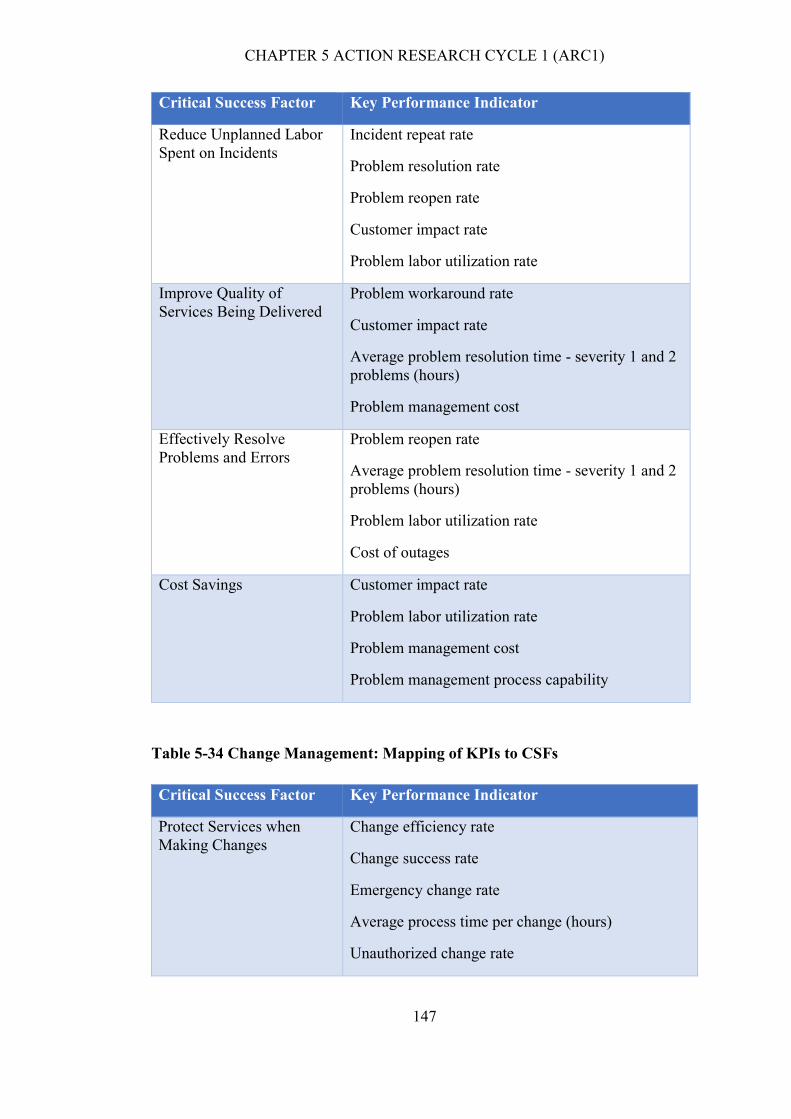
CHAPTER 5 ACTION RESEARCH CYCLE 1 (ARC1)
147
Critical Success Factor Key Performance Indicator
Reduce Unplanned Labor
Spent on Incidents
Incident repeat rate
Problem resolution rate
Problem reopen rate
Customer impact rate
Problem labor utilization rate
Improve Quality of
Services Being Delivered
Problem workaround rate
Customer impact rate
Average problem resolution time - severity 1 and 2
problems (hours)
Problem management cost
Effectively Resolve
Problems and Errors
Problem reopen rate
Average problem resolution time - severity 1 and 2
problems (hours)
Problem labor utilization rate
Cost of outages
Cost Savings Customer impact rate
Problem labor utilization rate
Problem management cost
Problem management process capability
Table 5-34 Change Management: Mapping of KPIs to CSFs
Critical Success Factor Key Performance Indicator
Protect Services when
Making Changes
Change efficiency rate
Change success rate
Emergency change rate
Average process time per change (hours)
Unauthorized change rate

CHAPTER 5 ACTION RESEARCH CYCLE 1 (ARC1)
148
Critical Success Factor Key Performance Indicator
Change labor workforce utilization
Make Changes Quickly
and Accurately in line with
Business Needs
Change success rate
Change reschedule rate
Unauthorized change rate
Change incident rate
Change management cost
Make Changes Efficiently
and Effectively
Change efficiency rate
Change success rate
Average process time per change (hours)
Change incident rate
Change labor workforce utilization
Cost of outages
Utilize a Repeatable
Process for Handling
Changes
Unauthorized change rate
Change labor workforce utilization
Change management cost
Change management process maturity
Cost Savings Change incident rate
Change management cost
Cost of outages
Change management process maturity
Table 5-35, Table 5-36 and Table 5-37 show the CSF attainment level and scores
derived from the highest value of the associated KPI scores as explained in §4.5.1.
Table 5-35 Incident Management: CSF Attainment and CSF Scores
Critical Success Factor CSF Attainment CSF Score
Quickly resolve incidents Low 3
Maintain IT service quality Low 3
Improve IT and business productivity Low 3
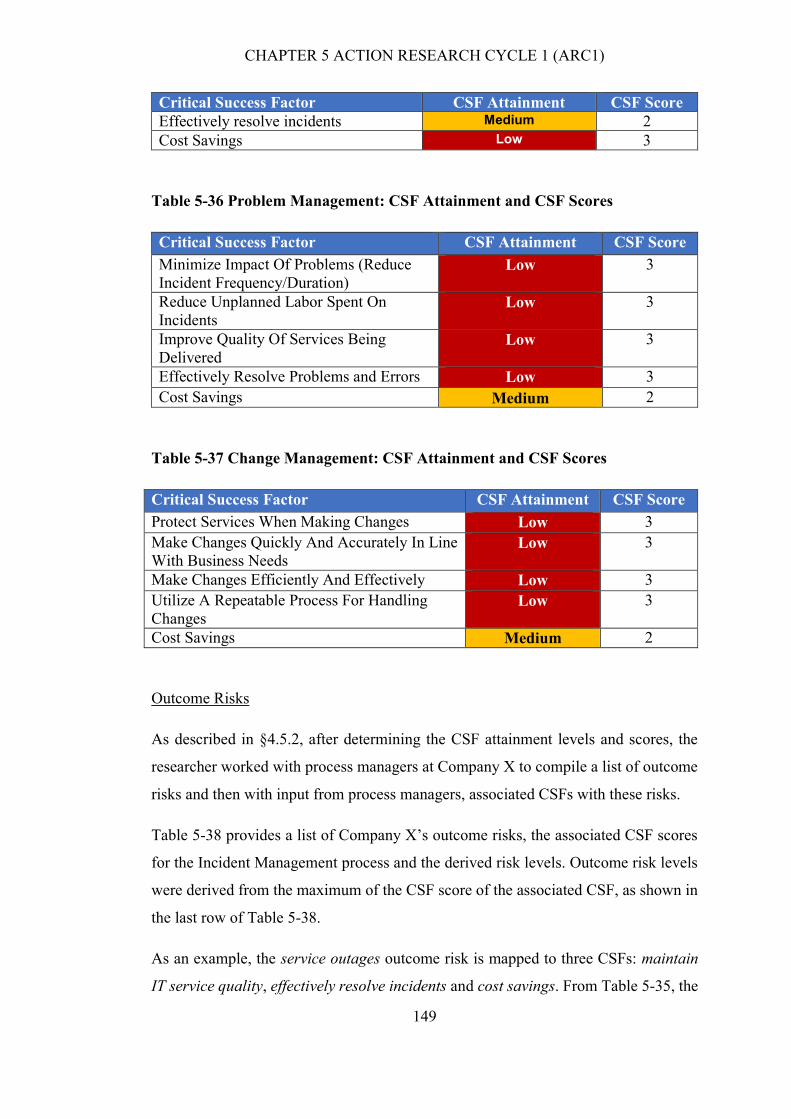
CHAPTER 5 ACTION RESEARCH CYCLE 1 (ARC1)
149
Critical Success Factor CSF Attainment CSF Score
Effectively resolve incidents Medium 2
Cost Savings Low 3
Table 5-36 Problem Management: CSF Attainment and CSF Scores
Critical Success Factor CSF Attainment CSF Score
Minimize Impact Of Problems (Reduce
Incident Frequency/Duration) Low 3
Reduce Unplanned Labor Spent On
Incidents Low 3
Improve Quality Of Services Being
Delivered Low 3
Effectively Resolve Problems and Errors Low 3
Cost Savings Medium 2
Table 5-37 Change Management: CSF Attainment and CSF Scores
Critical Success Factor CSF Attainment CSF Score
Protect Services When Making Changes Low 3
Make Changes Quickly And Accurately In Line
With Business Needs Low 3
Make Changes Efficiently And Effectively Low 3
Utilize A Repeatable Process For Handling
Changes Low 3
Cost Savings Medium 2
Outcome Risks
As described in §4.5.2, after determining the CSF attainment levels and scores, the
researcher worked with process managers at Company X to compile a list of outcome
risks and then with input from process managers, associated CSFs with these risks.
Table 5-38 provides a list of Company X’s outcome risks, the associated CSF scores
for the Incident Management process and the derived risk levels. Outcome risk levels
were derived from the maximum of the CSF score of the associated CSF, as shown in
the last row of Table 5-38.
As an example, the service outages outcome risk is mapped to three CSFs: maintain
IT service quality, effectively resolve incidents and cost savings. From Table 5-35, the

CHAPTER 5 ACTION RESEARCH CYCLE 1 (ARC1)
150
attainment of the CSFs maintain IT service quality and cost savings are Low, scoring
3, while the attainment of the CSF effectively resolve incidents is Medium, scoring 2.
To model the worst-case scenario, the maximum of these scores (3) is used to derive
the outcome risk level of High.
Table 5-39 and Table 5-40 provide a list of Company X’s outcome risks, derived risk
levels and the associated CSF scores for the Problem Management and Change
Management processes.

CHAPTER 5 ACTION RESEARCH CYCLE 1 (ARC1)
151
Table 5-38 Incident Management: Mapping of Outcome Risks to CSF Scores
Outcome Risk Item Critical Success Factor Score Risk Level
Quickly Resolve
Incidents
Maintain IT
Service
Quality
Improve IT
and Business
Productivity
Effectively
Resolve
Incidents
Cost
Savings
Service outages 0 3 0 2 3 High
Rework 3 0 3 2 3 High Waste 3 0 3 2 3 High
Delayed solutions 0 0 3 2 0 High
Slow operational processes 0 0 3 2 0 High
Security breaches 0 3 0 0 3 High
Slow turnaround times 0 0 0 2 0 Moderate
Unexpected costs 3 3 3 2 3 High
Higher or escalating costs 3 3 3 2 3 High
Slow response to business needs and
changes
3 0 3 2 3 High
Inability to scale 3 0 3 0 0 High
Fines and penalties 0 0 0 0 3 High
High levels of non-value labor 3 0 3 2 3 High
Loss of market share 0 3 3 2 3 High
Loss of revenue/sales 0 3 0 2 3 High

CHAPTER 5 ACTION RESEARCH CYCLE 1 (ARC1)
152
Table 5-39 Problem Management: Mapping of Outcome Risks to CSF Scores
Outcome Risk Item Critical Success Factor Risk Level
Minimize Impact of
Problems (Reduce
Incident
Frequency/Duration)
Reduce
Unplanned
Labor Spent
on Incidents
Improve
Quality of
Services
Being
Delivered
Effectively
Resolve
Problems
and Errors
Cost
Savings
Service outages 0 3 0 3 2 High
Rework 3 0 3 3 2 High
Waste 3 0 3 3 2 High
Delayed solutions 0 0 3 3 0 High
Slow operational processes 0 0 3 3 0 High
Security breaches 0 0 0 3 2 High
Slow turnaround times 3 0 0 3 0 High
Unexpected costs 3 3 3 3 2 High
Higher or escalating costs 3 3 3 3 2 High
Slow response to business needs and
changes
0 0 3 3 2 High
Inability to scale 3 0 3 0 0 High
Fines and penalties 0 0 0 0 2 Moderate
High levels of non-value labor 3 0 3 3 2 High
Loss of market share 0 3 3 3 2 High
Loss of revenue/sales 3 0 3 0 2 High

CHAPTER 5 ACTION RESEARCH CYCLE 1 (ARC1)
153
Table 5-40 Change Management: Mapping of Outcome Risks to CSF Scores
Outcome Risk Item Critical Success Factor Risk Level
Protect
Services when
Making
Changes
Make Changes
Quickly and
Accurately in
Line with
Business Needs
Make
Changes
Efficiently
and
Effectively
Utilize a
Repeatable
Process for
Handling
Changes
Cost
Savings
Service outages 0 3 0 3 2 High
Rework 3 0 3 3 2 High
Waste 3 0 3 3 2 High
Delayed solutions 0 0 3 3 0 High
Slow operational processes 0 0 3 3 0 High
Security breaches 0 0 0 3 2 High
Slow turnaround times 3 0 0 3 0 High
Unexpected costs 3 3 3 3 2 High
Higher or escalating costs 3 3 3 3 2 High
Slow response to business needs and changes 0 0 3 3 2 High
Inability to scale 3 0 3 0 0 High
Fines and penalties 0 0 0 0 2 Moderate
High levels of non-value labor 3 0 3 3 2 High
Loss of market share 0 3 3 3 2 High
Loss of revenue/sales 3 0 3 0 2 High

CHAPTER 5 ACTION RESEARCH CYCLE 1 (ARC1)
154
ITSMP2 Risk Level Scorecard
The researcher met with the three process managers at Company X, and the decision
was made to set the target risk threshold level at 2.0 or less (moderate or low risk) for
all performance dimensions of the ITSMP2. For each dimension of the ITSMP2, the
average score of the maximum Business Risk score associated with a dimension was
calculated are compared to the threshold to deduce the ITSMP2 Risk Level. If the Risk
Level Score was less than 1.0, the risk level was considered to be low, if less than 2.0
moderate, otherwise high. Table 5-41, Table 5-42 and Table 5-43 show the ITSMP2
Risk Level and scores derived from the average associated Business Risk score for
each of the three processes.
Table 5-41 Incident Management: ITSMP2 Risk Levels
ITSMP2 Performance
Dimension
Risk Level Score Risk Level
Operational 2.9 High
Customer Satisfaction 2.9 High
Productivity 2.9 High
Market 2.8 High
Financial 3.0 High
Table 5-42 Problem Management: ITSMP2 Risk Levels
ITSMP2 Performance Dimension Attainment Level Score Risk Level
Operational 3.0 High
Customer Satisfaction 3.0 High
Productivity 3.0 High
Market 2.8 High
Financial 2.9 High
Table 5-43 Change Management: ITSMP2 Risk Levels
ITSMP2 Performance Dimension Risk Level Score Risk Level
Operational 3.0 High
Customer Satisfaction 3.0 High
Productivity 3.0 High
Market 2.8 High
Financial 2.9 High

CHAPTER 5 ACTION RESEARCH CYCLE 1 (ARC1)
155
ITSMP2 Risk Level Scorecard
The ITSMP2 Risk Level scores in Table 5-41, Table 5-42 and Table 5-43 are
represented graphically to show their deviation from the target as shown in Figure 5-8,
Figure 5-9 and Figure 5-10. As a result of these outcomes, process improvement plans
were developed to improve processes.
Figure 5-8 ITSMP2 Risk Level Scorecard for Incident Management

CHAPTER 5 ACTION RESEARCH CYCLE 1 (ARC1)
156
Figure 5-9 ITSMP2 Risk Level Scorecard for Problem Management
Figure 5-10 ITSMP2 Risk Level Scorecard for Change Management

CHAPTER 5 ACTION RESEARCH CYCLE 1 (ARC1)
157
5.4 KISMET Phase 3: Plan process improvement action
This phase is the action part of the action research and served to specify actions the
organization needs to take to address the problems identified in the diagnose phase.
This phase seeks to provide a specific and tangible approach to trying out new ideas
in an attempt to solve the original problem(s). The researcher collaborated with
Company X practitioners to devise plans based on the results of the diagnosis to
improve processes.
The researcher met with the process managers in February 2016 to analyze the
challenges exposed by the process capability survey results and process performance
results to formulate improvement action plans.
The SMPA report and the outcome of the focus group workshop formed the basis of a
guide to the process improvement interviews. Semi-structured interviews/meetings
were conducted with the process managers from 22nd February 2016 to 29th February
2016. Participants were provided with an interview information sheet and a consent
form prior to the meetings (see Appendix B.3 and Appendix B.4). These meetings
were held in a conference room for about an hour per day for six days. Challenges
exposed by the process capability survey results were analyzed to formulate
improvement action plans. The reported SMPA recommendations were discussed and
actions proposed for the most applicable recommendations. The performance
assessment results were analyzed, and plans were made to improve high-risk areas.
5.4.1 Incident Management
An incident is an unplanned interruption to a service. An interruption to a service is a
reduction in quality below the agreed service levels. The purpose of Incident
Management is to restore service to the user. Incident Management can be measured
on the restoration of service (OGC 2007).
The primary goal of the Incident Management process is to restore normal service
operation as quickly as possible and minimize the adverse impact on business
operations, thus ensuring that the best possible levels of service quality and availability
are maintained.

CHAPTER 5 ACTION RESEARCH CYCLE 1 (ARC1)
158
The following activities of Incident Management were identified and immediate
potential improvements discussed.
Incident Case Creation
All communication (phone, email, instant messages) related to each incident should
be captured in a Case. Anything that is actionable should be a Case, including all
incidents and requests. All Cases should be logged into one system, for visibility,
history of interaction, knowledge base correlation and metrics.
Categorization of Incidents
A new redesigned Zendesk Case Form was developed. The purpose was to capture
key information such as requests vs. incidents, environment, and component. The
expected benefits were:
Reduced triage time (e.g., information needed to start investigations or process
requests are immediately available), and
Better metrics.
Prioritization of Incidents
A whiteboard session was organized by the researcher with Business Support and the
VP of Trading Operations to discuss Company X’s major incidents, the impact of them
and how to prioritize the incidents. A prioritization matrix was developed to establish
a hierarchy of elevation factors used to prioritize customer incidents and requests.
Figure 5-11 shows a photo taken of the whiteboard illustration around the discussion
of the following points:
Financial risk to customer;
Trading revenue;
Service criticality;
Number of customer organizations affected; and
The reputation of Company X.

CHAPTER 5 ACTION RESEARCH CYCLE 1 (ARC1)
159
Figure 5-11 Prioritization matrix (Photo by researcher)
Recommendations and Plan of Action for Incident Management Improvement
Appendix C.6 presents the SMPA process capability assessment report on
observations, recommendations, and comments entered by survey participants. Also
included are the actions planned for each item.
5.4.2 Problem Management
Problem Management, as defined by Company X, is the ongoing service concerned
with minimizing the impact of problems affecting the availability and services of the
service delivery environment, whilst minimizing expenditure of resource and
maintaining the highest level of client satisfaction.
The following activities and possible improvements of Problem Management were
discussed.

CHAPTER 5 ACTION RESEARCH CYCLE 1 (ARC1)
160
Problem Identification, Classification, and Prioritization
It was agreed by all participants of the meeting that in most cases problems were being
incorrectly identified. Incident Management performers were not linking incidents to
problems, and most major incidents were being identified as problems. Although
incidents were being resolved by the Service Desk, the root cause of the resolved
incidents was not being tracked to prevent re-occurrence of the incident. A comment
from the Incident Manager:
“Business Support tier 1 staff believe that incidents become problems, and so escalate
what they believe to be a major incident to tier 2 as problems”.
The following plan to improve problem identification, classification and prioritization
were discussed and agreed upon by all participants of the meeting:
To establish a clear definition of what is problem is for Company X;
The process of creating a bug for the problem in Jira, linking one or more
incidents to the bug and linking the SalesForce Case to the Zendesk ticket;
To create an escalation process for problems not meeting customer service
level agreements;
To create internal operational level agreements;
To establish a communication process to track the status and progress of the
resolution of problems;
To use the same classification scheme and prioritization matrix as Incident
Management.
Recommendations and Plan of Action for Problem Management Improvement
Appendix C.7 presents the SMPA process capability assessment report on
observations, recommendations, and comments entered by survey participants. Also
included are the actions planned for each item.
CHAPTER 5 ACTION RESEARCH CYCLE 1 (ARC1)
161
5.4.3 Change Management
According to ISO/IEC 20000-4, the purpose of the change management process to
ensure all changes are assessed, approved, implemented and reviewed in a controlled
manner (ISO/IEC 2010).
The expected outcomes of a successful implementation of the Change Management
process at Company X were discussed, and the following improvement plan was
devised:
• All change requests should be recorded and classified in Zendesk;
• Change requests should be assessed at a weekly meeting;
• Change requests are formally approved by a manager before changes are
developed and deployed;
• A schedule of changes and releases should be recorded in Zendesk and
communicated to interested parties;
• A checkout plan should be developed;
• A rollback plan should be in place.
A new Zendesk Case Form was designed to capture change requests. The purpose
was to capture key information such as listed above.
Recommendations and Plan of Action for Change Management Improvement
Appendix C.8 presents the SMPA process capability assessment report on
observations, recommendations, and comments entered by survey participants. Also
included are the actions planned for each item.
5.5 KISMET Phase 4: Design process improvement guidelines
The purpose of this phase is to define and document process roles and responsibilities,
actions, metrics, and relationships to other ITSM processes.
In this phase, the researcher in collaboration with process managers developed a
guideline for each process outlining the following items: definition of the main
objectives, key process terminology, the scope of the process, the definition of the

CHAPTER 5 ACTION RESEARCH CYCLE 1 (ARC1)
162
roles and responsibilities, process flow, escalation procedures, RACI charts, reporting
requirements and the process policy.
These guidelines were deployed to an Intranet site to communicate the plan. The site
was created using Google Sites as the platform. Appendix D.2, Appendix D.3, and
Appendix D.4 list these guidelines.
5.6 KISMET Phase 5: Execute the process improvement plan
Phase 3 of the Action Research cycle implements the planned action. This phase
involved active intervention by the researcher and process managers to ensure that the
plan was executed and changes were made. The intervention strategy involved both
directive intervention, where the researcher directed change, and non-directive where
the change was initiated indirectly.
The actor-network theory was further applied to enroll actors in the network of change.
Process managers tactfully enrolled key participants to enforce change, thus serving
as catalysts for change.
Although the KISMET model calls for deploying an ITSM process in this phase, the
researcher adapted this phase to implement improvement plans to an already deployed
ITSM process.
An email communication was sent to all participants on 3rd March 2016 detailing the
baseline findings and calling for action. Monthly schedule reports were generated by
the researcher in collaboration with staff responsible for Zendesk input, for each of the
three ITSM processes and for every KPI committed to by Company X.
5.6.1 Incident Management
Base Practices (Level 1)
Eight specific improvement actions were taken to improve base practices.
a) The incident logging workflow was reviewed periodically for improvement. Some
Zendesk fields were made mandatory, while others were deleted. New email groups
were created to facilitate the automation of Case updates to relevant parties. All

CHAPTER 5 ACTION RESEARCH CYCLE 1 (ARC1)
163
relevant parties to an Incident were added to the incident’s watch list for automated
updates. A new incident logging workflow diagram was created and communicated to
process performers.
b) A new mandatory field (Support Subtype) was added to the incident ticket form in
Zendesk on 15 May 2016. Incidents are now classified by component type. The aim
was to introduce an incident classification scheme to add visibility to identify software
components that cause the most incidents. This new classification type was
communicated to process performers and stakeholders on 1 June 2016. Figure 5-12
shows the number of incidents by subtype.
Figure 5-12 Number of Incidents by subtype for the period 16 May 2016 to 27
May 2016
c) Process managers conducted online training with staff on how to prioritize incidents
by walking through examples of historical incidents. A matrix to define the criteria for
each priority was developed and communicated. The impact/urgency matrix was also
made available to all process performers.
d) In collaboration with the Engineering, Operations and Quality Assurance groups,
process managers were tasked to scrutinize the number of incidents being logged.
Analysis of reports revealed that there were hundreds of internal alerts being
inappropriately categorized as incidents. As part of the DevOps initiative, engineers
are required to include automated alerts in critical paths of their code. When this code
path is executed, an alert is triggered that automatically notifies Operations and the

CHAPTER 5 ACTION RESEARCH CYCLE 1 (ARC1)
164
appropriate engineering component owner. The alert is categorized by component and
may be logged as an incident in Zendesk.
The following is an example of an alert inappropriately logged as a Case with an
incorrect component:
ERROR PROD ppfxiadp123 ERR0060: Trade ValueDate mismatch detected in
/CompanyX/logs/broker-adap-ISYAT/companyX.out.2015-12-30-07
This Zendesk Case was closed as [Grid Monitor/Value Date Issue] when in fact it
should have been marked as [Admin/Value Date Issue] and as an alert rather than a
Case.
Alerts could now be correctly categorized so that the metrics reported are accurate. A
repository of actions to take for each alert was set up in GoogleDocs™.
e) The incident resolution closure workflow was modified to fit the business and SLAs.
f) Process performers were trained to use an in-house developed online tool, FX
CloudWatch, to monitor the system health in real time. Figure 5-13 shows a screenshot
of the FX CloudWatch interface. FX CloudWatch collects business, application and
infrastructure data in real time, makes them easily accessible through a very clean user
interface so all data can be used together by staff and also notifies support desk when
something is not working correctly.
Figure 5-13 FX CloudWatch Interface
CHAPTER 5 ACTION RESEARCH CYCLE 1 (ARC1)
165
Features of the FX CloudWatch Interface include:
1. System-wide visibility of all applications running in any environment
(UAT/Production);
2. Single click monitoring of any server, service or component in the system;
3. Shows real-time grid-wide aggregated updates of rates, trades, customers and
providers in the bullet graph;
4. Access months of historical business, system and infrastructure data;
5. Interactive rich graphing;
6. Advanced alerting system to trigger notifications of anomalies;
7. Integrated release checkout process; and
8. Integrated Capacity Planning Tool and FX LogViewer to this portal.
g) A knowledgebase was not explicitly created, but the search functionality of Zendesk
and Jira was reviewed and communicated to process performers.
h) The improvement actions called for improved collaboration between DevOps and
process performers.
Generic Practices (Levels 2 to 3)
Four specific actions across PA 2.1 Performance Management, PA 3.1 Process
Definition, and PA 3.2 Process Deployment were undertaken to improve the generic
practices of Incident Management.
CL2 – PA 2.1 Performance Management
a) The scope of the Incident Management KPIs was defined and all stakeholders in the
process informed of the scope. The assumptions and constraints were considered while
identifying Incident Management KPIs so that the resultant KPIs were specific,
measurable, achievable, relevant and timely (S.M.A.R.T.). Tracking dashboards were
created in Zendesk and made available to all stakeholders. Figure 5-14 shows an
example of the dashboard for Incident Management.

CHAPTER 5 ACTION RESEARCH CYCLE 1 (ARC1)
166
Figure 5-14 Incident Management Dashboard (May-Oct 2015)
CL3 – PA 3.1 Process Definition
b) The standard Incident Management process workflow was modified to address
interfaces with other processes. These visible interfaces were defined in the process
workflow to maintain integrity with the related processes. The Incident Management
process workflow is illustrated in Figure 5-15 (below).
Figure 5-15 Incident Management Process Workflow

CHAPTER 5 ACTION RESEARCH CYCLE 1 (ARC1)
167
CL3 – PA 3.2 Process Deployment
c) The competencies of Incident Management staff were ascertained to determine if
they are adequate to perform Incident Management activities. Training was provided
to support staff.
d) The analysis of appropriate data regarding implementation of the Incident
Management process was conducted to provide a basis for understanding the behavior
of the process and its compliance with the standard Incident Management process.
This, in turn, contributed to the ongoing improvement of the implemented process and
the standard Incident Management process upon which the implemented process is
based.
5.6.2 Problem Management
Base Practices (Level 1)
Three action items were undertaken to improve the base practices of Problem
Management.
a) Problem identification was modified to include:
detection of an unknown root cause of one or more incidents;
the analysis of one or more incidents revealing an underlying problem;
a notification from an internal group of a problem with a component of the
service.
b) The problem records include relevant details of the problem, including the date and
time, and a cross-reference to the incident(s) that initiated the problem record. Jira has
a linked Case field that clearly indicates the incident(s) that caused the problem.
c) Problem classification and prioritization ensure that:

CHAPTER 5 ACTION RESEARCH CYCLE 1 (ARC1)
168
each problem is categorized to help determine its nature and to provide
meaningful information, making use of the same classification criteria that are
used in the incident and service request management process;
each problem is given priority for resolution according to its urgency and the
impact of related incidents;
time and resources for investigating the problem and identifying the best
options for resolution are allocated according to the priority of the problem;
the resolution of the problem is allocated time and resources according to the
priority of the problem and the benefit of making the change in order to fulfill
service requirements.
Generic Practices (Levels 2 to 3)
Four generic practice recommendations were implemented.
CL2 – PA 2.1 Performance Management
a) The objectives of Problem Management KPIs were identified based on the business
goals of the process and customer requirements for the service that uses Problem
Management process. The objectives of Problem Management KPIs define deadlines,
constraints, and targets to achieve for a process in regards to quality, process cycle
time or resource usage.
b) The scope of the Problem Management KPIs was defined and all stakeholders in
the process informed of the scope.
c) The assumptions and constraints were considered while identifying Problem
Management KPIs so that the resultant KPIs are specific, measurable, achievable,
relevant and timely (S.M.A.R.T.).
d) The activities of Problem Management are driven by the identified performance
targets so that the Problem Management could be monitored against the plans. Process
performance KPIs were established.
CHAPTER 5 ACTION RESEARCH CYCLE 1 (ARC1)
169
5.6.3 Change Management
One generic practice recommendation and two Performance Management
recommendations were implemented for Change Management.
Base Practices (Level 1)
Company X schedules major changes for patch releases on a 2 weekly cycle.
Generic Practices (Levels 2 to 3)
CL2 – PA 2.1 Performance Management
a) The objectives of Change Management KPIs were identified based on the business
goals of the process and customer requirements for the service that uses Change
Management process. The objectives of Change Management KPIs define deadlines,
constraints, and targets to achieve for a process in regards to quality, process cycle
time or resource usage.
b) The scope of the Change Management KPIs was defined and all stakeholders in the
process informed of the scope. The KPIs defined are specific, measurable, achievable,
relevant and timely (S.M.A.R.T.).
It was found during the focus group workshop that the activities and tasks of Change
Management are not clearly defined for staff to perform them effectively. The Change
Management guideline was reviewed and modified by the Change Management
process managers and emailed to all Change Management process performers.
5.7 KISMET Phase 6: Evaluate process improvement
The “evaluate process improvement” step of the KISMET model involves collecting
feedback regarding an improved process, tools, and training, and conducting fine-
tuning if applicable (Suhonen et al. 2013). The evaluate action phase served to review
and reflect on the improvement programs implemented and to evaluate the outcomes
of the process improvement programs. The aim was to identify changes in each of the
three ITSM process improvement areas, the effect on the processes, as well as the
challenges that occurred during implementation of the changes, and to make
suggestions for improvement. Detailed observation, monitoring, and recording

CHAPTER 5 ACTION RESEARCH CYCLE 1 (ARC1)
170
enabled the researcher to assess the effect of the action or intervention and hence the
effectiveness of the proposed change. In addition to the planned observations,
additional observations and insights were recorded in a journal on a regular basis.
5.7.1 Incident Management
Base Practices (Level 1)
The addition of the new Zendesk ticket field (Support Subtype) helped identify
common customer issues and most problematic software components. Incident Case
analysis of the top ten customers (with respect to revenue) helped reveal software and
process deficiencies.
The following are examples of incident Case analyses for the period June 2015 to July
2015 for two of the top ten customers.
Customer A
An analysis of incidents for Customer A over the period of June and July 2015, showed
that the top 86 percent of issues for Customer A was related to Rates, the Admin Portal
application, Orders and Connectivity issues. Figure 5-16 shows the breakdown of
incident subtypes for Customer A.

CHAPTER 5 ACTION RESEARCH CYCLE 1 (ARC1)
171
Figure 5-16 Breakdown of Incident Subtype for Customer A
A further breakdown of the number of incidents by component showed the problem
areas with more granularity, as illustrated in Figure 5-17.
Figure 5-17 Top 50% of Customer A tickets
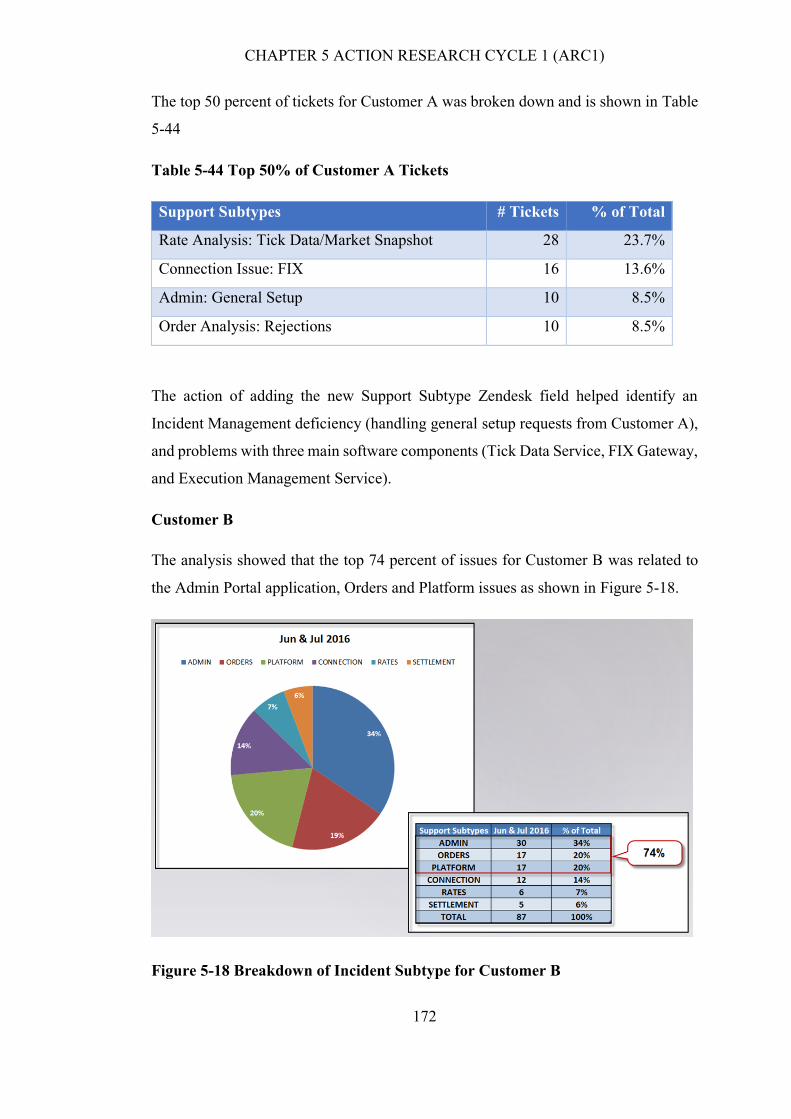
CHAPTER 5 ACTION RESEARCH CYCLE 1 (ARC1)
172
The top 50 percent of tickets for Customer A was broken down and is shown in Table
5-44
Table 5-44 Top 50% of Customer A Tickets
Support Subtypes # Tickets % of Total
Rate Analysis: Tick Data/Market Snapshot 28 23.7%
Connection Issue: FIX 16 13.6%
Admin: General Setup 10 8.5%
Order Analysis: Rejections 10 8.5%
The action of adding the new Support Subtype Zendesk field helped identify an
Incident Management deficiency (handling general setup requests from Customer A),
and problems with three main software components (Tick Data Service, FIX Gateway,
and Execution Management Service).
Customer B
The analysis showed that the top 74 percent of issues for Customer B was related to
the Admin Portal application, Orders and Platform issues as shown in Figure 5-18.
Figure 5-18 Breakdown of Incident Subtype for Customer B

CHAPTER 5 ACTION RESEARCH CYCLE 1 (ARC1)
173
A further breakdown by Support Subtype showed the problem areas with more
granularity (see Figure 5-19).
Figure 5-19 Top 50% of Customer B tickets
The top 50 percent of tickets for Customer B was broken down and is shown in Table
5-45.
Table 5-45 Top 50% of Customer B Tickets
Support Subtypes # Tickets % of Total
Admin: General Setup 9 10.3%
Admin: Users 9 10.3%
Platform: Functionality 9 10.3%
Connection: GUI 8 9.2%
Order Analysis: General Inquiry 8 9.2%

CHAPTER 5 ACTION RESEARCH CYCLE 1 (ARC1)
174
By adding the Support Subtype Zendesk field, Company X was able to detect three
areas of Incident Management deficiency (handling Customer B’s general setup issues,
provisioning of users, and general order analysis inquiries), and problems with two
software components (Trading Application and the Platform Infrastructure).
An analysis on a case by case basis was conducted for the Support Subtypes that made
up the top 50 percent of issues.
The analysis revealed the following areas that required action:
Password resets;
Trading application user permissions;
Access to IP restrictions for White Labelled customers;
Tickets not properly showing “Cancelled” status; and
Inquiries about the source of Order Cancellations.
The work performed to reclassify alerts helped reduce the number of incidents reported
month over month and provided more accurate metrics for reporting.
The graph in Figure 5-20 shows the decline in the number of incidents month-over-
month for the assessment period.
Figure 5-20 Total Number of Incidents per Month (May-Oct 2015)
Although the action plan called for the adherence to the impact/urgency matrix, an
evaluation revealed that this was not followed by all process performers.
CHAPTER 5 ACTION RESEARCH CYCLE 1 (ARC1)
175
After randomly selecting a few Zendesk Cases for analysis, it became apparent that
inappropriate priority was set for a high number of Cases without following the
guidelines to use urgency and impact to prioritize Cases. Most of these Cases were
logged by the Trading Solutions business unit, who are closest to customers and
naturally escalated the priority based on their relationships with customers.
The adoption of DevOps by the IT organization created a sense of collaboration
amongst staff and helped to proactively monitor for potential incidents. Only alerts
that had an external impact (customer exposed) were being logged as incidents in
Zendesk, while internal alerts were being logged as Jira bugs for further engineering
and operations analysis.
Generic Practices (Levels 2 and 3)
The Incident Management KPIs were evaluated for accuracy and relevance by
analyzing how the reporting criteria in Zendesk derived them from operational metrics.
The KPIs were considered by the process managers to be accurate and relevant.
5.7.2 Problem Management
Base Practices (Level 1)
After evaluating the changes to the Problem Management process, it was evident that
incident identification included:
detection of an unknown root cause of one or more incidents;
the analysis of one or more incidents revealing an underlying problem; and
a notification from an internal group of a problem with a component of the
service.
The problem records included relevant details of the problem, including the date and
time, and a cross-reference to the incident(s) that initiated the problem record. The
linking of Jira and Zendesk clearly identified the problems that were causing incidents.
By using the same classification criteria that are used in the incident and service
request management process, each problem was categorized appropriately with
CHAPTER 5 ACTION RESEARCH CYCLE 1 (ARC1)
176
detailed information for problem diagnosis. Problems were in most part prioritized
correctly according to urgency and impact of related incidents. The time and resources
for investigating problems were appropriately allocated based on the priority of the
problems.
Generic Practices (Levels 2 and 3)
The activities of Problem Management are driven by the identified performance targets
so that the Problem Management can now be monitored against the plans. Process
performance KPIs are now established.
5.7.3 Change Management
Base Practices (Level 1)
Major changes were scheduled for patch releases every two weeks instead of the four-
week release cycle.
Generic Practices (Levels 2 and 3)
The objectives of Change Management KPIs were identified based on the business
goals of the process and customer requirements for the service that uses Change
Management process. The objectives of Change Management KPIs define deadlines,
constraints, and targets to achieve the process in regards to quality, process cycle time
or resource usage.
The scope of the Change Management KPIs was defined and all stakeholders in the
process informed of the scope. The KPIs defined are specific, measurable, achievable,
relevant and timely (S.M.A.R.T.).
It was concluded that the activities and tasks of Change Management are not clearly
defined for staff to perform them effectively.
5.8 Kismet Phase 7 – Continual Process Improvement
This activity of the KISMET model included the following steps: conduct process
reviews frequently, identify and report process improvement ideas, and plan and
implement improvement actions (Suhonen et al. 2013).

CHAPTER 5 ACTION RESEARCH CYCLE 1 (ARC1)
177
Process reviews were diligently conducted on a regular basis. Ad-hoc reviews initiated
by the financial market events were also conducted through researcher intervention.
The planned reviews served as a checkpoint through the phases of the cycle, to
determine how Company X was performing and whether an intervention was required.
Although service improvement ideas and actions were identified by various
participants at different points in time, these ideas were never formally documented.
These ideas were expressed in the review meetings and tracked by email as minutes of
the meeting. Upon reflection, the researcher believes that these ideas and opportunities
should have been recorded in a Continuous Service Improvement (CSI) register for
evaluation and possible implementation. A CSI register is a database or structured
document used to log and manage improvement opportunities throughout their
lifecycle (Cabinet Office, 2011).
As explained in §3.5.2 the next phase of the Action Research cycle is Reflect.
However, the researcher realized that it is not only imperative to reflect at the end of a
given cycle; effective action researchers reflect on and critically scrutinize their
practice during the process of research (Baskerville 1999).
5.8.1 Process Capability
As shown in Table 5-46, the majority of the rating scores at Company X demonstrated
a very strong reliability score (12 High; one Moderate and two Poor reliability scores).
This meant that survey respondents predominantly agreed on their ratings.

CHAPTER 5 ACTION RESEARCH CYCLE 1 (ARC1)
178
Table 5-46 Process Assessment Reliability Scores
Level 1 Level 2 Level 3
Profile Process
Performance
Performance
Management
Work Product
Management
Process Definition Process Deployment
Incident Management
Score
Reliability
High High High High High
Problem Management
Score
Reliability
High Poor High High Moderate
Change Management
Score
Reliability
High High High High Poor

CHAPTER 5 ACTION RESEARCH CYCLE 1 (ARC1)
179
As discussed in §5.2.2.1, a focus group discussion was held at Company X with senior
staff to discuss the results of the SMPA assessment. The results for Problem and
Change Management were deemed inconsistent with the views held by the focus group
participants about the capability of these processes. However, the results for Incident
Management were in line with Company X expectations. After some probing
questions, the researcher discovered that five different business units were performing
the three assessed processes. Two of the business units are based at Company X’s head
office, while the other three business units are located in different countries. The focus
group discussed how the SMPA process capability assessment report results might
have been influenced by the specific characteristics of the five groups of staff.
Although all business units use the same process management tool (Zendesk), each
unit follows its own set of procedures and workflows. Only two business units,
Business Support, and Operations follow the same procedures and workflows.
Table 5-47 shows the distribution of the number of participants by organization
business unit per process assessed.
Table 5-47 Distribution of the number of participants by organization business
unit per process assessed
Organization
Business Unit
Change
Management
Incident
Management
Problem
Management
Geographic
Region
Business Support 3 9 3 US, UK,
Singapore
Operations 12 12 0 US, India
Trading Solutions 19 0 0 US, UK,
Singapore,
India
Execution Services 7 1 1 US
Engineering 0 0 14 US, India
Stakeholders 4 4 3 US
The Executive Management at Company X was very aware that Change Management
is the most immature process and it frequently causes financial loss and customer
dissatisfaction. It was surprising that the survey results gave Change Management a

CHAPTER 5 ACTION RESEARCH CYCLE 1 (ARC1)
180
rating score of Largely for all five process attributes, with a high reliability score for
all the process attributes except for PA3.2 (Process Deployment) which scored Poor
reliability.
Feedback after the assessment revealed that some of the participants were allocated
three surveys and they were unsure if they were responding on behalf of their business
unit or the entire organization. One of the participants mentioned that because some of
the questions seemed to be the same, he provided the same response without thinking
about it – so one can question the reliability in this case. Here is an example of two
similar questions: Do you know if requests for change (RFCs) are assessed to identify
new or changed information security risks? and Do you know if requests for change
(RFCs) are assessed to identify potential impact on the existing information security
policy and controls?
The same respondent explained that if he had printed all the questions, he would have
had a better understanding of what was being assessed and some questions may have
helped him understand others.
When processes are performed by multiple business units within an organization, each
unit may have a very different perspective on its process capability, especially if there
is no consistency in the procedures and workflows followed. This may result in
disparate results when assessing the organization as a whole. The focus group
members expressed the view that capability level 1 for Change Management may not
be accurate, as the largest business unit (Trading Solutions) may have biased the result
by being overly positive in their responses. The focus group members suggested that
overall PA1.1 (Process Performance) was only Partially attained. Similar views were
expressed for Problem Management, where the Engineering unit made up the largest
response group, and this may have influenced the results of this process.
5.8.2 Process Performance
The process performance data collected over the assessment period of 1 May 2015 to
31 October 2015 exhibited anomalies and required further analysis. Charts were
generated from Zendesk to enable visual analysis of trends. A deeper analysis was
conducted to explore possible causes of the peaks and troughs charted.

CHAPTER 5 ACTION RESEARCH CYCLE 1 (ARC1)
181
The number of incidents logged in Zendesk increased for the Business Support Level
1 unit for the months of May, June and July 2015, and then dropped in August and
stabilized over the following 3 months, while the Operations unit saw a significant
decrease in the number of incidents after May 2015. Figure 5-21 shows the number of
incidents per business unit over the assessment period.
Figure 5-21 Seasonality of Number of Incidents per Business Unit
Breaking down the number of Business Support Level 1 incidents created per day for
the months of June and July showed a spike on 28 June 2015 (see Figure 5-22).

CHAPTER 5 ACTION RESEARCH CYCLE 1 (ARC1)
182
Figure 5-22 Breakdown of the number of Business Support Level 1 incidents
Further analysis of this spike for this day revealed that the malfunction of the service
component Trading UI caused the most incidents (see Figure 5-23).

CHAPTER 5 ACTION RESEARCH CYCLE 1 (ARC1)
183
Figure 5-23 Breakdown by Service Component for 28 June 2015
The Trading UI Client is the trading application that customers use to interact with the
rest of the system. It is the User Interface into the Cloud service provided by Company
X. Deeper analysis revealed that a major update to the Cloud software was deployed
to Production by Company X on 28 June 2015 and the system went live the Sunday
28 June 2015.
The discovery of this event led to the historical analysis of operational metrics around
major software release dates at Company X. It was found that the number of incidents,
problems, and changes spiked soon after a major software release. Figure 5-24
historically charts the number of incidents, problems, and changes when major
software was released (highlighted).

CHAPTER 5 ACTION RESEARCH CYCLE 1 (ARC1)
184
Figure 5-24 Number of Incidents, Problems, and Changes around Major
Software Releases (Mar 2014-Oct 2015)
The analysis of the number of incidents, problems and changes identified a trough for
August and unveiled a seasonal influence. A historical trading volume report generated
by Company X’s internal analytics tool revealed that trading volume to Company X
decreased from July to August year over year from 2012. Further analysis unveiled the
fact that European FX traders usually take summer holidays at this time, thus the lower
trading volume. The decrease in the number of incidents reported for August may be
attributed to this. Figure 5-25 shows the trading volume trend month-by-month year-
over-year without the actual dollar amounts on the Y axis to preserve the anonymity
of Company X.

CHAPTER 5 ACTION RESEARCH CYCLE 1 (ARC1)
185
Figure 5-25 Seasonal Influence on Trading volume (May-Oct; 2012-2015)
5.8.3 Market Events
On 15 January 2015, the Swiss National Bank (SNB) abandoned a cap limiting the
value of the Swiss franc against the Euro sending the EUR/CHF to a record low. This
unexpected event sent shock waves through the financial markets. The Swiss franc
rocketed past the euro overnight causing chaos across the currency markets
(see Figure 5-26).

CHAPTER 5 ACTION RESEARCH CYCLE 1 (ARC1)
186
Figure 5-26 Chart of EUR/CHF (Popplewell 2015)
The event wiped out many small-scale investors and the brokerages that cater to them
and forced regulators to take a closer look at the sector. Some major banks also
suffered losses when the SNB scrapped its three-year-old cap on the franc against the
euro. The shutting down of retail brokerages added pressure on other market players,
taking on more volume and risk associated with it.
This event caused the trading volume for Company X to surge to its all-time high in
its 20+ years of existence. This event caused two major issues for multiple customers.
Table 5-48 lists the events of Issue A while Table 5-49 lists the events of Issue B.

CHAPTER 5 ACTION RESEARCH CYCLE 1 (ARC1)
187
Table 5-48 Events of Issue A for 15 January 2015
Issue A
Time (GMT) 09:31 – 09:54 GMT and 22:05 – 22:26 GMT
Server(s)
Affected
All
09:30 Swiss National Bank (SNB) announced the end of the
three-year-old cap for Swiss franc against Euro.
09:30 High volatility observed across all CHF crosses
following the SNB announcement.
09:31 Company X Rate Filters for liquidity providers took
effect and filtered the CHF prices as they breached the filter
threshold. Customers stopped receiving prices in CHF crosses.
09:54 Company X’s Support team modified the rate filters for
CHF crosses to allow trading to resume.
22:05 Another movement across CHF crosses observed.
Company X’s rate filters took effect and filtered the CHF
prices as they breached the filter threshold. Customers stopped
receiving prices in CHF crosses.
22:05 Customers continued to submit Market orders to
Company X’s system.
22:26 Company X’s Support team modified the rate filters for
CHF crosses to allow trading to resume.
Root Cause This is a similar occurrence of the event which happened on
December 17 for EUR/NOK where customers submitted
market orders to Company X system when Company X’s price
feed did not have active rates.
Company X rate filters have been configured to safeguard
against any off-market spikes in currency pairs, and the system
behaved as expected during the CHF news announcement.
This behavior and the recommended change to customer
applications was already communicated to customers by
Company X’s Sales and Account management team.
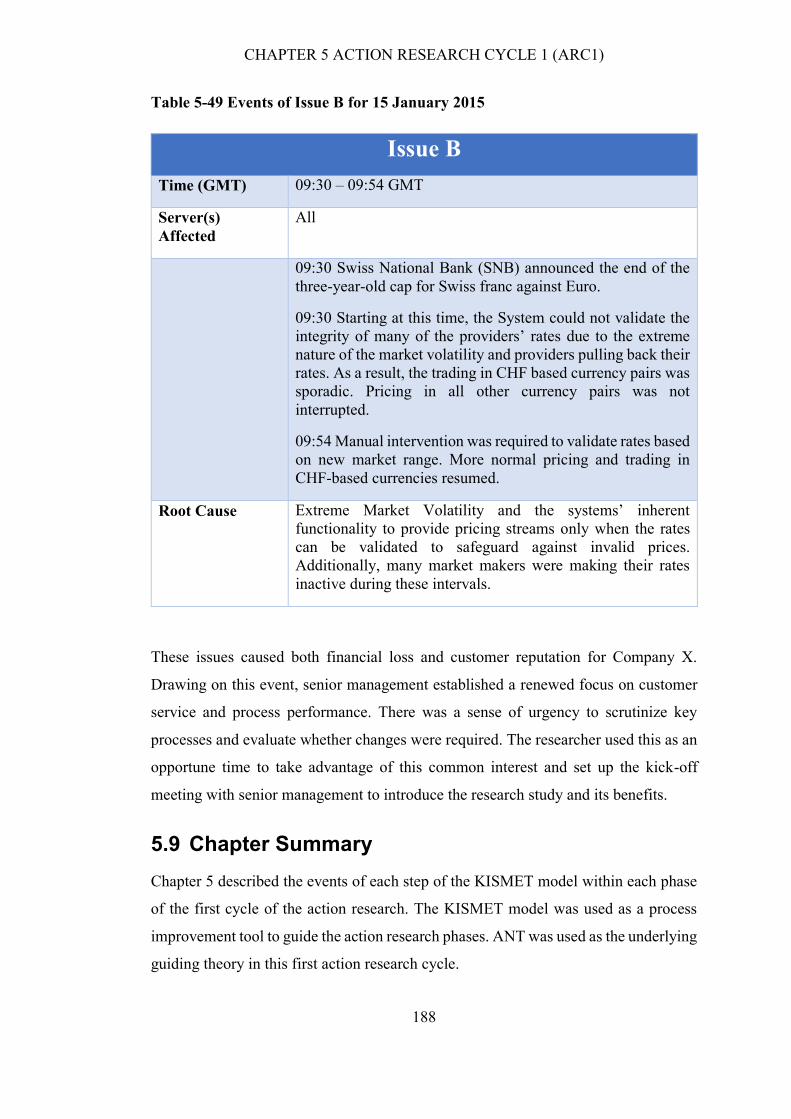
CHAPTER 5 ACTION RESEARCH CYCLE 1 (ARC1)
188
Table 5-49 Events of Issue B for 15 January 2015
Issue B
Time (GMT) 09:30 – 09:54 GMT
Server(s)
Affected
All
09:30 Swiss National Bank (SNB) announced the end of the
three-year-old cap for Swiss franc against Euro.
09:30 Starting at this time, the System could not validate the
integrity of many of the providers’ rates due to the extreme
nature of the market volatility and providers pulling back their
rates. As a result, the trading in CHF based currency pairs was
sporadic. Pricing in all other currency pairs was not
interrupted.
09:54 Manual intervention was required to validate rates based
on new market range. More normal pricing and trading in
CHF-based currencies resumed.
Root Cause Extreme Market Volatility and the systems’ inherent
functionality to provide pricing streams only when the rates
can be validated to safeguard against invalid prices.
Additionally, many market makers were making their rates
inactive during these intervals.
These issues caused both financial loss and customer reputation for Company X.
Drawing on this event, senior management established a renewed focus on customer
service and process performance. There was a sense of urgency to scrutinize key
processes and evaluate whether changes were required. The researcher used this as an
opportune time to take advantage of this common interest and set up the kick-off
meeting with senior management to introduce the research study and its benefits.
5.9 Chapter Summary
Chapter 5 described the events of each step of the KISMET model within each phase
of the first cycle of the action research. The KISMET model was used as a process
improvement tool to guide the action research phases. ANT was used as the underlying
guiding theory in this first action research cycle.

CHAPTER 5 ACTION RESEARCH CYCLE 1 (ARC1)
189
The Diagnose phase detailed the activities involved in setting up of the process
improvement infrastructure at Company X. The process capability assessment survey,
the performance assessment, and the financial measurement were conducted in this
phase. A focus group workshop was conducted to assess the SMPA tool, discuss the
findings of the process capability assessment report, and to triangulate the data
reported. This phase also operationalized the Behari ITSM Measurement Model
described in Chapter 3.
The Plan phase used the output of the Diagnose phase to detail the process
improvement activities. Meetings were conducted with key stakeholders to formulate
and document action plans for each ITSM process.
The Take Action phase served to deploy the documented plan from the Plan phase.
This phase involved active intervention by the researcher, to ensure that the process
improvement plans were being followed, and to make adjustments as deemed
necessary. Principles from ANT were used in this phase to build the network of actors.
The Evaluate Action phase served to review and reflect on the improvement program
implemented in the previous phase and to evaluate the outcomes of the process
improvement program.
The Reflect phase involved reflection of all the previous phases of the first cycle of
the action research.
The process capability, process performance, and financial performance results of
cycle 1 provided the benchmark data required to measure against the results of cycle
2. The outcome of cycle 1 forms the basis to answering RQ1. “How can the
association of ITSM process capability and process performance with financial
performance of an organization be determined?”
The application of the KISMET phases with the active intervention of the researcher
demonstrated how the ITSM measurement framework can be effectively applied for
CSI, thus contributing to RQ2. How can the ITSM measurement framework be
demonstrated for CSI?

CHAPTER 5 ACTION RESEARCH CYCLE 1 (ARC1)
190
Through cycle 1 the researcher realized that it is not only imperative to reflect at the
end of a given cycle; effective action researchers reflect on and critically scrutinize
their practice during the process of research (Baskerville, 1999). This led to the
redesign of cycle 2 by incorporating Reflection into every phase of KISMET

CHAPTER 6 ACTION RESEARCH - CYCLE 2 (ARC2)
191
CHAPTER 6 ACTION RESEARCH - CYCLE 2 (ARC2)
6.1 Introduction
Chapter 5 presented the first cycle of the action research study using the KISMET
model as a guide. This chapter aims to describe the events of the second cycle of the
action research. Chapter 6 comprises nine main sections. Section 6.1 introduces the
chapter. Section 6.2 details the activities of the first phase (Create a process
improvement infrastructure) of the KISMET model. Section 6.3 walks through the
second phase Assess process capability and performance, followed by section 6.4 Plan
process improvement action, and section 6.5 the Design process improvement
guidelines phase of KISMET. Section 6.6 details the activities of Execute the process
improvement plan followed by section 6.7 Evaluate process improvement and section
6.8 Continual process improvement. Finally, section 6.9 summarizes this chapter.
Figure 6-1 shows an overview of chapter 6.

CHAPTER 6 ACTION RESEARCH - CYCLE 2 (ARC2)
192
Figure 6-1 Overview of Chapter 6
The timeline of activities for the second action research cycle is presented in Figure
6-2.

CHAPTER 6 ACTION RESEARCH - CYCLE 2 (ARC2)
193
Figure 6-2 Action Research Cycle 2 Timeline

CHAPTER 6 ACTION RESEARCH - CYCLE 2 (ARC2)
194
6.2 KISMET Phase 1: Create a process improvement infrastructure
The diagnose phase of this second cycle of the action research focused on measuring
process capability, process performance and financial costs for the period 1 May 2016
to 31 October 2016, 12 months after the initial assessment. The measurement model
presented in chapter 4 was applied, and the results from this cycle are compared with
the results of cycle 1 (chapter 5).
Sixty-five assessment participants were identified by the process facilitator and
process managers and selected from each of the following six business units at
Company X: Business Support, Operations, Trading Solutions, Execution Services,
Engineering, and Program Management.
Several assessment participants were involved in multiple processes. The number of
participants in each business unit and process, as well as their geographical dispersion,
are listed in Table 6-1.
Table 6-1 Number of participants across business units, processes, and
geographic region
Organization
Business Unit
Change
Management
Incident
Management
Problem
Management
Geographic
Region
Business Support 3 9 2 US, UK,
Singapore
Operations 15 15 4 US, India
Trading Solutions 15 1 2 US, UK,
Singapore,
India
Execution Services 7 1 2 US
Engineering 2 2 13 US, India
Program
Management
4 3 4 US
Total 46 31 27

CHAPTER 6 ACTION RESEARCH - CYCLE 2 (ARC2)
195
Process managers and the VP of Operations reviewed the CSFs that were defined in
cycle 1. It was agreed that the CSFs identified in ARC1 (Table 5.2) were still
applicable to Company X’s goals.
6.2.1 Reflection on creating a process improvement infrastructure
The reflection of process capability and specifically the reliability scores for Change
Management in §5.8.1 revealed that work procedures and workflows needed to be
consistent across business units irrespective of the unit’s geographical location. The
Trading Solutions business unit was identified in cycle 1 as an integral part of the
engineering function of Company X. To improve the assessment reliability in cycle 2,
the researcher recommended a change to the organization structure to relocate the
Trading Solutions business unit from Sales to Engineering at Company X. From
January 2016 the Trading Solutions unit was transferred to the Engineering business
unit. Figure 6-3 shows the organizational chart for Company X after the transfer of the
Trading Solutions unit.

CHAPTER 6 ACTION RESEARCH - CYCLE 2 (ARC2)
196
Figure 6-3 Change to organizational structure

CHAPTER 6 ACTION RESEARCH - CYCLE 2 (ARC2)
197
Most participants from the first assessment were selected for the second round.
However, some participants played different roles in different processes in cycle 2.
Two participants from assessment one had left the company, and ten new participants
were identified for this round of assessment.
6.3 KISMET Phase 2: Assess process capability and performance
6.3.1 Process Capability Assessment
SMPA Surveys
Prior to the commencement of the assessment, the researcher contacted all survey 1
participants by email on 11 October 2016, to communicate the process capability
results of assessment 1 (see Appendix C.5). To commence the assessment, the
researcher contacted selected participants by email on 17 October 2016 (see Appendix
E.1). The email described the research project, explained the details of participant’s
involvement and advised to expect an email from the survey portal. An auto-generated
survey invitation email was sent to all participants (see Appendix E.2). On 27 October
2016, an automated email was sent from the SMPA tool to remind participants to
complete the surveys by the 7 November 2016 deadline (see Appendix E.3). The
survey deadline was extended to 14 November 2016 and advised to all participants.
All surveys were completed by the revised deadline, and the assessment report was
generated. An email was sent to all participants on 10 January 2017 to thank them for
their participation (Appendix E.4).
The report stated that all three processes were rated at capability level 1, indicating
that the process activities are performed.
Table 6-2 shows a summary of the process capability results for the second assessment.
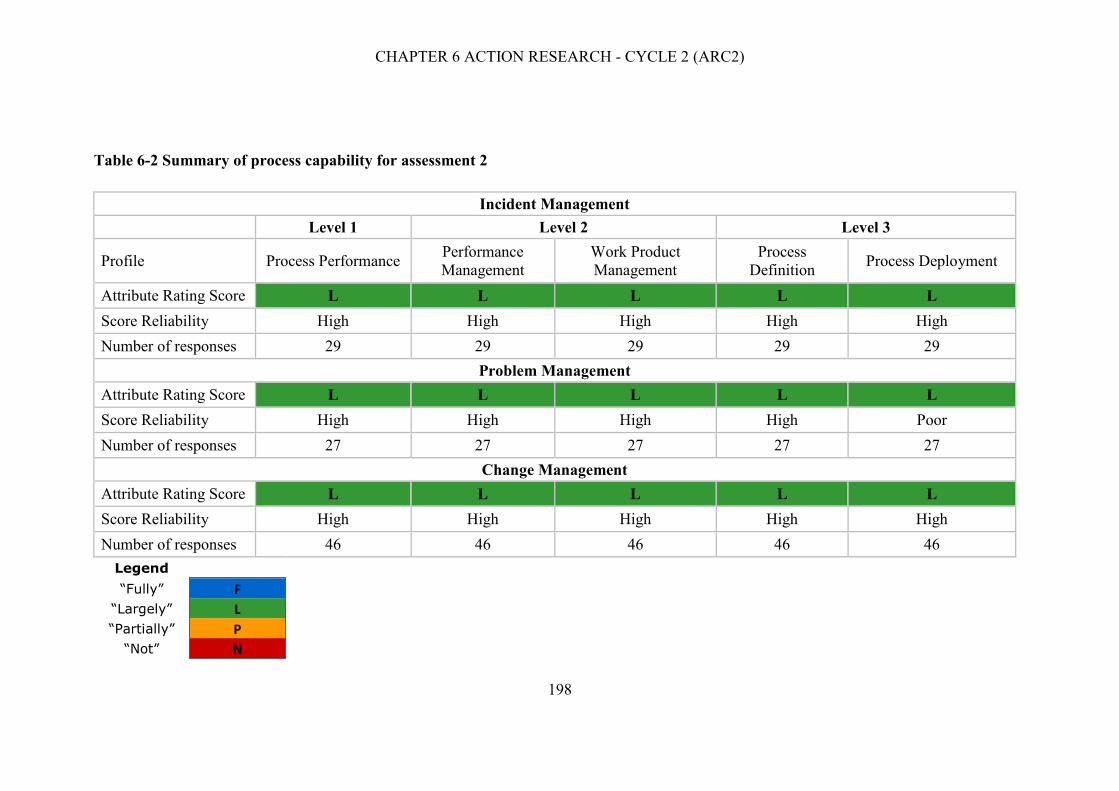
CHAPTER 6 ACTION RESEARCH - CYCLE 2 (ARC2)
198
Table 6-2 Summary of process capability for assessment 2
Incident Management
Level 1 Level 2 Level 3
Profile Process Performance Performance
Management
Work Product
Management
Process
Definition Process Deployment
Attribute Rating Score L L L L L
Score Reliability High High High High High
Number of responses 29 29 29 29 29
Problem Management
Attribute Rating Score L L L L L
Score Reliability High High High High Poor
Number of responses 27 27 27 27 27
Change Management
Attribute Rating Score L L L L L
Score Reliability High High High High High
Number of responses 46 46 46 46 46
Legend
“Fully” F
“Largely” L
“Partially” P
“Not” N

CHAPTER 6 ACTION RESEARCH - CYCLE 2 (ARC2)
199
The generated assessment profile for Incident Management considered 81 percent of
assessment survey responses as valid answers as 19 percent of respondents selected
the Do not know option. Problem management had 90 percent valid assessment survey
responses. All participants understood the questions with 10 percent choosing the Do
not know option. Eighty percent of assessment survey responses were considered in
generating the assessment profile for Change Management. The Do not know option
was selected by 20 percent of participants while less than 1 percent did not understand
the question. Two of the 31 invited participants for the Incident Management survey
did not attempt the survey, while all invited participants for Problem Management and
Change Management completed their respective surveys.
The comparison of the assessment results for all three processes is detailed in §6.2.2.2.
Focus Group Workshop
The researcher facilitated a focus group workshop at Company X on 21 March 2017.
The workshop was held to enable group level discussion to evaluate the SMPA tool
and discuss and refine the process capability assessment report results. A cross-section
of survey participants was selected to participate in the focus group. The participant
breakdown and coding are shown in Table 6-3.
Table 6-3 Coded participant breakdown
ITSM Process Process
Manager
Process
Performer
Process
Stakeholder
Incident Management IMPM2 IMPP1 IMPS2
Problem Management PMPM1 PMPP1 IMPS2
Change Management CMPM1 CMPP2 IMPS2
An invitation email was sent to seven participants to outline the purpose of the focus
group and provide the Participant Information Sheet and Consent Form as attachments
(see Appendix A.1, Appendix B.5, and Appendix B.6). The focus group participants
signed the consent forms before proceeding. The meeting was video and audio
CHAPTER 6 ACTION RESEARCH - CYCLE 2 (ARC2)
200
recorded with the facilitator taking notes as necessary. The meeting took about one
hour.
The researcher conducted the workshop with seven participants representing the six
business units to discuss the process capability results and triangulate the data. The
focus group reviewed the comments entered in the surveys for specific details of
perceptions of process challenges.
SMPA Tool Evaluation
An evaluation of the SMPA tool, using the same set of questions from the first
workshop, was conducted, and the participants agreed on the following evaluation of
the SMPA Tool:
- Online surveys to access processes facilitate speedy responses;
- Single-choice answer options were easy to follow;
- It was convenient to pause the survey and restart later;
- The examples allowed for a better understanding of the questions as they were
Company X specific.
During the workshop, time constraints permitted only the evaluation of survey
responses for Incident Management using the probing questions. Table 6-4 shows the
evaluation criteria and probing questions for Incident Management discussed in the
workshop.

CHAPTER 6 ACTION RESEARCH - CYCLE 2 (ARC2)
201
Table 6-4 Incident Management Survey Results Evaluation
Evaluation
Criteria
Probing Discussion
Questions
Summary of Responses
Communication Do you believe that the
information on Company
X’s Incident Management
Process was communicated
to all participants?
The focus group felt that
communication of the Incident
Management process was a
problem and that some
business units had more insight
into the process than others.
Knowledge Do you believe that all
participants have sufficient
knowledge to understand the
questions?
The Incident Management
process manager felt that only
senior staff members had the
knowledge to comprehend the
questions.
Rating Score Why do you think the rating
score was ranked Largely
for all 3 capability levels?
i.e., Process activities are
performed in the majority of
cases.
The focus group felt that this is
true and expected as incidents
are dealt with by many people
at Company X.
Score Reliability Why do you think there is
high reliability of responses
across all 3 levels?
Most people feel that Incident
Management is the most
mature process.
Answer
Breakdown
Why do you think 19
percent of participants chose
the Do not know answer?
Lack of communication of the
process.
The focus group reviewed the survey comments entered by participants for Incident
Management. Table 6-5 shows the assessment question, selected option and related
comment entered.

CHAPTER 6 ACTION RESEARCH - CYCLE 2 (ARC2)
202
Table 6-5 Survey Comments: Incident Management
Question Selected
Option
Comment
Do you know if incidents that are
not progressed according to agreed
service levels are escalated?
L Such cases have probably been
escalated to engineers.
Question is if there is an ETA
on the engineering side to
resolve these cases.
Do you know if the status and
progress of incidents are
communicated to interested parties
as needed?
P Depends on who is on the cc
list (i.e., TAMs, Support) to
revert back to the parties when
enquired.
Do you know if required
experience, knowledge and skills
are clearly defined to
perform process activities?
L Knowledge of system plays the
major role in my opinion.
Do you know if dependencies
between process outcomes are
identified and understood?
L I will think so...
Do you know if process outcomes
are documented and controlled in
accordance with defined
requirements?
L As long as the backlog/work
done have been diligently
noted down.
Do you know if the
standard process that includes
typical activities is formally
described in a reference guide or a
procedure?
L I will think so...
Do you think the incident
management process overall fulfills
its current or expected outcomes?
F Incident Management is very
good. Problem
definition/categorization may
not be documented in a fine
grain, but incident management
is overall very good.
Do you know if incidents are
prioritized and analyzed, taking
into account the impact and
urgency of the incident or service
request?
L Sometimes it takes some
diagnostic effort to even
understand the severity of the
service issue in order to assign
the appropriate priority

CHAPTER 6 ACTION RESEARCH - CYCLE 2 (ARC2)
203
Question Selected
Option
Comment
Do you know if incidents are
managed until they are resolved
and closed?
F On occasion, it takes multiple
attempts at resolution before a
functional solution is reached
and the incident log will be
closed and reopened.
Do you know if the status and
progress of incidents are
communicated to interested parties
as needed?
L Yes, when it is clear who the
parties are that should be
communicated with.
Do you know if there is effective
communication between
individuals and groups involved in
performing process activities?
L Making better use of group
communication tools could
make joint investigation efforts
more productive; last time there
was a major issue, everyone
gathered on a conference line,
and the number of participants
with their open lines made it
difficult to hear.
Overall, the focus group participants agreed with the survey comments recorded for
Incident Management. The central theme that came out of the discussion was the
importance of establishing SLAs between business units and the need for improved
communication.
The focus group reviewed the survey comments entered by participants for Problem
Management. Table 6-6 shows the selected option for the related survey question, and
the comment entered.
Table 6-6 Survey Comments: Problem Management
Question Selected
Option
Comment
Do you know if key milestones are
established to
perform process activities?
P There aren’t any “written”
milestones. this part is a bit
loose in our system
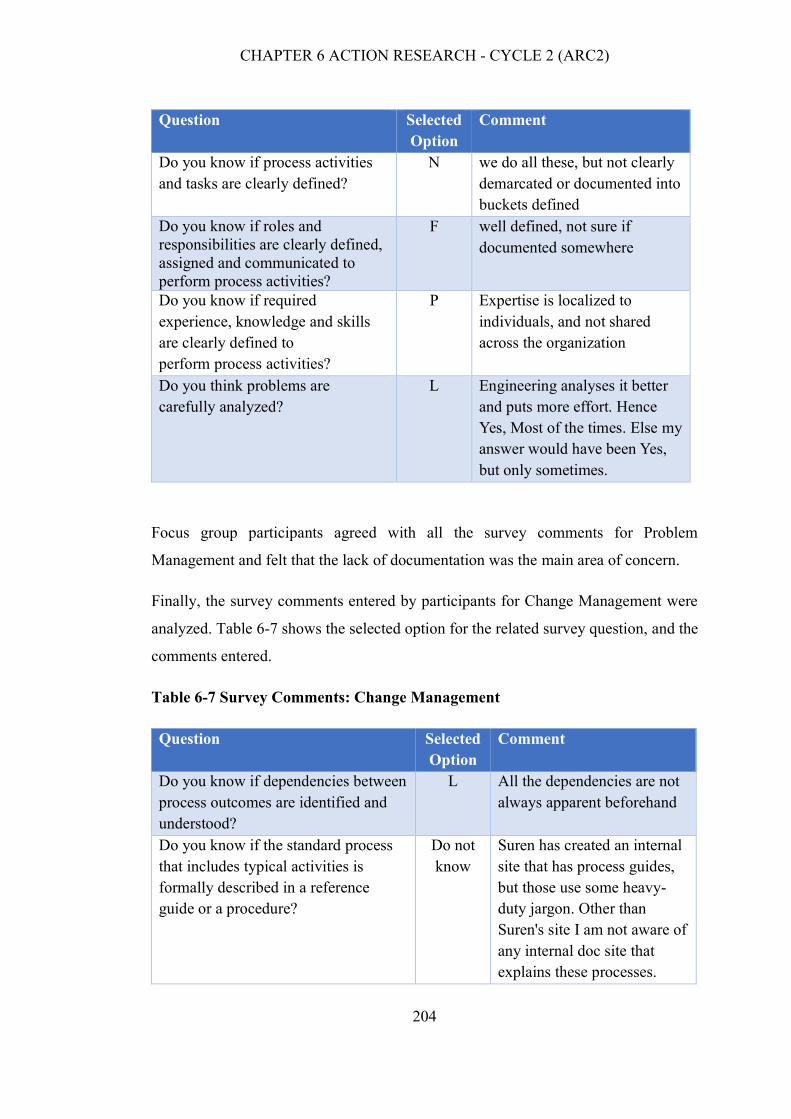
CHAPTER 6 ACTION RESEARCH - CYCLE 2 (ARC2)
204
Question Selected
Option
Comment
Do you know if process activities
and tasks are clearly defined?
N we do all these, but not clearly
demarcated or documented into
buckets defined
Do you know if roles and
responsibilities are clearly defined,
assigned and communicated to
perform process activities?
F well defined, not sure if
documented somewhere
Do you know if required
experience, knowledge and skills
are clearly defined to
perform process activities?
P Expertise is localized to
individuals, and not shared
across the organization
Do you think problems are
carefully analyzed?
L Engineering analyses it better
and puts more effort. Hence
Yes, Most of the times. Else my
answer would have been Yes,
but only sometimes.
Focus group participants agreed with all the survey comments for Problem
Management and felt that the lack of documentation was the main area of concern.
Finally, the survey comments entered by participants for Change Management were
analyzed. Table 6-7 shows the selected option for the related survey question, and the
comments entered.
Table 6-7 Survey Comments: Change Management
Question Selected
Option
Comment
Do you know if dependencies between
process outcomes are identified and
understood?
L All the dependencies are not
always apparent beforehand
Do you know if the standard process
that includes typical activities is
formally described in a reference
guide or a procedure?
Do not
know
Suren has created an internal
site that has process guides,
but those use some heavy-
duty jargon. Other than
Suren's site I am not aware of
any internal doc site that
explains these processes.

CHAPTER 6 ACTION RESEARCH - CYCLE 2 (ARC2)
205
Focus group participants felt that the intranet site created by the researcher was helpful,
but not all staff are familiar with the language used on the site.
A summary of the number of comments per selected option for each process is shown
in Table 6-8.
Table 6-8 Survey Comments: Summary by Process and Selected Option
Process
Selection Total
Comments
F L P N Don’t
Know
Incident
Management
2 8 1 0 0 11
Problem
Management
1 1 2 1 0 5
Change
Management
0 1 0 0 1 2
6.3.2 Reflection on the process capability assessment results
Process Attribute Scores
Following the transformation process described in §5.2.2.1, the survey responses were
averaged by the SMPA tool to calculate the attribute achievement rating.
Incident management and change management scored Largely for all process
attributes in both assessments, while problem management scored Largely for
Performance Management (PA 2.1) in both assessments, and Partially for all other
process attributes in assessment 1 with Largely in assessment 2. Without the actual
raw scores for each process attribute, it is not evident whether there was a process
capability improvement or not.
Table 6-9 shows the comparison of process attribute ratings for assessment 1 and
assessment 2.

CHAPTER 6 ACTION RESEARCH - CYCLE 2 (ARC2)
206
Table 6-9 Comparison of process attribute ratings for assessment 1 and assessment 2
Level 1 Level 2 Level 3
Process Action Research
Cycle
PA1.1
Process
Performance
PA2.1
Performance
Management
PA2.2
Work Product
Management
PA3.1
Process Definition
PA3.2
Process Deployment
Incident
Management
1
2
Problem
Management
1
2
Change
Management
1
2

CHAPTER 6 ACTION RESEARCH - CYCLE 2 (ARC2)
207
A comparative analysis of the number of recommendations/observations was
conducted to determine if the process capability improved year-over-year.
Incident Management
Figure 6-4 shows a comparison of the number of SMPA recommendations between
assessment 1 and 2 for Incident Management. The SMPA tool generates
recommendations/observations for every question for PA 1.1, and from PA 2.1
onwards recommendation items are only generated when the process rating score is
“Partially” (P) or “Not” (N). So, to determine if there was an improvement at PA 1.1,
only the questions that scored P and N were considered. In assessment 1 and
assessment 2 there were no recommendations for Process Performance (PA 1.1). There
were three recommendations/observations for Performance Management (PA 2.1) in
assessment 1 compared to none in assessment 2. Work Product Management (PA 2.2)
had no recommendations/observations in both assessments, while there were four
recommendations/observations for Process Definition (PA 3.1) in assessment 1 with
none in assessment 2. Process Deployment (PA 3.2) in assessment 1 reported two
recommendations/observations, with none for assessment 2. This indicates that the
incident management process improved from assessment 1 to assessment 2.

CHAPTER 6 ACTION RESEARCH - CYCLE 2 (ARC2)
208
Figure 6-4 A comparison of the number of SMPA recommendations between
assessment 1 and 2 for Incident Management
Problem Management
Figure 6-5 shows a comparison of the number of SMPA
recommendations/observations between assessment 1 and 2 for Problem Management.
In both assessments there were no recommendations for Process Performance (PA 1.1)
while there were 11 recommendations for Performance Management (PA 2.1) in
assessment 1 with none in assessment 2. Eight recommendations were reported in
assessment 1 for Work Product Management (PA 2.2), and none in assessment 2.
Process Definition (PA 3.1) had ten recommendations in assessment 1 with four in
assessment 2, while Process Deployment (PA 3.2) had five recommendations in
assessment 1 versus 3 in assessment 2. The decrease in recommendations/observations
indicates that the problem management process had improved.
Figure 6-5 A comparison of the number of SMPA recommendations between
assessment 1 and 2 for Problem Management

CHAPTER 6 ACTION RESEARCH - CYCLE 2 (ARC2)
209
Change Management
The Attribute Rating Scores for Change Management were identical for assessment 1
and assessment 2. However, a breakdown of the number of
recommendations/observations year-over-year revealed that the process improved in
cycle 2. Figure 6-6 shows a comparison of the number of SMPA
recommendations/observations for assessment 1 and 2 for Change Management.
In assessment 1 there was one recommendation that scored Partially (P) for Process
Performance (PA 1.1) with none in assessment 2. There were three recommendations
for Performance Management (PA 2.1) in assessment 1 and none in assessment 2.
Work Product Management (PA 2.2) had three recommendations in assessment 1 with
two in assessment 2. Process Definition (PA 3.1) had four recommendations in
assessment 1 with one in assessment 2, and Process Deployment (PA 3.2) had three
recommendations in assessment 1 with one in assessment 2.
Figure 6-6 A comparison of the number of SMPA recommendations between
assessment 1 and 2 for Change Management
At the Process Performance (PA 1.1) level every survey question had a corresponding
one-to-one knowledge item. However at higher process attributes the same knowledge
item was used for multiple questions in a number of instances since some of the

CHAPTER 6 ACTION RESEARCH - CYCLE 2 (ARC2)
210
questions were closely related and could be addressed by a single knowledge item. At
Process Performance (PA 1.1) the recommendations are specific to the process in
question. From Performance Management (PA 2.1) onwards, the recommendations are
developed as general guidelines that may apply to any process.
The average of the number of recommendations as a percentage of the total number of
knowledge items for each process was used as the KPI, with 30 percent as the target
and 50 percent for the warning.
Table 6-10 shows the average percentage of recommendations per process over both
assessments. The average recommendation ratio decreased considerably from cycle 1
to cycle 2 demonstrating process improvement. These measures were plugged into the
enhanced the ITSM3 for all three processes, as shown in Table 6-40, Table 6-41 and
Table 6-42.

CHAPTER 6 ACTION RESEARCH - CYCLE 2 (ARC2)
211
Table 6-10 Average Recommendation Ratio for the three processes
Incident Management Problem Management Change Management
Process Attributes # of
Knowledge
Items
Cycle 1 Cycle 2 # of
Knowledge
Items
Cycle 1 Cycle 2 # of
Knowledge
Items
Cycle 1 Cycle 2
PA 1.1 Process Performance 8 0 0 11 0 0 14 1 0
PA2.1 Performance Management 21 3 0 21 11 0 21 3 0
PA2.2 Work Product Management 13 0 0 13 8 0 13 3 2
PA3.1 Process Definition 11 4 0 11 10 4 11 4 1
PA3.2 Process Deployment 9 2 0 9 5 3 9 3 1
Total # of Knowledge Items 62 65 68
Total # of Recommendations 9 0 34 7 14 4
Average Recommendation Ratio 14.5% 0% 52.3% 10.8% 20.6% 5.9%

CHAPTER 6 ACTION RESEARCH - CYCLE 2 (ARC2)
212
Score reliability
In cycle 1, the focus group workshop discussed the reliability scores of the SMPA
assessment, as reported in §5.3. Table 6-11 shows a comparison of assessment
reliability scores for assessment 1 versus assessment 2 for all three processes. Incident
management demonstrated a high reliability score across all three capability levels in
cycle 1 and cycle 2. This meant that survey respondents predominantly agreed on their
ratings. When comparing reliability scores for Problem Management between
assessments, the Performance Management (PA 2.1) attribute increased from Poor to
High, and decreased from a Moderate score for Process Deployment (PA 3.2) to Poor.
Change Management reliability scores remained unchanged between assessment 1 and
assessment 2, except for an improvement in reliability from Poor to High for the
Process Deployment (PA 3.2) attribute.
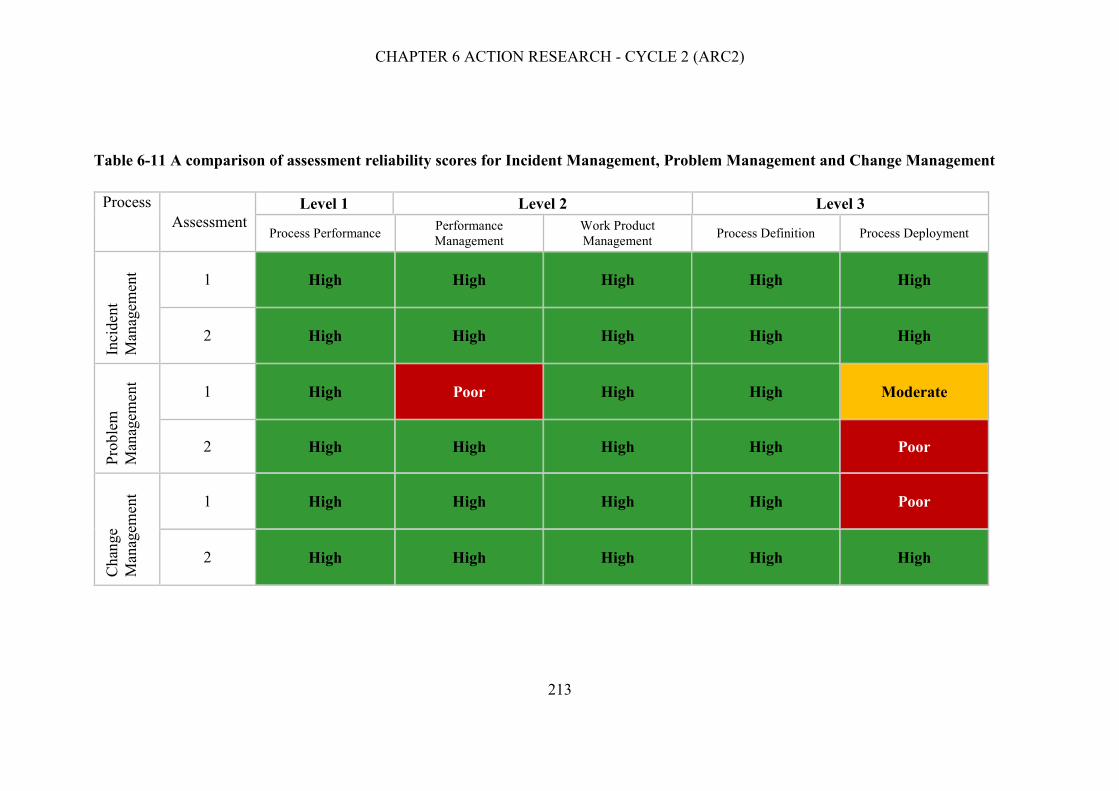
CHAPTER 6 ACTION RESEARCH - CYCLE 2 (ARC2)
213
Table 6-11 A comparison of assessment reliability scores for Incident Management, Problem Management and Change Management
Process
Assessment
Level 1 Level 2 Level 3
Process Performance Performance
Management
Work Product
Management Process Definition Process Deployment
Inci
den
t
Man
agem
ent
1 High High High High High
2 High High High High High
Pro
ble
m
Man
agem
ent
1 High Poor High High Moderate
2 High High High High Poor
Chan
ge
Man
agem
ent
1 High High High High Poor
2 High High High High High
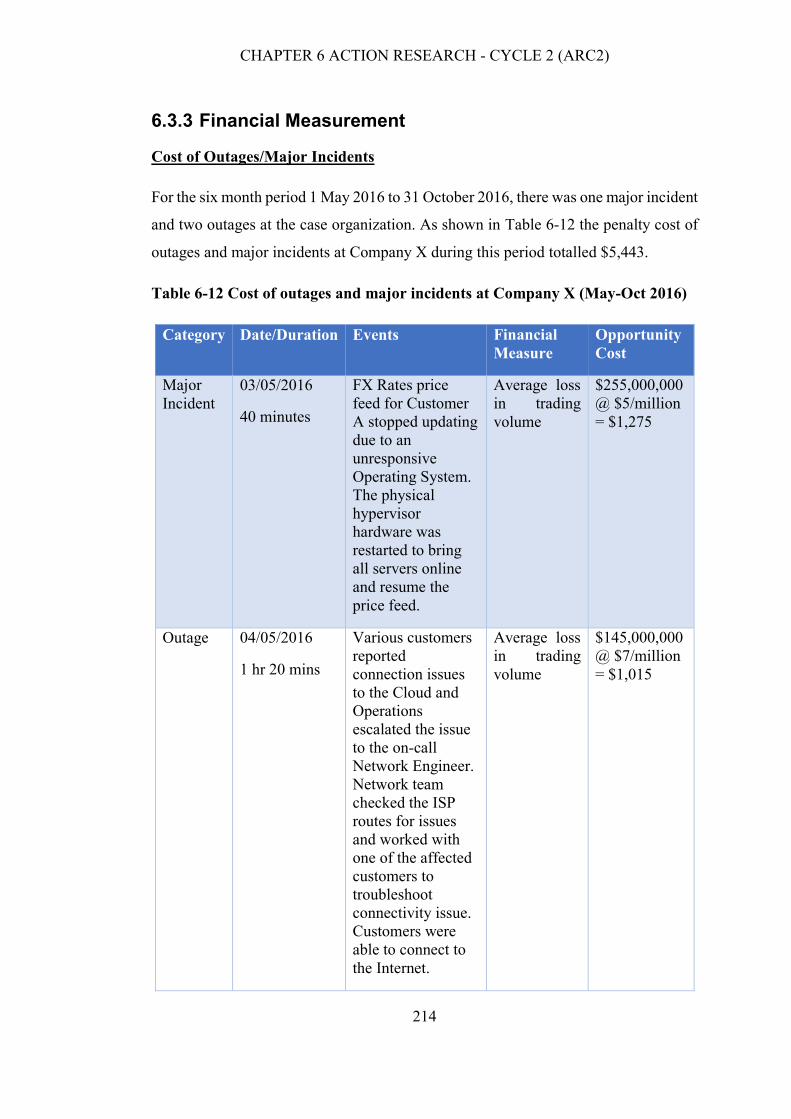
CHAPTER 6 ACTION RESEARCH - CYCLE 2 (ARC2)
214
6.3.3 Financial Measurement
Cost of Outages/Major Incidents
For the six month period 1 May 2016 to 31 October 2016, there was one major incident
and two outages at the case organization. As shown in Table 6-12 the penalty cost of
outages and major incidents at Company X during this period totalled $5,443.
Table 6-12 Cost of outages and major incidents at Company X (May-Oct 2016)
Category Date/Duration Events Financial
Measure
Opportunity
Cost
Major
Incident
03/05/2016
40 minutes
FX Rates price
feed for Customer
A stopped updating
due to an
unresponsive
Operating System.
The physical
hypervisor
hardware was
restarted to bring
all servers online
and resume the
price feed.
Average loss
in trading
volume
$255,000,000
@ $5/million
= $1,275
Outage 04/05/2016
1 hr 20 mins
Various customers
reported
connection issues
to the Cloud and
Operations
escalated the issue
to the on-call
Network Engineer.
Network team
checked the ISP
routes for issues
and worked with
one of the affected
customers to
troubleshoot
connectivity issue.
Customers were
able to connect to
the Internet.
Average loss
in trading
volume
$145,000,000
@ $7/million
= $1,015

CHAPTER 6 ACTION RESEARCH - CYCLE 2 (ARC2)
215
Category Date/Duration Events Financial
Measure
Opportunity
Cost
Outage 18/10/2016
52 minutes
Operations
received an alert
for power strip
failure on one
enclosure in the
Data Center. On-
site datacenter
engineer switched
the power supply to
an alternate power
circuit. Customers
were able to
connect to the
Internet.
Average loss
in trading
volume
$485,000,000
@ an average
of
$6.50/million
= $3,153
Total cost of outages and major incidents $5,443
Process Costs
The same labor assumptions used in Table 5-18 were applied in cycle 2. Table 6-13
shows the calculations for Company X’s on-cost to calculate the fully-burdened annual
cost per employee across six groups of staff. The total fully-burdened annual cost was
$817,138.
Process Stakeholders (Program Management), as identified in §6.2.1, do not directly
engage in process activities, but manage programs that track incidents, problems, and
changes. The calculation of process costs did not include this business unit.
The Business Support unit comprises two levels of support personnel (as described in
§5.2.1), and process costs were tracked per level.

CHAPTER 6 ACTION RESEARCH - CYCLE 2 (ARC2)
216
Table 6-13 Company X’s fully-burdened annual costs per employee for six groups of staff
Cost Item Tier 1 Tier 2 Operations Engineering Trading
Solutions
Execution
Services
Average annual salary $88,874 $108,927 $83,790 $144,744 $137,002 $127,836
Add: On-cost items:
Payroll taxes (8%) $7,110 $8,714 $6,703 $11,580 $10,960 $10,227
Insurance (5%) $4,444 $5,446 $4,190 $7,237 $6,850 $6,392
Medical benefits (1%) $889 $1,089 $838 $1,447 $1,370 $1,278
Onsite lunch $2,000 $2,000 $2,000 $2,000 $2,000 $2,000
Equipment $579 $550 $1,563 $2,300 $588 $489
Software licenses $1,200 $1,212 $1,750 $2,100 $1,200 $1,200
Supplies $100 $100 $150 $150 $150 $150
Training costs $0 $500 $500 $670 $0 $0
Total on-costs $16,321 $19,612 $17,694 $27,484 $23,118 $21,736
Total fully-burdened cost $105,195 $128,539 $101,484 $172,228 $160,120 $149,572
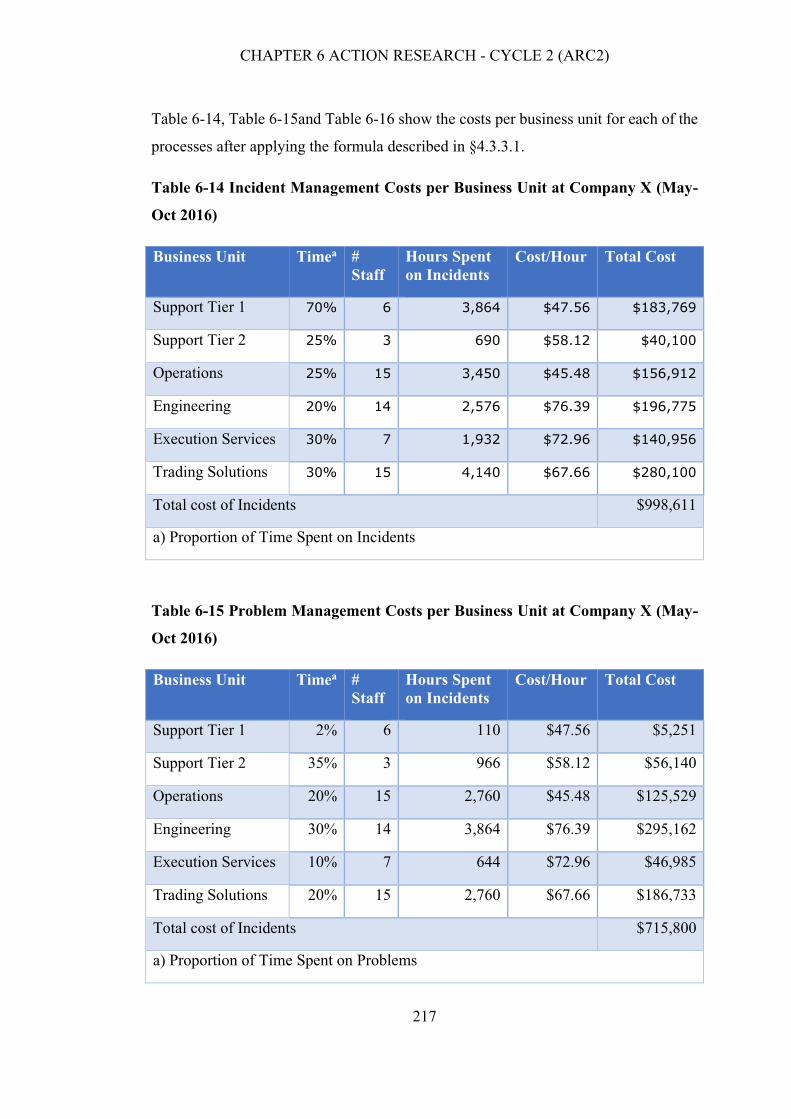
CHAPTER 6 ACTION RESEARCH - CYCLE 2 (ARC2)
217
Table 6-14, Table 6-15and Table 6-16 show the costs per business unit for each of the
processes after applying the formula described in §4.3.3.1.
Table 6-14 Incident Management Costs per Business Unit at Company X (May-
Oct 2016)
Business Unit Timea #
Staff
Hours Spent
on Incidents
Cost/Hour Total Cost
Support Tier 1 70% 6 3,864 $47.56 $183,769
Support Tier 2 25% 3 690 $58.12 $40,100
Operations 25% 15 3,450 $45.48 $156,912
Engineering 20% 14 2,576 $76.39 $196,775
Execution Services 30% 7 1,932 $72.96 $140,956
Trading Solutions 30% 15 4,140 $67.66 $280,100
Total cost of Incidents $998,611
a) Proportion of Time Spent on Incidents
Table 6-15 Problem Management Costs per Business Unit at Company X (May-
Oct 2016)
Business Unit Timea #
Staff
Hours Spent
on Incidents
Cost/Hour Total Cost
Support Tier 1 2% 6 110 $47.56 $5,251
Support Tier 2 35% 3 966 $58.12 $56,140
Operations 20% 15 2,760 $45.48 $125,529
Engineering 30% 14 3,864 $76.39 $295,162
Execution Services 10% 7 644 $72.96 $46,985
Trading Solutions 20% 15 2,760 $67.66 $186,733
Total cost of Incidents $715,800
a) Proportion of Time Spent on Problems

CHAPTER 6 ACTION RESEARCH - CYCLE 2 (ARC2)
218
Table 6-16 Change Management Costs per Business Unit at Company X (May-
Oct 2016)
Business Unit Timea #
Staff
Hours Spent
on Incidents
Cost/Hour Total Cost
Support Tier 1 1% 6 55 $47.56 $2,625
Support Tier 2 5% 3 138 $58.12 $8,020
Operations 35% 15 4,830 $45.48 $219,676
Engineering 10% 14 1,288 $76.39 $98,387
Execution Services 10% 7 644 $72.96 $46,985
Trading Solutions 20% 15 2,760 $67.66 $186,733
Total cost of Incidents $562,427
a) Proportion of Time Spent on Changes
6.3.3.1 Reflection on financial measurement
Employee salaries increased and on-costs changed between cycle 1 and cycle 2. Table
6-17 shows the comparison of annual salaries per employee per business unit year-
over-year and Figure 6-7 shows a graph comparing the salaries by cycle. Annual
salaries increased by an average of 8.04 percent.
Table 6-17 A comparison of employee annual salaries by business unit for cycle 1
and 2
Business Unit Cycle 1 Salary
2015 (Table
5-19)
Cycle 2 Salary
2016 (Table
6-13)
Salary
Increase
Percent
Increase
Tier 1 $97,691 $105,195 $7,504 7.68%
Tier 2 $119,375 $128,539 $9,164 7.68%
Operations $93,423 $101,484 $8,061 8.63%
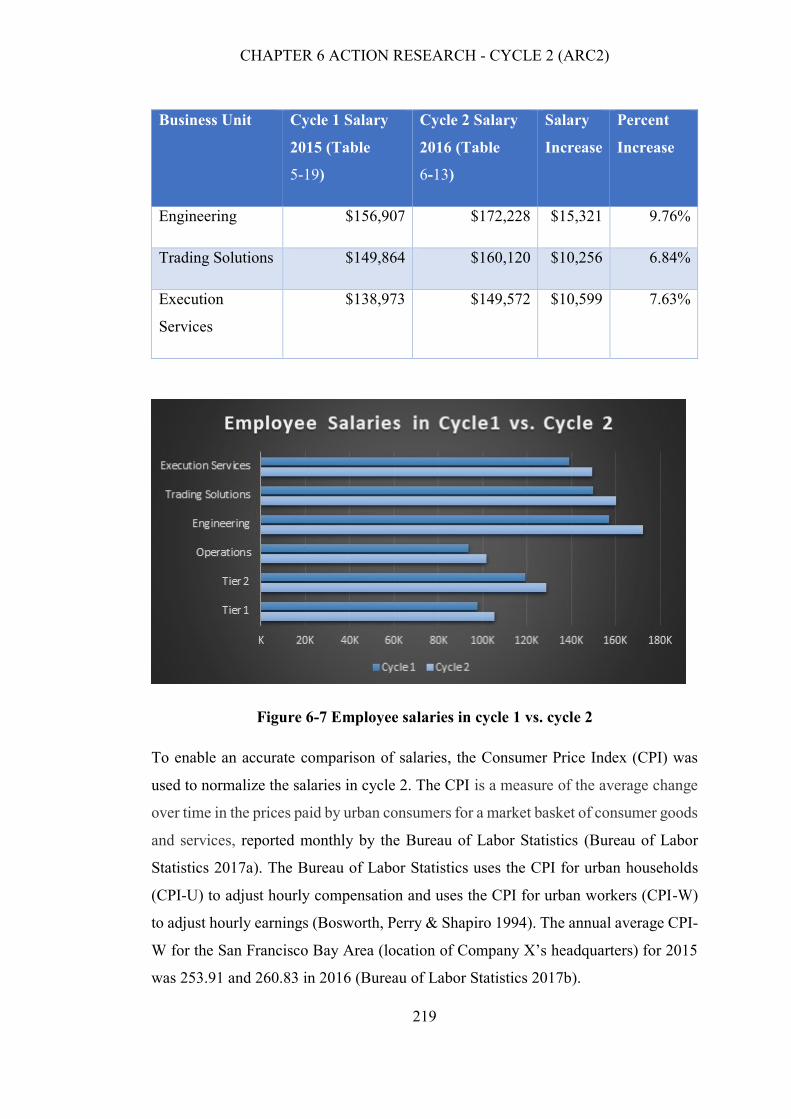
CHAPTER 6 ACTION RESEARCH - CYCLE 2 (ARC2)
219
Business Unit Cycle 1 Salary
2015 (Table
5-19)
Cycle 2 Salary
2016 (Table
6-13)
Salary
Increase
Percent
Increase
Engineering $156,907 $172,228 $15,321 9.76%
Trading Solutions $149,864 $160,120 $10,256 6.84%
Execution
Services
$138,973 $149,572 $10,599 7.63%
Figure 6-7 Employee salaries in cycle 1 vs. cycle 2
To enable an accurate comparison of salaries, the Consumer Price Index (CPI) was
used to normalize the salaries in cycle 2. The CPI is a measure of the average change
over time in the prices paid by urban consumers for a market basket of consumer goods
and services, reported monthly by the Bureau of Labor Statistics (Bureau of Labor
Statistics 2017a). The Bureau of Labor Statistics uses the CPI for urban households
(CPI-U) to adjust hourly compensation and uses the CPI for urban workers (CPI-W)
to adjust hourly earnings (Bosworth, Perry & Shapiro 1994). The annual average CPI-
W for the San Francisco Bay Area (location of Company X’s headquarters) for 2015
was 253.91 and 260.83 in 2016 (Bureau of Labor Statistics 2017b).

CHAPTER 6 ACTION RESEARCH - CYCLE 2 (ARC2)
220
The percentage increase (x) of the average 2016 CPI-W over the average 2015 CPI-W
was calculated as follows:
x = [(2016 CPI-W - 2015 CPI-W) / 2015 CPI-W] * 100
= [(260.83 – 253.91) / 253.91] * 100
≈ 2.73%
This percentage increase in CPI was applied to discount the 2016 fully-burdened
annual cost to align with 2015 fully-burdened annual cost.
2016 CPI-W Adjusted Cost = 2016 Cost – (2016 Cost * x)
Table 6-18 shows the CPI-W adjusted employee salaries using the CPI-W for 2015
and 2016.
Table 6-18 Normalized 2016 salaries using CPI-W for 2015 & 2016
Business Unit Cycle 1 Salary
2015
Cycle 2 Salary
2016
CPI-W
Adjusted Salary
2016 Tier 1 $97,691 $105,195 $102,328
Tier 2 $119,375 $128,539 $125,036
Operations $93,423 $101,484 $98,718
Engineering $156,907 $172,228 $167,534
Trading Solutions $149,864 $160,120 $155,756
Execution Services $138,973 $149,572 $145,496
Table 6-19, Table 6-20, and Table 6-21 show the costs per business unit for each of
the processes.

CHAPTER 6 ACTION RESEARCH - CYCLE 2 (ARC2)
221
Table 6-19 Incident Management Costs per Business Unit at Company X
Business
Unit
Timea # Staff Hours on
Incidents
CPI-Adjusted
Cost/Hour
Total Cost
Support
Tier 1
70% 6 3,864 $49.20 $190,095
Support
Tier 2
25% 3 690 $60.11 $41,478
Operations 25% 15 3,450 $47.46 $163,739
Engineering 20% 14 2,576 $80.55 $207,485
Execution
Services
30% 7 1,932 $74.88 $144,674
Trading
Solutions
30% 15 4,140 $69.95 $289,592
Total cost of Incidents $1,037,062
a) Proportion of Time Spent on Incidents

CHAPTER 6 ACTION RESEARCH - CYCLE 2 (ARC2)
222
Table 6-20 Problem Management Costs per Business Unit at Company X
Business Unit Timea # Staff Hours on
Problems
CPI-
Adjusted
Cost/Hour
Total Cost
Support Tier 1 2% 6 110 $49.20 $5,431
Support Tier 2 35% 3 966 $60.11 $58,069
Operations 20% 15 2,760 $47.46 $130,991
Engineering 30% 14 3,864 $80.55 $311,227
Execution
Services
10% 7 644 $74.88 $48,225
Trading Solutions 20% 15 2,760 $69.95 $193,062
Total cost of Problems $747,005
a) Proportion of Time Spent on Problems
Table 6-21 Change Management Costs per Business Unit at Company X
Business Unit Timea # Staff Hours on
Changes
CPI-
Adjusted
Cost/Hour
Total Cost
Support Tier 1 1% 6 55 $49.20 $2,716
Support Tier 2 5% 3 138 $60.11 $8,296
Operations 35% 15 4,830 $47.46 $229,234
Engineering 10% 14 1,288 $80.55 $103,742
Execution
Services
10% 7 644 $74.88 $48,225
Trading Solutions 20% 15 2,760 $69.95 $193,062
Total cost of Changes $585,274
a) Proportion of Time Spent on Changes

CHAPTER 6 ACTION RESEARCH - CYCLE 2 (ARC2)
223
The labor cost per business unit was normalized for 2016 to align with the cost for
2015. Table 6-22 shows the comparison of the normalized labor costs per process for
2015 and 2016.
Table 6-22 Normalized costs per process for 2015 and 2916
ITSM Process 2015 2016
Incident Management $1,303,416 $1,037,062
Problem Management $1,141,073 $747,005
Change Management $820,061 $585,274
Total Costs $3,266,565.0051 $2,371,357.00
6.3.4 Operationalizing the Measurement Model
Operational metrics
Using the same operational metrics selected for cycle 1 data were collected from
Zendesk for the six month period 1 May 2016 to 31 October 2016. Zendesk dashboards
were created presenting the operational metrics for each process. The operational
metrics selected for each process, with their source and actual data for the period
assessed are shown in Table 6-23, Table 6-24 and Table 6-25.
Table 6-23 Incident Management Operational Metrics (May-Oct 2016)
Operational Metric Data Source Count Time
Hours
Total number of incidents Zendesk 5,881
Average time to resolve Severity 1 and Severity 2
incidents
Zendesk 63.4
Number of incidents resolved within agreed service
levels
Zendesk 2,454
Number of high severity/major incidents Zendesk 912
Number of incidents with customer impact Zendesk 711
Number of incidents reopened Zendesk 397
Average incident response time Zendesk
2.5

CHAPTER 6 ACTION RESEARCH - CYCLE 2 (ARC2)
224
Operational Metric Data Source Count Time
Hours
Average incident closure duration Zendesk 60.5
Incidents completed without escalation Zendesk 1,278
Total available time to work on incidents Zendesk 22,080
Total time spent resolving incidents Labor reports 8,000
Table 6-24 Problem Management Operational Metrics (May-Oct 2016)
Operational Metric Data Source Count Time in Hours
Number of repeat incidents Zendesk 0
Number of major problems Zendesk 7
Total number of incidents Zendesk 1
Total number of problems in pipeline Zendesk 16
Number of problems removed (error control) Zendesk 14
Number of known errors (root cause is known
and workaround in place)
Zendesk 5
Number of problems reopened Zendesk 0
Number of problems with customer impact Zendesk 0
Average problem resolution time - severity 1
and 2 problems (hours)
Zendesk
473.2
Total available labor hours to work on
problems
Zendesk
1000
Total labor hours spent working on and
coordinating problems
Labor
reports
200
Table 6-25 Change Management Operational Metrics (May-Oct 2016)
Operational Metric Data Source Count Time in Hours
Total Changes In Pipeline Zendesk 1,252
Total Changes Implemented Zendesk 33
Number of Failed Changes Zendesk 17
Number of Emergency Changes Zendesk 24

CHAPTER 6 ACTION RESEARCH - CYCLE 2 (ARC2)
225
Operational Metric Data Source Count Time in Hours
Number of Unauthorized Changes Detected Zendesk 8
Number of Changes Rescheduled Zendesk 40
Average Process Time Per Change Zendesk
57
Number of Changes Resulting in Incidents Zendesk 27
Total Available Labor Hours To Coordinate (Not
Implement) Changes
Staffing
reports
49.1
Total Labor Hours Spent Coordinating Changes
40
Key Performance Indicators
The KPIs used in cycle 1 were used in cycle 2 as they remained important to meet the
CSFs of Company X.
Tolerance Thresholds and KPI Scoring
Based on the KPI method detailed in chapter 4 §4.2.4, the KPI items, established
threshold targets, the desirable result (polarity), the calculations of the KPI results, and
the actual results for the case organization for the period May-Oct 2016 are shown
below in Table 6-26, Table 6-27, and Table 6-28.
.
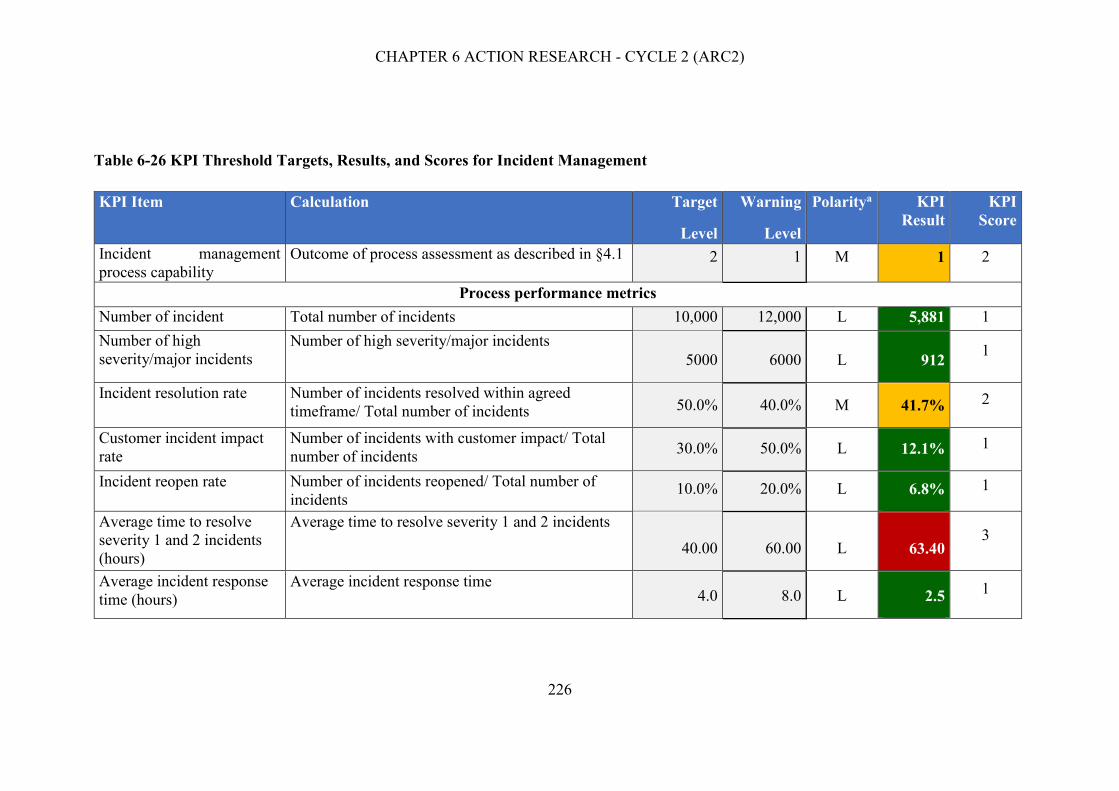
CHAPTER 6 ACTION RESEARCH - CYCLE 2 (ARC2)
226
Table 6-26 KPI Threshold Targets, Results, and Scores for Incident Management
KPI Item Calculation Target
Level
Warning
Level
Polaritya KPI
Result
KPI
Score
Incident management
process capability
Outcome of process assessment as described in §4.1 2 1 M 1 2
Process performance metrics
Number of incident
occurrences
Total number of incidents 10,000 12,000 L 5,881 1
Number of high
severity/major incidents
Number of high severity/major incidents
5000 6000 L 912 1
Incident resolution rate Number of incidents resolved within agreed
timeframe/ Total number of incidents 50.0% 40.0% M 41.7% 2
Customer incident impact
rate
Number of incidents with customer impact/ Total
number of incidents 30.0% 50.0% L 12.1% 1
Incident reopen rate Number of incidents reopened/ Total number of
incidents 10.0% 20.0% L 6.8% 1
Average time to resolve
severity 1 and 2 incidents
(hours)
Average time to resolve severity 1 and 2 incidents
40.00 60.00 L 63.40 3
Average incident response
time (hours)
Average incident response time 4.0 8.0 L 2.5
1
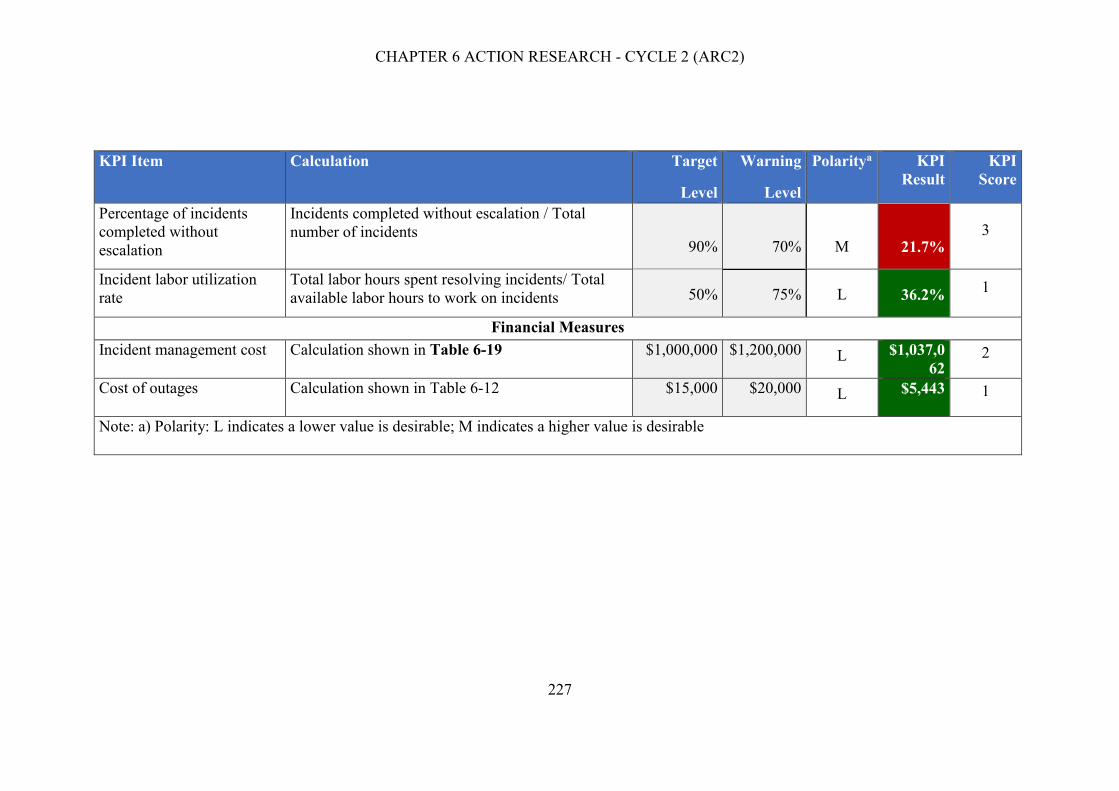
CHAPTER 6 ACTION RESEARCH - CYCLE 2 (ARC2)
227
KPI Item Calculation Target
Level
Warning
Level
Polaritya KPI
Result
KPI
Score
Percentage of incidents
completed without
escalation
Incidents completed without escalation / Total
number of incidents 90% 70% M 21.7%
3
Incident labor utilization
rate
Total labor hours spent resolving incidents/ Total
available labor hours to work on incidents 50% 75% L 36.2% 1
Financial Measures
Incident management cost Calculation shown in Table 6-19 $1,000,000 $1,200,000 L $1,037,0
62 2
Cost of outages Calculation shown in Table 6-12 $15,000 $20,000 L $5,443 1
Note: a) Polarity: L indicates a lower value is desirable; M indicates a higher value is desirable

CHAPTER 6 ACTION RESEARCH - CYCLE 2 (ARC2)
228
Table 6-27 KPI Threshold Targets, Results, and Scores for Problem Management
KPI Item Calculation Target
Level
Warning
Level
Polaritya KPI
Result
KPI
Score
Problem management
process capability
Outcome of process assessment as described in §4.1 2 1 M 1 2
Process performance metrics
Incident Repeat Rate Total number of incidents 15% 20% L 0% 1
Number Of Major Problems Number of high severity/major incidents 10 12 L 7 1
Problem Resolution Rate Number of incidents resolved within agreed
timeframe/ Total number of incidents 90.0% 80.0% M 87.5% 2
Problem Workaround Rate Number of incidents with customer impact/ Total
number of incidents 30.0% 50.0% L 31.3% 2
Problem Reopen Rate Number of incidents reopened/ Total number of
incidents 10.0% 20.0% L 0% 1
Customer Impact Rate Average time to resolve severity 1 and 2 incidents 15.0 20.0 L 0 1
Average Problem
Resolution Time - Severity
1 and 2 Problems (Hours)
Average incident response time
80.0 100.0 L 473.2 3
Problem Labor Utilization
Rate
Incidents completed without escalation / Total
number of incidents 50% 75% L 20% 1
Financial Measures
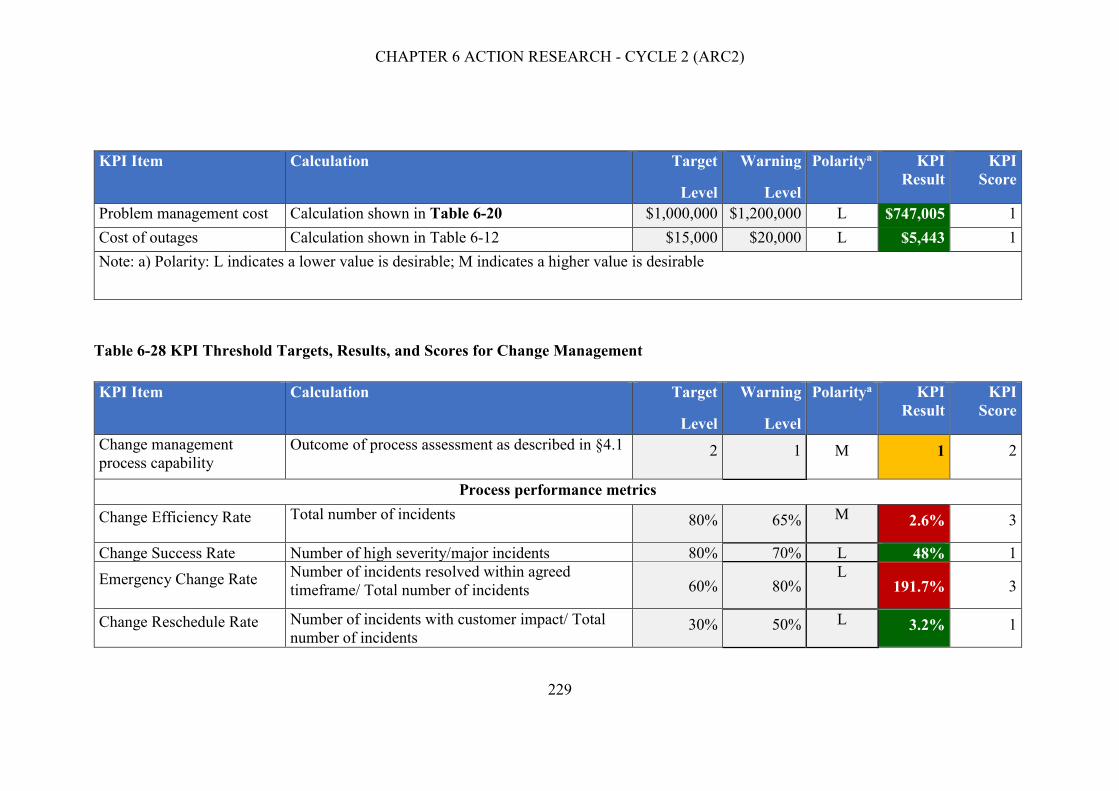
CHAPTER 6 ACTION RESEARCH - CYCLE 2 (ARC2)
229
KPI Item Calculation Target
Level
Warning
Level
Polaritya KPI
Result
KPI
Score
Problem management cost Calculation shown in Table 6-20 $1,000,000 $1,200,000 L $747,005 1
Cost of outages Calculation shown in Table 6-12 $15,000 $20,000 L $5,443 1
Note: a) Polarity: L indicates a lower value is desirable; M indicates a higher value is desirable
Table 6-28 KPI Threshold Targets, Results, and Scores for Change Management
KPI Item Calculation Target
Level
Warning
Level
Polaritya KPI
Result
KPI
Score
Change management
process capability
Outcome of process assessment as described in §4.1 2 1 M 1 2
Process performance metrics
Change Efficiency Rate Total number of incidents 80% 65% M 2.6% 3
Change Success Rate Number of high severity/major incidents 80% 70% L 48% 1
Emergency Change Rate Number of incidents resolved within agreed
timeframe/ Total number of incidents 60% 80% L
191.7% 3
Change Reschedule Rate Number of incidents with customer impact/ Total
number of incidents 30% 50% L 3.2% 1

CHAPTER 6 ACTION RESEARCH - CYCLE 2 (ARC2)
230
KPI Item Calculation Target
Level
Warning
Level
Polaritya KPI
Result
KPI
Score
Average Process Time Per
Change (Hours)
Number of incidents reopened/ Total number of
incidents 10% 20%
L 57.4 2
Unauthorized Change Rate Average time to resolve severity 1 and 2 incidents 15% 20% L 1.9% 1
Change Incident Rate Average incident response time 5% 7% L 0.8% 1
Change Labor Workforce
Utilization
Incidents completed without escalation / Total
number of incidents 50% 75% L
81% 3
Financial Measures
Change management cost Calculation shown in Table 6-21 $1,000,000 $1,200,000 L $585,274 1
Cost of outages Calculation shown in Table 6-12 $15,000 $20,000 L $5,443 1
Note: a) Polarity: L indicates a lower value is desirable; M indicates a higher value is desirable
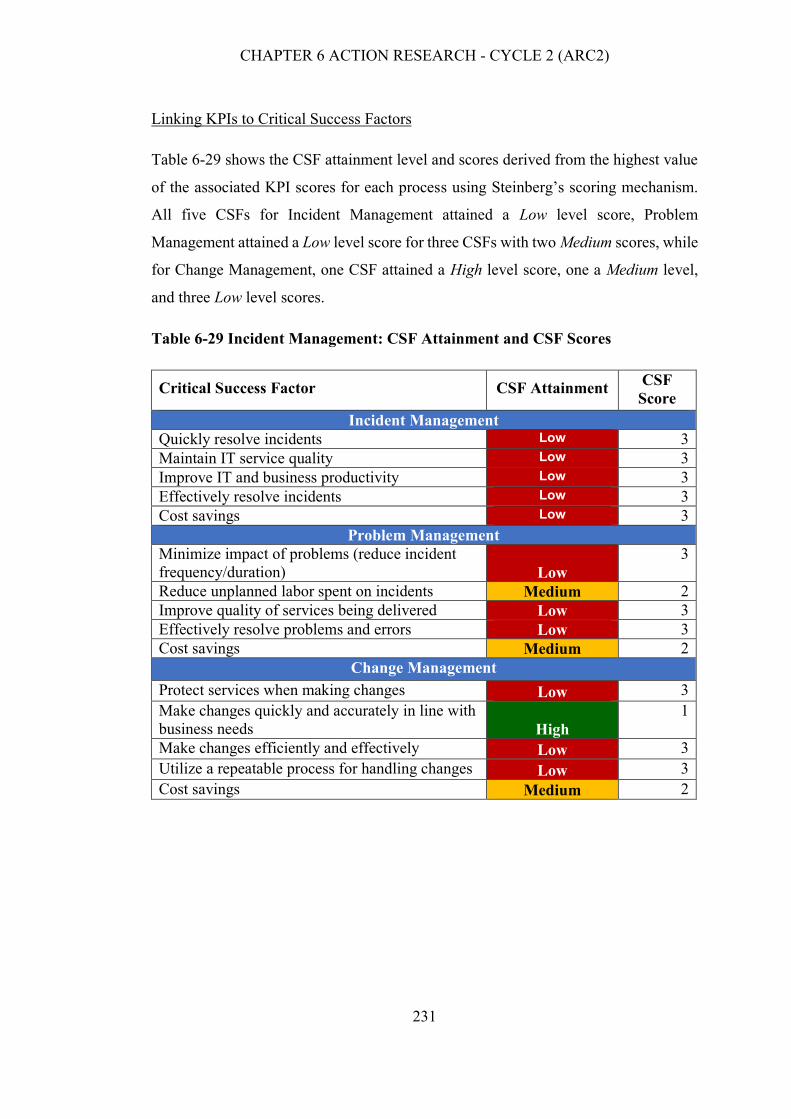
CHAPTER 6 ACTION RESEARCH - CYCLE 2 (ARC2)
231
Linking KPIs to Critical Success Factors
Table 6-29 shows the CSF attainment level and scores derived from the highest value
of the associated KPI scores for each process using Steinberg’s scoring mechanism.
All five CSFs for Incident Management attained a Low level score, Problem
Management attained a Low level score for three CSFs with two Medium scores, while
for Change Management, one CSF attained a High level score, one a Medium level,
and three Low level scores.
Table 6-29 Incident Management: CSF Attainment and CSF Scores
Critical Success Factor CSF Attainment CSF
Score
Incident Management
Quickly resolve incidents Low 3
Maintain IT service quality Low 3
Improve IT and business productivity Low 3
Effectively resolve incidents Low 3
Cost savings Low 3
Problem Management
Minimize impact of problems (reduce incident
frequency/duration) Low
3
Reduce unplanned labor spent on incidents Medium 2
Improve quality of services being delivered Low 3
Effectively resolve problems and errors Low 3
Cost savings Medium 2
Change Management
Protect services when making changes Low 3
Make changes quickly and accurately in line with
business needs High
1
Make changes efficiently and effectively Low 3
Utilize a repeatable process for handling changes Low 3
Cost savings Medium 2

CHAPTER 6 ACTION RESEARCH - CYCLE 2 (ARC2)
232
Business Risks
Table 6-30 provides a list of Company X’s outcome risks, derived risk levels and the
associated CSF scores for the Incident Management process. To derive the risk levels
of the CSFs, all non-zero values were replaced with the highest CSF score for that
outcome risk, and then the average of the non-zero values for each CSF were
calculated, as shown in the last row of Table 6-30. Table 6-31 and Table 6-32 provide
a list of Company X’s outcome risks, derived risk levels and the associated CSF scores
for the Problem Management and Change Management processes.

CHAPTER 6 ACTION RESEARCH - CYCLE 2 (ARC2)
233
Table 6-30 Incident Management: Mapping of Outcome Risks to CSF Scores
Outcome Risk Item Quickly resolve
incidents
Maintain
IT service
quality
Improve IT and
business
productivity
Effectively
resolve incidents
Cost savings Risk level
Service outages 0 3 0 3 3 High
Rework 3 0 3 3 3 High
Waste 3 0 3 3 3 High
Delayed solutions 0 0 3 3 0 High
Slow operational
processes 0 0 3 3 0 High
Security breaches 0 3 0 0 3 High
Slow turnaround times 0 0 0 3 0 Moderate
Unexpected costs 3 3 3 3 3 High
Higher or escalating costs 3 3 3 3 3 High
Slow response to business
needs and changes 3 0 3 3 3 High
Inability to scale 3 0 3 0 0 High
Fines and penalties 0 0 0 0 3 High
High levels of non-value
labor 3 0 3 3 3 High
Loss of market share 0 3 3 3 3 High
Loss of revenue/sales 0 3 0 3 3 High

CHAPTER 6 ACTION RESEARCH - CYCLE 2 (ARC2)
234
Table 6-31 Problem Management: Mapping of Outcome Risks to CSF Scores
Outcome Risk Item Minimize Impact Of
Problems (Reduce
Incident
Frequency/Duration)
Reduce
Unplanned
Labor Spent
On Incidents
Improve
Quality Of
Services Being
Delivered
Effectively
Resolve
Problems and
Errors
Cost savings Risk level
Service outages 0 2 0 3 2 High
Rework 3 0 3 3 2 High
Waste 3 0 3 3 2 High Delayed solutions 0 0 3 3 0 High Slow operational processes 0 0 3 3 0 High Security breaches 0 0 0 3 2 High Slow turnaround times 3 0 0 3 0 Moderate Unexpected costs 3 2 3 3 2 High Higher or escalating costs 3 2 3 3 2 High
Slow response to business
needs and changes 0 0 3 3 2 High
Inability to scale 3 0 3 0 0 High Fines and penalties 0 0 0 0 2 Moderate
High levels of non-value
labor
3 0 3 3 2 High Loss of market share 0 2 3 3 2 High Loss of revenue/sales 3 0 3 0 2 High
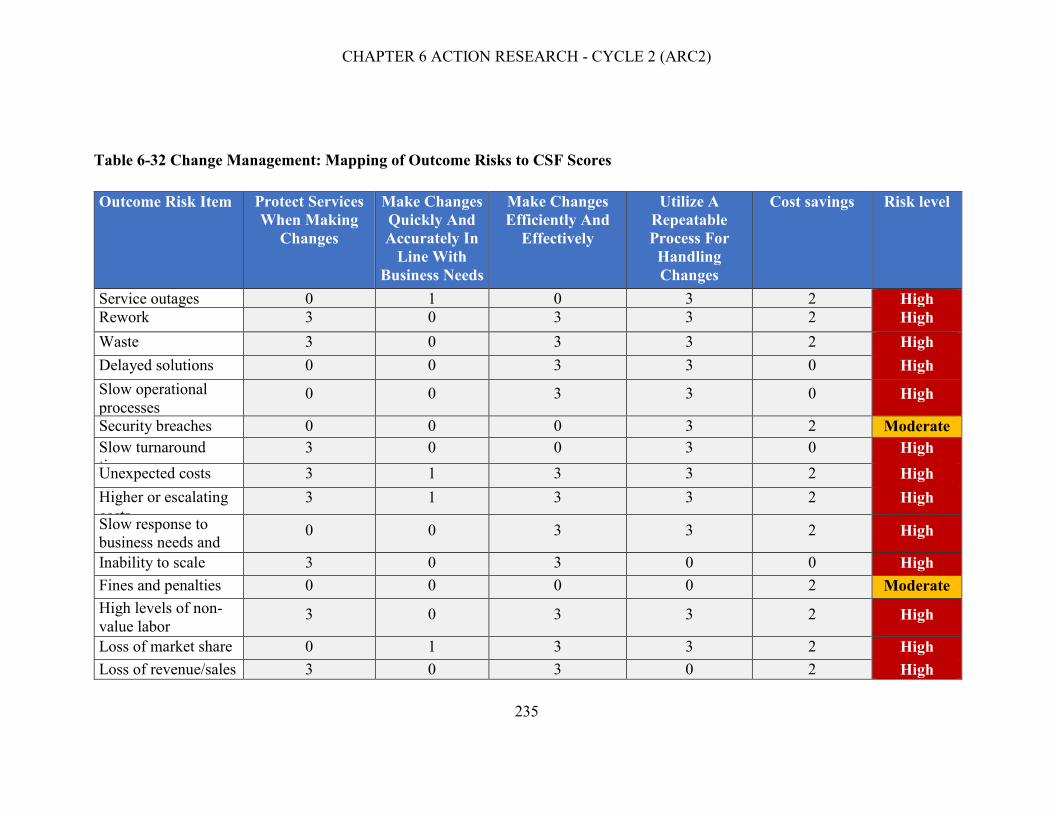
CHAPTER 6 ACTION RESEARCH - CYCLE 2 (ARC2)
235
Table 6-32 Change Management: Mapping of Outcome Risks to CSF Scores
Outcome Risk Item Protect Services
When Making
Changes
Make Changes
Quickly And
Accurately In
Line With
Business Needs
Make Changes
Efficiently And
Effectively
Utilize A
Repeatable
Process For
Handling
Changes
Cost savings Risk level
Service outages 0 1 0 3 2 High
Rework 3 0 3 3 2 High
Waste 3 0 3 3 2 High
Delayed solutions 0 0 3 3 0 High
Slow operational
processes 0 0 3 3 0 High
Security breaches 0 0 0 3 2 Moderate
Slow turnaround
times
3 0 0 3 0 High
Unexpected costs 3 1 3 3 2 High
Higher or escalating
costs
3 1 3 3 2 High
Slow response to
business needs and
changes
0 0 3 3 2 High
Inability to scale 3 0 3 0 0 High
Fines and penalties 0 0 0 0 2 Moderate
High levels of non-
value labor 3 0 3 3 2 High
Loss of market share 0 1 3 3 2 High
Loss of revenue/sales 3 0 3 0 2 High

CHAPTER 6 ACTION RESEARCH - CYCLE 2 (ARC2)
236
ITSMP2 Risk Level Scores
For this cycle, as agreed by senior management, the target risk threshold level
remained at 2.0 (moderate) for all dimensions of the ITSMP2. Table 6-33 shows the
ITSMP2 Risk Level scores and Risk Levels derived from the associated Business Risk
scores for all three processes.
Table 6-33 Incident Management: ITSMP2 Risk Levels
ITSM Process ITSMP2 Performance
Dimension
Risk Level
Score Risk Level
Incident
Management
Operational 3.0 High
Customer Satisfaction 3.0 High
Productivity 3.0 High
Market 3.0 High
Financial 3.0 High
Problem
Management
Operational 3.0 High
Customer Satisfaction 3.0 High
Productivity 3.0 High
Market 2.8 High
Financial 2.9 High
Change
Management
Operational 3.0 High
Customer Satisfaction 3.0 High
Productivity 3.0 High
Market 2.8 High
Financial 2.9 High
ITSMP2 Risk Level Scorecard
The ITSMP2 Risk Level scores in Table 6-33 is represented graphically to show their
deviation from their targets as shown in Figure 6-8, Figure 6-9, and Figure 6-10. As a
result of this outcome, Incident management process improvement plans have been
developed and are currently being executed on at Company X. Company X plans to
evaluate the actions taken over the following six months and then rerun this
measurement model to re-evaluate the ITSMP2 risks.

CHAPTER 6 ACTION RESEARCH - CYCLE 2 (ARC2)
237
Figure 6-8 ITSMP2 Risk Level Scorecard for Incident Management
Figure 6-9 ITSMP2 Risk Level Scorecard for Problem Management

CHAPTER 6 ACTION RESEARCH - CYCLE 2 (ARC2)
238
Figure 6-10 ITSMP2 Risk Level Scorecard for Change Management
6.3.5 Reflection on operationalizing the measurement model
A comparison of the ITSMP2 Risk Level scorecards for cycle 1 and cycle 2 revealed
that for Incident Management four of the ITSMP2 risk levels for cycle 2 were higher
than that of cycle 1 and one remained the same, while Problem Management and
Change Management risk levels were the same. Figure 6-11, Figure 6-12 and Figure
6-13 show a comparison of ITSMP2 risk levels for Incident Management, Problem
Management, and Change Management respectively cycle-over-cycle.

CHAPTER 6 ACTION RESEARCH - CYCLE 2 (ARC2)
239
Figure 6-11 Incident Management ITSMP2 Risk Level Scorecard for cycle 1 and cycle 2

CHAPTER 6 ACTION RESEARCH - CYCLE 2 (ARC2)
240
Figure 6-12 Problem Management ITSMP2 Risk Level Scorecard for cycle 1 and cycle 2
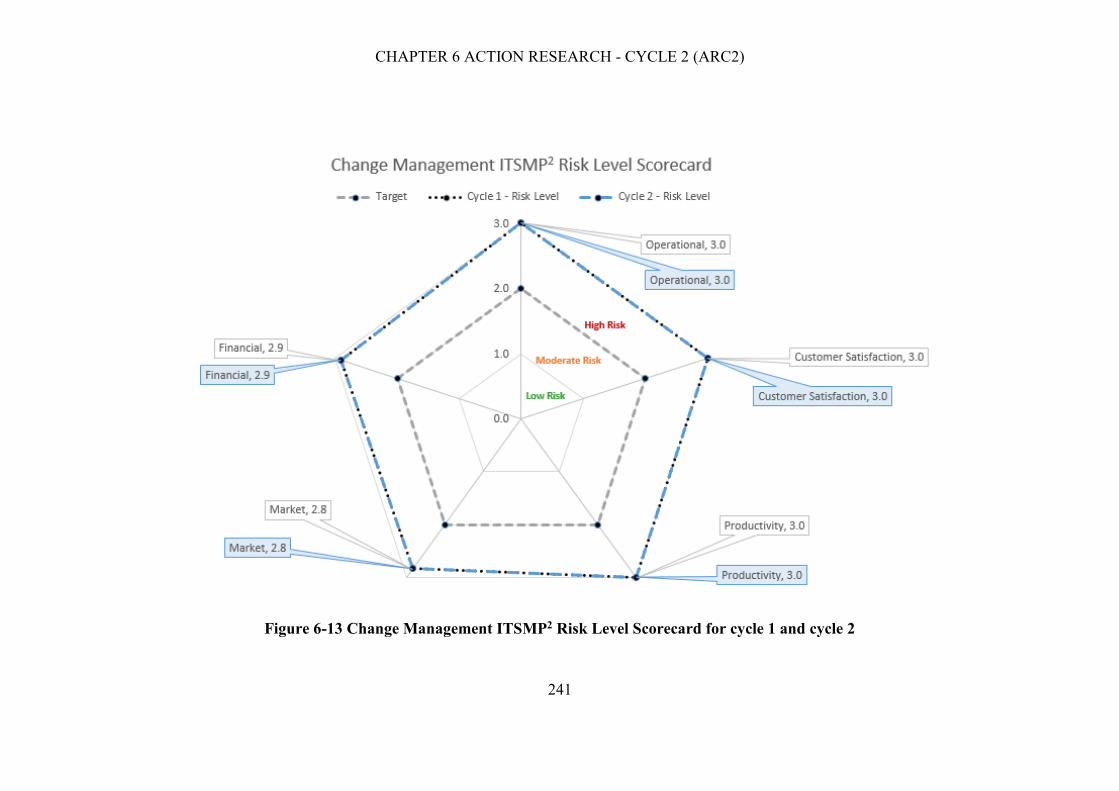
CHAPTER 6 ACTION RESEARCH - CYCLE 2 (ARC2)
241
Figure 6-13 Change Management ITSMP2 Risk Level Scorecard for cycle 1 and cycle 2

CHAPTER 6 ACTION RESEARCH - CYCLE 2 (ARC2)
242
In the reflection of Process Capability, in §6.2.2.2, it was determined that by using the
proportion of SMPA recommendations as a proxy measure for process capability, the
processes did improve yielding fewer recommendations in cycle 2 when compared to
cycle 1. In the reflection of process costs, in §6.2.2.4, the costs associated with running
the processes decreased year over year. Despite these two positive indicators of
improvement, the radar charts in Figure 6-11, Figure 6-12 and Figure 6-13 do not
indicate improvements in ITSMP2 risk levels.
This prompted further investigation into the underlying calculations of the ITSM3.
Incident Management
There are twelve KPI items for Incident Management, of which eight showed
improvement, two results remained the same and two scored worse when compared to
the results of cycle 1. Table 6-34 shows a comparison of Incident Management KPI
results between cycle 1 and cycle 2.
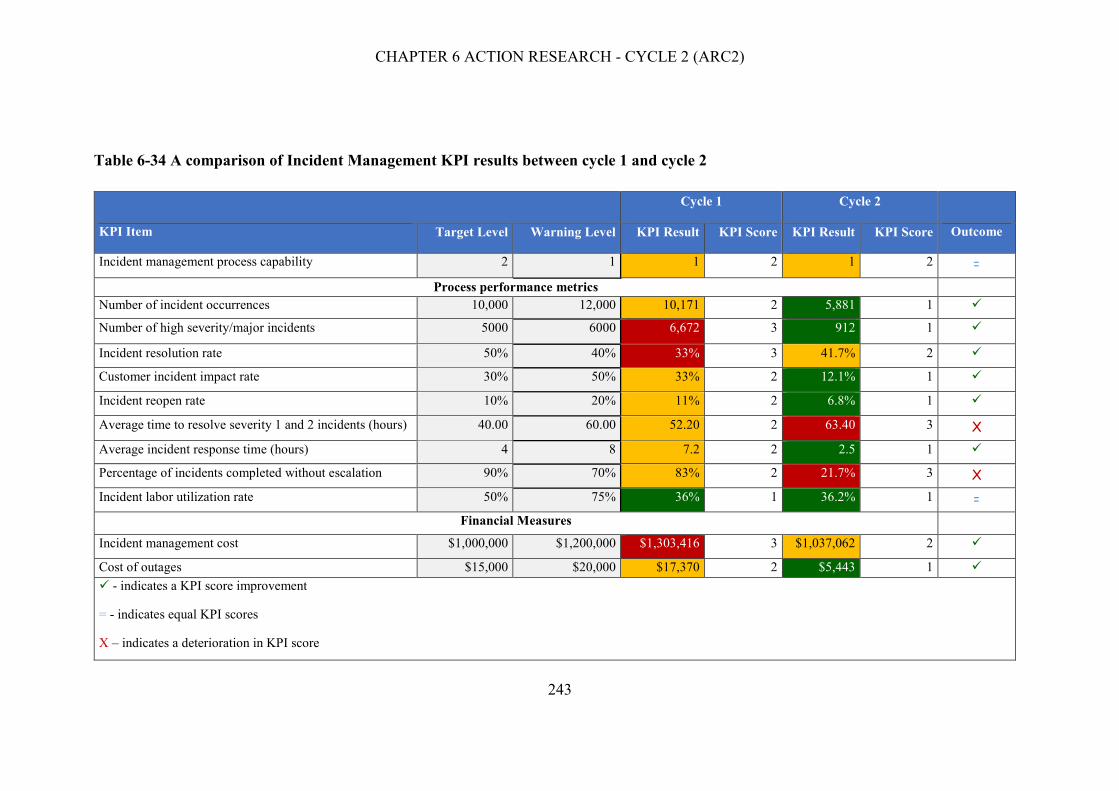
CHAPTER 6 ACTION RESEARCH - CYCLE 2 (ARC2)
243
Table 6-34 A comparison of Incident Management KPI results between cycle 1 and cycle 2
Cycle 1 Cycle 2
KPI Item Target Level Warning Level KPI Result KPI Score KPI Result KPI Score Outcome
Incident management process capability 2 1 1 2 1 2 =
Process performance metrics
Number of incident occurrences 10,000 12,000 10,171 2 5,881 1
Number of high severity/major incidents 5000 6000 6,672 3 912 1
Incident resolution rate 50% 40% 33% 3 41.7% 2
Customer incident impact rate 30% 50% 33% 2 12.1% 1
Incident reopen rate 10% 20% 11% 2 6.8% 1
Average time to resolve severity 1 and 2 incidents (hours) 40.00 60.00 52.20 2 63.40 3 X
Average incident response time (hours) 4 8 7.2 2 2.5 1
Percentage of incidents completed without escalation 90% 70% 83% 2 21.7% 3 X
Incident labor utilization rate 50% 75% 36% 1 36.2% 1 =
Financial Measures
Incident management cost $1,000,000 $1,200,000 $1,303,416 3 $1,037,062 2
Cost of outages $15,000 $20,000 $17,370 2 $5,443 1
- indicates a KPI score improvement
= - indicates equal KPI scores
X – indicates a deterioration in KPI score

CHAPTER 6 ACTION RESEARCH - CYCLE 2 (ARC2)
244
Although 67 percent (8 out of 12) of KPI scores improved cycle over cycle, of the five
CSFs, one decreased in attainment while four remained the same cycle-over-cycle.
Table 6-35 shows a comparison of Incident Management CSF attainment levels for
between cycle 1 and cycle 2.
Table 6-35 A comparison of Incident Management CSF attainment levels for
between cycle 1 and cycle 2
Critical Success Factor Cycle 1 Attainment Cycle 2 Attainment
Quickly Resolve Incidents Low Low
Maintain IT Service Quality Low Low
Improve IT And Business
Productivity Low Low
Effectively Resolve Incidents Moderate Low
Cost Savings Low Low
Problem Management
There are eleven KPI items for Problem Management, of which four showed
improvement, six results remained the same, and one scored worse when compared to
the results of cycle 1. Table 6-36 shows a comparison of Problem Management KPI
results between cycle 1 and cycle 2.

CHAPTER 6 ACTION RESEARCH - CYCLE 2 (ARC2)
245
Table 6-36 A comparison of Problem Management KPI results between cycle 1 and cycle 2
Cycle 1 Cycle 2
KPI Item Target
Level
Warning
Level
KPI Result KPI
Score
KPI
Result
KPI
Score
Outcome
Problem management process capability 2 1 1 2 1 2 =
Process performance metrics
Incident Repeat Rate 15% 20% 28.57% 3 0% 1
Number Of Major Problems 10 12 8 1 7 1 = Problem Resolution Rate 90% 80% 19.3% 3 87.5% 2
Problem Workaround Rate 30% 50% 6.0% 1 31.3% 2 X Problem Reopen Rate 10% 20% 3.6% 1 0% 1 =
Customer Impact Rate 15% 20% 0% 1 0% 1 =
Average Problem Resolution Time - Severity 1 and
2 Problems (Hours) 80 120 664.5 3 473.2 3 =
Problem Labor Utilization Rate 50% 75% 20% 1 20% 1 =
Financial Measures
Problem management cost $1,000,00
0
$1,200,0
00
$1,141,073 2 $747,005 1
Cost of outages $15,000 $20,000 $17,370 2 $5,443 1
- indicates a KPI score improvement
= - indicates equal KPI scores
X – indicates a deterioration in KPI score

CHAPTER 6 ACTION RESEARCH - CYCLE 2 (ARC2)
246
Although 36 percent (4 out of 11) of KPI scores improved cycle over cycle, of the five
CSFs, only one increased in attainment while four remained the same cycle-over-
cycle. Table 6-37 shows a comparison of Problem Management CSF attainment levels
for cycle 1 and cycle 2
Table 6-37 A comparison of Problem Management CSF attainment levels for
between cycle 1 and cycle 2
Critical Success Factor Cycle 1 Attainment Cycle 2 Attainment
Minimize Impact Of Problems
(Reduce Incident
Frequency/Duration) Low Low
Reduce Unplanned Labor Spent
On Incidents Low Moderate
Improve Quality Of Services
Being Delivered Low Low
Effectively Resolve Problems
and Errors Low Low
Cost Savings Moderate Moderate
Change Management
There are 11 KPI items for Change Management, of which three showed improvement,
seven results remained the same, and one scored worse when compared to the results
of cycle 1. Table 6-38 shows a comparison of Change Management KPI results for
cycle 1 and cycle 2.

CHAPTER 6 ACTION RESEARCH - CYCLE 2 (ARC2)
247
Table 6-38 A comparison of Change Management KPI results between cycle 1 and cycle 2
Cycle 1 Cycle 2
KPI Item Target
Level
Warning
Level
KPI
Result
KPI
Score
KPI
Result
KPI
Score Outcome
Change management process capability 2 1 1 2 1 2 =
Process performance metrics
Change Efficiency Rate 80% 65% 3.3% 3 2.6% 3 =
Change Success Rate 80% 70% 86% 1 48% 1 =
Emergency Change Rate 60% 80% 57.7% 1 191.7% 3 X
Change Reschedule Rate 30% 50% 65.5% 3 3.2% 1
Average Process Time Per Change (Hours) 10% 20% 401.6 3 57.4 2
Unauthorized Change Rate 15% 20% 0.6% 1 1.9% 1 = Change Incident Rate 5% 7% 0.2% 1 0.8% 1 =
Change Labor Workforce Utilization 50% 75% 81% 3 81% 3 = Financial Measures
Change management cost $1,000,000 $1,200,000 $820,061 1 $585,274 1 = Cost of outages $15,000 $20,000 $17,370 2 $5,443 1 - indicates a KPI score improvement
= - indicates equal KPI scores
X – indicates a deterioration in KPI score

CHAPTER 6 ACTION RESEARCH - CYCLE 2 (ARC2)
248
27 percent (3 out of 11) of KPI scores improved cycle over cycle, but of the five CSFs,
one increased in attainment while four remained the same cycle-over-cycle. Table 6-39
shows a comparison of Change Management CSF attainment levels for cycle 1 and
cycle 2
Table 6-39 A comparison of Change Management CSF attainment levels for
between cycle 1 and cycle 2
Critical Success Factor Cycle 1 Attainment Cycle 2 Attainment
Protect Services When
Making Changes Low Low
Make Changes Quickly And
Accurately In Line With
Business Needs Low High
Make Changes Efficiently
And Effectively Low Low
Utilize A Repeatable Process
For Handling Changes Low Low
Cost Savings Moderate Moderate
To meet the quality requirements of data used to populate the ITSM3, a first level
analysis of the operational metrics data generated by the researcher were analyzed
periodically by process managers for accuracy and applicability by reviewing the
Zendesk metrics of what to measure, how to measure, and the filters applied.
As an example, Figure 6-14 shows the What was measured, and the SQL statement
used to derive the metric. Figure 6-15 shows the filters applied to the query to derive
the number of Incidents reported.

CHAPTER 6 ACTION RESEARCH - CYCLE 2 (ARC2)
249
Figure 6-14 Zendesk metrics for number of Incidents
Figure 6-15 Zendesk metrics filters for number of Incidents
A second level of data quality analysis was conducted by the researcher and process
managers on the derivation of the KPI results, by examining the Excel formulas for

CHAPTER 6 ACTION RESEARCH - CYCLE 2 (ARC2)
250
the KPI results column. A further analysis was conducted on the KPI scoring based on
where the KPI result fell within the tolerance threshold range.
The third level of data quality analysis involved the scrutiny of how the KPIs
contributed to their associated CSF. The anomaly evident in the Incident Management
results prompted an analysis of the measurement model by the researcher. Steinberg’s
model assumes that all KPIs are equally valuable in achieving their associated CSF. In
contrast, an analysis by the researcher and senior management of how the KPIs were
scored and CSFs derived, revealed that in practice not all KPIs contribute equally to
attaining their associated CSF. To incorporate this realization, Steinberg’s approach
was modified to weight the KPIs associated with each CSF to better align with the
organization’s strategic goal. Weighting factors can be used to define the level of
importance of criteria (Paule & Mandel 1982). The attainment levels of CSFs are then
re-determined using the weighted average of the KPIs associated with them.
The KPI weighted average (�̅�) is equal to the summation of the product of the KPI
weight (wi) times the KPI score (xi) divided by the sum of the KPI weights. Figure
6-16 shows the KPI weighted average formula.
Figure 6-16 KPI Weighted Average Formula
In a further modification to the Steinberg model, the CSFs were also weighted to
determine the Business Risk Mitigation Level scores, and the ITSMP2 Attainment
Level scores were calculated as the weighted average of the associated CSFs scores.
The ITSMP2 Attainment Levels were derived by applying the ordinal NPLF scale: Not
(N); Partially (P); Largely (L) and Fully (F) as defined in the measurement framework
of ISO/IEC 15504 standard (ISO/IEC 2004).
Steinberg’s KPI scoring method scores the best outcome with a value of 1 and the
worst outcome with a value of 3. As this method seemed counter-intuitive, it was
reversed to score 3 for KPIs meeting their targets, 2 for KPIs between target and
warning thresholds, and 1 for KPIs not meeting their target.

CHAPTER 6 ACTION RESEARCH - CYCLE 2 (ARC2)
251
CSFs are scored by transforming the maximum score of the associated KPIs from the
ordinal scale to an integer value for the attainment of the CSF. The scoring method
was modified to align with the CSF NPLF scoring method.
Application of the enhanced ITSM3
The recommendation ratio (described in §6.3.2), normalized salaries for cycle 2
(described in §6.3.3.1) and the enhanced scoring method described above was applied
to the three ITSM processes at Company X. Table 6-40, Table 6-41, and Table 6-42
show a comparison of the KPI results for the three processes using the enhanced
ITSM3.

CHAPTER 6 ACTION RESEARCH - CYCLE 2 (ARC2)
252
Table 6-40 A comparison of Incident Management KPI results using the enhanced ITSM3
Cycle 1 Cycle 2
KPI Item Target
Level
Warning
Level KPI Result KPI Score KPI Result KPI Score
Incident management recommendation ratio 10% 20% 14.5% 2 0% 3
Process performance metrics
Number of incident occurrences 10,000 12,000 10,171 2 5,881 3
Number of high severity/major incidents 5,000 6,000 6,672 1 912 3
Incident resolution rate 50% 40% 33% 1 42% 2
Customer incident impact rate 30% 50% 33% 2 12% 3
Incident reopen rate 10% 20% 11% 2 7% 3
Average time to resolve severity 1 and 2 incidents (hours) 40 60 52.20 2 63.40 1
Average incident response time (hours) 4 8 7.2 2 2.5 3
Percentage of incidents completed without escalation 90% 70% 83% 2 22% 1
Incident labor utilization rate 50% 75% 36% 3 36% 3

CHAPTER 6 ACTION RESEARCH - CYCLE 2 (ARC2)
253
Cycle 1 Cycle 2
KPI Item Target
Level
Warning
Level KPI Result KPI Score KPI Result KPI Score
Financial Measures
Incident management cost $1,000,000 $1,200,000 $1,303,416 1 $1,307,062 1
Cost of outages $15,000 $20,000 $17,370 2 $5,443 3

CHAPTER 6 ACTION RESEARCH - CYCLE 2 (ARC2)
254
Table 6-41 A comparison of Problem Management KPI results using the enhanced ITSM3
Cycle 1 Cycle 2
KPI Item Target
Level
Warning
Level KPI Result KPI Score KPI Result KPI Score
Problem management recommendation ratio 10% 20% 52.3% 1 10.8% 2
Process performance metrics
Incident repeat rate 15% 20% 10,171 2 5,881 3
Number of major problems 10 12 6,672 1 912 3
Problem resolution rate 90.0% 80.0% 33% 1 42% 2
Problem workaround rate 30.0% 50.0% 33% 2 12% 3
Problem reopen rate 10.0% 20.0% 11% 2 7% 3
Customer impact rate 15.0 20.0 52.20 2 63.40 1
Average problem resolution time - severity 1 and 2
problems (days) 80.0 100.0 7.2 2 2.5 3
Problem labor utilization rate 50% 75% 83% 2 22% 1
Incident repeat rate 15% 20% 36% 3 36% 3

CHAPTER 6 ACTION RESEARCH - CYCLE 2 (ARC2)
255
Cycle 1 Cycle 2
KPI Item Target
Level
Warning
Level KPI Result KPI Score KPI Result KPI Score
Financial Measures
Problem management cost $1,000,000 $1,200,000 $1,141,073 2 $747,005 3
Cost of outages $15,000 $20,000 $17,370 2 $5,443 3

CHAPTER 6 ACTION RESEARCH - CYCLE 2 (ARC2)
256
Table 6-42 A comparison of Change Management KPI results using the enhanced ITSM3
Cycle 1 Cycle 2
KPI Item Target
Level
Warning
Level KPI Result KPI Score KPI Result KPI Score
Change management recommendation ratio 10% 20% 20.6% 1 5.9% 3
Process performance metrics
Change Efficiency Rate 80% 65% 3.3% 1 2.6% 1
Change Success Rate 80% 70% 86% 3 48% 1
Emergency Change Rate 60% 80% 57.7% 3 191.7% 1
Change Reschedule Rate 30% 50% 65.5% 1 3.2% 3
Average Process Time Per Change (Hours) 160 200 401.6 1 57.4 2
Unauthorized Change Rate 15% 20% 0.6% 3 1.9% 3
Change Incident Rate 5% 7% 0.2% 3 0.8% 3
Change Labor Workforce Utilization 50% 75% 81% 1 81% 1
Financial Measures
Change management cost $1,000,000 $1,200,000 $820,061 3 $585,274 3
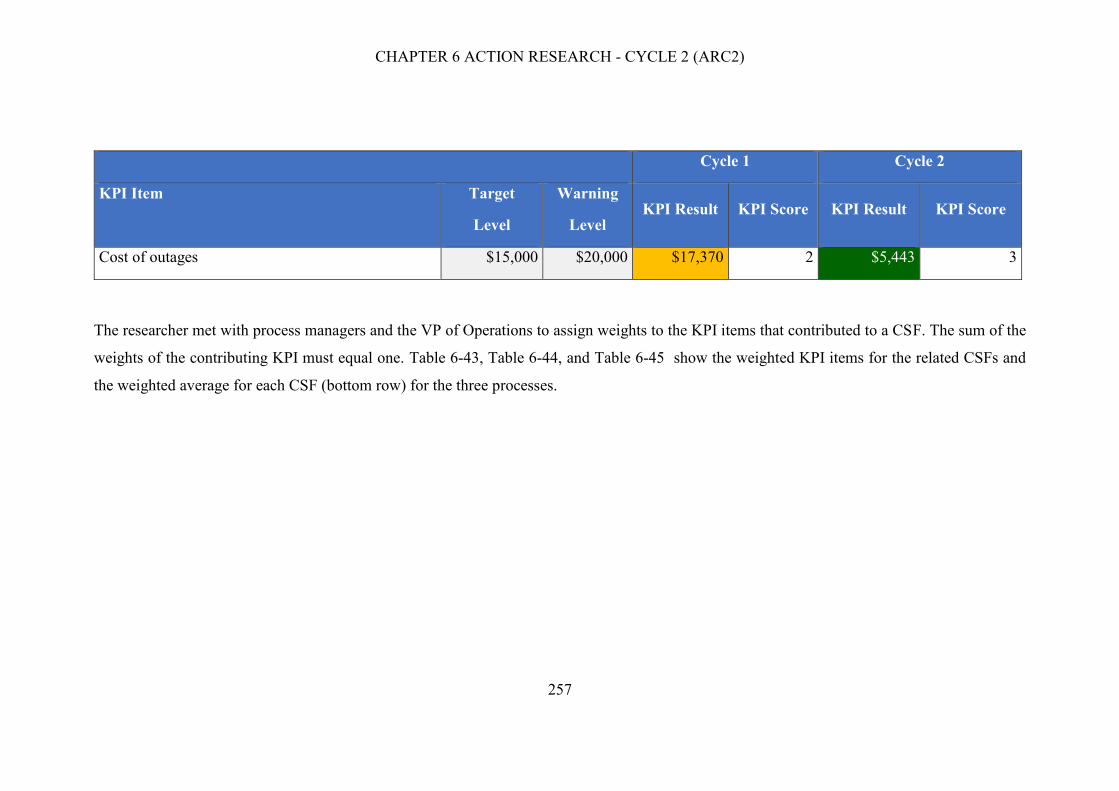
CHAPTER 6 ACTION RESEARCH - CYCLE 2 (ARC2)
257
Cycle 1 Cycle 2
KPI Item Target
Level
Warning
Level KPI Result KPI Score KPI Result KPI Score
Cost of outages $15,000 $20,000 $17,370 2 $5,443 3
The researcher met with process managers and the VP of Operations to assign weights to the KPI items that contributed to a CSF. The sum of the
weights of the contributing KPI must equal one. Table 6-43, Table 6-44, and Table 6-45 show the weighted KPI items for the related CSFs and
the weighted average for each CSF (bottom row) for the three processes.

CHAPTER 6 ACTION RESEARCH - CYCLE 2 (ARC2)
258
Table 6-43 Incident Management CSFs and related weighted KPIs
KPI Item KPI
Score
Quickly Resolve
Incidents
Maintain IT
Service Quality
Improve IT And
Business
Productivity
Effectively Resolve
Incidents Cost Savings
Incident management
process capability 3 0.00 0.00 0.10 0.00 0.15
Number of incident
occurrences 3 0.00 0.00 0.15 0.00 0.00
Number of high
severity/major incidents 3 0.10 0.15 0.00 0.00 0.10
Incident resolution rate 2 0.25 0.00 0.10 0.00 0.10
Customer incident impact
rate 3 0.00 0.15 0.00 0.00 0.00
Incident reopen rate 3 0.15 0.00 0.15 0.00 0.00
Average time to resolve
severity 1 and 2 incidents
(hours) 1 0.15 0.20 0.00 0.25 0.00
Average incident response
time (hours) 3 0.00 0.30 0.20 0.00 0.00
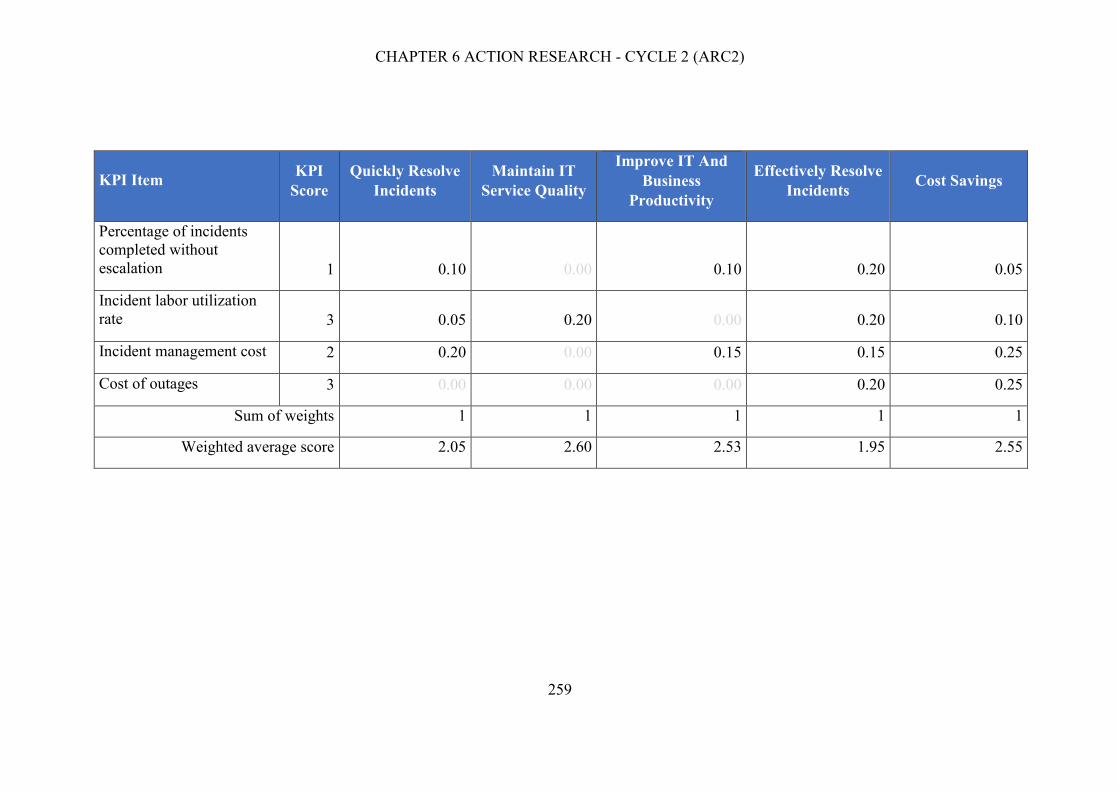
CHAPTER 6 ACTION RESEARCH - CYCLE 2 (ARC2)
259
KPI Item KPI
Score
Quickly Resolve
Incidents
Maintain IT
Service Quality
Improve IT And
Business
Productivity
Effectively Resolve
Incidents Cost Savings
Percentage of incidents
completed without
escalation 1 0.10 0.00 0.10 0.20 0.05
Incident labor utilization
rate 3 0.05 0.20 0.00 0.20 0.10
Incident management cost 2 0.20 0.00 0.15 0.15 0.25
Cost of outages 3 0.00 0.00 0.00 0.20 0.25
Sum of weights 1 1 1 1 1
Weighted average score 2.05 2.60 2.53 1.95 2.55

CHAPTER 6 ACTION RESEARCH - CYCLE 2 (ARC2)
260
Table 6-44 Problem Management CSFs and related weighted KPIs
KPI Item KPI
Score
Minimize Impact
Of Problems
(Reduce Incident
Frequency/Durati
on)
Reduce
Unplanned Labor
Spent On
Incidents
Improve Quality
Of Services Being
Delivered
Effectively Resolve
Problems and
Errors
Cost Savings
Problem management
process capability 2 0.00 0.00 0.00 0.00 0.15
Incident Repeat Rate 3 0.30 0.25 0.00 0.00 0.00
Number Of Major
Problems 3 0.25 0.00 0.00 0.00 0.00
Problem Resolution Rate 2 0.00 0.20 0.00 0.00 0.00
Problem Workaround Rate 2 0.25 0.00 0.15 0.00 0.00
Problem Reopen Rate 3 0.10 0.15 0.00 0.35 0.00
Customer Impact Rate 3 0.00 0.10 0.20 0.00 0.20
Average Problem
Resolution Time - Severity
1 and 2 Problems (Hours) 1 0.10 0.00 0.45 0.15 0.00

CHAPTER 6 ACTION RESEARCH - CYCLE 2 (ARC2)
261
KPI Item KPI
Score
Minimize Impact
Of Problems
(Reduce Incident
Frequency/Durati
on)
Reduce
Unplanned Labor
Spent On
Incidents
Improve Quality
Of Services Being
Delivered
Effectively Resolve
Problems and
Errors
Cost Savings
Problem Labor Utilization
Rate 3 0.00 0.30 0.00 0.30 0.35
Incident Repeat Rate 3 0.30 0.25 0.00 0.00 0.00
Incident management cost 3 0.00 0.00 0.20 0.00 0.30
Cost of outages 3 0.00 0.00 0.00 0.20 0.00
Sum of weights 1 1 1 1 1
Weighted average score 2.55 2.80 1.95 2.70 2.85

CHAPTER 6 ACTION RESEARCH - CYCLE 2 (ARC2)
262
Table 6-45 Change Management CSFs and related weighted KPIs
KPI Item KPI
Score
Protect Services
When Making
Changes
Make Changes
Quickly And
Accurately In
Line With
Business Needs
Make Changes
Efficiently And
Effectively
Utilize A
Repeatable
Process For
Handling
Changes
Cost Savings
Incident management process capability 3 0.00 0.00 0.00 0.25 0.35
Number of incident occurrences 1 0.00 0.00 0.00 0.00 0.00
Number of high severity/major incidents 1 0.00 0.00 0.00 0.00 0.00
Incident resolution rate 1 0.35 0.00 0.00 0.00 0.00
Customer incident impact rate 3 0.00 0.20 0.00 0.00 0.00
Incident reopen rate 2 0.20 0.00 0.25 0.00 0.00
Average time to resolve severity 1 and 2
incidents (hours) 3 0.20 0.30 0.00 0.25 0.00
Average incident response time (hours) 3 0.00 0.20 0.20 0.00 0.15
Percentage of incidents completed
without escalation 1 0.25 0.00 0.25 0.25 0.00
Incident labor utilization rate 1 0.00 0.00 0.00 0.00 0.00
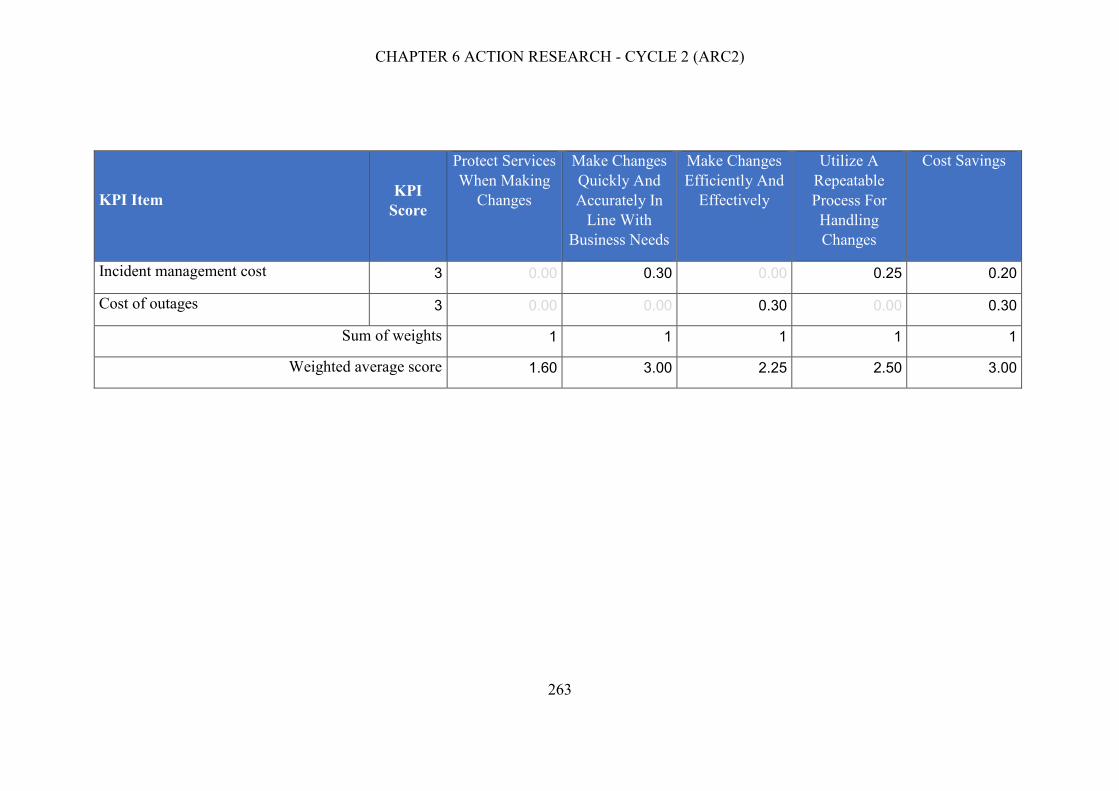
CHAPTER 6 ACTION RESEARCH - CYCLE 2 (ARC2)
263
KPI Item KPI
Score
Protect Services
When Making
Changes
Make Changes
Quickly And
Accurately In
Line With
Business Needs
Make Changes
Efficiently And
Effectively
Utilize A
Repeatable
Process For
Handling
Changes
Cost Savings
Incident management cost 3 0.00 0.30 0.00 0.25 0.20
Cost of outages 3 0.00 0.00 0.30 0.00 0.30
Sum of weights 1 1 1 1 1
Weighted average score 1.60 3.00 2.25 2.50 3.00

CHAPTER 6 ACTION RESEARCH - CYCLE 2 (ARC2)
264
The formula presented in Figure 6-16 was applied to derive the weighted average score
for each CSF. Using the Change Management process and the CSF Cost Savings as an
example, the score was derived as follows:
�̅� = [(0.35*3) + (0.15*3) + (0.2*3) + (0.3*3)] / 1
= 3.00
To derive the CSF attainment level for a process, the weighted average score for each
CSF (as shown in the last row of Table 6-43, Table 6-44, and Table 6-45) was divided
by the maximum attainable score of 3, and the attainment level was derived by
determining the point in ordinal NPLF scale that the result fell. If the result was greater
than 0.85, an attainment level of Fully (F) was assigned to the CSF. If the result was
greater than 0.50 and less than or equal to 0.85, an attainment level of Largely (L) was
assigned to the CSF. If the result was greater than 0.15 and less than or equal to 0.50,
an attainment level of Partially (P) was assigned to the CSF. If the result was less than
or equal to 0.15, an attainment level of Not (N) was assigned to the CSF.
The comparison of the CSF attainment levels for the three processes for cycle 1 and
cycle 2 after applying the enhanced ITSM3 is shown in Table 6-46, Table 6-47 and
Table 6-48.
Table 6-46 Comparison of Incident Management CSF attainment levels for cycle
1 and cycle 2 using the enhanced ITSM3
Critical Success Factor Cycle 1
Attainment
Cycle 2
Attainment
Quickly resolve incidents P L
Maintain IT service quality L F
Improve IT and business productivity L F
Effectively resolve incidents L L
Cost savings L L
Table 6-46 shows that three CSFs achieved a higher attainment level in cycle 2
compared to cycle 1, and two CSFs remained at the same level. However, in §6.2.2.6
in reflecting on operationalizing the measurement model, Table 6-35 shows that one
CSF lowered its attainment levels while four remained the same.

CHAPTER 6 ACTION RESEARCH - CYCLE 2 (ARC2)
265
Table 6-47 Comparison of Problem Management CSF attainment levels for cycle
1 and cycle 2 using the enhanced ITSM3
Critical Success Factor Cycle 1
Attainment
Cycle 2
Attainment
Minimize Impact Of Problems (Reduce
Incident Frequency/Duration) F L
Reduce Unplanned Labor Spent On
Incidents L F
Improve Quality Of Services Being
Delivered L L
Effectively Resolve Problems and Errors L F
Cost Savings L F
Table 6-47 shows that three CSFs achieved higher attainment levels in cycle 2
compared to cycle 1, one CSF remained at the same level, and one achieved a lower
attainment level. However, in §6.2.2.6 in reflecting on operationalizing the
measurement model, Table 6-37 shows that one CSF increased its attainment level
while four remained the same.
Table 6-48 Comparison of Change Management CSF attainment levels for cycle
1 and cycle 2 using the enhanced ITSM3
Critical Success Factor Cycle 1
Attainment
Cycle 2
Attainment
Quickly resolve incidents L L
Maintain IT service quality F F
Improve IT and business productivity L L
Effectively resolve incidents L L
Cost savings L F
Table 6-48 shows that one CSF achieved a higher attainment level in cycle 2 compared
to cycle 1, and four CSFs remained at the same level. However, in §6.2.2.6 in reflecting
on operationalizing the measurement model, Table 6-39 shows that one CSF increased
its attainment level while four remained the same.
For the business risks that are associated with a CSF, the weighted averages of the
applicable CSF scores were used to determine the Business Risk Mitigation Level

CHAPTER 6 ACTION RESEARCH - CYCLE 2 (ARC2)
266
scores. Table 6-49, Table 6-50, and Table 6-51 show the CSF weighted averages for
those CSFs associated with business risks in cycle 1 (last column) for all three
processes.

CHAPTER 6 ACTION RESEARCH - CYCLE 2 (ARC2)
267
Table 6-49 Weighted average of Incident Management CSFs associated with business risks
Business Risk Operational Customer
Satisfaction Productivity Market Financial
Weighted
Average
Service outages 0.00 0.15 0.00 0.10 0.05 0.82
Rework 0.15 0.00 0.15 0.05 0.05 0.75
Waste 0.10 0.00 0.20 0.05 0.05 0.75
Delayed solutions 0.00 0.00 0.15 0.10 0.00 0.81
Slow operational processes 0.00 0.00 0.15 0.05 0.00 0.79
Security breaches 0.00 0.25 0.00 0.00 0.05 0.79
Slow turnaround times 0.00 0.00 0.00 0.05 0.00 0.67
Unexpected costs 0.20 0.20 0.05 0.05 0.15 0.82
Higher or escalating costs 0.10 0.10 0.05 0.10 0.15 0.82
Slow response to business
needs and changes 0.10 0.00 0.05 0.05 0.05 0.81
Inability to scale 0.15 0.00 0.10 0.00 0.00 0.78
Fines and penalties 0.00 0.00 0.00 0.00 0.15 0.85
High levels of non-value labor 0.20 0.00 0.05 0.05 0.05 0.77
Loss of market share 0.00 0.15 0.05 0.20 0.05 0.82
Loss of revenue/sales 0.00 0.15 0.00 0.15 0.20 0.82

CHAPTER 6 ACTION RESEARCH - CYCLE 2 (ARC2)
268
Table 6-50 Weighted average of Problem Management CSFs associated with business risks
Business Risk Operational Customer Satisfaction
Productivity Market Financial Weighted
Average
Service outages 0.00 0.15 0.00 0.10 0.05 0.94
Rework 0.15 0.00 0.15 0.05 0.05 0.84
Waste 0.10 0.00 0.20 0.05 0.05 0.84
Delayed solutions 0.00 0.00 0.15 0.10 0.00 0.83
Slow operational processes 0.00 0.00 0.15 0.05 0.00 0.83
Security breaches 0.00 0.25 0.00 0.00 0.05 0.94
Slow turnaround times 0.00 0.00 0.00 0.05 0.00 0.83
Unexpected costs 0.20 0.20 0.05 0.05 0.15 0.90
Higher or escalating costs 0.10 0.10 0.05 0.10 0.15 0.90
Slow response to business needs
and changes 0.10 0.00 0.05 0.05 0.05 0.85
Inability to scale 0.15 0.00 0.10 0.00 0.00 0.78
Fines and penalties 0.00 0.00 0.00 0.00 0.15 0.95
High levels of non-value labor 0.20 0.00 0.05 0.05 0.05 0.85
Loss of market share 0.00 0.15 0.05 0.20 0.05 0.88
Loss of revenue/sales 0.00 0.15 0.00 0.15 0.20 0.87

CHAPTER 6 ACTION RESEARCH - CYCLE 2 (ARC2)
269
Table 6-51 Weighted average of Change Management CSFs associated with business risks
Business Risk Operational Customer Satisfaction
Productivity Market Financial
Weighte
d
Average
Service outages 0.00 0.15 0.00 0.10 0.05 0.97
Rework 0.15 0.00 0.15 0.05 0.05 0.73
Waste 0.10 0.00 0.20 0.05 0.05 0.73
Delayed solutions 0.00 0.00 0.15 0.10 0.00 0.78
Slow operational processes 0.00 0.00 0.15 0.05 0.00 0.78
Security breaches 0.00 0.25 0.00 0.00 0.05 0.95
Slow turnaround times 0.00 0.00 0.00 0.05 0.00 0.65
Unexpected costs 0.20 0.20 0.05 0.05 0.15 0.90
Higher or escalating costs 0.10 0.10 0.05 0.10 0.15 0.90
Slow response to business needs and
changes 0.10 0.00 0.05 0.05 0.05 0.83
Inability to scale 0.15 0.00 0.10 0.00 0.00 0.64
Fines and penalties 0.00 0.00 0.00 0.00 0.15 1.00
High levels of non-value labor 0.20 0.00 0.05 0.05 0.05 0.78
Loss of market share 0.00 0.15 0.05 0.20 0.05 0.88
Loss of revenue/sales 0.00 0.15 0.00 0.15 0.20 0.82

CHAPTER 6 ACTION RESEARCH - CYCLE 2 (ARC2)
270
Business Risk mitigation levels were derived using the weighted average scores of the
associated CSFs. Using the same NPLF scale, higher weighted average scores mean
business risk mitigation levels. Table 6-52 shows the mapping of the NPLF scale to
business risk levels.
Table 6-52 Mapping of the NPLF scale to business risk mitigation levels
Business Risk Mitigation Level Scale %
N 0 - 15
P >15 - 50
L >50 - 85
F >85 - 100
The business risk mitigation levels of cycle 1 were compared to that of cycle 2. Table
6-53 shows a comparison of Incident Management business risk mitigation levels
between cycle 1 and cycle 2. All of the Incident Management business risks remained
at the same business risk mitigation level of Largely.
Table 6-53 Comparison of Incident Management business risk levels for cycle 1
and cycle 2
Business Risk
Cycle 1
Business Risk
Mitigation
Level
Cycle 2
Business Risk
Mitigation
Level
Service outages L L
Rework L L
Waste L L
Delayed solutions L L
Slow operational processes L L
Security breaches L L
Slow turnaround times L L
Unexpected costs L L
Higher or escalating costs L L
Slow response to business needs and changes L L
Inability to scale L L
Fines and penalties L L
High levels of non-value labor L L
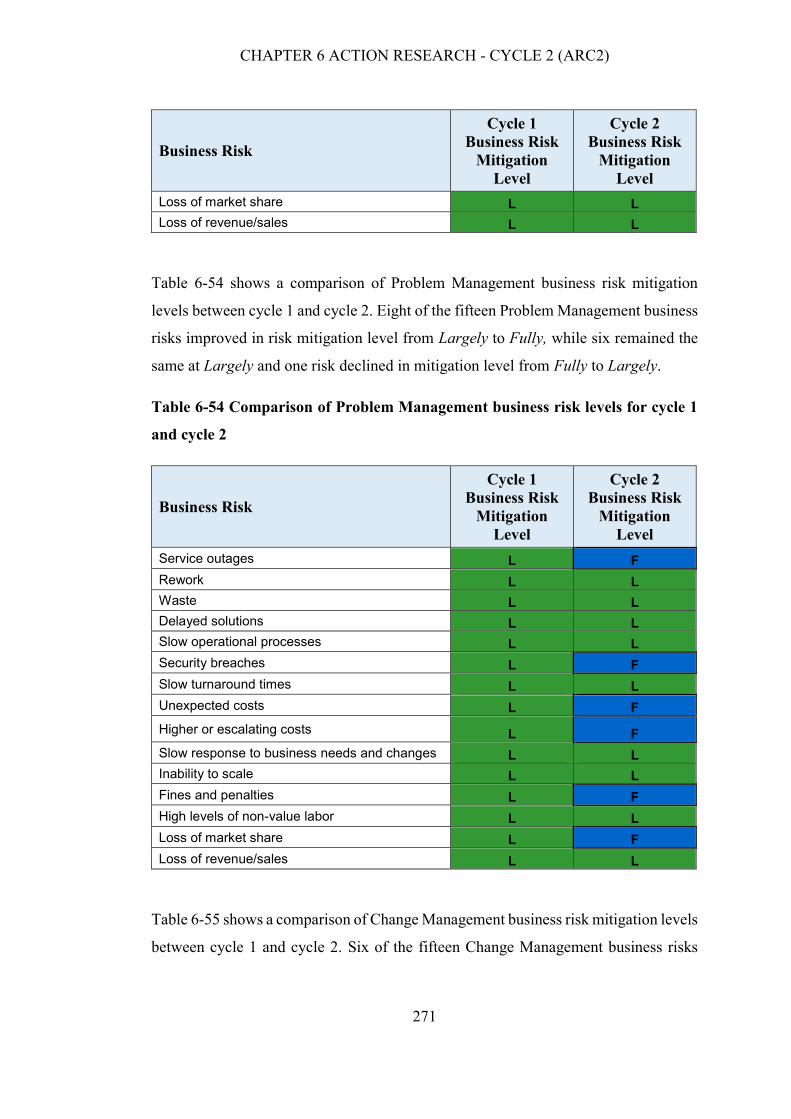
CHAPTER 6 ACTION RESEARCH - CYCLE 2 (ARC2)
271
Business Risk
Cycle 1
Business Risk
Mitigation
Level
Cycle 2
Business Risk
Mitigation
Level
Loss of market share L L
Loss of revenue/sales L L
Table 6-54 shows a comparison of Problem Management business risk mitigation
levels between cycle 1 and cycle 2. Eight of the fifteen Problem Management business
risks improved in risk mitigation level from Largely to Fully, while six remained the
same at Largely and one risk declined in mitigation level from Fully to Largely.
Table 6-54 Comparison of Problem Management business risk levels for cycle 1
and cycle 2
Business Risk
Cycle 1
Business Risk
Mitigation
Level
Cycle 2
Business Risk
Mitigation
Level
Service outages L F
Rework L L
Waste L L
Delayed solutions L L
Slow operational processes L L
Security breaches L F
Slow turnaround times L L
Unexpected costs L F
Higher or escalating costs L F
Slow response to business needs and changes L L
Inability to scale L L
Fines and penalties L F
High levels of non-value labor L L
Loss of market share L F
Loss of revenue/sales L L
Table 6-55 shows a comparison of Change Management business risk mitigation levels
between cycle 1 and cycle 2. Six of the fifteen Change Management business risks

CHAPTER 6 ACTION RESEARCH - CYCLE 2 (ARC2)
272
improved in risk mitigation level from Largely to Fully while nine remained at
Largely.
Table 6-55 Comparison of Change Management business risk levels for cycle 1
and cycle 2
Business Risk
Cycle 1 Business
Risk Mitigation
Level
Cycle 2 Business
Risk Mitigation
Level
Service outages L F
Rework L L
Waste L L
Delayed solutions L L
Slow operational processes L L
Security breaches L F
Slow turnaround times L L
Unexpected costs L F
Higher or escalating costs L F
Slow response to business needs and changes L L
Inability to scale L L
Fines and penalties L F
High levels of non-value labor L L
Loss of market share L F
Loss of revenue/sales L L
For the business risks that are associated with an ITSMP2 Performance Dimension, the
weighted averages of the applicable Business Risk Mitigation scores were used to
determine the ITSMP2 Attainment Level scores. Table 6-56, Table 6-57, and Table
6-58 show the Business Risk Mitigation weighted averages for those business risks
associated with ITSMP2 dimensions in cycle 2 (second last row), and the ITSMP2
Attainment Level (last row) for the three processes.

CHAPTER 6 ACTION RESEARCH - CYCLE 2 (ARC2)
273
Table 6-56 Weighted average of Incident Management Business Risk Mitigation scores associated with ITSMP2 dimensions
Business Risk Operational Customer Satisfaction Productivity Market Financial
Service outages 0.00 0.15 0.00 0.10 0.05
Rework 0.15 0.00 0.15 0.05 0.05
Waste 0.10 0.00 0.20 0.05 0.05
Delayed solutions 0.00 0.00 0.15 0.10 0.00
Slow operational processes 0.00 0.00 0.15 0.05 0.00
Security breaches 0.00 0.25 0.00 0.00 0.05
Slow turnaround times 0.00 0.00 0.00 0.05 0.00
Unexpected costs 0.20 0.20 0.05 0.05 0.15
Higher or escalating costs 0.10 0.10 0.05 0.10 0.15
Slow response to business needs and
changes 0.10 0.00 0.05 0.05 0.05
Inability to scale 0.15 0.00 0.10 0.00 0.00
Fines and penalties 0.00 0.00 0.00 0.00 0.15
High levels of non-value labor 0.20 0.00 0.05 0.05 0.05
Loss of market share 0.00 0.15 0.05 0.20 0.05
Loss of revenue/sales 0.00 0.15 0.00 0.15 0.20
Weighted Average 0.78 0.81 0.78 0.80 0.81
ITSMP2 Attainment L L L L L

CHAPTER 6 ACTION RESEARCH - CYCLE 2 (ARC2)
274
Table 6-57 Weighted average of Problem Management Business Risk Mitigation scores associated with ITSMP2 dimensions
Business Risk Operational Customer Satisfaction Productivity Market Financial
Service outages 0.00 0.15 0.00 0.10 0.05
Rework 0.15 0.00 0.15 0.05 0.05
Waste 0.10 0.00 0.20 0.05 0.05
Delayed solutions 0.00 0.00 0.15 0.10 0.00
Slow operational processes 0.00 0.00 0.15 0.05 0.00
Security breaches 0.00 0.25 0.00 0.00 0.05
Slow turnaround times 0.00 0.00 0.00 0.05 0.00
Unexpected costs 0.20 0.20 0.05 0.05 0.15
Higher or escalating costs 0.10 0.10 0.05 0.10 0.15
Slow response to business needs and
changes 0.10 0.00 0.05 0.05 0.05
Inability to scale 0.15 0.00 0.10 0.00 0.00
Fines and penalties 0.00 0.00 0.00 0.00 0.15
High levels of non-value labor 0.20 0.00 0.05 0.05 0.05
Loss of market share 0.00 0.15 0.05 0.20 0.05
Loss of revenue/sales 0.00 0.15 0.00 0.15 0.20
Weighted Average 0.85 0.91 0.84 0.87 0.89
ITSMP2 Attainment F F L F F

CHAPTER 6 ACTION RESEARCH - CYCLE 2 (ARC2)
275
Table 6-58 Weighted average of Change Management Business Risk Mitigation scores associated with ITSMP2 dimensions
Business Risk Operational Customer Satisfaction Productivity Market Financial
Service outages 0.00 0.15 0.00 0.10 0.05
Rework 0.15 0.00 0.15 0.05 0.05
Waste 0.10 0.00 0.20 0.05 0.05
Delayed solutions 0.00 0.00 0.15 0.10 0.00
Slow operational processes 0.00 0.00 0.15 0.05 0.00
Security breaches 0.00 0.25 0.00 0.00 0.05
Slow turnaround times 0.00 0.00 0.00 0.05 0.00
Unexpected costs 0.20 0.20 0.05 0.05 0.15
Higher or escalating costs 0.10 0.10 0.05 0.10 0.15
Slow response to business needs
and changes 0.10 0.00 0.05 0.05 0.05
Inability to scale 0.15 0.00 0.10 0.00 0.00
Fines and penalties 0.00 0.00 0.00 0.00 0.15
High levels of non-value labor 0.20 0.00 0.05 0.05 0.05
Loss of market share 0.00 0.15 0.05 0.20 0.05
Loss of revenue/sales 0.00 0.15 0.00 0.15 0.20
Weighted Average 0.79 0.91 0.77 0.83 0.88
ITSMP2 Attainment L F L L F

CHAPTER 6 ACTION RESEARCH - CYCLE 2 (ARC2)
276
Table 6-59 shows a comparison of Incident Management ITSMP2 Attainment Levels
between cycle 1 and cycle 2.
Table 6-59 Comparison of Incident Management ITSMP2 attainment levels for
cycle 1 and cycle 2
ITSMP2 Scorecard Cycle 1 Attainment Level Cycle 2 Attainment Level
Operational L L
Customer Satisfaction L L
Productivity L L
Market L L
Financial L L
Table 6-60 shows a comparison of Problem Management ITSMP2 Attainment Levels
between cycle 1 and cycle 2.
Table 6-60 Comparison of Problem Management ITSMP2 attainment levels for
cycle 1 and cycle 2
ITSMP2 Scorecard Cycle 1 Attainment
Level
Cycle 2 Attainment
Level
Operational L F
Customer Satisfaction L F
Productivity L L
Market L F
Financial L F
Table 6-61 shows a comparison of Change Management ITSMP2 Attainment Levels
between cycle 1 and cycle 2.
Table 6-61 Comparison of Change Management ITSMP2 attainment levels for
cycle 1 and cycle 2
ITSMP2 Scorecard Cycle 1 Attainment
Level
Cycle 2 Attainment
Level
Operational L L
Customer Satisfaction L F
Productivity L L

CHAPTER 6 ACTION RESEARCH - CYCLE 2 (ARC2)
277
ITSMP2 Scorecard Cycle 1 Attainment
Level
Cycle 2 Attainment
Level
Market L L
Financial L F
The ITSMP2 Scorecards from cycle 1 and cycle 2 were merged to chart the differences.
Figure 6-17, Figure 6-18 and Figure 6-19 show ITSMP2 Scorecard of cycle 1 and cycle
2 for all three processes.

CHAPTER 6 ACTION RESEARCH - CYCLE 2 (ARC2)
278
Figure 6-17 Comparison of the Incident Management ITSMP2 attainment between cycle 1 and cycle 2

CHAPTER 6 ACTION RESEARCH - CYCLE 2 (ARC2)
279
Figure 6-18 Comparison of the Problem Management ITSMP2 attainment for cycle 1 and cycle 2

CHAPTER 6 ACTION RESEARCH - CYCLE 2 (ARC2)
280
Figure 6-19 Comparison of the Change Management ITSMP2 attainment for cycle 1 and cycle 2

CHAPTER 6 ACTION RESEARCH - CYCLE 2 (ARC2)
281
6.4 KISMET Phase 3: Plan process improvement action
The SMPA report and the outcome of the focus group workshop served as a guide to
the process improvement meetings. The researcher conducted semi-structured
interviews/meetings with the process managers from 3rd April 2017 to 21st April 2017.
Participants were provided with an interview information sheet and a consent form
before the meetings (see Appendices C.1 and C.2). The researcher met with process
managers at their desk for about 30 minutes per day. Challenges exposed by the
process capability survey results were analyzed to formulate improvement action
plans. The researcher and process managers discussed the reported SMPA
recommendations and actions were proposed for the most applicable
recommendations. The performance assessment results were analyzed, and plans were
made to improve high-risk areas.
Incident Management
Since the SMPA report for Incident Management did not generate any
recommendations for the generic practices, the process improvement meetings for
Incident Management focused on revising the action plan for capability level 1 from
cycle 1. An analysis was also conducted of why 19 percent of survey participants
responded Do not know.
Process managers agreed on the following three actions:
Regular review of incident prioritization and classification;
More communication on process status;
Conduct training when necessary.
Problem Management
The SMPA report generated recommendations for levels 3.1 and 3.2. The planning
meetings were used to evaluate possible actions for these recommendations.
Process managers decided to execute the following two actions:

CHAPTER 6 ACTION RESEARCH - CYCLE 2 (ARC2)
282
Communicate the Problem Management process workflow to all business
units;
Audit data should be available in real time for management review;
More frequent analysis of appropriate data regarding implementation of the
Problem Management process to provide a basis for understanding the
behavior of the process and its compliance with the standard Problem
Management process.
Change Management
The SMPA report generated recommendations for levels 2.2, 3.1 and 3.2. The planning
meetings were used to evaluate possible actions for these recommendations.
The following actions were deemed necessary:
Integration of incident and problem performers;
Definition of a change review plan;
Definition of corrective action procedures.
6.4.1 Reflection on plan process improvement action
Process managers were more comfortable with identifying areas of process
improvement and discussing challenges. Less time was spent on these planning
meetings when compared to cycle 1. Process managers appeared to be complacent
about the results of cycle 2, as they were aware of the effort put in improving
processes.
6.5 KISMET Phase 4: Design process improvement guidelines
In this phase, the researcher and process managers reviewed the roles and
responsibilities, actions, metrics, and relationships to other ITSM processes that were
defined in cycle 1. The guidelines developed in cycle 1 were reviewed and
modifications made where appropriate. These guidelines were later deployed to the
Intranet site to communicate the plan.

CHAPTER 6 ACTION RESEARCH - CYCLE 2 (ARC2)
283
6.5.1 Reflection on design process improvement guidelines
The roles and responsibilities of staff had organically changed from cycle 1 to cycle 2
due to the creation of the RACI charts in cycle 1 and the enforcement of roles and
accountability.
6.6 KISMET Phase 5: Execute the process improvement plan
An email communication was sent to all participants detailing the cycle 2 findings and
call for action. Monthly schedules reports were generated in collaboration with staff
responsible for Zendesk input, for each of the three ITSM processes and for every KPI
committed to by Company X. This phase involved active intervention by the
researcher and process managers to ensure that the plan was executed and changes
were made.
6.6.1 Incident Management
The following actions were undertaken for the Base Practices (Level 1):
Zendesk codes for incident classification were reviewed, and ten cases were
analyzed for appropriate coding based on incident type;
The priority of incidents was analyzed for accuracy based on the revised
guideline of the KISMET4 activity;
The DevOps virtual team was tasked with automating case analysis for incident
classification and prioritization.
The following actions were undertaken for the Generic Practices (Levels 2 and 3):
Incident Management KPIs were evaluated by the researcher and process
managers for accuracy and relevance by analyzing how the reporting criteria
in Zendesk derived them from operational metrics;
Tracking dashboards were created in Zendesk and communicated to all
stakeholders;
The Incident Management process workflow was reviewed by process
managers to include other interfaces.

CHAPTER 6 ACTION RESEARCH - CYCLE 2 (ARC2)
284
6.6.2 Problem Management
The following actions were undertaken for the Base Practices (Level 1):
Zendesk dashboards were created by the researcher for real-time management
review.
Zendesk metrics were reviewed by process managers;
Zendesk dashboards were made generally available to all business units;
Problem records were analyzed for relevant details of the problem, including
the date and time, and a cross-reference to the incident(s) that initiated the
problem record;
Jira has a linked case field that clearly indicates the incident(s) that caused the
problem.
The following actions were undertaken for the Generic Practices (Levels 2 and 3):
The scope of the Problem Management KPIs was defined and all stakeholders
in the process informed of the scope;
The assumptions and constraints were considered while identifying Problem
Management KPIs so that the resultant KPIs are specific, measurable,
achievable, relevant and timely (S.M.A.R.T.);
Tracking dashboards were created in Zendesk and communicated to all
stakeholders;
The activities of Problem Management are driven by the identified
performance targets so that the Problem Management could be monitored
against the plans.
6.6.3 Change Management
The following actions were undertaken for the Base Practices (Level 1):
Action was taken to ensure that all relevant staff attended the weekly change
management meeting;
Training was performed on the scope and impact of change requests ;
Regular review of change requests was performed;

CHAPTER 6 ACTION RESEARCH - CYCLE 2 (ARC2)
285
A communication process was established to communicate approved changes
to Product Owners and other stakeholders prior to making changes.
The following actions were undertaken for the Generic Practices (Levels 2 and 3):
The scope of the Change Management KPIs was defined and all stakeholders
in the process informed of the scope;
All the required deliverables (documents) which are necessary for performing
Change Management activities were adequately reviewed.
6.6.4 Reflection on execute the process improvement plan
Staff at Company X was more receptive to the process improvement plans deployed
in this cycle of the action research, as they were familiar with the process improvement
plans from cycle 1. The intranet site that hosts the process improvement plans and
guidelines received more page visits by unique desktops, which indicated that more
staff members were interested in improving the processes.
6.7 KISMET Phase 6: Evaluate process improvement
6.7.1 Incident Management
The following evaluation was undertaken for the Base Practices (Level 1):
The intervention of case analyses helped reinforce the Zendesk classification
system, and made Incident process performers aware of the fact that their work
was being internally audited;
The DevOps virtual team did not automate the case analysis, however, process
managers felt that random case analysis was now a trivial task for them.
The following evaluation was undertaken for the Generic Practices (Levels 2 to 3):
The Incident Management KPIs were evaluated for accuracy and relevance by
analyzing how the reporting criteria in Zendesk derived them from operational
metrics;
The KPIs were accurate and relevant.

CHAPTER 6 ACTION RESEARCH - CYCLE 2 (ARC2)
286
6.7.2 Problem Management
The following evaluation was undertaken for the Base Practices (Level 1):
The analysis of Problem records showed more detailed description and a cross-
reference to the incident(s) that initiated the problem record.
The following evaluation was undertaken for the Generic Practices (Levels 2 to 3):
By tracking Zendesk page visits, it was evident that more people were viewing
the dashboards;
The activities of Problem Management were driven by the predefined
performance targets.
6.7.3 Change Management
The following evaluation was undertaken for the Base Practices (Level 1):
All invited staff members attended the weekly change management meeting;
The following evaluation was undertaken for the Generic Practices (Levels 2 to 3):
All the required deliverables (documents) which are necessary in performing
Change Management activities were adequately reviewed regularly by process
managers and performers.
6.7.4 Reflection on evaluate process improvement
In this cycle of the action research, it was evident that more staff members showed
interest in objectively evaluating the process improvements.

CHAPTER 6 ACTION RESEARCH - CYCLE 2 (ARC2)
287
6.8 Final Reflection
In order to externally and strategically analyze the attractiveness of forex trading
market and its different macroenvironmental factors a final reflection based on
PESTEL framework (Ho 2014) was conducted for understanding market movements,
business potential and further directions for operations.
At odds, the forex market is equally positively affected by political, environmental and
economic factors over large and abrupt changes. Abruptness and uncertainty create
volatility thus rapid movements on currency markets which attracts speculative capital.
For example in contrary to expectations, the ongoing crisis has fueled the market.
The reflection on market events as described in § 5.8.3 revealed that external factors
play an important role in process performance. The reflection in § 5.8.3 highlighted
one major economic event that caused both financial loss and loss of customer
reputation for Company X. A PESTEL analysis was conducted to explore other
external factors that affected the performance of processes and service delivery at
Company X.
This reflection on market events in section 5.8.3 prompted the need for a final
reflection on macro environmental factors based on the PESTEL framework. The final
reflection was not a construct of the research design and hence did not feature in
Chapter 3 Research Methodology. It was through cycle 1 (Chapter 5) of the action
research that it was realized that a deeper analysis of external factors was required for
further insight into the anomalies uncovered with process performance. The final
reflection also provides a holistic view of factors that may affect process performance
data.
6.8.1 Political Conditions
This section discusses the 2 major political events that occurred during the research
period, and how these events affected process performance at Company X.
Brexit
A historical trend analysis of trading volume at Company X showed that global events
cause higher trading volumes that are directly associated with higher numbers of

CHAPTER 6 ACTION RESEARCH - CYCLE 2 (ARC2)
288
incidents, problems, and changes. Brexit refers to the decision of the Government of
the United Kingdom (UK) to leave the European Union (EU) as a result of a
referendum held on 23 June 2016 (Goodwin & Heath 2016). In the early hours of
Friday, June 24, 2016, the United Kingdom released the results of its European Union
(EU) membership referendum (Brexit). The vote was in favor of leaving the EU,
sparking waves of uncertainty in global capital markets. The result was the single most
significant market event in more than two years, with U.S. equity market unpredictable
volatility spiking more than 40 percent that translated into exceptionally high foreign
exchange trading volumes. In fact, Company X’s highest daily trading volume to date
coincided with Brexit. The British Pound (GBP) started to weaken as poll numbers
were released from individual areas throughout the day. This marked the lowest the
pound had traded at since 1985. Globally foreign exchange trading volumes jumped
to record highs in June 2016. Although this event caused peak trading volumes,
Company X suffered minimal service disruptions, and the executive staff attributed
this positive situation to the actions taken to address some of the recommendations
provided by the SMPA method. Figure 6-20 charts the number of incidents and
changes per million transactions for the 3-month period May through July of 2015 and
2016.
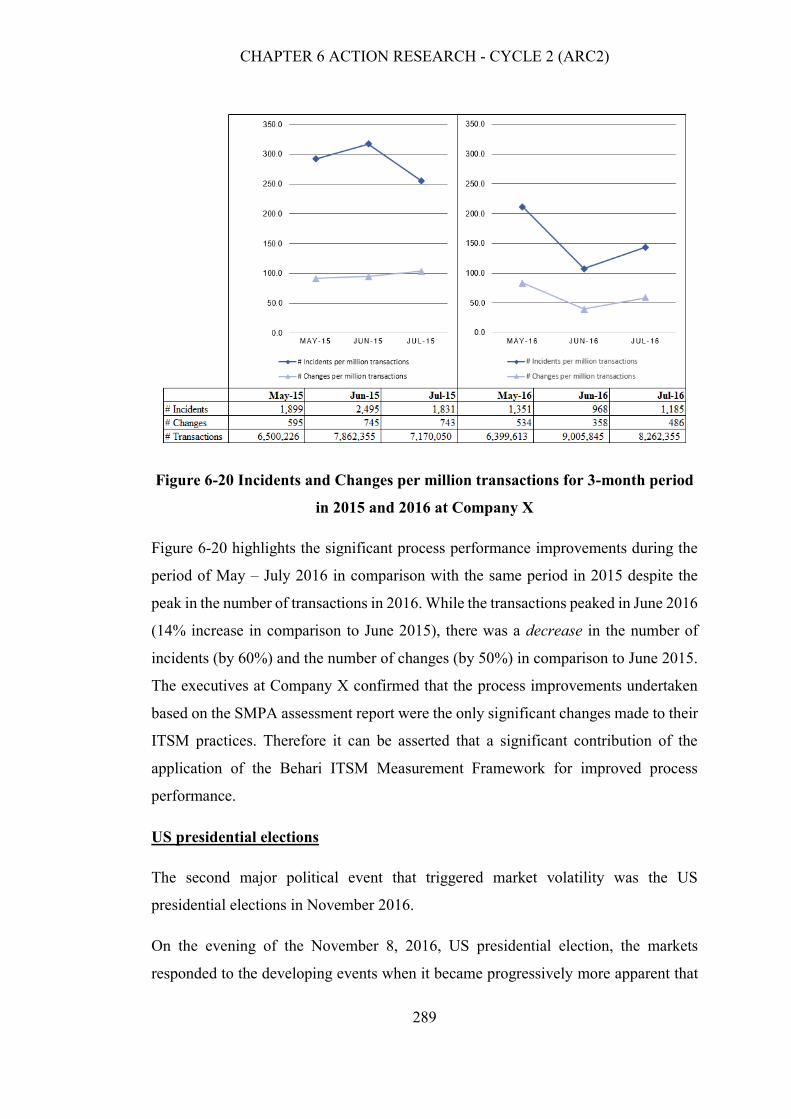
CHAPTER 6 ACTION RESEARCH - CYCLE 2 (ARC2)
289
Figure 6-20 Incidents and Changes per million transactions for 3-month period
in 2015 and 2016 at Company X
Figure 6-20 highlights the significant process performance improvements during the
period of May – July 2016 in comparison with the same period in 2015 despite the
peak in the number of transactions in 2016. While the transactions peaked in June 2016
(14% increase in comparison to June 2015), there was a decrease in the number of
incidents (by 60%) and the number of changes (by 50%) in comparison to June 2015.
The executives at Company X confirmed that the process improvements undertaken
based on the SMPA assessment report were the only significant changes made to their
ITSM practices. Therefore it can be asserted that a significant contribution of the
application of the Behari ITSM Measurement Framework for improved process
performance.
US presidential elections
The second major political event that triggered market volatility was the US
presidential elections in November 2016.
On the evening of the November 8, 2016, US presidential election, the markets
responded to the developing events when it became progressively more apparent that

CHAPTER 6 ACTION RESEARCH - CYCLE 2 (ARC2)
290
Republican candidate Donald Trump’s lead over Democratic nominee Hillary Clinton
was growing. The unexpected turn of events was immediately reflected in global
markets as the news developed and was processed by people around the world.
Overnight, Dow futures tumbled close to 800 points, and the S&P 500 dropped 5
percent (NYSE 2016). Foreign markets also dropped as uncertainty over the future of
global trade policies took root. Figure 6-21 charts the volatility of the stock market the
night of the US 2016 presidential elections.
Figure 6-21 Stock Market Volatility on the US Election night from CNN (2016)
However, by the end of the next trading day, the Dow hit new record highs,
demonstrating the resiliency of the markets in processing information in an orderly
manner. The end of this eventful week pushed the Dow industrials to their best week
since 2011. Figure 6-22 illustrates the performance of the US stock market for the week
of the US 2016 presidential elections.

CHAPTER 6 ACTION RESEARCH - CYCLE 2 (ARC2)
291
Figure 6-22 The US Stock Market Performance the week of the 2016 US Elections
(CNN 2016)
A number of news agencies (BBC 2016; CNN 2016; WSJ 2016) have reported on the
sectors that comprised the most prominent market movers, possible reasons for their
increase or decrease in performance and the market impact as shown in Table 6-62.
Table 6-62 Most prominent market movers with possible reasons and market
impact
Sector Reason for market movement Market Impact
US drug
companies
Hillary Clinton had pledged to
bring in controls to prevent
pharmaceutical companies from
hiking the price of drugs
following recent scandals.
Shares in Pfizer, the world’s
largest drug company, were
up 7%.

CHAPTER 6 ACTION RESEARCH - CYCLE 2 (ARC2)
292
Sector Reason for market movement Market Impact
Private Prison
Operators
Traders predicted that Trump
might row back the US
government’s decision to phase
out the private sector after finding
it is failing prisoners.
Shares in Corrections Corp
Of America (CCA) were up
41%, and rival Geo Group
shares were up 18%.
Construction Traders expected more work from
Trump’s pledge to build a wall
along the southern border with
Mexico and embark on a massive
program to repair and improve
America’s aging infrastructure.
Shares in construction
equipment company
Caterpillar were up 7%.
Banking
stocks
Traders speculated that Trump
would follow through with his
pledge to tear up red tape and
relax regulations.
Bank of America and SVB
Financial gained 17% and
20%, respectively.
Gun
companies
The election of Trump removed
fears that Clinton may have done
more to bring in gun controls. A
Democratic victory would
probably have sent gun
enthusiasts out to buy more
weapons out of fear they might
not have been able to in the
future.
Shares in the two biggest
listed gun companies, Smith
& Wesson and Sturm Ruger,
were both down 12%.
If the information provided by the above reports is not fake news (Allcott & Gentzkow
2017), the possible reasons for the market movement may be attributed to trader’s
emotions, sentiment, and beliefs (see section on Social Environment factors).

CHAPTER 6 ACTION RESEARCH - CYCLE 2 (ARC2)
293
The 2016 US presidential elections triggered erratic market volatility that transformed
into exceptionally high foreign exchange trading activity. The dollar recovered after
falling overnight, as traders said immediate fears of Trump’s impact on the economy
could have been overplayed. By 10am the dollar was down 1.4 percent against the yen.
It was little changed at $1.1033 per euro, having earlier tumbled by 2.4 percent. The
Sterling which fell to 30-year lows in the wake of the Brexit vote was up 0.5 percent
the next day.
Although this event caused peak trading activity, Company X’s processes performed
better when compared to the performance for the same 3 month period the previous
year. Figure 6-23 charts the number of incidents and changes per million transactions
for the 3-month period October through December of 2015 and 2016.
Figure 6-23 Incidents and Changes per million transactions for 3-month period
in 2015 and 2016 at Company X
Figure 6-23 highlights the significant process performance improvements during the
period of October – December 2016 in comparison with the same period in 2015
despite the increase in the number of transactions in November and December 2016.
While the number of transactions increased in November 2016 (20% increase in
comparison to November 2015), there was a decrease in the number of incidents (by
40%) and the number of changes (by 3%) in comparison to November 2015. The

CHAPTER 6 ACTION RESEARCH - CYCLE 2 (ARC2)
294
business and IT staff at Company X confirmed that both the process improvements
undertaken based on the SMPA assessment report and the implementation of circuit
breakers (see Appendix A.1 for definition) to mitigate risk help with the improvement
of processes during these volatile times. Therefore we can assert a contribution of the
application of the Behari ITSM Measurement Framework for improved process
performance.
6.8.2 Economic Factors
§5.8.3 discussed one economic event and its impact on the financial market. Another
economic event that influenced the process performance results at Company X was
Non-Farm Payroll (NFP).
Traders are continually monitoring various economic indicators to identify trends in
economic growth. Some of the most watched economic indicators include the
Consumer Price Index, housing starts, gross domestic product and the employment
report (Layton, Robinson & Tucker 2009). Out of these indicators, the employment
report contains a variety of data and statistics regarding the employment information
of the market.
The NFP report is a crucial economic indicator for the United States. The employment
report is released on the first Friday of every month by the Bureau of Labor Statistics,
providing data covering the previous month. The report contains information on
unemployment, job growth, and payroll data, among other stats.
Out of the payroll data that is provided, the most important statistic that is analyzed is
the non-farm payroll data, which represents the total number of paid U.S. workers of
any business, excluding general government employees, private household employees,
employees of non-profit organizations that provide assistance to individuals, and farm
employees. This data is analyzed carefully because of its importance in identifying the
rate of economic growth and inflation (Layton, Robinson & Tucker 2009). The NFP
report causes one of the consistently largest rate movements of any news
announcement in the forex market.

CHAPTER 6 ACTION RESEARCH - CYCLE 2 (ARC2)
295
NFP announcements cause an increase in trading activity, applying stress to the trading
infrastructure, thus making the system more vulnerable to an increase in incidents and
problems. To mitigate the impact of NFP announcements, one can proactively execute
measures to control trading activity and thus eliminate spikes in the number of
incidents and problems during these times, by widening prices, applying rate filters,
throttling price discovery or disabling erratic price streams.
6.8.3 Social Environment
There are numerous cognitive processes that influence how forex traders make
decisions. Being aware of those processes can help traders in how they approach the
forex market. It can help with their trading strategy and trading psychology as a whole
(Kahneman, Daniel 2011; Oberlechner & Hocking 2004).
6.8.4 Technological Factors
Technology is at the core of how organizations operate and maintain their competitive
edge in this highly competitive environment. Technological advances have made forex
trading more accessible to the masses. The ease of access and increased transparency
provided by electronic trading platforms appeal to a broader customer base, including
retail traders (Rime 2003).
Forex traders demand ultra-low latency networks, resilient trading infrastructure, and
robust risk management systems. In order to meet these stringent demands, forex
service providers need to be at the cutting-edge of technology in order to remain
relevant and be competitive.
Looking back at 2015 the outage and major incidents at Company X in cycle 1 of the
action research (as detailed in §5.3.2) were all technology-related. The outage was due
to a connectivity issue with one of Company X’s ISP. Company X has since
implemented a failover plan for all of its third-party dependencies. The major incidents
were caused by software-related issues that have been addressed by more stringent
software release criteria and application monitoring through the DevOps program. In
2016 one of the outages was caused by a hardware failure, the other by a connectivity
drop by an ISP, and the major incident was caused by a hardware failure.

CHAPTER 6 ACTION RESEARCH - CYCLE 2 (ARC2)
296
6.8.5 Environmental Factors
The environmental factors that potentially affected process performance at Company
X over the research period are discussed next.
Natural Disasters
The recent devastation by hurricanes Harvey and Irma has a widespread impact on
global financial markets. The human calamity of lost lives and the millions who were
dislocated by the floods is only one consequence of the natural disasters. The financial
press (Liesman 2017) has also noted the likely dip in U.S. economic growth in the
third quarter of 2017 due to lost productivity, offset by a pickup in jobs and production
in the final quarter of 2017.
Hurricane Harvey has already been a significant factor in President Donald Trump's
ability to reach an agreement with Democratic congressional leaders to fund the
government through mid-December (The New York Times 2017b). The storms could
also affect decision-making in three major central banks, influencing the future
direction of currency exchange rates, as well as global equity and bond markets (The
New York Times 2017b).
U.S. employment fell in September for the first time in seven years as Hurricanes
Harvey, and Irma left displaced workers temporarily unemployed and delayed hiring,
the latest indication that the storms undercut economic activity in the third quarter.
NFP decreased by 33,000 jobs in September 2017 amid a record drop in employment
in the leisure and hospitality sector (Journal 2017). The decline in payrolls was the
first since September 2010 (Journal 2017).
Man-made Disasters
The biggest driver of currency fluctuation and market volatility in 2017 had nothing
to do with monetary policy or economic data, but instead, the geopolitical tensions
between the U.S. and North Korea were the primary contributor to market swings in
2017.
On 22 September 2017, the war of words between President Trump and Kim Jong-un,
North Korea’s leader, raised concerns that it could escalate into a new and more

CHAPTER 6 ACTION RESEARCH - CYCLE 2 (ARC2)
297
volatile phase as the White House contemplated its next steps in response to a threat
by Pyongyang to conduct the world’s first atmospheric nuclear test in 37 years
(The New York Times 2017a). North Korea’s warning that it might test a nuclear bomb
over the Pacific Ocean added urgency to an administration debate over options for a
pre-emptive strike if preparations for a launch are detected (The New York Times
2017a).
On 25 September 2017, North Korea's Foreign Minister Ri Yong Ho accused US
President Donald Trump of declaring war on his country by tweeting over the weekend
that North Korea “won't be around much longer.” (Cohen, Z 2017). Stocks extended
losses, gold jumped, and Treasury yields fell in intra-day trading. The Dow Jones
industrial average closed 53.50 points lower, or 0.24 percent, at 22,296.09 (Cheng
2017).
This led to volatility in the forex market with the USD/JPY severely declining as
traders worry that this heated exchange could result in military action. Although the
US dollar is down sharply versus the Yen, it strengthened against other major
currencies such as sterling, the Australian and New Zealand dollars. So while there's
no question that war is negative for USD/JPY it can initially drive the dollar higher
against other currencies such as AUD and NZD. The Japanese Yen and Swiss Franc
perform best during times of war, which means all of the Yen crosses including
USD/JPY will weaken. The yen is often sought in times of geopolitical tension or
market turbulence because Japan has a large current account surplus and traders tend
to assume Japanese investors would repatriate funds at times of crisis.
Information technology had its worst day since August 17, falling 1.4 percent as the
greatest decliner in the S&P 500, which declined 5.56 points to 2,496.66. Apple shares
fell for a fourth straight day, down 0.88 percent. Facebook shares closed 4.5 percent
lower on their worst day of the year. Amazon.com fell 1.6 percent,
while Netflix dropped 4.7 percent.
The analysis of natural disasters that influence the stock and forex markets confirms
the previous studies that have reported that natural disasters have a detrimental impact
on the value of stock and currencies (Benson & Clay 2004; Cavallo et al. 2013;
Fengler, Ihsan & Kaiser 2008). The analysis of man-made disasters, such as the US-

CHAPTER 6 ACTION RESEARCH - CYCLE 2 (ARC2)
298
North Korea tensions, and the threat of war, confirms the assertions made by previous
studies (Barro 2009).
Terrorist Attacks
Unexpected terror attacks became more prevalent in 2016 and 2017 than in previous
years. The impact that an act of terror has on the marketplace varies depending on the
type of attack, locale and time in which it was committed. Some acts of terror cause
only a regional disturbance spiking volatility in domestic markets, while others send
shockwaves through the entire global financial system. No matter the size and scope
of the act, it brings uncertainty to the marketplace and ensures enhanced volatility
facing a wide variety of asset classes.
6.8.6 Legal Environment
The Retail Forex market experienced a major shock in January 2015 when the Swiss
National Bank ended its policy of capping the Swiss franc at 1.20 francs per Euro. The
change in policy caused the price of the Swiss franc to increase almost 30 percent in
value against the Euro (Graham 2015) and resulted in significant losses to market
participants (Iosebashvili, Ackerman & Wexler 2015). These events caused NFA to
tighten margin requirements for Retail Forex transactions involving specified foreign
currencies (National Futures Association 2016) and prompted calls for the CFTC to
consider increased requirements for Retail Forex (Ackerman 2015).
In February 2017, the CFTC brought an enforcement action against Forex Capital
Markets, LLC (FXCM), a registered FCM and RFED that was previously the largest
Retail Forex broker in the United States (Nguyen 2017), and two of its principals for
alleged fraudulent conduct in connection with FXCM’s Retail Forex platform (CFTC
2017). The CFTC’s settlement order alleged that FXCM had represented to customers
that it executed customer trades through its No Dealing Desk on strictly an agency or
riskless principal basis through external market makers, thus eliminating the conflict
of interest resulting from FXCM taking a principal position opposite its customers.
The CFTC, other regulators, and prosecutors continue to bring actions against
participants in both the retail and institutional markets.

CHAPTER 6 ACTION RESEARCH - CYCLE 2 (ARC2)
299
The Bank for International Settlement (BIS), an organization of 60 central banks, is in
the process of finalizing a Global Code of Conduct for the foreign exchange market
that is intended to promote integrity and effective functioning of the foreign exchange
market. BIS published an initial draft of the Global Code of Conduct in 2016 that set
forth standards regarding ethics, governance, information sharing, execution, risk
management and compliance and confirmation and settlement processes. The Global
Code of Conduct will be a voluntary code and will not have the force of regulation,
but BIS and the working group responsible for the Code are working to promote
widespread adoption of the Code, including among buy-side firms, sell-side firms and
other foreign exchange market participants (BIS 2016).
In the wake of the recent enforcement of regulation in the forex industry, financial
services businesses need to embrace the stringent laws and adapt their businesses to
comply in order to gain competitive advantage.
6.9 Chapter Summary
Chapter 6 described the events of each step of the KISMET model within each phase
of the second cycle of the action research. The KISMET model was used as a process
improvement guide to the action research phases.
The Diagnose phase detailed the activities involved in setting up of the process
improvement infrastructure at Company X. The process capability assessment survey,
the performance assessment, and the financial measurement were conducted in this
phase. A focus group workshop was conducted to assess the SMPA tool, discuss the
findings of the process capability assessment report, and to triangulate the data
reported. This phase also operationalized the Behari ITSM measurement model
described in chapter 3.
The Plan phase used the output of the Diagnose phase to detail the process
improvement activities. Meetings were conducted with key stakeholders to formulate
and document action plans for each ITSM process.
The Take Action phase served to deploy the documented plan from the Plan phase.
This phase involved active intervention by the researcher, to ensure that the process

CHAPTER 6 ACTION RESEARCH - CYCLE 2 (ARC2)
300
improvement plans were being followed, and to make adjustments as deemed
necessary.
The Evaluate Action phase served to review and reflect on the improvement program
implemented in the previous phase and to evaluate the outcomes of the process
improvement program.
“Using the results of the process capability, process performance, and financial
performance from cycle 1 (as described in Chapter 5) as the benchmark data for cycle
2 to measure against, Chapter 6 provides the answer to RQ1. “How can the association
of ITSM process capability and process performance with financial performance of an
organization be determined?”
Learning from the experience in cycle 1, that Reflection was a continual process, the
Action Research cycle and KISMET were adjusted in cycle 2, to incorporate
Reflection into every phase of KISMET. This new approach in cycle 2 further
demonstrated how the ITSM measurement framework can be effectively applied for
CSI, thus contributing to RQ2. How can the ITSM measurement framework be
demonstrated for CSI?”

CHAPTER 7 DISCUSSION
301
CHAPTER 7 DISCUSSION
7.1 Introduction
This chapter presents a discussion of the research findings. Chapter 4 presented the
design of the measurement model. Chapters 5 and 6 detailed the application of the
measurement model, the activities of the KISMET framework, and presented the
details and findings of the two cycles. The aim of this chapter is to provide a critical
examination of the research results with discussions based on the context of the
research method and reviewed literature. Discussions are structured to answer the two
research questions with a consideration of research work conducted and the
presentation of key themes emerging from this research.
As articulated in Chapter 1, this study addresses the research problem of the lack of a
pragmatic model and method that associates ITSM process capability and performance
with business performance.
Chapter 7 comprises six main sections. Section 7.1 introduces the chapter. Section 7.2
explains the discussion approach. Section 7.3 provides the discussion on research
question one. Section 7.4 discusses the findings related to research question two,
followed by Section 7.5 that extends the discussion to consider the researcher-
practitioner gap, by providing evidence of how the scholar-practitioner approach can
provide tangible benefits to organizations that participate in academic research, as well
as how academic research can advance by applying theory to solve real-world
problems. Finally, section 7.6 summarizes this chapter. Figure 7-1 shows the overview
of Chapter 7.

CHAPTER 7 DISCUSSION
302
Figure 7-1 Overview of Chapter 7

CHAPTER 7 DISCUSSION
303
7.2 Discussion Approach
The reflection sections in the previous two chapters contain a discussion of the analysis
of the data collected and the techniques applied. Discussions emergent from the
research methods and outcomes reported in the reflection sections of the previous two
chapters provide a context to communicate the contributions and impacts that this
research can make. The most significant reflections and outcomes are highlighted and
discussed. These reflections inform the remainder of this discussion chapter. Table 7-1
presents the most significant reflections, the sections where they were discussed, and
the resultant outcomes and actions.
Table 7-1 Summary of significant reflections and their outcomes extracted from
chapters 5 and 6
Research
Cycle
Significant
Reflection
Chapter
Section
Outcome
ARC1 Validity of the
process assessment
results
§5.6.1 Discussed Change Management
process capability anomaly at focus
group workshop
Validity of the
process
performance
metrics
§5.6.2 Historical analysis of operational
metrics around major software release
dates at Company X.
Effects of market
events on process
performance
§5.6.3 Senior management established a
renewed focus on customer service
and process performance. There was a
sense of urgency to scrutinize key
processes and evaluate whether
changes were required.

CHAPTER 7 DISCUSSION
304
Research
Cycle
Significant
Reflection
Chapter
Section
Outcome
ARC2 Validity of the
process assessment
results
§6.2.2.2 A comparative analysis of the number
of recommendations/observations was
conducted to determine if the process
capability improved year-over-year.
Validity and
reliability of the
financial
measurement
§6.2.2.3 Employee salaries increased between
cycle 1 and cycle 2. To enable an
accurate comparison of salaries, the
Consumer Price Index (CPI) was used
to normalize the salaries in cycle 2.
Validity of the
process
performance
metrics
§6.2.2.6 Further investigation into the
underlying calculations of the ITSM3.
Steinberg’s approach was modified to
weight the KPIs associated with each
CSF to better align with the
organization’s strategic goal.
Effects of external
factors on process
performance
§6.8 The PESTEL framework was used in
the final reflection of cycle 2 to
analyze the impact of the macro-
environmental factors on process
performance.
In chapter 5 and chapter 6 the measurement of the Incident Management, Problem
Management, and Change Management processes was discussed individually. For
each construct, the next sections combine and summarize outcomes of all processes,
and demonstrate the linkage to the underpinning theories and bodies of knowledge, to
answer each research question. This study addresses the research problem of the lack
of a pragmatic model and method that associates ITSM process maturity (process
capability and performance) with business performance.

CHAPTER 7 DISCUSSION
305
The next section discusses the findings related to RQ1: How can the association of
ITSM process capability and process performance with financial performance of an
organization be determined?
7.3 Discussion on findings related to research question one
7.3.1 Process Capability
Process capability improved for all three processes as measured by the comparison of
the number of recommendations/observations in the process capability assessment
reports in cycle 1 and 2. In particular, of the 62 potential recommendations for the
Incident Management process, no recommendations were presented by the SMPA
report in cycle 2 compared to nine recommendations in cycle 1. The Problem
Management process was presented with 34 of the 65 potential recommendations in
cycle 1, while only seven recommendations were presented in cycle 2. The Change
Management process decreased from 14 recommendations in cycle 1 to four in cycle
2 out of a potential of 68 recommendations.
Combining the recommendations for improvement across the three processes showed
an improvement in the total recommendations for improvement from 57 in cycle 1 to
11 in cycle 2.
Therefore, consistent with previous studies (Cater-Steel, Toleman & Rout 2006; Jäntti
et al. 2013), this study found that improving processes results in higher process
capability attainment, as evident by a reduction in the number of recommendations for
improvement.
7.3.1.1 Organizational Change
The focus group workshop discussion on the process capability results in cycle 1
prompted the decision to restructure the organization by transferring the Trading
Solutions business unit from the Sales to the Engineering department. The focus group
felt that the Trading Solutions business unit was detached from all the other
Engineering business units involved with process improvement, and by incorporating
this unit into Engineering, the restructure of the organization would facilitate the

CHAPTER 7 DISCUSSION
306
adoption of the Engineering department’s culture and policies by the Trading Solutions
business unit. The organizational change of restructuring strengthened the actor-
network by making it easier to enroll members in the process improvement initiative
since policies and inscriptions became more uniform.
Roles and responsibilities were organically developed and bestowed upon those who
best fit the position. For example, in cycle 2 one of the change managers from cycle 1
was given the role of problem manager, as this manager underwent ITSM training and
was most familiar with all processes. This empowered staff and made them champions
of ITSM in the actor-network that facilitated a broader reach for enrolling other actors
in the improvement initiatives.
This finding of organizational structure change is consistent with those of other
researchers who noted that ITSM improvement is typically accompanied by changes
to organizational structures (Hochstein, Tamm & Brenner 2005), staff position
descriptions (Iden 2009; Iden & Eikebrokk 2015) and training of staff on the ITIL
framework, ITSM processes and tools (Cater-Steel & Tan 2005; Hochstein, Tamm &
Brenner 2005; Iden & Langeland 2010; Pollard & Cater-Steel 2009).
Furthermore, it was apparent that a level of self-interest was evident in the SMPA
survey responses of members of the Trading Solutions business unit. The transfer of
the Trading Solutions unit to the Engineering group bridged the information
asymmetry gap and strengthened the actor-network. The outcome of the organizational
change is consistent with previous studies on agency theory (Amagoh 2009;
Eisenhardt 1989a; Lee, D & Setiawan 2013), and actor-network theory (Callon 1999;
Latour 1999).
Relocating the Trading Solutions unit to the Engineering group afforded the transfer
of ITSM knowledge that demonstrated the effects of the attributes of a firm’s IT
capability on its relationship with organizational performance. Knowledge transfer
was achieved by enforcing prescriptive policies, procedures, and tools of ITSM. This
confirms the views of previous studies on Resource Base Theory (Eisenhardt & Martin
2000; Grant 2016; Mills, Platts & Bourne 2003; Wade & Hulland 2004).

CHAPTER 7 DISCUSSION
307
7.3.1.2 Process Capability Scoring
As described in §6.2.2.2, the process attribute ratings generated by the SMPA tool
based on the four-point NPLF scale, without the actual raw scores for each process
attribute, were not informative and representative of the process improvement
perceived by the Process Managers. When the comparative SMPA results were
presented at the focus group workshop in cycle 2, one Process Manager stated the
following:
“That doesn’t look right, as I know on a day-to-day basis that we addressed those
recommendations you gave us and I believe that we improved the way we work with
all three processes” (IMPM1).
The decrease in the number of recommendations as a measure of process improvement
was more meaningful, and representative of the improvement achieved at a more
granular level. It is interesting to note that the revised version of the process assessment
standard (ISO/IEC 33020) provides finer granularity (than ISO/IEC 15504) with an
option to report process attribute achievement on a six-point scale: N, P-, P+, L-, L+,
F (ISO/IEC, 2015). A unique contribution of this research is the use of the number of
recommendations as an alternate measure of process capability rather than capability
level or attribute achievement.
7.3.2 Process Performance
Process performance improved as demonstrated by the operational metrics reported in
§6.2.2.6. From a total of 25 process performance KPI items for all three processes, 10
KPIs showed improvement, 11 remained the same, and 4 declined in cycle 2 when
compared to the results of cycle 1. The next sections highlight the factors that
contributed to the improvement in process performance and considers the macro-
environmental factors that affected the performance of processes.
7.3.2.1 Performance Metrics
The reflection on the process capability assessment results in §6.3.2 unveiled that by
using the proportion of SMPA recommendations as a proxy measure for process
capability, it was clear that the processes did improve yielding fewer recommendations

CHAPTER 7 DISCUSSION
308
in cycle 2 when compared to cycle 1. In the reflection on financial measurement, in
§6.3.3.1, the costs associated with performing the processes decreased year over year.
Despite these two positive indicators of improvement, the radar charts (Figures 6.8 –
6.10) generated for the CSF risk levels did not indicate improvements in CSFs.
A further investigation into the underlying calculations of the ITSM3 was conducted.
In collaboration with senior management (business) and ITSM process managers (IT),
it became evident that some KPIs are more important than others to achieve a CSF. In
response, Steinberg’s approach was modified to apply weightings to the KPIs
associated with each CSF to better align with the organization’s strategic goal.
Furthermore, the direction of Steinberg’s KPI attainment score scale was reversed to
score 3 for KPIs meeting their targets, 2 for KPIs between target and warning
thresholds, and 1 for KPIs not meeting their target. The revised scale aligns with the
direction of the CSF NPLF scoring method.
The exercise of adapting Steinberg’s measurement model in collaboration with the
business (senior management) and IT (ITSM process managers) facilitated a dialogue
between business and IT, that strengthened the alignment between these two groups,
thus confirming the assertions made in previous studies on ITSM and Business-IT
alignment (Chen 2008; Luftman 2000; Luftman & Ben-Zvi 2011; Luftman, Papp &
Brier 1999; Rahbar, Zeinolabedin & Afiati 2013; Silvius 2008; Tapia 2007). This
partnership between these two groups is in line with previous studies on strategic
alignment (Coleman & Papp 2006; Henderson & Venkatraman 1993; Reich &
Benbasat 1996; Ward & Peppard 2002).
7.3.2.2 Quality of Data
As stated in §5.6.1 the study prompted in-depth analysis and subsequent classification
of incidents and problems, thus improving the accuracy of the data, for example by
eliminating false positive alerts. In order to meet the quality requirements of data used
to populate the ITSM3, §6.3.5 discussed how the derivation of operational metrics from
Zendesk was reviewed. This is in alignment with the literature on the data accuracy in
performance measurement (Sheng & Mykytyn Jr 2002; Watson & Haley 1997).

CHAPTER 7 DISCUSSION
309
Steinberg’s ITSM Metrics Modeling Tool was adapted in §6.2.2.6 to derive CSFs from
the weighted average of the KPIs that were associated with the CSFs, rather than solely
using the lowest associated KPI for the CSF score. Furthermore, Steinberg’s Model
was modified to use the NPLF ordinal scale to score KPIs, in order to be consistent
with the outcomes. Steinberg’s model was further enhanced to weight the Business
Risks that were associated with CSFs to generate the CSF scorecards. These
enhancements to Steinberg’s model are in line with the literature on quality of data
that asserts that apart from data accuracy, data need to be fit for use in order to be
meaningful in the context of use (Sheng & Mykytyn Jr 2002; Watson & Haley 1997).
Employee salaries increased between cycle 1 and cycle 2. To enable an accurate
comparison of salaries, it was decided to apply the Consumer Price Index (CPI) to
normalize the salaries in cycle 2. This addressed the data accuracy requirement of the
financial measurement.
7.3.2.3 Use of Technology
The use of appropriate technology to derive metrics to measure process performance
is paramount for process improvement. As described in Chapter 5, SugarCRM was
used at Company X for sales-force automation, marketing initiatives, customer
support, and collaboration. However, SugarCRM did not provide the performance
metrics that mattered for process improvement at Company X. SugarCRM was
replaced by Zendesk for customer support to provide the required metrics to measure
process performance. The Zendesk software-as-a-service allowed the researcher to
create custom metrics that were relevant to the study and Company X that was
otherwise not easily possible. Bugzilla was used by Company X to track problems and
incidents but was not integrated with Zendesk. Bugzilla was replaced with Jira for its
tight integration with Zendesk to track problems that caused incidents. CSFs were also
weighted to determine the business risk scores and the CSF attainment level scores
were also calculated by applying the ordinal NPLF scale.
These activities confirm previous research that highlighted the critical importance of
appropriate ITSM tools (Pollard & Cater-Steel 2009).
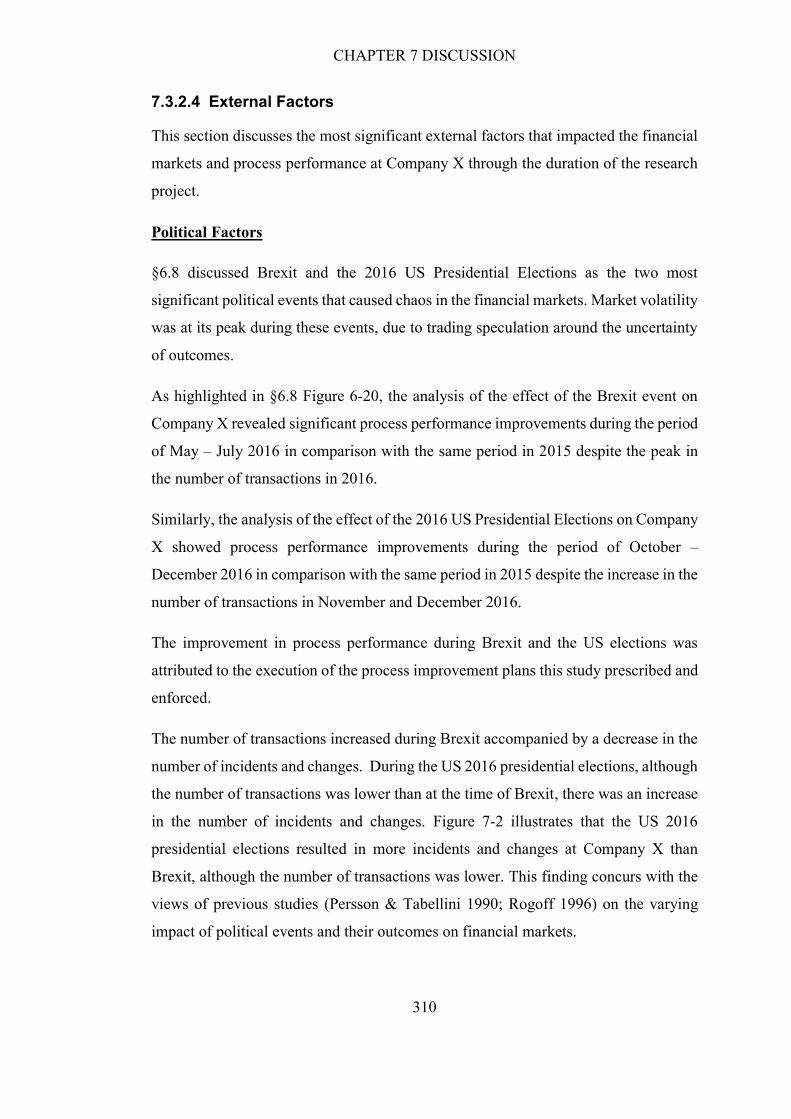
CHAPTER 7 DISCUSSION
310
7.3.2.4 External Factors
This section discusses the most significant external factors that impacted the financial
markets and process performance at Company X through the duration of the research
project.
Political Factors
§6.8 discussed Brexit and the 2016 US Presidential Elections as the two most
significant political events that caused chaos in the financial markets. Market volatility
was at its peak during these events, due to trading speculation around the uncertainty
of outcomes.
As highlighted in §6.8 Figure 6-20, the analysis of the effect of the Brexit event on
Company X revealed significant process performance improvements during the period
of May – July 2016 in comparison with the same period in 2015 despite the peak in
the number of transactions in 2016.
Similarly, the analysis of the effect of the 2016 US Presidential Elections on Company
X showed process performance improvements during the period of October –
December 2016 in comparison with the same period in 2015 despite the increase in the
number of transactions in November and December 2016.
The improvement in process performance during Brexit and the US elections was
attributed to the execution of the process improvement plans this study prescribed and
enforced.
The number of transactions increased during Brexit accompanied by a decrease in the
number of incidents and changes. During the US 2016 presidential elections, although
the number of transactions was lower than at the time of Brexit, there was an increase
in the number of incidents and changes. Figure 7-2 illustrates that the US 2016
presidential elections resulted in more incidents and changes at Company X than
Brexit, although the number of transactions was lower. This finding concurs with the
views of previous studies (Persson & Tabellini 1990; Rogoff 1996) on the varying
impact of political events and their outcomes on financial markets.

CHAPTER 7 DISCUSSION
311
Figure 7-2 Incidents and Changes per million transactions for 3-month period
around Brexit and the US 2016 Presidential Elections
Environmental Factors
The most significant environmental factor that caused market volatility and affected
process performance at Company X is discussed next.
The geopolitical tensions between the leadership of U.S. (Donald Trump) and North
Korea (Kim Jong-un) were the major driver of market volatility in 2017. On 10 August
2017, the US stock market underwent its sharpest decline in three months, and the
Chicago Board Options Exchange Market Volatility Index (VIX) jumped to its highest
level since the 2016 US election after President Trump exchanged a war of words with
North Korea (Wigglesworth, Platt & Bullock 2017). VIX is the most widely used
measure of market risk, often referred to as the “investor fear gauge” (Whaley 1993).
Figure 7-3 shows the spike in the VIX chart after President Trump’s retaliation to
North Korea’s threat.
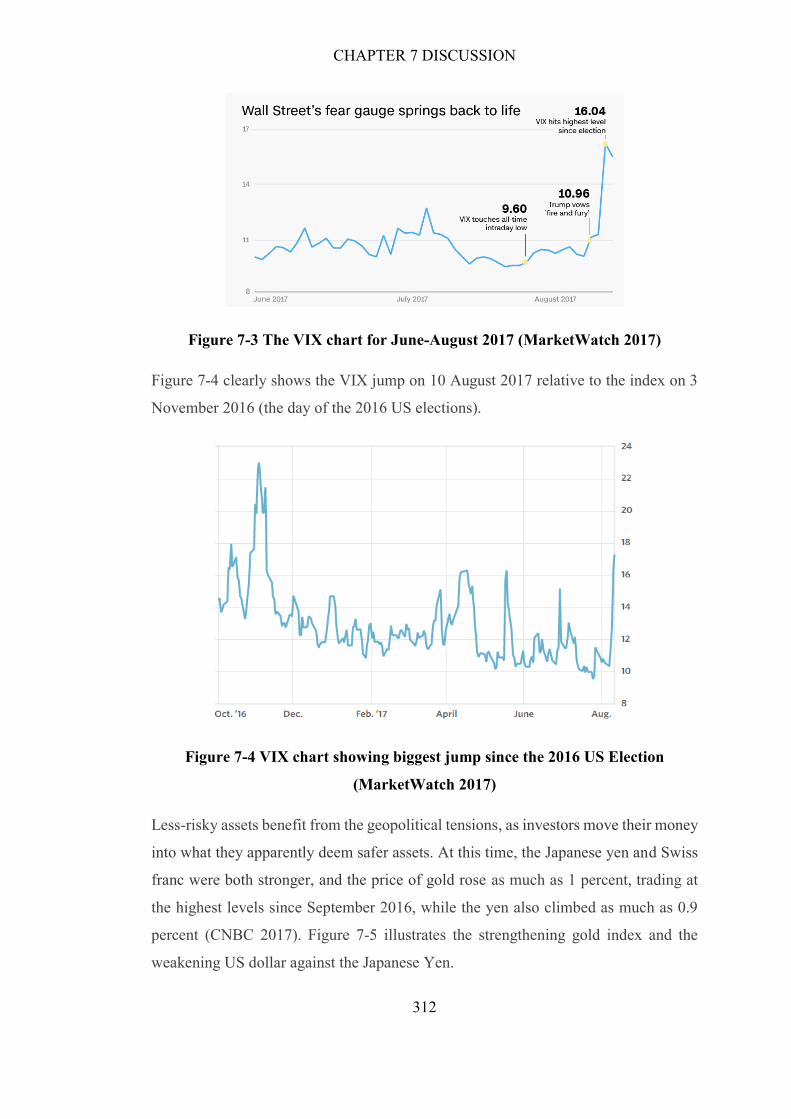
CHAPTER 7 DISCUSSION
312
Figure 7-3 The VIX chart for June-August 2017 (MarketWatch 2017)
Figure 7-4 clearly shows the VIX jump on 10 August 2017 relative to the index on 3
November 2016 (the day of the 2016 US elections).
Figure 7-4 VIX chart showing biggest jump since the 2016 US Election
(MarketWatch 2017)
Less-risky assets benefit from the geopolitical tensions, as investors move their money
into what they apparently deem safer assets. At this time, the Japanese yen and Swiss
franc were both stronger, and the price of gold rose as much as 1 percent, trading at
the highest levels since September 2016, while the yen also climbed as much as 0.9
percent (CNBC 2017). Figure 7-5 illustrates the strengthening gold index and the
weakening US dollar against the Japanese Yen.

CHAPTER 7 DISCUSSION
313
Figure 7-5 A comparative chart of Gold and the Japanese Yen (The Economic
Times 2017)
The effects of the market volatility described above on process performance at
Company X is illustrated in Figure 7-6 that charts and compares the number of
incidents and changes per million transactions for the 3-month period August through
October of 2016 and 2017.

CHAPTER 7 DISCUSSION
314
Figure 7-6 Incidents and Changes per million transactions for 3-month period
Aug-Oct 2016 and 2017
Figure 7-6 highlights the significant process performance improvements achieved by
the project during the period of August – October 2016 in comparison with the same
period in 2017 despite the peak in the number of transactions in 2017. While the
number of transactions peaked in August 2017 (19% increase in comparison to August
2016), there was a decrease in the number of incidents (by 5%) and the number of
changes (by 26%) in comparison to August 2016.
The market analysis conducted around the US-North Korea tensions, and the threat of
war, is consistent with previous studies on the effects of man-made disasters on the
financial markets (Barro 2009).
7.3.3 Business Performance
Prior to the commencement of the project, success factors at Company X were
informally defined and loosely implemented and monitored. This project introduced
the concept of CSFs, its definition, and scope. As described in KISMET Phase 1 in
chapter 5, meetings with senior management were convened by the researcher to

CHAPTER 7 DISCUSSION
315
discuss proposed CSFs. A list of Business Risks was compiled and distributed to senior
staff for approval, as described in §5.2.
7.3.3.1 CSF Attainment
In terms of business performance outcomes, five CSFs were derived from the
associated weighted KPIs for each process. Overall, three out of the seven operational
CSFs improved, three remained the same, and one declined. Three of the four quality
CSFs remained the same while one improved. All of the four financial CSFs improved.
7.3.3.2 Risk Assessment
The ITSMP2 was used to conduct a risk assessment for each ITSM process at Company
X. Risk mitigation levels were derived by weighting the association of business risks
with CSFs as detailed in §6.3.5.
Out of the 45 business risks, 22 improved mitigation levels from Largely in cycle 1 to
Fully in cycle 2, while 21 remained the same at Largely and one at Fully in both cycles,
with one declining from Fully to Largely cycle over cycle.
The risk assessment method applied by operationalizing the BITSMMF provided an
integrated, holistic approach to governance, risk, and compliance (GRC) through the
alignment of strategy, processes, technology, and people, thereby improving efficiency
and effectiveness. This outcome is in alignment with the definition of GRC provided
by Racz, Weippl and Seufert (2010).
7.3.3.3 ITSMP2 Scorecard
An ITSMP2 Scorecard was generated for each process by calculating the weighted
average of business risk scores for the risks associated with each dimension of the
ITSMP2. All performance dimensions of the ITSMP2 improved from cycle 1 to cycle
2.
7.3.3.4 Financial Performance
The financial performance of Company X was measured in terms of costs associated
with performing the processes and the cost of IT failures.

CHAPTER 7 DISCUSSION
316
In summary, the labor cost of performing the three improved processes decreased from
cycle 1 to cycle 2. Figure 7-7 illustrates the total labor cost savings when comparing
the labor cost of performing processes in cycle 1 with cycle 2. The total labor cost of
the three processes decreased by 27.64% providing a saving to Company X of
$895,210.
Figure 7-7 Total cost savings when comparing the labor cost of performing
processes in cycle 1 with cycle 2
The costs incurred from major incidents and outages were then included in calculating
the total cost savings year-over-year. Table 7-2 shows the total cost savings by
Company X year over year.
Table 7-2 Total cost savings year-over-year
ITSM Process 2015 2016
Incident Management $1,303,416 $1,037,062
Problem Management $1,141,073 $747,005
Change Management $820,061 $585,274
Cost of Major Incidents and Outages $17,370 $5,443
Total Costs $3,283,935.00 $2,376,800.00
Total Cost Savings $907,137

CHAPTER 7 DISCUSSION
317
To illustrate of the association of Process Capability, Process Performance with
Financial Performance, a similar technique to Process Capability determination was
used to measure process performance at a high level.
Table 7-3 shows that out of the 25 total process performance KPIs across all three
processes, while 13 KPIs did not meet their targets in cycle 1, only nine failed to meet
their targets in cycle 2.
Table 7-3 Comparison of Performance KPI Achievement: Cycle 1 & 2
Process Performance KPI
Cycle 1
Result
Cycle2
Result
Inci
den
t M
an
agem
ent
Number of Incident Occurrences 10,171 5,881
Number of High Severity/Major Incidents 6,672 912
Incident Resolution Rate 0.33 41.7%
Customer Incident Impact Rate 0.33 12.1%
Incident Reopen Rate 0.11 6.8%
Average Time to Resolve Severity 1 and
Severity 2 (hours) Incidents (Hours) 52.20 63.40
Average Incident Response Time (hours) 7.2 2.5
Percentage of Incidents completed without
escalation 0.83 21.7%
Incident Labor Utilization Rate 0.36 36.2%
Pro
ble
m M
an
agem
ent Incident Repeat Rate 28.57% 0.00%
Number of Major Problems 8 7
Problem Resolution Rate 19.3% 87.5%
Problem Workaround Rate 6.0% 31.3%
Problem Reopen Rate 3.6% 0.0%
Customer Impact Rate 0.0 0.0
Average Problem Resolution Time - Severity
1 and 2 Problems (Hours) 664.5 473.2
Problem Labor Utilization Rate 20.0% 20.0%
Ch
an
ge
Man
agem
ent
Change Efficiency Rate 3.3% 2.6%
Change Success Rate 86% 48%
Emergency Change Rate 57.7% 191.7%
Change Reschedule Rate 65.5% 3.2%
Average Process Time per Change (Hours) 401.6 57.4
Unauthorized Change Rate 0.6% 1.9%
Change Incident Rate 0.2 0.8
Change Labor Workforce Utilization 81% 81%
Total number of KPIs not meeting their targets
(Red and Yellow cells)
13 9

CHAPTER 7 DISCUSSION
318
Using the ratio of improvement recommendations, the ratio of process performance
KPIs that did not meet their targets, and the total costs year-over-year, Figure 7-8
compares cycle 1 and cycle 2 outcomes to illustrate the association of process
capability, process performance and financial performance at Company X.
Figure 7-8 Association of Process Capability, Process Performance and Financial
Performance
Using the recommendation ratio as a proxy for Process Capability, the ratio of non-
performing process performance KPIs as a proxy for Process Performance, and the
percentage change in costs, as a proxy for Financial Performance, comparing the
results of cycle 1 with cycle 2, Process Capability improved by 24 percent, Process
Performance improved by 16 percent and Financial Performance showed an
improvement of 30 percent between cycle 1 and cycle 2.
Corporate governance improved at Company X by minimizing costs and risks
associated with the isolation of the business from IT and with maximizing returns to
the business using the skills of IT staff. This concurs with the literature on corporate
governance and confirms the study by Licker (2007).

CHAPTER 7 DISCUSSION
319
7.3.4 Response to Research Question One
The first research question asked How can the association of ITSM process capability
and process performance with financial performance of an organization be
determined?
The review of previous academic research and empirical studies confirmed the lack of
a model and method to determine an association of process capability and process
performance with business performance. The ITSM Metrics Modelling Tool
(Steinberg 2013) was identified in the literature as a practical tool to use as a starting
point to answer research question one. The measurement model proposed by Steinberg
(2013) was adapted to include costs and other financial performance metrics and
extended to identify business risks associated with the established CSFs to present a
CSF Risk Mitigation Level Scorecard instead of using the balanced scorecard
approach Steinberg proposed.
The framework was developed as described in Chapter 4. The framework was first
applied in cycle 1 as described in Chapter 5. The metrics were reviewed, and minor
enhancements to the framework were applied in cycle 2 (Chapter 6).
At Company X, the improvement in process capability and process performance was
accompanied by an improvement in business performance, in terms of lower business
risks, cost savings and high CSF attainment levels. The results provide evidence that
process capability and process performance are associated with business performance.
To illustrate the association, the Incident Management process may be used as an
example. Six of the seven KPIs associated with the CSF of Improve IT and Business
Productivity showed improvement, while one did not improve. Table 7-4 shows the
comparison of KPI performance of cycle 1 and cycle 2.

CHAPTER 7 DISCUSSION
320
Table 7-4 Comparison of KPI Performance for Incident Management: Cycle 1 &
Cycle 2
Key Performance Indicator Cycle 1 KPI
Result
Cycle 2 KPI
Result Number Of Incident Occurrences 10,171 5,881
Incident Resolution Rate 33% 41.7%
Incident Reopen Rate 11% 6.8%
Average Incident Response Time (hours) 7.2 2.5
Percentage of Incidents completed without
escalation 83% 21.7%
Incident Management Cost $1,303,416 1,307,062
Incident Management Process Capability 14.5% 0%
The CSF attainment improved from cycle 1 to cycle 2 as shown in Table 7-5.
Table 7-5 Incident Management CSF Attainment Levels: Cycle 1 & Cycle 2
Action Research Cycle CSF Attainment CSF Attainment Score
Score Cycle 1 L 0.58
Cycle 2 F 0.88
All of the ten Business Risk Mitigation Levels remained the same at Largely as shown
in Table 7-6.
Table 7-6 Business Risk Mitigation Levels for the ITSMP2 Productivity
Dimension: Cycle 1 & Cycle 2
Outcome Risks Cycle 1 Risk
Level
Cycle 2 Risk
Level
Rework L L
Waste L L
Delayed Solutions L L
Slow Operational Processes L L
Unexpected Costs L L
Higher or escalating costs L L
Slow Response To Business Needs And Changes L L Inability to scale L L
High Levels Of Non-Value Labor L L
Loss of Market Share L L
The Productivity dimension of the ITSMP2 remained the same as shown in Table 7-7.

CHAPTER 7 DISCUSSION
321
Table 7-7 ITSMP2 Productivity Attainment Levels
Action Research Cycle CSF Attainment CSF Attainment Score
Score Cycle 1 L 0.58
Cycle 2 L 0.84
The Productivity dimension of ITSMP2 scored Largely in both cycle 1 and cycle 2
after associating business risks with the CSF, but in cycle 2 the score of 0.84 is on the
brink of being Fully attained.
7.3.4.1 Revised Behari ITSM Measurement Framework
The Behari ITSM Measurement Framework (BITSMMF) was developed by the
adaption of the Performance Pyramid proposed by Lynch and Cross (1991) and the
extension and enhancement of the ITSM Metrics Model proposed by Steinberg (2013).
The two components that comprise BITSMMF are the ITSM Performance Pyramid
(ITSMP2) and the ITSM Measurement Model (ITSM3).
ITSMP2
As detailed in §4.2.1, the ITSMP2 was based on Performance Pyramid developed by
Lynch and Cross (1991) and adapted to fit the study by merging the two levels between
the apex and base of the pyramid. This created a holistic, integrated performance
measurement system that was required to address the gap between the business and IT
at the case study organization.
ITSM3
Table 7-8 lists the changes made to each component of the Steinberg ITSM Metrics
Model Tool to develop the ITSM3.
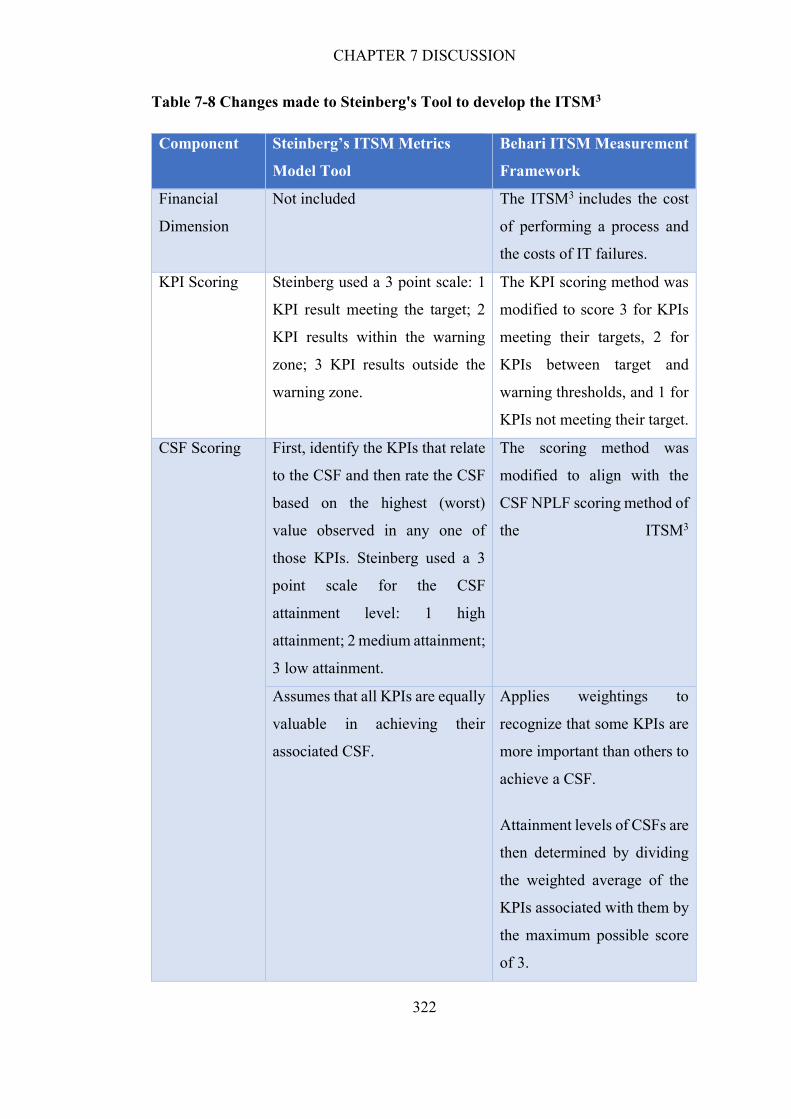
CHAPTER 7 DISCUSSION
322
Table 7-8 Changes made to Steinberg's Tool to develop the ITSM3
Component Steinberg’s ITSM Metrics
Model Tool
Behari ITSM Measurement
Framework
Financial
Dimension
Not included The ITSM3 includes the cost
of performing a process and
the costs of IT failures.
KPI Scoring Steinberg used a 3 point scale: 1
KPI result meeting the target; 2
KPI results within the warning
zone; 3 KPI results outside the
warning zone.
The KPI scoring method was
modified to score 3 for KPIs
meeting their targets, 2 for
KPIs between target and
warning thresholds, and 1 for
KPIs not meeting their target.
CSF Scoring First, identify the KPIs that relate
to the CSF and then rate the CSF
based on the highest (worst)
value observed in any one of
those KPIs. Steinberg used a 3
point scale for the CSF
attainment level: 1 high
attainment; 2 medium attainment;
3 low attainment.
The scoring method was
modified to align with the
CSF NPLF scoring method of
the ITSM3
Assumes that all KPIs are equally
valuable in achieving their
associated CSF.
Applies weightings to
recognize that some KPIs are
more important than others to
achieve a CSF.
Attainment levels of CSFs are
then determined by dividing
the weighted average of the
KPIs associated with them by
the maximum possible score
of 3.

CHAPTER 7 DISCUSSION
323
Component Steinberg’s ITSM Metrics
Model Tool
Behari ITSM Measurement
Framework
Outcome Risk
Level/Business
Risk
Mitigation
Level
Derived from using the highest
scoring CSF that the outcome
risks were associated with.
Derived from using the
weighted average of CSF
scores for the CSFs
associated with the business
risk.
Scored 3 for high risk; 2 for
moderate risk; and 1 for low risk.
Used the NPLF ordinal scale
to score the mitigation level
of business risk.
BSC Risk
Levels/ITSMP2
Attainment
Levels
The BSC Risk Levels were
derived using the average of the
CSF scores for the CSFs that
were associated with the BSC
dimension.
The ITSMP2 attainment
levels were scored by using
the weighted average of
business risks scores
associated with the ITSMP2
dimension.
Final Output The BSC Risk Level Scorecards
were represented as radar charts
showing the BSC Risk Levels.
ITSMP2 Scorecards were
represented as radar charts
showing the attainment of the
ITSMP2 dimensions using the
NPLF ordinal scale.
Figure 7-9 illustrates the changes made to the components of the Steinberg ITSM
Measurement Modelling Tool to develop the ITSM3. The changes are highlighted by
the grey background.

CHAPTER 7 DISCUSSION
324
Figure 7-9 Changes made to each component of the Steinberg ITSM Metrics
Modelling Tool to develop the ITSM3
Screenshots of the ITSM3 spreadsheet model for the Incident Management process are
shown in Appendix F. The next section discusses the findings related to RQ2: How
can the ITSM measurement framework be demonstrated for CSI?
.
CHAPTER 7 DISCUSSION
325
7.4 Discussion on findings related to research question two
7.4.1 Implementation of a method to demonstrate the ITSM Measurement Framework for CSI
As detailed in Chapter 3 §3.5.2, KISMET was selected to guide the process
improvement initiative essential to demonstrate the Behari ITSM Measurement
Framework. Previous studies have applied KISMET as both a model and tool to guide
process improvement, but to the author’s knowledge, none of the previous studies
explicitly linked KISMET and/or the application thereof to theory (Heikkinen et al.
2013; Jäntti, Cater-Steel & Shrestha 2012; Jäntti, Lahtela & Kaukola 2010; Jäntti &
Niskala 2014; Suhonen et al. 2013). The next section discusses how the
implementation of KISMET provided opportunities to contribute to the study’s
underlying theories.
7.4.1.1 Agency Theory
Agency Theory was introduced in Chapter 2 §2.4.1 as the backdrop to the literature
review and this research. Information asymmetry is an agency problem that occurs
when the agent has relevant information that the principal does not have. This agency
problem of information asymmetry was addressed at Company X by using the
KISMET framework for process and continual service improvements. The KISMET
framework called for the sharing of information at different levels of the organization,
thus affording the alignment of interests of the principal and agent.
The KISMET framework provided the practical approach required to align the
interests of the business and IT, by providing requirements at different phases of the
framework in a language familiar to both the business and IT. Each phase of the
KISMET framework required some level of collaboration between the principal
(business) and the agent (IT), thus making the information transparent to both the
business and IT. This led to IT staff understanding the core business and the business to
understand IT’s role and contribution.

CHAPTER 7 DISCUSSION
326
7.4.1.2 Business-IT Alignment
The KISMET framework in conjunction with ANT principles afforded the engagement
of management (principal) and staff (agent) to better align the business with IT. The
first phase of KISMET create a process improvement infrastructure effectively
enforced the code of collaboration between business and IT, by prescribing the joint
effort of the principal (business) and agent (IT) to discuss the interests of the business
needs and IT openly.
The concepts and prescriptions of KISMET were consistent with the culture of
Company X, while simultaneously underpinned by action research principles. Using
KISMET as a structured approach for the process improvement program offered the
predictability required by both business managers and IT staff at Company X. Both
groups were always aware of the next phase of KISMET and worked together on
meeting the requirements of a phase before moving on to the next phase.
KISMET offered a common industry-familiar language that makes it easy for both
business managers and IT personnel to understand without any issues of translation
and misinterpretation. The description of each phase of KISMET was practical, and
that made it ideal for business buy-in and process improvement execution.
Previous studies on ITSM and Business-IT alignment have focused on the effects of
the best practices of ITIL on Business-IT alignment (Luftman & Ben-Zvi 2011;
Luftman, Papp & Brier 1999), while this research extends the body of knowledge by
demonstrating how the application of the KISMET framework bridges the Business-
IT alignment gap.
The use of the KISMET framework in this research drove business value for Company
X, by continually assessing and aligning IT capabilities. KISMET facilitated the
alignment of IT activities with business strategy and performance goals.

CHAPTER 7 DISCUSSION
327
7.4.2 Structure of the method to achieve CSI
This research used KISMET as a framework within action research cycles to structure
ITSM process improvement as it supported action research methods which focus on
improving ITSM practices (Suhonen et al. 2013) and CSI. As discussed in Chapter 3,
the phases of KISMET harmonize with the phases of action research.
7.4.2.1 Enhancement of Action Research
As described in Chapter 3, prior to cycle 1, the KISMET phases were modified to take
into account enhancement of existing processes at Company X and process
performance. A major enhancement to KISMET was identified in the Continual
Process Improvement phase of Cycle 1 when it was realized that reflection should not
be done at the end of the cycle, but should be done in every phase. This is a significant
innovation and can be applied to Action Research principles to challenge the practice
of curtailing reflection to a final stage. The practice of continual reflection allowed for
timely intervention and corrective actions. This concept of continual reflection concurs
with Baskerville’s view (1999). Figure 7-10 shows the action research approach used
in this research.
Figure 7-10 Action research approach used in this research
7.4.2.2 Influence of the KISMET Framework
KISMET stresses the importance of the initial establishment of a process improvement
infrastructure. At Company X, ITSM tools including Zendesk and Jira played a critical
CHAPTER 7 DISCUSSION
328
role in providing metrics to support the processes. As detailed in Chapter 5, SugarCRM
was replaced with Zendesk to provide the required metrics to measure process
performance, and Bugzilla was replaced with Jira for its tight integration with Zendesk
to track problems that caused incidents. The KISMET framework influenced the
decision to use the fit for purpose software tools.
7.4.3 Response to Research Question Two
The second research question asked How can the ITSM measurement framework be
demonstrated for CSI?
To demonstrate the BITSMF, a process improvement initiative was undertaken as
detailed in Chapters 5 and 6. The BITSMF was applied to measure and compare
process capability, process performance and costs before and after three processes
were improved. The BITSMF was demonstrated for CSI based on the assessment and
improvement of three ITSM processes at Company X. KISMET as a framework
facilitated the formulation of a process improvement program and CSI that was
successfully followed by Company X to improve all three ITSM processes.
The enhanced KISMET framework is shown in Figure 6.1 and was applied in cycle 2.
The next section discusses the scholar-practitioner approach to this study.
7.5 Discussion on Scholar-Practitioner Approach
In addition to contributing to academic work in various bodies of knowledge, this study
provides an example of how the scholar-practitioner approach can provide tangible
benefits to organizations that participate in academic research, as well as how
academic research can advance by applying theory to solve real-world problems. The
benefits to Company X are knowledge, organizational culture change, process
efficiency, the mitigation of business risk, the alignment of business and IT, and cost
savings.
As the Director of Engineering at the case study organization, the researcher is an
integral contributor to the case organization’s ITSM program. The goal of using a
scholar-practitioner approach to solve a business problem was to bridge research,
CHAPTER 7 DISCUSSION
329
theory, and practice. Furthermore, the use of this approach with action research
afforded the introduction of critical thinking and reflection to the practice.
In line with the suggestions from Shrivastava and Mitroff (1984) and Cronholm
(2016), to make research more meaningful for practitioners, the BITSMMF design
uses self-explanatory variables (day-to-day operational metrics terminology) with
direct and actionable implications. The main objective of Company X’s process
improvement was to save costs, but the other CSFs were just as important. The CSFs
are the dependent variables in academic research parlance. Company X was interested
in knowing the organizational factors that were under its control, which in academic
terms are independent variables. The construction of these research variables supports
the goal relevance and operational validity expectations identified by Thomas, KW
and Tymon (1982). The research has a high degree of operational validity, and goal
congruence as the variables identified by the researcher are relevant to organizational
issues and can be manipulated by the practitioner (Thomas, KW & Tymon 1982).
This research balances the requirements of practice (relevance) by solving a real-world
business problem through collaboration with organizational staff to understand the
research findings with the incorporation of research rigor into the inquiry process
(Cronholm & Göbel 2016). This research outcome concurs with the findings of
Mohrman, Gibson and Mohrman (2001), that claim that research is more likely to be
seen as relevant and useful if there are opportunities for researchers and practitioners
incorporate each other’s perspectives to jointly participate in interpreting the results of
the research.
The value of the research outcomes to the business is evidenced by comments from
two executives at Company X:
“This information presented by the research is insightful and knowing that the
results are backed by academic theory makes it sound and reliable.” (CFO at
Company X, 30 October 2017)
“The relevance of the research to our day-to-day activities adds value as it
provides information that we can understand and therefore act on.” (VP of
Operations at Company X, 30 October 2017).

CHAPTER 7 DISCUSSION
330
7.6 Chapter Summary
This chapter discussed the improvement in process capability and process performance
with the associated improvement in business performance, in terms of lower business
risks, cost savings and high attainment of CSFs. The results provide evidence that
process capability and process performance are associated with business performance.
Chapter 7 also discussed the implementation of the KISMET framework as an
effective guide to process improvement. Finally, the benefits of the scholar-
practitioner research approach were highlighted. The next chapter concludes the
thesis.

CHAPTER 8 CONCLUSION
331
CHAPTER 8 CONCLUSION
8.1 Introduction
This chapter provides a conclusion to this thesis with a summary of the key research
findings to demonstrate how this research has met its objectives. This is followed by
an account of the contributions of the research to theory and practice. Finally, the
chapter also states the limitations of this research and directions for future research.
This chapter is organized into six sections. This section is an introduction to the final
chapter. A summary of the research findings is provided in section 8.2.
The contributions this research makes to theory and literature are presented in section
8.3. Section 8.4 presents the contribution this research makes to industry and practice.
Limitations of the research and suggested directions for future research are provided
in section 8.5. The final chapter summary is provided in section 8.6.
An overview of the chapter is shown in Figure 8-1.

CHAPTER 8 CONCLUSION
332
Figure 8-1 Overview of Chapter 8
8.2 Summary of Thesis
The aim of this research was to explore the association of ITSM process capability and
ITSM process performance with business performance. This research study is
presented in eight chapters. Chapter 1 provided the background to the research,
identified the research problem, presented the research questions and justification of
the research as well as the expected research contributions. Chapter 1 also presented
an introduction to the methodology, definition of key terms, scope delimitations and
key assumptions of this research.

CHAPTER 8 CONCLUSION
333
In Chapter 2, by dichotomizing the research topic into the streams of IT and business,
the literature review followed a structured method, using a top-down approach to
examine the academic, industry, theoretical and empirical studies related to ITSM
capability, ITSM performance, and business benefits, specifically financial benefits.
The literature review strategy used a top-down approach to logically synthesize studies
around the parent theories Strategic Alignment, Resource-Based View using Agency
Theory as the backdrop. Relationships across the lower level focus areas were
identified and confirmed. The literature review revealed that there is a lack of
theoretical and practical knowledge around the development and use of a method and
model to examine the association of ITSM process capability and process performance
with business performance. Furthermore, to date, there is no empirical evidence of
applying a pragmatic academic method and model as an ITSM process improvement
tool. Chapter 2 identified two research opportunities based on the literature review
findings.
Chapter 3 presented the blueprint for the research study. The underlying research
philosophy, epistemology, and ontology, driven by the research questions, formed the
basis for the overall research design and approach. The research design and approach
were underpinned by the research philosophy of pragmatism. The study used applied
research integrating mixed methods within a case study, following the action research
approach, to provide academic rigor and industry relevance.
The planned research design and activities to answer the two research questions were
also presented in Chapter 3. Finally, the ethical considerations made in this research
were provided.
In Chapter 4, the design of the measurement model was presented. Steinberg’s model
was extended to include financial measurements and incorporate business risks to chart
the risk levels of CSFs. A top-down conceptual model of measurement and control
linking process capability, process performance, and financial profitability to KPIs,
CSFs, and business risks was presented. The ITSM3 provided a method to derive KPIs
from operational metrics, link KPIs that operationalize CSFs to applicable CSFs to
achieve organizational goals, and associated business risks to these CSFs to ultimately
determine the risks of these CSFs or business objectives.

CHAPTER 8 CONCLUSION
334
Chapter 5 described the events of the first cycle of the action research. Using the action
research approach, the researcher, through direct participation, followed the cyclic
process of the approach to systematically enable process improvements and measure
financial benefit in the case study organization. The activities of the KISMET
framework were mapped to the phases of action research in Chapter 3 and used in the
first cycle as a process improvement guide in order to achieve the goals of this action
research study.
Chapter 6 described the events of each step of the KISMET framework within the
second cycle of the action research. Reflection was an ongoing activity throughout this
cycle. Further modifications to the measurement model were made and applied to the
results of cycle 2. The model was re-applied to the results of Chapter 5, and a
comparison of cycle 1 and cycle2 was presented.
In Chapter 7, a critical examination of the research results with discussions based on
the context of the research method and reviewed literature was provided. Discussions
were structured to answer the two research questions with a consideration of research
work conducted and the presentation of key themes emerging from this research.
The study answers the two research questions as stated below.
RQ1. How can the association of ITSM process capability and process performance
with financial performance of an organization be determined?
Through a literature review, the research confirmed the lack of a practical, cost-
effective measurement model and method to associate ITSM process capability and
performance with business performance. The ITSM Metrics Modelling Tool, proposed
by Steinberg (2013), was used as a starting point to the development of the ITSM3
(Chapter 4). In order to answer research question one, Steinberg’s model was adapted
and extended to include a financial dimension and was applied in two action research
cycles by operationalizing Key Performance Indicators (KPIs) to support Critical
Success Factors (CSFs) and associating CSFs with business risks to determine the
attainment levels of the ITSM Performance Pyramid dimensions. The SMPA tool was
used to determine a holistic measure of process capability. The SMPA tool was chosen
for its transparency, convenience, effectiveness, low costs, and for its ability to report
recommendations and observations. Rather than using the process capability score
CHAPTER 8 CONCLUSION
335
generated by the SMPA tool, the proportion of the number of recommendations
generated of the total number of recommendations was used as a measure in the
ITSM3. Business performance was measured across business risks, to provide a CSF
risk assessment.
The Behari ITSM Measurement Framework was developed and applied in two cycles
of the action research. Improvement in process capability was accompanied by
improved process performance, financial performance, and overall business
performance.
RQ2. How can the ITSM measurement framework be demonstrated for CSI?
As described in Chapter 3, the activities of the KISMET framework were mapped to
the phases of the action research cycle. This mapping afforded the use of a scholar-
practitioner approach to process improvement and CSI. The concepts and prescriptions
of KISMET as an adaption of action research were consistent with the culture of ITSM
practice. Moreover, KISMET enforced collaboration between the business and IT, by
providing a common language, thus improving the alignment of the principal
(business) and agent (IT).
The KISMET framework was adapted and applied to answer research question two.
The adapted KISMET model was found to be effective in guiding improvements in
Incident, Problem and Change Management processes, and in demonstrating CSI.
8.3 Contribution to Theory, ITSM Literature, and Research Methodology
The research provides a structure to, and synthesis of the academic literature in the
field of ITSM. A comprehensive and empirically validated conceptualization of the
factors (within the scope of this research) pertaining to the association of process
capability, performance and business performance is presented.
8.3.1 Contribution to Underpinning Theories
Agency Theory
The research contributes to the underpinning parent theory, Agency Theory, by
presenting an example of bridging the information asymmetry gap that is often held as

CHAPTER 8 CONCLUSION
336
a cause of many agency problems. The operationalization of the BITSMMF called for
the collaboration of the business and IT. Both the business and IT were involved with
the ITSM function to derive KPIs that support the organization’s CSFs. This resulted
in the business understanding the goals of IT at the KPI level and IT understanding the
business’s strategic goals at the CSF level. Business management at Company X had
access to accurate information on IT activities to make better business decisions, while
IT had insight into how their work affected the CSFs of the company. This
transparency of information helped bridge the information asymmetry gap.
Business-IT Alignment
This research contributes to the literature on ITSM and Business-IT alignment by using
KISMET as a process improvement framework to facilitate the alignment of business
and IT. The use of a practical framework, that was previously empirically tested
(Heikkinen et al. 2013; Jäntti, Cater-Steel & Shrestha 2012; Suhonen et al. 2013),
provided the appropriate business-IT language to allow for the alignment of the
interests of the business and IT.
Resource-Based View
Although this study was expected to exhibit the attributes of a firm’s IT capability and
its relationship to organizational performance, the text of this thesis does not
prominently demonstrate a contribution to the resource-based view theory.
However, a contribution to RBV can be inferred by the information uncovered by this
research on how ITSM frameworks, such as ITIL, are able to provide a positive
influence on knowledge transfer by prescribing policies, procedures and tools that
serve as valuable enablers of knowledge generation and application These frameworks
influence the IT organization’s resources and capabilities, and ultimately can lead to
improvement of a firm’s competitive advantage.

CHAPTER 8 CONCLUSION
337
8.3.2 Contribution to ITSM Literature
ITSM Adoption, Implementation, and Benefits
The literature on the adoption, implementation and benefits of ITSM reports business
benefits such as improved resource utilization, more timely deliverables, improved
communication with IT departments within the organization, a reduction of server
errors, elimination of redundant work and a decrease of rework, and the justification
of the cost of quality (Cater-Steel, Toleman & Tan 2006). Previous empirical studies
focused on process-specific benefits, and not financial returns (Gacenga, Cater-Steel
& Toleman 2010). This research contributes to this body of knowledge by providing
empirical evidence of the benefits of cost savings and risk mitigation by a business
through improving ITSM process capability and performance.
ITSM Capability
The research contributes to the body of knowledge on ITSM process capability, by
using a standards-based maturity model, ISO/IEC 15504 for the measurement of
process capability, and adapting it to provide a fit-for-purpose measurement model.
The adaption was to use the variation in the number of recommendations (generated
by the SMPA report) based on process attributes to determine improvement in process
capability rather than the process capability level. The account of the use of a
transparent, efficient tool (SMPA) for process assessment contributes to the literature
on process assessments.
ITSM Performance
The novel approach to combine CSFs and KPIs in the ITSM3 contributes to the
literature on using CSFs and KPIs in IT performance measurement systems.
By using a scholar-practitioner approach to this research, the overarching contribution
of this research is the demonstration that academia can benefit by partnering with
practice to bridge the research-practice gap. Academic scholars can significantly
increase the prospect of evolving knowledge for theory and practice when they
interact, collaborate, and forge a partnership with practitioners.
CHAPTER 8 CONCLUSION
338
8.3.3 Contribution to Research Methodology
Actor-Network Theory
ANT has not been prominent in the thesis text, however, the principles and inscriptions
of ANT were indeed intentionally followed by the researcher throughout the research
project. This research did not contribute to ANT as expected.
Action Research
Previous action research studies in IT (Jäntti & Niskala 2014; Kang 2008; Phaal,
Farrukh & Probert 2001; Suhonen et al. 2013) have used various models of action
research (Baskerville & Pries-Heje 1999; Costello 2003; Kemmis, McTaggart &
Nixon 2013; Maslen & Lewis 1994; McNiff 2013; McTaggart & Kemmis 1988;
Susman & Evered 1978) but most followed the prescribed sequence of phases.
Following the stages or cycles of a particular model too rigidly, could adversely affect
the unique opportunity offered by the emerging nature and flexibility that are the
hallmarks of action research.
By engaging in reflective practice throughout the entire action research project, the
research-practitioner was able to reflect on activities during each phase of the action
research cycles and the KISMET model to respond with prompt and apt revisions and
interventions. This continual reflection allowed for real monitoring of the progress of
change. By adopting this continual reflective approach, the researcher-practitioner is
equipped to make decisions and revisions to the process throughout the
implementation. Reflection is integrated throughout the action research cycle and
should not be seen as a final phase of the cycle. This is a significant revelation and can
be applied to Action Research principles to challenge the practice of curtailing
reflection to a final stage. The practice of continual reflection allowed for timely
intervention and corrective actions and concurs with the suggestions made by
Baskerville and Wood-Harper (1996).
The KISMET model may be seen as a limitation if used as-is with action research. As
described in section 3.5.2 Table 3-1, the phases of the KISMET model did not
automatically map to the phases of action research, so following a pragmatist
approach, the researcher mapped the KISMET phases to the action research phases to

CHAPTER 8 CONCLUSION
339
fit this study. Furthermore, some of the phases of the KISMET model were renamed
to offer familiarity to the case study organization. Future action researchers, especially
those outside the ITSM domain, may choose to further adapt and/or remap KISMET
to action research to fit their study.
8.4 Contribution to ITSM Industry and Practice
The study contributes to the ITSM industry and practice by providing a measurement
model and method to identify opportunities to reduce costs and increase efficiency in
ITSM processes that can ultimately lead to increased competitiveness. The research
aimed to meet the challenges and opportunities that arise in businesses. The challenges
are to increase revenue or decrease cost through the design of effective business
processes.
The results suggest that it is possible to use the ITSM3 as a starting point for self-
improvement for businesses, identifying gaps in processes, benchmarking within an
organization as well as guiding an organization’s improvement efforts.
Some of the key features of this measurement model include:
support for continual improvement;
offers a process- and service-based IT service management approach;
presents a scalable and flexible fit-for-purpose model;
aggregates metrics to formulate key performance indicators;
derives a method for filtering improvement initiatives and tracking
performance status; and
provides the ability to report on CSF attainment levels to develop performance
improvements.
A practical measurement model was developed to determine the association of ITSM
process capability, process performance and business performance. The model can be
used to conduct What-If analyses to model the impacts of future business decisions on
KPIs and CSFs. This can be achieved by increasing or decreasing the values of the
Operational indicators that may be related. The model may also be used for analytics,
for example, drilling down to more specific operational metrics. The measurement

CHAPTER 8 CONCLUSION
340
model presented in this study can be quickly implemented, adapted and evolved to
meet the organization’s needs. The Behari ITSM Measurement Framework is an
exemplar that other organizations can benefit from. In response to the unpredictable
market volatility, Company X has started to implement other ITSM processes such as
Release and Deployment Management, Availability Management, and Service Level
Management, and has extended the ITSM3 to incorporate these new processes.
The rhythm of the KISMET cycles and the operationalization of the Behari ITSM
Measurement Framework have been institutionalized at Company X. The lasting
benefits to Company X are the implementation of new software tools (Zendesk, Jira,
and the ITSM3), the alignment of business and IT through organizational change, staff
development through ITIL training, and the continual service improvement offered by
the BITSMMF.
The practical contribution of the research is that it offers an example from which other
organizations can learn to measure their business performance and financial return on
investment in ITSM improvement. It seeks to provide an understanding of how to
derive KPIs from operational metrics, link KPIs that operationalize CSFs to applicable
CSFs to achieve organizational goals and associate business/outcome risks to these
CSFs to ultimately determine the risks of these CSFs or business objectives. It aims to
provide an understanding of the potential degree of financial benefits realizable due to
process improvements. The application of the model establishes the link between IT
capability and performance and financial measures.
The operationalization of the BITSMMF will be shared with practice through
presentations at the San Francisco Bay Area itSMF Local Interest Group, and through
articles in itSMF Bulletins. LinkedIn will be used as a social media tool to share the
research findings with practice. The researcher plans to take the spreadsheet-based
measurement model to the next level, to develop Software-as-a-Service to expose the
BITSMMF by initially integrating with the Zendesk API to automate the population
of the ITSM3.
Some of the major ITSM software tool vendors, such as ServiceNow, BMC, Cherwell
Software, and Ivanti (Matchett, Doheny & Gonzalez 2017) will be approached to foster

CHAPTER 8 CONCLUSION
341
a business partnership to provide the ITSM3 as a plugin or add-on to these vendors’
offerings.
Although not core to this research, the PESTEL analysis and the reflection thereof
contributes to the increasing literature on market volatility studies (Bjønnes & Rime
2005; Brada, Kutan & Yigit 2006; Dolan 2011).
An overarching contribution of this research is the presentation of an exemplar that
demonstrates how academic studies can be effectively used to solve business problems
and contribute to the success of the business.
8.5 Limitations and Agenda for Future Research
This section discusses the limitations of the research and recommends future research
topics. This research explores the association of ITSM Process Capability, Process
Performance and Business Performance. The limitations of the research are
categorized into Literature Review, Methodology, and the Behari ITSM Measurement
Framework.
8.5.1 Literature Review
The limits defined in the literature review protocol (Chapter 2, Table 2.1) resulted in
the exclusion of literature that did not meet the predefined criteria. It is possible that
relevant research is available in literature from non-English academic and industry
literature excluded in this study, that can be explored in future research. Future
research can explore academic and industry literature that did not meet the criteria for
review in this study, to complement and/or further contribute to the research problem.
8.5.2 Methodology
The scope of this research is delimited by the philosophical worldview, theoretical
underpinnings, research design and the selected research methods as discussed in
Chapter 1, §1.7. Future research may be conducted using a different worldview,
underpinning theories, research design and research methods to extend and/or enhance
this study.
8.5.2.1 Single Case Study
CHAPTER 8 CONCLUSION
342
This research was based on a single case study focused on three ITSM processes. Using
a single case study often generates a question around replication logic and
generalization. The use of multiple case studies would have strengthened the data,
information and context used to develop the design of the artefact (BITSMMF). This
limitation was mitigated by the iterative improvement and enhancement of BITSMMF
facilitated by the Action Research cycles. However, using the framework developed
in this research, the approach can be easily extended to other organizations and all
ITSM processes. It can also be extended to work beyond ITSM.
Beyond the software engineering discipline, the ISO/IEC 15504 standard, originally
referred to as Software Process Improvement and Capability DEtermination (SPICE),
has now been established as a general process assessment standard and is being
transformed into a new standard family of ISO/IEC 330xx series (Rout 2014). The
fundamental evolution of the ISO/IEC 15504 standard architecture has opened up the
way to other sectors of the industry and new horizons for process assessment (Cortina
et al. 2014). In recent years the standard has been broadened to address non-software
domains such as management systems, banking, automotive, medical devices and
aerospace (Cortina et al. 2014; Di Renzo et al. 2007; McCaffery, Dorling & Casey
2010; Rout et al. 2007; Van Loon 2007). Beyond the discipline of ITSM, the SMPA
approach (used in this research project to assess process capability) can potentially be
applied to other models or domains where a compliant assessment model is available.
The operationalization of BITSMMF by deriving KPIs from operational metrics,
linking KPIs to applicable CSFs to achieve organizational goals and associating
business risks to these CSFs to ultimately determine the attainment of business
performance dimensions, is a generic approach to exploring the association of process
capability, process performance and financial performance.
Using the automotive industry as an example, two operational metrics could be the
Number of Vehicles Manufactured and the Number of Defective/Recalled Vehicles.
An example of a KPI that can be derived from these operational metrics is Defective
Units/Recall Rate, which would be calculated by taking the total number of vehicles
that have been recalled due to a defect in the vehicle produced within a specified time
period and dividing by the total number of vehicles produced within the same time
period. An examples of an associated CSF is cost savings. A business risk for the

CHAPTER 8 CONCLUSION
343
automotive industry that is associated with the Financial performance dimension of
ITSMP2 could be Fines and Penalties. Examples of process financial costs could
include manufacturing equipment outages and worker injuries. Further research can be
undertaken to apply the framework in different industry sectors, using different tools
for data collection and methods to calculate financial measures and business
performance.
The validity threats around single case study research are concerned with the ability to
generalize the results. Positivist studies aim at finding objective truths, which implies
that they are valid for the respective sample, and hence positivists are after being able
to generalize from a sample to a population (Petersen & Gencel, 2013). In interpretivist
and action research studies generalizability has to be viewed differently. As Yin (2009)
points out, one should not talk about a sample of cases, given that one would not aim
to generalize to a population. Instead, one would like to generalize to similar contexts,
and find supporting cases and conflicting cases for theories, and by doing that being
able to conduct cross-case comparison (Petersen & Gencel, 2013). Practitioners are
often most interested in cases, in particular those that match their company context
(e.g. in terms of domain, size and complexity of development, use of similar processes,
and so forth). Hence, reporting context is very important to know which cases to
compare (Petersen & Wohlin, 2009). Overall, this makes clear that case studies should
not be rejected due to that they represent only a single case, each case is an important
contribution to learning, in particular as case studies provide a deep understanding
(Runeson & Höst, 2009; Yin, 2009) of a situation in a particular context. The same
applies to action research, which is also focused on being conducted in the real world,
and hence produces context dependent results (Kock, 2004).
8.5.2.2 Action Research
One may view the choice of Action Research over Design Science Research a
limitation, as it is evident that the development of the artefact (BITSMMF) is core to
this research. However, the primary focus of this research was to address the real-
world business problem of exploring the association of ITSM Process Capability,
Performance and Business Performance.

CHAPTER 8 CONCLUSION
344
As described in section 3.2.1 p.67, the researcher’s philosophical worldview of
pragmatism, and in particular, methodological pragmatism, underpinned this research
study. Please see section 3.2.1 for details of the researcher’s philosophical stance that
underpinned the research approach.
Researchers with other worldviews, for example critical realism, may consider the
Design Science Research approach to further extend and enhance the BITSMMF. This
philosophical stance may focus on the improvement of the artefact developed and
applied in this study.
8.5.2.3 Scholar-Practitioner Approach
The researcher may not be seen as an objective and neutral observer, as the researcher
is professionally involved with the case organization and academically embedded in
ITSM. However, this study should not be seen as being compromised by my
involvement, as the methods of rigor discussed in chapter 3 are executed and upheld
to counteract this. Moreover, given each researcher’s individual and unique
perceptions and interpretations of phenomena, research is essentially biased to begin
with, so there is no point in trying to “establish validity” in any external or objective
sense (Trochim & Donnelly 2007).
8.5.3 Process Capability
This study used the SMPA tool for the process capability assessment, primarily for its
transparency and convenience. As discussed in the reflection on process capability
assessment results, in §6.3.2, the SMPA process attribute scores are not granular
enough to determine improvement in ITSM process capability. Using a process
capability assessment instrument that offers a finer degree of granularity may produce
more accurate process capability results.
Furthermore, the SMPA tool ignores the survey responses of “Do not know” and “Do
not understand” to calculate the process capability level. These two answer responses
and vital to a process improvement program, as they indicate the lack of knowledge or
communication.
The SMPA tool does not provide an automated mechanism to incorporate reliability
scores to determine process attribute scores. A path for future research when using the

CHAPTER 8 CONCLUSION
345
SMPA approach or any process assessment instrument is to further analyze the
reliability of the assessment results before determining the capability rating of a
process. The process attribute scores and corresponding maturity level should be
considered in light of the reliability measures. This study did not analyze the
assessment reliability scores in detail but merely used the results at face value.
Results from other process assessment methods can be easily incorporated into the
measurement. The SMPA survey was conducted as a cross-sectional survey annually
at two points in time. A cross-sectional survey presents a single snapshot in time and
further understanding may be provided by a longitudinal survey that will provide multiple
snapshots across time.
Using the SMPA Tool as an instrument to access ITSM process capability of an
organization has some potential issues. Survey participants are required to assess
capability by responding to questions that are directly mapped to an ordinal scale
(NPLF). This is problematic as one survey participant’s interpretation of maturity or
the question being posed may differ from another participant’s. People with different
roles in different parts of an organization may have different views on the capability
of processes, as evidenced in §5.8.1 and §6.2.1. Additionally, the assessment
instrument creates a proxy measure of the process capability of an organization and
there is always inherent error in such an approach.
8.5.4 Process Performance
The limitations around process performance comprise the accuracy and quality of data
used to populate the ITSM3. Although §7.3.2.2 discussed how issues around the
accuracy and quality of data were addressed in this study, the KPI scoring method and
the use of weighted averages in ITSM3 may be viewed as limitations that could prompt
further research.
8.5.4.1 KPI Scoring
KPIs can measure different kinds of data, which are often quantified differently using
different units of measurement, for example, currency, integers, ratios, and time.

CHAPTER 8 CONCLUSION
346
The KPI scores in this study were not normalized to a linear range using consistent
thresholds. In order to evenly distribute the scores future research could investigate the
application of consistency to underpin all score calculations.
For example, Commercial software tools, such as Microsoft Power BI™ (Microsoft
2017), use a method referred to as banding to evenly distribute KPI scores (Hulen,
Chau & Yang 2005). The banding method is the choice of calculation to use to
compare the actual KPI result to a target result. This method creates a normalized range
(0% to n%) for the KPI using this calculation.
8.5.4.2 Weighted Averages
The use of weighted averages to score CSF attainment levels, business risk mitigation
levels, and derive scores for ITSMP2, may be perceived as a limitation as the “pattern”
of thinking of the human assignee is reflected in the weights assigned, which is often
referred to as the utility function (Mill 1901).
In decision processes, such as deciding which business risk is more important to
mitigate from a set of related business risks, the value of the weights are at best
imprecise, and heuristically arrived at with parameters which are likely to have little
or no relationship to each other as they are not integrated through any physical process
with quantifiable parameters. Scores and weights are deliberately biased by human
evaluators, and no single unique value can represent human thought processes.
8.5.5 Business Performance
Business performance was measured using the constraints of the ITSMP2. The model
confines the performance measures to nine high-level dimensions. Using other
performance measurement systems may provide additional performance dimensions
to consider. The focus of this research was the financial dimension, so future research
can focus on other specific dimensions or provide more in-depth analysis into other
business performance measures.

CHAPTER 8 CONCLUSION
347
8.5.5.1 Financial Measurement
The primary focus of this research was to provide a monetary value to the cost savings
realized by improving ITSM processes, in both capability and performance. However,
this may be limiting, as there are numerous other financial measures that were unveiled
by the literature review. Future studies can incorporate other measures into the
BITSMMF, or use ITSM3 to model ITIL’s Financial Management for IT Services.
A further limitation to the financial measurement is that the BITSMF did not
incorporate the costs involved with staff participation in the surveys, focus groups,
meetings, and the setup of the Zendesk metrics, as these costs were negligible. These
costs can be easily included in the measurement model.
8.6 Chapter Summary
This research established a connection between theory and practice by drawing on
academic and practitioner literature and collaborating with academia and industry to
develop a measurement model and method (framework) to improve ITSM processes,
with the ultimate intention of determining whether there is an association of ITSM
process capability, ITSM process performance, and business performance.
The objectives of this research have been achieved.

CHAPTER 8 CONCLUSION
348
Acknowledgements
ITIL® and Information Technology Infrastructure Library ® are registered trademarks
of AXELOS Limited.
Jira Service Desk™ is a trademark of Atlassian Inc.
Zendesk® is a registered trademark of Zendesk Inc.
ServiceNow™ is a trademark of ServiceNow Inc.
SugarCRM is a registered trademark of SugarCRM Inc.
COBIT® is a registered trademark of ISACA.
Microsoft® Outlook® are registered trademarks of the Microsoft Corporation.
Micosoft Power BI is a trademark of Microsoft Corporation.
SalesForce is a trademark of salesforce.com, Inc.
GoodData is a registered trademark of GoodData Corporation.
Google Docs™ is a registered trademark of Google Inc.
The study leans on the research in KISMET project funded by the National Technology
Agency TEKES (no.70035/10), European Regional Development Fund (ERDF), and
industrial partners.

References
349
References
Aaker, DA & Adler, DA 1984, Developing business strategies, Wiley New York, NY
USA.
Acharya, VV & Pedersen, LH 2005, 'Asset pricing with liquidity risk', Journal of
financial Economics, vol. 77, no. 2, pp. 375-410.
Ackerman, A 2015, CFTC Reviews Retail Forex-Trading Rules Following FXCM
Debacle, The Wall Street Journal, viewed 22 October 2017,
<https://www.wsj.com/articles/cftc-reviewing-retail-forex-trading-rules-following-
fxcm-debacle-1423673421>.
Addy, R 2007, Effective IT service management: To ITIL and beyond!, Springer-
Verlag, New York, NY USA.
Aguilar, FJ 1967, Scanning the business environment, Macmillan, New York, NY
USA.
Ahmad, M 2013, 'IT BSC: A Comprehensive Framework for IT Evaluation, IT
Management, and IT Governance', paper presented to 3rd International Conference on
ICT, Alexandria, Egypt.
AIS 2011, Senior Scholars’ Basket of Journals, Association for Information Systems,
viewed 30 December 2017, <https://aisnet.org/?SeniorScholarBasket>.
Aitken, I 2003, Value-driven IT Management, Computer Weekly Professional,
Routledge, London, United Kingdom.
Alaeddini, M & Salekfard, S 2013, 'Investigating the role of an enterprise architecture
project in the business-IT alignment in Iran', Information Systems Frontiers, vol. 15,
no. 1, pp. 67-88.
Allcott, H & Gentzkow, M 2017, 'Social Media and Fake News in the 2016 Election',
Journal of Economic Perspectives, vol. 31, no. 2, pp. 211-36.
Amagoh, F 2009, 'Information asymmetry and the contracting out process', The
Innovation Journal: The Public Sector Innovation Journal, vol. 14, no. 2, pp. 1-14.

References
350
American Psychological Association 2007, Getting in: A step-by-step plan for gaining
admission to graduate school in psychology, American Psychological Association,
Washington, DC USA.
Anthony, R, Dearden, J & Vancil, R 1972, Management Control Systems: Text, cases
and readings, Willard J. Graham series in accounting, Irwin, Homewood, IL USA.
Aoki, M 2001, Toward a comparative institutional analysis, MIT Press, Cambridge,
MA USA.
Argyris, C, Putnam, R & McLain Smith, D 1985, Action science. Concepts, methods
and skills for research and intervention Jossey Bass, San Francisco, CA USA.
Artto, KA 1999, 'Management across the Organization', Project Management, vol. 4,
no. 1, pp. 4-9.
Atlassian 2017, viewed 6 May 2017, <https://www.atlassian.com/>.
Australian Bureau of Statistics 1993, 1993 Feature Article - Understanding Labour
Costs, viewed 5 November 2017,
<http://www.abs.gov.au/ausstats/[email protected]/featurearticlesbytitle/930EB829AA7743E
2CA256FE10079E615?OpenDocument>.
Avison, D, Baskerville, R & Myers, M 2001, 'Controlling action research projects',
Information technology & people, vol. 14, no. 1, pp. 28-45.
Avison, D, Lau, F, Myers, M & Nielsen, P 1999, 'Action research', Communications
of the ACM, vol. 42, no. 1, pp. 94-7.
Ayat, M, Sharifi, M, Sahibudin, S & Ibrahim, S 2009, 'Adoption factors and
implementation steps of ITSM in the target', in 3rd Asia International Conference on
Modelling & Simulation, Bali, Indonesia, pp. 369-74.
Baker, T 2002, Key Performance Indicators Manual: A Practical Guide for the Best
Practice Development, Implementation and Use of KPIs, Allen & Unwin, Crows Nest,
NSW Australia.
Balladur, E 1999, 'The International Monetary System: Facing the Challenge of
Globalization', in Institute for International Economics, Washington, DC USA.

References
351
Bank of International Settlements 2016, Foreign exchange turnover, April 2016,
Triennial Central Bank Survey.
Barafort, B, Di Renzo, B, Lejeune, V, Prime, S & Simon, J 2005, 'ITIL Based Service
Management Measurement and ISO/IEC 15504 Process Assessment: A Win-Win
Opportunity ', paper presented to 5th International SPICE Conference, Klagenfurt,
Austria.
Barafort, B & Rousseau, A 2009a, 'Sustainable Service Innovation Model: A
Standardized IT Service Management Process Assessment Framework', Software
Process Improvement, pp. 69-80.
—— 2009b, 'Sustainable Service Innovation Model: A Standardized IT Service
Management Process Assessment Framework', in European Conference on Software
Process Improvement, Alcala de Henares, Spain, pp. 69-80.
Bardhan, IR, Demirkan, H, Kannan, P, Kauffman, RJ & Sougstad, R 2010, 'An
interdisciplinary perspective on IT services management and service science', Journal
of Management Information Systems, vol. 26, no. 4, pp. 13-64.
Barney, J 1991, 'Firm resources and sustained competitive advantage', Journal of
Management, vol. 17, no. 1, pp. 99-120.
Barro, RJ 2009, 'Rare disasters, asset prices, and welfare costs', The American
Economic Review, vol. 99, no. 1, pp. 243-64.
Baskerville, R 1999, 'Investigating information systems with action research',
Communications of the AIS, vol. 2, no. 3es, p. 4.
Baskerville, R & Myers, M 2004, 'Special issue on action research in information
systems: Making IS research relevant to practice: Foreword', MIS Quarterly, pp. 329-
35.
Baskerville, R & Pries-Heje, J 1999, 'Grounded action research: a method for
understanding IT in practice', Accounting, Management and Information
Technologies, vol. 9, no. 1, pp. 1-23.
Baskerville, R & Wood-Harper, A 1996, 'A critical perspective on action research as
a method for information systems research', Journal of Information Technology, vol.
11, no. 3, pp. 235-46.
References
352
BBC 2016, US Election 2016: Markets meltdown fails to materialise, BBC News,
viewed 23 October 2017, <http://www.bbc.com/news/business-37921036>.
Behari-Leak, K 2015, 'Conditions Enabling Or Constraining the Exercise of Agency
Among New Academics in Higher Education, Conducive to the Social Inclusion of
Students', PhD thesis, Rhodes University.
Behari, S, Cater-Steel, A, Shrestha, A & Soar, J 2016, 'A measurement model to link
process operational measures to risks associated with attainment of business critical
success factors', paper presented to 6th International Engaged Management
Scholarship Conference, Paris, France.
Belkhamza, Z 2012, Measuring Organizational Information Systems Success: New
Technologies and Practices, IGI Global, Hershey, PA USA.
Benbasat, I 1984, 'An analysis of research methodologies', in The information systems
research challenge, Harvard Business School Press, Boston, MA USA, pp. 47-85.
Bennett, PD & Green, RT 1972, 'Political instability as a determinant of direct foreign
investment', Thunderbird International Business Review, vol. 14, no. 3, pp. 20-1.
Benson, C & Clay, EJ 2004, Understanding the economic and financial impacts of
natural disasters, Disaster Risk Management, World Bank Publications, Washington,
DC USA.
Berle Jr, AA & Means, GC 1930, 'Corporations and the public investor', The American
Economic Review, pp. 54-71.
Bernard, P 2012, Foundations of ITIL® 2011 Edition, Van Haren Publishig,
Zaltbommel, The Netherlands.
Bianco, A & Lavelle, L 2000, The CEO Trap, Bloomberg,
<https://www.bloomberg.com/news/articles/2000-12-10/the-ceo-trap>.
Bickman, L & Rog, DJ 2008, The Sage handbook of applied social research methods,
Sage Publications, Thousand Oaks, CA USA.
Birch, C 2000, Future Success: A Balanced Approach to Measuring and Improving
Success in Your Organisation, Pearson Education Australia, Frenchs Forest, NSW
Australia.

References
353
BIS 2016, FX Global Code Public Update on Adherence, Bank for International
Settlement viewed 22 October 2017,
<http://www.bis.org/mktc/fxwg/am_may16.pdf>.
Bjønnes, GH & Rime, D 2005, 'Dealer behavior and trading systems in foreign
exchange markets', Journal of financial Economics, vol. 75, no. 3, pp. 571-605.
Blomberg, SB & Hess, GD 1997, 'Politics and exchange rate forecasts', Journal of
International Economics, vol. 43, no. 1, pp. 189-205.
Blumer, H 1969, Symbolic interactionism; perspective and method, Prentice-Hall,
Englewood Cliffs, NJ USA.
Bonoma, TV 1985, 'Case Research in Marketing: Opportunities, Problems, and a
Process', Journal of marketing research, vol. 22, no. 2, pp. 199-208.
Bosworth, B, Perry, GL & Shapiro, MD 1994, 'Productivity and Real Wages: Is There
a Puzzle?', Brookings Papers on Economic Activity, vol. 1994, no. 1, pp. 317-44.
Braa, K & Vidgen, R 1999, 'Interpretation, intervention, and reduction in the
organizational laboratory: a framework for in-context information system research',
Accounting, Management and Information Technologies, vol. 9, no. 1, pp. 25-47.
Brada, JC, Kutan, AM & Yigit, TM 2006, 'The effects of transition and political
instability on foreign direct investment inflows', Economics of Transition, vol. 14, no.
4, pp. 649-80.
Brignall, T, Fitzgerald, L, Johnston, R & Silvestro, R 1991, 'Performance measurement
in service businesses', Management Accounting, vol. 69, no. 10, p. 34.
Brooks, P 2006, Metrics for IT Service Management, Best Practice Library: IT
Management, Van Haren Publishing, Zaltbommel, the Netherlands.
Bryman, A 2006, 'Paradigm peace and the implications for quality', International
Journal of Social Research Methodology, vol. 9, no. 2, pp. 111-26.
Bureau of Labor Statistics 2017a, Consumer Price Index, United States Department of
Labor, viewed 15 December 2017, <https://www.bls.gov/cpi/questions-and-
answers.htm>.

References
354
—— 2017b, SAN FRANCISCO-OAKLAND-SAN JOSE Consumer Price Index, All
Items, 1982-84=100 for Urban Wage Earners and Clerical Workers (CPI-W), United
States Department of Labor, viewed 15 December 2017,
<https://www.bls.gov/regions/west/data/consumerpriceindex_sanfrancisco_table.pdf
>.
Burkholder, G, Cox, K & Crawford, L 2016, The Scholar-Practitioner's Guide to
Research Design, Laureate Publishing, Baltimore, MD USA.
Callon, M 1999, 'Actor-network theory—the market test', The Sociological Review,
vol. 47, no. 1_suppl, pp. 181-95.
Callon, M & Latour, B 1981, 'Unscrewing the big Leviathan: how actors macro-
structure reality and how sociologists help them to do so', Advances in social theory
and methodology: Toward an integration of micro-and macro-sociologies, pp. 277-
303.
Cannon, D 2011, ITIL Service Strategy, The Stationery Office, London, UK.
Caralli, RA, Stevens, JF, Willke, BJ & Wilson, WR 2004, The Critical Success Factor
Method: Establishing a Foundation for Enterprise Security Management, Carnegie-
Mellon University of Pittsburgh PA Software Engineering Institute, Pittsburgh, PA
USA.
Carter, B & New, C 2005, Making realism work: Realist social theory and empirical
research, Routledge, London, United Kingdom.
Cater-Steel, A 2009, 'IT service departments struggle to adopt a service-oriented
philosophy', International Journal of Information Systems in the Service Sector
(IJISSS), vol. 1, no. 2, pp. 69-77.
Cater-Steel, A & McBride, N 2007, 'IT Service Management Improvement – An Actor
Network Perspective', paper presented to European Conference of Information
Systems, St Gallen, Switzerland.
Cater-Steel, A & Tan, W-G 2005, 'Implementation of IT Infrastructure Library (ITIL)
in Australia: Progress and success factors', in 2005 IT Governance International
Conference, Auckland, New Zealand, pp. 39-52.
Cater-Steel, A, Tan, W-G & Toleman, M 2009a, 'itSMF Australia 2009 Conference:
Summary Report of ITSM Standards and Frameworks Survey', in itSMF Australia
2009 Conference, Adelaide, Australia, pp. 1-16.
References
355
—— 2009b, 'Using Institutionalism as a Lens to Examine ITIL Adoption and
Diffusion', paper presented to 20th Australasian Conference on Information Systems,
Melbourne, Australia, 2-4 Dec 2009.
Cater-Steel, A & Toleman, M 2008, 'Education for IT service management standards',
Selected Readings on Information Technology Management: Contemporary Issues,
vol. 293.
Cater-Steel, A, Toleman, M & Rout, T 2006, 'Process improvement for small firms:
An evaluation of the RAPID assessment-based method', Information and Software
Technology, vol. 48, no. 5, pp. 323-34.
Cater-Steel, A, Toleman, M & Tan, W-G 2006, 'Transforming IT Service Management
– the ITIL Impact', paper presented to 17th Australasian Conference on Information
Systems, Adelaide, Australia, 6-8 Dec 2006.
Cavallo, E, Galiani, S, Noy, I & Pantano, J 2013, 'Catastrophic natural disasters and
economic growth', Review of Economics and Statistics, vol. 95, no. 5, pp. 1549-61.
CFTC 2017, Order Instituting Proceedings Pursuant to Sections 6(C) and 6(D) of the
Commodity Exchange Act, Making Findings, and Imposing Remedial Sanctions,
Commodity Futures Trading Commission,
<https://www.google.com/url?sa=t&rct=j&q=&esrc=s&source=web&cd=1&cad=rja
&uact=8&ved=0ahUKEwjcseumlIXXAhVpiFQKHeQ9BdAQFggoMAA&url=http
%3A%2F%2Fwww.cftc.gov%2Fidc%2Fgroups%2Fpublic%2F%40lrenforcementact
ions%2Fdocuments%2Flegalpleading%2Fenfforexcapitalorder020617.pdf&usg=AO
vVaw2DPgoNa0QZT7giKXNLxOHa>.
Chang, JC-J & King, WR 2005, 'Measuring the performance of information systems:
a functional scorecard', Journal of Management Information Systems, vol. 22, no. 1,
pp. 85-115.
Chen, H-M 2008, 'Towards Service Engineering: Service Orientation and Business-IT
Alignment', in 41st Annual Hawaii International Conference on System Sciences
Hawaii, p. 114.
Cheng, E 2017, Stocks close lower after tech slide, North Korea threats, CNBC,
viewed 22 October 2017, <https://www.cnbc.com/2017/09/25/us-stocks-open-lower-
after-german-election-fed-speakers-eyed.html>.
Chesbrough, HW 2011, 'Bringing open innovation to services', MIT Sloan
Management Review, vol. 52, no. 2, p. 85.

References
356
Cheung, Y-W & Chinn, MD 1999, 'Macroeconomic Implications of the Beliefs and
Behavior of Foreign Exchange Traders', National Bureau of Economic Research.
Cheung, Y-W & Chinn, MD 2001, 'Currency traders and exchange rate dynamics: a
survey of the US market', Journal of international money and finance, vol. 20, no. 4,
pp. 439-71.
Choo, CW 2001, 'Environmental scanning as information seeking and organizational
learning', Information Research, vol. 7, no. 1, pp. 7-1.
Choo, CW & Auster, E 1993, 'Environmental Scanning: Acquisition and Use of
Information by Managers', Annual Review of information Science and technology
(Arist), vol. 28, pp. 279-314.
Christopher, J 2010, 'Corporate governance—A multi-theoretical approach to
recognizing the wider influencing forces impacting on organizations', Critical
Perspectives on Accounting, vol. 21, no. 8, pp. 683-95.
Clacy, B & Jennings, B 2007, 'Service management: Driving the future of IT',
Computer, vol. 40, no. 5, pp. 98-100.
Clark, VP & Creswell, JW 2011, Designing and Conducting Mixed Methods Research,
SAGE Publications, Thousand Oaks, CA USA.
CMMI Product Team 2011, CMMI for Services Version 1.3, Software Engineering
Institute, Pittsburgh, PA USA.
CNBC 2017, GLOBAL MARKETS-Trump's "fire and fury" warning hits stocks, lifts
Swiss franc and gold, viewed 23 October 2017,
<https://www.cnbc.com/2017/08/09/reuters-america-global-markets-trumps-fire-and-
fury-warning-hits-stocks-lifts-swiss-franc-and-gold.html>.
CNN 2016, 'Wall Street welcomes Trump with a bang', CNN.
Cochrane, AL 1972, Effectiveness and efficiency: random reflections on health
services, vol. 900574178, Royal Society of Medicine Press, London, United Kingdom.
Cohen, L & Frazzini, A 2008, 'Economic links and predictable returns', The Journal
of Finance, vol. 63, no. 4, pp. 1977-2011.

References
357
Cohen, Z 2017, North Korea accuses Trump of declaring war, CNN, viewed 27
October 2017, <http://www.cnn.com/2017/09/25/politics/north-korea-fm-us-
bombers/index.html>.
Cokins, G 2009, Performance management: Integrating strategy execution,
methodologies, risk, and analytics, John Wiley & Sons, London, United Kingdom.
Cole, R, Purao, S, Rossi, M & Sein, M 2005, 'Being Proactive: Where Action Research
Meets Design Research', in International Conference on Information Systems, Las
Vegas, NV, USA, p. 27.
Coleman, P & Papp, R 2006, 'Strategic alignment: analysis of perspectives', in 2006
Southern Association for Information Systems Conference, Jacksonville, Florida USA.
Colurcio, M 2009, 'TQM: a knowledge enabler?', The TQM Magazine, vol. 21, no. 3,
pp. 236-48.
Conger, S, Winniford, M & Erickson-Harris, L 2008, 'Service Management in
Operations', paper presented to 14th Americas Conference on Information Systems
(AMCIS), Ontario, Canada.
Conner, KR 1991, 'A historical comparison of resource-based theory and five schools
of thought within industrial organization economics: do we have a new theory of the
firm?', Journal of Management, vol. 17, no. 1, pp. 121-54.
Coopers, P 2004, 'Integrity-driven performance a new strategy for success through
integrated Governance, Risk and Compliance Management', USA:
PricewaterhouseCoopers.
Costello, PJ 2003, Action research, Continuum Research Methods, A&C Black,
London, United Kingdom.
Creswell, JW 2009, Research Design: Qualitative, Quantitative, and Mixed Methods
Approaches, 3rd edn, SAGE Publications, Thousand Oaks, CAUSA.
Cronen, VE 2001, 'Practical theory, practical art, and the pragmatic‐systemic account
of inquiry', Communication theory, vol. 11, no. 1, pp. 14-35.
Cronholm, S 2016, 'Empirical Evaluation of Action Design Research', paper presented
to Australasian Conference on Information Systems, Wollongong, Australia.

References
358
Cronholm, S & Göbel, H 2016, 'Evaluation of the Information Systems Research
Framework : Empirical Evidence from a Design Science Research Project', Electronic
Journal of Information Systems Evaluation, vol. 19, no. 3, pp. 157-67.
Cronholm, S, Göbel, H, Haraldson, S, Lind, M, Salomonson, N & Seigerroth, U 2011,
'Collaborative practice: an action research approach to efficient ITSM', in Presented
at 1 st International & Inter-disciplinary Workshop on Practice Research. June 8,
2011. Helsinki, Finland.
Cronholm, S & Goldkuhl, G 2004, 'Conceptualising participatory action research–
Three different practices', Electronic Journal of Business Research Methods, vol. 2,
no. 2, pp. 47-58.
Cronholm, S & Hjalmarsson, A 2011, 'Experiences from sequential use of mixed
methods', The Electronic Journal of Business Research Methods, vol. 9, no. 2, pp. 87-
95.
Cuske, C, Dickopp, T, Korthaus, A & Seedorf, S 2008, 'Resolving conceptual
ambiguities in technology risk management', in Handbook on Information Technology
in Finance, Springer, Berlin, Heidelberg, Berlin, Germany, pp. 333-55.
Daft, RL, Sormunen, J & Parks, D 1988, 'Chief executive scanning, environmental
characteristics, and company performance: An empirical study', Strategic
Management Journal, vol. 9, no. 2, pp. 123-39.
Dale, R 1994, 'Issues in international banking regulation: global policies for global
markets', Financial Review, vol. 32, pp. 118-50.
Danermark, B, Ekstrom, M & Jakobsen, L 2001, Explaining society: an introduction
to critical realism in the social sciences, Routledge, London, United Kingdom.
Daniel, D 1961, 'Management Information Crisis', Harvard Business Review, vol. 39,
no. 5, pp. 111-6.
De Haes, S, Debreceny, R & Van Grembergen, W 2013, 'Understanding the core
concepts in COBIT 5', Isaca Journal, vol. 5, pp. 1-8.
De Haes, S & Van Grembergen, W 2004, 'IT governance and its mechanisms',
Information Systems Control Journal, vol. 1, pp. 27-33.

References
359
De Haes, S, Van Grembergen, W & Debreceny, RS 2013, 'COBIT 5 and enterprise
governance of information technology: Building blocks and research opportunities',
Journal of Information Systems, vol. 27, no. 1, pp. 307-24.
Dedrick, J, Gurbaxani, V & Kraemer, KL 2003, 'Information technology and economic
performance: A critical review of the empirical evidence', ACM Computing Surveys
(CSUR), vol. 35, no. 1, pp. 1-28.
Dehning, B & Richardson, VJ 2002, 'Returns on Investments in Information
Technology: A Research Synthesis', Journal of Information Systems, vol. 16, no. 1,
pp. 7-30.
Delone, WH & McLean, ER 2003, 'The DeLone and McLean model of information
systems success: a ten-year update', Journal of Management Information Systems, vol.
19, no. 4, pp. 9-30.
DeLuca, D & Kock, N 2007, 'Publishing information systems action research for a
positivist audience', Communications of the Association for Information Systems, vol.
19, no. 1, p. 10.
Denzin, NK 1970, The research act: a theoretical introduction to sociological
methods, Aldine Pub. Co, Chicago, IL USA.
—— 2005, 'In NK Denzin & YS Lincoln', Introduction: The discipline and practice
of qualitative research, NK Denzin, YS Lincoln (Eds.), Handbook of qualitative
research (3rd ed.), Sage Publications, Thousand Oaks, CA USA (2005), pp. 1-32.
Dewey, J 1938, Logic: the Theory of Inquiry, Henry Holt and Company, New York,
USA.
Diao, Y & Bhattacharya, K 2008, 'Estimating business value of IT services through
process complexity analysis', in Network Operations and Management Symposium,
2008. NOMS 2008. IEEE, pp. 208-15.
Dick, B 1993, You Want to Do an Action Research Thesis?: How to Conduct and
Report Action Research,(including a Beginner's Guide to the Literature), Interchange,
Brisbane, Australia.
—— 2002, 'Postgraduate programs using action research', The Learning Organization,
vol. 9, no. 4, pp. 159-70.

References
360
Distefano, A, Rudestam, K & Silverman, R 2004, Encyclopedia of Distributed
Learning, Thousand Oaks, CA USA, 2017/10/13,
<http://sk.sagepub.com/reference/distributedlearning>.
Dolan, B 2011, Currency trading for dummies, John Wiley & Sons, Hoboken, NJ
USA.
Doran, GT 1981, 'There’s a SMART way to write management’s goals and objectives',
Management review, vol. 70, no. 11, pp. 35-6.
Economides, N 2001, 'The impact of the Internet on financial markets', Journal of
Financial Transformation, vol. 1, no. 1, pp. 8-13.
Egeler, M 2008, 'Perceived benefits for customer service of ITIL IT control use',
Auckland University of Technology.
Eisenhardt, K 1989a, 'Agency theory: An assessment and review', Academy of
Management Review, vol. 14, no. 1, pp. 57-74.
—— 1989b, 'Building Theories from Case Study Research', Academy of Management
Review, vol. 14, no. 4, pp. 532-50.
Eisenhardt, K & Martin, J 2000, 'Dynamic capabilities: what are they?', Strategic
Management Journal, vol. 21, no. 10-11, pp. 1105-21.
Fahey, L & King, WR 1977, 'Environmental scanning for corporate planning',
Business horizons, vol. 20, no. 4, pp. 61-71.
Fahey, L & Narayanan, VK 1986, Macroenvironmental analysis for strategic
management, West Publishing, St Paul, MN USA.
Fama, EF & Jensen, MC 1983, 'Separation of ownership and control', The journal of
law and Economics, vol. 26, no. 2, pp. 301-25.
Fengler, W, Ihsan, A & Kaiser, K 2008, Managing Post-Disaster Reconstruction
Finance, World Bank Publications, Washington, DC USA.
Fetterman, DM 2010, Ethnography: Step-by-Step, Applied Social Research Methods
(Book 17), SAGE Publications, Thousand Oaks, CA USA.
References
361
Fleming, W 2005, 'Using cost of service to align IT', Presentation at itSMF, Chicago,
IL.
Forbes 2017, Delivering Value to Today’s Digital Enterprise - The State of IT Service
Management, 2017, Forbes, viewed 8 January 2018, <http://www.bmc.com/info/itsm-
survey.html>.
Fraser, P, Moultrie, J & Gregory, M 2002, 'The use of maturity models/grids as a tool
in assessing product development capability', in Engineering Management
Conference, 2002. IEMC'02. 2002 IEEE International, vol. 1, pp. 244-9.
Frentrop, P 2003, A History of Corporate Governance: 1602-2002, A translation by
Ted Alkins of Ondernemingen en hun aandeelhouders sinds de VOC, De minor Press,
Amsterdam, the Netherlands.
Funnell, W & Robertson, J 2013, Accounting by the First Public Company: The
Pursuit of Supremacy, Routledge New Works in Accounting History (Book 13),
Routledge, New York, USA.
Gacenga, F 2013, 'A performance measurement framework for IT service
management', PhD thesis, University of Southern Queensland.
Gacenga, F, Cater-Steel, A & Toleman, M 2010, 'An international analysis of IT
service management benefits and performance measurement', Journal of Global
Information Technology Management, vol. 13, no. 4, pp. 28-63.
Galliers, RD & Leidner, DE 2014, Strategic Information Management: Challenges
and Strategies in Managing Information Systems, Routledge, New York, NY USA.
Galup, SD, Dattero, R, Quan, JJ & Conger, S 2009, 'An overview of IT service
management', Communications of the ACM, vol. 52, no. 5, pp. 124-7.
Gartner 2017, Gartner Says Global IT Spending to Reach $3.7 Trillion in 2018, viewed
15 December 2017, <https://www.gartner.com/newsroom/id/3811363>.
Gelderblom, O, De Jong, A & Jonker, J 2013, 'The formative years of the modern
corporation: The Dutch East India Company VOC, 1602–1623', The Journal of
Economic History, vol. 73, no. 4, pp. 1050-76.
Gewald, H & Hinz, D 2004, 'A Framework for Classifying the Operational Risks of
Outsourcing-Integrating Risks from Systems, Processes, People and External Events

References
362
within the Banking Industry', in 8th Pacific Asia Conference on Information Systems,
Shanghai, China.
Ghalayini, AM, Noble, JS & Crowe, TJ 1997, 'An integrated dynamic performance
measurement system for improving manufacturing competitiveness', International
Journal of production economics, vol. 48, no. 3, pp. 207-25.
Glenfis-AG 2014, ITIL® Knowledge - Overview, viewed 4 June
<http://www.itil.org/>.
Globerman, S, Shapiro, DM, Canada, CI & Program, ICRP 2002, National political
infrastructure and foreign direct investment, Industry Canada Publications, Ottawa,
ON Canada.
Göbel, H, Cronholm, S & Seigerroth, U 2013, 'Towards an agile method for ITSM
self-assessment: A Design Science Research Approach', in Proceedings of the
International Conference on Management, Leadership and Governance (ICMLG
2013), pp. 135-42.
Goergen, M 2012, International Corporate Governance, Pearson Education Limited,
Harlow, United Kingdom.
Goldkuhl, G 2008a, 'Practical Inquiry as Action Research and Beyond', in 16th
European Conference on Information Systems, Galway, Ireland, pp. 267-78.
—— 2008b, 'What kind of pragmatism in information systems research', in AIS SIG
Prag Inaugural Meeting, Paris, France.
—— 2012, 'Pragmatism vs interpretivism in qualitative information systems research',
European Journal of Information Systems, vol. 21, no. 2, pp. 135-46.
—— 2013, 'Action research vs. design research: using practice research as a lens for
comparison and integration', in 2nd international SIG Prag workshop on IT Artefact
Design & Workpractice Improvement, Tilburg, the Netherlands.
GoodData 2015, viewed 22 March 2015, <http://www.gooddata.com/>.
Goodwin, MJ & Heath, O 2016, 'The 2016 Referendum, Brexit and the Left Behind:
An Aggregate‐level Analysis of the Result', The Political Quarterly, vol. 87, no. 3, pp.
323-32.

References
363
Goubil-Gambrell, P 1992, 'A Practitioner's Guide to Research Methods', Technical
communication, vol. 39, no. 4, pp. 582-91.
Graham, P 2015, Swiss franc jumps 30 percent after Swiss National Bank dumps euro
ceiling, Reuters, viewed 22 October 2017, <https://www.reuters.com/article/us-
markets-franc/swiss-franc-jumps-30-percent-after-swiss-national-bank-dumps-euro-
ceiling-idUSKBN0KO16Y20150115>.
Grant, R 1996, 'Toward a knowledge-based theory of the firm', Strategic Management
Journal, vol. 17, no. 10, pp. 109-22.
—— 2016, Contemporary Strategy Analysis Text Only, John Wiley & Sons,
Chichester, West Sussex, United Kingdom.
Guba, EG & Lincoln, YS 1994, 'Competing paradigms in qualitative research. In N.
K. Denzin & Y. S. Lincoln (Eds.)', in Handbook of qualitative research, Sage,
Thousand Oaks, CA USA, pp. 105-17.
Harkness, WL, Kettinger, WJ & Segars, AH 1996, 'Sustaining Process Improvement
and Innovation in the Information Services Function: Lessons Learned at the Bose
Corporation', MIS Quarterly, vol. 20, no. 3, pp. 349-68.
Heikkinen, S, Suhonen, A, Kurenniemi, M & Jäntti, M 2013, 'Creating a ITIL-based
Software Incident Categorization Model for Measurement: A Case Study', in 8th
International Conference on Software Engineering Advances, Venice, Italy, pp. 450-
6.
Henderson, J & Venkatraman, N 1991, 'Understanding strategic alignment', Business
Quarterly, vol. 55, no. 3, pp. 72-8.
—— 1993, 'Strategic alignment: Leveraging information technology for transforming
organizations', IBM Systems Journal, vol. 32, no. 1.
Hevner, AR, March, ST, Park, J & Ram, S 2004, 'Design science in information
systems research.', MIS Quarterly: Management Information Systems, vol. 28, no. 1,
pp. 75-105.
Hinkelmann, K, Gerber, A, Karagiannis, D, Thoenssen, B, Van der Merwe, A &
Woitsch, R 2016, 'A new paradigm for the continuous alignment of business and IT:
Combining enterprise architecture modelling and enterprise ontology', Computers in
Industry, vol. 79, pp. 77-86.

References
364
Ho, JK-K 2014, 'Formulation of a systemic PEST analysis for strategic analysis',
European academic research, vol. 2, no. 5, pp. 6478-92.
Hochstein, A, Tamm, G & Brenner, W 2005, 'Service oriented IT management:
benefit, cost and success factors', in European Conference on Information Systems,
Regensburg, Germany, p. 98.
Hochstein, A, Zarnekow, R & Brenner, W 2004, 'Managing IT service quality as
perceived by the customer: The service oriented IT SERVQUAL', in International
Telecommunications Society (ITS) 15th Biennial Conference, Berlin, Germany.
Huang, S-J, Wu, M-S & Chen, L-W 2013, 'Critical success factors in aligning IT and
business objectives: A Delphi study', Total Quality Management & Business
Excellence, vol. 24, no. 9-10, pp. 1219-40.
Hulen, C, Chau, C & Yang, V 2005, System and method for multi-dimensional
average-weighted banding status and scoring, US Patent 20140129298A1.
Iden, J 2009, 'Implementing IT Service Management: Lessons Learned from a
University IT Department', in Information Technology Governance and Service
Management: Frameworks and Adaptations, IGI Global, Hershey, PA USA, pp. 333-
49.
Iden, J & Eikebrokk, TR 2014, 'Using the ITIL process reference model for realizing
IT Governance: An empirical investigation', Information Systems Management, vol.
31, no. 1, pp. 37-58.
—— 2015, 'The impact of senior management involvement, organisational
commitment and group efficacy on ITIL implementation benefits', Information
Systems and e-Business Management, vol. 13, no. 3, pp. 527-52.
Iden, J & Langeland, L 2010, 'Setting the stage for a successful ITIL adoption: A
Delphi study of IT experts in the Norwegian armed forces', Information Systems
Management, vol. 27, no. 2, pp. 103-12.
Iivari, J & Venable, J 2009, 'Action research and design science research–seemingly
similar but decisively dissimilar', in 17th European Conference on Information
Systems, Verona, Italy, pp. 1-13.
International Data Corporation 2017, Worldwide IT Spending Forecast to Sustain
Growth of More Than 3% Through 2020 Led by Financial Services and Manufacturing

References
365
Industries, According to IDC, IDC, viewed 15 December 2017,
<https://www.idc.com/getdoc.jsp?containerId=prUS42298417>.
Iosebashvili, I, Ackerman, A & Wexler, A 2015, Surge of Swiss Franc Triggers
Hundreds of Millions in Losses, The Wall Street Journal, viewed 22 October 2017,
<https://www.wsj.com/articles/swiss-franc-move-cripples-currency-brokers-
1421371654>.
ISACA 2012, COBIT 5: A Business Framework for the Governance and Management
of Enterprise IT, ISACA, Rolling Measows, IL USA.
—— 2017, Information Systems Audit and Control Association,
<https://www.isaca.org/>.
ISO 2009, '31000: 2009 Risk management–Principles and guidelines', International
Organization for Standardization, Geneva, Switzerland.
ISO/IEC 1998, ISO/IEC TR 15504 Information Technology - Software process
assessment Parts 1-9, International Organization for Standardization, Geneva.
—— 2004, ISO/IEC 15504-3:2004 – Information Technology – Process Assessment –
Part 3: Guidance on Performing an Assessment, International Organization for
Standardization, Geneva, Switzerland.
—— 2005, ISO/IEC 15504-4:2005 - Information Technology - Process Assessment -
Part 4: Guidance on Use for Process Improvement and Process Capability
Determination., International Organization for Standardization, Geneva, Switzerland.
—— 2010, ISO/IEC TR 20000-4:2010 – Information Technology – Service
Management – Part 4: Process Reference Model, International Organisation for
Standardisation, Geneva, Switzerland.
—— 2011, ISO/IEC 20000-1:2011 – Information Technology – Service Management
– Part 1: Service Management System Requirements, International Organisation for
Standardisation, Geneva, Switzerland.
—— 2012, ISO/IEC TS 15504-8 Information Technology - Process Assessment - Part
8: An Exemplar Process Assessment Model for IT Service Management, International
Organization for Standardization, Geneva, Switzerland.

References
366
—— 2017, ISO/IEC JTC1/SC7 WG10 Transition from ISO/IEC 15504 to ISO/IEC
330xx, International Organisation for Standardisation.
Jäntti, M, Cater-Steel, A & Shrestha, A 2012, 'Towards an improved IT service desk
system and processes: a case study', International Journal on Advances in Systems and
Measurements, vol. 5, no. 3 & 4, pp. 203-15.
Jäntti, M, Lahtela, A & Kaukola, J 2010, 'Establishing a Measurement System for IT
Service Management Processes: A Case Study', International Journal on Advances in
Systems and Measurements, vol. 3, no. 3, pp. 125-36.
Jäntti, M & Niskala, J 2014, 'Improving Change Management Systems and Processes',
in ICONS 2014, The Ninth International Conference on Systems, Nice, France, pp.
220-5.
Jäntti, M, Rout, T, Wen, L, Heikkinen, S & Cater-Steel, A 2013, 'Exploring the impact
of IT service management process improvement initiatives: a case study approach', in
13th International Conference on Software Process Improvement and Capability
Determination, Bremen, Germany, pp. 176-87.
Järvinen, P 2007, 'Action research is similar to design science', Quality & Quantity,
vol. 41, no. 1, pp. 37-54.
Jensen, MC & Meckling, WH 1976, 'Theory of the firm: Managerial behavior, agency
costs and ownership structure', Journal of financial Economics, vol. 3, no. 4, pp. 305-
60.
Johnson, G, Scholes, K & Whittington, R 2011, Exploring corporate strategy: text &
cases, Pearson Education, New York, NY USA.
Johnson, RB & Onwuegbuzie, AJ 2004, 'Mixed methods research: A research
paradigm whose time has come', Educational researcher, vol. 33, no. 7, pp. 14-26.
Johnson, S 2005, The pyramids and pitfalls of performance measurement, viewed 18
Novemeber 2017, <http://www.accaglobal.com/us/en/student/exam-support-
resources/professional-exams-study-resources/p5/technical-articles/the-
pyramids.html>.
Journal, TWS 2017, U.S. Economy Lost 33,000 Jobs in September, The Wall Street
Journal, viewed 23 October 2017, <https://www.wsj.com/livecoverage/september-
2017-jobs-report>.

References
367
Juran, J & Godfrey, A 1999, Juran's Quality Handbook, 5th edn, McGraw-Hill, New
York, NY USA.
Kadan, O, Michaely, R & Moulton, PC 2014, 'Speculating on private information: Buy
the rumor, sell the news'.
Kahneman, D 2011, Thinking, fast and slow, Farrar, Straus and Giroux, London,
United Kingdom.
Kahneman, D, Slovic, P & Tversky, A 1982, Judgement Under Uncertainty:
Heuristics and Biases, Cambridge University Press, Cambridge, United Kingdom.
Kanapathy, K & Khan, KI 2012, 'Assessing the Relationship between ITIL
Implementation Progress and Firm Size: Evidence from Malaysia', International
Journal of Business and Management, vol. 7, no. 2.
Kang, MC 2008, 'An action research derived piezoelectric approach for information
risk management', PhD thesis, Southern Cross University.
Kaplan, R 1986 'The role for empirical research in management accounting',
Accounting, Organizations and Society, vol. 11, no. 4-5, pp. 429-52.
Kaplan, R & Norton, D 1992, 'The Balanced Scorecard - Measures That Drive
Performance', Harvard Business Review, vol. 70, no. 1, pp. 71-9.
—— 1996, 'Linking the balanced scorecard to strategy', California management
review, vol. 39, no. 1, pp. 53-79.
Kappelman, L, McLean, E, Johnson, V & Torres, R 2016, 'The 2015 SIM IT Issues
and Trends Study', MIS Quarterly Executive, vol. 15, no. 1.
Kapstein, EB 1992, 'Between power and purpose: central bankers and the politics of
regulatory convergence', International Organization, vol. 46, no. 01, pp. 265-87.
Kark, K, White, M, Briggs, B & Shaikh, A 2017, Navigating legacy: Charting the
course to business value 2016–2017 global CIO survey, Deloitte University Press,
viewed 3 September 2017, <https://dupress.deloitte.com/dup-us-
en/topics/leadership/global-cio-
survey.html?id=us:2sm:3li:dup3561:awa:dup:112916:ciosurvey>.

References
368
Keegan, WJ 1974, 'Multinational scanning: A study of the information sources utilized
by headquarters executives in multinational companies', Administrative science
quarterly, pp. 411-21.
Kefalas, A & Schoderbek, PP 1973, 'Scanning the business environment: some
empirical results', Decision Sciences, vol. 4, no. 1, pp. 63-74.
Kemmis, S, McTaggart, R & Nixon, R 2013, The action research planner: Doing
critical participatory action research, 4th edn, Springer, Singapore.
Kerr, S 2000, 'Key performance indicators as a policy implementation technique', PhD
thesis, University of Alberta.
Khurshid, N & Bannerman, PL 2014, 'Modeling SPI Sustainment in Software-
Developing Organizations: A Research Framework', in SI Publishing (ed.),
International Conference on Software Process Improvement and Capability
Determination (SPICE), Switzerland, pp. 214-25.
Kitchenham, B, Brereton, OP, Budgen, D, Turner, M, Bailey, J & Linkman, S 2009,
'Systematic literature reviews in software engineering–a systematic literature review',
Information and Software Technology, vol. 51, no. 1, pp. 7-15.
Kitchenham, B & Charters, S 2007, 'Guidelines for performing systematic literature
reviews in software engineering', in Technical report, Ver. 2.3 EBSE Technical Report.
EBSE, sn.
Kohlborn, T, Fielt, E, Korthaus, A & Rosemann, M 2009, 'Towards a service portfolio
management framework', in Evolving Boundaries and New Frontiers: Defining the IS
Discipline: Proceedings of the 20th Australasian Conference on Information Systems,
pp. 861-70.
Kohli, R & Hoadley, E 2006, 'Towards developing a framework for measuring
organizational impact of IT-enabled BPR: case studies of three firms', ACM SIGMIS
Database, vol. 37, no. 1, pp. 40-58.
Kolb, DA 2014, Experiential learning: Experience as the source of learning and
development, 2nd edn, Pearson Education, Upper Saddle River, NJ USA.
Koshy, V 2005, Action research for improving practice a practical guide, Sage
Publications, Thousand Oaks, CA USA.
References
369
Lahtela, A & Jäntti, M 2010, 'Improving IT service management processes: A case
study on IT service support', in European Conference on Software Process
Improvement, Berlin Heidelberg, Germany, pp. 95-106.
Lai, KS & Pauly, P 1992, 'Random walk or bandwagon: some evidence from foreign
exchanges in the 1980s', Applied Economics, vol. 24, no. 7, pp. 693-700.
Laitinen, EK 2002, 'A dynamic performance measurement system: evidence from
small Finnish technology companies', Scandinavian journal of management, vol. 18,
no. 1, pp. 65-99.
Latour, B 1999, 'On recalling ANT', The Sociological Review, vol. 47, no. S1, pp. 15-
25.
Law, J 2009, 'Actor Network Theory and Material Semiotics', in The new Blackwell
companion to social theory, Wiley-Blackwell, Oxford, United Kingdom, pp. 141-58.
Law, J & Hassard, J 1999, Actor Network Theory and After, Wiley-Blackwell, Oxford,
United Kingdom.
Lawkobkit, M 2008, 'Information Technology Service Management: A Thailand
Perspective', paper presented to 9th ACIS international conference on software
engineering, artificial intelligence, networking, and parallel/distributed computing,
Phuket, Thailand.
Layton, A, Robinson, T & Tucker, I 2009, Economics for Today, 3rd Asian Pacific
Edition edn, Cengage Learning, Melbourne, Victoria Australia.
Lee, D & Setiawan, B 2013, 'Information Technology Governance: The Effectiveness
in Banking Sector', in 7th International Conference of Information and
Communication Technology and Systems, Kaunas, Lithuania, pp. 117-22.
Lee, H, Gourley, L, Duffy, S, Esteve, J, Lee, J & Day, N 1989, 'Colorectal cancer and
diet in an Asian population—A case‐control study among Singapore Chinese',
International journal of cancer, vol. 43, no. 6, pp. 1007-16.
Lee, J & Shailer, G 2008, 'The Effect of Board‐Related Reforms on Investors'
Confidence', Australian Accounting Review, vol. 18, no. 2, pp. 123-34.
Lei, K & Rawles, PT 2003, 'Strategic decisions on technology selections for
facilitating a network/systems laboratory using real options & total cost of ownership

References
370
theories', in 4th conference on Information technology curriculum, Lafayette, IN USA,
pp. 76-92.
Lenz, RT & Engledow, JL 1986, 'Environmental analysis units and strategic decision‐
making: A field study of selected ‘leading‐edge’corporations', Strategic Management
Journal, vol. 7, no. 1, pp. 69-89.
Lewin, K 1946, 'Action research and minority problems', Journal of social issues, vol.
2, no. 4, pp. 34-46.
Licker, P 2007, 'Stewardship models of it governance: Beyond agency theory', in
Midwestern Decision Sciences Institute Annual Conference, Chicago, IL USA, pp. 13-
4.
Liesman, S 2017, Hurricanes Irma, Harvey will have a significant negative impact on
third-quarter GDP growth, CNBC, viewed 23 October 2017,
<https://www.cnbc.com/2017/09/13/the-hurricanes-will-have-a-significant-negative-
impact-on-third-quarter-gdp-growth.html>.
Lincoln, Y & Guba, E 1985, Naturalistic inquiry, Sage, Beverly Hills, CA USA.
Luftman, J 2000, 'Assessing Business-IT Alignment Maturity', Communications of the
Association for Information Systems, vol. 4, p. 14.
—— 2004, 'Assessing business-IT alignment maturity', Strategies for information
technology governance, vol. 4, p. 99.
Luftman, J & Ben-Zvi, T 2011, 'Key Issues for IT Executives 2011: Cautious
Optimism in Uncertain Economic Times', MIS Quarterly Executive, vol. 10, no. 4, pp.
203-12.
Luftman, J, Lewis, P & Oldach, S 1993, 'Transforming the enterprise: The alignment
of business and information technology strategies', IBM Systems Journal, vol. 32, no.
1, pp. 198-221.
Luftman, J & McLean, E 2004, 'Key Issues for IT Executives', MIS Quarterly
Executive, vol. 3.
Luftman, J, Papp, R & Brier, T 1999, 'Enablers and Inhibitors of Business-IT
Alignment', Communications of the Association for Information Systems, vol. 1, no.
11, pp. 1-33.

References
371
Lukomnik, J 2016, 'Thoughts on the Origins and Development of the Modern
Corporate Governance Movement and Shareholder Activism', The Handbook of Board
Governance: A Comprehensive Guide for Public, Private, and Not-for-Profit Board
Members, p. 450.
Lynch, RL & Cross, KF 1991, Measure up!: Yardsticks for Continuous Improvement,
Blackwell Publishers, Cambridge, MA USA.
Lyons, RK 2002, 'The future of the foreign exchange market', Brookings-Wharton
papers on financial services, vol. 2002, no. 1, pp. 253-92.
Mainville, D 2014, 2014 ITSM Industry Survey Results, Consulting-Portal Inc.,
Georgia, USA.
Marchand, M & Raymond, L 2008, 'Researching performance measurement systems:
An information systems perspective', International Journal of Operations &
Production Management, vol. 28, no. 7, pp. 663-86.
MarketWatch 2017, CBOE Volatility Index, viewed 23 October 2017,
<https://www.marketwatch.com/investing/index/vix/charts>.
Marrone, M 2010, 'Searching for Mechanisms of Knowledge Integration in IT
Operational Frameworks: The Case of ITIL', in Sprouts: Working Papers on
Information Systems, vol. 10.
Marrone, M, Gacenga, F, Cater-Steel, A & Kolbe, L 2014, 'IT Service Management:
A Cross-national Study of ITIL Adoption', Communications of the Association for
Information Systems, vol. 34.
Marrone, M & Kolbe, L 2010, 'ITIL and the Creation of Benefits: An Empirical Study
on Benefits, Challenges and Processes', paper presented to 18th European Conference
on Information Systems, Pretoria, South Africa.
—— 2011, 'Uncovering ITIL claims: IT executives’ perception on benefits and
Business-IT alignment', Information Systems and e-Business Management, vol. 9, no.
3, pp. 363-80.
Mårtensson, P & Lee, AS 2004, 'Dialogical action research at omega corporation', MIS
Quarterly, pp. 507-36.
References
372
Maslen, R & Lewis, M 1994, 'Procedural action research', in Proceedings of the British
Academy of Management Conference, Lancaster University, Lancaster England.
Masuku, S 2014, 'Towards an inclusive reconceptualization of IT governance:
espoused theory and theories-in-use', University of Cape Town.
Matchett, C, Doheny, R & Gonzalez, K 2017, Magic Quadrant for IT Service
Management Tools, Gartner, viewed 9 November 2017,
<https://www.gartner.com/doc/3782163/magic-quadrant-it-service-management>.
Mathiassen, L 2002, 'Collaborative practice research', Information technology &
people, vol. 15, no. 4, pp. 321-45.
Maxwell, JA 2012, Qualitative research design: An interactive approach, Applied
Social Research Methods, Sage, Thousand Oaks, CA USA.
McNaughton, B, Ray, P & Lewis, L 2010, 'Designing an evaluation framework for IT
service management', Information & Management, vol. 47, no. 4, pp. 219-25.
McNiff, J 2013, Action Research: Principles and practice 3rd edn, Routledge,
Abingdon, PA USA.
McTaggart, R & Kemmis, S 1988, The action research planner, Deakin University,
Victoria Australia.
Mertler, CA 2015, Introduction to educational research, SAGE Publications,
Thousand Oaks, CA USA.
Mesquida, A, Mas, A, Amengual, E & Calvo-Manzano, J 2012, 'IT Service
Management Process Improvement based on ISO/IEC 15504: A Systematic Review',
Information and Software Technology, vol. 54, no. 3, pp. 239-47.
Metawie, M & Gilman, M 2005, 'Problems with the implementation of performance
measurement systems in the public sector where performance is linked to pay: a
literature review drawn from the UK', in 3rd Conference on Performance
Measurements and Management Control, Nice, France.
Metcalfe, M 2008, 'Pragmatic inquiry', Journal of the Operational Research Society,
vol. 59, no. 8, pp. 1091-9.

References
373
Mettler, T 2012, 'Thinking in terms of design decisions when developing maturity
models', in Decision Making Theories and Practices from Analysis to Strategy, IGI
Global, Hershey, PA USA, pp. 170-83.
Microsoft 2017, Microsoft Power BI, Microsoft Corporation, viewed 22 November
2017, <https://powerbi.microsoft.com/en-us/>.
Miles, M & Huberman, A 1994, Qualitative data analysis: An expanded sourcebook,
2nd edn, Sage, Thousand Oaks, CA USA.
Mill, JS 1901, Utilitarianism, Longmans, Green and Company.
Mills, J, Platts, K & Bourne, M 2003, 'Applying resource-based theory: methods,
outcomes and utility for managers', International Journal of Operations & Production
Management, vol. 23, no. 2, pp. 148-66.
Moeller, RR 2011, COSO Enterprise Risk Management: Establishing Effective
Governance, Risk, and Compliance (GRC) Processes, vol. 560, John Wiley & Sons,
Chichester, United Kingdom.
Mohrman, SA, Gibson, CB & Mohrman, AM 2001, 'Doing research that is useful to
practice a model and empirical exploration', Academy of Management Journal, vol.
44, no. 2, pp. 357-75.
Moran, M 1990, The politics of the financial services revolution: The USA, UK and
Japan, Palgrave Macmillan, United Kingdom.
Morse, JM, Niehaus, L, Wolfe, RR & Wilkins, S 2006, 'The role of the theoretical
drive in maintaining validity in mixed-method research', Qualitative Research in
Psychology, vol. 3, no. 4, pp. 279-91.
Moura, A, Sauve, J, Jornada, J & Radziuk, E 2006, 'A quantitative approach to IT
investment allocation to improve business results', in 7th IEEE International
Workshop on Policies for Distributed Systems and Networks, London, Ontario,
Canada, pp. 9 pp.-95.
Mueller, DC 2012, The Oxford Handbook of Capitalism, Oxford Handbooks, Oxford
University Press, Oxford, NY USA.
Mullineux, A 2003, Technology and Finance: Challenges for financial markets,
business strategies and policy makers, vol. 17, Psychology Press.

References
374
Myers, M 2008, Qualitative research in business & management, SAGE Publications
Limited, Thousand Oaks, CA USA.
National Futures Association 2016, viewed 22 October 2017,
<https://www.nfa.futures.org/news/newsNotice.asp?ArticleID=4764>.
Neely, A 2005, 'The evolution of performance measurement research: developments
in the last decade and a research agenda for the next', International Journal of
Operations & Production Management, vol. 25, no. 12, pp. 1264-77.
Neely, A, Adams, C & Kennerley, M 2002, The performance prism: The scorecard
for measuring and managing business success, Financial Times Series, Financial
Times/Prentice Hall, London, United Kingdom.
Neely, A, Mills, J, Platts, K, Richards, H, Gregory, M, Bourne, M & Kennerley, M
2000, 'Performance measurement system design: developing and testing a process-
based approach', International Journal of Operations & Production Management, vol.
20, no. 10, pp. 1119-45.
Netter, JM & Poulsen, AB 2003, 'Operational Risk in Financial Service Providers and
the Proposed Basel Capital Accord: An Overview', Advances in Financial Economics,
vol. 8, pp. 147-71.
Nguyen, L 2017, Gain Capital Is Set to Become the Biggest U.S. Retail FX Provider,
Bloomberg L.P., viewed 22 October 2017,
<https://www.bloomberg.com/news/articles/2017-02-24/gain-capital-to-take-top-
slot-in-u-s-retail-fx-as-fxcm-exits>.
Nicho, M & Khan, S 2017, 'IT Governance Measurement Tools and its Application in
IT-Business Alignment', Journal of International Technology & Information
Management, vol. 26, no. 1, pp. 81-111.
Nonaka, I & Takeuchi, H 1995, The knowledge-creating company, Oxford University
Press, New York.
Norreklit, H 2000, 'The balance on the balanced scorecard a critical analysis of some
of its assumptions', Management accounting research, vol. 11, no. 1, pp. 65-88.
NYSE 2016, Overnight, Dow futures tumbled close to 800 points and the S&P 500
dropped 5 percent, The New York Stock Exchange, viewed 24 October 2017,
<https://www.nyse.com/article/market-volatility-election>.

References
375
Oates, BJ 2006, Researching Information Systems and Computing, SAGE
Publications, London, United Kindom.
Oberlechner, T & Hocking, S 2004, 'Information sources, news, and rumors in
financial markets: Insights into the foreign exchange market', Journal of Economic
Psychology, vol. 25, no. 3, pp. 407-24.
OECD 2003, NON-WAGE LABOUR COST, Organisation for Economic Co-operation
and Development, viewed 10 October 2017,
<https://stats.oecd.org/glossary/detail.asp?ID=4837>.
OGC 2007, Office of Government Commerce, OGC, London, England.
—— 2011a, ITIL Continual Service Improvement, The Stationery Office (TSO),
London, United Kingdom.
—— 2011b, ITIL Continual Service Improvement 2011 Edition, The Stationery Office
(TSO), London, United Kingdom.
—— 2011c, ITIL Service Design 2011 Edition, The Stationery Office (TSO), London,
United Kingdom.
—— 2011d, ITIL Service Operation 2011 Edition, The Stationery Office (TSO),
London, United Kingdom.
—— 2011e, ITIL Service Strategy 2011 Edition, The Stationery Office (TSO),
London, United Kingdom.
—— 2011f, ITIL Service Transition 2011 Edition, The Stationery Office (TSO),
London, United Kingdom.
Onwuegbuzie, AJ & Leech, NL 2006, 'Linking research questions to mixed methods
data analysis procedures 1', The Qualitative Report, vol. 11, no. 3, pp. 474-98.
Orlov, LM 2005, 'Make IT matter for business innovation', Forrester Research.
Papp, R 1999, 'Business-IT alignment: productivity paradox payoff?', Industrial
Management & Data Systems, vol. 99, no. 8, pp. 367-73.

References
376
Parasuraman, A, Zeithaml, VA & Berry, LL 1985, 'A conceptual model of service
quality and its implications for future research', the Journal of Marketing, pp. 41-50.
Pasquini, A & Galiè, E 2013, 'COBIT 5 and the Process Capability Model.
Improvements Provided for IT Governance Process', Proceedings of FIKUSZ, vol. 13,
pp. 67-76.
Paule, RC & Mandel, J 1982, 'Consensus values and weighting factors', Journal of
Research of the National Bureau of Standards, vol. 87, no. 5, pp. 377-85.
Paulk, MC, Weber, CV, Garcia, SM, Chrissis, MBC & Bush, M 1993, Key practices
of the capability maturity model version 1.1, CMU/SEI-93-TR-025.
Payne, R 2003, 'Informed trade in spot foreign exchange markets: an empirical
investigation', Journal of International Economics, vol. 61, no. 2, pp. 307-29.
Pedersen, K, Kræmmergaard, P, Lynge, BC & Schou, CD 2010, 'ITIL implementation:
Critical success factors a comparative case study using the BPC framework', Journal
of Information Technology Case and Application Research, vol. 12, no. 2, pp. 11-35.
Peersman, G 1996, 'A descriptive mapping of health promotion in young people ',
University of London.
Peppard, J & Breu, K 2003, 'Beyond alignment: a coevolutionary view of the
information systems strategy process', in International Conference on Information
Systems, Seattle, WA USA, p. 61.
Perry, C 1998, 'A structured approach for presenting theses', Australasian marketing
journal (AMJ), vol. 6, no. 1, pp. 63-85.
Persson, T & Tabellini, GE 1990, Macroeconomic policy, credibility and politics,
Harwood Academia Publishers, Chur, Switzerland.
Petersen, K, Feldt, R, Mujtaba, S & Mattsson, M 2008, 'Systematic Mapping Studies
in Software Engineering', in 12th International Conference on Evaluation and
Assessment in Software Engineering, University of Bari, Italy, pp. 68-77.
Peterson, R 2004, 'Crafting information technology governance', Information Systems
Management, vol. 21, no. 4, pp. 7-22.

References
377
Phaal, R, Farrukh, C & Probert, D 2001, 'Technology management process
assessment: a case study', International Journal of Operations & Production
Management, vol. 21, no. 8, pp. 1116-32.
Pitt, LF, Watson, RT & Kavan, CB 1995, 'Service quality: a measure of information
systems effectiveness', MIS Quarterly, pp. 173-87.
Pollard, C & Cater-Steel, A 2009, 'Justifications, strategies, and critical success factors
in successful ITIL implementations in US and Australian companies: an exploratory
study', Information Systems Management, vol. 26, no. 2, pp. 164-75.
Popplewell, D 2015, Flash Crash Ensues After Swiss Drop Euro Cap, Forbes, viewed
5 November 2017, <https://www.forbes.com/sites/deanpopplewell/2015/01/15/flash-
crash-ensues-after-swiss-drop-euro-cap/#79c318f56359>.
Porter, T & Williams, R 2016, States, markets and regimes in global finance, Palgrave
Macmillan, United Kingdom.
Potgieter, B, Botha, J & Lew, C 2005, 'Evidence that use of the ITIL framework is
effective', in 18th Annual conference of the national advisory committee on computing
qualifications, Tauranga, New Zealand, pp. 160-7.
Praeg, C & Schnabel, U 2006, 'IT-service cachet - managing IT-service performance
and IT-service quality', in 39th Hawaii International Conference on System Sciences,
Hawaii, vol. Jan 04-07, pp. 34-43.
Racz, N, Panitz, JC, Amberg, M, Weippl, E & Seufert, A 2010, 'Governance, risk &
compliance (GRC) status quo and software use: results from a survey among large
enterprises', in Australasian Conference on Information Systems, Brisbane, Australia.
Racz, N, Weippl, E & Seufert, A 2010, 'A process model for integrated IT governance,
risk, and compliance management', in Ninth Baltic Conference on Databases and
Information Systems, Riga, Latvia, pp. 155-70.
Rahbar, N, Zeinolabedin, N & Afiati, S 2013, 'Investigating business-IT alignment
through ITIL', IRACST–Engineering Science and Technology, vol. 3, no. 2.
Reason, P & Bradbury, H 2008, The SAGE handbook of action research : participative
inquiry and practice, SAGE, Los Angeles, CA USA.
References
378
Reich, BH & Benbasat, I 1996, 'Measuring the linkage between business and
information technology objectives', MIS Quarterly, pp. 55-81.
Rex, J 2013, 'The Federal Banking Regulators: Agency Capture, Regulatory Failure,
And Industry Collapse During The 2008 Financial Crisis', PhD thesis, Wayne State
University.
Rime, D 2003, 'New Electronic Trading Systems in the Foreign Exchange Markets', in
New Economy Handbook, Academic Press, San Diego, CA USA, vol. 21, pp. 471-504.
Rockart, J 1979, 'Chief Executives Define Their Own Data Needs', Harvard Business
Review, vol. March-April, p. 85.
Rogoff, K 1996, 'The purchasing power parity puzzle', Journal of Economic literature,
vol. 34, no. 2, pp. 647-68.
Rule, P & John, V 2011, Your guide to case study research, Van Schaik Publishers,
Pretoria.
Saarenketo, Sea 2009, 'A knowledge-based view of growth in new ventures', European
Business Review, vol. 21, no. 6, pp. 531-46.
Sadgrove, K 2016, The complete guide to business risk management, Gower
Publishing, Burlington, VT USA.
Salesforce 2015, viewed 21 July 2015, <https://www.salesforce.com/>.
Sallé, M 2004, 'IT Service Management and IT Governance: review, comparative
analysis and their impact on utility computing', in Hewlett-Packard Company, Palo
Alto, CA USA, pp. 8-17.
Sapsford, R & Jupp, V 2006, Data Collection and Analysis. Data Collection and
Analysis. SAGE Publications Ltd, SAGE Publications Ltd, London, United Kingdom.
Saunders, C & Jones, J 1992, 'Measuring performance of the information systems
function', Journal of Management Information Systems, vol. 8, no. 4, pp. 63-82.
Saunders, M, Lewis, P & Thornhill, A 2012, Research methods for business students,
6th edn, Financial Times Prentice Hall, London, United Kingdom.

References
379
Schuh, K & Barab, S 2007, 'Philosophical Perspectives', in Handbook of Research on
Educational Communications and Technology, Routledge, London, United Kingdom.
Schulze, WS 1992, 'The Two Resource-Based Models of the Firm: Definitions and
Implications for Research', Academy of Management Proceedings, pp. 37-41.
Scott, JE 1995, 'The measurement of information systems effectiveness: evaluating a
measuring instrument', ACM SIGMIS Database, vol. 26, no. 1, pp. 43-61.
Scully-Russ, E, Lehner, R & Shuck, B 2013, 'A scholar-practitioner case approach:
Implications for advancing theory and research through informed practice', Advances
in Developing Human Resources, vol. 15, no. 3, pp. 243-51.
Seddon, PB, Graeser, V & Willcocks, LP 2002, 'Measuring organizational IS
effectiveness: an overview and update of senior management perspectives', ACM
SIGMIS Database, vol. 33, no. 2, pp. 11-28.
Shang, SS & Lin, S-F 2010, 'Barriers to implementing ITIL-a multi-case study on the
service-based industry', Contemporary Management Research, vol. 6, no. 1, p. 53.
Sharifi, M, Ayat, M, Ibrahim, S & Sahibuddin, S 2009, 'The most applicable KPIs of
problem management process in organizations', International Journal of Simulation:
Systems, Science & Technology, vol. 10, no. 3, pp. 77-83.
Sheng, YH & Mykytyn Jr, PP 2002, 'Information Technology Investment and Firm
Performance: A Perspective of Data Quality', in 7th International Conference on
Information Quality, Cambridge MA USA, pp. 132-41.
Shrestha, A 2015, 'Development and evaluation of a software-mediated process
assessment approach in IT service management', PhD thesis, University of Southern
Queensland.
Shrestha, A, Cater-Steel, A, Tan, W-G & Toleman, M 2012, 'A model to select
processes for IT service management improvement', in 23rd Australasian Conference
on Information Systems, Deakin University, Australia.
—— 2014, 'Software-mediated process assessment for IT service capability
management', in 22nd European Conference on Information Systems, Tel Aviv, Israel.

References
380
Shrivastava, P & Mitroff, II 1984, 'Enhancing organizational research utilization: The
role of decision makers' assumptions', Academy of Management Review, vol. 9, no. 1,
pp. 18-26.
Shwartz, L, Ayachitula, N, Buco, M, Surendra, M, Ward, C & Weinberger, S 2007,
'Service provider considerations for IT service management', in 10th IFIP/IEEE
International Symposium on Integrated Network Management, Munich, Germany, pp.
757-60.
Silvius, A 2008, 'The impact of national cultures on business & IT alignment',
Communications of the IIMA, vol. 8, no. 2, p. 11.
Šimková, E & Basl, J 2006, 'Business value of IT', in Systems Integration Conference,
Prague, Czech Republic.
Singh, H & Jun, KW 1995, Some new evidence on determinants of foreign direct
investment in developing countries, World Bank Publications, Washington, DC USA.
Sink, DS & Tuttle, TC 1989, Planning and measurement in your organization of the
future, Industrial Engineering and Management Press, Norcross, GA USA.
Son, S, Weitzel, T & Laurent, F 2005, 'Designing a process-oriented framework for IT
performance management systems', Electronic Journal of Information Systems
Evaluation, vol. 8, no. 3.
Steinberg, RA 2013, Measuring ITSM: Measuring, Reporting, and Modeling the IT
Service Management Metrics that Matter Most to IT Senior Executives, Trafford
Publishing, Canada.
Stevenson, C 2005, 'Practical inquiry/theory in nursing', Journal of Advanced Nursing,
vol. 50, no. 2, pp. 196-203.
Stone, EF 1978, Research methods in organizational behavior, Goodyear Publishing
Company, Santa Monica, CA USA.
Straub, D & Ang, S 2011, 'Editor's comments: Rigor and relevance in IS research:
Redefining the debate and a call for future research', MIS Quarterly, pp. iii-xi.
Striteska, M & Spickova, M 2012, 'Review and comparison of performance
measurement systems', Journal of Organizational Management Studies, p. 13.

References
381
Stubbart, C 1982, 'Are environmental scanning units effective?', Long range planning,
vol. 15, no. 3, pp. 139-45.
Subramanian, G 2015, 'CORPORATE GOVERNANCE 2.0', Harvard Business
Review, vol. 93, no. 3, pp. 96-105.
SugarCRM 2015, viewed 21 July 2015, <http://www.sugarcrm.com/>.
Suhonen, A, Heikkinen, S, Kurenniemi, M & Jäntti, M 2013, 'Implementation of the
ITIL-based service level management process to improve an organizations efficiency:
A case study', paper presented to 8th International Conference on Software
Engineering Advances (ICSEA), Venice, Italy.
Susman, GI & Evered, RD 1978, 'An assessment of the scientific merits of action
research', Administrative science quarterly, vol. 23, no. 4, pp. 582-603.
Suss, D 2015, 'T4 MAP™: A Scholar‐Practitioner Model for Performance
Improvement', Performance Improvement Quarterly, vol. 27, no. 4, pp. 49-75.
Sutton, H 1988, Competitive intelligence, Conference Board, New York, NY USA.
Tan, W-G, Cater-Steel, A & Toleman, M 2009, 'Implementing it service management:
A case study focussing on critical success factors', Journal of Computer Information
Systems, vol. 50, no. 2, pp. 1-12.
Tangen, S 2004, 'Performance measurement: from philosophy to practice',
International journal of productivity and performance management, vol. 53, no. 8, pp.
726-37.
—— 2005, 'Analysing the requirements of performance measurement systems',
Measuring business excellence, vol. 9, no. 4, pp. 46-54.
Tapia, RS 2007, 'Developing a maturity model for IT alignment in a cross-
organizational environment', in 2nd Dutch/Belgian conference on enterprise
information systems (EIS), Groningen, Netherlands.
Tarantino, A 2008, Governance, risk, and compliance handbook: technology, finance,
environmental, and international guidance and best practices, John Wiley & Sons,
Hoboken, NJ USA.

References
382
Tashakkori, A & Teddlie, C 1998, Mixed methodology: Combining qualitative and
quantitative approaches, Applied Social Research Methods Series, Sage Publications,
Thousand Oaks, CA USA.
The Economic Times 2017, These 5 charts show how North Korea is affecting global
markets viewed 23 October 2017,
<https://economictimes.indiatimes.com/markets/stocks/news/these-5-charts-show-
how-north-korea-is-affecting-global-markets/articleshow/60359185.cms>.
The New York Times 2017a, Prospect of Atmospheric Nuclear Test by North Korea
Raises Specter of Danger, The New York Times, viewed 23 October 2017,
<https://www.nytimes.com/2017/09/22/world/asia/north-korea-atmospheric-nuclear-
test-risks.html>.
—— 2017b, Trump Bypasses Republicans to Strike Deal on Debt Limit and Harvey
Aid, viewed 23 October 2017,
<https://www.nytimes.com/2017/09/06/us/politics/house-vote-harvey-aid-debt-
ceiling.html>.
Thomas, KW & Tymon, WG 1982, 'Necessary properties of relevant research: Lessons
from recent criticisms of the organizational sciences', Academy of Management
Review, vol. 7, no. 3, pp. 345-52.
Thomas, PS 1974, 'Environmental analysis for corporate planning', Business horizons,
vol. 17, no. 5, pp. 27-38.
Tiong, C, Cater-Steel, A & Tan, W-G 2009, 'Measuring Return on Investment from
Implementing ITIL', Information Technology Governance and Service Management:
Frameworks and Adaptations, p. 408.
Torbert, WR 1999, 'The Distinctive Questions Developmental Action Inquiry Asks',
Management Learning, vol. 30, no. 2, pp. 189-206.
Tranfield, D & Denyer, D 2004, 'Linking Theory to Practice: A ‘Grand Challenge’for
Management Research in the 21st Century?', Organization Management Journal, vol.
1, no. 1, pp. 10-4.
Trochim, WM & Donnelly, JP 2007, Research methods knowledge base, 3rd edn,
Cengage Learning, Mason, OH USA.
Tsoukas, H 1996, 'The firm as a distributed knowledge system: a constructionist
approach', Strategic Management Journal, vol. 17, no. WINTER, pp. 11-25.

References
383
USQ 2017, Guidelines for the Preparation of Research Thesis University of Southern
Queensland, viewed 26 November 2017, <https://www.usq.edu.au/-
/media/USQ/Library/ePrints/Guidelines-for-the-Preparation-of-Research-
Thesis_new.ashx?la=en>.
Valdés, O, St-Jean, M, Renault, A, Picard, M, Cortina, S, Betry, V & Barafort, B 2009,
ITSM process assessment supporting ITIL, Van Haren Publishing, Amersfoort, the
Netherlands.
Van Bon, J 2004, IT Service Management: An Introduction Based on ITIL, ITSM
Library, Van Haren Publishing, Pennsylvania, USA.
—— 2007, Foundations of IT Service Management based on ITIL V3, 1st edn, Van
Haren Publishing, Netherlands.
Van Bon, J, De Jong, A, Kolthof, A, Pieper, M, Tjassing, R, van der Veen, A &
Verheijen, T 2008, Foundations of IT Service Management Based on ITIL®, vol. 3,
Van Haren Publishing, Amsterdam, the Netherlands.
Van der Zee, J & de Jong, B 1999, 'Alignment is not enough: integrating business and
information technology management with the balanced business scorecard', Journal of
Management Information Systems, vol. 16, no. 2, pp. 137-56.
Van Grembergen, W 2000, 'The balanced scorecard and IT governance', in
Information Resources Management Association International Conference,
Anchorage, Alaska, pp. 1123-4.
Van Grembergen, W, De Haes, S & Amelinckx, I 2003, 'Using COBIT and the
balanced scorecard as instruments for service level management', Information Systems
Control Journal, vol. 4, pp. 56-62.
Van Loon, H 2007, Process Assessment and ISO/IEC 15504: A Reference Book, 2 edn,
vol. 775, Springer Science & Business Media, New York, NY USA.
Vayanos, D 2004, 'Flight to quality, flight to liquidity, and the pricing of risk', National
Bureau of Economic Research.
Vessey, I, Ramesh, V & Glass, R 2002, 'Research in information systems: An
empirical study of diversity in the discipline and its journals', Journal of Management
Information Systems, vol. 19, no. 2, pp. 129-74.
References
384
Wade, M & Hulland, J 2004, 'Review: The resource-based view and information
systems research: Review, extension, and suggestions for future research', MIS
Quarterly, vol. 28, no. 1, pp. 107-42.
Walsham, G 1995, 'Interpretive case studies in IS research: nature and method',
European Journal of Information Systems, vol. 4, no. 2, pp. 74-81.
Ward, J & Peppard, J 2002, Strategic Planning for Information Systems, John Willey
& Sons, Ltd, New York, NY, USA.
Watson, HJ & Haley, BJ 1997, 'Data warehousing: A framework and survey of current
practices', Journal of Data Warehousing, vol. 2, no. 1, pp. 10-7.
Webb, P, Pollard, C & Ridley, G 2006, 'Attempting to define IT governance: Wisdom
or folly?', in 39th Annual Hawaii International Conference on System Sciences,
Hawaii.
Weill, P 1992, 'The relationship between investment in information technology and
firm performance: A study of the valve manufacturing sector', Information systems
research, vol. 3, no. 4, pp. 307-33.
Weill, P & Ross, JW 2004, IT Governance: How Top Performers Manage IT Decision
Rights for Superior Results, Harvard Business Press, Boston, MA USA.
Wernerfelt, B 1984, 'A resource-based view of the firm', Strategic Management
Journal, vol. 5, no. 2, pp. 171-80.
Whaley, RE 1993, 'Derivatives on market volatility: Hedging tools long overdue', The
journal of Derivatives, vol. 1, no. 1, pp. 71-84.
Wigglesworth, R, Platt, E & Bullock, N 2017, US stock market hit by fears over North
Korea, The Financial Times, viewed 23 October 2017,
<https://www.ft.com/content/e113ab3a-7e0e-11e7-9108-edda0bcbc928>.
Winniford, M, Conger, S & Erickson-Harris, L 2009, 'Confusion in the Ranks: IT
Service Management Practice and Terminology', Information Systems Management,
vol. 26, no. 2, pp. 153-63.
WSJ 2016, '2016 Election: Market Reactions', The Wall Street Journal,.

References
385
Wu, C-S & Chen, R 2012, 'A study on key performance indicators (KPIs) for basic
education in Taiwan', in innovation research in the changing and challenge world
conference, Phuket, Thailand, pp. 46-56.
Wulf, J, Winkler, TJ & Brenner, W 2015, 'Measuring IT service management
capability: Scale development and empirical validation', in 12th International
Conference on Wirtschaftsinformatik, Osnabrück, Germany.
Yang, P 2009, 'A Preliminary Study of Setting Strategic‐based Key Performance
Indicator Model: Taking a Listed High‐tech Company as an Example', Congress
Monthly, vol. 37, no. 9, pp. 52-78.
Yin, RK 2003, Applications of case study research, 2nd edn, Sage Publications,
Thousand Oaks, CA USA.
—— 2009, Case study research: design and methods, 4th edn, Sage Publications,
Beverly Hills, CA USA.
—— 2011, Applications of case study research, Sage Publications, Thousand Oaks,
CA USA.
—— 2013, Case study research: Design and methods, Sage Publications, Thousand
Oaks, CA USA.
Zendesk 2018, viewed 28 April 2018, <https://www.zendesk.com/>.
Zhen, W & Xin-yu, Z 2007, 'An ITIL-based IT service management model for chinese
universities', in 5th ACIS International Conference on Software Engineering Research,
Management & Applications, Busan, South Korea, pp. 493-7.

Appendices
386
List of Appendices
APPENDIX A.1. LIST OF TERMS
APPENDIX A.2. LITERATURE REVIEW SYSTEMATIC MAP
APPENDIX B. DOCUMENTATION RELATED TO RESEARCH ETHICS APPROVAL
APPENDIX B.1. ETHICS APPROVAL LETTER
APPENDIX B.2. COMPANY X APPROVAL LETTER
APPENDIX B.3. INTERVIEW/MEETING PARTICIPANT INFORMATION SHEET
APPENDIX B.4. INTERVIEW/MEETING CONSENT FORM
APPENDIX B.5. FOCUS GROUP PARTICIPANT INFORMATION SHEET
APPENDIX B.6. FOCUS GROUP CONSENT FORM
APPENDIX B.7. STEINBERG’S CONSENT TO USE HIS ITSM METRICS MODELLING TOOL
APPENDIX C. ARC1 - DOCUMENTATION RELATED TO PROCESS CAPABILITY ASSESSMENT
APPENDIX C.1. PROCESS ASSESSMENT SURVEY INVITATION EMAIL
APPENDIX C.2. FOLLOW-UP EMAIL
APPENDIX C.3. EMAIL TO EXTEND SURVEY DUE DATE
APPENDIX C.4. FOCUS GROUP INVITATION EMAIL
APPENDIX C.5. EMAIL COMMUNICATING PROCESS CAPABILITY RESULTS
APPENDIX C.6. INCIDENT MANAGEMENT SMPA PROCESS CAPABILITY ASSESSMENT REPORT WITH ACTION PLAN
APPENDIX C.7. PROBLEM MANAGEMENT SMPA PROCESS CAPABILITY ASSESSMENT REPORT WITH ACTION PLAN
APPENDIX C.8. CHANGE MANAGEMENT SMPA PROCESS CAPABILITY ASSESSMENT REPORT WITH ACTION PLAN
APPENDIX D. DOCUMENTATION RELATED PROCESS GUIDELINES
APPENDIX D.1. EMAIL COMMUNICATION OF PROCESS GUIDELINES
APPENDIX D.2. INCIDENT MANAGEMENT GUIDELINES
APPENDIX D.3. PROBLEM MANAGEMENT GUIDELINES
APPENDIX D.4. CHANGE MANAGEMENT GUIDELINES
APPENDIX E. ARC2 - DOCUMENTATION RELATED TO PROCESS CAPABILITY ASSESSMENT
APPENDIX E.1. PROCESS ASSESSMENT SURVEY INVITATION EMAIL
APPENDIX E.2. AUTO-GENERATED SURVEY INVITATION EMAIL
APPENDIX E.3. AUTO-GENERATED SURVEY REMINDER EMAIL
APPENDIX E.4. THANK YOU EMAIL
APPENDIX E.5. FOCUS GROUP INVITATION EMAIL
APPENDIX F. ITSM3 SPREADSHEET MODEL
APPENDIX F.1. OPERATIONAL METRICS

Appendices
387
APPENDIX F.2. KEY PERFORMANCE INDICATORS
APPENDIX F.3. CRITICAL SUCCESS FACTORS
APPENDIX F.4. BUSINESS RISKS
APPENDIX G. RESEARCH TIMELINE
Appendix A.1
388
Appendix A.1. List of Terms1
alert - A notification that a threshold has been reached, something has changed, or a
failure has occurred. Alerts are often created and managed by system management
tools and are managed by the event management process.
assessment - Inspection and analysis to check whether a standard or set of guidelines
is being followed, that records are accurate, or that efficiency and effectiveness targets
are being met.
baseline - A snapshot that is used as a reference point. Many snapshots may be taken
and recorded over time but only some will be used as baselines. For example: An ITSM
baseline can be used as a starting point to measure the effect of a service improvement
plan. A performance baseline can be used to measure changes in performance over the
lifetime of an IT service. A configuration baseline can be used as part of a back-out
plan to enable the IT infrastructure to be restored to a known configuration if a change
or release fails. A baseline that is used to compare related data sets as part of a
benchmarking exercise. For example, a recent snapshot of a process can be compared
to a previous baseline of that process, or a current baseline can be compared to industry
data or best practice. The process responsible for comparing a benchmark with related
data sets such as a more recent snapshot, industry data or best practice. The term is
also used to mean creating a series of benchmarks over time, and comparing the results
to measure progress or improvement. This process is not described in detail within the
core ITIL publications
best practice - Proven activities or processes that have been successfully used by
multiple organizations. ITIL is an example of best practice.
business - An overall corporate entity or organization formed of a number of business
units. In the context of ITSM, the term includes public sector and not-for-profit
organizations, as well as companies. An IT service provider provides IT services to a
customer within a business. The IT service provider may be part of the same business
1 ITIL® Glossary of Terms English v.1.0
Appendix A.1
389
as its customer (internal service provider), or part of another business (external service
provider).
business objective - The objective of a business process, or of the business as a whole.
Business objectives support the business vision, provide guidance for the IT strategy,
and are often supported by IT services.
business unit - A segment of the business that has its own plans, metrics, income and
costs. Each business unit owns assets and uses these to create value for customers in
the form of goods and services.
capability - The ability of an organization, person, process, application, IT service or
other configuration item to carry out an activity. Capabilities are intangible assets of
an organization. -
Capability Maturity Model Integration (CMMI) - A process improvement
approach developed by the Software Engineering Institute (SEI) of Carnegie Mellon
University, US. CMMI provides organizations with the essential elements of effective
processes. It can be used to guide process improvement across a project, a division or
an entire organization. CMMI helps integrate traditionally separate organizational
functions, set process improvement goals and priorities, provide guidance for quality
processes, and provide a point of reference for appraising current processes. See
www.sei.cmu.edu/cmmi for more information.
Change - The addition, modification or removal of anything that could have an effect
on IT services. The scope should include changes to all architectures, processes, tools,
metrics and documentation, as well as changes to IT services and other configuration
items.
Change Management - The process responsible for controlling the lifecycle of all
changes, enabling beneficial changes to be made with minimum disruption to IT
services.
Circuit Breaker - A software development design pattern used to detect failures and
encapsulates the logic of preventing a failure from constantly recurring, during
maintenance, temporary external system failure or unexpected system difficulties.

Appendix A.1
390
Continual Service Improvement (CSI) - A stage in the lifecycle of a service.
Continual service improvement ensures that services are aligned with changing
business needs by identifying and implementing improvements to IT services that
support business processes. The performance of the IT service provider is continually
measured and improvements are made to processes, IT services and IT infrastructure
in order to increase efficiency, effectiveness and cost effectiveness. Continual service
improvement includes the seven-step improvement process. Although this process is
associated with continual service improvement, most processes have activities that
take place across multiple stages of the service lifecycle.
Cost - The amount of money spent on a specific activity, IT service or business unit.
Costs consist of real cost (money), notional cost (such as people’s time) and
depreciation.
Critical Success Factor (CSF) - Something that must happen if an IT service, process,
plan, project or other activity is to succeed. Key performance indicators are used to
measure the achievement of each critical success factor. For example, a critical success
factor of protect IT services when making changes could be measured by key
performance indicators such as percentage reduction of unsuccessful changes,
percentage reduction in changes causing incidents, and so on.
effectiveness - A measure of whether the objectives of a process, service or activity
have been achieved. An effective process or activity is one that achieves its agreed
objectives.
Efficiency - A measure of whether the right amount of resource has been used to
deliver a process, service or activity. An efficient process achieves its objectives with
the minimum amount of time, money, people or other resources.
Failure - Loss of ability to operate to specification, or to deliver the required output.
The term may be used when referring to IT services, processes, activities,
configuration items etc. A failure often causes an incident.
first-line support - The first level in a hierarchy of support groups involved in the
resolution of incidents. Each level contains more specialist skills, or has more time or
other resources.

Appendix A.1
391
fit for purpose - The ability to meet an agreed level of utility. Fit for purpose is also
used informally to describe a process, configuration item, IT service etc. that is capable
of meeting its objectives or service levels. Being fit for purpose requires suitable
design, implementation, control and maintenance.
fit for use - The ability to meet an agreed level of warranty. Being fit for use requires
suitable design, implementation, control and maintenance.
follow the sun - A methodology for using service desks and support groups around
the world to provide seamless 24/7 service. Calls, incidents, problems and service
requests are passed between groups in different time zones.
Governance - Ensures that policies and strategy are actually implemented, and that
required processes are correctly followed. Governance includes defining roles and
responsibilities, measuring and reporting, and taking actions to resolve any issues
identified.
Guideline - A document describing best practice, which recommends what should be
done. Compliance with a guideline is not normally enforced.
incident - An unplanned interruption to an IT service or reduction in the quality of an
IT service. Failure of a configuration item that has not yet affected service is also an
incident – for example, failure of one disk from a mirror set.
incident management - The process responsible for managing the lifecycle of all
incidents. Incident management ensures that normal service operation is restored as
quickly as possible and the business impact is minimized.
International Organization for Standardization (ISO) - The International
Organization for Standardization (ISO) is the world’s largest developer of standards.
ISO is a non-governmental organization that is a network of the national standards
institutes of 156 countries.
ISO/IEC 20000 - An international standard for IT service management.
IT service - A service provided by an IT service provider. An IT service is made up
of a combination of information technology, people and processes. A customer-facing
IT service directly supports the business processes of one or more customers and its

Appendix A.1
392
service level targets should be defined in a service level agreement. Other IT services,
called supporting services, are not directly used by the business but are required by the
service provider to deliver customer-facing services.
IT service management (ITSM) - The implementation and management of quality
IT services that meet the needs of the business. IT service management is performed
by IT service providers through an appropriate mix of people, process and information
technology.
ITIL® - A set of best-practice publications for IT service management. Owned by the
Cabinet Office, ITIL gives guidance on the provision of quality IT services and the
processes, functions and other capabilities needed to support them. The ITIL
framework is based on a service lifecycle and consists of five lifecycle stages (service
strategy, service design, service transition, service operation and continual service
improvement), each of which has its own supporting publication. There is also a set of
complementary ITIL publications providing guidance specific to industry sectors,
organization types, operating models and technology architectures.
key performance indicator (KPI) - A metric that is used to help manage an IT
service, process, plan, project or other activity. Key performance indicators are used
to measure the achievement of critical success factors. Many metrics may be measured,
but only the most important of these are defined as key performance indicators and
used to actively manage and report on the process, IT service or activity. They should
be selected to ensure that efficiency, effectiveness and cost effectiveness are all
managed.
knowledge base - A logical database containing data and information used by the
service knowledge management system.
knowledge management - The process responsible for sharing perspectives, ideas,
experience and information, and for ensuring that these are available in the right place
and at the right time. The knowledge management process enables informed decisions,
and improves efficiency by reducing the need to rediscover knowledge.
Maturity - A measure of the reliability, efficiency and effectiveness of a process,
function, organization etc. The most mature processes and functions are formally

Appendix A.1
393
aligned to business objectives and strategy, and are supported by a framework for
continual improvement.
maturity level - A named level in a maturity model, such as the Carnegie Mellon
Capability Maturity Model Integration.
metric - Something that is measured and reported to help manage a process, IT service
or activity.
operational - The lowest of three levels of planning and delivery (strategic, tactical,
operational). Operational activities include the day-to-day or short-term planning or
delivery of a business process or IT service management process.
opportunity cost - A cost that is used in deciding between investment choices.
Opportunity cost represents the revenue that would have been generated by using the
resources in a different way. For example, the opportunity cost of purchasing a new
server may include not carrying out a service improvement activity that the money
could have been spent on. Opportunity cost analysis is used as part of a decision-
making process, but opportunity cost is not treated as an actual cost in any financial
statement.
performance - A measure of what is achieved or delivered by a system, person, team,
process or IT service.
performance management - Activities to ensure that something achieves its expected
outcomes in an efficient and consistent manner.
plan - A detailed proposal that describes the activities and resources needed to achieve
an objective – for example, a plan to implement a new IT service or process. ISO/IEC
20000 requires a plan for the management of each IT service management process.
Priority - A category used to identify the relative importance of an incident, problem
or change. Priority is based on impact and urgency, and is used to identify required
times for actions to be taken. For example, the service level agreement may state that
Priority 2 incidents must be resolved within 12 hours.

Appendix A.1
394
problem - A cause of one or more incidents. The cause is not usually known at the
time a problem record is created, and the problem management process is responsible
for further investigation.
problem management - The process responsible for managing the lifecycle of all
problems. Problem management proactively prevents incidents from happening and
minimizes the impact of incidents that cannot be prevented.
process - A structured set of activities designed to accomplish a specific objective. A
process takes one or more defined inputs and turns them into defined outputs. It may
include any of the roles, responsibilities, tools and management controls required to
reliably deliver the outputs. A process may define policies, standards, guidelines,
activities and work instructions if they are needed.
process manager -A role responsible for the operational management of a process.
The process manager’s responsibilities include planning and coordination of all
activities required to carry out, monitor and report on the process. There may be several
process managers for one process – for example, regional change managers or IT
service continuity managers for each data center. The process manager role is often
assigned to the person who carries out the process owner role, but the two roles may
be separate in larger organizations.
process owner - The person who is held accountable for ensuring that a process is fit
for purpose. The process owner’s responsibilities include sponsorship, design, change
management and continual improvement of the process and its metrics. This role can
be assigned to the same person who carries out the process manager role, but the two
roles may be separate in larger organizations.
project management office (PMO) - A function or group responsible for managing
the lifecycle of projects.
RACI - A model used to help define roles and responsibilities. RACI stands for
responsible, accountable, consulted and informed.
risk - A possible event that could cause harm or loss, or affect the ability to achieve
objectives. A risk is measured by the probability of a threat, the vulnerability of the
asset to that threat, and the impact it would have if it occurred. Risk can also be defined

Appendix A.1
395
as uncertainty of outcome, and can be used in the context of measuring the probability
of positive outcomes as well as negative outcomes.
risk assessment - The initial steps of risk management: analyzing the value of assets
to the business, identifying threats to those assets, and evaluating how vulnerable each
asset is to those threats. Risk assessment can be quantitative (based on numerical data)
or qualitative.
risk management - The process responsible for identifying, assessing and controlling
risks. Risk management is also sometimes used to refer to the second part of the overall
process after risks have been identified and assessed, as in risk assessment and
management.
role - A set of responsibilities, activities and authorities assigned to a person or team.
A role is defined in a process or function. One person or team may have multiple roles
– for example, the roles of configuration manager and change manager may be carried
out by a single person. Role is also used to describe the purpose of something or what
it is used for.
Sarbanes-Oxley (SOX) - US law that regulates financial practice and corporate
governance.
second-line support - The second level in a hierarchy of support groups involved in
the resolution of incidents and investigation of problems. Each level contains more
specialist skills, or has more time or other resources.
service - A means of delivering value to customers by facilitating outcomes customers
want to achieve without the ownership of specific costs and risks. The term ‘service’
is sometimes used as a synonym for core service, IT service or service package.
service desk - The single point of contact between the service provider and the users.
A typical service desk manages incidents and service requests, and also handles
communication with the users.
service improvement plan (SIP) - A formal plan to implement improvements to a
process or IT service.

Appendix A.1
396
service level - Measured and reported achievement against one or more service level
targets. The term is sometimes used informally to mean service level target.
service level agreement (SLA) - An agreement between an IT service provider and a
customer. A service level agreement describes the IT service, documents service level
targets, and specifies the responsibilities of the IT service provider and the customer.
A single agreement may cover multiple IT services or multiple customers.
service management - A set of specialized organizational capabilities for providing
value to customers in the form of services.
SMART - An acronym for helping to remember that targets in service level
agreements and project plans should be specific, measurable, achievable, relevant and
time-bound.
stakeholder - A person who has an interest in an organization, project, IT service etc.
Stakeholders may be interested in the activities, targets, resources or deliverables.
Stakeholders may include customers, partners, employees, shareholders, owners etc.
standard - A mandatory requirement. Examples include ISO/IEC 20000 (an
international standard), an internal security standard for Unix configuration, or a
government standard for how financial records should be maintained. The term is also
used to refer to a code of practice or specification published by a standards
organization such as ISO or BSI.
support group - A group of people with technical skills. Support groups provide the
technical support needed by all of the IT service management processes.
Utility - The functionality offered by a product or service to meet a particular need.
Utility can be summarized as what the service does, and can be used to determine
whether a service is able to meet its required outcomes, or is fit for purpose. The
business value of an IT service is created by the combination of utility and warranty.
warranty - Assurance that a product or service will meet agreed requirements. This
may be a formal agreement such as a service level agreement or contract, or it may be
a marketing message or brand image. Warranty refers to the ability of a service to be
available when needed, to provide the required capacity, and to provide the required

Appendix A.1
397
reliability in terms of continuity and security. Warranty can be summarized as how the
service is delivered, and can be used to determine whether a service is ‘fit for use’. The
business value of an IT service is created by the combination of utility and warranty.

Appendix A.2
398
Appendix A.2. Literature Review Systematic Map
Table A.2 Literature Review Systematic Map
Underpinning Theories ITSM Process
Capability ITSM Process Performance Business
Performance
Researcher/Author
Sou
rce
ITSM
Bes
t P
ract
ice
Fram
ewo
rks
IT G
ove
rnan
ce &
B
usi
nes
s-IT
A
lign
men
t
Res
ou
rce
-Bas
ed V
iew
Act
or-
Net
wo
rk
Theo
ry
ITSM
Ad
op
tio
n
ITSM
Ou
tco
mes
an
d
Ben
efit
s
ITSM
Im
ple
men
tati
on
ITSM
Per
form
ance
M
easu
rem
ent
ITSM
Cap
abili
ty
Ass
essm
ent
CSF
s/K
PIs
KIS
MET
ITSM
Pro
cess
Im
pro
vem
ent
Bu
sin
ess
Met
rics
ITSM
Fin
anci
al
Mea
sure
men
t
Year
Pu
blis
hed
Pollard, C., & Cater-Steel, A. (2009)
JA x x
2009
Marrone, M., & Kolbe, L. M. (2010)
JA x
2010
Egeler, M. (2008) JA x 2008
Marrone, M. (2010) JA x x 2010
Marrone, M., & Kolbe, L. M. (2011)
JA x x x x
2010
Gacenga, F., Cater-Steel, A., & Toleman, M. (2010)
JA x x x x
2010
Wan, S. H. C., & Chan, Y. H. (2008)
JA x
2008
Cater-Steel, A. (2009) JA x x
2009

Appendix A.2
399
Underpinning Theories ITSM Process
Capability ITSM Process Performance Business
Performance
Researcher/Author
Sou
rce
ITSM
Bes
t P
ract
ice
Fram
ewo
rks
IT G
ove
rnan
ce &
B
usi
nes
s-IT
A
lign
men
t
Res
ou
rce
-Bas
ed V
iew
Act
or-
Net
wo
rk
Theo
ry
ITSM
Ad
op
tio
n
ITSM
Ou
tco
mes
an
d
Ben
efit
s
ITSM
Im
ple
men
tati
on
ITSM
Per
form
ance
M
easu
rem
ent
ITSM
Cap
abili
ty
Ass
essm
ent
CSF
s/K
PIs
KIS
MET
ITSM
Pro
cess
Im
pro
vem
ent
Bu
sin
ess
Met
rics
ITSM
Fin
anci
al
Mea
sure
men
t
Year
Pu
blis
hed
Marrone, M., Gacenga, F., Cater-Steel, A., & Kolbe, L. (2014)
JA
x
2014
Kanapathy, K., & Khan, K. I. (2012)
JA x
2012
Tan, W.-G., Cater-Steel, A., & Toleman, M. (2009)
JA x
2009
Iden, J., & Eikebrokk, T. R. (2014)
JA x
2014
Lepmets, M., Cater-Steel, A., Gacenga, F., & Ras, E. (2012)
JA x
2012
Lepmets, M., Mesquida, A. L., Cater-Steel, A., Mas, A., & Ras, E. (2014)
JA
x
2014
Shrestha, A., Cater-Steel, A., & Toleman, M. (2016)
JA x
2016
Smith, H. A., McKeen, J. D., & Street, C. (2004)
JA x
2004

Appendix A.2
400
Underpinning Theories ITSM Process
Capability ITSM Process Performance Business
Performance
Researcher/Author
Sou
rce
ITSM
Bes
t P
ract
ice
Fram
ewo
rks
IT G
ove
rnan
ce &
B
usi
nes
s-IT
A
lign
men
t
Res
ou
rce
-Bas
ed V
iew
Act
or-
Net
wo
rk
Theo
ry
ITSM
Ad
op
tio
n
ITSM
Ou
tco
mes
an
d
Ben
efit
s
ITSM
Im
ple
men
tati
on
ITSM
Per
form
ance
M
easu
rem
ent
ITSM
Cap
abili
ty
Ass
essm
ent
CSF
s/K
PIs
KIS
MET
ITSM
Pro
cess
Im
pro
vem
ent
Bu
sin
ess
Met
rics
ITSM
Fin
anci
al
Mea
sure
men
t
Year
Pu
blis
hed
Iden, J., L. Langeland. (2010) JA x 2010
Kanapathy, K., & Khan, K. I. (2012)
JA x
2012
McBride, N. (2009) JA x 2009
Tan, W. G., A. Cater-Steel, M. Toleman. (2009)
JA x
2009
Wan, J., & Wan, D. (2011) JA x 2011
Suhonen, A., Heikkinen, S., Kurenniemi, M., & Jäntti, M. (2013)
JA
x x
2010
Winniford, M., S. Conger, L. Erickson-Harris. (2009)
JA x
2009
Hochstein, A., Tamm, G., & Brenner, W. (2005)
JA x
2005
Cater-Steel, A., Tan, W. G., & Toleman, M. (2006)
JA x
2006

Appendix A.2
401
Underpinning Theories ITSM Process
Capability ITSM Process Performance Business
Performance
Researcher/Author
Sou
rce
ITSM
Bes
t P
ract
ice
Fram
ewo
rks
IT G
ove
rnan
ce &
B
usi
nes
s-IT
A
lign
men
t
Res
ou
rce
-Bas
ed V
iew
Act
or-
Net
wo
rk
Theo
ry
ITSM
Ad
op
tio
n
ITSM
Ou
tco
mes
an
d
Ben
efit
s
ITSM
Im
ple
men
tati
on
ITSM
Per
form
ance
M
easu
rem
ent
ITSM
Cap
abili
ty
Ass
essm
ent
CSF
s/K
PIs
KIS
MET
ITSM
Pro
cess
Im
pro
vem
ent
Bu
sin
ess
Met
rics
ITSM
Fin
anci
al
Mea
sure
men
t
Year
Pu
blis
hed
Kashanchi, R. & Toland, J. (2006)
JA x
2006
Jäntti, M., Cater-Steel, A., & Shrestha, A. (2012)
JA x
2012
Walker, A., & Lok, H. (1995) JA x 1995
Rahbar, N., Zeinolabedin, N., & Afiati, S. (2013)
JA x
2013
Silvius, A. (2008) JA x 2008
Weill, P., & Ross, J. W. (2004)
JA x 2004
Peterson, R. (2004) JA x 2004
De Haes, S., & Van Grembergen, W. (2004)
JA x
2004
Luftman, J. (2000) JA x 2000
Luftman, J., Papp, R., & Brier, T. (1999)
JA x
1999
Luftman, J., & Ben-Zvi, T. (2011)
JA x
2011

Appendix A.2
402
Underpinning Theories ITSM Process
Capability ITSM Process Performance Business
Performance
Researcher/Author
Sou
rce
ITSM
Bes
t P
ract
ice
Fram
ewo
rks
IT G
ove
rnan
ce &
B
usi
nes
s-IT
A
lign
men
t
Res
ou
rce
-Bas
ed V
iew
Act
or-
Net
wo
rk
Theo
ry
ITSM
Ad
op
tio
n
ITSM
Ou
tco
mes
an
d
Ben
efit
s
ITSM
Im
ple
men
tati
on
ITSM
Per
form
ance
M
easu
rem
ent
ITSM
Cap
abili
ty
Ass
essm
ent
CSF
s/K
PIs
KIS
MET
ITSM
Pro
cess
Im
pro
vem
ent
Bu
sin
ess
Met
rics
ITSM
Fin
anci
al
Mea
sure
men
t
Year
Pu
blis
hed
Paulk, M. C., Weber, C. V., Garcia, S. M., Chrissis, M. B. C., & Bush, M. (1993)
JA
x
1993
Mesquida, A., Mas, A., Amengual, E., & Calvo-Manzano, J. (2012)
JA
x
2012
Dehning, B., & Richardson, V. J. (2002)
JA x
2002
Kohli, R., & Hoadley, E. (2006)
JA x
2006
Tiong, C., Cater-Steel, A., & Tan, W.-G. (2009)
JA x
2009
Callon, M. (1999) JA x 1999
Latour, B. (1999) JA x 1999
Wernerfelt, B. (1984) JA x 1984
Barney, J. (1991) JA x 1991
Conner, K. R. (1991) JA x 1991

Appendix A.2
403
Underpinning Theories ITSM Process
Capability ITSM Process Performance Business
Performance
Researcher/Author
Sou
rce
ITSM
Bes
t P
ract
ice
Fram
ewo
rks
IT G
ove
rnan
ce &
B
usi
nes
s-IT
A
lign
men
t
Res
ou
rce
-Bas
ed V
iew
Act
or-
Net
wo
rk
Theo
ry
ITSM
Ad
op
tio
n
ITSM
Ou
tco
mes
an
d
Ben
efit
s
ITSM
Im
ple
men
tati
on
ITSM
Per
form
ance
M
easu
rem
ent
ITSM
Cap
abili
ty
Ass
essm
ent
CSF
s/K
PIs
KIS
MET
ITSM
Pro
cess
Im
pro
vem
ent
Bu
sin
ess
Met
rics
ITSM
Fin
anci
al
Mea
sure
men
t
Year
Pu
blis
hed
Wade, M., & Hulland, J. (2004)
JA x
2004
Mills, J., Platts, K., & Bourne, M. (2003)
JA x
2003
Grant, R. (1996) JA x 1996
Eisenhardt, K. M., & Martin, J. A. (2000)
JA x
2000
Colurcio, M. (2009) JA x 2009
Saarenketo, S. e. a. (2009) JA x 2009
Tsoukas, H. (1996) JA x 1996
De Haes, S., Debreceny, R., & Van Grembergen, W. (2013)
JA x
2013
De Haes, S., Van Grembergen, W., & Debreceny, R. S. (2013)
JA
x
2013

Appendix A.2
404
Underpinning Theories ITSM Process
Capability ITSM Process Performance Business
Performance
Researcher/Author
Sou
rce
ITSM
Bes
t P
ract
ice
Fram
ewo
rks
IT G
ove
rnan
ce &
B
usi
nes
s-IT
A
lign
men
t
Res
ou
rce
-Bas
ed V
iew
Act
or-
Net
wo
rk
Theo
ry
ITSM
Ad
op
tio
n
ITSM
Ou
tco
mes
an
d
Ben
efit
s
ITSM
Im
ple
men
tati
on
ITSM
Per
form
ance
M
easu
rem
ent
ITSM
Cap
abili
ty
Ass
essm
ent
CSF
s/K
PIs
KIS
MET
ITSM
Pro
cess
Im
pro
vem
ent
Bu
sin
ess
Met
rics
ITSM
Fin
anci
al
Mea
sure
men
t
Year
Pu
blis
hed
Galup, S. D., Dattero, R., Quan, J. J., & Conger, S. (2009)
JA
x
2009
Masuku, S. (2014) JA x 2014
Kaplan, R., & Norton, D. (1992)
JA x
1992
Kaplan, R., & Norton, D. (1996)
JA x
1996
Ahmad, M. (2009) JA x 2009
Norreklit, H. (2000) JA x 2000
Van Grembergen, W. (2000) CP x 2000
Schulze, W. S. (1992) CP x 1992
Lei, K., & Rawles, P. T. (2003)
CP x
2003
Racz, N., Panitz, J. C., Amberg, M., Weippl, E., & Seufert, A. (2010)
CP x
2010

Appendix A.2
405
Underpinning Theories ITSM Process
Capability ITSM Process Performance Business
Performance
Researcher/Author
Sou
rce
ITSM
Bes
t P
ract
ice
Fram
ewo
rks
IT G
ove
rnan
ce &
B
usi
nes
s-IT
A
lign
men
t
Res
ou
rce
-Bas
ed V
iew
Act
or-
Net
wo
rk
Theo
ry
ITSM
Ad
op
tio
n
ITSM
Ou
tco
mes
an
d
Ben
efit
s
ITSM
Im
ple
men
tati
on
ITSM
Per
form
ance
M
easu
rem
ent
ITSM
Cap
abili
ty
Ass
essm
ent
CSF
s/K
PIs
KIS
MET
ITSM
Pro
cess
Im
pro
vem
ent
Bu
sin
ess
Met
rics
ITSM
Fin
anci
al
Mea
sure
men
t
Year
Pu
blis
hed
Barafort, B., & Rousseau, A. (2009)
CP x
2009
Chen, H.-M. (2008) CP x 2008
Tapia, R. S. (2007) CP x 2007
Licker, P. (2007) CP x 2007
Webb, P., Pollard, C., & Ridley, G. (2006)
CP x
2006
Hochstein, A., Tamm, G., & Brenner, W. (2005)
CP x
2005
Cater-Steel, A., Toleman, M., & Tan, W.-G. (2006)
CP x
2006
Disterer, G. (2012) CP x 2012
Salling Pedersen, A., & Bjørn-Andersen, N. (2011)
CP x
2011
Mohammed, T. (2008) CP x 2008
Cater-Steel, A., & McBride, N. (2007)
CP x x
2007
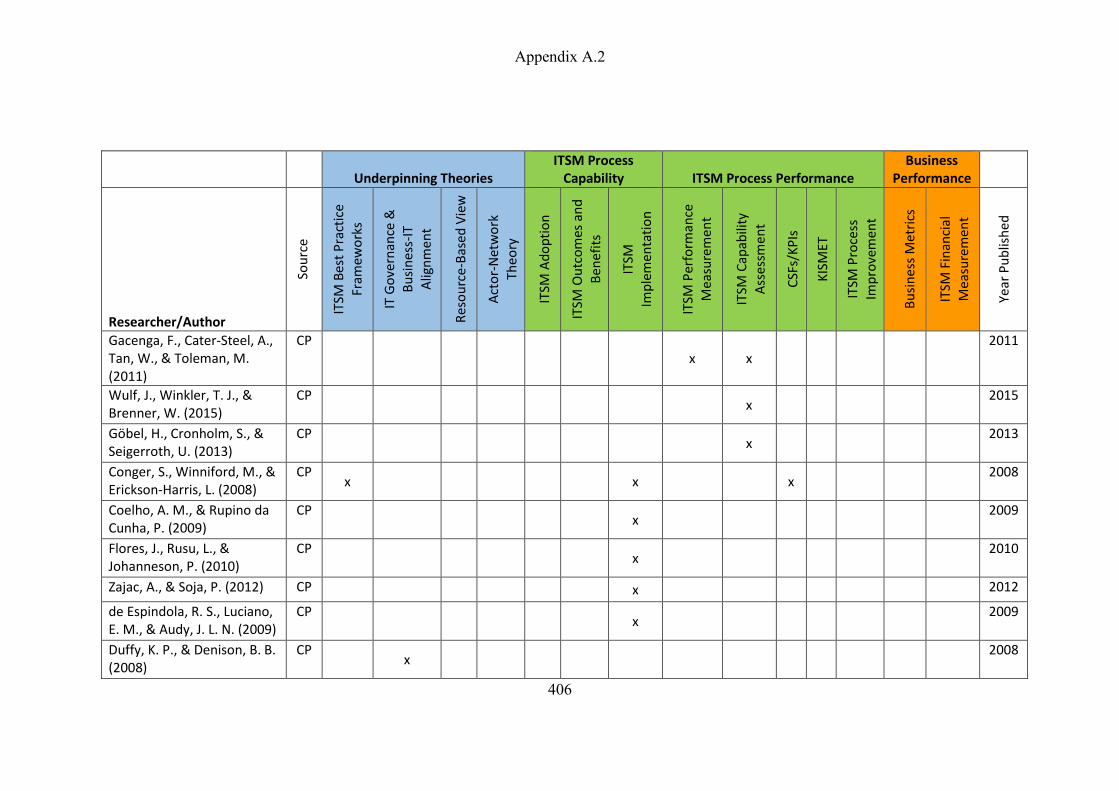
Appendix A.2
406
Underpinning Theories ITSM Process
Capability ITSM Process Performance Business
Performance
Researcher/Author
Sou
rce
ITSM
Bes
t P
ract
ice
Fram
ewo
rks
IT G
ove
rnan
ce &
B
usi
nes
s-IT
A
lign
men
t
Res
ou
rce
-Bas
ed V
iew
Act
or-
Net
wo
rk
Theo
ry
ITSM
Ad
op
tio
n
ITSM
Ou
tco
mes
an
d
Ben
efit
s
ITSM
Im
ple
men
tati
on
ITSM
Per
form
ance
M
easu
rem
ent
ITSM
Cap
abili
ty
Ass
essm
ent
CSF
s/K
PIs
KIS
MET
ITSM
Pro
cess
Im
pro
vem
ent
Bu
sin
ess
Met
rics
ITSM
Fin
anci
al
Mea
sure
men
t
Year
Pu
blis
hed
Gacenga, F., Cater-Steel, A., Tan, W., & Toleman, M. (2011)
CP
x x
2011
Wulf, J., Winkler, T. J., & Brenner, W. (2015)
CP x
2015
Göbel, H., Cronholm, S., & Seigerroth, U. (2013)
CP x
2013
Conger, S., Winniford, M., & Erickson-Harris, L. (2008)
CP x x x
2008
Coelho, A. M., & Rupino da Cunha, P. (2009)
CP x
2009
Flores, J., Rusu, L., & Johanneson, P. (2010)
CP x
2010
Zajac, A., & Soja, P. (2012) CP x 2012
de Espindola, R. S., Luciano, E. M., & Audy, J. L. N. (2009)
CP x
2009
Duffy, K. P., & Denison, B. B. (2008)
CP x
2008

Appendix A.2
407
Underpinning Theories ITSM Process
Capability ITSM Process Performance Business
Performance
Researcher/Author
Sou
rce
ITSM
Bes
t P
ract
ice
Fram
ewo
rks
IT G
ove
rnan
ce &
B
usi
nes
s-IT
A
lign
men
t
Res
ou
rce
-Bas
ed V
iew
Act
or-
Net
wo
rk
Theo
ry
ITSM
Ad
op
tio
n
ITSM
Ou
tco
mes
an
d
Ben
efit
s
ITSM
Im
ple
men
tati
on
ITSM
Per
form
ance
M
easu
rem
ent
ITSM
Cap
abili
ty
Ass
essm
ent
CSF
s/K
PIs
KIS
MET
ITSM
Pro
cess
Im
pro
vem
ent
Bu
sin
ess
Met
rics
ITSM
Fin
anci
al
Mea
sure
men
t
Year
Pu
blis
hed
Heikkinen, S., Suhonen, A., Kurenniemi, M., & Jäntti, M. (2013)
CP x
2013
Jäntti, M., Rout, T., Wen, L., Heikkinen, S., & Cater-Steel, A. (2013)
CP
x x x
2013
Jäntti, M., & Niskala, J. (2014)
CP x
2014
Lahtela, A., Jäntti, M. (2014) CP x 2014
Jäntti, M., Kurenniemi, M. (2013)
CP x
2013
Fraser, P., Moultrie, J., & Gregory, M. (2002)
CP x x
2002
Pasquini, A., & Galiè, E. (2013)
CP x
2013
Grant, R. (2002) B x 2002
Nonaka, I., & Takeuchi, H. (1995)
B x
1995
Mettler, T. (2012) B x 2012

Appendix A.2
408
Underpinning Theories ITSM Process
Capability ITSM Process Performance Business
Performance
Researcher/Author
Sou
rce
ITSM
Bes
t P
ract
ice
Fram
ewo
rks
IT G
ove
rnan
ce &
B
usi
nes
s-IT
A
lign
men
t
Res
ou
rce
-Bas
ed V
iew
Act
or-
Net
wo
rk
Theo
ry
ITSM
Ad
op
tio
n
ITSM
Ou
tco
mes
an
d
Ben
efit
s
ITSM
Im
ple
men
tati
on
ITSM
Per
form
ance
M
easu
rem
ent
ITSM
Cap
abili
ty
Ass
essm
ent
CSF
s/K
PIs
KIS
MET
ITSM
Pro
cess
Im
pro
vem
ent
Bu
sin
ess
Met
rics
ITSM
Fin
anci
al
Mea
sure
men
t
Year
Pu
blis
hed
Juran, J., & Godfrey, A. (1999)
B x
1999
Tarantino, A. (2008) B x 2008
Moeller, R. R. (2011) B x 2011
Sadgrove, K. (2016) B x 2016
Steinberg, R. A. (2013) B x 2013
Callon, M., & Latour, B. (1981)
B x
1981
Law, J. (2009) B x 2009
Law, J., & Hassard, J. (1999) B x 1999
Shrestha, A. (2015) T x 2015
Mainville, D. (2014) IR x 2014
Coopers, P. (2004) IR x 2004
ISACA. (2012) IR x 2012
Glenfis-AG. (2014) IR x 2014
Cabinet Office (2011) IR x 2011
Forbes. (2017) IR x 2017
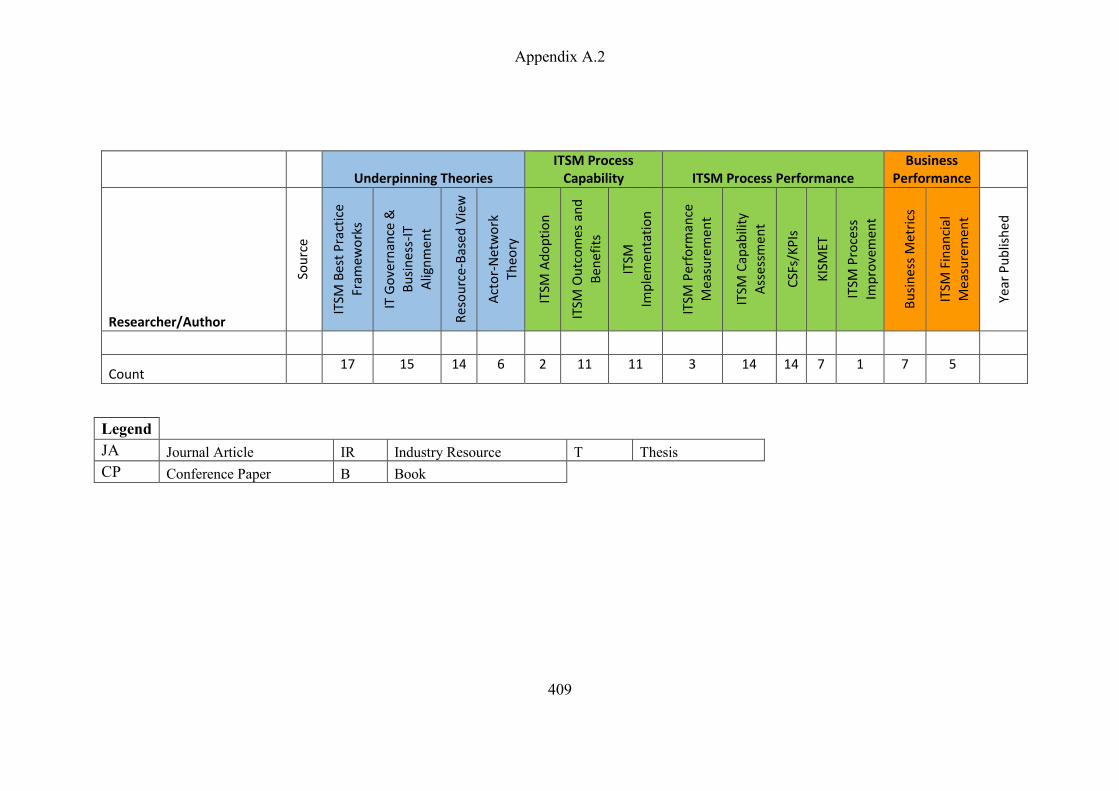
Appendix A.2
409
Underpinning Theories ITSM Process
Capability ITSM Process Performance Business
Performance
Researcher/Author
Sou
rce
ITSM
Bes
t P
ract
ice
Fram
ewo
rks
IT G
ove
rnan
ce &
B
usi
nes
s-IT
A
lign
men
t
Res
ou
rce
-Bas
ed V
iew
Act
or-
Net
wo
rk
Theo
ry
ITSM
Ad
op
tio
n
ITSM
Ou
tco
mes
an
d
Ben
efit
s
ITSM
Im
ple
men
tati
on
ITSM
Per
form
ance
M
easu
rem
ent
ITSM
Cap
abili
ty
Ass
essm
ent
CSF
s/K
PIs
KIS
MET
ITSM
Pro
cess
Im
pro
vem
ent
Bu
sin
ess
Met
rics
ITSM
Fin
anci
al
Mea
sure
men
t
Year
Pu
blis
hed
Count
17 15 14 6 2 11 11 3 14 14 7 1 7 5
Legend JA Journal Article IR Industry Resource T Thesis
CP Conference Paper B Book

Appendix B.1
410
Appendix B. Documentation related to research ethics
approval
Appendix B.1. Ethics Approval Letter

Appendix B.1
411

Appendix B.2
412
Appendix B.2. Company X Approval Letter

Appendix B.3
413
Appendix B.3. Interview/Meeting Participant Information
Sheet

Appendix B.3
414

Appendix B.3
415

Appendix B.4
416
Appendix B.4. Interview/Meeting Consent Form

Appendix B.5
417
Appendix B.5. Focus Group Participant Information
Sheet

Appendix B.5
418

Appendix B.6
419
Appendix B.6. Focus Group Consent Form
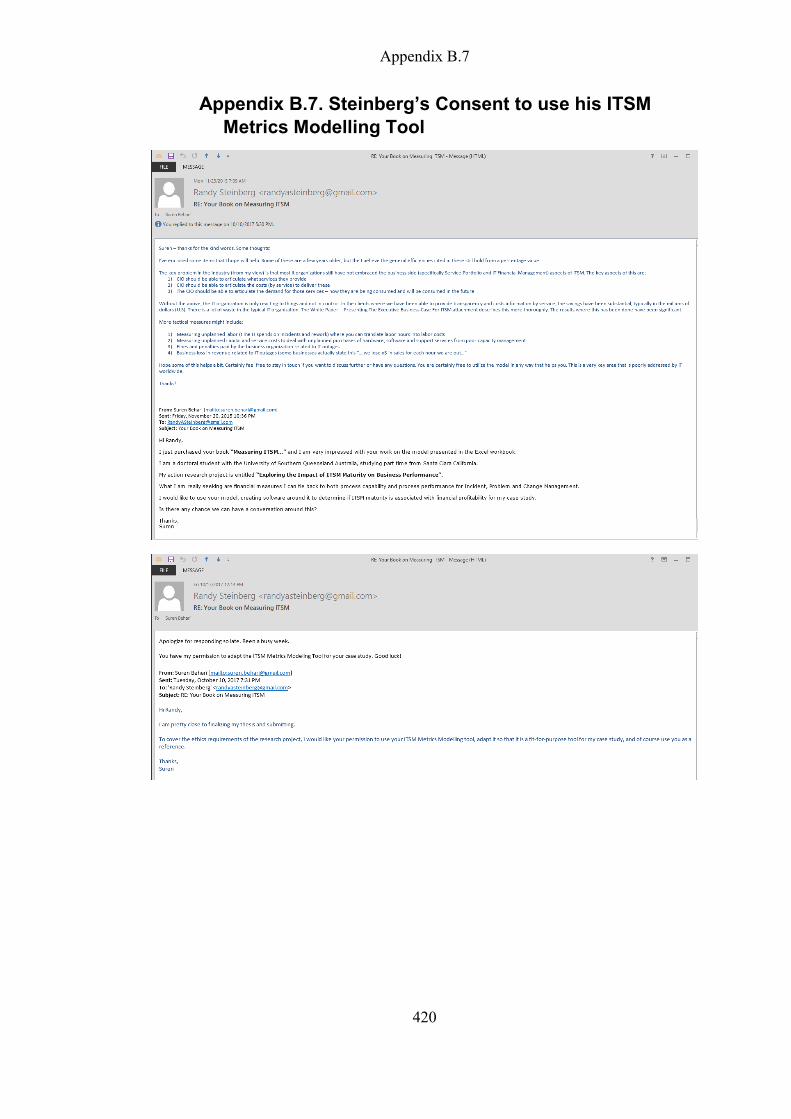
Appendix B.7
420
Appendix B.7. Steinberg’s Consent to use his ITSM
Metrics Modelling Tool

Appendix C.1
421
Appendix C. ARC1 - Documentation related to Process
Capability Assessment
Appendix C.1. Process assessment survey invitation

Appendix C.2
422
Appendix C.2. Follow-up email

Appendix C.3
423
Appendix C.3. Email to extend survey due date

Appendix C.4
424
Appendix C.4. Focus Group Invitation Email

Appendix C.5
425
Appendix C.5. Email communicating Process Capability
Results

Appendix C.6
426
Appendix C.6. Incident Management SMPA Process
capability assessment report with Action Plan
Table C.6.1 below presents all knowledge items relating to how well the incident
management process has achieved its purpose and expected outcomes. These
recommendations and the level of achievement determined by survey responses
provide specific guidelines to optimally perform Incident Management process
activities (also called base practices).
The recommendation items for process improvement guidelines presented in Table
C.6.1 are defined to specific activities of the Incident Management process. If any of
the level of achievements in Table C.6.1 is not ; that is, there is no certainty these
process activities are usually performed; those activities must be reviewed and
performed according to the recommendations provided to fully achieve Capability
Level 1.

Appendix C.6
427
Table C.6.1 Incident Management Process Performance – Base Practices (Level 1)
Indicator Score
Reliability
Score
Rating
Observation &
Recommendation
Action Plan
Level 1: How well the implemented Incident Management process achieves its purpose and expected outcomes.
RES1.1
High All incidents must be recorded,
including priority and date/time of
the incident.
This applies to incidents received
via the service desk as well as
those that are detected
automatically via an event warning
system. Incidents are typically
recorded or logged by Business
Support. Most of the service
disruptions are characterized by
one or several incidents. Incidents
can also be recorded directly by
users either via the service desk or
via other tools such as self-service.
Review incident logging workflow and communicate the
policy to the field.

Appendix C.6
428
Indicator Score
Reliability
Score
Rating
Observation &
Recommendation
Action Plan
RES1.1
High An appropriate coding technique
can be used to classify incidents
according to their type. This is
important to analyze incident types
and frequencies at a later date.
An example of an incident
classification scheme can be:
Hardware > Server > Email >
Exchange Server configuration.
Communicate that classification is being recorded in Zendesk
when identified.
RES1.1
High Appropriate priority status must be
assigned to all incidents so that
major incidents are distinguished
from other incidents. This is
important so that support staff and
tools can handle major incidents
following a major incident
procedure where applicable.
Train Business Support on how to prioritize incidents.
Develop a matrix of criteria for each priority.

Appendix C.6
429
Indicator Score
Reliability
Score
Rating
Observation &
Recommendation
Action Plan
RES1.2
High The impact and urgency of the
incident must be considered to
prioritize and analyze the
incidents. The impact of an
incident is indicated by the number
of users affected by an incident.
The urgency of an incident is
indicated by the priority of
business requirements to resolve
the incident.
RES1.3
High Resolution and recovery efforts of
an incident must be monitored and
verified so that the affected users
are satisfied with the solution.
When the resolution is complete,
the incident can be formally closed
after following any closing
procedures your organization may
have.
Review incident resolution closure workflow and
communicate policy.

Appendix C.6
430
Indicator Score
Reliability
Score
Rating
Observation &
Recommendation
Action Plan
RES1.4
Moderate The service desk examines
diagnostic scripts and known error
database to resolve the incident in
the first instance. If this is not
possible, the incident is escalated
in one of two ways:
(a) functional escalation - to
second-tier and/or third-tier
support team based on technical
expertise; and
(b) hierarchical escalation - to
relevant supervisors and managers
based on management hierarchy so
that adequate resources can be
allocated or suppliers can be called
upon to handle the incident.
Collaborate with DevOps to tool up for improved diagnostics.
Investigate ways of creating and maintaining a knowledge
base.
RES1.5
High The status and progress of
incidents should be readily
available to be communicated to
interested parties. This increases
the visibility and communication
of incidents to business and IT
support staff.
Automate Status updates to relevant parties.

Appendix C.6
431
Indicator Score
Reliability
Score
Rating
Observation &
Recommendation
Action Plan
GP1.1.1 High Incident management process
manages every event that disrupts
or might potentially disrupt a
service so that proper resolution
can be found to restore service to
agreed levels.
Integration with DevOps.
Table C.6.2 below presents relevant knowledge items relating to all generic practices of the incident management process, i.e. from capability
level 2 (PA2.1) to capability level 3 (PA3.2). These recommendations are extracted from the knowledge base only when any process area
demonstrates significant risks based on survey responses, i.e. when the final score of any question is either or .
The recommendation items for process improvement guidelines presented in Table C.6.2 are defined at a broader level. Discussions with key
stakeholders of the problem management process are very important to consider these recommendations; contextualize them to your organization
and process environment, and finally, produce actionable items to address the risks in the process areas as highlighted in the table. This will ensure
the progressive achievement of process capability scores above Capability Level 1.
Table C.6.2 Incident Management - Generic Practices (Levels 2 to 3)
Indicator Score
Reliability
Score
Rating
Observation & Recommendation Action Plan
Level 2.1: How well the performance of Incident Management process is managed. It is important to apply basic process management
techniques to provide reasonable assurance that incident management performance objectives are met.
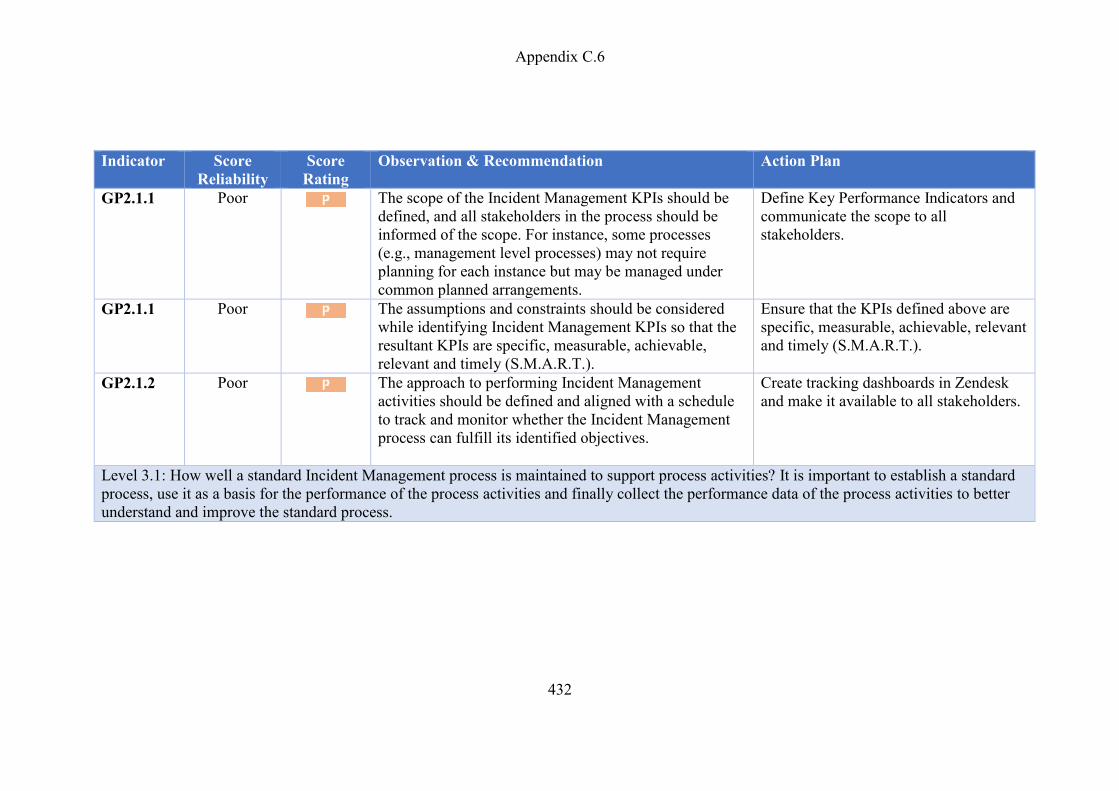
Appendix C.6
432
Indicator Score
Reliability
Score
Rating
Observation & Recommendation Action Plan
GP2.1.1
Poor The scope of the Incident Management KPIs should be
defined, and all stakeholders in the process should be
informed of the scope. For instance, some processes
(e.g., management level processes) may not require
planning for each instance but may be managed under
common planned arrangements.
Define Key Performance Indicators and
communicate the scope to all
stakeholders.
GP2.1.1 Poor The assumptions and constraints should be considered
while identifying Incident Management KPIs so that the
resultant KPIs are specific, measurable, achievable,
relevant and timely (S.M.A.R.T.).
Ensure that the KPIs defined above are
specific, measurable, achievable, relevant
and timely (S.M.A.R.T.).
GP2.1.2
Poor The approach to performing Incident Management
activities should be defined and aligned with a schedule
to track and monitor whether the Incident Management
process can fulfill its identified objectives.
Create tracking dashboards in Zendesk
and make it available to all stakeholders.
Level 3.1: How well a standard Incident Management process is maintained to support process activities? It is important to establish a standard
process, use it as a basis for the performance of the process activities and finally collect the performance data of the process activities to better
understand and improve the standard process.

Appendix C.6
433
Indicator Score
Reliability
Score
Rating
Observation & Recommendation Action Plan
GP3.1.2 Poor The standard Incident Management process workflow
should address interfaces with other processes typically
using a process model diagram or schema. A process
workflow may interface with other service management
processes; other business processes (HR, security) or
even processes from external service providers. For
example, consider the interfaces between Service Level
Management, Change Management, Release
Management and Configuration Management during an
update of service provision to a customer. Such visible
interfaces should be defined in the process workflow and
maintain integrity with the related processes. Note that
the sequence and interaction of processes do not
necessarily imply sequential activities; it may mean
concurrent activities, feedback cycle or another form of
interaction as well.
Revisit process workflow to include
other interfaces and communicate
workflow to all stakeholders.
GP3.1.5 Poor There should be a mechanism to monitor actual process
activities with the standard Incident Management process
so that the data about real process activities provide a
basis for accumulating a better understanding the
behavior of the standard process.
Ensure that the KPIs defined above are
specific, measurable, achievable,
relevant and timely (S.M.A.R.T.).
Level 3.2: How well the standard Incident Management process is implemented as process activities to achieve its outcomes. It is important to
effectively implement process activities tailored to the standard process using resources available in the organization.

Appendix C.6
434
Indicator Score
Reliability
Score
Rating
Observation & Recommendation Action Plan
GP3.2.3 Poor The current competencies of Incident Management staff
should be ascertained to ensure whether they are adequate
to perform Incident Management activities or not. If they
are inadequate, hiring competent staff and training existing
staff properly should be considered.
Consider training.
GP3.2.6 Poor The analysis of appropriate data regarding implementation
of the Incident Management process should be conducted
to provide a basis for understanding the behavior of the
process and its compliance with the standard Incident
Management process. This, in turn, contributes to the
ongoing improvement of the implemented process and the
standard Incident Management process upon which the
implemented process is based.
Ensure that the KPIs defined above are
specific, measurable, achievable,
relevant and timely (S.M.A.R.T.).
Comments
Comments from Survey Participants provide a rich source of qualitative information about process capabilities, interpretation of survey questions
and responses; discussions regarding process strengths, weaknesses, opportunities and threats; contextual information about organization related
processes, people issues, technology factors, constraints, etc.
These components provide useful information to help in process assessments in two ways:
(a) Feedback for further improvement of questions in the software tool;

Appendix C.6
435
(b) Information to discuss current process issues and improvements opportunities.
Question Selected
Option
Comment Action Plan
Do you know if process inputs and outputs are
regularly reviewed?
For Incident Management, inputs could be: (a)
customer feedback; and (b) events triggered from
event management and outputs could be: (a)
incident management records; and (b) escalation
of problem records for incidents whose
underlying cause has not been identified.
P Depends on the urgency or how important
the customer is.
Develop a review plan.
Do you know if required experience, knowledge
and skills are clearly defined to
perform process activities?
For Incident Management, minimum
qualifications, number of years of experience and
skill set could be defined in a job description.
L Number of years of experience may not
correlate with the skill set each analyst
currently has.
Consider training.
Do you know if process outcomes are easily
accessible?
For Incident Management, this means that
process outcomes such as “incident and
resolution history” are available for its interfaces
such as “service level management process”.
Do Not
Know
Maybe recorded in Jira or somewhere, but
not everyone has access to review. We only
depend on internal communication at the
moment.
Knowledgebase.

Appendix C.6
436
Question Selected
Option
Comment Action Plan
Do you know if the standard process provides
information to implement multiple requirements?
For Incident Management, the standard process
could relate to several process requirements such
as “incident identification”, “incident logging”,
“incident categorization” and “incident
prioritization” requirements.
Do Not
Know
If this process is documented, it's not
disseminated to all team members.
Document process and
disseminate to all
stakeholders.
Do you know if process activities in your
organization follow the standard process?
For Incident Management, process activities
should conform to the requirements of the
standard process, possibly based on IT
frameworks such as ITIL, ISO/IEC 20000 or
COBIT.
Do Not
Know
This is possible, but I doubt it. Need to document and
distribute the standard.
Do you know if there is required information is
available in your organization to understand
the process activities?
For Incident Management, information could be
available in corporate social networks,
knowledge management systems, help files or
through support staff to understand the process
activities.
N The overall process is “understood.” I don't
think we have proper documentation (at
least that's been shared to all involved)
detailing the process to the degree that's
being asked in this survey, no.
Need to document and
distribute the standard.
Do you know if incidents are classified with an
appropriate priority?
L Sometimes identifying the root cause,
which is part of the classification, is
difficult even though the required corrective
actions may be obvious.
Training.
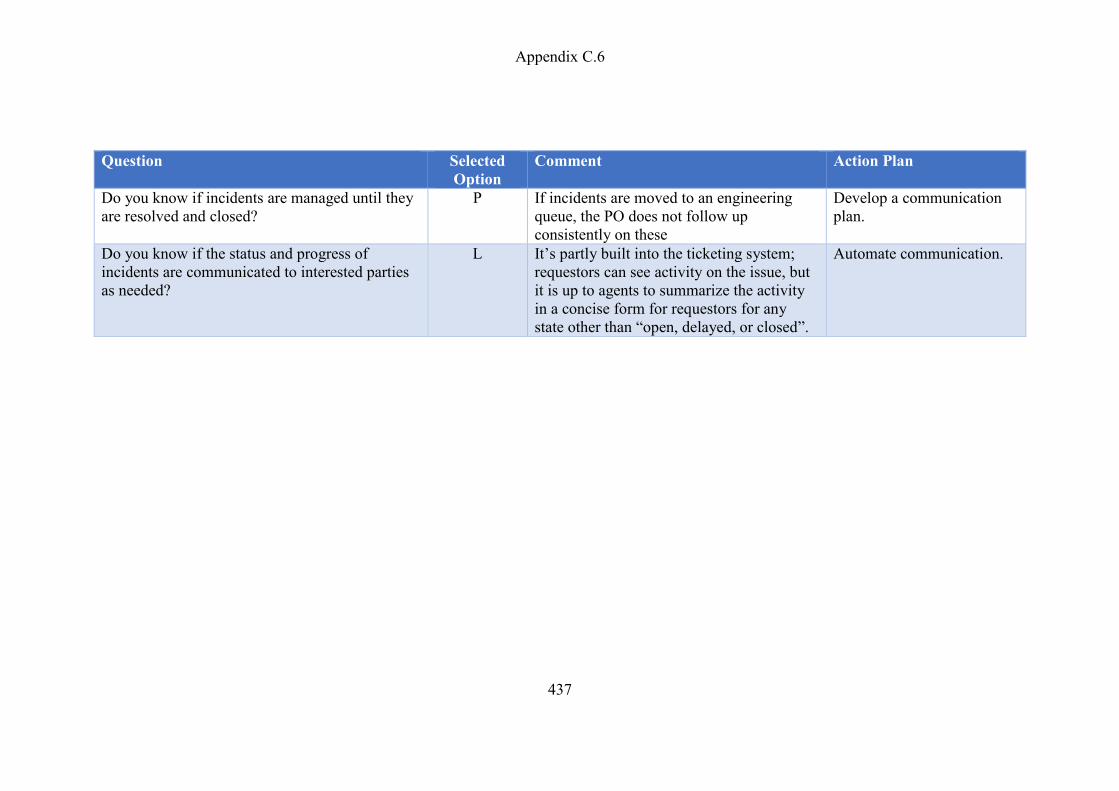
Appendix C.6
437
Question Selected
Option
Comment Action Plan
Do you know if incidents are managed until they
are resolved and closed?
P If incidents are moved to an engineering
queue, the PO does not follow up
consistently on these
Develop a communication
plan.
Do you know if the status and progress of
incidents are communicated to interested parties
as needed?
L It’s partly built into the ticketing system;
requestors can see activity on the issue, but
it is up to agents to summarize the activity
in a concise form for requestors for any
state other than “open, delayed, or closed”.
Automate communication.

Appendix C.7
438
Appendix C.7. Problem Management SMPA Process capability assessment report with Action Plan
Recommendations and Plan of Action
Table C.7.1 below presents all knowledge items relating to how well the problem management process has achieved its purpose and expected
outcomes. These recommendations and the level of achievement determined by survey responses provide specific guidelines to optimally perform
Problem Management process activities (also called base practices).
Score rating provides an overall score (Fully, Largely, Partially & Not) for how well the recommended action is performed based on the responses
to the question related to each standard indicator. Score reliability defines how reliable the score rating is (High, Moderate, Poor) based on the
degree of variation in the responses.
The recommendation items for process improvement guidelines presented in Table C.7.1 are defined to specific activities of the Problem
Management process. If any of the level of achievements in Table C.7.1 is not ; that is, there is no certainty these process activities are
usually performed; those activities must be reviewed and performed according to the recommendations provided to fully achieve Capability Level
1.
Table C.7.1 Problem Management Process Performance – Base Practices (Level 1)

Appendix C.7
439
Indicator Score
Reliability
Score
Rating
Observation &
Recommendation
Action Plan
Level 1: How well the implemented Problem Management process achieves its purpose and expected outcomes.
RES3.1 Moderate Problems should be
comprehensively identified from
different sources. Consider the
following scenarios and ensure
problems are properly identified
in these cases, among others:
• The service desk may identify
an unknown cause of one or more
incidents and registers a problem.
• The technical support group
may identify an underlying
problem while analyzing an
incident.
• An event or alert tool in the
ITSM software may
automatically trace an error that
registers problems.
• A supplier may report a problem
that they identified.
• Proactive problem management
activities may identify problems
during analysis of incidents.
Problem identification should include:
1) detection of an unknown root cause of one or more incidents;
2) the analysis of one or more incidents revealing an underlying
problem;
3) notification from a supplier or an internal group of a problem
with a component of the service.

Appendix C.7
440
Indicator Score
Reliability
Score
Rating
Observation &
Recommendation
Action Plan
RES3.1 Moderate Identified problems should be
properly recorded. In most cases,
it means an entry in the ITSM
software tool. This ensures that a
comprehensive historic problem
report could be made available for
control and escalation if required.
The problem records should include relevant details of the problem,
including the date and time, and a cross-reference to the incident(s)
that initiated the problem record.
RES3.1 Moderate Problems should be accurately
classified (for example problem
areas could be hardware, network,
and software). This helps in
analyzing the cause of and
solution to the problem quickly.
Problem classification and prioritization should ensure that:
1) each problem is categorized to help determine its nature and to
provide meaningful information, making use of the same
classification criteria that are used in the incident and service
request management process;
2) each problem is given a priority for resolution according to its
urgency and the impact of related incidents;
3) time and resources for investigating the problem and identifying
the best options for resolution are allocated according to the priority
of the problem;
4) the resolution of the problem is allocated time and resources
according to the priority of the problem and the benefit of making
the change in order to fulfill service requirements.

Appendix C.7
441
Indicator Score
Reliability
Score
Rating
Observation &
Recommendation
Action Plan
RES3.2 Moderate Problems should be assigned a
priority because not all problems
are equally important to fix as
soon as they occur. For example,
the status of a problem could be
emergency, urgent, important,
and not urgent. While prioritizing
a problem, the frequency and
impact of the related incidents
and the seriousness of the
problem in relation to the costs
involved, resolution time and
impact on mission-critical
services should be considered.

Appendix C.7
442
Indicator Score
Reliability
Score
Rating
Observation &
Recommendation
Action Plan
RES3.2 Moderate Analyses of any problem largely
depend on the nature and priority
of the problem. However in
general problems that are
carefully analyzed should follow
formal diagnosis, investigation,
and problem-solving techniques.
For example, consider using
techniques such as fault isolation,
chronological analysis, pareto
analysis, ishikawa diagrams,
brainstorming, pain value
analysis, 5 whys, Kepner Tregoe
Methodology. (see ITIL
guidelines for further information
on the problem-solving
techniques).
Problem investigation and diagnosis, which should ensure that:
1) each problem is investigated to diagnose the root cause;
2) a method of resolution can be identified, which depends on the
impact of the related incident(s) and potential incidents, whether or
not a temporary fix exists and the estimated cost of resolution;
3) a decision to resolve the problem depends on the impact of
related incidents, whether a temporary fix exists and the cost of
resolution;
4) a decision not to resolve the problem is managed according to
the problem management policy;
5) the problem management process is able to support the incident
and service request management process even before the known
error is found, through identifying a temporary fix;
6) problem diagnosis is complete when the root cause is identified
and a method of resolving the problem is identified.

Appendix C.7
443
Indicator Score
Reliability
Score
Rating
Observation &
Recommendation
Action Plan
RES3.3
Moderate As soon as a solution to a
problem has been found, the
solution should be applied to
resolve the problem whether it is
a workaround solution or a
permanent fix. However, effective
problem resolution may require
testing so that a solution does not
cause other problems. Effective
problem resolution may also
require changes that should
follow the change management
process.
Ensure that all problem resolutions go through QA and Change
Management.

Appendix C.7
444
Indicator Score
Reliability
Score
Rating
Observation &
Recommendation
Action Plan
RES3.3
High A problem should be closed along
with its related outstanding
incidents when a solution has
been successfully applied to the
problem. Any changes resulting
from problem resolution should
also be properly reviewed
following the change
management process. When a
problem is closed, a known error
record should also be generated.
Documenting known errors should ensure that:
1) when the root cause and a proposed method of resolving the
problem is identified, a known error is recorded in the known error
database, together with details of any temporary fix;
2) a known error record is not closed until after the permanent
solution has been successfully implemented via the change
management process;
3) known error records are made available to all relevant personnel,
and they are regularly made aware of any new or updated known
error records;
4) if a known error record stays open for a defined duration of time,
it is reviewed and kept up to date so that no obsolete information is
held in the known error database;
5) all known errors are recorded against the current and potentially
affected services and the configuration item suspected of being at
fault.

Appendix C.7
445
Indicator Score
Reliability
Score
Rating
Observation &
Recommendation
Action Plan
RES3.4
Moderate An unresolved problem should be
escalated to the expert technical
team (either in-house or
outsourced) who specialize in that
type of problem resolution. This
is particularly important when
problems seriously impact
services offered according to the
agreed service levels. It is also
common practice to escalate
unresolved critical problems to
management for reporting.
Define escalation points and procedures.

Appendix C.7
446
Indicator Score
Reliability
Score
Rating
Observation &
Recommendation
Action Plan
RES3.5
Moderate While any problem is unresolved,
different activities should be
undertaken to minimize its
adverse effect where applicable.
• In some cases, a temporary
solution, a workaround, should be
provided for resolving incidents
that were caused by a problem if
applicable.
• As soon as the diagnosis is
undertaken to find the cause, the
identified known errors should be
listed in a known error report and
recorded in the known error
database to provide up-to-date
information.
Example activities:
1) identification of related incident(s) breaching service targets;
2) cascading information to the customer so they can take
appropriate actions to minimize the impact of the unresolved
problem;
3) enable the service desk or level 1 support to provide regular
updates to affected users or customers;
4) defining the escalation points.
RES3.6
Moderate It is important to notify all
concerned stakeholders (for
example problem manager,
incident manager, service level
manager, and customer) about the
status and progress of problem
resolution to keep them up-to-
date and to enable management to
monitor and review the process
for future improvements.
Keep all concerned in the loop by:
1) cascading information to the customer so they can take
appropriate actions to minimize the impact of the unresolved
problem;
2) enable the service desk or level 1 support to provide regular
updates to affected users or customers;

Appendix C.7
447
GP1.1.1
Moderate Problem management process
overall must be reviewed and
improved in order to fulfill its
current and expected outcomes.
Major problem reviews held to investigate unresolved, unusual or
high impact problems, should ensure:
1) risks to the business, the customer or service provider are
identified and managed;
2) there is management visibility into the reasons for unresolved
problems, as well as their ongoing business impact.
Problem reviews should be recorded and should include appropriate
recommendations for improvements to the service. They should
examine:
1) opportunities to improve the problem management process;
2) opportunities to improve other processes, services or the SMS;
3) how to prevent recurrence or a particular type of problem;
4) whether training or awareness should be provided to correct or
prevent incidents caused by human error;
5) whether there has been any responsibility on the part of
suppliers, customers or internal groups for problems that have
occurred and whether any follow-up actions are required.
Proactive problem management should ensure that:
1) incident and problem data, the CMDB and other relevant
information sources are analyzed to identify trends;
2) incident and problem data, the CMDB and other relevant
information sources can be used to improve decision making and
assist with pre-empting possible degradations of service;

Appendix C.7
448
Indicator Score
Reliability
Score
Rating
Observation &
Recommendation
Action Plan
3) the knowledge gained from a problem review is communicated
to the customer to ensure that the customer is aware of the actions
taken and the service improvement recommendations identified;
4) key measurements that demonstrate the business value of
proactive problem management are defined;
5) potential single points of failure, emerging trends and risks to
services are identified and options are proposed through the change
management process.
Table C.7.2 below presents relevant knowledge items relating to all generic practices of the problem management process, i.e. from capability
level 2 (PA2.1) to capability level 3 (PA3.2). These recommendations are extracted from the knowledge base only when any process area
demonstrates significant risks based on survey responses, that is, when the final score of any question is either or .
The recommendation items for process improvement guidelines presented in Table C.7.2 are defined at a broader level. Discussions with key
stakeholders of the problem management process are very important to consider these recommendations; contextualize them to your organization
and process environment, and finally, produce actionable items to address the risks in the process areas as highlighted in the table. This will ensure
the progressive achievement of process capability scores above Capability Level 1.
Table C.7.2 Problem Management - Generic Practices (Levels 2 to 3)

Appendix C.7
449
Indicator Score
Reliability
Score
Rating
Observation & Recommendation Action Plan
Level 2.1: How well the performance of Problem Management process is managed. It is important to apply basic process management
techniques to provide reasonable assurance that problem management performance objectives are met.
GP2.1.1 Poor
The objectives of Problem Management KPIs should be identified
based on the business goals of the process and customer
requirements for the service that uses Problem Management
process. The objectives of Problem Management KPIs can define
deadlines, constraints or targets to achieve for a process in regards
to quality, process cycle time or resource usage. Such objectives
may be expressed in qualitative terms (e.g., peer reviews) or
quantitative terms (e.g., average service downtime).
Define Key Performance
Indictors and communicate
the scope to all stakeholders.
GP2.1.1 Poor The scope of the Problem Management KPIs should be defined,
and all stakeholders in the process should be informed of the scope.
For instance, some processes (e.g., management level processes)
may not require planning for each instance but may be managed
under common planned arrangements.
Ensure that the KPIs defined
above are specific,
measurable, achievable,
relevant and timely
(S.M.A.R.T.).
GP2.1.1 Poor The assumptions and constraints should be considered while
identifying Problem Management KPIs so that the resultant KPIs
are specific, measurable, achievable, relevant and timely
(S.M.A.R.T.).
Create tracking dashboards in
Zendesk and make it available
to all stakeholders.
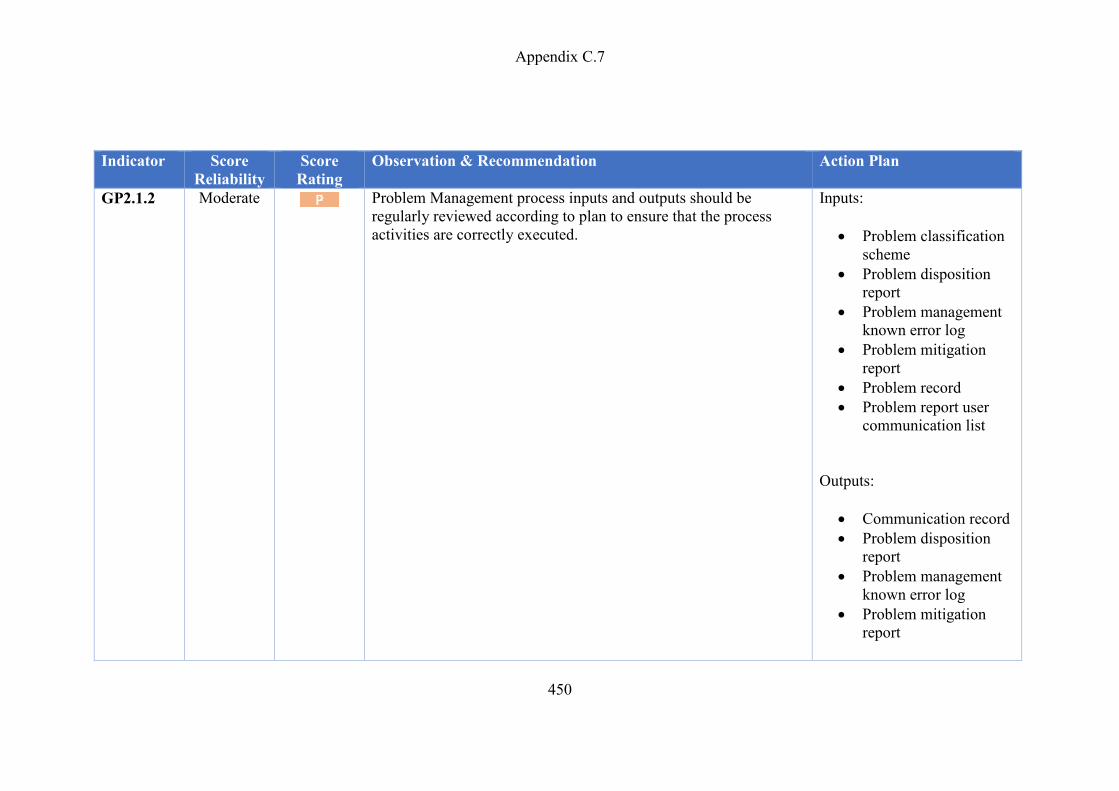
Appendix C.7
450
Indicator Score
Reliability
Score
Rating
Observation & Recommendation Action Plan
GP2.1.2 Moderate Problem Management process inputs and outputs should be
regularly reviewed according to plan to ensure that the process
activities are correctly executed.
Inputs:
Problem classification
scheme
Problem disposition
report
Problem management
known error log
Problem mitigation
report
Problem record
Problem report user
communication list
Outputs:
Communication record
Problem disposition
report
Problem management
known error log
Problem mitigation
report

Appendix C.7
451
Indicator Score
Reliability
Score
Rating
Observation & Recommendation Action Plan
GP2.1.2 Poor The activities of Problem Management should be driven by the
identified performance targets so that the Problem Management
can be monitored against the plans.
Establish process performance
KPIs.
GP2.1.3 Poor When the Problem Management activities are not well performed,
the potential issues of such cases should be identified. This can be
discussed in a process performance review meeting.
To discuss in Product
Questions meeting on
Thursday mornings.
GP2.1.3 Poor When the Problem Management performance targets and KPIs are
not achieved, corrective actions should be taken to re-define the
targets and KPIs, or to address the issues identified in the process
activities wherever appropriate.
Revisit KPIs regularly.
GP2.1.4 Poor The need for experience, knowledge, and skills to perform Problem
Management activities should be clearly defined. This helps in
determining training needs and in understanding current and future
staff competencies required to perform the process activities.
Ensure that the component
owner troubleshoots
problems.
GP2.1.5 Poor Proper human and infrastructure resources that include competent
people, reliable partners (vendors and suppliers), well-performed
processes (based on ITIL guidelines) and relevant technologies
(e.g. ITSM tools) – these resources should be sufficient enough to
perform Problem Management activities effectively. It is especially
important to be prepared to make appropriate changes to the
resources as the process is changed for improvements.
None
Level 2.2: How well the work products (inputs and outputs) produced by Problem Management process is managed. It is important to apply
basic process management techniques to ensure that the deliverables of the process are appropriately identified, documented, and controlled.

Appendix C.7
452
Indicator Score
Reliability
Score
Rating
Observation & Recommendation Action Plan
GP2.2.1 Poor The requirements for Problem Management deliverables should be
identified to provide a basis for the development and verification of
those deliverables (which are mainly records and documents
concerning the process). The requirements for process deliverables
could be functional requirements (e.g., performance, quality,
compliance, etc.) or non-functional requirements that are not
directly related to the deliverables (e.g., reporting structure,
notification to customer, etc.) or a combination of both.
None
GP2.2.1 Poor In certain circumstances, it is important to set quality criteria for
the Problem Management deliverables since such deliverables
likely have a significant influence on the requirements of the
process performance.
None
GP2.2.2 Poor The dependencies between various Problem Management
deliverables should be identified and understood to determine how
the deliverables contribute together in the achievement of the
process objectives.
None
GP2.2.2 Poor The approval and review of Problem Management deliverables
should also be defined using controls such as versioning, consistent
document naming, setting up of access rules and maintaining the
confidentiality of the concerned documents in the organization.
None
GP2.2.3 Moderate All the required deliverables (documents) which are necessary in
performing Problem Management activities properly should be
identified.
None
GP2.2.3 Poor Change control should be set up for the Problem Management
deliverables based on the defined requirements for documentation
and control of those deliverables.
None

Appendix C.7
453
Indicator Score
Reliability
Score
Rating
Observation & Recommendation Action Plan
GP2.2.4 Poor The Problem Management deliverables resulting from the
implementation of the process should be reviewed in accordance
with planned arrangements and adjusted as necessary to meet the
defined requirements.
None
GP2.2.4 Poor
After a careful review of the Problem Management deliverables,
corrective actions should be undertaken to resolve any issues
identified as part of the management of the process deliverables.
None
Level 3.1: How well is a standard Problem Management process maintained to support process activities? It is important to establish a
standard process, use it as a basis for the performance of the process activities and finally collect the performance data of the process activities
to better understand and improve the standard process.
GP3.1.1 Poor There should be a formal description of a standard Problem
Management process with explicit specification of goals, scope,
and policies at a general level. This will be a basis for performance
of the “defined” process – that is, implementing the standard
process to suit the organizational constraints and conditions.
None
GP3.1.1 Moderate The defined standard Problem Management process should
consider and cater for different conditions and criteria for its
implementation. The standard process by itself is defined at a
general level that may not be directly usable to perform a process,
but it should support diverse contexts in the organization.
None
GP3.1.1 Poor The standard Problem Management process should define some
form of “tailoring guidelines” to enable implementation of the
standard process in different situations so that the process can be
altered for different requirements to meet the objectives,
constraints, and environment of the project or activities involved.
None
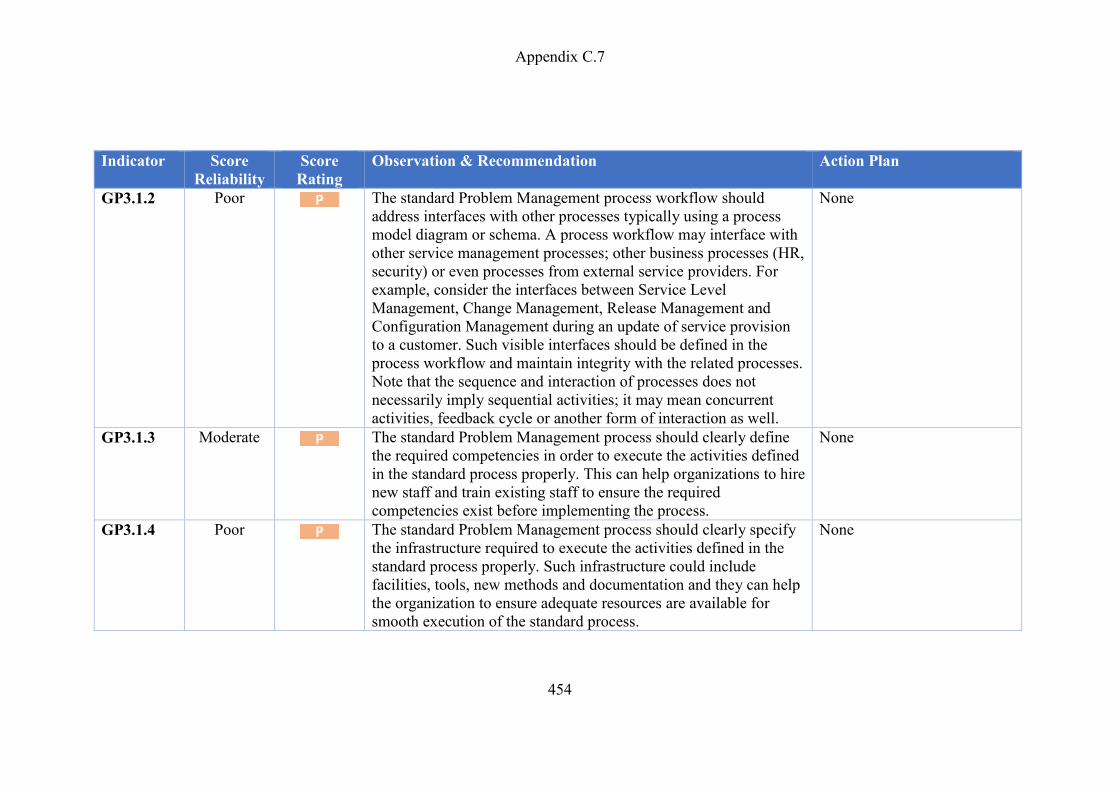
Appendix C.7
454
Indicator Score
Reliability
Score
Rating
Observation & Recommendation Action Plan
GP3.1.2 Poor The standard Problem Management process workflow should
address interfaces with other processes typically using a process
model diagram or schema. A process workflow may interface with
other service management processes; other business processes (HR,
security) or even processes from external service providers. For
example, consider the interfaces between Service Level
Management, Change Management, Release Management and
Configuration Management during an update of service provision
to a customer. Such visible interfaces should be defined in the
process workflow and maintain integrity with the related processes.
Note that the sequence and interaction of processes does not
necessarily imply sequential activities; it may mean concurrent
activities, feedback cycle or another form of interaction as well.
None
GP3.1.3 Moderate The standard Problem Management process should clearly define
the required competencies in order to execute the activities defined
in the standard process properly. This can help organizations to hire
new staff and train existing staff to ensure the required
competencies exist before implementing the process.
None
GP3.1.4 Poor The standard Problem Management process should clearly specify
the infrastructure required to execute the activities defined in the
standard process properly. Such infrastructure could include
facilities, tools, new methods and documentation and they can help
the organization to ensure adequate resources are available for
smooth execution of the standard process.
None

Appendix C.7
455
Indicator Score
Reliability
Score
Rating
Observation & Recommendation Action Plan
GP3.1.4 Poor The standard Problem Management process should clearly identify
and describe the work environment required to execute the
activities defined in the standard process properly. Such work
environment factors could include ergonomics (worker movement,
fatigue, location, social interaction, heat, light, noise, and airflow),
personal safety and facility conditions that are conducive to
perform the process. For example, a well-defined Occupational
Health and Safety (OH&S) policy can address work environment
requirements in a standard process.
None
GP3.1.5 Poor There should be a mechanism to monitor actual process activities
with the standard Problem Management process so that the data
about real process activities provide a basis for accumulating a
better understanding the behavior of the standard process.
None
GP3.1.5 Poor It is important to explicitly establish a need to audit and review the
standard Problem Management process by management so that the
collected review data could be used for the improvement of the
standard process.
None
Level 3.2: How well the standard Problem Management process is implemented as process activities to achieve its outcomes. It is important to
effectively implement process activities tailored to the standard process using resources available in the organization.
GP3.2.1 Poor The defined activities of Problem Management process should
conform to the requirements of the standard Problem Management
process and implemented following the tailoring guidelines (if any)
to consider the specific constraints and conditions. This will ensure
that the activities undertaken in the Problem Management process
is consistent across the organization.
None

Appendix C.7
456
Indicator Score
Reliability
Score
Rating
Observation & Recommendation Action Plan
GP3.2.3 Poor The current competencies of Problem Management staff should be
ascertained to ensure whether they are adequate to perform
Problem Management activities or not. If they are inadequate,
hiring competent staff and training existing staff properly should be
considered.
None
GP3.2.6 Poor Information about the Problem Management process activities such
as process documentation (e.g., procedures) and location of the
latest version of documents should be collected and made readily
available to understand and monitor the Problem Management
activities for suitability and effectiveness.
None
GP3.2.6 Poor The analysis of appropriate data regarding implementation of the
Problem Management process should be conducted to provide a
basis for understanding the behavior of the process and its
compliance with the standard Problem Management process. This,
in turn, contributes to the ongoing improvement of the
implemented process and the standard Problem Management
process upon which the implemented process is based.
None
Comments

Appendix C.7
457
Comments from Survey Participants provide a rich source of qualitative information about process capabilities, interpretation of survey questions
and responses; discussions regarding process strengths, weaknesses, opportunities and threats; contextual information about organization related
processes, people issues, technology factors, constraints, etc.
These components provide useful information to help in process assessments in two ways:
(a) Feedback for further improvement of questions in the software tool;
(b) Information to discuss current process issues and improvements opportunities.
Question Selected Option Comment Action Plan
Do you know if roles and responsibilities are clearly
defined, assigned and communicated to perform
process activities?
For Problem Management, roles and responsibilities
could be defined, assigned and communicated in the
form of a responsibility assignment matrix (or RACI
matrix) that describes participation by various roles
to perform process activities, or in the job
description and employment contracts as well.
L Implicitly understood by
participants.
Define and communicate roles
and responsibilities.

Appendix C.7
458
Question Selected Option Comment Action Plan
Do you know if required experience, knowledge and
skills are clearly defined to perform process
activities?
For Problem Management, minimum qualifications,
number of years of experience and skill set could be
defined in a job description.
L It's not documented, but
everyone around has a fairly
good idea of people's skills and
experience. So, it's clearly
defined in the minds of decision-
makers, but don’t think it's
recorded anywhere.
Consider training.
Do you know if corrective actions are undertaken to
resolve any issues arising from review of process
outcomes?
For Problem Management, if a process outcome
target such as “90% problem resolution” is
consistently missed by your organization; corrective
actions are taken to revise the process.
N Review is not done so corrective
actions are not taken.
Implement review process.
Do you know if the standard process is actually
implemented with the help of procedures or work
instructions?
For Problem Management, the standard process
could be institutionalized in your organization in the
form of guidelines and templates to follow.
N One man defines everything Define standards and procedure
and communicate to all
stakeholders.

Appendix C.7
459
Question Selected Option Comment Action Plan
Do you know if there is a good organizational
support to manage and perform process activities
effectively?
For Problem Management, organizational support
could mean the provision of a good working
relationship between IT service functions: service
desk, IT Operations, Technical Management and
Applications Management team - for effective
process activities.
P Support to actually fix the
problems is not there. Until that
priority (fixing issues vs. adding
new features) is changed this
whole process will continue to
be broken as far as customer is
concerned. My response is, 'Yes,
but in reality this would be a
'Yes - only if you're deemed a
priority.'
Revisit priorities and business
impact.
Do you know if problems are assigned a priority? P Automatically, but not really
followed
Define an impact/severity
matrix.
Do you know if problems are effectively resolved?
NOTE: Problems are effectively resolved when a
workaround (or even better a permanent solution)
has been found.
F If a stakeholder is aware Review Known Error database
regularly.
Do you know if stakeholders are kept informed
about the status and progress of problem resolution?
P based on priority Automate communication.
Do you know if stakeholders are kept informed
about the status and progress of problem resolution?
P there should be a Yes, hardly Automate communication.

Appendix C.8
460
Appendix C.8. Change Management SMPA Process capability assessment report with Action Plan
Recommendations and Plan of Action
Table C.8.1 below presents all knowledge items relating to how well the change management process has achieved its purpose and expected
outcomes. These recommendations and the level of achievement determined by survey responses provide specific guidelines to optimally perform
Change Management process activities (also called base practices).
The recommendation items for process improvement guidelines presented in Table C.8.1 are defined to specific activities of the Change
Management process. If any of the level of achievements in Table C.8.1 is not ; that is, there is no certainty these process activities are usually
performed; those activities must be reviewed and performed according to the recommendations provided to fully achieve Capability Level 1.
Table C.8.1 Change Management Process Performance – Base Practices (Level 1)
Indicator Score
Reliability
Score
Rating
Observation & Recommendation Action Plan
Level 1: How well the implemented Change Management process achieves its purpose and expected outcomes.

Appendix C.8
461
Indicator Score
Reliability
Score
Rating
Observation & Recommendation Action Plan
CON1.1 Moderate A change should be raised by a request
requiring the change. Such requests for
change (RFCs) should be properly recorded
either in a document or ideally in a change
management system. The scope and impact
of the change should typically determine
how much information is required to record
the change.
Enforce scope and impact of change requests.
CON1.1 Moderate Changes should be classified (for example
normal change, standard change, emergency
change) based on the issue of risk and/or
priority. The likelihood that the risk will
occur and its possible impact should
determine the risk category of the change.
Ensure that the change record caters for
classification of changes.
CON1.2 Poor Impact assessment of the change requests
should be guided by “the seven R’s of
change management” (see ITIL guidelines
for the seven aspects to be considered during
assessment of a change request). One of the
activities during change assessment is to
evaluate the impact of the change on the
existing information security policy and
controls. Another activity during change
assessment is to evaluate the impact of the
change on releases and implementation
plans.
Who RAISED the Change?
What is the REASON for the change?
What RETURN will the change deliver?
What RISKS are there is we do or do not carry out
the change?
What RESOURCES will be required to perform
this change?
Who is RESPONSIBLE for this change being
performed?
What RELATIONSHIPS are there between this
and other changes?
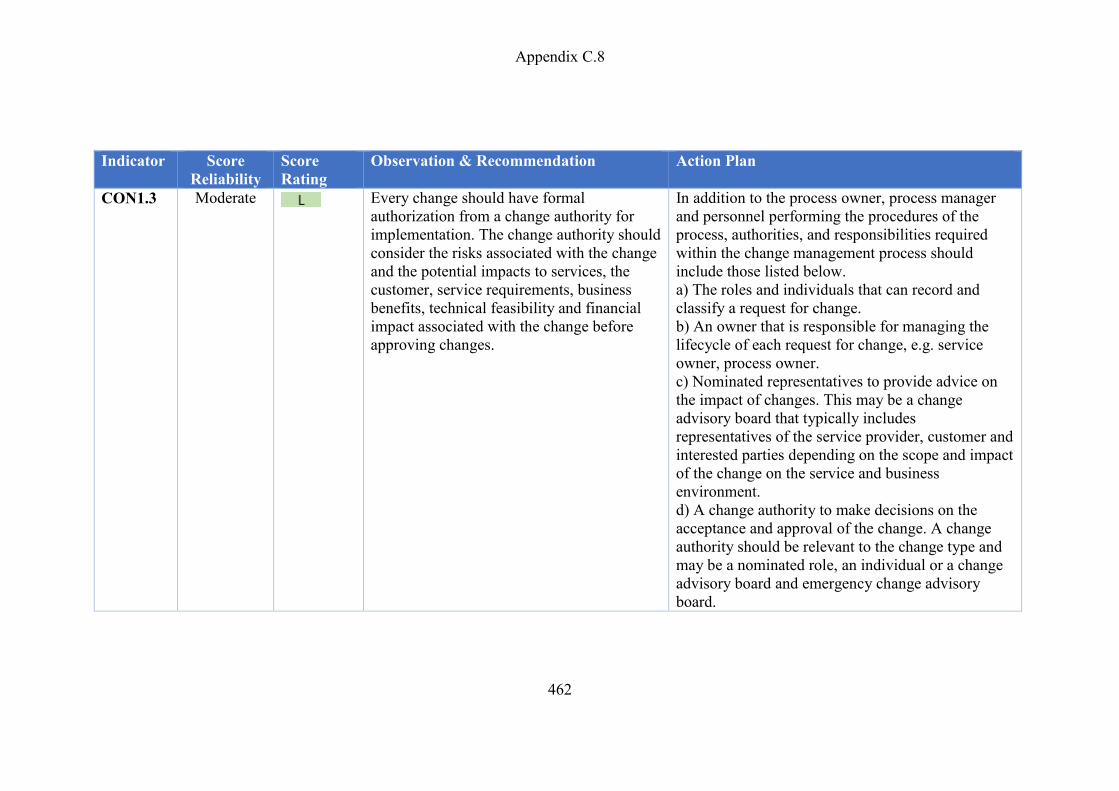
Appendix C.8
462
Indicator Score
Reliability
Score
Rating
Observation & Recommendation Action Plan
CON1.3 Moderate Every change should have formal
authorization from a change authority for
implementation. The change authority should
consider the risks associated with the change
and the potential impacts to services, the
customer, service requirements, business
benefits, technical feasibility and financial
impact associated with the change before
approving changes.
In addition to the process owner, process manager
and personnel performing the procedures of the
process, authorities, and responsibilities required
within the change management process should
include those listed below.
a) The roles and individuals that can record and
classify a request for change.
b) An owner that is responsible for managing the
lifecycle of each request for change, e.g. service
owner, process owner.
c) Nominated representatives to provide advice on
the impact of changes. This may be a change
advisory board that typically includes
representatives of the service provider, customer and
interested parties depending on the scope and impact
of the change on the service and business
environment.
d) A change authority to make decisions on the
acceptance and approval of the change. A change
authority should be relevant to the change type and
may be a nominated role, an individual or a change
advisory board and emergency change advisory
board.

Appendix C.8
463
Indicator Score
Reliability
Score
Rating
Observation & Recommendation Action Plan
CON1.4 Poor The approved changes should be scheduled
on the change calendar: “the Schedule of
Change (SC)” where applicable. The change
calendar should contain details of all
approved changes and their plans, e.g.
implementation dates.
NOTE: a Schedule of Change (SC) is also
termed as a Forward Schedule of Change
(FSC) in ITIL.
If we don’t have one already, let’s create one for at
least end of week changes.
CON1.4 Poor It is important to make sure that
implementation plans (which are performed
in detail using a Release and Deployment
Management process) is well coordinated
with the change management process. In
consultation with the relevant IT
departments, the Change Advisory Board
(CAB) should set up fixed times to
implement new changes, choosing times
when existing services will be impacted as
little as possible.
We should discipline ourselves in following a
schedule for changes based on impact.
CON1.4 Poor Authorized changes should be passed to the
relevant stakeholders to develop a release for
the change. The Release and Deployment
Management process should discuss this
activity in detail.
Ensure that the automated communication methods
are sufficient to achieve this.

Appendix C.8
464
Indicator Score
Reliability
Score
Rating
Observation & Recommendation Action Plan
CON1.5 Poor It is important to make sure that the schedule
of change is communicated to the concerned
stakeholders in a timely manner.
Communicate approved changes to Product Owners
and other stakeholders prior to making changes.
CON1.6 Poor Authorized changes should be passed to the
relevant technical groups for developing a
release for the change. The Release and
Deployment Management process should
detail this activity in detail. Likewise, the
changes, its remediation and implementation
methods should be tested thoroughly. The
service validation and testing process (if
implemented) should discuss this activity in
detail.
Ensure that Release Management, QA, and DevOps
are in sync.
CON1.7 High A recovery plan should be prepared in case a
change implementation is unsuccessful
detailing how to roll back or remedy
problematic changes.
This needs to be addressed in the change request
ticket.
GP1.1.1 Poor Change management process overall must be
reviewed and improved in order to fulfil its
current and expected outcomes.
Kick-off regular meetings around change
management.
Table C.8.2 below presents relevant knowledge items relating to all generic practices of the change management process, i.e. from capability level
2 (PA2.1) to capability level 5 (PA5.2). These recommendations are extracted from the knowledge base only when any process area demonstrates
significant risks based on survey responses, that is, when the final score of any question is either or .

Appendix C.8
465
The recommendation items for process improvement guidelines presented in Table C.82 are defined at a broader level. Discussions with key
stakeholders of the change management process are very important to consider these recommendations; contextualize them to your organization
and process environment, and finally, produce actionable items to address the risks in the process areas as highlighted in the table. This will ensure
the progressive achievement of process capability scores above Capability Level 1.
Table C.8.2 Change Management - Generic Practices (Levels 2 to 5)
Indicator Score
Reliability
Score
Rating
Observation & Recommendation Action Plan
Level 2.1: How well the performance of Change Management process is managed. It is important to apply basic process management
techniques to provide reasonable assurance that change management performance objectives are met.
GP2.1.1
Poor The objectives of Change Management KPIs
should be identified based on the business
goals of the process and customer
requirements for the service that uses Change
Management process. The objectives of
Change Management KPIs can define
deadlines, constraints or targets to achieve
for a process in regards to quality, process
cycle time or resource usage. Such objectives
may be expressed in qualitative terms (e.g.,
peer reviews) or quantitative terms (e.g.,
average service downtime).
Ensure that the KPIs defined above are specific,
measurable, achievable, relevant and timely
(S.M.A.R.T.).
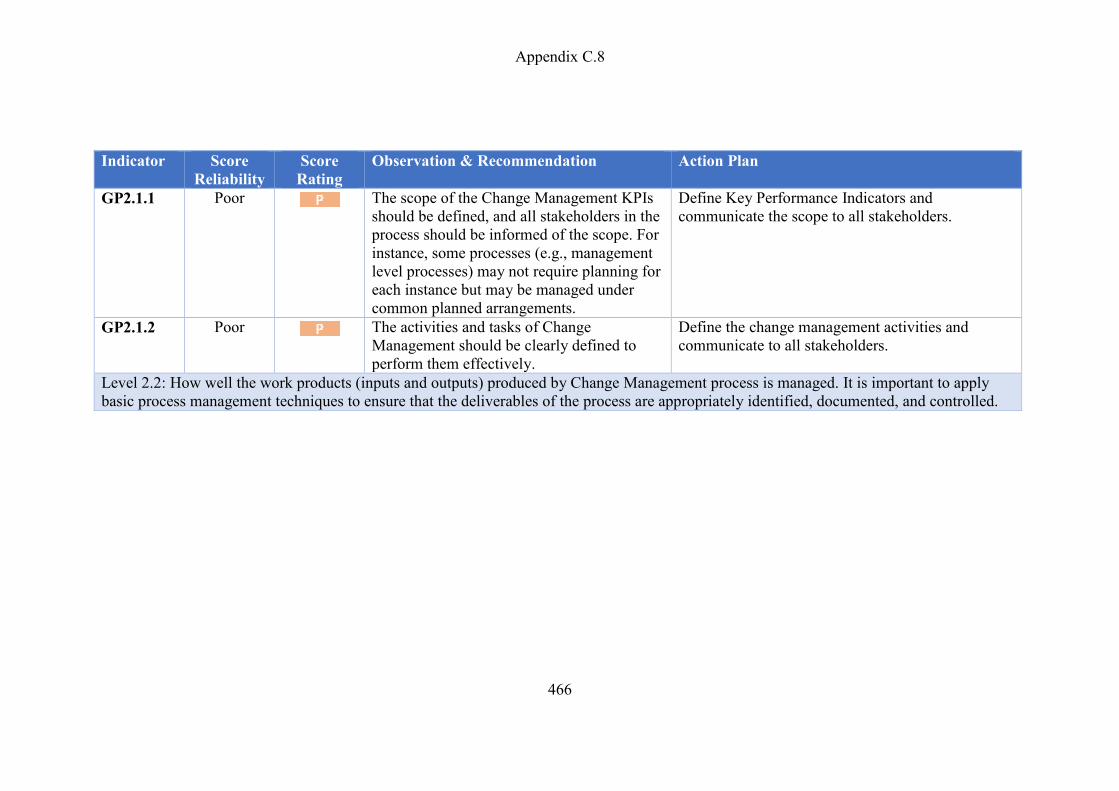
Appendix C.8
466
Indicator Score
Reliability
Score
Rating
Observation & Recommendation Action Plan
GP2.1.1 Poor The scope of the Change Management KPIs
should be defined, and all stakeholders in the
process should be informed of the scope. For
instance, some processes (e.g., management
level processes) may not require planning for
each instance but may be managed under
common planned arrangements.
Define Key Performance Indicators and
communicate the scope to all stakeholders.
GP2.1.2
Poor The activities and tasks of Change
Management should be clearly defined to
perform them effectively.
Define the change management activities and
communicate to all stakeholders.
Level 2.2: How well the work products (inputs and outputs) produced by Change Management process is managed. It is important to apply
basic process management techniques to ensure that the deliverables of the process are appropriately identified, documented, and controlled.

Appendix C.8
467
Indicator Score
Reliability
Score
Rating
Observation & Recommendation Action Plan
GP2.2.3 Poor All the required deliverables (documents)
which are necessary for performing Change
Management activities properly should be
identified.
The documents, including records that should be
produced and retained:
a) change management policy;
b) change management process documentation and
procedures, including an emergency change
procedure and a standard change procedure;
c) a list of approved standard changes;
d) a schedule of changes;
e) recorded requests for change and any related
information e.g. risk assessment, remediation plan,
deployment plan;
f) change management process effectiveness and
efficiency reports;
g) change management reports, including post-
implementation reviews.
GP2.2.4 Poor The Change Management deliverables
resulting from the implementation of the
process should be reviewed in accordance
with planned arrangements and adjusted as
necessary to meet the defined requirements.
Define a review plan.
GP2.2.4 Poor After a careful review of the Change
Management deliverables, corrective actions
should be undertaken to resolve any issues
identified as part of the management of the
process deliverables.
Define corrective action procedures.

Appendix C.8
468
Indicator Score
Reliability
Score
Rating
Observation & Recommendation Action Plan
Level 3.1: How well is a standard Change Management process maintained to support process activities? It is important to establish a standard
process, use it as a basis for performance of the process activities and finally collect the performance data of the process activities to better
understand and improve the standard process.
GP3.1.2 Poor The standard Change Management process workflow should
address interfaces with other processes typically using a
process model diagram or schema. A process workflow may
interface with other service management processes; other
business processes (HR, security) or even processes from
external service providers. For example, consider the
interfaces between Service Level Management, Change
Management, Release Management and Configuration
Management during an update of service provision to a
customer. Such visible interfaces should be defined in the
process workflow and maintain integrity with the related
processes. Note that the sequence and interaction of
processes does not necessarily imply sequential activities; it
may mean concurrent activities, feedback cycle or another
form of interaction as well.
None
GP3.1.4 Poor The standard Change Management process should clearly
specify the infrastructure required to execute the activities
defined in the standard process properly. Such infrastructure
could include facilities, tools, new methods and
documentation and they can help the organization to ensure
adequate resources are available for smooth execution of the
standard process.
None

Appendix C.8
469
Indicator Score
Reliability
Score
Rating
Observation & Recommendation Action Plan
GP3.1.5 Poor There should be a mechanism to monitor actual process
activities with the standard Change Management process so
that the data about real process activities provide a basis for
accumulating a better understanding the behavior of the
standard process.
None
Level 3.2: How well the standard Change Management process is implemented as process activities to achieve its outcomes. It is important to
effectively implement process activities tailored to the standard process using resources available in the organization.
GP3.2.3 Poor The current competencies of Change Management staff
should be ascertained to ensure whether they are adequate to
perform Change Management activities or not. If they are
inadequate, hiring competent staff and training existing staff
properly should be considered.
None
GP3.2.6 Poor Information about the Change Management process activities
such as process documentation (e.g. procedures) and location
of the latest version of documents should be collected and
made readily available to understand and monitor the Change
Management activities for suitability and effectiveness.
None
GP3.2.6 Poor The analysis of appropriate data regarding implementation of
the Change Management process should be conducted to
provide a basis for understanding the behavior of the process
and its compliance with the standard Change Management
process. This, in turn, contributes to the ongoing
improvement of the implemented process and the standard
Change Management process upon which the implemented
process is based.
None

Appendix C.8
470
Comments
Comments from Survey Participants provide a rich source of qualitative information about process capabilities, interpretation of survey questions
and responses; discussions regarding process strengths, weaknesses, opportunities and threats; contextual information about organization related
processes, people issues, technology factors, constraints, etc.
These components provide useful information to help in process assessments in two ways:
(a) Feedback for further improvement of questions in the software tool;
(b) Information to discuss current process issues and improvements opportunities.
Question Selected
Option
Comment Action Plan
Do you know if process inputs and outputs are
regularly reviewed?
For Incident Management, inputs could be: (a)
customer feedback; and (b) events triggered from
event management and outputs could be: (a) incident
management records; and (b) escalation of problem
records for incidents whose underlying cause has not
been identified.
P Depends on the urgency or how
important the customer is.
Develop a review plan.

Appendix C.8
471
Question Selected
Option
Comment Action Plan
Do you know if required experience, knowledge and
skills are clearly defined to
perform process activities?
For Incident Management, minimum qualifications,
number of years of experience and skill set could be
defined in a job description.
L Number of years of exp may not
correlate with the skill set each
analyst currently has.
Consider training.
Do you know if process outcomes are easily
accessible?
For Incident Management, this means that process
outcomes such as “incident and resolution history” are
available for its interfaces such as “service level
management process”.
Do Not Know Maybe recorded in Jira or
somewhere, but not everyone has
access to review. We only
depend on internal
communication at the moment.
Knowledgebase.
Do you know if the standard process provides
information to implement multiple requirements?
For Incident Management, the standard process could
relate to several process requirements such as
“incident identification”, “incident logging”, “incident
categorization”, and “incident prioritization”
requirements.
Do Not Know If this process is documented, it's
not disseminated to all team
members.
Document process and
disseminate to all stakeholders.
Do you know if process activities in your organization
follow the standard process?
For Incident Management, process activities should
conform to the requirements of the standard process,
possibly based on IT frameworks such as ITIL,
ISO/IEC 20000 or COBIT.
Do Not Know This is possible, but I doubt it. Need to document and distribute
the standard.

Appendix C.8
472
Question Selected
Option
Comment Action Plan
Do you know if there is required information is
available in your organization to understand
the process activities?
For Incident Management, information could be
available in corporate social networks, knowledge
management systems, and help files or through
support staff to understand the process activities.
N The overall process is
“understood.” I don't think we
have proper documentation (at
least that's been shared to all
involved) detailing the process to
the degree that's being asked in
this survey, no.
Need to document and distribute
the standard.
Do you know if incidents are classified with an
appropriate priority?
L Sometimes identifying the root
cause, which is part of the
classification, is difficult even
though the required corrective
actions may be obvious.
Training.
Do you know if incidents are managed until they are
resolved and closed?
P If incidents are moved to an
engineering queue, the PO does
not follow up consistently on
these
Do you know if the status and progress of incidents
are communicated to interested parties as needed?
L It’s partly built into the ticketing
system; requestors can see
activity on the issue, but it is up
to agents to summarize the
activity in a concise form for
requestors for any state other
than “open, delayed, or closed”.
Automate communication.

Appendix D.1
473
Appendix D. Documentation related Process Guidelines
Appendix D.1. Email Communication of Process Guidelines

Appendix D.2
474
Appendix D.2. Incident Management Guidelines
An incident is an unplanned interruption to a service. An interruption to a service is a
reduction in quality below the agreed service levels. The purpose of Incident
Management is to restore service to the user. Incident Management can be measured
on the restoration of service.
Primary goal
The primary goal of the Incident Management process is to restore normal service
operation as quickly as possible and minimize the adverse impact on business
operations, thus ensuring that the best possible levels of service quality and availability
are maintained. ‘Normal service operation’ is defined here as service operation within
SLA limits (be it internal or external).
Process Definition:
Incident Management includes any event which disrupts, or which could disrupt a
service. This includes events which are communicated directly by users or Company
X staff through the Service Desk or through an interface from Event Management to
Incident Management tools.
Objectives - Provide a consistent process to track incidents that ensure:
Incidents are properly logged
Incidents are properly routed
Incident status is accurately reported
Queue of unresolved incidents is visible and reported
Incidents are properly prioritized and handled in the appropriate sequence
Resolution provided meets the requirements of the SLA for the customer
Definitions
Customer
A customer is someone who buys goods or Services. The Customer of an IT Service
Provider is the person utilizing the service purchased by the customer’s organization.
The term Customers is also sometimes informally used to mean Users, for example,
“Company X is a Customer focused Organization”.
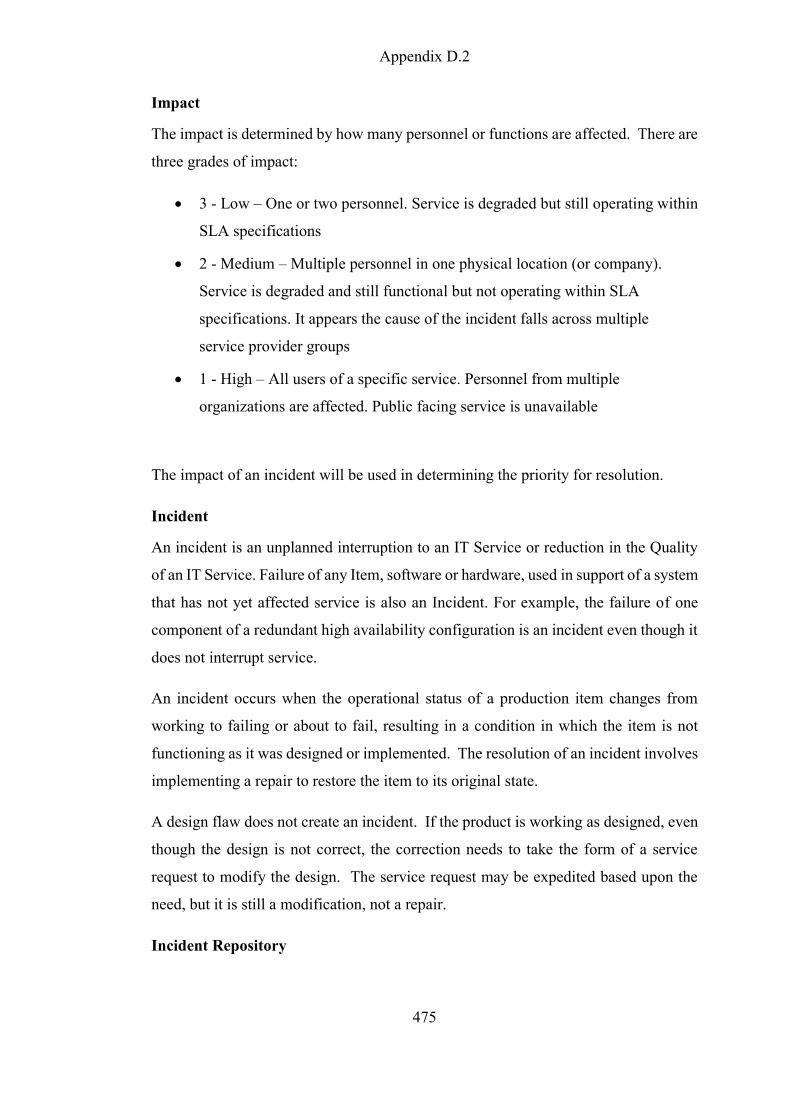
Appendix D.2
475
Impact
The impact is determined by how many personnel or functions are affected. There are
three grades of impact:
3 - Low – One or two personnel. Service is degraded but still operating within
SLA specifications
2 - Medium – Multiple personnel in one physical location (or company).
Service is degraded and still functional but not operating within SLA
specifications. It appears the cause of the incident falls across multiple
service provider groups
1 - High – All users of a specific service. Personnel from multiple
organizations are affected. Public facing service is unavailable
The impact of an incident will be used in determining the priority for resolution.
Incident
An incident is an unplanned interruption to an IT Service or reduction in the Quality
of an IT Service. Failure of any Item, software or hardware, used in support of a system
that has not yet affected service is also an Incident. For example, the failure of one
component of a redundant high availability configuration is an incident even though it
does not interrupt service.
An incident occurs when the operational status of a production item changes from
working to failing or about to fail, resulting in a condition in which the item is not
functioning as it was designed or implemented. The resolution of an incident involves
implementing a repair to restore the item to its original state.
A design flaw does not create an incident. If the product is working as designed, even
though the design is not correct, the correction needs to take the form of a service
request to modify the design. The service request may be expedited based upon the
need, but it is still a modification, not a repair.
Incident Repository

Appendix D.2
476
The Incident Repository is a database containing relevant information about all
Incidents whether they have been resolved or not. General status information along
with notes related to activity should also be maintained in a format that supports
standardized reporting. At Company X, the incident repository is currently contained
within Zendesk.
Priority
Priority is determined by utilizing a combination of the incident’s impact and severity.
For a full explanation of the determination of priority refer to the paragraph titled
Priority Determination.
Response
Time elapsed between the time the incident is reported and the time it is assigned to
an individual for resolution.
Resolution
Service is restored to a point where the customer can perform their job. In some cases,
this may only be a workaround solution until the root cause of the incident is identified
and corrected.
Service Agreement
A Service Agreement is a general agreement outlining services to be provided, as well
as costs of services and how they are to be billed. A service agreement may be initiated
between Company X and another entity. A service agreement is distinguished from a
Service Level Agreement in that there are no ongoing service level targets identified
in a Service Agreement.
Service Level Agreement
Often referred to as the SLA, the Service Level Agreement is the agreement between
Company X and the customer outlining services to be provided, and operational
support levels as well as costs of services and how they are to be billed.
Service Level Target
Service Level Target is a commitment that is documented in a Service Level
Agreement. Service Level Targets are based on Service Level Requirements and are
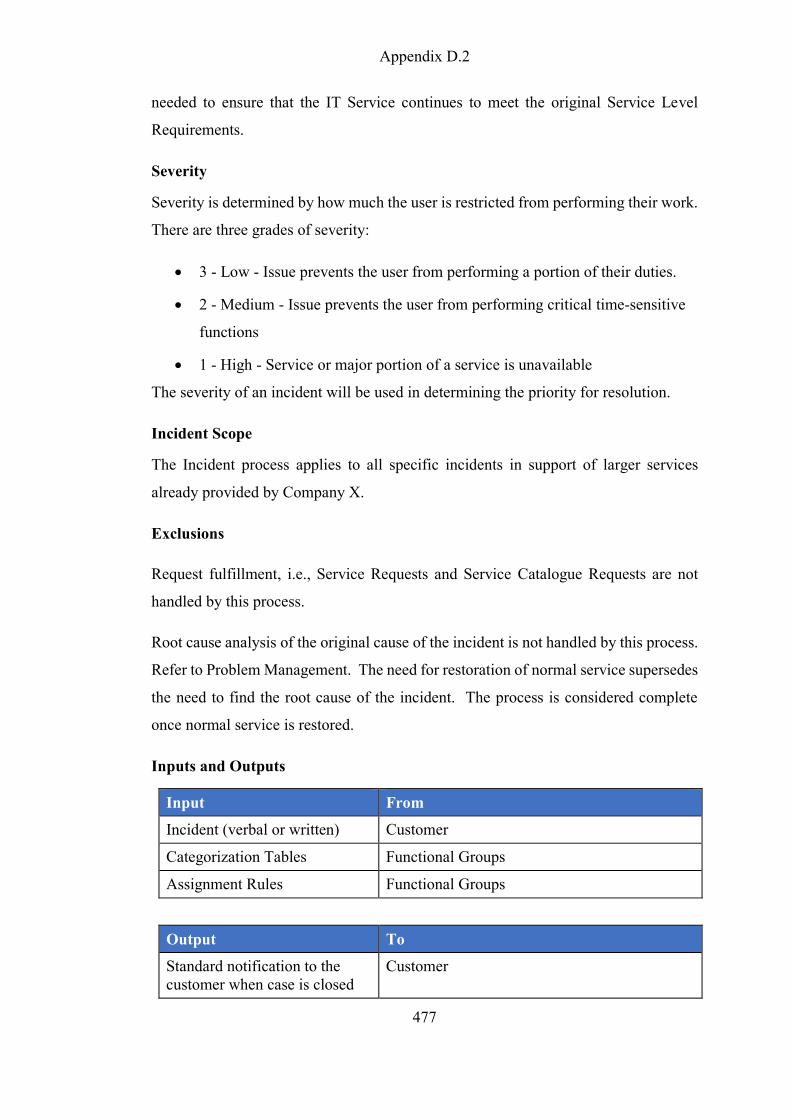
Appendix D.2
477
needed to ensure that the IT Service continues to meet the original Service Level
Requirements.
Severity
Severity is determined by how much the user is restricted from performing their work.
There are three grades of severity:
3 - Low - Issue prevents the user from performing a portion of their duties.
2 - Medium - Issue prevents the user from performing critical time-sensitive
functions
1 - High - Service or major portion of a service is unavailable
The severity of an incident will be used in determining the priority for resolution.
Incident Scope
The Incident process applies to all specific incidents in support of larger services
already provided by Company X.
Exclusions
Request fulfillment, i.e., Service Requests and Service Catalogue Requests are not
handled by this process.
Root cause analysis of the original cause of the incident is not handled by this process.
Refer to Problem Management. The need for restoration of normal service supersedes
the need to find the root cause of the incident. The process is considered complete
once normal service is restored.
Inputs and Outputs
Input From
Incident (verbal or written) Customer
Categorization Tables Functional Groups
Assignment Rules Functional Groups
Output To
Standard notification to the
customer when case is closed
Customer

Appendix D.2
478
Metrics
Roles and Responsibilities
Responsibilities may be delegated, but escalation does not remove responsibility from
the individual accountable for a specific action.
The following roles and responsibilities were defined:
Service Desk
Owns all reported incidents
Ensure that all incidents received by the Service Desk are recorded in Zendesk
Identify nature of incidents based on reported symptoms and categorization rules
supplied by provider groups
Prioritize incidents based on impact to the users and SLA guidelines
Responsible for incident closure
Delegates responsibility by assigning incidents to the appropriate provider group
for resolution based on the categorization rules
Performs post-resolution customer review to ensure that all work services are
functioning properly and all incident documentation is complete
Prepare reports showing statistics of Incidents resolved / unresolved
Service Provider Group
Composed of technical and functional staff involved in supporting services
Correct the issue or provide a workaround to the customer that will provide
functionality that approximates normal service as closely as possible.
Metric Purpose
Process tracking metrics
# of incidents by type, status, and
customer – see detail under Reports
and Meetings
To determine if incidents are being
processed in reasonable time frame,
frequency of specific types of incidents,
and determine where bottlenecks exist.

Appendix D.2
479
If an incident reoccurs or is likely to reoccur, notify problem management so that
root cause analysis can be performed and a standard workaround can be deployed
Incident Categorization, Target Times, Prioritization, and Escalation
In order to adequately determine if SLA’s are met, it will be necessary to correctly
categorize and prioritize incidents quickly.
Categorization
The goals of proper categorization are:
Identify Service impacted and appropriate SLA and escalation timelines
Indicate what support groups need to be involved
Provide meaningful metrics on system reliability
For each incident, the specific service (subtype) will be identified. It is critical to
establish with the user the specific area of the service being provided. Identifying the
service properly establishes the appropriate Service Level Agreement and relevant
Service Level Targets.
In addition, the severity and impact of the incident need to also be established. All
incidents are important to the user, but incidents that affect large groups of personnel
or mission-critical functions need to be addressed before those affecting 1 or 2 people.
Does the incident cause a work stoppage for the user or do they have other means of
performing their job? An example would be a broken link on a web page is an incident,
but if there is another navigation path to the desired page, the incident’s severity would
be low because the user can still perform the needed function.
The incident may create a work stoppage for only one person, but the impact is far
greater because it is a critical function.
Priority Determination
The priority given to an incident that will determine how quickly it is scheduled for
resolution will be set depending upon a combination of the incident severity and
impact.

Appendix D.2
480
Incident Priority Severity
3 - Low
Issue prevents the user
from performing a
portion of their duties.
2 - Medium
Issue prevents the user
from performing critical
time-sensitive functions
1 - High
Service or major
portion of a service is
unavailable
Imp
act
3 -
Low
One or two personnel
Degraded Service Levels but still processing
within SLA constraints 3 - Low 3 - Low 2 - Medium
2 -
Med
ium
Multiple personnel in one physical location
(or organization)
Degraded Service Levels but not processing
within SLA constraints or able to perform
only minimum level of service
It appears cause of incident falls across
multiple functional areas
2 - Medium 2 - Medium 1 - High
1 -
Hig
h
All users of a specific service
Personnel from multiple organizations are
affected
Public facing service is unavailable
Any item listed in the Crisis Response tables
1 - High 1 - High 1 - High

Appendix D.2
481
Target Times
Incident support for existing services is provided 24 hours per day, 5 1/2 days per
week, and 365 days per year. Following are the current targets for response and
resolution for incidents based upon priority.
Priority Target
Response Resolve
3 - Low 90% - 24 hours 90% - 7 days
2 - Medium 90% - 2 hours 90% - 4 hours
1 - High 95% - 15 minutes 90% - 2 hours
Process Flow
The following is the standard incident management process flow outlined in ITIL
Service Operation but represented as a swim lane chart with associated roles within
Company X.
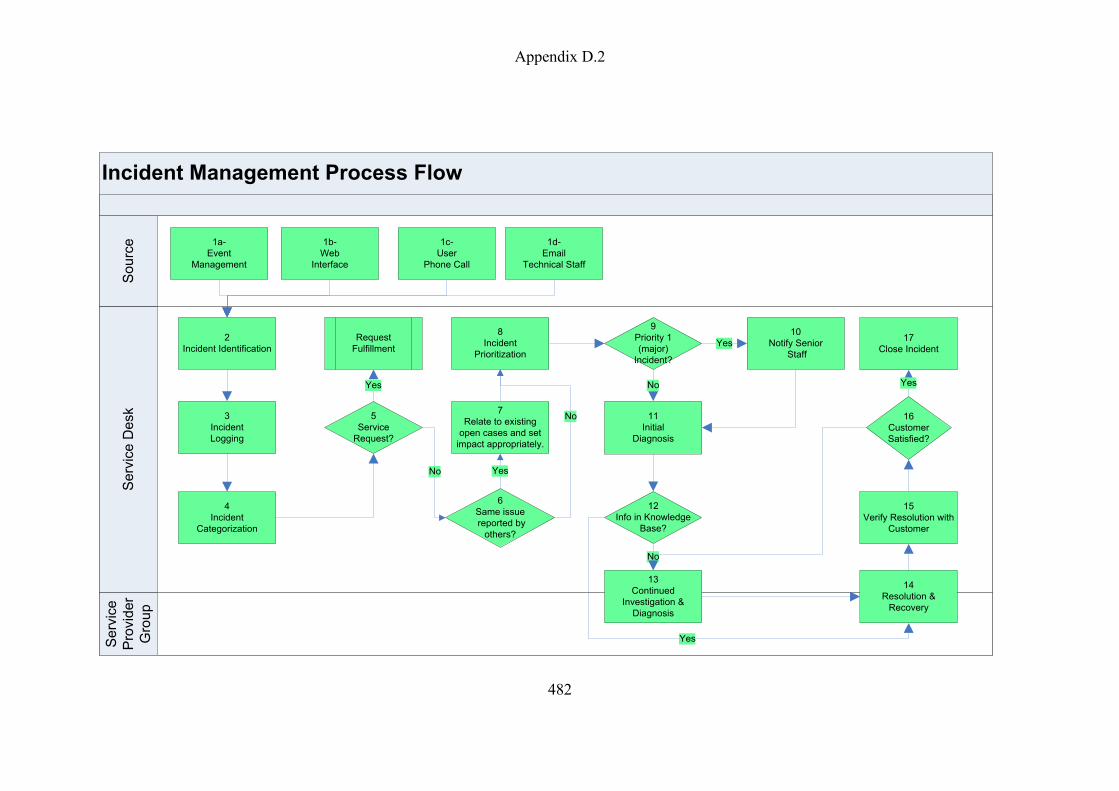
Appendix D.2
482
Incident Management Process Flow
Se
rvic
e
Pro
vid
er
Gro
up
Se
rvic
e D
esk
So
urc
e
No
No
No
Yes
Yes
Yes
15
Verify Resolution with
Customer
1d-
Technical Staff
Request
Fulfillment
5
Service
Request?
9
Priority 1
(major)
Incident?
2
Incident Identification
1c-
User
Phone Call
14
Resolution &
Recovery
11
Initial
Diagnosis
12
Info in Knowledge
Base?
1b-
Web
Interface
13
Continued
Investigation &
Diagnosis
8
Incident
Prioritization
3
Incident
Logging
1a-
Event
Management
4
Incident
Categorization
10
Notify Senior
Staff
17
Close Incident
16
Customer
Satisfied?
Yes
7
Relate to existing
open cases and set
impact appropriately.
6
Same issue
reported by
others?
No
Yes

Appendix D.2
483
Incident Management Process Flow Steps
Role Step Description
Requesting
Customer
1 Incidents can be reported by the customer or internal staff through various means, i.e., phone, email, or a self-
service web interface. Incidents may also be reported through the use of automated tools performing Event
Management.
Company X
Service
Desk
2 Incident identification
Work cannot begin on dealing with an incident until it is known that an incident has occurred. As far as
possible, all key components should be monitored so that failures or potential failures are detected early so that
the incident management process can be started quickly.
2 Incident logging
All incidents must be fully logged and date/time stamped, regardless of whether they are raised through a Service
Desk telephone call or whether automatically detected via an event alert. All relevant information relating to the
nature of the incident must be logged so that a full historical record is maintained – and so that if the incident has
to be referred to another support group (s), they will have all relevant information at hand to assist them.

Appendix D.2
484
Role Step Description
4 Incident categorization
All incidents will relate to one of the published services listed in the Service Catalogue. If the customer is calling
about an issue they have that is not related to one of the services in the catalogue, then it is not an incident.
5 Is this actually a Service Request incorrectly categorized as an incident? If so, update the case to reflect that it
is a Service Request and follow the appropriate Service Request process.
6 Has this issue already been reported by others?
7 If this is another person reporting the same issue, relate the issue to the cases already reported. More people
reporting the same issue means the impact of the issue is broader than what might have been reported at first.
The impact needs to be recorded based on current knowledge of the impact.
8 Incident prioritization
Before an incident priority can be set, the severity and impact need to be assessed. See paragraph 3.2 Incident
Prioritization. Once the severity and impact are set, the priority can be derived using the prescriptive table.
9 Is this a priority 1 (major) incident?

Appendix D.2
485
Role Step Description
10 If this is a priority 1 incident meaning that a service is unavailable in part or whole, all Senior Management at
Company X should be alerted to make certain any resources necessary to the resolution will be immediately made
available.
11 Initial diagnosis
If the incident has been routed via the Service Desk, the Service Desk analyst must carry out the initial diagnosis,
using diagnostic scripts and known error information to try to discover the full symptoms of the incident and to
determine exactly what has gone wrong. The Service Desk representative will utilize the collected information
on the symptoms and use that information to initiate a search of the Knowledge Base to find an appropriate
solution. If possible, the Service Desk Analyst will resolve the incident and close the incident if the resolution is
successful.
12 Is the necessary information in the Knowledge Base to resolve the incident? If not, the case should then be
assigned to the provider group that supports the service.
13 If the necessary information to resolve the incident is not in the Knowledge Base, the incident must be
immediately assigned to an appropriate provider group for further support. The assignee will then research the
issue to determine cause and remediation options.

Appendix D.2
486
Role Step Description
14 After a possible resolution has been determined either from the Knowledge Base or through research, attempt the
resolution.
15 Verify with the customer that the resolution was satisfactory and the customer is able to perform their work. An
incident resolution does not require that the underlying cause of the incident has been corrected. The resolution
only needs to make it possible for the customer to be able to continue their work.
16 If the customer is satisfied with the resolution, proceed to closure, otherwise, continue investigation and
diagnosis.

Appendix D.2
487
Role Step Description
Company X
Service
Desk
17 Incident Closure
The Service Desk should check that the incident is fully resolved and that the users are satisfied and willing to
agree the incident can be closed. The Service Desk should also check the following:
Closure categorization. Check and confirm that the initial incident categorization was correct or, where the
categorization subsequently turned out to be incorrect, update the record so that a correct closure categorization
is recorded for the incident – seeking advice or guidance from the resolving group(s) as necessary.
User satisfaction survey. Carry out a user satisfaction call-back or e-mail survey for the agreed percentage of
incidents.
Incident documentation. Chase any outstanding details and ensure that the Incident Record is fully documented
so that a full historical record at a sufficient level of detail is complete.
Ongoing or recurring problem? Determine (in conjunction with resolver groups) whether it is likely that the
incident could recur and decide whether any preventive action is necessary to avoid this. In conjunction with
Problem Management, raise a Problem Record in all such cases so that preventive action is initiated.
Formal closure. Formally close the Incident Record.

Appendix D.2
488
Incident Escalation
According to ITIL standards, although assignment may change, ownership of incidents
always resides with the Service Desk. As a result, the responsibility of ensuring that
an incident is escalated when appropriate also resides with the Service Desk.
The Service Desk will monitor all incidents, and escalate them based on the following
guidelines:
Priority Time Limit before Escalation
3 - Low 3 business days Manager
2 - Medium 4 hours Manager
If on-call contact cannot be reached during non-
business hours
Manager
If neither on-call contact or their manager cannot be
reached during non-business hours
Senior Mgt
48 hours Senior Mgt
1 - High Immediate Manager
Immediate Senior Mgt
Functional Escalation
When the Service Desk receives notification of an incident, they are to perform the
initial identification and diagnosis to classify the incident according to service category
and prioritization. If the incident is a known problem with a known solution, the
Service Desk will attempt a resolution. If it is not a known problem or if the attempted
solution fails, they will delegate responsibility for an incident to an appropriate
provider group.
Escalation Notifications:
Any time a case is escalated, notification will occur to various individuals or groups
depending upon the priority of the incident. Following are basic guidelines for
notifications:
The default mechanism for notification will be by email unless otherwise
explicitly stated.

Appendix D.2
489
Whenever escalation or notification by phone is indicated, all known numbers
for contact should be utilized, leaving voicemail on each until the person is
contacted.
Senior management notification will include VP, CEO, and all functional
managers. Escalation of a case does not remove the assignment from an
individual. It is up to the manager of the provider group to make certain the
right personnel are assigned. When additional personnel needs to be
involved, they may be added as interested parties.
Any time a case is escalated, the case will be updated to reflect the escalation
and the following notifications will be performed by the Service Desk:
o Customer will receive a standard escalation email informing them
of the escalation.
o Person to whom the case is currently assigned will be notified.
o Manager of the functional group to whom case is currently
assigned will be notified

Appendix D.2
490
Incident Escalation Process:
Escalation ProcessS
erv
ice
De
sk
No
No
Yes
Yes
8
Notify Provider Group
Manager
1
Examine Incident
Priority
2
Priority 1 (Major)
7
Priority 2
(Medium)
9
Off Hours?
No
3
Notify Senior
Management via
phone and email
Yes16
Monitor
11
Contact Provider
Group Manager
17
Resolved?
18
Notify all previously
notified parties
via email
Yes
Yes
No
5
Resolved?
4
Monitor
6
Notify Senior
Management via
phone and email
Finish
14
Time Limit to
Resolve Elapsed?
10
On Call Person
Available?
No
13
Notify Senior
Management via
12
Manager
Available?
15
Notify Provider Group
Manager
Yes
No

Appendix D.2
491
Incident Escalation Process Steps:
All escalation process steps are performed by the Service Desk. Some of the steps may be automated.
Step Description
1 Examine all open incidents and determine actions based upon incident priority.
2 Is this a priority 1 (high priority) incident?
3 If it is a high priority incident, immediately notify Company X senior management personnel. Senior management
personnel should be contacted by email and phone.
4 Monitor the status of the priority 1 incident providing informational updates to management at a minimum of every 4
hours.
5 Has the incident been resolved? If not continue to monitor.
6 If the incident has been resolved, notify Company X senior management of the resolution. Senior management should
be notified by email and phone.
7 Is this a priority 2 (medium priority) incident?
8 If so, notify the manager of the provider group performing the resolution. Notification should be by email.

Appendix D.2
492
Step Description
9 Has the incident occurred during business hours or off hours? If during business hours, proceed to step 14.
10 If the incident occurred during off-hours, is the on-call person available?
11 If the on-call person is not available, call the manager of the provider group assigned for resolution.
12 Is the manager of the provider group available?
13 If neither the provider group on-call person nor the manager of the provider group is available, notify senior management
via email and phone.
14 Has the time limit to resolve the incident elapsed?
15 If the time limit to resolve has elapsed, notify the manager of the provider group via email.
16 Continue to monitor the incident
17 Has the incident been resolved?
18 If the incident has been resolved notify the customer and all personnel previously contacted of the resolution.

Appendix D.2
493
RACI Chart
Obligation Role Description
Responsible Responsible for performing the assigned task
Accountable (only 1 person) Accountable to make certain work is assigned and performed
Consulted Consulted about how to perform the task appropriately
Informed Informed about key events regarding the task
Activity
Senior
Manager
Service
Provider
Manager
Service
Provider
Service
Desk
Company X
Service Desk
Manager
Record Incident in Zendesk R A
Accept Information from Customer R R R R A/R

Appendix D.2
494
Reports and Meetings
A critical component of success in meeting service level targets is for Company X
Trading Operations to hold itself accountable for deviations from acceptable
performance. This will be accomplished by producing meaningful reports that can be
utilized to focus on areas that need improvement. The reports must then be used in
coordinated activities aimed at improving the support.
Reports
Service Interruptions
A report showing all incidents related to service interruptions will be reviewed weekly
during the operational meeting. The purpose is to discover how serious the incident
was, what steps are being taken to prevent reoccurrence and if root cause needs to be
pursued.
Metrics
Metrics reports should generally be produced monthly with quarterly summaries.
Metrics to be reported are:
Total numbers of Incidents (as a control measure)
Breakdown of incidents at each stage (e.g., logged, work in progress, and
closed)
Size of current incident backlog
Number and percentage of major incidents
Mean elapsed time to achieve incident resolution or circumvention, broken
down by impact code
Percentage of incidents handled within agreed response time as defined by
SLA’s standards
Number of incidents reopened and as a percentage of the total
Number and percentage of incidents incorrectly assigned
Number and percentage of incidents incorrectly categorized

Appendix D.2
495
Percentage of Incidents closed by the Service Desk without reference to other
levels of support (often referred to as ‘first point of contact’)
Number and percentage the of incidents processed per Service Desk agent
Breakdown of incidents by time of day, to help pinpoint peaks and ensure
matching of resources.
Meetings
The Quality Assurance Manager will conduct sessions with each service provider
group to review performance reports. The goal of the sessions is to identify:
Processes that are working well and need to be reinforced.
Patterns related to incidents where support failed to meet targets
Reoccurring incidents where the underlying problem needs to be identified
and resolution activities are pursued
Identification of work around solutions that need to be developed until root
cause can be corrected
Incident Policy
The Incident process should be followed for all incidents covered by an
existing service agreement, regardless of whether the request is eventually
managed as a project or through the Incident process.
Support for or enhancement of existing services identified in existing Service
Agreements requires an Incident case to be opened.
If Company X already provides a service to a customer, but that customer
wants to significantly expand that service beyond the existing cost support
model in place, the request should be treated as a Service Catalogue Request
and forwarded to the Company X Service Desk.
Incidents should be prioritized based upon impact to the customer and the
availability of a workaround.
“Incident Ownership remains with the Service Desk! Regardless of where an
incident is referred to during its life, ownership of the incident remains with
the Service Desk at all times. The Service Desk remains responsible for

Appendix D.2
496
tracking progress, keeping users informed and ultimately for Incident
Closure.” – ITIL Service Operation
Rules for re-opening incidents - Despite all adequate care, there will be
occasions when incidents recur even though they have been formally closed.
If the incident recurs within one working day then it can be re-opened – but
that beyond this point a new incident must be raised, but linked to the
previous incident(s).
Work arounds should be in conformance with OSF ISD standards and
policies.

Appendix D.3
497
Appendix D.3. Problem Management Guidelines
Primary goal
Problem Management is the process responsible for managing the lifecycle of all
problems. The primary objectives of Problem Management are to:
prevent problems and resulting incidents from happening;
eliminate recurring incidents;
minimize the impact of incidents that cannot be prevented.
Process Definition
Problem Management includes the activities required to diagnose the root cause of
incidents and to determine the resolution to those problems. It is also responsible for
ensuring that the resolution is implemented through the appropriate control
procedures.
Objectives
Provide a consistent process to track Problems that ensures:
Problems are properly logged
Problems are properly routed
Problem status is accurately reported
Queue of unresolved Problems is visible and reported
Problems are properly prioritized and handled in the appropriate sequence
Resolution provided meets the requirements of the SLA for the customer
Definitions
Impact
The impact is determined by how many personnel or functions are affected. There are
three grades of impact:
3 - Low – One or two personnel. Service is degraded but still operating
within SLA specifications

Appendix D.3
498
2 - Medium – Multiple personnel in one physical location (or
organization). Service is degraded and still functional but not operating
within SLA specifications. It appears the cause of the Problem falls
across multiple service provider groups
1 - High – All users of a specific service. Personnel from multiple
organizations are affected. Public facing service is unavailable
The impact of the incidents associated with a problem will be used in determining the
priority for resolution.
Incident
An incident is an unplanned interruption to an IT Service or reduction in the Quality
of an IT Service. Failure of any Item, software or hardware, used in support of a system
that has not yet affected service is also an Incident. For example, the failure of one
component of a redundant high availability configuration is an incident even though it
does not interrupt service.
An incident occurs when the operational status of a production item changes from
working to failing or about to fail, resulting in a condition in which the item is not
functioning as it was designed or implemented. The resolution of an incident involves
implementing a repair to restore the item to its original state.
A design flaw does not create an incident. If the product is working as designed, even
though the design is not correct, the correction needs to take the form of a service
request to modify the design. The service request may be expedited based upon the
need, but it is still a modification, not a repair.
Known Error Record
An entry in Zendesk which includes the symptoms related to open problems and the
incidents the problem is known to create. If available, the entry will also have a link
to entries in the Knowledge Base which show potential workarounds to the problem.
Knowledge Base

Appendix D.3
499
A database housed within Zendesk that contains information on how to fulfill requests
and resolve incidents using previously proven methods / scripts.
Problem
A problem is the underlying cause of an incident.
Problem Repository
The Problem Repository is a database containing relevant information about all
problems whether they have been resolved or not. General status information along
with notes related to activity should also be maintained in a format that supports
standardized reporting. At Company X, the Problem Repository is contained within
Zendesk and Jira.
Priority
Priority is determined by utilizing a combination of the problem’s impact and severity.
For a full explanation of the determination of priority refer to the paragraph titled
Priority Determination.
Response
Time elapsed between the time the problem is reported and the time it is assigned to
an individual for resolution.
Resolution
The root cause of incidents is corrected so that the related incidents do not continue to
occur.
Service Agreement
A Service Agreement is a general agreement outlining services to be provided, as well
as costs of services and how they are to be billed. A service agreement may be initiated
between Company X and another entity. A service agreement is distinguished from a
Service Level Agreement in that there are no ongoing service level targets identified
in a Service Agreement.

Appendix D.3
500
Service Level Agreement
Often referred to as the SLA, the Service Level Agreement is the agreement between
Company X and the customer outlining services to be provided, and operational
support levels as well as costs of services and how they are to be billed.
Service Level Target
Service Level Target is a commitment that is documented in a Service Level
Agreement. Service Level Targets are based on Service Level Requirements, and are
needed to ensure that the IT Service continues to meet the original Service Level
Requirements. Service Level Targets are relevant in that they are tied to Incidents
and Assistance Service Requests. There are no targets tied to Problem Management.
Severity
Severity is determined by how much the user is restricted from performing their work.
There are three grades of severity:
3 - Low - Issue prevents the user from performing a portion of their duties.
2 - Medium - Issue prevents the user from performing critical time-sensitive functions
1 - High - Service or major portion of a service is unavailable
The severity of a problem will be used in determining the priority for resolution.
Problem Scope
Problem Management includes the activities required to diagnose the root cause of
incidents and to determine the resolution to those problems. It is also responsible for
ensuring that the resolution is implemented through the appropriate control
procedures, especially Change Management and Release Management.
Problem Management will also maintain information about problems and the
appropriate workarounds and resolutions so that the organization is able to reduce the
number and impact of incidents over time. In this respect, Problem Management has a
strong interface with Knowledge Management, and tools such as the Known Error
Database will be used for both.

Appendix D.3
501
Although Incident and Problem Management are separate processes, they are closely
related and will typically use the same tools, and use the same categorization, impact
and priority coding systems. This will ensure effective communication when dealing
with related incidents and problems.
Exclusions
Request fulfillment, i.e., Service Requests and Service Catalogue Requests are not
handled by this process.
Initial incident handling to restore service is not handled by this process. Refer to
Incident Management.
Inputs and Outputs
Input From
Problem Service Desk, Problem Management Team,
Service Provider Group
Categorization Tables Functional Groups
Assignment Rules Functional Groups
Output To
Standard notification to the
problem reporter and QA when
case is closed
Problem Reporter, QA Manager
Metrics
Metric Purpose
Process tracking metrics
# of Problems by type, status, and
customer – see detail under
To determine if problems are being
processed in reasonable time frame,
frequency of specific types of problems, and

Appendix D.3
502
Roles and Responsibilities
Responsibilities may be delegated, but escalation does not remove responsibility from
the individual accountable for a specific action.
Service Desk
Ensure that all problems received by the Service Desk are recorded in Zendesk
Delegates responsibility by assigning problems to the appropriate provider group
for resolution based on the categorization rules
Performs post-resolution customer review to ensure that all work services are
functioning properly
Quality Assurance
Owns all reported problems
Identify nature of problems based on reported symptoms and categorization rules
supplied by provider groups
Prioritize problems based upon impact to the users and SLA guidelines
Responsible for problem closure
Prepare reports showing statistics of problems resolved / unresolved
Service Provider Group
Composed of technical and functional staff involved in supporting services
Perform root cause analysis of the problem and develop potential solutions
Test potential solutions and develop implementation plan
Problem Reporter
Anyone within Company X can request a problem case to be opened.
The typical sources of problems are the Service Desk, Service Provider Groups,
and proactive problem management through Quality Assurance.
Reports and Meetings determine where bottlenecks exist.

Appendix D.3
503
Problem Management Review Team
This may be multiple teams depending upon the service supported
Composed of technical and functional staff involved in supporting services,
Service Desk, and Quality Assurance
Problem Categorization, Target Times, Prioritization, and Escalation
In order to adequately determine if SLA’s are met, it will be necessary to correctly
categorize and prioritize problems quickly.
Categorization
The goals of proper categorization are:
Identify Service impacted
Associate problems with related incidents
Indicate what support groups need to be involved
Provide meaningful metrics on system reliability
For each problem, the specific service (as listed in the published Service Catalogue)
will be identified. It is critical to establish with the user the specific area of the service
being provided. Identifying the service properly establishes the appropriate Service
Level Agreement and relevant Service Level Targets.
In addition, the severity and impact of the problem need to also be established. All
problems are important to the user, but problems that affect large groups of personnel
or mission-critical functions need to be addressed before those affecting 1 or 2 people.
Does the problem cause a work stoppage for the user or do they have other means of
performing their job? An example would be a broken link on a web page is an incident,
but if there is another navigation path to the desired page, the incident’s severity would
be low because the user can still perform the needed function.
The problem may create a work stoppage for only one person, but the impact is far
greater because it is a critical function.

Appendix D.3
504
Priority Determination
The priority given to a problem that will determine how quickly it is scheduled for resolution will be set depending upon a combination of the
related incidents’ severity and impact.
Problem Priority Severity
3 - Low
Issue prevents the user
from performing a
portion of their duties.
2 - Medium
Issue prevents the user
from performing critical
time-sensitive functions
1 - High
Service or major
portion of a service is
unavailable
Imp
act
3 -
Low
One or two personnel
Degraded Service Levels but still processing
within SLA constraints 3 - Low 3 - Low 2 - Medium
2 -
Med
ium
Multiple personnel in one physical location
Degraded Service Levels but not processing
within SLA constraints or able to perform only
minimum level of service
It appears cause of incident falls across
multiple functional areas
2 - Medium 2 - Medium 1 - High
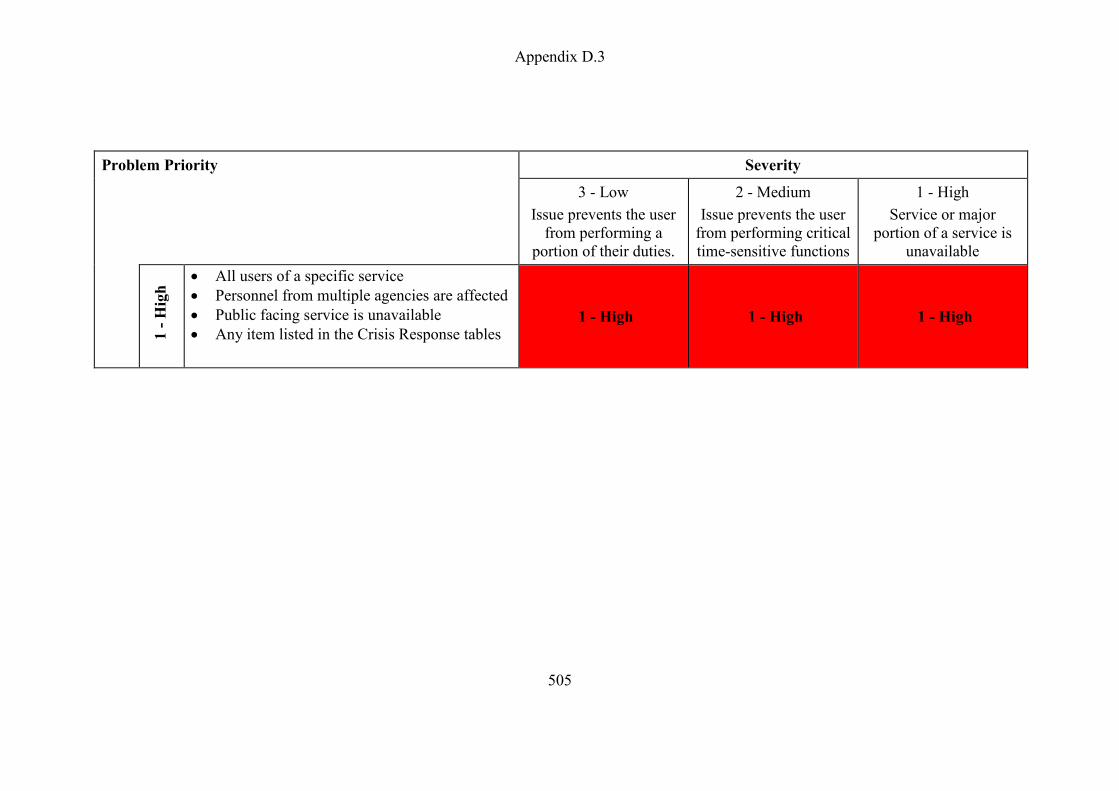
Appendix D.3
505
Problem Priority Severity
3 - Low
Issue prevents the user
from performing a
portion of their duties.
2 - Medium
Issue prevents the user
from performing critical
time-sensitive functions
1 - High
Service or major
portion of a service is
unavailable
1 -
Hig
h All users of a specific service
Personnel from multiple agencies are affected
Public facing service is unavailable
Any item listed in the Crisis Response tables 1 - High 1 - High 1 - High
Appendix D.3
506
Workarounds
In some cases, it may be possible to find a workaround to the incidents caused by the
problem – a temporary way of overcoming the difficulties.
In some cases, the workaround may be instructions provided to the customer on how
to complete their work using an alternate method. These workarounds need to be
communicated to the Service Desk so they can be added to the Knowledge Base and
therefore be accessible by the Service Desk to facilitate resolution during future
recurrences of the incident.
In cases where a workaround is found, it is important that the problem record remains
open and details of the workaround are always documented within the Problem
Record.
Known Error Record
As soon as the diagnosis is far enough along to clearly identify the problem and its
symptoms, and particularly where a workaround has been found (even though it may
not yet be a permanent resolution), a Known Error Record must be raised and placed
in the Known Error tables within Zendesk or other repository – so that if further
incidents or problems arise, they can be identified, and the service restored more
quickly.
However, in some cases it may be advantageous to raise a Known Error Record even
earlier in the overall process – just for information purposes, for example – even
though the diagnosis may not be complete or a workaround found.
The known error record must contain all known symptoms so that when a new incident
occurs, a search of known errors can be performed and find the appropriate match.
Major Problem Review
Each major (priority 1) problem will be reviewed on an ad-hoc basis to determine
progress made and what assistance may be needed. The review will include:
Which configuration items failed
Specifics about the failure

Appendix D.3
507
Efforts toward root cause analysis are being taken
Solutions are being considered
Time frame to implement solution
What could be done better in the future to identify the issue for earlier
correction
How to prevent recurrence
Whether there has been any third-party responsibility and whether follow-
up actions are needed.
Any lessons learned will be documented in appropriate procedures, work instructions,
diagnostic scripts or Known Error Records. The Problem Manager (Quality Assurance
Manager) facilitates the session and documents any agreed actions.
Process Flow
The following is the standard problem management process flow outlined in ITIL
Service Operation but represented as a swim lane chart with associated roles within
Company X.

Appendix D.3
508
Problem Management Process FlowS
olu
tion
Pro
vid
er
Gro
up
Pro
ble
m M
an
ag
em
en
t
Re
vie
w T
ea
m
Pro
ble
m
Re
po
rte
r
Yes
7
Work
Around?
4
Categorization
1c
Proactive Problem
Management
1a
Service Desk
1b
Service Provider
Group
2
Problem Detection
3
Problem Logging
5
Prioritization
6
Investigation &
Diagnosis
8
Create Known
Error Record
Known Error
Database
9
Solution?
10
Resolution
12
Closure
End
11
Change
Management
No
13
Major
Problem
Review

Appendix D.3
509
Problem Management Process Flow Steps
Role Step Description
Problem Reporter 1 Problems can be reported by any group within Company X that has the opportunity to recognize a
situation that is likely to create incidents. The Service Desk or the Service Provider Group may
recognize there is a problem because of multiple related incidents. Quality Assurance or other
groups may do trend analysis to identify potential recurring issues.
Problem
Management
Review Team
2 Problem detection
It is likely that multiple ways of detecting problems will exist in all organizations. These will include:
Suspicion or detection of an unknown cause of one or more incidents by the Service Desk,
resulting in a Problem Record being raised – the desk may have resolved the incident but has not
determined a definitive cause and suspects that it is likely to recur, so will raise a Problem Record
to allow the underlying cause to be resolved. Alternatively, it may be immediately obvious from
the outset that an incident, or incidents, has been caused by a major problem, so a Problem
Record will be raised without delay.
Analysis of an incident by a technical support group which reveals that an underlying problem
exists, or is likely to exist.
Automated detection of an infrastructure or application fault, using event/alert tools
automatically to raise an incident which may reveal the need for a Problem Record.
Analysis of incidents as part of proactive Problem Management – resulting in the need to raise a
Problem Record so that the underlying fault can be investigated further.

Appendix D.3
510
Role Step Description
Problem
Management
Review Team
3 Problem Logging
Regardless of the detection method, all the relevant details of the problem must be recorded so that
a full historical record exists. This must be date and time stamped to allow suitable control and
escalation.
A cross-reference must be made to the incident(s) which initiated the Problem Record – and all
relevant details must be copied from the Incident Record(s) to the Problem Record. It is difficult to
be exact, as cases may vary, but typically this will include details such as:
User details
Service details
Date/time initially logged
Priority and categorization details
Incident description
Details of all diagnostic or attempted recovery actions taken.
4 Problem Categorization
Problems must be categorized in the same way as incidents using the same codes so that the true
nature of the problem can be easily tied to the supported service and related incidents.

Appendix D.3
511
Role Step Description
5 Problem Prioritization
Problems must be prioritized in the same way and for the same reasons as incidents – but the
frequency and impact of related incidents must also be taken into account. Before a problem priority
can be set, the severity and impact need to be assessed. See paragraph 3.2 Incident Prioritization.
Once the severity and impact are set, the priority can be derived using the prescriptive table.
Solution Provider
Group
6 Problem Investigation and Diagnosis
An investigation should be conducted to try to diagnose the root cause of the problem – the speed
and nature of this investigation will vary depending upon the priority.
7 Workarounds
In some cases, it may be possible to find a workaround to the incidents caused by the problem – a
temporary way of overcoming the difficulties. In cases where a workaround is found, it is
important that the problem record remains open, and details of the workaround are always
documented within the Problem Record.
8 Raising a Known Error Record
As soon as the diagnosis has progressed enough to know what the problem is even though the cause
may not yet be identified, a Known Error Record must be raised and placed in the Known Error
Database – so that if further incidents arise, they can be identified and related to the problem record.
9 Has the root cause been determined and a solution identified?

Appendix D.3
512
Role Step Description
10 Problem resolution
As soon as a solution has been found and sufficiently tested, it should be fully documented and
prepared for implementation.
Problem
Management
Review Team /
Change
Management /
Solution Provider
Group
11 Changes to production to implement the solution need to be scheduled and approved through the
Change Management process.
Problem
Management
Review Team
12 Problem Closure
When any change has been completed (and successfully reviewed), and the resolution has been
applied, the Problem Record should be formally closed – as should any related Incident Records that
are still open. A check should be performed at this time to ensure that the record contains a full
historical description of all events – and if not, the record should be updated.
The status of any related Known Error Record should be updated to shown that the resolution has
been applied.
Service Provider
Group Managers
& VP
13 Weekly review of the status of open major (priority 1) problems (See Paragraph 3.5 Major Problem
Review)

Appendix D.3
513
RACI Chart
Obligation Role Description
Responsible Responsible for performing the assigned task
Accountable (only 1 person) Accountable to make certain work is assigned and performed
Consulted Consulted about how to perform the task appropriately
Informed Informed about key events regarding the task
Activity Service Desk
Service Desk
Manager
Service Provider
Group
Service Provider
Group Manager
QA
Manager
Record Problem in Zendesk R A I I C
Categorize problem according to service and
priority C I R A I
Perform Root Cause Analysis I R A I
Develop Solution I I R A I
Document conditions for known problem record I I R A I
Create known problem record R A C I I
Document workaround solution I I R A I
Enter workaround solutions into knowledge base R A C I I
Update Zendesk with current status on problem
analysis & resolution I I R A I
Verify solution with customer R A C C I

Appendix D.3
514
Reports and Meetings
A critical component of success in meeting service level targets is for Company X Trading
Operations to hold itself accountable for deviations from acceptable performance. This
will be accomplished by producing meaning reports that can be utilized to focus on areas
that need improvement. The reports must then be used in coordinated activities aimed at
improving the support.
Reports
Service Interruptions
A report showing all problems related to service interruptions will be reviewed weekly
during the operational meeting. The purpose is to discover how serious the problem was,
what steps are being taken to prevent reoccurrence and if root cause needs to be pursued.
Metrics
Metrics reports should generally be produced monthly with quarterly summaries. Metrics
to be reported are:
Total numbers of problems (as a control measure)
Breakdown of problems at each stage (e.g., logged, work in progress, and
closed.)
Size of current problem backlog
Number and percentage of major problems
Meetings
The Quality Assurance Manager will conduct sessions with each service provider group
to review performance reports. The goal of the sessions is to identify:
Status of previously identified problems
Identification of work around solutions that need to be developed until root cause
can be corrected
Discussion of newly identified problems
Problem Policy
The Problem process should be followed to find and correct the root cause of
significant or recurring incidents.
Problems should be prioritized based on impact to the customer and the
availability of a workaround.
Problem Ownership remains with Quality Assurance! Regardless of where a
problem is referred to during its life, ownership of the problem remains with the

Appendix D.3
515
Quality Assurance at all times. Quality Assurance remains responsible for
tracking progress, keeping users informed and ultimately for Problem Closure.
Rules for re-opening problems - Despite all adequate care, there will be
occasions when problems recur even though they have been formally closed. If
the related incidents continue to occur under the same conditions, the problem
case should be re-opened. If similar incidents occur, but the conditions are not
the same, a new problem should be opened.
Workarounds should be in conformance with Company X standards and policies.

Appendix D.4
516
Appendix D.4. Change Management Guidelines
The purpose of the change management process is to ensure that:
• Standardized methods and procedures are used for efficient and prompt handling of
all changes
• Business risk is managed and minimized
• All authorized changes support business needs and goals
Changes should be managed to:
• Reduce risk exposure
• Minimize the severity of any impact and disruption
• Be successful on the first attempt
Benefits of Change Management
Risk Reduction
Change Management minimizes the risk of introducing harmful changes into the
production environment.
Service Quality Improvement
The proper assessment of the impact of changes prevents unscheduled service outages.
This increases service quality. Change records allow for continuous process
improvement and facilitate the resolution of issues related to change.
Cost Reduction
Effective change management reduces rework and backouts.
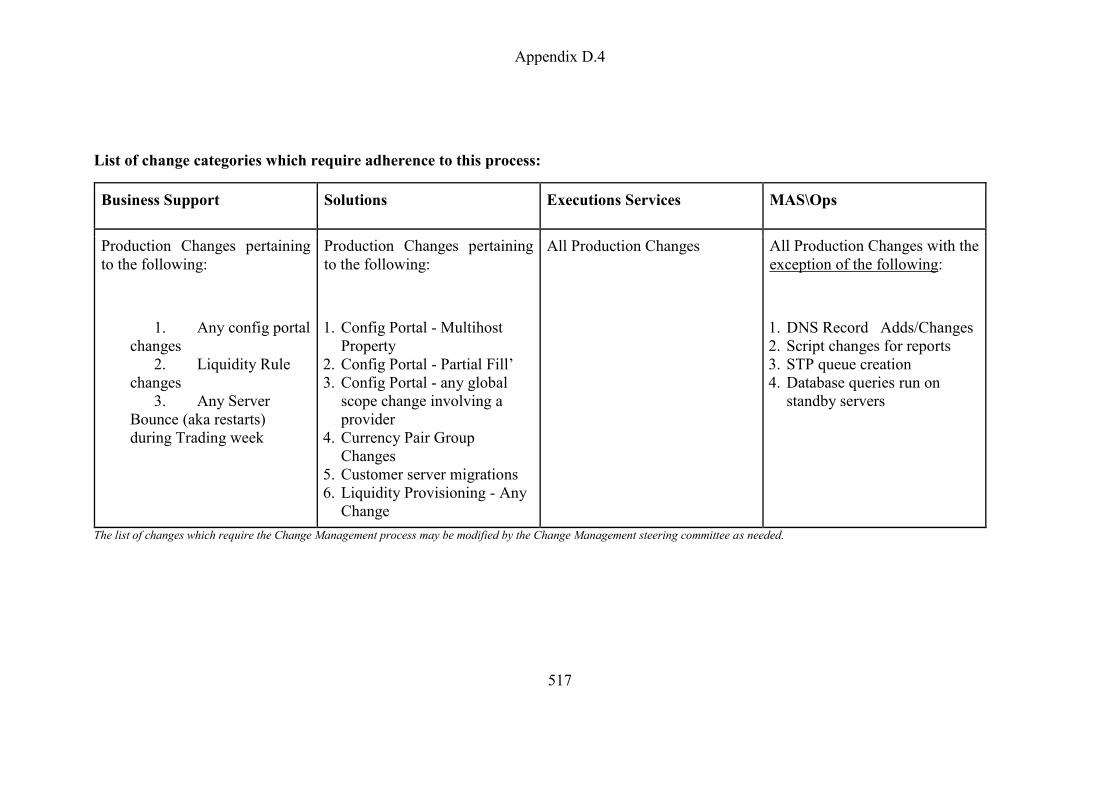
Appendix D.4
517
List of change categories which require adherence to this process:
Business Support Solutions Executions Services MAS\Ops
Production Changes pertaining
to the following:
1. Any config portal
changes
2. Liquidity Rule
changes
3. Any Server
Bounce (aka restarts)
during Trading week
Production Changes pertaining
to the following:
1. Config Portal - Multihost
Property
2. Config Portal - Partial Fill’
3. Config Portal - any global
scope change involving a
provider
4. Currency Pair Group
Changes
5. Customer server migrations
6. Liquidity Provisioning - Any
Change
All Production Changes All Production Changes with the
exception of the following:
1. DNS Record Adds/Changes
2. Script changes for reports
3. STP queue creation
4. Database queries run on
standby servers
The list of changes which require the Change Management process may be modified by the Change Management steering committee as needed.

Appendix D.4
518

Appendix D.4
519
Change Management Process:
1. An RFC (Request for Change) triggers the process. RFC’s are raised and
submitted by the person making the change (hereinafter referred to as “change
implementer”.)
2. The RFC answers a set of predefined questions which help teams analyze
proposed changes and plan for successful implementation.
3. The RFC becomes a change record that tracks the change through the
process.
4. All RFC’s should be associated with an existing Zendesk ticket.
5. RFC’s are created on an existing ticket by using the Zendesk Macro “Change
Control”. This macro populates the ticket with a private comment containing the
RFC questions. described in further detail in the Submit a Request For Change
section of this document.
6. After the RFC is completed, the change implementer needs to set the Change
Control Status to Submitted.
7. Submitting an RFC triggers a notification email to be sent to the change
implementer’s authorized approver group.
8. The Change Approvers are comprised of managers of Business Support,
Operations, Solutions, and Execution Services.
9. Change approvers will review submitted RFC’s for completeness and
adequate documentation of change steps, validation plans, and rollback steps. The
change approver reviewing the RFC has the right to reject the RFC, which sends it
back to the ticket assignee to modify the RFC as needed.
10. To approve the RFC, the Change Approver needs to set the Change Control
Status to Approved. Upon saving the ticket with the approved status, notification
emails are sent to both the change implementer, as well as the Change Management
steering committee.
11. The notification to the steering committee allows managers from other global
support groups to be aware of changes being made by other groups. Members of the
change management steering committee may raise objections or questions to the
approved changes by commenting on the ticket directly.
12. Upon receiving the approval, the change implementer is authorized to
proceed with implementation of the changes per the steps and schedule defined in the

Appendix D.4
520
RFC. Any deviation from the RFC will require modification to the RFC and
submission for re-evaluation.
13. After implementation of the changes, the change implementer is responsible
for setting the Change Control status field to Completed. This ends the workflow of
change management
The 4 steps of Distributed Change Management
1. Submit Request for Change (RFC)
2. Evaluate and Approve RFC
3. Implement the change and Complete RFC
4. Post Implementation Review in Change Management Steering
Committee
1) Submit a Request for Change (RFC)
The change implementer is ultimately responsible for completing the RFC form and
having the necessary evaluations done prior to the RFC being reviewed.
RFC Questions Instructions
Describe the change being made Brief summary explaining the proposed
changes and the business need for the
changes
Who requested the change?
(Customer, Product Owner, eStaff
member, ...)
If Customer, list the name(s) of the
requester. If applicable, list FXI OrgID of
the customer. If request is being made
internally, list the person’s name
Which individual(s) are
implementing the changes?
List all people involved in implementing the
changes.
List the configuration items
involved with the change (orgs,
servers, config portal properties,
network devices)
i.e., Admin Portal, Config Portal. Which
Org namespace(s) involved in changed? If
physical infrastructure, list device name,
hostname, IP address.
What is the impact if this change? Explain how this change impacts the
functionality of the system\application

Appendix D.4
521
RFC Questions Instructions
being changed
List the specific steps taken to make
this change
All steps involved in this change MUST be
listed.
Scheduled date and time of change Date and time when this change should be
implemented. Make note If the change can
only be implemented outside of trading
hours.
Who will be affected? Impact to
customers? How many customers
impacted?
Who reviewed this change before it
is implemented
Changes should be reviewed by a peer or
manager to ensure the implementation steps
are correct
What is the checkout plan? (How
will the change be validated for
success?)
List, in detail, how this change will be
validated once the change is implemented
Does this change require validation
by the customer? If so, how?
For changes that have significant impact to
the customer(s), we should ask the customer
to validate that the changes they are
requesting have been implemented
successfully, without any negative impact.
How to roll back the change List the steps needed to successfully
rollback to the state immediately prior to
making the changes.
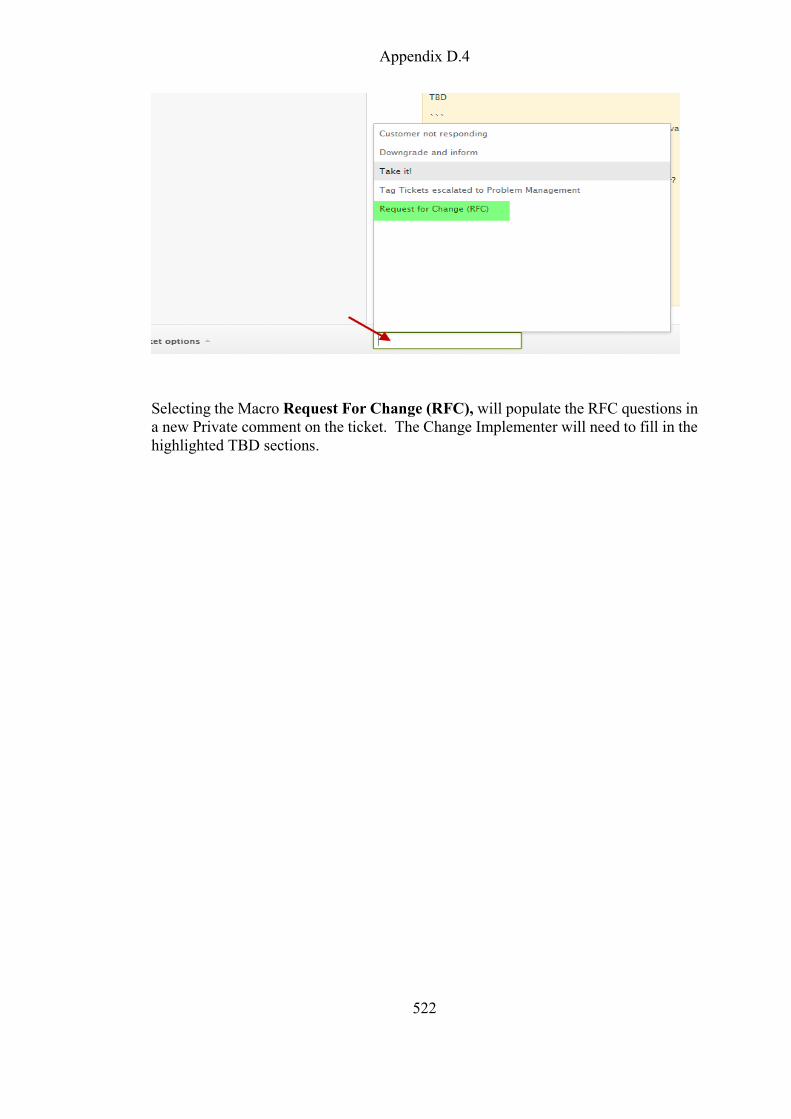
Appendix D.4
522
Selecting the Macro Request For Change (RFC), will populate the RFC questions in
a new Private comment on the ticket. The Change Implementer will need to fill in the
highlighted TBD sections.

Appendix D.4
523

Appendix D.4
524
2) Evaluate and Approve RFC
● There is a need for reviewers within each group to review and
approve RFC’s
● Reviewers are designated from each group making the change or a
part of the change
● Zendesk RFC case to be updated as appropriate based on review
● When the Zendesk RFC case is approved, Zendesk will send an email
to cross-functional Change Management Steering Committee. The members of
this group can respond with any issues or concerns they have with the change
prior to that change being implemented.
● RFC States:
● Submitted
○ Change Request has been submitted for review.
● Approved
○ Change is approved, go ahead and make the change at
the requested date / time.
● Rejected
○ Change is rejected either for inadequate information in
the RFC or the proposed plan is flawed.
○ If changes to scope, validation, backout plan, etc., are
required the Zendesk RFC must be updated to reflect those changes.
It is imperative the RFC be an accurate reflection of the change and
the plan for that change.
● Completed
○ Changes have been implemented. Setting the change
control status to completed signals completion of the change control
process.
Authorized Change Approvers for each Group:

Appendix D.4
525
Business Support Solutions Executions Services MAS\Ops
● BS1
● BS2
● BS3
● S1
● S2
● S3
● ES1
● OPS1
● OPS2
● OPS3
3) Complete RFC
● Approved RFC’s where an attempt to implement was made will be
reviewed in the next applicable Change Management Steering Committee
meeting.
● It is the Change Implementer’s responsibility to update the ticket’s
Change Control Status to “Completed” once the changes have been implemented.
4) Post Implementation Review in Change Management Steering Committee
● A weekly review of changes made:
● What went well?
● What didn’t go well?
● Anything learned?
● Membership
● Primary members must designate a secondary when they cannot
attend
● Chair:
● Schedules and facilitates the weekly Change Management Steering
Committee meetings
● Presents the list of RFC’s to be reviewed (changes made since the last
meeting)
● Takes notes and action items. Follows up on outstanding action items.
● Maintains change reporting (out of Zendesk)
○ Publishes the list of changes made since the last meeting
Emergency Change Model

Appendix D.4
526
● For changes that must be implemented immediately, change
requesters still must create an RFC case in Zendesk.
● The requestor must announce this emergency change to group
reviewers explaining why the change cannot wait to be reviewed and approved
before it is implemented.
● Group reviewers to review RFC post-implementation.
Change categories
● Normal = changes that must be reviewed by group reviewers
● Standard = Self-approved and may with the consent of group
reviewers be removed from change management process.
● Emergency = changes that must be implemented ASAP to resolve a
major incident. These go through the emergency change process
Synopsis
● We are taking this distributed review and approval to accommodate
the rapid rate at which teams need to make changes to the production
environment.
● This distributed model provides standards to enable a disciplined
approach to make changes to the production environment. It requires change
requestors to think through the changes they are making.
● The fields in the Zendesk RFC case form are designed to facilitate
thinking through a change, asking change requestors to detail implementation,
validation, and back out steps as well as assess risk and potential impact.
● Group reviewers are ultimately accountable for ensuring change
requestors are thoughtful and careful with the changes they are making.
● We do recommend all changes (normal, standard, emergency) be
logged as an RFC case in Zendesk to provide a log of all changes made to the
production environment.
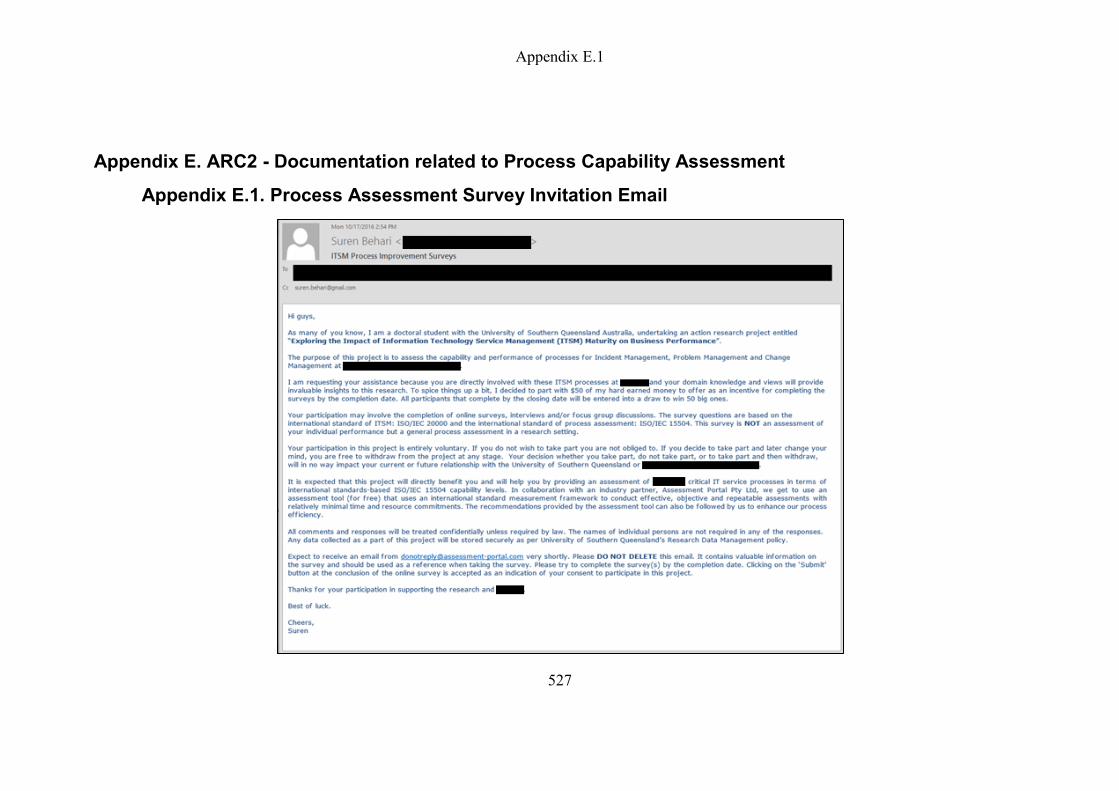
Appendix E.1
527
Appendix E. ARC2 - Documentation related to Process Capability Assessment
Appendix E.1. Process Assessment Survey Invitation Email

Appendix E.2
528
Appendix E.2. Auto-generated survey invitation email

Appendix E.3
529
Appendix E.3. Auto-generated survey reminder email

Appendix E.4
530
Appendix E.4. Thank you email

Appendix E.5
531
Appendix E.5. Focus Group Invitation Email

Appendix F
532
Appendix F. ITSM3 Spreadsheet Model
Appendix F.1. Operational Metrics
Appendix F.2. Key Performance Indicators

Appendix F
533
Appendix F.3. Critical Success Factors
Appendix F.4. Business Risks

Appendix G
534
Appendix G. Research Timeline
Research Activity
Research Methodology Coursework Mar-2014 Oct-2014
Literature Review Mar-2015 Dec-2017
Proposal Development Mar-2015 May-2015
Proposal Submission and Revision Jun-2015 Jun-2015
Confirmation of Candidature Presentation Jul-2015 Jul-2015
Ethics Approval Oct-2015 Oct-2015
Action
Research
Phase
KISMET Phase & Activity Start Date End Date
Diagnose
Action Research Cycle 1 KISMET Phase 1: Create a process improvement
infrastructure
23-Feb-2015 31-Oct-2015
Project Kickoff 23-Feb-2015 23-Feb-2015
Meeting to review current state of ITSM processes 27-Feb-2015 27-Feb-2015
Strategic planning meeting to establish CSFs 28-Feb-2015 2-Mar-2015
Selection and Deployment of ITSM Software Tools 1-Mar-2015 30-Apr-2015
Migration of data from SugarCRM and Bugzilla to
Zendesk and Jira
1-May-2015 31-Jul-2015
Set up Performance Metrics 1-Aug-2015 31-Oct-2015
KISMET Phase 2: Assess process capability and
performance
10-Nov-2015 29-Feb-2016
Process assessment preparation 10-Nov-2015 12-Nov-2015
Process assessment data collection 16-Nov-2015 30-Nov-2015
Analysis of process capability assessment report 1-Dec-2015 9-Dec-2015
Focus group workshop 13-Jan-2016 13-Jan-2016
Financial measurement 1-Feb-2016 29-Feb-2016
Process performance assessment 1-Feb-2016 29-Feb-2016
Action Research Cycle 2
KISMET Phase 1: Create a process improvement
infrastructure
1-Oct-2016 30-Nov-2016
Meeting to identify process assessment survey
participants
1-Oct-2016 1-Oct-2016
Strategic planning meeting to review CSFs 10-Oct-2016 10-Oct-2016
KISMET Phase 2: Assess process capability and
performance
17-Oct-2016 29-Feb-2016
Process assessment preparation 17-Oct-2016 17-Oct-2016
Process assessment data collection 17-Oct-2016 14-Nov-2016
Analysis of process capability assessment report 15-Nov-2016 31-Dec-2016
Financial measurement 1-Jan-2017 31-Jan-2017
Process performance assessment 1-Feb-2017 02/29/2017
Focus group workshop 21-Mar-2017 21-Mar-2017

Appendix G
535
Plan
Action Research Cycle 1
KISMET Phase 3: Plan process improvement action 22-Feb-2016 27-Feb-2016
Interviews/Meetings to discuss process improvement
action
22-Feb-2016 27-Feb-2016
Action Research Cycle 2
KISMET Phase 3: Plan process improvement action 3-Apr-2017 21-Apr-2017
Interviews/Meetings to discuss process improvement
action
3-Apr-2017 21-Apr-2017
Take
Action
Action Research Cycle 1
KISMET Phase 4: Design process improvement
guidelines
1-Mar-2016 23-Mar-2016
Development of process guidelines 1-Mar-2016 23-Mar-2016
KISMET Phase 5: Execute the process
improvement plan
1-May-2016 31-Oct-2016
Execute on improvement plan 1-May-2016 31-Oct-2016
Action Research Cycle 2
KISMET Phase 4: Design process improvement
guidelines
24-Apr-2017 30-Apr-2017
Development of process guidelines 24-Apr-2017 30-Apr-2017
KISMET Phase 5: Execute the process
improvement plan
1-May-2016 31-Oct-2016
Execute on improvement plan 1-May-2016 31-Oct-2016
Evaluate
Action
Action Research Cycle 1 KISMET Phase 6: Evaluate process improvement 1-Nov-2016 30-Nov-2016
Evaluate the outcomes of the process improvement
program
1-Nov-2016 30-Nov-2016
Action Research Cycle 2
KISMET Phase 6: Evaluate process improvement 1-Nov-2017 30-Nov-2017
Evaluate the outcomes of the process improvement
program
1-Nov-2017 30-Nov-2017
Reflect
Action Research Cycle 1 KISMET Phase 7: Continual service improvement 1-Dec-2016 31-Dec-2016
Conduct process reviews and report process
improvement ideas
1-Dec-2016 31-Dec-2016
Action Research Cycle 2 KISMET Phase 7: Continual service improvement 1-Oct-2016 31-Dec-2017
Conduct process reviews and report process
improvement ideas
1-Oct-2016 31-Dec-2017