issues in measuring knowledge: the contribution of r\u0026d and ict to growth
TRANSCRIPT
1
Issues in Measuring Knowledge:
The Contribution of R&D and ICT to Growth#*
by
Jacques Mairesse (CREST-INSEE and NBER)
and
Yusuf Kocoglu (Université de la Méditéranée)
Document de Travail CEDERS May, 2005
DRAFT VERSION - COMMENTS MOST WELCOME
Abstract: The paper discusses the evaluation of R&D’s contribution to growth within the
standard growth accounting framework. It does so in parallel (and contrast) with the
evaluation of ICT’s contribution to growth, by considering three illustrative variants,
differing mainly in their assumptions about spillovers and quality adjustment. This
measurement exercise is performed for aggregate data from the United States and France
over the last twenty years. It raises some major problems of evaluation and interpretation.
# A first version of this paper has been presented to the OECD Conference “On the Measurement of
Non-Financial Assets”, Voorburg (Netherlands), 15-17 April 2003; to the 28th Conference of
International Association for Research in Income and Wealth, Cork (Ireland) 22-28 August, 2004. it
has been revised for presentation at the National Academies Conference on “Advancing Knowledge
and the Knowledge Economy”, Washington(USA), 10-11 January 2005, and at the Conference on
Research on Income and Wealth, Cambridgen NBRE Summer Institute, 25-26 July 2005.
We are thankful to G. Cette, J. Bournay, C. Corrado, B. Fraumeni, D. Guellec, B. H. Hall, J. Magniez and A. Wykoff for their discussion and useful comments. We are also thankful to B. H. Hall for helping us in rewriting the December 2004 version of the CEDERS WP.
This paper is posted on the following website: www.ceders.org;
* CEDERS, Université de la Méditerranée, Marseille, [email protected];
** CREST-INSEE, Paris and NBER, [email protected]
2
OUTLINE
I. INTRODUCTION....................................................................................................................................... 3
II. THREE CONCEPTUAL VARIANTS ...................................................................................................... 5
1. GROWTH ACCOUNTING FRAMEWORK: A SHORT REMINDER.......................................................................5
2. CAPITAL, CAPITAL SERVICES AND USER COST OF CAPITAL ......................................................................6
3. THE NET RATE OF RETURN.........................................................................................................................7
3.a Conceptual Issues ...........................................................................................................................7
3.b Measurement Issues and Calibration .............................................................................................8
4. THE DEPRECIATION RATE..........................................................................................................................9
4.a Conceptual Issues ...........................................................................................................................9
4.b Measurement Issues and Calibration ...........................................................................................10
5. THE PRICE AND QUALITY ADJUSTMENT.................................................................................................11
5.a Conceptual Issues .........................................................................................................................11
5.b Measurement Issues and Calibration ...........................................................................................13
6. SUMMARY OF THE THREE CONCEPTUAL VARIANTS................................................................................15
III. R&D AND ICT CONTRIBUTION TO GROWTH IN THE US AND FRANCE .......................... 18
1. INVESTMENT IN R&D AND ICT: VALUE, PRICE AND QUANTITY .............................................................18
2. R&D AND ICT CAPITAL STOCKS............................................................................................................19
3. USER COST OF CAPITAL AND SHARE OF CAPITAL SERVICES...................................................................20
4. THE CONTRIBUTION OF R&D AND ICT CAPITAL TO GROWTH................................................................21
IV. CONCLUSION..................................................................................................................................... 26
V. APPENDIX................................................................................................................................................ 28
VI. BIBLIOGRAPHY ................................................................................................................................ 36
VII. ADDITIONAL TABLES ..................................................................................................................... 40

3
I. Introduction
Innovation and technical change have long been considered by economists as major sources
of long term economic growth and productivity. The recent developments in endogenous
growth theories have significantly contributed in building more explicit links between the
previous theoretical models where technological progress was more in the nature of “manna
from heaven” and the many empirical case studies and econometric analyses showing that
this progress was largely due to research and innovation and to education and training. The
problems and puzzles, however, are particularly numerous in trying to assess precisely the
contribution of research and innovation activities to growth and productivity (see for example
Griliches, 1988 "The Productivity Puzzle and R&D: Another Non-explanation" and 1994
"Productivity, R&D, and the Data Constraint").
Many of these problems are related to major measurement difficulties and uncertainties. In
particular, largely because of the integration of research and production activities within
firms and the relatively limited extent of technological markets, there is an important lack of
direct information on research and innovation outputs. And quantitative studies are mainly
left with a measure of Research and Development (R&D) expenditures, which covers an
important, yet limited part of innovative activities expenditures, and is basically an input
measure. Moreover, for other practical reasons and accounting considerations, but
inappropriately from the strict point of view of economic analysis, the present system of
national accounts (SNA) in most countries does not treat R&D expenditures as being an
investment.1 As a consequence, the contribution of R&D capital services is often ignored in
standard accounting studies of growth and implicitly subsumed in the residual or Total Factor
Productivity (TFP) as conventionally estimated.
In this study, we adopt the framework of traditional growth accounting and its main
assumptions, but propose, as an exercise in measurement, to estimate R&D capital and its
contribution to growth under different hypotheses or “conceptual variants”. We thus try to
assess the impact of important characteristics of R&D as an investment on its estimated
contribution and the incidence of major uncertainties in our knowledge about them. We do
this exercise both for France and the United States (USA), in the interest of the comparison
1See however Fraumeni, Barbara M. and Sumiye Okubo (2004).
4
but also as a good way to sharpen our understanding of the results. We also extend our
exercise to the measurement of capital in Information and Communication Technologies
(ICT) and its contribution to growth in the two countries. The comparison with ICT is
particularly interesting because business expenditures on investment in R&D and ICT are of
roughly similar orders of magnitude in the two countries (about 1% to 2% of GDP in France
and 3% to 4% of GDP in the USA, during the 1990’s), and because the impressive revival of
growth and productivity of the “New economy”, especially in the USA, has been largely
imputed to ICT, both through standard capital-deepening effects in the ICT-using industries
and through “direct” impacts on TFP in the ICT-producing industries (see, for example,
amidst a burgeoning literature: Oliner-Sichel [2000, 2002], Jorgenson-Stiroh [2000],
Jorgenson [2001] for the USA; Cette-Mairesse-Kocoglu [2000, 2002] for France; Colecchia-
Schreyer [2001], Pilat-Lee [2001] for many OECD countries). Even more deeply, the
comparison is relevant since some of the important factual and conceptual uncertainties that
concern our knowledge of R&D characteristics as an investment also affect the measurement
and understanding of ICT investment. Moreover, as we shall see, there is an essential trade
off between the contribution to growth and productivity imputed to ICT and that which can
be imputed to R&D: the more is ascribed to ICT, the less to R&D, and conversely. This is
basically a matter of interpretation and understanding, but one which should not be forgotten,
especially when tempted to draw policy recommendations from necessary and useful, but
largely conventional, growth accounting estimations.
In the next section of the paper, we discuss the most important conceptual and measurement
difficulties that bear directly on the estimated R&D and ICT contributions to growth in a
standard growth accounting analysis. In this section, we also explain our choice of three main
“conceptual variants” in the estimation of R&D and ICT capital services and their
contributions to growth, and why these variants can be viewed as alternative as well as
complementary. In the last section, we present in detail and comment the corresponding
estimates for the business sector over the period 1980-2002 for France and the USA. We then
briefly summarize and conclude.

5
II. Three Conceptual Variants
1. Growth accounting framework: a short reminder
Our results here focus on the respective magnitude of R&D and ICT contributions to growth
and we do not consider the contributions to growth of other types of investments, either
tangible (in equipments and structures) or intangible nor those due to disaggregation of labor
into different types, and hence that of TFP (the residual).2 Our results are based on the usual
growth accounting methodology and its main economic assumptions.
The growth accounting framework assumes that output (denoted Q) is obtained through
production by the combination of capital (K), labor force (L) and technological progress
(often referred to as Total Factor Productivity TFP or A). It is usually assumed that this
technological progress is exogenous to the economy ("a manna from heaven") and freely
available to all firms:
( , ) Q A F K L= (1)
Differentiating equation (1) with respect to time gives us the growth rate of output relative to
the growth rate of each input and the growth of TFP (equation (2)). The growth accounting
framework expresses the growth of output as a weighted sum of the growth of capital, labor
and total factor productivity (A), where the weights (α and β) are the share of each input in
the output (see Hulten, 2000 for a review):
Q jii j
i ji j
LKQ A
Q A K Lα β
∆∆∆ ∆= + +∑ ∑ (2)
where Q denotes output, Ki the ith type of capital stock, Lj the jth component of the labor
force, and A Total Factor Productivity.
Because the shares of each input in producing output are not directly observable,
approximations must be used. The usual neoclassical assumption, that the weight on each
input is given by its marginal productivity or its marginal cost, is often adopted. According to
this methodology the marginal contribution of capital is given by the user cost of capital
multiplied by the share of capital stock in the output. Note that most conventional growth
2 See Corrado-Hulten-Sichel, 2002, for an “expanded framework for measuring capital and technology” in which an exhaustive list of nine categories of tangible and intangible assets are defined and for which the authors have worked out series of estimates at the business sector level for the USA.
6
accounting studies assume constant returns to scale and estimate the growth of TFP as a
residual. However, in this paper, we do not assume constant returns to scale.
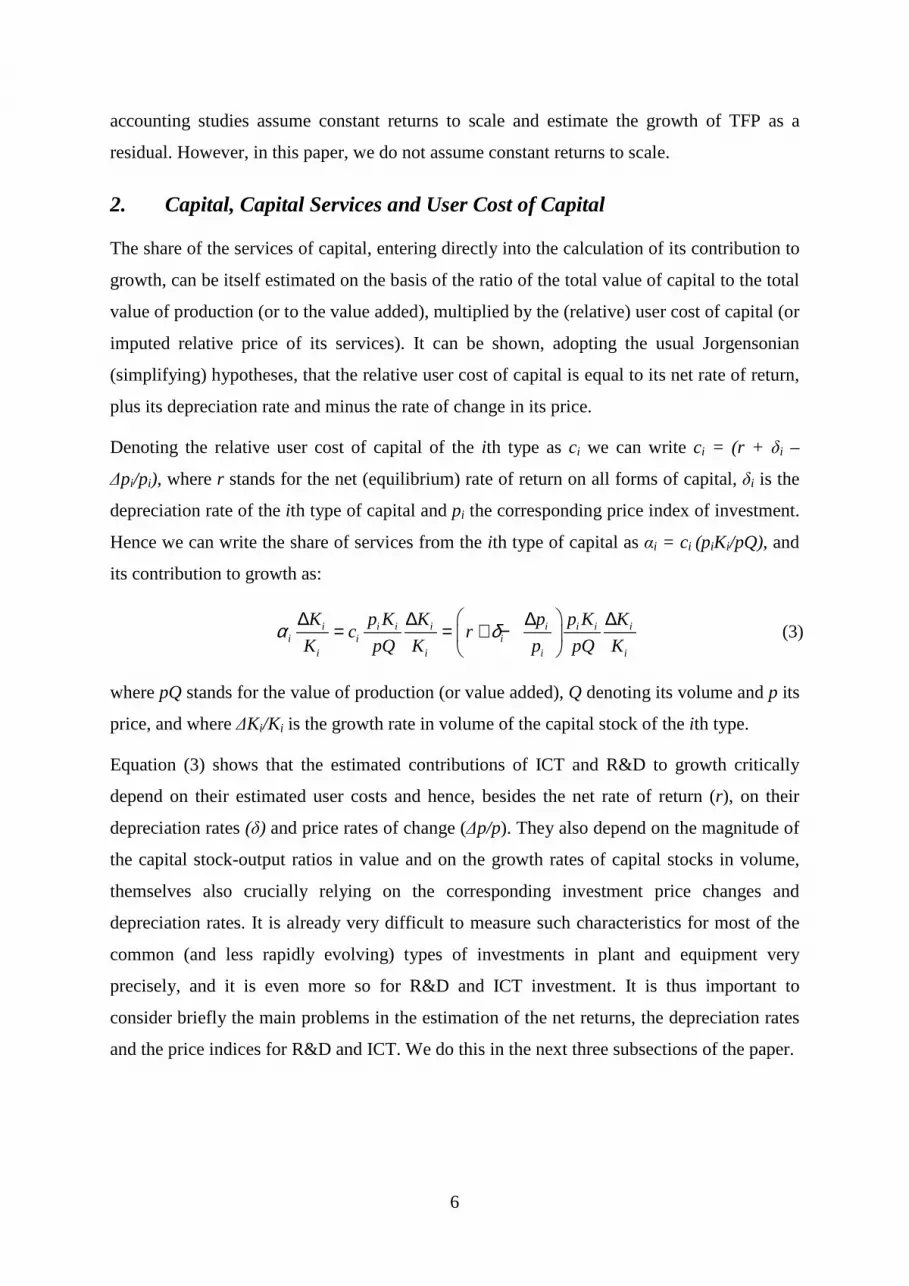
2. Capital, Capital Services and User Cost of Capital
The share of the services of capital, entering directly into the calculation of its contribution to
growth, can be itself estimated on the basis of the ratio of the total value of capital to the total
value of production (or to the value added), multiplied by the (relative) user cost of capital (or
imputed relative price of its services). It can be shown, adopting the usual Jorgensonian
(simplifying) hypotheses, that the relative user cost of capital is equal to its net rate of return,
plus its depreciation rate and minus the rate of change in its price.
Denoting the relative user cost of capital of the ith type as ci we can write ci = (r + δi –
∆pi/pi), where r stands for the net (equilibrium) rate of return on all forms of capital, δi is the
depreciation rate of the ith type of capital and pi the corresponding price index of investment.
Hence we can write the share of services from the ith type of capital as αi = ci (piKi/pQ), and
its contribution to growth as:
i i i i i i i ii i i
i i i i
K p K K p p K Kc r
K pQ K p pQ Kα δ
∆ ∆ ∆ ∆= = + −
(3)
where pQ stands for the value of production (or value added), Q denoting its volume and p its
price, and where ∆Ki/Ki is the growth rate in volume of the capital stock of the ith type.
Equation (3) shows that the estimated contributions of ICT and R&D to growth critically
depend on their estimated user costs and hence, besides the net rate of return (r), on their
depreciation rates (δ) and price rates of change (∆p/p). They also depend on the magnitude of
the capital stock-output ratios in value and on the growth rates of capital stocks in volume,
themselves also crucially relying on the corresponding investment price changes and
depreciation rates. It is already very difficult to measure such characteristics for most of the
common (and less rapidly evolving) types of investments in plant and equipment very
precisely, and it is even more so for R&D and ICT investment. It is thus important to
consider briefly the main problems in the estimation of the net returns, the depreciation rates
and the price indices for R&D and ICT. We do this in the next three subsections of the paper.

7
3. The net rate of return
3.a Conceptual Issues
There are essentially two approaches to estimating the net rate of return to capital, either
external or internal. The external approach uses an exogenous value from the market interest
rate, perhaps adjusted for risk. The logic behind this is that theoretically the net rate of return
of all types of investment should correspond to the risk-adjusted nominal interest rate because
the firm compares the financial cost (opportunity and borrowing costs) of this investment to
its predicted benefits. Therefore, in equilibrium the interest rate is equal to the net rate of
return. With the internal approach, the rate of return to capital is calculated to ensure constant
returns to scale given the depreciation rate of capital, the capital gains (price evolution of
capital) and labor compensation.3 The internal approach is therefore consistent with the
growth accounting framework under the constant returns to scale assumption. Because this
paper focuses only on the contributions of ICT and R&D capital to growth it is not possible
to use an internal rate of return and the external approach is therefore used.
The net rate of return considered above is the private net rate of return reflecting the profits
received by the owner of capital. At the economy-wide level, this is the correct measure of
the benefits from capital when there is no externality which is associated to its use in
production. When there are externalities, it is more accurate to consider the social rate of
return which includes the benefits that spillover to other agents in the economy. What are
these externalities from R&D? -- generally speaking they are classed in two groups (see
Griliches [1994 and 1995]).
The first group is pecuniary or financial externalities: they are is due to the fact that users can
buy a product with higher quality at the same price or buy an equivalent product at a lower
price. These kinds of financial externalities come directly from the results of R&D activities.
The second group of externalities (nonpecuniary) relates to the diffusion of knowledge,
which is the main input and output of R&D activity. Knowledge has to some extent the same
characteristics than a public good, in that it can be used simultaneously by many researchers.
Moreover, the cost of knowledge diffusion is very low compare to its production cost and this
fact favors diffusion to the community of researchers. Since current innovations are based on
3 See OECD (2001) for more detailed presentation.

8
past innovations that are often freely or cheaply available, R&D investment creates a social
benefit for subsequent innovators.
Thus innovators cannot capture all the benefits generated by their innovation. Typically
patent systems grant innovators a temporary monopoly on the use of their invention. But this
protection is limited in time and the system does not stop the diffusion of knowledge to other
researchers, on the contrary it is designed to encourage it. For Arrow (1962), the output of
R&D are like information more broadly and is therefore difficult to appropriate fully. This
limitation on the ability of innovators to capture all the benefits of an innovation creates
social benefits, implying that the social rate of return to R&D may be higher than the private
rate of return.
To take account of our uncertainty about the appropriate level for this rate of return to R&D
capital we propose two alternatives in the following: 1) the market interest rate with no R&D
externality, that is, a private rate of return; and 2) a social rate of return to R&D capital that is
higher than the private rate of return.
3.b Measurement Issues and Calibration
As mentioned in the previous section, with the external approach to measuring the rate of
return, the net private rate of return to capital should equal the nominal interest rate (possibly
plus a risk adjustment). For the period of the study (1980-2000) we used the average long-
term interest rate of 10%, which is slightly higher than that observed, which was
approximately 9% in France.
Because of externalities of research activities it is assumed that the social return to R&D
investment is higher than the private. But by how much? Despite a growing number of
econometric studies, estimates of the importance of externalities remain very imprecise and
highly uncertain. Being very high, they lend credence to the idea of gross social returns (net
social returns plus the depreciation rate) to R&D that would be at least double, and often
three or more times the private one.4 Despite measurement and methodological difficulties,
one can summarize the econometric estimates for gross private and social rate of returns to
R&D capital as being on average between 20 to 30 percent for private returns and from 30 to
80 percent for social returns (Fraumeni and Okubo [2004]).
4 See notably the study by Griliches (1992) and by Mairesse and Mohnen (1996 and 1999).

9
The assumption adopted here is that the gross social rate of return is double the gross private
return of 25%. So the assumed social rate of return to R&D capital is 50%, which is the same
as that used by Fraumeni and Okubo (2002) for the U.S. economy.
4. The depreciation rate
4.a Conceptual Issues
The evaluation of investment as a factor of production implies evaluation of the capital stock
resulting from its accumulation, since it is in this form (or, to be more exact, in the form of
the services provided by this capital) that it contributes to growth. The stock of intangible
assets like R&D is generally obtained by cumulating investment flows using the declining
balance method, which is also the most widely used method by national accounts statisticians
to measure capital stock. It consists of simulating the process of capital accumulation using
knowledge of the series for past investment, and specifying rules for the rates of
decommissioning and depreciation.
The depreciation of R&D is assumed to be due to obsolescence of knowledge since new
R&D activities destroy the older ones, as in Schumpeter. The choice of depreciation pattern
for R&D stocks is generally based on an arbitrary decision and does not come from empirical
observation. Furthermore, it may not be appropriate to use the same depreciation pattern or
rate for each kind of R&D activity.5 One can also speculate that depreciation varies across the
three conventional categories of R&D: “basic” or pure scientific inquiry; “applied,” directed
towards a specific need or application; and “development”. It is conjectured that the
depreciation rate of the development activities is higher than that of applied research which is
in turn higher than that for basic research.
Two additional points could be also considered with respect to the depreciation of R&D. First
should one take into account the increased importance of ICT relative to other industries, as
did Fraumeni and Okubo (2002)? Because the evolution of technological change is more
rapid in ICT producing sectors, the obsolescence of innovation in ICT is also more rapid, and
that implies that the depreciation R&D in that sector could be also more rapid. Second, it is
likely that the social rate of depreciation is in fact much lower than the private, which
captures the decline in the ability to earn private returns from a particular piece of knowledge.
5 See Rosa and Rose (2004) and Rose and Lonmo (2003) for examples about debates on the rate of obsolescence for R&D capital. See also Hall (2007) for empirical estimates of private rates of obsolescence.

10
Because the social rate of return of R&D activities is higher than private one, it is also
reasonable to think that the social depreciation rate of R&D activities is lower than the
private one. One innovation could indeed continue to have some social benefits especially for
imitators and for buyers even if the benefits to the innovator have ceased.
We therefore propose two alternatives to measure the depreciation rate of R&D capital. The
first alternative treats R&D capital as private capital and uses a private depreciation rate. The
second alternative treats R&D capital as social and uses a social depreciation rate. The
assumption made here is that the social depreciation rate of R&D capital is lower than its
private depreciation rate.
4.b Measurement Issues and Calibration
The literature on the R&D capital depreciation rate is not very abundant (See Rosa and Rose
[2004] for a review). Two methods are used to estimate the depreciation rate of R&D capital.
The first one is based on econometric estimations of production functions where R&D is
included as an input along with tangible capital (see Nadiri and Prucha [1993] for example).
Identification of precise lag structures is difficult due to the relative smoothness of the R&D
series. The second method, simplest and the most popular, is based on the perpetual inventory
method (declining balance method) and more or less arbitrarily fixed depreciation rate.6 In
this case the depreciation rate used is usually between 10% and 20% (most often 15%).
There is some discussion in the literature about the measurement or R&D depreciation and
how it varies according to the nature of industrial activities: for example the knowledge used
in an industry with rapid technological progress, such as computers, should have a higher
depreciation rate than knowledge used in an industry with slower technological progress such
as mining).7 Although this discussion is important and interesting for the capitalization of
6 The assumption of a geometric series for decommissioning (mortality) at a constant rate δ is the usual one adopted by American national accounts statisticians (as well as by Jorgenson and Stiroh, 2000, and Oliner and Sichel, 2000). It has the advantage of enabling the stock of capital to be calculated by a simple recursive method and hence, in particular, to facilitate the calculation of variants. The volume of capital Kj,t+1 for good j, at the beginning of year t+1 (and the end of year t) is equal to the capital (Kjt) at the beginning of year t increased by the volume of investment (I jt) in year t, and diminished by the decommissioning (δjKj1), giving the usual declining balance formula: Kj,t+1 = (1-δj)Kjt + I jt. This assumption, however, means that the decommissioning of capital does not depend on its age and the notion of gross capital is then blurred with that of net capital (and the notion of decommissioning with that of depreciation). The results relating to the medium- and long-term evolutions in capital that are of importance to us here are relatively similar, as we have verified, to those obtained using decommissioning rules of the log-normal type used in the French national accounts (cf. notably Mairesse, 1971 and Mairesse, 1972).
7 See Rose and Lonmo [2004] for a summarized review.
11
R&D (especially from National Accounts perspective), this is not the main focus of the
present paper but represent an interesting point for future development (see Hall, 2007).
Therefore, our starting point here for the depreciation of R&D capital is the simplest method.
That is we use the declining balance method to construct R&D capital stock with a fixed
depreciation rate of 15%.
There is essentially no literature on the value of the social depreciation rate. However, as we
discussed above, the social depreciation rate is expected to be lower than private. To be as
realistic as possible we took the lower bound of the range of depreciation rates of R&D
capital estimated in the literature, 10%.
The chronological method with a constant annual geometrical depreciation rate is also used to
obtain the stock of capital in ICT. Generally, ICT equipment is divided into three
components: Computers and peripherals, Communication equipment, and Software. For each
component a capital stock is calculated with a specific depreciation rate. For example
Mairesse, Cette and Kocoglu [2002] use a 30% depreciation rate for IT equipment and
software and 15% for communication equipment. These high rates seem realistic and are in
general consistent with those implicitly used for the French national accounts. They are also
close to those used in the United States national accounts. But in this paper, in order to
simplify and without a large impact on the results, we use aggregate investment in ICT and
the depreciation rate is the weighted average depreciation rate of the above three components,
that is, 24%.8 We do not consider any social benefits from the use of ICT so the social
depreciation rate is the same than the private.
5. The Price and Quality Adjustment
5.a Conceptual Issues
Because we need quantity series to compute real input growth, we need a price index to split
the nominal value of investment into the two components quantity and price. Doing this
computation for ordinary investment is difficult and even more so when the production
techniques and performance of investment goods progress quickly, as in the case of ICT
8 In fact, the depreciation rate is slightly different in the United States and France because the shares of IT, communication equipment and software are different. Because the average depreciation rate over the period 1980-2000 is about 23% in France and 25% in the United States we use the same depreciation rate (24%) for both countries.
12
investment (see below). Even worse, because R&D investment has not been considered
investment by national account systems, there is no official price index. Studies with R&D
capital generally use the GDP price as a deflator.9 This method has the advantage of
simplicity but does not take into account progress (or regress)) in the efficiency of R&D
activities.
What is the progress in R&D efficiency? It is linked to the performance of researcher
productivity measured in terms of product quality. For example, consider Intel
microprocessors. Researchers at the beginning of nineties were able to produce the first
version of the Pentium chip which had 75 MHz speed capacity. In 2001, research output
enabled production of the Pentium IV with 3000 MHz speed capacity. If one measures
researcher productivity at constant quality, there is clearly a large gain. Of course this
progress in productivity of microprocessors sectors is not the general situation of the whole
economy. But it is good illustration of progress in quality or the productivity of researchers.
How could we measure this progress? The main objective of R&D activities is either to
improve the quality of current products or to create new products and it is difficult to estimate
the gain in economic growth due to the latter. Hedonic methods can be used to estimate
improvement in the quality of existing products or products like them and might provide a
way out. However, hedonics methods are based on econometric estimation of market price as
a function of the most important characteristics of the investment product (for example for IT
it’s the hard disk capacity, the processor speed…). For R&D expenditures, because there is
no specific market for research it is difficult to identify their main characteristics and all the
more so their price. Because technological progress in tangible and intangible products is
largely due to R&D, it seems reasonable to estimate progress in the quality of R&D
expenditures as similar to the technological progress of the economy. This method assumes
that quality of products is an index of the quality of R&D activities. Currently hedonic
methods (see below) are used mainly for ICT products, suggesting that the price index for
ICT products could be used as an indicator of the progress in the quality of R&D activities.
Therefore we propose two alternatives for the measurement of price and quality of R&D
investment. The first one assumes no quality improvement in R&D and uses the GDP price
9 A number of US studies use a deflator pioneered by Griliches that combines the GDP deflator with a labor cost deflator using almost equal weights.
13
deflator. The second alternative assumes quality or productivity increases in R&D
performance and adds this quality effect onto the GDP price index.
The measurement of ICT products, which corresponds to computers and peripheral
equipments, software and communication equipment, also raises some methodological
difficulties. One of the most important is the measurement of the evolution of its component
prices. Because of the rapid evolution of their productive performance, following “Moore’s
Law”, it is crucial to construct a price index “at constant quality” so that the evolution in
volume includes the evolution in quality.
The “hedonic” method, used in complement to or in replacement of the matched-model
method for computing price changes between adjacent periods, seems to be the most suitable
for this approach, and national account statisticians have been progressively adopting it,
despite application difficulties, in fairly large number of countries. In particular, this is true
for the United States, where the Bureau of Economic Analysis (BEA) introduced a hedonic
price for IT equipment (when?) and more recently for software (Grimm et al. [2002], Moylan
and Robinson [2003]). With respect to communication equipment the hedonic method for
quality adjustment is used for telephone switching equipment and for local area network
equipment. These components represented almost half of total investment in communication
equipment (Grimm et al. [2002]). The measurement of the communication equipment price
index, and to a less extent the software price index, could be improved in the future to take
better account of the progress in productive performance of these products. Therefore, the
current price index for ICT products may underestimate the rise of quality and the real
decline of the price may be higher.
5.b Measurement Issues and Calibration
The price index is crucial in growth accounting framework because it plays a big part in the
level of capital stock and also in its growth rate. Splitting the values of investment into
quantity and price is extremely complex especially when there is a rapid change in the
performance of the products, which is the case for ICT and R&D.
As mentioned above hedonic methods are used the estimate the price evolution of computers,
some of software and a share of communication equipment. The resulting ICT price index
14
shows a decrease of 5% and 3% per year from 1980 to 2000 respectively in the United States
and in France.10
However, there is a methodological difference in the treatment of the three components of
ICT investment because a non-negligible part of software and a large share of communication
equipment are not adjusted to take into account the progress in their performance. While the
price of computers declined on average by 15% per year, the price of software and
communication equipment declined respectively by 1.5% and 0.1% per year during the
period 1980-2000 in the United States. This year BEA plans to improve the measurement for
own account software to take into account changes in productivity over time (See Moylan
and Robinson [2004]). The growth rate of the ICT deflator relative to the GDP deflator is
about minus 8% and minus 7% respectively in the United States and in France. So because
we lack an accurate hedonic price for software and communication equipment we assume
that the ICT price declines 10% per year relative to the GDP price.11 This “full quality” effect
is assumed to be the same in both countries.
As concerns the measurement of the R&D price deflator we propose two alternatives. The
first alternative assumes that there is no quality or productivity progress in R&D activities,
and the price of R&D is equal to the GDP price as usual. The second alternative considers
that there is quality or productivity progress in R&D activities and proposes to measure this
progress with the hedonic price of ICT, on the grounds that the rapid progress of ICT
performance is to some extent due to the quality improvement of R&D investment.
Technological progress in economy is not due to “manna from heaven” especially in ICT
producing sectors which represent around 25% of R&D expenditures (OECD [1995] and
OECD ANBERD data Base). To measure the progress in performance of R&D activities we
assume that 50% of the progress in the quality of ICT is due to the R&D activities of ICT
producers. This assumption does not affect the growth rate of technological progress of the
whole economy which is supposed to be constant. So the second alternative proposes to move
one half (50%) of quality progress from ICT to R&D with no impact on TFP (see description
10 The growth rate of ICT price index is different in France compared to the United States because the French price index is adjusted to take into account variation in the exchange rate (See Cette, Mairesse and Kocoglu [2002]).
11 The negative growth rate of an average 10% per year over the period 1980-2000 of the ICT price index corresponds roughly to a decrease of 5% per year in the software and communication price indices.
15
of variant 3 in the next section for more details). The progress in quality of R&D is set to 3%
per year.
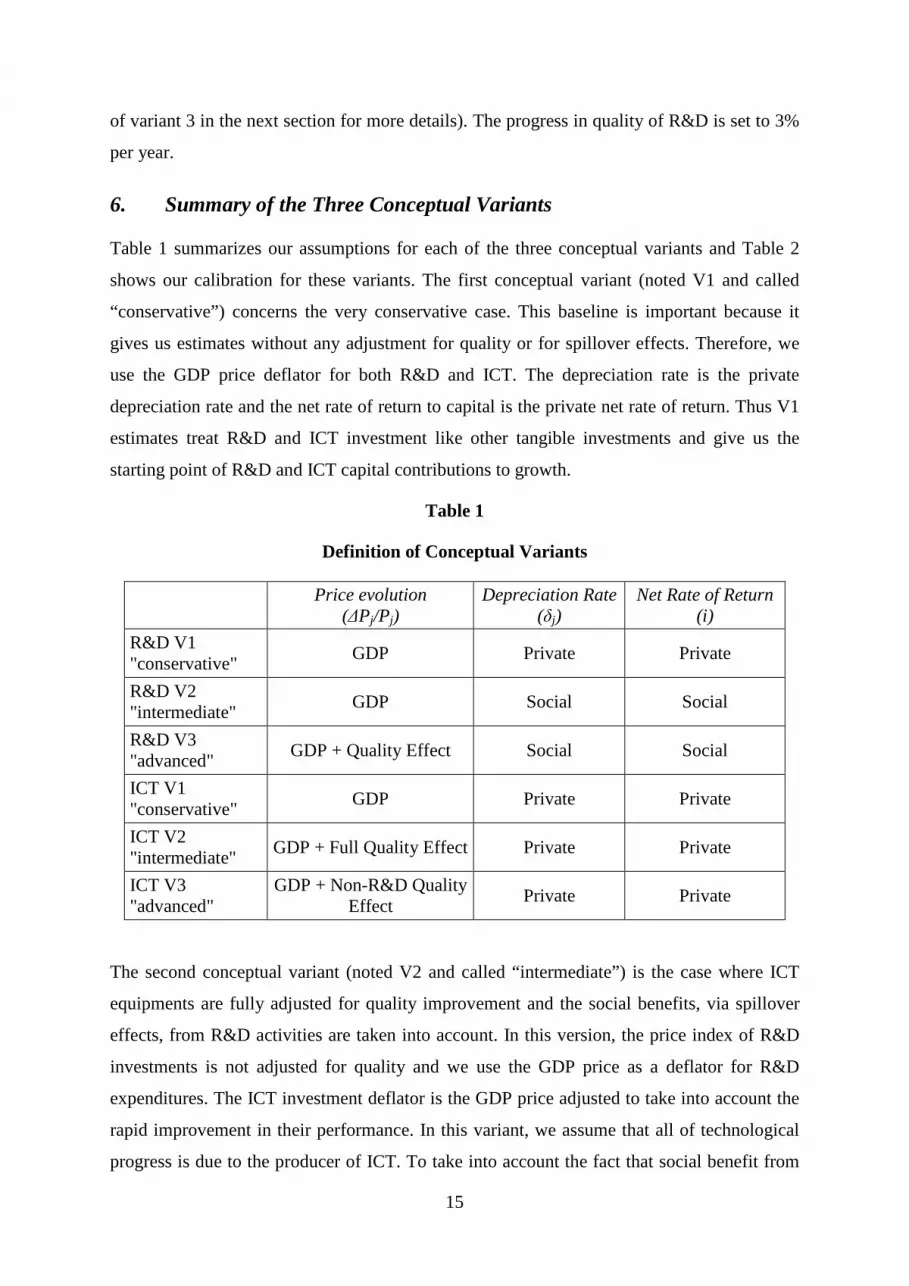
6. Summary of the Three Conceptual Variants
Table 1 summarizes our assumptions for each of the three conceptual variants and Table 2
shows our calibration for these variants. The first conceptual variant (noted V1 and called
“conservative”) concerns the very conservative case. This baseline is important because it
gives us estimates without any adjustment for quality or for spillover effects. Therefore, we
use the GDP price deflator for both R&D and ICT. The depreciation rate is the private
depreciation rate and the net rate of return to capital is the private net rate of return. Thus V1
estimates treat R&D and ICT investment like other tangible investments and give us the
starting point of R&D and ICT capital contributions to growth.
Table 1
Definition of Conceptual Variants
Price evolution
(∆Pj/Pj) Depreciation Rate
(δj) Net Rate of Return
(i)
R&D V1 "conservative"
GDP Private Private
R&D V2 "intermediate"
GDP Social Social
R&D V3 "advanced"
GDP + Quality Effect Social Social
ICT V1 "conservative"
GDP Private Private
ICT V2 "intermediate"
GDP + Full Quality Effect Private Private
ICT V3 "advanced"
GDP + Non-R&D Quality Effect
Private Private
The second conceptual variant (noted V2 and called “intermediate”) is the case where ICT
equipments are fully adjusted for quality improvement and the social benefits, via spillover
effects, from R&D activities are taken into account. In this version, the price index of R&D
investments is not adjusted for quality and we use the GDP price as a deflator for R&D
expenditures. The ICT investment deflator is the GDP price adjusted to take into account the
rapid improvement in their performance. In this variant, we assume that all of technological
progress is due to the producer of ICT. To take into account the fact that social benefit from
16
R&D activities is higher than the private one, we use a social depreciation rate and a social
net rate of return. ICT investment is treated like other tangible investment goods, with no
spillover effect or social benefit from the use of ICT, so the rate of return to ICT capital and
the depreciation rate are private , taken from the national account systems.
The last conceptual variant (noted V3 and called “advanced”) assumes that there is quality
improvement in R&D expenditures so that the price deflator of R&D investment is the GDP
price adjusted for quality. To avoid double counting the same quality effect (both in ICT and
R&D investment) we have to remove the quality adjustment from ICT that is due to R&D
investment. Thus the price deflator of ICT investment is adjusted only for “Non-R&D”
quality improvement.
To estimate the quality improvement in R&D activities we made two important assumptions.
First assumption: the sum of R&D capital and ICT capital contribution to growth with the
variant V3 should be equal to the same sum with the variant V2. This assumption ensures that
the contribution of technological progress measured through the progress in quality remains
the same between variant V2 and variant V3. One important consequence of this assumption
is that TFP is the same in Variant V2 and variant V3. Our object here is only to trade-off one
part of ICT technological change to R&D activities because part of technological progress in
ICT investment is due to R&D expenditures. But what is the share of technological progress
in ICT that is due to R&D? Our second assumption is made here.
Because ICT industries are relatively intensive in R&D expenditures and since there is no
evaluation of this share we simply decide to treat half of technological progress in ICT as due
to the R&D expenditures of ICT industries.12 The other 50% is then due to other factors such
as improvement in organization and in labor quality. Therefore, the ICT price index shows a
decrease of 5% per year relative to GDP price in the variant V3 compared to a decrease of
10% per year in the previous variant V2. Given the two assumptions we obtain a price index
of R&D investment with quality adjustment that falls an average 3% per year compared to
the GDP price index growth rate.13
12 R&D expenditure in the ICT sector is 25% of total R&D expenditure in the United States while the Gross Value Added (GVA) of ICT industries are only 10% of total US GVA.
13 Note that i) This rate changes from year to year but to simplify we use an average for the whole period; and ii) For the United States the average is slightly higher than 3% and for France it is slightly lower. We use 3% for both countries.
17
Because we removed the part of technological progress due to R&D from the ICT
contribution to growth, one can ask why we did not remove the component due to ICT
products from the R&D contribution to growth. R&D spending is divided into three
components: labor cost (on average 60% of total expenditures), intermediate consumption
(30%) and capital (10%). Within the expenditures on capital there is buildings and structures,
ICT products and other equipment. Thus, the share of expenditure on ICT products is not
very important.14 However it is clear that there is some sort of double counting here and the
contribution of R&D to growth should be a bit reduced. Furthermore, it is also clear that
research activities make most of the progress in quality in ICT products.
So to summarize, with the conceptual variant V3 the ICT and R&D price index decrease by
respectively 5% and 3% per year compared to the GDP price growth rate. Note that the
technological progress is still higher for ICT than for R&D and that we do not adjust R&D
expenditures for the technological progress that affects the other part of the economy. The
reason is simple: we don’t know the rate of technological progress for the other component of
the economy. Therefore, one can say that we still underestimate the quality adjustment of
R&D price index. Also, in variant V3, the assumptions of variant V2 for the depreciation rate
and the net rate of return are used. That is, we use the social depreciation rate and social net
rate of return for R&D capital and private depreciation rate and private net return for ICT
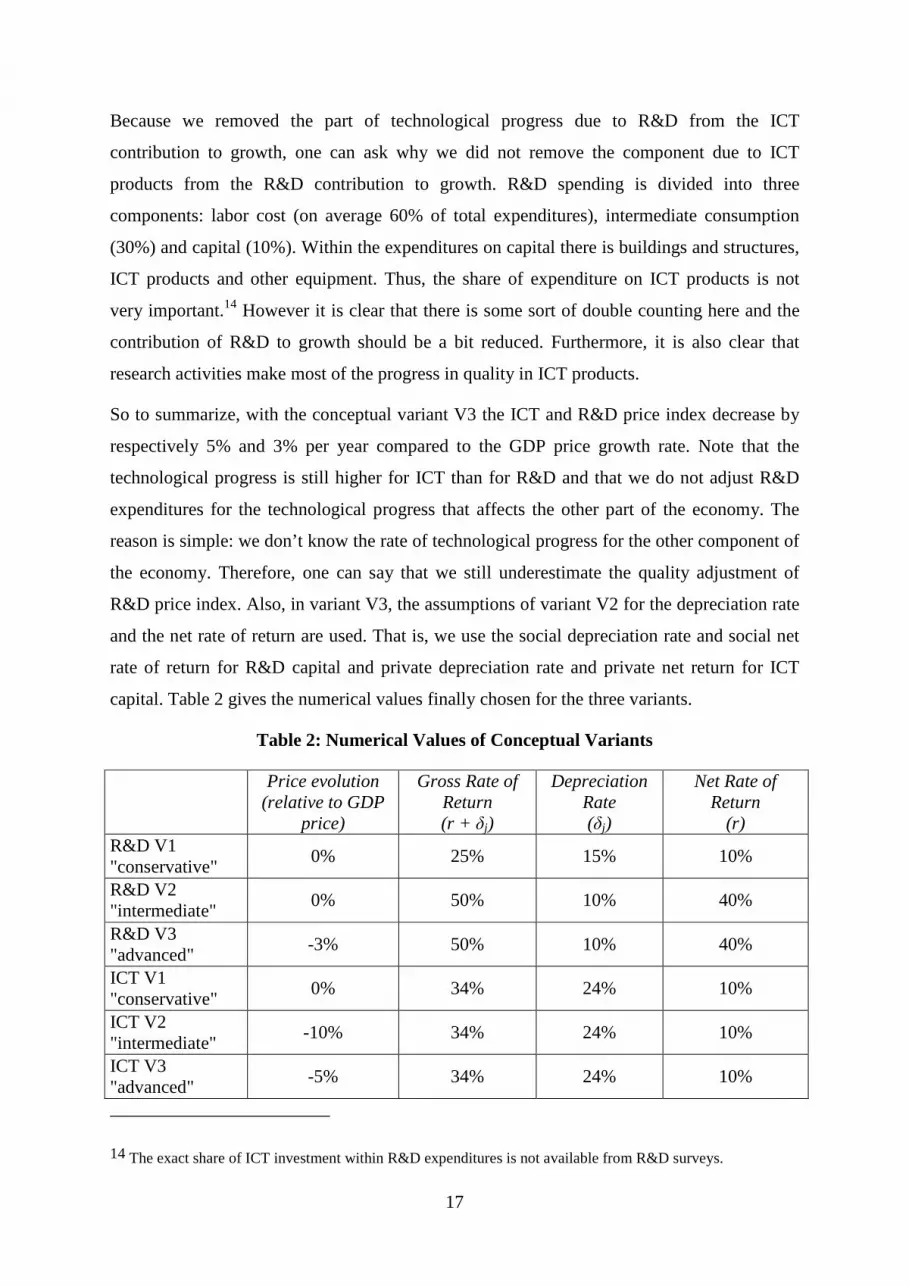
capital. Table 2 gives the numerical values finally chosen for the three variants.
Table 2: Numerical Values of Conceptual Variants
Price evolution
(relative to GDP price)
Gross Rate of Return (r + δj)
Depreciation Rate (δj)
Net Rate of Return
(r) R&D V1 "conservative"
0% 25% 15% 10%
R&D V2 "intermediate"
0% 50% 10% 40%
R&D V3 "advanced"
-3% 50% 10% 40%
ICT V1 "conservative"
0% 34% 24% 10%
ICT V2 "intermediate"
-10% 34% 24% 10%
ICT V3 "advanced"
-5% 34% 24% 10%
14 The exact share of ICT investment within R&D expenditures is not available from R&D surveys.

18
III. R&D and ICT contribution to growth in the US and France
1. Investment in R&D and ICT: Value, Price and Quantity
Tables 4A and 4B in annexes present the evolution of R&D and ICT investment series under
the three different variants. We note that on average growth rates of the two investment series
were very close in the United States and in France, with around 7% per year for R&D and
around 10% per year for ICT over the period 1980-2000. However, three further observations
are important.
First, during the period 1990-1995 the growth rate of investment in ICT declined sharply in
France (1.4% per year after 12.8% per year over 1980-1990), but it still remained high in the
United States (9.2%). The gap in ICT investment between France and United States increased
seriously during this period.
Second, the US economy increased R&D more rapidly than the French economy, especially
during the period 1995-2000, when the growth rate of R&D investment was roughly three
times higher in the United States than in France (8.6% compare to 3.1%).
Third, during the period 2000-2002, we observe a big decrease in ICT investment compared
to the period 1995-2000. In the United States ICT investment decreased 7% per year after
rising 14.5% in the previous period. In France the growth rate also declined sharply but
remained positive, from 14% per year to about 1% per year.
With respect to the evolution of the price of R&D investment there is nothing special to note.
Variants V1 and V2 have the GDP price deflator and Variant V3 the GDP price deflator less
3 points. The growth rate of the GDP deflator was slightly lower in the United States than in
France over the period 1980-2000, respectively 3.2% and 3.8% per year. For ICT price
evolution we note the case of variant V2, with the “full quality effect”, where the price
decrease was slightly more rapid in the United States than in France, –6.8% per year
compared to –6.2% per year. The difference appears because the French GDP deflator grows
more quickly than the US deflator.
A brief look at the quantity series shows that if we do not adjust series for improvement in
quality (variant V1), investment in ICT decreased slightly in France during the periods 1990-
1995 and 2000-2002. This decrease happens only during the final two years for the United

19
States but the size is more important than in France (-8.6% compared to –0.6%). The
decrease in ICT investment in the United States during the period 2000-2002 was so large
that even with the variant V3, which takes into account half of the progress in ICT
performance, the evolution of ICT investment quantity was negative (-3.9% per year).
2. R&D and ICT Capital Stocks
The resulting estimates of the growth rates and value shares of the capital stock, both of
which enter the computation of contributions to growth, exhibit some interesting results (see
Tables 5A and 5B in appendix). First, when we compare the growth rate of R&D and ICT
capital calculated without any adjustment for quality (that is, the variant V1), we observe that
despite more rapid depreciation rate the stock of capital of ICT has grown over the long run
more rapidly than R&D capital stock. The difference is larger in the United States (7.8%
compared to 4%) than in France (5% compared to 4.1%). Second, although the growth rate of
R&D capital was roughly the same in both countries, the growth rate of ICT capital was
considerably faster in the United States. This result confirms the United States advance in
ICT compared to France and more generally compared to other industrialized big countries
(See Cette, Mairesse and Kocoglu [2002] and Colechia and Shreyer [2002] for more detailed
comparisons). The last observation concerns the ratio of capital stocks in gross value added
(GVA). In both countries the ratio of R&D capital stock in GVA is higher than the ratio of
ICT capital stock. It is slightly higher in the United States (11.6% compare to 9.4%) but
almost double in France (9.1% compare to 4.8%).
Next we look at the impact on capital stock growth of the assumptions made in conceptual
variant V2. Recall that variant V2 adjusts R&D investment for its social benefits and adjusts
ICT investment for its technological progress (see Tables 1 and 2). With respect to R&D the
use of the social depreciation rate of 10% instead of 15% has no effect on the growth of R&D
capital. This result is well known (e.g., see Mairesse [1971 and 1972]) -- when one uses a
constant geometric depreciation pattern the rate of depreciation has no effect on the long run
capital growth rate since the path of investment growth is more or less regular. But it has a
significant impact on the level of capital stock. For example, capital stock to value added
ratio grows from 11.6% to 15.3% in the United States over the long run.
Because we adjust the ICT price for “full” quality effect, the growth rate of ICT capital is
very high, reaching 16% per year in France and 19% per year in the United States over the
long run. This in variant V2, the growth of ICT capital is around five times and four times

20
more rapid than the growth of R&D capital, respectively in the United States and in France.
This is an extremely rapid growth rate for capital stock if one recalls that the depreciation rate
is relatively high, at 24%. The impact of the quality adjustment on the level of ICT capital
stock is well known: the ratio to value added of capital stock decreases when one replaces the
a slow-growing investment price index with a new price index that grows quickly. With
variant V2, the ICT capital stock ratio to value added in the United States is 6.9% compared
to 9.4% with the baseline V1.
For the third conceptual variant (V3), compared to the results of V2, the growth rate of R&D
capital stock is higher and that of ICT capital stock is lower. Since we adjust R&D price for
progress in performance, the growth rate of its investment in volume increases, which also
increases the growth rate of capital stock (7.0% compare to 3.8%, for the United States). The
lower growth rate of ICT capital stock also reflects the assumption about the quality effect.
Since we removed the component of progress in performance due to R&D, the price of ICT
exhibits falls more slowly and there is a correspondingly lower growth rate in quantity and
therefore of capital stock (13.3% compared to 19.3%, for the United States).
3. User Cost of Capital and Share of Capital Services
Recall that the relative user cost of capital is equal to its net rate of return, increased by its
depreciation rate and reduced (or increased) by the rate of price growth. Since the conceptual
variants affect each component of the relative user cost of capital its value changes
considerably from one variant to another. Results for the relative user cost of capital and the
share of capital services are given in Tables 6A and 6B in appendix.
Begin with the “conservative” variant V1. Here the net rate of return to capital and the price
evolution are the same for R&D and ICT capital so that the difference between the relative
user cost of the R&D capital and ICT capital reflect only the higher depreciation rate of ICT
capital stock (24% compare to 15%). As concerns the variant V2, we made two changes: we
double the gross rate of return to R&D capital (from 25% to 50%) and we subtracted 10
percentage points from the evolution of the ICT price, which increases the last term in the
user cost. Thus the relative user cost of R&D and ICT capital increase respectively about 25
percentage points (from 21.5% to 46.5%) and about 10 percentage points (from 30.5% to
40.5%) in the United States over the long run. With these two changes the user cost of ICT
capital becomes higher than the user cost of R&D capital. Finally, because the last variant V3

21
removes some of the quality effect from ICT and adds it to R&D investment, the user cost of
R&D capital grows by 3 percentage points and that of ICT declines by 5 percentage points.
The share of capital services, which is equal to its relative user cost multiplied by its ratio to
Gross Value Added (GVA), shows a different result. The share of ICT capital services is not
very affected by our varying assumptions. Whichever conceptual variant we choose, the share
of ICT capital services is about 2.8% in the United States and about 1.4% in France. The
reason is that increases in the relative user cost are compensated for by the decrease of the
ratio of capital stock to GVA. That is, the volume measure of capital services is not that
affected by the time pattern of investment used to construct capital. This result is important
because it means that the contribution of ICT capital to growth will vary only with the growth
rate of its capital stock. The second interesting result is that in the United States the share of
ICT capital services is twice as higher as in France. This means that even if the growth rate of
ICT capital is the same in France and in the United States its contribution to growth will be
double in the United States than in France.
With respect to the share of R&D capital services the results are quite different. The share of
capital services grows sharply when we introduce social benefits (from 2.5% to 7.1% in the
United States) and decline slightly when we adjust R&D price for quality (from 7.1% to
6.4%). The contribution of R&D capital varies with the growth rate of its capital stock but
also with its share in capital services.
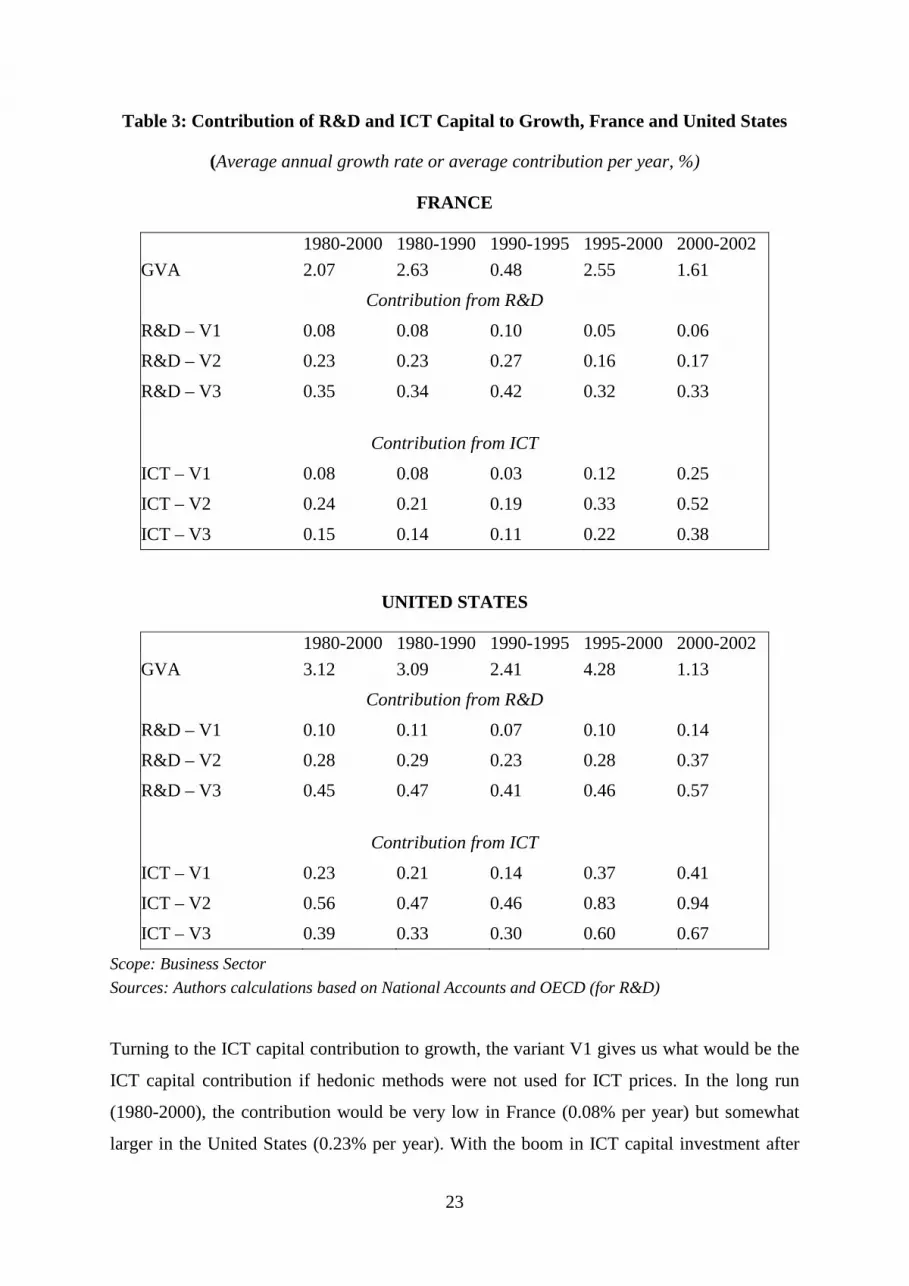
4. The Contribution of R&D and ICT Capital to Growth
The contribution of R&D and ICT capital to growth for United States and France over the
period 1980-2002 are given in Table 3 and Figure 1. The first variant V1, which is the
standard framework for estimates of R&D contribution to growth, shows as usual a very low
contribution of R&D capital to growth: around 0.08% per year and 0.10% per year
respectively in France and in the United States. This negligible contribution of R&D capital
is the source of the “R&D puzzle”. That is, traditional economic analyses are not able to
confirm the important role assigned by the theoretical literature to R&D spending. When we
adjust R&D for spillover effects through higher gross rates of return (Variant V2), the
contribution of R&D to growth increases significantly, by roughly three times in both
countries. The contribution of R&D capital growth increases from 0.10% to 0.28% in the
United States and from 0.08% to 23% in France. One can deduce that the contribution to
growth of the social benefits of R&D activities is about 0.18% per year in the United States

22
and about 0.15% per year in France. This result highlights how much is important to take
account of the spillover effect in a growth accounting framework with R&D capital. When
we adjust the R&D price to take into account progress in performance (variant V3), the
contribution of R&D capital increases by another 0.17 percentage points in the United States
and by 0.12 percentage points in France. These increases in R&D capital contribution
measure the component of quality adjustments.
The result is that the contribution of R&D capital to growth increased by 0.35 percentage
points for the US economy and by 0.28 percentage points for French economy in variant V3
over V1. Roughly half of this increase is due to adjustment for the spillover effect and the
other part is due to adjustment for progress in performance. Thus the contribution of R&D
capital to growth is about 0.45% per year in the United States and about 0.35% per year in
France over the long run. In each country, these contributions are 4.5 times higher than those
obtained with the more conservative and traditional growth accounting framework!!
Moreover, recall that our quality adjustment of the R&D deflator underestimated the
technological progress in R&D because we only adjusted its price for ICT technological
progress and not for technological progress in other investment goods.
23
Table 3: Contribution of R&D and ICT Capital to Growth, France and United States
(Average annual growth rate or average contribution per year, %)
FRANCE
1980-2000 1980-1990 1990-1995 1995-2000 2000-2002
GVA 2.07 2.63 0.48 2.55 1.61
Contribution from R&D
R&D – V1 0.08 0.08 0.10 0.05 0.06
R&D – V2 0.23 0.23 0.27 0.16 0.17
R&D – V3 0.35 0.34 0.42 0.32 0.33
Contribution from ICT
ICT – V1 0.08 0.08 0.03 0.12 0.25
ICT – V2 0.24 0.21 0.19 0.33 0.52
ICT – V3 0.15 0.14 0.11 0.22 0.38
UNITED STATES
1980-2000 1980-1990 1990-1995 1995-2000 2000-2002
GVA 3.12 3.09 2.41 4.28 1.13
Contribution from R&D
R&D – V1 0.10 0.11 0.07 0.10 0.14
R&D – V2 0.28 0.29 0.23 0.28 0.37
R&D – V3 0.45 0.47 0.41 0.46 0.57
Contribution from ICT
ICT – V1 0.23 0.21 0.14 0.37 0.41
ICT – V2 0.56 0.47 0.46 0.83 0.94
ICT – V3 0.39 0.33 0.30 0.60 0.67
Scope: Business Sector
Sources: Authors calculations based on National Accounts and OECD (for R&D)
Turning to the ICT capital contribution to growth, the variant V1 gives us what would be the
ICT capital contribution if hedonic methods were not used for ICT prices. In the long run
(1980-2000), the contribution would be very low in France (0.08% per year) but somewhat
larger in the United States (0.23% per year). With the boom in ICT capital investment after
24
1995 in the United States, the contribution increased from 0.14% during 1990-1995 to 0.37%
during the period 1995-2000. Even if progress in performance is not taken into account, the
rapid increase in ICT investment occurred during these years is enough to cause an increase
of 0.24% per year in the ICT capital contribution to growth. Note that in France, because of
the lower increase in ICT investment during the period 1995-2000 (see Table 6), the increase
is much lower but increases during the final two years (2000-2002). These results are far
from those of recent literature estimates. Jorgenson, Ho and Stiroh (2002) and Oliner and
Sichel (2002) estimate the contribution of ICT capital to productivity growth in the United
States respectively to 0.80% and 1.0% per year over the period 1995-2000. Their estimates
are at least the double those obtained here using the conservative assumptions. For France,
Cette, Mairesse and Kocoglu (2002) present results where the contributions of ICT capital are
on average three times higher than those presented here using variant V1.
When we adjust ICT prices for quality improvement, the contribution of ICT capital to
growth increases to 0.56% per year in the United States (more than double the result of V1)
and to 0.24% per year in France (three times the result of V1) during the period 1980-2000.
These results are close to those presented in the literature cited above.15 The differences in
ICT contribution to growth between V1 and V2 measure the contribution to growth of ICT
technological progress. This contribution is about 0.33% in the United States and about
0.16% in France. Finally, when we remove the technological progress due to R&D from the
ICT price, the contribution of ICT to growth falls to 0.39% in the United States and to 0.15%
in France.
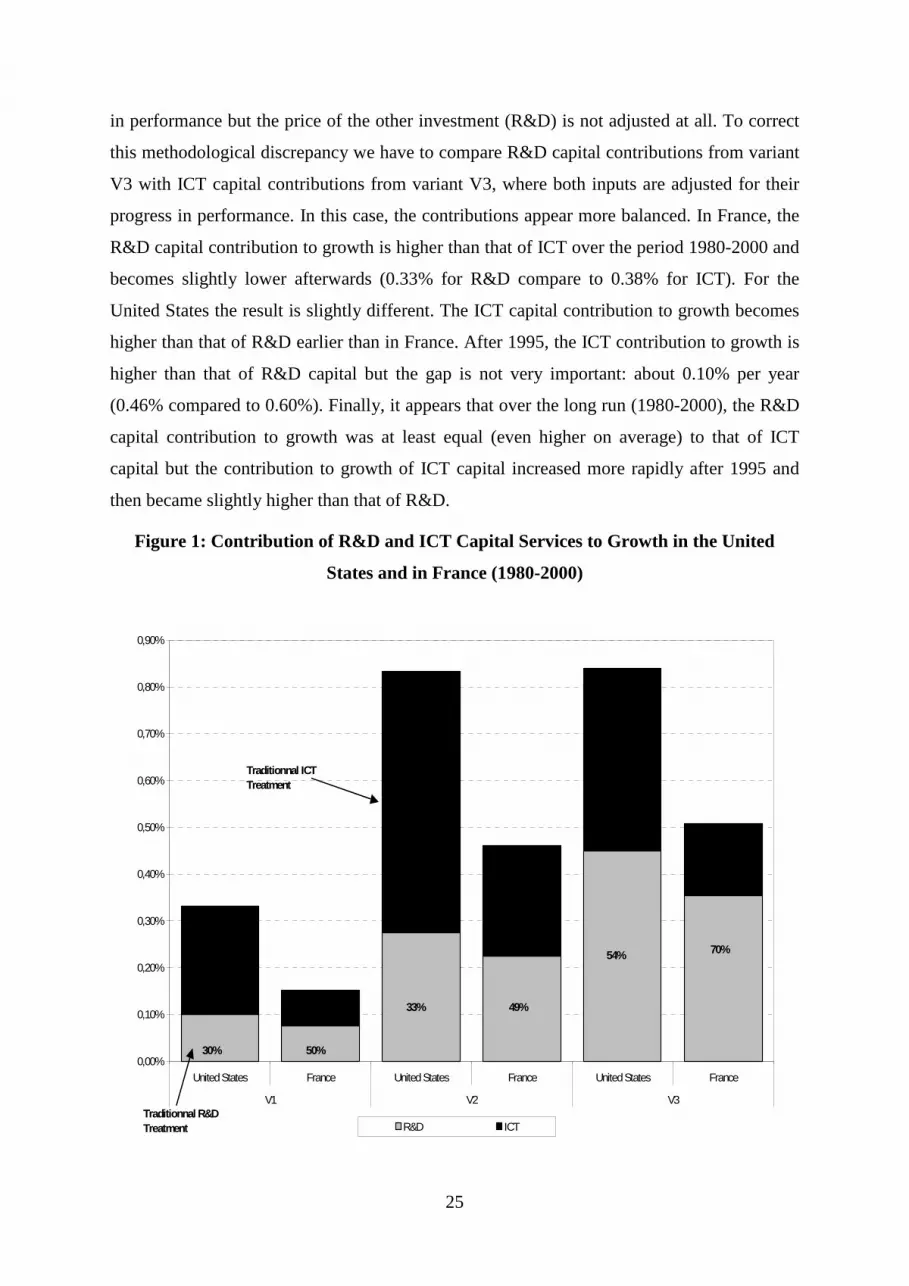
We now compare the R&D capital contribution to growth with that of ICT capital.
Traditional growth accounting studies would compare the results from variant V1 for R&D
capital with the results from variant V2 for ICT capital (see Figure 1). There is no doubt
about the result of this comparison. The ICT capital contribution to growth is considerably
higher than the contribution of R&D capital: 0.56% per year for ICT capital compared to
0.10% per year for R&D capital over the period 1980-2000 in the United States. This gap will
be bigger if one compares the period 1995-2000: 0.83% per year for ICT compare to 0.10%
per year for R&D. However this comparison is not really valid because there is a big
methodological discrepancy: the price of one investment (ICT) is fully adjusted for progress
15 Note that precise comparisons between the estimates presented here and those presented in the literature is not relevant because here the complete growth accounting is not done. Therefore the crucial hypothesis of constant returns to scale has not been verified.
25
in performance but the price of the other investment (R&D) is not adjusted at all. To correct
this methodological discrepancy we have to compare R&D capital contributions from variant
V3 with ICT capital contributions from variant V3, where both inputs are adjusted for their
progress in performance. In this case, the contributions appear more balanced. In France, the
R&D capital contribution to growth is higher than that of ICT over the period 1980-2000 and
becomes slightly lower afterwards (0.33% for R&D compare to 0.38% for ICT). For the
United States the result is slightly different. The ICT capital contribution to growth becomes
higher than that of R&D earlier than in France. After 1995, the ICT contribution to growth is
higher than that of R&D capital but the gap is not very important: about 0.10% per year
(0.46% compared to 0.60%). Finally, it appears that over the long run (1980-2000), the R&D
capital contribution to growth was at least equal (even higher on average) to that of ICT
capital but the contribution to growth of ICT capital increased more rapidly after 1995 and
then became slightly higher than that of R&D.
Figure 1: Contribution of R&D and ICT Capital Services to Growth in the United
States and in France (1980-2000)
0,00%
0,10%
0,20%
0,30%
0,40%
0,50%
0,60%
0,70%
0,80%
0,90%
United States France United States France United States France
V1 V2 V3
R&D ICTTraditionnal R&D Treatment
Traditionnal ICT Treatment
30%
33%
54% 70%
49%
50%

26
Thus the conclusion is that R&D investment is almost as important as ICT investment if a
proper growth accounting is performed. During the recent decades the economic literature on
growth accounting has highlighted the role of ICT and neglected the role of R&D, but it
appears that it should pay more attention to the empirical relationship between R&D and
growth. Given the recent attention paid to the importance of intangible investments in
national wealth, this seems to be an appropriate time to undertake more such studies.
IV. Conclusion
The aim of this paper was to present some explorations of the contribution of R&D and ICT
capital to growth from methodological and measurement point of view. The starting point
was the disconnect between the theoretical evidence of important role of R&D for economic
growth and the difficulties of its measurement especially in growth accounting framework.
The goal of the paper was not to present very accurate and detailed estimations of the R&D
capital services to economic growth but to open debate on some methodological aspects. We
discussed three components of the cost of capital used in the growth accounting exercise: the
rate of R&D capital depreciation, the net rate of return to R&D capital and quality adjustment
of R&D price. We first raised some methodological issue and then we proposed some
specific directions to deal with the problems.
The paper asked two questions. The first one and the most important is: are the
methodological aspects raised here relevant? That is, should we or should we not adjust the
net rate of return and the rate of depreciation of R&D capital for its social benefits and should
we or should we not adjust the price index of R&D expenditures for the progress in quality?
If there is an agreement about these methodological aspects then we can debate about the
second question raised by the paper. That is: are the assumptions made here appropriate to
cope with the methodological problems discuss above? They seem reasonable with respect to
the earlier literature but have to be assessed more precisely and the discussion is still open.
When R&D is adjusted for its social benefits and for technological progress the contribution
to growth of its capital becomes significant: around 0.5% per year in the United States and
around 0.3% per year in France over the long run. Comparison with the ICT capital
contribution to growth shows that the traditional growth accounting exercise leans toward the
ICT contribution because of a methodological discrepancy: ICT price is adjusted for
technological progress but the R&D price is not. If we adjust both investment prices for

27
quality improvements then the match between the two investments appears more balanced.
The contribution of R&D capital is on average higher than that of ICT capital over the period
1980-1995 and becomes slightly lower afterwards. This exercise shows how important it is to
consider all the conceptual aspects when one estimates growth accounting with R&D capital.
Future research should pay more attention on these aspects. Moreover since intangible
investments have become more important in the economy, creating a renewed interest in their
measurement, growth accounting economists should pay more attention to the estimates of
the R&D contribution to growth.

28
V. Appendix
Table 4A: Growth Rates of Investment Values, Prices and Volumes
(Average annual growth rate, %)
UNITED STATES
1980-2000 1980-1990 1990-1995 1995-2000 2000-2002
Values R&D 7.8 9.4 3.8 8.6 4.3 ICT 11.4 10.9 9.2 14.5 -7.0
Prices R&D – V1 3.2 4.3 2.5 1.7 1.7 R&D – V2 3.2 4.3 2.5 1.7 1.7 R&D – V3 0.2 1.3 -0.5 -1.3 -1.3
ICT – V1 3.2 4.3 2.5 1.7 1.7 ICT – V2 -6.8 -5.7 -7.5 -8.3 -8.3 ICT – V3 -1.8 -0.7 -2.5 -3.3 -3.3
Volumes
R&D – V1 4.5 5.0 1.2 6.8 2.5 R&D – V2 4.5 5.0 1.2 6.8 2.5 R&D – V3 7.6 8.1 4.3 10.3 5.6 ICT – V1 7.9 6.4 6.5 12.5 -8.6 ICT – V2 19.5 17.7 18.0 24.8 1.4 ICT – V3 13.4 11.8 12.0 18.4 -3.9
Scope: Business Sector
Sources: Authors calculations based on National Accounts and OECD (For R&D)

29
Table 4B: Growth Rates of Investment Values, Prices and Volumes
(Average annual growth rate, %)
FRANCE
1980-2000 1980-1990 1990-1995 1995-2000 2000-2002
Values R&D 7.3 11.9 2.8 3.1 3.6 ICT 10.2 12.8 1.4 14.2 1.2
Prices R&D – V1 3.8 6.1 2.1 1.0 1.8 R&D – V2 3.8 6.1 2.1 1.0 1.8 R&D – V3 0.8 3.1 -0.9 -2.0 -1.2
ICT – V1 3.8 6.1 2.1 1.0 1.8 ICT – V2 -6.2 -4.0 -7.9 -9.0 -8.2 ICT – V3 -1.2 1.0 -2.9 -4.0 -3.2
Volumes R&D – V1 3.4 5.5 0.7 2.0 1.8 R&D – V2 3.4 5.5 0.7 2.0 1.8
R&D – V3 6.5 8.6 3.7 5.1 4.9 ICT – V1 6.2 6.4 -0.7 13.1 -0.6 ICT – V2 17.5 17.5 10.1 25.5 10.3 ICT – V3 11.6 11.6 4.5 19.0 4.6
Scope: Business Sector
Sources: Authors calculations based on National Accounts and OECD (For R&D)

30
Table 5A: Growth Rates of Capital Stocks and Capital Stocks to Value-Added Ratios
UNITED STATES
1980-2000 1980-1990 1990-1995 1995-2000 2000-2002 Growth rates of capital stocks in volume (∆Kj / Kj)
(average annual growth rate, %)
R&D – V1 4.0 4.8 2.6 3.8 4.9
R&D – V2 3.8 4.3 3.0 3.7 4.7
R&D – V3 7.0 7.6 5.8 6.8 8.0
ICT – V1 7.8 8.8 4.2 9.5 8.4
ICT – V2 19.3 20.1 15.1 22.2 19.8
ICT – V3 13.3 14.2 9.4 15.5 13.8
Capital stocks to value-added ratios (PjKj / PQ) (in per cent)
R&D – V1 11.6 11.1 12.3 11.8 12.6
R&D – V2 15.3 14.7 16.2 15.7 16.6
R&D – V3 12.9 12.4 13.7 13.2 13.9
ICT – V1 9.4 7.8 10.1 12.6 14.7
ICT – V2 6.9 5.8 7.3 9.2 10.8
ICT – V3 8.0 6.7 8.6 10.7 12.5
Scope: Business Sector
Sources: Authors calculations based on National Accounts and OECD (For R&D)

31
Table 5B: Growth Rates of Capital Stocks and Capital Stocks to Value-Added Ratios
FRANCE
1980-2000 1980-1990 1990-1995 1995-2000 2000-2002 Growth rates of capital stocks in volume (∆Kj / Kj)
(average annual growth rate, %)
R&D – V1 4.1 5.0 4.4 1.9 2.5
R&D – V2 4.2 5.0 4.4 2.4 2.6
R&D – V3 7.2 8.0 7.5 5.2 5.7
ICT – V1 5.0 6.2 1.8 6.0 10.7
ICT – V2 16.2 17.2 12.0 18.4 23.6
ICT – V3 10.3 11.4 6.6 11.9 16.9
Capital stocks to value-added ratios (PjKj / PQ) (in per cent)
R&D – V1 9.1 8.0 9.8 10.6 10.4
R&D – V2 11.9 10.4 12.6 14.0 13.8
R&D – V3 10.1 8.9 10.8 11.8 11.5
ICT – V1 4.8 4.2 5.2 6.1 6.9
ICT – V2 3.5 3.1 3.7 4.3 5.0
ICT – V3 4.1 3.6 4.4 5.1 5.8
Scope: Business Sector
Sources: Authors calculations based on National Accounts and OECD (For R&D)

32
Table 6A: User Cost of Capital and Shares of Capital Services
UNITED STATES
1980-2000 1980-1990 1990-1995 1995-2000 2000-2002 User Cost of Capital (r + δj – ∆pj/pj)
(in per cent) R&D – V1 21.5 20.3 22.2 23.2 23.2
R&D – V2 46.5 45.3 47.2 48.2 48.2
R&D – V3 49.5 48.3 50.2 51.2 51.2 ICT – V1 30.5 29.8 31.6 31.2 32.1
ICT – V2 40.5 39.8 41.6 42.2 42.1
ICT – V3 35.5 34.8 36.6 37.2 37.1
Share of services (r + δj – ∆pj/pj)*(p jKj/PQ) (in per cent)
R&D – V1 2.5 2.3 2.7 2.7 2.9
R&D – V2 7.1 6.7 7.7 7.6 8.0
R&D – V3 6.4 6.0 6.9 6.7 7.1 ICT – V1 2.8 2.3 3.2 3.8 4.4
ICT – V2 2.7 2.3 3.0 3.6 4.3
ICT – V3 2.8 2.3 3.1 3.7 4.4
Scope: Business Sector
Sources: Authors calculations based on National Accounts and OECD (For R&D)

33
Table 6B: User Cost of Capital and Shares of Capital Services
FRANCE
1980-2000 1980-1990 1990-1995 1995-2000 2000-2002 User Cost of Capital (r + δj – ∆pj/pj)
(in per cent) R&D – V1 20.8 18.4 22.7 23.9 23.2
R&D – V2 45.8 43.4 47.7 48.9 48.2
R&D – V3 48.8 46.4 50.7 51.9 51.2 ICT – V1 29.8 28.2 32.0 32.8 32.5
ICT – V2 39.8 38.2 42.0 42.8 42.5
ICT – V3 34.8 33.2 37.0 37.8 37.5
Share of services (r + δj – ∆pj/pj)*(p jKj/PQ) (in per cent)
R&D – V1 1.9 1.5 2.2 2.5 2.4
R&D – V2 5.5 4.5 6.0 6.8 6.6
R&D – V3 5.0 4.2 5.5 6.1 5.9 ICT – V1 1.4 1.2 1.7 1.9 2.1
ICT – V2 1.4 1.2 1.6 1.7 2.0
ICT – V3 1.4 1.2 1.6 1.8 2.0
Scope: Business Sector
Sources: Authors calculations based on National Accounts and OECD (For R&D)

34
Figure 2A: Ratios of Investments in R&D and ICT relative to GVA
Figure 2B: Comparison of relative investment in R&D and ICT between France and
United States (USA=1)
Sources: BEA, OECD and INSEE. Business Economy.
0,0%
0,5%
1,0%
1,5%
2,0%
2,5%
3,0%
3,5%
4,0%
4,5%
5,0%
5,5%
1980 1981 1982 1983 1984 1985 1986 1987 1988 1989 1990 1991 1992 1993 1994 1995 1996 1997 1998 1999 2000 2001 2002
R & D U S A IC T U SA R &D F ranc e IC T F rance
0,40
0 ,50
0 ,60
0 ,70
0 ,80
0 ,90
1 ,00
1 ,10
1980 1981 1982 1983 1984 1985 1986 1987 1988 1989 1990 1991 1992 1993 1994 1995 1996 1997 1998 1999 2000 2001 2002
R &D IC T U S=1

35
Figure 3
R&D and ICT Contributions to Growth: Comparison between France and the US
United States=1, Variant V3
-
0,20
0,40
0,60
0,80
1,00
1,20
1,40
1980 1981 1982 1983 1984 1985 1986 1987 1988 1989 1990 1991 1992 1993 1994 1995 1996 1997 1998 1999 2000 2001 2002
R&D ICT USA=1
36
VI. Bibliography
Bureau of Economic Analysis [BEA]: Data Base on US National Accounts. Internet web site: www.bea.doc.gov.
Bresnahan T. et Gordon R. eds. (1996): The Economics of New Goods, The University of Chicago Press.
Carson C. (1994): "A satellite Account for Research and Development", Survey of Current Business, vol. 74, n° 11, p. 37-71, November.
Colecchia A. and Schreyer P. (2001): “ICT Investment and Economic Growth in the 1990s: Is the United States a Unique Case?”, OECD, DSTI/DOC(2001)7, 25 October.
Cette G., Mairesse J. et Kocoglu Y. (2002): Croissance économique et diffusion des TIC: le cas de la France sur longue période (1980-2000) ", Revue Française d’Economie, Vol. XVI, n° 3, p. 155-192, janvier.
Cette G., Mairesse J. et Kocoglu Y. (2000): " La mesure de l’investissement en technologies de l’information et de la communication: quelques considérations méthodologiques", Economie et Statistique, n° 339-340, 2000 – 9/10, p. 73-91.
Corrado C., Hulten Ch, and Sichel D. (2002): " Measuring Capital and Technology: An Expanded Framework ", mimeo, April 2002 (Revised, June 2004).
Erumban A. A. (2004): "Twenty Ways to Aggregate Capital: Does It Really Matter for a Study of Economic Growth?", Paper Presented for the 28th general Conference of The International Association for Research in Income and Wealth, Cork Ireland, August 22-28, 2004, http://www.iariw.org.
Fraumeni B. (1997): "The Measurement of Depreciation in the U.S National Income and Product Accounts", Survey of Current Business, vol. 77, n° 7, p. 7-23, July.
Fraumeni, Barbara M. and Sumiye Okubo (2004): "R&D in the National Income and Product Accounts: A First Look at its Effect on GDP" paper presented at the CRIW Conference, Measuring Capital in the New Economy. Washington, D.C., April 2003.
Gordon R. (1990): The Measurement of Durables Goods Prices, University of Chicago Press for the National Bureau of Economic Research.
Gordon R. (2000): " Does the ‘New Economy’ Measure up to the Great Inventions of the Past? ", Journal of Economic Perspectives, vol. 14, n° 4, p. 49-74.
Gordon R. (2002): "Technology and Economic Performance in the American Economy", NBER Working Paper, n° 8771, February.
Greenan N., Mairesse J. and Topiol-Bensaid A. (1999):"Investissements immatériels, productivité et qualifications ", Revue Economique, Vol. 50, n° 3, 1999, p. 417-430.
Greenan N., Mairesse J. and Topiol-Bensaid A. (2001): "Information Technology and Research and Development Impacts on Productivity and Skills: Looking for Correlations on French Firm Level Data", in Information Technology, Productivity and Economic Growth, M. Pohjola ed., Oxford University Press, p. 119-148.
Griliches Z. (1988): " The Productivity Puzzle and R&D: Another Non-explanation ", Journal of Economic Perspectives, vol. 2, p. 9-21.
37
Griliches Z. (1994): " Productivity, R&D, and the Data Constraint ", The American Economic Review, vol. 84, n°1, p. 1-18.
Griliches Z. (1995): " R&D and Productivity: Econometric Results and Measurement Issues ", in Handbook of the Economics of Innovation and Technological Change, Blackwell, Cambridge, MA, May.
Griliches, Zvi (1996): "The Discovery of the Residual: A Historical Note" Journal of Economic Literature vol 34 (September) p. 1324-1330.
Grimm B., Moulton B. and Wasshaussen (2002): "Information Processing Equipment and Software in the National Accounts", BEA Working Paper n° WP2002-02, April 26.
Hall B. et Mairesse J. (1995): "Exploring the Relationship between R&D and Productivity in French Manufacturing Firms", Journal of Econometrics, vol. 65, n° 1, p. 263-294.
Hulten C. R. (1992): " Growth accounting when technical change is embodied in capital ", American Economic Review, vol 84, n° 4, p 964-980, September.
Hulten C. R. (2000): « Total Factor Productivity: A Short Biography », NBER Working Paper, n° 7471, January.
Jorgenson D. (1966): " The embodiment hypothesis ", Journal of Political Economy, vol. LXXIV, n°1, p. 1-17, février.
Jorgenson D. (2001): " Information Technology and the US Economy ", The American Economic Review, vol. 91, n°1, p. 1-32, mars.
Jorgenson D. et Stiroh K. (2000): "Raising the Speed Limit: U. S. Economic Growth in the Information Age", Brookings Papers on Economic Activity, n° 1, p. 125-211.
Jorgenson D., Ho M. et Stiroh K. (2002): " Projecting productivity growth: lessons from the U.S growth resurgence ", Conference on Technology, Growth and the Labor Market, Federal Reserve Bank of Atlatanta, janvier.
Landelfed S. et Fraumeni B. (2001): "Measuring the New Economy", Survey of Current Business, vol. 81, n° 3, p. 23-40, March.
Landelfed S. et Grimm B. (2000): "A Note on the Impact of the Hedonics and Computers on Real GDP", Survey of Current Business, vol. 80, n° 12, p. 17-22, December.
Mairesse J. (1971): "L'estimation du capital fixe productif: méthode chronologique", Économie et Statistique, n° 25, p. 33-55.
Mairesse J. (1972): "L'évaluation du capital fixe productif, méthode et résultats", Collections de l'INSEE, Série C, n° 18-19.
Mairesse J. et Sassenou M. (1991): "R&D and Productivity: A Survey of Econometric Studies at the Firm Level", NBER Working Paper, n° 3666.
Mairesse J., Cette G. and Kocoglu Y. (2000): " Les technologies de l’information et de la communication en France: diffusion et contribution à la croissance ", Economie et Statistique, n°339-340, 2000 – 9/10, p. 117-146.
Moylan C. and Robinson B. (2003): " Preview of the 2003 Comprehensive Revision of the National Income and Product Accounts ", Survey of Current Business, September 2003.
Moore Gordon E (1965): " Cramming more components onto integrated circuits ". Electronics, vol 38, n° 8, 19 avril 1965.

38
Moore Gordon E (1997): " An update on Moore’s law ", Santa Clara, CA: Intel Corporation, 30 September.
Nadiri M. I. (1993): "Innovations and Technological Spillovers", NBER Working Papers, n°4423.
Nadiri M. I. and Prucha I. R. (1996): "Estimation of Depreciation Rate of Physical and R&D Capital in the U.S Total Manufacturing Sector", Economic Inquiry, vol XXXIV, n° 1, p. 43-56.
Nakamura, Leonard (2003): "The Rise in Gross Private Investment in Intangible Assets Since 1978" Mimeo, Federal Reserve Bank of Philadelphia.
Nordhaus, William D. (1997): "Do Real Output and Real Wage Measures Capture Reality? The History of Light Suggests Not" In The Economics of New Goods, ed. Timothy F.Bresnahan and Robert J. Gordon, 29-66. Studies in Income and Wealth, vol. 58. Chicago: The University of Chicago Press.
OECD (1995): Les dépenses de recherche et développement dans l’industrie, 1973-1992, Paris.
OECD (2001): Measuring Capital, OECD Manual, Measurement of Capital Stocks, Consumption of Fixed Capital and capital Services, Paris, www.oecd.org.
OECD (2001): The New Economy: Beyond the Hype. Final Report on the OECD Growth Project, OECD, Paris, www.oecd.org.
OECD (2002): Measuring the Information Economy, 2002, OCDE, Paris.
OECD (2002): "Report of the Task Force on Software Measurement in the National Accounts", STD/NA(2002)2, October, Paris.
Oliner S. and Sichel D. (2000): "The Resurgence of Growth in the Late 1990s: Is Information Technology the Story?", Journal of Economic Perspectives, vol. 14, n° 4, p. 3-22.
Oliner S. and Sichel D. (2002): "Information Technology and Productivity: Where Are We Now and Where Are We Going?", Conference on Technology, Growth and the Labor Market, Federal Reserve Bank of Atlanta, January.
Pilat D. and Lee F. C. (2001): “Productivity growth in ICT-producing and ICT-using industries: a source of growth differentials in the OECD?”, mimeo, DSTI/DOC (2001) 4, 18 June.
Romer P. (1994): "The Origins of Endogenous Growth", Journal of Economic Perspective, vol.8, n° 1, p. 3-22.
Rosa J-M and Rose A. (2004): " Rate of Obsolescence for Research and Development Capital Stocks: An Overview of the Empirical Literature on R&D Depreciation Rate ", Mimeo, Canberra II Group on the Measurement of Non-Financial Assets, Washinton DC, March 17-19, 2004.
Rose A. and Lonmo C. (2004): " R&D Capitalization: Discussion on Price Deflator and Rates of Obsolescence ", Mimeo, Canberra II Group on the Measurement of Non-Financial Assets, Paris, October, 2003.
Seskin E. and Larkins D. (2004): " Improved Estimates of the National Income Product Accounts for 1929-2002 ", Survey of Current Business, February 2004.

39
Solow R. (1956): "A Contribution to the Theory of Growth", Quarterly Journal of Economics, vol. 70, p. 65-94.
Solow R. (1957): "Technical Change and the Aggregate Production Function", Review of Economics and Statistics, vol. 39, p. 312-320.
Solow R. (1960): " Investment and technical change progress ", in Kenneth J. Arrow, Samuel Karlin and Patrick Suppes (eds), Mathematical Methods in the Social Sciences, Stanford University Press.
Solow R. (1994): "Perspectives on Growth Theory", Journal of Economic Perspectives, vol. 8, n°1, p. 45-54.
Triplett J. (1999): " The Solow Paradox: What do Computer do to Productivity?", Canadian Journal of Economics, vol. 32, n°2.

40
VII. Additional tables
Table ADD1: Levels of R&D expenditures (Business sector and Public sector)
Expenditures in values
(in Millions of euros or dollars) Expenditures as % of GDP
1970 1980 1990 1994 2000 1970 1980 1990 1994 2000
France
GERD1 of which 2 280 7 777 23 959 26 484 30 954 1.83 1.76 2.37 2.34 2.18
Business sector 1 269 4 694 14 476 16 340 19 348 1.02 1.07 1.43 1.45 1.37
Public sector2 1 011 3 083 9 483 10 144 11 606 0.81 0.74 0.94 0.89 0.81
United States GERD1 of which 26 458 63 760 152 451 169 633 265 180 2.54 2.28 2.63 2.40 2.70
Business sector 18 067 44 505 109 727 119 595 199 539 1.74 1.59 1.89 1.70 2.03
Public sector2 8 391 19 255 42 724 50 038 65 641 0.80 0.69 0.74 0.70 0.67
Table ADD2: Levels and Relative Shares of Investments in R&D and ICT
Values
Billions of Euros or Dollars Share in total investment
(%) Ratio in GVA
(%)
1980 1990 1995 2000 1980 1990 1995 2000 1980 1990 1995 2000
France R&D1 4.7 14.5 16.6 19.3 7.7 9.7 11.6 10.2 1.4 1.8 1.9 1.8 ICT 3.4 11.5 12.3 24.0 5.6 7.7 8.6 12.6 1.0 1.5 1.4 2.2
Total invest. 61.0 148.7 143.4 190.1 100.0 100.0 100.0 100.0 18.0 18.8 16.0 17.7
United States R&D1 44.5 109.7 132.1 199.5 8.4 11.5 10.6 10.6 1.9 2.3 2.1 2.4 ICT 46.5 131.4 204.2 401.7 8.8 13.7 16.4 21.4 2.0 2.7 3.3 4.9 Total invest. 530.1 956.1 1245.0 1878.4 100.0 100.0 100.0 100.0 22.6 19.8 20.2 22.7
1 R&D performed by private firms. 2 Including Households to be comparable with France.
Sources: Authors calculations based on National Accounts and OECD (For R&D)
Scope: Business Sector