iron titanium phosphates as high-specific-capacity electrode materials for lithium ion batteries
TRANSCRIPT

Seediscussions,stats,andauthorprofilesforthispublicationat:https://www.researchgate.net/publication/258119977
Irontitaniumphosphatesashigh-specific-capacityelectrodematerialsforlithiumionbatteries
ARTICLEinJOURNALOFALLOYSANDCOMPOUNDS·FEBRUARY2014
ImpactFactor:3·DOI:10.1016/j.jallcom.2013.09.093
CITATIONS
8
READS
54
11AUTHORS,INCLUDING:
BrahimElBali
UniversitéMohammedPremier
178PUBLICATIONS576CITATIONS
SEEPROFILE
MohamedNaji
EuropeanCommission,Germany
12PUBLICATIONS21CITATIONS
SEEPROFILE
SaidBenmokhtar
UniversitéHassanIIdeCasablanca
55PUBLICATIONS247CITATIONS
SEEPROFILE
MichalDusek
InstituteofPhysicsASCR
407PUBLICATIONS2,206CITATIONS
SEEPROFILE
Availablefrom:RachidEssehli
Retrievedon:09February2016
Journal of Alloys and Compounds 585 (2014) 434–441
Contents lists available at ScienceDirect
Journal of Alloys and Compounds
journal homepage: www.elsevier .com/locate / ja lcom
Iron titanium phosphates as high-specific-capacity electrode materialsfor lithium ion batteries
0925-8388/$ - see front matter � 2013 Elsevier B.V. All rights reserved.http://dx.doi.org/10.1016/j.jallcom.2013.09.093
⇑ Corresponding author at: Laboratory of Mineral Solid and Analytical Chemistry(LMSAC), Department of Chemistry, Faculty of Sciences, University Mohamed I, PO.Box 717, 60000 Oujda, Morocco. Tel.: +212668104952..
E-mail address: [email protected] (R. Essehli).
R. Essehli a,b,⇑, B. El Bali a, A. Faik c, M. Naji d, S. Benmokhtar e, Y.R. Zhong f, L.W. Su f, Z. Zhou f, J. Kim g,K. Kang g, M. Dusek h
a Laboratory of Mineral Solid and Analytical Chemistry (LMSAC), Department of Chemistry, Faculty of Sciences, University Mohamed I, PO. Box 717, 60000 Oujda, Moroccob ESECO SYSTEMS 270 rue Thomas Edison, Atelier Relais No 6, 34400 Lunel, Francec CIC energigune, Parque Tecnológico de Álava, Albert Einstein 48, 01510 Miñano, Álava, Spaind CNRS, UPR3079 CEMHTI, 1D avenue de la Recherche Scientifique, 45071 Orléans cedex 2, Francee LCPGM, Laboratoire de Chimie-Physique Générale des Matériaux, Département de Chimie, Université Hassan II-Mohammedia, Faculté des Sciences Ben M’Sik, Casablanca, Moroccof Institute of New Energy Material Chemistry, Synergetic Innovation Center of Chemical Science and Engineering (Tianjin), Nankai University, Tianjin 300071, PR Chinag Department of Materials Science and Engineering, Seoul National University, Gwanak-ro, Gwanak-gu, Seoul 151-742, Republic of Koreah Institute of Physics of the ASCR, v.v.i., Na Slovance 2, 182 21 Praha 8, Czech Republic
a r t i c l e i n f o a b s t r a c t
Article history:Received 29 January 2013Received in revised form 12 September2013Accepted 16 September 2013Available online 25 September 2013
Keywords:Crystal structureElectrolyteNasiconOxyphosphateLithium-ion batteries
Two iron titanium phosphates, Fe0.5TiOPO4 and Fe0.5Ti2(PO4)3, were prepared, and their crystal structuresand electrochemical performances were compared. The electrochemical measurements of Fe0.5TiOPO4 asan anode of a lithium ion cell showed that upon the first discharge down to 0.5 V, the cell delivered acapacity of 560 mA h/g, corresponding to the insertion of 5 Li’s per formula unit Fe0.5TiOPO4. Ex-situXRD reveals a gradual evolution of the structure during cycling of the material, with lower crystallinityafter the first discharge cycle. By correlating the electrochemical performances with the structural stud-ies, new insights are achieved into the electrochemical behaviour of the Fe0.5TiOPO4 anode material, sug-gesting a combination of intercalation and conversion reactions. The Nasicon-type Fe0.5Ti2(PO4)3 consistsof a three-dimensional network made of corners and edges sharing [TiO6] and [FeO6] octahedra and [PO4]tetrahedra leading to the formation of trimmers [FeTi2O12]. The first discharge of lithium ion cells basedon Fe0.5Ti2(PO4)3 materials showed electrochemical activity of Ti4+/Ti3+ and Fe2+/Fe0 couples in the 2.5–1 V region. Below this voltage, the discharge profiles are typical of phosphate systems where Li3PO4 isa product of the electrochemical reaction with lithium; moreover, the electrolyte solvent is reduced.An initial capacities as high as 1100 mA h g�1 can be obtained at deep discharge. However, there is anirreversible capacity loss in Fe0.5Ti2(PO4)3 due to the occurrence of insulating products as Li3PO4 and asolid electrolyte interface.
� 2013 Elsevier B.V. All rights reserved.
1. Introduction
Recently a large interest has been invoked by the metal-tita-nium phosphates with oxyphosphate and Nasicon-type structures,which were exploited as anode materials for Li ion batteries [1–5].Oxyphosphates M0.5TiO(PO4) where M = Cr, Fe, Co, Ni, Cu and Mgare isotypical, all crystallizing in monoclinic system (P21/c). Fromthe structural point of view, they are theoretically expected toaccommodate one lithium atom per formula unit, following thereduction of Ti4+ to Ti3+. However, according to our recent findingsand those of other research groups, M0.5TiO(PO4) (M = Co, Ni andFe) are rather reacting with 3.5 lithium per formula unit [1–5].
As a matter of fact, they are generating an initial practical capacityof 434 mA h/g, which suggest that such phases could be used inhigh energy–density Li ion cells [1–5]. However, on delithiationonly two lithium atoms are practically extracted reversibly, indi-cating that one lithium is irreversibly trapped during the first cycle.We have recently reported from in situ X-ray synchrotron struc-tural studies, that this irreversible capacity was due to an amorphi-sation of the parent crystal structure and the to formation of a newunreactive phase, which crystallizes also in the monoclinic sym-metry (P21/c) with slightly different cell parameters [5]. Accord-ingly, different approaches for enhancing the electrochemicalperformance of these compounds were described [5]. In a recentpaper, we have compared the electrochemical performance ofNi0.5TiOPO4 and the corresponding core–shell phase Ni0.5TiOPO4/C.The former was reaction using a solid state synthesised method,whereas the core–shell composite was hydrothermally synthe-sized by treating Ni0.5TiOPO4 in a glucose solution. The composites

Fig. 2. X-ray powder diffraction profiles of Fe0.5Ti2(PO4)3 experimental (. . .) andcalculated patterns (—).
Table 1Crystal data and structure refinement for Fe0.5Ti2(PO4)3.
Structural formula Fe0.5Ti2(PO4)3
Molecular weight 817.2Crystal system Hexagonal
R. Essehli et al. / Journal of Alloys and Compounds 585 (2014) 434–441 435
were shown to form small particles with varying sizes coated in a3 nm thick carbon layer. A specific capacity of 276 mA h/g was ob-served after 30 cycles at a current density of 42.7 mA g�1, com-pared to 155 mA h/g from the solid state synthesised material [6].
Nasicon-kind M0.5Ti2(PO4)3, M as before defined, have beenfound to crystallize in rhombohedral system with three differentspace-group (R-3, R32, R-3c). The electrochemical behaviour oflithium insertion of these materials has been investigated [7,8].In M0.5Ti2(PO4)3 (M = Co, Mn and Mg), a capacity value of183.85 mA h/g, after the first discharge at 1.6 V was reported[7,8]. Such capacity value is by all means higher than the theoret-ical capacity for Ti4+/Ti3+ reduction.
We report in this work on the synthesis, crystal structure andnew electrochemical behaviour upon lithium insertion of twoiron-titatnium phosphates Fe0.5TiOPO4 and Fe0.5Ti2(PO4)3 belong-ing to the oxyphosphate and Nasicon types structrures, whichshow a high capacities compared to literature.
2. Experimental
2.1. Samples preparations
Powder samples of Fe0.5TiO(PO4) were prepared by solid state reaction, i.e. FeO,TiO2 and TiP2O7 are stoechiometrically mixed according to the scheme:
FeOþ TiO2 þ TiP2O7 ! 2Fe0:50TiOPO4 ð1Þ
The mixture was placed in a quartz tube, sealed under vacuum, and heated up to650 �C, and then to 1050 �C with intermittent regrinding. The refined X-rays diffrac-tion pattern of the end-product is depicted on Fig. 1.
Fe0.50Ti2(PO4)3 was prepared by a same way: Amounts of titanyl pyrophosphateand iron titanium oxyphosphate were thoroughly homogenized with the desiredcomposition ratio in an agate mortar. Afterwards, this mixture was sealed in quartztube under vacuum and dried at 1000 �C for 5 d according to the reaction:
Fe0:50TiOðPO4Þ þ TiP2O7 ! Fe0:5Ti2ðPO4Þ3: ð2Þ
The sample was held at 1150 ± 20 �C for 1 day, and cooled to 500 �C, at a rate of 3 �C/h, and finally cooled to room temperature by just cutting of the power. Small or-ange–red crystals were obtained. Fig. 2 depicts the X-ray diffraction profiles fromFe0.5Ti2(PO4)3 showing a good agreement with the calculated patterns. The powderdiffraction pattern was fully indexed based on the rhombohedral cell parameters.
2.2. Instrumental analysis
2.2.1. Powder analysisThe powders were analyzed using a STOE STADI P diffractometer, equipped
with a linear position sensitive detector and using Cu Ka1 radiation (k = 1.5418 Å)in flat-sample transmission mode.
2.2.2. Single crystal study of Fe0.5Ti2(PO4)3
The X-ray diffraction data for the title compound were collected on a four-cir-cles diffractometre Gemini of Oxford Diffraction (now Agilent Technologies), usinggraphite monochromatized Mo Ka radiation (k = 0.7173 Å) collimated with Mo-En-hance and an Atlas CCD detector. The intensity data were corrected for Lorentz and
Fig. 1. X-ray powder diffraction profiles of Fe0.50TiO(PO4) experimental (. . .) andcalculated patterns (—).
polarization effects. A numerical absorption correction based on the crystal shapewas carried out with the program CrysAlis RED [9]. The structures were solved bythe Direct Methods procedure of SIR97 [10] and refined by a full-matrix least-squares technique based on F2 with Jana2006 [11].
The Laue symmetry of the diffraction pattern of Fe0.50Ti2(PO4)3 was �3m1 butthe structure could only be solved in the subgroup R-3 using the lost symmetryoperation y, x, �z of R-3m as twinning operation. The volume fraction of the secondtwin domain was refined as 0.499(3) giving thus an explanation why the false high-er Laue symmetry was exactly simulated by twinning. The final structure model hasR factor of 20% without twinning and 1.63% with twinning.
Table 1 reports the crystallographic data, the experimental details about datacollection, the structure refinements. Atomic coordinates and equivalent thermalparameters are reported in Table 2, and selected bond distances in Table 3.
Supplementary structural data have been deposited with the Inorganic CrystalStructure Database (FIZ), under deposition number CCDC885923.
2.3. Electrochemical measurements
Electrochemical measurements were performed in Li test cells assembled in anargon-filled glove box. Test electrodes were prepared by mixing active material,acetylene black, and polytetrafluoroethylene (PVDF) binder with a weight ratio of80:15:5. The mixture was compressed into sheets and cut into 8 mm diameterstrips, and then loaded on Cu foil. The cells were assembled after the strips weredried at 100 �C overnight. Lithium foil was used as counter and reference electrodes.The electrolyte consists in a 1 M solution of LiPF6 dissolved in ethylene carbonate(EC)-ethyl methyl carbonate (EMC)-dimethyl carbonate (DMC) (1:1:1 vol.%). Thedischarge/charge cycling tests were performed on Land CT2001 battery testers with
Wavelength (Å) 0.71073Space group R-3Cell dimension a = 8.513(3) Å
b = 8.513(3) Åc = 21.011(6) Å
Temperature (K) 295(2)Cell volume 1318.91(8)Z 3Crystal size (mm3) 0.1650 � 0.1241 � 0.1189Diffractometer Gemini, oxford diffractionColour OrangeDensity (g cm�1) 3.0856F(000) 1188h range (deg) 4.63–31.96Index range �11 6 h 6 0, 0 6 k 6 12,0 6 l 6 30Data collection temperature (K) 293(2)h range for data collection (�) 2.91–26.45Goodness of fit on F2 1.225Final R indices [I > 2r(I)] R1 = 0.0181, wR2 = 0.0655Extinction coefficient 4600(400)Largest diff. peak and hole (e Å�3) 0.79 and �1.15

Table 2Atomic coordinates and equivalent isotropic displacement parameters (Å2 � 104) forFe0.50Ti2(PO4)3.
Atom x y z U (eq)
Fe 0.666667 0.333333 0.333333 151(3)Ti(1) 0.666667 0.333333 0.18603(3) 45(2)Ti(2) 0.333333 �0.333333 0.30204(3) 46(2)P(1) 0.71545(8) 0.00594(9) 0.25306(3) 47(3)O(1) 0.5342(3) �0.1695(3) 0.25211(9) 105(7)O(2) 0.6819(2) 0.1684(3) 0.25288(9) 83(7)O(3) 0.8494(3) 0.3265(3) 0.14123(9) 96(7)O(4) 0.8301(3) 0.0280(3) 0.31078(10) 140(8)
Table 3Anisotropic displacement parameters (Å2 � 104).
Atom U11 U22 U33 U12 U13 U23
Fe 189(4) 189(4) 73(4) 94.6(18) 0 0Ti(1) 52(3) 52(3) 31(3) 25.8(14) 0 0Ti(2) 45(3) 45(3) 47(4) 22.7(14) 0 0P(1) 44(4) 46(3) 54(3) 25(3) 4(2) 12(2)O(1) 78(8) 91(9) 113(9) 17(8) 30(8) 1(8)O(2) 129(9) 83(9) 72(8) 79(7) 19(7) 20(7)O(3) 94(9) 96(9) 101(9) 51(8) 46(7) 11(7)O(4) 158(11) 169(11) 124(9) 105(8) �54(8) �2(8)
The anistropic displacement factor exponent takes the form: �2p2[h2a�2U11+� � �+2hka�b�U12]
Fig. 3. [TiO6] octahedra running parallel to the c axis in the structure of Fe0.5TiOPO4,face sharing from [FeO6] and [TiO6] leads to trimmers [Ti2FeO12].
Fig. 4. Polyhedral view down [110] of the Fe0.5Ti2(PO4)3 structure ([TiO6] octahedraare shown with light shading, [PO4] tetrahedra with dark shading, Fe/h as circles).
436 R. Essehli et al. / Journal of Alloys and Compounds 585 (2014) 434–441
a voltage range of 0.5–3.0 V. Cyclic voltammetry (CV) was conducted on a CHI 600Aelectrochemical analyzer with a scan rate of 0.01 mV/s in the potential range of 0.5–3 V (vs. Li/Li+).
The lithiated pure cathode LixFe0.5TiO (PO4) (0 < x < 1) was synthesized bychemical lithiation using n-butyl lithium in hexane solution under vigorous stirringat room temperature for 48 h. The precipitate was aged at room temperature, andwashed several times with hexanes before drying under vacuum. The amount ofintercalated lithium was performed by inductively coupled plasma optical–emis-sion spectrometry.
For ex situ XRD studies, electrodes were fabricated by using approximately200 mg of active material without PVDF. The cells were discharged to various stagesat C/20. After the experiments, the cells were dismantled in glove box and powderwas collected. XRD patterns were recorded on the electrodes under vacuum byusing a special chamber attached to the XRD instrument.
3. Results and discussion
3.1. Crystal structures
3.1.1. Fe0.5TiOPO4
Fe0.5TiOPO4 is isotypic with Co0.50TiOPO4 [3], its structure canbe described as previously reported in [3], i.e. a framework madeof [TiO6] octahedra, triangular based antiprism [FeO6] and isolated[PO4] phosphate groups. Fe2+ cations are located in a triangularbased antiprism sharing faces with two [TiO6] octahedral leadingto trimmers [FeTi2O12]. The latter is interconnected via corners asthrough O–P–O bridges from isolated [PO4] tetrahedral, to expandin the space (Fig. 3). The structure also contains octahedral vacantsites that constitute favourable locations for lithium insertion.
3.1.2. Fe0.5Ti2(PO4)3
Based on powder data, Fe0.5Ti2(PO4)3 was first described withhexagonal symmetry (R-3) [12]. Here, we undertook the crystalsynthesis and structure based on the crystal data. The crystal struc-ture is built upon a 3D network made of corners and edges sharing[TiO6] and [FeO6] octahedra and [PO4] tetrahedra (Fig. 4). In thisframework [Ti(1)O6] and [FeO6] octahedra share edges to form‘‘trimmers’’ [FeTi2O12], which are connected to another octahedron,[Ti(2)O6], via O–P–O bridges from the orthophosphate group, thusforming an infinite chain along c. The chains are interconnectedwith another set of P–O–P bridges (Fig. 4). [TiO6] octahedra are dis-
torted with Ti–O distances ranging from 1.844(2) Å to 2.036(2) Å,and 1.893(2) Å to 1.942(3) Å for Ti(1) and Ti(2) sites, respectively(Table 4).

Table 4Bond distances (Å) and angles (�) for Fe0.50Ti2(PO4)3.
Bond Angles
O(2)–Fe–O(2)#2 69.36(8)Fe–O(2) 2.242(2) O(2)–Fe–O(2)#3 69.36(9)Fe–O(2)#2 2.2423(19) O(2)–Fe–O(2)#16 180Fe–O(2)#3 2.242(2) O(2)–Fe–O(2)#17 110.64(8)Fe–O(2)#16 2.242(2) O(2)–Fe–O(2)#18 110.64(9)Fe–O(2)#17 2.423(19) O(2)#2–Fe–O(2)#3 69.36(7)Fe–O(2)#18 2.242(2) O(2)#2–Fe–O(2)#16 110.64(8)
O(2)#2–Fe–O(2)#17 180O(2)#2–Fe–O(2)#18 110.64(7)O(2)#3–Fe–O(2)#16 110.64(9)O(2)#3–Fe–O(2)#17 110.64(7)O(2)#3–Fe–O(2)#18 180O(2)#16–Fe–O(2)#17 69.36(8)O(2)#16–Fe–O(2)#18 69.36(9)O(2)#17–Fe–O(2)#18 69.36(7)O(2)–Ti(1)–O(2)#2 77.63(9)
Ti(1)–O(2) 2.036(2) O(2)–Ti(1)–O(2)#3 77.63(10)Ti(1)–O(2)#2 2.0356(19) O(2)–Ti(1)–O(3) 89.13(10)Ti(1)–O(2)#3 2.036(3) O(2)–Ti(1)–O(3)#2 166.17(9)Ti(1)–O(3) 1.844(2) O(2)–Ti(1)–O(3)#3 95.80(9)Ti(1)–O(3)#2 1.844(3) O(2)–Ti(1)–O(2)#3 77.63(8)Ti(1)–O(3)#3 1.844(2) O(2)#2–Ti(1)–O(3) 95.80(9)
O(2)#2–Ti(1)–O(3)#2 89.13(10)O(2)#2–Ti(1)–O(3)#3 166.17(9)O(2)#3–Ti(1)–O(3) 166.17(11)O(2)#3–Ti(1)–O(3)#2 95.80(11)O(2)#3–Ti(1)–O(3)#3 89.13(10)O(3)–Ti(1)–O(3)#2 96.26(11)O(3)–Ti(1)–O(3)#3 96.26(11)O(3)#2–Ti(1)–O(3)#3 96.26(10)O(1)–Ti(2)–O(1)#2 92.26(9)
Ti(2)–O(1) 1.8933(17) O(1)–Ti(2)–O(1)#3 92.26(10)Ti(2)–O(1)#2 1.893(3) O(1)–Ti(2)–O(4)#16 87.67(9)Ti(2)–O(1)#3 1.893(2) O(1)–Ti(2)–O(4)#17 90.57(9)Ti(2)–O(4)#16 1.942(3) O(1)–Ti(2)–O(4)#18 177.16(12)Ti(2)–O(4)#17 1.942(3) O(1)#2–Ti(2)–O(4)#3 92.26(13)Ti(2)–O(4)#18 1.942(3) O(1)#2–Ti(2)–O(4)#16 177.16(11)
O(1)#2–Ti(2)–O(4)#17 87.67(12)O(1)#2–Ti(2)–O(4)#18 90.57(11)O(1)#3–Ti(2)–O(4)#16 90.57(11)O(1)#3–Ti(2)–O(4)#17 177.16(9)O(1)#3–Ti(2)–O(4)#18 87.67(10)O(4)#16–Ti(2)–O(4)#17 89.49(11)O(4)#16–Ti(2)–O(4)#18 89.49(11)O(4)#17–Ti(2)–O(4)#18 89.49(10)O(1)–P–O(2) 109.19(13)
P–O(1) 1.5193(17) O(1)–P–O(3)#10 106.59(11)P–O(2) 1.546(3) O(1)–P–O(4) 114.13(11)P–O(3)#10 1.544(2) O(2)–P–O(3)#10 110.37(12)P–O(4) 1.509(2) O(2)–P–O(4) 106.75(12)
O(3)#10–P–O(4) 109.83(14)
Note. Symmetry transformations used to generate equivalent atoms:#1, x,y,z; #2, �y,x�y,z; #3, �x + y,�x,z; #4, �x,�y,�z; #5, y,�x + y,�z; #6, x�y,x,�z#7, x + 2/3,y + 1/3,z + 1/3; #8, �y + 2/3,x�y + 1/3,z + 1/3 ; #9, �x + y + 2/3,�x + 1/3,z + 1/3#10, �x + 2/3,�y + 1/3,�z + 1/3 ; #11, y + 2/3,�x + y + 1/3,�z + 1/3 ; #12, x�y + 2/3,x + 1/3,�z + 1/3#13, x + 1/3,y + 2/3,z + 2/3 ; #14, �y + 1/3,x�y + 2/3,z + 2/3; #15, �x + y + 1/3,�x + 2/3,z + 2/3#16, �x + 1/3,�y + 2/3,�z + 2/3 ; #17, y + 1/3,�x + y + 2/3,�z + 2/3; #18, x�y + 1/3,x + 2/3,�z + 2/3
Fig. 5. Charge/Discharge curve of Fe0.5TiOPO4 with a current density of 42.7 mA/gin the voltage range of 0.5–4.0 V for the first cycle.
R. Essehli et al. / Journal of Alloys and Compounds 585 (2014) 434–441 437
[FeO6] octahedron is less distorted compared to [TiO6], with anaverage Fe–O distance of 2.242(2) Å and angles ranging from69.36� to 180�. The Fe–O bond distance derived from X-ray powderdata was found to be in the range of 2.18 and 2.50 Å [12]. In the ti-tle compound d(Fe2+–O) = 2.00–2.20 Å is similar to what is found inother hexa-coordinated Fe2+-phosphates such as Fe2P2O7 or Fe2P4
O12 where d(Fe2+–O) are respectively ranging in the fields 2.019–2.168 Å [13] and 2.046–2.186 Å [14], which agree with our results.[PO4] tetrahedron is also distorted in the framework of Fe0.5Ti2
(PO4)3, with P–O distances ranging from 1.509(2) Å to 1.546(3) Å
and an average 1.529(4) Å which is of the same magnitude as com-monly recorded in M0.5Ti2(PO4)3 (M = Mn, Co) [15] and generally inhomologous phosphates [16].
3.2. Electrochemical performances
3.2.1. Fe0.5TiOPO4
The electrochemical performance of Fe0.5TiOPO4 anode wasevaluated, at room temperature, using a galvanostatic method witha current density of 42.7 mA/g, in the voltage range of 0.5–4.0 V(Fig. 5). The first discharge curve, signals an intriguing behaviourcorresponding to the apparition of three pseudo-plateaus: twosmall ones at �1.8 V with the reaction of �1 lithium ion per for-mula unit, and the �1 V then a long plateau down to 0.67 V. Samephenomenon has been observed in similar metal-titanium oxy-phosphate compounds [1–5]. The cell delivers a capacity of about560 mA h/g, corresponding to the insertion of 5 Li per formula unitFe0.5TiOPO4, which is much higher than the theoretical capacity ofthe material (285 mA h/g), estimated from the redox pairs Ti4+/Ti3+
and Fe2+/Fe0. It is very instructive to compare the observed specificcapacity to other titanium oxyphosphates used as anode materials.Fig. 6 displays a histogram plot of several titanium oxyphosphatesprepared with different methods in order to improve their specificcapacity. As one can see, Fe0.5TiOPO4 displays a capacity close tothe one observed in LiFePO4 as anode (about 600 mA h/g) uponthe first discharge [17], which is approximately 4 to 5 times higherthan the corresponding room temperature specific capacity valuesof LiFePO4 cathodes [18]. The first charge process exhibits a highervoltage plateau than the discharge process, with a sloping potentialnear 2 V corresponding to the extraction of two Li atoms. The cyclicperformances of Fe0.5TiOPO4 are shown in Fig. 7. In contrast, thecapacity of the pure Fe0.5TiOPO4 decreased continuously with fur-ther cycling at different rates. The discharge capacity was560 mA h g�1 in the 1st cycle but faded to 300 mA hg�1 after 10 cy-cles at 42.7 mA/g which is still comparable to the graphite capacity(about 375 mA h/g). Fig. 8, shows the cyclic voltammetry (CV)curves of Fe0.5TiOPO4 for two cycles at a scanning rate of0.01 mVs�1. Fe0.5TiOPO4 exhibits similar CV behaviour for the M0.5-
TiOPO4 (M = Co, Ni) [1–5] with three reduction peaks in the catho-dic process and three oxidation peaks in the anodic process,respectively. For the first cathodic scan the minor peak, at�1.81 V, is assigned to titanium reduction (Ti4+ to Ti3+) by an inser-tion of lithium ions into the structure, a medium at�0.66 V is asso-ciated with the reduction of Fe2+ to Fe0 .This matches well with thereduction potential of FeO at �0.75 V reported in literature [19]and a major one third appearing as a sharp peak at �0.35 V canbe attributed to the decomposition of the electrolyte, which is re-ported to lead to the formation of the solid electrolyte interphase

Fig. 6. Displays a histogram plot of several titanium oxyphosphates prepared withdifferent methods in order to improve their specific capacity.
Fig. 7. Cycling performance of Fe0.5TiOPO4 with different current density in thevoltage range of 0.5–4.0 V at 25 �C.
Fig. 8. The initial two-cycle CV curves of Fe0.5TiOPO4.
10 20 30 50 60LixFe0.5TiOPO4
x=1.2
x=0.8
x=0.6
x=0.4
x=0.2
Fig. 9. Ex situ XRD patterns X-ray diffraction patterns of a Li//LixFe0.5TiO(PO4) celldischarged from 0.5 to 4 V at C/5 rate.
438 R. Essehli et al. / Journal of Alloys and Compounds 585 (2014) 434–441
(SEI) films [1–4]. In contrast, during the second cycle, three peakswhose been observed respectively at 1.7 V, 1.58 V that might beattributed to the reduction of Ti4+/Ti3+ and Fe2+/Fe0 in new environ-ments as compared to the starting Fe0.5TiOPO4 material. Thisbehaviour has been confirmed by change of energy of the Kaabsorption edge of iron and titanium in ex situ XAS measurementsfor Fe0.5TiOPO4 upon �1 and �2 Li ion lithiation in Fe0.5TiOPO4 at7110 and 4977.5 eV respectively. Lasri et al. [20], detected metallicFe upon chemical lithiation of Fe0.5TiOPO4 by Mössbauer spectros-copy. The most plausible reaction of the material would be:
Fe0:5TiIVOPO4 þ Li! LiFe0:5TiIIIOPO4 E ¼ 1:7 V ð3Þ
LiFe0:5TiIIIOPO4 þ Li! Fe0 þ Li2TiIIIOPO4 E ¼ 1:58 V ð4Þ
The third one at 1.08 may be attributed to the reduction of Ti3+/Ti2+.The presence of Ti2+ has been confirmed by XAS measurements forupon �3 Li ions lithiation in Fe0.5TiOPO4 at 4976 eV.
Li2TiIIIOPO4 þ Li! Li3TiIIOPO4 E ¼ 1:08 V ð5Þ
During the first discharge, the electrode exhibits a wide voltage pla-teau at about 0.67 V followed by a sloping curve, corresponding toat about 0.67 V, corresponding to the decomposition of materialsinto Ti, and the formation of amorphous Li3PO4, Li2O and solid elec-trolyte interface (SEI) layer.
Li3TiIIOPO4 þ 2Li! Tiþ Li2Oþ Li3PO4 E ¼ 0:67 V ð6Þ
The presence of Li3PO4, which is formed during the discharge reac-tions, is insulating and it may damages the electrode performanceand probably decreases the capacity. For the anodic scan, three oxi-dation peaks appear during the first and second scan at the samepotential 1.68, 1.83, and 2.09 V. These peaks could be attributedto the oxidation of Ti3+ to Ti4+ and Fe0 to Fe2+ corresponds to theFeO formation and Li2O decomposition. Upon delithiation at 3 Vour ex XAS measurements of the Ti K-edge and the Fe K-edgeshowed that both Ti and Fe metals are reoxidised to Ti4+
(4979 eV) and Fe2+ (7120 eV).To examine the structural changes accompanying lithium inter-
calation in Fe0.5TiOPO4, ex situ XRD patterns were recorded onphases corresponding to intercalation between 0.2–1.2 Li atoms.Fig. 9. The displays X-ray diffraction pattern of Li3.5Fe0,5TiOPO4
showing the low crystallinity of the sample where a new lithiatedphase and aggregates of metallic Fe0 (JCPDS 87-0722) could be eas-ily distinguished. The lithiated pure cathode LixFe0.5TiO(PO4)(0 < x < 1) synthesized by chemical lithiation were subject to X-ray diffraction investigations and the corresponding lattice param-eters have been refined by the Rietveld method shown on Fig. 10.All phases are compatible with the proposed structure model ob-tained from that of Fe0.5TiOPO4 by an additional occupation ofthe (2a)-site at (0, 0, 0) with Li. But, Li intercalation by transitionfrom Fe2+ to Fe0 was unreasonable because Fe1+ ion is very unstableand Fe0 means the precipitation of Fe metal from the crystal struc-ture. Therefore, we think that the reaction is not an intercalationbut rather a conversion. As shown on Fig. 8, the degradation ofcrystal structure by conversion reaction is observed, instead ofintercalation which would appears as shifts in the XRD picks. Thestructure of LixFe0.5TiOPO4 0 < x < 1 consists of a 3D anionic frame-
Inte
nsity
(ar b
. uni
ts)
Bragg Angle 2θ (deg)
Li0.9Fe0.5TiOPO4
Inte
nsity
(arb
. uni
ts)
Bragg Angle 2θ (deg)
Inte
nsity
(arb
. un i
t s)
Bragg Angle 2θ (deg)
Li0.6Fe0.5TiOPO4
10 20 30 40 50 60 70 80
10 20 30 40 50 60 70 80 90
10 20 30 40 50 60 70 80 90
10 20 30 40 50 60 70 80 90
90
Inte
nsi ty
(arb
. uni
ts)
Bragg Angle 2θ (deg)
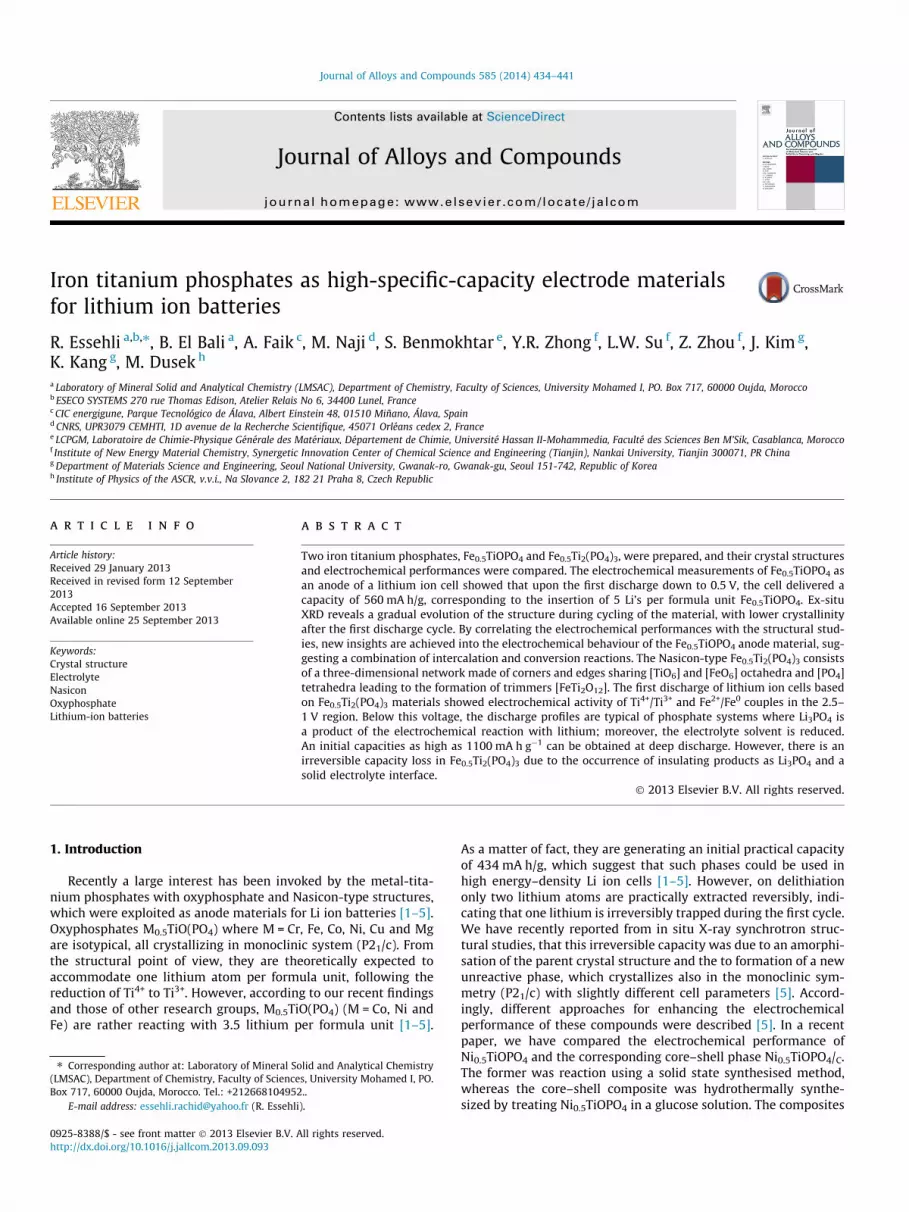
Fig. 10. Rietveld refinements of the LixFe0.5TiOPO4 with x = 0.2, 0.4, 0.6 and 0.9.
R. Essehli et al. / Journal of Alloys and Compounds 585 (2014) 434–441 439
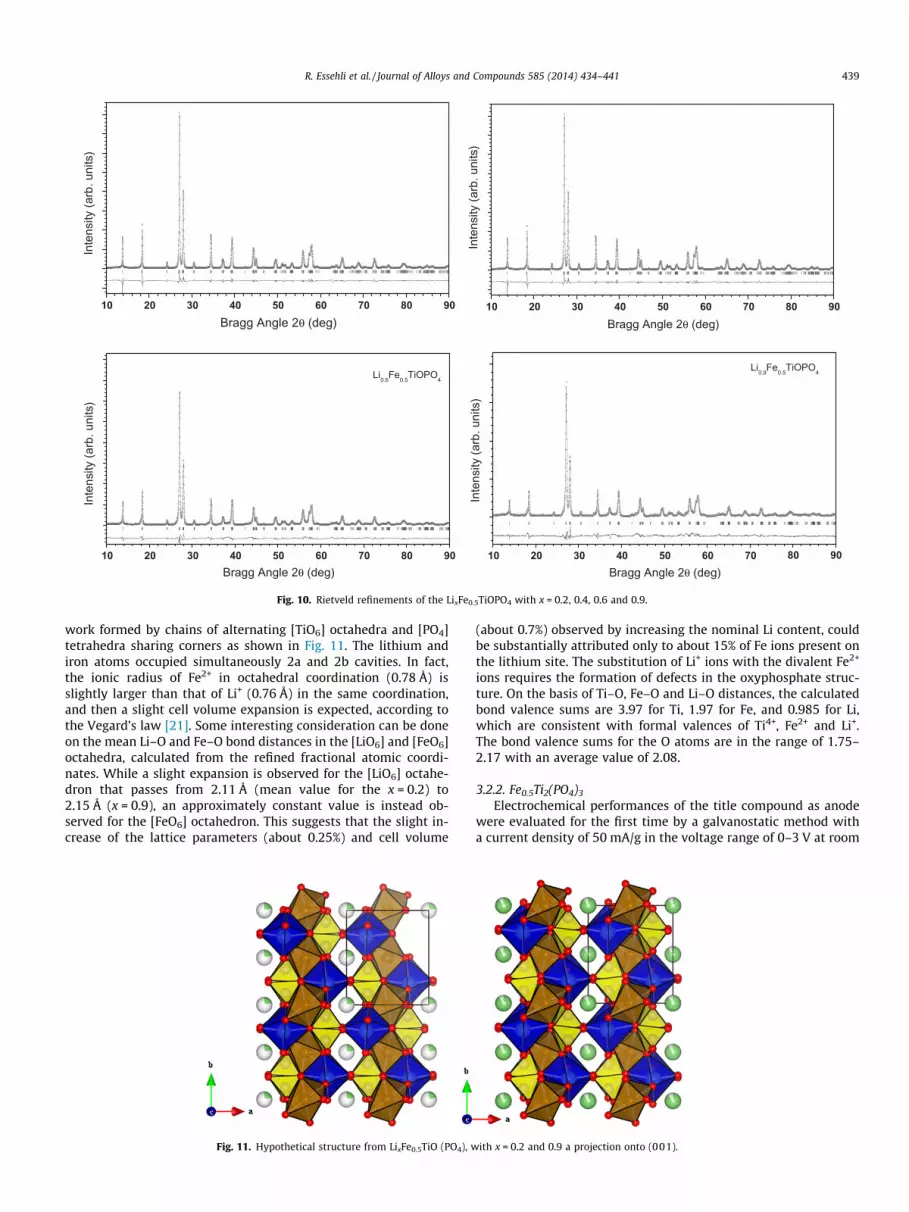
work formed by chains of alternating [TiO6] octahedra and [PO4]tetrahedra sharing corners as shown in Fig. 11. The lithium andiron atoms occupied simultaneously 2a and 2b cavities. In fact,the ionic radius of Fe2+ in octahedral coordination (0.78 Å) isslightly larger than that of Li+ (0.76 Å) in the same coordination,and then a slight cell volume expansion is expected, according tothe Vegard’s law [21]. Some interesting consideration can be doneon the mean Li–O and Fe–O bond distances in the [LiO6] and [FeO6]octahedra, calculated from the refined fractional atomic coordi-nates. While a slight expansion is observed for the [LiO6] octahe-dron that passes from 2.11 Å (mean value for the x = 0.2) to2.15 Å (x = 0.9), an approximately constant value is instead ob-served for the [FeO6] octahedron. This suggests that the slight in-crease of the lattice parameters (about 0.25%) and cell volume
Fig. 11. Hypothetical structure from LixFe0.5TiO (PO4), w
(about 0.7%) observed by increasing the nominal Li content, couldbe substantially attributed only to about 15% of Fe ions present onthe lithium site. The substitution of Li+ ions with the divalent Fe2+
ions requires the formation of defects in the oxyphosphate struc-ture. On the basis of Ti–O, Fe–O and Li–O distances, the calculatedbond valence sums are 3.97 for Ti, 1.97 for Fe, and 0.985 for Li,which are consistent with formal valences of Ti4+, Fe2+ and Li+.The bond valence sums for the O atoms are in the range of 1.75–2.17 with an average value of 2.08.
3.2.2. Fe0.5Ti2(PO4)3
Electrochemical performances of the title compound as anodewere evaluated for the first time by a galvanostatic method witha current density of 50 mA/g in the voltage range of 0–3 V at room
ith x = 0.2 and 0.9 a projection onto (001).

Fig. 12. Voltage versus x plots of Fe0.5Ti2(PO4)3 measured at 42.7 mA/g in thepotential range of 0.5–4.0 V.
Fig. 13. Capacity performance of lithium cells assembled with Fe0.5Ti2(PO4)3
measured at 50 mA/g.
440 R. Essehli et al. / Journal of Alloys and Compounds 585 (2014) 434–441
temperature. Upon the first discharge (Fig. 12), the cell delivers acapacity of about 1100 mA h/g corresponding to the insertion of14 Li per formula unit Fe0.5Ti2(PO4)3. In order to examine the pre-liminary life performance of Fe0.5Ti2(PO4)3 anode, 25 (C/D) cycleswere carried out at low rate. Fig. 12 shows the (C/D) curves ofLi//Fe0.5Ti2(PO4)3 cells cycled between 0.5 and 3.5 V at 50 mA/g.The first discharge capacity is 1100 mA h/g. On charge, the capacitydecreases to 600 mA h/g, losing about one third of its dischargecapacity. This capacity loss is probably due to the above mentionedirreversible electrochemical processes during the first discharge ofthe anode. During the following cycles, good reversible capacityretention and better cyclability were obtained. Fig. 13 shows thecycling performance of Fe0.5Ti2(PO4)3 in the first three cycles inthe voltage range of 0–3 V, at 298 K. The long plateau at around0.75 V corresponds to the decomposition of the Fe0.5Ti2(PO4)3 tometallic Fe, P4 and Li2O in the initial discharge. In a first approachthe pseudoplateau at 2.5–1.25 V a voltage with an extension of110 mA h g�1. This profile is similar to that found for a wide varietyof titanium Nasicon phosphates: M1.5Ti1.5(PO4)3 with M = Co & Cu[22]. However this pseudoplateau was not present in other sam-ples like LiFePO4 [17] or FePO4 and FePO4.H2O [23]. The capacityprovided by a theoretical titanium reduction according to:
Fe0:5TiðIVÞ2 ðPO4Þ3 þ 2Li! Li2Fe0:5TiðIIIÞ2 ðPO4Þ3 ð7Þ
is close to 120 mA h g�1, which is well in line with that shown byFe0.5Ti2(PO4)3 before the development of the 1.6–1.25 V plateau.
This behaviour has been confirmed by change of energy of the Kaabsorption edge of iron and titanium in ex-situ XAS measurementsfor LixFe0.5Ti(IV)
2(PO4)3 upon �2 Li ion lithiation in Fe0.5Ti(IV)2(PO4)3
at 7120 and 4977.5 eV respectively. Whereas the second process at1.25–0.9 V is more complex, corresponding to a reaction with lith-ium that yields Fe and Li3PO4. If we consider that the product ofreaction (8) further reacts with lithium according to:
Li2Fe0:5TiðIIIÞ2 ðPO4Þ3 þ 4Li! 0:5Fe0 þ Li3PO4 þ Li3TiðIIIÞ2 ðPO4Þx ð8Þ
Upon lithiation at �1 V, the ex-situ XAS measurements of the Ti K-edge and the Fe K-edge showed that both Ti and Fe are trivalent andmetal respectively. Between 0.9 V and 0.75 V, the curves show avoltage tail that provides 600 mA h g�1 for Fe0.5Ti2(PO4). This profileis similar to be what reported in other hydrated and anhydrous ironphosphates [22]. Probably, below 1.0 V, these titanium phosphatesreact with lithium to yield Ti, Li2O and P4 according to:
Li2TiðIIIÞ2 ðPO4Þx þ 6Li! 4Li2Oþ 2Tiþ xP4 ð9Þ
Another possible explanation is the reduction of solvent at low volt-ages, especially when carbonaceous materials are present in theelectrode. Worthy to mention is that within the field 0.75–0 V,the product of the reduction is an insulator solid electrolyte inter-face (SEI) that usually leads to poor electrochemical performanceswhen cycling the electrodes [17,22]. A better understanding of thecharge/discharge (C/D) reaction mechanism in this compound isreachable from the observations cited above. Further experimentalinvestigations are by all means suggested for future works. For thispurpose in situ DXR and 7Li NMR measurements are under scrutiny.
4. Conclusions
Two iron titanium phosphates: Fe0.5TiOPO4, belonging to themonoclinic (P21/c) isotypical oxyphosphates series M0.5TiO(PO4)(M = 3d divalent metal), and a Nasicon-kind Fe0.5Ti2(PO4)3 phos-phate, have been prepared and structurally investigated. The crys-tal structure of Fe0.5Ti2(PO4)3 is built upon a tridimensionalnetwork made of corners and edges sharing [TiO6] and [FeO6] octa-hedra and [PO4] tetrahedra. [Ti(1)O6] and [FeO6] octahedrons shareedges to form a ‘‘trimmers’’ [FeTi2O12]. The electrochemical mea-surements of Fe0.5TiO(PO4) anode was evaluated by a galvanostaticmethod with a current density of 42.7 mA/g in the voltage range of0.5–4.0 V at room conditions. The cell delivers a capacity of560 mA h/g, which corresponds to the insertion of 3.5 Li per for-mula unit Fe0.5TiOPO4. Fe0.5Ti2(PO4)3 anode was evaluated by a gal-vanostatic method with a current density of 50 mA/g in the voltagerange of 0–3 V at room conditions. The cell delivers a capacity of1100 mA h/g which corresponds to the insertion of 14 Li per for-mula unit Fe0.5Ti2(PO4)3.
Acknowledgment
R. Essehli would thank K. Fejfarova (Institute of Physics, Prag,Czeck Republic) for the structure investigations.
References
[1] I. Belharouak, K. Amine, Electrochem. Commun. 7 (2005) 648–651.[2] R. Essehli, B. El Bali, H. Ehrenberg, I. Svoboda, N. Bramnik, H. Fuess, Mater. Res.
Bull. 44 (2009) 817–821.[3] K. Maher, K. Edström, I. Saadoune, T. Gustafsson, M. Mansori, J. Power Sources
196 (2011) 2819–2825.[4] R. Essehli, B. El Bali, A. Faik, S. Benmokhtar, B. Manoun, Y. Zhang, X.J. Zhang, Z.
Zhou, H. Fuess, J. Alloys Comp. 530 (2012) 178–185.[5] V.A. Godbole, C. Villevieille, P. Novák, Electrochim. Acta 93 (2013) 179–188.[6] X.J. Zhang, Y. Zhang, Z. Zhou, J.P. Wei, R. Essehli, B. El Bali, Electrochem. Acta 56
(2011) 2290–2294.[7] C. Vidal-Abarca, P. Lavela, G. Ortiz, J.L. Tirado, Electrochim. Acta 77 (2012) 150–
156.

R. Essehli et al. / Journal of Alloys and Compounds 585 (2014) 434–441 441
[8] C. Vidal-Abarcaa, J.M. Ateba Mba, C. Masquelier, J.L. Tirado, P. Lavela, J.Electrochem. Soc. 159 (10) (2012) A1716–A1721.
[9] Agilent, CrysAlis PRO, Agilent Technologies, Yarnton, England, 2010.[10] SIR97, Altomare A., Burla M.C., Camalli M., Cascarano G.L., Giacovazzo C.,
Guagliardi A., Moliterni A.G.G., Polidori G. and Spagna R. J Appl Cryst 32(1999)115.
[11] V. Petrícek, M. Dušek, L. Palatinus, Jana 2006 Structure Determination SoftwarePrograms, Praha, Czech Republic, Institute of Physics, 2007.
[12] S. Benmokhtar, A. El Jazouli, A. Aatiq, J.P. Chaminade, P. Gravereau, A.Wattiaux, L. Fournes, J.C. Grenier, J. Solid State Chem. 180 (2007) 2004–2012.
[13] C. Parada, J. Perles, R. Saez-Puche, C. Ruiz-Valero, N. Snejko, Chem. Mater. 15(2003) 3347–3351.
[14] T. Ericsson, A.G. Nord, M.M.O. Ahmed, A. Gismelseed, F. Khangi, HyperfineInteract. 57 (1990) 2179–2186.
[15] R. Essehli, B. El Bali, S. Benmokhtar, K. Fejfarová, M. Dusek, Mater. Res. Bull. 44(2009) 1502–1510.
[16] D.E.C. Corbridge, Phosphorus, 4th ed., Elsevier, Amsterdam, 1990.[17] X.W. Guo, X.P. Fang, Y. Mao, Z.X. Wang, F. Wu, L.Q. Chen, J. Phys. Chem. C 115
(2011) 3803–3808.[18] Xu-Heng Liu, Zhong-wei Zhao, Powder Technol. 197 (3) (2010)
309–313.[19] P. Poizot, S. Laruelle, S. Grugeon, L. Dupont, J.M. Tarascon, Nature 407 (2000)
496–499.[20] K. Lasri, I. Saadoune, Y. Bentaleb, D. Mikhailova, H. Ehrenberg, L. Häggström, K.
Edström, Solid State Ionics 224 (2012) 15–20.[21] L. Vegard, Die Konstitution der Mischkristalle und die Raumfüllung der Atome,
Zeits. Phys. 5 (17) (1921).[22] J. Santos-Peña, M. Cruz-Yusta, P. Soudan, S. Franger, J.J. Cuart-Pascual, Solid
State Ionics 177 (2006) 2667–2674.[23] D. Son, E. Kim, T.G. Kim, M.G. Kim, J. Cho, B. Park, Appl. Phys. Lett. 85 (2004)
5875–5878.