iodine124-labeled iodo-azomycin-galactoside imaging of tumor hypoxia in mice with serial micropet...
TRANSCRIPT
European Journal of Nuclear Medicine and Molecular Imaging Vol. 31, No. 1, January 2004
Abstract. Tumor hypoxia, present in many human can-cers, can lead to resistance to radiation and chemothera-py, is associated with a more aggressive tumor pheno-type and is an independent prognostic factor of clinicaloutcome. It is therefore important to identify and localizetumor hypoxia in cancer patients. In the current study,serial microPET imaging was used to evaluate io-dine-124-labeled iodo-azomycin-galactoside (124I-IAZG)(4.2-day physical half-life) as a hypoxia imaging agentin 17 MCa breast tumors and six FSaII fibrosarcomasimplanted in mice. For comparison, another promisinghypoxic-cell PET radiotracer, fluorine-18-labeled fluoro-misonidazole (18F-FMISO), was also imaged in the sametumor-bearing animals. Twelve animals were also im-aged with 18F-labeled fluoro-deoxyglucose (18F-FDG).In addition, histological examination was performed, anddirect measurement of tumor oxygenation status carriedout with the Oxylite probe system. Two size groups wereused, relatively well-oxygenated tumors in the range of80–180 mg were designated as small, and those >300 mgand highly hypoxic, as large. Based on the data from 11 MCa and six FSaII tumors, both 124I-IAZG and 18F-FMISO images showed high tracer uptake in the largetumors. In 18F-FMISO images at 1, 3–4, and 6–8 h post-injection (p.i.), there was considerable whole-body back-ground activity. In contrast, 124I-IAZG imaging was opti-mal when performed at 24–48 h p.i., when the whole-body background had dissipated considerably. As a re-sult, the 124I-IAZG images at 24–48 h p.i. had higher tu-mor to whole-body activity contrast than the 18F-FMISOimages at 3–6 h p.i. Region-of-interest analysis was per-formed as a function of time p.i. and indicated a tumoruptake of 5–10% (of total-body activity) for FMISO at
3–6 h p.i., and of ~17% for IAZG at 48 h p.i. This wascorroborated by biodistribution data in that the tumor-to-normal tissue (T/N, normal tissues of blood, heart, lung,liver, spleen, kidney, intestine, and muscle) activity ra-tios of IAZG at 24 h p.i. was 1.5–2 times higher thanthose of FMISO at 3 h p.i., with the exception of stom-ach. Statistical analysis indicated that these differencesin T/N ratios were significant. The small tumors were vi-sualized in the 18F-FDG images, but not in the 124I-IAZGor 18F-FMISO images. This was perhaps due to the com-bined effect of a smaller tumor volume and a lower hyp-oxic fraction. Oxylite probe measurement indicated alesser proportion of regions with pO2<2.5 mmHg in thesmall tumors (e.g., pO2 was <2.5 mmHg in 28% and67% of the data in small and large FSaII tumors, respec-tively), and the biodistribution data showed lower uptakeof the tracers in the small tumors than in the large tu-mors. In the first study of its kind, using serial microPETimaging in conjunction with biodistribution analysis anddirect probe measurements of local pO2 to evaluate tu-mor hypoxia markers, we have provided data showingthe potential of 124I-IAZG for hypoxia imaging.
Keywords: IAZG – FMISO – Tumor hypoxia – micro-PET
Eur J Nucl Med Mol Imaging (2004) 31:117–128DOI 10.1007/s00259-003-1322-y
Introduction
Tumor hypoxia has been shown to be a common featureof many human cancers, based on histological studies[1], pO2 probe measurements [2, 3, 4], and scintigraphicimaging [5, 6]. Since hypoxic cells are radioresistant, ithas been suggested that some failures in radiation thera-py may be due to hypoxia-induced radioresistance [2, 3].
Clifton Ling (✉)Memorial Sloan Kettering Cancer Center, 1275 York Avenue,New York, NY 10021, USAe-mail: [email protected].: +1-212-6398301, Fax: +1-212-7173290
Molecular imaging
Iodine-124-labeled iodo-azomycin-galactoside imaging of tumor hypoxia in mice with serial microPET scanningPat Zanzonico1, Joseph O’Donoghue1, J Donald Chapman2, Richard Schneider2, Shangde Cai1, Steven Larson1, Bixiu Wen1, Yuchun Chen1, Ronald Finn1, Shutian Ruan1, Leo Gerweck3, John Humm1, Clifton Ling1
1 Memorial Sloan Kettering Cancer Center, New York, USA2 Fox Chase Cancer Center, Philadelphia, PA, USA3 Massachusetts General Hospital, Boston, MA, USA
Published online: 2 October 2003© Springer-Verlag 2003

In addition, tumor hypoxia also appears to be associatedwith a more aggressive tumor phenotype with a higherlikelihood of metastasis [4]. Furthermore, several recentclinical trials have shown that tumor hypoxia is an im-portant determinant of local relapse and overall survival[2, 3, 4]. Accordingly, it appears important to identifyand localize tumor hypoxia in the management and treat-ment of cancer patients.
In this regard, a promising approach is to use positronemission tomography (PET) scanning with a hypoxia-specific radiotracer to assess tumor hypoxia. Indeed, anumber of radiotracers for viable hypoxic cells in solidtumors have been developed, and several of these arenow being evaluated clinically [7]. The initial imagingstudies of tumor hypoxia used the 2-nitroimidazoles, io-dine-123-labeled iodoazomycin arabinoside (IAZA) withsingle-photon emission tomography (SPET) [6] and fluo-rine-18-labeled fluoro-misonidazole (FMISO) with PET[8]. Recently, Lehtiö et al. [9] evaluated the use of 18F-fluoro-erythronitroimidazole (FETNIM) as a hypoxiaimaging agent. Another 2-nitroimidazole, 2-(2-nitro-1H-imidazol-1-yl)-N-(2,2,3,3,3-pentafluoropropyl acetamide(EF5), showed promise in hypoxia imaging studies in ro-dent models and human tumor sections [10, 11]. Clinicalstudies using EF5 labeled with 18F in PET imaging arebeing planned [12]. More recently, the 2-nitroimidazolefluoro-azomycin arabinoside (FAZA), labeled with 18F,has been studied in tumor-bearing mice using PET [13].
Cu(II)-diacetyl-bis(N4-methylthiosemicarbazone)(Cu-ATSM), labeled with the positron emitters copper-62 (T1/2 9.74 min), copper-60 (T1/2 24.0 min), or copper-64 (T1/2 12.7 h), is another promising hypoxia imagingagent under evaluation [14, 15]. In fact, two recent re-ports indicated an inverse correlation between the levelof Cu-ATSM uptake in tumor and clinical outcome datain non-small cell lung cancer and cervical carcinoma pa-tients [16, 17]. These are very encouraging clinical stud-ies on the potential of Cu-ATSM in hypoxia imaging.
The specific aim of the current study was to study theuse of iodine-124-labeled iodo-azomycin-galactoside(124I-IAZG) as a hypoxia imaging agent in tumor-bearingmice using microPET imaging. For comparison, anotherpromising hypoxic-cell PET radiotracer, 18F-FMISO,was also used. Both are 2-nitroimidazoles compoundsthat are enzymatically reduced within viable cells. Theone-electron reduction product, a radical anion, rapidlytransfers its unpaired electron to the more electron-aff-inic molecular oxygen [18] and thus is dependent on thelevel of intracellular oxygen. Specifically, under hypoxicconditions, additional reductions can result in highly re-active nitroso and hydroxylamino products which can becovalently linked to cellular molecules. The levels of ra-diolabeled 2-nitroimidazole adducts trapped within cellscan therefore provide information on intracellular oxy-gen concentrations. Important in the comparison of 124I-IAZG and 18F-FMISO is the relatively long physicalhalf-life of 124I, 4.2 days, which allows imaging to be
performed at times up to several days post-injection(p.i.), with the associated clearance of background activ-ity. This is not possible with short-lived 18F-labeled com-pounds (physical half-life: 1.8 h).
To provide a reference for the hypoxia images fromthe microPET, biodistribution studies were performedfor both IAZG and FMISO, and direct measurement oftumor oxygenation status performed with the OxyLitesystem (Oxford Optronix, Oxford, UK). The OxyLitesystem measures tissue oxygen tension using an opticalsensor that measures the oxygen-dependent de-excitationrate of a fluorescently activated dye. Comparative stud-ies have shown that the OxyLite system yields an oxy-gen distribution comparable with that obtained by themore established Eppendorf system [19], which is basedon electrochemical reduction of oxygen at the cathodeand is therefore dependent on oxygen level. However,unlike the Eppendorf system, the Oxylite probe does notconsume oxygen, such that the pO2 level can be continu-ously measured [20].
Materials and methods
Animal tumor models. Animals were maintained and used accord-ing to the guidelines of the Memorial Sloan Kettering Cancer Cen-ter. The experimental protocol was approved by the InstitutionalAnimal Care and Use Committee.
The murine mammary carcinoma MCa and fibrosarcoma FsaII,in female C3H/HeJ mice, were used as tumor models. Tumorswere initiated by the subcutaneous injection of approximately4×105 or 1×10⁶ cells in the right hind leg. In a limited number ofcases, other subcutaneous sites were employed as noted. Follow-ing injection, the mice were periodically examined and the tumordimensions measured. For some of the studies, to achieve an ade-quate number of mice bearing tumors of the appropriate volume,all arising from the same tumor cell suspension, a substantial num-ber of mice were injected, and tumors of the appropriate volumewere selected. Tumors in the size range of 80–180 mg were desig-nated as small, and those >300 mg as large.
Study design. In the first imaging experiment, nine mice werestudied. Four mice were implanted with FSaII only, and three withMCa tumors only. In the remaining two mice, one had an FSaII tu-mor in the leg and an MCa tumor on the shoulder, and the other anMCa tumor in the leg and an FSaII tumor on the shoulder. The av-erage masses of the MCa and FSaII tumors were 1,220 mg and500 mg respectively. On day 1 of the imaging studies, each mousewas injected with ~7.4 MBq (200 µCi) of 18F-FMISO and imagedin a small-animal PET scanner (microPET, Concorde Microsys-tems) at 1, 3–4, and 6–8 h p.i. On day 2, each mouse was injectedwith ~16.7 MBq (450 µCi) of 124I-IAZG and imaged at 1, 3, 6, 12,24, and 48 h p.i.
In the second imaging experiment, two groups of six micebearing small and large MCa tumors were imaged. The averagemasses of the small and large tumors were 80 mg and 500 mg re-spectively. As a reference, microPET imaging with 18F-labeledfluoro-deoxyglucose (18F-FDG) (~11.1 MBq = 300 mCi) at 1 hp.i. was also performed on day 1 of the experiment for all 12 ani-mals. The balance of the imaging protocol was the same as for the
118
European Journal of Nuclear Medicine and Molecular Imaging Vol. 31, No. 1, January 2004

first imaging experiments. In this experiment, the thyroids of themice were blocked by adding SSKI to their drinking water 2 daysbefore the 124I-IAZG injection.
A third experiment was designed to preclude potential biasesarising from the sequential administration of 18F-FMISO followedby 124I-IAZG, such as an increasing hypoxic fraction between 18F-MISO and 124I-IAZG injection, and unexpected perturbations ofdrug metabolism or clearance due to repeated anesthesia. In thisexperiment, mice bearing MCa tumors derived from the same poolof tumor cell suspension were divided into three arms. In the firstarm, 1.1–1.5 MBq (30–40 µCi) of 125I-IAZG (instead of 124I-IAZG) and 22–33 MBq (600–900 µCi) of 18F-FMISO were co-in-jected into tumor-bearing mice. Tumor and normal tissues wereexcised following animal sacrifice at 3 and 24 h p.i., and the activ-ities of both tracers were then determined. The second and thirdarms of this experiment were pO2 measurement with the Oxyliteprobe and histological examination. Different animals were usedin the three arms of this experiment to avoid artifacts that mayarise due to the effect of one type of measurement upon the resultsof another; for example, the effect of pO2 probe insertion on histo-logical examination.
Table 1 lists the number of tumors (n) assigned to each arm ofthis experiment, and their masses in mg calculated as (a×b×c)π/6,where a, b, and c are the tumor dimensions in mm as measuredwith calipers in three mutually perpendicular directions. The tu-mor masses in animals studied for biodistribution were also deter-mined by weighing, and were similar to the values derived fromcaliper measurements. The tumor masses are uniform within eachsize group, and very similar in the three arms of the experiment.There is no overlap in individual tumor masses between the twosize groups.
Oxygen tension measurements. Oxygen tension measurementswere made in FSaII and MCa tumors spanning the size range ofthose used for tissue distribution studies and imaging. In these ani-mals, the OxyLite probe was used to assay oxygen tensions (inmmHg) within the tumors, as previously described [20]. The cali-bration of each pO2 probe, provided by the manufacturer, was in-dependently verified in our laboratory prior to its use. Additional-ly, to assure proper probe functioning, calibration checks wereperformed in 0.2% oxygen-saturated saline prior to the measure-ment in tumors.
Anesthetized animals were placed in the prone position on atemperature-regulated heating pad, and the core (rectal) tempera-ture was maintained at 36.5±0.8°C. Anesthesia was accomplishedwith a gas mixture containing 3% isofluorane in the inductionphase, and 1–1.25% in the maintenance phase, with the balance ofthe mixture being air. The Oxylite pO2 probe was connected to amicromanipulator and inserted into the tumor through openings inthe skin created with a 23-gauge needle. pO2 levels were measuredat different depths by advancing the probe in steps of approxi-mately 1 mm. Measurements were performed along at least four
parallel tracks, depending on the tumor size, with a total of 24–35measurements in the small and 50–55 measurements in the largetumors.
Radiotracers. 18F-FDG was obtained commercially (Eastern Iso-topes). To prepare 18F-FMISO, 18F-fluoride was produced in theMSKCC cyclotron (Model CS-15, Cyclotron Corp.) by proton ir-radiation of an enriched 18O-water target in a small-volume titani-um chamber. Following addition of kryptofix-2.2.2 and anhydrouspotassium carbonate, the solution was dried by azeotropic distilla-tion with acetonitrile additions. 18F-FMISO was then prepared asreported with minor modifications [21]. The tosyl analog of miso-nidazole, 1-(2’-nitro-1’-imidazoyl)-2-O-tetrahydrophyranyl-3-O-toluenesulfonyl-propanediol (ABX, Radeberg, Germany), was dis-solved in acetonitrile and added to the kryptofix-fluoride complex.The mixture was warmed to 135°C for 10 min and the labeledmixture purified by solid-phase extraction, hydrolyzed at 135°Cfor 10 min, and neutralized. The crude product was chromatog-raphed using a preparative reverse phase C-18 column eluted with5% ethanol USP in normal saline USP and the product solutionsterilized by filtration.
IAZG was radiolabeled with 124I by exchange labeling betweenthe non-radioactive iodo-azomycin nucleoside and cyclotron-pro-duced 124I-NaI and purified by AgCl-treated Celite/anion ex-change chromatography [22].
Radiochemical purity, evaluated by thin-layer chromatography,was >98% for both 18F-FMISO and 124I-IAZG.
microPET imaging. After tail vein radiotracer injections, the anes-thetized mice were imaged in the microPET, a dedicated 3Dsmall-animal PET scanner (Concorde Microsystems). In general, aminimum of ~20 million events were acquired in 10–40 min, de-pending on the radiotracer injected, the administered activity, andthe time post injection. For the microPET, the measured in-planespatial resolution [full-width at half-maximum (FWHM) of theline spread function] is 2.2 mm for 18F and 3.3 mm for 124I at thecenter of the field of view and 3.2 mm for 18F and 4.1 mm for 124Iat 2.5 cm from the center of the field of view. The resulting list-mode data were sorted into 2D histograms by Fourier re-binningand transverse images reconstructed by filtered back-projection in-to a 128×128×64 (0.72×0.72×1.3-mm) matrix; no attenuation,scatter, or partial-volume averaging correction was applied.
The kinetics of 18F-FMISO and 124I-IAZG in mice bearinglarge MCa and FSaII tumors were evaluated by region-of-interest(ROI) analysis of the serial microPET images. Using our MIAU(Multiple Image Analysis Utility) software, ROIs circumscribingvarious structures of interest were manually drawn on the coronalsection images. The counts within the ROIs were summed overthe entire thickness of each mouse, yielding the total uptake ineach structure. The structures of interest thus analyzed were thetotal body, tumor, heart, urinary bladder, liver and intestines, andthyroid (only in those animals in which the thyroid was notblocked with SSKI). The liver and intestines were combined forthis analysis because they could not be reliably distinguished onthe microPET images.
Biodistribution studies. Ten mice in each tumor size group wereco-injected with 18F-FMISO and 125I-IAZG. Five mice from eachsize group were sacrificed by cervical dislocation at 3 h p.i. andthe other five at 24 h p.i. Tumors and normal tissues were harvest-ed, weighed, and counted in an LKB well scintillation counter. Forthe 3-h p.i. biodistribution, samples were counted immediately af-ter sacrifice for 18F activity using a 20% energy window centered
119
European Journal of Nuclear Medicine and Molecular Imaging Vol. 31, No. 1, January 2004
Table 1. Mass of tumors (mg; ±SD) assigned to each arm of theexperiment
Small tumors Large tumors
Biodistribution 111±23 (n=10) 843±201 (n=10)pO2 120±36 (n=5) 745±47 (n=5)Histology 110, 100 (n=2) 809±16 (n=3)
on 511 keV. Subsequently, the 3-h p.i. samples were counted asecond time, after all the 18F had decayed, to derive 125I activityusing a 50% energy window centered on 30 keV. The 24-h p.i.samples were counted for 125I activity only. The scintillation wellcounter was calibrated for these measurements with known stan-dard activities of 18F and 125I, and the activities were corrected forradioactive decay to the time of tracer injection.
Tumor histology. For histological examination, following animalsacrifice the tumors were removed, snap frozen in dry ice and iso-pentane, and then embedded in a tissue mold in OCT (OptimalCutting Tissue). The masses of the MCa tumors examined are list-ed in Table 1; in addition, two small FSaII tumors (140 and136 mg) and two large FSaII tumors (611 and 859 mg) were stud-ied. Tumors sections of 8 µm thickness were obtained near thecenter of the tumor using a cryostat microtome, and then stainedwith hematoxylin/eosin. Regions stained with hematoxylin wereidentified as viable tumor; those stained with eosin were consid-ered necrotic. The tumor sections were digitally photographed andROI analysis was then performed using Image-PRO image analy-sis software (Media Cybernetics, Silver Spring, MD). The frac-tional necrotic volume was estimated from the ratio of the necroticarea An to the total tumor area At raised to power of 1.5 to trans-late from area to volume fraction, i.e. (An /At )3/2.
Statistical analysis. Results are given as mean ± standard devia-tion. Student’s t tests were used to determine the statistical signifi-cance of differences between measured quantities in groups of ani-mals. Either paired or unpaired tests were used as appropriate.
Results
Oxygen tension measurements
The results of oxygen level measurements in tumors ofdifferent size are shown in Table 2. The data for eachgroup are from four or five tumors, with approximately150 measurement points in each small tumor group, and250 in each large tumor group. Regions of low pO2(<2.5 mmHg) were detected in all the tumors examined,and the percentage of data points with low pO2 signifi-cantly increased with increasing tumor volume. Like-wise, the other indices for overall tumor oxygenation sta-tus, the median and mean pO2 value, became lower withincreasing tumor volume. This effect of decreasing pO2with increasing tumor volume was somewhat more pro-nounced in the FSaII tumors. Intermediate tumor vol-umes exhibited intermediate oxygen status (data notshown).
Histology data
The average necrotic fractions were 0.062±0.016 and0.30±0.13 in the small and large MCa tumors respective-ly. For the FSaII model, the average necrotic fractionswere 0.238±0.025 and 0.40±0.12 in the small and largetumors respectively.
microPET imaging data
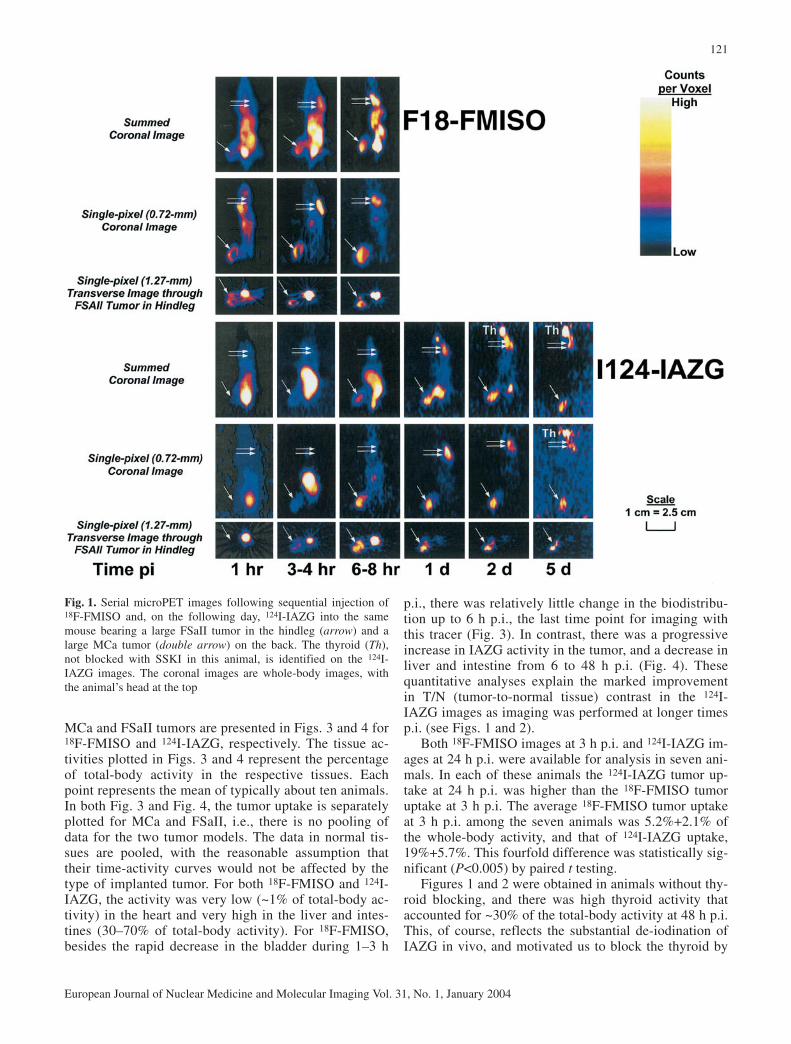
Tumor-bearing mice were injected with 18F-FMISO and124I-IAZG sequentially and imaged with the microPET asdescribed previously. The images in Fig. 1, of a mousewith a large MCa tumor on its back and a large FSaII tu-mor in its hindleg, are typical of those obtained in micewith large tumors. The 18F-FMISO images showed highuptake, relative to background, in both the FSaII andMCa tumors, with the tumor-to-whole-body activity con-trast progressively increasing with time p.i. However,even at the last imaging time point, 6–8 p.i., considerablenormal tissue activity persisted in the liver and gut. Theimages also show high 124I-IAZG uptake in both theFSaII and the MCa tumor. Tumor-to-whole body activitycontrast for 124I-IAZG increased much more slowly thanthat for 18F-FMISO, the tumors being virtually impercep-tible at 1 h and not becoming apparent until 6–12 h p.i.Importantly, at 1–2 day p.i., the liver and gut activity haddecreased dramatically, such that the tumor-to-wholebody activity contrast for 124I-IAZG appeared consider-ably higher than that achieved with 18F-FMISO at 6–8 hp.i. The 124I-IAZG activity persisted in both the MCa andFSaII tumors, and the tumor-to-normal tissue contrastcontinued to increase up to 120 h p.i. (Fig. 1). By thistime, however, the total activity remaining was quite low,so that acquisition of sufficient events required sacrific-ing the animal and imaging the carcass for ~12 h.
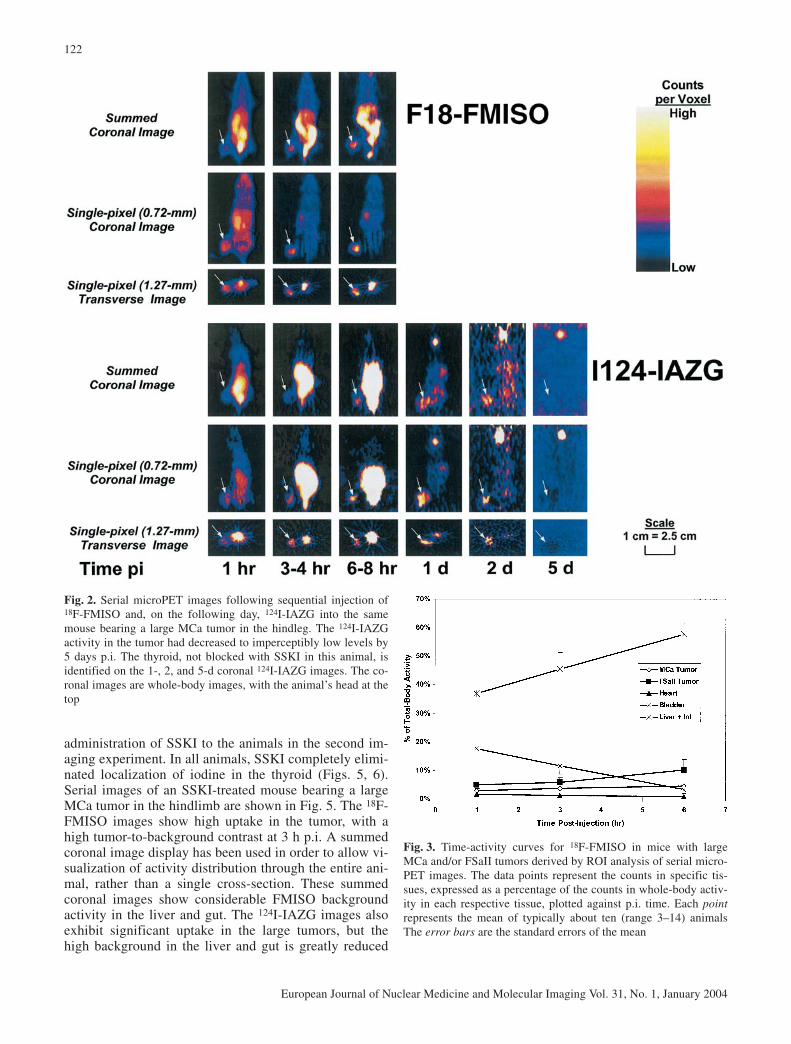
The serial images of the 18F-FMISO and 124I-IAZG inthe other large tumor-bearing animals are similar tothose shown in Fig. 1. There are, however, differencesamong mice. For example, in the mouse whose imagesare shown in Fig. 2, the maximum tumor-to-backgroundactivity for 124I-IAZG occurred at 24 h p.i., and by 120 hp.i. the IAZG activity in the tumor had decreased to thepoint of being imperceptible.
The “time-activity” curves derived by ROI analysisof the serial microPET images of mice bearing large
120
European Journal of Nuclear Medicine and Molecular Imaging Vol. 31, No. 1, January 2004
Table 2. Results with respect to indices for overall tumor oxygenation in tumors of different size
MCA FSaII
Tumor mass (mg) 120±36 (n=5) 745±47 (n=5) 115±24 (n=4) 809±16 (n=5)% <2.5 mmHg 47% 79% 28% 67%Median mmHg 2.84 1.48 16.8 1.42Mean mmHg 11.5 5.09 24 7.14
121
European Journal of Nuclear Medicine and Molecular Imaging Vol. 31, No. 1, January 2004
Fig. 1. Serial microPET images following sequential injection of18F-FMISO and, on the following day, 124I-IAZG into the samemouse bearing a large FSaII tumor in the hindleg (arrow) and alarge MCa tumor (double arrow) on the back. The thyroid (Th),not blocked with SSKI in this animal, is identified on the 124I-IAZG images. The coronal images are whole-body images, withthe animal’s head at the top
MCa and FSaII tumors are presented in Figs. 3 and 4 for18F-FMISO and 124I-IAZG, respectively. The tissue ac-tivities plotted in Figs. 3 and 4 represent the percentageof total-body activity in the respective tissues. Eachpoint represents the mean of typically about ten animals.In both Fig. 3 and Fig. 4, the tumor uptake is separatelyplotted for MCa and FSaII, i.e., there is no pooling ofdata for the two tumor models. The data in normal tis-sues are pooled, with the reasonable assumption thattheir time-activity curves would not be affected by thetype of implanted tumor. For both 18F-FMISO and 124I-IAZG, the activity was very low (~1% of total-body ac-tivity) in the heart and very high in the liver and intes-tines (30–70% of total-body activity). For 18F-FMISO,besides the rapid decrease in the bladder during 1–3 h
p.i., there was relatively little change in the biodistribu-tion up to 6 h p.i., the last time point for imaging withthis tracer (Fig. 3). In contrast, there was a progressiveincrease in IAZG activity in the tumor, and a decrease inliver and intestine from 6 to 48 h p.i. (Fig. 4). Thesequantitative analyses explain the marked improvementin T/N (tumor-to-normal tissue) contrast in the 124I-IAZG images as imaging was performed at longer timesp.i. (see Figs. 1 and 2).
Both 18F-FMISO images at 3 h p.i. and 124I-IAZG im-ages at 24 h p.i. were available for analysis in seven ani-mals. In each of these animals the 124I-IAZG tumor up-take at 24 h p.i. was higher than the 18F-FMISO tumoruptake at 3 h p.i. The average 18F-FMISO tumor uptakeat 3 h p.i. among the seven animals was 5.2%+2.1% ofthe whole-body activity, and that of 124I-IAZG uptake,19%+5.7%. This fourfold difference was statistically sig-nificant (P<0.005) by paired t testing.
Figures 1 and 2 were obtained in animals without thy-roid blocking, and there was high thyroid activity thataccounted for ~30% of the total-body activity at 48 h p.i.This, of course, reflects the substantial de-iodination ofIAZG in vivo, and motivated us to block the thyroid by
administration of SSKI to the animals in the second im-aging experiment. In all animals, SSKI completely elimi-nated localization of iodine in the thyroid (Figs. 5, 6).Serial images of an SSKI-treated mouse bearing a largeMCa tumor in the hindlimb are shown in Fig. 5. The 18F-FMISO images show high uptake in the tumor, with ahigh tumor-to-background contrast at 3 h p.i. A summedcoronal image display has been used in order to allow vi-sualization of activity distribution through the entire ani-mal, rather than a single cross-section. These summedcoronal images show considerable FMISO backgroundactivity in the liver and gut. The 124I-IAZG images alsoexhibit significant uptake in the large tumors, but thehigh background in the liver and gut is greatly reduced
122
European Journal of Nuclear Medicine and Molecular Imaging Vol. 31, No. 1, January 2004
Fig. 2. Serial microPET images following sequential injection of18F-FMISO and, on the following day, 124I-IAZG into the samemouse bearing a large MCa tumor in the hindleg. The 124I-IAZGactivity in the tumor had decreased to imperceptibly low levels by5 days p.i. The thyroid, not blocked with SSKI in this animal, isidentified on the 1-, 2, and 5-d coronal 124I-IAZG images. The co-ronal images are whole-body images, with the animal’s head at thetop
Fig. 3. Time-activity curves for 18F-FMISO in mice with largeMCa and/or FSaII tumors derived by ROI analysis of serial micro-PET images. The data points represent the counts in specific tis-sues, expressed as a percentage of the counts in whole-body activ-ity in each respective tissue, plotted against p.i. time. Each pointrepresents the mean of typically about ten (range 3–14) animalsThe error bars are the standard errors of the mean
123
European Journal of Nuclear Medicine and Molecular Imaging Vol. 31, No. 1, January 2004
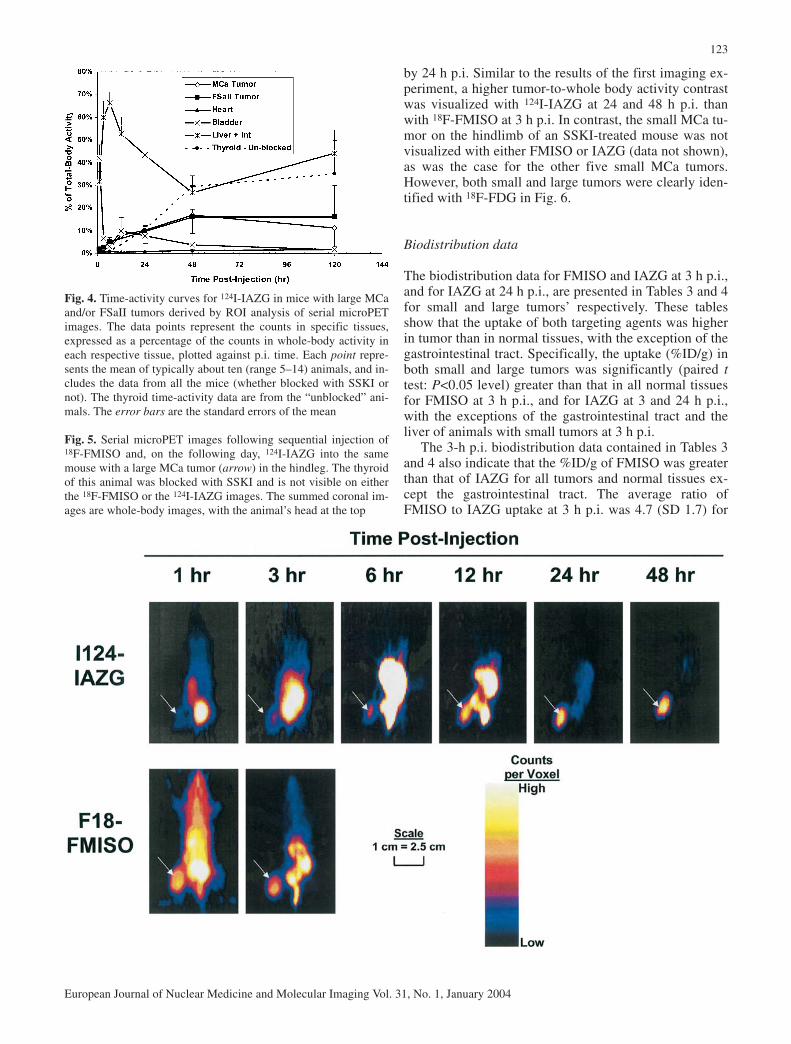
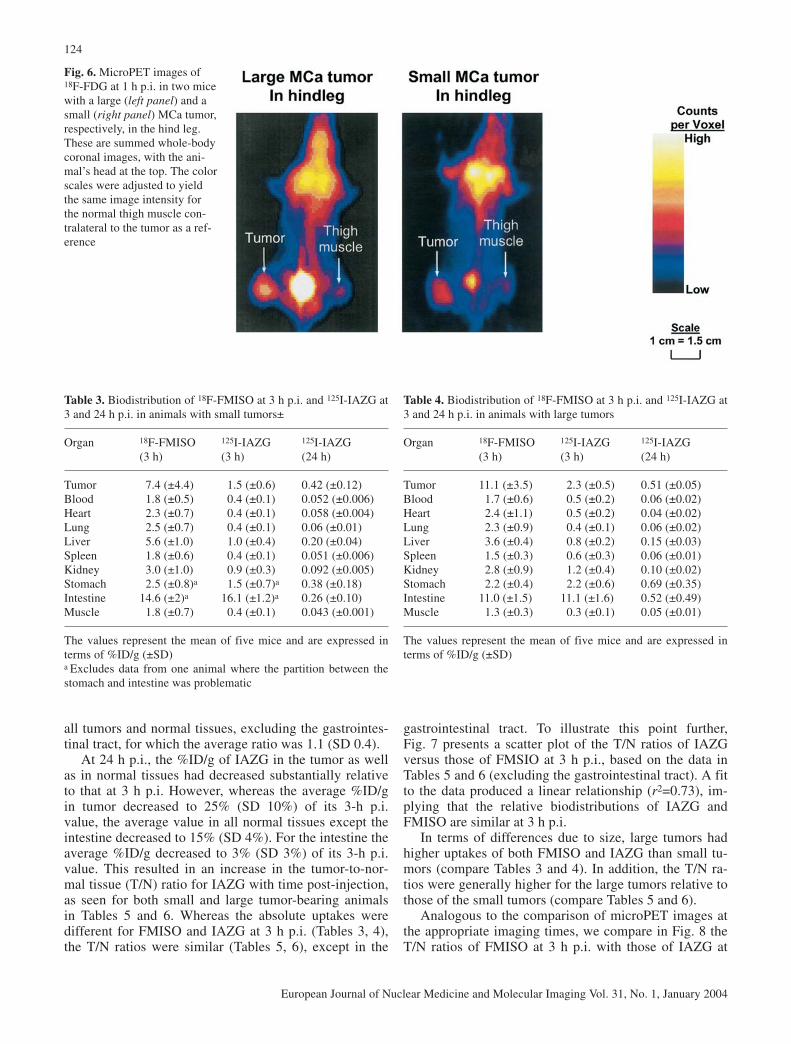
by 24 h p.i. Similar to the results of the first imaging ex-periment, a higher tumor-to-whole body activity contrastwas visualized with 124I-IAZG at 24 and 48 h p.i. thanwith 18F-FMISO at 3 h p.i. In contrast, the small MCa tu-mor on the hindlimb of an SSKI-treated mouse was notvisualized with either FMISO or IAZG (data not shown),as was the case for the other five small MCa tumors.However, both small and large tumors were clearly iden-tified with 18F-FDG in Fig. 6.
Biodistribution data
The biodistribution data for FMISO and IAZG at 3 h p.i.,and for IAZG at 24 h p.i., are presented in Tables 3 and 4for small and large tumors’ respectively. These tablesshow that the uptake of both targeting agents was higherin tumor than in normal tissues, with the exception of thegastrointestinal tract. Specifically, the uptake (%ID/g) inboth small and large tumors was significantly (paired ttest: P<0.05 level) greater than that in all normal tissuesfor FMISO at 3 h p.i., and for IAZG at 3 and 24 h p.i.,with the exceptions of the gastrointestinal tract and theliver of animals with small tumors at 3 h p.i.
The 3-h p.i. biodistribution data contained in Tables 3and 4 also indicate that the %ID/g of FMISO was greaterthan that of IAZG for all tumors and normal tissues ex-cept the gastrointestinal tract. The average ratio ofFMISO to IAZG uptake at 3 h p.i. was 4.7 (SD 1.7) for
Fig. 4. Time-activity curves for 124I-IAZG in mice with large MCaand/or FSaII tumors derived by ROI analysis of serial microPETimages. The data points represent the counts in specific tissues,expressed as a percentage of the counts in whole-body activity ineach respective tissue, plotted against p.i. time. Each point repre-sents the mean of typically about ten (range 5–14) animals, and in-cludes the data from all the mice (whether blocked with SSKI ornot). The thyroid time-activity data are from the “unblocked” ani-mals. The error bars are the standard errors of the mean
Fig. 5. Serial microPET images following sequential injection of18F-FMISO and, on the following day, 124I-IAZG into the samemouse with a large MCa tumor (arrow) in the hindleg. The thyroidof this animal was blocked with SSKI and is not visible on eitherthe 18F-FMISO or the 124I-IAZG images. The summed coronal im-ages are whole-body images, with the animal’s head at the top
124
European Journal of Nuclear Medicine and Molecular Imaging Vol. 31, No. 1, January 2004
all tumors and normal tissues, excluding the gastrointes-tinal tract, for which the average ratio was 1.1 (SD 0.4).
At 24 h p.i., the %ID/g of IAZG in the tumor as wellas in normal tissues had decreased substantially relativeto that at 3 h p.i. However, whereas the average %ID/gin tumor decreased to 25% (SD 10%) of its 3-h p.i. value, the average value in all normal tissues except theintestine decreased to 15% (SD 4%). For the intestine theaverage %ID/g decreased to 3% (SD 3%) of its 3-h p.i.value. This resulted in an increase in the tumor-to-nor-mal tissue (T/N) ratio for IAZG with time post-injection,as seen for both small and large tumor-bearing animalsin Tables 5 and 6. Whereas the absolute uptakes weredifferent for FMISO and IAZG at 3 h p.i. (Tables 3, 4),the T/N ratios were similar (Tables 5, 6), except in the
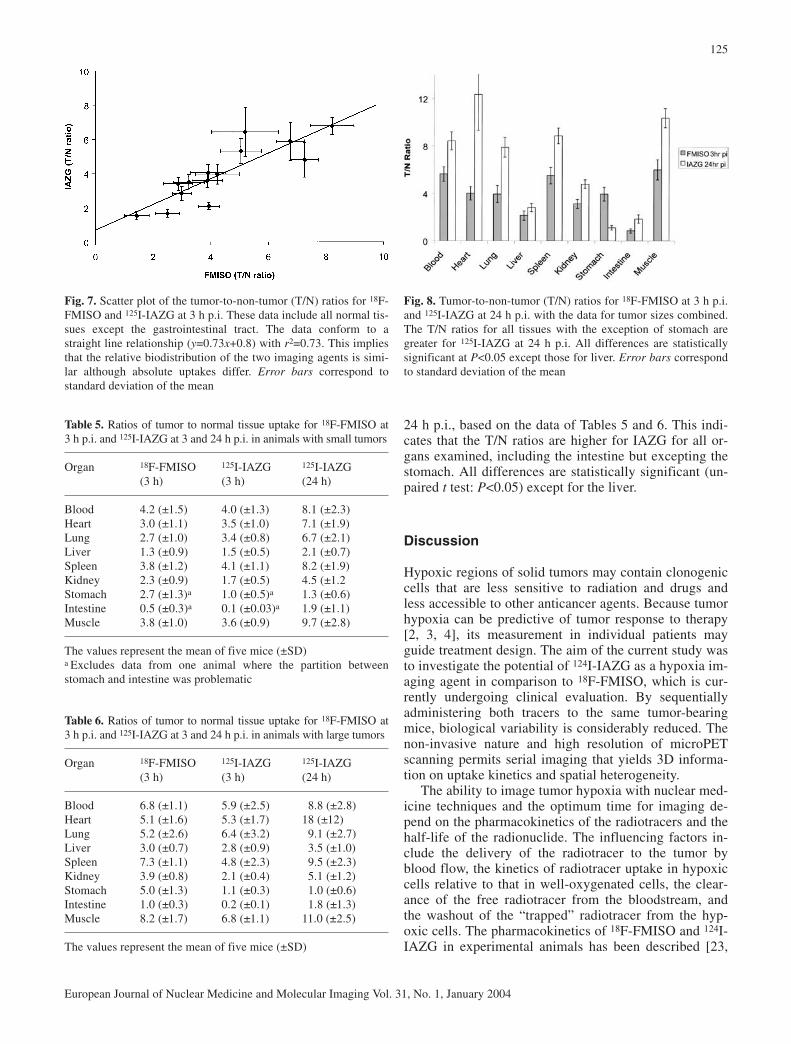
gastrointestinal tract. To illustrate this point further,Fig. 7 presents a scatter plot of the T/N ratios of IAZGversus those of FMSIO at 3 h p.i., based on the data inTables 5 and 6 (excluding the gastrointestinal tract). A fitto the data produced a linear relationship (r2=0.73), im-plying that the relative biodistributions of IAZG andFMISO are similar at 3 h p.i.
In terms of differences due to size, large tumors hadhigher uptakes of both FMISO and IAZG than small tu-mors (compare Tables 3 and 4). In addition, the T/N ra-tios were generally higher for the large tumors relative tothose of the small tumors (compare Tables 5 and 6).
Analogous to the comparison of microPET images atthe appropriate imaging times, we compare in Fig. 8 theT/N ratios of FMISO at 3 h p.i. with those of IAZG at
Fig. 6. MicroPET images of18F-FDG at 1 h p.i. in two micewith a large (left panel) and asmall (right panel) MCa tumor,respectively, in the hind leg.These are summed whole-bodycoronal images, with the ani-mal’s head at the top. The colorscales were adjusted to yieldthe same image intensity forthe normal thigh muscle con-tralateral to the tumor as a ref-erence
Table 3. Biodistribution of 18F-FMISO at 3 h p.i. and 125I-IAZG at3 and 24 h p.i. in animals with small tumors±
Organ 18F-FMISO 125I-IAZG 125I-IAZG(3 h) (3 h) (24 h)
Tumor 7.4 (±4.4) 1.5 (±0.6) 0.42 (±0.12)Blood 1.8 (±0.5) 0.4 (±0.1) 0.052 (±0.006)Heart 2.3 (±0.7) 0.4 (±0.1) 0.058 (±0.004)Lung 2.5 (±0.7) 0.4 (±0.1) 0.06 (±0.01)Liver 5.6 (±1.0) 1.0 (±0.4) 0.20 (±0.04)Spleen 1.8 (±0.6) 0.4 (±0.1) 0.051 (±0.006)Kidney 3.0 (±1.0) 0.9 (±0.3) 0.092 (±0.005)Stomach 2.5 (±0.8)a 1.5 (±0.7)a 0.38 (±0.18)Intestine 14.6 (±2)a 16.1 (±1.2)a 0.26 (±0.10)Muscle 1.8 (±0.7) 0.4 (±0.1) 0.043 (±0.001)
The values represent the mean of five mice and are expressed interms of %ID/g (±SD)a Excludes data from one animal where the partition between thestomach and intestine was problematic
Table 4. Biodistribution of 18F-FMISO at 3 h p.i. and 125I-IAZG at3 and 24 h p.i. in animals with large tumors
Organ 18F-FMISO 125I-IAZG 125I-IAZG(3 h) (3 h) (24 h)
Tumor 11.1 (±3.5) 2.3 (±0.5) 0.51 (±0.05)Blood 1.7 (±0.6) 0.5 (±0.2) 0.06 (±0.02)Heart 2.4 (±1.1) 0.5 (±0.2) 0.04 (±0.02)Lung 2.3 (±0.9) 0.4 (±0.1) 0.06 (±0.02)Liver 3.6 (±0.4) 0.8 (±0.2) 0.15 (±0.03)Spleen 1.5 (±0.3) 0.6 (±0.3) 0.06 (±0.01)Kidney 2.8 (±0.9) 1.2 (±0.4) 0.10 (±0.02)Stomach 2.2 (±0.4) 2.2 (±0.6) 0.69 (±0.35)Intestine 11.0 (±1.5) 11.1 (±1.6) 0.52 (±0.49)Muscle 1.3 (±0.3) 0.3 (±0.1) 0.05 (±0.01)
The values represent the mean of five mice and are expressed interms of %ID/g (±SD)
125
European Journal of Nuclear Medicine and Molecular Imaging Vol. 31, No. 1, January 2004
24 h p.i., based on the data of Tables 5 and 6. This indi-cates that the T/N ratios are higher for IAZG for all or-gans examined, including the intestine but excepting thestomach. All differences are statistically significant (un-paired t test: P<0.05) except for the liver.
Discussion
Hypoxic regions of solid tumors may contain clonogeniccells that are less sensitive to radiation and drugs andless accessible to other anticancer agents. Because tumorhypoxia can be predictive of tumor response to therapy[2, 3, 4], its measurement in individual patients mayguide treatment design. The aim of the current study wasto investigate the potential of 124I-IAZG as a hypoxia im-aging agent in comparison to 18F-FMISO, which is cur-rently undergoing clinical evaluation. By sequentiallyadministering both tracers to the same tumor-bearingmice, biological variability is considerably reduced. Thenon-invasive nature and high resolution of microPETscanning permits serial imaging that yields 3D informa-tion on uptake kinetics and spatial heterogeneity.
The ability to image tumor hypoxia with nuclear med-icine techniques and the optimum time for imaging de-pend on the pharmacokinetics of the radiotracers and thehalf-life of the radionuclide. The influencing factors in-clude the delivery of the radiotracer to the tumor byblood flow, the kinetics of radiotracer uptake in hypoxiccells relative to that in well-oxygenated cells, the clear-ance of the free radiotracer from the bloodstream, andthe washout of the “trapped” radiotracer from the hyp-oxic cells. The pharmacokinetics of 18F-FMISO and 124I-IAZG in experimental animals has been described [23,
Fig. 7. Scatter plot of the tumor-to-non-tumor (T/N) ratios for 18F-FMISO and 125I-IAZG at 3 h p.i. These data include all normal tis-sues except the gastrointestinal tract. The data conform to astraight line relationship (y=0.73x+0.8) with r2=0.73. This impliesthat the relative biodistribution of the two imaging agents is simi-lar although absolute uptakes differ. Error bars correspond tostandard deviation of the mean
Fig. 8. Tumor-to-non-tumor (T/N) ratios for 18F-FMISO at 3 h p.i.and 125I-IAZG at 24 h p.i. with the data for tumor sizes combined.The T/N ratios for all tissues with the exception of stomach aregreater for 125I-IAZG at 24 h p.i. All differences are statisticallysignificant at P<0.05 except those for liver. Error bars correspondto standard deviation of the mean
Table 5. Ratios of tumor to normal tissue uptake for 18F-FMISO at3 h p.i. and 125I-IAZG at 3 and 24 h p.i. in animals with small tumors
Organ 18F-FMISO 125I-IAZG 125I-IAZG(3 h) (3 h) (24 h)
Blood 4.2 (±1.5) 4.0 (±1.3) 8.1 (±2.3)Heart 3.0 (±1.1) 3.5 (±1.0) 7.1 (±1.9)Lung 2.7 (±1.0) 3.4 (±0.8) 6.7 (±2.1)Liver 1.3 (±0.9) 1.5 (±0.5) 2.1 (±0.7)Spleen 3.8 (±1.2) 4.1 (±1.1) 8.2 (±1.9)Kidney 2.3 (±0.9) 1.7 (±0.5) 4.5 (±1.2Stomach 2.7 (±1.3)a 1.0 (±0.5)a 1.3 (±0.6)Intestine 0.5 (±0.3)a 0.1 (±0.03)a 1.9 (±1.1)Muscle 3.8 (±1.0) 3.6 (±0.9) 9.7 (±2.8)
The values represent the mean of five mice (±SD)a Excludes data from one animal where the partition betweenstomach and intestine was problematic
Table 6. Ratios of tumor to normal tissue uptake for 18F-FMISO at3 h p.i. and 125I-IAZG at 3 and 24 h p.i. in animals with large tumors
Organ 18F-FMISO 125I-IAZG 125I-IAZG(3 h) (3 h) (24 h)
Blood 6.8 (±1.1) 5.9 (±2.5) 8.8 (±2.8)Heart 5.1 (±1.6) 5.3 (±1.7) 18 (±12)Lung 5.2 (±2.6) 6.4 (±3.2) 9.1 (±2.7)Liver 3.0 (±0.7) 2.8 (±0.9) 3.5 (±1.0)Spleen 7.3 (±1.1) 4.8 (±2.3) 9.5 (±2.3)Kidney 3.9 (±0.8) 2.1 (±0.4) 5.1 (±1.2)Stomach 5.0 (±1.3) 1.1 (±0.3) 1.0 (±0.6)Intestine 1.0 (±0.3) 0.2 (±0.1) 1.8 (±1.3)Muscle 8.2 (±1.7) 6.8 (±1.1) 11.0 (±2.5)
The values represent the mean of five mice (±SD)

24] previously, laying the foundation for preclinical andclinical evaluation. Consistent with these reports, tissuecounting data in this study at 3 h p.i. indicated a similarbiodistribution of the two tracers (Fig. 7), both of whichare 2-nitroimidazoles.
The present study shows that both tracers can be usedwith microPET to image tumor hypoxia in large FSaIIand MCa tumors. Visual examination of the serial imag-es indicated that the optimum time for imaging is24–48 h p.i. for 124I-IAZG and 3–4 h p.i. for 18F-FMISO,and that tumor-to-whole body activity contrast is higherfor 124I-IAZG images than for 18F-FMISO images at therespective optimum imaging times. This observation wassupported by ROI analysis performed as a function oftime post-injection, which indicated that the tumor up-take was between 4% and 10% of total-body activity forFMISO at 3–6 h p.i. (Fig. 3), and ~17% for IAZG at 48 hp.i. (Fig. 4). This was further corroborated by the biodis-tribution data of the tumor and normal tissues (Tables 3,4, 5 and 6, and Fig. 8). In both small and large tumors,the T/N ratios for blood, heart, lung, liver, spleen, kid-ney, intestine and muscle were higher for IAZG at 24 hp.i. than for FMISO at 3 h p.i. Statistical analysis indi-cated that most of these differences were significant. Theobserved difference in T/N contrast between FMISO at3–6 h p.i. and IAZG at 48 h p.i. was due not to differ-ences in pharmacokinetics between the two moleculesbut largely to the much longer physical half-life of 124Irelative to 18F. This permits imaging at a longer timepost-injection subsequent to the tracer’s biological clear-ance. If MISO could be labeled with a longer half-life ra-dionuclide without altering its pharmacokinetic behavior,improved tumor-to-whole body activity contrast may re-sult by imaging at a longer time post-injection.
Neither 18F-FMISO nor 124I-IAZG images could visu-alize the small tumors used in this study. This was pre-sumably due to a combination of factors. The smaller tu-mor volume and lower hypoxic fraction (as shown by thepO2 probe data) would have led to less tracer uptake inthe small tumors. Also, a smaller tumor volume wouldbe associated with the partial volume averaging effect.However, the clear visualization of the small tumors with18F-FDG (Fig. 6) makes it unlikely that partial-volumeaveraging was the principal reason for their non-visual-ization with 18F-MISO or 124I-IAZG.
Histological examination of the tumors indicated thatthe necrotic fractions increased with increase in tumormass. Because oxygen level is usually low in necrotictissues, the necrotic fractions will affect the Oxylite pO2data (Table 2) relative to the determination of hypoxicfractions. For both FSaII and MCa tumors, after takinginto account the influence of necrotic fractions, therewas an increase in hypoxic fraction as the size of tumorincreased. Thus, the visualization of tumor hypoxia inlarge tumors by FMISO and IAZG is probably influ-enced by the combination of larger hypoxic fractions andlarger tumor masses.
Previous studies have shown that gaseous anestheticssuch as methoxyflurane and isofluorane minimally affectblood gases such as pO2, pCO2, mean arterial pressure,and tissue oxygenation, depending upon the concentra-tion and duration of anesthesia (e.g., [25, 26]). Further, itis well known that the carrier gas phase, e.g., carbogenor 100% oxygen, can substantially increase tissue pO2when employed in combination with a variety of anes-thetics, and we have confirmed this effect when used incombination with isofluorane (data not shown). There-fore in the present study air was employed as the carriergas phase, but most importantly, it should be noted thatthe effect of anesthesia under air breathing conditions onsystemic physiology and tissue perfusion would equallyhave affected all the animals studied, whether withIAZG or FMISO, in imaging studies, histological exam-inations, and pO2 measurements.
There are several technical disadvantages to the use of124I-IAZG for hypoxia imaging, but it is likely that noneis so severe as to limit its potential clinical utility. First,typical of radioiodinated tracers, there is considerable de-iodination of 124I-IAZG in vivo (Figs. 1, 2). The higherlevel of radioactivity in the bladder and the lower tumorand normal tissue uptakes (in terms of %ID/g) are likelydue in part to the de-iodination of IAZG in vivo (Figs. 3,4; Tables 3, 4). However, as shown in this study, “block-ing” is effective in preventing uptake of free iodine by thethyroid (Figs. 5, 6), although this does not prevent de-ha-logenation. In this regard, iodinated radiopharmaceuticalshave long been effectively used in nuclear medicine forimaging and treatment [e.g., meta-iodo-benzylguanidine(MIBG) for neuroblastomas and pheochromocytomas,with Lugol’s solution or SSKI as the thyroid-blockingagent]. The 820- to 980-keV positrons of 124I, with arange of 6.2–8.4 mm in water, may degrade spatial reso-lution, and the abundant (80%) high-energy gamma rays(603, 723, and 690 keV) may introduce random coinci-dence artifacts. However, in quantitative PET studies,Pentlow et al reported that the spatial resolution of 124Iimages is only slightly degraded relative to that of 18F im-ages [27, 28]. Third, the long half-life and low positronabundance (22%) of 124I may require higher administeredactivities to achieve adequate count statistics and may re-sult in higher patient doses. However, for patients withbiopsy-proven cancer to be treated with radiotherapy, thisshould not be a major concern. Thus, we are enthusiasticabout the clinical potential of 124I-IAZG and shall con-duct additional preclinical studies for further evaluation.Eventually, we hope to test it in clinical studies and onlythen can we actually determine its efficacy.
Because of the relatively small size of the mouse tu-mors and the spatial resolution of the microPET(2–3 mm for 18F and 3–4 mm for 124I), only limited in-formation on the radiotracer distribution within the tu-mors could be obtained. Nevertheless, there appeared tobe differences in the spatial distributions of 18F-FMISOand 124I-IAZG within tumors. The pO2 dependence of
126
European Journal of Nuclear Medicine and Molecular Imaging Vol. 31, No. 1, January 2004

uptake of the two tracers as well as the different imagingtimes post-injection may have accounted for these differ-ences. We are at present planning to extend these studiesto larger tumor models in rats in order to better deter-mine the intratumoral spatial heterogeneity of hypoxia.This will also facilitate comparison between direct pO2measurement and hypoxia images in a spatially correlat-ed manner.
To the best of our knowledge, this is the first study inwhich serial microPET imaging has been used to evalu-ate tumor hypoxia markers with corroboration by directpO2 probe measurement and biodistribution determina-tion. Using this approach, we have provided data show-ing the potential of 124I-IAZG for hypoxia imaging. Thepossibility of obtaining high-contrast hypoxia-specificPET images of the tumor at 24–48 h p.i., when the back-ground activity in the rest of the body and possibly with-in the tumor itself has dissipated, strongly supports fur-ther investigation of this radiotracer.
Acknowledgements. This work was supported in part by RO1CA84596 and R24 CA83084 from the NCI, National Institutes ofHealth, USA.
References
1. Thomlinson R, Gray L. The histological structure of some hu-man lung cancers and the possible implications for radiothera-py. Br J Cancer 1955; 9:539–549.
2. Nordsmark M, Overgaard M, Overgaard J. Pretreatment oxy-genation predicts radiation response in advanced squamouscell carcinoma of the head and neck. Radiother Oncol 1996;41:31–39.
3. Hockel M, Knoop C, Schlenger K, Vorndran B, Baussmann E,Mitze M, Knapstein PG, Vaupel P. Intratumoral pO2 predictssurvival in advanced cancer of the uterine cervix. RadiotherOncol 1993; 26:45–50.
4. Brizel DM, Scully SP, Harrelson JM, Layfield LJ, Bean JM,Prosnitz LR, Dewhirst MW. Tumor oxygenation predicts forthe likelihood of distant metastases in human soft tissue sarco-ma. Cancer Res 1996; 56:941–943.
5. Chapman JD, Engelhardt EL, Stobbe CC, Schneider RF,Hanks GE. Measuring hypoxia and predicting tumor radiore-sistance with nuclear medicine assays. Radiother Oncol 1998;46:229–237.
6. Urtasun RC, Parliament MB, McEwan AJ, Mercer JR, Mannan RH, Wiebe LI, Morin C, Chapman JD. Measurementof hypoxia in human tumours by non-invasive SPECT imag-ing of iodoazomycin arabinoside. Br J Cancer 1996; 74 Suppl27:S209–S212.
7. Ballinger JR. Imaging hypoxia in tumors. Semin Nucl Med2001; 31:321–329.
8. Rasey JS, Koh WJ, Evans ML, Peterson LM, Lewellen TK,Graham MM, Krohn KA. Quantifying regional hypoxia in hu-man tumors with positron emission tomography of [18F]flu-oromisonidazole: a pretherapy study of 37 patients. Int J Ra-diat Oncol Biol Phys 1996; 36:417–428.
9. Lehtiö K, Oikonen V, Gronroos T, Eskola O, Kalliokoski K,Bergman J, Solin O, Grenman R, Nuutila P, Minn H. Imaging
of blood flow and hypoxia in head and neck cancer: initialevaluation with [(15)O]H(2)O and [(18)F]fluoroerythronitro-imidazole PET. J Nucl Med 2001; 42:1643–1652.
10. Evans SM, Kachur AV, Shiue CY, Hustinx R, Jenkins WT,Shive GG, Karp JS, Alavi A, Lord EM, Dolbier WR Jr, KochCJ. Noninvasive detection of tumor hypoxia using the 2-nitro-imidazole [18F]EF1. J Nucl Med 2000; 41:327–336.
11. Evans SM, Hahn SM, Magarelli DP, Koch CJ. Hypoxic het-erogeneity in human tumors: EF5 binding, vasculature, necro-sis, and proliferation. Am J Clin Oncol 2001; 24:467–472.
12. Dolbier WR Jr, Li AR, Koch CJ, Shiue CY, Kachur AV. [18F]-EF5, a marker for PET detection of hypoxia: synthesis of pre-cursor and a new fluorination procedure. Appl Radiat Isot2001; 54:73–80.
13. Piert M, Machulla HJ, Reichel G, Ziegler S, Kumar P, Schwaiger M, Wiebe LI. 18F labeled fluoroazomycin arabino-side (FAZA): imaging tumor hypoxia with improved biokinet-ics. J Nucl Med 2002; 43 (Suppl):278P.
14. Lewis JS, McCarthy DW, McCarthy TJ, Fujibayashi Y, WelchMJ. Evaluation of 64Cu-ATSM in vitro and in vivo in a hyp-oxic tumor model. J Nucl Med 1999; 40:177–183.
15. Chao KS, Bosch WR, Mutic S, Lewis JS, Dehdashti F, MintunMA, Dempsey JF, Perez CA, Purdy JA, Welch MJ. A novelapproach to overcome hypoxic tumor resistance: Cu-ATSM-guided intensity-modulated radiation therapy. Int J Radiat On-col Biol Phys 2001; 49:1171–1182.
16. Dehdashti F, Mintun M, Lewis J, Bradley J, Govidan R, Laforest R, Welch M, Siegel B. In vivo assessment of tumorhypoxia in lung cancer with 60Cu-ATSM. Eur J Nucl Med MolImaging 2003; 30:844–850.
17. Dehdashti F, Grigsby P, Mintun M, Lewis J, Siegel B, WelchM. Assessing tumor hypoxia in cervical cancer by positronemission tomography with 60Cu-ATSM: relationship to thera-peutic response-a preliminary report. Int J Radiat Oncol BiolPhys 2003; 55:1233–1238.
18. Chapman J, Lee J, Meeker B. Adduct formation by 2-nitroim-idazole drugs in mammalian cells: optimization of markers fortissue oxygenation. In: Adams G, ed. Selective activation ofdrugs by redox processes. New York: Plenum Press; 1990:313–323.
19. Seddon BM, Honess DJ, Vojnovic B, Tozer GM, Workman P.Measurement of tumor oxygenation: in vivo comparison of aluminescence fiber-optic sensor and a polarographic needleelectrode in the P22 tumor. Radiat Res 2001; 155:837–846.
20. Urano M, Chen Y, Humm J, Koutcher JA, Zanzonico P, LingC. Measurements of tissue oxygen tension using a time-re-solved luminescence-based optical Oxylite probe: comparisonwith a paired survival assay. Radiat Res 2002; 167–173.
21. Cherif A, Yang DJ, Tansey W, Kim EE, Wallace S. Rapid syn-thesis of 3-[18F]fluoro-1–2-(2’-nitro-imidazolyl)-2-propranol-([18F]fluoromisonidazole). Pharm Res 1994; 11:466–469.
22. Schneider R, Englehardt E, Stobbe C, Fenning M, Chapman J.The synthesis and radiolabeling of novel markers of tissuehypoxia of the iodinated azomycin nucleoside class. J LabelCompd Radiopharm 1997; XXXIX:541–557.
23. Rasey JS, Koh WJ, Grierson JR, Grunbaum Z, Krohn KA. Ra-diolabelled fluoromisonidazole as an imaging agent for tumorhypoxia. Int J Radiat Oncol Biol Phys 1989; 17:985–991.
24. Iyer R, Haynes P, Schneider R, Movsas B, Chapman J. Marking hypoxia in rat prostate carcinomas with β-D-[125I]azomycin galactopyranoside and [99mTc]HL-91: correlationwith microelectrode measurements. J Nucl Med 2001; 42:337–344.
127
European Journal of Nuclear Medicine and Molecular Imaging Vol. 31, No. 1, January 2004
25. Liu KJ, Bacic G, Hoopes PJ, Jiang J, Du H, Ou LC, Dunn HF,Swartz HM. Assessment of cerebral pO2 by EPR oximetry inrodents: effects of anesthesia, ischemia, and breathing gas.Brain Res 1995; 685:91–98.
26. Menke H, Vaupel P. Effect of injectable or inhalational anesthetics and of neuroleptic neuroleptanalgesic and seda-tive agents on tumor blood flow. Radiat Res 1988; 114:64–76.
27. Pentlow KS, Graham MC, Lambrecht RM, Cheung NK, Larson SM. Quantitative imaging of I-124 using positronemission tomography with applications to radioimmunodiag-nosis and radioimmunotherapy. Med Phys 1991; 18:357–366.
28. Pentlow KS, Graham MC, Lambrecht RM, Daghighian F, Bacharach SL, Bendriem B, Finn RD, Jordan K, Kalaigian H,Karp JS, Robeson WR, Larson SM. Quantitative imaging ofiodine-124 with PET. J Nucl Med 1996; 37:1557–1562.
128
European Journal of Nuclear Medicine and Molecular Imaging Vol. 31, No. 1, January 2004