investor sentiment in news and the calendar anomaly -new evidence from a large textual data-
TRANSCRIPT

Investor Sentiment in News and the Calendar Anomaly - New Evidence from a Large Textual Data-
Katsuhiko Okada1, Takahiro Yamasaki2
ABSTRACT
The well-known stock market adage “sell in May and go away” arose from long-term stock market seasonality in major financial markets around the globe. Kamastra, Kramer and Levy (2003) present evidence that Seasonal Affective Disorder causes this seasonality, as this condition has a profound effect on people’s mood and makes people increasingly risk averse as daylight diminishes with the onset of winter. In this paper, we present evidence that change in market mood is reflected in the prospect statement in the news text. We employ a text-mining technique to analyze a large quantity of newspaper articles for the period 1986–2010 and created our market mood proxy. We find investor psychology is skewed to optimism in the first half of the calendar year and pessimism in the latter. We also find that semi-annual mood fluctuation is synchronous with market seasonality. JEL Classifications: G12, G14 Keywords: Seasonality, Textual Analysis, Anomaly, Support Vector Machine, Market Psychology
1 Kwansei Gakuin University Institute of Business and Accounting, Nishinomiya Japan. All correspondence should be directed to [email protected] 2 Osaka Sangyo University, School of Engineering, Osaka Japan
2
Introduction Every year, usually in the month of May, the European financial press makes reference to a presumably inherent market truism: “sell in May and go away.” According to this truism, the month of May signals the start of a lethargic market, so that investors are better off selling their stocks and holding cash. The adage ends with the following note: “but remember to come back in September.” Even in the Japanese press, this Western adage is quoted in multiple newspaper articles, giving indirect warning to the investors to be cautious after May.3 This seasonal effect is indeed significant in the global stock market. Bouman and Jacobsen (2002) find the sell in May effect or they dubbed the “Halloween” effect in 36 countries out of 37 examined. The Japanese market is one of the 36 countries that show a sell in May effect in their study; however, Sakakibara, Yamasaki and Okada (2013) argue that the Japanese stock market shows strong performance in the month of June, and thus warn investors that direct application of ‘sell in May’ is not the best strategy. Instead, they argue that “sell in June and buy back in December” strategy works best in Japan. They call this unique seasonality in the Japanese stock market the “Dekansho-Bushi” effect. Sakakibara, Yamasaki and Okada (2013) concludes with a behavioral conjecture that investors may be driven by positive events, which make them optimistic. These events are concentrated in the first half of the year. The calendar new year celebration (Oshogatsu) occurs in January, while the fiscal new year starts for companies and schools in April (“Shinnendo” signifies fresh new start), and the Golden Week holidays are distributed between late April to early May. The notion that financial market
3 For example, due to the rising expectation of “Abenomics” in 2013, the Japanese stock market had an impressive bull run.
Despite the rising momentum in the market, the most broadly subscribed Japanese business paper Nihon Keizai Shimbun
issued sober articles in May quoting this adage. (Abenomics—a portmanteau of Abe and economics—refers to the economic
policies advocated by Shinzō Abe, the current Prime Minister of Japan. Abe assumed office on 26 December 2012. The
neologism refers back to previous political terms such as Clintonomics (based on American President Bill Clinton) and
Rogernomics (based on New Zealand Minister of Finance Roger Douglas). Abe aims to expand the economy of Japan, still
facing challenges related to the global economic recession, by a combination of measures such as aggressive quantitative
easing from the Bank of Japan, a surge in public infrastructure spending, and devaluation of the yen.
3
participants may be impacted by psychological factors is not new. For example, the effect of indices crossing psychological barriers, such as the 9,000 level of the Dow, is discussed in Donaldson and Kim (1993). Kamastra, Kramer and Levy (2000) report the sleep desynchronosis caused by daylight savings time, which brings about statistically significant impacts on stock returns. Kamastra, Kramer and Levy (2003) present evidence that global stock market return is affected by seasonal affective disorder (SAD). These studies focus on the investor psychology and its correlation to the anomalous behavior of the stock market. We believe that if investor psychology is indeed the key driving cause behind market seasonality, the psychology of market news reporters or pundits quoted in the financial press should manifest itself in their word usage in news texts. In this paper, we examine textual data from newspapers to investigate whether a more optimistic future outlook prevails in the first half of the year than the latter half. We use the four business newspapers published by Nihon Keizai Shimbun Co. Ltd, whose combined circulation is more than five million across Japan, by far the largest business newspapers in the country. We electronically collect every news articles issued for the period 1986 to 2010. We then identify news that is related to stock market using the tag information attached to each articles. We further select news in which contain expressions that states the future outlook of the market. We call this type of news as ‘predictive’. Out of over 7 million articles, we end up with the total of 102,898 market related predictive news articles. We use these articles to estimate the bullish/bearish sentiment of the market participants by looking into the optimistic/pessimistic expression in each outlook. Given the large size of the news data, manual categorization by humans could be flimsy. Therefore we use computer algorithm to do the work. First, we pick a number of typical news articles with optimistic/pessimistic outlook expressions. We then convert them to word vector expressions, i.e. converting textual data to numerical data. Subsequently, the algorithm estimates the vector distance between the sample article to the typical article, which gives us a guideline whether the given article is closer to optimistic or pessimistic. We use a methodology called supervised machine learning4 for the job but we refrain from describing methodological details
4 We use a machine learning algorithm called Support Vector Machines (SVMs). These are supervised learning models with associated
4
in this paper. Based on the calculated distance from the typical news, 102,898 articles are categorized into three psychological classes: optimistic, pessimistic, and neutral. We count the number of optimistic, pessimistic, and neutral articles published each month from January through December of each year. The skewness of the positive/negative is our proxy for the calendar month mood fluctuations in investor psychology. The result indicates that there are more optimistic outlooks mentioned in the press in the first half of the year than the latter half. Specifically, January, followed by June, are the most optimistic months, in the sense that the ratio of optimistic to pessimistic articles is highest in these months. In the 25-year period investigated, we found more optimistic prospects in the first half of the year in 17 years. On the other hand, there are more pessimistic outlooks prevalent in the latter half of the year. The difference is statistically significant. However, throughout the year, the prospect in news is not skewed. Our finding is consistent with the notion that people’s mood in the first half is optimistic, while in the latter half it is pessimistic. We further investigate whether the investor psychology in textual data is in sync with that of the stock market. For this purpose, we compute the difference in optimistic versus pessimistic prospect occurrences for each month and aggregate it for six-month period. And we investigate whether the prospects manifestation in news matches with the Dekansho-Bushi pattern appearance. We find almost perfect correlation between the news and the market. The only exception is 2009, when most economic and market outlooks remained dire after the Lehman shock; however, the stock market rebounded from an oversold condition in the first half of 2009. This paper is organized as follows. Section I explains the study background. Section II explains our data and methodology. Because we deal with a large textual data, we employ techniques from the realm of computer science, which many financial economists may not be familiar with. In Section III, we present evidence that investor psychology leans toward optimism in the January to June period and reverses pattern in the July to December period. Our conclusions are presented in Section IV.
learning algorithms that analyze data and recognize patterns that are used for classification. For details, see Steinwart and Christmann (2008).
5
I. Background
The psychology literature considers how emotion and mood influence human decision-making. Individuals who are in good moods make more optimistic choices. A highly robust effect is that individuals in good moods have more positive evaluations of many sorts, such as life satisfaction, past events, people, and consumer products (see, e.g., Wright and Bower (1992)). There is a mood congruency effect, wherein people who are in bad moods (good moods) tend to find negative (positive) material more available or salient (see, e.g., Forgas and Bower (1987)). Forgas (1995) reports that mood most strongly affects relatively abstract judgments about which people lack concrete information. Schwarz (1990) and Loewenstein, Elke, and Welch (2001) set forth theories linking mood and feelings to general decision-making, while Etzioni (1988), Romer (2000), Hanock (2002), and Mehra and Sah (2002) establish the importance of emotion in economic decision-making. Mood itself can be influenced by situational and environmental factors (Watson (2000)), some of which may cause mood misattribution (Schwarz and Clore (1983); Schwarz (1990); Clore and Parrot (1991)). For instance, people tend to rate their life satisfaction much higher on sunny days than on cloudy or rainy days (Schwarz and Clore (1983)), even though their well-being does not change on a daily basis. We focus on mood, as reflected in newspaper articles. Specifically, we examine articles that mention future outlook and use them as a proxy for market mood. Cutler, Poterba, and Summers (1989) is one of the first empirical studies to explore the link between news coverage and stock prices. There are several important papers that investigate news effect on stock price (see, e.g., Tetlock (2007); Tetlock, Saar-Tsechansky and Macskassy (2008)) but few, to the best of our knowledge, focus on the predictive statement of the news text and its relationship with market seasonal anomalies.
II. Data and Methodology
A. Data
6
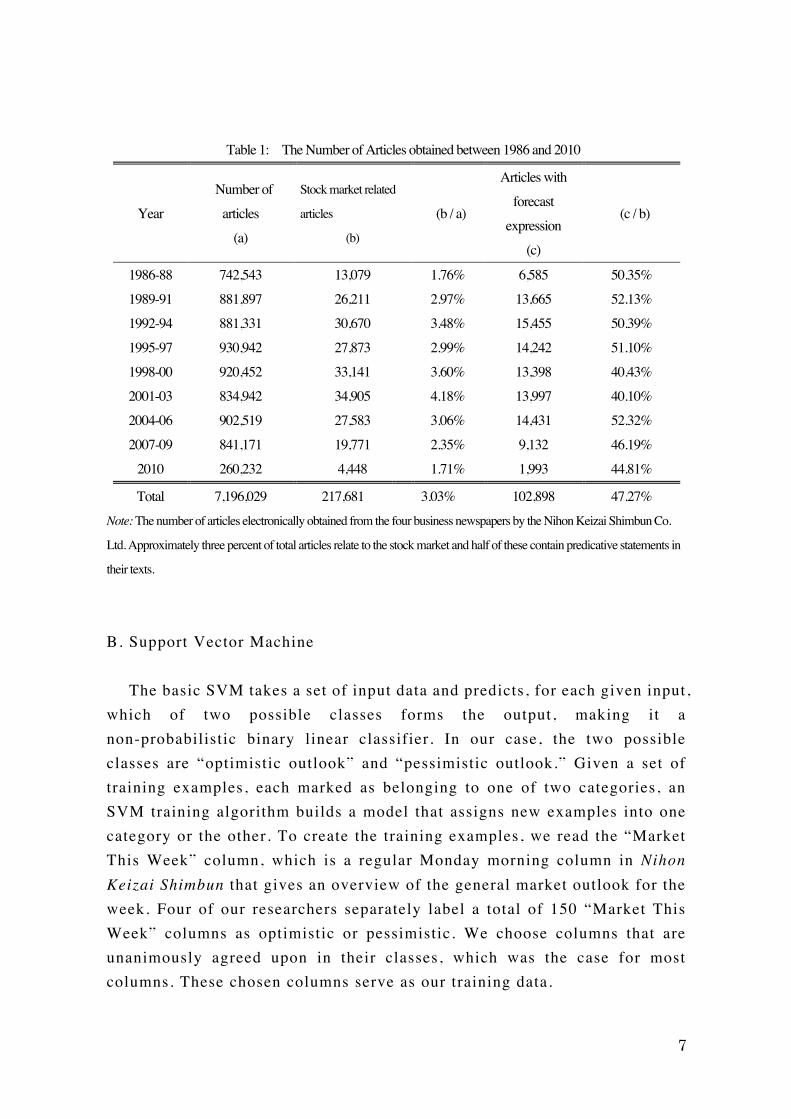
We extract newspaper articles from the digital news archives of four newspapers published by Nihon Keizai Shimbun Co. Ltd; they are: Nihon Keizai Shimbun (morning edition has 3 million daily circulation while evening edition has 1.6 million), Nikkei MJ (0.25 million circulation with marketing focus), Nikkei Sangyo Shimbun (0.18 million circulation with manufacturing focus), and Nikkei Veritas (0.1 million circulation with finance focus). Table 1 shows a description of newspaper articles for our sample period. The number of articles collected electronically is 7,196,029 for the 25-year period between 1986 and 2010. Each article contains keywords at the bottom, which categorize the article type. We picked 20 keywords that contain “stock” or “market.”5 Articles with these keywords are presumably related to the stock market, and approximately 3% of all news (217,681 articles) is deemed relevant. Because we are interested in the market psychology expressed in news text, we identify articles that contain textual expressions stating future outlook for the market. Specifically, we select news articles that have predictive statements. As shown in the rightmost column of Table 1, about half of stock market news consists of statements about the future. Among the total of 102,898 articles, we are interested in the proportion with optimistic/pessimistic outlook, aggregated for each month throughout our sample period. It is difficult for humans to make a categorization by hand because of the sheer number of articles. Therefore, we employ a technique commonly used in text-mining realm and let the computer algorithm perform the classification. For this task, supervised machine learning models are appropriate, because they are well suited to the task of grouping textual data into two groups. Specifically, we use support vector machines (SVMs) that analyze data and recognize patterns for classification. Since this methodology is unfamiliar to most financial economists, we refrain from detailed discussion of the algorithmic setting. In the next section, we sketch out the rough contents of the algorithm and elaborate our application.
5 Keywords chosen are “Stock market,” “Stock market futures,” “Stock investment,” “Stock investment futures,” “Market outlook,” ”Market,” “Stock evaluation,” “Stock buy and sell,” “Stock trade,” “Stock portfolio investment,” “Listed stocks,” ”Stock mutual fund,” “Stock general,” “Stock information,” “Mutual fund,” “Domestic stock market,” “Tokyo Stock Exchange,” “Tokyo stock market,” “All equity,” and “Stock technical analysis.”
7
Table 1: The Number of Articles obtained between 1986 and 2010
Year Number of
articles (a)
Stock market related
articles
(b)
(b / a)
Articles with forecast
expression (c)
(c / b)
1986-88 742,543 13,079 1.76% 6,585 50.35% 1989-91 881,897 26,211 2.97% 13,665 52.13% 1992-94 881,331 30,670 3.48% 15,455 50.39% 1995-97 930,942 27,873 2.99% 14,242 51.10% 1998-00 920,452 33,141 3.60% 13,398 40.43% 2001-03 834,942 34,905 4.18% 13,997 40.10% 2004-06 902,519 27,583 3.06% 14,431 52.32% 2007-09 841,171 19,771 2.35% 9,132 46.19%
2010 260,232 4,448 1.71% 1,993 44.81%
Total 7,196,029 217,681 3.03% 102,898 47.27% Note: The number of articles electronically obtained from the four business newspapers by the Nihon Keizai Shimbun Co.
Ltd. Approximately three percent of total articles relate to the stock market and half of these contain predicative statements in
their texts.
B. Support Vector Machine The basic SVM takes a set of input data and predicts, for each given input, which of two possible classes forms the output, making it a non-probabilistic binary linear classifier. In our case, the two possible classes are “optimistic outlook” and “pessimistic outlook.” Given a set of training examples, each marked as belonging to one of two categories, an SVM training algorithm builds a model that assigns new examples into one category or the other. To create the training examples, we read the “Market This Week” column, which is a regular Monday morning column in Nihon Keizai Shimbun that gives an overview of the general market outlook for the week. Four of our researchers separately label a total of 150 “Market This Week” columns as optimistic or pessimistic. We choose columns that are unanimously agreed upon in their classes, which was the case for most columns. These chosen columns serve as our training data.
8
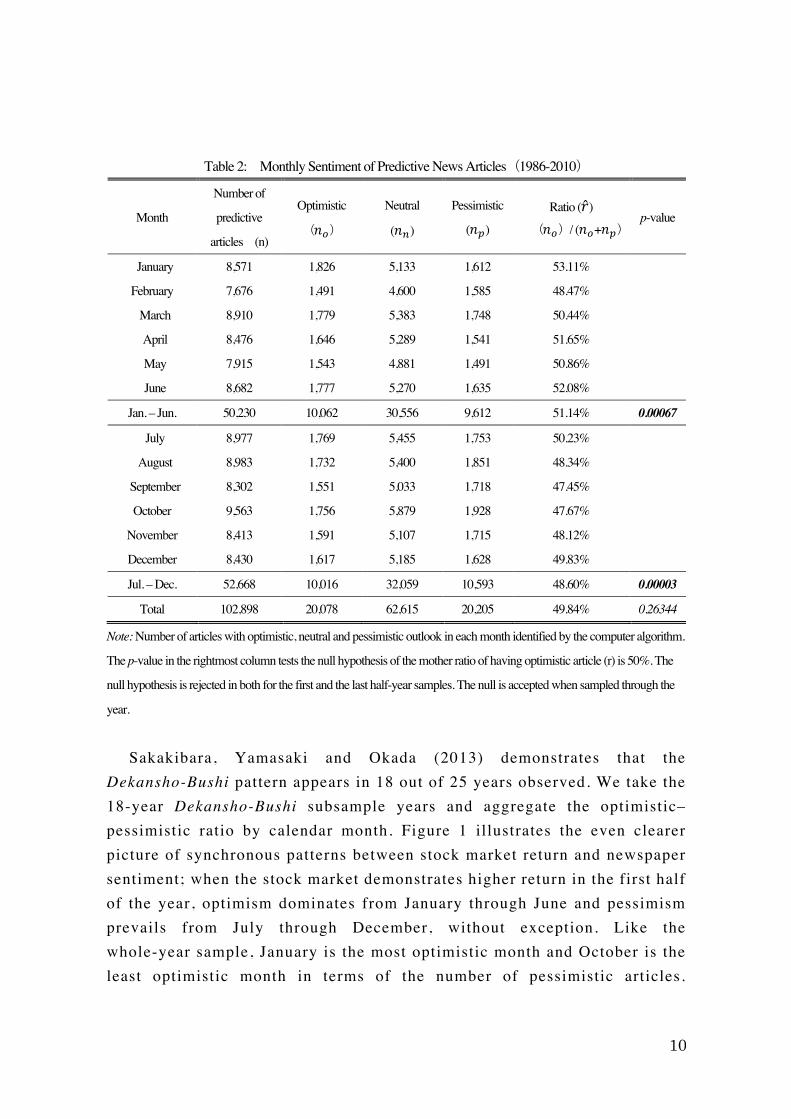
An SVM model is a representation of the examples as points in space, mapped so that the examples of the separate category columns are divided by a clear gap that is as wide as possible. This gives us the evaluation function. Using this evaluation function, the 102,898 articles with predictive statements are then mapped into that same space and predicted to belong to a particular category based on which side of the gap they fall. Specifically, we extract “feature word” to express articles with vectors from our news articles. We select 270 frequently appearing and seemingly relevant feature words in the newspaper articles, including: “go up,” “go down,” “expect,” “worry,” “rosy,” “anxious,” “slow down,” “nervous,” “clear,” “confident,” “jittery,” among others. Thus, our sample news articles are expressed in 270-vector space. The prepared training data from “Market This Week” have the value 1 if the column sounded pessimistic and 2 if optimistic. The evaluation function is fully specified by these training sets. We calculate regression estimates of each of our sample articles from the SVM algorithm. If a sample’s estimated value is close to 1 (meaning the article is close to the training columns that carry a pessimistic outlook), the article is classified into the pessimistic class. If that value is close to 2 (meaning the article is close to the training columns that have an optimistic outlook), the article is classified into the optimistic class. An article is classified as neutral if its estimated value is in the vicinity of an intermediate value, which is an average of all estimated values. The threshold value is determined by the intermediate value plus or minus 𝛼. 6 III. Results A. Seasonality in Nikkei News Based on the classification of articles by the SVM algorithm, we aggregate Nikkei news sentiment for the 25-year period by calendar month. Table 2 summarizes the results. In terms of the number of articles, October has the largest number of news article that contain predictive statements. This may be due to the fact that October is historically a volatile month. The market is repeatedly reminded of past disastrous Octobers, such as Black Thursday in 1929 and Black Monday in 1987.
6 We report the experimental results using 𝛼 = 0.06, however, our results are robust with other threshold values.

9
The second to the rightmost column shows the proportion of optimistic news. The higher the ratio, the better is the mood. The ratio is by far highest in January. This is intuitive in the sense that people tend to make optimistic forecasts at the beginning of the year. The ancient Romans began each year by making promises to the god Janus, for whom the month of January is named. High optimism in January is also consistent with the well-known January Effect. It is interesting that June is the second highest month for optimism. As pointed out by Sakakibara, Yamasaki and Okada (2013), Japan’s stock market is unique in that June exhibits strong positive returns; therefore the sell in May adage is not applicable. The optimistic mood in June is consistent with this phenomenon. For the first half of the year, the proportion of optimistic articles (𝑟) is 51.14%. The null hypothesis (H0) is that the mother ratio of having optimistic articles (r) is 50%. The alternative hypothesis (H1) is that r > 0.5. Our test statistics reject H0 at the 1% confidence interval. The optimistic mood begins to fade in the latter half of the year; the most pessimistic month is September, closely followed by October. For the latter six months of the year, 𝑟 is 48.60%. With this observation, (H0: r=0.5 and H1: r < 0.5) H0 is rejected at the 1% confidence interval. The second half of the year is significantly pessimistic. For the year as a whole, the ratio is 49.84% and the null hypothesis is accepted.
10
Table 2: Monthly Sentiment of Predictive News Articles(1986-2010)
Month
Number of
predictive
articles (n)
Optimistic
(𝑛!)
Neutral
(𝑛!)
Pessimistic
(𝑛!)
Ratio (𝑟)
(𝑛!)/ (𝑛!+𝑛!) p-value
January 8,571 1,826 5,133 1,612 53.11%
February 7,676 1,491 4,600 1,585 48.47%
March 8,910 1,779 5,383 1,748 50.44%
April 8,476 1,646 5,289 1,541 51.65%
May 7,915 1,543 4,881 1,491 50.86%
June 8,682 1,777 5,270 1,635 52.08%
Jan. – Jun. 50,230 10,062 30,556 9,612 51.14% 0.00067
July 8,977 1,769 5,455 1,753 50.23%
August 8,983 1,732 5,400 1,851 48.34%
September 8,302 1,551 5,033 1,718 47.45%
October 9,563 1,756 5,879 1,928 47.67%
November 8,413 1,591 5,107 1,715 48.12%
December 8,430 1,617 5,185 1,628 49.83%
Jul. – Dec. 52,668 10,016 32,059 10,593 48.60% 0.00003
Total 102,898 20,078 62,615 20,205 49.84% 0.26344
Note: Number of articles with optimistic, neutral and pessimistic outlook in each month identified by the computer algorithm.
The p-value in the rightmost column tests the null hypothesis of the mother ratio of having optimistic article (r) is 50%. The
null hypothesis is rejected in both for the first and the last half-year samples. The null is accepted when sampled through the
year.
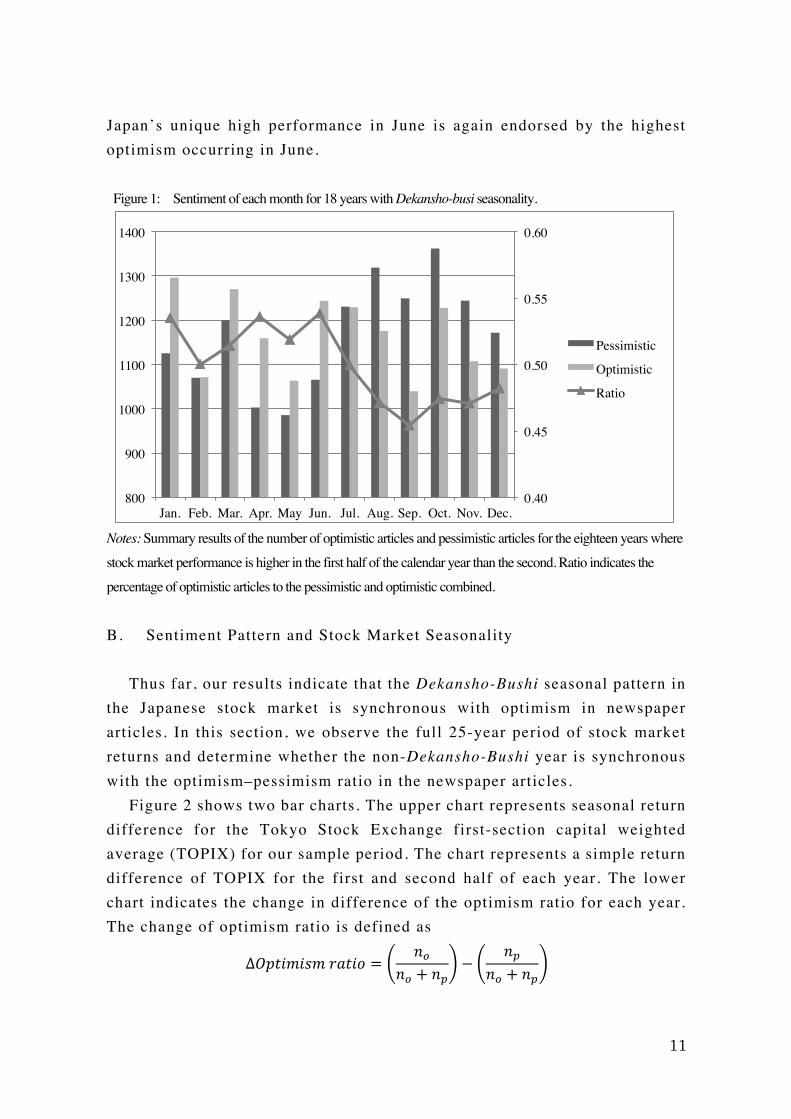
Sakakibara, Yamasaki and Okada (2013) demonstrates that the Dekansho-Bushi pattern appears in 18 out of 25 years observed. We take the 18-year Dekansho-Bushi subsample years and aggregate the optimistic–pessimistic ratio by calendar month. Figure 1 illustrates the even clearer picture of synchronous patterns between stock market return and newspaper sentiment; when the stock market demonstrates higher return in the first half of the year, optimism dominates from January through June and pessimism prevails from July through December, without exception. Like the whole-year sample, January is the most optimistic month and October is the least optimistic month in terms of the number of pessimistic articles.
11
Japan’s unique high performance in June is again endorsed by the highest optimism occurring in June.
Figure 1: Sentiment of each month for 18 years with Dekansho-busi seasonality.
Notes: Summary results of the number of optimistic articles and pessimistic articles for the eighteen years where stock market performance is higher in the first half of the calendar year than the second. Ratio indicates the percentage of optimistic articles to the pessimistic and optimistic combined.
B. Sentiment Pattern and Stock Market Seasonality Thus far, our results indicate that the Dekansho-Bushi seasonal pattern in the Japanese stock market is synchronous with optimism in newspaper articles. In this section, we observe the full 25-year period of stock market returns and determine whether the non-Dekansho-Bushi year is synchronous with the optimism–pessimism ratio in the newspaper articles. Figure 2 shows two bar charts. The upper chart represents seasonal return difference for the Tokyo Stock Exchange first-section capital weighted average (TOPIX) for our sample period. The chart represents a simple return difference of TOPIX for the first and second half of each year. The lower chart indicates the change in difference of the optimism ratio for each year. The change of optimism ratio is defined as
∆𝑂𝑝𝑡𝑖𝑚𝑖𝑠𝑚 𝑟𝑎𝑡𝑖𝑜 =𝑛!
𝑛! + 𝑛!−
𝑛!𝑛! + 𝑛!
0.40
0.45
0.50
0.55
0.60
800
900
1000
1100
1200
1300
1400
Jan. Feb. Mar. Apr. May Jun. Jul. Aug. Sep. Oct. Nov. Dec.
Pessimistic
Optimistic
Ratio
12
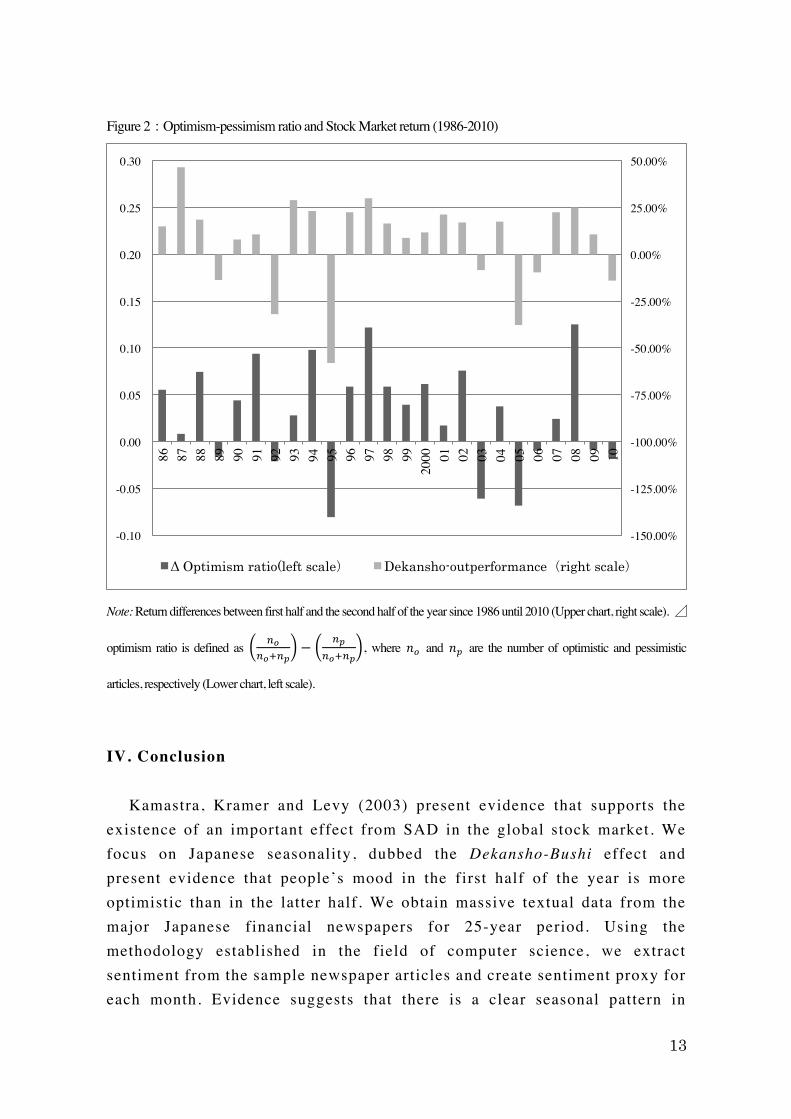
where 𝑛𝑜 and 𝑛𝑝 are the number of optimistic and pessimistic articles, respectively. As shown in Figure 2, ∆𝑂𝑝𝑡𝑖𝑚𝑖𝑠𝑚 𝑟𝑎𝑡𝑖𝑜 is in almost perfect correlation with stock market seasonality. A year with more optimistic outlook in the first half of the year demonstrates higher return in the January–June period than the July–December period, without exception. A year with pessimistic outlook in the first half of the year demonstrates lower return in the January–June period than the July–December period, with only one exception, 2009. This is the year after the financial crisis and the media outlook on the market was presumably quite bleak. As a result, pessimism prevailed in the first half of 2009 while the stock market rebounded sharply from its oversold condition.
13
Figure 2:Optimism-pessimism ratio and Stock Market return (1986-2010)
Note: Return differences between first half and the second half of the year since 1986 until 2010 (Upper chart, right scale). ⊿
optimism ratio is defined as !!!!!!!
− !!!!!!!
, where 𝑛! and 𝑛! are the number of optimistic and pessimistic
articles, respectively (Lower chart, left scale).
IV. Conclusion Kamastra, Kramer and Levy (2003) present evidence that supports the existence of an important effect from SAD in the global stock market. We focus on Japanese seasonality, dubbed the Dekansho-Bushi effect and present evidence that people’s mood in the first half of the year is more optimistic than in the latter half. We obtain massive textual data from the major Japanese financial newspapers for 25-year period. Using the methodology established in the field of computer science, we extract sentiment from the sample newspaper articles and create sentiment proxy for each month. Evidence suggests that there is a clear seasonal pattern in
-150.00%
-125.00%
-100.00%
-75.00%
-50.00%
-25.00%
0.00%
25.00%
50.00%
-0.10
-0.05
0.00
0.05
0.10
0.15
0.20
0.25
0.30 86
87
88
89
90
91
92
93
94
95
96
97
98
99
2000
01
02
03
04
05
06
07
08
09
10
Δ Optimism ratio(left scale) Dekansho-outperformance(right scale)
14
sentiment appearing in the newspaper articles. In general, people tend to have a more optimistic outlook in the first half of the year than the latter half; seasonal fluctuation of market psychology indeed exists. In the 25 sample years observed, there are 18 Dekansho-Bushi years and 7 non–Dekansho-Bushi years. In the Dekansho-Bushi years, our sentiment proxy indicates that optimism in the market is stronger in the first half of the year, without exception. In the non–Dekansho-Bushi years, pessimism in the market is stronger in the first half of the year, except for 2009. Only in 2009, the sentiment proxy pessimistic in the first half but the stock performance was better. However, the fact our sentiment proxy has almost perfect correlation with the stock market return is noteworthy. Because the newspaper articles we use are those with future prospect statements, the causality direction is clear. 7 Investor psychology indeed creates the anomalous market seasonality.
7 We assume the article writers / market pundits’ opinions in the news texts are not driven by stock market performance.
15
References
Bouman, S. and B. Jacobsen (2002), “‘Sell in May and Go Away’: Another Puzzle,” American Economic Review , 92, 1618-1635
Cao, M and J. Wei (2005), “Stock Market Returns: A Temperature Anomaly,” Journal of Banking and Finance, 29, 1559-1573.
Clore, G.L. and G.W. Parrot (1991), “Moods and Their Vicissitudes: Thoughts and Feelings as Information,” In: Forgas, J.P. (Ed.), Emotion and Social Judgements . Pergamon Press, Oxford, 107-123.
Cutler, D.M., J.M. Poterba, and L.H. Summers (1989), “What Moves Stock Prices?” Journal of Portfolio Management,15, 4-12.
Donaldson, G. and H. Kim (1993), “Price Barriers in the Dow Jones Industrial Average.” Journal of Financial and Quantitative Analysis, 28 (3), 313-30.
Etzioni, A. (1988), “Normative–Affective Factors: Towards a New Decision-making Model,” Journal of Economic Psychology, 9 (2), 125-150.
Forgas, J.P. (1995), “Mood and Judgment: The Affect Infusion Model (AIM),” Psychological Bulletin, 117, 39-66.
Forgas, J.P. and G.H. Bower (1987), “Mood Effects on Person-perception Judgments,” Journal of Personality and Social Psychology, 20, 497-513.
Hanock, Y. (2002), “Neither an Angel nor an Ant”: Emotion as an Aid to Bounded Rationality,” Journal of Economic Psychology, 23 (1), 1-25.
Kamastra, M., L. Kramer and M. Levy (2000), “Losing Sleep at the Market: The Daylight Saving Anomaly,” American Economic Review, 90 (4), 1005-1011.
Kamastra, M., L. Kramer and M. Levy (2003), “Winter Blues: A SAD Stock Market Cycle,” American Economic Review, 93 (1), 324-343.
Loewenstein, G.F., U.W. Elke, K.H. Christopher and N. Welch (2001), “Risk as Feelings,” Psychological Bulletin, 127 (2), 267-286.
Mehra, R., and R. Sah (2002), “Mood Fluctuations, Projection Bias and Volatility of Equity Prices,” Journal of Economic Dynamics and Control , 26, 869-887.
Okada, K, and Y. Hamuro (2011), “How Does Emotion in the Market Affect Stock Volatility?—Evidence from Sentiment Index Generated through Computational Linguistics,” Securities Analyst Journal , 49 (8), 37-48 (in Japanese: Soba no Kanjyo to Sono Hendo).
16
Romer, P.M. (2000), “Thinking and Feeling.” American Economic Review, 90 (2), 439-443.
Sakakibara, S, T. Yamasaki and K. Okada (2013), “The Calendar Structure of the Japanese Stock Market: The ‘Sell in May Effect’ Versus the ‘Dekansho-Bushi Effect,’” International Review of Finance , 13 (2), 161-185.
Schwarz, N. (1990), “Feelings as Information: Informational and Motivational Functions of Affective States.” In: Higgins, E.T., Sorrentino, R.M. (Eds.), Handbook of Motivation and Cognition, 2 . Guilford Press, New York, 527-561.
Schwarz, N. and G.L. Clore (1983), “Mood, Misattribution, and Judgements of Well-being: Informative and Directive Functions of Affective States,” Journal of Personality and Social Psychology, 45, 513-523.
Tetlock, P.C. (2007), “Giving Content to Investor Sentiment,” Journal of Finance, 62 (3), 1139-1168.
Tetlock, P.C., M. Saar-Tsechansky and S. Macskassy (2008), “All the News That’s Fit to Reprint,” Journal of Finance, 63 (3), 1437-1467.
Tokunaga, H. (1993), “The Use and Abuse of Consumer Credit: Application of Psychological Theory and Research,” Journal of Economic Psychology , 14 (2), 285-316.
Watson, D. (2000), “Situational and Environmental Influence on Mood.” In: Mood and Temperament, David Watson (ed) . Guilford Press, New York (Chapter 3, pp62-82).
Wong, A. and B. Carducci (1991), “Sensation Seeking and Financial Risk Taking in Everyday Money Matters,” Journal of Business and Psychology , 5 (4), 525-530.
Wright, W.F. and G.H. Bower (1992), “Mood Effects on Subjective Probability Assessment,” Organizational Behavior and Human Decision Processes, 52, 276-291.