investigator group expedition 2006: benthic macroalgal studies at islands in the eastern great...
TRANSCRIPT
INVESTIGATOR GROUP EXPEDITION 2006: BENTHIC MACROALGAL STUDIES ATISLANDS IN THE EASTERN GREAT AUSTRALIAN BIGHT OVER THREE DECADES
J.L. BAKER1,2, S.A. SHEPHERD1, D. TURNER1,3 & K. EDYVANE1,4
1. SARDI Aquatic Sciences, PO Box 120 Henley Beach S.A. 50222. Present address: 8 Fairfield Ave, Somerton Park, S.A. 5044. Email: [email protected]. Present address: Department for Environment and Heritage, GPO Box 1047, Adelaide, S.A. 5001
4. Present address: Arafura Timor Research Facility, PO Box 41321, Casuarina, N.T. 0811
Abstract
Studies of benthic macroalgae have been undertaken in the Investigator Group and at St FrancisIsles for over three decades, and methods of study have changed from quadrat-based biomass dataand general collections, to nondestructive, line-intercept transects (LIT), in which cover of speciesis recorded. We review the utility of classifying data into different structural groups, based onform, and compare this with biomass data. The time series of data enabled a comparison ofquadrat-based biomass data between the 1970s and 1990s surveys at Pearson I. and at St FrancisI, and comparison of structural group data for Pearson I., providing examples of both stability(and change) in macroalgal assemblages over a 22–24 year period. While the LIT approach forsampling cannot accurately record species’ richness, it is valuable for temporal comparisons, andfor studies of ecosystem function and health.
KEY WORDS: Benthic macroalgae, macroalgal assemblages, macroalgal species richness, canopy,understorey, line intercept transects, temporal comparisons, subtidal survey, southern Australia.
Introduction
The ecological study of macroalgae has made dramatic advances since the early 1950s, with the advent ofSCUBA. In the first three decades of this period, when the macroalgal flora of southern Australia was beingdescribed and catalogued by H.B.S. Womersley and his students, emphasis was given to collecting anddescribing the diversity of macroalgae, as well as the quantitative structure of assemblages at specific sitesin southern Australia (reviewed by Underwood & Kennelly 1990). The papers of Shepherd and Womersley(1970, 1971, 1976, 1981), resulting from these endeavours, sought to describe macroalgal zonation anddistribution with respect to environmental variables such as depth and water movement. Of these studies,those at Pearson I. and St Francis I. in the eastern Great Australian Bight (GAB) are relevant to this paper.
During the 1980s, Australian ecologists became interested in the interactions between canopy species ofmacroalgae and understorey organisms (see Underwood & Kennelly 1990). At the same time, ideas on thefunctional morphology of macroalgae emerged, culminating in the algal ‘functional group’ approach (seeLittler & Arnold 1982; Littler & Littler 1985), in which benthic macroalgae are described in terms of forms,based upon structure and morphology. ‘Functional groups’ of macroalgae have been considered ecologicallyrelevant because each group has a specified level of primary productivity (Littler & Arnold 1982), and levelof herbivore resistance due to physical structure such as thallus “toughness”, and chemical defencecompounds (Littler et al. 1983). Since structure is related to function, and a true functional approach (basedon guild relationships – see Cousins 1994) is virtually impossible to measure in most marine systems, the‘functional group’ approach to benthic description and assessment is applied here, and referred to as the‘structural category’ approach.
In the early 1990s, an ambitious program was developed in South Australia (SA) and other States, as part ofthe Commonwealth-funded ‘Ocean Rescue 2000’ program, to classify coastal waters into bioregions (IMCRATechnical Group 1998), based in part on the description of macroalgal assemblages, using species
251
Transactions of the Royal Society of South Australia (2008), 132(2): 251–267

composition and relative biomass data (Edyvane & Baker 1996). The program, undertaken by the SouthAustralian Research and Development Institute (SARDI) Aquatic Sciences, required extensive sampling ofmacroalgal habitats, carried out at a range of spatial scales along the SA coast, and data from two islandgroups in the eastern GAB in 1992–1993 referred to above are relevant here (Fig. 1).
The above methods required the extensive destructive sampling of the benthos, both for identification ofmacroalgae, and for estimating biomass. With increasing concern about the status of coastal systems, theneed for non-destructive sampling was recognised, and Turner (1994) adapted the ‘line-intercept transect’(LIT) method used in tropical marine research (English et al. 1994), to non-destructively sample the benthosof temperate ecosystems, a method that also employed the algal ‘structural group’ categories, first introducedby Littler as ‘functional forms’. During the course of the 2006 expedition to the Investigator Group of islands,data using the LIT method were obtained at Pearson, Ward and Flinders Is (Fig. 1). This paper also includesa summary of data from those islands. By presenting and comparing results of studies from 1969 to thepresent, using methods and analyses that have evolved over time, we provide diverse and detailed descriptionsof the macroalgal flora of the region, and at the same time illustrate in a historical setting the strengths and
252
J.L. BAKER, S.A. SHEPHERD, D. TURNER & K. EDYVANE
Figure 1. St Francis Isles, and the Investigator Group, with sites from the five surveys (1969, 1971, 1992,1993, and 2006) marked. Of these, the paper discusses comparable sites on the NW side of Pearson I.(1969 and 1993); the NW side of St Francis I. (1971 and 1992) and SE Pearson I. (Anchorage Cove) (1993and 2006).

weaknesses of the particular methods of sampling these benthic assemblages. We also compare species,biomass and structural category data from 1969 – 70 and from 1992 – 3, taken at the same exposed sites ontwo islands, Pearson I. and St Francis I., to give a picture of changes in macroalgal assemblages over a timeperiod of 22–24 years.
Materials and Methods
Survey sites
The Investigator Group of islands in the eastern Great Australian Bight comprises four main islands, as wellas smaller islets. The main islands are Pearson I., 64 km from the mainland, Ward I., 25 km north of PearsonI., and Flinders I., 25 km from the mainland. St Francis I., an outer island of Nuyts Archipelago in the NEGAB is 180 km to the NW of Pearson I., and 56 km from the mainland. All the islands have a granitic base,and all except Pearson I. have a calcarenite capping (Robinson et al. 1996).
In Shepherd and Womersley’s January 1969 survey of Pearson I., biomass data (from 5–7 samples, each 0.1m2) were obtained at 5 m depth intervals to 30–50 m depth (according to site) at two sites; these weresupplemented by extensive general collections of macroalgae at each depth interval, and by otherobservations, to give a picture of the depth range of many species (Shepherd & Womersley 1971).
At St Francis I., in a similar survey in Feb. 1971, at each site an average of 20 samples, using 0.125m2
quadrats, were collected at 6–10 m depth intervals, with supplementary general collections to 20–60 m depth,until rock met the sand (Shepherd & Womersley 1976). The sample data were converted to g m-2, whichenabled the present comparison of samples using equivalent units of measurement.
In 1992 and 1993, during SARDI’s benthic surveys of the same islands, a representative sampling schemewas used, whereby four, 1 m2 quadrat samples were taken within each of two replicate transects at depths of5, 10, 15 and 20 m, resulting in eight replicate samples per depth, per site, per island. Quadrats were placedsystematically to proportionally represent the pattern of dominant cover at each depth. These surveys weredone in June 1992 (for St Francis I.) and Feb. 1993 (for Pearson I. and Ward I.).
In 2006, the ‘line intercept transect’ method was used at 5 m depth only. The method employed a weighted1m ruler along a 20 m transect line, to record transitions from one taxon to the next (see Turner & Cheshire2003). A life-form classification (structural categories, as per Littler & Arnold 1982) was used to simplifytaxonomic identification and avoid destructive sampling. Sites at Pearson (N and S), Flinders (Bryant Bay,and a site between Groper Bay and Seal Point) and Ward Is. were surveyed (Fig. 1) in May 2006.
In all surveys, macroalgae collected were preserved in 4–10% formalin solution, examined in the laboratory andidentified to species, and voucher material (selected species only in 2006 survey) lodged in the State Herbarium.
In this paper, biomass data are summarised in g m-2 wet weight, and data presented according to thestructural categories (‘functional groups’) given in Appendix 1, adapted from the Littler and Arnold codes(1982), but including more categories, to account for the variety in structure and form of southern Australianmacroalgae (Appendix 1).
Results
Pearson Island
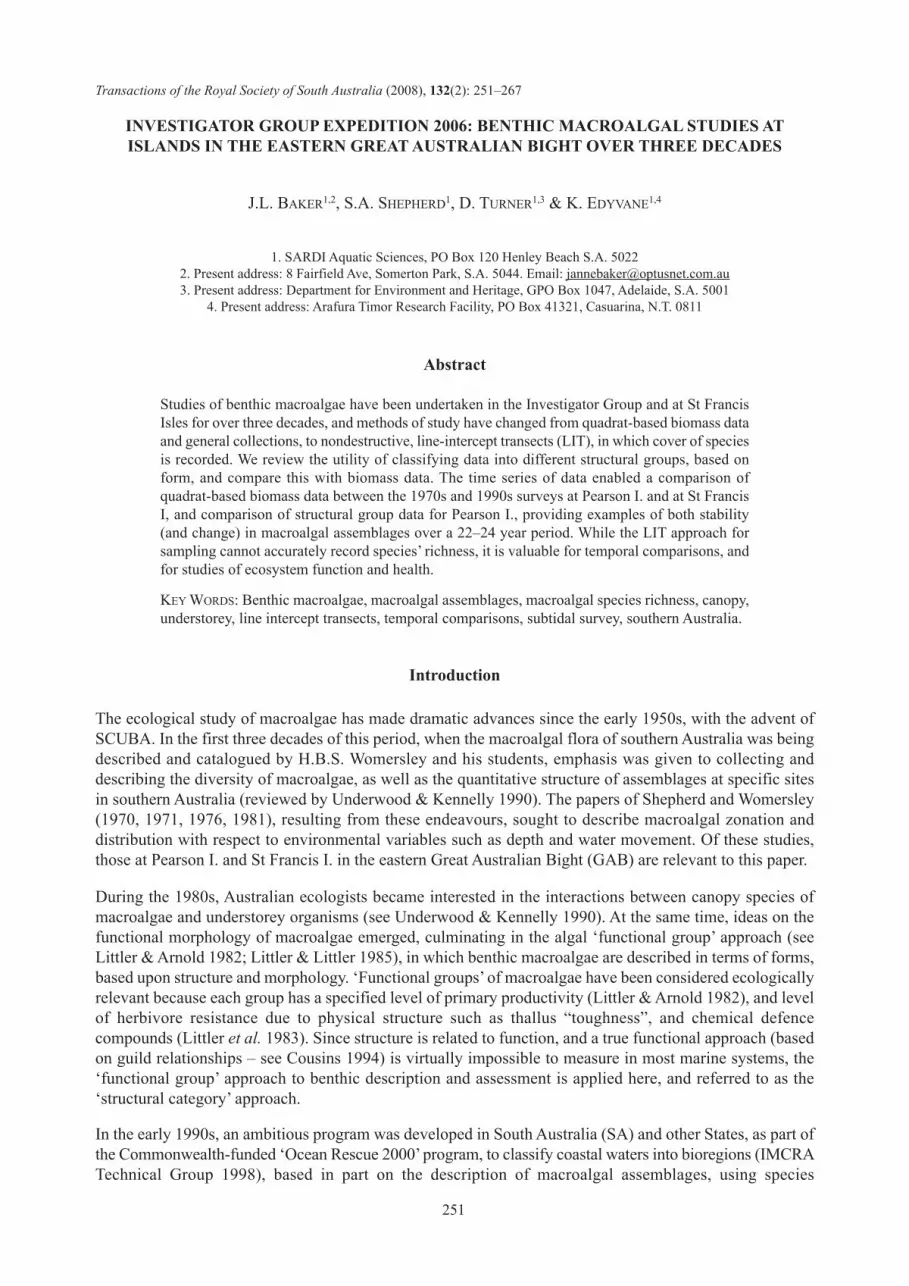
Average biomass data at 10 and 20 m depths, and taken 24 years apart, are shown in Figure 2 for an exposedsite on the NW side of the island in three categories―canopy dominants, other canopy species, andcommoner understorey species―with added notes on presence and range for the 1969 survey. Not includedare 74 understorey species at 10 m depth, and 71 understorey species at 20 m with biomass <10 g m-2. Themean biomass of species >10 g m-2 from the 1993 survey, together with notes on abundance in 1969, aregiven in Table 1.
253
INVESTIGATOR GROUP EXPEDITION 2006: BENTHIC MACROALGAL STUDIES IN THE GAB

254
J.L. BAKER, S.A. SHEPHERD, D. TURNER & K. EDYVANE
Table 1: Rank order mean biomass (g m-2) for benthic floral species recorded at exposed NW side of Pearson I., at 10 and 20m depth (see Figure 2 for species recorded as abundant in 1969 but not recorded in 1993). Only understorey species ≥10 g m-
2 are shown (equating to 25 and 19 understorey species at 20 m and 10 m respectively) i.e. 16 out of 74 species at 10 m, and19 out of 71 species at 20 m in 1993. The fourth column gives the 1969 data at the same site from Shepherd & Womersley(1971). A blank space indicates that a species was not recorded in 1969. SD = standard deviation. P = present and recorded;C= common. * = Only 1 plant of Codium galeatum, of high biomass (872g) recorded in 1 quadrat, hence high standarddeviation.
10 m 1993 1993 1969Mean SD Data and Description
Homoeostrichus sinclairii 1397 761 C 32 – 35 mAcrocarpia paniculata 981 1718 C 8 – 20 m; ~1700 g m-2 at 10 mPlocamium costatum 266 394Ecklonia radiata 244 570 P 15 m; C 20 – 35 mPlocamium angustum 201 219 C 8 – 35 m; ~400 g m-2 at 10 mZonaria spiralis 159 297 P 8 – 22 m; C 18 – 22 m; ~150 g m-2 at 10 mCallophyllis rangiferina 140 237 P 8 – 32 mCystophora subfarcinata 98 211 C only on other sides of the islandPtilocladia pulchra 85 215 P 20 – 25 mCystophora monilifera 76 214 C 20 – 32 mCalliblepharis planicaulis 58 147Haliptilon roseum 54 100 P to 25 m; C 0 – 8 m; ~500 g m-2 at 10 mPlocamium cartilagineum 45 76Hypnea ramentacea 35 88 C 8 – 25 mDelisea pulchra 32 57Caulerpa flexilis var. muelleri 27 58 C 8 m – 26 mAntithamnion hanovioides 27 37Metagoniolithon radiatum 25 60 C 0 – 15 m; ~525 g m-2 at 10 mCaulerpa flexilis 19 37 P 18 – 35 mSargassum linearifolium 19 53Sargassum verruculosum 18 48 P 20 m; C 30 – 35 mHymenena sp. 12 29Sargassum decipiens 11 30
20m 1993 1993 1969Mean SD Data and Description
Ecklonia radiata 987 1204 P 15 – 35 m, 50 m; C 20 – 25 m; ~500gm2 at 20 mCaulerpa obscura 631 1196 C 20 – 35 mPlocamium angustum 433 449 C 8 – 35 m; ~400 gm-2 at 20 mHomoeostrichus sinclairii 341 379 P 15 – 35 m; C 32 – 35 mAcrocarpia paniculata 339 647 C 8 – 20 m; P to 32 m; ~ 250 g m-2 at 20 mDelisea pulchra 207 222 C 0 – 35 m; ~350 g m-2 at 20 mCaulerpa vesiculifera 143 325 Not recorded at exposed sitePlocamium cartilagineum 136 181 Not recorded at exposed sitePlocamium preissianum 132 198 P 15 – 35 m; C 20 – 35 m; ~350 g m-2 at 20 mCodium galeatum * 109 308 P 30 – 32 m

Acrocarpia was the dominant canopy species at 10 m, and Ecklonia at 20 m during both time periods,although standard deviations were high (Fig. 2; Table 1). Few other canopy taxa were present at either 10 or20 m depth, and those present were in low abundance. At 10 m, understorey macroalgae differed substantiallybetween the two time periods (Fig. 2A), as shown in Table 1. Notable examples include the prostrate,foliaceous brown Homoeostrichus sinclairii (sub nom. Zonaria sinclairii in Shepherd & Womersley 1971),which formed a dense cover at sampled sites (i.e. an average of ~1400 g m-2 and more than 2 kg m-2 in somesamples), whereas this species was not recorded at 10 m during the 1969 survey. However, H. sinclairii wasrecorded as a common understorey species at lower depths (32–35 m) during the 1969 survey. In contrast,Pachydictyon paniculatum, a foliaceous brown of similar form to Homoeostrichus, was a main understoreyspecies in1969 (Fig. 2A), but sparse in 1993 (<20g m-2, recorded in only three of eight quadrats). Of the“bushy” red Plocamium species, P. angustum was recorded as a common understorey taxon during both timeperiods. However, P. costatum was dominant in the understorey at sampled sites in 1993 (average 265g m-2),but not recorded at all at Pearson I. in 1969. Plocamium cartilagineum, recorded as patchy in 1993 (i.e. 0-200 g m-2)was not recorded at the exposed side of the island during 1969. Other differences in understorey flora recordedat 10 m between the two time periods (Fig. 2A, Table 1), include the multi-branched red Austrophyllisalcicornis and the green Caulerpa scalpelliformis. Species of Caulerpa were the most dense understoreycomponents during both 1969 and 1993, but species composition differed. Whilst the bushy green C. obscurawas common during both time periods (Fig. 2B, Table 1), other dense, bushy Caulerpa species recorded ascommon during the 1969 survey were not recorded in 1993 (e.g. C. cliftonii), or were recorded as sparse (e.g.C. longifolia with 10 g m-2 and present in only one quadrat). C. vesiculifera was recorded as abundant inpatches (e.g. biomass 0-925g m-2) in 1993, but not recorded on the exposed NW side of Pearson I. in 1969.
At 20 m, the understorey flora at the two time periods showed many similarities. For example, ten of the top12 species in terms of biomass recorded from samples at 20 m in 1993, were recorded as present at that depthin 1969, and nine of those species were common components of the benthos at that time (Fig. 2B). Dominant
255
INVESTIGATOR GROUP EXPEDITION 2006: BENTHIC MACROALGAL STUDIES IN THE GAB
Table 1. Continued from previous page
20m 1993 1993 1969Mean SD Data and Description
Zonaria spiralis 87 71 P 8 – 22 m; C 18 – 22 m; ~230 g m-2 at 20 mCallophyllis rangiferina 66 141 P 8 – 32 mSonderopelta coriacea 50 61 C 20 – 35 m; high cover at >20 mLaurencia elata 48 88 C 20 – 35 mRhodophyllis membranacea 47 69 C 22 – 35 mSargassum paradoxum 43 45Caulerpa flexilis 42 82 P 18 – 35 m; C at >20 m; ~400 g m-2 at 20 mPlocamium mertensii 29 82 P 16 – 35 m; C >18 m; ~765 g m-2 at 20 mDelisea hypneoides 29 30 C 20 – 25 mPhacelocarpus sessilis 29 73 P only at 30 – 32 mScytothalia dorycarpa 26 59 C 34 – 35 m; 50 mCalliblepharis planicaulis 25 50Champia viridis 20 49Metagoniolithon radiatum 19 26 C 0 – 15 m; P 20 – 35 mCaulerpa flexilis var. muelleri 17 28 C 8 – 26 mRhodymenia australis 15 22 P 16 – 35 m, 50 m; C 20 – 24 mPeyssonnelia foliosa 12 19Amphiroa anceps 11 27 P 18 – 35 m; C 20 – 35 mHypnea ramentacea 10 22 C 8 – 25 m
understorey flora recorded during both time periods included the reds Plocamium angustum and Deliseapulchra, and the brown Homoeostrichus sinclairii. However, a number of taxa recorded as dominantunderstorey components in 1969 were not recorded in 1993, or recorded in very low biomass, e.g.Austrophyllis alcicornis, Peyssonnelia novaehollandiae and Amphiroa anceps (Table 1; Fig. 2B).
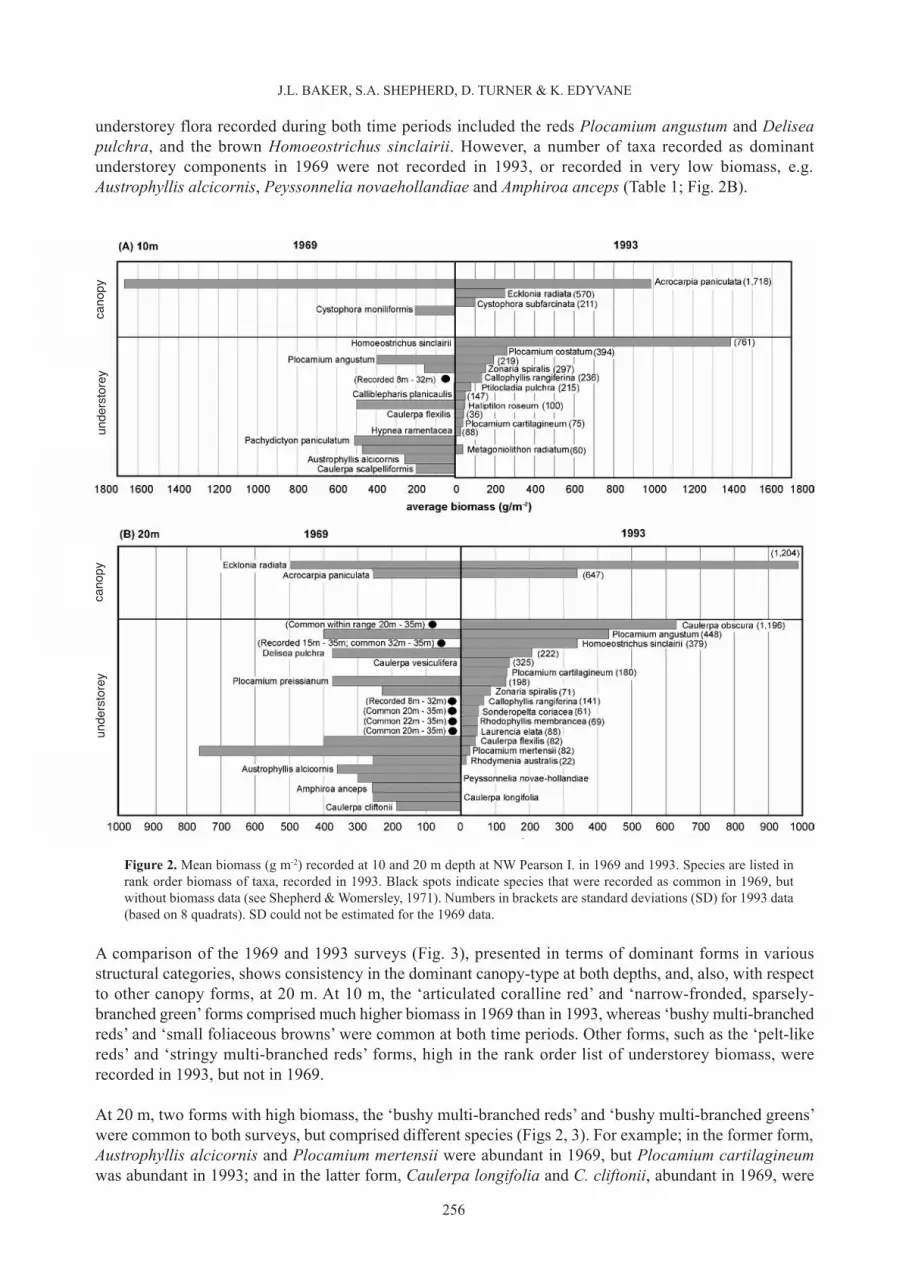
A comparison of the 1969 and 1993 surveys (Fig. 3), presented in terms of dominant forms in variousstructural categories, shows consistency in the dominant canopy-type at both depths, and, also, with respectto other canopy forms, at 20 m. At 10 m, the ‘articulated coralline red’ and ‘narrow-fronded, sparsely-branched green’ forms comprised much higher biomass in 1969 than in 1993, whereas ‘bushy multi-branchedreds’ and ‘small foliaceous browns’ were common at both time periods. Other forms, such as the ‘pelt-likereds’ and ‘stringy multi-branched reds’ forms, high in the rank order list of understorey biomass, wererecorded in 1993, but not in 1969.
At 20 m, two forms with high biomass, the ‘bushy multi-branched reds’ and ‘bushy multi-branched greens’were common to both surveys, but comprised different species (Figs 2, 3). For example; in the former form,Austrophyllis alcicornis and Plocamium mertensii were abundant in 1969, but Plocamium cartilagineumwas abundant in 1993; and in the latter form, Caulerpa longifolia and C. cliftonii, abundant in 1969, were
256
J.L. BAKER, S.A. SHEPHERD, D. TURNER & K. EDYVANE
Figure 2. Mean biomass (g m-2) recorded at 10 and 20 m depth at NW Pearson I. in 1969 and 1993. Species are listed inrank order biomass of taxa, recorded in 1993. Black spots indicate species that were recorded as common in 1969, butwithout biomass data (see Shepherd & Womersley, 1971). Numbers in brackets are standard deviations (SD) for 1993 data(based on 8 quadrats). SD could not be estimated for the 1969 data.
canopy
understorey
canopy
understorey

replaced by C. obscura in 1993. In the ‘small foliaceous browns’, Pachydictyon paniculatum, abundant in1969, was replaced by Homoeostrichus sinclairii in 1993. Hence, despite differences in species’ composition,the understorey structure appears to remain constant over time (Fig. 3), although some minor forms e.g. the‘articulated coralline reds’, ‘succulent branched greens’and ‘stringy multi-branched reds’, did change in biomass.
Overall, observed differences over time were greater at 10 m than at 20 m, and of note was the much higherbiomass of the understorey (with12 species >100 g m-2) at 20 m in 1969 than in 1993 (Fig. 2B, Fig. 3).
Of the sites surveyed in 2006 (Fig. 1), only one site on SE Pearson I. (Anchorage Cove) was comparable witha previously sampled location in 1993. At that site, dominants recorded in 1993 included Ecklonia and mixedCystophora species (largely C. monilifera, with C. moniliformis and C. subfarcinata also present) at 5 m, withan understorey of Caulerpa flexilis, Osmundaria, mixed species of Laurencia and Plocamium, and the turfingbrown Homoeostrichus sinclairii. In 2006, using the LIT technique, % cover data (Appendix 2) showed thesame pattern of dominant species, and similarity in some understorey species, such as Caulerpa spp.St Francis Island
257
INVESTIGATOR GROUP EXPEDITION 2006: BENTHIC MACROALGAL STUDIES IN THE GAB
Figure 3: Results of Pearson I. surveys in 1969 and 1993, presented in terms of dominant forms in various structuralgroups. The top 12 species (in mean biomass) were grouped into structural forms for the 20 m example, and the top sevenspecies were grouped for the 10 m example, because biomass records for more than seven of the dominant understorey taxawere not available for 1969. Numbers on bars are standard deviations (SD) for 1993 data (based on eight quadrats). SD couldnot be estimated for the 1969 data.

Here we were only able to compare samples taken at 11–13 m depth on the exposed NW side of the islandover the time period 1971–1992, and only during different seasons (summer and winter). The mean biomassof those species >10 g m-2 from the two surveys is given in Table 2. Overall, at the 11–13 m depth interval,the abundance of both canopy and understorey species e.g. Scytothalia dorycarpa and Osmundaria prolifera(Fig. 4), differed substantially, with only 9 species of the total of 53 species recorded in common for bothperiods. Three out of 8 canopy species were recorded as common to both surveys (Fig. 4). In 1971, only 10species, none of high biomass, were recorded in the understorey at sampled sites on the NW side of the island(see Table 2; Shepherd & Womersley 1976). In 1992, 29 understorey species were recorded, all in lowabundance (Table 2; Fig. 4). Of these, Osmundaria prolifera was dominant in 1992, but absent in 1971.
258
J.L. BAKER, S.A. SHEPHERD, D. TURNER & K. EDYVANE
Table 2: Mean biomass (g m-2) for benthic macroalgae ≥5 g m-2 recorded at exposed NW side of St Francis I. from 13 m (1971data) and 11 m (1992 data), in rank order according to 1992 data. Species present at 13 m in 1971 were also present at 10 m(Shepherd & Womersley 1976), hence data are considered comparable with those recorded at 11 m in 1992. SD = standarddeviation. S = sparse i.e. present in only one of eight replicate quadrats. D = dense but patchy i.e. high biomass recorded in only1 or 2 of 8 quadrats. P = species present at 12 - 13 m; biomass not recorded (Shepherd & Womersley 1976).
1971 1992 1992 1992Mean Mean SD Notes
Osmundaria prolifera 0 2281 2127Ecklonia radiata 300 539 641Sargassum verruculosum 0 419 331Scytothalia dorycarpa 2560 298 426Cystophora monilifera 0 170 233Sargassum decipiens 0 133 361 DCystophora platylobium 0 129 364 DCystophora expansa 0 123 348 DCystophora subfarcinata 0 89 198Sargassum varians 0 88 90Cystophora pectinata 600 56 110Cystophora moniliformis 0 52 147 SLaurencia filiformis 0 50 110Zonaria spiralis 20 32 52Sporochnus radiciformis 0 32 72Pterosiphonia sp. 0 29 40Plocamium mertensii P 25 24Cystophora brownii 0 23 66 SSargassum lacerifolium P 20 31Hymenocladia usnea 0 17 49 DSargassum podacanthum 0 13 37 SSargassum sp. 0 13 25Pachydictyon paniculatum 0 10 13Thamnoclonium dichotomum 0 10 29 SDilophus sp. 0 9 18Callophyllis lambertii 0 5 15 SSargassum heteromorphum 0 5 15 SPlocamium preissianum 20 2 4Sargassum fallax 315 0 0Zonaria turneriana 30 0 023 minor species P (6 spp) 26 S

Species Richness
At both St Francis I. and Pearson I., the number of species recorded from 5–20 m during the two pairs of surveyswas remarkably similar (Table 3), apart from the high rhodophyte tally (many of them rare) at Pearson I. in 1993.
Discussion
Factors influencing temporal macroalgal comparisons
Many factors can influence temporal comparisons of an algal flora, and we here set out those which couldhave played a role in the observed decadal differences at the two sites.
Differences in samplingAn assessment of natural variation or stability over time may be masked by variations in sampling technique,as occurred in these studies, where three different sampling protocols were used for the three time periods,and locations of resurveyed sites were estimated in the absence of fixed markers. Further, although GPSmarks for each site were taken in 1992 and 1993, these were not used in the 2006 sampling. Apart fromseasonal effects (discussed below) we note here other potential influences of sampling protocol, such asdifferent observers over time. The reliability of future comparisons would be assisted by attention to surveyrepeatability over time, in terms of exact site marking, sampling in the same month, and standardisation ofsampling techniques. These improvements would thus enable meaningful statistical treatment of the data(e.g. utilising multivariate measures of similarity).
Spatial patchinessIn addition to the imprecise location of sites, the natural patchiness of macroalgae in both abundance andspecies’ composition, may influence any discussion of temporal change. Canopy species such as Acrocarpia
Table 3: Total numbers of green, brown and red macroalgae recorded from 5 – 20 m depth, at Pearson I. in 1969 and 1993,and at St Francis I. in 1971 and 1992. See Baker & Edyvane (2003) for a complete species list for the 1992 survey. A full listof verified species recorded during the 1993 survey is available from the first author.
Pearson Island St Francis Island
1969 1993 1971 1992
Chlorophyta 15 17 4 4Phaeophyta 37 49 37 34Rhodophyta 74 136 45 38
259
INVESTIGATOR GROUP EXPEDITION 2006: BENTHIC MACROALGAL STUDIES IN THE GAB
Figure 4. Mean biomass (g m-2) of canopy and understorey taxa recorded in 1971 and 1992 at St Francis I., listedin rank order biomass for 1992. Numbers in brackets are standard deviations (SD) for 1992 data (based on 8quadrats). SD could not be estimated for the 1971 data.
canopy
understorey

and Ecklonia, the dominant canopy species at Pearson I. at 10 and 20 m respectively in 1992 and 1993, maybe patchy at the scale of metres, resulting in standard deviations that are double the mean, or higher. Due tothis natural patchiness, the observed differences in relative abundance in canopy species between the timeperiods may be due to sampling artefacts, rather than any change in mean density or cover. This canexaggerate observed differences over time (see Fig. 2) , in which at 10 m, observed biomass of Acrocarpiain 1993 was almost half of the 1969 biomass, and at 20 m, the observed cover of Ecklonia was almost doublethat recorded in 1969. The lack of other canopy species in these areas may be due to the physical dominanceof Acrocarpia and Ecklonia plants, which can exclude other species. This contrasts with sites in other partsof South Australia, where mixed species of smaller areal cover are abundant in the canopy (e.g. mixedCystophora or Sargassum species at St Francis I. ― see Baker & Edyvane 2003).
Understorey species are also patchily distributed, even more so than canopy species, so clearly, in terms ofrecords, absence of evidence is not evidence of absence. One example is the corallines Haliptilon roseum andMetagoniolithon radiatum, which dominated the understorey in the 1969 survey (sub nom. Corallina cuvieriand M. charoides), but were patchily sparse in 1993, with high standard deviations. The same may apply to“bushy” reds such as Plocamium species and various species of the green Caulpera, all of which may be verypatchy. Nevertheless, during the 1993 sampling, other species were remarkably consistent between quadrats,such as the foliaceous understorey browns Homoeostrichus sinclairii and Zonaria spiralis. These showedhigh biomass in all sampled quadrats, hence low standard deviations.
Disturbances from stormsThese can remove canopy taxa, and understorey species directly through dislodgement, and may indirectlyaffect the understorey by removal of the canopy and through the consequent provision of space and light(Kennelly 1987, 1988; Holbrook et al. 1990; Rogers 1996; review of Minchinton 2007). For example,Shepherd (1979, 1981) found a significant inverse correlation between an index of swell height and algalunderstorey biomass in a red algal community, and found that up to 30% of the understorey algae could betorn out annually by storms. Other factors involved in the high turnover of understorey species are the naturalattrition of plants and overshadowing by competitive dominants. Many understorey species are ephemeral,colonising disturbed habitats, and have seasonal turnover periods (Rodriguez-Morales & Siqueiros-Beltrones1999; Shepherd 1981), so their biomass will vary greatly over space and time. The greater temporaldifferences recorded at 10 m than at 20 m at Pearson I. may have been due to the greater disturbance fromswell at the shallow site compared with the deeper one.
GrazingGrazing can remove canopy and understorey species (Holbrook et al. 1990; Sala et al. 1998). In the easternGAB, grazing or foraging by the following fish and turbinid gastropods is common. The western blue groper,Achoerodus gouldii, when foraging by the ‘ram-and-bite’ technique, removes patches of Caulerpa fronds andrhizomes (Shepherd 2006), and the scalyfin, Parma victoriae, can remove canopy species from its territories(Shepherd et al. 2008). However, the extent to which scalyfin influences changes to macroalgal canopystructure in the GAB is not known, but local effects might occur. The turbinid, Turbo torquatus, clears smallpatches of algae on reefs, and takes both understorey red algae and canopy species (Wernberg et al. 2008),and its congener, the much larger T. jourdani, leaves obvious, cleared patches where it has recently grazed(S.A.S. personal observations). Greenlip abalone, which are abundant herbivores in the eastern GAB, are driftfeeders, and would therefore have little impact on macroalgal composition in this region. Cascade effects uponmacroalgae from the removal of top-order predators have not been investigated in this region, but it is notablethat herbivorous fishes are largely not targeted by fishers in the GAB, and are not a key food source for manyof the major predatory species in this area.
Seasonal and long-term effectsSeveral species of Sargassum shed laterals and fertile parts annually in summer and regrow them in winter,so that large differences in biomass and cover would be recorded between summer and winter sampling(Edgar 1983; Womersley 1987; Kendrick & Walker 1994; Turner & Collings 2008). Although neither surveyat St Francis I. was done during the period of peak growth of Sargassum species (spring to early summer),some differences in canopy biomass may have been due to seasonal differences in sampling. The ephemeral
260
J.L. BAKER, S.A. SHEPHERD, D. TURNER & K. EDYVANE

character of many understorey species, referred to above, could also account for marked differences in theirpresence and abundance over time. In addition to short-term effects, inter-annual shifts in algal communitystructure may also occur. Long-term studies by Edgar and Barrett (1997, 1999) on Tasmanian reefs in marineparks, showed cyclic changes in biomass of algal dominants, as well as changes in grazer abundances,compared with control fished areas. Large-scale and long-term oceanographic shifts affecting macro-algaeand grazers (e.g. Dayton et al 1998; Ettinger-Epstein & Kingsford 2008) might also play a role.
Canopy-understorey interactionsThe suppression of an understorey by canopy species is well known, especially for the kelp, Ecklonia(Kennelly 1987, 1988; Schiel 1988; Kendrick et al. 1999; review by Connell 2007). This effect could accountfor the sparse understorey recorded under the dense canopy of Scytothalia in 1971 at St Francis I. (Fig. 4).Another species which can dominate extensive patches is the large, leathery perennial rhodophyte,Osmundaria prolifera. This species was virtually absent in 1971, but patchily dominant in 1992 at St FrancisI. (Fig. 4; Table 2).
Comparison of species and structural measures for macroalgal communitiesDespite the importance of documenting species richness, the task of identifying species is daunting andcostly, and many ecologists have turned to the ‘structural categories’ approach as a practical, simple, non-destructive, and ecologically relevant alternative for benthic descriptions. The theory underlying this approachis that functional groups or life-forms better indicate the role of often unrelated species than the species’phylogenetic affinities (Steneck & Dethier 1994). Given the many similarities in ecological functions ofmembers within structural groups, presence/absence tallies of species in temporal studies may exaggerate theecological significance of differences observed over time. Structural group approaches may provide resultsthat have a longer “shelf-life” for assessing benthic patterns over time, compared with highly variabletaxonomic data such as species composition. Structural groups also provide a consistent basis for benthiccomparisons over long time frames because their definitions are not subject to the rapid changes to whichspecies-level rapid taxonomy is subjected. In the latter case, species-, genus-, and even family-levelassignments can change markedly over decadal time scales, according to the extent of systematic research(e.g. Woekerling 1997; Womersley 1984, 1987, 1994, 1996, 1998). The maintenance of structural diversityover various scales may have an important role in maintaining biodiversity. Benthic structural groupsencompass a wide variety of taxonomic levels, morphologies, niches and ecological functions. The structuralvariability in height, biomass, and density of macro-algal stands, as well as spatial arrangement of the plants,all may be as important as taxonomic variety in determining the ecosystem functions of marine benthos.Hence, the description of functional categories is arguably more appropriate for temporal comparisons, andfor examining ecosystem function and ‘ecosystem health’ within the community (Miller et al. 1997; Turner& Cheshire 2003; review of Turner et al. 2006). Many macroalgae are taxonomically distinct, but structurally(and functionally) similar e.g. the succulent branched reds, Rhabdonia verticillata and Erythrocloniummuelleri are almost indistinguishable in habit, but have different cell structures (Womersley 1994). Eventaxa in different phyla can be very similar in morphology, size, and habit, and can co-occur in an area; e.g.the branched brown Dictyota prolifera and the foliaceous red Rhodophyllis membranacea. Classification ofthe structural diversity of sites in which such convergent characters occur in the biota may be consideredsimpler and more ecologically relevant than a full taxonomic assessment. Within a single structural group,numerous species may have the same ecological functions. Examples include the ‘bushy reds’ such as speciesof Plocamium, Callophyllis, and Austrophyllis alcicornis etc, to which some grazers and epibiota are attracted,and the green genus Caulerpa, which provide habitat for diatoms and dinoflagellates (Samann et al. 1988),and for amphipods (Fenwick 1976), and are eaten by some opisthobranch molluscs (Jensen 1979, 1980,1994). In South Australia, at least four saccoglossan opisthobranchs obligately feed on species of Caulerpa(Burn 1989). Similarities in functional significance despite taxonomic differences could be expected forfoliaceous multi-branched brown understorey taxa, such as Homoeostrichus sinclairii (abundant in 1993samples from Pearson I.) and Pachydictyon paniculatum (abundant in 1969 samples). Many species of thecanopy genus Cystophora also have similar structure, and would therefore serve similar roles, such asproviding microhabitat for epifauna and epiflora, and camouflaging fish that use the plants to hide frompredators (J. Baker, pers. obs.).
261
INVESTIGATOR GROUP EXPEDITION 2006: BENTHIC MACROALGAL STUDIES IN THE GAB

Given the limited time available for such studies, the LIT technique has obvious benefits. One is that not onlydoes it provide a rapid way to record structure, but it also provides valuable information on the spatialrelations of canopy species (e.g. Turner & Cheshire 2003). LIT may be used to rapidly collect large amountsof data across large areas, whereas quadrat-based methods are time-consuming, and a limited area is coveredwith each survey. However, the novelty of the LIT technique, and its lack of species-specificity, has largelyprevented comparison with the earlier macroalgal data sets available, although it will now provide a valuablebaseline for future comparisons. A striking disadvantage of the technique, illustrated in Appendix 2, isuncertainty about many minor species’ identities. For determining species’ identity, there is no substitute forslow, painstaking algal collections, as shown by the comparable richness of species recorded by this methodin 1969–71 and 1992–3 (Table 3). A hybrid survey technique could be useful to develop, which wouldincorporate the LIT to characterise the benthos, supplemented by some targeted collecting or ancillaryquadrats, to provide relevant taxonomic information.
Although the variations in sampling over time may preclude meaningful statistical analysis of these data,those for Pearson I. apparently indicate that at a site without anthropogenic impacts, but subject to naturaldisturbance, overall structure of the algal community may remain similar, despite natural variation in species’composition and abundance. But we add the caveat that a limitation of most sampling approaches, includingstructural groups, is that they are applicable only for repeated sampling in the same season, as shown by theSt Francis I. temporal comparison, due to the seasonality of the canopy in some species of Sargassum (see above).
The macroalgal productivity (Turner & Cheshire 2003) and species richness at the St Francis Isles (Baker &Edyvane 2003) and the Investigator Group (Shepherd & Womersley 1971) are known to be remarkably high.Regionally, this is due to a high biogeographic algal diversity (Phillips 2001), and locally to the very clearwater and high light penetration, which enable macroalgal communities to flourish to >50 m deep (Shepherd& Womersley 1971). This species richness, a biodiversity conservation value, contributes to the significanceof the islands for protection, as has long been recommended (see Baker 2004).
Acknowledgements
We thank Giovanna Lorenzin, Annette Doonan, Val Boxall and Deborah Nias for laboratory assistance insorting and pressing the plant specimens from 1992 and 1993; Andrew Dalgetty and Brian Davies for divingassistance in 1992 and 1993; Tim Kildea, James Brook and Yvette Eglinton for diving assistance in 2006, andthe crew of the MRV Ngerin for assistance on board. We especially thank Professor Bryan Womersley foralgal identifications over four decades. This work forms part of the first author’s Ph.D. at Adelaide University.Environment Australia and the Australian Heritage Commission provided funding assistance for the BenthicSurveys Program, of which the 1992 and 1993 surveys were part.
262
J.L. BAKER, S.A. SHEPHERD, D. TURNER & K. EDYVANE

Appendix 1
A structural classification, utilising ‘functional groups’ first devised by Littler and Arnold 1982, for southern Australian marineplants, based upon samples recorded during a seven-year-long South Australian benthic survey program (1992–1998).Categories are based upon the relative size, shape and morphological complexity of the benthic flora in each phylum formacroalgae, and in four families of seagrasses. Several additional categories that complete the classification have not beenincluded in this table, such as those that apply to flora from the southern and south-eastern parts of South Australia.
STRGRAS Small, stringy seagrass (species of Zostera and Heterozostera)
SLFGRAS Small, leafy seagrass (species of Halophila)
LWRGRAS Large, wiry seagrass (species of Amphibolis)
STPGRAS Large, strappy seagrass (species of Posidonia)
MIXDEPI Small, multi-branched epiphytes (species of Acrothamnion and Antithamnion; Pachydictyon polycladum;Metagoniolithon stelliferum; Jania pusilla; small species of Mychodea, Dicranema revolutum; small speciesof Jeannerettia; Polycerea nigrescens; epiphytic species of Champia)
FILTURF Small, soft, filamentous epiphytes and benthic turf (small species of Cladophora; species of Ectocarpus andSphacelaria; small species of Polysiphonia etc)
NAROGRN Narrow-fronded, sparsely-branched greens (Caulerpa scalpelliformis, C. trifaria, C. alternans etc)
SUCBGRN Thick, succulent branched greens (some species of Codium, such as C. galeatum, C. muelleri andC. harveyi; species of Caulerpa such as C. cactoides, C. vesiculifera, C. papillosa and C. simpliciuscula)
SUCUGRN Thick, succulent greens, not branched (some species of Codium, such asC. pomoides,C.mammilosum,C spongiosum)
BUSHGRN Bushy greens (species of Bryopsis; bushy species of Caulerpa such as C. obscura and C. cliftonii;Apjohnia laetevirens)
STRGBWN Soft stringy browns (e.g. Cladosiphon filum; Chordaria cladosiphon etc)
MEMBBWN Flat membranous browns (Colpomenia sinuosa; Hydroclathrus clathratus; Asperococcus bullosus)
FOLIBWN Small bushy, foliaceous and/or branched browns within thin (and mostly flat) cortex and branches (e.g.species of Zonaria, Distromium, Padina, Halopteris, Homoeostrichus, Dictyota and Dilophus; Lobospirabicuspidata; Pachydictyon paniculatum; Cladostephus spongiosus; Lobophora variegata)
FLBRBWN Medium to large browns, branched or unbranched, with flat, broad axes (e.g. Glossophora nigricans, Dictyotanaevosa, Dictyopteris muelleri, some Myriodesma species, such as M. callophyllum and M. quercifolium).
LGTHBWN Large, branched browns with narrow, terete axes (e.g. most species of Sporochnus; Perithalia caudata;Encyothalia cliftonii; Myriodesma integrifolium)
RBBRBWN Large, robust branched browns (e.g. Acrocarpia paniculata; Seirococcus axillaris; Scytothalia dorycarpa;Scaberia agardhii; species of Cystophora; mature plants of species of Sargassum)
RBBLBWN Robust blade-shaped brown (Ecklonia radiata)
ENCRRED Encrusting corallines (e.g. species of Sporolithon, Lithothamnion, Mesophyllum)
CORLRED Articulated coralline reds (e.g. species of Amphiroa, Metagoniolithon and Jania; Haliptilon roseum; Corallinaofficinalis; Metamastophora flabellata)
FLMBRED Flat, foliose, membranous reds, some branched (e.g. Halymenia floresia and H. plana; Kallymenia cribrosaand K. cribrogloea; Rhodoglossum gigartinoides; Glaphrymenia pustulosa; Hymenocladia chondricola)
FLATRED Flat, encrusting, lobed reds (e.g. species of Peyssonnelia such as P. capensis and P. novae-hollandiae;Sonderopelta coriacea)
FOLIRED Small, foliaceous reds with flat branches (e.g. species of Craspedocarpus, such as C. ramentacea andC. venosus; species of Rhodymenia such as R. australis and R. verrucosa; Carpopeltis phyllophora;Hemineura frondosa; Myriogramme erosa; species of Rhodophyllis, such as R. membranacea and R. volans;Leptophyllis conferta)
SOFTRED Soft, gelatinous branched reds (e.g. species of Nemalion, Helminthora and Liagora)
SUCCRED Succulent, mostly branched, reds (e.g. species of Coeloclonium and Coelarthrum; Rhabdonia clavigera;Erythroclonium sonderi; Botryocladia sonderi; Solieria robusta; Gloiosaccion brownii; larger, non-epiphyticspecies of Champia; species of Webervanbossea; some species of Chondria)
STRGRED Stringy, multi-branched reds (e.g. Calliblepharis planicaulis; Hypnea ramentacea; some larger species ofPolysiphonia; some species of Laurencia; Doxodasya bulbochaete; Chirocanthia arborea)
263
INVESTIGATOR GROUP EXPEDITION 2006: BENTHIC MACROALGAL STUDIES IN THE GAB

Appendix 1. Continued from previous page.
SMWRRED Small wiry, branched reds (e.g. Dolichoscelis sp., Pterocladia capillacea and P. lucida; Gelidium australe; someGigartina species, such as G. densa and G. pinnata; Polyopes constrictus; Kraftia dichotoma; species of Mychodea)
BUSHRED Bushy, multi-branched reds (e.g. species of Phacelocarpus and Plocamium; Delisea pulchra; Dictymeniaspecies such as D. harveyana; Areschougia congesta and A. ligulata; Ptilonia australasica; Calliblepharisplanicaulis; Callophyllis rangiferina and C. lambertii; Vidalia spiralis; Amansia pinnatifida etc)
FLUFRED Fluffy reds (e.g. most species of Dasya, Micropeuce, Spongoclonium, and Brongniartella; Asparagopsisarmata; Ballia callitricha and B. mariana; Delisea hypneoides and D. elegans; Claudia elegans)
PELTRED Small pelt-like reds (e.g. Haloplegma preissii, Euptilocladia spongiosa, Ptilocladia australis, Wrangelianobilis and W. velutina, Thuretia australasica)
LETHRED Thick “leathery” reds (e.g. Osmundaria prolifera, Cladurus elatus, Lenormandia pardalis, Thamnocloniumdichotomum).
Appendix 2
Mean percentage cover data for LIT (line intercept transects) for five of the sites sampled in 2006. Numbers are average ofcalculated percentage cover data for four transects. Excluded are species with <5% cover recorded in only one of four transects.
Pearson I. Pearson I. Ward I. Flinders I. Flinders I.North South Bob’s Nose Bryant Bay
Acrocarpia robusta 1 4 7 21Caulerpa brownii 7 18 8Caulerpa flexilis 19 13 30 16 5Caulerpa simpliciuscula 5Caulerpa sp. A 10Caulerpa sp. B 2Corallina sp. 1Cystophora brownii 3 5Cystophora expansa 5 7 4Cystophora monilifera 10 9 1 3 19Cystophora moniliformis 13 10 10 13 4Cystophora siliquosa 1 4Cystophora subfarcinata 1 10 10 8 6Ecklonia radiata 29 6 15 4Lobospira bicuspidata <1Metagoniolithon sp.? 1 3Osmundaria prolifera <1 3 12Sargassum (Arthrophycus) sp. 5Sargassum (Sargassum) sp. 2 8Sargassum (Phyllotrichia) sp. <1Sargassum sonderi 4Sargassum verruculosum <1 4Unidentified coralline red <1 5Unidentified encrusting red 4 4Unidentified turfing red 6 4 <1 2Unidentified foliaceous brown <1Unidentified foliaceous red 0 2 2 1Unidentified foliaceous red 1 1Unidentified foliaceous red 2 2Unidentified foliaceous red 3 (F) 2Unidentified macroalgae (DDD) 4Zonaria, Padina, Lobophora 2
264
J.L. BAKER, S.A. SHEPHERD, D. TURNER & K. EDYVANE

References
Baker, J.L. (2004). ‘Towards a System of Ecologically Representative Marine Protected Areas in South Australian MarineBioregions - Technical Report’. Report for Coast and Marine Conservation Branch, Department for Environment andHeritage, South Australia. 1250 pp. http://www.environment.sa.gov.au/coasts/marineparks/pdfs/mpa_report/part_1.pdfhttp://www.environment.sa.gov.au/coasts/marineparks/pdfs/mpa_report/part_2.pdf
Baker, J.L. & Edyvane, K.E. (2003). Subtidal macrofloral survey of St Francis and Fenelon Islands, South Australia. Transactionsof the Royal Society of South Australia, 127(2): 177–188.
Burn, R. (1989). Opisthobranchs. In ‘Marine Invertebrates of Southern Australia. Part 2’. (Eds S.A. Shepherd and I.M. Thomas).Handbook of the Flora and Fauna of South Australia. pp. 504–724. (Government Printer, Adelaide, South Australia).
Connell, S.D. (2007). Subtidal temperate rocky habitats: habitat heterogeneity at local to continental scales. In ‘Marine Ecology’ (EdsS.D. Connell & B.M. Gillanders) pp. 378–401 (Oxford University Press, Melbourne).
Cousins, S. (1994). Taxonomy and functional biotic measurement, or, will the Ark work? In ‘Systematics and ConservationEvaluation’ (Eds P. Forey, C. Humphries & R. Vane-Wright) pp. 397–419 (Clarendon Press, Oxford, U.K.).
Dayton, P., Tegner, M., Edwards, P. & Riser, K. (1998). Sliding baseline, ghosts, and reduced expectations in kelp forest communities.Ecological Applications, 8: 309–322.
Edgar, G. (1983). The ecology of south-east Tasmanian phytal animal communities. 2. Seasonal change in plant and animalpopulations. Journal of Experimental Marine Biology and Ecology, 70: 159–179.
Edgar, G. & Barrett, N. (1997). Short term monitoring of biotic change in Tasmanian marine reserves. Journal of ExperimentalMarine Biology and Ecology, 213: 261–279.
Edgar, G. & Barrett, N. (1999). Effects of the declaration of marine reserves on Tasmanian reef fishes, invertebrates and plants.Journal of Experimental Marine Biology and Ecology, 242: 107–144.
Edyvane, K.E. & Baker, J.L. (1996). Marine Benthic Survey of the St Francis Isles and Investigator Isles, South Australia: ProgressReport. Report prepared for the Australian Heritage Commission, Canberra. (SARDI Aquatic Sciences, South Australia). 28pp.
English, S., Wilkinson, C. & Baker, V. (1994). ‘Survey Manual for Tropical Marine Resources’. ASEAN Australian Marine SciencesProject. (Australian Institute of Marine Science, Townsville, Queensland).
Ettinger-Epstein, P. & Kingsford, M.J. (2008). Effects of the El Niño southern oscillation on Turbo torquatus (Gastropoda) and theirkelp habitat. Austral Ecology, 33: 594–600.
Fenwick, G. (1976). The effect of wave exposure on the amphipod fauna of the alga Caulerpa brownii. Journal of ExperimentalMarine Biology and Ecology, 25: 1–18.
Holbrook, S., Schmitt, R. & Ambrose, R. (1990). Biogenic habitat structure and characteristics of temperate reef fish assemblages.Australian Journal of Ecology, 15 489–503.
IMCRA Technical Group (1998). ‘Interim Marine and Coastal Regionalisation for Australia: an ecosystem-based classification formarine and coastal environments’. (Environment Australia, Canberra).
Jensen, K. (1979). Feeding biology of some Florida sacoglossans. Florida Science, 42(1) (supplement): 23.
Jensen, K. (1980).Areview of sacoglossan diets, with comparative notes on radular and buccal anatomy. Malacological Review, 13: 55–77.
Jensen, K. (1994). Behavioural adaptations and diet specificity of sacoglossan opisthobranchs. Ethology, Ecology & Evolution, 6: 87–101.
Kendrick, G. & Walker, D. (1994). Role of recruitment in structuring beds of Sargassum spp. (Phaeophyta) at Rottnest Island,Western Australia. Journal of Phycology, 30: 200–208.
Kendrick, G.A., Lavery, P.S. & Phillips, J.C. (1999). Influence of Ecklonia radiata kelp canopy on structure of macro-algalassemblages in Marmion Lagoon, Western Australia. Hydrobiologia, 398–399: 275–283.
Kennelly, S. (1987). Physical disturbances in an Australian kelp community. 1. Temporal effects. Marine Ecology Progress Series,40: 145–153.
Kennelly, S. (1988). Effects of kelp canopies on understorey species due to shade and scour. Marine Ecology Progress Series, 50: 215–224.
265
INVESTIGATOR GROUP EXPEDITION 2006: BENTHIC MACROALGAL STUDIES IN THE GAB

Littler, M. & Arnold, K. (1982). Primary productivity of marine macroalgal functional-form groups from south-western NorthAmerica. Journal of Phycology, 18: 307–311.
Littler, M. & Littler, D. (1985). ‘Handbook of Phycological Methods. Volume 3: Ecological Field Methods: Macroalgae’ (CambridgeUniversity Press, N.Y.).
Littler, M., Littler, D. & Taylor, P. (1983). Evolutionary strategies in a tropical barrier reef system: Functional-form groups of marinemacroalgae. Journal of Phycology, 19: 229–237.
Miller, D., Cheshire, A., Hall, S. & Havenhand, J. (1997). Assessing the status of temperate reefs in Gulf St Vincent III: evaluationand description of methodologies. (Department of Botany, University of Adelaide, and School of Biological Sciences,Flinders University).
Minchinton, T. (2007). Natural disturbance and regeneration of marine benthic communities. In ‘Marine Ecology’ (Eds S.D. Connell& B.M. Gillanders) pp. 138–174 (Oxford University Press, Melbourne).
Phillips, J.A. (2001). Marine macroalgal biodiversity hotspots: why is there high species richness and endemism in southern Australianmarine benthic flora? Biodiversity and Conservation, 10(9): 1555–1577.
Robinson, A., Canty, P., Mooney, P. & Ruddock, P. (1996). ‘South Australia’s Offshore Islands’. (South Australian Department ofEnvironment and Natural Resources, Adelaide, South Australia).
Rodriguez Morales, E. & Siqueiros Beltrones, D. (1999). Time variations in a subtropical macroalgal assemblage from the MexicanPacific (Variaciones temporales en una asociacion de macroalgas subtropical del Pacifico Mexicano). Investigaciones MarinasCICIMAR [Oceanides], 13 &14: 11–24.
Rogers, R. (1996). Spatial, seasonal and secular patterns in the cover of green algae on Heron Reef Flat, Great Barrier Reef, Australia.Botanica Marina, 39: 415-419.
Sala, E., C. Boudouresque & Harmelin-Vivien, M. (1998). Fishing, trophic cascades and the structure of algal assemblages: evaluationof an old but untested paradigm. OIKOS 82: 425–439.
Samaan, A., Bekheet, I., Abdalla, R. & Mikhail, S. (1988). Epiphytes growing on some marine algae in the Eastern Harbour ofAlexandria, Egypt. Bulletin of the National Institute of Oceanography and Fisheries (Egypt), 14: 181–190.
Schiel, D. (1988). Algal interactions on shallow subtidal reefs in northern New Zealand: A review. New Zealand Journal of Marineand Freshwater Research, 22: 481–489.
Shepherd, S.A. (1979). The ecology of a deep water red algal community off Cape Northumberland, South Australia. M.Env.St.Thesis (University of Adelaide, Adelaide).
Shepherd, S.A. (1981). Ecological strategies in a deep water red algal community. Botanica Marina, 24: 457–463.
Shepherd, S.A. (2006). Ontogenetic changes in diet, feeding behaviour and activity of the western blue groper, Achoerodus gouldii.pp 477–494 In ‘The Marine Fauna and Flora of Esperance, Western Australia Volume 2’ (Proceedings of the 12th InternationalMarine Biology Workshop) (Eds F.E. Wells, D.I. Walker and G.A. Kendrick) (Western Australian Museum, Perth).
Shepherd, S. A. & Womersley, H. B. S. (1970). The sublittoral ecology of West Island, South Australia. I. Environmental featuresand algal ecology. Transactions of the Royal Society of South Australia, 94: 105–138.
Shepherd, S.A. & Womersley. H.B.S. (1971). Pearson Island expedition 1969. 7: The subtidal ecology of benthic algae. Transactionsof the Royal Society of South Australia, 95: 155–167.
Shepherd, S.A. & Womersley, H.B.S. (1976). The subtidal algal and seagrass ecology of St Francis Island, South Australia.Transactions of the Royal Society of South Australia, 100: 177–191.
Shepherd, S.A. & Womersley, H.B.S. (1981). The algal and seagrass ecology of Waterloo Bay, South Australia. Aquatic Botany, 11:305–371.
Shepherd, S.A., Clark, M., & Ferguson, G. (2008). Habitat-dependent foraging behaviour and diet of the scalyfin, Parma victoriae,in South Australia. Transactions of the Royal Society of South Australia 132(2): 134–146.
Steneck, R.S. & Dethier, M.N. (1994). A functional group approach to the structure of algal-dominated communities (review) Oikos,69: 476–498.
Turner, D.J. (1994). A comparative study of destructive and non-destructive survey techniques for us in macroalgal systems. Honoursthesis. Botany Department (University of Adelaide, South Australia).
266
J.L. BAKER, S.A. SHEPHERD, D. TURNER & K. EDYVANE

Turner D.J. & Cheshire, A.C. (2003). Encounter 2002 expedition to the Isles of St Francis, South Australia: structure and productivityof benthic macroalgal communities. Transactions of the Royal Society of South Australia, 127: 153–166.
Turner, D.J. & Collings, G.J. (2008). Chapter 20. Subtidal macroalgal communities of Gulf St Vincent. In ‘Natural History of GulfSt Vincent’ (Eds S.A. Shepherd, S. Bryars, I. Kirkegaard, P. Harbison & J.T. Jennings) pp. 264–278 (Royal Society ofSouth Australia, Adelaide).
Turner, D.J., Kildea, T. & Murray-Jones, S. (2006). Examining the health of subtidal reef environments in South Australia. Part I.Background review and rationale for the development of the monitoring program. SARDI Research Report Series No. 125.Publication No. RD 03/0252-3. (SARDI Aquatic Sciences, Adelaide).
Underwood, A.J. & Kennelly, S.J. (1990). Ecology of marine algae on rocky shores and subtidal reefs in temperate Australia.Hydrobiologia, 192: 3–20.
Wernberg, T., White, M. & Vanderclift, M.A. (2008). Population structure of turbinid gastropods on wave-exposed subtidal reefs:effects of density, body size and algae on grazing behaviour. Marine Ecology Progress Series, 362: 169–179.
Woelkerling, W. (1997). The biodiversity of Corallinales (Rhodophyta) in southern Australia: 1976 vs 1996, with implications forgenerating a world biodiversity database. Cryptogamie: Algologie, 18: 225–261.
Womersley, H.B.S. (1984). ‘The Marine Benthic Flora of Southern Australia. Part I’. (South Australian Government Printing Division,Adelaide, South Australia). 329 pp.
Womersley, H.B.S. (1987). ‘The Marine Benthic Flora of Southern Australia. Part II.’ (South Australian Government PrintingDivision, Adelaide, South Australia). 484 pp.
Womersley, H.B.S. (1994). ‘The Marine Benthic Flora of Southern Australia. Part IIIA’. (Australian Biological Resources Study,Canberra). 508 pp.
Womersley, H.B.S. (1996). ‘The Marine Benthic Flora of Southern Australia. Part IIIB’. (Australian Biological Resources Study,Canberra, Australia). 392 pp.
Womersley, H.B.S. (1998). ‘The Marine Benthic Flora of Southern Australia. Part IIIC’. (State Herbarium of South Australia). 535 pp.
267
INVESTIGATOR GROUP EXPEDITION 2006: BENTHIC MACROALGAL STUDIES IN THE GAB