investigation on the utility of permanent maxillary molar cusp areas for sex estimation
TRANSCRIPT
1 23
Forensic Science, Medicine,and Pathology ISSN 1547-769XVolume 7Number 3 Forensic Sci Med Pathol (2011)7:233-247DOI 10.1007/s12024-010-9204-7
Investigation on the utility of permanentmaxillary molar cusp areas for sexestimation
P. James Macaluso

1 23
Your article is protected by copyright and
all rights are held exclusively by Springer
Science+Business Media, LLC. This e-offprint
is for personal use only and shall not be self-
archived in electronic repositories. If you
wish to self-archive your work, please use the
accepted author’s version for posting to your
own website or your institution’s repository.
You may further deposit the accepted author’s
version on a funder’s repository at a funder’s
request, provided it is not made publicly
available until 12 months after publication.
ORIGINAL ARTICLE
Investigation on the utility of permanent maxillary molar cuspareas for sex estimation
P. James Macaluso Jr.
Accepted: 30 October 2010 / Published online: 16 November 2010
� Springer Science+Business Media, LLC 2010
Abstract Digital photogrammetric methods were
employed to assess the level of sexual dimorphism present
in permanent maxillary molar cusp areas of black South
Africans (130 males, 105 females). Odontometric standards
were then developed for diagnosing sex, based on the cusp
area data derived for these teeth. Results demonstrated that
all cusp area measurements of both the first and second
maxillary molars were significantly dimorphic (P \0.0001)
in this group. Univariate and multivariate discriminant
function analyses yielded overall sex prediction accuracy
rates between 59.6 and 74.5%. Comparable allocation
results were also obtained for binary logistic regression
analyses, but with larger classification sex biases. The
highest classification accuracies were observed for different
combinations of just two cusp areas for the first molar.
Allocation rates of formulae derived for second molar
dimensions were on average 4.3% lower than those obtained
for the first molar. Analyses incorporating cusp areas of both
maxillary molars did not improve classification accuracies
achieved when only using first molar measurements. The
classification rates are below the suggested minimum
accuracy of 75–80% for reliable forensic application of a
method; however, the derived formulae may provide a
useful statistical indication as to the sex of fragmentary
remains in which complete or even partial tooth crowns are
the only materials available for examination. Furthermore,
the formulae can be applied not only to adults but also to
subadults (above the age of 3 years) in which the more
accurate sex discriminating features of the pelvis and skull
are yet to develop.
Keywords Discriminant analysis � Photogrammetry � Sex
discrimination � Dentition � South Africa
Introduction
The determination of sex is a primary concern in the analysis
of human skeletal remains. Sex is most often and accurately
assessed by examination of the pelvis and cranium; how-
ever, this may not always be possible in forensic or
archaeological contexts as skeletal remains are frequently
incomplete or damaged. Metric methods that employ non-
pelvic postcranial bones to estimate sex can be useful in
such cases where the hip bone and skull are not available for
study. In addition, DNA analysis can be used to determine
sex, even in highly fragmentary specimens, provided
nuclear DNA is preserved; although this method is more
expensive and time-consuming [1].
A number of studies have also demonstrated the useful-
ness of the permanent dentition in sex assessment of human
skeletal remains. Odontometric analyses have traditionally
relied on linear measurements of whole tooth crowns using
sliding calipers. The most widely used dimensions in sex
determination studies have been mesiodistal and buccolin-
gual crown diameters [2–6]. However, diagonal crown
measurements, such as mesiobuccal-distolingual and dis-
tobuccal-mesiolingual diameters [7–9], and root lengths
[10–12] have also been employed.
Various researchers have devised alternative approaches
for measuring tooth size in which intra-coronal components
(e.g., intercusp distances, cusp areas) are studied instead of
the whole crown [13–20]. Earlier efforts received limited
attention given the labor-intensive methods required
to collect and analyze the data. However, the advent of
digital photography and the availability of image-analysis
P. J. Macaluso Jr. (&)
Department of Anthropology, Binghamton University (SUNY),
P.O. Box 6000, Binghamton, NY 13902-6000, USA
e-mail: [email protected]
123
Forensic Sci Med Pathol (2011) 7:233–247
DOI 10.1007/s12024-010-9204-7
Author's personal copy
computer software programs now permit crown components
to be measured with relative ease.
Recently, standardized digital occlusal photographs have
been used to measure intercusp distances and basal cusp
areas of the postcanine teeth among modern humans
[17–21]. Although several of the above mentioned studies
have demonstrated that cusp areas of the maxillary molars
display greater sexual dimorphism than conventional crown
length and breadth dimensions [20, 21], they do not attempt
to apply classificatory procedures for separating the sexes.
Therefore, the purpose of this preliminary investigation is to
explore the potential utility of cusp area measurements of
the permanent maxillary molars for sex determination of
unidentified human remains from medicolegal or archaeo-
logical contexts. To this end, digital photogrammetric
methods were employed to assess the level of sexual
dimorphism present in cusp areas of the maxillary molars of
a documented skeletal series. Odontometric standards were
then developed for determining sex, based on the cusp area
measurements derived for these teeth.
Materials and methods
Sample
Dental measurements were collected from 235 black South
Africans drawn from the Raymond A. Dart Collection of
Human Skeletons (School of Anatomical Sciences, Uni-
versity of the Witwatersrand) and the Pretoria Bone Col-
lection (Department of Anatomy, School of Medicine,
Faculty of Health Sciences, University of Pretoria). The
specimens in these documented skeletal series largely
derive from unclaimed bodies at public hospitals which
were used in medical training and research [22, 23]. The
selected sample comprised the permanent maxillary molars
of 130 males and 105 females between the ages-at-death of
12 and 78 years. Although different indigenous population
groups constitute the South African black sample, in this
study they were regarded as a single group given that
previous analyses showed no significant inter-populational
differences in most of the metric and morphological char-
acteristics of their skulls [24] and dentition [25]. In addi-
tion, in many forensic situations the local population is not
known, and thus the use of a general model which incor-
porates the various ethnic groups is more appropriate [26].
This study focuses on the first and second maxillary
molars, given that the third molar is frequently absent
among modern humans due to incomplete maturation,
extraction or agenesis [18, 19, 27–30]. In addition, the
occlusal surface of the third molar is more variable than the
mesial two molars [30–32], and therefore interpretation of
detailed crown morphology, including cusp boundaries, is
often difficult. Individuals possessing tooth crowns in which
the fissures separating the cusps could not be identified, due
to pathology, dental restorations or marked occlusal wear,
were excluded from the analysis. Only molars possessing
all four principal cusps (paracone, protocone, metacone,
hypocone) were utilized. This included teeth exhibiting
hypocone (cusp 4) expression consistent with grade 3.5
(moderate-sized cusp) or higher according to the Arizona
State University Dental Anthropology System [33]. Given
that asymmetry in dental metrics and morphological traits,
including cusp configurations, tends to be minor [30, 32, 34,
35], only teeth on the left side of the dental arch were
measured; but in cases where this was not possible, the
corresponding tooth on the right side was utilized.
Data acquisition
Standardized high-resolution photographs of the occlusal
surfaces of maxillary first and second molars were obtained
for each specimen using a Nikon Coolpix S610 digital
camera. The camera was mounted on a tripod and a lev-
eling device was used to ensure a consistent camera angle.
Several different crown orientation systems have been
employed in studies based on occlusal surface photographs
[36 and references therein]. Although a recent study has
demonstrated that inter-observer error due to orientation
method when measuring cusp areas is insignificant [37],
not all orientation systems are applicable to dental remains
from forensic and archaeological contexts due to occlusal
wear. Therefore, in this study each tooth was oriented such
that the buccal and, where possible, mesial and distal cer-
vical enamel line was perpendicular to the optical axis of
the camera, given that this method does not rely on the
preservation on cusps apices. A millimeter scale, placed
parallel to the tooth and in approximately the same hori-
zontal plane as the occlusal surface, was included in each
photograph for calibration.
The digital photographs were then transferred to a per-
sonal computer, calibrated, and measured on-screen using
the NIH ImageJ software program developed and freely
distributed by the National Institutes of Health, USA
(http://rsb.info.nih.gov/ij/). Calibration was accomplished
by using the program’s set scale function and the milli-
meter scale present in each image. The polygon, straight
line, and freehand line tools within the NIH ImageJ pro-
gram were used to take measurements.
Individual cusp areas were measured by tracing the
tooth perimeter and the course of the primary fissures
separating the four principal cusps. When a fissure did not
extend to the crown margin, its course was projected by
following the direction of the fissure before it became
obscure [37]. Following the protocol of Wood and Engl-
eman [38], when an additional cuspule was present (e.g.,
234 Forensic Sci Med Pathol (2011) 7:233–247
123
Author's personal copy
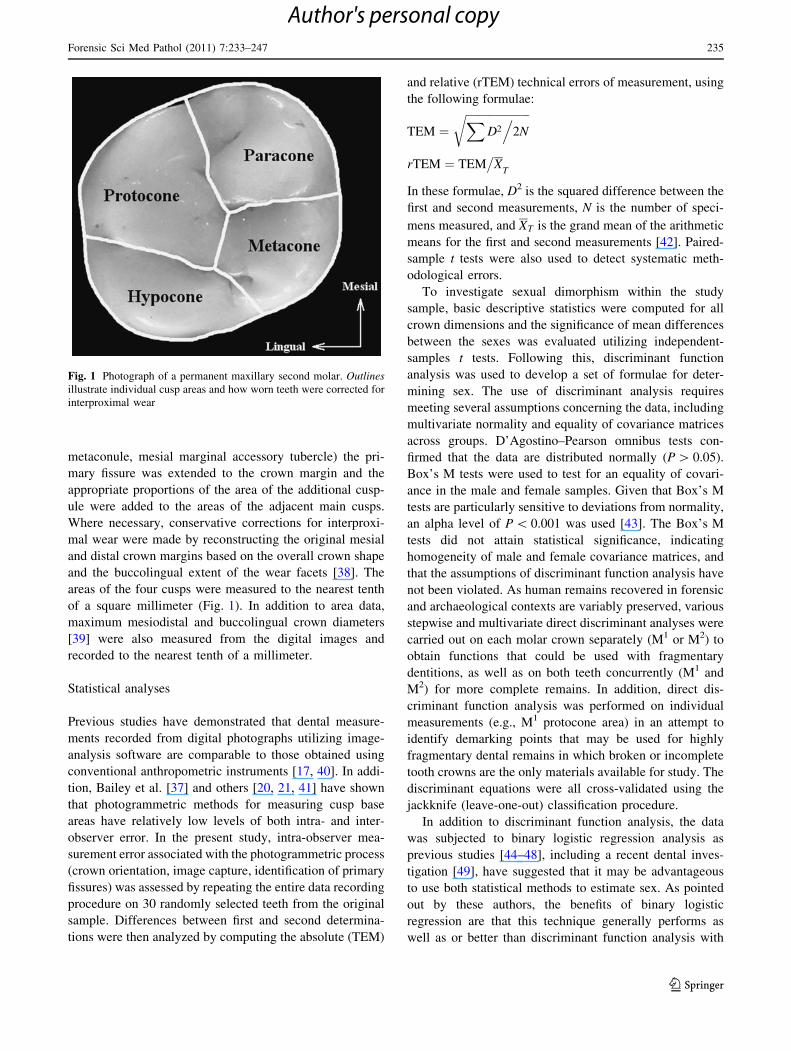
metaconule, mesial marginal accessory tubercle) the pri-
mary fissure was extended to the crown margin and the
appropriate proportions of the area of the additional cusp-
ule were added to the areas of the adjacent main cusps.
Where necessary, conservative corrections for interproxi-
mal wear were made by reconstructing the original mesial
and distal crown margins based on the overall crown shape
and the buccolingual extent of the wear facets [38]. The
areas of the four cusps were measured to the nearest tenth
of a square millimeter (Fig. 1). In addition to area data,
maximum mesiodistal and buccolingual crown diameters
[39] were also measured from the digital images and
recorded to the nearest tenth of a millimeter.
Statistical analyses
Previous studies have demonstrated that dental measure-
ments recorded from digital photographs utilizing image-
analysis software are comparable to those obtained using
conventional anthropometric instruments [17, 40]. In addi-
tion, Bailey et al. [37] and others [20, 21, 41] have shown
that photogrammetric methods for measuring cusp base
areas have relatively low levels of both intra- and inter-
observer error. In the present study, intra-observer mea-
surement error associated with the photogrammetric process
(crown orientation, image capture, identification of primary
fissures) was assessed by repeating the entire data recording
procedure on 30 randomly selected teeth from the original
sample. Differences between first and second determina-
tions were then analyzed by computing the absolute (TEM)
and relative (rTEM) technical errors of measurement, using
the following formulae:
TEM ¼ffiffiffiffiffiffiffiffiffiffiffiffiffiffiffiffiffiffiffiffiffiffiffi
X
D2.
2N
r
rTEM ¼ TEM�
XT
In these formulae, D2 is the squared difference between the
first and second measurements, N is the number of speci-
mens measured, and XT is the grand mean of the arithmetic
means for the first and second measurements [42]. Paired-
sample t tests were also used to detect systematic meth-
odological errors.
To investigate sexual dimorphism within the study
sample, basic descriptive statistics were computed for all
crown dimensions and the significance of mean differences
between the sexes was evaluated utilizing independent-
samples t tests. Following this, discriminant function
analysis was used to develop a set of formulae for deter-
mining sex. The use of discriminant analysis requires
meeting several assumptions concerning the data, including
multivariate normality and equality of covariance matrices
across groups. D’Agostino–Pearson omnibus tests con-
firmed that the data are distributed normally (P [ 0.05).
Box’s M tests were used to test for an equality of covari-
ance in the male and female samples. Given that Box’s M
tests are particularly sensitive to deviations from normality,
an alpha level of P \ 0.001 was used [43]. The Box’s M
tests did not attain statistical significance, indicating
homogeneity of male and female covariance matrices, and
that the assumptions of discriminant function analysis have
not been violated. As human remains recovered in forensic
and archaeological contexts are variably preserved, various
stepwise and multivariate direct discriminant analyses were
carried out on each molar crown separately (M1 or M2) to
obtain functions that could be used with fragmentary
dentitions, as well as on both teeth concurrently (M1 and
M2) for more complete remains. In addition, direct dis-
criminant function analysis was performed on individual
measurements (e.g., M1 protocone area) in an attempt to
identify demarking points that may be used for highly
fragmentary dental remains in which broken or incomplete
tooth crowns are the only materials available for study. The
discriminant equations were all cross-validated using the
jackknife (leave-one-out) classification procedure.
In addition to discriminant function analysis, the data
was subjected to binary logistic regression analysis as
previous studies [44–48], including a recent dental inves-
tigation [49], have suggested that it may be advantageous
to use both statistical methods to estimate sex. As pointed
out by these authors, the benefits of binary logistic
regression are that this technique generally performs as
well as or better than discriminant function analysis with
Fig. 1 Photograph of a permanent maxillary second molar. Outlinesillustrate individual cusp areas and how worn teeth were corrected for
interproximal wear
Forensic Sci Med Pathol (2011) 7:233–247 235
123
Author's personal copy
fewer statistical assumptions when predicting dichotomous
variables such as sex, and the resulting score used to
classify an unknown individual also provides a probability
value for the allocation. A set of univariate and multivar-
iate formulae for predicting sex, comparable to that gen-
erated using discriminant function analysis, was developed
utilizing logistical regression methods. All statistical
analyses were conducted using various subroutines of the
SPSS 14.0 statistical software package.
Results
Assessment of methodological error
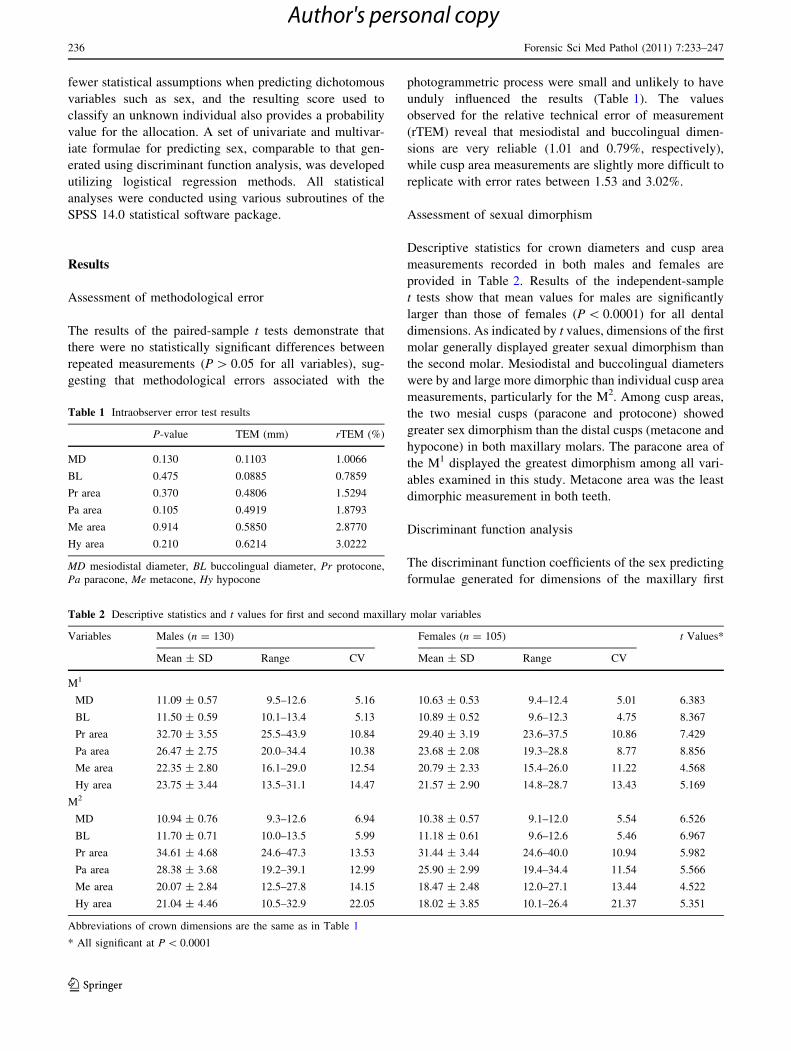
The results of the paired-sample t tests demonstrate that
there were no statistically significant differences between
repeated measurements (P [ 0.05 for all variables), sug-
gesting that methodological errors associated with the
photogrammetric process were small and unlikely to have
unduly influenced the results (Table 1). The values
observed for the relative technical error of measurement
(rTEM) reveal that mesiodistal and buccolingual dimen-
sions are very reliable (1.01 and 0.79%, respectively),
while cusp area measurements are slightly more difficult to
replicate with error rates between 1.53 and 3.02%.
Assessment of sexual dimorphism
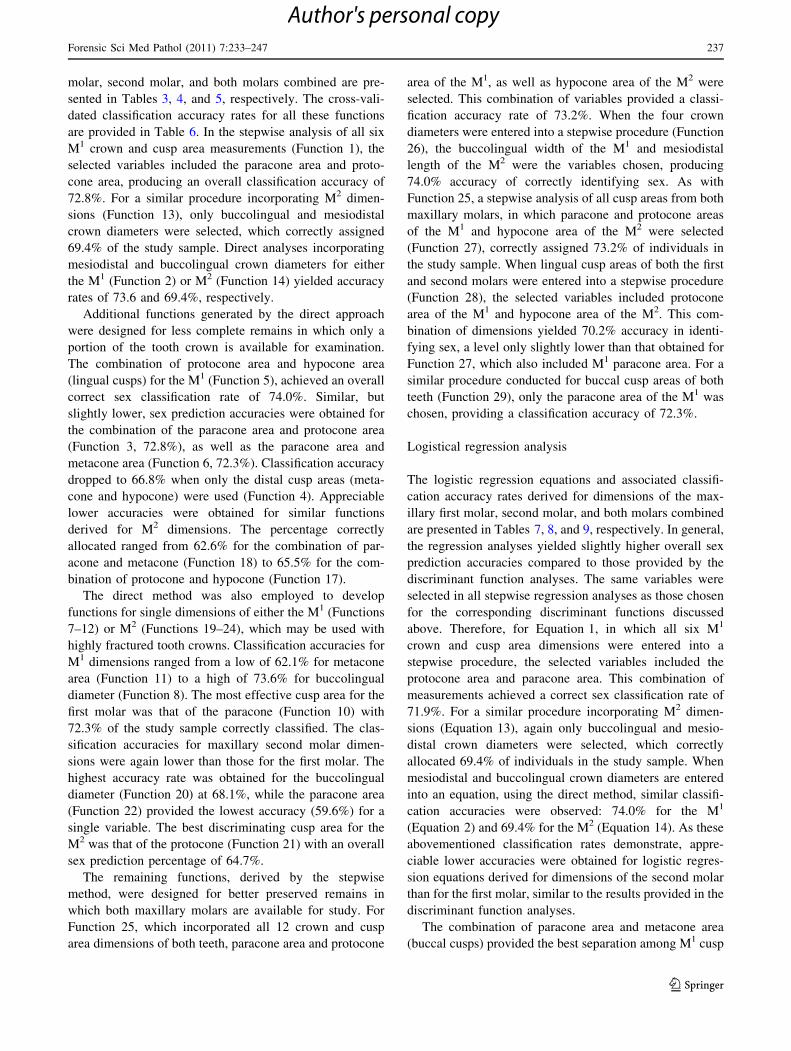
Descriptive statistics for crown diameters and cusp area
measurements recorded in both males and females are
provided in Table 2. Results of the independent-sample
t tests show that mean values for males are significantly
larger than those of females (P \ 0.0001) for all dental
dimensions. As indicated by t values, dimensions of the first
molar generally displayed greater sexual dimorphism than
the second molar. Mesiodistal and buccolingual diameters
were by and large more dimorphic than individual cusp area
measurements, particularly for the M2. Among cusp areas,
the two mesial cusps (paracone and protocone) showed
greater sex dimorphism than the distal cusps (metacone and
hypocone) in both maxillary molars. The paracone area of
the M1 displayed the greatest dimorphism among all vari-
ables examined in this study. Metacone area was the least
dimorphic measurement in both teeth.
Discriminant function analysis
The discriminant function coefficients of the sex predicting
formulae generated for dimensions of the maxillary first
Table 1 Intraobserver error test results
P-value TEM (mm) rTEM (%)
MD 0.130 0.1103 1.0066
BL 0.475 0.0885 0.7859
Pr area 0.370 0.4806 1.5294
Pa area 0.105 0.4919 1.8793
Me area 0.914 0.5850 2.8770
Hy area 0.210 0.6214 3.0222
MD mesiodistal diameter, BL buccolingual diameter, Pr protocone,
Pa paracone, Me metacone, Hy hypocone
Table 2 Descriptive statistics and t values for first and second maxillary molar variables
Variables Males (n = 130) Females (n = 105) t Values*
Mean ± SD Range CV Mean ± SD Range CV
M1
MD 11.09 ± 0.57 9.5–12.6 5.16 10.63 ± 0.53 9.4–12.4 5.01 6.383
BL 11.50 ± 0.59 10.1–13.4 5.13 10.89 ± 0.52 9.6–12.3 4.75 8.367
Pr area 32.70 ± 3.55 25.5–43.9 10.84 29.40 ± 3.19 23.6–37.5 10.86 7.429
Pa area 26.47 ± 2.75 20.0–34.4 10.38 23.68 ± 2.08 19.3–28.8 8.77 8.856
Me area 22.35 ± 2.80 16.1–29.0 12.54 20.79 ± 2.33 15.4–26.0 11.22 4.568
Hy area 23.75 ± 3.44 13.5–31.1 14.47 21.57 ± 2.90 14.8–28.7 13.43 5.169
M2
MD 10.94 ± 0.76 9.3–12.6 6.94 10.38 ± 0.57 9.1–12.0 5.54 6.526
BL 11.70 ± 0.71 10.0–13.5 5.99 11.18 ± 0.61 9.6–12.6 5.46 6.967
Pr area 34.61 ± 4.68 24.6–47.3 13.53 31.44 ± 3.44 24.6–40.0 10.94 5.982
Pa area 28.38 ± 3.68 19.2–39.1 12.99 25.90 ± 2.99 19.4–34.4 11.54 5.566
Me area 20.07 ± 2.84 12.5–27.8 14.15 18.47 ± 2.48 12.0–27.1 13.44 4.522
Hy area 21.04 ± 4.46 10.5–32.9 22.05 18.02 ± 3.85 10.1–26.4 21.37 5.351
Abbreviations of crown dimensions are the same as in Table 1
* All significant at P \ 0.0001
236 Forensic Sci Med Pathol (2011) 7:233–247
123
Author's personal copy
molar, second molar, and both molars combined are pre-
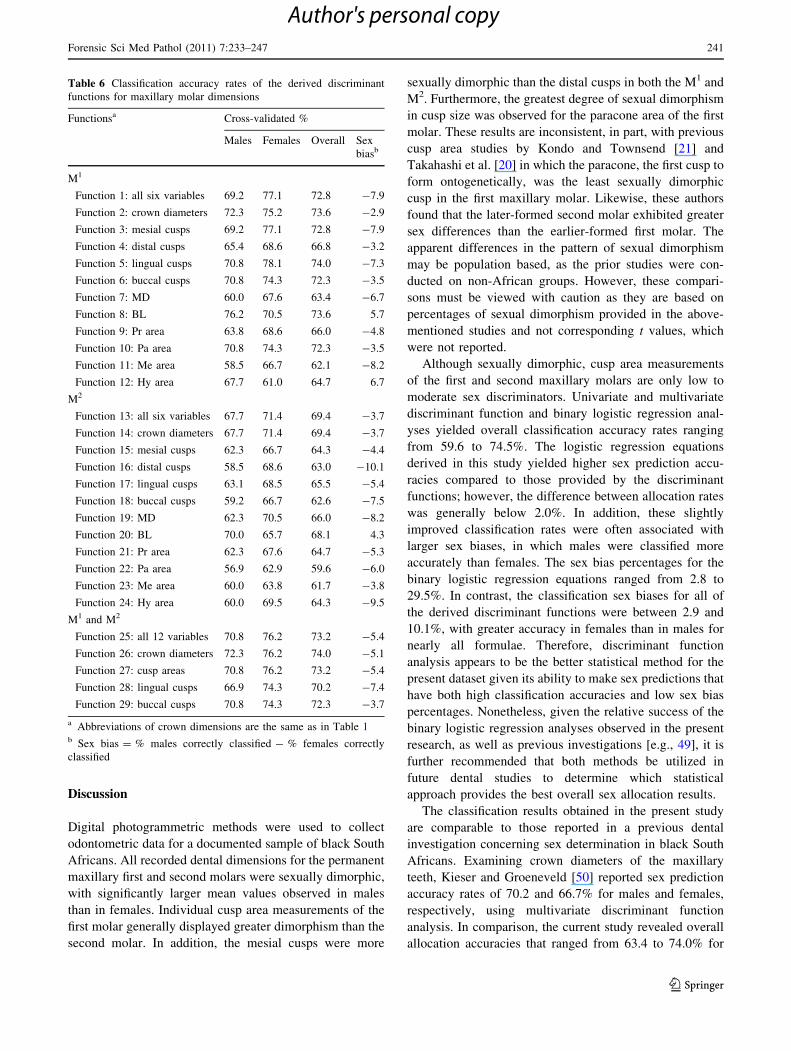
sented in Tables 3, 4, and 5, respectively. The cross-vali-
dated classification accuracy rates for all these functions
are provided in Table 6. In the stepwise analysis of all six
M1 crown and cusp area measurements (Function 1), the
selected variables included the paracone area and proto-
cone area, producing an overall classification accuracy of
72.8%. For a similar procedure incorporating M2 dimen-
sions (Function 13), only buccolingual and mesiodistal
crown diameters were selected, which correctly assigned
69.4% of the study sample. Direct analyses incorporating
mesiodistal and buccolingual crown diameters for either
the M1 (Function 2) or M2 (Function 14) yielded accuracy
rates of 73.6 and 69.4%, respectively.
Additional functions generated by the direct approach
were designed for less complete remains in which only a
portion of the tooth crown is available for examination.
The combination of protocone area and hypocone area
(lingual cusps) for the M1 (Function 5), achieved an overall
correct sex classification rate of 74.0%. Similar, but
slightly lower, sex prediction accuracies were obtained for
the combination of the paracone area and protocone area
(Function 3, 72.8%), as well as the paracone area and
metacone area (Function 6, 72.3%). Classification accuracy
dropped to 66.8% when only the distal cusp areas (meta-
cone and hypocone) were used (Function 4). Appreciable
lower accuracies were obtained for similar functions
derived for M2 dimensions. The percentage correctly
allocated ranged from 62.6% for the combination of par-
acone and metacone (Function 18) to 65.5% for the com-
bination of protocone and hypocone (Function 17).
The direct method was also employed to develop
functions for single dimensions of either the M1 (Functions
7–12) or M2 (Functions 19–24), which may be used with
highly fractured tooth crowns. Classification accuracies for
M1 dimensions ranged from a low of 62.1% for metacone
area (Function 11) to a high of 73.6% for buccolingual
diameter (Function 8). The most effective cusp area for the
first molar was that of the paracone (Function 10) with
72.3% of the study sample correctly classified. The clas-
sification accuracies for maxillary second molar dimen-
sions were again lower than those for the first molar. The
highest accuracy rate was obtained for the buccolingual
diameter (Function 20) at 68.1%, while the paracone area
(Function 22) provided the lowest accuracy (59.6%) for a
single variable. The best discriminating cusp area for the
M2 was that of the protocone (Function 21) with an overall
sex prediction percentage of 64.7%.
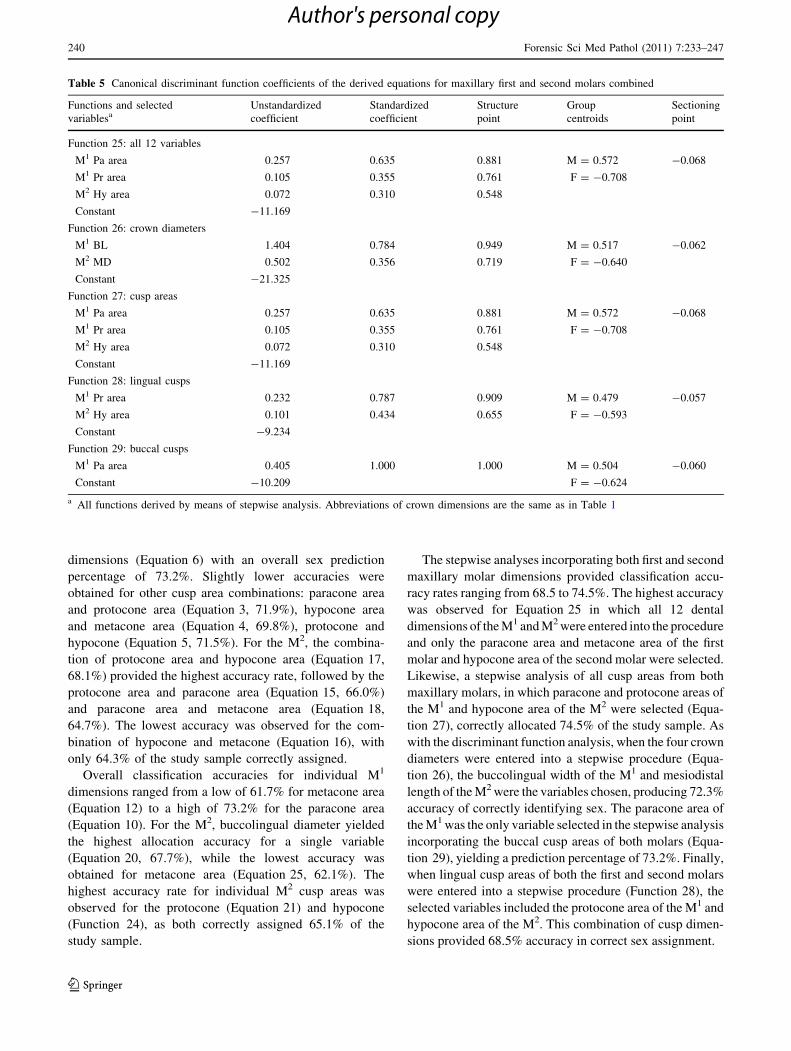
The remaining functions, derived by the stepwise
method, were designed for better preserved remains in
which both maxillary molars are available for study. For
Function 25, which incorporated all 12 crown and cusp
area dimensions of both teeth, paracone area and protocone
area of the M1, as well as hypocone area of the M2 were
selected. This combination of variables provided a classi-
fication accuracy rate of 73.2%. When the four crown
diameters were entered into a stepwise procedure (Function
26), the buccolingual width of the M1 and mesiodistal
length of the M2 were the variables chosen, producing
74.0% accuracy of correctly identifying sex. As with
Function 25, a stepwise analysis of all cusp areas from both
maxillary molars, in which paracone and protocone areas
of the M1 and hypocone area of the M2 were selected
(Function 27), correctly assigned 73.2% of individuals in
the study sample. When lingual cusp areas of both the first
and second molars were entered into a stepwise procedure
(Function 28), the selected variables included protocone
area of the M1 and hypocone area of the M2. This com-
bination of dimensions yielded 70.2% accuracy in identi-
fying sex, a level only slightly lower than that obtained for
Function 27, which also included M1 paracone area. For a
similar procedure conducted for buccal cusp areas of both
teeth (Function 29), only the paracone area of the M1 was
chosen, providing a classification accuracy of 72.3%.
Logistical regression analysis
The logistic regression equations and associated classifi-
cation accuracy rates derived for dimensions of the max-
illary first molar, second molar, and both molars combined
are presented in Tables 7, 8, and 9, respectively. In general,
the regression analyses yielded slightly higher overall sex
prediction accuracies compared to those provided by the
discriminant function analyses. The same variables were
selected in all stepwise regression analyses as those chosen
for the corresponding discriminant functions discussed
above. Therefore, for Equation 1, in which all six M1
crown and cusp area dimensions were entered into a
stepwise procedure, the selected variables included the
protocone area and paracone area. This combination of
measurements achieved a correct sex classification rate of
71.9%. For a similar procedure incorporating M2 dimen-
sions (Equation 13), again only buccolingual and mesio-
distal crown diameters were selected, which correctly
allocated 69.4% of individuals in the study sample. When
mesiodistal and buccolingual crown diameters are entered
into an equation, using the direct method, similar classifi-
cation accuracies were observed: 74.0% for the M1
(Equation 2) and 69.4% for the M2 (Equation 14). As these
abovementioned classification rates demonstrate, appre-
ciable lower accuracies were obtained for logistic regres-
sion equations derived for dimensions of the second molar
than for the first molar, similar to the results provided in the
discriminant function analyses.
The combination of paracone area and metacone area
(buccal cusps) provided the best separation among M1 cusp
Forensic Sci Med Pathol (2011) 7:233–247 237
123
Author's personal copy
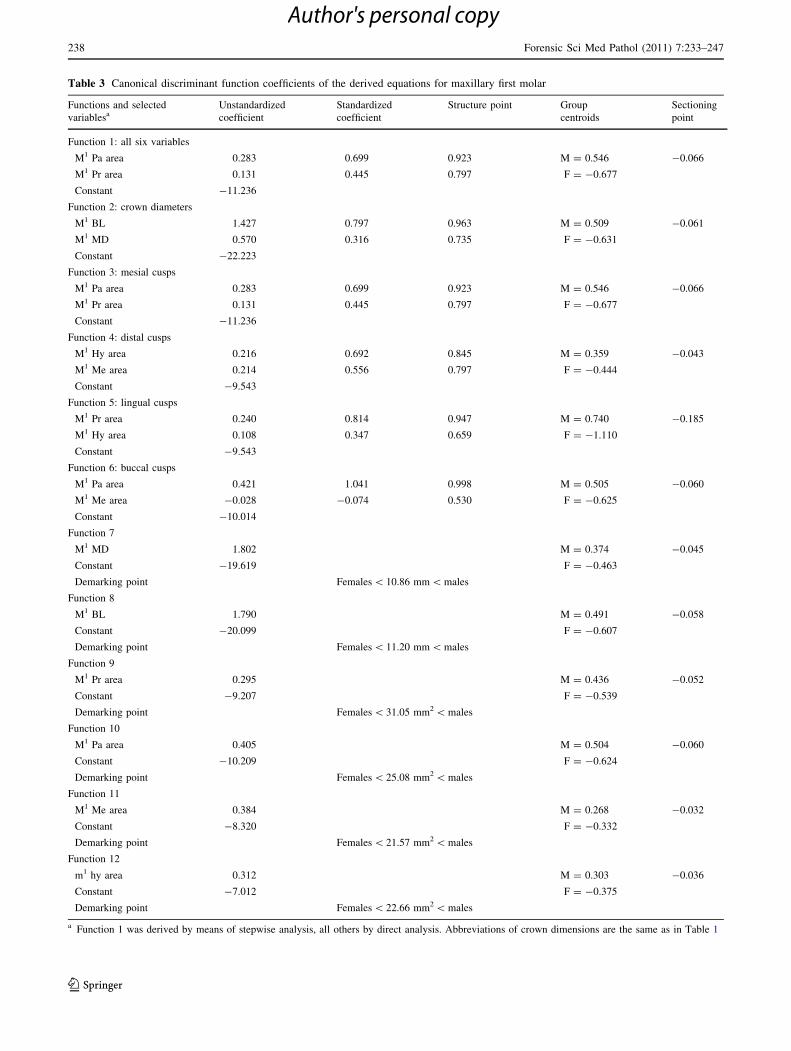
Table 3 Canonical discriminant function coefficients of the derived equations for maxillary first molar
Functions and selected
variablesaUnstandardized
coefficient
Standardized
coefficient
Structure point Group
centroids
Sectioning
point
Function 1: all six variables
M1 Pa area 0.283 0.699 0.923 M = 0.546 -0.066
M1 Pr area 0.131 0.445 0.797 F = -0.677
Constant -11.236
Function 2: crown diameters
M1 BL 1.427 0.797 0.963 M = 0.509 -0.061
M1 MD 0.570 0.316 0.735 F = -0.631
Constant -22.223
Function 3: mesial cusps
M1 Pa area 0.283 0.699 0.923 M = 0.546 -0.066
M1 Pr area 0.131 0.445 0.797 F = -0.677
Constant -11.236
Function 4: distal cusps
M1 Hy area 0.216 0.692 0.845 M = 0.359 -0.043
M1 Me area 0.214 0.556 0.797 F = -0.444
Constant -9.543
Function 5: lingual cusps
M1 Pr area 0.240 0.814 0.947 M = 0.740 -0.185
M1 Hy area 0.108 0.347 0.659 F = -1.110
Constant -9.543
Function 6: buccal cusps
M1 Pa area 0.421 1.041 0.998 M = 0.505 -0.060
M1 Me area -0.028 -0.074 0.530 F = -0.625
Constant -10.014
Function 7
M1 MD 1.802 M = 0.374 -0.045
Constant -19.619 F = -0.463
Demarking point Females \ 10.86 mm \ males
Function 8
M1 BL 1.790 M = 0.491 -0.058
Constant -20.099 F = -0.607
Demarking point Females \ 11.20 mm \ males
Function 9
M1 Pr area 0.295 M = 0.436 -0.052
Constant -9.207 F = -0.539
Demarking point Females \ 31.05 mm2 \ males
Function 10
M1 Pa area 0.405 M = 0.504 -0.060
Constant -10.209 F = -0.624
Demarking point Females \ 25.08 mm2 \ males
Function 11
M1 Me area 0.384 M = 0.268 -0.032
Constant -8.320 F = -0.332
Demarking point Females \ 21.57 mm2 \ males
Function 12
m1 hy area 0.312 M = 0.303 -0.036
Constant -7.012 F = -0.375
Demarking point Females \ 22.66 mm2 \ males
a Function 1 was derived by means of stepwise analysis, all others by direct analysis. Abbreviations of crown dimensions are the same as in Table 1
238 Forensic Sci Med Pathol (2011) 7:233–247
123
Author's personal copy
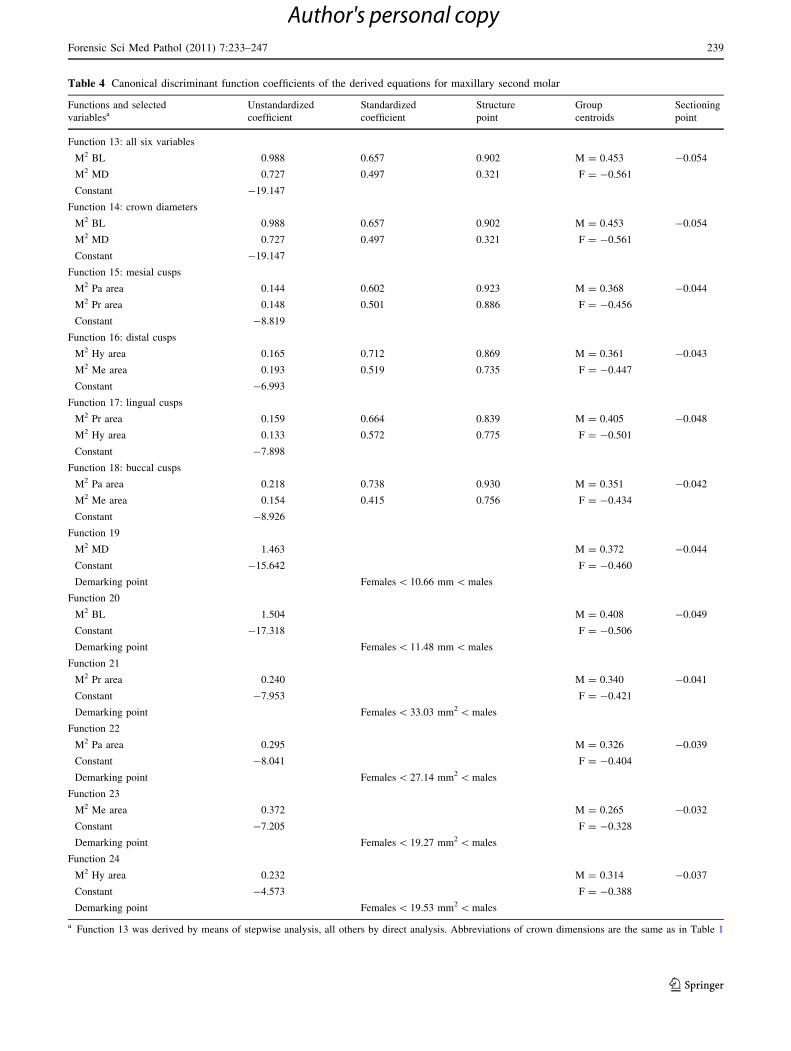
Table 4 Canonical discriminant function coefficients of the derived equations for maxillary second molar
Functions and selected
variablesaUnstandardized
coefficient
Standardized
coefficient
Structure
point
Group
centroids
Sectioning
point
Function 13: all six variables
M2 BL 0.988 0.657 0.902 M = 0.453 -0.054
M2 MD 0.727 0.497 0.321 F = -0.561
Constant -19.147
Function 14: crown diameters
M2 BL 0.988 0.657 0.902 M = 0.453 -0.054
M2 MD 0.727 0.497 0.321 F = -0.561
Constant -19.147
Function 15: mesial cusps
M2 Pa area 0.144 0.602 0.923 M = 0.368 -0.044
M2 Pr area 0.148 0.501 0.886 F = -0.456
Constant -8.819
Function 16: distal cusps
M2 Hy area 0.165 0.712 0.869 M = 0.361 -0.043
M2 Me area 0.193 0.519 0.735 F = -0.447
Constant -6.993
Function 17: lingual cusps
M2 Pr area 0.159 0.664 0.839 M = 0.405 -0.048
M2 Hy area 0.133 0.572 0.775 F = -0.501
Constant -7.898
Function 18: buccal cusps
M2 Pa area 0.218 0.738 0.930 M = 0.351 -0.042
M2 Me area 0.154 0.415 0.756 F = -0.434
Constant -8.926
Function 19
M2 MD 1.463 M = 0.372 -0.044
Constant -15.642 F = -0.460
Demarking point Females \ 10.66 mm \ males
Function 20
M2 BL 1.504 M = 0.408 -0.049
Constant -17.318 F = -0.506
Demarking point Females \ 11.48 mm \ males
Function 21
M2 Pr area 0.240 M = 0.340 -0.041
Constant -7.953 F = -0.421
Demarking point Females \ 33.03 mm2 \ males
Function 22
M2 Pa area 0.295 M = 0.326 -0.039
Constant -8.041 F = -0.404
Demarking point Females \ 27.14 mm2 \ males
Function 23
M2 Me area 0.372 M = 0.265 -0.032
Constant -7.205 F = -0.328
Demarking point Females \ 19.27 mm2 \ males
Function 24
M2 Hy area 0.232 M = 0.314 -0.037
Constant -4.573 F = -0.388
Demarking point Females \ 19.53 mm2 \ males
a Function 13 was derived by means of stepwise analysis, all others by direct analysis. Abbreviations of crown dimensions are the same as in Table 1
Forensic Sci Med Pathol (2011) 7:233–247 239
123
Author's personal copy
dimensions (Equation 6) with an overall sex prediction
percentage of 73.2%. Slightly lower accuracies were
obtained for other cusp area combinations: paracone area
and protocone area (Equation 3, 71.9%), hypocone area
and metacone area (Equation 4, 69.8%), protocone and
hypocone (Equation 5, 71.5%). For the M2, the combina-
tion of protocone area and hypocone area (Equation 17,
68.1%) provided the highest accuracy rate, followed by the
protocone area and paracone area (Equation 15, 66.0%)
and paracone area and metacone area (Equation 18,
64.7%). The lowest accuracy was observed for the com-
bination of hypocone and metacone (Equation 16), with
only 64.3% of the study sample correctly assigned.
Overall classification accuracies for individual M1
dimensions ranged from a low of 61.7% for metacone area
(Equation 12) to a high of 73.2% for the paracone area
(Equation 10). For the M2, buccolingual diameter yielded
the highest allocation accuracy for a single variable
(Equation 20, 67.7%), while the lowest accuracy was
obtained for metacone area (Equation 25, 62.1%). The
highest accuracy rate for individual M2 cusp areas was
observed for the protocone (Equation 21) and hypocone
(Function 24), as both correctly assigned 65.1% of the
study sample.
The stepwise analyses incorporating both first and second
maxillary molar dimensions provided classification accu-
racy rates ranging from 68.5 to 74.5%. The highest accuracy
was observed for Equation 25 in which all 12 dental
dimensions of the M1 and M2 were entered into the procedure
and only the paracone area and metacone area of the first
molar and hypocone area of the second molar were selected.
Likewise, a stepwise analysis of all cusp areas from both
maxillary molars, in which paracone and protocone areas of
the M1 and hypocone area of the M2 were selected (Equa-
tion 27), correctly allocated 74.5% of the study sample. As
with the discriminant function analysis, when the four crown
diameters were entered into a stepwise procedure (Equa-
tion 26), the buccolingual width of the M1 and mesiodistal
length of the M2 were the variables chosen, producing 72.3%
accuracy of correctly identifying sex. The paracone area of
the M1 was the only variable selected in the stepwise analysis
incorporating the buccal cusp areas of both molars (Equa-
tion 29), yielding a prediction percentage of 73.2%. Finally,
when lingual cusp areas of both the first and second molars
were entered into a stepwise procedure (Function 28), the
selected variables included the protocone area of the M1 and
hypocone area of the M2. This combination of cusp dimen-
sions provided 68.5% accuracy in correct sex assignment.
Table 5 Canonical discriminant function coefficients of the derived equations for maxillary first and second molars combined
Functions and selected
variablesaUnstandardized
coefficient
Standardized
coefficient
Structure
point
Group
centroids
Sectioning
point
Function 25: all 12 variables
M1 Pa area 0.257 0.635 0.881 M = 0.572 -0.068
M1 Pr area 0.105 0.355 0.761 F = -0.708
M2 Hy area 0.072 0.310 0.548
Constant -11.169
Function 26: crown diameters
M1 BL 1.404 0.784 0.949 M = 0.517 -0.062
M2 MD 0.502 0.356 0.719 F = -0.640
Constant -21.325
Function 27: cusp areas
M1 Pa area 0.257 0.635 0.881 M = 0.572 -0.068
M1 Pr area 0.105 0.355 0.761 F = -0.708
M2 Hy area 0.072 0.310 0.548
Constant -11.169
Function 28: lingual cusps
M1 Pr area 0.232 0.787 0.909 M = 0.479 -0.057
M2 Hy area 0.101 0.434 0.655 F = -0.593
Constant -9.234
Function 29: buccal cusps
M1 Pa area 0.405 1.000 1.000 M = 0.504 -0.060
Constant -10.209 F = -0.624
a All functions derived by means of stepwise analysis. Abbreviations of crown dimensions are the same as in Table 1
240 Forensic Sci Med Pathol (2011) 7:233–247
123
Author's personal copy
Discussion
Digital photogrammetric methods were used to collect
odontometric data for a documented sample of black South
Africans. All recorded dental dimensions for the permanent
maxillary first and second molars were sexually dimorphic,
with significantly larger mean values observed in males
than in females. Individual cusp area measurements of the
first molar generally displayed greater dimorphism than the
second molar. In addition, the mesial cusps were more
sexually dimorphic than the distal cusps in both the M1 and
M2. Furthermore, the greatest degree of sexual dimorphism
in cusp size was observed for the paracone area of the first
molar. These results are inconsistent, in part, with previous
cusp area studies by Kondo and Townsend [21] and
Takahashi et al. [20] in which the paracone, the first cusp to
form ontogenetically, was the least sexually dimorphic
cusp in the first maxillary molar. Likewise, these authors
found that the later-formed second molar exhibited greater
sex differences than the earlier-formed first molar. The
apparent differences in the pattern of sexual dimorphism
may be population based, as the prior studies were con-
ducted on non-African groups. However, these compari-
sons must be viewed with caution as they are based on
percentages of sexual dimorphism provided in the above-
mentioned studies and not corresponding t values, which
were not reported.
Although sexually dimorphic, cusp area measurements
of the first and second maxillary molars are only low to
moderate sex discriminators. Univariate and multivariate
discriminant function and binary logistic regression anal-
yses yielded overall classification accuracy rates ranging
from 59.6 to 74.5%. The logistic regression equations
derived in this study yielded higher sex prediction accu-
racies compared to those provided by the discriminant
functions; however, the difference between allocation rates
was generally below 2.0%. In addition, these slightly
improved classification rates were often associated with
larger sex biases, in which males were classified more
accurately than females. The sex bias percentages for the
binary logistic regression equations ranged from 2.8 to
29.5%. In contrast, the classification sex biases for all of
the derived discriminant functions were between 2.9 and
10.1%, with greater accuracy in females than in males for
nearly all formulae. Therefore, discriminant function
analysis appears to be the better statistical method for the
present dataset given its ability to make sex predictions that
have both high classification accuracies and low sex bias
percentages. Nonetheless, given the relative success of the
binary logistic regression analyses observed in the present
research, as well as previous investigations [e.g., 49], it is
further recommended that both methods be utilized in
future dental studies to determine which statistical
approach provides the best overall sex allocation results.
The classification results obtained in the present study
are comparable to those reported in a previous dental
investigation concerning sex determination in black South
Africans. Examining crown diameters of the maxillary
teeth, Kieser and Groeneveld [50] reported sex prediction
accuracy rates of 70.2 and 66.7% for males and females,
respectively, using multivariate discriminant function
analysis. In comparison, the current study revealed overall
allocation accuracies that ranged from 63.4 to 74.0% for
Table 6 Classification accuracy rates of the derived discriminant
functions for maxillary molar dimensions
Functionsa Cross-validated %
Males Females Overall Sex
biasb
M1
Function 1: all six variables 69.2 77.1 72.8 -7.9
Function 2: crown diameters 72.3 75.2 73.6 -2.9
Function 3: mesial cusps 69.2 77.1 72.8 -7.9
Function 4: distal cusps 65.4 68.6 66.8 -3.2
Function 5: lingual cusps 70.8 78.1 74.0 -7.3
Function 6: buccal cusps 70.8 74.3 72.3 -3.5
Function 7: MD 60.0 67.6 63.4 -6.7
Function 8: BL 76.2 70.5 73.6 5.7
Function 9: Pr area 63.8 68.6 66.0 -4.8
Function 10: Pa area 70.8 74.3 72.3 -3.5
Function 11: Me area 58.5 66.7 62.1 -8.2
Function 12: Hy area 67.7 61.0 64.7 6.7
M2
Function 13: all six variables 67.7 71.4 69.4 -3.7
Function 14: crown diameters 67.7 71.4 69.4 -3.7
Function 15: mesial cusps 62.3 66.7 64.3 -4.4
Function 16: distal cusps 58.5 68.6 63.0 -10.1
Function 17: lingual cusps 63.1 68.5 65.5 -5.4
Function 18: buccal cusps 59.2 66.7 62.6 -7.5
Function 19: MD 62.3 70.5 66.0 -8.2
Function 20: BL 70.0 65.7 68.1 4.3
Function 21: Pr area 62.3 67.6 64.7 -5.3
Function 22: Pa area 56.9 62.9 59.6 -6.0
Function 23: Me area 60.0 63.8 61.7 -3.8
Function 24: Hy area 60.0 69.5 64.3 -9.5
M1 and M2
Function 25: all 12 variables 70.8 76.2 73.2 -5.4
Function 26: crown diameters 72.3 76.2 74.0 -5.1
Function 27: cusp areas 70.8 76.2 73.2 -5.4
Function 28: lingual cusps 66.9 74.3 70.2 -7.4
Function 29: buccal cusps 70.8 74.3 72.3 -3.7
a Abbreviations of crown dimensions are the same as in Table 1b Sex bias = % males correctly classified - % females correctly
classified
Forensic Sci Med Pathol (2011) 7:233–247 241
123
Author's personal copy
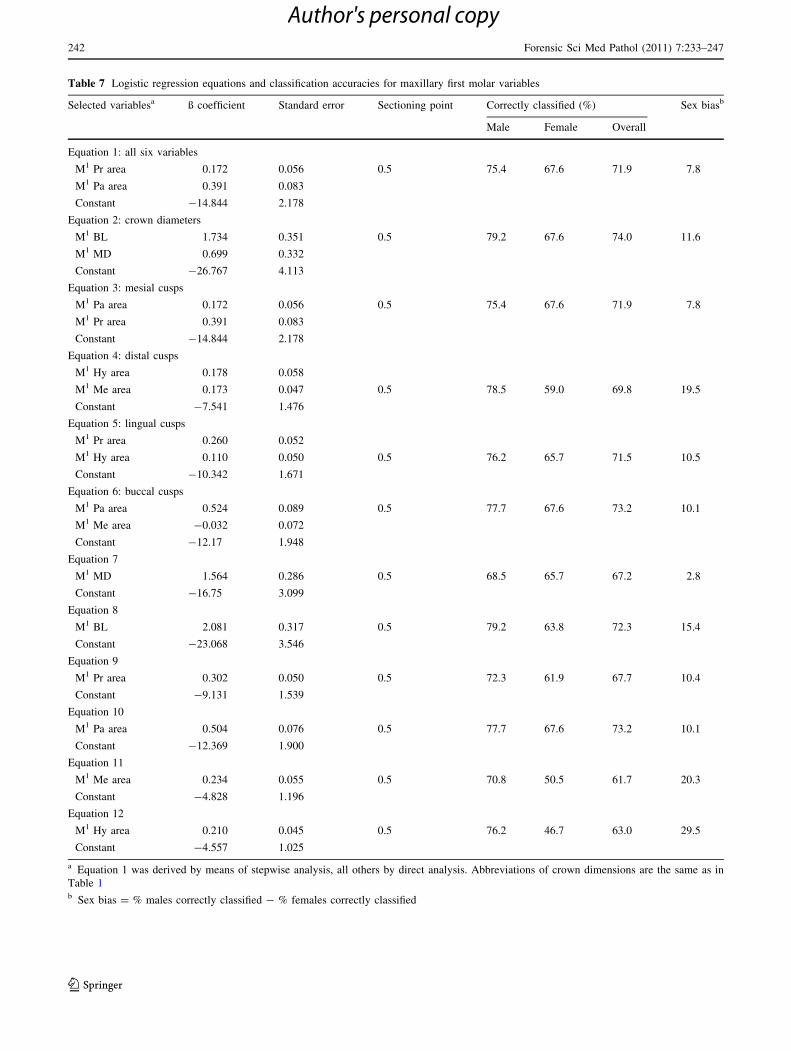
Table 7 Logistic regression equations and classification accuracies for maxillary first molar variables
Selected variablesa ß coefficient Standard error Sectioning point Correctly classified (%) Sex biasb
Male Female Overall
Equation 1: all six variables
M1 Pr area 0.172 0.056 0.5 75.4 67.6 71.9 7.8
M1 Pa area 0.391 0.083
Constant -14.844 2.178
Equation 2: crown diameters
M1 BL 1.734 0.351 0.5 79.2 67.6 74.0 11.6
M1 MD 0.699 0.332
Constant -26.767 4.113
Equation 3: mesial cusps
M1 Pa area 0.172 0.056 0.5 75.4 67.6 71.9 7.8
M1 Pr area 0.391 0.083
Constant -14.844 2.178
Equation 4: distal cusps
M1 Hy area 0.178 0.058
M1 Me area 0.173 0.047 0.5 78.5 59.0 69.8 19.5
Constant -7.541 1.476
Equation 5: lingual cusps
M1 Pr area 0.260 0.052
M1 Hy area 0.110 0.050 0.5 76.2 65.7 71.5 10.5
Constant -10.342 1.671
Equation 6: buccal cusps
M1 Pa area 0.524 0.089 0.5 77.7 67.6 73.2 10.1
M1 Me area -0.032 0.072
Constant -12.17 1.948
Equation 7
M1 MD 1.564 0.286 0.5 68.5 65.7 67.2 2.8
Constant -16.75 3.099
Equation 8
M1 BL 2.081 0.317 0.5 79.2 63.8 72.3 15.4
Constant -23.068 3.546
Equation 9
M1 Pr area 0.302 0.050 0.5 72.3 61.9 67.7 10.4
Constant -9.131 1.539
Equation 10
M1 Pa area 0.504 0.076 0.5 77.7 67.6 73.2 10.1
Constant -12.369 1.900
Equation 11
M1 Me area 0.234 0.055 0.5 70.8 50.5 61.7 20.3
Constant -4.828 1.196
Equation 12
M1 Hy area 0.210 0.045 0.5 76.2 46.7 63.0 29.5
Constant -4.557 1.025
a Equation 1 was derived by means of stepwise analysis, all others by direct analysis. Abbreviations of crown dimensions are the same as in
Table 1b Sex bias = % males correctly classified - % females correctly classified
242 Forensic Sci Med Pathol (2011) 7:233–247
123
Author's personal copy
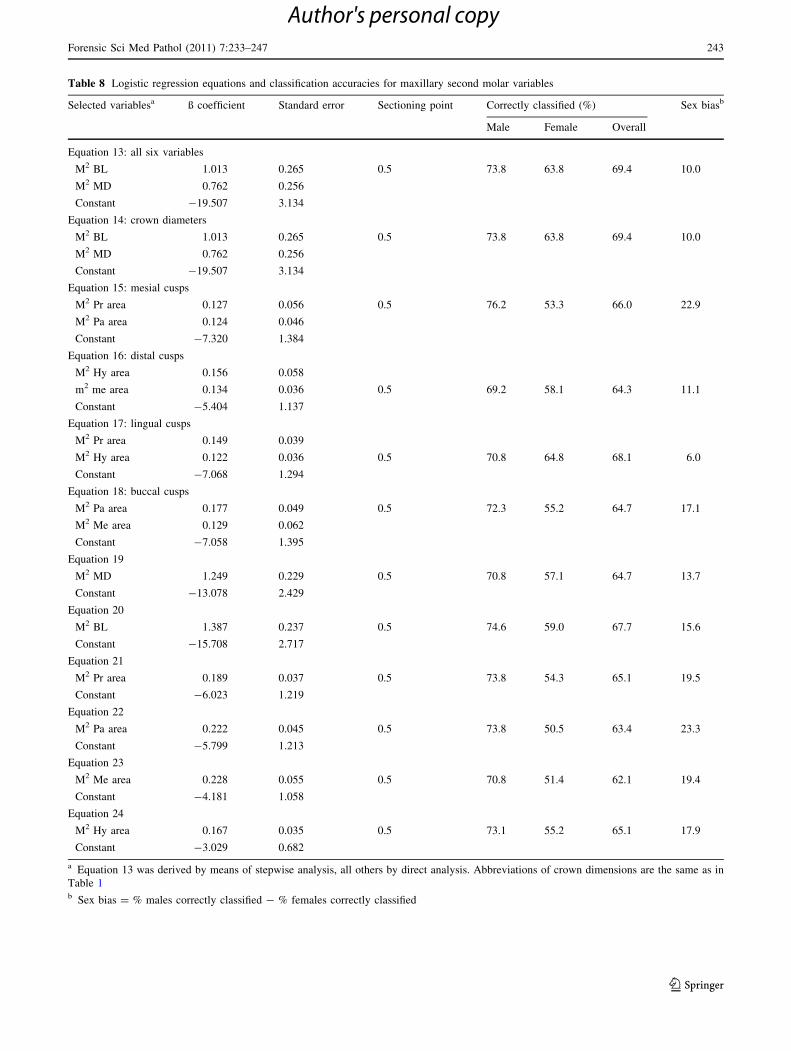
Table 8 Logistic regression equations and classification accuracies for maxillary second molar variables
Selected variablesa ß coefficient Standard error Sectioning point Correctly classified (%) Sex biasb
Male Female Overall
Equation 13: all six variables
M2 BL 1.013 0.265 0.5 73.8 63.8 69.4 10.0
M2 MD 0.762 0.256
Constant -19.507 3.134
Equation 14: crown diameters
M2 BL 1.013 0.265 0.5 73.8 63.8 69.4 10.0
M2 MD 0.762 0.256
Constant -19.507 3.134
Equation 15: mesial cusps
M2 Pr area 0.127 0.056 0.5 76.2 53.3 66.0 22.9
M2 Pa area 0.124 0.046
Constant -7.320 1.384
Equation 16: distal cusps
M2 Hy area 0.156 0.058
m2 me area 0.134 0.036 0.5 69.2 58.1 64.3 11.1
Constant -5.404 1.137
Equation 17: lingual cusps
M2 Pr area 0.149 0.039
M2 Hy area 0.122 0.036 0.5 70.8 64.8 68.1 6.0
Constant -7.068 1.294
Equation 18: buccal cusps
M2 Pa area 0.177 0.049 0.5 72.3 55.2 64.7 17.1
M2 Me area 0.129 0.062
Constant -7.058 1.395
Equation 19
M2 MD 1.249 0.229 0.5 70.8 57.1 64.7 13.7
Constant -13.078 2.429
Equation 20
M2 BL 1.387 0.237 0.5 74.6 59.0 67.7 15.6
Constant -15.708 2.717
Equation 21
M2 Pr area 0.189 0.037 0.5 73.8 54.3 65.1 19.5
Constant -6.023 1.219
Equation 22
M2 Pa area 0.222 0.045 0.5 73.8 50.5 63.4 23.3
Constant -5.799 1.213
Equation 23
M2 Me area 0.228 0.055 0.5 70.8 51.4 62.1 19.4
Constant -4.181 1.058
Equation 24
M2 Hy area 0.167 0.035 0.5 73.1 55.2 65.1 17.9
Constant -3.029 0.682
a Equation 13 was derived by means of stepwise analysis, all others by direct analysis. Abbreviations of crown dimensions are the same as in
Table 1b Sex bias = % males correctly classified - % females correctly classified
Forensic Sci Med Pathol (2011) 7:233–247 243
123
Author's personal copy
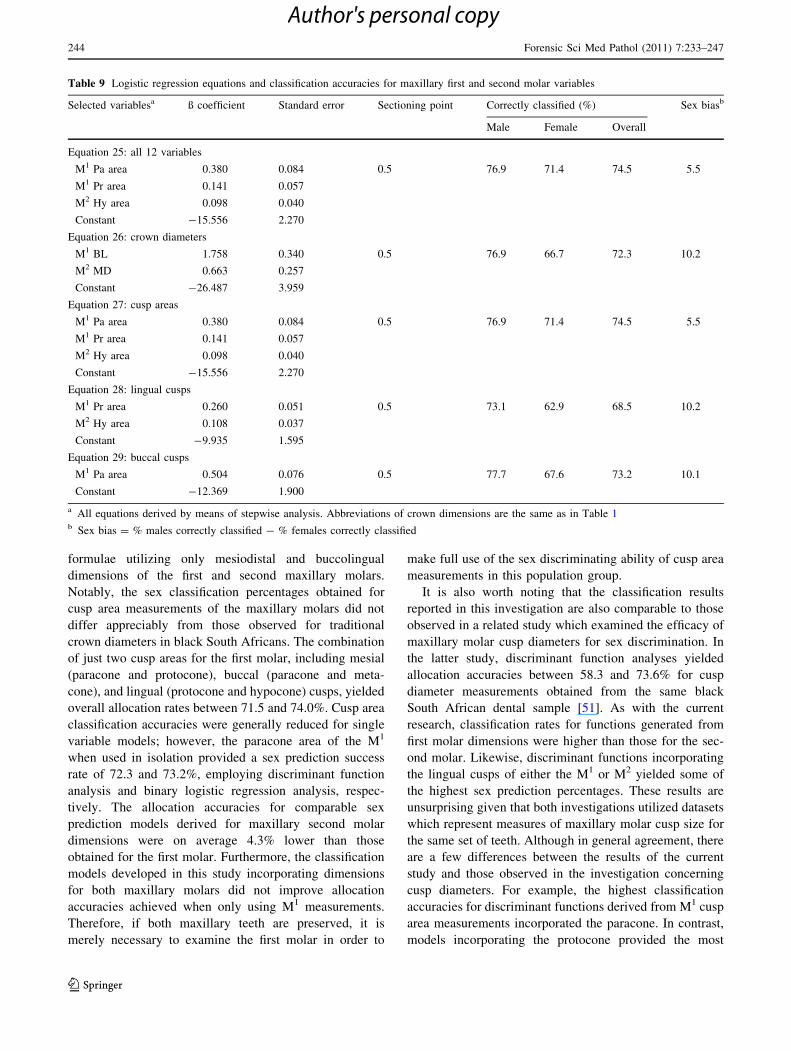
formulae utilizing only mesiodistal and buccolingual
dimensions of the first and second maxillary molars.
Notably, the sex classification percentages obtained for
cusp area measurements of the maxillary molars did not
differ appreciably from those observed for traditional
crown diameters in black South Africans. The combination
of just two cusp areas for the first molar, including mesial
(paracone and protocone), buccal (paracone and meta-
cone), and lingual (protocone and hypocone) cusps, yielded
overall allocation rates between 71.5 and 74.0%. Cusp area
classification accuracies were generally reduced for single
variable models; however, the paracone area of the M1
when used in isolation provided a sex prediction success
rate of 72.3 and 73.2%, employing discriminant function
analysis and binary logistic regression analysis, respec-
tively. The allocation accuracies for comparable sex
prediction models derived for maxillary second molar
dimensions were on average 4.3% lower than those
obtained for the first molar. Furthermore, the classification
models developed in this study incorporating dimensions
for both maxillary molars did not improve allocation
accuracies achieved when only using M1 measurements.
Therefore, if both maxillary teeth are preserved, it is
merely necessary to examine the first molar in order to
make full use of the sex discriminating ability of cusp area
measurements in this population group.
It is also worth noting that the classification results
reported in this investigation are also comparable to those
observed in a related study which examined the efficacy of
maxillary molar cusp diameters for sex discrimination. In
the latter study, discriminant function analyses yielded
allocation accuracies between 58.3 and 73.6% for cusp
diameter measurements obtained from the same black
South African dental sample [51]. As with the current
research, classification rates for functions generated from
first molar dimensions were higher than those for the sec-
ond molar. Likewise, discriminant functions incorporating
the lingual cusps of either the M1 or M2 yielded some of
the highest sex prediction percentages. These results are
unsurprising given that both investigations utilized datasets
which represent measures of maxillary molar cusp size for
the same set of teeth. Although in general agreement, there
are a few differences between the results of the current
study and those observed in the investigation concerning
cusp diameters. For example, the highest classification
accuracies for discriminant functions derived from M1 cusp
area measurements incorporated the paracone. In contrast,
models incorporating the protocone provided the most
Table 9 Logistic regression equations and classification accuracies for maxillary first and second molar variables
Selected variablesa ß coefficient Standard error Sectioning point Correctly classified (%) Sex biasb
Male Female Overall
Equation 25: all 12 variables
M1 Pa area 0.380 0.084 0.5 76.9 71.4 74.5 5.5
M1 Pr area 0.141 0.057
M2 Hy area 0.098 0.040
Constant -15.556 2.270
Equation 26: crown diameters
M1 BL 1.758 0.340 0.5 76.9 66.7 72.3 10.2
M2 MD 0.663 0.257
Constant -26.487 3.959
Equation 27: cusp areas
M1 Pa area 0.380 0.084 0.5 76.9 71.4 74.5 5.5
M1 Pr area 0.141 0.057
M2 Hy area 0.098 0.040
Constant -15.556 2.270
Equation 28: lingual cusps
M1 Pr area 0.260 0.051 0.5 73.1 62.9 68.5 10.2
M2 Hy area 0.108 0.037
Constant -9.935 1.595
Equation 29: buccal cusps
M1 Pa area 0.504 0.076 0.5 77.7 67.6 73.2 10.1
Constant -12.369 1.900
a All equations derived by means of stepwise analysis. Abbreviations of crown dimensions are the same as in Table 1b Sex bias = % males correctly classified - % females correctly classified
244 Forensic Sci Med Pathol (2011) 7:233–247
123
Author's personal copy
accurate allocation results among maxillary first molar
cusp diameters.
The abovementioned sex classification accuracies for
cusp area measurements of the permanent maxillary first
and second molar are lower than those reported in previous
studies of other skeletal elements in black South Africans,
including the cranium [52, 53], mandible [26, 54], pelvis
[55], humerus [56], radius and ulna [57], femur [58, 59],
patella [60], talus [61], and calcaneus [62]. The classifi-
cation success rates obtained for maxillary molar cusp
areas were also below the suggested minimum accuracy of
75–80% for reliable application of a method for forensic
sex identification [63–66]. Therefore, the derived discrim-
inant functions and binary logistic regression equations
should be used in conjunction with other methods to assist
sex determination, if additional skeletal materials are ade-
quately preserved. Notwithstanding, the utility of these
odontometric formulae lies in the fact that the dentition is
highly resistant to postmortem insults and thus may be
employed with fragmentary remains.
Although prior dental investigations have established
sex discriminating standards with higher classification
accuracies than those observed in the current study, these
approaches require fairly complete maxillary and/or man-
dibular dentitions, or at least some portion of the anterior
tooth row, particularly the canines [8, 9, 67–69]. For
example, in a recent dental sex assessment study in the
Nepalese, up to 93% of the sample population could be
correctly allocated utilizing a stepwise discriminant func-
tion procedure, which incorporated a combination of
mesiodistal and buccolingual crown dimensions for selec-
ted teeth from both jaws [70]. However, in many forensic
situations, such as dismemberments, mass disasters and
cremations, the measurement of each tooth class in either
dental arcade is not often possible. Similarly, the anterior
dentition, including the highly dimorphic canines, may not
be available for examination given that these single-rooted
teeth are more often lost postmortem [71]. Furthermore,
various taphonomic processes and antemortem modifica-
tions, such as interproximal restorations (fillings), can
variably affect the dentition rendering overall crown size
measurements ineffective, yet still allowing individual cusp
areas to be accurately recorded. Therefore, an additional
advantage of the odontometric formulae developed in this
study is that they may be applied to isolated molar teeth or
even partial tooth crowns.
Finally, the sex discriminating standards provided in this
study can be used with the remains of immature individ-
uals, as well as adults, given that the permanent dentition
develops early in life and remains unchanged during the
growth process. The first maxillary molar crown completes
development approximately three years after birth, while
the crown of the second maxillary molar is fully formed at
around the seventh year. Therefore, cusp area measure-
ments, although not highly accurate, may provide a sta-
tistically useful indication as to the sex of an individual in
which the secondary sexual characteristics of the skeleton
are not yet developed. This is of particular importance
given that attributing sex to immature remains is one of the
most problematic observations in skeletal identification.
Key points
1. Cusp area measurements for the first and second per-
manent maxillary molars were collected for a sample
of black South Africans utilizing digital photogram-
metric methods.
2. All cusp areas of both maxillary molars were found to
be sexually dimorphic in this population group.
3. Univariate and multivariate discriminant function and
logistic regression analyses yielded overall sex classi-
fication accuracy rates between 59.6% and 74.5% for
cusp area dimensions.
4. The derived formulae, although not as accurate as
those reported for other skeletal elements in black
South Africans, can be used with fragmentary remains
in which complete or even partial tooth crowns are
preserved.
5. An added benefit is that these osteometric standards
can be applied, not only to adults, but also to subadults
in which the more accurate sex discriminating features
of the pelvis and skull are yet to develop.
Acknowledgments The author would like to thank the Department
of Anatomical Sciences, University of the Witwatersrand for per-
mission to study the Raymond A. Dart Collection of Human Skele-
tons, and Mr. Brendon Billings for his generosity and help during data
collection. The author also wishes to express his gratitude to Professor
Maryna Steyn for granting access to the Pretoria Bone Collection,
housed in the Department of Anatomy, School of Medicine, Faculty
of Health Sciences, University of Pretoria and Mr. Marius Loots and
Dr. Ericka L’Abbe of the same department for their hospitality and
assistance with the skeletal material in their care.
Conflict of interest The authors declare that they have no conflict
of interest.
References
1. Rosing FW, Graw M, Marre B, et al. Recommendations for the
forensic diagnosis of sex and age from skeletons. HOMO-J Comp
Hum Biol. 2007;58:75–89.
2. Ditch LE, Rose JC. A multivariate dental sexing technique. Am J
Phys Anthropol. 1972;37:61–4.
3. Garn SM, Cole PE, Wainwright RL, Guire KE. Sex discrimina-
tion effectiveness using combinations of permanent teeth. J Dent
Res. 1977;56:697.
Forensic Sci Med Pathol (2011) 7:233–247 245
123
Author's personal copy
4. Rosing FW, Paul G, Schnutenhaus S. Sexing skeletons by tooth
size. In: Radlanski RJ, Renz H, editors. Proceedings of the 10th
international symposium on dental morphology. Berlin: M Mar-
keting; 1995. p. 373–6.
5. Iscan MY, Kedici PS. Sexual variation in bucco-lingual dimen-
sions in Turkish dentition. Forensic Sci Int. 2003;137:160–4.
6. Prabhu S, Acharya AB. Odontometric sex assessment in Indians.
Forensic Sci Int. 2009;192:129.e1–5.
7. Lund H, Mornstad H. Gender determination by odontometrics in
a Swedish population. J Forensic Odontostomat. 1999;17:30–4.
8. Karaman F. Use of diagonal teeth measurements in predicting
gender in a Turkish population. J Forensic Sci. 2006;51:630–5.
9. Pereira C, Bernardo M, Pestana D, Santos JC, de Mendonca MC.
Contribution of teeth in human forensic identification—discrim-
inant function sexing odontometrical techniques in Portuguese
population. J Forensic Leg Med. 2009;. doi:10.1016/j.jflm.2009.
09.001.
10. Garn SM, Cole PE, Van Alstine WL. Sex discriminatory effec-
tiveness using combinations of root lengths and crown diameters.
Am J Phys Anthropol. 1979;50:115–8.
11. Duncan C. Sex determination using tooth measurements. In:
Anderson S, editor. Current and recent research in osteoarchae-
ology. Proceedings of the 3rd meeting of the osteoarchaeological
research group. Oxford: Oxbow; 1998. p. 51–62.
12. Harris EF, Couch WM. The relative sexual dimorphism of human
incisor crown and root dimensions. Dent Anthropol. 2006;19:
87–94.
13. Biggerstaff RH. The basal area of posterior tooth crown com-
ponents: the assessment of within tooth variations of premolars
and molars. Am J Phys Anthropol. 1969;31:163–70.
14. Wood BA, Abbott SA, Graham SH. Analysis of the dental
morphology of Plio-Pleistocene hominids II. Mandibular molars-
study of cusp areas, fissure pattern and cross sectional shape of
the crown. J Anat. 1983;137:287–314.
15. Yamada H, Brown T. Contours of maxillary molars studied in
Australian Aborigines. Am J Phys Anthropol. 1988;76:399–407.
16. Mayhall JT, Alvesalo L. Sexual dimorphism in the three-
dimensional determinations of the maxillary first molar: cusp
height, area, volume and position. In: Smith P, Tchernov E,
editors. Structure, function, and evolution of teeth. London:
Freund Publishing House; 1991. p. 425–36.
17. Townsend GC, Richards L, Hughes T. Molar intercuspal
dimensions: genetic input to phenotypic variation. J Dent Res.
2003;82:350–5.
18. Kondo S, Townsend GC, Yamada H. Sexual dimorphism of cusp
dimensions in human maxillary molars. Am J Phys Anthropol.
2005;128:870–7.
19. Harris EF, Dinh DP. Intercusp relationships of the permanent
maxillary first and second molars in American whites. Am J Phys
Anthropol. 2006;130:514–28.
20. Takahashi M, Kondo S, Townsend GC, Kanazawa E. Variability
in cusp size of human maxillary molars, with particular reference
to the hypocone. Arch Oral Biol. 2007;52:1146–54.
21. Kondo S, Townsend GC. Associations between Carabelli trait
and cusp areas in human permanent maxillary first molars. Am J
Phys Anthropol. 2006;129:196–203.
22. L’Abbe EN, Loots M, Meiring JH. The pretoria bone collection: a
modern South African skeletal sample. HOMO-J Comp Hum
Biol. 2005;56:197–205.
23. Dayal MR, Kegley ADT, Strkalj G, Bidmos MA, Kuykendall KL.
The history, composition of the Raymond A. Dart Collection of
Human Skeletons at the University of the Witwatersrand, Johan-
nesburg, South Africa. Am J Phys Anthropol. 2009;140:324–35.
24. De Villiers H. The skull of the South African Negro. Johannes-
burg: Witwatersrand University Press; 1968.
25. Jacobson A. The dentition of the South African Negro. Anniston:
Higginbotham; 1982.
26. Franklin D, Higgins PO, Oxnard CE, Dadour I. Discriminant
function sexing of the mandible of Indigenous South Africans.
Forensic Sci Int. 2008;179:84.e1–5.
27. Brekhus PJ, Oliver CP, Montelius G. A study of the pattern and
combinations of congenitally missing teeth in man. J Dent Res.
1944;23:117–31.
28. Garn SM, Lewis ME, Vicinus JH. Third molar polymorphism and
its significance to dental genetics. J Dent Res. 1963;42:1344–63.
29. Lavelle CLB, Moore WJ. The incidence of agenesis and poly-
genesis in the primate dentition. Am J Phys Anthropol.
1973;38:671–80.
30. Hillson S. Dental anthropology. Cambridge: Cambridge Univer-
sity Press; 1996.
31. Scott GR, Turner CG. The anthropology of modern human teeth.
Cambridge: Cambridge University Press; 1997.
32. Scott GR. Dental Morphology. In: Katzenberg MA, Saunders SR,
editors. Biological anthropology of the human skeleton. 2nd ed.
Hoboken: Wiley; 2008. p. 265–98.
33. Turner CG, Nichol CR, Scott GR. Scoring procedures for key
morphological traits of the permanent dentition: the Arizona State
University Dental Anthropology System. In: Kelley MA, Larson
CS, editors. Advances in dental anthropology. New York: Wiley-
Liss; 1991. p. 13–31.
34. Bollini GA, Rodrıguez-Florez CD, Colantonio SE. Bilateral
asymmetry in permanent dentition of 13 pre-conquest samples
from Argentina (South America). HOMO-J Comp Hum Biol.
2008;60:127–37.
35. Cardoso HFV. Sample-specific (universal) metric approaches for
determining the sex of immature human skeletal remains using
permanent tooth dimensions. J Archaeol Sci. 2008;35:158–68.
36. Benazzi S, Fantini M, de Crescenzio F, Persiani F, Gruppioni G.
Improving the spatial orientation of human teeth using a virtual
3D approach. J Hum Evol. 2008;56:286–93.
37. Bailey SE, Pilbrow VC, Wood BA. Interobserver error involved
in independent attempts to measure cusp base areas of Pan M1s.
J Anat. 2004;205:323–31.
38. Wood BA, Engleman CA. Analysis of the dental morphology of
Plio-Pleistocene hominids V. Maxillary postcanine tooth mor-
phology. J Anat. 1988;161:1–35.
39. Mayhall JT. Dental morphology: techniques and strategies. In:
Katzenberg MA, Saunders SR, editors. Biological anthropology
of the human skeleton. Hoboken: Wiley-Liss; 2000. p. 103–34.
40. Pilbrow V. Population systematics of chimpanzees using molar
morphometrics. J Hum Evol. 2006;51:646–62.
41. Bernal V. Size and shape analysis of human molars: comparing
traditional and geometric morphometric techniques. HOMO-J
Comp Hum Biol. 2007;58:279–96.
42. Harris EF, Smith RN. Accounting for measurement error: a
critical but often overlooked process. Arch Oral Biol. 2009;
54:S107–17.
43. Tabachnick BG, Fidell LS. Using multivariate statistics. 5th ed.
Boston: Allyn & Bacon; 2007.
44. Saunders SR, Hoppa RD. Sex allocation from long bone mea-
surements using logistic regression. Can Soc Forensic Sci.
1997;30:49–60.
45. Torwalt CRMM, Hoppa RD. A test of sex determination from
measurements of chest radiographs. J Forensic Sci. 2005;50:
785–90.
46. Walker PL. Sexing skulls using discriminant function analysis of
visually assessed traits. Am J Phys Anthropol. 2008;136:39–50.
47. Albanese J, Eklics G, Tuck A. A metric method for sex deter-
mination using the proximal femur and fragmentary hipbone.
J Forensic Sci. 2008;53:1283–8.
246 Forensic Sci Med Pathol (2011) 7:233–247
123
Author's personal copy
48. Gapert R, Black S, Last J. Sex determination from the occipital
condyle; discriminant function analysis in an eighteenth and
nineteenth century British sample. Am J Phys Anthropol. 2009;
138:384–94.
49. Acharya AB, Prabhu S, Muddapur MV. Odontometric sex
assessment from logistic regression analysis. Int J Leg Med.
2010;. doi:10.1007/s00414-010-0417-9.
50. Kieser JA, Groeneveld HT. The unreliability of sex allocation
based on human odontometric data. J Forensic Odontostomat.
1989;7:1–12.
51. Macaluso PJ. Sex discrimination potential of permanent maxil-
lary molar cusp diameters. J Forensic Odontostomat. 2010;28, in
press.
52. Franklin D, Freedman L, Milne N. Sexual dimorphism and dis-
criminant function sexing in indigenous South African crania.
HOMO-J Comp Hum Biol. 2005;55:213–28.
53. Dayal MR, Spocter MA, Bidmos MA. An assessment of sex
using the skull of black South Africans by discriminant function
analysis. HOMO-J Comp Hum Biol. 2008;59:209–21.
54. Franklin D, O’Higgins P, Oxnard CE. Sexual dimorphism in the
mandible of indigenous South Africans: a geometric morpho-
metric approach. S Afr J Sci. 2008;104:101–6.
55. Patriquin ML, Steyn M, Loth SR. Metric analysis of sex differ-
ences in South African black and white pelves. Forensic Sci Int.
2005;147:119–27.
56. Steyn M, Iscan MY. Osteometric variation in the humerus:
sexual dimorphism in South Africans. Forensic Sci Int. 1999;
106:77–85.
57. Barrier ILO, L’Abbe EN. Sex determination from the radius and
ulna in a modern South African sample. Forensic Sci Int.
2008;179:85.e1–7.
58. Asala SA. Sex determination from the head of the femur of South
African whites and blacks. Forensic Sci Int. 2001;117:15–22.
59. Asala SA, Bidmos MA, Dayal MR. Discriminant function sexing
of fragmentary femur of South African blacks. Forensic Sci Int.
2004;145:25–9.
60. Dayal MR, Bidmos MA. Discriminating sex in South African
blacks using patella dimensions. J Forensic Sci. 2005;50:1294–7.
61. Bidmos MA, Dayal MR. Further evidence to show population
specificity of discriminant function equations for sex determina-
tion using the talus of South African blacks. J Forensic Sci.
2004;49:1165–70.
62. Bidmos MA, Asala SA. Sexual dimorphism of the calcaneus of
South African blacks. J Forensic Sci. 2004;49:446–50.
63. De Vito C, Saunders SR. A discriminant function analysis of
deciduous teeth to determine sex. J Forensic Sci. 1990;35:
845–58.
64. Rogers TL. A visual method of determining the sex of skeletal
remains using the distal humerus. J Forensic Sci. 1999;44:57–60.
65. du Jardin P, Ponsaille J, Alunni-Perret V, Quatrehomme G. A
comparison between neural network and other metric methods to
determine sex from the upper femur in a modern French popu-
lation. Forensic Sci Int. 2009;192:127.e1–6.
66. Kemkes A, Gobel T. Metric assessment of the ‘‘mastoid trian-
gle’’ for sex determination: a validation study. J Forensic Sci.
2006;51:985–9.
67. Rao NG, Rao NN, Pai ML, Kotian MS. Mandibular canine index:
a clue for establishing sex identity. Forensic Sci Int. 1989;42:
249–54.
68. Pettenati-Soubayroux I, Signoli M, Dutour O. Sexual dimorphism
in teeth: discriminatory effectiveness of permanent lower canine
size observed in a XVIIIth century osteological series. Forensic
Sci Int. 2002;126:227–32.
69. Ates M, Karaman F, Iscan MY, Erdem TL. Sexual differences in
Turkish dentition. Leg Med. 2006;8:288–92.
70. Acharya AB, Mainali S. Univariate sex dimorphism in the
Nepalese dentition and the use of discriminant functions in
gender assessment. Forensic Sci Int. 2007;173:47–56.
71. Schimdt CW. Forensic dental anthropology: issues and guide-
lines. In: Irish JD, Nelson GC, editors. Technique and application
in dental anthropology. Cambridge: Cambridge University Press;
2008. p. 266–92.
Forensic Sci Med Pathol (2011) 7:233–247 247
123
Author's personal copy