investigating the simulated diving reflex in professional divers
TRANSCRIPT

Western University Western University
Scholarship@Western Scholarship@Western
Electronic Thesis and Dissertation Repository
9-13-2019 1:30 PM
Investigating the simulated diving reflex in professional divers Investigating the simulated diving reflex in professional divers
Sydney O. Smith, The University of Western Ontario
Supervisor: Shoemaker, J Kevin, The University of Western Ontario
A thesis submitted in partial fulfillment of the requirements for the Master of Science degree in
Kinesiology
© Sydney O. Smith 2019
Follow this and additional works at: https://ir.lib.uwo.ca/etd
Part of the Exercise Science Commons, and the Other Kinesiology Commons
Recommended Citation Recommended Citation Smith, Sydney O., "Investigating the simulated diving reflex in professional divers" (2019). Electronic Thesis and Dissertation Repository. 6799. https://ir.lib.uwo.ca/etd/6799
This Dissertation/Thesis is brought to you for free and open access by Scholarship@Western. It has been accepted for inclusion in Electronic Thesis and Dissertation Repository by an authorized administrator of Scholarship@Western. For more information, please contact [email protected].
I
Abstract
Background: Submergence underwater activates the diving response (DR) in both diving
mammals and humans in order to preserve oxygen. Some evidence suggests that the DR
can be trained in humans to provide a larger magnitude of bradycardia during submergence.
Hypothesis: Individuals with breath holding experience will have a greater magnitude of
bradycardia during the DR than untrained, age-matched controls.
Methods: Participants performed three different protocols: 1) an apnea to volitional end
point, or until 30 seconds of involuntary breathing movements were observed (APNEA),
2) one minute of cold pack to the forehead (COLD), and 3) one minute of cold pack
contact on forehead during an apnea (COLD+APNEA).
Results: BHD had a larger magnitude of bradycardia during COLD+APNEA compared
to controls (p=0.099).
Conclusions: The greater magnitude of bradycardia and MAP response in BHD shows that
there is a physiological difference between trained and untrained individuals in breath hold
diving.
Keywords
Breath hold diving; apnea; diving response; bradycardia; heart rate; total peripheral
resistance; mean arterial blood pressure
II
Summary for Lay Audience
When mammals dive underwater the activate a reflex that allows them to maintain as
much oxygen in their blood as possible. This reflex is called the diving response (DR).
The characteristics of the DR are a reduction in heart rate (HR), an increase in blood
pressure, and an increase in the blood vessels throughout the body constricting. In order
to measure how extreme the DR is you measure how much HR decreases. Some
researchers have found that some individuals can actually train the DR to be more
extreme by practicing diving and breath holding.
This study investigated whether or not the DR can actually be trained by observing
whether professional breath hold divers had a more extreme response than naïve
individuals.
Professional breath hold divers (BHD) and naïve individuals who have never completed
breath hold training participated in this study. They completed three different trials: 1) all
participants held their breath for as long as possible; 2) an ice pack was placed on their
forehead; 3) they held their breath for as long as possible while an ice pack was placed on
their forehead.
This study found that BHD recovered their HR faster than naïve individuals. This means
that their HR recovered to normal resting levels at a faster rate than naïve individuals
after just a cold pack was placed on their forehead.
These results indicate that the BHD have developed some adaptation in recovery to cold
exposure. Otherwise, there were no adaptations observed that related directly to the
extremity of the DR.

III
Acknowledgments
To Dr. Kevin Shoemaker, thank you for your amazing support and guidance throughout
this whole process. I would not be where I am today without your acceptance into your
lab not only to complete my Master’s but truly as part of a big family. Thank you for
supporting my decisions to try out a different path in business. Your acceptance of my
choices helped me to excel not only in my research but into another path. You are an
inspiration to many, and I wish you continued success.
To my Serbia labmates. Emilie and Erin, thank you for pushing with me through the long
hours in Serbia testing but also for emotional support through that busy time. You both
were there to help when we all needed a shoulder to lean on.
Emilie and Jenna, I treasure our friendship and I thank you for your hard work throughout
these two years because you pushed me to be the best I could be in my work. I will never
forget the times we shared and the fun we had. I know there will be many more
adventures in the future.
Baraa, I truly would not have made it through these two years without you. You are an
amazing friend and mentor and I wish you all the best in your time at McMaster. I know
you will inspire the lives of many others in your time there just as you did at Western.
To the Neurovascular Research Laboratory, I thank you. You all welcomed me into your
lab and helped teach me the ways! The mentorship and learning that occurred for me are
unmatched and I thank you all for your contributions to my success.

IV
To Dr. Otto Barak, Enis, Nebojsha and other Serbian lab members, you made our journey
to Serbia so amazing. We could not have completed our work without your constant
support. Enis, we would not have been able to do what we did without your running
around the streets of Novi Sad to retrieve things such as ice or power converters. Your
commitment to our success made a difference in the outcomes of our projects.
To my Mother, Father, Brother, Grandparents, and all other family members, thank you
for supporting me through all the good and bad times. Your love helped me push through
times when I was questioning myself and my abilities. Thank you for accepting and
loving me for me! I love you all and I know you will continue to support me through all
the chapters in my life. I treasure how close our family is and I love you all for the
supportive and accepting environment we have fostered.
To my roommates, Cadence and Steven, thank you for going through this process a year
in advance. It helped me see the hard work it took to be successful. Thank you for
supporting me through this process. I know you both will do great things and I wish you
all the best.
To Western track and field, thank you for helping me reach my potential again. I never
realized how such a large team can come together as one and become a family. I have
never experienced such an amazing team atmosphere and I thank you for accepting me as
you did when I came from another school. The coaching, team, and support helped me to
finally reach my potential again and make me love the sport of track and field. I will
never forget the amazing times with my sprint crew and the rest of the team.

V
To Dr. Derek Kimmerly and Dr. Scott Grandy, thank you for showing me physiology
and helping me get to my Masters at Western. Both of you introduced me to the field and
showed me research before I committed to a Master's degree. You inspired me to begin
this chapter in my life and helped facilitate my acceptance.
To Pam Gray, I would not be the person I am today without your willingness to work
with me through various life and career choices. You have been there for me no matter
what the issue to support me and provide unparalleled guidance in all my endeavours.
To everyone else who took a part in the completion of this degree, I thank you. There
were so many individuals who helped me through this process and I will never forget
your contributions. I cannot believe this chapter of my life is now closing and I know I
could not have done it on my own.
VI
Table of Contents
Abstract ................................................................................................................................ I
Summary for Lay Audience ................................................................................................ II
Acknowledgments............................................................................................................. III
Table of Contents .............................................................................................................. VI
List of Tables .................................................................................................................... IX
List of Figures .................................................................................................................... X
List of Appendices ........................................................................................................... XII
List of Abbreviations ..................................................................................................... XIII
Chapter 1 ............................................................................................................................. 1
1 Introduction .................................................................................................................... 1
Chapter 2 ............................................................................................................................. 3
2 Literature Review ........................................................................................................... 3
2.1 Autonomic Nervous System Characteristics and Divisions ................................... 3
2.2 Resting Physiological Variables ............................................................................. 4
2.2.1 Resting Heart Rate ...................................................................................... 4
2.2.2 Heart Rate Variability ................................................................................. 4
2.2.3 Respiratory Sinus Arrhythmia .................................................................... 6
2.3 Anatomy of the Autonomic Nervous System ......................................................... 7
2.3.1 Sympathetic Nervous System ..................................................................... 8
2.3.2 Parasympathetic Nervous System ............................................................... 9
2.4 Diving Response ..................................................................................................... 9
2.4.1 Specific Cardiovascular Changes During the Diving Response ............... 10
2.5 Apnea Reflex ........................................................................................................ 11
2.6 Overview of Reflexes ........................................................................................... 11
VII
2.6.1 Monosynaptic reflexes .............................................................................. 12
2.6.2 Polysynaptic Reflexes ............................................................................... 12
2.6.3 Autonomic Reflexes.................................................................................. 13
2.7 Trigeminal Nerve Reflexes ................................................................................... 13
2.7.1 Anatomy of the Trigeminal Nerve ............................................................ 13
2.7.2 The Trigeminocardiac Reflex ................................................................... 14
2.7.3 Antagonistic and Synergistic Activation of Vagal and Sympathetic
Outflow in Trigeminal Reflexes ............................................................... 15
2.8 History of the Sport of Breath Holding................................................................. 17
2.9 Apnea Overview ................................................................................................... 18
2.9.1 Phases of Apnea ........................................................................................ 18
2.9.2 Apnea Training ......................................................................................... 19
2.10 The Effect of Training on the Diving Response ................................................... 20
2.11 Purposes and Hypotheses ...................................................................................... 21
Chapter 3 ........................................................................................................................... 22
3 Methods ........................................................................................................................ 22
3.1 Participants ............................................................................................................ 22
3.2 Experimental Protocol .......................................................................................... 23
3.2.1 Protocol 1 – APNEA ................................................................................. 24
3.2.2 Protocol 1 – COLD ................................................................................... 24
3.2.3 Protocol 1 – COLD + APNEA ................................................................. 25
3.3 Physiological Recordings...................................................................................... 25
3.4 Physiological Data Analysis ................................................................................. 25
3.5 Statistical Analyses ............................................................................................... 27
Chapter 4 ........................................................................................................................... 29
4 Results .......................................................................................................................... 29
VIII
4.1 Physiological Results ............................................................................................ 29
4.1.1 Baseline Results ........................................................................................ 29
4.1.2 Heart Rate ................................................................................................. 29
4.1.3 Heart Rate Variability ............................................................................... 31
4.1.4 Mean Arterial Pressure (MAP) ................................................................. 31
4.1.5 Total Peripheral Resistance....................................................................... 33
4.1.6 Cardiac Output .......................................................................................... 34
4.1.7 Duration of Apnea..................................................................................... 35
4.1.8 Heart Rate at Apnea Duration Match ........................................................ 35
Chapter 5 ........................................................................................................................... 37
5 Discussion .................................................................................................................... 37
5.1 Heart Rate ............................................................................................................. 37
5.2 Heart Rate Variability ........................................................................................... 39
5.3 Mean Arterial Pressure ......................................................................................... 40
5.4 Total Peripheral Resistance................................................................................... 41
5.5 Perspectives........................................................................................................... 42
5.6 Assumptions and Limitations ............................................................................... 43
5.7 Conclusions ........................................................................................................... 44
References ......................................................................................................................... 45
Appendices ........................................................................................................................ 51
Curriculum Vitae .............................................................................................................. 91

IX
List of Tables
Table 1: Participant Characteristics ...................................................................................22
Table 2: Resting Values of HR, MAP, CO, TPR, RMSSD, LF, HF .................................29
X
List of Figures
Figure 1: Example of spectral analysis of HRV in a healthy subject at rest and during
passive tilt; used with permission (Malliani, Lombardi, & Pagani, 1994). ............... Error!
Bookmark not defined.
Figure 2: Depiction of how R-R intervals are calculated using an electrocardiogram
(ECG) tracing. R-R intervals are calculated by measuring the time between subsequent R
peaks. ...................................................................................................................................5
Figure 3: Example of what RSA looks like on strain gauge tracing (Respitrace) of
breathing movements and calculated HR from ECG. Peaks on Respitrace show peak
inspiration which match up in time with peaks in HR. Nadir values on Respitrace show
peak of expiration ................................................................................................................7
Figure 4: Schematic diagram of monosynaptic (solid line) and polysynaptic reflexes; used
with permission (Hunyor, 1994). .......................................................................................12
Figure 5: Schematic diagram of pupillary light reflex; used with permission (autonomic
reflex; Hunyor, 1994)......................................................... Error! Bookmark not defined.
Figure 6: Schematic diagram of the trigeminal nerve and its branches; used with
permission (Moses, Banks, Nava, & Petersen, 2005) ........................................................14
Figure 7: Schematic diagram of the pathways and effected organs activated by the
trigeminal nerve; used with permission (Buchholz et al., 2017) .......................................17
Figure 8: Diagram of strain gauge tracing around abdomen during an elite prolonged
breath hold. ........................................................................................................................19
Figure 9: Depiction of ECG, Respitrace, HR, MAP, and TPR tracings during one
APNEA+COLD protocol. ..................................................................................................27
Figure 10: Heart Rate values for all three conditions, BHD and CTL. Condition*Group
interaction=0.08; * = p < 0.05, † = p < 0.1; bpm=beats per minute ..................................30
XI
Figure 11: Root mean square of successive differences values for all three conditions,
BHD and CTL. Condition*Group interaction= 0.71; ms=milliseconds ............................31
Figure 12: Mean Arterial Pressure values for all three conditions, BHD and CTL.
Condition*Group interaction= 0.001; * = p < 0.05; mmHg=millimeters of mercury .......33
Figure 13: Total Peripheral Resistance values for all three conditions, BHD and CTL.
Condition*Group interaction= 0.13; mmHg=millimeters of mercury; min=minutes;
L=liters. ..............................................................................................................................34
Figure 14: Depiction of Heart Rate of BHD and CTL at the same time each CTL
completed their apnea. .......................................................................................................36

XII
List of Appendices
Appendix A: Permissions for Figure 1 ..............................................................................51
Appendix B: Permissions for Figures 4 and 5 ...................................................................55
Appendix C: BREATHE Research Ethics Board Approval #111375 ...............................59
Appendix D: Somatosensory Nerve Stimulation Study Research Ethics Board Approval
#108026..............................................................................................................................60
Appendix E: Ischemic Heart Disease Research Ethics Board Approval #107620 ............61
Appendix F: Ischemic Heart Disease Letter of Information #107620 ...............................62
Appendix G: Somatosensory Nerve Stimulation Study Letter of Information #108026...69
Appendix H: BREATHE Study Ethics Letter of Information #111375 ............................78
Appendix I: Raw Data .......................................................................................................82
XIII
List of Abbreviations
ANS – Autonomic Nervous System
APNEA – apnea protocol
BHD – Breath hold divers
bpm – beats per minute
CNS – central nervous system
COLD – Cold protocol
COLD+APNEA – cold and apnea protocol
CVLM – caudal ventrolateral medulla
DR – Diving response
HR – Heart rate
HRV – Heart rate variability
IML – intermediolateral cell column
MAP – mean arterial pressure
NA – Nucleus Ambiguous
NTS – Nucleus tractus solitarius
PFC – Prefrontal cortex
PNS – parasympathetic nervous system
RVLM – rostral ventrolateral medulla
SNS – sympathetic nervous system
TPR – total peripheral resistance
1
Chapter 1
1 Introduction
Oxygen deprivation even for a short period of time can be detrimental to many
species. Thus, animals have developed and adapted to be able to survive in such hypoxic
conditions. The main adaptation found in animals to maintain consciousness and blood
distribution during diving is the “diving response”. It is characterized by bradycardia,
peripheral vasoconstriction and subsequent increase in mean arterial pressure. This
response allows the animal to redistribute blood flow to areas such as the heart and brain
and restriction of the peripheral vascular beds and vasculature in the digestive organs.
Although these responses are reserved for mammals who dive frequently (e.g. seals,
ducks etc.) humans also possess some similar mechanisms. The magnitude of the DR
may be characterized by the magnitude of the bradycardia the mammal experiences.
The DR demonstrates the complicated balance of the two divisions of the
autonomic nervous system. It is activated by simultaneous activation of the cold receptors
of the face along with cessation of breathing, called apnea (Foster & Sheel, 2005).
Submersion of the face activates a vagal response to reduce heart rate (HR) whereas
apnea elicits a sympathetic response that causes an increase in blood pressure through
peripheral vasoconstriction (Buchholz, Kelly, Bernatene, Diodati, & Gelpi, 2017). In
humans peripheral resistance increases dramatically to raise blood pressure higher than
normal physiological levels. Unlike humans, other mammals (e.g. seals, whales,
dolphins) that have adapted to diving appear to maintain their BP within normal ranges
despite a large increase in sympathetic tone (Buchholz et al., 2017). This dissertation

2
examined the autonomic and cardiovascular physiology of the DR in humans with
particular focus on the adaptations that may occur in elite breath-hold divers.
3
Chapter 2
2 Literature Review
2.1 Autonomic Nervous System Characteristics and Divisions
The autonomic nervous system (ANS) can function without conscious awareness
and is responsible for many visceral responses and the preservation of homeostasis in the
human body. The ANS is connected with functions associated with the cardiorespiratory
system, metabolism, and immune system (Wehrwein, Orer, & Barman, 2016). These
functions are regulated through activation of various visceral sensors, which provide
information to the ANS sections of the brain. In the ANS sections of the brain
information is refined and specific motor responses are transferred throughout the body
(Shields, 1993).
The ANS comprises of three primary divisions: the sympathetic nervous system
(SNS), the parasympathetic nervous system (PNS) and the enteric nervous system (ENS)
and has an influence on most functions in the human body. Specifically, this paper will
focus on the SNS and PNS.
The SNS and PNS can function separately, together (synergistically) or against one
another (antagonistically). The SNS is specifically known to cause “fight or flight”
reactions such as, increasing heart rate, and mean arterial pressure during a stressful
situation. Thus, it is thought that the SNS responds to threats, danger and other
emergency situations.
4
The PNS is responsible for “rest and digest” reactions because of its role during rest
of saving energy and encouraging resting metabolism. The PNS also plays an integral
part in the normal movements of the eye, sphincter muscles and tear production.
Although the PNS and SNS are generally thought in the simple terms of “fight or flight”
and “rest and digest” they do allow for automatic actions that are outside those scopes of
understanding.
2.2 Resting Physiological Variables
2.2.1 Resting Heart Rate
The dynamic interplay of both the sympathetic and parasympathetic nervous
systems on the sinoatrial node in the heart are what determine heart rate in a given
physiological state (Jose & Collison, 1970). Vagal tone is dominant over sympathetic
tone in healthy individuals in a resting state, allowing heart rate to be lower compared to
some states where sympathetic tone would be increased. This was shown by Jose and
Collison, (1970) where they injected propranolol and atropine for autonomic blockade,
which allowed them to measure intrinsic HR. Their results showed that intrinsic HR was
higher than resting HR demonstrating that vagal tone influences resting HR.
2.2.2 Heart Rate Variability
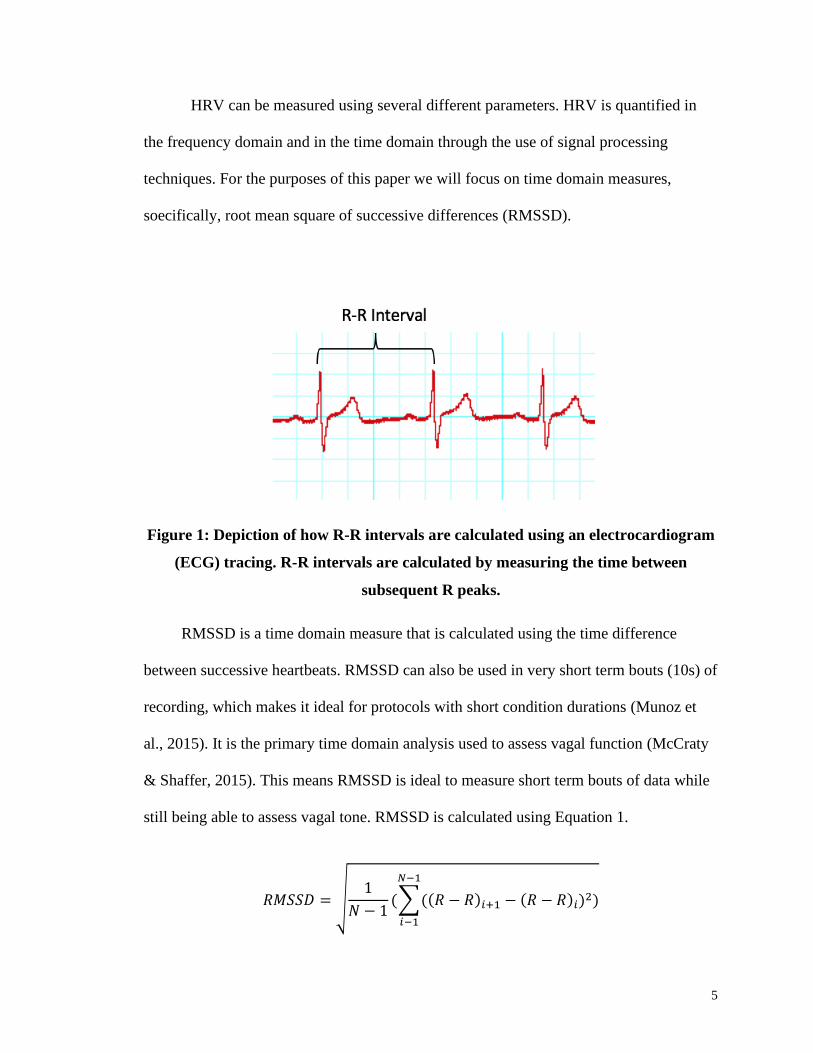
Heart rate variability (HRV) is a measure of the variation in R-R intervals over a
certain time period. R-R intervals are the measure of time between successive heart beats.
This normal irregularity of heart rate can be used to characterize and measure the status
of the ANS and is a valuable tool in investigating the interplay of both the SNS and PNS
(Acharya, Joseph, Kannathal, Lim, & Suri, 2006).
5
HRV can be measured using several different parameters. HRV is quantified in
the frequency domain and in the time domain through the use of signal processing
techniques. For the purposes of this paper we will focus on time domain measures,
soecifically, root mean square of successive differences (RMSSD).
Figure 1: Depiction of how R-R intervals are calculated using an electrocardiogram
(ECG) tracing. R-R intervals are calculated by measuring the time between
subsequent R peaks.
RMSSD is a time domain measure that is calculated using the time difference
between successive heartbeats. RMSSD can also be used in very short term bouts (10s) of
recording, which makes it ideal for protocols with short condition durations (Munoz et
al., 2015). It is the primary time domain analysis used to assess vagal function (McCraty
& Shaffer, 2015). This means RMSSD is ideal to measure short term bouts of data while
still being able to assess vagal tone. RMSSD is calculated using Equation 1.
𝑅𝑀𝑆𝑆𝐷 = √1
𝑁 − 1(∑((𝑅 − 𝑅)𝑖+1 − (𝑅 − 𝑅)𝑖)2)
𝑁−1
𝑖−1
6
Equation 1: Formula used to calculate RMSSD. N=number of RR intervals.
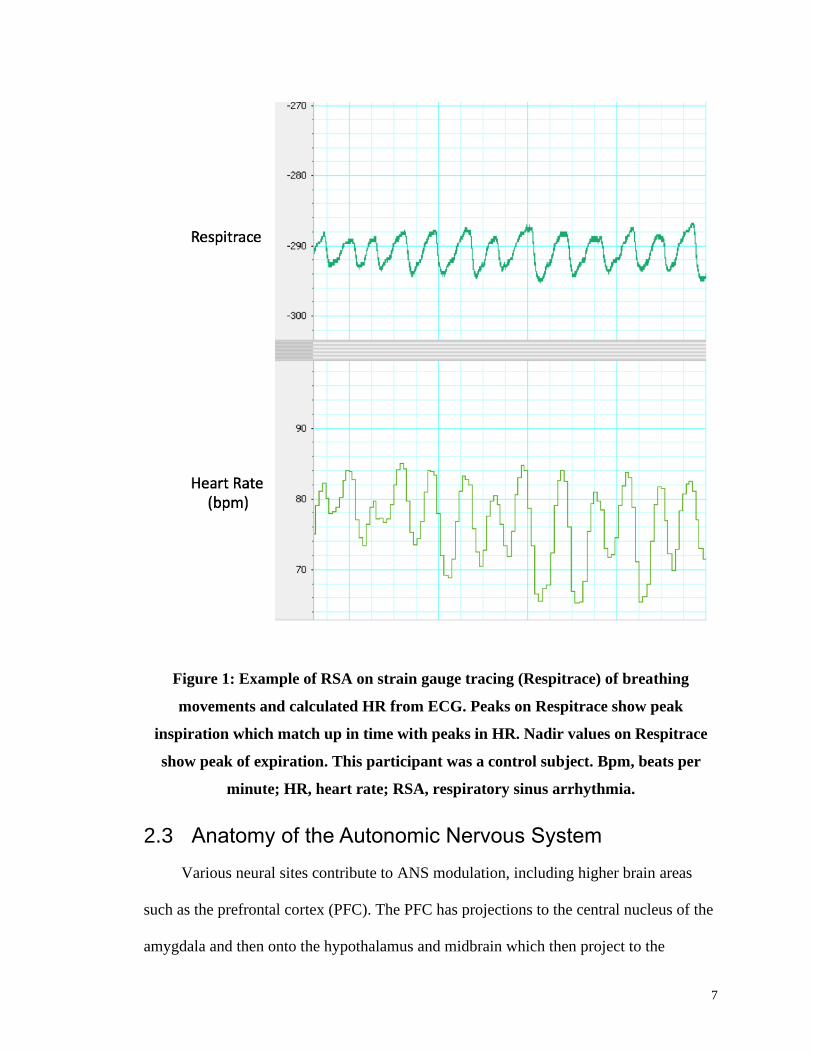
2.2.3 Respiratory Sinus Arrhythmia
The ANS plays an important role in the integration and connections between the
respiratory and circulatory systems. One of the interactions seen between the respiratory
and circulatory systems is respiratory sinus arrhythmia (RSA). This is when heart rate
changes synchronously with an individual’s breaths. R-R intervals are shortened during
inspiration and increased during expiration. The cardiac vagal nerve activity is thought to
be determined by respiratory rhythm therefore, heart rate is ultimately controlled by
respiratory rhythm. It is thought that both the respiratory centres and circulatory centres
of the brainstem control RSA (Yasuma & Hayano, 2004).
Two major physiological mechanisms have been recognized in developing RSA.
The first is the control of cardiac vagal neurons by respiratory pattern and the second is
the inhibition of cardiac vagal activity during lung expansion. During expiration the vagal
efferent fibres are excited leading to bradycardia whereas, during inspiration inflation of
the lungs occurs causing inhibition of the vagal efferent fibres. This then leads to
tachycardia during inspiration due to almost complete abolishment of efferent cardiac
vagal activity. To measure magnitude of RSA the difference in R-R interval from
inspiration and expiration may be taken, which also can be a reflection of an individual’s
cardiac vagal function (Yasuma & Hayano, 2004).
7
Figure 1: Example of RSA on strain gauge tracing (Respitrace) of breathing
movements and calculated HR from ECG. Peaks on Respitrace show peak
inspiration which match up in time with peaks in HR. Nadir values on Respitrace
show peak of expiration. This participant was a control subject. Bpm, beats per
minute; HR, heart rate; RSA, respiratory sinus arrhythmia.
2.3 Anatomy of the Autonomic Nervous System
Various neural sites contribute to ANS modulation, including higher brain areas
such as the prefrontal cortex (PFC). The PFC has projections to the central nucleus of the
amygdala and then onto the hypothalamus and midbrain which then project to the
8
medulla. Primary baroreceptor afferent fibres run through the glossopharyngeal and
vagus nerves synapse onto the NTS. Neurons from the NTS project to the nucleus
ambiguous and the caudal ventrolateral medulla (CVLM). Neurons from the CVLM then
inhibit the rostral ventral lateral medulla (RVLM) that normally emits high levels of
sympathetic nerve activity (Dampney, 2016). The NA is a source of vagal outflow to the
heart. The cell bodies of both the SNS and the PNS originate in the spinal cord and the
brain stem. Axons then leave through ventral roots and cranial nerves to synapse onto
second order neurons which innervate smooth muscle, cardiac muscle, and other
autonomic targets. Autonomic sensory fibres are the specific fibres which relay
information to the brain stem and spinal cord and thus, the ANS centres. Some ANS
organs and viscera are innervated by both the SNS and PNS and can be antagonistically
activated (Shields, 1993).
2.3.1 Sympathetic Nervous System
Some of the cell bodies of the SNS are located in the intermediolateral (IML) cell
column, of the spinal cord, between T1 and L2. There are two components to the efferent
SNS. The first includes the neurons within the spinal cord and brain whereas the second
involves the neurons projecting beyond the paravertebral ganglia. Distribution of
postganglionic sympathetic axons exiting the spinal cord is organized in segments. T1
and T2 supply the face and neck, T2-T8 supply the upper extremities, T5-T10 the
abdominal viscera, T11-L1 the colon up to the splenic flexure, and T6-L2 the adrenal
glands (Shields, 1993).
9
2.3.2 Parasympathetic Nervous System
Some of the cell bodies of the PNS lie in specific cranial nerve nuclei and the IML
cell column of the sacral spinal cord. Like the SNS, the PNS efferent system contains two
different neurons, one in the CNS and one that projects from the ganglia to the organ.
However, in the PNS case, the ganglia exist distant from the spinal cord and are normally
in the organ being innervated. The cranial preganglionic nerve fibres of the PNS include:
the oculomotor (III) nerve, the facial (VII) nerve, the glossopharyngeal (IX) nerve, and
the vagus (X) nerve (Shields, 1993).
2.4 Diving Response
Lack of oxygen is detsrimental to all mammals and birds. Therefore, animals have
developed various mechanisms to increase their survival capabilities to help budget the
usage of oxygen during diving (Foster & Sheel, 2005). Together, these mechanisms form
the “DR”. The DR is characterized by bradycardia and an increase in total peripheral
resistance (TPR). One prime example of the magnitude of the DR is seen in diving seals.
Their baseline HR can start at 100 bpm and dramatically decrease to approximately 10
bpm immediately after submersion in water (Hurwitz & Furedy, 1986). This is viewed as
beneficial due to the reduction in oxygen needed for cardiac metabolism.
Also, during the DR an impressive change in blood flow distribution is seen in
many animals. Blood is redistributed to essential organs such as the brain and is restricted
from the periphery and non-essential organs such as the kidneys (Hurwitz & Furedy,
1986).
10
Some evidence has also shown a change in splenic contraction volumes during a
breath hold. Schagatay and colleagues (2012) has reported a correlation between breath
hold duration and spleen size (Erika Schagatay, Richardson, & Lodin-Sundström, 2012).
Also, trained apneists have been reported to have larger spleens (E. Schagatay, 2014).
Splenic contraction is important in the context of diving because the spleen can act as a
red blood cell reservoir that can contract and dispense red blood cells during hypoxia
(Foster & Sheel, 2005).
The mechanisms that mediate the DR are known. Contact of the face and water
excites the areas of the face supplied by the trigeminal nerve (TGN). Excitation of the
TGN causes “inhibition and excitation of vasomotor centers and cardiac vagal
motorneurones” in the brainstem (Foster & Sheel, 2005). However, some factors
determine the magnitude of the DR. For example, temperature of the water during
submergence has been shown to affect the magnitude of the DR. Schagatay and Holm
(1996) found that an increase in air temperature generally increased the amount of
bradycardia seen during facial immersion and an increase in water temperature saw a
general decline in HR during immersion. This suggests that the change in temperature
from room air to the water during submergence has an effect on the DR (Erika Schagatay
& Holm, 1996).
2.4.1 Specific Cardiovascular Changes During the Diving Response
During the DR some specific physiological and cardiovascular changes occur. The
dynamic interplay of both the sympathetic and vagal nervous systems cause changes in
heart rate, blood pressure and peripheral resistance. More specifically, heart rate tends to
11
follow a pattern based on the length of the breath hold and response in general. During a
prolonged breath hold in cold water, the HR of trained apneists may dip as low as 20-30
beats per minute. This reduction in HR allows the body to reduce oxygen consumption
that can, in turn, lead to a longer duration maximal apnea (Bain, Drvis, Dujic, MacLeod,
& Ainslie, 2018). The bradycardia response to apnea can be largely influence by the
duration of the breath hold and the level of facial cooling (Bain et al., 2018).
Also, during a prolonged apnea, elevation of sympathetic nerve activity occurs.
This then causes an increase in peripheral vasoconstriction leading to elevated TPR and
MAP. These increases in blood pressure may also allow the baroreflex to cause
reductions in HR (Bain et al., 2018).
2.5 Apnea Reflex
The DR is activated by the submergence underwater along with apnea. The latter
portion of this response also has its own reflex, the apnea reflex. When an individual
performs a static apnea without submergence underwater or facial cooling there is still a
decrease in HR as reported by Perini et al., (2008). Also, an increase in both SBP and
DBP was seen at the end of maximal dry static apnea. This increase is due to a
corresponding increase in vasoconstriction of vascular beds elicited by the sympathetic
response (Perini et al., 2008).
2.6 Overview of Reflexes
Reflexes are automatic responses generally concerned with protective and
regulatory functions of the body. The simplest reflex pathways include, at the very least,
12
a receptor, an afferent neuron, synapses, an integrating centre or ganglion, an efferent
neuron or effector organ (Hunyor, 1994).
2.6.1 Monosynaptic reflexes
Monosynaptic reflexes are the simplest of the reflex arcs and they contain one
synapse. One example of a monosynaptic reflex is the stretch reflex (Hunyor, 1994).
2.6.2 Polysynaptic Reflexes
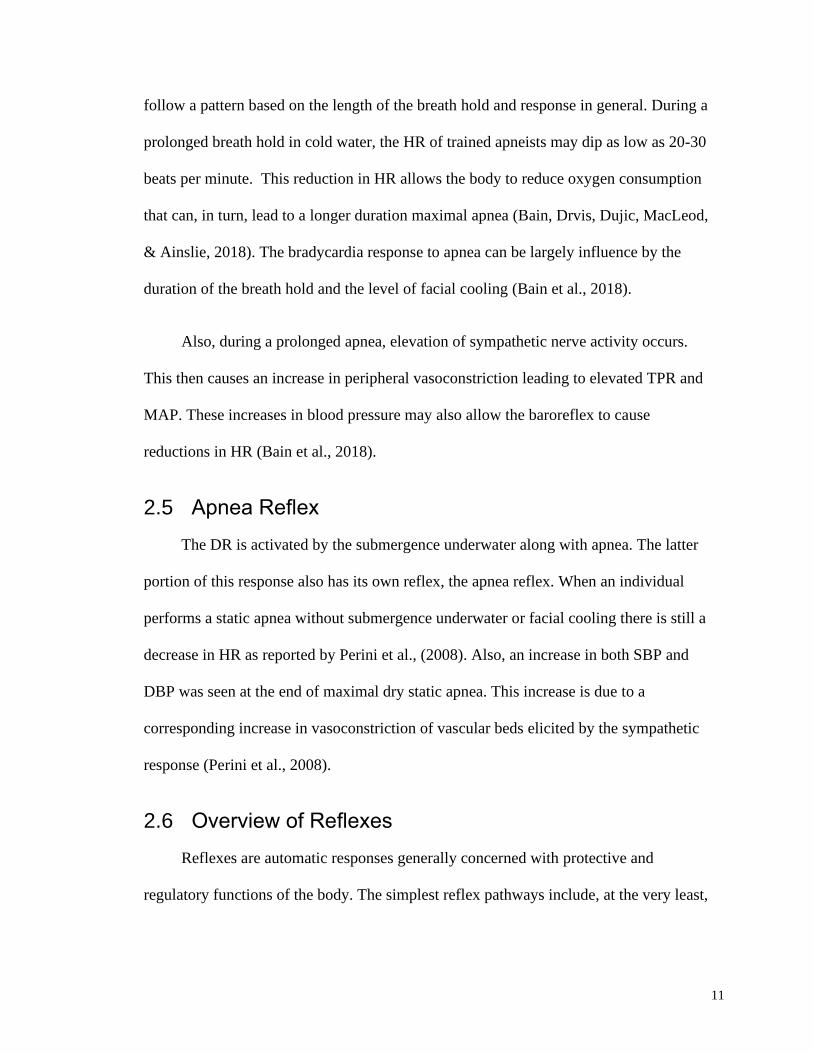
Polysynaptic reflexes are more complicated in that they contain multiple synapses
and more extensive afferent and efferent pathways. These pathways contain various
numbers of interneurons and synaptic connections. One example of a polysynaptic reflex
is the flexor reflex, which is a protective reflex by withdrawing a limb away from a
noxious stimulus by activating the flexor muscles of a limb (Hunyor, 1994).
Figure 2: Schematic diagram of monosynaptic (solid line) and polysynaptic reflexes;
used with permission (Hunyor, 1994).
13
2.6.3 Autonomic Reflexes
Autonomic reflex pathways occur at different levels. Some local reflexes relay
through the spinal cord whereas, others relay through the brainstem and higher brain
centres.
2.7 Trigeminal Nerve Reflexes
Part of the DR occurs due to activation of receptors in the TGN. Along with the DR
there are other reflexes that occur by activation of receptors in the TGN.
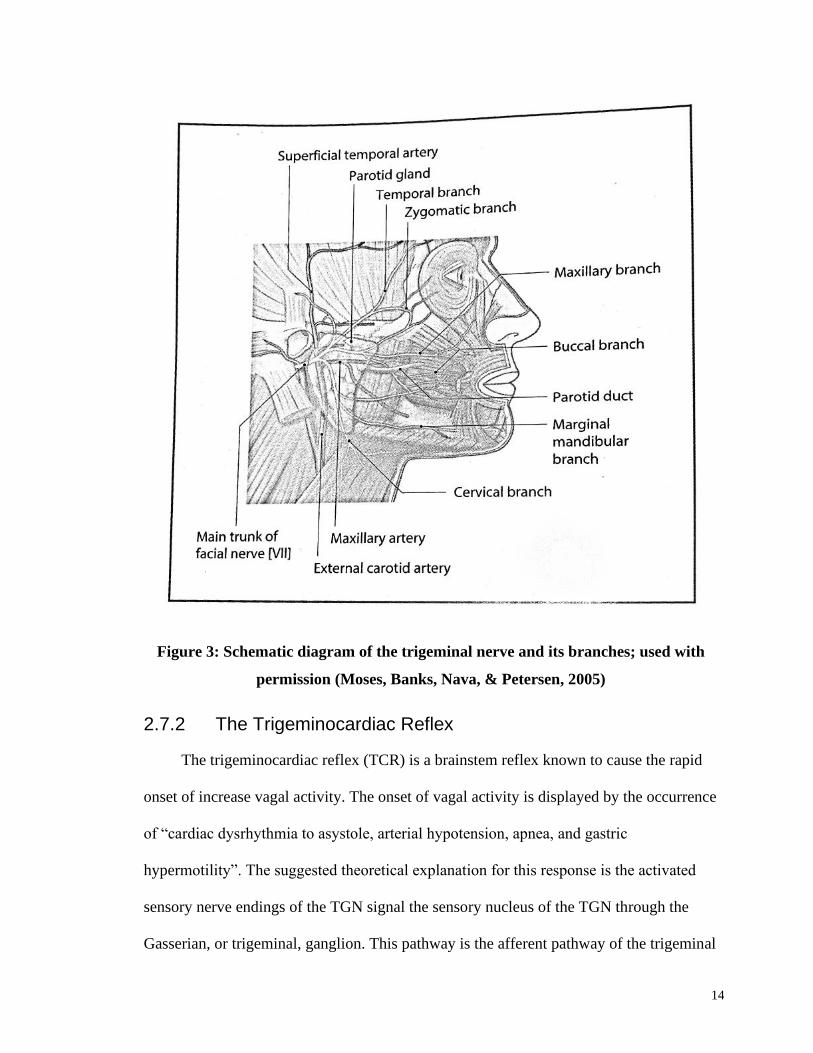
2.7.1 Anatomy of the Trigeminal Nerve
The trigeminal nerve, also known as the fifth cranial nerve, is made up of three
different branches: the ophthalmic (V1), the maxillary (V2), and the mandibular (V3). It
is the largest cranial nerve and is primarily distributed throughout the suprahyoid neck.
The ophthalmic and maxillary nerve are both sensory nerves whereas, the mandibular
nerve contains both sensory and motor components. V1 is the smallest division of the
TGN and V3 is the largest. All the divisions converge within Meckel’s cave where they
form the trigeminal (semilunar) ganglion. This ganglion contains the cell bodies of first
order sensory neurons. In contrast, the first order motor neurons from V3 are located in
the mesencephalic nucleus. The semilunar ganglion separates and continues through the
prepontine cistern to the brainstem (Bathla & Hegde, 2013).
In the brainstem the divisions diverge to three different sensory nuclei: principal
sensory nucleus located in the pontine tegmentum, the mesencephalic nucleus, and the
spinal trigeminal nucleus (Bathla & Hegde, 2013).
14
Figure 3: Schematic diagram of the trigeminal nerve and its branches; used with
permission (Moses, Banks, Nava, & Petersen, 2005)
2.7.2 The Trigeminocardiac Reflex
The trigeminocardiac reflex (TCR) is a brainstem reflex known to cause the rapid
onset of increase vagal activity. The onset of vagal activity is displayed by the occurrence
of “cardiac dysrhythmia to asystole, arterial hypotension, apnea, and gastric
hypermotility”. The suggested theoretical explanation for this response is the activated
sensory nerve endings of the TGN signal the sensory nucleus of the TGN through the
Gasserian, or trigeminal, ganglion. This pathway is the afferent pathway of the trigeminal
15
reflex arc. The afferent pathway then extends through the internuncial nerve fibers in the
reticular formation which then synapses on with the motor nucleus, of the vagus nerve,
which starts the efferent pathway of the trigeminal reflex arc (Schaller et al., 2009).
The activation of the TCR is generally known to cause bradycardia. This
bradycardia occurs via stimulation of the TGN’s afferent receptors. These receptors can
be from the main branches of the TGN or even the peripheral branches. Although the
pathway of the nerves of the TCR has been studied extensively there is still no sufficient
evidence to say exactly the pathway of this reflex. Some studies have tried blocking
certain areas of the brain stem but there have been no conclusions made about the
connections of the TGN and the brainstem autonomic system (Schaller et al., 2009).
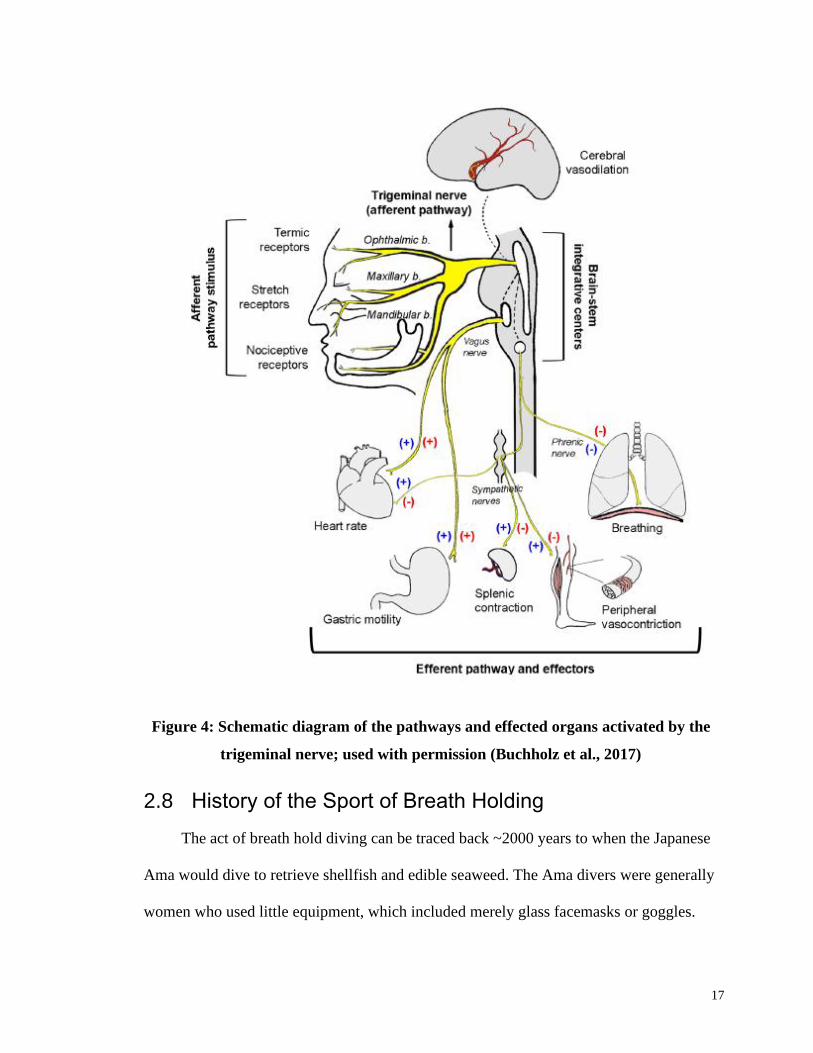
2.7.3 Antagonistic and Synergistic Activation of Vagal and Sympathetic Outflow in Trigeminal Reflexes
Many of the trigeminal reflexes have similar characteristics but ultimately their
outcomes are different. These different outcomes can occur from contrasting sympathetic
and parasympathetic reactions. Specifically, the DR occurs through co-activation, or
synergistic, outflow of both the vagal and sympathetic branches of the ANS. This
activation occurs through stimulation of facial thermoreceptors and apnea. The
competing branches of the ANS allow for simultaneous reduction in heart rate as
controlled by the vagal system and maintenance of peripheral constriction and in turn,
increase in mean arterial pressure (MAP), via sympathetic activation. Also, there is
evidence that shows the DR also causes an increase in splenic contraction (Buchholz et
al., 2017).
16
Two other trigeminal reflexes, nasopharyngeal and oculocardiac, occur from nasal
mucosa irritation and physical arousal of the eye, respectively. Both these reflexes, like
the DR, cause synergistic co-activation of the PNS and SNS (Buchholz et al., 2017).
Conversely, the TCR occurs through stronger vagal activation and sympathetic
inhibition decreases in HR, peripheral resistance, MAP, and an increase in gastric
motility. This activation occurs through apnea and the direct stimulation of the TGN
(Buchholz et al., 2017).
17
Figure 4: Schematic diagram of the pathways and effected organs activated by the
trigeminal nerve; used with permission (Buchholz et al., 2017)
2.8 History of the Sport of Breath Holding
The act of breath hold diving can be traced back ~2000 years to when the Japanese
Ama would dive to retrieve shellfish and edible seaweed. The Ama divers were generally
women who used little equipment, which included merely glass facemasks or goggles.
18
They would perform repeated dives, continuously every day, of up to 80 feet requiring
breath holds of up to two minutes (Hong & Rahn, 1967).
Although historically, breath hold diving has not been a source of competition but
rather a source of income, recently in the past ~30 years apnea competition has become
an organized sport. There are two governing bodies in the competitive sport of apnea
diving, The Association Internationale pour le Développement de l’Apnée (AIDA) and
the World Confederation of Underwater Activities (CMAS).
Competitive apnea diving can be divided into different disciplines based on breath
hold time, distance or depth swam during breath hold. The two main streams of breath
hold type are static, where the individual does not perform exercise during apnea and
simply lies facedown in a body of water and dynamic, where the individual will swim
either to a maximum depth of water or maximum distance of water. No matter the type of
breath hold, the competition relies on the individual’s ability to conserve oxygen during
apnea. The sport also includes spearfishing, underwater hockey and rugby, synchronized
swimming among others (Bain et al., 2018).
2.9 Apnea Overview
2.9.1 Phases of Apnea
During a breath hold the human body undergoes various physiological stresses,
which cause discomfort. During the apnea respiratory signals cause the body to contract
the breathing muscles involuntarily. These contractions are called involuntary breathing
movements (IBM) (Bain et al., 2018).
19
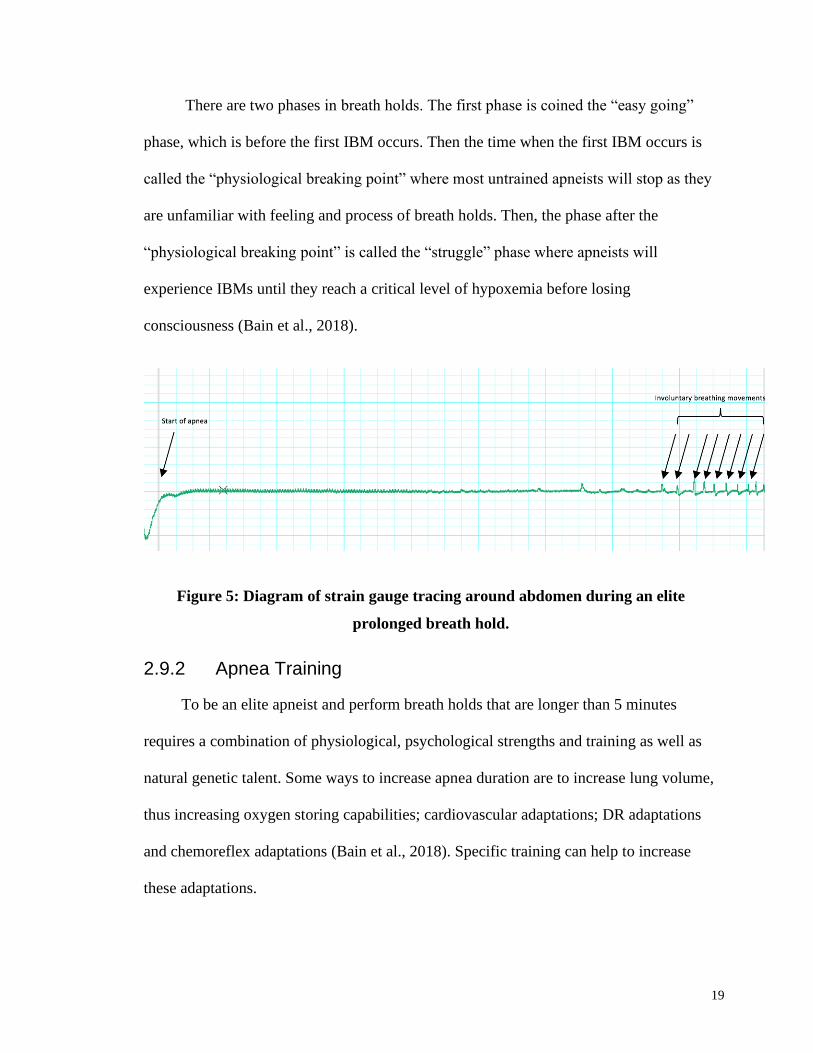
There are two phases in breath holds. The first phase is coined the “easy going”
phase, which is before the first IBM occurs. Then the time when the first IBM occurs is
called the “physiological breaking point” where most untrained apneists will stop as they
are unfamiliar with feeling and process of breath holds. Then, the phase after the
“physiological breaking point” is called the “struggle” phase where apneists will
experience IBMs until they reach a critical level of hypoxemia before losing
consciousness (Bain et al., 2018).
Figure 5: Diagram of strain gauge tracing around abdomen during an elite
prolonged breath hold.
2.9.2 Apnea Training
To be an elite apneist and perform breath holds that are longer than 5 minutes
requires a combination of physiological, psychological strengths and training as well as
natural genetic talent. Some ways to increase apnea duration are to increase lung volume,
thus increasing oxygen storing capabilities; cardiovascular adaptations; DR adaptations
and chemoreflex adaptations (Bain et al., 2018). Specific training can help to increase
these adaptations.
20
2.10 The Effect of Training on the Diving Response
The idea that trained apneists have a greater magnitude of DR is generally
accepted, although there is some speculation whether this difference could be due largely
to an increased duration of apnea. Evidence from Perini and colleagues (2008) shows that
after the first 30 seconds of dry apnea there is a small decrease in HR but those who were
able to sustain apnea for longer than 100 seconds saw an even greater decrease in HR
(Perini et al., 2008). This shows that duration of apnea needs to be taken into
consideration when comparing DR magnitude and changes in HR.
Although there has been some exploration of the effect that apneic training can
have on the magnitude of the DR a true reflection of this relationship has yet to be
determined. The closest any study has come to fully understanding the relationship
between training and DR responses was done by Schagatay and colleagues (2000). After
a two week training program, previously untrained individuals significantly increased the
magnitude of their bradycardia during a simulated DR where apnea duration was also
longer (Erika Schagatay, Van Kampen, Emanuelsson, & Holm, 2000). It remains
uncertain whether the greater bradycardia response is due to an adaptation in the actual
reflex or simply to a longer apnea. Although DR effects emerge after a short training
program of two weeks, the question still arises as to whether there would be an effect of
long-term apnea training on the magnitude of the reflex. Some cross sectional and case
studies have attempted to determine the magnitude of the response in professional and
lifetime diving populations. One such investigation by Schagatay and Andersson (1988)
observed different populations, who are known to participate in breath hold training, and
their heart rate reduction and apnea times. They found that only young divers had a more
21
pronounced DR compared to young controls and older divers and controls (Erika
Schagatay & Andersson, 1998).
Also, one specific population that has been studied in regard to the DR are the
Japanese Ama divers. This specific population of women has been diving for seaweed for
over 1500 years. The demands of these dives require the women to perform 30-120
second dives multiple times per day (Hong & Rahn, 1967). Nonetheless, the divers have
extreme abilities to hold their breath but evidence to support an extreme DR is scarce:
According to Schagatay and Andersson (1988) there is a linear relationship between
duration of maximal apnea and magnitude of bradycardia response.
This leaves the questions of whether apneic training for long periods of an
individual’s life can cause a greater DR.
2.11 Purposes and Hypotheses
The purpose of the current study was to investigate whether there is a training
effect of the DR. This study tested the hypothesis that BHD will have a larger magnitude
of DR than CTL as shown by BHD divers having lower HR and greater TPR and MAP
during the DR.
22
Chapter 3
3 Methods
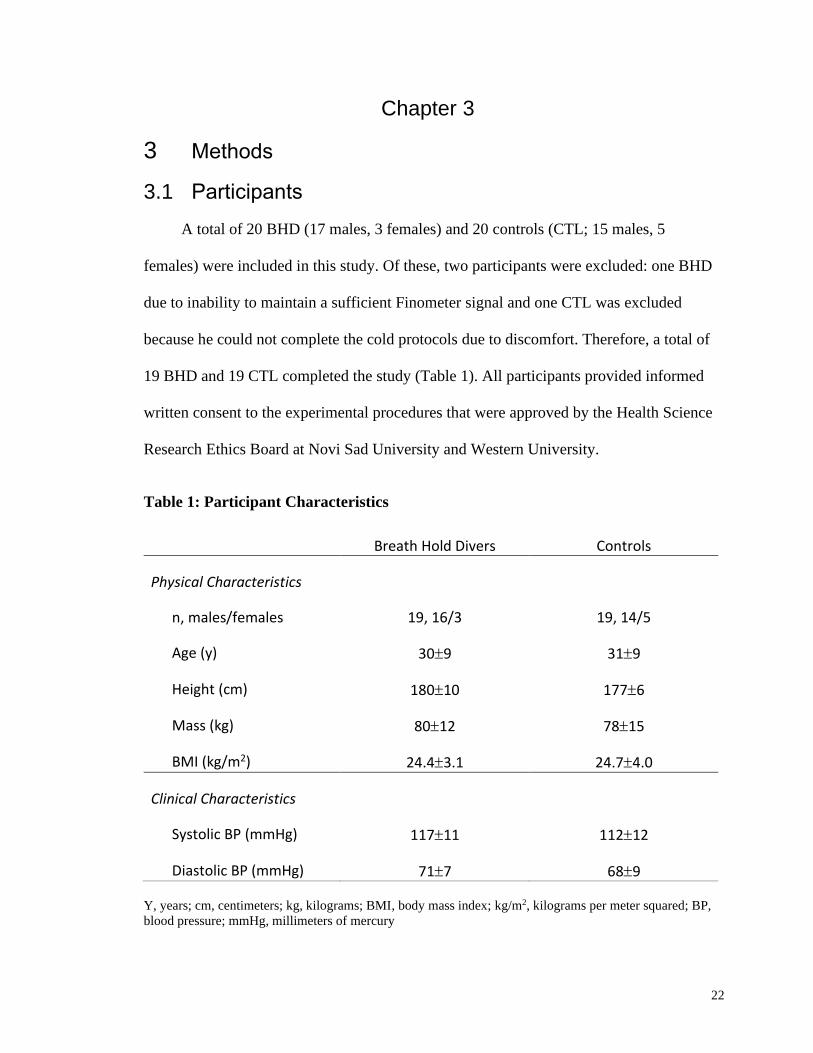
3.1 Participants
A total of 20 BHD (17 males, 3 females) and 20 controls (CTL; 15 males, 5
females) were included in this study. Of these, two participants were excluded: one BHD
due to inability to maintain a sufficient Finometer signal and one CTL was excluded
because he could not complete the cold protocols due to discomfort. Therefore, a total of
19 BHD and 19 CTL completed the study (Table 1). All participants provided informed
written consent to the experimental procedures that were approved by the Health Science
Research Ethics Board at Novi Sad University and Western University.
Table 1: Participant Characteristics
Breath Hold Divers Controls
Physical Characteristics
n, males/females 19, 16/3 19, 14/5
Age (y) 309 319
Height (cm) 18010 1776
Mass (kg) 8012 7815
BMI (kg/m2) 24.43.1 24.74.0
Clinical Characteristics
Systolic BP (mmHg) 11711 11212
Diastolic BP (mmHg) 717 689
Y, years; cm, centimeters; kg, kilograms; BMI, body mass index; kg/m2, kilograms per meter squared; BP,
blood pressure; mmHg, millimeters of mercury
23
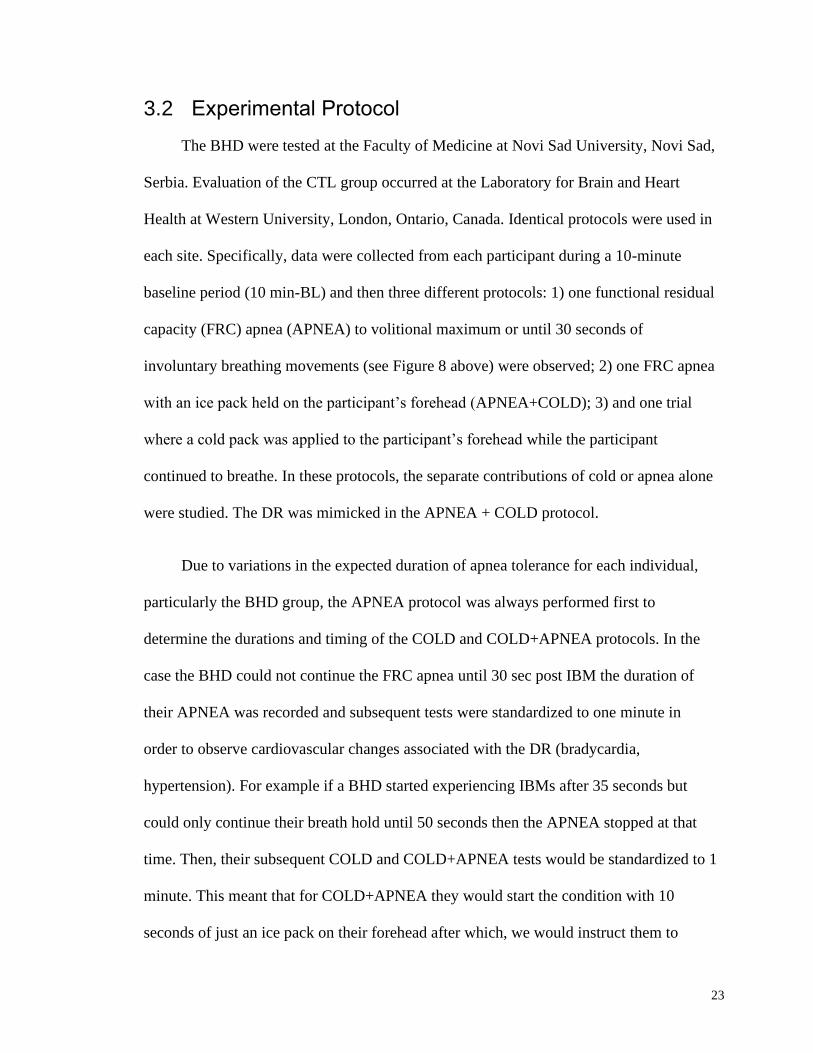
3.2 Experimental Protocol
The BHD were tested at the Faculty of Medicine at Novi Sad University, Novi Sad,
Serbia. Evaluation of the CTL group occurred at the Laboratory for Brain and Heart
Health at Western University, London, Ontario, Canada. Identical protocols were used in
each site. Specifically, data were collected from each participant during a 10-minute
baseline period (10 min-BL) and then three different protocols: 1) one functional residual
capacity (FRC) apnea (APNEA) to volitional maximum or until 30 seconds of
involuntary breathing movements (see Figure 8 above) were observed; 2) one FRC apnea
with an ice pack held on the participant’s forehead (APNEA+COLD); 3) and one trial
where a cold pack was applied to the participant’s forehead while the participant
continued to breathe. In these protocols, the separate contributions of cold or apnea alone
were studied. The DR was mimicked in the APNEA + COLD protocol.
Due to variations in the expected duration of apnea tolerance for each individual,
particularly the BHD group, the APNEA protocol was always performed first to
determine the durations and timing of the COLD and COLD+APNEA protocols. In the
case the BHD could not continue the FRC apnea until 30 sec post IBM the duration of
their APNEA was recorded and subsequent tests were standardized to one minute in
order to observe cardiovascular changes associated with the DR (bradycardia,
hypertension). For example if a BHD started experiencing IBMs after 35 seconds but
could only continue their breath hold until 50 seconds then the APNEA stopped at that
time. Then, their subsequent COLD and COLD+APNEA tests would be standardized to 1
minute. This meant that for COLD+APNEA they would start the condition with 10
seconds of just an ice pack on their forehead after which, we would instruct them to
24
complete their APNEA for 50 seconds. This would total 1 minute of testing for
COLD+APNEA. The order of COLD and COLD+APNEA were randomized.
3.2.1 Protocol 1 – APNEA
Participants were instructed to perform an APNEA by taking a normal tidal
inhalation, normal tidal exhalation, and then at the end of the exhale to start their breath
hold. Participants were instructed to hold their breath until 30 seconds after the first IBM
was observed (BHD) or until their volitional maximum (CTL). The total time of the
APNEA was recorded and then used for subsequent protocols. In the case that IBMs were
not observed, or the participant could not hold their breath for 30 seconds after the first
IBM, the participant was instructed to start breathing when they could no longer perform
the apnea (volitional maximum). Participants then rested until heart rate and blood
pressure returned to resting values before the subsequent trial.
3.2.2 Protocol 1 – COLD
Participants laid still while an ice pack was placed on their forehead. This ice pack
was made of a mixture of ethanol and water mixture to form a slurry that would mold to
the participant’s forehead contours. The ice pack remained on the participant’s forehead
for the duration of the apnea that was determined during the APNEA protocol.
Participants were instructed to lie still and quiet while ice was applied. The COLD
protocol was included as a control to determine the separate effect of COLD on the
trigeminal nerve.
25
3.2.3 Protocol 1 – COLD + APNEA
Participants were instructed to perform an APNEA the same way that was
performed during the normal APNEA protocol. When the participant started the breath
hold the ice pack was placed on the participant’s forehead. The ice pack remained on the
forehead for the duration of the APNEA and they were instructed to hold the apnea for
the same amount of time as the first APNEA protocol.
3.3 Physiological Recordings
Three adhesive electrodes were placed on the participant’s chest (one just below
each collar bone and one just below the left 12th intercostal) to record the
electrocardiogram (lead 2). ECG was sampled at 1000Hz. An automated
sphygmomanometer was used to perform 3 resting blood pressure measurements. Blood
pressure was also measured continuously throughout all protocols using ADInstruments
Human NIBP Nano system at University of Novi Sad, and Finometer at Western
University. A respiratory belt transducer (ADInstruments, MLT1132 Piezo Respiratory
Belt Transducer, Colorado Springs, CO, USA) placed around each participants waist was
used to record breathing movements. All measurements were recorded and stored for
later analysis (PowerLab, ADInstruments, Colorado Springs, CO).
3.4 Physiological Data Analysis
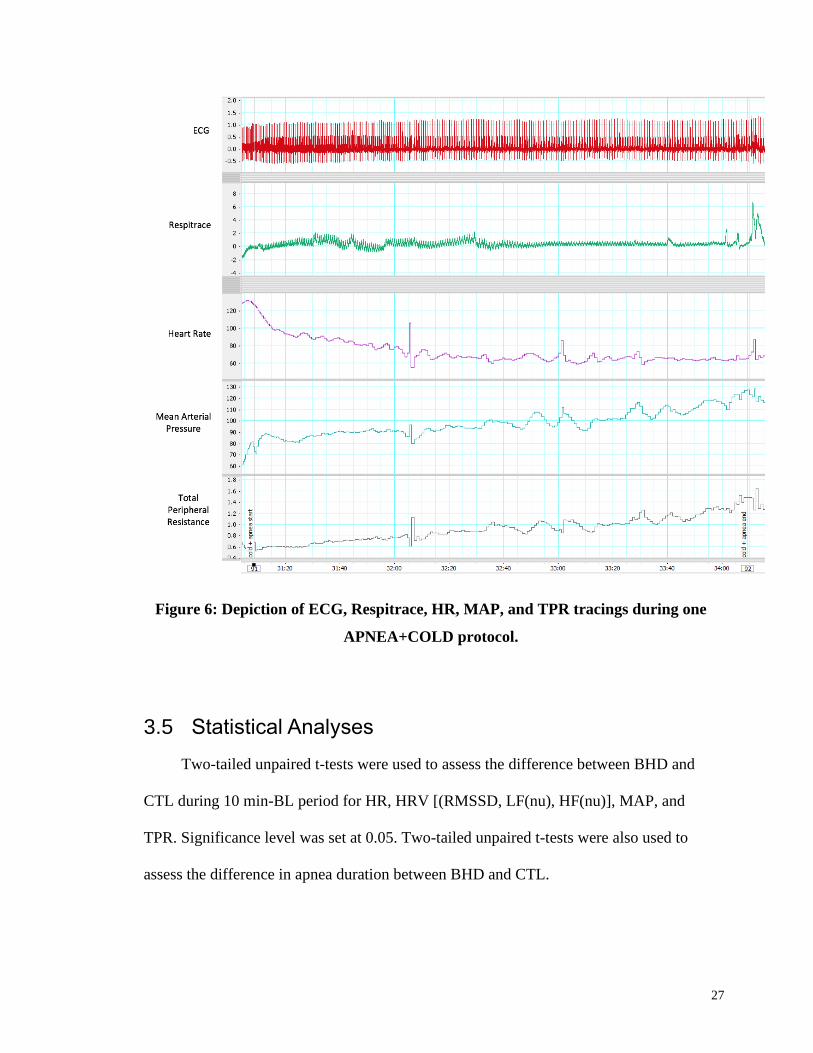
An illustration of data from a representative participant is provided in Figure 9.
Baseline data were averaged over 10 min at the beginning of each subject’s test session.
Subsequently, HR, MAP, and TPR were averaged for 30 seconds of baseline that
occurred prior to each protocol (Baseline), for 10 seconds at the end of each protocol
26
(average during), and 30 seconds after the protocol was complete (recovery). The peak
bradycardia, MAP, and TPR during each protocol were also recorded (peak during).
Heart rate variability (HRV) was used as a measure of vagal influence over heart
rate. The root mean squared standard deviation (RMSSD) approach was used which
provides a reliable approach to reporting short-term data samples (Shaffer & Ginsberg,
2017). Thirty second epochs of RMSSD were recorded for baseline and recovery
measures for each protocol. Twenty second epochs of RMSSD were recorded during the
end of each protocol. The change in HR, RMSSD, MAP and TPR (∆HR, ∆RMSSD,
∆MAP, ∆TPR) values from baseline to the peak response were calculated.
For all participants, HR, MAP, and TPR were averaged for 10 min-BL. Cardiac
output was calculated using the ModelFlow calculation(Sugawara et al., 2003). TPR was
calculated in LabChart using the formula, TPR=MAP/(SVxHR) (Dyson, Shoemaker,
Arbeille, & Hughson, 2010). In addition to the time domain measures of heart rate (bpm),
frequency domain measurements of HRV were also calculated. This approach quantified
spectral power at the low frequency (LF; 0.04-0.15 Hz), high frequency (HF; 0.15-0.40
Hz) and the LF/HF ratio using a Fast Fourier analysis model within ADInstruments post-
processing programs (Shaffer & Ginsberg, 2017).
27
Figure 6: Depiction of ECG, Respitrace, HR, MAP, and TPR tracings during one
APNEA+COLD protocol.
3.5 Statistical Analyses
Two-tailed unpaired t-tests were used to assess the difference between BHD and
CTL during 10 min-BL period for HR, HRV [(RMSSD, LF(nu), HF(nu)], MAP, and
TPR. Significance level was set at 0.05. Two-tailed unpaired t-tests were also used to
assess the difference in apnea duration between BHD and CTL.
28
A two-way mixed analysis of variance (ANOVA) was used to determine two-way
interactions for HR, RMSSD, MAP, and TPR between all three conditions (COLD,
COLD+APNEA, and APNEA). When there was a significant one tailed group*condition
interaction (p<0.1) separate one-way ANOVA’s were run to determine if there were any
simple main effects present.
A three-way mixed model ANOVA was used to determine if there was a
condition*time*group interaction for HR for all three conditions (COLD+APNEA,
COLD, and APNEA) and all three time periods (baseline, during, and recovery). The
directional hypothesis justified the significance level to be set at p<0.1.
29
Chapter 4
4 Results
4.1 Physiological Results
4.1.1 Baseline Results
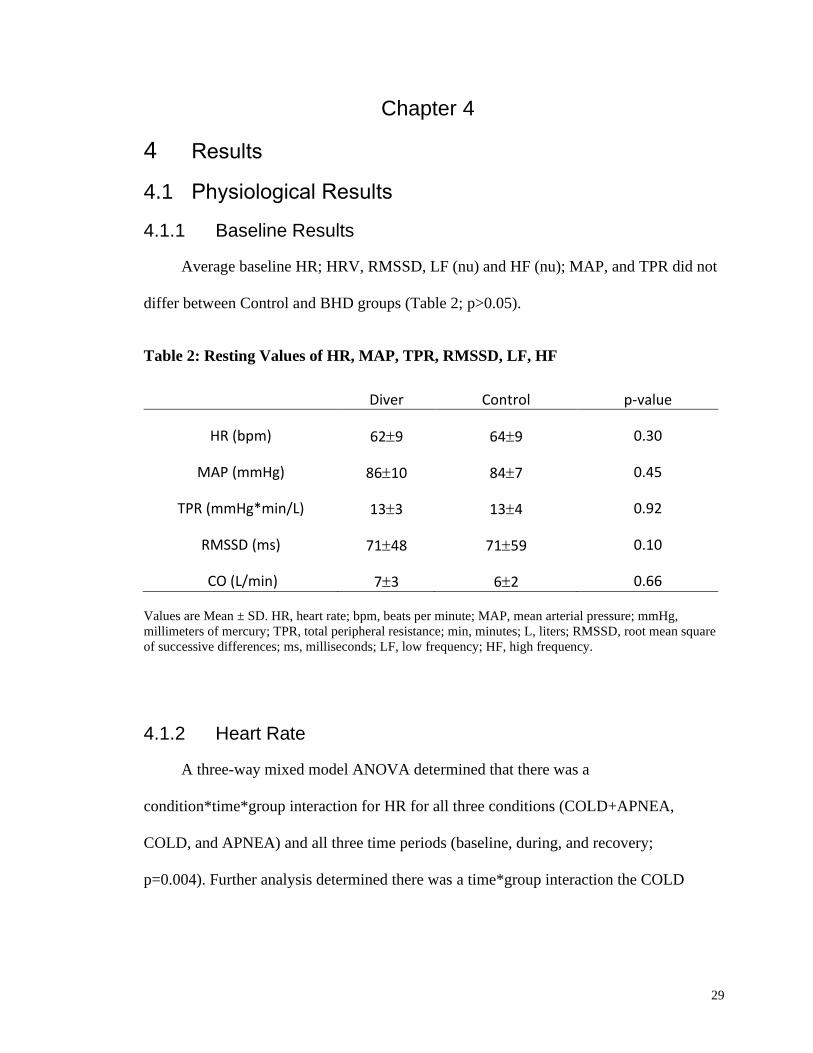
Average baseline HR; HRV, RMSSD, LF (nu) and HF (nu); MAP, and TPR did not
differ between Control and BHD groups (Table 2; p>0.05).
Table 2: Resting Values of HR, MAP, TPR, RMSSD, LF, HF
Diver Control p-value
HR (bpm) 629 649 0.30
MAP (mmHg) 8610 847 0.45
TPR (mmHg*min/L) 133 134 0.92
RMSSD (ms) 7148 7159 0.10
CO (L/min) 73 62 0.66
Values are Mean ± SD. HR, heart rate; bpm, beats per minute; MAP, mean arterial pressure; mmHg,
millimeters of mercury; TPR, total peripheral resistance; min, minutes; L, liters; RMSSD, root mean square
of successive differences; ms, milliseconds; LF, low frequency; HF, high frequency.
4.1.2 Heart Rate
A three-way mixed model ANOVA determined that there was a
condition*time*group interaction for HR for all three conditions (COLD+APNEA,
COLD, and APNEA) and all three time periods (baseline, during, and recovery;
p=0.004). Further analysis determined there was a time*group interaction the COLD
30
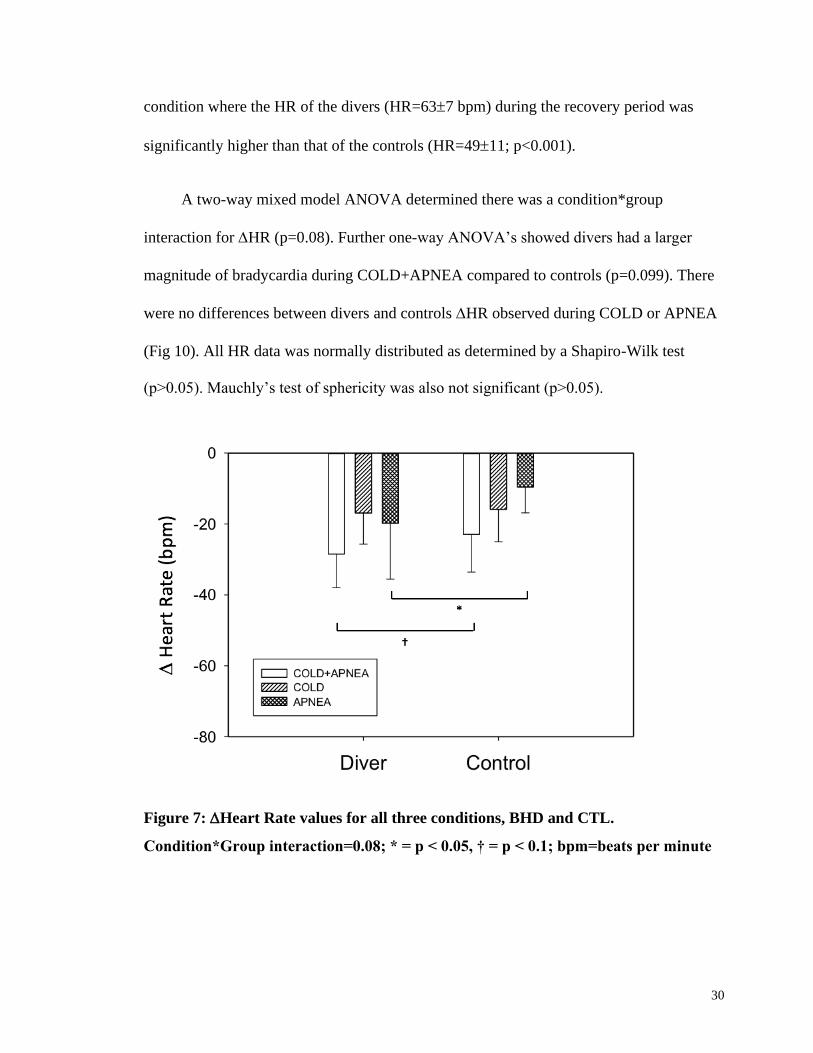
condition where the HR of the divers (HR=637 bpm) during the recovery period was
significantly higher than that of the controls (HR=4911; p<0.001).
A two-way mixed model ANOVA determined there was a condition*group
interaction for HR (p=0.08). Further one-way ANOVA’s showed divers had a larger
magnitude of bradycardia during COLD+APNEA compared to controls (p=0.099). There
were no differences between divers and controls HR observed during COLD or APNEA
(Fig 10). All HR data was normally distributed as determined by a Shapiro-Wilk test
(p>0.05). Mauchly’s test of sphericity was also not significant (p>0.05).
Figure 7: Heart Rate values for all three conditions, BHD and CTL.
Condition*Group interaction=0.08; * = p < 0.05, † = p < 0.1; bpm=beats per minute

31
4.1.3 Heart Rate Variability
A three-way mixed model ANOVA determined there was no condition*time*group
interaction for RMSSD for all three conditions (COLD+APNEA, COLD, and APNEA)
and all three time periods (baseline, during, and recovery; p>0.1).
A two-way mixed model ANOVA determined there was no condition*group
interaction found for RMSSD for all three conditions (p>0.1; Fig 11).
Figure 8: Root mean square of successive differences values for all three
conditions, BHD and CTL. Condition*Group interaction= 0.71; ms=milliseconds
4.1.4 Mean Arterial Pressure (MAP)
A three-way mixed model ANOVA determined there was a condition*time*group
interaction for MAP for all three conditions (COLD+APNEA, COLD, and APNEA) and
all three time periods (baseline, during, and recovery; p<0.001). Further analysis showed
32
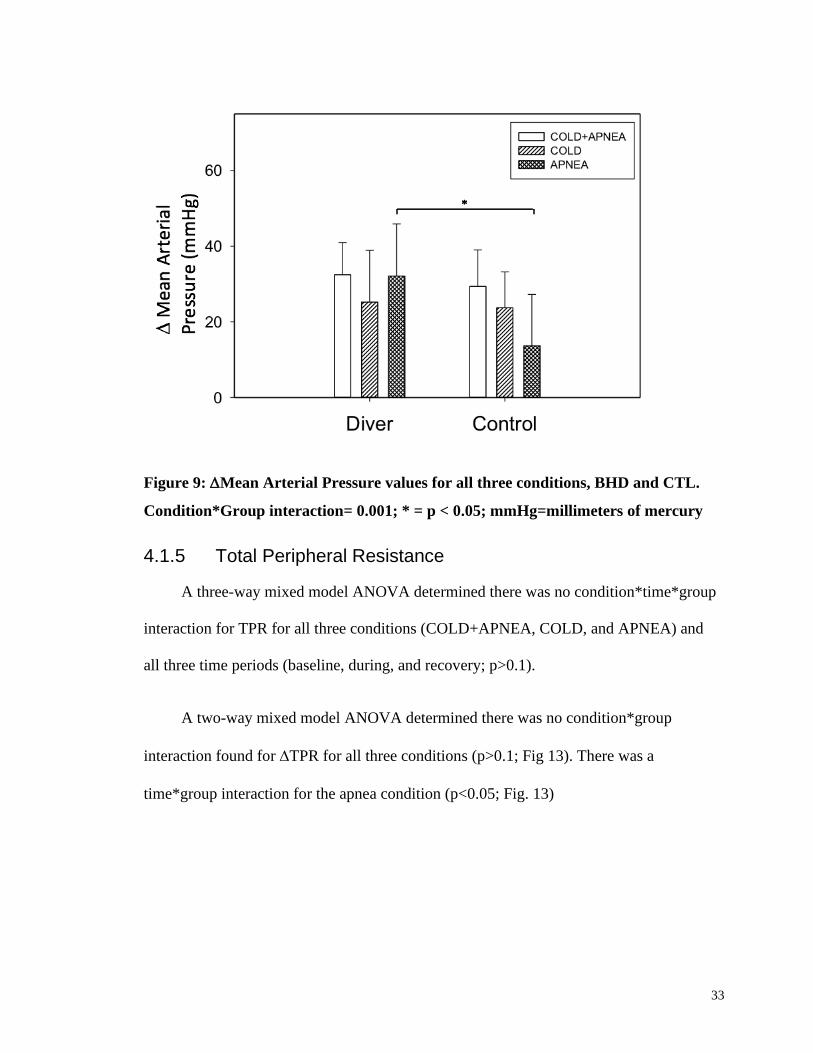
a time*group interaction during the APNEA condition where divers had a higher MAP
during (12219 mmHg) than controls (10619 mmHg; p<0.001).
A two-way mixed model ANOVA determined there was a condition*group
interaction found for ∆MAP for all three conditions (p=0.001). Further one-way
ANOVAs showed divers had a larger magnitude of MAP during APNEA compared to
controls (p<0.001). There were no differences between divers and controls MAP
observed during COLD+APNEA or COLD (Fig 12). All MAP data was normally
distributed as determined by a Shapiro-Wilk test (p>0.05). Mauchly’s test of sphericity
was also not significant for all conditions (p>0.05) except for time (p<0.000). This is
acceptable due to the fact that ANOVA’s are robust and are not significantly affected by
data that violated the sphericity assumption (Kirk, 2005).
33
Figure 9: Mean Arterial Pressure values for all three conditions, BHD and CTL.
Condition*Group interaction= 0.001; * = p < 0.05; mmHg=millimeters of mercury
4.1.5 Total Peripheral Resistance
A three-way mixed model ANOVA determined there was no condition*time*group
interaction for TPR for all three conditions (COLD+APNEA, COLD, and APNEA) and
all three time periods (baseline, during, and recovery; p>0.1).
A two-way mixed model ANOVA determined there was no condition*group
interaction found for TPR for all three conditions (p>0.1; Fig 13). There was a
time*group interaction for the apnea condition (p<0.05; Fig. 13)
34
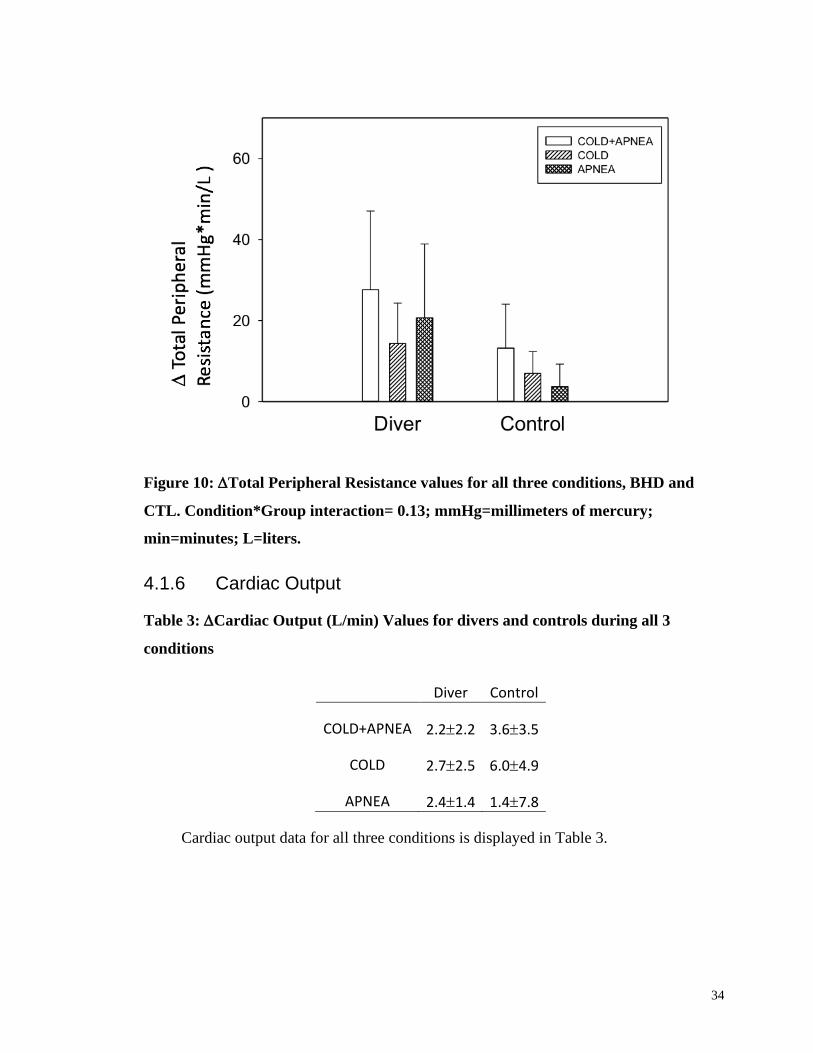
Figure 10: Total Peripheral Resistance values for all three conditions, BHD and
CTL. Condition*Group interaction= 0.13; mmHg=millimeters of mercury;
min=minutes; L=liters.
4.1.6 Cardiac Output
Table 3: Cardiac Output (L/min) Values for divers and controls during all 3
conditions
Diver Control
COLD+APNEA 2.22.2 3.63.5
COLD 2.72.5 6.04.9
APNEA 2.41.4 1.47.8
Cardiac output data for all three conditions is displayed in Table 3.
35
4.1.7 Duration of Apnea
A one-tailed, paired t-test showed BHD (80 ± 43 seconds) had longer duration
apneas compared to CTL (30 ± 10 seconds; p<0.001).
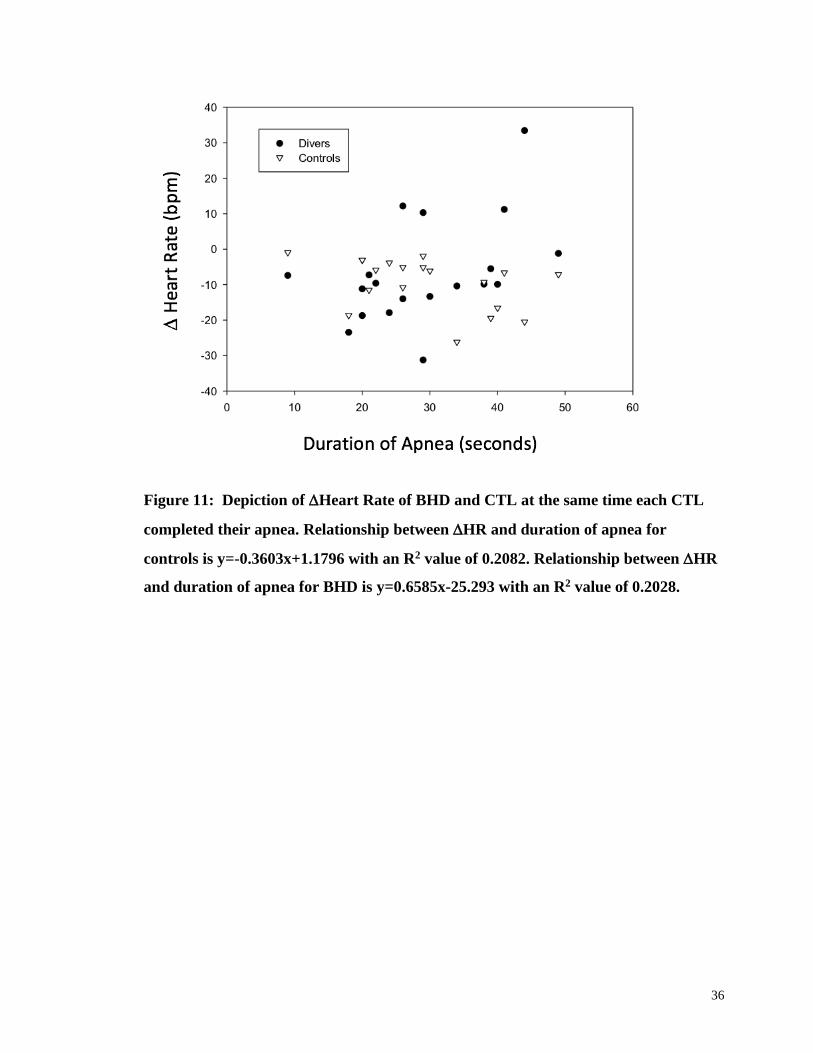
4.1.8 Heart Rate at Apnea Duration Match
It is possible that any differences between BHD and CTL groups was due simply to
the fact that BHD can hold their breath longer than CTL. To adjust for variations in the
ability in apnea duration between BHD and CTL each BHD and CTL were matched
based on duration of apnea performed by the CTL. Specifically, in matched pairs the HR
at the end of an apnea performed by a CTL participant provided the time at which the HR
was also derived from the BHD’s performance. A scatterplot of the HR data of BHD
and CTL at the matched CTL’s break point time are plotted in (Fig. 14).
36
Figure 11: Depiction of Heart Rate of BHD and CTL at the same time each CTL
completed their apnea. Relationship between HR and duration of apnea for
controls is y=-0.3603x+1.1796 with an R2 value of 0.2082. Relationship between HR
and duration of apnea for BHD is y=0.6585x-25.293 with an R2 value of 0.2028.
37
Chapter 5
5 Discussion
This study demonstrated four important findings. First, divers had a larger
magnitude of bradycardia during COLD+APNEA compared to controls. Second, divers
had higher heart rate on average during the recovery portion of the COLD condition.
Third, divers had a higher MAP during the APNEA+COLD protocol than controls. Last,
divers had a larger MAP during APNEA than the controls. These data suggest that
divers have developed some adaptations through apneic training that untrained naïve
individuals would not possess. However, when BHD were studied at the same duration
of apnea as the CTLs, the differences between groups was no longer present. Thus, apnea
duration appears to determine the magnitude of bradycardia rather than adaptations from
training. The first major observation above supports the hypothesis that divers have a
larger magnitude of DR.
5.1 Heart Rate
Some results from the current study are not in accordance with those of Schagatay
and Andersson (1998) where the experienced breath holders had a greater reduction in
HR during the simulated DR compared to untrained controls. In contrast to Schagatay
and Andersson (1998) our results did not show a difference between BHD and CTL
during a simulated DR, but rather showed that BHD had higher HR during recovery of
COLD. This suggests that BHD have developed the ability to recover faster after a
COLD stimulus. Although this COLD stimulus was used as a control to separate the
competing portions of the DR some unique results were observed. After multiple
38
literature searches we determined that there is no similar research investigating the HR
responses during the recovery period of a DR.
One possible adaptation that the BHD could have developed is the augmented
activity of the enzyme acetylcholine (ACh) esterase. The activity of this enzyme is the
main mechanism for removing ACh, which is a neurotransmitter released during vagal
activity. Thus, by having augmented ability of ACh esterase or a greater number of these
enzymes would allow divers to recover faster from vagal activity during the COLD
protocol. More investigation is necessary to determine the how this mechanism differs
between the full simulated DR and just the COLD stimulation (Gorini, Philbin, Bateman,
& Mendelowitz, 2010).
Another possible adaptation that the BHD could have developed is modified brain
stem trigeminally evoked neurotransmission to cardiac vagal neurons. It is possible that
the inhibition of the vagal efferent pathway could be faster in the divers (Michael
Panneton, 2013).
One uncertainty with the current observations that BHD exhibit a greater
bradycardia is the relationship between duration of a breath hold and the ensuing
reduction in heart rate. Specifically, our results indicated that BHD had a significantly
longer breath hold than CTL, a finding that is in accordance with Schagatay and
Andersson (1998). Further, the magnitude of the DR can be affected by the length of the
apnea. Perini et al., (2008) found three phases of cardiovascular changes occur during an
apnea based on the duration. The first phase usually lasts approximately 30 seconds
during which HR is reduced. In phase 2 HR remained unchanged for approximately 150
39
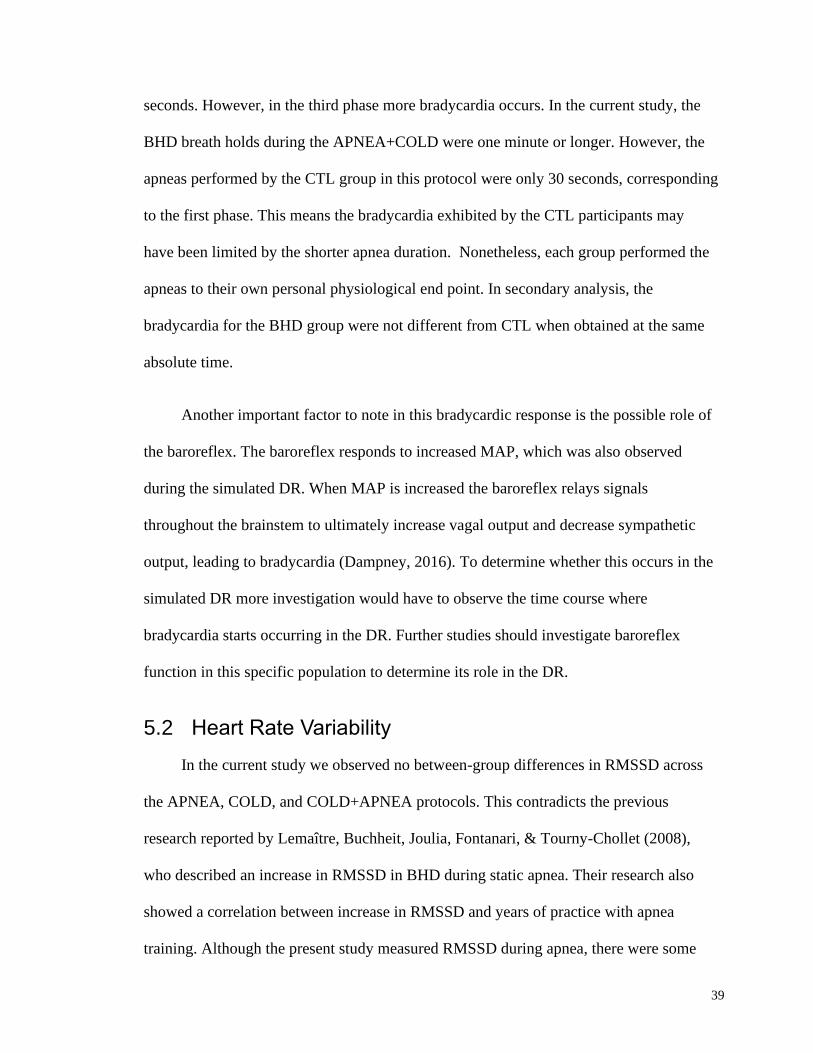
seconds. However, in the third phase more bradycardia occurs. In the current study, the
BHD breath holds during the APNEA+COLD were one minute or longer. However, the
apneas performed by the CTL group in this protocol were only 30 seconds, corresponding
to the first phase. This means the bradycardia exhibited by the CTL participants may
have been limited by the shorter apnea duration. Nonetheless, each group performed the
apneas to their own personal physiological end point. In secondary analysis, the
bradycardia for the BHD group were not different from CTL when obtained at the same
absolute time.
Another important factor to note in this bradycardic response is the possible role of
the baroreflex. The baroreflex responds to increased MAP, which was also observed
during the simulated DR. When MAP is increased the baroreflex relays signals
throughout the brainstem to ultimately increase vagal output and decrease sympathetic
output, leading to bradycardia (Dampney, 2016). To determine whether this occurs in the
simulated DR more investigation would have to observe the time course where
bradycardia starts occurring in the DR. Further studies should investigate baroreflex
function in this specific population to determine its role in the DR.
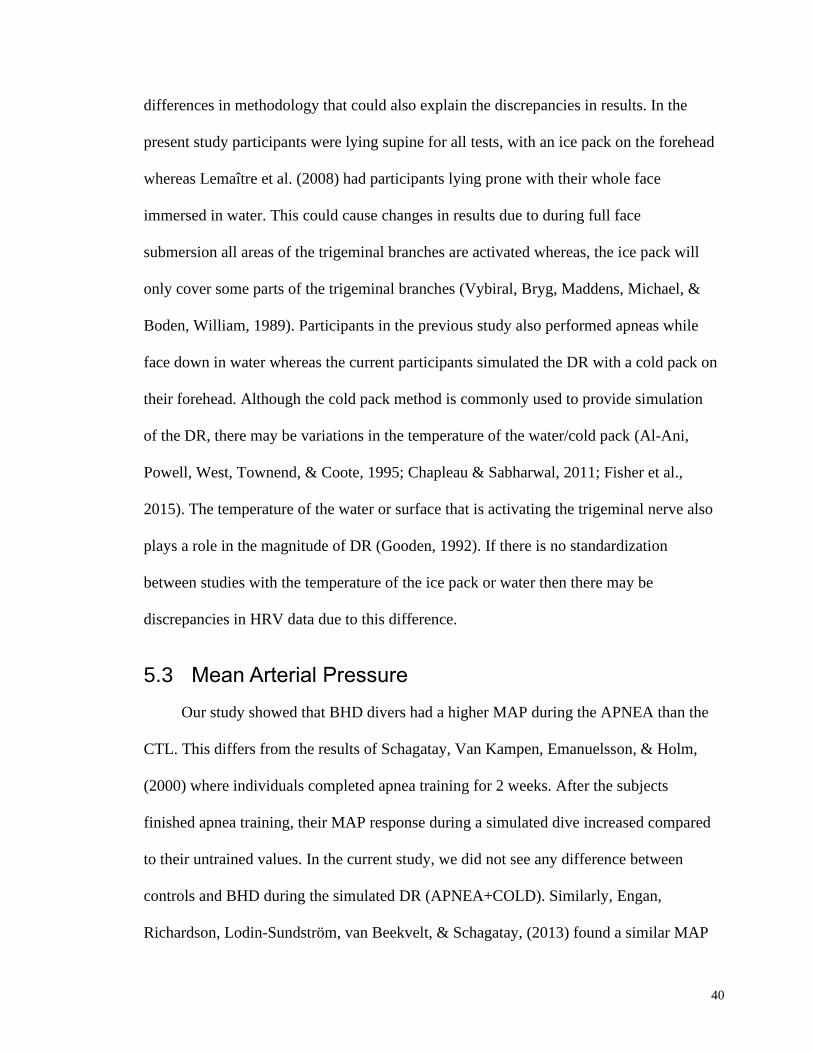
5.2 Heart Rate Variability
In the current study we observed no between-group differences in RMSSD across
the APNEA, COLD, and COLD+APNEA protocols. This contradicts the previous
research reported by Lemaître, Buchheit, Joulia, Fontanari, & Tourny-Chollet (2008),
who described an increase in RMSSD in BHD during static apnea. Their research also
showed a correlation between increase in RMSSD and years of practice with apnea
training. Although the present study measured RMSSD during apnea, there were some
40
differences in methodology that could also explain the discrepancies in results. In the
present study participants were lying supine for all tests, with an ice pack on the forehead
whereas Lemaître et al. (2008) had participants lying prone with their whole face
immersed in water. This could cause changes in results due to during full face
submersion all areas of the trigeminal branches are activated whereas, the ice pack will
only cover some parts of the trigeminal branches (Vybiral, Bryg, Maddens, Michael, &
Boden, William, 1989). Participants in the previous study also performed apneas while
face down in water whereas the current participants simulated the DR with a cold pack on
their forehead. Although the cold pack method is commonly used to provide simulation
of the DR, there may be variations in the temperature of the water/cold pack (Al-Ani,
Powell, West, Townend, & Coote, 1995; Chapleau & Sabharwal, 2011; Fisher et al.,
2015). The temperature of the water or surface that is activating the trigeminal nerve also
plays a role in the magnitude of DR (Gooden, 1992). If there is no standardization
between studies with the temperature of the ice pack or water then there may be
discrepancies in HRV data due to this difference.
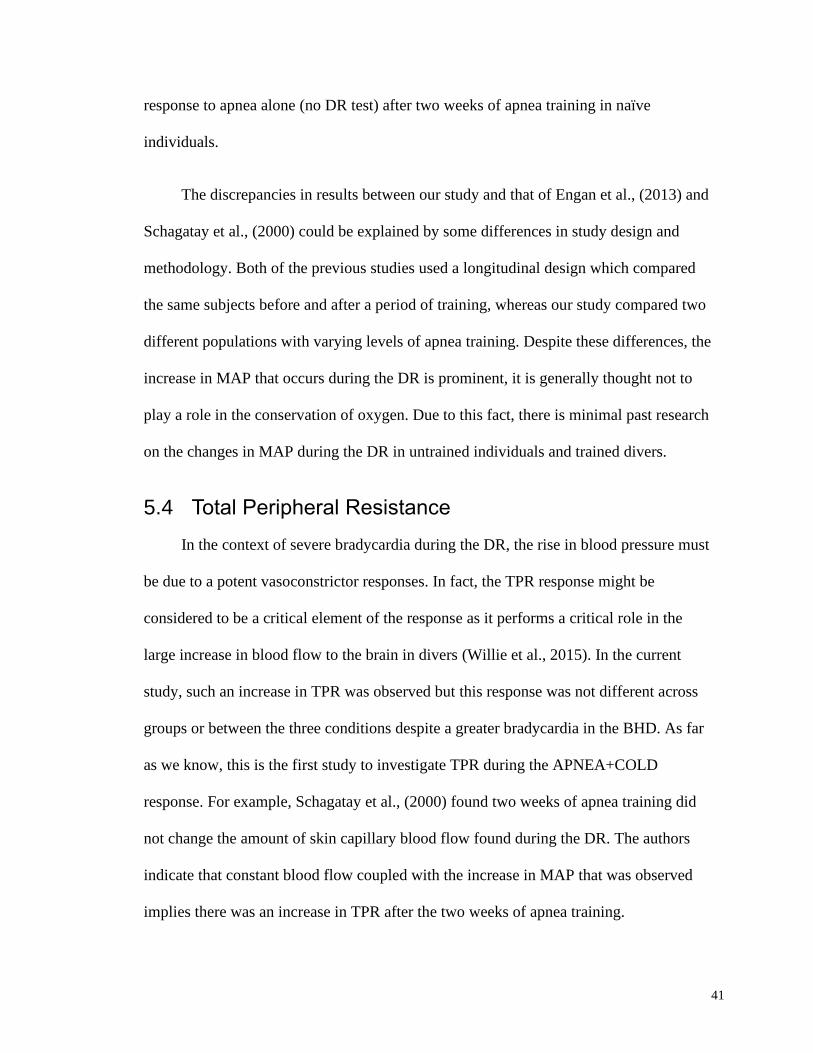
5.3 Mean Arterial Pressure
Our study showed that BHD divers had a higher MAP during the APNEA than the
CTL. This differs from the results of Schagatay, Van Kampen, Emanuelsson, & Holm,
(2000) where individuals completed apnea training for 2 weeks. After the subjects
finished apnea training, their MAP response during a simulated dive increased compared
to their untrained values. In the current study, we did not see any difference between
controls and BHD during the simulated DR (APNEA+COLD). Similarly, Engan,
Richardson, Lodin-Sundström, van Beekvelt, & Schagatay, (2013) found a similar MAP
41
response to apnea alone (no DR test) after two weeks of apnea training in naïve
individuals.
The discrepancies in results between our study and that of Engan et al., (2013) and
Schagatay et al., (2000) could be explained by some differences in study design and
methodology. Both of the previous studies used a longitudinal design which compared
the same subjects before and after a period of training, whereas our study compared two
different populations with varying levels of apnea training. Despite these differences, the
increase in MAP that occurs during the DR is prominent, it is generally thought not to
play a role in the conservation of oxygen. Due to this fact, there is minimal past research
on the changes in MAP during the DR in untrained individuals and trained divers.
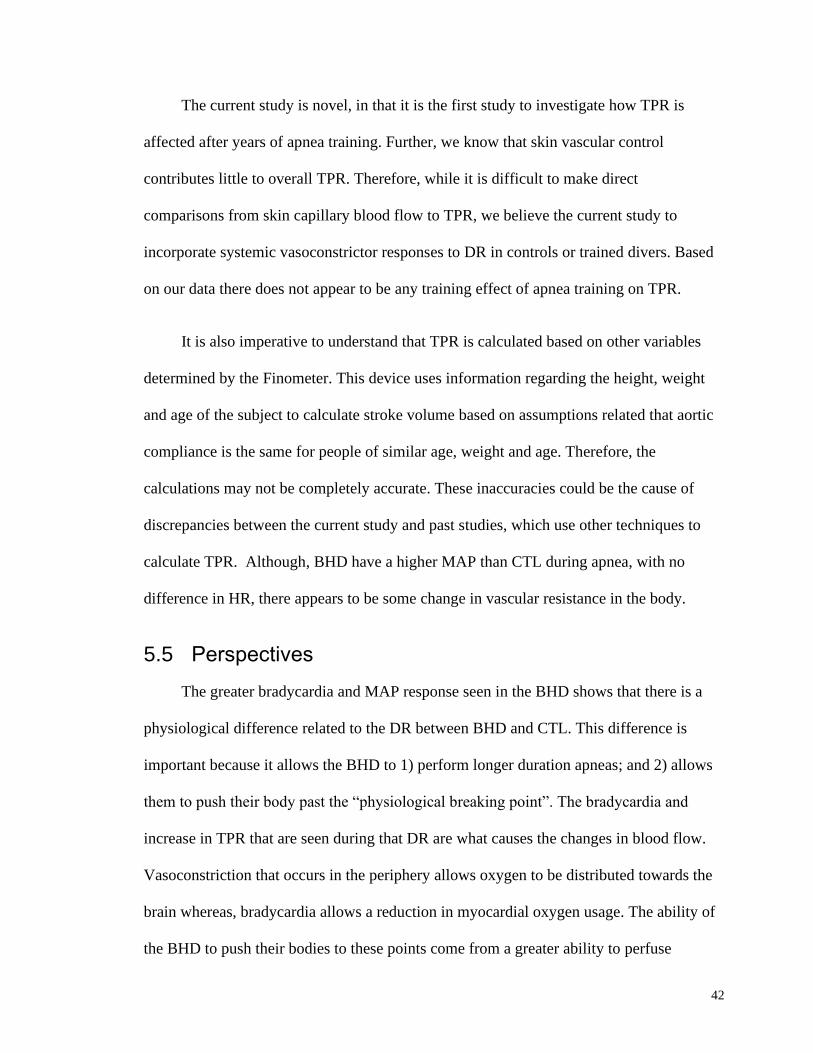
5.4 Total Peripheral Resistance
In the context of severe bradycardia during the DR, the rise in blood pressure must
be due to a potent vasoconstrictor responses. In fact, the TPR response might be
considered to be a critical element of the response as it performs a critical role in the
large increase in blood flow to the brain in divers (Willie et al., 2015). In the current
study, such an increase in TPR was observed but this response was not different across
groups or between the three conditions despite a greater bradycardia in the BHD. As far
as we know, this is the first study to investigate TPR during the APNEA+COLD
response. For example, Schagatay et al., (2000) found two weeks of apnea training did
not change the amount of skin capillary blood flow found during the DR. The authors
indicate that constant blood flow coupled with the increase in MAP that was observed
implies there was an increase in TPR after the two weeks of apnea training.
42
The current study is novel, in that it is the first study to investigate how TPR is
affected after years of apnea training. Further, we know that skin vascular control
contributes little to overall TPR. Therefore, while it is difficult to make direct
comparisons from skin capillary blood flow to TPR, we believe the current study to
incorporate systemic vasoconstrictor responses to DR in controls or trained divers. Based
on our data there does not appear to be any training effect of apnea training on TPR.
It is also imperative to understand that TPR is calculated based on other variables
determined by the Finometer. This device uses information regarding the height, weight
and age of the subject to calculate stroke volume based on assumptions related that aortic
compliance is the same for people of similar age, weight and age. Therefore, the
calculations may not be completely accurate. These inaccuracies could be the cause of
discrepancies between the current study and past studies, which use other techniques to
calculate TPR. Although, BHD have a higher MAP than CTL during apnea, with no
difference in HR, there appears to be some change in vascular resistance in the body.
5.5 Perspectives
The greater bradycardia and MAP response seen in the BHD shows that there is a
physiological difference related to the DR between BHD and CTL. This difference is
important because it allows the BHD to 1) perform longer duration apneas; and 2) allows
them to push their body past the “physiological breaking point”. The bradycardia and
increase in TPR that are seen during that DR are what causes the changes in blood flow.
Vasoconstriction that occurs in the periphery allows oxygen to be distributed towards the
brain whereas, bradycardia allows a reduction in myocardial oxygen usage. The ability of
the BHD to push their bodies to these points come from a greater ability to perfuse

43
oxygen away from organs such as, skin, skeletal muscle, spleen, heart and lungs (Bain et
al., 2018) allowing increased blood flow towards the brain.
5.6 Assumptions and Limitations
There were a few limitations in this study. To truly understand the trainability of
the DR we would need to have a different study design that was longitudinal, instead of
the current cross-sectional design. This would allow us to observe the same participants
as they completed apnea training over a number of years, and we could see how this
affected their cardiovascular variables. Another limitation was the differences in ability
of BHD compared to CTL in duration of apnea as well as the ability of the BHD to
complete the apnea past the “physiological breaking point”. This can cause differences in
the results because the bradycardia and MAP outcomes will be greater with longer apnea
(Perini et al., 2008). To try to combat this discrepancy, comparisons were made of the
BHD’s cardiovascular variables at the same time points as CTL’s were completing their
apneas. This allowed us to investigate whether duration did have an effect on their
results.
Another limitation of this study was some of the BHD had not completed apnea
training for a number of years. It is possible that due to their lack of recent training, their
bodies no longer had the adaptations from the intense training they used to participate in.
This could cause their cardiovascular changes to not have the same magnitude as they did
when they were training.
One assumption of the current study is the calculations of certain values, such as
cardiac output and with it, TPR, from the Finometer. An assumption of cardiac output is
44
based on the height, weight and age of the individual (Bogert & Van Lieshout, 2005).
With this assumption we were able to estimate continuous MAP, SBP, DBP and TPR.
Although this calculation has been validated for young healthy population it has not been
directly validated for this specific population of divers and those performing apneas.
Although this is a different population of individuals performing unique maneuvers there
does not appear to be a large discrepancy in the TPR calculations.
5.7 Conclusions
This study investigated the trainability of the DR by measuring HR, HRV, MAP
and TPR in BHD and naïve untrained age-matched CTL. It demonstrated that there might
be a training effect from apnea training on the DR but only for some portions of the DR.
For example, when just COLD was applied to subject’s foreheads, BHD were able to
recover faster after the stimulus compared to CTL. Also, during APNEA, BHD had
higher MAP than CTL. This could partially be due to the longer duration of the APNEA
that the BHD were able to complete compared to the CTL. Also, it could be due to apnea
training causing a more pronounced DR and in turn, greater peripheral constriction as
indicated by the TPR response. As few studies have explored the DR in elite breath hold
divers, the current data need to be replicated. Nonetheless, although cross-sectional in
design, the current observations support the overall hypothesis that BHD improves the
DR with greater bradycardia and TPR. In the absence of previous studies in the area of
DR trainability, additional data to replicate the current study and, more importantly, a
prospective BHD training study is required to study directly the trainability of this reflex.
Future research should focus on more studies to determine if this reflex, specifically the
magnitude of bradycardia, can be increased through apnea or some other kind of training.
45
This would allow professional diving athletes to maximize their training ability and to
train in more efficient manners.
References
Acharya, U. R., Joseph, K. P., Kannathal, N., Lim, C. M., & Suri, J. S. (2006). Heart rate
variability: A review. Medical and Biological Engineering and Computing, 44(12),
46
1031–1051. https://doi.org/10.1007/s11517-006-0119-0
Al-Ani, M., Powell, L., West, J., Townend, J., & Coote, J. H. (1995). Exercise and
diving, two conflicting stimuli influencing cardiac vagal tone in man. The Journal of
Physiology, 489(2), 603–612. https://doi.org/10.1113/jphysiol.1995.sp021076
Bain, A. R., Drvis, I., Dujic, Z., MacLeod, D. B., & Ainslie, P. N. (2018). Physiology of
static breath holding in elite apneists. Experimental Physiology, 103(5), 635–651.
https://doi.org/10.1113/EP086269
Bathla, G., & Hegde, A. N. (2013). The trigeminal nerve: An illustrated review of its
imaging anatomy and pathology. Clinical Radiology, 68(2), 203–213.
https://doi.org/10.1016/j.crad.2012.05.019
Bogert, L. W. J., & Van Lieshout, J. J. (2005). Non-invasive pulsatile arterial pressure
and stroke volume changes from the human finger. Experimental Physiology, 90(4),
437–446. https://doi.org/10.1113/expphysiol.2005.030262
Buchholz, B., Kelly, J., Bernatene, E. A., Diodati, N. M., & Gelpi, R. J. (2017).
Antagonistic and synergistic activation of cardiovascular vagal and sympathetic
motor outflows in trigeminal reflexes. Frontiers in Neurology, 8(FEB), 1–6.
https://doi.org/10.3389/fneur.2017.00052
Chapleau, M. W., & Sabharwal, R. (2011). Methods of assessing vagus nerve activity and
reflexes. Heart Failure Reviews, 16(2), 109–127. https://doi.org/10.1007/s10741-
010-9174-6
Dampney, R. A. L. (2016). Central neural control of the cardiovascular system: current
perspectives. Advances in Physiology Education, 40(3), 283–296.
https://doi.org/10.1152/advan.00027.2016
Dyson, K. S., Shoemaker, J. K., Arbeille, P., & Hughson, R. L. (2010). Modelflow
estimates of cardiac output compared with Doppler ultrasound during acute changes
in vascular resistance in women. Experimental Physiology, 95(4), 561–568.
https://doi.org/10.1113/expphysiol.2009.050815
47
Engan, H., Richardson, M. X., Lodin-Sundström, A., van Beekvelt, M., & Schagatay, E.
(2013). Effects of two weeks of daily apnea training on diving response, spleen
contraction, and erythropoiesis in novel subjects. Scandinavian Journal of Medicine
and Science in Sports, 23(3), 340–348. https://doi.org/10.1111/j.1600-
0838.2011.01391.x
Fisher, J. P., Fernandes, I. A., Barbosa, T. C., Prodel, E., Coote, J. H., Nóbrega, A. C. L.,
& Vianna, L. C. (2015). Diving and exercise: The interaction of trigeminal receptors
and muscle metaboreceptors on muscle sympathetic nerve activity in humans.
American Journal of Physiology-Heart and Circulatory Physiology, 308(5), H367–
H375. https://doi.org/10.1152/ajpheart.00728.2014
Foster, G. E., & Sheel, A. W. (2005). The human diving response, its function, and its
control. Scandinavian Journal of Medicine and Science in Sports, 15(1), 3–12.
https://doi.org/10.1111/j.1600-0838.2005.00440.x
Gooden, B. A. (1992). Why some people do not drown. The Medical Journal of
Australia, 84(9), 629–532.
Gorini, C., Philbin, K., Bateman, R., & Mendelowitz, D. (2010). Endogenous inhibition
of the trigeminally evoked neurotransmission to cardiac vagal neurons by
muscarinic acetylcholine receptors. Journal of Neurophysiology, 104(4), 1841–
1848. https://doi.org/10.1152/jn.00442.2010
Hong, S. K., & Rahn, H. (1967). The diving women of Korea and Japan. Scientific
American, 216(5), 34–43. https://doi.org/10.1038/scientificamerican0567-34
Hunyor, A. P. (1994). Reflexes and the eye. Australian and New Zealand Journal of
Ophthalmology, 22(3), 155–159. https://doi.org/10.1111/j.1442-
9071.1994.tb01710.x
Hurwitz, B. E., & Furedy, J. F. (1986). The Human Dive Reflex : An Experimental ,
Topographical and Physiological Analysis I. Physiology and Behavior, 36, 287–294.
Jose, A. D., & Collison, D. (1970). The normal range and determinants of the intrinsic
48
heart rate in man. Cardiovascular Research, 4(2), 160–167.
https://doi.org/10.1093/cvr/4.2.160
Kirk, R. E. (2005). Analysis of Variance: Classification. Encyclopedia of Statistics in
Behavioural Science.
Lemaître, F., Buchheit, M., Joulia, F., Fontanari, P., & Tourny-Chollet, C. (2008). Static
apnea effect on heart rate and its variability in elite breath-hold divers. Aviation
Space and Environmental Medicine, 79(2), 99–104.
https://doi.org/10.3357/ASEM.2142.2008
McCraty, R., & Shaffer, F. (2015). Heart rate variability: New perspectives on
physiological mechanisms, assessment of self-regulatory capacity, and health risk.
Global Advances In Health and Medicine, 4(1), 46–61.
https://doi.org/10.7453/gahmj.2014.073
Michael Panneton, W. (2013). The Mammalian Diving Response: An Enigmatic Reflex
to Preserve Life? Physiology, 28(5), 284–297.
https://doi.org/10.1152/physiol.00020.2013
Munoz, M. L., Van Roon, A., Riese, H., Thio, C., Oostenbroek, E., Westrik, I., …
Snieder, H. (2015). Validity of (Ultra-)Short recordings for heart rate variability
measurements. PLoS ONE, 10(9), 1–15.
https://doi.org/10.1371/journal.pone.0138921
Perini, R., Tironi, A., Gheza, A., Butti, F., Moia, C., & Ferretti, G. (2008). Heart rate and
blood pressure time courses during prolonged dry apnoea in breath-hold divers.
European Journal of Applied Physiology, 104(1), 1–7.
https://doi.org/10.1007/s00421-008-0771-1
Schagatay, E. (2014). Human breath-hold diving ability and the underlying physiology.
Human Evolution, 29(1–3), 125–140.
Schagatay, Erika, & Andersson, J. P. A. (1998). Diving response and apneic time in
humans. Undersea & Hyperbaric Medicine: Journal of the Undersea and
49
Hyperbaric Medical Society, (March).
Schagatay, Erika, & Holm, B. (1996). Effects of water and ambient air temperatures on
human diving bradycardia. European Journal of Applied Physiology, 73, 1–6.
Schagatay, Erika, Richardson, M. X., & Lodin-Sundström, A. (2012). Size matters:
Spleen and lung volumes predict performance in human apneic divers. Frontiers in
Physiology, 3 JUN(June), 1–8. https://doi.org/10.3389/fphys.2012.00173
Schagatay, Erika, Van Kampen, M., Emanuelsson, S., & Holm, B. (2000). Effects of
physical and apnea training on apneic time and the diving response in humans.
European Journal of Applied Physiology, 82(3), 161–169.
https://doi.org/10.1007/s004210050668
Schaller, B., Cornelius, J. F., Prabhakar, H., Koerbel, A., Gnanalingham, K., Sandu, N.,
… Buchfelder, M. (2009). The trigemino-cardiac reflex: An update of the current
knowledge. Journal of Neurosurgical Anesthesiology, 21(3), 187–195.
https://doi.org/10.1097/ANA.0b013e3181a2bf22
Shaffer, F., & Ginsberg, J. P. (2017). An Overview of Heart Rate Variability Metrics and
Norms. Frontiers in Public Health, 5(September), 1–17.
https://doi.org/10.3389/fpubh.2017.00258
Shields, R. W. W. (1993). Functional anatomy of the autonomic nervous system. Journal
of Clinical Neurophysiology : Official Publication of the American
Electroencephalographic Society. Retrieved from
http://journals.lww.com/clinicalneurophys/Abstract/1993/01000/Functional_Anatom
y_of_the_Autonomic_Nervous_System.2.aspx%5Cnhttp://www.ncbi.nlm.nih.gov/p
ubmed/8458993
Sugawara, J., Tanabe, T., Miyachi, M., Yamamoto, K., Takahashi, K., Iemitsu, M., …
Matsuda, M. (2003). Non-invasive assessment of cardiac output during exercise in
healthy young humans: comparison between Modelflow method and Doppler
echocardiography method. Acta Physiologica Scandinavica, 179(4), 361.
50
https://doi.org/10.1046/j.0001-6772.2003.01211.x
Vybiral, T., Bryg, R. J., Maddens, Michael, E., & Boden, William, E. (1989).
9485180.pdf. The American Journal of Cardiology, 63, 1117–1120.
Wehrwein, E. A., Orer, H. S., & Barman, S. M. (2016). Overview of the Anatomy,
Physiology, and Pharmacology of the Autonomic Nervous System. Comprehensive
Physiology, 6(3), 1239–1278. https://doi.org/10.1002/cphy.c150037
Willie, C. K., Ainslie, P. N., Drvis, I., MacLeod, D. B., Bain, A. R., Madden, D., …
Dujic, Z. (2015). Regulation of brain blood flow and oxygen delivery in elite breath-
hold divers. Journal of Cerebral Blood Flow and Metabolism, 35(1), 66–73.
https://doi.org/10.1038/jcbfm.2014.170
Yasuma, F., & Hayano, J. (2004). Why does the heartbeat synchronize with respiratory
rhythm? Chest.

51
Appendices
Appendix A: Permissions for Figure 1
52
53
54
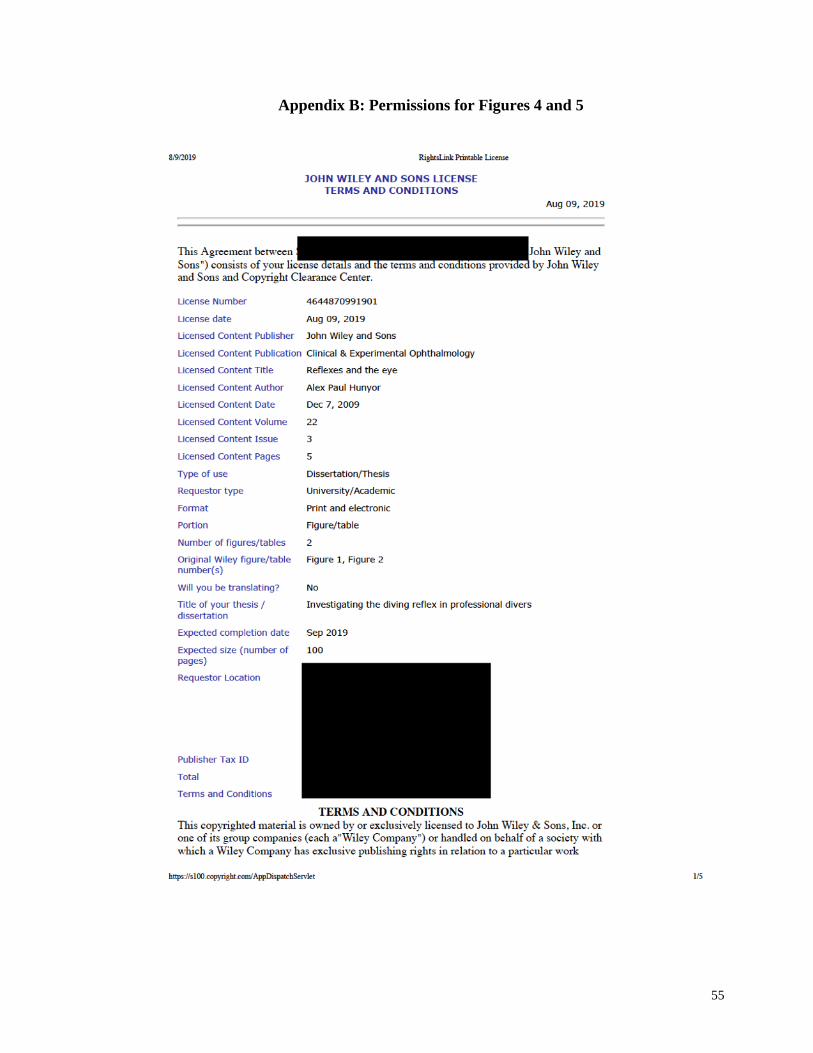
55
Appendix B: Permissions for Figures 4 and 5
56
57
58
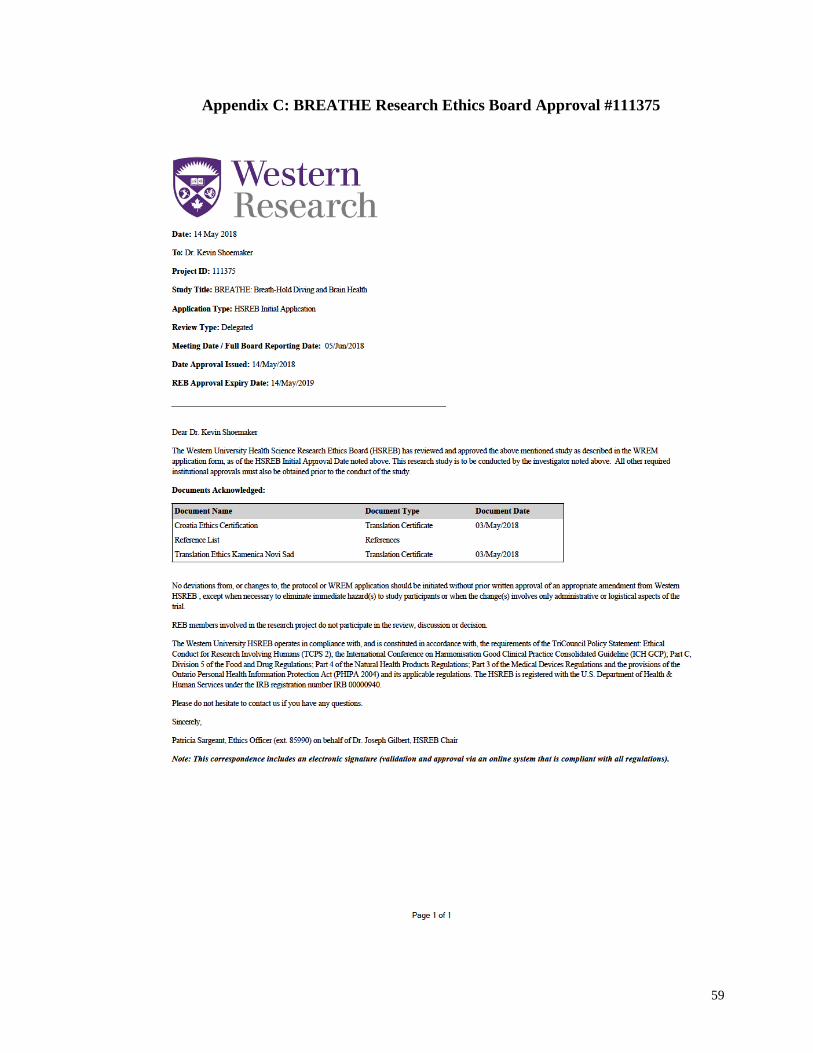
59
Appendix C: BREATHE Research Ethics Board Approval #111375
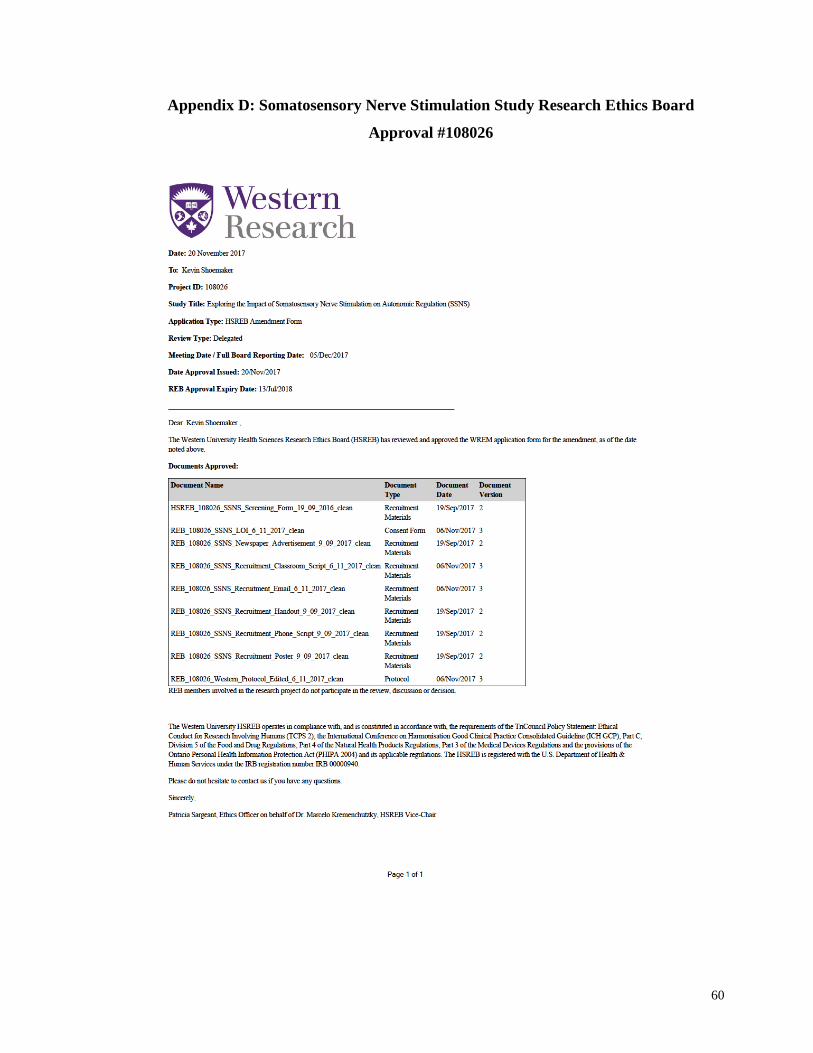
60
Appendix D: Somatosensory Nerve Stimulation Study Research Ethics Board
Approval #108026
61
Appendix E: Ischemic Heart Disease Research Ethics Board Approval #107620

62
Appendix F: Ischemic Heart Disease Letter of Information #107620
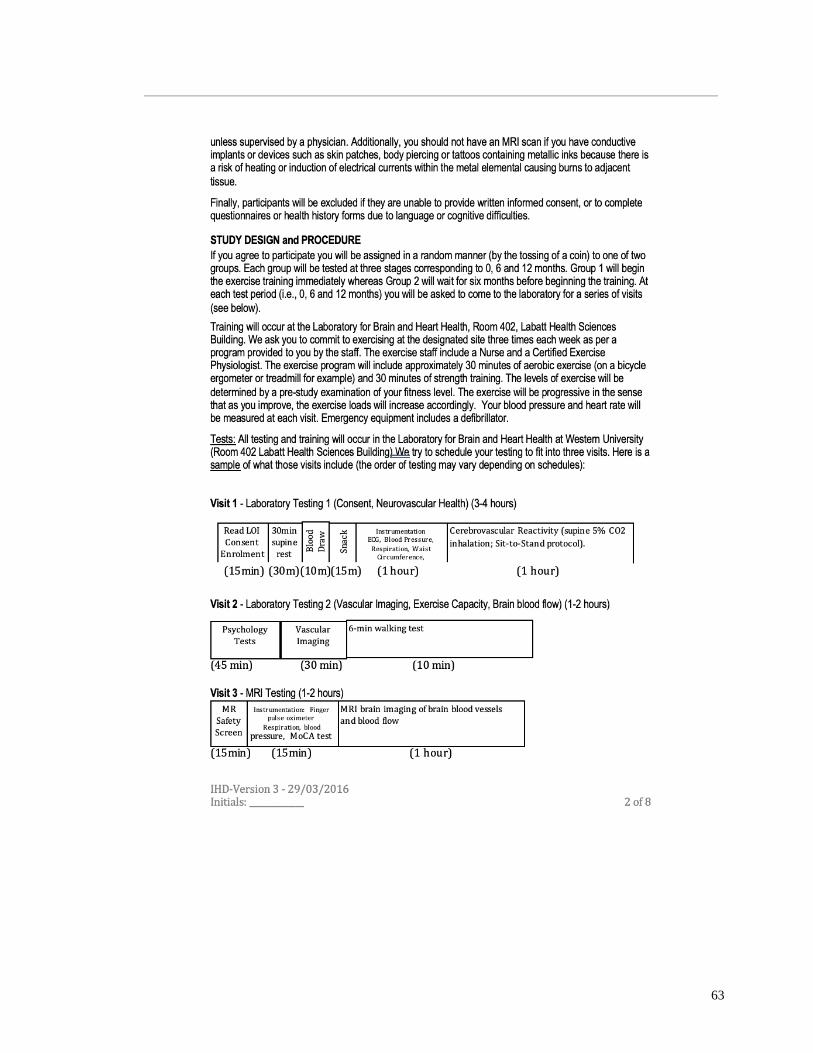
63
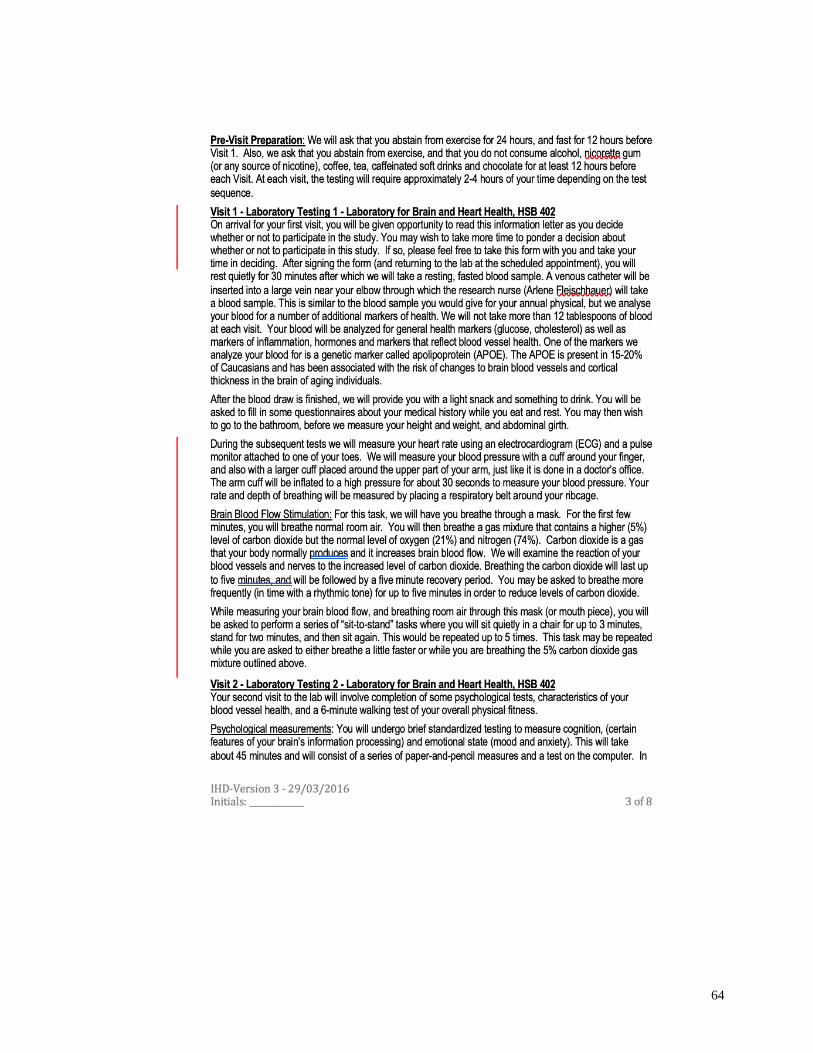
64
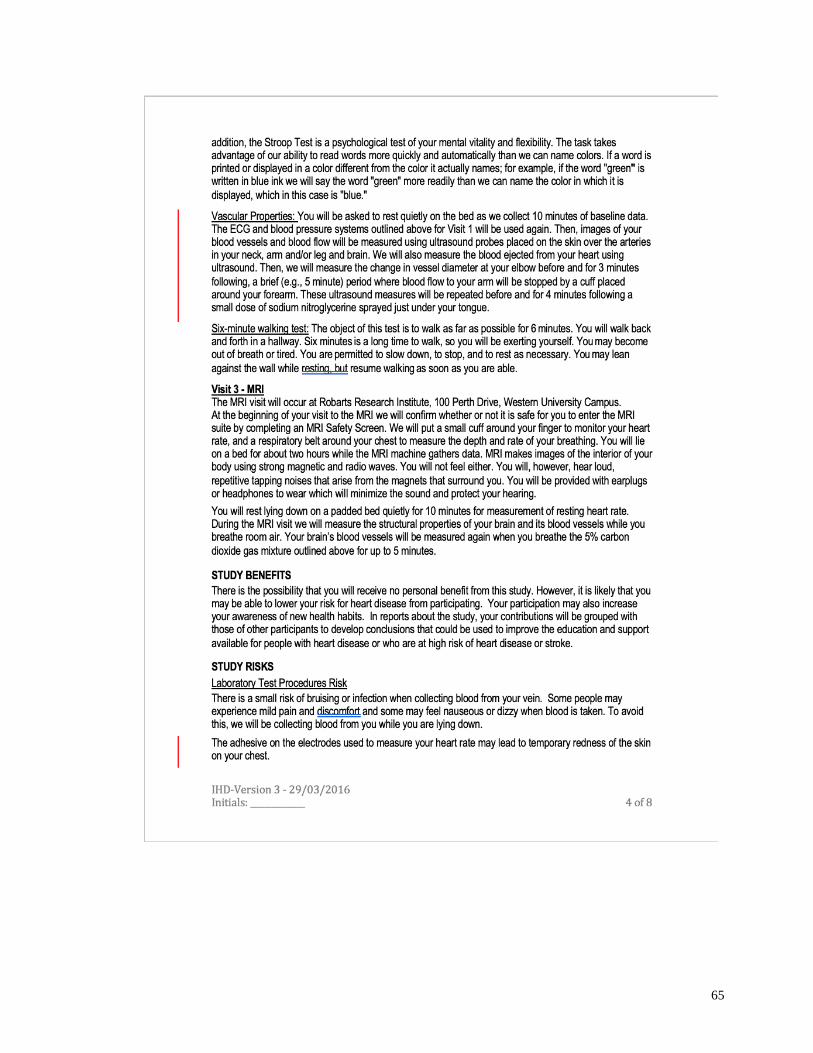
65
66
67
68
69
Appendix G: Somatosensory Nerve Stimulation Study Letter of Information
#108026
70
71
72
73
74
75

76
77
78
Appendix H: BREATHE Study Ethics Letter of Information #111375

79

80
81
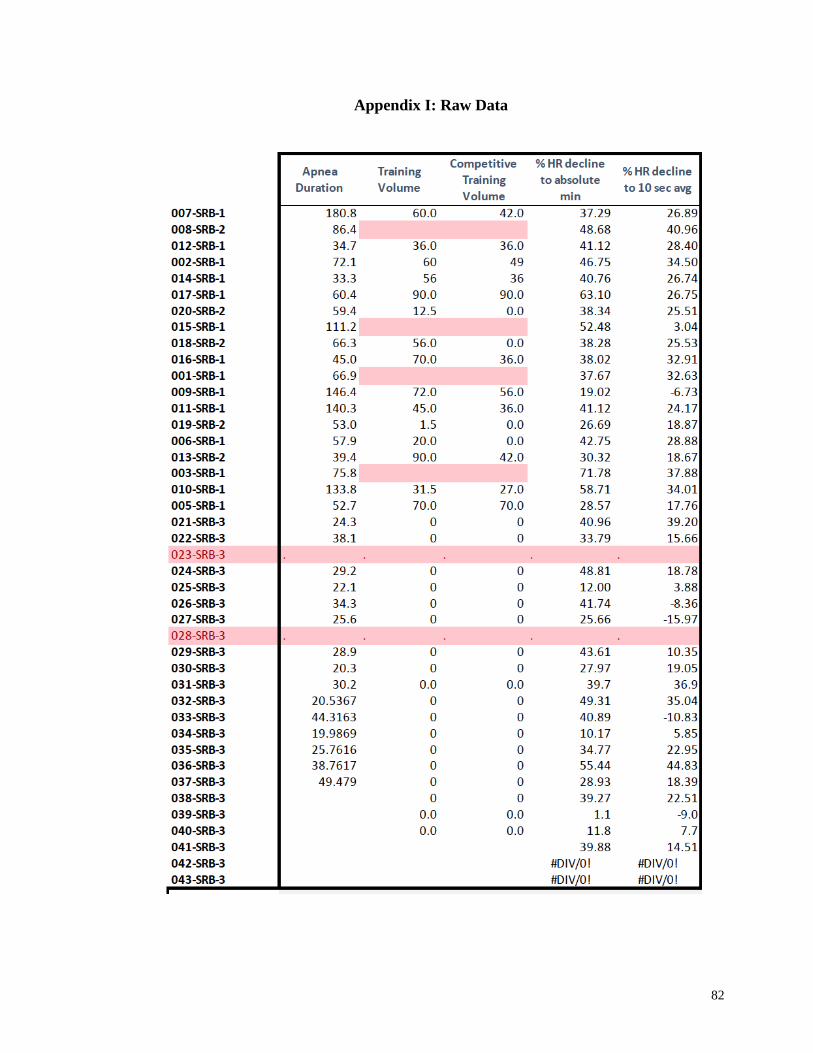
82
Appendix I: Raw Data
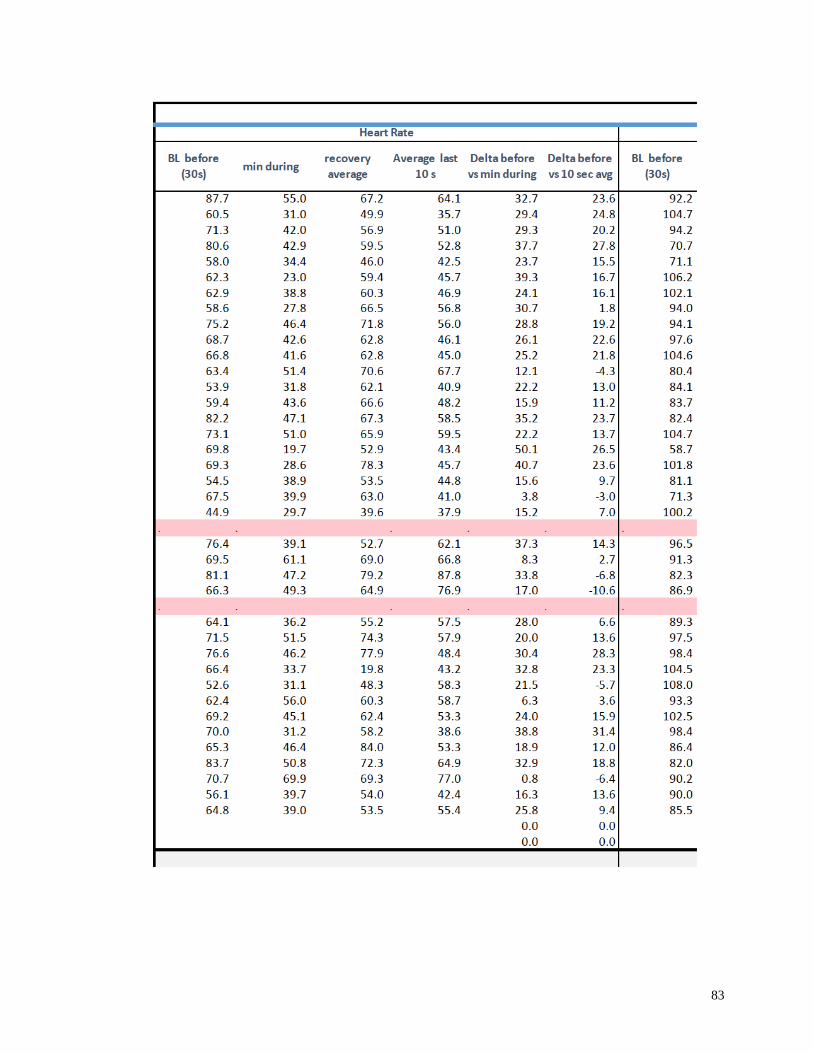
83
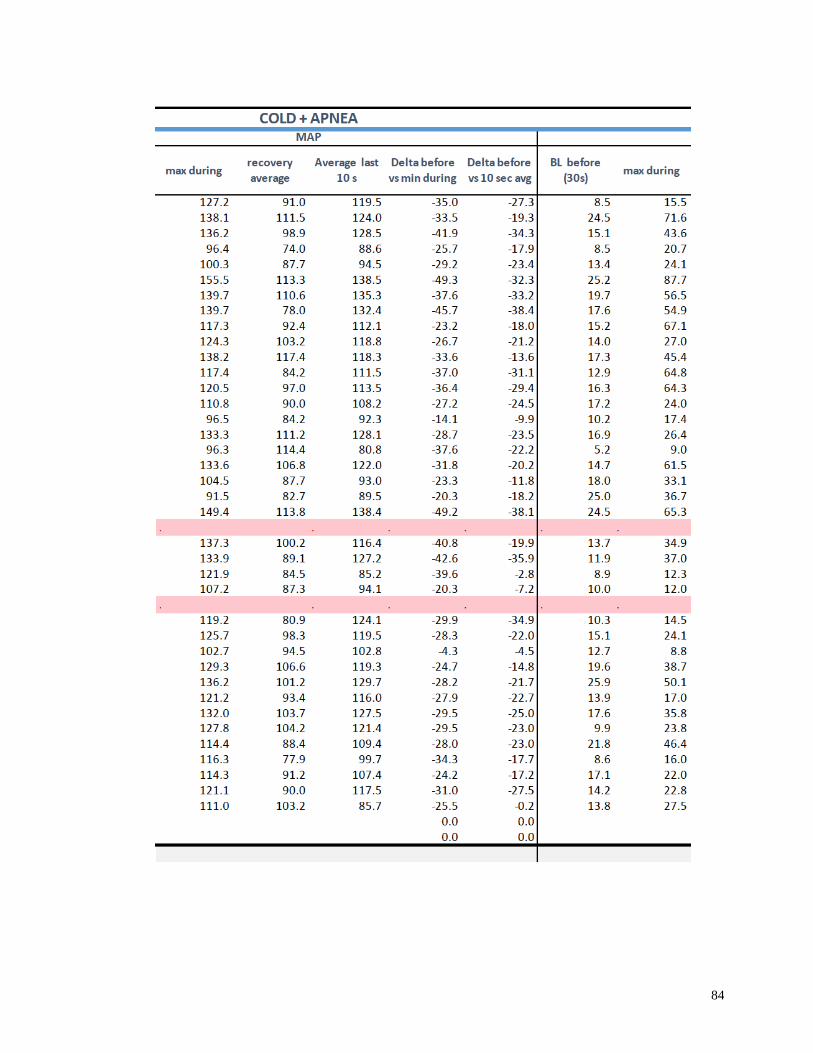
84
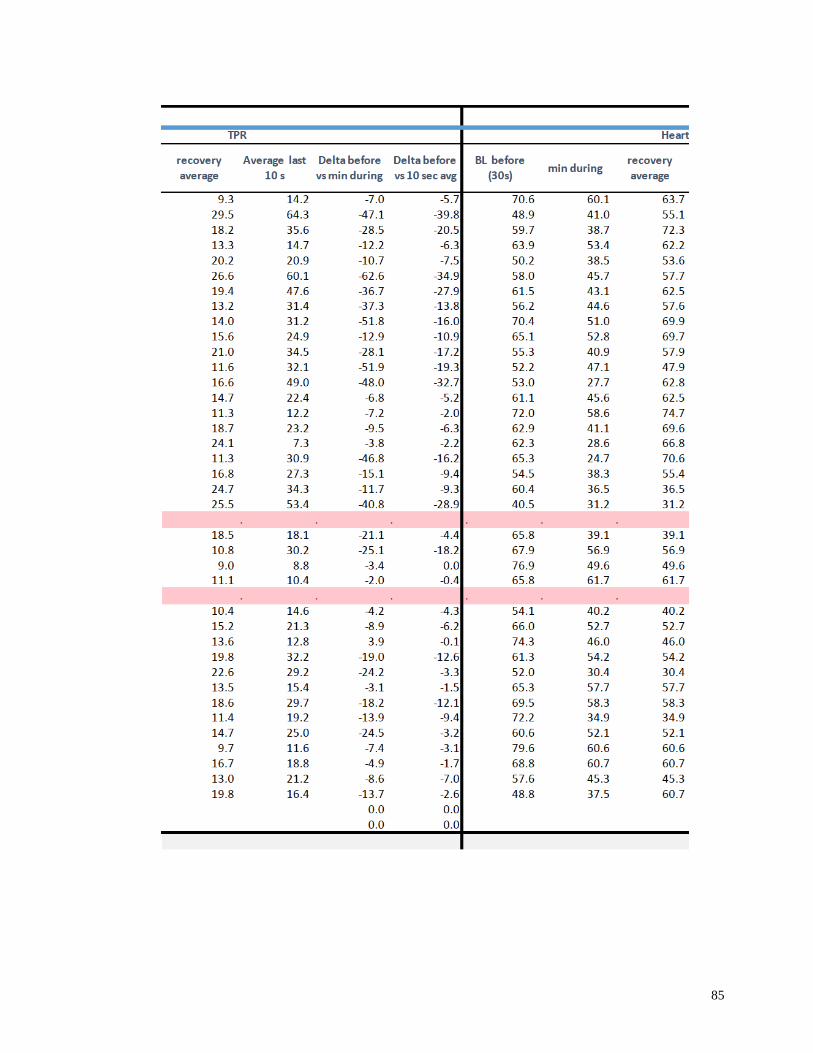
85
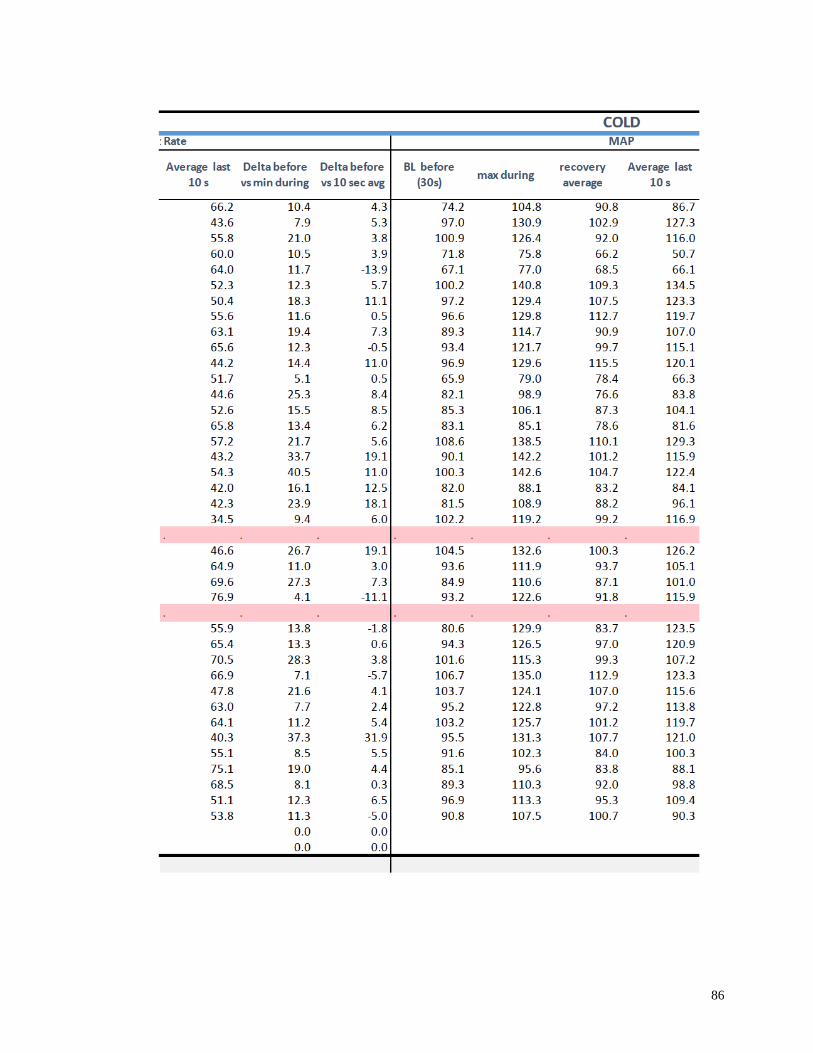
86
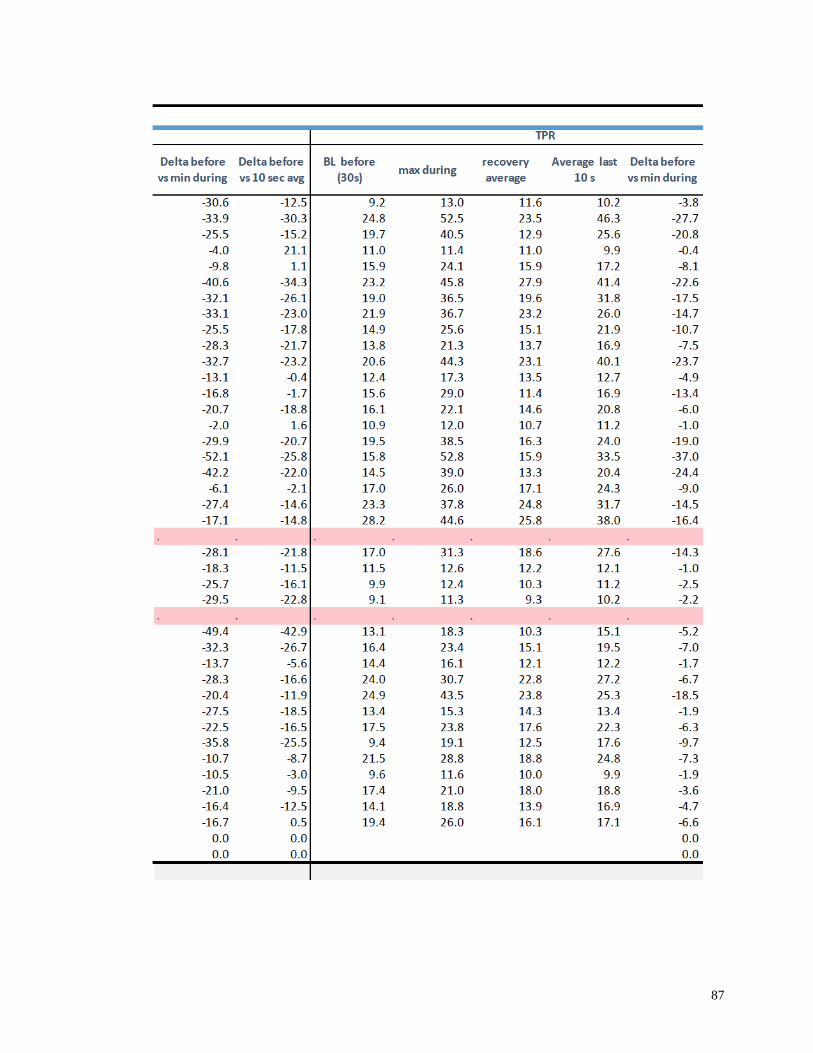
87
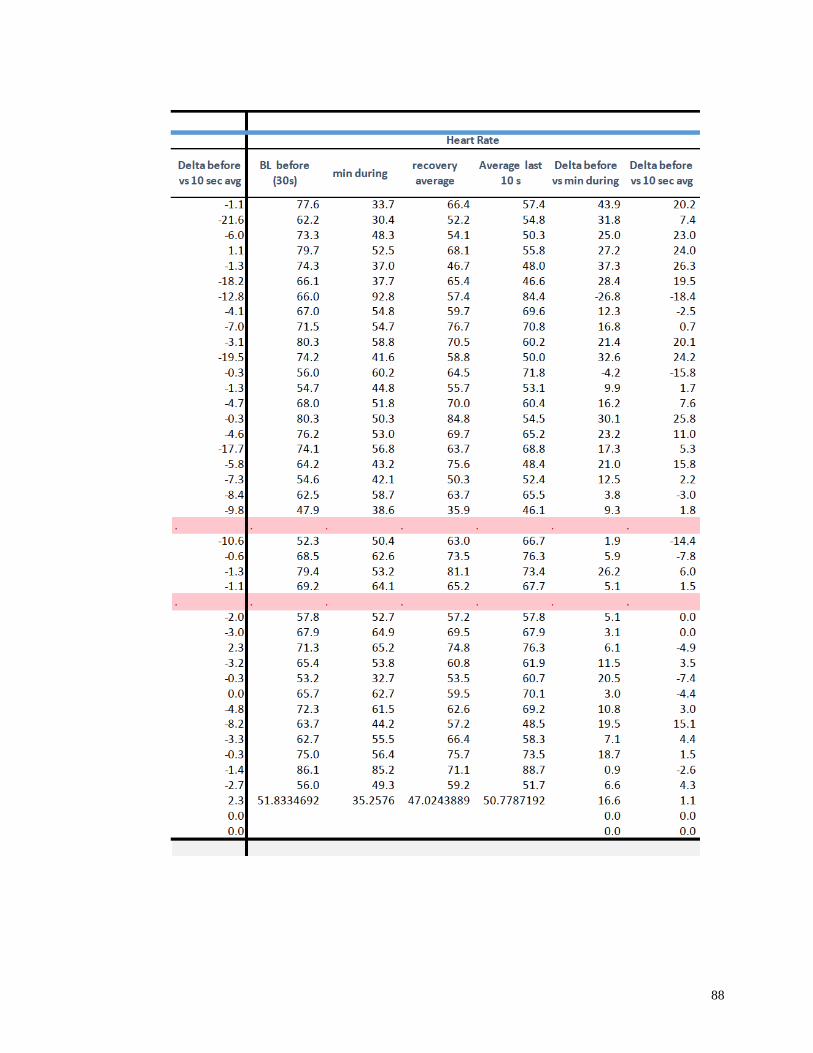
88
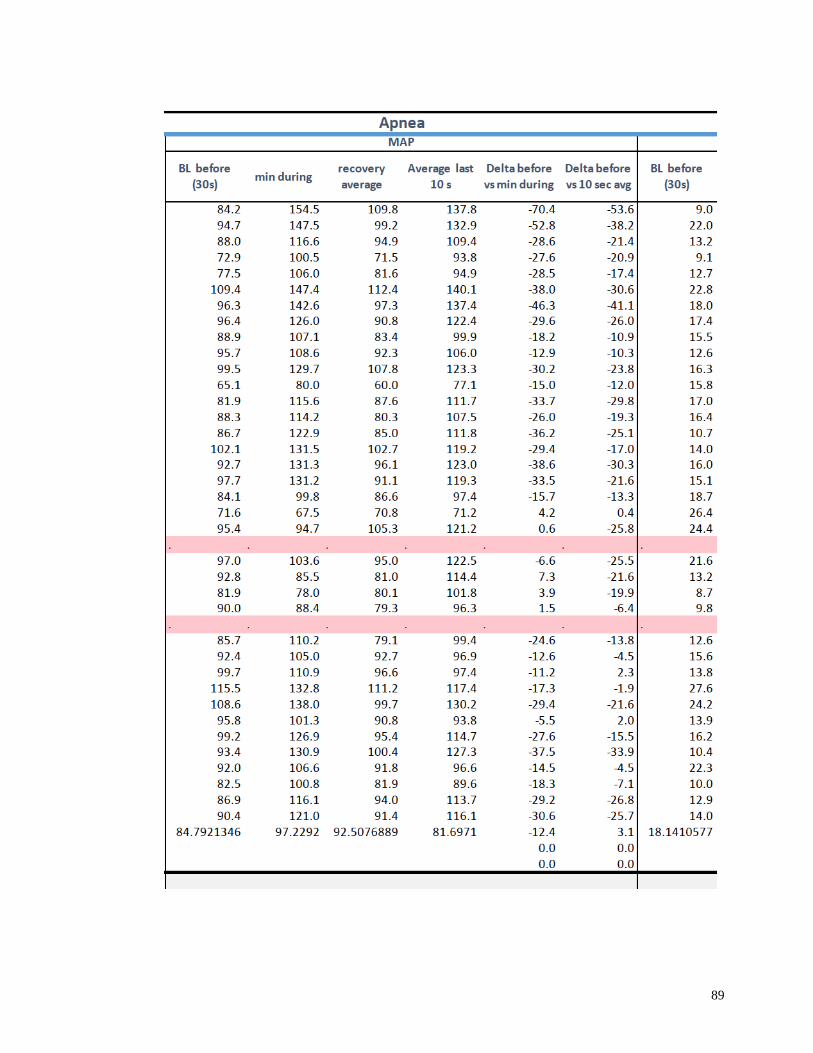
89
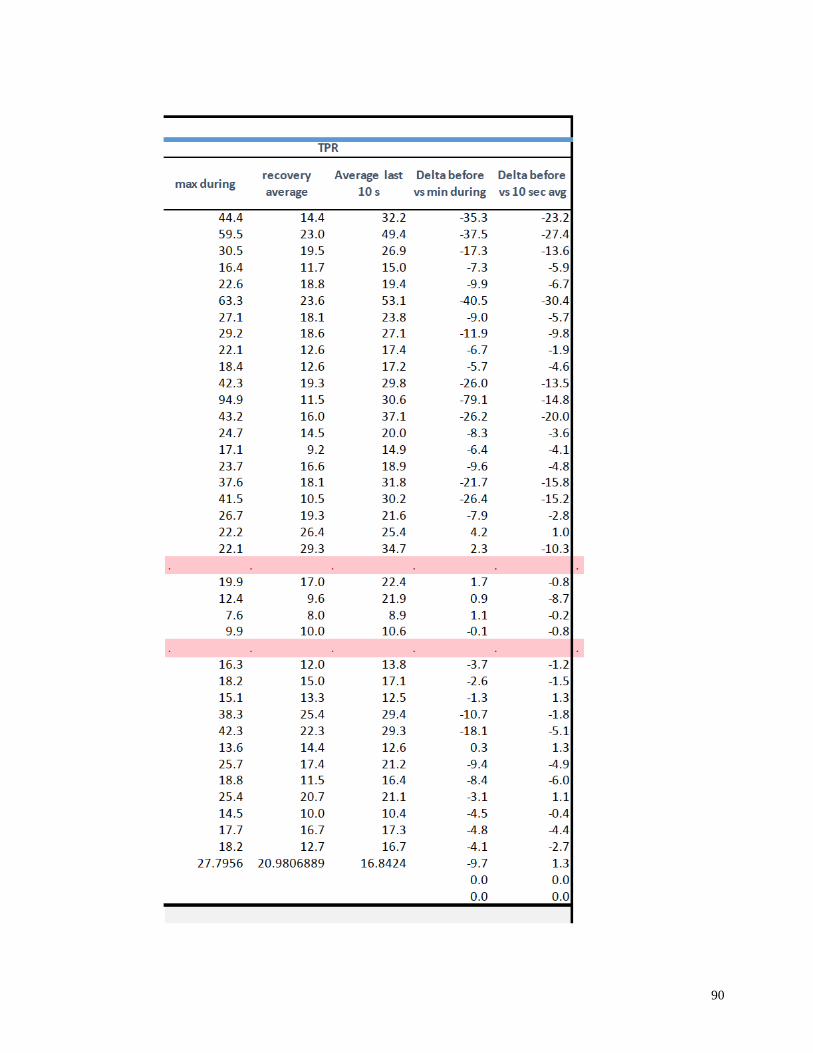
90
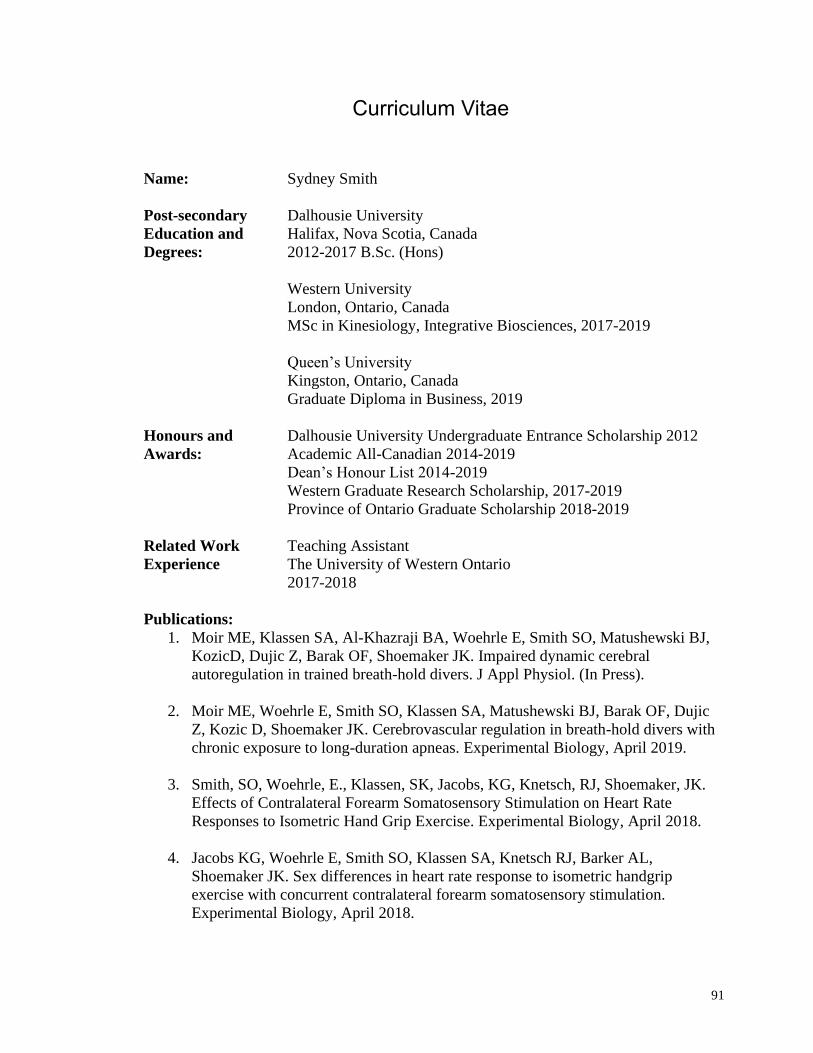
91
Curriculum Vitae
Name: Sydney Smith
Post-secondary Dalhousie University
Education and Halifax, Nova Scotia, Canada
Degrees: 2012-2017 B.Sc. (Hons)
Western University
London, Ontario, Canada
MSc in Kinesiology, Integrative Biosciences, 2017-2019
Queen’s University
Kingston, Ontario, Canada
Graduate Diploma in Business, 2019
Honours and Dalhousie University Undergraduate Entrance Scholarship 2012
Awards: Academic All-Canadian 2014-2019
Dean’s Honour List 2014-2019
Western Graduate Research Scholarship, 2017-2019
Province of Ontario Graduate Scholarship 2018-2019
Related Work Teaching Assistant
Experience The University of Western Ontario
2017-2018
Publications:
1. Moir ME, Klassen SA, Al-Khazraji BA, Woehrle E, Smith SO, Matushewski BJ,
KozicD, Dujic Z, Barak OF, Shoemaker JK. Impaired dynamic cerebral
autoregulation in trained breath-hold divers. J Appl Physiol. (In Press).
2. Moir ME, Woehrle E, Smith SO, Klassen SA, Matushewski BJ, Barak OF, Dujic
Z, Kozic D, Shoemaker JK. Cerebrovascular regulation in breath-hold divers with
chronic exposure to long-duration apneas. Experimental Biology, April 2019.
3. Smith, SO, Woehrle, E., Klassen, SK, Jacobs, KG, Knetsch, RJ, Shoemaker, JK.
Effects of Contralateral Forearm Somatosensory Stimulation on Heart Rate
Responses to Isometric Hand Grip Exercise. Experimental Biology, April 2018.
4. Jacobs KG, Woehrle E, Smith SO, Klassen SA, Knetsch RJ, Barker AL,
Shoemaker JK. Sex differences in heart rate response to isometric handgrip
exercise with concurrent contralateral forearm somatosensory stimulation.
Experimental Biology, April 2018.

92
5. Smith, S., Grandy, S., (2017). Investigating the necessity for cardiovascular
screening for college aged cross country runners. Atlantic Provinces Exercise
Scientist and Socioculturalists (APES+) March 2017; Crossroads Conference,
March 2017.