investigating the effects of maltreatment and acute stress on
TRANSCRIPT

Page 1/23
Investigating the Effects of Maltreatment and AcuteStress on the Concordance of Blood and DNAMethylation Methods of Estimating Immune CellProportionsAbner T. Apsley
Pennsylvania State UniversityLaura Etzel
Pennsylvania State UniversityWaylon J. Hastings
Pennsylvania State UniversityChristine C. Heim
Pennsylvania State UniversityJennie G. Noll
Pennsylvania State UniversityKieran J. O’Donnell
Yale UniversityHannah M. C. Schreier
Pennsylvania State UniversityChad E. Shenk
Pennsylvania State UniversityQiaofeng Ye
Pennsylvania State UniversityIdan Shalev ( [email protected] )
Pennsylvania State University
Research Article
Keywords: Immune cell proportions, DNA methylation, Complete blood count, Childhood maltreatment, Acutepsychosocial stress
Posted Date: September 12th, 2022
DOI: https://doi.org/10.21203/rs.3.rs-2043165/v1
License: This work is licensed under a Creative Commons Attribution 4.0 International License. Read FullLicense
Page 2/23
AbstractBackground:
Immune cell proportions can be used to detect pathophysiological states and are also critical covariates ingenomic analyses. The complete blood count (CBC) is the most common method of immune cell proportionestimation, but immune cell proportions can also be estimated using whole-genome DNA methylation (DNAm).Although the concordance of CBC and DNAm estimations has been validated in various adult and clinicalpopulations, less is known about the concordance of existing estimators among stress-exposed individuals. Asearly life adversity and acute psychosocial stress have both been associated with unique DNAm alterations, theconcordance of CBC and DNAm immune cell proportion needs to be validated in various states of stress.
Results:
We report the correlation and concordance between CBC and DNAm estimates of immune cell proportions usingthe Illumina EPIC DNAm array within two unique studies: Study 1, a high-risk pediatric cohort of childrenoversampled for exposure to maltreatment (n=365, age 8 to 14 years), and Study 2, a sample of young adultswho have participated in an acute laboratory stressor with four pre- and post-stress measurements (n=28,number of observations=100). Comparing CBC and DNAm proportions across both studies, estimates ofneutrophils (r=0.948, p<0.001), lymphocytes (r=0.916, p<0.001), and eosinophils (r=0.933, p<0.001) were highlycorrelated, while monocyte estimates were moderately correlated (r=0.766, p<0.001) and basophil estimates wereweakly correlated (r=0.189, p<0.001). In Study 1, we observed signi�cant deviations in raw values between thetwo approaches for some immune cell subtypes, however, the observed differences were not signi�cantlypredicted by exposure to child maltreatment. In Study 2, while signi�cant changes in immune cell proportionswere observed in response to acute psychosocial stress for both CBC and DNAm estimates, the observedchanges were similar for both approaches.
Conclusions:
Although signi�cant differences in immune cell proportion estimates between CBC and DNAm exist, as well asstress-induced changes in immune cell proportions, neither child maltreatment nor acute psychosocial stressalters the concordance of CBC and DNAm estimation methods. These results suggest that the agreementbetween CBC and DNAm estimators of immune cell proportions is robust to exposure to child maltreatment andacute psychosocial stress.
BackgroundBlood proportions of immune cells, such as monocytes, lymphocytes and granulocytes, are tightly regulated inhealthy individuals (1). Deviations from normative immune cell proportions can be used to predict and monitorthe progression of many diseases and conditions including chronic in�ammation, viral infections, arterialdisease, coronary heart disease, gastroenteritis, endocrine disorders, leukemia, and lymphoma (2–6). Thus, it iscritical to accurately measure the proportion of circulating immune cell subtypes for both diagnosis andmonitoring of disease progress (7,8).
Page 3/23
Beyond clinical implications, it is critical to accurately measure immune cell proportions for basic researchinvestigating connections between environmental/psychosocial exposures and health. Molecular pro�les ofwhole blood, such as gene expression (9), DNA methylation (DNAm) (10), and telomere length (11), are oftenderived by averaging the measurement of these molecular features across a heterogeneous mixture of immunecell subtypes within each blood sample. However, each immune cell subtype has different functions andmolecular signatures (e.g., methylation patterns, gene expression, telomere length distribution) and thus theresulting molecular pro�les of whole blood are dependent upon the immune cell proportions of the sample(10,12). The variability of immune cell proportions – whether due to stress or other factors – across biologicalsamples has implications for the accuracy and reliability of genomic studies. For example, controlling forimmune cell proportions in epigenome-wide association studies (EWAS) can lead to improved biologicalinterpretability, whereas not accounting for immune cell proportions in EWAS can lead to false positive results(13–15).
The complete blood count (CBC) is the most widely used clinical test for determining immune cell proportions(6,16) and analyzes major immune cell components via �ow cytometry sorting. Despite its ubiquitous applicationin clinical practice, the CBC method has some disadvantages in population research settings. The application of�ow cytometry to determine CBC estimates requires the collection of blood which is often di�cult to obtain,especially in pediatric cohorts. Additionally, CBC tests must be performed within 24 hours of sample collectionand cannot be performed on stored (e.g., dried or frozen) samples. In contrast to CBC estimators, molecularpro�les can be reliably generated from dried or frozen blood samples, as well as from non-invasive saliva orbuccal swab samples. These alternative molecular methods for detecting immune cell proportions are ofconsiderable interest for a broad range of research �elds.
One alternative method for estimating immune cell proportions is the use of whole-genome DNAm data. Becauseof the unique pattern of methylation inherent in each cell type, methylation signals at speci�c 5'-cytosine-phosphate-guanine-3' (CpG) sites can be used to estimate immune cell proportions (17–19). Houseman andcolleagues developed the �rst statistical algorithm for estimating immune cell proportions using CpG probesfrom the Illumina 27k DNAm array (20,21), which was later updated by constructing reference sets for theIllumina 450k DNAm array (14,22–25). Salas and colleagues provided an updated algorithm and a reference setspeci�cally tailored to the Illumina EPIC DNAm array (26–28). Each iteration of immune cell estimators wasdesigned to make estimations with greater accuracy than previous versions. More recently, Salas and colleaguesreleased a revised reference set for the Illumina EPIC DNAm array enabling estimation of a much larger variety ofimmune cell subtypes than previously possible (29). Although the accuracy of some of these reference sets andalgorithms has been validated in various clinical populations (e.g., patients with head and neck cancer, ovariancancer, Down syndrome and obesity) (20), in cord blood (30), and in older adults (14), to our knowledge, no workhas been done to determine the effects of exposure to child maltreatment (CM), as well as acute psychosocialstress, on the concordance of CBC and DNAm estimates of immune cell proportions.
Exposure to early-life adversity (ELA), such as CM, has been shown to alter the DNAm pro�les of individual genessuch as NR3C1, BDNF, PRF1, SLC6A4, OXTR, COMT, AVP, and CRF (31–37), as well as alter the DNAm pro�les ofimmune cells (38–41). Moreover, the effects of CM and other adverse environmental exposures on DNAmpro�les could extend beyond candidate genes and introduce DNAm alterations on a genome-wide scale (42,43).These alterations could in�uence the concordance of CBC and DNAm estimations of immune cell proportions ifsuch alterations overlap with the CpG sites of established DNAm algorithms used to discriminate between
Page 4/23
immune cell subtypes. Therefore, it is important to validate the concordance of CBC and DNAm methods forestimating immune cell proportions in individuals who have experienced CM.
Beyond CM, changes in DNAm pro�les in response to acute psychosocial stress could also alter the concordanceof CBC and DNAm methods for estimating immune cell proportions. Evidence suggests that immune cell DNAmlevels within promoter regions of stress-related genes respond to acute psychosocial stress (44,45). It is unknownwhether these alterations persist after the acute stressor has subsided, and whether or not additional areas of themethylome are impacted by acute stress. In addition, DNAm levels in rats and mice are reported to be sensitive toacute stress in various brain regions such as the hippocampus, cortex, and periaqueductal gray area (46,47).Given the observed correlations between brain and blood cell methylomes (48,49), it is plausible that similarchanges in DNAm levels of immune cells could be occurring. Changes in DNAm pro�les of immune cells inresponse to acute psychosocial stress can have implications for study designs in which biological samples arecollected before, during, and following stressful events.
This study aims to assess the concordance of CBC and DNAm methods for estimating immune cell proportionsin blood when implemented 1) cross-sectionally in children who have been investigated for CM, and 2) in fourrepeated samples of young adults undergoing an acute psychosocial stressor. We hypothesized that CM andacute psychosocial stress would alter the concordance between CBC and DNAm methods for estimating immunecell proportions, with lower concordance under conditions of stress. To test our hypotheses, we compared CBCand DNAm estimates of immune cell proportions in two studies. In Study 1, we included children from theongoing Child Health Study (CHS), a large multidisciplinary study designed to provide prospective, longitudinaldata on the health and development of children with and without a history of investigations for CM (physical andsexual abuse, and neglect). Study 1 was used to determine the effects of CM on the concordance between CBCand DNAm methods for estimating immune cell proportions. In Study 2, we used a sample of healthy youngadults exposed to the Trier Social Stress Test (TSST), a laboratory stressor shown to promote robust sympatheticand adrenal stress responses (50) and elicit changes in immune cell proportions within individuals across time(51). Study 2 was used to determine the effects of acute psychosocial stress on the concordance between CBCand DNAm methods of estimating immune cell proportions. We used the recent Illumina EPIC DNAm method ofestimating immune cell proportions (29) and provide supplementary analyses using the previous Illumina EPICDNAm iteration (26-28).
ResultsStudy 1 – Testing the impact of child maltreatment on the concordance between CBC and DNAm estimates ofimmune cell proportions
Study 1 was designed such that it included both individuals with a history of CM investigations (for sexualabuse, physical abuse, or neglect) who were oversampled, and non-exposed individuals without a history of CMinvestigations, resulting in a total N=365 (N=307 youth with a maltreatment history and N=58 comparisonyouth). Tests for demographic differences by CM status demonstrated that the CM group had, older age(p=0.035), higher BMI (p=0.002), more advanced pubertal stage (p<0.001), and lower household income(p<0.001) (see Table 1 for complete demographic comparisons).
Page 5/23
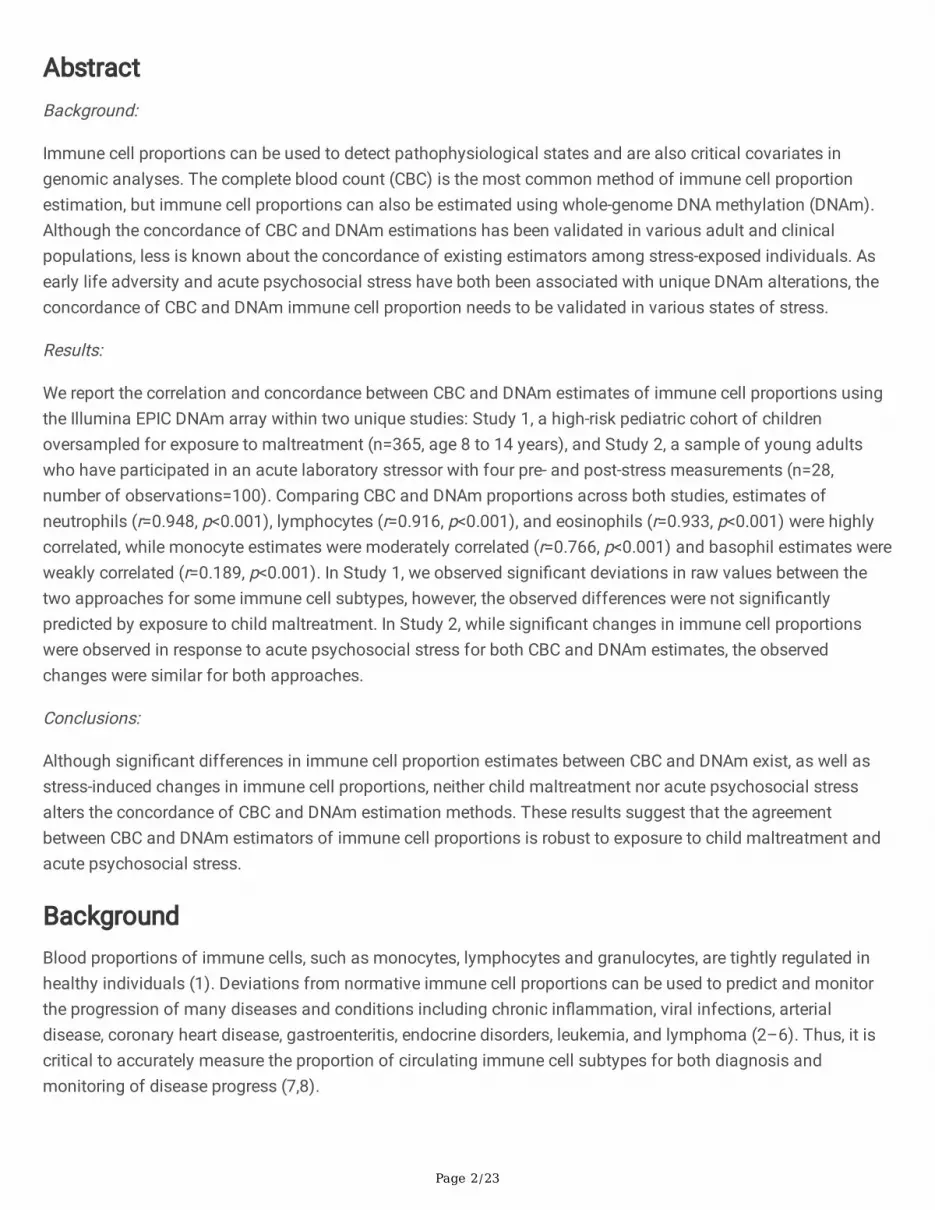
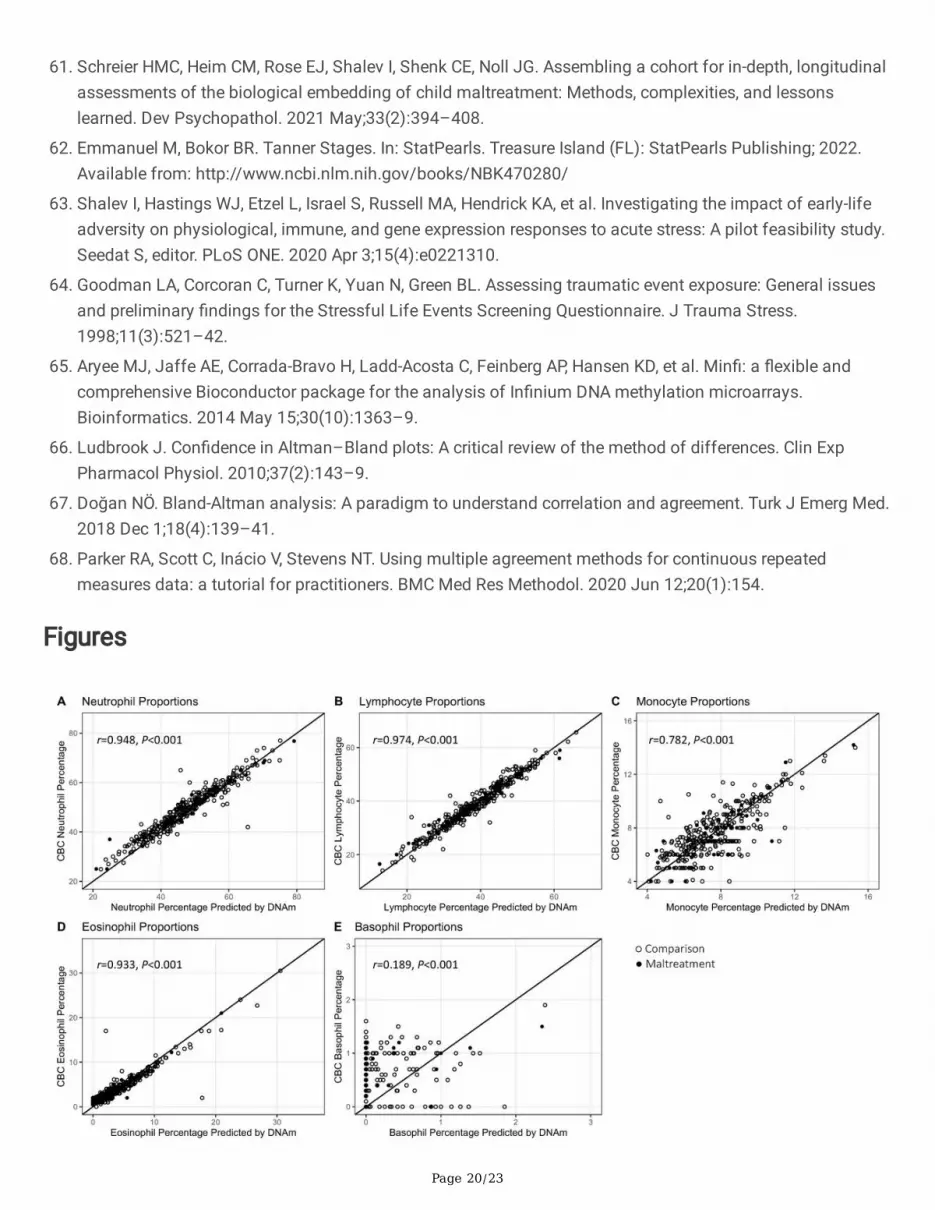
There were no differences in mean values of CBC or DNAm estimates of all immune cell subtypes whencomparing CM and comparison groups (Table 1). Across all participants, CBC and DNAm estimates of immunecell proportions were highly correlated with one another for each cell type, with the exception of basophils(Pearson’s correlation: neutrophils: r=0.948, p<0.001; lymphocytes: r=0.974, p<0.001; monocytes: r=0.782,p<0.001; eosinophils: r=0.933, p<0.001; basophils: r=0.189, p<0.001; Table S1). Excluding zero observations ofbasophils for CBC and DNAm estimates increased the correlation for basophils (r=0.380, p<0.001). Figure1 shows CBC estimates plotted as a function of DNAm estimates with a 45-degree identity reference line andstrati�ed by CM status. Distributions of CBC and DNAm estimates for each cell type are shown in Figure S1.

Page 6/23
Table 1 – Study 1 Descriptive Statistics
Comparison (N=58) CM History (N=307) Total (N=365) P-value
Mean (SD) / Count (%)
Sex
Male 28 (48.3%) 158 (51.5%) 186 (51.0%) 0.762
Female 30 (51.7%) 149 (48.5%) 179 (49.0%)
Age (years) 11.11 (1.4) 11.53 (1.4) 11.47 (1.4) 0.035
BMI 19.93 (4.9) 22.27 (5.9) 21.89 (5.8) 0.002
Puberty Status 2.08 (0.9) 2.58 (1.0) 2.50 (1.0) <0.001
Income $10,000/year 5.74 (3.8) 3.37 (3.1) 3.75 (3.3) <0.001
Race
White 45 (77.6%) 210 (68.4%) 255 (69.9%) 0.214
Not white 13 (22.4%) 97 (31.6%) 110 (30.1%)
Ethnicity
Hispanic 3 (5.2%) 48 (15.6%) 51 (14.0%) 0.057
Non-hispanic 55 (94.8%) 259 (84.4%) 314 (86.0%)
CBC Proportions
Neutrophils 48.97 (9.6) 49.07 (9.9) 49.05 (9.8) 0.941
Lymphocytes 38.75 (8.8) 38.56 (9.0) 38.59 (9.0) 0.879
Monocytes 7.57 (2.1) 7.57 (1.9) 7.57 (1.9) 0.985
Eosinophils 4.13 (3.3) 4.16 (3.7) 4.16 (3.6) 0.936
Basophils 0.54 (0.4) 0.55 (0.4) 0.55 (0.4) 0.863
DNAm Proportions
Neutrophils 47.45 (10.9) 47.55 (10.2) 47.53 (10.3) 0.948
Lymphocytes 38.43 (9.9) 38.29 (9.3) 38.31 (9.3) 0.920
Monocytes 7.63 (2.1) 7.64 (1.8) 7.64 (1.9) 0.979
Eosinophils 4.16 (3.6) 4.09 (4.2) 4.10 (4.1) 0.899
Basophils 0.14 (0.4) 0.15 (0.3) 0.15 (0.4) 0.935
P-values are given as a result of t-tests or Chi-square tests between control and maltreatment groups.
We next examined the agreement between CBC and DNAm estimates among each cell type using the Bland-Altman method. Neutrophil CBC and DNAm estimates were signi�cantly different from one another (b=-1.52,

Page 7/23
p<0.001) with DNAm estimates being, on average, lower than CBC estimates (Figure 2A). Lymphocyte CBC andDNAm estimates were also signi�cantly different from one another (b=-0.28, p=0.014), with DNAm estimates, onaverage, being lower than CBC estimates (Figure 2B). In contrast, monocyte and eosinophil CBC and DNAmestimates did not show signi�cant differences from one another (monocytes: b=0.07, p=0.28; eosinophils:b=-0.06, p=0.46; Figure 2C and Figure 2D). Finally, basophil CBC and DNAm estimates were signi�cantly differentfrom one another (b=-0.41, p<0.001), with DNAm estimates being, on average, lower than CBC estimates (Figure2E).
Immune cell proportion difference scores [DNAm estimate – CBC estimate] were regressed onto CM status andcovariates (Table 2). Although lymphocytes showed a signi�cant difference in the Bland-Altman analysis, onlyneutrophils (b=-1.77, p<0.001) and basophils (b=-0.37, p<0.001) showed signi�cant intercepts in our regressionanalysis, meaning that only these two cell types had signi�cant differences between DNAm and CBC estimatesafter accounting for covariates. CM status was not a signi�cant predictor of differences in CBC and DNAmestimates for all immune cell subtypes (neutrophils: b=-0.02, p=0.96; lymphocytes: b=0.06, p=0.85; monocytes:b=-0.14, p=0.43; eosinophils: b=0.04, p=0.85; basophils: b=-0.06, p=0.43; Table 2).
Table 2 – Study 1 Multivariate Linear Regression Results
Neutrophils Lymphocytes Monocytes Eosinophils Basophils
Estimate SE Estimate SE Estimate SE Estimate SE Estimate SE
Intercept -1.770*** 0.50 -0.222 0.32 0.323 0.18 -0.121 0.23 -0.369*** 0.07
CMhistory
-0.024 0.49 0.062 0.32 -0.142 0.18 0.042 0.22 -0.058 0.07
Sex 0.276 0.35 -0.301 0.21 -0.151 0.12 -0.050 0.15 -0.014 0.05
Age 0.147 0.16 -0.028 0.10 -0.124* 0.06 0.009 0.07 -0.077** 0.02
Income 0.029 0.06 -0.017 0.04 -0.014 0.02 0.001 0.03 -0.009 0.01
BMI 0.006 0.03 0.018 0.02 0.004 0.01 -0.040** 0.01 0.005 0.00
Pubertalstage
0.177 0.23 -0.207 0.15 0.202* 0.08 -0.080 0.10 0.105** 0.03
Race -0.067 0.40 -0.009 0.26 0.549*** 0.15 -0.207 0.18 0.122* 0.06
Ethnicity -0.716 0.51 0.296 0.33 0.068 0.19 0.037 0.23 -0.101 0.07
Models were constructed with difference scores (DNAm estimate – CBC estimate) as the outcome, CM as thepredictor, and all demographic variables as covariates. * p < 0.05. ** p < 0.01. *** p < 0.001.
Study 2 – Testing the impact of acute psychosocial stress on the concordance between CBC and DNAmestimates of immune cell proportions
Study 2 participants ranged in age from 18-24 years (mean age = 21.3, SD = 1.3), had an average BMI of 24.2(SD = 3.7), and were primarily female (64.3%). This study was designed to test the impact of ELA, and thusapproximately half of the study participants recruited reported exposure to multiple adverse events in early life (N= 13 ELA exposure young adults and N = 15 control young adults). Four repeated blood samples were collected
Page 8/23
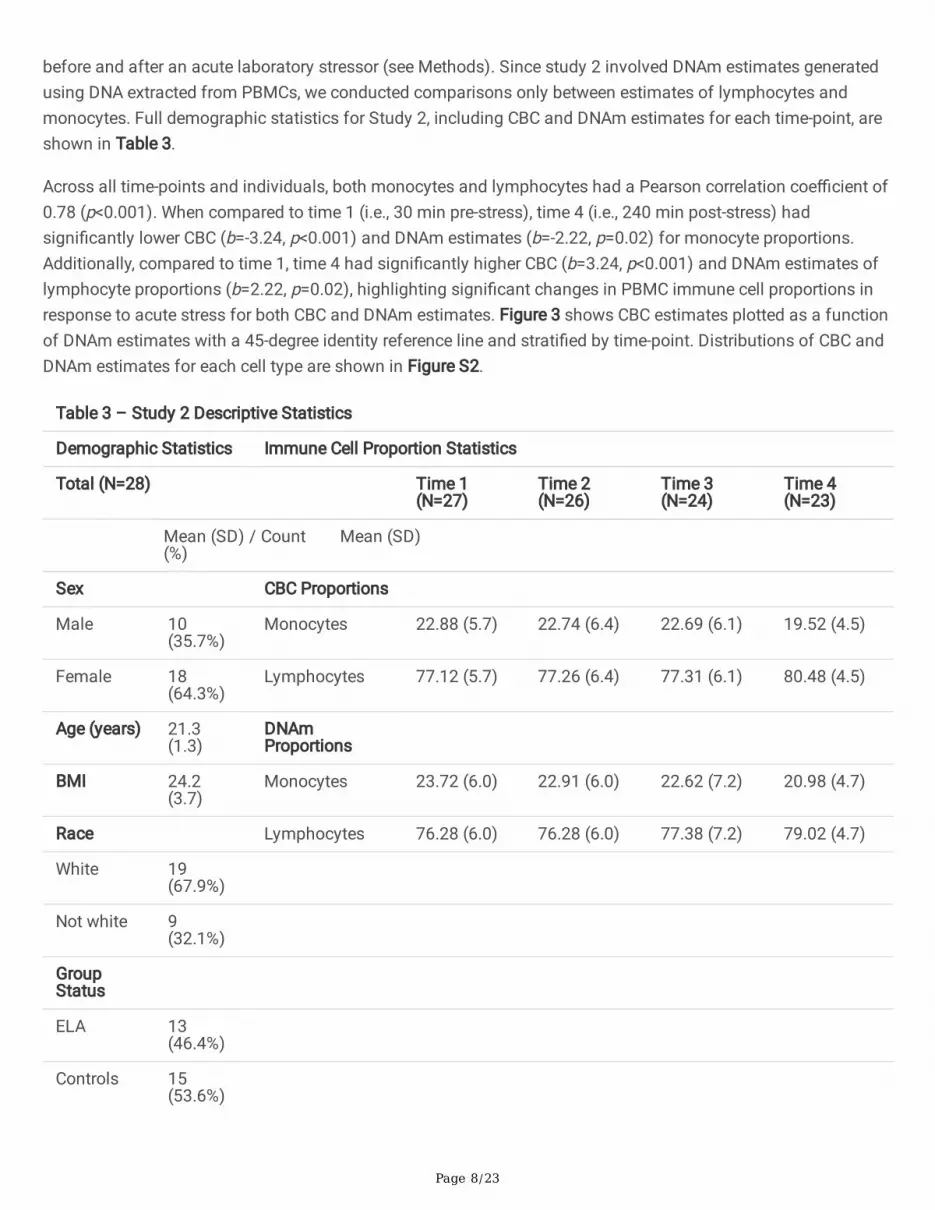
before and after an acute laboratory stressor (see Methods). Since study 2 involved DNAm estimates generatedusing DNA extracted from PBMCs, we conducted comparisons only between estimates of lymphocytes andmonocytes. Full demographic statistics for Study 2, including CBC and DNAm estimates for each time-point, areshown in Table 3.
Across all time-points and individuals, both monocytes and lymphocytes had a Pearson correlation coe�cient of0.78 (p<0.001). When compared to time 1 (i.e., 30 min pre-stress), time 4 (i.e., 240 min post-stress) hadsigni�cantly lower CBC (b=-3.24, p<0.001) and DNAm estimates (b=-2.22, p=0.02) for monocyte proportions.Additionally, compared to time 1, time 4 had signi�cantly higher CBC (b=3.24, p<0.001) and DNAm estimates oflymphocyte proportions (b=2.22, p=0.02), highlighting signi�cant changes in PBMC immune cell proportions inresponse to acute stress for both CBC and DNAm estimates. Figure 3 shows CBC estimates plotted as a functionof DNAm estimates with a 45-degree identity reference line and strati�ed by time-point. Distributions of CBC andDNAm estimates for each cell type are shown in Figure S2.
Table 3 – Study 2 Descriptive Statistics
Demographic Statistics Immune Cell Proportion Statistics
Total (N=28) Time 1(N=27)
Time 2(N=26)
Time 3(N=24)
Time 4(N=23)
Mean (SD) / Count(%)
Mean (SD)
Sex CBC Proportions
Male 10(35.7%)
Monocytes 22.88 (5.7) 22.74 (6.4) 22.69 (6.1) 19.52 (4.5)
Female 18(64.3%)
Lymphocytes 77.12 (5.7) 77.26 (6.4) 77.31 (6.1) 80.48 (4.5)
Age (years) 21.3(1.3)
DNAmProportions
BMI 24.2(3.7)
Monocytes 23.72 (6.0) 22.91 (6.0) 22.62 (7.2) 20.98 (4.7)
Race Lymphocytes 76.28 (6.0) 76.28 (6.0) 77.38 (7.2) 79.02 (4.7)
White 19(67.9%)
Not white 9(32.1%)
GroupStatus
ELA 13(46.4%)
Controls 15(53.6%)
Page 9/23
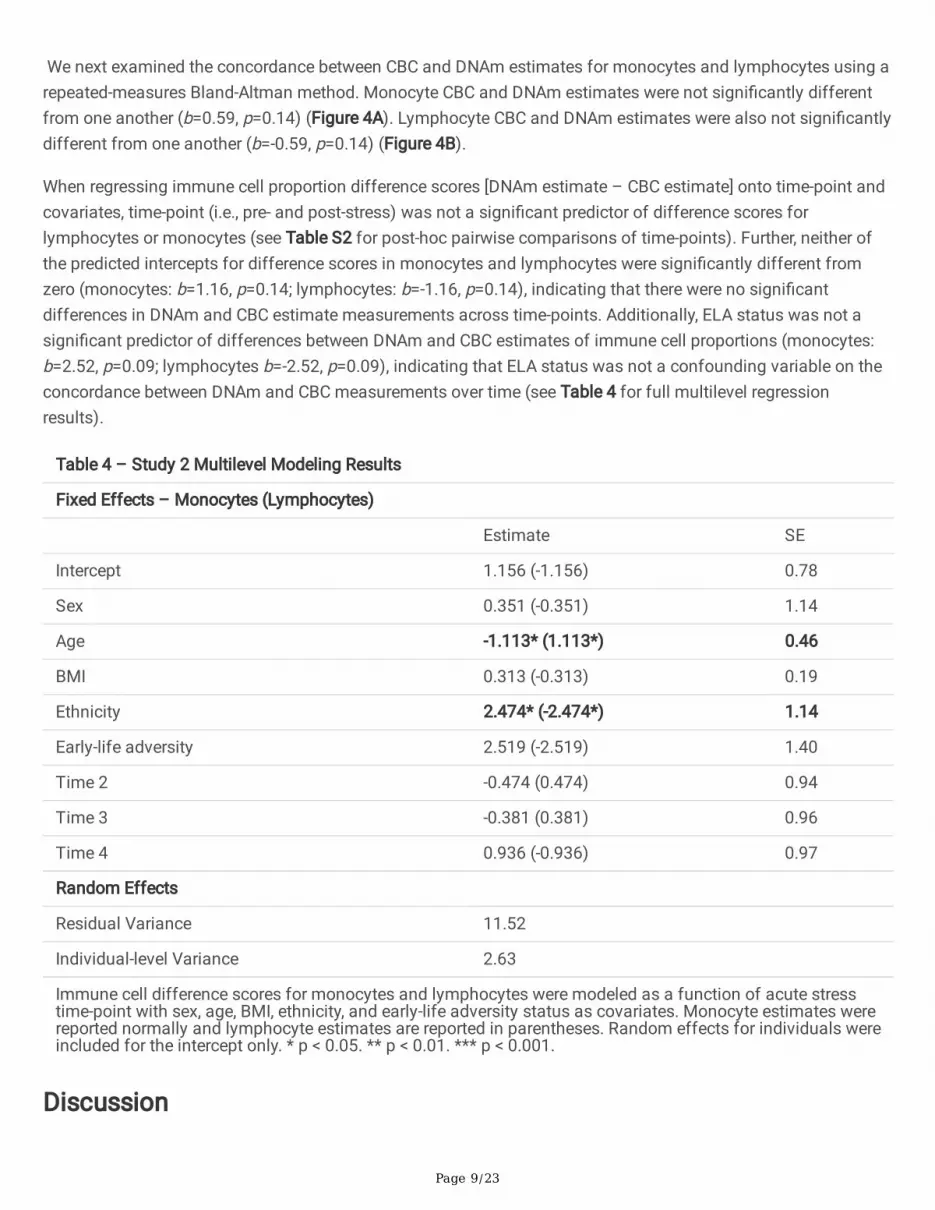
We next examined the concordance between CBC and DNAm estimates for monocytes and lymphocytes using arepeated-measures Bland-Altman method. Monocyte CBC and DNAm estimates were not signi�cantly differentfrom one another (b=0.59, p=0.14) (Figure 4A). Lymphocyte CBC and DNAm estimates were also not signi�cantlydifferent from one another (b=-0.59, p=0.14) (Figure 4B).
When regressing immune cell proportion difference scores [DNAm estimate – CBC estimate] onto time-point andcovariates, time-point (i.e., pre- and post-stress) was not a signi�cant predictor of difference scores forlymphocytes or monocytes (see Table S2 for post-hoc pairwise comparisons of time-points). Further, neither ofthe predicted intercepts for difference scores in monocytes and lymphocytes were signi�cantly different fromzero (monocytes: b=1.16, p=0.14; lymphocytes: b=-1.16, p=0.14), indicating that there were no signi�cantdifferences in DNAm and CBC estimate measurements across time-points. Additionally, ELA status was not asigni�cant predictor of differences between DNAm and CBC estimates of immune cell proportions (monocytes:b=2.52, p=0.09; lymphocytes b=-2.52, p=0.09), indicating that ELA status was not a confounding variable on theconcordance between DNAm and CBC measurements over time (see Table 4 for full multilevel regressionresults).
Table 4 – Study 2 Multilevel Modeling Results
Fixed Effects – Monocytes (Lymphocytes)
Estimate SE
Intercept 1.156 (-1.156) 0.78
Sex 0.351 (-0.351) 1.14
Age -1.113* (1.113*) 0.46
BMI 0.313 (-0.313) 0.19
Ethnicity 2.474* (-2.474*) 1.14
Early-life adversity 2.519 (-2.519) 1.40
Time 2 -0.474 (0.474) 0.94
Time 3 -0.381 (0.381) 0.96
Time 4 0.936 (-0.936) 0.97
Random Effects
Residual Variance 11.52
Individual-level Variance 2.63
Immune cell difference scores for monocytes and lymphocytes were modeled as a function of acute stresstime-point with sex, age, BMI, ethnicity, and early-life adversity status as covariates. Monocyte estimates werereported normally and lymphocyte estimates are reported in parentheses. Random effects for individuals wereincluded for the intercept only. * p < 0.05. ** p < 0.01. *** p < 0.001.
Discussion
Page 10/23
This study assessed the concordance between CBC and DNAm estimates of immune cell proportions using therecent Illumina EPIC DNAm method (29) in the context of CM and acute psychosocial stress. In Study 1, DNAmestimates were signi�cantly correlated with CBC values for all immune cells. The lower correlation coe�cients inmonocyte and basophil estimates may be due to the limited range of these cell type proportions in comparison toneutrophils, lymphocytes and eosinophils (52). Using Bland-Altman analysis, DNAm estimates of bothneutrophils and basophils were signi�cantly lower than CBC estimates, though CM did not signi�cantly explainany variation between estimation methods. DNAm estimates of lymphocytes, monocytes, and eosinophilsshowed no signi�cant deviations from CBC estimates. In Study 2, DNAm estimates were signi�cantly correlatedwith CBC values for both lymphocytes and monocytes. Additionally, using Bland-Altman analysis, DNAm andCBC estimates were not signi�cantly different from one another for both monocytes and lymphocytes. While theacute stress manipulation caused signi�cant changes in both monocyte and lymphocyte proportions over timeacross both approaches, it did not explain any variation in difference scores between CBC and DNAm estimates.Furthermore, in an exploratory analysis, ELA-status did not impact the concordance of CBC and DNAm estimatesfor either lymphocytes or monocytes over time.
Previous studies investigating the concordance between DNAm and CBC estimates of immune cell proportionshave been conducted in limited populations (e.g., patients with cancer, Down syndrome, obesity) (20) or nichetissues such as cord blood. Houseman and colleagues reported median difference scores between CBC andDNAm estimates to be 6.5% for neutrophils and 1.1% for monocytes when using their initial DNAm estimationlibrary. Lymphocyte subset values ranged from 0.1% – 2.1% (20). Importantly, the directionality of these resultscannot be interpreted because the errors were reported as absolute values. Using the Houseman et al. DNAmestimation libraries, Koestler and colleagues reported the correlations of CBC and DNAm estimates to be around0.60 for both lymphocytes and monocytes in PBMC samples (53), which is in line with our �ndings. Further, workby Accomando and colleagues (21) reported correlations between all immune cell subtypes when using theHouseman et al. DNAm estimation libraries, similar to our �ndings. However, Bland-Altman plots from this studyexhibited negligible mean bias in immune cell subtype proportions.
Although prior work exists validating the original Houseman reference library, little research has been done tovalidate the concordance of CBC and DNAm estimates of immune cell proportions using the �rst EPIC arraylibrary generated by Salas and colleagues (26). Salas and colleagues reported all lymphocyte cell subsets havingDNAm estimates higher (>1.25%) than CBC estimates. Monocyte values showed a similar trend with the mediandifference being less than 1% and neutrophils showed an opposite trend, with DNAm estimates being around1.5% lower than CBC estimates. Each of these values are comparable to and in the same direction as thedifferences seen in Study 1 results when using the �rst EPIC array library for DNAm estimates, with the exceptionof neutrophils, which had a similar effect size but in the opposite direction (see Tables S3-S7 for results of ouranalysis using the �rst EPIC array library generated by Salas and colleagues (26)).
To the best of the authors’ knowledge, there have been no previous studies assessing the concordance of CBCand DNAm estimates of immune cell proportions in a sample of maltreated children or in adults within thecontext of acute psychosocial stress. Further, this is the �rst study, to our knowledge, validating the recentlyreleased “FlowSorted.BloodExtended.EPIC” library (29) (see Methods). Study 1 provided a unique sample fortesting the impact of CM on the concordance between CBC and DNAm estimates of immune cell proportions in apediatric cohort. The experimental design employed by Study 2 allowed us to probe stress-induced temporaleffects on the concordance of CBC and DNAm estimates of immune cell proportions. Additionally, repeated

Page 11/23
measurements of immune cell proportions in Study 2 were obtained over a 5 hour time-window in response to anacute laboratory stressor, enabling us to detect the presence of temporal effects (54) of acute psychosocialstress on the concordance of immune cell proportion estimates. Contrary to expectations, we did not observesigni�cant effects of CM or acute psychosocial stress on the concordance of CBC and DNAm immune cellestimates.
This study is not without limitations. For both studies, accurately comparing CBC and DNAm estimates ofimmune cell proportions is contingent on the assumption that whole blood immune cell proportions areequivalent in different blood tubes collected from the same venipuncture of an individual. Although most studieson the reliability of CBC estimates operate under the same premise (55–58), it is nevertheless still anassumption. In addition, all experiences of CM were grouped into one category which does not acknowledge theheterogeneity of biological effects resulting from differing age of �rst CM incident, type of CM, and severity ofCM (59). Future studies should examine the impact of detailed CM classi�cation on the concordance of CBC andDNAm estimates. A limitation of Study 2 was the relatively smaller sample size and the assumption that allindividuals experienced a comparable increase in psychosocial stress from baseline to follow-up time-pointsduring the acute stress procedure. Additionally, our exploratory analysis of the impact of ELA on CBC and DNAmestimate difference scores could have been improved by using a larger sample of ELA and control individuals.
The null effects of CM and acute psychosocial stress on the concordance of CBC and DNAm estimates ofimmune cell proportions may be due in part to minimal overlap between CpG sites altered by exposure to stressand the libraries of CpG sites used in DNAm estimators. Alternatively, alterations in DNAm patterns induced byCM or acute psychosocial stress at CpG sites overlapping with sites used in DNAm estimators of immune cellproportions may not be substantial enough to alter these estimates in a signi�cant way (see Table S8 for effectsof CM and acute psychosocial stress on FlowSorted.BloodExtended.EPIC library probes). Future studies shouldexplore whether speci�c CpG sites used in DNAm estimations of immune cell proportions overlap with othercommon CpG sites associated with physical or mental disorders. Additionally, future work should also beperformed to test potential DNAm changes that take place in response to acute psychosocial stress over anextended period of time. Finally, we also recommend that more clinically practical methods (8,60) of estimatingimmune cell proportions be tested for their accuracy in populations of individuals that have experienced CM andin individuals that have experienced acute psychosocial stress.
ConclusionAlthough signi�cant differences in raw value estimation between CBC and DNAm exist for some immune cellproportions, CM and acute psychosocial stress did not alter the existing concordance of CBC and DNAmestimations of immune cell proportions. These �ndings extend previous research and suggest that study designswhich include individuals with an exposure to adverse events, as well as study designs employing acute stressparadigms can rely on existing DNAm methods to estimate proportions of immune cell subtypes.
MethodsStudy 1: Participants and Procedures

Page 12/23
Study 1 participants were members of the CHS (61), a large multidisciplinary study designed to provideprospective, longitudinal data on the health and development of children with and without a history ofmaltreatment. The CHS is currently recruiting a large state-wide cohort of children recently investigated for CMand non-maltreated comparison children. The goals of the CHS are to elucidate the multiple etiologicalprocesses, as well as mediators and moderators, believed to play a role in the onset and maintenance of adversehealth outcomes among survivors of CM, and to better inform intervention opportunities to reverse the negativeconsequences of CM.
Recruitment for the CHS is ongoing. Children with a recent (<12 months) report of CM exposure are identi�ed incollaboration with Pennsylvania’s Statewide Child Welfare Information System (CWIS). Subjects with recentinvolvement in the CWIS are invited to participate in the study through home mailings and phone contact bystudy coordinators. Eligibility criteria include: 1) aged 8 to 13 years, 2) subject of a CWIS maltreatment report (i.e.,an allegation is made and investigated) and agreement for participation within 12 months of CWIS involvement,and 3) agreement of participation by a non-abusing caregiver. Non-maltreated comparison children are recruitedvia targeted advertisements in the same Pennsylvania counties as children with a history of CM investigations.Eligibility for participation includes: 1) no previous CWIS reports or contact, and 2) demographic similarity to amaltreatment participant. After recruitment, participating families are invited to visit the Center for HealthyChildren at The Pennsylvania State University for a full day of assessments and biospecimen collection.Approval from The Pennsylvania State University Institutional Review Board was granted, and informed assent(child) or consent (caregiver) was obtained from all participants.
Families of participants arrived at the Center for Healthy Children at 7:30 a.m. After an introduction to the study,youth underwent a physical exam followed by fasting whole blood collection in 10 mL and 4mL EDTA tubes viaantecubital venipuncture by a trained phlebotomist. Blood samples collected in 4mL EDTA tubes were sent toQuest Diagnostics for CBC analyses within 24 hours of collection. Genomic DNA was extracted from whole bloodusing a semi-automated approach (QIASymphony, Qiagen). Whole-genome DNAm levels were analyzed using theIllumina In�nium EPIC array.
Demographic information for each participant was collected by survey. Body mass index (BMI) was obtained viaa trained staff member collecting weight and height information from each participant and then calculating theirstandard weight to height-squared ratio. Pubertal stage was assessed by a trained staff member by taking anaverage of self-reported Tanner pubertal status measures of breast growth and pubic hair growth (62). Totalhousehold income before taxes was self-reported by caregivers using a 0-11 Likert scale (0 = Under $10,000/year,1 = $10,000-$19,999/year… 11 = More than $120,000/year). Race was caregiver-reported and collapsed into abinary variable where “White” was coded as zero and all other races were coded as one. This was done to ensurea large enough sample size in each category to detect statistically signi�cant effects of race. Ethnicity wascaregiver-reported as either “Hispanic” or “Non-Hispanic”.
Cross-sectional data reported in Study 1 were drawn from the baseline (i.e., Time 1) assessment of currentlyenrolled CHS participants. Although recruitment for this cohort study is ongoing with a target enrollment of 700children, an initial subset of 439 participants were available for the purpose of these analyses. Of the 439participants who had completed Time 1 assessments, 435 consented to anthropometric measurements and 401consented to and successfully completed blood draws (1 caregiver refusal, 33 participant refusals, 4 attemptedbut incomplete). The �rst batch for DNAm analysis constituted 286 total samples and 275 samples survived
Page 13/23
DNAm QC measures. A second batch, including 126 samples, was submitted for DNAm analysis, of which allsamples survived DNAm QC measures. Both batches combined amounted to a total of 401 individuals. Of these401 samples, 36 were excluded from the current analyses due to failed/missing CBC tests or other missingcovariates, making our �nal analytic sample a total of 365 participants. No demographic differences werepresent between groups included and excluded from the analysis, with the exception of BMI and pubertal status(BMI being higher in the included group and pubertal status being lower; p<0.05).
Study 2: Participants and Procedures
Study 2 was comprised of a sample of 28 healthy individuals aged 18 to 25 years. Participants were recruited byword of mouth and advertisements on campus bulletin boards. During a visit to The Pennsylvania StateUniversity’s Clinical Research Center, participants were subjected to the Trier Social Stress Test (TSST) followedby a 4-hour post-test sampling and questionnaire period. Testing for each participant began at 11:00am andended by 4:15pm. Blood was drawn at four different points during this time period (30 minutes before the TSSTand 30, 90, and 240 minutes post-TSST). Participants were given speci�c instructions to refrain from excessivephysical activity on the day of the testing, consuming alcohol for 12 hours before their arrival, and eating anddrinking (besides water) for 2 hours prior to the testing session. The TSST was scheduled to begin at 12:00pm tominimize the effects of circadian changes in cortisol. Detailed information on study procedures, including detailson the TSST, has been reported previously (63).
The original motivation for this data collection was to examine differences in gene expression due to ELA status.For the purpose of the current investigation, we combined data from all participants, including those who hadexperienced ELA and controls. Exploratory analyses in Study 2 further examined differences in DNAm estimatesof immune cell proportions by ELA status. ELA status of participants was assessed by a trained clinicalinterviewer during a phone interview using the Stressful Life Events Screening Questionnaire (64), as describedpreviously (63). BMI was obtained by collecting weight and height information from each participant and thencalculating their standard weight to height-squared ratio. Ethnicity was self-reported as either “Hispanic” or “Non-Hispanic”.
Whole blood samples were repeatedly collected via an IV catheter into the antecubital vein. Blood samplescollected in 4mL EDTA tubes were sent to Quest Diagnostics for CBC analysis within 24 hours. Blood samplescollected in 10mL EDTA tubes were immediately centrifuged for 10 minutes at 1500g prior to collection ofplasma. Peripheral blood mononuclear cells (PBMCs) were then isolated through density-gradient centrifugationusing Ficoll. A small fraction of granulocytes in PBMC samples may have been retained (mean remaininggranulocyte composition was 1.6% according to DNAm estimates) during processing. DNA was extracted fromPBMCs using QIAmp mini kit (Qiagen) and sent to the Genome Sciences Core at The Pennsylvania StateUniversity for whole genome DNAm analysis.
DNAm Quality Control and Immune Cell Proportion Estimations
For both studies, DNA was bisul�te converted and processed by either McGill University (Study 1) or the GenomeSciences Core at The Pennsylvania State University (Study 2). DNAm levels were probed using the IlluminaIn�nium EPIC array (26). EPIC array idat imaging �les were converted to DNAm M and b value matrices with themin� (65) package using R statistical software (R v4.1.2). Sample normalization was performed according torecommendations by Salas and colleagues using the noob normalization method in the min� package (29) and

Page 14/23
DNAm estimates of blood cell proportions were computed using the ProjectCellType_CP function in theFlowSorted.Blood.EPIC package, which is equivalent to the ProjectCellType function in min�.The“FlowSorted.BloodExtended.EPIC” library (29) was used as reference data for blood cell proportion estimates inboth studies.
Modeling CBC and DNAm Estimates
The results from CBC tests and the DNAm estimates of immune cell proportions do not report the samecategories of immune cell subtypes. CBC tests report neutrophils, lymphocytes, monocytes, eosinophils, andbasophils whereas the recent Salas et al. DNAm estimates (29) provide a much larger subset of lymphocytessuch as memory and naïve CD4T, CD8T and B-cells, as well as natural killer (NK) cells and regulatory T-cells. Allgranulocytes (neutrophils, eosinophils and basophils) were modeled in Study 1, whereas only PBMCs (composedonly of monocytes and lymphocytes) were used in Study 2. The following formulae were used to compare thediffering cell type reports from CBC and DNAm estimates:
Statistical Analysis
Study 1
In Study 1, Pearson correlation coe�cients were calculated to test the association between CBC and DNAmestimates of immune cell proportions. Bland-Altman analyses (66,67) were then performed to test for theconcordance between each cell type’s CBC and DNAm estimates.
Multivariate linear regression was used to test whether the presence of CM signi�cantly altered the concordanceof CBC and DNAm estimates of immune cell proportions. The difference between CBC and DNAm estimates[DNAm estimate – CBC estimate] was treated as the outcome and CM was treated as a predictor. Additionalcovariates included age, sex, BMI, household income, average Tanner measurements for pubertal stage, race, andethnicity. Although income was assessed as a categorical variable, it was treated as continuous. ‘White’ and ‘non-Hispanic’ racial and ethnic categorizations were treated as reference groups due to the fact that they were thelargest groups in the sample. Continuous covariates were sample-mean centered and dichotomous covariates (0or 1) were coded as -0.5 or 0.5 to allow for easier interpretation of regression estimates for the sample mean.
Study 2

Page 15/23
In Study 2, correlation coe�cients were calculated to test the association between CBC and DNAm estimates ofimmune cell proportions. A repeated-measures Bland-Altman analysis (68) for each cell type’s CBC and DNAmestimates was used to test for the concordance of these values.
Due to the repeated measures study design, a multilevel modeling framework was used to test whether acutepsychosocial stress signi�cantly altered the concordance of CBC and DNAm estimates of immune cellproportions. The difference between CBC and DNAm estimates of cell proportions [DNAm estimate – CBCestimate] was treated as the outcome and the time-point was treated as the predictor to determine if there wassigni�cant variation in difference scores across time-points. Individual random effects were included for themodel intercept and additional covariates included sex, age, BMI, ethnicity, and ELA status. All variables, otherthan time-point, were mean-centered as described for Study 1.
AbbreviationsDNAm: DNA methylation; EWAS: Epigenome-wide association studies; CBC: Complete blood count; CpG: 5'-cytosine-phosphate-guanine-3'; CM: Child maltreatment; ELA: Early life adversity; CHS: Child Health Study; TSST:Trier Social Stress Test; CWIS: Pennsylvania’s Statewide Child Welfare Information System; BMI: Body-massindex; PBMCs: Peripheral blood mononuclear cells; NK: Natural killer cells
DeclarationsEthics approval and consent to participate:
Study 1: Approval for this study was provided by the institutional review board of The Pennsylvania StateUniversity (protocol STUDY00006550). Informed assent (child) and consent (caregiver) was obtained from allparticipants in the study. All methods were carried out in accordance with relevant guidelines and regulations(Declaration of Helsinki).
Study 2: The study was approved by the institutional review board of The Pennsylvania State University (protocolSTUDY00008751), registered at ClinicalTrials.gov (Identi�er: NCT03637751), and all participants provided writteninformed consent.
Consent for publication:
N/A.
Availability of data and materials:
The datasets used and/or analyzed during the current study are available from the corresponding author onreasonable requests.
Competing interests:
N/A.
Funding:

Page 16/23
Research reported in this manuscript was supported by grants from the National Institutes of Health, NationalInstitute of Child Health and Human Development P50HD089922 (J.G.N), R01HD072468 (J.G.N), NationalInstitutes of Aging through R01AG04879 (J.G.N), National Institutes of Aging through R21AG055621 (I.S.), andby the National Center for Advancing Translational Sciences through UL1 TR002014 grant. A.T.A and L.E. weresupported by National Institute on Aging Grant T32 AG049676 to The Pennsylvania State University. The contentis solely the responsibility of the authors and does not necessarily represent the o�cial views of the NationalInstitutes of Health.
Authors’ contributions:
A.T.A, L.E and I.S contributed to the analysis, conception, design, and writing of the manuscript. All authors readand approved the �nal manuscript.
Acknowledgements:
For Study 1, we thank the children and caregivers for their participation in the study, and Child Health Study stafffor their dedication, hard work and insights. For Study 2, we thank all nurses at the CRC and the participants inthis study. We would also like to acknowledge the important formative work that Salas et al. (29) and Housemanet al. (20) have done.
References1. Scheiermann C, Frenette PS, Hidalgo A. Regulation of leucocyte homeostasis in the circulation. Cardiovasc
Res. 2015 Aug 1;107(3):340–51.
2. Jung YJ, Kim JH, Park YJ, Kahng J, Lee H, Lee KY, et al. Evaluation of cell population data on the UniCel DxH800 Coulter Cellular Analysis system as a screening for viral infection in children. Int J Lab Hematol.2012;34(3):283–9.
3. Velioglu Y, Yuksel A. Complete blood count parameters in peripheral arterial disease. Aging Male. 2019 Jul3;22(3):187–91.
4. Madjid M, Fatemi O. Components of the Complete Blood Count as Risk Predictors for Coronary HeartDisease. Tex Heart Inst J. 2013;40(1):17–29.
5. Wielińska-Wiśniewska H, Nowak JK, Da browski M, Szydłowska P, Szczepanik M, Cichocka K, et al.Reliability of Capillary Complete Blood Count in Children With Acute Gastroenteritis. Front Pediatr. 2021 Aug1;9.
�. Dixon L. The Complete Blood Count: Physiologic Basis and Clinical Usage. J. Perinat Neonat Nurs.1997;11(3):1-18
7. Blumenreich MS. The White Blood Cell and Differential Count. In: Walker HK, Hall WD, Hurst JW, editors.Clinical Methods: The History, Physical, and Laboratory Examinations. 3rd ed. Boston: Butterworths; 1990.
�. Frobel J, Božić T, Lenz M, Uciechowski P, Han Y, Herwartz R, et al. Leukocyte Counts Based on DNAMethylation at Individual Cytosines. Clin Chem. 2018 Mar 1;64(3):566–75.
9. Cole SW. Elevating the perspective on human stress genomics. Psychoneuroendocrinology. 2010 Aug1;35(7):955–62.

Page 17/23
10. Adalsteinsson BT, Gudnason H, Aspelund T, Harris TB, Launer LJ, Eiriksdottir G, et al. Heterogeneity in WhiteBlood Cells Has Potential to Confound DNA Methylation Measurements. PLoS ONE. 2012 Oct5;7(10):e46705.
11. Lin J, Cheon J, Brown R, Coccia M, Puterman E, Aschbacher K, et al. Systematic and Cell Type-Speci�cTelomere Length Changes in Subsets of Lymphocytes. J Immunol Res. 2016;2016:5371050.
12. Satija R, Shalek AK. Heterogeneity in immune responses: from populations to single cells. Trends Immunol.2014 May;35(5):219–29.
13. Qi L, Teschendorff AE. Cell-type heterogeneity: Why we should adjust for it in epigenome and biomarkerstudies. Clin Epigenetics. 2022 Dec;14(1):1–8.
14. Jaffe AE, Irizarry RA. Accounting for cellular heterogeneity is critical in epigenome-wide association studies.Genome Biol. 2014 Feb;15(2):1–9.
15. Campbell KA, Colacino JA, Park SK, Bakulski KM. Cell Types in Environmental Epigenetic Studies: Biologicaland Epidemiological Frameworks. Curr Environ Health Rep. 2020 Sep 1;7(3):185–97.
1�. Walters MC, Abelson HT. Interpretation of the Complete Blood Count. Pediatr Clin North Am. 1996 Jun1;43(3):599–622.
17. Álvarez-errico D, Vento-tormo R, Sieweke M, Ballestar E. Epigenetic control of myeloid cell differentiation,identity and function. Nat Rev Immunol. 2015 Jan;15(1):7–17.
1�. Kim M, Costello J. DNA methylation: an epigenetic mark of cellular memory. Exp Mol Med. 2017Apr;49(4):e322–e322.
19. Schmidt M, Maié T, Dahl E, Costa IG, Wagner W. Deconvolution of cellular subsets in human tissue based ontargeted DNA methylation analysis at individual CpG sites. BMC Biol. 2020 Dec;18(1):1–13.
20. Houseman EA, Accomando WP, Koestler DC, Christensen BC, Marsit CJ, Nelson HH, et al. DNA methylationarrays as surrogate measures of cell mixture distribution. BMC Bioinformatics. 2012;13-86
21. Accomando WP, Wiencke JK, Houseman EA, Nelson HH, Kelsey KT. Quantitative reconstruction of leukocytesubsets using DNA methylation. Genome Biol. 2014;15(3):R50.
22. Bakulski KM, Feinberg JI, Andrews SV, Yang J, Brown S, L. McKenney S, et al. DNA methylation of cord bloodcell types: Applications for mixed cell birth studies. Epigenetics. 2016 May 3;11(5):354–62.
23. Youse� P, Huen K, Quach H, Motwani G, Hubbard A, Eskenazi B, et al. Estimation of blood cellularheterogeneity in newborns and children for epigenome-wide association studies: Blood CellularHeterogeneity in Newborns and Children. Environ Mol Mutagen. 2015 Dec;56(9):751–8.
24. Guintivano J, Aryee MJ, Kaminsky ZA. A cell epigenotype speci�c model for the correction of brain cellularheterogeneity bias and its application to age, brain region and major depression. Epigenetics. 2013 Mar1;8(3):290–302.
25. Reinius LE, Acevedo N, Joerink M, Pershagen G, Dahlén SE, Greco D, et al. Differential DNA Methylation inPuri�ed Human Blood Cells: Implications for Cell Lineage and Studies on Disease Susceptibility. PLoS ONE.2012 Jul 25;7(7):e41361.
2�. Salas LA, Koestler DC, Butler RA, Hansen HM, Wiencke JK, Kelsey KT, et al. An optimized library for reference-based deconvolution of whole-blood biospecimens assayed using the Illumina HumanMethylationEPICBeadArray. Genome Biol. 2018 Dec;19(1):64.

Page 18/23
27. Salas LA, Koestler DC. FlowSorted.Blood.EPIC. Immunomethylomics Working Group; 2022. Available from:https://github.com/immunomethylomics/FlowSorted.Blood.EPIC
2�. Koestler DC, Jones MJ, Usset J, Christensen BC, Butler RA, Kobor MS, et al. Improving cell mixturedeconvolution by identifying optimal DNA methylation libraries (IDOL). BMC Bioinformatics. 2016Dec;17(1):120.
29. Salas LA, Zhang Z, Koestler DC, Butler RA, Hansen HM, Molinaro AM, et al. Enhanced cell deconvolution ofperipheral blood using DNA methylation for high-resolution immune pro�ling. Nat Commun. 2022 Feb9;13(1):761.
30. Gervin K, Salas LA, Bakulski KM, van Zelm MC, Koestler DC, Wiencke JK, et al. Systematic evaluation andvalidation of reference and library selection methods for deconvolution of cord blood DNA methylation data.Clin Epigenetics. 2019 Dec;11(1):1–15.
31. Murgatroyd C, Patchev AV, Wu Y, Micale V, Bockmühl Y, Fischer D, et al. Dynamic DNA methylation programspersistent adverse effects of early-life stress. Nat Neurosci. 2009 Dec;12(12):1559–66.
32. Elliott E, Ezra-Nevo G, Regev L, Neufeld-Cohen A, Chen A. Resilience to social stress coincides with functionalDNA methylation of the Crf gene in adult mice. Nat Neurosci. 2010 Nov;13(11):1351–3.
33. Szyf M. The early life social environment and DNA methylation: DNA methylation mediating the long-termimpact of social environments early in life. Epigenetics. 2011 Aug;6(8):971–8.
34. Szyf M. The early-life social environment and DNA methylation. Clin Genet. 2012;81(4):341–9.
35. Hing B, Braun P, Cordner ZA, Ewald ER, Moody L, McKane M, et al. Chronic social stress induces DNAmethylation changes at an evolutionary conserved intergenic region in chromosome X. Epigenetics. 2018Jun 3;13(6):627–41.
3�. Lapp HE, Hunter RG. Early life exposures, neurodevelopmental disorders, and transposable elements.Neurobiol Stress. 2019 May 21;11:100174.
37. Spengler D, Binder E, editors. Epigenetics and Neuroendocrinology: Clinical Focus on Psychiatry, Volume 2.Cham: Springer International Publishing; 2016. (Epigenetics and Human Health). Available from:http://link.springer.com/10.1007/978-3-319-29901-3
3�. Parade SH, Huffhines L, Daniels TE, Stroud LR, Nugent NR, Tyrka AR. A systematic review of childhoodmaltreatment and DNA methylation: candidate gene and epigenome-wide approaches. Transl Psychiatry.2021 Feb 19;11(1):1–33.
39. Cecil CAM, Zhang Y, Nolte T. Childhood maltreatment and DNA methylation: A systematic review. NeurosciBiobehav Rev. 2020 May 1;112:392–409.
40. Seif EA, Diab IH, Ibrahim SA, Hussein HA, Ghitani SA. Association between different parameters of childmaltreatment and global DNA methylation. Alex J Med. 2019 Jan 2;55(1):82–8.
41. Houtepen LC, Hardy R, Maddock J, Kuh D, Anderson EL, Relton CL, et al. Childhood adversity and DNAmethylation in two population-based cohorts. Transl Psychiatry. 2018 Dec 3;8(1):1–12.
42. Fraga MF, Ballestar E, Paz MF, Ropero S, Setien F, Ballestar ML, et al. Epigenetic differences arise during thelifetime of monozygotic twins. Proc Natl Acad Sci. 2005 Jul 26;102(30):10604–9.
43. Yang BZ, Zhang H, Ge W, Weder N, Douglas-Palumberi H, Perepletchikova F, et al. Child Abuse and EpigeneticMechanisms of Disease Risk. Am J Prev Med. 2013 Feb 1;44(2):101–7.

Page 19/23
44. de Rooij SR, Costello PM, Veenendaal MVE, Lillycrop KA, Gluckman PD, Hanson MA, et al. Associationsbetween DNA methylation of a glucocorticoid receptor promoter and acute stress responses in a largehealthy adult population are largely explained by lifestyle and educational differences.Psychoneuroendocrinology. 2012 Jun;37(6):782–8.
45. Unternaehrer E, Luers P, Mill J, Dempster E, Meyer AH, Staehli S, et al. Dynamic changes in DNA methylationof stress-associated genes (OXTR, BDNF ) after acute psychosocial stress. Transl Psychiatry. 2012Aug;2(8):e150–e150.
4�. Rodrigues GM, Toffoli LV, Manfredo MH, Francis-Oliveira J, Silva AS, Raquel HA, et al. Acute stress affectsthe global DNA methylation pro�le in rat brain: Modulation by physical exercise. Behav Brain Res. 2015 Feb15;279:123–8.
47. Floriou-Servou A, von Ziegler L, Waag R, Schläppi C, Germain PL, Bohacek J. The Acute Stress Response inthe Multiomic Era. Biol Psychiatry. 2021 Jun 15;89(12):1116–26.
4�. Tylee DS, Kawaguchi DM, Glatt SJ. On the outside, looking in: A review and evaluation of the comparabilityof blood and brain “-omes.” Am J Med Genet B Neuropsychiatr Genet. 2013;162(7):595–603.
49. Sullivan PF, Fan C, Perou CM. Evaluating the comparability of gene expression in blood and brain. Am J MedGenet B Neuropsychiatr Genet. 2006;141B(3):261–8.
50. Allen AP, Kennedy PJ, Dockray S, Cryan JF, Dinan TG, Clarke G. The Trier Social Stress Test: Principles andpractice. Neurobiol Stress. 2016 Nov 12;6:113–26.
51. Etzel L, Apsley AT, Mattern BC, Hastings WJ, Heller T, Ram N, et al. Immune cell dynamics in response to anacute laboratory stressor: A within person – between group analysis of the biological impact of early lifeadversity. Under Review.
52. Bland JM, Altman DG. Correlation in restricted ranges of data. BMJ Br Med J Online. 2011 Mar 11;342.
53. Koestler DC, Christensen BC, Karagas MR, Marsit CJ, Langevin SM, Kelsey KT, et al. Blood-based pro�les ofDNA methylation predict the underlying distribution of cell types. Epigenetics. 2013 Aug 1;8(8):816–26.
54. Sapolsky RM, Romero LM, Munck AU. How Do Glucocorticoids In�uence Stress Responses? IntegratingPermissive, Suppressive, Stimulatory, and Preparative Actions*. Endocr Rev. 2000 Feb 1;21(1):55–89.
55. Gunawardena D, Jayaweera S, Madhubhashini G, Lokumarakkala DD, Senanayake SJ. Reliability ofParameters of Complete Blood Count With Different Storage Conditions. J Clin Lab Anal. 2016 Aug27;31(2):e22042.
5�. Hedberg P, Lehto T. Aging stability of complete blood count and white blood cell differential parametersanalyzed by Abbott CELL-DYN Sapphire hematology analyzer. Int J Lab Hematol. 2009;31(1):87–96.
57. Nakul-Aquaronne D, Sudaka-Sammarcelli I, Ferrero-Vacher C, Starck B, Bayle J. Evaluation of the Sysmex Xe-2100® hematology analyzer in hospital use. J Clin Lab Anal. 2003;17(4):113–23.
5�. Buttarello M. Quality speci�cation in haematology: the automated blood cell count. Clin Chim Acta. 2004Aug 2;346(1):45–54.
59. Lay�eld SD, Duffy LA, Phillips KA, Lardenoije R, Klengel T, Ressler KJ. Multiomic biological approaches to thestudy of child abuse and neglect. Pharmacol Biochem Behav. 2021 Nov;210:173271.
�0. Pittella-Silva F. Targeting DNA Methylation as an Epigenetic Leukocyte Counting Tool. Clin Chem. 2022 Mar12;hvac035.
Page 20/23
�1. Schreier HMC, Heim CM, Rose EJ, Shalev I, Shenk CE, Noll JG. Assembling a cohort for in-depth, longitudinalassessments of the biological embedding of child maltreatment: Methods, complexities, and lessonslearned. Dev Psychopathol. 2021 May;33(2):394–408.
�2. Emmanuel M, Bokor BR. Tanner Stages. In: StatPearls. Treasure Island (FL): StatPearls Publishing; 2022.Available from: http://www.ncbi.nlm.nih.gov/books/NBK470280/
�3. Shalev I, Hastings WJ, Etzel L, Israel S, Russell MA, Hendrick KA, et al. Investigating the impact of early-lifeadversity on physiological, immune, and gene expression responses to acute stress: A pilot feasibility study.Seedat S, editor. PLoS ONE. 2020 Apr 3;15(4):e0221310.
�4. Goodman LA, Corcoran C, Turner K, Yuan N, Green BL. Assessing traumatic event exposure: General issuesand preliminary �ndings for the Stressful Life Events Screening Questionnaire. J Trauma Stress.1998;11(3):521–42.
�5. Aryee MJ, Jaffe AE, Corrada-Bravo H, Ladd-Acosta C, Feinberg AP, Hansen KD, et al. Min�: a �exible andcomprehensive Bioconductor package for the analysis of In�nium DNA methylation microarrays.Bioinformatics. 2014 May 15;30(10):1363–9.
��. Ludbrook J. Con�dence in Altman–Bland plots: A critical review of the method of differences. Clin ExpPharmacol Physiol. 2010;37(2):143–9.
�7. Doğan NÖ. Bland-Altman analysis: A paradigm to understand correlation and agreement. Turk J Emerg Med.2018 Dec 1;18(4):139–41.
��. Parker RA, Scott C, Inácio V, Stevens NT. Using multiple agreement methods for continuous repeatedmeasures data: a tutorial for practitioners. BMC Med Res Methodol. 2020 Jun 12;20(1):154.
Figures

Page 21/23
Figure 1
Study 1: CBC estimates of immune cell proportions are displayed on the y-axis and DNAm estimates aredisplayed on the x-axis. A 45-degree reference line is shown to display the trajectory of perfect concordancebetween CBC and DNAm estimates.
Figure 2
Study 1: Bland-Altman plots of neutrophils, lymphocytes, monocytes, eosinophils, and basophils. Differences (y-axis) are de�ned as [DNAm estimates – CBC estimates]. Positive observed biases indicate DNAm estimatesoverestimating CBC estimates, and negative observed biases indicate DNAm estimates underestimating CBCestimates.

Page 22/23
Figure 3
Study 2: CBC estimates of immune cell proportions are displayed on the y-axis and DNAm estimates aredisplayed on the x-axis. A 45-degree reference line is shown to display the trajectory of perfect concordancebetween CBC and DNAm estimates.

Page 23/23
Figure 4
Study 2: Bland-Altman plots of monocytes and lymphocytes. Differences (y-axis) are de�ned as [DNAmestimates – CBC estimates]. Positive observed biases indicate DNAm estimates overestimating CBC estimates,and negative observed biases indicate DNAm estimates underestimating CBC estimates.
Supplementary Files
This is a list of supplementary �les associated with this preprint. Click to download.
AdditionalFile1.xlsx
SupplementaryFigures.docx