investigating childhood leukemia in churchill county, nevada
TRANSCRIPT
IntroductionAcute lymphocytic leukemia (ALL) is the mostcommonly diagnosed pediatric cancer in theUnited States (American Cancer Society 2005;Linet et al. 1999; Sandler and Ross 1997).Established risk factors such as ionizing radia-tion and prenatal exposure to volatile organiccompounds (VOCs) do not explain most ALLdiagnoses (Belson et al. 2006; Greaves 1997;Linet and Cartwright 1996). For the most part,clustering of children diagnosed with ALL hasbeen attributed to chance (Boyle et al. 1996;Caldwell 1990; Caldwell and Heath 1976).However, when a county of 26,000 peopleincurred more than a dozen leukemia diagnosesduring a 4-year period in which fewer than twocases were expected, an investigation seemedwarranted [Nevada State Health Division(NSHD) 2001; Steinmaus et al. 2004).
Potential environmental exposures. Thecity of Fallon (population 8,000) is the onlyurban center in Churchill County, Nevada.The Naval Air Station–Fallon (NAS Fallon)contributes an additional 3,000 residents to thecity’s population. The local community identi-fied four major areas of concern related to envi-ronmental exposures. A pipeline runs throughdowntown Fallon, delivering a continuous sup-ply of JP-8 jet fuel to the base. Both municipaland NAS water supplies have historicallyreported naturally occurring arsenic levels that
exceed U.S. Environmental Protection Agency(U.S. EPA) standards (Welch and Lico 1998;Welch et al. 1989). Fallon is also a center formelon and alfalfa production, and agriculturalpesticides are applied to fields surrounding thecity. Two facilities related to tungsten refiningand use are located in Churchill County: Anadministrative center and laboratory are indowntown Fallon, and a tungsten carbide pro-cessing plant is 11 miles north of Fallon[Agency for Toxic Substances and DiseaseRegistry (ATSDR) 2003].
Initial identification of the cluster. In July2000, an astute local health care provider noti-fied state health officials that several ChurchillCounty children had recently been diagnosedwith leukemia. In general, state cancer registriesexperience significant reporting lag, so statehealth officials conducted active case finding toverify leukemia occurrence. By February 2001,the NSHD had identified 12 children who hadbeen diagnosed with leukemia since 1997 andwho had lived in Churchill County before theirdiagnosis. The state convened an expert panelcomposed of national cancer specialists, epi-demiologists, and public health officials toreview these cases. The panel recommendedthat the state epidemiologist request technicalassistance from the Centers for DiseaseControl and Prevention (CDC) to investigatewhether ongoing exposure to environmental
contaminants in Churchill County might beendangering human health (Robison et al.2001). Two new cases were added to the state’slist shortly after the expert panel report wascompleted, bringing the number of casesincluded in the state’s investigation to 14.
Multiagency response. The NSHDresponded to recommendations of the expertpanel by approaching the CDC for assistancein Churchill County. Beginning in March2001 the CDC led a multiagency effort toconduct a comprehensive cross-sectional expo-sure assessment. In Table 1 we list the stateand federal agencies that were involved andidentify the responsibilities of each agency. Allinvolved agencies were represented at commu-nity meetings held throughout the studyperiod to provide updates on the status of thestudy. During the course of the investigation,all biologic and environmental laboratoryresults were reviewed as they were receivedand were collectively assessed for risk by mul-tidisciplinary expert panels (CDC 2004); thisjoint review was conducted to fulfill theCDC’s promise to the community that anyresults suggesting the possibility of an ongoinghealth risk, regardless of known significance tothe cluster analysis, would be released to thecommunity immediately rather than waitinguntil the end of the study.
Materials and Methods
Case definition and selection of comparisonfamilies. We defined a case family as the childdiagnosed with leukemia and all other peoplecurrently living in the child’s home (i.e., allsiblings, parents, guardians, and other adults),
Environmental Health Perspectives • VOLUME 115 | NUMBER 1 | January 2007 151
Research | Mini-Monograph
This article is part of the mini-monograph “CancerCluster Activities at the Centers for Disease Controland Prevention.”
Address correspondence to C.S. Rubin, CDC,NCEH, 4770 Buford Hwy. NE, Building 101, Room1156, Atlanta, GA 30341 USA. Telephone: (770)488-3406. Fax: (770) 488-3450. E-mail: [email protected]
We thank K. Service, J. Najima, J. Ryan,M. Candreia, B. Goetsch, D. Henahan, J. Wamsley,D. Wollin, D. Reissman, A. Wolkin, R. Sabogal,K. Schmeichel, J. Mutter, D. Ashley, D. Paschal,M. Gallagher, S. O’Connor, R. Boneva, L. Levy,K. Tedford, and the entire City of Fallon for theirsupport of and contributions to this investigation.
The findings and conclusions in this report arethose of the author(s) and do not necessarily repre-sent the views of the CDC.
The authors declare they have no competingfinancial interests.
Received 18 January 2006; accepted 15 June 2006.
Investigating Childhood Leukemia in Churchill County, Nevada
Carol S. Rubin,1 Adrianne K. Holmes,1 Martin G. Belson,1 Robert L. Jones,2 W. Dana Flanders,2 Stephanie M. Kieszak,1
John Osterloh,2 George E. Luber,1 Benjamin C. Blount,1 Dana B. Barr,2 Karen K. Steinberg,1 Glen A. Satten,1
Michael A. McGeehin,1 and Randall L. Todd 2
1National Center for Environmental Health, Centers for Disease Control and Prevention, Atlanta, Georgia, USA; 2Nevada State HealthDivision, Carson City, Nevada, USA
BACKGROUND. Sixteen children diagnosed with acute leukemia between 1997 and 2002 lived inChurchill County, Nevada, at the time of or before their illness. Considering the county populationand statewide cancer rate, fewer than two cases would be expected.
OBJECTIVES. In March 2001, the Centers for Disease Control and Prevention led federal, state, andlocal agencies in a cross-sectional, case-comparison study to determine if ongoing environmentalexposures posed a health risk to residents and to compare levels of contaminants in environmentaland biologic samples collected from participating families.
METHODS. Surveys with more than 500 variables were administered to 205 people in 69 families.Blood, urine, and cheek cell samples were collected and analyzed for 139 chemicals, eight viralmarkers, and several genetic polymorphisms. Air, water, soil, and dust samples were collected fromalmost 80 homes to measure more than 200 chemicals.
RESULTS. The scope of this cancer cluster investigation exceeded any previous study of pediatricleukemia. Nonetheless, no exposure consistent with leukemia risk was identified. Overall, tungstenand arsenic levels in urine and water samples were significantly higher than national comparisonvalues; however, levels were similar among case and comparison groups.
CONCLUSIONS. Although the cases in this cancer cluster may in fact have a common etiology, theirsmall number and the length of time between diagnosis and our exposure assessment lessen theability to find an association between leukemia and environmental exposures. Given the limitationsof individual cancer cluster investigations, it may prove more efficient to pool laboratory and ques-tionnaire data from similar leukemia clusters.
KEY WORDS: ALL, AML, Churchill County, cancer cluster, environment, Fallon, leukemia, tung-sten. Environ Health Perspect 115:151–157 (2007). doi:10.1289/ehp.9022 available viahttp://dx.doi.org/ [Online 30 November 2006]
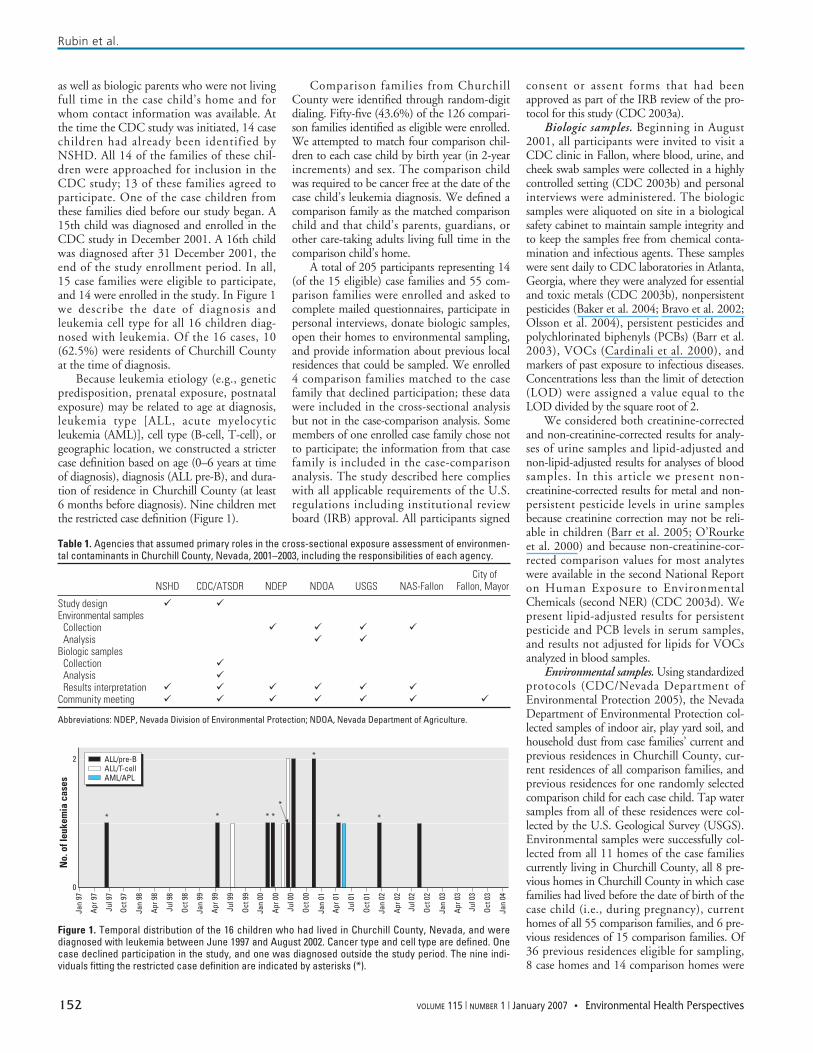
as well as biologic parents who were not livingfull time in the case child’s home and forwhom contact information was available. Atthe time the CDC study was initiated, 14 casechildren had already been identified byNSHD. All 14 of the families of these chil-dren were approached for inclusion in theCDC study; 13 of these families agreed toparticipate. One of the case children fromthese families died before our study began. A15th child was diagnosed and enrolled in theCDC study in December 2001. A 16th childwas diagnosed after 31 December 2001, theend of the study enrollment period. In all,15 case families were eligible to participate,and 14 were enrolled in the study. In Figure 1we describe the date of diagnosis andleukemia cell type for all 16 children diag-nosed with leukemia. Of the 16 cases, 10(62.5%) were residents of Churchill Countyat the time of diagnosis.
Because leukemia etiology (e.g., geneticpredisposition, prenatal exposure, postnatalexposure) may be related to age at diagnosis,leukemia type [ALL, acute myelocyticleukemia (AML)], cell type (B-cell, T-cell), orgeographic location, we constructed a strictercase definition based on age (0–6 years at timeof diagnosis), diagnosis (ALL pre-B), and dura-tion of residence in Churchill County (at least6 months before diagnosis). Nine children metthe restricted case definition (Figure 1).
Comparison families from ChurchillCounty were identified through random-digitdialing. Fifty-five (43.6%) of the 126 compari-son families identified as eligible were enrolled.We attempted to match four comparison chil-dren to each case child by birth year (in 2-yearincrements) and sex. The comparison childwas required to be cancer free at the date of thecase child’s leukemia diagnosis. We defined acomparison family as the matched comparisonchild and that child’s parents, guardians, orother care-taking adults living full time in thecomparison child’s home.
A total of 205 participants representing 14(of the 15 eligible) case families and 55 com-parison families were enrolled and asked tocomplete mailed questionnaires, participate inpersonal interviews, donate biologic samples,open their homes to environmental sampling,and provide information about previous localresidences that could be sampled. We enrolled4 comparison families matched to the casefamily that declined participation; these datawere included in the cross-sectional analysisbut not in the case-comparison analysis. Somemembers of one enrolled case family chose notto participate; the information from that casefamily is included in the case-comparisonanalysis. The study described here complieswith all applicable requirements of the U.S.regulations including institutional reviewboard (IRB) approval. All participants signed
consent or assent forms that had beenapproved as part of the IRB review of the pro-tocol for this study (CDC 2003a).
Biologic samples. Beginning in August2001, all participants were invited to visit aCDC clinic in Fallon, where blood, urine, andcheek swab samples were collected in a highlycontrolled setting (CDC 2003b) and personalinterviews were administered. The biologicsamples were aliquoted on site in a biologicalsafety cabinet to maintain sample integrity andto keep the samples free from chemical conta-mination and infectious agents. These sampleswere sent daily to CDC laboratories in Atlanta,Georgia, where they were analyzed for essentialand toxic metals (CDC 2003b), nonpersistentpesticides (Baker et al. 2004; Bravo et al. 2002;Olsson et al. 2004), persistent pesticides andpolychlorinated biphenyls (PCBs) (Barr et al.2003), VOCs (Cardinali et al. 2000), andmarkers of past exposure to infectious diseases.Concentrations less than the limit of detection(LOD) were assigned a value equal to theLOD divided by the square root of 2.
We considered both creatinine-correctedand non-creatinine-corrected results for analy-ses of urine samples and lipid-adjusted andnon-lipid-adjusted results for analyses of bloodsamples. In this article we present non-creatinine-corrected results for metal and non-persistent pesticide levels in urine samplesbecause creatinine correction may not be reli-able in children (Barr et al. 2005; O’Rourkeet al. 2000) and because non-creatinine-cor-rected comparison values for most analyteswere available in the second National Reporton Human Exposure to EnvironmentalChemicals (second NER) (CDC 2003d). Wepresent lipid-adjusted results for persistentpesticide and PCB levels in serum samples,and results not adjusted for lipids for VOCsanalyzed in blood samples.
Environmental samples. Using standardizedprotocols (CDC/Nevada Department ofEnvironmental Protection 2005), the NevadaDepartment of Environmental Protection col-lected samples of indoor air, play yard soil, andhousehold dust from case families’ current andprevious residences in Churchill County, cur-rent residences of all comparison families, andprevious residences for one randomly selectedcomparison child for each case child. Tap watersamples from all of these residences were col-lected by the U.S. Geological Survey (USGS).Environmental samples were successfully col-lected from all 11 homes of the case familiescurrently living in Churchill County, all 8 pre-vious homes in Churchill County in which casefamilies had lived before the date of birth of thecase child (i.e., during pregnancy), currenthomes of all 55 comparison families, and 6 pre-vious residences of 15 comparison families. Of36 previous residences eligible for sampling,8 case homes and 14 comparison homes were
Rubin et al.
152 VOLUME 115 | NUMBER 1 | January 2007 • Environmental Health Perspectives
Table 1. Agencies that assumed primary roles in the cross-sectional exposure assessment of environmen-tal contaminants in Churchill County, Nevada, 2001–2003, including the responsibilities of each agency.
City of NSHD CDC/ATSDR NDEP NDOA USGS NAS-Fallon Fallon, Mayor
Study design � �Environmental samples
Collection � � � �Analysis � �
Biologic samples Collection �Analysis �Results interpretation � � � � � �
Community meeting � � � � � � �
Abbreviations: NDEP, Nevada Division of Environmental Protection; NDOA, Nevada Department of Agriculture.
Figure 1. Temporal distribution of the 16 children who had lived in Churchill County, Nevada, and werediagnosed with leukemia between June 1997 and August 2002. Cancer type and cell type are defined. Onecase declined participation in the study, and one was diagnosed outside the study period. The nine indi-viduals fitting the restricted case definition are indicated by asterisks (*).
No.
of l
euke
mia
cas
es
2
0
* * * * * *
*
Jan
97
Apr 9
7
Jul 9
7
Oct 9
7
Jan
98
Apr 9
8
Jul 9
8
Oct 9
8
Jan
99
Apr 9
9
Jul 9
9
Oct 9
9
Jan
00
Apr 0
0
Jul 0
0
Oct 0
0
Jan
01
Apr 0
1
Jul 0
1
Oct 0
1
Jan
02
Apr 0
2
Jul 0
2
Oct 0
2
Jan
03
Apr 0
3
Jul 0
3
Oct 0
3
Jan
04
ALL/pre-BALL/T-cellAML/APL
*
not accessible (e.g., house was destroyed orvacant, or current owner was nonresponsive).Current and previous residences outsideof Churchill County were not sampled.Household samples were tested for heavy met-als, persistent and nonpersistent pesticides,PCBs, VOCs, radon, and radionuclides.Environmental samples were analyzed by theUSGS, U.S. EPA Region 9, the NevadaDepartment of Agriculture, and several contractlaboratories. In this article we present results ofenvironmental sample analysis only when theyare relevant to biologic sample results.
Statistical analysis. In our primary analysis,we used univariate statistics to describe each ofthe exposures analyzed. For continuous vari-ables, we used geometric means and selectedpercentiles to summarize the range and distrib-ution of the data for the various subpopula-tions of interest. We calculated geometricmeans [with 95% confidence intervals (CIs)]assuming that the data approximated a log-normal distribution, and only when the pro-portion of results above the LOD was at least60%. The estimates of the mean and 95% CIare based on a statistical model that controlledfor the possible correlation of observationswithin a family (i.e., a variance componentsmodel), when appropriate. Categorical vari-ables, frequency counts, and percentages arepresented as summary statistics for the subpop-ulations of interest. In the secondary analysis,we compared exposure among the case andcomparison populations using conditionallogistic regression; we initially analyzed all casesand their corresponding controls, and thenonly those cases and their corresponding con-trols meeting the restricted case definition.
For categorical exposure variables, oddsratios (ORs) are used to assess the associationbetween disease and exposure between twospecific levels of the categorical variable. Forcontinuous exposure variables, the ORs arebased on data that were standardized beforeanalysis. The exposure measures were stan-dardized by dividing each individual responseby the standard deviation observed among theentire study population. Because of the lim-ited sample size, ORs were not adjusted forpotential confounders. The LogXact softwarefrom Cytel Corporation (version 4.0; CytelSoftware Corp., Cambridge, MA) was used tofit the conditional logistic regression models.
For this investigation, many of the logisticregression models compared current levels ofexposure among the case and comparison pop-ulations. Because both populations were sam-pled after diagnosis of leukemia among thecase population, treatment, past diagnosticprocedures, changes in behavior, and changesin chemical exposures over time may all havesignificant, although immeasurable, impact onthe relationships that were explored in oursecondary analysis.
Tungsten follow-up. When preliminarystudy results suggested unusually high levels oftungsten in urine and water samples collectedfrom Churchill County, we decided to expandour study to include tungsten measurements inthree other Nevada communities to determineif the findings in Churchill County wereunique or represented levels characteristic ofthe region. The towns of Lovelock, Yerington,and Pahrump were chosen for a cross-sectionaltungsten exposure based on hydrogeologic cri-teria and history of tungsten mining (CDC2003c). A geographically random sample poolwas selected in each town, including 30 house-holds each from Yerington and Pahrump and11 households from Lovelock. For sampleselection, coordinate grids were superimposedover maps of a given city. A random list of Xand Y grid coordinates was generated; the first30 coordinates falling within the city limitswere selected, and the household closest to eachcoordinate was approached for recruitment. Ifthe first house refused participation or was ineli-gible, the next closest house was approached.The eligibility criteria for households are resi-dence in the city for at least 1 month before theinterview and the presence of one adult and onechild younger than 18 years who consent toparticipate in the study. Eligibility criteriaincluded residence for at least 1 month beforethe interview. Environmental samplingincluded tap water, floor dust, and yard soilfrom each household. Urine samples were col-lected from one adult and one child youngerthan 18 years in each family. A total of 141 par-ticipants were recruited, ranging in age from2 to 65 years (children younger than 18 aver-aged 9.4 years of age and adults averaged38.9 years of age). Sample collection proceduresand their analytical parameters were identical tothose used to measure tungsten in the ChurchillCounty study.
Results
Data collected in Churchill County includedresponses to 500 questionnaire items, levels of139 chemicals, and eight viral markers meas-ured in blood and urine samples, includinggenetic analysis of DNA specimens from wholeblood collected from 205 people in 69 families.Levels of more than 200 chemicals were meas-ured in air, water, soil, or dust from almost80 homes. Among our 69 study children(14 case and 55 comparison), 34 were femaleand 61 were white. There were no significantdifferences in proportions of sex, race, and eth-nicity between case and comparison children.
Our primary analysis was a cross-sectionalstudy that included biologic measurements.Our secondary analysis compared question-naire information, biologic values, andenvironmental findings between case andcomparison children and families. We recog-nized that the primary and secondary analyses
of hundreds of questionnaire and laboratorydata points would, by sheer probability, resultin some statistically significant findings due tochance occurrence. Therefore, we reviewed allresults in terms of biological plausibility andalso rigorously sought the opinions of panelsof experts who reviewed the results of themany data outcomes. Enrolled case children(7 girls and 7 boys) ranged in age from 2 to19 years at diagnosis; case and matched com-parison children (27 girls and 28 boys) rangedin age from 3 to 20 years at time of samplecollection. In this article we present resultsrelating to a) one environmental contaminantfound to be unusually elevated and therefore apotential and ongoing health risk (i.e., tung-sten); b) lifestyle and demographic factors(e.g., birth weight, breast-feeding) associatedwith leukemia or exposures to known or sus-pected carcinogens (e.g., VOCs, arsenic, ioniz-ing radiation, pesticides); and c) findings thatwere statistically significant (e.g., parental age)or of community interest (e.g., military sta-tus). Complete results are available at http://www.cdc.gov/nceh/clusters/Fallon (CDC2004), and genetic results will be presentedelsewhere (Steinberg et al. 2006).
Tungsten. The median tungsten levelfound in urine samples from the entire studypopulation was 0.97 µg/L (geometric mean,1.19 µg/L), compared with 0.07 µg/L (geo-metric mean, 0.08 µg/L) in the 1999National Health and Nutrition ExaminationSurvey (NHANES), the most current popula-tion reference available in August 2002 or inthe second NER (CDC 2003d). In our sec-ondary analysis, median levels were similar forcase and comparison children (1.93 and2.35 µg/L) and case and comparison families(0.61 and 0.62 µg/L). Almost 80% of theChurchill County participants had tungstenlevels above the 95th percentile (0.48 µg/L)reported in the second NER. The level ofexposure to tungsten that may cause healtheffects is not known. The CDC successfullypetitioned the National Toxicology Programof the National Institute of EnvironmentalHealth Sciences, National Institutes ofHealth, to prioritize research regarding thehealth effects of tungsten exposure. The CDCcontracted with USGS to collect and measuretungsten in tap water samples from partici-pants’ homes. Results ranged from < LOD to290 µg/L. There is no regulatory limit fortungsten in drinking water.
In the three additional Nevada communi-ties that were sampled for tungsten, 68% ofthe participants had geometric mean levels ofurinary tungsten at or above the 95thpercentile second NER levels (Table 2).Yerington, the town most similar to ChurchillCounty with respect to hydrology, geology,and land use, had levels of tungsten in urineand water samples that were statistically similar
Cancer cluster in Churchill County, Nevada
Environmental Health Perspectives • VOLUME 115 | NUMBER 1 | January 2007 153
to Churchill County’s samples. Few house-hold soil and dust samples from the threecomparison communities yielded detectabletungsten levels; however, the method usedhad a high LOD (50 µg/g).
Arsenic. In our cross-sectional analysis,arsenic levels in urine ranged from < LOD to1,180 µg/L, with a geometric mean of34.6 µg/L and median of 37.4 µg/L. Anational reference value for urinary arsenic lev-els is currently unavailable. However, a studyof arsenic exposure in Washington Stateshowed urinary arsenic levels ranging from19.6 µg/L (associated with high exposure) to9.4 µg/L (associated with low exposure)(Kalman et al. 1990). Furthermore, the 95thpercentile for nonrandom samples of the U.S.population is 22 µg/L (CDC, unpublisheddata). Noncarcinogenic clinical effects areobserved at urinary concentrations > 200 µg/L(Hall 1998); however, clinical effects fromconcentrations < 200 µg/L may be possible.Although not a statistically significant finding,levels of arsenic were nominally higher (p =0.25) in children (geometric mean, 38.9 µg/L)than in their parents (geometric mean,32.3 µg/L). In our secondary analysis, arseniclevels did not differ significantly (p = 0.29)between case children (geometric mean,29.8 µg/L) and comparison children (geomet-ric mean, 41.3 µg/L) or between case families(geometric mean, 23.9 µg/L) and comparisonfamilies (geometric mean, 36.0 µg/L) (p =0.18). Arsenic was also measured in tap water
samples collected from 70 current and previousresidences. Overall results ranged from < LODto 874 µg/L (median, 50.9 µg/L). At the timeof this study, the U.S. EPA regulatory limit forarsenic in municipal drinking water systemswas 50 µg/L; as of 1 January 2006, the regula-tory limit is 10 µg/L.
Known or suspected risk factors. Biologicallyplausible environmental risk factors of concernin Churchill County included exposure to ben-zene and other VOCs from JP-8 fuel and alsoexposure to persistent and nonpersistent pesti-cides. We analyzed other lifestyle and demo-graphic risk factors that have been implicated inthe development of leukemia, including expo-sure to ionizing radiation (Doll 1995; Miller1967; Preston et al. 1994), parental age atchild’s birth (Dockerty et al. 2001), birthweight (Hjalgrim et al. 2004; Robison et al.1987), breast-feeding (Kwan et al. 2004), his-tory of allergies (Schuz et al. 1999; Wen et al.2000a), and parental military service (CDC1988; Wen et al. 2000b).
VOCs. We analyzed blood samples for12 VOCs, including benzene, which is a minorcomponent of JP-8 fuel and gasoline. Moststudy participants had blood benzene levelsbelow method LODs (0.06 ng/mL). MedianVOC levels in Churchill County were similarto those reported in NHANES III (Churchillet al. 2001) and other peer-reviewed referencelevels (Table 3). Levels of 2,5-dimethylfuranamong the study population were consistentwith levels reported in the literature (Ashley
et al. 1996) for smokers and nonsmokers. Inthe Churchill County population, smokers hada median level of 0.08 µg/L and nonsmokershad a median level below the LOD (= 0.024).In our secondary analysis, 7 VOCs weredetectable in a high enough percentage of sam-ples to calculate ORs. Exposure to ethyl-benzene suggested increased risk for leukemiaamong case children using the broader casedefinition (OR 2.67; 95% CI, 1.04–6.84) aswell as the restricted case definition (OR 6.13;95% CI, 1.29–29.00). When comparing caseand control families using the broad definitionof a case, we found a slightly positive, althoughnot statistically significant, association betweenleukemia status and exposure to ethylbenzene(OR 1.14; 95% CI, 0.73–1.78). This OR wassomewhat lower and still not statistically signif-icant when we analyzed levels of ethylbenzeneamong case and control families using therestricted case definition (OR 1.08; 95% CI,0.60–1.94).
Tetrachloroethylene was the only VOCthat showed a slightly significant protectiveOR (0.35; 95% CI, 0.14–0.86) between caseand comparison families (including case andcomparison children and their family membersbut excluding siblings). When comparing caseand comparison children, however, wedetected no statistical differences in VOClevels using either the broad case definition(OR 0.32; 95% CI, 0.05–2.14) or therestricted case definition (OR 0.39; 95% CI,0.04–3.91).
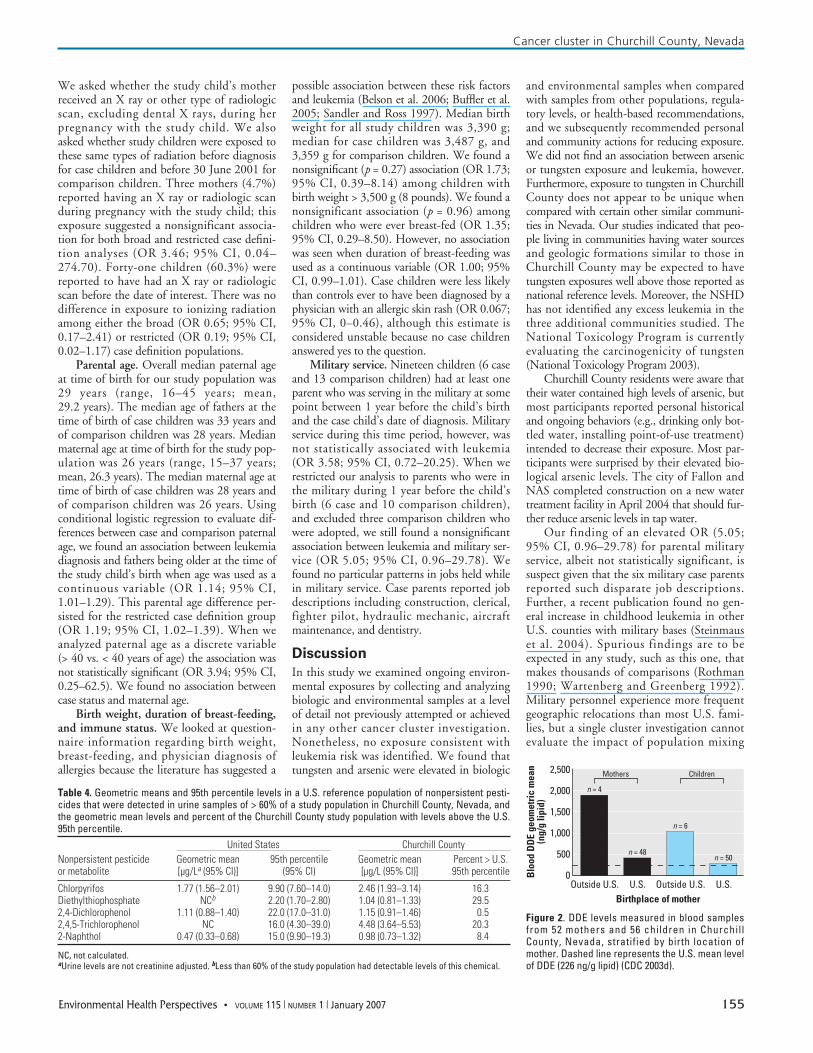
Pesticides. Geometric mean levels of 5 ofthe 31 nonpersistent pesticides that we meas-ured in urine samples were above the referencegeometric mean (Table 4); 5 of the pesticideswere well below the national reference values,and the rest were very similar to reference lev-els. In our secondary analysis, none of the non-persistent pesticides were associated withleukemia risk.
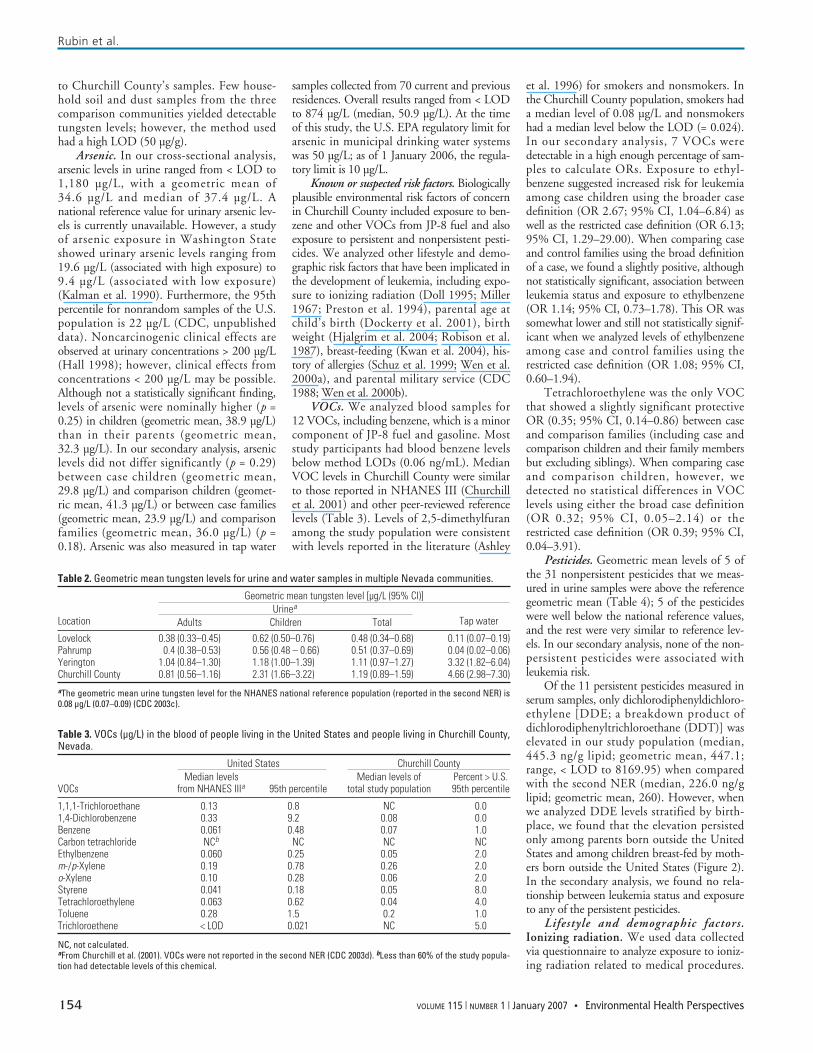
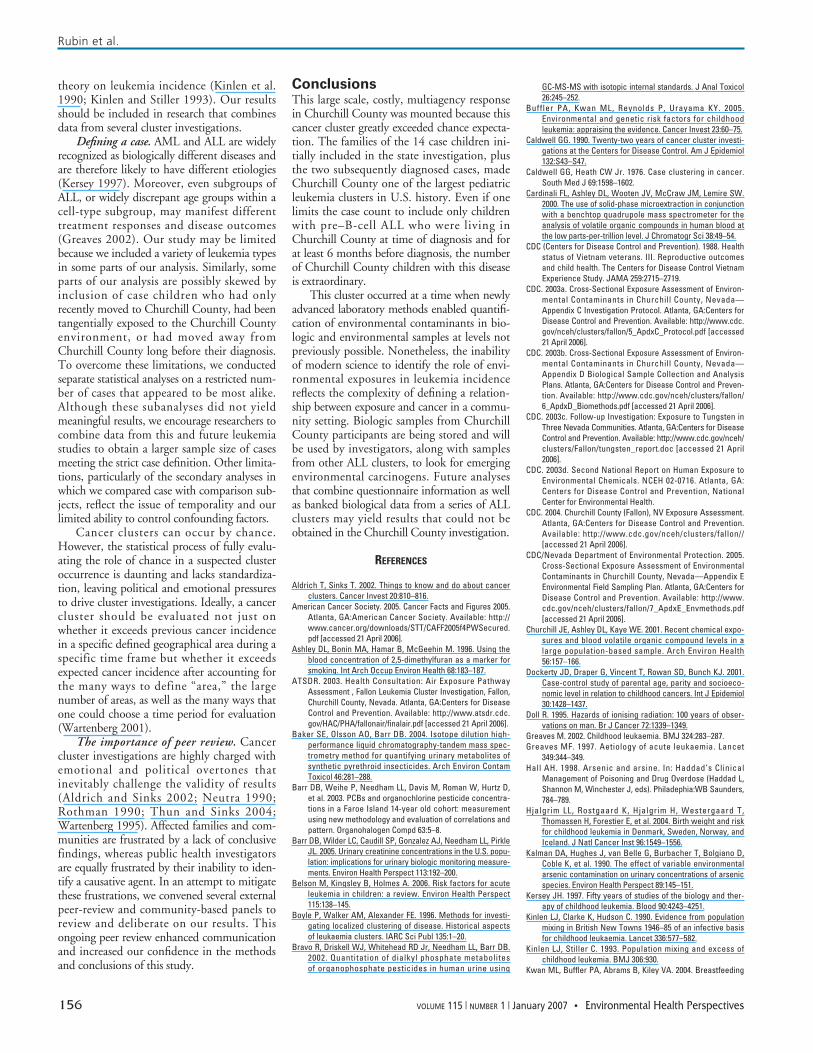
Of the 11 persistent pesticides measured inserum samples, only dichlorodiphenyldichloro-ethylene [DDE; a breakdown product ofdichlorodiphenyltrichloroethane (DDT)] waselevated in our study population (median,445.3 ng/g lipid; geometric mean, 447.1;range, < LOD to 8169.95) when comparedwith the second NER (median, 226.0 ng/glipid; geometric mean, 260). However, whenwe analyzed DDE levels stratified by birth-place, we found that the elevation persistedonly among parents born outside the UnitedStates and among children breast-fed by moth-ers born outside the United States (Figure 2).In the secondary analysis, we found no rela-tionship between leukemia status and exposureto any of the persistent pesticides.
Lifestyle and demographic factors.Ionizing radiation. We used data collectedvia questionnaire to analyze exposure to ioniz-ing radiation related to medical procedures.
Rubin et al.
154 VOLUME 115 | NUMBER 1 | January 2007 • Environmental Health Perspectives
Table 2. Geometric mean tungsten levels for urine and water samples in multiple Nevada communities.
Geometric mean tungsten level [µg/L (95% CI)]Urinea
Location Adults Children Total Tap water
Lovelock 0.38 (0.33–0.45) 0.62 (0.50–0.76) 0.48 (0.34–0.68) 0.11 (0.07–0.19)Pahrump 0.4 (0.38–0.53) 0.56 (0.48 – 0.66) 0.51 (0.37–0.69) 0.04 (0.02–0.06)Yerington 1.04 (0.84–1.30) 1.18 (1.00–1.39) 1.11 (0.97–1.27) 3.32 (1.82–6.04)Churchill County 0.81 (0.56–1.16) 2.31 (1.66–3.22) 1.19 (0.89–1.59) 4.66 (2.98–7.30)aThe geometric mean urine tungsten level for the NHANES national reference population (reported in the second NER) is0.08 µg/L (0.07–0.09) (CDC 2003c).
Table 3. VOCs (µg/L) in the blood of people living in the United States and people living in Churchill County,Nevada.
United States Churchill CountyMedian levels Median levels of Percent > U.S.
VOCs from NHANES IIIa 95th percentile total study population 95th percentile
1,1,1-Trichloroethane 0.13 0.8 NC 0.01,4-Dichlorobenzene 0.33 9.2 0.08 0.0Benzene 0.061 0.48 0.07 1.0Carbon tetrachloride NCb NC NC NCEthylbenzene 0.060 0.25 0.05 2.0m-/p-Xylene 0.19 0.78 0.26 2.0o-Xylene 0.10 0.28 0.06 2.0Styrene 0.041 0.18 0.05 8.0Tetrachloroethylene 0.063 0.62 0.04 4.0Toluene 0.28 1.5 0.2 1.0Trichloroethene < LOD 0.021 NC 5.0
NC, not calculated.aFrom Churchill et al. (2001). VOCs were not reported in the second NER (CDC 2003d). bLess than 60% of the study popula-tion had detectable levels of this chemical.
We asked whether the study child’s motherreceived an X ray or other type of radiologicscan, excluding dental X rays, during herpregnancy with the study child. We alsoasked whether study children were exposed tothese same types of radiation before diagnosisfor case children and before 30 June 2001 forcomparison children. Three mothers (4.7%)reported having an X ray or radiologic scanduring pregnancy with the study child; thisexposure suggested a nonsignificant associa-tion for both broad and restricted case defini-tion analyses (OR 3.46; 95% CI, 0.04–274.70). Forty-one children (60.3%) werereported to have had an X ray or radiologicscan before the date of interest. There was nodifference in exposure to ionizing radiationamong either the broad (OR 0.65; 95% CI,0.17–2.41) or restricted (OR 0.19; 95% CI,0.02–1.17) case definition populations.
Parental age. Overall median paternal ageat time of birth for our study population was29 years (range, 16–45 years; mean,29.2 years). The median age of fathers at thetime of birth of case children was 33 years andof comparison children was 28 years. Medianmaternal age at time of birth for the study pop-ulation was 26 years (range, 15–37 years;mean, 26.3 years). The median maternal age attime of birth of case children was 28 years andof comparison children was 26 years. Usingconditional logistic regression to evaluate dif-ferences between case and comparison paternalage, we found an association between leukemiadiagnosis and fathers being older at the time ofthe study child’s birth when age was used as acontinuous variable (OR 1.14; 95% CI,1.01–1.29). This parental age difference per-sisted for the restricted case definition group(OR 1.19; 95% CI, 1.02–1.39). When weanalyzed paternal age as a discrete variable(> 40 vs. < 40 years of age) the association wasnot statistically significant (OR 3.94; 95% CI,0.25–62.5). We found no association betweencase status and maternal age.
Birth weight, duration of breast-feeding,and immune status. We looked at question-naire information regarding birth weight,breast-feeding, and physician diagnosis ofallergies because the literature has suggested a
possible association between these risk factorsand leukemia (Belson et al. 2006; Buffler et al.2005; Sandler and Ross 1997). Median birthweight for all study children was 3,390 g;median for case children was 3,487 g, and3,359 g for comparison children. We found anonsignificant (p = 0.27) association (OR 1.73;95% CI, 0.39–8.14) among children withbirth weight > 3,500 g (8 pounds). We found anonsignificant association (p = 0.96) amongchildren who were ever breast-fed (OR 1.35;95% CI, 0.29–8.50). However, no associationwas seen when duration of breast-feeding wasused as a continuous variable (OR 1.00; 95%CI, 0.99–1.01). Case children were less likelythan controls ever to have been diagnosed by aphysician with an allergic skin rash (OR 0.067;95% CI, 0–0.46), although this estimate isconsidered unstable because no case childrenanswered yes to the question.
Military service. Nineteen children (6 caseand 13 comparison children) had at least oneparent who was serving in the military at somepoint between 1 year before the child’s birthand the case child’s date of diagnosis. Militaryservice during this time period, however, wasnot statistically associated with leukemia(OR 3.58; 95% CI, 0.72–20.25). When werestricted our analysis to parents who were inthe military during 1 year before the child’sbirth (6 case and 10 comparison children),and excluded three comparison children whowere adopted, we still found a nonsignificantassociation between leukemia and military ser-vice (OR 5.05; 95% CI, 0.96–29.78). Wefound no particular patterns in jobs held whilein military service. Case parents reported jobdescriptions including construction, clerical,fighter pilot, hydraulic mechanic, aircraftmaintenance, and dentistry.
Discussion
In this study we examined ongoing environ-mental exposures by collecting and analyzingbiologic and environmental samples at a levelof detail not previously attempted or achievedin any other cancer cluster investigation.Nonetheless, no exposure consistent withleukemia risk was identified. We found thattungsten and arsenic were elevated in biologic
and environmental samples when comparedwith samples from other populations, regula-tory levels, or health-based recommendations,and we subsequently recommended personaland community actions for reducing exposure.We did not find an association between arsenicor tungsten exposure and leukemia, however.Furthermore, exposure to tungsten in ChurchillCounty does not appear to be unique whencompared with certain other similar communi-ties in Nevada. Our studies indicated that peo-ple living in communities having water sourcesand geologic formations similar to those inChurchill County may be expected to havetungsten exposures well above those reported asnational reference levels. Moreover, the NSHDhas not identified any excess leukemia in thethree additional communities studied. TheNational Toxicology Program is currentlyevaluating the carcinogenicity of tungsten(National Toxicology Program 2003).
Churchill County residents were aware thattheir water contained high levels of arsenic, butmost participants reported personal historicaland ongoing behaviors (e.g., drinking only bot-tled water, installing point-of-use treatment)intended to decrease their exposure. Most par-ticipants were surprised by their elevated bio-logical arsenic levels. The city of Fallon andNAS completed construction on a new watertreatment facility in April 2004 that should fur-ther reduce arsenic levels in tap water.
Our finding of an elevated OR (5.05;95% CI, 0.96–29.78) for parental militaryservice, albeit not statistically significant, issuspect given that the six military case parentsreported such disparate job descriptions.Further, a recent publication found no gen-eral increase in childhood leukemia in otherU.S. counties with military bases (Steinmauset al. 2004). Spurious findings are to beexpected in any study, such as this one, thatmakes thousands of comparisons (Rothman1990; Wartenberg and Greenberg 1992).Military personnel experience more frequentgeographic relocations than most U.S. fami-lies, but a single cluster investigation cannotevaluate the impact of population mixing
Cancer cluster in Churchill County, Nevada
Environmental Health Perspectives • VOLUME 115 | NUMBER 1 | January 2007 155
Table 4. Geometric means and 95th percentile levels in a U.S. reference population of nonpersistent pesti-cides that were detected in urine samples of > 60% of a study population in Churchill County, Nevada, andthe geometric mean levels and percent of the Churchill County study population with levels above the U.S.95th percentile.
United States Churchill CountyNonpersistent pesticide Geometric mean 95th percentile Geometric mean Percent > U.S. or metabolite [µg/La (95% CI)] (95% CI) [µg/L (95% CI)] 95th percentile
Chlorpyrifos 1.77 (1.56–2.01) 9.90 (7.60–14.0) 2.46 (1.93–3.14) 16.3Diethylthiophosphate NCb 2.20 (1.70–2.80) 1.04 (0.81–1.33) 29.52,4-Dichlorophenol 1.11 (0.88–1.40) 22.0 (17.0–31.0) 1.15 (0.91–1.46) 0.52,4,5-Trichlorophenol NC 16.0 (4.30–39.0) 4.48 (3.64–5.53) 20.32-Naphthol 0.47 (0.33–0.68) 15.0 (9.90–19.3) 0.98 (0.73–1.32) 8.4
NC, not calculated. aUrine levels are not creatinine adjusted. bLess than 60% of the study population had detectable levels of this chemical.
Figure 2. DDE levels measured in blood samplesfrom 52 mothers and 56 children in ChurchillCounty, Nevada, stratified by birth location ofmother. Dashed line represents the U.S. mean levelof DDE (226 ng/g lipid) (CDC 2003d).
Outside U.S. Outside U.S.U.S. U.S.
2,500
2,000
1,500
1,000
500
0
Birthplace of mother
Blo
od D
DE
geom
etri
c m
ean
(ng/
g lip
id)
Mothers Children
n = 4
n = 48
n = 6
n = 50
theory on leukemia incidence (Kinlen et al.1990; Kinlen and Stiller 1993). Our resultsshould be included in research that combinesdata from several cluster investigations.
Defining a case. AML and ALL are widelyrecognized as biologically different diseases andare therefore likely to have different etiologies(Kersey 1997). Moreover, even subgroups ofALL, or widely discrepant age groups within acell-type subgroup, may manifest differenttreatment responses and disease outcomes(Greaves 2002). Our study may be limitedbecause we included a variety of leukemia typesin some parts of our analysis. Similarly, someparts of our analysis are possibly skewed byinclusion of case children who had onlyrecently moved to Churchill County, had beentangentially exposed to the Churchill Countyenvironment, or had moved away fromChurchill County long before their diagnosis.To overcome these limitations, we conductedseparate statistical analyses on a restricted num-ber of cases that appeared to be most alike.Although these subanalyses did not yieldmeaningful results, we encourage researchers tocombine data from this and future leukemiastudies to obtain a larger sample size of casesmeeting the strict case definition. Other limita-tions, particularly of the secondary analyses inwhich we compared case with comparison sub-jects, reflect the issue of temporality and ourlimited ability to control confounding factors.
Cancer clusters can occur by chance.However, the statistical process of fully evalu-ating the role of chance in a suspected clusteroccurrence is daunting and lacks standardiza-tion, leaving political and emotional pressuresto drive cluster investigations. Ideally, a cancercluster should be evaluated not just onwhether it exceeds previous cancer incidencein a specific defined geographical area during aspecific time frame but whether it exceedsexpected cancer incidence after accounting forthe many ways to define “area,” the largenumber of areas, as well as the many ways thatone could choose a time period for evaluation(Wartenberg 2001).
The importance of peer review. Cancercluster investigations are highly charged withemotional and political overtones thatinevitably challenge the validity of results(Aldrich and Sinks 2002; Neutra 1990;Rothman 1990; Thun and Sinks 2004;Wartenberg 1995). Affected families and com-munities are frustrated by a lack of conclusivefindings, whereas public health investigatorsare equally frustrated by their inability to iden-tify a causative agent. In an attempt to mitigatethese frustrations, we convened several externalpeer-review and community-based panels toreview and deliberate on our results. Thisongoing peer review enhanced communicationand increased our confidence in the methodsand conclusions of this study.
ConclusionsThis large scale, costly, multiagency responsein Churchill County was mounted because thiscancer cluster greatly exceeded chance expecta-tion. The families of the 14 case children ini-tially included in the state investigation, plusthe two subsequently diagnosed cases, madeChurchill County one of the largest pediatricleukemia clusters in U.S. history. Even if onelimits the case count to include only childrenwith pre–B-cell ALL who were living inChurchill County at time of diagnosis and forat least 6 months before diagnosis, the numberof Churchill County children with this diseaseis extraordinary.
This cluster occurred at a time when newlyadvanced laboratory methods enabled quantifi-cation of environmental contaminants in bio-logic and environmental samples at levels notpreviously possible. Nonetheless, the inabilityof modern science to identify the role of envi-ronmental exposures in leukemia incidencereflects the complexity of defining a relation-ship between exposure and cancer in a commu-nity setting. Biologic samples from ChurchillCounty participants are being stored and willbe used by investigators, along with samplesfrom other ALL clusters, to look for emergingenvironmental carcinogens. Future analysesthat combine questionnaire information as wellas banked biological data from a series of ALLclusters may yield results that could not beobtained in the Churchill County investigation.
REFERENCES
Aldrich T, Sinks T. 2002. Things to know and do about cancerclusters. Cancer Invest 20:810–816.
American Cancer Society. 2005. Cancer Facts and Figures 2005.Atlanta, GA:American Cancer Society. Available: http://www.cancer.org/downloads/STT/CAFF2005f4PWSecured.pdf [accessed 21 April 2006].
Ashley DL, Bonin MA, Hamar B, McGeehin M. 1996. Using theblood concentration of 2,5-dimethylfuran as a marker forsmoking. Int Arch Occup Environ Health 68:183–187.
ATSDR. 2003. Health Consultation: Air Exposure PathwayAssessment , Fallon Leukemia Cluster Investigation, Fallon,Churchill County, Nevada. Atlanta, GA:Centers for DiseaseControl and Prevention. Available: http://www.atsdr.cdc.gov/HAC/PHA/fallonair/finalair.pdf [accessed 21 April 2006].
Baker SE, Olsson AO, Barr DB. 2004. Isotope dilution high-performance liquid chromatography-tandem mass spec-trometry method for quantifying urinary metabolites ofsynthetic pyrethroid insecticides. Arch Environ ContamToxicol 46:281–288.
Barr DB, Weihe P, Needham LL, Davis M, Roman W, Hurtz D,et al. 2003. PCBs and organochlorine pesticide concentra-tions in a Faroe Island 14-year old cohort: measurementusing new methodology and evaluation of correlations andpattern. Organohalogen Compd 63:5–8.
Barr DB, Wilder LC, Caudill SP, Gonzalez AJ, Needham LL, PirkleJL. 2005. Urinary creatinine concentrations in the U.S. popu-lation: implications for urinary biologic monitoring measure-ments. Environ Health Perspect 113:192–200.
Belson M, Kingsley B, Holmes A. 2006. Risk factors for acuteleukemia in children: a review. Environ Health Perspect115:138–145.
Boyle P, Walker AM, Alexander FE. 1996. Methods for investi-gating localized clustering of disease. Historical aspectsof leukaemia clusters. IARC Sci Publ 135:1–20.
Bravo R, Driskell WJ, Whitehead RD Jr, Needham LL, Barr DB.2002. Quantitation of dialkyl phosphate metabolitesof organophosphate pesticides in human urine using
GC-MS-MS with isotopic internal standards. J Anal Toxicol26:245–252.
Buffler PA, Kwan ML, Reynolds P, Urayama KY. 2005.Environmental and genetic risk factors for childhoodleukemia: appraising the evidence. Cancer Invest 23:60–75.
Caldwell GG. 1990. Twenty-two years of cancer cluster investi-gations at the Centers for Disease Control. Am J Epidemiol132:S43–S47.
Caldwell GG, Heath CW Jr. 1976. Case clustering in cancer.South Med J 69:1598–1602.
Cardinali FL, Ashley DL, Wooten JV, McCraw JM, Lemire SW.2000. The use of solid-phase microextraction in conjunctionwith a benchtop quadrupole mass spectrometer for theanalysis of volatile organic compounds in human blood atthe low parts-per-trillion level. J Chromatogr Sci 38:49–54.
CDC (Centers for Disease Control and Prevention). 1988. Healthstatus of Vietnam veterans. III. Reproductive outcomesand child health. The Centers for Disease Control VietnamExperience Study. JAMA 259:2715–2719.
CDC. 2003a. Cross-Sectional Exposure Assessment of Environ-mental Contaminants in Churchill County, Nevada—Appendix C Investigation Protocol. Atlanta, GA:Centers forDisease Control and Prevention. Available: http://www.cdc.gov/nceh/clusters/fallon/5_ApdxC_Protocol.pdf [accessed21 April 2006].
CDC. 2003b. Cross-Sectional Exposure Assessment of Environ-mental Contaminants in Churchill County, Nevada—Appendix D Biological Sample Collection and AnalysisPlans. Atlanta, GA:Centers for Disease Control and Preven-tion. Available: http://www.cdc.gov/nceh/clusters/fallon/6_ApdxD_Biomethods.pdf [accessed 21 April 2006].
CDC. 2003c. Follow-up Investigation: Exposure to Tungsten inThree Nevada Communities. Atlanta, GA:Centers for DiseaseControl and Prevention. Available: http://www.cdc.gov/nceh/clusters/Fallon/tungsten_report.doc [accessed 21 April2006].
CDC. 2003d. Second National Report on Human Exposure toEnvironmental Chemicals. NCEH 02-0716. Atlanta, GA:Centers for Disease Control and Prevention, NationalCenter for Environmental Health.
CDC. 2004. Churchill County (Fallon), NV Exposure Assessment.Atlanta, GA:Centers for Disease Control and Prevention.Available: http://www.cdc.gov/nceh/clusters/fallon//[accessed 21 April 2006].
CDC/Nevada Department of Environmental Protection. 2005.Cross-Sectional Exposure Assessment of EnvironmentalContaminants in Churchill County, Nevada—Appendix EEnvironmental Field Sampling Plan. Atlanta, GA:Centers forDisease Control and Prevention. Available: http://www.cdc.gov/nceh/clusters/fallon/7_ApdxE_Envmethods.pdf[accessed 21 April 2006].
Churchill JE, Ashley DL, Kaye WE. 2001. Recent chemical expo-sures and blood volatile organic compound levels in alarge population-based sample. Arch Environ Health56:157–166.
Dockerty JD, Draper G, Vincent T, Rowan SD, Bunch KJ. 2001.Case-control study of parental age, parity and socioeco-nomic level in relation to childhood cancers. Int J Epidemiol30:1428–1437.
Doll R. 1995. Hazards of ionising radiation: 100 years of obser-vations on man. Br J Cancer 72:1339–1349.
Greaves M. 2002. Childhood leukaemia. BMJ 324:283–287.Greaves MF. 1997. Aetiology of acute leukaemia. Lancet
349:344–349.Hall AH. 1998. Arsenic and arsine. In: Haddad’s Clinical
Management of Poisoning and Drug Overdose (Haddad L,Shannon M, Winchester J, eds). Philadephia:WB Saunders,784–789.
Hjalgrim LL, Rostgaard K, Hjalgrim H, Westergaard T,Thomassen H, Forestier E, et al. 2004. Birth weight and riskfor childhood leukemia in Denmark, Sweden, Norway, andIceland. J Natl Cancer Inst 96:1549–1556.
Kalman DA, Hughes J, van Belle G, Burbacher T, Bolgiano D,Coble K, et al. 1990. The effect of variable environmentalarsenic contamination on urinary concentrations of arsenicspecies. Environ Health Perspect 89:145–151.
Kersey JH. 1997. Fifty years of studies of the biology and ther-apy of childhood leukemia. Blood 90:4243–4251.
Kinlen LJ, Clarke K, Hudson C. 1990. Evidence from populationmixing in British New Towns 1946–85 of an infective basisfor childhood leukaemia. Lancet 336:577–582.
Kinlen LJ, Stiller C. 1993. Population mixing and excess ofchildhood leukemia. BMJ 306:930.
Kwan ML, Buffler PA, Abrams B, Kiley VA. 2004. Breastfeeding
Rubin et al.
156 VOLUME 115 | NUMBER 1 | January 2007 • Environmental Health Perspectives
and the risk of childhood leukemia: a meta-analysis. PublicHealth Rep 119:521–535.
Linet MS, Cartwright RA. 1996. The leukemias. In: CancerEpidemiology and Prevention (Schottenfeld D, Fraumeni J Jr,eds). New York:Oxford University Press, 841–892.
Linet MS, Ries LA, Smith MA, Tarone RE, Devesa SS. 1999.Cancer surveillance series: recent trends in childhood can-cer incidence and mortality in the United States. J NatlCancer Inst 91:1051–1058.
Miller RW. 1967. Persons with exceptionally high risk ofleukemia. Cancer Res 27:2420–2423.
National Toxicology Program. 2003. Tungsten and SelectedTungsten Compounds: Review of Toxicological Literature.Research Triangle Park, NC:National Toxicology Program,National Institute of Environmental Health Sciences.Available: http://ntp-server.niehs.nih.gov/htdocs/Chem_Background/ExSumPdf/tungsten.pdf [accessed 21 April2006].
Neutra RR. 1990. Counterpoint from a cluster buster. Am JEpidemiol 132:1–8.
NSHD. 2001. Acute Lymphocytic (Lymphoblastic) LeukemiaFallon, Nevada, Review and Recommendations of the ExpertPanel. Carson City, NV:Nevada State Health Division.Available: http://health2k.state.nv.us/healthofficer/leukemia/fallonexpreport32001.pdf [accessed 21 April 2006].
Olsson AO, Baker SE, Nguyen JV, Romanoff LC, Udunka SO,Walker RD, et al. 2004. A liquid chromatography-tandemmass spectrometry multiresidue method for quantification ofspecific metabolites of organophosphorus pesticides,
synthetic pyrethroids, selected herbicides, and DEET inhuman urine. Anal Chem 76:2453–2461.
O’Rourke MK, Lizardi PS, Rogan SP, Freeman NC, Aguirre A,Saint CG. 2000. Pesticide exposure and creatinine variationamong young children. J Expo Anal Environ Epidemiol10:672–681.
Preston DL, Kusumi S, Tomonaga M, Izumi S, Ron E, Kuramoto A,et al. 1994. Cancer incidence in atomic bomb survivors. PartIII. Leukemia, lymphoma and multiple myeloma, 1950–1987.Radiat Res 137:S68–S97.
Robison LL, Codd M, Gunderson P, Neglia JP, Smithson WA, KingFL. 1987. Birth weight as a risk factor for childhood acutelymphoblastic leukemia. Pediatr Hematol Oncol 4:63–72.
Robison L, Sinks T, Smith A, Smith M. 2001. Acute LymphoblasticLeukemia, Fallon, NV, Review and Recommendations of theExpert Panel. Atlanta, GA:Centers for Disease Control andPrevention. Available: http://www.cdc.gov/nceh/clusters/Fallon/4_ApdxB_Exppanelreport.pdf [accessed 21 April 2006].
Rothman KJ. 1990. A sobering start for the cluster busters’ con-ference. Am J Epidemiol 132:S6–13.
Sandler DP, Ross JA. 1997. Epidemiology of acute leukemia inchildren and adults. Semin Oncol 24:3–16.
Schuz J, Kaletsch U, Meinert R, Kaatsch P, Michaelis J. 1999.Association of childhood leukaemia with factors related tothe immune system. Br J Cancer 80:585–590.
Steinberg KK, Relling MV, Gallagher ML, Greene CN, Rubin CS,French D, et al. 2006. Genetic studies of a cluster of acutelymphoblastic leukemia in Churchill County, Nevada. EnvironHealth Perspect 115:158–164.
Steinmaus C, Lu M, Todd RL, Smith AH. 2004. Probability esti-mates for the unique childhood leukemia cluster in Fallon,Nevada, and risks near other U.S. Military aviation facilities.Environ Health Perspect 112:766–771.
Thun MJ, Sinks T. 2004. Understanding cancer clusters. CACancer J Clin 54:273–280.
Wartenberg D. 1995. Should we boost or bust cluster investiga-tions? Epidemiology 6:575–576.
Wartenberg D. 2001. Investigating disease clusters: why, whenand how? J R Statist Soc A 164:13–22.
Wartenberg D, Greenberg M. 1992. Methodological problems ininvestigating disease clusters. Sci Total Environ 127:173–185.
Welch AH, Lico MS. 1998. Factors controlling As and U in shal-low ground water, southern Carson Desert, Nevada. ApplGeochem 13:521–539.
Welch AH, Plume RW, Frick EA, Hughes JL. 1989. Ground WaterQuality Assessment of the Carson River Basin, Nevada andCalifornia and Analysis of Water Quality Data through 1987.Reston, VA:U.S. Geological Survey. Available: http://pubs.er.usgs.gov/pubs/ofr/ofr89382 [accessed 21 April 2006].
Wen W, Shu XO, Linet MS, Neglia JP, Potter JD, Trigg ME, et al.2000a. Allergic disorders and the risk of childhood acutelymphoblastic leukemia (United States). Cancer CausesControl 11:303–307.
Wen WQ, Shu XO, Steinbuch M, Severson RK, Reaman GH,Buckley JD, et al. 2000b. Paternal military service and riskfor childhood leukemia in offspring. Am J Epidemiol151:231–240.
Cancer cluster in Churchill County, Nevada
Environmental Health Perspectives • VOLUME 115 | NUMBER 1 | January 2007 157