introgressive hybridization in pinus montezumae lamb and pinus pseudostrobus lindl. (pinaceae):...
TRANSCRIPT
INTROGRESSIVE HYBRIDIZATION IN PINUS MONTEZUMAE LAMB ANDPINUS PSEUDOSTROBUS LINDL. (PINACEAE): MORPHOLOGICAL
AND MOLECULAR (cpSSR) EVIDENCE
Patricia Delgado,1,* Rodolfo Salas-Lizana,y Alejandra Vazquez-Lobo,y Ana Wegier,y Maria Anzidei,z
Elena R. Alvarez-Buylla,y Giovanni G. Vendramin,z and Daniel Pinero2
*Centro de Investigacion Cientıfica de Yucatan, Calle 43 Numero 30, Colonia Chuburna de Hidalgo, C.P. 97200 Merida,Yucatan, Mexico; yInstituto de Ecologıa, Universidad Nacional Autonoma de Mexico, Apartado Postal 70-725,
Ciudad Universitaria, 04510 Mexico D.F., Mexico; and zIstituto di Genetica Vegetale, ConsiglioNazionale delle Ricerche, Via Madonna del Piano 10, 50019 Sesto Fiorentino, Firenze, Italy
Pinus pseudostrobus and Pinus montezumae are closely related species. They belong to the subsectionPonderosae, with a wide geographical distribution in Mexico and Central America. Morphological, bio-chemical, and anatomical information suggests that these species can form hybrids in natural populations. Inthis study, molecular (chloroplast microsatellites) and morphological markers were studied in 13 naturalpopulations of these species to test the existence of introgressive hybridization, infer its dynamics, and describethe phylogeographic structure of the populations. Using analytical methods of population genetics, as well asBayesian inference and coalescent approach, we show that putative hybrid populations are more similar to P.pseudostrobus than to P. montezumae and that these populations had the highest estimates of morphologicaland genetic variation. Furthermore, a greater introgression rate was observed from P. montezumae to putativehybrid and P. pseudostrobus populations. We showed that genetic structure as well as introgression dynamicsof populations could be the result of colonization events, historical expansion, and isolation by distance. Ourresults suggest the existence of three independent lineages (P. pseudostrobus, P. montezumae, and putativehybrid) that have coexisted and diversified during the past 11–27 million years as well as the possible origin ofevolutionary new lineages through repeated introgressive hybridization combined with lineage sorting ofancestral polymorphisms.
Keywords: Pinus montezumae, Pinus pseudostrobus, introgression dynamics, population structure, historicaldemography.
Introduction
Introgressive hybridization is an important evolutionary pro-cess (Anderson 1949; Rieseberg 1995). It has been defined asthe selective incorporation of external genetic material as theresult of repeated interbreeding (Anderson 1949). Recent mo-lecular techniques have allowed detection of different mecha-nisms and dynamics of introgressive hybridization in naturalpopulations of plants and animals and of its role in the evolu-tion of new species (Rieseberg and Ellstrand 1993; Rieseberg1995; Avise 2000; Templeton 2001; Linder and Rieseberg2004). Introgressive hybridization seems to have been impor-tant in the evolution of Pinus species. In Mexico, Matos andSchaal (2000) reported events of ancestral introgression amongnatural populations of Pinus montezumae and Pinus hartwegii,while in Asia, Pinus densata may have been derived from thehybridization between Pinus tabulaeformis and Pinus yun-nanensis (Wang et al. 2001; Song et al. 2002; Ma et al. 2006).Hybrid zones have also been detected between Pinus pumilaand Pinus parviflora var. pentaphylla (Senjo et al. 1999; Watanoet al. 2004). This process has also been detected in subsect.
Halepensis in Europe (Bucci et al. 1998) and in some speciesin North America (Pinus ponderosae [Epperson et al. 2003]and Pinus taeda and Pinus echinata [Edwards et al. 1997]).
Recent studies have analyzed introgression based on prob-abilistic approaches of maximum likelihood and Bayesian in-ference by organizing populations in a hierarchical way basedon genetic criteria (Pritchard et al. 2000; Corander et al.2003; Falush et al. 2003; Corander and Tang 2007). Anotherrecent approach to detecting genetic barriers or areas wherethe rate of change in allelic frequencies is particularly highwas developed by Dupanloup et al. (2002) and consists in de-fining groups of populations geographically homogenous andmaximally differentiated. The history of genealogical lineagescan also be traced in explicit evolutionary relationship withgeographical distribution of lineages to infer demographicscenarios (e.g., population expansion, colonization, and frag-mentation; Templeton et al. 1992, 1995; Templeton 1998,2004). This framework has the potential of straddling the in-terface between intra- and interspecific evolution. It is pre-cisely at this interface that the process of speciation occurs(Templeton 2001). The null hypothesis to be tested is that theorganisms sampled are derived from a single evolutionary line-age; if it is rejected, the causes can be suggested (transspecificpolymorphisms, lineage sorting, and hybridization; Templetonet al. 1992, 1995; Templeton 2001). Thus, pines give us the
1 Author for correspondence; e-mail [email protected] Author for correspondence; e-mail [email protected].
Manuscript received July 2006; revised manuscript received December 2006.
861
Int. J. Plant Sci. 168(6):861–875. 2007.
� 2007 by The University of Chicago. All rights reserved.
1058-5893/2007/16806-0007$15.00
opportunity to test related hypotheses with the process ofspeciation by reticulate evolution, as well as the possible evo-lutionary consequences that are implicated in the generationor extinction of lineages.
Introgressive hybridization based on morphological, bio-chemical, and anatomical characters has been suggested be-tween P. montezumae and Pinus pseudostrobus (Mirov 1967;Perry 1991). Both species belong to subsect. Ponderosae andare phylogenetically closely related (Farjon and Styles 1997;Price et al. 1998). In P. montezumae, events of introgressionwith other pine species, such as P. hartwegii (Matos andSchaal 2000), Pinus michoacana (Templeton 1994), and Pinusdouglasiana (Perry 1991), have been suggested. Both speciesare distributed in Mexico and Central America within a widealtitudinal range (1600–3300 m above sea level). Their popu-lations can be either allopatric or sympatric. The allopatricpopulations are found in most of the species’ distributions,while the majority of sympatric populations are found withinthe trans-Mexican volcanic belt (TMVB), where more than25% of species, subspecies, and varieties of Mexican pines oc-cur (Perry 1991). This area has also been cited as a core regionfor the hybrid origin of some pine species and varieties (Styles1993). In this scenario, it is also expected that we will findsimilar chloroplasts in closely related species because of hy-bridization and/or the retention of ancestral polymorphisms(Golden and Bain 2000). These two phenomena could be insome instances dissociated through the analysis of the geo-graphic distribution of the putative hybrids and their positionin a haplotype network. In particular, Matos and Schaal(2000) have shown geographic rather than taxonomic struc-ture in chloroplast markers in pines that render different evo-lutionary histories for nuclear and chloroplast markers. Thisis probably due to long-distance pollen-mediated gene flowresulting in chloroplast capture. Also, the existence, in sym-patry, of several species that have been reported to hybridizewith P. pseudostrobus, P. montezumae, or both enhances thepossible outcomes of a hybridization study and limits ourability to make relevant inferences.
In this study, we analyzed six morphological charactersfrom needles and female cones in order to support the hypoth-esis of the existence of three population groups that representthe two parental species and putative hybrid populations. Wealso analyzed the hypothesis of introgressive hybridization atthe molecular level with the use of chloroplast microsatellites(cpSSRs). Recently, these markers, which are probably devoidof recombination, have been used in conifer species to studypopulation genetics, since they allow monitoring of pollen-mediated gene flow (Vendramin et al. 1998; Gomez et al.2003). The goals of this research were (1) to test the hypoth-esis of introgressive hybridization among natural populationsof P. montezumae and P. pseudostrobus and (2) to analyzethe population phylogeographic structure and the introgres-sion dynamics of these two species.
Material and Methods
Vegetative Material Collection
Needle tissue from 303 individuals was collected from Pi-nus montezumae and Pinus pseudostrobus in 13 populations
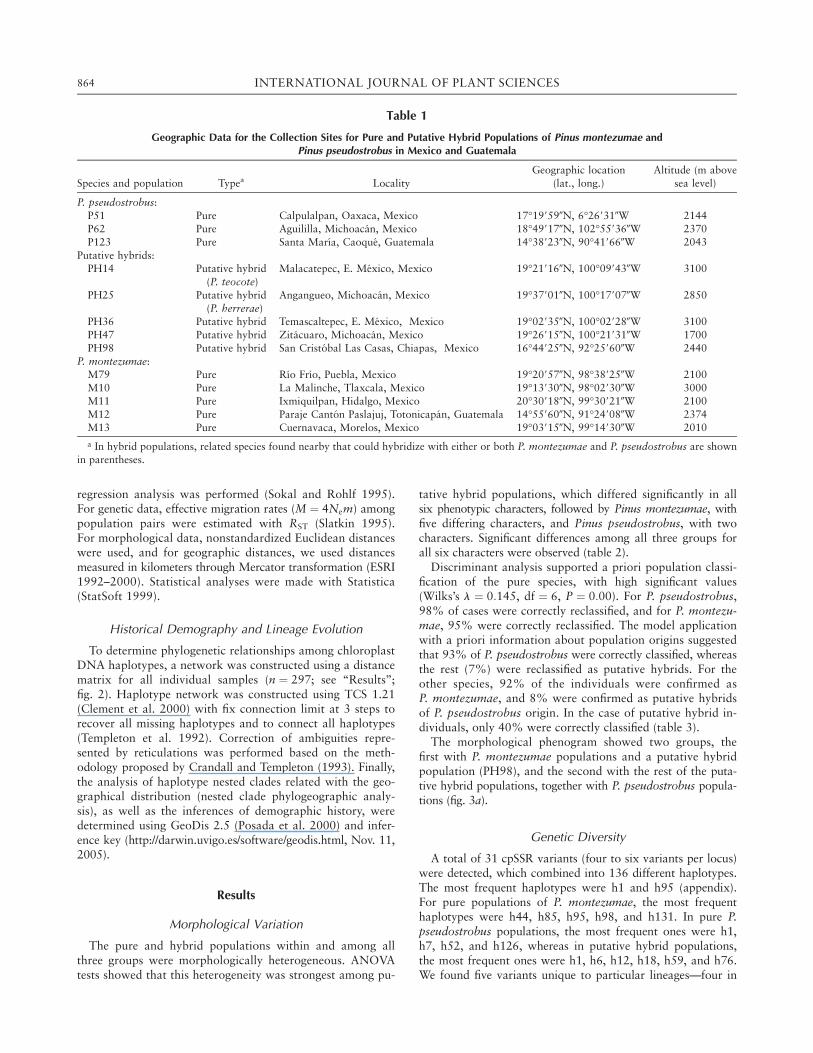
(Perry 1991). These populations include five pure popula-tions of P. montezumae, three pure populations of P. pseu-dostrobus, and five putative hybrid populations (fig. 1; table1). In all putative hybrid populations, we registered the pres-ence of other species that could hybridize with P. montezu-mae and/or P. pseudostrobus (table 1). Three to five femalecones were collected as three small branches per tree accord-ing to Patino et al. (1983). Branches were stored at �72�Cfor quantification of resin channels and DNA extraction.
Morphological Analyses
A morphological data matrix was obtained for two needleand four cone characters in 245 individuals according toMadrigal (1986; female cone form, needle length, and num-ber of resin channels) and P. Delgado (personal communica-tion; number of seed scales, female cone length, and femalecone width). These characters were coded as binary (1, 0, re-spectively) in the following manner for P. pseudostrobus andP. montezumae: female cone form (ovoid, brown ocher; coni-cal, dark brown), needle length (slightly pendant, 20–30 cm;straight, 14–21 cm), number of resin channels (2–3; 4–8),number of seed scales (66–136; 136–250), female cone length(7.6–9.5; 9.6–17.5 cm), and female cone width (3.5–7.5;7.6–12.5 cm). The six characters were measured in four inde-pendent repetitions, following Perron and Bousquet (1997).This transformation enabled us to include cone form that is adiscrete character in the analysis and to perform a discrimi-nant analysis based on the preassignment of individuals toeither P. montezumae or P. pseudostrobus. We then confirmedthat the individuals from pure populations were assigned toeither of the two species as presented in table 1. We carriedout a univariate ANOVA in order to establish which charac-ters differed between the two species and were intermediatein the hybrid populations. Based on this, we reconstructed amodel that represented the three population groups (parentalpopulations for each species and putative hybrid popula-tions). Nonstandardized Euclidean distances were also estimatedamong pairs of populations in order to group populations ina hierarchical manner, and this analysis was summarized ina phenogram (UPGMA algorithm, Sokal and Sneath 1963).Morphological analyses were carried out with the programStatistica (StatSoft 1999).
DNA Extraction and cpSSR Amplification
Genomic DNA was extracted using a Miniprep CTABmethod as described by Cuenca et al. (2003). Six cpSSRprimer pairs derived from the sequenced chloroplast of Pinusthunbergii, Pt1254, Pt9383, Pt15169, Pt30204, Pt71936, andPt87268 (Vendramin et al. 1996), were used. PCR condi-tions, electrophoresis, and fragment size determination werecarried out as described by Vendramin et al. (1996).
Variation and Genetic Structure
Total gene diversity (H) and the average unbiased geneticdiversity (HE) were estimated based on haplotype composi-tion (Nei 1987). Relative population sizes were estimatedwith u ¼ 2Neu, where Ne is the effective population size,based on the infinite allele model and assuming a constant
862 INTERNATIONAL JOURNAL OF PLANT SCIENCES
mutation rate (u; Hedrick 1999; Provan et al. 1999). A hier-archical molecular variance analysis (AMOVA; Excoffier et al.1992) according to the stepwise mutation model (Ohta andKimura 1973) was used to obtain the genetic structure amongpopulations FST, among population groups FCT, and amongpopulations within groups FSC. Statistical significance of allthese estimates was obtained with 1000 nonparametric permu-tations and calculated with the program Arlequin 3.0 (Excoffieret al. 2005). In addition, the geographical structure of the ge-netic variation was investigated with a simulated annealingprocedure implemented in the SAMOVA algorithm (Dupanloupet al. 2002). This approach defines groups of populationsthat are geographically homogeneous and maximally differ-entiated from each other. Estimations were done assumingvalues from one to 10 groups (K) and were run for 10,000 it-erations from each of 500 random initial conditions.
Gene Pool and Introgression
Standardized distances of haplotype frequency among pairsof populations were used as estimates of genetic relatednessbetween populations (Nei et al. 1983) as a first approxima-tion. A tree was built using neighbor-joining of five pure pop-ulations of P. montezumae, three P. pseudostrobus populations,and five putative hybrid populations (NJBAFD program,Takezaki 1998). Its support was estimated using a permuta-tion test with 1000 replicates (Takezaki and Nei 1996). Thesecond approximation was carried out based on a Bayesianapproach (Corander et al. 2003; Falush et al. 2003) to clusterindividuals and estimate admixture using a priori clusters
based on either two or three lineages. Chloroplasts are inher-ited uniparentally in most plants. Conifers differ from mostplants by having paternally inherited chloroplasts; these areconsidered linked because of the apparent absence of recom-bination (Petit et al. 2005a; but see Marshall et al. 2001). Wefirst clustered the individuals and then performed an admix-ture analysis with two alternative approaches for linked loci:one described by Corander and Tang (2007) and one de-scribed by Piry et al. (2004). Results from both analyses werevery similar. We report here only the results using the Coranderand Tang (2007) approach. Analyses were repeated 30 timesfor either two or three lineages, which in all cases producedlarger log marginal likelihood estimates for three lineages.We then ran 1000 replicates for the three lineages and selectedthe one with the largest log marginal likelihood. Admixtureproportions were estimated using clustering of individualswith the following conditions: 200 iterations to estimate theadmixture for each individual, 200 reference individuals foreach population, and 20 iterations to estimate the admixturecoefficients for the reference individuals. For each individual,we used as significance level a 5% proportion of reference in-dividuals simulated from the population in which the individ-ual was originally clustered, having the admixture coefficientof the cluster. For this analysis, the BAPS4 program was used(Corander et al. 2003).
Genetic, Morphological, and Geographic Association
To verify the existence of geographic patterns in geneticand morphological variation for all 13 populations, a linear
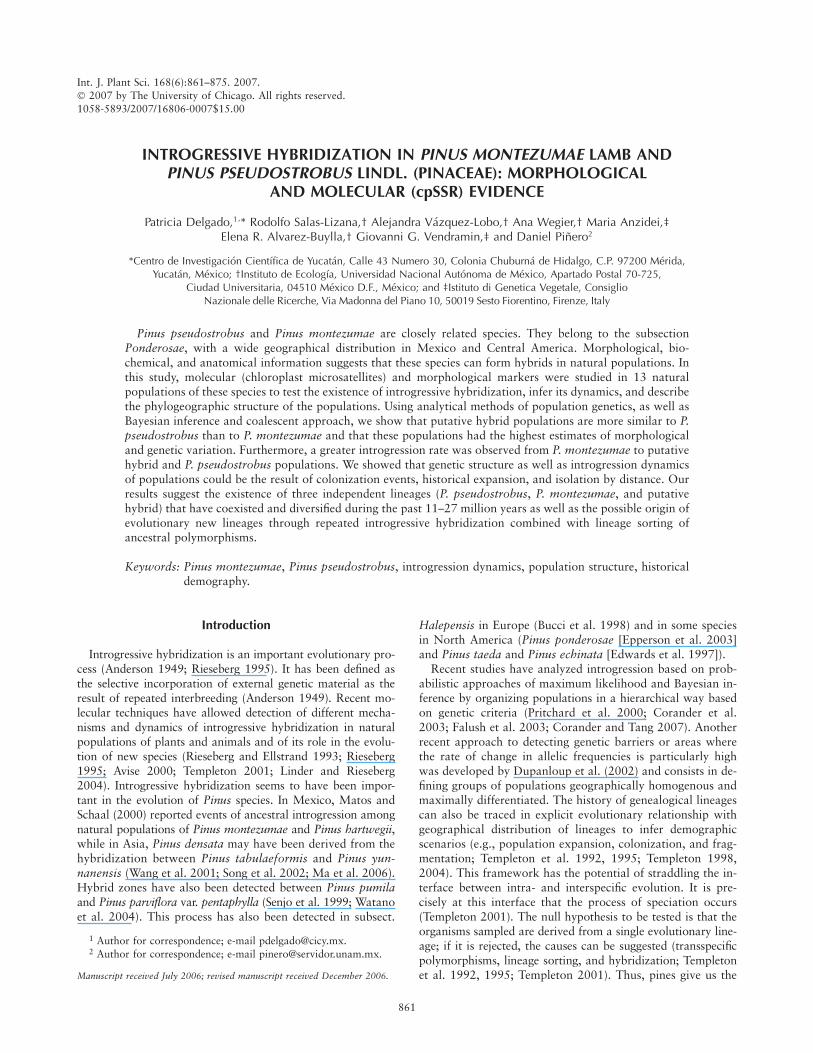
Fig. 1 Geographic distribution of 13 collected populations of Pinus pseudostrobus, Pinus montezumae, and putative hybrids in Mexico and
Guatemala. Circles represent the proportion of ancestry in lineages K1 (white), K2 (gray), and K3 (black).
863DELGADO ET AL.—INTROGRESSIVE HYBRIDIZATION IN PINES
regression analysis was performed (Sokal and Rohlf 1995).For genetic data, effective migration rates (M ¼ 4Nem) amongpopulation pairs were estimated with RST (Slatkin 1995).For morphological data, nonstandardized Euclidean distanceswere used, and for geographic distances, we used distancesmeasured in kilometers through Mercator transformation (ESRI1992–2000). Statistical analyses were made with Statistica(StatSoft 1999).
Historical Demography and Lineage Evolution
To determine phylogenetic relationships among chloroplastDNA haplotypes, a network was constructed using a distancematrix for all individual samples (n ¼ 297; see ‘‘Results’’;fig. 2). Haplotype network was constructed using TCS 1.21(Clement et al. 2000) with fix connection limit at 3 steps torecover all missing haplotypes and to connect all haplotypes(Templeton et al. 1992). Correction of ambiguities repre-sented by reticulations was performed based on the meth-odology proposed by Crandall and Templeton (1993). Finally,the analysis of haplotype nested clades related with the geo-graphical distribution (nested clade phylogeographic analy-sis), as well as the inferences of demographic history, weredetermined using GeoDis 2.5 (Posada et al. 2000) and infer-ence key (http://darwin.uvigo.es/software/geodis.html, Nov. 11,2005).
Results
Morphological Variation
The pure and hybrid populations within and among allthree groups were morphologically heterogeneous. ANOVAtests showed that this heterogeneity was strongest among pu-
tative hybrid populations, which differed significantly in allsix phenotypic characters, followed by Pinus montezumae, withfive differing characters, and Pinus pseudostrobus, with twocharacters. Significant differences among all three groups forall six characters were observed (table 2).
Discriminant analysis supported a priori population classi-fication of the pure species, with high significant values(Wilks’s l ¼ 0:145, df ¼ 6, P ¼ 0:00). For P. pseudostrobus,98% of cases were correctly reclassified, and for P. montezu-mae, 95% were correctly reclassified. The model applicationwith a priori information about population origins suggestedthat 93% of P. pseudostrobus were correctly classified, whereasthe rest (7%) were reclassified as putative hybrids. For theother species, 92% of the individuals were confirmed asP. montezumae, and 8% were confirmed as putative hybridsof P. pseudostrobus origin. In the case of putative hybrid in-dividuals, only 40% were correctly classified (table 3).
The morphological phenogram showed two groups, thefirst with P. montezumae populations and a putative hybridpopulation (PH98), and the second with the rest of the puta-tive hybrid populations, together with P. pseudostrobus popula-tions (fig. 3a).
Genetic Diversity
A total of 31 cpSSR variants (four to six variants per locus)were detected, which combined into 136 different haplotypes.The most frequent haplotypes were h1 and h95 (appendix).For pure populations of P. montezumae, the most frequenthaplotypes were h44, h85, h95, h98, and h131. In pure P.pseudostrobus populations, the most frequent ones were h1,h7, h52, and h126, whereas in putative hybrid populations,the most frequent ones were h1, h6, h12, h18, h59, and h76.We found five variants unique to particular lineages—four in
Table 1
Geographic Data for the Collection Sites for Pure and Putative Hybrid Populations of Pinus montezumae andPinus pseudostrobus in Mexico and Guatemala
Species and population Typea Locality
Geographic location
(lat., long.)
Altitude (m above
sea level)
P. pseudostrobus:P51 Pure Calpulalpan, Oaxaca, Mexico 17�199590N, 6�269310W 2144P62 Pure Aguililla, Michoacan, Mexico 18�499170N, 102�559360W 2370
P123 Pure Santa Marıa, Caoque, Guatemala 14�389230N, 90�419660W 2043
Putative hybrids:PH14 Putative hybrid
(P. teocote)
Malacatepec, E. Mexico, Mexico 19�219160N, 100�099430W 3100
PH25 Putative hybrid
(P. herrerae)
Angangueo, Michoacan, Mexico 19�379010N, 100�179070W 2850
PH36 Putative hybrid Temascaltepec, E. Mexico, Mexico 19�029350N, 100�029280W 3100
PH47 Putative hybrid Zitacuaro, Michoacan, Mexico 19�269150N, 100�219310W 1700
PH98 Putative hybrid San Cristobal Las Casas, Chiapas, Mexico 16�449250N, 92�259600W 2440
P. montezumae:M79 Pure Rıo Frıo, Puebla, Mexico 19�209570N, 98�389250W 2100
M10 Pure La Malinche, Tlaxcala, Mexico 19�139300N, 98�029300W 3000
M11 Pure Ixmiquilpan, Hidalgo, Mexico 20�309180N, 99�309210W 2100
M12 Pure Paraje Canton Paslajuj, Totonicapan, Guatemala 14�559600N, 91�249080W 2374M13 Pure Cuernavaca, Morelos, Mexico 19�039150N, 99�149300W 2010
a In hybrid populations, related species found nearby that could hybridize with either or both P. montezumae and P. pseudostrobus are shownin parentheses.
864 INTERNATIONAL JOURNAL OF PLANT SCIENCES
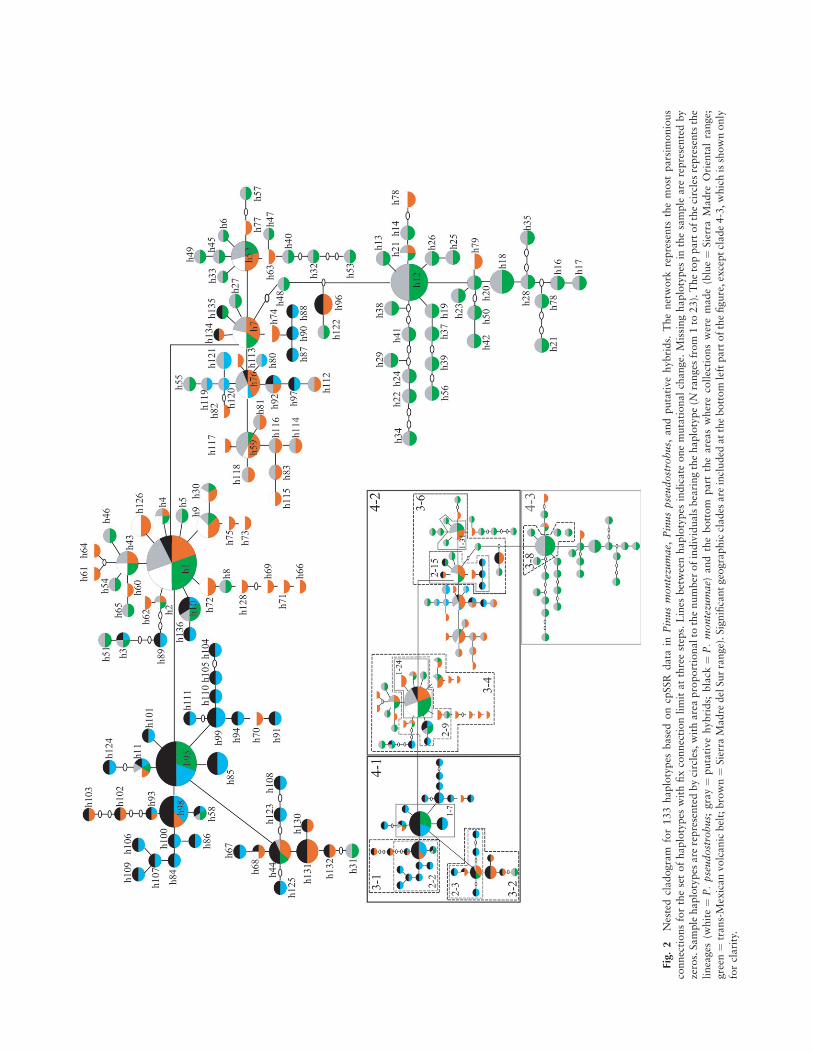
Fig.
2N
este
dcl
adogra
mfo
r133
haplo
types
base
don
cpSSR
data
inP
inus
monte
zum
ae,
Pin
us
pse
udost
robus,
and
puta
tive
hybri
ds.
The
net
work
repre
sents
the
most
pars
imonio
us
connec
tions
for
the
set
of
haplo
types
wit
hfix
connec
tion
lim
itat
thre
est
eps.
Lin
esbet
wee
nhaplo
types
indic
ate
one
muta
tional
change.
Mis
sing
haplo
types
inth
esa
mple
are
repre
sente
dby
zero
s.Sam
ple
haplo
types
are
repre
sente
dby
circ
les,
wit
hare
apro
port
ionalto
the
num
ber
of
indiv
iduals
bea
ring
the
haplo
type
(Nra
nges
from
1to
23).
The
top
part
of
the
circ
les
repre
sents
the
linea
ges
(whit
e¼
P:
pse
udost
robus;
gra
y¼
puta
tive
hybri
ds;
bla
ck¼
P:
monte
zum
ae)
and
the
bott
om
part
the
are
as
wher
eco
llec
tions
wer
em
ade
(blu
e¼
Sie
rra
Madre
Ori
enta
lra
nge;
gre
en¼
trans-
Mex
ican
volc
anic
bel
t;bro
wn¼
Sie
rra
Madre
del
Sur
range)
.Sig
nifi
cant
geo
gra
phic
clades
are
incl
uded
at
the
bott
om
left
part
of
the
figure
,ex
cept
clade
4-3
,w
hic
his
show
nonly
for
clari
ty.
putative hybrid populations (143 and 144, Pt71936; 124,Pt15169; and 143, Pt30204), only one in P. pseudostrobus(159, Pt87268), and none in P. montezumae. On the otherhand, most haplotypes (118 out of 136) were unique to one ofthe three lineages, 15 were shared by two lineages, and onlythree (h1, h11, and h76) were shared by P. pseudostrobus,P. montezumae, and putative hybrids (appendix). The most ge-netically diverse populations were the putative hybrids (HE ¼0:519), followed by P. pseudostrobus (HE ¼ 0:416) and P.montezumae populations (HE ¼ 0:409). For all three groups,the population displaying the highest diversity was PH36,from Mexico, and the one showing the lowest diversity wasM13, from Morelos (table 4). Similarly, the relative effectivepopulation size estimation (2Neu), was larger for putative hy-brid populations (48.77) than for P. pseudostrobus (36.20)and P. montezumae (17.00).
Genetic Divergence
The highest genetic divergence of the three defined a prioripopulation groups was among putative hybrid populations(RST ¼ 0:449), followed by P. montezumae pure populations(RST ¼ 0:258) and P. pseudostrobus pure populations (RST ¼0:166) (table 4). The hierarchical analysis of molecular vari-ance shows a high variance among populations (FST ¼ 0:406,P < 0:000) and among population groups (FCT ¼ 0:313, P <0:000), whereas average variance among populations withingroups (FSC) was low (0.069, P < 0:050). A figure of K ¼ 6groups was obtained using the SAMOVA algorithm, showinga high differentiation among them (FCT ¼ 0:331). The first
group is represented by three populations of P. montezumae(M10, M11, and M79); the second by two P. pseudostrobuspopulations (P62 and P123), one P. montezumae population(M12), and two putative hybrid populations (PH14, PH47);whereas the remaining four groups include three hybrid pop-ulations (PH25, PH36, and PH98) and one P. montezumae(M12) population.
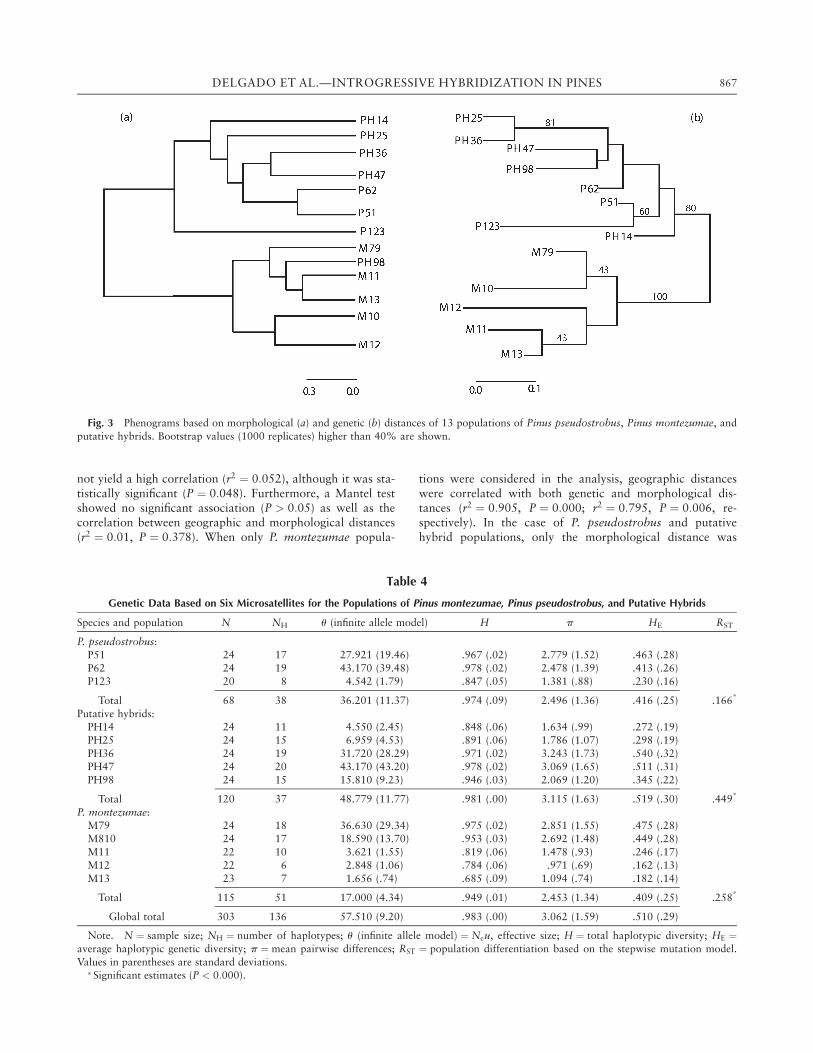
Neighbor-joining phenogram analysis using cpDNA micro-satellites shows patterns similar to those found using morpho-logical data. Two groups were distinguished: one encompassingall putative hybrid populations and P. pseudostrobus andanother made up of all the populations of P. montezumae(fig. 3b).
Introgression Dynamics and Admixture Proportions
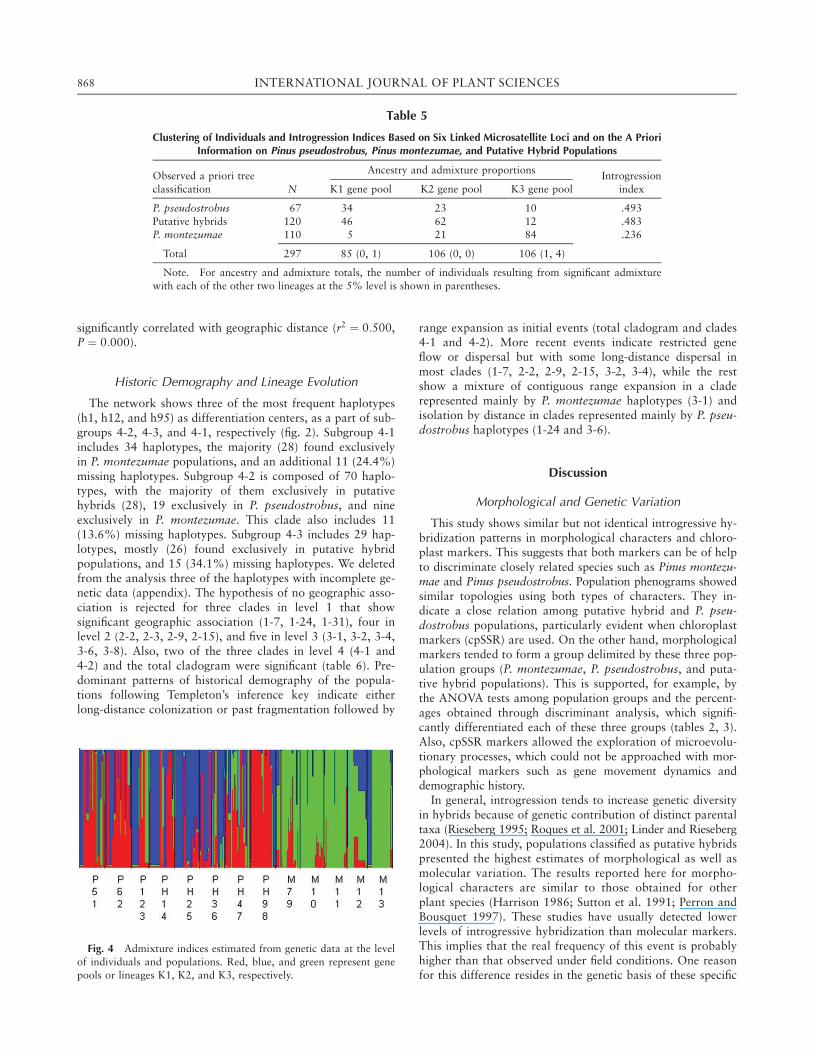
We found ancestry proportions of 51.7% and 50.7% ofpopulation individuals that were classified a priori as pure P.pseudostrobus or putative hybrids within lineages K1 andK2, respectively. On the other hand, 76.4% of individuals ofP. montezumae populations had ancestry provided by groupK3 (table 5). Admixture was found in all populations (fig. 4),but only in six individuals was it statistically significant (table5). The majority of those (four) were related to individualsfrom lineage K2, which showed significant admixture withlineage K3, with a Bayesian probability of 5%.
Geographic, Genetic, and Morphological Patterns
Regression analysis between geographic distribution andthe estimated migration rate (M) among population pairs did
Table 2
Mean and Variation of Six Morphological Characters in the Three Population Groups Pinus montezumae, Pinus pseudostrobus,and Putative Hybrids, Based on ANOVAs among Population within Groups and among Groups
Among population within groups
P. pseudostrobus Putative hybrids P. montezumae Among groups
Variable Mean 6 SD df F Mean 6 SD df F Mean 6 SD df F Mean 6 SD df F
Needle length (cm) 21.15 6 2.18 2 .51 18.84 6 2.93 4 11.85* 18.57 6 2.08 4 .80 19.20 6 2.63 2 23.91*
Number of resiniferous
channels 2.50 6 .73 2 3.60* 2.82 6 1.11 4 4.15* 3.36 6 .48 4 2.32* 3.17 6 2.24 2 12.04*
Number of cone scales 120.6 6 15.7 2 3.53* 136 6 23.56 4 32.39* 176 6 21.6 4 5.18* 150 6 32.1 2 91.13*
Cone width (cm) 6.49 6 .86 2 2.75 6.88 6 .93 4 13.44* 7.78 6 1.18 4 27.40* 7.18 6 1.17 2 22.95*
Cone length (cm) 8.62 6 1.27 2 2.3 9.82 6 1.48 4 7.48* 11.69 6 1.83 4 8.90* 10.3 6 2.03 2 50.98*
Cone form 1.00 6 .00 2 .00 .44 6 .49 4 6.88* .09 6 .28 4 16.07* .43 6 .49 2 272.50*
� Statistically significant differences (P < 0:05).
Table 3
Number of Reclassified Trees Using a Discriminant Analysis Based on Six Morphological Characters andA Priori Tree Classification in the 13 Analyzed Populations
Predicted classification by discriminant analysis
Observed a priori tree
classification NPinus
pseudostrobusPutative
hybrids
Pinusmontezumae
Percentage
correct
P. pseudostrobus 59 55 4 0 93.22
Putative hybrids 80 27 32 21 40.00
P. montezumae 106 4 4 98 92.45
Total 245 86 40 119 75.51
866 INTERNATIONAL JOURNAL OF PLANT SCIENCES
not yield a high correlation (r2 ¼ 0:052), although it was sta-tistically significant (P ¼ 0:048). Furthermore, a Mantel testshowed no significant association (P > 0:05) as well as thecorrelation between geographic and morphological distances(r2 ¼ 0:01, P ¼ 0:378). When only P. montezumae popula-
tions were considered in the analysis, geographic distanceswere correlated with both genetic and morphological dis-tances (r2 ¼ 0:905, P ¼ 0:000; r2 ¼ 0:795, P ¼ 0:006, re-spectively). In the case of P. pseudostrobus and putativehybrid populations, only the morphological distance was
Fig. 3 Phenograms based on morphological (a) and genetic (b) distances of 13 populations of Pinus pseudostrobus, Pinus montezumae, and
putative hybrids. Bootstrap values (1000 replicates) higher than 40% are shown.
Table 4
Genetic Data Based on Six Microsatellites for the Populations of Pinus montezumae, Pinus pseudostrobus, and Putative Hybrids
Species and population N NH u (infinite allele model) H p HE RST
P. pseudostrobus:P51 24 17 27.921 (19.46) .967 (.02) 2.779 (1.52) .463 (.28)
P62 24 19 43.170 (39.48) .978 (.02) 2.478 (1.39) .413 (.26)
P123 20 8 4.542 (1.79) .847 (.05) 1.381 (.88) .230 (.16)
Total 68 38 36.201 (11.37) .974 (.09) 2.496 (1.36) .416 (.25) .166*
Putative hybrids:PH14 24 11 4.550 (2.45) .848 (.06) 1.634 (.99) .272 (.19)
PH25 24 15 6.959 (4.53) .891 (.06) 1.786 (1.07) .298 (.19)
PH36 24 19 31.720 (28.29) .971 (.02) 3.243 (1.73) .540 (.32)PH47 24 20 43.170 (43.20) .978 (.02) 3.069 (1.65) .511 (.31)
PH98 24 15 15.810 (9.23) .946 (.03) 2.069 (1.20) .345 (.22)
Total 120 37 48.779 (11.77) .981 (.00) 3.115 (1.63) .519 (.30) .449*
P. montezumae:
M79 24 18 36.630 (29.34) .975 (.02) 2.851 (1.55) .475 (.28)M810 24 17 18.590 (13.70) .953 (.03) 2.692 (1.48) .449 (.28)
M11 22 10 3.621 (1.55) .819 (.06) 1.478 (.93) .246 (.17)
M12 22 6 2.848 (1.06) .784 (.06) .971 (.69) .162 (.13)
M13 23 7 1.656 (.74) .685 (.09) 1.094 (.74) .182 (.14)
Total 115 51 17.000 (4.34) .949 (.01) 2.453 (1.34) .409 (.25) .258*
Global total 303 136 57.510 (9.20) .983 (.00) 3.062 (1.59) .510 (.29)
Note. N ¼ sample size; NH ¼ number of haplotypes; u (infinite allele modelÞ ¼ Neu, effective size; H ¼ total haplotypic diversity; HE ¼average haplotypic genetic diversity; p ¼ mean pairwise differences; RST ¼ population differentiation based on the stepwise mutation model.
Values in parentheses are standard deviations.� Significant estimates (P < 0:000).
867DELGADO ET AL.—INTROGRESSIVE HYBRIDIZATION IN PINES
significantly correlated with geographic distance (r2 ¼ 0:500,P ¼ 0:000).
Historic Demography and Lineage Evolution
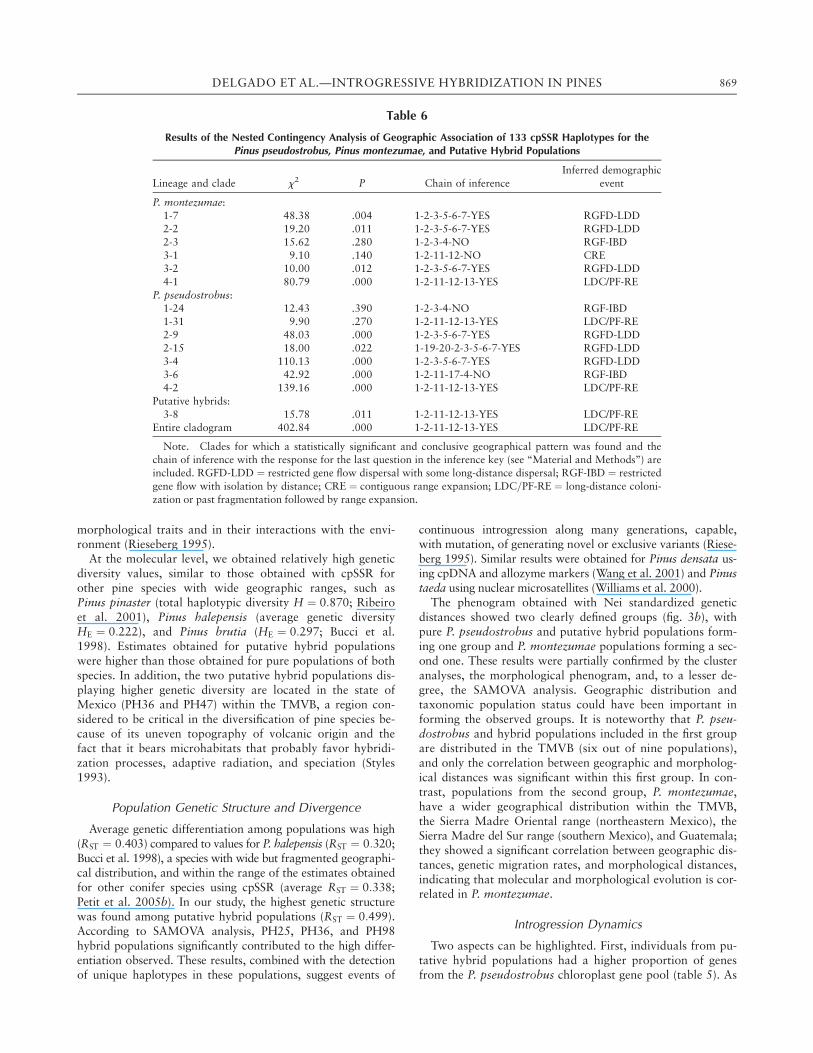
The network shows three of the most frequent haplotypes(h1, h12, and h95) as differentiation centers, as a part of sub-groups 4-2, 4-3, and 4-1, respectively (fig. 2). Subgroup 4-1includes 34 haplotypes, the majority (28) found exclusivelyin P. montezumae populations, and an additional 11 (24.4%)missing haplotypes. Subgroup 4-2 is composed of 70 haplo-types, with the majority of them exclusively in putativehybrids (28), 19 exclusively in P. pseudostrobus, and nineexclusively in P. montezumae. This clade also includes 11(13.6%) missing haplotypes. Subgroup 4-3 includes 29 hap-lotypes, mostly (26) found exclusively in putative hybridpopulations, and 15 (34.1%) missing haplotypes. We deletedfrom the analysis three of the haplotypes with incomplete ge-netic data (appendix). The hypothesis of no geographic asso-ciation is rejected for three clades in level 1 that showsignificant geographic association (1-7, 1-24, 1-31), four inlevel 2 (2-2, 2-3, 2-9, 2-15), and five in level 3 (3-1, 3-2, 3-4,3-6, 3-8). Also, two of the three clades in level 4 (4-1 and4-2) and the total cladogram were significant (table 6). Pre-dominant patterns of historical demography of the popula-tions following Templeton’s inference key indicate eitherlong-distance colonization or past fragmentation followed by
range expansion as initial events (total cladogram and clades4-1 and 4-2). More recent events indicate restricted geneflow or dispersal but with some long-distance dispersal inmost clades (1-7, 2-2, 2-9, 2-15, 3-2, 3-4), while the restshow a mixture of contiguous range expansion in a claderepresented mainly by P. montezumae haplotypes (3-1) andisolation by distance in clades represented mainly by P. pseu-dostrobus haplotypes (1-24 and 3-6).
Discussion
Morphological and Genetic Variation
This study shows similar but not identical introgressive hy-bridization patterns in morphological characters and chloro-plast markers. This suggests that both markers can be of helpto discriminate closely related species such as Pinus montezu-mae and Pinus pseudostrobus. Population phenograms showedsimilar topologies using both types of characters. They in-dicate a close relation among putative hybrid and P. pseu-dostrobus populations, particularly evident when chloroplastmarkers (cpSSR) are used. On the other hand, morphologicalmarkers tended to form a group delimited by these three pop-ulation groups (P. montezumae, P. pseudostrobus, and puta-tive hybrid populations). This is supported, for example, bythe ANOVA tests among population groups and the percent-ages obtained through discriminant analysis, which signifi-cantly differentiated each of these three groups (tables 2, 3).Also, cpSSR markers allowed the exploration of microevolu-tionary processes, which could not be approached with mor-phological markers such as gene movement dynamics anddemographic history.
In general, introgression tends to increase genetic diversityin hybrids because of genetic contribution of distinct parentaltaxa (Rieseberg 1995; Roques et al. 2001; Linder and Rieseberg2004). In this study, populations classified as putative hybridspresented the highest estimates of morphological as well asmolecular variation. The results reported here for morpho-logical characters are similar to those obtained for otherplant species (Harrison 1986; Sutton et al. 1991; Perron andBousquet 1997). These studies have usually detected lowerlevels of introgressive hybridization than molecular markers.This implies that the real frequency of this event is probablyhigher than that observed under field conditions. One reasonfor this difference resides in the genetic basis of these specific
Table 5
Clustering of Individuals and Introgression Indices Based on Six Linked Microsatellite Loci and on the A PrioriInformation on Pinus pseudostrobus, Pinus montezumae, and Putative Hybrid Populations
Observed a priori tree
classification
Ancestry and admixture proportionsIntrogression
indexN K1 gene pool K2 gene pool K3 gene pool
P. pseudostrobus 67 34 23 10 .493
Putative hybrids 120 46 62 12 .483
P. montezumae 110 5 21 84 .236
Total 297 85 (0, 1) 106 (0, 0) 106 (1, 4)
Note. For ancestry and admixture totals, the number of individuals resulting from significant admixture
with each of the other two lineages at the 5% level is shown in parentheses.
Fig. 4 Admixture indices estimated from genetic data at the level
of individuals and populations. Red, blue, and green represent gene
pools or lineages K1, K2, and K3, respectively.
868 INTERNATIONAL JOURNAL OF PLANT SCIENCES
morphological traits and in their interactions with the envi-ronment (Rieseberg 1995).
At the molecular level, we obtained relatively high geneticdiversity values, similar to those obtained with cpSSR forother pine species with wide geographic ranges, such asPinus pinaster (total haplotypic diversity H ¼ 0:870; Ribeiroet al. 2001), Pinus halepensis (average genetic diversityHE ¼ 0:222), and Pinus brutia (HE ¼ 0:297; Bucci et al.1998). Estimates obtained for putative hybrid populationswere higher than those obtained for pure populations of bothspecies. In addition, the two putative hybrid populations dis-playing higher genetic diversity are located in the state ofMexico (PH36 and PH47) within the TMVB, a region con-sidered to be critical in the diversification of pine species be-cause of its uneven topography of volcanic origin and thefact that it bears microhabitats that probably favor hybridi-zation processes, adaptive radiation, and speciation (Styles1993).
Population Genetic Structure and Divergence
Average genetic differentiation among populations was high(RST ¼ 0:403) compared to values for P. halepensis (RST ¼ 0:320;Bucci et al. 1998), a species with wide but fragmented geographi-cal distribution, and within the range of the estimates obtainedfor other conifer species using cpSSR (average RST ¼ 0:338;Petit et al. 2005b). In our study, the highest genetic structurewas found among putative hybrid populations (RST ¼ 0:499).According to SAMOVA analysis, PH25, PH36, and PH98hybrid populations significantly contributed to the high differ-entiation observed. These results, combined with the detectionof unique haplotypes in these populations, suggest events of
continuous introgression along many generations, capable,with mutation, of generating novel or exclusive variants (Riese-berg 1995). Similar results were obtained for Pinus densata us-ing cpDNA and allozyme markers (Wang et al. 2001) and Pinustaeda using nuclear microsatellites (Williams et al. 2000).
The phenogram obtained with Nei standardized geneticdistances showed two clearly defined groups (fig. 3b), withpure P. pseudostrobus and putative hybrid populations form-ing one group and P. montezumae populations forming a sec-ond one. These results were partially confirmed by the clusteranalyses, the morphological phenogram, and, to a lesser de-gree, the SAMOVA analysis. Geographic distribution andtaxonomic population status could have been important informing the observed groups. It is noteworthy that P. pseu-dostrobus and hybrid populations included in the first groupare distributed in the TMVB (six out of nine populations),and only the correlation between geographic and morpholog-ical distances was significant within this first group. In con-trast, populations from the second group, P. montezumae,have a wider geographical distribution within the TMVB,the Sierra Madre Oriental range (northeastern Mexico), theSierra Madre del Sur range (southern Mexico), and Guatemala;they showed a significant correlation between geographic dis-tances, genetic migration rates, and morphological distances,indicating that molecular and morphological evolution is cor-related in P. montezumae.
Introgression Dynamics
Two aspects can be highlighted. First, individuals from pu-tative hybrid populations had a higher proportion of genesfrom the P. pseudostrobus chloroplast gene pool (table 5). As
Table 6
Results of the Nested Contingency Analysis of Geographic Association of 133 cpSSR Haplotypes for thePinus pseudostrobus, Pinus montezumae, and Putative Hybrid Populations
Lineage and clade x2 P Chain of inference
Inferred demographic
event
P. montezumae:
1-7 48.38 .004 1-2-3-5-6-7-YES RGFD-LDD2-2 19.20 .011 1-2-3-5-6-7-YES RGFD-LDD
2-3 15.62 .280 1-2-3-4-NO RGF-IBD
3-1 9.10 .140 1-2-11-12-NO CRE3-2 10.00 .012 1-2-3-5-6-7-YES RGFD-LDD
4-1 80.79 .000 1-2-11-12-13-YES LDC/PF-RE
P. pseudostrobus:1-24 12.43 .390 1-2-3-4-NO RGF-IBD1-31 9.90 .270 1-2-11-12-13-YES LDC/PF-RE
2-9 48.03 .000 1-2-3-5-6-7-YES RGFD-LDD
2-15 18.00 .022 1-19-20-2-3-5-6-7-YES RGFD-LDD
3-4 110.13 .000 1-2-3-5-6-7-YES RGFD-LDD3-6 42.92 .000 1-2-11-17-4-NO RGF-IBD
4-2 139.16 .000 1-2-11-12-13-YES LDC/PF-RE
Putative hybrids:
3-8 15.78 .011 1-2-11-12-13-YES LDC/PF-REEntire cladogram 402.84 .000 1-2-11-12-13-YES LDC/PF-RE
Note. Clades for which a statistically significant and conclusive geographical pattern was found and thechain of inference with the response for the last question in the inference key (see ‘‘Material and Methods’’) are
included. RGFD-LDD ¼ restricted gene flow dispersal with some long-distance dispersal; RGF-IBD ¼ restricted
gene flow with isolation by distance; CRE ¼ contiguous range expansion; LDC=PF-RE ¼ long-distance coloni-
zation or past fragmentation followed by range expansion.
869DELGADO ET AL.—INTROGRESSIVE HYBRIDIZATION IN PINES
a consequence, putative hybrid populations can be classifiedas original or indigenous of this species. Second, consideringthat putative hybrid populations are closer to the P. pseudo-strobus evolutionary lineage, introgression occurs mainlythrough P. montezumae pollen to putative hybrids and P.pseudostrobus populations at a rate close to 50%. The pro-portion of ancestry of individuals obtained from the K3 line-age is represented in populations M10 (1.00) and M11(0.91) (fig. 1), which can be classified as the purest or mostancestral populations of P. montezumae. The K1 and K2 lin-eages are more difficult to interpret since putative hybridpopulations contain the highest proportion of ancestry inboth lineages as PH25 (0.96 in lineage K2) and PH98 (0.80in lineage K1) populations. This conclusion is supported bySAMOVA results, which separated these two populations.On the other hand, populations classified as pure P. pseudo-strobus showed lower ancestry values, and even the P123population showed relatively predominant proportion of lin-eage K1 (0.36) and K2 (0.35). The rest of the putative hybridpopulations (PH14 and PH47) also contain intermediate an-cestry values, which probably conform to core genetic diver-sification populations. Ancestry and admixture results (fig. 1;table 5), although suggestive, could also be due to pure sto-chasticity and should be considered with great care sincechloroplast markers represent only one linkage group.
Historic Demography and Lineage Evolution
The association of different haplotypes and nested groupssuggests five important processes in the demographic history ofthese populations: long-distance colonization or past fragmen-tation, restricted gene flow with some long-distance dispersal,restricted gene flow with isolation by distance, long-distancecolonization possibly coupled with subsequent fragmenta-tion, and contiguous range expansion. Three of these involvelong-distance dispersal or colonization and include both re-cent (2-2) and ancestral (2-15, 3-2, 3-4, and 3-8) clades. Inother cases we could not distinguish between long-distancecolonization and past fragmentation (clades 1-31, 4-1, and4-2 and total cladogram), but in the case of the most recentclade (1-31), long-distance colonization is more probable,while in the ancestral ones (4-1 and 4-2 and total clado-gram), past fragmentation is more probable. The fourth in-ferred process is restricted gene flow with isolation bydistance (clade 1-24, with a majority found in P. pseudostro-bus, and clade 2-3, mostly in P. montezumae); P. pseudostro-bus and P. montezumae are related to haplotypes from theSierra Madre del Sur range and the TMVB and the SierraMadre Oriental range, respectively, suggesting similar expan-sion processes in both species. The last process is contiguousrange expansion (clade 3-1) in P. montezumae populationsfrom the Sierra Madre Oriental. According to these results,two routes of expansion can be hypothesized, the first onefrom the northeast region, followed possibly by fragmenta-tion and gene flow in P. montezumae, and the second onefrom the southwest region, followed by gene flow in P. pseu-dostrobus and putative hybrid populations. These demo-graphic processes include derived or tip haplotypes, which,according to the coalescent theory, are of more recent origin(Matos and Schaal 2000). These haplotypes were detected in
pure P. pseudostrobus and hybrid populations distributed inthe TMVB (Mexico and Michoacan) and part of the SierraMadre del Sur (Chiapas and Oaxaca).
The hypothesis of the existence of ancestral introgressioncan be tested following two main approaches that were pro-posed to infer the origin of evolutionary lineages by intro-gression: close relatedness among haplotypes from differentfragmented groups (Templeton 2001) and the presence of di-vergent haplotypes within putative hybrid populations (Avise2000). These patterns were observed in this study, consider-ing that the same haplotypes were found in fragmented pop-ulations and distributed in different geographic regions (e.g.,haplotype h1 detected in populations P11 in Guatemala, H10in Hidalgo, and PH14 in the state of Mexico) and that diver-gent haplotypes were observed mostly in the putative hybridpopulations PH25 and PH36 (fig. 2). Some haplotypes (e.g.,h11 and h92) found in these putative hybrid populations andin some individuals of P. pseudostrobus are genealogicallycloser to the P. montezumae lineage. Furthermore, shared hap-lotypes are present in different parts of the network (fig. 2)and in derived (h3 and h4), ancestral (h1, h2, h21, h52, andh76), and intermediate (h10, h11, and h68) positions. Conse-quently, the existence of divergent lineages produced throughancestral introgression of P. montezumae to P. pseudostrobusand putative hybrids can be proposed. These patterns arecomparable to those obtained by Matos and Schaal (2000)and Templeton (1994), who, in analyzing three pine species(P. montezumae, Pinus hartwegii, and Pinus michoacana), sug-gested that these species represent three evolutionary lineagesbut with sporadic introgression events.
Alternative explanations for our results could be the exis-tence of lineage sorting of ancestral polymorphisms and/orsize homoplasy. To distinguish between these and hybridiza-tion, we need to distinguish between recent and ancestral hap-lotype sharing, and we also need molecular markers from thenucleus and/or the mitochondria.
The putative hybrid clade (fig. 2) is more closely relatedto the P. pseudostrobus clade (4-2) than to P. montezumae(4-1), suggesting that introgression from this latter species toP. pseudostrobus probably started very early. Furthermore,the fact that it forms a separate clade argues for a repeatedscenario of introgression in recent and ancestral times. Also,the proportion of missing haplotypes in the sample is larger(34.1% in putative hybrids, 24.4% in P. montezumae, and13.6% in P. pseudostrobus) within this putative hybrid cladein spite of the fact that the TMVB was better sampled thanthe Sierra Madre Oriental and Sierra Madre del Sur. Thisprobably argues not only for a lack of sampling, which couldexplain part of this pattern (particularly in P. montezumaefrom the Sierra Madre Oriental), but also for the existence ofdivergent phenotypes within this putative hybrid lineageprobably due to the existence of hybridization with otherrelated species in the TMVB. These species include P. hart-wegii, Pinus maximinoi, P. michoacana, Pinus douglasiana,and Pinus lawsonii and were not sampled because their pheno-types are divergent but also because we selected the locationsbased on the absence of these species nearby (table 1). Hy-bridization among these species has been shown, but we pur-posely selected locations in which these species were absentfrom nearby areas. Finally, it can be deduced that collecting
870 INTERNATIONAL JOURNAL OF PLANT SCIENCES
these species, particularly within the TMVB, can completethe network, and this could probably produce the emergenceof other clades centered on the most frequent haplotypes ofthese species.
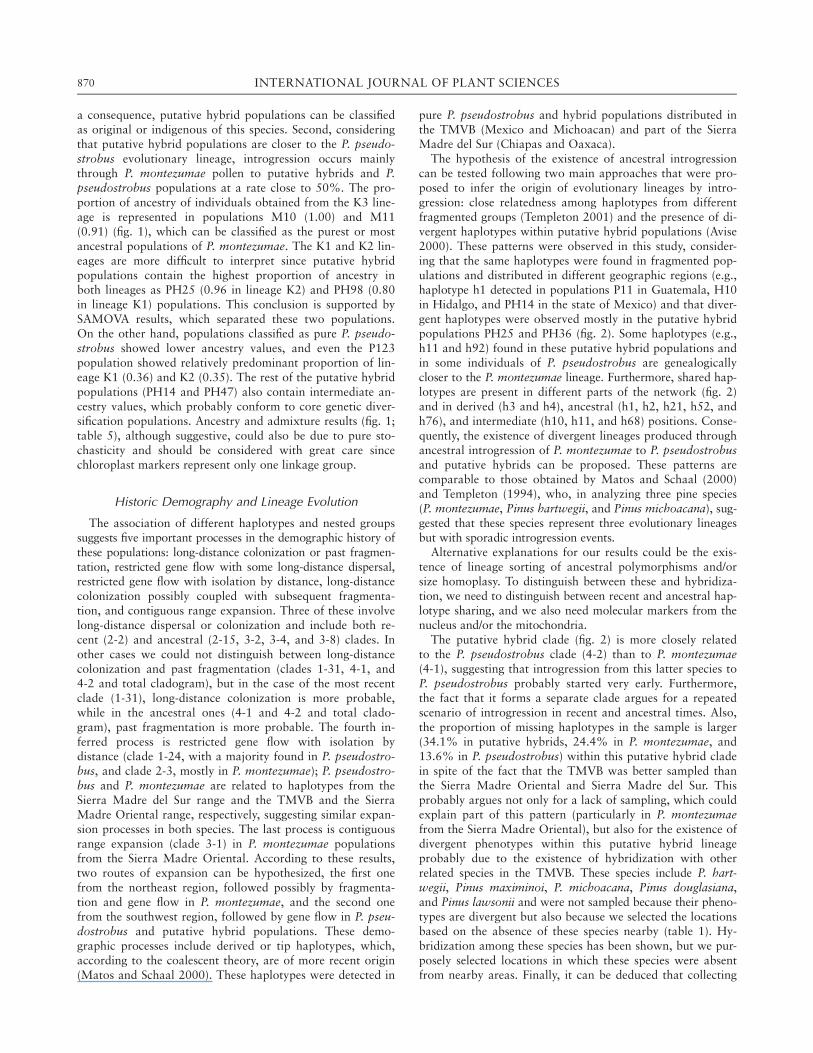
It has been suggested that the most important diversifica-tion in Pinus occurred 20 million years ago (MYA) (Millar1993). Climate changes associated with cyclic glaciationsthat took place during this period caused fragmentation orisolation of many species and/or populations in separate geo-graphical refugia. At the end of the last glaciation (ca.18,000 yr ago), temperature was still low and caused speciesmigration from refugia to other previously uninhabited areas(Webb and Bartlein 1992). This is the scenario that can beproposed for the two species studied here, in particular forP. montezumae: the continuous expansion could have em-braced a larger geographical range in the past, while the ac-tual distribution is represented by fragmented populations,where a significant isolation-by-distance pattern (r2 ¼ 0:905,P ¼ 0:000) was observed. In contrast, P. pseudostrobus couldhave had in the past more limited adaptive capabilities thanP. montezumae, and as a consequence its evolutionary his-tory could have been determined through restricted gene flowevents. However, dispersal and recent colonization processesdetected in this group (clade 4-2) could have increased thesize of these populations, as the current estimates of large ef-fective population size and average genetic diversity seem toindicate (table 4). To summarize, the evolutionary history ofthese species has probably involved colonization events, rangeexpansion, and isolation by distance, with geographic isolationdynamics, dispersion due to glaciations, and frequent intro-gression events. This last process is highlighted in the centralpart of Mexico within the TMVB, where putative hybridpopulations are spread and show the highest levels of geneticdiversity. Therefore, these results support the proposal of Styles(1993) that suggests the TMVB as a core region for the hybridorigin of some pine species and variates, and they are in agree-ment with recent studies about introgression zones in Quercusspecies (Gonzalez et al. 2004).
According to Farjon and Styles (1997), there are fossilizedcones from the Tertiary that could belong to ancestors of thetwo species studied here. For P. montezumae, these fossilswere found in Colorado and correspond to the late Oligo-cene (26.5 MYA; Axelrod 1986), and for P. pseudostrobus,they were found in Nevada and correspond to the Miocene(12.5 MYA; Axelrod 1986). This information indicates as apreliminary hypothesis, assuming species assignment to becorrect, that both species had a more northerly distributionin the past. To support this hypothesis we can approximatelyestimate the time during which these species have coexisted,on the basis of the time to the most recent common ancestorfor all populations, the generation time for each species, and
the mutation rate. Coalescence estimates can be obtainedfrom u ¼ 2Neu ¼ 57:51 (table 4), and assuming chloroplastmutation rate values published by Provan et al. (1999) (be-tween 3:2 3 10�5 and 7:9 3 10�5), these estimates are 1,797,889and 727,975 generations before present (expected coalescencetime in generations is twice the number of females, assum-ing balance among drift and mutation with small variance onthe size of fragments; Hartl and Clark 1997). Considering ageneration time of 15 yr (Patino et al. 1983), these two spe-cies could have coexisted for between 27 and 11 millionyears, which coincides with the estimate by Millar (1993) of20 million years for a period of high speciation in the genusPinus.
Conclusions
The results suggest that Pinus montezumae and Pinuspseudostrobus are two different but closely related speciesthat probably have hybridized frequently. These species rep-resent two divergent lineages that have prevailed but havebeen associated through introgression. This process origi-nated the present-day divergent lineages as those detected inthe putative hybrid populations PH14, PH25, PH36, andPH47, which are probably in an early stage of new speciationprocesses. Even when our results support the hypothesis ofintrogressive hybridization and suggest demographic scenar-ios and evolutionary patterns of introgression among thesespecies, it is important to continue to study these processesby sampling more populations of P. pseudostrobus and P.montezumae in other parts of the distribution range, also us-ing nuclear and mitochondrial markers to identify the ances-tral populations of these lineages and explore other possibleareas of contact and hybridization.
Acknowledgments
We thank I. Ramirez, L. Eguiarte, A. Pineyro, and twoanonymous reviewers for their valuable suggestions on dataanalysis and comments on earlier versions of the manuscript.We thank P. de la Garza and particularly F. Nepamucenofrom the National Institute for Forestry, Agriculture, andLivestock for their suggestions and help in the selection ofseveral putative hybrid populations. We thank A. R. Vazquez,E. Huerta, F. Ramırez, O. Chassin, and O. Rodrıguez forhelping in sample collection and laboratory work. This workwas financed by a PhD scholarship CONACYT-138507 toP. Delgado and projects SEMARNAT-CONACYT A1-201, toD. Pinero, and CONABIO-R116, to P. Delgado.
871DELGADO ET AL.—INTROGRESSIVE HYBRIDIZATION IN PINES
Appendix
Table A1
Haplotype Frequency Based on Microsatellite Data in Pinus montezumae, Pinus pseudostrobus, and Putative Hybrid Populations
Population
Haplotype cpSSR size P51 P62 P123 PH14 PH25 PH36 PH47 PH98 M79 M10 M11 M12 M13 Total
h1 68/147/160/126/141/89 3 1 6 9 4 23
h2 68/146/160/126/136/89 2 2 4
h3 68/147/161/126/136/89 1 1 2h4 68/147/160/125/141/89 1 1 2
h5 68/147/160/126/142/89 2 2
h6 68/146/160/126/142/90 2 2 1 5
h7 68/146/160/126/141/89 1 2 2 3 1 9h8 68/148/160/125/141/89 1 1
h9 67/147/160/126/141/89 3 1 4
h10 68/147/160/126/140/89 1 3 4
h11 68/148/161/126/141/89 1 1 1 3h12 68/146/163/126/141/89 8 1 9
h13 68/146/164/126/141/89 1 1
h14 67/146/163/125/141/89 1 1
h15 67/146/163/126/143/89 1 1h16 68/146/163/125/143/89 1 1
h17 68/146/163/125/142/89 1 1
h18 68/146/163/126/142/90 1 4 5h19 68/146/163/126/142/89 2 2
h20 68/146/163/126/141/90 1 1
h21 67/146/163/126/141/89 1 1 2
h22 68/145/163/125/142/89 1 1 2h23 68/145/163/126/141/90 1 1
h24 68/145/163/125/141/89 2 2
h25 68/146/163/124/141/89 1 1
h26 68/146/163/125/141/89 1 1h27 69/146/160/126/141/89 2 2
h28 68/146/163/126/143/90 1 1
h29 68/144/163/125/141/88 1 1h30 67/146/160/126/141/89 1 1 1 3
h31 68/146/161/126/142/88 1 1
h32 69/146/161/127/141/91 1 1
h33 69/146/160/126/141/90 1 1h34 68/144/163/124/142/90 1 1
h35 68/144/163/127/143/90 1 1
h36 67/146/163/126/144/91 1 1
h37 68/146/163/126/142/88 1 1h38 68/146/163/127/141/90 1 1
h39 68/144/163/126/142/88 1 1
h40 68/146/160/127/141/91 1 1
h41 68/144/163/127/141/89 1 1h42 69/147/162/126/141/90 1 1
h43 68/147/160/126/141/90 2 1 3 6
h44 68/147/161/127/141/89 1 5 1 7h45 68/146/161/126/141/90 1 1
h46 68/147/160/126/140/90 1 1
h47 68/146/160/126/140/91 1 1
h48 68/146/162/126/140/89 1 1h49 68/146/161/126/140/90 1 1
h50 69/147/163/126/141/90 1 1
h51 68/147/161/126/136/90 1 1
h52 68/146/160/126/141/90 3 3 1 7h53 69/145/161/127/142/90 1 1
h54 68/147/160/127/141/90 1 1
h55 69/144/161/126/141/89 1 1h56 69/144/163/126/142/89 1 1
h57 68/146/162/125/141/90 1 1
872
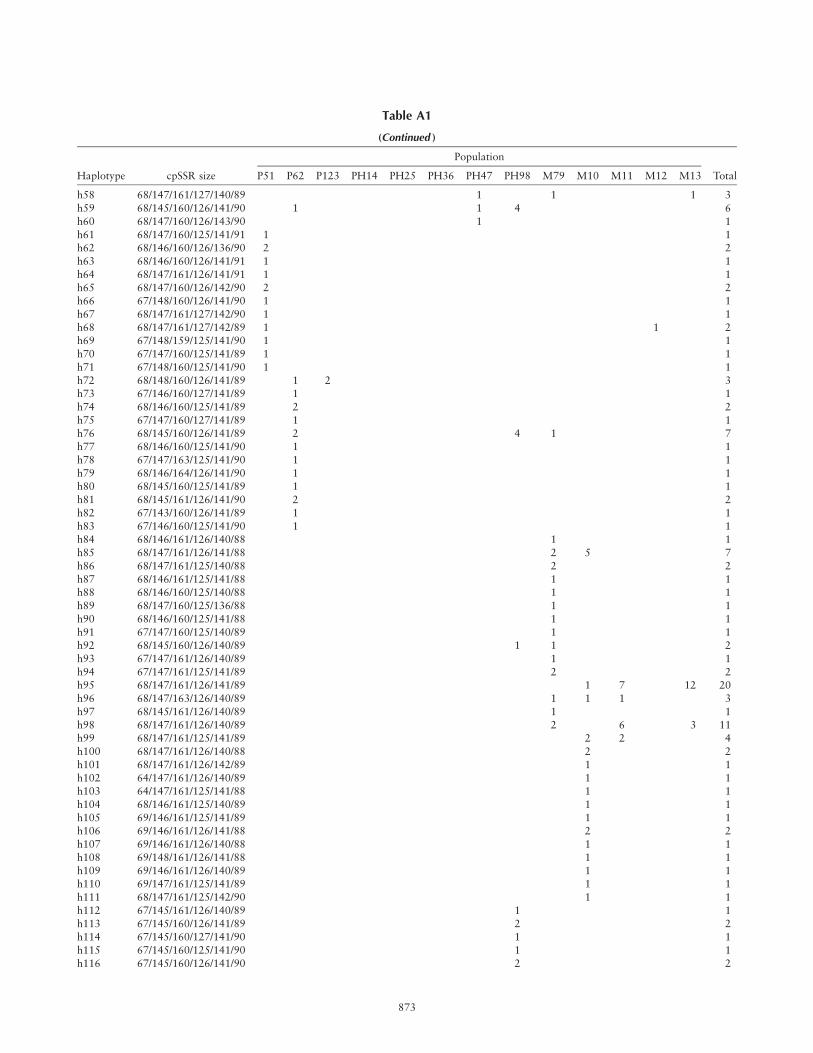
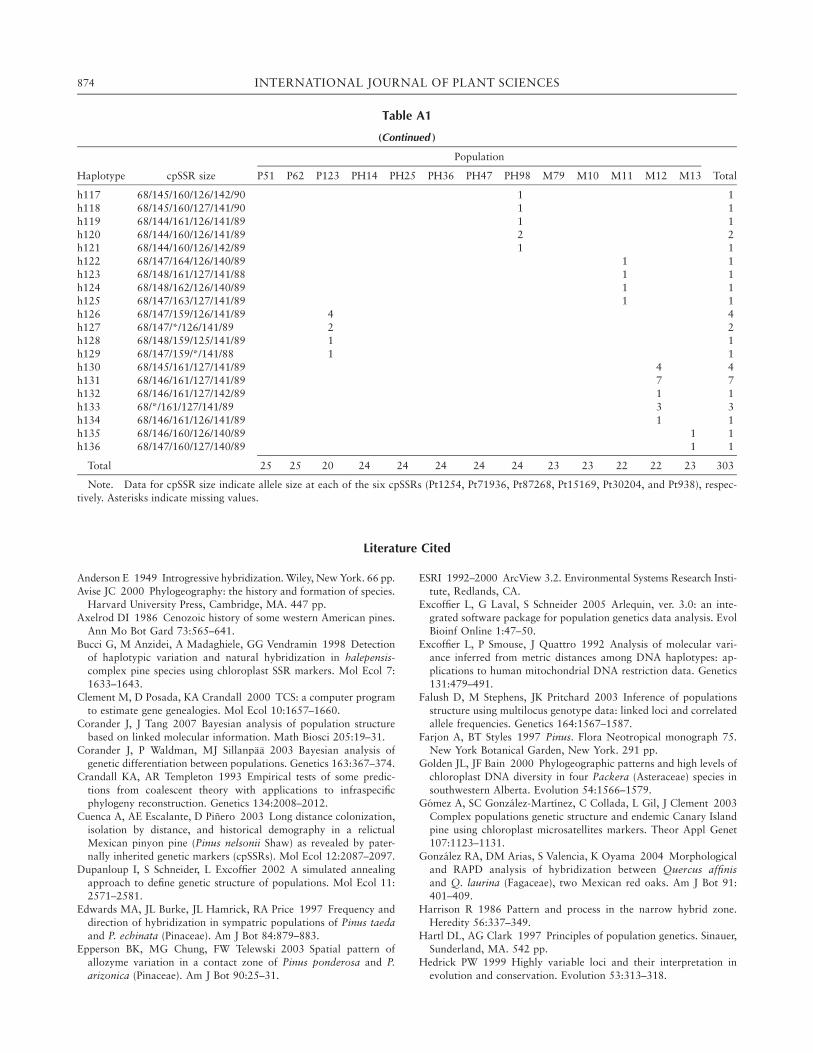
Table A1
(Continued )
Population
Haplotype cpSSR size P51 P62 P123 PH14 PH25 PH36 PH47 PH98 M79 M10 M11 M12 M13 Total
h58 68/147/161/127/140/89 1 1 1 3
h59 68/145/160/126/141/90 1 1 4 6
h60 68/147/160/126/143/90 1 1
h61 68/147/160/125/141/91 1 1h62 68/146/160/126/136/90 2 2
h63 68/146/160/126/141/91 1 1
h64 68/147/161/126/141/91 1 1
h65 68/147/160/126/142/90 2 2h66 67/148/160/126/141/90 1 1
h67 68/147/161/127/142/90 1 1
h68 68/147/161/127/142/89 1 1 2h69 67/148/159/125/141/90 1 1
h70 67/147/160/125/141/89 1 1
h71 67/148/160/125/141/90 1 1
h72 68/148/160/126/141/89 1 2 3h73 67/146/160/127/141/89 1 1
h74 68/146/160/125/141/89 2 2
h75 67/147/160/127/141/89 1 1
h76 68/145/160/126/141/89 2 4 1 7h77 68/146/160/125/141/90 1 1
h78 67/147/163/125/141/90 1 1
h79 68/146/164/126/141/90 1 1h80 68/145/160/125/141/89 1 1
h81 68/145/161/126/141/90 2 2
h82 67/143/160/126/141/89 1 1
h83 67/146/160/125/141/90 1 1h84 68/146/161/126/140/88 1 1
h85 68/147/161/126/141/88 2 5 7
h86 68/147/161/125/140/88 2 2
h87 68/146/161/125/141/88 1 1h88 68/146/160/125/140/88 1 1
h89 68/147/160/125/136/88 1 1
h90 68/146/160/125/141/88 1 1
h91 67/147/160/125/140/89 1 1h92 68/145/160/126/140/89 1 1 2
h93 67/147/161/126/140/89 1 1
h94 67/147/161/125/141/89 2 2h95 68/147/161/126/141/89 1 7 12 20
h96 68/147/163/126/140/89 1 1 1 3
h97 68/145/161/126/140/89 1 1
h98 68/147/161/126/140/89 2 6 3 11h99 68/147/161/125/141/89 2 2 4
h100 68/147/161/126/140/88 2 2
h101 68/147/161/126/142/89 1 1
h102 64/147/161/126/140/89 1 1h103 64/147/161/125/141/88 1 1
h104 68/146/161/125/140/89 1 1
h105 69/146/161/125/141/89 1 1h106 69/146/161/126/141/88 2 2
h107 69/146/161/126/140/88 1 1
h108 69/148/161/126/141/88 1 1
h109 69/146/161/126/140/89 1 1h110 69/147/161/125/141/89 1 1
h111 68/147/161/125/142/90 1 1
h112 67/145/161/126/140/89 1 1
h113 67/145/160/126/141/89 2 2h114 67/145/160/127/141/90 1 1
h115 67/145/160/125/141/90 1 1
h116 67/145/160/126/141/90 2 2
873
Literature Cited
Anderson E 1949 Introgressive hybridization. Wiley, New York. 66 pp.
Avise JC 2000 Phylogeography: the history and formation of species.Harvard University Press, Cambridge, MA. 447 pp.
Axelrod DI 1986 Cenozoic history of some western American pines.
Ann Mo Bot Gard 73:565–641.
Bucci G, M Anzidei, A Madaghiele, GG Vendramin 1998 Detectionof haplotypic variation and natural hybridization in halepensis-complex pine species using chloroplast SSR markers. Mol Ecol 7:
1633–1643.Clement M, D Posada, KA Crandall 2000 TCS: a computer program
to estimate gene genealogies. Mol Ecol 10:1657–1660.
Corander J, J Tang 2007 Bayesian analysis of population structure
based on linked molecular information. Math Biosci 205:19–31.Corander J, P Waldman, MJ Sillanpaa 2003 Bayesian analysis of
genetic differentiation between populations. Genetics 163:367–374.
Crandall KA, AR Templeton 1993 Empirical tests of some predic-
tions from coalescent theory with applications to infraspecificphylogeny reconstruction. Genetics 134:2008–2012.
Cuenca A, AE Escalante, D Pinero 2003 Long distance colonization,
isolation by distance, and historical demography in a relictualMexican pinyon pine (Pinus nelsonii Shaw) as revealed by pater-
nally inherited genetic markers (cpSSRs). Mol Ecol 12:2087–2097.
Dupanloup I, S Schneider, L Excoffier 2002 A simulated annealing
approach to define genetic structure of populations. Mol Ecol 11:2571–2581.
Edwards MA, JL Burke, JL Hamrick, RA Price 1997 Frequency and
direction of hybridization in sympatric populations of Pinus taedaand P. echinata (Pinaceae). Am J Bot 84:879–883.
Epperson BK, MG Chung, FW Telewski 2003 Spatial pattern of
allozyme variation in a contact zone of Pinus ponderosa and P.arizonica (Pinaceae). Am J Bot 90:25–31.
ESRI 1992–2000 ArcView 3.2. Environmental Systems Research Insti-
tute, Redlands, CA.Excoffier L, G Laval, S Schneider 2005 Arlequin, ver. 3.0: an inte-
grated software package for population genetics data analysis. Evol
Bioinf Online 1:47–50.
Excoffier L, P Smouse, J Quattro 1992 Analysis of molecular vari-ance inferred from metric distances among DNA haplotypes: ap-
plications to human mitochondrial DNA restriction data. Genetics
131:479–491.Falush D, M Stephens, JK Pritchard 2003 Inference of populations
structure using multilocus genotype data: linked loci and correlated
allele frequencies. Genetics 164:1567–1587.
Farjon A, BT Styles 1997 Pinus. Flora Neotropical monograph 75.New York Botanical Garden, New York. 291 pp.
Golden JL, JF Bain 2000 Phylogeographic patterns and high levels of
chloroplast DNA diversity in four Packera (Asteraceae) species in
southwestern Alberta. Evolution 54:1566–1579.Gomez A, SC Gonzalez-Martınez, C Collada, L Gil, J Clement 2003
Complex populations genetic structure and endemic Canary Island
pine using chloroplast microsatellites markers. Theor Appl Genet107:1123–1131.
Gonzalez RA, DM Arias, S Valencia, K Oyama 2004 Morphological
and RAPD analysis of hybridization between Quercus affinisand Q. laurina (Fagaceae), two Mexican red oaks. Am J Bot 91:401–409.
Harrison R 1986 Pattern and process in the narrow hybrid zone.
Heredity 56:337–349.
Hartl DL, AG Clark 1997 Principles of population genetics. Sinauer,Sunderland, MA. 542 pp.
Hedrick PW 1999 Highly variable loci and their interpretation in
evolution and conservation. Evolution 53:313–318.
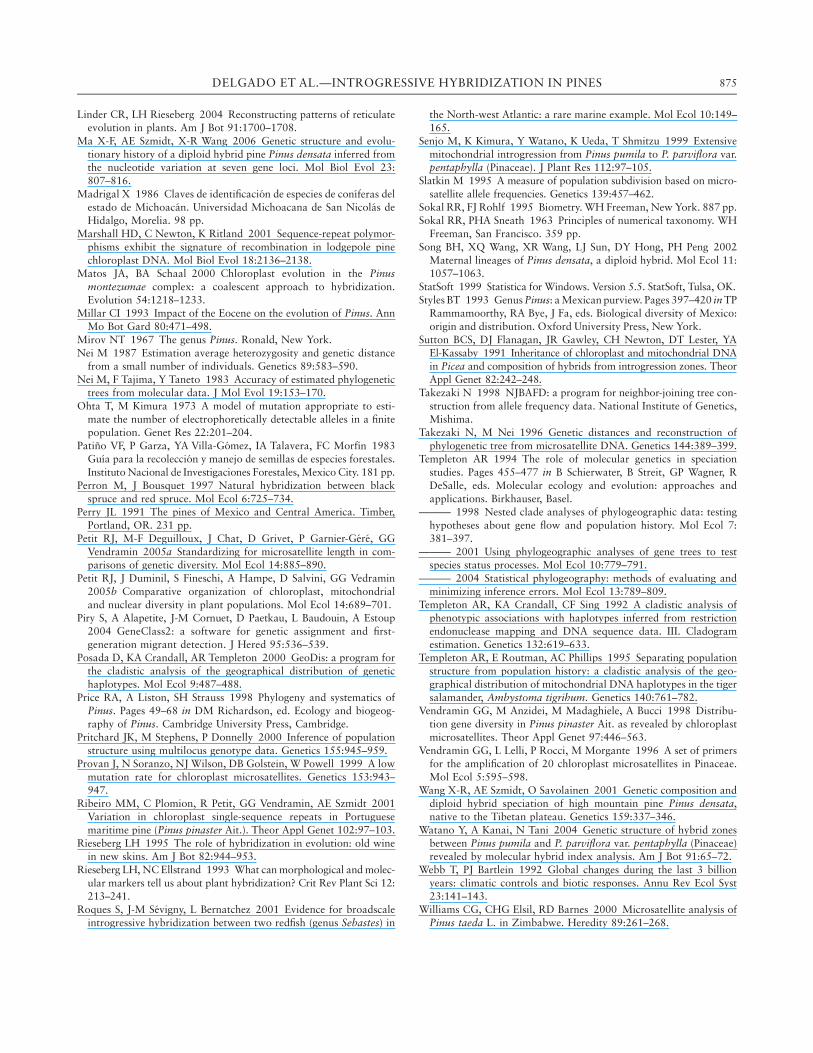
Table A1
(Continued )
Population
Haplotype cpSSR size P51 P62 P123 PH14 PH25 PH36 PH47 PH98 M79 M10 M11 M12 M13 Total
h117 68/145/160/126/142/90 1 1
h118 68/145/160/127/141/90 1 1
h119 68/144/161/126/141/89 1 1
h120 68/144/160/126/141/89 2 2h121 68/144/160/126/142/89 1 1
h122 68/147/164/126/140/89 1 1
h123 68/148/161/127/141/88 1 1
h124 68/148/162/126/140/89 1 1h125 68/147/163/127/141/89 1 1
h126 68/147/159/126/141/89 4 4
h127 68/147/*/126/141/89 2 2h128 68/148/159/125/141/89 1 1
h129 68/147/159/*/141/88 1 1
h130 68/145/161/127/141/89 4 4
h131 68/146/161/127/141/89 7 7h132 68/146/161/127/142/89 1 1
h133 68/*/161/127/141/89 3 3
h134 68/146/161/126/141/89 1 1
h135 68/146/160/126/140/89 1 1h136 68/147/160/127/140/89 1 1
Total 25 25 20 24 24 24 24 24 23 23 22 22 23 303
Note. Data for cpSSR size indicate allele size at each of the six cpSSRs (Pt1254, Pt71936, Pt87268, Pt15169, Pt30204, and Pt938), respec-
tively. Asterisks indicate missing values.
874 INTERNATIONAL JOURNAL OF PLANT SCIENCES
Linder CR, LH Rieseberg 2004 Reconstructing patterns of reticulateevolution in plants. Am J Bot 91:1700–1708.
Ma X-F, AE Szmidt, X-R Wang 2006 Genetic structure and evolu-
tionary history of a diploid hybrid pine Pinus densata inferred fromthe nucleotide variation at seven gene loci. Mol Biol Evol 23:
807–816.
Madrigal X 1986 Claves de identificacion de especies de conıferas del
estado de Michoacan. Universidad Michoacana de San Nicolas deHidalgo, Morelia. 98 pp.
Marshall HD, C Newton, K Ritland 2001 Sequence-repeat polymor-
phisms exhibit the signature of recombination in lodgepole pine
chloroplast DNA. Mol Biol Evol 18:2136–2138.Matos JA, BA Schaal 2000 Chloroplast evolution in the Pinus
montezumae complex: a coalescent approach to hybridization.
Evolution 54:1218–1233.Millar CI 1993 Impact of the Eocene on the evolution of Pinus. Ann
Mo Bot Gard 80:471–498.
Mirov NT 1967 The genus Pinus. Ronald, New York.
Nei M 1987 Estimation average heterozygosity and genetic distancefrom a small number of individuals. Genetics 89:583–590.
Nei M, F Tajima, Y Taneto 1983 Accuracy of estimated phylogenetic
trees from molecular data. J Mol Evol 19:153–170.
Ohta T, M Kimura 1973 A model of mutation appropriate to esti-mate the number of electrophoretically detectable alleles in a finite
population. Genet Res 22:201–204.
Patino VF, P Garza, YA Villa-Gomez, IA Talavera, FC Morfın 1983Guıa para la recoleccion y manejo de semillas de especies forestales.
Instituto Nacional de Investigaciones Forestales, Mexico City. 181 pp.
Perron M, J Bousquet 1997 Natural hybridization between black
spruce and red spruce. Mol Ecol 6:725–734.Perry JL 1991 The pines of Mexico and Central America. Timber,
Portland, OR. 231 pp.
Petit RJ, M-F Deguilloux, J Chat, D Grivet, P Garnier-Gere, GG
Vendramin 2005a Standardizing for microsatellite length in com-parisons of genetic diversity. Mol Ecol 14:885–890.
Petit RJ, J Duminil, S Fineschi, A Hampe, D Salvini, GG Vedramin
2005b Comparative organization of chloroplast, mitochondrial
and nuclear diversity in plant populations. Mol Ecol 14:689–701.Piry S, A Alapetite, J-M Cornuet, D Paetkau, L Baudouin, A Estoup
2004 GeneClass2: a software for genetic assignment and first-
generation migrant detection. J Hered 95:536–539.Posada D, KA Crandall, AR Templeton 2000 GeoDis: a program for
the cladistic analysis of the geographical distribution of genetic
haplotypes. Mol Ecol 9:487–488.
Price RA, A Liston, SH Strauss 1998 Phylogeny and systematics ofPinus. Pages 49–68 in DM Richardson, ed. Ecology and biogeog-
raphy of Pinus. Cambridge University Press, Cambridge.
Pritchard JK, M Stephens, P Donnelly 2000 Inference of population
structure using multilocus genotype data. Genetics 155:945–959.Provan J, N Soranzo, NJ Wilson, DB Golstein, W Powell 1999 A low
mutation rate for chloroplast microsatellites. Genetics 153:943–
947.Ribeiro MM, C Plomion, R Petit, GG Vendramin, AE Szmidt 2001
Variation in chloroplast single-sequence repeats in Portuguese
maritime pine (Pinus pinaster Ait.). Theor Appl Genet 102:97–103.
Rieseberg LH 1995 The role of hybridization in evolution: old winein new skins. Am J Bot 82:944–953.
Rieseberg LH, NC Ellstrand 1993 What can morphological and molec-
ular markers tell us about plant hybridization? Crit Rev Plant Sci 12:
213–241.Roques S, J-M Sevigny, L Bernatchez 2001 Evidence for broadscale
introgressive hybridization between two redfish (genus Sebastes) in
the North-west Atlantic: a rare marine example. Mol Ecol 10:149–165.
Senjo M, K Kimura, Y Watano, K Ueda, T Shmitzu 1999 Extensive
mitochondrial introgression from Pinus pumila to P. parviflora var.pentaphylla (Pinaceae). J Plant Res 112:97–105.
Slatkin M 1995 A measure of population subdivision based on micro-
satellite allele frequencies. Genetics 139:457–462.
Sokal RR, FJ Rohlf 1995 Biometry. WH Freeman, New York. 887 pp.Sokal RR, PHA Sneath 1963 Principles of numerical taxonomy. WH
Freeman, San Francisco. 359 pp.
Song BH, XQ Wang, XR Wang, LJ Sun, DY Hong, PH Peng 2002
Maternal lineages of Pinus densata, a diploid hybrid. Mol Ecol 11:1057–1063.
StatSoft 1999 Statistica for Windows. Version 5.5. StatSoft, Tulsa, OK.
Styles BT 1993 Genus Pinus: a Mexican purview. Pages 397–420 in TPRammamoorthy, RA Bye, J Fa, eds. Biological diversity of Mexico:
origin and distribution. Oxford University Press, New York.
Sutton BCS, DJ Flanagan, JR Gawley, CH Newton, DT Lester, YA
El-Kassaby 1991 Inheritance of chloroplast and mitochondrial DNAin Picea and composition of hybrids from introgression zones. Theor
Appl Genet 82:242–248.
Takezaki N 1998 NJBAFD: a program for neighbor-joining tree con-
struction from allele frequency data. National Institute of Genetics,Mishima.
Takezaki N, M Nei 1996 Genetic distances and reconstruction of
phylogenetic tree from microsatellite DNA. Genetics 144:389–399.Templeton AR 1994 The role of molecular genetics in speciation
studies. Pages 455–477 in B Schierwater, B Streit, GP Wagner, R
DeSalle, eds. Molecular ecology and evolution: approaches and
applications. Birkhauser, Basel.——— 1998 Nested clade analyses of phylogeographic data: testing
hypotheses about gene flow and population history. Mol Ecol 7:
381–397.
——— 2001 Using phylogeographic analyses of gene trees to testspecies status processes. Mol Ecol 10:779–791.
——— 2004 Statistical phylogeography: methods of evaluating and
minimizing inference errors. Mol Ecol 13:789–809.
Templeton AR, KA Crandall, CF Sing 1992 A cladistic analysis ofphenotypic associations with haplotypes inferred from restriction
endonuclease mapping and DNA sequence data. III. Cladogram
estimation. Genetics 132:619–633.Templeton AR, E Routman, AC Phillips 1995 Separating population
structure from population history: a cladistic analysis of the geo-
graphical distribution of mitochondrial DNA haplotypes in the tiger
salamander, Ambystoma tigrihum. Genetics 140:761–782.Vendramin GG, M Anzidei, M Madaghiele, A Bucci 1998 Distribu-
tion gene diversity in Pinus pinaster Ait. as revealed by chloroplast
microsatellites. Theor Appl Genet 97:446–563.
Vendramin GG, L Lelli, P Rocci, M Morgante 1996 A set of primersfor the amplification of 20 chloroplast microsatellites in Pinaceae.
Mol Ecol 5:595–598.
Wang X-R, AE Szmidt, O Savolainen 2001 Genetic composition anddiploid hybrid speciation of high mountain pine Pinus densata,
native to the Tibetan plateau. Genetics 159:337–346.
Watano Y, A Kanai, N Tani 2004 Genetic structure of hybrid zones
between Pinus pumila and P. parviflora var. pentaphylla (Pinaceae)revealed by molecular hybrid index analysis. Am J Bot 91:65–72.
Webb T, PJ Bartlein 1992 Global changes during the last 3 billion
years: climatic controls and biotic responses. Annu Rev Ecol Syst
23:141–143.Williams CG, CHG Elsil, RD Barnes 2000 Microsatellite analysis of
Pinus taeda L. in Zimbabwe. Heredity 89:261–268.
875DELGADO ET AL.—INTROGRESSIVE HYBRIDIZATION IN PINES