introduction 1.1 blood, coagulation and hemostasis blood is
TRANSCRIPT
1
Chapter 1: Introduction
1.1 Blood, Coagulation and Hemostasis
Blood is an essential body fluid that helps transport nutrients to all cells of the body, while
simultaneously transporting metabolic waste products away from the cells for excretion. [1] An
average human being contains almost 4 liters of blood within the body. Part of this is made up of
proteins, which float in the liquid fraction of blood called plasma and are essential for coagulation
and transportation of nutrients. The other part of blood is composed of cells. Three major types
of cells make up the cellular composition of blood, namely: (I) Red blood cells (erythrocytes) –
essential for carrying oxygen to various tissues of the body. (II) White blood cells (leucocytes) –
essential for fighting infections and performing various protective functions. (iii) Platelets
(thrombocytes) – essential for prevention of blood loss [1].
Overall, these components of blood help perform a variety of functions such as supplying
nutrients and oxygen to various parts of the body, transporting waste products from various
tissues to the kidneys, lungs and liver for metabolism and excretion, protecting the body from
various infections maintaining body pH, hydration and temperature, and coagulation in case of
injury. Thus, proper blood flow within the body is essential to maintain the homeostatic balance
of the body [1]. To maintain appropriate blood flow conditions, procoagulant and anticoagulant
factors are present within the blood [2]. In case of injury, excessive blood loss is prevented by
procoagulant factors, which result in hemostasis. Simultaneously, anticoagulant factors help
maintain proper blood flow within the rest of the body. This balance of procoagulant and
anticoagulant factors constituents the coagulation cascades, which also utilizes the platelet cell
of blood [2].
2
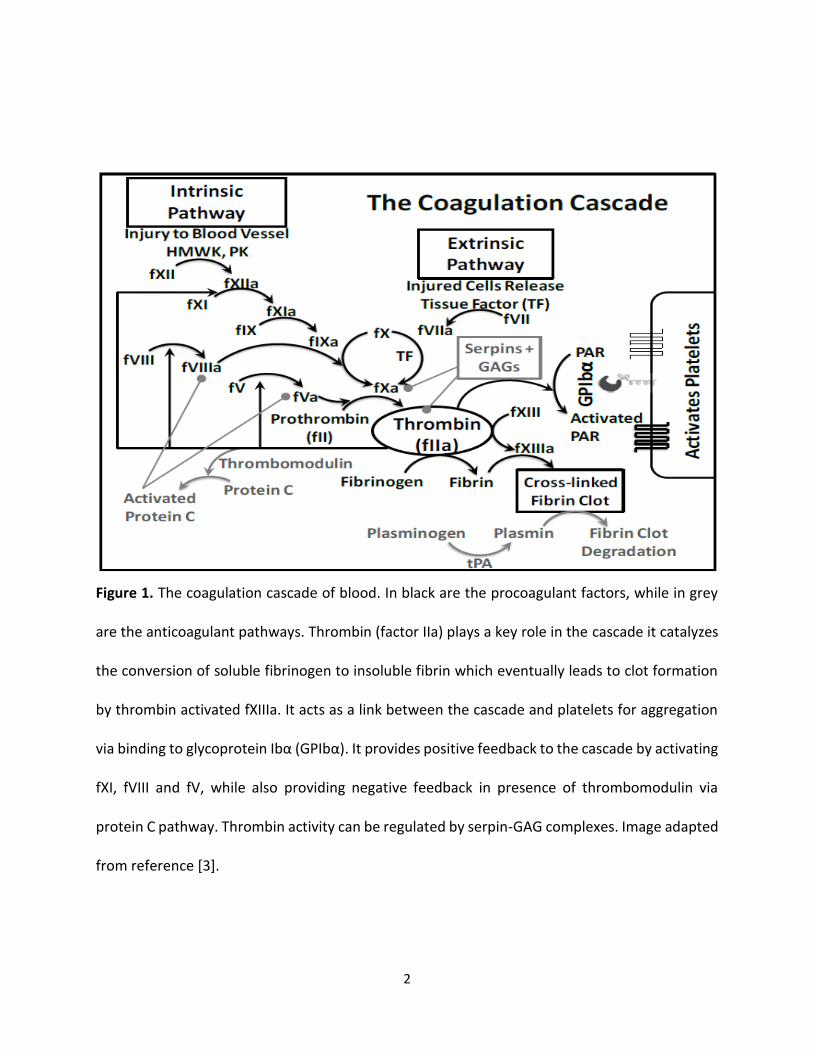
Figure 1. The coagulation cascade of blood. In black are the procoagulant factors, while in grey
are the anticoagulant pathways. Thrombin (factor IIa) plays a key role in the cascade it catalyzes
the conversion of soluble fibrinogen to insoluble fibrin which eventually leads to clot formation
by thrombin activated fXIIIa. It acts as a link between the cascade and platelets for aggregation
via binding to glycoprotein Ibα (GPIbα). It provides positive feedback to the cascade by activating
fXI, fVIII and fV, while also providing negative feedback in presence of thrombomodulin via
protein C pathway. Thrombin activity can be regulated by serpin-GAG complexes. Image adapted
from reference [3].
3
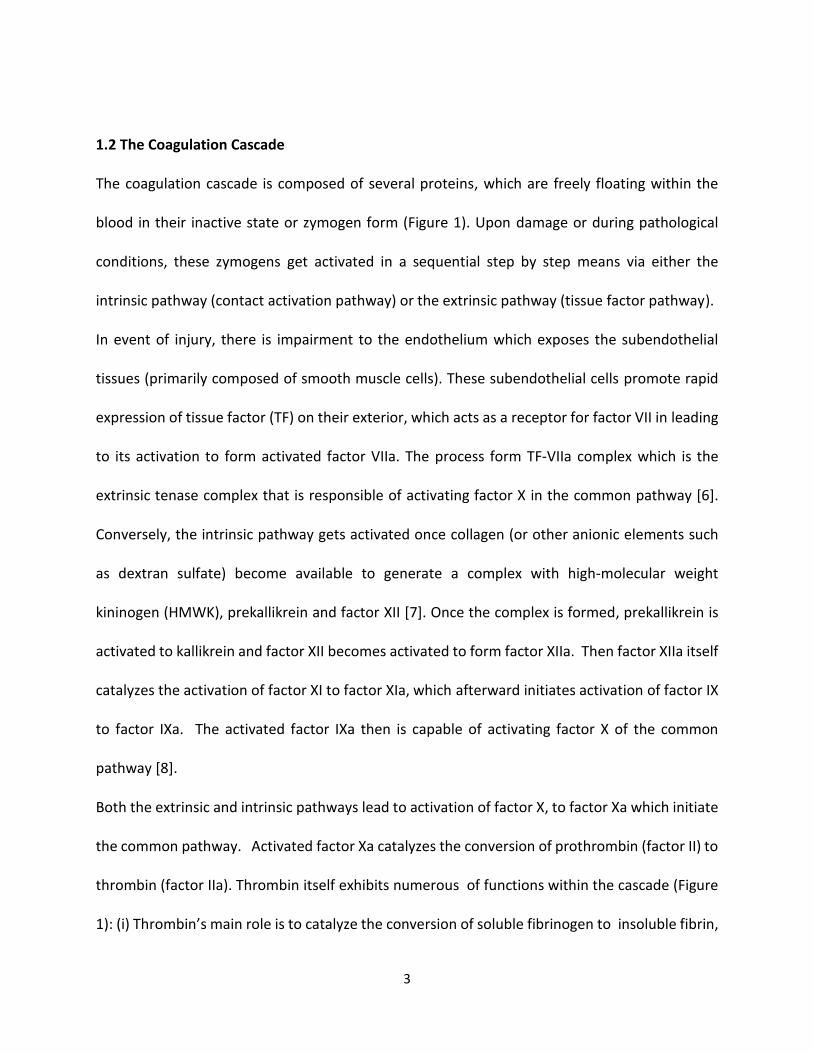
1.2 The Coagulation Cascade
The coagulation cascade is composed of several proteins, which are freely floating within the
blood in their inactive state or zymogen form (Figure 1). Upon damage or during pathological
conditions, these zymogens get activated in a sequential step by step means via either the
intrinsic pathway (contact activation pathway) or the extrinsic pathway (tissue factor pathway).
In event of injury, there is impairment to the endothelium which exposes the subendothelial
tissues (primarily composed of smooth muscle cells). These subendothelial cells promote rapid
expression of tissue factor (TF) on their exterior, which acts as a receptor for factor VII in leading
to its activation to form activated factor VIIa. The process form TF-VIIa complex which is the
extrinsic tenase complex that is responsible of activating factor X in the common pathway [6].
Conversely, the intrinsic pathway gets activated once collagen (or other anionic elements such
as dextran sulfate) become available to generate a complex with high-molecular weight
kininogen (HMWK), prekallikrein and factor XII [7]. Once the complex is formed, prekallikrein is
activated to kallikrein and factor XII becomes activated to form factor XIIa. Then factor XIIa itself
catalyzes the activation of factor XI to factor XIa, which afterward initiates activation of factor IX
to factor IXa. The activated factor IXa then is capable of activating factor X of the common
pathway [8].
Both the extrinsic and intrinsic pathways lead to activation of factor X, to factor Xa which initiate
the common pathway. Activated factor Xa catalyzes the conversion of prothrombin (factor II) to
thrombin (factor IIa). Thrombin itself exhibits numerous of functions within the cascade (Figure
1): (i) Thrombin’s main role is to catalyze the conversion of soluble fibrinogen to insoluble fibrin,
4
which eventually leads to a clot formation which subsequently plug the hemorrhage or injury
site;[9] (ii) moreover, it also triggers factor XIII activation to factor XIIIa, that aids in cross-linking
of the fibrin; [9] (iii) In addition, it plays a critical role in the coagulation cascade by activating
factor VIII [10] and factor V [11] so as to generate a positive feedback that can intensely
propagate the formation of the clot by making tenase and prothrombinase complexes;
(iv)thrombin by itself is capable of activating factor XI to factor XIa for additional positive
feedback; [12] (v) Thrombin also can activate platelets by binding to platelet glycoprotein Ibα
(GPIbα) and clearing PARs which can aid in platelet plug formation through activation and
aggregation; [13] (vi) Finally, thrombin as well plays an anticoagulant role through
thrombomodulin by activation of protein C, which in turn inactivation’s factor VIIIa and factor Va
[14,15].
The formed fibrin clot, along with the aggregated platelets lead to the formation of the
thrombus, which aids in prevention of blood loss and initiation of wound healing process. Several
anticoagulant factors, e.g., serine protease inhibitors (serpins), antithrombin and heparin co-
factor II, play an important role in preserving appropriate blood flow in the blood circulation at a
distance from the thrombus formation site [16]. Moreover, fibrinolytic pathways plus plasmin
can assist in breakdown of preexisting clots to reinstate blood flow [17].
1.3 The Platelets
Bone marrow contains hematopoietic stem cells, which differentiate into matured
megakaryocyte cells. The role of these cells is to produce and release platelets into the circulation
5
[18]. Platelets are the smallest cells found in the circulation and characterized as a nuclear, cells
with discoid formed, range from 1-3 μm in diameter and 0.5 μm in thickness [19,20].
Endothelial cells form the layer that line blood vessel walls and perform vital physiological roles
and contribute directly in hemostasis by interfacing with blood components (Figure 2) [21]. As
clearly known that endothelial cells release nitric oxide and prostacyclin, both of which play a
critical role in keeping the platelets in their inactive state. Moreover, under the endothelial cell
layer there is a layer of basement membrane. The basement membrane (subendothelium)
produces collagen on the surface to which platelets bind through a cell adhesion protein named
the von Willebrand factor (vWF), which exists in blood (Figure 2). Hence, under physiological
conditions collagen is not in direct contact with blood where platelets are present. But, in the
case of wound, collagen comes unprotected and triggers platelet activation due to the presence
of vWF in the blood. [22] When platelets get activated, they release alpha and dense granules,
which lead to more platelet activation generating a chains reaction (Figure 2). That plays an
important role in adhesion and aggregation of platelets as well as procoagulation and repairing
mechanism in nature [23]. Aspirin, an antiplatelet drug, affects the biosynthesis of thromboxane
(TXA-2) to deliver antiplatelet effects. Platelets activation similarly leaks phosphatidylserine on
the platelet surface, leading to fXa activation, which in turn enhances thrombin generation and
proliferation of the coagulation cascade to generate a fibrin mesh [24]. The exceptional character
of activated platelets is that they display major morphological change with protrusion on their
surface. Platelets facilitate a numeral of vascular and cellular responses through several receptors
equally. [26,27] There is substantial cross-talk between coagulation factors and platelets through
receptors. The platelet receptors that primarily involved in such inter-play include:
6
1. Glycoprotein Ibα (GPIbα) - which is recognized by thrombin, vWF and as well as other
coagulation factors, such as factors XIa, XIIa, VIIa and kininogen.
2. Protease activated receptors PAR1, PAR3 and PAR4 – which are receptors for thrombin and
are stimulated by thrombin.
3. Integrins like αIIbβ3 – which bind with fibrinogen and vWF for adhesion. One of the most
important reactions is the GPIbα-thrombin reaction, which is considered the most vital for
Changing platelet shape is a complex process, that regulated by proteins responsible of actin
architecture regulation. [25] Such a platelet is able to clump with platelets to generate the
platelet plug platelet-coagulation inter-play. GPIbα is characterized one of the richest surface
receptors on platelets and thrombin. When thrombin binds to GPIbα it displays augmented
catalytic ability to PAR activation signifying that physiologically this complex might play a central
role in engaging platelets throughout hemostasis induced by the coagulation system.
7
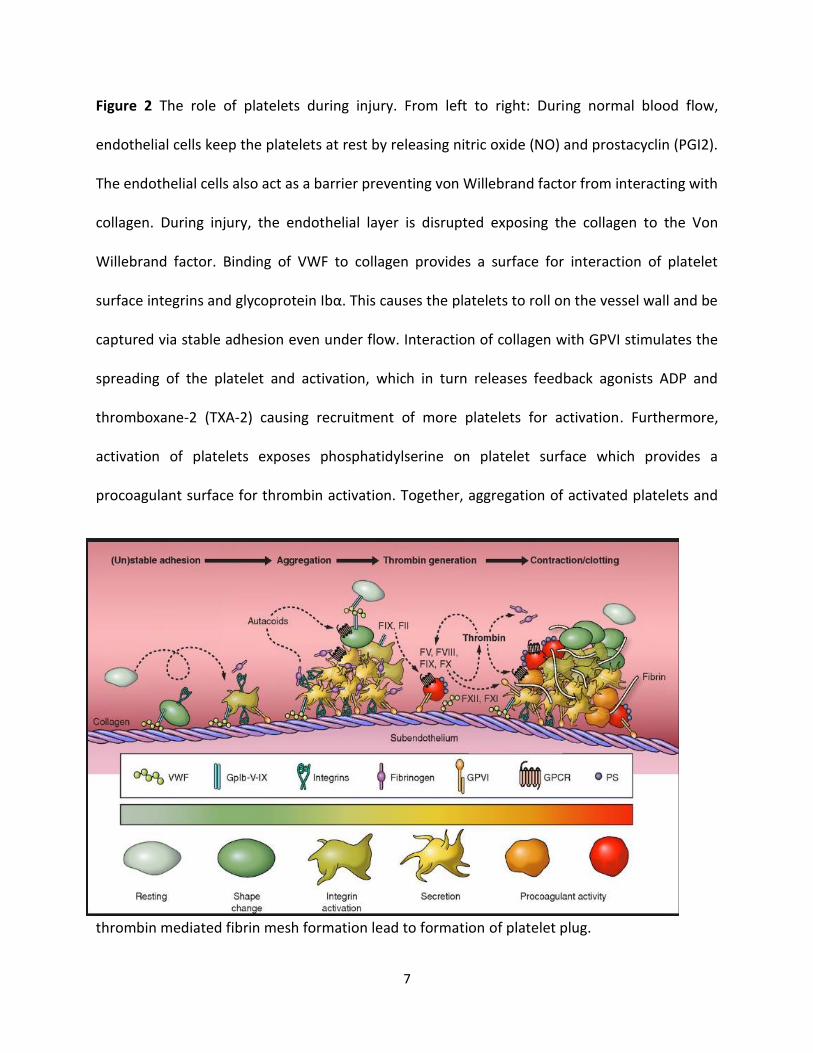
Figure 2 The role of platelets during injury. From left to right: During normal blood flow,
endothelial cells keep the platelets at rest by releasing nitric oxide (NO) and prostacyclin (PGI2).
The endothelial cells also act as a barrier preventing von Willebrand factor from interacting with
collagen. During injury, the endothelial layer is disrupted exposing the collagen to the Von
Willebrand factor. Binding of VWF to collagen provides a surface for interaction of platelet
surface integrins and glycoprotein Ibα. This causes the platelets to roll on the vessel wall and be
captured via stable adhesion even under flow. Interaction of collagen with GPVI stimulates the
spreading of the platelet and activation, which in turn releases feedback agonists ADP and
thromboxane-2 (TXA-2) causing recruitment of more platelets for activation. Furthermore,
activation of platelets exposes phosphatidylserine on platelet surface which provides a
procoagulant surface for thrombin activation. Together, aggregation of activated platelets and
thrombin mediated fibrin mesh formation lead to formation of platelet plug.
8
1.4 Synthesis and Structure of Thrombin
Thrombin is synthesized by enzymatic cleavage of two sites on prothrombin by activated FXa.
Activated factor Xa’s activity is significantly boosted by binding to activated factor V (Va), which in
turn form the complex prothrombinase. In fact, prothrombin is synthesized in the liver and is co-
translationally modified by vitamin K-dependent reactions that convert ten glutamic acid
residues present on prothrombin to gamma- carboxyglutamic acid (Gla). In the presence of
calcium, the Gla residues tether prothrombin to phospholipid bilayers. Absence of vitamin K or
infusion of the warfarin as an anticoagulant inhibits the biosynthesis of Gla residues resulting in
slowing the activation of the coagulation cascade. The molecular weight of Prothrombin is 72,000
Da. However, when the catalytic domain is released from both sites 1 and 2 of prothrombin,
thrombin will be formed as an active enzyme has a molecular weight of 36,000 Da.
Activated thrombin possesses an amino terminal light chain (“A” chain ~6,000 Da) and a carboxy
terminal heavy chain (“B” chain ~31,000 Da). Both chains are covalently connected through only
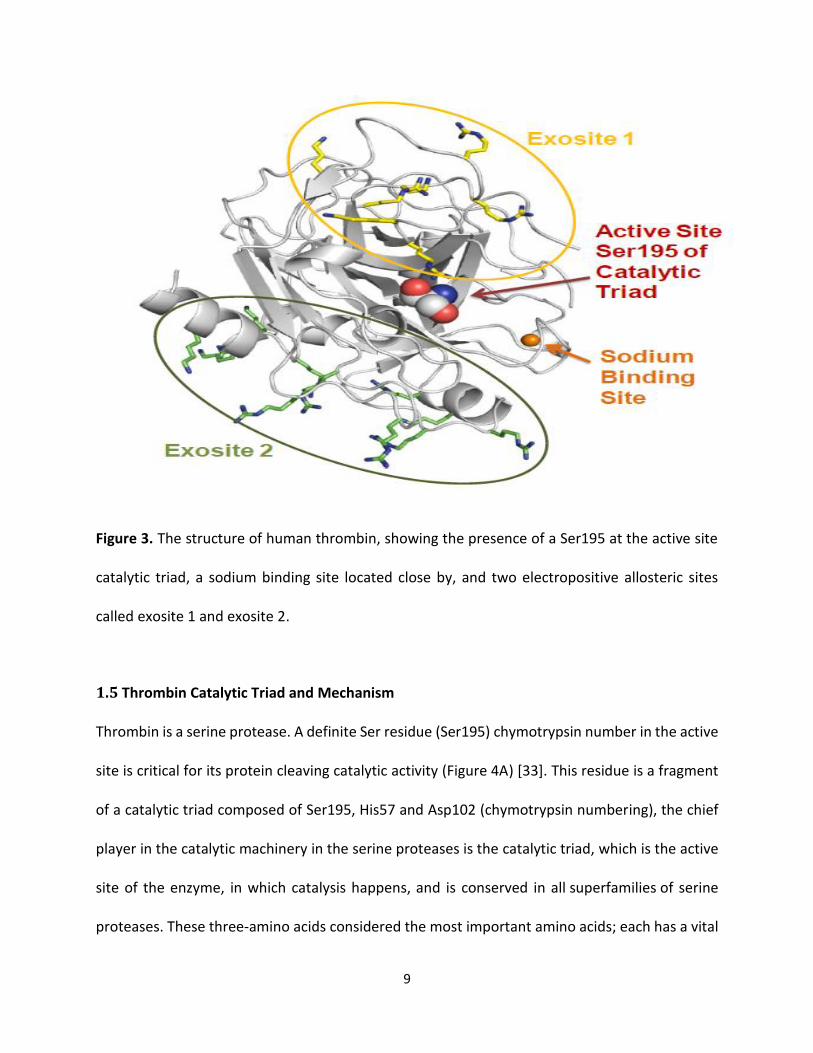
one disulfide bond. [32] Architecturally, thrombin comprises an active site with a catalytic triad,
a sodium binding site and two allosteric electropositive sites, called exosite 1 and exosite 2
(Figure 3).
9
Figure 3. The structure of human thrombin, showing the presence of a Ser195 at the active site
catalytic triad, a sodium binding site located close by, and two electropositive allosteric sites
called exosite 1 and exosite 2.
1.5 Thrombin Catalytic Triad and Mechanism
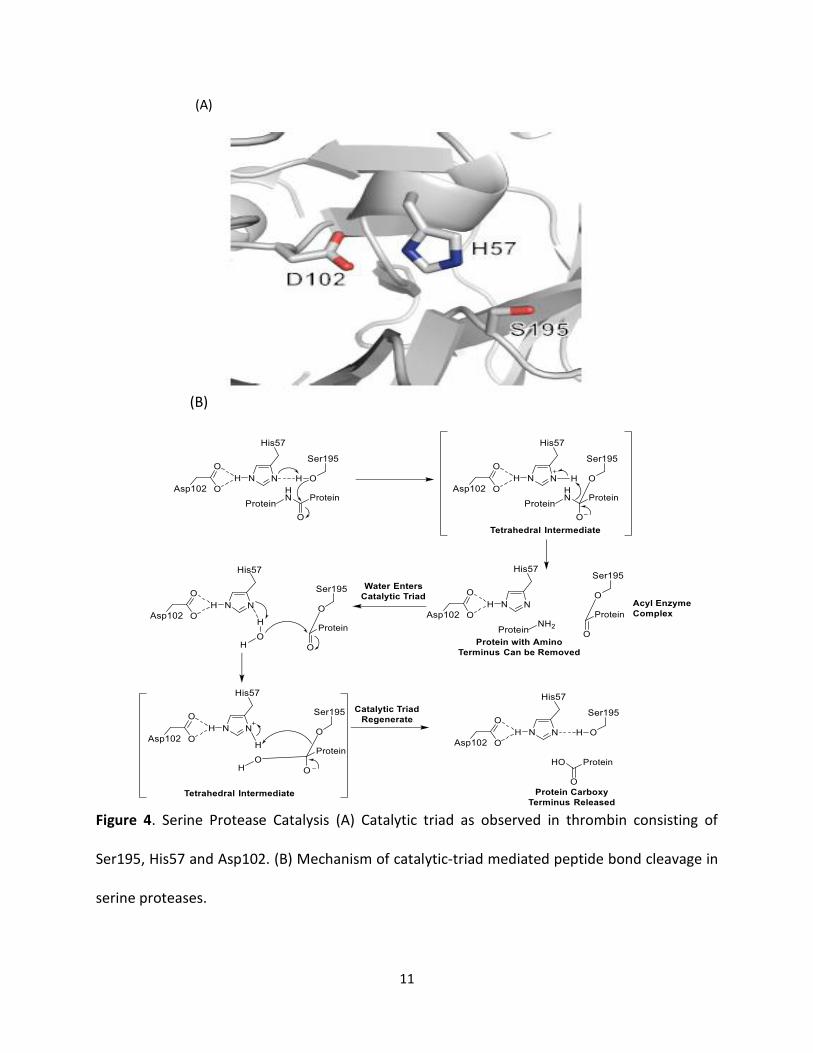
Thrombin is a serine protease. A definite Ser residue (Ser195) chymotrypsin number in the active
site is critical for its protein cleaving catalytic activity (Figure 4A) [33]. This residue is a fragment
of a catalytic triad composed of Ser195, His57 and Asp102 (chymotrypsin numbering), the chief
player in the catalytic machinery in the serine proteases is the catalytic triad, which is the active
site of the enzyme, in which catalysis happens, and is conserved in all superfamilies of serine
proteases. These three-amino acids considered the most important amino acids; each has a vital
10
role in the cleaving capability of the proteases. Although the triad amino acids are located apart
from each another on the protein sequence, due to the protein folding, they occur nearby each
another, in the heart of the enzyme. The triad amino acids geometries are highly representative
to their specific function. In the occasion of catalysis, a well-organized mechanism happens. The
catalysis of the peptide cleavage can be pictured as a ping-pong ping-mechanism of catalysis, that
allows a substrate to bind and produce a product (the N-terminus "half" of the peptide), while,
another substrate binds (in this case, water), to release another product (the C-terminus "half"
of the peptide). Therefore, each amino acid in the triad accomplishes an exact job:
• OH- group on the Ser acts as a nucleophile, reacting with the carbonyl carbon of the
scissile peptide bond of the substrate. A couple of electrons on the histidine nitrogen has
the capability to take the hydrogen from the serine -OH group, hence organizing the
attack of the peptide bond.
• Aspartic acid carboxyl group exchange hydrogen bonds with histidine, generating the
more negatively charged nitrogen atom. The entire process can be picturized as shown
in red.
11
(A)
(B)
Figure 4. Serine Protease Catalysis (A) Catalytic triad as observed in thrombin consisting of
Ser195, His57 and Asp102. (B) Mechanism of catalytic-triad mediated peptide bond cleavage in
serine proteases.
12
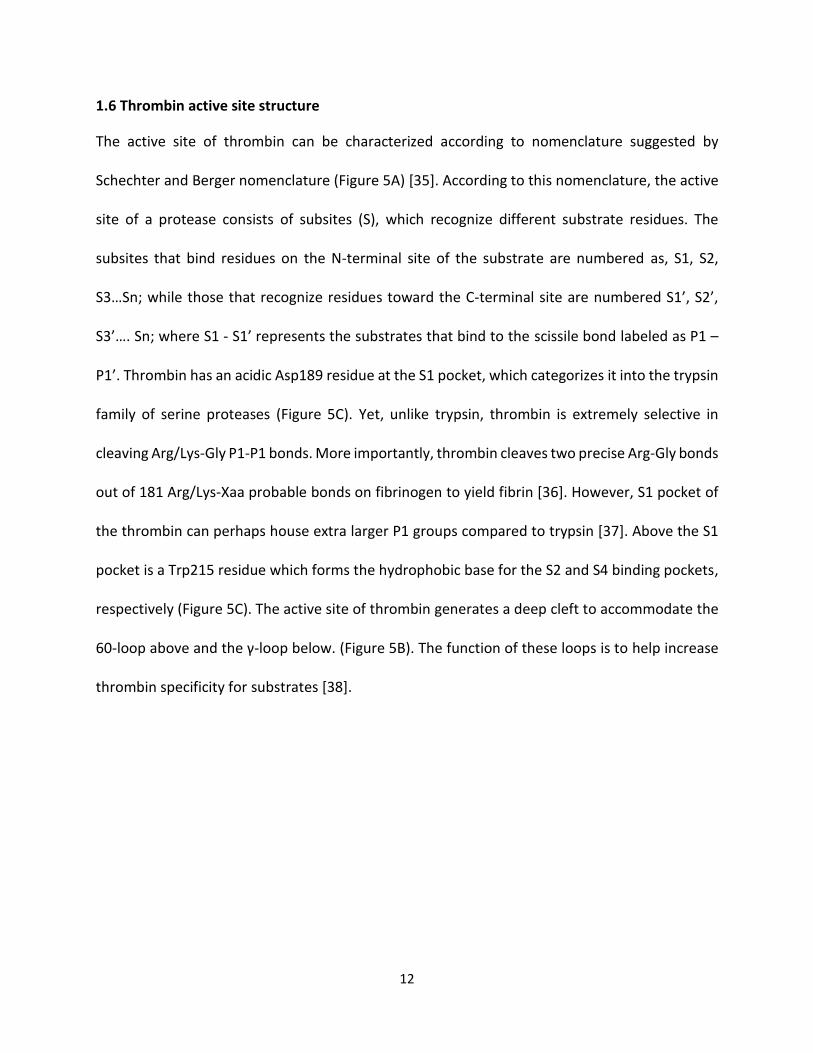
1.6 Thrombin active site structure
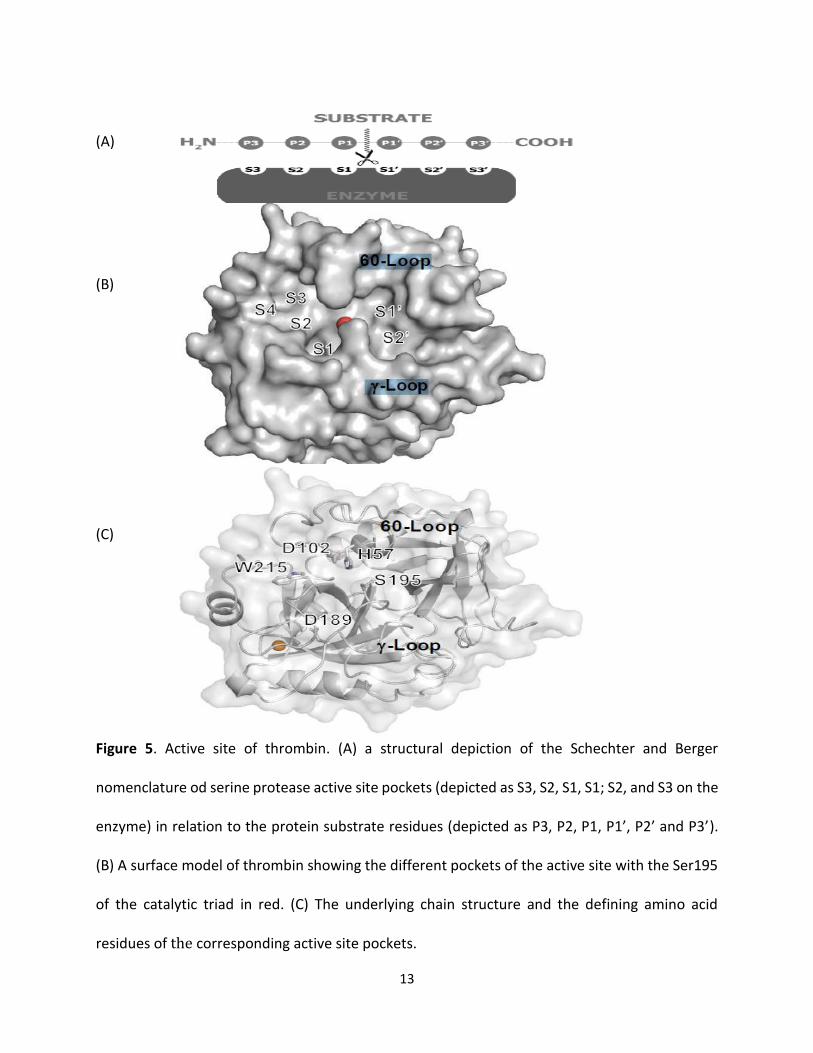
The active site of thrombin can be characterized according to nomenclature suggested by
Schechter and Berger nomenclature (Figure 5A) [35]. According to this nomenclature, the active
site of a protease consists of subsites (S), which recognize different substrate residues. The
subsites that bind residues on the N-terminal site of the substrate are numbered as, S1, S2,
S3…Sn; while those that recognize residues toward the C-terminal site are numbered S1’, S2’,
S3’…. Sn; where S1 - S1’ represents the substrates that bind to the scissile bond labeled as P1 –
P1’. Thrombin has an acidic Asp189 residue at the S1 pocket, which categorizes it into the trypsin
family of serine proteases (Figure 5C). Yet, unlike trypsin, thrombin is extremely selective in
cleaving Arg/Lys-Gly P1-P1 bonds. More importantly, thrombin cleaves two precise Arg-Gly bonds
out of 181 Arg/Lys-Xaa probable bonds on fibrinogen to yield fibrin [36]. However, S1 pocket of
the thrombin can perhaps house extra larger P1 groups compared to trypsin [37]. Above the S1
pocket is a Trp215 residue which forms the hydrophobic base for the S2 and S4 binding pockets,
respectively (Figure 5C). The active site of thrombin generates a deep cleft to accommodate the
60-loop above and the γ-loop below. (Figure 5B). The function of these loops is to help increase
thrombin specificity for substrates [38].
13
(A)
(B)
(C)
Figure 5. Active site of thrombin. (A) a structural depiction of the Schechter and Berger
nomenclature od serine protease active site pockets (depicted as S3, S2, S1, S1; S2, and S3 on the
enzyme) in relation to the protein substrate residues (depicted as P3, P2, P1, P1’, P2’ and P3’).
(B) A surface model of thrombin showing the different pockets of the active site with the Ser195
of the catalytic triad in red. (C) The underlying chain structure and the defining amino acid
residues of the corresponding active site pockets.
14
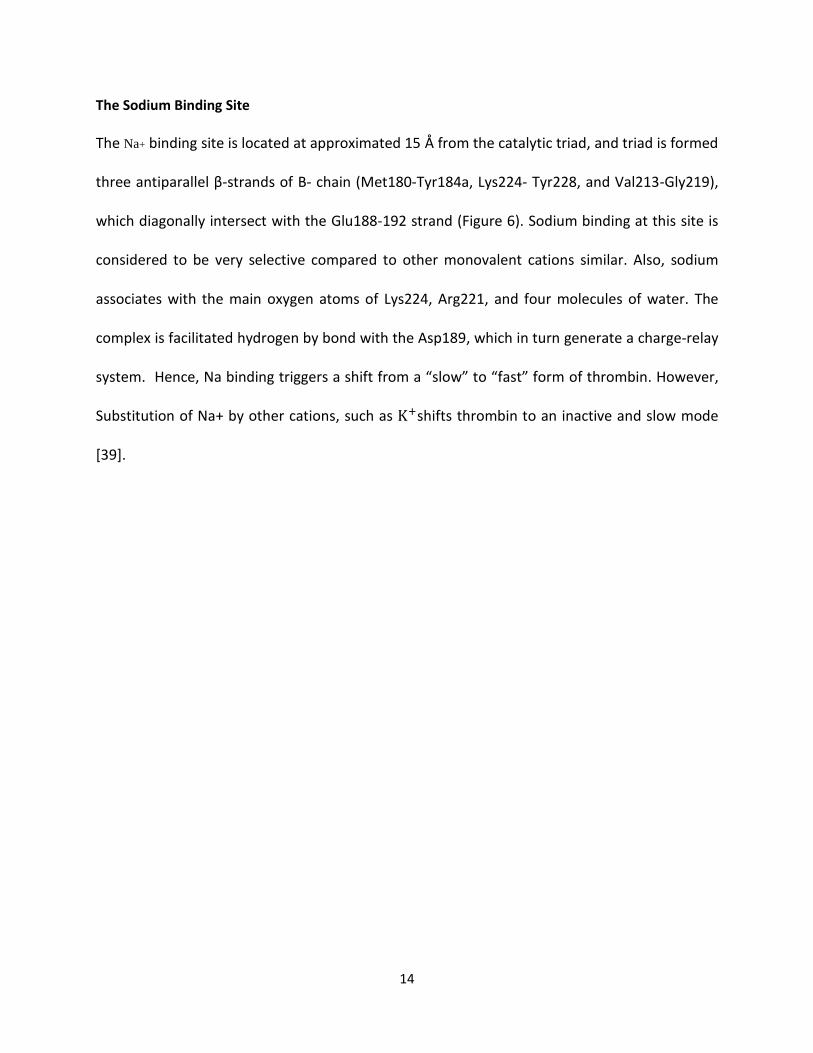
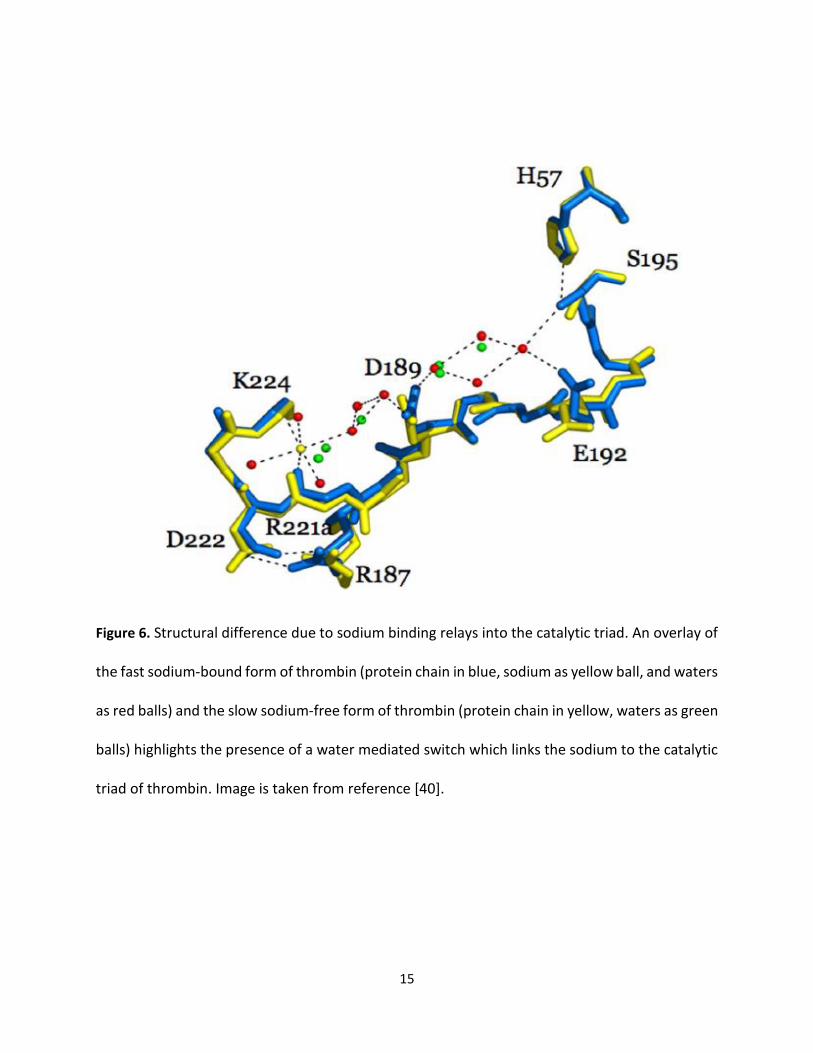
The Sodium Binding Site
The Na+ binding site is located at approximated 15 Å from the catalytic triad, and triad is formed
three antiparallel β-strands of B- chain (Met180-Tyr184a, Lys224- Tyr228, and Val213-Gly219),
which diagonally intersect with the Glu188-192 strand (Figure 6). Sodium binding at this site is
considered to be very selective compared to other monovalent cations similar. Also, sodium
associates with the main oxygen atoms of Lys224, Arg221, and four molecules of water. The
complex is facilitated hydrogen by bond with the Asp189, which in turn generate a charge-relay
system. Hence, Na binding triggers a shift from a “slow” to “fast” form of thrombin. However,
Substitution of Na+ by other cations, such as K+shifts thrombin to an inactive and slow mode
[39].
15
Figure 6. Structural difference due to sodium binding relays into the catalytic triad. An overlay of
the fast sodium-bound form of thrombin (protein chain in blue, sodium as yellow ball, and waters
as red balls) and the slow sodium-free form of thrombin (protein chain in yellow, waters as green
balls) highlights the presence of a water mediated switch which links the sodium to the catalytic
triad of thrombin. Image is taken from reference [40].
16
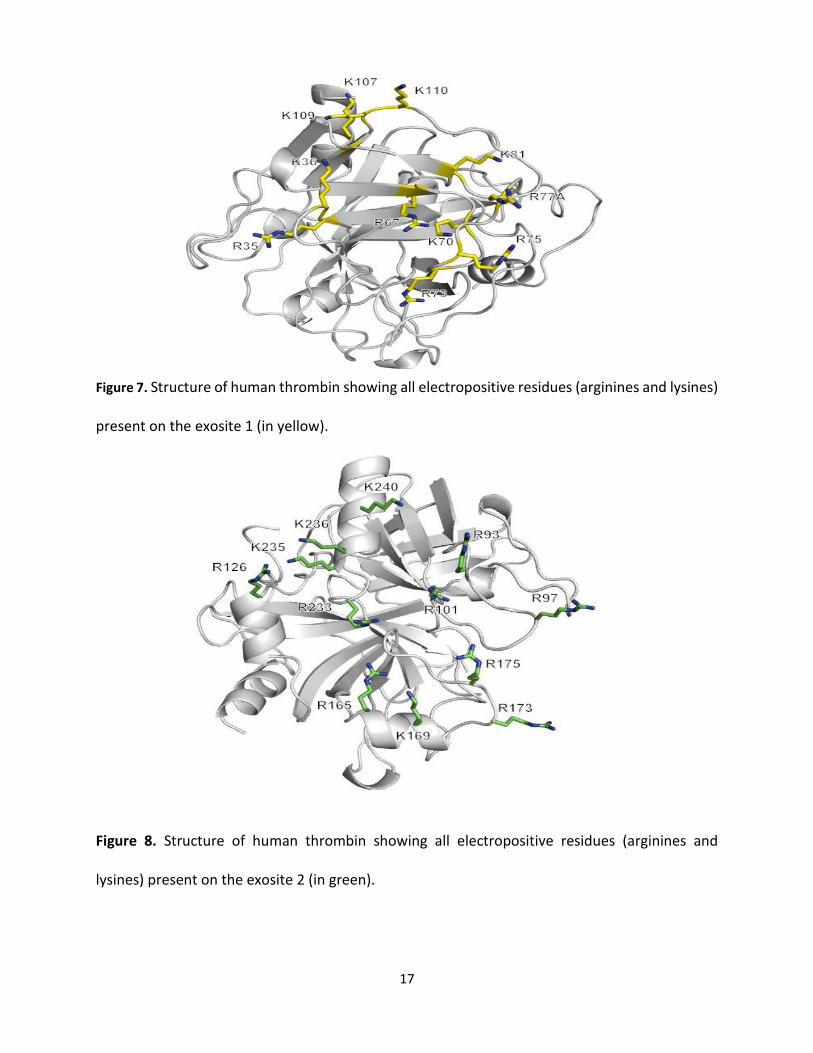
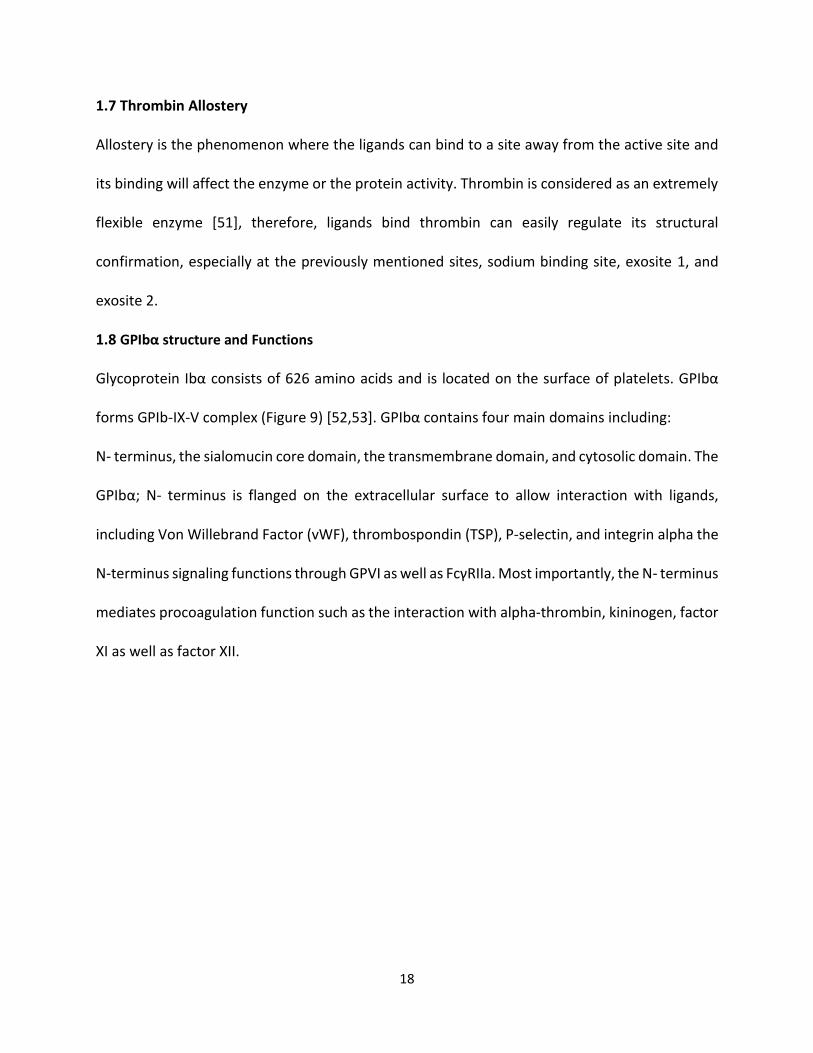
Exosite 1
Exosite 1 considered electropositive in nature due to the abundance of positively charged
residues, such as Lys36, Lys70, Lys81, Lys107, Lys109, and Lys110 along with Arg67, Arg75, Arg77
[32]. Exosite 1 is estimated to be 20 Å form the active site. This site considered to be vital for the
fibrinogen conversion to fibrin by the thrombin (Figure 7).
Exosite 2
Exosite 2 characterizes the largest and most positively charged site. It is a location adjacent to
the C- terminus of thrombin heavy chain. The positively charged residues at exosite 2 contain Arg93,
Arg97, Arg101, Arg126, Arg165, Lys169, Arg173, Arg175, Arg233, Lys235, Lys236 and Lys240 [32,47].
Also, this site known as heparin -binding site. The presence of highly positively charged residues
at this site is critical to attract a negatively charged molecules, such as heparin. Moreover, this
site could interact with GPIbα of platelets receptor, [49] prothrombin [48], sulfated thrombomodulin
[50], factor VIII [44], and other endogenous ligands.
17
Figure 7. Structure of human thrombin showing all electropositive residues (arginines and lysines)
present on the exosite 1 (in yellow).
Figure 8. Structure of human thrombin showing all electropositive residues (arginines and
lysines) present on the exosite 2 (in green).
18
1.7 Thrombin Allostery
Allostery is the phenomenon where the ligands can bind to a site away from the active site and
its binding will affect the enzyme or the protein activity. Thrombin is considered as an extremely
flexible enzyme [51], therefore, ligands bind thrombin can easily regulate its structural
confirmation, especially at the previously mentioned sites, sodium binding site, exosite 1, and
exosite 2.
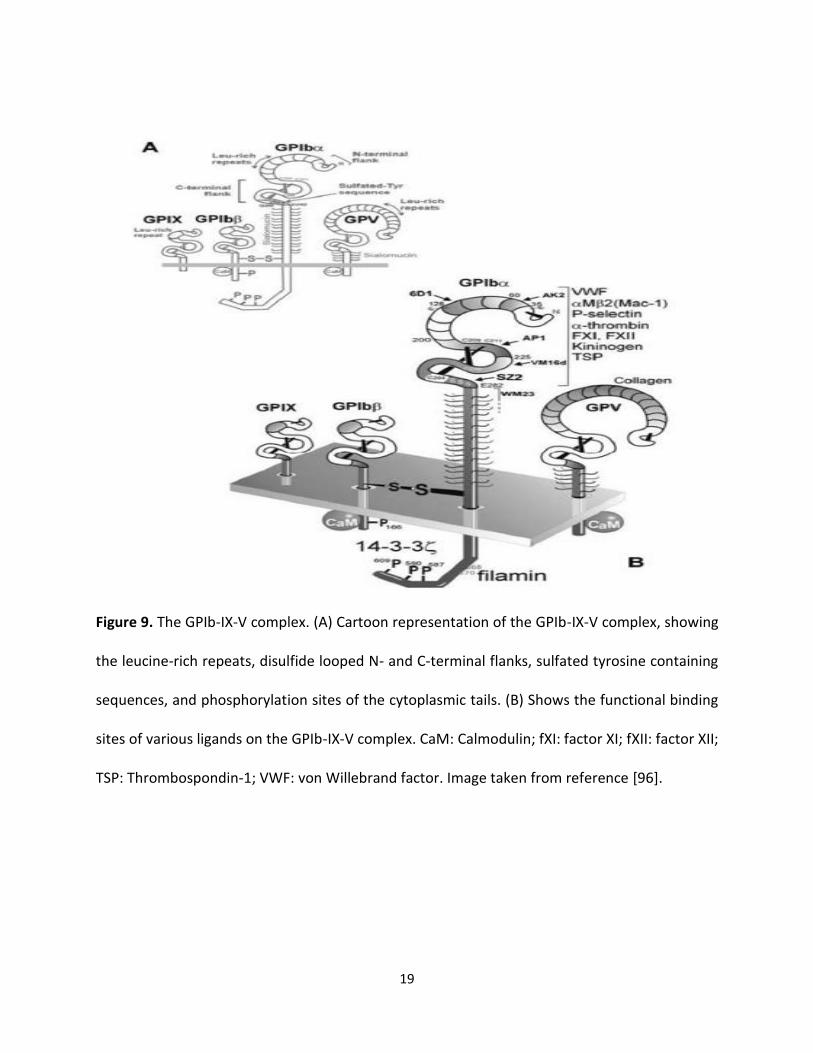
1.8 GPIbα structure and Functions
Glycoprotein Ibα consists of 626 amino acids and is located on the surface of platelets. GPIbα
forms GPIb-IX-V complex (Figure 9) [52,53]. GPIbα contains four main domains including:
N- terminus, the sialomucin core domain, the transmembrane domain, and cytosolic domain. The
GPIbα; N- terminus is flanged on the extracellular surface to allow interaction with ligands,
including Von Willebrand Factor (vWF), thrombospondin (TSP), P-selectin, and integrin alpha the
N-terminus signaling functions through GPVI as well as FcγRIIa. Most importantly, the N- terminus
mediates procoagulation function such as the interaction with alpha-thrombin, kininogen, factor
XI as well as factor XII.
19
Figure 9. The GPIb-IX-V complex. (A) Cartoon representation of the GPIb-IX-V complex, showing
the leucine-rich repeats, disulfide looped N- and C-terminal flanks, sulfated tyrosine containing
sequences, and phosphorylation sites of the cytoplasmic tails. (B) Shows the functional binding
sites of various ligands on the GPIb-IX-V complex. CaM: Calmodulin; fXI: factor XI; fXII: factor XII;
TSP: Thrombospondin-1; VWF: von Willebrand factor. Image taken from reference [96].
20
1.9 Thrombin Interaction with GPIbα
In the past three decades, the interaction of thrombin with GPIbα has been extensively studied.
Mutagenesis studies have shown the binding sites on GPIbα to an anionic tyrosine rich peptide
of the protein [12]. However, until recently the binding site on thrombin has been extensively
discussed. that a such integration will cause some allosteric changes in the activity and specificity
of the thrombin [54,55].
1.10 Structure and Function of Factor XIa – as an Evolving Target for Prophylactic
Anticoagulation
The role of prophylactic anticoagulant therapy is to be able to maintain thrombosis and
hemostasis. Factor XIa is considered one of the factors that can contributes selectively to
thrombus but not to hemostasis. Factor XI is an exceptional serine protease with molecular
weight of 160 kDa. It is a dimer of identical subunits in contrast to other vitamin-K dependent
proteases (Figure 10A). Each subunit of the dimer contains four Apple domains (A1, A2, A3, and
A4) with an N-terminus of approximately 90 amino acids. The C-terminus contains catalytic
domain. The domains are connected by a Cys321-Cys321 disulfide bond [32,56,57,58].
Factor XI can be activated by factor XIIa, which cleaves the Arg369-Ile370 peptide bond on
each subunit. Subsequent to the activation, the enzyme is predicted to experience a dramatic
modification triggering structural re-orientation at both catalytic domains of the two subunits.
This reorientation brings the two subunits closer to each other (Figure 10B) [59]. In addition,
factor XIa has the ability to bind numerous natural macromolecules such as high molecular
weight kininogen, [60] thrombin, [130] heparin, [61-62] factor IX, [63-64] Platelet GPIbα, [138-
139] and apolipoprotein E receptor [21,40] through allosteric sites (figure 10C) [33].
21
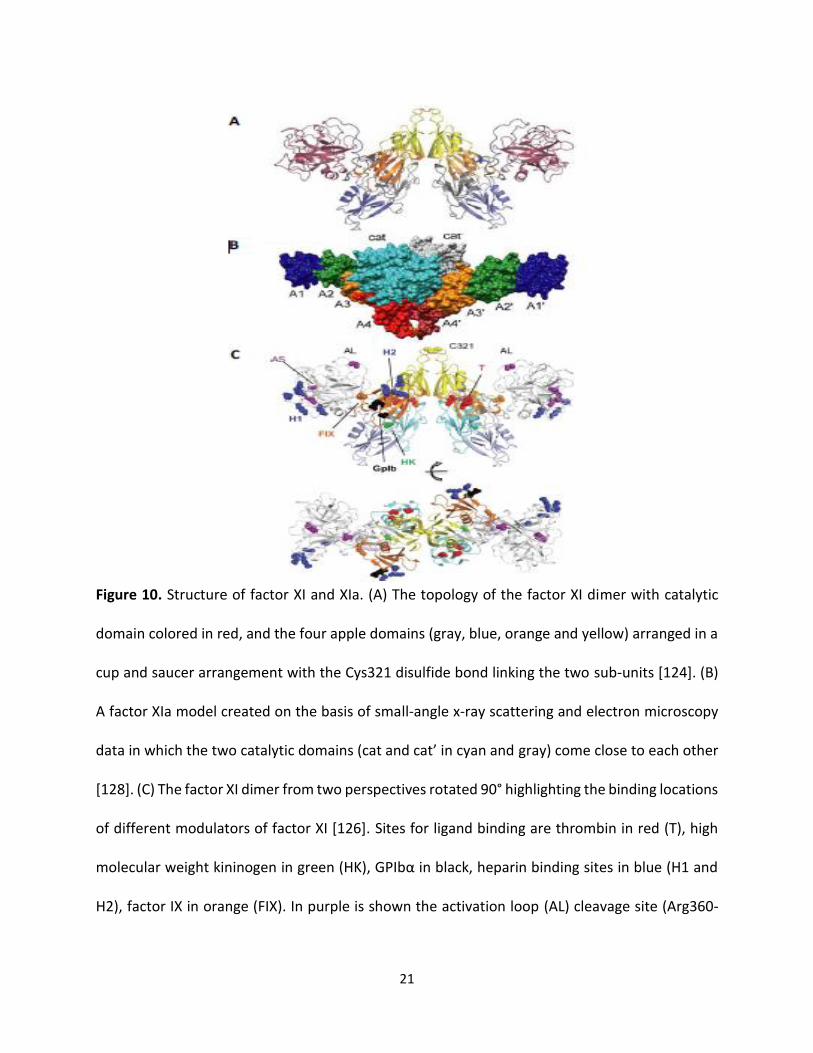
Figure 10. Structure of factor XI and XIa. (A) The topology of the factor XI dimer with catalytic
domain colored in red, and the four apple domains (gray, blue, orange and yellow) arranged in a
cup and saucer arrangement with the Cys321 disulfide bond linking the two sub-units [124]. (B)
A factor XIa model created on the basis of small-angle x-ray scattering and electron microscopy
data in which the two catalytic domains (cat and cat’ in cyan and gray) come close to each other
[128]. (C) The factor XI dimer from two perspectives rotated 90° highlighting the binding locations
of different modulators of factor XI [126]. Sites for ligand binding are thrombin in red (T), high
molecular weight kininogen in green (HK), GPIbα in black, heparin binding sites in blue (H1 and
H2), factor IX in orange (FIX). In purple is shown the activation loop (AL) cleavage site (Arg360-
22
Ile370) and the active site (AS) catalytic triad (Ser557, Asp462, and His413). Note: All images for
this figure are taken directly from literature or corresponding supplementary information.
In the intrinsic pathway, factor XIa triggers the activation of factor IX, while FIXa in turn
activates the subsequent coagulation cascade. Therefore, it eventually contributes to the
development of a stable clot [65]. Separately from fXIIa, fXI exhibits autoactivation. More
interestingly, thrombin produced in small amounts in early stages of coagulation, in an
independent manner of factor XIIa, can lead to factor XI activation [64,66]. FXIa is accounted with
fast generation of thrombin which is crucial for preserving the integrity of fibrin clot. Therefore,
coagulation has a major positive feedback for coagulation. [67] Since, FXIa is linking the extrinsic
and the common pathways of the coagulation cascade therefore, targeting a such protease will
prevent possible excessive bleeding [68].
Numerous studies have proven that fXIa is a useful target can be used to develop
prophylactic anticoagulant therapy [69]. A pilot study was conducted to test a fXIa deficient mice
and compared to wild type mice in FeCl3 injury assay. Result revealed that the FXIa deficient mice
is less susceptible to either arterial nor venous thrombosis [70]. Furthermore, fXI-deficient mice
are thought to be healthier, thus inhibiting FXIa would result in safe anticoagulation effect [71].
Alternative studies using deactivating antibodies against fXI have also confirmed a decrease in
thrombus development in rabbits [72] as well as in humans. Individuals who have fXI deficiency
(hemophilia type C), show minor bleeding phenotype compared to other types of hemophilia
[73-74]. These findings provide solid evidence that fXIa inhibition may offer harmless
anticoagulant modality [75-76].
23
1.11 Glycosaminoglycans
Glycosaminoglycans (GAGs) are a group of negatively charged extended chain, unbranched
carbohydrate polymers that exhibit molecular weights ranged between 10 to 100 kDa. GAGs exist
on the cell surface in proteoglycan form virtually on all cells as well as in extracellular matrix
(ECM) [77-78]. GAGs hydration and structural support. Moreover, sulfated GAGs exhibit
additional critical roles in the development, maintenance, and pathophysiology of mammalian
tissues. They can be serve as receptors as well as reservoirs via electrostatic interaction with
proteins.
Classification of GAGs
Heparin is considered as major one GAG. Heparin mainly formed by mast cells and is stored
in granules to be released into the extracellular space via exocytosis. Heparin is very potent
anticoagulant and is extensively used as intravenously infused blood thinner. Heparan sulfate
(HS) is structurally related to heparin and possesses extremely diverse biological actions. Heparin
as a member of GAGs has the highest sulfation degree and highest charge density compared to
any known biopolymer. It associates with a plethora of proteins including coagulation factors,
growth factors, cytokines, adhesion proteins, and pathogen-related proteins. The use of heparin
for other biological applications is considered limited, partially due to its quick turnover and risks
of extensive bleeding upon infusion.
24
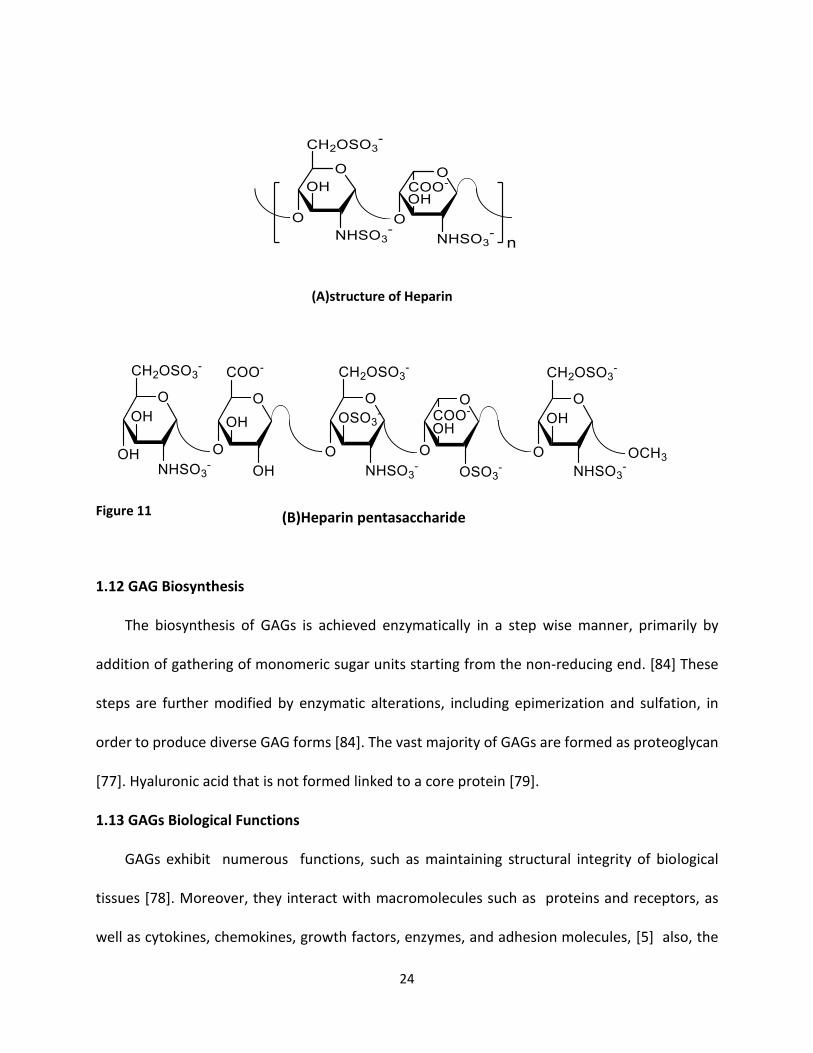
(A)structure of Heparin
Figure 11
1.12 GAG Biosynthesis
The biosynthesis of GAGs is achieved enzymatically in a step wise manner, primarily by
addition of gathering of monomeric sugar units starting from the non-reducing end. [84] These
steps are further modified by enzymatic alterations, including epimerization and sulfation, in
order to produce diverse GAG forms [84]. The vast majority of GAGs are formed as proteoglycan
[77]. Hyaluronic acid that is not formed linked to a core protein [79].
1.13 GAGs Biological Functions
GAGs exhibit numerous functions, such as maintaining structural integrity of biological
tissues [78]. Moreover, they interact with macromolecules such as proteins and receptors, as
well as cytokines, chemokines, growth factors, enzymes, and adhesion molecules, [5] also, the
(B)Heparin pentasaccharide
25
have the ability to modify a multitude of processes including coagulation, growth, infection,
inflammation, angiogenesis, tumor progression and metastasis[84–88]. Heparin is one of GAGs
members has been used as an anticoagulant since 1935 [89]. Subsequently, GAGs have been
studied extensively for potential therapeutic use in a number of indications including cancer,
wound healing, lung diseases [91–94].
1.14 GAG Interaction with Proteins
A number of GAG binding proteins have been recognized and studied[18]. Serine proteases,
serine protease inhibitors (serpins), growth factors, lipolytic enzymes, extracellular matrix
proteins, viral coat proteins, and transcription factors interact with GAG [19]. GAG binding
proteins generally have collections of basic amino acid residues on their surface, a feature that
has frequently been used to identify GAG binding proteins, as well as GAG binding sites on these
proteins[97]. The collection and property of amino acids are critical in determining GAG
interaction.[97] For example, if a protein has a surface with broadly spread out cationic residues,
it may exhibit better interaction with GAGs with lower sulfation level, such like heparan sulfate,
compared to highly sulfated GAG, such as heparin[98].
GAGs have ability to interact with a number of their binding partners due to their highly
charged nature. Non-specific electrostatic binding is dependent primarily on charge density of
the GAGs [78]. These interactions occur between the acidic sulfate groups and the basic side
chains, such as arginine and lysine, that are exposed on the surface of the protein [98]. In some
cases, histidine residues are involved [98]. Serine proteases and serpins are the most extensively
studied GAGs binding partners and their interactions shine light on GAG-protein interactions.
26
1.15 Serine Protease Inhibitors(Serpins)
Serpins are natural inhibitors of serine proteases and comprise of prototypical serpins
α1-antrypsin, ATIII, heparin cofactor II and protein C inhibitor among many others [34]. Serpins
are important in preserving homeostasis in various physiological processes including
inflammation, coagulation and digestion. The particular mechanism of inhibition employed by
serpins is very unique, which involves substantial conformational changes [111]. Inhibition can
be initiated when the reactive site loop of the serpin interacts with the active site of the serine
protease, which cleaves the loop [112]. A major conformational change then reveals substantial
movement of the protease to the other resulting in irreversible inhibition [111,112].
1.16 Antithrombin (ATIII)
Antithrombin is one of the serpin member and is considered an inhibitor of serine
proteases of the coagulation cascade including thrombin, fXa, fIXa, fXIa and fXIIa [125]. Heparin
exercises its anticoagulant activity by activating ATIII, which accelerates inhibition of proteases.
In fact, ATIII alone inhibits thrombin and fXa slowly. However, in the presence of heparin this
process can be enhanced by more than >2000-fold [113]. The inhibition of thrombin, by heparin
co-factor II (HCII) can also be enhanced by dermatan sulfate and heparin by more >1000-fold
[38]. FXa is inhibited by ATIII in the presence of a pentameric heparin sequence [115–116].
Conversely, thrombin requires a longer sequence of 18 monosaccharide units in order to be
inhibited by ATIII [117]. Several studies have introduced a bridging mechanism, in which ATIII and
thrombin bind to the same heparin chain to enable the interaction. But, the occurrence of a
27
conformational change in the reactive center loop of fXa by the short pentasaccharide heparin is
important for inhibition [113,118,119].
1.17 Glycosaminoglycan Mimetics
As previously mentioned, GAGs are complex heterogeneous complexes that can interact
with a vast number of proteins. However, only few of these GAGs have been extensively studied.
One of the reasons is that GAGs are obtain from animal source [120,121]. There is likely to be
impurities in GAGs [122–123]. The need to purify GAGs require several chemical steps on the
other hand [124,125]. GAG mimetics, have a vast advantage of overcoming some of major delays
naturally derived GAGs. They are free of impurities. In addition, there is an opportunity of
obtaining structurally uniform species, which can help perform studies and reduce off target
effect. Further, desired pharmacokinetic properties may be accomplished by the incorporation
of diverse chemical moieties, such as hydrophobic moieties into GAG mimetics. There may not
be achieved by GAGs [126,127].
Additional challenges exist. There is inadequate structural evidence on the interaction of
GAGs with their protein targets [128]. Also, the diversity in GAG sequences makes it problematic
to find exact GAG sequences that will produce the anticipated response [128]. Investigators have
used computational methods in order to detect GAG sequences that interact with proteins of
interest. Yet, there are substantial gaps that continue to exist to date [98–102]. The chief factor
here is the flexibility of GAGs complexes [128]. Moreover, chemical synthesis of GAG mimetics
is extremely difficult to accomplish. It demands several chemical steps and has low yields [129].
In this respect, GAG mimetics that are not based on a saccharide scaffold, referred to as non-
saccharide GAG mimetics (NSGMs),offer substantial benefits [130].
28
1.18 Non-Saccharide GAG Mimetics (NSGMs)
NSGMs are complexes that exhibit a non-sugar backbone and sulfates, sulfonates,
carboxylates and phosphates as a negatively charged groups. At the present time, the
investigation of NSGMs is in its premature steps [130]. Yet, this is a promising area for the
expansion of compounds that control the activity of GAG binding proteins for several reasons.
Primarily, these molecules are not difficult to synthesize. They are homogenous. They can be
sustained in high yields and in high purity. Moreover, the synthesis can lead to structural analogs,
and later, generation of chemical libraries that can help understand the structural activity
relationships. Furthermore, computational studies of these molecules can be easier to handle
compared to GAGs as they exhibit much less structural complexity.
Additional benefit of NSGMs is that their site of interaction on the proteins is allosteric site
not to the active sites. Allostery results several benefits over orthostery. First of all, allosteric sites
are less preserved than orthosteric sites, therefore, targeting allosteric sites is possible to result
in more selective compounds [131–132]. Additionally, orthosteric inhibition will lead to a total
loss of the activity; however, in allosteric inhibition, there can be submaximal inhibitor efficacy.
Accordingly, allosteric inhibitors can normalize and not completely inhibit activity. The purpose
of designing NSGMs is to target proteins of the coagulation cascade, inflammatory processes,
cancer and infection among others.
29
1.19 The Role of NSGMs in Hemostasis
All current anticoagulants, such as heparins and vitamin K antagonist, warfarin, continue to
be the backbone of anticoagulant therapy [108]. These drugs act through an indirect mechanism
to convey inhibition of a several of coagulation enzymes. However, their use leads to several
serious side effects such as excessive bleeding risk and unpredictability of patient response.
Moreover, continuous monitoring is mandatory, particularly with warfarin, because of its
narrow therapeutic window [133]. It was proposed that direct inhibitors of the coagulation
cascade enzymes would improve anticoagulants as they would have to act more precisely by
targeting specific enzymes of the coagulation cascade. Nevertheless, these drugs still possess
some bleeding risk [134]. Therefore, the need for new anticoagulants continues. Thus, it is not
unusual astonishing that the coagulation is a major area for which NSGMs have been studies.
Therefore, several NSGMs have been discovered and designed to target coagulation cascade
proteins, such as ATIII, thrombin, factor Xa, factor XIa and plasmin, and their structures and
properties have been reported.
30
Chapter 2: Rationale
2.1. Background
The occurrence of thrombosis in numerous cardiovascular disorders has led to an
anticoagulant market of more than 10 billion dollars [3]. The clinically available anticoagulants
such as heparins, coumarins, and other synthetic peptidomimetics mainly target specific factors
(thrombin and/or factor Xa) within the coagulation cascade [1,2]. Regardless of their clinical
achievement, every individual agent is accompanied with several side effects, particularly major
and/or minor bleeding [3,4]. Additionally, less desirable effects like osteoporosis,
thrombocytopenia, inconsistent patient response, drug- food and drug-drug interactions, or
absence of antidote [5]. Bleeding along with the lack of antidote to reverse bleeding also present
recent target-specific anticoagulants such as fondaparinux, dabigatran, rivaroxaban, and
apixaban, in spite of their overall enhanced safety profile in contrast to the older anticoagulants.
Numerous indications suggest that factor XIa (fXIa) is a target to advance a new line of
anticoagulants with possibly negligible risk of bleeding [6, 7]. For instance, hemophilia C patients
with inherited fXI deficiency suffer minimal bleeding and severe absence of fXI has been resolved
via the use of fXI concentrates [8–10]. Several epidemiologic studies have shown that fXI-
deficient patients are less vulnerable to venous thrombosis [11], and ischemic stroke [12],
whereas on the other hand, higher levels of fXIa induce higher risk for cardiovascular diseases in
women [13]. Supportive studies have been conducted in humans, and animal models of arterial,
venous, and cerebral thrombosis have confirmed fXIa as a promising drug target [14]. Finally, the
inhibition of fXIa seems to only affect the abnormal coagulation process (thrombosis) without
affecting physiologic process (hemostasis) [16, 17].
31
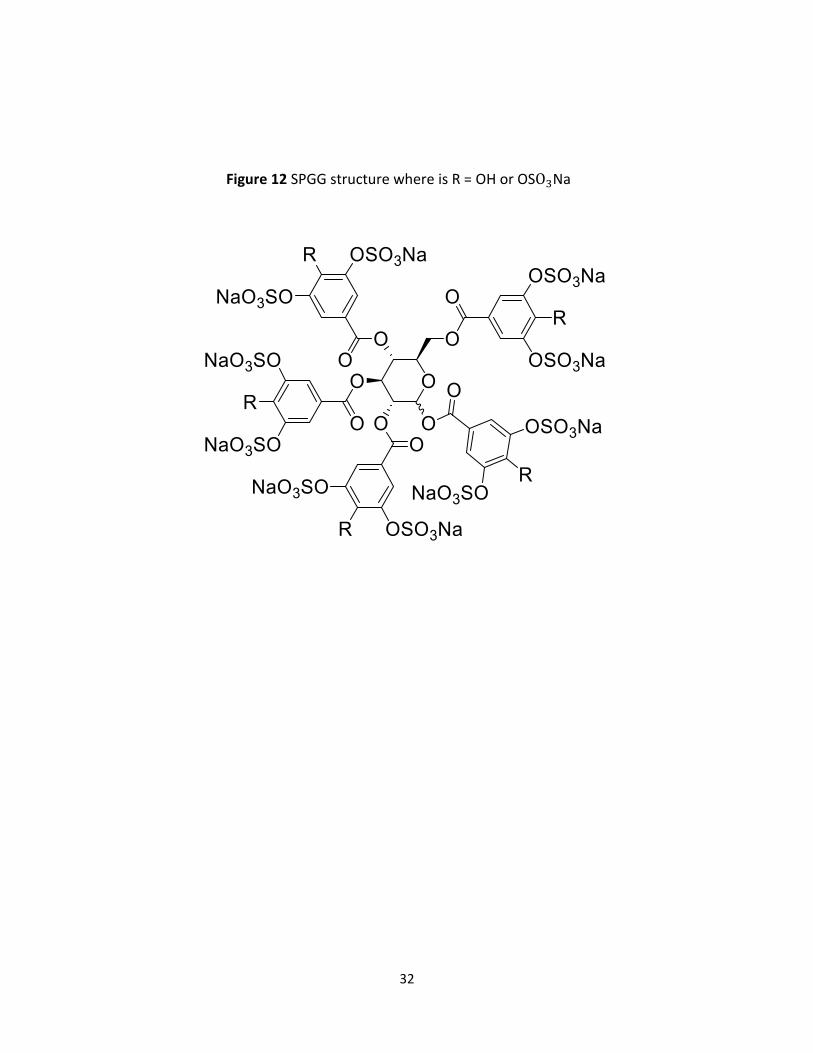
An NSGM studied in this project is a Sulfated Pentagalloyl β-D-Glucopyranoside SPGG analog,
called SMI, that was developed in the Desai lab we wanted to evaluate whether SMI exhibits
properties similar to SPGG as an anticoagulant targeting fXI (Figure 12).
This work helps to understand the ex vivo and in vivo coagulation properties of SMI. Another
part of the project is directed to understand the difference between lab synthesized and CRO-
synthesized sample of an NSGM called G2.2. The Desai lab has published earlier that G2.2 is a
potent anti-cancer stem cell agent (Patel, et al 2014). To advance this research to the clinic, the
Desai lab asked the CRO to prepare G2.2 on a 20g scale. When the CRO synthesized G2.2 on
higher scale, the product exhibited a pale-yellow color, while the G2.2 made in Desai lab was
white. When toxicity studies were performed by the Center Animal Line of Massey Cancer Center,
G2.2Y (yellow) displayed higher vascular bleeding property in comparison to G2.2W (white).
UPLC-MS analysis in the Desai lab revealed that G2.2Y was 85% pure, while G2.2W was 100%
pure. We wanted to evaluate whether G2.2Y induces dysfunction of coagulation in vitro. Overall,
this work is a study of the coagulation profile of SMI, G2.2Y, and G2.2W. We have used an
experimental protocol of in vivo, ex vivo, and in vitro to evaluate the nature of coagulation effect.
The inquiries that were set up here as follow: (a) can these compounds induce inhibition of fXIa?
(b) Is inhibition concentration dependent? (c) Is inhibition selective to fXIa? (d) IS bleeding a
consequence arising out of fXIa inhibition? These experiments will not only aid resolve
coagulation related aspects of these NSGMs but may also help recognize a new class of
antithrombotics. Furthermore, such studies may highlight major protein- protein interaction to
target so as to derive compounds with variable functions.
32
Figure 12 SPGG structure where is R = OH or OSO3Na
33
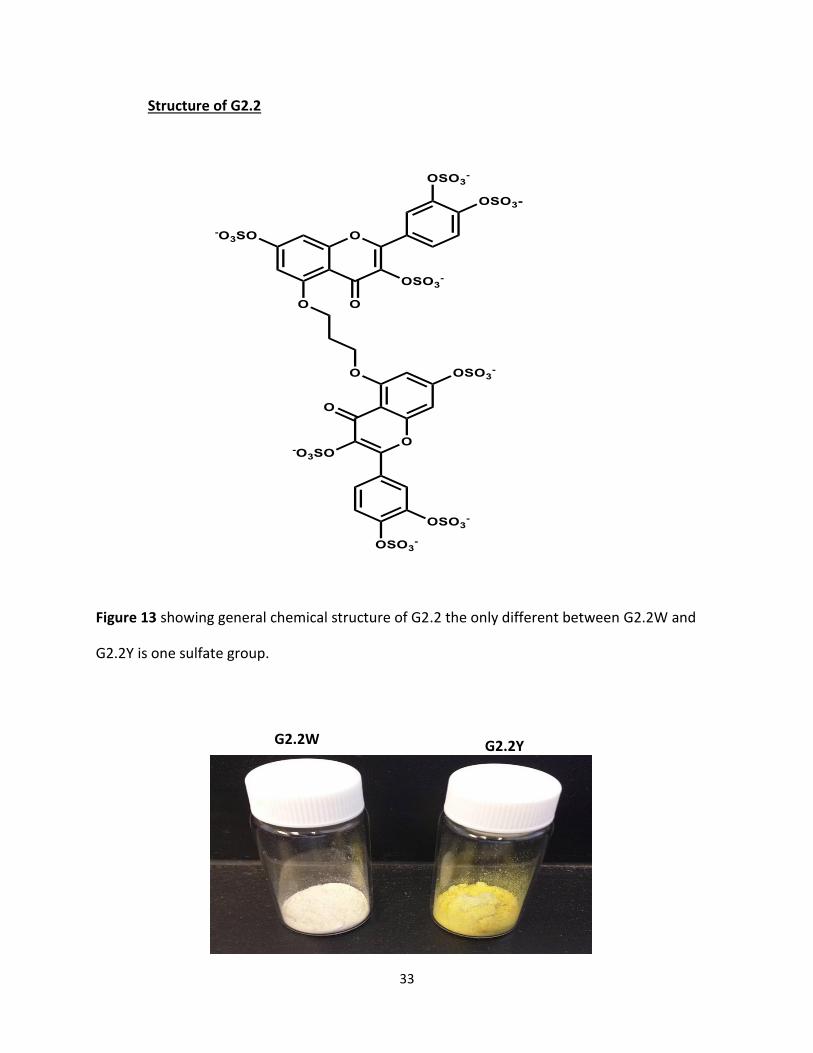
Structure of G2.2
Figure 13 showing general chemical structure of G2.2 the only different between G2.2W and
G2.2Y is one sulfate group.
G2.2Y G2.2W
34
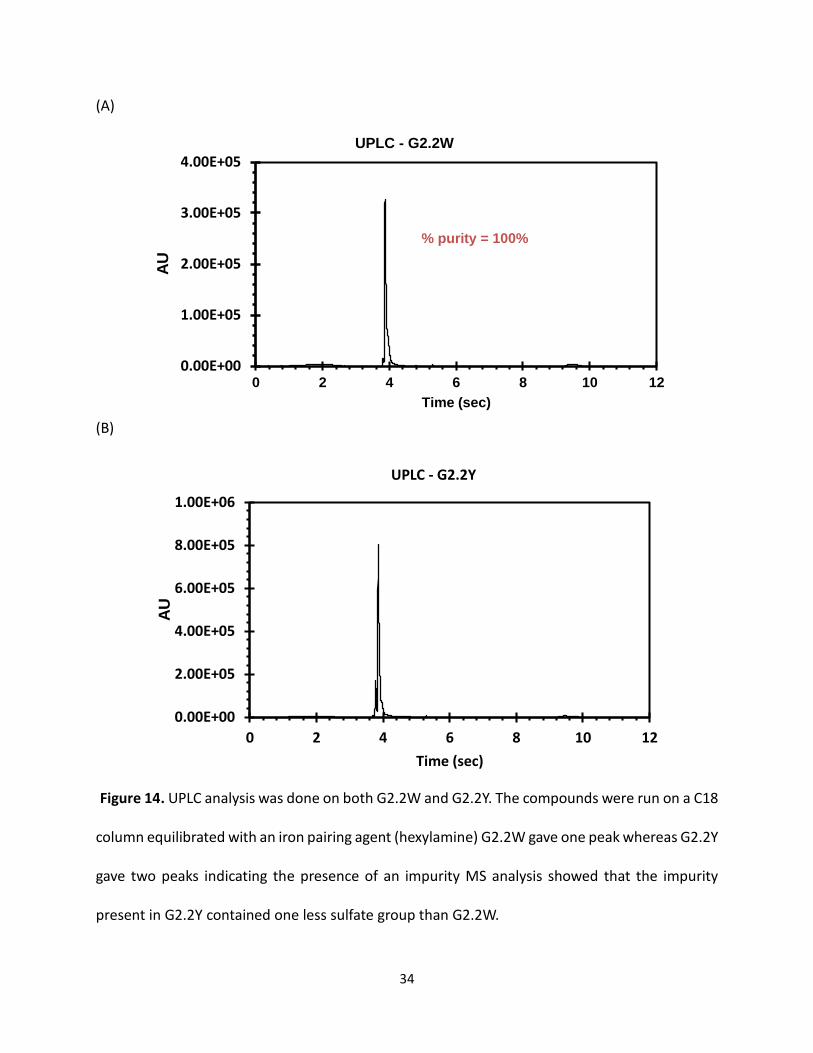
(A)
(B)
Figure 14. UPLC analysis was done on both G2.2W and G2.2Y. The compounds were run on a C18
column equilibrated with an iron pairing agent (hexylamine) G2.2W gave one peak whereas G2.2Y
gave two peaks indicating the presence of an impurity MS analysis showed that the impurity
present in G2.2Y contained one less sulfate group than G2.2W.
0.00E+00
1.00E+05
2.00E+05
3.00E+05
4.00E+05
0 2 4 6 8 10 12
AU
Time (sec)
UPLC - G2.2W
% purity = 100%
0.00E+00
2.00E+05
4.00E+05
6.00E+05
8.00E+05
1.00E+06
0 2 4 6 8 10 12
AU
Time (sec)
UPLC - G2.2Y
35
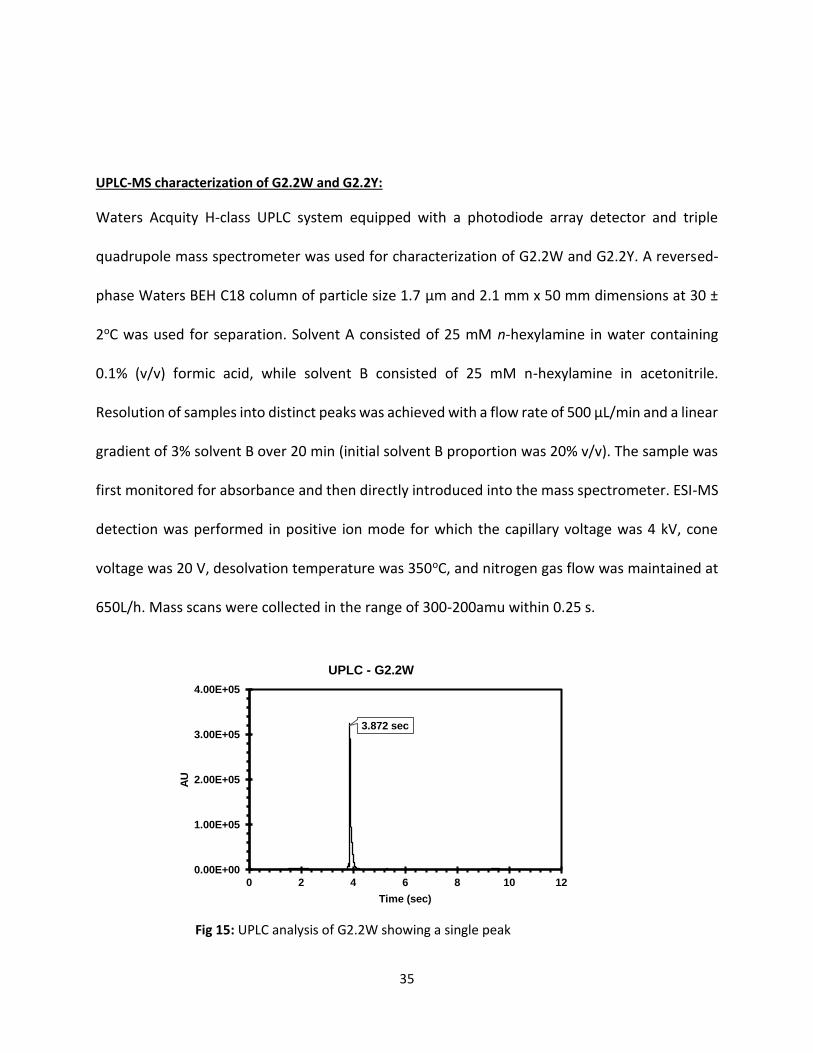
UPLC-MS characterization of G2.2W and G2.2Y:
Waters Acquity H-class UPLC system equipped with a photodiode array detector and triple
quadrupole mass spectrometer was used for characterization of G2.2W and G2.2Y. A reversed-
phase Waters BEH C18 column of particle size 1.7 µm and 2.1 mm x 50 mm dimensions at 30 ±
2oC was used for separation. Solvent A consisted of 25 mM n-hexylamine in water containing
0.1% (v/v) formic acid, while solvent B consisted of 25 mM n-hexylamine in acetonitrile.
Resolution of samples into distinct peaks was achieved with a flow rate of 500 µL/min and a linear
gradient of 3% solvent B over 20 min (initial solvent B proportion was 20% v/v). The sample was
first monitored for absorbance and then directly introduced into the mass spectrometer. ESI-MS
detection was performed in positive ion mode for which the capillary voltage was 4 kV, cone
voltage was 20 V, desolvation temperature was 350oC, and nitrogen gas flow was maintained at
650L/h. Mass scans were collected in the range of 300-200amu within 0.25 s.
Fig 15: UPLC analysis of G2.2W showing a single peak
3.872 sec
0.00E+00
1.00E+05
2.00E+05
3.00E+05
4.00E+05
0 2 4 6 8 10 12
AU
Time (sec)
UPLC - G2.2W
36
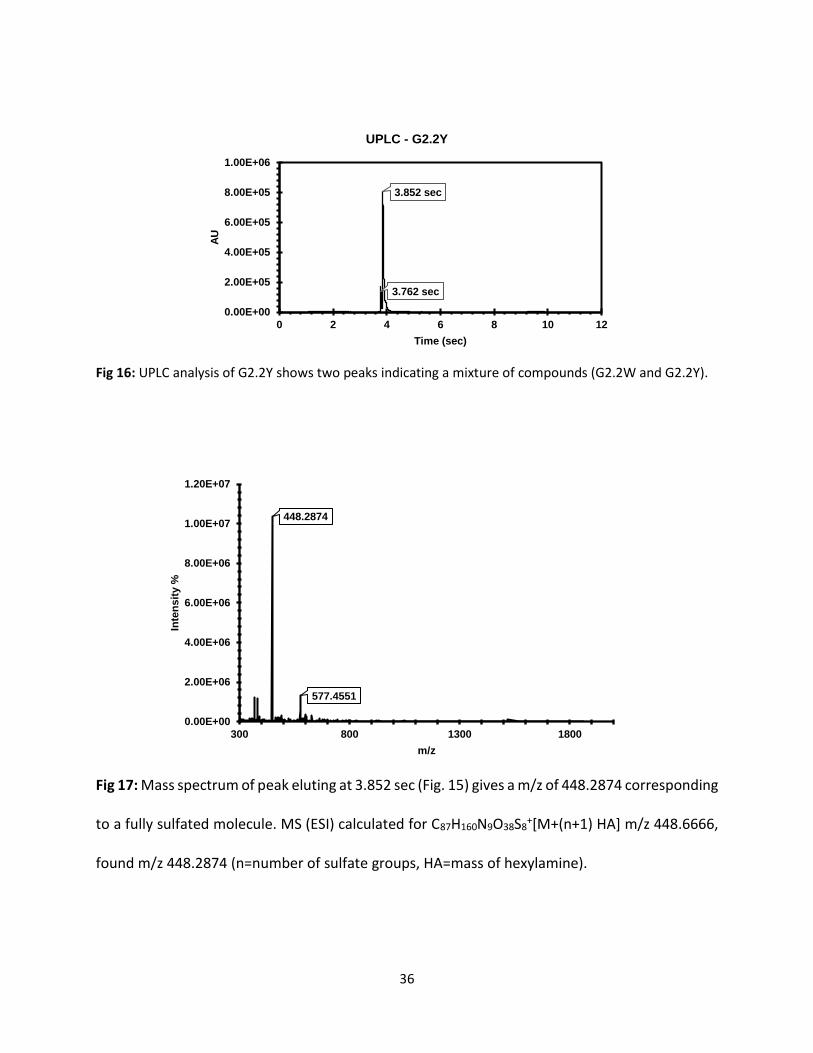
Fig 16: UPLC analysis of G2.2Y shows two peaks indicating a mixture of compounds (G2.2W and G2.2Y).
Fig 17: Mass spectrum of peak eluting at 3.852 sec (Fig. 15) gives a m/z of 448.2874 corresponding
to a fully sulfated molecule. MS (ESI) calculated for C87H160N9O38S8+[M+(n+1) HA] m/z 448.6666,
found m/z 448.2874 (n=number of sulfate groups, HA=mass of hexylamine).
3.762 sec
3.852 sec
0.00E+00
2.00E+05
4.00E+05
6.00E+05
8.00E+05
1.00E+06
0 2 4 6 8 10 12
AU
Time (sec)
UPLC - G2.2Y
448.2874
577.4551
0.00E+00
2.00E+06
4.00E+06
6.00E+06
8.00E+06
1.00E+07
1.20E+07
300 800 1300 1800
Inte
ns
ity %
m/z
37
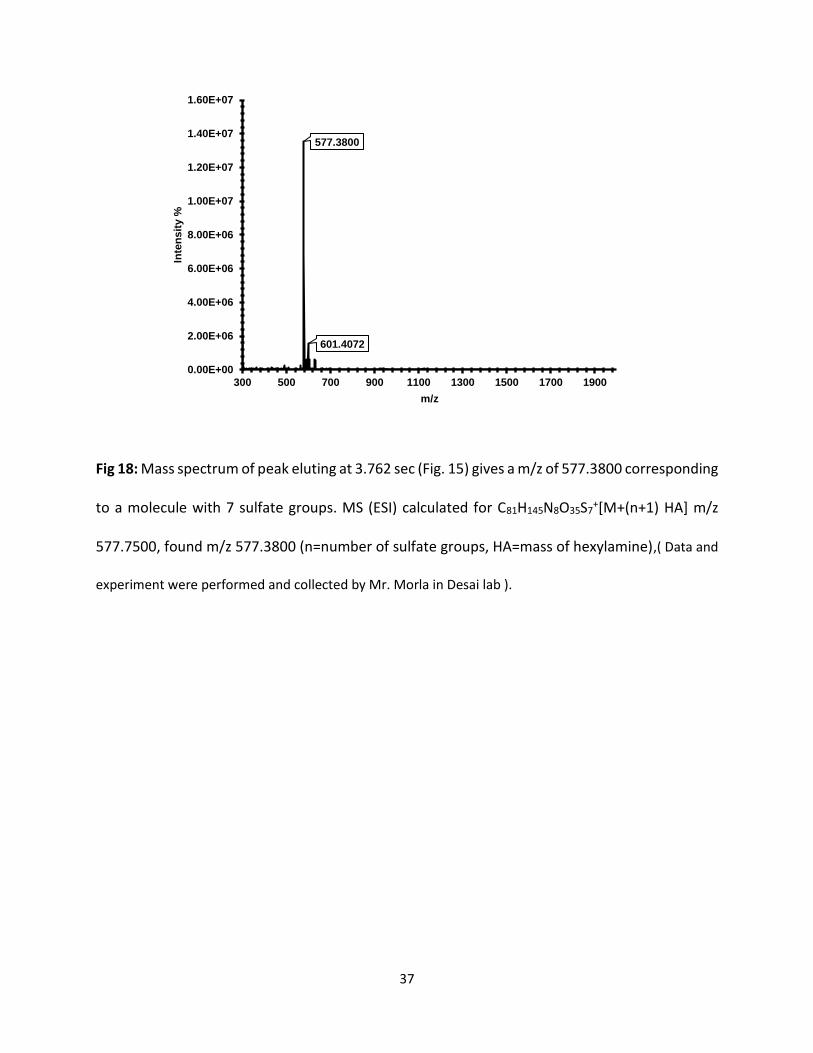
Fig 18: Mass spectrum of peak eluting at 3.762 sec (Fig. 15) gives a m/z of 577.3800 corresponding
to a molecule with 7 sulfate groups. MS (ESI) calculated for C81H145N8O35S7+[M+(n+1) HA] m/z
577.7500, found m/z 577.3800 (n=number of sulfate groups, HA=mass of hexylamine),( Data and
experiment were performed and collected by Mr. Morla in Desai lab ).
577.3800
601.4072
0.00E+00
2.00E+06
4.00E+06
6.00E+06
8.00E+06
1.00E+07
1.20E+07
1.40E+07
1.60E+07
300 500 700 900 1100 1300 1500 1700 1900
Inte
ns
ity %
m/z
38
Chapter 3: Characterization of the Anticoagulation Profile of G2.2 in Plasma and Blood
3.1 Introduction
Thrombin and factor Xa, are two important enzymes of the coagulation cascade, that have been
targets by anticoagulation drugs for a long time [189]. Both enzymes can be inhibited directly or
indirectly Conventional anticoagulants, including heparin, low-molecular-weight heparin
(LMWH) and warfarin can initiate their indirect inhibition through intermediate co-factor, such
as antithrombin or vitamin K. In the past seven decades, these indirect inhibitors have been the
backbone of anticoagulant therapy. Thus, they exhibit some limitations, such as enhanced
bleeding risk, variable response, heparin-induced thrombocytopenia and lack of inhibition of clot-
bound thrombin.
Conversely, direct inhibition of thrombin and factor Xa has been thought to be a better
alternative, which offered an important advantage of inhibition of both circulating and clot-
bound thrombin. Hirudin is one of the classical members of inhibitors, which target the active-
site and exosite 1 of thrombin, and several derivatives of this peptide are now clinically available
[37]. Intensive efforts are also being made to advance the first orally bio-available thrombin
inhibitor. These molecules are small pro-drugs that target the active site of these enzymes.
However, the challenges with these molecules, are enzyme binding affinity that is not associated
with excessive bleeding, accomplishing inhibition of both clot-bound and unbound proteinase,
and without liver toxicity [37].
Conventional anticoagulant, heparin or LMWH, is considered the anticoagulant of choice due to
its good efficacy and essay availability. Heparin is a linear polymer of glucosamine (GlcNp) and
39
iduronic acid(IdoAp) residues linked in a 1—4 manner [27]. Also, heparin is a complex
heterogeneous, ploydisperse molecule. Furthermore, the high sulfation level of heparin produces
massive electronegative charge density, thus presenting a capability to bind to a huge number of
proteins in the plasma [29], a likely reason for some of its side-effects.
In order to decrease these limitations of heparin therapy, we have focused on designing scaffolds
that possess lower anionic character, but have more hydrophobic, and hydrophilic nature. As well
as retain the function and structure to bind into fXIa heparin binding sites [90-94]. In this process,
we chose to explore NSGMs derivatives including sulfated pentagalloyl β-D-Glucopyranoside
(SPGG) analog SMI and G2.2, which was developed in Desai lab and reported earlier as a potent
anti-cancer stem cell agent (ACS). Another study was performed to test G2.2 analogs in direct
inhibition of fXIa by chromogenic substrate hydrolysis assay for fXa, fXIa, and thrombin in the
presence and the absence of antithrombin. The result suggested that both G2.2 analogs did not
inhibit neither fXa nor thrombin even through in the presence of antithrombin in a concentration
up to 500 µM. However, the assay showed that G2.2Y inhibited fXIa almost 2-fold better than
G2.2W. In addition, we conducted UPLC-MS characterization to inspect the variation between
the two G2.2 samples G2.2Y and G2.2W. The data revealed that G2.2Y was an 85 :15 blend of
two compounds. Nonetheless, elemental NMR and MS information offered that G2.2W was fully
sulfated flavonoid derivatives as expected, while G2.2Y had one less sulfate group. Therefore,
depth studies are necessary to understand the specific structure and the mechanism of these
NSGMs. Our results put forward the suggestion that the loss of one sulfate group induces
substantial adverse effects and lead to a discovery of a new anticoagulant drug design. These
40
studies also help the design of effective strategies for SMI and G2.2, to be evaluated in animal
models of bleeding arising from excessive anticoagulation.
3.2 Introduction to Different Assays
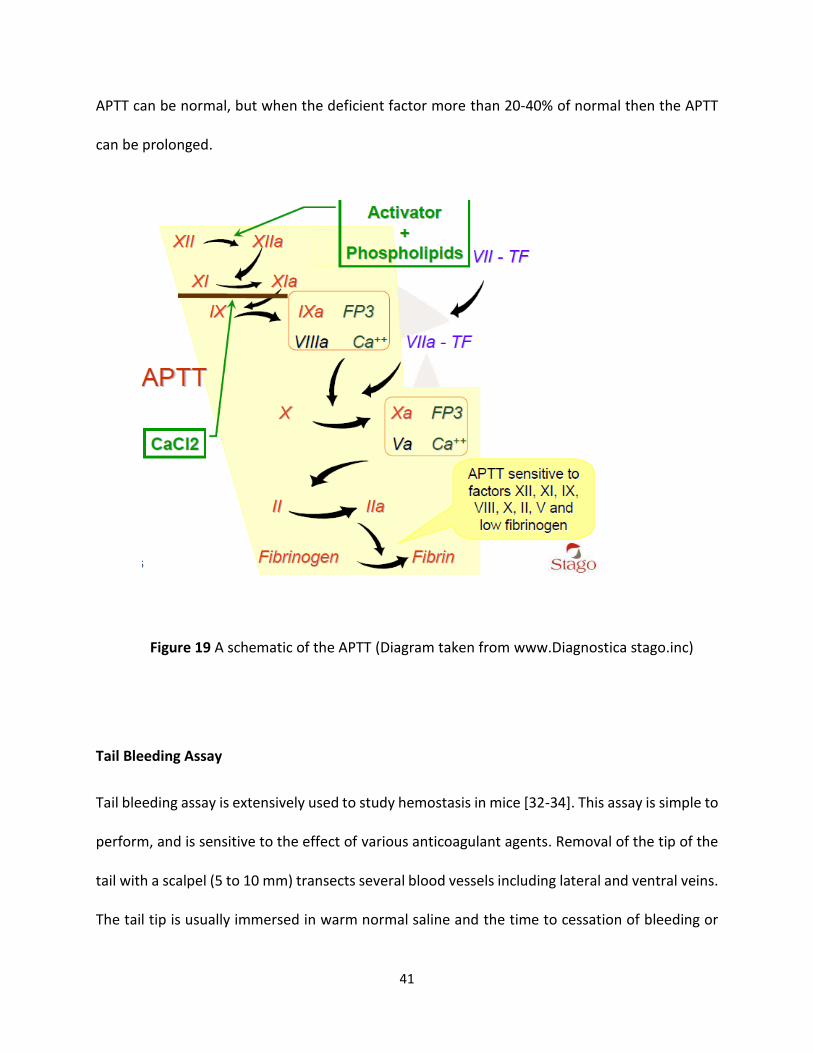
Activate partial thromboplastin time (APTT)
APTT, measures the activity of the intrinsic and common pathways of coagulation. The division
of the clotting cascade into the intrinsic, extrinsic and common pathways has little in vivo validity
but remains a useful concept for interpreting the results of laboratory investigations. The term
'thromboplastin' in this test refers to the formation of a complex formed from various plasma
clotting factors which converts prothrombin to thrombin and the subsequent formation of the
fibrin clot. Platelet poor plasma [PPP] is incubated at 37°C then phospholipid (cephalin) and a
contact activator (e.g. Kaolin, micronized silica or ellagic acid) are added followed by calcium (all
pre-warmed to 37°C). The addition of calcium initiates clotting and timing begins. The APTT is the
time taken from the addition of a contact activator to the formation of a fibrin clot. Almost all
laboratories use an automated method for the APTT in which clot formation is deemed to have
happened when the optical density of the mixture has exceeded a certain threshold (clot
formation makes the mixture denser and less light passes through). The diagram below shows
the clotting cascade and the factors that affect the APTT. Mild deficiencies of either XII, XI, IX VIII
41
APTT can be normal, but when the deficient factor more than 20-40% of normal then the APTT
can be prolonged.
Figure 19 A schematic of the APTT (Diagram taken from www.Diagnostica stago.inc)
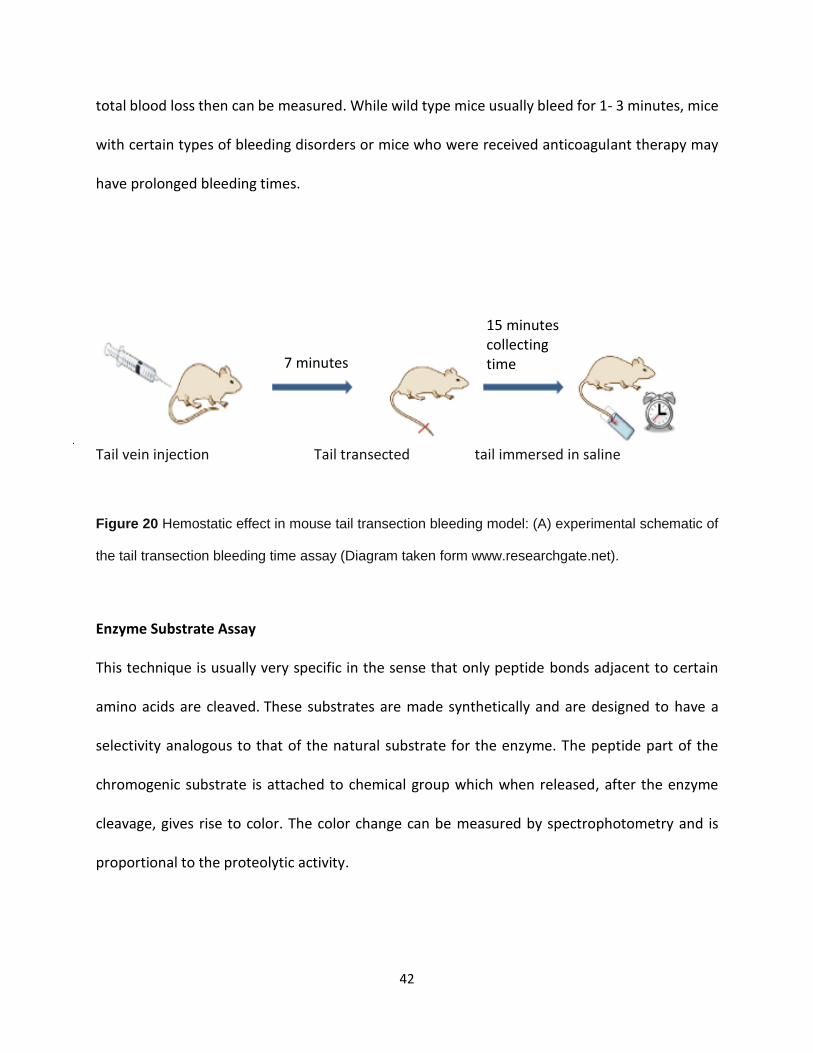
Tail Bleeding Assay
Tail bleeding assay is extensively used to study hemostasis in mice [32-34]. This assay is simple to
perform, and is sensitive to the effect of various anticoagulant agents. Removal of the tip of the
tail with a scalpel (5 to 10 mm) transects several blood vessels including lateral and ventral veins.
The tail tip is usually immersed in warm normal saline and the time to cessation of bleeding or
42
total blood loss then can be measured. While wild type mice usually bleed for 1- 3 minutes, mice
with certain types of bleeding disorders or mice who were received anticoagulant therapy may
have prolonged bleeding times.
Tail vein injection Tail transected tail immersed in saline
Figure 20 Hemostatic effect in mouse tail transection bleeding model: (A) experimental schematic of
the tail transection bleeding time assay (Diagram taken form www.researchgate.net).
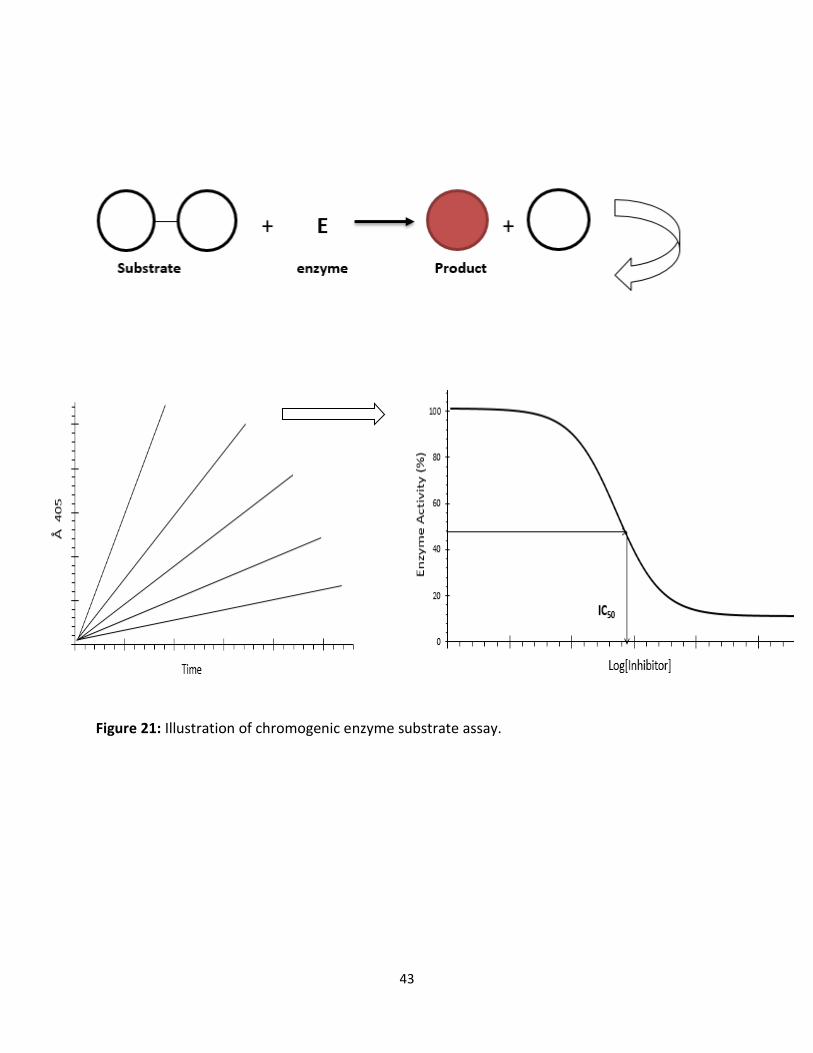
Enzyme Substrate Assay
This technique is usually very specific in the sense that only peptide bonds adjacent to certain
amino acids are cleaved. These substrates are made synthetically and are designed to have a
selectivity analogous to that of the natural substrate for the enzyme. The peptide part of the
chromogenic substrate is attached to chemical group which when released, after the enzyme
cleavage, gives rise to color. The color change can be measured by spectrophotometry and is
proportional to the proteolytic activity.
7 minutes
15 minutes collecting time
43
Figure 21: Illustration of chromogenic enzyme substrate assay.
44
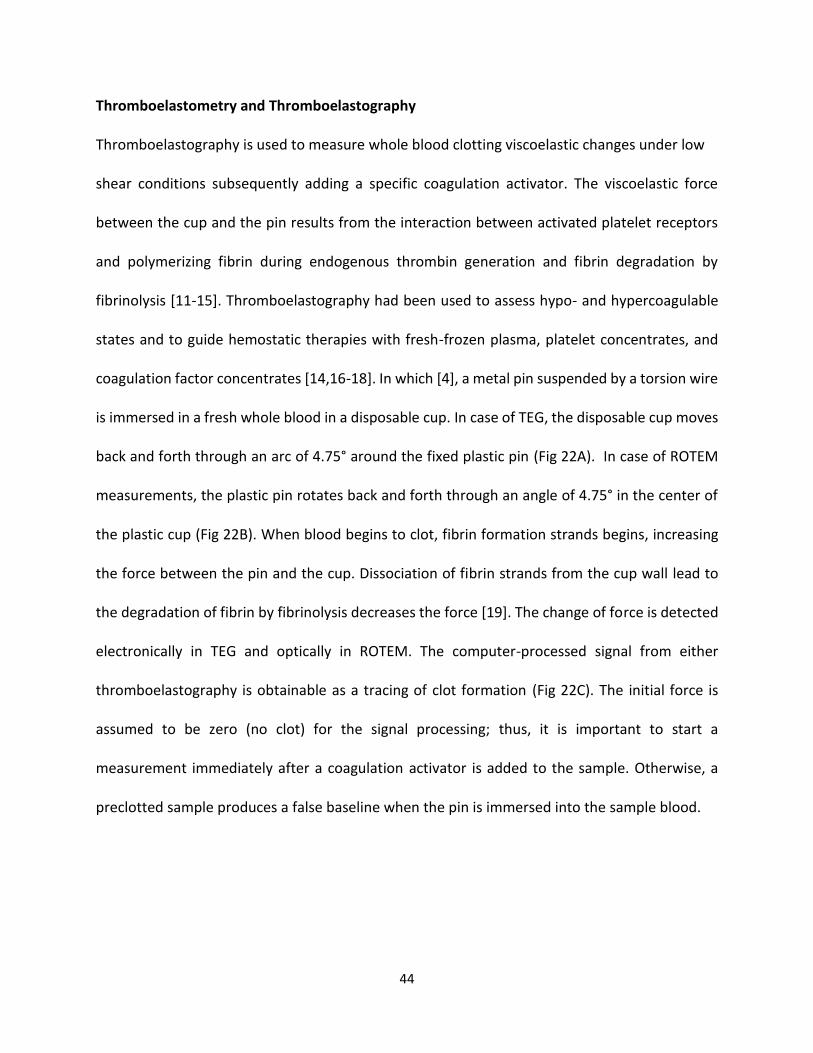
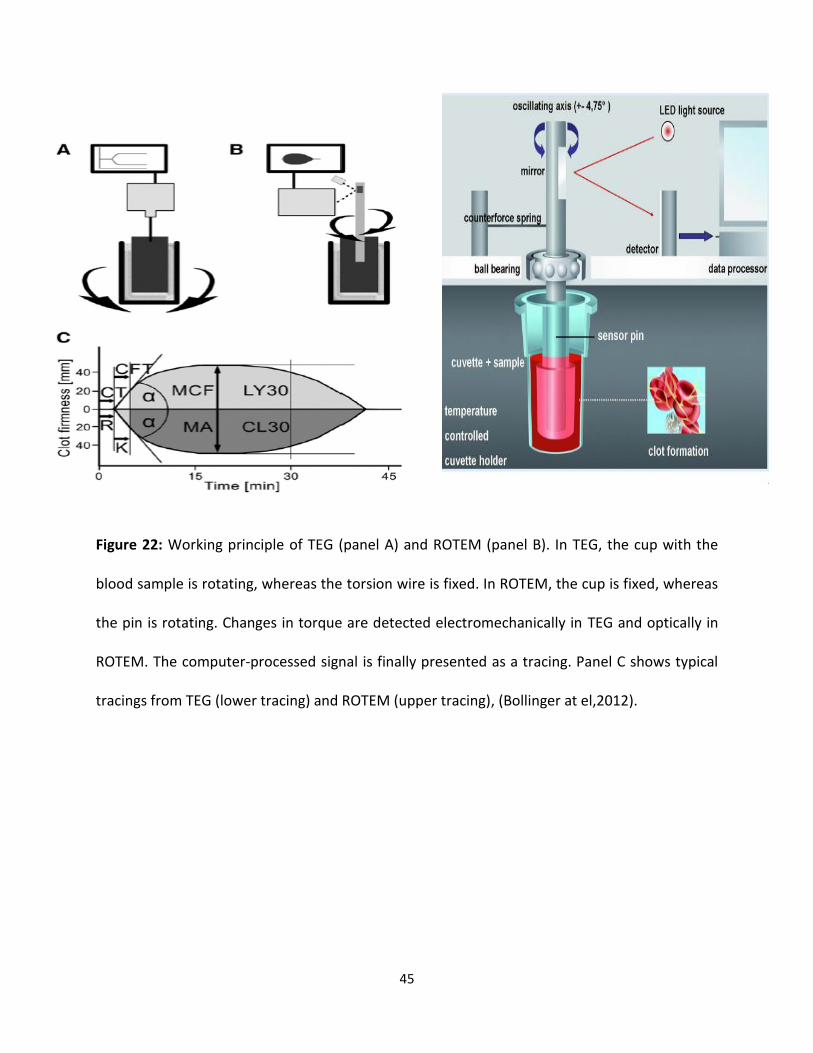
Thromboelastometry and Thromboelastography
Thromboelastography is used to measure whole blood clotting viscoelastic changes under low
shear conditions subsequently adding a specific coagulation activator. The viscoelastic force
between the cup and the pin results from the interaction between activated platelet receptors
and polymerizing fibrin during endogenous thrombin generation and fibrin degradation by
fibrinolysis [11-15]. Thromboelastography had been used to assess hypo- and hypercoagulable
states and to guide hemostatic therapies with fresh-frozen plasma, platelet concentrates, and
coagulation factor concentrates [14,16-18]. In which [4], a metal pin suspended by a torsion wire
is immersed in a fresh whole blood in a disposable cup. In case of TEG, the disposable cup moves
back and forth through an arc of 4.75° around the fixed plastic pin (Fig 22A). In case of ROTEM
measurements, the plastic pin rotates back and forth through an angle of 4.75° in the center of
the plastic cup (Fig 22B). When blood begins to clot, fibrin formation strands begins, increasing
the force between the pin and the cup. Dissociation of fibrin strands from the cup wall lead to
the degradation of fibrin by fibrinolysis decreases the force [19]. The change of force is detected
electronically in TEG and optically in ROTEM. The computer-processed signal from either
thromboelastography is obtainable as a tracing of clot formation (Fig 22C). The initial force is
assumed to be zero (no clot) for the signal processing; thus, it is important to start a
measurement immediately after a coagulation activator is added to the sample. Otherwise, a
preclotted sample produces a false baseline when the pin is immersed into the sample blood.
45
Figure 22: Working principle of TEG (panel A) and ROTEM (panel B). In TEG, the cup with the
blood sample is rotating, whereas the torsion wire is fixed. In ROTEM, the cup is fixed, whereas
the pin is rotating. Changes in torque are detected electromechanically in TEG and optically in
ROTEM. The computer-processed signal is finally presented as a tracing. Panel C shows typical
tracings from TEG (lower tracing) and ROTEM (upper tracing), (Bollinger at el,2012).
46
3.2 Experimental
Materials and Methods
Human plasma proteases including thrombin, factor Xa, FXIa, and anti-thrombin were obtained
from Haematologic Technologies (Essex Junction, VT). Stock solutions of coagulation enzymes
were prepared in 50 mM Tris-HCl buffer, pH 7.4, containing 150 mM NaCl, 0.1% PEG8000, and
0.02% Tween 80. Chromogenic substrates, Spectrozyme TH (H-D-yclohexylalanyl-Ala-Arg-p-
nitroanilide), and Spectrozyme factor Xa (methoxycarbonyl-Dcyclohexylglycyl-Gly-Arg-p-
nitroanilide) were obtained from American Diagnostica (Greenwich, CT). Factor XIa chromogenic
substrate (S-2366, L-PyroGlu-Pro-Arg-p-nitroaniline·HCl) was obtained from Diapharma (West
Chester, OH). G2.2W was synthesized in the Desai lab by a graduate student and G2.2Y was
obtained from OrganiX Inc (Woburn, MA). Pooled normal plasma for coagulation assays was
purchased from Valley Biomedical (Winchester, VA). Activated thromboplastin time reagent
containing ellagic acid (APTT-LS), thromboplastin-D, and 25 mM CaCl2 were obtained from Fisher
Diagnostics (Middletown, VA). FXI, FX, FVII, and FIX deficient plasma was from Heamatologic
Technologies (Essex Junction, VT). Thromboelastograph® Coagulation Analyzer 5000 (TEG®),
disposable cups and pins, and 200 mM stock CaCl2 were obtained from Haemoscope Corporation
(Niles, IL). All other chemicals were analytical reagent grade from either Sigma Chemicals (St.
Louis, MO) or Fisher (Pittsburgh, PA) and used without further purification. Rotational
Thromboelastometry (ROTEM),20 μL CaCl2 0.2 mol/L, 20 μL thromboplastin-phospholipid,
(factors XII, XI, IX, VIII, X, II, I and platelets) obtained from Valley Biochemical (Winchester, VA),
300 μL fresh whole blood obtain from healthy individuals. Wild-type ICR mice were obtained from
47
ENVIGO. All other material avertin, heating pod, syringes, needles,1.7 eppendrof tubes, heating
block were obtained from Dr Stefano lab.
Chromogenic Substrate Hydrolysis Assay
Procedure (fXIa):
Each well of the 96 well microplate contained 183μL of pH 7.4 Tris-HCl buffer to which 5 μL of
SPGG (or solvent reference) and 10μL of fXIa (0.765 nM final concentration) were sequentially
added. After 10-min incubation, 2μL of factor XIa substrate (345μM) was rapidly added and the
residual fXIa activity was measured from the initial rate of increase in absorbance at 405nm.
Stocks of potential fXIa inhibitors were serially diluted to give 12 different aliquots in the wells.
Relative residual fXIa activity at each concentration of the inhibitor was calculated from the ratio
of fXIa activity in the presence and absence of the inhibitor. Logistic equation (below) was used
to fit the dose dependence of residual protease activity to obtain the potency (IC50) and efficacy
(ΔY) of inhibition. In this equation, Y is the ratio of residual factor XIa activity in the presence of
inhibitor to that in its absence (fractional residual activity), 𝑌𝑀 and 𝑌0 are the maximum and
minimum possible values of the fractional residual proteinase activity, IC50 is the concentration
of the inhibitor that results in 50% inhibition of enzyme activity, and HS is the Hill slope. Nonlinear
curve fitting resulted in 𝑌𝑀, 𝑌0, IC50, and HS values.
Procedure (Thrombin):
Chromogenic substrate hydrolysis assay was used to measure potency of inhibition. The assay
was performed using Flexstation III (Molecular Devices, Sunnyvale, CA) by monitoring substrate
hydrolysis at 405 nm. For thrombin, 180μL of buffer (20 mM Tris-HCl, 100 mM NaCl, 2.5 mM
𝒀 = 𝒀𝟎 + 𝒀𝑴 − 𝒀𝟎
𝟏 + 𝟏𝟎(𝐥𝐨𝐠 [𝐈𝐧𝐡𝐢𝐛𝐢𝐭𝐨𝐫]𝟎−𝐥𝐨𝐠𝐈𝐂𝟓𝟎)(𝐇𝐒)
48
CaCl2, 0.1% (polyethylene glycol) PEG 8000, pH 7.4) was added to each well followed by 5 μL of
240 nM thrombin and 10μL of drug in DMSO to give 0.002 to 250μM final concentration (or 10
μL of DMSO alone). After incubation for 10 minutes at 25 °C, 5 μL of 2 mM Spectrozyme TH was
added to each well simultaneously and allowed to react for 60 seconds at 25 °C while
simultaneously monitoring the reaction to obtain the rate of increase in A405.The slopes
generated from each experiment were used to calculate the fractional residual activity (Y) at each
concentration of the inhibitor, and analyzed using logistic equation 1, in which 𝑌𝑀 is the
maximum efficacy, 𝑌0 is minimum efficacy and HS is the Hill slope.
Procedure (fXa):
Each well of the 96-well microplate had 185μL pH 7.4 buffer to which 5 μL potential fXa
inhibitor (or solvent reference) was added, to which 5 μL fXa (stock conc. 43.5nM) was further
added. After 10 minutes incubation at 37 ºC, 5 μL fXa substrate (stock conc. 5mM) was rapidly
added and the residual FXa activity was measured from the initial rate of increase in absorbance
at 405 nm.
Procedure (fXa in presence of Antithrombin):
The kinetics of inhibition of fXa by AT in the presence of the designed non-saccharide
aromatic activators were measured spectrophotometrically under pseudo-first order conditions.
Briefly, a fixed concentration of fXa (20 nM) was incubated with fixed concentrations of plasma
AT (1.075 μM) and the drug in buffer. At regular time intervals, an aliquot of the inhibition
reaction was quenched with 900 μL of 100 μM Spectrozyme fXa in 20 mM sodium phosphate
buffer, pH 7.4, containing 100 mM sodium chloride at 25 ºC. To determine the residual FXa
activity, the initial rate of substrate hydrolysis was measured
49
from the increase in absorbance at 405 nm. (experiments performed by Mr. Morla in Desai lab).
Activated Partial Thromboplastin Time (APTT) Clotting time was measured in a standard one–stage recalcification assay with a BBL Fibrosystem
fibrometer (Becton-Dickinson, Sparles, MD), as described previously [43–46]. For the APTT assay,
10 μL of inhibitors was mixed with 90μL of citrated human plasma and 100μL of prewarmed APTT
reagent (0.2% ellagic acid). After incubation for 4 minutes at 37 °C, clotting was initiated by
adding 100 μL of prewarmed 25 mM CaCl2 and the time needed to clot was noted. The data were
fit to a quadratic trend line, which was used to determine the concentration of the inhibitor
necessary to double the clotting time. Clotting time in the absence of an anticoagulant was
determined in similar fashion using 10 μL of deionized water and/or appropriate organic vehicle
and was found to be 34.4 sec for APTT.
Rotational Thromboelastometry (ROTEM)
Modified rotational Thromboelastometry was determined on a ROTEM® Delta Hemostasis
Analyzer (Pentapharm GmbH, Munich, Germany) using Pentapharm software version 2.2.0. The
device temperature was set to 37°C and the maximum runtime to 90 minutes. Coagulation
function was assessed in citrated whole-blood samples by INTEM test: 20 μL CaCl20.2 mol/L, 20
μL thromboplastin-phospholipid, 300 μL blood, for monitoring the intrinsic system (factors XII,
XI, IX, VII, X, II, I and platelets). Parameters measured included coagulation time (CT, sec; time to
clotting initiation), clot formation time (CFT, sec; time from clot initiation until a clot firmness of
20 mm is detected), maximum clot firmness (MCF, mm) which reflects the maximum structural
integrity obtained by the clot. The clot, which is dependent on fibrin content, fibrin structure,
50
platelet concentration and platelet function. All analyses were completed within two hours of
collection.
Tail bleeding time studies Wild-type ICR mice (n ≥ 7; weight, 29–50 g) were anesthetized with an intraperitoneal injection
of pentobarbital (50 mg /kg) and tail bleeding was performed, as described previously [8,134].
Briefly, following anesthesia, the mice were placed on a 37 °C heating pad. Different inhibitors
such as: G2.2W and G2.2Y, along with LMWH (0.1–0.5 mg), or control (PBS), prepared in 50µl of
PBS, was injected into the lateral tail vein with a syringe. Two minutes later, the tail tip (0.1- 0.2
cm) was transected with a scalpel and immediately immersed in a 1.7 mL eppendrof tube filled
with 1200 µL of PBS positioned in a 37 °C heating block. The mice were monitored for 15 minutes.
The total bleed time (defined as the sum of all bleeding events occurring within 15 minutes) and
the weight of blood lost were recorded for each mouse. Mice are sacrificed prior to recovering
from anesthesia.
Statistical Analysis
The experiments were done multiple times as indicated by the (N = 10) number of animals.
The error bars represent ± 1 standard error of the mean (N = 10). G2.2Y and SMI were found to
have a tendency to induce tail bleeding significantly compared to control and LMWH respectively.
51
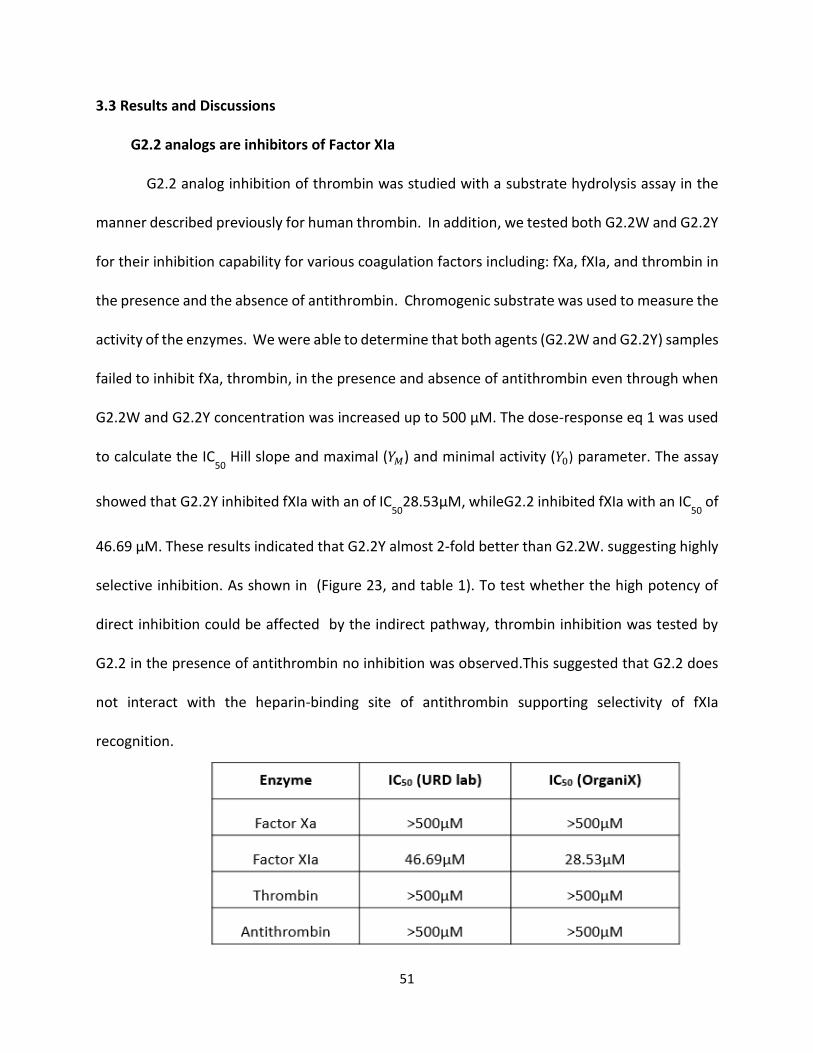
3.3 Results and Discussions
G2.2 analogs are inhibitors of Factor XIa
G2.2 analog inhibition of thrombin was studied with a substrate hydrolysis assay in the
manner described previously for human thrombin. In addition, we tested both G2.2W and G2.2Y
for their inhibition capability for various coagulation factors including: fXa, fXIa, and thrombin in
the presence and the absence of antithrombin. Chromogenic substrate was used to measure the
activity of the enzymes. We were able to determine that both agents (G2.2W and G2.2Y) samples
failed to inhibit fXa, thrombin, in the presence and absence of antithrombin even through when
G2.2W and G2.2Y concentration was increased up to 500 µM. The dose-response eq 1 was used
to calculate the IC50
Hill slope and maximal (𝑌𝑀) and minimal activity (𝑌0) parameter. The assay
showed that G2.2Y inhibited fXIa with an of IC50
28.53µM, whileG2.2 inhibited fXIa with an IC50
of
46.69 µM. These results indicated that G2.2Y almost 2-fold better than G2.2W. suggesting highly
selective inhibition. As shown in (Figure 23, and table 1). To test whether the high potency of
direct inhibition could be affected by the indirect pathway, thrombin inhibition was tested by
G2.2 in the presence of antithrombin no inhibition was observed.This suggested that G2.2 does
not interact with the heparin-binding site of antithrombin supporting selectivity of fXIa
recognition.

52
Table 1. table of IC50
for G2.2W and G2.2Y with fXa, fXIa, and thrombin in the presence
and absence of antithrombin (Data are collected by Mr. Morla in Desai Lab).
(A)
(B)
Figure 23. Chromogenic substrate hydrolysis assay in (a) and (b) showing G2.2W IC
50 – 46 µM
and G2.2Y IC50
– 28 µM respectively for fXIa inhibition (experiment and cures performed by Mr.
Morla in Desai lab).
IC50
– 46 µM
0
20
40
60
80
100
-4.5 -3.5 -2.5 -1.5 -0.5
Res
idu
al F
XIa
act
ivit
y (%
)
log([G2.2W] µM)
53
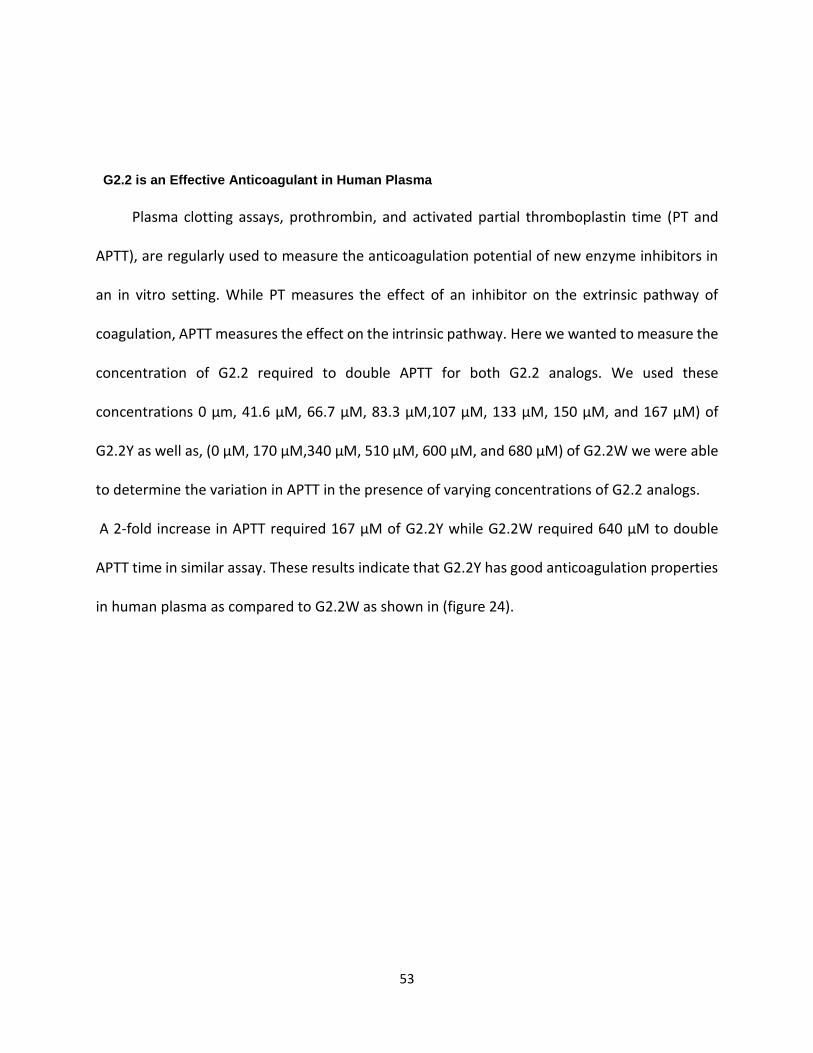
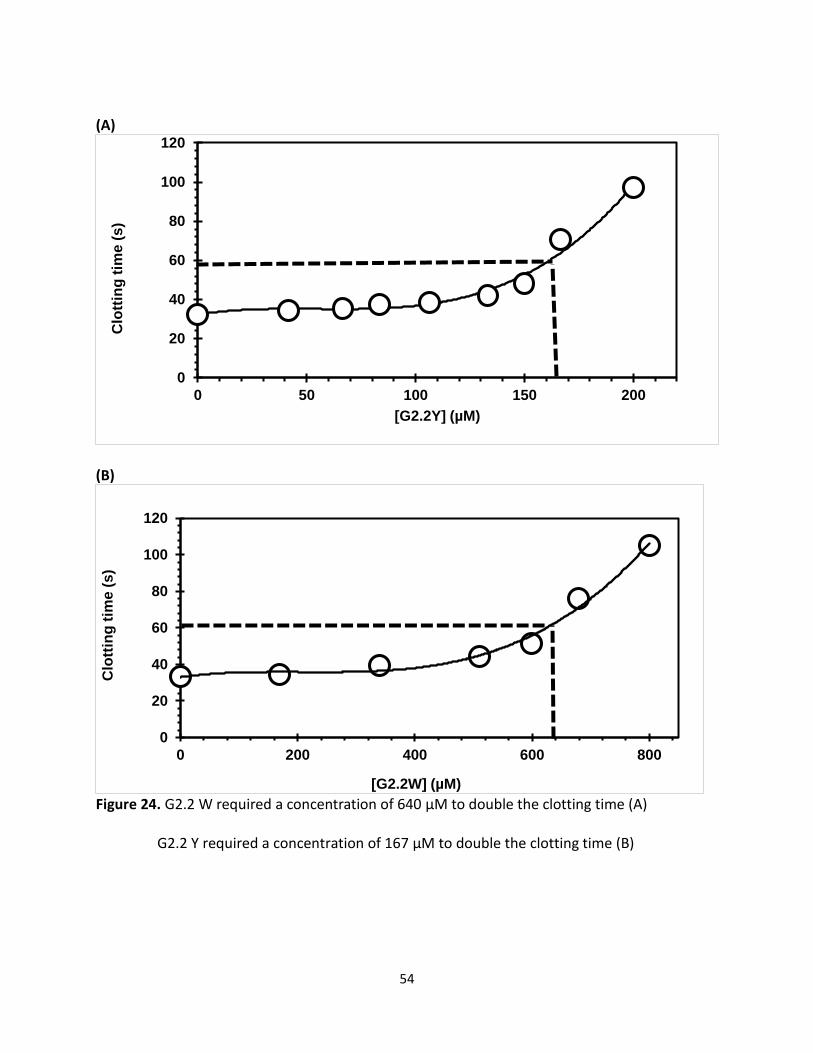
G2.2 is an Effective Anticoagulant in Human Plasma
Plasma clotting assays, prothrombin, and activated partial thromboplastin time (PT and
APTT), are regularly used to measure the anticoagulation potential of new enzyme inhibitors in
an in vitro setting. While PT measures the effect of an inhibitor on the extrinsic pathway of
coagulation, APTT measures the effect on the intrinsic pathway. Here we wanted to measure the
concentration of G2.2 required to double APTT for both G2.2 analogs. We used these
concentrations 0 µm, 41.6 µM, 66.7 µM, 83.3 µM,107 µM, 133 µM, 150 µM, and 167 µM) of
G2.2Y as well as, (0 µM, 170 µM,340 µM, 510 µM, 600 µM, and 680 µM) of G2.2W we were able
to determine the variation in APTT in the presence of varying concentrations of G2.2 analogs.
A 2-fold increase in APTT required 167 μM of G2.2Y while G2.2W required 640 μM to double
APTT time in similar assay. These results indicate that G2.2Y has good anticoagulation properties
in human plasma as compared to G2.2W as shown in (figure 24).
54
(A)
(B)
Figure 24. G2.2 W required a concentration of 640 µM to double the clotting time (A)
G2.2 Y required a concentration of 167 µM to double the clotting time (B)
0
20
40
60
80
100
120
0 50 100 150 200
Clo
ttin
g t
ime
(s
)
[G2.2Y] (µM)
0
20
40
60
80
100
120
0 200 400 600 800
Clo
ttin
g t
ime
(s
)
[G2.2W] (µM)
55
G2.2 is an Effective Anticoagulant in Human Whole Blood as Indicated by
Thromboelastometry
To assess the anticoagulation properties of G2.2 in human whole blood, thromboelastometry
was employed. This technique is an ex vivo protocol utilized to evaluate the anticoagulant activity
of G2.2 in whole blood. To determine whether G2.2 differ from other anticoagulant in whole
blood, we used thromboelastometry (ROTEM) a technique that used more often in clinical
settings as well as used after anticoagulation therapy with LMWHs. [221-223]. ROTEM measures
several responses of a formed clot to shearing force. In this technique, a pin is inserted into an
oscillating cup containing whole blood. As fibrin polymerizes, the pin starts to move with the
oscillating cup and the movement of the pin is recorded as amplitude, which in time reaches
maximum clot firmness (MCF) (Figure 25). The stronger the clot, the more the pin moves with
the cup and higher the MCF. MCF a measures of clot stiffness. Additionally, clotting time CT and
angle α (Figure 22) are also obtained in a ROTEM experiment. CT is the time required for the
appearance of the first detectable signal of 2mm in amplitude and is interpreted as the time
required for the initial fibrin formation. Angle α is the rate of formation of three-dimensional
fibrin network. Parameters that affect MCF include fibrin concentration and structure,
concentration and functional state of platelets, deficiency of coagulation factors and presence of
clotting inhibitors [224].
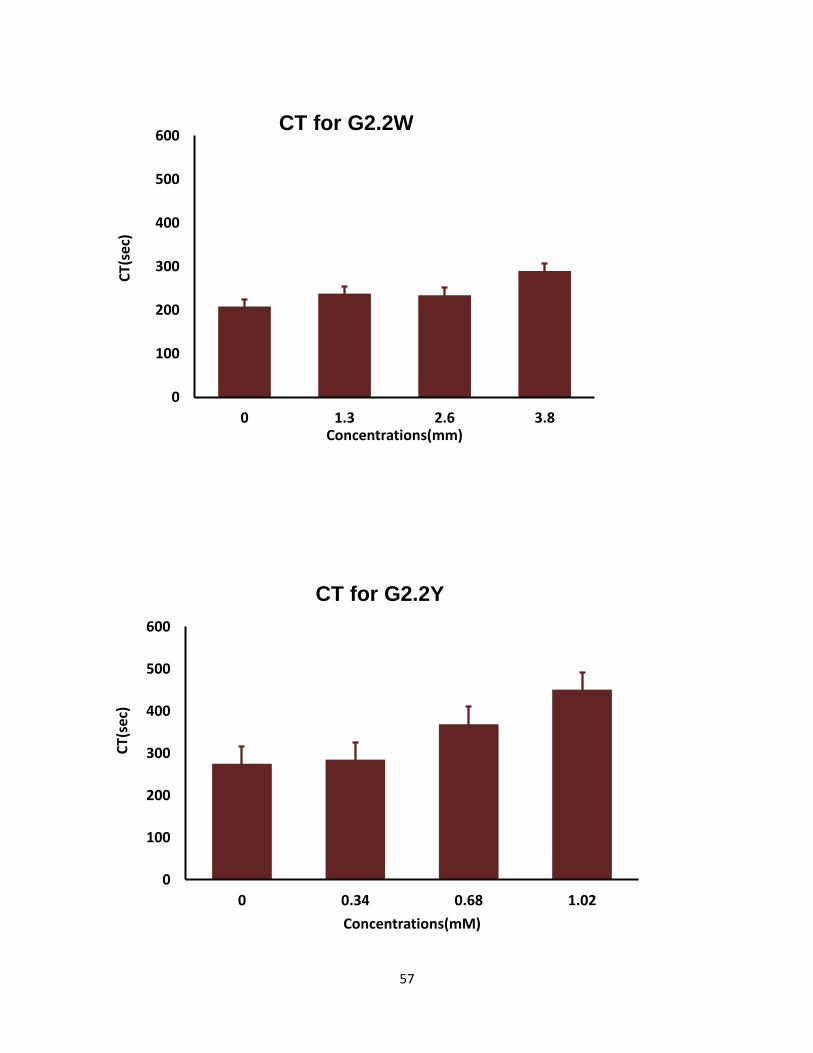
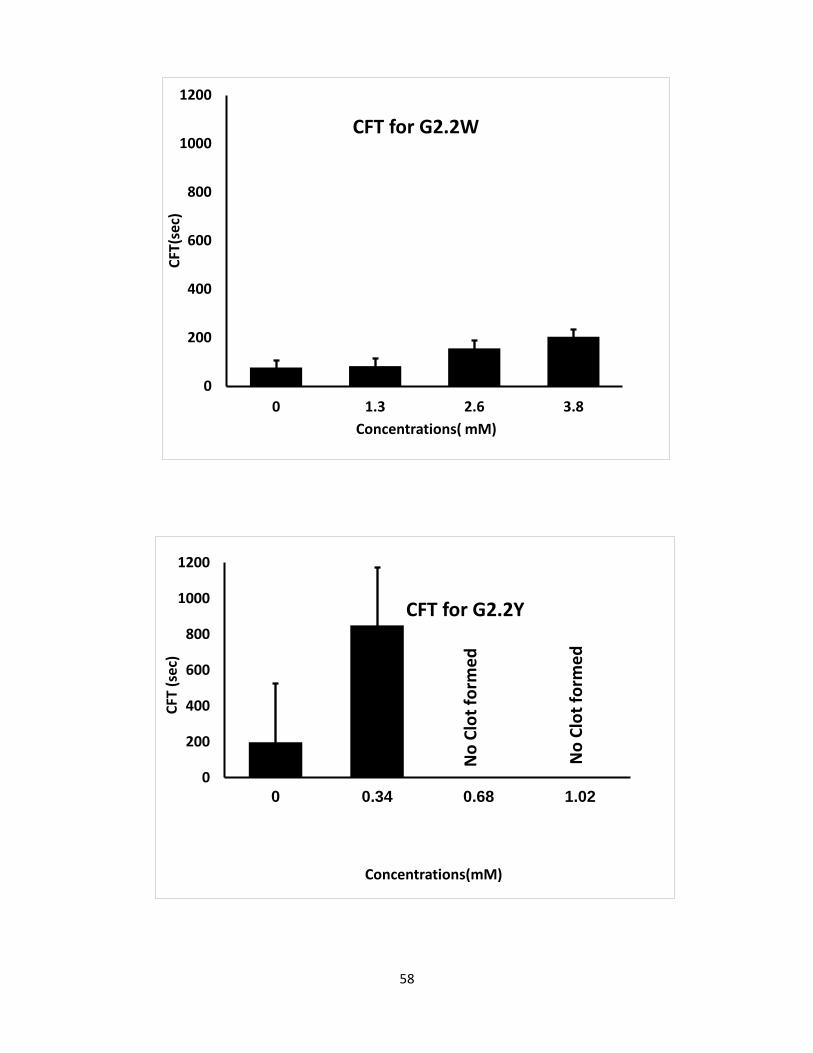
Both G2.2 analogs affect CT, α, MCF, and CFT parameters in dose-dependent manner (Table 4).
The kinetics of clot formation and growth as well as the strength and stability of the formed clot
are measured through parameters such as maximum amplitude (MCF) of clot formation; shear
elastic modulus strength (CT) of clot; the reaction time (MCF) for the start of clotting; and the
56
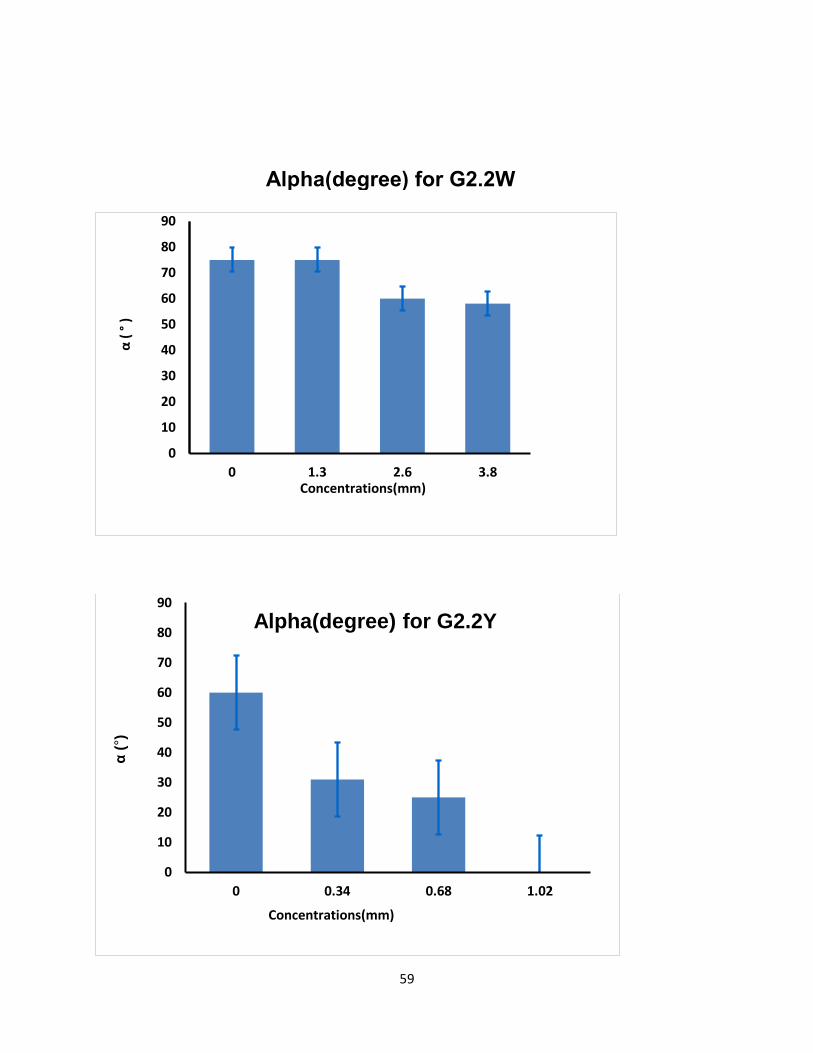
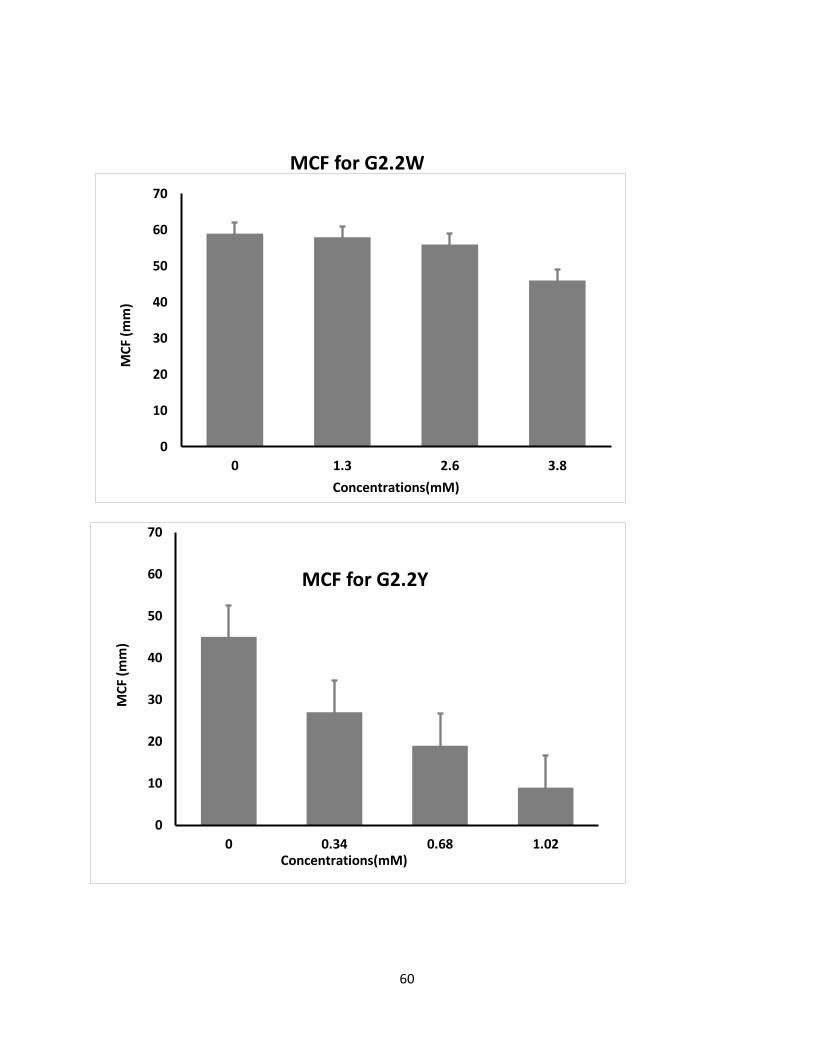
angle (α), which is a measure of fibrin buildup and cross-linking (Figure 25) shows the effects of
G2.2W and G2.2Y in human whole blood with respect to the changes in α, CT, and MCF
parameters. For both G2.2, increasing the concentration increases CT and decreases α, MCF, and
CT parameters. Briefly, CT increases from 275 secs to 451 secs as the concentration of G2.2Y
increases from 0mM to 1.02mM, while α decreases from 60° to less than 9° suggesting a
significant decrease in the fibrin polymerization and network formation. G2.2W demonstrates
less effect on CT and α parameters, at a range of 0 to 3.84 mM compared to G2.2Y. G2.2W
decreases MCF and A10 measurements by about 1.5– and 2–fold, respectively. In similar fashion,
G2.2Y reduces MCF and A10 by approximately 4– to 8–fold. These results suggest that G2.2Y is a
better anticoagulant in human whole blood.
57
0
100
200
300
400
500
600
0 1.3 2.6 3.8
CT(
sec)
Concentrations(mm)
CT for G2.2W
0
100
200
300
400
500
600
0 0.34 0.68 1.02
CT(
sec)
Concentrations(mM)
CT for G2.2Y
58
0
200
400
600
800
1000
1200
0 0.34 0.68 1.02
CFT
(se
c)
Concentrations(mM)
No
Clo
t fo
rme
d
No
Clo
t fo
rme
d
0
200
400
600
800
1000
1200
0 1.3 2.6 3.8
CFT
(sec
)
Concentrations( mM)
CFT for G2.2W
CFT for G2.2Y
59
0
10
20
30
40
50
60
70
80
90
0 1.3 2.6 3.8
α(
°)
Concentrations(mm)
0
10
20
30
40
50
60
70
80
90
0 0.34 0.68 1.02
α(°
)
Concentrations(mm)
Alpha(degree) for G2.2Y
Alpha(degree) for G2.2W
60
0
10
20
30
40
50
60
70
0 1.3 2.6 3.8
MC
F (m
m)
Concentrations(mM)
0
10
20
30
40
50
60
70
0 0.34 0.68 1.02
MC
F (m
m)
Concentrations(mM)
MCF for G2.2W
MCF for G2.2Y
61
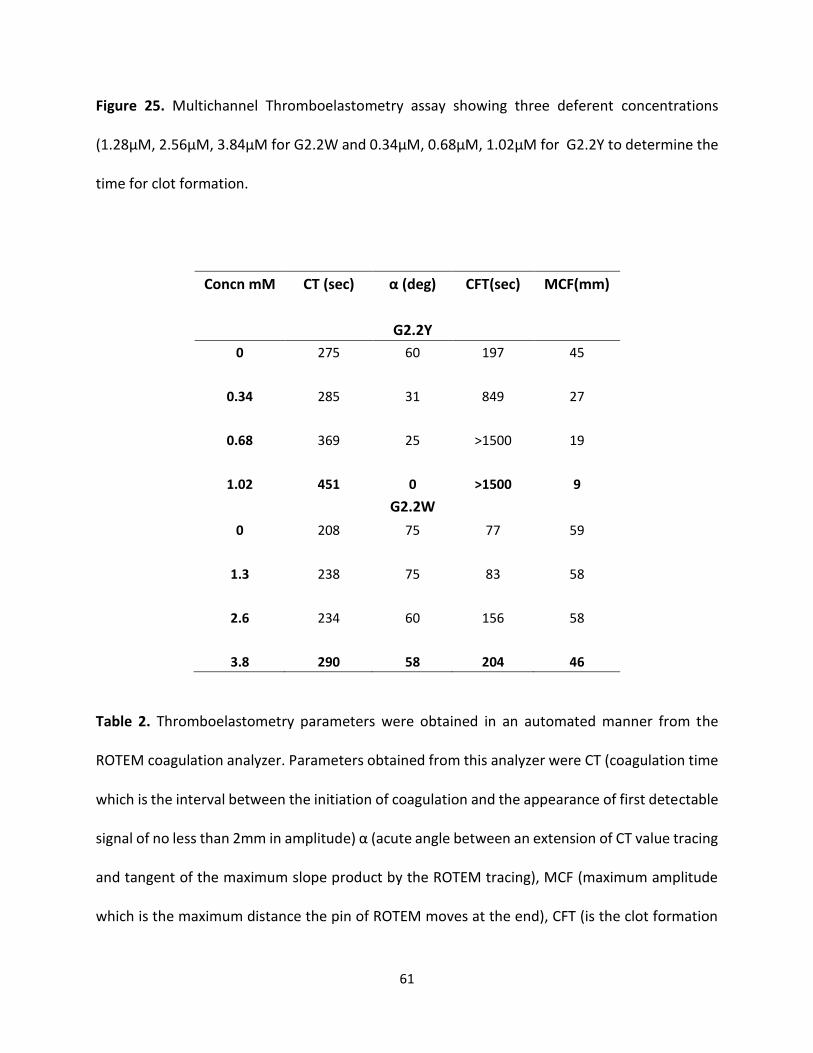
Figure 25. Multichannel Thromboelastometry assay showing three deferent concentrations
(1.28µM, 2.56µM, 3.84µM for G2.2W and 0.34µM, 0.68µM, 1.02µM for G2.2Y to determine the
time for clot formation.
Concn mM CT (sec) α (deg) CFT(sec) MCF(mm)
G2.2Y
0 275 60 197 45
0.34 285 31 849 27
0.68 369 25 >1500 19
1.02 451 0 >1500 9
G2.2W
0 208 75 77 59
1.3 238 75 83 58
2.6 234 60 156 58
3.8 290 58 204 46
Table 2. Thromboelastometry parameters were obtained in an automated manner from the
ROTEM coagulation analyzer. Parameters obtained from this analyzer were CT (coagulation time
which is the interval between the initiation of coagulation and the appearance of first detectable
signal of no less than 2mm in amplitude) α (acute angle between an extension of CT value tracing
and tangent of the maximum slope product by the ROTEM tracing), MCF (maximum amplitude
which is the maximum distance the pin of ROTEM moves at the end), CFT (is the clot formation
62
time in which the clot appearance from 2 to 20mm). The reported values are the mean of two
independent experiments which were recorded automatically.
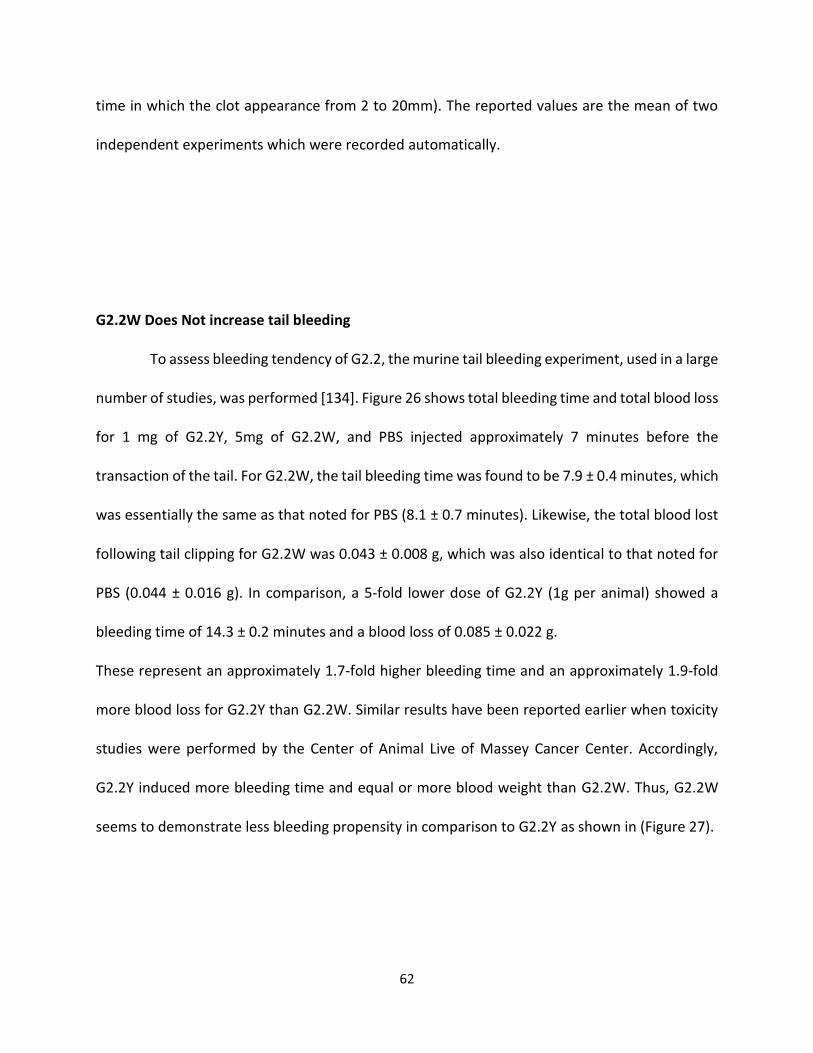
G2.2W Does Not increase tail bleeding To assess bleeding tendency of G2.2, the murine tail bleeding experiment, used in a large
number of studies, was performed [134]. Figure 26 shows total bleeding time and total blood loss
for 1 mg of G2.2Y, 5mg of G2.2W, and PBS injected approximately 7 minutes before the
transaction of the tail. For G2.2W, the tail bleeding time was found to be 7.9 ± 0.4 minutes, which
was essentially the same as that noted for PBS (8.1 ± 0.7 minutes). Likewise, the total blood lost
following tail clipping for G2.2W was 0.043 ± 0.008 g, which was also identical to that noted for
PBS (0.044 ± 0.016 g). In comparison, a 5-fold lower dose of G2.2Y (1g per animal) showed a
bleeding time of 14.3 ± 0.2 minutes and a blood loss of 0.085 ± 0.022 g.
These represent an approximately 1.7-fold higher bleeding time and an approximately 1.9-fold
more blood loss for G2.2Y than G2.2W. Similar results have been reported earlier when toxicity
studies were performed by the Center of Animal Live of Massey Cancer Center. Accordingly,
G2.2Y induced more bleeding time and equal or more blood weight than G2.2W. Thus, G2.2W
seems to demonstrate less bleeding propensity in comparison to G2.2Y as shown in (Figure 27).
63
Figure 26. A comparison of mouse tail bleeding subsequent IV injection of either 5 mg of G2.2W,
1 mg of G2.2Y, and 0.3 mg of LMWH or PBS in 50 µl of PBS. Two parameters were followed
including bleeding time in minutes. Error bars represent ± 1 SEM using N = 10. G2.2Y was found
to exhibit significant bleeding propensity in comparison to G2.2W which was not significantly
different from vehicle.
0
0.5
1
1.5
2
2.5
CONTROL LMWH G2.2 W
Blo
od
wei
ght
(mg)
0
0.5
1
1.5
2
2.5
CONTROL LMWH G2.2 Y
Blo
od
wei
ght
(mg)
64
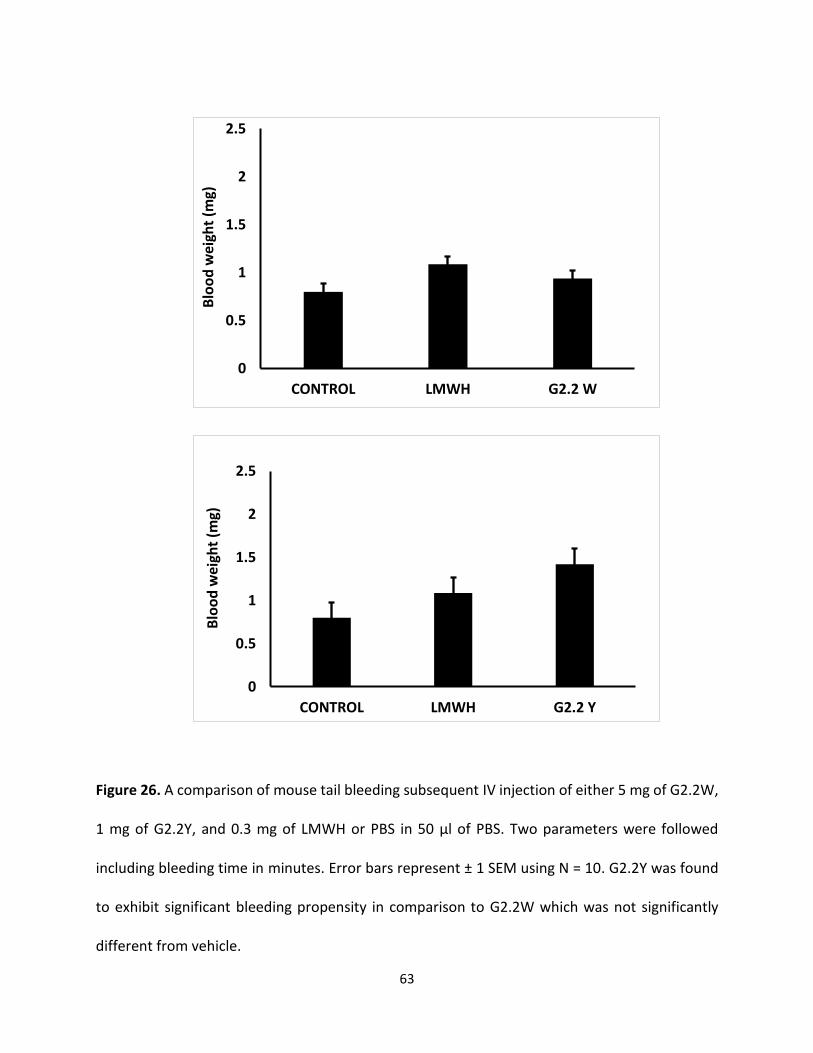
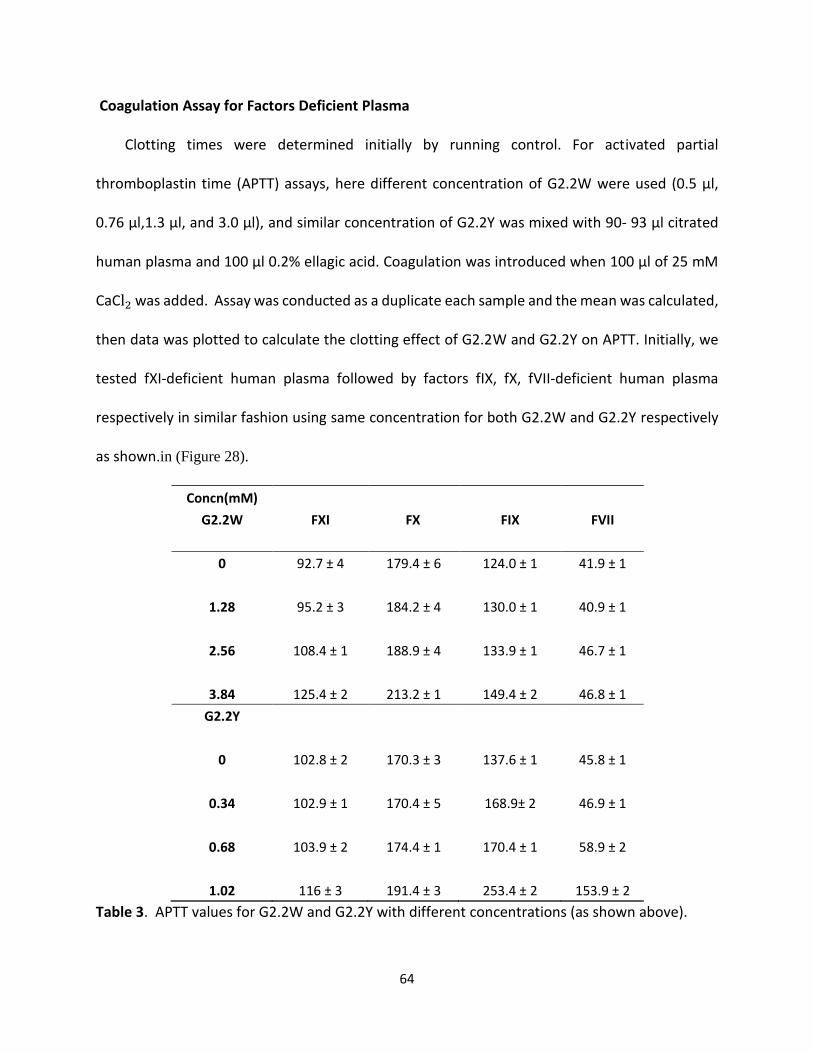
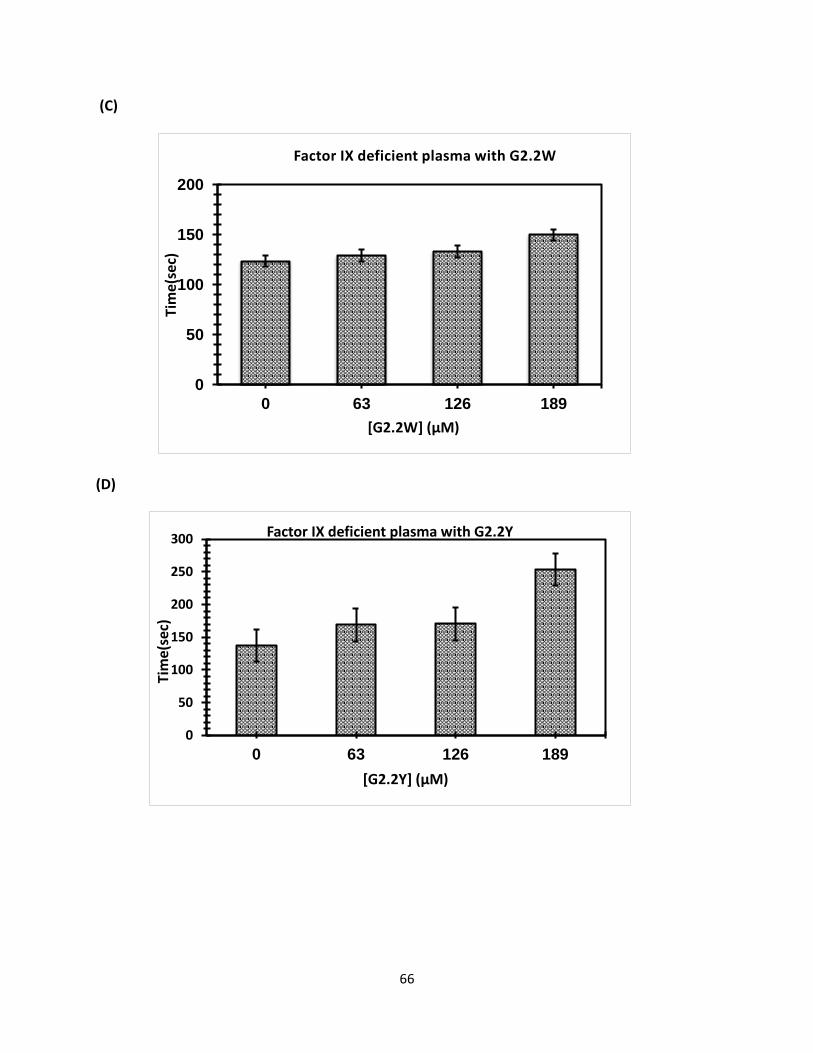
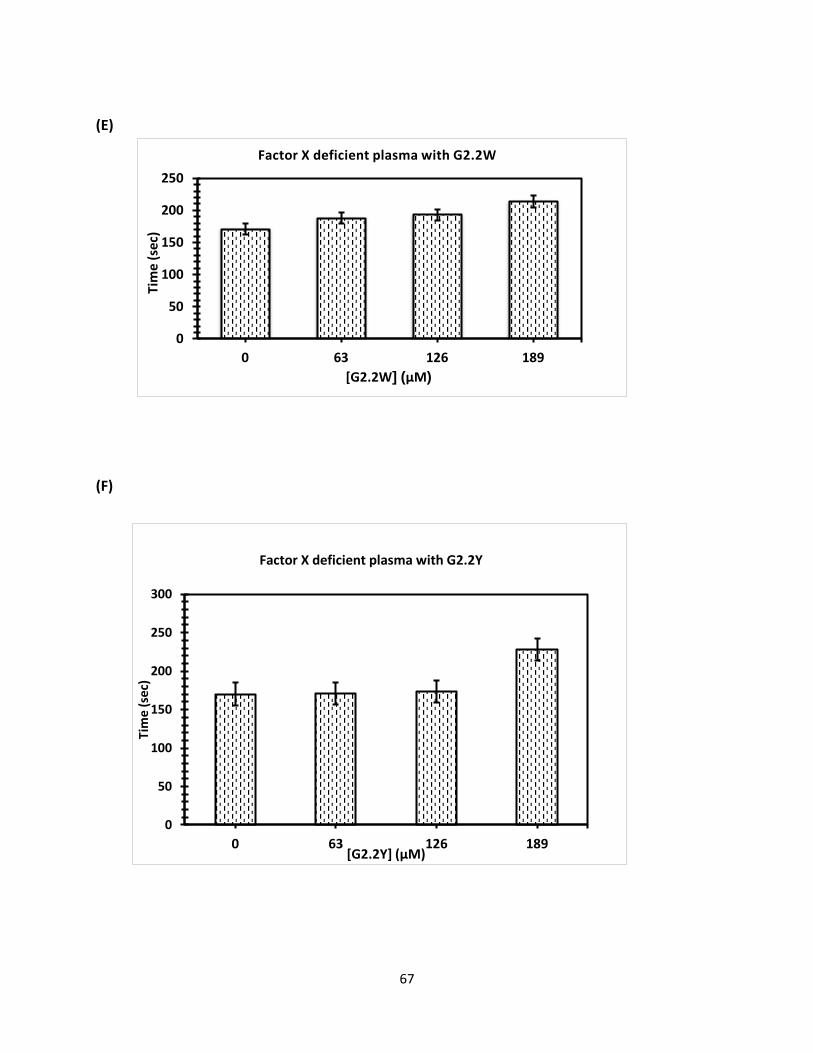
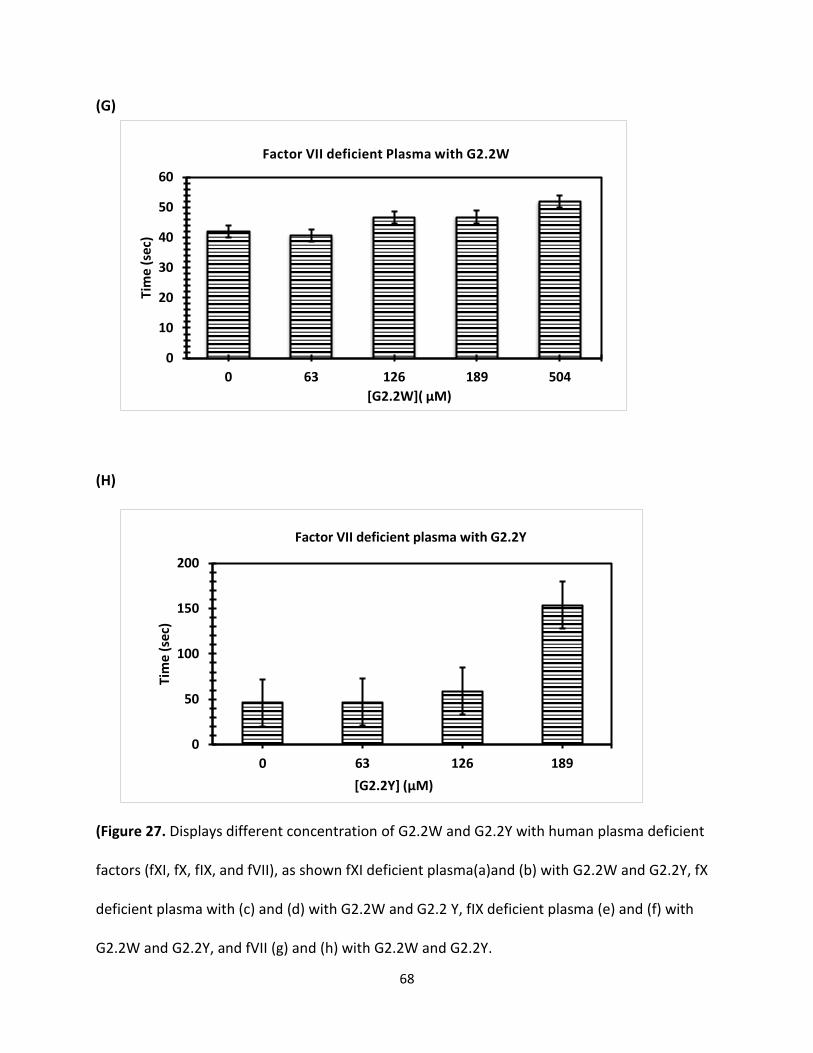
Coagulation Assay for Factors Deficient Plasma Clotting times were determined initially by running control. For activated partial
thromboplastin time (APTT) assays, here different concentration of G2.2W were used (0.5 μl,
0.76 μl,1.3 μl, and 3.0 μl), and similar concentration of G2.2Y was mixed with 90- 93 μl citrated
human plasma and 100 μl 0.2% ellagic acid. Coagulation was introduced when 100 μl of 25 mM
CaCl2 was added. Assay was conducted as a duplicate each sample and the mean was calculated,
then data was plotted to calculate the clotting effect of G2.2W and G2.2Y on APTT. Initially, we
tested fXI-deficient human plasma followed by factors fIX, fX, fVII-deficient human plasma
respectively in similar fashion using same concentration for both G2.2W and G2.2Y respectively
as shown.in (Figure 28).
Concn(mM)
G2.2W FXI FX FIX FVII
0 92.7 ± 4 179.4 ± 6 124.0 ± 1 41.9 ± 1
1.28 95.2 ± 3 184.2 ± 4 130.0 ± 1 40.9 ± 1
2.56 108.4 ± 1 188.9 ± 4 133.9 ± 1 46.7 ± 1
3.84 125.4 ± 2 213.2 ± 1 149.4 ± 2 46.8 ± 1
G2.2Y
0 102.8 ± 2 170.3 ± 3 137.6 ± 1 45.8 ± 1
0.34 102.9 ± 1 170.4 ± 5 168.9± 2 46.9 ± 1
0.68 103.9 ± 2 174.4 ± 1 170.4 ± 1 58.9 ± 2
1.02 116 ± 3 191.4 ± 3 253.4 ± 2 153.9 ± 2
Table 3. APTT values for G2.2W and G2.2Y with different concentrations (as shown above).
65
(A)
(B)
0
20
40
60
80
100
120
0 63 126 189 315
Tim
e (s
ec)
[G2.2Y] (µM)
Factor XI deficient plasma with G2.2Y
0
50
100
150
200
250
0 63 126 189
Tim
e (s
ec)
[G2.2W] (µM)
Factor XI deficient plasma with G2.2W
66
(C)
(D)
0
50
100
150
200
0 63 126 189
Tim
e(se
c)
[G2.2W] (µM)
Factor IX deficient plasma with G2.2W
0
50
100
150
200
250
300
0 63 126 189
Tim
e(se
c)
[G2.2Y] (µM)
Factor IX deficient plasma with G2.2Y
67
(E)
(F)
0
50
100
150
200
250
0 63 126 189
Tim
e (
sec)
[G2.2W] (µM)
Factor X deficient plasma with G2.2W
0
50
100
150
200
250
300
0 63 126 189
Tim
e (s
ec)
[G2.2Y] (µM)
Factor X deficient plasma with G2.2Y
68
(G)
(H)
(Figure 27. Displays different concentration of G2.2W and G2.2Y with human plasma deficient
factors (fXI, fX, fIX, and fVII), as shown fXI deficient plasma(a)and (b) with G2.2W and G2.2Y, fX
deficient plasma with (c) and (d) with G2.2W and G2.2 Y, fIX deficient plasma (e) and (f) with
G2.2W and G2.2Y, and fVII (g) and (h) with G2.2W and G2.2Y.
0
10
20
30
40
50
60
0 63 126 189 504
Tim
e (
sec)
[G2.2W]( µM)
Factor VII deficient Plasma with G2.2W
0
50
100
150
200
0 63 126 189
Tim
e (
sec)
[G2.2Y] (µM)
Factor VII deficient plasma with G2.2Y
69
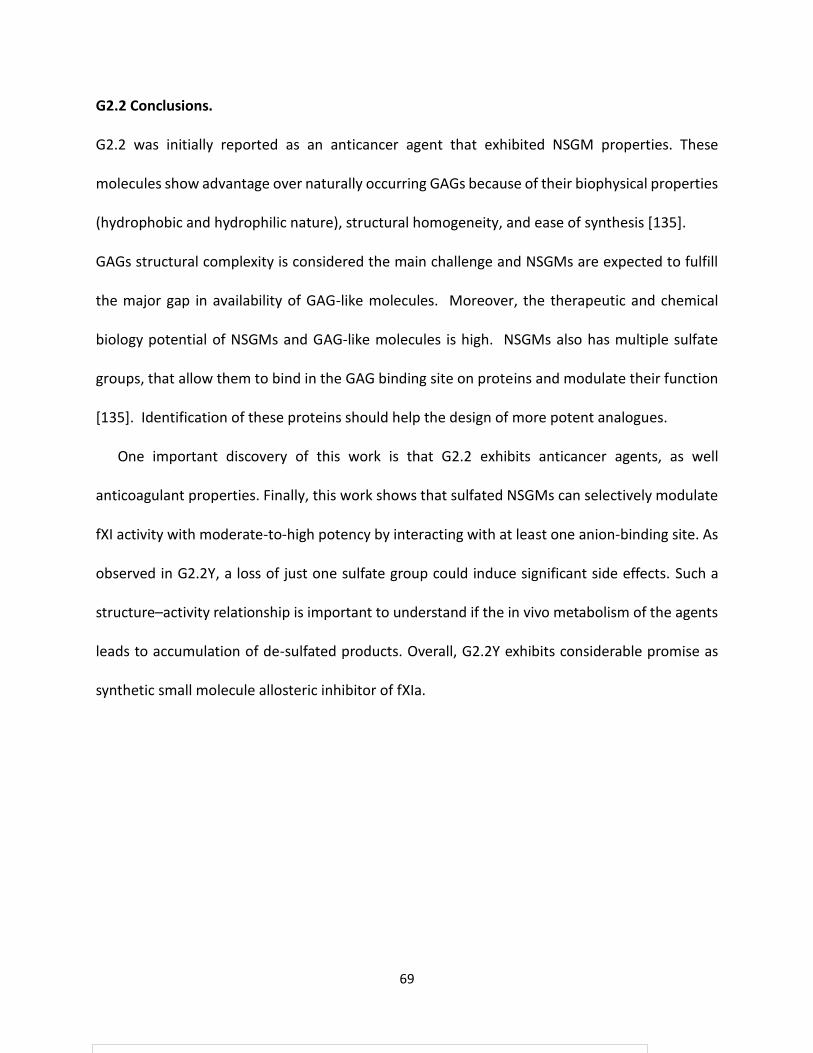
G2.2 Conclusions.
G2.2 was initially reported as an anticancer agent that exhibited NSGM properties. These
molecules show advantage over naturally occurring GAGs because of their biophysical properties
(hydrophobic and hydrophilic nature), structural homogeneity, and ease of synthesis [135].
GAGs structural complexity is considered the main challenge and NSGMs are expected to fulfill
the major gap in availability of GAG-like molecules. Moreover, the therapeutic and chemical
biology potential of NSGMs and GAG-like molecules is high. NSGMs also has multiple sulfate
groups, that allow them to bind in the GAG binding site on proteins and modulate their function
[135]. Identification of these proteins should help the design of more potent analogues.
One important discovery of this work is that G2.2 exhibits anticancer agents, as well
anticoagulant properties. Finally, this work shows that sulfated NSGMs can selectively modulate
fXI activity with moderate-to-high potency by interacting with at least one anion-binding site. As
observed in G2.2Y, a loss of just one sulfate group could induce significant side effects. Such a
structure–activity relationship is important to understand if the in vivo metabolism of the agents
leads to accumulation of de-sulfated products. Overall, G2.2Y exhibits considerable promise as
synthetic small molecule allosteric inhibitor of fXIa.
70
Chapter 4: Advanced Level Characterization of Antithrombotics Potential of SMI
4.1 Introduction
As mentioned previously in Chapter 1, factor XIa (fXIa) is emerging as a suitable target for
prophylactic treatments of hyper-thrombotic states [145]. It is thought that developing novel
inhibitors for f XIa may perhaps stop thrombosis and prevent bleeding. It has been reported that
the allosteric inhibition of fXIa can be brought about by large molecules with highly charged
polyanions such as: dextran sulfate, heparin, hypersulfated heparin, sulfated pentagalloyl
glucoside (SPGG) and sulfated quinazolin-4(3H)-ones (QAOs) [122,124]. Although a number of
active site inhibitors have been reported, there has been only one report on allosteric small-
molecule inhibitors (<1000 Da) of fXIa [35]. These are the sulfated QAOs, that demonstrated a
maximum potency of only 52 μM. This leaves room for more potent small-molecule allosteric
inhibitors for fXIa to be discovered. The sulfated QAOs were found to bind near the heparin
binding site (HBS). Sulfated QAOs are expected to display poor bioavailability owing to their large
size and high charge density. Finally, no inhibitor of factor XIa has been approved for use as
anticoagulant in the clinic. SMI is one of SPGG’s analogs, it has shown to inhibit fXIa. Therefore,
series of in vivo and in vitro assays were designed to evaluate its anticoagulation potential.
4.2 Experimental Procedures
Methods and Materials
Pooled normal human plasma for coagulation assays was withdrawn from a healthy individual
(Activated partial thromboplastin time (APTT) reagent containing ellagic acid, thromboplastin-D
and 25 mM CaCl2 were received from Fisher Diagnostics (Middletown, VA)).
Thromboelastograph® Coagulation Analyzer 5000 (TEG), disposable cups and pins, and 200 mM
71
stock CaCl2 were obtained from Haemoscope Corporation (Niles, IL). All other chemicals were
analytical reagent grade from either Sigma Chemicals (St. Louis, MO) or Fisher (Pittsburgh, PA)
and used without further purification as reported earlier.
Activated Partial Thromboplastin Time Assay(APTT)
To perform the APTT assay, several concentrations of SMI solution were added to 90 μL of
citrated human plasma and 100 μL of prewarmed APTT reagent (0.2% ellagic acid). After
incubation for 300 seconds at 37 °C, clotting was initiated by adding 100 μL of prewarmed 25 mM
CaCl2 and time to clot was collected. The data were fitted to a quadratic trend line, which was
used to determine the concentration of SMI required to double the clotting time. Effect of SMI
on APTT using FXI-deficient human plasma along with others such as fIX, fX, fVII -deficient human
plasma was also studied in a comparable manner.
Rotational Thromboelastometry (ROTEM)
Modified rotational thromboelastometry was determined on a ROTEM® Delta Hemostasis
Analyzer (Pentapharm GmbH, Munich, Germany) using Pentapharm software version 2.2.0. The
device temperature was set to 37°C and the maximum runtime to 90 minutes. Coagulation
function was assessed in citrated whole-blood samples by INTEM test: The 20 μL CaCl2 0.2 mol/L,
20 μL thromboplastin-phospholipid, 300 μL blood. This assay is used for monitoring the intrinsic
system (factors XII, XI, IX, VII, X, and platelets). Parameters measured included coagulation time
(CT, sec; time to clotting initiation), clot formation time (CFT, sec; time from clot initiation until a
clot firmness of 20 mm is detected), and maximum clot firmness (MCF, mm) which reflects the
maximum structural integrity obtained by the clot. The clot which is dependent on fibrin content,
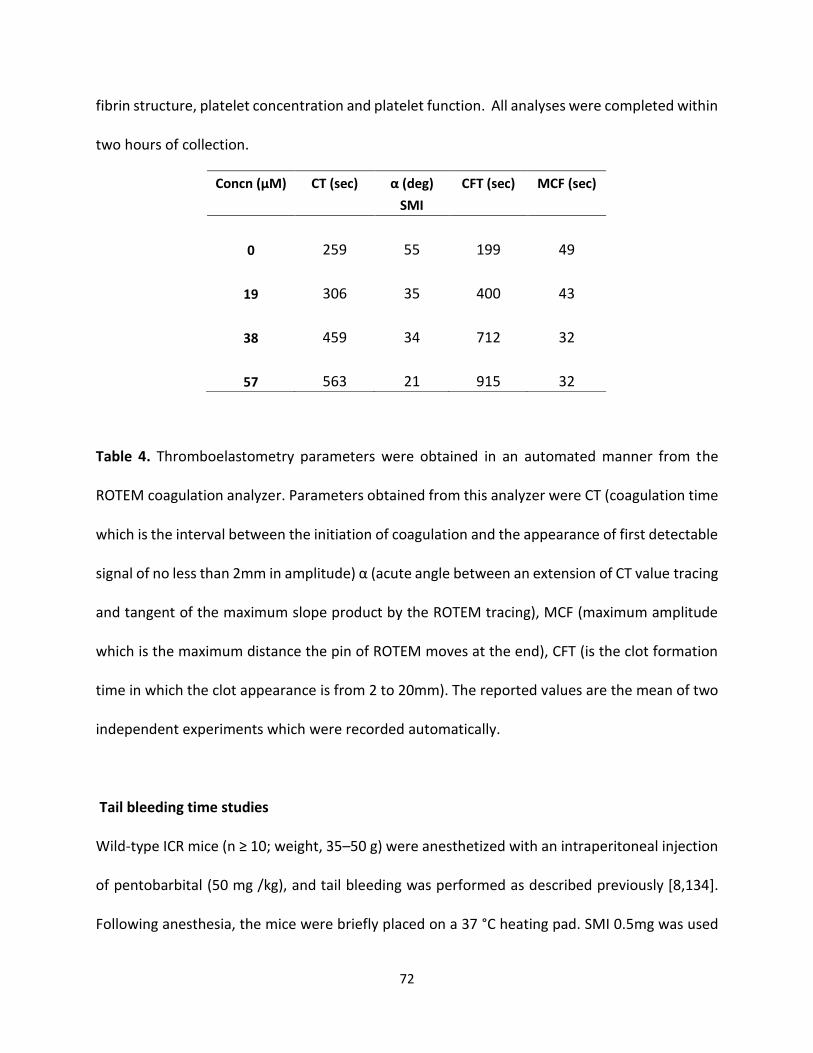
72
fibrin structure, platelet concentration and platelet function. All analyses were completed within
two hours of collection.
Table 4. Thromboelastometry parameters were obtained in an automated manner from the
ROTEM coagulation analyzer. Parameters obtained from this analyzer were CT (coagulation time
which is the interval between the initiation of coagulation and the appearance of first detectable
signal of no less than 2mm in amplitude) α (acute angle between an extension of CT value tracing
and tangent of the maximum slope product by the ROTEM tracing), MCF (maximum amplitude
which is the maximum distance the pin of ROTEM moves at the end), CFT (is the clot formation
time in which the clot appearance is from 2 to 20mm). The reported values are the mean of two
independent experiments which were recorded automatically.
Tail bleeding time studies Wild-type ICR mice (n ≥ 10; weight, 35–50 g) were anesthetized with an intraperitoneal injection
of pentobarbital (50 mg /kg), and tail bleeding was performed as described previously [8,134].
Following anesthesia, the mice were briefly placed on a 37 °C heating pad. SMI 0.5mg was used
Concn (µM) CT (sec) α (deg) CFT (sec) MCF (sec)
SMI
0 259 55 199 49
19 306 35 400 43
38 459 34 712 32
57 563 21 915 32
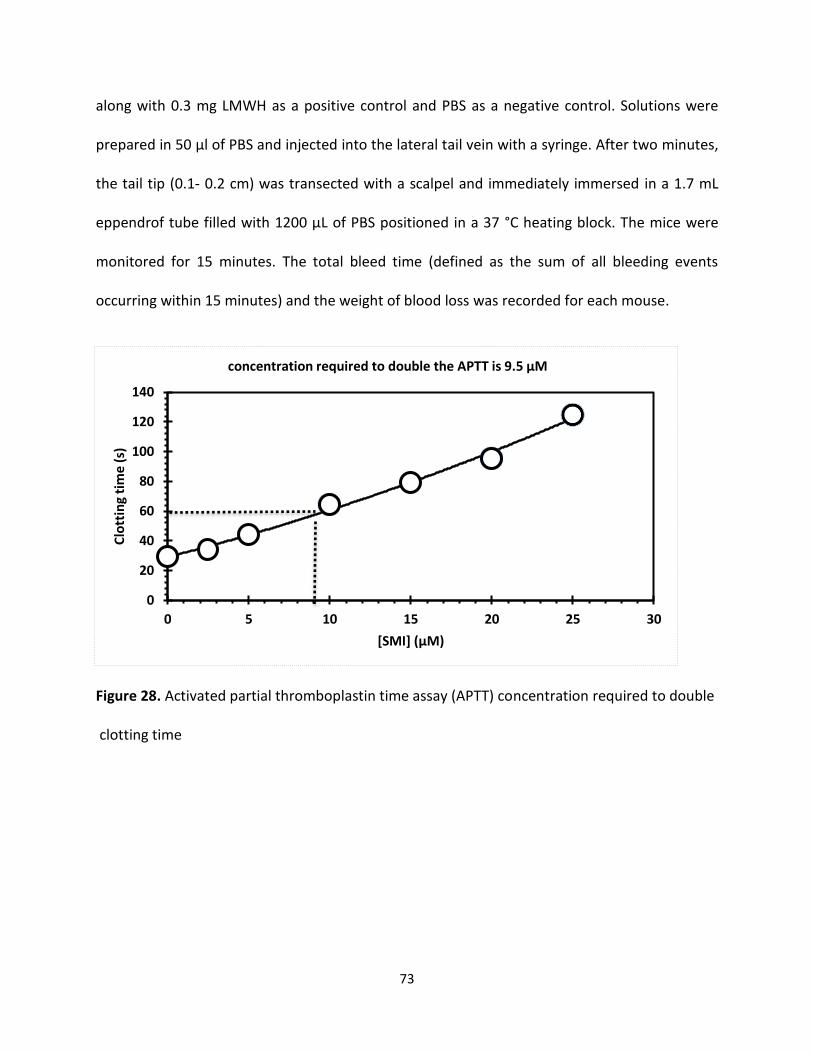
73
along with 0.3 mg LMWH as a positive control and PBS as a negative control. Solutions were
prepared in 50 µl of PBS and injected into the lateral tail vein with a syringe. After two minutes,
the tail tip (0.1- 0.2 cm) was transected with a scalpel and immediately immersed in a 1.7 mL
eppendrof tube filled with 1200 µL of PBS positioned in a 37 °C heating block. The mice were
monitored for 15 minutes. The total bleed time (defined as the sum of all bleeding events
occurring within 15 minutes) and the weight of blood loss was recorded for each mouse.
Figure 28. Activated partial thromboplastin time assay (APTT) concentration required to double clotting time
0
20
40
60
80
100
120
140
0 5 10 15 20 25 30
Clo
ttin
g ti
me
(s)
[SMI] (µM)
concentration required to double the APTT is 9.5 µM
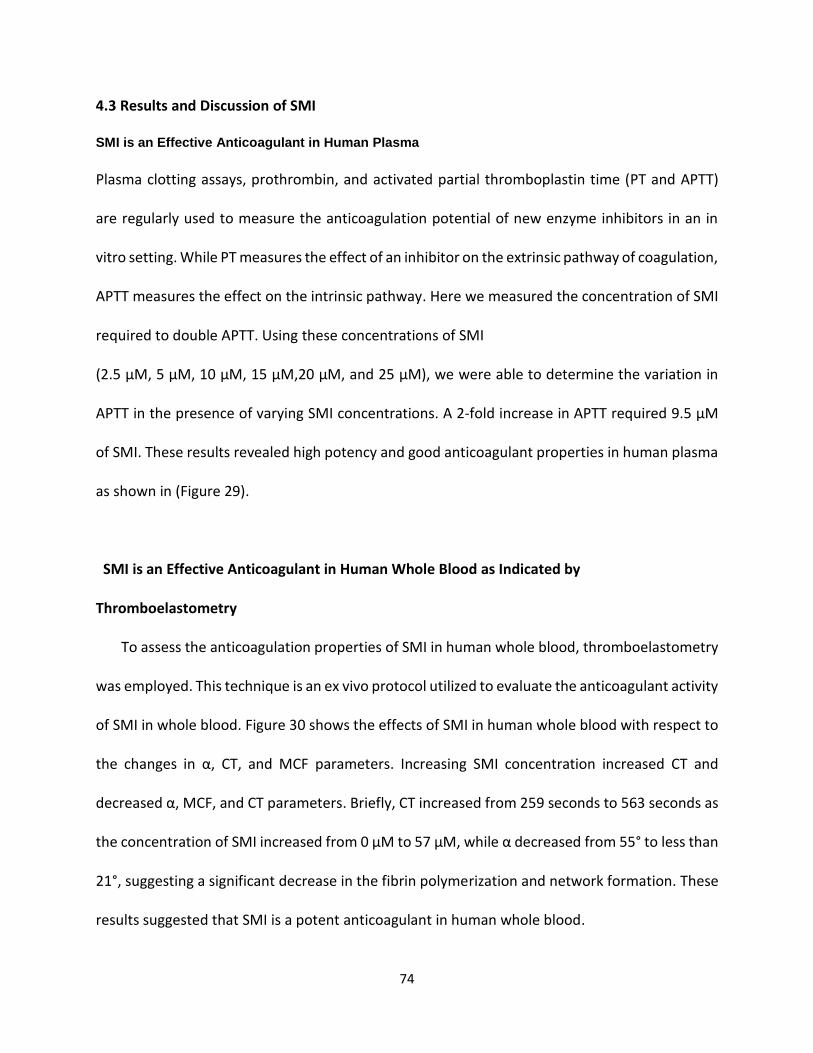
74
4.3 Results and Discussion of SMI SMI is an Effective Anticoagulant in Human Plasma
Plasma clotting assays, prothrombin, and activated partial thromboplastin time (PT and APTT)
are regularly used to measure the anticoagulation potential of new enzyme inhibitors in an in
vitro setting. While PT measures the effect of an inhibitor on the extrinsic pathway of coagulation,
APTT measures the effect on the intrinsic pathway. Here we measured the concentration of SMI
required to double APTT. Using these concentrations of SMI
(2.5 µM, 5 µM, 10 µM, 15 µM,20 µM, and 25 µM), we were able to determine the variation in
APTT in the presence of varying SMI concentrations. A 2-fold increase in APTT required 9.5 μM
of SMI. These results revealed high potency and good anticoagulant properties in human plasma
as shown in (Figure 29).
SMI is an Effective Anticoagulant in Human Whole Blood as Indicated by
Thromboelastometry
To assess the anticoagulation properties of SMI in human whole blood, thromboelastometry
was employed. This technique is an ex vivo protocol utilized to evaluate the anticoagulant activity
of SMI in whole blood. Figure 30 shows the effects of SMI in human whole blood with respect to
the changes in α, CT, and MCF parameters. Increasing SMI concentration increased CT and
decreased α, MCF, and CT parameters. Briefly, CT increased from 259 seconds to 563 seconds as
the concentration of SMI increased from 0 μM to 57 μM, while α decreased from 55° to less than
21°, suggesting a significant decrease in the fibrin polymerization and network formation. These
results suggested that SMI is a potent anticoagulant in human whole blood.
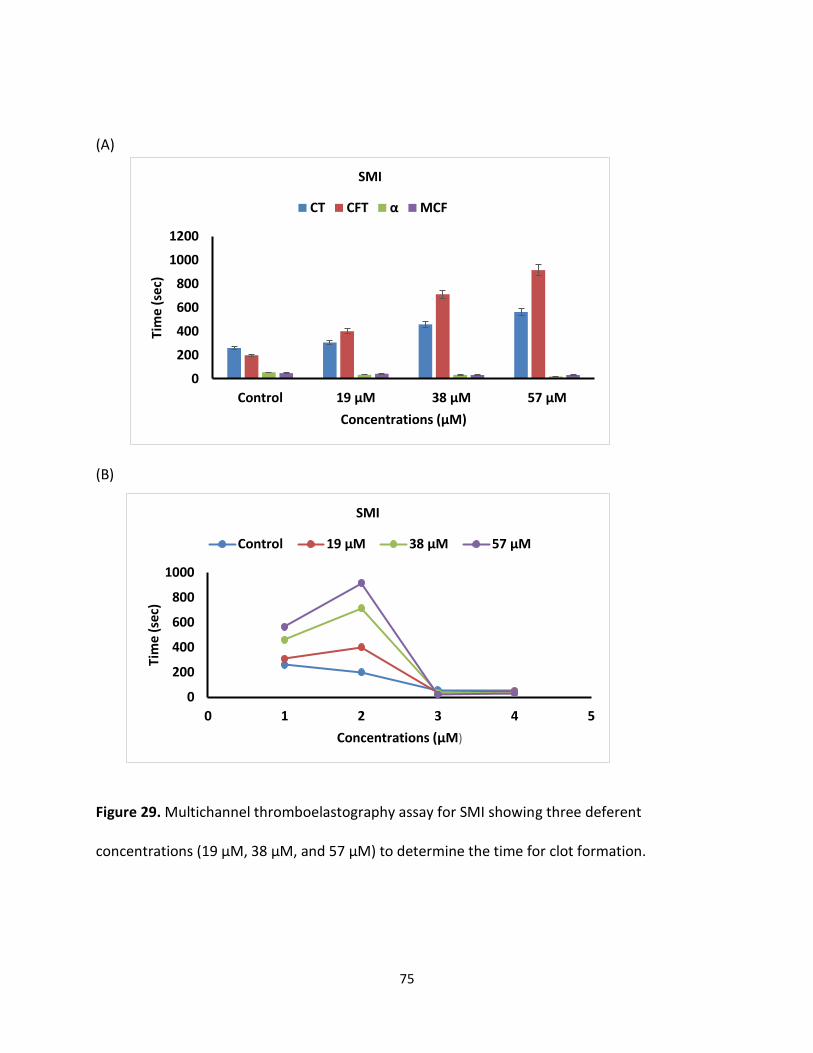
75
(A)
(B)
Figure 29. Multichannel thromboelastography assay for SMI showing three deferent
concentrations (19 µM, 38 µM, and 57 µM) to determine the time for clot formation.
0
200
400
600
800
1000
1200
Control 19 µM 38 µM 57 µM
Tim
e (
sec)
Concentrations (µM)
SMI
CT CFT α MCF
0
200
400
600
800
1000
0 1 2 3 4 5
Tim
e (
sec)
Concentrations (µM)
SMI
Control 19 µM 38 µM 57 µM
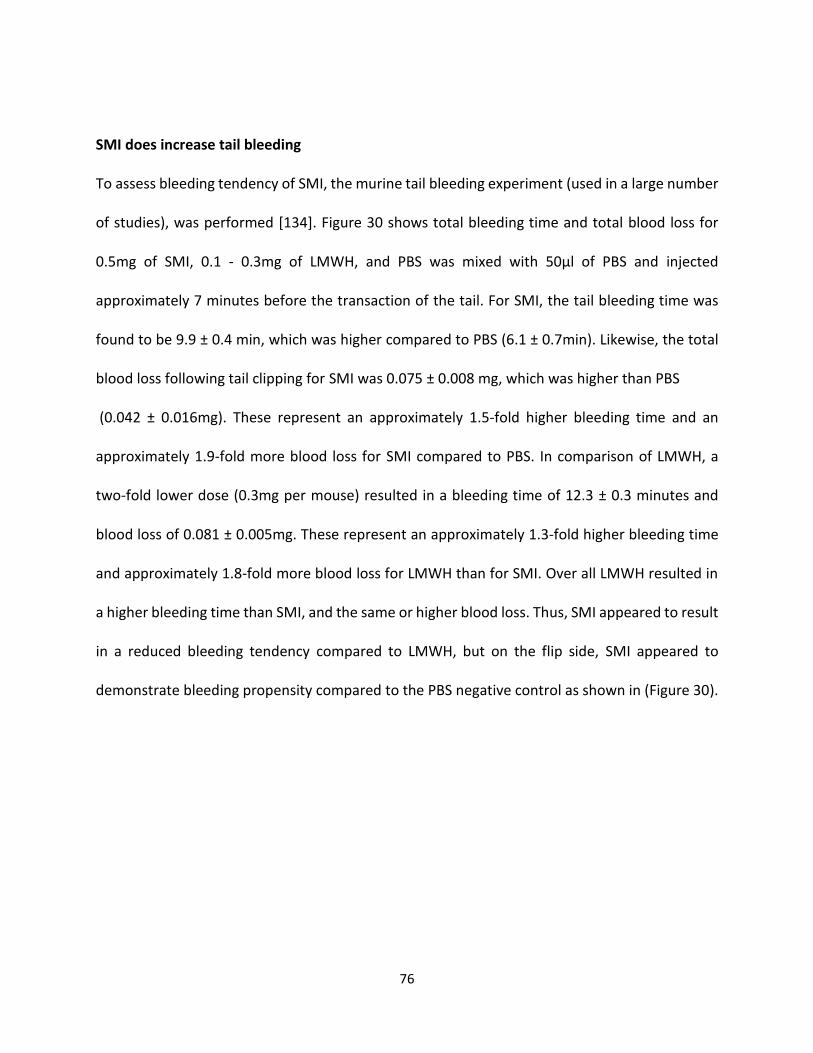
76
SMI does increase tail bleeding To assess bleeding tendency of SMI, the murine tail bleeding experiment (used in a large number
of studies), was performed [134]. Figure 30 shows total bleeding time and total blood loss for
0.5mg of SMI, 0.1 - 0.3mg of LMWH, and PBS was mixed with 50µl of PBS and injected
approximately 7 minutes before the transaction of the tail. For SMI, the tail bleeding time was
found to be 9.9 ± 0.4 min, which was higher compared to PBS (6.1 ± 0.7min). Likewise, the total
blood loss following tail clipping for SMI was 0.075 ± 0.008 mg, which was higher than PBS
(0.042 ± 0.016mg). These represent an approximately 1.5-fold higher bleeding time and an
approximately 1.9-fold more blood loss for SMI compared to PBS. In comparison of LMWH, a
two-fold lower dose (0.3mg per mouse) resulted in a bleeding time of 12.3 ± 0.3 minutes and
blood loss of 0.081 ± 0.005mg. These represent an approximately 1.3-fold higher bleeding time
and approximately 1.8-fold more blood loss for LMWH than for SMI. Over all LMWH resulted in
a higher bleeding time than SMI, and the same or higher blood loss. Thus, SMI appeared to result
in a reduced bleeding tendency compared to LMWH, but on the flip side, SMI appeared to
demonstrate bleeding propensity compared to the PBS negative control as shown in (Figure 30).
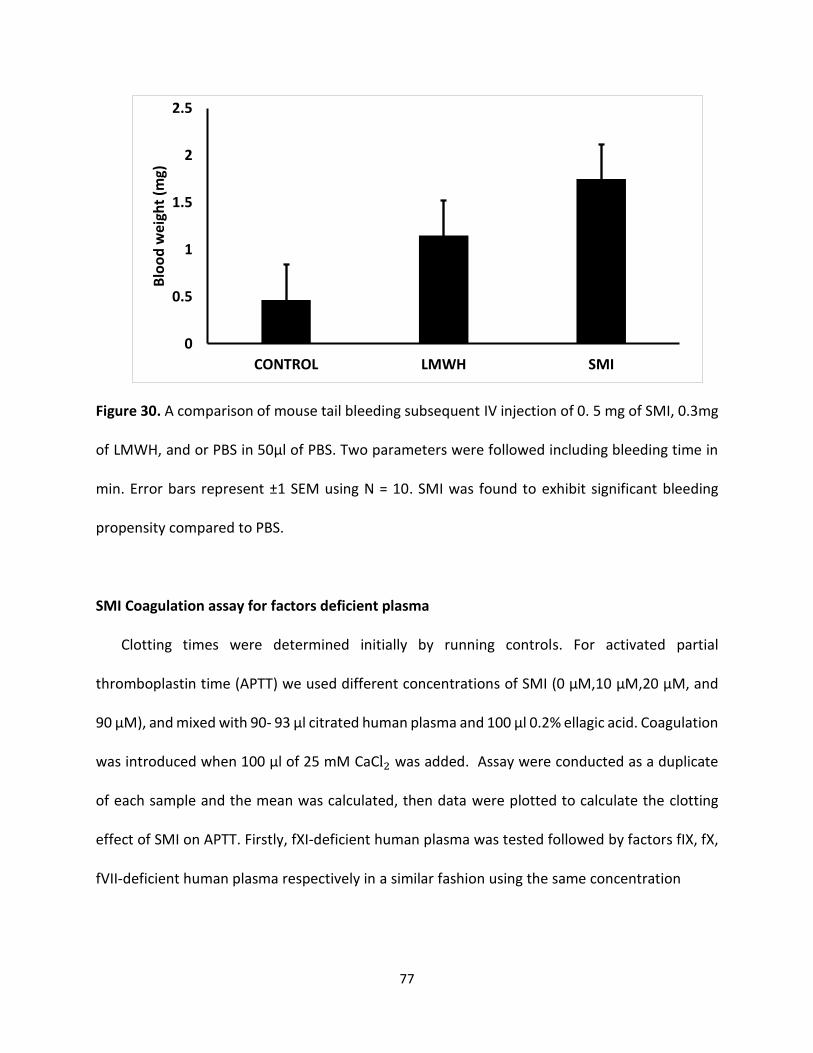
77
Figure 30. A comparison of mouse tail bleeding subsequent IV injection of 0. 5 mg of SMI, 0.3mg
of LMWH, and or PBS in 50µl of PBS. Two parameters were followed including bleeding time in
min. Error bars represent ±1 SEM using N = 10. SMI was found to exhibit significant bleeding
propensity compared to PBS.
SMI Coagulation assay for factors deficient plasma Clotting times were determined initially by running controls. For activated partial
thromboplastin time (APTT) we used different concentrations of SMI (0 μM,10 μM,20 μM, and
90 μM), and mixed with 90- 93 μl citrated human plasma and 100 μl 0.2% ellagic acid. Coagulation
was introduced when 100 μl of 25 mM CaCl2 was added. Assay were conducted as a duplicate
of each sample and the mean was calculated, then data were plotted to calculate the clotting
effect of SMI on APTT. Firstly, fXI-deficient human plasma was tested followed by factors fIX, fX,
fVII-deficient human plasma respectively in a similar fashion using the same concentration
0
0.5
1
1.5
2
2.5
CONTROL LMWH SMI
Blo
od
wei
ght
(mg)
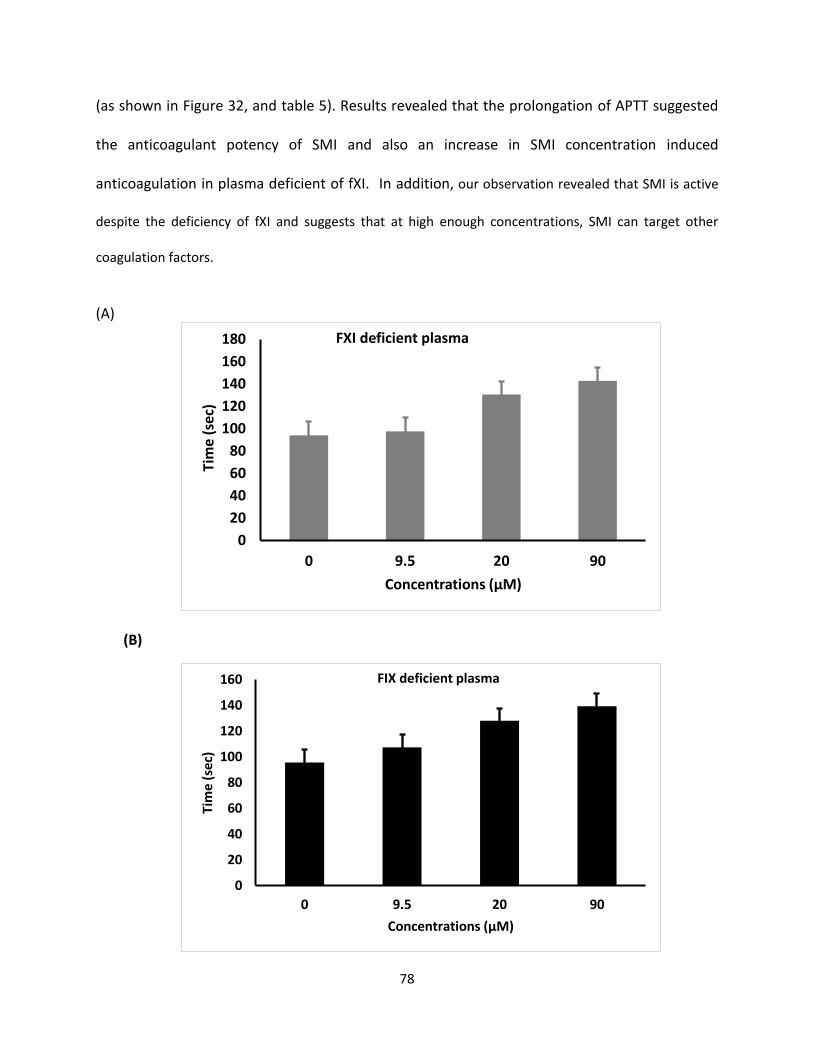
78
(as shown in Figure 32, and table 5). Results revealed that the prolongation of APTT suggested
the anticoagulant potency of SMI and also an increase in SMI concentration induced
anticoagulation in plasma deficient of fXI. In addition, our observation revealed that SMI is active
despite the deficiency of fXI and suggests that at high enough concentrations, SMI can target other
coagulation factors.
(A)
(B)
0
20
40
60
80
100
120
140
160
180
0 9.5 20 90
Tim
e (s
ec)
Concentrations (µM)
FXI deficient plasma
0
20
40
60
80
100
120
140
160
0 9.5 20 90
Tim
e (
sec)
Concentrations (µM)
FIX deficient plasma
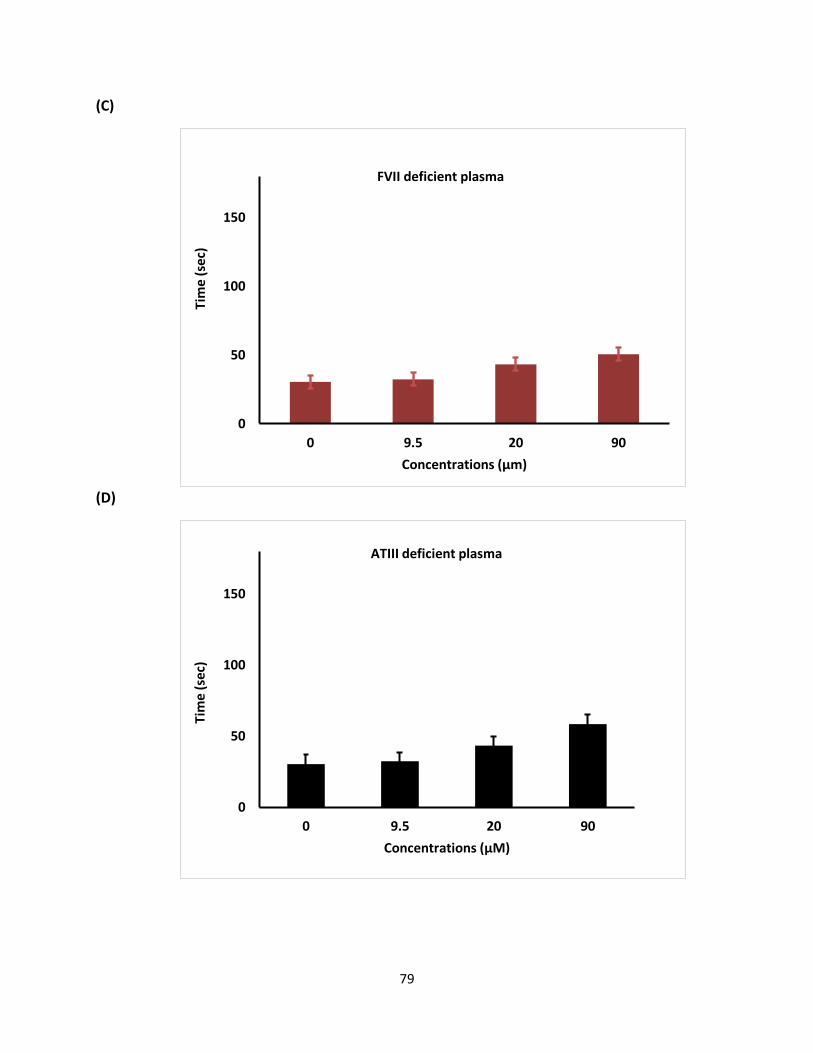
79
(C)
(D)
0
50
100
150
0 9.5 20 90
Tim
e (
sec)
Concentrations (µm)
FVII deficient plasma
0
50
100
150
0 9.5 20 90
Tim
e (
sec)
Concentrations (µM)
ATIII deficient plasma
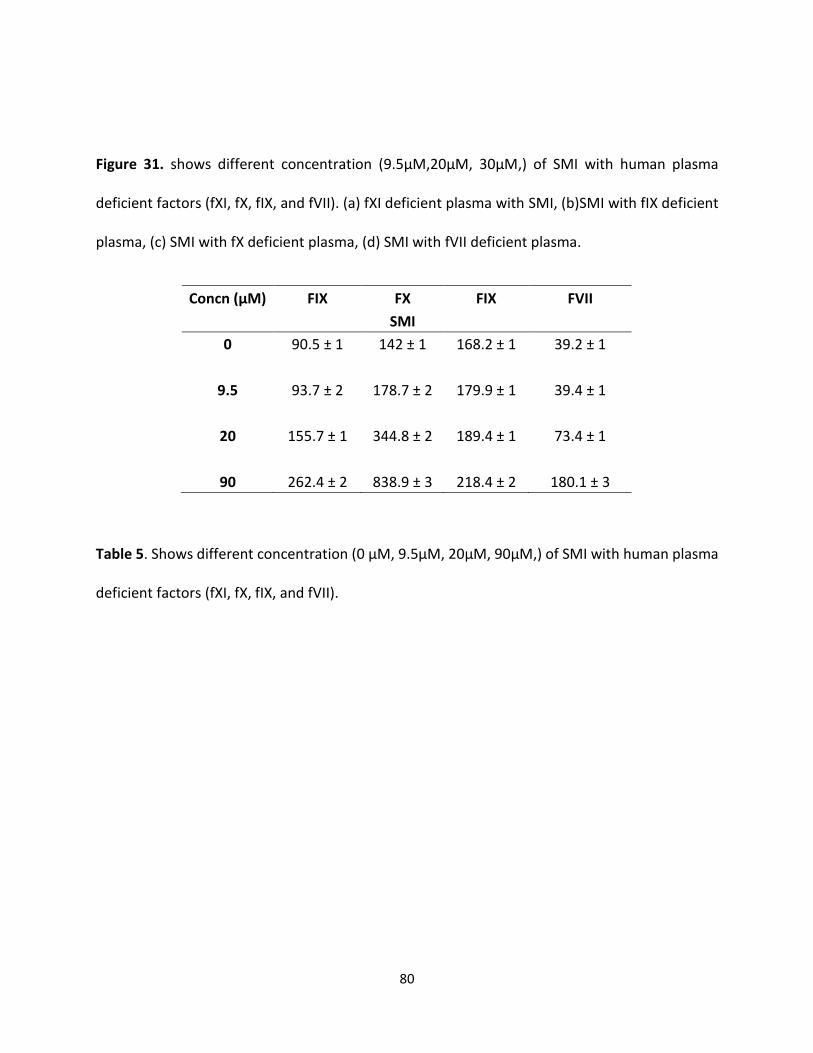
80
Figure 31. shows different concentration (9.5µM,20µM, 30µM,) of SMI with human plasma
deficient factors (fXI, fX, fIX, and fVII). (a) fXI deficient plasma with SMI, (b)SMI with fIX deficient
plasma, (c) SMI with fX deficient plasma, (d) SMI with fVII deficient plasma.
Table 5. Shows different concentration (0 µM, 9.5µM, 20µM, 90µM,) of SMI with human plasma
deficient factors (fXI, fX, fIX, and fVII).
Concn (µM) FIX FX FIX FVII
SMI
0 90.5 ± 1 142 ± 1 168.2 ± 1 39.2 ± 1
9.5 93.7 ± 2 178.7 ± 2 179.9 ± 1 39.4 ± 1
20 155.7 ± 1 344.8 ± 2 189.4 ± 1 73.4 ± 1
90 262.4 ± 2 838.9 ± 3 218.4 ± 2 180.1 ± 3
81
4.4 SMI Conclusion
A new NSGM exposed in the process includes sulfated pentagalloyl β -D-Glucopyranoside (SPGG,
Figure 1), which effectively inhibited fXIa [6,7]. Structurally, SPGG characterizes a unique NSGM
comprising multiple sulfate groups on an aromatic scaffold. The essential value used in the design
of SPGG was that a proper anionic scaffold will target the extremely positively charged heparin-
binding site(s) of fXIa. Subsequent binding site(s) in allosteric dysfunction of its fXIa’s catalytic
function. SPGG, is considered the primary synthetic small allosteric inhibitor of human fXIa with
a capable plasma and whole blood anticoagulant potential [6, 7]. Key results were revealed by
comparing APTT and tail bleeding data. Both suggested that SMI was a very potent anticoagulant
agent in human and animal whole blood and plasma.
82
Chapter 5: Investigation of Anticoagulation Properties of Sulfated Glycosaminoglycan Mimetics
5.1 Conclusions and Future Directions
The hypothesis behind this work was that human factor XIa can be allosterically inhibited
considering its high homology with other serine proteases, especially thrombin, which has been
targeted by NSGMs of different structural features [37- 45,46]. Coagulation proteases have one
or more allosteric anion-binding site(s) that are recognized by heparin and related GAGs
[33,34,55,58]. Yet, these exosites possess different structure due to their Arg/ Lys residues in
terms of the number, position, and configuration {32-35]. Characterization of G2.2 is extremely
challenging. In order to test that we used UPLC-MS. The results revealed that G2.2 displayed
85:15 blends of two compounds compared to G2.2W, which was fully sulfated flavonoid
derivatives. Moreover, In vitro studies for thrombin, fXa, and fXIa were performed with G2.2Y
and G2.2W and the results demonstrated that the concentration of G2.2W capable of inhibiting
50% of the enzyme activity (IC50) for fXa was approximately 46 µM compared to 28 µM for G2.2Y.
In the flip side, both G2.2 analogues did not inhibit fXa and thrombin in the presence and absence
of antithrombin in a concentration up to 500 µM. These results indicated that G2.2Y inhibited
human fXIa 2-fold better than G2.2W. This is a significat improvement in selectivity compared to
G2.2W. Also, this work shows that sulfated NSGMs such as G2.2W, G2.2Y, and SPGG analog SMI
can modulate factor XI catalytic activity with moderate-to-high potency by interacting with at
least one anion-binding site depending on their structural-activity relationship and the number
of sulfated group that they possess. Further investigation will be required to evaluate their
advance pharmacological effect and their clinical relevance. This includes their effect on bleeding
in an animal model. Currently, NSGMs G2.2Y analog represent the best and the most exciting
83
lead towards the first allosteric regulator of fXI due to its high potency. Identification of these
proteins should help the design of more potent analogues. One important discovery of this work
is that G2.2 exhibits anticancer agents, as well anticoagulant properties. Finally, this work shows
that sulfated NSGMs can selectively modulate fXI activity with moderate-to-high potency by
interacting with at least one anion-binding site. As observed in G2.2Y, a loss of just one sulfate
group could induce significant side effects. Structure–activity relationship is important to
understand if the in vivo metabolism of the agents leads to accumulation of de-sulfated products.
Overall, G2.2Y exhibits considerable promise as a synthetic small molecule allosteric inhibitor of
fXIa. However, potency alone does not guarantee success. The ratio of potency to toxicity of
a molecule is a better measure of clinical success. In this respect, NSGMs are likely to offer more
promise because of their high-water solubility. In fact, literature reports show that highly
sulfated small molecules possess little cytotoxicity. Moreover, G2.2 was first reported as an
anticancer agent which exhibit NSGM properties. These molecules show advantage over
naturally occurring GAGs because of their biophysical properties (hydrophobic and hydrophilic
nature), structural homogeneity, and ease to synthesize [135]. This work does not address G2.2’s
possible use as antimetastatic agents in treatment of cancer, but possibilities are equally
promising.
84
Literature Cited
[1] Tortora, G. J.; Derrickson, B. Principles of anatomy & physiology. 13th ed.; Wiley:
Hoboken, NJ, 2012.
[2] Marder, V. J. Hemostasis and thrombosis: basic principles and clinical practice. 6th ed.;
Wolters Kluwer/Lippincott Williams & Wilkins Health: Philadelphia, 2013.
[3] Mehta, A. Y.; Jin, Y.; Desai, U. R. An update on recent patents on thrombin inhibitors
(2010 - 2013). Expert Opin Ther Pat 2014, 24, 47-6
[4] Konigsberg, W.; Kirchhofer, D.; Riederer, M. A.; Nemerson, Y. The TF: VIIa complex:
clinical significance, structure-function relationships and its role in signaling and
Metastasis. Thromb. Haemost. 2001, 86, 757-771.
[5] Mackman, N.; Tilley, R. E.; Key, N. S. Role of the extrinsic pathway of blood
coagulation in hemostasis and thrombosis. Arterioscler. Thromb. Vasc. Biol. 2007,27,
1687-1693.
[ 6]. Stassen, J. M.; Arnout, J.; Deckmyn, H. The hemostatic system. Curr. Med. Chem. 2004,
11, 2245-2260.
[7]. Woodruff, R. S.; Sullenger, B.; Becker, R. C. The many faces of the contact pathway and
their role in thrombosis. J. Thromb. Thrombolysis 2011, 32, 9-20.
[8]. Gailani, D.; Renne, T. Intrinsic pathway of coagulation and arterial thrombosis.
Arterioscler. Thromb. Vasc. Biol. 2007, 27, 2507-2513.
[9]. Greenberg, C. S.; Miraglia, C. C.; Rickles, F. R.; Shuman, M. A. Cleavage of blood
coagulation factor XIII and fibrinogen by thrombin during in vitro clotting. J. Clin.
Invest. 1985, 75,1463-1470
85
[10]. Ozge-Anwar, A. H.; Connell, G. E.; Mustard, J. F. The activation of factor 8 by
thrombin. Blood 1965, 26, 500-509.
[11]. Monkovic, D. D.; Tracy, P. B. Activation of human factor V by factor Xa and thrombin.
Biochemistry (Mosc). 1990, 29, 1118-1128.
[12]. Oliver, J. A.; Monroe, D. M.; Roberts, H. R.; Hoffman, M. Thrombin activates factor XI
on activated platelets in the absence of factor XII. Arterioscler. Thromb. Vasc. Biol.
1999,19 - 170-177
[ 13]. De Candia, E. Mechanisms of platelet activation by thrombin: a short history. Thromb.
Res. 2012, 129, 250-256
[ 14]. Esmon, C. T.; Esmon, N. L.; Harris, K. W. Complex formation between thrombin and
thrombomodulin inhibits both thrombin-catalyzed fibrin formation and factor V
activation. J.Biol. Chem. 1982, 257, 7944-7947. 15
[ 15]. Rezaie, A. R. Regulation of the protein C anticoagulant and anti-inflammatory pathways.
Curr. Med. Chem. 2010, 17, 2059-2069.
[16]. Rau, J. C.; Beaulieu, L. M.; Huntington, J. A.; Church, F. C. Serpins in thrombosis,
hemostasis and fibrinolysis. J Thromb Haemost 2007, 5 Suppl 1, 102-115.
[ 17]. Kluft, C. The fibrinolytic system and thrombotic tendency. Pathophysiol Haemost
[18]. Patel, S. R.; Hartwig, J. H.; Italiano, J. E., Jr. The biogenesis of platelets from
megakaryocyte proplatelets. J. Clin. Invest. 2005, 115, 3348-3354 Thromb 2003, 33, 425-
429.
[19]. Machlus, K. R.; Italiano, J. E., Jr. The incredible journey: From megakaryocyte
development to platelet formation. J. Cell Biol. 2013, 201, 785-796.
86
[20]. White, J. G. Platelet Structure. In Platelets, 2nd ed.; Michelson, A. D., Ed. Academic
Press - Elsevier: Waltham, MA, 2007; pp 45-74.
[21]. Udan, R. S.; Culver, J. C.; Dickinson, M. E. Understanding vascular development. Wiley
Interdiscip Rev Dev Biol 2013, 2, 327-346
[22]. Chen, J.; Lopez, J. A. Interactions of platelets with subendothelium and endothelium.
Microcirculation 2005, 12, 235-246.
[23]. Rendu, F.; Brohard-Bohn, B. The platelet release reaction: granules' constituents,
secretion and functions. Platelets 2001, 12, 261-273.
[24]. Monroe, D. M.; Hoffman, M.; Roberts, H. R. Platelets and thrombin generation.
Arterioscler. Thromb. Vasc. Biol. 2002, 22, 1381-1389.
[25]. Hartwig, J. H. The Platelet Cytoskeleton. In Platelets, 2nd ed.; Michelson, A. D., Ed.
Elsevier: Oxford, UK, 2007; pp 75-97.
26. Kauskot, A.; Hoylaerts, M. F. Platelet Receptors. In Antiplatelet Agents, Gresele, P.;
Born, G. V. R.; Patrono, C.; Page, C. P., Eds. Handbook of Experimental Pharmacology 210;
Springer-Verlag: Berlin, Heidelberg, 2012; pp 23-57.
[27]. Clemetson, K. J.; Clemetson, J. M. Platelet Receptors. In Platelets, 3rd ed.; Michelson,
A. D., Ed. Academic Press - Elsevier: Waltham, MA, 2013; pp 169-194.
[28]. Nesheim, M. E.; Mann, K. G. The kinetics and cofactor dependence of the two cleavages
involved in prothrombin activation. J. Biol. Chem. 1983, 258, 5386-5391
[29[. Mann, K. G.; Elion, J.; Butkowski, R. J.; Downing, M.; Nesheim, M. E. Prothrombin.
Methods Enzymol. 1981, 80 Pt C, 286-302.
87
[30]. Butkowski, R. J.; Elion, J.; Downing, M. R.; Mann, K. G. Primary structure of human
prethrombin 2 and alpha-thrombin. J. Biol. Chem. 1977, 252, 4942-4957.
[31]. Walz, D. A.; Hewett-Emmett, D.; Seegers, W. H. Amino acid sequence of human
prothrombin fragments 1 and 2. Proc. Natl. Acad. Sci. U. S. A. 1977, 74, 1969-1972
[32]. Bode, W.; Turk, D.; Karshikov, A. The refined 1.9-A X-ray crystal structure of D-Phe
Pro-Arg chloromethylketone-inhibited human alpha-thrombin: structure analysis, overall
structure, electrostatic properties, detailed active-site geometry, and structure-function
relationships. Protein Sci. 1992, 1, 426-471.
[33]. Davie, E. W.; Kulman, J. D. An overview of the structure and function of thrombin.
Semin. Thromb. Hemost. 2006, 32 Suppl 1, 3-15.
[34]. Hedstrom, L. Serine protease mechanism and specificity. Chem. Rev. 2002, 102, 4501
4524.
[35]. Schechter, I.; Berger, A. On the size of the active site in proteases. I. Papain. Biochem.
Biophys. Res. Commun. 1967, 27, 157-162.
[36]. Blomback, B.; Blomback, M.; Hessel, B.; Iwanaga, S. Structure of N-terminal fragments
of fibrinogen and specificity of thrombin. Nature 1967, 215, 1445-1448.
[37]. Chen, Z.; Li, Y.; Mulichak, A. M.; Lewis, S. D.; Shafer, J. A. Crystal structure of human
alpha-thrombin complexed with hirugen and p-amidinophenylpyruvate at 1.6 A
resolution. Arch.
Biochem. Biophys. 1995, 322, 198-203.
[38]. Chang, J. Y. Thrombin specificity. Requirement for apolar amino acids adjacent to the
thrombin cleavage site of polypeptide substrate. Eur. J. Biochem. 1985, 151, 217-224.
88
[39]. Carrell, C. J.; Bush, L. A.; Mathews, F. S.; Di Cera, E. High resolution crystal structures
of free thrombin in the presence of K (+) reveal the molecular basis of monovalent cation
selectivity and an inactive slow form. Biophys. Chem. 2006, 121, 177-184.
[40]. Di Cera, E. Thrombin. Mol. Aspects Med. 2008, 29, 203-254.
[41]. Naski, M. C.; Fenton, J. W., 2nd; Maraganore, J. M.; Olson, S. T.; Shafer, J. A. The
COOH-terminal domain of hirudin. An exosite-directed competitive inhibitor of the action
of alpha-thrombin on fibrinogen. J. Biol. Chem. 1990, 265, 13484-13489.
[42]. Ayala, Y. M.; Cantwell, A. M.; Rose, T.; Bush, L. A.; Arosio, D.; Di Cera, E. Molecular
mapping of thrombin-receptor interactions. Proteins 2001, 45, 107-116.
[43]. Dharmawardana, K. R.; Olson, S. T.; Bock, P. E. Role of regulatory exosite I in binding
of thrombin to human factor V, factor Va, factor Va subunits, and activation fragments. J.
Biol. Chem. 1999, 274, 18635-18643.
[44]. Esmon, C. T.; Lollar, P. Involvement of thrombin anion-binding exosites 1 and 2 in the
activation of factor V and factor VIII. J. Biol. Chem. 1996, 271, 13882-13887.
[45]. Yun, T. H.; Baglia, F. A.; Myles, T.; Navaneetham, D.; Lopez, J. A.; Walsh, P. N.;
Leung, L. L. Thrombin activation of factor XI on activated platelets requires the interaction
of factor XI and platelet glycoprotein Ib alpha with thrombin anion-binding exosites I and II,
respectively. J. Biol. Chem. 2003, 278, 48112-48119.
89
[46]. Fortenberry, Y. M.; Whinna, H. C.; Gentry, H. R.; Myles, T.; Leung, L. L.; Church, F. C.
Molecular mapping of the thrombin-heparin cofactor II complex. J. Biol. Chem. 2004, 279,
43237-43244.
[47]. Mengwasser, K. E.; Bush, L. A.; Shih, P.; Cantwell, A. M.; Di Cera, E. Hirudin binding
reveals key determinants of thrombin allostery. J. Biol. Chem. 2005, 280, 26997-27003.
[48]. Arni, R. K.; Padmanabhan, K.; Padmanabhan, K. P.; Wu, T. P.; Tulinsky, A. Structure of
the non-covalent complex of prothrombin kringle 2 with PPACK-thrombin. Chem. Phys.
Lipids 1994, 67-68, 59-66.
[49]. Lechtenberg, B. C.; Freund, S. M.; Huntington, J. A. GpIbalpha Interacts Exclusively
with Exosite II of Thrombin. J. Mol. Biol. 2014, 426, 881-893.
[50]. Liu, L. W.; Rezaie, A. R.; Carson, C. W.; Esmon, N. L.; Esmon, C. T. Occupancy of
anion binding exosite 2 on thrombin determines Ca2+ dependence of protein C activation.
J.Biol. Chem. 1994, 269, 11807-11812.
[51]. Huntington, J. A. Thrombin plasticity. Biochim. Biophys. Acta 2012, 1824, 246-252.
[52]. Berndt, M. C.; Gregory, C.; Kabral, A.; Zola, H.; Fournier, D.; Castaldi, P. A.
Purification and preliminary characterization of the glycoprotein Ib complex in the human
platelet membrane. Eur. J. Biochem. 1985, 151, 637-649.
[53]. Li, C. Q.; Dong, J. F.; Lanza, F.; Sanan, D. A.; Sae-Tung, G.; Lopez, J. A. Expression of
platelet glycoprotein (GP) V in heterologous cells and evidence for its association with GP
Ib lpha in forming a GP Ib-IX-V complex on the cell surface. J. Biol. Chem. 1995, 270, 16302-
16307
[54]. Li, C. Q.; Vindigni, A.; Sadler, J. E.; Wardell, M. R. Platelet glycoprotein Ib alpha binds
90
to thrombin anion-binding exosite II inducing allosteric changes in the activity of
thrombin. The Journal of biological chemistry 2001, 276, 6161-6168.
[55]. Jandrot-Perrus, M.; Clemetson, K. J.; Huisse, M. G.; Guillin, M. C. Thrombin interaction
with platelet glycoprotein Ib: effect of glycocalicin on thrombin specificity. Blood 1992, 80,
2781-2786.
[56]. Papagrigoriou, E.; McEwan, P. A.; Walsh, P. N.; Emsley, J. Crystal structure of the factor
XI zymogen reveals a pathway for transactivation. Nat Struct Mol Biol 2006, 13, 557-558.
[57]. Emsley, J.; McEwan, P. A.; Gailani, D. Structure and function of factor XI. Blood 2010,
115, 2569-2577.
[58]. Geng, Y.; Verhamme, I. M.; Smith, S. B.; Sun, M. F.; Matafonov, A.; Cheng, Q.; Smith,
S. A.; Morrissey, J. H.; Gailani, D. The dimeric structure of factor XI and zymogen activation.
Blood 2013, 121, 3962-3969.
[59]. Samuel, D.; Cheng, H.; Riley, P. W.; Canutescu, A. A.; Nagaswami, C.; Weisel, J. W.;
Bu, Z.; Walsh, P. N.; Roder, H. Solution structure of the A4 domain of factor XI sheds light
on the mechanism of zymogen activation. Proc. Natl. Acad. Sci. U. S. A. 2007, 104, 15693-
15698
[60]. Renne, T.; Gailani, D.; Meijers, J. C.; Muller-Esterl, W. Characterization of the H
kininogen-binding site on factor XI: a comparison of factor XI and plasma prekallikrein. J.
Biol.Chem. 2002, 277, 4892-4899.
[61]. Ho, D. H.; Badellino, K.; Baglia, F. A.; Walsh, P. N. A binding site for heparin in the
apple 3 domains of factor XI. J. Biol. Chem. 1998, 273, 16382-16390.
[62]. Yang, L.; Sun, M. F.; Gailani, D.; Rezaie, A. R. Characterization of a heparin-binding
91
site on the catalytic domain of factor XIa: mechanism of heparin acceleration of factor XIa
inhibition by the serpins antithrombin and C1-inhibitor. Biochemistry (Mosc). 2009, 48,
1517-1524.
[63]. Sun, Y.; Gailani, D. Identification of a factor IX binding site on the third apple domain of
activated factor XI. J. Biol. Chem. 1996, 271, 29023-29028.
[64]. Geng, Y.; Verhamme, I. M.; Messer, A.; Sun, M. F.; Smith, S. B.; Bajaj, S. P.; Gailani,
D. A sequential mechanism for exosite-mediated factor IX activation by factor XIa. J. Biol.
Chem. 2012, 287, 38200-38209
[65]. Gailani, D. Activation of factor IX by factor XIa. Trends Cardiovasc. Med. 2000, 10,
198-204.
[66]. Baglia, F. A.; Walsh, P. N. Thrombin-mediated feedback activation of factor XI on the
activated platelet surface is preferred over contact activation by factor XIIa or factor XIa. J.
Biol. Chem. 2000, 275, 20514-20519.
[67]. von dem Borne, P. A.; Meijers, J. C.; Bouma, B. N. Feedback activation of factor XI by
thrombin in plasma results in additional formation of thrombin that protects fibrin clots
from fibrinolysis. Blood 1995, 86, 3035-3042.
[68]. Schumacher, W. A.; Luettgen, J. M.; Quan, M. L.; Seiffert, D. A. Inhibition of factor XIa
as a new approach to anticoagulation. Arterioscler. Thromb. Vasc. Biol. 2010, 30, 388-392.
[69]. Renne, T.; Oschatz, C.; Seifert, S.; Muller, F.; Antovic, J.; Karlman, M.; Benz, P. M.
Factor XI deficiency in animal models. J Thromb Haemost 2009, 7 Suppl 1, 79-83.
[70]. Furie, B.; Furie, B. C. In vivo thrombus formation. J Thromb Haemost 2007, 5 Suppl 1,
12-17
92
[71]. Gailani, D.; Lasky, N. M.; Broze, G. J., Jr. A murine model of factor XI deficiency.
Blood Coagul. Fibrinolysis 1997, 8, 134-144.
[72]. Yamashita, A.; Nishihira, K.; Kitazawa, T.; Yoshihashi, K.; Soeda, T.; Esaki, K.;
Imamura, T.; Hattori, K.; Asada, Y. Factor XI contributes to thrombus propagation on injured
neointima of the rabbit iliac artery. J Thromb Haemost 2006, 4, 1496-1501.
[73]. Seligsohn, U. Factor XI deficiency in humans. J Thromb Haemost 2009, 7 Suppl 1, 8487.
[74]. Duga, S.; Salomon, O. Factor XI Deficiency. Semin. Thromb. Hemost. 2009, 35, 416-425.
[75]. Luo, D.; Szaba, F. M.; Kummer, L. W.; Johnson, L. L.; Tucker, E. I.; Gruber, A.; Gailani,
D.; Smiley, S. T. Factor XI-deficient mice display reduced inflammation, coagulopathy, and
bacterial growth during listeriosis. Infect. Immun. 2012, 80, 91-99.
[76]. Jankowski, M.; Undas, A.; Kaczmarek, P.; Butenas, S. Activated factor XI and tissue
factor in chronic obstructive pulmonary disease: links with inflammation and thrombin
generation. Thromb. Res. 2011, 127, 242-246
[77] N.S. Gandhi, R.L. Mancera, The structure of glycosaminoglycans and their interactions
with proteins, Chem. Biol. Drug Des. 72 (2008) 455–482.
[78] U. Lindahl, Glycosaminoglycans and, (1978) 385–417.
[79] J.D. Esko, K. Kimata, U. Lindahl, Proteoglycans and Sulfated Glycosaminoglycans, in:
Essentials Glycobiol., 2009: p. 784.
[80] R. Sasisekharan, G. Venkataraman, Heparin and heparan sulfate: Biosynthesis, structure
and function, Curr. Opin. Chem. Biol. 4 (2000) 626–631.
[81] A. Imberty, H. Lortat-Jacob, S. Pérez, Structural view of glycosaminoglycan-protein
interactions, Carbohydr. Res. 342 (2007) 430–439.
93
[82] A.P. Spicer, J.L. Tien, A. Joo, R.A. Bowling, Investigation of hyaluronan function in the
mouse through targeted mutagenesis, Glycoconj. J. 19 (2003) 341–345.
[83] I. Capila, R.J. Linhardt, Heparin-protein interactions., Angew. Chem. Int. Ed. Engl. 41
(2002) 391–412.
[84] K. Sugahara, H. Kitagawa, Recent advances in the study of the biosynthesis and functions
of sulfated glycosaminoglycans, Curr. Opin. Struct. Biol. 10 (2000) 518–527.
[85] R. V. Iozzo, Heparan sulfate proteoglycans: Intricate molecules with intriguing functions,
J. Clin. Invest. 108 (2001) 165–167.
[86] R.S. Aquino, E.S. Lee, P.W. Park, Diverse functions of glycosaminoglycans in infectious
diseases, Elsevier Inc., 2010.
[87] R. Sasisekharan, Z. Shriver, G. Venkataraman, U. Narayanasami, Roles of heparan-
sulphate glycosaminoglycans in cancer., Nat. Rev. Cancer. 2 (2002) 521–528.
[88] J.P. Li, I. Vlodavsky, Heparin, heparan sulfate and heparanase in inflammatory reactions,
in: Thromb. Haemost., 2009: pp. 823–828.
[89] D.L. Rabenstein, Heparin and heparan sulfate: structure and function, Nat. Prod. Rep. 19
(2002) 312–331.
[90] N. Volpi, Therapeutic applications of glycosaminoglycans., Curr. Med. Chem. 13 (2006)
1799–810.
[91] S. Yamada, K. Sugahara, Potential therapeutic application of chondroitin
sulfate/dermatan sulfate, Curr Drug Discov Technol. 5 (2008) 289–301.
[92] F. Gervais, R. Chalifour, D. Garceau, X. Kong, J. Laurin, R. Mclaughlin, et al.,
Glycosaminoglycan mimetics: a therapeutic approach to cerebral amyloid angiopathy,
94
Amyloid. 8 Suppl 1 (2001) 28–35. http://www.ncbi.nlm.nih.gov/pubmed/11676287.
[93] G.W. Yip, M. Smollich, M. Götte, Therapeutic value of glycosaminoglycans in cancer.,
Mol. Cancer Ther. 5 (2006) 2139–2148.
[94] L. Zhang, Glycosaminoglycan (GAG) biosynthesis and GAG-binding proteins, 1st ed.,
Elsevier Inc., 2010.
[95] R.L. Jackson, S.J. Busch, a D. Cardin, Glycosaminoglycans: molecular properties, protein
interactions, and role in physiological processes., Physiol. Rev. 71 (1991) 481–539.
[96] R.E. Hileman, J.R. Fromm, J.M. Weiler, R.J. Linhardt, Glycosaminoglycan-protein
interactions: Definition of consensus sites in glycosaminoglycan binding proteins,
BioEssays. 20 (1998) 156–167.
[97] J.M. J. R. Fromm, R. E. Hileman, E. E. Caldwell, W. and R.J. Linhardt, Pattern and spacing
of basic amino acids in heparin binding sites, 343 (1997) 343, 92–100.
[98] R.E. Hileman, R.N. Jennings, R.J. Linhardt, Thermodynamic analysis of the heparin
interaction with a basic cyclic peptide using isothermal titration calorimetry,
Biochemistry. 37 (1998) 15231–15237.
[99] J.R. Fromm, R.E. Hileman, E.E.O. Caldwell, J.M. Weiler, R.J. Linhardt, Differences in the
Interaction of Heparin with Arginine and Lysine and the Importance of these Basic Amino
Acids in the Binding of Heparin to Acidic Fibroblast Growth Factor, Arch. Biochem.
Biophys. 323 (1995) 279–287.
[100] A.D. Cardin, H.J. Weintraub, Molecular modeling of protein-glycosaminoglycan
interactions., Arteriosclerosis. 9 (1989) 21–32.
[101] H. Margalit, N. Fischer, S.A. Ben-Sasson, Comparative analysis of structurally defined
95
heparin binding sequences reveals a distinct spatial distribution of basic residues, J. Biol.
Chem. 268 (1993) 19228–19231.
[102] J. Bae, U.R. Desai, A. Pervin, E.E. Caldwell, J.M. Weiler, R.J. Linhardt, Interaction of
heparin with synthetic antithrombin III peptide analogues., Biochem. J. 301 (1994) 121–
129.
http://www.pubmedcentral.nih.gov/articlerender.fcgi?artid=1137151&tool=pmcentrez&
rendertype=abstract.
[103] E. Hajjar, T. Broemstrup, C. Kantari, V. Witko-Sarsat, N. Reuter, Structures of human
proteinase 3 and neutrophil elastase--so similar yet so different., FEBS J. 277 (2010)
2238–54.
[104] G. Kostoulas, D. Hörler, A. Naggi, B. Casu, A. Baici, Electrostatic interactions between
human leukocyte elastase and sulfated glycosaminoglycans: physiological implications,
Biol. Chem. 378 (1997) 1481–1489.
[105] H.W. Redini Francois, Tixier Jean_Michel, Petitou Maurice, Choay Jean, Robert Ladislas,
Inhibition of leucocyte elastase by heparin and its derivatives, Biochem J. 252 (1988)
515–519.
[106] N. Volpi, Inhibition of human leukocyte elastase activity by chondroitin sulfates, Chem.
Biol. Interact. 105 (1997) 157–167.
[107] R.L. Walsh, T.J. Dillon, R. Scicchitano, G. McLennan, Heparin and heparan sulphate are
inhibitors of human leucocyte elastase, Clin. Sci. 81 (1991) 341–346.
[108] M.A. Fath, X. Wu, R.E. Hileman, R.J. Linhardt, M.A. Kashem, R.M. Nelson, et al.,
Interaction of secretory leukocyte protease inhibitor with heparin inhibits proteases
96
involved in asthma, J. Biol. Chem. 273 (1998) 13563–13569.
[109] A. Malik, S. Ahmad, Sequence and structural features of carbohydrate binding in
proteins and assessment of predictability using a neural network., BMC Struct. Biol. 7
(2007) 1.
[110] C.W. Pratt, General features of the heparin-binding serpins antithrombin, heparin
cofactor II and protein C inhibitor, Blood Coagul. Fibrinolysis. 4 (1997) 479–490.
[111] J.A. Huntington, R.J. Read, R.W. Carrell, Structure of a serpin-protease complex shows
inhibition by deformation., Nature. 407 (2000) 923–6.
[112] P.G.W. Gettins, Serpin structure, mechanism, and function, Chem. Rev. 102 (2002)
4751–4803.
[113] U.R. Desai, New Antithrombin-Based Anticoagulants, Med. Res. Rev. 24 (2004) 151–181.
[114] W. Li, T.E.T.E. Adams, J. Nangalia, C.T.C.T. Esmon, J.A.J.A. Huntington, Molecular basis of
thrombin recognition by protein C inhibitor revealed by the 1.6-A structure of the
heparin-bridged complex., Proc. Natl. Acad. Sci. U. S. A. 105 (2008) 4661–6.
[115] T.C. Laurent, a Tengblad, L. Thunberg, M. Höök, U. Lindahl, The molecular-weight-
dependence of the anti-coagulant activity of heparin., Biochem. J. 175 (1978) 691–701.
[116] B. Bray, D.A. Lane, J.M. Freyssinet, G. Pejler, U. Lindahl, Anti-thrombin activities of
heparin. Effect of saccharide chain length on thrombin inhibition by heparin cofactor II
and by antithrombin., Biochem. J. 262 (1989) 225–32.
[117] C.M.J. L Thunberg, U Lindahl, A Tengblad, T C Laurent, On the Molecular-Weight-
Dependence of the Anticoagulant Activity of Heparin, Biochem. J. 181 (1979) 241–243.
[118] D.J.D. Johnson, W. Li, T.E. Adams, J. a Huntington, Antithrombin-S195A factor Xa-heparin
97
structure reveals the allosteric mechanism of antithrombin activation., EMBO J. 25 (2006)
2029–37.
[119] W. Li, D.J.D. Johnson, C.T. Esmon, J. a Huntington, Structure of the antithrombin-
thrombin-heparin ternary complex reveals the antithrombotic mechanism of heparin.,
Nat. Struct. Mol. Biol. 11 (2004) 857–862.
[120] A.P.C.G.K.A.J.X.-J.H.R.J. Linhardt, Preparation and structural characterization of large
heparin-derived oligosaccharides, Glycobiology. 5 (1995) 83–95.
[121] R.J. Linhardt, K.G. Rice, Y.S. Kim, D.L. Lohse, H.M. Wang, D. Loganathan, Mapping and
quantification of the major oligosaccharide components of heparin, Biochem. J. 254
(1988) 781–787.
[122] H. Liu, Z. Zhang, R.J. Linhardt, Lessons learned from the contamination of heparin., Nat.
Prod. Rep. 26 (2009) 313–21.
[123] P.L. DeAngelis, Glycosaminoglycan polysaccharide biosynthesis and production: Today
and tomorrow, Appl. Microbiol. Biotechnol. 94 (2012) 295–305.
[124] E.I. Oduah, R.J. Linhardt, S.T. Sharfstein, Heparin: Past, present, and future,
Pharmaceuticals. 9 (2016) 1–12.
[125] B. Ernst, J.L. Magnani, From carbohydrate leads to glycomimetic drugs., Nat. Rev. Drug
Discov. 8 (2009) 661–677.
[126] J.L. Magnani, B. Ernst, Glycomimetic drugs--a new source of therapeutic opportunities 2,
Discov.Med. 8 (2009) 247–252.
[127] S.A. Samsonov, M.T. Pisabarro, Computational analysis of interactions in structurally
available protein-glycosaminoglycan complexes, Glycobiology. 26 (2016) 850–861.
98
proteins, Glycobiology. 24 (2014) 1323–1333.
[ [128] D.C. Koester, A. Holkenbrink, D.B. Werz, Recent advances in the synthesis of
carbohydrate mimetics, Synthesis (Stuttg). (2010) 3217–3242.
[129] U.R. Desai, The promise of sulfated synthetic small molecules as modulators of
glycosaminoglycan function., Future Med. Chem. 5 (2013) 1363–6.
[130] A. Shen, Allosteric regulation of protease activity by small molecules, Mol. Biosyst. 6
(2010) 1431.
[131] P. Hauske, C. Ottmann, M. Meltzer, M. Ehrmann, M. Kaiser, Allosteric regulation of
proteases., Chembiochem. 9 (2008) 2920–8.
[132] B.F. Gage, S.D. Fihn, R.H. White, Management and dosing of warfarin therapy, Am. J.
Med. 109 (2000) 481–488.
[133] C.T. Ruff, R.P. Giugliano, E. Braunwald, E.B. Hoffman, N. Deenadayalu, M.D. Ezekowitz, et
al., Comparison of the efficacy and safety of new oral anticoagulants with warfarin in
patients with atrial fibrillation: A meta-analysis of randomised trials, Lancet. 383 (2014)
955–962.
[134] Gailani D, Cheng Q, Ivanov IS. Murine models in the evaluation of heparin sulfated
anticoagulants. Methods Mol.Biol 2015;1229:483-96

99

100

101

102