interesting cities: five approaches to urban school reform
TRANSCRIPT

Research report by Alex Elwick and Tony McAleavy
With foreword by Steve Munby
Interesting cities:five approaches to urban school reform


Interesting cities:five approaches to urban school reform
CfBT Education Trust Highbridge House, 16–18 Duke Street, Reading, Berkshire RG1 4RU
T +44 (0) 118 902 1000 E [email protected] W www.cfbt.com
1

© CopyrighT CfBT EduCaTion TrusT 2015. ThE viEWs and opinions ExprEssEd in This puBliCaTion arE ThosE of ThE auThors and do noT nECEssarily rEprEsEnT ThE viEWs of CfBT EduCaTion TrusT.
isBn: 978-1-909437-71-5 11/15
2

about the authors 5
acknowledgements 5
foreword 6
Chapter 1: Transforming urban education 8
Our choice of cities 9
Case studies in education and equity 10
A diverse group of cities 11
Methodology 12
Where are the RCTs? The absence of robust 13 testing of promising interventions
No single blueprint for reform 14
Beyond a compartmentalised view of 15 policy effectiveness
Cross-cutting improvement themes 16
Key theme 1: Effective leadership at all levels 17
Key theme 2: Data-driven reform 19
Key theme 3: Building coalitions for change 20
Key theme 4: Making teaching a career of 21 choice for talented young people
Key theme 5: Combining high accountability 22 with high levels of professional support
Key theme 6: New forms of 24 government school provision
Key theme 7: An emphasis on 25 school-to-school collaboration
Chapter 2: ho Chi Minh City, vietnam 26
An equitable system 30
The theory of change 31
Focused and sustained leadership 32
Building a coalition for change 32
Investment in education 33
School leadership 36
Changes in curriculum and pedagogy 37
Improving the teacher workforce 39
Summary 41
Chapter 3: london, uK 42
The theory of change 46
Political support 47
Leadership at every level 47
An effective school improvement programme 48
Improving teacher quality and supply 49
Diversification of the school system 50
Effective use of data 51
Professional development 53
Summary 54
Chapter 4: dubai, uaE 56
The theory of change 59
Accountability 59
Consistent system leadership 62
Support and collaboration 63
School improvement 64
Community engagement and optimism 65
Summary 66
Chapter 5: new york City, usa 68
The theory of change 73
Political leadership 73
School leadership 74
Accountability 76
School structures 77
New forms of schooling 79
Teacher quality 81
Difficulties in the creation of 83 a coalition for change
Summary 83
Chapter 6: rio de Janeiro, Brazil 86
The theory of change 91
Political leadership within an increasingly 91 decentralised system
A curriculum based on clear expectations 92
Data-driven reform 93
School-to-school collaboration 94
Targeting underperformance 95
New forms of school 96
Improving teacher quantity and quality 97
Community engagement 100
Summary 101
Chapter 7: Conclusions – interesting cities 102
references 106
Contents
3
CfBT Education Trust
CfBT Education Trust, established over 40 years ago, is a large charity providing
education services for public benefit in the UK and internationally. We aspire to
be the world’s leading provider of education services, with a particular interest in
school effectiveness.
Our work involves school improvement through inspection, school workforce
development and curriculum design for the UK’s Department for Education, local
authorities and an increasing number of independent and state schools, free
schools and academies. We provide services direct to learners in our schools.
Internationally we have successfully implemented education programmes for
governments in the Middle East, Sub-Saharan Africa and South East Asia, and
work on projects funded by donors such as the Department for International
Development, the European Commission, the Australian Department of
Foreign Affairs and Trade, the World Bank and the US Agency for International
Development, in low- and middle-income countries.
Surpluses generated by our operations are reinvested in our educational research
programme.
Visit www.cfbt.com for more information.
4

about the authors
Alex Elwick is Research Officer at CfBT Education Trust. He has an AHRC-funded
PhD from Newcastle University on non-formal learning in museums and art
galleries and has been a RCUK Fellow at the Library of Congress, Washington DC.
He has co-authored two reports on school system reform in London and also
written on topics including youth custody and the UK digital divide.
Tony McAleavy is CfBT’s Research and Development Director, with corporate
oversight of the educational impact of all CfBT’s activities and CfBT public domain
research programme. Tony has worked extensively on school reform in many
countries, particularly in the Middle East. He has an MA in Modern History from
St John’s College, University of Oxford.
acknowledgements
We would like to thank:
• independent consultants Suzanne Roddis and Laura Lewis in the USA;
Rita Damasceno in Brazil; and Nguyen van Giang in Vietnam
• Rasheeda Azam and Anna Riggall, from CfBT Education Trust
• Will Richards, a Teach First Ambassador, for his initial research on education in
New York City
• Centre for London and LKMco for their research into education in London and their
collaboration on a previous research project from which we have drawn.
We would like to thank all those who were interviewed as part of the project for
giving up their time and commenting so openly and thoughtfully.
And finally our thanks go to the Knowledge and Human Development Authority
(KHDA), Government of Dubai, for their collaboration throughout this project.
5

foreword
This important report considers education reform in five global cities: London,
New York, Dubai, Rio de Janeiro and Ho Chi Minh City. They represent, of course,
five hugely different societies in terms of economic development, politics and
culture. We chose these cities because each place seemed to have a promising
story to tell about policy leading to improved quality outcomes for schools. The
global education debate has rightly moved to a focus on quality and this is where
the hard work really starts. Improving learning outcomes is difficult and it is easy to
be pessimistic and defeatist. However, each of these stories provides grounds for
optimism that the right choice of reform policy can make a real difference.
Untangling cause and effect is very difficult but in every one of these cities it is
possible to see a connection between policy decisions and improved outcomes.
Of course we need to be very careful about truth claims. Maybe these cities
benefited from good policy but there are other important factors such as the
power of culture and the aspirations of parents that almost certainly played a
part. Another word of caution is required about the way the city reforms were
introduced. We could not find a single case of reforms that had been trialled using
robust impact measurement approaches, such as randomised controlled trials. In
every case policymakers simply went straight to scale. As a result we cannot be
absolutely sure about causal relationships and the analysis can only be tentative
and provisional.
The cities are all distinctive and there is no single detailed blueprint for
transformation. Despite this, some common themes emerged. They included a
commitment in all the cities to practical measures intended to raise the status of
the teaching profession, making school teaching a career of choice for talented
graduates. It is possible to change the attractiveness of teaching to potential
teachers.
In every one of the cities there was an emphasis on increasing the accountability
of education professionals. At the same time there was also a recognition that
accountability alone is not enough to drive reform. Teachers and school leaders
also need access to first-rate professional development and the best people to
provide this are excellent current practitioners.
Another theme that emerges powerfully from the case studies is the importance
of leadership. In every city we found high-level political commitment to school
reform, often sustained over several years. Our expert witnesses consistently
described the centrality of ambitious, energetic and optimistic leadership at all
levels, including leadership of the city-wide school system. The senior leaders,
without exception, had a distinct Theory of Change and in each case went about
implementation of this theory in a relentless, persistent way. The city-wide leaders
were sometimes controversial but they were undoubtedly charismatic and driven
senior leaders.
6

The authors of the report were keen not to overstate the achievements of the cities
and not to oversimplify the analysis. There are also no grounds for complacency.
Michael Barber talks about the need to ensure the irreversibility of the reform
agenda. I don’t think the achievements in any of these cities meet the irreversibility
test yet. Achievements can be fragile and key person dependent. The story from
the cities is fundamentally about leadership, but leaders come and go. Some of
the key people associated with the transformation of these cities have now moved
on. There is a danger that the trajectory of reform may not be sustained. So our
optimism must be tempered with some caution. Nevertheless, these case studies
do provide grounds for optimism. They show above all that it is possible to take
action to break the connection between poverty and educational outcomes.
steve Munby
Chief Executive
CfBT Education Trust
7

Chapter 1
Transforming urban education

All over the world policymakers responsible for urban school systems are exploring approaches to reform, driven by a desire to improve the learning outcomes for the more than one billion children living in the towns and cities of the planet.
The challenge and choice facing policymakers is at first sight bewildering. There is
an enormous menu of potential policy levers for school reform. In 2015 the OECD
identified no fewer than 63 possible major policy options.1 The same study analysed
over 450 separate initiatives that had been undertaken across 34 member states in
recent years.2 So which options should be chosen and how might they be effectively
combined? This study is an attempt to make a modest, pragmatic and empirical
contribution to the answering of this question. We explore five promising approaches
to the challenges of school reform in five very different urban contexts: Ho Chi Minh
City in Vietnam; London in the UK; Dubai in the UAE; Rio de Janeiro in Brazil; and
New York City in the USA.
These cities are dramatically different from each other in terms of economic
development, political structures and culture. However, in each case there is
provisional evidence of improved teaching and learning over recent years linked to
the implementation of specific reform policies.
our choice of cities
In choosing these cities we started not with theoretical models for reform but with
real world evidence of improved outcomes. We identified places where learning
outcomes or the improvement in learning outcomes looked impressive and where
the success story appeared to be associated with a distinct approach to education
policymaking. This led to our choice of these five cities. In each case there was
measurable evidence of either a striking trajectory of improvement or a pattern of
relatively high-level performance as measured by reliable test instruments. In each
case there appeared to be an interesting policy context associated with the story of
positive learning outcomes. Some of the headlines for each city’s story are presented
below:
• Using the national tests for 16-year-olds in England as the measure, Inner London
has gone recently from being the worst-performing of the ten government regions
in England to being second only to the more affluent region of Outer London. This
extraordinary turnaround took place in just ten years.
ChapTEr 1: inTroduCTion
1 OECD 2015a (p.30) 2 OECD 2015a (p.20)
We explore five promising approaches to the challenges of school reform in five very different urban contexts
9

ChapTEr 1: inTroduCTion
• Vietnam, the poorest country out of all 65 jurisdictions participating in PISA 2012,
achieved the 8th best science results in the world. The Vietnamese students
outperformed students from much richer countries such as the UK, the USA and
most Western countries. We know that the results of the students in Ho Chi Minh
City (HCMC) were better still than this impressive national average. HCMC has a
graduation rate of 99% for those students enrolled in upper secondary, and a 98%
literacy rate amongst those aged 15.
• In 2002 the high school graduation rate in New York City was just 50%. Today the
rate is 75%. New York City is a much more disadvantaged place than the larger New
York State, but the academic achievement gap has been closing rapidly between
the City and the State.
• Dubai is a city-state within the federal United Arab Emirates (UAE). The UAE is the
highest-performing state in the Middle East in terms of PISA performance and there
was a marked improvement in PISA scores between 2009 and 2012. Results from
PISA 2012 showed that Dubai’s mean score of 464 in mathematics was higher than
the mean result for Jordan (386) and Qatar (376).3
• Between 2003 and 2012 the increase in Brazil’s PISA scores represented the largest
performance gains of any country worldwide, with particularly impressive gains
in mathematics. In the city of Rio de Janeiro (Rio) the functional illiteracy rate for
4th–6th grade students fell from 13.6 per cent in 2009 to 3.1 per cent in 2013.
These are, by any standard, interesting performance statistics. Our study sought to
investigate the policy contexts within which these apparently impressive outcomes
had been achieved.
Case studies in education and equity
Our chosen cities were particularly interesting because the reform agenda was
explicitly linked to issues of equity. In Dubai the government was concerned to
make sure that all the ethnically diverse communities based in the city had access
to a good quality of education. In London, New York and Rio the reforms were
driven by a commitment to close the gap between the performance of students
from disadvantaged and more privileged backgrounds. In London students from
high-poverty backgrounds perform spectacularly better in national examinations
compared to similar students in other parts of England. In Rio the focus for reform
has been the need to improve outcomes for the students who live in highly
deprived urban slums. In New York a major driver was a wish to reduce the disparity
in outcomes between white students and those from other ethnic groups. The
leaders in the cities were driven by a determination to show that there need not
be a mechanistic relationship between socio-economic background and learning
outcomes.
The Vietnamese story had a rather different global equity dimension. Worldwide
there is a close connection between economic advantage and educational
outcomes. The 2012 PISA results for mathematics, for example, when mapped
against national income show a clear linkage between outcomes and wealth
3 KHDA 2013
In London, New York and Rio the reforms were driven by a commitment to close the gap between the performance of students from disadvantaged and more privileged backgrounds
10

ChapTEr 1: inTroduCTion
at national level (see Figure 1.1). Vietnam is the outlier; the single poorest
participating country that has achieved results in line with those of the richest
countries. Vietnam appears to show at a global level that income need not
determine outcomes.
a diverse group of cities
Each city appeared to have an interesting story to tell. The diversity of the cities
was also important. We deliberately sought to select a spread of cities in order
to represent a range of different geographical and socio-economic contexts.
The chosen cities are scattered widely across Europe, North and South America,
the Middle East and Asia (see Figure 1.2). While these urban areas are markedly
diverse, in each instance the cities constituted either the largest or second-
largest centre of population in the respective country, each having a school-
age population of at least a quarter of a million. Although only one of the five
cities, London, is the national capital, each city is nonetheless nationally and
internationally important. All five cities have been listed as ‘global cities’ on a
respected index published by the consultancy firm A.T. Kearney.5 The Kearney
Global Cities Index ranks the world’s top metropolitan areas in terms of five
broad categories: business activity, human capital, information exchange,
political engagement and cultural experience.
We deliberately sought to select a spread of cities in order to represent a range of different geographical and socio-economic contexts
100%
90%
80%
70%
60%
50%
40%
30%
20%
10%
0%
PER
CEN
TAG
E O
F ST
UD
ENTS
SC
OR
ING
LEV
EL 2
OR
ABO
VE
IN M
ATH
EMAT
ICS
(PIS
A 20
12)
GDP PER CAPITA, PPP (CURRENT INTERNATIONAL $)
0
5,00
0
10,0
00
15,0
00
20,0
00
25,0
00
30,0
00
35,0
00
40,0
00
45,0
00
50,0
00
FIGURE 1.1: PERCENTAGE OF STUDENTS SCORING LEVEL 2 AND ABOVE IN MATHEMATICS (PISA 2012) COMPARED WITH THEIR GDP (ONLY COUNTRIES WITH GDP OF $50,000 OR LESS INCLUDED)4 VIETNAM
4 World Bank 2015b; OECD 2014 5 Hales et al. 2014
11

Methodology
The analysis in this report is based on three main data sources for each of our global
cities:
• A review of relevant literature relating to the city (and in some cases, the country in
which each city was located)
• A re-assessment of available data, particularly data relating to student learning
outcomes
• In-depth qualitative interviews in each city with ‘expert witnesses’ from different
backgrounds who had been involved in the reform process
The intention was first of all to confirm that school improvement had indeed happened
in each of our chosen cities. We also used these sources to attempt to understand what
had happened and why it had happened, with a particular emphasis on the views of
participants in the reform process.
In total, over 100 key witnesses were interviewed, either individually or as part of small
group sessions, from the five cities studied. These expert witnesses were a mixture of
policymakers, government officials, university academics, school leaders and teachers.
ChapTEr 1: inTroduCTion
figurE 1.2: ThE fivE CiTiEs
12
Our data collection methods primarily focused on education at the school level. A
common structure was used for the interviews with expert witnesses. The interview
schedules broadly asked participants to describe their country’s and city’s
education system; outline any changes that had taken place, particularly over the
last decade; explain how and why they thought changes had occurred and whether
these changes had led to improvement; and speculate on future challenges for
education within their context.
The methodology was based on that used in two previous reports investigating
school improvement in London: School improvement in London and Lessons from
London schools.6 These studies started from the premise that if you want to make
sense of a situation, the best people to ask are those who were actors in different
roles in the events. The testimony of these expert witnesses, combined with a
thorough literature and data review, can provide unusual insights into the working
of the reform process.
Where are the rCTs? The absence of robust testing of promising interventions
The key message of this report is that there are grounds for optimism about our
ability to transform school systems. However, the findings need to be treated as
tentative and provisional because the impact evidence is far from conclusive. In
the case of the two cities that have received the most extensive analysis – London
and New York – there is a lack of consensus among researchers and many of
the claims for the effectiveness of policy are contested. This is not surprising
because the policies adopted in the focus cities were not subject to exhaustive
evaluation through the use of best practice experimental research. We could find
no instances where approaches were tested using a randomised controlled trial
(RCT) methodology as part of the design of the reforms. Few of the interventions
described in this book were initially undertaken on a small-scale pilot basis, with
‘roll-out’ following on from a rigorous evaluation of the pilot. In almost every case
the policymakers in our focus cities simply went straight to scale.
Across all five cities only one intervention can claim to be underpinned by
conclusive evidence of impact, and this was the result of an accident. The small
schools of choice (SSC) initiative in New York generated ‘quasi-experimental’
data of a high quality. This was an accidental consequence of the use of a lottery
for school admissions purposes in New York. As a result of this lottery system
of place allocation, attendance at these schools was randomised, and as such
it was possible to make valid comparisons about the learning outcomes partly
for students of similar backgrounds who either did or did not attend SSCs. This
has made possible a definitive evaluation because ‘it is valid to attribute any
differences in their future academic outcomes to their access to an SSC.’7 This
research demonstrated conclusively that the introduction of these small schools in
New York was highly effective in terms of enhanced learning outcomes.
It cannot be a coincidence that, with the exception of this ‘natural experiment’,
none of the interventions in the cities was subject to rigorous initial scrutiny.
The key message of this report is that there are grounds for optimism about our ability to transform school systems
ChapTEr 1: inTroduCTion
6 McAleavy & Elwick 2015; Baars et al. 2014 7 Bloom & Unterman 2013 (p.3)
13

Policymakers worldwide are impatient about results. They are not typically prepared
to wait for the results of pilot phases or experiments involving a control group
of schools that are excluded from new improvement interventions. This may be
understandable but the result is that impact claims are necessarily weak. This is
great pity because the case for replication of the promising practices described
in this book would be greatly strengthened if the policymakers in these cities had
insisted on more rigorous evaluation.
Some of our expert witnesses reinforced this point about policy and evidence. When
asked to explain the change in London schools one of our interviewees replied that
we simply do not understand the relative effect of different interventions:
‘The honest answer is we don’t know the reasons. Because we did no
randomised controlled trials, we didn’t say, “This group will be part of this, this
group will be part of this, this group will have both interventions,” so it’s very
hard to know.’
no single blueprint for reform
Each city studied was unique and the five city reform strategies were all distinctive.
Key contextual features varied enormously. The level of decentralisation of
decision-making to the city authorities, for example, varied widely from place to
place. The US federal government has relatively little power over schools in New
York but the ministry of the national government in Vietnam has considerable say
over policy in a city such as HCMC.
Although, as we shall see, there were several cross-cutting themes that linked
together the reform stories, there were also distinctive city-specific reform
strategies. In Rio alone a new city-level curriculum was developed. In HCMC there
was little evidence of parental choice of school as an improvement lever but there
was a distinctive focus on the need for a new pedagogy. New York was unique in
that large schools were often broken up into much smaller units. We can learn from
the diversity of reform in these cities as well as from the cross-cutting themes.
The poorer cities in our sample faced some different challenges to those in the
more affluent cities, and this led to some different policy priorities. In Rio and
HCMC there was insufficient funding available until recently to ensure the provision
of a full day shift of schooling in all government schools. Correcting this was rightly
a priority in these cities but was not an issue elsewhere.
In four out of five cities the focus for our investigation was on policy intended to
improve government schools. The exception was Dubai. The Government of Dubai
interprets its responsibilities differently from all of the other government authorities
in this study. The private school sector dominates, with almost 90% of students and
more than half of Emirati students attending a private school. With public schools
being a federal responsibility, the Dubai authorities have concentrated their efforts
on improving the quality of the private school system. The result is a flourishing and
highly diverse private school system that offers a great variety of curricula across a
wide range of fee rates. This policy context was not found in any other city.
ChapTEr 1: inTroduCTion
Each city studied was unique and the five city reform strategies were all distinctive. Key contextual features varied enormously
14

Beyond a compartmentalised view of policy effectiveness
Throughout our study we sought to compare policy in practice with the policy
guidance that has emerged from the most robust educational research. We
made particular use of John Hattie’s work, including his influential meta-
analysis, Visible learning, which was published in 2008. Hattie’s findings often
coincided with the policies in action. There was, for example, a widespread
recognition in our case study cities of the importance of diagnostic assessment
and feedback at the level of the individual student. What was more interesting
was that, on occasion, there was an apparent disconnect between Hattie’s
meta-analysis and the lessons from the cities. Our conclusion was that it can
be seriously misleading simply to base policy on headline findings relating to
the effectiveness of single policies reviewed in isolation. This view has recently
been articulated by Hattie himself in the context of the debate about the impact
of reduced class size. Hattie’s overall meta-analysis suggests that reducing
class size is likely to have zero effect on outcomes. Recently he has indicated
that reducing class size might indeed improve learning outcomes but only in
combination with other strategies. He commented that ‘reduction needs to
be aligned with specific, evidence-based proposals for investment in teacher
expertise to teach differently – and more effectively – in smaller classes.’8
The question of policy on class size arose in Vietnam. In HCMC our expert
witnesses spoke in consistently positive terms about the beneficial impact of
investment in reduced class sizes. This might seem to run against research
findings but perhaps the difference is that this policy lever was not used in
isolation in HCMC. The reduction in student-teacher ratios in HCMC was
explicitly linked to a requirement on teachers to adopt a much more student-
centred pedagogy for which substantial teacher training was provided. The
investments were aligned carefully with changes in the curriculum and the
pedagogy. The reduced class sizes provided an opportunity for changes in
teaching styles. So while the reductions in class sizes in Vietnam may not have
been solely responsible for improved pupil outcomes, the combined effect of
this and investment in teachers and in teacher training is likely to have made a
difference.
We saw a similar issue in Rio over the question of grade retention. Hattie has
synthesised hundreds of studies, for example looking at the impact of grade
retention/repetition whereby students are held back a year if they fail to meet
the curriculum requirements of the grade. The headline finding was that overall
this policy was likely to have a negative impact on learning outcomes. However,
the policy of grade retention/repetition was not abolished but rather introduced
by Claudia Costin as part of her apparently successful reform strategy in Rio. At
first sight this seems to be entirely contrary to the research evidence. The key
difference is that Costin did not simply introduce grade repetition and expect
this act alone to drive improvement. She combined grade repetition with a highly
individualised catch-up tutoring programme for the students who were not
operating at the level of the age-related expectations.
Throughout our study we sought to compare policy in practice with the policy guidance that has emerged from the most robust educational research
ChapTEr 1: inTroduCTion
8 Hattie 2015a (p.11)
15

9 Hattie 2015a (p.25) 10 World Bank 2015c 11 Hattie 2015a (p.25)
There is a danger that policy instruments are seen too much in a compartmentalised,
atomised way by policymakers. It can be the judicious combination of reinforcing
policies that leads to beneficial change.
It is also important to recognise the significance of context. Education policy should
not be a question of the application of immutable laws that always operate in the
same way in all situations. Although investment in education is not a predictor
of pupil outcomes in the majority of Western countries, it appears to be a good
predictor of mean pupil performance among middle- and low-income countries.9
Hattie has suggested that there might be a ‘tipping point’: a threshold of investment
up to which additional expenditure does make a significant difference in terms of
learning outcomes. As Vietnam is a lower middle-income country10 it seems likely
that the increased spending on education evident in the period in question was
below this threshold and therefore a contributor to improved performance.11
Cross-cutting improvement themes
Although each city had a unique story there were also key themes that connected
several of the different narratives. Our analysis identified seven key themes:
• Effective leadership at all levels. We saw a consistent pattern of education reform
supported by committed political leadership. In several of the cities, inspirational
educational leadership was provided by those in charge of the reform project at city
level. At school level, principals and other school leaders played a pivotal role in the
practical implementation of reform.
• data-driven reform. The fuel for the engine of reform was, in several cases, reliable
performance data. The existence of such data made it possible for the reformers to
challenge underperformance and to identify the outlier schools where performance
was exceptionally good.
• Building coalitions for change. Although some reformers were more successful
than others, all recognised the importance of an effective communications strategy.
By building coalitions of different stakeholders they sought to create momentum
for change. In particular the leaders in each city reached out to teachers, who were
potential opponents of change, and to parents, who had the potential to apply local
pressure for change.
• Making teaching a career of choice for talented young people. The city reform
projects often involved a new teacher recruitment strategy. While it is possible to
make significant incremental progress by training the existing workforce, it is much
easier to make transformational ‘step change’ progress if the fundamental calibre of
the teacher workforce is improved.
• Combining high accountability with high levels of professional support. Without
exception the reformers sought to make professionals more accountable for
their work. This was done in different ways, including school inspection, teacher
performance management and the publication of student test results. In every case
there was also a recognition that accountability was not enough; teachers also
needed access to high quality support through, for example, the provision of better
resources and better training.
ChapTEr 1: inTroduCTion
Without exception the reformers sought to make professionals more accountable for their work
16

• new forms of government school provision. In several of the cities new types of
government school were established as part of the reform agenda. Although the
impact of these measures is contested, there is some evidence that the new schools
achieved better outcomes than conventional government schools and applied a
useful competitive pressure on the whole school system.
• an emphasis on school-to-school collaboration. The reformers often sought to
strike a balance between creating momentum for change through competition,
while at the same time making possible different forms of collaboration across
schools. There was, in particular, a tendency to link together high-performing and
low-performing schools in order to close the gap in learning outcomes.
Each of these seven key themes is explored in more detail in the following section.
Key theme 1: Effective leadership at all levels
In each of our case study cities there was evidence of high-level political
commitment to school reform, often sustained over many years. Our expert
witnesses consistently described the centrality of ambitious, energetic and
optimistic leadership at a high political level. We found that the senior leaders
in each city had a distinct ‘theory of change’ and in every case they went about
the implementation of this theory in a relentless, persistent way. In London, for
example, we saw a highly unusual consistency in policy from 2000 onwards.
Similarly, there has been a consistent set of guiding principles for reform in Vietnam
since the 1998 Education Act. The Dubai authorities have been pursuing a policy of
accountability and support for informed parental choice consistently for a decade.
In New York, London and Rio our expert witnesses repeatedly highlighted the
contribution of key individual city-level leaders such as Joel Klein, Tim Brighouse
and Claudia Costin. Klein was the schools chief for Mayor Michael Bloomberg.
ChapTEr 1: inTroduCTion
EFFECTIVELEADERSHIP
DATA-DRIVENREFORM
BUILDINGCOALITIONS FOR
CHANGE
CROSS-CUTTING THEMES
MAKINGTEACHING ACAREER OF
CHOICE
ACCOUNT-ABILITY AND
SUPPORT
NEW FORMS OFSCHOOL
PROVISION
COLLABORATIONBETWEENSCHOOLS
The reformers often sought to strike a balance between creating momentum for change through competition, while at the same time making possible different forms of collaboration across schools
figurE 1.3: Cross-CuTTing iMprovEMEnT ThEMEs
17

Brighouse ran the London Challenge project and Costin was the Secretary of
Schools for the city of Rio. These were sometimes controversial figures but they
were undoubtedly determined and driven senior leaders. In Dubai the work of
the Knowledge and Human Development Authority (KHDA) is closely associated
with the work of one leader, Dr Abdulla al Karam, who has been the Director
General of KHDA since its inception ten years ago.
Several of the city-level leaders had a background outside the sphere of school
education. Claudia Costin in Rio was a university academic before moving
into the area of school reform. Abdulla al Karam in Dubai has a professional
background in information technology. Joel Klein in New York is a lawyer by
training. Perhaps the unconventional background of these leaders enabled them
to think radical thoughts and to challenge existing orthodoxies when shaping
school reform in their cities.
One of the most important forms of leadership that was frequently mentioned
by our expert witnesses was that of the headteacher. In London, New York
and HCMC there was a strong concept of the headteacher as the instructional
leader whose core role was the monitoring and improvement of teaching and
not administration. Our Vietnamese witnesses were surprised by the question
when we asked whether HCMC headteachers spent much time monitoring
teaching quality. Of course, they replied, what else would you expect effective
headteachers to do? The New York and Rio reforms explicitly focused on
building the capacity of headteachers in such areas as school-based decision-
making and data analysis. The leaders of the best schools were expected to act
as system leaders and in three of the cities – Rio, London and HCMC – there
were formal twinning relationships between highly effective and weak schools.
In Vietnam the senior staff of the district education system are almost exclusively
drawn from the cadre of highly effective school leaders. This gives them the
expertise and the credibility needed to engage in a dialogue about quality with
the schools.
The training of school leaders was taken seriously in the cities. London
schools benefited from the work of the National College for School Leadership
in England. Klein’s reforms in New York placed particular emphasis on the
development of the capacity of school principals. A new leadership training
institute was established in New York. Vietnam has two national institutes for
the development of educational leaders including school principals: one for
the north and one for the south of the country, based in Hanoi and HCMC
respectively. In addition to the training of education leaders the institutes also
undertake research into aspects of education management. Future principals and
vice-principals are given training prior to taking up their roles.
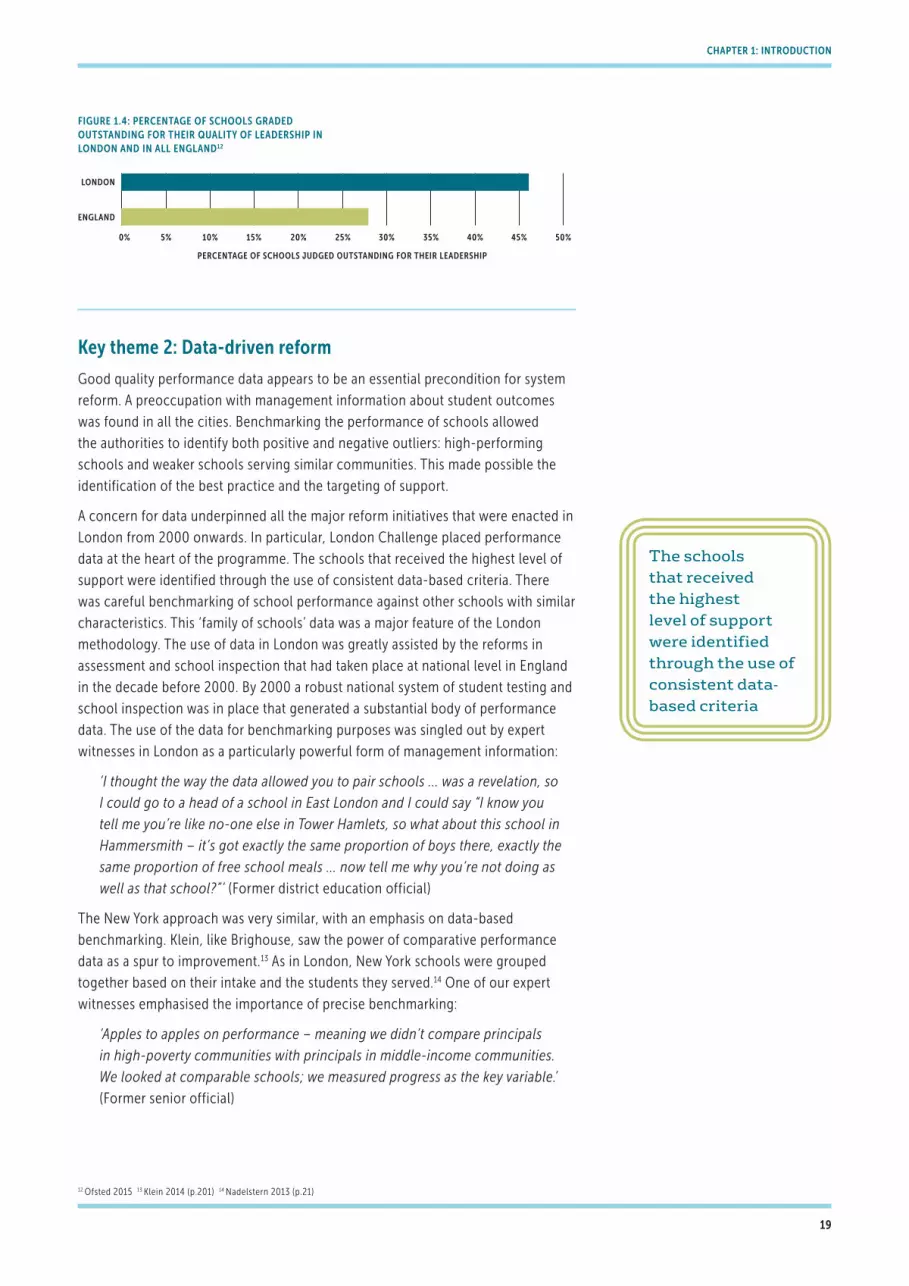
The investment in leadership capacity appeared to pay dividends. Take the
example of London. After a decade of reform the school leaders of London
were judged by the national school inspectors to be more effective than school
leaders in every other region of England. There was a particularly wide difference
between the percentage of leaders judged Outstanding (the top grade) in
London compared to England as a whole (see Figure 1.4).
In London, New York and HCMC there was a strong concept of the headteacher as the instructional leader whose core role was the monitoring and improvement of teaching and not administration
ChapTEr 1: inTroduCTion
18
Key theme 2: data-driven reform
Good quality performance data appears to be an essential precondition for system
reform. A preoccupation with management information about student outcomes
was found in all the cities. Benchmarking the performance of schools allowed
the authorities to identify both positive and negative outliers: high-performing
schools and weaker schools serving similar communities. This made possible the
identification of the best practice and the targeting of support.
A concern for data underpinned all the major reform initiatives that were enacted in
London from 2000 onwards. In particular, London Challenge placed performance
data at the heart of the programme. The schools that received the highest level of
support were identified through the use of consistent data-based criteria. There
was careful benchmarking of school performance against other schools with similar
characteristics. This ‘family of schools’ data was a major feature of the London
methodology. The use of data in London was greatly assisted by the reforms in
assessment and school inspection that had taken place at national level in England
in the decade before 2000. By 2000 a robust national system of student testing and
school inspection was in place that generated a substantial body of performance
data. The use of the data for benchmarking purposes was singled out by expert
witnesses in London as a particularly powerful form of management information:
‘I thought the way the data allowed you to pair schools ... was a revelation, so
I could go to a head of a school in East London and I could say “I know you
tell me you’re like no-one else in Tower Hamlets, so what about this school in
Hammersmith – it’s got exactly the same proportion of boys there, exactly the
same proportion of free school meals ... now tell me why you’re not doing as
well as that school?”’ (Former district education official)
The New York approach was very similar, with an emphasis on data-based
benchmarking. Klein, like Brighouse, saw the power of comparative performance
data as a spur to improvement.13 As in London, New York schools were grouped
together based on their intake and the students they served.14 One of our expert
witnesses emphasised the importance of precise benchmarking:
‘Apples to apples on performance – meaning we didn’t compare principals
in high-poverty communities with principals in middle-income communities.
We looked at comparable schools; we measured progress as the key variable.’
(Former senior official)
ChapTEr 1: inTroduCTion
LONDON
ENGLAND
PERCENTAGE OF SCHOOLS JUDGED OUTSTANDING FOR THEIR LEADERSHIP
50%0% 5% 10% 15% 20% 25% 30% 35% 40% 45%
FIGURE 1.4: PERCENTAGE OF SCHOOLS GRADED OUTSTANDING FOR THEIR QUALITY OF LEADERSHIP IN LONDON AND IN ALL ENGLAND12
The schools that received the highest level of support were identified through the use of consistent data-based criteria
12 Ofsted 2015 13 Klein 2014 (p.201) 14 Nadelstern 2013 (p.21)
19
Claudia Costin in Rio also placed data at the heart of her approach to reform. She
introduced key tests at the end of each two-month curriculum block. This provided
a rapid feedback loop. These bi-monthly tests (in Portuguese, mathematics, science
and writing) provided a management tool for school principals and city officials. As
in London, the emphasis was on benchmarking performance. The data was analysed
at every level of the system down to individual students. 28,000 individual students
in Grades 4–6 were identified as being ‘at risk’ in terms of their literacy and a highly
successful catch-up programme was put in place. During Costin’s initial period
in office the new testing framework allowed her to identify students who were
functionally illiterate, leading to the inception of remedial classes to help them catch
up.15 Costin set a target of ensuring 95% functional literacy for 6th Grade students
by 2016. This target was comfortably exceeded and by 2013 Rio had achieved a 97%
literacy rate. None of this would have been possible without the emphasis on data.
Key theme 3: Building coalitions for change
All the policymakers in our case study cities saw that there was a need to ‘win hearts
and minds’ of different groups, particularly of teachers and parents. In each case they
sought to build momentum for change by reaching out to the key stakeholders.
The introduction of a new inspection regime in Dubai from 2007 was accompanied
by a careful communications campaign so that different stakeholders were well
informed about the rationale behind the reforms. The government wanted some very
different groups to support the changes: private school owners, school principals
and teachers, the business community, media and parents. This communications
campaign has been very successful, to such an extent that the new transparency
about school performance is now effectively irreversible. Parents and the media now
see transparent inspection data as a clear entitlement. The best schools appear to
welcome scrutiny and the opportunity to engage in a professional dialogue about
school effectiveness.
In the very different context of HCMC, our interviews with stakeholders also
suggested that there had been a highly successful communications strategy resulting
in a shared understanding of the reform agenda at every level of the system, including
professionals of all types as well as parents and community groups. The authorities in
HCMC had apparently created an effective ‘coalition for change’, with parents as a key
part of the coalition. The teachers and school leaders that we interviewed consistently
mentioned their successful engagement with parents as partners in educational
transformation.
Tim Brighouse in London took communications with stakeholders very seriously. In
particular, he was keen to enlist the support of the staff of underperforming schools
as part of the reform coalition. Sensing that these schools were feeling demotivated
by extensive negative publicity, he deliberately designated them as ‘Keys to Success
schools’ in order to create a positive, constructive relationship with the teachers.
In her reflections on the reform project in Rio, Claudia Costin has stressed that the
success of her programmes was only possible as a result of a deliberate policy of
engaging with the workforce. She said: ‘You can only transform education together
All the policymakers in our case study cities saw that there was a need to ‘win hearts and minds’ of different groups, particularly of teachers and parents
ChapTEr 1: inTroduCTion
15 Costin 2014
20

ChapTEr 1: inTroduCTion
with the teachers.’16 The new curriculum in Rio was co-constructed by city officials
and serving teachers so that teachers would have a sense of real ownership of the
proposed approach to learning. Costin was aware that there were limits to the extent
to which she could ask for more from the workforce. She was constantly mindful
that she might provoke teachers into resistance. She described, in interesting terms,
how she consciously set a ‘speed’ for the reforms at a level that she thought the
workforce could tolerate: ‘The speed was given by the capacity of having teachers
on board. We challenged them to the limit, but not more than the limit.’17
Although all the policymakers attempted to reach out to teachers, some were more
successful than others. Claudia Costin in Rio made teacher engagement a priority
but she also had significant disagreements with the city’s teaching union and the
schools were disrupted by a serious teachers’ strike in 2013. Joel Klein in New
York had great difficulty establishing a good working relationship with the school
workforce and saw this as his greatest source of frustration when looking back at the
New York reforms.
Key theme 4: Making teaching a career of choice for talented young people
It has long been known that in educationally high-performing countries, such as
Finland and Japan, talented school-leavers often choose to become school teachers
because teaching is a respected profession, seen on a level with other prestigious
professions such as medicine and law. The status of teachers in any society is linked
to history and culture. However, it is possible to make changes in the way teaching is
perceived. Policymakers in several of the case study cities made strenuous efforts to
improve the quality of new recruits to school teaching. They achieved considerable
success.
In HCMC there was an emphasis on the professionalisation of the workforce.
The qualification level of primary and lower secondary school teachers has
improved considerably since 2000. There was a consensus among our Vietnamese
expert witnesses that the current generation of teachers was the best ever; one
government official in HCMC told us that he believed that the quality of teaching
staff was now ‘exceptionally high’.
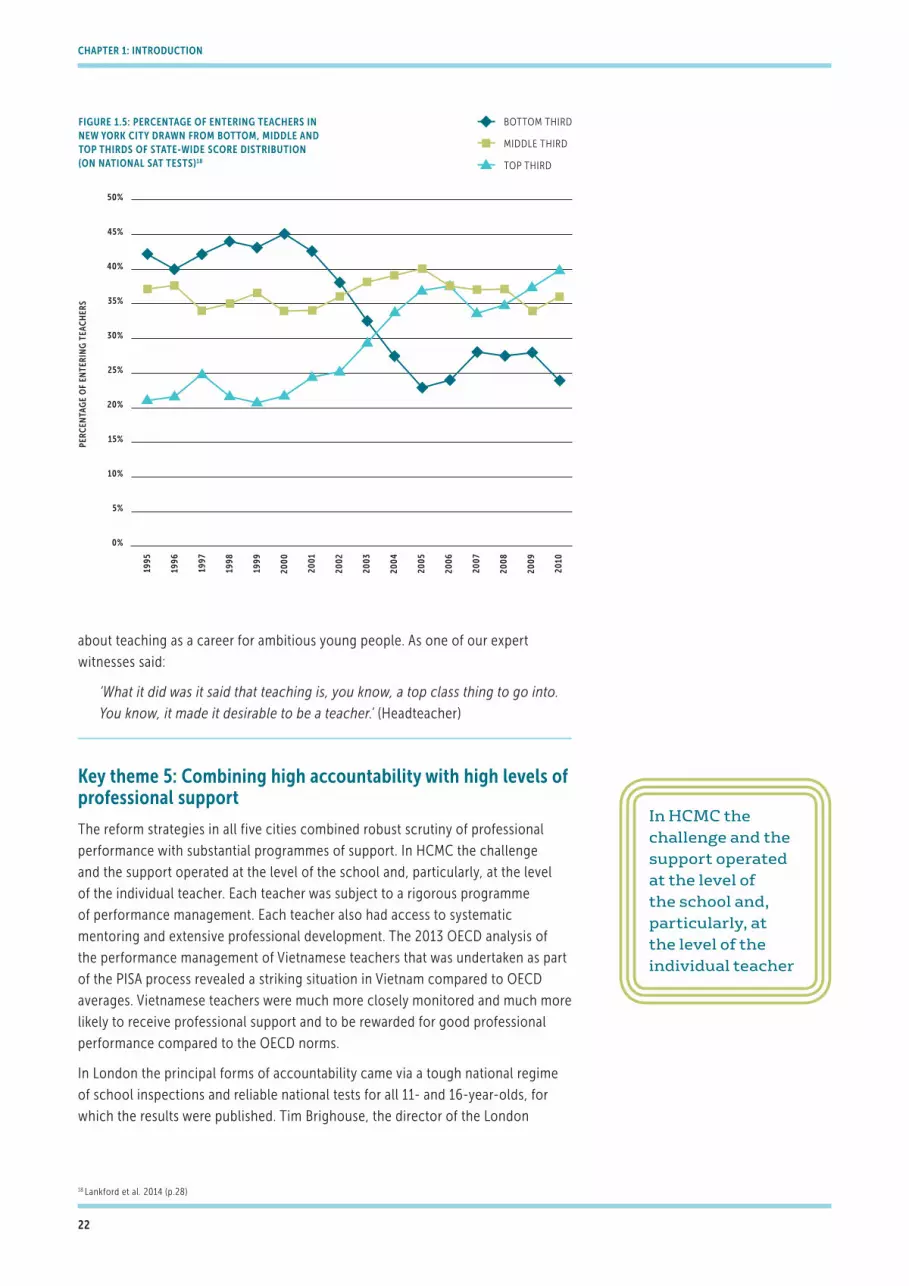
In New York, Klein made the transformation of teacher quality into a top priority.
The entry requirements for teaching were raised and there was a dramatic
improvement in the likelihood of young people who were in the top third in the
pre-university aptitude test choosing to become teachers. This dramatic
improvement is shown in Figure 1.5.
The key teacher recruitment reform in London was the programme called Teach
First which began in 2003. Teach First provided a new route into teaching for some
of the highest-performing graduates of top UK universities. These recruits made a
commitment to teach for two years in very disadvantaged government schools in
London. The Teach First programme contributed significantly to a new perception of
teaching in London as a high-status profession for idealistic and talented graduates.
The scheme was extremely successful and helped change perceptions in London
The new curriculum in Rio was co-constructed by city officials and serving teachers so that teachers would have a sense of real ownership of the proposed approach to learning
16 Pearson 2011 17 Costin 2014
21
about teaching as a career for ambitious young people. As one of our expert
witnesses said:
‘What it did was it said that teaching is, you know, a top class thing to go into.
You know, it made it desirable to be a teacher.’ (Headteacher)
Key theme 5: Combining high accountability with high levels of professional support
The reform strategies in all five cities combined robust scrutiny of professional
performance with substantial programmes of support. In HCMC the challenge
and the support operated at the level of the school and, particularly, at the level
of the individual teacher. Each teacher was subject to a rigorous programme
of performance management. Each teacher also had access to systematic
mentoring and extensive professional development. The 2013 OECD analysis of
the performance management of Vietnamese teachers that was undertaken as part
of the PISA process revealed a striking situation in Vietnam compared to OECD
averages. Vietnamese teachers were much more closely monitored and much more
likely to receive professional support and to be rewarded for good professional
performance compared to the OECD norms.
In London the principal forms of accountability came via a tough national regime
of school inspections and reliable national tests for all 11- and 16-year-olds, for
which the results were published. Tim Brighouse, the director of the London
ChapTEr 1: inTroduCTion
In HCMC the challenge and the support operated at the level of the school and, particularly, at the level of the individual teacher
1995
1996
1997
1998
1999
2000
2001
2002
2003
2004
2005
2006
2007
2008
2009
2010
50%
45%
40%
35%
30%
25%
20%
15%
10%
5%
0%
PER
CEN
TAG
E O
F EN
TER
ING
TEA
CH
ERS
BOTTOM THIRD
MIDDLE THIRD
TOP THIRD
FIGURE 1.5: PERCENTAGE OF ENTERING TEACHERS IN NEW YORK CITY DRAWN FROM BOTTOM, MIDDLE AND TOP THIRDS OF STATE-WIDE SCORE DISTRIBUTION (ON NATIONAL SAT TESTS)18
18 Lankford et al. 2014 (p.28)
22

ChapTEr 1: inTroduCTion
Challenge programme, accepted these accountability methods but felt that there
was an imbalance between these high levels of challenge and the low levels of
support. He ensured that London teachers, particularly those in low-performing
schools, also received greatly enhanced levels of training and coaching.
The Dubai reforms, especially, placed a big emphasis on the power of accountability
through school inspection leading to published inspection reports. It seems that
high accountability through inspection can lead to improvement through at least
two mechanisms: the results of the inspection can be used by parents to apply
pressure for change; and the inspection expectations can also be used by schools
themselves for the purpose of improvement planning. The research of Melanie Ehren
into inspection systems in six European countries has shown the importance of this
latter possibility. Ehren has demonstrated that inspection can enhance schools’
internal management capacity by providing a picture of excellence that school
leaders can internalise via their own school development planning.19 Our expert
witnesses in Dubai confirmed this tendency, with the inspection Framework view
of excellence (or ‘outstanding’ provision in the words of the Framework) featuring
prominently in the internal planning of school leaders:
‘Our school improvement plans are based completely on, almost completely on,
the recommendations and on the frameworks and what it is to be Outstanding.’
(School director)
The inspection system in Dubai began in 2008. By 2011/2012 it was clear to the
policymakers that there was a need to mobilise the knowledge about best practice
identified through inspection. The result was the ‘What Works’ initiative, launched
in 2012. This series of ongoing professional development events has been designed
as a way to foster collaboration between schools and is focused on the sharing
of best practice. It is run by schools for schools, with support from KHDA.’20 The
accountability mechanisms have created a common vocabulary relating to school
quality in Dubai. The What Works programme allowed teachers across schools to use
the common vocabulary in a dialogue about school improvement.
Tests or assessments of student achievement
Teacher peer review of lesson plans, assessment instruments and lessons
principal or senior staff observations of lessons
observations of classes by inspectors or other persons external to school
vietnam 98 83 97 85
oECd average 78 60 69 27
figurE 1.6: pErCEnTagE of sTudEnTs in sChools WhErE ThE prinCipal rEporTEd ThE folloWing MoniToring METhods21
figurE 1.7: pErCEnTagE of sTudEnTs in sChools WhosE prinCipal rEporTEd ThaT appraisals or fEEdBaCK lEd dirECTly To ThE lisTEd aCTions22
a change in salary
a financial bonus
opportunities for professional development
a change in the likelihood of career advancement
public recognition from the principal
a role in school development initiatives
vietnam 72 92 98 95 99 92
oECd average 27 30 73 53 79 81
It seems that high accountability through inspection can lead to improvement through at least two mechanisms: the results of the inspection can be used by parents to apply pressure for change; and the inspection expectations can also be used by schools themselves for the purpose of improvement planning
19 Schoolinspections 2014 20 Thacker & Cuadra 2014 (p.26) 21 OECD 2013b (p.156) 22 OECD 2013b (p.157)
23
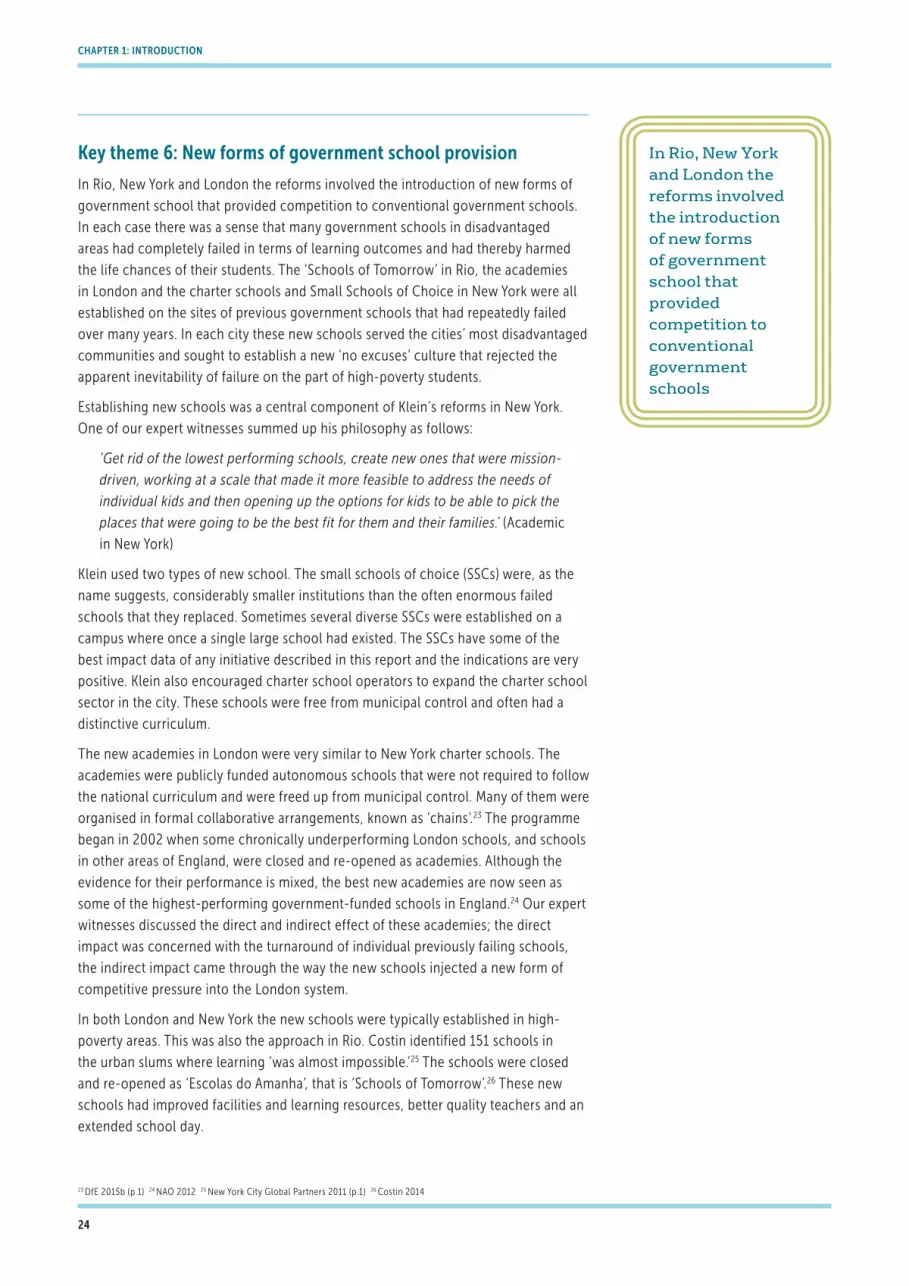
Key theme 6: new forms of government school provision
In Rio, New York and London the reforms involved the introduction of new forms of
government school that provided competition to conventional government schools.
In each case there was a sense that many government schools in disadvantaged
areas had completely failed in terms of learning outcomes and had thereby harmed
the life chances of their students. The ‘Schools of Tomorrow’ in Rio, the academies
in London and the charter schools and Small Schools of Choice in New York were all
established on the sites of previous government schools that had repeatedly failed
over many years. In each city these new schools served the cities’ most disadvantaged
communities and sought to establish a new ‘no excuses’ culture that rejected the
apparent inevitability of failure on the part of high-poverty students.
Establishing new schools was a central component of Klein’s reforms in New York.
One of our expert witnesses summed up his philosophy as follows:
‘Get rid of the lowest performing schools, create new ones that were mission-
driven, working at a scale that made it more feasible to address the needs of
individual kids and then opening up the options for kids to be able to pick the
places that were going to be the best fit for them and their families.’ (Academic
in New York)
Klein used two types of new school. The small schools of choice (SSCs) were, as the
name suggests, considerably smaller institutions than the often enormous failed
schools that they replaced. Sometimes several diverse SSCs were established on a
campus where once a single large school had existed. The SSCs have some of the
best impact data of any initiative described in this report and the indications are very
positive. Klein also encouraged charter school operators to expand the charter school
sector in the city. These schools were free from municipal control and often had a
distinctive curriculum.
The new academies in London were very similar to New York charter schools. The
academies were publicly funded autonomous schools that were not required to follow
the national curriculum and were freed up from municipal control. Many of them were
organised in formal collaborative arrangements, known as ‘chains’.23 The programme
began in 2002 when some chronically underperforming London schools, and schools
in other areas of England, were closed and re-opened as academies. Although the
evidence for their performance is mixed, the best new academies are now seen as
some of the highest-performing government-funded schools in England.24 Our expert
witnesses discussed the direct and indirect effect of these academies; the direct
impact was concerned with the turnaround of individual previously failing schools,
the indirect impact came through the way the new schools injected a new form of
competitive pressure into the London system.
In both London and New York the new schools were typically established in high-
poverty areas. This was also the approach in Rio. Costin identified 151 schools in
the urban slums where learning ‘was almost impossible.’25 The schools were closed
and re-opened as ‘Escolas do Amanha’, that is ‘Schools of Tomorrow’.26 These new
schools had improved facilities and learning resources, better quality teachers and an
extended school day.
ChapTEr 1: inTroduCTion
In Rio, New York and London the reforms involved the introduction of new forms of government school that provided competition to conventional government schools
23 DfE 2015b (p.1) 24 NAO 2012 25 New York City Global Partners 2011 (p.1) 26 Costin 2014
24

ChapTEr 1: inTroduCTion
Student assessment data suggests that the Schools of Tomorrow programme has
been highly successful. There was a dramatic reduction in truancy rates after the
opening of the schools. In terms of standardised test scores, students in these
schools made rapid progress in the early years of the project (see Figure 1.8).
Key theme 7: an emphasis on school-to-school collaboration
Expert witnesses in several of our case study cities identified the importance of
collaborative arrangements between schools and particularly between school
leaders. In HCMC there are regular meetings of headteachers at district level
to undertake joint problem solving. Interviewees described the vertical and
horizontal dimensions of these meetings, by which they meant that there was
a collaborative horizontal or peer-to-peer element to the process as well as a
form of vertical or ‘top-down’ accountability built in to these arrangements. In
HCMC there are also formal partnership arrangements between some of the more
effective and less effective schools, brokered by the middle-tier authorities.
At the heart of the London Challenge methodology was a twinning relationship
between the low-performing schools and high-performing schools which were
designated as teaching schools. The heads of the teaching schools and other
outstanding headteachers provided coaching support to the heads of the low-
performing schools. While collaborative relationships were central to the London
reform project there was also a recognition that schools needed assistance
when working collaboratively. Highly effective headteachers may need training,
for example, in order to work as consultant headteachers providing coaching
to others.
Collaboration is also the central principle of the Dubai What Works initiative. Our
interviewees in both London and Dubai considered that they had moved from a
period of high competition to a phase characterised by a mix of competition and
collaboration.
In Rio, Claudia Costin herself personally brokered partnership arrangements
between the leaders of the best-performing schools and the worst-performing
schools. As in London the data was the basis for the twinning arrangements.
Costin called the high-performing schools ‘godmother schools’. In Rio, as in
London, there was an expectation that one of the responsibilities of a high-
performing school was that it should undertake outreach of this sort.
Expert witnesses in several of our case study cities identified the importance of collaborative arrangements between schools and particularly between school leaders
FIRST YEARS
FINAL YEARS
PERCENTAGE POINT INCREASE IN IDEB SCORES (2009–2011)
0% 5% 10% 15% 20% 25% 30% 35%
SCHOOLS OF TOMORROW
OTHER MUNICIPAL SCHOOLS
FIGURE 1.8: IMPROVEMENT IN IDEB SCORES FOR SCHOOLS OF TOMORROW AND OTHER MUNICIPAL SCHOOLS (2009–2011)27
27 Prefeitura do Rio de Janeiro 2014 (p.42–3)
25

Chapter 2
Ho Chi Minh City, Vietnam

Vietnam stunned the world28 when, in the 2012 international PISA tests, it was
ranked 17th out of the 65 participating countries.29
Vietnam’s performance in the PISA tests was surprising given its status as a lower/
middle-income country30 and the fact it had the lowest GDP per capita of any of
the countries participating.31
Education in Vietnam follows a 5-4-3 pattern, with students from the age of six
undertaking five years at primary school, four years at lower secondary and three
years at upper secondary. Education across the country is organised by the Ministry
of Education and Training (MOET), although much decision-making power relating
to pre-schools and general education is decentralised to provincial Departments of
Education and Training (DOETs).32
Vietnam’s success in the 2012 PISA tests prompted its inclusion in this study, and as
the evidence from PISA strongly suggests that high performance is likely to occur
in urban areas, the largest of these in Vietnam has been selected: Ho Chi Minh City
(HCMC).
As with all five cities in this study, the research method adopted involved a review
of available literature; analysis of performance data where it existed (particularly
international test data which allows for comparison external to Vietnam); and a
series of in-depth qualitative interviews. Ten ‘expert witnesses’ were interviewed
from HCMC, including teachers, school principals, teacher trainers, education
department officials and academics. A further group of researchers and teachers
working in Vietnam responded to a questionnaire by email.
Figure 2.1 shows that in 2012 Vietnam outperformed the OECD average across all
three domains measured by PISA (mathematics, reading and science), performing
particularly well in science.33
Vietnam also had a much smaller percentage of low performers in each of the
three subjects, as can be seen from Figure 2.2, and comparable levels of top-
performers. This suggests that the country’s performance is not down to a small
number of high-performing students pulling up the average, but is the result of a
more equitable system with narrower gaps between high performers and low.
Vietnam is the easternmost country on the Indochina peninsula in south east Asia and, with around 93 million inhabitants, it is the world’s 13th most populous country. Its largest city, Ho Chi Minh City (formerly Saigon), is located in the south of the country and has a population of almost eight million.
ChapTEr 2: ho Chi Minh CiTy, viETnaM
28 World Bank 2013 29 OECD 2014 30 World Bank 2015a 31 OECD 2013a 32 World Bank 2011 (p.6) 33 ‘In each test subject, the score for each participating country is the average of all student scores in that country.’ Scores are normally distributed around a mean of 500 with a standard deviation of 100 (OECD 2015b).
Ho Chi Minh City, Vietnam
27

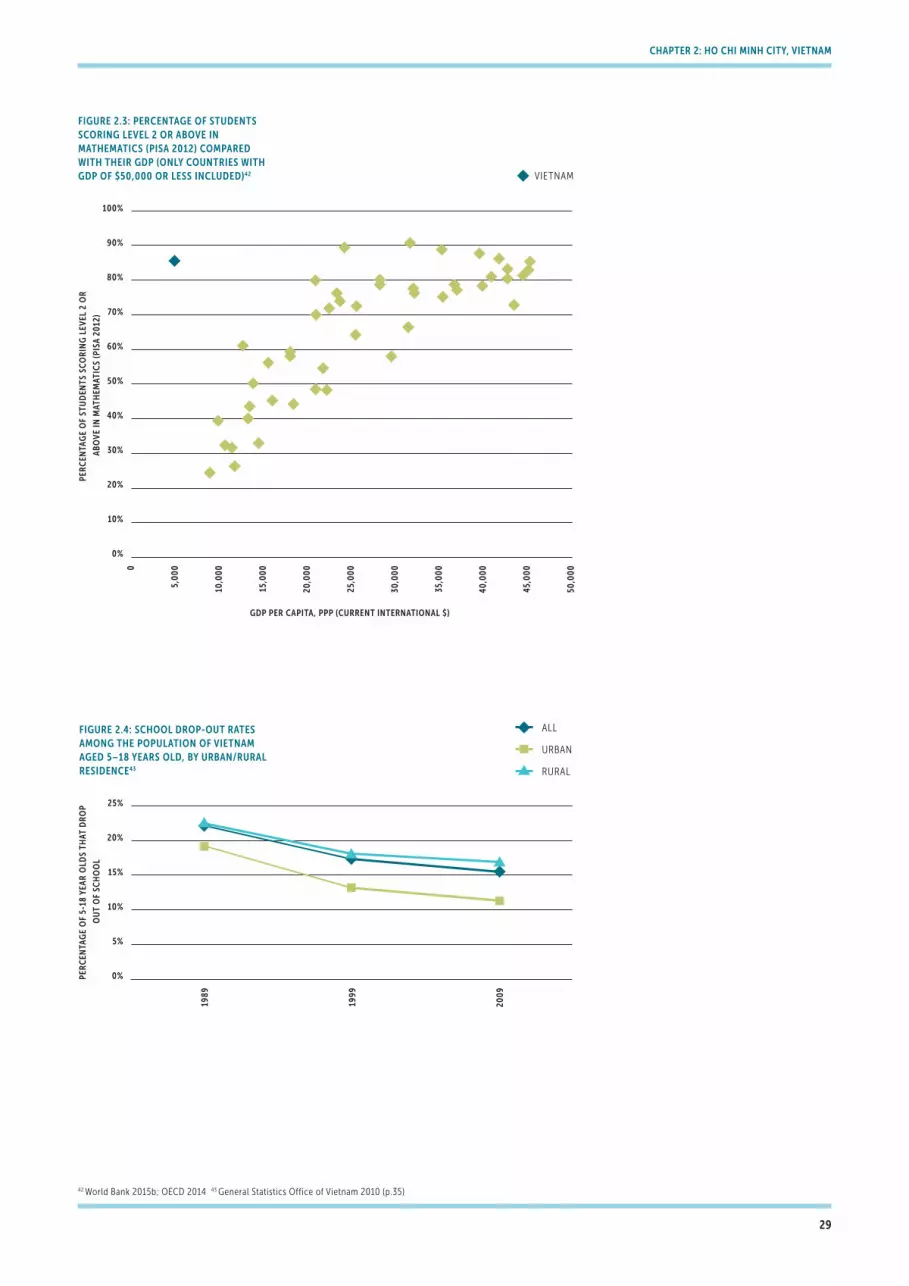
The performance of Vietnam is all the more extraordinary when you take into account
the economic situation of the country. Comparing mathematics results in PISA
with GDP per capita, Figure 2.3 shows a strong global correlation between income
levels and performance – with the one significant outlier (highlighted in blue) being
Vietnam, the country with the lowest income.
Based on the PISA index of economic, social and cultural status (ESCS) (an index
created from five variables, including parental education and availability of
educational resources at home)36 Vietnam comes last of all the participating countries.
Parental education is widely accepted as a strong predictor of children’s educational
outcomes,37 yet Vietnam once again seems to buck this trend.
Although results of the 2012 PISA tests, published in 2013, caused a particular stir,
two other significant studies had already recognised that Vietnam’s education system
was rapidly improving. The World Bank’s 2011 report on Vietnam, in conjunction with
the UK’s Department for International Development (DFID) and the Government of
Belgium, noted that the country’s performance was:
‘Overall quite remarkable. In particular, when we consider the combined increase
in attendance, completion and standardized scores. This increase suggests that
there has been no trade-off between quantity and quality so far, but that higher
quality may have reinforced the motivation to stay in and complete school.’38
Similarly, Oxford University’s Department of International Development has carried
out a long-term study in four countries, including Vietnam,39 which found that
‘Vietnam is a beacon of hope’ and that pupil performance there is ‘truly exceptional’.40
One of the most impressive aspects of the Vietnam story is the modesty of
representatives of the Vietnamese government, who are keen to point out that
much more remains to be done and that the system is far from perfect. There are
challenges, for example, in the rate of school completion. As Figure 2.4 shows, the
school drop-out rate is still high, although it is lower in urban areas and has been
steadily decreasing. The primary to secondary transition rate was only 93.4 per cent
in 2012 and only 87.1 per cent for females.41
Mathematics science reading
Score Rank Score Rank Score Rank
vietnam 511 17th 528 8th 508 19th
oECd average 494 501 496
figurE 2.1: TaBlE shoWing sCorE and ranK of viETnaM and ThE oECd avEragE froM 2012 pisa TEsTs34
% of low performers (scoring below level 2)
% of top performers (scoring at level 5 or 6)
Mathematics Science Reading Mathematics Science Reading
vietnam 14.2 9.4 6.7 13.3 4.5 8.1
oECd average 23.0 18.0 17.8 12.6 8.4 8.4
figurE 2.2: TaBlE shoWing pErCEnTagE of loW and Top pErforMErs in viETnaM, as MEasurEd By pisa 201235
ChapTEr 2: ho Chi Minh CiTy, viETnaM
34 OECD 2014 35 OECD 2014 36 OECD 2003 37 Dubow et al. 2009 38 World Bank 2011 (p.12) 39 Young Lives 2014 40 Boyden 2013 41 UNESCO 2015
One of the most impressive aspects of the Vietnam story is the modesty of representatives of the Vietnamese government, who are keen to point out that much more remains to be done and that the system is far from perfect
28
ChapTEr 2: ho Chi Minh CiTy, viETnaM
100%
90%
80%
70%
60%
50%
40%
30%
20%
10%
0%
PER
CEN
TAG
E O
F ST
UD
ENTS
SC
OR
ING
LEV
EL 2
OR
ABO
VE
IN M
ATH
EMAT
ICS
(PIS
A 20
12)
GDP PER CAPITA, PPP (CURRENT INTERNATIONAL $)
0
5,00
0
10,0
00
15,0
00
20,0
00
25,0
00
30,0
00
35,0
00
40,0
00
45,0
00
50,0
00
VIETNAM
FIGURE 2.3: PERCENTAGE OF STUDENTS SCORING LEVEL 2 OR ABOVE IN MATHEMATICS (PISA 2012) COMPARED WITH THEIR GDP (ONLY COUNTRIES WITH GDP OF $50,000 OR LESS INCLUDED)42
1989
1999
2009
25%
20%
15%
10%
5%
0%PER
CEN
TAG
E O
F 5-
18 Y
EAR
OLD
S TH
AT D
RO
P
OU
T O
F SC
HO
OL
ALL
URBAN
RURAL
FIGURE 2.4: SCHOOL DROP-OUT RATES AMONG THE POPULATION OF VIETNAM AGED 5–18 YEARS OLD, BY URBAN/RURAL RESIDENCE43
42 World Bank 2015b; OECD 2014 43 General Statistics Office of Vietnam 2010 (p.35)
29

The evidence from PISA and other studies shows that Vietnam’s success is magnified
in urban areas. PISA 2012 results show that the average performance of a pupil from
a rural area, after accounting for socio-economic status, was 547 (OECD average
479), and from a city was 574 (OECD average 498).44 Meanwhile the Young Lives
project administered basic literacy and numeracy tests to 1,000 eight-year-olds,
which showed that urban children outperformed their rural peers in all cases.45
This provides a rationale for selecting one of the country’s major cities in terms of
investigating this success in a more concentrated locale. The choice of Ho Chi Minh
City was prompted by data from the 2009 Vietnam Population and Housing Census,
which shows that of all the provinces in Vietnam, HCMC had the third-highest
proportion of over five-year-olds with completed upper, secondary and higher
education and the joint-highest literacy rate of the population aged 15 and older.46
Graduation rates in HCMC have steadily improved over the past 15 years – see
Figure 2.5 – so that in 2013 over 99% of students enrolled in upper secondary
completed their education. Similar figures for the whole of Vietnam show that this
trend is reflected across the country, although to a lesser extent.47
an equitable system
A paper commissioned for the Education for All (EFA) Global Monitoring Report,
2013–14, suggests that when matched up to three comparator countries, the
poorest students in Vietnam perform virtually as well as even the least poor in
Ethiopia, Peru and India.48 In addition, the relationship between social background
(measured by household wealth) and performance is weakest in Vietnam.49 This
suggests that the Vietnamese system is more equitable, a position supported by
interviews with key witnesses in HCMC.
An official from the Bureau of Education and Training (BOET) in District 8 (HCMC
is divided into 24 districts) stated that he believed the improvement in HCMC had
been ‘widespread and consistent’ across the city, while both teachers and principals
working in the city used similar language to emphasise the parity amongst schools.
ChapTEr 2: ho Chi Minh CiTy, viETnaM
2001
-200
2
2002
-200
3
2003
-200
4
2004
-200
5
2005
-200
6
2006
-200
7
2007
-200
8
2008
-200
9
2009
-201
0
2010
-201
1
2011
-201
2
2012
-201
3
100%
95%
90%
85%
80%
0
PER
CEN
TAG
E O
F G
RA
DU
ATES
IN U
PPER
SEC
ON
DA
RY (H
CM
C)
FIGURE 2.5: PERCENTAGE OF UPPER SECONDARY STUDENTS WHO GRADUATE IN HCMC
The poorest students in Vietnam perform virtually as well as even the least poor in Ethiopia, Peru and India
44 OECD 2014 45 Young Lives 2006 46 General Statistics Office of Vietnam 2010 47 General Statistics Office of Vietnam c.2014 48 Rolleston et al. 2013 (p.11) 49 Rolleston et al. 2013 (p.27)
30

ChapTEr 2: ho Chi Minh CiTy, viETnaM
This view was supported by the Young Lives study: their report for UNESCO
specifically noted that ‘in Vietnam standards are high and the specific targeting of
inequality in national policy is likely linked to a relatively equitable distribution of
school quality.’50
Our expert witnesses were convinced that the effectiveness of the schools
had improved in recent years. Experienced teachers stated that they had seen
‘rapid developments over time,’ that the schools were ‘well structured, with a
strong linkage between learning levels,’ and that ‘there have been widespread
improvements in all facets of schools.
The theory of change
The approach to educational reform in HCMC, as in much of Vietnam, is multi-
faceted. The strategy for reform is based on greater investment in both teachers
and resources; the adoption of a new curriculum and new, modern, student-
centred teaching methods; and the increased professionalisation of the workforce
– all supported by focused and committed political leadership.
The Vietnamese model assumes that investment is necessary but not sufficient.
Investment alone does not necessarily bring about change, but the targeted use of
funds to improve teacher standards and training has enabled more modern forms
of pedagogy to become embedded. The story of reform in HCMC also reveals the
importance of stakeholder engagement and communication. Stakeholders at every
level of the system have a remarkable understanding of the reform agenda and the
role that they must play. There is an impressive coalition for change in HCMC that
includes both professionals at all levels of the system and parents.
FOCUSED ANDCOMMITTEDPOLITICAL
LEADERSHIP
STAKEHOLDERENGAGEMENT
HO CHIMINHCITY
INVESTMENTIN TEACHERS
ANDRESOURCES
NEWCURRICULUM
ANDPEDAGOGY
INCREASEDPROFESSIONAL-
ISATION OFWORKFORCE
Our expert witnesses were convinced that the effectiveness of the schools had improved in recent years
50 Rolleston et al. 2013 (p.31)
figurE 2.6: ThEory of ChangE
31

ChapTEr 2: ho Chi Minh CiTy, viETnaM
51 World Bank 2006 (p.37) 52 Tan Dung 2012 53 Tan Dung 2012
focused and sustained leadership
The reform of Vietnam’s education system has taken place over a period of more
than 15 years. Our expert witnesses described a consistent reform policy that
could be traced back to political decisions in the period 1998–2000. As early as
2006 the World Bank commented favourably on the long-term approach adopted
by the government of Vietnam which was showing both determination and
consistency in their actions to reform school education.51 During the subsequent
decade the government of Vietnam has continued to take action based on a clear
and consistent theory of change most recently articulated through the Education
Development Strategic Plan 2011–2020, which identified key solutions towards
meeting the objective to ‘basically and comprehensively renovate national
education toward standardization, modernization, socialization, democratization
and international integration’ by 2020.52 These solutions include increased
investment in school education, the reform of the curriculum and improved
pedagogy, and the development of the teacher workforce and school leaders.53
Building a coalition for change
Our interviews with stakeholders in HCMC suggested that there had been a highly
successful communications strategy resulting in a shared understanding of the
reform agenda at every level of the system, including both professionals of all
types and parents and community groups. A school principal highlighted the ‘close
collaboration among relevant authorities, including the BOET, DOET and MOET’,
noting that ‘parents are an important link in this chain as well.’ An official from
HCMC mentioned how this close collaboration supported a focused approach to
education involving:
‘… many training sessions for not only principals and vice-principals but also
heads of subject groups and chairmen of trade unions across educational
institutions so that they will ... form a strong force for accomplishing the overall
mandate of education sector in the district.’ (BOET official)
The authorities in HCMC had apparently created an effective ‘coalition for
change’, with parents as a key part of the coalition. All of the teachers interviewed
mentioned the role of parents in educational transformation: ‘the improvement
comes from better awareness among parents of the importance of education for
their next generations’ (teacher); and ‘improvement comes from the requirements
of parents and pupils themselves’ (teacher). Another principal that we interviewed
emphasised the importance of parental engagement, and the role educators
needed to play in ‘propagating’ or promoting the importance of education:
‘We have to do a good job of propagating education and its importance to the
general public. Our experience is that if we want to do any activity successfully
and effectively, the first step is to gain agreement and support from parents.’
(Principal)
The reform of Vietnam’s education system has taken place over a period of more than 15 years
32
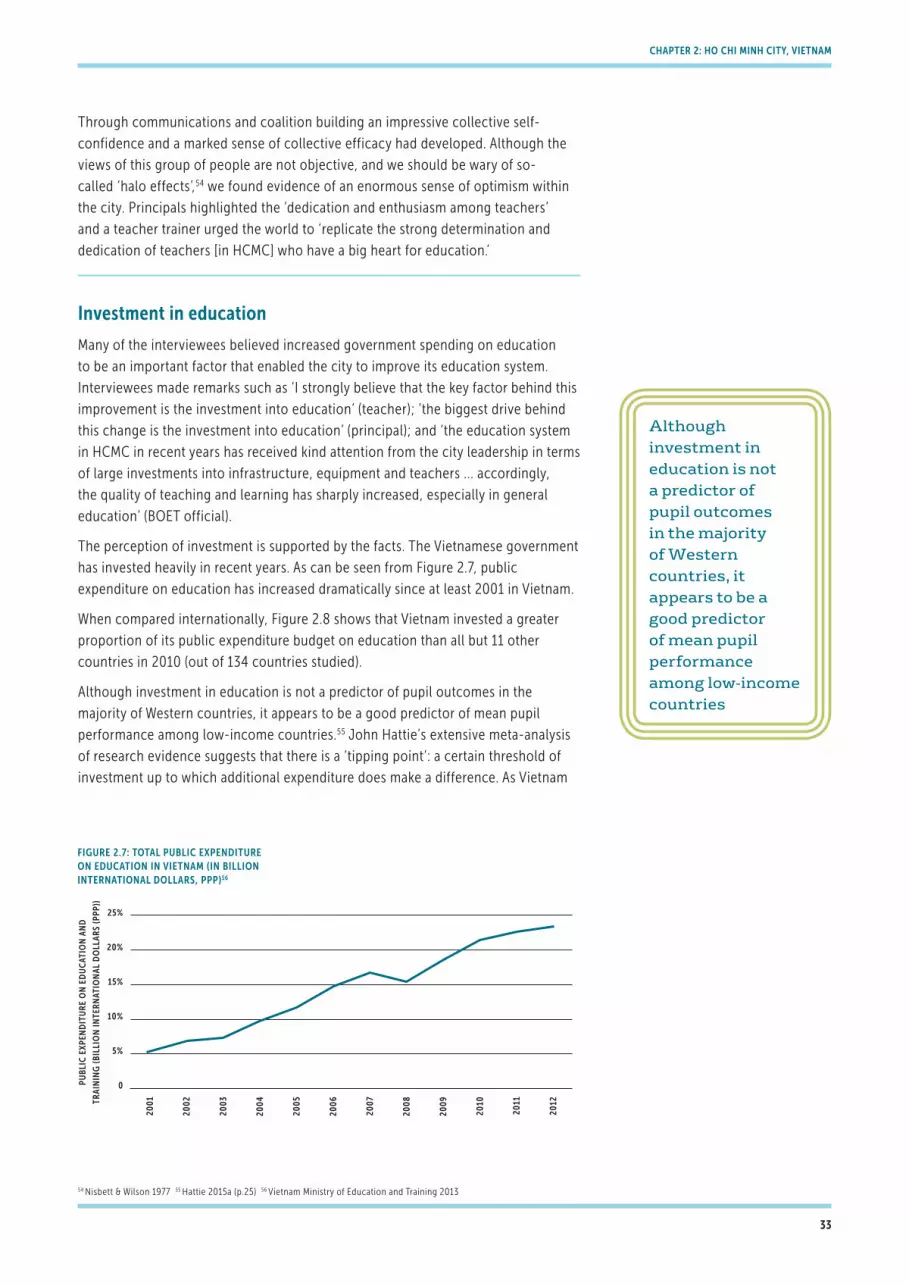
ChapTEr 2: ho Chi Minh CiTy, viETnaM
Through communications and coalition building an impressive collective self-
confidence and a marked sense of collective efficacy had developed. Although the
views of this group of people are not objective, and we should be wary of so-
called ‘halo effects’,54 we found evidence of an enormous sense of optimism within
the city. Principals highlighted the ‘dedication and enthusiasm among teachers’
and a teacher trainer urged the world to ‘replicate the strong determination and
dedication of teachers [in HCMC] who have a big heart for education.’
investment in education
Many of the interviewees believed increased government spending on education
to be an important factor that enabled the city to improve its education system.
Interviewees made remarks such as ‘I strongly believe that the key factor behind this
improvement is the investment into education’ (teacher); ‘the biggest drive behind
this change is the investment into education’ (principal); and ‘the education system
in HCMC in recent years has received kind attention from the city leadership in terms
of large investments into infrastructure, equipment and teachers ... accordingly,
the quality of teaching and learning has sharply increased, especially in general
education’ (BOET official).
The perception of investment is supported by the facts. The Vietnamese government
has invested heavily in recent years. As can be seen from Figure 2.7, public
expenditure on education has increased dramatically since at least 2001 in Vietnam.
When compared internationally, Figure 2.8 shows that Vietnam invested a greater
proportion of its public expenditure budget on education than all but 11 other
countries in 2010 (out of 134 countries studied).
Although investment in education is not a predictor of pupil outcomes in the
majority of Western countries, it appears to be a good predictor of mean pupil
performance among low-income countries.55 John Hattie’s extensive meta-analysis
of research evidence suggests that there is a ‘tipping point’: a certain threshold of
investment up to which additional expenditure does make a difference. As Vietnam
2001
2002
2003
2004
2005
2006
2007
2008
2009
2010
2011
2012
25%
20%
15%
10%
5%
0PUBL
IC E
XPEN
DIT
UR
E O
N E
DU
CAT
ION
AN
D
TRA
ININ
G (B
ILLI
ON
INTE
RN
ATIO
NA
L D
OLL
AR
S (P
PP))
FIGURE 2.7: TOTAL PUBLIC EXPENDITURE ON EDUCATION IN VIETNAM (IN BILLION INTERNATIONAL DOLLARS, PPP)56
Although investment in education is not a predictor of pupil outcomes in the majority of Western countries, it appears to be a good predictor of mean pupil performance among low-income countries
54 Nisbett & Wilson 1977 55 Hattie 2015a (p.25) 56 Vietnam Ministry of Education and Training 2013
33
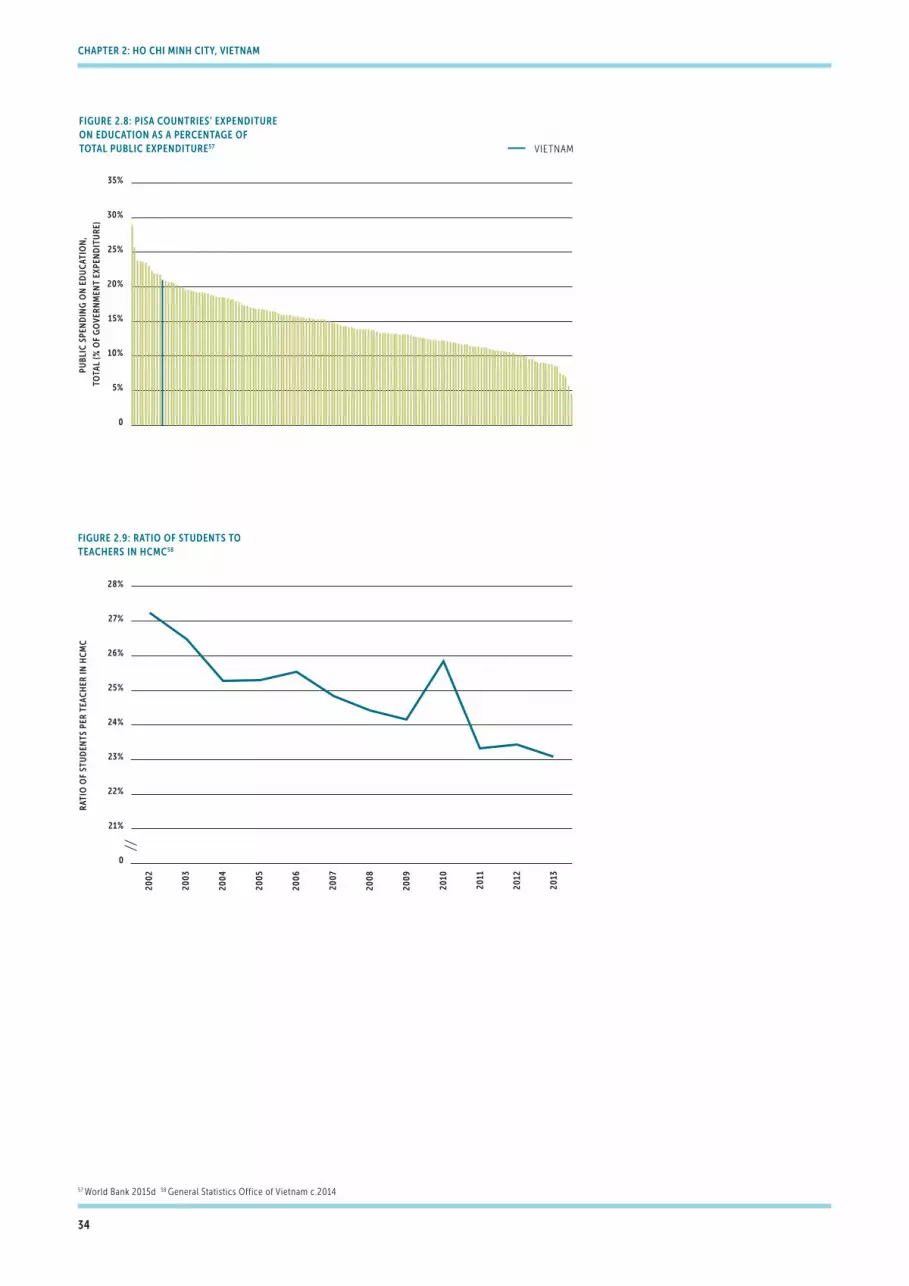
ChapTEr 2: ho Chi Minh CiTy, viETnaM
35%
30%
25%
20%
15%
10%
5%
0
PUBL
IC S
PEN
DIN
G O
N E
DU
CAT
ION
,
TOTA
L (%
OF
GO
VER
NM
ENT
EXPE
ND
ITU
RE)
VIETNAM
FIGURE 2.8: PISA COUNTRIES’ EXPENDITURE ON EDUCATION AS A PERCENTAGE OF TOTAL PUBLIC EXPENDITURE57
2002
2003
2004
2005
2006
2007
2008
2009
2010
2011
2012
2013
28%
27%
26%
25%
24%
23%
22%
21%
0
RAT
IO O
F ST
UD
ENTS
PER
TEA
CH
ER IN
HC
MC
FIGURE 2.9: RATIO OF STUDENTS TO TEACHERS IN HCMC58
57 World Bank 2015d 58 General Statistics Office of Vietnam c.2014
34
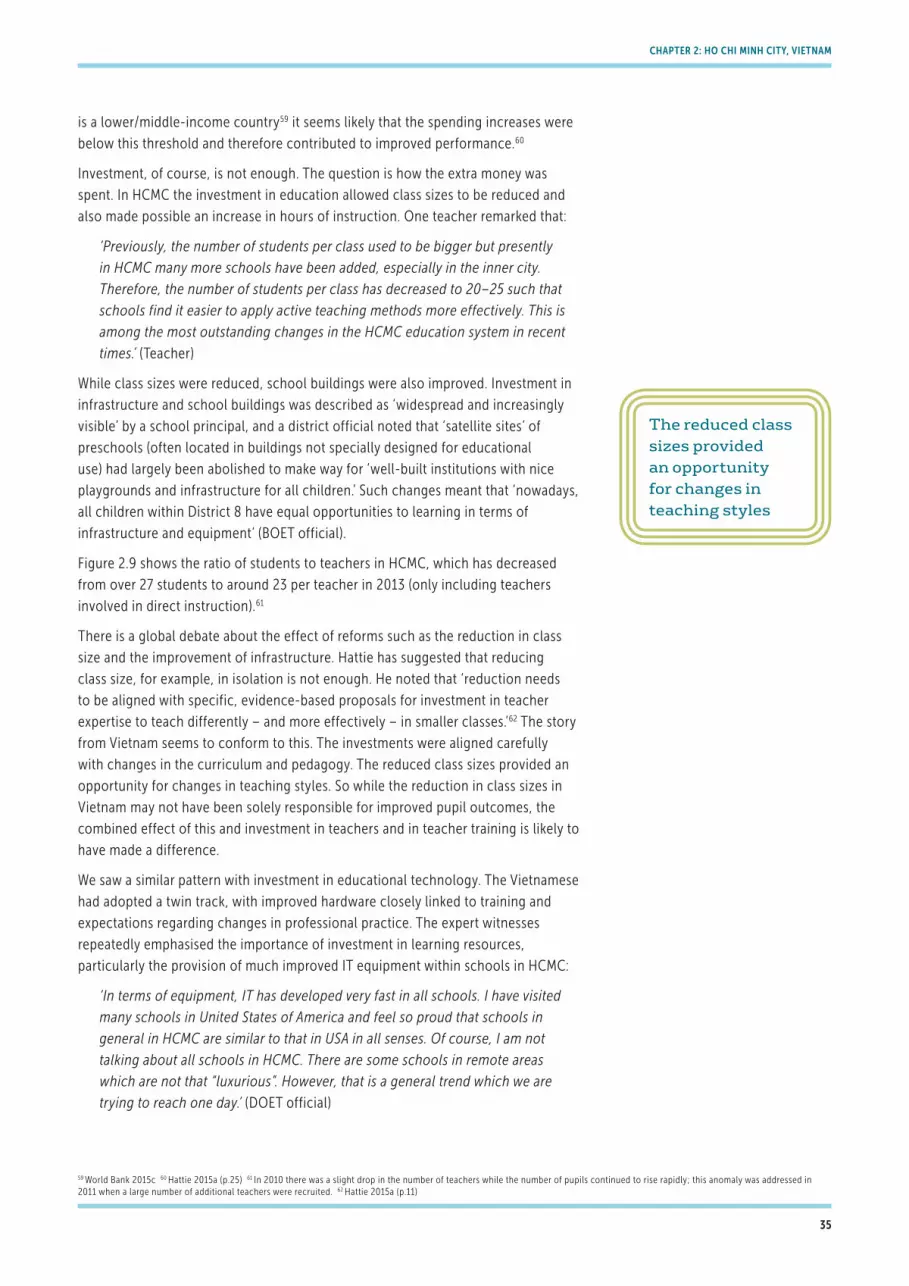
ChapTEr 2: ho Chi Minh CiTy, viETnaM
is a lower/middle-income country59 it seems likely that the spending increases were
below this threshold and therefore contributed to improved performance.60
Investment, of course, is not enough. The question is how the extra money was
spent. In HCMC the investment in education allowed class sizes to be reduced and
also made possible an increase in hours of instruction. One teacher remarked that:
‘Previously, the number of students per class used to be bigger but presently
in HCMC many more schools have been added, especially in the inner city.
Therefore, the number of students per class has decreased to 20–25 such that
schools find it easier to apply active teaching methods more effectively. This is
among the most outstanding changes in the HCMC education system in recent
times.’ (Teacher)
While class sizes were reduced, school buildings were also improved. Investment in
infrastructure and school buildings was described as ‘widespread and increasingly
visible’ by a school principal, and a district official noted that ‘satellite sites’ of
preschools (often located in buildings not specially designed for educational
use) had largely been abolished to make way for ‘well-built institutions with nice
playgrounds and infrastructure for all children.’ Such changes meant that ‘nowadays,
all children within District 8 have equal opportunities to learning in terms of
infrastructure and equipment’ (BOET official).
Figure 2.9 shows the ratio of students to teachers in HCMC, which has decreased
from over 27 students to around 23 per teacher in 2013 (only including teachers
involved in direct instruction).61
There is a global debate about the effect of reforms such as the reduction in class
size and the improvement of infrastructure. Hattie has suggested that reducing
class size, for example, in isolation is not enough. He noted that ‘reduction needs
to be aligned with specific, evidence-based proposals for investment in teacher
expertise to teach differently – and more effectively – in smaller classes.’62 The story
from Vietnam seems to conform to this. The investments were aligned carefully
with changes in the curriculum and pedagogy. The reduced class sizes provided an
opportunity for changes in teaching styles. So while the reduction in class sizes in
Vietnam may not have been solely responsible for improved pupil outcomes, the
combined effect of this and investment in teachers and in teacher training is likely to
have made a difference.
We saw a similar pattern with investment in educational technology. The Vietnamese
had adopted a twin track, with improved hardware closely linked to training and
expectations regarding changes in professional practice. The expert witnesses
repeatedly emphasised the importance of investment in learning resources,
particularly the provision of much improved IT equipment within schools in HCMC:
‘In terms of equipment, IT has developed very fast in all schools. I have visited
many schools in United States of America and feel so proud that schools in
general in HCMC are similar to that in USA in all senses. Of course, I am not
talking about all schools in HCMC. There are some schools in remote areas
which are not that “luxurious”. However, that is a general trend which we are
trying to reach one day.’ (DOET official)
The reduced class sizes provided an opportunity for changes in teaching styles
59 World Bank 2015c 60 Hattie 2015a (p.25) 61 In 2010 there was a slight drop in the number of teachers while the number of pupils continued to rise rapidly; this anomaly was addressed in 2011 when a large number of additional teachers were recruited. 62 Hattie 2015a (p.11)
35
ChapTEr 2: ho Chi Minh CiTy, viETnaM
‘All preschools, primary schools, lower secondary schools have equipped
themselves with interactive whiteboards through which teachers are also given
the chance to make best use of IT applications in their teaching and learning
practices.’ (BOET official)
‘In my school, in every classroom, the audio system has been installed
including projectors, speakers, interactive whiteboards.’ (Principal)
As with the reduced class sizes, there was an expected trade-off between increased
resources and changed pedagogy. This relationship was highlighted by one teacher
we interviewed:
‘IT applications help us to teach interactively. When students acquire
knowledge and skills from that interactive whiteboard, I see that they are so
happy and excited to interact with us directly.’
school leadership
Headteachers play a pivotal role in the school system in HCMC. In addition, the
senior managers who manage the ‘middle tier’ school effectiveness organisations
– the DOET and BOET – are invariably former headteachers chosen for their
effectiveness as school leaders. There are regular meetings of headteachers at
BOET level to undertake joint problem solving. Interviewees described the vertical
and horizontal dimensions of these meetings, by which they meant that there was
a collaborative horizontal or peer-to-peer element to the process and there was
also a form of vertical or ‘top-down’ accountability built in to these arrangements.
There are also formal partnership arrangements between some of the more
effective and less effective schools, brokered by the middle-tier authorities.
There are some distinctive features to school leadership in Vietnam. Unusually,
headteachers are elected by staff members, including both teaching and non-
teaching staff and approved by the authorities. Headteachers have a greater degree
of site-level autonomy than is found in many systems. They have a degree of
discretion regarding finance. They have control over staff appointments, with the
exception of the appointment of vice-principals.
The concept of school leadership found in HCMC corresponds closely to the idea
of the instructional leader, whose primary function is to monitor and improve the
quality of teaching. As a result, the performance management of teachers featured
prominently in the work of the headteachers of HCMC. Our interviewees expressed
surprise when we asked the question about whether headteachers were involved
in the observing of their staff. They took it for granted that this was the central
accountability of the effective headteacher.
The training of school leaders is taken seriously. Vietnam has two national
institutes for the development of educational leaders including school principals:
one for the north and one for the south of the country, based in Hanoi and HCMC
respectively. In addition to the training of education leaders the institutes also
undertake research into aspects of education management. Future principals and
vice-principals are given training prior to taking up their roles.
The concept of school leadership found in HCMC corresponds closely to the idea of the instructional leader, whose primary function is to monitor and improve the quality of teaching
36

Changes in curriculum and pedagogy
One major milestone in the education reform journey of Vietnam was the adoption
of a ‘National Curriculum of Basic Education’ in 2002 to cover primary and lower
secondary education.63 This required teachers to approach pedagogy in a much
more student-centred way. The 2002 curriculum set out to ‘strengthen students’
ability to cooperate and self-study and to apply knowledge in practice.’64 Part of
the underlying philosophy of this curriculum was that it ‘should focus on children,
based on their positive activities to help them create the demands of studies and
learn how to teach themselves, seek and acquire new knowledge by themselves.’65
The approach signalled a partial move away from the traditional Vietnamese
pedagogy towards a new, modern pedagogy. Our expert witnesses repeatedly
described the importance of the subsequent push for teachers to adopt the new
pedagogy.
A 2006 World Bank report highlighted that since 2000 ‘Vietnam has continuously
made efforts to build an education system ... with a learner-centred approach
to education ... [and] to meet people’s diverse learning needs.’66 It was clear
throughout the interviews conducted almost a decade later that these changes in
curriculum and pedagogy (‘teaching content and methods’) remained particularly
prominent aspects of the reform agenda in the minds of our witnesses. Every single
one of those interviewed mentioned these reforms as having a considerable effect
on the education system and they all identified such changes as playing some part
in Vietnam’s education success.
A principal from HCMC suggested that since the turn of the century the style
of pedagogy has changed significantly, moving away from a ‘one-way style of
communication’ within the classroom. The ‘old-fashioned’ method of traditional
teaching was characterised as ‘passive’ by teachers and principals alike, with one
teacher stating that:
‘10–15 years back, in most cases, teachers were the key speakers in the class;
students just sat silently to listen passively to what the teacher was saying.
Students did not raise questions or seek further clarifications from the teachers.
Students were learning in a very passive way.’ (Teacher)
An official from the DOET in HCMC believed that previously ‘students did not know
how to apply what they had learnt in the classroom, nor did they know how to
solve real world problems. The official criticised the traditional teaching method
for not ‘bringing together knowledge from various subjects’, instead treating them
as stand-alone and isolated from each other.
In contrast, the current situation in HCMC was viewed far more positively, with a
mixed approach favoured amongst the majority of those interviewees working in
schools:
‘Both a traditional approach and new teaching approach are combined to teach
students. In doing so, we have drawn the best of both approaches together.
Specifically, when it comes to the traditional approach, the teacher would play
ChapTEr 2: ho Chi Minh CiTy, viETnaM
One major milestone in the education reform journey of Vietnam was the adoption of a ‘National Curriculum of Basic Education’ in 2002 to cover primary and lower secondary education
63 UNESCO c.2001 (p.3) 64 Bodewig & Badiani-Magnusson 2014 (p.120) 65 UNESCO c.2001 (p.5) 66 World Bank 2006 (p.37)
37

an active role in terms of transferring core knowledge and skills to students,
using textbooks and guidebooks. When it comes to the new approaches,
we have allowed the use of modern teaching methods such as group-work,
inquiry-based approaches, active teaching and learning.’ (Teacher)
A university vice-dean emphasised that the context of the situation helped
determine the blend of teaching methods and an official from District 8 BOET
said that ‘a combination of teacher-centred and student-centred approaches are
applied, coupled with the real-life knowledge embedded in the lessons given by
teachers.’
The new modern pedagogy was described in depth by many of the interviewees.
Broadly speaking it was characterised as ‘leaving room for the students to work
for themselves’ and adopting a ‘child-centred approach’ (both quotes from
teachers). As a result of specific methods – such as ‘problem-solving methods,
inquiry-based methods, active teaching and learning, game methods, group-
work’ (teacher) – contact time between teachers and students was ‘optimised’
(Principal).
Andreas Schleicher noted in a 2015 article that ‘students [in Vietnam] are
expected to leave education not just able to recite what they have learned
in class, but to apply those concepts and practices in unfamiliar contexts.’67
The curriculum reforms were linked to a view of 21st-century workforce
requirements. In particular there was an emphasis on the need for both academic
achievement and the development of the soft skills needed in the modern
workplace:
‘The bottom line is that as our society is growing very fast with increasing
requirements at work: students must be ready to work in the competitive
environment. It is the teacher’s job to prepare students with such skills.’
(University vice-dean)
‘They learn not just academic knowledge but also life skills through what is
known as integrated learning.’ (Principal)
‘Nowadays, however, the active teaching method has focused on fostering
skills for students, teaching them how to think – “meta-cognitive thinking” –
or learning how to learn.’ (DOET official)
‘Classroom teachers must be able to create momentum for students, letting
them know the real purpose of schooling, why they should go to school
instead of staying back home, inspiring them in educational activities.’
(Teacher)
The changes in curriculum and pedagogy in Vietnam were the result of national
directives from the MOET, but the evidence from the interviewees suggests
that the education community in HCMC was at the forefront of these changes,
adopting them readily and rapidly. The clear message which emerged from those
educators spoken to was that a combined approach had been pursued, retaining
aspects of the traditional method of teaching while encouraging ‘active learning’
through a raft of new approaches and teaching styles.
ChapTEr 2: ho Chi Minh CiTy, viETnaM
In particular there was an emphasis on the need for both academic achievement and the development of the soft skills needed in the modern workplace
67 Schleicher 2015
38

improving the teacher workforce
There has been a marked improvement in the qualification levels of the teacher
workforce since 2000. Teachers in Vietnam are required to possess a teaching
qualification: as shown in Figure 2.10 (from the Vietnamese Ministry of Education
and Training), around 99% of teachers at all stages are now qualified. The
improvement in qualification levels has been more marked in the primary and
lower secondary phases.
The trend towards a better qualified workforce appeared to be particularly notable
in HCMC. One of the teachers interviewed, who had spent time teaching in other
parts of Vietnam before HCMC, remarked that ‘compared to teachers in other
provinces of the country, teachers of general education in HCMC generally have
higher qualifications.’ Interviewees suggested that it was now possible to attract
highly skilled people into the school teaching profession. A DOET official told us:
‘I strongly believe that quality of teaching staff is exceptionally high – there is no
teacher who is “under-qualified” according to the standards set out by the MOET.’
The performance management of teachers is a very prominent feature of the
Vietnamese system. Vietnam adopted teacher professional standards in 2007,
differentiated by education stage and by seniority. These standards encompass a
teacher’s knowledge, pedagogical skills, attitudes and behaviour.68 These standards
are used as a key means of improving the profession and are closely tied to a
number of accountability measures. PISA 2012 showed that monitoring of teachers
in Vietnam is far more widespread than in the vast majority of countries or the
OECD average (see Figure 2.11).
ChapTEr 2: ho Chi Minh CiTy, viETnaM
1999
-200
0
2000
-200
1
2001
-200
2
2002
-200
3
2003
-200
4
2004
-200
5
2005
-200
6
2006
-200
7
2007
-200
8
2008
-200
9
2009
-201
0
2010
-201
1
2011
-201
2
2012
-201
3
100%
95%
90%
85%
80%
75%
0
PER
CEN
TAG
E O
F Q
UA
LIFI
ED T
EAC
HER
S
FIGURE 2.10: PERCENTAGE OF QUALIFIED TEACHERS IN VIETNAM69
UPPER SECONDARY WITH STANDARDQUALIFICATION AND OVER
LOWER SECONDARY TEACHERS WITH STANDARD QUALIFICATION AND OVER
PRIMARY TEACHERS WITH STANDARDQUALIFICATION AND OVER
The trend towards a better qualified workforce appeared to be particularly notable in HCMC
68 World Bank 2011 (p.8) 69 Vietnam Ministry of Education and Training 2013
39

Meanwhile, these monitoring activities are more likely to have direct consequences
for the teachers in Vietnam than elsewhere (e.g. a change in salary) (Figure 2.12).
Although such strong connections between measures of teacher performance
and salary/career progression mark Vietnam out when compared with other
PISA countries (only one other country had such a high percentage of principals
reporting these connections) the interviews did not suggest that teachers resented
this level of accountability. One teacher said:
‘The teachers in HCMC are highly regarded for their high level of
professionalism, dedication, and strong determination: a great desire for
students’ successes. Also, teachers are very hard-working in trying to update
their knowledge and skills ... I believe that teachers always act as the key agents
to the successes of students. It is therefore extremely important to devise
proper policies for teachers so that they have a strong incentive to work in
teaching occupations.’ (Teacher)
As well as the strong accountability system in Vietnam, there exists an extensive
network of support for teachers through training and mentoring: 99 per cent of
principals in Vietnam reported that there was a teacher mentoring programme
within their school.72 There is university-level training as well as sessions on
pedagogy run by the BOET or DOET; one principal noted that she sends teachers
on these sessions and then expects them to share the training with other staff
members. There is also an experimental school connected to Sai Gon University
which gives trainee teachers the chance to ‘experiment new teaching styles’
according to one our interviewees who was involved in teacher training.
Continuing education for teachers is compulsory in Vietnam; over half of teachers
surveyed in PISA 2102 (all mathematics teachers) had attended a programme
of professional development within the previous three months.73 Teachers are
expected to attend training institutes during the summer vacation. In addition there
is substantial informal professional development as teachers jointly plan schemes
ChapTEr 2: ho Chi Minh CiTy, viETnaM
Test or assessments of student achievement
Teacher peer review of lesson plans, assessment instruments and lessons
principal or senior staff observations of lessons
observations of classes by inspectors or other persons external to school
vietnam 98 83 97 85
oECd average 78 60 69 27
figurE 2.11: pErCEnTagE of sTudEnTs in sChools WhErE ThE prinCipal rEporTEd ThE folloWing MoniToring METhods70
figurE 2.12: pErCEnTagE of sTudEnTs in sChools WhosE prinCipal rEporTEd ThaT appraisals or fEEdBaCK lEd dirECTly To ThE lisTEd aCTions71
a change in salary
a financial bonus
opportunities for professional development
a change in the likelihood of career advancement
public recognition from the principal
a role in school development initiatives
vietnam 72 92 98 95 99 92
oECd average 27 30 73 53 79 81
As well as the strong accountability system in Vietnam, there exists an extensive network of support for teachers through training and mentoring
70 OECD 2013b (p.156) 71 OECD 2013b (p.157) 72 OECD 2013b (p.153) 73 OECD 2013b (p.102)
40
of work together. There are weekly ‘professional briefing sessions’ in which
teachers reflect together on how well their teaching has gone and develop plans
together.
Outstanding teachers are designated as ‘key teachers’ for the purpose of
professional development and run school-based professional development
workshops using materials developed centrally. Training sessions of this type have
been provided, for example, related to the pedagogical approaches that underpin
the new curriculum such as whole-class presentation, managing class discussion,
collaborative work and interactive learning.
summary
Following a strong performance in PISA 2012 Vietnam caught the world’s attention.
Our research suggests that this success was not just a one-off, and that the
education system in the country has been steadily improving for over a decade,
particularly in major cities such as HCMC. The national and local government
implemented a reform programme based on a comprehensive theory of change
using a small number of linked key policy levers: targeted investment, a changed
curriculum and pedagogy, and a focus on teacher quality. Alongside this, there has
been an emphasis on communications and the creation of a social coalition for
change. Educators have engaged widely with stakeholders throughout, capitalising
on what one interviewee referred to as the ‘human factor’:
‘I believe that people are always the most important factors in the entire
process. When I refer to people, I mean everyone in the process: including
relevant authorities; educational managers; teachers; parents. Put it this way, if
infrastructure and equipment are well-furnished, but there is no good teacher
there to teach students, then there is no quality education. Therefore, it is the
human factor that creates the success story in education.’ (Teacher)
Education reform in Vietnam has enjoyed committed political support, and this
was evident in discussions with participants in HCMC. There has been a striking
harmonisation of activity at the different levels of political influence in the city (at
national, municipal and district level) which has enabled a coherent approach to
the reform measures. Investment in additional resources in HCMC has been closely
linked to pedagogical changes. There is now a new consensus about teaching,
combining traditional, more didactic approaches with newer methods that are
more learner-centric. This combination of investment, particularly to reduce class
sizes, together with better training for teachers and the implementation of a new
approach to teaching appears to have made a substantial contribution to HCMC’s,
and Vietnam’s, success.
ChapTEr 2: ho Chi Minh CiTy, viETnaM
There is now a new consensus about teaching, combining traditional, more didactic approaches with newer methods that are more learner-centric
41

Chapter 3
London, UK

London, the capital of the UK, is the most populous city in Europe. With over 8.6 million inhabitants, it accounts for over a tenth of the entire population of the country.
Education in London, organised across 33 districts or local authorities (LAs), has
experienced a remarkable transformation since 2000; with school-level attainment
rising dramatically over the past 15 years.
The investigation of London’s education journey was based upon two previous
studies conducted by CfBT Education Trust and Centre for London.74 As well as
reviewing literature and conducting a thorough analysis of available data, 25
experts were interviewed who had been involved in London’s education reforms,
including academics, headteachers, local government officials and politicians.
Focus group interviews were also conducted with 26 participants at five London
schools, involving a mixture of teachers and school leaders.
Students in London now outperform every other region in the country based upon
school leavers’ examinations; a greater number of London’s students progress
to university compared to the rest of the country;75 and the gap in attainment
between the most disadvantaged students and others is lower in London than in
the rest of England.
London’s improvement can be most markedly seen when compared with the
rest of England: Figure 3.1 shows the performance at GCSE (General Certificate
of Secondary Education, the standard school leavers’ examinations in England,
sat at age 15/16) of students by region. Inner London (comprising 14 of the most
74 McAleavy & Elwick 2015; Baars et al. 2014 75 HEFCE 2012 (p.3) 76 DfES 2004
ChapTEr 3: london, uK
PER
CEN
TAG
E O
F ST
UD
ENTS
AC
HIE
VIN
G 5
A*–
C
60%
50%
40%
30%
20%
10%
0%
INN
ER L
ON
DO
N
YOR
KS
& H
UM
BER
NO
RTH
EA
ST
NO
RTH
WES
T
LON
DO
N
WES
T M
IDLA
ND
S
EAST
MID
LAN
DS
ENG
LAN
D
OU
TER
LO
ND
ON
EAST
SOU
TH W
EST
SOU
TH E
AST
FIGURE 3.1: PERCENTAGE OF STUDENTS ACHIEVING 5 A*–C AT GCSE IN 2003, BY REGION76
London, UK
43

deprived LAs in the country78) was ranked last of all the regions in 2003 (shown in
blue), while London as a whole was ranked sixth out of the nine overarching regions.
By 2014, as can be seen in Figure 3.2, London was the best-performing region in
the country, with inner London outperforming every other area aside from outer
London.
The inspection body in England, Ofsted, inspects all publicly funded schools
and some private schools. Figure 3.3 shows the percentage of schools inspected
in London that achieved either a Good or Outstanding judgement (the top two
categories) – which has increased each year since a new framework was introduced
in 2010. Good or better schools now account for 86 per cent of all schools in
London (compared with 81 per cent in England as a whole), with just one per cent of
schools rated as Inadequate (the lowest category).79
It is also possible to use school inspection results to compare how the most
deprived schools do. Figure 3.4 shows that while London outperforms England by
five percentage points across all schools, the gap increases to nine percentage
points when only taking into account the most deprived schools. This suggests that
London has created a more equitable system in which the correlation between the
level of deprivation and the attainment of students is weaker.
The level of equity in London can also be demonstrated by comparing how the city’s
most disadvantaged students do in national examinations. Figure 3.5 shows how
high-poverty students performed in each of England’s local authorities in 2014; with
those in London generally doing significantly better than those across the rest of the
country. The performance of high-poverty students in London has also improved at
a much greater rate than in other regions: in 2012 54 per cent achieved five or more
good grades in their GCSEs compared with 40 per cent of high-poverty students in
the next best performing region.80
77 DfE 2015a 78 DfE 2014 79 Ofsted 2015 80 Greaves, Macmillan & Sibieta 2014
ChapTEr 3: london, uK
Good or better schools now account for 86 per cent of all schools in London (compared with 81 per cent in England as a whole), with just one per cent of schools rated as Inadequate (the lowest category)
PER
CEN
TAG
E O
F ST
UD
ENTS
AC
HIE
VIN
G 5
A*–
C
INC
LUD
ING
EN
GLI
SH A
ND
MAT
HEM
ATIC
S
60%
50%
40%
30%
20%
10%
0%
YOR
KS
& H
UM
BER
EAST
MID
LAN
DS
NO
RTH
EA
ST
WES
T M
IDLA
ND
S
NO
RTH
WES
T
SOU
TH W
EST
ENG
LAN
D
EAST
SOU
TH E
AST
INN
ER L
ON
DO
N
LON
DO
N
OU
TER
LO
ND
ON
FIGURE 3.2: PERCENTAGE OF STUDENTS ACHIEVING 5 A*–C INCLUDING ENGLISH AND MATHEMATICS AT GCSE IN 2014, BY REGION77
44

ChapTEr 3: london, uK
ALL
SCHOOLS
MOST
DEPRIVED
SCHOOLS
PERCENTAGE OF SCHOOLS JUDGED GOOD OR OUTSTANDING AT INSPECTION
100%0% 10% 20% 30% 40% 50% 60% 70% 80% 90%
FIGURE 3.4: INSPECTION GRADES FOR ALL SCHOOLS AND MOST DISADVANTAGED SCHOOLS (PERCENTAGE OF SCHOOLS JUDGED GOOD OR BETTER)82
5PTS
9PTS
ENGLAND
LONDON
100%
90%
80%
70%
60%
50%
40%
30%
20%
10%
0%
PER
CEN
TAG
E O
F H
IGH
–PO
VER
TY S
TUD
ENTS
ATT
AIN
ING
5 O
R M
OR
E G
OO
D
GR
AD
ES A
T G
CSE
INC
LUD
ING
EN
GLI
SH A
ND
MAT
HEM
ATIC
S
LONDON LOCAL AUTHORITY
NON-LONDON LOCAL AUTHORITY
FIGURE 3.5: RESULTS OF HIGH-POVERTY STUDENTS BY LOCAL AUTHORITY (EACH LINE REPRESENTS THE PERFORMANCE OF STUDENTS IN ONE LOCAL AUTHORITY)83
100%0% 10% 20% 30% 40% 50% 60% 70% 80% 90%
2010
2011
2012
2013
2014
PERCENTAGE OF ALL SCHOOLS IN LONDON
FIGURE 3.3: OFSTED JUDGEMENTS OF SCHOOLS IN LONDON81
INADEQUATE
SATISFACTORY/REQUIRES IMPROVEMENT
GOOD OR OUTSTANDING
81 Ofsted 2015 82 Ofsted 2015 83 Ofsted 2014
45

SUSTAINEDPOLITICAL
LEADERSHIP
EFFECTIVEUSE OF DATA
LONDON
SCHOOLLEADERS ACT
AS SYSTEMLEADERS
OPENING UPTHE SYSTEM
TO NEWPROVIDERS
IMPROVINGTHE QUALITYAND SUPPLY
OF TEACHERS
ChapTEr 3: london, uK
It should be noted that London’s students are different from those in the rest of
England; in particular London has a higher proportion of non-white British students
than the country as whole. It can be shown that this particular ethnic mixture is
partly responsible for London’s high-performing results, although when using the
standard government performance measures, even controlling for ethnicity and
prior achievement, students in London still perform significantly better.84
A lack of authoritative evidence – apportioning relative success to each of the
reforms enacted in London – can be partly attributed to the lack of randomised
controlled trials related to the implementation of such reforms. As such, a number of
competing theories have been advanced which attempt to explain London’s success
(e.g. that the improvement in London at GCSE was caused by an improvement at
primary level85). This study draws heavily on the views of the expert witnesses that
were interviewed in order to identify the range of factors involved, although it does
not attempt to differentiate just how much relative impact each had.
The theory of change
Political support for London’s reforms has been unusually sustained and has made
possible the implementation of a reform strategy based on a coherent theory of
change. Built upon strong leadership at every level of the system, and the use of
school leaders as system leaders, the internal effectiveness of schools has changed
for the better. London’s reforms, focused on a successful school improvement
programme, were underpinned by particularly effective use of data. Programmes
such as Teach First brought greater numbers of talented and idealistic new teachers
into schools serving disadvantaged communities and the UK government’s
academies programme made new forms of school governance possible and opened
up the system to new providers.
It should be noted that London’s students are different from those in the rest of England; in particular London has a higher proportion of non-white British students than the country as whole
84 Burgess 2014 (p.29) 85 Greaves, Macmillan & Sibieta 2014 (p.6); Blandson et al. 2015
figurE 3.6: ThEory of ChangE
46

86 Slater 2013a (p.30) 87 Ofsted 2015
ChapTEr 3: london, uK
political support
Political support for the changes enacted in London has remained remarkably
consistent over a continuous period of time. The five-year election cycle in the UK
has a tendency to encourage short-termist political thinking, and yet the London
reforms were allowed to take root and establish over the course of a decade.
Significantly, high-performing countries such as Singapore, Japan and Finland
have an unusual pattern of greater policy consistency over time.86
Support for reform came from the highest level. One of the interviewees was a
former junior government minister who described how during the early 2000s both
the Prime Minister and successive education ministers personally endorsed London
school reform as a priority:
‘Then, politically, you know, this was a programme that Tony Blair, Estelle
Morris, Charles Clarke, David Miliband, you know, all of the senior people in the
government that were there when it was set up, they believed in it, it came from
them and it had buy-in at the senior level. I think, again, if we hadn’t had that it
might not have had the impact that it did.’ (Former government minister).
leadership at every level
At its heart, it could be argued that the London story was about effective leadership
at every level. As one headteacher put it: ‘It’s all about leadership, isn’t it? So
whether it’s leadership at local authority level, whether it’s leadership at the
Department [for Education] level, or whether it’s leadership at the school level.’
The interviewees had, without exception, a highly positive view of the overall
quality of the leadership in London schools now, after more than a decade of
reform. One former minister talked about ‘the amazing headteachers’ of London
today. A senior academic talked about the ‘exceptional leaders and systems
leaders’ of London who were the architects of innovative new approaches to
leadership that are now widespread in London.
‘There was an increasing sense in London schools that London teachers and
London headteachers, London leaders, were there for all the children in
London, not just the children that were in their school.’ (Former headteacher).
After a decade of reform the school leaders of London were judged by Ofsted to be
more effective than those in every other region of England, with a wide difference
in the percentage of leaders judged Outstanding (see Figure 3.7).
The five-year election cycle in the UK has a tendency to encourage short-termist political thinking, and yet the London reforms were allowed to take root and establish over the course of a decade
LONDON
ENGLAND
PERCENTAGE OF SCHOOLS IN JUDGED OUTSTANDING FOR QUALITY OF LEADERSHIP
50%0% 5% 10% 15% 20% 25% 30% 35% 40% 45%
FIGURE 3.7: PERCENTAGE OF SCHOOLS GRADED OUTSTANDING FOR THEIR QUALITY OF LEADERSHIP87
47

While many headteachers before 2000 had been preoccupied with ‘firefighting’
and school-level crisis management, the headteachers of today had the
opportunity and ability to focus on the leadership of learning.
an effective school improvement programme
The London Challenge programme, a combination of approaches which together
focused on school improvement in London,88 was rolled out in two phases, firstly
across London’s secondary schools from 2003 to 2008, and then to also include
primary schools, from 2008 to 2011. The key tenet of the programme was to
provide targeted support to two high-priority groups: schools in five key districts
(where the government was particularly concerned about performance); and
underperforming schools across London that were subsequently described as ‘keys
to success’ (KTS) schools.
At the heart of the school improvement work was a twinning relationship between
the low-performing schools and high-performing schools which were designated
as teaching schools. The heads of the teaching schools and other outstanding
headteachers provided coaching support to the heads of the low-performing
schools. One educationalist who was interviewed outlined the underlying ethos
behind the programme:
‘And that sounds a little bit idealistic but I kind of think there was a bit of that,
and still is. So that sense of collaborating for the London child rather than just
for the child that goes to your school is really important. But, you know, that’s
sort of underpinned by a kind of moral purpose; that we’re here not just for our
own self-aggrandisement or for the benefit of our own school; we’re here for
the system in London.’ (Former headteacher)
Our interviewees regularly cited the people involved in education in London as
the crucial lever which enabled improvement: a senior official who had worked at
the Department of Education said: ‘I personally put that down to very much better
leadership of schools who focused on teaching and learning, and who became
very clever at enabling teachers to improve their game’, while the leader of a chain
of schools described the ‘one absolutely critical aspect in the London Challenge’
as having ‘the right people, then you’ve got a chance.’ The differentiating factor
in a number of local authorities can also be traced back to some inspirational
individuals: senior figures working in Tower Hamlets (an inner London local
authority) were directly named by interviewees and credited with driving
improvement through their own set of policies: ‘building quite collaborative
models ... and bringing in some great headteachers’ (former education department
official).
Professional development was another important part of the London Challenge
programme: teachers were able to engage in one of two development programmes
which led to further accreditation. A former schools inspector reflected that: ‘The
development of the leaders, recognition, means of recognition, salary scales, and
a general climate in which the teaching profession in London was recognised as
being important was key to the success.’
At the heart of the school improvement work was a twinning relationship between the low-performing schools and high-performing schools which were designated as teaching schools
ChapTEr 3: london, uK
88 Ogden 2013
48

An independent evaluation of London Challenge identified some of the indicators
of success during the final years of the programme, 2008–2011:
• The number of schools performing academically ‘below the floor target’ (a
minimum standard used by the government at the time) fell at a greater rate than
the national rate.
• The gap between the performance in tests of economically disadvantaged students
and non-disadvantaged students narrowed at both primary and secondary levels.
• The percentage of schools achieving Good or Outstanding grades from Ofsted
increased at a higher rate than the national average.89
improving teacher quality and supply
There is considerable evidence that variability in teacher effectiveness is the factor
that has the most marked impact on pupil outcomes after a pupil’s socio-economic
background.90 Attracting and retaining the most effective teachers, therefore, can
be one of the best ways to improve results for a school system.
Teacher supply was of particular concern in London during the 2000s, following a
period in 2001 when vacancy rates were over three times those across the rest of
the country.91 One of the interviewees noted:
‘At that time London schools had a serious shortage of teachers and they were
very demoralised institutions ... And the teachers themselves were leaving
London in considerable numbers or leaving teaching, and the gaps they
created were often being filled by part-time people, temporary people or
people from abroad.’ (Education department consultant)
One of the key reforms which helped to reduce this shortage, as well as improving
the standard of teaching across the city, was the creation of Teach First: the first
cohort of new teachers started work in 2003. Teach First provided a new route
into teaching for some of the most academically able graduates of UK universities.
These recruits made a commitment to teach for two years in some of the more
economically disadvantaged government schools in London. The Teach First
programme contributed significantly to a new perception of teaching in London as
a high status profession for both idealistic and talented recruits.
‘But what it [Teach First] did was it said that teaching is, you know, a top class
thing to go into. You know, it made it desirable to be a teacher … The idea
20 years ago that, you know, Russell Group universities [an association of
24 particularly high-performing and research-focused universities in the UK]
would have a roadshow coming to them which attempted to pick out the best
graduates to go into teaching … they’d have been laughed out, wouldn’t they?’
(Headteacher)
In the past many well qualified teachers have sought posts in schools serving
relatively prosperous communities. Teach First changed this by requiring
participants to teach in the capital’s most disadvantaged schools; contributing to a
renewed sense of energy and optimism in these schools.
ChapTEr 3: london, uK
Teach First provided a new route into teaching for some of the most academically able graduates of UK universities
89 Hutchings et al. 2012 90 OECD 2006; Ko & Sammons 2013 91 DCSF 2009
49
There is now a body of around 1,400 Teach First teachers in London, amounting
to roughly six per cent of the teaching population92 and the programme places
around 800 new teachers in London schools each year.93
‘As far as the teachers themselves were concerned ... there was a considerable
change of approach I think brought about by Teach First. I know the number
is only relatively small compared with the total number of teachers in London,
but I think the effect of those teachers was considerable in these schools and
there are schools now which have ... 50% of their staff are ex-Teach First-ers.
I think that’s been ... a really important development bringing, if you like, a
different attitude into teaching. A much more of a can-do attitude and I think
that’s had a knock-on effect with the teachers who might otherwise have been
inclined to sit there and say, “We can never do much for these youngsters given
their home background”.’ (Education department consultant)
As well as improving the raw supply of teachers, Teach First is often credited with
improving the overall quality and effectiveness of the workforce: one headteacher
believed that the new route had helped to get ‘better graduates in,’ while another
interviewee said of them:
‘They are high quality people who wouldn’t have probably come into teaching
normally because Teach First has made teaching quite a high status thing for
those people and they wouldn’t have done it before. So we are getting great
graduates who know their subject and are able people.’ (Head of a group of
schools)
diversification of the school system
The school system in London has become more diverse since 2000, with the
introduction of a new form of school – academies – particularly driving this move
towards diversification. Academies are publicly funded independent schools
that are not required to follow the national curriculum. There are currently over
4,000 academies in England, and more than half of these are organised in formal
collaborative arrangements, colloquially known as academy chains.94 While some
London schools benefited from improved local authority support, others were
removed from local authority control and were designated as academies. Several
commentators believe that allowing new providers of education services who
compete for students with existing providers can drive change and improvement:
Hill stated that ‘school diversity and choice can undoubtedly contribute to school
improvement’95 and Sahlgren’s research into school choice and education quality
argued that increasing choice (e.g. by allowing new providers entry to the market)
‘can be especially important for disadvantaged students’.96
The first academies opened in London in 2002 and replaced failing schools
with new schools that were removed from district control and run instead by a
government-approved ‘sponsor’. Although the evidence for their performance
is mixed, the best new sponsored academies are now some of the highest-
performing government-funded schools in England.97 Some of our expert
witnesses discussed the direct and indirect effect of these academies:
The school system in London has become more diverse since 2000, with the introduction of a new form of school – academies – particularly driving this move towards diversification
ChapTEr 3: london, uK
92 Teach First 2013 93 Baars et al. 2014 (p.79) 94 DfE 2015b (p.1) 95 Hill 2012 (p.12) 96 Sahlgren 2013 (p.97) 97 NAO 2012
50

ChapTEr 3: london, uK
‘I don’t think you should underestimate the importance of the academies –
their input into London. Because it did mean that where there needed to be
a structural solution, there was a structural solution available. I think it’s very
important that that avenue was opened.’ (Senior educationalist)
‘The local authority have had these schools, they had failed, their own solution
didn’t work … taking them away from that culture and saying you are now part
of an independent movement where expectations are different, terms and
conditions are different, things are going to be different, was a short sharp
shock that allowed those schools to change their culture ... For us though,
the kind of schools we have taken on and I am sure for ARK and Oasis [two
academy chains with schools in London] and the other academy chains that
have done it, it has been removing them from the monolithic culture where
failure has been accepted.’ (Head of a group of schools)
One academy leader explained that the schools his chain takes on are those ‘where
the school has failed and local solutions haven’t worked – often over an extended
period of time.’ In this way, he argues, academies acted as a backstop, injecting
‘new hope, new drive, [a sense that] things are going to be different and a more
robust approach to running the school.’
In addition, since 2010 schools that receive a Good or Outstanding inspection
judgement have been able to ‘convert’ to academy status, which has seen the
number of academies across England, but particularly in London, increase sharply.
In addition, s shows the percentage of secondary school students attending an
academy in London in 2010 and again in 2014.
Effective use of data
One of the recurring themes that emerged throughout the investigation into
London schools was the effective use of education performance data at every level
of the system. The data was used both to identify underperformance and to target
support.
‘I thought the way the data allowed you to pair schools ... was a revelation, so
I could go to a head of a school in East London and I could say “I know you
tell me you’re like no-one else in Tower Hamlets, so what about this school in
Hammersmith – it’s got exactly the same proportion of boys there, exactly the
same proportion of free school meals ... now tell me why you’re not doing as
well as that school?”’ (Former district education official)
‘A large part of our focus is identifying areas where we can develop and
improve and that is down to using things like improving our data analysis,
making sure staff are able to analyse their own data.’ (Teacher)
Interviews with stakeholders showed that a preoccupation with data drove virtually
all the major initiatives that were enacted in the 2000s:
• London Challenge placed performance data at the heart of the programme. The
schools that received the highest level of support were identified through the use
of consistent data-based criteria.
One of the recurring themes that emerged throughout the investigation into London schools was the effective use of education performance data at every level of the system
51

ChapTEr 3: london, uK
FIGURE 3.8: CHANGE IN THE NUMBER OF STUDENTS STUDYING AT A SECONDARY ACADEMY, 2010–201498
2010
2014
100%0% 50%
98 DfE 2010; DfE 2014
52

ChapTEr 3: london uK
• The best academies emphasised data analysis and student target-setting as
central components of their educational methodology. These schools have been
consistently praised by Ofsted for the way that they use data to guide their work.
• The most effective local authorities placed a substantial emphasis on the need
to support school improvement through systematic data analysis. A recent report
on the transformation of the Tower Hamlets district states that ‘a particular
strong feature to drive school improvement has been the emphasis put upon the
collection, dissemination and analysis of assessment data.’99
• Teach First makes careful use of data, targeting the deployment of its teachers
through the use of deprivation data in order to ensure that these teachers are
serving communities with a disproportionate share of disadvantaged students.
professional development
A further defining characteristic of the London reforms was that they were all
concerned with the improvement of teaching quality through better professional
development. Programmes like Teach First were built around intensive
development opportunities, while according to a local authority education official:
‘A lot of local authorities in London have developed highly regarded
development programmes for teachers, bringing teachers together across the
secondary sector by kind of leadership issue or by specialist subjects; so you
see local authorities making a contribution to professional development there.’
(Local authority education official)
There was also a shared rejection of traditional forms of professional development
which used ‘off-site’ training workshops as the main mechanism for professional
development. Instead of attending courses at teacher centres or other central
places, the London reforms made the school itself the main setting for professional
development:
‘The whole concept of what professional development looks like has been
changed from going on courses and programmes, to be being much more
about what happens in the classroom and coaching and mentoring and
teachers working together on improving and observing and coaching.’
(Former government adviser)
‘But the very best schools of course saw that as an opportunity, so that
when someone was stepping up and working out beyond the school ... that
gave opportunity to others in the school to be rewarded and to be given the
development opportunities to, you know, one or two days a week, be leading in
a role that was the next step up on their own career path.’ (Educationalist)
The London reforms made the school itself the main setting for professional development
99 Woods, Husbands & Brown 2013 (p.25)
53

summary
London’s education system has undergone a remarkable transformation over the
past ten years, to the extent that it now constitutes the best-performing region
in England in terms of national test results, and has the greatest proportion of
top schools according to the national inspection body. A complicated system of
governance makes unpicking the London story difficult, but it is clear that at each
level there was a strong theory of change based upon: the use of data to target
support and provide challenge; professional development programmes which were
practitioner-led; and effective leadership across the board. This was built upon
sustained political will over time.
The exact model adopted in London varied by district: some local authorities
introduced new forms of school governance through academies; others received
additional support through the London Challenge programme; and some districts
addressed teacher shortage and quality issues with the aid of the Teach First
scheme. Throughout these reforms it was obvious, speaking to those directly
involved, that there was a real appetite for change, and a positive belief that
change was possible through working together:
‘I think there is a real spirit of collegiality across London schools ... there is a
real pride in being in a London school and being part of this very successful
movement ... and even though people know that circumstances can be
challenging they also know that there is support out there because the support
will come from other London headteacher colleagues.’ (Headteacher)
ChapTEr 3: london, uK
London’s education system has undergone a remarkable transformation over the past ten years, to the extent that it now represents the best-performing region in England in terms of national test results
54

ChapTEr 3: london uK
55

Chapter 4
Dubai, UAE

Located on the southeast corner of the Arabian peninsula, the city-state of Dubai is one of seven emirates that make up the United Arab Emirates (UAE). The population of Dubai is 2.3 million, 34 per cent higher than in 2008, due to a large influx of expatriates.100
Dubai’s population is very young: nearly 45% is aged 29 years and younger.
The presence of this young population in Dubai places pressure on the
education sector.
There is a mixture of public and private schools in Dubai serving Emirati
nationals and expatriates (the latter of whom make up the majority of the
population in the city). Over 89 per cent of all students in Dubai attend a
private school, including a rising number of Emirati nationals (despite public
schooling being free for Emiratis to access).101
As with all five cities included in this project, the educational journey of Dubai
was investigated through a mixed-methods approach. Relevant literature was
reviewed; data (particularly related to student performance in Dubai (and
the UAE) and school inspection data) was analysed; and key witnesses to the
education system were interviewed. In Dubai small group interviews with
31 teachers, school directors and school staff were carried out, drawn from
seven different private schools, teaching a variety of curricula.
In terms of international tests of student outcomes, the UAE achieved
significantly higher scores in PISA 2012 than it did in 2009, making it ‘one of
only six countries that saw a significant improvement to their PISA ranking out
of the 65 countries that took part in PISA 2012.’102
Figure 4.1 shows the UAE’s scores in PISA 2009 and 2012. These figures
indicate that the UAE has made a marked improvement over the period. The
UAE outscores all other participating countries in the MENA region.103
ChapTEr 4: duBai, uaE
2009 2012 difference
Mathematics 421 434 +13
reading 431 442 +11
science 438 448 +10
figurE 4.1: ChangE in uaE pisa sCorEs (2009 To 2012)104
100 Dubai Statistics Center 2015 101 KHDA 2015a 102 Pearson Middle East 2014 103 OECD 2014 104 UAE MOE 2013 (p.9)
Dubai, UAE
57

ChapTEr 4: duBai, uaE
Dubai’s education system is remarkably diverse, with 173 private schools offering
16 different national and international curricula.106 There are marked differences in
the performance of schools teaching these different curricula, as shown in Figure
4.2. The International Baccalaureate (IB) and UK curricula schools both performed
above the OECD average across all three subjects,107 while private schools teaching
the Ministry of Education curricula, and those following a Pakistani curricula had
lower-than-average performance.
Recognising the pivotal role of high quality education in attracting foreign talent
and building a knowledge-based economy, the government’s Dubai Strategic Plan
underscores the UAE-wide vision for promoting human capital excellence and
preparing Dubai’s workforce for a high value, knowledge-based economy.108
MEA
N S
CO
RE
(PIS
A 20
12)
600
550
500
450
400
350
300
200
250
150
100
50
0
IB UK
IND
IAN US
PHIL
IPPI
NE
MO
E (P
RIV
ATE)
PAK
ISTA
NI
FIGURE 4.2: MEAN SCORES ON PISA 2012 BY CURRICULA105
MATHEMATICS
READING
SCIENCE
Dubai’s education system is remarkably diverse, with 173 private schools offering 16 different national and international curricula
105 KHDA 2014a (p.31) 106 KHDA 2015b 107 OECD 2014 108 Government of Dubai 2015
58

ChapTEr 4: duBai, uaE
The theory of change
Dubai has gradually driven improvement in its private school system through a
combination of support and challenge. Consistent leadership of key bodies has
allowed reform to embed and has enabled Dubai’s government to introduce
regulation of the private school system. A form of ‘short route’ accountability has
been introduced for parents in Dubai through the publication of school inspection
reports. Simultaneously, the government provides a forum for collaboration and
support networks, so that schools are encouraged to work together in order to
drive improvement.
accountability
Dubai’s private education system is regulated by the Knowledge and Human
Development Authority (KHDA). KHDA was established in 2006 with a mandate to
develop the school sector in Dubai, particularly through monitoring performance
and quality in the emirate’s private schools. At the end of 2007 an inspection
organisation was set up, known as the Dubai Schools Inspection Bureau (DSIB),
which is an agency of KHDA.
The main functions assigned to the DSIB were to:
(i) ‘set standards for education quality including the indicators for measuring them;’
(ii) ‘adopt a reporting system to measure and monitor school performance using
those standards and to publish those reports.’109
SUSTAINEDLEADERSHIP
DUBAI REGULATION
COLLAB-ORATIONBETWEENSCHOOLS
SHORTROUTE
ACCOUNT-ABILITY
Consistent leadership of key bodies has allowed reform to embed and has enabled Dubai’s government to introduce regulation of the private school system
109 Thacker & Cuadra 2014 (p.23)
figurE 4.3: ThEory of ChangE
59

ChapTEr 4: duBai, uaE
MEA
N A
CH
IEV
EMEN
T SC
OR
E (P
ISA
2012
)
600
500
400
300
200
100
0
OU
TSTA
ND
ING
GO
OD
ACC
EPTA
BLE
UN
SATI
SFAC
TORY
FIGURE 4.4: MEAN ACHIEVEMENT SCORES ON PISA 2012 ACROSS SCHOOL INSPECTION RATINGS IN DUBAI110
MATHEMATICS
READING
SCIENCE
PROBLEM SOLVING
100%0% 10% 20% 30% 40% 50% 60% 70% 80% 90%
2008-2009
2009-2010
2010-2011
2011-2012
2012-2013
2013-2014
PERCENTAGE OF STUDENTS IN PRIVATE SCHOOLS BY INSPECTION GRADE
FIGURE 4.5: PERCENTAGE OF STUDENTS ATTENDING PRIVATE SCHOOLS IN DUBAI, BY SCHOOL INSPECTION GRADE111
OUTSTANDING
GOOD
ACCEPTABLE
UNSATISFACTORY
110 Inspection ratings from 2011/12; KHDA 2013 (p.61) 111 KHDA 2014a (p.10)
60

ChapTEr 4: duBai, uaE
The inspection ratings of DSIB can be corroborated to some extent by comparing
the average performance on PISA 2012 with school inspection categories. Figure
4.4 shows the scores of schools on the PISA 2012 tests according to their inspection
category.
Since inspections began, the number of students attending a private school rated
as either Good or Outstanding has steadily climbed, as can be seen in Figure 4.5.
Combined with the responses of our interviewees, this suggests that since the
inspection framework and regime were introduced (and it should be noted that the
results of inspections are published by KHDA) schools have responded in an effort
to improve their rating.
As well as using inspection as a means to hold schools to account, the Dubai
government – through the DSIB and KHDA – uses the inspection framework in
order to improve standards and drive change. The interviewees confirmed this role:
‘The inspection regime has actually had an influence on that [school
improvement] ... that has an influence on how you mould the school too, and
you focus more of your resources in that particular area.’ (School director)
‘Our school improvement plans are based completely on, almost completely on,
the recommendations and on the frameworks and what it is to be Outstanding. I
mean that’s what we’ve set for our goals.’ (School director)
Perhaps unsurprisingly, school directors noted the impact of inspection on
their school improvement agenda; there is considerable research which shows
that similar practices happen in England in response to Ofsted inspections.112
Respondents from the seven schools involved in this research were generally very
positive about the role of inspection and the benefits that Dubai’s accountability
system brought. One teacher described the approach as ‘constructive criticism’,
while a school director viewed inspection as a ‘catalyst’ for change within his
school. Other interviewees reflected on the dialogue that inspection made possible:
‘It’s not, “I’m coming to judge you.” Yes, we’re going through this period, but it’s
more “we’re coming to help you to improve and get to the maximum level that
you possibly can” in a very harmonious way. Not in an aggressive or degrading
manner.’ (Teacher)
‘Personally I welcome inspection because what we get is four or five people
who’ve never seen the school before come and have a look at it with fresh eyes
and they’ll say, “This is good, this needs work on, this is your way forward” ...
there has been a much improved dialogue.’ (School director)
These views were confirmed by a small-scale survey carried out by David Hicks,
Principal of Emirates International School, a private school in Dubai, which found
that ‘in general, inspections are perceived to have contributed positively to overall
school improvement in the schools which participated ... inspections are perceived
to have impacted positively upon classroom practice and upon processes for
tracking students’ progress.’113
Through the inspection framework, the government of Dubai has encouraged
schools to change their pedagogy – moving away from traditional approaches
Since inspections began, the number of students attending a private school rated as either Good or Outstanding has steadily climbed
112 Ehren 2014 (p.2) 113 Hicks 2013 (p.50)
61

ChapTEr 4: duBai, uaE
towards a more modern pedagogy in which the teacher is cast as the ‘facilitator’,
according to one school director. A teacher described it as ‘the whole move away
from that knowledge-based curriculum that we were all taught in, where it was
all about learning knowledge ... it has become a far more skills-based curriculum.’
School staff were generally quite clear in their attribution for this change to the
inspection process:
‘I joined the school in 2009. Concerning the teaching and learning back then
it was whole class instruction, no differentiation, the teacher goes to the
class, explains, and then goes out. With the inspection over the years we have
differentiation now, different levels in teaching, the methodology has changed
from that time to now.’ (Teacher)
The DSIB Inspection Handbook describes the following as (amongst others) some
features of outstanding schools:
• ‘Students are independent, reflective learners;’
• ‘Students are motivated and eager participants in their learning. They are actively
involved in their own learning and development, and show increasing skills as
learners;’
• ‘Teachers’ interactions with students ensure they are always active participants in
achieving meaningful and relevant learning;’
• ‘Teaching strategies very successfully meet the individual needs of students.’114
Research into inspection systems in six European countries has shown that
over the long term, inspection can improve schools’ capacity to improve and
effectiveness by ‘the fact that school inspections set expectations on good
education.’115 Interviewees also acknowledged that along with inspection, other
elements drive improvement. One school director highlighted the internal drive for
improvement that schools need to have:
‘You have to have this willingness to constantly challenge what you are, on
a day-to-day, week-to-week basis, 40 to 45 weeks of the year. If the only
springboard for improvement was inspection you would never, ever have a
good school.’ (School director)
Consistent system leadership
Sustained and consistent leadership at the highest levels of Dubai’s school system
has ensured that reform has been able to take root, embed and flourish, leading to
the marked improvement in outcomes for the emirate. As with many of the other
cities in this study, strong and visible leadership from key individuals has resulted
in a focused approach towards reform.
Before the establishment of KHDA, members of the KHDA Board led the
development of Dubai’s Knowledge Village in 2002 as part of the ‘free zone’
concept aimed at developing a pool of qualified local talent. The vision for
developing quality education services in Dubai is set out in the Dubai Strategic Plan
2015 which underscores the need for high quality education institutions as a key
factor in economic development.
As with many of the other cities in this study, strong and visible leadership from key individuals has resulted in a focused approach towards reform
114 KHDA 2014b 115 Schoolinspections 2014
62

ChapTEr 4: duBai, uaE
There has been a long period of consistency in terms of the leadership at KHDA
and the DSIB, with both organisations retaining many of their senior leaders since
their inception.
support and collaboration
One of the key ways in which KHDA has moved beyond an approach based
primarily on accountability measures as a means to challenge schools is the ‘What
Works’ initiative, launched in 2012. This series of professional development events
has been designed as a way to foster collaboration between schools and is focused
on the sharing of practices that work in schools. It is run by schools for schools
with support from KHDA.116 The initiative has seen considerable support from
across Dubai’s private schools, with over 1,500 educators taking part in 2012/13.117
The World Bank’s 2014 report on Dubai’s private education system suggested that:
‘It may not necessarily be competition that is helping schools to improve.
Market forces put pressure on schools to improve, certainly, but that does not
necessarily help them in the process of improvement. Rather, what does seem
to help is the opposite of competition, collaboration.’118
School inspections created a common vocabulary about quality that all Dubai’s
private schools can relate to, and this is the connecting factor between and among
schools.
Teachers saw these collaborative sessions as a chance to learn from each other,
and as a means to drive school improvement:
‘That’s where I got the ideas: “oh this is how the other schools are monitoring
their kids / are tracking their kids,” and so I come back and make these things.
So having that ability to attend their sessions was huge – just seeing what other
schools were doing that would get the “Outstandings” or even if they were just
moving from Acceptable to Good – just hearing how did they do it was huge.’
(Teacher)
One teacher suggested that this collaborative initiative represented a significant
change, stating that ‘a few years ago we contacted different schools to try and
be involved in this and were told blankly no, they wouldn’t do anything with us,’
whereas now schools are much more open. As a school director noted: ‘everybody
is wanting the same thing, they are all on the same page.’ A different school
director emphasised some of the challenges around competition that derives from
Dubai’s private school system:
‘I think it’s very interesting and very challenging as well because you’re talking
about sharing what works among a bunch of competitors. When you look at
… the private school business model here, we’re looking at trying to share
best practices amongst schools who are trying to sell their school over that
school and I think it’s a very challenging thing to do because it’s not ... it’s in
educator’s natures to share, to beg, borrow or steal, copy, do whatever we can
because it’s about our kids, about our students.’ (School director)
School inspections created a common vocabulary about quality that all Dubai’s private schools can relate to
116 Thacker & Cuadra 2014 (p.26) 117 Thacker & Cuadra 2014 (p.26) 118 Thacker & Cuadra 2014 (p.44)
63

It was clear through discussions with staff from seven different schools that they
all bought into the ethos of the ‘What Works’ programme; whether that went
against their natural instincts to regard each other as competitors, or whether they
were more open to the idea of sharing from the outset:
‘We’re a global community of educators and the colour of your skin doesn’t
matter you know ... one doesn’t have to be so insular and frightened ... That
friendliness and friendship that has, I think, been remarkable, is because of
KHDA and therefore the growth of our school globally.’ (School director)
school improvement
Perhaps in response to the inspection framework, or as a result of greater
engagement with the global discourse on school improvement, school directors
in Dubai have recently adopted innovations and approaches to drive improvement
in their own schools.
One example of such an innovation is the use of peer review. In 2012 Parkville
Global Advisory found that ‘compared to only 56% of principals in 2007, over
82% of [them] reported teacher peer reviews taking place in 2011,’ which the
World Bank has suggested showed that a trend towards more collaboration
was emerging in Dubai.119 One of the school directors interviewed made direct
reference to such a scheme in their school:
‘Yes but I think what’s important is the mentoring that happens and they’ve
got to ensure that if they’re not up to speed they observe their peers and when
they observe their peers they’ve got to identify two best practices that they’re
good at and that’s what carries the momentum for us. So we’re not only
dependent on professional development workshops that happen but that does
happen a lot but I think an equally powerful parallel is the peer mentoring
that happens and not only within the department but across, you know within
departments as well.’ (School director)
There was further evidence from interviews that collaboration extended
interactions at What Works sessions, with one school director remarking that ‘it’s
a big family ... we go to workshops together, we have exchange programmes,
we have competitions for the children, the teachers get together,’ and another
noting the partnerships his school has formed with other schools, despite having
different owners.
Several school leaders and teachers suggested that their school had actively
changed the staff structure through the use of distributed models of leadership,
often in order to directly improve performance:
‘Distributing that leadership and having middle-level leaders and those sorts
of things help support that whole structure and reviewing our performance in
that sense really has made a difference.’ (Teacher)
Instead of emphasising the role of a small senior leadership team, school directors
talked about bringing all staff ‘to the table’ in order to brainstorm, or encouraging
ChapTEr 4: duBai, uaE
School directors in Dubai have recently adopted innovations and approaches to drive improvement in their own schools
119 Parkville Global Advisory 2012 (p.36) cited in Thacker & Cuadra 2014
64

staff ‘in pockets throughout the school, through entire faculties’ to ‘bring their
ideas.’ Another director espoused the idea that the role of the principal was to
‘let the team do the work’ and provide a level of ‘support’ rather than exerting
control.
Teachers, in particular, were often vocal in expressing their beliefs that they were
increasingly afforded the opportunity to be creative and innovative in their roles:
‘I feel that here, leadership allows us to be more creative; they give us more
freedom’; ‘it’s about adapting dynamically’. This view was supported by school
directors: ‘we decided that we were going to invent, invent what we don’t have
and make do and therein started this intensive journey of self-training’; ‘I will
support you, please take risks, get out there, I don’t mind if you fail as long as you
learn.’
Community engagement and optimism
Changes in practice within Dubai’s private education system, whether directly
encouraged by KHDA or not, have been supported by strong stakeholder
engagement and by a general sense of optimism within schools. School
inspection data found that ‘86 per cent of schools had good or better
involvement with parents and the community’,120 while one school director
remarked that ‘parents are on board’ and another said ‘it’s become a united family
with all these projects and innovations that we’ve undertaken and the parents are
very proud that this is a thinking school.’ A teacher noted: ‘and our student voice
is very strong in our school ... we work on projects together, we work on policies
together with the students in the senior school ... they play a very integral role in
the, in the functioning of the school on a day-to-day basis.’
School staff were overwhelmingly positive when talking about their school and
the education system more widely. They shared a passion for their practice and
spoke with optimism and positivity:
‘I mean I want whatever students are here for this time to be successful and
then if, if they go on, then fine but I want them to be able to move on and
be successful somewhere else and not have to go somewhere and be at a
detriment or be behind. You know I want to give them the best education I
can and I think that [the] team and the majority of the teachers as well feel the
same way and when you have that kind of vibe that goes through you know
it’s, it works the same as negativity or positivity, it’s contagious.’ (Teacher)
‘I think what it is that people like ... it’s being part of a successful team, you
can’t necessarily say why it’s successful but you know that it is and you all
have your different roles to play in that team. So being part of something
which is successful and it feels right is, I think, the most motivating factor
because we’re all doing different roles in that.’ (School director)
ChapTEr 4: duBai, uaE
School inspection data found that ‘86 per cent of schools had good or better involvement with parents and the community’
120 KHDA 2014a
65

summary
The private school system in Dubai is unique, in that almost 90 per cent of students
in the city attend a private fee-paying institution. This uniqueness in turn presents
a potential challenge for the Government of Dubai in terms of the extent to
which it can improve schools which it does not run or own. The creation of KHDA
and DSIB in order to make schools accountable, and as a means of encouraging
school improvement, has enabled the government to drive up standards through
inspection. The Inspection Handbook sets out a clear framework which schools
should meet, which this research has shown in turn influences schools’ own
improvement plans. As well as these clear priorities, a highly incentivised system
(the level of fees a school is allowed to charge is dictated by inspection gradings,
as is a school’s ability to expand) and the publicly available nature of inspection
reports, ensures schools are encouraged to improve their grade.
However, as Michael Fullan argues, ‘successful system reform is a judicious mixture
of push [challenge/pressure] and pull actions’;121 improving education requires
more than accountability and challenge. In light of this, KHDA launched the ‘What
Works’ initiative in 2012 as a means to provide support for schools, encourage
collaboration and create a forum for sharing of best practice, at a school-to-school
level. A key point made by interviewees was that such an approach has changed
the culture in Dubai, moving away from an environment driven by competition,
to one much more focused on working together. KHDA has effectively brokered a
school improvement dialogue through the What Works events. School directors in
Dubai have also pursued other strategies in order to drive improvement, including
the formation of partnerships, staff visiting other schools and engaging teachers in
peer review and mentoring schemes. As one school director said, ‘What Works will
stimulate an idea and then we will make it flower.’
In addition to these two broad aspects of reform introduced by KHDA, other
themes to emerge from the research include the use of models of distributed
leadership within schools and the inculcation of a culture of innovation and
creativity. The changes in Dubai have been supported through engagement with
all stakeholders (especially students and parents) and a general sense of positivity
around such reform.
Dubai’s school system has moved forward rapidly in the past eight years, with
improvements in international tests mirrored by an increase in the number and
proportion of students at schools rated as Good or Outstanding at inspection. A
general trend of Emirati students choosing to attend private schools, combined
with disaggregated PISA results suggests that the private school system in Dubai
outperforms government-run public schools. The Government of Dubai has
employed a clear theory of change, based at first on accountability, combined
later with support and collaboration. As one teacher remarked, in Dubai ‘we have a
culture of change and moving forward.’
ChapTEr 4: duBai, uaE
The changes in Dubai have been supported through engagement with all stakeholders (especially students and parents) and a general sense of positivity around such reform
121 Fullan & Boyle 2014 (p.10)
66

ChapTEr 4: duBai, uaE
67

Chapter 5
New York City, USA
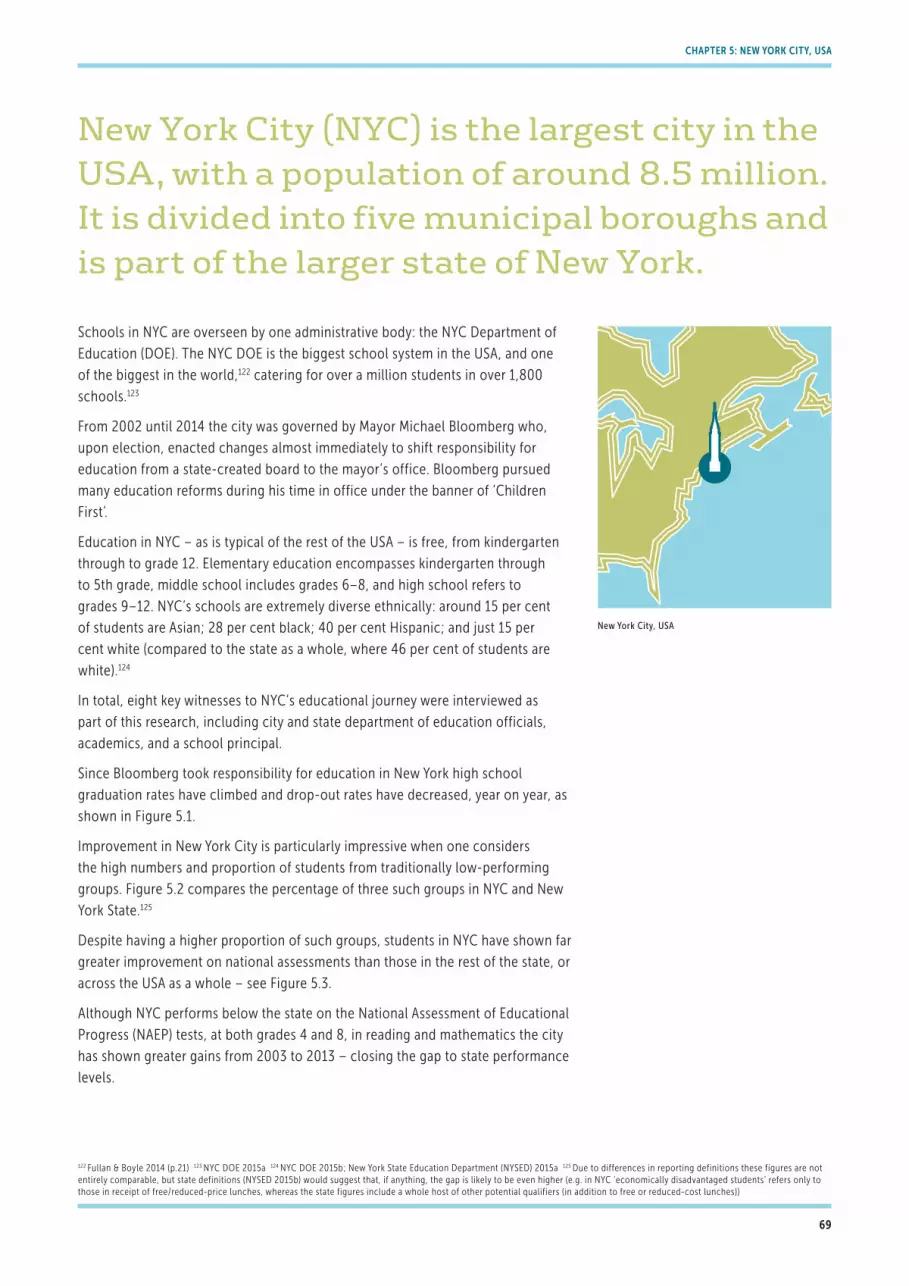
New York City (NYC) is the largest city in the USA, with a population of around 8.5 million. It is divided into five municipal boroughs and is part of the larger state of New York.
Schools in NYC are overseen by one administrative body: the NYC Department of
Education (DOE). The NYC DOE is the biggest school system in the USA, and one
of the biggest in the world,122 catering for over a million students in over 1,800
schools.123
From 2002 until 2014 the city was governed by Mayor Michael Bloomberg who,
upon election, enacted changes almost immediately to shift responsibility for
education from a state-created board to the mayor’s office. Bloomberg pursued
many education reforms during his time in office under the banner of ‘Children
First’.
Education in NYC – as is typical of the rest of the USA – is free, from kindergarten
through to grade 12. Elementary education encompasses kindergarten through
to 5th grade, middle school includes grades 6–8, and high school refers to
grades 9–12. NYC’s schools are extremely diverse ethnically: around 15 per cent
of students are Asian; 28 per cent black; 40 per cent Hispanic; and just 15 per
cent white (compared to the state as a whole, where 46 per cent of students are
white).124
In total, eight key witnesses to NYC’s educational journey were interviewed as
part of this research, including city and state department of education officials,
academics, and a school principal.
Since Bloomberg took responsibility for education in New York high school
graduation rates have climbed and drop-out rates have decreased, year on year, as
shown in Figure 5.1.
Improvement in New York City is particularly impressive when one considers
the high numbers and proportion of students from traditionally low-performing
groups. Figure 5.2 compares the percentage of three such groups in NYC and New
York State.125
Despite having a higher proportion of such groups, students in NYC have shown far
greater improvement on national assessments than those in the rest of the state, or
across the USA as a whole – see Figure 5.3.
Although NYC performs below the state on the National Assessment of Educational
Progress (NAEP) tests, at both grades 4 and 8, in reading and mathematics the city
has shown greater gains from 2003 to 2013 – closing the gap to state performance
levels.
ChapTEr 5: nEW yorK CiTy, usa
122 Fullan & Boyle 2014 (p.21) 123 NYC DOE 2015a 124 NYC DOE 2015b; New York State Education Department (NYSED) 2015a 125 Due to differences in reporting definitions these figures are not entirely comparable, but state definitions (NYSED 2015b) would suggest that, if anything, the gap is likely to be even higher (e.g. in NYC ‘economically disadvantaged students’ refers only to those in receipt of free/reduced-price lunches, whereas the state figures include a whole host of other potential qualifiers (in addition to free or reduced-cost lunches))
New York City, USA
69
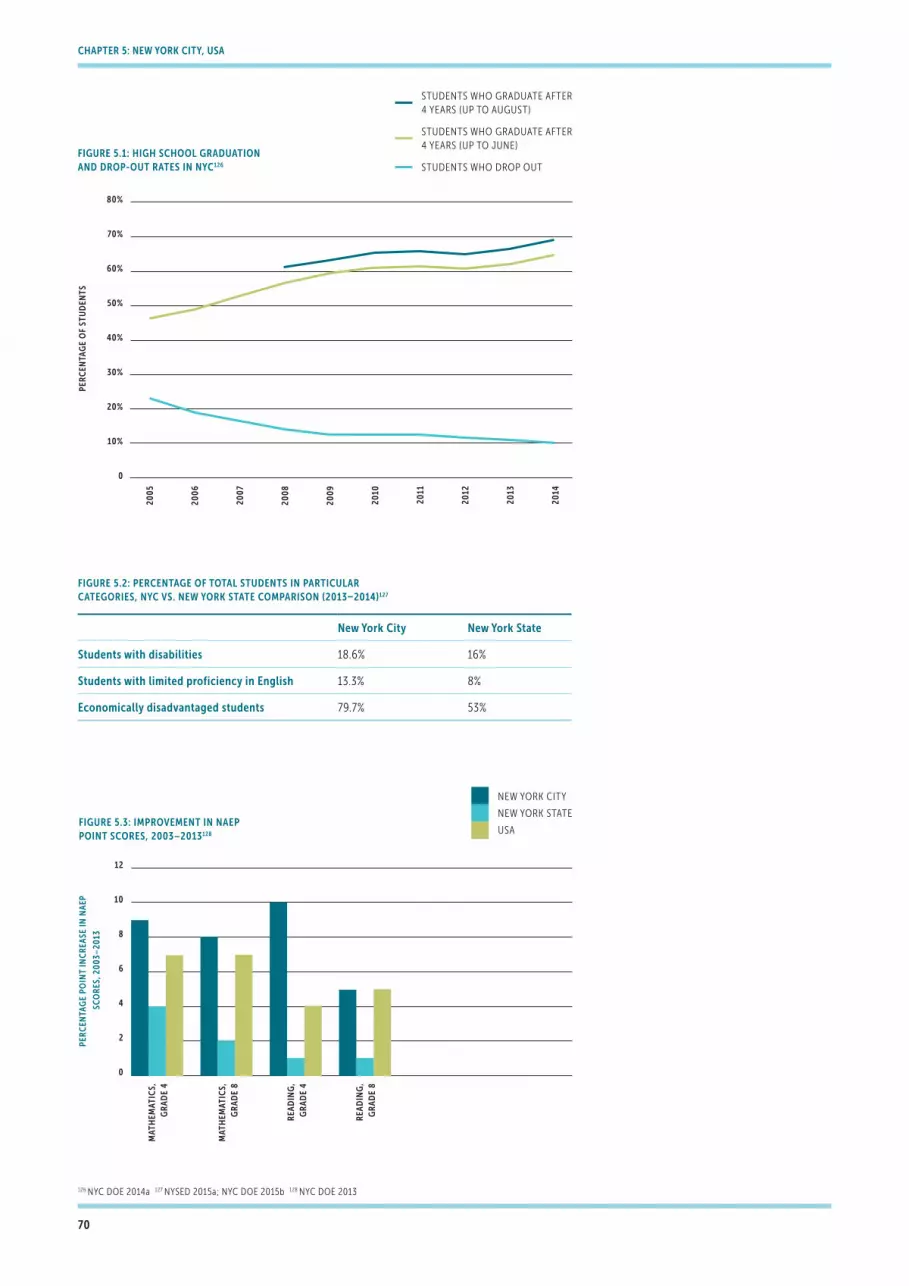
figurE 5.2: pErCEnTagE of ToTal sTudEnTs in parTiCular CaTEgoriEs, nyC vs. nEW yorK sTaTE CoMparison (2013–2014)127
new york City new york state
students with disabilities 18.6% 16%
students with limited proficiency in English 13.3% 8%
Economically disadvantaged students 79.7% 53%
ChapTEr 5: nEW yorK CiTy, usa
2005
2006
2007
2008
2009
2010
2011
2012
2013
2014
80%
70%
60%
50%
40%
30%
20%
10%
0
PER
CEN
TAG
E O
F ST
UD
ENTS
FIGURE 5.1: HIGH SCHOOL GRADUATION AND DROP-OUT RATES IN NYC126
STUDENTS WHO GRADUATE AFTER 4 YEARS (UP TO AUGUST)
STUDENTS WHO GRADUATE AFTER 4 YEARS (UP TO JUNE)
STUDENTS WHO DROP OUT
PER
CEN
TAG
E PO
INT
INC
REA
SE IN
NA
EP
SCO
RES
, 200
3–20
13
12
10
8
6
4
2
0
MAT
HEM
ATIC
S,
GR
AD
E 4
MAT
HEM
ATIC
S,
GR
AD
E 8
REA
DIN
G,
GR
AD
E 4
REA
DIN
G,
GR
AD
E 8
FIGURE 5.3: IMPROVEMENT IN NAEP POINT SCORES, 2003–2013128
NEW YORK CITY
NEW YORK STATE
USA
126 NYC DOE 2014a 127 NYSED 2015a; NYC DOE 2015b 128 NYC DOE 2013
70
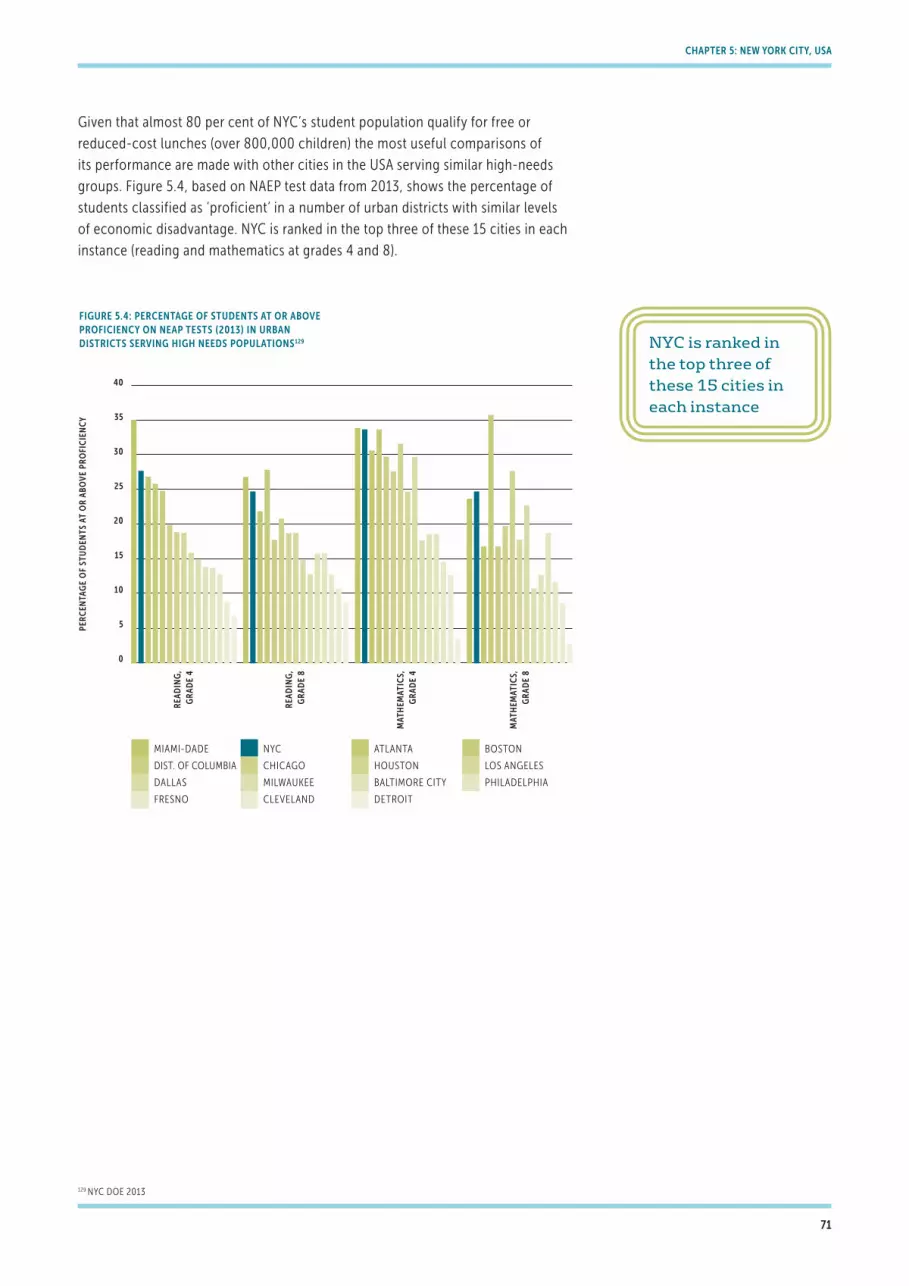
ChapTEr 5: nEW yorK CiTy, usa
PER
CEN
TAG
E O
F ST
UD
ENTS
AT
OR
ABO
VE
PRO
FIC
IEN
CY
40
35
30
25
20
15
10
5
0
REA
DIN
G,
GR
AD
E 4
REA
DIN
G,
GR
AD
E 8
MAT
HEM
ATIC
S,
GR
AD
E 4
MAT
HEM
ATIC
S,
GR
AD
E 8
FIGURE 5.4: PERCENTAGE OF STUDENTS AT OR ABOVE PROFICIENCY ON NEAP TESTS (2013) IN URBAN DISTRICTS SERVING HIGH NEEDS POPULATIONS129
MIAMI-DADE
DIST. OF COLUMBIA
DALLAS
FRESNO
NYC
CHICAGO
MILWAUKEE
CLEVELAND
ATLANTA
HOUSTON
BALTIMORE CITY
DETROIT
BOSTON
LOS ANGELES
PHILADELPHIA
129 NYC DOE 2013
Given that almost 80 per cent of NYC’s student population qualify for free or
reduced-cost lunches (over 800,000 children) the most useful comparisons of
its performance are made with other cities in the USA serving similar high-needs
groups. Figure 5.4, based on NAEP test data from 2013, shows the percentage of
students classified as ‘proficient’ in a number of urban districts with similar levels
of economic disadvantage. NYC is ranked in the top three of these 15 cities in each
instance (reading and mathematics at grades 4 and 8).
NYC is ranked in the top three of these 15 cities in each instance
71

130 Kemple 2013 (p.13) 131 Achieve 2015 132 Peterson & Ackerman 2015 133 NYC DOE 2014b
PER
CEN
TAG
E O
F ST
UD
ENTS
AT
OR
ABO
VE
PRO
FIC
IEN
CY
(GR
AD
ES 3
–8)
100
90
80
70
60
50
40
30
20
10
0
2006
2007
2008
2009
2010
2011
2012
2013
2014
FIGURE 5.5: PROFICIENCY RATES OF GRADE 3–8 STUDENTS IN NYC ON STATE TESTS OF MATHEMATICS AND ENGLISH133
MATHEMATICS
ENGLISH
Proficiency rates in state tests also indicate improving performance trends in
NYC, shown in Figure 5.5. As can be seen from this graph, there were two distinct
drops in the level of students attaining a standard of ‘proficient’, in 2010 and then
in 2013. This is due to changes in the assessment measures: in 2010 the cut score
was changed130 which meant students had to score considerably higher on these
tests in order to be classified as proficient. In 2013 a new, more rigorous, ‘Common
Core’ exam was introduced to reflect the new curriculum being taught across the
country (with the result that New York State is rated as the top ‘truth-teller’ in the
USA in terms of closeness between scores on state tests and NAEP tests131 and has
the strongest state proficiency levels132). As such, although it is not possible to
make comparisons across this entire time period, it is possible to do so within each
‘bracket’ – and in each case there is an upward trend in outcomes.
ChapTEr 5: nEW yorK CiTy, usa
72
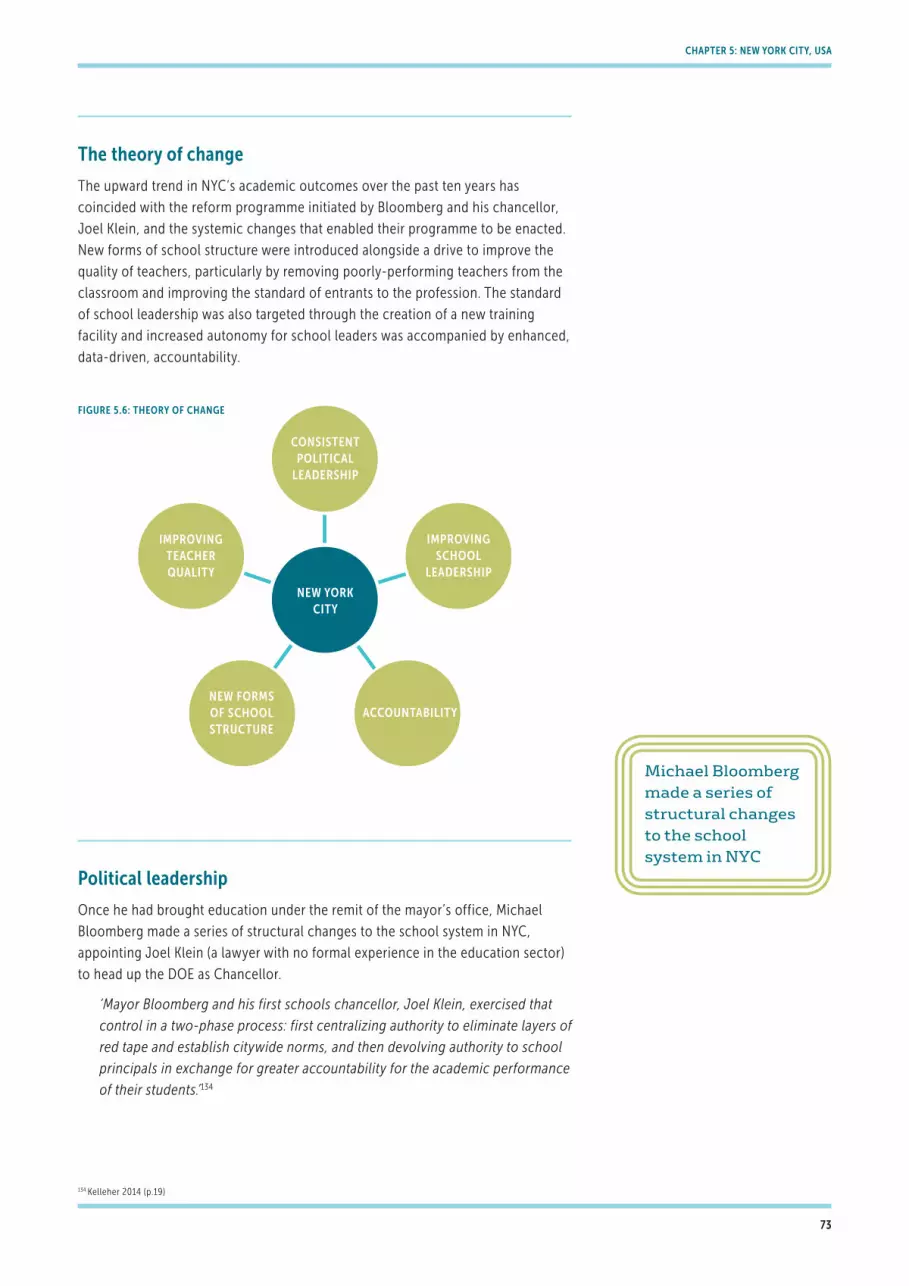
CONSISTENTPOLITICAL
LEADERSHIP
IMPROVINGTEACHERQUALITY
NEW YORKCITY
IMPROVINGSCHOOL
LEADERSHIP
NEW FORMSOF SCHOOLSTRUCTURE
ACCOUNTABILITY
134 Kelleher 2014 (p.19)
figurE 5.6: ThEory of ChangE
The theory of change
The upward trend in NYC’s academic outcomes over the past ten years has
coincided with the reform programme initiated by Bloomberg and his chancellor,
Joel Klein, and the systemic changes that enabled their programme to be enacted.
New forms of school structure were introduced alongside a drive to improve the
quality of teachers, particularly by removing poorly-performing teachers from the
classroom and improving the standard of entrants to the profession. The standard
of school leadership was also targeted through the creation of a new training
facility and increased autonomy for school leaders was accompanied by enhanced,
data-driven, accountability.
political leadership
Once he had brought education under the remit of the mayor’s office, Michael
Bloomberg made a series of structural changes to the school system in NYC,
appointing Joel Klein (a lawyer with no formal experience in the education sector)
to head up the DOE as Chancellor.
‘Mayor Bloomberg and his first schools chancellor, Joel Klein, exercised that
control in a two-phase process: first centralizing authority to eliminate layers of
red tape and establish citywide norms, and then devolving authority to school
principals in exchange for greater accountability for the academic performance
of their students.’134
Michael Bloomberg made a series of structural changes to the school system in NYC
ChapTEr 5: nEW yorK CiTy, usa
73

The Children First reforms were driven by ‘a philosophy of change’ from the outset
according to Klein135 and although the Bloomberg/Klein reforms did not always
meet with universal approval, there was nonetheless a significant level of political
support within the mayor’s office. Change was pursued relentlessly by those in
power. Eli Broad, a philanthropist who heads up the Broad Foundation, said of
NYC that ‘the strong leadership by the mayor, the chancellor, and a progressive
teachers’ union has allowed the nation’s largest school system to dramatically
improve student achievement in a relatively short period of time’136 when awarding
NYC the Broad Prize in 2007.137
Bloomberg and Klein initiated a period of increased centralisation in NYC,
removing layers of bureaucracy from the system, which later enabled them
to devolve authority and responsibility more easily to the school principals
(see below). Schools in the city had previously been accountable to district
superintendents138 and community school boards – a ‘top-down structure where
superintendents could dictate a school’s approach, even if it wasn’t in the best
interests of students.’139 These powerful hierarchies were replaced with 10 regional
offices, directly accountable to the chancellor, and with much less authority and
power than their predecessors.140
Two senior officials who formerly worked at the DOE both commented on the
importance of political support that had backed up the changes during the 2000s
in NYC:
‘Now we spent a lot of time, both at the mayor’s level and my level, working
with politicians, keeping them onside, sometimes you’d have to negotiate,
sometimes you’d push harder than they might have liked.’ (Former senior
official at the NYC DOE)
‘[Political support] is essential – the fact that the mayor was supportive, was
willing to accept responsibility for public education in a way that previous
mayors had not.’ (Former senior official at the NYC DOE)
The restructuring of NYC’s education system has not escaped criticism: Randi
Weingarten, president of a powerful teaching union in the city, asked in 2007: ‘How
many more of these restructurings must we go through?’141 and in his analysis of
school reform in NYC, Michael Fullan suggested that the changes were not entirely
effective because they emphasised structural issues rather than deep cultural
issues. Fullan said that ‘restructuring has prevailed over reculturing.’142
school leadership
The global literature suggests that school leaders play a crucial part in the success
of high-performing and rapidly improving school systems.143 In NYC Klein believed
that school principals and leaders were a crucial ‘piece in the education puzzle,’
describing them as ‘key agents of reform’ and ‘the most important piece.’144 This
view was echoed by a former official from the education department:
135 Klein 2014 (p.22) 136 Medina 2007 137 ‘Awarded each year to honor urban school districts that demonstrate the greatest overall performance and improvement in student achievement while reducing achievement gaps among low-income students and students of color.’ (The Broad Foundation 2015) 138 Nadelstern 2013 (p.15) 139 Gonen 2015 140 Fullan & Boyle 2014 (p.27) 141 Gonzalez 2007 142 Fullan & Boyle 2014 (p.58) 143 Slater 2013b (p.40) 144 Klein 2014 (p.61 & 184)
The Children First reforms were driven by ‘a philosophy of change’ from the outset
ChapTEr 5: nEW yorK CiTy, usa
74

145 Nadelstern 2013 (p.18) 146 Kelleher 2014 (p.15) 147 Klein 2014 (p.41)
‘The principal is the key leverage point in a large urban school district. And
getting the best people you can find, supporting them, developing them [is
crucial].’ (Former senior official at the NYC DOE)
As well as devolving responsibility to principals, reform in NYC also made the
professional development of school leaders a priority, with an emphasis on
ensuring that school leaders had the skills to make best use of their enhanced
responsibilities. This led to the creation of a new training and development centre
for school leaders in NYC.
There was a ‘tight-loose’ quality to the NYC approach to centralisation-
decentralisation. Eric Nadelstern, a member of Klein’s team, articulated this as
follows: ‘the more authority you share, the more influential you become’145 and
it was clear, both through discussing with interviewees and evaluating literature
on the topic, that although reforms in NYC did centralise some aspects of
the education system (e.g. the removal of district superintendents) there was
nonetheless a gradual roll-out of increased autonomy, at first through a pilot
scheme known as the ‘Autonomy Zone’ and gradually to all schools. One of the
ways in which the DOE increased autonomy was by decentralising the support
networks available to schools – giving each principal the choice of one of 55
networks which they could affiliate to and buy support from, based upon the needs
of their school.146
Klein’s retrospective view was that the principals went from being ‘the weakest
players in the whole system’147 to become a positive force for improvement as they
were gradually given greater control over their staff and their budget. As a former
DOE official said, ‘they need the right to recruit, they need supports and they
ultimately need the right to terminate teachers. You can talk about fair processes
and all that, but controlling your human resources is number one. Number two,
controlling your budget.’ The same official then explained how a lack of autonomy
in certain areas restricted decision-making in others:
‘A simple example. People would say let’s all have 22 to one class size. And so if
you’re a principal meeting that requirement may mean you end up with virtually
no discretionary funds. Let’s say you wanted to do an intervention program for
struggling readers. And I was much more of the view: give principals budget
based on a fair allocation formula and then let them decide. Give them control
over their budgets.’ (Former senior official in the NYC DOE)
While a school principal we interviewed agreed that it was important ‘to make sure
that the funding source is coming to the principal so we can use that when we see
something fit for the population that we have,’ and while she welcomed greater
discretionary authority, she was also critical of the removal of a level of hierarchy
above school leaders:
‘When the mayor changed the power structure, the superintendents weren’t
really as in control of their schools as they needed to be. There were other
people who were almost lateral people who were your supervisors who you
had to report to. In that, it created almost a sort of combative situation between
people – “Who am I actually reporting to and why am I reporting to someone
who is less senior to me?”’ (School principal)
As well as devolving responsibility to principals, reform in NYC also made the professional development of school leaders a priority
ChapTEr 5: nEW yorK CiTy, usa
75

148 Nadelstern 2013 (p.7) 149 Nadelstern 2013 (p.8)
The increased autonomy introduced in NYC did enable the DOE to introduce a new
funding formula intended to enable school leaders to target support at those who
most needed it:
‘Fair Student Funding was really intended to tie appropriate per capita weights
that reflected student need and the intention behind that, I believe, was to
incentivise exactly the sort of micro-building level decisions that a principal
would be making in favour of students that schools had historically found it
difficult to serve. In other words, students who were special education or who
were over-age per grade or were reading below grade level now carried an
additional funding weight in the hopes that schools would reorient themselves
toward better serving higher numbers of those kids.’ (Former special adviser to
the chancellor)
In order to improve the quality of leadership and to enable principals to use their
new freedoms effectively, a development programme was initiated – the NYC
Leadership Academy. Nadelstern saw this academy as serving multiple ends:
‘The initiative served to create a cadre of leaders loyal to the chancellor and his
efforts to place children first. It also served as something of a wake-up call for
those who directed university principal preparation programs that the future
was not what it used to be.’148
Many of the candidates for the academy came directly from the school system,
having previously been effective teachers.149 The programme centred on ‘solution-
driven training ... how you deal with budget, how you deal with angry parents, how
you get teachers who are resistant aligned with your mission, etc.’ (former senior
official in the city education department). Two of the interviewees talked at length
about the importance of developing strong principals (their choice of language
implying an ability to stand up to pressure from, for examples, teachers and their
unions):
‘I think if you don’t have really good, strong principals, your schools are
just not going to work well.’ (Former senior official in the city education
department)
‘I don’t think you can have a successful system without successful schools and
you can’t have successful schools without strong principals.’ (Academic and
former special assistant to the chancellor)
accountability
The basic policy of providing more autonomy to school principals was tied to a
more stringent accountability system. As one of the interviewees said:
‘What we were attempting to do was create networks that were autonomous as
well and that loosely orbited the Department of Education for accountability
purposes only.’ (Former senior official at the NYC DOE)
All of the principals who signed up to the pilot Autonomy Zone ‘had a performance
contract with the city’ (former senior official in the NYC DOE); school inspections
In order to improve the quality of leadership and to enable principals to use their new freedoms effectively, a development programme was initiated – the NYC Leadership Academy
ChapTEr 5: nEW yorK CiTy, usa
76

Perhaps the most radical reform instigated by Bloomberg and Klein was their policy of identifying underperforming schools and closing them
150 Kelleher 2014 (p.22) 151 Nadelstern 2013 (p.21) 152 Klein 2014 (p.201) 153 Nadelstern 2013 (p.22) 154 Nadelstern 2013 (p.22) 155 Klein 2014 (p.78) 156 Nadelstern 2013 (p.36) 157 Fertig 2014 158 NYC Public School Parents 2012
by external experts, known as ‘quality reviews,’ were introduced; and each
school received a graded progress report based upon variables including school
environment, student performance and progress.150 Accountability was based on
data-based benchmarking. Schools were grouped together based on their intake
and the students they served,151 which mean that comparison was:
‘Apples to apples on performance – meaning we didn’t compare principals
in high-poverty communities with principals in middle-income communities.
We looked at comparable schools; we measured progress as the key variable.’
(Former senior official in NYC DOE)
According to Klein, for the first time in NYC ‘people were getting information about
kids and using it to help them improve.’152
The appointment of Jim Liebman to the role of chief accountability officer at
the DOE accelerated the development of this new accountability regime which
provided a much greater range of data on individual schools, both in terms of
progress and ‘quality’ – judged through the inspection visits which looked at
leadership, classroom instruction, teacher practice and staff use of data to inform
instruction.153
school structures
Perhaps the most radical reform instigated by Bloomberg and Klein was their policy
of identifying underperforming schools and closing them. Enabled by the new
accountability measures the DOE had put in place, it was possible to isolate the
worst-performing schools according to the quality reviews, progress reports and
an extensive survey of teachers and parents.154
‘Our research showed that at least 10 per cent [of schools] were chronically
underperforming ... we began to target the most troubled schools for
closure.’155
Although, as is shown later, stakeholder engagement was a priority for the DOE,
it was accepted that the only way to bring about meaningful change was to take
drastic and sometimes unpopular action:
‘In so doing, it was necessary to break through the rules, roles and relationships
that had grown up over the decades. And get people re-focused in new ways
on achieving higher levels of student performance.’ (Former senior official in
the NYC DOE)
One of our expert witnesses, who was a senior charter school executive, endorsed
the strategy, commenting that when a culture of failure is ingrained, the only
option is to sweep the board clean. This view was echoed by Nadelstern, who
claimed that ‘large failed organizations, including schools, never reinvent
themselves.’156 More than 160 of NYC’s public schools either closed or were
scheduled to close during Bloomberg’s time in office:157 mostly large high schools
in disadvantaged areas. The strategy was at times unpopular.158 Similar approaches
have been adopted in other parts of the USA. Recent research, for example, from
ChapTEr 5: nEW yorK CiTy, usa
77
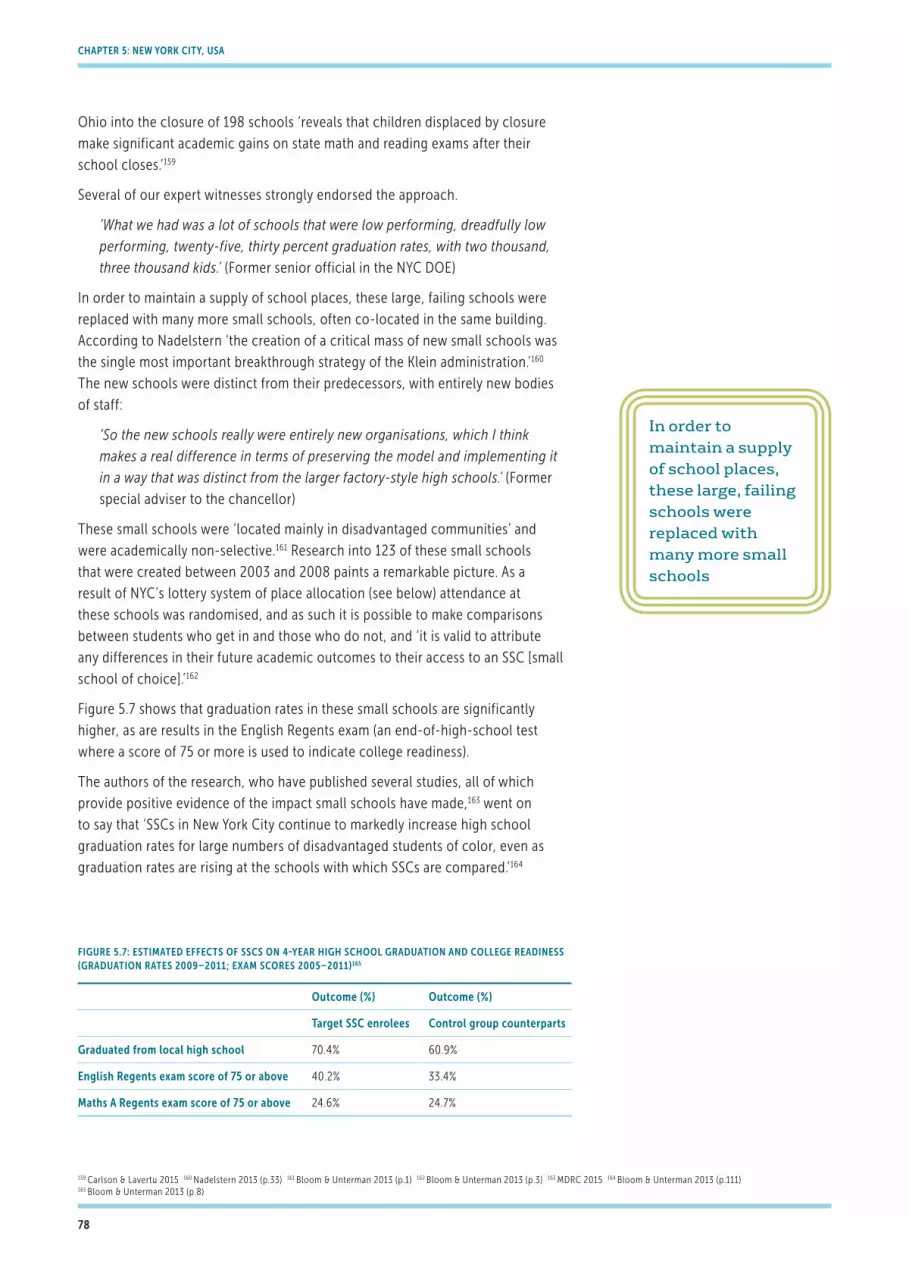
159 Carlson & Lavertu 2015 160 Nadelstern 2013 (p.33) 161 Bloom & Unterman 2013 (p.1) 162 Bloom & Unterman 2013 (p.3) 163 MDRC 2015 164 Bloom & Unterman 2013 (p.111) 165 Bloom & Unterman 2013 (p.8)
figurE 5.7: EsTiMaTEd EffECTs of ssCs on 4-yEar high sChool graduaTion and CollEgE rEadinEss (graduaTion raTEs 2009–2011; ExaM sCorEs 2005–2011)165
outcome (%) outcome (%)
Target ssC enrolees Control group counterparts
graduated from local high school 70.4% 60.9%
English regents exam score of 75 or above 40.2% 33.4%
Maths a regents exam score of 75 or above 24.6% 24.7%
Ohio into the closure of 198 schools ‘reveals that children displaced by closure
make significant academic gains on state math and reading exams after their
school closes.’159
Several of our expert witnesses strongly endorsed the approach.
‘What we had was a lot of schools that were low performing, dreadfully low
performing, twenty-five, thirty percent graduation rates, with two thousand,
three thousand kids.’ (Former senior official in the NYC DOE)
In order to maintain a supply of school places, these large, failing schools were
replaced with many more small schools, often co-located in the same building.
According to Nadelstern ‘the creation of a critical mass of new small schools was
the single most important breakthrough strategy of the Klein administration.’160
The new schools were distinct from their predecessors, with entirely new bodies
of staff:
‘So the new schools really were entirely new organisations, which I think
makes a real difference in terms of preserving the model and implementing it
in a way that was distinct from the larger factory-style high schools.’ (Former
special adviser to the chancellor)
These small schools were ‘located mainly in disadvantaged communities’ and
were academically non-selective.161 Research into 123 of these small schools
that were created between 2003 and 2008 paints a remarkable picture. As a
result of NYC’s lottery system of place allocation (see below) attendance at
these schools was randomised, and as such it is possible to make comparisons
between students who get in and those who do not, and ‘it is valid to attribute
any differences in their future academic outcomes to their access to an SSC [small
school of choice].’162
Figure 5.7 shows that graduation rates in these small schools are significantly
higher, as are results in the English Regents exam (an end-of-high-school test
where a score of 75 or more is used to indicate college readiness).
The authors of the research, who have published several studies, all of which
provide positive evidence of the impact small schools have made,163 went on
to say that ‘SSCs in New York City continue to markedly increase high school
graduation rates for large numbers of disadvantaged students of color, even as
graduation rates are rising at the schools with which SSCs are compared.’164
In order to maintain a supply of school places, these large, failing schools were replaced with many more small schools
ChapTEr 5: nEW yorK CiTy, usa
78

The DOE in NYC revolutionised the system whereby children were allocated a school place
166 Klein 2014 (p.78) 167 Nadelstern 2013 (p.37) 168 Klein 2014 (p.110)
One of our expert witnesses, an education department official, outlined why he
thought small schools had been so successful in NYC:
‘The first reason is they’re simply easier to manage. It’s very difficult to find
people who can effectively manage a school of 5,000. It’s much easier to find
someone who can manage a school of 500 ... Whereas, if you have 400–500
kids in a school, then you have 20–25 teachers and they each have 20–25 kids
in a class and that strikes me as the right ratio ... And small schools differed
from the large failed schools they replaced in that they could grow slowly
and carefully as we phased them in. It built a strong culture and they could
build from the ideas on up, rather than from the oppression of precedent and
tradition.’ (Former senior official in the NYC DOE)
As the official noted, the new small schools were phased in slowly – ‘ramped up
one grade at a time’166 which was one of the key reasons they ‘worked so well’,
according to Nadelstern.167
As well as creating a host of new small schools, the DOE in NYC revolutionised
the system whereby children were allocated a school place. The selection process
that favoured those from an already advantaged background was replaced with a
complex lottery that allowed both students to rank their school preferences and
schools to express certain admissions criteria, and then matched student to school
in a system described by Klein as one which ‘maximized the total good across the
entire school population.’168 One of our expert witnesses described it as:
‘A universal choice system that no longer tied students to local communities
[but] allowed them access to any high school in the city with a whole portfolio
of schools that were ranging from purely unscreened schools where there
was absolutely no admissions criteria to those that had pretty high stakes.’
(Academic)
The rationale for the new approach of closing failing schools and opening new
small schools of choice was succinctly summarised by an interviewee who had
spent a considerable time researching the NYC system:
‘Get rid of the lowest-performing schools, create new ones that were mission-
driven, working at a scale that made it more feasible to address the needs of
individual kids and then opening up the options for kids to be able to pick the
places that were going to be the best fit for them and their families.’ (Academic)
new forms of schooling
The increased level of choice in NYC, partly achieved through district-run SSCs,
was extended still further by an open invitation from the DOE to charter school
organisations; encouraging them to open new schools in the city. Charter schools
are public schools that are free to attend, often supported by private financial
backers. They are not conventional government schools as they are not controlled
by traditional school boards or hierarchies. Their proponents believe that charter
schools provide greater accountability (charters are granted by the government
ChapTEr 5: nEW yorK CiTy, usa
79
169 Klein 2014 (p.81) 170 National Alliance for Public Charter Schools 2015 171 Klein 2014 (p.112) 172 Kelleher 2014 (p.32) 173 Hoxby et al. 2009 (p.IV–8) 174 Hoxby et al. 2009 (p.IV–8) 175 CREDO 2013 (p.14) 176 CREDO 2015 (p.12–15) 177 Ravitch 2012
and come up for renewal at regular intervals, with underperforming schools
‘required by law to be shut down’169), while also giving principals greater freedom
to innovate.170
‘Charter schools were built on a model of empowerment and accountability,
which made great organisational sense.’171
‘Very often in charter schools you don’t have to deal with the other b**t. It’s
very clear that your job is to raise student performance and as long as you do
that, you’re left to do your job.’ (Former senior official in the NYC DOE)
Although charter schools nationally have achieved mixed results,172 those in NYC
do overall seem to outperform other district schools. Taking advantage of the
lottery system used to allocate places in order to provide quasi-experimental data,
Hoxby’s 2009 review found that:
‘By the end of third grade, the charter school students’ scores are just about
five points higher than those of their lotteried-out counterparts. By the end
of the sixth grade, their scores are about 21 points higher than those of their
lotteried-out counterparts. And so on up to the eighth grade, at which time
their scores are about 30 points higher than those of their lotteried-out
counterparts.’173
The authors state that this 30-point gap is similar to the difference in student
performance in Scarsdale (one of NYC’s most affluent suburbs) and Harlem (a
particularly disadvantaged district where many of the city’s charter schools
are located)174 – which suggests that charter schools close the attainment gap
significantly for their more disadvantaged intake.
Further evidence was provided by a 2013 study by CREDO (The Centre for Research
on Education Outcomes) which showed that ‘on average, students in New York
City charter schools learned significantly more than their virtual counterparts in
reading and mathematics’.175 This study again took advantage of the lottery system
to pair charter school students up with a ‘virtual twin’ in the form of a conventional
government school. In line with the findings of Hoxby’s 2009 report, improvement
was identified in both reading and mathematics, although it was significantly
more pronounced in mathematics. CREDO’s 2015 report on charter schools in
urban districts found that charters in NYC obtained greater learning gains in both
mathematics and reading when compared with average achievement of all schools
in the region.176
As can be seen in Figure 5.8, in each of the three neighbourhoods in NYC where
charter schools are most concentrated, the percentage of students deemed
‘proficient’ in mathematics and English is higher in charter schools than in district-
run schools.
The lack of randomised controlled trials (RCTs) amongst the interventions
enacted in NYC means that there is very little definitive and uncontested evidence
relating to which aspects of the reform programme might be responsible for
improvements. Criticism of NYC’s education system has often come from the
academic Diane Ravitch, who has identified instances where charter schools serve
different populations from those of their district-run counterparts.177 This might
Although charter schools nationally have achieved mixed results, those in NYC do overall seem to outperform other district schools
ChapTEr 5: nEW yorK CiTy, usa
80

PER
CEN
TAG
E O
F ST
UD
ENTS
PR
OFI
CIE
NT
60
50
40
30
20
10
0
MAT
HS
ELA
MAT
HS
ELA
MAT
HS
ELA
FIGURE 5.8: PROFICIENCY RATES (ALL GRADES) IN THE THREE DISTRICTS WITH HIGHEST CONCENTRATION OF CHARTER SCHOOLS (2014)178
DISTRICT SCHOOLS
CHARTER SCHOOLS
SOUTH BRONX HARLEM CENTRAL BROOKLYN
178 NYC Charter School Center 2014 179 CREDO 2015 (p.7) 180 Kelleher 2014 (p.27–8) 181 NYC DOE 2015a 182 Klein 2014 (p.189) 183 Klein 2014 (p.189)
explain some of the difference in performance when comparisons are drawn within
individual areas; however, it would not account for the improved performance
identified by CREDO’s 2013 study which created pairs of individual students.
Furthermore, the 2015 CREDO study suggested that charter schools in NYC have
14% of students in special education and 81% students in poverty, while traditional
public schools in the city have 14% of students in special education and 82% of
students in poverty.179
By 2013, there were 183 charter schools in NYC and 337 new SSCs180 out of
around 1,800 schools in the city as a whole: around a quarter;181 representing a
significantly increased level of school choice and competition and – given that
both SSCs and charter schools have been shown to outperform other district-run
schools – a means to increase levels of performance.
Teacher quality
Addressing the quality of teachers was another critical action point for Klein: ‘the
biggest factor in the education equation is teacher quality.’182 He has discussed
the need to professionalise teachers and remove poor teachers,183 a point of view
shared by the senior charter school executive interviewed as part of this research
project. This individual was a former adviser to the chancellor and noted that
teacher quality was closely tied to the increased autonomy that had been given
to principals, allowing them to make ‘more strategic and detailed decisions about
how the funding that they have is going to be used’ in terms of the teachers they
recruited and the resultant blend of experience: ‘so they can decide on the mix
of teachers within their building to make sure they are able to attract high quality
teachers but at a decent price’ (academic and former special assistant to the
chancellor).
Addressing the quality of teachers was another critical action point for Klein
ChapTEr 5: nEW yorK CiTy, usa
81

184 Lankford et al. 2014 (p.28) 185 Lankford et al. 2014 (p.28) 186 Klein 2014
There is evidence that the quality of teachers recruited in NYC did indeed improve
during the Klein years. Figure 5.9 shows the distribution of new teachers in terms
of their SAT scores (a standardised test often used for college admissions in the
USA).
‘In 1999, 43 percent of individuals hired to teach in NYC are drawn from the
bottom third of the SAT distribution; by 2010, 24 percent are. In 1999, 21
percent of novice NYC teachers have SAT scores in the top third; by 2010 this
figure increases to 40 percent.’185
One of our interviewees, a school principal, suggested that the ‘criteria to become
a teacher have got more rigorous – which is good’ and that the standard had
improved, describing the majority of teachers in NYC as ‘people who are trying to
look for the best methods to convey the information to the students.’
The previously deep-rooted dysfunctional nature of NYC schools is often blamed
on the stranglehold that teaching unions held over the administration.186 Amongst
other counterintuitive practices (in terms of improving learning outcomes for
students) were requirements that teachers had to be appointed based on seniority
and not ability; after three years’ service teachers would automatically receive
tenure, making it very difficult to remove them; and the fact that there was a
complete lack of autonomy for principals in terms of who they could hire (right
down to their assistant/deputy principals).
1995
1996
1997
1998
1999
2000
2001
2002
2003
2004
2005
2006
2007
2008
2009
2010
50%
45%
40%
35%
30%
25%
20%
15%
10%
5%
0%
PER
CEN
TAG
E O
F EN
TER
ING
TEA
CH
ERS
BOTTOM THIRD
MIDDLE THIRD
TOP THIRD
FIGURE 5.9: PERCENTAGE OF ENTERING TEACHERS IN NYC DRAWN FROM BOTTOM, MIDDLE AND TOP THIRDS OF STATE-WIDE SCORE DISTRIBUTION (ON NATIONAL SAT TESTS)184
There is evidence that the quality of teachers recruited in NYC did indeed improve during the Klein years
ChapTEr 5: nEW yorK CiTy, usa
82

The restructuring of NYC’s education system by Mayor Bloomberg helped to win him three successive election victories and brought about clear educational improvement
187 Freedman 2007 & Kugler 2010 188 Kelleher 2014 (p.42) 189 Klein 2014 190 Klein 2014 (p.196)
The removal of poorly-performing tenured teachers was so difficult that
‘reassignment centres’ were created (so-called ‘rubber rooms’) where teachers
were paid their full salaries while not teaching, awaiting disciplinary hearings.
Although the arbitration process was streamlined, the removal of incompetent
teachers still took years to complete.187
A former senior official in the city education department that we interviewed
believed that the most ‘important relationship in a school district is the relationship
between kids and teachers and everyone and everything external to schools ought
to exist in support of that relationship.’ Although the Bloomberg/Klein reforms
were not able to solve completely the problem of removing poor teachers from the
system, they did establish new pathways for training teachers; open up the market
for hiring teachers and transferring them; and instituted pay increases and a limited
system of performance-related pay in order to attract better applicants.188
difficulties in the creation of a coalition for change
There was a close alignment in NYC between the different levels of political
leadership and their influence over education – Joel Klein often talks of how direct
the lines of communication were between the Mayor’s Office and the Department
of Education.189 Klein wanted to create a coalition for change with all the key
stakeholders, including the teachers. However, he became increasingly frustrated
because Union regulations did not allow him to communicate in the same way with
teachers in the NYC school system:
‘I just wish I had had the ability to explain to them directly what we were doing
and why and to hear and address their reactions.’190
Klein cites high approval ratings for his work in 2010 from both principals and
parents, but was dismayed by the comparatively low figures he received from
teachers in the city. Unable to interact directly with teachers en masse, Klein felt
he had been robbed of the opportunity to explain his theory of change and was
instead being judged on false information propagated through the media.
summary
Over the past ten years graduation rates in NYC have climbed and drop-out
rates have decreased. Schools in the city have closed the attainment gap with
their counterparts across New York State despite serving a more economically
disadvantaged population. In 2013 the city’s performance on national tests placed
it amongst the best urban school districts in the country when compared with
cities serving similar populations.
The restructuring of NYC’s education system by Mayor Bloomberg helped to
win him three successive election victories and brought about clear educational
improvement. While not always popular amongst teachers and the unions,
the reforms nonetheless largely carried public support (with some notable
exceptions around the closure of schools) and contributed to a trend of enhanced
performance.
ChapTEr 5: nEW yorK CiTy, usa
83

Schools Chancellor for much of Bloomberg’s time in office, Joel Klein led the
reform effort, particularly focusing on improving equality across the city. As well as
introducing fairer systems of funding, policies such as encouraging charter schools
to open were often explicitly aimed at helping disadvantaged students who had
been historically let down by the government school system.
‘I think that was one of his accomplishments. I think he managed to put
together a system to channel dollars into schools with high need populations.
I do believe that Joel was very much committed to social equity in education.’
(Academic and former special assistant to the chancellor)
Klein and Bloomberg rooted out poor performance, with an aggressive policy of
school closures matched by the opening of hundreds of new small schools which
gave parents and students greater choice. Their reforms were based on a view that
improving the quality of teachers and principals was an essential precondition for
school improvement:
‘Whatever else we do, we need to make teaching a well-respected profession
that attracts our best college graduates and ensures that they have the training
in the subject area they will teach as well as in pedagogy and classroom
management.’191
Klein regularly talks about inspiring or motivating people to do the best for
children and his ability to ‘energise everyone in the city’ helped to drive the
transformation of NYC’s education landscape.192
191 Klein 2014 (p.283) 192 Klein 2014 (p.84)
Policies such as encouraging charter schools to open were often explicitly aimed at helping disadvantaged students who had been historically let down by the government school system
ChapTEr 5: nEW yorK CiTy, usa
84

ChapTEr 5: nEW yorK CiTy, usa
85

Chapter 6
Rio de Janeiro, Brazil
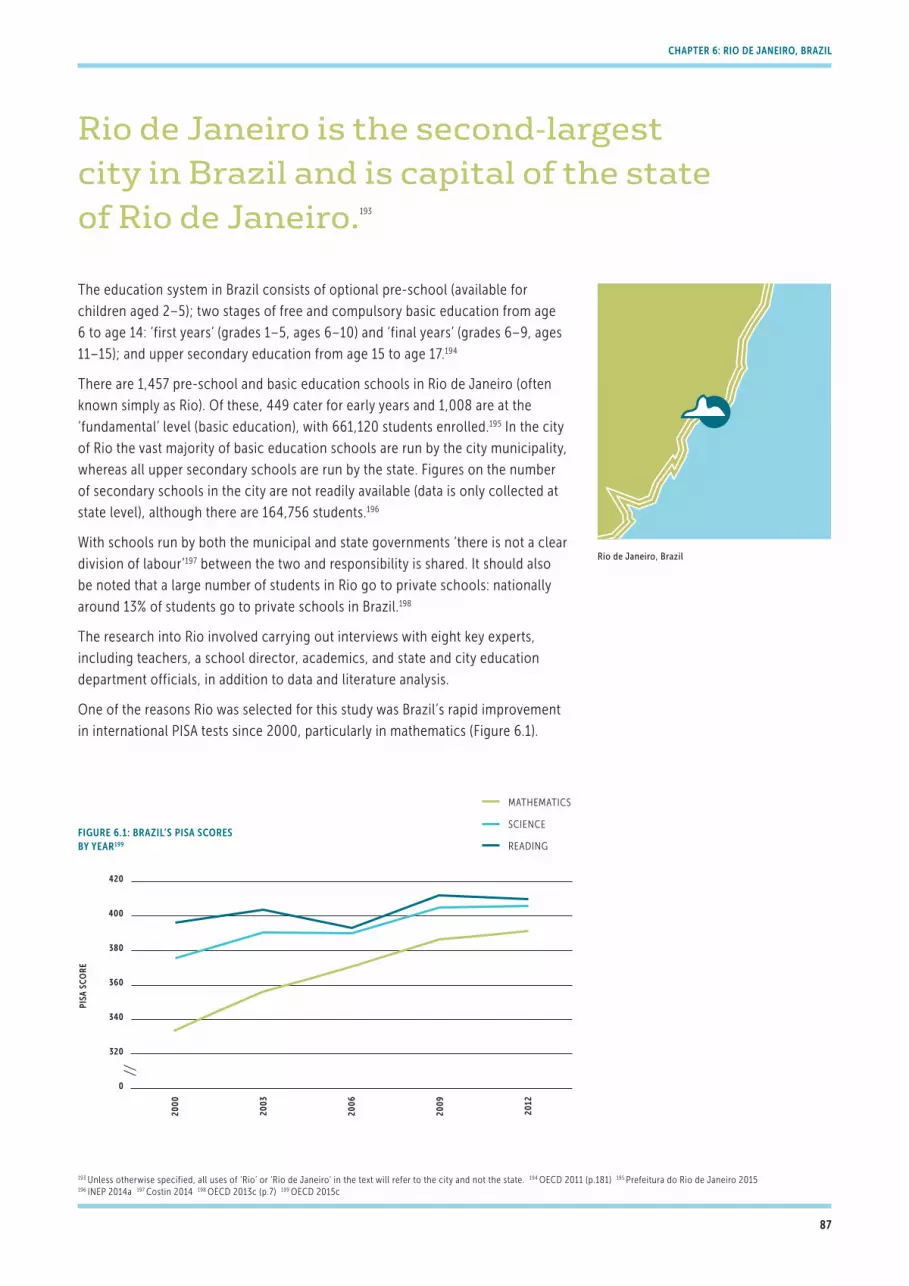
Rio de Janeiro is the second-largest city in Brazil and is capital of the state of Rio de Janeiro.193
The education system in Brazil consists of optional pre-school (available for
children aged 2–5); two stages of free and compulsory basic education from age
6 to age 14: ‘first years’ (grades 1–5, ages 6–10) and ‘final years’ (grades 6–9, ages
11–15); and upper secondary education from age 15 to age 17.194
There are 1,457 pre-school and basic education schools in Rio de Janeiro (often
known simply as Rio). Of these, 449 cater for early years and 1,008 are at the
‘fundamental’ level (basic education), with 661,120 students enrolled.195 In the city
of Rio the vast majority of basic education schools are run by the city municipality,
whereas all upper secondary schools are run by the state. Figures on the number
of secondary schools in the city are not readily available (data is only collected at
state level), although there are 164,756 students.196
With schools run by both the municipal and state governments ‘there is not a clear
division of labour’197 between the two and responsibility is shared. It should also
be noted that a large number of students in Rio go to private schools: nationally
around 13% of students go to private schools in Brazil.198
The research into Rio involved carrying out interviews with eight key experts,
including teachers, a school director, academics, and state and city education
department officials, in addition to data and literature analysis.
One of the reasons Rio was selected for this study was Brazil’s rapid improvement
in international PISA tests since 2000, particularly in mathematics (Figure 6.1).
ChapTEr 6: rio dE JanEiro, BraZil
2000
2003
2006
2009
2012
420
400
380
360
340
320
0
PISA
SC
OR
E
FIGURE 6.1: BRAZIL’S PISA SCORES BY YEAR199
MATHEMATICS
SCIENCE
READING
193 Unless otherwise specified, all uses of ‘Rio’ or ‘Rio de Janeiro’ in the text will refer to the city and not the state. 194 OECD 2011 (p.181) 195 Prefeitura do Rio de Janeiro 2015 196 INEP 2014a 197 Costin 2014 198 OECD 2013c (p.7) 199 OECD 2015c
Rio de Janeiro, Brazil
87
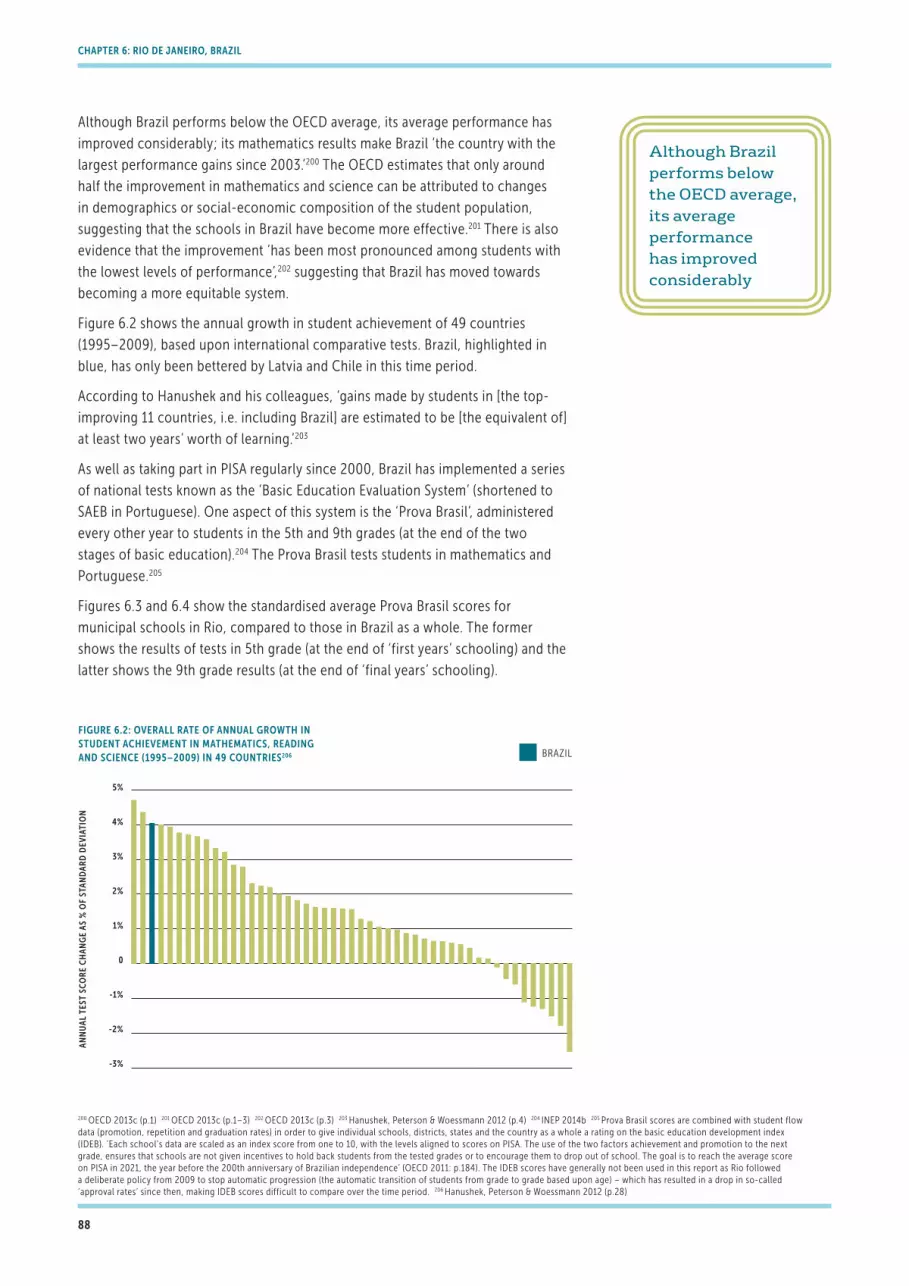
Although Brazil performs below the OECD average, its average performance has
improved considerably; its mathematics results make Brazil ‘the country with the
largest performance gains since 2003.’200 The OECD estimates that only around
half the improvement in mathematics and science can be attributed to changes
in demographics or social-economic composition of the student population,
suggesting that the schools in Brazil have become more effective.201 There is also
evidence that the improvement ‘has been most pronounced among students with
the lowest levels of performance’,202 suggesting that Brazil has moved towards
becoming a more equitable system.
Figure 6.2 shows the annual growth in student achievement of 49 countries
(1995–2009), based upon international comparative tests. Brazil, highlighted in
blue, has only been bettered by Latvia and Chile in this time period.
According to Hanushek and his colleagues, ‘gains made by students in [the top-
improving 11 countries, i.e. including Brazil] are estimated to be [the equivalent of]
at least two years’ worth of learning.’203
As well as taking part in PISA regularly since 2000, Brazil has implemented a series
of national tests known as the ‘Basic Education Evaluation System’ (shortened to
SAEB in Portuguese). One aspect of this system is the ‘Prova Brasil’, administered
every other year to students in the 5th and 9th grades (at the end of the two
stages of basic education).204 The Prova Brasil tests students in mathematics and
Portuguese.205
Figures 6.3 and 6.4 show the standardised average Prova Brasil scores for
municipal schools in Rio, compared to those in Brazil as a whole. The former
shows the results of tests in 5th grade (at the end of ‘first years’ schooling) and the
latter shows the 9th grade results (at the end of ‘final years’ schooling).
ChapTEr 6: rio dE JanEiro, BraZil
AN
NU
AL
TEST
SC
OR
E C
HA
NG
E A
S %
OF
STA
ND
AR
D D
EVIA
TIO
N
5%
4%
3%
2%
1%
0
-1%
-2%
-3%
FIGURE 6.2: OVERALL RATE OF ANNUAL GROWTH IN STUDENT ACHIEVEMENT IN MATHEMATICS, READING AND SCIENCE (1995–2009) IN 49 COUNTRIES206 BRAZIL
Although Brazil performs below the OECD average, its average performance has improved considerably
200 OECD 2013c (p.1) 201 OECD 2013c (p.1–3) 202 OECD 2013c (p.3) 203 Hanushek, Peterson & Woessmann 2012 (p.4) 204 INEP 2014b 205 Prova Brasil scores are combined with student flow data (promotion, repetition and graduation rates) in order to give individual schools, districts, states and the country as a whole a rating on the basic education development index (IDEB). ‘Each school’s data are scaled as an index score from one to 10, with the levels aligned to scores on PISA. The use of the two factors achievement and promotion to the next grade, ensures that schools are not given incentives to hold back students from the tested grades or to encourage them to drop out of school. The goal is to reach the average score on PISA in 2021, the year before the 200th anniversary of Brazilian independence’ (OECD 2011: p.184). The IDEB scores have generally not been used in this report as Rio followed a deliberate policy from 2009 to stop automatic progression (the automatic transition of students from grade to grade based upon age) – which has resulted in a drop in so-called ‘approval rates’ since then, making IDEB scores difficult to compare over the time period. 206 Hanushek, Peterson & Woessmann 2012 (p.28)
88

ChapTEr 6: rio dE JanEiro, BraZil
2007
2009
2011
2013
6.5
6.0
5.5
5.0
4.5
4.0
0
STA
ND
AR
DIS
ED A
VER
AGE
PRO
VA B
RA
SIL
SCO
RE
(MU
NIC
IPA
L SC
HO
OLS
)
FIGURE 6.3: AVERAGE SCORE IN NATIONAL MATHEMATICS AND PORTUGUESE TESTS (MUNICIPAL SCHOOLS ONLY), FIRST YEARS207
RIO DE JANEIRO
BRAZIL
2007
2009
2011
2013
6.5
6.0
5.5
5.0
4.5
4.0
0
STA
ND
AR
DIS
ED A
VER
AGE
PRO
VA B
RA
SIL
SCO
RE
(MU
NIC
IPA
L SC
HO
OLS
)
FIGURE 6.4: AVERAGE SCORE IN NATIONAL MATHEMATICS AND PORTUGUESE TESTS (MUNICIPAL SCHOOLS ONLY), FINAL YEARS208
RIO DE JANEIRO
BRAZIL
2008
2009
2010
2012
2013
18
16
14
12
10
8
6
0
DR
OP-
OU
T R
ATE
IN S
ECO
ND
ARY
SC
HO
OLS
FIGURE 6.5: DROP-OUT RATES AT SECONDARY LEVEL209
RIO DE JANEIRO
BRAZIL
207 INEP 2015 208 INEP 2015 209 Todos Pela Educaco 2015
89

ChapTEr 6: rio dE JanEiro, BraZil
As can be seen from these two graphs, schools in Rio have improved since 2007,
and have done so at a greater rate than those across the country as a whole.
While it is not possible to isolate test scores for upper secondary schools (as
these are run by the state in Rio rather than the municipality and cannot be
disaggregated from all other schools in the state), it is possible to track drop-out
rates across the city’s secondary schools, as shown in Figure 6.5. Again, this graph
indicates that schools in Rio have been improving year on year at a greater rate
than other schools in the country.
Figure 6.6 shows that the state of Rio de Janeiro has the second-highest literacy
rates in Brazil behind the Federal District (a relatively small district primarily
consisting of the capital, Brasilia).
As with the PISA scores, test results on Brazil’s national assessments have shown
that the improvements of recent times have increased the extent to which the
education system is equitable in terms of outcomes for different groups:
‘Gains have been generally somewhat larger for students from families with
fewer academic resources ... [they] are definitely not falling farther behind
their more advantaged counterparts; to the contrary, they may be gaining on
advantaged students.’211
PER
CEN
TAG
E O
F PE
OPL
E LI
TER
ATE
(5 Y
EAR
S A
ND
OV
ER)
100%
90%
80%
70%
60%
50%
40%
30%
20%
10%
0
FIGURE 6.6: LITERACY RATES OF BRAZILIAN STATES (2011)210 RIO DE JANEIRO
DIS
TRIT
O F
EDER
AL
RIO
DE
JAN
EIR
O
SAO
PAU
LO
SAN
TA C
ATA
RIN
A
RIO
GR
AN
DE
DO
SU
L
PAR
AN
A
MAT
O G
RO
SSO
DO
SU
L
ESPI
RIT
O S
AN
TO
GO
IAS
MIN
AS
GER
AIS
MAT
O G
RO
SSO
AM
APA
RO
ND
ON
IA
AM
AZO
NA
S
RO
RA
IMA
TOC
AN
TIN
S
PAR
A
BAH
IA
PER
NA
MBU
CO
CEA
RA
RIO
GR
AN
DE
DO
NO
RTE
PAR
AIB
A
ACR
E
SER
GIP
E
PIAU
I
ALA
GO
AS
MA
RA
NH
AO
Schools in Rio have improved since 2007, and have done so at a greater rate than those across the country as a whole
210 Knoema 2015 211 Carnoy et al. 2014 (p.28–9)
90
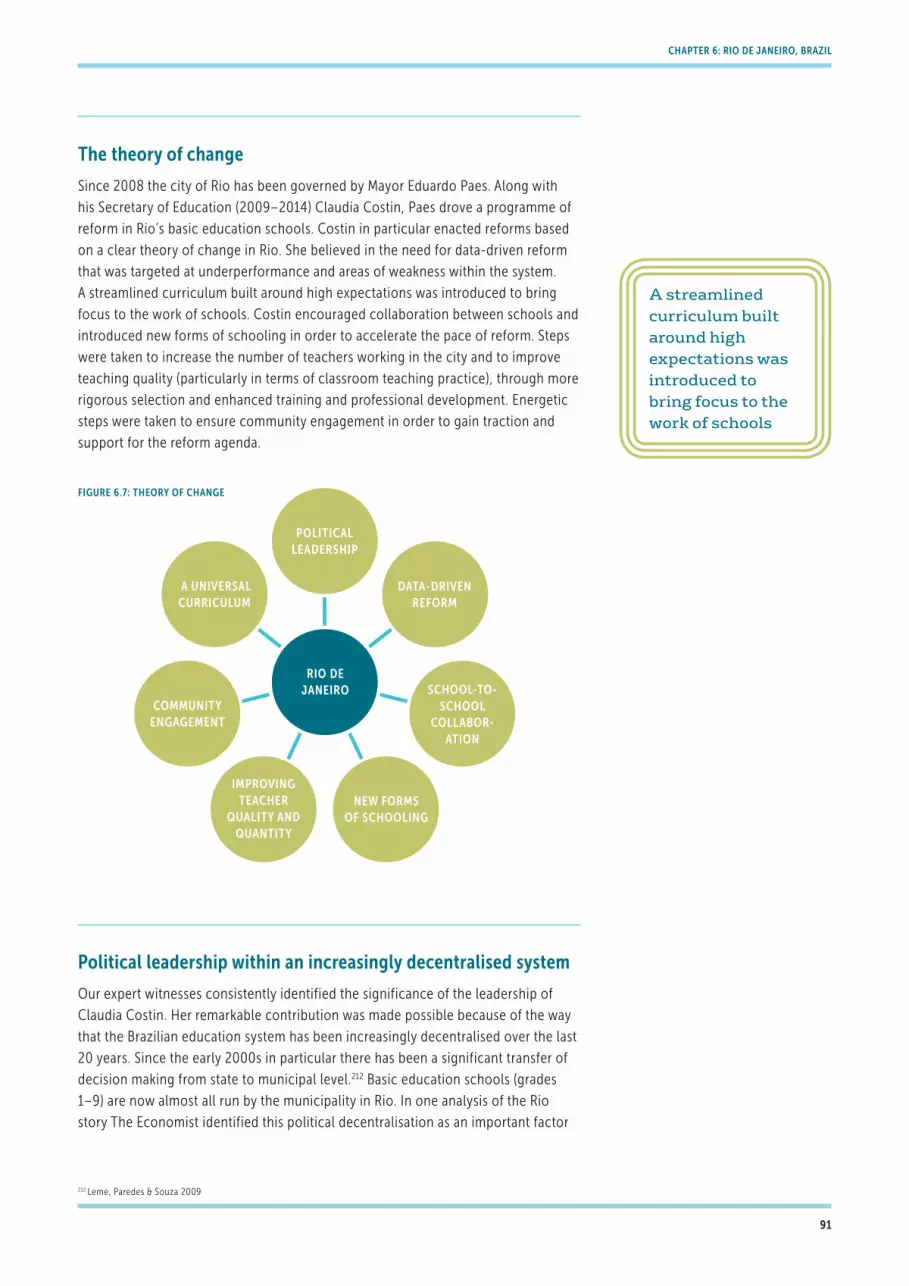
ChapTEr 6: rio dE JanEiro, BraZil
The theory of change
Since 2008 the city of Rio has been governed by Mayor Eduardo Paes. Along with
his Secretary of Education (2009–2014) Claudia Costin, Paes drove a programme of
reform in Rio’s basic education schools. Costin in particular enacted reforms based
on a clear theory of change in Rio. She believed in the need for data-driven reform
that was targeted at underperformance and areas of weakness within the system.
A streamlined curriculum built around high expectations was introduced to bring
focus to the work of schools. Costin encouraged collaboration between schools and
introduced new forms of schooling in order to accelerate the pace of reform. Steps
were taken to increase the number of teachers working in the city and to improve
teaching quality (particularly in terms of classroom teaching practice), through more
rigorous selection and enhanced training and professional development. Energetic
steps were taken to ensure community engagement in order to gain traction and
support for the reform agenda.
political leadership within an increasingly decentralised system
Our expert witnesses consistently identified the significance of the leadership of
Claudia Costin. Her remarkable contribution was made possible because of the way
that the Brazilian education system has been increasingly decentralised over the last
20 years. Since the early 2000s in particular there has been a significant transfer of
decision making from state to municipal level.212 Basic education schools (grades
1–9) are now almost all run by the municipality in Rio. In one analysis of the Rio
story The Economist identified this political decentralisation as an important factor
POLITICALLEADERSHIP
DATA-DRIVENREFORM
A UNIVERSALCURRICULUM
COMMUNITYENGAGEMENT
NEW FORMSOF SCHOOLING
IMPROVINGTEACHER
QUALITY ANDQUANTITY
SCHOOL-TO-SCHOOL
COLLABOR-ATION
RIO DEJANEIRO
A streamlined curriculum built around high expectations was introduced to bring focus to the work of schools
212 Leme, Paredes & Souza 2009
figurE 6.7: ThEory of ChangE
91

ChapTEr 6: rio dE JanEiro, BraZil
because it allowed for ‘a good idea [to] be put into practice everywhere,’ across the
city.213 Critically, Costin had the authority to initiate city-wide reforms, such as the
provision of new curriculum guidelines and the introduction of bi-monthly student
assessments (addressed in more detail below).214
Costin was responsible for a campaign of transformational change which one of
the interviewees, a university academic, described as ‘management shock’. Another
witness, a school director, paid tribute to the way Costin energised the municipality
and ensured a ‘unified’ focus on school improvement. One of her key reforms
(which remains ‘work in progress’) is the gradual transition towards single-shift
schooling. Many schools teach students in one of either two or three shifts a day
(morning, afternoon and evening), meaning many young people in Rio only study
at school for around 20 hours a week. Costin identified instructional time as an
extremely important issue and began increasing the number of school hours,
although such a process required considerable investment:
‘We decided all the schools will have seven hours a day and not four as they are
now. So we made a complicated plan to have them all in one shift. Which means
at the end of the day double the schools.’215
According to the city government around 20 per cent of the schools in Rio operated
in a single-shift pattern by 2014 and ‘by 2016, the municipal school network will
have 35 per cent of its students studying full-time, based on a single seven-hour
timetable, with more classes in Portuguese, mathematics and science.’216 Those
schools that already teach full-time have shown improved performance: ‘in IDEB
2013 [the latest round of national tests], the Early Years [grades 1–5] advanced 17%
compared to 2009, while in the Final Years [grades 6–9] growth was even higher,
reaching 51.4%.’217
The global literature suggests that instructional time is a particularly important
variable in determining learning outcomes. Interestingly, reforms in both Ho Chi
Minh City and Rio placed this issue at the centre of the reform agenda. One recent
meta-analysis has suggested that significant increases in instructional time can
have a demonstrable beneficial effect on student outcomes.218 John Hattie has
also undertaken a meta-analysis that did not find any correlation between hours
of instruction and average PISA scores.219 However, all the countries involved in his
analysis provided more contact time than was formerly the norm in Rio. Costin was
convinced that this question of instructional time mattered. She stated that each of
the top 15 performing countries in PISA taught for seven hours a day, and on this
basis she wanted the same for students in Rio.220
a curriculum based on clear expectations
As well as increasing the amount of time students spent at school, Costin
introduced a new, standardised curriculum in all the schools across the basic
education system. The new curriculum was organised in two-month blocks and
determined ‘precisely what every child should learn.’221 To support teachers in the
delivery of the curriculum, additional guidance and materials were produced and
the municipal government created an online platform – ‘Educopedia’ – which was
populated by the teachers themselves and provided digital support materials.222
The global literature suggests that instructional time is a particularly important variable in determining learning outcomes
213 The Economist 2011 214 Bruns, Evans & Luque 2012 (p.111) 215 Costin 2014 216 Prefeitura do Rio de Janeiro 2014 (p.2–3) 217 Prefeitura do Rio de Janeiro 2013a 218 Farbman 2015 (p.3) 219 Hattie 2015a (p.27) 220 Tadeu 2012 221 Tadeu 2012 222 Robinson 2015
92
ChapTEr 6: rio dE JanEiro, BraZil
In an interview Costin emphasised the importance of getting teacher ‘buy-in’. The
new curriculum had been designed in a close partnership with the city’s teachers:
‘Teachers weren’t really resistant to the new curriculum. We built it together,
and teachers piloted and evaluated it.’223
For Costin a clearer curriculum was essential because it allowed teachers to
‘precisely define learning expectations and standards so that teachers could
know what was expected at each grade level.’224 All of Rio’s schools now teach
this single curriculum and our expert witnesses described how this had resulted
in consistently high expectations across the system. From a position where ‘each
school, each teacher, decided what content they were going to teach the students,
what syllabus they were going to follow’ (senior official in the state education
department), Rio moved to a common curriculum that helped teachers. This was
described by one of our interviewees, a senior official in the municipal education
department, as among Costin’s first and most important actions.
data-driven reform
Testing in Rio happens at two levels. Firstly all students in 5th and 9th grades sit
national tests every two years (the ‘Prova Brasil’). These assessments are a means
to ‘evaluate the quality of education in public schools,’225 with results available
at national, state and school level. Results are not made available at the level of
individual students. For Costin this was not enough. The Prova Brasil provided a
health check on the system but was not the basis for individualised assessment
for learning. She introduced the second form of testing. There are now tests in Rio
at the end of each two-month curriculum block, run by the municipal education
department, with the aim of more regularly and quickly providing feedback to
school principals and teachers on the performance not only of schools but also of
individual students.226 The idea of the need for a rapid feedback loop underpinned
this reform.
‘Ongoing assessment and feedback is critical. In Brazil, I have seen a lot of
standardised tests that take too long to give feedback to teachers. Without that
information teachers can’t re-assess the way they teach.’227
The data is presented to schools as the basis for a benchmarking exercise. Costin
herself has described how these bi-monthly tests (in Portuguese, mathematics,
science and writing) act as a management tool for school principals, allowing
them to compare themselves with the system average. A senior official in the state
education department noted that these tests also allowed for close monitoring of
individual students – to ‘check what the weaknesses are’ across key curriculum
areas and then to provide additional support. There is strong support from the
global literature for a focus on assessment for learning and diagnostic feedback
at the level of the individual student. Hattie, for example, has noted that based
upon his meta-analysis of evidence, ‘know thy impact’ was one of the critical
tasks schools should engage in; suggesting that ‘ten- to twelve-week cycles of
evaluation are about optimal,’228 Hattie’s advice corresponds very closely to the bi-
monthly (i.e. approximately nine weeks) testing undertaken in Rio.
All of Rio’s schools now teach this single curriculum and our expert witnesses described how this had resulted in consistently high expectations across the system
223 The Economist 2011 224 Robinson 2015 225 INEP 2014b 226 Prefeitura do Rio de Janeiro 2014 (p.9) 227 Robinson 2015 228 Hattie 2015b (p.15)
93

ChapTEr 6: rio dE JanEiro, BraZil
Costin’s local reform of assessment was further supported by national changes
in assessment. The changes involved a move away from snapshot tests which
only included a sample of students, to universal assessment in Portuguese and
mathematics for all students in grades 5 and 9. According to our expert witnesses
these national tests were important because they allow ‘the whole cycle’ to be
assessed (senior official in the state education department) in an objective manner
(education lobbyist). Crucially the test results, which are known as IDEB (‘Brazilian
Education Quality Index’), are made public and so can be used by parents and
communities to apply pressure for improvement. The OECD has suggested that the
public nature of scores on the IDEB has helped drive improvement:
‘The results of IDEB are published broadly, by school, by municipality, by state
and for the nation as a whole, and parents and community members are aware
of their school’s ratings. The target and the actual performance are compared
to see which schools are outperforming their targets. This has added public
pressure to the push for improved school performance.’229
The ability to compare schools on a like-for-like basis, and the longitudinal
nature of the index, tracking schools and regions over time, has meant that
‘educators accept the system because they believe it is fair to compare a school’s
performance against its past performance, rather than set one arbitrary score all
schools should reach each year.’230
The focus on performance data is not universally popular. One of our expert
witnesses described the suspicion and even fear with which some school principals
viewed the new systems of data-based accountability:
‘They are scared of being assessed ... I think there is even a very negative
concept about the evaluation and assessment ... The evaluation is in order to
improve the programmes but people don’t have this concept and the managers
don’t. But even if you have the concept that evaluations are to improve
programmes, there is always a risk that the press and the political parties can
make use of these results and it might have a negative impact for the principal,
for the mayor or the governor or the president, for all those who in the end are
responsible for the management.’ (Academic)
Despite this trepidation on the part of some school principals, there seems
little doubt that assessment at school and student levels has helped to drive
improvement in the Rio schools.
school-to-school collaboration
When in office Costin regularly met with principals of the best-performing schools
to discuss their success, and the leaders of the worst-performing schools to
identify what was going wrong. One of the direct outcomes from such meetings
was action to help schools to collaborate with each other:
‘Every quarter I meet with the best performing schools for lunch and discuss
why they succeeded, and the worst performing schools, and they received a
godmother school, a school that is in the same area ... that is having success,
and together they plan how to transform learning in that school.’231
The focus on performance data is not universally popular
229 OECD 2011 (p.185) 230 OECD 2011 (p.184) 231 Costin 2014
94

ChapTEr 6: rio dE JanEiro, BraZil
Her approach was similar to that used successfully in London. Data was used
to identify schools serving similar students but achieving different results. The
high-performing schools – described by her as the godmother schools – were
expected to provide support to the weaker schools. Costin believed that it was the
responsibility of high-performing schools to help those that were proving to be
less effective and, underpinned by the extensive data she had collected, formally
instigated such partnerships. Interestingly, she talked about how the effective
and ineffective schools planned together. She talked not about the one-way
transmission of expertise but a respectful collaborative relationship based on a
shared commitment to the students of the area.
Targeting underperformance
Rio is the largest municipal education network in Brazil.232 The school population
is large and resources are finite. Costin decided to use the data to target resources
on the most disadvantaged communities and students. This targeted policy agenda
identified areas of the city where underperformance was high and individual
students were failing – providing additional schooling for them and ending the
practice of automatically moving students up a grade:
‘The reformulation of the pedagogical project of Rio de Janeiro’s public
(government) education network brought about positive changes to the
education scenario in the city. “Automatic passing” was discontinued, parents
were encouraged to be more participative in their children’s education, and
children in risk areas got special attention in the “Schools for Tomorrow.”’233
Aspects of this approach run counter to current orthodoxy. Although there is
extensive international evidence that grade repetition is detrimental for pupils,234
some such as Hattie have argued that organising pupils into cohorts based
solely on their age, and automatically moving them to the next year and the next
curriculum level at a pre-determined time was also potentially damaging.235 He
argued for a more fluid approach based upon the levels students were working at,
which seems to align with the structure adopted in Rio.
During Costin’s initial period in office the new testing framework allowed her to
identify students that were functionally illiterate,236 leading to the introduction of
remedial tutoring classes in order to help them catch up.237
‘In 2009, approximately 28 thousand functionally illiterate students were
identified between the 4th and 6th grades in Rio de Janeiro’s municipal school
network. The Tutoring (‘Reforço Escolar’) Project was created with a special
focus on re-literacy and acceleration to ensure a successful learning process
for all students in the network.’238
According to the education department, the scheme was a great success,
particularly as it allowed students to return to the correct grade for their age:
‘From 2009 to 2013, nearly 38,000 students were retaught how to read and
write. The functional illiteracy rate fell from 13.6 per cent in 2009 to 3.1 per
cent in 2013, comfortably beating the target to reduce to under 5 per cent by
Costin believed that it was the responsibility of high-performing schools to help those that were proving to be less effective
232 Prefeitura do Rio de Janeiro 2014 233 Prefeitura do Rio de Janeiro 2013b (p.58) 234 EEF 2015 235 Hattie 2015a (p.13) 236 Lacking the literacy necessary for coping with most jobs and many everyday situations. 237 Costin 2014 238 Prefeitura do Rio de Janeiro 2013b (p.66)
95

ChapTEr 6: rio dE JanEiro, BraZil
2016. The reinforcement classes allowed 60,500 students to return to classes
with other students of roughly their age between 2010 and 2013.’239
Extra support for those students who were falling behind was enabled at least partly
through greater cooperation between schools and universities. According to an
official from the state education department, universities provided materials for
teachers and students and additional training for teachers on competencies or skills
that had not previously been learned.
new forms of school
Costin targeted at-risk students and at-risk districts. In highly disadvantaged areas
she introduced a new type of school. The ‘Schools of Tomorrow’ programme
(‘Escolas do Amanha’) was designed for students living in particularly challenging
contexts in Rio: specifically the ‘favelas’ (low-income informal urban areas,
often controlled by drug dealers and other criminal elements). 151 schools were
identified where, in the words of Costin, learning ‘was almost impossible ... those
schools were the only presence of the state in those areas.’240 The schools were
then re-designated as ‘Schools of Tomorrow,’241 receiving special support, ‘including
infrastructure improvements, books and materials, and hardship pay for teachers.’242
Barbara Bruns and colleagues highlighted the important role that such schools
played in these deprived areas, and by implication the benefit that additional focus
on such schools can provide:
‘Most [young people there] have never set foot outside the favela, been to a Rio
beach, or even seen a shopping mall. The school is a respected island in the
community and, for many students, the cleanest and safest place they know.’243
The programme extended beyond the usual academic curriculum and involved
provision of sport, cultural and social welfare facilities. There was an extended
school day. Our expert witnesses spoke positively about the work of these
schools. The curriculum on offer at these schools was specifically designed to be
comprehensive – providing a rounded experience for students:
‘The school is a means for the children to grow and to learn how to live in
society, and we need to help them with that ... we have to be concerned with
the child as a person.’ (School director)
Student assessment data suggests that the ‘Schools of Tomorrow’ programme has
brought great benefit to those students it serves. One of the interviewees described
the project as ‘the most innovative in Rio’ (academic). Despite working in such
difficult circumstances these schools showed greater improvements than other
district schools, as can be seen in Figure 6.8.
These schools also showed a remarkable improvement in terms of reducing
truancy, bringing about a 37.6 per cent decrease between 2008 and 2011:
‘The program has proved to be effective both at keeping children at school
and in its capacity to promote significant learning gains among people most in
need. The initiative’s positive impact goes beyond the students, transforming
the lives of whole families in deprived areas.’244
Student assessment data suggests that the ‘Schools of Tomorrow’ programme has brought great benefit to those students it serves
239 Prefeitura do Rio de Janeiro 2014 (p.10–11) 240 New York City Global Partners 2011 (p.1) 241 Costin 2014 242 Bruns, Evans & Luque 2012 (p.111) 243 Bruns, Evans & Luque 2012 (p.111) 244 Prefeitura do Rio de Janeiro 2014 (p.42–3)
96
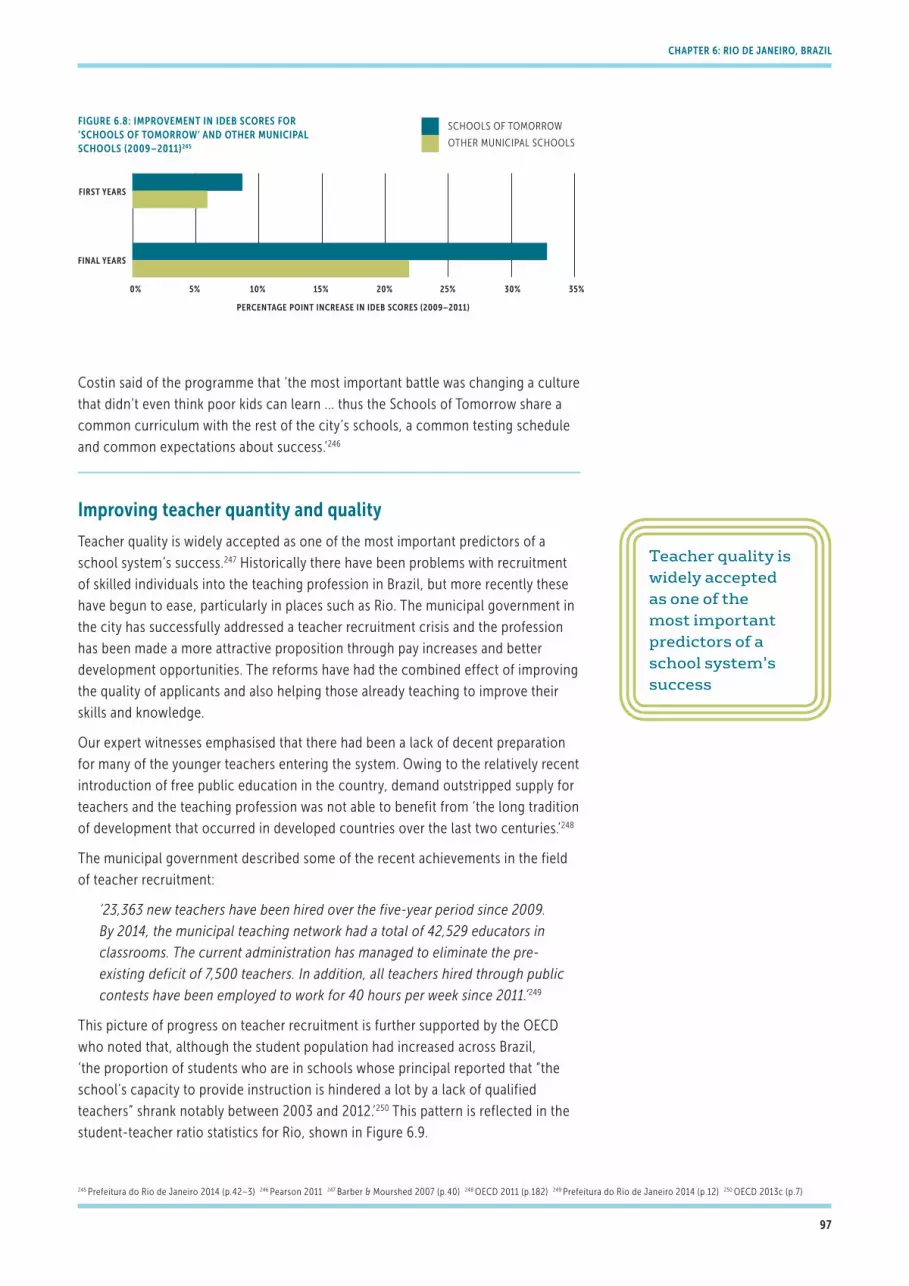
ChapTEr 6: rio dE JanEiro, BraZil
Costin said of the programme that ‘the most important battle was changing a culture
that didn’t even think poor kids can learn ... thus the Schools of Tomorrow share a
common curriculum with the rest of the city’s schools, a common testing schedule
and common expectations about success.’246
improving teacher quantity and quality
Teacher quality is widely accepted as one of the most important predictors of a
school system’s success.247 Historically there have been problems with recruitment
of skilled individuals into the teaching profession in Brazil, but more recently these
have begun to ease, particularly in places such as Rio. The municipal government in
the city has successfully addressed a teacher recruitment crisis and the profession
has been made a more attractive proposition through pay increases and better
development opportunities. The reforms have had the combined effect of improving
the quality of applicants and also helping those already teaching to improve their
skills and knowledge.
Our expert witnesses emphasised that there had been a lack of decent preparation
for many of the younger teachers entering the system. Owing to the relatively recent
introduction of free public education in the country, demand outstripped supply for
teachers and the teaching profession was not able to benefit from ‘the long tradition
of development that occurred in developed countries over the last two centuries.’248
The municipal government described some of the recent achievements in the field
of teacher recruitment:
‘23,363 new teachers have been hired over the five-year period since 2009.
By 2014, the municipal teaching network had a total of 42,529 educators in
classrooms. The current administration has managed to eliminate the pre-
existing deficit of 7,500 teachers. In addition, all teachers hired through public
contests have been employed to work for 40 hours per week since 2011.’249
This picture of progress on teacher recruitment is further supported by the OECD
who noted that, although the student population had increased across Brazil,
‘the proportion of students who are in schools whose principal reported that “the
school’s capacity to provide instruction is hindered a lot by a lack of qualified
teachers” shrank notably between 2003 and 2012.’250 This pattern is reflected in the
student-teacher ratio statistics for Rio, shown in Figure 6.9.
FIRST YEARS
FINAL YEARS
PERCENTAGE POINT INCREASE IN IDEB SCORES (2009–2011)
0% 5% 10% 15% 20% 25% 30% 35%
FIGURE 6.8: IMPROVEMENT IN IDEB SCORES FOR ‘SCHOOLS OF TOMORROW’ AND OTHER MUNICIPAL SCHOOLS (2009–2011)245
SCHOOLS OF TOMORROW
OTHER MUNICIPAL SCHOOLS
Teacher quality is widely accepted as one of the most important predictors of a school system’s success
245 Prefeitura do Rio de Janeiro 2014 (p.42–3) 246 Pearson 2011 247 Barber & Mourshed 2007 (p.40) 248 OECD 2011 (p.182) 249 Prefeitura do Rio de Janeiro 2014 (p.12) 250 OECD 2013c (p.7)
97
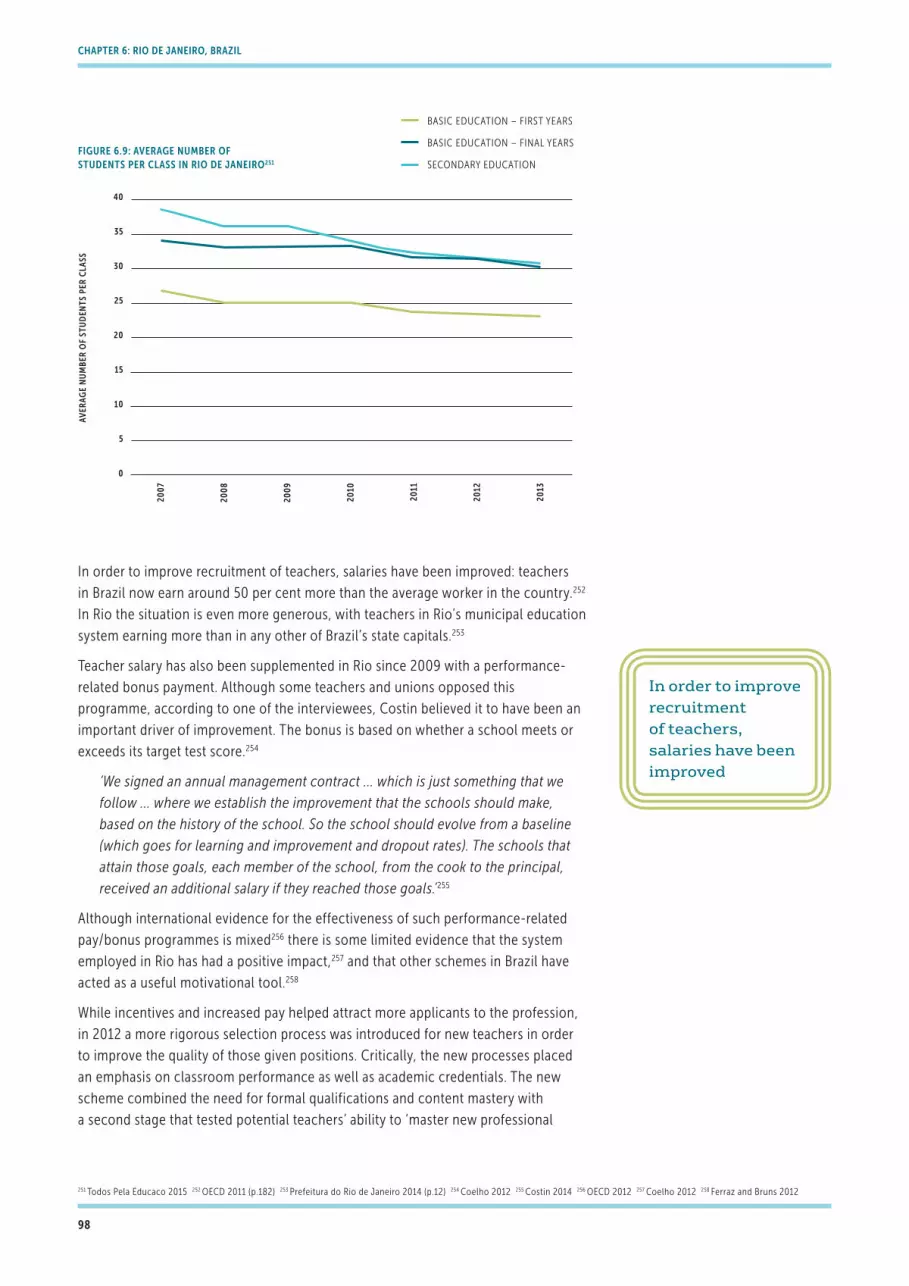
In order to improve recruitment of teachers, salaries have been improved: teachers
in Brazil now earn around 50 per cent more than the average worker in the country.252
In Rio the situation is even more generous, with teachers in Rio’s municipal education
system earning more than in any other of Brazil’s state capitals.253
Teacher salary has also been supplemented in Rio since 2009 with a performance-
related bonus payment. Although some teachers and unions opposed this
programme, according to one of the interviewees, Costin believed it to have been an
important driver of improvement. The bonus is based on whether a school meets or
exceeds its target test score.254
‘We signed an annual management contract ... which is just something that we
follow ... where we establish the improvement that the schools should make,
based on the history of the school. So the school should evolve from a baseline
(which goes for learning and improvement and dropout rates). The schools that
attain those goals, each member of the school, from the cook to the principal,
received an additional salary if they reached those goals.’255
Although international evidence for the effectiveness of such performance-related
pay/bonus programmes is mixed256 there is some limited evidence that the system
employed in Rio has had a positive impact,257 and that other schemes in Brazil have
acted as a useful motivational tool.258
While incentives and increased pay helped attract more applicants to the profession,
in 2012 a more rigorous selection process was introduced for new teachers in order
to improve the quality of those given positions. Critically, the new processes placed
an emphasis on classroom performance as well as academic credentials. The new
scheme combined the need for formal qualifications and content mastery with
a second stage that tested potential teachers’ ability to ‘master new professional
ChapTEr 6: rio dE JanEiro, BraZil
2007
2008
2009
2010
2011
2012
2013
40
35
30
25
20
15
10
5
0
AVER
AGE
NU
MBE
R O
F ST
UD
ENTS
PER
CLA
SS
FIGURE 6.9: AVERAGE NUMBER OF STUDENTS PER CLASS IN RIO DE JANEIRO251
BASIC EDUCATION – FIRST YEARS
BASIC EDUCATION – FINAL YEARS
SECONDARY EDUCATION
In order to improve recruitment of teachers, salaries have been improved
251 Todos Pela Educaco 2015 252 OECD 2011 (p.182) 253 Prefeitura do Rio de Janeiro 2014 (p.12) 254 Coelho 2012 255 Costin 2014 256 OECD 2012 257 Coelho 2012 258 Ferraz and Bruns 2012
98

development content and the quality of their classroom teaching practice.’259
Candidates who satisfied the initial requirements were required to undergo an 80-
hour training course on ‘effective classroom management, child development, class
preparation, and other hands-on topics’ and then teach a sample class to a panel of
expert teachers.’260
In addition to improving the quality of teachers actually entering the profession,
there is evidence that improvement in teacher quality was also driven from the
bottom up. A school director interviewed for this research believed that teachers
were improving by taking advantage of development and training opportunities
themselves:
‘Well, I think the teachers nowadays are more concerned with their own training
... you have many training courses, many conferences, many workshops, and
that concern about their own training, is the concern that is part of the teachers
nowadays.’ (School director)
She did not believe that this renewed sense of interest in development had been
forced upon teachers, but was instead due to their own motivation to improve
and to ‘become better’. The municipal education department’s role should not be
discounted – teachers are now guaranteed a week’s training each year261 and a
teacher training school has been established ‘to help educators continually develop
their skills’:
‘By carrying out continuing education through in-person, semi-distance and
distance courses, municipal teachers expand their horizons and stay abreast of
teaching practices and new content discussed in Brazil and around the world.’262
Improvements in the workforce have taken place at the level of both classroom
teachers and school principals. Our interviewees pointed out that the approach to
appointing principals had changed in recent years, moving away from appointment
by political party towards a system of meritocracy:
‘Also, introduction of meritocracy in the system, for example, in the choice
of school directors. Those used to be political appointees. The introduction
of meritocracy is actually part of the national education plan and is to be
implemented all over Brazil.’ (Senior official in the city education department)
‘What is important to emphasise here is that we broke away from this
appointment by political influence here in Rio de Janeiro ... So today the
directors of schools, head teachers, co-ordinators, managers – they were all
selected on merit and they all have to be teachers who belong to the grid, to the
network of schools.’ (Senior official in the state education department)
Costin believed that the success of her programmes in Rio had only been made
possible by engaging with the workforce: ‘you can only transform education
together with the teachers;’263 ‘in addition to building laws, we decided we needed
to build ownership from the teachers’ perspectives.’264 She stated that when she first
took office she spoke to 1,000 school principals in order to understand where they
were coming from.265
Costin recognised that there was a need to be mindful of the possibility of provoking
teachers into rejection of the reform agenda. She described how as a policymaker
ChapTEr 6: rio dE JanEiro, BraZil
There is evidence that improvement in teacher quality was also driven from the bottom up
259 Bruns & Luque 2014 (p.182) 260 Bruns & Luque 2014 (p.182) 261 The Economist 2011 262 Prefeitura do Rio de Janeiro 2014 (p.13) 263 Pearson 2011 264 Robinson 2015 265 Costin 2014
99

she had to set a ‘speed’ for the reforms that the workforce would tolerate: ‘The
speed was given by the capacity of having teachers on board. We challenged them
to the limit, but not more than the limit.’266 Several expert witnesses highlighted the
issue of teacher resistance to the reform agenda.
‘Even if these changes can bring benefits for those children, you have a strong
reaction from the teachers … teachers react immediately and … belong to a
strong union then they end up going on strike and this is very difficult, it’s a huge
obstacle and if you want to implement these types of measures you will have to
negotiate properly with the teachers because the teachers are not really thinking
about their students, they’re not putting their students first, they’re putting
themselves first.’ (Academic)
‘We discussed, communicated a lot with our teachers. I’m not going to say
that it was easy. No, it wasn’t easy at all when we implemented the minimum
syllabus. It wasn’t easy to get the support from all the teachers, and we’ve got to
remember that we’ve got a large network of schools ... so we cannot please all
the teachers.’ (Senior official in the state education department)
Teacher resistance to the reform agenda manifested itself dramatically in August
2013 when teachers across Rio went on strike for over two months.267 The strike
was organised by a large teaching union in the city and involved both state and
municipal teachers. Costin was highly critical of the union: ‘The teachers’ union
was very radical, from the extreme left, but not very representative, opposed to the
reforms since the beginning.’268
Like Klein in New York, Costin was unable to create a coalition for change that
included all the teachers and the teachers’ union. Nevertheless, her achievements
in the area of workforce reform were considerable. There are now over 40,000
teachers working in Rio, each earning a competitive wage, and with far greater
access to professional development opportunities than previously. The municipal
government successfully addressed a recruitment crisis in order to deal with the
growing numbers of pupils, and then turned their attention to raising the standard of
teachers entering the profession – through a stricter selection process – and those
already engaged in the profession.
Community engagement
As well as attempting to engage with teachers, the municipal education department
in Rio went to great lengths to also reach out to parents and communities; not only
to win support for reform, but also to ensure better support for individual students. A
senior official in the state education department noted that in driving reform, open
communication was crucial: ‘also, transparency in terms of the communication was
very much needed, we needed a lot of transparency and communication.’ Some
evidence of community support for the reform initiatives was the re-election of the
city mayor in 2012, by an overwhelming majority.269
Costin saw parents as potential partners in learning. As a result her focus on parental
involvement centred on the support she saw them being able to provide for their
children: ‘we want to show that parents can be an element to change schools,’
ChapTEr 6: rio dE JanEiro, BraZil
Teacher resistance to the reform agenda manifested itself dramatically in August 2013 when teachers across Rio went on strike for over two months
266 Costin 2014 267 Girgenti 2014 268 Costin 2014 269 BBC 2012
100
through what they do at home with their child, and also by holding schools to
account more broadly.270 ‘I don’t think it’s mandatory to have a huge involvement
of parental involvement ... but to have some involvement is important, and support
from home.’271
The education department instigated a number of changes, particularly through
their ‘Schools of Tomorrow’ programme: moving parent-teacher meetings to
Saturdays so that parents were able to attend; hiring local residents to teach arts and
other extra-curricular activities. As Costin remarked: ‘it is important to have good
role models. Even in violent areas, there are talented people who want only good for
kids.’ She encouraged schools to communicate more clearly how parents could help
their children with their learning.272
summary
Brazil as a whole, and Rio in particular, have both shown rapid educational
improvement over the last decade, albeit from relatively low starting positions.
Since 2008, when a new mayor was elected in the city, the pace of reform has been
relentless.
The results are encouraging. Drop-out rates have decreased while test scores have
gone up – all in the face of a growing school-age population. Rio de Janeiro now
has the second highest literacy rate out of all the states in Brazil.
There appears to be optimism and a real belief in the city that change is possible,
linked to a high level of ambition. Rio’s future ‘municipal plan’ aspires for the city to
become ‘the [state] capital with the best public education system in Brazil.’273
Several policy levers have been used in a co-ordinated way. The introduction of
a standardised curriculum; the gradual transition towards single shift schooling
for all students; and a range of targeted programmes which specifically address
underperformance, have all contributed to the reform of Rio schools. In addition,
issues with teacher supply have been addressed and the education department has
begun to drive up standards in teacher quality, through a more rigorous selection
process and better development and training opportunities.
Although Rio’s education system is complex – with governance at municipal, state
and federal level – there is nonetheless political coherence within the city: for
example the Schools of Tomorrow programme ‘reflects coordinated efforts from
the Municipal Secretaries of Culture, Health, Sports & Entertainment, Social Welfare,
Quality of Life, Civil Works, and the Rio State Public Defender.’274 There has also
been continued support for the education reforms: after leaving office Claudia
Costin noted that under the new education secretary all was well ‘and things are still
continuing.’275
This combination of a clear reform agenda, supported by sustained political will, has
placed Rio at the forefront of Brazil’s educational improvement, leading the way for
other cities and states in the country. Education reform in Rio is clearly unfinished
business but the story is a source of optimism and practical policy lessons for other
school systems.
ChapTEr 6: rio dE JanEiro, BraZil
There appears to be optimism and a real belief in the city that change is possible
270 Pearson 2011 271 Costin 2014 272 Pearson 2011 273 Prefeitura do Rio de Janeiro 2013b (p.12) 274 New York City Global Partners 2011 (p.2) 275 Robinson 2015
101

Chapter 7
Conclusion – interesting cities

We chose the title of this report deliberately. Interesting cities. The signs from these cities are, at the very least, promising and it seems reasonable to claim that they have something valuable to tell us about system reform and policymaking.
Some aspects of the story from these cities are interesting but problematic. As
stated in Chapter 1, it is disappointing to note that none of the major reforms in any
of the cities has been evaluated using the so-called gold standard of a randomised
controlled trial investigation. In almost every case policymakers adopted policies
for change that appeared desirable but they failed to demonstrate conclusively just
how effective the reforms were. The evidence from these five cities is therefore
limited, so they cannot be definitely identified as places where learning outcomes
have been transformed through the application of specific policies.
We concluded from the evidence available that the achievements in these cities
were real but also that they were in some cases fragile. We were impressed by
the Vietnamese expert witnesses who were keen to point out that HCMC faced
many problems and that it was important not to over-state the significance of the
Vietnam 2012 PISA performance. Similarly, policymakers in Rio and Dubai are not
remotely complacent and they believe that much remains to be done. The PISA
performance of Brazil and the UAE in 2012 was impressive in terms of improvement
but remained below OECD averages.
The story from the cities is fundamentally about leadership, but leaders come
and go. The transformation of schools serving disadvantaged students in Rio was
driven by one remarkable woman, Claudia Costin. She was the city’s Secretary
for Education but now she has left and gone to work for the World Bank. In New
York the reform project was energetically led by Mayor Michael Bloomberg and
his Schools Chancellor, Joel Klein. These have now moved on. Are the New
York achievements in jeopardy now that Bloomberg and Klein are no longer in
charge? London appears to have benefited from the inspirational leadership of
Tim Brighouse and the policies of the pre-2010 Labour government, such as the
London Challenge project. Is there a danger of a loss of momentum in London now
that Brighouse has left and the UK is under new political leadership?
So there are many questions that remain and no grounds for complacency or
simplistic analysis. At the same time the message from these cities is one of
optimism and hope. In each city energetic policymakers have challenged the lazy
and immoral assumption that economically disadvantaged students must inevitably
fail at school. The results are not conclusive but they are encouraging.
ChapTEr 7: ConClusion – inTErEsTing CiTiEs
The story from the cities is fundamentally about leadership
103

The science of education system reform is in its infancy. Two pioneering thinkers
in this field are the Canadian scholar, Michael Fullan and the British writer, Michael
Barber. The lessons from the five cities are closely in line with their thinking.
Barber has suggested that effective reform requires not only a well-crafted theory
of change but also attention to the detail of implementation. In his groundbreaking
study of education reform in the Punjab province of Pakistan he highlighted the
importance of persistence:
‘Persist. The single word says it all. In Punjab, we’re just embarking on year three
... It hasn’t been easy. It won’t get any easier for a long time, but there is visible
progress and persistence will be rewarded ultimately.’276
The leaders in our case study cities were undoubtedly persistent. They each had
a good plan and they stuck to it. In several of the case studies the persistence
has continued over decades and this relentless approach appears to be paying
dividends.
The leadership approach demonstrated in action in the case study cities
corresponded closely to the theoretical models for leadership of system reform
developed by Michael Fullan. The leaders had theories underpinned by an
optimistic assumption that improvement was, of course, possible because all
children, regardless of their background, have a physiological aptitude for learning.
Policymakers in our case study cities had developed plans involving a small
number of carefully identified key priorities. This again was in line with Fullan’s
theoretical model.277 In keeping with Fullan’s framework, the leaders in the cities
crafted reform programmes based on a ‘judicious mixture’ of interventions
including the smart use of data, courageous interventions to tackle failure and the
importance of creating a sense that the reform strategy was jointly owned by the
key stakeholders.378
Fullan has argued over many years for an aligned policy approach that goes
beyond the implementation of individual initiatives. In the case study cities there
was a consistent recognition that reform needed to be multi-faceted.
In our cities policy was multi-faceted but also concentrated on the things that
seem to matter: leadership, teacher quality, data-based accountability, powerful
professional learning based on collaboration, building coalitions for change. Our
conclusion is that the case for school reform along the lines adopted in these cities
is not conclusive but it is strong.
ChapTEr 7: ConClusion – inTErEsTing CiTiEs
The leaders had theories underpinned by an optimistic assumption that improvement was, of course, possible because all children, regardless of their background, have a physiological aptitude for learning
276 Barber 2013 (p.70) 277 Fullan 2010 (p.24) 278 Fullan & Boyle 2014 (p.10-12)
104

ChapTEr 7: ConClusion – inTErEsTing CiTiEs
105

Achieve (2015) Proficient vs prepared: Disparities between state tests and the 2013 NAEP. [Online] available from: <http://www.achieve.org/files/NAEPBriefFINAL051415.pdf>
Baars, S., Bernardes, E., Elwick, A., Malortie, A., McAleavy, T., McInerney, L., Menzies, L. & Riggall, A. (2014) Lessons from London Schools: investigating the success. Reading: CfBT Education Trust
Barber, M. & Mourshed, M. (2007) How the world’s best-performing school systems come out on top. New York: McKinsey & Company. [Online] available from: <http://mckinseyonsociety.com/downloads/reports/Education/Worlds_School_Systems_Final.pdf>
Barber, M. (2013) The good news from Pakistan. [Online] available from: <http://www.reform.co.uk/wp-content/uploads/2014/10/The_good_news_from_Pakistan_final.pdf>
BBC (British Broadcasting Corporation) (2012) Eduardo Paes re-elected as Rio de Janeiro mayor. [Online] available from: <http://www.bbc.co.uk/news/world-latin-america-19866081>
Blandson, J., Greaves, E., Gregg, P., Macmillan, L. and Sibieta, L. (2015) Understanding the improved performance of disadvantaged pupils in London. [Online] available from: <http://sticerd.lse.ac.uk/dps/case/spcc/wp21.pdf>
Bloom, H. & Unterman, R. (2013) Sustained progress: New findings about the effectiveness and operation of small public high schools of choice in New York City. [Online] available from: <http://www.mdrc.org/sites/default/files/sustained_progress_FR_0.pdf>
Bodewig, C. & Badiani-Magnusson, R. (2014) Skilling up Vietnam: Preparing the workforce for a modern market economy. Washington DC: The World Bank
Boyden, J. (2013) ‘What Can Vietnam’s excellent schools teach us about education quality and equality?’ Oxfam. [Online] available from: <http://oxfamblogs.org/fp2p/what-can-vietnams-excellent-schools-teach-us-about-education-quality-and-equality/>
The Broad Foundation (2015) Overview. [Online] available from: <http://www.broadprize.org/about/overview.html>
Bruns, B., Evans, N. & Luque, J. (2012) Achieving world-class education in Brazil: The next agenda. Washington DC: The World Bank
Bruns, B. & Luque, J. (2014) Great teachers: How to raise student learning in Latin America and the Caribbean. Washington DC: The World Bank
Burgess, S. (2014) Understanding the success of London’s schools. [Online] available from: <http://www.bristol.ac.uk/media-library/sites/cmpo/migrated/documents/wp333.pdf>
Carlson, D. & Lavertu, S. (2015) School closures and student achievement. Washington DC: Thomas Fordham Institute
Carnoy, M., Khavenson, T., Costa, L., Fonseca, I. & Marotta, L. (2014) Is Brazilian education improving? A comparative foray using PISA and SAEB Brazil test scores. Moscow: National Research University Higher School of Economics. [Online] available from: <http://www.hse.ru/data/2014/12/16/1103403236/22EDU2014.pdf>
Coelho, T. (2012) Bônus por Desempenho de Professores: Análise da Experiência Carioca. [Online] available from: <http://www.econ.puc-rio.br/uploads/adm/trabalhos/files/MONOGRAFIA_FINAL.pdf>
Costin, C. (2014) Implementing system-wide change (fast) in education: The case of Rio de Janeiro. Presentation for the World Bank, February 2014. [Online] available from: <http://www.worldbank.org/en/events/2014/02/13/education-rio-de-janeiro#4>
CREDO (The Center for Research on Education Outcomes) (2013) Charter school performance in New York City. [Online] available from: <https://credo.stanford.edu/documents/NYC_report_2013_FINAL_20130219_000.pdf>
CREDO (2015) Urban charter school study: Report on 41 regions. [Online] available from: <http://urbancharters.stanford.edu/download/Urban%20Charter%20School%20Study%20Report%20on%2041%20Regions.pdf >
DCSF (Department for Children, Schools and Families) (2009) School workforce in England (including Local Authority level figures), January 2009 (Revised). [Online] available from: <http://webarchive.nationalarchives.gov.uk/20101008101451/http://www.dcsf.gov.uk/rsgateway/DB/SFR/s000874/index.shtml>
DfE (Department for Education) (2010) Schools, pupils and their characteristics: January 2010. [Online] available from: <https://www.gov.uk/government/statistics/schools-pupils-and-their-characteristics-january-2010>
DfE (2014) Schools, pupils and their characteristics: January 2014. [Online] available from: <https://www.gov.uk/government/statistics/schools-pupils-and-their-characteristics-january-2014>
DfE (2015a) Revised GCSE and equivalent results in England: 2013 to 2014. [Online] available from: <https://www.gov.uk/government/statistics/revised-gcse-and-equivalent-results-in-england-2013-to-2014>
DfE (2015b) Measuring the performance of schools within academy chains and local authorities. [Online] available from: <https://www.gov.uk/government/uploads/system/uploads/attachment_data/file/415659/SFR09_2015.pdf>
DfES (Department for Education and Skills) (2004) GCSE/GNVQ Examination results for young people in England, 2002/2003 (Provisional). [Online] available from: <http://webarchive.nationalarchives.gov.uk/20110907100731/http://education.gov.uk/rsgateway/DB/SFR/s000419/index.shtml>
Dubai Statistics Center (2015) Population clock. [Online] available from: <https://www.dsc.gov.ae/en-us/EServices/Pages/Population-Clock.aspx>
References
106

Dubow, E., Boxer, P. & Huesmann, L. (2009) ‘Long-term effects of parents’ education on children’s educational and occupational success: mediation by family interactions, child aggression, and teenage aspirations’ Merrill-Palmer Quarterly, 55 (3). [Online] available from: <http://www.ncbi.nlm.nih.gov/pmc/articles/PMC2853053/>
The Economist (2011) Rio’s ace up its sleeve. [Online] available from: <http://www.economist.com/blogs/americasview/2011/09/education-brazil>
EEF (Education Endowment Foundation) (2015) ‘Repeating a year’ Teaching and learning toolkit. [Online] available from: <https://educationendowmentfoundation.org.uk/toolkit/toolkit-a-z/repeating-a-year/>
Ehren, M. (2014) Accountability and school inspections. SREE Spring 2012 Conference [Online] available from: <https://www.ioe.ac.uk/about/documents/About_Policies/Ehren_et_al_-_FINAL.pdf>
Farbman, D. (2015) The case for improving and expanding time in school. Boston MA: National Center on Time & Learning
Ferraz, C. & Bruns, B. (2012) Paying teachers to perform: The impact of bonus pay in Pernambuco, Brazil. [Online] available from: <http://files.eric.ed.gov/fulltext/ED530173.pdf>
Fertig, B. (2014) ‘Top five education issues facing Mayor de Blasio’ WNYC. [Online] available from: <http://www.wnyc.org/story/five-education-issues-facing-mayor-elect-de-blasio/>
Freedman, S. (2007) ‘Where teachers sit, awaiting their fate’ The New York Times. [Online] available from: <http://www.nytimes.com/2007/10/10/education/10education.html?_r=0>
Fullan, M. & Boyle, A. (2014) Big city school reforms: lessons from New York, Toronto and London. New York: Teachers College Press
Fullan, M. (2010) ‘Change theory: a force for school improvement’ in Centre for Strategic Education Seminar Series, 157
General Statistics Office of Vietnam (2010) Education in Vietnam: An analysis of key indicators. [Online] available from: <http://vietnam.unfpa.org/webdav/site/vietnam/shared/Census%20publications/5_Monograph-Education.pdf>
General Statistics Office of Vietnam (c.2014) Education statistics. [Online] available from: <http://www.gso.gov.vn/default_en.aspx?tabid=782>
Girgenti, G. (2014) Rio de Janeiro Teacher’s Union wins increased wages, security, and professional autonomy, 2013. [Online] available from: <http://nvdatabase.swarthmore.edu/content/rio-de-janeiro-teacher-s-union-wins-increased-wages-security-and-professional-autonomy-2013>
Gonen, Y. (2015) ‘De Blasio and Fariña plan to shift power from principals to superintendents’ New York Post. [Online] available from: <http://nypost.com/2015/01/10/de-blasio-and-farina-plan-to-shift-power-from-principals-to-superintendents/>
Gonzalez, J. (2007) ‘Mike’s ed shakeup. Once again schools set to undergo makeover – privatization all the rage’ New York Daily News. [Online] available from: <http://www.nydailynews.com/news/mike-ed-shakeup-schools-set-undergo-makeover-privatization-rage-article-1.262001>
Government of Dubai (2015) Dubai Strategic Plan. [Online] available from: <http://www.dubaiplan2021.ae/dsp-2015-2/>
Greaves, E., Macmillan, L. & Sibieta, L. (2014) Lessons from London schools for attainment gaps and social mobility. London: Social Mobility and Child Poverty Commission
Hales, M., Pena, A., Gott, J. & Peterson, E. (2014) Global cities, present and future. [Online] available from; <https://www.atkearney.com/research-studies/global-cities-index/2014>
Hanushek, E., Peterson, P. & Woessmann, L. (2012) Achievement growth: International and U.S. state trends in student performance. [Online] available from: <http://www.hks.harvard.edu/pepg/PDF/Papers/PEPG12-03_CatchingUp.pdf>
Hattie, J. (2015a) What doesn’t work in education: The politics of distraction. London: Pearson
Hattie, J. (2015b) What works best in education: The politics of collaborative expertise. London: Pearson
HEFCE (Higher Education Funding Council for England) (2012) POLAR3: Young participation rates in higher education.
Hicks, D. (2013) The introduction of school inspections in Dubai – do teachers and head-teachers perceive it as a catalyst for school improvement. Unpublished MA thesis
Hill, R. (2012) The missing middle: The case for school commissioners. [Online] available from: <http://www.thersa.org/__data/assets/pdf_file/0017/630053/RSA-The_Missing_Middle_report_2012.pdf>
Hoxby, C., Murarka, S. & Kang, J. (2009) How New York City’s charter schools affect achievement. [Online] available from: <http://users.nber.org/~schools/charterschoolseval/how_NYC_charter_schools_affect_achievement_sept2009.pdf>
Hutchings, M., Greenwood, C., Hollingworth, S., Mansaray, A., Rose, A. & Glass, K. (2012) Evaluation of the City Challenge programme. [Online] available from: <https://www.gov.uk/government/uploads/system/uploads/attachment_data/file/184093/DFE-RR215.pdf >
INEP (Instituto Nacional de Estudio e Pesquisas Educacionais) (2014a) School census. [Online] available from: <http://portal.inep.gov.br/basica-censo>
INEP (2014b) SAEB. [Online] available from: <http://portal.inep.gov.br/web/saeb/aneb-e-anresc>
INEP (2015) INEP website. [Online] available from: <http://portal.inep.gov.br/>
107
Kelleher, M. (2014) New York City’s children first. Washington DC: Center for American Progress
Kemple, J. (2013) The condition of New York City high schools: Examining trends and looking toward the future. New York: The Research Alliance for New York City Schools
KHDA (Knowledge and Human Development Authority) (2013) Dubai PISA 2012 report [Online] available from: <https://www.khda.gov.ae/CMS/WebParts/TextEditor/Documents/PISA2013EnglishReport.pdf>
KHDA (2014a) Key findings 2013–14: Inspection of private schools. [Online] available from: <http://www.khda.gov.ae/cms/webparts/texteditor/documents/dsib%20key%20findings%20report_english%20final.pdf>
KHDA (2014b) Inspection handbook 2014–15. [Online] available from: <https://www.khda.gov.ae/CMS/WebParts/TextEditor/Documents/handbook2014English.pdf>
KHDA (2015a) Schools. [Online] available from: <https://www.khda.gov.ae/Pages/en/schoolsen.aspx>
KHDA (2015b) A place in the sun. [Online] available from: <http://www.khda.gov.ae/CMS/WebParts/TextEditor/Documents/Final_035_KHDA-ENGLISH.pdf>
Klein, J. (2014) Lessons of hope: How to fix our schools. New York: Harper Collins
Knoema (2015) ‘Literacy rate’ World Data Atlas. [Online] available from: <http://knoema.com/atlas/Brazil/ranks/Literacy-rate?baseRegion=BR-RJ>
Ko, J. & Sammons, P. (2013) Effective teaching: a review of research and evidence. Reading: CfBT Education Trust
Kugler, S. (2010) ‘NYC to stop paying teachers to do nothing’ The Guardian. [Online] available from: <http://www.theguardian.com/world/feedarticle/9032803>
Lankford, H., Loeb, S., McEachin, A., Miller, L. & Wyckoff, J. (2014) Who enters teaching? Encouraging evidence that the status of teaching is improving. [Online] available from: <https://cepa.stanford.edu/sites/default/files/Who%20Enters%20Teaching%202014.11.18.pdf>
Leme, M., Paredes, R. & Souza, A. (2009) ‘A Municipalizacao do Ensino Fundamental e seu Impacto sobre a Proficiencia no Brasil’ in Veloso, F., Pessoa, S., Henriques, R. & Giambiagi, F. (eds.) Educação básica no Brasil – construindo o país do future. Rio de Janeiro: Elsevier
McAleavy, T. & Elwick, A. (2015) School improvement in London: a global perspective. Reading: CfBT Education Trust
MDRC (2015) New York City Small schools of choice evaluation. [Online] available from: <http://www.mdrc.org/project/new-york-city-small-schools-choice-evaluation#overview>
Medina, J. (2007) ‘New York Schools win Award for Improvement’ New York Times. [Online] available from: <http://www.nytimes.com/2007/09/19/education/19prize.html?pagewanted=print&_r=0>
Nadelstern, E. (2013) 10 lessons from New York City schools: What really works to improve education. New York: Teachers College Press
NAO (National Audit Office) (2012) Managing the expansion of the academies programme. [Online] available from: <http://www.nao.org.uk/report/managing-the-expansion-of-the-academies-programme/>
National Alliance for Public Charter Schools (2015) Public charter schools. [Online] available from: <http://www.publiccharters.org/get-the-facts/public-charter-schools/>
New York City Charter School Center (2014) 2013–14 Test Scores Show Gains. [Online] available from: http://www.nyccharterschools.org/blog/testscores2014
New York City Global Partners (2011) Best practice: Providing safe and engaging schools for low-income, drug-affected neighborhoods. [Online] available from: <http://www.nyc.gov/html/ia/gprb/downloads/pdf/Rio_SchoolsofTomorrow.pdf>
Nisbett, R. & Wilson, T. (1977) ‘The halo effect: evidence for unconscious alteration of judgements’ Journal of Personality and Social Psychology, 35 (4), 250-256. [Online] available from: <http://deepblue.lib.umich.edu/bitstream/handle/2027.42/92158/TheHaloEffect.pdf?seq>
NYC DOE (New York City Department of Education) (2013) NAEP National Assessment of Educational Progress Reading & Mathematics 4th and 8th Grade State and National Release. [Online] available from: <http://schools.nyc.gov/NR/rdonlyres/102DCC35-7F3E-4159-B093-9018D537782C/0/2013NAEPReleaseDeck8714.pdf>
NYC DOE (2014a) New York City graduation rates: Class of 2014 (2010 cohort). [Online] available from: <http://schools.nyc.gov/NR/rdonlyres/04A151BF-F9E4-4960-8881-E1B07AA57DF8/179863/2014GraduationRatesPublicWebsite.pdf>
NYC DOE (2014b) 2014 New York state test results: New York City grades 3-8. [Online] available from: <http://schools.nyc.gov/NR/rdonlyres/C7E210CA-F686-4805-BEA6-EDD91F76E58B/167997/2014MathELAPublic.pdf>
NYC DOE (2015a) About us. [Online] available from: <http://schools.nyc.gov/AboutUs/default.htm>
NYC DOE (2015b) NYC Data. [Online] available from: <http://schools.nyc.gov/Accountability/data/default.htm>
NYC Public School Parents (2012) DeWitt Clinton HS: another victim of the Bloomberg preference to close schools rather than allow them to improve. [Online] available from: <http://nycpublicschoolparents.blogspot.co.uk/2012/12/dewitt-clinton-hs-another-victim-of.html>
108

NYSED (New York State Education Department) (2015a) NY State Public school enrollment (2013-14). [Online] available from: <http://data.nysed.gov/enrollment.php?year=2014&state=yes);>
NYSED (2015b) Glossary of terms: Enrollment data. [Online] available from: <http://data.nysed.gov/glossary.php?report=enrollment>
OECD (Organisation for Economic Cooperation and Development) (2003) Glossary of statistical terms. [Online] available from: <https://stats.oecd.org/glossary/detail.asp?ID=5401>
OECD (2006) Attracting, Developing and Retaining Effective Teachers – Final Report: Teachers Matter. [Online] available from: <http://www.oecd.org/document/52/0,3746,en_2649_3926323 1_34991988_1_1_1_1,00.html>
OECD (2011) Strong performers and successful reformers: Lessons from PISA for the United States. [Online] available from: <http://www.oecd.org/pisa/46623978.pdf>
OECD (2012) Does performance-based pay improve teaching? [Online] available from: <http://www.oecd.org/pisa/pisaproducts/pisainfocus/50328990.pdf>
OECD (2013a) PISA 2012 Results: Excellence through Equity (Volume II): Giving every student the chance to succeed. [Online] available from: <http://www.oecd.org/pisa/keyfindings/pisa-2012-results-volume-ii.htm>
OECD (2013b) PISA 2012 Results: What makes schools successful? [Online] available from: <http://www.oecd.org/pisa/keyfindings/pisa-2012-results-volume-IV.pdf>
OECD (2013c) Country note: Brazil, key findings. [Online] available from: <http://www.oecd.org/education/PISA-2012-results-brazil.pdf>
OECD (2014) PISA 2012 results in focus. [Online] available from: <http://www.oecd.org/pisa/keyfindings/pisa-2012-results-overview.pdf>
OECD (2015a) Education policy outlook 2015: making reforms happen. [Online] available from: <http://www.oecd-ilibrary.org/education/education-policy-outlook-2015_9789264225442-en>
OECD (2015b) PISA FAQ. [Online] available from: <http://www.oecd.org/pisa/aboutpisa/pisafaq.htm>
OECD (2015c) Key findings. [Online] available from: <http://www.oecd.org/pisa/keyfindings/>
Ofsted (Office for Standards in Education, Children’s Services and Skills (2014) The pupil premium: an update. [Online] available from: <http://www.ofsted.gov.uk/resources/pupil-premium-update>
Ofsted (2015) Data view [Online] available from: <http://dataview.ofsted.gov.uk>
Ogden, V. (2013) Making sense of policy in London secondary education: What can be learned from the London Challenge? Unpublished thesis.
Parkville Global Advisory (2012) ‘4 years of KHDA: Student achievement in Dubai 2007 and 2011’ cited in Thacker, S. & Cuadra, E. (2014) The road traveled: Dubai’s journey towards improving private education. World Bank: Washington DC
Pearson (2011) Changing the physical environment of education. [Online] available from: <http://m.thelearningcurve.pearson.com/case-studies/article/changing-the-physical-environment-of-education>
Pearson Middle East (2014) Evidenced-based education policy yielding results in the UAE. [Online] available from: <http://www.pearsonmiddleeastawe.com/evidenced-based-education-policy-yielding-results-in-the-uae>
Peterson, P. & Ackerman, M. (2015) ‘States raise proficiency standards in math and reading.’ Education Next, 15 (3). [Online] available from: <http://educationnext.org/states-raise-proficiency-standards-math-reading/>
Prefeitura do Rio de Janeiro (2013a) Full-time schools. [Online] available from: <http://www.rio.rj.gov.br/web/sme/exibeconteudo?id=4228426>
Prefeitura do Rio de Janeiro (2013b) Strategic plan: Rio de Janeiro municipal government, 2013-2016. [Online] available from: <http://www.conselhodacidade.com/v3/Book_StrategicPlanRio20132016/content/Strategic_Plan_Rio_City_Government_2013_2016.pdf>
Prefeitura do Rio de Janeiro (2014) Education: Quick guide to public policies. [Online] available from: <http://www.rio.rj.gov.br/dlstatic/10112/4379008/4130265/EducacaoING1211.pdf>
Prefeitura do Rio de Janeiro (2015) Education in numbers. [Online] available from: <http://www.rio.rj.gov.br/web/sme/educacao-em-numeros>
Ravitch, D. (2012) Reader calls out NY Daily News for charter spin: UPDATE. [Online] available from: <http://dianeravitch.net/2012/12/03/reader-calls-out-ny-daily-news-for-charter-spin-2/>
Robinson, J. (2015) Ensuring lasting education reforms by delivering results: a discussion with Claudia Costin, Senior Director for Education at the World Bank. [Online] available from: <http://www.brookings.edu/blogs/education-plus-development/posts/2015/01/07-education-reforms-claudia-costin-perlman-robinson>
Rolleston, C., James, Z. & Aurino, E. (2013) Exploring the effect of educational opportunity and inequality on learning outcomes in Ethiopia, Peru, India, and Vietnam. [Online] available from: <http://www.younglives.org.uk/publications/PP/exploring-educational-opportunity-and-inequality/exploring-educational-opportunity-and-inequality>
109
Sahlgren, G. (2013) Incentivising excellence: school choice and education quality. London: The Centre for Market Reform of Education
Schleicher, A. (2015) ‘Vietnam’s ‘stunning’ rise in school standards’ BBC News. [Online] available from: <http://www.bbc.co.uk/news/business-33047924>
Schoolinspections (2014) Summary of results year 1 – 3. [Online] available from: <http://schoolinspections.eu/impact/summary-of-results-year-1-3/>
Slater, L. (2013a) Quality assurance and accountability. Reading: CfBT Education Trust
Slater, L. (2013b) Leadership. Reading: CfBT Education Trust
Tadeu, M. (2012) ‘No Rio, professores e secretaria trabalham juntos’ revistapont.com [Online] available from: <http://www.revistapontocom.org.br/entrevistas/”professores-devem-ter-uma-critica-aqui-um-elogio-ali-mas-e-um-trabalho-conjunto”>
Tan Dung (2012) ‘Decision No. 711/QD-TTg of June 13, 2012: Approving the 2011-2020 education development strategy’ Vietnam Law and Legal Forum. [Online] available from: <http://vietnamlawmagazine.vn/news/decision-no-/qd-ttg-of-june---approving-the---education-development-strategy/2ca7ad0d-ebbf-4b08-a679-9d91d9cdcd30.html>
Teach First (2013) Unpublished data
Thacker, S. & Cuadra, E. (2014) The road traveled: Dubai’s journey towards improving private education. World Bank: Washington DC
Todos Pela Educaco (2015) Indicators. [Online] available from: <http://www.todospelaeducacao.org.br/indicadores/>
UAE MOE (United Arab Emirates Ministry of Education) (2013) PISA 2012 Results, preparedness for life: skills at age 15 in the UAE. [Online] available from: <https://www.moe.gov.ae/Arabic/Docs/AssessmentDeptPISA/Brochure%20_%20english.pdf>
UNESCO (United Nations Educational, Scientific and Cultural Organization) (c.2001) Vietnam. [Online] available from: <http://www.ibe.unesco.org/curriculum/Asia%20Networkpdf/VIETNAM.pdf>
UNESCO (2015) ‘Vietnam’ UNESCO Country profiles. [Online] available from: <http://www.uis.unesco.org/DataCentre/Pages/country-profile.aspx?code=VNM®ioncode=40515>
Vietnam Ministry of Education and Training (2013) Education statistics 2013. [Online] available from: <http://www.moet.gov.vn/?page=11.11&view=5251>
Woods, D., Husbands, C. & Brown C. (2013) Transforming education for all: The Tower Hamlets story [Online] available from: <http://www.towerhamlets.gov.uk/idoc.ashx?docid=97c33ccb-15f7-44d4-91a9-7352903051f5&version=-1>
World Bank (2006) Education in Vietnam: Development history, challenges and solutions. [Online] available from: <http://siteresources.worldbank.org/EDUCATION/Resources/278200-1121703274255/1439264-1153425508901/Education_Vietnam_Development.pdf>
World Bank (2011) Vietnam: High quality education for all by 2020. [Online] available from: <http://documents.worldbank.org/curated/en/2011/06/16230668/vietnam-high-quality-education-all-2020-vol-2-2-analytical-report>
World Bank (2013) What explains Vietnam’s stunning performance in PISA 2012? [Online] available from: <http://blogs.worldbank.org/eastasiapacific/what-explains-vietnam-s-stunning-performance-pisa-2012>
World Bank (2015a) Data [Online] available from: <http://data.worldbank.org/income-level/LMC>
World Bank (2015b) GDP per capita, PPP. [Online] available from: <http://data.worldbank.org/indicator/NY.GDP.PCAP.PP.CD>
World Bank (2015c) Vietnam. [Online] available from: <http://www.worldbank.org/en/country/Vietnam>
World Bank (2015d) Government expenditure on education. [Online] available from: <http://data.worldbank.org/indicator/SE.XPD.TOTL.GB.ZS/countries?page=1>
Young Lives (2006) Education for All in Vietnam: High enrolment but problems of quality remain. [Online] available from: <http://www.younglives.org.uk/publications/PP/New%20URL%20-%20suggested%20education-for-all-Vietnam-high-enrolment-quality-problems/education-for-all-in-vietnam-high-enrolment-but-problems-of-quality-remain>
Young Lives (2014) Young lives: An international study of childhood poverty. [Online] available from: <http://www.younglives.org.uk/>
110

111

112

CfBT Education Trust is changing... to Education development Trust
We are changing our name in January 2016. Why? Our aim is to transform lives
by improving education around the world and to help achieve this, we work in
different ways in many locations.
CfBT was established nearly 50 years ago; since then our work has naturally
diversified and intensified and so today, our name (which used to stand for
Centre for British Teachers) is not representative of who we are or what we do.
We believe that our new company name, Education Development Trust – while
it is a signature, not an autobiography – better represents both what we do
and, as a charity strongly guided by our core values, the outcomes we want for
young people around the world.

CfBT Education Trust is a registered charity (No. 270901) and company limited by guarantee (No. 867944) • Registered in England and Wales • Registered office as above
CfBT Education Trust Highbridge House, 16–18 Duke Street, Reading, Berkshire RG1 4RU T +44 (0) 118 902 1000 E [email protected] W www.cfbt.com