interaction of heparin with internally quenched fluorogenic peptides derived from heparin-binding...
TRANSCRIPT

Biochem. J. (2002) 366, 435–446 (Printed in Great Britain) 435
Interaction of heparin with internally quenched fluorogenic peptidesderived from heparin-binding consensus sequences, kallistatinand anti-thrombin IIIDaniel C. PIMENTA*, Iseli L. NANTES†, Eduardo S. DE SOUZA‡, Bernard Le BONNIEC§, Amando S. ITO‡,Ivarne L. S. TERSARIOL†, Vitor OLIVEIRAs, Maria A. JULIANOs and Luiz JULIANOs1
*Centro de Toxinologia Aplicada, CAT/CEPID, Av. Vital Brasil, 1500, Sa4 o Paulo SP-05503-900, Brazil, †Centro Interdisciplinar de Investigac: a4 o Bioquı!mica (CIIB), UMC,Avenida Ca# ndido Xavier de Almeida Souza, 200, Mogi das Cruzes-SP, 08780-911, Brazil, ‡Departamento de Fı!sica e Matema! tica, FFCLRP, Universidade de Sa4 o Paulo,Av. Bandeirantes 3900, Ribeira4 o Preto, SP 14040-901, Brazil, §INSERM, U428, Universite! Paris V, Faculte! de Pharmacie, 4 Avenue de l ’Observatoire, 75270 Paris,cedex 06, France, and sUniversidade Federal de Sa4 o Paulo, Escola Paulista de Medicina, Departmento de Biofı!sica, Rua Tre# s de Maio, 100, Sa4 o Paulo 04044-020,Brazil
Internally quenched fluorogenic (IQF) peptides bearing the fluor-
escence donor}acceptor pair o-aminobenzoic acid (Abz)}N-(2,4-
dinitrophenyl)ethylenediamine (EDDnp) at N- and C-terminal
ends were synthesized containing heparin-binding sites from the
human serpins kallistatin and antithrombin, as well as consensus
heparin-binding sequences (Cardin clusters). The dissociation
constant (Kd), as well as the stoichiometry for the heparin–peptide
complexes, was determined directly by measuring the decrease in
fluorescence of the peptide solution. Experimental procedures
were as sensitive as those used to follow the fluorescence change
of tryptophan in heparin-binding proteins. The conformation of
the peptides and the heparin–peptide complexes were obtained
from measurements of time-resolved fluorescence decay and CD
spectra. Kallistatin (Arg$!!–Pro$"*)-derived peptide (HC2) and
one derived from antithrombin III helix D [(AT3D), correspond-
ing to Ser""#–Lys"$*], which are the heparin-binding sites in these
serpins, showed significant affinity for 4500 Da heparin, for
which Kd
values were 17 nM and 100 nM respectively. The
CD spectra of the heparin–HC2 peptide complex did not show
INTRODUCTION
Glycosaminoglycans (GAGs) bind to a large number of proteins,
taking part in a myriad of biological functions, such as the modu-
lation of proteolytic enzymes and their inhibitors, the regulation
of cell growth and the assembly of extracellular matrix [1].
Antithrombin requires activation by heparin in order to inhibit
thrombin and factor Xa, which are their main targets, and the
mechanisms of inhibition depend on the protease [2–7]. Unlike
most of the serpins that have their protease-inhibition activity
accelerated by heparin, kallistatin, which is a specific serpin that
inhibits human tissue kallikrein, has heparin as a suppressor of its
inhibitory activity [8]. Moreover, GAGs have been demonstrated
to modulate the reactivity and resistance to pH denaturation of
cysteine proteases, such as papain [9] and cathepsin B [10]. The
regulatory role of GAGs in cell adhesion, cell motility, cell pro-
liferation and tissue morphogenesis is due to their ability to bind
to laminin [11,12], chemokines [13] and growth factors [14] (for a
general review, see [15]).
GAGs bind to either peptides or protein domains that exhibit
certainpreferred conformations [16,17], or induce conformational
changes upon its binding [6,18]. Heparin is often used as a model
Abbreviations used: Abz, o-aminobenzoic acid ; EDDnp, N-(2,4-dinitrophenyl)ethylenediamine; GAG, glycosaminoglycan; IQF, internally quenchedfluorogenic ; MALDI-TOF, matrix-assisted laser desorption–time-of-flight.
1 To whom correspondence should be addressed (e-mail juliano.biof!epm.br).
any significant α-helix content, different from the situation
with peptide AT3D, for which complex-formation with heparin
resulted in 24% α-helix content. The end-to-end distance distri-
bution and the time-resolved fluorescence-decay measurements
agree with the CD spectra and Kdvalues. The synthetic α-methyl
glycoside pentasaccharide AGA*IAM
(where A represents N,6-
O-sulphated α--glucosamine; G, β--glucuronic acid; A*, N,3,
6-O-sulphated α--glucosamine; I, 2-O-sulphated α--iduronic
acid; and AM, α-methyl glycoside of A) also binds to AT3D
and other consensus heparin-binding sequences, although with
lower affinity. The interaction of IQF peptides with 4500 Da
heparin was displaced by protamine. In conclusion, IQF peptides
containing Abz}EDDnp as the donor}acceptor fluorescence pair
are very promising tools for structure–activity relationship
studies on heparin–peptide complexes, as well as for the develop-
ment of new peptides as heparin reversal-effect compounds.
Key words: binding assay, glycosaminoglycan, kallikrein,
time-resolved fluorescence.
to examine the effects of GAGs on the structure of proteins
[19,20] and peptides [21]. Heparin interaction with proteins has
usually been monitored by fluorescence change of tryptophan
[22], depending on this amino acid being present in the protein
and also on whether heparin changes its environment upon bind-
ing. The interaction of heparin with tryptophan-containing pep-
tides is not expected to cause significant variation in the amino
acid environment and, consequently, no change would be de-
tected in its fluorescence signal. Therefore heparin binding to
peptides has been assayed through the use of fluorescence-
anisotropy changes [18] : the binding of peptides to radiolabelled
or biotinylated heparin, whose complexes are detected by a
retarded migration in comparison with heparin on affinity co-
electrophoresis gels [21], or by competition with a protein that
binds heparin [8,23].
The design of peptides aimed to neutralize the effects of heparin
as an alternative to protamine has been tried because of the side
effects of this mixture of arginine-rich basic peptides from fish-
sperm nuclei [21,24]. Extensive studies on the structure–activity
relationship of the interaction of different forms of heparins with
peptides and the effects of physical or chemical agents on this in-
teraction have limitations owing to the absence of a sensitive and
# 2002 Biochemical Society

436 D. C. Pimenta and others
Figure 1 Comparison between two possible conformations of peptideRKK-4 (Table 1), determined by molecular modeling using HyperChemsoftware (Hypercube Inc., Gainesville, FL, U.S.A., http://www.hyper.com)
Shown is the drastic structural change upon heparin binding, as suggested by the CD signal :
the end-to-end distance is reduced by more than 50%, leading to an increase in the efficiency
of the fluorescence quenching.
easy-to-handle method for the determination of the dissociation
constant, Kd. Internally quenched fluorogenic (IQF) peptides
have been used as very efficient peptide substrates for proteolytic
enzymes [25–27]. The efficiency of the fluorescence quenching is
highly dependent on the distance separating the fluorescence
donor and the fluorescence quencher groups [28]. Therefore there
are limits for the size of the peptides, above which the quenching
of the fluorescence is ineffective and the sequences do not function
as IQF peptides. If heparin binds to such peptides, inducing pre-
ferred structures and leading to a shorter end-to-end distances
when compared with their random conformation in solution, a
decrease in the fluorescence signal would occur, which is a conse-
quence of the diminishing of the distance separating the fluor-
escence donor and acceptor groups (Figure 1). In the present
study, we have explored this possibility, synthesizing previously
described peptides [21] on the basis of the heparin-binding
consensus sequences XBBXBX and XBBBXXBX (where
‘X’ represents hydropathic or uncharged amino acids, and ‘B’
represents basic amino acids) containing the fluorescent probe
o-aminobenzoic acid (Abz; the donor) and the quencher group
Gln-[N-(2,4-dinitrophenyl)ethylenediamine (EDDnp)] (the ac-
ceptor) at the N- and C-terminal ends respectively. These motifs
were determined by Cardin and Weintraub [29] on the basis of an
extensive survey of amino acid sequences present on known
heparin-binding proteins. We have also synthesized IQF peptides
derived from the heparin-binding sites of antithrombin III and
kallistatin and assayed the effect of low-molecular-mass heparin
(4500 Da, modal mass) on the fluorescence of all obtained
peptides. In the present study, IQF peptides derived from the
reactive centre loops of kallistatin and α"-antichymotrypsin were
examined, since heparin is known to impair the inhibitory
activities of these two serpins over their target serine proteases
[8,30]. In addition, we have also examined the interaction of IQF
peptides derived from the heparin-binding sites of antithrom-
bin III and two model heparin-binding peptide with synthetic
α-methyl glycoside pentasaccharide AGA*IAM
(where A rep-
resents N,6-O-sulphated α--glucosamine; G, β--glucuronic
acid; A*, N,3,6-O-sulphated α--glucosamine; I, 2-O-sulphated
α--iduronic acid; and AM, α-methyl glycoside of A). The
dissociation constants (Kd
values) for the interaction of IQF
peptides with heparin or the pentasaccharide were determined on
the basis of the decrease in the fluorescence signal caused by the
addition of heparin or the pentasaccharide over a buffered range
of IQF peptide solutions. Furthermore, we have examined the
conformation of the IQF peptides in their free form and
complexed with heparin by using CD spectroscopy, as well as by
time-resolved fluorescence.
MATERIALS AND METHODS
Reagents
Low-molecular-mass heparin (4500 Da, modal mass) was pur-
chased from Aventis (Parsippany, NJ, U.S.A.). The penta-
saccharide AGA*IAM
was synthesized and provided by Sanofi
Recherche (Toulouse, France). The concentration of the oligo-
saccharides was determined by stoichiometric titrations with
antithrombin of known concentration [22]. Protamine and all
chemicals used were from Sigma–Aldrich (St. Louis, MO, U.S.A.)
or from Calbiochem (San Diego, CA, U.S.A.).
Synthetic substrates
All the IQF peptides contained EDDnp attached to glutamine, a
necessary result of the solid-phase peptide synthesis strategy
employed, as described previously [31]. An automated bench-top
simultaneous multiple solid-phase peptide synthesizer (PSSM 8
system, from Shimadzu) was used for the solid-phase synthesis of
all the peptides using the fluoren-9-ylmethoxycarbonyl (‘Fmoc’)
procedure. The final deprotected peptides were purified by
binary semi-preparative HPLC using an Econosil C-18 column
(10 µm, 22.5 mm¬250 mm) and solvents A [trifluoroacetic
acid}H#O (1:1000, v}v)], and B [trifluoroacetic acid}acetonitrile}
H#O (1:900:100, by vol.)]. The column was eluted at a flow
rate of 5 ml}min with a 10–60% gradient of solvent B over the
course of 30 to 45 min, depending on the sequence. Analytical
HPLC was performed using a binary HPLC system from Shim-
adzu with a SPD-10AV Shimadzu UV–visible light detector and
a Shimadzu RF-10AXL fluorescence detector, coupled with an
Ultrasphere C-18 column (5 µm, 4.6 mm¬150 mm) that was
eluted with solvent systems A and B at a flow rate of 1 ml}min
and a 10–80% gradient of B over 20 min. The HPLC column
eluates were monitored by their absorbance at 220 nm and
by fluorescence emission at 420 nm following excitation at
320 nm. The molecular mass and purity of synthesized peptides
were checked by matrix-assisted laser-desorption–time-of-flight
(MALDI-TOF) MS (TofSpec-E, Micromass, Manchester, U.K.)
and}or peptide sequencing using a protein sequencer PPSQ-23
(Shimadzu Tokyo, Japan).
Heparin binding to IQF peptides
Heparin binding to IQF peptides was measured at 37 °C in
50 mM Tris}HCl buffer, containing 100 mM NaCl and 0.2%
(w}v) poly(ethylene glycol) 6000 (‘PEG 6000’), pH 7.4, except
where different conditions are stated. The fluorescence of the
peptide solutions was monitored by measuring the fluorescence
at λem
¯ 420 nm (20 nm slit) after excitation at λex
¯ 320 nm
(10 nm slit) in a Hitachi F-2000 spectrofluorimeter. The 1 cm
path-length cuvette containing 2 ml of the buffered peptide
solution was placed in a thermostatically controlled cell com-
partment under constant magnetic stirring in the spectro-
fluorimeter for 5 min prior to the addition of small aliquots of a
highly concentrated heparin solution (220 and}or 2200 µM) with
minimal dilution (less than 5%), and the instantaneous decrease
in fluorescence signal was read.
The dependence of the relative fluorescence change, i.e.
∆F}F!¯ (F
!®F
obs)}F
!, where F
!is the initial peptide solution
fluorescence value and Fobs
is the observed fluorescence value
after each addition of heparin, was analysed by non-linear least-
# 2002 Biochemical Society

437Heparin-binding peptides
squares data fitting by the binding equation (eqn 1), as described
in [22], using Grafit Software ([32] ; also see the website
http:}}www.erithacus.com):
∆F
F!
¯∆F
max
F!
¬[(PnHK
d)®o(PnHK
d)#®4 [P [ nH ]
2P(1)
where P is the total peptide concentration, H represents the
added heparin concentration, n is the stoichiometry, Kd
is
the dissociation constant and ∆Fmax
}F!is the maximum relative
fluorescence change. The same effect is obtained if a fixed con-
centration of heparin is titrated with small aliquots of a highly
concentrated solution of peptide; however, the inflection of the
curve is in the opposite direction. The stoichiometry of the inter-
action was calculated by using the Hill plot, i.e. the slope of
log(∆F}F!)¬log [H], considering only the linear part of the curve
(generally that encompassing 15 and 85% of the maximum effect
[33]) on the basis of the following eqns:
PnHeg nPH (2)
Kapp
¯[P] [ [H ]n
[nPH ](3)
and ∆Fmax
¯ [P]total
, corresponding to 100% saturation, and
∆F¯ [nPH ], corresponding to partial saturation. Rearranging
eqns (1) and (2) yields eqns (4) and (5) :
∆F
∆Fmax
¯[(PnHK
d)®o(PnHK
d)#®4 [P [ nH ]
2P(4)
[H ]n
Kapp
[H ]n¯
[nPH ]
[P](5)
Combining eqns (4) and (5) gives rise to the following equation:
[H ]n
Kapp
[H ]n¯
[nPH ]
[P]¯
∆F
∆Fmax
¯[(PnHK
d)®o(PnHK
d)#®4 [P [ nH ]
2P
which are the two forms of describing the phenomenon, the first
part stands for the equilibrium, whereas the second represents
the ligand depletion. Applying logs to both sides of the equation
and rearranging it, gives rise to linearization and provides a
means to calculate the stoichiometry according to the Hill plot :
log∆F
F!
¯ n [ log[H ]®log Kapp
(6)
The effect of the ionic strength on the dissociation constant was
investigated by adjusting the buffer ionic strength with NaCl.
The Kd
value relates to the ionic strength according to the
polyelectrolyte theory of Record et al. [34] by using eqn (7) :
logKd¯ logK
NIZψ log I (7)
where KNI
is the non-ionic dissociation constant at 1 M NaCl, Z
is the number of ionic interactions, I is the ionic strength and
ψ is the fraction of bound counter-ion for each charged site on the
polysaccharide that is released upon binding to the peptides.
The ionic strength of the buffer solution was calculated
according to eqn (8) :
I¯ 0.5 [ (C"[Z#
"C
#[Z#
#IC
n[Z#
n) (8)
where I is the ionic strength; C is the molar concentration and Z
is the charge.
CD spectrometry
CD measurements in far-ultraviolet regions (195–260 nm) were
performed in a JASCO J-700 spectropolarimeter scanning at a
rate of 100 nm}min at 37 °C. Cells of 0.1 cm for the far-
UV experiments were used. The experiments were performed
in 10 mM Tris}HCl, pH 7.4, containing 50 µM of each pep-
tide. The observed ellipticity was normalized to units of
degrees .cm# .dmol−". All dichroic spectra were smoothed and
corrected by subtraction of the background for the spectrum
obtained either with buffer alone or buffer containing heparin.
The CD spectra for the peptides were analysed for the relative
amounts, inpercentage terms,of the secondarystructural elements
using a program based on comparison with the spectra obtained
for the structures of known proteins. The results were also com-
pared with the fractional percentage α-helix content calculated
from [θ]### nm
as described by Chakrabartty et al. [35], and
Sreerama and Wood analysis [36].
Time-resolved fluorescence
Time-resolved experiments were performed using an apparatus
on the basis of the time-correlated single-photon-counting
method. The excitation source was a Tsunami 3950 Spectra Phys-
ics titanium–sapphire laser, pumped by a 2060 Spectra Physics
argon laser. The repetition rate of the 5 ps pulses was set to
400 kHz or 800 kHz using the pulse picker 3980 Spectra Physics.
The laser was tuned to give output at 930 nm and a third
harmonic generator BBO crystal (GWN-23PL Spectra Physics)
gave the 310 nm excitation pulses that were directed to an
Edinburgh FL900 spectrometer, where the emission wavelength
was selected by a monochromator, and emitted photons were
detected by a refrigerated Hamamatsu R3809U micro-channel
plate photomultiplier. The L-format configuration of the spectro-
meter allowed the detection of the emission at right angles
from the excitation source, and for anisotropy measurements a
Glan Thompson polarizer in the emission beam and a Soleil
Babinet compensator in the excitation beam were employed
respectively. The FWHM (‘full width at half-maximum’) of the
instrument response function was typically 45 ps, determined
with a time resolution of 6.0 ps per channel. Measurements of the
peptide decays were made using a time resolution of 12 ps per
channel or 24 ps per channel, depending on the presence of the
acceptor. Software provided by Edinburgh Instruments was used
to analyse the decay curves, and the adequacy of the multi-
exponential decay fitting was judged by inspection of the plots of
weighted residuals and by statistical parameters, such as the
reduced chi-square method.
Computation
The fluorescence decay of the donor, characterized by its lifetime
τd, becomes faster in the presence of the acceptor bound to the
peptide. Eqn (9) describes the intensity decay in the case of a
fixed distance between donor and acceptor groups:
I(t)¯ I!exp
A
B
E
F
®1
τd
®R'
o
τdr'
G
H
t
C
D
(9)
However, this equation fails to fit to the experimental decay
when more than one distance is present during the time decay of
the fluorophore. If the distance distribution can be represented
by a function f (r), it can be recovered from the experimental
data by using the CONTIN program [37], which inverts general
# 2002 Biochemical Society

438 D. C. Pimenta and others
Table 1 IQF peptides with a Cardin motif and dissociation constant (Kd) with the stoichiometry (n) for their interaction with low-molecular-mass heparin
Conditions for Kd determination used were 50 mM Tris/HCl, pH 7.4/100 mM NaCl/0.2% (w/v) PEG 6000 at 37 °C. N. I., no interaction was detected with heparin ; N. D., not determined.
Name Sequence of peptide Kd* (nM) Stoichiometry† (n)
KK-1 Abz-A-K-K-A-R-A-Q-EDDnp N. I. –
KK-2 Abz-A-K-K-A-R-A-A-K-K-A-R-A-Q-EDDnp 2690³80 0.5
KK-3 Abz-A-K-K-A-R-A-A-K-K-A-R-A-A-K-K-A-R-A-Q-EDDnp 153³15 1.0
KK-4 Abz-A-K-K-A-R-A-A-K-K-A-R-A-A-K-K-A-R-A-A-K-K-A-R-A-Q-EDDnp 82³5 0.9
RKK-1 Abz-A-R-K-K-A-A-K-A-Q-EDDnp N. I. –
RKK-2 Abz-A-R-K-K-A-A-K-A-A-R-K-K-A-A-K-A-Q-EDDnp 1103³20 0.7
RKK-3 Abz-A-R-K-K-A-A-K-A-A-R-K-K-A-A-K-A-A-R-K-K-A-A-K-A-Q-EDDnp 21³4 1.1
RKK-4 Abz-A-R-K-K-A-A-K-A-A-R-K-K-A-A-K-A-A-R-K-K-A-A-K-A-A-R-K-K-A-A-K-A-Q-EDDnp 8³1 0.9
KK-A Abz-A-K-K-A-R-A-A-K-K-A-R-A-A-K-K-A-R-A-Q-NH2 N. D. –
KK-Q A-K-K-A-R-A-A-K-K-A-R-A-A-K-K-A-R-A-Q-EDDnp N. D. –
* The Kd value is already corrected as a function of the stoichiometry, i.e. (Kd)n.
† n is the stoichiometry calculated according to the Hill plot.
systems of linear algebraic equations of the type:
y(tk)¯&b
a
f (r)K(r, tk) dr3
NL
j="
Lkj
βi, k¯ 1,…N
y(10)
In our experimental conditions, y(tk) corresponds to the observed
intensity of fluorescence at the instant tk. The distance distribution
function f (r) is recovered within a chosen interval for r, initially
set between 5 to 100 AI (1 AI 30.1 nm), divided in N equally
spaced intervals, and the integral is converted, by numerical
integration, into a summation in rj. The function inside the
integral is then written as K(rj, t
k) and corresponds to eqn (10),
written for the instant tk
and deconvoluted from the instrument
response function, and assumed to be valid for each distance rj
within the chosen interval. The second term in eqn (10) accounts
for ‘ impurities ’ that may be present contributing to the decay
profile. The program recovers the parameter βjcorresponding to
the contribution Lkj
of the jth impurity to the fluorescence
intensity at the instant tk. In the analysis we also imposed the
constraint of non-negativity for the distribution function. The
best solution was found using the weighted least-squares method
with the employment of a regularizer on the basis of the principles
of parsimony [37].
The distance Ro, as used in eqn (11) for the function K(r
j, t
k),
was determined from the spectral data of the donor’s emission
Fd(λ) and acceptor’s molar absorption coefficient for absorption
εa(λ), i.e.
R'o¯
9000(ln10)κ#Φd
128π&n%N!
&Fd(λ)ε
a(λ)λ% dλ (11)
where n is the refractive index of the medium, Φdis the quantum
yield of the donor and κ is the orientation term dependent on
the relative angles between dipoles ’ moments from donor and
acceptor.
RESULTS
Synthesized peptides
Table 1 shows the IQF peptides synthesized on the basis of
Cardin motifs [29] that were previously reported by Verrecchio
et al. [21] for heparin binding. The peptides were divided into two
series based upon the kernel of the heparin-binding motif (KK
or RKK). Tandem repeats (up to 4-mer) of each pattern were
synthesized, and the peptides were named after the pattern and
the number of repeats. Two peptides derived from peptide KK-3
were synthesized as controls, one containing only the fluorescent
probe (KK-A) and the other containing only the quencher group
(KK-Q). Table 2 shows the sequence of IQF peptides syn-
thesized based upon part of the reported heparin-binding sites
of antithrombin-III (AT3D) [6] and kallistatin (HC2) [8].
Antithrombin-III Cys"#) residue, originally included in this
segment, which is disulphide-bounded to Cys), was replaced by
a methionine residue. For comparison, we have synthesized two
other peptides derived from kallistatin that also contain basic
residue clusters (HC1 and HF). The IQF peptides related to the
reactive-centre loops of kallistatin (KLL) and α"-antichymo-
trypsin (ACT) were also studied, because their hydrolysis by
human tissue kallikrein and cathepsin G, respectively, was
protected in the presence of heparin (results not shown). The
peptides were named on the basis of the protein regions they
derived, i.e. for kallistatin, KLL corresponds to its reactive
centre loop; HC1 is from the region between the H helix and the
C1 sheet ; HC2 is from H helix and C2 sheet ; HF is from helix
F. For antithrombin III, AT3D is derived essentially from the D
helix, which was demonstrated to be part of the heparin-binding
site in the three-dimensional structure of the antithrombin
III–heparin complex crystal [5,6,38].
Heparin alters the fluorescence of the IQF peptides
Figure 2 shows the effect of the addition of highly concentrated
aliquots of heparin solution (220 µM and}or 2200 µM, with final
dilution less than 5%) over a buffered 1.05 µM RKK-2 peptide
solution. Initially, the peptide fluorescence decreases steeply by
the addition of heparin, followed by a slower decrease till the
saturation is reached after approx. 1 µM heparin concentra-
tion, and no further change in the fluorescence is observed. The
fluorescence remained in the saturated IQF peptide–heparin
complexes, indicating that the complexes are partially quenched.
The inset of Figure 2 shows the same interaction, but through the
addition of a highly concentrated peptide solution over a buffered
heparin solution. The lower slope represents heparin titration
and, after the inflexion point that is the end of titration, the
upper slope corresponds to a variation in the fluorescence as if
only peptide was added. The stoichiometry obtained by simple
inspection of these graphics is between 0.4 and 0.7, and since this
method is very approximate and has a high level of error, it is
not significantly different to the value of 0.7 (RKK-2; Table 1)
obtained from the Hill plot. Moreover, the fluorescence of
0.3 µM peptide KK-A solution, which contains only the
fluorescent group, did not change with progressive addition of
# 2002 Biochemical Society

439Heparin-binding peptides
Table 2 IQF peptides derived from kallistatin, antithrombin III and α1-antichymotrypsin, and dissociation constant (Kd) with the stoichiometry (n) for theirinteraction with low-molecular-mass heparin
Name Serpin* Sequence of peptide Kd† (nM) n‡
Heparin-binding sites
HC2 Kallistatin300–319 Abz-R-W-N-N-L-L-R-K-R-N-F-Y-K-K-L-E-L-H-L-P-Q-EDDnp 17³2 0.8
HC1 Kallistatin107–126 Abz-F-N-L-T-E-L-S-E-S-D-V-H-R-G-F-Q-H-L-L-H-Q-EDDnp 79000³5000 0.2
HF Kallistatin176–195 Abz-V-G-T-I-Q-L-I-N-D-H-V-K-K-E-T-R-G-K-I-V-Q-EDDnp 270000³10000 0.2
AT3D Antithrombin112–139 Abz-S-E-K-T-S-D-Q-I-H-F-F-F-A-K-L-N-M-R-L-Y-R-K-A-N-K-S-S-K-Q-EDDnp 100³6 0.8
Reactive centre loop
KLL Kallistatin384–401 Abz-A-I-K-F-F-S-A-Q-T-N-R-H-I-L-R-F-N-R-Q-EDDnp 712³50§ 1.0
ACT Antichymotrypsin379–397 Abz-K-I-T-L-L-S-A-L-V-E-T-R-T-I-V-R-F-N-R-Q-EDDnp 498³11s 0.8
* Numbering is on the basis of the SwissProt entries. Conditions used for Kd determination were 50 mM Tris/HCl, pH 7.4/100 mM NaCl/0.2% (w/v) PEG 6000, 37 °C.† The Kd value is already corrected as a function of the stoichiometry, i.e. (Kd)
n.
‡ n is the stoichiometry calculated according to the Hill plot.
§ Buffer used was 20 mM Tris/HCl, pH 9/1 mM EDTA at 37 °C.s Buffer used was 50 mM Tris/HCl, pH 8/5 mM CaCl2 at 37 °C.
Figure 2 Fluroescence of RRK-2 peptide in the presence of 4500 Daheparin
RKK-2 peptide (1.05 µM; see Table 1) has its fluorescence diminished by the addition of
increasing concentrations of 4500 Da heparin in 50 mM Tris/HCl, pH 7.4 containing 100 mM
NaCl and 0.2% (w/v) PEG 6000 at 37 °C. The two lines represent the two phases of this
titration, the end-point being significantly different from the blank. The inset shows an alternative
experiment : 0.2 µM 4500 Da heparin was titrated with increasing concentrations of RKK-2
peptide in 50 mM Tris/HCl, pH 7.4, containing 100 mM NaCl, 0.2% (w/v) PEG 6000 at 37 °C.The two phases are also present, the slope of the second curve being the same as if peptide
was added to a buffered solution without heparin. AUF, arbitrary units of fluorescence.
heparin up to 30 µM. Similarly, the fluorescence of an equimolar
solution of peptides KK-A and KK-Q (1.2 µM each) also did not
change up to the addition of 50 µM heparin, although heparin
was able to complex with each one of these peptides, as revealed
in theCD spectra (results not shown). These observations indicate
that heparin does not promote unspecific aggregation of these
peptides.
A solution of heparin–peptide complex was stored at room
temperature for a period of 10 h, and its HPLC did not show any
difference in the retention time or in the area of the peak of
the peptide when compared with the initial peptide solution. The
Figure 3 Juxtaposed excitation and emission spectra of RKK-2 peptide
Juxtaposed excitation (at λex ¯ 320 nm) and emission (at λem ¯ 420 nm) spectra of RKK-
2 peptide (1.05 µM; Table 1) are shown at heparin concentrations of 0 nM (trace a), 100 nM
(trace b), 200 nM (trace c) and 300 nM (trace d) in 50 mM Tris/HCl containing 100 mM NaCl,
0.2% (w/v) PEG 6000, pH 7.4, 37 °C. The effect of heparin addition is observed both at
excitation and emission spectra and no blue or red shifts were detected.
MALDI-TOF spectrometric mass analysis of the same solution
also indicated the integrity of the peptide (results not shown).
The absorbance wavelength scan of IQF peptides spanning the
range 200–800 nm did not show any shift in the presence or in
the absence of heparin (results not shown). Figure 3, on the other
hand, shows the effect of heparin on the excitation and emission
spectra of peptide RKK-2. The spectra were collected in the
absence (trace a) and in the presence (traces b, c and d) of
different concentrations of heparin, and the effects were observed
solely on the intensity of the maximum for both the excitation
and the emission, and no red or blue shift was detected.
# 2002 Biochemical Society
440 D. C. Pimenta and others
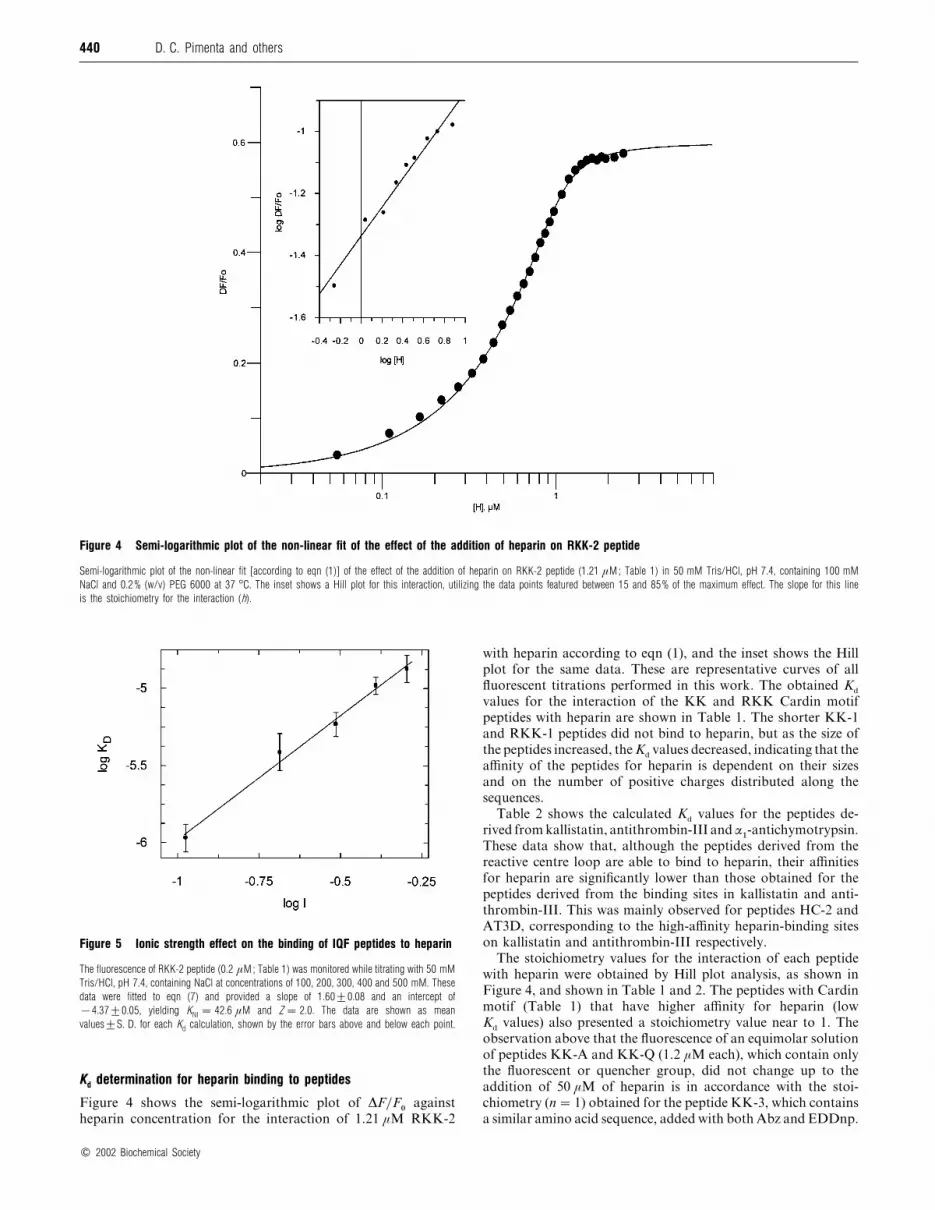
Figure 4 Semi-logarithmic plot of the non-linear fit of the effect of the addition of heparin on RKK-2 peptide
Semi-logarithmic plot of the non-linear fit [according to eqn (1)] of the effect of the addition of heparin on RKK-2 peptide (1.21 µM; Table 1) in 50 mM Tris/HCl, pH 7.4, containing 100 mM
NaCl and 0.2% (w/v) PEG 6000 at 37 °C. The inset shows a Hill plot for this interaction, utilizing the data points featured between 15 and 85% of the maximum effect. The slope for this line
is the stoichiometry for the interaction (h).
Figure 5 Ionic strength effect on the binding of IQF peptides to heparin
The fluorescence of RKK-2 peptide (0.2 µM; Table 1) was monitored while titrating with 50 mM
Tris/HCl, pH 7.4, containing NaCl at concentrations of 100, 200, 300, 400 and 500 mM. These
data were fitted to eqn (7) and provided a slope of 1.60³0.08 and an intercept of
®4.37³0.05, yielding KNI ¯ 42.6 µM and Z ¯ 2.0. The data are shown as mean
values³S. D. for each Kd calculation, shown by the error bars above and below each point.
Kd determination for heparin binding to peptides
Figure 4 shows the semi-logarithmic plot of ∆F}F!
against
heparin concentration for the interaction of 1.21 µM RKK-2
with heparin according to eqn (1), and the inset shows the Hill
plot for the same data. These are representative curves of all
fluorescent titrations performed in this work. The obtained Kd
values for the interaction of the KK and RKK Cardin motif
peptides with heparin are shown in Table 1. The shorter KK-1
and RKK-1 peptides did not bind to heparin, but as the size of
the peptides increased, the Kdvalues decreased, indicating that the
affinity of the peptides for heparin is dependent on their sizes
and on the number of positive charges distributed along the
sequences.
Table 2 shows the calculated Kd
values for the peptides de-
rived fromkallistatin, antithrombin-III andα"-antichymotrypsin.
These data show that, although the peptides derived from the
reactive centre loop are able to bind to heparin, their affinities
for heparin are significantly lower than those obtained for the
peptides derived from the binding sites in kallistatin and anti-
thrombin-III. This was mainly observed for peptides HC-2 and
AT3D, corresponding to the high-affinity heparin-binding sites
on kallistatin and antithrombin-III respectively.
The stoichiometry values for the interaction of each peptide
with heparin were obtained by Hill plot analysis, as shown in
Figure 4, and shown in Table 1 and 2. The peptides with Cardin
motif (Table 1) that have higher affinity for heparin (low
Kd
values) also presented a stoichiometry value near to 1. The
observation above that the fluorescence of an equimolar solution
of peptides KK-A and KK-Q (1.2 µM each), which contain only
the fluorescent or quencher group, did not change up to the
addition of 50 µM of heparin is in accordance with the stoi-
chiometry (n¯ 1) obtained for the peptide KK-3, which contains
a similar amino acid sequence, added with both Abz and EDDnp.
# 2002 Biochemical Society

441Heparin-binding peptides
Table 3 Internally quenched fluorescent peptides with Cardin motif and dissociation constant (Kd) with the stoichiometry (n) for their interaction with thepentassaccharide AGA*IAM
Conditions used for Kd determination were : 50 mM Tris/HCl, pH 7.4, containing 100 mM NaCl and 0.2% (w/v) PEG 6000 at 37 °C.
Name Sequence of peptide Kd* (nM) n†
RKK-2 Abz-A-R-K-K-A-A-K-A-A-R-K-K-A-A-K-A-Q-EDDnp 9768³120 1.4
RKK-4 Abz-A-R-K-K-A-A-K-A-A-R-K-K-A-A-K-A-A-R-K-K-A-A-K-A-A-R-K-K-A-A-K-A-Q-EDDnp 732³20 0.6
AT3D Abz-S-E-K-T-S-D-Q-I-H-F-F-F-A-K-L-N-M-R-L-Y-R-K-A-N-K-S-S-K-Q-EDDnp 9163³506 0.3
* The Kd value is already corrected as a function of the stoichiometry, i.e. (Kd)n.
† n is the stoichiometry calculated according to the Hill plot.
Figure 6 Semi-logarithmic plot of the non-linear fit, according to eqn (1),of the effect of the addition of heparin over 0.2 µm AT3D peptide, in theabsence (open circles) or presence of 1.15 µg/ml (closed circles), 5.75 µg/ml(open squares) or 11.5 µg/ml (closed squares) protamine
Experiments were performed in 50 mM Tris/HCl, pH 7.4, containing 100 mM NaCl and 0.2%
(w/v) PEG 6000 at 37 °C.
On the other hand, the shorter peptides KK-2 and RKK-2,
which showed low affinity for heparin compared with the larger
peptides (KK-3, KK-4, RKK-3 and RKK-4), had their
stoichiometries of binding around 0.5.
The peptides derived from kallistatin, antithrombin III and
α"-antichymotrypsin (Table 2) showed the same overall corre-
lation between stoichiometry and dissociation constants as for
the peptides with the Cardin motif. Stoichiometry values near to
1 were observed for peptide HC2, which corresponds to the more
probable heparin-binding site in kallistatin, and peptide AT3D,
which is part of the heparin-binding site in antithrombin III.
The peptides containing the reactive centre loops of kallistatin
and α"-antichymotrypsin also have stoichiometry values close
to 1, despite their high Kd
values. On the other hand, the
kallistatin-derived peptides HC1 and HF showed low affinity and
heparin–peptide stoichiometries of 0.2.
The variation in the dissociation constant over the ionic
strength of the buffer for the binding of peptide RKK-2 is shown
in Figure 5 by plotting the linear fit of the logarithm of the
dissociation constants against the log of the ionic strength.
According to the polyelectrolyte theory of Manning and Record
(eqn 7), the y-axis intercept is the log of the dissociation constant
Table 4 α-Helix content determined by far UV-CD spectra (195–260 nm) ofrepresentative IQF peptides in the presence or absence of low-molecular-mass heparin
Conditions used were : 50 µM peptide in 10 mM Tris buffer, pH 7.4, at 37 °C in absence
(buffer) and presence of 50 µM heparin. The evaluations of α-helical content were performed
as described by the analysis of Sreerama and Woody [36] and by residue molar ellipticity
at 222 nm (shown by values in parentheses). The error for these determinations was
approx. 2%.
α-Helical content (%)
Peptide (source of peptide) Buffer Heparin
HC2 (kallistatin) 31.5 (26.5) 39.0 (35.5)
HF (kallistatin) 24.8 (28.0) 25.6 (56.4)
AT3D (antithrombin) 8.5 (8.6) 23.5 (24.3)
RKK-1 (Cardin-motif peptides) Random coil Random coil
RKK-4 (Cardin-motif peptides) Random coil 89.6 (81.5)
KK-4 (Cardin-motif peptides) Random coil 30.6 (25)
at 1 M salt and represents the strength of the non-ionic binding
(KNI
), and the slope is related to the number of ionic interactions
(Z) by the fraction of univalent counter-ions released upon
binding to the peptide (ψ), taken as 0.8 for heparin [19]. For this
peptide, the obtained slope was 1.62³0.12 and the y-axis inter-
cept was ®4.57³0.07, yielding Z¯ 2.00 and KNI
¯ 42.6 µM
respectively.
Figure 6 shows the effect of protamine on the binding of IQF
peptide to heparin. On increasing the amount of protamine, the
titration curve of AT3D peptide with heparin is displaced to
the right, indicating competition for heparin between the IQF
peptide and protamine.
We also examined the interaction of the synthetic penta-
saccharide AGA*IAM
with the IQF peptides RKK-2, RKK-4
and AT3D. Table 3 shows the obtained Kdvalues. In comparison
with the values with 4500 Da heparin (Table 1 and 2), the Kdfor
RKK-2 with the pentasaccharide was one order of magnitude
higher, and the Kdfor the IQF peptides RKK-4 and AT3D were
two orders of magnitude higher. The stoichiometry for these two
peptides with the pentasaccharide is lower than that obtained
with 4500 Da heparin. Another significant difference between the
interactions of these polysaccharides with the three examined
IQF peptides was the lower values for the maximum decrease
in fluorescence observed with the pentasaccharide (10–15% of in-
itial fluorescence) in comparison with 4500 Da heparin (20–40%
of initial fluorescence). These differences in the fluorescence
decrease with IQF peptides upon binding to 4500 Da heparin
and pentasaccharide is a result of the conformation adopted
by each peptide, and also by the different stoichiometry of the
interaction.
# 2002 Biochemical Society

442 D. C. Pimenta and others
D)
Figure 7 CD spectra of representative peptides
Peptides studied were (A) peptide KK-1 (Abz-A-K-K-A-R-A-Q-EDDnp), (B) peptide KK-4 (Abz-A-K-K-A-R-A-A-K-K-A-R-A-A-K-K-A-R-A-A-K-K-A-R-A-Q-EDDnp) and (C) peptide RKK-4 (Abz-A-R-K-K-
A-A-K-A-A-R-K-K-A-A-K-A-A-R-K-K-A-A-K-A-A-R-K-K-A-A-K-A-Q-EDDnp) (amino acids are shown using the single-letter code). The thinner lines in (A–C) are the spectra pertaining to the 50 µM
peptides collected in 10 mM Tris-HCl, pH 7.4, in the absence of heparin, and the thicker lines represent the spectra collected after the addition of 50 µM 4500 Da heparin. Corrections were made
for the buffer and added heparin. (D) CD spectra of AT3D, a peptide derived from the D helix of human anti-(thrombin-II). Thin line, 50 µM AT3D ; thick line, 50 µM AT3D with 50 µM 4500 Da
heparin added ; dotted line, 50 µAT3D with pentasaccharide AGA*IAM (50 µM) added. Experiments were performed in 10 mM Tris/HCl, pH 7.4, at 37 °C.
CD spectra
The far-UV–visible CD spectra of the peptides KK-1, KK-4,
RKK-4 and AT3D are shown in Figures 7(A), 7(B), 7(C) and
7(D) respectively. The fractional percentage of α-helix content
calculated from [θ]### nm
, as described by Chakrabartty et al. [35]
and by Sreerama and Wood analysis [36], are shown in Table 4.
Peptide AT3D exhibited approx. 8% α-helix structure, and the
addition of an equimolar quantity of 4500 Da heparin induced
an increase in the α-helix content of peptide ATD3. For peptide
HC2, the Sreerama and Woody analysis [36], as well as the resi-
due molar ellipticity at 222 nm, indicate that the increase in
α-helix content was not significant, although drastic spectral
alterations were observed. These data suggest that heparin
induces other types of secondary structures in which the end-to-
end distances should be shorter than in the flexible random
conformation, because the fluorescence of peptide HC2 decreases
approx. 30% in the presence of heparin. The Sreerama and
Woody analysis [36], when compared with the residue molar
ellipticity at 222 nm for the secondary structure of the pep-
tide HF, does not correlate (Table 4), possibly because the
peptide–heparin complex exhibits an atypical secondary
structure.
The CD spectra of the peptides KK-1, KK-4 and RKK-4
(Figures 7A, 7B and 7C) clearly indicate the presence of a totally
random structure, which was corroborated by the calculated
residue molar ellipticity at 222 nm. Heparin induced a significant
amount of α-helix on the peptides RKK-4 and KK-4 (Table 4),
and the obtained values of α-helix content suggest that heparin
induces the occurrence of eight turns of helix in the peptide
RKK-4 (Figure 7C). Only visible-light spectral analysis was
possible for the peptide KK-1 (Figure 7A), because this peptide
has a sequence that prevents the formation of any type of
secondary structure, and in this case, the CD spectrum suggests
# 2002 Biochemical Society
443Heparin-binding peptides
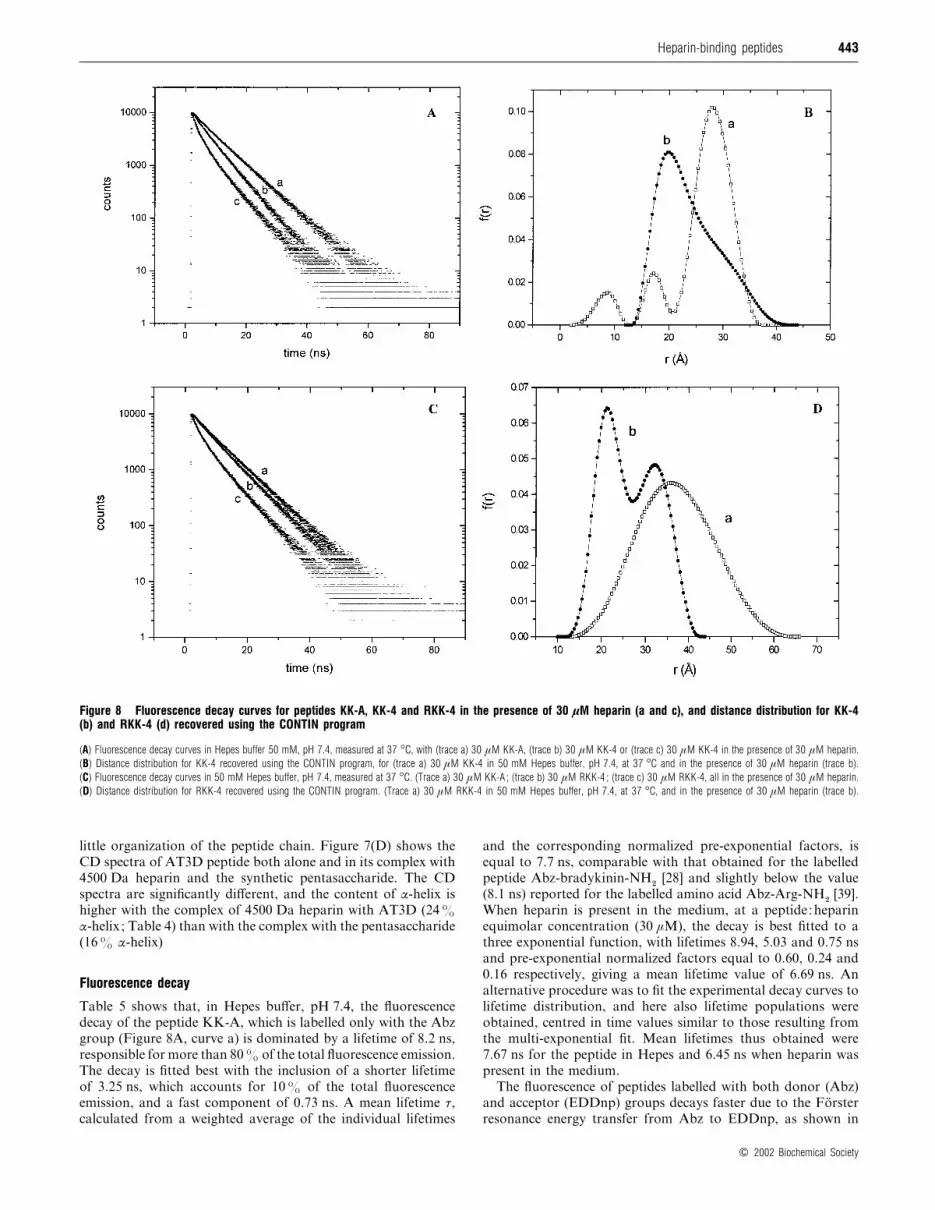
Figure 8 Fluorescence decay curves for peptides KK-A, KK-4 and RKK-4 in the presence of 30 µM heparin (a and c), and distance distribution for KK-4(b) and RKK-4 (d) recovered using the CONTIN program
(A) Fluorescence decay curves in Hepes buffer 50 mM, pH 7.4, measured at 37 °C, with (trace a) 30 µM KK-A, (trace b) 30 µM KK-4 or (trace c) 30 µM KK-4 in the presence of 30 µM heparin.
(B) Distance distribution for KK-4 recovered using the CONTIN program, for (trace a) 30 µM KK-4 in 50 mM Hepes buffer, pH 7.4, at 37 °C and in the presence of 30 µM heparin (trace b).
(C) Fluorescence decay curves in 50 mM Hepes buffer, pH 7.4, measured at 37 °C. (Trace a) 30 µM KK-A ; (trace b) 30 µM RKK-4 ; (trace c) 30 µM RKK-4, all in the presence of 30 µM heparin.
(D) Distance distribution for RKK-4 recovered using the CONTIN program. (Trace a) 30 µM RKK-4 in 50 mM Hepes buffer, pH 7.4, at 37 °C, and in the presence of 30 µM heparin (trace b).
little organization of the peptide chain. Figure 7(D) shows the
CD spectra of AT3D peptide both alone and in its complex with
4500 Da heparin and the synthetic pentasaccharide. The CD
spectra are significantly different, and the content of α-helix is
higher with the complex of 4500 Da heparin with AT3D (24%
α-helix ; Table 4) than with the complex with the pentasaccharide
(16% α-helix)
Fluorescence decay
Table 5 shows that, in Hepes buffer, pH 7.4, the fluorescence
decay of the peptide KK-A, which is labelled only with the Abz
group (Figure 8A, curve a) is dominated by a lifetime of 8.2 ns,
responsible for more than 80% of the total fluorescence emission.
The decay is fitted best with the inclusion of a shorter lifetime
of 3.25 ns, which accounts for 10% of the total fluorescence
emission, and a fast component of 0.73 ns. A mean lifetime τ,
calculated from a weighted average of the individual lifetimes
and the corresponding normalized pre-exponential factors, is
equal to 7.7 ns, comparable with that obtained for the labelled
peptide Abz-bradykinin-NH#
[28] and slightly below the value
(8.1 ns) reported for the labelled amino acid Abz-Arg-NH#[39].
When heparin is present in the medium, at a peptide:heparin
equimolar concentration (30 µM), the decay is best fitted to a
three exponential function, with lifetimes 8.94, 5.03 and 0.75 ns
and pre-exponential normalized factors equal to 0.60, 0.24 and
0.16 respectively, giving a mean lifetime value of 6.69 ns. An
alternative procedure was to fit the experimental decay curves to
lifetime distribution, and here also lifetime populations were
obtained, centred in time values similar to those resulting from
the multi-exponential fit. Mean lifetimes thus obtained were
7.67 ns for the peptide in Hepes and 6.45 ns when heparin was
present in the medium.
The fluorescence of peptides labelled with both donor (Abz)
and acceptor (EDDnp) groups decays faster due to the Fo$ rsterresonance energy transfer from Abz to EDDnp, as shown in
# 2002 Biochemical Society

444 D. C. Pimenta and others
Table 5 Time-resolved fluorescence parameters for the fluorescent peptide KK-A in buffer medium and in the presence of heparin
Conditions used were 30 µM KK-A in 50 mM Hepes buffer, pH 7.4 at 37 °C, in the absence or presence of 30 µM heparin. τi and ai , lifetime and normalized pre-exponential factor for component
i of the fluorescence decay ; φi and bi , rotational correlation time and normalized pre-exponential factor for component i of the anisotropy decay.
Parameter
τ1 (ns) τ2 (ns) τ3 (ns) a1 a2 a3 φ1 (ns) φ2 (ns) b1 b2
Buffer 8.24 3.25 0.73 0.81 0.022 0.023 0.069 0.412 0.106 0.252
Heparin 8.94 5.03 0.75 0.60 0.24 0.16 0.182 1.78 0.155 0.242
Figure 8 (A) (curve b) for the peptide KK-4. The increase in the
decay rate was accentuated by the presence of heparin (Figure 8A,
curve c), suggesting a decrease in the donor–acceptor distance
due to the peptide–heparin interaction.
Estimation of Abz–EDDnp distance distribution
From the emission spectrum of the Abz-labelled peptide KK-A
and the absorption spectrum of the C-terminal EDDnp-labelled
peptide KK-Q, the overlap integral J and the Fo$ rster distance Ro
were calculated. The calculation was similar to that described
previously [28] for bradykinin labelled with the same donor and
acceptor groups. Fast movement of both donor and acceptor
groups was assumed during the excited state lifetime, so that the
geometric parameter κ# was set equal to 2}3. This assumption
was on the basis of measurements of time-resolved fluorescence
anisotropy (Table 5). The anisotropy decay of Abz bound to the
N-terminal of the peptide KK-A was best fitted to a bi-
exponential decay. In buffer solution, without heparin, a shorter
correlation time (0.069 ns) was observed and a longer (0.412 ns)
component that changed to 0.182 ns and 1.78 ns, respectively, in
the presence of heparin. Similar results were obtained for the
peptide KK-4. The short correlation time is ascribed to the local
motion of the fluorescent probe, indicating a fast rotational re-
laxation. The long component can be due to the overall
tumbling of the peptide, and the interaction with heparin results
in a complex of larger volume, decreasing the time rate of the
anisotropy decay. The calculated Fo$ rster distance Roin aqueous
medium was equal to 24 AI , comparable with the value obtained
in labeller bradykinins [28]. Spectroscopic data measured in
the presence of heparin lead to a similar value for the dis-
tance Ro.
The decay profile of Abz emission in the peptides containing
the acceptor group is complex and quite distinct from the decay
curves of the peptides without EDDnp (Figure 8A). We analysed
the experimental decay with the assumption that the distance
between donor and acceptor is not fixed, as is usually found in
peptides in aqueous medium. Then we used the CONTIN
program to recover a distribution function f (r) from the decay
curve, without any a priori hypothesis concerning the distances r
or the shape of the distribution curves. The results for the peptide
KK-4, shown in Figure 8(B), reveal that most of the molecules
(83%) has an end-to-end distance of approx. 28 AI , and a minor
population of the peptides presents shorter distances, near
to 17 AI and below 10 AI . The longer peptide RKK-4 presents
a broad distribution of end-to-end distance centred at approx.
36 AI , possibly reflecting structural flexibility of the peptide
(Figure 8D).
When heparin is present in themedium, the end-to-end distance
decreases, and the distance distribution for the peptide KK-4
shows a maximum in the population distance of approx. 19.7 AI ,and a broad asymmetrical distribution extending to above 35 AI ,
revealing the presence of a population centred at approx. 30 AIpartially superimposed on to the former distribution (Figure
8B). The peptide RKK-4, upon interaction with heparin, displays
an equilibrium between two distance populations, centred at 32.9
and 21.2 AI , with relative contribution of 46% and 54% resp-
ectively (Figure 8D).
DISCUSSION
All the heparin-binding peptides labelled with the fluorescence
donor and acceptor groups Abz and EDDnp at their N- and
C-terminal ends respectively showed upon heparin binding a
fluorescence decrease that was large enough to allow deter-
mination of Kdvalues up to 8 nM. The experimental procedures
are as simple, fast and sensitive as those used to follow the fluor-
escence change of tryptophan in proteins that bind to heparin
[22]. The calculated errors involved in the Kd
determinations
we obtained were similar to that reported for the interaction of
heparin with antithrombin III, which involves the fluorescence
of four tryptophan residues [40].
The Kd
values for the binding of heparin to the shorter IQF
peptides with the tandem repeats AKKARA and ARKKAAKA
(Table 1) were lower than those previously reported with the
same peptide sequences without Abz and Q (Gln)-EDDnp in a
study that employed affinity co-electrophoresis [21] for the
determination of Kd. The largest difference (24-fold) was observed
when comparing the Kdvalues of peptides (AKKARA)
#[21] and
KK-2, which showed the lowest detectable affinity. This result
suggests that Abz and}or Q-EDDnp might take part in the non-
ionic heparin–peptide interaction, particularly in short peptides,
because the ionic interactions with the peptide (AKKARA)#are
less than those found in any other peptide, and the relative effects
of Abz and Q-EDDnp on binding to heparin would be higher.
According to this hypothesis, the value of KNI
¯ 42.6 µM for
the binding of heparin to peptide RKK-2 (Figure 5), which is the
dissociation constant at 1 M salt concentration (representing
the strength of the non-ionic binding), is very significant. Peptide
RKK-4 has the strongest peptide–heparin interaction so far
reported, as demonstrated by its Kd
of 8 nM, which is approx.
3 times lower than the Kd
reported for its homologue pep-
tide (ARKKAAKA)%[21]. In this larger heparin-binding peptide,
with high affinity for heparin, the effects of Abz and Q-EDDnp
seemed to be absent, or, if present, they were quite small. The CD
spectra of peptides KK-4 and RKK-4 indicated a significant
induction of α-helix by heparin, which is in accordance with
previous observations with the peptide (AKKARA)'
[21]. Al-
though the increase in the concentration of heparin above the 1:1
stoichiometry disrupted the α-helix detected by CD spectroscopy
[21], no variation in the fluorescence of the peptide–heparin
1:1 complexes was observed after the addition of heparin up to
a concentration that was 5 times higher than the peptide con-
centration. These observations suggest that the structure of the
# 2002 Biochemical Society

445Heparin-binding peptides
peptide–heparin complex may be modified by the addition of
extra heparin, but the end-to-end distance of the peptides in the
complex does not change, at least not to an extent that could
be detected by fluorescence measurements.
The amino acids Lys$"#–Lys$"$ in the region between the H
helix and C2 sheet of kallistatin comprise the major heparin-
binding site responsible for kallistatin’s heparin-suppressed
human tissue-kallikrein binding [8]. The peptide HC2 encom-
passes the segment between the amino acids Arg$!! to Pro$"*
of kallistatin, and its binding with heparin revealed a Kdvalue of
17 nM. Interestingly, this peptide contains two consensus
heparin-binding motifs (XBBBXXB) between the residues Leu$!&
and Leu$"). On the other hand, peptide HC1 has only one
consensus heparin-binding sequence in the segment His"")–His"#$,
and HF peptide has none. In addition, heparin–peptide stoichio-
metry for peptide HC2 was 1:1, whereas for the peptides HC1
and HF the stoichiometry was 0.2. Both of these peptides have
significantly higher Kdvalues compared with that of peptide HC2.
Although the region between the H helix and C2 sheet of
kallistatin is the major heparin-binding site of this serpin [8], and
peptide HC2, which encompasses this region, has a high affinity
towards heparin, it cannot be concluded purely on an exam-
ination of the peptide–heparin interaction alone that this segment
is the heparin-binding site in the whole protein. In fact, the low
affinity of the pentasaccharide towards the peptide AT3D con-
trasts with the high affinity of this GAG for antithrombin III,
in which the segment that the peptide AT3D encompasses is an
important part of the pentasaccharide-binding site.
The CD spectra for the peptide HC2 did not show significant
variation in the amount of α-helix upon heparin binding,
although drastic spectral alterations were observed (results not
shown). Moreover, in the kallistatin-modelled structure [41], the
region corresponding to HC2 peptide is not in an α-helix
conformation; therefore it is possible that the binding of heparin
at this site, impairing the inhibition of human tissue kallikrein
by kallistatin, occurs without any induction of α-helix.
Peptide AT3D, derived from antithrombin III segment
Ser""#–Lys"$*, has a significant affinity towards 4500 Da heparin
(Kd100 nM), which is of the same order of magnitude as the K
d
values described for the interaction of antithrombin III with
heparin [6,42,43]. The Kd
value for the interaction of heparin
with the peptide AT3D is approx. 1000-fold lower than that
previously described for a shorter homologue peptide, acetyl-F"#$
AKLNCRLYRKANKSSK"$* [23]. This observation suggests
that the additional sequence S""#EKTSDQIHFF"## present in
peptide AT3D plays a significant role in its binding to heparin.
In contrast, the synthetic pentasaccharide AGA*IAM
showed a
lower affinity for AT3D peptide, as was also observed with the
peptides RKK-2 and RKK-4. The pre-existing α-helix of peptide
AT3D in helix D of anti-thrombin III seems to be essential for
the high-affinity binding of the pentasaccharide, and the small
size of this pentasaccharide does not induce the convenient
conformational change needed for its binding.
The fluorescence decay of labelled Cardin-motif peptides in
aqueous solution is dominated by a lifetime component of
approx. 8 ns, and the mean-lifetime value is comparable with
those obtained for labelled amino acids or peptides [28,39]. In the
presence of heparin, we detected an increase in the long-lifetime
component, but its relative contribution decreases, resulting in a
decreased mean lifetime. The anisotropy decay clearly demon-
strates the formation of a peptide–heparin complex, as revealed
by the increase in the long rotational correlation time when
heparin was added in equimolar concentration to the peptide
solution (Figure 8). That result is consistent with an increase in
the volume associated with the rotational diffusion of the
macromolecule to which the probe is attached, originating from
the formation of a peptide–heparin complex.
Protamine toxicity justifies the search and development of
alternative heparin-reversal compounds. Once heparin is in a
mixture of polysaccharides, a polymer with masses distributed
along a Gaussian curve, its activities over different proteins may
depend on the chain length. Therefore the development of
specific peptides to neutralize either all or part of heparin effects,
which may lead to only one specific population of heparin
molecules having its effect preserved, could be an important
therapeutic strategy. In this way, IQF peptides containing
Abz}Q-EDDnp as a donor}acceptor fluorescence pair provide a
sensitive and handy method for evaluating the formation of
peptide–heparin complexes, and to obtain structural informa-
tion by means of an examination of the fluorescence decay in
addition to their CD spectra analysis.
This work was supported by Fundac: a4 o de Amparo Pesquisa do Estado de Sa4 o Paulo(FAPESP), Conselho Nacional de Desenvolvimento Cientı!fico e Tecnolo! gico (CNPq),and Human Frontiers for Science Progress (RG 00043/2000-M). We are grateful toDr Adelaide Faljoni-Alario (Instituto de Quı!mica, Universidade de Sa4 o Paulo) forcollaboration in the CD analysis, and to Dr Otaciro Rangel Nascimento (Instituto deFı!sica, Universidade de Sa4 o Paulo) for the use of the JASCO J-700 spectropolarimeter.We are grateful to Dr S. W. Provencher for providing us with the CONTIN manual.
REFERENCES
1 Jackson, R. L., Busch, S. J. and Cardin, A. D. (1991) Glycosaminoglycans :
molecular properties, protein interactions, and role in physiological
processes. Physiol. Rev. 71, 481–539
2 Lane, D. A., Denton, J., Flynn, A. M., Thunberg, L. and Lindahl, U. (1984)
Anticoagulant activities of heparin oligosaccharides and their neutralization by
platelet factor 4. Biochem. J. 218, 725–732
3 Olson, S. T., Bjork, I., Sheffer, R., Craig, P. A., Shore, J. D. and Choay, J. (1992)
Role of the antithrombin-binding pentasaccharide in heparin acceleration of
antithrombin–proteinase reactions. Resolution of the antithrombin conformational
change contribution to heparin rate enhancement. J. Biol. Chem. 267, 12528–12538
4 Carrell, R. W., Evans, D. L. and Stein, P. E. (1991) Mobile reactive centre of serpins
and the control of thrombosis. Nature (London) 353, 576–578
5 Jin, L., Abrahams, J. P., Skinner, R., Petitou, M., Pike, R. N. and Carrell, R. W.
(1997) The anticoagulant activation of antithrombin by heparin. Proc. Natl. Acad. Sci.
U.S.A. 94, 14683–14688
6 Belzar, K. J., Dafforn, T. R., Petitou, M., Carrell, R. W. and Huntington, J. A. (2000)
The effect of a reducing-end extension on pentasaccharide binding by antithrombin.
J. Biol. Chem. 275, 8733–8741
7 Chuang, Y. J., Swanson, R., Raja, S. M. and Olson, S. T. (2001) Heparin enhances
the specificity of antithrombin for thrombin and factor Xa independent of the reactive
centre loop sequence. Evidence for an exosite determinant of factor Xa specificity in
heparin-activated antithrombin. J. Biol. Chem. 276, 14961–14971
8 Chen, V., Chao, L., Pimenta, D. C., Bledsoe, G., Juliano, L. and Chao, J. (2001)
Identification of a major heparin-binding site in kallistatin. J. Biol. Chem.
276, 1276–1284
9 Almeida, P. C., Nantes, I. L., Rizzi, C. C., Judice, W. A., Chagas, J. R., Juliano, L.,
Nader, H. B. and Tersariol, I. L. (1999) Cysteine proteinase activity regulation.
A possible role of heparin and heparin-like glycosaminoglycans. J. Biol. Chem.
274, 30433–30438
10 Almeida, P. C., Nantes, I. L., Chagas, J. R., Rizzi, C. C., Faljoni-Alario, A.,
Carmona, E., Juliano, L., Nader, H. B. and Tersariol, I. L. S. (2001) Cathepsin B
activity regulation. Heparin-like glycosaminoglycans protect human cathepsin B from
alkaline pH-induced inactivation. J. Biol. Chem. 276, 944–951
11 Nielsen, P. and Yamada, Y. (2001) Identification of cell-binding sites on the Laminin
α5 N-terminal domain by site-directed mutagenesis. J. Biol. Chem.
276, 10906–10912
12 Nomizu, M., Kuratomi, Y., Malinda, K. M., Song, S. Y., Miyoshi, K., Otaka, A.,
Powell, S. K., Hoffman, M. P., Kleinman, H. K. and Yamada, Y. (1998) Cell binding
sequences in mouse laminin α1 chain. J. Biol. Chem. 273, 32491–32499
13 Spillmann, D., Witt, D. and Lindahl, U. (1998) Defining the interleukin-8-binding
domain of heparan sulfate. J. Biol. Chem. 273, 15487–15493
14 Kjellen, L. and Lindahl, U. (1991) Proteoglycans : structures and interactions.
Annu. Rev. Biochem. 60, 443–475
15 Tumova, S., Woods, A. and Couchman, J. R. (2000) Heparan sulfate proteoglycans
on the cell surface : versatile coordinators of cellular functions. Int. J. Biochem.
Cell Biol. 32, 269–288
# 2002 Biochemical Society

446 D. C. Pimenta and others
16 Deprez, P., Doss-Pepe, E., Brodsky, B. and Inestrosa, N. C. (2000) Heparan sulphate
proteoglycans on the cell surface : versatile coordinators of cellular functions.
Biochem. J. 350, 283–290
17 Ferran, D. S., Sobel, M. and Harris, R. B. (1992) Design and synthesis of a helix
heparin-binding peptide. Biochemistry 31, 5010–5016
18 Jayaraman, G., Wu, C. W., Liu, Y. J., Chien, K. Y., Fang, J. C. and Lyu, P. C. (2000)
Binding of a de novo designed peptide to specific glycosaminoglycans. FEBS Lett.
482, 154–158
19 Olson, S. T. and Bjo$ rk, I. (1991) Predominant contribution of surface approximation
to the mechanism of heparin acceleration of the antithrombin–thrombin reaction.
Elucidation from salt concentration effects. J. Biol. Chem. 266, 6353–6364
20 Olson, S. T., Halvorson, H. R. and Bjo$ rk, I. (1991) Quantitative characterization of
the thrombin–heparin interaction. Discrimination between specific and non-specific
binding models. J. Biol. Chem. 266, 6342–6352
21 Verrecchio, A., Germann, M. W., Schick, B. P., Kung, B., Twardowski, T. and
San Antonio, J. D. (2000) Design of peptides with high affinities for heparin and
endothelial cell proteoglycans. J. Biol. Chem. 275, 7701–7707
22 Olson, S. T., Bjo$ rk, I. and Shore, J. D. (1993) Kinetic characterization of
heparin-catalyzed and uncatalyzed inhibition of blood coagulation proteinases by
antithrombin. Methods Enzymol. 222, 525–559
23 Bae, J., Desai, U. R., Pervin, A., Caldwell, E. E. O., Weiler, J. M. and Linhardt, R. J.
(1994) Interaction of heparin with synthetic antithrombin III peptide analogues.
Biochem. J. 301, 121–129
24 Schick, B. P., Gradowski, J. F., San Antonio, J. D. and Martinez, J. (2001) Novel
design of peptides to reverse the anticoagulant activities of heparin and other
glycosaminoglycans. Thromb. Haemost. 85, 482–487
25 Chagas, J. R., Juliano, L. and Prado, E. S. (1991) Intramolecularly quenched
fluorogenic tetrapeptide substrates for tissue and plasma kallikreins. Anal. Biochem.
192, 419–425
26 Knight, G. C. (1995) Fluorimetric Assays of Proteolytic Enzymes. Methods Enzymol.
248, 18–34
27 Gershkovich, A. A. and Kholodovych, V. V. (1996) Fluorogenic substrates for
proteases based on intramolecular fluorescence energy transfer (IFETS).
J. Biochem. Biophys. Methods 33, 135–162
28 Souza, E. S., Hirata, I. Y, Juliano, L. and Ito, A. S. (2000) End-to-end distance
distribution in bradykinin observed by Fo$ rster resonance energy transfer.
Biochem. Biophys. Acta 1474, 251–261
29 Cardin, A. D. and Weintraub, H. J. R. (1989) Molecular modeling of
protein–glycosaminoglycan interactions. Arteriosclerosis 9, 21–32
Received 4 January 2002/2 May 2002 ; accepted 8 May 2002
Published as BJ Immediate Publication 8 May 2002, DOI 10.1042/BJ20020023
30 Ermolief, J., Boudier, C., Laine, A., Meyer, B. and Bieth, J. (1994) Heparin protects
cathepsin G against inhibition by protein proteinase inhibitors. J. Biol. Chem.
269, 29502–29508
31 Hirata, Y. I., Cezari, M. H. S., Nakaie, C. R., Boschcov, P., Ito, A. S., Juliano, M. A.
and Juliano, L. (1994) Internally quenched fluorogenic protease substrates :
solid-phase synthesis and fluorescence spectroscopy of peptides containing
ortho-aminobenzoyl/dinitrophenyl groups as donor-acceptor pairs. Lett. Pept. Sci.
1, 299–308
32 Leatherbarrow, R. J. (1992) Grafit Version 3.0, Erithacus Software Ltd, Staines, U.K.
33 Segel, I. H. (1993) Behavior and analysis of rapid equilibrium and steady-state
enzyme systems. In Enzyme Kinetics, pp. 371–374, John Wiley and Sons,
New York, NY
34 Record, M. T. J., Lohman, M. L. and De Haseth, P. (1976) Ion effects on
ligand–nucleic acid interactions. J. Mol. Biol. 107, 145–158
35 Chakrabartty, A., Schellman, J. A. and Baldwin, R. (1991) Large differences in the
helix propensities of alanine and glycine. Nature (London) 351, 586–588
36 Sreerama, N. and Woody, R. W. (1993) A self-consistent method for the analysis of
protein secondary structure from circular dichroism. Anal. Biochem. 209, 32–44
37 Provencher, S. W. (1982) A constrained regularization method for inverting data
represented by linear algebraic or integral-equations. Comp. Physics Commun.
27, 229–242
38 Ersdal-Badju, E., Lu, A., Zuo, Y., Picard, V. and Block, S. C. (1997) Identification of
the antithrombin III heparin binding site. J. Biol. Chem. 272, 19393–19400
39 Ito, A. S., Turchiello, R. F, Hirata, I. Y, Cezari, M. H. S., Meldal, M. and Juliano, L.
(1998) Fluorescent properties of amino acids labeled with ortho-aminobenzoic acid.
Biospectroscopy 4, 395–402
40 Meagher, J. L., Beechem, J. M., Olson, S. T. and Gettins, P. G. (1998) Deconvolution
of the fluorescence emission spectrum of human antithrombin and identification of the
tryptophan residues that are responsive to heparin binding. J. Biol. Chem.
273, 23283–23289
41 Chen, V., Chao, L. and Chao, J. (2000) A positively charged loop on the surface of
kallistatin functions to enhance tissue kallikrein inhibition by acting as a secondary
binding site for kallikrein. J. Biol. Chem. 275, 40371–40377
42 Nordenman, B., Danielsson, A. and Bjork, I. (1978) The binding of low-affinity and
high-affinity heparin to antithrombin. Fluorescence studies. Eur. J. Biochem. 90, 1–6
43 Lindahl, U., Thunberg, L., Backstrom, G., Riesenfeld, J., Nordling, K. and Bjork, I.
(1984) Extension and structural variability of the antithrombin-binding sequence in
heparin. J. Biol. Chem. 259, 12368–12376
# 2002 Biochemical Society