integrating security concerns into safety analysis of
TRANSCRIPT

Integrating Security Concerns intoSafety Analysis of Embedded Systems
Using Component Fault Trees
Vom Fachbereich Informatik derTechnischen Universität Kaiserslautern
zur Verleihung des akademischen Grades
Doktor der Ingenieurwissenschaften (Dr.-Ing.)
genehmigte Dissertation
von
Dipl.-Inf. Max Steiner
Datum der wissenschaftlichen Aussprache: 29. August 2016
Dekan: Prof. Dr. Klaus SchneiderErster Berichterstatter: Prof. Dr. Peter LiggesmeyerZweiter Berichterstatter: Prof. Dr. Karsten Berns
D 386

II

Zusammenfassung
Nahezu alle neu entwickelten Systeme enthalten heutzutage eingebettete Sys-teme zur Steuerung von Systemfunktionen. Ein eingebettetes System nimmtseine Umwelt über Sensoren wahr und interagiert mit ihr mittels Aktoren. Sys-teme, die ihrer Umwelt durch fehlerhaftes Verhalten Schaden zufügen können,werden üblicherweise auf ihre Betriebssicherheit (Safety) hin untersucht. DieAngriffs- oder Datensicherheit (Security) von eingebetteten Systemen wirdmeistens überhaupt nicht betrachtet. Durch die neuen Entwicklungen im Be-reich Industrie 4.0 und Internet of Things werden solche Systeme immer stär-ker miteinander vernetzt. Dadurch kommen neue Ursachen für Systemausfällezum Tragen: Schwachstellen in den Software- und Kommunikationskompo-nenten können von Angreifern ausgenutzt werden, um einerseits die Kontrolleüber ein System zu erlangen und andererseits durch gezielte Eingriffe das Sys-tem in einen kritischen Zustand zu bringen, der entweder dem System selbstoder der Umwelt schadet. Beispiele solcher Schwachstellen und auch erfolgrei-che Angriffe werden in letzter Zeit immer häufiger bekannt.
Aus diesem Grund muss man bei eingebetteten Systemen bei der Analyseder Betriebssicherheit (Safety) auch die Datensicherheit (Security) zumindestsoweit berücksichtigen, wie sie Auswirkungen auf Ausfälle von Systemkompo-nenten haben kann.
Ziel dieser Arbeit ist es, in einem Modell zu beschreiben, wie sich Bedro-hungen aus Securitysicht auf die Safetyeigenschaft eines Systems auswirkenkönnen. Da aber weiterhin die Betriebssicherheit der Systeme im Vordergrundsteht, wird die Safetyanalyse erweitert, um Bedrohungen der Security mit zuberücksichtigen, die eine Wirkung auf die Safety des Systems haben können.Komponentenfehlerbäume eignen sich sehr gut dazu, Ursachen eines Ausfallszu untersuchen und Ausfallszenarien zu finden. Ein Komponentenfehlerbaumeines zu untersuchenden Systems wird um zusätzliche Ereignisse erweitert, diesich auch durch gezielte Angriffe auslösen lassen. Qualitative und quantitativeAnalysen werden erweitert, um die zusätzlichen Securityereignisse zu berück-sichtigen. Dadurch lassen sich Ursachen für Ausfälle finden, die auf Safety-und/oder Securityproblemen basieren. Quantitative oder Semi-quantitative

IV
Analysen ermöglichen es, Securitymaßnahmen besser zu bewerten und dieNotwendigkeit solcher zu begründen.
Der Ansatz wurde in mehreren Analysen von Beispielsystemen angewen-det: Die Sicherheitskette des Off-road Roboters ravon, ein adaptiver Tem-pomat, ein Smart Farming Szenario und ein Modell einer generischen Infusi-onspumpe wurden untersucht. Das Ergebnis war bei allen Beispielen, dass da-durch zusätzliche Ausfallursachen gefunden werden konnten, die in einem klas-sischen Komponentenfehlerbaum nicht auftauchen würden. Teilweise wurdenauch Ausfallszenarien gefunden, die nur durch einen Angriff ausgelöst werdenkönnen und nicht von Ausfällen von Systemkomponenten anhängig sind. Dassind besonders kritische Szenarien, die in dieser Form nicht vorkommen soll-ten und durch eine klassische Analyse nicht gefunden werden. Dadurch zeigtsich ein Mehrwert des Ansatzes bei einer Sicherheitsanalyse, der sich durchdie Anwendung etablierter Techniken auch mit wenig zusätzlichem Aufwanderreichen lässt.

Abstract
Nowadays, almost every newly developed system contains embedded systemsfor controlling system functions. An embedded system perceives its environ-ment via sensors, and interacts with it using actuators such as motors. Forsystems that might damage their environment by faulty behavior usually asafety analysis is performed. Security properties of embedded systems are usu-ally not analyzed at all. New developments in the area of Industry 4.0 andInternet of Things lead to more and more networking of embedded systems.Thereby, new causes for system failures emerge: Vulnerabilities in softwareand communication components might be exploited by attackers to obtaincontrol over a system. By targeted actions a system may also be brought intoa critical state in which it might harm itself or its environment. Examples forsuch vulnerabilities, and also successful attacks, became known over the lastfew years.
For this reason, in embedded systems safety as well as security has tobe analyzed at least as far as it may cause safety critical failures of systemcomponents.
The goal of this thesis is to describe in one model how vulnerabilitiesfrom the security point of view might influence the safety of a system. Thefocus lies on safety analysis of systems, so the safety analysis is extended toencompass security problems that may have an effect on the safety of a system.Component Fault Trees are very well suited to examine causes of a failure andto find failure scenarios composed of combinations of faults. A ComponentFault Tree of an analyzed system is extended by additional Basic Events thatmay be caused by targeted attacks. Qualitative and quantitative analyses areextended to take the additional security events into account. Thereby, causesof failures that are based on safety as well as security problems may be found.Quantitative or at least semi-quantitative analyses allow to evaluate securitymeasures more detailed, and to justify the need of such.
The approach was applied to several example systems: The safety chainof the off-road robot ravon, an adaptive cruise control, a smart farmingscenario, and a model of a generic infusion pump were analyzed. The result of

VI
all example analyses was that additional failure causes were found which wouldnot have been detected in traditional Component Fault Trees. In the analysesalso failure scenarios were found that are caused solely by attacks, and that arenot depending on failures of system components. These are especially criticalscenarios which should not happen in this way, as they are not found in aclassical safety analysis. Thus the approach shows its additional benefit to asafety analysis which is achieved by the application of established techniqueswith only little additional effort.

Acknowledgements
I would like to take the opportunity to thank everyone who supported meduring the time I worked on this thesis.
First of all, I would like to thank my supervisor Prof. Dr. Peter Liggesmeyerwho made this work possible in the first place. He inspired me to write thisthesis about the combination of safety and security analysis. Special thanksgo to Prof. Dr. Karsten Berns who initially referred me to Prof. Liggesmeyer,and who agreed to be my second referee on such short notice.
I would also like to thank my past and present colleagues at the chairSoftware Engineering: Dependability: Patric Keller for the support during theearly stages and the motivation to write the first publication, Kai Bizik for thegood times in our shared office and the many helpful conversations about ourthesis topics, and Michael Roth who motivated me with his working moraleand his everlasting high spirits to finish the thesis.
Special thanks also go to Thomas Schneider and Caroline Frey for thecontinuing support with technical or organizational obstacles and especiallyfor the organization of the scholarship for the last six months of this work.
I also thank my other colleagues for the good teamwork that lasted foryears.


Contents
Contents . . . . . . . . . . . . . . . . . . . . . . . . . . . . . . . . . . . . . . . . . . . . . . . . . . . . . . . IX
List of Figures . . . . . . . . . . . . . . . . . . . . . . . . . . . . . . . . . . . . . . . . . . . . . . . . . XIII
List of Tables . . . . . . . . . . . . . . . . . . . . . . . . . . . . . . . . . . . . . . . . . . . . . . . . . . XVII
1 Introduction . . . . . . . . . . . . . . . . . . . . . . . . . . . . . . . . . . . . . . . . . . . . . . . 11.1 Motivation . . . . . . . . . . . . . . . . . . . . . . . . . . . . . . . . . . . . . . . . . . . . . 21.2 Problem Statement . . . . . . . . . . . . . . . . . . . . . . . . . . . . . . . . . . . . . . 51.3 Contribution . . . . . . . . . . . . . . . . . . . . . . . . . . . . . . . . . . . . . . . . . . . . 51.4 Structure . . . . . . . . . . . . . . . . . . . . . . . . . . . . . . . . . . . . . . . . . . . . . . . 6
2 Related Work and Fundamentals . . . . . . . . . . . . . . . . . . . . . . . . . . 72.1 Safety Analysis Techniques . . . . . . . . . . . . . . . . . . . . . . . . . . . . . . . 8
2.1.1 Fault Tree Analysis (FTA) . . . . . . . . . . . . . . . . . . . . . . . . . 92.1.2 Inductive Safety Analysis Techniques . . . . . . . . . . . . . . . . 20
2.2 Security Analysis Techniques . . . . . . . . . . . . . . . . . . . . . . . . . . . . . . 222.2.1 Attack Tree Analysis . . . . . . . . . . . . . . . . . . . . . . . . . . . . . . 242.2.2 Threat Modeling . . . . . . . . . . . . . . . . . . . . . . . . . . . . . . . . . . 31
2.3 Combinations of Safety and Security Analysis . . . . . . . . . . . . . . . 342.3.1 Integration of FTs and ATs . . . . . . . . . . . . . . . . . . . . . . . . . 352.3.2 Security Analysis with Safety Implications . . . . . . . . . . . . 372.3.3 Failure Mode, Vulnerabilities and Effects Analysis
(FMVEA) . . . . . . . . . . . . . . . . . . . . . . . . . . . . . . . . . . . . . . . . 392.3.4 Other Related Approaches that Combine Safety and
Security Analysis . . . . . . . . . . . . . . . . . . . . . . . . . . . . . . . . . . 412.4 Critique of Quantified Security Properties . . . . . . . . . . . . . . . . . . 422.5 Conclusion . . . . . . . . . . . . . . . . . . . . . . . . . . . . . . . . . . . . . . . . . . . . . 43

X CONTENTS
3 A Comprehensive Safety Modeling Approach . . . . . . . . . . . . . . 453.1 Overall Modeling and Analysis Process . . . . . . . . . . . . . . . . . . . . . 453.2 Discussing Different Combinations of Component Fault
Trees (CFTs) and Attack Trees (ATs) . . . . . . . . . . . . . . . . . . . . . . 473.2.1 An AT Extended by a CFT . . . . . . . . . . . . . . . . . . . . . . . . . 473.2.2 A CFT Extended by an AT. . . . . . . . . . . . . . . . . . . . . . . . . 473.2.3 Nested Trees . . . . . . . . . . . . . . . . . . . . . . . . . . . . . . . . . . . . . . 48
3.3 Tree Creation Approaches . . . . . . . . . . . . . . . . . . . . . . . . . . . . . . . . 483.3.1 Combination of two Complete Separate Trees . . . . . . . . . 483.3.2 Extension of a Tree . . . . . . . . . . . . . . . . . . . . . . . . . . . . . . . . 51
3.4 Development of a Security-enhanced Component FaultTree (SeCFT) . . . . . . . . . . . . . . . . . . . . . . . . . . . . . . . . . . . . . . . . . . . 52
3.5 Rules for the Development of an SeCFT . . . . . . . . . . . . . . . . . . . . 56
4 The Analysis of Security-enhanced Component Fault Trees 594.1 Ratings of Basic Events in SeCFTs . . . . . . . . . . . . . . . . . . . . . . . . 59
4.1.1 Probabilities . . . . . . . . . . . . . . . . . . . . . . . . . . . . . . . . . . . . . . 614.1.2 Likelihood . . . . . . . . . . . . . . . . . . . . . . . . . . . . . . . . . . . . . . . . 624.1.3 Tuple Rating . . . . . . . . . . . . . . . . . . . . . . . . . . . . . . . . . . . . . 64
4.2 Calculation Rules for SeCFTs . . . . . . . . . . . . . . . . . . . . . . . . . . . . . 654.2.1 Probabilities . . . . . . . . . . . . . . . . . . . . . . . . . . . . . . . . . . . . . . 664.2.2 Likelihood . . . . . . . . . . . . . . . . . . . . . . . . . . . . . . . . . . . . . . . . 664.2.3 Tuple Rating . . . . . . . . . . . . . . . . . . . . . . . . . . . . . . . . . . . . . 68
4.3 Qualitative Analysis of SeCFTs . . . . . . . . . . . . . . . . . . . . . . . . . . . 704.3.1 Minimal Cut Set Analysis . . . . . . . . . . . . . . . . . . . . . . . . . . 704.3.2 Importance of Basic Events . . . . . . . . . . . . . . . . . . . . . . . . . 73
4.4 Quantitative Analysis of SeCFTs . . . . . . . . . . . . . . . . . . . . . . . . . . 734.5 Summary: Analysis Process of SeCFTs . . . . . . . . . . . . . . . . . . . . . 77
5 Evaluation of the Approach . . . . . . . . . . . . . . . . . . . . . . . . . . . . . . . . 795.1 Tool Support . . . . . . . . . . . . . . . . . . . . . . . . . . . . . . . . . . . . . . . . . . . 795.2 Analysis Example: RAVON . . . . . . . . . . . . . . . . . . . . . . . . . . . . . . . 81
5.2.1 Description RAVON . . . . . . . . . . . . . . . . . . . . . . . . . . . . . . . 815.2.2 Analysis . . . . . . . . . . . . . . . . . . . . . . . . . . . . . . . . . . . . . . . . . . 835.2.3 Results . . . . . . . . . . . . . . . . . . . . . . . . . . . . . . . . . . . . . . . . . . . 84
5.3 Analysis Example: Adaptive Cruise Control . . . . . . . . . . . . . . . . . 895.3.1 Description Adaptive Cruise Control . . . . . . . . . . . . . . . . . 895.3.2 Analysis . . . . . . . . . . . . . . . . . . . . . . . . . . . . . . . . . . . . . . . . . . 905.3.3 Results . . . . . . . . . . . . . . . . . . . . . . . . . . . . . . . . . . . . . . . . . . . 91
5.4 Analysis Example: Smart Farming . . . . . . . . . . . . . . . . . . . . . . . . . 955.4.1 Description: Smart Farming . . . . . . . . . . . . . . . . . . . . . . . . 955.4.2 Analysis . . . . . . . . . . . . . . . . . . . . . . . . . . . . . . . . . . . . . . . . . . 995.4.3 Results . . . . . . . . . . . . . . . . . . . . . . . . . . . . . . . . . . . . . . . . . . . 99
5.5 Analysis Example: Infusion Pump . . . . . . . . . . . . . . . . . . . . . . . . . 1035.5.1 Description: Infusion Pump . . . . . . . . . . . . . . . . . . . . . . . . . 103

CONTENTS XI
5.5.2 Analysis . . . . . . . . . . . . . . . . . . . . . . . . . . . . . . . . . . . . . . . . . . 1035.5.3 Results . . . . . . . . . . . . . . . . . . . . . . . . . . . . . . . . . . . . . . . . . . . 106
5.6 Conclusion . . . . . . . . . . . . . . . . . . . . . . . . . . . . . . . . . . . . . . . . . . . . . 107
6 Conclusion . . . . . . . . . . . . . . . . . . . . . . . . . . . . . . . . . . . . . . . . . . . . . . . . 109
A Appendix . . . . . . . . . . . . . . . . . . . . . . . . . . . . . . . . . . . . . . . . . . . . . . . . . . 111A.1 Evaluation Example: Ravon . . . . . . . . . . . . . . . . . . . . . . . . . . . . . . . 112A.2 Evaluation Example: Adaptive Cruise Control . . . . . . . . . . . . . . . 115A.3 Evaluation Example: Smart Farming . . . . . . . . . . . . . . . . . . . . . . . 129A.4 Evaluation Example: Infusion Pump . . . . . . . . . . . . . . . . . . . . . . . 137
Abbreviations . . . . . . . . . . . . . . . . . . . . . . . . . . . . . . . . . . . . . . . . . . . . . . . . . 141
Index . . . . . . . . . . . . . . . . . . . . . . . . . . . . . . . . . . . . . . . . . . . . . . . . . . . . . . . . . . 143
References . . . . . . . . . . . . . . . . . . . . . . . . . . . . . . . . . . . . . . . . . . . . . . . . . . . . . 145


List of Figures
1.1 An embedded system . . . . . . . . . . . . . . . . . . . . . . . . . . . . . . . . . . . . . 11.2 Networked embedded systems . . . . . . . . . . . . . . . . . . . . . . . . . . . . . . 3
2.1 An example Fault Tree . . . . . . . . . . . . . . . . . . . . . . . . . . . . . . . . . . . . 102.2 A CFT consisting of three subcomponents . . . . . . . . . . . . . . . . . . . 122.3 A corresponding Reduced Ordered Binary Decision
Diagram (ROBDD) for the example from Fig. 2.1 . . . . . . . . . . . . 172.4 The cause-effect chain of an Failure Mode and Effects
Analysis (FMEA) . . . . . . . . . . . . . . . . . . . . . . . . . . . . . . . . . . . . . . . . 202.5 An example to illustrate the interrelations of the definitions . . . . 232.6 An example Attack Tree (AT) . . . . . . . . . . . . . . . . . . . . . . . . . . . . . 252.7 The cause-effect chain of Failure Mode, Vulnerabilities and
Effects Analysis (FMVEA) from [Schmittner 14] . . . . . . . . . . . . . 40
3.1 The safety analysis process according to IEC 60300–3–1 . . . . . . . 463.2 The extended safety analysis process . . . . . . . . . . . . . . . . . . . . . . . . 463.3 Combinations of CFTs and ATs. Fig. 3.3b shows the
combination that is used for this thesis. . . . . . . . . . . . . . . . . . . . . . 483.4 Nested combinations of CFTs and ATs . . . . . . . . . . . . . . . . . . . . . . 493.5 The combination approach of a CFT and an separate AT . . . . . . 503.6 The extension of a Fault Tree . . . . . . . . . . . . . . . . . . . . . . . . . . . . . . 523.7 The extension of a Component Fault Tree . . . . . . . . . . . . . . . . . . . 533.8 The development of a Security-enhanced Component Fault
Tree (SeCFT) . . . . . . . . . . . . . . . . . . . . . . . . . . . . . . . . . . . . . . . . . . . . 543.9 An attacker component with two possible attacks . . . . . . . . . . . . . 56
4.1 An example attacker component . . . . . . . . . . . . . . . . . . . . . . . . . . . . 604.2 An example SeCFT consisting of a controller component and
an attacker component . . . . . . . . . . . . . . . . . . . . . . . . . . . . . . . . . . . . 65

XIV LIST OF FIGURES
4.3 The example from Fig. 4.2 with ratings for safety and securityBasic Events (BEs) . . . . . . . . . . . . . . . . . . . . . . . . . . . . . . . . . . . . . . . 69
4.4 An SeCFT with highlighted Minimal Cut Sets (MCSs) fromthe example in Fig. 4.2 . . . . . . . . . . . . . . . . . . . . . . . . . . . . . . . . . . . 72
4.5 The extended analysis process after the SeCFT is created . . . . . 77
5.1 A screenshot of the prototype tool for the analysis of SeCFTs . . 805.2 The ravon robot 2009 at the University of Kaiserslautern . . . . . 825.3 The ravon safety chain . . . . . . . . . . . . . . . . . . . . . . . . . . . . . . . . . . . 835.4 A CFT of the ravon safety chain . . . . . . . . . . . . . . . . . . . . . . . . . . 855.5 The Adaptive Cruise Control (ACC) example system . . . . . . . . . 895.6 The modeled architecture of the ACC . . . . . . . . . . . . . . . . . . . . . . . 905.7 A high level CFT of the ACC example system . . . . . . . . . . . . . . . 915.8 An overview of the smart farming ecosystem . . . . . . . . . . . . . . . . . 955.9 An overview of the smart farming system components . . . . . . . . . 965.10 A high level SeCFT of the smart farming example system . . . . . 1005.11 The SeCFT of the attacker component in the smart farming
example system . . . . . . . . . . . . . . . . . . . . . . . . . . . . . . . . . . . . . . . . . . 1015.12 A simplified architecture of a generic patient controlled
analgesia pump based on [Arney 09] . . . . . . . . . . . . . . . . . . . . . . . . 1035.13 A high-level SeCFT model of the pump model shown in Fig. 5.121045.14 The attacker component of the infusion pump analysis . . . . . . . . 105
A.1 SeCFT: ACC.System . . . . . . . . . . . . . . . . . . . . . . . . . . . . . . . . . . . . . 115A.2 SeCFT: ACC.Vehicle . . . . . . . . . . . . . . . . . . . . . . . . . . . . . . . . . . . . . 116A.3 SeCFT: ACC.ACC . . . . . . . . . . . . . . . . . . . . . . . . . . . . . . . . . . . . . . . 117A.4 SeCFT: ACC.Brake Interface . . . . . . . . . . . . . . . . . . . . . . . . . . . . . . 118A.5 SeCFT: ACC.Control Logic Unit . . . . . . . . . . . . . . . . . . . . . . . . . . . 119A.6 SeCFT: ACC.Speedometer . . . . . . . . . . . . . . . . . . . . . . . . . . . . . . . . 120A.7 SeCFT: ACC.Communication System . . . . . . . . . . . . . . . . . . . . . . . 121A.8 SeCFT: ACC.Front Antenna . . . . . . . . . . . . . . . . . . . . . . . . . . . . . . . 122A.9 SeCFT: ACC.Wheelspeed Sensor . . . . . . . . . . . . . . . . . . . . . . . . . . . 123A.10 SeCFT: ACC.Brake Actor . . . . . . . . . . . . . . . . . . . . . . . . . . . . . . . . . 123A.11 SeCFT: ACC.Distance Sensor . . . . . . . . . . . . . . . . . . . . . . . . . . . . . . 123A.12 SeCFT: SmartFarming.Driving . . . . . . . . . . . . . . . . . . . . . . . . . . . . . 129A.13 SeCFT: SmartFarming.EngineActuatorController . . . . . . . . . . . . . 130A.14 SeCFT: SmartFarming.BreakActuatorController . . . . . . . . . . . . . . 130A.15 SeCFT: SmartFarming.SteeringActuatorController . . . . . . . . . . . . 130A.16 SeCFT: SmartFarming.SpeedController . . . . . . . . . . . . . . . . . . . . . 131A.17 SeCFT: SmartFarming.DirectionController . . . . . . . . . . . . . . . . . . 132A.18 SeCFT: SmartFarming.TractorBus . . . . . . . . . . . . . . . . . . . . . . . . . . 132A.19 SeCFT: SmartFarming.GasPedalSensorController . . . . . . . . . . . . . 132A.20 SeCFT: SmartFarming.BreakPedalSensorController . . . . . . . . . . . 133A.21 SeCFT: SmartFarming.SteeringWheelSensorController . . . . . . . . 133A.22 SeCFT: SmartFarming.GasPedal . . . . . . . . . . . . . . . . . . . . . . . . . . . 133

LIST OF FIGURES XV
A.23 SeCFT: SmartFarming.BreakPedal . . . . . . . . . . . . . . . . . . . . . . . . . 134A.24 SeCFT: SmartFarming.SteeringWheel . . . . . . . . . . . . . . . . . . . . . . . 134A.25 SeCFT: SmartFarming.RemoteControl . . . . . . . . . . . . . . . . . . . . . . 135A.26 SeCFT: SmartFarming.Attacker . . . . . . . . . . . . . . . . . . . . . . . . . . . . 136A.27 SeCFT: InfusionPump . . . . . . . . . . . . . . . . . . . . . . . . . . . . . . . . . . . . 137A.28 SeCFT: InfusionPump.Alarm . . . . . . . . . . . . . . . . . . . . . . . . . . . . . . 138A.29 SeCFT: InfusionPump.PumpDriver . . . . . . . . . . . . . . . . . . . . . . . . . 138A.30 SeCFT: InfusionPump.ErrorHandler . . . . . . . . . . . . . . . . . . . . . . . . 138A.31 SeCFT: InfusionPump.FlowRateMonitor . . . . . . . . . . . . . . . . . . . . 139A.32 SeCFT: InfusionPump.PumpSensors . . . . . . . . . . . . . . . . . . . . . . . . 139A.33 SeCFT: InfusionPump.PumpUnit . . . . . . . . . . . . . . . . . . . . . . . . . . 139A.34 SeCFT: InfusionPump.UserInput . . . . . . . . . . . . . . . . . . . . . . . . . . . 140A.35 SeCFT: InfusionPump.Attacker . . . . . . . . . . . . . . . . . . . . . . . . . . . . 140


List of Tables
2.1 Importance values for the example BEs . . . . . . . . . . . . . . . . . . . . . 192.2 Examples for values assigned to BEs in ATs from [Schneier 99] . 242.3 Operations for conjunction and disjunction for different
attributes . . . . . . . . . . . . . . . . . . . . . . . . . . . . . . . . . . . . . . . . . . . . . . . 282.4 Parameters used to calculate the outcome of an attack
according to Buldas et al. [Buldas 06] . . . . . . . . . . . . . . . . . . . . . . . 292.5 Threats and security properties from [Hernan 06] . . . . . . . . . . . . . 322.6 Descriptions of security properties from [Hernan 06] . . . . . . . . . . 332.7 Threats affecting data flow diagram elements according
to [Hernan 06] . . . . . . . . . . . . . . . . . . . . . . . . . . . . . . . . . . . . . . . . . . . 332.8 Comparison of safety and security risk analysis processes
according to [Eames 99] . . . . . . . . . . . . . . . . . . . . . . . . . . . . . . . . . . . 352.9 Ratings of attack scenario criteria as used in [Bloomfield 12] . . . 382.10 FMVEA elements and their correspondents in
FMEA [Schmittner 14] . . . . . . . . . . . . . . . . . . . . . . . . . . . . . . . . . . . . 402.11 Ratings of the properties necessary to determine the attack
probability according to [Schmittner 14] . . . . . . . . . . . . . . . . . . . . . 41
3.1 STRIDE maps threats to security properties . . . . . . . . . . . . . . . . . 55
4.1 MCSs according to type, whereas controller and attackerrefer to the appropriate components . . . . . . . . . . . . . . . . . . . . . . . . 64
4.2 MCSs according to type, whereas controller and attackerrefer to the appropriate components . . . . . . . . . . . . . . . . . . . . . . . . 72
4.3 Qualitative importance of BEs . . . . . . . . . . . . . . . . . . . . . . . . . . . . . 734.4 Conditions for an order of mixed MCSs according to two
tuples (P1, L1) and (P2, L2) . . . . . . . . . . . . . . . . . . . . . . . . . . . . . . . . 744.5 MCSs from example 1 ordered according to probability and
likelihood . . . . . . . . . . . . . . . . . . . . . . . . . . . . . . . . . . . . . . . . . . . . . . . 754.6 BEs together with their ratings from the example . . . . . . . . . . . . 75

XVIII LIST OF TABLES
5.1 ravon technical data . . . . . . . . . . . . . . . . . . . . . . . . . . . . . . . . . . . . . 815.2 Ratings of the Basic Events in the ravon safety chain . . . . . . . . 865.3 MCSs of size 1 found during a qualitative analysis of the
ravon safety chain . . . . . . . . . . . . . . . . . . . . . . . . . . . . . . . . . . . . . . . 865.4 Most critical MCSs according to the security likelihood of the
ravon safety chain . . . . . . . . . . . . . . . . . . . . . . . . . . . . . . . . . . . . . . . 875.5 Most critical MCSs according to the safety probability of the
ravon safety chain . . . . . . . . . . . . . . . . . . . . . . . . . . . . . . . . . . . . . . . 885.6 Ratings of the Basic Events in the ACC system . . . . . . . . . . . . . . 925.7 MCSs of size 1 found during a qualitative analysis of the ACC . 935.8 Most critical MCSs according to the security likelihood of the
ACC. . . . . . . . . . . . . . . . . . . . . . . . . . . . . . . . . . . . . . . . . . . . . . . . . . . . 935.9 Most critical MCSs according to the safety probability of the
ACC. . . . . . . . . . . . . . . . . . . . . . . . . . . . . . . . . . . . . . . . . . . . . . . . . . . . 935.10 Ratings of the Basic Events in the smart farming scenario . . . . . 1015.11 MCSs of size 1 found during a qualitative analysis of the
smart farming scenario . . . . . . . . . . . . . . . . . . . . . . . . . . . . . . . . . . . . 1025.12 Most critical MCSs according to the security likelihood and
the safety probability of the smart farming scenario . . . . . . . . . . . 1025.13 Ratings of the Basic Events in the infusion pump example . . . . . 1055.14 All MCSs including their ratings of the infusion pump scenario . 106
A.1 MCSs of the SeCFT of the ravon safety chain . . . . . . . . . . . . . . . 112A.2 MCSs of the SeCFT of the Adaptive Cruise Control system . . . . 124A.3 Most critical MCSs according to the safety probability of the
ACC. . . . . . . . . . . . . . . . . . . . . . . . . . . . . . . . . . . . . . . . . . . . . . . . . . . . 127A.4 MCSs of the SeCFT of the smart farming scenario . . . . . . . . . . . . 134

1
Introduction
Nowadays, almost everything, from a simple toaster to complex humanoidrobots contains embedded systems. An embedded system is able to monitorits environment using different kinds of sensors, and interacts with it using ac-tuators such as electric motors. The sensor inputs are evaluated via controllercomponents that calculate outputs for the actuator components (cf. Fig. 1.1).
Environment
Embedded System
ControllerSensors Actuators
Fig. 1.1. An embedded system
Embedded systems are systems composed of software (controller) andhardware components (sensors, actuators). For systems that might cause harmto its environment, or people in its vicinity, due to system failures, tradition-

2 1 Introduction
ally a safety analysis is necessary. By a safety analysis risks can be detected,and then they can be reduced to an acceptable level by suitable counter-measures. During the approval process of new systems it has to be ensuredthat only acceptable risks for the system’s environment remain in the finishedsystem.
For a safety analysis of a system there are analysis techniques that arepartly decades old, accordingly widespread, and accepted by industry and re-searchers. One prominent technique is Fault Tree Analysis (FTA) which thisthesis uses as a basis. Additional to the hardware components, which mostof the techniques were initially developed for, in embedded systems there aresoftware components that have to be taken into account too. The initiallyhardware-specialized analysis techniques were adapted and extended to en-compass software components too. That was the first big change in safetyanalysis.
1.1 Motivation
The newest development in embedded systems is the Internet of Things andits application to industry under the term Industry 4.0. Embedded systemsare connected to larger networks of systems, mostly via open networks as theInternet. Such connected embedded systems are often called Cyber-PhysicalSystems (CPSs) (cf. Fig. 1.2). Not only newly developed systems are con-nected but also existing, older systems are retrofitted to be connected to largersystems. This offers the ability to remotely manage or maintain systems.
But the downside is that most older systems were developed for isolatedconditions where the access control was achieved by physically locking thesystem in some kind of box. An authorized technician had a key to thatbox, and only then he had complete access to the system. If such devicesare connected to the Internet, it might be that an attacker who can connectto a device immediately gains complete access to control the system. Thatsuch systems exist show several examples which became known over the lastfew years (more about that later). To conclude so far: Networking embeddedsystems introduces new vulnerabilities into the systems.
That would be manageable if this fact would be taken into account duringthe retrofitting of existing systems, or the development of new systems. Thecurrent safety analyses only take into account failures that result from randomfaults, but not targeted manipulations of systems or system components. Byusing software components, and at the same time more and more networkingof different systems, new causes for system failures appear: Vulnerabilitiesin software components that are accessible via remote connections may beexploited by attackers to gain control over a system, or to bring it into acritical system state by targeted actions.
Examples for vulnerabilities, but also successful attacks, became increas-ingly known over the last few years. Attackers not only attack web servers to

1.1 Motivation 3
Environment
ControllerS A
Communication
ControllerS A
Communication
ControllerS A
Communication
common communication channel
S: SensorsA: Actuators
Fig. 1.2. Networked embedded systems
obtain information from connected databases as they used to, but now alsocontrol systems of industrial plants, cars, trains, or planes are targets for at-tacks. Most of the reports about possible attacks refer to security researchersthat found critical vulnerabilities in embedded systems. Those found vulner-abilities are often not actively exploited because the necessary effort makesthose attack scenarios mostly theoretical.
There are a number of reports about vulnerabilities in embedded systemsthat are used to control industrial plants. The widely used control systemSiemens Simatic had a few vulnerabilities that allowed a possible attacker fullaccess to the system which is used to control whole production cycles (e.g.:in chemical plants) [Bachfeld 11a, Bachfeld 11b, Schmidt 11, ICS-CERT 11,Schirrmacher 15, Klick 15].
A presentation at the Chaos Communication Congress 2014 on security inindustrial plants shows that there are a lot of vulnerabilities in such controlsystems. But most of them can only be exploited by an attacker with detailedbackground knowledge and a considerable amount of effort [Kleinz 14]. Ageneral overview about security problems of industrial control systems is givenin [Kargl 14].
By the increasing availability of networked devices of the Internet of Thingssuch attacks become dangerous to private citizens also. A possible attackon the upcoming smart grid may cripple the supply of electricity or water.A heating system from the company Vaillant that used controllers from thecompany Saia-Burgess was vulnerable to attacks over the Internet that allowedan attacker full access to the burner control [Stahl 13]. It was possible to shutoff the heating, or overheat it which would cause damage to the whole system.

4 1 Introduction
Other related examples of vulnerabilities with possibly catastrophic conse-quences are in the medical sector where failing devices may directly influencelife or death of people. Infusion pumps allow attackers to re-program them viaWireless Local Area Network (WLAN) [Scherschel 15, Bergert 15, Zetter 15].Other medical devices have hard-coded, never changing, default passwords,or are running on old operating systems with known vulnerabilities that areseveral years old [Pauli 15, ICS-CERT 13].
Beside industrial control systems, more and more cars, and even airplanesare vulnerable. Hugo Teso gave a presentation at the Hack-in-the-box con-ference 2013 on how to manipulate the course of a flying airplane using asmartphone and some preparations [Teso 13].
The growing functionality of a car’s on-board computer also introducessome critical vulnerabilities. In 2010 security researchers found out that tirepressure measuring systems could be manipulated [Rouf 10]. By itself this isnot yet safety critical, but it might be possible to convince drivers to stoptheir car, or to overwhelm them with false alarms that they ignore real ones.Checkoway, Koscher et al. did an experimental analysis of modern cars toshow what might happen if an attacker gains access to one of the control sys-tem components [Koscher 10, Checkoway 11]. They conclude that in generalattackers can influence all of the car’s systems if they gain access to one ofthe internal components of a car.
In 2015 publications about vulnerabilities in cars heap up. Some are onlysecurity relevant, but others also have implications on the safety of the car.The vehicle immobilizer in cars of several brands has a flaw that allows tocircumvent it with only low effort [Verdult 15]. This work was already doneand ready to publish in 2013, but it was held back until 2015 because themanufacturer enforced a holdback period via court order. This is an examplefor the problems with publishing security vulnerabilities. Companies do notwant them published at all because they fear a decrease in reputation.
Other researchers found ways to remotely access the car’s operating sys-tem. They were able to unlock current model BMWs equipped with the Con-nectedDrive technology via the mobile phone network [Holland 15], or to sendcommands to the on-board computer using a diagnose dongle of a Corvettevia SMS [Foster 15].
Car manufacturers such as General Motors add remote control capabili-ties via smartphone applications to their cars. Those applications running onthe smartphone can contain new vulnerabilities [Kamkar 15] that allow anattacker to control the car.
The most recent and most demonstrative example for safety critical vul-nerabilities is the hack of a Jeep Cherokee [Greenberg 15]. The researchersMiller and Valasek were able to exploit a vulnerability in the infotainmentsystem of the Jeep using the mobile network. The flaw in the infotainmentsystem allowed them to access the CAN bus, and they were able to controlsystem functions such as acceleration, brake, door locks, and during reversedrive even the steering.

1.3 Contribution 5
Besides those mentioned vulnerabilities that to my knowledge were notactively exploited so far, there are some real attacks on running systems.Maybe the best known attack on an industrial control system was the sabotageof uranium centrifuges in Iran using the malware Stuxnet [Langner 11].
In 2014 there were reports about an attack in a German steel millthat resulted in heavy damage to the facility. The reports did not mentionwhich steel mill was attacked and all operating companies denied the at-tack [Scherschel 14].
Another example is a pipeline in Turkey that exploded as the consequenceof an attack on the control system of a valve [Robertson 14]. An attack onthe network of an unnamed railroad company in the US disrupted their trainservice [Zetter 12].
The problem is not only that current control systems are vulnerable, butpatching known vulnerabilities is harder than in pure software systems. Oftensimple update mechanisms are missing [Schneier 14]. A lot of the previouslymentioned vulnerabilities remained untreated for years. What makes this evenworse is that there are search engines such as Shodan1 which simplify thesearch for vulnerable control systems significantly.
1.2 Problem Statement
Security flaws in existing systems such as the examples mentioned earlier re-mained mostly undetected because in a traditional safety analysis such causesfor safety failures are not found. This results from the fact that there are sepa-rate experts and analysis techniques for safety and security. If a safety expertanalyzes a system according to safety, security is not taken into account, andvice versa. Control systems are usually analyzed for safety only, not for se-curity. A current safety analysis only investigates random faults, deliberateattacks are not taken into account. Countermeasures resulting from a safetyanalysis are only implemented to mitigate causes that are the most probableaccording to the analysis. Attacks on the other hand may cause events thatotherwise would only come to happen with an extremely low probability whichwould not have required countermeasures. Thereby an attack that eventuallywould also be easily conducted without requiring much resources could bringthe system into a critical state which might cause substantial damage. For thisreason it is especially important that during the development of new systemsa safety analysis also takes security causes into account.
1.3 Contribution
The goal of this thesis is to describe in a comprehensive model how vulnerabil-ities of the security of systems can have an effect on the safety of said systems.
1 https://www.shodan.io/

6 1 Introduction
To this end Component Fault Trees (CFTs) developed for safety analysis areextended by additional causes that arise from security problems. In the re-sulting enhanced CFT the same qualitative analyses can be conducted as inpure safety CFTs. Additionally, it is investigated to what extend quantitativeanalysis techniques for CFTs can be adapted for the enhanced CFTs. By thoseanalyses that take into account safety as well as security aspects, causes forfailures can be identified that depend on safety as well as security problems.Quantitative, or at least semi-quantitative, analyses make it possible to esti-mate security measures and to justify the necessity thereof. The extension ofestablished analysis methods facilitates the use by experienced safety analyststhat know how to analyze CFTs.
1.4 Structure
This thesis is structured into 6 chapters. Following this introduction, Chap. 2discusses the state of the art in safety and security analysis. The state of theart is divided into three parts. The first part (Sect. 2.1) explains safety anal-ysis techniques starting with FTA and its derivatives, followed by supportingtechniques Failure Mode and Effects Analysis (FMEA) and Hazard and Op-erability Study (HAZOP) that will be used for this thesis. The second part(Sect. 2.2) is handling security analysis based on Attack Trees (ATs), followedby threat modeling techniques that are used to develop the Attack Trees. Andthe third part (Sect. 2.3) shows the related work about combining safety andsecurity analysis. The main contribution is distributed over Chaps. 3 and 4.It starts with the overall process how to model a system taking additionalsecurity events into account. Then different combinations and approaches forbuilding the combined trees of Component Fault Trees and Attack Trees arediscussed, and ends with the description of the final modeling approach. Af-ter modeling the combined trees, in Chap. 4 the extensions to qualitative andquantitative analysis are shown including a discussion of ratings for events,and calculation rules. The whole approach is applied to several examples inChap. 5. And finally, Chap. 6 concludes the thesis.

2
Related Work and Fundamentals
In the past, most embedded systems used to run in encapsulated environ-ments. Maintenance actions needed physical access to the system itself toeven connect to it. Access control was implicitly provided by limiting physicalaccess to the existing maintenance interfaces. Login mechanisms or encryptedcommunication were not a high priority.
Nowadays, on the other hand, the majority of embedded systems is con-nected to a network, so maintenance or monitoring of the systems becomeseasier. If that is done with systems developed without security in mind, at-tackers with different motivations may threaten the system’s ability to runaccording to the specifications. An example for an embedded system withsuch vulnerabilities was the Siemens Simatic micro programmable logic con-troller [ICS-CERT 11].
To avoid such problems, not only safety but also effects of security threatson safety has to be taken into account during the development of new sys-tems. The main contribution of this thesis is an approach to integrate securityaspects into safety analysis.
This chapter will first provide an overview about safety analysis (Sect. 2.1)as well as security analysis (Sect. 2.2), and will later discuss approaches thatinclude both safety and security aspects (Sect. 2.3).
The focus lies on Fault Trees (FTs) and their derivations because they arewell established and widely accepted by industry and researchers to conductsafety analyses. The component-oriented Component Fault Trees (CFTs) al-low to model and analyze complex systems with acceptable effort. They arean appropriate instrument to analyze interrelationships between faults and tofind combinations of causes that lead to a failure. Therefore, they are verywell suited to include additional causes for failures and their effects on safetyof the system under study.
8 2 Related Work and Fundamentals
2.1 Safety Analysis TechniquesAccording to [IEC 61508-4 10] a system is safe if it is free from unacceptablerisks. Safety analysis is required to determine whether a system is safe enoughfor its intended use.Definition 1 (Safety) In [IEC 61508-4 10] safety is defined as “freedomfrom unacceptable risk”.Definition 2 (Risk) Risk is defined as the “combination of the probabilityof occurrence of harm and the severity of that harm” [IEC 61508-4 10].Definition 3 (Harm) Harm is defined as “physical injury or damage to thehealth of people or damage to property or the environment” [IEC 61508-4 10].
Safety is also related to reliability in the sense that safety of a systemdepends on the reliability of safety-related system components.Definition 4 (Reliability) Reliability is the property of an entity regardingits qualification to fulfill the reliability requirements during or after given timeperiods with given application requirements [DIN 40041 90].
Nicol et al. conducted a survey concerning existing model-based techniquesfor evaluating system dependability (respective reliability), and how they areextended to evaluate system security [Nicol 04]. They conclude that for systemreliability there have been quantitative techniques for a long time, but forsystem security quantitative techniques are much less common. Over the yearsa lot of techniques to analyze safety were developed. They can be classified intotechniques that find failures by examining the effects of faults on the system(inductive methods), and techniques that examine failures to find their causes(deductive methods).Definition 5 (Fault) A fault is an abnormal condition that may cause areduction in, or loss of, the capability of a functional unit to perform a requiredfunction [IEC 61508-4 10]. A fault may be the cause of a failure.Definition 6 (Failure) A failure is either the termination of the ability of afunctional unit to provide a required function, or operation of a functional unitin any way other than as required [IEC 61508-4 10]. A failure of a subcompo-nent can be seen as a fault in the context of the superordinate component orsystem.
Some sources also define the term error as the underlying cause of afault [Avizienis 04]. Although, there might be some confusion about the useof that term because of different definitions. This thesis uses the definitions ofIEC 61508 as a reference which only distinguishes between faults and failures.
In the following, the focus lies on deductive methods and Fault Tree Anal-ysis in particular because it is a technique that is widely used in industry.Failure Mode and Effects Analysis (FMEA) and Hazard and OperabilityStudy (HAZOP) are explained as examples for inductive methods that canbe used in combination with Fault Tree Analysis (FTA).

2.1 Safety Analysis Techniques 9
2.1.1 Fault Tree Analysis (FTA)
A method often used in industry for safety and reliability analysis is FaultTree Analysis (FTA). FTA was developed in the 1960s in the Bell Labs(see [Ericson 99] for a history of Fault Trees (FTs)). The US Nuclear Regula-tory Commission Regulation (NUREG) published an extensive compendium,the NUREG-0492 Fault Tree Handbook [Vesely 81] that treats FTA in detail.Later, NASA published a book, the Fault Tree Handbook with Aerospace Ap-plications [Vesely 02] that deals with the application of FTA to the aerospacedomain. Together, these books provide a comprehensive insight into FTA. Theapplication of FTA is standardized in international standard [IEC 61025 06]and German national standard [DIN 25424-1 81, DIN 25424-2 90].
FTA is a deductive method for finding causes and combinations of causesthat lead to system failures. It can be used in early phases of the developmentprocess, when only a few details are known about the system. Then, a pre-liminary qualitative analysis is possible. This preliminary FT can be used tomake high-level decisions during system development. In later developmentstages, when more details are known, the preliminary FT can be extended tomake a quantitative analysis possible. Analyses can cover systems that consistof hardware and/or software components.
An FT consists basically of events and gates that combine events. Thereare three types of events in an FT: Top Events, Basic Events and IntermediateEvents. In standard FTs there are three basic gates: AND, OR, and NOT-gatesthat implement their corresponding logic functions. Derived from these basicgates, standard FTs may also include XOR or N-out-of-M (NooM) gates. Butthe NOT gate and the derived gates XOR and NooM should the handled withcare [Andrews 00]:
A NOT-gate implies that working components can contribute to a failure ofthe system, and vice versa, a failed component can improve system reliability.This is counterintuitive for the engineer creating the FT to his perceptionof the functionality of systems. Using only AND and OR-gates makes an FTcoherent. Adding additional failures cannot improve the overall reliability.Most works handling FTs use coherent FTs. Calculations in non-coherent FTsbecome much more complex than in coherent FTs. There may be, however,situations in which gates derived from NOT are necessary to model a particularcircumstance. This is why the NOT-gate will also be defined in this thesis. Butit will be avoided during modeling.
The dependencies between Basic Events (BEs) and Top Event (TE) areusually represented in a tree structure. The different event types will be de-fined in the following.
Definition 7 (Top Event (TE)) The system failure modeled in a FaultTree is called a Top Event (TE). It is the root of the Fault Tree. Sometimesit is also called a top level event.

10 2 Related Work and Fundamentals
Definition 8 (Basic Event (BE)) The basic causes for a Top Event arecalled Basic Events (BEs). They are the leaves of the Fault Tree.
Definition 9 (Intermediate Event (IE)) If BEs are combined using logicgates, the result is an Intermediate Event (IE). Intermediate Events aresometimes separate nodes in the Fault Tree, as in the original definitionfrom [Vesely 81], or the logic gates have also the function of IntermediateEvents by attaching a label to the gates. In this thesis the term gate will beused synonymously with Intermediate Event.
Figure 2.1 shows an example FT consisting of three BEs (BE1, BE2, BE3),one AND-gate (AND1), one OR-gate (OR1) and a TE (Out1). The example ismodeled with the tool ESSaRel [ESSaRel 09] using the following symbols:Black triangles represent TEs, white boxes are gates (using the Europeannotation) and white circles depict the BEs. All events should have a labelthat is the name of the event.
AND_1
Out_1
BE_1 BE_2 BE_3
&
>= 1 OR_1
Fig. 2.1. An example Fault Tree
In this work CFTs are used, a derivative of FTs. The analyses that aredescribed here for FTs are also applicable for CFTs [Kaiser 03b].
Component Fault Trees
A Component Fault Tree (CFT) is an extended FT with an additional focus onsystem components and reusability of subtrees [Kaiser 02, Kaiser 03b]. A sys-tem usually consists of several components which by themselves may consist ofnested subcomponents. One CFT models one of these components (that may

2.1 Safety Analysis Techniques 11
also contain subcomponents) following the component hierarchy of the system.All examples in this work are modeled with the tool ESSaRel [ESSaRel 09].
In Fig. 2.2 an example CFT model is shown. It models a system with threesubcomponents. Figure 2.2a shows the highest hierarchy level of the model.The components (gray rounded boxes) are interconnected via output ports(small black boxes) and input ports (small white boxes). The arrows of theconnectors always point from output ports to input ports. The TE (blacktriangle) of a component defines an output port. The CFTs in Figs. 2.2b– 2.2d model the three subcomponents Comp1, Comp2, and Comp3. The CFTof Comp1 models the same structure as the FT in Fig. 2.1. This shows thecommonalities of FTs and CFTs. The CFTs of Comp2 and Comp3 show somedifferences. Figure 2.2c is an example that a CFT allows to model all failuremodes of a component at once. This fact simply leads to more than one TEand therefore more output ports. And finally Fig. 2.2d shows that a CFT canhave input ports (white triangles). The TE of Comp3 depends on both internal(BE_1) and external causes (In_1, In_2, In_3).
If a CFT of one component is analyzed by itself, input ports can be seenas BEs. But if this CFT is analyzed as part of a higher level CFT, the inputports directly link to other CFTs as if the referenced CFT would be insertedinstead of the input port.
The component-wise construction of CFTs allows easier modeling of largesystems than with FTs. Although the name suggests it, complex CFTs arenot necessarily trees, but they are Directed Acyclic Graphs (DAGs). So, mesh-like structures are possible but cyclic dependencies have to be avoided. In theremainder of this thesis, the term tree is also used for CFTs.
The distinction of components allows the independent development ofCFTs. The naming conventions ensure that events from different compo-nents can be distinguished. In the previous example BE_1 appears in all threecomponents Comp1, Comp2, and Comp3. They are referred to as Comp1.BE_1,Comp2.BE_1, and Comp3.BE_1 outside their respective components. Despitethese differences, CFTs are semantically equivalent to FTs, and the sameanalyses are possible.
Qualitative Analysis
As a first analysis step, independent of probabilities or other ratings for BEs,a qualitative analysis may be conducted. It can already be done in early devel-opment phases using preliminary FTs. Some qualitative analysis techniqueswill be described in the following. In every FTA, the first step is to determinethe Minimal Cut Sets (MCSs) for the TE.
Definition 10 (Minimal Cut Set) A Minimal Cut Set (MCS) is a small-est combination of Basic Events (BEs) which, if they all occur, will cause theTop Event (TE) to occur [Vesely 81].

12 2 Related Work and Fundamentals
Component_1
Comp1
Component_2
Comp2
Out_1
Component_3 Comp3
(a) An example CFT (Overview).
AND_1
Out_1
BE_1 BE_2 BE_3
&
>= 1 OR_1
(b) An example CFT (Subtree forComp1).
BE_1 BE_2 BE_3 BE_4
&AND_1 >= 1 OR_1
& AND_2
Out_2 Out_1
(c) An example CFT (Subtree forComp2).
>= 1 OR_1
BE_1
>= 1OR_2 & AND_1
Out_1
In_1In_3 In_2
(d) An example CFT (Subtree forComp3).
Fig. 2.2. A CFT consisting of three subcomponents
Strictly speaking, the term Minimal Cut Set is only defined for coher-ent FTs, thus FTs that do not contain NOT-gates or negated BEs. The moregeneral term is Prime Implicant (PI) which also includes non-coherent FTs(see [Rauzy 01] for the mathematical foundations of PIs). PIs appear less com-monly in failure analysis, because the use of negations in FTs is less intuitiveas discussed earlier in Sect. 2.1.1. In this thesis, the term Minimal Cut Set is

2.1 Safety Analysis Techniques 13
used for minimal failure scenarios because no negated events were modeled.But still, all aspects of this work also apply to PIs, unless indicated otherwise.
Every MCS represents a minimal failure scenario. In general, an FT con-tains multiple MCSs corresponding to different failure scenarios. The TE ofan FT can be depicted as the result of the disjunction of all Minimal Cut SetsMCSi, 1 ≤ i ≤ n, n ∈ N.
TE = MCS1 ∨MCS2 ∨MCS3 ∨ · · · ∨MCSn (2.1)
Whereas, MCSi is a conjunction of Basic Events BEj , 1 ≤ j ≤ m, m ∈ N.
MCSi = BE1 ∧BE2 ∧BE3 ∧ · · · ∧BEm (2.2)
MCSs can be determined using a variety of different algorithms. One ofthe most common is the top-down algorithm which is described in [Vesely 81,Vesely 02]. The FT is translated into Boolean equations. Starting with theequation for the TE, the Intermediate Events (IEs) are substituted by theirexpressions and the equation is expanded until the MCS expression for theTE is obtained. This step is repeated until all IEs are substituted. At last,redundancies are removed to obtain the MCSs.
Applied to the example FT depicted in Fig. 2.1, the following steps areneeded: First, these are the Boolean equations for the FT:
Out1 = BE1 ∧OR1 (2.3)
OR1 = BE2 ∨BE3 (2.4)
Equation 2.3 is already in MCS form, so the IE OR1 is substituted with theright side of equation 2.4 and expanded which yields:
Out1 = BE1 ∧ (BE2 ∨BE3)= BE1 ∧BE2 ∨BE1 ∧BE3
(2.5)
The MCSs resulting from equation 2.5 are:
MCS1 = {BE1, BE2}MCS2 = {BE1, BE3}
More sophisticated algorithms can also handle large FTs and calculatePrime Implicants for non-coherent FTs. In [Rauzy 01] algorithms based onBinary Decision Diagrams (BDDs) [Bryant 86] to calculate MCSs are de-scribed.
As mentioned earlier, FTs will most probably have several MCSs. Con-sidering all of them can be time-consuming in large FTs. An analysis shouldfocus on the most critical ones. So, it is part of the analysis to determine themost critical MCSs.
Qualitative rankings of MCSs can be determined according to their con-tributions to the TE (see [Vesely 81]). MCSs can be ordered according to

14 2 Related Work and Fundamentals
cardinality from small to large. For example, the larger an MCS is, the moreBEs have to occur simultaneously, so that the TE is triggered. From thatfollows that the cardinality (or size) of an MCS can be a qualitative measurefor criticality of an MCS. In absence of quantitative data, it can be said thata greater MCS size correlates with a lower criticality.
Definition 11 (MCS size) The size of an MCS is defined as the number ofevents included in the MCS.
The size of MCSs can be used to check design criteria, e.g.: “no single pointsof failure allowed” which is equal to “MCSs with size 1 have to be mitigated”.The set of MCSs can also be used to find BEs that are part of several MCSs. ABE that is contained in many relevant1 MCSs is more important than one thatis contained in only one MCS. Finding such BEs can be used to determine theposition of countermeasures: With countermeasures against one BE severalMCSs may be mitigated. The decision which BE to counter depends on thecost-effect balance of the countermeasures. First, BEs from small MCSs (thatare more likely to happen) are selected. From that list a combination of BEsis selected that counters all required MCSs with the least effort.
In terms of the previous example: Both MCSs have the same size, but BE1is included in both MCSs. So, a countermeasure against BE1 mitigates bothMCSs at once.
Quantitative Analysis
After finishing the qualitative analysis, a quantitative analysis of FTs may beconducted. For that purpose probabilities of failure, or failure rates, for BEshave to be available.
Definition 12 (Failure rate) The failure rate λ(t) of an entity is a relia-bility parameter. λ(t)× dt is the probability that this entity will fail within thetime interval [t, t + dt] under the condition that it did not fail during timeinterval [0, t].
Failure rates usually vary over the lifetime of a system and also depend onenvironmental conditions. A common description of failure rates over systemlifetime is the so-called bathtub curve [Klutke 03]. It can be divided into threeintervals: In the beginning there is a “break-in”-period during which the failurerate decreases because initial bugs are corrected. During the middle periodthe failure rate is nearly constant when the system runs under its intendedworking conditions. And the last interval is a “wear-out”-period when thesystem slowly degrades due to physical stress. For software systems the failurerate is also generally not constant over the whole lifetime. Whenever a bugis fixed, the failure rate decreases. If new functionality is introduced, often
1 What relevant MCSs are has to be defined before. Usually MCSs up to a size of2 or 3 are defined as relevant [Vesely 81].

2.1 Safety Analysis Techniques 15
new bugs emerge, so the failure rate increases. So, the failure rate can onlybe constant during a period of time when the software is not changed.
In classic FTs only constant failure rates per hour or per duty cycle areconsidered, while time dependent effects are ignored. A constant failure rateper hour λ leads to exponential failure probability distributions. A constantfailure rate per duty cycle is equivalent to the failure probability. Componentscan have standby failure rates and operating failure rates which themselvesare constant.
The quantitative analysis provides more detailed insight in the order ofmagnitude of the BE probabilities. Results can be probabilities of the TE orMCSs. It is used to check compliance to customer or regulatory requirements,and in case of violated requirements, to decide on which BEs the effort ofcountermeasures will be concentrated.
If BEs are connected via logic gates and probabilities are known for all BEs,the resulting probabilities are calculated as follows. For both the AND and OR-gates calculation rules for gates with two inputs (equations 2.6 and 2.8), andn inputs (equations 2.7 and 2.9) are presented. All BEs have to be stochas-tically independent from each other for these calculations to be correct. Theprobability calculation for the NOT-gate is shown in equation 2.10.
AND P (A ∧B) = P (A)× P (B) A,B ∈ BE (2.6)
P
(n∧i=1
Xi
)=
n∏i=1
P (Xi) i, n ∈ N, Xi ∈ BE (2.7)
OR P (A ∨B) = P (A) + P (B)− P (A)× P (B) A,B ∈ BE (2.8)
P
(n∨i=1
Xi
)= 1−
n∏i=1
(1− P (Xi)) i, n ∈ N, Xi ∈ BE (2.9)
NOT P (A) = 1− P (A) A ∈ BE (2.10)
There are different possibilities to calculate the failure probability of a TE(see [Vesely 81]). Provided, the failure probabilities of all MCSs are alreadycalculated, the failure probability of the TE can be approximated. An upperbound P ′(TE) for the TE failure probability is gained by summing up thefailure probabilities of all MCSs. The TE results from an OR combination ofall MCSs (see equation 2.1). Equation 2.8 shows the calculation of an OR-gatewith two inputs. If instead the probabilities of the MCSs are simply summedup without subtracting the probability of the intersection of two MCSs, theresult will always be greater or equal the exact value – in other words, it isa conservative approximation. For the purpose of this example the followingprobability values are arbitrarily chosen:
P (BE1) = 10−5 P (BE2) = 2× 10⁻³ P (BE3) = 4× 10⁻²
Applied to the example from Fig. 2.1, the results are:

16 2 Related Work and Fundamentals
P (MCS1) = P (BE1 ∧BE2)= P (BE1)× P (BE2) (equation 2.6)= 2× 10⁻⁸
P (MCS2) = P (BE1 ∧BE3)= P (BE1)× P (BE3) (equation 2.6)= 4× 10⁻⁷
P ′(TE) = P (MCS1) + P (MCS2)= 2× 10⁻⁸ + 4× 10−7
= 4.2× 10⁻⁷
If an approximation is not enough, the exact probability value can be cal-culated bottom-up based on the BE probabilities using the rules expressedin equations 2.6 to 2.10. The bottom-up calculation is now applied to theexample FT:
P (OR1) = P (BE2) + P (BE3)− P (BE2)× P (BE3) (equation 2.8)= 2× 10⁻³ + 4× 10⁻² − 2× 10−3 × 4× 10−2
= 4.192× 10⁻²
P (TE) = P (Out1) = P (AND1)= P (BE1)× P (OR1)= 10−5 × 4.192× 10−2
= 4.192× 10⁻⁷
The results show the difference between the approximation P ′(TE) and theexact result P (TE).
P ′(TE) = 4.2× 10⁻⁷
P (TE) = 4.192× 10⁻⁷
There is another, more efficient, method to calculate the exact TE prob-abilities. The Boolean formula which is depicted by the FT with the BEs asvariables, can be described by a BDD (see [Vesely 02] or [Rauzy 01] for amore detailed description on BDD algorithms). This BDD is simplified to aReduced Ordered Binary Decision Diagram (ROBDD), to reduce calculationeffort. For each BE ei the probability P (ei) is assigned to the true branches,and 1 − P (ei) is assigned to the false branches of the BDD. For each pathleading to terminal symbol 1, the branch probabilities are multiplied, as theyare combined via AND-gates. The results of all paths leading to terminal sym-bol 1 are summed up to receive the probability of the TE P (TE). Becausethese minimal paths are disjoint, this summation yields the exact result forthis OR-combination of paths.

2.1 Safety Analysis Techniques 17
In Fig. 2.3 an ROBDD for the example with variable order BE1, BE2, BE3is shown. Solid lines are assigned to true branches, dashed lines to falsebranches. There are two paths leading to terminal symbol 1:
Path1 = BE1BE2
Path2 = BE1BE2BE3
The probability is calculated as:
P (Path1) = P (BE1)× P (BE2)= 10−5 × 2× 10−3
= 2× 10⁻⁸
P (Path2) = P (BE1)× (1− P (BE2))× P (BE3)= 10−5 × (1− 2× 10−3)× 4× 10−2
= 3.992× 10⁻⁷
P (TE) = P (Path1) + P (Path2)= 2× 10⁻⁸ + 3.992× 10−7
= 4.192× 10⁻⁷
10
BE_1
BE_2
BE_3
Fig. 2.3. A corresponding ROBDD for the example from Fig. 2.1
MCSs are determined to find combinations of faults leading to the sys-tem failure, or different failure scenarios. The failure probability of a TEis calculated to check if a system complies with given requirements. If theTE probability has to be decreased, some countermeasures have to be imple-mented against BEs. But not all BEs contribute to the TE probability to the
18 2 Related Work and Fundamentals
same degree. According to Vesely et al. only about 10–20% of the BEs con-tribute significantly to the TE probability [Vesely 02]. An importance analysisis conducted to find the BEs whose countering has the most effect on the TEprobability.
Importance Measures
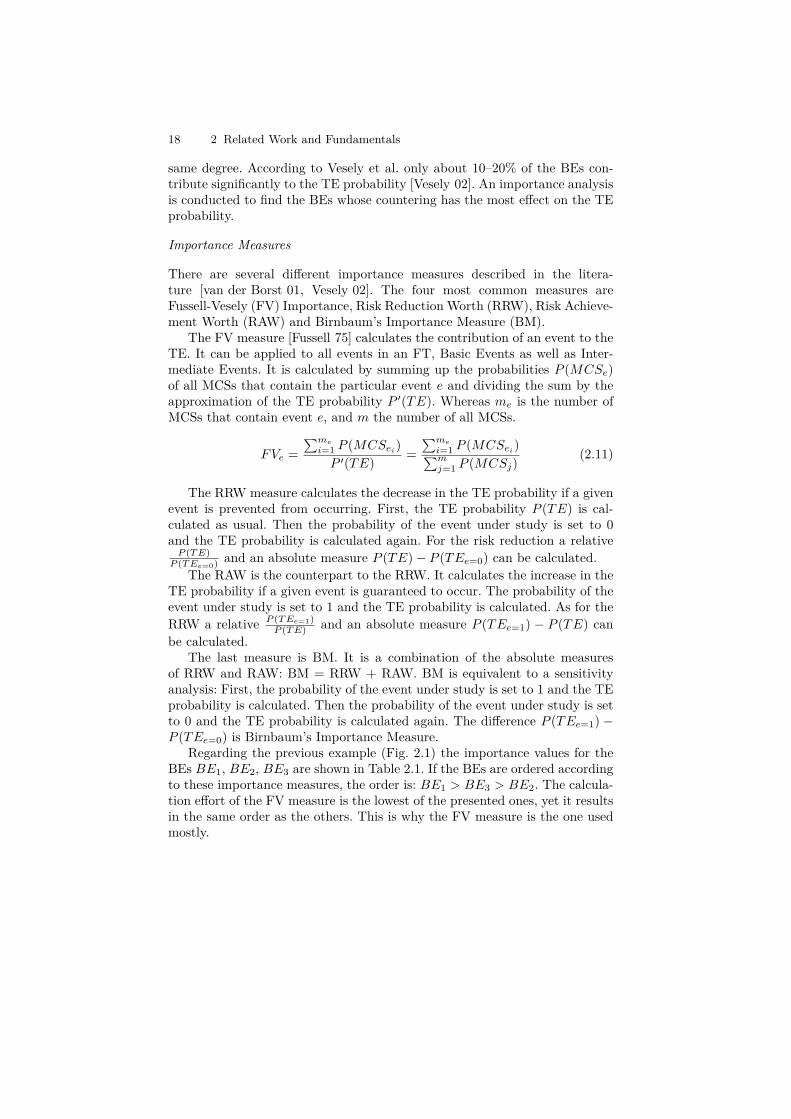
There are several different importance measures described in the litera-ture [van der Borst 01, Vesely 02]. The four most common measures areFussell-Vesely (FV) Importance, Risk Reduction Worth (RRW), Risk Achieve-ment Worth (RAW) and Birnbaum’s Importance Measure (BM).
The FV measure [Fussell 75] calculates the contribution of an event to theTE. It can be applied to all events in an FT, Basic Events as well as Inter-mediate Events. It is calculated by summing up the probabilities P (MCSe)of all MCSs that contain the particular event e and dividing the sum by theapproximation of the TE probability P ′(TE). Whereas me is the number ofMCSs that contain event e, and m the number of all MCSs.
FVe =∑me
i=1 P (MCSei)P ′(TE) =
∑me
i=1 P (MCSei)∑m
j=1 P (MCSj)(2.11)
The RRW measure calculates the decrease in the TE probability if a givenevent is prevented from occurring. First, the TE probability P (TE) is cal-culated as usual. Then the probability of the event under study is set to 0and the TE probability is calculated again. For the risk reduction a relativeP (TE)
P (TEe=0) and an absolute measure P (TE)− P (TEe=0) can be calculated.The RAW is the counterpart to the RRW. It calculates the increase in the
TE probability if a given event is guaranteed to occur. The probability of theevent under study is set to 1 and the TE probability is calculated. As for theRRW a relative P (TEe=1)
P (TE) and an absolute measure P (TEe=1) − P (TE) canbe calculated.
The last measure is BM. It is a combination of the absolute measuresof RRW and RAW: BM = RRW + RAW. BM is equivalent to a sensitivityanalysis: First, the probability of the event under study is set to 1 and the TEprobability is calculated. Then the probability of the event under study is setto 0 and the TE probability is calculated again. The difference P (TEe=1) −P (TEe=0) is Birnbaum’s Importance Measure.
Regarding the previous example (Fig. 2.1) the importance values for theBEs BE1, BE2, BE3 are shown in Table 2.1. If the BEs are ordered accordingto these importance measures, the order is: BE1 > BE3 > BE2. The calcula-tion effort of the FV measure is the lowest of the presented ones, yet it resultsin the same order as the others. This is why the FV measure is the one usedmostly.

2.1 Safety Analysis Techniques 19
Table 2.1. Importance values for the example BEs
Basic event FV RRW RAW BMabs rel abs rel
BE1 1 4.192× 10⁻⁷ ∞ 4.192× 10⁻² 105 4.192× 10⁻²
BE2 0.048 0.192× 10⁻⁷ 1.048 9.581× 10⁻⁶ 23.855 9.6× 10⁻⁶
BE3 0.952 3.992× 10⁻⁷ 20.96 9.581× 10⁻⁶ 23.855 9.98× 10⁻⁶
Extensions of Fault Trees
One big disadvantage of FTs or CFTs is that they are unable to analyzesequences of events or timed behavior. It is, however, possible to combineMarkov models with FTs to solve these problems [Vesely 02]. There also existseveral extensions of FTs that introduce new gates that allow modeling ofdynamic behavior. In Parametric Fault Trees (PFTs) identical subtrees canbe replaced by one parameterized subtree to simplify and to reduce the overallFT [Bobbio 03].
Dynamic Fault Trees (DFTs) allow the modeling of functional or temporaldependencies between BEs [Bechta Dugan 92]. In this way it is possible tomodel prioritized events or sequences of events.
Repairable Fault Trees (RFTs) were developed to model especially repairprocesses, consisting of a set of components that can be triggered by failureevents [Codetta-Raiteri 04].
Generalized Fault Trees (GFTs) combine logic gates from FTs, PFTs,DFTs, and RFTs to a unified model [Codetta-Raiteri 05]. Thereby depen-dencies, redundancies, symmetries, and repair mechanisms can be modeledusing one modeling technique. For the evaluation the GFTs are transformedinto Generalized Stochastic Petri Nets (GSPNs) and analyzed using the usualPetri net analysis methods [Marsan 95].
Another technique that combines CFTs and state-based approaches, areState/Event Fault Trees (SEFTs). Introduced by Kaiser in [Kaiser 03a], theycan be used to model complex behavior of systems consisting of hardware andsoftware [Steiner 12].
The quantitative analysis of FTs and their derivatives depends on failurerates or probabilities of occurrences of faults. Sometimes those are hard toobtain. There are approaches that use value intervals that are easier to es-timate, instead of fixed numbers to evaluate FTs [Carreras 01]. Förster andTrapp [Förster 09] developed an FT-based method to cope with the prob-lem of few or no information about failures early in the development. Theybase the analysis on CFTs to model system composition. The uncertainty of(software) safety probabilities for BEs is modeled with probability distribu-tions over intervals instead of single probabilities. For calculating an overallprobability distribution every interval is sampled numerously and the overallprobability per sample is calculated.

20 2 Related Work and Fundamentals
To summarize, FTs are an important tool to conduct a safety analysis dur-ing the development of a system. They can be used to conduct high-level qual-itative analyses as well as detailed quantitative analyses. With the mentionedextensions they can also handle state-based behavior of complex systems.
2.1.2 Inductive Safety Analysis Techniques
In standards such as [IEC 61025 06] or [IEC 60300-3-1 05] for Fault Tree Anal-ysis a combination of inductive and deductive analysis techniques is suggested.They especially mention FMEA and HAZOP. These two techniques will bedescribed in short in this section since they are used as supporting techniquesto create the CFTs in this thesis.
Failure Mode and Effects Analysis
Failure Mode and Effects Analysis (FMEA) is a systematic approach toinvestigate cause-consequence relationships between component faults (cf.Definition 5 on p. 8) and system failures (cf. Definition 6 on p. 8). Stan-dard [IEC 60812 06] describes the basic approach to conduct an FMEA. It isa widely used inductive analysis technique that can be applied to functions,interfaces, software, or whole systems [Bowles 01]. A disadvantage is that itcannot be used to find combinations of faults, only single faults can be found.Therefore, a subsequent FTA often is used to deduct combinations of causesfor the found failure modes [IEC 61025 06, IEC 60300-3-1 05]. The result of anFMEA is a table which includes the failure modes of each system component,and for each failure mode possible causes and effects. Commonly used entriesin this table are according to [IEC 60812 06]: investigated component, failuremode, description of the failure mode/local effect of the failure mode, possiblecause for the failure, effect at the system level, recommended failure detectionmechanism, recommended mitigation mechanism, and recommended designchanges. The analysis is conducted by a moderated group of domain expertsfor all aspects of the product or process.
The system under study is divided into its components, and for each com-ponent the failure modes are identified. For each failure mode the effect onthe system level and the cause (originating in the component itself or in othercomponents) are also identified (see Fig. 2.4).
failure cause failure mode failure effect
Fig. 2.4. The cause-effect chain of an FMEA
If a Failure Mode, Effects, and Criticality Analysis (FMECA) is conducted,an additional risk analysis is done. It consists of:

2.1 Safety Analysis Techniques 21
1. an estimation of the severity (S) of the failure effect on the system orcustomer,
2. an estimation of the probability of occurrence (O),3. an estimation of the probability that the failure is not detected (D),4. and the calculation of the Risk Priority Number (RPN)RPN = S ×O ×D ,where S,O,D ∈ {1, 2, . . . , 10}The risk for the studied system is estimated by ranking the failure modes
according to the RPN. The identified failure modes can be investigated inmore detail by using them as TEs for an FTA.
Hazard and Operability Study
HAZOP is a qualitative technique to find derivations from intended behaviordeveloped first by the British chemical industry in the 1960s. It is described instandard [IEC 61882 01]. It has since then been applied to many other fields.For example Software Hazard Analysis and Resolution in Design (SHARD)is a derivative for software safety analysis [Pumfrey 99]. Like FMEA it isa team-based inductive analysis technique that can be applied to systemsconsisting of hardware and software. This interdisciplinary team consists offive to ten persons. HAZOP can be conducted in early development phases assoon as first drafts of the component design, and the material and data flowsare available. The analysis concentrates on the behavior of the flows betweencomponents rather than failure modes of the components themselves.
A set of guide words is combined with parameters of the flows to findquestions about potential failure modes. Every combination of guide wordsand parameters is tested, but not all may make sense. The standard guidewords of HAZOP for process plants are: no, more, less, as well as, part of,other than, and reverse. For different applications there can be different guidewords. In the SHARD approach the guide words are: omission, commission,early, late, and value. The effect on the system is investigated for each de-viation found. For problems that are not safety related, a justification whythe design is acceptable is recorded. Safety problems have to be investigatedfurther to find possible mitigations. The results are documented in tabularform [IEC 61882 01].
There are also applications of HAZOP to conduct security analyses. Lanoet al. propose HAZOP guide words for the security analysis of object-orientedmodels in the Unified Modeling Language (UML) [Lano 02]. They providenew guide word interpretations for different UML diagram types, amongstothers state-transition, class, and sequence diagrams. The basic elements ofan analysis of state-transition diagrams are the transitions. For the attributesof transitions, events, and actions, the guide words are newly interpreted totake the interaction between software and hardware into account. Deviationsfrom design intend described by a class diagram are covered by new guidewords. They also developed guide words for sequence diagrams for messagetiming, message destination, and message conditions.

22 2 Related Work and Fundamentals
The HAZOP approach can be used during the development of CFTs toidentify input and output ports of components (see also Sect. 2.1.1).
2.2 Security Analysis Techniques
This section deals with security analysis techniques that can be integratedwith the safety analysis techniques described in Sect. 2.1. But before analysistechniques are discussed, a few definitions are necessary. First, what is securityin the context of this thesis? The following definitions from the ISO/IEC 27000standard series are used:
Definition 13 (Security) Security is commonly defined as a combination ofconfidentiality, integrity, and availability (the C-I-A attributes) [Avizienis 04,ISO/IEC 27000 09].
Definition 14 (Confidentiality) Confidentiality is the property of a systemthat information is not made available or disclosed to unauthorized individu-als, entities, or processes [ISO/IEC 27000 09].
Definition 15 (Integrity) Integrity is the property of safeguarding the ac-curacy and completeness of assets, and that assets are not improperly al-tered [Avizienis 04, ISO/IEC 27000 09].
Definition 16 (Availability) Availability is the property of being accessibleand correctly usable upon demand by an authorized entity [ISO/IEC 27000 09].
Safety was defined in a way that the operation of a system should not endan-ger its environment (cf. Sect. 2.1). Concerning security the effective directionis reversed: The environment of a system should not endanger the operation ofthe system. Another distinction between safety and security is that safety han-dles random accidental faults whereas security usually deals with intentionalattacks [Saglietti 06].
In general, complex software-controlled systems will most likely containsome vulnerabilities. Those vulnerabilities may lead to undesired events whichmay compromise assets. Figure 2.5 shows the interrelations between the de-fined terms below.
Definition 17 (Vulnerability) A vulnerability is a flaw or weakness of anasset or control that can be exploited by a threat [ISO/IEC 27000 09].
Definition 18 (Asset) An asset can be anything that has value to the orga-nization [ISO/IEC 27000 09]. Assets can be information, software, hardware,services, people and their qualifications, skills, and experience, or reputationand image.

2.2 Security Analysis Techniques 23
Definition 19 (Control/Countermeasure) A control is a means of man-aging risk, including policies, procedures, guidelines, practices or organiza-tional structures which can be administrative, technical, management, or legalin nature [ISO/IEC 27000 09]. It is a mechanism to reduce the effects of vul-nerabilities. Here they will be called countermeasures.
Definition 20 (Threat) [ISO/IEC 27000 09]: A threat is a potential causeof an unwanted incident which may result in harm to a system or organization.
Definition 21 (Attack) An attack is an attempt to destroy, expose, alter,disable, steal, or gain unauthorized access to or make unauthorized use of anasset [ISO/IEC 27000 09]. In other words, an attack is the exploitation orexecution of a threat by a threat agent.
threat attack
risk
asset
ReputationPeopleServices
HardwareSoftwareInformation
vulnerability
is e
xplo
ited
by
is executed by
countermeasures
Fig. 2.5. An example to illustrate the interrelations of the definitions
Security analysis tries to identify the vulnerabilities of a system that maylead to compromised assets. An analysis shows what kind of threats may ex-ploit vulnerabilities and which effects on the system they might have. Result ofa security analysis is a ranked list of vulnerabilities for which countermeasureshave to be implemented.

24 2 Related Work and Fundamentals
The focus in this section lies on security analysis techniques that can beeasily integrated with safety analysis techniques based on Fault Trees (FTs)or Component Fault Trees (CFTs). The first part is about Attack Trees whichare very similar to FTs. After that, threat modeling, a technique that can beused to find vulnerabilities in systems, is described.
2.2.1 Attack Tree Analysis
Attack Trees (ATs), sometimes also called Threat Trees [van Lamsweerde 04,Buldas 06], were introduced 1999 by Bruce Schneier in [Schneier 99]. Derivedfrom FTs (see Sect. 2.1.1), ATs are a tool to model threats in a structuredway. They represent attacks on a system in a tree structure with the attackgoal as the root (Top Event (TE), see Definition 7 in Sect. 2.1.1), and partialattacks as sub-nodes (Intermediate Events (IEs), see Definition 9) and leaves(Basic Events (BEs), see Definition 8). To model combinations of events, asin FTs, there are AND and OR-gates as IEs. An AND-gate represents all requiredsteps to reach the attack goal. An OR-gate represents the different alternativesfor reaching the goal. Leaves, respective BEs in FT nomenclature, can beassigned with either Boolean or continuous values. Examples for values areshown in Table 2.2.
Table 2.2. Examples for values assigned to BEs in ATs from [Schneier 99]
Boolean values continuous values
possible impossible probability of success of a given attacklikelihood that an attacker will try a given attack
expensive inexpensive cost
Several other authors also use FT-like structures to model attacks in asecurity analysis [Brooke 03, Rushdi 04, Rushdi 05, Helmer 02]. Essentially,they do the same as Schneier with his ATs, they just do not call it that.
Figure 2.6 shows an example AT. The example models a computer sys-tem that is accessible via Local Area Network (LAN) or Wireless Local AreaNetwork (WLAN). Additional credentials are necessary for authentication.Access to the LAN is limited by Media Access Control (MAC) address filtersthat only allow access to clients whose MAC address is on a list. Access to theWLAN is restricted by Wi-Fi Protected Access 2 (WPA2) encryption. TheAT was modeled using the tool ESSaRel as are the FT examples in Sect. 2.1.1.The BEs e1 to e5 represent the basic attack actions which are combined byan attacker as modeled in the AT to gain access to the system.
According to Schneier the following steps are required to create an AT andto conduct an analysis:
1. identify possible attack goals and create one tree per goal

2.2 Security Analysis Techniques 25
&
& &access LAN
e1: find LAN access port
e2: spoof MAC address
access WLAN
gain access to private network
gain access to target system
out: tampering: change controller data
e3: find WLAN
e4: break WPA key
e5: get credentials
>=1
Fig. 2.6. An example Attack Tree (AT)
2. think of all attacks against a goal3. refine the tree4. add values (they can change over time)5. compare and rank attacks
The main problem is to find the attack goals and to assign suitable valuesfor the attributes. Results of the analysis can be an attribute value of the TE(attack goal) or a subtree fitting to a certain condition.
To rate the BEs, according to Schneier, knowledge about the potentialattacker has to be taken into account. He mentions three example attackertypes with different properties:
• bored graduate students who would not attempt illegal attacks such asbribery or blackmail,
• organized crime which is also prepared to attempt expensive attacks andto go to jail for an attack,
• or terrorists who are even willing to die to achieve the attack goal.
To determine attribute values of BEs, a certain knowledge about the at-tacker is required (a large intelligence service has greater resources than anangry neighbor). Examples for the use of ATs to analyze security are ananalysis of the routing protocol of the Internet, the Border Gateway Proto-col [Convery 02], or an analysis of vulnerabilities in Supervisory Control andData Acquisition (SCADA) systems [Byres 04].
Attacker Modeling
In [Vigo 12] the author models attacker capabilities especially for Cyber-Physical Systems (CPSs). CPSs are systems that consist of sensors, actua-tors, and controlling components. Usually different system components are

26 2 Related Work and Fundamentals
networked to form a larger system. An example is a wireless sensor networkin which different sensors send their data to one or more control units thatevaluate it and send the data to other systems.
Vigo divides threats to CPSs into physical or cyber threats. The exploita-tion of physical threats require physical access to the system. Cyber threatson the other hand require only proximity to the transceivers of the system.
In contrast to other systems an attacker can simply influence the environ-ment to affect the behavior of a CPS. Broadly distributed systems cannot besecured physically as well as monolithic systems. Additionally, the communi-cation channels between system components have to be secured. Especially, awireless sensor network can consist of a large number of single components.To keep costs relatively low, they are usually not tamper-proof which makescapturing a node easier.
Vigo models an attacker as a set of characteristics comprised of the at-tacker’s location, capabilities, costs of attack actions, and needed resources.The paper also lists concrete physical attacks such as: removing a node fromthe network, reading/writing memory of a node, revealing content of the localcontrol program, reprogramming the local control program, starving a nodefrom energy, and inserting a new node into the network. The first four requiredirect physical access to a node, the last ones can be executed from a dis-tance. Cyber-attacks such as: blocking messages, eavesdropping, or injectingnew messages go against the communication between components (nodes).
A similar model for attackers of wireless sensor networks is describedin [Benenson 08]. They describe attackers by two parameters: presence andintervention. Presence is the location of the attacker, and intervention rep-resents his capabilities at that location. By combining these attributes theycreate attacker profiles.
Amenaza Technologies, a vendor of an Attack Tree modeling tool, quan-tify attacks using indicators such as cost of attack, probability of apprehen-sion, probability of success, or technical difficulty [Ingoldsby 03, Ingoldsby 13].Then they create different attacker profiles depending on the indicators usedin the AT. Depending on the indicator values they can decide whether anattacker profile will be a threat to the system.
Attacks are evaluated similar to the calculation of the Risk Priority Num-ber (RPN) in Failure Mode, Effects, and Criticality Analysis (FMECA) whereweighted values from different properties are used (cf. Sect. 2.1.2).
Qualitative Analysis
As mentioned before, Attack Trees use the same tree structure and the samelogic gates as Fault Trees. Therefore, the same qualitative analyses that de-pend only on the structure are possible. At first, the Minimal Cut Sets (MCSs)are determined (refer to Sect. 2.1.1 for a description how to determine MCSs).An MCS represents all actions that are necessary for an attack scenario tobe successful. The size of an MCS determines its qualitative importance. The

2.2 Security Analysis Techniques 27
smaller the MCS the more important it is to counter that specific MCS. Fromthe list of MCSs the qualitative importance of BEs can also be determined.BEs that are part of a larger number of MCSs are more important than BEsthat are only part of a smaller number of MCSs. Refer also to Sect. 2.1.1 fora description of the qualitative analysis of MCSs in Fault Trees.
Quantitative Analysis
Besides the modeling structure, Schneier also proposed some rules for quan-titative analyses using ATs [Schneier 99]. Attributes of Intermediate Eventsand Top Events are calculated from BEs as in FTs. Schneier gives some exam-ples for calculation rules: For Boolean attributes the value of a combinationof two events is calculated as defined in equations 2.12 and 2.13 [Schneier 99].
value(AND) ={
possible , if all child events are possibleimpossible , otherwise
(2.12)
value(OR) ={
impossible , if all child events are impossiblepossible , otherwise
(2.13)For the continuous valued attribute cost he proposes calculations as definedin equations 2.14 and 2.15.
value(AND) =∑
(costs of child events) (2.14)
value(OR) = min(costs of child events) (2.15)
Several other researchers since then defined calculation rules for quan-titative analyses in ATs. Based on Schneier’s definition of ATs, Mauw andOostdijk try to formalize ATs in [Mauw 06]. They use a slightly differentnomenclature: An AT defines an attack suite, a collection of possible attacks.Basic Events are called attack components, the gates are nodes and a bundle isthe equivalent to an MCS. In general, an attack suite is defined as a union ofbundles. Or in other terms: Their ATs consist of a conjunction of MCSs andthey show that every tree can be reduced to such a normalized tree. Mauwand Oostdijk try to formalize ATs as general as possible. They define generaltree reduction and rearranging rules. For attribute calculation they also definegeneral rules: For every attribute an operation for conjunction and disjunctionof events has to exist so that attributes for TEs can be calculated. They donot define a negation operation (see also Sect. 2.1.1 for an explanation why).Some example operations for different attributes are shown in Table 2.3.
So far, the quantitative evaluations all use relatively crude values. Thefollowing works try to use more precise estimates in the evaluation. Buldaset al. propose a quantitative analysis by calculating the risk of an attack byequation 2.16 [Buldas 06]. Where τ is a security threat, Pr[τ ] the probabilityof τ and Loss[τ ] the loss by τ .

28 2 Related Work and Fundamentals
Table 2.3. Operations for conjunction and disjunction for different attributes
attribute domain and operations
cost of the cheapest attack (N, min, +)maximal damage (N, max, +)minimum skill required (N, min, max)possibility of attack (B, ∧, ∨)special equipment required (B, ∨, ∧)
Risk =∑τ
Pr[τ ]× Loss[τ ] (2.16)
Based on the calculation of the risk, they decide to put a countermeasurein place if either the risk is too high to be tolerated, or the cost of the measureis lower than the risk difference. Otherwise a countermeasure would not bereasonable. According to them, it is usually very hard to come by accurateprobabilities, especially for targeted attacks that only happen once. Even ifthere is experienced data, companies are very reluctant on providing them toothers out of fear for the loss of reputation towards their clients.
This might change in Germany in the future because of the “IT-Sicherheits-gesetz” (IT security law) which was passed in July 2015 [ITSG 15]. Accordingto that law, providers of critical infrastructure have to report serious attacksto the BSI2.
On the other hand, there are expert estimates for typical attacks. Fromthese estimates for basic attacks, they want to determine probabilities of morecomplex attacks using ATs. They limit their effort to rational attackers whoonly go through with an attack if there is a positive outcome, and if so, theychoose the one with the highest outcome. Therefore, they try to estimate thepossibility of an attack using a cost-benefit calculation from the attacker’spoint of view. Their calculation of the outcome is shown in equation 2.17.They criticize that in previous works usually only one parameter is used inthe trees and therefore the decision of an attacker to attack is not modeledvery accurate. The attacker’s decision is modeled with the parameters: at-tacker’s gain, probability of success, probability of getting caught and possiblepenalties (listed in Table 2.4).
Outcome = p×Gains− Costs− p× π+ − (1− p)× π− (2.17)
For two nodes with the parameters valuesi = (Costsi, pi, π+i , π
−i ), and
(i = 1, 2) the following computation rules shown in equations 2.18 and 2.19are established.
2 Bundesamt für Sicherheit in der Informationstechnik (Federal Office for Informa-tion Security)

2.2 Security Analysis Techniques 29
Table 2.4. Parameters used to calculate the outcome of an attack according toBuldas et al. [Buldas 06]
parameter description
p probability that the attack is successfulGains the attacker’s gainCosts the costs of the attack (material, bribes, . . . )π+ penalty if the attack is successful
(penalty × probability to be caught)π− penalty if the attack is unsuccessful
(penalty × probability to be caught)
values(AND)
=
Costs = Costs1 + Costs2,p = p1 × p2,π+ = π+
1 + π+2 ,
π− = p1(1−p2)(π+1 +π−
2 )+(1−p1)p2(π−1 +π+
2 )+(1−p1)(1−p2)(π−1 +π−
2 )1−p1p2
(2.18)
values(OR) ={values1, if Outcome1 > Outcome2values2, if Outcome1 ≤ Outcome2
(2.19)
Whereas Outcomei for (i = 1, 2) is calculated according to equation 2.17.π− is the average penalty if at least one of the child-attacks was not successful.Costs and penalties of node i can be combined to the value
Expensesi = Costi + pi × π+i + (1− pi)× π−i
Jürgenson and Willemson do generally the same in [Jürgenson 08]. Butthey criticize that the calculations from [Buldas 06] are violating the generalcalculation rules from [Mauw 06]. To calculate the value of an OR-gate, theoutcome of both inputs has to be compared for which the gain of each sub-attack is needed. Because this value is usually not available, Buldas et al.use the gain of the overall attack which is too high for this calculation. Also,they only consider the case that only one path of an OR-gate is executed.But Jürgenson and Willemson claim that in practice several attack paths aretried as long as they are feasible for the attacker. Therefore Buldas et al.underestimate the outcome of an attack and by this the attack probability.In [Jürgenson 08] they propose an improved approach that does not violatethe criteria from [Mauw 06] but with a higher computational complexity. Thecomputation rule for the outcome in [Buldas 06] is a lower bound for themaximum outcome as computed by Jürgenson and Willemson.
To summarize [Buldas 06] and [Jürgenson 08], they both do cost-benefitcalculations from the attacker’s point of view. Together with [Mauw 06], theypropose a formal basis for calculations in attack trees. But they do not mention

30 2 Related Work and Fundamentals
how to obtain the probabilities for an attack to be successful other than byrough expert estimations. Without those, their approach is not feasible.
Extensions of Attack Trees and Related Techniques
As for FTs, there are extensions of ATs as well. Defense Trees (DTs) extendedATs with the ability to model countermeasures [Bistarelli 06]. BEs in a DTare annotated with a set of suitable countermeasures. They model DTs inDisjunctive Normal Form (DNF) which means DTs depict the set of possibleattacks, or the combination of all MCSs in FT terminology. Their approachincludes qualitative as well as quantitative evaluation of DTs. They use costsas a measure. Countermeasures are rated by a Return on Investment (ROI)from the defender’s point of view and a Return on Attack (ROA) from theattacker’s point of view. Interdependencies between sub-attacks are consideredby rating the MCS/whole attack scenario instead of every BE by itself.
Previously mentioned Generalized Fault Trees (GFTs) (cf. Sect. 2.1.1)are another example of safety modeling techniques used to model secu-rity [Codetta-Raiteri 13]. Using GFTs repair and recovery mechanisms, anddynamic behavior can be modeled. This can lead to more accurate attackmodels, and if attack probabilities are available, the model can be calculatedmore accurate. But, the ATs based on GFTs are getting more complex. For ananalysis they are transformed into Generalized Stochastic Petri Nets (GSPNs)and analyzed using the usual Petri net analysis methods [Marsan 95]. There-fore, they have the same advantages and drawbacks as Petri nets. Analysescan be very detailed, but the analysis effort increases exponentially with thesize of the model. GFTs still depend on probabilities for attack events whichare difficult to obtain.
There are state-based approaches that allow modeling dynamic behaviorin attacks. Petri Net Attack Modelings (PENETs) [Pudar 09] is an extensionof ATs with dynamic constructs such as time dependencies, or defense andrepair mechanisms. They are analyzed by converting them into an equivalentPetri net.
In security attack statecharts [Ariss 11] states correspond to successfulsteps necessary to execute an attack. Events trigger transitions between thestates. The decisions of an attacker are represented using statechart repre-sentations of logic gates such as AND, OR, and Priority-AND. It is possible tomodel conditional cycles, preconditions, concurrency, or collaboration.
Sheyner et al. describe attack graphs in [Sheyner 02] to analyze networks.The network is modeled as a finite state machine. Security properties are spec-ified and state transitions correspond to atomic actions an attacker performsto violate these properties. The modeled state machines are evaluated using amodel checker to find the most critical attacks, or the ones a defender has toprevent to counteract attacks. Other metrics for attack graphs are the shortestpath to an attack goal or the number of paths [Idika 10].

2.2 Security Analysis Techniques 31
McDermott models attacks using Petri nets as so-called attack netsin [McDermott 00]. It is basically a Petri net representation of ATs with theadditional ability to model sequences.
ADversary VIew Security Evaluation (ADVISE) [LeMay 11] is an ap-proach to generate an executable model, the attack execution graph, thatrepresents the steps an attacker is likely to take to reach his attack goal. It isalso a state-based model that extends the attack graph concept with attackerprofiles. By executing attack steps, an attacker gains access to system compo-nents or reaches the goal. The graph also includes the skills and knowledge anattacker needs to execute an attack step. Attacker profiles are defined whichinclude the attacker’s attack preferences, attack goals, and attack skills. Thechoice which attack steps to take depends on cost, payoff, and probabilityof detection, and is calculated by an attack decision function. From an ini-tial state the path with the most attractive attack steps is calculated whichrepresents the most likely attack sequence.
State-based approaches are able to create more precise models than ATs,but they all have the problem of the state space explosion in larger systems.Therefore they are more suited to model partial aspects of a system in detailthan the whole system. For the overall view of a system ATs are better suited,and they can be extended by state-based models for more detailed models.
2.2.2 Threat Modeling
The term threat modeling was coined by Microsoft as an “attack-focused anal-ysis activity used to find security flaws in software” [Dhillon 11]. Threat mod-eling is effective to find classes of coding issues that stem from architecturalor technology-selection decisions. It is recommended to apply threat modelingduring early development phases, namely the architecture or design phase. Thethreat modeling process is described in four steps according to [Dhillon 11]:
1. Creating an annotated data flow diagram2. Identifying and analyzing threats, guided by the STRIDE approach or a
threat library3. Assessing technical risks of threats4. Mitigating threats to reduce risk
From an attacker’s point of view data flows are interaction points with thesystem. Attacks especially are directed towards data flows. Data Flow Dia-grams (DFDs) that are used for threat modeling should be annotated to sim-plify the following analysis steps. Useful annotations according to [Dhillon 11]are:
• different privilege levels• embedded components• programming languages• critical security functions

32 2 Related Work and Fundamentals
• network and local data flows• data flow type (HTTP, SQL, API call, . . . )• authenticated data flows• encrypted and/or signed data flows/stores• sensitive information in data stores• how sensitive information is intended to flow through the system
DFDs consist of data flows, data stores, processes, interactors, and trustboundaries [Hernan 06]. Microsoft also provides general rules for the creationof data flow diagrams for threat modeling:• there should be no “magic” data sources or sinks• model all data transports, meaning there should always be a process that
reads and writes data• similar elements in one trust boundary should be collapsed for simpler
modeling• components on either side of a trust boundary should not be modeled
simultaneously but separately with the respective other side as an externalinteractorAfter developing the DFDs, the next step is to identify threats to system
assets. In Microsoft’s Security Development Lifecycle they use the STRIDEapproach [Howard 06, Microsoft 10]. It is an acronym for Spoofing, Tamper-ing, Repudiation, Information Disclosure, Denial of Service, Elevation of Priv-ilege (STRIDE). For each security property there is a specific threat whichis shown in Table 2.5. The individual security properties are described inTable 2.6.
Table 2.5. Threats and security properties from [Hernan 06]
threat security property
Spoofing authenticationTampering integrityRepudiation non-repudiationInformation disclosure confidentialityDenial of service availabilityElevation of privilege authorization
For the STRIDE approach the system is divided into relevant components,each component is analyzed, and threats found are mitigated by additionalmeasures. Table 2.7 shows which DFD elements are susceptible to which se-curity threats.
For the analysis a security expert goes through the list of componentsand checks each for the threats listed in Table 2.7. The analyst has tofind the individual threats fitting to the system in question. This step re-lies heavily on experience and can never be complete. But there are tools

2.2 Security Analysis Techniques 33
Table 2.6. Descriptions of security properties from [Hernan 06]
property description
confidentiality data is only available to the people with the appropriateclearance
integrity data and system resources are only changed in appropriateways by appropriate people
availability systems are ready when needed and perform acceptablyauthentication the identity of users is establishedauthorization users are explicitly allowed or denied access to resourcesnon-repudiation users cannot perform an action and later deny performing
it
Table 2.7. Threats affecting data flow diagram elements according to [Hernan 06]
element spoofing tampering repudiation informationdisclosure
denial ofservice
elevation ofprivilege
data flows X X Xdata stores X X Xprocesses X X X X X Xinteractors X X
that ease that task. Chapter 22 in Microsoft’s “The Security DevelopmentLifecycle” [Howard 06] has a number of threat tree patterns for the securityproperties of DFD elements. There are pre-built threat trees with design ques-tions about all elements that help to understand the pattern. Common typesof attacks are listed in libraries such as “Writing Secure Code” by Howard andLeBlanc [Howard 02] or the “Common Weakness Enumeration [MITRE 14].
The STRIDE taxonomy is general enough to encompass most attacks onsoftware. But the downside is, to apply it a substantiated knowledge aboutsoftware security is required. So, if normal developers should be able to ap-ply threat modeling to their development process, they need a techniquethat requires less security knowledge. A simplification of the analysis is tofocus threat modeling efforts on interactions between elements in the dataflow diagrams. A threat library was developed that, at the time of the pa-per [Dhillon 11], included around 35 entries which are maintained and up-dated by security experts. It consists of the minimum considerations that arerequired for the systems that are developed by their company. A threat librarycan never be complete but it can be a good baseline of actions. Major criteriafor including entries in the threat library are:
• identifiable during design time?• at least moderate security risk?• can actionable mitigation guidance be provided?
An entry of the library has the following fields:
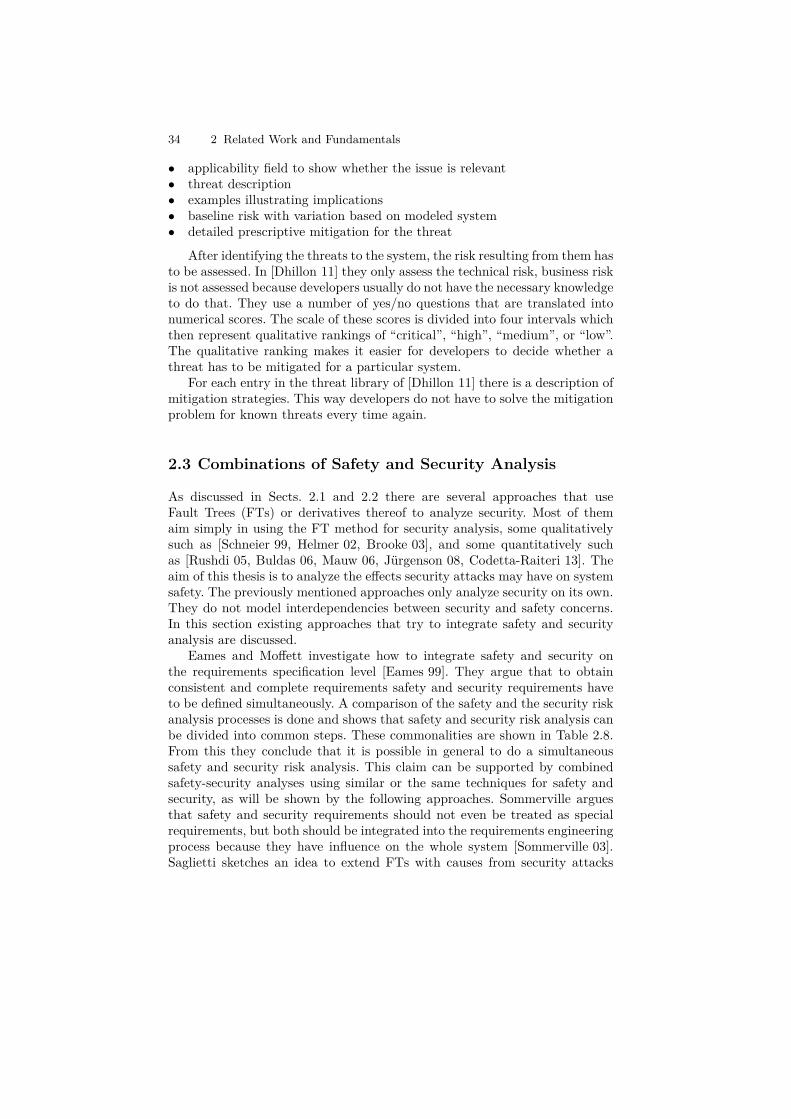
34 2 Related Work and Fundamentals
• applicability field to show whether the issue is relevant• threat description• examples illustrating implications• baseline risk with variation based on modeled system• detailed prescriptive mitigation for the threat
After identifying the threats to the system, the risk resulting from them hasto be assessed. In [Dhillon 11] they only assess the technical risk, business riskis not assessed because developers usually do not have the necessary knowledgeto do that. They use a number of yes/no questions that are translated intonumerical scores. The scale of these scores is divided into four intervals whichthen represent qualitative rankings of “critical”, “high”, “medium”, or “low”.The qualitative ranking makes it easier for developers to decide whether athreat has to be mitigated for a particular system.
For each entry in the threat library of [Dhillon 11] there is a description ofmitigation strategies. This way developers do not have to solve the mitigationproblem for known threats every time again.
2.3 Combinations of Safety and Security Analysis
As discussed in Sects. 2.1 and 2.2 there are several approaches that useFault Trees (FTs) or derivatives thereof to analyze security. Most of themaim simply in using the FT method for security analysis, some qualitativelysuch as [Schneier 99, Helmer 02, Brooke 03], and some quantitatively suchas [Rushdi 05, Buldas 06, Mauw 06, Jürgenson 08, Codetta-Raiteri 13]. Theaim of this thesis is to analyze the effects security attacks may have on systemsafety. The previously mentioned approaches only analyze security on its own.They do not model interdependencies between security and safety concerns.In this section existing approaches that try to integrate safety and securityanalysis are discussed.
Eames and Moffett investigate how to integrate safety and security onthe requirements specification level [Eames 99]. They argue that to obtainconsistent and complete requirements safety and security requirements haveto be defined simultaneously. A comparison of the safety and the security riskanalysis processes is done and shows that safety and security risk analysis canbe divided into common steps. These commonalities are shown in Table 2.8.From this they conclude that it is possible in general to do a simultaneoussafety and security risk analysis. This claim can be supported by combinedsafety-security analyses using similar or the same techniques for safety andsecurity, as will be shown by the following approaches. Sommerville arguesthat safety and security requirements should not even be treated as specialrequirements, but both should be integrated into the requirements engineeringprocess because they have influence on the whole system [Sommerville 03].Saglietti sketches an idea to extend FTs with causes from security attacks
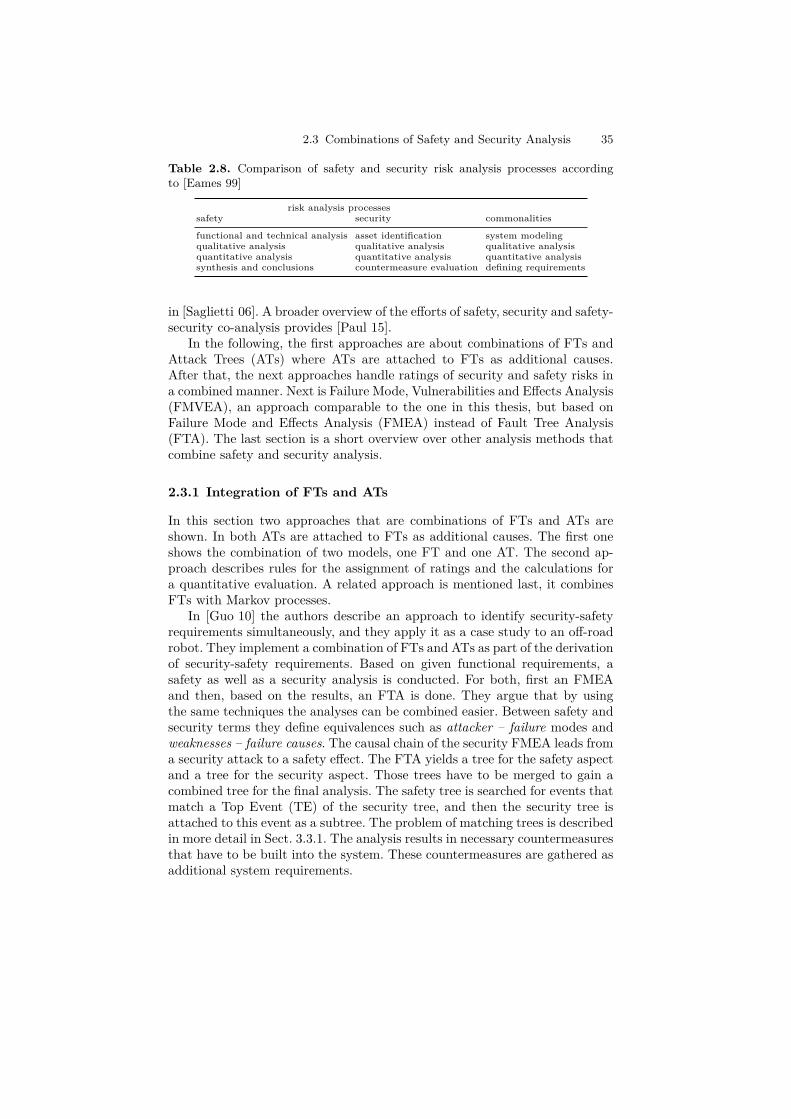
2.3 Combinations of Safety and Security Analysis 35
Table 2.8. Comparison of safety and security risk analysis processes accordingto [Eames 99]
risk analysis processessafety security commonalities
functional and technical analysis asset identification system modelingqualitative analysis qualitative analysis qualitative analysisquantitative analysis quantitative analysis quantitative analysissynthesis and conclusions countermeasure evaluation defining requirements
in [Saglietti 06]. A broader overview of the efforts of safety, security and safety-security co-analysis provides [Paul 15].
In the following, the first approaches are about combinations of FTs andAttack Trees (ATs) where ATs are attached to FTs as additional causes.After that, the next approaches handle ratings of security and safety risks ina combined manner. Next is Failure Mode, Vulnerabilities and Effects Analysis(FMVEA), an approach comparable to the one in this thesis, but based onFailure Mode and Effects Analysis (FMEA) instead of Fault Tree Analysis(FTA). The last section is a short overview over other analysis methods thatcombine safety and security analysis.
2.3.1 Integration of FTs and ATs
In this section two approaches that are combinations of FTs and ATs areshown. In both ATs are attached to FTs as additional causes. The first oneshows the combination of two models, one FT and one AT. The second ap-proach describes rules for the assignment of ratings and the calculations fora quantitative evaluation. A related approach is mentioned last, it combinesFTs with Markov processes.
In [Guo 10] the authors describe an approach to identify security-safetyrequirements simultaneously, and they apply it as a case study to an off-roadrobot. They implement a combination of FTs and ATs as part of the derivationof security-safety requirements. Based on given functional requirements, asafety as well as a security analysis is conducted. For both, first an FMEAand then, based on the results, an FTA is done. They argue that by usingthe same techniques the analyses can be combined easier. Between safety andsecurity terms they define equivalences such as attacker – failure modes andweaknesses – failure causes. The causal chain of the security FMEA leads froma security attack to a safety effect. The FTA yields a tree for the safety aspectand a tree for the security aspect. Those trees have to be merged to gain acombined tree for the final analysis. The safety tree is searched for events thatmatch a Top Event (TE) of the security tree, and then the security tree isattached to this event as a subtree. The problem of matching trees is describedin more detail in Sect. 3.3.1. The analysis results in necessary countermeasuresthat have to be built into the system. These countermeasures are gathered asadditional system requirements.

36 2 Related Work and Fundamentals
The article only describes exemplarily the building of the FTs. A detailedanalysis of the resulting trees is not presented. At least a qualitative analysisis straightforward as the trees are standard FTs which can be analyzed usingMinimal Cut Sets (MCSs) as described in Sect. 2.1.1.
This next approach is about the calculations for a quantitative evalua-tion of a combination of FTs and ATs. Fovino et al. describe in [Fovino 09]an approach to integrate ATs and FTs to assess the influence of security-relevant events on safety TEs. They try to formalize ATs similar to [Mauw 06,Buldas 06, Jürgenson 08] to be able to calculate ratings for the TE of a com-bined tree. They call the root of an AT the goal of an attack. They partitionBasic Events (BEs) into assertions and vulnerabilities. Assertions are definedas conditions under which an attack is possible. Vulnerabilities can be ex-ploited by an attacker. For vulnerabilities the attributes name, type, descrip-tion, vulnerability reference, list of affected components, countermeasures list,severity, likelihood, and resources required are recorded. All possible actionsin the context of the system are called operations. Operations are conjunc-tions of assertions and vulnerabilities in the tree. Goals of ATs may appear asevents in an FT. ATs and FTs can be integrated at that point via an OR-gateto which the FT event and the AT goal are connected (similar to [Guo 10]).Also similar to [Guo 10] they combine two existing trees instead of expandingone tree (see Sect. 3.3.1 for a discussion of that problem). It is mentioned thatthere could also be Intermediate Events (IEs) as side effects of an attack in anAT that correspond to other events in the FT. These are also merged usingthe IE the same way as a goal. They call that combined tree an ExtendedFault Tree (EFT). Under the precondition that probabilities for all eventsexist in the EFT, security as well as safety-related, they use the usual rulesof probabilistic Boolean logic to calculate probability of the safety-related TEof the FT.
The basic idea is very similar to the approach of this thesis, except forthe following main differences: First, they say attack tree probabilities aredifficult to determine, and they use likelihood values. Later they use the cal-culation rules as if there were probability values for all events. But as theystate before, probabilities for attack trees are mostly unavailable, and there-fore the calculation rules are merely theoretical. No qualitative analysis of theEFT is described that in some way takes into account that there are eventsof different types (deliberate attacks and random faults).
Boolean logic Driven Markov Processes (BDMPs) have a similar syntaxto FTs and ATs. They are extended by triggers that model dependencies be-tween events [Bouissou 03] and use AND, OR, and PAND-gates. If the origin of atrigger is true (the event occurs), the target of the trigger gets activated. Onlyactivated events may become true. Triggers may activate or deactivate partsof a tree. Thereby it is possible to model simple dependencies, sequences, de-tections, reactions, and repair actions. Leaves of the tree (BEs) are modeledby Markov processes that represent the component’s behavior depending onactivation. BEs can model both failures in operation and failures on demand

2.3 Combinations of Safety and Security Analysis 37
with possible repair actions. BDMPs are able to model the same dependen-cies as Dynamic Fault Trees (DFTs), Repairable Fault Trees (RFTs), or otherstate-based approaches (cf. Sect. 2.1.1). In [Piètre-Cambacédès 10a] the au-thors add security BEs such as attacker actions, timed security events andinstantaneous security events. If an attacker action is activated, the attackerattempts an attack step. The timed security event models an event whichinfluences an attack, but it is not under the attacker’s control. The timeto success for both is exponentially distributed. The instantaneous securityevent happens with probability γ directly after activation. Using those eventsBDMPs can be used to model complex attack sequences with interdependen-cies. In this way they are comparable to Defense Trees (DTs), an extension ofATs including defense mechanisms and countermeasures (cf. Sect. 2.2.1). Theauthors also combined safety and security models to model interdependenciesbetween them [Piètre-Cambacédès 10b]. They are able to model similar struc-tures as described in [Guo 10] and [Fovino 09] such as adding security eventsas additional causes for safety failures. Because of the generalized model theyalso can model security failures that depend on safety causes. Results of theanalysis depend on quantitative input data that are difficult to obtain for se-curity events as mentioned earlier. Qualitative results are the possible failuresequences.
This approach is very similar to the one in [Fovino 09] and has the samedrawbacks. It depends on attack probabilities respective attack rates to beuseful, and they are hard to obtain. The qualitative results, the failure se-quences, may be more detailed than in ATs. The usefulness depends on therequired level of detail of an analysis. For an overview of a system, FTs andATs are better suited. For more detailed parts of a system the greater effortof creating Markov Processes may pay off.
The next section will cover some approaches that use qualitative ratingsinstead of probability values, and they describe how to obtain the ratings.
2.3.2 Security Analysis with Safety Implications
The approaches of this section are mostly about how to obtain ratings forsecurity and safety risks in a combined manner. How they obtain the scenariosthey analyze is not in every case described. Some also use FTA to analyze theirexamples.
Bloomfield et al. conduct a security analysis of the European RailwayTraffic Management System (ERTMS) including an impact analysis of thefound vulnerabilities on the safety of the system [Bloomfield 12]. Attacks wererated according to several criteria:
• type of access required to exploit a vulnerability• level of technical sophistication required to exploit a vulnerability• type of failure caused by a successful attack• scale of effect for a successful attack

38 2 Related Work and Fundamentals
• scalability of the attack from the attacker’s perspective• type of impact caused by a successful attack• types of mitigation strategies that are possible• level of difficulty for implementing each mitigationFor each criterion a qualitative rating along the lines of {HIGH,Medium, low}is used (see Table 2.9).
Table 2.9. Ratings of attack scenario criteria as used in [Bloomfield 12]
minimumaccessrequired
technicalsophistication
type offailure
scale ofeffect
REMOTEACCESS LOW LOSS OF LIFE
GLOBAL,NATIONAL
Access toinfrastructure,but not thesystem itself Medium Denial of service Regionalphysical access tothe system high local
scalabilityof the attack
type ofimpact
mitigationstrategies
ease ofmitigation
HIGH
SAFETYCRITICAL,ECONOMIC HARD
Medium Political Reactive Mediumlow psychological preventive easy
They do not try to use a compound rating, but instead they argue thatthe different ratings show the trade-offs a decision maker has to deal with.These ratings can be used to make more informed decisions.
In essence this is a security analysis in which safety implications are takeninto account. The approach is directly inverse to the approach of this the-sis. After the rating no further analysis is described, neither qualitative norquantitative.
Also the same analysis direction as [Bloomfield 12], this approach fromCasals et al. describes a security analysis that takes safety implications intoaccount [Casals 12]. It is another example of an approach that uses qualitativeratings for the attack likelihood.
They describe an application of security risk assessment to avionics sys-tems. As risk needs to be quantified to avoid unnecessary costs, they proposea quantitative risk assessment framework. Their methodology consists of sixsteps:1. context establishment

2.3 Combinations of Safety and Security Analysis 39
2. preliminary risk assessment3. vulnerability assessment4. risk estimation5. security requirements6. risk treatment
The interesting step for this thesis is the risk estimation. The attack likeli-hood is rated using five likelihood levels: frequent, probable, remote, extremelyremote, and extremely improbable. The level is determined by a combinationof ratings for exposure of the asset to threats and attacker capabilities. Valuesfor exposure and attacker capabilities have to be determined by experts. Therisk, in turn, is determined by a combination of likelihood and safety impact.For the safety impact they also use five levels: no safety effect, minor, major,hazardous, and catastrophic [ED-202 10].
The authors use an FT structure to model the combinations of attacks thatlead to the system failure (in this case an aircraft that crashes during take-off). Just as the authors of [Bloomfield 12], Casals et al. conduct a securityanalysis that includes the effects of security attacks on system safety. Thiscan extend, but not replace, an existing safety analysis. A complete safetyanalysis is necessary nevertheless.
Reichenbach et al. also describe a security risk assessment approach thatis extended to include the impact on system safety [Reichenbach 12]. Theypropose a combined approach for safety and security analysis to have a moreconsistent, less redundant analysis. Based on Threat Vulnerability and RiskAssessment (TVRA) [ETSI TS 102 165-1 11], they add the Safety IntegrityLevel (SIL) to get a rating of an attack that includes the impact on safety.Factors affecting the risk are time, expertise, knowledge, opportunity, equip-ment, asset impact, and intensity. The likelihood of an attack is based on theattack potential value which is based on time, expertise, knowledge, opportu-nity, and equipment. The impact of an attack depends on asset impact, attackintensity, and SIL. All these values have to be determined by experts duringthe analysis.
This is more a risk estimation approach than an analysis technique. It canbe used after the risks are identified by other methods.
In this section the approaches used extensions of security risk assessmentapproaches to also assess the risk on the system under study. They cannot beused as standalone techniques but they may be used together with techniquessuch as FTA or FMEA that provide the failure scenarios. The next section onthe other hand shows an approach that includes the scenario finding as wellas the evaluation of ratings of risks.
2.3.3 Failure Mode, Vulnerabilities and Effects Analysis (FMVEA)
Schmittner et al. extend FMEA (see Sect. 2.1.2) to include vulnerabilities andattacks as additional causes in the analysis [Schmittner 14]. They describe a

40 2 Related Work and Fundamentals
combined analysis of safety and security based on the FMEA cause-effectchain. A generic set of security based failure modes called threat modes basedon the STRIDE classification (see Sect. 2.2.2) is proposed. Table 2.10 showscorresponding FMEA and FMVEA elements. To the cause-effect chain ofFMEA vulnerabilities, threat agent, threat mode, threat effect, and attackprobability are added as additional elements. Figure 2.7 shows the cause-effectchain of FMVEA. The dashed areas show the security respective safety specificelements. The gray background indicates that probabilities are determinedfor failure causes as well as attacks which are composed of vulnerabilities andthreat agents that exploit them.
Table 2.10. FMVEA elements and their correspondents in FMEA [Schmittner 14]
FMEA elements FMVEA elements
failure cause vulnerabilityrandom event threat agentfailure mode threat modefailure effect threat effectfailure probability attack probability
&
failure cause failure mode
vulnerability
threat agentthreat mode
effect
severity
probability
criticality
&
safety
security
Fig. 2.7. The cause-effect chain of FMVEA from [Schmittner 14]
Like the approaches from the previous section, Schmittner et al. use aqualitative rating to describe the attack probability. The attack probabilityis calculated as the sum of threat properties and system susceptibility. The

2.3 Combinations of Safety and Security Analysis 41
value of the threat properties is determined by the sum of motivation andcapabilities. System susceptibility is determined by the sum of reachabilityand unusualness. Schmittner et al. define scales with three values for all ofthese properties. Table 2.11 shows the properties and the corresponding ratingvalues. The values of the resulting attack probability can then be interpreted
Table 2.11. Ratings of the properties necessary to determine the attack probabilityaccording to [Schmittner 14]
property rating values
threat properties motivation 1 = opportunity target2 = mildly interested3 = main target
capabilities 1 = low2 = medium3 = high
system susceptibility reachability 1 = no network2 = private network3 = public network
unusualness 1 = restricted2 = commercially available3 = standard
as low for values 4–6, medium for values 7–9, and high for values 10–12.This is an approach that could be used in combination to the approach of
this thesis. As with FMEA and FTA where the FMEA is used to find failuremodes that are analyzed further using FTA, FMVEA could be used to findfailure modes (and also some of the causes and effects) which then are analyzedfurther using the Security-enhanced Component Fault Trees (SeCFTs) of thisthesis.
2.3.4 Other Related Approaches that Combine Safety andSecurity Analysis
In this section other approaches that in some way combine safety and securityanalysis are mentioned in a short overview.
In [Roth 13] the approach proposed in this thesis is extended by a securityanalysis from the attacker’s point of view using FMECA-like ratings.
[Dobbing 06a, Dobbing 06b] describe a standard that integrates safety andsecurity on an assurance case level. This standard is based on British DefenseStandard [MoD DS 00-56 07] and Common Criteria [ISO/IEC 15408 12]. Itwas developed under the SafSec study of the British Ministry of Defense.However, it does not claim to be necessarily sufficient for safety or securitycertification, but it provides a framework how safety and security standardscan be applied more cost efficient and with reduced risk.

42 2 Related Work and Fundamentals
Großpietsch and Silayeva propose architectural means to achieve safetyand security in [Grosspietsch 04]. They analyze their approach using a Byzan-tine fault model to integrate security failure models into time-dependent re-liability analysis using different attacker models. No concrete attacks are an-alyzed, but the effects of failed elements on the overall system due to attacksare analyzed.
[Lanotte 03] integrates safety and security analysis based on timed au-tomata and symbolic model checking.
There exist only a few publications that try to combine FTs and ATs,despite of the similarities, to combine safety and security analyses. This thesisproposes an approach that enhances safety analysis to encompass securityrisks as additional causes for safety failures. Some researchers are doing theopposite approach by including safety effects into security analysis. Thereis work done on the level of standardization to include security into safetystandards such as [IEC 61508 10]. But mostly security and safety are aspectsof systems that are still analyzed separately and sometimes even in isolation.
2.4 Critique of Quantified Security Properties
In safety analysis it is common to conduct a quantitative analysis if more pre-cise statements about a system are required. This practice has been triedto adapt to security analysis. Although quantitative approaches for secu-rity assessment have been intensively studied, quantification is still in itsinfancy [Förster 10].
In [Verendel 09], the author provides a representative overview of worksbetween 1981 and 2008 containing security models, security metrics, or se-curity frameworks for a quantitative analysis of system security. A few ofthem have been discussed in Sect. 2.2. According to him, the validity of mostmethods is unclear, and most of the methods were not successfully used ina real life analysis. A lot of the works Verendel studied for his survey claimsthat quantitative analysis of security is necessary. But that depends on thecorrect representation of security with quantitative information. In securityanalysis usual assumptions are that security related events are stochasticallyindependent, that attackers are rational or choose the optimal way, or thatsecurity properties do not change over time. In general, these assumptions arenot correct. Most of the surveyed work on quantification of security is not val-idated in a repeatable way. Based on the survey, Verendel states that at timeof the paper (2009) security cannot be represented correctly with quantitativeinformation.
Earlier described approaches such as [Mauw 06, Buldas 06, Jürgenson 08,Fovino 09, Piètre-Cambacédès 10b] illustrate that finding. They define calcu-lation rules for probabilities of security events similar to the ones for safetyanalysis in FTs, but they do not discuss the fact that such probabilities are

2.5 Conclusion 43
usually not available. Without input values their whole calculation model issimply theoretical.
According to [Brooke 03], the major benefit of fault tree analysis is theidentification of the relationship of events, not a quantitative evaluation ofsecurity. Quantitative analysis often has no additional value.
2.5 Conclusion
In the beginning of this state of the art, Fault Trees (FTs) are described thatare suited to find and model causes and combinations of causes of failures.In combination with Failure Mode and Effects Analysis (FMEA) and Hazardand Operability Study (HAZOP) to find the failure modes, they are a well-established method in industry to analyze safety. They are also easily extend-able to add the ability to model dynamic behavior using Markov processes.The extension to Component Fault Trees (CFTs) allows the component-wisemodeling of larger systems.
The following sections show that Attack Trees (ATs) are a good match fora combined analysis. Even if they are not perfect to model security in muchdetail in their basic form, they can be extended to the needs of a modeler,just like CFTs. Comparable to safety analysis, ATs can be combined withFailure Mode, Vulnerabilities and Effects Analysis (FMVEA) or STRIDE tofind vulnerabilities. The approaches that directly provided the possibility tomodel dynamic behavior for both safety as well as security, were all morecomplicated in both modeling and analysis. Experience shows that CFTs inindustry are hierarchically built. Only if it is necessary, more detailed modelsare built. So, using one of the dynamic modeling techniques such as Booleanlogic Driven Markov Processes (BDMPs) to model the whole system createsmuch unnecessary overhead.
Also, using much too formal models for security does not help either be-cause usually the necessary input data is not available. If such data would beavailable however, it can also be used without much additional effort in anAT.


3
A Comprehensive Safety Modeling Approach
In the introduction of this thesis it was established that networked embeddedsystems (or sometimes called Cyber-Physical Systems) introduce security vul-nerabilities into systems that were not present in isolated systems. Embeddedsystems mostly are analyzed with regard to safety, but not to security. Sothe vulnerabilities newly introduced by networking systems together are nottaken into account.
The idea of this thesis is to augment safety analysis based on ComponentFault Trees (CFTs) by adding security concerns modeled as Attack Trees(ATs) that have an influence on the safety of the analyzed system. FaultTrees (FTs) in general, or CFTs in particular here, are a well-known toolto conduct a safety analysis. ATs are an established technique for securityanalysis. The motivation of this approach is to use established techniqueswith which engineers are familiar, and to extend these. First ideas of theproposed approach were described in [Förster 10] and [Roth 13].
In this chapter, the modeling part of the approach will be described. First,the extensions will be embedded in a usual analysis process for safety criticalsystems (Sect. 3.1). After that, different variants are discussed to combineFTs or rather CFTs with ATs in Sect. 3.2. Section 3.3 shows two approachesto create a combined tree, and Sect. 3.4 describes the selected approach indetail.
3.1 Overall Modeling and Analysis Process
Safety analysis using Fault Tree Analysis (FTA) is a process of several steps.The overall process is the same, independent of the use of FTs or CFTs.
Standards such as [IEC 61025 06] or [IEC 60300-3-1 05] recommend acombination of inductive and deductive techniques to minimize the poten-tial of omitted failure modes. Inductive techniques as Failure Mode andEffects Analysis (FMEA) [IEC 60812 06] or Hazard and Operability Study

46 3 A Comprehensive Safety Modeling Approach
(HAZOP) [IEC 61882 01] can be used to find the Top Events (TEs). Deduc-tive techniques as FTA [IEC 61025 06] are used to refine the analysis and tofind causes and moreover combinations of causes that lead to the TE. Theresulting tree is used to conduct qualitative and quantitative analyses. Fig-ure 3.1 shows the general process in three steps. Strictly speaking, a CFT isnot a tree but a Directed Acyclic Graph (DAG). To simplify naming mattersCFTs will also be referred to as “trees” in the course of this thesis.
FMEA, HAZOP
1. find TE2. deduce causes for TE
3. Analysis(qual./quant.)
FTA, CFT
data flow,system structure
Fig. 3.1. The safety analysis process according to IEC 60300–3–1
The approach to introduce security aspects into safety analysis proposedin this thesis is based on CFTs. It extends the process described earlier byan additional step and modifies the analysis step. Figure 3.2 shows the ex-tended analysis process. After developing the CFT, it is extended by possiblesecurity attacks as additional causes that also could lead to the safety-relatedTE. Those security attacks are found by analyzing data flow and interfacespecifications because most attacks are made at communication interfaces (cf.Sect. 2.2.1). Techniques to find security vulnerabilities that may lead to at-tacks are STRIDE (cf. Sect. 2.2.2) or Failure Mode, Vulnerabilities and EffectsAnalysis (FMVEA) (cf. Sect. 2.3.3).
FMEA, HAZOP
1. find TE2. deduce causes for TE
4. Analysis(qual./quant.)
FTA, CFT
3. extend CFT
data flow,system structure
data flow,interface specification
STRIDE, FMVEA
Fig. 3.2. The extended safety analysis process

3.2 Discussing Different Combinations of CFTs and ATs 47
3.2 Discussing Different Combinations of CFTs and ATs
Before describing the extension of CFTs, this chapter will discuss the issue ofhow safety and security concerns can be combined in an analysis. Dependingon the focus of the analysis, two variants for combinations are possible: AnAT as the main tree with additional branches from a CFT, or a CFT as themain tree with additional AT branches.
If the focus lies on security analysis, the TE will be an attack goal and theunderlying tree will be an AT. In this AT there can be branches of CFTs ifcomponent failures are necessary for an attack to succeed (see Fig. 3.3a).
If, on the other hand, the focus lies on safety analysis, the TE will be asystem failure and the underlying tree will be a CFT. In this CFT, there canbe events that may also be caused by security attacks, hence in such a CFTthere can be branches of ATs (see Fig. 3.3b).
Nesting of both variants is also imaginable (see Fig. 3.4). Both variantswill be described in more detail in the next sections. But first, some definitionsare needed to distinguish events of different types in the combined trees.
Definition 22 (Safety Event) The term safety event is used for a BasicEvent (BE) which occurs due to a random fault in the system [Förster 10].The BEs in standard CFTs are all safety events.
Definition 23 (Security Event) The term security event is used for a Ba-sic Event (BE) which is triggered from outside the system by a maliciousattacker (or a random fault) [Förster 10]. The BEs in standard ATs are allsecurity events.
3.2.1 An AT Extended by a CFT
Figure 3.3a shows an AT with an attached CFT branch. The TE of thiscombination is an attack goal that is refined for security analysis. The interfacebetween the AT and the CFT part is an event that can be caused by a securityevent as well as by a safety event. This is basically a normal AT as some attacksmight depend on failures in the targeted system.
This combination variant is aiming at security analysis, and it is not exam-ined further here because the goal of this thesis is to improve safety analysis.
3.2.2 A CFT Extended by an AT
Figure 3.3b shows a CFT with an AT branch attached to it as additionalcause for the TE. The interface between the CFT and the AT branch is anevent in the CFT that may be caused by a safety event as well as by a securityevent. This security event does not have to be the goal of an attack but itcould also be a by-product, or an intermediate step of a more complex attack.This combination is used for a safety analysis that is extended to also includesecurity events as causes for the TE, the system failure.

48 3 A Comprehensive Safety Modeling Approach
This will be the type of combination that will be used in the furthercourse of this thesis. In general, it could also be possible to use the type fromFig. 3.4b. But this only would be necessary if an aspect of a security eventwould have to be analyzed in highest detail.
AT
ATCFT
(a) An AT extendedby a CFT.
CFT
AT CFT
(b) A CFT extendedby an AT.
Fig. 3.3. Combinations of CFTs and ATs. Fig. 3.3b shows the combination that isused for this thesis.
3.2.3 Nested Trees
To make the list complete, Fig. 3.4a and 3.4b depict combinations of theprevious two (Figs. 3.3a and 3.3b). As mentioned before, combination 3.4bcould be interesting if and only if an attack that is causing a system failurehas to be examined down to the last detail. Combination 3.4a is not pursuedfurther here based on the same grounds as combination 3.3a. It focuses onsecurity, in contrast to this thesis which has its focus on safety.
3.3 Tree Creation Approaches
After introducing the different combination variants in Sect. 3.2, this sectionis about the development of such a combined tree. In general there are twovariants to generate a combined tree: The first variant is to model a CFT aswell as a separate AT and to find points of intersection to combine the trees.
The second one is to generate a CFT for safety analysis and to extend itby adding security events as additional causes. In the following, both variantswill be discussed.
3.3.1 Combination of two Complete Separate Trees
The first variant that comes to mind if a combined tree should be generated,is to create two separate trees and combine them afterwards. Figure 3.5 shows

3.3 Tree Creation Approaches 49
AT
AT
AT
CFT
(a) An AT extendedby a CFT which isextended by anotherAT.
AT
CFT
CFT
CFT
(b) A CFT extendedby an AT which isextended by anotherCFT.
Fig. 3.4. Nested combinations of CFTs and ATs
the combination process for this approach on the basis of a CFT and an AT.In the first step safety experts build a CFT, and security experts build an ATusing a set of predefined common rules for syntax and semantic. Such rulesare necessary for the next step where the trees are searched for intersections,namely common events. These common events could be any combination ofevents. In Fig. 3.5 the example shows the combination at two IntermediateEvents (IEs) i1 and i2. At the position of these events a new OR-gate (i3)is inserted between the trees, and the events i1 and i2 and their respectivesubtrees are connected to it. That results in a combined tree shown in thelower part of the figure. In this example an IE is the interface between CFTand AT. This results in a graph with two TEs. Depending on the viewpointof the analysis (safety or security) the appropriate TE is used.
This approach for the development of a combined tree has the advantagethat if an analysis of either safety or security already exists, it could be reusedunder certain circumstances (provided the rules for constructing the trees arethe same). Also, conducting two separate analyses in detail might lead tofewer omitted causes.
But it also has its disadvantages: The construction of the trees depends ontwo different views. In a CFT for a safety analysis failures are modeled as TEswhereas in an AT for security analysis attack goals are modeled. Attack goalscan be different from failures because attackers may not want to crash thesystem but to gain access to it. Also, if the system is modeled modularly ina CFT, the AT is modeled for the whole system, similar to a traditional FT.This can lead to matching problems, as different parts of the AT can match todifferent components. Common events can also be events that have the same

50 3 A Comprehensive Safety Modeling Approach
Attack Tree(Security)
Component Fault Tree(Safety)
search for common events
combined tree
Safety Experts
common rules forsyntax and semantics
Security Experts
d e
&&
≥1
a b
c≥1
&
3 4
&
≥1
1 2
CFT
&
a b
c≥1
d e
&
≥1
AT
≥1
&
&≥1
1 2 3 4
i1 i2
i1 i2
i3
safety relevant part
Fig. 3.5. The combination approach of a CFT and an separate AT
effect on the system but are named different. This is why naming conventionsare especially important for this approach. These problems prevent a simpleautomatic merge of the trees because even same names not necessarily meansame semantics. So it can be difficult to find common events in the treeswithout manually going through the whole tree with both safety and securityexperts present. If only one analysis perspective (safety or security) is needed,this approach creates an unnecessary overhead. On the other hand, if the

3.3 Tree Creation Approaches 51
system requires both perspectives, this approach may be beneficial to thecompleteness of the analyses.
3.3.2 Extension of a Tree
The second approach is the extension of an existing tree. An example is shownin Fig. 3.6 (FT version) and 3.7 (CFT version). Most of the time an analysisis either concerning security or safety. So it is not required nor desired toanalyze both aspects completely because of the additional effort. The shownexample is about the extension of an FT respective CFT for a safety analysisthat includes security events as additional causes. An FT/CFT is extendedby branches of an AT. In the first step of this approach safety experts buildan FT/CFT (left side of Figs. 3.6 and 3.7). This FT/CFT is the basis of thenext step, when security experts search through the tree and identify eventsthat could additionally be caused by security events (circled AND-gate/IE i1).To do that, additional information about the system is needed. Informationabout the data flow in the system and between the system and its environmentis useful for security analysis because communication interfaces are preferredtargets for an attack. This is why the specifications for the communicationinterfaces are also helpful at this stage.
In a traditional FT one would do the following: In place of the identifiedevents, an OR-gate (i2) is inserted into the tree and the former event i1 andthe newly found security event a are attached to it (right side of Fig. 3.6).
In a CFT however, the security event a (the vulnerability) should be mod-eled as an input port and the actual attack in a separate component (seeFig. 3.7). This separate component models the attacker that includes all rele-vant security events. These security events are accessible for other componentsvia the output ports of the attacker component. So instead of a security event,an input port (sec_in1) is attached to the OR-gate (i2) (see Fig. 3.7).
In a first iteration of the combined tree the tree is finished now (right sideof Fig. 3.6 or 3.7). If more detailed information about the new security event isneeded, the attacker component can be refined just like any other component.For each TE, respective output port, of the attacker component an AT canbe developed that describes the attack in more detail. Also, additional inputports are imaginable if the attack requires failures from other components(compare Fig. 3.4b).
The advantage of this approach is that the analysis team concentrates onthe aspect that is important for them (in this case safety), and tries to findall possible causes for the TE. Only one aspect (either security or safety)is analyzed completely, so there is less analysis effort than for two completeanalyses as in Sect. 3.3.1. Usually a system is either security critical, likedatabases, or safety critical, like embedded systems that control machines. Soin practice only one aspect is interesting as analysis objective for a specificsystem.

52 3 A Comprehensive Safety Modeling Approach
Security Experts
Safety Experts
&
≥1
1 2
3 4
extended FT
& a
≥1
can be extendedfurther if needed
&
&≥1
1 2 3 4
FTFault Tree(Safety) identify security
critical events
i1 i2
i1
data flow, communication interfaces
Fig. 3.6. The extension of a Fault Tree
3.4 Development of a Security-enhanced ComponentFault Tree (SeCFT)
As stated earlier, the objective of this thesis is to improve safety analysis.Therefore, the second combination variant (Sect. 3.3.2) is the technique ofchoice. Figure 3.8 shows the development process of an SeCFT. First, a CFTis created by safety experts for the system or component failures under con-sideration. During the development of a CFT, some rules have to be obeyed.They are recalled in Sect. 3.5. The failure modes (TEs) of the CFT can befound using FMEA or HAZOP as supporting techniques (cf. Sect. 2.1.2) anda description of the system structure including data flows. When that CFTis finished so far, it is searched for events that may additionally be caused bysecurity events (e.g. intentional manipulation of the system). This step canalso be intertwined with the creation of the initial CFT. In the example IE i1is identified as an event that may be caused by an attacker (circled AND-gate).
Often, those events appear at interfaces to the system environment orbetween components. So, these interfaces should receive special consideration.Possible points to attack a system are (this list is not necessarily complete):

3.4 Development of a SeCFT 53
Cattacker
a1 a2
a_out1 a_out2
Security Experts
Safety Experts
&
≥1
1 2
3 4
&
≥1
Component Fault Tree(Safety)
identify security critical events
&
&≥1
1 2 3 4
i1 i2
i1
data flow, communication interfaces
sec_in1
can be extendedfurther if needed
extended CFT
Fig. 3.7. The extension of a Component Fault Tree
• interfaces between system components and the environment (e.g. mal-formed data can be injected at sensor or actuator interfaces),
• communication channels that run through the system environment (mean-ing the channel is potentially accessible from the environment),
• and the software/hardware of the system components themselves (chang-ing the behavior of the system itself).
From the attacker’s point of view, the first two are usually the most promisingpoints because they are accessible relatively easy from the system’s environ-ment. Spoofing or denial of service attacks can be aimed at sensors to bring thesystem in a vulnerable or dangerous state. An example could be a robot thatuses infrared range finders to avoid obstacles. If the range finder is blinded byan infrared laser pointer, the robot might either ignore an existing obstacle orimagine a non-existing one. In both situations the robot might damage itselfor its environment.

54 3 A Comprehensive Safety Modeling Approach
Security Experts
Safety Experts
identify security critical events
data flow, interface description, STRIDE classification
FMECA
data flow, system structure
top events for fault trees
CFT(Safety)
a1 a2
a_out1 a_out2
can be extendedfurther if needed
Attacker
&
&≥1
1 2 3 4
i1
&
≥1
1 2
3 4
&
≥1 i2
i1
a1
SeCFT
Fig. 3.8. The development of a Security-enhanced Component Fault Tree (SeCFT)
Communication channels that run through the environment (wired andradio signals alike) are susceptible to denial of service (jamming) or spoofingattacks (sending malicious signals). Denial of service attacks have the sameeffects as random faults of the communication. That means, this type shouldhave already been handled by a traditional safety analysis. But it also couldbe the case that the probability of a random fault of the communication wasdetermined as so low that no countermeasures were implemented. If attackshowever would have been taken into account, the countermeasures would benecessary to avoid a deliberately caused failure.
Attacks on software/hardware level of a component are the ones which canhave the most effects because the system behavior can change in an unforeseenmanner. However, such attacks on the software are more difficult becausethey require unrestricted access to the software which usually requires eithera previous attack on the communication or another way of access. Hardwareattacks on the other hand are a special case, they require physical access to thesystem which can raise the necessary effort to high levels. Hardware attacksare also the ones that have almost unrestricted effects on the system, and theycan hardly be detected unless they are foreseen during system development.

3.4 Development of a SeCFT 55
Having identified potential points of attacks by analyzing information suchas data flow or interface descriptions together with the CFT, the next step isto find out which attack types are possible at those locations. Known attacksare collected in online databases such as the Open Web Application SecurityProject [OWASP 15] or vulnerability databases provided by several ComputerEmergency Response Teams (CERT). The STRIDE classification is a tool toidentify attacks (cf. Sect. 2.2.2). Table 3.1 shows the categories of the STRIDEclassification.
Table 3.1. STRIDE maps threats to security properties
Threats Security properties
Spoofing AuthenticationTampering IntegrityRepudiation Non-repudiationInformation Disclosure ConfidentialityDenial of Service AvailabilityElevation of Privilege Authorization
With potential points of attack in mind, an analyst searches the CFT fromTE to BEs for events that can be triggered by an attack. For each event inquestion the STRIDE categories are checked to determine which attack typesare possible.
No events should be left out from the beginning, unless the causes for thatare documented in the tree or in a separate document that is linked to thetree. If an event is found that can also be caused by an attack, the tree isextended by an OR-gate to which the previous subtree and the new securitycause are attached (see Fig. 3.8). The security causes are modeled as inputports which are connected to an attacker component (see Fig. 3.9) in whichthe actual security events are located.
In terms of CFTs the attacker would then be a new component which isinteracting with the system. From a semantic view point this makes sense be-cause the attacks are not part of the system components as they could be seenif they would be modeled as BEs in the components. The input port mod-els the vulnerability, and the attacker component models the actual attack.Modeling the attacker as a separate component therefore fits to the compo-nent concept of CFTs [Kaiser 03b] and to the security model where an attackexploits a vulnerability. Also, this eases necessary changes if new attacks areknown because the only changes in the CFT of the system are new input portsand additional attacks in the attacker component.
The attacker component as shown in Fig. 3.9 can simply be a CFT withas many output ports as there are different attacks. The attacks themselvescan be modeled simply as BEs (a1) or be refined as an AT (a2).

56 3 A Comprehensive Safety Modeling Approach
Cattacker
a1
a_out1 a_out2
&
a2.2 a2.3
a2.1 ≥1
a2
Fig. 3.9. An attacker component with two possible attacks
It is also imaginable that there is more than one attacker component mod-eled. If so, they can interact just like CFT components. This analysis processwas also described in a paper for a workshop at the SafeComp conference2013 [Steiner 13a].
The modeling process can be summarized as follows:
1. create a CFT2. search for points of attacks/vulnerabilities3. identify the types of vulnerabilities4. develop ATs to model the attacks
3.5 Rules for the Development of an SeCFT
For the development of an SeCFT the same rules apply as defined in [Kaiser 06]for CFTs. Precondition for a quantitative analysis is that all input ports ofa component are connected. Otherwise necessary information is missing if acomponent depends on external inputs. Also, BEs should be independent fromeach other because of the same reasons they should be in FTs (cf. [Vesely 81]).Kaiser defined some rules for the creation of CFTs:
• only one edge can lead to a target, more than one edge is forbidden• but one or more edges can start from the same point• if a target should have more than one input, a gate has to be used to join
the edges• directed cycles are not allowed• a component cannot contain itself as a subcomponent

3.5 Rules for the Development of an SeCFT 57
Also, he stated that small and self-contained subcomponents are preferredfor later reuse. Therefore only BEs that really belong to the current componentshould be added there. For BEs that are in fact external causes, an input portshould be added and the actual event should be placed in another component(thus the external attacker component mentioned earlier).


4
The Analysis of Security-enhanced ComponentFault Trees
In Chap. 3 the modeling approach for an analysis with Security-enhancedComponent Fault Trees (SeCFTs) is described. This chapter deals with theanalysis of such SeCFTs. Qualitative and quantitative analysis methods willbe described. The analysis process is also handled in [Steiner 15].
To be able to conduct a quantitative analysis, a comprehensive rating ofall the events in an SeCFT has to be present. For that purpose differentrating schemes for the security events of the SeCFTs are introduced, andit is discussed how they can be integrated with the safety rating schemesstemming from a Component Fault Tree (CFT). Using a comprehensive ratingfor all events the individual impact of an attack on the occurrence of the TopEvent (TE) can be determined.
This chapter is built-up as follows: First, different rating schemes thatcan be included in an SeCFT are discussed. There are probabilities for safetyevents, likelihood values for security events, and a combination of both to beable to rate Minimal Cut Sets (MCSs) according to safety and security.
Then, calculations rules for the different rating schemes are described.Calculation rules used in CFTs for probabilities are recalled, new rules forlikelihood values are discussed, and they are applied to the tuple rating thatis composed of probabilities and likelihood.
After that the application of the established rules for qualitative and quan-titative analysis is dealt with.
In the end the whole analysis process is summarized, and some ideas howto decide on countermeasures are devised.
4.1 Ratings of Basic Events in SeCFTs
In a CFT several ratings can be assigned to elements. Usually, ratings areassigned to Basic Events (BEs). Ratings of MCSs are calculated from theratings of their corresponding BEs. The rating of a TE is calculated by the

60 4 The Analysis of Security-enhanced Component Fault Trees
combination of all BEs or less accurate, but more conservative, from the sumof the ratings of all MCSs.
In CFTs BEs are typically rated using probabilities or reliability values(see also Sect. 2.1.1). These are used to calculate the respective values forMCSs and the TE.
The modular composition of CFTs (one CFT per system component) al-lows for the calculation of ratings for subcomponents of a larger system andfor later reuse of these values. This can be done if a CFT is not dependingon inputs from other CFTs. Then, MCSs as well as other ratings can be cal-culated for the output ports respective the TEs of the CFT. Especially forbasic components that are used in several systems this makes sense, and itcan reduce the analysis effort [Kaiser 06]. Measures for the contribution ofcomponents to the overall system can also be calculated.
In an Attack Tree (AT) the same basic elements exist as in a CFT. EitherBoolean or continuous values can be assigned to BEs. As Boolean valuesvalue pairs such as possible – impossible or expensive – not expensive areused. Continuous values for BEs can be costs to execute an attack, probabilityof success of a given attack, or probability that an attack is actually conducted.The latter probability however is problematic as a rating for BEs in an AT(cf. Sect. 2.2.1).
Figure 4.1 shows an example of an attacker component with two outputports out1 and out2. For the output port out2 it is basically an AT whichconsists of 4 gates and 5 BEs. Two MCSs are present which represent twodifferent attack scenarios: {e1, e2, e5} and {e3, e4, e5}.
&
& &
out1: tampering: change output value too high
e6: tampering: change output value too high
access LAN
e1: find LAN access port
e2: spoof MAC address
access WLAN
gain access to private network
gain access to target system
out2: tampering: change controller data
e3: find WLAN
e4: break WPA key
e5: get credentials
>=1
Fig. 4.1. An example attacker component
If an attack is consisting of several actions an attacker has to perform, likethe ones for output port out2 in the example, these actions are not stochas-tically independent in general. The usual assumption is if an attacker plansto attack a given system, and that attack requires him to execute different

4.1 Ratings of Basic Events in SeCFTs 61
actions (security events, sub-attacks), it is most likely that he will at leasttry all sub-attacks that are necessary to reach his goal (an attacker acts ra-tional [Buldas 06]). In terms of the given example this means if an attackerchooses to try BE e1 and he succeeds, he most probably will also try e2 ande5. In general this means, in an AT the events contained in an MCS are notindependent from each other.
Therefore, it can make more sense to assign a probability to a whole MCSwhich represents the attack, instead of the BEs. The other rating values (otherthan probabilities) can be calculated for the MCSs from their respective BEs.
A first result from a safety analysis based on SeCFTs is the set of MCSs, asthey are all combinations of BEs that lead to the analyzed system failure – thefailure scenarios. To decide which of these combinations have to be mitigatedto reach a certain safety level, this set of MCSs has to be prioritized. Andof course to decide whether a system is complying to a given safety levelfrom a standard or another requirement, the TE rating of the CFT has to becalculated.
Depending on available data, different rating schemes can be used. Theywill be described in the next sections.
4.1.1 Probabilities
Probabilities of occurrence, just like they are used in CFTs, are the first thingthat comes to mind when thinking about ratings for BEs in SeCFTs. If thosewould be available for all events in the SeCFT – safety as well as security– in a comparable accuracy, a probability of occurrence for the TE and allMCSs could be easily calculated (see also [Mauw 06, Buldas 06, Fovino 09]).For safety events this comes naturally because often there are tables withfailure probabilities for different system components. Of course, for softwarecomponents they are more difficult to find than for hardware components.There exist some approaches that try to handle this fact by using easier toestimate probability intervals instead of single probability values [Carreras 01,Förster 09]. But probabilities for security events lead to several problems:The probability of occurrence for a security event corresponds directly tothe combination of the probability that an attacker conducts an attack andthe probability that this attack is successful. A probability that an attack issuccessful could be determined from expert knowledge and experienced datajust like failure probabilities (cf. Sect. 2.2.1). But even the success probabilityis difficult to determine. There is only a small portion of the data aboutsuccessful attacks available. Most successful attacks are not published becausecompanies fear the loss of trust of their customers (cf. Sect. 2.2.1).
The bigger problem is the probability that an attacker actually conductsan attack. First, this probability depends on different aspects: the attacker’smotivation, experience, availability of assets/money/knowledge, and accessi-bility of the system. And second of all, if this attack requires several distinct

62 4 The Analysis of Security-enhanced Component Fault Trees
actions that are modeled as separate security events, these events are not in-dependent, as it would be required for most calculation algorithms for CFTs.Some estimate of the attack frequency of specific systems can be obtained bymeasuring the frequency of attacks to honey pots that are built to mimic real,vulnerable systems [Wilhoit 13].
There are some approaches that try to deal with the uncertainty ofprobabilities for some events of a CFT which can also be applied to anSeCFT. One approach is to derive a pseudo-probability from security indi-cators [Förster 10]. Together with other available probabilities, a probabilityfor the TE can be calculated. This approach has the advantage that the samecalculation rules can be applied as if there would be probabilities available forall BEs. But there are also some problems: Security attacks that are part ofa larger compound attack directly depend on each other and therefore do notfulfill the independence criterion for probabilities in CFTs. Also, it is impor-tant to find the correct order of magnitude for the probabilities of securityevents, otherwise the resulting probability can deviate in a matter that makesthe whole analysis obsolete. And last but not least, the numerical results fromsuch an analysis suggest a level of accuracy that can be misleading.
Another approach is to do a random-sampling instead of using precisevalues (cf. Sect. 2.1.1). For every BE a probability interval is chosen insteadof a precise probability. The stochastic distribution of probabilities in thoseintervals can be chosen as well (it should be uniform, if nothing is knownabout the BE). By randomly sampling values from the probability intervalsof the BEs the TE probability of the TE is calculated for a large number oftimes, thus resulting in the probability distribution of the TE. This methodis described in detail in [Förster 09].
To summarize, probabilities of the required accuracy for safety events arerelatively easy to obtain. But for security events they are either not as accurateas the ones for safety events and therefore not directly comparable, or theyare not independent from each other, so the usual calculation algorithms donot work. The next sections show different approaches that avoid problemsthat arise with probabilities for security events.
4.1.2 Likelihood
Instead of trying to assign probabilities to security events, it is a better ideato use a more coarse scale with only a few discrete values. [IEC 61025 06]states for Fault Tree Analysis (FTA) that in case when probabilities can-not be assigned to BEs, a “descriptive likelihood of occurrence” can be usedwith values such as: highly probable, very probable, medium probability, remoteprobability, etc. Different standards use different numbers of distinct values,e.g. [ED-202 10] considers five levels: extremely improbable, extremely remote,remote, probable, and frequent [Casals 12]. This likelihood can be used to ratesecurity events in an SeCFT. Assigning more precise numerical values wouldonly add fictitious precision which can be misleading in the interpretation of

4.1 Ratings of Basic Events in SeCFTs 63
the results as mentioned earlier in Sect. 4.1.1. This also has to be kept inmind when calculating values for combinations of events that are rated withlikelihood values.
The values of that likelihood are determined from several indicators suchas: attack cost, attack resources, attacker motivation, accessibility, or attackertype. For a first step a three-step scale is proposed which can be easily extendedif required. The scale represents the likelihood of a security event to occur.To each value a numerical value is assigned for easier comparisons. From thisfollows that the likelihood would be mapped to integer values from the interval[1,m] with m ∈ N the number of discrete values. In case of the IEC 61025scale this means highly probable := 4 and remote probability := 1. A highrating corresponds with a high likelihood of occurrence and a low rating witha low one. The number of different values depends on the granularity of theused security indicators. If almost nothing is known about an attack, a three-step scale is sufficient. But if more detailed indicators are available, it makessense to expand the scale. For example if six levels of accessibility can bedistinguished for a system, the likelihood derived from that should have also6 levels (e.g.: remote via Internet, remote via local wired network, remotevia local wireless network, easy physical access (no access restrictions), hardphysical access (security doors), no access). The methodology is independentof the number of likelihood steps.
The used likelihood scale as well as the origin of the values has to bedefined before the analysis. A possible method is to calculate the likelihood ina similar way as the Risk Priority Number (RPN) of a Failure Mode, Effects,and Criticality Analysis (FMECA) (cf. Sect. 2.1.2).
The attack scenarios are rated by security experts according to knownindicators. A predefined rating scheme is required for each indicator for aconsistent rating. The relative importance of each indicator should be deter-mined in advance. As it is difficult to achieve consensus among experts, itis generally recommended to restrict rating schemes to rather coarse scales.As mentioned before, it should only be as detailed as there is distinct dataavailable. The value vi of each indicator i can be determined on a scale from1 to n, where 1 indicates a small likelihood that the attack is carried outaccording to indicator i, and n indicates a high likelihood. For example, po-tential damage or risk of attack is typically rated as low, medium, or high,thus n = 3. The relative importance of each indicator results in an influencefactor fi ∈ R+ which has to be determined for each indicator. The influencefactor depends also on the type of attacker. Depending on his resources, capa-bilities, motives, and his preparedness to take risks, the factor is increased ordecreased. For each attacker type taken into account a set of influence factorshas to be created. An overall likelihood for an attack could then be calculatedas L =
∑i vi× fi where i is the index of the indicator [Förster 10]. An exam-
ple for this approach is the rating used in Failure Mode, Vulnerabilities andEffects Analysis (FMVEA) (cf. Sect. 2.3.3)

64 4 The Analysis of Security-enhanced Component Fault Trees
A possibility to achieve a common rating between safety and securityevents, other than probabilities, is to use the likelihood for both safety andsecurity events. The advantage of this approach is that values for all BEscan be determined relatively easy, and comparisons of likelihood are easilyperformed. The disadvantage is that the accuracy coming from rating safetyevents with probabilities is lost.
To use the advantages of both, probabilities for safety events and likeli-hood for security events, the next section will describe an approach using acombination of both probability and likelihood.
4.1.3 Tuple Rating
In Sect. 4.1.1 it was established that rating BEs with probabilities is thepreferred way for safety events. Section 4.1.2 concluded that for security eventsa rating with likelihoods is more feasible.
Hence in an SeCFT there can be both likelihoods and probabilities fordifferent events. When MCSs are determined in a tree that includes safety aswell as security events, there can be three types of MCSs as defined in thefollowing:
Definition 24 (Safety MCS) A safety Minimal Cut Set contains only safetyevents (cf. Definition 22 on p. 47).
Definition 25 (Security MCS) A security Minimal Cut Set contains onlysecurity events (cf. Definition 23 on p. 47).
Definition 26 (Mixed MCS) A mixed Minimal Cut Set contains safetyevents as well as security events.
The TE will most certainly depend on safety as well as security events.Therefore a combination of both probabilities and likelihood is needed tocalculate ratings for MCSs and TEs. Figure 4.2 shows an example SeCFT thatuses the attacker component from Fig. 4.1. For the TE controller valuetoo high there are MCSs of all three types in this example (see Table 4.1).
Table 4.1. MCSs according to type, whereas controller and attacker refer to theappropriate components
MCS type Basic Events
safety MCS: {controller.e1}security MCSs: {attacker.e1, attacker.e2, attacker.e5},
{attacker.e3, attacker.e4, attacker.e5}mixed MCS: {attacker.e6, controller.e2}

4.2 Calculation Rules for SeCFTs 65
Controllerc.out: controller value too high (TE)c.in1: sensor input too highc.in2: change controller behaviorc.e1: wrong controller behaviorc.e2: no mitigation/error handling behavior present
Attackera.out1: tampering: change output value too higha.out2: tampering: change controller dataa.e1: find LAN access porta.e2: spoof MAC addressa.e3: find WLANa.e4: break WPA keya.e5: get credentialsa.e6: tampering: change output value too high
out
&
& &
controller
attacker
controller
attacker
controller value too high
>=1&
>=1
in2
e1in1
e2
>=1 e5
e4e3e2e1
out1 out2
e6
Fig. 4.2. An example SeCFT consisting of a controller component and an attackercomponent
Events in a safety MCS are rated with probabilities. Therefore the overallrating of a safety MCS is also a probability. Events in a security MCS are ratedwith likelihoods. So the overall rating of a security MCS is also a likelihood. Ina mixed MCS however, there are both probabilities and likelihoods. As theyare not directly comparable, the rating of a mixed MCS is a tuple consisting ofthe overall probability of all included safety events and the overall likelihoodof all included security events. For TEs in an SeCFT, the same holds as formixed MCSs.
The next section will introduce the extensions for the calculation rulesneeded for an SeCFT to handle the tuples of probabilities and likelihoods.
4.2 Calculation Rules for SeCFTs
In this section the rules how to perform the calculations needed to rate MCSsand TEs are described. The partitioning of this section is the same as the sec-tion before. First, the rules for calculating probabilities are recollected. Then,new rules to calculate likelihood results of AND and OR-gates are discussed,and at last the rules are adapted to the tuples needed in SeCFTs.

66 4 The Analysis of Security-enhanced Component Fault Trees
4.2.1 Probabilities
For the calculation of the probabilities at least calculation rules for the gatesAND, OR, and NOT are required. Other gates such as XOR or voter gates can beconstructed from these three basic gates. Their calculation rules result fromthem accordingly.
For recollection, the calculation rules for the gates AND, and OR will follow.The outcome of an AND-gate with two independent input events A,B, or moregeneral n independent input events Xi, is calculated as follows:
P (A ∧B) = P (A)× P (B) (4.1)
P
(n∧i=1
Xi
)=
n∏i=1
P (Xi) , i, n ∈ N (4.2)
The outcome of an OR-gate with two independent input events A,B, ormore general n independent input events Xi, is calculated as follows:
P (A ∨B) = P (A) + P (B)− P (A)× P (B) (4.3)
P
(n∨i=1
Xi
)= 1−
n∏i=1
(1− P (Xi)) , i, n ∈ N (4.4)
As already discussed in Sect. 2.1.1 the NOT-gate will be avoided in SeCFTmodels. The calculation of probabilities for the basic gates is discussed indetail in Sect. 2.1.1. In Sect. 4.1 it was established that it is not feasible touse probabilities for security events. On the other hand, if probabilities existfor safety events, it is recommended to use them in an analysis.
Using these probabilities a partial quantitative analysis can be performed.Resulting probabilities can be calculated for MCSs and TEs if events withoutprobability values are ignored. This means that only safety events are takeninto account for the calculation of a resulting probability. Thereby an upperbound for the probability of MCSs is calculated.
4.2.2 Likelihood
Likelihood was defined as a qualitative probability for the occurrence of asecurity event. Security events are in most cases attacks conducted by anattacker. The following definitions for combinations are used:Definition 27 (Likelihood AND-gate) All subordinate events have to occurin order that the combined event occurs. Therefore, the event with the lowestlikelihood determines the likelihood L of the combined event.
L
(n∧i=1
Xi
)=
nmini=1
[L(Xi)] , i, n ∈ N (4.5)

4.2 Calculation Rules for SeCFTs 67
Another calculation can be derived from the calculation for the probabilityof an AND-gate (cf. Sect. 4.2.1). Values P (Xi) are from the interval [0, 1].Equation 4.2 holds for those values. The values L(Xi) are from the integerinterval [1,m], where m ∈ N is the maximum likelihood value defined. ValuesL(Xi) can be transformed from interval [1,m] to interval
[ 1m ,
mm
]by dividing
by m. For m → ∞ follows 1m → 0. In that new interval
[ 1m , 1
], the same
functions that are used for the probability calculations can be used. For nindependent input events Xi, the likelihood of an AND-gate is calculated asfollows:
L′
(n∧i=1
Xi
)=
n∏i=1
L(Xi)m
, i, n,m ∈ N (4.6)
The result of the AND-gate can only have the precision of the inputs. So,it has to be transformed back to the integer interval [1,m]. This is done bymultiplying the result L′ with m and rounding up. Rounding up ensures thatno underestimation occurs.
L(x) = dm× L′(x)e ,m ∈ N (4.7)
In comparison to this calculation, the minimum function from Definition 27is a worst-case estimation.
The OR-gate can be defined along the same lines. The first idea assumedthat if an attacker can choose which attack to perform, he would choose themost profitable or easiest one, and ignore the other ones [Steiner 15]. Then theoutcome of an OR-gate can be calculated using the maximum likelihood valueof all inputs. But then one might underestimate the likelihood of an attackbecause it does not take into account that several attackers might attack atthe same time.
Definition 28 (Likelihood OR-gate) At least one of the subordinate eventshas to occur in order that the combined event occurs. An attacker will mostlikely choose the event with the highest likelihood. But more than one attackermay attack at the same time. This equation only takes into account singleattackers that always only choose one attack path:
L
(n∨i=1
Xi
)= nmax
i=1[L(Xi)] , i, n ∈ N (4.8)
If more than one attacker or attackers that try several paths at once shouldbe taken into account, the following calculation should be used. It is againderived from the probability calculation, and it depends on the transformationof the value interval described for the AND-gate.
L′
(n∨i=1
Xi
)= 1−
n∏i=1
(1− L(Xi)m
) , i, n,m ∈ N (4.9)

68 4 The Analysis of Security-enhanced Component Fault Trees
And again the result L′(x) is transformed back to the value interval [1,m]by equation 4.7. This might result in values greater than m which is the max-imum value. This together with equation 4.9 results in
L(x) = min (dm× L′(x)e,m) ,m ∈ N (4.10)
for the likelihood outcome of an OR-gate.
The likelihood is propagated through the SeCFT like the probabilities: Allevents without a likelihood are ignored. It is expected that every safety eventhas a probability, and every security event has a likelihood assigned to them.For the calculation of a resulting likelihood only the security events are takeninto account.
4.2.3 Tuple Rating
Following the calculation rules for probabilities (Sect. 4.2.1) and likelihood(Sect. 4.2.2), rules how to handle the combination of both in terms of thetuples described in Sect. 4.1.3 are defined. To do that all ratings of BEs areinterpreted as tuples (P,L), where P is a probability and L a likelihood. Forsafety events esaf there is no likelihood leading to (Pesaf
,−) with an undefinedLesaf
, and for security events esec there is no probability value leading to(−, Lesec) with an undefined Pesec . Undefined values will be ignored in thecalculation of the rating.
This has to be explained further: The alternative to undefined values,would be values that do not influence the order between the events. To achievethis, an identity element or neutral element for all possible gate-operationswould be needed. This would mean in terms of probabilities, a value is neededwhich is the identity element for addition and multiplication. Such a valuedoes not exist because the identity element for the addition is 0, and theidentity element for the multiplication is 1. The same problem arises for thelikelihood operations. These values exclude each other, so no value is selected,and the undefined values are ignored during the calculation.
The tuple elements of a combination of events by logic gates are calculatedindependent of each other according to the rules established in Sects. 4.2.1and 4.2.2. Figure 4.3 shows the SeCFT from earlier with ratings for all BEs,safety as well as security. Likelihood in this example is a three-level scale of{low, medium, high} with corresponding values of {1,2,3}. Now, it will beshown exemplarily how to calculate the tuple ratings of the MCSs and theTE.
The ratings of the four MCSs result in the following:
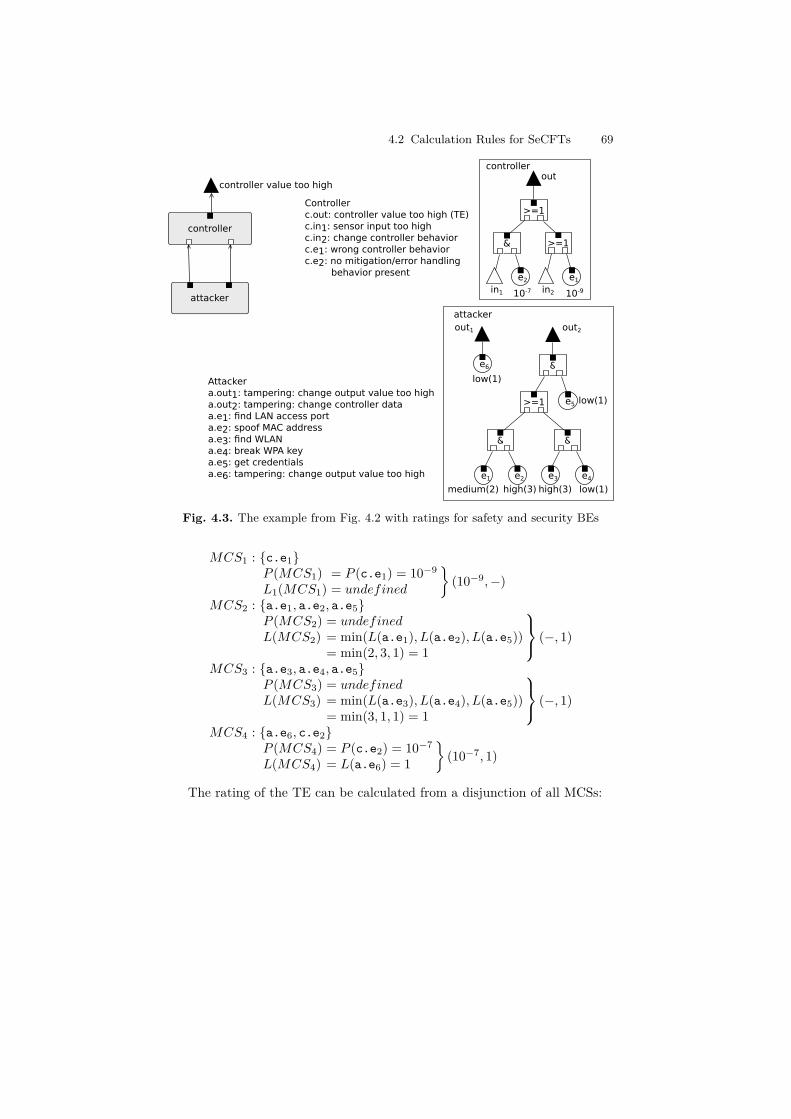
4.2 Calculation Rules for SeCFTs 69
Controllerc.out: controller value too high (TE)c.in1: sensor input too highc.in2: change controller behaviorc.e1: wrong controller behaviorc.e2: no mitigation/error handling behavior present
Attackera.out1: tampering: change output value too higha.out2: tampering: change controller dataa.e1: find LAN access porta.e2: spoof MAC addressa.e3: find WLANa.e4: break WPA keya.e5: get credentialsa.e6: tampering: change output value too high
out
&
& &
controller
attacker
controller
attacker
controller value too high
>=1&
>=1
in2
e1
in1
e2
>=1 e5
e4e3e2e1
out1 out2
e6
10-910-7
low(1)
low(1)
low(1)medium(2) high(3) high(3)
Fig. 4.3. The example from Fig. 4.2 with ratings for safety and security BEs
MCS1 : {c.e1}P (MCS1) = P (c.e1) = 10−9
L1(MCS1) = undefined
}(10−9,−)
MCS2 : {a.e1, a.e2, a.e5}P (MCS2) = undefinedL(MCS2) = min(L(a.e1), L(a.e2), L(a.e5))
= min(2, 3, 1) = 1
(−, 1)
MCS3 : {a.e3, a.e4, a.e5}P (MCS3) = undefinedL(MCS3) = min(L(a.e3), L(a.e4), L(a.e5))
= min(3, 1, 1) = 1
(−, 1)
MCS4 : {a.e6, c.e2}P (MCS4) = P (c.e2) = 10−7
L(MCS4) = L(a.e6) = 1
}(10−7, 1)
The rating of the TE can be calculated from a disjunction of all MCSs:

70 4 The Analysis of Security-enhanced Component Fault Trees
P (TE) = 1− (1− P (MCS1))(1− (MCS4))= 10−9 + 10−7 − 10−16 = 1.009999999× 10⁻⁷
L′(TE) = 1− (1− L(MCS2)3 )(1− L(MCS3)
3 )(1− L(MCS4)3 )
= 1− (1− 13 )(1− 1
3 )(1− 13 ) = 0.7
L(TE) = min (d3× 0.7e, 3) = 3
(1.01× 10⁻⁷, 3)
The calculation of the TE using the maximum function would result inan overall likelihood of 1 in comparison to 3 from the sum calculation. Forsmaller scales such as the one used in the example the sum calculation of theOR-gate tends to overestimate the likelihood. So it can be useful to additionallycalculate the maximum of the involved likelihood values to get a notion of thepossible range of likelihoods. The undefined values P (MCS2), P (MCS3) andL(MCS1) are ignored in this calculation. How these tuple ratings are used ina quantitative analysis of an SeCFT will be described in Sect. 4.4.
4.3 Qualitative Analysis of SeCFTs
The most important activity of a qualitative analysis in CFTs and SeCFTsis the determination of MCSs. They describe minimal failure scenarios of thesystem. MCSs also are used to derive a coarse classification of the criticalityof failure scenarios and BEs, and they allow to make statements about thegeneral endangerment of the analyzed system (see also Sect. 2.1.1). MCSs arealso an important starting point for a following quantitative analysis. Basedon the MCSs a basic importance analysis of BEs and MCSs can be conducted.
In Sect. 2.1.1 the qualitative analysis of traditional Fault Trees (FTs)(or CFTs) is described. This section deals with necessary extensions of thequalitative analysis to cope with additional security events in the SeCFT. Thefirst step is again the determination of the MCSs. The interpretation of anMCS is the same as in CFTs: A minimal safety failure scenario (but possiblydepending also on security attacks). As mentioned earlier in Sect. 2.1.1 a CFT(and therefore an SeCFT as well) can be transformed into a set of MCSs thatrepresents all failure scenarios which are relevant for the system. In general,a tree contains multiple MCSs corresponding to different failure scenarios.
4.3.1 Minimal Cut Set Analysis
An analysis of MCSs of an SeCFT differs from the analysis of a traditionalCFT in a few points. The first step is to calculate the MCSs per TE. The sec-ond step is to sort the MCSs according to their size. The result of a qualitativeanalysis is an ordered list of MCSs.
As discussed in detail in Sects. 4.1 and 4.2, ratings of safety and securityevents cannot be compared directly. Therefore it makes sense to sort the MCSsaccording to safety events and security events. Then, one receives three listsof MCSs:

4.3 Qualitative Analysis of SeCFTs 71
1. safety MCSs (cf. Definition 24)2. security MCSs (cf. Definition 25)3. mixed MCSs (cf. Definition 26)
Safety MCSs are analyzed as usual: A qualitative analysis starts with anordering according to the size of the MCS (Definition 11 in Sect. 2.1.1). Thesmaller an MCS is, the more critically it should be analyzed. This is explainedby the fact that all events in an MCS have to occur, so that the TE occurs andthe system fails. The lesser events have to occur, the more the TE dependson individual events. So events in smaller MCSs deserve more attention in ananalysis. An especially critical case is an MCS with only one event – a singlepoint of failure which itself can directly lead to the system failure.
Security MCSs are a more special case: In this case a system failure onlydepends on external influences and does not depend on failures of internalsystem components. But here also holds that smaller MCSs are more criticalthan larger ones. Pure security MCSs are not more critical per se than puresafety MCSs, but the uncertainty of the modeling of an attack is relativelyhigh. Depending on the threat scenario and the attacker type the likelihoodvalue changes over time. Necessary tools become better available and cheaperover time which can make an attack more probable in the future. Also, theattacker type, the attacker’s motivation and capabilities can and will changeover time – potentially to the disadvantage of the system. This is why puresecurity MCSs should be avoided by adding suited countermeasures whichconvert security MCSs to mixed MCSs.
Mixed MCSs on the other hand can be managed better than securityMCSs: For the occurrence of the TE all events of a mixed MCS have tooccur which means regular safety events have to occur. These occurrences ofsafety events can be managed with the usual methods such as redundancy ormonitoring. The probability for a mixed MCS to cause the TE has an upperbound: the probability of the contained safety events. This way the criticalityof security events can be mitigated by safety events with low probability. Theprobability of statistically independent safety events is multiplied to obtainthe probability of the TE (cf. Sect. 4.2.1). That means, the more statisticallyindependent safety events an MCS contains, the lesser probable it is to causethe TE. With this in mind, adding more events to an MCS increases the safetyof the system without knowing the exact probabilities.
Figure 4.4 shows the example SeCFT with highlighted MCSs. MCS1 isa safety MCS, MCS2 and MCS3 are security MCSs, and MCS4 is a mixedMCS (see Table 4.2).
To summarize the qualitative analysis of MCSs: There are three types ofMCSs which differ in the level of controllability of their BEs. Controllabilityin this context means how much a failure scenario (MCS) depends on faults ofthe system as opposed to external factors as for example attacks. In descendingorder according to their controllability these are: safety MCSs, mixed MCSsand security MCSs. Resulting from that, additionally to MCSs containing only

72 4 The Analysis of Security-enhanced Component Fault Trees
Table 4.2. MCSs according to type, whereas controller and attacker refer to theappropriate components
MCS number Basic Events MCS type
MCS1 {controller.e1} safety MCSMCS4 {attacker.e6, controller.e2} mixed MCSMCS2 {attacker.e1, attacker.e2, attacker.e5}, security MCSsMCS3 {attacker.e3, attacker.e4, attacker.e5}
one event (single points of failure) also plain security MCSs should be avoidedby adding more (safety) BEs. Also, the more MCSs exist in a given SeCFT,
out
e1
&
in1
e2
in2
e6
out1
&
e5
&
e1 e2
&
e3 e4
out2
MCS1
MCS2
MCS3
MCS4
controller
attacker
>= 1
>= 1
>= 1
Fig. 4.4. An SeCFT with highlighted MCSs from the example in Fig. 4.2

4.4 Quantitative Analysis of SeCFTs 73
the more opportunities for the TE exist which indicates a higher vulnerabilityof the system with respect to this TE.
4.3.2 Importance of Basic Events
Another goal of an analysis is to determine the importance of BEs. The im-portance shows how much of an impact a BE has on a TE. BEs that arepart of more than one MCS are more important than the ones that are onlypart of one MCS. But the size of MCSs is also a factor. BEs in smaller MCSsare more important than the ones in larger MCSs. More accurate importanceanalysis is possible within a quantitative analysis. Referred to the example, ifthe importance of BEs within MCSs of the same size is compared, this resultsin the order of importance shown in Table 4.3.
Table 4.3. Qualitative importance of BEs
MCS size basic events (in descending order of importance)
1 c.e12 {c.e2, a.e6}3 a.e5 > {a.e1, a.e2, a.e3, a.e4}
4.4 Quantitative Analysis of SeCFTs
A quantitative analysis is conducted if more accurate statements about thesystem safety are necessary than the results from a qualitative analysis whichare mainly the determination and preliminary ordering of MCSs. Further anal-ysis of the MCSs brings more insight into the contribution of single failurescenarios (MCSs) to the vulnerability of the system. Systems have to fulfillcustomer requirements or to comply with certain standards which may includeminimum sizes of MCSs or maximum values for system failure probabilities.A quantitative analysis therefore has several goals [Vesely 81, IEC 61025 06]:
• to determine the rating of the TE under consideration to compare it tothe given requirements from standards or customers,
• to determine ratings of the individual MCSs to determine the MCS thathas the biggest contribution to the TE (the most probable failure scenario),
• and derived from the previous ones: to determine where countermeasureswould have the most effect.
A quantitative analysis of an SeCFT starts with a quantitative evaluationof its MCSs. The first step here is to assign probabilities to safety events andlikelihoods to security events. During the assignment of likelihood values to

74 4 The Analysis of Security-enhanced Component Fault Trees
security events it should be kept in mind that those security events belongingto the same MCS can influence each other.
After the determination of the MCSs there are two possibilities to orderthem: According to size and type (see qualitative analysis in Sect. 4.3) oraccording to type and ratings (probability and likelihood). An ordering sim-ply according to the ratings is not possible for all MCSs in general becauseof the incomparability of probabilities and likelihoods (see also Sect. 4.1).For each MCS a tuple rating (P,L) is calculated according to the rules de-scribed in Sect. 4.2.3. For probabilities this means the value for the MCS isthe product of all probabilities of the contained events. (Under the precondi-tion that all events are independent which is usually given for safety events.)For the likelihood of an MCS the minimum of all likelihoods of the includedevents is determined. This approach was previously described in [Steiner 13a]and [Steiner 15].
Each type of MCSs can be ordered by itself. To compare two Minimal CutSets MCS1 and MCS2 with tuple ratings (P1, L1) and (P2, L2) Table 4.4 isused. The table defines a partial order for MCSs.
Table 4.4. Conditions for an order of mixed MCSs according to two tuples (P1, L1)and (P2, L2)
P1 < P2 P1 = P2 P1 > P2
L1 < L2 MCS1 < MCS2 MCS1 < MCS2 undefinedL1 = L2 MCS1 < MCS2 MCS1 = MCS2 MCS1 > MCS2
L1 > L2 undefined MCS1 > MCS2 MCS1 > MCS2
The two states named undefined have to be analyzed further. To ordertwo MCSs that fall into these states, the ordering has to be prioritized eitheraccording to probability or to likelihood. The resulting ordered list of MCSs re-flects the relative criticality of the represented failure scenarios. Higher ratingshere correspond to a higher criticality and vice versa. To find out if the systemcomplies with the given requirements, the list of MCSs is filtered accordingto the requirements (e.g.: “show me all MCSs with size ≤ 2”, “P > 10−7” or“L ≥ medium”). The results then are the failure scenarios that require coun-termeasures. Table 4.5 shows the MCSs from the example ordered accordingto probability and likelihood with the values for the tuple rating calculatedin Sect. 4.2.3.
As mentioned earlier, requirements can define boundary values for MCSsin size or rating, but usually the main requirement is a boundary value for therating of the TEs: “The system shall not fail with a probability more than . . . ”The TE probability can be calculated either as the sum of the probabilities ofall MCSs if only AND and OR-gates are used. This defines an upper boundaryfor the probability P ′(TE) (see equation 4.11 and also Sect. 2.1.1).

4.4 Quantitative Analysis of SeCFTs 75
Table 4.5. MCSs from example 1 ordered according to probability and likelihood
MCS number tuple rating (P,L)
MCS4 (10−7, 1)MCS1 (10−9,−)MCS2 (−, 1)MCS3 (−, 1)
P (TE) ≤ P ′(TE) =n∑i=1
P (MCSi) , i, n ∈ N, n number of MCSs (4.11)
The other variant is to calculate P (TE) using the Binary Decision Diagram(BDD) algorithm described in Sect. 2.1.1 which returns the exact probabilityvalue. To adapt the BDD algorithm to SeCFTs only the BEs with an assignedprobability value are considered for the calculation as already discussed inSect. 4.2.3.
The likelihood L(TE) of the TE is calculated from the likelihoods of allMCSs as defined in equation 4.9 and 4.10 in Sect. 4.2.2:
L′
(n∨i=1
Xi
)= 1−
n∏i=1
(1− L(Xi)m
) , i, n,m ∈ N
L(x) = min (dm× L′(x)e,m) ,m ∈ N
A simpler estimation of the TE likelihood can be obtained by just summingthe likelihood values of all MCSs.
Table 4.6 shows again the chosen values for probabilities and likelihoodin the example. Concerning the example, the rating of the TE results in the
Table 4.6. BEs together with their ratings from the example
Basic Event tuple rating (P,L)
c.e1 (10−9,−)c.e2 (10−7,−)a.e1 (−, 2)a.e2 (−, 3)a.e3 (−, 3)a.e4 (−, 1)a.e5 (−, 1)a.e6 (−, 1)
following:

76 4 The Analysis of Security-enhanced Component Fault Trees
P ′(TE) = 10−9 + 10−7 = 1.01× 10⁻⁷
P (TE) = 1.009999999× 10⁻⁷
L(TE) = 3
For all BEs an importance value can be calculated corresponding to theFussell-Vesely (FV) importance. As with all the other calculations so far,the importance will be calculated separate for probability and likelihood. Torecall, the FV importance of an event e is calculated as:
FVe =∑me
i=1 P (MCSei)∑m
j=1 P (MCSj)
WhereasMCSe are the MCSs that contain event e, me is the number thereof,and m the number of all MCSs. A similar value can be calculated for thelikelihood:
FVLe =∑me
i=1 L(MCSei)∑m
j=1 L(MCSj)
Using these importance values for probabilities and likelihood, the events canbe identified that have the most impact on the rating of the TE. This knowl-edge is used to decide where is the system countermeasures should be imple-mented.
As to the nature of MCSs, their probabilities can be reduced in two ways:either by reducing the probability of a single event (or more), or by addingmore events. The likelihood decreases if a new event with a lower likelihoodis added, or the minimum likelihood is decreased. Adding more events shouldalso decrease the criticality of an MCS, but does not directly affect the likeli-hood value.
The decision for or against a countermeasure for a certain MCS can alsobe based on partially available data. For example an MCS that includes atleast one extremely improbable event can be given a low priority even if notall probabilities of BEs are known. As probabilities of independent BEs aremultiplied in order to calculate the MCS probability, the probability of theevent with the lowest probability in an MCS defines an upper bound for theMCS probability.
P (MCSi) ≤ P (eij) ,∀eij ∈MCSi, i, j ∈ N (4.12)
If for the analysis of the security events indicators as attack cost or attackertype are used, those can also be used to prioritize MCSs: Known attack costscan be used as lower bounds of attacks, and systems can be designed towithstand only some attacker types.
With the proposed extensions of established techniques qualitative analy-ses of SeCFTs are possible taking into account safety as well as security causesof system failures.

4.5 Summary: Analysis Process of SeCFTs 77
4.5 Summary: Analysis Process of SeCFTs
This section will summarize the complete analysis process to give an overviewof all required tasks. In Fig. 4.5 the analysis process is shown after the tree iscreated.
sorted list of MCS
examine critical MCS
find countermeasures
minimal cut sets
qualitative analysisquantitative analysis
assign values to eventssafety -> probabilitiessecurity -> likelihood
&
≥1
1 2
3 4
&
≥1 i2
i1
a1
a1 a2
a_out1 a_out2
SECFT
Attacker
Fig. 4.5. The extended analysis process after the SeCFT is created
The analysis process can be divided into two parts. First, the MCSs aredetermined which serve as a basis for a qualitative and a quantitative analysis.In the qualitative analysis (right side of the figure) the MCSs are prioritizedaccording to type and size to find the most critical ones. For the quantitativeanalysis (left side of the figure) values are assigned to all BEs, probabilitiesto safety events and likelihoods to security events. From these values the re-sulting ratings of the MCSs and the TEs are calculated. The ratings of theMCSs and TEs now can be compared to the requirements. If the require-ments are met, the analysis is finished here, and it can serve as evidence formeeting the requirements. If not, a further analysis is done to find out whereand how the system has to be improved. Using the ratings, the MCSs canbe prioritized. The MCSs are sorted according to type and either size, prob-ability or likelihood. Thereby the most critical MCSs (the ones that eitherdirectly violate the requirements or contribute substantially to it) are iden-

78 4 The Analysis of Security-enhanced Component Fault Trees
tified. Against these most critical MCSs countermeasures have to be found.After the implementation of those countermeasures the SeCFTs are extendedto incorporate them and a new analysis begins with the new SeCFTs to checkif the countermeasures have the desired effect.

5
Evaluation of the Approach
In the following chapter the analyses of the systems that were conductedduring the course of this work within different projects are presented. Thefirst on is an analysis of the robot ravon, followed by an adaptive cruisecontrol, a smart farming scenario, and an automatic infusion pump.
As the analyses of the examples were conducted during the developmentof the method, they reflect the particular development stages (cf. Sect. 3.3.2).The first analysis of ravon was modeled similar to a Fault Tree (FT). Thewhole tree was modeled in one component, and the attacks were modeledas additional Basic Events (BEs). The second example, the adaptive cruisecontrol, was modeled with separate components, but the attacks were stilladditional BEs. The last two examples, the smart farming scenario and theinfusion pump, show the last iteration of the modeling process. The systemswere modeled with different components, vulnerabilities were inserted as inputports, and the attacks were modeled in a separate attacker component.
The following section describes the workflow that was followed to conductthe analyses of the systems using Security-enhanced Component Fault Trees(SeCFTs).
5.1 Tool Support
The example systems were modeled using the CFT modeling tool ESSaRelin version 5.0.2 [ESSaRel 09]. Safety Basic Events are rated with a probabil-ity just like they would be in a Component Fault Tree (CFT) analysis. Thedistinction between safety BEs and security BEs is done via the descriptionfield of the BEs. For that purpose security BEs are marked in the descriptionwith the tag [sec]. Security BEs are rated with a likelihood value. This like-lihood is also put into the description field, from where it can be read later inthe analysis. From the viewpoint of ESSaRel the SeCFTs do not differ fromstandard CFTs, except that not all BEs have a probability value assigned tothem. Thereby, it is possible to use ESSaRel to calculate the Minimal Cut

80 5 Evaluation of the Approach
Sets (MCSs) for the desired Top Event. The resulting MCSs can be exportedinto an XML file which can be used for further analysis. Based on the ex-ported list of MCSs, the first analyses were conducted manually using Excelrespective LibreOffice Calc.
To simplify this second step, a small prototype tool was developed thatuses the exported list of MCSs and the ESSaRel model to calculate the safetyand security ratings for MCSs and Top Events. The tool requires the XMLfile containing the MCSs and the folder containing the ESSaRel model. Thisdata is imported and all ratings are calculated. The tool returns a sorted listof the MCSs according to either size and type, safety probabilities, or secu-rity likelihoods. With that the most critical MCSs depending on the systemrequirements can be determined. Figure 5.1 shows a screenshot of the toolprototype.
Fig. 5.1. A screenshot of the prototype tool for the analysis of SeCFTs
As this tool is a prototype with only a minimum of functionality, there aresome restrictions in the usage. The tool cannot handle more than one proxy ofa component, and the name of a proxy has to be the same as the name of theinstantiated component. This is because ESSaRel does save the BEs includedin an MCS using the proxy name, but the model of the component is savedunder the component name. To merge the MCS information with the ratingsof the BEs, the tool has to map proxy names to component names. The valueof the description field also has to be in very strict bounds for the security

5.2 Analysis Example: RAVON 81
BEs. The tag [sec] has to be the first string value in the description, followedby either a space character or a comma and the rating of the security BE.This rating in the current version can be one of [low], [medium], or [high]in exactly that notation. Other values can also the used in theory, but theywould have to be implemented in the code of the tool.
5.2 Analysis Example: RAVON
The first analysis using the approach of this thesis was done during the BMBF1
funded project ViERforES2. In the next sections first the demonstrator ravonis described, and afterwards the analysis and the results are presented.
5.2.1 Description RAVON
ravon is a mobile robot developed by the Robotics Research Lab at theUniversity of Kaiserslautern3 to research off-road navigation of autonomousvehicles [Armbrust 09, Schäfer 11]. Using different sensor systems it is able toperceive its environment. Figure 5.2 shows the robot outside the universityduring a presentation. The technical data is summarized in Table 5.1.
Table 5.1. ravon technical data
Length 2.35 mWidth 1.4 mHeight 1.8 m (highest point: GPS antenna)Weight 750 kgPower Supply 8 sealed lead batteries (12 V, 55 A h each)Operation Time about 4 hDrive four wheel drive with four independent electric motorsSteering front and rear wheel steering via linear motorsVelocity 10 km h−1 max.Controller 2 Motorola 56F803 DSPsComputer 4 Industrial PCsFloor Clearance 0.3 mWheel Diameter 0.75 mMax. Slope 100 % (at 7 km h−1)
Laser scanners in the front and the back measure distance and detect ob-stacles. Two horizontally mounted 2D laser scanners are used for short range
1 Bundesministerium für Bildung und Forschung (Federal Ministry of Educationand Research)
2 Virtuelle und Erweiterte Realität für höchste Sicherheit und ZuverlässigkeitEingebetteter Systeme (ViERforES), http://www.vivera.org/ViERforES/ (ac-cessed 2015-11-09)
3 http://agrosy.informatik.uni-kl.de (accessed 2015-11-09)

82 5 Evaluation of the Approach
Fig. 5.2. The ravon robot 2009 at the University of Kaiserslautern
obstacle detection. In the front of the robot two stereo camera systems areinstalled for mid-range obstacle detection (up to 20 m) and for far-range ter-rain classification (up to 40 m). In addition to the cameras a 3D laser scanneris used for better detection of obstacles in distances up to 15 m. Two spring-mounted bumpers in the front and the back are used for tactile detection ofdense vegetation and act as emergency stop triggers.
The different sensor inputs are merged and evaluated in the control soft-ware. The control software is realized using the behavior-based control ar-chitecture iB2C [Proetzsch 10]. Depending on the evaluated sensor data it isdecided if an obstacle is lying in the planned way of the robot, and if so,evasion behaviors make sure that the obstacle is not hit.
ravon is driven by four battery-powered electric wheel hub motors bring-ing it to a maximum velocity of 10 km h−1. Its total mass of 750 kg bringsup a potential risk of serious damage to itself and the environment includinginjuries in collisions with humans. It is therefore imperative that the systemis analyzed for residual risks and to check if the built-in safeguards are suffi-cient. Unfavorable environmental conditions could lead to a non-detection ofan obstacle by one or more sensors. As a last resort, if the sensors did notdetect an obstacle, a safety chain has been implemented. It stops the robotimmediately in case the bumper sensors are triggered. Figure 5.3 shows thestructure of the safety chain implemented in ravon.
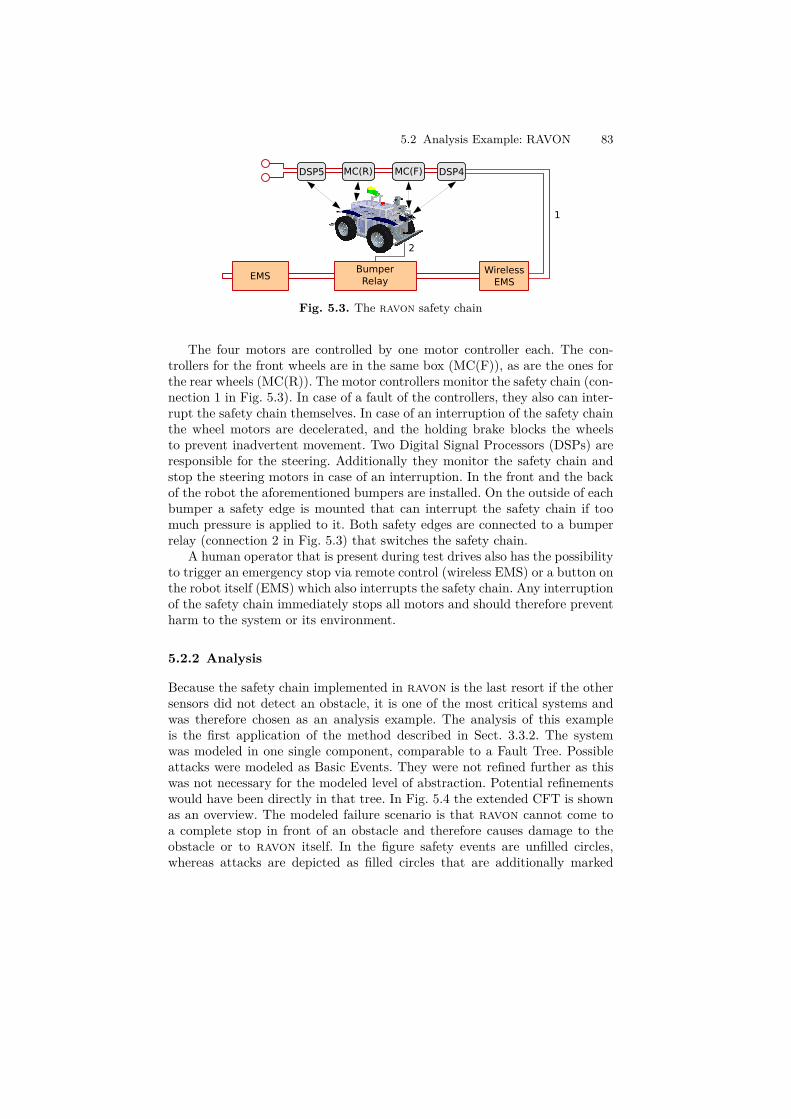
5.2 Analysis Example: RAVON 83
DSP5 DSP4MC(F)
2
1
MC(R)
BumperRelayEMS
WirelessEMS
Fig. 5.3. The ravon safety chain
The four motors are controlled by one motor controller each. The con-trollers for the front wheels are in the same box (MC(F)), as are the ones forthe rear wheels (MC(R)). The motor controllers monitor the safety chain (con-nection 1 in Fig. 5.3). In case of a fault of the controllers, they also can inter-rupt the safety chain themselves. In case of an interruption of the safety chainthe wheel motors are decelerated, and the holding brake blocks the wheelsto prevent inadvertent movement. Two Digital Signal Processors (DSPs) areresponsible for the steering. Additionally they monitor the safety chain andstop the steering motors in case of an interruption. In the front and the backof the robot the aforementioned bumpers are installed. On the outside of eachbumper a safety edge is mounted that can interrupt the safety chain if toomuch pressure is applied to it. Both safety edges are connected to a bumperrelay (connection 2 in Fig. 5.3) that switches the safety chain.
A human operator that is present during test drives also has the possibilityto trigger an emergency stop via remote control (wireless EMS) or a button onthe robot itself (EMS) which also interrupts the safety chain. Any interruptionof the safety chain immediately stops all motors and should therefore preventharm to the system or its environment.
5.2.2 Analysis
Because the safety chain implemented in ravon is the last resort if the othersensors did not detect an obstacle, it is one of the most critical systems andwas therefore chosen as an analysis example. The analysis of this exampleis the first application of the method described in Sect. 3.3.2. The systemwas modeled in one single component, comparable to a Fault Tree. Possibleattacks were modeled as Basic Events. They were not refined further as thiswas not necessary for the modeled level of abstraction. Potential refinementswould have been directly in that tree. In Fig. 5.4 the extended CFT is shownas an overview. The modeled failure scenario is that ravon cannot come toa complete stop in front of an obstacle and therefore causes damage to theobstacle or to ravon itself. In the figure safety events are unfilled circles,whereas attacks are depicted as filled circles that are additionally marked

84 5 Evaluation of the Approach
with [sec] in the description. The tree can be divided into two parts: On theleft side below the topmost OR-gate (safety chain does not decelerate Ravonsufficiently) the causes emanating from the motor controllers (MC initiate noemergency stop) are analyzed. Three classes of faults at the motor controllersare considered: faults in the control software of the controllers, wrong parame-ters for the brake maneuver, or not initiating the emergency stop because thecorresponding signal is not interpreted correctly. For all three of those thereis a possibility of random faults or targeted attacks as the cause.
The right subtree refers to the interruption (or lack thereof) of the safetychain (safety chain is not interrupted). The safety chain is divided in threeparts that all have to fail together for the system to fail. An emergency stopbutton (EMS does not interrupt SC ), a wireless emergency stop button (wire-less EMS does not interrupt SC ), and the bumper relay which is triggered bythe safety edges on the bumpers (bumper relay does not interrupt SC ) all haveto fail so that the safety chain is not interrupted in case of an emergency. Theemergency stop button could be not reachable, or the button could not bepressed due to mechanical or electrical reasons that could be caused by ran-dom faults or sabotage. The wireless emergency stop button is modeled assender and receiver that could be sabotaged or fail randomly. Additionally,an attacker could jam the radio signal to hinder an emergency stop trigger.The bumper relay does not switch if it has a defect, it is bypassed, or thesafety edges do not send the switching signal.
Plausible orders of magnitude were chosen for the probabilities of safetyevents. For emergency stop buttons there exist device specifications that statea failure probability of 1×10⁻⁷. Based on that the values for the other systemcomponents, for which no values were available, were estimated. The securityratings in this model were chosen from a scale of three steps {low, medium,high}. The difficulty of all considered attacks depends directly on the level ofaccess to the system. So the rating depends on the level of access an attackerhas to the system. Direct physical access leads to a low likelihood becausethis is generally the most difficult to achieve. Access to the wireless sender ofthe wireless emergency stop button is rated with medium, and jamming theradio signal is rated with high, because this attack can be conducted withoutdirect access to the system from a distance. There are 21 Basic Events (BEs),11 thereof are safety BEs and 10 security BEs. The ratings of all consideredBEs are listed in Table 5.2.
5.2.3 Results
During the qualitative analysis of the SeCFT of the safety chain of ravon126 Minimal Cut Sets (MCSs) were found. Table A.1 in Appendix A.1 showsall found MCSs in the order in which they were calculated by ESSaRel. The 6MCSs shown in Table 5.3 have a size of 1 and are ordered according to theirtype. They are single points of failure in this model and should be analyzedfurther. The remaining 120 MCSs have a size of 3.
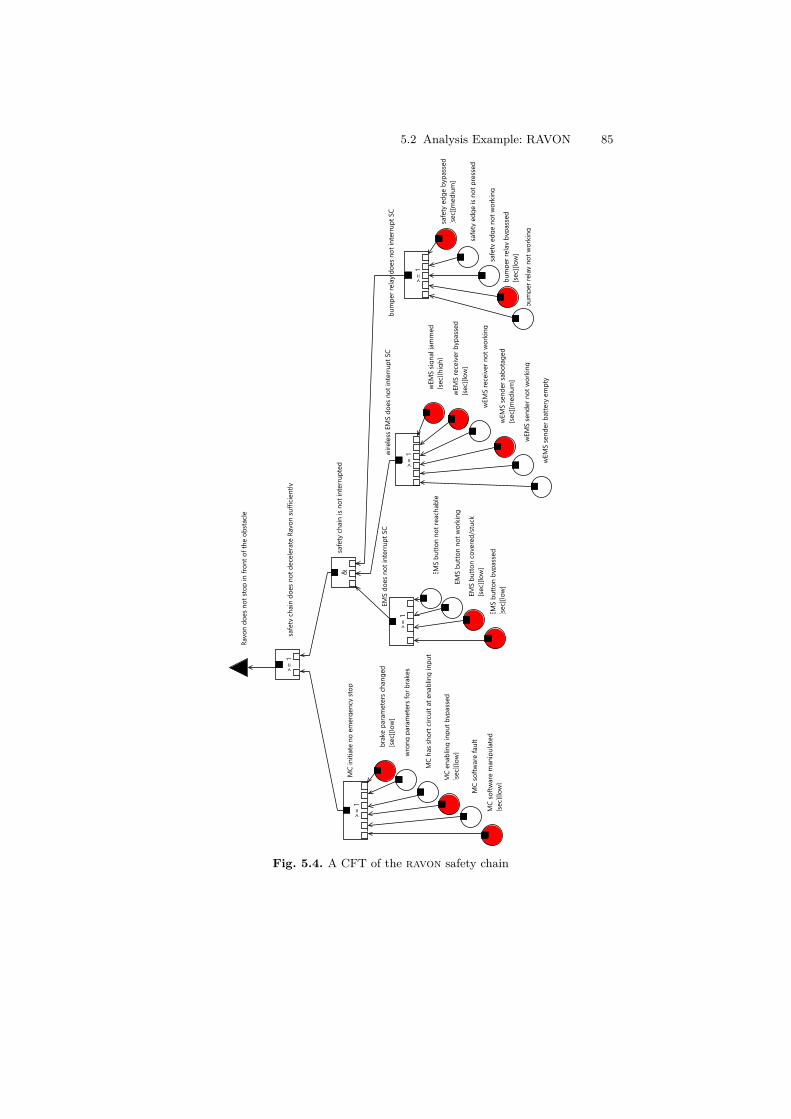
5.2 Analysis Example: RAVON 85
brak
e pa
ram
eter
s ch
ange
d[s
ec][l
ow]
MC
softw
are
man
ipul
ated
[sec
][low
]MC
enab
ling
inpu
t byp
asse
d[s
ec][l
ow]
MC
softw
are
faul
t
MC
has
shor
t circ
uit a
t ena
blin
g in
put
wro
ng p
aram
eter
s fo
r bra
kes
>=
1M
C in
itiat
e no
em
erge
ncy
stop
>=
1sa
fety
cha
in d
oes
not d
ecel
erat
e Ra
von
suffi
cien
tly
Ravo
n do
es n
ot s
top
in fr
ont o
f the
obs
tacl
e
>=
1
bum
per r
elay
doe
s no
t int
erru
pt S
C>
= 1
EMS
does
not
inte
rrup
t SC
&sa
fety
cha
in is
not
inte
rrup
ted >=
1wire
less
EM
S do
es n
ot in
terr
upt S
C
safe
tyed
geis
notp
ress
ed
wEM
S si
gnal
jam
med
[sec
][hig
h]
wEM
S se
nder
not
wor
king
EMS
butt
onno
trea
chab
le
bum
per r
elay
not
wor
king
wEM
Sre
ceiv
erno
twor
king
wEM
S re
ceiv
er b
ypas
sed
[sec
][low
]
safe
ty e
dge
bypa
ssed
[sec
][med
ium
]
wEM
S se
nder
bat
tery
em
pty
EMS
butt
on b
ypas
sed
[sec
][low
]EMS
butt
onno
twor
king
wEM
S se
nder
sab
otag
ed[s
ec][m
ediu
m]
bum
per r
elay
byp
asse
d[s
ec][l
ow]
safe
ty e
dge
not w
orki
ng
EMS
butt
on c
over
ed/s
tuck
[sec
][low
]
Fig. 5.4. A CFT of the ravon safety chain

86 5 Evaluation of the Approach
Table 5.2. Ratings of the Basic Events in the ravon safety chain
Component.Basic event Rating Type
SafetyChain.brake parameters changed low securitySafetyChain.bumper relay bypassed low securitySafetyChain.bumper relay not working 1E-07 safetySafetyChain.EMS button bypassed low securitySafetyChain.EMS button covered/stuck low securitySafetyChain.EMS button not reachable 1E-05 safetySafetyChain.EMS button not working 1E-07 safetySafetyChain.MC enabling input bypassed low securitySafetyChain.MC has short circuit at enabling input 1E-05 safetySafetyChain.MC software fault 1E-07 safetySafetyChain.MC software manipulated low securitySafetyChain.safety edge bypassed medium securitySafetyChain.safety edge is not pressed 1E-05 safetySafetyChain.safety edge not working 1E-07 safetySafetyChain.wEMS receiver bypassed low securitySafetyChain.wEMS receiver not working 1E-07 safetySafetyChain.wEMS sender battery empty 1E-05 safetySafetyChain.wEMS sender not working 1E-07 safetySafetyChain.wEMS sender sabotaged medium securitySafetyChain.wEMS signal jammed high securitySafetyChain.wrong parameters for brakes 1E-05 safety
Table 5.3. MCSs of size 1 found during a qualitative analysis of the ravon safetychain
MCS ID Basic Event Type
2 SafetyChain.brake parameters changed security3 SafetyChain.MC software manipulated security5 SafetyChain.MC enabling input bypassed security1 SafetyChain.wrong parameters for brakes safety4 SafetyChain.MC software fault safety6 SafetyChain.MC has short circuit at enabling input safety
Overall, there are 21 safety MCSs and 90 mixed MCSs. 15 of all MCSsare security MCSs that would not have been found without the considerationof attacks as additional causes for failures. The security MCSs should receivespecial attention, as their occurrence only depends on the actions of an at-tacker. The later quantitative analysis showed that their likelihood is low. Socountermeasures only have to be taken if MCSs of size 1 have to be avoidedat all cost.
A following quantitative analysis yields a rating of the Top Event Ravondoes not stop in front of the obstacle of (1.8× 10⁻⁴, high). The relative largenumber of security MCSs explains the high likelihood for the security partof the SeCFT. The most critical MCSs according to the security likelihoodand the safety probability of this system were determined. Table 5.4 showsthe MCSs with likelihood values of high. As can be seen in the table, thoseare mixed MCSs, and their safety probabilities are very low. Thus it appears

5.2 Analysis Example: RAVON 87
that these MCSs are not critical despite their high security likelihood, becausethey contain safety events with a very low probability of occurrence.
Table 5.4. Most critical MCSs according to the security likelihood of the ravonsafety chain
MCS ID Type Rating Basic Events
55 mixed (1E-10, high) SafetyChain.EMS button not reachableSafetyChain.safety edge is not pressedSafetyChain.wEMS signal jammed
104 mixed (1E-12, high) SafetyChain.EMS button not reachableSafetyChain.wEMS signal jammedSafetyChain.safety edge not working
103 mixed (1E-12, high) SafetyChain.EMS button not reachableSafetyChain.wEMS signal jammedSafetyChain.bumper relay not working
59 mixed (1E-12, high) SafetyChain.EMS button not workingSafetyChain.safety edge is not pressedSafetyChain.wEMS signal jammed
108 mixed (1E-14, high) SafetyChain.EMS button not workingSafetyChain.wEMS signal jammedSafetyChain.safety edge not working
107 mixed (1E-14, high) SafetyChain.EMS button not workingSafetyChain.wEMS signal jammedSafetyChain.bumper relay not working
Table 5.5 shows the most critical MCSs with a probability of at least1× 10−5. Those failure scenarios would also have been found using standardCFTs. As the table shows, the system has no failure scenarios with a higherprobability than 1× 10⁻⁵.
The analysis of the ravon safety chain using SeCFTs shows that thereare security MCSs in the system which may directly cause the system failure.Those security MCSs would not have been found in a classical Fault TreeAnalysis (FTA) using CFTs. Some of these attack scenarios also consist of onlyone security event. Depending on the requirements for the system, those haveto be avoided or at least argued that they are not critical. The quantitativeanalysis rated those single event security MCSs with a low likelihood. So, aslong as the grounds on which they were rated do not change, they can be seenas non-critical MCSs.

88 5 Evaluation of the Approach
Table 5.5. Most critical MCSs according to the safety probability of the ravonsafety chain
MCS ID Type Rating Basic Events
1 safety (1E-05, – ) SafetyChain.wrong parameters for brakes6 safety (1E-05, – ) SafetyChain.MC has short circuit at enabling input8 mixed (1E-05, medium) SafetyChain.wEMS sender sabotaged
SafetyChain.EMS button not reachableSafetyChain.safety edge bypassed
57 mixed (1E-05, medium) SafetyChain.EMS button not reachableSafetyChain.safety edge bypassedSafetyChain.wEMS signal jammed
63 mixed (1E-05, low) SafetyChain.EMS button not reachableSafetyChain.bumper relay bypassedSafetyChain.wEMS receiver bypassed
15 mixed (1E-05, low) SafetyChain.wEMS sender sabotagedSafetyChain.EMS button not reachableSafetyChain.bumper relay bypassed
75 mixed (1E-05, low) SafetyChain.EMS button covered/stuckSafetyChain.safety edge is not pressedSafetyChain.wEMS receiver bypassed
83 mixed (1E-05, low) SafetyChain.EMS button covered/stuckSafetyChain.safety edge is not pressedSafetyChain.wEMS signal jammed
79 mixed (1E-05, low) SafetyChain.EMS button bypassedSafetyChain.safety edge is not pressedSafetyChain.wEMS signal jammed
29 mixed (1E-05, low) SafetyChain.wEMS sender battery emptySafetyChain.EMS button bypassedSafetyChain.bumper relay bypassed
21 mixed (1E-05, low) SafetyChain.wEMS sender sabotagedSafetyChain.EMS button covered/stuckSafetyChain.safety edge is not pressed
24 mixed (1E-05, low) SafetyChain.wEMS sender battery emptySafetyChain.EMS button bypassedSafetyChain.safety edge bypassed
19 mixed (1E-05, low) SafetyChain.wEMS sender sabotagedSafetyChain.EMS button bypassedSafetyChain.safety edge is not pressed
30 mixed (1E-05, low) SafetyChain.wEMS sender battery emptySafetyChain.EMS button covered/stuckSafetyChain.bumper relay bypassed
26 mixed (1E-05, low) SafetyChain.wEMS sender battery emptySafetyChain.EMS button covered/stuckSafetyChain.safety edge bypassed
49 mixed (1E-05, low) SafetyChain.EMS button not reachableSafetyChain.safety edge bypassedSafetyChain.wEMS receiver bypassed
71 mixed (1E-05, low) SafetyChain.EMS button bypassedSafetyChain.safety edge is not pressedSafetyChain.wEMS receiver bypassed
67 mixed (1E-05, low) SafetyChain.EMS button not reachableSafetyChain.bumper relay bypassedSafetyChain.wEMS signal jammed

5.3 Analysis Example: Adaptive Cruise Control 89
5.3 Analysis Example: Adaptive Cruise Control
This second example describes the modeling of an Adaptive Cruise Control(ACC) of a car. The ACC example was created during the BMBF4 fundedproject ViERforES II5. It was used in [Steiner 13a] to illustrate the modelingapproach of this thesis.
5.3.1 Description Adaptive Cruise Control
In the considered system vehicles are to drive in a platoon with other vehicles.A defined distance should be kept between the vehicles. A vehicle sends itsmeasured distances to both leading and following vehicles, and its velocity tothe following vehicle. Figure 5.5 shows a schematic of the system with twocars.
VB VA
distance to VA
current velocity
distance to VB
wheel speed wheel speed
distance
Fig. 5.5. The ACC example system
The used system architecture is shown in Fig. 5.6. Components not used inthe analysis scenario are painted in gray. It is based on the system describedin [Spang 10]. Four wheel speed sensors provide the own current speed of thevehicle to the speedometer. The distance to the other vehicle is provided byfront and rear distance sensors. Each vehicle receives the measured velocityand distance values from the leading vehicle by an antenna component. Dis-tance values and foreign velocities are used by the communication systemwhich provides them to the control logic unit. From the distance and thevelocity the new target velocity is calculated by the ACC component whichthen increases or decreases the vehicle speed. The received distance and themeasured one are fused in the communication system. The received velocityis used as is.
4 Bundesministerium für Bildung und Forschung (Federal Ministry of Educationand Research)
5 Virtuelle und Erweiterte Realität für höchste Sicherheit und ZuverlässigkeitEingebetteter Systeme – Zweite Phase (ViERforES II), http://www.vivera.org/ViERforES/ (accessed 2015-11-09)

90 5 Evaluation of the Approach
sensors vehicle control
wheel speed
front right
front left
rear left
rear right
distance
rear
front
antennareceiver
rear
frontsp
eedom
ete
rco
mm
un
icatio
n sy
stem
contro
l logic u
nit
actuators
antennatransmitter
rear
front
vehiclespeed
throttle
brake
interface
brake
acceleration
acc
distance to VA
distance to VB
dist to VA
vel to VA
dist to VB
current velocity
dist to
VA
vel to
VA
Fig. 5.6. The modeled architecture of the ACC
5.3.2 Analysis
The analyzed scenario is: There are two vehicles in a platoon, a leading vehicleVA and a following vehicle VB . Due to a failure in the ACC system VB is toofast and crashes against VA.
The components of this example system were modeled as separate CFTs.Attacks were added as additional Basic Events (BEs) in the respective CFTs.Comparable to the previous example, the attacks were not refined furtherthan one BE. This modeling example illustrates an intermediate stage of thedevelopment of SeCFTs in between the modeling as FTs as in the first examplein Sect. 5.2, and the final SeCFTs as in the following examples in Sects. 5.4and 5.5.
In Fig. 5.7 one can see the high level overview of the CFT model of theACC. An enlarged version including all subtrees can be found in Appendix A.2in Figs. A.1 to A.11. The CFTs for the ACC system are built along thesystem components and their composition. Accordingly, there is one CFTper component and different nesting levels. In the highest level CFT shownin Fig. 5.7 directly below the Top Event crash with VA is the brake CFT,followed by the vehicle CFT in which all control tasks are handled, and atthe bottom there are the sensor CFTs. The vehicle CFT contains the CFTs

5.3 Analysis Example: Adaptive Cruise Control 91
for speedometer, the actual ACC, and the communication system. Therebythe CFTs are built according to the data flow from sensors to actuators usingan overall number of 10 components, whereas the wheel speed sensor CFT isinstantiated four times. Possible attacks on the vehicle sensors and the wirelesscommunication were considered as well as the more theoretical attacks tomanipulate vehicle components directly.
crash_with_VA
Brake_Actor Brake_Actor
Vehicle Vehicle
Front_Antenna
Front_Antenna
Front_Distance_Sensor
Front_Distance_Sensor
FL_Wheelspeed_Sensor
FL_Wheelspeed_Sensor
FR_Wheelspeed_Sensor
FR_Wheelspeed_Sensor
RR_Wheelspeed_Sensor
RR_Wheelspeed_Sensor
RL_Wheelspeed_Sensor
RL_Wheelspeed_Sensor
Fig. 5.7. A high level CFT of the ACC example system
The values for the safety events for the quantitative analysis are takenfrom [Spang 10]. Security events were rated using an estimation for difficultyof access to the system and difficulty of conducting the attack (high difficultyresults in a low rating). The final rating is the average of both values. Thereare 39 Basic Events (BEs) in all CFTs, thereof 13 safety BEs and 26 securityBEs. The ratings of all considered BEs are listed in Table 5.6.
5.3.3 Results
In a qualitative analysis of the SeCFT for the Top Event crash with VA 124separate MCSs were found. Table A.2 in Appendix A.2 shows all found MCSsin the order in which they were calculated by ESSaRel. In Table 5.7 the 14MCSs of size of 1 are shown. They are single points of failure in this modeland should be analyzed further. The remaining 110 MCSs have a size of 2.
Overall, there are 28 safety MCSs and 54 mixed MCSs. 42 of all MCSsare security MCSs that would not have been found without the considerationof attacks as additional causes for failures. The security MCSs, especially asthere are a lot of them in this system, should receive special attention, as theiroccurrence only depends on the actions of an attacker.
A following quantitative analysis yields a rating for the Top Event crashwith VA of (0.05, high). The system has a very high failure probability, sofurther analysis is necessary to find the most critical MCSs to find coun-termeasures to minimize the failure probability. The relative large number of

92 5 Evaluation of the Approach
Table 5.6. Ratings of the Basic Events in the ACC system
Component.Basic event Rating Type
ACC.tampering deceleration value too low low securityBrake Actor.Brake reacts not as expected 1E-05 safetyBrake Actor.spoofing a too low value low securityBrake Interface.tampering brake disabled/deceleration value too low low securityBrake Interface.tampering distance VA too high low securityBrake Interface.tampering own velocity too low low securityBrake Interface.tampering velocity VA too high low securityCommunication System.tampering distance value too high low securityCommunication System.tampering too high velocity value low securityControl Logic Unit.tampering distance value too high low securityControl Logic Unit.tampering output brake disabled low securityControl Logic Unit.tampering own velocity too low low securityControl Logic Unit.tampering velocity VA value too high low securityFL Wheelspeed Sensor.denial of service low securityFL Wheelspeed Sensor.Noise in Sensor Magnet Field 1E-05 safetyFL Wheelspeed Sensor.Sensor malfunction 1E-05 safetyFL Wheelspeed Sensor.Spoofing sensor values low securityFR Wheelspeed Sensor.denial of service low securityFR Wheelspeed Sensor.Noise in Sensor Magnet Field 1E-05 safetyFR Wheelspeed Sensor.Sensor malfunction 1E-05 safetyFR Wheelspeed Sensor.Spoofing sensor values low securityFront Antenna.Received distance to VA is too high 0.017 safetyFront Antenna.Received velocity of VA too high 0.015 safetyFront Antenna.Spoofing of a distance signal medium securityFront Antenna.Spoofing velocity too high medium securityFront Antenna.Tampering Distance Signal to a too high value high securityFront Antenna.Tampering Velocity too high value high securityFront Distance Sensor.Assumed sonic velocity too high 2E-05 safetyFront Distance Sensor.denial of service high securityFront Distance Sensor.Echo time too high 0.001 safetyFront Distance Sensor.Spoofing sensor values medium securityRL Wheelspeed Sensor.denial of service low securityRL Wheelspeed Sensor.Noise in Sensor Magnet Field 1E-05 safetyRL Wheelspeed Sensor.Sensor malfunction 1E-05 safetyRL Wheelspeed Sensor.Spoofing sensor values low securityRR Wheelspeed Sensor.denial of service low securityRR Wheelspeed Sensor.Noise in Sensor Magnet Field 1E-05 safetyRR Wheelspeed Sensor.Sensor malfunction 1E-05 safetyRR Wheelspeed Sensor.Spoofing sensor values low securitySpeedometer.tampering velocity too low value low security
security MCSs explains the high likelihood for the security part of the SeCFT.The most critical MCSs according to the security likelihood and the safetyprobability of this system were determined. Table 5.8 shows the MCSs withlikelihood values of high. MCS114 (a single event MCS) and MCS6 are se-curity MCSs that are rated with a high likelihood of occurrence. MCS120and MCS8 also have a high safety probability. Therefore they are criticalfrom both security and safety points of view. Countermeasures against thesefailure scenarios have to be found. These should introduce new safety BasicEvents into MCS114 and MCS6 to transform them to mixed MCSs that arenot only depending on the actions of an attacker, and reduce the probabilitiesof all MCSs to an acceptable level.
Table 5.9 shows the MCSs with a probability of at greater than 1× 10⁻⁵.There are additional 49 MCS with a probability of 1× 10⁻⁵ which are shown
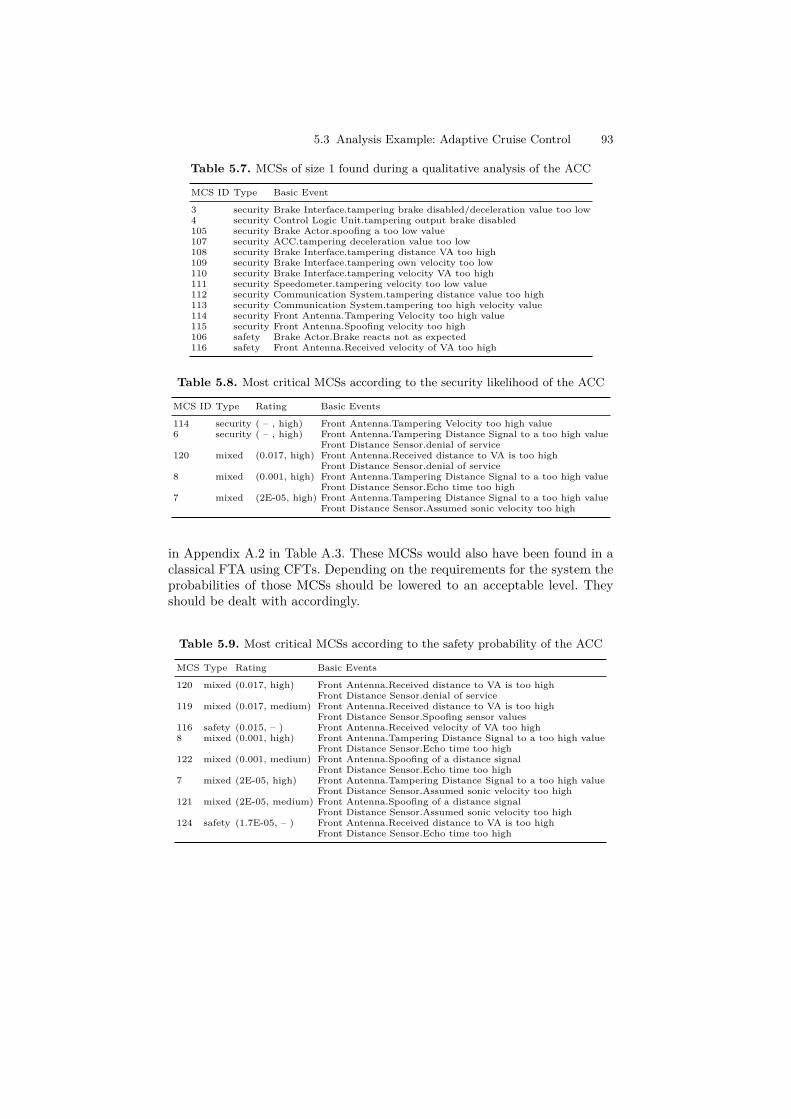
5.3 Analysis Example: Adaptive Cruise Control 93
Table 5.7. MCSs of size 1 found during a qualitative analysis of the ACC
MCS ID Type Basic Event
3 security Brake Interface.tampering brake disabled/deceleration value too low4 security Control Logic Unit.tampering output brake disabled105 security Brake Actor.spoofing a too low value107 security ACC.tampering deceleration value too low108 security Brake Interface.tampering distance VA too high109 security Brake Interface.tampering own velocity too low110 security Brake Interface.tampering velocity VA too high111 security Speedometer.tampering velocity too low value112 security Communication System.tampering distance value too high113 security Communication System.tampering too high velocity value114 security Front Antenna.Tampering Velocity too high value115 security Front Antenna.Spoofing velocity too high106 safety Brake Actor.Brake reacts not as expected116 safety Front Antenna.Received velocity of VA too high
Table 5.8. Most critical MCSs according to the security likelihood of the ACC
MCS ID Type Rating Basic Events
114 security ( – , high) Front Antenna.Tampering Velocity too high value6 security ( – , high) Front Antenna.Tampering Distance Signal to a too high value
Front Distance Sensor.denial of service120 mixed (0.017, high) Front Antenna.Received distance to VA is too high
Front Distance Sensor.denial of service8 mixed (0.001, high) Front Antenna.Tampering Distance Signal to a too high value
Front Distance Sensor.Echo time too high7 mixed (2E-05, high) Front Antenna.Tampering Distance Signal to a too high value
Front Distance Sensor.Assumed sonic velocity too high
in Appendix A.2 in Table A.3. These MCSs would also have been found in aclassical FTA using CFTs. Depending on the requirements for the system theprobabilities of those MCSs should be lowered to an acceptable level. Theyshould be dealt with accordingly.
Table 5.9. Most critical MCSs according to the safety probability of the ACC
MCS Type Rating Basic Events
120 mixed (0.017, high) Front Antenna.Received distance to VA is too highFront Distance Sensor.denial of service
119 mixed (0.017, medium) Front Antenna.Received distance to VA is too highFront Distance Sensor.Spoofing sensor values
116 safety (0.015, – ) Front Antenna.Received velocity of VA too high8 mixed (0.001, high) Front Antenna.Tampering Distance Signal to a too high value
Front Distance Sensor.Echo time too high122 mixed (0.001, medium) Front Antenna.Spoofing of a distance signal
Front Distance Sensor.Echo time too high7 mixed (2E-05, high) Front Antenna.Tampering Distance Signal to a too high value
Front Distance Sensor.Assumed sonic velocity too high121 mixed (2E-05, medium) Front Antenna.Spoofing of a distance signal
Front Distance Sensor.Assumed sonic velocity too high124 safety (1.7E-05, – ) Front Antenna.Received distance to VA is too high
Front Distance Sensor.Echo time too high

94 5 Evaluation of the Approach
The analysis of the Adaptive Cruise Control system using SeCFTs showsthat there are security MCSs in the system which may directly cause the sys-tem failure. The qualitative analysis shows that the system contains attackscenarios that are single points of failure. The followed quantitative analysiseven shows that those attack scenarios are very likely to happen. The detailedresults show that the velocity value coming from the front antenna is criticalbecause it can be tampered with easily, and it can be measured wrong with ahigh probability. It is even a single point of failure and can lead to a crash oftwo vehicles. The other value in the front antenna component, the distance tothe other car, is not as critical as the velocity because it is measured addition-ally by the own car. But it is shown that both values can be manipulated byan attacker, and there are no countermeasures in the shown system design.

5.4 Analysis Example: Smart Farming 95
5.4 Analysis Example: Smart Farming
The third application example of the approach was an analysis of a smartfarming system. It was also created during the course of the project ViERforESII6, same as the previous example. In [Steiner 13b], a technical report for theproject, it was used to test the whole approach from modeling to analysis.
5.4.1 Description: Smart Farming
The system under study is a living lab called smart farming from the Fraun-hofer IESE7. It is used to show how the work with agricultural machines canbe automated and linked to sensors and remote services. In the system thereare different vehicles (Harvester, Mower, and Tractor), sensors (cameras, GPS,and weather sensors), implements for the tractor, and mobile devices for re-mote control and planning. In Fig. 5.8 the components of the smart farmingecosystem are shown.
Ecosystem
Applications
+ Farm Management System
Users / Stakeholders
+ Farmer+ Legal Authority+ Obstacle+ Operator+ Person+ Standardization Body
Platforms / Infrastructures
+ Context Broker+ FloRLP+ IND2UCE Android+ Policy Management Point+ Weather Data
Vehicles
+ Harvester+ Husky Robot+ Mower+ Virtual Tractor
Mobile
+ Growers Notebook+ Harvesting+ Remote Control
Implements
+ Hayrake
+ Camera Tracking+ GPS Tracking+ Weather Sensors
Sensors
Fig. 5.8. An overview of the smart farming ecosystem
From the safety point of view the tractor and its remote control are es-pecially interesting, because tractors are heavy machines moving around that
6 Virtuelle und Erweiterte Realität für höchste Sicherheit und ZuverlässigkeitEingebetteter Systeme – Zweite Phase (ViERforES II), http://www.vivera.org/ViERforES/ (accessed 2015-11-09)
7 http://www.iese.fraunhofer.de/de/presse/press_archive/press_2013/PM_2013_06_050313_cebit.html (accessed 2015-11-09)

96 5 Evaluation of the Approach
may harm other machines or people. In the smart farming scenario the trac-tor drives a predefined trajectory over the field which avoids known stationaryobstacles and the field’s boundaries. Using the remote control it can be drivenmanually. The combination of automated tractor and remote control is ana-lyzed using the SeCFT approach of this thesis.
First, the considered system components are described. Figure 5.9 showsan overview of the system components of the tractor and their interconnec-tions. The hardware components of the sensors and actuators are not presentin the model, the model ends at the respective controllers. There are fourgroups of components: sensors, logic components, actuators, and buses. Theones that are not used for the analysis are also mentioned for a completeoverview, but they are set in brackets in the description and in gray in thefigure.
sensorcontroller
logiccontroller
actuatorcontroller
tractor bus
ISOBUS
pedal
steering wheel
wheel speed
remote controldriving
light switch
hitch
GPS
implement
break
steering
engine
transmission
light
hitch
implement
implement
task
virtualterminal
tractor
direction
speed
Fig. 5.9. An overview of the smart farming system components
Sensors:
Steering Wheel Sensor Controller: The steering wheel sensor controller col-lects the current rotation angle of the steering wheel and provides this infor-mation for further processing.Pedal Sensor Controller: The pedal sensor controller collects informationabout the pedal position.

5.4 Analysis Example: Smart Farming 97
Wheel Speed Sensor Controller: The wheel speed sensor controller determinesthe current turning speed of the tractor’s wheels.
Remote Control Driving Sensor Controller: The remote control driving sensorcontroller receives and processes control commands for steering, pedal, light,and hitch from a remote control system. It creates the corresponding sensorcontroller messages for the command as if it was generated from the actualsensor controller.
(GPS Sensor Controller): The GPS sensor controller determines the currentposition of the tractor based on GPS data.
(Implement Sensor Controller): The implement sensor controller is the soft-ware unit in the implement to monitor a physical sensor and send sensor datamessages via the bus.
(Light Switch Sensor Controller): The light switch sensor controller deter-mines the current position of the tractor’s headlight and turn indicationswitches.
(Hitch Switch Sensor Controller): The hitch switch sensor controller detectsthe current position of the switch in the tractor to control the position of thehitch.
Logic:
Speed Controller: The speed controller serves as the main computing softwareunit to control the tractor’s current driving speed. It processes the gas andbreak position data, computes required engine rotational speed and breakpressure, and sends according control commands to the actuators.
Direction Controller: The direction controller serves as the main computingsoftware unit to control the tractor’s current direction. It processes steeringwheel position data, computes the required wheel rotation angle, and createsand sends steering commands to the steering actuator controller.
(Tractor Controller): The tractor controller serves as the central computingunit for the tractor behavior. It takes sensor input signals and based on thiscomputes control commands that it sends to actuator controllers. Thereby italso performs analyses to ensure correct and safe behavior of the tractor. Ad-ditionally it serves as the interface between the tractor bus and the ISOBUS.
(Virtual Terminal): The virtual terminal is the software control unit for thetractor’s main graphical user interface. It visualizes tractor and control oper-ational data as well as interfaces for the user to control the tractor and theimplement. It also allows the user to create tasks.

98 5 Evaluation of the Approach
(Task Controller): The task controller executes predefined tasks created witha farm management system or with the tractor display. It executes thesecommands by triggering the single actions a task consists of, based on timingor sensor data, such as the current position. To trigger the single actions, itcreates control messages that are sent to the implement or tractor controller.It also logs farming activities and transfers the data to the farm managementfor later analysis.
(Implement Controller): The implement controller is the central computingsoftware unit in the implement. It processes sensor data, computes an im-plement behavior, and creates and sends according control commands to thecorresponding actuators.
Actuators:
Steering Actuator Controller: The steering actuator controller changes theangle of the tractors front wheels according to the direction controller’s com-mand.
Break Actuator Controller: The break actuator controller adjusts the breakpressure according to the commands given by the speed controller.
Engine Actuator Controller: The engine actuator controller adjusts the en-gine’s rotational speed.
(Transmission Actuator Controller): The transmission actuator controller isresponsible to set the tractor’s gear.
(Light Actuator Controller): The light actuator controller turns the tractor’sheadlights and turn indicator lights on or off.
(Hitch Actuator Controller): The hitch actuator controller is responsible forraising or lowering the hitch, and to physically connect the hitch to the tractor.
(Implement Actuator Controller): The implement actuator controller is re-sponsible for moving the implement depending on the type of implement.
Buses:
Tractor Bus: The tractor bus is the channel for the communication betweenthe controller components within the tractor.
(ISOBUS): The ISOBUS is the channel for communication between the trac-tor and the implement.

5.4 Analysis Example: Smart Farming 99
5.4.2 Analysis
The analyzed failure scenario in the smart farming example is that a tractoris hitting an obstacle in its path due to non-responding steering or too highspeed. The tractor is either driven by someone on the driver’s seat or via aremote control.
As stated before, this analysis was the first one that completely followsthe modeling approach described in Sect. 3.4. For each system componenta separate CFT was modeled. Potential vulnerabilities were considered asadditional input ports of the respective components. The actual attacks aremodeled in a separate attacker component.
Figure 5.10 shows the highest level SeCFT of the modeled system. Anenlarged version including all subtrees can be found in Appendix A.3 inFigs. A.12 to A.26. The SeCFT shown in Fig. 5.10 is built in layers. Forthe tractor to crash into an obstacle, it has either to drive too fast, so that itcannot brake in time, or to steer in the wrong direction, so that the obstacleis hit. The SeCFT is modeled along the signal flow coming from the controlsvia the tractor bus to the actuators. Only the control elements are modeledas possible points of attack. In theory all other components could also beconsidered as points of attack. But such attacks would require fundamentalchanges in the physical systems which means great effort on one hand, and ahigh chance to be detected on the other. Therefore, they were not consideredin this model. Besides, the analysis was about showing the additional risksof a connected vehicle with a possibility for remote control. The attacker wasmodeled as one that wants to harm the owner of the tractor with a minimalrisk of detection. In total, the model consists of 13 system components andone attacker component.
The attacker component was kept simple in this example. How the attackscould be conducted in detail is only modeled as a next step if the analysisresults in attacks that highly influence the safety of the system. For that stepa security expert would be necessary. The attacker component modeled forthis example is shown in Fig. 5.11.
Table 5.10 shows all 23 Basic Events (BEs) in the scenario. 17 safety BEsand 6 security BEs were identified. The ratings for safety BEs are probabilitiesof occurrence, for security BEs it is a three-valued scale high – medium – lowrepresenting a likelihood of occurrence. The probability of failure of the engineand break controllers were assumed to be in the range of Safety Integrity Level(SIL) 4. The other values were estimated accordingly. The likelihood values ofthe security BEs were estimated depending on the difficulty of accessing thenecessary system components.
5.4.3 Results
In a qualitative analysis of the SeCFT for the Top Event Tractor deviates fromits planned trajectory and damages an object or hurts a person 20 Minimal Cut

100 5 Evaluation of the Approach
Tractor deviates from its planned trajectory and damages an object or hurts a person
>= 1 Tractor drives too fast or steers in the wrong direction
BreakActuatorController
BreakActuatorController
EngineActuatorController
EngineActuatorController
SteeringActuatorController
SteeringActuatorController
SpeedControllerSpeedController DirectionControllerDirectionController
TractorBusTractorBus
GasPedalSensorController
GasPedalSensorController
BreakPedalSensorController
BreakPedalSensorController
SteeringWheelSensorController
SteeringWheelSensorController
GasPedal
GasPedal
BreakPedal
BreakPedal
RemoteControl
RemoteControl
SteeringWheel
SteeringWheel
Attacker
Attacker
Fig. 5.10. A high level SeCFT of the smart farming example system
Sets (MCSs) were found. Table A.4 in Appendix A.3 shows all found MCSs inthe order in which they were calculated by ESSaRel. 13 MCSs contained onlyone BE, 4 contained two BEs and 3 contained three BEs. The MCSs of size 1are shown in Table 5.11. Those single points of failure are especially criticaland should be avoided by altering the system to add countermeasures whichresult in more BEs in those MCSs.
The classification according to safety and security events results in 16safety MCSs, 1 security MCS, and 3 mixed MCSs. The found security MCSdescribes a failure scenario that would not have been found without the con-sideration of attacks as additional causes for failures.

5.4 Analysis Example: Smart Farming 101
Attacker sets low break value
[sec] Attacker sets wrong steering angle
[sec]
Attacker sets high gas value
[sec]
Hardware manipulation
[sec]
&&
&
&
Attacker hijacks remote control[sec] [medium]
Attacker sets low break value[sec] [high] Attacker sets wrong steering angle
[sec] [high]Attacker sets high gas value[sec] [high]
Hardware manipulation[sec] [low]
Attacker gains hardware access[sec] [low]
Fig. 5.11. The SeCFT of the attacker component in the smart farming examplesystem
Table 5.10. Ratings of the Basic Events in the smart farming scenario
Component.Basic event Rating Type
Attacker.Attacker gains hardware access low securityAttacker.Attacker hijacks remote control medium securityAttacker.Attacker sets high gas value high securityAttacker.Attacker sets low break value high securityAttacker.Attacker sets wrong steering angle high securityAttacker.Hardware manipulation low securityBreakActuatorController.Calculated break pressure value too low 1E-09 safetyBreakPedal.Pedal pressure too low 5E-08 safetyBreakPedalSensorController.Wrong interpretation of sensor input 1E-08 safetyDirectionController.Calculated steering angle wrong 2E-07 safetyEngineActuatorController.Calculated rotational speed value too high 2E-09 safetyGasPedal.Pedal pressure too high 5E-08 safetyGasPedalSensorController.Wrong interpretation of sensor input 1E-08 safetyRemoteControl.Remote control active 0.04 safetyRemoteControl.Remote control sets high gas value 1E-06 safetyRemoteControl.Remote control sets low break value 1E-06 safetyRemoteControl.Remote control sets wrong steering angle 1E-06 safetySpeedController.CalculateBreakage value too low 2E-07 safetySpeedController.CalculateRotations value too high 2E-07 safetySteeringActuatorController.Calculated steering angle wrong 2E-08 safetySteeringWheel.Steering wheel position wrong 5E-08 safetySteeringWheelSensorController.Wrong interpretation of sensor input 1E-08 safetyTractorBus.Bus delay 5E-09 safety
A following quantitative analysis yields a rating for the Top Event Tractordeviates from its planned trajectory and damages an object or hurts a personof (0.11, high). The high probability and likelihood requires measures to ei-ther lower the probability or likelihood. The most critical MCSs according tothe security likelihood and the safety probability of this system were deter-mined. The highest likelihood values in this analysis are medium, but theircombination yields a high value for the Top Event. The results from the qual-

102 5 Evaluation of the Approach
Table 5.11. MCSs of size 1 found during a qualitative analysis of the smart farmingscenario
MCS ID Basic Event Type
8 safety DirectionController.Calculated steering angle wrong9 safety SteeringWheelSensorController.Wrong interpretation of sensor input10 safety SteeringWheel.Steering wheel position wrong11 safety EngineActuatorController.Calculated rotational speed value too high12 safety SpeedController.CalculateRotations value too high13 safety TractorBus.Bus delay14 safety GasPedalSensorController.Wrong interpretation of sensor input15 safety GasPedal.Pedal pressure too high16 safety BreakActuatorController.Calculated break pressure value too low17 safety SpeedController.CalculateBreakage value too low18 safety BreakPedalSensorController.Wrong interpretation of sensor input19 safety BreakPedal.Pedal pressure too low20 safety SteeringActuatorController.Calculated steering angle wrong
itative analysis show that there are 4 MCSs which contain security events.One even consists of only security events (MCS7). This is not that criticalas it was rated with low. But the other three MCSs (MCS2,MCS3,MCS4)have a medium security likelihood and a high safety probability (0.04). Ta-ble 5.12 shows the MCSs with the highest likelihood values. In this example,they are also the MCSs with the highest safety probabilities. The probabilitiesof these MCSs are so high that measures should be implemented to reducethe risk. The remote control is usually only a problem if it is not monitored.So it should only be activated if someone actively watches the machine. Thatsomeone could deactivate the remote control in case of a problem. By imple-menting a measure that monitors the remote control for unauthorized accessthe risk of a successful attack could also be reduced.
Table 5.12. Most critical MCSs according to the security likelihood and the safetyprobability of the smart farming scenario
MCS ID Type Rating Basic Events
2 mixed (0.04, medium) RemoteControl.Remote control activeAttacker.Attacker hijacks remote controlAttacker.Attacker sets high gas value
3 mixed (0.04, medium) RemoteControl.Remote control activeAttacker.Attacker hijacks remote controlAttacker.Attacker sets low break value
4 mixed (0.04, medium) RemoteControl.Remote control activeAttacker.Attacker hijacks remote controlAttacker.Attacker sets wrong steering angle
This example shows that the additional consideration of security duringsafety analysis finds additional causes for system failures that were not foundbefore. In this case, a fifth of the MCSs (4 out of 20) are containing securityevents which would not have been considered in a classical safety analysis.

5.5 Analysis Example: Infusion Pump 103
5.5 Analysis Example: Infusion Pump
The last example is an analysis of a generic model of an automatic infusionpump which was enriched by a known vulnerability of an existing infusionpump. The analysis was conducted during the project Embedded Multi-Coresystems for Mixed Criticality applications in dynamic and changeable real-time environments8 (EMC2) and is used to illustrate the analysis methodin [Steiner 15].
5.5.1 Description: Infusion Pump
Basis of the analysis is a model of a generic patient controlled analgesia pumpdeveloped at the University of Pennsylvania [Arney 09]. This complex modelwas simplified, and a subsystem of it was analyzed. Figure 5.12 shows a high-level view of the architecture of a generic patient controlled analgesia pumpwith all modeled components. The simplified model used for this analysis con-sists of a PumpUnit that receives inputs from a user (a patient or hospitalstaff) and controls a PumpDriver which executes the actual pumping task.The PumpUnit is monitored by a FlowRateMonitor that raises an alarm ifthe delivery rate of the pump exceeds predefined limits. During the year 2015several vulnerabilities of real infusion pumps in use became known. The secu-rity part of the analysis is inspired by the security flaw of the infusion pumpHospira PCA3 that was published in [Scherschel 15].
UserInput PumpUnit
PumpSensors FlowRateMonitor
PumpDriver
ErrorHandler Alarm
Fig. 5.12. A simplified architecture of a generic patient controlled analgesia pumpbased on [Arney 09]
5.5.2 Analysis
The analyzed scenario is that an automatic infusion pump delivers a wrongdosage of a drug, and no alarm is raised at the same time. A dosage toohigh might lead to poisoning of the patient. A dosage too low on the otherhand might lead to increased pain, or a general deterioration of the patient’scondition. Figure 5.13 shows the high-level SeCFT of the pump model. InAppendix A.4 the SeCFTs of the subcomponents (Figs. A.27 to A.35) can befound. For all of the 7 considered components from Fig. 5.12 one SeCFT was
8 http://www.artemis-emc2.eu/ (accessed 2015-11-09)

104 5 Evaluation of the Approach
built. Potential vulnerabilities were added as input ports like in the previousexample. The structure of the SeCFTs is according to the data flow of thepump model.
ErrorHandler
PumpDriver
PumpSensors PumpUnit
UserInput
&
FlowRateMonitor
wrong dosage + no alarm
Attacker
Alarm
Fig. 5.13. A high-level SeCFT model of the pump model shown in Fig. 5.12
An additional attacker component was created that models the followingattack scenario (see Fig. 5.14): The attacker gains access to the Ethernet con-nector of the infusion pump and logs into the pump operating system (a Linuxderivative) via Telnet. In the previously named Hospira infusion pump therewas no authentication of the Telnet access, so an attacker could directly login with root privileges. Having root privileges on the pump operating system,the attacker has the possibility for any action imaginable. For example, anattacker might disable the alarms or change settings such as flow rates.

5.5 Analysis Example: Infusion Pump 105
[physical] access the ethernet interface of the pump[sec],[high]
access telnet service of the pump[sec] [high]
&get root access of the pumps OS
change flow rate settings (flow rate monitor)
[sec]
disable alarm trigger
[sec]
change flow rate settings (pump unit)
[sec]
disable alarm
[sec]
Fig. 5.14. The attacker component of the infusion pump analysis
Table 5.13 shows all 10 Basic Events (BEs) in the scenario. 8 safety BEsand 2 security BEs were identified. Suitable ratings for all BEs were chosen.The required Safety Integrity Level for the individual components was esti-mated and used as order of magnitude for the rating of the safety BEs. Therating of the security BEs was chosen due to the simplicity of the physicalaccess (to attach an Ethernet cable) and Telnet access (no authentication nec-essary to get root access). The likelihood for the security BEs in this exampleis on a three-level scale of {low, medium, high}.
Table 5.13. Ratings of the Basic Events in the infusion pump example
Component.Basic event Rating Type
Alarm.alarm fails 1E-07 safetyAttacker.[physical] access the Ethernet interface of the pump high securityAttacker.access telnet service of the pump high securityErrorHandler.error handler fails 1E-07 safetyFlowRateMonitor.flow rate monitor fails 1E-07 safetyPumpDriver.pump driver fails 1E-08 safetyPumpSensors.sensors provide wrong values 1E-07 safetyPumpUnit.check of user input fails 1E-07 safetyPumpUnit.pump unit sets wrong values 1E-07 safetyUserInput.user sets wrong values 1E-06 safety

106 5 Evaluation of the Approach
5.5.3 Results
A qualitative analysis of the infusion pump example concerning the Top Eventwrong dosage + no alarm results in 7 Minimal Cut Sets (MCSs). Of those 7MCSs 6 are safety MCSs, and one is a security MCS. In this example thereare no mixed MCSs. One MCS contains only one Basic Event (BE), and theother 6 contain two BEs. All MCSs are shown in Table 5.14 with their typeand ratings.
Table 5.14. All MCSs including their ratings of the infusion pump scenario
MCS ID Type Rating Basic Events
1 safety (1E-07, – ) PumpUnit.pump unit sets wrong values2 security ( – , high) Attacker.[physical] access the Ethernet interface of the pump
Attacker.access telnet service of the pump3 safety (1E-13, – ) UserInput.user sets wrong values
PumpUnit.check of user input fails4 safety (1E-15, – ) PumpDriver.pump driver fails
Alarm.alarm fails5 safety (1E-15, – ) PumpDriver.pump driver fails
ErrorHandler.error handler fails6 safety (1E-15, – ) PumpDriver.pump driver fails
FlowRateMonitor.flow rate monitor fails7 safety (1E-15, – ) PumpDriver.pump driver fails
PumpSensors.sensors provide wrong values
This simple model is an example for systems that have security flaws thatwould not have been considered in classical CFTs, but will lead to a failureif an attack is conducted (MCS2). A subsequent quantitative analysis showsthat the safety MCSs are not very critical as the failure probabilities are allbelow or equal to 1 × 10⁻⁷. But the single security MCS was rated with alikelihood of high. This leads to a rating for the Top Event wrong dosage + noalarm of (1×10⁻⁷, high). The security MCS with the high likelihood requirescountermeasures to either lower the likelihood, or to introduce safety eventswith a reasonably low probability into the MCS. Thereby the failure scenariodoes not only depend on actions of an attacker, but also on the failure of acountermeasure which can be controlled.

5.6 Conclusion 107
5.6 Conclusion
The examples in this chapter show that with a little more effort in comparisonto CFTs, additional security causes for system failures can be found withSeCFTs. The initial analysis even can be conducted by analysts that are safetyexperts with little expertise in security analysis. Only if attacks have to beanalyzed in more detail, a security expert should be present for the analysis.Because the safety analysis using SeCFTs is based on CFTs, a qualitativeanalysis can find all failure scenarios that would have been found with CFTs.Additional failure scenarios can be found that only depend on security BasicEvents (BEs) and such that are caused by safety as well as security BEs. Thesescenarios would not have been found in an analysis using only CFTs. Thequantitative analysis can give further insight on the criticality of a MinimalCut Set (MCS). Even security MCSs consisting of only one BE might benot critical, based on the likelihood value, as long as the grounds for thedetermination of the likelihood rating do not change. The analysis of theravon safety chain is an example for that. So a quantitative analysis maysafe resources that would have been spent otherwise.
In the analyzed example systems only likelihood values from a scale of{low, medium, high} were used. This is because no more precise or experi-enced data were available to the author. If such data exists for an analyzedsystem, it is reasonable that more fine-grained scales would be used. The cal-culations and analyses of this thesis are kept general enough to handle scalesof different granularity. The minimalistic tool used to support the analyses,however, would have to be adapted.


6
Conclusion
This thesis has presented the extension of safety analysis based on ComponentFault Trees (CFTs) by failure causes from a security point of view. The stillexisting separation of the viewpoints of safety and security analysis has shownin numerous examples that it is not suitable for the current and coming net-worked embedded systems (Cyber-Physical Systems). In most cases duringthe development of embedded systems only a safety analysis is conducted,security concerns are not even addressed. A complete security analysis on theother hand would mean substantial additional effort, and would produce anunnecessary overhead for most embedded systems. This is why in this thesisan existing safety analysis technique was extended so that no complete sepa-rate security analysis is necessary. Only security concerns that might lead tosafety issues are analyzed. Therefore, the additional effort is minimized.
The extended safety analysis using Security-enhanced Component FaultTrees (SeCFTs) is based on safety analysis using CFTs and extended by partsof Attack Trees (ATs). In doing so, the scalability and modularity of CFTs isused. The qualitative analysis of SeCFTs does not differ significantly from theone of CFTs. The calculation of Minimal Cut Sets (MCSs) and the classifica-tion according to size can be done using the same tools as for CFTs. Only theclassification according to the type of the MCSs (safety, security, or mixed)is added. In the quantitative analysis the ratings of MCSs and Top Eventsare calculated separately for safety probability and security likelihood. Thesecurity events are deliberately not rated using probabilities, because thesecannot be determined with the same accuracy as for the safety events. If suchprobabilities would be available, however, they could be used in the analysis.But still then they should be separated from the safety probabilities becausesecurity probabilities may change whereas the safety probabilities may mostlikely not. To avoid misunderstandings about the accuracy of the values ofthe security likelihood, instead a more coarse scale is used. This results ina tuple of safety probabilities and security likelihoods as the rating for theMCSs and the Top Events. Failure scenarios are evaluated depending on theirtype. Safety MCSs are handled just as they would in classical CFTs, the risk

110 6 Conclusion
of mixed MCSs can be estimated by the probability value as a worst case,and security MCSs can at least be compared to each other to find the mostcritical ones. Having these prioritizations the application of countermeasurescan also be prioritized, so they do not have to be used across-the-board. Bythe extension of established methods for modeling and analysis, SeCFTs canbe applied by safety experts with only little learning effort. Security expertsare only necessary for the eventual deeper analysis of critical attacks.
The approach was applied in several analyses of example systems, thesafety chain of the off-road robot ravon, an Adaptive Cruise Control system,a smart farming scenario, and a generic infusion pump. The result in all exam-ples was that by using SeCFTs additional failure causes could be found thatwould not have been found using classical CFTs. In all of the analyzed ex-amples whole failure scenarios were found which only depended on actions ofan attacker, not on failures of system components. These cases should receiveextra consideration because they would not have been found in a classicalsafety analysis. Thereby the additional value of the approach using SeCFTsfor safety analysis is shown, and the improvement can be achieved with littleextra effort.
Concluding it can be said that with the application of Security-enhancedComponent Fault Trees instead of Component Fault Trees the safety of net-worked embedded systems which are becoming more popular every day canbe improved.

A
Appendix

112 A Appendix
A.1 Evaluation Example: Ravon
Table A.1. MCSs of the SeCFT of the ravon safety chain
ID contained Basic Events ID contained Basic Events
1 SafetyChain.wrong parameters for brakes 30 SafetyChain.wEMS sender battery empty2 SafetyChain.brake parameters changed SafetyChain.EMS button covered/stuck3 SafetyChain.MC software manipulated SafetyChain.bumper relay bypassed4 SafetyChain.MC software fault 31 SafetyChain.wEMS sender sabotaged5 SafetyChain.MC enabling input bypassed SafetyChain.EMS button not reachable6 SafetyChain.MC has short circuit at enabling input SafetyChain.bumper relay not working7 SafetyChain.wEMS sender sabotaged 32 SafetyChain.wEMS sender sabotaged
SafetyChain.EMS button not reachable SafetyChain.EMS button not reachableSafetyChain.safety edge is not pressed SafetyChain.safety edge not working
8 SafetyChain.wEMS sender sabotaged 33 SafetyChain.wEMS sender sabotagedSafetyChain.EMS button not reachable SafetyChain.EMS button not workingSafetyChain.safety edge bypassed SafetyChain.bumper relay not working
9 SafetyChain.wEMS sender sabotaged 34 SafetyChain.wEMS sender sabotagedSafetyChain.EMS button not working SafetyChain.EMS button not workingSafetyChain.safety edge is not pressed SafetyChain.safety edge not working
10 SafetyChain.wEMS sender sabotaged 35 SafetyChain.wEMS sender battery emptySafetyChain.EMS button not working SafetyChain.EMS button not reachableSafetyChain.safety edge bypassed SafetyChain.bumper relay not working
11 SafetyChain.wEMS sender battery empty 36 SafetyChain.wEMS sender battery emptySafetyChain.EMS button not reachable SafetyChain.EMS button not reachableSafetyChain.safety edge is not pressed SafetyChain.safety edge not working
12 SafetyChain.wEMS sender battery empty 37 SafetyChain.wEMS sender battery emptySafetyChain.EMS button not reachable SafetyChain.EMS button not workingSafetyChain.safety edge bypassed SafetyChain.bumper relay not working
13 SafetyChain.wEMS sender battery empty 38 SafetyChain.wEMS sender battery emptySafetyChain.EMS button not working SafetyChain.EMS button not workingSafetyChain.safety edge is not pressed SafetyChain.safety edge not working
14 SafetyChain.wEMS sender battery empty 39 SafetyChain.wEMS sender sabotagedSafetyChain.EMS button not working SafetyChain.EMS button bypassedSafetyChain.safety edge bypassed SafetyChain.bumper relay not working
15 SafetyChain.wEMS sender sabotaged 40 SafetyChain.wEMS sender sabotagedSafetyChain.EMS button not reachable SafetyChain.EMS button bypassedSafetyChain.bumper relay bypassed SafetyChain.safety edge not working
16 SafetyChain.wEMS sender sabotaged 41 SafetyChain.wEMS sender sabotagedSafetyChain.EMS button not working SafetyChain.EMS button covered/stuckSafetyChain.bumper relay bypassed SafetyChain.bumper relay not working
17 SafetyChain.wEMS sender battery empty 42 SafetyChain.wEMS sender sabotagedSafetyChain.EMS button not reachable SafetyChain.EMS button covered/stuckSafetyChain.bumper relay bypassed SafetyChain.safety edge not working
18 SafetyChain.wEMS sender battery empty 43 SafetyChain.wEMS sender battery emptySafetyChain.EMS button not working SafetyChain.EMS button bypassedSafetyChain.bumper relay bypassed SafetyChain.bumper relay not working
19 SafetyChain.wEMS sender sabotaged 44 SafetyChain.wEMS sender battery emptySafetyChain.EMS button bypassed SafetyChain.EMS button bypassedSafetyChain.safety edge is not pressed SafetyChain.safety edge not working
20 SafetyChain.wEMS sender sabotaged 45 SafetyChain.wEMS sender battery emptySafetyChain.EMS button bypassed SafetyChain.EMS button covered/stuckSafetyChain.safety edge bypassed SafetyChain.bumper relay not working
21 SafetyChain.wEMS sender sabotaged 46 SafetyChain.wEMS sender battery emptySafetyChain.EMS button covered/stuck SafetyChain.EMS button covered/stuckSafetyChain.safety edge is not pressed SafetyChain.safety edge not working
22 SafetyChain.wEMS sender sabotaged 47 SafetyChain.EMS button not reachableSafetyChain.EMS button covered/stuck SafetyChain.safety edge is not pressedSafetyChain.safety edge bypassed SafetyChain.wEMS receiver bypassed
23 SafetyChain.wEMS sender battery empty 48 SafetyChain.EMS button not reachableSafetyChain.EMS button bypassed SafetyChain.safety edge is not pressedSafetyChain.safety edge is not pressed SafetyChain.wEMS sender not working
24 SafetyChain.wEMS sender battery empty 49 SafetyChain.EMS button not reachableSafetyChain.EMS button bypassed SafetyChain.safety edge bypassedSafetyChain.safety edge bypassed SafetyChain.wEMS receiver bypassed
25 SafetyChain.wEMS sender battery empty 50 SafetyChain.EMS button not reachableSafetyChain.EMS button covered/stuck SafetyChain.safety edge bypassedSafetyChain.safety edge is not pressed SafetyChain.wEMS sender not working
26 SafetyChain.wEMS sender battery empty 51 SafetyChain.EMS button not workingSafetyChain.EMS button covered/stuck SafetyChain.safety edge is not pressedSafetyChain.safety edge bypassed SafetyChain.wEMS receiver bypassed
27 SafetyChain.wEMS sender sabotaged 52 SafetyChain.EMS button not workingSafetyChain.EMS button bypassed SafetyChain.safety edge is not pressedSafetyChain.bumper relay bypassed SafetyChain.wEMS sender not working
28 SafetyChain.wEMS sender sabotaged 53 SafetyChain.EMS button not workingSafetyChain.EMS button covered/stuck SafetyChain.safety edge bypassedSafetyChain.bumper relay bypassed SafetyChain.wEMS receiver bypassed
29 SafetyChain.wEMS sender battery empty 54 SafetyChain.EMS button not workingSafetyChain.EMS button bypassed SafetyChain.safety edge bypassedSafetyChain.bumper relay bypassed SafetyChain.wEMS sender not working

A.1 Evaluation Example: Ravon 113
ID contained Basic Events ID contained Basic Events
55 SafetyChain.EMS button not reachable 82 SafetyChain.EMS button bypassedSafetyChain.safety edge is not pressed SafetyChain.safety edge bypassedSafetyChain.wEMS signal jammed SafetyChain.wEMS receiver not working
56 SafetyChain.EMS button not reachable 83 SafetyChain.EMS button covered/stuckSafetyChain.safety edge is not pressed SafetyChain.safety edge is not pressedSafetyChain.wEMS receiver not working SafetyChain.wEMS signal jammed
57 SafetyChain.EMS button not reachable 84 SafetyChain.EMS button covered/stuckSafetyChain.safety edge bypassed SafetyChain.safety edge is not pressedSafetyChain.wEMS signal jammed SafetyChain.wEMS receiver not working
58 SafetyChain.EMS button not reachable 85 SafetyChain.EMS button covered/stuckSafetyChain.safety edge bypassed SafetyChain.safety edge bypassedSafetyChain.wEMS receiver not working SafetyChain.wEMS signal jammed
59 SafetyChain.EMS button not working 86 SafetyChain.EMS button covered/stuckSafetyChain.safety edge is not pressed SafetyChain.safety edge bypassedSafetyChain.wEMS signal jammed SafetyChain.wEMS receiver not working
60 SafetyChain.EMS button not working 87 SafetyChain.EMS button bypassedSafetyChain.safety edge is not pressed SafetyChain.bumper relay bypassedSafetyChain.wEMS receiver not working SafetyChain.wEMS receiver bypassed
61 SafetyChain.EMS button not working 88 SafetyChain.EMS button bypassedSafetyChain.safety edge bypassed SafetyChain.bumper relay bypassedSafetyChain.wEMS signal jammed SafetyChain.wEMS sender not working
62 SafetyChain.EMS button not working 89 SafetyChain.EMS button covered/stuckSafetyChain.safety edge bypassed SafetyChain.bumper relay bypassedSafetyChain.wEMS receiver not working SafetyChain.wEMS receiver bypassed
63 SafetyChain.EMS button not reachable 90 SafetyChain.EMS button covered/stuckSafetyChain.bumper relay bypassed SafetyChain.bumper relay bypassedSafetyChain.wEMS receiver bypassed SafetyChain.wEMS sender not working
64 SafetyChain.EMS button not reachable 91 SafetyChain.EMS button bypassedSafetyChain.bumper relay bypassed SafetyChain.bumper relay bypassedSafetyChain.wEMS sender not working SafetyChain.wEMS signal jammed
65 SafetyChain.EMS button not working 92 SafetyChain.EMS button bypassedSafetyChain.bumper relay bypassed SafetyChain.bumper relay bypassedSafetyChain.wEMS receiver bypassed SafetyChain.wEMS receiver not working
66 SafetyChain.EMS button not working 93 SafetyChain.EMS button covered/stuckSafetyChain.bumper relay bypassed SafetyChain.bumper relay bypassedSafetyChain.wEMS sender not working SafetyChain.wEMS signal jammed
67 SafetyChain.EMS button not reachable 94 SafetyChain.EMS button covered/stuckSafetyChain.bumper relay bypassed SafetyChain.bumper relay bypassedSafetyChain.wEMS signal jammed SafetyChain.wEMS receiver not working
68 SafetyChain.EMS button not reachable 95 SafetyChain.EMS button not reachableSafetyChain.bumper relay bypassed SafetyChain.wEMS receiver bypassedSafetyChain.wEMS receiver not working SafetyChain.bumper relay not working
69 SafetyChain.EMS button not working 96 SafetyChain.EMS button not reachableSafetyChain.bumper relay bypassed SafetyChain.wEMS receiver bypassedSafetyChain.wEMS signal jammed SafetyChain.safety edge not working
70 SafetyChain.EMS button not working 97 SafetyChain.EMS button not reachableSafetyChain.bumper relay bypassed SafetyChain.wEMS sender not workingSafetyChain.wEMS receiver not working SafetyChain.bumper relay not working
71 SafetyChain.EMS button bypassed 98 SafetyChain.EMS button not reachableSafetyChain.safety edge is not pressed SafetyChain.wEMS sender not workingSafetyChain.wEMS receiver bypassed SafetyChain.safety edge not working
72 SafetyChain.EMS button bypassed 99 SafetyChain.EMS button not workingSafetyChain.safety edge is not pressed SafetyChain.wEMS receiver bypassedSafetyChain.wEMS sender not working SafetyChain.bumper relay not working
73 SafetyChain.EMS button bypassed 100 SafetyChain.EMS button not workingSafetyChain.safety edge bypassed SafetyChain.wEMS receiver bypassedSafetyChain.wEMS receiver bypassed SafetyChain.safety edge not working
74 SafetyChain.EMS button bypassed 101 SafetyChain.EMS button not workingSafetyChain.safety edge bypassed SafetyChain.wEMS sender not workingSafetyChain.wEMS sender not working SafetyChain.bumper relay not working
75 SafetyChain.EMS button covered/stuck 102 SafetyChain.EMS button not workingSafetyChain.safety edge is not pressed SafetyChain.wEMS sender not workingSafetyChain.wEMS receiver bypassed SafetyChain.safety edge not working
76 SafetyChain.EMS button covered/stuck 103 SafetyChain.EMS button not reachableSafetyChain.safety edge is not pressed SafetyChain.wEMS signal jammedSafetyChain.wEMS sender not working SafetyChain.bumper relay not working
77 SafetyChain.EMS button covered/stuck 104 SafetyChain.EMS button not reachableSafetyChain.safety edge bypassed SafetyChain.wEMS signal jammedSafetyChain.wEMS receiver bypassed SafetyChain.safety edge not working
78 SafetyChain.EMS button covered/stuck 105 SafetyChain.EMS button not reachableSafetyChain.safety edge bypassed SafetyChain.wEMS receiver not workingSafetyChain.wEMS sender not working SafetyChain.bumper relay not working
79 SafetyChain.EMS button bypassed 106 SafetyChain.EMS button not reachableSafetyChain.safety edge is not pressed SafetyChain.wEMS receiver not workingSafetyChain.wEMS signal jammed SafetyChain.safety edge not working
80 SafetyChain.EMS button bypassed 107 SafetyChain.EMS button not workingSafetyChain.safety edge is not pressed SafetyChain.wEMS signal jammedSafetyChain.wEMS receiver not working SafetyChain.bumper relay not working
81 SafetyChain.EMS button bypassed 108 SafetyChain.EMS button not workingSafetyChain.safety edge bypassed SafetyChain.wEMS signal jammedSafetyChain.wEMS signal jammed SafetyChain.safety edge not working

114 A Appendix
ID contained Basic Events
109 SafetyChain.EMS button not workingSafetyChain.wEMS receiver not workingSafetyChain.bumper relay not working
110 SafetyChain.EMS button not workingSafetyChain.wEMS receiver not workingSafetyChain.safety edge not working
111 SafetyChain.EMS button bypassedSafetyChain.wEMS receiver bypassedSafetyChain.bumper relay not working
112 SafetyChain.EMS button bypassedSafetyChain.wEMS receiver bypassedSafetyChain.safety edge not working
113 SafetyChain.EMS button bypassedSafetyChain.wEMS sender not workingSafetyChain.bumper relay not working
114 SafetyChain.EMS button bypassedSafetyChain.wEMS sender not workingSafetyChain.safety edge not working
115 SafetyChain.EMS button covered/stuckSafetyChain.wEMS receiver bypassedSafetyChain.bumper relay not working
116 SafetyChain.EMS button covered/stuckSafetyChain.wEMS receiver bypassedSafetyChain.safety edge not working
117 SafetyChain.EMS button covered/stuckSafetyChain.wEMS sender not workingSafetyChain.bumper relay not working
118 SafetyChain.EMS button covered/stuckSafetyChain.wEMS sender not workingSafetyChain.safety edge not working
119 SafetyChain.EMS button bypassedSafetyChain.wEMS signal jammedSafetyChain.bumper relay not working
120 SafetyChain.EMS button bypassedSafetyChain.wEMS signal jammedSafetyChain.safety edge not working
121 SafetyChain.EMS button bypassedSafetyChain.wEMS receiver not workingSafetyChain.bumper relay not working
122 SafetyChain.EMS button bypassedSafetyChain.wEMS receiver not workingSafetyChain.safety edge not working
123 SafetyChain.EMS button covered/stuckSafetyChain.wEMS signal jammedSafetyChain.bumper relay not working
124 SafetyChain.EMS button covered/stuckSafetyChain.wEMS signal jammedSafetyChain.safety edge not working
125 SafetyChain.EMS button covered/stuckSafetyChain.wEMS receiver not workingSafetyChain.bumper relay not working
126 SafetyChain.EMS button covered/stuckSafetyChain.wEMS receiver not workingSafetyChain.safety edge not working

A.2 Evaluation Example: Adaptive Cruise Control 115
A.2 Evaluation Example: Adaptive Cruise Control
crash_with_VA
Brake_Actor
Brake_Actor
Vehicle
Vehicle
Front_Antenna
Front_Antenna
Front_Distance_Sensor
Front_Distance_Sensor
FL_W
heelspeed_Sensor
FL_W
heelspeed_Sensor
FR_W
heelspeed_Sensor
FR_W
heelspeed_Sensor
RR_W
heelspeed_Sensor
RR_W
heelspeed_Sensor
RL_W
heelspeed_Sensor
RL_W
heelspeed_Sensor
Fig. A.1. SeCFT: ACC.System

116 A Appendix
Out
put_
Dec
eler
atio
n_va
lue_
too_
low
RL_w
s_to
o_lo
w
FR_w
s_to
o_lo
wm
easu
red_
dist
ance
_too
_hig
hRR
_ws_
too_
low
Rece
ived
_dist
ance
_too
_hig
h
Rece
ived
_vel
ocity
_too
_hig
h
FL_w
s_to
o_lo
w
ACC
ACC
Spee
dom
eter
Spee
dom
eter
Com
mun
icat
ion_
Syst
emCo
mm
unic
atio
n Sy
stem
Fig. A.2. SeCFT: ACC.Vehicle

A.2 Evaluation Example: Adaptive Cruise Control 117
Out
put_
Dec
eler
atio
n_va
lue_
too_
low
velo
city
_of_
VA_t
oo_h
igh
dist
ance
_to_
VA_t
oo_h
igh
own_
velo
city
_too
_low
Cont
rol_L
ogic
_Uni
tCo
ntro
l Log
ic U
nit
Brak
e_In
terfa
ceBr
ake
Inte
rface
>=
1
tam
perin
g_de
cele
ratio
n_va
lue_
too_
low
[sec
],[lo
w]
Fig. A.3. SeCFT: ACC.ACC

118 A Appendix
Out
put_
Dec
eler
atio
n_va
lue_
too_
low
velo
city
_of_
VA_t
oo_h
igh
own_
velo
city
_too
_low
Brak
e_m
istak
enly
_disa
bled
dist
ance
_to_
VA_t
oo_h
igh
>=
1
>=
1
tam
perin
g_br
ake_
disa
bled
/dec
eler
atio
n_de
cele
ratio
n_va
lue_
too_
low
[sec
],[lo
w]
tam
perin
g_ow
n_ve
loci
ty_t
oo_lo
w[s
ec],[
low
]
tam
perin
g_di
stan
ce_V
A_to
o_hi
gh[s
ec],[
low
]
tam
perin
g_ve
loci
ty_V
A_to
o_hi
gh[s
ec],[
low
]
Fig. A.4. SeCFT: ACC.Brake Interface

A.2 Evaluation Example: Adaptive Cruise Control 119
Brak
e_m
istak
enly
_disa
bled
dist
ance
_to_
VA_t
oo_h
igh
own_
velo
city
_too
_low
velo
city
_of_
VA_is
_too
_hig
h
>=
1
&
tam
perin
g_ow
n_ve
loci
ty_t
oo_lo
w[s
ec],[
low
]
>=
1
tam
perin
g_di
stan
ce_v
alue
_too
_hig
h[s
ec],[
low
]
tam
perin
g_ve
loci
ty_V
A_va
lue_
too_
high
[sec
],[lo
w]
>=
1
tam
perin
g_ou
tput
_bra
ke_d
isabl
ed[s
ec],[
low
]
Fig. A.5. SeCFT: ACC.Control Logic Unit

120 A Appendix
own_
velo
city
_too
_low
RR_w
s_to
o_lo
wFL
_ws_
too_
low
FR_w
s_to
o_lo
wRL
_ws_
too_
low
>=
1
tam
perin
g_ve
loci
ty_t
oo_lo
w_v
alue
[sec
],[lo
w]
Moo
N
Fig. A.6. SeCFT: ACC.Speedometer

A.2 Evaluation Example: Adaptive Cruise Control 121
dist
ance
_to_
VA_t
oo_h
igh
velo
city
_of_
VA_t
oo_h
igh
rece
ived
_vel
ocity
_too
_hig
h
mea
sure
d_di
stan
ce_t
oo_h
igh
rece
ived
_dist
ance
_too
_hig
h
&ta
mpe
ring_
too_
high
_vel
ocity
_val
ue[s
ec],[
low
]
>=
1
tam
perin
g_di
stan
ce_v
alue
_too
_hig
h[s
ec],[
low
]
>=
1
Fig. A.7. SeCFT: ACC.Communication System

122 A Appendix
dist
ance
_too
_hig
hve
loci
ty_t
oo_h
igh
>=
1>
= 1
Rece
ived
_vel
ocity
_of_
VA_t
oo_h
igh
Spoo
fing_
velo
city
_too
_hig
h[s
ec],[
med
ium
]
Tam
perin
g_Ve
loci
ty_t
oo_h
igh_
valu
e[s
ec],[
high
]Sp
oofin
g_of
_a_d
istan
ce_s
igna
l[s
ec],[
med
ium
]
Tam
perin
g_D
istan
ce_S
igna
l_to_
a_to
o_hi
gh_v
alue
[sec
],[hi
gh]
Rece
ived
_dist
ance
_to_
VA_is
_too
_hig
h
Fig. A.8. SeCFT: ACC.Front Antenna

A.2 Evaluation Example: Adaptive Cruise Control 123
measured_ws_too_low
>= 1
Sensor_malfunction
Noise_in_Sensor_Magnet_Field
Spoofing_sensor_values[sec],[low]
denial_of_service[sec],[low]
Fig. A.9. SeCFT: ACC.Wheelspeed Sensor
Deceleration_too_low
Input_Deceleration_value_too_low
Brake_reacts_not_as_expected
>= 1
spoofing_a_too_low_value[sec],[low]
Fig. A.10. SeCFT: ACC.Brake Actor
distance_too_high
>= 1
Assumed_sonic_velocity_too_high
Echo_time_too_high
denial_of_service[sec],[high]
Spoofing_sensor_values[sec],[medium]
Fig. A.11. SeCFT: ACC.Distance Sensor

124 A Appendix
Table A.2. MCSs of the SeCFT of the Adaptive Cruise Control system
ID contained Basic Events
1 Control Logic Unit.tampering own velocity too lowControl Logic Unit.tampering distance value too high
2 Control Logic Unit.tampering own velocity too lowControl Logic Unit.tampering velocity VA value too high
3 Brake Interface.tampering brake disabled/deceleration value too low4 Control Logic Unit.tampering output brake disabled5 Front Antenna.Tampering Distance Signal to a too high value
Front Distance Sensor.Spoofing sensor values6 Front Antenna.Tampering Distance Signal to a too high value
Front Distance Sensor.denial of service7 Front Antenna.Tampering Distance Signal to a too high value
Front Distance Sensor.Assumed sonic velocity too high8 Front Antenna.Tampering Distance Signal to a too high value
Front Distance Sensor.Echo time too high9 FR Wheelspeed Sensor.Noise in Sensor Magnet Field
FL Wheelspeed Sensor.Noise in Sensor Magnet Field10 FR Wheelspeed Sensor.Noise in Sensor Magnet Field
FL Wheelspeed Sensor.denial of service11 FR Wheelspeed Sensor.denial of service
FL Wheelspeed Sensor.Noise in Sensor Magnet Field12 FR Wheelspeed Sensor.denial of service
FL Wheelspeed Sensor.denial of service13 FR Wheelspeed Sensor.Noise in Sensor Magnet Field
FL Wheelspeed Sensor.Spoofing sensor values14 FR Wheelspeed Sensor.Noise in Sensor Magnet Field
FL Wheelspeed Sensor.Sensor malfunction15 FR Wheelspeed Sensor.denial of service
FL Wheelspeed Sensor.Spoofing sensor values16 FR Wheelspeed Sensor.denial of service
FL Wheelspeed Sensor.Sensor malfunction17 FR Wheelspeed Sensor.Spoofing sensor values
FL Wheelspeed Sensor.Noise in Sensor Magnet Field18 FR Wheelspeed Sensor.Spoofing sensor values
FL Wheelspeed Sensor.denial of service19 FR Wheelspeed Sensor.Sensor malfunction
FL Wheelspeed Sensor.Noise in Sensor Magnet Field20 FR Wheelspeed Sensor.Sensor malfunction
FL Wheelspeed Sensor.denial of service21 FR Wheelspeed Sensor.Spoofing sensor values
FL Wheelspeed Sensor.Spoofing sensor values22 FR Wheelspeed Sensor.Spoofing sensor values
FL Wheelspeed Sensor.Sensor malfunction23 FR Wheelspeed Sensor.Sensor malfunction
FL Wheelspeed Sensor.Spoofing sensor values24 FR Wheelspeed Sensor.Sensor malfunction
FL Wheelspeed Sensor.Sensor malfunction25 FR Wheelspeed Sensor.Noise in Sensor Magnet Field
RL Wheelspeed Sensor.Noise in Sensor Magnet Field26 FR Wheelspeed Sensor.Noise in Sensor Magnet Field
RL Wheelspeed Sensor.denial of service27 FR Wheelspeed Sensor.denial of service
RL Wheelspeed Sensor.Noise in Sensor Magnet Field28 FR Wheelspeed Sensor.denial of service
RL Wheelspeed Sensor.denial of service29 FR Wheelspeed Sensor.Noise in Sensor Magnet Field
RL Wheelspeed Sensor.Spoofing sensor values30 FR Wheelspeed Sensor.Noise in Sensor Magnet Field
RL Wheelspeed Sensor.Sensor malfunction31 FR Wheelspeed Sensor.denial of service
RL Wheelspeed Sensor.Spoofing sensor values32 FR Wheelspeed Sensor.denial of service
RL Wheelspeed Sensor.Sensor malfunction33 FR Wheelspeed Sensor.Spoofing sensor values
RL Wheelspeed Sensor.Noise in Sensor Magnet Field34 FR Wheelspeed Sensor.Spoofing sensor values
RL Wheelspeed Sensor.denial of service35 FR Wheelspeed Sensor.Sensor malfunction
RL Wheelspeed Sensor.Noise in Sensor Magnet Field36 FR Wheelspeed Sensor.Sensor malfunction
RL Wheelspeed Sensor.denial of service37 FR Wheelspeed Sensor.Spoofing sensor values
RL Wheelspeed Sensor.Spoofing sensor values38 FR Wheelspeed Sensor.Spoofing sensor values
RL Wheelspeed Sensor.Sensor malfunction39 FR Wheelspeed Sensor.Sensor malfunction
RL Wheelspeed Sensor.Spoofing sensor values40 FR Wheelspeed Sensor.Sensor malfunction
RL Wheelspeed Sensor.Sensor malfunction41 FR Wheelspeed Sensor.Noise in Sensor Magnet Field
RR Wheelspeed Sensor.Noise in Sensor Magnet Field

A.2 Evaluation Example: Adaptive Cruise Control 125
ID contained Basic Events
42 FR Wheelspeed Sensor.Noise in Sensor Magnet FieldRR Wheelspeed Sensor.denial of service
43 FR Wheelspeed Sensor.denial of serviceRR Wheelspeed Sensor.Noise in Sensor Magnet Field
44 FR Wheelspeed Sensor.denial of serviceRR Wheelspeed Sensor.denial of service
45 FR Wheelspeed Sensor.Noise in Sensor Magnet FieldRR Wheelspeed Sensor.Spoofing sensor values
46 FR Wheelspeed Sensor.Noise in Sensor Magnet FieldRR Wheelspeed Sensor.Sensor malfunction
47 FR Wheelspeed Sensor.denial of serviceRR Wheelspeed Sensor.Spoofing sensor values
48 FR Wheelspeed Sensor.denial of serviceRR Wheelspeed Sensor.Sensor malfunction
49 FR Wheelspeed Sensor.Spoofing sensor valuesRR Wheelspeed Sensor.Noise in Sensor Magnet Field
50 FR Wheelspeed Sensor.Spoofing sensor valuesRR Wheelspeed Sensor.denial of service
51 FR Wheelspeed Sensor.Sensor malfunctionRR Wheelspeed Sensor.Noise in Sensor Magnet Field
52 FR Wheelspeed Sensor.Sensor malfunctionRR Wheelspeed Sensor.denial of service
53 FR Wheelspeed Sensor.Spoofing sensor valuesRR Wheelspeed Sensor.Spoofing sensor values
54 FR Wheelspeed Sensor.Spoofing sensor valuesRR Wheelspeed Sensor.Sensor malfunction
55 FR Wheelspeed Sensor.Sensor malfunctionRR Wheelspeed Sensor.Spoofing sensor values
56 FR Wheelspeed Sensor.Sensor malfunctionRR Wheelspeed Sensor.Sensor malfunction
57 FL Wheelspeed Sensor.Noise in Sensor Magnet FieldRL Wheelspeed Sensor.Noise in Sensor Magnet Field
58 FL Wheelspeed Sensor.Noise in Sensor Magnet FieldRL Wheelspeed Sensor.denial of service
59 FL Wheelspeed Sensor.denial of serviceRL Wheelspeed Sensor.Noise in Sensor Magnet Field
60 FL Wheelspeed Sensor.denial of serviceRL Wheelspeed Sensor.denial of service
61 FL Wheelspeed Sensor.Noise in Sensor Magnet FieldRL Wheelspeed Sensor.Spoofing sensor values
62 FL Wheelspeed Sensor.Noise in Sensor Magnet FieldRL Wheelspeed Sensor.Sensor malfunction
63 FL Wheelspeed Sensor.denial of serviceRL Wheelspeed Sensor.Spoofing sensor values
64 FL Wheelspeed Sensor.denial of serviceRL Wheelspeed Sensor.Sensor malfunction
65 FL Wheelspeed Sensor.Spoofing sensor valuesRL Wheelspeed Sensor.Noise in Sensor Magnet Field
66 FL Wheelspeed Sensor.Spoofing sensor valuesRL Wheelspeed Sensor.denial of service
67 FL Wheelspeed Sensor.Sensor malfunctionRL Wheelspeed Sensor.Noise in Sensor Magnet Field
68 FL Wheelspeed Sensor.Sensor malfunctionRL Wheelspeed Sensor.denial of service
69 FL Wheelspeed Sensor.Spoofing sensor valuesRL Wheelspeed Sensor.Spoofing sensor values
70 FL Wheelspeed Sensor.Spoofing sensor valuesRL Wheelspeed Sensor.Sensor malfunction
71 FL Wheelspeed Sensor.Sensor malfunctionRL Wheelspeed Sensor.Spoofing sensor values
72 FL Wheelspeed Sensor.Sensor malfunctionRL Wheelspeed Sensor.Sensor malfunction
73 FL Wheelspeed Sensor.Noise in Sensor Magnet FieldRR Wheelspeed Sensor.Noise in Sensor Magnet Field
74 FL Wheelspeed Sensor.Noise in Sensor Magnet FieldRR Wheelspeed Sensor.denial of service
75 FL Wheelspeed Sensor.denial of serviceRR Wheelspeed Sensor.Noise in Sensor Magnet Field
76 FL Wheelspeed Sensor.denial of serviceRR Wheelspeed Sensor.denial of service
77 FL Wheelspeed Sensor.Noise in Sensor Magnet FieldRR Wheelspeed Sensor.Spoofing sensor values
78 FL Wheelspeed Sensor.Noise in Sensor Magnet FieldRR Wheelspeed Sensor.Sensor malfunction
79 FL Wheelspeed Sensor.denial of serviceRR Wheelspeed Sensor.Spoofing sensor values
80 FL Wheelspeed Sensor.denial of serviceRR Wheelspeed Sensor.Sensor malfunction
81 FL Wheelspeed Sensor.Spoofing sensor valuesRR Wheelspeed Sensor.Noise in Sensor Magnet Field

126 A Appendix
ID contained Basic Events
82 FL Wheelspeed Sensor.Spoofing sensor valuesRR Wheelspeed Sensor.denial of service
83 FL Wheelspeed Sensor.Sensor malfunctionRR Wheelspeed Sensor.Noise in Sensor Magnet Field
84 FL Wheelspeed Sensor.Sensor malfunctionRR Wheelspeed Sensor.denial of service
85 FL Wheelspeed Sensor.Spoofing sensor valuesRR Wheelspeed Sensor.Spoofing sensor values
86 FL Wheelspeed Sensor.Spoofing sensor valuesRR Wheelspeed Sensor.Sensor malfunction
87 FL Wheelspeed Sensor.Sensor malfunctionRR Wheelspeed Sensor.Spoofing sensor values
88 FL Wheelspeed Sensor.Sensor malfunctionRR Wheelspeed Sensor.Sensor malfunction
89 RL Wheelspeed Sensor.Noise in Sensor Magnet FieldRR Wheelspeed Sensor.Noise in Sensor Magnet Field
90 RL Wheelspeed Sensor.Noise in Sensor Magnet FieldRR Wheelspeed Sensor.denial of service
91 RL Wheelspeed Sensor.denial of serviceRR Wheelspeed Sensor.Noise in Sensor Magnet Field
92 RL Wheelspeed Sensor.denial of serviceRR Wheelspeed Sensor.denial of service
93 RL Wheelspeed Sensor.Noise in Sensor Magnet FieldRR Wheelspeed Sensor.Spoofing sensor values
94 RL Wheelspeed Sensor.Noise in Sensor Magnet FieldRR Wheelspeed Sensor.Sensor malfunction
95 RL Wheelspeed Sensor.denial of serviceRR Wheelspeed Sensor.Spoofing sensor values
96 RL Wheelspeed Sensor.denial of serviceRR Wheelspeed Sensor.Sensor malfunction
97 RL Wheelspeed Sensor.Spoofing sensor valuesRR Wheelspeed Sensor.Noise in Sensor Magnet Field
98 RL Wheelspeed Sensor.Spoofing sensor valuesRR Wheelspeed Sensor.denial of service
99 RL Wheelspeed Sensor.Sensor malfunctionRR Wheelspeed Sensor.Noise in Sensor Magnet Field
100 RL Wheelspeed Sensor.Sensor malfunctionRR Wheelspeed Sensor.denial of service
101 RL Wheelspeed Sensor.Spoofing sensor valuesRR Wheelspeed Sensor.Spoofing sensor values
102 RL Wheelspeed Sensor.Spoofing sensor valuesRR Wheelspeed Sensor.Sensor malfunction
103 RL Wheelspeed Sensor.Sensor malfunctionRR Wheelspeed Sensor.Spoofing sensor values
104 RL Wheelspeed Sensor.Sensor malfunctionRR Wheelspeed Sensor.Sensor malfunction
105 Brake Actor.spoofing a too low value106 Brake Actor.Brake reacts not as expected107 ACC.tampering deceleration value too low108 Brake Interface.tampering distance VA too high109 Brake Interface.tampering own velocity too low110 Brake Interface.tampering velocity VA too high111 Speedometer.tampering velocity too low value112 Communication System.tampering distance value too high113 Communication System.tampering too high velocity value114 Front Antenna.Tampering Velocity too high value115 Front Antenna.Spoofing velocity too high116 Front Antenna.Received velocity of VA too high117 Front Antenna.Spoofing of a distance signal
Front Distance Sensor.Spoofing sensor values118 Front Antenna.Spoofing of a distance signal
Front Distance Sensor.denial of service119 Front Antenna.Received distance to VA is too high
Front Distance Sensor.Spoofing sensor values120 Front Antenna.Received distance to VA is too high
Front Distance Sensor.denial of service121 Front Antenna.Spoofing of a distance signal
Front Distance Sensor.Assumed sonic velocity too high122 Front Antenna.Spoofing of a distance signal
Front Distance Sensor.Echo time too high123 Front Antenna.Received distance to VA is too high
Front Distance Sensor.Assumed sonic velocity too high124 Front Antenna.Received distance to VA is too high
Front Distance Sensor.Echo time too high
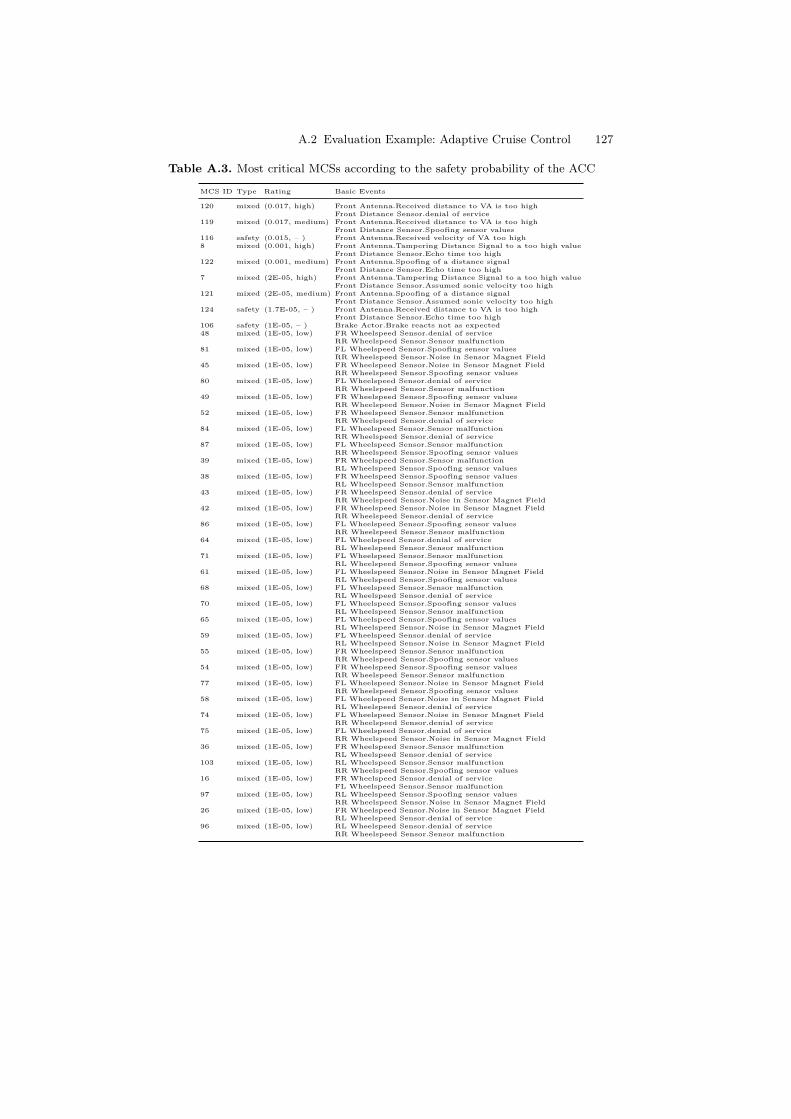
A.2 Evaluation Example: Adaptive Cruise Control 127
Table A.3. Most critical MCSs according to the safety probability of the ACC
MCS ID Type Rating Basic Events
120 mixed (0.017, high) Front Antenna.Received distance to VA is too highFront Distance Sensor.denial of service
119 mixed (0.017, medium) Front Antenna.Received distance to VA is too highFront Distance Sensor.Spoofing sensor values
116 safety (0.015, – ) Front Antenna.Received velocity of VA too high8 mixed (0.001, high) Front Antenna.Tampering Distance Signal to a too high value
Front Distance Sensor.Echo time too high122 mixed (0.001, medium) Front Antenna.Spoofing of a distance signal
Front Distance Sensor.Echo time too high7 mixed (2E-05, high) Front Antenna.Tampering Distance Signal to a too high value
Front Distance Sensor.Assumed sonic velocity too high121 mixed (2E-05, medium) Front Antenna.Spoofing of a distance signal
Front Distance Sensor.Assumed sonic velocity too high124 safety (1.7E-05, – ) Front Antenna.Received distance to VA is too high
Front Distance Sensor.Echo time too high106 safety (1E-05, – ) Brake Actor.Brake reacts not as expected48 mixed (1E-05, low) FR Wheelspeed Sensor.denial of service
RR Wheelspeed Sensor.Sensor malfunction81 mixed (1E-05, low) FL Wheelspeed Sensor.Spoofing sensor values
RR Wheelspeed Sensor.Noise in Sensor Magnet Field45 mixed (1E-05, low) FR Wheelspeed Sensor.Noise in Sensor Magnet Field
RR Wheelspeed Sensor.Spoofing sensor values80 mixed (1E-05, low) FL Wheelspeed Sensor.denial of service
RR Wheelspeed Sensor.Sensor malfunction49 mixed (1E-05, low) FR Wheelspeed Sensor.Spoofing sensor values
RR Wheelspeed Sensor.Noise in Sensor Magnet Field52 mixed (1E-05, low) FR Wheelspeed Sensor.Sensor malfunction
RR Wheelspeed Sensor.denial of service84 mixed (1E-05, low) FL Wheelspeed Sensor.Sensor malfunction
RR Wheelspeed Sensor.denial of service87 mixed (1E-05, low) FL Wheelspeed Sensor.Sensor malfunction
RR Wheelspeed Sensor.Spoofing sensor values39 mixed (1E-05, low) FR Wheelspeed Sensor.Sensor malfunction
RL Wheelspeed Sensor.Spoofing sensor values38 mixed (1E-05, low) FR Wheelspeed Sensor.Spoofing sensor values
RL Wheelspeed Sensor.Sensor malfunction43 mixed (1E-05, low) FR Wheelspeed Sensor.denial of service
RR Wheelspeed Sensor.Noise in Sensor Magnet Field42 mixed (1E-05, low) FR Wheelspeed Sensor.Noise in Sensor Magnet Field
RR Wheelspeed Sensor.denial of service86 mixed (1E-05, low) FL Wheelspeed Sensor.Spoofing sensor values
RR Wheelspeed Sensor.Sensor malfunction64 mixed (1E-05, low) FL Wheelspeed Sensor.denial of service
RL Wheelspeed Sensor.Sensor malfunction71 mixed (1E-05, low) FL Wheelspeed Sensor.Sensor malfunction
RL Wheelspeed Sensor.Spoofing sensor values61 mixed (1E-05, low) FL Wheelspeed Sensor.Noise in Sensor Magnet Field
RL Wheelspeed Sensor.Spoofing sensor values68 mixed (1E-05, low) FL Wheelspeed Sensor.Sensor malfunction
RL Wheelspeed Sensor.denial of service70 mixed (1E-05, low) FL Wheelspeed Sensor.Spoofing sensor values
RL Wheelspeed Sensor.Sensor malfunction65 mixed (1E-05, low) FL Wheelspeed Sensor.Spoofing sensor values
RL Wheelspeed Sensor.Noise in Sensor Magnet Field59 mixed (1E-05, low) FL Wheelspeed Sensor.denial of service
RL Wheelspeed Sensor.Noise in Sensor Magnet Field55 mixed (1E-05, low) FR Wheelspeed Sensor.Sensor malfunction
RR Wheelspeed Sensor.Spoofing sensor values54 mixed (1E-05, low) FR Wheelspeed Sensor.Spoofing sensor values
RR Wheelspeed Sensor.Sensor malfunction77 mixed (1E-05, low) FL Wheelspeed Sensor.Noise in Sensor Magnet Field
RR Wheelspeed Sensor.Spoofing sensor values58 mixed (1E-05, low) FL Wheelspeed Sensor.Noise in Sensor Magnet Field
RL Wheelspeed Sensor.denial of service74 mixed (1E-05, low) FL Wheelspeed Sensor.Noise in Sensor Magnet Field
RR Wheelspeed Sensor.denial of service75 mixed (1E-05, low) FL Wheelspeed Sensor.denial of service
RR Wheelspeed Sensor.Noise in Sensor Magnet Field36 mixed (1E-05, low) FR Wheelspeed Sensor.Sensor malfunction
RL Wheelspeed Sensor.denial of service103 mixed (1E-05, low) RL Wheelspeed Sensor.Sensor malfunction
RR Wheelspeed Sensor.Spoofing sensor values16 mixed (1E-05, low) FR Wheelspeed Sensor.denial of service
FL Wheelspeed Sensor.Sensor malfunction97 mixed (1E-05, low) RL Wheelspeed Sensor.Spoofing sensor values
RR Wheelspeed Sensor.Noise in Sensor Magnet Field26 mixed (1E-05, low) FR Wheelspeed Sensor.Noise in Sensor Magnet Field
RL Wheelspeed Sensor.denial of service96 mixed (1E-05, low) RL Wheelspeed Sensor.denial of service
RR Wheelspeed Sensor.Sensor malfunction

128 A Appendix
MCS ID Type Rating Basic Events
100 mixed (1E-05, low) RL Wheelspeed Sensor.Sensor malfunctionRR Wheelspeed Sensor.denial of service
102 mixed (1E-05, low) RL Wheelspeed Sensor.Spoofing sensor valuesRR Wheelspeed Sensor.Sensor malfunction
20 mixed (1E-05, low) FR Wheelspeed Sensor.Sensor malfunctionFL Wheelspeed Sensor.denial of service
22 mixed (1E-05, low) FR Wheelspeed Sensor.Spoofing sensor valuesFL Wheelspeed Sensor.Sensor malfunction
17 mixed (1E-05, low) FR Wheelspeed Sensor.Spoofing sensor valuesFL Wheelspeed Sensor.Noise in Sensor Magnet Field
27 mixed (1E-05, low) FR Wheelspeed Sensor.denial of serviceRL Wheelspeed Sensor.Noise in Sensor Magnet Field
33 mixed (1E-05, low) FR Wheelspeed Sensor.Spoofing sensor valuesRL Wheelspeed Sensor.Noise in Sensor Magnet Field
32 mixed (1E-05, low) FR Wheelspeed Sensor.denial of serviceRL Wheelspeed Sensor.Sensor malfunction
90 mixed (1E-05, low) RL Wheelspeed Sensor.Noise in Sensor Magnet FieldRR Wheelspeed Sensor.denial of service
23 mixed (1E-05, low) FR Wheelspeed Sensor.Sensor malfunctionFL Wheelspeed Sensor.Spoofing sensor values
10 mixed (1E-05, low) FR Wheelspeed Sensor.Noise in Sensor Magnet FieldFL Wheelspeed Sensor.denial of service
11 mixed (1E-05, low) FR Wheelspeed Sensor.denial of serviceFL Wheelspeed Sensor.Noise in Sensor Magnet Field
13 mixed (1E-05, low) FR Wheelspeed Sensor.Noise in Sensor Magnet FieldFL Wheelspeed Sensor.Spoofing sensor values
29 mixed (1E-05, low) FR Wheelspeed Sensor.Noise in Sensor Magnet FieldRL Wheelspeed Sensor.Spoofing sensor values
91 mixed (1E-05, low) RL Wheelspeed Sensor.denial of serviceRR Wheelspeed Sensor.Noise in Sensor Magnet Field
93 mixed (1E-05, low) RL Wheelspeed Sensor.Noise in Sensor Magnet FieldRR Wheelspeed Sensor.Spoofing sensor values

A.3 Evaluation Example: Smart Farming 129
A.3 Evaluation Example: Smart Farming
Tractor deviates from its planned trajectory and damages an object or hurts a person
>= 1 Tractor drives too fast or steers in the wrong direction
BreakActuatorController
BreakActuatorController
EngineActuatorController
EngineActuatorController
SteeringActuatorController
SteeringActuatorController
SpeedControllerSpeedController DirectionControllerDirectionController
TractorBusTractorBus
GasPedalSensorController
GasPedalSensorController
BreakPedalSensorController
BreakPedalSensorController
SteeringWheelSensorController
SteeringWheelSensorController
GasPedal
GasPedal
BreakPedal
BreakPedal
RemoteControl
RemoteControl
SteeringWheel
SteeringWheel
Attacker
Attacker
Fig. A.12. SeCFT: SmartFarming.Driving

130 A Appendix
Calculated rotational speed value too high
>= 1
Acceleration too high
Rotational speed value too high
Fig. A.13. SeCFT: SmartFarming.EngineActuatorController
Calculated break pressure value too low
>= 1
Break value too low
Break pressure value too low
Fig. A.14. SeCFT: SmartFarming.BreakActuatorController
Steering angle wrong
Steering angle wrong
Calculated steering angle wrong
>= 1
Fig. A.15. SeCFT: SmartFarming.SteeringActuatorController

A.3 Evaluation Example: Smart Farming 131
Calc
ulat
eBre
akag
e va
lue
too
low
>=
1
Calc
ulat
eRot
atio
ns v
alue
too
high
>=
1
Brea
k pr
essu
re to
o lo
wRo
tatio
nal s
peed
val
ue to
o hi
gh
Brea
k se
nsor
val
ue to
o lo
w
Rem
ote
cont
rol s
ets
low
bre
ak v
alue
Gas
sen
sor v
alue
too
high
Rem
ote
cont
rol s
ets
high
gas
val
ue
Fig. A.16. SeCFT: SmartFarming.SpeedController

132 A Appendix
Steering angle wrong
Steering wheel sensor value wrong
Remote control sets wrong steering angle
>= 1
Calculated steering angle wrong
Fig. A.17. SeCFT: SmartFarming.DirectionController
Gas value too high Break value too low
Break sensor value too low
Gas sensor value too high
Wrong steering angle
Wrong steering angle
>= 1 >= 1
Bus delay
>= 1
Fig. A.18. SeCFT: SmartFarming.TractorBus
Sensor value too high
Pedal pressure too high
>= 1
Wrong interpretation of sensor input
Fig. A.19. SeCFT: SmartFarming.GasPedalSensorController

A.3 Evaluation Example: Smart Farming 133
Sensor value too low
Pedal Pressure too low
>= 1
Wrong interpretation of sensor input
Fig. A.20. SeCFT: SmartFarming.BreakPedalSensorController
Sensor value wrong
Steering wheel position wrong
Wrong interpretation of sensor input
>= 1
Fig. A.21. SeCFT: SmartFarming.SteeringWheelSensorController
Pedal pressure too high
Hardware manipulation
[sec]
>= 1
Pedal pressure too high
Fig. A.22. SeCFT: SmartFarming.GasPedal

134 A Appendix
Pedal pressure too low
Hardware manipulation
[sec]
>= 1
Pedal pressure too low
Fig. A.23. SeCFT: SmartFarming.BreakPedal
Steering wheel position wrong
Hardware manipulation
[sec]
>= 1
Steering wheel position wrong
Fig. A.24. SeCFT: SmartFarming.SteeringWheel
Table A.4. MCSs of the SeCFT of the smart farming scenario
MCS ID contained Basic Events
1 RemoteControl.Remote control activeRemoteControl.Remote control sets high gas value
2 RemoteControl.Remote control activeAttacker.Attacker hijacks remote controlAttacker.Attacker sets high gas value
3 RemoteControl.Remote control activeAttacker.Attacker hijacks remote controlAttacker.Attacker sets low break value
4 RemoteControl.Remote control activeAttacker.Attacker hijacks remote controlAttacker.Attacker sets wrong steering angle
5 RemoteControl.Remote control activeRemoteControl.Remote control sets low break value
6 RemoteControl.Remote control activeRemoteControl.Remote control sets wrong steering angle
7 Attacker.Hardware manipulationAttacker.Attacker gains hardware access
8 DirectionController.Calculated steering angle wrong9 SteeringWheelSensorController.Wrong interpretation of sensor input10 SteeringWheel.Steering wheel position wrong11 EngineActuatorController.Calculated rotational speed value too high12 SpeedController.CalculateRotations value too high13 TractorBus.Bus delay14 GasPedalSensorController.Wrong interpretation of sensor input15 GasPedal.Pedal pressure too high16 BreakActuatorController.Calculated break pressure value too low17 SpeedController.CalculateBreakage value too low18 BreakPedalSensorController.Wrong interpretation of sensor input19 BreakPedal.Pedal pressure too low20 SteeringActuatorController.Calculated steering angle wrong

A.3 Evaluation Example: Smart Farming 135
Rem
ote
cont
rol s
ets
low
bre
ak v
alue
Rem
ote
cont
rol s
ets
high
gas
val
ueRe
mot
e co
ntro
l set
s w
rong
ste
erin
g an
gle
Atta
cker
set
s hi
gh g
as v
alue
[sec
]
Atta
cker
set
s lo
w b
reak
val
ue[s
ec]
Atta
cker
set
s w
rong
ste
erin
g an
gle
[sec
]
>=
1Re
mot
e co
ntro
l set
s hi
gh g
as v
alue
>=
1Re
mot
e co
ntro
l set
s lo
w b
reak
val
ue
>=
1
&
&
&
Rem
ote
cont
rol s
ets
wro
ng s
teer
ing
angl
e
Rem
ote
cont
rol s
ets
low
bre
ak v
alue
Rem
ote
cont
rol s
ets
high
gas
val
ue
Rem
ote
cont
rol a
ctiv
e
Fig. A.25. SeCFT: SmartFarming.RemoteControl

136 A Appendix
Atta
cker
set
s lo
w b
reak
val
ue
[sec
]At
tack
er s
ets
wro
ng s
teer
ing
angl
e
[sec
]
Atta
cker
set
s hi
gh g
as v
alue
[sec
]
Har
dwar
e m
anip
ulat
ion
[sec
]
&&
&
&
Atta
cker
hija
cks
rem
ote
cont
rol
[sec
] [m
ediu
m]
Atta
cker
set
s lo
w b
reak
val
ue[s
ec] [
high
]At
tack
er s
ets
wro
ng s
teer
ing
angl
e[s
ec] [
high
]At
tack
er s
ets
high
gas
val
ue[s
ec] [
high
]Har
dwar
e m
anip
ulat
ion
[sec
] [lo
w]
Atta
cker
gai
ns h
ardw
are
acce
ss[s
ec] [
low
]
Fig. A.26. SeCFT: SmartFarming.Attacker

A.4 Evaluation Example: Infusion Pump 137
A.4 Evaluation Example: Infusion Pump
ErrorHandler
PumpDriver
PumpSensors PumpUnit
UserInput
&
FlowRateMonitor
wrong dosage + no alarm
Attacker
Alarm
Fig. A.27. SeCFT: InfusionPump

138 A Appendix
>= 1
alarm fails
no alarm raised
no alarm triggered
attacker disables alarm
[sec]
Fig. A.28. SeCFT: InfusionPump.Alarm
wrong dosage
pump unit sets wrong values
>= 1pump driver has wrong value settings
pump driver fails
Fig. A.29. SeCFT: InfusionPump.PumpDriver
>= 1
error handler fails
no alarm triggered
attacker disables alarm trigger
[sec]
no alarm state sent from flow rate monitor
Fig. A.30. SeCFT: InfusionPump.ErrorHandler

A.4 Evaluation Example: Infusion Pump 139
flow rate monitor fails
>= 1
no alarm state reported
attacker changes values
[sec]
wrong values from sensors
wrong value set by user
Fig. A.31. SeCFT: InfusionPump.FlowRateMonitor
sensors provide wrong values
sensors provide wrong values
Fig. A.32. SeCFT: InfusionPump.PumpSensors
>= 1
pump unit sets wrong values
wrong settings
wrong user input
attacker changes settings
[sec]&
check of user input fails
Fig. A.33. SeCFT: InfusionPump.PumpUnit

140 A Appendix
wrong value settings
user sets wrong values
Fig. A.34. SeCFT: InfusionPump.UserInput
[physical] access the ethernet interface of the pump[sec],[high]
access telnet service of the pump[sec] [high]
&get root access of the pumps OS
change flow rate settings (flow rate monitor)
[sec]
disable alarm trigger
[sec]
change flow rate settings (pump unit)
[sec]
disable alarm
[sec]
Fig. A.35. SeCFT: InfusionPump.Attacker

B
Abbreviations
ACC Adaptive Cruise Control . . . . . . . . . . . . . . . . . . . . . . . . . . . . . . . . 89ADVISE ADversary VIew Security Evaluation. . . . . . . . . . . . . . . . . . . .31AT Attack Tree . . . . . . . . . . . . . . . . . . . . . . . . . . . . . . . . . . . . . . . . . . . 109BDD Binary Decision Diagram . . . . . . . . . . . . . . . . . . . . . . . . . . . . . . . 75BDMP Boolean logic Driven Markov Process . . . . . . . . . . . . . . . . . . . 43BE Basic Event. . . . . . . . . . . . . . . . . . . . . . . . . . . . . . . . . . . . . . . . . . . . .79BM Birnbaum’s Importance Measure . . . . . . . . . . . . . . . . . . . . . . . . 18CFT Component Fault Tree . . . . . . . . . . . . . . . . . . . . . . . . . . . . . . . . . 109CPS Cyber-Physical System . . . . . . . . . . . . . . . . . . . . . . . . . . . . . . . . . 25DAG Directed Acyclic Graph . . . . . . . . . . . . . . . . . . . . . . . . . . . . . . . . . 46DFD Data Flow Diagram. . . . . . . . . . . . . . . . . . . . . . . . . . . . . . . . . . . . .31DFT Dynamic Fault Tree . . . . . . . . . . . . . . . . . . . . . . . . . . . . . . . . . . . . 37DNF Disjunctive Normal Form . . . . . . . . . . . . . . . . . . . . . . . . . . . . . . . 30DSP Digital Signal Processor. . . . . . . . . . . . . . . . . . . . . . . . . . . . . . . . .83DT Defense Tree . . . . . . . . . . . . . . . . . . . . . . . . . . . . . . . . . . . . . . . . . . . .37EFT Extended Fault Tree . . . . . . . . . . . . . . . . . . . . . . . . . . . . . . . . . . . . 36ERTMS European Railway Traffic Management System. . . . . . . . . .37FMEA Failure Mode and Effects Analysis . . . . . . . . . . . . . . . . . . . . . . 45FMECA Failure Mode, Effects, and Criticality Analysis . . . . . . . . . . 63FMVEA Failure Mode, Vulnerabilities and Effects Analysis . . . . . . .63FTA Fault Tree Analysis . . . . . . . . . . . . . . . . . . . . . . . . . . . . . . . . . . . . . 87FT Fault Tree . . . . . . . . . . . . . . . . . . . . . . . . . . . . . . . . . . . . . . . . . . . . . . 79FV Fussell-Vesely . . . . . . . . . . . . . . . . . . . . . . . . . . . . . . . . . . . . . . . . . . . 76GFT Generalized Fault Tree . . . . . . . . . . . . . . . . . . . . . . . . . . . . . . . . . . 30GSPN Generalized Stochastic Petri Net . . . . . . . . . . . . . . . . . . . . . . . . 30HAZOP Hazard and Operability Study . . . . . . . . . . . . . . . . . . . . . . . . . . 45IE Intermediate Event . . . . . . . . . . . . . . . . . . . . . . . . . . . . . . . . . . . . . 49LAN Local Area Network . . . . . . . . . . . . . . . . . . . . . . . . . . . . . . . . . . . . 24MAC Media Access Control . . . . . . . . . . . . . . . . . . . . . . . . . . . . . . . . . . . 24MCS Minimal Cut Set. . . . . . . . . . . . . . . . . . . . . . . . . . . . . . . . . . . . . . .109

142 B Abbreviations
NUREG US Nuclear Regulatory Commission Regulation . . . . . . . . . . 9PENET Petri Net Attack Modeling . . . . . . . . . . . . . . . . . . . . . . . . . . . . . . 30PFT Parametric Fault Tree . . . . . . . . . . . . . . . . . . . . . . . . . . . . . . . . . . 19PI Prime Implicant . . . . . . . . . . . . . . . . . . . . . . . . . . . . . . . . . . . . . . . . 12RAW Risk Achievement Worth. . . . . . . . . . . . . . . . . . . . . . . . . . . . . . . .18RFT Repairable Fault Tree . . . . . . . . . . . . . . . . . . . . . . . . . . . . . . . . . . . 37ROA Return on Attack . . . . . . . . . . . . . . . . . . . . . . . . . . . . . . . . . . . . . . . 30ROBDD Reduced Ordered Binary Decision Diagram . . . . . . . . . . . . . 16ROI Return on Investment. . . . . . . . . . . . . . . . . . . . . . . . . . . . . . . . . . .30RPN Risk Priority Number . . . . . . . . . . . . . . . . . . . . . . . . . . . . . . . . . . . 63RRW Risk Reduction Worth . . . . . . . . . . . . . . . . . . . . . . . . . . . . . . . . . . 18SCADA Supervisory Control and Data Acquisition . . . . . . . . . . . . . . 25SeCFT Security-enhanced Component Fault Tree . . . . . . . . . . . . . . 109SEFT State/Event Fault Tree . . . . . . . . . . . . . . . . . . . . . . . . . . . . . . . . . 19SHARD Software Hazard Analysis and Resolution in Design . . . . . 21SIL Safety Integrity Level . . . . . . . . . . . . . . . . . . . . . . . . . . . . . . . . . . . 99STRIDE Spoofing, Tampering, Repudiation, Information Disclosure,
Denial of Service, Elevation of Privilege . . . . . . . . . . . . . . . . . 32TE Top Event . . . . . . . . . . . . . . . . . . . . . . . . . . . . . . . . . . . . . . . . . . . . . . 59TVRA Threat Vulnerability and Risk Assessment . . . . . . . . . . . . . . 39UML Unified Modeling Language . . . . . . . . . . . . . . . . . . . . . . . . . . . . . 21WLAN Wireless Local Area Network . . . . . . . . . . . . . . . . . . . . . . . . . . . 24WPA2 Wi-Fi Protected Access 2 . . . . . . . . . . . . . . . . . . . . . . . . . . . . . . . 24

Index
Asset, 22Attack, 23Availability, 22
Confidentiality, 22Control, see CountermeasureCountermeasure, 23
EventBasic Event, 9Intermediate Event, 10Safety Event, 47Security Event, 47Top Event, 9
Failure, 8Failure Rate, 14Fault, 8
Harm, 8
Integrity, 22
LikelihoodAND-gate, 66
OR-gate, 67
Minimal Cut Set, 11Minimal Cut Set size, 14Mixed Minimal Cut Set, 64Safety Minimal Cut Set, 64Security Minimal Cut Set, 64
ProbabilityAND-gate, 66OR-gate, 66
Reliability, 8Risk, 8
Safety, 8Security, 22
Threat, 23
Vulnerability, 22
143


References
[Andrews 00] J. D. Andrews. To Not or Not to Not. In 18th InternationalSystem Safety Conference, Fort Worth Texas, Radisson Plaza, Sep 2000.
[Ariss 11] Omar El Ariss, Dianxiang Xu. Modeling Security Attacks withStatecharts. In Proceedings of the joint ACM SIGSOFT conference – QoSAand ACM SIGSOFT symposium – ISARCS on Quality of software architec-tures – QoSA and architecting critical systems – ISARCS, QoSA-ISARCS’11, pp. 123–132. ACM, 2011.
[Armbrust 09] Christopher Armbrust, Tim Braun, Tobias Föhst, Mar-tin Proetzsch, Alexander Renner, Bernd-Helge Schäfer, Karsten Berns.RAVON — The Robust Autonomous Vehicle for Off-road Navigation. InProceedings of the IARP International Workshop on Robotics for Risky In-terventions and Environmental Surveillance 2009 (RISE 2009), Brussels,Belgium, Jan 12–14 2009. IARP.
[Arney 09] David Arney, Raoul Jetley, Yi Zhang, Paul Jones, Oleg Sokolsky,Insup Lee, Arnab Ray. The Generic Patient Controlled Analgesia PumpModel. http://rtg.cis.upenn.edu/gip.php3, 2009. (accessed 2015-10-23).
[Avizienis 04] Algirdas Avizienis, Jean-Claude Laprie, Brian Randell, CarlLandwehr. Basic Concepts and Taxonomy of Dependable and Secure Com-puting. IEEE Transactions on Dependable and Secure Computing, 1(1):11–33, Jan-Mar 2004.
[Bachfeld 11a] Daniel Bachfeld. Siemens schließt Lücken in Automa-tisierungssystemen. http://heise.de/-1259623, 2011. (accessed 2015-10-23).
[Bachfeld 11b] Daniel Bachfeld. Weitere Siemens-Industriesteuerungen fürAngriffe anfällig. http://heise.de/-1274912, 2011. (accessed 2015-10-23).
[Bechta Dugan 92] J. Bechta Dugan, Salvatore J. Bavuso, M.A. Boyd. Dy-namic fault-tree models for fault-tolerant computer systems. Reliability,IEEE Transactions on, 41(3):363–377, Sep 1992.

146 REFERENCES
[Benenson 08] Zinaida Benenson, Peter M Cholewinski, Felix C Freiling. Vul-nerabilities and attacks in wireless sensor networks. Wireless Sensors Net-works Security, Cryptology & Information Security Series (CIS), pp. 22–43,2008.
[Bergert 15] Denise Bergert, Axel Kannenberg. Weitere Sicherheitslücke inHospira-Infusionspumpen. http://heise.de/-2682272, 2015. (accessed2015-10-23).
[Bistarelli 06] Stefano Bistarelli, Fabio Fioravanti, Pamela Peretti. Defensetrees for economic evaluation of security investments. In Availability, Reli-ability and Security, 2006. ARES 2006. The First International Conferenceon, pp. 8 pp.–, Apr 2006.
[Bloomfield 12] Richard Bloomfield, Robin Bloomfield, Ilir Gashi, RobertStroud. How Secure Is ERTMS? In Frank Ortmeier, Peter Daniel (Hrsg.),Computer Safety, Reliability, and Security , Lecture Notes in ComputerScience Bd. 7613. Springer Berlin Heidelberg, 2012.
[Bobbio 03] Andrea Bobbio, Giuliana Franceschinis, Rossano Gaeta, LuigiPortinale. Parametric fault tree for the dependability analysis of redun-dant systems and its high-level Petri net semantics. Software Engineering,IEEE Transactions on, 29(3):270–287, Mar 2003.
[Bouissou 03] Marc Bouissou, Jean-Louis Bon. A new formalism that com-bines advantages of fault-trees and Markov models: Boolean logic drivenMarkov processes. Reliability Engineering & System Safety, 82(2):149 –163, 2003.
[Bowles 01] John B. Bowles, Chi Wan. Software Failure Modes and EffectsAnalysis For a Small Embedded Control System. In 2001 Proceedings An-nual Reliability and Maintainability Symposium. IEEE, 2001.
[Brooke 03] Phillip J. Brooke, Richard F. Paige. Fault trees for security sys-tem design and analysis. Computers & Security, 33:256–264, 2003.
[Bryant 86] R.E. Bryant. Graph-Based Algorithms for Boolean Function Ma-nipulation. Computers, IEEE Transactions on, C-35(8):677–691, Aug 1986.
[Buldas 06] Ahto Buldas, Peeter Laud, Jaan Priisalu, Märt Saarepera, JanWillemson. Rational Choice of Security Measures Via Multi-parameterAttack Trees. In Critical Information Infrastructures Security, 2006.
[Byres 04] Eric J. Byres, Matthew Franz, Darrin Miller. The Use of AttackTrees in Assessing Vulnerabilities in SCADA Systems. In IEEE Interna-tional Infrastructure Survivability Workshop, 2004.
[Carreras 01] C. Carreras, I. D. Walker. Interval Methods for Fault-Tree Anal-yses in Robotics. IEEE Transactions on Reliability, 50(1):3–11, Mar 2001.
[Casals 12] Silvia Gil Casals, Philippe Owezarski, Gilles Descargues. RiskAssessment for Airworthiness Security. In Frank Ortmeier, Peter Daniel(Hrsg.), Computer Safety, Reliability, and Security , Lecture Notes in Com-puter Science Bd. 7612. Springer Berlin Heidelberg, 2012.
[Checkoway 11] Stephen Checkoway, Damon McCoy, Brian Kantor, DannyAnderson, Hovav Shacham, Stefan Savage, Karl Koscher, Alexei Czeskis,Franziska Roesner, Tadayoshi Kohno et al. Comprehensive Experimental

REFERENCES 147
Analyses of Automotive Attack Surfaces. In USENIX Security Symposium,2011.
[Codetta-Raiteri 04] D. Codetta-Raiteri, G. Franceschinis, M. Iacono, V. Vit-torini. Repairable fault tree for the automatic evaluation of repair policies.In Dependable Systems and Networks, 2004 International Conference on,pp. 659–668, Jun 2004.
[Codetta-Raiteri 05] D Codetta-Raiteri. Extended Fault Trees Analysis sup-ported by Stochastic Petri Nets. Dissertation, Università di Torino, Nov2005.
[Codetta-Raiteri 13] Daniele Codetta-Raiteri. Generalized Fault-Trees: fromreliability to security. In International Workshop on Quantitative Aspectsin Security Assurance (QASA), 2013.
[Convery 02] S. Convery, D. Cook, M. Franz. An Attack Tree for the BorderGateway Protocol. Technischer Bericht, Cisco, 2002.
[Dhillon 11] Danny Dhillon. Developer-Driven Threat Modeling: LessonsLearned in the Trenches. IEEE Security and Privacy, 9:41–47, 2011.
[DIN 25424-1 81] DIN 25424: Fehlerbaumanalyse Teil 1: Methode und Bildze-ichen, Sep 1981.
[DIN 25424-2 90] DIN 25424: Fehlerbaumanalyse Teil 2: Handrechenver-fahren zur Auswertung eines Fehlerbaumes, Apr 1990.
[DIN 40041 90] DIN 40041: Zuverlässigkeit - Begriffe, Dec 1990.[Dobbing 06a] Brian Dobbing, Samantha Lautieri. SafSec: Integration of
Safety & Security Certification - Methodology: Guidance Material. Tech-nischer Bericht, Praxis High Integrity Systems, 2006.
[Dobbing 06b] Brian Dobbing, Samantha Lautieri. SafSec: Integration ofSafety & Security Certification - Methodology: Standard. TechnischerBericht, Praxis High Integrity Systems, 2006.
[Eames 99] David Peter Eames, Jonathan Moffett. The Integration of Safetyand Security Requirements. In Computer Safety, Reliability and Security,1999.
[ED-202 10] ED-202: Airworthiness security process specification, 2010.[Ericson 99] Clifton A. Ericson. Fault Tree Analysis - A History. In Pro-
ceedings of The 17th International System Safety Conference, The BoeingCompany, Seattle, Washington, 1999.
[ESSaRel 09] Embedded System Safety and Reliability Analyzer (ESSaRel).http://www.essarel.de, 2009. (accessed 2015-10-23).
[ETSI TS 102 165-1 11] ETSI TS 102 165-1: TISPANMethods and Protocols;Method and proforma for Threat, Risk, Vulnerability Analysis, 2011.
[Foster 15] Ian Foster, Andrew Prudhomme, Karl Koscher, Stefan Savage.Fast and Vulnerable: A Story of Telematic Failures. In Proceedings of the9th USENIX Conference on Offensive Technologies, pp. 15–15. USENIXAssociation, 2015.
[Fovino 09] Igor Nai Fovino, Marcelo Masera, Alessio De Cian. Integratingcyber attacks within fault trees. Reliability Engineering and System Safety,94:1394–1402, 2009.

148 REFERENCES
[Fussell 75] J.B. Fussell. How to Hand-Calculate System Reliability andSafety Characteristics. Reliability, IEEE Transactions on, R-24(3):169–174,1975.
[Förster 09] Marc Förster, Mario Trapp. Fault tree analysis of software-controlled component systems based on second-order probabilities. In IS-SRE 2009 proceedings, 2009.
[Förster 10] Marc Förster, Reinhard Schwarz, Max Steiner. Integration ofModular Safety and Security Models for the Analysis of the Impact of Secu-rity on Safety. Technischer Bericht 078.10/E, Fraunhofer IESE, TechnischeUniversität Kaiserslautern, Kaiserslautern, Germany, 2010.
[Greenberg 15] Andy Greenberg. Hackers Remotely Kill a Jeep onthe Highway – With Me in It. http://www.wired.com/2015/07/hackers-remotely-kill-jeep-highway/, 2015. (accessed 2015-10-23).
[Grosspietsch 04] Karl-Erwin Grosspietsch, Tanya A. Silayeva. A CombinedSafety/Security Approach for Co-Operative Distributed Systems. In Pro-ceedings of the 18th International Parallel and Distributed Processing Sym-posium (IPDPS’04), 2004.
[Guo 10] Zhengsheng Guo, Dirk Zeckzer, Peter Liggesmeyer, Oliver Mäckel.Identification of Security-Safety Requirements for the Outdoor RobotRAVON Using Safety Analysis Techniques. In Software Engineering Ad-vances (ICSEA), 2010 Fifth International Conference on, pp. 508–513,2010.
[Helmer 02] Guy Helmer, Johnny Wong, Mark Slagell, Vasant Honavar, LesMiller, Robyn Lutz. A Software Fault Tree Approach to Requirements Anal-ysis of an Intrusion Detection System. Requirements Engineering Journal,7(4):207–220, 2002.
[Hernan 06] Shawn Hernan, Scott Lambert, Tomasz Ostwald, AdamShostack. Uncover Security Design Flaws Using The STRIDE Approach.MSDN Magazine, Nov 2006.
[Holland 15] Martin Holland. ConnectedDrive: Der BMW-Hack im Detail.http://heise.de/-2540786, 2015. (accessed 2015-10-23).
[Howard 02] Michael Howard, David E. Leblanc. Writing Secure Code. Mi-crosoft Press, Redmond, WA, USA, Ausgabe 2nd, 2002.
[Howard 06] Michael Howard, Steve Lipner. The Security Development Life-cycle: A Process for Developing Demonstrably More Secure Software. Mi-crosoft Press, 2006.
[ICS-CERT 11] ICS-CERT. Alert (ICS-ALERT-11-161-01) - Siemens S7-1200 PLC Vulnerabilities. https://ics-cert.us-cert.gov/alerts/ICS-ALERT-11-161-01, Jun 2011. (accessed 2015-09-17).
[ICS-CERT 13] ICS-CERT. Alert (ICS-ALERT-13-164-01) - Medical De-vices Hard-Coded Passwords. https://ics-cert.us-cert.gov/alerts/ICS-ALERT-13-164-01, Jun 2013. (accessed 2015-10-23).
[Idika 10] Nwokedi Idika, Bharat Bhargava. Extending Attack Graph-basedSecurity Metrics and Aggregating Their Application. IEEE Transactionson Dependable and Secure Computing, 2010.

REFERENCES 149
[IEC 60300-3-1 05] IEC 60300-3-1: Dependability management - Part 3-1: Ap-plication guide; Analysis techniques for dependability; Guide on methodol-ogy, May 2005.
[IEC 60812 06] IEC 60812: Analysis techniques for system reliability - Proce-dure for Failure Mode and Effects Analysis (FMEA), Jan 2006.
[IEC 61025 06] IEC 61025: Fault tree Analysis (FTA), Dec 2006.[IEC 61508-4 10] IEC 61508-4: Functional safety of electrical / electronic /
programmable electronic safety-related systems - Part 4: Definitions andabbreviations, Apr 2010.
[IEC 61508 10] IEC 61508: Functional safety of electrical / electronic / pro-grammable electronic safety-related systems, 2010.
[IEC 61882 01] IEC 61882: Hazard and operability studies (HAZOP studies)- Application guide, May 2001.
[Ingoldsby 03] Terrance R Ingoldsby. Understanding Risks Through At-tack Tree Analysis. Amenaza Technologies Ltd. Copyright, 2003. http://amenaza.com/downloads/docs/Methodology.pdf.
[Ingoldsby 13] Terrance R Ingoldsby. Attack tree-based threat risk analy-sis. Amenaza Technologies Ltd. Copyright, 2013. https://amenaza.com/downloads/docs/AttackTreeThreatRiskAnalysis.pdf.
[ISO/IEC 15408 12] ISO/IEC 15408 Common Criteria for Information Tech-nology Security Evaluation, Sep 2012.
[ISO/IEC 27000 09] DIN ISO/IEC 27000 Information technology - Securitytechniques - Information security management systems - Overview and vo-cabulary, May 2009.
[ITSG 15] Gesetz zur Erhöhung der Sicherheit informationstechnischer Sys-teme (IT-Sicherheitsgesetz). "http://www.bgbl.de/xaver/bgbl/start.xav?startbk=Bundesanzeiger_BGBl&jumpTo=bgbl115s1324.pdf", Jul2015. (accessed 2015-10-23).
[Jürgenson 08] Aivo Jürgenson, Jan Willemson. Computing Exact Outcomesof Multi-parameter Attack Trees. In On the Move to Meaningful InternetSystems, 2008.
[Kaiser 02] Bernhard Kaiser. Integration von Sicherheits- und Zuverläs-sigkeitsmodellen in den Entwicklungsprozess Eingebetteter Systeme. Tech-nischer Bericht, Hasso-Plattner Institut für Softwaretechnik an der Univer-sität Potsdam, 2002.
[Kaiser 03a] Bernhard Kaiser. A Fault-Tree Semantics to model Software-Controlled Systems. Technischer Bericht, Hasso-Plattner Institute for Soft-ware Systems Engineering at the University of Potsdam, 2003.
[Kaiser 03b] Bernhard Kaiser, Peter Liggesmeyer, Oliver Mäckel. A NewComponent Concept for Fault Trees. In 8th Australian Workshop on SafetyCritical Systems and Software, Canberra, Oct 2003.
[Kaiser 06] Bernhard Kaiser. State/Event Fault Trees: A Safety and Reli-ability Analysis Technique for Software-Controlled Systems. Dissertation,Technische Universität Kaiserslautern, 2006.

150 REFERENCES
[Kamkar 15] Samy Kamkar. Drive It Like You Hacked It: New Attacks andTools to Wirelessly Steal Cars. In DEF CON 23, 2015.
[Kargl 14] Frank Kargl, Rens W. van der Heijden, Hartmut König, AlfonsoValdes, Marc C. Dacier. Insights on the Security and Dependability ofIndustrial Control Systems. Security Privacy, IEEE, 12(6):75–78, Nov 2014.
[Kleinz 14] Torsten Kleinz, Hajo Schulz. 31C3: Wie man ein Chemiewerkhackt. http://heise.de/-2507259, 2014. (accessed 2015-10-23).
[Klick 15] Johannes Klick, Stephan Lau, Daniel Marzin, Jan-Ole Malchow,Volker Roth. Internet-facing PLCs - A New Back Orifice. In Blackhat USA2015,, 2015.
[Klutke 03] G.A. Klutke, P.C. Kiessler, M.A. Wortman. A critical look atthe bathtub curve. Reliability, IEEE Transactions on, 52(1):125–129, Mar2003.
[Koscher 10] Karl Koscher, Alexei Czeskis, Franziska Roesner, Shwetak Pa-tel, Tadayoshi Kohno, Stephen Checkoway, Damon McCoy, Brian Kantor,Danny Anderson, Hovav Shacham, Stefan Savage. Experimental SecurityAnalysis of a Modern Automobile. In 2010 IEEE Symposium on Securityand Privacy, 2010.
[Langner 11] Ralph Langner. Stuxnet: Dissecting a Cyberwarfare Weapon.Security Privacy, IEEE, 9(3):49–51, May 2011.
[Lano 02] Kevin Lano, David Clark, Kelly Androutsopoulos. Safety and Se-curity Analysis of Object-Oriented Models. In Safecomp, 2002.
[Lanotte 03] Ruggero Lanotte. An automaton-theoretic approach to safety andsecurity in real-time systems. Dissertation, Università degli Studi di Pisa,2003.
[LeMay 11] E. LeMay, M.D. Ford, K. Keefe, W.H. Sanders, C. Muehrcke.Model-based Security Metrics Using ADversary VIew Security Evaluation(ADVISE). In Quantitative Evaluation of Systems (QEST), 2011 EighthInternational Conference on, pp. 191–200, Sep 2011.
[Marsan 95] Marco A. Marsan, Gianfranco Balbo, Gianni Conte, Susanna Do-natelli, Giuliana Franceschinis. Modelling with Generalized Stochastic PetriNets. John Wiley & Sons, Inc., 1995.
[Mauw 06] Sjouke Mauw, Martijn Oostdijk. Foundations of Attack Trees. InInformation Security and Cryptology - ICISC 2005, 2006.
[McDermott 00] J. P. McDermott. Attack Net Penetration Testing. In Pro-ceedings of the 2000 Workshop on New Security Paradigms, NSPW ’00, pp.15–21, New York, NY, USA, 2000. ACM.
[Microsoft 10] Microsoft. Security Development Lifecycle. 2010.[MITRE 14] MITRE. Common Weakness Enumeration. http://cwe.mitre.
org, 2014. (accessed 2015-10-23).[MoD DS 00-56 07] Defence Standard 00-56, Safety Management Require-
ments for Defence Systems, Jun 2007.[Nicol 04] David M. Nicol, William H. Sanders, Kishor S. Trivedi. Model-
Based Evaluation: From Dependability to Security. IEEE Transactions onDependable and Secure Computing, 1(1):48–65, Jan-Mar 2004.
REFERENCES 151
[OWASP 15] Open Web Application Security Project (OWASP). https://www.owasp.org/, 2015. (accessed 2015-10-18).
[Paul 15] Stephane Paul, Laurent Rioux. Over 20 Years of Research in Cyber-security and Safety Engineering: a short Bibliography. In 6th InternationalConference on Safety and Security Engineering (SAFE), 2015.
[Pauli 15] Darren Pauli. Thousands of ’directly hackable’ hospital devices ex-posed online. http://www.theregister.co.uk/2015/09/29/thousands_of_directly_hackable_hospital_devices_found_exposed/, 2015. (ac-cessed 2015-10-23).
[Piètre-Cambacédès 10a] Ludovic Piètre-Cambacédès, Marc Bouissou. At-tack and Defense Modeling with BDMP. In Igor Kotenko, Victor Skormin(Hrsg.), Computer Network Security , Lecture Notes in Computer ScienceBd. 6258, pp. 86–101. Springer Berlin Heidelberg, 2010.
[Piètre-Cambacédès 10b] Ludovic Piètre-Cambacédès, Marc Bouissou. Mod-eling safety and security interdependencies with BDMP (Boolean logicDriven Markov Processes). In Systems Man and Cybernetics (SMC), 2010IEEE International Conference on, pp. 2852–2861, Oct 2010.
[Proetzsch 10] Martin Proetzsch, Tobias Luksch, Karsten Berns. Develop-ment of Complex Robotic Systems Using the Behavior-Based Control Ar-chitecture iB2C. Robotics and Autonomous Systems, 58(1):46–67, Jan 2010.
[Pudar 09] Srdjan Pudar, G. Manimaran, Chen-Ching Liu. PENET: A prac-tical method and tool for integrated modeling of security attacks and coun-termeasures. Computers & Security, 28(8):754 – 771, 2009.
[Pumfrey 99] David John Pumfrey. The Principled Design of Computer Sys-tem Safety Analyses. Dissertation, University of York, 1999.
[Rauzy 01] Antoine Rauzy. Mathematical Foundations of Minimal Cutsets.IEEE Transactions on Reliability, 50(4):389–396, Dec 2001.
[Reichenbach 12] F. Reichenbach, J. Endresen, M.M.R. Chowdhury,J. Rossebo. A Pragmatic Approach on Combined Safety and Security RiskAnalysis. In Software Reliability Engineering Workshops (ISSREW), 2012IEEE 23rd International Symposium on, pp. 239–244, Nov 2012.
[Robertson 14] Jordan Robertson, Michael A. Riley. Mys-terious ’08 Turkey Pipeline Blast Opened New Cyber-war. http://www.bloomberg.com/news/articles/2014-12-10/mysterious-08-turkey-pipeline-blast-opened-new-cyberwar, 2014.(accessed 2015-10-23).
[Roth 13] Michael Roth, Max Steiner, Peter Liggesmeyer. Ein Ansatz zurintegrierten Sicherheitsanalyse komplexer Systeme. In Wolfgang A. Ha-lang (Hrsg.), Kommunikation unter Echtzeitbedingungen, Informatik ak-tuell. Springer Berlin Heidelberg, 2013.
[Rouf 10] Ishtiaq Rouf, Rob Miller, Hossen Mustafa, travis Taylor, SanghoOh, Wanyuan Xu, Marco Gruteser, Wade Trappe, Ivan Seskar. Securityand Privacy Vulnerabilities of In-Car Wireless Networks: A Tire PressureMonitoring Case Study. Technischer Bericht, Dept. of CSE, Univ. of South

152 REFERENCES
Carolina, Columbia, SC USA and WINLAB, Rutgers Univ. Pscataway, NJUSA, 2010.
[Rushdi 04] Ali M. Rushdi, Omar M. Ba-Rukab. A Doubly-Stochastic Fault-Tree Assessment of the Probabilities of Security Breaches in ComputerSystems. In Saudi Science Conference, 2004.
[Rushdi 05] Ali M. Rushdi, Omar M. Ba-Rukab. Fault.-tree modelling ofcomputer system security. International Journal of Computer Mathematics,82:805–819, 2005.
[Saglietti 06] Francesca Saglietti. Interaktion zwischen funktionaler Sicherheitund Datensicherheit. In Sicherheit - Schutz und Zuverlässigkeit (Sicher-heit 2006), Lecture Notes in Informatics, pp. 373–383, Magedeburg, 2006.Gesellschaft für Informatik.
[Scherschel 14] Fabian Scherschel. BSI-Sicherheitsbericht: ErfolgreicheCyber-Attacke auf deutsches Stahlwerk. http://heise.de/-2498990,2014. (accessed 2015-10-23).
[Scherschel 15] Fabian Scherschel. Root-Shell im Krankenhaus: Hospira-Infusionspumpe mit Telnet-Lücke. http://heise.de/-2633529, 2015. (ac-cessed 2015-10-23).
[Schirrmacher 15] Dennis Schirrmacher. Scada-Sicherheit: Siemens-PLC wirdzum Einbruchswerkzeug. http://heise.de/-2774812, 2015. (accessed2015-10-23).
[Schmidt 11] Jürgen Schmidt. Siemens bezieht Stellung zu den "SCADA-Affen". http://heise.de/-1318547, 2011. (accessed 2015-10-23).
[Schmittner 14] Christoph Schmittner, Thomas Gruber, Peter Puschner, Er-win Schoitsch. Security Application of Failure Mode and Effect Analysis(FMEA). In Andrea Bondavalli, Felicita Di Giandomenico (Hrsg.), Com-puter Safety, Reliability, and Security , Lecture Notes in Computer ScienceBd. 8666, pp. 310–325. Springer International Publishing, 2014.
[Schneier 14] Bruce Schneier. The Internet of Things Is Wildly Insecure -And Often Unpatchable. https://www.schneier.com/essays/archives/2014/01/the_internet_of_thin.html, 2014. (accessed 2015-10-23).
[Schneier 99] Bruce Schneier. Attack Trees. Dr. Dobb’s Journal, Dec 1999.[Schäfer 11] Bernd Helge Schäfer. Robot Control Design Schemata and their
Application in Off-road Robotics. Dissertation, TU Kaiserslautern, 2011.[Sheyner 02] Oleg Sheyner, Joshua Haines, Somesh Jha, Richard Lippmann,
Jeannette M. Wing. Automated Generation and Analysis of Attack Graphs.In Security and Privacy, 2002. Proceedings. 2002 IEEE Symposium on, pp.273–284, 2002.
[Sommerville 03] Ian Sommerville. An Integrated Approach to Dependabil-ity Requirements Engineering. In Proceedings of the 11th Safety-CriticalSystems Symposium, 2003.
[Spang 10] Silke Spang, Rasmus Adler, Tanvir Hussain, Robert Eschbach.Scrutinizing the impact of security on safety on an Communicating vehicleplatoon. Technischer Bericht, Fraunhofer IESE, 2010.

REFERENCES 153
[Stahl 13] Louis-F. Stahl, Ronald Eikenberg. Kritisches Sicherheitsupdatefür 200.000 Industriesteuerungen. http://heise.de/-1934787, 2013. (ac-cessed 2015-10-23).
[Steiner 12] Max Steiner, Patric Keller, Peter Liggesmeyer. Modeling the Ef-fects of Software on Safety and Reliability in Complex Embedded Systems.In Frank Ortmeier, Peter Daniel (Hrsg.), Computer Safety, Reliability, andSecurity, Bd. 7613, pp. 454–465. Springer Berlin Heidelberg, 2012. Pro-ceedings of the 3rd International Workshop in Digital Engineering.
[Steiner 13a] Max Steiner, Peter Liggesmeyer. Combination of Safety andSecurity Analysis - Finding Security Problems that Threaten the Safetyof a System. In Matthieu ROY (Hrsg.), Proceedings of Workshop DECS(ERCIM/EWICS Workshop on Dependable Embedded and Cyber-physicalSystems) of the 32nd International Conference on Computer Safety, Relia-bility and Security, 2013.
[Steiner 13b] Max Steiner, Adrien Mouaffo, Davide Taibi. EmpirischeEvaluierung der Analysetechniken dokumentiert. Technischer Bericht, Uni-versity of Kaiserslautern, 2013. Meilensteinbericht zum Arbeitspaket 6.3.2,Meilenstein 30.
[Steiner 15] Max Steiner, Peter Liggesmeyer. Qualitative and QuantitativeAnalysis of CFTs Taking Security Causes into Account. In Floor Koorn-neef, Coen van Gulijk (Hrsg.), Computer Safety, Reliability, and Security ,Lecture Notes in Computer Science Bd. 9338, pp. 109–120. Springer Inter-national Publishing, 2015.
[Teso 13] Hugo Teso. Aircraft Hacking: Practical Aero Series. http://conference.hitb.org/hitbsecconf2013ams/hugo-teso/, 2013. (ac-cessed 2015-10-23).
[van der Borst 01] M van der Borst, H Schoonakker. An overview of {PSA}importance measures. Reliability Engineering & System Safety, 72(3):241–245, 2001.
[van Lamsweerde 04] Axel van Lamsweerde. Elaborating Security Require-ments by Construction of Intentional Anti-Models. In International Con-ference on Software Engineering, 2004.
[Verdult 15] Roel Verdult, Flavio D. Garcia, Barıs Ege. Dismantling MegamosCrypto: Wirelessly Lockpicking a Vehicle Immobilizer. In 24nd USENIXSecurity Symposium, 2015.
[Verendel 09] Vilhelm Verendel. Quantified security is a weak hypothesis: acritical survey of results and assumptions. In NSPW ’09: Proceedings ofthe 2009 workshop on New security paradigms workshop, pp. 37–50, NewYork, NY, USA, 2009. ACM.
[Vesely 02] William Vesely. Fault Tree Handbook with Aerospace Applications.NASA, 2002.
[Vesely 81] W.E. Vesely, F.F. Goldberg, N.H. Roberts, D.F. Haasl. Fault TreeHandbook. U.S. Nuclear Regulatory Commission, 1981.
154 REFERENCES
[Vigo 12] Roberto Vigo. The Cyber-Physical Attacker. In Frank Ortmeier,Peter Daniel (Hrsg.), Computer Safety, Reliability, and Security, Bd. 7613,pp. 347–356. Springer Berlin Heidelberg, 2012.
[Wilhoit 13] Kyle Wilhoit. Who’s Really Attacking Your ICS Equipment?Trend Micro Incorporated, 2013.
[Zetter 12] Kim Zetter. Hackers Breached Railway Network, Disrupted Ser-vice. http://www.wired.com/2012/01/railyway-hack/, 2012. (accessed2015-10-23).
[Zetter 15] Kim Zetter. Hacker Can Send Fatal Dose toHospital Drug Pumps. http://www.wired.com/2015/06/hackers-can-send-fatal-doses-hospital-drug-pumps/, 2015. (ac-cessed 2015-10-23).
Max SteinerCurriculum Vitae
Name Max Philipp Steiner
Higher Education2003 – 2009 Study of Computer Science at the University of Kaiserslautern
Diploma Thesis, Integrating Reinforcement Learning intoBehaviour-Based Control of Bipedal Robots.
04/2009 Diplom Informatik (Dipl.-Inf.), University of Kaiserslautern,Kaiserslautern.
08/2009 –01/2016
PhD Student at University of Kaiserslautern at the Chair ofSoftware Engineering: Dependability
Work Experience08/2009 –01/2016
Researcher, University of Kaiserslautern, Chair of SoftwareEngineering: Dependability, Area of research: safety and securityanalysis of embedded systems.