integrated solid waste management and energy production-a life cycle assessment approach: the case...
TRANSCRIPT
at SciVerse ScienceDirect
Journal of Cleaner Production 27 (2012) 141e150
Contents lists available
Journal of Cleaner Production
journal homepage: www.elsevier .com/locate/ jc lepro
Integrated solid waste management and energy production - a life cycleassessment approach: the case study of the city of Thessaloniki
Christopher J. Koroneos a,*, Evanthia A. Nanaki b
a Interdisciplinary Postgraduate Program, ‘Environment and Development’, School of Rural and Surveying Engineering, National Technical University of Athens, IroonPolytecniou 9, Zografou 157 80, Athens, GreecebUniversity of Western Macedonia, Department of Mechanical Engineering, Mpakola & Sialvera, Kozani 50100, Greece
a r t i c l e i n f o
Article history:Received 1 October 2011Received in revised form11 January 2012Accepted 11 January 2012Available online 20 January 2012
Keywords:Solid waste managementLife cycle assessmentThessaloniki
* Corresponding author.E-mail addresses: [email protected],
(C.J. Koroneos), [email protected] (E.A. Nanaki).
0959-6526/$ e see front matter � 2012 Elsevier Ltd.doi:10.1016/j.jclepro.2012.01.010
a b s t r a c t
Innovative strategies are needed to deal with the waste we produce today to prevent it from causingproblems for future generations. As waste management issues gain public awareness, concern has risenabout the appropriateness of various disposal methods. The objective of this work is the environmentalassessment of different municipal solid waste treatment strategies for the city of Thessaloniki, within themethodological frameworks of Life Cycle Assessment (LCA) and the Integrated Solid Waste Managementstrategy, taking into account social, environmental and economic effects. The waste managementmethods in this study include: landfill of all waste fractions, recycling of paper, and anaerobic digestionof food waste in a biological treatment plant. The waste fractions considered are the total amount of food,paper and plastic waste produced in Thessaloniki during the period of one year. Environmental impactsare decreased when the solid waste management methods include some kind of recovery from waste.The results of this work indicate that paper recycling and anaerobic digestion of food waste is preferablecompared to landfilling. It is also shown that landfilling of food waste utilizing the biocells method ismore attractive than anaerobic digestion in a separate plant; nevertheless, energy recovery is about 45%lower.
� 2012 Elsevier Ltd. All rights reserved.
1. Introduction
During the past decades environmentally sound wastemanagement was recognized bymost countries as an issue of majorconcern. Waste management is an important factor in ensuringboth human health and environmental protection. Waste genera-tion in EU is estimated at about 1.3 billion tones per year. Thisincludes, waste from manufacturing (427 million tones), fromenergy production and water supply (127 million tones), from theconstruction sector (510 million tones) and municipal waste (241million tones). Between 1998 and 2002, hazardous waste genera-tion increased by 13% to reach 58.4 million tones. Both GDP andmunicipal waste grew by 19% between 1995 and 2003 (EuropeanCommission, 2003).
Sustainability governs the general direction of waste manage-ment and forms the basis for the hierarchy of waste managementoptions in EU policy. The hierarchy, which consists of Prevention/Mitigation, Materials Recovery, Energy Recovery and Landfill, was
All rights reserved.
first introduced in the Waste Framework Directive (EuropeanCommission, 1975; European Commission, 1989; EuropeanCommission, 1991) and constitutes a component of all relevantwaste directives. At national level, the legal framework includes theJoint Ministerial Decision 50910/2727/2003 concerning thescheduling and permission status of the landfill sites selection(Joint Ministerial Decision 50910/2727/2003) and the Joint Minis-terial Decision 29407/3508/2002 defining mainly the technicalspecifications for the landfill construction and operation, as well asthe environmental targets to be achieved (JointMinisterial Decision29407/3508/2002). In order to implement these Europeanrequirements, it is of great importance the existence of a sustain-able waste management approach that will lead to effective envi-ronmental and economic solutions, and it will evaluate on the bestapproach for the combination of collection, processing and disposalsystems that will best serve the present and future needs ofa particular community. It is obvious that a sustainable wastemanagement approach should be efficient in terms of environ-mental protection, social acceptability as well as efficiency in termsof economic viability.
The methodology of Life Cycle Assessment is very useful onshowing paths that could possibly decrease the environmentalimpacts caused by the waste management process. LCA originates
Table 1Air emissions that arise from the production and usage of 1 MJ of electricity fromlignite based power plants.
Air emission SO2 NOx Particles CO2
[Kg/MJ] 4,80E-03 1,71E-03 6,64E-04 1,47Eþ00
Table 2Non renewable resource use that arises from theproduction and usage of 1 MJ of electricity fromlignite based power plants.
Fuel [Kg]
Coal 3,91E-03Lignite 1,20E-01Natural gas 1,72E-04Diesel 3,75E-03Heavy oil 1,93E-02
C.J. Koroneos, E.A. Nanaki / Journal of Cleaner Production 27 (2012) 141e150142
from “net energy analysis” studies, first published in the 1970s(Boustead, 1972; Hannon, 1972; Sundstrom, 1973). These studiestook into consideration only energy use over the life cycle ofa product or a process. Later studies included wastes and emissions(Lundolm and Sundstrom, 1985; Boustead, 1989); nevertheless,none of themwent further than the quantification of materials andenergy use. As a result the Society of Environmental Toxicology andChemistry and the International Organization for Standardization(ISO 14040, 1997; ISO 14041, 1998; ISO 14042, 2000a; ISO 14043,2000b) developed in the 1990s a complete LCA methodology. In2006, standard ISO 14040 was revised (ISO 14040, 2006) and a newstandard ISO 14044 (ISO 14044, 2006) was presented. Formalchanges include the reduced number of standards, the reducednumber of annexes and the reduced number of pages that containall the requirements. All these changes are intended to increase thereadability and accessibility of the standards. The two new stan-dards, ISO 14040 and ISO 14044, reconfirm the validity of the maintechnical content of the previous standards. Errors and inconsis-tencies were removed and the readability was improved(Finkbeiner et al., 2006). Further details on the current state-of-the-art of the LCA methodology can be found on the publications pagesof the European Platform of Life Cycle Assessment or the UNEP/SETAC Life Cycle Initiative (UNEP, 2010; European Commission,2010).
As far as integrated solid waste management systems are con-cerned, they incorporate all the policies, programs and technolo-gies that are necessary to manage the waste streams. The mix andemphasis of approaches that are taken, generally varies fromregion-to-region and depends on local conditions (UNEP, 2005). Anumber of studies have been published during the past decade,investigating the usefulness of LCA methodology in sustainablewaste management (Finnveden et al., 1995; Liamsanguan andGheewala, 2012; Moberg et al., 2005; Reich, 2005). The conceptof Integrated Solid Waste Management (ISWM) can be defined invarious ways, but generally it is considered as an optimized wastemanagement system in which environmentally and economicallybest solution for each individual case is sought (Sundqvist, 1999;McDougall and Hruska, 2000).
An LCA regarding the assessment of different waste manage-ment scenarios has been carried out in the city of Thessaloniki. Themethods of treatment considered in this work include landfill of allwaste fractions, anaerobic biological treatment of food waste, andrecycling of paper. Emphasis has been given to air emissions andwater pollution caused by landfilling, since it is one of the mostcommon and environmentally hazardous “treatment method”.
The objective of this study is to analyze the environmentalimpacts caused by waste management methods and to comparealternative scenarios regarding these methods, providing a casestudy from the Greek sector. It should be noted that not all envi-ronmental impacts have been analyzed in this study (odors, noise,thermal pollution and radiation were not included). The impactcategories of total energy usage as well as contribution to the globalwarming effect were taken into consideration. These two categorieshave a significant environmental impact and are factors that havebeen thoroughly investigated in the LCA as their results areconsidered highly credible. In addition, the impact categories ofhuman toxicology and eutrophication/acidification as well as theland use were also included and analyzed in a sensitivity analysisscenario.
2. Description of the geographic area under study
Thessaloniki is the second largest city in Greece located in thenorthern part of the country. The population in the greater The-ssaloniki area is about one million with a high density of
inhabitation in most of the peripheral municipalities. The wholearea is served by a sanitary landfill operated by the Association ofLocal Authorities of Greater Thessaloniki for the last 14 years.
The functional unit used is the treatment of municipal solidwaste collected during one year in Thesssaloniki. It is noted that thesolid waste life cycle stages of waste collection and transportationhave not been included in this study.
The fractions of municipal solid waste included in the study arethe total amount of food waste, paper, and plastic collected duringthe period of one year. The amounts of these waste fractions arebased on 2004 data, whereas their average composition is based on1998 data, since the effect of change in time is insignificant. Thesethree waste fractions account for 74% of the total waste produced inThessaloniki and due to their physical and chemical properties,various treatment methods could be utilized to avoid the hazardsthey create (Papachristou et al., 2002).
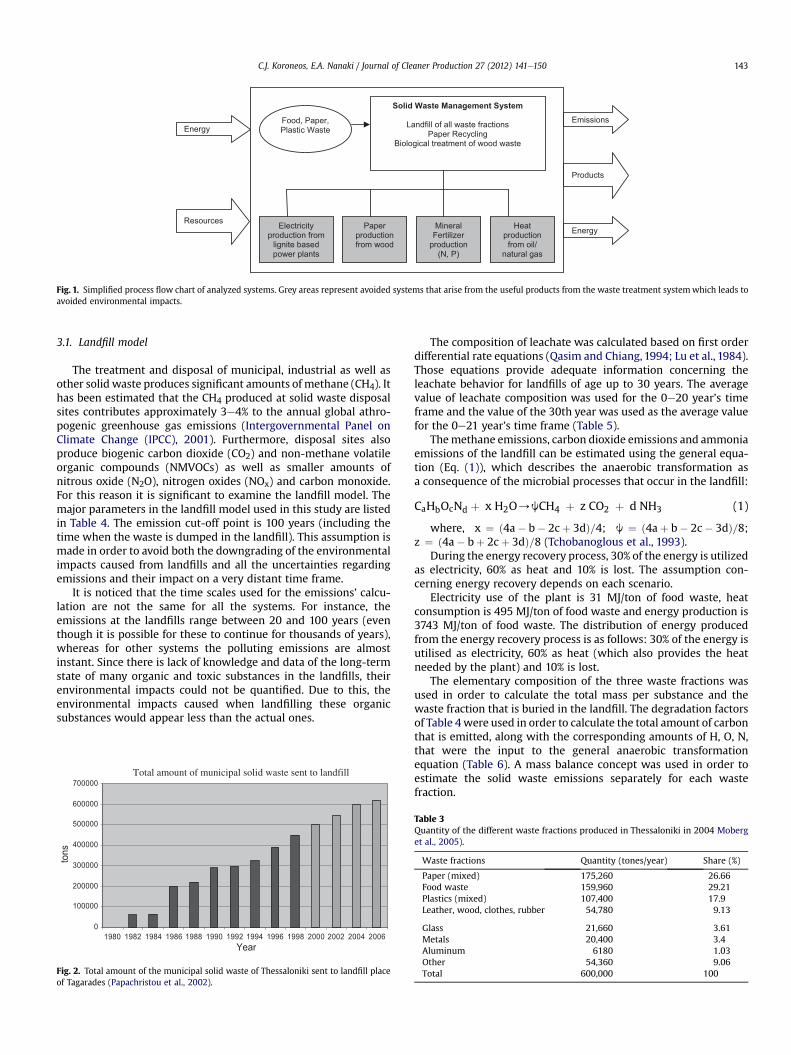
Greece’s electric energy system was taken into consideration inorder to analyze the corresponding air emissions corresponding toelectricity used that is produced by the use of non renewablerecourses such as lignite. It should be mentioned that for eachprocess related with energy recovery, the corresponding amountsof air emissions and non renewable resource use are considered asavoided environmental impacts; whereas other avoided environ-mental impacts associated with paper recycling, use the anaerobicdigestion residue as a fertilizer and heat production from methaneflaring are not. Air emissions and non renewable energy sources usethat correspond to the production and usage of 1 MJ of electricityfrom lignite based power plants are listed in Tables 1 and 2. Thesame methodology has been applied also for the avoided envi-ronmental impacts systems. Fig. 1 presents a simplified flow chartof all the systems analyzed in this study.
The total amount of municipal solid waste of Thessaloniki thatare sent to the landfill located on the outskirts of the city in a placecalled Tagarades, during the last two decades, is presented in Fig. 2.The quantity and the composition of the municipal solid waste ofThessaloniki (Table 3), indicate that the amounts of paper, foodwaste and plastics make up two thirds of the total waste. A decreaseof the compostable organic is observed, whereas recyclable mate-rials present an increase. This can be attributed to the rise of thestandard of living and the change of consumption habits, during thelast decade.
3. Waste treatment methods
In this work the waste treatment methods that have beenconsidered and are used in setting up the various scenarios include,landfill, biological treatment, and paper recycling.
Solid Waste Management System
Landfill of all waste fractions Paper Recycling
Biological treatment of wood waste
Electricity production from
lignite based power plants
Paperproductionfrom wood
MineralFertilizer
production(N, P)
Energy
Resources
Products
Emissions
Energy
Food, Paper, Plastic Waste
Heatproduction
from oil/ natural gas
Fig. 1. Simplified process flow chart of analyzed systems. Grey areas represent avoided systems that arise from the useful products from the waste treatment systemwhich leads toavoided environmental impacts.
C.J. Koroneos, E.A. Nanaki / Journal of Cleaner Production 27 (2012) 141e150 143
3.1. Landfill model
The treatment and disposal of municipal, industrial as well asother solid waste produces significant amounts of methane (CH4). Ithas been estimated that the CH4 produced at solid waste disposalsites contributes approximately 3e4% to the annual global athro-pogenic greenhouse gas emissions (Intergovernmental Panel onClimate Change (IPCC), 2001). Furthermore, disposal sites alsoproduce biogenic carbon dioxide (CO2) and non-methane volatileorganic compounds (NMVOCs) as well as smaller amounts ofnitrous oxide (N2O), nitrogen oxides (NOx) and carbon monoxide.For this reason it is significant to examine the landfill model. Themajor parameters in the landfill model used in this study are listedin Table 4. The emission cut-off point is 100 years (including thetime when the waste is dumped in the landfill). This assumption ismade in order to avoid both the downgrading of the environmentalimpacts caused from landfills and all the uncertainties regardingemissions and their impact on a very distant time frame.
It is noticed that the time scales used for the emissions’ calcu-lation are not the same for all the systems. For instance, theemissions at the landfills range between 20 and 100 years (eventhough it is possible for these to continue for thousands of years),whereas for other systems the polluting emissions are almostinstant. Since there is lack of knowledge and data of the long-termstate of many organic and toxic substances in the landfills, theirenvironmental impacts could not be quantified. Due to this, theenvironmental impacts caused when landfilling these organicsubstances would appear less than the actual ones.
0
100000
200000
300000
400000
500000
600000
700000
1980 1982 1984 1986 1988 1990 1992 1994 1996 1998 2000 2002 2004 2006Year
tons
Total amount of municipal solid waste sent to landfill
Fig. 2. Total amount of the municipal solid waste of Thessaloniki sent to landfill placeof Tagarades (Papachristou et al., 2002).
The composition of leachate was calculated based on first orderdifferential rate equations (Qasim and Chiang, 1994; Lu et al., 1984).Those equations provide adequate information concerning theleachate behavior for landfills of age up to 30 years. The averagevalue of leachate composition was used for the 0e20 year’s timeframe and the value of the 30th year was used as the average valuefor the 0e21 year’s time frame (Table 5).
Themethane emissions, carbon dioxide emissions and ammoniaemissions of the landfill can be estimated using the general equa-tion (Eq. (1)), which describes the anaerobic transformation asa consequence of the microbial processes that occur in the landfill:
CaHbOcNd þ x H2O/jCH4 þ z CO2 þ d NH3 (1)
where, x ¼ ð4a� b� 2cþ 3dÞ=4; j ¼ ð4aþ b� 2c� 3dÞ=8;z ¼ ð4a� bþ 2cþ 3dÞ=8 (Tchobanoglous et al., 1993).
During the energy recovery process, 30% of the energy is utilizedas electricity, 60% as heat and 10% is lost. The assumption con-cerning energy recovery depends on each scenario.
Electricity use of the plant is 31 MJ/ton of food waste, heatconsumption is 495 MJ/ton of food waste and energy production is3743 MJ/ton of food waste. The distribution of energy producedfrom the energy recovery process is as follows: 30% of the energy isutilised as electricity, 60% as heat (which also provides the heatneeded by the plant) and 10% is lost.
The elementary composition of the three waste fractions wasused in order to calculate the total mass per substance and thewaste fraction that is buried in the landfill. The degradation factorsof Table 4were used in order to calculate the total amount of carbonthat is emitted, along with the corresponding amounts of H, O, N,that were the input to the general anaerobic transformationequation (Table 6). A mass balance concept was used in order toestimate the solid waste emissions separately for each wastefraction.
Table 3Quantity of the different waste fractions produced in Thessaloniki in 2004 Moberget al., 2005).
Waste fractions Quantity (tones/year) Share (%)
Paper (mixed) 175,260 26.66Food waste 159,960 29.21Plastics (mixed) 107,400 17.9Leather, wood, clothes, rubber 54,780 9.13
Glass 21,660 3.61Metals 20,400 3.4Aluminum 6180 1.03Other 54,360 9.06Total 600,000 100
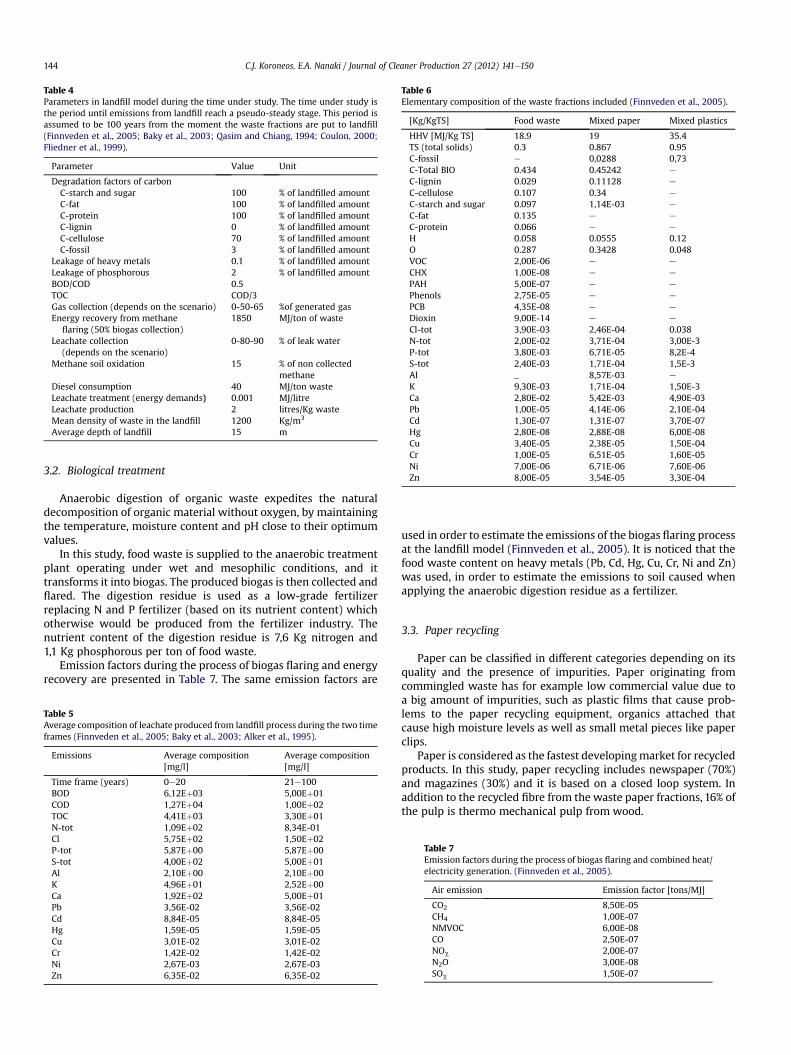
Table 4Parameters in landfill model during the time under study. The time under study isthe period until emissions from landfill reach a pseudo-steady stage. This period isassumed to be 100 years from the moment the waste fractions are put to landfill(Finnveden et al., 2005; Baky et al., 2003; Qasim and Chiang, 1994; Coulon, 2000;Fliedner et al., 1999).
Parameter Value Unit
Degradation factors of carbonC-starch and sugar 100 % of landfilled amountC-fat 100 % of landfilled amountC-protein 100 % of landfilled amountC-lignin 0 % of landfilled amountC-cellulose 70 % of landfilled amountC-fossil 3 % of landfilled amount
Leakage of heavy metals 0.1 % of landfilled amountLeakage of phosphorous 2 % of landfilled amountBOD/COD 0.5TOC COD/3Gas collection (depends on the scenario) 0-50-65 %of generated gasEnergy recovery from methane
flaring (50% biogas collection)1850 MJ/ton of waste
Leachate collection(depends on the scenario)
0-80-90 % of leak water
Methane soil oxidation 15 % of non collectedmethane
Diesel consumption 40 MJ/ton wasteLeachate treatment (energy demands) 0.001 MJ/litreLeachate production 2 litres/Kg wasteMean density of waste in the landfill 1200 Kg/m3
Average depth of landfill 15 m
Table 6Elementary composition of the waste fractions included (Finnveden et al., 2005).
[Kg/KgTS] Food waste Mixed paper Mixed plastics
HHV [MJ/Kg TS] 18.9 19 35.4TS (total solids) 0.3 0.867 0.95C-fossil e 0,0288 0,73C-Total BIO 0.434 0.45242 e
C-lignin 0.029 0.11128 e
C-cellulose 0.107 0.34 e
C-starch and sugar 0.097 1,14E-03 e
C-fat 0.135 e e
C-protein 0.066 e e
H 0.058 0.0555 0.12O 0.287 0.3428 0.048VOC 2,00E-06 e e
CHX 1,00E-08 e e
PAH 5,00E-07 e e
Phenols 2,75E-05 e e
PCB 4,35E-08 e e
Dioxin 9,00E-14 e e
Cl-tot 3,90E-03 2,46E-04 0.038N-tot 2,00E-02 3,71E-04 3,00E-3P-tot 3,80E-03 6,71E-05 8,2E-4S-tot 2,40E-03 1,71E-04 1,5E-3Al _ 8,57E-03 e
K 9,30E-03 1,71E-04 1,50E-3Ca 2,80E-02 5,42E-03 4,90E-03Pb 1,00E-05 4,14E-06 2,10E-04Cd 1,30E-07 1,31E-07 3,70E-07Hg 2,80E-08 2,88E-08 6,00E-08Cu 3,40E-05 2,38E-05 1,50E-04Cr 1,00E-05 6,51E-05 1,60E-05Ni 7,00E-06 6,71E-06 7,60E-06Zn 8,00E-05 3,54E-05 3,30E-04
C.J. Koroneos, E.A. Nanaki / Journal of Cleaner Production 27 (2012) 141e150144
3.2. Biological treatment
Anaerobic digestion of organic waste expedites the naturaldecomposition of organic material without oxygen, by maintainingthe temperature, moisture content and pH close to their optimumvalues.
In this study, food waste is supplied to the anaerobic treatmentplant operating under wet and mesophilic conditions, and ittransforms it into biogas. The produced biogas is then collected andflared. The digestion residue is used as a low-grade fertilizerreplacing N and P fertilizer (based on its nutrient content) whichotherwise would be produced from the fertilizer industry. Thenutrient content of the digestion residue is 7,6 Kg nitrogen and1,1 Kg phosphorous per ton of food waste.
Emission factors during the process of biogas flaring and energyrecovery are presented in Table 7. The same emission factors are
Table 5Average composition of leachate produced from landfill process during the two timeframes (Finnveden et al., 2005; Baky et al., 2003; Alker et al., 1995).
Emissions Average composition[mg/l]
Average composition[mg/l]
Time frame (years) 0e20 21e100BOD 6,12Eþ03 5,00Eþ01COD 1,27Eþ04 1,00Eþ02TOC 4,41Eþ03 3,30Eþ01N-tot 1,09Eþ02 8,34E-01Cl 5,75Eþ02 1,50Eþ02P-tot 5,87Eþ00 5,87Eþ00S-tot 4,00Eþ02 5,00Eþ01Al 2,10Eþ00 2,10Eþ00K 4,96Eþ01 2,52Eþ00Ca 1,92Eþ02 5,00Eþ01Pb 3,56E-02 3,56E-02Cd 8,84E-05 8,84E-05Hg 1,59E-05 1,59E-05Cu 3,01E-02 3,01E-02Cr 1,42E-02 1,42E-02Ni 2,67E-03 2,67E-03Zn 6,35E-02 6,35E-02
used in order to estimate the emissions of the biogas flaring processat the landfill model (Finnveden et al., 2005). It is noticed that thefood waste content on heavy metals (Pb, Cd, Hg, Cu, Cr, Ni and Zn)was used, in order to estimate the emissions to soil caused whenapplying the anaerobic digestion residue as a fertilizer.
3.3. Paper recycling
Paper can be classified in different categories depending on itsquality and the presence of impurities. Paper originating fromcommingled waste has for example low commercial value due toa big amount of impurities, such as plastic films that cause prob-lems to the paper recycling equipment, organics attached thatcause high moisture levels as well as small metal pieces like paperclips.
Paper is considered as the fastest developingmarket for recycledproducts. In this study, paper recycling includes newspaper (70%)and magazines (30%) and it is based on a closed loop system. Inaddition to the recycled fibre from the waste paper fractions, 16% ofthe pulp is thermo mechanical pulp from wood.
Table 7Emission factors during the process of biogas flaring and combined heat/electricity generation. (Finnveden et al., 2005).
Air emission Emission factor [tons/MJ]
CO2 8,50E-05CH4 1,00E-07NMVOC 6,00E-08CO 2,50E-07NOc 2,00E-07N2O 3,00E-08SOc 1,50E-07
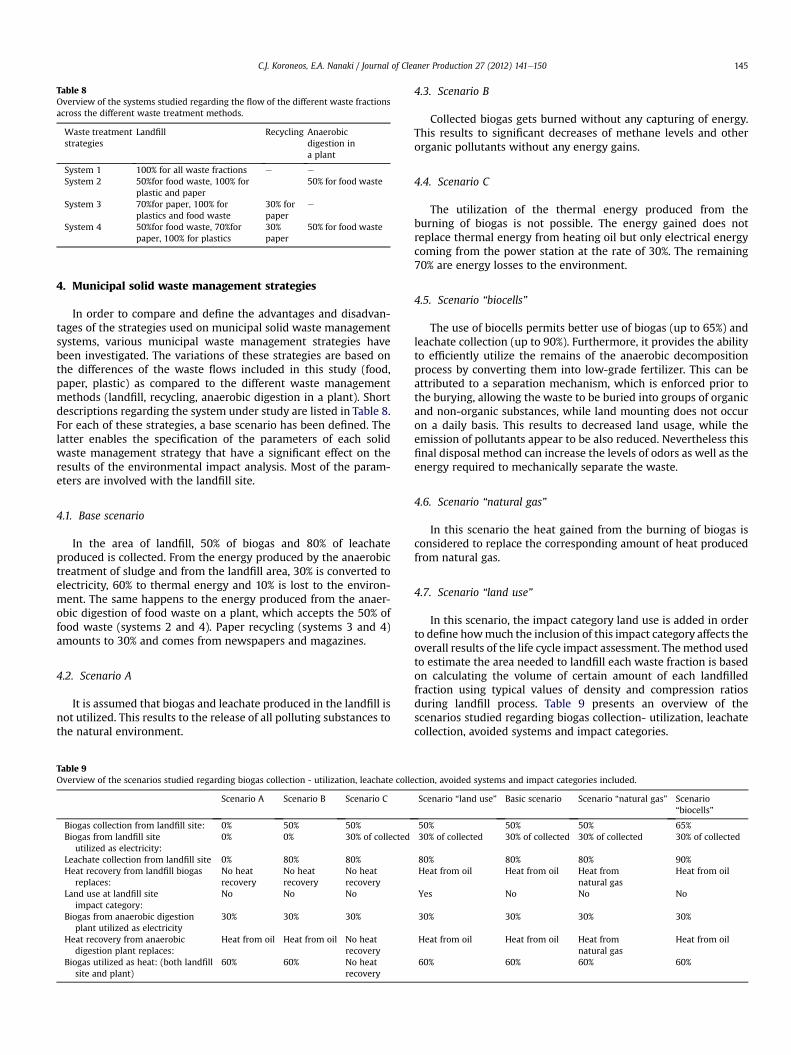
Table 8Overview of the systems studied regarding the flow of the different waste fractionsacross the different waste treatment methods.
Waste treatmentstrategies
Landfill Recycling Anaerobicdigestion ina plant
System 1 100% for all waste fractions e e
System 2 50%for food waste, 100% forplastic and paper
50% for food waste
System 3 70%for paper, 100% forplastics and food waste
30% forpaper
e
System 4 50%for food waste, 70%forpaper, 100% for plastics
30%paper
50% for food waste
C.J. Koroneos, E.A. Nanaki / Journal of Cleaner Production 27 (2012) 141e150 145
4. Municipal solid waste management strategies
In order to compare and define the advantages and disadvan-tages of the strategies used on municipal solid waste managementsystems, various municipal waste management strategies havebeen investigated. The variations of these strategies are based onthe differences of the waste flows included in this study (food,paper, plastic) as compared to the different waste managementmethods (landfill, recycling, anaerobic digestion in a plant). Shortdescriptions regarding the system under study are listed in Table 8.For each of these strategies, a base scenario has been defined. Thelatter enables the specification of the parameters of each solidwaste management strategy that have a significant effect on theresults of the environmental impact analysis. Most of the param-eters are involved with the landfill site.
4.1. Base scenario
In the area of landfill, 50% of biogas and 80% of leachateproduced is collected. From the energy produced by the anaerobictreatment of sludge and from the landfill area, 30% is converted toelectricity, 60% to thermal energy and 10% is lost to the environ-ment. The same happens to the energy produced from the anaer-obic digestion of food waste on a plant, which accepts the 50% offood waste (systems 2 and 4). Paper recycling (systems 3 and 4)amounts to 30% and comes from newspapers and magazines.
4.2. Scenario A
It is assumed that biogas and leachate produced in the landfill isnot utilized. This results to the release of all polluting substances tothe natural environment.
Table 9Overview of the scenarios studied regarding biogas collection - utilization, leachate colle
Scenario A Scenario B Scenario C
Biogas collection from landfill site: 0% 50% 50%Biogas from landfill site
utilized as electricity:0% 0% 30% of collected
Leachate collection from landfill site 0% 80% 80%Heat recovery from landfill biogas
replaces:No heatrecovery
No heatrecovery
No heatrecovery
Land use at landfill siteimpact category:
No No No
Biogas from anaerobic digestionplant utilized as electricity
30% 30% 30%
Heat recovery from anaerobicdigestion plant replaces:
Heat from oil Heat from oil No heatrecovery
Biogas utilized as heat: (both landfillsite and plant)
60% 60% No heatrecovery
4.3. Scenario B
Collected biogas gets burned without any capturing of energy.This results to significant decreases of methane levels and otherorganic pollutants without any energy gains.
4.4. Scenario C
The utilization of the thermal energy produced from theburning of biogas is not possible. The energy gained does notreplace thermal energy from heating oil but only electrical energycoming from the power station at the rate of 30%. The remaining70% are energy losses to the environment.
4.5. Scenario “biocells”
The use of biocells permits better use of biogas (up to 65%) andleachate collection (up to 90%). Furthermore, it provides the abilityto efficiently utilize the remains of the anaerobic decompositionprocess by converting them into low-grade fertilizer. This can beattributed to a separation mechanism, which is enforced prior tothe burying, allowing the waste to be buried into groups of organicand non-organic substances, while land mounting does not occuron a daily basis. This results to decreased land usage, while theemission of pollutants appear to be also reduced. Nevertheless thisfinal disposal method can increase the levels of odors as well as theenergy required to mechanically separate the waste.
4.6. Scenario “natural gas”
In this scenario the heat gained from the burning of biogas isconsidered to replace the corresponding amount of heat producedfrom natural gas.
4.7. Scenario “land use”
In this scenario, the impact category land use is added in orderto define howmuch the inclusion of this impact category affects theoverall results of the life cycle impact assessment. Themethod usedto estimate the area needed to landfill each waste fraction is basedon calculating the volume of certain amount of each landfilledfraction using typical values of density and compression ratiosduring landfill process. Table 9 presents an overview of thescenarios studied regarding biogas collection- utilization, leachatecollection, avoided systems and impact categories.
ction, avoided systems and impact categories included.
Scenario “land use” Basic scenario Scenario “natural gas” Scenario“biocells”
50% 50% 50% 65%30% of collected 30% of collected 30% of collected 30% of collected
80% 80% 80% 90%Heat from oil Heat from oil Heat from
natural gasHeat from oil
Yes No No No
30% 30% 30% 30%
Heat from oil Heat from oil Heat fromnatural gas
Heat from oil
60% 60% 60% 60%
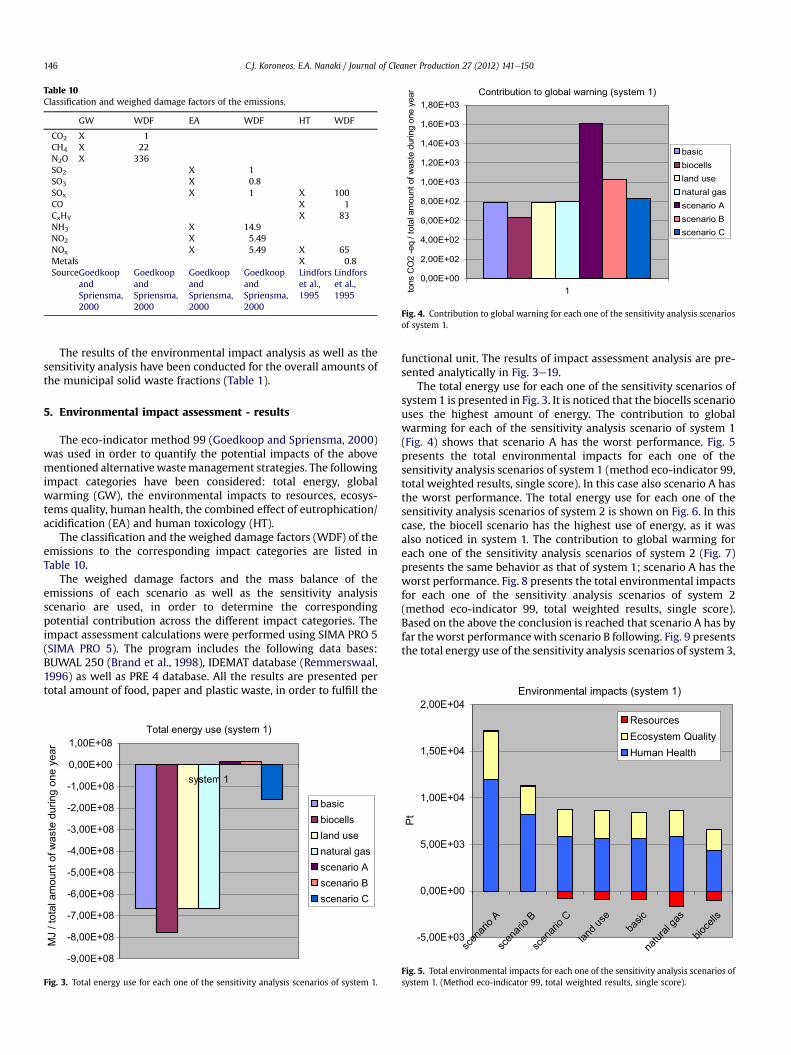
Table 10Classification and weighed damage factors of the emissions.
GW WDF EA WDF HT WDF
CO2 X 1CH4 X 22N2O X 336SO2 X 1SO3 X 0.8SOx X 1 X 100CO X 1CxHY X 83NH3 X 14.9NO2 X 5.49NOx X 5.49 X 65Metals X 0.8SourceGoedkoop
andSpriensma,2000
GoedkoopandSpriensma,2000
GoedkoopandSpriensma,2000
GoedkoopandSpriensma,2000
Lindforset al.,1995
Lindforset al.,1995
Contribution to global warning (system 1)
0,00E+00
2,00E+02
4,00E+02
6,00E+02
8,00E+02
1,00E+03
1,20E+03
1,40E+03
1,60E+03
1,80E+03
1tons
CO
2 -e
q / t
otal
am
ount
of w
aste
dur
ing
one
year
basicbiocellsland usenatural gasscenario Ascenario Bscenario C
Fig. 4. Contribution to global warning for each one of the sensitivity analysis scenariosof system 1.
Environmental impacts (system 1)
C.J. Koroneos, E.A. Nanaki / Journal of Cleaner Production 27 (2012) 141e150146
The results of the environmental impact analysis as well as thesensitivity analysis have been conducted for the overall amounts ofthe municipal solid waste fractions (Table 1).
5. Environmental impact assessment - results
The eco-indicator method 99 (Goedkoop and Spriensma, 2000)was used in order to quantify the potential impacts of the abovementioned alternativewastemanagement strategies. The followingimpact categories have been considered: total energy, globalwarming (GW), the environmental impacts to resources, ecosys-tems quality, human health, the combined effect of eutrophication/acidification (EA) and human toxicology (HT).
The classification and the weighed damage factors (WDF) of theemissions to the corresponding impact categories are listed inTable 10.
The weighed damage factors and the mass balance of theemissions of each scenario as well as the sensitivity analysisscenario are used, in order to determine the correspondingpotential contribution across the different impact categories. Theimpact assessment calculations were performed using SIMA PRO 5(SIMA PRO 5). The program includes the following data bases:BUWAL 250 (Brand et al., 1998), IDEMAT database (Remmerswaal,1996) as well as PRE 4 database. All the results are presented pertotal amount of food, paper and plastic waste, in order to fulfill the
Total energy use (system 1)
-9,00E+08
-8,00E+08
-7,00E+08
-6,00E+08
-5,00E+08
-4,00E+08
-3,00E+08
-2,00E+08
-1,00E+08
0,00E+00
1,00E+08
system 1
MJ
/ tot
al a
mou
nt o
f was
te d
urin
g on
e ye
ar
basicbiocellsland usenatural gasscenario Ascenario Bscenario C
Fig. 3. Total energy use for each one of the sensitivity analysis scenarios of system 1.
functional unit. The results of impact assessment analysis are pre-sented analytically in Fig. 3e19.
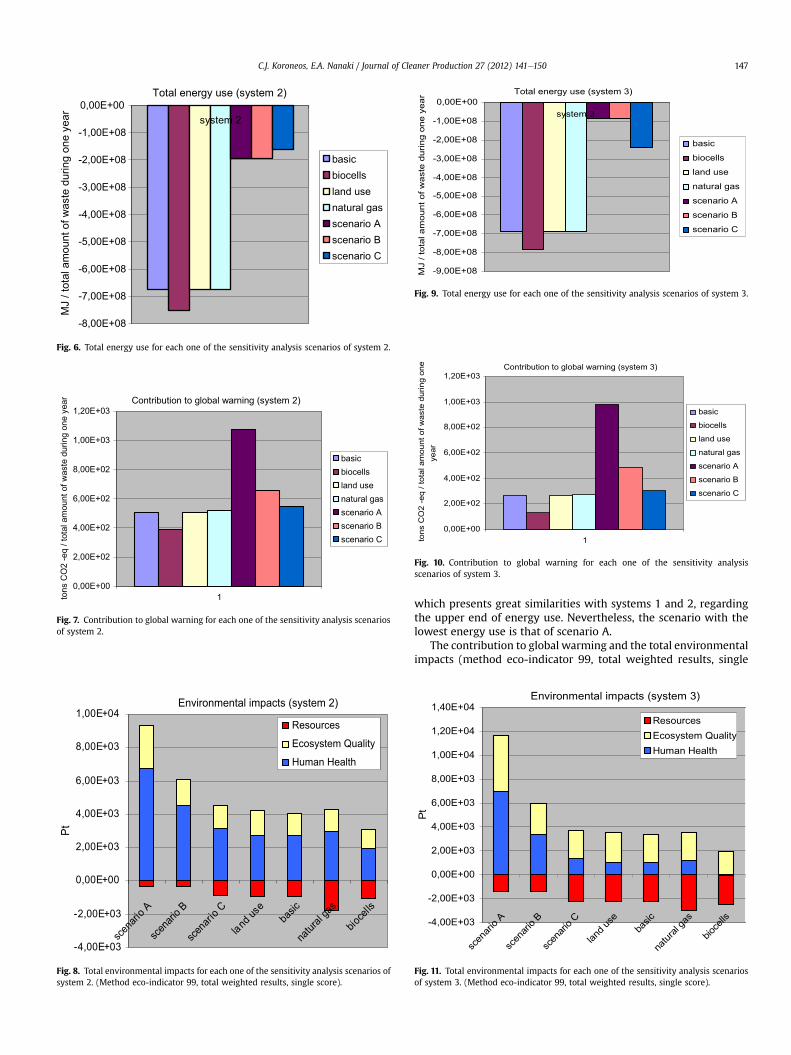
The total energy use for each one of the sensitivity scenarios ofsystem 1 is presented in Fig. 3. It is noticed that the biocells scenariouses the highest amount of energy. The contribution to globalwarming for each of the sensitivity analysis scenario of system 1(Fig. 4) shows that scenario A has the worst performance. Fig. 5presents the total environmental impacts for each one of thesensitivity analysis scenarios of system 1 (method eco-indicator 99,total weighted results, single score). In this case also scenario A hasthe worst performance. The total energy use for each one of thesensitivity analysis scenarios of system 2 is shown on Fig. 6. In thiscase, the biocell scenario has the highest use of energy, as it wasalso noticed in system 1. The contribution to global warming foreach one of the sensitivity analysis scenarios of system 2 (Fig. 7)presents the same behavior as that of system 1; scenario A has theworst performance. Fig. 8 presents the total environmental impactsfor each one of the sensitivity analysis scenarios of system 2(method eco-indicator 99, total weighted results, single score).Based on the above the conclusion is reached that scenario A has byfar theworst performancewith scenario B following. Fig. 9 presentsthe total energy use of the sensitivity analysis scenarios of system 3,
-5,00E+03
0,00E+00
5,00E+03
1,00E+04
1,50E+04
2,00E+04
scen
ario A
scen
ario B
scen
ario C
land u
seba
sic
natur
al ga
s
bioce
lls
Pt
ResourcesEcosystem QualityHuman Health
Fig. 5. Total environmental impacts for each one of the sensitivity analysis scenarios ofsystem 1. (Method eco-indicator 99, total weighted results, single score).
Environmental impacts (system 2)
-4,00E+03
-2,00E+03
0,00E+00
2,00E+03
4,00E+03
6,00E+03
8,00E+03
1,00E+04
scena
rio A
scena
rio B
scena
rio C
land us
eba
sic
natur
al ga
s
bioce
lls
Pt
Resources
Ecosystem Quality
Human Health
Fig. 8. Total environmental impacts for each one of the sensitivity analysis scenarios ofsystem 2. (Method eco-indicator 99, total weighted results, single score).
Total energy use (system 3)
-9,00E+08
-8,00E+08
-7,00E+08
-6,00E+08
-5,00E+08
-4,00E+08
-3,00E+08
-2,00E+08
-1,00E+08
0,00E+00system 3
MJ
/ tot
al a
mou
nt o
f was
te d
urin
g on
e ye
ar
basic
biocells
land use
natural gas
scenario A
scenario B
scenario C
Fig. 9. Total energy use for each one of the sensitivity analysis scenarios of system 3.
Contribution to global warning (system 3)
0,00E+00
2,00E+02
4,00E+02
6,00E+02
8,00E+02
1,00E+03
1,20E+03
1tons
CO
2 -e
q / t
otal
am
ount
of w
aste
dur
ing
one
year
basic
biocells
land use
natural gas
scenario A
scenario B
scenario C
Fig. 10. Contribution to global warning for each one of the sensitivity analysisscenarios of system 3.
Contribution to global warning (system 2)
0,00E+00
2,00E+02
4,00E+02
6,00E+02
8,00E+02
1,00E+03
1,20E+03
1tons
CO
2 -e
q / t
otal
am
ount
of w
aste
dur
ing
one
year
basicbiocellsland usenatural gasscenario Ascenario Bscenario C
Fig. 7. Contribution to global warning for each one of the sensitivity analysis scenariosof system 2.
Total energy use (system 2)
-8,00E+08
-7,00E+08
-6,00E+08
-5,00E+08
-4,00E+08
-3,00E+08
-2,00E+08
-1,00E+08
0,00E+00system 2
MJ
/ tot
al a
mou
nt o
f was
te d
urin
g on
e ye
ar
basicbiocellsland usenatural gasscenario Ascenario Bscenario C
Fig. 6. Total energy use for each one of the sensitivity analysis scenarios of system 2.
C.J. Koroneos, E.A. Nanaki / Journal of Cleaner Production 27 (2012) 141e150 147
which presents great similarities with systems 1 and 2, regardingthe upper end of energy use. Nevertheless, the scenario with thelowest energy use is that of scenario A.
The contribution to global warming and the total environmentalimpacts (method eco-indicator 99, total weighted results, single
Environmental impacts (system 3)
-4,00E+03
-2,00E+03
0,00E+00
2,00E+03
4,00E+03
6,00E+03
8,00E+03
1,00E+04
1,20E+04
1,40E+04
scen
ario A
scen
ario B
scen
ario C
land u
seba
sic
natur
al ga
s
bioce
lls
Pt
ResourcesEcosystem QualityHuman Health
Fig. 11. Total environmental impacts for each one of the sensitivity analysis scenariosof system 3. (Method eco-indicator 99, total weighted results, single score).
Total energy use
-6,00E+08
-5,00E+08
-4,00E+08
-3,00E+08
-2,00E+08
-1,00E+08
0,00E+001
MJ
/ tot
al a
mou
nt o
f was
te d
urin
g on
e ye
ar
system 1
system 2
system 3
system 4
Fig. 15. Total energy use for each one of the four systems. The bars represent theaverage value of the sensitivity analysis scenarios of each system.
Contribution to global warning (system 4)
-2,00E+02
-1,00E+02
0,00E+00
1,00E+02
2,00E+02
3,00E+02
4,00E+02
5,00E+02
1
tons
CO
2 -e
q / t
otal
am
ount
of w
aste
dur
ing
one
year
basic
biocells
land use
natural gas
scenario A
scenario B
scenario C
Fig. 13. Contribution to global warning for each one of the sensitivity analysisscenarios of system 4.
Total energy use (system 4)
-8,00E+08
-7,00E+08
-6,00E+08
-5,00E+08
-4,00E+08
-3,00E+08
-2,00E+08
-1,00E+08
0,00E+00system 4
MJ
/ tot
al a
mou
nt o
f was
te d
urin
g on
e ye
ar
basicbiocellsland usenatural gasscenario Ascenario Bscenario C
Fig. 12. Total energy use for each one of the sensitivity analysis scenarios of system 4.
Contribution to global warning
0,00E+00
1,00E+02
2,00E+02
3,00E+02
4,00E+02
5,00E+02
6,00E+02
7,00E+02
8,00E+02
9,00E+02
1,00E+03
1
tons
CO
2-eq
/ to
tal a
mou
nt o
f was
te d
urin
g system 1system 2system 3system 4
one
year
Fig. 16. Contribution to global warning for each one of the four systems. The barsrepresent the average value of the sensitivity analysis scenarios of each system.
C.J. Koroneos, E.A. Nanaki / Journal of Cleaner Production 27 (2012) 141e150148
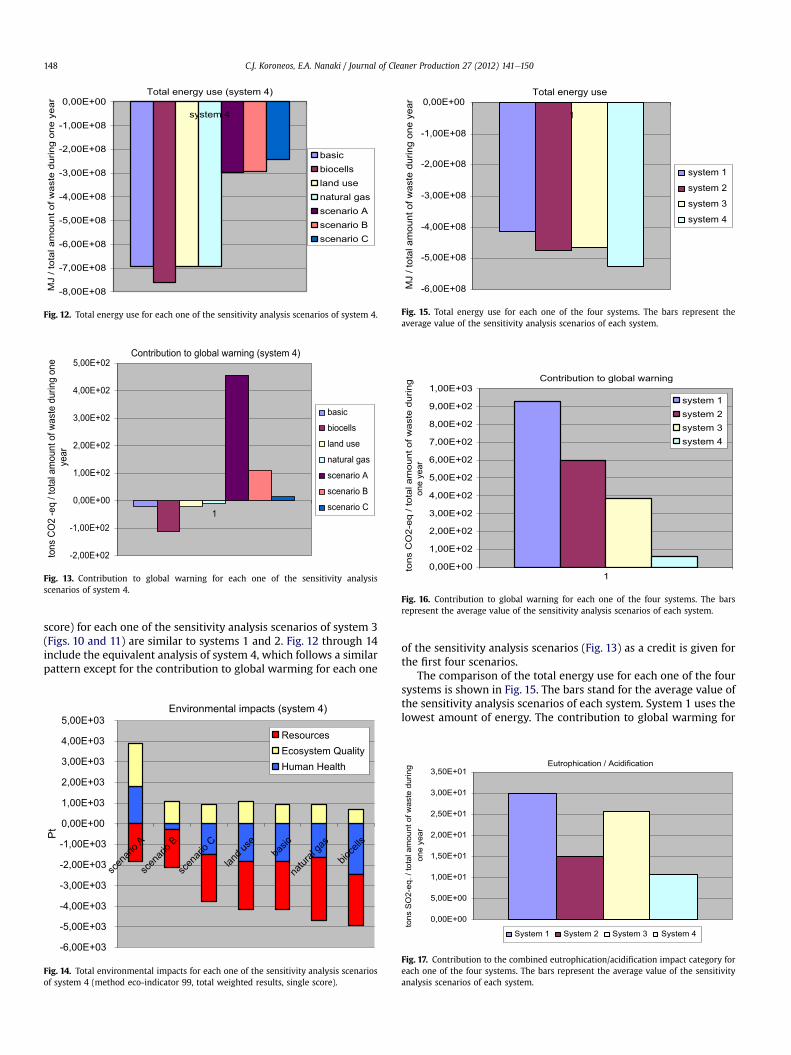
score) for each one of the sensitivity analysis scenarios of system 3(Figs. 10 and 11) are similar to systems 1 and 2. Fig. 12 through 14include the equivalent analysis of system 4, which follows a similarpattern except for the contribution to global warming for each one
Environmental impacts (system 4)
-6,00E+03
-5,00E+03
-4,00E+03
-3,00E+03
-2,00E+03
-1,00E+03
0,00E+00
1,00E+03
2,00E+03
3,00E+03
4,00E+03
5,00E+03
scen
ario A
scen
ario B
scen
ario C
land u
seba
sic
natur
al ga
s
bioce
lls
Pt
ResourcesEcosystem QualityHuman Health
Fig. 14. Total environmental impacts for each one of the sensitivity analysis scenariosof system 4 (method eco-indicator 99, total weighted results, single score).
of the sensitivity analysis scenarios (Fig. 13) as a credit is given forthe first four scenarios.
The comparison of the total energy use for each one of the foursystems is shown in Fig. 15. The bars stand for the average value ofthe sensitivity analysis scenarios of each system. System 1 uses thelowest amount of energy. The contribution to global warming for
Eutrophication / Acidification
0,00E+00
5,00E+00
1,00E+01
1,50E+01
2,00E+01
2,50E+01
3,00E+01
3,50E+01
tons
SO
2-eq
. / to
tal a
mou
nt o
f was
te d
urin
g on
e ye
ar
System 1 System 2 System 3 System 4
Fig. 17. Contribution to the combined eutrophication/acidification impact category foreach one of the four systems. The bars represent the average value of the sensitivityanalysis scenarios of each system.
Environmental impacts
-4,00E+03
-2,00E+03
0,00E+00
2,00E+03
4,00E+03
6,00E+03
8,00E+03
1,00E+04
1,20E+04
System 1 System 2 System 3 System 4
Pt
ResourcesEcosystem QualityHuman Health
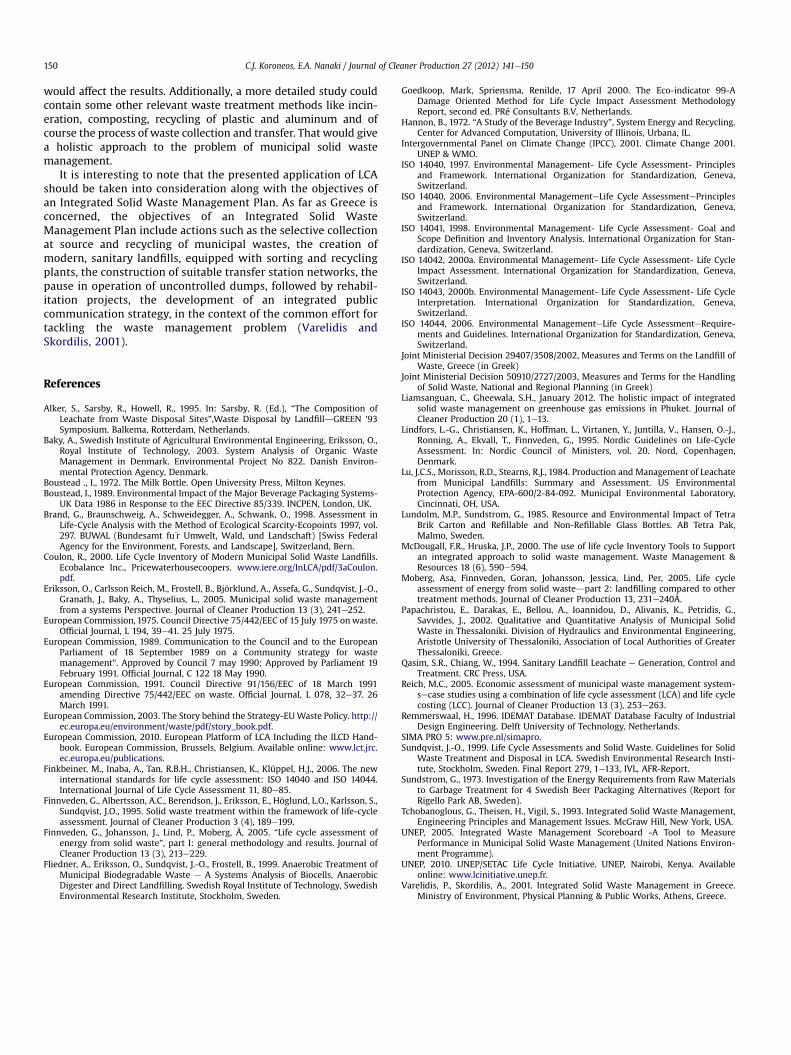
Fig. 19. Total environmental impacts for each one of the four systems. The barsrepresent the average value of the sensitivity analysis scenarios of each system.(Method eco-indicator 99, total weighted results, single score).
Human Toxicology
-2,00E+01
-1,50E+01
-1,00E+01
-5,00E+00
0,00E+00
5,00E+00
1,00E+01
1,50E+01
2,00E+01
2,50E+01
3,00E+01
tons
CO
-eq.
/ to
tal a
mou
nt o
f was
te d
urin
g on
e ye
ar
System 1 System 2 System 3 System 4
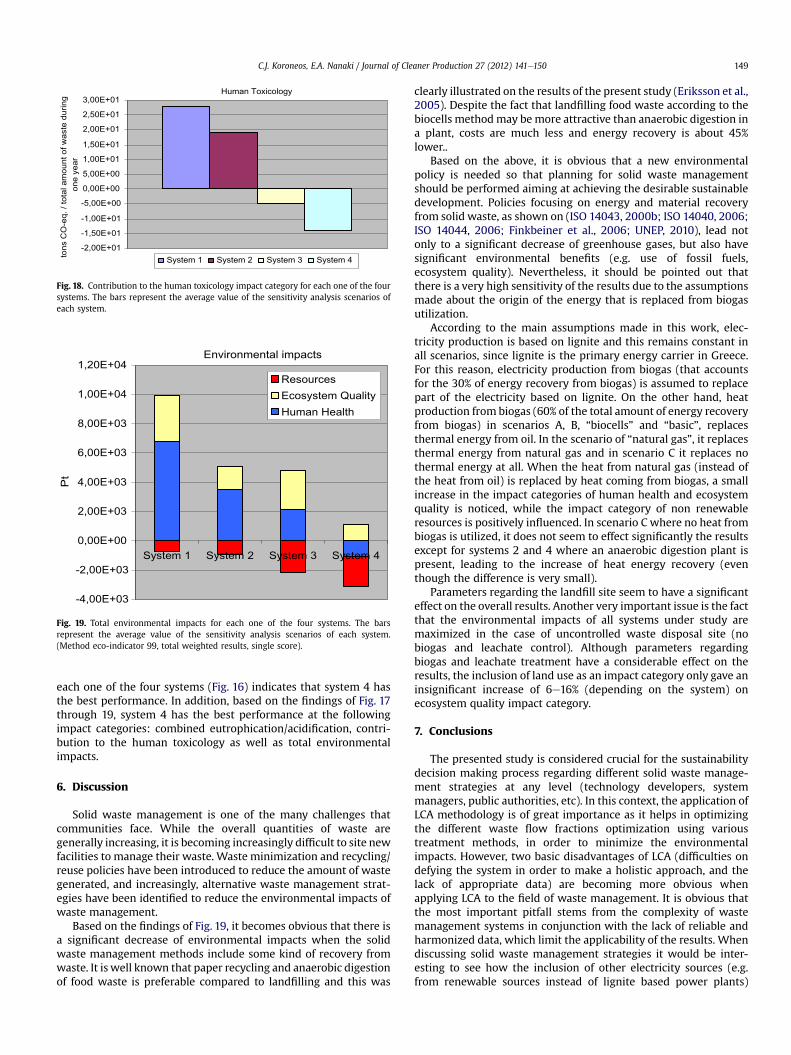
Fig. 18. Contribution to the human toxicology impact category for each one of the foursystems. The bars represent the average value of the sensitivity analysis scenarios ofeach system.
C.J. Koroneos, E.A. Nanaki / Journal of Cleaner Production 27 (2012) 141e150 149
each one of the four systems (Fig. 16) indicates that system 4 hasthe best performance. In addition, based on the findings of Fig. 17through 19, system 4 has the best performance at the followingimpact categories: combined eutrophication/acidification, contri-bution to the human toxicology as well as total environmentalimpacts.
6. Discussion
Solid waste management is one of the many challenges thatcommunities face. While the overall quantities of waste aregenerally increasing, it is becoming increasingly difficult to site newfacilities to manage their waste. Waste minimization and recycling/reuse policies have been introduced to reduce the amount of wastegenerated, and increasingly, alternative waste management strat-egies have been identified to reduce the environmental impacts ofwaste management.
Based on the findings of Fig. 19, it becomes obvious that there isa significant decrease of environmental impacts when the solidwaste management methods include some kind of recovery fromwaste. It is well known that paper recycling and anaerobic digestionof food waste is preferable compared to landfilling and this was
clearly illustrated on the results of the present study (Eriksson et al.,2005). Despite the fact that landfilling food waste according to thebiocells methodmay bemore attractive than anaerobic digestion ina plant, costs are much less and energy recovery is about 45%lower..
Based on the above, it is obvious that a new environmentalpolicy is needed so that planning for solid waste managementshould be performed aiming at achieving the desirable sustainabledevelopment. Policies focusing on energy and material recoveryfrom solid waste, as shown on (ISO 14043, 2000b; ISO 14040, 2006;ISO 14044, 2006; Finkbeiner et al., 2006; UNEP, 2010), lead notonly to a significant decrease of greenhouse gases, but also havesignificant environmental benefits (e.g. use of fossil fuels,ecosystem quality). Nevertheless, it should be pointed out thatthere is a very high sensitivity of the results due to the assumptionsmade about the origin of the energy that is replaced from biogasutilization.
According to the main assumptions made in this work, elec-tricity production is based on lignite and this remains constant inall scenarios, since lignite is the primary energy carrier in Greece.For this reason, electricity production from biogas (that accountsfor the 30% of energy recovery from biogas) is assumed to replacepart of the electricity based on lignite. On the other hand, heatproduction from biogas (60% of the total amount of energy recoveryfrom biogas) in scenarios A, B, “biocells” and “basic”, replacesthermal energy from oil. In the scenario of “natural gas”, it replacesthermal energy from natural gas and in scenario C it replaces nothermal energy at all. When the heat from natural gas (instead ofthe heat from oil) is replaced by heat coming from biogas, a smallincrease in the impact categories of human health and ecosystemquality is noticed, while the impact category of non renewableresources is positively influenced. In scenario C where no heat frombiogas is utilized, it does not seem to effect significantly the resultsexcept for systems 2 and 4 where an anaerobic digestion plant ispresent, leading to the increase of heat energy recovery (eventhough the difference is very small).
Parameters regarding the landfill site seem to have a significanteffect on the overall results. Another very important issue is the factthat the environmental impacts of all systems under study aremaximized in the case of uncontrolled waste disposal site (nobiogas and leachate control). Although parameters regardingbiogas and leachate treatment have a considerable effect on theresults, the inclusion of land use as an impact category only gave aninsignificant increase of 6e16% (depending on the system) onecosystem quality impact category.
7. Conclusions
The presented study is considered crucial for the sustainabilitydecision making process regarding different solid waste manage-ment strategies at any level (technology developers, systemmanagers, public authorities, etc). In this context, the application ofLCA methodology is of great importance as it helps in optimizingthe different waste flow fractions optimization using varioustreatment methods, in order to minimize the environmentalimpacts. However, two basic disadvantages of LCA (difficulties ondefying the system in order to make a holistic approach, and thelack of appropriate data) are becoming more obvious whenapplying LCA to the field of waste management. It is obvious thatthe most important pitfall stems from the complexity of wastemanagement systems in conjunction with the lack of reliable andharmonized data, which limit the applicability of the results. Whendiscussing solid waste management strategies it would be inter-esting to see how the inclusion of other electricity sources (e.g.from renewable sources instead of lignite based power plants)
C.J. Koroneos, E.A. Nanaki / Journal of Cleaner Production 27 (2012) 141e150150
would affect the results. Additionally, a more detailed study couldcontain some other relevant waste treatment methods like incin-eration, composting, recycling of plastic and aluminum and ofcourse the process of waste collection and transfer. That would givea holistic approach to the problem of municipal solid wastemanagement.
It is interesting to note that the presented application of LCAshould be taken into consideration along with the objectives ofan Integrated Solid Waste Management Plan. As far as Greece isconcerned, the objectives of an Integrated Solid WasteManagement Plan include actions such as the selective collectionat source and recycling of municipal wastes, the creation ofmodern, sanitary landfills, equipped with sorting and recyclingplants, the construction of suitable transfer station networks, thepause in operation of uncontrolled dumps, followed by rehabil-itation projects, the development of an integrated publiccommunication strategy, in the context of the common effort fortackling the waste management problem (Varelidis andSkordilis, 2001).
References
Alker, S., Sarsby, R., Howell, R., 1995. In: Sarsby, R. (Ed.), “The Composition ofLeachate from Waste Disposal Sites”,Waste Disposal by LandfilldGREEN ’93Symposium. Balkema, Rotterdam, Netherlands.
Baky, A., Swedish Institute of Agricultural Environmental Engineering, Eriksson, O.,Royal Institute of Technology, 2003. System Analysis of Organic WasteManagement in Denmark. Environmental Project No 822. Danish Environ-mental Protection Agency, Denmark.
Boustead ., I., 1972. The Milk Bottle. Open University Press, Milton Keynes.Boustead, I., 1989. Environmental Impact of the Major Beverage Packaging Systems-
UK Data 1986 in Response to the EEC Directive 85/339. INCPEN, London, UK.Brand, G., Braunschweig, A., Schweidegger, A., Schwank, O., 1998. Assessment in
Life-Cycle Analysis with the Method of Ecological Scarcity-Ecopoints 1997, vol.297. BUWAL (Bundesamt fu€r Umwelt, Wald, und Landschaft) [Swiss FederalAgency for the Environment, Forests, and Landscape], Switzerland, Bern.
Coulon, R., 2000. Life Cycle Inventory of Modern Municipal Solid Waste Landfills.Ecobalance Inc., Pricewaterhousecoopers. www.iere.org/InLCA/pdf/3aCoulon.pdf.
Eriksson, O., Carlsson Reich, M., Frostell, B., Björklund, A., Assefa, G., Sundqvist, J.-O.,Granath, J., Baky, A., Thyselius, L., 2005. Municipal solid waste managementfrom a systems Perspective. Journal of Cleaner Production 13 (3), 241e252.
European Commission, 1975. Council Directive 75/442/EEC of 15 July 1975 onwaste.Official Journal, L 194, 39e41. 25 July 1975.
European Commission, 1989. Communication to the Council and to the EuropeanParliament of 18 September 1989 on a Community strategy for wastemanagement”. Approved by Council 7 may 1990; Approved by Parliament 19February 1991. Official Journal, C 122 18 May 1990.
European Commission, 1991. Council Directive 91/156/EEC of 18 March 1991amending Directive 75/442/EEC on waste. Official Journal, L 078, 32e37. 26March 1991.
European Commission, 2003. The Story behind the Strategy-EUWaste Policy. http://ec.europa.eu/environment/waste/pdf/story_book.pdf.
European Commission, 2010. European Platform of LCA Including the ILCD Hand-book. European Commission, Brussels, Belgium. Available online: www.lct.jrc.ec.europa.eu/publications.
Finkbeiner, M., Inaba, A., Tan, R.B.H., Christiansen, K., Klüppel, H.J., 2006. The newinternational standards for life cycle assessment: ISO 14040 and ISO 14044.International Journal of Life Cycle Assessment 11, 80e85.
Finnveden, G., Albertsson, A.C., Berendson, J., Eriksson, E., Höglund, L.O., Karlsson, S.,Sundqvist, J.O., 1995. Solid waste treatment within the framework of life-cycleassessment. Journal of Cleaner Production 3 (4), 189e199.
Finnveden, G., Johansson, J., Lind, P., Moberg, Å, 2005. “Life cycle assessment ofenergy from solid waste”, part I: general methodology and results. Journal ofCleaner Production 13 (3), 213e229.
Fliedner, A., Eriksson, O., Sundqvist, J.-O., Frostell, B., 1999. Anaerobic Treatment ofMunicipal Biodegradable Waste e A Systems Analysis of Biocells, AnaerobicDigester and Direct Landfilling. Swedish Royal Institute of Technology, SwedishEnvironmental Research Institute, Stockholm, Sweden.
Goedkoop, Mark, Spriensma, Renilde, 17 April 2000. The Eco-indicator 99-ADamage Oriented Method for Life Cycle Impact Assessment MethodologyReport, second ed. PRé Consultants B.V, Netherlands.
Hannon, B., 1972. “A Study of the Beverage Industry”, System Energy and Recycling.Center for Advanced Computation, University of Illinois, Urbana, IL.
Intergovernmental Panel on Climate Change (IPCC), 2001. Climate Change 2001.UNEP & WMO.
ISO 14040, 1997. Environmental Management- Life Cycle Assessment- Principlesand Framework. International Organization for Standardization, Geneva,Switzerland.
ISO 14040, 2006. Environmental ManagementeLife Cycle AssessmentePrinciplesand Framework. International Organization for Standardization, Geneva,Switzerland.
ISO 14041, 1998. Environmental Management- Life Cycle Assessment- Goal andScope Definition and Inventory Analysis. International Organization for Stan-dardization, Geneva, Switzerland.
ISO 14042, 2000a. Environmental Management- Life Cycle Assessment- Life CycleImpact Assessment. International Organization for Standardization, Geneva,Switzerland.
ISO 14043, 2000b. Environmental Management- Life Cycle Assessment- Life CycleInterpretation. International Organization for Standardization, Geneva,Switzerland.
ISO 14044, 2006. Environmental ManagementeLife Cycle AssessmenteRequire-ments and Guidelines. International Organization for Standardization, Geneva,Switzerland.
Joint Ministerial Decision 29407/3508/2002, Measures and Terms on the Landfill ofWaste, Greece (in Greek)
Joint Ministerial Decision 50910/2727/2003, Measures and Terms for the Handlingof Solid Waste, National and Regional Planning (in Greek)
Liamsanguan, C., Gheewala, S.H., January 2012. The holistic impact of integratedsolid waste management on greenhouse gas emissions in Phuket. Journal ofCleaner Production 20 (1), 1e13.
Lindfors, L.-G., Christiansen, K., Hoffman, L., Virtanen, Y., Juntilla, V., Hansen, O.-J.,Ronning, A., Ekvall, T., Finnveden, G., 1995. Nordic Guidelines on Life-CycleAssessment. In: Nordic Council of Ministers, vol. 20. Nord, Copenhagen,Denmark.
Lu, J.C.S., Morisson, R.D., Stearns, R.J., 1984. Production and Management of Leachatefrom Municipal Landfills: Summary and Assessment. US EnvironmentalProtection Agency, EPA-600/2-84-092. Municipal Environmental Laboratory,Cincinnati, OH, USA.
Lundolm, M.P., Sundstrom, G., 1985. Resource and Environmental Impact of TetraBrik Carton and Refillable and Non-Refillable Glass Bottles. AB Tetra Pak,Malmo, Sweden.
McDougall, F.R., Hruska, J.P., 2000. The use of life cycle Inventory Tools to Supportan integrated approach to solid waste management. Waste Management &Resources 18 (6), 590e594.
Moberg, Asa, Finnveden, Goran, Johansson, Jessica, Lind, Per, 2005. Life cycleassessment of energy from solid wastedpart 2: landfilling compared to othertreatment methods. Journal of Cleaner Production 13, 231e240Å.
Papachristou, E., Darakas, E., Bellou, A., Ioannidou, D., Alivanis, K., Petridis, G.,Savvides, J., 2002. Qualitative and Quantitative Analysis of Municipal SolidWaste in Thessaloniki. Division of Hydraulics and Environmental Engineering,Aristotle University of Thessaloniki, Association of Local Authorities of GreaterThessaloniki, Greece.
Qasim, S.R., Chiang, W., 1994. Sanitary Landfill Leachate e Generation, Control andTreatment. CRC Press, USA.
Reich, M.C., 2005. Economic assessment of municipal waste management system-secase studies using a combination of life cycle assessment (LCA) and life cyclecosting (LCC). Journal of Cleaner Production 13 (3), 253e263.
Remmerswaal, H., 1996. IDEMAT Database. IDEMAT Database Faculty of IndustrialDesign Engineering. Delft University of Technology, Netherlands.
SIMA PRO 5: www.pre.nl/simapro.Sundqvist, J.-O., 1999. Life Cycle Assessments and Solid Waste. Guidelines for Solid
Waste Treatment and Disposal in LCA. Swedish Environmental Research Insti-tute, Stockholm, Sweden. Final Report 279, 1e133, IVL, AFR-Report.
Sundstrom, G., 1973. Investigation of the Energy Requirements from Raw Materialsto Garbage Treatment for 4 Swedish Beer Packaging Alternatives (Report forRigello Park AB, Sweden).
Tchobanoglous, G., Theisen, H., Vigil, S., 1993. Integrated Solid Waste Management,Engineering Principles and Management Issues. McGraw Hill, New York, USA.
UNEP, 2005. Integrated Waste Management Scoreboard -A Tool to MeasurePerformance in Municipal Solid Waste Management (United Nations Environ-ment Programme).
UNEP, 2010. UNEP/SETAC Life Cycle Initiative. UNEP, Nairobi, Kenya. Availableonline: www.lcinitiative.unep.fr.
Varelidis, P., Skordilis, A., 2001. Integrated Solid Waste Management in Greece.Ministry of Environment, Physical Planning & Public Works, Athens, Greece.