integrated simulation model for patient flow between
TRANSCRIPT
Integrated Simulation Model for Patient Flow Between Operating Rooms and Progressive
Care Units Using Custom Objects
A thesis presented to
the faculty of
the Russ College of Engineering and Technology of Ohio University
In partial fulfillment
of the requirements for the degree
Master of Science
Ryan L. Miller
December 2020
© 2020 Ryan L. Miller. All Rights Reserved.
2
This thesis titled
Integrated Simulation Model for Patient Flow Between Operating Rooms and Progressive
Care Units Using Custom Objects
by
RYAN L. MILLER
has been approved for
the Department of Industrial and Systems Engineering
and the Russ College of Engineering and Technology by
Dušan Šormaz
Professor of Industrial and Systems Engineering
Mei Wei
Dean, Russ College of Engineering and Technology
3
ABSTRACT
MILLER, RYAN L., M.S., December 2020, Industrial and Systems Engineering
Integrated Simulation Model for Patient Flow Between Operating Rooms and Progressive
Care Units
Director of Thesis: Dušan Šormaz
Process improvements in hospitals usually focus on a single department (eg.
emergency department, operating theater, specialty clinic, etc). However, actions taken in
one department inevitably affect the performance of other departments. Therefore, higher
efficiency improvements can be obtained by considering the patient care process as one
synergetic activity involving several departments and various sets of resources. In this
research we propose an integrated approach for modeling the patient lifecycle for
multiple departments.
First we describe a patient flow from his/her entry into the hospital through a
progressive care unit until the patient has fully recovered. We use process mapping
methods to address value added activities and other necessary activities in the patient
lifecycle. Then, a simulation model is developed in Simio using customized objects
created in previous works. Those customized objects carry their own logic and behavior.
For example, the Bed object includes logic for a patient recovering while using several
hospital resources (nurses, therapist) in his/her hospital stay. Those objects were used to
build several configurations of an integrated model with multiple departments.
Data about patient arrival patterns, their health acuity, and procedure needs were
obtained from a real hospital in order to test our approach. The procedures duration data
4 (which were different for different levels of patient acuity and for different surgical and
other procedures) were used to obtain service distribution using statistical analysis
methods.
Modular simulation objects and data distributions from real hospitals allowed us
to build an integrated simulation model with several configurations of the process flow.
Simulation experiments were performed on these models and performance recorded. The
recommendation for implementations in the hospitals is also reported.
5
DEDICATION
This thesis is dedicated to my wife Laura DiNardo Miller. Her hard working attitude
inspired me to see this through, after life had taken me away from studies for a long time.
Without her every day encouragement I would have never completed this work.
6
ACKNOWLEDGMENTS
I would like to give a big thanks to my advisor, Dr. Dusan Sormaz. He has never
wavered in his support for both my studies and life in general. There have been many
challenges we have had to overcome to complete this work, including a global pandemic.
Without his belief in me and his guidance, I don’t know that I would have ever been able
to reach this goal.
My wife and family have always been of great support to me, and I’m so very
grateful for them. I also wish to give a great thanks to my good friend and academic peer
Arkopaul Sarkar who has quietly pushed and encouraged me to get this work done.
Finally, a big thanks to the entire ISE department at Ohio University. The faculty
and staff have always been accommodating and encouraging. It is evident that they truly
care about the students.
7
TABLE OF CONTENTS
Page
Abstract ............................................................................................................................... 3
Dedication ........................................................................................................................... 5
Acknowledgments............................................................................................................... 6
List of Tables ...................................................................................................................... 9
List of Figures ................................................................................................................... 10
Chapter 1: Introduction ..................................................................................................... 13
Advantages .................................................................................................................. 15
Disadvantages ............................................................................................................. 15
Chapter 2: Literature Review ............................................................................................ 19
2.1 Discrete Event Simulation in Healthcare Systems................................................ 19
2.2 Simulation Studies on Patient Flow ...................................................................... 22
2.2.1 Simulation of Multiple Associated Healthcare Units .................................. 25
2.2.2 Generic Modeling ........................................................................................ 26
2.2.3 Object Oriented Modeling ........................................................................... 28
Chapter 3: Thesis Objective and Overview ...................................................................... 32
3.1 PCU Overview ...................................................................................................... 32
3.2 Surgical Unit Overview ........................................................................................ 38
3.3 Principles of Integration ........................................................................................ 41
Chapter 4: Methodology ................................................................................................... 44
4.1 Testing Bed Object ............................................................................................... 44
4.2 Enhancing Bed Unit Model .................................................................................. 48
4.2.1 Rounding Conflicts ...................................................................................... 52
4.2.2 Adjusting for Multiple Beds ........................................................................ 72
4.2.3 Changing Acuity and Routing Final Destination ......................................... 76
4.3 Two Units Integrated to One Model ..................................................................... 84
4.4 Statistic Collection & Experiments ....................................................................... 93
4.4.1 Statistic Collection ....................................................................................... 93
4.4.2 Experiments ................................................................................................. 98
Chapter 5: Conclusion and Future Work ........................................................................ 103
5.1 Summary ............................................................................................................. 103

8
5.2 Conclusion .......................................................................................................... 104
5.3 Future Work ........................................................................................................ 105
References ....................................................................................................................... 106
9
LIST OF TABLES
Table 1: Patient Origin Breakdown .................................................................................. 34
Table 2: Patient Origin broken down by acuity level ....................................................... 34
Table 3: PCU patient arrival distribution .......................................................................... 35
Table 4: PCU Activities .................................................................................................... 37
Table 5: Patient Destinations ............................................................................................ 38
Table 6: DailyAppointments Data Table ........................................................................... 41
Table 7: Resource Rounding Times - Gantt Chart vs Simulation Comparison ................ 47
Table 8: HospitalData (transposed) .................................................................................. 50
Table 9: Patient Property and Variables in relation to Data Table ................................... 52
Table 10: Gantt Chart Data with one conflict ................................................................... 69
Table 11: HospitalData Data Input for one conflict ......................................................... 70
Table 12: Altered Gantt Chart Data .................................................................................. 70
Table 13: HospitalData data input for many conflicts ..................................................... 72
Table 14: Resource mix .................................................................................................. 100
Table 15: Results for time in system and resource utilization ........................................ 102
Table 16: Results for wait time and bed cycles .............................................................. 102
10
LIST OF FIGURES
Figure 1: 2D View of Bed Object ..................................................................................... 30
Figure 2: 3D View of Bed Object ..................................................................................... 30
Figure 3: Snapshot of Bed Object Processes .................................................................... 31
Figure 4: Libraries of custom objects used for integration ............................................... 33
Figure 5: Generic Process Map ......................................................................................... 36
Figure 6: Summary of patient origin and destination information ................................... 37
Figure 7: Library and Main Model Relationship .............................................................. 39
Figure 8: Custom Library in Simio ................................................................................... 39
Figure 9: Surgical Unit Patient Flow ................................................................................ 43
Figure 10: Gantt Chart for Testing Bed Object ................................................................ 45
Figure 11: Fixed Times Data for Gantt Chart ................................................................... 45
Figure 12: Test Bed Model ............................................................................................... 45
Figure 13: Test Bed Worker Utilization Plot .................................................................... 46
Figure 14: Test Bed Results from Bed-BedTestModel-v2-4.spfx ...................................... 47
Figure 15: Patient Properties ............................................................................................. 49
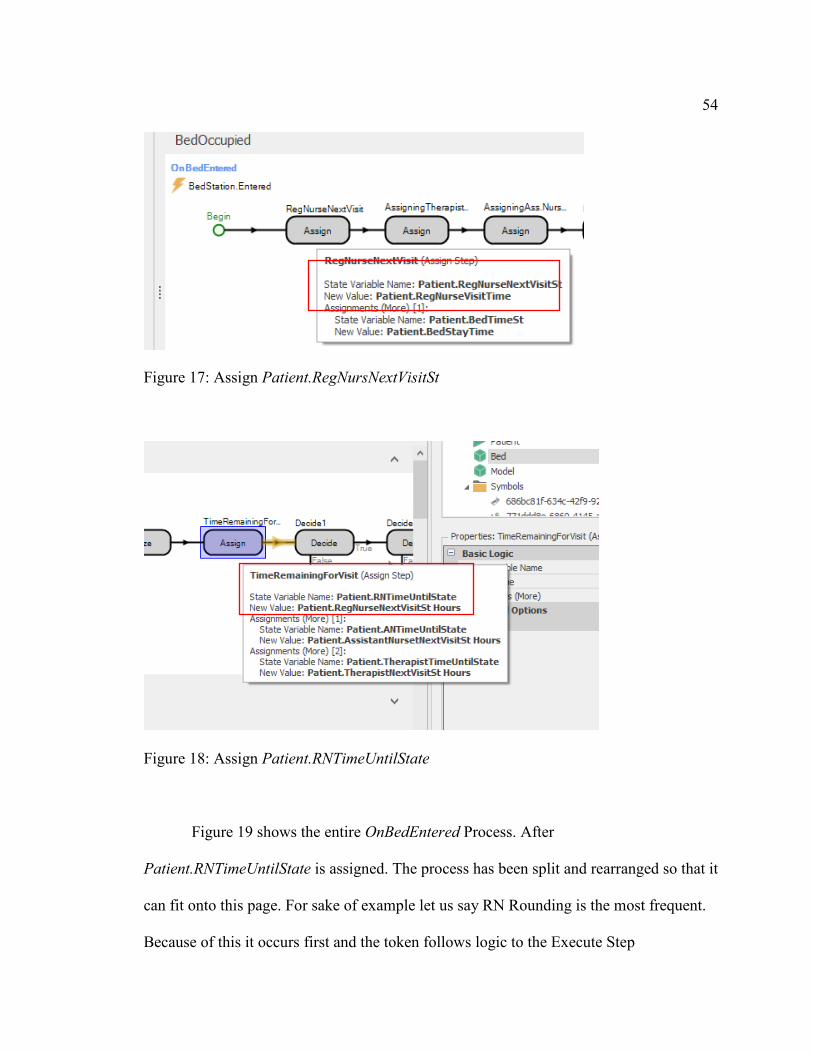
Figure 16: Assign RegNurseNextVisit .............................................................................. 52
Figure 17: Assign Patient.RegNursNextVisitSt................................................................. 54
Figure 18: Assign Patient.RNTimeUntilState ................................................................... 54
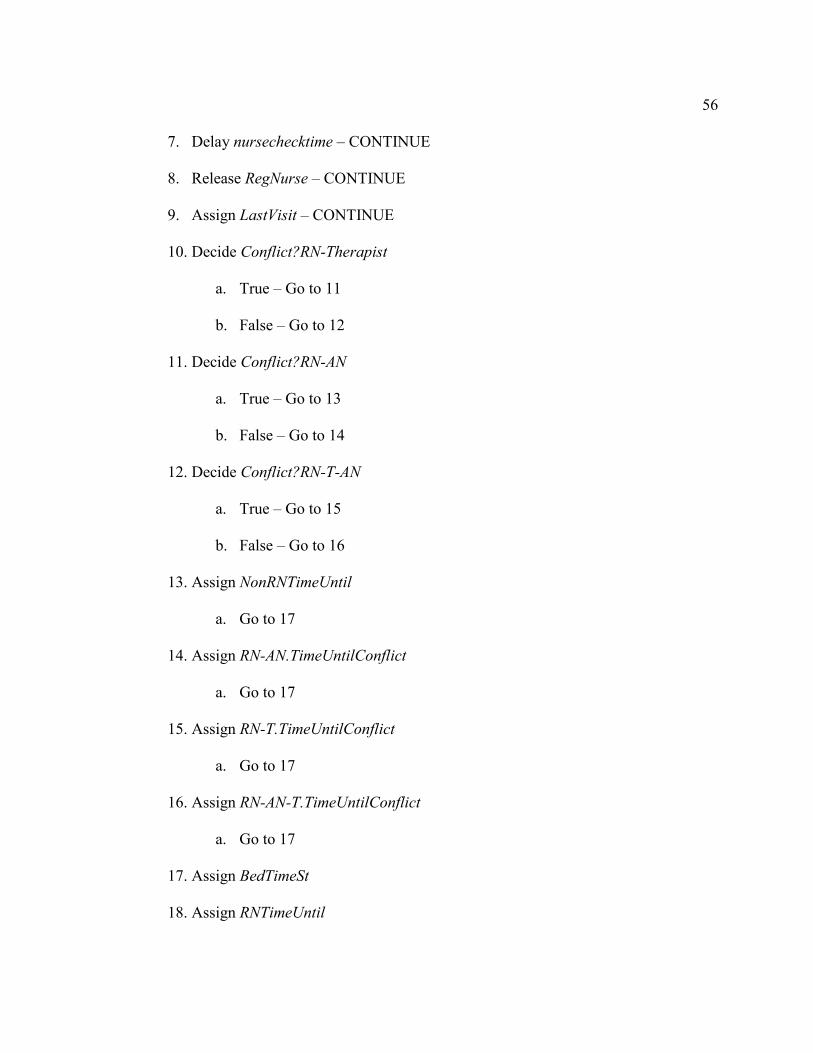
Figure 19: OnBedEntered Process .................................................................................... 55
Figure 20: Entire RNProcess – with conflict resolution ................................................... 59
Figure 21: Delay for Patient.RegularNurseChecktimeState ............................................. 60
Figure 22: Decide Conflict?RN-Therapist ........................................................................ 62
Figure 23: Decide Conflict?RN-AN .................................................................................. 63
Figure 24: Non-RN Time Until Assignments in RN Process ........................................... 64
Figure 25: State Variable Assignments to handle conflict ................................................ 65
Figure 26: Assign new Patient.BedTimeSt and new Patient.RegNurseNextVisit ............. 65
Figure 27: Assign Patient.RNTimeUntil ........................................................................... 66
Figure 28: Decide Next Rounding Process ....................................................................... 67
Figure 29: Assign NewTherapistCheckTime .................................................................... 67
Figure 30: Decide IfThereIsTimeRemaining ..................................................................... 68
Figure 31: Delay for RemainingStayTime......................................................................... 68
11 Figure 32: Bed_Exit Process ............................................................................................. 69
Figure 33: Gantt Chart with Conflict Circled ................................................................... 69
Figure 34: Altered Gantt Chart ......................................................................................... 71
Figure 35: Animation results for conflict run ................................................................... 71
Figure 36: Animation results for run with many conflicts ................................................ 72
Figure 37: Assign BeginRNWait ....................................................................................... 73
Figure 38: Assign step for calculating wait time .............................................................. 73
Figure 39: Assign LastVisitSt............................................................................................ 73
Figure 40: Adjusted Decide Step for conflict handling .................................................... 74
Figure 41: Reset wait time ................................................................................................ 75
Figure 42: Results for simulation run with many conflicts............................................... 76
Figure 43: DestinationList ................................................................................................ 77
Figure 44: Changes to HospitalData for destinations....................................................... 77
Figure 45: Changes to Bed_Enter for a change in acuity ................................................. 78
Figure 46: Assign first destination upon arrival to bed ..................................................... 78
Figure 47: Pass HospitalData to Bed Model .................................................................... 79
Figure 48: Assign DestinationNodeState .......................................................................... 80
Figure 49: HospitalData for Change in Acuity Test ........................................................ 81
Figure 50: Model Trace proves token takes correct path .................................................. 81
Figure 51: Original DestinationState ................................................................................ 82
Figure 52: New DestinationState ...................................................................................... 83
Figure 53: Routing Test Results ....................................................................................... 84
Figure 54: Patient Flow in Integrated Model .................................................................... 85
Figure 55: Facility view for integrated model .................................................................. 86
Figure 56: SeizeInpatientBed Process ............................................................................... 86
Figure 57: Seize Step for patients from OR ...................................................................... 87
Figure 58: PostSurgeryRouting Process ........................................................................... 88
Figure 59: Source for patients FromOR ............................................................................ 88
Figure 60: FromOR_CreatedEntity Process ..................................................................... 89
Figure 61: SendPatientToBed process sends patient from Admission to the Bed ............ 90
Figure 62: Screenshot of IntegratedModelDataFile.xlsx.................................................. 91
Figure 63: Assignment for CountFromORState ............................................................... 91
Figure 64: Status label for FromOR.................................................................................. 92
12 Figure 65: Arrivals after 1 week ....................................................................................... 92
Figure 66: Assign Acuity Tracker..................................................................................... 94
Figure 67: Assign Bed Cycle Count ................................................................................. 96
Figure 68: Assign Patient.TimeEnterBed ......................................................................... 96
Figure 69: Tally times spent in bed for all patients .......................................................... 97
Figure 70: Patient in bed statistics collection ................................................................... 97
Figure 71: Tally wait for resources ................................................................................... 98
Figure 72: 3D View of 16 Bed Model .............................................................................. 99
Figure 73: Screenshot of HospitalData Final ................................................................... 99
Figure 74: Screenshot of Experiments ............................................................................ 100
13
CHAPTER 1: INTRODUCTION
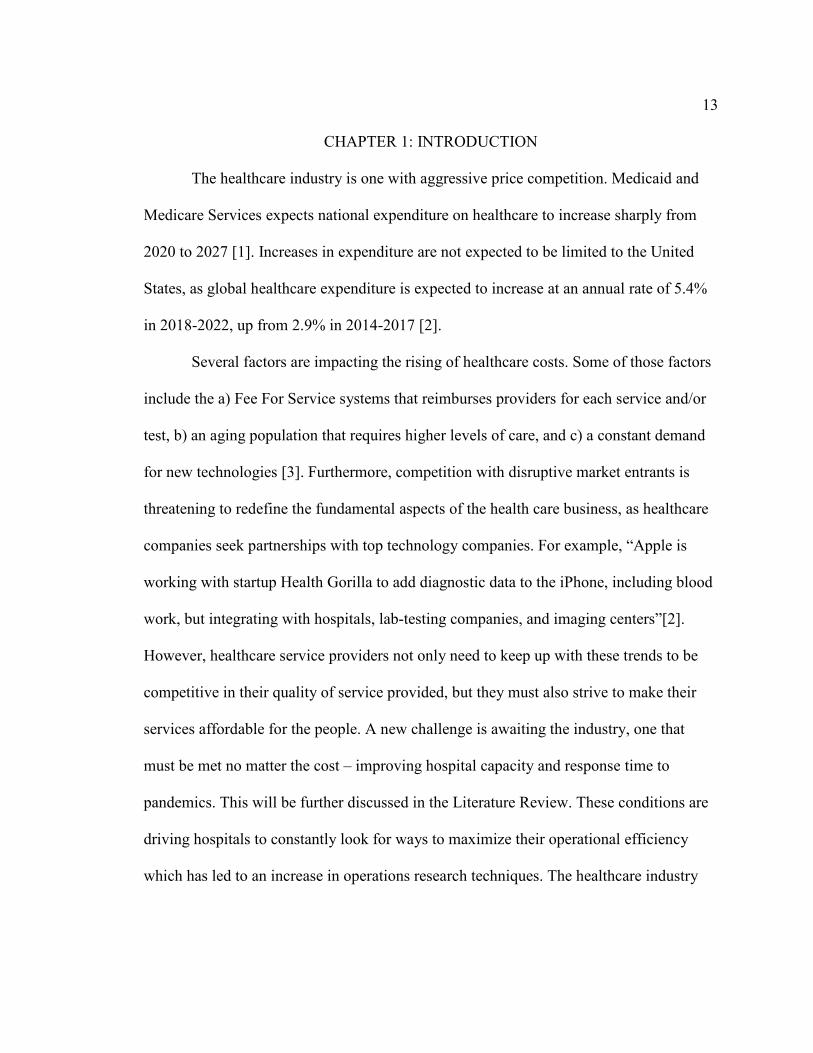
The healthcare industry is one with aggressive price competition. Medicaid and
Medicare Services expects national expenditure on healthcare to increase sharply from
2020 to 2027 [1]. Increases in expenditure are not expected to be limited to the United
States, as global healthcare expenditure is expected to increase at an annual rate of 5.4%
in 2018-2022, up from 2.9% in 2014-2017 [2].
Several factors are impacting the rising of healthcare costs. Some of those factors
include the a) Fee For Service systems that reimburses providers for each service and/or
test, b) an aging population that requires higher levels of care, and c) a constant demand
for new technologies [3]. Furthermore, competition with disruptive market entrants is
threatening to redefine the fundamental aspects of the health care business, as healthcare
companies seek partnerships with top technology companies. For example, “Apple is
working with startup Health Gorilla to add diagnostic data to the iPhone, including blood
work, but integrating with hospitals, lab-testing companies, and imaging centers”[2].
However, healthcare service providers not only need to keep up with these trends to be
competitive in their quality of service provided, but they must also strive to make their
services affordable for the people. A new challenge is awaiting the industry, one that
must be met no matter the cost – improving hospital capacity and response time to
pandemics. This will be further discussed in the Literature Review. These conditions are
driving hospitals to constantly look for ways to maximize their operational efficiency
which has led to an increase in operations research techniques. The healthcare industry
14 has long acknowledged the importance of operations research techniques, especially
simulation, in planning and managing hospital resources [4].
Simulation is defined as, “a set of numerical and programming techniques for
representing stochastic models and conducting sample experiments on those models
using a digital computer” [5]. This means that, by using math and technology, one can
effectively analyze a large number of unknown relationships between a cause and an
effect. For instance, a popcorn machine pops fresh kernels at a certain rate and an
employee scoops the popcorn out at another rate. If we know these rates, we may be able
to simulate the amount of kernels in the base of the machine at any given time.
There are three types of simulation: Monte Carlo, continuous, and discrete. Monte
Carlo simulation is a type of numerical experimentation technique, defined by Halton et
al. [4] as “representing the solution of a problem as a parameter of a hypothetical
population, and using a random sequence of numbers to construct a sample of the
population, from which statistical estimates of the parameter can be obtained.”
Continuous simulations are those in which state changes and/or events happen
continuously through time. Discrete simulations, on the other hand, only model changes
in the system at discrete points in time, called events. Therefore, discrete simulations are
further described as discrete-event simulations, or DES [5]. The research for this thesis
uses discrete event simulation modeling. Detailed DES applications are discussed in the
Literature Review.
Simulation studies in healthcare present the following advantages and
disadvantages:
15
Advantages
• Simulation provides a unique way to perform “what-if” analysis, so that healthcare
companies can experiment with their systems and understand the impact of
unexpected events like rescheduling of an appointment or a surge in patients [6].
• Simulation studies can provide insight to the effects of future events allowing
hospitals to experiment with new strategies without the risk of losing money and
patient lives [7].
• Simulation is a great tool to convey the effects of new strategies to stakeholders in
order to convince them to implement changes [7].
Disadvantages
• Simulation software is generally expensive and requires training to operate [8]. While
there are definite savings in using simulation to experiment with solutions prior to
implementation, there is a significant investment required in the early stages.
• “Although the technique permits framing the model to the depth required to
adequately address the decision problem, this may lead to a more complex structure
and the need for additional controlling equations. The increased complexity and level
of detail, even if appropriate to the problem, may appear to reduce transparency and
make it more difficult for reviewers to grasp the model and verify that it is a
reasonable representation and correctly implemented” [9].
• “The ability to handle more complex structures and to implement all necessary
components of a problem also tends to increase the data requirements” [11]
16
Although, historically, there are numerous technical reports offering evidence that
simulation can be used as an effective tool in health care, there is a widely admitted lack
of implementation of the improvements suggested from simulation studies in health care
[10]. The lack of acceptance, and therefore implementation, could stem from the fact that
health professionals are trained largely in the biological sciences in which mathematics is
mostly removed [11]. For example, many studies are not implemented because of
physician resistance, because they are mostly concerned with the quality of individual
patient care plans, and rightfully so. Even if the simulation study provides convincing
numbers to suggest a certain change to their practices, they have veto power if they feel it
interferes with their quality of patient care.
To combat this low acceptance of simulation studies among healthcare
professionals, simulation professionals in health care need to improve three aspects of
their work to help increase stakeholder acceptance of simulation modeling. They must a)
improve their ability to make valid verified models, b) better understand their customer’s
business needs, and c) provide those customers with insights to their own business [12].
The present research takes each of these items into consideration.
A) Valid/verified Models - There are many ways to ensure simulation model
validation, depending on the level of detail included in the model, availability
of real data, and the intended use for the model. One method would be to
compare theoretical results with computer simulated results, where theoretical
results are produced by using a static decision model. By using non-stochastic
arrivals, arrival times, and processing times in both models to schedule events,
17
the simulation results should be similar to a high degree of statistical
significance. Thus, the model logic can be verified.
B) Understanding customer’s needs - In one instance, Miller and Šormaz [13]
worked with healthcare professionals at a hospital in Ohio to generalize the
cyclical services performed by nurses, nurse assistants, and therapists
throughout a patient lifecycle in their Progressive Care Unit (PCU). The
healthcare professionals communicated their needs/concerns and through their
conversations Miller and Šormaz were able to produce a process map of those
cyclical operations, ensuring that there was a sufficient level of understanding
of the process as a whole. Process mapping for any particular unit is not
completed until all interactions with associated units are considered. Perhaps a
higher level of detail is shown in a specific unit, but at the very least the
process map will integrate patient transfers between units. However,
simulation applications to integrated health care systems (as opposed to
individual units) has been slow to pick up. An important conclusion in a
review by Gunal and Pidd [14] states that “the studies reported in most papers
are unit specific.” This is arguably due to difficulties in modeling the systems
of such a large, complex, diverse and often interconnected industry [10]. The
present research aims to integrate multiple units into one simulation model.
C) Provide insight to the customer - Since the 1980’s most simulation modelers
have grown accustomed to a process orientation. Although the process
orientation has been an effective modeling paradigm, “an object orientation
18
provides an attractive alternative modeling paradigm that has the potential to
be more natural and easier to use.” In an object orientation, the model is built
using objects that make up the system, and the processes are then defined
within those objects [15]. This object oriented view also allows healthcare
professionals to gain a better understanding of simulation models, since what
is pictured on screen represents physical objects in real life. Furthermore,
custom objects for very specific uses can be created that include specific
process triggers.
The next chapter is a literature review of simulation applications in health care.
Following the literature review, Chapter 3 is a Thesis Objective & Overview where the
thesis objective is presented, followed by some background information. Chapter 4 gives
a detailed description of the methodology used. Chapter 5 draws conclusions from the
present research.
19
CHAPTER 2: LITERATURE REVIEW
The Literature Review has been divided into 2 sections. First, the literature review
gives an introduction to discrete event simulation studies done in healthcare systems.
Second, the literature review will discuss simulation studies done in healthcare focusing
on patient flow. The second section is divided into subsections based on three select
modeling approaches.
2.1 Discrete Event Simulation in Healthcare Systems
Simulation has been used in many industries to maintain or improve progress,
while saving on costs. Beginning in the 1960s, a wide variety of studies have applied
simulation as an effective tool in healthcare. Since then, many researchers have used
simulation to convince stakeholders of the effectiveness of new strategies. Simulation
helps decision makers in healthcare to better understand their facility and helps modelers
communicate potential improvements via “what if” experimentation. Brailsford [16]
states that the most widely-used simulation approach is Discrete Event Simulation (DES).
Discrete-event simulation (DES) modeling is preferred to other optimization
techniques such as Markov modeling and linear programming. Particularly because, “It
can model queueing for limited resources, capture individual patient histories,
accommodate complexity and uncertainty, represent time flexibility, model competing
for risks and accommodate multiple events simultaneously” [17].
Brailsford describes DES as a form of simulation “in which individual entities
flow around and network of queues for services” and goes on to say that DES “appears to
be tailor-made for hospital systems in which patients join waiting lists for appointments,
20 investigations, and treatments.” Furthermore, these entities can assume attributes that
represent all necessary human characteristics such as age, gender, diagnosis, blood group,
disease status, sexual preference, hair color, etc.
Brailsford identifies three advantages of DES applications for healthcare. First,
much in the same way that patients have individual characteristics that will dictate their
unique pathway through the hospital system, entities may follow a unique pathway
through the simulation network based on individual characteristics. This helps a modeler
psychologically, because it’s easy to assign necessary human characteristics of a patient
to the entities. Second, DES has mathematical advantages. “Unlike Markov models
which take no account of medical history, ‘service time’ distributions can be dependent
on individual characteristics and previous history, and any parametric or empirical
distribution can be chosen to model activity durations.” Randomness, variability, and
uncertainty is built into the model by using these distributions. By running enough
simulation runs modelers can achieve statistically significant results. Finally, an
advantage of DES is that there are many different software packages available, ranging in
price and features. Some packages are even tailored towards the healthcare industry such
as FlexSim HC [18]. A common theme in all of them is that they provide some kind of
“graphical facility which enables the user to visualize the model.” This in particular is
invaluable as a communication tool with healthcare professionals, who oftentimes do not
have the necessary mathematical and technical background.
To help identify the wide variety of applications, Brailsford classifies healthcare
models into three levels. Level 1 models are models of the human body, commonly
21 referred to as “disease models” although they can represent biological processes in
healthy individuals as well. For example, simulation may be used to model the
biochemical effects of drugs before they are introduced to the market. Level 2 involves
models focus on operations and/or tactics within a given healthcare unit, such as an
Intensive Care Unit or Emergency Room. These models focus on individual patient flow
through that unit, and are used for projects involving capacity planning, resource
allocation, and process redesign. Level 3 models are system-wide models and aspire to
answer big picture questions, such as how many doctors our country will need in 20
years.
As the COVID-19 disease wreaks havoc on the planet, many scholars are
focusing their studies on the disease in order to answer questions about mortality rates,
infection rates, and to predict average number of social contacts with and without virus
contamination practices [19]. These such studies fall under the Level 3 category
described by Brailsford. However, there is a need to continue to focus studies in Level 2
in order to improve surge capacities of hospitals. Surge capacity is defined as “a
hospital’s ability to adequately care for a significant influx of patients,” as is the case
with the influx of patients from COVID-19. There was already a bed shortage in hospitals
across the country before the pandemic. According to Blumenberg et al. “even prior to
the development of COVID-19, many hospitals faced emergency department crowding
and strains on hospital capacity” [20]. Simulation can help in these times because
modelers are able to experiment with various resource levels, shared resources, hospital
layouts, and process changes in efforts to increase capacity. These efforts may be utilized
22 to provide robust solutions to the current pandemic overcrowding crisis. The present
research applies DES to a patient flow scenario in “Level 2,” as described by Brailsford.
2.2 Simulation Studies on Patient Flow
Brailsford states that simulation in Level 2 “denotes operational or tactical models
at the healthcare unit level…These usually (although not always) still model individual
patients, but are not concerned with modeling the physiological or clinical processes
going on inside them. Rather, they are concerned with modeling the flows of patients
around this system, and identifying and eliminating bottlenecks.” In general, Level 2
simulations are oftentimes used to “address organizational issues of resource allocation
and capacity planning.” Some popular units studied in Level 2 include Emergency
Departments (ED) and Intensive Care Units (ICU) [16].
Discrete Event Simulation studies focusing on patient flow, generally aim to
reduce patient waiting times and subsequent overcrowding caused by excessive waiting.
This is evident in the studies discussed throughout this section. Many studies have
focused on reducing waiting times in Emergency Department’s since they have a high
potential for overcrowding due to the nature of the unit, where there are no appointments.
Overcrowding is especially evident during surges resulting from a disaster of some kind
(i.g. earthquakes, riots).
Crawford [21] created a “discrete-event simulation model of patient pathway
through an acute care hospital” to analyze various discharge strategies using ARENA
v12. The authors analyzed a static discharge strategy which was largely based on the state
of the patient, and two proactive strategies which considered ED resources and the
23 subsequent chances for ED crowding. Their analysis indicated that while the proactive
strategies significantly reduced ED waiting and boarding times, it was at the sacrifice of
readmission rate, as readmissions rose when using proactive discharge strategies.
Raunak [22] used the Little-JIL process definition language to study the effects on
patient flow in an emergency department when varying resource mixes and utilization
strategies. For instance, “adding resources of only one type (e.g. more doctors) is rarely
sufficient to reduce delays, however, as patient care typically requires the use of many
types of additional resources (e.g. beds, nurses, and equipment). Increasing resources in
an unbalanced way can thus lead to underutilization of some resources and increased
expense, but not improvement in service.” A number of simulations were run in which
the ED processes were fixed but resource mixes were varied. Length-of-stay for patients
and resource utilization were key measures reported. Reported results were limited, as
model requires further validation.
Intensive Care Units are such an important focus for hospitals because they are
both very expensive, and absolutely necessary. Each bed generally requires at least a 1:1
nurse to bed ratio, and is accompanied by costly specialized equipment. That means that
if there’s an excess capacity (too many beds) then a hospital will grossly overspend, but
with a capacity shortage (not enough beds) will lead to canceled elective surgeries at best
and at worst, loss of life [21].
Griffiths et al [23] studied an ICU at a teaching hospital that is pioneering a
method for early detection of patients in general care that may require ICU care. They
used simulation to test effectiveness of this method. Using Simul8 they built a DES
24 model, where the number of beds was considered to be flexible. “The ICU under
consideration is officially a 14-bed unit. However, extra beds/specialist equipment are
available for use during busy periods.” The purpose of the study was to determine the
appropriate number of nurses, given that there is a fixed number of scheduled nurses
permanently based in the ICU for each shift. These nurses are known as rostered nurses.
During busy periods, when the number of establishment staff is not sufficient,
supplementary nurses are brought in. These supplementary nurses can be either bank
nurses or agency nurses. Bank nurses do not have a set schedule but are available if they
are needed, in which case they are paid overtime. Agency nurses are hired from third
parties and are utilized when no bank nurses are available, since they are most costly.
Additionally they may be unfamiliar with the environment and colleagues, leading to
further complications.
The authors used data from almost 1,100 admitted patients in the year 2000 to
build the model. Patients were categorized by type and a distribution for length of stay
was fitted to each type. The actual number of rostered nurses per shift was 14, but the
model showed that if there was 16 rostered nurses the unit would observe a savings of
37%. Additionally, the authors evaluated a physician theory that by offering early ICU
care the length of stay could be reduced. Physicians believe that there could be a 10-20%
reduction in length of stay with new early detection methods. The authors found that if a
20% length of stay was achieved, the ICU would require one less rostered nurse per shift.
25
2.2.1 Simulation of Multiple Associated Healthcare Units
In 2006, Hall, Jacobson, and Swisher [6] reported that there was a lack of
investigations into inter-departmental relationships in DES studies. Since then, the
literature shows that there has been an effort to study these interactions between multiple
associated departments (or units). An example of how two separate units may interact is
observed in surgeries. After surgery (occurring in a surgical unit), patients must recover
in another unit. Thus, a model built for an operating room is incomplete without
consideration of patient transfer to recovery units.
In patient transfer scenarios, modelers must consider bed availability in the unit
being transferred to. Mustafee et al [24] created a simulation model of specialized and
integrated care units in which considers bed blocking, which is where “patients that are
clinically ready to be discharged from wards that provide higher levels of care (e.g.
Intensive Therapy Unit) cannot be transferred to wards offering reduced care (e.g. High
Dependency Unit, general ward) because of the non-availability of beds in the latter
wards.” This study focuses on the bed blocking in a Cardiac Intensive Care Unit (CICU)
which has a direct bearing on the number of cardiac operations performed, because a bed
must be available for recovery before surgery is performed. The authors used length of
stay data to input to a Monte Carlo Simulation (MCS) to simulate bed blocking on the
CICU. This MCS model is used in conjunction with a Simul8 DES model that simulates
the patient flow for cardiac operations and recovery. The MCS study experimented with
different bed numbers to find the optimal number of beds. Future work will focus on
26 experimentation with the DES model to investigate several bed management strategies,
considering that an increase in beds is not feasible in short term.
Olabisi [25] employed a DES study using Simul8 at a university teaching hospital
in Nigeria to analyze three different scenarios to improve patient flow through the
antenatal department and interactions with associated departments. Three different
scenarios were tested to observe the effect on patient flow. In scenario A the overall
capacity of care givers was increased for all associated units. Scenario B presents
alternate patient routing to improve waiting times in the pharmacy and medical lab care
units. Scenario C is a combination of the increased capacities and alternate routing. Each
scenario improved average waiting time and average queue length. Model validation was
based on comparing simulated results vs actual data for the number of departing patients
via Pharmacy and Medical Lab – both associated with the antenatal department.
Validation of all phases should be conducted to have confidence in the model.
2.2.2 Generic Modeling
A review by Gunal and Pidd [14] concludes that while simulation studies in
healthcare are being implemented increasingly, there remains a lack of generic models.
A majority of the work has been done is unit specific and facility specific, thus is not
easily replicated in a different setting. Furthermore, there is a need to improve turnaround
time on healthcare simulation projects in order to keep up with the rapidly changing
environment, and the use of generic models could aid in this challenge, as described by
Young et al. (2009) [26]
27
To solve this, Busby and Carter [27] used to a data driven approach to create a
generic model for ED, inpatient units and ORs. Experimentation was to investigate surge
protocols and how departments affect one another based on those protocols. The model
was built using Simul8, and case specific inputs to the model are recorded in a Excel file.
These inputs include logical details such as scheduling rules as well as one year of patient
data. Attributes for each patient record show the arrival time of day, patient services
received, and length of stay. The model can be used in different hospitals if these records
are provided.
Arrivals are modeled in a unique fashion, in that volume is determined
statistically but day by day scheduling is determined by historical data. All entities arrive
to the model at midnight according to a Poisson distribution, are assigned a set of patient
characteristics from historical data, and then enter the ED according patient record
attributes from the Excel file. “This method allows day-of-week patterns to be maintained
while still having random arrivals throughout the day.” Historical data is used for all
patient service times, so after an entity adopts a patient record there is no further
processing randomization. Like the current research, the authors combined multiple
hospital units into one model and use an Excel file to feed data into the model. However,
the current research introduces another level of detail by modeling hospital worker
processes during patient stay. Also, this model is built using a process oriented approach
and the current research uses object oriented modeling approach.
A powerful feature of object oriented modeling is the ability to build custom
objects which can be reused in generic applications. The present research uses this
28 method. The next section covers object oriented modeling and contains a subsection
discussing custom objects
2.2.3 Object Oriented Modeling
As stated in the Introduction to the present research, there has been a lack of
implementation of the work done in healthcare simulation studies. Object oriented
modeling could help healthcare professionals understand the simulation modeling efforts
because what is pictured on the screen during simulation represents actual objects within
the hospital. The literature shows that since then there has been research that uses object
oriented modeling to solve healthcare problems. One of the earliest examples of using
object oriented modeling in healthcare came in 1991 where Birch and Cook [28] used
SMALLTALK to model a hospital’s bed resource utilization.
In object oriented modeling, underlying process logic can be defined within
objects. Take a car wash simulation for example. A picture of a car wash is shown on the
screen but the simulation could be running a variety of logic that is not shown, like
individual washing functions and drying. A powerful object oriented modeling tool is
Simio [29]. Simio aims to solve an object oriented modeling difficulty in that their
objects are process-based rather than code-based. Other object oriented modeling tools
are code-based and implemented in a high-level programming language. “If the tool
supports user-defined objects, then the user must implement any new objects in the same
programming language.” [30]. So, if the user wishes to customize a particular object they
are required to be highly knowledgeable of the concepts in object-orientation and skilled
29 in a particular programming language. In Simio, this is not the case since custom objects
are created using a process-based interface.
Venkitasubramanian et al [31] used an object oriented modeling approach to
improve the long waiting times at clinics of the North Carolina State Student health
Services (SHS). The authors detailed a comprehensive object-oriented simulation
framework for healthcare that “provides a conceptual basis for healthcare that can be
employed by an object-oriented simulation language…From a simulation software design
point of view, (they) view healthcare operations as composed of three basic object classes
(i.e., Stationary, Mobile, and Agent objects).” Similar to the present research, the authors
built a “Patient Bed” object under their Stationary Object class in the hierarchy of the
framework. Like the present research, they built their model using Simio custom objects.
The authors’ goal is to improve communication with stakeholders (oftentimes healthcare
professionals) by adhering to standard healthcare terminology and making a small
amount of minor customizations so that the object can be reused for similar purposes. For
instance the input buffer was set to zero on their bed object, as patients do not wait for a
bed at bedside. They wait in a waiting room. Unlike the present research, the bed object
did not include inbuilt procedures that are triggered throughout the simulation.
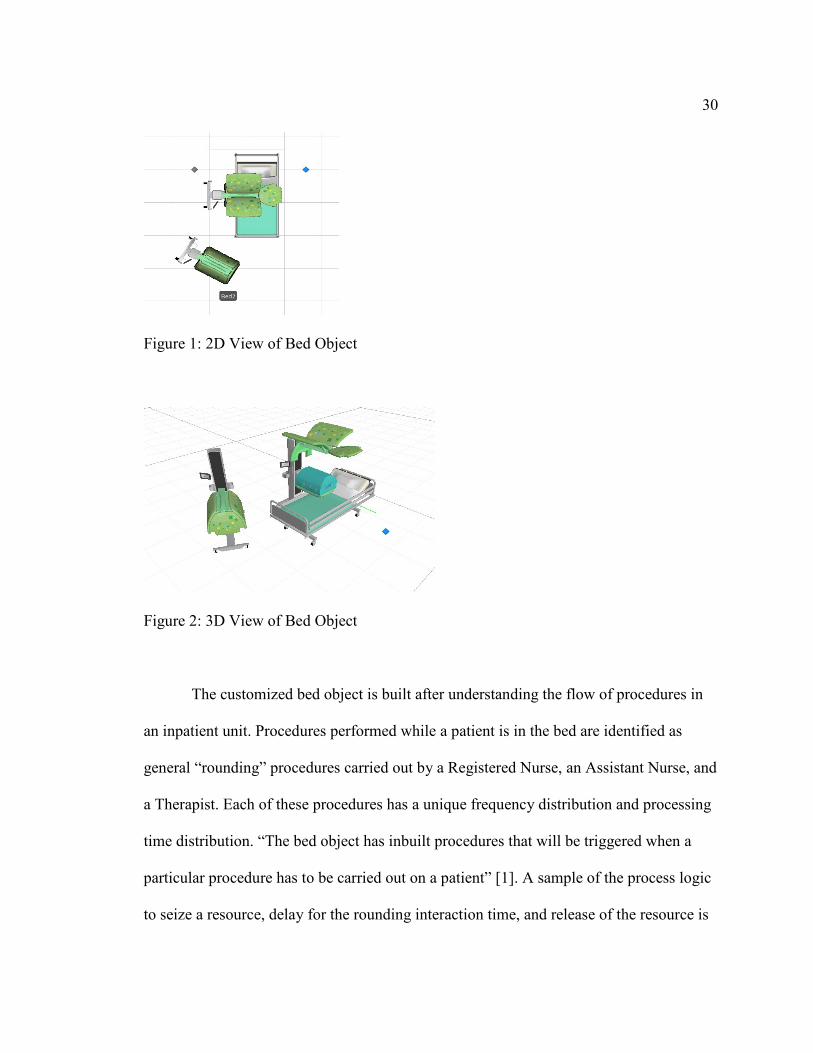
In one object oriented modeling approach, Šormaz and Malik [32] employ a simulation
study of patient flow that uses custom “bed” objects in Simio that have been designed
uniquely for inpatient units and can be reused for future inpatient unit applications. Bed
object is pictured below in Figure 1 and Figure 2.
30
Figure 1: 2D View of Bed Object
Figure 2: 3D View of Bed Object
The customized bed object is built after understanding the flow of procedures in
an inpatient unit. Procedures performed while a patient is in the bed are identified as
general “rounding” procedures carried out by a Registered Nurse, an Assistant Nurse, and
a Therapist. Each of these procedures has a unique frequency distribution and processing
time distribution. “The bed object has inbuilt procedures that will be triggered when a
particular procedure has to be carried out on a patient” [1]. A sample of the process logic
to seize a resource, delay for the rounding interaction time, and release of the resource is
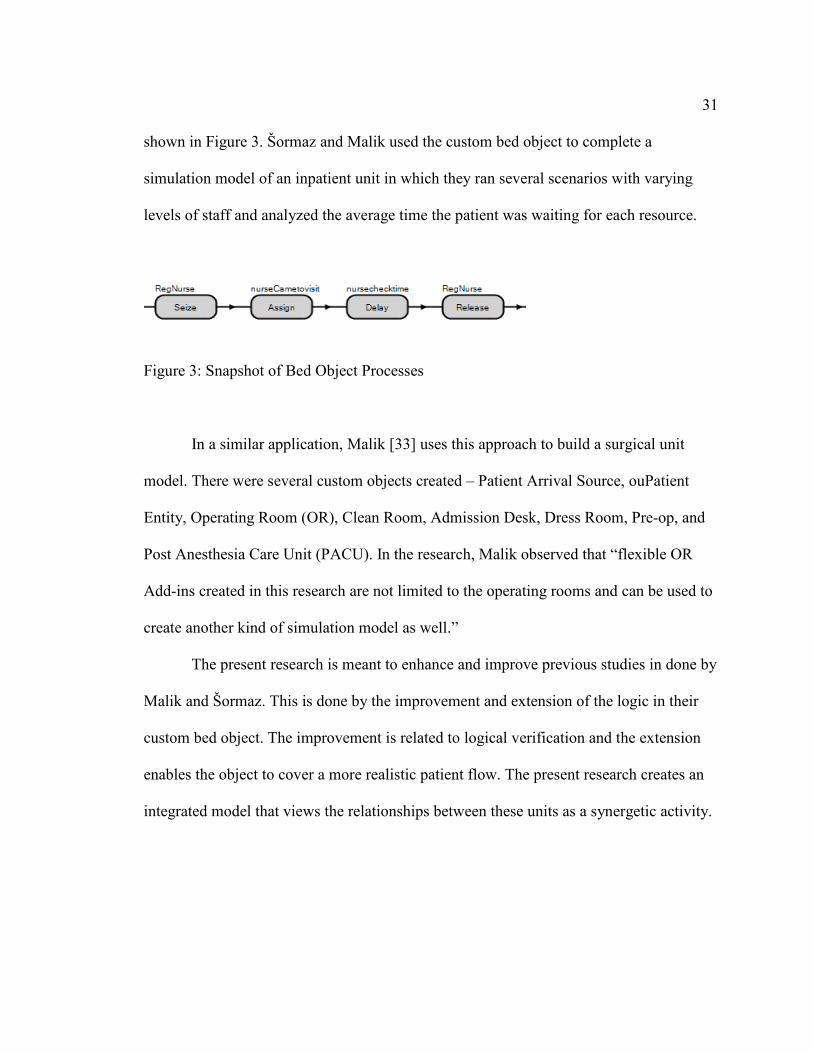
31 shown in Figure 3. Šormaz and Malik used the custom bed object to complete a
simulation model of an inpatient unit in which they ran several scenarios with varying
levels of staff and analyzed the average time the patient was waiting for each resource.
Figure 3: Snapshot of Bed Object Processes
In a similar application, Malik [33] uses this approach to build a surgical unit
model. There were several custom objects created – Patient Arrival Source, ouPatient
Entity, Operating Room (OR), Clean Room, Admission Desk, Dress Room, Pre-op, and
Post Anesthesia Care Unit (PACU). In the research, Malik observed that “flexible OR
Add-ins created in this research are not limited to the operating rooms and can be used to
create another kind of simulation model as well.”
The present research is meant to enhance and improve previous studies in done by
Malik and Šormaz. This is done by the improvement and extension of the logic in their
custom bed object. The improvement is related to logical verification and the extension
enables the object to cover a more realistic patient flow. The present research creates an
integrated model that views the relationships between these units as a synergetic activity.
32
CHAPTER 3: THESIS OBJECTIVE AND OVERVIEW
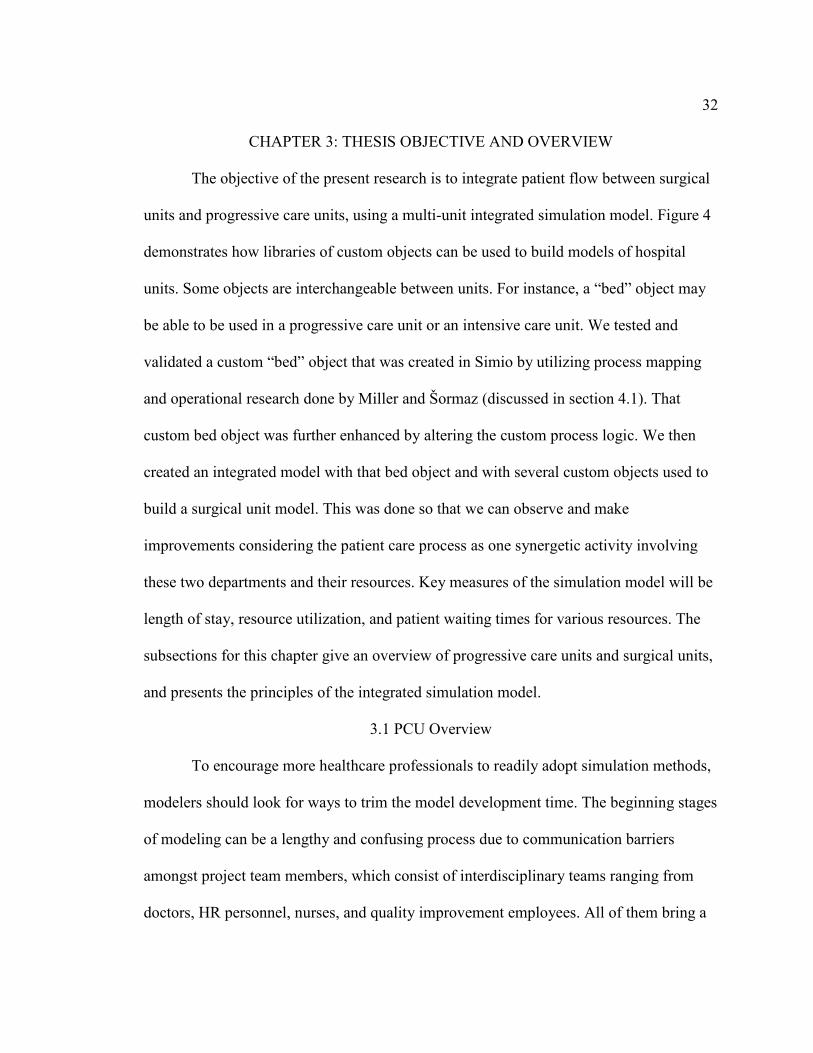
The objective of the present research is to integrate patient flow between surgical
units and progressive care units, using a multi-unit integrated simulation model. Figure 4
demonstrates how libraries of custom objects can be used to build models of hospital
units. Some objects are interchangeable between units. For instance, a “bed” object may
be able to be used in a progressive care unit or an intensive care unit. We tested and
validated a custom “bed” object that was created in Simio by utilizing process mapping
and operational research done by Miller and Šormaz (discussed in section 4.1). That
custom bed object was further enhanced by altering the custom process logic. We then
created an integrated model with that bed object and with several custom objects used to
build a surgical unit model. This was done so that we can observe and make
improvements considering the patient care process as one synergetic activity involving
these two departments and their resources. Key measures of the simulation model will be
length of stay, resource utilization, and patient waiting times for various resources. The
subsections for this chapter give an overview of progressive care units and surgical units,
and presents the principles of the integrated simulation model.
3.1 PCU Overview
To encourage more healthcare professionals to readily adopt simulation methods,
modelers should look for ways to trim the model development time. The beginning stages
of modeling can be a lengthy and confusing process due to communication barriers
amongst project team members, which consist of interdisciplinary teams ranging from
doctors, HR personnel, nurses, and quality improvement employees. All of them bring a
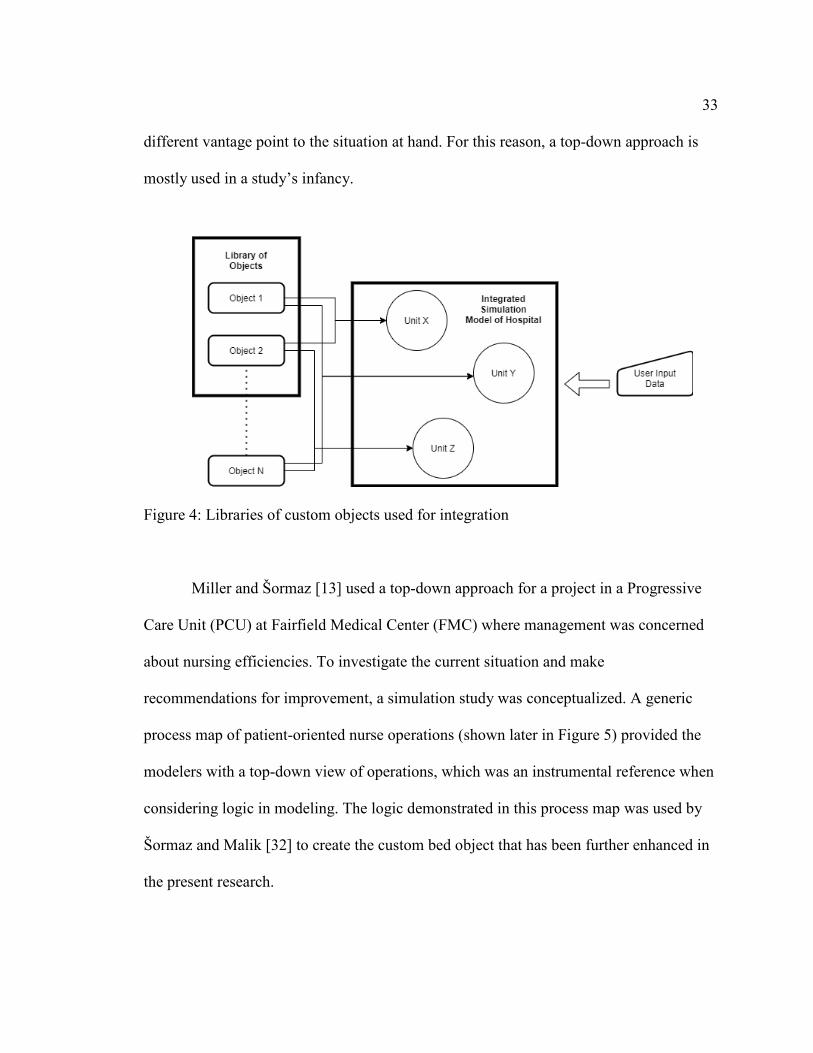
33 different vantage point to the situation at hand. For this reason, a top-down approach is
mostly used in a study’s infancy.
Figure 4: Libraries of custom objects used for integration
Miller and Šormaz [13] used a top-down approach for a project in a Progressive
Care Unit (PCU) at Fairfield Medical Center (FMC) where management was concerned
about nursing efficiencies. To investigate the current situation and make
recommendations for improvement, a simulation study was conceptualized. A generic
process map of patient-oriented nurse operations (shown later in Figure 5) provided the
modelers with a top-down view of operations, which was an instrumental reference when
considering logic in modeling. The logic demonstrated in this process map was used by
Šormaz and Malik [32] to create the custom bed object that has been further enhanced in
the present research.
34
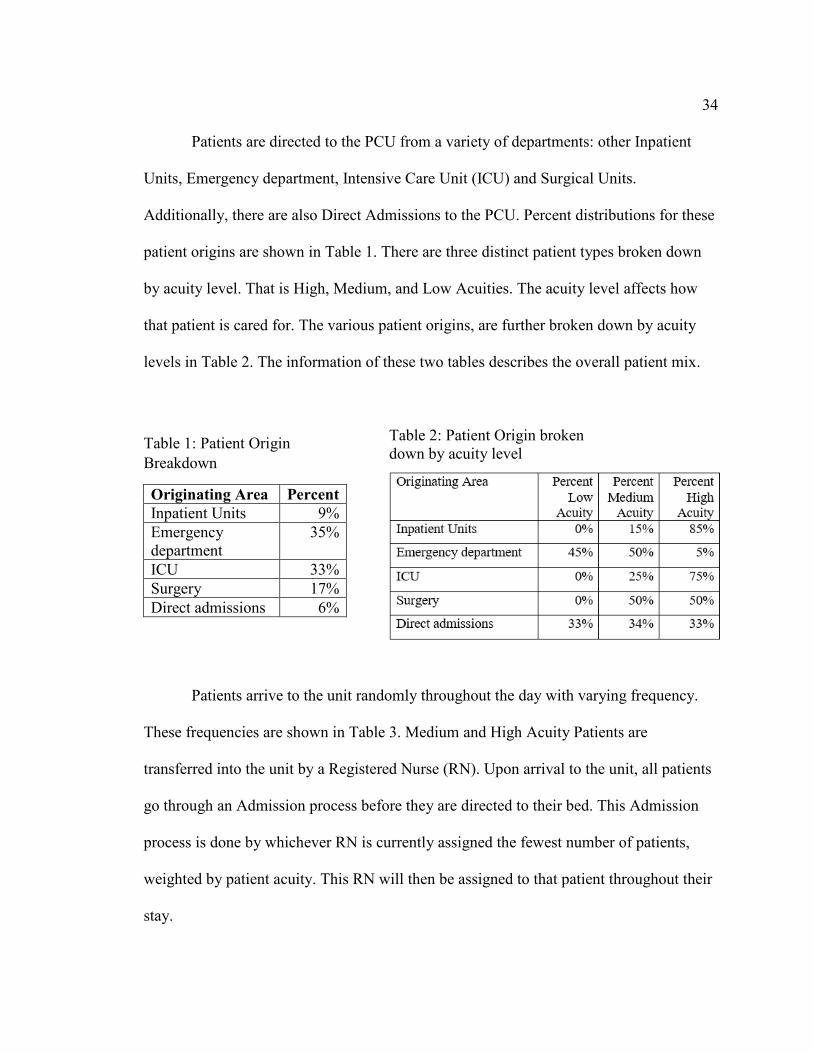
Patients are directed to the PCU from a variety of departments: other Inpatient
Units, Emergency department, Intensive Care Unit (ICU) and Surgical Units.
Additionally, there are also Direct Admissions to the PCU. Percent distributions for these
patient origins are shown in Table 1. There are three distinct patient types broken down
by acuity level. That is High, Medium, and Low Acuities. The acuity level affects how
that patient is cared for. The various patient origins, are further broken down by acuity
levels in Table 2. The information of these two tables describes the overall patient mix.
Table 1: Patient Origin Breakdown
Originating Area Percent Inpatient Units 9% Emergency department
35%
ICU 33% Surgery 17% Direct admissions 6%
Table 2: Patient Origin broken down by acuity level
Patients arrive to the unit randomly throughout the day with varying frequency.
These frequencies are shown in Table 3. Medium and High Acuity Patients are
transferred into the unit by a Registered Nurse (RN). Upon arrival to the unit, all patients
go through an Admission process before they are directed to their bed. This Admission
process is done by whichever RN is currently assigned the fewest number of patients,
weighted by patient acuity. This RN will then be assigned to that patient throughout their
stay.
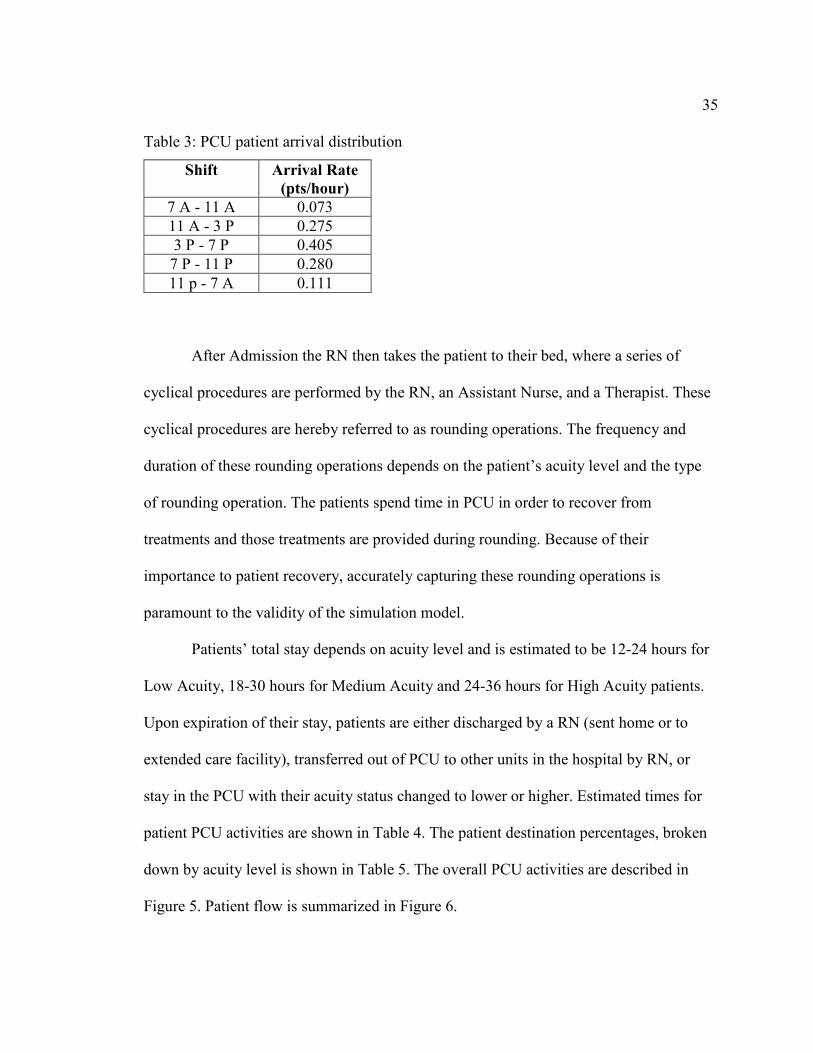
35 Table 3: PCU patient arrival distribution
After Admission the RN then takes the patient to their bed, where a series of
cyclical procedures are performed by the RN, an Assistant Nurse, and a Therapist. These
cyclical procedures are hereby referred to as rounding operations. The frequency and
duration of these rounding operations depends on the patient’s acuity level and the type
of rounding operation. The patients spend time in PCU in order to recover from
treatments and those treatments are provided during rounding. Because of their
importance to patient recovery, accurately capturing these rounding operations is
paramount to the validity of the simulation model.
Patients’ total stay depends on acuity level and is estimated to be 12-24 hours for
Low Acuity, 18-30 hours for Medium Acuity and 24-36 hours for High Acuity patients.
Upon expiration of their stay, patients are either discharged by a RN (sent home or to
extended care facility), transferred out of PCU to other units in the hospital by RN, or
stay in the PCU with their acuity status changed to lower or higher. Estimated times for
patient PCU activities are shown in Table 4. The patient destination percentages, broken
down by acuity level is shown in Table 5. The overall PCU activities are described in
Figure 5. Patient flow is summarized in Figure 6.
Shift Arrival Rate (pts/hour)
7 A - 11 A 0.073 11 A - 3 P 0.275 3 P - 7 P 0.405 7 P - 11 P 0.280 11 p - 7 A 0.111
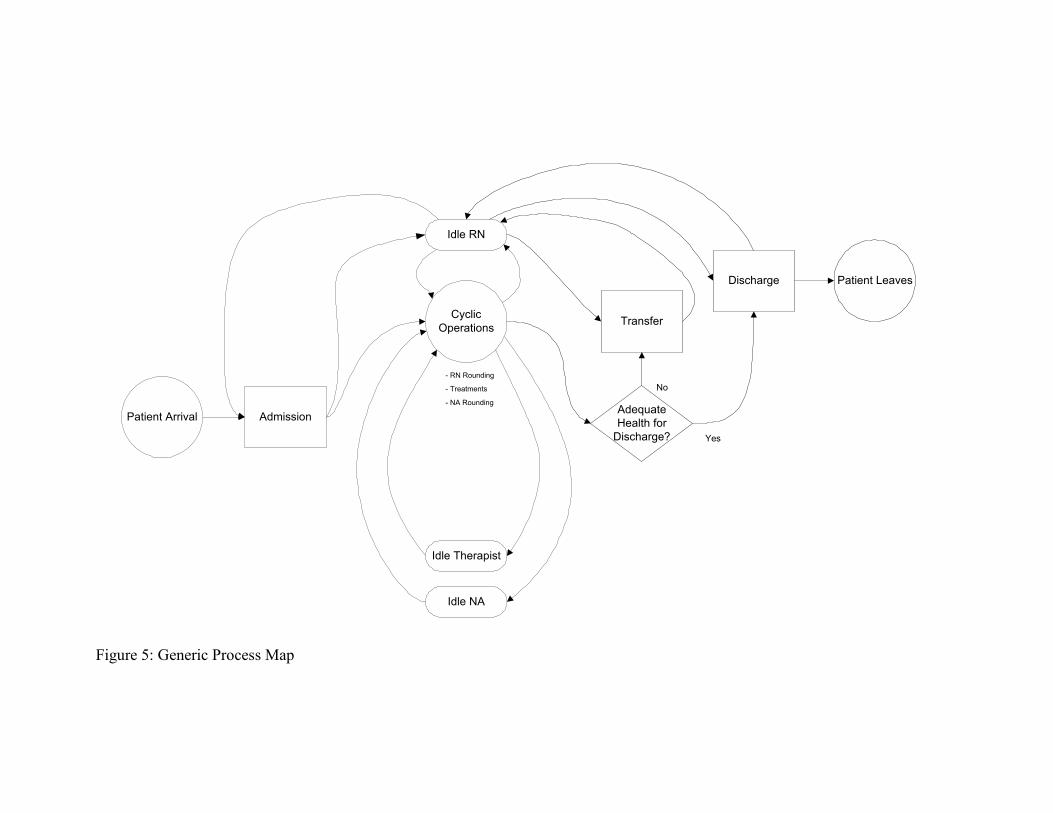
Figure 5: Generic Process Map
Idle AN
Discharge
Transfer
Admission
Cyclic Operations
Adequate Health for
Discharge? Yes
No
Idle RN
Idle Therapist
Idle NA
Patient Leaves
Patient Arrival
- RN Rounding
- Treatments
- NA Rounding
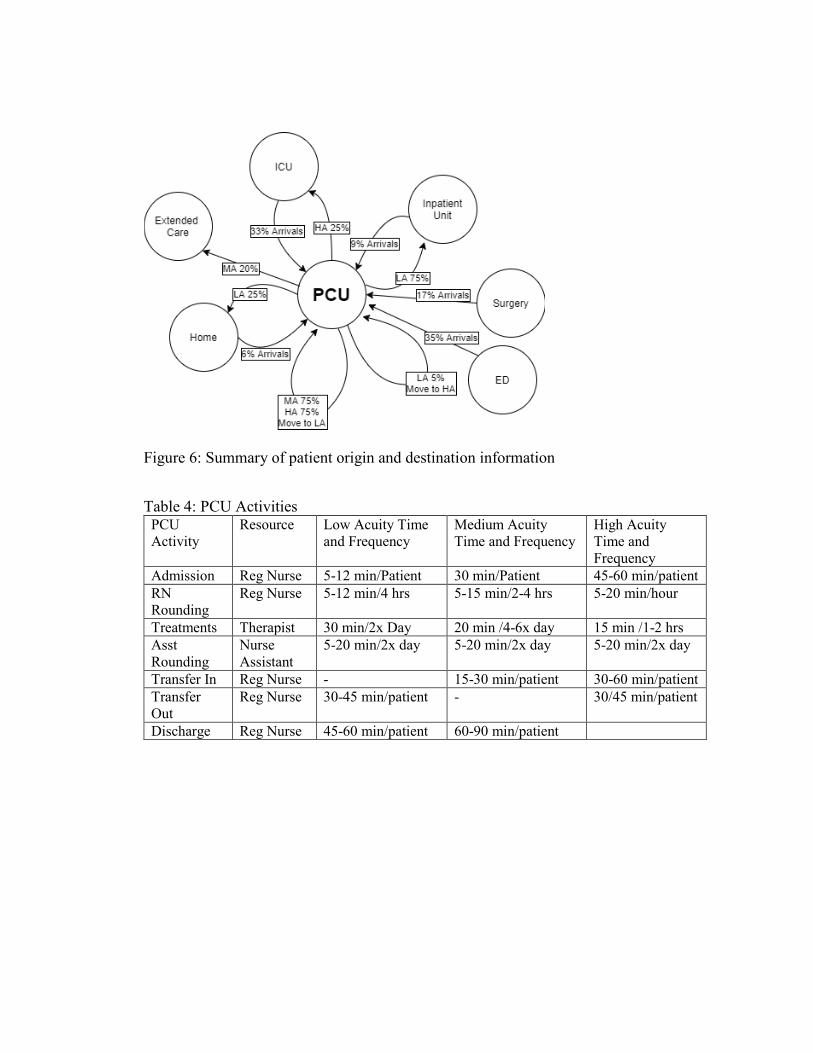
Figure 6: Summary of patient origin and destination information
Table 4: PCU Activities PCU Activity
Resource Low Acuity Time and Frequency
Medium Acuity Time and Frequency
High Acuity Time and Frequency
Admission Reg Nurse 5-12 min/Patient 30 min/Patient 45-60 min/patient RN Rounding
Reg Nurse 5-12 min/4 hrs 5-15 min/2-4 hrs 5-20 min/hour
Treatments Therapist 30 min/2x Day 20 min /4-6x day 15 min /1-2 hrs Asst Rounding
Nurse Assistant
5-20 min/2x day 5-20 min/2x day 5-20 min/2x day
Transfer In Reg Nurse - 15-30 min/patient 30-60 min/patient Transfer Out
Reg Nurse 30-45 min/patient - 30/45 min/patient
Discharge Reg Nurse 45-60 min/patient 60-90 min/patient
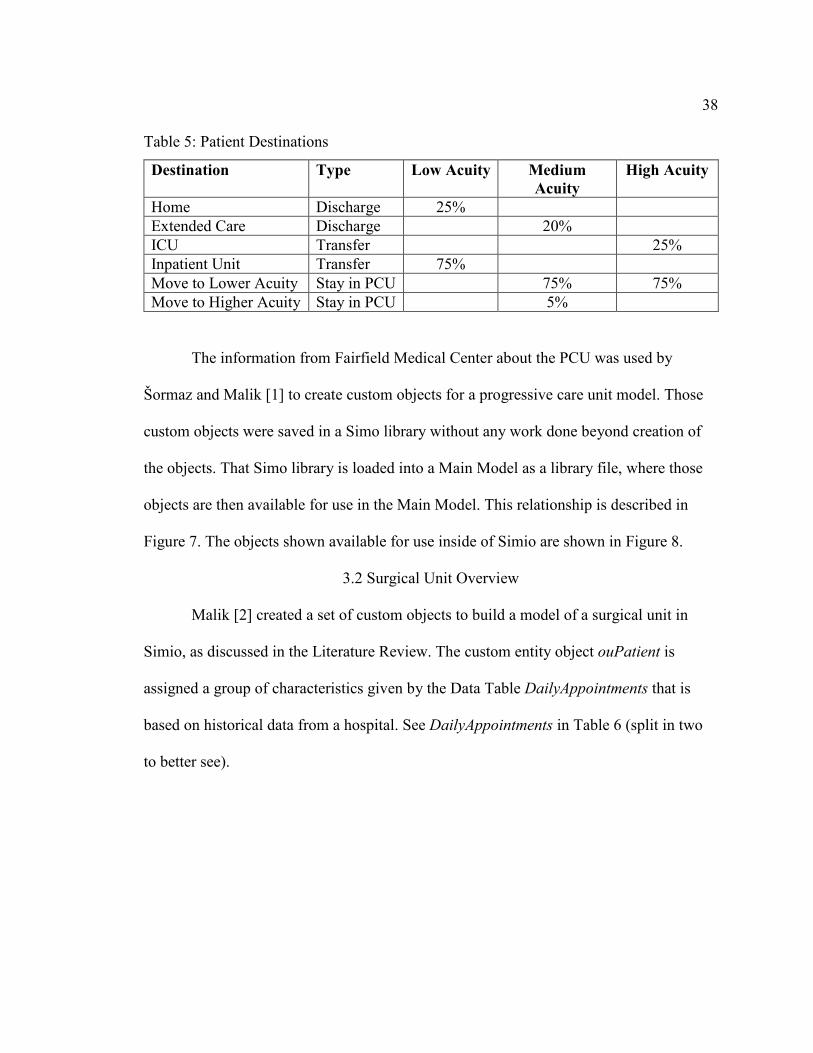
38 Table 5: Patient Destinations
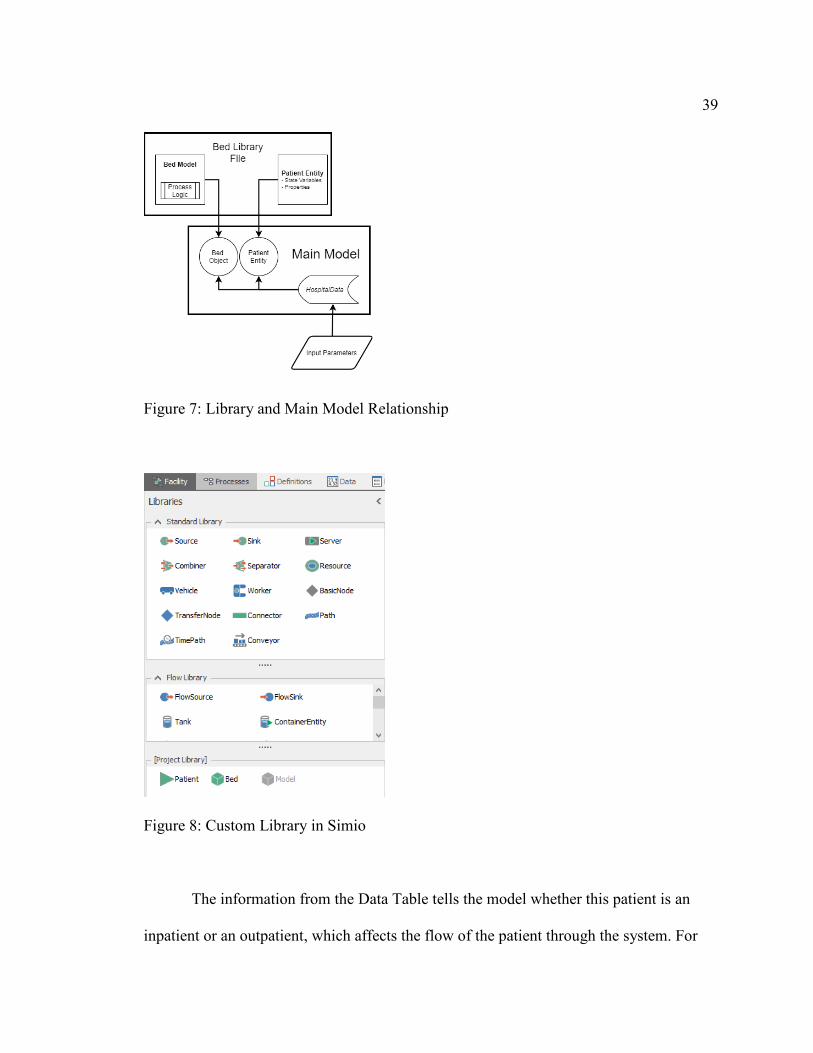
The information from Fairfield Medical Center about the PCU was used by
Šormaz and Malik [1] to create custom objects for a progressive care unit model. Those
custom objects were saved in a Simo library without any work done beyond creation of
the objects. That Simo library is loaded into a Main Model as a library file, where those
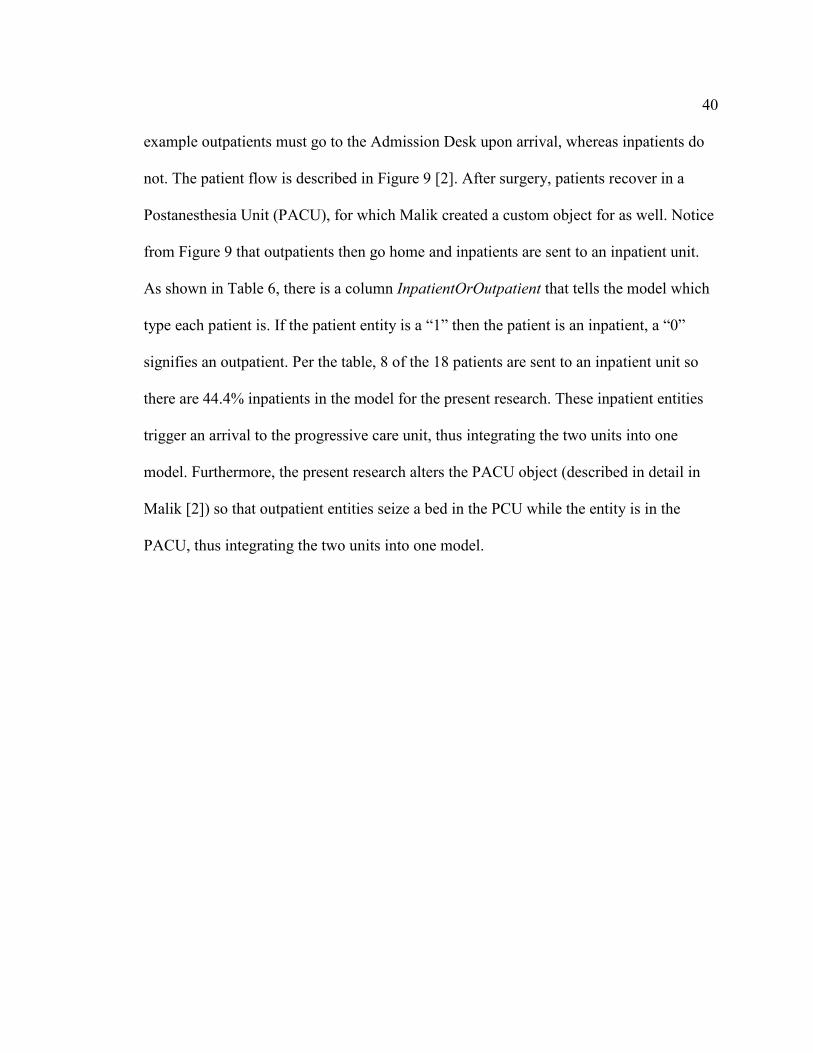
objects are then available for use in the Main Model. This relationship is described in
Figure 7. The objects shown available for use inside of Simio are shown in Figure 8.
3.2 Surgical Unit Overview
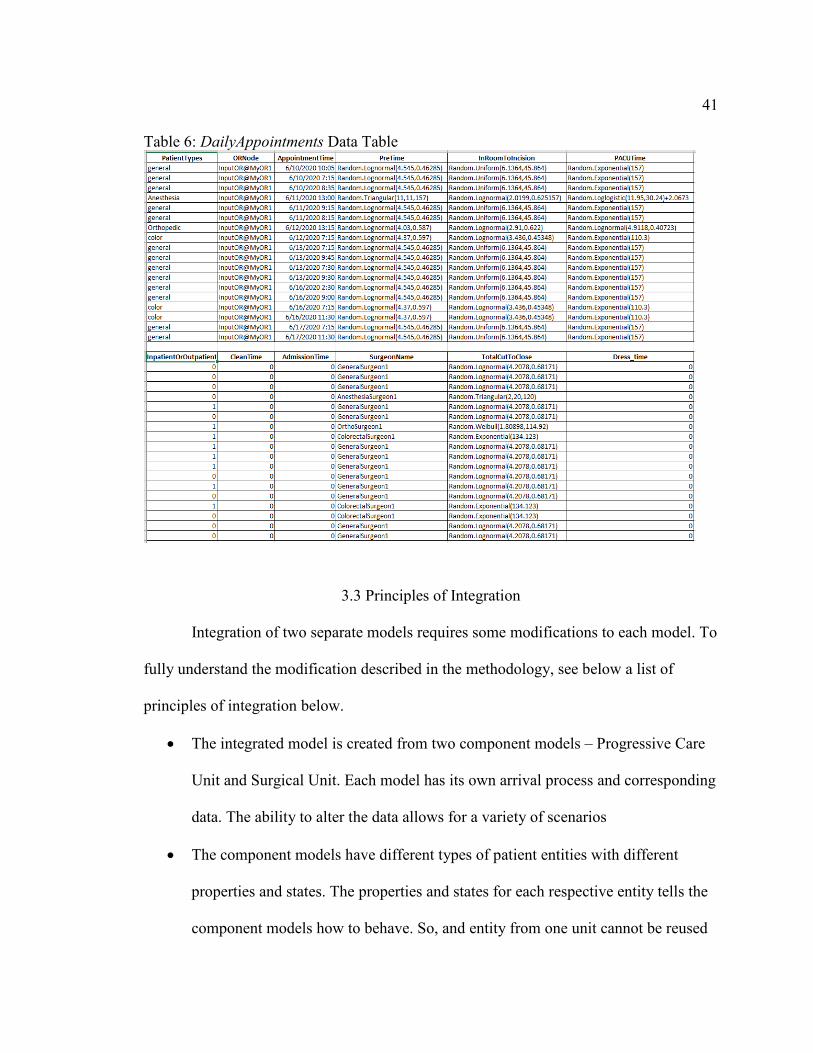
Malik [2] created a set of custom objects to build a model of a surgical unit in
Simio, as discussed in the Literature Review. The custom entity object ouPatient is
assigned a group of characteristics given by the Data Table DailyAppointments that is
based on historical data from a hospital. See DailyAppointments in Table 6 (split in two
to better see).
Destination Type Low Acuity Medium Acuity
High Acuity
Home Discharge 25% Extended Care Discharge 20% ICU Transfer 25% Inpatient Unit Transfer 75% Move to Lower Acuity Stay in PCU 75% 75% Move to Higher Acuity Stay in PCU 5%
39
Figure 7: Library and Main Model Relationship
Figure 8: Custom Library in Simio
The information from the Data Table tells the model whether this patient is an
inpatient or an outpatient, which affects the flow of the patient through the system. For
40 example outpatients must go to the Admission Desk upon arrival, whereas inpatients do
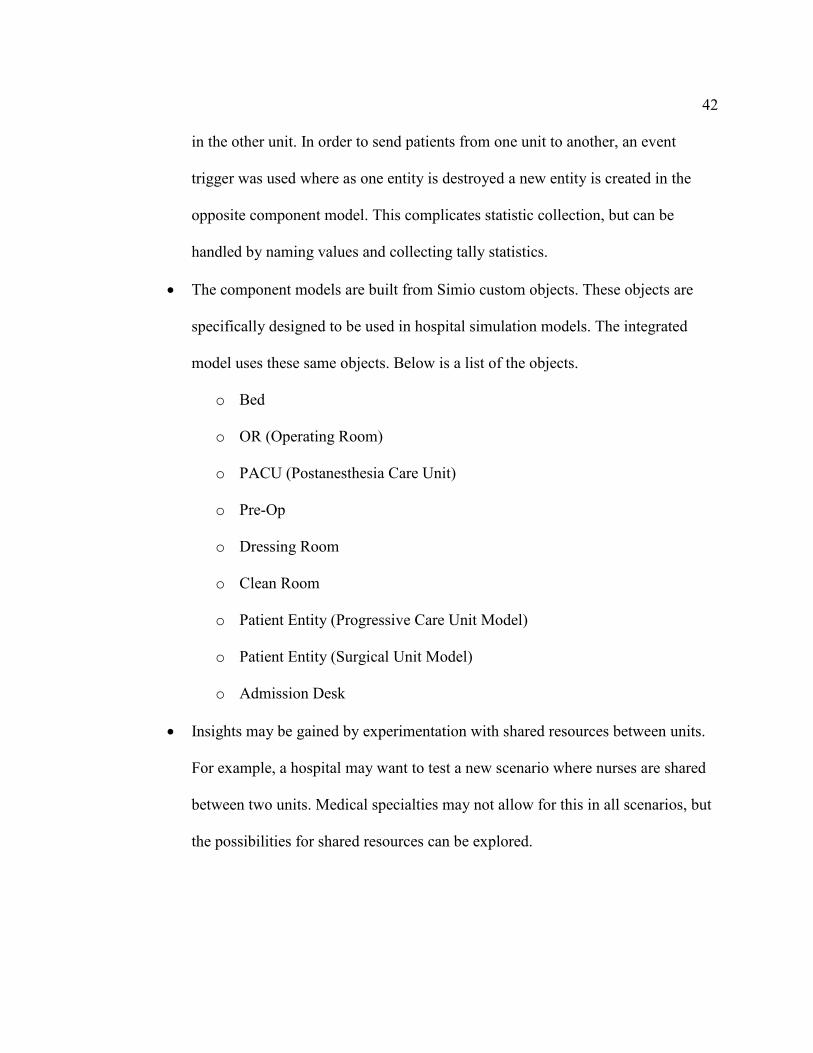
not. The patient flow is described in Figure 9 [2]. After surgery, patients recover in a
Postanesthesia Unit (PACU), for which Malik created a custom object for as well. Notice
from Figure 9 that outpatients then go home and inpatients are sent to an inpatient unit.
As shown in Table 6, there is a column InpatientOrOutpatient that tells the model which
type each patient is. If the patient entity is a “1” then the patient is an inpatient, a “0”
signifies an outpatient. Per the table, 8 of the 18 patients are sent to an inpatient unit so
there are 44.4% inpatients in the model for the present research. These inpatient entities
trigger an arrival to the progressive care unit, thus integrating the two units into one
model. Furthermore, the present research alters the PACU object (described in detail in
Malik [2]) so that outpatient entities seize a bed in the PCU while the entity is in the
PACU, thus integrating the two units into one model.
41 Table 6: DailyAppointments Data Table
3.3 Principles of Integration
Integration of two separate models requires some modifications to each model. To
fully understand the modification described in the methodology, see below a list of
principles of integration below.
• The integrated model is created from two component models – Progressive Care
Unit and Surgical Unit. Each model has its own arrival process and corresponding
data. The ability to alter the data allows for a variety of scenarios
• The component models have different types of patient entities with different
properties and states. The properties and states for each respective entity tells the
component models how to behave. So, and entity from one unit cannot be reused
42
in the other unit. In order to send patients from one unit to another, an event
trigger was used where as one entity is destroyed a new entity is created in the
opposite component model. This complicates statistic collection, but can be
handled by naming values and collecting tally statistics.
• The component models are built from Simio custom objects. These objects are
specifically designed to be used in hospital simulation models. The integrated
model uses these same objects. Below is a list of the objects.
o Bed
o OR (Operating Room)
o PACU (Postanesthesia Care Unit)
o Pre-Op
o Dressing Room
o Clean Room
o Patient Entity (Progressive Care Unit Model)
o Patient Entity (Surgical Unit Model)
o Admission Desk
• Insights may be gained by experimentation with shared resources between units.
For example, a hospital may want to test a new scenario where nurses are shared
between two units. Medical specialties may not allow for this in all scenarios, but
the possibilities for shared resources can be explored.
43
Figure 9: Surgical Unit Patient Flow
44
CHAPTER 4: METHODOLOGY
The objective of the present research is to integrate patient flow between surgical
units and progressive care units, using a multi-unit integrated simulation model. To do
that, this research consists of four parts:
• Testing Custom Bed Object created by Šormaz and Malik
• Enhancing Bed Object and Bed Unit Model
• Modeling of surgical unit and inpatient unit as one integrated simulation model
• Experiments to improve patient flow in an integrated simulation model
4.1 Testing Bed Object
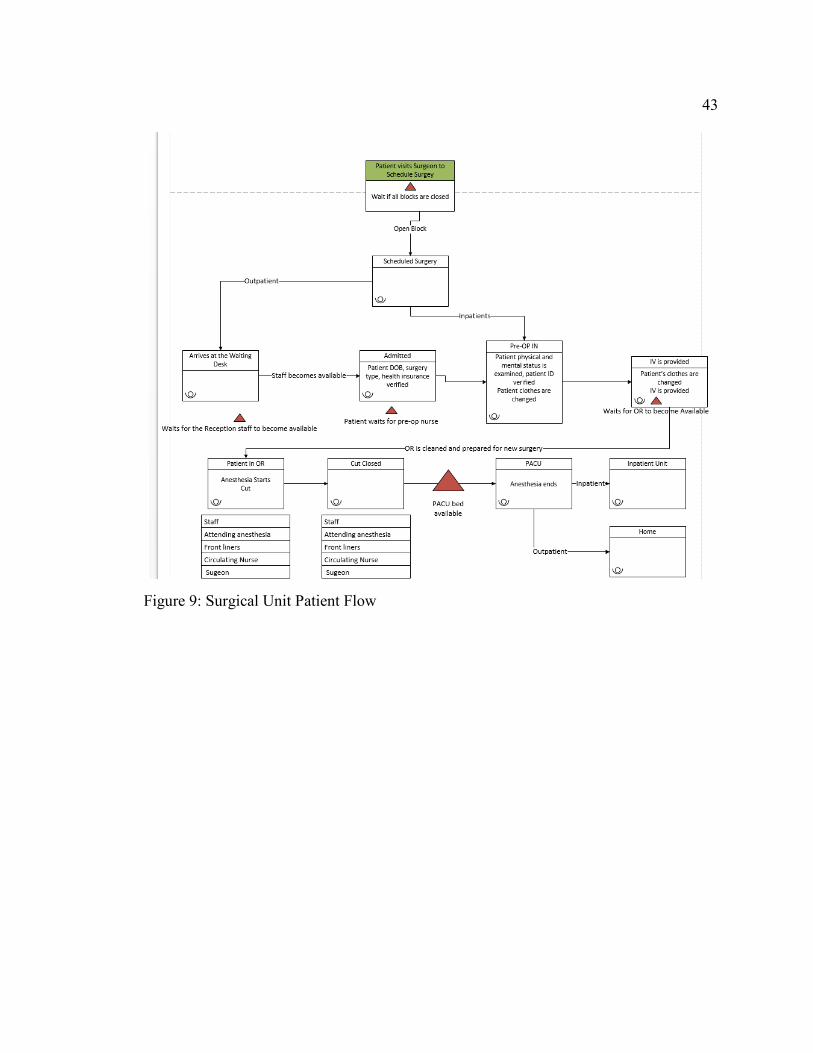
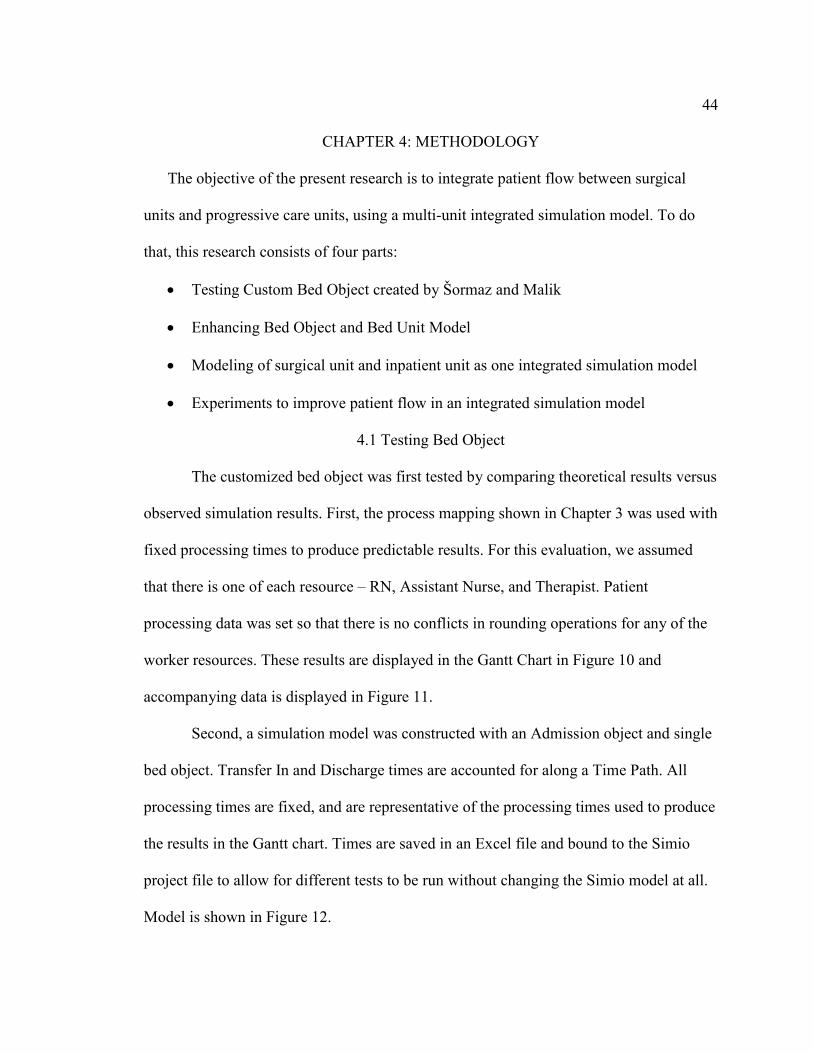
The customized bed object was first tested by comparing theoretical results versus
observed simulation results. First, the process mapping shown in Chapter 3 was used with
fixed processing times to produce predictable results. For this evaluation, we assumed
that there is one of each resource – RN, Assistant Nurse, and Therapist. Patient
processing data was set so that there is no conflicts in rounding operations for any of the
worker resources. These results are displayed in the Gantt Chart in Figure 10 and
accompanying data is displayed in Figure 11.
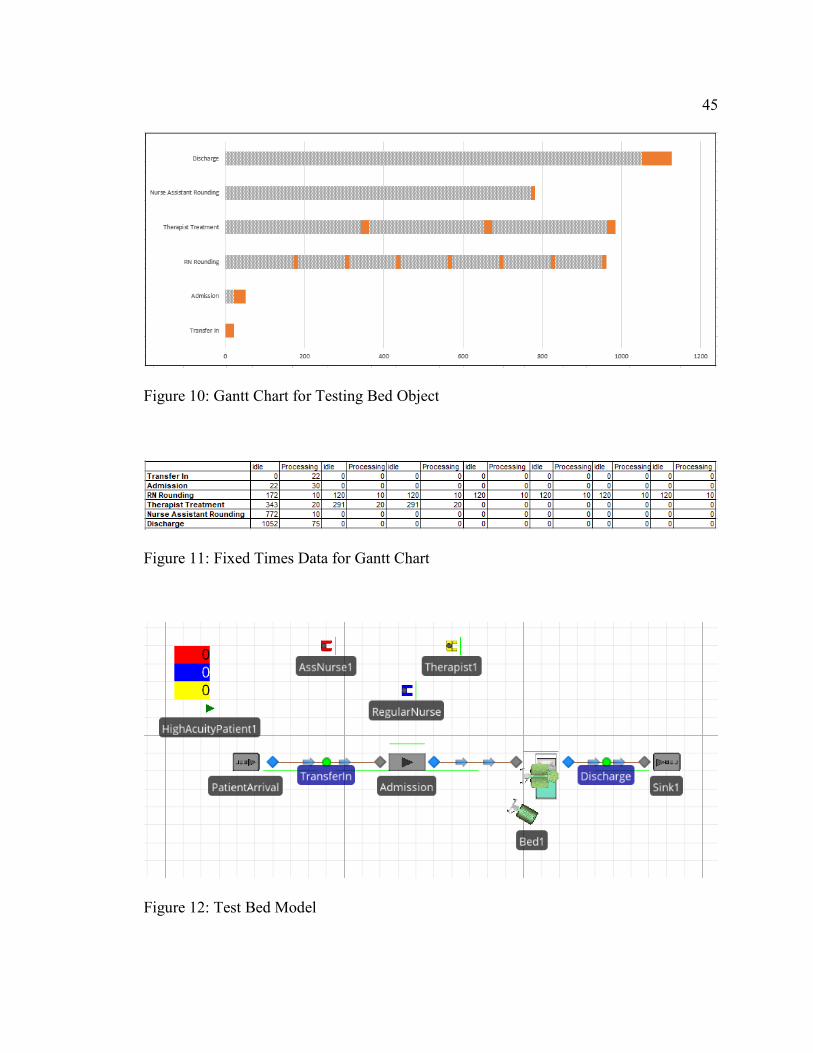
Second, a simulation model was constructed with an Admission object and single
bed object. Transfer In and Discharge times are accounted for along a Time Path. All
processing times are fixed, and are representative of the processing times used to produce
the results in the Gantt chart. Times are saved in an Excel file and bound to the Simio
project file to allow for different tests to be run without changing the Simio model at all.
Model is shown in Figure 12.
45
Figure 10: Gantt Chart for Testing Bed Object
Figure 11: Fixed Times Data for Gantt Chart
Figure 12: Test Bed Model
46
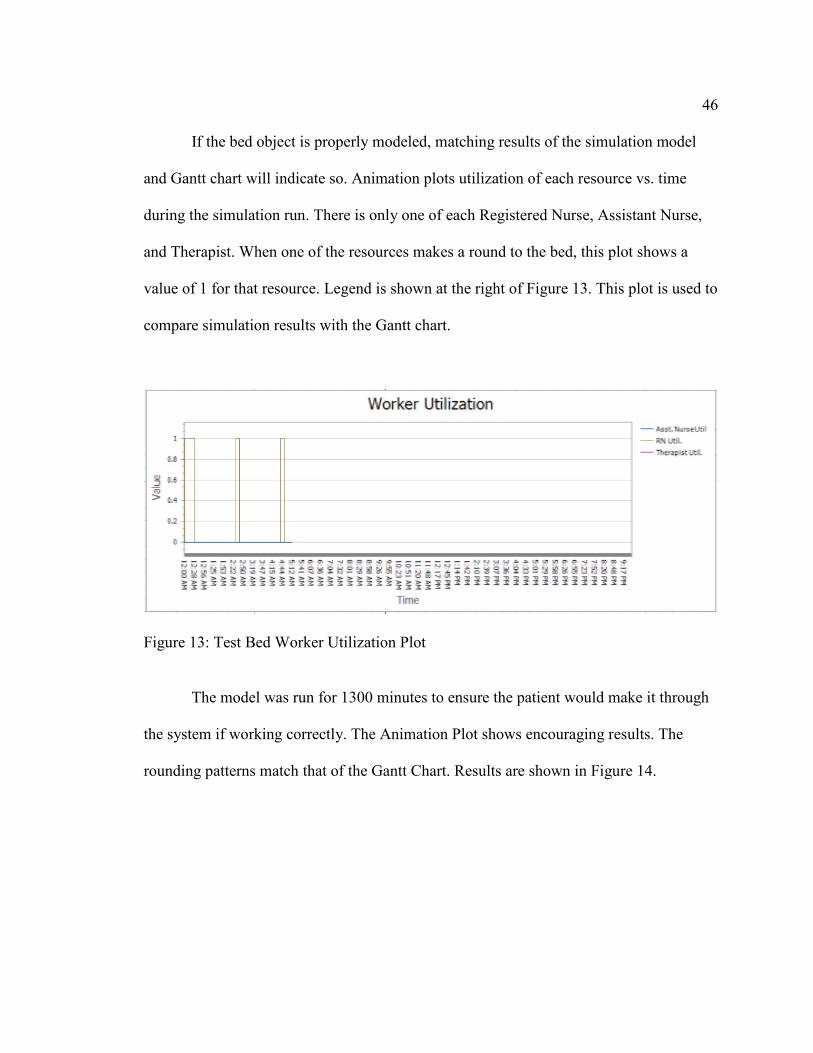
If the bed object is properly modeled, matching results of the simulation model
and Gantt chart will indicate so. Animation plots utilization of each resource vs. time
during the simulation run. There is only one of each Registered Nurse, Assistant Nurse,
and Therapist. When one of the resources makes a round to the bed, this plot shows a
value of 1 for that resource. Legend is shown at the right of Figure 13. This plot is used to
compare simulation results with the Gantt chart.
Figure 13: Test Bed Worker Utilization Plot
The model was run for 1300 minutes to ensure the patient would make it through
the system if working correctly. The Animation Plot shows encouraging results. The
rounding patterns match that of the Gantt Chart. Results are shown in Figure 14.
47
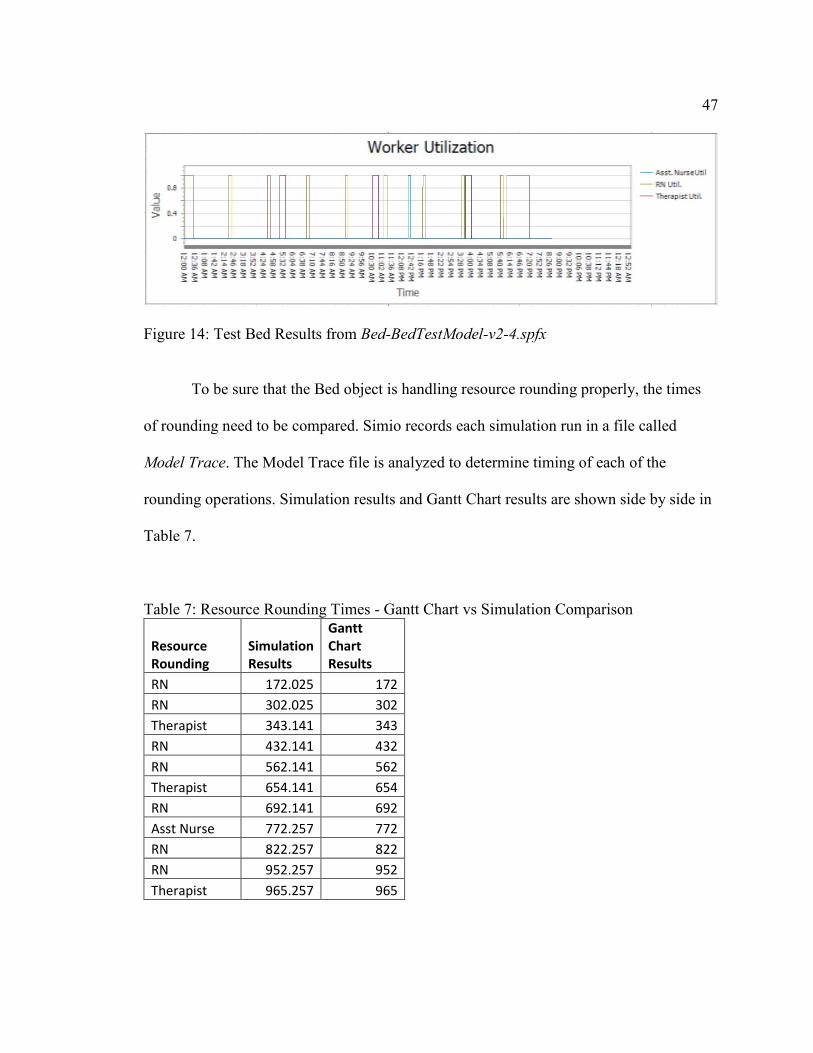
Figure 14: Test Bed Results from Bed-BedTestModel-v2-4.spfx
To be sure that the Bed object is handling resource rounding properly, the times
of rounding need to be compared. Simio records each simulation run in a file called
Model Trace. The Model Trace file is analyzed to determine timing of each of the
rounding operations. Simulation results and Gantt Chart results are shown side by side in
Table 7.
Table 7: Resource Rounding Times - Gantt Chart vs Simulation Comparison
Resource Rounding
Simulation Results
Gantt Chart Results
RN 172.025 172 RN 302.025 302 Therapist 343.141 343 RN 432.141 432 RN 562.141 562 Therapist 654.141 654 RN 692.141 692 Asst Nurse 772.257 772 RN 822.257 822 RN 952.257 952 Therapist 965.257 965
48 From these results we can confirm that the Bed object is correctly scheduling and
executing resource rounding processes. Any differences can be attributed to delays
caused by worker travel time. This is true for when there is no conflicts in rounding. That
is, no two resources are ever are scheduled to make rounds to the patient at the same
time.
4.2 Enhancing Bed Unit Model
The Custom Bed Object was not originally designed to handle instances where
there is a conflict with rounding operations. Furthermore, scheduling is thrown off when
a patient entity has to wait to seize a worker resource (nurses, therapists). Another
complication comes from scenarios where patient acuity changes during their stay. From
previous works with Fairfield Medical Center we know that there are cases where
patients change in acuity while they stay in the bed (See Table 5). So, the current research
introduces logic to change the acuity of the patient. Finally, the current research includes
routing logic to handle how patients leave the bed unit - either by transferring out of the
unit to another area of the hospital or by discharge.
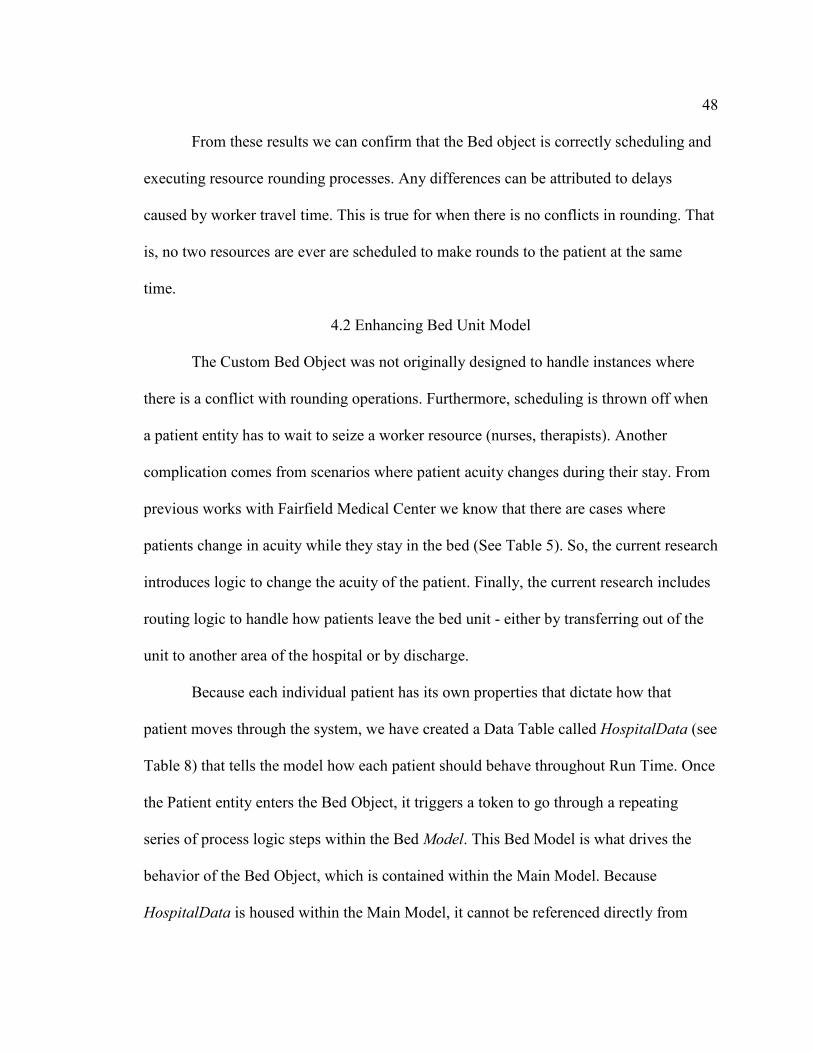
Because each individual patient has its own properties that dictate how that
patient moves through the system, we have created a Data Table called HospitalData (see
Table 8) that tells the model how each patient should behave throughout Run Time. Once
the Patient entity enters the Bed Object, it triggers a token to go through a repeating
series of process logic steps within the Bed Model. This Bed Model is what drives the
behavior of the Bed Object, which is contained within the Main Model. Because
HospitalData is housed within the Main Model, it cannot be referenced directly from
49 within the Bed Model. Therefore, a mechanism must be in place to pass data from
HospitalData to the patient and then into the Bed Model. This is done using Patient
Properties and State Variables. Patient Properties and State Variables are defined within
the Patient object. The properties pull data from a Data Table called HospitalData. This
is shown in Figure 15.
Figure 15: Patient Properties
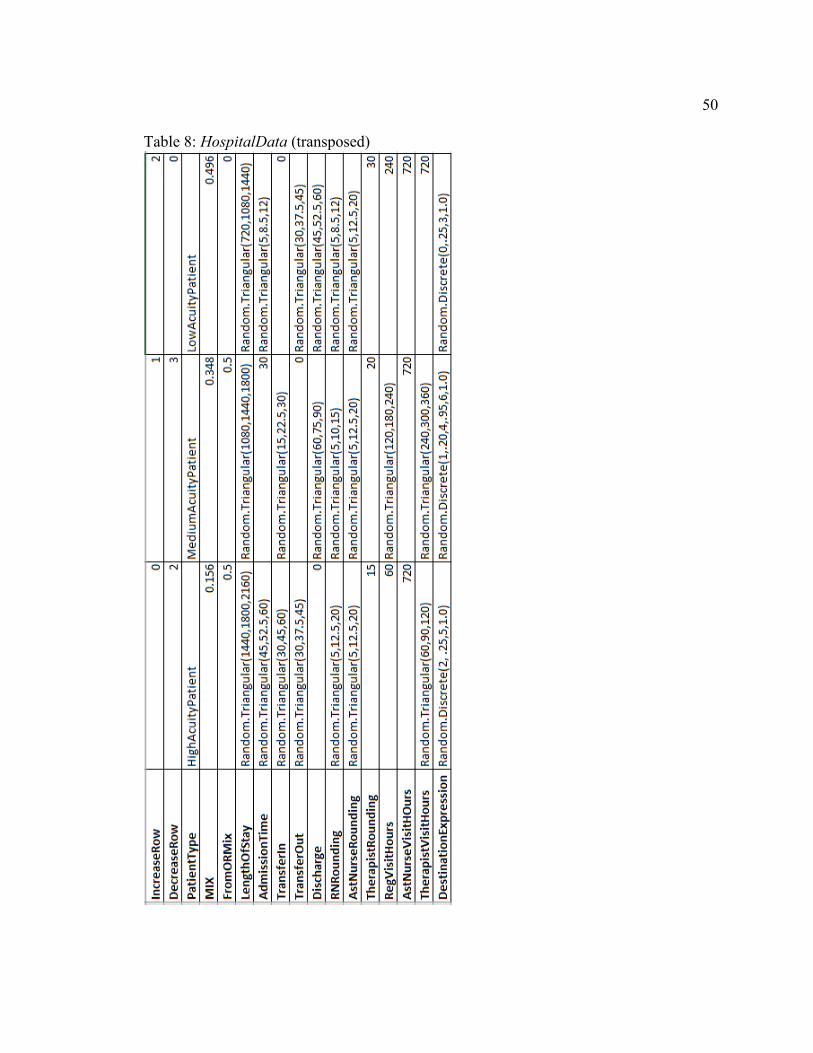
50 Table 8: HospitalData (transposed)
51
The Patient Properties are all of type “Expression Property” so that each time they
are referenced, they will pull a new value from HospitalData. This is necessary because
not all the values in HospitalData are discrete. Rather, they are taken from a probability
distribution and therefore could change each time a given field is referenced in
HospitalData. So, the purpose of the relationship between Data Table Patient
Properties is to make this calculation whenever a Patient Property is referenced within the
Bed Object. This happens when assigning values to Patient State Variables. For example,
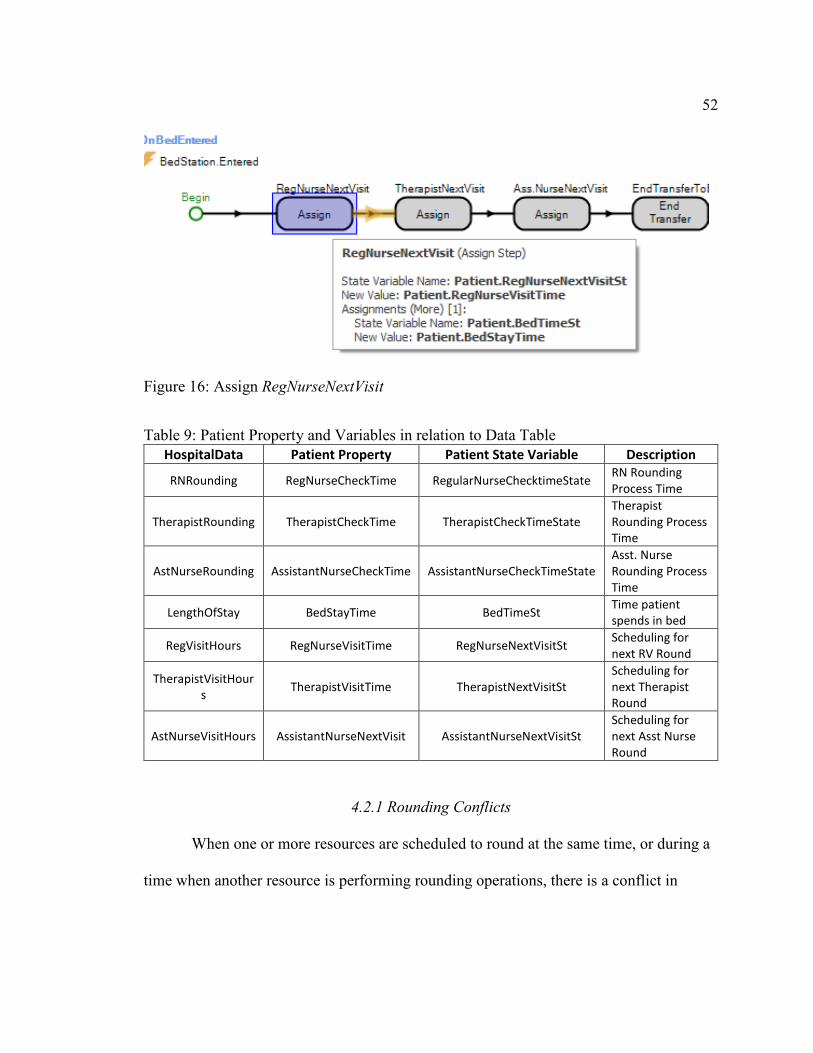
several assignments are made as soon as a patient enters the Bed Object. See Figure 16
below that shows RegNurseNextVisit, TherapistNextVisit, and Ass.NurseNextVisit
assignments. This schedules the worker resource rounding operations in the future of the
Run Time. Figure 16 also shows the assignment within the RegNurseNextVisit Step.
What is not shown is the passing of data from HospitalData
Patient.RegNurseVisitTime, but this happens each time Patient.RegNurseVisitTime is
called upon in the Bed Model process logic. So, Patient.RegNurseVisitTime takes a value
from a statistical distribution and then passes that value on to the State Variable
Patient.RegNurseNextVisitSt. That value stays with that State Variable until another
assignment is made for that variable. Table 9 below shows the relationships between the
Data Table Patient Properties Patient State Variables.
52
Figure 16: Assign RegNurseNextVisit
Table 9: Patient Property and Variables in relation to Data Table HospitalData Patient Property Patient State Variable Description
RNRounding RegNurseCheckTime RegularNurseChecktimeState RN Rounding Process Time
TherapistRounding TherapistCheckTime TherapistCheckTimeState Therapist Rounding Process Time
AstNurseRounding AssistantNurseCheckTime AssistantNurseCheckTimeState Asst. Nurse Rounding Process Time
LengthOfStay BedStayTime BedTimeSt Time patient spends in bed
RegVisitHours RegNurseVisitTime RegNurseNextVisitSt Scheduling for next RV Round
TherapistVisitHours TherapistVisitTime TherapistNextVisitSt
Scheduling for next Therapist Round
AstNurseVisitHours AssistantNurseNextVisit AssistantNurseNextVisitSt Scheduling for next Asst Nurse Round
4.2.1 Rounding Conflicts
When one or more resources are scheduled to round at the same time, or during a
time when another resource is performing rounding operations, there is a conflict in
53 timing. Using the same model that was used to validate the bed object in Section 4.1, the
methods described in this section improve the logic to handle resource rounding conflicts.
To handle conflicts several different state variables are used in conjunction to
keep track of timing. There is a detailed explanation later in this section, but for now
understand that there must be a variable assigned to each rounding process that keeps
track of the “time until” that particular rounding process. So, we created a patient state
variable for each rounding process in the format Patient.(Resource)TimeUntil (where
“Resource” can be either RN, Assistant Nurse, or Therapist). In the original Bed Model,
Patient.(Resource)NextVisit state variable was created to schedule each subsequent
rounding process for each resource type. This State Variable is used again, but
calculations are altered. These variables are initially assigned the same value when the
patient first enters the Bed, during the OnBedEntered process. While
Patient.(Resource)NextVisit will continually increase to schedule the rounding processes
as Run Time increases, Patient.(Resource)TimeUntil is reset after each resource
completes its rounding. To illustrate this scenario, the following description will focus on
RN Rounding. These assignments for RN shown below in Figure 17 & Figure 18.
54
Figure 17: Assign Patient.RegNursNextVisitSt
Figure 18: Assign Patient.RNTimeUntilState
Figure 19 shows the entire OnBedEntered Process. After
Patient.RNTimeUntilState is assigned. The process has been split and rearranged so that it
can fit onto this page. For sake of example let us say RN Rounding is the most frequent.
Because of this it occurs first and the token follows logic to the Execute Step
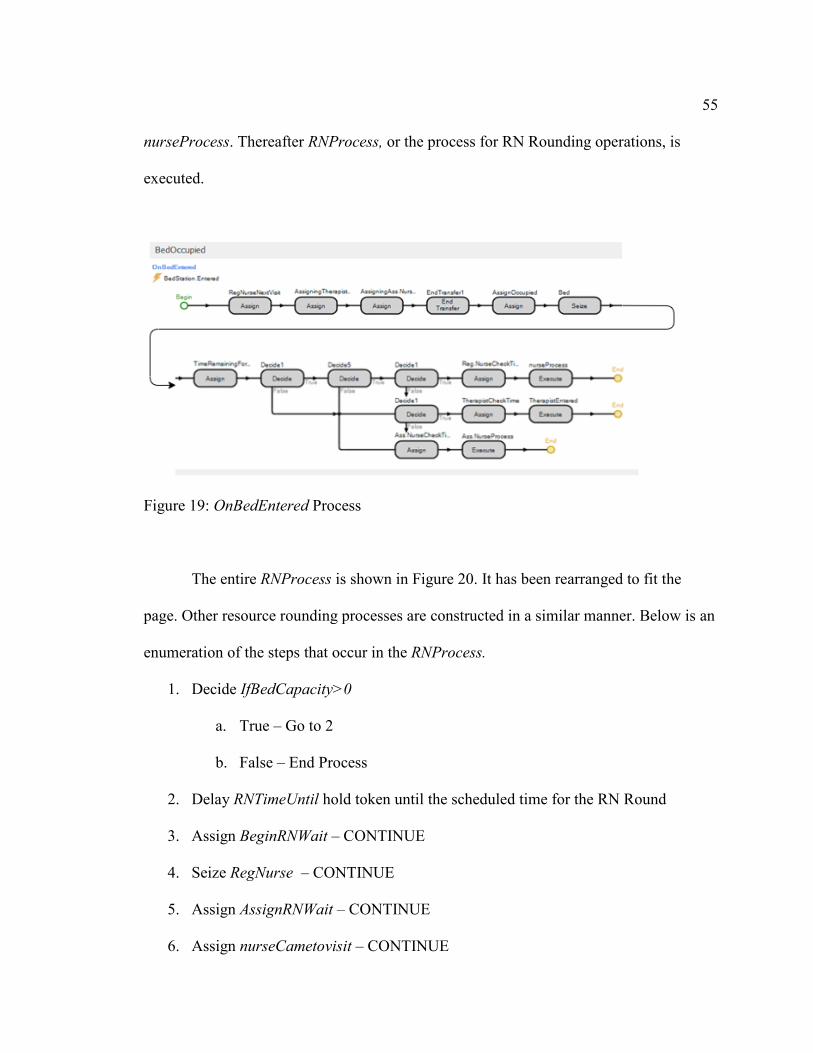
55 nurseProcess. Thereafter RNProcess, or the process for RN Rounding operations, is
executed.
Figure 19: OnBedEntered Process
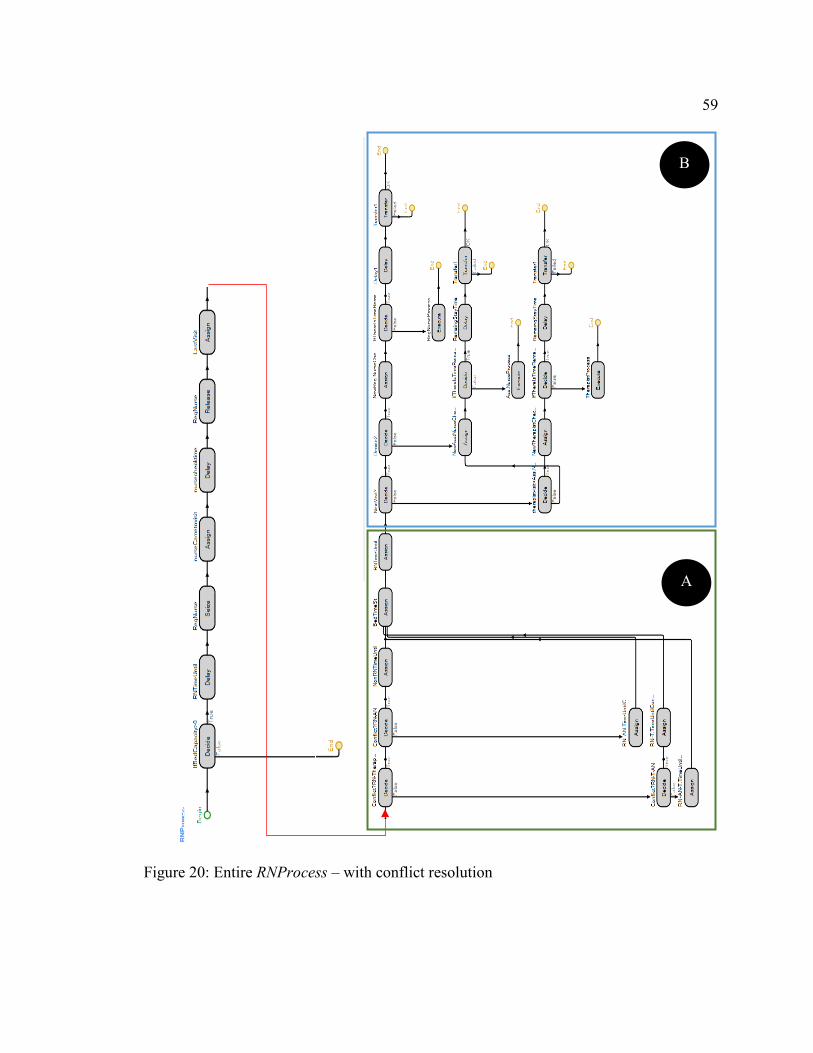
The entire RNProcess is shown in Figure 20. It has been rearranged to fit the
page. Other resource rounding processes are constructed in a similar manner. Below is an
enumeration of the steps that occur in the RNProcess.
1. Decide IfBedCapacity>0
a. True – Go to 2
b. False – End Process
2. Delay RNTimeUntil hold token until the scheduled time for the RN Round
3. Assign BeginRNWait – CONTINUE
4. Seize RegNurse – CONTINUE
5. Assign AssignRNWait – CONTINUE
6. Assign nurseCametovisit – CONTINUE
56
7. Delay nursechecktime – CONTINUE
8. Release RegNurse – CONTINUE
9. Assign LastVisit – CONTINUE
10. Decide Conflict?RN-Therapist
a. True – Go to 11
b. False – Go to 12
11. Decide Conflict?RN-AN
a. True – Go to 13
b. False – Go to 14
12. Decide Conflict?RN-T-AN
a. True – Go to 15
b. False – Go to 16
13. Assign NonRNTimeUntil
a. Go to 17
14. Assign RN-AN.TimeUntilConflict
a. Go to 17
15. Assign RN-T.TimeUntilConflict
a. Go to 17
16. Assign RN-AN-T.TimeUntilConflict
a. Go to 17
17. Assign BedTimeSt
18. Assign RNTimeUntil

57
19. Assign ResetWaitTime
20. Decide NextVisit?
a. True – Go to 21
b. False – Go to 22
21. Decide Decide2
a. True – Go to 23
b. False – Go to 24
22. Decide therapistvisit<Ass.NurseVisit
a. True – Go to 25
b. False – Go to 24
23. Assign NewReg.NurseCheckTime
a. Go to 26
24. Assign NewAssNurseCheckTime
a. Go to 27
25. Assign NewTherapistCheckTime
a. Go to 28
26. Decide IfThereIsTimeRemaining (if no time, follows true branch)
a. True – Go to 32
b. False – Go to 29
27. Decide IfThereIsTimeRemaining (if no time, follows true branch)
a. True – Go to 32
b. False – Go to 30
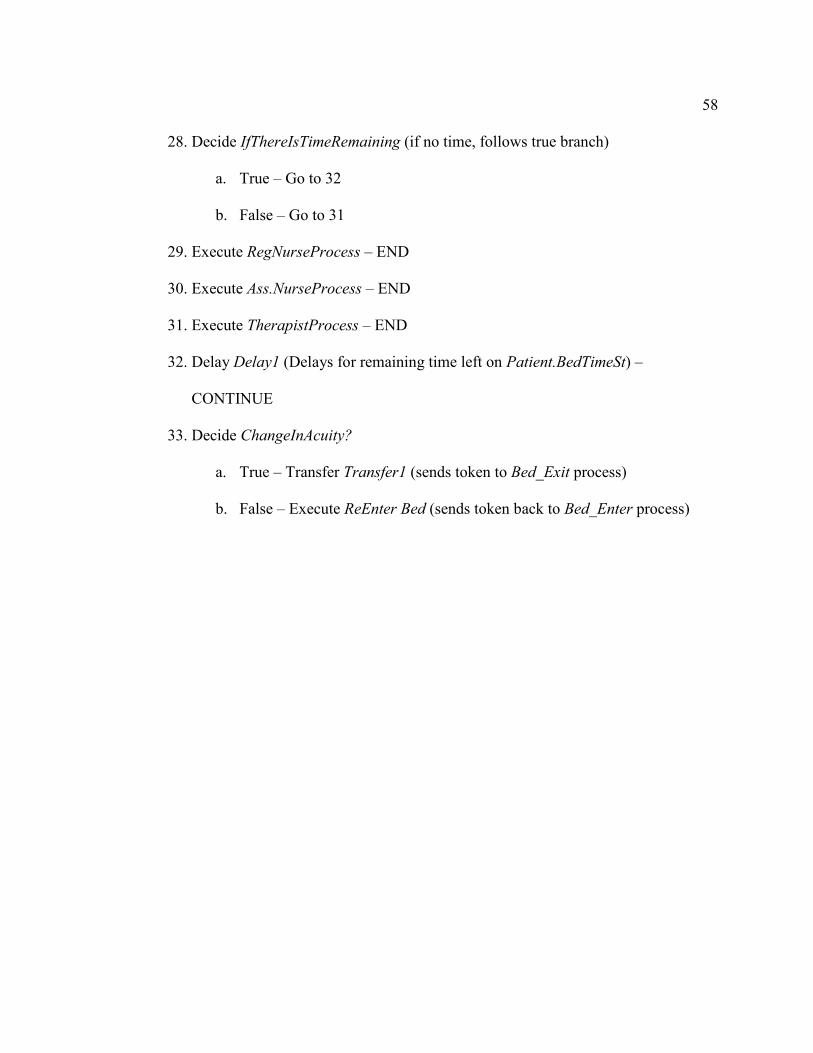
58
28. Decide IfThereIsTimeRemaining (if no time, follows true branch)
a. True – Go to 32
b. False – Go to 31
29. Execute RegNurseProcess – END
30. Execute Ass.NurseProcess – END
31. Execute TherapistProcess – END
32. Delay Delay1 (Delays for remaining time left on Patient.BedTimeSt) –
CONTINUE
33. Decide ChangeInAcuity?
a. True – Transfer Transfer1 (sends token to Bed_Exit process)
b. False – Execute ReEnter Bed (sends token back to Bed_Enter process)
59
Figure 20: Entire RNProcess – with conflict resolution
A
B
60
The token arrives at RNProcess and first goes through the Decide Step
IfBedCapacity>0. This is simply a just in case measure, for an instance where this
process is triggered without a patient at the Bed object. This branching has not been
observed in any trial runs.
From there the token enters the Delay Step RNTimeUntil. Here, the token is held
as the Run Time advances for the amount of time held in the variable
Patient.RNTimeUntilState. From the data and previously described assignments, we
know that this value is 120. So the token is held here for 120 minutes until it is time for
the RN to make a round to the patient. Then the RN is seized at the RegNurse Seize Step,
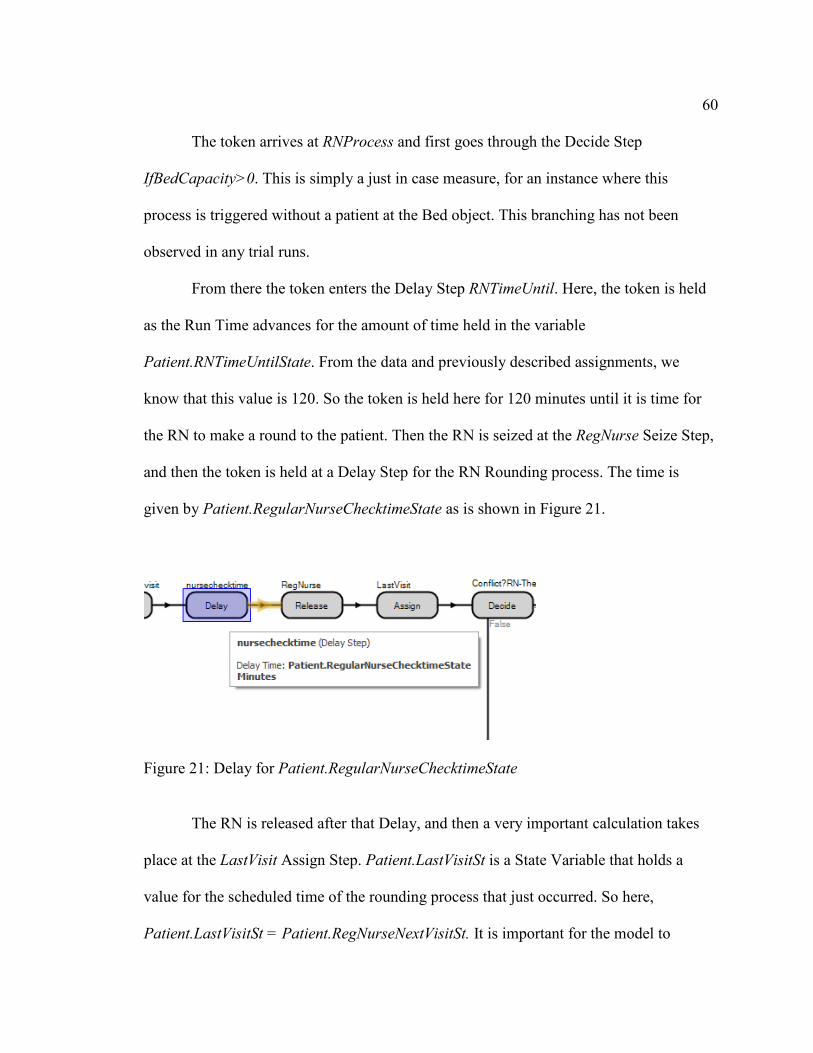
and then the token is held at a Delay Step for the RN Rounding process. The time is
given by Patient.RegularNurseChecktimeState as is shown in Figure 21.
Figure 21: Delay for Patient.RegularNurseChecktimeState
The RN is released after that Delay, and then a very important calculation takes
place at the LastVisit Assign Step. Patient.LastVisitSt is a State Variable that holds a
value for the scheduled time of the rounding process that just occurred. So here,
Patient.LastVisitSt = Patient.RegNurseNextVisitSt. It is important for the model to
61 remember this value, because Patient.RegNurseNextVisitSt is subsequently reassigned to
schedule the following rounding process for RN.
After the LastVisit Assign Step, the token enters a group of logic steps that does
most of the resource rounding logical conflict resolution. This group is in the “A” box in
Figure 20. First, it must be decided if there was a conflict. Second, appropriate
assignments to variables have to be made for each specific scenario. The following
paragraphs discuss how this works.
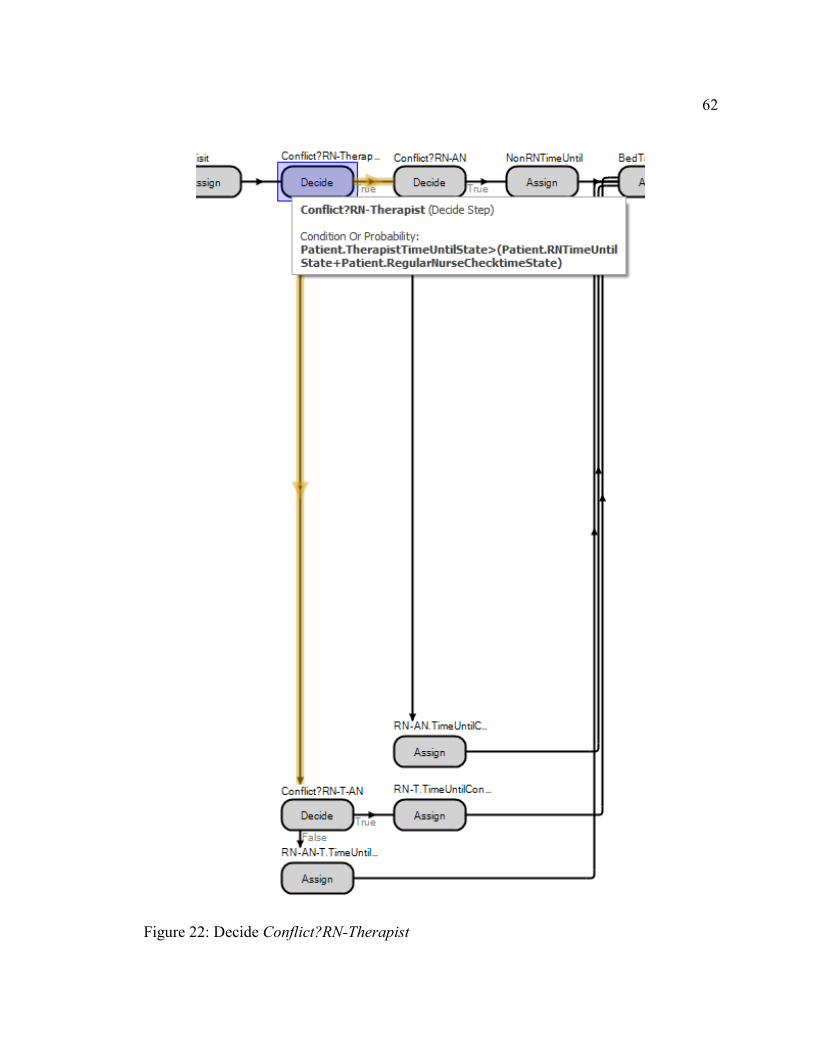
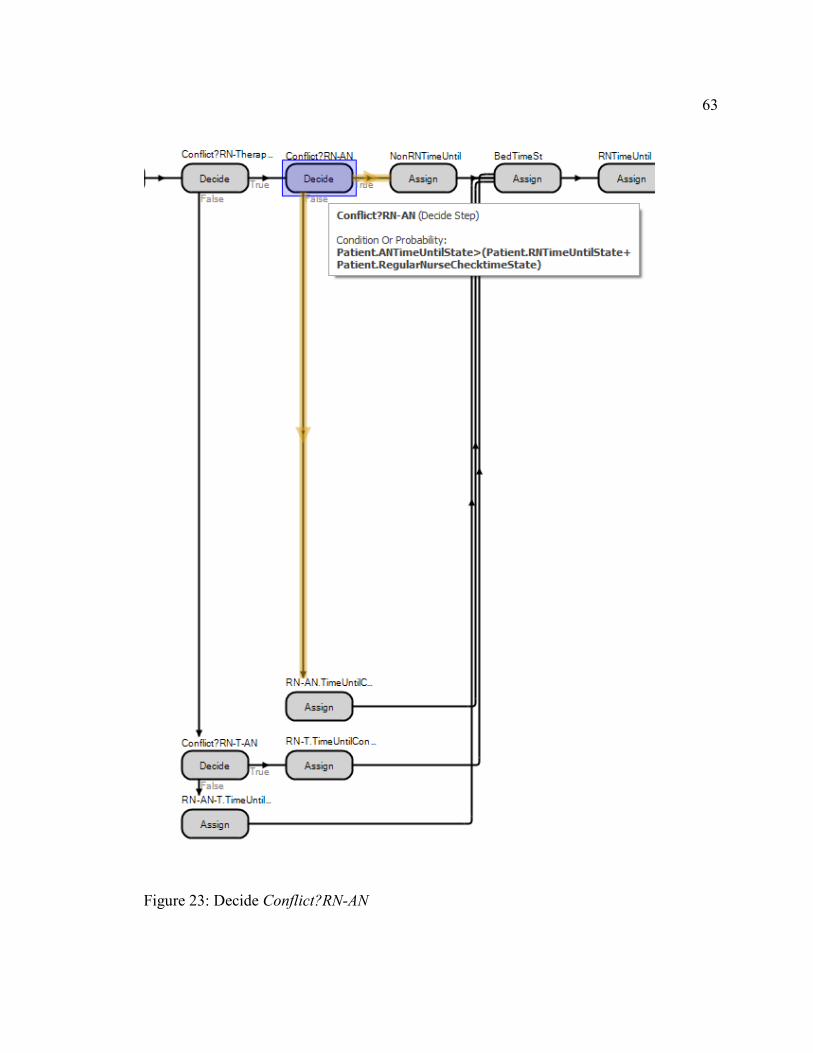
First, the token comes to Decide Conflict?RN-Therapist. This step is to decide
whether or not a Therapist round was scheduled to occur during the time in which the
token has spent in the RNProcess. In the current figuration, this can be determined by the
condition shown in Figure 22. If True, there is no conflict and the token moves on to the
next Decide Step Conflict?RN-AN that is to decide whether or not an Assistant Nurse
round was scheduled to occur during the time in which the token has spent in the
RNProcess. Like the previous Decide Step, this can be determined by the condition
shown in Figure 23. In summary, if the TimeUntil of a certain non-current rounding
process is greater than both the value for TimeUntil given unto the current rounding
process AND the processing time for that current rounding process, then there is no
conflict in rounding.
62
Figure 22: Decide Conflict?RN-Therapist
63
Figure 23: Decide Conflict?RN-AN
64
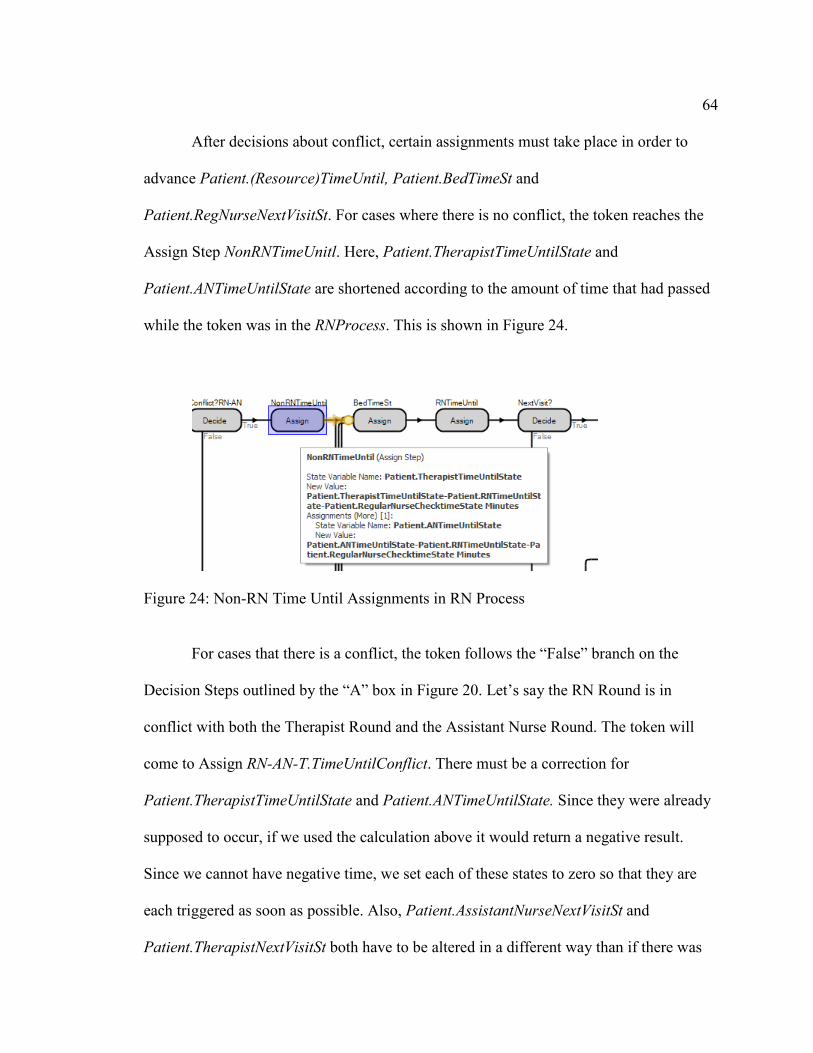
After decisions about conflict, certain assignments must take place in order to
advance Patient.(Resource)TimeUntil, Patient.BedTimeSt and
Patient.RegNurseNextVisitSt. For cases where there is no conflict, the token reaches the
Assign Step NonRNTimeUnitl. Here, Patient.TherapistTimeUntilState and
Patient.ANTimeUntilState are shortened according to the amount of time that had passed
while the token was in the RNProcess. This is shown in Figure 24.
Figure 24: Non-RN Time Until Assignments in RN Process
For cases that there is a conflict, the token follows the “False” branch on the
Decision Steps outlined by the “A” box in Figure 20. Let’s say the RN Round is in
conflict with both the Therapist Round and the Assistant Nurse Round. The token will
come to Assign RN-AN-T.TimeUntilConflict. There must be a correction for
Patient.TherapistTimeUntilState and Patient.ANTimeUntilState. Since they were already
supposed to occur, if we used the calculation above it would return a negative result.
Since we cannot have negative time, we set each of these states to zero so that they are
each triggered as soon as possible. Also, Patient.AssistantNurseNextVisitSt and
Patient.TherapistNextVisitSt both have to be altered in a different way than if there was
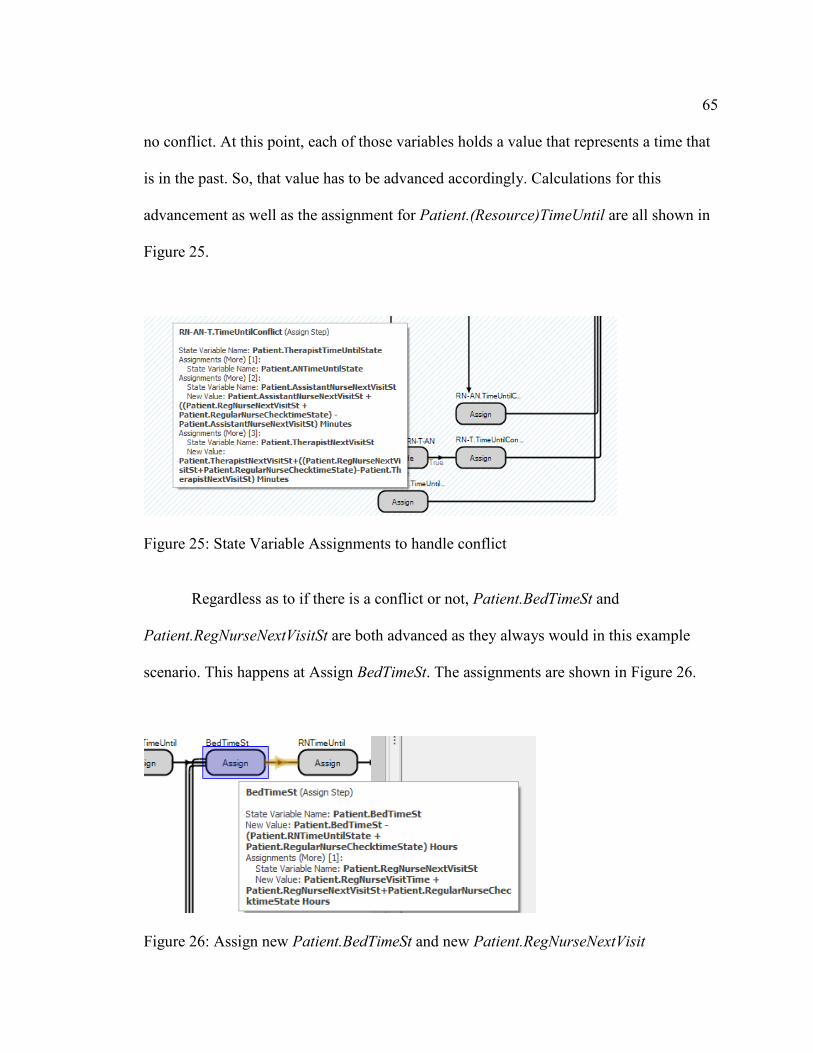
65 no conflict. At this point, each of those variables holds a value that represents a time that
is in the past. So, that value has to be advanced accordingly. Calculations for this
advancement as well as the assignment for Patient.(Resource)TimeUntil are all shown in
Figure 25.
Figure 25: State Variable Assignments to handle conflict
Regardless as to if there is a conflict or not, Patient.BedTimeSt and
Patient.RegNurseNextVisitSt are both advanced as they always would in this example
scenario. This happens at Assign BedTimeSt. The assignments are shown in Figure 26.
Figure 26: Assign new Patient.BedTimeSt and new Patient.RegNurseNextVisit
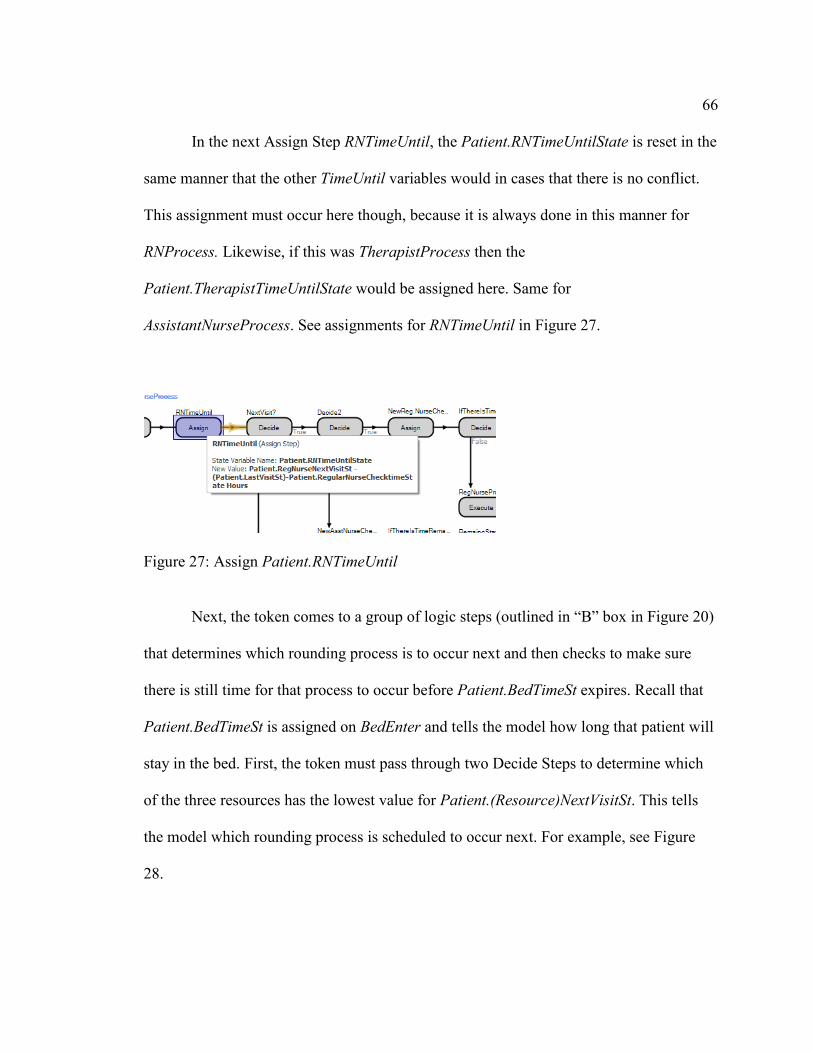
66 In the next Assign Step RNTimeUntil, the Patient.RNTimeUntilState is reset in the
same manner that the other TimeUntil variables would in cases that there is no conflict.
This assignment must occur here though, because it is always done in this manner for
RNProcess. Likewise, if this was TherapistProcess then the
Patient.TherapistTimeUntilState would be assigned here. Same for
AssistantNurseProcess. See assignments for RNTimeUntil in Figure 27.
Figure 27: Assign Patient.RNTimeUntil
Next, the token comes to a group of logic steps (outlined in “B” box in Figure 20)
that determines which rounding process is to occur next and then checks to make sure
there is still time for that process to occur before Patient.BedTimeSt expires. Recall that
Patient.BedTimeSt is assigned on BedEnter and tells the model how long that patient will
stay in the bed. First, the token must pass through two Decide Steps to determine which
of the three resources has the lowest value for Patient.(Resource)NextVisitSt. This tells
the model which rounding process is scheduled to occur next. For example, see Figure
28.
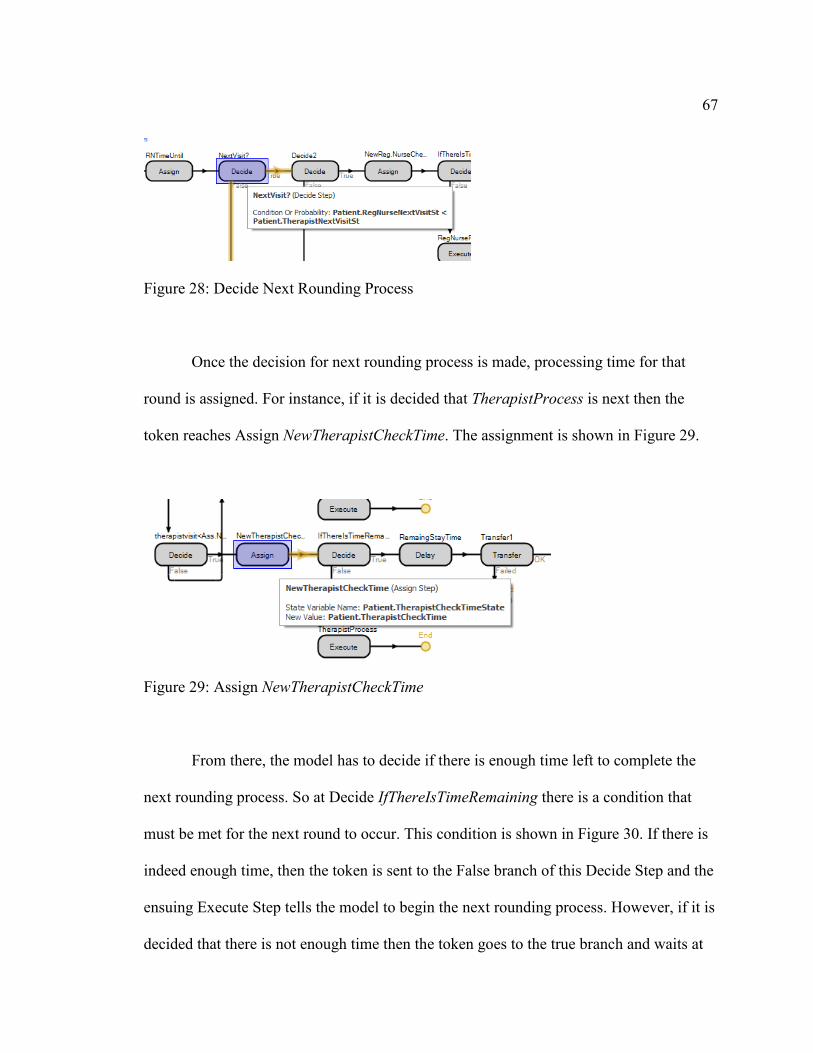
67
Figure 28: Decide Next Rounding Process
Once the decision for next rounding process is made, processing time for that
round is assigned. For instance, if it is decided that TherapistProcess is next then the
token reaches Assign NewTherapistCheckTime. The assignment is shown in Figure 29.
Figure 29: Assign NewTherapistCheckTime
From there, the model has to decide if there is enough time left to complete the
next rounding process. So at Decide IfThereIsTimeRemaining there is a condition that
must be met for the next round to occur. This condition is shown in Figure 30. If there is
indeed enough time, then the token is sent to the False branch of this Decide Step and the
ensuing Execute Step tells the model to begin the next rounding process. However, if it is
decided that there is not enough time then the token goes to the true branch and waits at
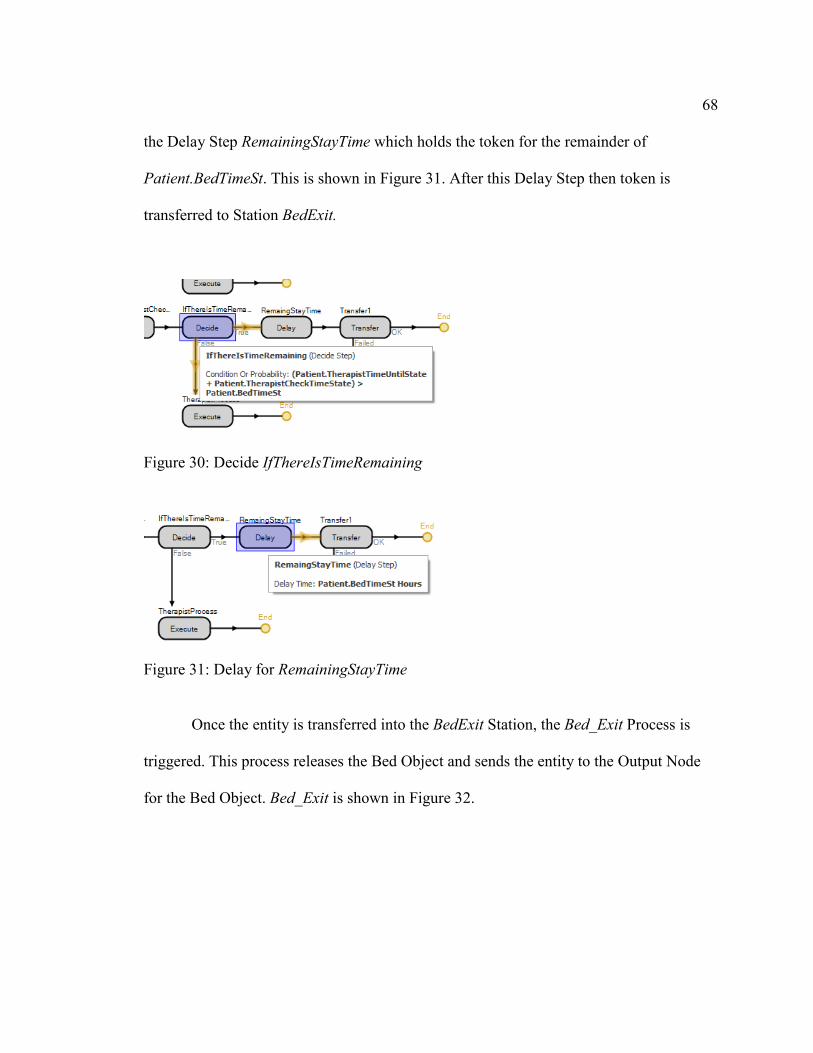
68 the Delay Step RemainingStayTime which holds the token for the remainder of
Patient.BedTimeSt. This is shown in Figure 31. After this Delay Step then token is
transferred to Station BedExit.
Figure 30: Decide IfThereIsTimeRemaining
Figure 31: Delay for RemainingStayTime
Once the entity is transferred into the BedExit Station, the Bed_Exit Process is
triggered. This process releases the Bed Object and sends the entity to the Output Node
for the Bed Object. Bed_Exit is shown in Figure 32.
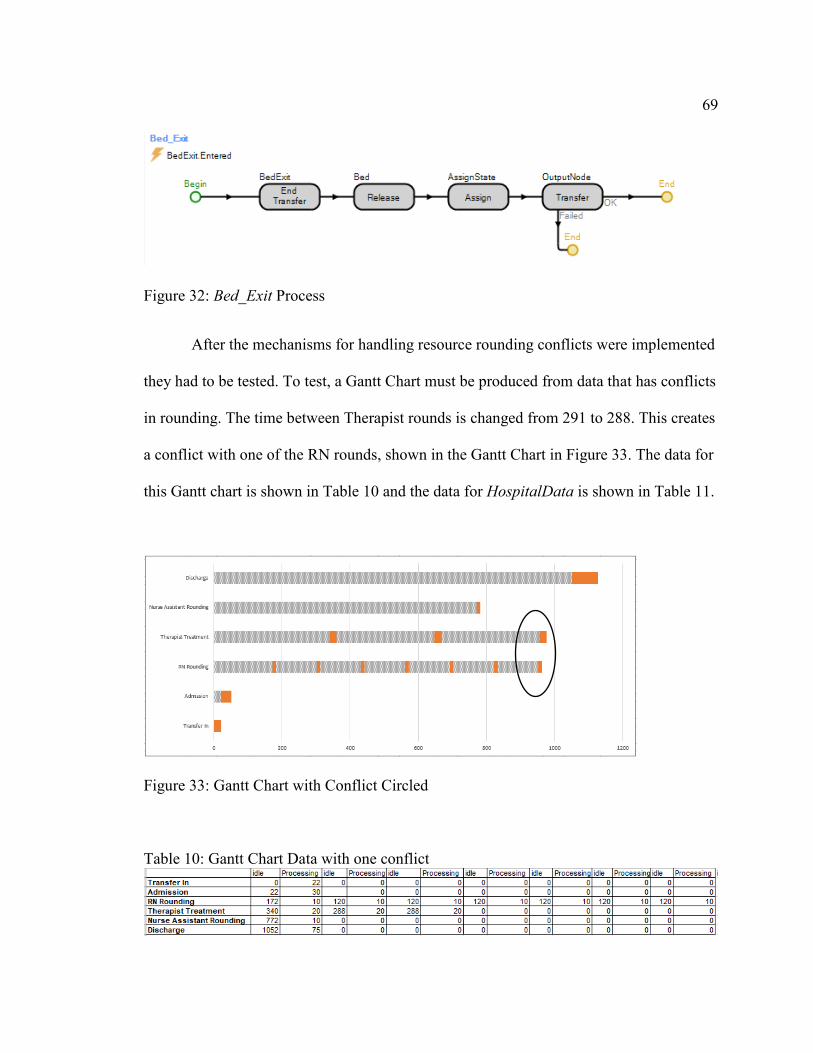
69
Figure 32: Bed_Exit Process
After the mechanisms for handling resource rounding conflicts were implemented
they had to be tested. To test, a Gantt Chart must be produced from data that has conflicts
in rounding. The time between Therapist rounds is changed from 291 to 288. This creates
a conflict with one of the RN rounds, shown in the Gantt Chart in Figure 33. The data for
this Gantt chart is shown in Table 10 and the data for HospitalData is shown in Table 11.
Figure 33: Gantt Chart with Conflict Circled
Table 10: Gantt Chart Data with one conflict
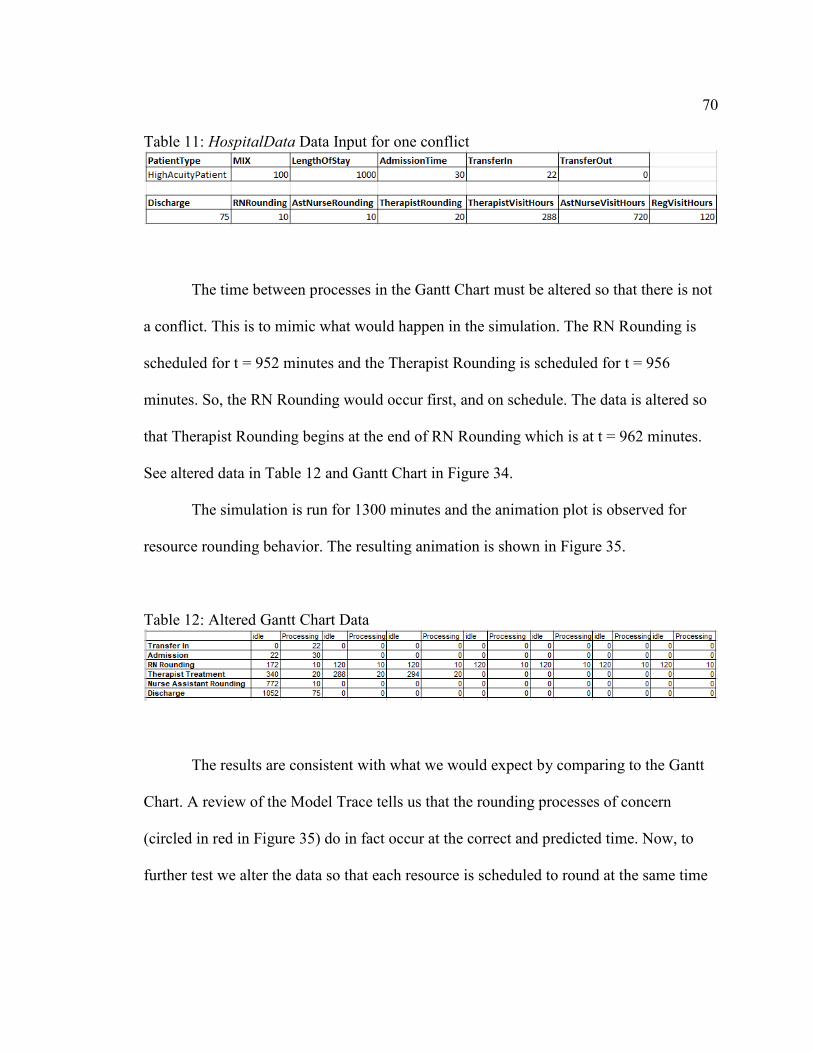
70 Table 11: HospitalData Data Input for one conflict
The time between processes in the Gantt Chart must be altered so that there is not
a conflict. This is to mimic what would happen in the simulation. The RN Rounding is
scheduled for t = 952 minutes and the Therapist Rounding is scheduled for t = 956
minutes. So, the RN Rounding would occur first, and on schedule. The data is altered so
that Therapist Rounding begins at the end of RN Rounding which is at t = 962 minutes.
See altered data in Table 12 and Gantt Chart in Figure 34.
The simulation is run for 1300 minutes and the animation plot is observed for
resource rounding behavior. The resulting animation is shown in Figure 35.
Table 12: Altered Gantt Chart Data
The results are consistent with what we would expect by comparing to the Gantt
Chart. A review of the Model Trace tells us that the rounding processes of concern
(circled in red in Figure 35) do in fact occur at the correct and predicted time. Now, to
further test we alter the data so that each resource is scheduled to round at the same time
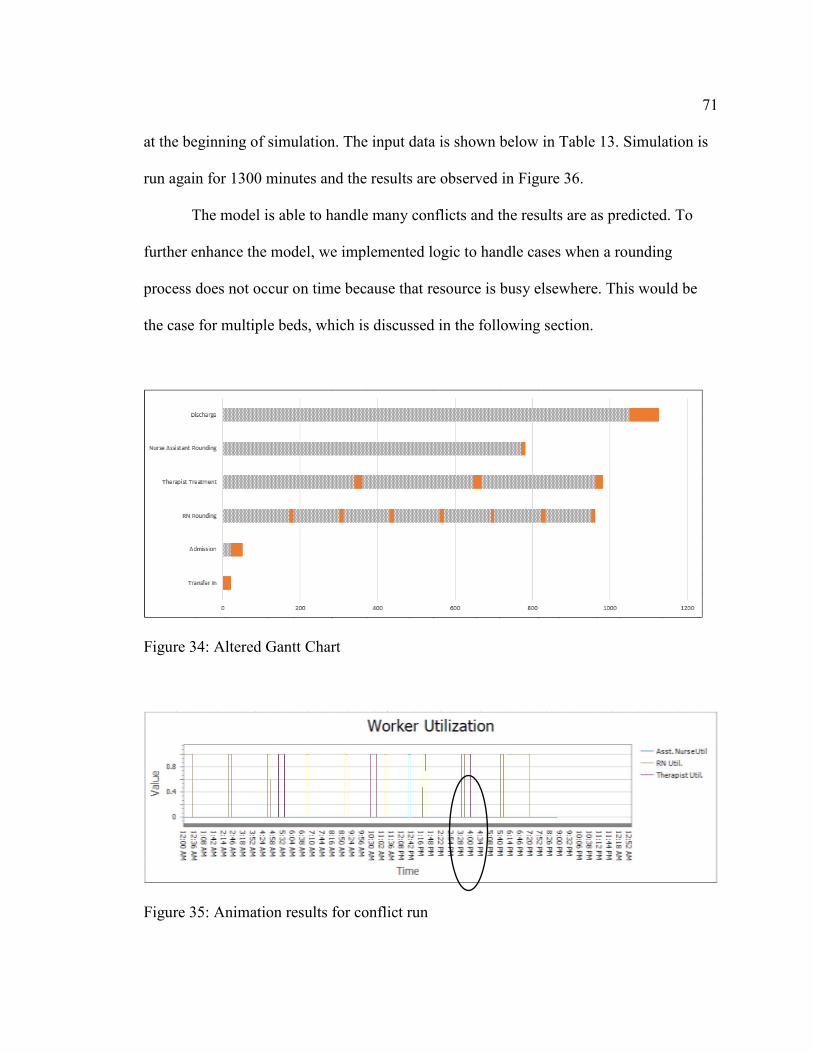
71 at the beginning of simulation. The input data is shown below in Table 13. Simulation is
run again for 1300 minutes and the results are observed in Figure 36.
The model is able to handle many conflicts and the results are as predicted. To
further enhance the model, we implemented logic to handle cases when a rounding
process does not occur on time because that resource is busy elsewhere. This would be
the case for multiple beds, which is discussed in the following section.
Figure 34: Altered Gantt Chart
Figure 35: Animation results for conflict run
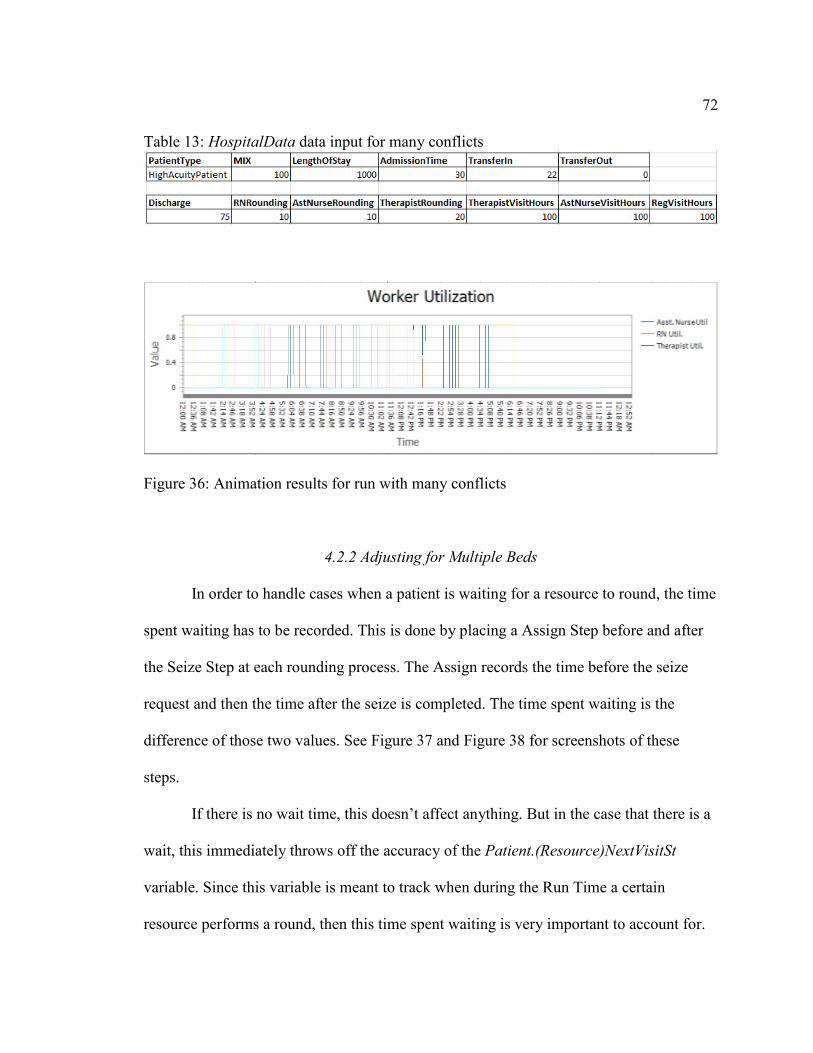
72 Table 13: HospitalData data input for many conflicts
Figure 36: Animation results for run with many conflicts
4.2.2 Adjusting for Multiple Beds
In order to handle cases when a patient is waiting for a resource to round, the time
spent waiting has to be recorded. This is done by placing a Assign Step before and after
the Seize Step at each rounding process. The Assign records the time before the seize
request and then the time after the seize is completed. The time spent waiting is the
difference of those two values. See Figure 37 and Figure 38 for screenshots of these
steps.
If there is no wait time, this doesn’t affect anything. But in the case that there is a
wait, this immediately throws off the accuracy of the Patient.(Resource)NextVisitSt
variable. Since this variable is meant to track when during the Run Time a certain
resource performs a round, then this time spent waiting is very important to account for.
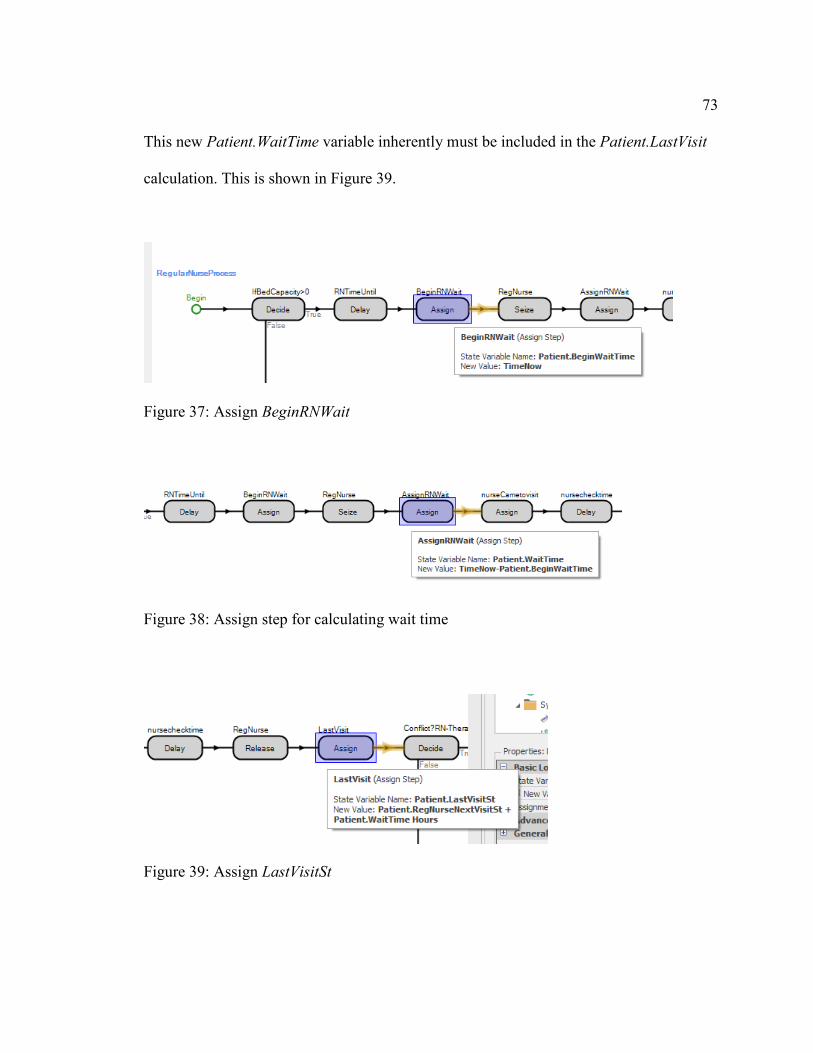
73 This new Patient.WaitTime variable inherently must be included in the Patient.LastVisit
calculation. This is shown in Figure 39.
Figure 37: Assign BeginRNWait
Figure 38: Assign step for calculating wait time
Figure 39: Assign LastVisitSt
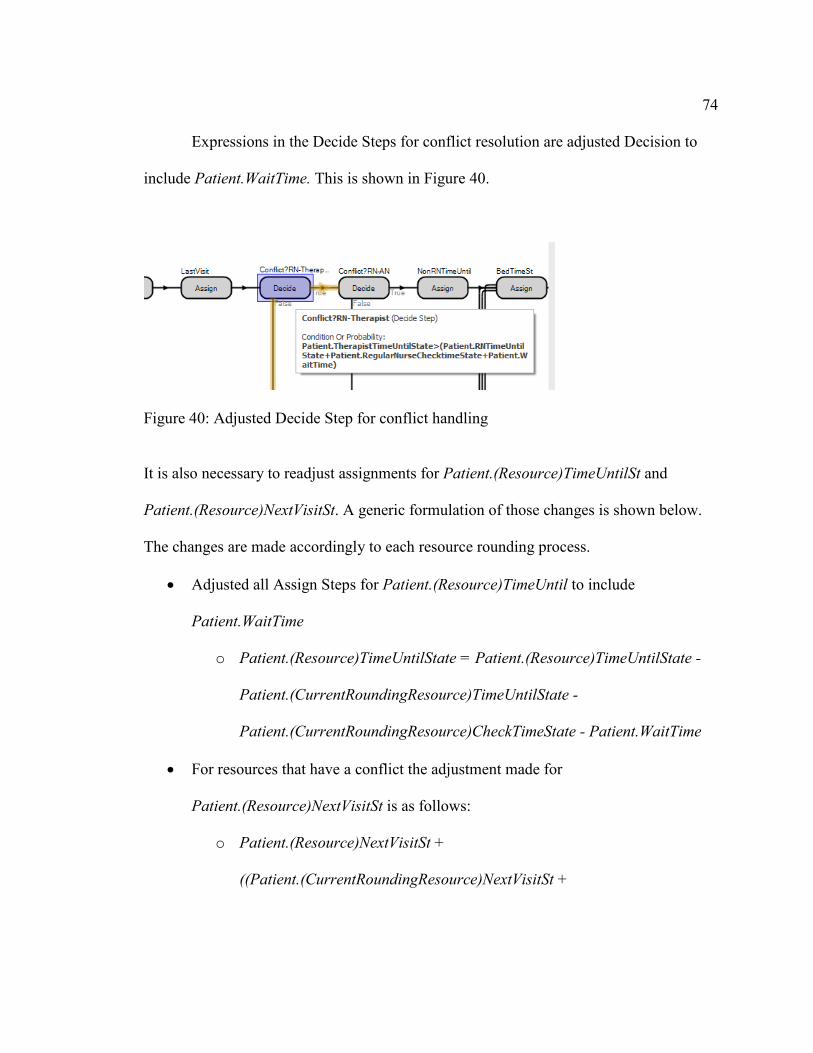
74
Expressions in the Decide Steps for conflict resolution are adjusted Decision to
include Patient.WaitTime. This is shown in Figure 40.
Figure 40: Adjusted Decide Step for conflict handling
It is also necessary to readjust assignments for Patient.(Resource)TimeUntilSt and
Patient.(Resource)NextVisitSt. A generic formulation of those changes is shown below.
The changes are made accordingly to each resource rounding process.
• Adjusted all Assign Steps for Patient.(Resource)TimeUntil to include
Patient.WaitTime
o Patient.(Resource)TimeUntilState = Patient.(Resource)TimeUntilState -
Patient.(CurrentRoundingResource)TimeUntilState -
Patient.(CurrentRoundingResource)CheckTimeState - Patient.WaitTime
• For resources that have a conflict the adjustment made for
Patient.(Resource)NextVisitSt is as follows:
o Patient.(Resource)NextVisitSt +
((Patient.(CurrentRoundingResource)NextVisitSt +
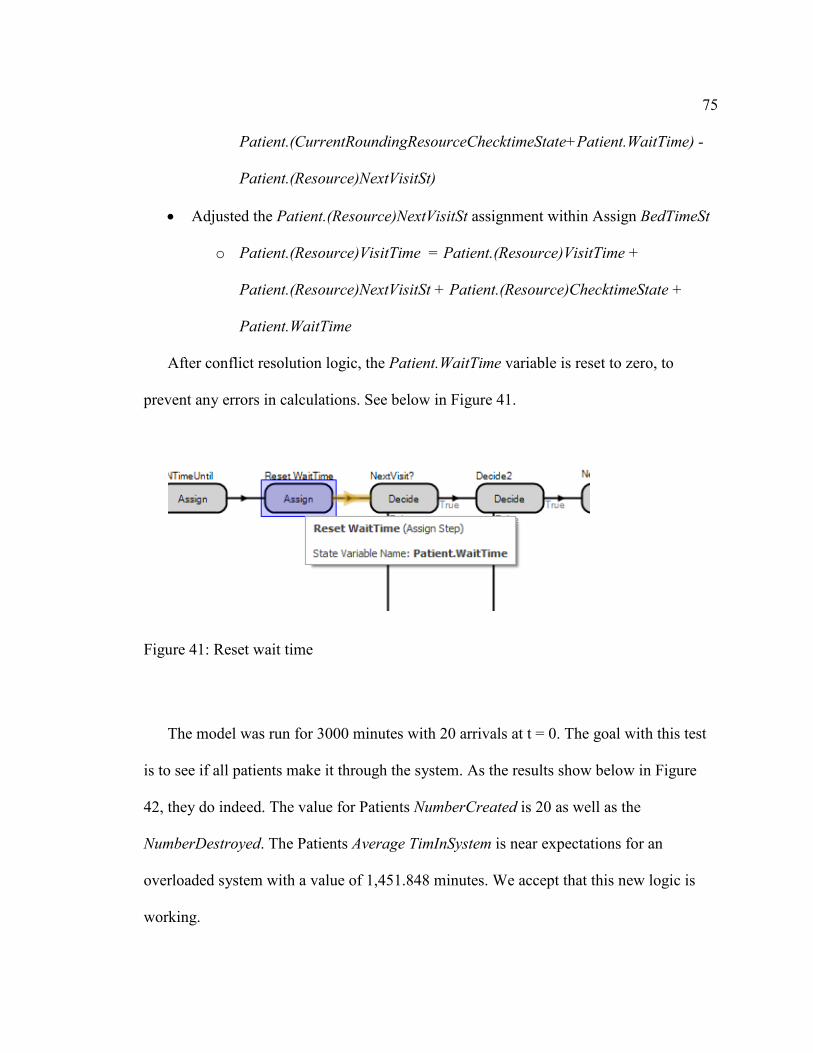
75
Patient.(CurrentRoundingResourceChecktimeState+Patient.WaitTime) -
Patient.(Resource)NextVisitSt)
• Adjusted the Patient.(Resource)NextVisitSt assignment within Assign BedTimeSt
o Patient.(Resource)VisitTime = Patient.(Resource)VisitTime +
Patient.(Resource)NextVisitSt + Patient.(Resource)ChecktimeState +
Patient.WaitTime
After conflict resolution logic, the Patient.WaitTime variable is reset to zero, to
prevent any errors in calculations. See below in Figure 41.
Figure 41: Reset wait time
The model was run for 3000 minutes with 20 arrivals at t = 0. The goal with this test
is to see if all patients make it through the system. As the results show below in Figure
42, they do indeed. The value for Patients NumberCreated is 20 as well as the
NumberDestroyed. The Patients Average TimInSystem is near expectations for an
overloaded system with a value of 1,451.848 minutes. We accept that this new logic is
working.
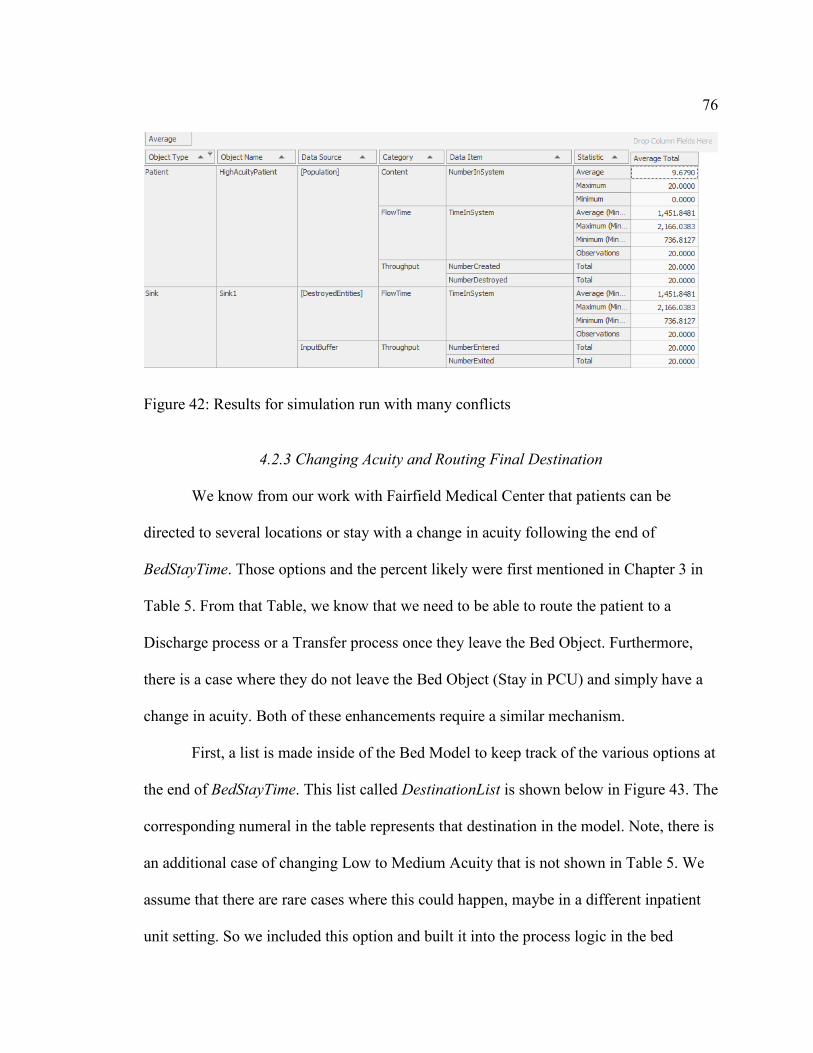
76
Figure 42: Results for simulation run with many conflicts
4.2.3 Changing Acuity and Routing Final Destination
We know from our work with Fairfield Medical Center that patients can be
directed to several locations or stay with a change in acuity following the end of
BedStayTime. Those options and the percent likely were first mentioned in Chapter 3 in
Table 5. From that Table, we know that we need to be able to route the patient to a
Discharge process or a Transfer process once they leave the Bed Object. Furthermore,
there is a case where they do not leave the Bed Object (Stay in PCU) and simply have a
change in acuity. Both of these enhancements require a similar mechanism.
First, a list is made inside of the Bed Model to keep track of the various options at
the end of BedStayTime. This list called DestinationList is shown below in Figure 43. The
corresponding numeral in the table represents that destination in the model. Note, there is
an additional case of changing Low to Medium Acuity that is not shown in Table 5. We
assume that there are rare cases where this could happen, maybe in a different inpatient
unit setting. So we included this option and built it into the process logic in the bed
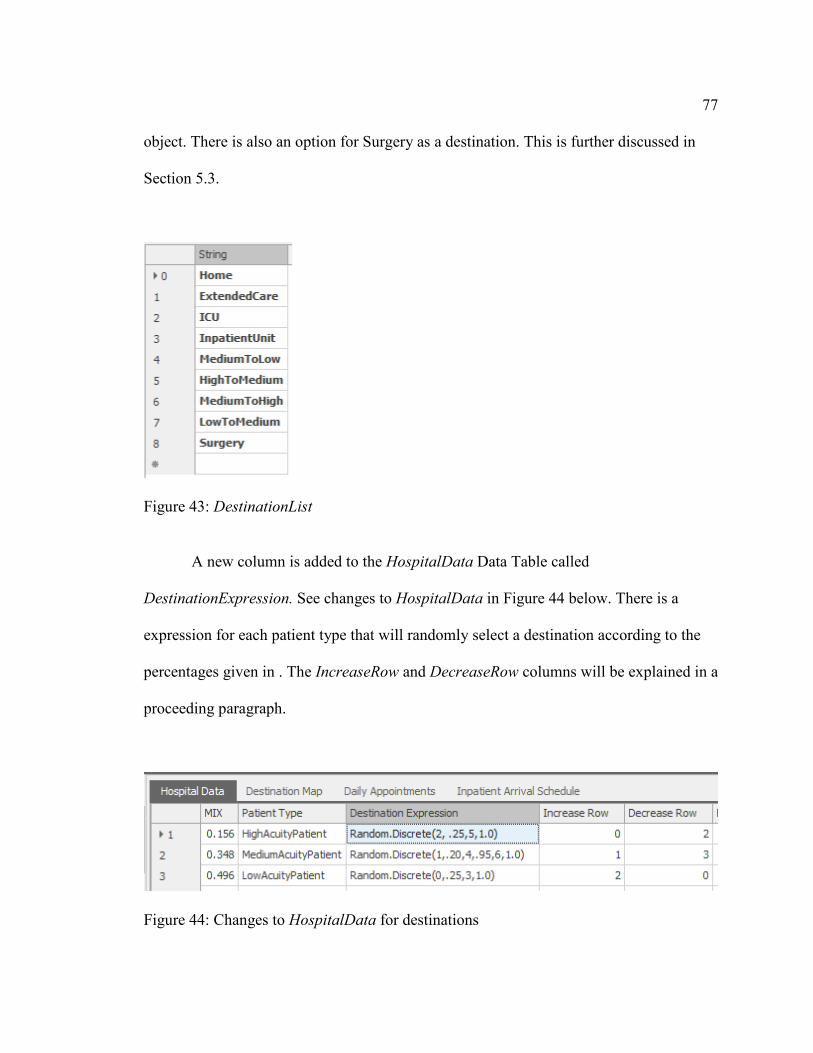
77 object. There is also an option for Surgery as a destination. This is further discussed in
Section 5.3.
Figure 43: DestinationList
A new column is added to the HospitalData Data Table called
DestinationExpression. See changes to HospitalData in Figure 44 below. There is a
expression for each patient type that will randomly select a destination according to the
percentages given in . The IncreaseRow and DecreaseRow columns will be explained in a
proceeding paragraph.
Figure 44: Changes to HospitalData for destinations
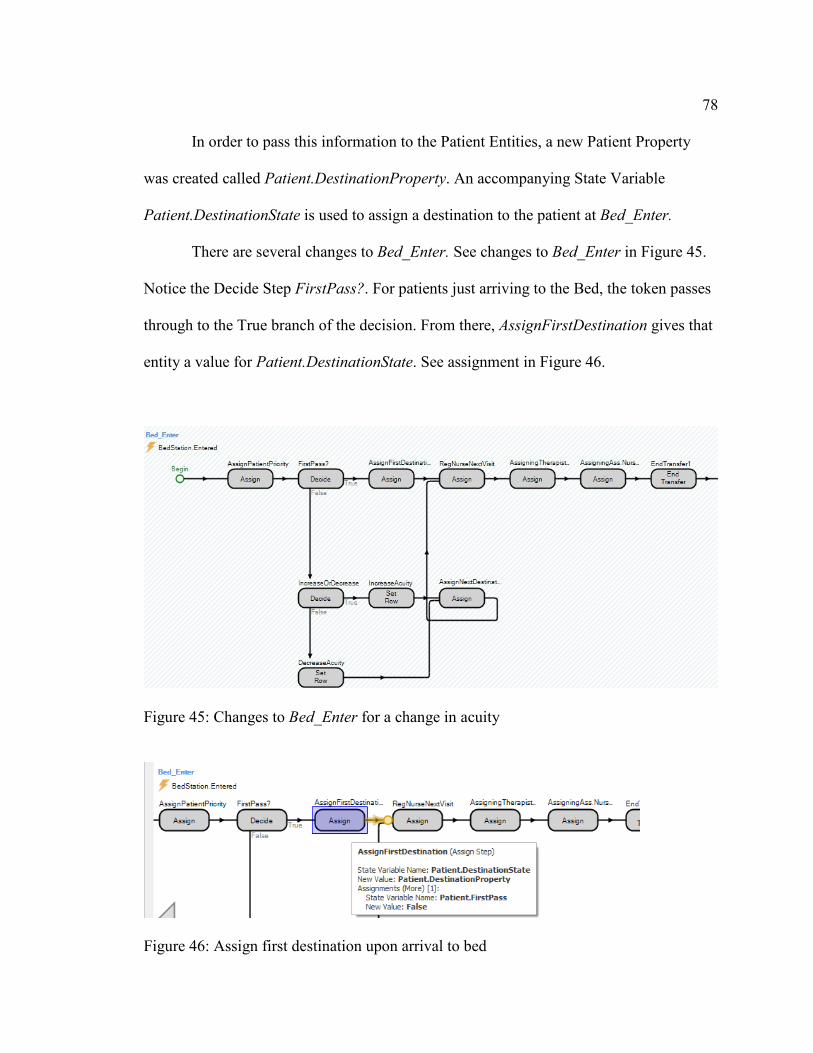
78
In order to pass this information to the Patient Entities, a new Patient Property
was created called Patient.DestinationProperty. An accompanying State Variable
Patient.DestinationState is used to assign a destination to the patient at Bed_Enter.
There are several changes to Bed_Enter. See changes to Bed_Enter in Figure 45.
Notice the Decide Step FirstPass?. For patients just arriving to the Bed, the token passes
through to the True branch of the decision. From there, AssignFirstDestination gives that
entity a value for Patient.DestinationState. See assignment in Figure 46.
Figure 45: Changes to Bed_Enter for a change in acuity
Figure 46: Assign first destination upon arrival to bed
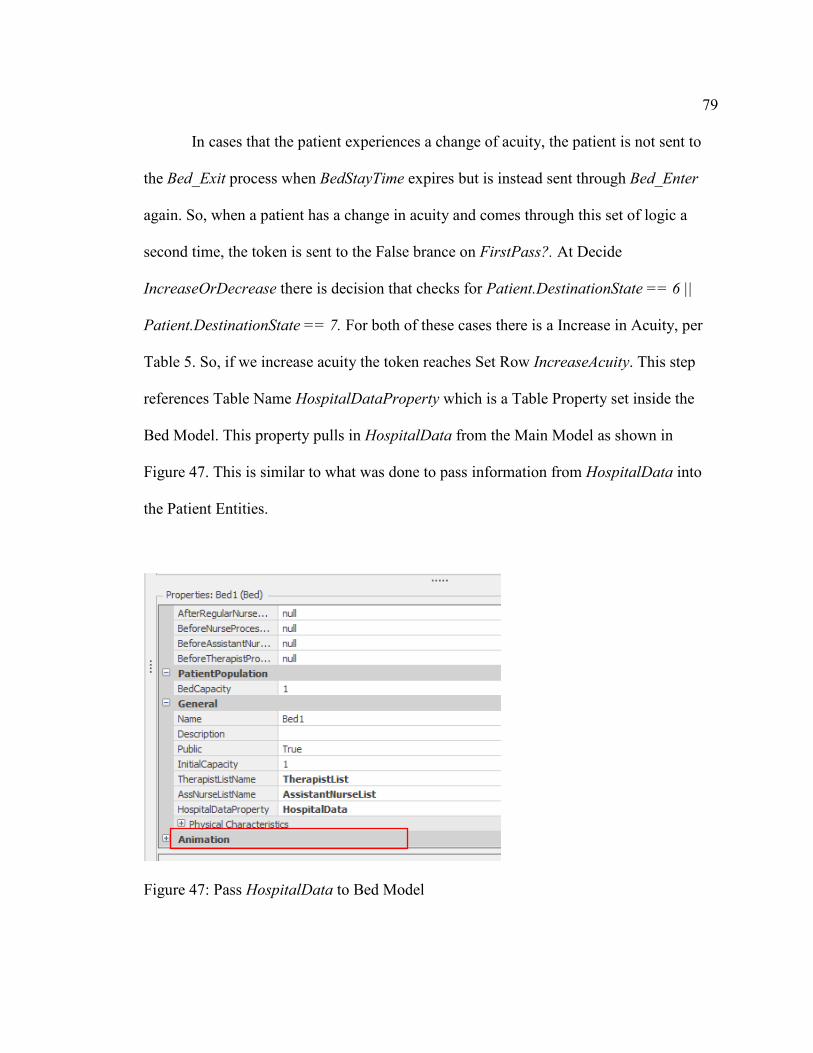
79
In cases that the patient experiences a change of acuity, the patient is not sent to
the Bed_Exit process when BedStayTime expires but is instead sent through Bed_Enter
again. So, when a patient has a change in acuity and comes through this set of logic a
second time, the token is sent to the False brance on FirstPass?. At Decide
IncreaseOrDecrease there is decision that checks for Patient.DestinationState == 6 ||
Patient.DestinationState == 7. For both of these cases there is a Increase in Acuity, per
Table 5. So, if we increase acuity the token reaches Set Row IncreaseAcuity. This step
references Table Name HospitalDataProperty which is a Table Property set inside the
Bed Model. This property pulls in HospitalData from the Main Model as shown in
Figure 47. This is similar to what was done to pass information from HospitalData into
the Patient Entities.
Figure 47: Pass HospitalData to Bed Model
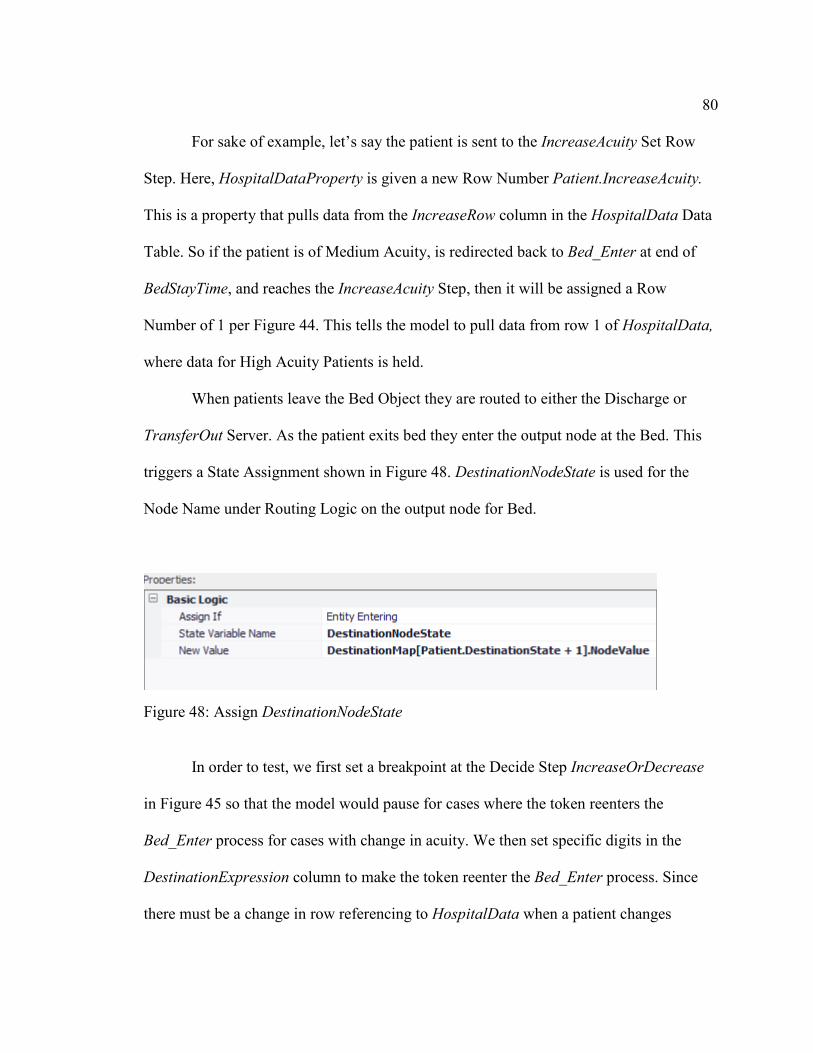
80
For sake of example, let’s say the patient is sent to the IncreaseAcuity Set Row
Step. Here, HospitalDataProperty is given a new Row Number Patient.IncreaseAcuity.
This is a property that pulls data from the IncreaseRow column in the HospitalData Data
Table. So if the patient is of Medium Acuity, is redirected back to Bed_Enter at end of
BedStayTime, and reaches the IncreaseAcuity Step, then it will be assigned a Row
Number of 1 per Figure 44. This tells the model to pull data from row 1 of HospitalData,
where data for High Acuity Patients is held.
When patients leave the Bed Object they are routed to either the Discharge or
TransferOut Server. As the patient exits bed they enter the output node at the Bed. This
triggers a State Assignment shown in Figure 48. DestinationNodeState is used for the
Node Name under Routing Logic on the output node for Bed.
Figure 48: Assign DestinationNodeState
In order to test, we first set a breakpoint at the Decide Step IncreaseOrDecrease
in Figure 45 so that the model would pause for cases where the token reenters the
Bed_Enter process for cases with change in acuity. We then set specific digits in the
DestinationExpression column to make the token reenter the Bed_Enter process. Since
there must be a change in row referencing to HospitalData when a patient changes
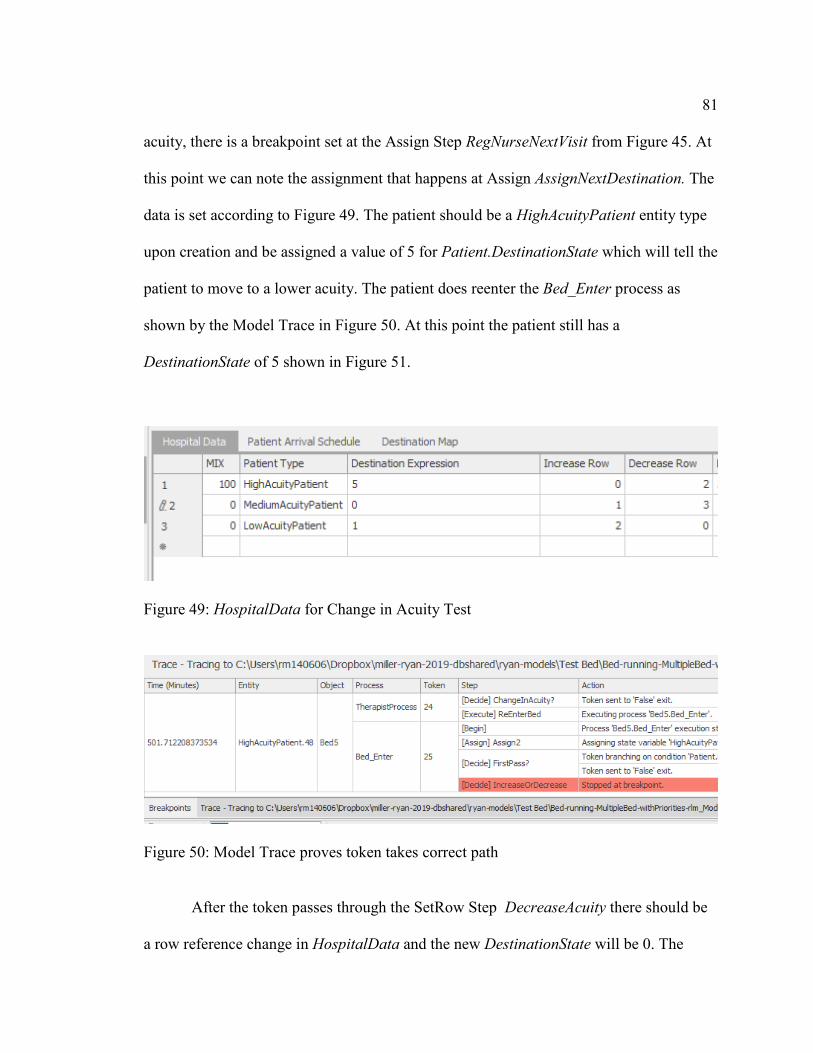
81 acuity, there is a breakpoint set at the Assign Step RegNurseNextVisit from Figure 45. At
this point we can note the assignment that happens at Assign AssignNextDestination. The
data is set according to Figure 49. The patient should be a HighAcuityPatient entity type
upon creation and be assigned a value of 5 for Patient.DestinationState which will tell the
patient to move to a lower acuity. The patient does reenter the Bed_Enter process as
shown by the Model Trace in Figure 50. At this point the patient still has a
DestinationState of 5 shown in Figure 51.
Figure 49: HospitalData for Change in Acuity Test
Figure 50: Model Trace proves token takes correct path
After the token passes through the SetRow Step DecreaseAcuity there should be
a row reference change in HospitalData and the new DestinationState will be 0. The
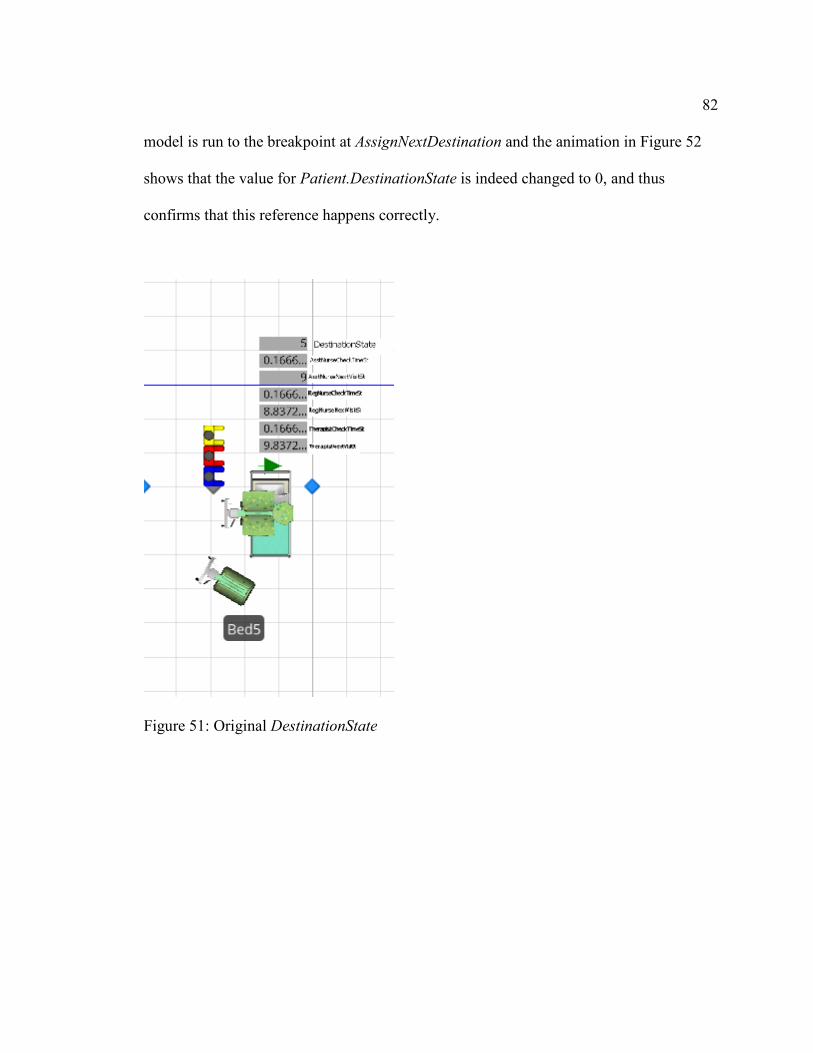
82 model is run to the breakpoint at AssignNextDestination and the animation in Figure 52
shows that the value for Patient.DestinationState is indeed changed to 0, and thus
confirms that this reference happens correctly.
Figure 51: Original DestinationState
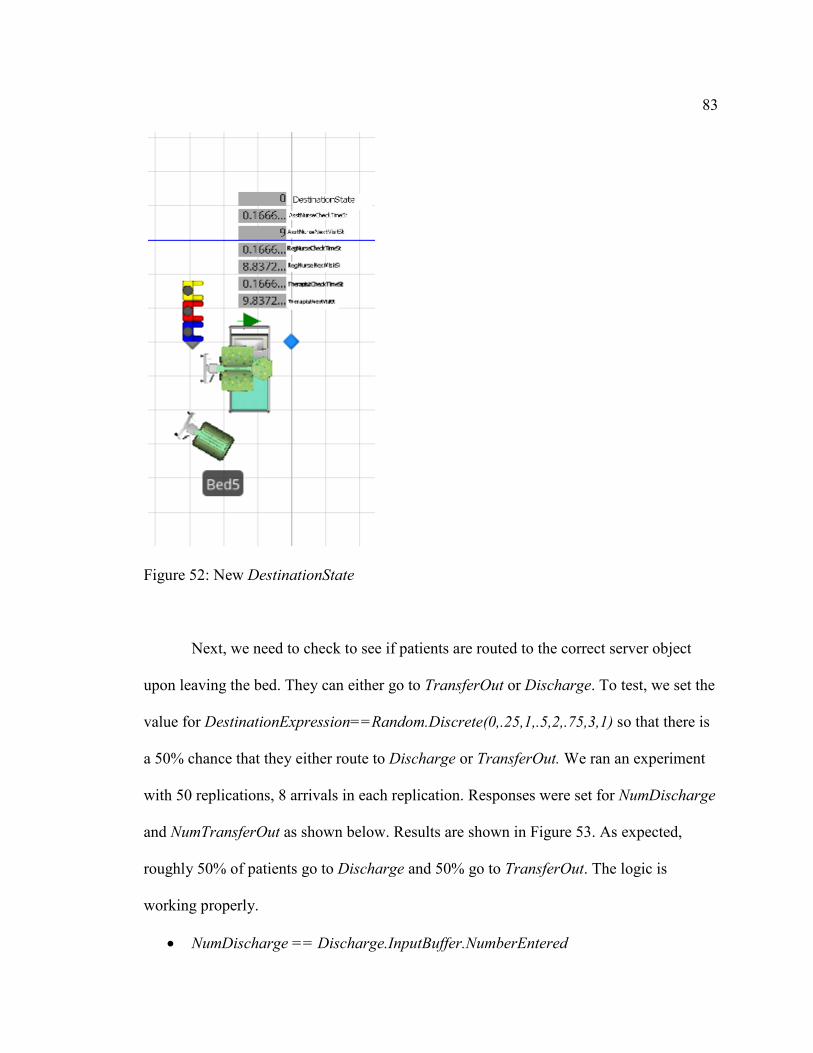
83
Figure 52: New DestinationState
Next, we need to check to see if patients are routed to the correct server object
upon leaving the bed. They can either go to TransferOut or Discharge. To test, we set the
value for DestinationExpression==Random.Discrete(0,.25,1,.5,2,.75,3,1) so that there is
a 50% chance that they either route to Discharge or TransferOut. We ran an experiment
with 50 replications, 8 arrivals in each replication. Responses were set for NumDischarge
and NumTransferOut as shown below. Results are shown in Figure 53. As expected,
roughly 50% of patients go to Discharge and 50% go to TransferOut. The logic is
working properly.
• NumDischarge == Discharge.InputBuffer.NumberEntered
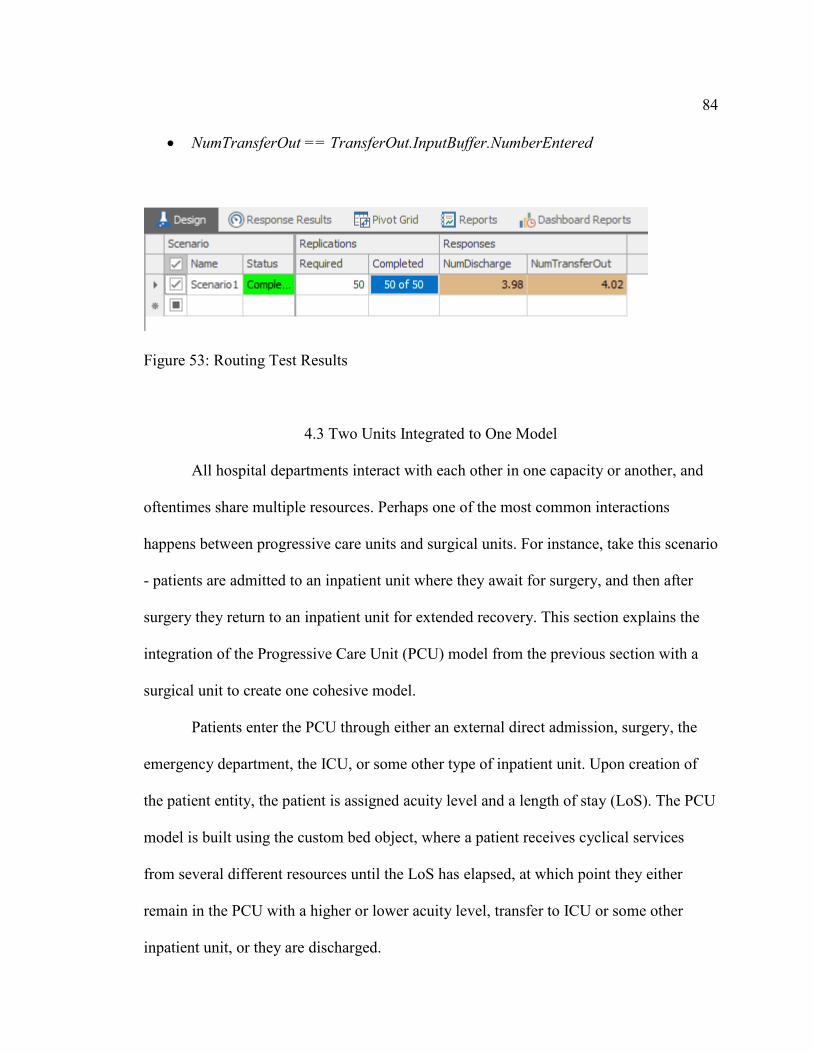
84
• NumTransferOut == TransferOut.InputBuffer.NumberEntered
Figure 53: Routing Test Results
4.3 Two Units Integrated to One Model
All hospital departments interact with each other in one capacity or another, and
oftentimes share multiple resources. Perhaps one of the most common interactions
happens between progressive care units and surgical units. For instance, take this scenario
- patients are admitted to an inpatient unit where they await for surgery, and then after
surgery they return to an inpatient unit for extended recovery. This section explains the
integration of the Progressive Care Unit (PCU) model from the previous section with a
surgical unit to create one cohesive model.
Patients enter the PCU through either an external direct admission, surgery, the
emergency department, the ICU, or some other type of inpatient unit. Upon creation of
the patient entity, the patient is assigned acuity level and a length of stay (LoS). The PCU
model is built using the custom bed object, where a patient receives cyclical services
from several different resources until the LoS has elapsed, at which point they either
remain in the PCU with a higher or lower acuity level, transfer to ICU or some other
inpatient unit, or they are discharged.
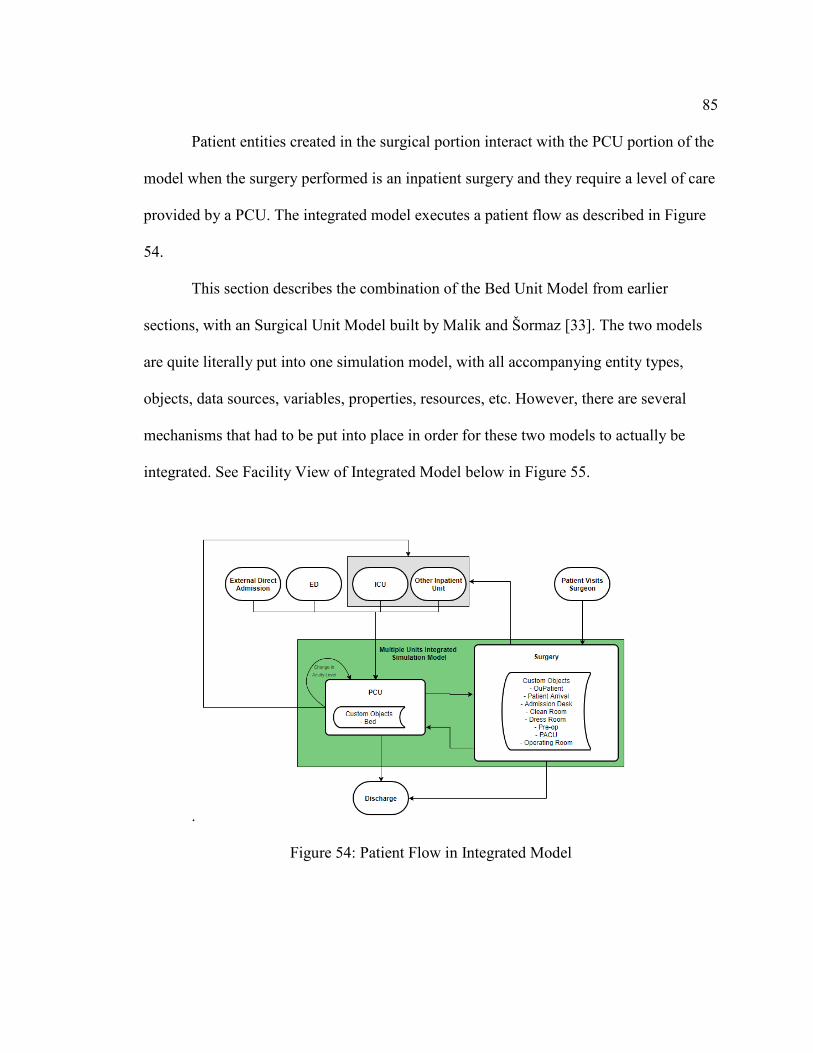
85
Patient entities created in the surgical portion interact with the PCU portion of the
model when the surgery performed is an inpatient surgery and they require a level of care
provided by a PCU. The integrated model executes a patient flow as described in Figure
54.
This section describes the combination of the Bed Unit Model from earlier
sections, with an Surgical Unit Model built by Malik and Šormaz [33]. The two models
are quite literally put into one simulation model, with all accompanying entity types,
objects, data sources, variables, properties, resources, etc. However, there are several
mechanisms that had to be put into place in order for these two models to actually be
integrated. See Facility View of Integrated Model below in Figure 55.
.
Figure 54: Patient Flow in Integrated Model
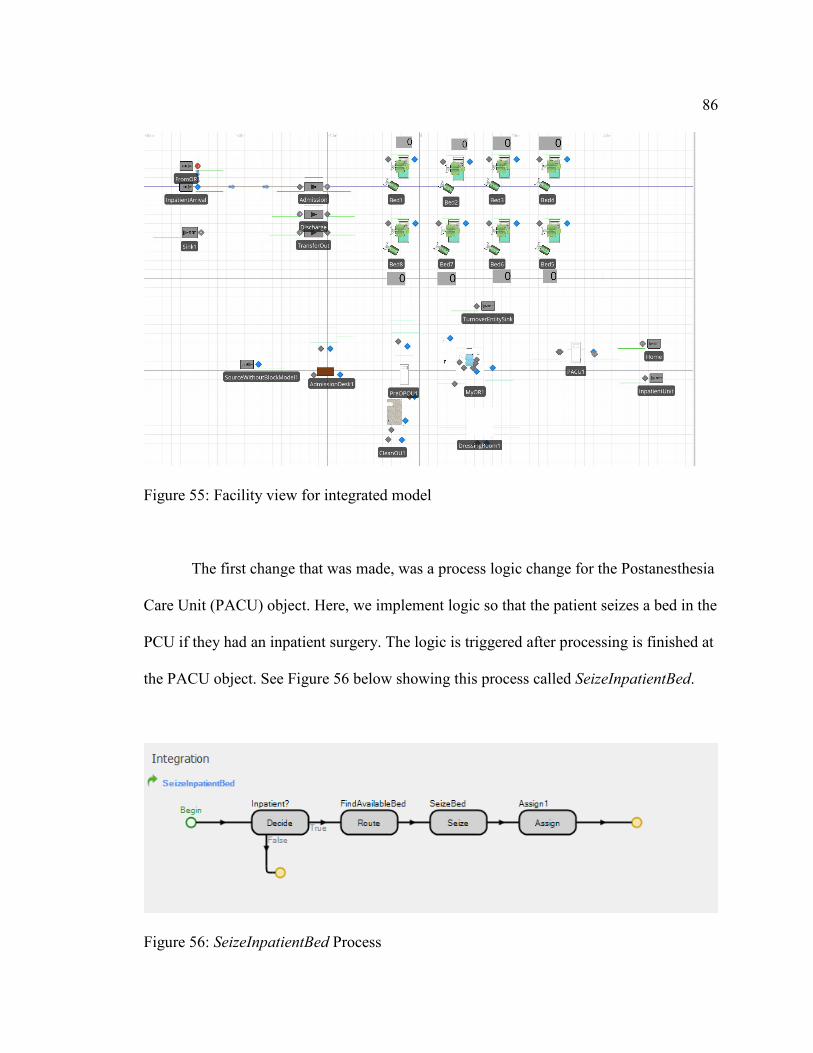
86
Figure 55: Facility view for integrated model
The first change that was made, was a process logic change for the Postanesthesia
Care Unit (PACU) object. Here, we implement logic so that the patient seizes a bed in the
PCU if they had an inpatient surgery. The logic is triggered after processing is finished at
the PACU object. See Figure 56 below showing this process called SeizeInpatientBed.
Figure 56: SeizeInpatientBed Process
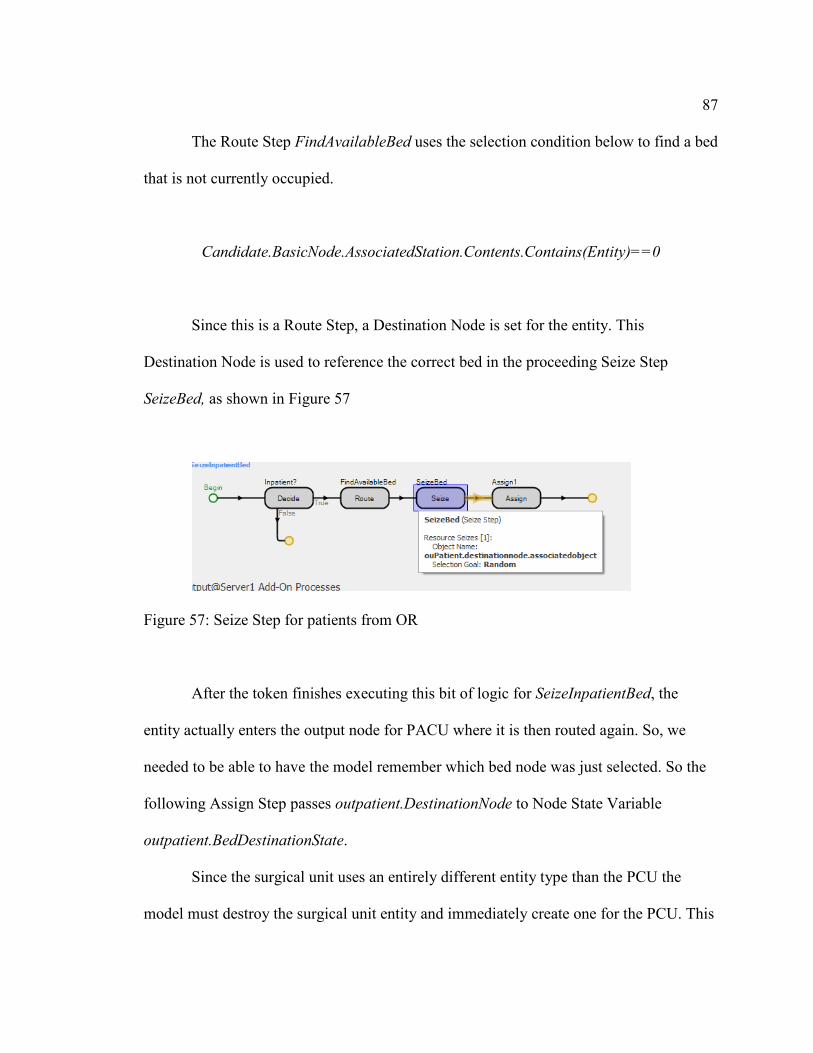
87 The Route Step FindAvailableBed uses the selection condition below to find a bed
that is not currently occupied.
Candidate.BasicNode.AssociatedStation.Contents.Contains(Entity)==0
Since this is a Route Step, a Destination Node is set for the entity. This
Destination Node is used to reference the correct bed in the proceeding Seize Step
SeizeBed, as shown in Figure 57
Figure 57: Seize Step for patients from OR
After the token finishes executing this bit of logic for SeizeInpatientBed, the
entity actually enters the output node for PACU where it is then routed again. So, we
needed to be able to have the model remember which bed node was just selected. So the
following Assign Step passes outpatient.DestinationNode to Node State Variable
outpatient.BedDestinationState.
Since the surgical unit uses an entirely different entity type than the PCU the
model must destroy the surgical unit entity and immediately create one for the PCU. This
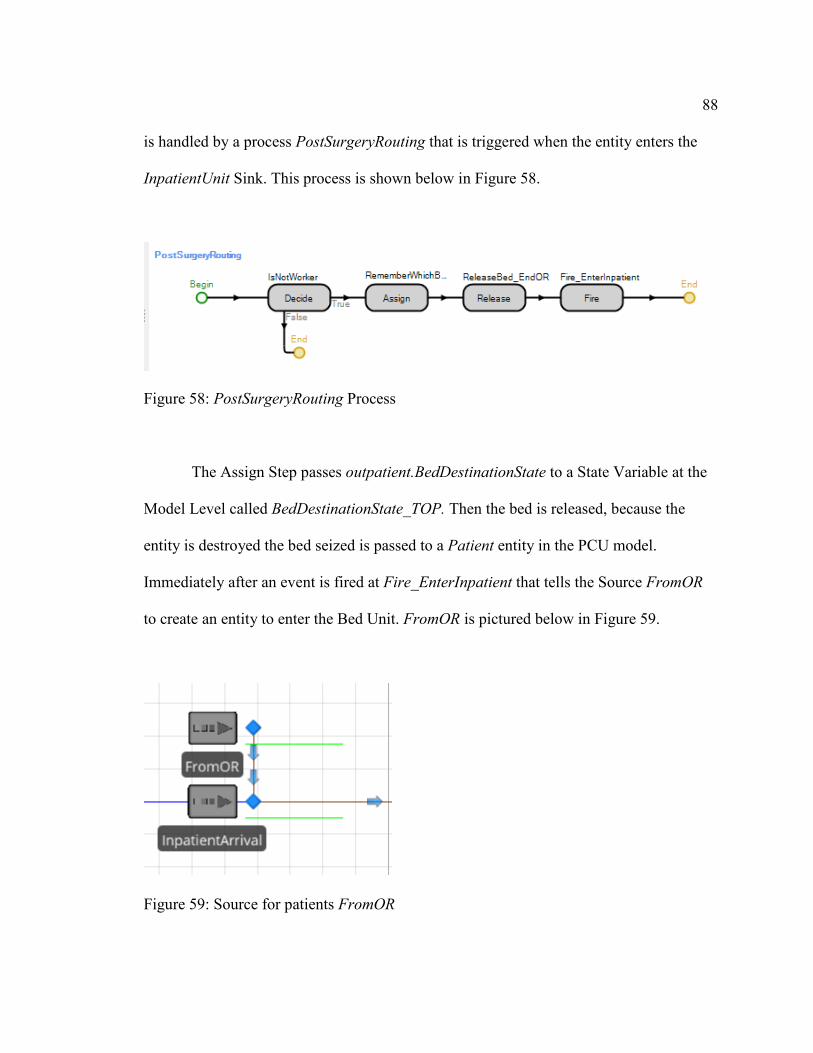
88 is handled by a process PostSurgeryRouting that is triggered when the entity enters the
InpatientUnit Sink. This process is shown below in Figure 58.
Figure 58: PostSurgeryRouting Process
The Assign Step passes outpatient.BedDestinationState to a State Variable at the
Model Level called BedDestinationState_TOP. Then the bed is released, because the
entity is destroyed the bed seized is passed to a Patient entity in the PCU model.
Immediately after an event is fired at Fire_EnterInpatient that tells the Source FromOR
to create an entity to enter the Bed Unit. FromOR is pictured below in Figure 59.
Figure 59: Source for patients FromOR
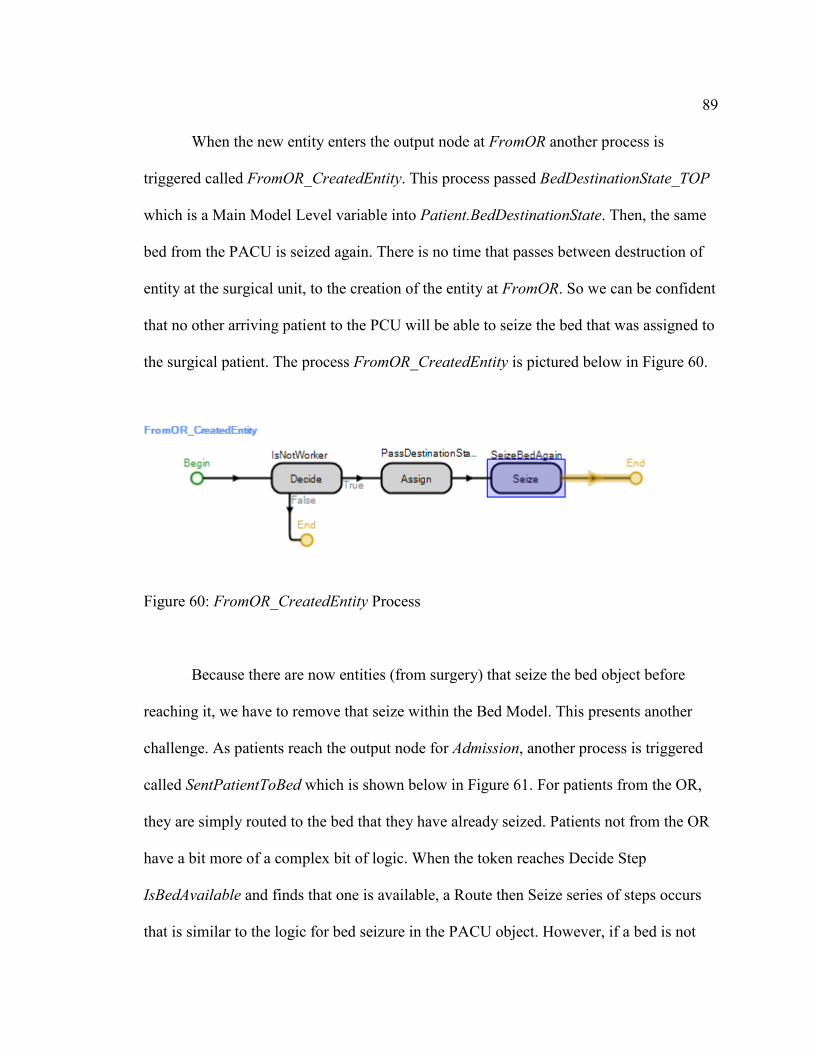
89
When the new entity enters the output node at FromOR another process is
triggered called FromOR_CreatedEntity. This process passed BedDestinationState_TOP
which is a Main Model Level variable into Patient.BedDestinationState. Then, the same
bed from the PACU is seized again. There is no time that passes between destruction of
entity at the surgical unit, to the creation of the entity at FromOR. So we can be confident
that no other arriving patient to the PCU will be able to seize the bed that was assigned to
the surgical patient. The process FromOR_CreatedEntity is pictured below in Figure 60.
Figure 60: FromOR_CreatedEntity Process
Because there are now entities (from surgery) that seize the bed object before
reaching it, we have to remove that seize within the Bed Model. This presents another
challenge. As patients reach the output node for Admission, another process is triggered
called SentPatientToBed which is shown below in Figure 61. For patients from the OR,
they are simply routed to the bed that they have already seized. Patients not from the OR
have a bit more of a complex bit of logic. When the token reaches Decide Step
IsBedAvailable and finds that one is available, a Route then Seize series of steps occurs
that is similar to the logic for bed seizure in the PACU object. However, if a bed is not
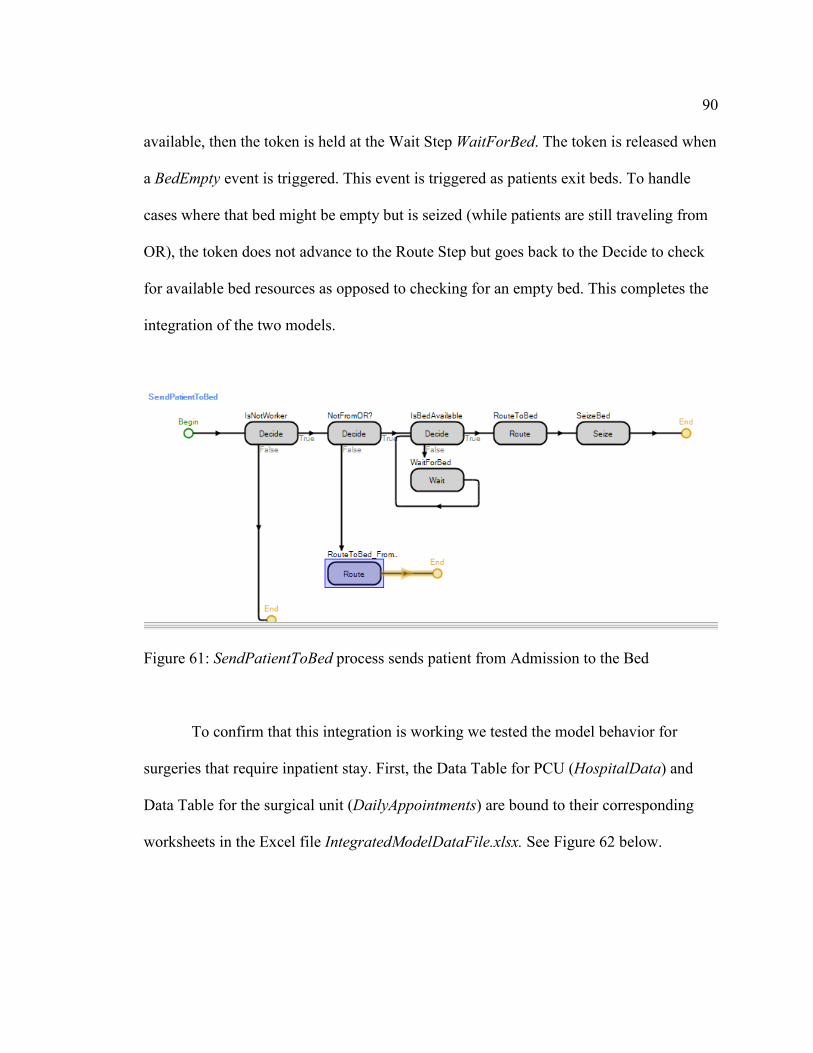
90 available, then the token is held at the Wait Step WaitForBed. The token is released when
a BedEmpty event is triggered. This event is triggered as patients exit beds. To handle
cases where that bed might be empty but is seized (while patients are still traveling from
OR), the token does not advance to the Route Step but goes back to the Decide to check
for available bed resources as opposed to checking for an empty bed. This completes the
integration of the two models.
Figure 61: SendPatientToBed process sends patient from Admission to the Bed
To confirm that this integration is working we tested the model behavior for
surgeries that require inpatient stay. First, the Data Table for PCU (HospitalData) and
Data Table for the surgical unit (DailyAppointments) are bound to their corresponding
worksheets in the Excel file IntegratedModelDataFile.xlsx. See Figure 62 below.
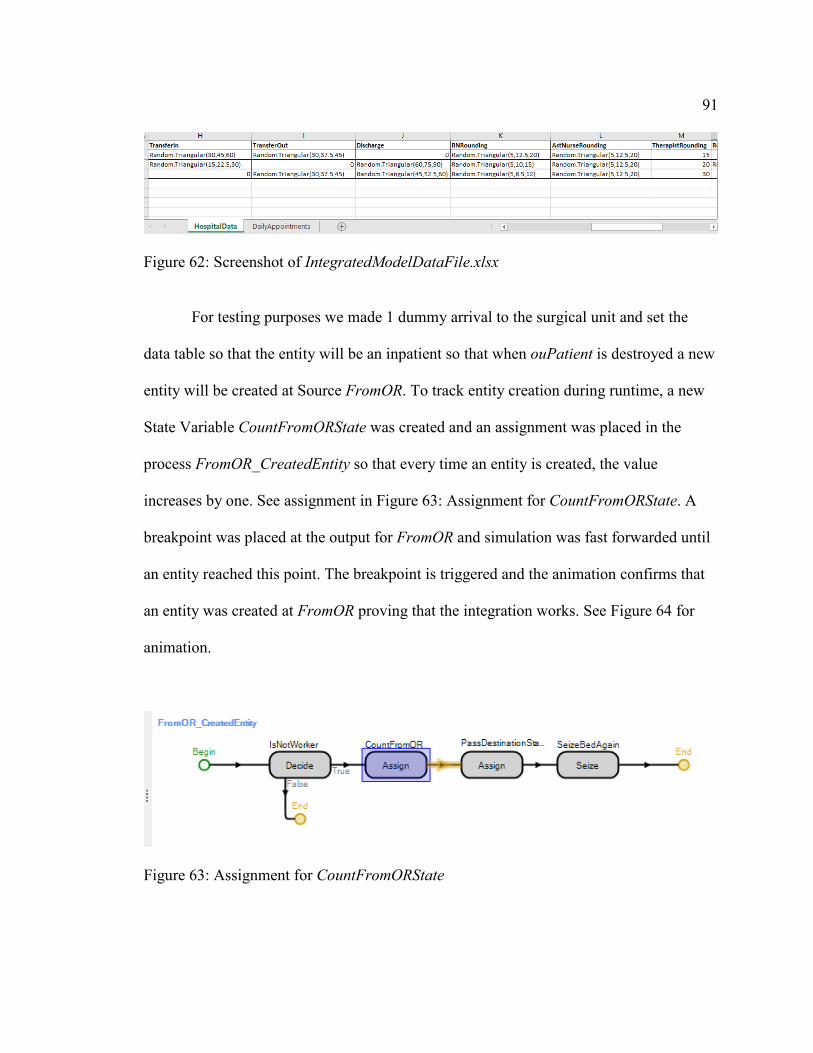
91
Figure 62: Screenshot of IntegratedModelDataFile.xlsx
For testing purposes we made 1 dummy arrival to the surgical unit and set the
data table so that the entity will be an inpatient so that when ouPatient is destroyed a new
entity will be created at Source FromOR. To track entity creation during runtime, a new
State Variable CountFromORState was created and an assignment was placed in the
process FromOR_CreatedEntity so that every time an entity is created, the value
increases by one. See assignment in Figure 63: Assignment for CountFromORState. A
breakpoint was placed at the output for FromOR and simulation was fast forwarded until
an entity reached this point. The breakpoint is triggered and the animation confirms that
an entity was created at FromOR proving that the integration works. See Figure 64 for
animation.
Figure 63: Assignment for CountFromORState
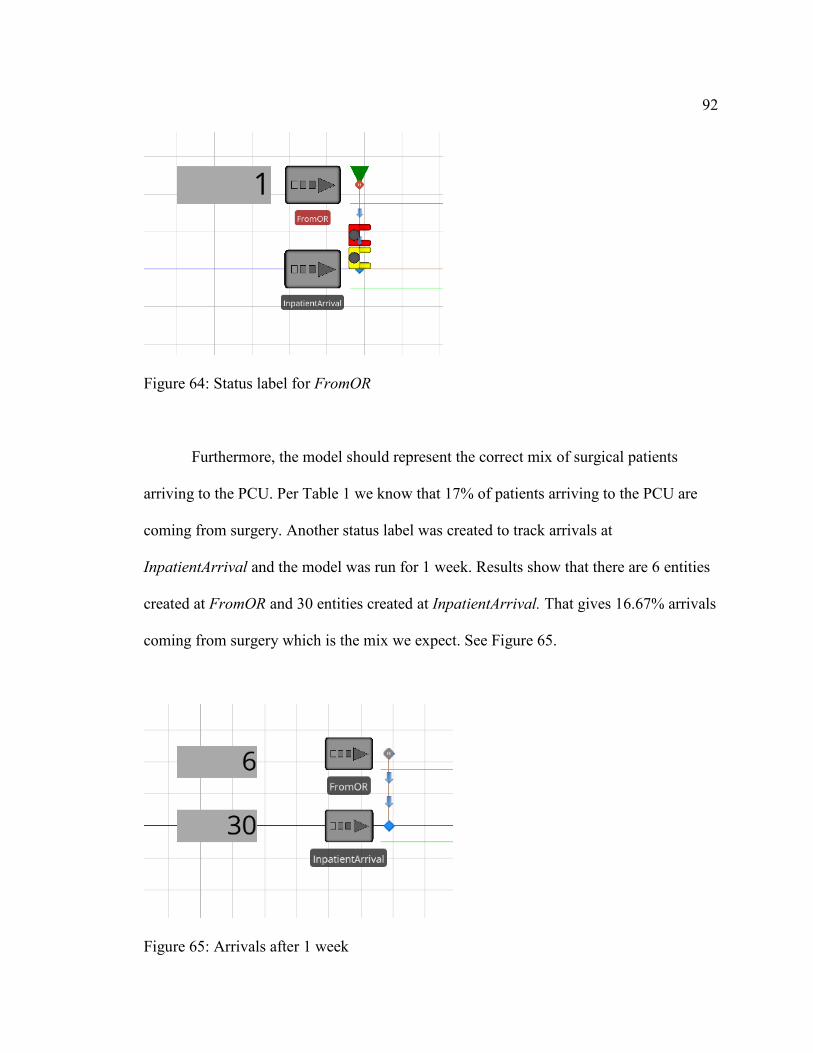
92
Figure 64: Status label for FromOR
Furthermore, the model should represent the correct mix of surgical patients
arriving to the PCU. Per Table 1 we know that 17% of patients arriving to the PCU are
coming from surgery. Another status label was created to track arrivals at
InpatientArrival and the model was run for 1 week. Results show that there are 6 entities
created at FromOR and 30 entities created at InpatientArrival. That gives 16.67% arrivals
coming from surgery which is the mix we expect. See Figure 65.
Figure 65: Arrivals after 1 week
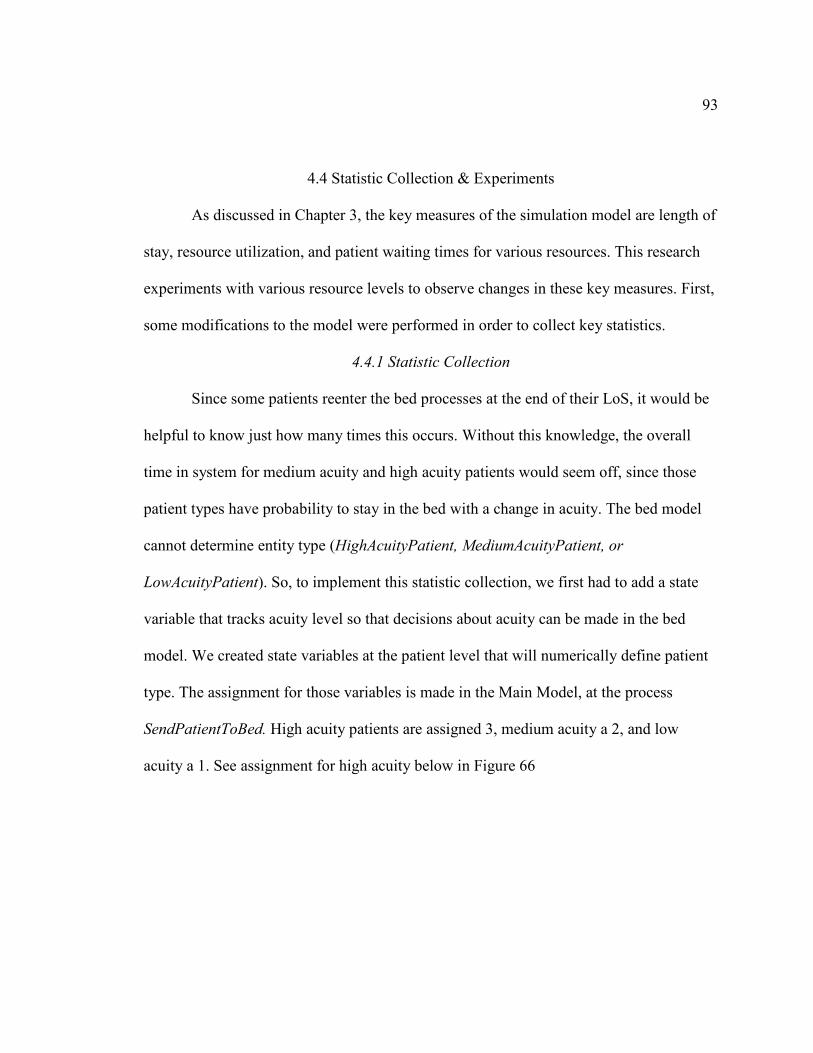
93
4.4 Statistic Collection & Experiments
As discussed in Chapter 3, the key measures of the simulation model are length of
stay, resource utilization, and patient waiting times for various resources. This research
experiments with various resource levels to observe changes in these key measures. First,
some modifications to the model were performed in order to collect key statistics.
4.4.1 Statistic Collection
Since some patients reenter the bed processes at the end of their LoS, it would be
helpful to know just how many times this occurs. Without this knowledge, the overall
time in system for medium acuity and high acuity patients would seem off, since those
patient types have probability to stay in the bed with a change in acuity. The bed model
cannot determine entity type (HighAcuityPatient, MediumAcuityPatient, or
LowAcuityPatient). So, to implement this statistic collection, we first had to add a state
variable that tracks acuity level so that decisions about acuity can be made in the bed
model. We created state variables at the patient level that will numerically define patient
type. The assignment for those variables is made in the Main Model, at the process
SendPatientToBed. High acuity patients are assigned 3, medium acuity a 2, and low
acuity a 1. See assignment for high acuity below in Figure 66
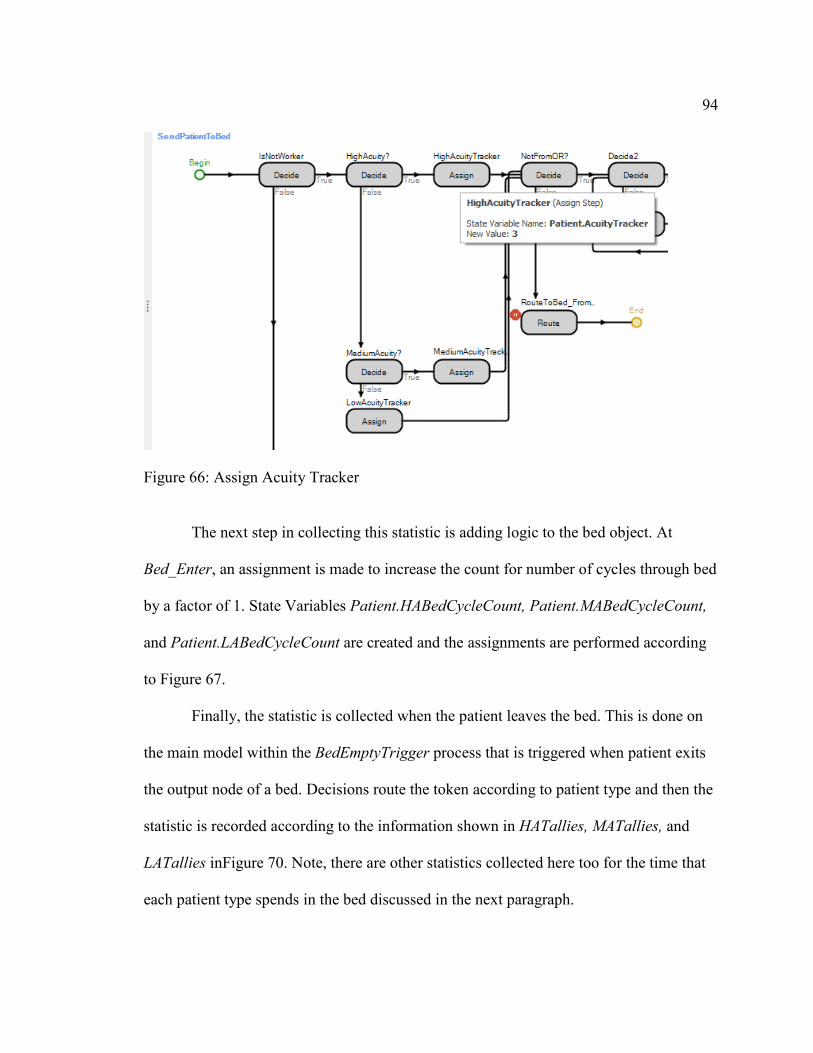
94
Figure 66: Assign Acuity Tracker
The next step in collecting this statistic is adding logic to the bed object. At
Bed_Enter, an assignment is made to increase the count for number of cycles through bed
by a factor of 1. State Variables Patient.HABedCycleCount, Patient.MABedCycleCount,
and Patient.LABedCycleCount are created and the assignments are performed according
to Figure 67.
Finally, the statistic is collected when the patient leaves the bed. This is done on
the main model within the BedEmptyTrigger process that is triggered when patient exits
the output node of a bed. Decisions route the token according to patient type and then the
statistic is recorded according to the information shown in HATallies, MATallies, and
LATallies inFigure 70. Note, there are other statistics collected here too for the time that
each patient type spends in the bed discussed in the next paragraph.
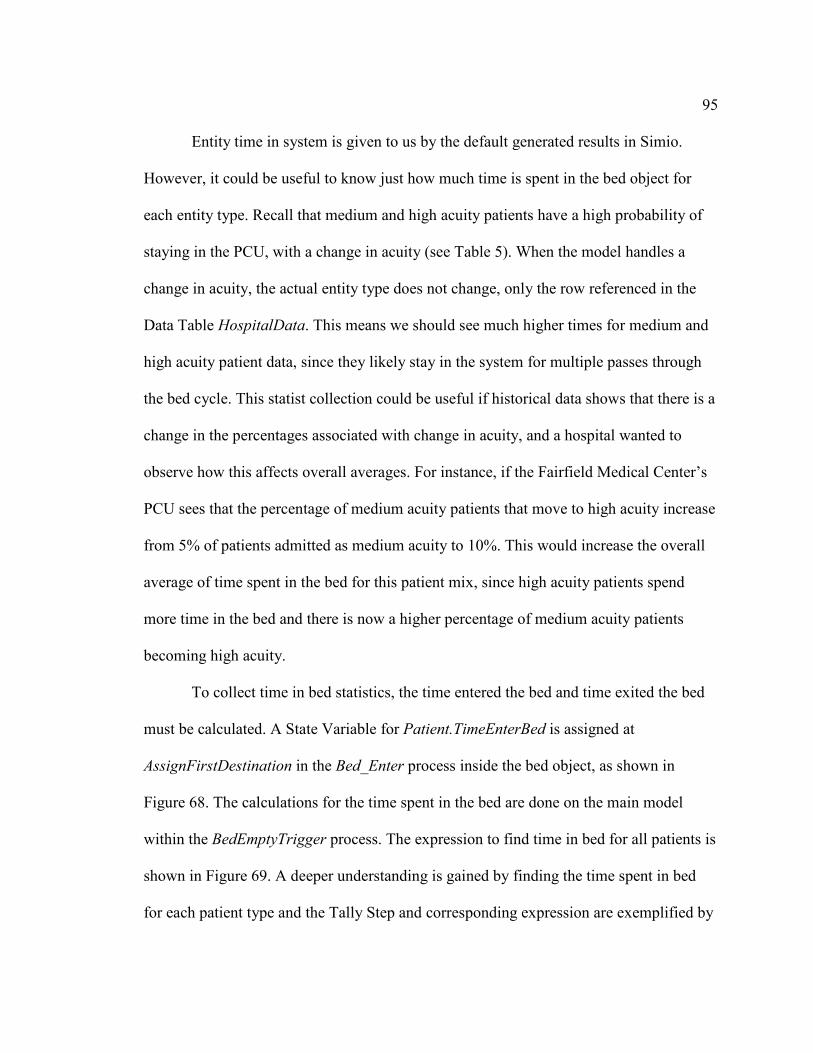
95
Entity time in system is given to us by the default generated results in Simio.
However, it could be useful to know just how much time is spent in the bed object for
each entity type. Recall that medium and high acuity patients have a high probability of
staying in the PCU, with a change in acuity (see Table 5). When the model handles a
change in acuity, the actual entity type does not change, only the row referenced in the
Data Table HospitalData. This means we should see much higher times for medium and
high acuity patient data, since they likely stay in the system for multiple passes through
the bed cycle. This statist collection could be useful if historical data shows that there is a
change in the percentages associated with change in acuity, and a hospital wanted to
observe how this affects overall averages. For instance, if the Fairfield Medical Center’s
PCU sees that the percentage of medium acuity patients that move to high acuity increase
from 5% of patients admitted as medium acuity to 10%. This would increase the overall
average of time spent in the bed for this patient mix, since high acuity patients spend
more time in the bed and there is now a higher percentage of medium acuity patients
becoming high acuity.
To collect time in bed statistics, the time entered the bed and time exited the bed
must be calculated. A State Variable for Patient.TimeEnterBed is assigned at
AssignFirstDestination in the Bed_Enter process inside the bed object, as shown in
Figure 68. The calculations for the time spent in the bed are done on the main model
within the BedEmptyTrigger process. The expression to find time in bed for all patients is
shown in Figure 69. A deeper understanding is gained by finding the time spent in bed
for each patient type and the Tally Step and corresponding expression are exemplified by
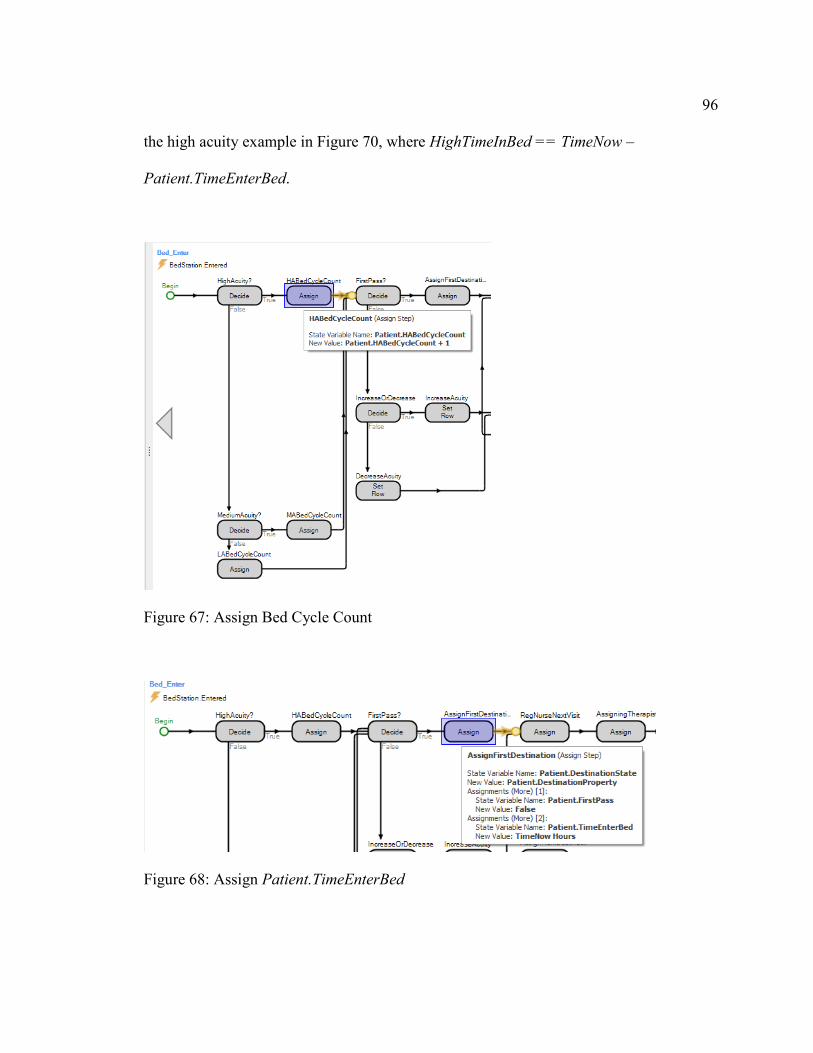
96 the high acuity example in Figure 70, where HighTimeInBed == TimeNow –
Patient.TimeEnterBed.
Figure 67: Assign Bed Cycle Count
Figure 68: Assign Patient.TimeEnterBed
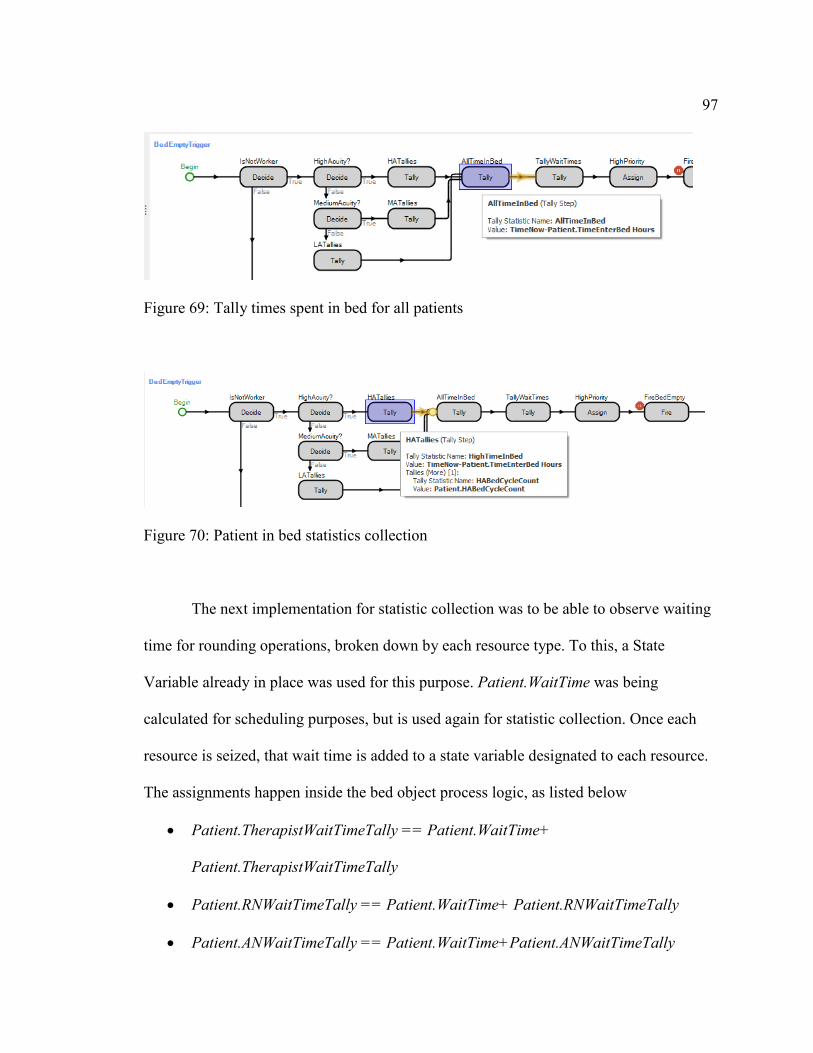
97
Figure 69: Tally times spent in bed for all patients
Figure 70: Patient in bed statistics collection
The next implementation for statistic collection was to be able to observe waiting
time for rounding operations, broken down by each resource type. To this, a State
Variable already in place was used for this purpose. Patient.WaitTime was being
calculated for scheduling purposes, but is used again for statistic collection. Once each
resource is seized, that wait time is added to a state variable designated to each resource.
The assignments happen inside the bed object process logic, as listed below
• Patient.TherapistWaitTimeTally == Patient.WaitTime+
Patient.TherapistWaitTimeTally
• Patient.RNWaitTimeTally == Patient.WaitTime+ Patient.RNWaitTimeTally
• Patient.ANWaitTimeTally == Patient.WaitTime+Patient.ANWaitTimeTally
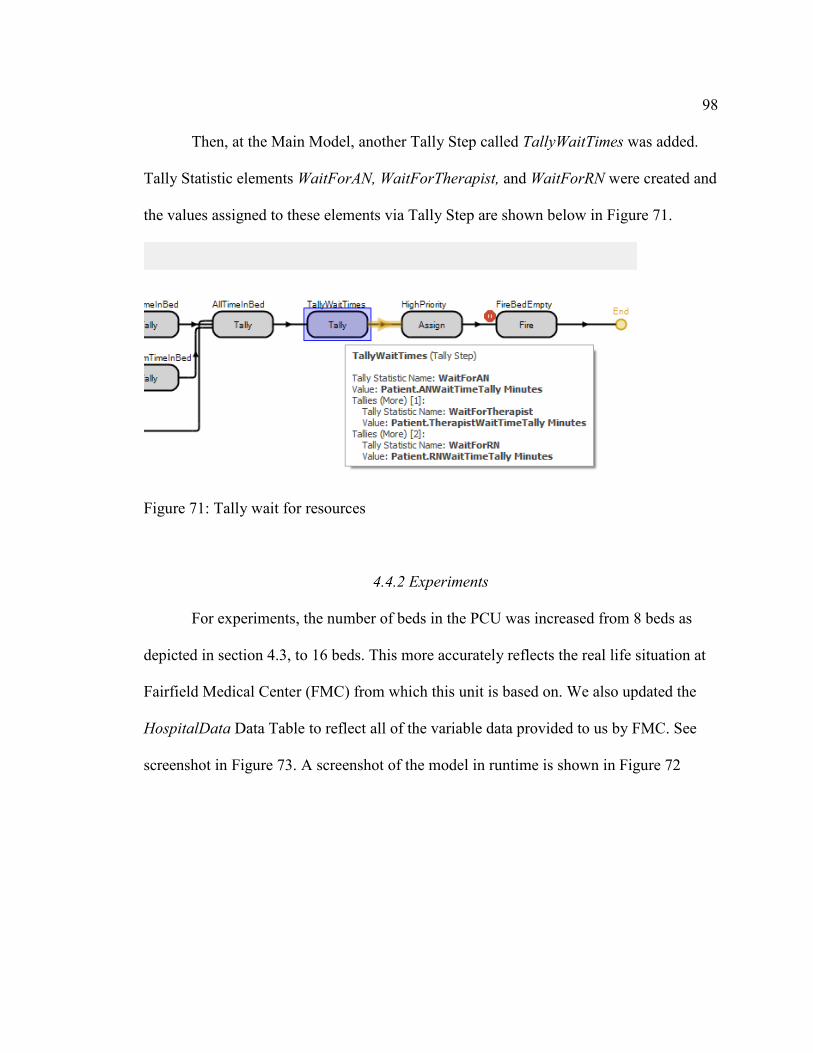
98
Then, at the Main Model, another Tally Step called TallyWaitTimes was added.
Tally Statistic elements WaitForAN, WaitForTherapist, and WaitForRN were created and
the values assigned to these elements via Tally Step are shown below in Figure 71.
Figure 71: Tally wait for resources
4.4.2 Experiments
For experiments, the number of beds in the PCU was increased from 8 beds as
depicted in section 4.3, to 16 beds. This more accurately reflects the real life situation at
Fairfield Medical Center (FMC) from which this unit is based on. We also updated the
HospitalData Data Table to reflect all of the variable data provided to us by FMC. See
screenshot in Figure 73. A screenshot of the model in runtime is shown in Figure 72
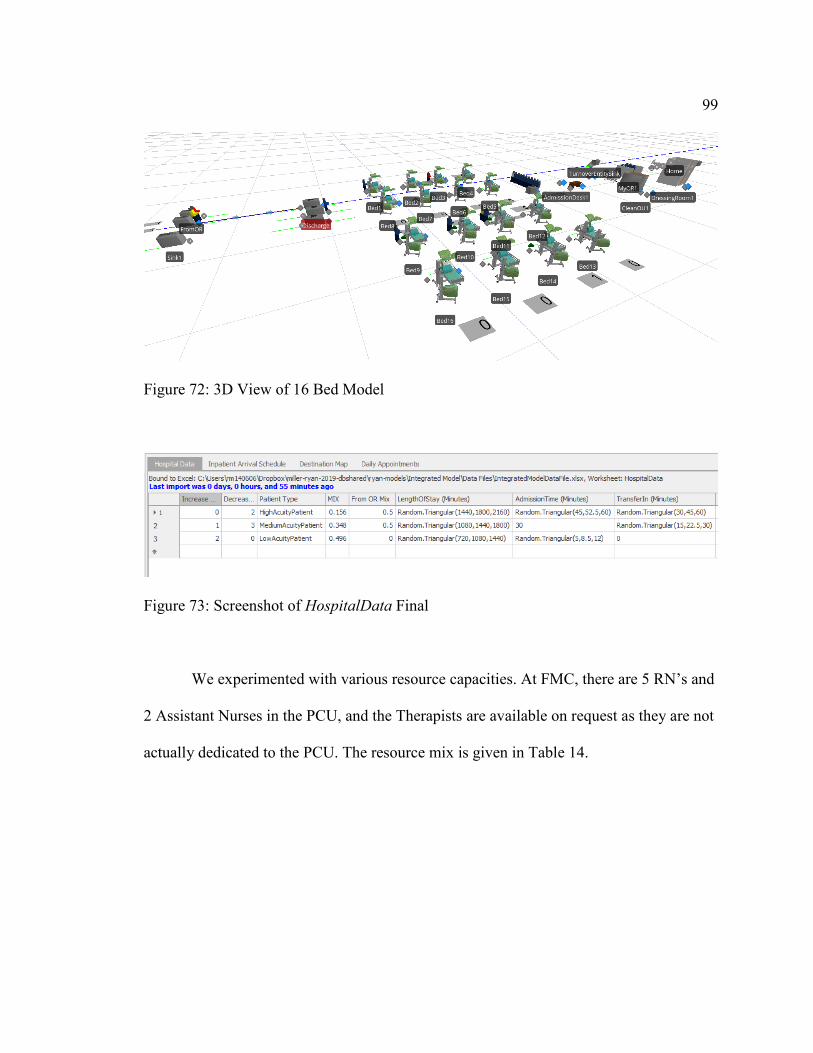
99
Figure 72: 3D View of 16 Bed Model
Figure 73: Screenshot of HospitalData Final
We experimented with various resource capacities. At FMC, there are 5 RN’s and
2 Assistant Nurses in the PCU, and the Therapists are available on request as they are not
actually dedicated to the PCU. The resource mix is given in Table 14.
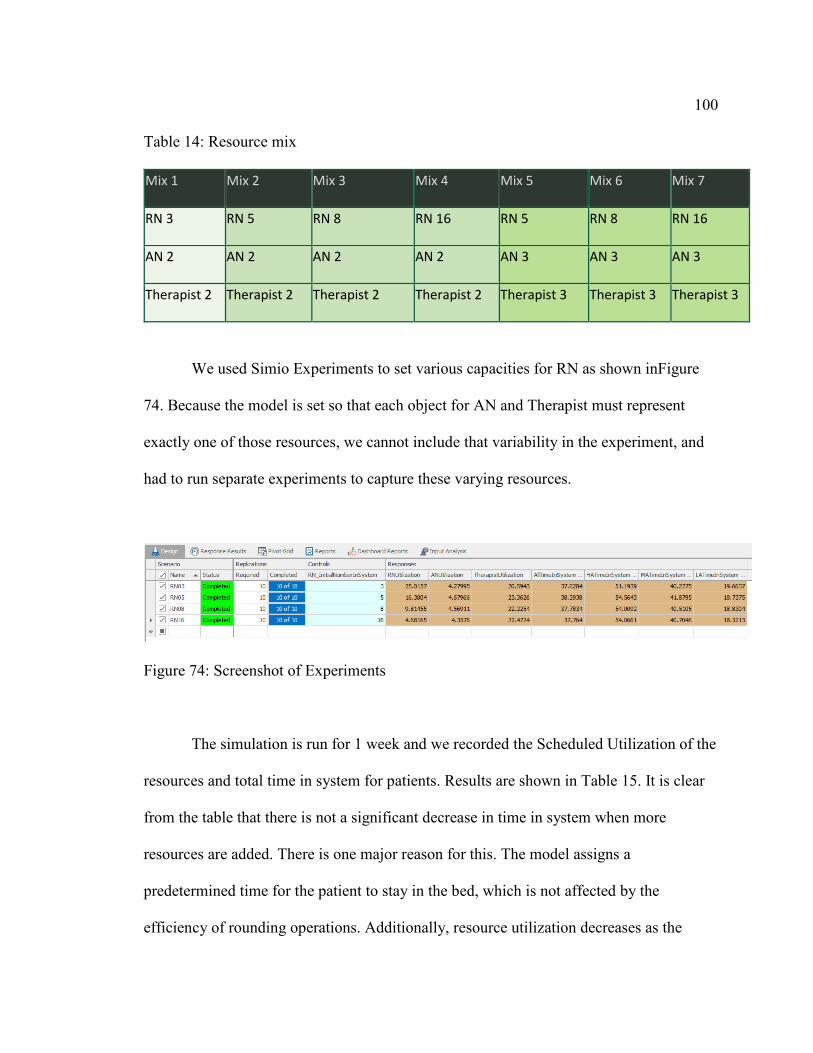
100 Table 14: Resource mix
Mix 1 Mix 2 Mix 3 Mix 4 Mix 5 Mix 6 Mix 7 RN 3 RN 5 RN 8 RN 16 RN 5 RN 8 RN 16 AN 2 AN 2 AN 2 AN 2 AN 3 AN 3 AN 3 Therapist 2 Therapist 2 Therapist 2 Therapist 2 Therapist 3 Therapist 3 Therapist 3
We used Simio Experiments to set various capacities for RN as shown inFigure
74. Because the model is set so that each object for AN and Therapist must represent
exactly one of those resources, we cannot include that variability in the experiment, and
had to run separate experiments to capture these varying resources.
Figure 74: Screenshot of Experiments
The simulation is run for 1 week and we recorded the Scheduled Utilization of the
resources and total time in system for patients. Results are shown in Table 15. It is clear
from the table that there is not a significant decrease in time in system when more
resources are added. There is one major reason for this. The model assigns a
predetermined time for the patient to stay in the bed, which is not affected by the
efficiency of rounding operations. Additionally, resource utilization decreases as the
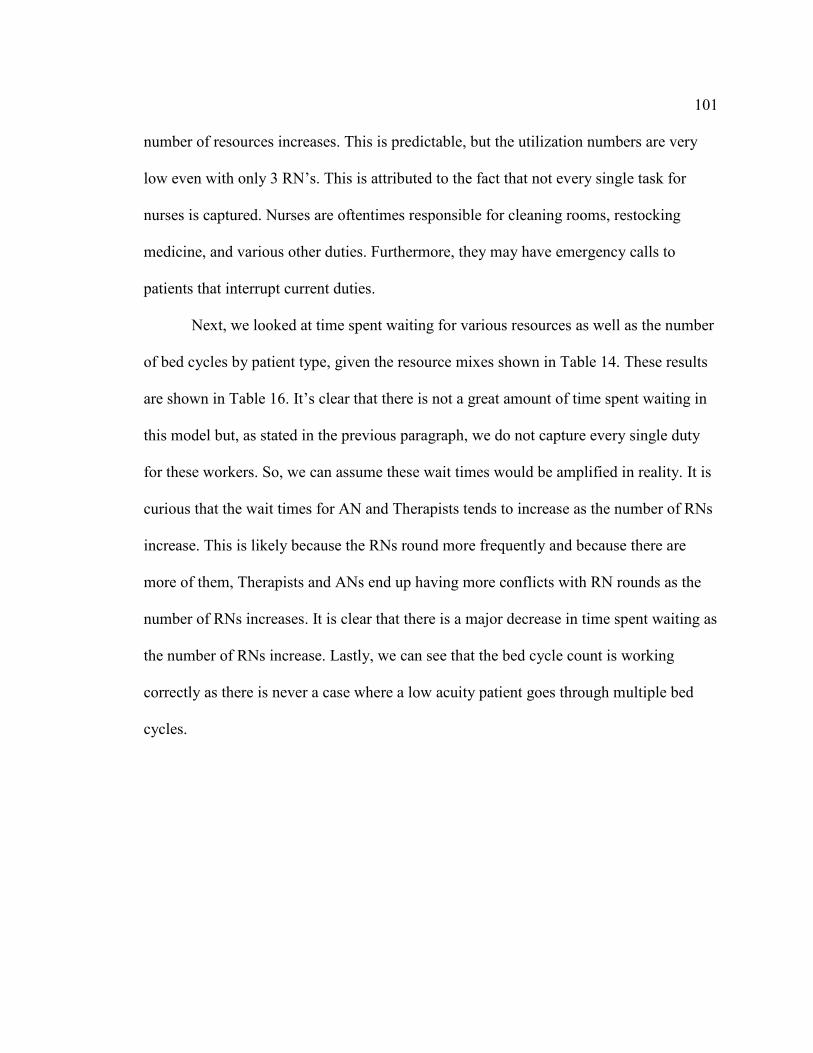
101 number of resources increases. This is predictable, but the utilization numbers are very
low even with only 3 RN’s. This is attributed to the fact that not every single task for
nurses is captured. Nurses are oftentimes responsible for cleaning rooms, restocking
medicine, and various other duties. Furthermore, they may have emergency calls to
patients that interrupt current duties.
Next, we looked at time spent waiting for various resources as well as the number
of bed cycles by patient type, given the resource mixes shown in Table 14. These results
are shown in Table 16. It’s clear that there is not a great amount of time spent waiting in
this model but, as stated in the previous paragraph, we do not capture every single duty
for these workers. So, we can assume these wait times would be amplified in reality. It is
curious that the wait times for AN and Therapists tends to increase as the number of RNs
increase. This is likely because the RNs round more frequently and because there are
more of them, Therapists and ANs end up having more conflicts with RN rounds as the
number of RNs increases. It is clear that there is a major decrease in time spent waiting as
the number of RNs increase. Lastly, we can see that the bed cycle count is working
correctly as there is never a case where a low acuity patient goes through multiple bed
cycles.
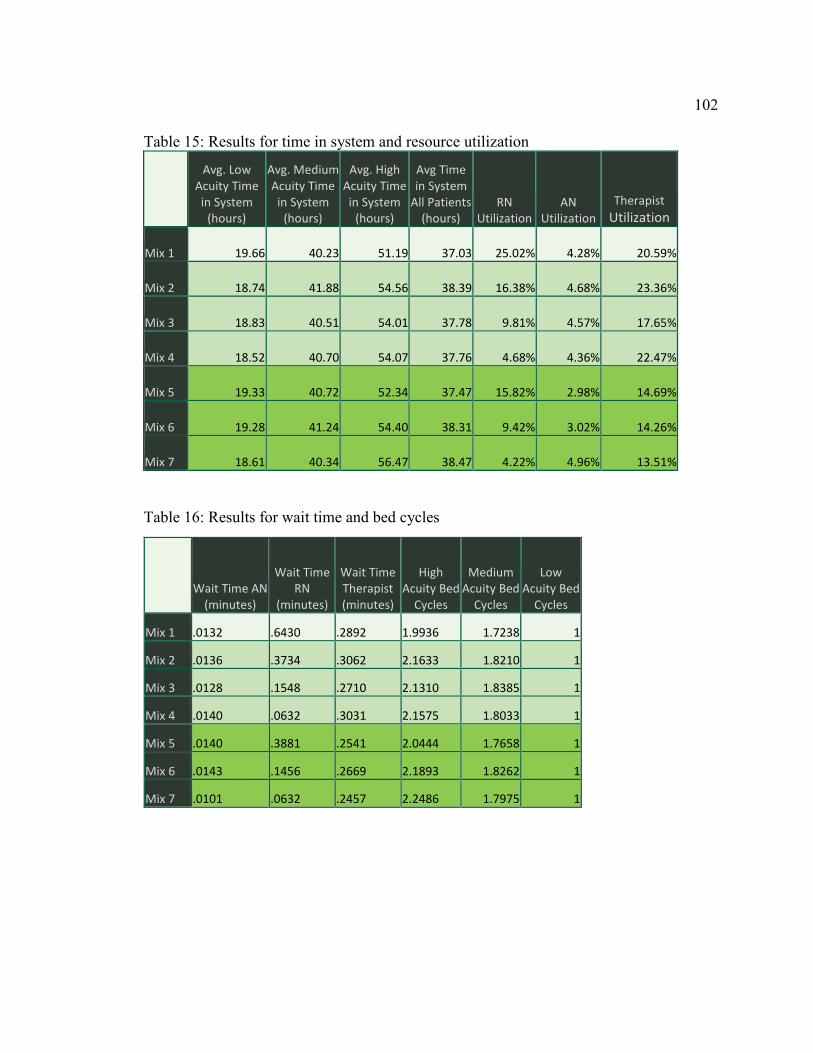
102 Table 15: Results for time in system and resource utilization
Avg. Low Acuity Time in System
(hours)
Avg. Medium Acuity Time in System
(hours)
Avg. High Acuity Time in System
(hours)
Avg Time in System
All Patients (hours)
RN Utilization AN
Utilization Therapist
Utilization Mix 1 19.66
40.23 51.19
37.03 25.02% 4.28% 20.59% Mix 2 18.74
41.88 54.56
38.39 16.38% 4.68% 23.36% Mix 3 18.83
40.51 54.01
37.78 9.81% 4.57% 17.65% Mix 4 18.52
40.70 54.07
37.76 4.68% 4.36% 22.47% Mix 5 19.33
40.72 52.34
37.47 15.82% 2.98% 14.69% Mix 6 19.28
41.24 54.40
38.31 9.42% 3.02% 14.26% Mix 7 18.61
40.34 56.47
38.47 4.22% 4.96% 13.51%
Table 16: Results for wait time and bed cycles
Wait Time AN (minutes)
Wait Time RN
(minutes) Wait Time Therapist (minutes)
High Acuity Bed
Cycles Medium
Acuity Bed Cycles
Low Acuity Bed
Cycles Mix 1 .0132 .6430 .2892 1.9936 1.7238 1 Mix 2 .0136 .3734 .3062 2.1633 1.8210 1 Mix 3 .0128 .1548 .2710 2.1310 1.8385 1 Mix 4 .0140 .0632 .3031 2.1575 1.8033 1 Mix 5 .0140 .3881 .2541 2.0444 1.7658 1 Mix 6 .0143 .1456 .2669 2.1893 1.8262 1 Mix 7 .0101 .0632 .2457 2.2486 1.7975 1
103
CHAPTER 5: CONCLUSION AND FUTURE WORK
In this research, two separate hospital units are integrated into one simulation
model using custom Simio objects. The objective is to create a codependency between
these two units within that model, in order to fully integrate them. To do that, logic had to
be altered within the custom objects, variables created, and new process logic created at
the Main Model level. The changes were implemented and the methods were tested to
prove the integration behaves accordingly.
5.1 Summary
Several custom objects were used to build an integrated model of a surgical unit
and a progressive care unit. The surgical unit contained objects for patient entity,
admission desk, clean room, pre-op, operating room, dressing room, and postanesthesia
care unit. The progressive care unit had objects for the bed and for the patient entity.
The Bed Object was tested for validity before it was substantially enhanced.
These enhancements were implemented to handle various scheduling conflicts, to
properly route patients and to handle scenarios where the patient undergoes a change in
acuity level during their stay.
A great challenge for integration was the fact that there are two customized
patient entity objects, one for each unit. These entities contain vital information to drive
the model in their respective units. In cases a patient undergoes surgery and requires an
inpatient stay multiple entity types are required to capture such instances. Further
complicating this situation is the handling of bed resource seizures. A surgical patient
must be able to seize a bed while recovering in the postanesthesia care unit (PACU).
104 Logic was altered for the PACU object so that inpatients would be able to seize a bed
before that entity leaves the PACU and is inherently destroyed. Logic had to be
implemented to release the bed object and instantaneously seize that same bed again as a
new entity is created for that patient, on the PCU side of the model. This method was
tested and proved effective in seizing the bed before transferring to the PCU.
5.2 Conclusion
The integrated simulation model can be reused for different scenarios by altering
the data in the Excel file IntegratedModelDataFile.xlsx. This integration is not limited to
progressive care units and can be used for any inpatient units if the appropriate data items
are altered. Furthermore, multiple operating rooms may be used for the surgical unit. This
simulation model can help optimize resources requirements and experiment with shared
resources between the models such as shared nurses. In conclusion, the integrated
simulation model is a great tool to study a more complete patient lifecycle. Instead of
focusing on just one unit, hospitals could use such a model to be able to study patient
flow through both units as they oftentimes do. Of particular interest is bed availability
inpatient units for incoming patients from the surgical units. Improving patient flow is of
great relevance today, with a global pandemic that is causing a great shortage of inpatient
beds. Higher efficiency services can improve patient flow, getting patients in and out of
the hospital faster so that they may service the growing number of people in demand of
services.
105
5.3 Future Work
The current model integrates flow from the surgical unit to the progressive care
unit, but in a real life scenario patients that elect for inpatient surgery will generally arrive
to the hospital the evening before surgery to be admitted to an inpatient bed. Therefore,
we need to integrate flow from the PCU (or other inpatient units) to the surgical unit. The
care these patients receive previous to surgery may also be different than the regular
rounding operations for other patients. Research on these practices must be done to
advance this principle.
Further experimentation with shared resources between PCU and surgical units
could allow for some insightful recommendations to hospitals. There could also be shared
resources between various inpatient units. Future work should consider this.
Resource priorities are currently stochastic but in reality are dynamic. If there is
an excessive queue, nurses will focus on that queue before others, unless there is a
immediate danger to a patient’s health. This should also be considered. We know from
conversations with FMC that there are instances where patients require immediate and
sometimes emergency attention. This is not captured in the model because the statistics
were not available. Further discussion with healthcare professionals is required.
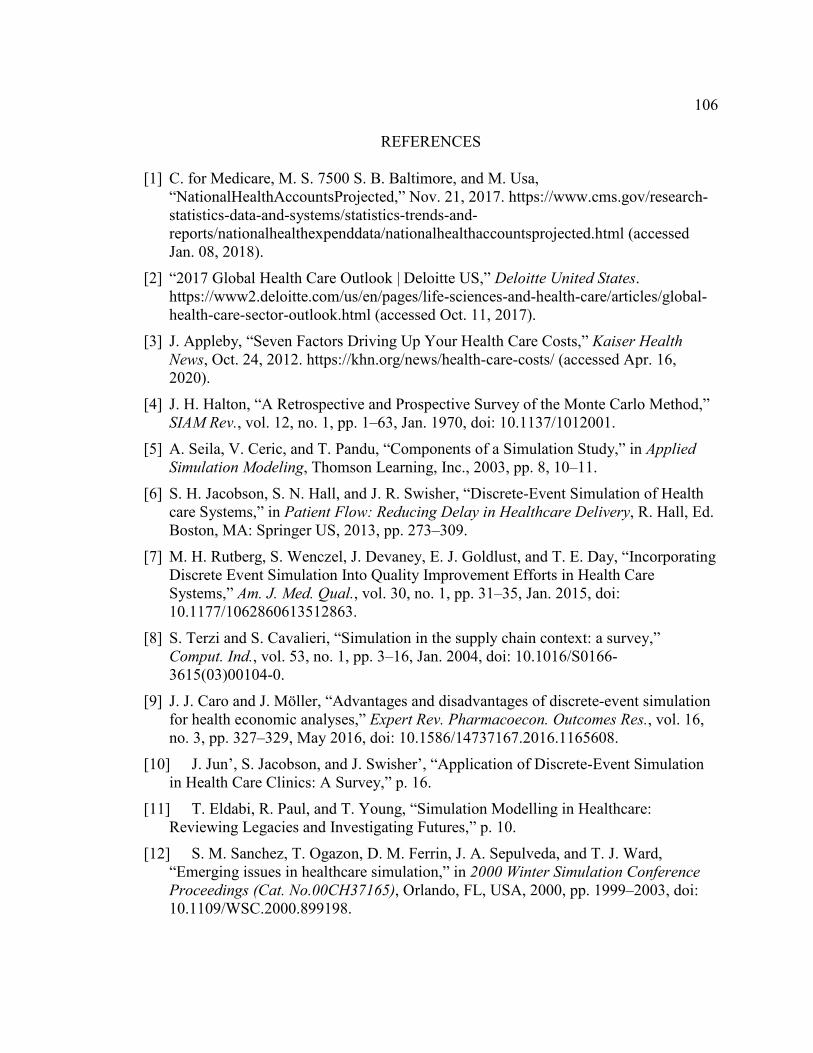
106
REFERENCES
[1] C. for Medicare, M. S. 7500 S. B. Baltimore, and M. Usa, “NationalHealthAccountsProjected,” Nov. 21, 2017. https://www.cms.gov/research-statistics-data-and-systems/statistics-trends-and-reports/nationalhealthexpenddata/nationalhealthaccountsprojected.html (accessed Jan. 08, 2018).
[2] “2017 Global Health Care Outlook | Deloitte US,” Deloitte United States. https://www2.deloitte.com/us/en/pages/life-sciences-and-health-care/articles/global-health-care-sector-outlook.html (accessed Oct. 11, 2017).
[3] J. Appleby, “Seven Factors Driving Up Your Health Care Costs,” Kaiser Health News, Oct. 24, 2012. https://khn.org/news/health-care-costs/ (accessed Apr. 16, 2020).
[4] J. H. Halton, “A Retrospective and Prospective Survey of the Monte Carlo Method,” SIAM Rev., vol. 12, no. 1, pp. 1–63, Jan. 1970, doi: 10.1137/1012001.
[5] A. Seila, V. Ceric, and T. Pandu, “Components of a Simulation Study,” in Applied Simulation Modeling, Thomson Learning, Inc., 2003, pp. 8, 10–11.
[6] S. H. Jacobson, S. N. Hall, and J. R. Swisher, “Discrete-Event Simulation of Health care Systems,” in Patient Flow: Reducing Delay in Healthcare Delivery, R. Hall, Ed. Boston, MA: Springer US, 2013, pp. 273–309.
[7] M. H. Rutberg, S. Wenczel, J. Devaney, E. J. Goldlust, and T. E. Day, “Incorporating Discrete Event Simulation Into Quality Improvement Efforts in Health Care Systems,” Am. J. Med. Qual., vol. 30, no. 1, pp. 31–35, Jan. 2015, doi: 10.1177/1062860613512863.
[8] S. Terzi and S. Cavalieri, “Simulation in the supply chain context: a survey,” Comput. Ind., vol. 53, no. 1, pp. 3–16, Jan. 2004, doi: 10.1016/S0166-3615(03)00104-0.
[9] J. J. Caro and J. Möller, “Advantages and disadvantages of discrete-event simulation for health economic analyses,” Expert Rev. Pharmacoecon. Outcomes Res., vol. 16, no. 3, pp. 327–329, May 2016, doi: 10.1586/14737167.2016.1165608.
[10] J. Jun’, S. Jacobson, and J. Swisher’, “Application of Discrete-Event Simulation in Health Care Clinics: A Survey,” p. 16.
[11] T. Eldabi, R. Paul, and T. Young, “Simulation Modelling in Healthcare: Reviewing Legacies and Investigating Futures,” p. 10.
[12] S. M. Sanchez, T. Ogazon, D. M. Ferrin, J. A. Sepulveda, and T. J. Ward, “Emerging issues in healthcare simulation,” in 2000 Winter Simulation Conference Proceedings (Cat. No.00CH37165), Orlando, FL, USA, 2000, pp. 1999–2003, doi: 10.1109/WSC.2000.899198.
107 [13] R. Miller and D. Sormaz, “Generic Process Mapping and Simulation Modeling of
Inpatient Units in a Medical Center,” p. 6. [14] M. M. Günal and M. Pidd, “Discrete event simulation for performance modelling
in health care: a review of the literature,” J. Simul., vol. 4, no. 1, pp. 42–51, Mar. 2010, doi: 10.1057/jos.2009.25.
[15] C. D. Pegden, “Intelligent Objects: The Future of Simulation,” p. 7. [16] S. C. Brailsford, “Tutorial: Advances and challenges in healthcare simulation
modeling,” in 2007 Winter Simulation Conference, Washington, DC, USA, Dec. 2007, pp. 1436–1448, doi: 10.1109/WSC.2007.4419754.
[17] L. Standfield, T. Comans, and P. Scuffham, “MARKOV MODELING AND DISCRETE EVENT SIMULATION IN HEALTH CARE: A SYSTEMATIC COMPARISON,” Int. J. Technol. Assess. Health Care, vol. 30, no. 2, pp. 165–172, Apr. 2014, doi: 10.1017/S0266462314000117.
[18] “FlexSim Healthcare | Healthcare Simulation and Modeling,” FlexSim Healthcare. https://healthcare.flexsim.com/ (accessed Jul. 29, 2020).
[19] D. Adam, “Special report: The simulations driving the world’s response to COVID-19,” Nature, vol. 580, no. 7803, Art. no. 7803, Apr. 2020, doi: 10.1038/d41586-020-01003-6.
[20] “COVID-19 and surge capacity in U.S. hospitals.” https://www.the-hospitalist.org/hospitalist/article/220527/coronavirus-updates/covid-19-and-surge-capacity-us-hospitals (accessed Aug. 11, 2020).
[21] E. A. Crawford, P. J. Parikh, N. Kong, and C. V. Thakar, “Analyzing Discharge Strategies during Acute Care: A Discrete-Event Simulation Study,” Med. Decis. Making, vol. 34, no. 2, pp. 231–241, Feb. 2014, doi: 10.1177/0272989X13503500.
[22] M. Raunak, L. Osterweil, A. Wise, L. Clarke, and P. Henneman, “Simulating patient flow through an Emergency Department using process-driven discrete event simulation,” in 2009 ICSE Workshop on Software Engineering in Health Care, Vancouver, BC, Canada, 2009, pp. 73–83, doi: 10.1109/SEHC.2009.5069608.
[23] J. D. Griffiths, N. Price-Lloyd, M. Smithies, and J. E. Williams, “Modelling the requirement for supplementary nurses in an intensive care unit,” J. Oper. Res. Soc., vol. 56, no. 2, pp. 126–133, Feb. 2005, doi: 10.1057/palgrave.jors.2601882.
[24] N. Mustafee, T. Lyons, P. Rees, L. Davies, M. Ramsey, and M. D. Williams, “Planning of bed capacities in specialized and integrated care units: Incorporating bed blockers in a simulation of surgical throughput,” in Proceedings Title: Proceedings of the 2012 Winter Simulation Conference (WSC), Berlin, Germany, Dec. 2012, pp. 1–12, doi: 10.1109/WSC.2012.6465102.
[25] U. O. Olabisi and N. Chukwunoso, “Discrete-Event Simulation Modeling of Patient Flow in Healthcare Systems,” p. 26.
108 [26] T. Young, J. Eatock, M. Jahangirian, A. Naseer, and R. Lilford, “Three critical
challenges for modeling and simulation in healthcare,” in Proceedings of the 2009 Winter Simulation Conference (WSC), Austin, TX, USA, Dec. 2009, pp. 1823–1830, doi: 10.1109/WSC.2009.5429186.
[27] C. R. Busby and M. W. Carter, “Data-driven generic discrete event simulation model of hospital patient flow considering surge,” in 2017 Winter Simulation Conference (WSC), Las Vegas, NV, Dec. 2017, pp. 3006–3017, doi: 10.1109/WSC.2017.8248022.
[28] G. Birch and S. Cook, “Discrete event simulation in Smalltalk/V Windows,” in IEE Colloquium on Object-Oriented Simulation and Control, Mar. 1991, p. 5/1-5/3.
[29] J. S. Smith, D. T. Sturrock, and W. D. Kelton, Simio & Simulation - Modeling, Analysis, Applications, 5th edition. McGraw Hill, 2014.
[30] C. D. Pegden, “How Simio Objects Differ from Other Object-Oriented Modeling Tools,” p. 1.
[31] A. Venkitasubramanian, S. D. Roberts, and J. A. Joines, “Object oriented framework for healthcare simulation,” in 2015 Winter Simulation Conference (WSC), Huntington Beach, CA, USA, Dec. 2015, pp. 1436–1446, doi: 10.1109/WSC.2015.7408266.
[32] D. Sormaz and M. Malik, “Use of Simulation in Allocating Resources in the Inpatient Unit,” p. 6.
[33] M. Malik, “Discrete Event Simulatino of Operating Rooms Using Data-Driven Modeling,” Ohio University, 2018.

!!!!!!!!!!!!!!!!!!!!!!!!!!!!!!!!!!!!!!!
!!
Thesis and Dissertation Services