integrated management of tomato late blight
TRANSCRIPT
INTEGRATED MANAGEMENT OF TOMATO LATE BLIGHT
[Phytophthora infestans (Mont.) de Bary] THROUGH HOST PLANT
RESISTANCE AND REDUCED FREQUENCY OF FUNGICIDE
APPLICATION IN GAMO GOFA ZONE, SOUTHERN ETHIOPIA
MSc THESIS
GETACHEW GUDERO MENGESHA
JUNE 2017
HARAMAYA UNIVERSITY, HARAMAYA
INTEGRATED MANAGEMENT OF TOMATO LATE BLIGHT
[Phytophthora infestans (Mont.) de Bary] THROUGH HOST PLANT
RESISTANCE AND REDUCED FREQUENCY OF FUNGICIDE
APPLICATION IN GAMO GOFA ZONE, SOUTHERN ETHIOPIA
A Thesis Submitted to the School of Plant Sciences (Plant Protection
Program), College of Agriculture and Environmental Sciences
Postgraduate Programs Directorate
HARAMAYA UNIVERSITY
In Partial Fulfillment of the Requirements for the Degree of
MASTER OF SCIENCE IN PLANT PATHOLOGY
By
GETACHEW GUDERO MENGESHA
JUNE 2017
HARAMAYA UNIVERSITY, HARAMAYA
ii
POSTGRADUATE PROGRAMS DIRECTORATE
HARAMAYA UNIVERSITY
We hereby certify that we have read and evaluated this Thesis prepared under our guidance by
GETACHEW GUDERO MENGESHA entitled ‘‘Integrated Management of Tomato
Late Blight [Phytophthora infestans (Mont.) de Bary] Through Host Plant Resistance
and Reduced Frequency of Fungicide Application in Gamo Gofa Zone, Southern
Ethiopia’’. We recommend that it be submitted as fulfilling the Thesis requirements.
1. Prof. Temam Hussien ( PhD) Name of Major Adviser Signature Date 2. Asso. Prof. Mashilla Dejene (PhD) Name of Co-Adviser Signature Date 3. Dr. Birhanu Biazin (PhD) _ _ Name of Co-Adviser Signature Date
As members of the Board of Examiners of the MSc Thesis Open Defense Examination, we
certify that we have read, evaluated the Thesis prepared by GETACHEW GUDERO
MENGESHA, and examined the candidate. We recommend that the Thesis be accepted as
fulfilling the Thesis requirements for the Degree of Master of Science in Plant Pathology.
Dr. Mulatu Wakgari (PhD) _________________ _______________
Chairperson Signature Date
Prof. Chemeda Fininsa (PhD) _________________ _______________
Internal Examiner Signature Date
Dr. Bekele Kassa (PhD) _________________ _______________
External Examiner Signature Date
iii
DEDICATION
This MSc Thesis is dedicated to my beloved wife, Mrs. Nigist Sahile, and my daughter, Adey
Getachew, and my beloved parents, Ato Gudero Mengesha, W/ro Yewoyin’eshet Tefera, Ato
Sahile Haile, W/ro Aselefech Jemal and Ms. Elsabet Sahile, for their unlimited affection and
effort in the success of my research work.
iv
STATEMENT OF THE AUTHOR
By my signature below, I declare and affirm that this Thesis is my own work. I have followed
all ethical principles of scholarship in the preparation, data collection, data analysis and
completion of this Thesis. All scholarly matters that have been included in the Thesis have
been given recognition through citations. I affirm that I have cited and referenced all sources
used in this document. Every serious effort has been made to avoid any plagiarism in the
preparation of this Thesis.
This Thesis is submitted in partial fulfillment of the requirements for a degree from the
Postgraduate Programs Directorate at Haramaya University. The Thesis is deposited in the
Haramaya University Library and is made available to borrowers under the rules of the
Library. I solemnly declare that this Thesis has not been submitted to any other institution
anywhere for the award of any academic degree, diploma or certificate.
Brief quotations from this Thesis may be used without special permission provided that
accurate and complete acknowledgement of the source is made. Requests for permission for
extended quotations from, or reproduction of, this Thesis in whole or in part may be granted
by the Head of the School or the Director of the Postgraduate Programs Directorate when in
his or her judgment the proposed use of the material is in the interest of scholarship. In all
other instances, however, permission must be obtained from the author of the Thesis.
Name: Getachew Gudero Mengesha
Signature:
Date: 13 June 2017
School: Plant Sciences, Haramaya University, Haramaya
v
BIOGRAPHICAL SKETCH
The author was born in Wonji-Shoa, East Shoa Zone of Oromia Regional State on 20 March
1987 G.C. He attended his primary and junior secondary education at Wonji Gefersa
Elementary School and Wonji Comprehensive Secondary high School, respectively, and his
preparatory education at Adama Hawas Preparatory School.
After successfully passing the Ethiopian Schools Leaving Certificate Examination (ESLCE),
he joined Ambo University in 2007 G.C and graduated with Bachelor of Science Degree in
Agriculture (Crop Production) in July 2009. Following his graduation, the author was
employed by the Ministry of Agriculture and stationed at the Agricultural and Rural
Development Office in Siltie Zone Lanfuro Woreda of Southern Nations, Nationalities and
Peaople’s Regional State, Ethiopia, and served as a Crop Production and Protection Expert at
crop work process since 2010 G.C. After two years of services, he joined the Arbaminch
Agricultural Research Center (AARC) of Southern Agricultural Research Institute (SARI) in
2012 G.C and has served as a Plant Pathology Researcher for three successive years.
After giving a long service in the Ministry of Agriculture and Natural Resources (Previously
known by Ministry of Agriculture and Rural Development), he joined the Postgraduate
Programs Directorate of Haramaya University in 2015 to pursue his MSc Degree in Plant
Pathology. The author is married and father of one daughter.
vi
ACKNOWLEDGEMENTS
First and foremost, I thank the Almighty and Merciful God, for providing me all the patience
and endurance in all aspects and for successful completion of my Thesis research work.
My special appreciation and deepest thanks go to my research major advisor Prof. Temam
Hussien Ayalew (Haramaya University), for shaping my thinking and keeping momentum
going during problem solving, intellectual stimulation, professional guidance, inspiring
discussion, encouragement, and valuable criticism on the whole set up of the Thesis
manuscript. You provided me with tremendous constructive and valuable comments and
suggestions. As the same line, next to him, I am also delighted to acknowledge my research
co-advisors Dr. Mashilla Dejene (Haramaya University) and Dr. Birhanu Biazin
(LIVES/ILRI) for their outstanding suggestions, motivations, genuine criticism and close
supervision of the study sites.
My immense thanks go to my friends: Abu Jambo Yae Bule Hora University and colleagues
in Plant Pathology, Agronomy and Plant Breeding for their incontestable attitude and kind
collaboration and moral support, during the course of the Thesis research. Mr Gezimu Gelu
(Natural Resource Research Work Process Co-ordinator at AARC), Otoro Olikie (Agricultural
Growth Program Co-ordinator at SARI) and Mekete Manjura (Livestock Research Work
Process Co-ordinator at AARC) are highly praised and in no way forgettable. I owe debt to
extend my heartfelt appreciation and special gratitude to all fellows who helped me in one
way or another for the accomplishment of this study.
This study would have not been completed without the help of the Southern Agricultural
Research Institute (SARI) and Livestock and Irrigation Value Chain for Ethiopian
Smallholders (LIVES). I am thankful to SARI and LIVES/ILRI for granting me a study leave
and accommodation and for providing me with the required financial support for the Thesis
research work, respectively. I am also grateful to the Haramaya University for raising my
education to the current level.
Furthermore, I want to express my deepest gratitude to my father and Mother for their
determination to encourage and take care of me throughout my life. The rest of my relatives
vii
also deserve high appreciation and are acknowledged for their unreserved material and moral
supports. Last but not the least, the motivation, assistance and effort made by my lovely wife,
and rest of the staff members are priceless and beyond word expression for me.
viii
ABBREVIATIONS AND ACRONYMS
AARC Arbaminch Agricultural Research Center
ARPTD2 ARP Tomato D2
ANOVA Analysis of Variance
AUDPC Area Under Disease Progress Curve
CSA Central Statistical Agency
CYI Change in Yield Increase
DẬP Diammonium Phosphate
DAT Date After Planting
DIC Difference in Input Cost
DNI Difference in Net Income
EIAR Ethiopian Institute of Agricultural Research
IDM Integrated Disease Management
ILRI International Livestock Research institute
LIVES Livestock and Irrigation Value Chain for Ethiopian
Smallholders
LSD Least Significant Difference
MARC Melkassa Agricultural Research Center
MRR Marginal Rate of Return
NDP Number of Diseased Plants
NPR Number of Plants Rated
PSI Percent Severity Index
RCBD Randomized Complete Block Design
SARI Southern Agricultural Research institute
SNNPR
Southern Nations, Nationalities and People’s Region
ix
TABLE OF CONTENTS
STATEMENT OF THE AUTHOR iv
BIOGRAPHICAL SKETCH v
ACKNOWLEDGEMENTS vi
ABBREVIATIONS AND ACRONYMS viii
TABLE OF CONTENTS ix
LIST OF TABLES xii
LIST OF FIGURES xiii
LIST OF TABLES IN THE APPENDIX xiv
ABSTRACT xv
1. INTRODUCTION 1
1.1. Background and Justifications 1
1.2. Significance of the Study 3
2. LITERATURE REVIEW 5
2.1. Tomato and Its Production 5
2.1.1. Biology, Importance and Habitat of Tomato (Solanum lycopersicum Mill.) 5
2.1.2. Tomato Production 6
2.2. Tomato Production Constraints 7
2.3. Tomato Late Blight (Phytophthora infestans) 8
2.3.1. Economic Importance and Distribution of P. infestans 8
2.3.2. Biology of the Pathogen (P. infestans) 10
2.3.3. Host Range of P. infestans 12
2.3.4. Symptoms and Signs P. infestans 12
2.3.5. Disease Cycle and Epidemiology P. infestans 14
2.3.5.1. Disease Cycle of P. infestans 14
2.3.5.2. Epidemiology of P. infestans 16
2.3.6. Management Options for P. infestans 18
2.3.6.1. Cultural Practices 18
x
TABLE OF CONTENTS… (Continueed)
2.3.6.2. Host Plant Resistance 19
2.3.6.3. Biological Control 20
2.3.6.4. Chemical Control 20
2.3.6.5. Integrated Disease Management 22
3. MATERIALS AND METHODS 24
3.1. Description of the Experimental Site 24
3.2. Experimental Materials 24
3.3. Seedling Raising and Transplanting 25
3.4. Treatments, Experimental Design and Trial Management 25
3.5. Disease Assessment 28
3.6. Assessment of Growth, Yield and Yield Related Traits and Meteorological
Data 30
3.7. Data Analysis 31
3.8. Relative Percent of Pield Loss and Yield Increase in Fruit Yield 31
3.9. Cost and Benefit Analysis 32
4. RESULTS AND DISCUSSION 33
4.1. Effect of Variety and Fungicide Applications on Tomato Late Blight
Development 33
4.1.1. Incidence of Late Blight 33
4.1.2. Severity of Late Blight 34
4.1.3. Area Under Disease Progress Curve 36
4.1.4. Disease Progress Rate 37
4.1.5. Percent Fruit Infection per Plant 39
4.1.6. Other Diseases and Insect Pests of Tomato 41
xi
TABLE OF CONTENTS… (Continueed)
4.2. Effect of Variety and Fungicide Frequencies on Tomato Late Blight on Crop
Growth, Yield and Yield Related Parameters 42
4.2.1. Crop Growth Parameters 42
4.2.1.1. Days to 50% Flowering and Fruit Setting 43
4.2.1.2. First and Last Picking Date 43
4.2.1.3. Number of Branches per Plant and Plant Stand Count at Harvest 45
4.2.2. Yield and Yield Related Parameters 47
4.2.2.1. Marketable, Unmarketable and Total Fruit Yield 47
4.2.2.2. Yield Related Parameters 48
4.3. Association of Late Blight Epidemics with Tomato Fruit Yields 50
4.4. Relative Yield Loss and Yield Increase in Fruit Yields 53
4.5. Cost and Benefit Analysis 55
5. SUMMARY, CONCLUSIONS AND RECOMMENDATIONS 58
6. REFERENCES 60
7. APPENDICES 74
xii
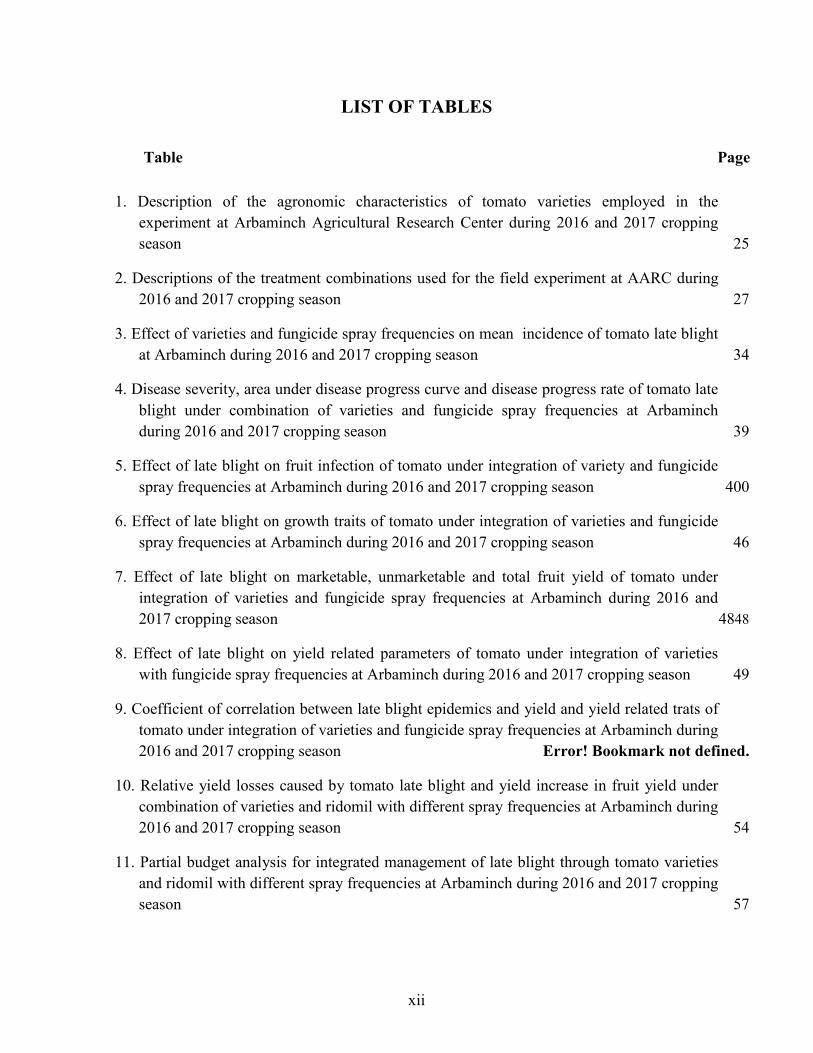
LIST OF TABLES
Table Page
1. Description of the agronomic characteristics of tomato varieties employed in the
experiment at Arbaminch Agricultural Research Center during 2016 and 2017 cropping
season 25
2. Descriptions of the treatment combinations used for the field experiment at AARC during
2016 and 2017 cropping season 27
3. Effect of varieties and fungicide spray frequencies on mean incidence of tomato late blight
at Arbaminch during 2016 and 2017 cropping season 34
4. Disease severity, area under disease progress curve and disease progress rate of tomato late
blight under combination of varieties and fungicide spray frequencies at Arbaminch
during 2016 and 2017 cropping season 39
5. Effect of late blight on fruit infection of tomato under integration of variety and fungicide
spray frequencies at Arbaminch during 2016 and 2017 cropping season 400
6. Effect of late blight on growth traits of tomato under integration of varieties and fungicide
spray frequencies at Arbaminch during 2016 and 2017 cropping season 46
7. Effect of late blight on marketable, unmarketable and total fruit yield of tomato under
integration of varieties and fungicide spray frequencies at Arbaminch during 2016 and
2017 cropping season 4848
8. Effect of late blight on yield related parameters of tomato under integration of varieties
with fungicide spray frequencies at Arbaminch during 2016 and 2017 cropping season 49
9. Coefficient of correlation between late blight epidemics and yield and yield related trats of
tomato under integration of varieties and fungicide spray frequencies at Arbaminch during
2016 and 2017 cropping season Error! Bookmark not defined.
10. Relative yield losses caused by tomato late blight and yield increase in fruit yield under
combination of varieties and ridomil with different spray frequencies at Arbaminch during
2016 and 2017 cropping season 54
11. Partial budget analysis for integrated management of late blight through tomato varieties
and ridomil with different spray frequencies at Arbaminch during 2016 and 2017 cropping
season 57
xiii
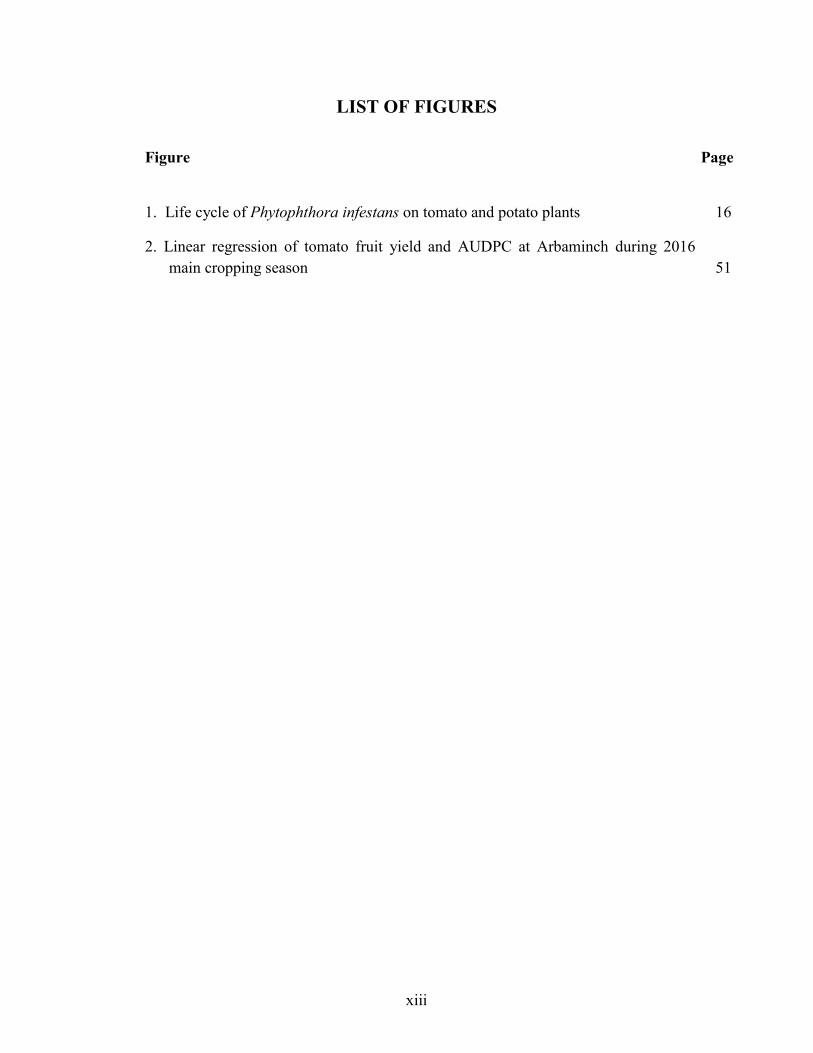
LIST OF FIGURES
Figure Page
1. Life cycle of Phytophthora infestans on tomato and potato plants 16
2. Linear regression of tomato fruit yield and AUDPC at Arbaminch during 2016
main cropping season 51
xiv
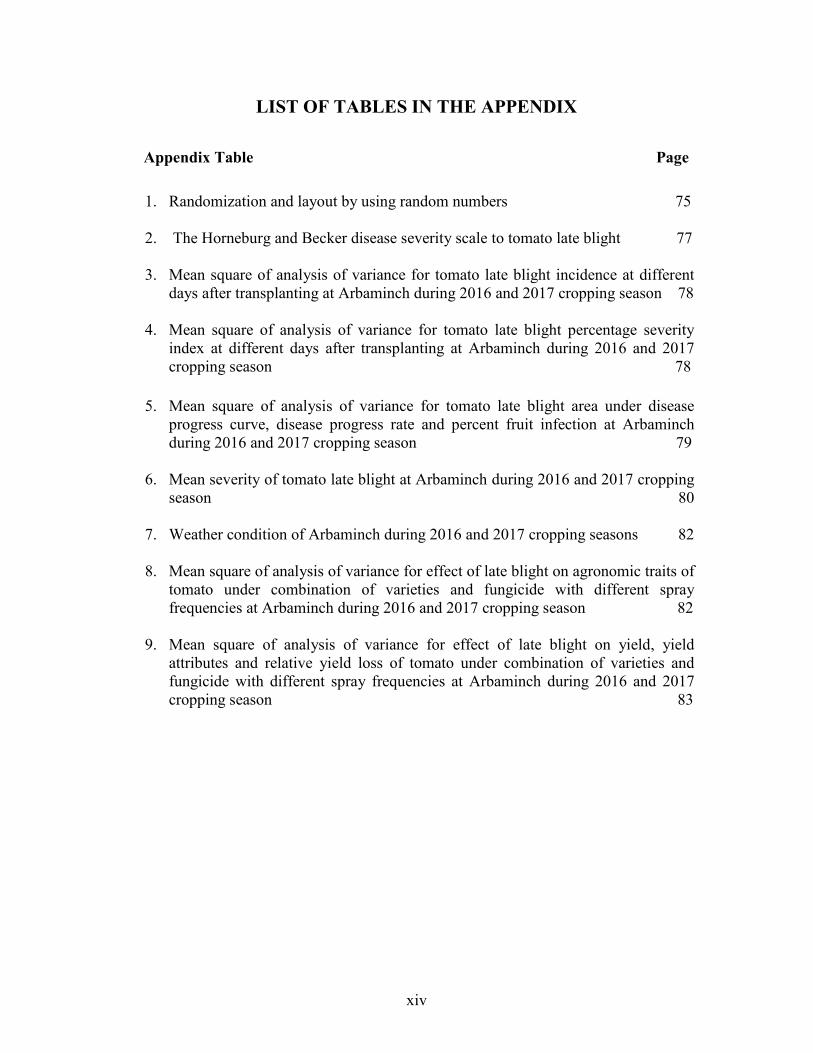
LIST OF TABLES IN THE APPENDIX
Appendix Table Page
1. Randomization and layout by using random numbers 75
2. The Horneburg and Becker disease severity scale to tomato late blight 77
3. Mean square of analysis of variance for tomato late blight incidence at different
days after transplanting at Arbaminch during 2016 and 2017 cropping season 78
4. Mean square of analysis of variance for tomato late blight percentage severity index at different days after transplanting at Arbaminch during 2016 and 2017 cropping season 78
5. Mean square of analysis of variance for tomato late blight area under disease progress curve, disease progress rate and percent fruit infection at Arbaminch during 2016 and 2017 cropping season 79
6. Mean severity of tomato late blight at Arbaminch during 2016 and 2017 cropping
season 80
7. Weather condition of Arbaminch during 2016 and 2017 cropping seasons 82
8. Mean square of analysis of variance for effect of late blight on agronomic traits of tomato under combination of varieties and fungicide with different spray frequencies at Arbaminch during 2016 and 2017 cropping season 82
9. Mean square of analysis of variance for effect of late blight on yield, yield
attributes and relative yield loss of tomato under combination of varieties and fungicide with different spray frequencies at Arbaminch during 2016 and 2017 cropping season 83
xv
INTEGRATED MANAGEMENT OF TOMATO LATE BLIGHT
[Phytophthora infestans (Mont.) de Bary] THROUGH HOST PLANT
RESISTANCE AND REDUCED FREQUENCY OF FUNGICIDE
APPLICATION IN GAMO GOFA ZONE, SOUTHERN ETHIOPIA
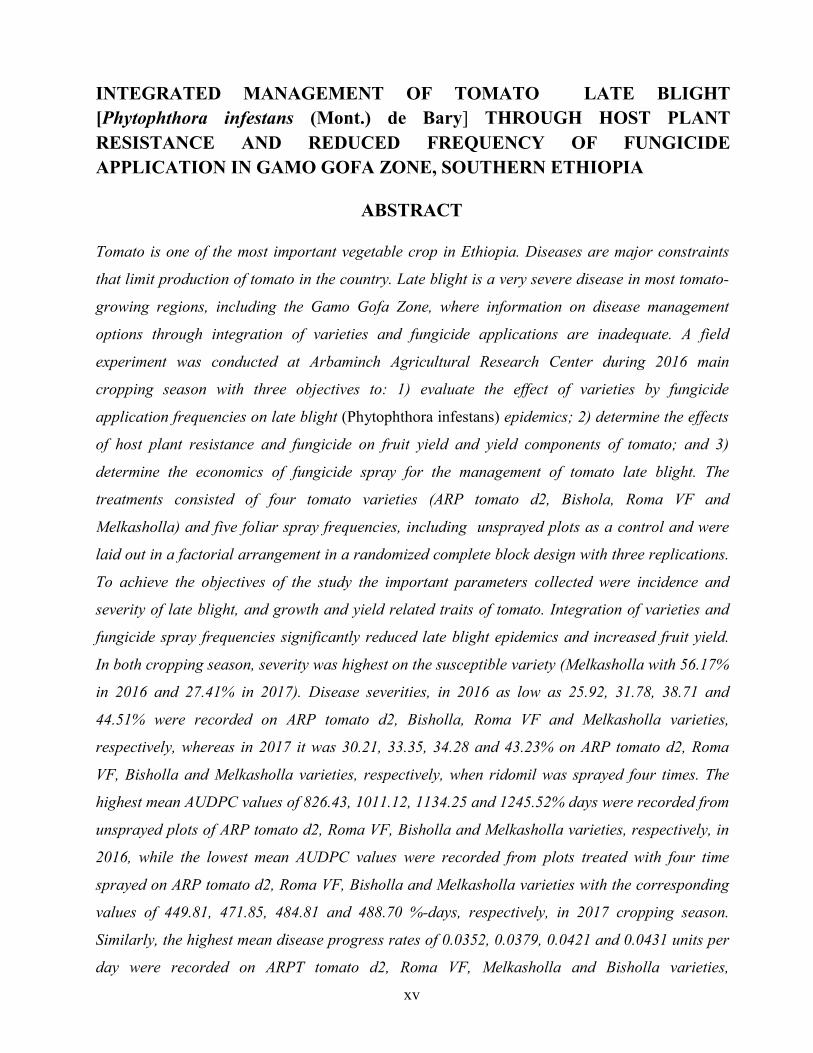
ABSTRACT Tomato is one of the most important vegetable crop in Ethiopia. Diseases are major constraints
that limit production of tomato in the country. Late blight is a very severe disease in most tomato-
growing regions, including the Gamo Gofa Zone, where information on disease management
options through integration of varieties and fungicide applications are inadequate. A field
experiment was conducted at Arbaminch Agricultural Research Center during 2016 main
cropping season with three objectives to: 1) evaluate the effect of varieties by fungicide
application frequencies on late blight (Phytophthora infestans) epidemics; 2) determine the effects
of host plant resistance and fungicide on fruit yield and yield components of tomato; and 3)
determine the economics of fungicide spray for the management of tomato late blight. The
treatments consisted of four tomato varieties (ARP tomato d2, Bishola, Roma VF and
Melkasholla) and five foliar spray frequencies, including unsprayed plots as a control and were
laid out in a factorial arrangement in a randomized complete block design with three replications.
To achieve the objectives of the study the important parameters collected were incidence and
severity of late blight, and growth and yield related traits of tomato. Integration of varieties and
fungicide spray frequencies significantly reduced late blight epidemics and increased fruit yield.
In both cropping season, severity was highest on the susceptible variety (Melkasholla with 56.17%
in 2016 and 27.41% in 2017). Disease severities, in 2016 as low as 25.92, 31.78, 38.71 and
44.51% were recorded on ARP tomato d2, Bisholla, Roma VF and Melkasholla varieties,
respectively, whereas in 2017 it was 30.21, 33.35, 34.28 and 43.23% on ARP tomato d2, Roma
VF, Bisholla and Melkasholla varieties, respectively, when ridomil was sprayed four times. The
highest mean AUDPC values of 826.43, 1011.12, 1134.25 and 1245.52% days were recorded from
unsprayed plots of ARP tomato d2, Roma VF, Bisholla and Melkasholla varieties, respectively, in
2016, while the lowest mean AUDPC values were recorded from plots treated with four time
sprayed on ARP tomato d2, Roma VF, Bisholla and Melkasholla varieties with the corresponding
values of 449.81, 471.85, 484.81 and 488.70 %-days, respectively, in 2017 cropping season.
Similarly, the highest mean disease progress rates of 0.0352, 0.0379, 0.0421 and 0.0431 units per
day were recorded on ARPT tomato d2, Roma VF, Melkasholla and Bisholla varieties,
xvi
respectively, in 2016, whereas the lowest rate on ARP tomato d2, Roma VF, Bisholla and
Melkasholla varieties with corresponding value of 0.0112, 0.0148, 0.0176 and 0.0219 units per
day, respectively, were recorded in 2017 cropping season, as a result of four times sprayed. Late
blight severity, AUDPC and disease progress rate were reduced on variety ARPTD2and Roma VF
as compared to the other two varieties in both cropping season. In 2016 and 2017 cropping
season, three times foliar applications with ridomil proved to be an effective treatment against late
blight and gave the highest (44.16 and 38.25 t ha-1) marketable fruit yield over the control (22.92
and 19.59 t ha-), respectively. Fruit yield loss of up to 54.41 % and 62.55 % were calculated on
unsprayed control plots as compared to highly treated plots in 2016 and 2017 cropping season,
respectively. Nevertheless, marginal analysis indicated that the highest 40.00% and 41.30%
marginal rate of return in comparison with unsprayed plots was obtained where ridomil at two
times for ARPT tomato d2 variety for both cropping seasons as compared to other spray
frequencies. In conclusion, integrations of varieties and two times for ARPTD2and Roma VF
varieties and three times for Bisholla and Melkasholla varieties ridomil foliar sprays were found
to be an effective treatment in reducing tomato late blight epidemics and increasing fruit yield.
Thus it is recommended to use this spray frequency as it gave the highest protection against late
blight and the highest monetary benefit as compared to the other treatments and the control.
However, further extensive studies have to be undertaken for developing concrete recommendation
for late blight management options through integration of varieties and fungicide applications that
may contribute to sustainability by stabilizing tomato production in the country.
Keywords: AUDPC, disease progress rate, disease severity, marginal analysis, Phytophthora
infestans, ridomil sprays, Solanum lycopersicon, tomato varieties, yield.
1. INTRODUCTION
1.1. Background and Justifications
Tomato, Solanum lycopersicum Mill. (syn. Lycopersicon esculentum Mill or Lycopersicon
lycopersicum Mill), is an important vegetable crop grown around the world and is second to
potato only (Rubatzky and Yamaguchi, 1997; Mutschler et al., 2006). Tomato is the most
widely cultivated and lucrative vegetable in Ethiopia in particular and in the world in general.
Tomato is one of the most important vegetable crops and widely grown in Ethiopia, ranking
8th in annual national production (Derbew et al., 2012). The importance of tomato is
increasing and since it is a high value commodity, it has been given top priority in vegetable
research too in Ethiopia (Tsedeke, 2007). Small-scale farmers and commercial growers could
grow the crop for its fruits in different regions of the country. It is produced both during the
rainy and dry seasons under supplemental irrigation (Lemma, 2002). Under this circumstance
the total area under tomato production in Ethiopia reaches 9767.78 ha and in Meher season
production is estimated to be over 913,013.42 t with the average productivity of 93.47 t ha-
1(CSA, 2016).
Despite its importance, the average national yield of tomato in the country is significantly
low due to different reasons: insect pests and plant pathogens causing serious diseases that
affect tomato yields significantly and play an essential role in agricultural production. Poor
agricultural practices lead to increased disease incidences. Insect pests and diseases, not only
cause reduction of produce and quality, but also increase cost of production. Sommer (1985)
reported that fungi are the most important and prevalent pathogens causing destructive and
economically important losses (30 – 100%). These diseases cause massive deaths of plants
resulting in reduced yields and decrease in incomes to farmers. In particular, these diseases
and unavailability or inaccessibility of improved varieties against the diseases are major
constraints contributing much to the production and promotion reduction of the component
crops in the growing areas. To reduce such losses and severity of the diseases, management
options, including up to date information, must be forwarded to decide on the management
measures.
2
In Gamo Gofa and its surrounding areas, the environmental condition is favourable for
tomato production. Due to this, currently the crop is widely grown on about 3,520 ha of land
and its production is increasing from time to time. However, the yield of this crop is very low
(estimated at 4.85 t ha-1) as compared with the national average yield of 93.47 t ha-1 (CSA,
2016). This low productivity is attributed to several factors among which diseases, like late
blight, are the main ones according to Arbaminch Crop Protection Clinic and Gamo Gofa
Zonal Agriculture Bureau (Unpublished data, 2015). The diseases affect the crop at different
growth stages in the field. Late blight [Phytophthora infestans (Mont.) de Bary] has a
property of occurring due to the availability of suitable environmental conditions, which
encompass high moisture and low temperature for tomato late blight in the surrounding study
areas (Agrios, 2005; Stone, 2014). Tomato late blight disease occurs year after year in this
area and causes considerable yield losses, 63.7 - 100% in tomato fields in the study areas,
Gamo Gofa in southern Ethiopia (Working paper, 2014).
To prevent the tomato yield loss due to late blight, farmers use indiscriminately whatever
fungicide they find in their areas singly or in combination with each other or frequent sprays
of single fungicide for a particular disease up to harvesting for all tomato varieties
irrespective of cropping season if they showed the first appearance of the disease symptoms
on the leaves. However, the indiscriminate use of fungicides has adverse effects on human
and animal health, pollute the environment and also lead to development of resistance by the
pathogen (Green et al., 1990; WHO, 2004). This necessitates the use of integrated disease
management options that include host plant resistance and alternate sprays, like frequency of
either protectant or systemic fungicides, in different year with different cropping seasons. In
addition, reports on combination of varieties and fungicide sprays indicate that performance
of varieties may vary with frequency of sprays. A variety may perform well with one spray;
another with two sprays and yet another may require more sprays. This has economic as well
as ecological implications. A variety that will perform well with one or two sprays will
definitely be preferred to a variety that requires more spray frequencies and also the need for
frequent application of fungicide may vary with cropping season which may favor or delay
the development of the target pathogen during the growing period, either in the same
cropping season in different location or in different year with different cropping seasons.
These alternative management options and host plant disease resistance including different
year and cropping season have not been evaluated in the study area.
3
With this background and based on the principle of integrated disease management (IDM),
which states developing IDM should focus on no or minimum input of chemical pesticide,
the research addresses questions, such as: What are the effects of host plant résistance and
frequencies of application of different fungicide on epidemics of tomato late blight? How
much relative fruit yield loss is caused by late blight under different management systems?
Answers based on empirical studies under field conditions to the above questions would help
stabilize yield of tomato fruits and would improve the returns to farmers producing the crop,
thereby promoting large-scale production on commercial basis. Hence the hypothesis of the
study was that the use of host plant resistance and use of appropriate fungicide application
would reduce the epidemics and associated damages caused by Phytophthora infestans and
would increase yield and gross margin obtained in the tomato plots.
Thus, this study was carried out with the general objective to determine the effects host plant
resistance and fungicide frequencies for the management of tomato late blight and to ensure
their technical know-how on tomato production and protection and draw implication of
extensions.
Therefore, the research was done with the following prime and specific objectives to:
1. Evaluate the effect of host plant resistance and fungicide spray frequencies on
tomato late blight epidemics;
2. Determine the effects of host plant resistance and fungicide on fruit yield and
yield components of tomato; and
3. Determine the economics of fungicide spray for the management of tomato late
blight.
1.2. Significance of the Study
The occurrence of tomato late blight, if it gets suitable environmental conditions, can cause
considerable yield losses; even can lead to 100% yield losses (Guenthner et al., 2001). It is
known that decline of tomato productivity is due to different factors and tomato late blight is
one of such factors that impair quality and quantity of the yield. This leads to reduction in
supply of tomato to the market demand and income dwindling for smallholder farmers and
investors. For the disease management, most of the farmers do not use proper cultural
4
practices, like intra and inter row spacing and staking, to prevent fall down of tomato to the
ground, and disease resistant variety(-ies). Instead, they use different fungicides irrespective
of the right frequencies and rates. This obviously leads to material wastage, yield losses and
health problem for humans and the quality properties of the crop itself as well as
development of resistance by the pathogen to the fungicide(s) (WHO, 2004; Majid et al.,
2008).
Therefore, the significance of the study was to overcome or reduce the constraints caused by
tomato late blight. Hence, the disease management adoption by farmers will be analyzed and
the economic losses of tomatoes due to the disease be determined in due time, and the
disease attack of the tomato varieties evaluated by integrated management through host plant
resistance and fungicide based on the recommended uses of fungicides, and finally
recommendations for the disease management in the areas were provided; and also the
cost/benefit analysis of the use of fungicides for the management of this disease revealed the
downstreaming of the high tomato production costs.
Furthermore, the scope of the study was restricted to the evaluation of the integrated effect of
host plant resistance and fungicide applications on late blight disease epidemics, and effect
on fruit yield and yield components of tomato. Accordingly, the farming communities of the
areas, consumers, traders, researchers, government and nongovernmental organizations are
expected to be benefited from the outcomes of this particular study. Also, from this research,
an article would be published following presentation of the research outcomes.
5
2. LITERATURE REVIEW
2.1. Tomato and Its Production
2.1.1. Biology, Importance and Habitat of Tomato (Solanum lycopersicum Mill.)
Although tomato (Solanum lycopersicumn L.) is actually an herbaceous perennial, it is grown
as an annual vegetable crop and develops into branched bush or vine with compound leaves
and yellow flowers (Rice and Rice, 2000). The plant is commonly used as an annual herb
with erect to prostrate stems, i.e. growth habit ranges between erect and prostrate, and the
plant has a strong taproot with a dense system of lateral and adventitious roots. Additionally,
the stem is solid, coarsely hairy and glandular. Leaves are spirally arranged, and flowers are
bisexual (self-pollinated) and regular. Fruits are fleshy berry, globular to oblate in shape.
Seeds are numerous, kidney or pear shaped (Akida et. al., 2015).
The crop is grown for its fruits, which are used in salads or cooked as a vegetable, in
processed form as tomato paste (puree), tomato sauce, ketchup and juice and the ripe fruits
are rich in nutrients, minerals and vitamins A, B and C. Consumption of tomato is important
because it contains lycopene, a food component known to reduce incidences of prostate
cancer, heart and age-related diseases as well as a source of β-carotene (USDA, 2005).
Processing type varieties are used for the production of purees, juices, canned fruits and
sauces. The seeds contain 24% edible oil (Tindall, 1988). In the growing areas, tomato is
produced mainly as a source of income and food both under rainfed and irrigated conditions
and in home gardens as well. The majority of fresh market tomato is produced by small scale
farmers and commercial growers along river banks and lake areas.
Tomato plants are described as determinate or indeterminate. The term 'determinate' refers to
the plant growth habit, where determinate tomato plants grow like a bush to a certain size
(about 0.9 to 1.5 meter), set fruit, and then decline. Most of the early ripening tomato
varieties are of the determinate type,whereas the vines of indeterminate plants continue to
grow until frost or disease kills them. Many of the standard sized and all summer tomatoes
typical of the home garden are of the indeterminate type; they require support of some kind
for best results since the fruit would otherwise be in contact with the soil and thus susceptible
to rot and other diseases (Babu et al., 2000).
6
2.1.2. Tomato Production
Tomato is planted predominantly in low altitude growing-areas. This crop has a special place
in the farming system because of the intensive nature of the crop. Tomato can give high yield
per unit area of land compared to cereals and, hence, generates high income for farmers due
to multiple cropping per year, high market value and profitability.
Tomato is the second most important vegetable crop next to potato. Present world production
is about 100 million tons fresh fruit produced on 3.7 million hectares. Tomato production has
been reported for 144 countries, the major country being China in both hectares of harvested
production (1,255,100 ha) and total weight of fruit produced (30,102,040 t). The two leading
countries in fruit yield per hectare are the Netherlands (546.92 t ha-1) and Belgium (459.29 t
ha-1). The top five leading fruit-producing countries are China, Egypt, India, Turkey and the
United States (FAOSTAT, 2012). During the last few years, tomato production in Ethiopia
showed a marked increase. The margin of the current achievements, in area and output is a
small development compared to the possible level that can be attained. However, the national
average tomato fruit yield in Ethiopia is very low (61.12 t ha-1) compared to the world
productivity even to the neighboring. Tomato production of individual peasant farm is
mainly for self-sufficiency in food and income. Nevertheless, state organizations and
currently few private sectors get their land mechanized for commercial purposes.
Tomato production requires a relatively cool, dry climate for high yield and premium quality.
However, it is adapted to a wide range of climatic conditions from temperate to hot and
humid tropical conditions. The optimum temperature for most tomato varieties lies between
21 and 24 °C. The tomato plants can survive a range of temperatures, but the plant tissues are
damaged below 10 and above 38 °C. Water stress and long dry periods will cause buds and
flowers to drop off, and the fruits to split. Tomato requires a deep, loamy, well-drained soil
with a range of pH between 5.5 and 6.8. If soil drainage is a problem then tomato can be
planted in a raised bed. Generally, tomato grows well on most mineral soils that have proper
water holding capacity and aeration, and are free of salt (Akida et. al., 2015). Like all fruiting
plants, tomato requires full sun for most of the day.
Tomato is cultivated in every country at latitude from the equator virtually to the polar circle.
Its versatility in fresh or processed form and adaptability has played a major role in its rapid
7
spread. Tomato gives more yields per unit area than cereals and its price in the market is also
attractive, especially when it is produced during slack period of production. In Ethiopia, the
crop is grown between 700 and 2000 meter above sea level (m.a.s.l.), with about 700 to over
1400 millimeter annual rainfall, in different areas and seasons, in different soils, under
different weather conditions, but also at different levels of technology (example, with furrow,
drip or spate/furrow irrigation) and yields (Lemma, 2002; Birhanu and Ketema, 2010). In the
past, Ethiopia was renowned for its subsistence agriculture or food production that was
dependent on rainfall. Wherever there was shortage or unreliable rainfall, the country,
therefore, relied on food aids. Frequent dry spells and droughts exacerbate the incidence of
crop failure and hence food insecurity and poverty (Awulachew et al., 2007). However, use
of irrigated tomato production can alleviate tomato shortage due to the prevailing droughts
and effect of disease during the rainy season.
2.2. Tomato Production Constraints Production challenges for tomato crop include insect pests, diseases, weeds and harsh
environmental conditions, like climate change. It is well known that diseases remain and
pose the biggest challenges in tomato production. It is estimated that there are more than 200
known diseases affecting tomatoes worldwide. Tomato diseases are rampant in lowlands and
highlands in the tropics and can cause 15 - 95% crop loss (Jarvis and McKeen, 2013).
Tesfaye and Habtu (1986), Sakhuja et al. (2004) and Seid et al. (2015) reported that early
blight (Alternaria solani), late blight (Phytophthora infestans), fruit spot (Xanthomonas
campestris pv. vesicatoria), Septoria leaf spot (Septoria lycopersici), powdery mildew
(Leveillula taurica), bacterial wilt [Ralstonia (Pseudomonas) solanacearum or Clavibacter
michiganense subsp. michganense], tomato leaf curl (Tobacco virus 16 or Nicotiana virus
10) and plant-parasitic nematodes (genera: Pratylenchus, Meloidogyne, Helicotylenchus, and
Longidorus) are the major and economically important tomato diseases in Ethiopia.
In Gamo Gofa and its surrounding areas, foliar disease like tomato late blight is the most
common one. Tomato late blight disease is a threat to tomato production in the areas,
especially Arbaminch areas during the rainy season because of the environmental condition
which is high rain-fall, relative humidity and lower temperature and these favour the build up
of the pathogen, Phytophthora infestans, and in addition, the pathogen has other important
alternate hosts, like potato in the Gamo highlands (Chencha, Dita, Boreda and other districts)
8
of the area to lowland come through run-off. These areas produce potato dominantly
throughout the year, both in the main and the belg seasons and create management
difficulties for the disease. Moreover, production of tomato is constrained due to shortage of
high yielding varieties, low inputs, lack of appropriate postharvest technologies, inadequate
technology transfer system, shortage of knowledge in utilization of the crops, poor marketing
system, poor cultural practices, poor irrigation system and lack of responsible organization to
multiply seeds of improved varieties, and these are additional productivity-limiting factors
(Unpublished data).
2.3. Tomato Late Blight (Phytophthora infestans)
2.3.1. Economic Importance and Distribution of P. infestans
The highlands of central Mexico are considered by many to be the center of origin of P.
infestans although others have proposed its origin to be in the Andes, which is also the origin
of potatoes (Grünwald and Flier, 2005; Gomez-Alpizar et al., 2007). Before 1980, the A1
mating type of P. infestans was the only strain distributed worldwide, with the A2 mating
type only reported in central Mexico where mating and oospore formation occurred in the
field. Since 1980, the A2 mating type and oospores have been discovered in Switzerland
(Hohl and Iselin, 1984), the UK (Tantius et al., 1986), the Netherlands (Frinking et al., 1987)
and Germany (Dagget et al., 1993). Previously, the A2 mating type occurs in all continents
except Australia (Fry et al., 1992; Kato et al., 1992; Shattock, 1995) but currently it is found
in all continents though the exception for the countries within the continents (Ye Guang et
al., 2008). First reports of the A2 mating type in Africa were made on Egyptian potatoes in
1984 (Shaw et al., 1985).
A recent study evaluated these two alternate hypotheses and found conclusive support for
central Mexico being the center of origin (Goss et al., 2014). Migrations from Mexico to
North America or Europe have occurred several times throughout history, probably linked to
the movement of potato tubers and tomato fruits (Goodwin et al., 1994; Yoshida et al.,
2013). Until the 1970s, the A2 mating type was restricted to Mexico, but now in many
regions of the world both A1 and A2 mating type isolates can be found in the same region.
The co-occurrence of the two mating types is significant due to the possibility of sexual
recombination and formation of oospores, which can survive the winter. Only in Mexico and
9
Scandinavia, however, is oospore formation thought to play a role in overwintering (Gomez-
Alpizar et al., 2007; Fry, 2008). In other parts of Europe, increasing genetic diversity has
been observed as a consequence of sexual reproduction. This is notable since different forms
of P. infestans vary in their aggressiveness on potato or tomato, in sporulation rate, and
sensitivity to fungicides. Variation in such traits also occurs in North America; however,
importation of new genotypes from Mexico appears to be the predominant cause of genetic
diversity, as opposed to sexual recombination within potato or tomato fields. Many of the
strains that appeared outside of Mexico since the 1980s have been more aggressive, leading
to increased crop losses (Fry, 2008; Nowakowska, 2014).
It is well known that late blight affects both potato and tomato crops. Its impact on these
crops is the devastation and reduction of both nutritional and aesthetic value. Phytophthora
infestans is an important and destructive pathogen on potato and tomato, the pathogen has
been one of the most devastating diseases of tomatoes in both temperate and tropical regions
(Bolkan, 1997). It has historical significance as the cause of the Irish potato famine during
the 1840s. This famine resulted in the death of more than one million people and the
displacement of nearly two million more people during a short, five-year period. The Irish
potato famine is a devastating example of the epidemic potential of late blight. Wet, cool
environmental conditions, such as those prevalent during the 1840s in Ireland, favor
development of late blight. During wet, cool weather, crop loss due to late blight can be rapid
and nearly impossible to contro if preventative measures are not used (Ye Guang et al., 2008;
Stone, 2014). But on tomato crop the disease is not as such important as potato crop that
caused the historical famine in the world, particularly in Ireland.
Phytophthora infestans is economically the most important and most destructive tomato and
potato disease worldwide and the disease causes annual losses of several billion dollars and it
is a global threat for potato and tomato growers. The disease is capable of wiping out entire
crops even in commercial sized fields if the environmental/weather conditions are favorable.
Not only will potato and tomato yields decrease in a given year, but also infected tubers
could reside in the soil to infect future crops if not managed properly. Late blight can have a
large economic impact on a community through loss of tomato and potato yields, increased
unemployment, as well as through the cost of control. A study by Guenthner et al. (2001)
estimated the late blight cost to United State growers to be over US$ 287 million or US$ 507
per hectare taking into account yield decrease, storage loss, and decline in quality, price
10
adjustment, and fungicide use. Additionally, fungicide application requires the use of
machinery, which increases the amount of fuel or labour needed. From an environmental
standpoint, this may lead to decreases in energy supplies and increased pollution of the air
and water (Haverkort et al., 2008).
Worldwide average losses on unprotected fields in fruits and tuber yield due to late blight are
70% and with early disease outbreak even 100%. Under favourable weather conditions, the
pathogen can destroy tomato and potato foliage in 10 to 15 days and potential yield can be
reduced by 50 - 70% (Tymčenko and Jefronová, 1987). Currently late blight is more
dangerous to tomato and potato production than in the past and its management is more
difficult. Genetic changes within pathogen population represent the major challenge in the
efficient disease management (Hansen et al., 2003).
2.3.2. Biology of the Pathogen (P. infestans) Phytophthora infestans (Mont.) de Bary, as translated from Greek for “plant destroyer,” is a
member of the oomycetes. The oomycetes are a group of fungus-like microorganisms
sometimes referred to as the “water molds.” Fungus-like characteristics, including
heterotrophy and filamentous growth led to the belief that oomycetes, such as P. infestans,
were closely related to fungi; however, oomycetes are now considered to be more closely
related to photosynthetic microorganisms such as brown algae and diatoms than the true
fungi (de Bary, 1876; Lamour et al., 2007). It is belongs to a group of plant pathogens as
mentioned earlier commonly called “water molds” because of their affinity and special
adaptations to water habitat. Until the late 20th century, water molds were classified as fungi.
However, as their evolutionary relationships were revealed, they were reclassified within the
stramenophiles, a group with many aquatic organisms, such as brown algae. The species
Phytophthora infestans belongs to the domain: Eukaryota, kingdom: Chromista, phylum:
Heterokontophyta, class: Oomycetes, order: Peronosporales, family: Pythiaceae, and genus:
Phytophthora. The organism is morphologically similar to fungi but phylogenetically related
to brown algae, golden-brown algae and diatoms (Sogin and Silberman, 1998). The cell wall
consists mainly of cellulose and other glucans, in contrast to the true fungi where chitin is the
major cell wall component. Within the Oomycetes, the genus Phytophthora lacks the ability
to synthesize sterol and thiamine, and consequently needs to acquire these essential
compounds from the host plant (Avila-Adame et al., 2006; Nowicki, 2013).
11
Phytophthora infestans can grow on selective culture media. Commonly used media are rye
agar, V-8 juice agar, pea agar, cornmeal agar, corn seed agar, and lima bean agar. In culture,
the mycelium is white and fluffy; the colony is somewhat slow growing. Some isolates
produce a lumpy appearance: this has sometimes been associated with the A2 mating type. In
contrast to higher fungi, P. infestans has a nonseptated mycelium. It is a coenocytic
oomycete with rare cross walls or have no septation on the mycelium, and the mycelia are
branched and inter- or intra-cellular, often with haustoria. Another important difference
between fungi and Phytophthora species is that Phytophthora species produce motile spores
called “zoospores.” Zoospores are chemically attracted to plant tissue and able to swim
through water (example, in soil, drainage ditches, etc.) toward plant tissue where they form
an infective cyst. This characteristic has practical implications because P. infestans rapidly
produces abundant sporangia (lemon-shaped, zoospore-containing structures) on host tissue
during wet, cool weather (Nowicki, 2013).
Zoosporangia are oval or lemon-shaped, borne on ordinary mycelium or in sporangiospores.
Zoospores have two flagella, one long directed-forward tinsel type and a short backward-
directed whiplash type (Heterokont). Zoospores are usually uninucleate, but binucleate
zoospores have been detected (Turner, 2005). Asexual reproduction is via sporangia that are
ellipsoid to lemon-shaped with a small pedicel. Sporangia are 29 - 36 x 19 - 22 micrometer.
Sporangia germinate either directly to form a germ tube at temperatures of 15 – 24 OC, or
indirectly via zoospores at temperatures below 18 OC. Oogonia (sexual part), 38 (maximum
50) micrometer diameters, tapering at base, is rare in host or single culture, but develop
promptly on pairing isolates of opposite compatibility type. Oospores average 30
micrometer, aplerotic, wall three to four micrometers (Smart and Fry, 2001).
There are many strains of P. infestans, and they vary in their aggressiveness on potato and
tomato. Some isolates from potato are not too aggressive on tomato, but some can be
aggressive on both tomato and potato, such as the new strains isolated in the United States in
2009 (Avila-Adame et al., 2006; Stone, 2010). Shattock (1976) reported that the Oomycete
phytopathogen Phytophthora infestans undergoes frequent genetic changes. The population
of P. infestans associated with potato and tomato late blight is comprised only by isolates of
the A1 mating type, as previously reported in Ethiopia (Schiessendoppler and Molnar, 2002).
Recently, according to Daniel (2015) genotypic diversity and population structure of P.
infestans in Ethiopia associated with potato and tomato late blight is comprised only by
12
isolates of the A1 mating type, as a result, a sexually compatible genotype might not yet
introduced into the country. This would reduced the consequence of the high chance of
sexual reproduction to take place and the establishment of a recombining population as
reported elsewhere (Lehtinen and Hannukkala, 2004; Fry et al., 2009).
2.3.3. Host Range of P. infestans Phytophthora infestans is a hemi-biotrophic pathogen with a narrow host range. Most host
plants belong to the Solanum and Lycopersicum genera in the family Solanaceae (Vega-
Sanchez et al., 2000). The two main host crops in agriculture for P. infestans are potato and
tomato. Although generally considered to have a limited host range and to be a near-
biotrophic pathogen, P. infestans has been reported to cause infection on a large number of
species. Mycelia survive in plant debris under natural conditions and continue to cause
infection for short periods if contact is made with susceptible plant tissue. Oospores are the
main structure by which the pathogen survives in the soil for longer periods in the absence of
host tissue (Pittis and Shattock 1994; Drenth et al., 1995) and are important in infection of
potato and late blight epidemiology (Fry et al., 1992; Pittis and Shattock 1994; Drenth et al.,
1995). Tomatoes have been reported to support more oospore production than potatoes
(Cohen et al., 1997). Recently in 2009, Filipas (2009) listed 89 host species, but more than
25% of these were included because artificial inoculations resulted in lesions. In addition to
these globally important agricultural crops, P. infestans attacks wild and cultivated species of
Solanum in the world. Therefore, although the host range of P. infestans is potentially wide;
many pathogen genotypes may be specific to certain hosts.
2.3.4. Symptoms and Signs P. infestans Tomato late blight (P. infestans) is one of the most common and damaging diseases of
tomatoes. P. infestans can quickly devastate tomato at any time during plant ontogeny. It can
infect all above-ground parts of the plant, causing leaf and stem necrosis, fruit rot and
eventual plant death. It can also infect tomato seed (Rubin et al., 2001; Rubin and Cohen,
2004). The first symptoms usually appear on leaves as water-soaked, oily, pale or dark-green
or brown/black, circular or irregular lesions near leaflet margins. As the disease progresses,
lesions may occur elsewhere on the leaves. Typically, younger, more succulent, tissue is
affected first. As the disease progresses leaflets shrivel and die and the disease spreads to the
rest of the foliage, leading to extensive defoliation. During periods of abundant moisture,
13
sporulation of the pathogen can be seen by the naked eye as a white, cottony growth on the
underside of affected leaves and/or on fruit lesions. Moreover, it is primarily leaf spot and
foliage blight, but also may cause a black spotting around the stem end and shoulders of ripe
fruits in late autumn. Infected tomatoes have shallow, brownish or purplish lesions on the
surface of the leaves and fruits (Schumann and D’Arcy, 2000; Agrios, 2005).
When wet and cool conditions are prevalent, the disease usually progresses rapidly through
the plant canopy and crop, resulting in brown, shriveled foliage. Both green and ripe
tomatoes are susceptible to severe injury from late blight. Oily, brown/copper in color, and
often-sunken lesions form on both green and ripe fruits, this may remain firm. Lesions may
spread over the surface of the tomato, and secondary decay organisms generally follow the
late blight infection, causing various fruit rots. Often, the stem end of the fruit is affected
first, because spores tend to land on the top of fruit and small cracks favor infection by the
pathogen; however, this is not always the case. Petioles and stems also develop dark, oily
lesions. The odor from rotting, late blight-diseased plants and fruits is characteristically foul.
Dark brown late blight stem lesions often first appear at the top of the stem or at a node and
may progress down the stem. Firm, brown, and greasy tomato fruit lesions are often located
at the stem end and sides of green fruit, rendering them unmarketable. Infected tomato fruit
may be invaded by secondary organisms, causing soft-rot disease. Late blight lesions can
serve as pathways for other fruit diseases, including bacterial soft rot to enter, so late blight
symptoms can sometimes be obscured by symptoms of other diseases (Schumann and
D’Arcy, 2000; Agrios, 2005).
Identification of late blight on tomato plants is done by inspection of the fruit and foliage and
will initially appear as gray areas on the leaves. These areas will then spread and a mold will
develop on the lower surfaces of the leaves. The fuzzy growth on the underside of the tomato
leaf indicates that the late blight fungus is growing and producing spores. Brown spots on the
plant stems, as well as the loss of foliage, are also indications of late blight (Schumann and
D’Arcy, 2000).
14
2.3.5. Disease Cycle and Epidemiology P. infestans
2.3.5.1. Disease Cycle of P. infestans The life cycle of P. infestans includes rapid, asexual reproduction conducive to disease
development as well as sexual reproduction, which can lead to the generation of new
pathogen races. The success of P. infestans as a pathogen originates from its effective
asexual and sexual life cycles. Cool, humid, rainy or foggy conditions favor late blight
infection (Majid et al., 2008).
The asexual life cycle of P. infestans is characterized by alternating phases of hyphal growth,
sporulation, sporangia germination (either through zoospore release or direct germination, i.e.
germ tube emergence from the sporangium), and the re-establishment of hyphal growth
(Nowicki et al., 2013). The disease cycle begins when sporangia, spore-producing structures,
land on host plant tissue, which must be covered with a film of water. Sporangia germinate at
temperatures above 21 OC (optimally at 25 OC) directly on host tissue in a process taking
between 8 and 48 hours. Below 21 OC, up to eight biflagellate zoospores are released from
the sporangia. Biflagellate zoospores penetrate through the film of water, lose their flagella
and encyst until they produce germ tubes. This occurs after approximately two hours at an
optimum temperature between 12 and 15 OC. Germ tubes differentiate into appressoria that
invade the host through the leaf cuticle, or less frequently, the stomata. Germ tube
differentiation occurs optimally between 21 and 24 OC. Intercellular hyphae develop and
travel inside the host between cells, using haustoria to form biotrophic feeding relationships
in the mesophyll. Rapid colonization occurs optimally between 22 and 24 OC with relative
humidity of 70 - 80% for two days or more. Hyphae spread and sporangiophores eventually
emerge from stomata, soon after disease symptoms are apparent, which is often between 5
and 10 days after inoculation (Judelson, 1997).
Sporulation occurs to produce 2N sporangia, which eventually release zoospores to promote
aerial transmission of disease and continue the disease cycle (Judelson, 1997; Majid et al.,
2008). Both sporangia and zoospores are short-lived, in contrast to oospores, which can
persist in a viable form for many years. Under ideal conditions, the life cycle can be
completed on potato or tomato foliage in about five days (Nowicki et al., 2013). Disease
development ceases if temperatures increase above 35 OC though P. infestans can survive in
15
living host tissue and the disease can progress when conditions again become favorable
(Judelson and Blanco, 2005; Majid et al., 2008).
There is also a sexual cycle, which occurs when isolates of opposite mating type (A1 and A2)
meet. Hormonal communication triggers the formation of the sexual spores, called oospores
(Judelson and Blanco, 2005). When plants are infected with isolates of both mating types (A1
and A2), sexual reproduction with oospores formation may occur (Cohen et al., 1997;
Judelson and Blanco, 2005). The mating types are not dimorphic forms of P. infestans, but
are compatibility types differentiated by mating hormones (Judelson, 1997; Judelson and
Blanco, 2005). When mycelia of the two mating types interact, mating hormones induce
gametangial formation in the opposing mating types, resulting in sexual propagation by
means of oospore formation. During gametangia formation, vegetative, diploid mycelia
undergo meiosis to form haploid antheridia and oogonia. During the sexual life cycle, an
antheridium fuses with an oogonium to form a diploid oospore. Unlike sporangia, which are
airborne, fragile, and need live plants for survival, oospores can survive for extended periods
in harsh conditions outside the living host plant. Oospores can germinate under
environmentally favorable conditions and release diploid progeny of A1 or A2 mating type
(Judelson, 1997; Judelson and Blanco, 2005; Majid et al., 2008).
Asexually, sporangia are formed on infected leaf-surface in humid weather and are spread by
the wind or splashed by water to other plants. Both sporangia and zoospores are infective but
zoospores are believed to be more important inocula. Sexual reproduction results in
oospores-thick-walled spores that can survive or persist for several years in the soil.
Oospores are more abundantly formed in stems than in foliage, probably because the stems
survive blight attack longer than leaves (Mosa et al., 1991).
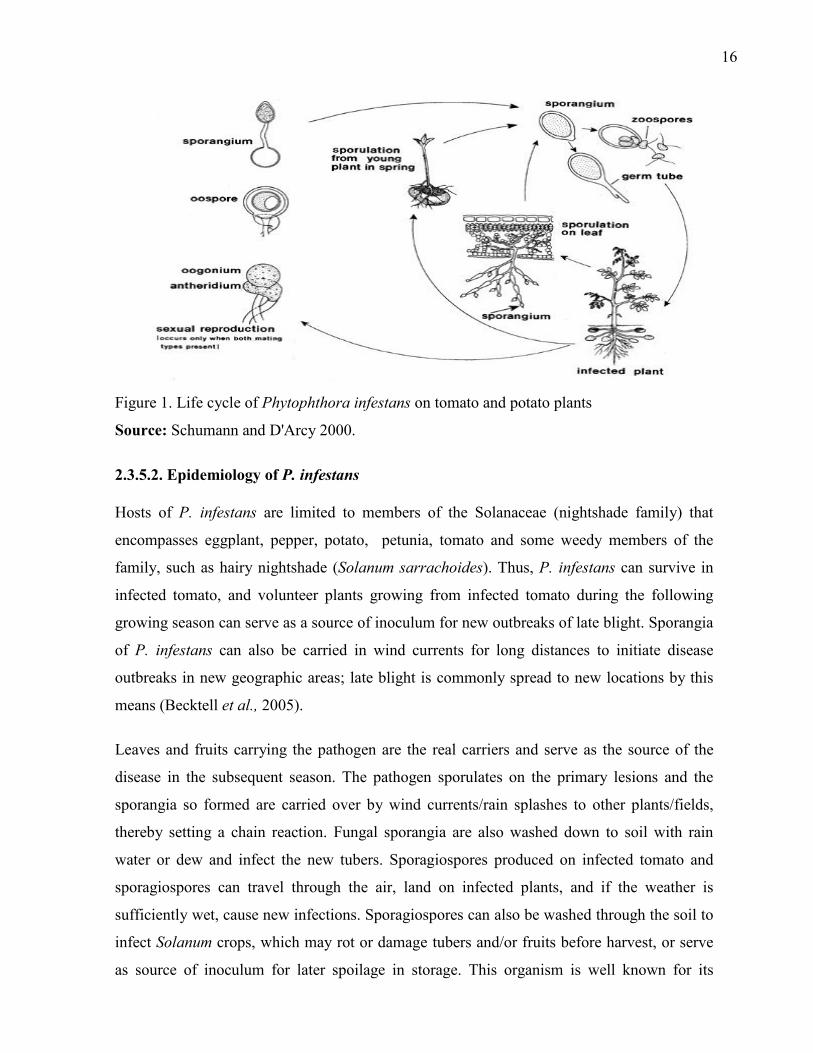
The complete life cycle, sexual and asexual reproduction, were shown in Figure 1.
16
Figure 1. Life cycle of Phytophthora infestans on tomato and potato plants
Source: Schumann and D'Arcy 2000.
2.3.5.2. Epidemiology of P. infestans Hosts of P. infestans are limited to members of the Solanaceae (nightshade family) that
encompasses eggplant, pepper, potato, petunia, tomato and some weedy members of the
family, such as hairy nightshade (Solanum sarrachoides). Thus, P. infestans can survive in
infected tomato, and volunteer plants growing from infected tomato during the following
growing season can serve as a source of inoculum for new outbreaks of late blight. Sporangia
of P. infestans can also be carried in wind currents for long distances to initiate disease
outbreaks in new geographic areas; late blight is commonly spread to new locations by this
means (Becktell et al., 2005).
Leaves and fruits carrying the pathogen are the real carriers and serve as the source of the
disease in the subsequent season. The pathogen sporulates on the primary lesions and the
sporangia so formed are carried over by wind currents/rain splashes to other plants/fields,
thereby setting a chain reaction. Fungal sporangia are also washed down to soil with rain
water or dew and infect the new tubers. Sporagiospores produced on infected tomato and
sporagiospores can travel through the air, land on infected plants, and if the weather is
sufficiently wet, cause new infections. Sporagiospores can also be washed through the soil to
infect Solanum crops, which may rot or damage tubers and/or fruits before harvest, or serve
as source of inoculum for later spoilage in storage. This organism is well known for its
17
ability to produce millions of sporagiospores from infected plants under the wet weather
conditions that favor the disease (Agrios, 2005; Fry, 2008; Kawchuk et al., 2011).
The disease occurs commonly in most tomato and potato growing areas, depending on the
presence of the pathogen and cool, wet weather conditions. Sources of P. infestans inocula
are seed tubers, dumps, volunteers, closely related weed hosts and adjacent plants of potatoes
or tomatoes that are affected by the pathogen. Sporagiospores released from infected plants
are known to be capable of wind-borne migration over several kilometers. This pathogen can
survive in plant debris and initiate the disease in subsequent years. Therefore, leaving crop
debris in the field should be avoided and crop rotation exclusive of tomato, potato, eggplant
and pepper for three or more years is recommended to reduce the pathogen populations in the
field. Survival in infected tubers in the fields and piles or tomato seeds are considered to be
the most important primary inoculum sources (Zwankhuisen et al., 2000; Majid et al., 2008).
Phytophthora infestans survives poorly in nature apart from its host plants. Under most
conditions, the hyphae and sporangia can survive for only brief periods in plant debris or soil,
and are generally killed off during frosts or very warm weather. The exceptions involve
oospores, and hyphae present within tubers. The persistence of viable pathogen mycelium (or
oospores) within tubers, such as those that are left in the ground after the previous year's
harvest or left in cull piles, are major problems in disease management. This is because it
might left inocula for the next season eather of it or its alternate host, Solanum crops. In
particular, volunteer plants sprouting from infected tubers are thought to be a major source of
inocula at the start of a growing season (Koepsell and Pscheidt, 1994). This can have
devastating effects by destroying the entire crops.
Sporagiospores are produced during the night because they are sensitive to light. Cloudiness
or heavy wetness following lower temperature favours disease development. Zoospore
survival in soil is uncertain; sporangia remain infective to tomato seedlings for 15 - 77 days
in different soils. Oospores are able to survive at least one winter in the field under European
conditions. The keys to success of P. infestans epidemics are abundant sporulation, wind
dissemination and long distance migration, persistent, tenacious pathogen and survival
potential or ability on potato tubers or tomato plant parts in the field or in the storage (Majid
et al., 2008; Kawchuk et al., 2011). Long-distance dispersal of P. infestans is associated with
human transport of diseased plant material (Fry et al., 1992; Shattock 1995). Short-distance
18
dispersal of sporangia is through wind and rain splash (Gretna, 1983; Fry et al., 1992; Vega-
Sanchez et al., 2000) with zoospores contributing to short distance spread of the disease.
2.3.6. Management Options for P. infestans For a polycyclic disease such as late blight, the rate of disease progress determines the
increase in severity and reducing this rate is the main goal for disease management
(Whitehead, 2006). Management options to prevent late blight include cultural practices, host
plant resistance, biological control, fungicide applications and integrated disease
management before the disease is present in the garden or field. This is because, under
favorable environmental conditions (cool and moist weather), the late blight pathogen
spreads extremely rapidly through the crop, producing abundant amounts of inocula that
initiate new infections. A grower who waits until the disease is present in a crop to begin
control tactics generally will be fighting a losing battle if environmental conditions are
favorable for disease development.
2.3.6.1. Cultural Practices Cultural practices are important components of growers’ strategy in disease management,
and they can curb disease development and avert disease outbreaks. The aims of cultural
measures against late blight is to minimize inoculum buildup, prevent introduction of
inoculum from nearby potato cull piles or from tomato transplants, minimize infection rate
and generate conditions unfavorable for disease development and spread. Infected tomato
plant parts, including seed and diseased potato tuber, and infested soil are the primary
sources of the disease. Late blight management, therefore, requires elimination or lowering
down of the inoculum load on the tomatoes and potatoes as well as in soil. Sanitation is the
first line of defense against late blight. Avoid piles of culled potato tubers and tomato fruits.
It should be disked, buried, composted, or otherwise disposed of the fields before the new
crop emerges. Eggplant, pepper, potato, and tomato are all host plants to late blight and
should be avoided in rotation and as neighboring crops (CIP, 1989; Majid et al., 2008).
Management of contaminated sources, such as waste heaps, infected tomato seeds or potato
tubers, volunteer plants, use of disease-free seeds, destruction of haulms neighboring fields
and sound crop rotation can help in the management of the disease (Majid et al., 2008;
Stevenson, 2009). Also, removal of diseased plants or destruction of disease plants
19
immediately after harvest or, alternatively, burial of diseased crop debris by deep ploughing
helps reduce spore levels available for infection of new plants Removing late blight diseased
plants to prevent spread to other plants is not likely to be effective, because this disease
spreads so rapidly and produces so many airborne inocula. Nevertheless, removal of late-
blight-diseased plants is recommended in garden settings to reduce inoculum available for
new infections. Options for disposing of diseased plants include tilling or burying plants,
placing plants in plastic bags, and covering plants with a tarp until the tissue is completely
killed (Agrios, 2005; Stone, 2014).
Any cultural practice that reduces leaf wetness (example, spacing plants adequately, limiting
the size of the plant canopy, avoiding overhead irrigation, irrigating in the morning to
promote foliar drying, staking plants, planting in locations with good air movement) is
recommended. Avoidance of excessive use of nitrogen fertilizer, which promotes succulent
tissue that is more prone to infection, and exclusion of large foliar canopies that favor leaf
wetness are good cultural practices (Stone, 2014).
2.3.6.2. Host Plant Resistance Late blight caused by P.infestans is among the most economically important diseases of
tomato. The use of host plant resistance offers cost-effective and environmentally sound.
Late blight resistance in tomato was derived from wild relative of Solanum pimpinellifolium.
Late blight may quickly destroy foliage, stems, and fruit of tomato plants if weather
conditions favor the pathogen, causing heavy yield losses if no management measures are
applied (Tumwine et al., 2002; Ojiewo et al., 2010). Losses vary, depending on prevailing
weather conditions, management practices, and presence of other tomato diseases (AVRDC,
2004).
The contribution of host resistance to slowing down disease progress can be large and for
that reason resistance has been the principal approach for effective late blight management in
both developing and developed countries (Forbes and Jarvis, 1994; McGrath et al., 2014).
With the use of at least partially resistant varieties, the number of fungicide applications
and/or the rate of application can be significantly reduced (Shtienberg et al., 1994; Kirk et
al., 2001; Stevenson et al., 2007), particularly when combined with cultural practices,
biological control and blight forecasting (Grunwald et al., 2002). Moreover, the more
resistant the cultivar, the greater the potential for fungicide reduction (Naerstad et al., 2007).
20
Tomato and potato varieties with varying resistance to some races of P. infestans have been
developed and breeding for resistance in tomato ongoing. However, varieties resistant to all
races of the pathogen are not currently available, so late-blight-resistant plants are not
reliable in all cases (Nowakowska, 2014).
Host resistance to P. infestans is of significance in integrated late blight management due to
its long-term economic benefits for farmers. Biotechnology is also being employed in the
pursuit of late blight resistance (ATTRA, 2004; Agrios, 2005). The use of plants with field
resistance can slow down the pathogen growth rates. However, no Solanum (Potato and/ or
tomato) are fully resistant to late blight (ATTRA, 2004; Majid et al., 2008; Stone, 2014). It
should be noted that varieties with higher level of resistance require less fungicide spray
frequencies than varieties with lower levels of resistance.
2.3.6.3. Biological Control There has been research to manage the disease problem using microbial antagonists, for
example, Trichoderma harzianum and T. viride to manage P. infestans (late blight of tomato
and potato) (Majid et al., 2008). Some reports have indicated that Aspergillus terreus and
Penicillium oxalicum could inhibit the growth of P. infestans in potato (Roy et al., 1991).
The fungal species belonging to the genus Trichoderma occur throughout the world and can
be easily isolated from soil, decaying wood, and organic matter. The potential of this genus
in the biological control of pathogens was first noticed in the early 1930s. The success of
Trichoderma spp. in plant disease management has lead to the commercial production of
several Trichoderma species for crop growth and disease management. Trichoderma
atroviride is a fast growing fungus, which produces profuse spores and is resistant to
metalaxyl and captan, while having high tolerance to mancozeb and other chemical
fungicides (Ezziyyani et al., 2007). Trichoderma atroviride forges a symbiotic relationship
with plants and has been associated with plant growth promotion in addition to disease
suppression (McBeath et al., 2000).
2.3.6.4. Chemical control Chemical measures have included the use of both protectant and systemic fungicides.
Protectant, preventative or contact fungicides are usually applied before infection or
emergence of the disease, whereas systemic fungicides are applied before or upon disease
21
development. Farmers or home gardeners should rely on repeated applications of
preventative fungicides to avoid late blight problems. Spread of late blight is so rapid under
favorable environmental conditions that fungicides must be applied before the disease is
observed to be effective. If the weather in a given location is predominantly hot (i.e. above
30 OC) and dry, preventative sprays would not be recommended. If a fungicide application is
needed, thorough coverage of plant foliage is essential for effective late blight suppression,
and hence repeated applications will be necessary (Brent and Hollomon, 2007; Majid et al.,
2008).
At a global level, the major approach to prevent P. infestans development has been
application of fungicides. Fungicide applications, for example metalaxyl, fostyl A-1,
mancozeb, ridomil, cruzate, fentin-acetate phosphate, kocide, chlorothalonil and captafol, are
an important means of P. infestans management, particularly in humid areas. Current
chemical practices to manage late blight include a mixture of fungicides designed to slow the
disease progress (Gisi and Cohen, 1996). Systemic fungicides inhibit ribosomal RNA
(rRNA) polymerases in fungi by reducing incorporation of uridine (Majid et al., 2008).
Contact fungicides are effective aginst pathogen arrival to the plant and have not resulted in
pathogen resistance after many years of use. They coat the leaves to prevent infection, but
cannot stop infections once they occur. They also must be reapplied at certain intervals to
protect new growth when disease threatens. Therefore, they must be applied before plants are
exposed to sporangia (Binyam et al., 2014). They can only protect new uninfected growth
from the disease (McGrath, 2016). The new strains of the oomycete produced as
recombinants of fertilization of the two mating-types (A1 and A2) are resistant to some of the
systemic fungicides, like metalaxyl or ridomil and, therefore, sprays with such materials are
ineffective against such strains. When applying contact fungicides, complete coverage of the
foliage with fungicide is necessary to enable disease prevention; regardless of the application
methods (ground or air, traditional or newer technology sprays) (MAFRI, 2002). Farmers can
lose the entire crop if timely application of fungicides is not done.
To avoid development of pesticide resistance when using at-risk pesticide products, it is
required to use at-risk products only as protectants, not as eradicants; apply at-risk products
in a mixture with a broad spectrum protectant product, following label rates; apply foliar
applications to manage foliar outbreaks; and limit sprays of an at-risk product to two to four
consecutive applications in a crop annually, with applications no more than 14 days apart
22
(Brent and Hollomon, 2007). Despite the fact that fungicide use increases production costs
and has negative consequences on environment and human health, the efficacy of fungicides
is appealing to resource-poor farmers and fungicide use is a common practice in almost all
developing countries.
2.3.6.5. Integrated Disease Management Management of late blight, caused by P. infestans, remains a major challenge, especially
among small-scale farmers in the tropical countries. Attempts to manage late blight are
almost entirely through use of fungicides on varieties with low to moderate levels of
resistance (Haverkort, 2008). For most poor farmers, there is inadequate suppression of the
disease, resulting in heavy losses and, in some cases, complete crop loss. For instance, it is
estimated that approximately 30 – 60% of the crop is lost to late blight annually in Kenya
(Nyankanga et al., 2004). Integrated disease management (IDM) has helped farmers
drastically reduce the need for chemical plant protection, while increasing production (FAO,
2008). Effective management of P. infestans requires implementing an IDM approach (Kirk
et al., 2005). In IDM the host resistance contributes to reducing the number of sprays
required to keep P. infestans below an economic threshold level. The integration of reduced
rate of ridomil application and moderately resistant potato varieties in the management of
potato late blight, alternate host, is very important in reducing environmental pollution and
input cost of the fungicide, and increase in production and profitability of high quality potato
tuber yield (Kirk et al., 2005; Binyam et al., 2014). Fungicides cannot be used alone for
effective management of P. infestans, but must be used as a component in an integrated
management strategy.
Generally, application of fungicides has been the only reliable management for late blight.
Disease management strategies primarily depend on sanitary practices and well-timed
fungicide applications based on favorable weather conditions, because decision support
systems often are lacking in many developing countries (Fry and Godwin, 1997; Ojiewo et
al., 2010). Use of chemicals to manage late blight in tomato increases production costs up to
20% (Mizubuti, 2006). Emergence or predominance of resistant P. infestans strains
necessitates use of increased quantities of fungicide or the substitution of cheaper fungicides
by more expensive ones, raising production costs further (Reis et al., 2005; Ojiewo et al.,
2010). For instance, in Kenya the highest pesticide use during tomato production is for
23
management of early and late blights, with up to 40 applications per crop season (Waiganjo
et al., 2006).
Besides posing possible health hazards from residues on tomato produced for the fresh
market or for processing, extensive fungicide application pollutes water, air, and soil; drift
affects non-target microorganisms. The development of fungicide resistance within
populations of P. infestans has become a major problem in many tomato-growing regions
(Fry and Godwin, 1997; Ojiewo et al., 2010). Effective fungicides are too expensive for
many tomato farmers in the developing world, most of whom are resource-poor producers.
Alternative approaches that can be incorporated into IDM strategies for management of
tomato late blight disease are needed. Host plant resistance is potentially the most
economically viable, technically feasible, environmentally friendly, and socially acceptable
disease management strategy for tomato late blight in IDM programs (Ojiewo et al., 2010).
Integrated management of potato late blight has been adopted as a strategy in Ethiopia over
the past many years (Kassa et al., 2002). In this regard, late blight resistant or tolerant
varieties have been released over the years and are now part and parcel of the production
systems in different parts of the country. Nonetheless, the ability of P. infestans to develop
new physiological races and breakdown of varietal resistance has been encountered.
To date, the vast majority of improved potato and tomato varieties commonly grown have
lost resistance to late blight (Colon et al., 1995; Fry, 2008) and must be supplemented with
fungicides to reduce the rate of disease progress (Kassa et al., 2002). This was achieved
through the use of the phenylamide fungicides, like ridomil. The first spray with ridomil MZ
63.5% WP at a rate of 2 kg ha-1 and followed by 2-3 sprays of dithane M-45 at a rate of 3 kg
ha-1 were found to be effective in managing late blight in Ethiopia (Bekele and Yaynu, 1996).
According to Mesfin and Gebre-Medhin (2007), three sprays with ridomil gave the lowest
area under disease pressure curve (AUDPC) and the highest yield. Mancozeb sprayed
treatment at emergence and then followed at 15 days interval gave the second highest yield,
while one ridomil spray at symptom appearance gave the third highest yield and there was no
significant difference between ridomil and mancozeb treatments.
24
3. MATERIALS AND METHODS
3.1. Description of the Experimental Site Among the major tomato-growing areas of southern Nations, Nationalities and People’s
Region (SNNPR), Arba-Minch Woreda, Gamo Gofa Zone, was considered for the study. It is
geographically located at 06o06’841’’ latitude and 037o35’122’’ longitude. The woreda is
surrounded by Dita and Chencha on the north, Dita, Chencha and Bonke on the northwest,
Derashe on the south, Derashe and Bonke on the southwest, Lake Chamo and Lake Abaya on
the east. The site is laid at altitude of 1216 m.a.s.l. in the plateau of southern part of Ethiopia
about 505 km south of Addis Ababa and 280 km southwest of Hawassa, the administrative
town of SNNPR State in the vicinity of Abaya and Chamo lakes. The district is characterized
by a bimodal rainfall pattern where short rainy season occurs during the months of March
and April and the main rain starts in mid August and extends to mid November. Very high
amount of rainfall is obtained in the months of late August, September and up to mid
October. The average annual rainfall and temperature of the areas are 750 mm and 27.5 oC,
respectively. The soil is characterized by alluvial, black sandy-loam and clay-loam. In the
area maize, fruits like banana, mango and avocado and root crops like cassava and sweet
potatoes, are grown. Others crops like cereals, pulses, oil crops, like sesame and stimulant
crops (khat) are also grown in the area (Unpublished data, 2015).
3.2. Experimental Materials The experiment for management of tomato late blight through host plant resistance and
fungicide application has been carried out during the 2016 and 2017 in winter and spring
cropping season, long and short rainy season, respectively, with supplementary of irrigation.
The study was conducted using four tomato varieties (ARP tomato d2, Roma VF, Bisholla
and Melkasholla), which were currently under production and differed in their resistance
levels to late blight, were used as varietal components of the treatments. Brief description of
the agronomic characteristics of the tomato varieties are given below in tabular form (Table
1). In addition, Ridomil MZ Gold 68.5% WG as a foliar spray was used at the manufacturer’s
label dose of 3 kg ha-1 (Anonymous, 2011) with five spray frequencies (no spray, one time,
two times, three times and four times). Thus there were 20 treatment combinations of four
tomato varieties along with five fungicide spray frequencies.
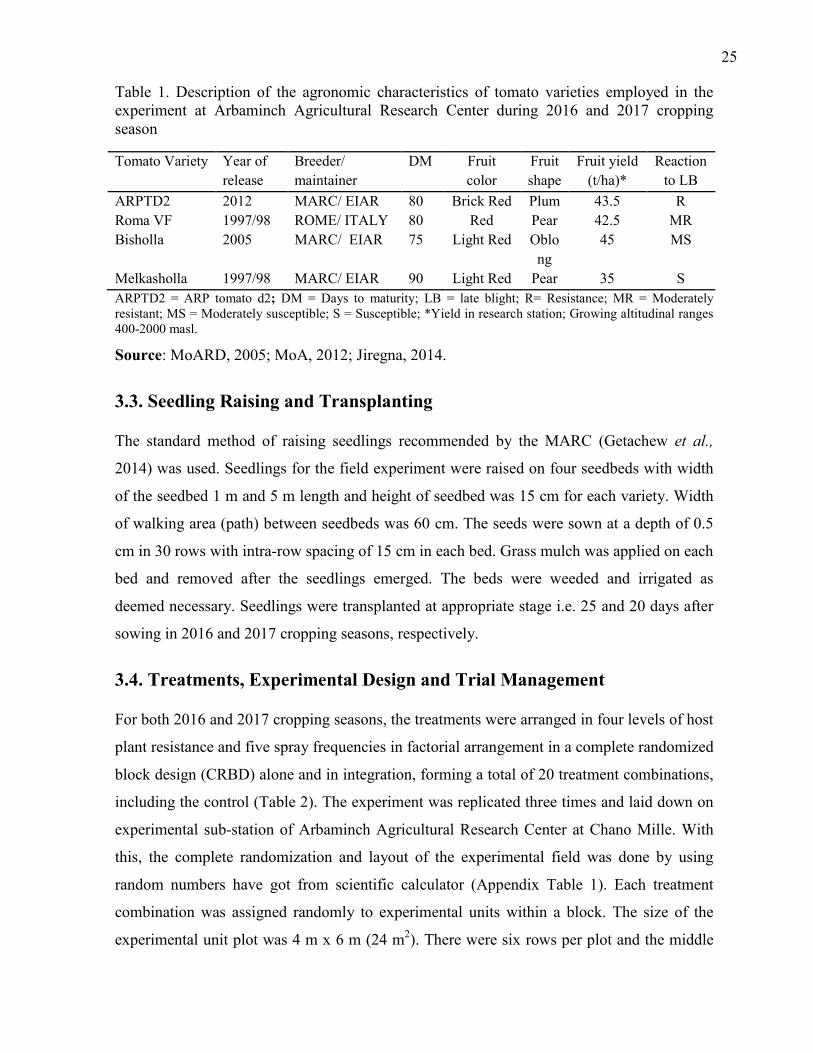
25
Table 1. Description of the agronomic characteristics of tomato varieties employed in the experiment at Arbaminch Agricultural Research Center during 2016 and 2017 cropping season
Tomato Variety Year of
release
Breeder/
maintainer
DM Fruit
color
Fruit
shape
Fruit yield
(t/ha)*
Reaction
to LB
ARPTD2 2012 MARC/ EIAR 80 Brick Red Plum 43.5 R
Roma VF 1997/98 ROME/ ITALY 80 Red Pear 42.5 MR
Bisholla 2005 MARC/ EIAR 75 Light Red Oblo
ng
45 MS
Melkasholla 1997/98 MARC/ EIAR 90 Light Red Pear 35 S
ARPTD2 = ARP tomato d2; DM = Days to maturity; LB = late blight; R= Resistance; MR = Moderately resistant; MS = Moderately susceptible; S = Susceptible; *Yield in research station; Growing altitudinal ranges 400-2000 masl.
Source: MoARD, 2005; MoA, 2012; Jiregna, 2014.
3.3. Seedling Raising and Transplanting The standard method of raising seedlings recommended by the MARC (Getachew et al.,
2014) was used. Seedlings for the field experiment were raised on four seedbeds with width
of the seedbed 1 m and 5 m length and height of seedbed was 15 cm for each variety. Width
of walking area (path) between seedbeds was 60 cm. The seeds were sown at a depth of 0.5
cm in 30 rows with intra-row spacing of 15 cm in each bed. Grass mulch was applied on each
bed and removed after the seedlings emerged. The beds were weeded and irrigated as
deemed necessary. Seedlings were transplanted at appropriate stage i.e. 25 and 20 days after
sowing in 2016 and 2017 cropping seasons, respectively.
3.4. Treatments, Experimental Design and Trial Management For both 2016 and 2017 cropping seasons, the treatments were arranged in four levels of host
plant resistance and five spray frequencies in factorial arrangement in a complete randomized
block design (CRBD) alone and in integration, forming a total of 20 treatment combinations,
including the control (Table 2). The experiment was replicated three times and laid down on
experimental sub-station of Arbaminch Agricultural Research Center at Chano Mille. With
this, the complete randomization and layout of the experimental field was done by using
random numbers have got from scientific calculator (Appendix Table 1). Each treatment
combination was assigned randomly to experimental units within a block. The size of the
experimental unit plot was 4 m x 6 m (24 m2). There were six rows per plot and the middle
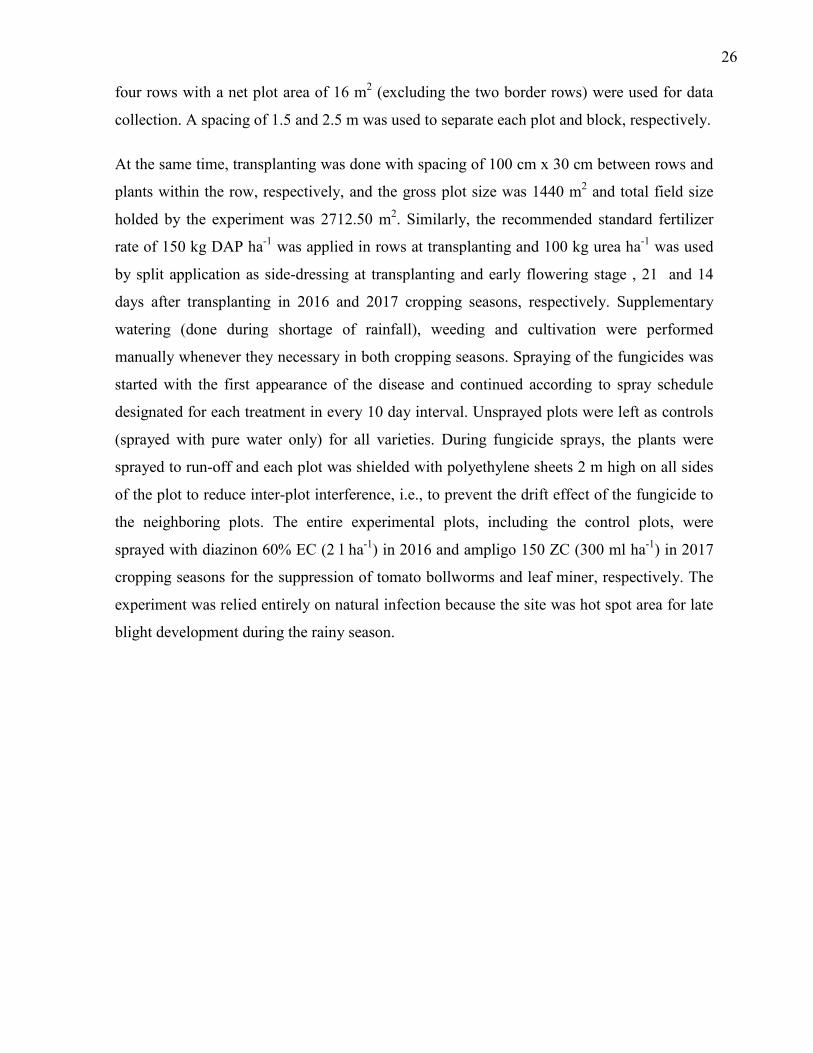
26
four rows with a net plot area of 16 m2 (excluding the two border rows) were used for data
collection. A spacing of 1.5 and 2.5 m was used to separate each plot and block, respectively.
At the same time, transplanting was done with spacing of 100 cm x 30 cm between rows and
plants within the row, respectively, and the gross plot size was 1440 m2 and total field size
holded by the experiment was 2712.50 m2. Similarly, the recommended standard fertilizer
rate of 150 kg DAP ha-1 was applied in rows at transplanting and 100 kg urea ha-1 was used
by split application as side-dressing at transplanting and early flowering stage , 21 and 14
days after transplanting in 2016 and 2017 cropping seasons, respectively. Supplementary
watering (done during shortage of rainfall), weeding and cultivation were performed
manually whenever they necessary in both cropping seasons. Spraying of the fungicides was
started with the first appearance of the disease and continued according to spray schedule
designated for each treatment in every 10 day interval. Unsprayed plots were left as controls
(sprayed with pure water only) for all varieties. During fungicide sprays, the plants were
sprayed to run-off and each plot was shielded with polyethylene sheets 2 m high on all sides
of the plot to reduce inter-plot interference, i.e., to prevent the drift effect of the fungicide to
the neighboring plots. The entire experimental plots, including the control plots, were
sprayed with diazinon 60% EC (2 l ha-1) in 2016 and ampligo 150 ZC (300 ml ha-1) in 2017
cropping seasons for the suppression of tomato bollworms and leaf miner, respectively. The
experiment was relied entirely on natural infection because the site was hot spot area for late
blight development during the rainy season.
27
Table 2. Descriptions of the treatment combinations used for the field experiment at AARC during 2016 and 2017 cropping season
S.No. Treatments Details of the treatment combinations Assigned Treatment Code
1 ART + FUt0 ART tomato d2 + Fungicide Untreated plot T1
2 ART + FT1 ART tomato d2 + Fungicide Treated plot (one time) T2
3 ART + FT2 ART tomato d2 + Fungicide Treated plot (two time) T3
4 ART + FT3 ART tomato d2 + Fungicide Treated plot (three time) T4
5 ART + FT4 ART tomato d2 + Fungicide Treated plot (four time) T5
6 Bis + FUt0 Bishola+ Fungicide Untreated plot T6
7 Bis + FT1 Bishola + Fungicide Treated plot (one time) T7
8 Bis + FT2 Bishola + Fungicide Treated plot (two time) T8
9 Bis + FT3 Bishola + Fungicide Treated plot (three time) T9
10 Bis + FT4 Bishola + Fungicide Treated plot (four time) T10
11 Mel + FUt0 Melkashola + Fungicide Untreated plot T11
12 Mel + FT1 Melkashola + Fungicide Treated plot (one time) T12
13 Mel + FT2 Melkashola + Fungicide Treated plot (two time) T13
14 Mel + FT3 Melkashola + Fungicide Treated plot (three time) T14
15 Mel + FT4 Melkashola + Fungicide Treated plot (four time) T15
16 RVF + FUt0 Roma VF + Fungicide Untreated plot T16
17 RVF + FT1 Roma VF + Fungicide Treated plot (one time) T17
18 RVF + FT2 Roma VF + Fungicide Treated plot (two time) T18
19 RVF + FT3 Roma VF + Fungicide Treated plot (three time) T19
20 RVF + FT4 Roma VF + Fungicide Treated plot (four time) T20
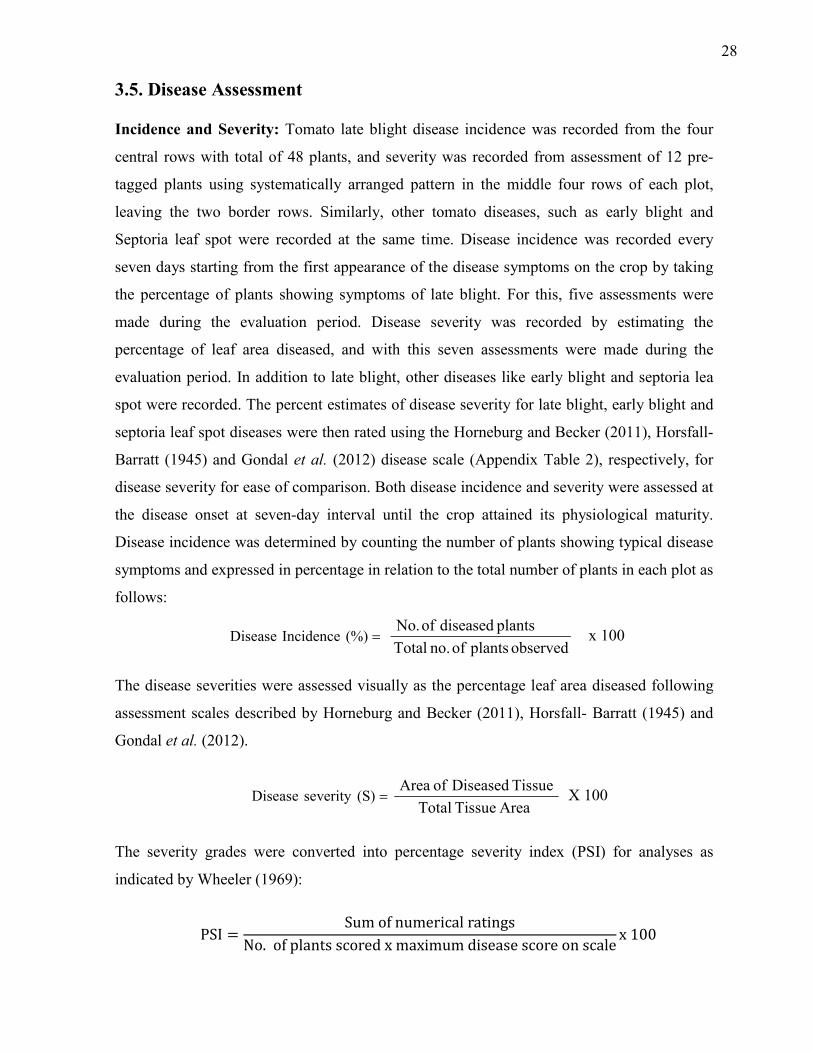
28
3.5. Disease Assessment Incidence and Severity: Tomato late blight disease incidence was recorded from the four
central rows with total of 48 plants, and severity was recorded from assessment of 12 pre-
tagged plants using systematically arranged pattern in the middle four rows of each plot,
leaving the two border rows. Similarly, other tomato diseases, such as early blight and
Septoria leaf spot were recorded at the same time. Disease incidence was recorded every
seven days starting from the first appearance of the disease symptoms on the crop by taking
the percentage of plants showing symptoms of late blight. For this, five assessments were
made during the evaluation period. Disease severity was recorded by estimating the
percentage of leaf area diseased, and with this seven assessments were made during the
evaluation period. In addition to late blight, other diseases like early blight and septoria lea
spot were recorded. The percent estimates of disease severity for late blight, early blight and
septoria leaf spot diseases were then rated using the Horneburg and Becker (2011), Horsfall-
Barratt (1945) and Gondal et al. (2012) disease scale (Appendix Table 2), respectively, for
disease severity for ease of comparison. Both disease incidence and severity were assessed at
the disease onset at seven-day interval until the crop attained its physiological maturity.
Disease incidence was determined by counting the number of plants showing typical disease
symptoms and expressed in percentage in relation to the total number of plants in each plot as
follows:
(%) Incidence Disease observed plants of no. Total
plants diseased of No. x 100
The disease severities were assessed visually as the percentage leaf area diseased following
assessment scales described by Horneburg and Becker (2011), Horsfall- Barratt (1945) and
Gondal et al. (2012).
(S)severity Disease Area Tissue Total
Tissue Diseased of Area X 100
The severity grades were converted into percentage severity index (PSI) for analyses as
indicated by Wheeler (1969):
PSI =Sumofnumericalratings
No.ofplantsscoredxmaximumdiseasescoreonscalex100
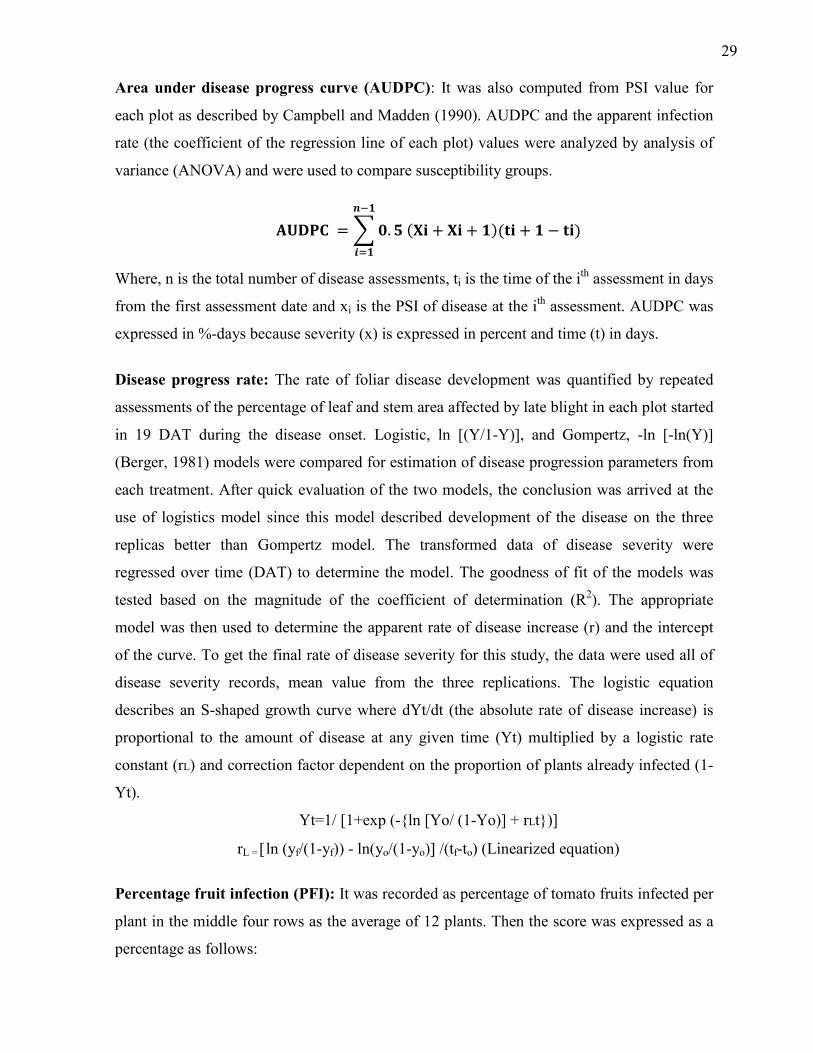
29
Area under disease progress curve (AUDPC): It was also computed from PSI value for
each plot as described by Campbell and Madden (1990). AUDPC and the apparent infection
rate (the coefficient of the regression line of each plot) values were analyzed by analysis of
variance (ANOVA) and were used to compare susceptibility groups.
����� = ��. �(�� + �� + �)(�� + � − ��)
���
���
Where, n is the total number of disease assessments, ti is the time of the ith assessment in days
from the first assessment date and xi is the PSI of disease at the ith assessment. AUDPC was
expressed in %-days because severity (x) is expressed in percent and time (t) in days.
Disease progress rate: The rate of foliar disease development was quantified by repeated
assessments of the percentage of leaf and stem area affected by late blight in each plot started
in 19 DAT during the disease onset. Logistic, ln [(Y/1-Y)], and Gompertz, -ln [-ln(Y)]
(Berger, 1981) models were compared for estimation of disease progression parameters from
each treatment. After quick evaluation of the two models, the conclusion was arrived at the
use of logistics model since this model described development of the disease on the three
replicas better than Gompertz model. The transformed data of disease severity were
regressed over time (DAT) to determine the model. The goodness of fit of the models was
tested based on the magnitude of the coefficient of determination (R2). The appropriate
model was then used to determine the apparent rate of disease increase (r) and the intercept
of the curve. To get the final rate of disease severity for this study, the data were used all of
disease severity records, mean value from the three replications. The logistic equation
describes an S-shaped growth curve where dYt/dt (the absolute rate of disease increase) is
proportional to the amount of disease at any given time (Yt) multiplied by a logistic rate
constant (rL) and correction factor dependent on the proportion of plants already infected (1-
Yt).
Yt=1/ [1+exp (-{ln [Yo/ (1-Yo)] + rLt})]
rL = ln (yf/(1-yf)) - ln(yo/(1-yo) /(tf-to) (Linearized equation)
Percentage fruit infection (PFI): It was recorded as percentage of tomato fruits infected per
plant in the middle four rows as the average of 12 plants. Then the score was expressed as a
percentage as follows:
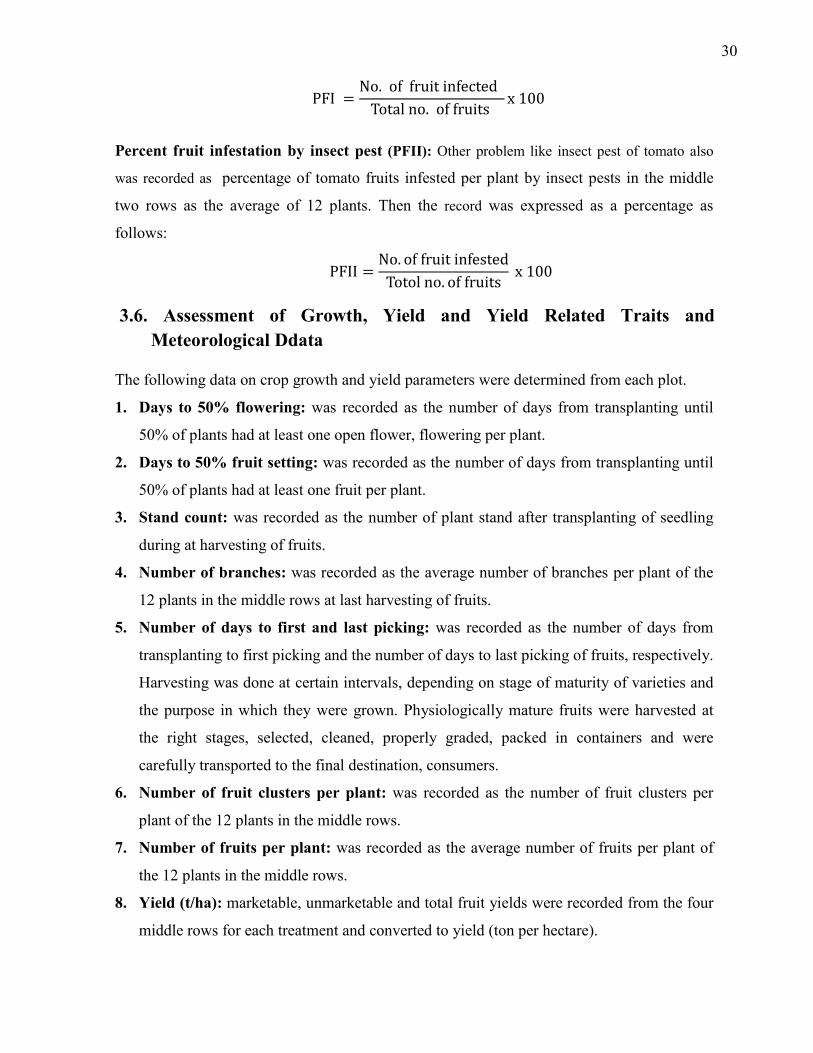
30
PFI =No.offruitinfected
Totalno.offruitsx100
Percent fruit infestation by insect pest (PFII): Other problem like insect pest of tomato also
was recorded as percentage of tomato fruits infested per plant by insect pests in the middle
two rows as the average of 12 plants. Then the record was expressed as a percentage as
follows:
PFII =No. offruitinfested
Totolno. offruitsx100
3.6. Assessment of Growth, Yield and Yield Related Traits and
Meteorological Ddata The following data on crop growth and yield parameters were determined from each plot.
1. Days to 50% flowering: was recorded as the number of days from transplanting until
50% of plants had at least one open flower, flowering per plant.
2. Days to 50% fruit setting: was recorded as the number of days from transplanting until
50% of plants had at least one fruit per plant.
3. Stand count: was recorded as the number of plant stand after transplanting of seedling
during at harvesting of fruits.
4. Number of branches: was recorded as the average number of branches per plant of the
12 plants in the middle rows at last harvesting of fruits.
5. Number of days to first and last picking: was recorded as the number of days from
transplanting to first picking and the number of days to last picking of fruits, respectively.
Harvesting was done at certain intervals, depending on stage of maturity of varieties and
the purpose in which they were grown. Physiologically mature fruits were harvested at
the right stages, selected, cleaned, properly graded, packed in containers and were
carefully transported to the final destination, consumers.
6. Number of fruit clusters per plant: was recorded as the number of fruit clusters per
plant of the 12 plants in the middle rows.
7. Number of fruits per plant: was recorded as the average number of fruits per plant of
the 12 plants in the middle rows.
8. Yield (t/ha): marketable, unmarketable and total fruit yields were recorded from the four
middle rows for each treatment and converted to yield (ton per hectare).
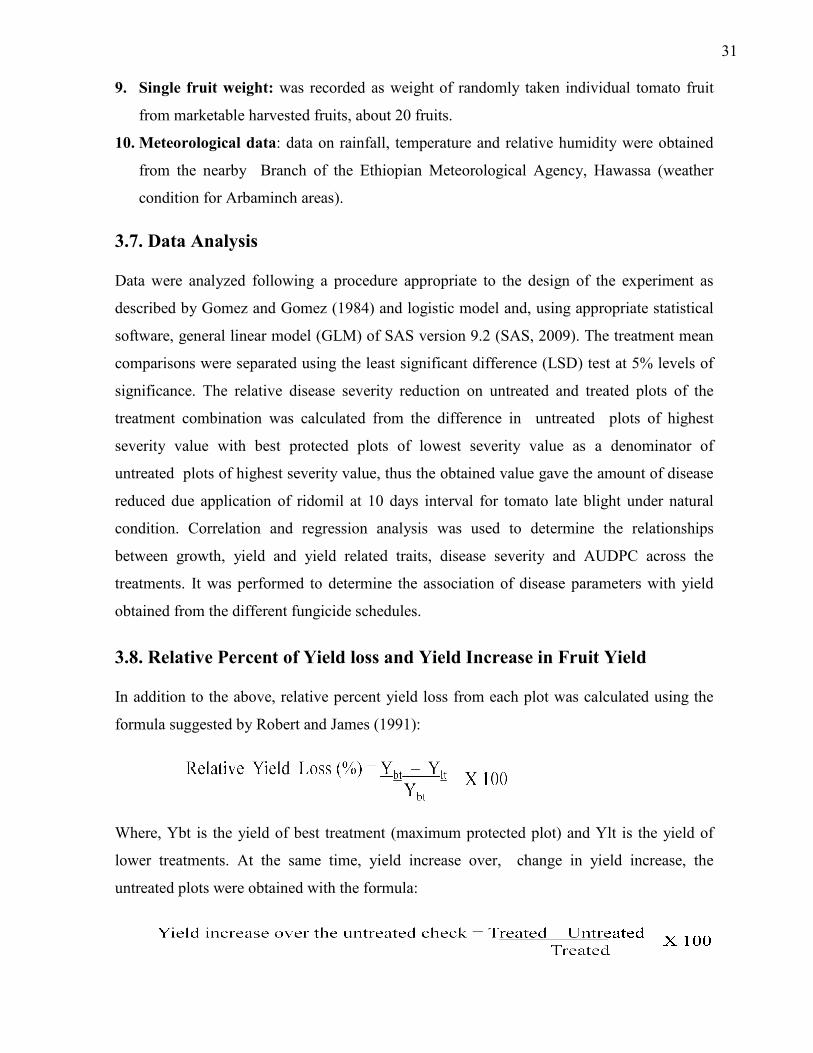
9. Single fruit weight: was recorded as weight of randomly taken
from marketable harvested fruits, about 20 fruits.
10. Meteorological data: data on rainfall, temperature and relative humidity were obtained
from the nearby Branch of the Ethiopian Meteorological Agency, Hawas
condition for Arbaminch areas).
3.7. Data Analysis Data were analyzed following a procedure appropriate to the design of the experiment as
described by Gomez and Gomez (1984) and logistic model and, using appropriate
software, general linear model (GLM) o
comparisons were separated using the least significant difference (LSD) test at 5% levels of
significance. The relative disease severity reduction on untreated and treated plots of the
treatment combination was calculated from the difference in untreated plots of highest
severity value with best protected plots of lowest severity value as a denominator of
untreated plots of highest severity value, thus the obtained value gave the amount of disease
reduced due application of ridomil at 10 days interval for tomato late blight under natural
condition. Correlation and regression
between growth, yield and yield related traits, disease severity and AUDPC across the
treatments. It was performed to determine the association of disease parameters with yield
obtained from the different fungicide schedules.
3.8. Relative Percent of Y In addition to the above, relative percent yield loss from each plot was calculated using the
formula suggested by Robert and James (1991):
Where, Ybt is the yield of best treatment (maximum protected plot) and Ylt is the yield of
lower treatments. At the same time, y
untreated plots were obtained with the formula:
was recorded as weight of randomly taken individual tomato fruit
from marketable harvested fruits, about 20 fruits.
: data on rainfall, temperature and relative humidity were obtained
from the nearby Branch of the Ethiopian Meteorological Agency, Hawas
Arbaminch areas).
Data were analyzed following a procedure appropriate to the design of the experiment as
described by Gomez and Gomez (1984) and logistic model and, using appropriate
near model (GLM) of SAS version 9.2 (SAS, 2009). The treatment mean
comparisons were separated using the least significant difference (LSD) test at 5% levels of
The relative disease severity reduction on untreated and treated plots of the
treatment combination was calculated from the difference in untreated plots of highest
severity value with best protected plots of lowest severity value as a denominator of
treated plots of highest severity value, thus the obtained value gave the amount of disease
reduced due application of ridomil at 10 days interval for tomato late blight under natural
and regression analysis was used to determine th
between growth, yield and yield related traits, disease severity and AUDPC across the
treatments. It was performed to determine the association of disease parameters with yield
obtained from the different fungicide schedules.
Percent of Yield loss and Yield Increase in Fruit Y
In addition to the above, relative percent yield loss from each plot was calculated using the
formula suggested by Robert and James (1991):
Where, Ybt is the yield of best treatment (maximum protected plot) and Ylt is the yield of
At the same time, yield increase over, change in yield increase, the
d with the formula:
31
individual tomato fruit
: data on rainfall, temperature and relative humidity were obtained
from the nearby Branch of the Ethiopian Meteorological Agency, Hawassa (weather
Data were analyzed following a procedure appropriate to the design of the experiment as
described by Gomez and Gomez (1984) and logistic model and, using appropriate statistical
). The treatment mean
comparisons were separated using the least significant difference (LSD) test at 5% levels of
The relative disease severity reduction on untreated and treated plots of the
treatment combination was calculated from the difference in untreated plots of highest
severity value with best protected plots of lowest severity value as a denominator of
treated plots of highest severity value, thus the obtained value gave the amount of disease
reduced due application of ridomil at 10 days interval for tomato late blight under natural
analysis was used to determine the relationships
between growth, yield and yield related traits, disease severity and AUDPC across the
treatments. It was performed to determine the association of disease parameters with yield
and Yield Increase in Fruit Yield
In addition to the above, relative percent yield loss from each plot was calculated using the
Where, Ybt is the yield of best treatment (maximum protected plot) and Ylt is the yield of
ield increase over, change in yield increase, the
32
3.9. Cost and Benefit Analysis Cost and benefit of each treatment was analyzed using partially and marginal rate of return
(MRR) as computed by considering the variable cost (fungicides and knapsack sprayer costs
and cost of labor for fungicide applications) available for the respective treatment. Price of
fruits of each tomato variety per kilogram was obtained from the prevailing local market at
harvest and total sale from one hectare were computed. Cost-benefit analysis of each
fungicide schedule was made to evaluate the economic benefits expected using the farm gate
price of tomato at the time of harvest.
Partial budgeting was employed to assess profitability of any new technologies (practices) to
be imposed to the agricultural business practice. Partial budget analysis is a method of
organizing data and information about the cost and benefit of various agricultural alternatives
(CIMMYT, 1988). Marginal analysis is concerned with the process of making choice
between alternative factor-product combinations considering small changes. Marginal rate of
return is a criterion which measures the effect of additional capital invested on net returns
using new managements compared with the previous one (CIMMYT, 1988). It provides the
value of benefit obtained per the amount of additional cost (variable cost) incurred
percentage. MRR was calculated using:
MRR = ���
���x 100
Where, DNI = difference in net income compared with control, and DIC = difference in input
cost compared with control.
The following points were considered during cost benefit analysis using partial budget:
❖ Costs for all agronomic practices were uniform for all treatments.
❖ Cost of labor and spraying equipment were taken based on the prevailing rates of
payment in the locality.
❖ Costs, return and benefit were calculated on hectare basis.
❖ It is assumed that farmers produce this variety under integrated management of
tomato late blight when the variety provided 100% marginal rate of returns.
33
4. RESULTS AND DISCUSSION
4.1. Effect of Variety and Fungicide Applications on Tomato Late Blight
Development
In 2016 and 2017 cropping seasons, the main effects of variety and fungicide spray frequency
did not reveal significant difference on disease parameters; to this effect, only their interaction
effects are presented, except for late blight incidence and percent fruit infection on which only
their independent effect on integration of host plant resistance and fungicide spray frequencies
are presented.
4.1.1. Incidence of Late Blight
In both 2016 and 2017 cropping seasons, host plant resistance and fungicide spray
frequencies of the experiment did not revealed significant (p > 0.05) difference interaction
on late blight incidence at all dates of assessments (Day after transplanting) (Appendix Table
3). In 2016 cropping seasons, mean late blight incidence did not exceed 73.89% on ARPTD2,
but reached up to 99.19% on Roma VF, 99.03% on Bisholla and 98.75% on Melkasholla at
final assessment date (PSIf). Similarly, in 2017 cropping seasons, at final date of assessment
(PSIf) mean late blight incidences were recorded as 55.56, 75.83, 91.39 and 91.94% on the
varieties ARPTD2, Roma VF, Bisholla and Melkasholla, respectively. Disease incidence on
ARPTD2 was reduced by 25.51% over Roma VF in 2016 and 39.57% over Melkasholla in
2017 cropping season at final date of assessment at Arbaminch. Among the fungicide spray
frequencies, at the final date of assessment (PSIf), the highest mean incidence such as 95.66
and 90.97% was recorded from unsprayed plots of all varieties in both cropping seasons,
respectively. Similarly, at the same time the lowest such as 90.01 and 68.75% mean
incidence at final date of assessment was recorded from plots treated four times with ridomil
at 10 days interval on all varieties as compared to the unsprayed plots, respectively (Table 3).
As Berger (1988), Bedi et al. (1989), and Fry and Shtienberg (1990) stated disease
incidences among different varieties with reaction to diseases development were variable and
increase with time at the rates of epidemic much faster than disease severities for the same
pathosystem under the same conditions. The maximum incidence for many pathosystem is near
100% and this maximum commonly is reached early in the season, when disease severity may be low.
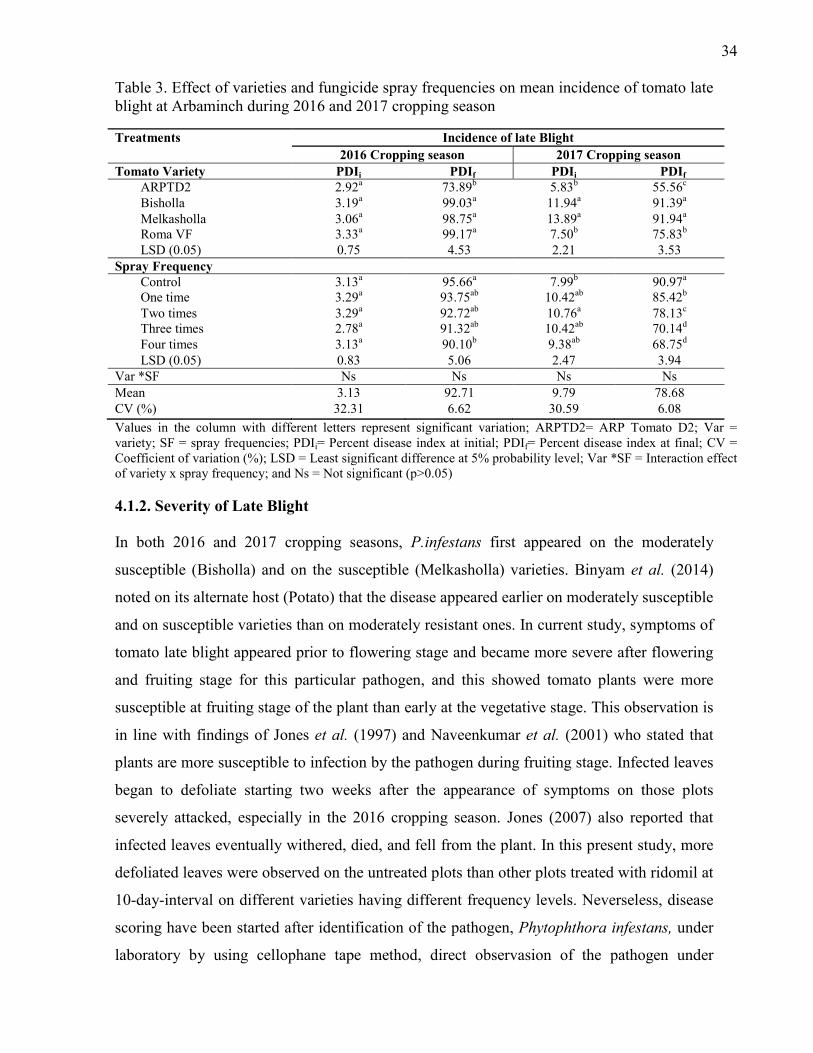
34
Table 3. Effect of varieties and fungicide spray frequencies on mean incidence of tomato late blight at Arbaminch during 2016 and 2017 cropping season
Treatments Incidence of late Blight
2016 Cropping season 2017 Cropping season
Tomato Variety PDIi PDIf PDIi PDIf ARPTD2 2.92a 73.89b 5.83b 55.56c Bisholla 3.19a 99.03a 11.94a 91.39a Melkasholla 3.06a 98.75a 13.89a 91.94a Roma VF 3.33a 99.17a 7.50b 75.83b LSD (0.05) 0.75 4.53 2.21 3.53
Spray Frequency Control 3.13a 95.66a 7.99b 90.97a One time 3.29a 93.75ab 10.42ab 85.42b Two times 3.29a 92.72ab 10.76a 78.13c Three times 2.78a 91.32ab 10.42ab 70.14d Four times 3.13a 90.10b 9.38ab 68.75d LSD (0.05) 0.83 5.06 2.47 3.94
Var *SF Ns Ns Ns Ns Mean 3.13 92.71 9.79 78.68 CV (%) 32.31 6.62 30.59 6.08
Values in the column with different letters represent significant variation; ARPTD2= ARP Tomato D2; Var = variety; SF = spray frequencies; PDIi= Percent disease index at initial; PDIf= Percent disease index at final; CV = Coefficient of variation (%); LSD = Least significant difference at 5% probability level; Var *SF = Interaction effect of variety x spray frequency; and Ns = Not significant (p>0.05)
4.1.2. Severity of Late Blight
In both 2016 and 2017 cropping seasons, P.infestans first appeared on the moderately
susceptible (Bisholla) and on the susceptible (Melkasholla) varieties. Binyam et al. (2014)
noted on its alternate host (Potato) that the disease appeared earlier on moderately susceptible
and on susceptible varieties than on moderately resistant ones. In current study, symptoms of
tomato late blight appeared prior to flowering stage and became more severe after flowering
and fruiting stage for this particular pathogen, and this showed tomato plants were more
susceptible at fruiting stage of the plant than early at the vegetative stage. This observation is
in line with findings of Jones et al. (1997) and Naveenkumar et al. (2001) who stated that
plants are more susceptible to infection by the pathogen during fruiting stage. Infected leaves
began to defoliate starting two weeks after the appearance of symptoms on those plots
severely attacked, especially in the 2016 cropping season. Jones (2007) also reported that
infected leaves eventually withered, died, and fell from the plant. In this present study, more
defoliated leaves were observed on the untreated plots than other plots treated with ridomil at
10-day-interval on different varieties having different frequency levels. Neverseless, disease
scoring have been started after identification of the pathogen, Phytophthora infestans, under
laboratory by using cellophane tape method, direct observasion of the pathogen under
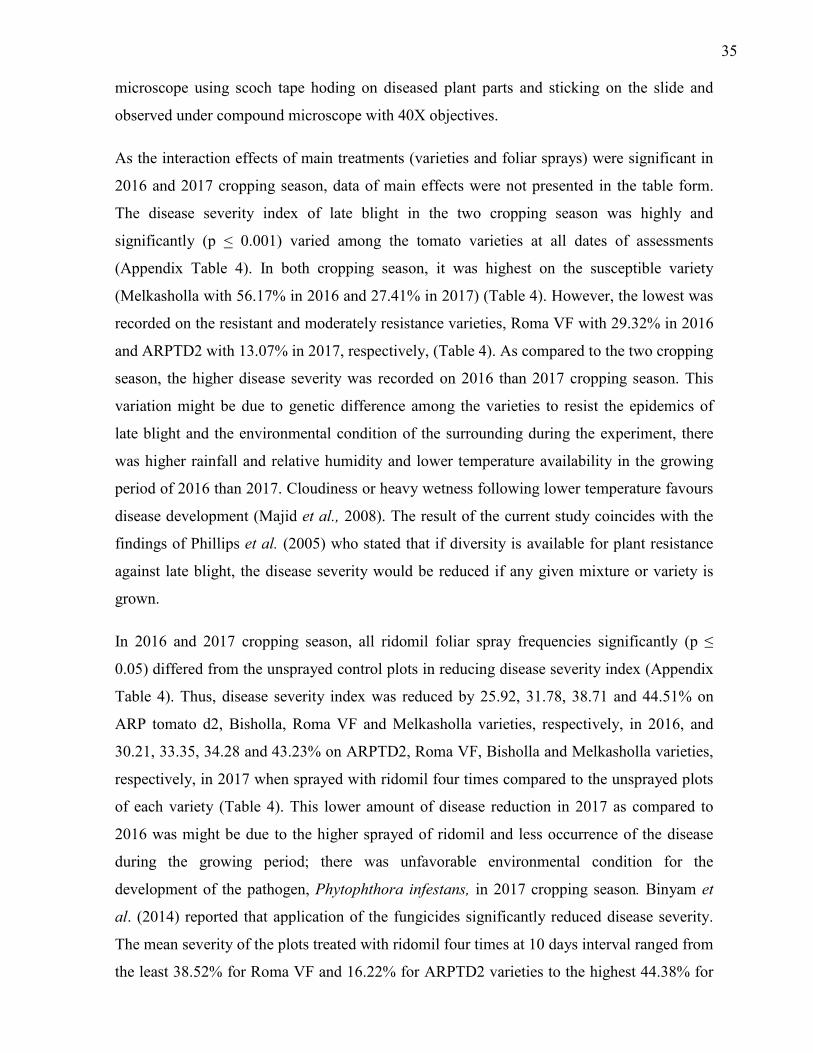
35
microscope using scoch tape hoding on diseased plant parts and sticking on the slide and
observed under compound microscope with 40X objectives.
As the interaction effects of main treatments (varieties and foliar sprays) were significant in
2016 and 2017 cropping season, data of main effects were not presented in the table form.
The disease severity index of late blight in the two cropping season was highly and
significantly (p < 0.001) varied among the tomato varieties at all dates of assessments
(Appendix Table 4). In both cropping season, it was highest on the susceptible variety
(Melkasholla with 56.17% in 2016 and 27.41% in 2017) (Table 4). However, the lowest was
recorded on the resistant and moderately resistance varieties, Roma VF with 29.32% in 2016
and ARPTD2 with 13.07% in 2017, respectively, (Table 4). As compared to the two cropping
season, the higher disease severity was recorded on 2016 than 2017 cropping season. This
variation might be due to genetic difference among the varieties to resist the epidemics of
late blight and the environmental condition of the surrounding during the experiment, there
was higher rainfall and relative humidity and lower temperature availability in the growing
period of 2016 than 2017. Cloudiness or heavy wetness following lower temperature favours
disease development (Majid et al., 2008). The result of the current study coincides with the
findings of Phillips et al. (2005) who stated that if diversity is available for plant resistance
against late blight, the disease severity would be reduced if any given mixture or variety is
grown.
In 2016 and 2017 cropping season, all ridomil foliar spray frequencies significantly (p ≤
0.05) differed from the unsprayed control plots in reducing disease severity index (Appendix
Table 4). Thus, disease severity index was reduced by 25.92, 31.78, 38.71 and 44.51% on
ARP tomato d2, Bisholla, Roma VF and Melkasholla varieties, respectively, in 2016, and
30.21, 33.35, 34.28 and 43.23% on ARPTD2, Roma VF, Bisholla and Melkasholla varieties,
respectively, in 2017 when sprayed with ridomil four times compared to the unsprayed plots
of each variety (Table 4). This lower amount of disease reduction in 2017 as compared to
2016 was might be due to the higher sprayed of ridomil and less occurrence of the disease
during the growing period; there was unfavorable environmental condition for the
development of the pathogen, Phytophthora infestans, in 2017 cropping season. Binyam et
al. (2014) reported that application of the fungicides significantly reduced disease severity.
The mean severity of the plots treated with ridomil four times at 10 days interval ranged from
the least 38.52% for Roma VF and 16.22% for ARPTD2 varieties to the highest 44.38% for
36
Bisholla and 22.22% for Melkasholla varieties, used as control plots in 2016 and 2017
cropping season, respectively. From the results, different foliar spray frequencies of ridomil
would be possible to deduce that four times foliar sprays of ridomil at 10 days interval could
effectively reduce the magnitude of late blight severity on each variety. Frequent foliar
applications (4 times) of ridomil might be a reason for its high efficacy; even during the wet
season it has less chance to be washed off by rainfall that used to maintain its high efficacy.
Therefore, it is advisable to use this fungicide accordingly. This result of the present study
coincides with the investigation of Abhinandan et al. (2004) who reported that frequently
applied fungicides by far reduced disease severity as compared to the less frequently sprayed
fungicides and unsprayed plots.
4.1.3. Area Under Disease Drogress Curve
The area under disease progress curve (AUDPC) is a very convenient summary of plant
disease epidemics that incorporates initial disease severity, the rate parameter and the
duration of the epidemic, which determines final disease severity (Madden et al., 2008).
Hence the effects of disease resistance on disease progress on crops can be evaluated using
AUDPC. Very highly significant (P ≤ 0.001) difference was observed in the magnitude of the
AUDPC among the varieties as well as different foliar spray frequencies in both cropping
season (Appendix Table 5). Late blight severity was calculated in the range of 661.11-
1245.52 %-days in 2016 from the moderately resistant variety Roma VF to the susceptible
variety Melkasholla, respectively, and 449.81-693.52 %-days from the resistant variety
ARPTD2 to the susceptible variety Melkasholla, respectively, in 2017 cropping season. On
resistance (in 2017) and moderately resistant (in 2016) varieties, ARPTD2 and Roma VF,
respectively, the AUDPC values were significantly less than the other varieties at both
cropping season (Table 4). Generally, the high degree of significance in difference of
AUDPC values among the evaluated varieties might be due to their genotypic resistance
characteristics to late blight reaction, and in addition the difference in the cropping season
which favored or delayed the development of Phytophthora infestans (Table 4).
However, the highest mean AUDPC values were recorded from unsprayed control plots of
ARPTD2, Roma VF, Bisholla and Melkasholla varieties with the corresponding values of
826.43, 1011.12, 1134.25 and 1245.52 %-days and 535.37, 570.37, 642.96 and 693.52 %-
days, which were significantly different from all the sprayed plots in 2016 and 2017 cropping
37
seasons, respectively. Similarly, in the current study, the lowest mean AUDPC values were
recorded from plots treated with four time spray frequencies of ridomil at 10 day interval on
ARPTD2, Roma VF, Bisholla and Melkasholla varieties with the corresponding values of
449.81, 471.85, 484.81 and 488.70 %-days, respectively, in 2017 cropping season (Table 4).
This indicated that all evaluated four times ridomil foliar spray frequencies at 10 days
interval had significant impact on late blight development on tomato genotypes, especially
when combined with ARPTD2 and Roma VF varieties as it showed the lowest AUDPC
values of the other two varieties in both cropping season (Table 4). Previous researchers
reported that the highest value of AUDPC resulted from the highest disease development on
plots that were not treated with any combinations of crop varieties and fungicide applications
with favorable environmental conditions for the development of the pathogen (Campbell and
Madden, 1990; Binyam et al., 2014; Desta and Yesuf, 2015). The findings of the current
study, especially the 2016 cropping season, is consistent with the report of Mesfin and
Gebremedhin (2007) and Ayda (2015) who found that , on its alternate host (Irish potato), the
moderately resistant varieties had the lowest AUDPC values when supplemented with
fungicide treatments in wet season.
4.1.4. Disease Progress Rate
The rate of late blight progress significantly (p ≤ 0.001) differed among the tomato varieties
in both 2016 and 2017 cropping seasons (Appendix Table 5). In 2016 cropping season, the
highest mean disease progress rates on ARPTD2, Roma VF, Melkasholla and Bisholla
varieties were 0.0352, 0.0379, 0.0421 and 0.0431 units per day, respectively. At the same
time, in 2017 cropping season the highest mean disease progress rates on ARPTD2, Roma
VF, Melkasholla and Bisholla varieties were 0.0191, 0.0236, 0.0285 and 0.0294 units per
day, respectively (Table 4). However, as compared to the two seasons, the lowest mean
disease progress rate on ARPTD2, Roma VF, Bisholla and Melkasholla varieties with
corresponding value of 0.0112, 0.0148, 0.0176 and 0.0219 units per day, respectively, were
recorded in 2017 cropping season (Table 4). Variation in disease progress rate of late blight
among the varieties might be due to the genetic background of varieties (their resistance
level) and the importance of environmental conditions which would favored or delayed the
development of the target pathogen during the growing period both in 2016 and 2017
cropping seasons. At the same time, the highest mean disease progress rates on different
spray frequencies i.e. zero, one time, two times, three times and four times at 10 days
38
intervals were 0.0489, 0.0444, 0.0389, 0.0344 and 0.0311 units per day, respectively, in 2016
cropping season, whereas the lowest mean disease progress rates were recorded in 2017
cropping season with corresponding value of 0.0252, 0.0210, 0.0154 and 0.0088 units per
day, respectively (Table 4). The reduction of disease progress rates occurred as a result of the
frequent application of ridomil at 10 days interval, and the more and less chance to occur the
disease in 2016 and 2017 cropping season, respectively.
Disease progress rates in plots of individual treatment varied very highly and significantly (p
≤ 0.001) among each treatments both in 2016 and 2017 cropping seasons (Appendix Table
5). The highest disease progress rate of 0.0547 units per day was obtained in unsprayed
control plot of the variety Melkasholla in 2016 cropping season, whereas the lowest disease
progress rate of 0.0048 units per day was recorded from the plots of ARPTD2 variety treated
with ridomil four times at 10 days interval in 2017 cropping season (Table 4). Hence, the rate
of late blight progress was faster on unsprayed control plots of Melkasholla variety than the
unsprayed plots of other varieties in both cropping season (Table 4). On unsprayed plots, in
2016 and 2017 cropping season late blight increased at a rate of 0.477 and 0.832 units per
day, respectively. However, all the sprayed plots reduced the disease progress rate
significantly. Moreover, among the different foliar spray frequencies, the lower infection
rates were recorded from the plots treated with ridomil four times at 10 days interval on each
variety in 2016 and 2017 cropping seasons. This might be due to its high spray frequencies
(four times spray). Generally, variation was clearly observed in late blight infection rates due
to the variable resistance levels of the genotypes and the different fungicide spray
frequencies and inclusion of the importance of environmental conditions during the growing
period at both cropping season. In both cropping seasons, late blight increased more rapidly
on unsprayed plots than on the sprayed plots. The lower values observed on plots sprayed
with four indicate the impacts of frequent application of ridomil on late blight development
and epidemic condition. Bekele and Hailu (2001) reported that frequent application of
fungicide could retard the rate of potato late blight progress in the field, alternate host for the
pathogen.
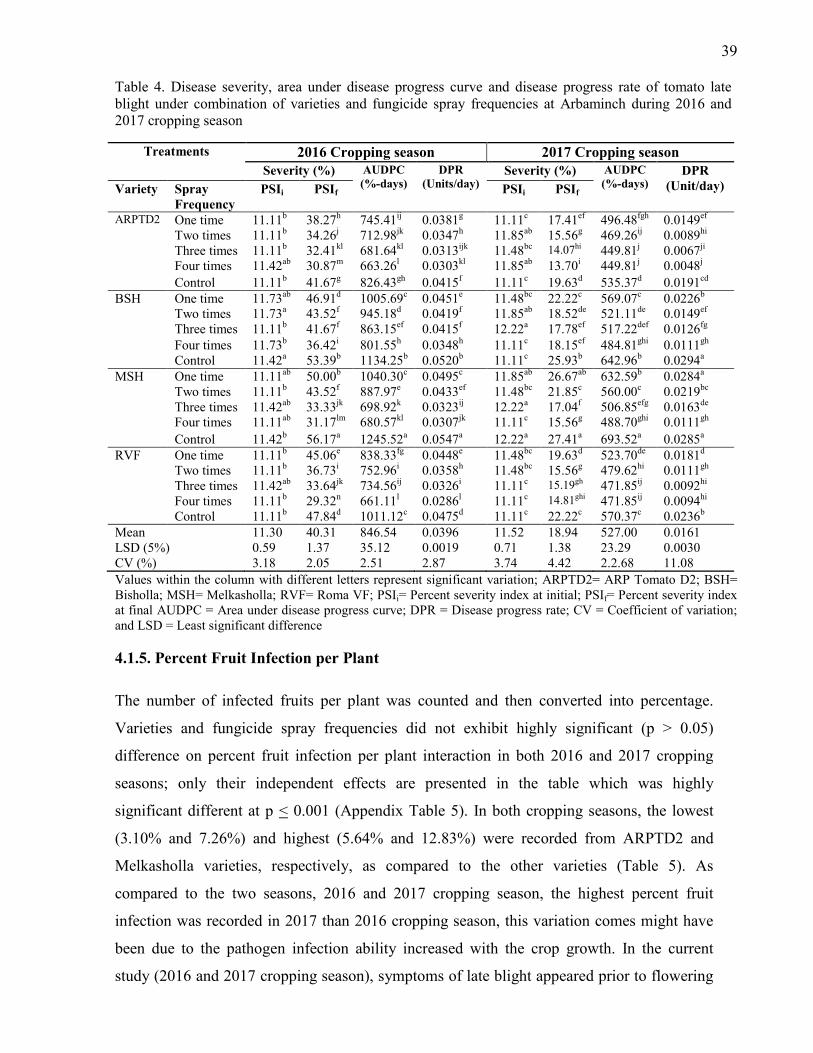
39
Table 4. Disease severity, area under disease progress curve and disease progress rate of tomato late blight under combination of varieties and fungicide spray frequencies at Arbaminch during 2016 and 2017 cropping season
Treatments 2016 Cropping season 2017 Cropping season Severity (%) AUDPC
(%-days) DPR
(Units/day) Severity (%) AUDPC
(%-days) DPR
(Unit/day) Variety Spray Frequency
PSIi PSIf PSIi PSIf
ARPTD2 One time 11.11b 38.27h 745.41ij 0.0381g 11.11c 17.41ef 496.48fgh 0.0149ef Two times 11.11b 34.26j 712.98jk 0.0347h 11.85ab 15.56g 469.26ij 0.0089hi Three times 11.11b 32.41kl 681.64kl 0.0313ijk 11.48bc 14.07hi 449.81j 0.0067ji Four times 11.42ab 30.87m 663.26l 0.0303kl 11.85ab 13.70i 449.81j 0.0048j
Control 11.11b 41.67g 826.43gh 0.0415f 11.11c 19.63d 535.37d 0.0191cd BSH One time 11.73ab 46.91d 1005.69c 0.0451e 11.48bc 22.22c 569.07c 0.0226b
Two times 11.73a 43.52f 945.18d 0.0419f 11.85ab 18.52de 521.11de 0.0149ef Three times 11.11b 41.67f 863.15ef 0.0415f 12.22a 17.78ef 517.22def 0.0126fg Four times 11.73b 36.42i 801.55h 0.0348h 11.11c 18.15ef 484.81ghi 0.0111gh Control 11.42a 53.39b 1134.25b 0.0520b 11.11c 25.93b 642.96b 0.0294a
MSH One time 11.11ab 50.00b 1040.30c 0.0495c 11.85ab 26.67ab 632.59b 0.0284a Two times 11.11b 43.52f 887.97e 0.0433ef 11.48bc 21.85c 560.00c 0.0219bc Three times 11.42ab 33.33jk 698.92k 0.0323ij 12.22a 17.04f 506.85efg 0.0163de Four times 11.11ab 31.17lm 680.57kl 0.0307jk 11.11c 15.56g 488.70ghi 0.0111gh
Control 11.42b 56.17a 1245.52a 0.0547a 12.22a 27.41a 693.52a 0.0285a RVF One time 11.11b 45.06e 838.33fg 0.0448e 11.48bc 19.63d 523.70de 0.0181d
Two times 11.11b 36.73i 752.96i 0.0358h 11.48bc 15.56g 479.62hi 0.0111gh Three times 11.42ab 33.64jk 734.56ij 0.0326i 11.11c 15.19gh 471.85ij 0.0092hi Four times 11.11b 29.32n 661.11l 0.0286l 11.11c 14.81ghi 471.85ij 0.0094hi Control 11.11b 47.84d 1011.12c 0.0475d 11.11c 22.22c 570.37c 0.0236b
Mean 11.30 40.31 846.54 0.0396 11.52 18.94 527.00 0.0161 LSD (5%) 0.59 1.37 35.12 0.0019 0.71 1.38 23.29 0.0030 CV (%) 3.18 2.05 2.51 2.87 3.74 4.42 2.2.68 11.08
Values within the column with different letters represent significant variation; ARPTD2= ARP Tomato D2; BSH= Bisholla; MSH= Melkasholla; RVF= Roma VF; PSIi= Percent severity index at initial; PSIf= Percent severity index at final AUDPC = Area under disease progress curve; DPR = Disease progress rate; CV = Coefficient of variation; and LSD = Least significant difference
4.1.5. Percent Fruit Infection per Plant
The number of infected fruits per plant was counted and then converted into percentage.
Varieties and fungicide spray frequencies did not exhibit highly significant (p > 0.05)
difference on percent fruit infection per plant interaction in both 2016 and 2017 cropping
seasons; only their independent effects are presented in the table which was highly
significant different at p < 0.001 (Appendix Table 5). In both cropping seasons, the lowest
(3.10% and 7.26%) and highest (5.64% and 12.83%) were recorded from ARPTD2 and
Melkasholla varieties, respectively, as compared to the other varieties (Table 5). As
compared to the two seasons, 2016 and 2017 cropping season, the highest percent fruit
infection was recorded in 2017 than 2016 cropping season, this variation comes might have
been due to the pathogen infection ability increased with the crop growth. In the current
study (2016 and 2017 cropping season), symptoms of late blight appeared prior to flowering
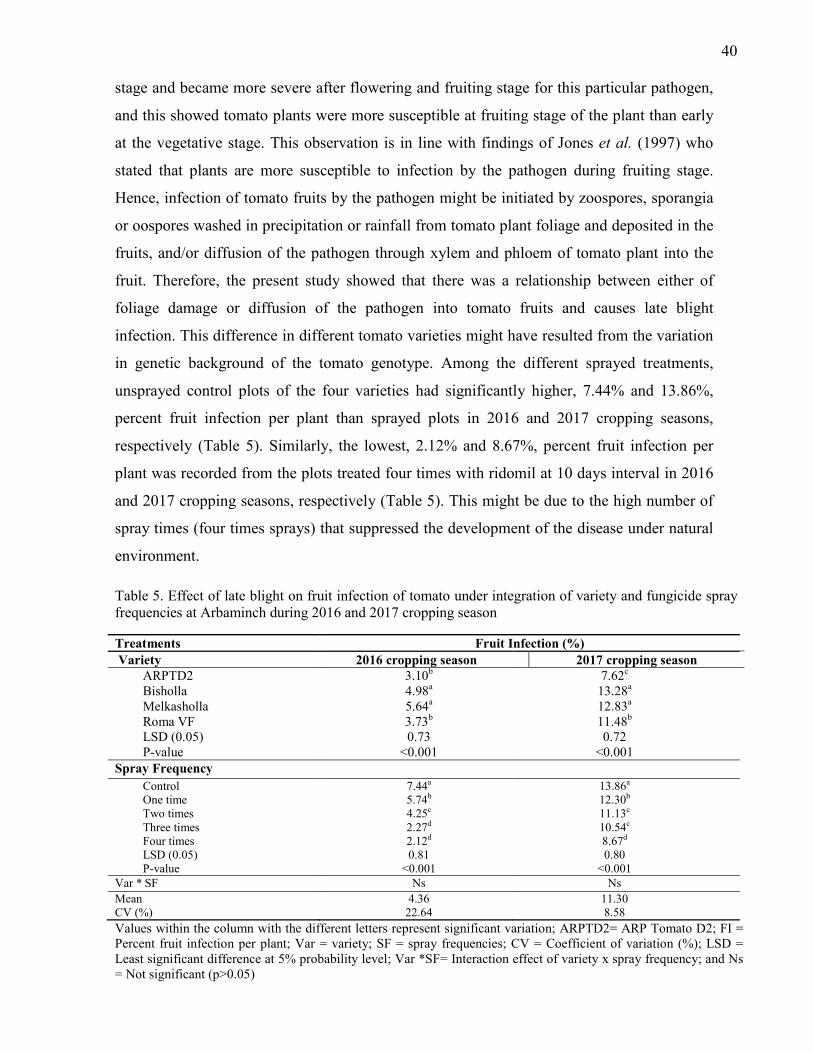
40
stage and became more severe after flowering and fruiting stage for this particular pathogen,
and this showed tomato plants were more susceptible at fruiting stage of the plant than early
at the vegetative stage. This observation is in line with findings of Jones et al. (1997) who
stated that plants are more susceptible to infection by the pathogen during fruiting stage.
Hence, infection of tomato fruits by the pathogen might be initiated by zoospores, sporangia
or oospores washed in precipitation or rainfall from tomato plant foliage and deposited in the
fruits, and/or diffusion of the pathogen through xylem and phloem of tomato plant into the
fruit. Therefore, the present study showed that there was a relationship between either of
foliage damage or diffusion of the pathogen into tomato fruits and causes late blight
infection. This difference in different tomato varieties might have resulted from the variation
in genetic background of the tomato genotype. Among the different sprayed treatments,
unsprayed control plots of the four varieties had significantly higher, 7.44% and 13.86%,
percent fruit infection per plant than sprayed plots in 2016 and 2017 cropping seasons,
respectively (Table 5). Similarly, the lowest, 2.12% and 8.67%, percent fruit infection per
plant was recorded from the plots treated four times with ridomil at 10 days interval in 2016
and 2017 cropping seasons, respectively (Table 5). This might be due to the high number of
spray times (four times sprays) that suppressed the development of the disease under natural
environment.
Table 5. Effect of late blight on fruit infection of tomato under integration of variety and fungicide spray frequencies at Arbaminch during 2016 and 2017 cropping season
Treatments Fruit Infection (%)
Variety 2016 cropping season 2017 cropping season ARPTD2 3.10b 7.62c Bisholla 4.98a 13.28a Melkasholla 5.64a 12.83a Roma VF 3.73b 11.48b LSD (0.05) 0.73 0.72 P-value <0.001 <0.001
Spray Frequency
Control 7.44a 13.86a One time 5.74b 12.30b Two times 4.25c 11.13c Three times 2.27d 10.54c Four times 2.12d 8.67d LSD (0.05) 0.81 0.80 P-value <0.001 <0.001
Var * SF Ns Ns
Mean 4.36 11.30 CV (%) 22.64 8.58
Values within the column with the different letters represent significant variation; ARPTD2= ARP Tomato D2; FI = Percent fruit infection per plant; Var = variety; SF = spray frequencies; CV = Coefficient of variation (%); LSD = Least significant difference at 5% probability level; Var *SF= Interaction effect of variety x spray frequency; and Ns = Not significant (p>0.05)
41
4.1.6. Other Diseases and Insect Pests of Tomato
In the current study, apart from tomato late blight, other tomato disease was recorded during
the field experiment, including tomato early blight in both 2016 and 2017 cropping seasons.
Although these disease occurred prior to late blight in both cropping season, the disease
incidence and severities were recorded at last during the growing periods similar to late
blight. However, that is why the present study was concerned with only the epidemics of late
blight for the targeted areas. Early blight appeared first on the varieties Melkasholla, Bisholla
and Roma VF and at last on ARPTD2 at 14 and 7 DAT in 2016 and 2017 cropping seasons,
respectively. The disease appeared in all, except ARPTD2, varieties during the last
assessment date in both cropping seasons. The maximum mean incidence and severity were
82.95 and 20.08% in 2016 (Appendix Table 6a) and 88.12 and 25.67% in 2017 cropping
season, respectively, (Appendix Table 6b). According to Tesfaye and Habtu (1985) and
Tsedeke (2007), late blight, early blight caused by Alternaria solani is one of important
disease that limit tomato production in Ethiopia; however, late blight is the most severe
disease in most tomato-growing regions, mainly in wet season.
With regard to insect pests, in 2016 and 2017 cropping seasons the major insect pests that
occurred during the experiment included African bollworm (Helicoverpa armigera), red
spider mite (Tetranychus evans) and Tomato leaf miner (except for 2016 cropping seaseon),
and were found to severely damaging the tomato plants soon after fruit setting. The number
of damaged fruits per plant by insect pests was counted and then converted into percentage.
The highest (7.85 and 12.58%) and the lowest (2.64 and 9.17%) score damaged fruits were
counted from the varieties Bisholla and Roma VF in both 2016 and 2017 cropping seasons,
respectively (Appendix Table 6a and b). Tadele (2016) reported the insects named as African
bollworm, leaf miner and red spider mite were the most destructive pests on tomato, causing
fruit yield losses with the range of 1.57 to 4.33% on seven different tomato varieties. In the
present study, during 2016 cropping season no leaf miner occurred during the experiment. In
this current study, the effect of insect pests in reducing tomato fruit yield and limiting its
production was found as equally important as the influence by other diseases that appeared
on tomato.
42
4.1.7. Meteorological Information
Meteorological variables, such as temperature, rainfall and relative humidity, are important
factors of interest in plant disease epidemiology as they can have profound individual and
interactive influence on initiation and progress of epidemics (Campbell and Madden, 1990).
In view of this, meteorological data of the experimental site was obtained from Southern
Meteorological Branch Office, Ethiopian Meteorological Agency (Appendix Table 7). The
data included maximum and minimum daily air temperature (OC), relative humidity and daily
rainfall (mm) around Arbaminch areas.
Sporangia of P. infestans germinate at temperatures above 21 OC (optimally at 25 OC) directly
on host tissue in a process taking between 8 and 48 hours. Below 21◦C, up to eight
biflagellate zoospores are released from the sporangia (Judelson, 1997; Majid et al., 2008).
Inspection of the temperatures (Appendix Table 7) during the growing periods, both in 2016
and 2017 cropping seasons, at Arbaminch areas meteorological stations revealed that the
minimum, 16.54 and 17.65 OC, and maximum, 32.03 and 32.69 OC temperatures, respectively,
implying that more favorable environmental conditions especially prolonged period lower
temperature ranging from 16.19 to 17.55 oC, which could be one cause for the high severity
observed, were prevalent in the study during 2016 as compared to 2017 cropping season.
Moreover, data on rainfall and relative humidity also showed that there was availability of
moisture during the growing period for sporangia germination to occur and for tomato late
blight to develop extensively, especially during 2016 cropping season.
4.2. Effect of Variety and Fungicide Frequencies on Tomato Late Blight on
Crop Growth, Yield and Yield Related Parameters
4.2.1. Crop Growth Parameters
The interaction effects (varieties x spray frequencies) did not reveal significant difference on
crop growth parameters such as days to 50% flowering, first ( in 2016) and last harvesting
date, plant stands per plot and number of branches per plant; to this effect, only their
independent effects are presented. This implies that each variety responded differently to the
different foliar spray frequencies. However, days to 50% fruit setting and first harvesting
date in 2017 there were significant difference on interaction effect on varieties x spray
frequencies; to this effect only their interaction mean value of the two parameters are
43
presented in the table, the table consisted mean value of both main and interaction effect of
crop growth parameters.
4.2.1.1. Days to 50% Flowering and Fruit Setting
In 2016 and 2017 cropping seasons, very highly significant (p≤0.001) difference was
observed among the varieties and fungicide spray frequencies with regard to days to 50%
flowering and fruit setting (Appendix Table 8). Melkasholla had longer days to 50%
flowering and fruit setting than the other varieties in both cropping season (Table 6). This
difference might have resulted from the variation in genetic background of the tomato
varieties. Kaushik et al. (2011) who found significant variability in yield produced by six
tomato varieties evaluated for pest and disease and productivity in Botswana. Similarly, this
result is in agreement with the finding of Shushay and Haile (2014) who found that days to
50% flowering ranged from 29 to 38. However, the author indicated that among the different
varieties, ‘ARPTD2 and Roma VF’ showed earliest flowering, whereas ‘Bisholla’ and
‘Melkasholla’ had delayed flowering, and the current observation coincides with the finding
of Shushay and Haile (2014). In contrast to this study, Ajal and Ajani (2014) reported that
days to 50% flowering ranged from 46.75 to 64.
With regard to ridomil spray frequencies in 2016 and 2017 cropping seasons, the unsprayed
control plots of the four varieties had also significantly shorter days to 50% flowering and
fruit setting than sprayed plots (Table 6). Three times ridomil spray frequencies showed early
to 50% days to flowering and fruit setting as compared to the other spray frequencies at 10
days intervals in both cropping seasons. This indicates that fungicide application might have
enhanced days to 50% flowering and fruit setting due to the encouraging ability of the
fungicides in reducing disease stress; as a result the plant continues in its normal
physiological processes.
4.2.1.2. First and Last Picking Date Very highly significant (p≤0.001) difference was observed among the tomato varieties on
first and last harvesting date in both 2016 and 2017 cropping seasons (Appendix Table 8).
Roma VF had relatively shorter first and last harvesting dates than the other varieties on both
cropping season (Table 6). The number of days to first harvesting ranged from 63.40 – 76.60
days in 2016 and 52.00 - 68.27 days in 2017 cropping season for the varieties Roma VF and
44
Melkasholla, respectively. Similarly, the number of days to last harvesting ranged from 89.60
– 98.53 days in 2016 and 81.47 – 93.93 days in 2017 for Roma VF and Melkasholla
varieties, respectively. Roma VF took the shortest (89.60 and 81.47 days) period and
Melkasholla the longest (98.53 and 93.93 days) period to cease fruit bearing in 2016 and
2017 cropping season, respectively (Table 6). This difference might have resulted from the
variation in genetic background of the varieties and likely to be due the favorable agro-
ecology of the growing areas for the varieties to bearded and ceased fruits earlier in the
growing period in both cropping season. Moraru et al. (2004) and Ketema et al. (2016)
recognized the presence of a wider range of variability in days to first harvest amongst ten
and nine tomato varieties tested, respectively. Moreover, Bohner and Bangerth (1988) also
reported that time from transplant to first harvest of plum types and large fruited-type
tomatoes ranged between 70 to 90 days, where the earlier maturity occurred for plum types
and the late harvesting for large fruited types of tomatoes, which is in agreement with the
present findings. This was true for the varieties ARPTD2, Bisholla and Melkasholla but for
Roma VF it was in contrast since first harvesting date for this variety was less than
predetermined date range found by Bohner and Bangerth (1988) (Table 6).
Spray treatments had no significant (p>0.05) difference in the duration for first harvesting
date in 2016 but there was significant (p<0.001) difference in 2017 cropping season, whereas
significantly varied on last harvesting date in both cropping seasons (Appendix Table 8). In
2017 cropping season, the shortest first harvesting date was recorded from unsprayed and one
time sprayed plots of all varieties, and the longest was recorded from three and four time
sprayed plots of all varieties. Unsprayed plots of the four varieties had significantly shorter
last harvesting days (82.25 and 80.58) than the sprayed plots in both 2016 and 2017 cropping
season, respectively, and the longest first and last harvesting duration, i.e. 74.00 and 101.25
days in 2016, and 67.00 and 90.00 days in 2017 cropping seasons, respectively, took three
and four times ridomil spray frequencies at 10 days intervals (Table 6). This indicates that
wise application of fungicides would reduce the magnitude of disease severity and enhance
the plants to perform its normal physiological process. Similar results were reported by Ayda
(2015) and opined that fungicide application in integration with resistant genotypes and
fungicide treatment lengthened the time required by the potato genotypes, alternate host for
P.infestans, to reach physiological maturity.
45
4.2.1.3. Number of Branches per Plant and Plant Stand Count at Harvest
Varieties and fungicide spray frequencies exhibited very highly significant (p≤0.001)
difference on the number of branches per plant and plant stand count at harvest both in 2016
and 2017 cropping season (Appendix Table 8). In 2016 and 2017 cropping season, the
maximum number of branches per plant was recorded in the varieties Melkasholla (14.79)
and Roma VF (13.43), respectively, and the minimum number of branches per plant was
recorded in the variety ARPTD2 (12.58 and 11.48), respectively (Table 6). This present
result is in close conformity with the findings of Meseret et al. (2012) who reported that the
significant variations among the varieties of tomato for the number of branches per plant.
ARPTD2 had relatively better plant stand count at harvest, while Melkasholla and Roma VF
in 2016 and Roma VF in 2017 cropping season had more number of branches per plant than
other tomato varieties (Table 6). This difference might have resulted from the variation in
genetic background of the varieties.
Similarly, unsprayed plots of the four tomato varieties had significantly (p≤0.001) less
number of branches per plant (12.04 and 10.77) and plant stand count (29.50 and 28.33) at
harvest than the sprayed plots regardless of the spray frequencies of ridomil at 10 days
intervals in 2016 and 2017 cropping season (Table 6). At the same time, the highest plant
stand count and numbers of branches of 40.25 and 15.19 were recorded from the sprayed
plots of three times spray frequencies at 10 days intervals and unsprayed plot, respectively in
2016 cropping season (Table 6). Nevertheless, in 2017 cropping season the highest plant
stand count and numbers of branches were recorded in plots treated with three and four times
with corresponding value of 39.50 and 37.60 and two and three times 13.36 and 13.96 spray
frequencies at 10 days intervals, respectively (Table 6). This indicates that wise application
of fungicides would reduce the magnitude of disease severity on the number of branches per
plant and plant stand count and would enhance the plants to perform its normal physiological
process.
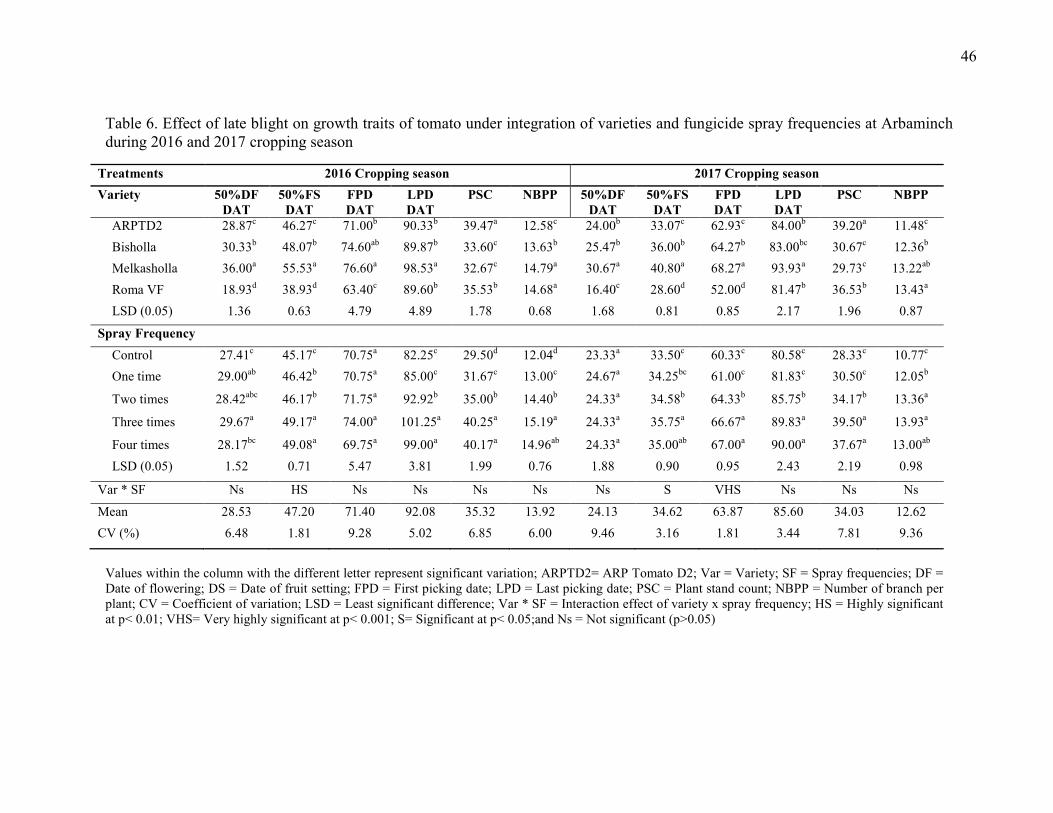
46
Table 6. Effect of late blight on growth traits of tomato under integration of varieties and fungicide spray frequencies at Arbaminch during 2016 and 2017 cropping season
Treatments 2016 Cropping season 2017 Cropping season
Variety 50%DF DAT
50%FS DAT
FPD DAT
LPD DAT
PSC NBPP 50%DF DAT
50%FS DAT
FPD DAT
LPD DAT
PSC NBPP
ARPTD2 28.87c 46.27c 71.00b 90.33b 39.47a 12.58c 24.00b 33.07c 62.93c 84.00b 39.20a 11.48c
Bisholla 30.33b 48.07b 74.60ab 89.87b 33.60c 13.63b 25.47b 36.00b 64.27b 83.00bc 30.67c 12.36b
Melkasholla 36.00a 55.53a 76.60a 98.53a 32.67c 14.79a 30.67a 40.80a 68.27a 93.93a 29.73c 13.22ab
Roma VF 18.93d 38.93d 63.40c 89.60b 35.53b 14.68a 16.40c 28.60d 52.00d 81.47b 36.53b 13.43a
LSD (0.05) 1.36 0.63 4.79 4.89 1.78 0.68 1.68 0.81 0.85 2.17 1.96 0.87
Spray Frequency
Control 27.41c 45.17c 70.75a 82.25c 29.50d 12.04d 23.33a 33.50c 60.33c 80.58c 28.33c 10.77c
One time 29.00ab 46.42b 70.75a 85.00c 31.67c 13.00c 24.67a 34.25bc 61.00c 81.83c 30.50c 12.05b
Two times 28.42abc 46.17b 71.75a 92.92b 35.00b 14.40b 24.33a 34.58b 64.33b 85.75b 34.17b 13.36a
Three times 29.67a 49.17a 74.00a 101.25a 40.25a 15.19a 24.33a 35.75a 66.67a 89.83a 39.50a 13.93a
Four times 28.17bc 49.08a 69.75a 99.00a 40.17a 14.96ab 24.33a 35.00ab 67.00a 90.00a 37.67a 13.00ab
LSD (0.05) 1.52 0.71 5.47 3.81 1.99 0.76 1.88 0.90 0.95 2.43 2.19 0.98
Var * SF Ns HS Ns Ns Ns Ns Ns S VHS Ns Ns Ns
Mean 28.53 47.20 71.40 92.08 35.32 13.92 24.13 34.62 63.87 85.60 34.03 12.62
CV (%) 6.48 1.81 9.28 5.02 6.85 6.00 9.46 3.16 1.81 3.44 7.81 9.36
Values within the column with the different letter represent significant variation; ARPTD2= ARP Tomato D2; Var = Variety; SF = Spray frequencies; DF = Date of flowering; DS = Date of fruit setting; FPD = First picking date; LPD = Last picking date; PSC = Plant stand count; NBPP = Number of branch per plant; CV = Coefficient of variation; LSD = Least significant difference; Var * SF = Interaction effect of variety x spray frequency; HS = Highly significant at p< 0.01; VHS= Very highly significant at p< 0.001; S= Significant at p< 0.05;and Ns = Not significant (p>0.05)
47
4.2.2. Yield and Yield Related Parameters
Since, the main effects of varieties x spray frequencies did not exhibit significant difference
(p>0.001) on all components of yield attributes, except unmarketable yield (i.e, exhibit
significant (p≤0.001) for its main effects in the experiment) (Appendix Table 9), only their
interaction effect of mean value of variety and spray frequencies of all parameters were
considered in the table, and including unmarketable yield. This implied that each variety is
affected by the level of the different foliar spray frequencies, except for unmarketable yield.
4.2.2.1. Marketable, Unmarketable and Total Fruit Yield
Marketable, unmarketable and total fruit yield were very highly and significantly (p≤0.001)
varied among tomato varieties and spray frequencies in 2016 and 2017 cropping seasons.
ARPTD2 (39.63 and 37.22 t ha-1) and Roma VF (37.25 and 35.73 t ha-1) varieties had the
highest marketable and lowest unmarketable fruit yield (5.72 and 5.85t ha-1 for ARPTD2) as
compared to the other tomato varieties in 2016 and 2017 cropping seasons, respectively.
Similarly, in cropping season (2016 and 2017), the highest such as 46.59 and 46.54 t ha-1
total fruit yield was obtained from Roma VF, respectively (Table 7). This difference might
have resulted from the variation in genetic background of the varieties. The report of
MoARD (2005) showed that the varieties Melkasholla and Bisholla yielded up to 35 and 45 t
ha-1, respectively, in Ethiopia. However, in this experiment the yield was less than that of the
potential yields of the varieties Melkasholla and Bisholla that gave 30.95 and 29.88 t ha-1 in
2016 and 28.29 and 29.27 t ha-1, in 2017 cropping seasons, respectively. This might indicate
that the disease pressure was high during the experiment leading to very low yield (Table 7).
But compared to this present study report, MoARD (2005), Belay (2009) and MoA (2012)
reported that yields of the varieties ranged from 31.4 (Roma VF) to 43.5 t ha-1 (ARPD2); it
can be seen that in general the fruit yields of the varieties ARPTD2 and Roma VF were
relatively higher than the yield of the variety Bisholla and Melkasholla even while being
under high disease pressure in this study in both cropping seasons (Table 7).
With regard to the spray treatments in 2016 and 2017 cropping seasons, the lowest (22.92
and 19.59 t ha-1) marketable and total fruit yield (34.08 and 35.54 t ha-1) and highest (11.16
and 12.69 t ha-1) unmarketable fruit yield were obtained from unsprayed control plots,
respectively (Table 7). At the same time both in 2016 and 2017 cropping seasons, the highest
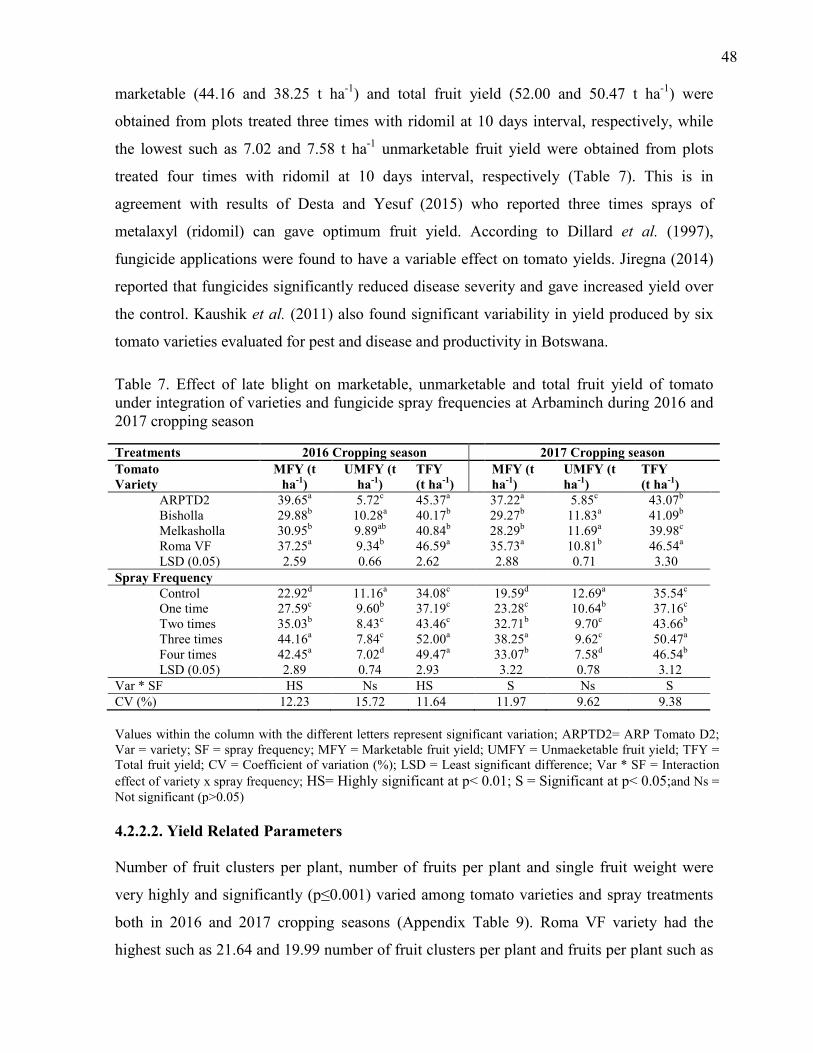
48
marketable (44.16 and 38.25 t ha-1) and total fruit yield (52.00 and 50.47 t ha-1) were
obtained from plots treated three times with ridomil at 10 days interval, respectively, while
the lowest such as 7.02 and 7.58 t ha-1 unmarketable fruit yield were obtained from plots
treated four times with ridomil at 10 days interval, respectively (Table 7). This is in
agreement with results of Desta and Yesuf (2015) who reported three times sprays of
metalaxyl (ridomil) can gave optimum fruit yield. According to Dillard et al. (1997),
fungicide applications were found to have a variable effect on tomato yields. Jiregna (2014)
reported that fungicides significantly reduced disease severity and gave increased yield over
the control. Kaushik et al. (2011) also found significant variability in yield produced by six
tomato varieties evaluated for pest and disease and productivity in Botswana.
Table 7. Effect of late blight on marketable, unmarketable and total fruit yield of tomato under integration of varieties and fungicide spray frequencies at Arbaminch during 2016 and 2017 cropping season
Treatments 2016 Cropping season 2017 Cropping season
Tomato Variety
MFY (t ha-1)
UMFY (t ha-1)
TFY (t ha-1)
MFY (t ha-1)
UMFY (t ha-1)
TFY (t ha-1)
ARPTD2 39.65a 5.72c 45.37a 37.22a 5.85c 43.07b Bisholla 29.88b 10.28a 40.17b 29.27b 11.83a 41.09b Melkasholla 30.95b 9.89ab 40.84b 28.29b 11.69a 39.98c Roma VF 37.25a 9.34b 46.59a 35.73a 10.81b 46.54a LSD (0.05) 2.59 0.66 2.62 2.88 0.71 3.30
Spray Frequency Control 22.92d 11.16a 34.08c 19.59d 12.69a 35.54c One time 27.59c 9.60b 37.19c 23.28c 10.64b 37.16c Two times 35.03b 8.43c 43.46c 32.71b 9.70c 43.66b Three times 44.16a 7.84c 52.00a 38.25a 9.62c 50.47a Four times 42.45a 7.02d 49.47a 33.07b 7.58d 46.54b LSD (0.05) 2.89 0.74 2.93 3.22 0.78 3.12
Var * SF HS Ns HS S Ns S CV (%) 12.23 15.72 11.64 11.97 9.62 9.38
Values within the column with the different letters represent significant variation; ARPTD2= ARP Tomato D2; Var = variety; SF = spray frequency; MFY = Marketable fruit yield; UMFY = Unmaeketable fruit yield; TFY = Total fruit yield; CV = Coefficient of variation (%); LSD = Least significant difference; Var * SF = Interaction
effect of variety x spray frequency; HS= Highly significant at p< 0.01; S = Significant at p< 0.05;and Ns = Not significant (p>0.05)
4.2.2.2. Yield Related Parameters
Number of fruit clusters per plant, number of fruits per plant and single fruit weight were
very highly and significantly (p≤0.001) varied among tomato varieties and spray treatments
both in 2016 and 2017 cropping seasons (Appendix Table 9). Roma VF variety had the
highest such as 21.64 and 19.99 number of fruit clusters per plant and fruits per plant such as
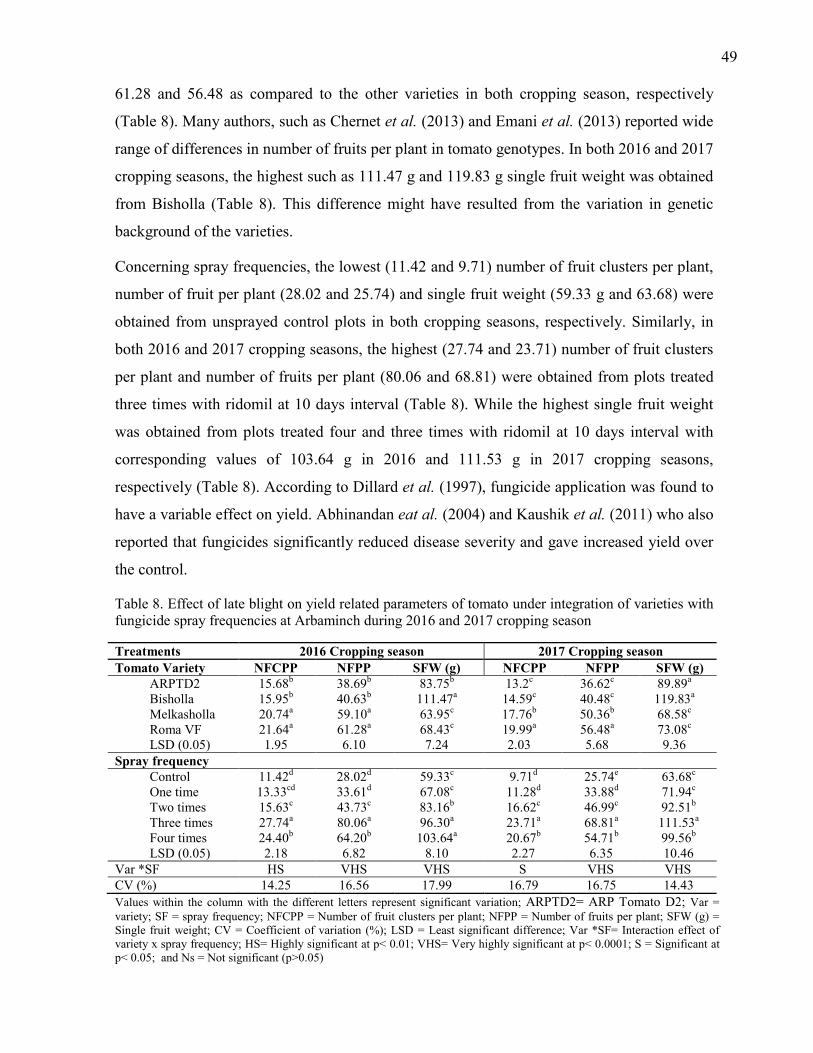
49
61.28 and 56.48 as compared to the other varieties in both cropping season, respectively
(Table 8). Many authors, such as Chernet et al. (2013) and Emani et al. (2013) reported wide
range of differences in number of fruits per plant in tomato genotypes. In both 2016 and 2017
cropping seasons, the highest such as 111.47 g and 119.83 g single fruit weight was obtained
from Bisholla (Table 8). This difference might have resulted from the variation in genetic
background of the varieties.
Concerning spray frequencies, the lowest (11.42 and 9.71) number of fruit clusters per plant,
number of fruit per plant (28.02 and 25.74) and single fruit weight (59.33 g and 63.68) were
obtained from unsprayed control plots in both cropping seasons, respectively. Similarly, in
both 2016 and 2017 cropping seasons, the highest (27.74 and 23.71) number of fruit clusters
per plant and number of fruits per plant (80.06 and 68.81) were obtained from plots treated
three times with ridomil at 10 days interval (Table 8). While the highest single fruit weight
was obtained from plots treated four and three times with ridomil at 10 days interval with
corresponding values of 103.64 g in 2016 and 111.53 g in 2017 cropping seasons,
respectively (Table 8). According to Dillard et al. (1997), fungicide application was found to
have a variable effect on yield. Abhinandan eat al. (2004) and Kaushik et al. (2011) who also
reported that fungicides significantly reduced disease severity and gave increased yield over
the control.
Table 8. Effect of late blight on yield related parameters of tomato under integration of varieties with fungicide spray frequencies at Arbaminch during 2016 and 2017 cropping season
Treatments 2016 Cropping season 2017 Cropping season
Tomato Variety NFCPP NFPP SFW (g) NFCPP NFPP SFW (g) ARPTD2 15.68b 38.69b 83.75b 13.2c 36.62c 89.89a Bisholla 15.95b 40.63b 111.47a 14.59c 40.48c 119.83a Melkasholla 20.74a 59.10a 63.95c 17.76b 50.36b 68.58c Roma VF 21.64a 61.28a 68.43c 19.99a 56.48a 73.08c LSD (0.05) 1.95 6.10 7.24 2.03 5.68 9.36
Spray frequency Control 11.42d 28.02d 59.33c 9.71d 25.74e 63.68c One time 13.33cd 33.61d 67.08c 11.28d 33.88d 71.94c Two times 15.63c 43.73c 83.16b 16.62c 46.99c 92.51b Three times 27.74a 80.06a 96.30a 23.71a 68.81a 111.53a Four times 24.40b 64.20b 103.64a 20.67b 54.71b 99.56b LSD (0.05) 2.18 6.82 8.10 2.27 6.35 10.46
Var *SF HS VHS VHS S VHS VHS CV (%) 14.25 16.56 17.99 16.79 16.75 14.43
Values within the column with the different letters represent significant variation; ARPTD2= ARP Tomato D2; Var = variety; SF = spray frequency; NFCPP = Number of fruit clusters per plant; NFPP = Number of fruits per plant; SFW (g) = Single fruit weight; CV = Coefficient of variation (%); LSD = Least significant difference; Var *SF= Interaction effect of variety x spray frequency; HS= Highly significant at p< 0.01; VHS= Very highly significant at p< 0.0001; S = Significant at p< 0.05; and Ns = Not significant (p>0.05)
50
4.3. Association of Late Blight Epidemics with Tomato Fruit Yields
In the analyzing of correlation and regression between disease parameters and yield and yield
components was crucial since change of either of the parameters influenced the response of
the other during the experiment. For this experiment, simple correlation and linear regression
analysis was used for studying the association between disease and yield parameters.
Significance of associations between disease and yield parameters was examined using
simple correlation analysis. Determined Pearson correlation coefficients (r) were used as
indices for strength of the association (Table 9). The negative correlation of late blight
development with yield was found to be stronger with the final severity than AUDPC both in
2016 and 2017 cropping seasons. Total fruit yield and final PSI and percent fruit infection
showed very highly significant (p≤0.001) and were negatively correlated, r = -0.81 and -0.67
in 2016 and -0.67 and -0.44 in 2017 cropping seasons, respectively. Similarly, AUDPC
values and disease progress rates also revealed very high significant (p≤0.001) and negative
association with fruit yield with correlation coefficient values of r = -0.74 and -0.81 in 2016
and -0.63 and -0.67 in 2017 cropping seasons, respectively (Table 9). This indicates that the
observed value of the disease had a considerable adverse effect on fruit yield of the tomato.
This result is in agreement with the finding of Fekede (2011) who reported that the
associated disease parameters had a negative impact on yield parameters.
In general both in 2016 and 2017 cropping seasons, final PSI, percent fruit infection, disease
progress rate and AUDPC had high and significant negative correlations with yield and yield
related parameters (Marketable fruit yield, number of fruit clusters per plant, number of fruits
per plant and single fruit) except unmarketable fruit yield for they had positive correlation
(Table 9). This indicates that the observed levels of late blight epidemics had a considerable
adverse effect on yield related parameters of tomato varieties. Previously, researchers found
that early infection due to P. infestans causing late blight of potato and tomato resulted in
severe disease and highest correlations between yield and disease indices under natural field
conditions (Olanya et al., 2001). Similar findings were reported by Bekele and Gebremedhin
(2000) who indicated that late blight severity, AUDPC and infection rates were strongly
correlated with final yields of potato, alternate host of P. infestans.
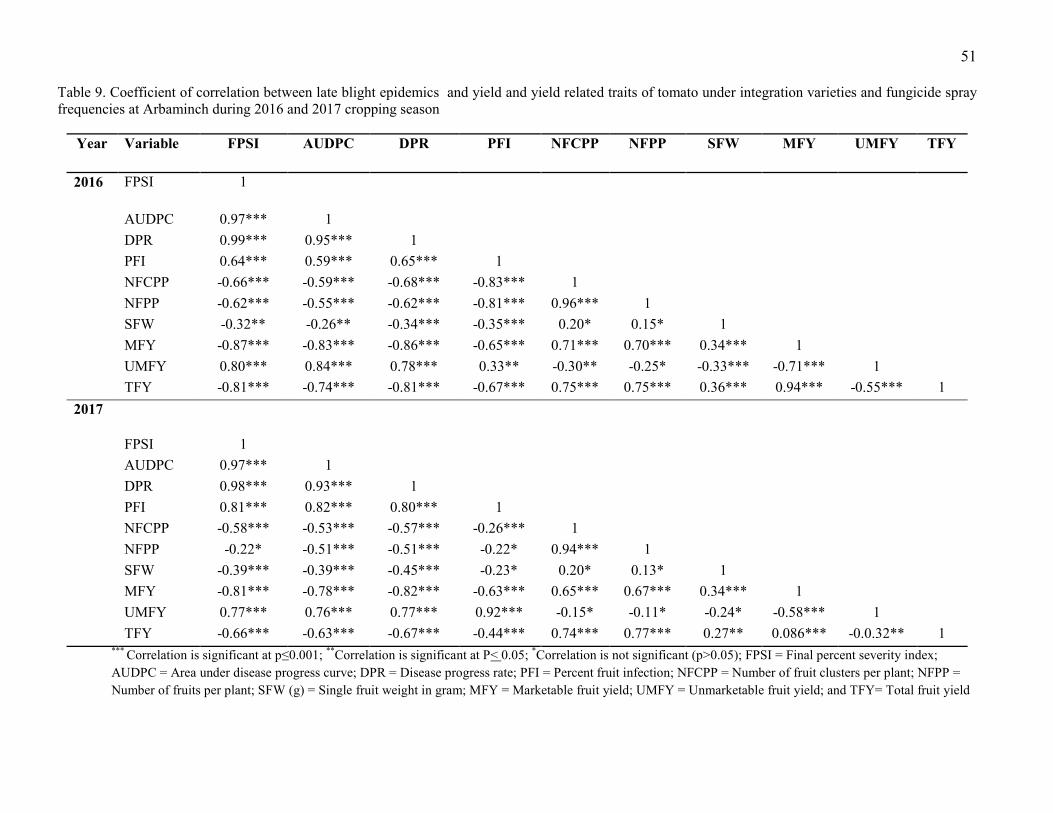
51
Table 9. Coefficient of correlation between late blight epidemics and yield and yield related traits of tomato under integration varieties and fungicide spray frequencies at Arbaminch during 2016 and 2017 cropping season
Year Variable FPSI AUDPC DPR PFI NFCPP NFPP SFW MFY UMFY TFY
2016 FPSI 1
AUDPC 0.97*** 1
DPR 0.99*** 0.95*** 1
PFI 0.64*** 0.59*** 0.65*** 1
NFCPP -0.66*** -0.59*** -0.68*** -0.83*** 1
NFPP -0.62*** -0.55*** -0.62*** -0.81*** 0.96*** 1
SFW -0.32** -0.26** -0.34*** -0.35*** 0.20* 0.15* 1
MFY -0.87*** -0.83*** -0.86*** -0.65*** 0.71*** 0.70*** 0.34*** 1
UMFY 0.80*** 0.84*** 0.78*** 0.33** -0.30** -0.25* -0.33*** -0.71*** 1
TFY -0.81*** -0.74*** -0.81*** -0.67*** 0.75*** 0.75*** 0.36*** 0.94*** -0.55*** 1
2017
FPSI 1
AUDPC 0.97*** 1
DPR 0.98*** 0.93*** 1
PFI 0.81*** 0.82*** 0.80*** 1
NFCPP -0.58*** -0.53*** -0.57*** -0.26*** 1
NFPP -0.22* -0.51*** -0.51*** -0.22* 0.94*** 1
SFW -0.39*** -0.39*** -0.45*** -0.23* 0.20* 0.13* 1
MFY -0.81*** -0.78*** -0.82*** -0.63*** 0.65*** 0.67*** 0.34*** 1
UMFY 0.77*** 0.76*** 0.77*** 0.92*** -0.15* -0.11* -0.24* -0.58*** 1
TFY -0.66*** -0.63*** -0.67*** -0.44*** 0.74*** 0.77*** 0.27** 0.086*** -0.0.32** 1 *** Correlation is significant at p≤0.001; **Correlation is significant at P< 0.05; *Correlation is not significant (p>0.05); FPSI = Final percent severity index;
AUDPC = Area under disease progress curve; DPR = Disease progress rate; PFI = Percent fruit infection; NFCPP = Number of fruit clusters per plant; NFPP =
Number of fruits per plant; SFW (g) = Single fruit weight in gram; MFY = Marketable fruit yield; UMFY = Unmarketable fruit yield; and TFY= Total fruit yield
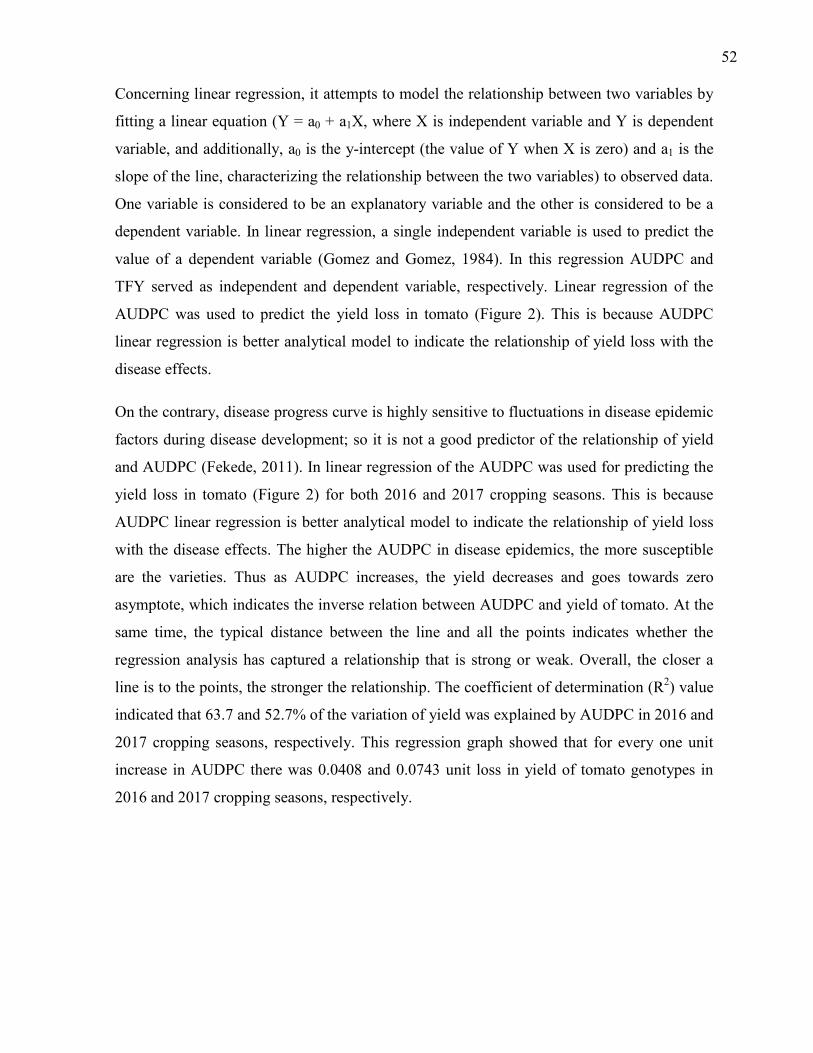
52
Concerning linear regression, it attempts to model the relationship between two variables by
fitting a linear equation (Y = a0 + a1X, where X is independent variable and Y is dependent
variable, and additionally, a0 is the y-intercept (the value of Y when X is zero) and a1 is the
slope of the line, characterizing the relationship between the two variables) to observed data.
One variable is considered to be an explanatory variable and the other is considered to be a
dependent variable. In linear regression, a single independent variable is used to predict the
value of a dependent variable (Gomez and Gomez, 1984). In this regression AUDPC and
TFY served as independent and dependent variable, respectively. Linear regression of the
AUDPC was used to predict the yield loss in tomato (Figure 2). This is because AUDPC
linear regression is better analytical model to indicate the relationship of yield loss with the
disease effects.
On the contrary, disease progress curve is highly sensitive to fluctuations in disease epidemic
factors during disease development; so it is not a good predictor of the relationship of yield
and AUDPC (Fekede, 2011). In linear regression of the AUDPC was used for predicting the
yield loss in tomato (Figure 2) for both 2016 and 2017 cropping seasons. This is because
AUDPC linear regression is better analytical model to indicate the relationship of yield loss
with the disease effects. The higher the AUDPC in disease epidemics, the more susceptible
are the varieties. Thus as AUDPC increases, the yield decreases and goes towards zero
asymptote, which indicates the inverse relation between AUDPC and yield of tomato. At the
same time, the typical distance between the line and all the points indicates whether the
regression analysis has captured a relationship that is strong or weak. Overall, the closer a
line is to the points, the stronger the relationship. The coefficient of determination (R2) value
indicated that 63.7 and 52.7% of the variation of yield was explained by AUDPC in 2016 and
2017 cropping seasons, respectively. This regression graph showed that for every one unit
increase in AUDPC there was 0.0408 and 0.0743 unit loss in yield of tomato genotypes in
2016 and 2017 cropping seasons, respectively.
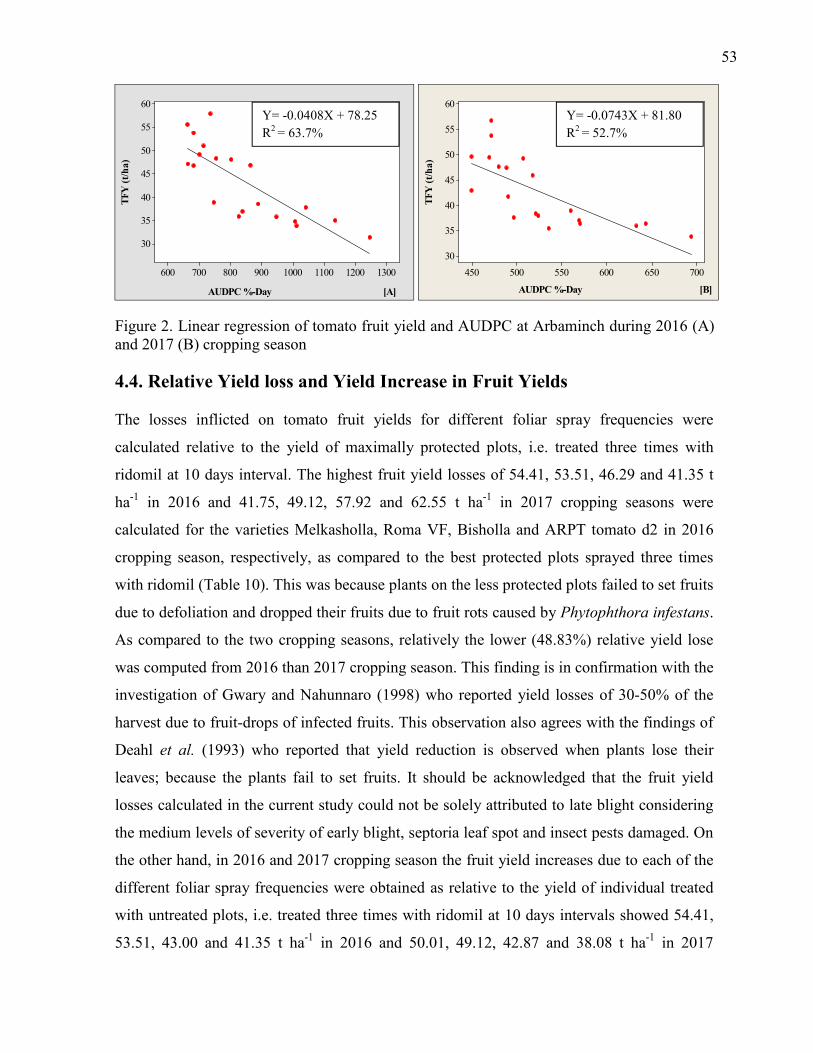
53
AUDPC %-Day [A]
TF
Y (
t/h
a)
1300120011001000900800700600
60
55
50
45
40
35
30
AUDPC %-Day [B]
TF
Y (
t/h
a)
700650600550500450
60
55
50
45
40
35
30
Figure 2. Linear regression of tomato fruit yield and AUDPC at Arbaminch during 2016 (A) and 2017 (B) cropping season
4.4. Relative Yield loss and Yield Increase in Fruit Yields
The losses inflicted on tomato fruit yields for different foliar spray frequencies were
calculated relative to the yield of maximally protected plots, i.e. treated three times with
ridomil at 10 days interval. The highest fruit yield losses of 54.41, 53.51, 46.29 and 41.35 t
ha-1 in 2016 and 41.75, 49.12, 57.92 and 62.55 t ha-1 in 2017 cropping seasons were
calculated for the varieties Melkasholla, Roma VF, Bisholla and ARPT tomato d2 in 2016
cropping season, respectively, as compared to the best protected plots sprayed three times
with ridomil (Table 10). This was because plants on the less protected plots failed to set fruits
due to defoliation and dropped their fruits due to fruit rots caused by Phytophthora infestans.
As compared to the two cropping seasons, relatively the lower (48.83%) relative yield lose
was computed from 2016 than 2017 cropping season. This finding is in confirmation with the
investigation of Gwary and Nahunnaro (1998) who reported yield losses of 30-50% of the
harvest due to fruit-drops of infected fruits. This observation also agrees with the findings of
Deahl et al. (1993) who reported that yield reduction is observed when plants lose their
leaves; because the plants fail to set fruits. It should be acknowledged that the fruit yield
losses calculated in the current study could not be solely attributed to late blight considering
the medium levels of severity of early blight, septoria leaf spot and insect pests damaged. On
the other hand, in 2016 and 2017 cropping season the fruit yield increases due to each of the
different foliar spray frequencies were obtained as relative to the yield of individual treated
with untreated plots, i.e. treated three times with ridomil at 10 days intervals showed 54.41,
53.51, 43.00 and 41.35 t ha-1 in 2016 and 50.01, 49.12, 42.87 and 38.08 t ha-1 in 2017
Y= -0.0408X + 78.25
R2 = 63.7%
Y= -0.0743X + 81.80
R2 = 52.7%
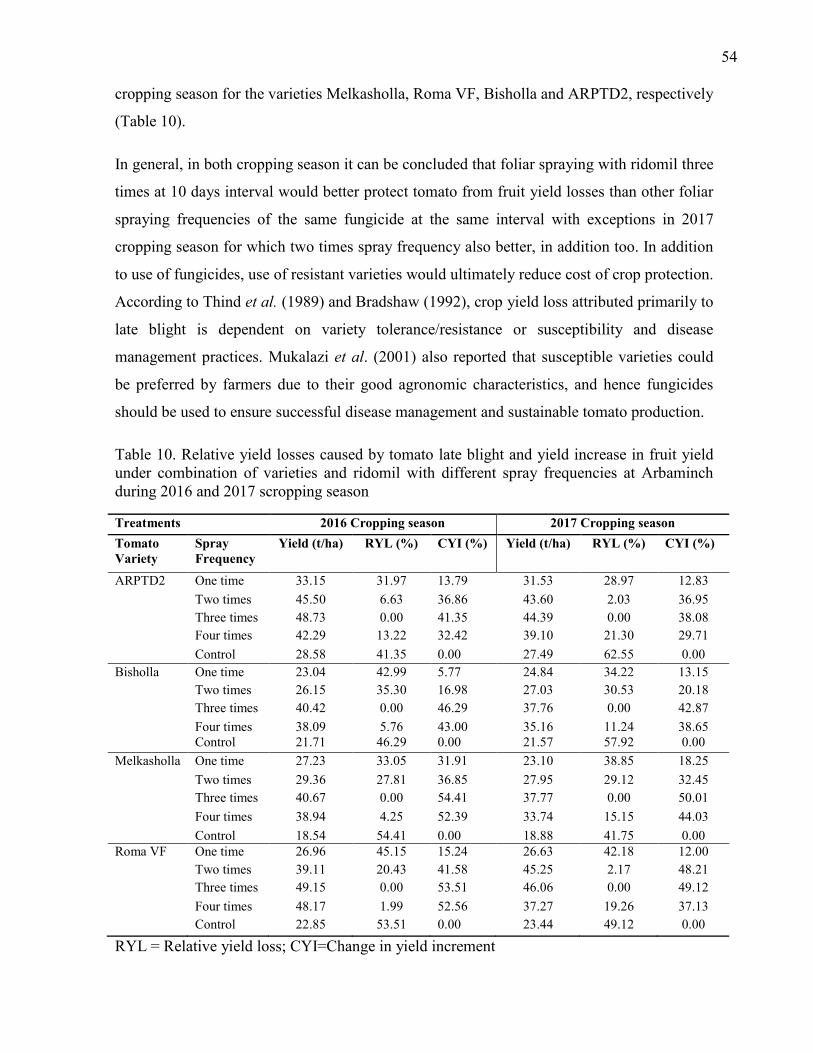
54
cropping season for the varieties Melkasholla, Roma VF, Bisholla and ARPTD2, respectively
(Table 10).
In general, in both cropping season it can be concluded that foliar spraying with ridomil three
times at 10 days interval would better protect tomato from fruit yield losses than other foliar
spraying frequencies of the same fungicide at the same interval with exceptions in 2017
cropping season for which two times spray frequency also better, in addition too. In addition
to use of fungicides, use of resistant varieties would ultimately reduce cost of crop protection.
According to Thind et al. (1989) and Bradshaw (1992), crop yield loss attributed primarily to
late blight is dependent on variety tolerance/resistance or susceptibility and disease
management practices. Mukalazi et al. (2001) also reported that susceptible varieties could
be preferred by farmers due to their good agronomic characteristics, and hence fungicides
should be used to ensure successful disease management and sustainable tomato production.
Table 10. Relative yield losses caused by tomato late blight and yield increase in fruit yield under combination of varieties and ridomil with different spray frequencies at Arbaminch during 2016 and 2017 scropping season
Treatments 2016 Cropping season 2017 Cropping season
Tomato Variety
Spray Frequency
Yield (t/ha) RYL (%) CYI (%) Yield (t/ha) RYL (%) CYI (%)
ARPTD2 One time 33.15 31.97 13.79 31.53 28.97 12.83
Two times 45.50 6.63 36.86 43.60 2.03 36.95
Three times 48.73 0.00 41.35 44.39 0.00 38.08
Four times 42.29 13.22 32.42 39.10 21.30 29.71
Control 28.58 41.35 0.00 27.49 62.55 0.00
Bisholla One time 23.04 42.99 5.77 24.84 34.22 13.15
Two times 26.15 35.30 16.98 27.03 30.53 20.18
Three times 40.42 0.00 46.29 37.76 0.00 42.87
Four times 38.09 5.76 43.00 35.16 11.24 38.65 Control 21.71 46.29 0.00 21.57 57.92 0.00
Melkasholla One time 27.23 33.05 31.91 23.10 38.85 18.25
Two times 29.36 27.81 36.85 27.95 29.12 32.45
Three times 40.67 0.00 54.41 37.77 0.00 50.01
Four times 38.94 4.25 52.39 33.74 15.15 44.03
Control 18.54 54.41 0.00 18.88 41.75 0.00 Roma VF One time 26.96 45.15 15.24 26.63 42.18 12.00
Two times 39.11 20.43 41.58 45.25 2.17 48.21
Three times 49.15 0.00 53.51 46.06 0.00 49.12
Four times 48.17 1.99 52.56 37.27 19.26 37.13
Control 22.85 53.51 0.00 23.44 49.12 0.00
RYL = Relative yield loss; CYI=Change in yield increment
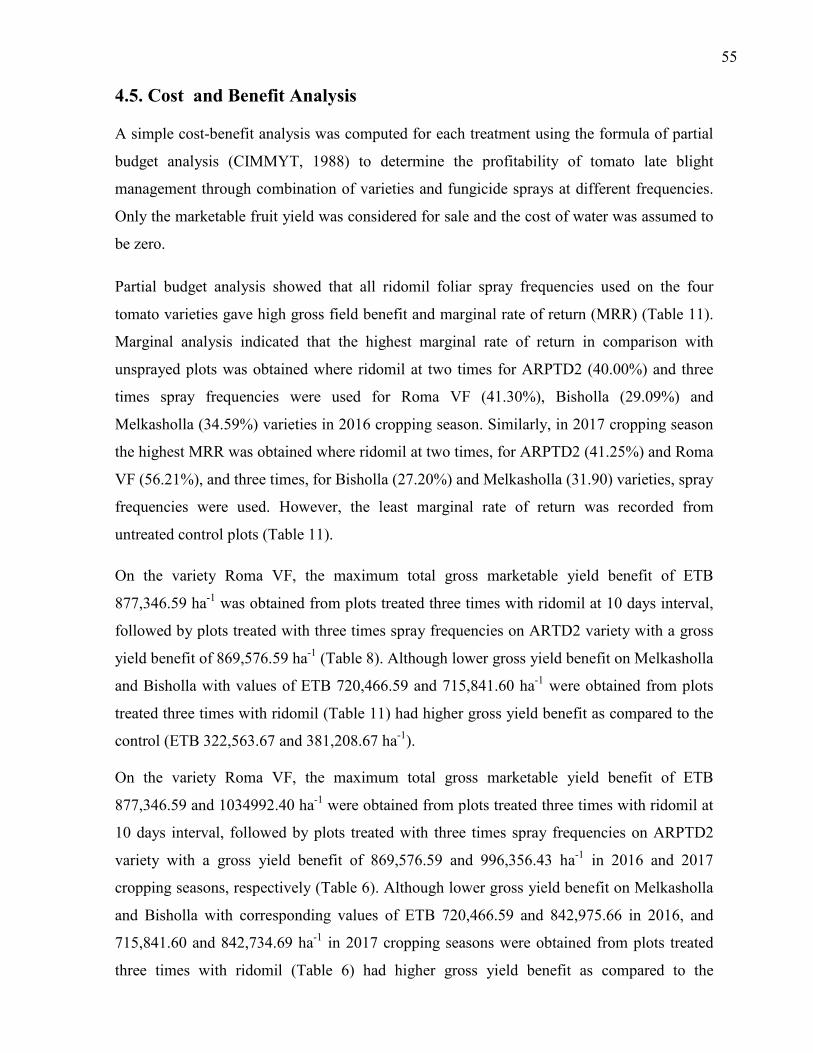
55
4.5. Cost and Benefit Analysis
A simple cost-benefit analysis was computed for each treatment using the formula of partial
budget analysis (CIMMYT, 1988) to determine the profitability of tomato late blight
management through combination of varieties and fungicide sprays at different frequencies.
Only the marketable fruit yield was considered for sale and the cost of water was assumed to
be zero.
Partial budget analysis showed that all ridomil foliar spray frequencies used on the four
tomato varieties gave high gross field benefit and marginal rate of return (MRR) (Table 11).
Marginal analysis indicated that the highest marginal rate of return in comparison with
unsprayed plots was obtained where ridomil at two times for ARPTD2 (40.00%) and three
times spray frequencies were used for Roma VF (41.30%), Bisholla (29.09%) and
Melkasholla (34.59%) varieties in 2016 cropping season. Similarly, in 2017 cropping season
the highest MRR was obtained where ridomil at two times, for ARPTD2 (41.25%) and Roma
VF (56.21%), and three times, for Bisholla (27.20%) and Melkasholla (31.90) varieties, spray
frequencies were used. However, the least marginal rate of return was recorded from
untreated control plots (Table 11).
On the variety Roma VF, the maximum total gross marketable yield benefit of ETB
877,346.59 ha-1 was obtained from plots treated three times with ridomil at 10 days interval,
followed by plots treated with three times spray frequencies on ARTD2 variety with a gross
yield benefit of 869,576.59 ha-1 (Table 8). Although lower gross yield benefit on Melkasholla
and Bisholla with values of ETB 720,466.59 and 715,841.60 ha-1 were obtained from plots
treated three times with ridomil (Table 11) had higher gross yield benefit as compared to the
control (ETB 322,563.67 and 381,208.67 ha-1).
On the variety Roma VF, the maximum total gross marketable yield benefit of ETB
877,346.59 and 1034992.40 ha-1 were obtained from plots treated three times with ridomil at
10 days interval, followed by plots treated with three times spray frequencies on ARPTD2
variety with a gross yield benefit of 869,576.59 and 996,356.43 ha-1 in 2016 and 2017
cropping seasons, respectively (Table 6). Although lower gross yield benefit on Melkasholla
and Bisholla with corresponding values of ETB 720,466.59 and 842,975.66 in 2016, and
715,841.60 and 842,734.69 ha-1 in 2017 cropping seasons were obtained from plots treated
three times with ridomil (Table 6) had higher gross yield benefit as compared to the
56
unsprayed plots (ETB 322,563.67 and 381,208.67 in 2016 and 418,584.86 and 480,960.81
ha-1 in 2017 cropping seasons). Thus, the variation in net benefit and MRR were among the
four varieties due to the inherent behavior of the genotypes and additional use of fungicide
applications.
As the variety ARPTD2 was relatively high yielder among the remaining three tomato
varieties, the net profit was very satisfactory and the variety even with one time and two
times spray frequencies still resulted in greater benefit than others both in 2016 and 2017
cropping seasons. Thus it can be suggested that it would be better not to use ridomil with
spray frequencies on the varietis ARPTD2 and Roma VF more than two times to obtain
better yield and economically feasible expenses for tomato production, while considering the
residual effects of the fungicides. But, in both 2016 and 2017 cropping seasons, this was not
also true for other tomato varieties with respect to spray frequencies of ridomil at 10 days
interval to overcome the impact of late blight for tomato crop and the others gave highest
yield at three times spray frequencies. This may be attributed to the genetic character of the
variety but not due to the fungicides; this was observed as the effect of the fungicides on the
varieties among the five different spray frequencies, including the control (Table 11).
Macleod and Sweetingham (1990) indicated that when assessing a crop for risk, it is also
necessary to assess it for its potential to cover the cost of application, which depends on the
potential yield. As Haverkort (1990) and Rechcing and Rechcing (1997) stated that
fungicides are used because they provide effective and reliable disease control, deliver
production in the form of crop yield and quality at an economic price and can be used safely.
Forbes and Jarvis (1994) and Ojiewo et al. (2010) showed that in developing countries
growers used to manage the disease almost solely based on fungicide applications.
Epidemiological research should be fostered in the developing countries to optimize
fungicide usage without compromising profit. With this fungicide application would be more
effective and efficient if they are integrated with forecast systems. Decision support systems,
like BLITECAST and TOM-CAST, are important tools in reducing or optimizing the large
amount of fungicides applied to suppress disease intensity (Mizubuti et al., 2006). In
Ethiopia, there exists no such kind of system at present and farmers may rely on calendar-
based spray schedules and frequencies only. To minimize the problems related to misuse,
application of fungicide should be considered in the future perspectives under Ethiopian
condition as it has been practiced in other parts of the world.
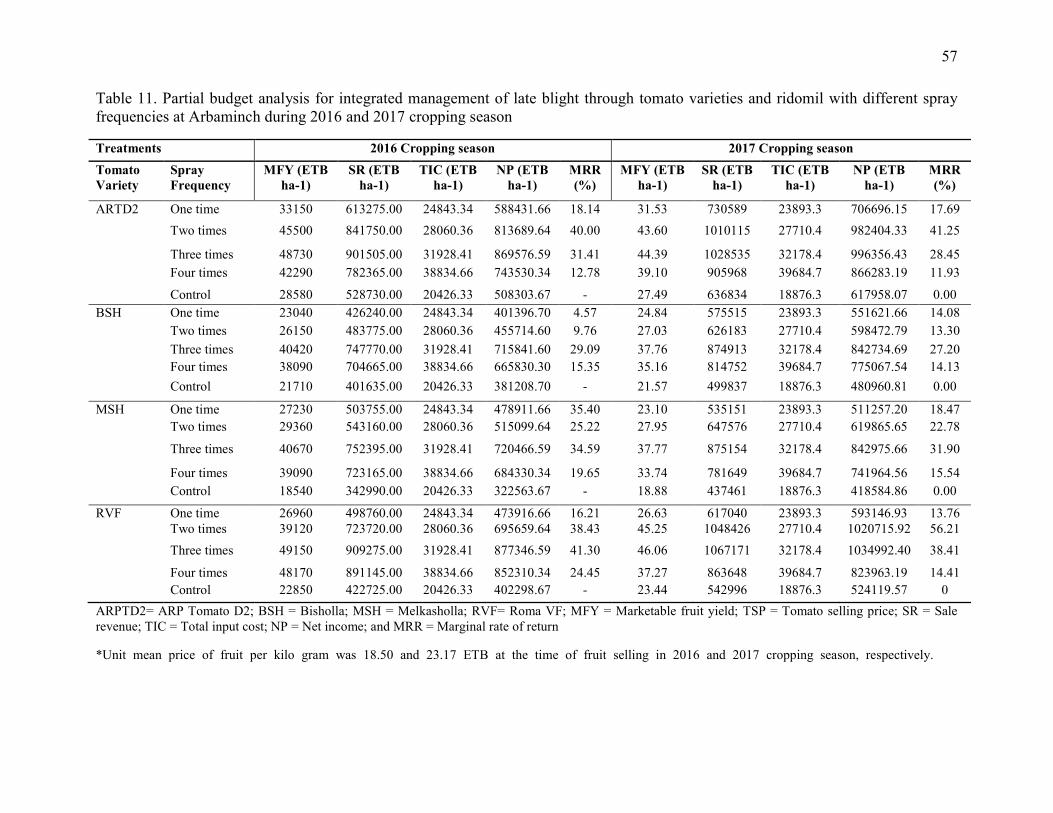
57
Table 11. Partial budget analysis for integrated management of late blight through tomato varieties and ridomil with different spray frequencies at Arbaminch during 2016 and 2017 cropping season
Treatments 2016 Cropping season 2017 Cropping season
Tomato Variety
Spray Frequency
MFY (ETB ha-1)
SR (ETB ha-1)
TIC (ETB ha-1)
NP (ETB ha-1)
MRR (%)
MFY (ETB ha-1)
SR (ETB ha-1)
TIC (ETB ha-1)
NP (ETB ha-1)
MRR (%)
ARTD2 One time 33150 613275.00 24843.34 588431.66 18.14 31.53 730589 23893.3 706696.15 17.69
Two times 45500 841750.00 28060.36 813689.64 40.00 43.60 1010115 27710.4 982404.33 41.25
Three times 48730 901505.00 31928.41 869576.59 31.41 44.39 1028535 32178.4 996356.43 28.45
Four times 42290 782365.00 38834.66 743530.34 12.78 39.10 905968 39684.7 866283.19 11.93
Control 28580 528730.00 20426.33 508303.67 - 27.49 636834 18876.3 617958.07 0.00
BSH One time 23040 426240.00 24843.34 401396.70 4.57 24.84 575515 23893.3 551621.66 14.08
Two times 26150 483775.00 28060.36 455714.60 9.76 27.03 626183 27710.4 598472.79 13.30
Three times 40420 747770.00 31928.41 715841.60 29.09 37.76 874913 32178.4 842734.69 27.20
Four times 38090 704665.00 38834.66 665830.30 15.35 35.16 814752 39684.7 775067.54 14.13
Control 21710 401635.00 20426.33 381208.70 - 21.57 499837 18876.3 480960.81 0.00
MSH One time 27230 503755.00 24843.34 478911.66 35.40 23.10 535151 23893.3 511257.20 18.47
Two times 29360 543160.00 28060.36 515099.64 25.22 27.95 647576 27710.4 619865.65 22.78
Three times 40670 752395.00 31928.41 720466.59 34.59 37.77 875154 32178.4 842975.66 31.90
Four times 39090 723165.00 38834.66 684330.34 19.65 33.74 781649 39684.7 741964.56 15.54
Control 18540 342990.00 20426.33 322563.67 - 18.88 437461 18876.3 418584.86 0.00
RVF One time 26960 498760.00 24843.34 473916.66 16.21 26.63 617040 23893.3 593146.93 13.76 Two times 39120 723720.00 28060.36 695659.64 38.43 45.25 1048426 27710.4 1020715.92 56.21
Three times 49150 909275.00 31928.41 877346.59 41.30 46.06 1067171 32178.4 1034992.40 38.41
Four times 48170 891145.00 38834.66 852310.34 24.45 37.27 863648 39684.7 823963.19 14.41
Control 22850 422725.00 20426.33 402298.67 - 23.44 542996 18876.3 524119.57 0
ARPTD2= ARP Tomato D2; BSH = Bisholla; MSH = Melkasholla; RVF= Roma VF; MFY = Marketable fruit yield; TSP = Tomato selling price; SR = Sale revenue; TIC = Total input cost; NP = Net income; and MRR = Marginal rate of return
*Unit mean price of fruit per kilo gram was 18.50 and 23.17 ETB at the time of fruit selling in 2016 and 2017 cropping season, respectively.
58
5. SUMMARY, CONCLUSIONS AND RECOMMENDATIONS
Tomato is widely recognized as an important cash crop in Ethiopia. However, its production
is constrained by several biotic and abiotic factors among which diseases are the major ones.
Late blight is one of the most severe disease in most tomato-growing regions. However, there
are gaps of information on the specific management of late blight through integration of
tomato varieties and fungicide foliar sprays. In Arbaminch areas where the bulk of tomato is
produced, late blight is an important disease that calls for better attention to achieve
economical management with fungicides and resistant varieties. Therefore, this study was
undertaken to evaluate the integrated effect of varieties and fungicide applications on late
blight epidemics, and yield and yield components of tomato, and the evaluation also included
the cost-benefit of the fungicide used.
A field experiment consisting of four varieties x five foliar spray frequencies was conducted
at Arbaminch during 2016 and 2017 cropping seasons where the treatments were arranged in
a factorial experiment in a randomized complete block design with three replications under
natural condition during 2016 main cropping season. The tomato varieties with different
level of resistance to Phytophthora infestans included ARPTD2 (resistant), Roma VF
(moderately resistant), Bisholla (moderately susceptible) and Melkasholla (susceptible). The
systemic fungicide, ridomil, was applied with zero, one time, two times, three times and four
times foliar spray frequencies and relevant disease and crop parameters were measured.
All the four tomato varieties supplemented with application of fungicide foliar spray
frequencies had pronounced effect in reducing late blight epidemics. However, relatively
better result in management of the disease was obtained from the use of ridomil foliar spray
at 10 days interval at a rate of 3 kg ha-1 with two times (for ARPTD2 varity) and three times
(for Roma VF, Bisholla and Melkasholla varieties) spray frequencies right after appearance
of the disease symptoms. Likewise, the maximum yield and net benefit were also obtained
from tomato plots treated with the above mentioned fungicide spray frequencies. In contrast,
unsprayed control plots had the highest disease severity, AUDPC and provided minimum
yield and marginal net benefit. Therefore, results of the present finding clearly indicated that
integration of tomato varieties and appropriate fungicide spray frequencies significantly
minimized the intensity of late blight and increased the fruit yield of Tomato.
59
In conclusion, the 2016 and 2017 cropping seasons study indicated that ARPTD2 variety
appears to have comparative resistance to late blight and is a promising tomato variety.
Further investigation should be carried out to verify whether it has a real genetic resistance;
until that moment comes, this variety can be used in combination with other management
measures, wherever the disease is a pressing problem. Also, instead of using several
fungicides indiscriminately, two times ridomil foliar applications at 10 days can substantially
manage the disease if used in combination with resistant varieties, like ARPTD2 variety,
even with three times for susceptible varieties, like Melkasholla, giving maximum net benefit
and avoiding risk of development of fungicide resistance by the pathogens and minimizing
cost of production.
In general, complete management of late blight is difficult to achieve, especially during rainy
seasons. However, substantial level of disease suppression could be achieved through
integration of varieties and foliar fungicide applications. Thus the use of ridomil with spray
frequencies of two times for resistance and moderately resistance varieties, like ARPTD2,
Roma VF varieties, and three times for moderately susceptible and susceptible varieties, like
susceptible Bisholla and Melkasholla, are recommended as it gave relatively the highest
protection against late blight and the highest monetary benefit as compared to the other
treatments and the control. Therefore, integrated management practices must be adopted by
all tomato growers: small farmers, private investors, and state enterprises, for curbing the
development of late blight and sustainable tomato production. Also, further extensive studies
are recommended for evaluation of varieties and management options under different agro-
ecological conditions to come up with suitable conclusive management option and to
enhance high quality tomato production in the study areas and elsewhere in Ethiopia, having
similar agro-ecologies. On other hands, performance based on pest resistance/tolerant of the
varieties, specifically against early blight and septoria leaf spot diseases, and insect pests’ problems
on the varieties needs further investigations.
60
6. REFERENCES Abdelmageed, A.H.A. and Gruda, N. 2009. Performance of different tomato genotypes in the
arid tropics of the Sudan during the summer season. Journal of Agriculture and Rural
Development, 110:145 - 154.
Abhinandan, D., Randhawa, H.S. and Sharma, R.C. 2004. Incidence of Alternaria leaf blight in
tomato and efficacy of commercial fungicides for its control. Annual Biological Science,
20: 211 - 218.
Agrios, G.N. 2005. Plant Pathology. 5th edition. Elsevier Academic Press. Salt Lake City, USA,
922 pp.
Ajal, M.O. and Ajani, O.O. 2014. Variation in fruit yield and correlations between seed quality
components and fruit yield of tomato (Lycopersicon esculentum Mill.). Tanzania Journal
of Agricultural Sciences, 8(2): 115 - 126.
Akida, I., Meya, A.I., Mamiro, D.P. and Kusolwa, P. 2015. Response of late blight disease
resistant-variety to common occurring tomato diseases in the field. Asian Journal of
Plant Science and Research, 5(6): 8 - 15.
Anonymous. 2011. Commercial vegetable disease control guide. Virginia, USA, 22 pp.
ATTR (Appropriate Technology Transfer to Rural Area). 2004. Organic alternatives for late
blight control in potatoes. National sustainable agriculture information service. George
Kuepper and Preston Silivan. No. IP131. NCAT Agriculture Specialists.
http://attra.ncat.org/ 29-10-2010.
Avila-Adame, C., Gomez, L., Buell, C.R. and Ristaino, J.B. 2006. Mitochondrial genome
sequencing of the haplotypes of the Irish potato famine pathogen, Phytophthora
infestans. Current Genetics, 49: 39 - 46.
AVRDC (Asian Vegetable Research and Development Center). 2004. The world vegetable
center. Proceeding of the APSA- AVRDC workshop. May 6-7/ 2004. Shanhua, Taiwan.
AVRDC Publication Number 05-619.
Awulachew Sileshi Bekele, Yilma Aster Deneke, Loulseged Mekonnen, Loiskandl Willibald,
Ayana Mekonnen. and Alamirew Tena. 2007. Water resources and irrigation
development in Ethiopia: International water management institute, 78 pp.
61
Ayda Tsegaye. 2015. Effect of fungicides and resistant genotypes on severity of potato late
blight [Phytophthora infestans (Mont.) de Bary] and yield and yield components at
Haramaya, Eastern Ethiopia. M.Sc. Thesis, Haramaya University, Haramaya, Ethiopia.
Awol Seid, Muluken Goftishu, Lemma Degebassa. and Tesfamariam Mekete. 2015. Occurrence,
distribution, and abundance of plant-parasitic nematodes associated with khat (Catha
edulis Forsk) in East Hararghe Zone, Ethiopia. Nematropica, 45: 208 - 214.
Babu, S., Seetharaman, K., Nandakumar, R. and Johansson, I. 2000. Efficacy of fungal
antagonists against leaf blight of tomato caused by Alternaria solani (Ell. and Mart.)
Jones and Grout. Journal of Biological Control, 14(2): 79 - 81.
Becktell, M.C., Daughtrey, M.L. and Fry, W.E. 2005. Epidemiology and management of petunia
and tomato late blight in the greenhouse. Plant Disease, 89: 1000 – 1008.
Bedi, J.S., Thind, T.S., Grewal, R.K. and Sokhi, S.S. 1989. Role of application time of
fungicides in the control of late blight of potato. Plant Disease Research, 4(2): 113 - 117.
Bekele Kassa. and Yaynu Hiskias. 1996. Tuber yield loss assessment of potato cultivars with
different levels of resistance to late blight. pp. 149-152 In: Eshetu Bekele, Abdurrahman
Abdullah and Aynekulu Yemane (eds.), Proceedings of the 3rd Annual Conference of
Crop Protection Society of Ethiopia, 18 - 19 May, Addis Ababa, Ethiopia.
Bekele Kassa. and Gebremedhin Weldegiorgis. 2000. Effect of planting dates on late blight
severity and tuber yields on different potato varieties. Journal of Pest Management
Ethiopia, 4: 53 - 63.
Bekele Kassa. and Hailu Beyene. 2001. Efficacy and economics of fungicide spray in the control
of late blight of potato in Ethiopia. Journal of African Crop Science, 9(1): 245 - 250.
Belay Habtegebriel. 2009. Early blight (Alternaria Solani) of tomato in East shoa zone:
Importance and management through host resistance and fungicides in central rift valley,
Ethiopia. M.Sc. Thesis, Haramaya University, Haramaya, Ethiopia.
Berger, R.D. 1981. Comparison of the gompertz and logistic equation to describe plant disease
progress. Phytopathology, 71: 716 - 719.
Berger, R.D. 1988. Measuring disease intensity. Special report: biological and cultural tests for
control of plant diseases. American Phytopathology Society, 2: 1 - 3.
62
Binyam Tsedaley, Temam Hussen and Tekalign Tsegaw. 2014. Efficacy of reduced dose of
fungicide sprays in the management of late blight (Phytophthora infestans) disease on
selected potato (Solanum tuberosum L.) varieties, Haramaya, Eastern Ethiopia. Journal of
Biology, Agriculture and Health Care, 4(20): 46 - 52.
Birhanu Kassa. and Ketema Tilahun. 2010. Fruit yield and quality of drip-irrigated tomato under
deficit irrigation. African Journal of Food Agriculture Nutrition and Development, 10
(2): 2139 - 2151.
Bohner, J. and Bangerth, F. 1988. Cell number, cell size, and hormone levels in semi-isogenic mutants
of Lycopersicon pimpinellifolium differing in fruit size. Physiology of Planta, 72: 316 - 320.
Bolkan, H. 1997. Integrated pest management for processing tomatoes: present and future
strategies. Proceedings of the 1st International Conference on the Processing Tomato, 18-
21 November 1996, and the 1st International Symposium on Tropical Tomato Diseases,
21-22 November 1996. Recife, Pernambuco, Brazil, pp: 60 - 70.
Bradshaw, N.J. 1992. The use of fungicides for control of potato late blight (Phytophthora
infestans). Aspects of Applied Biology, 33: 101-106.
Brent, K.J. ad Hollomon, D.W. 2007: Fungicide Resistance in Crop Pathogens: How Can it be
Managed? FRAC Monograph 1. 2nd ed. Brussels, Crop life international. Brussels: 55.
Campbell, C.L. and Madden, L.V. 1990. Temporal analysis of epidemics I. Description and
comparison of disease progress curves. In: Introduction to Plant disease Epidemiology,
ISBN 0471832367. 532 pp.
Chernet Shushay, Belew Derbew. and Abay Fetien. 2013. Genetic variability and association of
characters in tomato (Solanum lycopersicon L.) genotype in Northern Ethiopia.
International Journal of Agricultural Research, 8: 67 - 76.
CIMMYT (International Maize and Wheat Improvement Center). 1988. From agronomic data to
farmer recommendations: an economics training manual. Completely revised edition.
Mexico, ISBN 968-6127-18-6. 79 pp.
CIP (International Potato Center). 1989. Fungal diseases of potato. Report of planning
conference on fungal diseases of the potato. CIP, Lima, Peru, 216 pp.
Cohen, Y., Farkash, S., Reshit, Z. and Baider, A. 1997. Oospore production of Phytophthora
infestans in potato and tomato leaves. Phytopathology, 87: 191 - 196.
63
Colon, L.T., Turkensteen, L.J., Prummel, W., Budding, D.J. and Hoogendoorn, J. 1995. Durable
resistance to late blight (Phytophthora infestans) in old potato cultivars. European
Journal of Plant Pathology, 101: 387 - 397.
CSA (Central Statistics Agency). 2016. statistics agency agricultural sample survey 2015/2016.
Statistical Bulletin. Volume 1, No. 578. Addis Ababa, Ethiopia.
Daggett, S.S., Goètz, E. and Therrien, C.D. 1993. Phenotypic changes in population of
Phytophthora infestans from Eastern Germany. Phytopathology, 83: 319 - 323.
Daniel Shimelash. 2015. Diversity of Phytophthora infestans (Mont.) de Bary on potato
(Solanum tuberosum L.) and tomato (Solanum lycopersicum Mill.) in Ethiopia. PhD.
Dessertation, Haramaya University, Haramaya, Ethiopia.
Deahl, K., Inglis, D. and DeMuth, S. 1993. Testing for resistance to metalaxyl in Phytophthora
infestans isolates from Northwestern Washington. American Journal of Potato Research,
70: 779 - 795.
de Bary, A. 1876. Researches into the nature of the potato-fungus- Phytophthora infestans.
Journal of Royal Agricultural Society, 12: 239 – 268.
Derbew Belew, Ali Mohammed. and Amina, J.G. 2012. Yield and quality of indeterminate
tomato (Lycopersicon esculentum Mill.) varieties with staking methods in Jimma.
Singapore Journal of Scientific Research, 2(2): 33 - 46.
Desta Mehari. and Yesuf Mohamed. 2015. Efficacy and economics of fungicides and their
application schedule for early blight (Alternaria solani) management and yield of tomato
at south Tigray, Ethiopia. Journal of Plant Pathology and Microbiology, 6: 268.
Dillard, H.R., Johnston, S.A., Cobb, A.C. and Hamilton, G.H. 1997. An assessment of fungicide
benefits for the control of fungal diseases of processing tomatoes in New York and New
Jersey. Plant Disease, 81: 677 - 681.
Drenth, A., Janssen, E.M. and Govers, F. 1995. Formation and survival of oospores of
Phytophthora infestans under natural conditions. Plant Pathology, 44: 86-94.
Emani, A., Homayouni-Far, M., Razavi, R. and Eivazi, A.R. 2013. Introduction of superior tomato
cultivars (Solanum lycopersicon Mill.). Journal of Food science and Technology, 1: 19 - 26.
Ezziyyani, M., Requena, M.E., Egea-Gilabert, C., and Candela, M.E. 2007. Biological control of
Phytophthora root rot of pepper using Trichoderma harzianum and Streptomyces rochei
in combination. Journal of Phytopathology, 155 (6): 342 – 349.
64
FAO (Food and Agriculture Organization). 2008. Potato World: Africa international year of the
potato 2008. http://www.potato2008.org/en/world/africa.html.
FAOSTAT (Food and Agriculture Organization/Statistics). 2012. Statistical database of the Food
and Agriculture Organization of the United Nations. FAO, Rome, Italy.
Fekede Girma. 2011. Management of late blight (Phytophthora infestans) of potato (Solanum
tuberosum L.) through potato cultivars and fungicides in Hararghe highlands, Ethiopia.
M.Sc. Thesis, Haramaya University, Haramaya, Ethiopia.
Filipas, A.S. 2009. Potato protection from phytophthora with Infinito. Plant protection and
quarantine, 5: 28.
Forbes, G.A. and Jarvis, M.C. 1994. Host resistance for management of potato late blight. pp.
439-57. In: Zehnder, G., Jansson, R. and Raman, K.V. (eds.), Advances in potato pest
biology and management. American Phytopathological Society, 439: 57.
Frenking, H.D., Davidse, L.C. and Limburg, H. 1987. Oospore formation by Phytophthora
infestans in host tissue after inoculation with isolates of opposite mating type found in the
Netherlands. Netherlands Journal of Plant Pathology, 93: 147 - 149.
Fry, W.E. and Shtienberg, D. 1990. Integration of host resistance and fungicide to manage
diseases. Canadian Journal of Plant Pathology, 12: 111 – 116.
Fry, W.E., Goodwin, S.B., Matuszak, J.M., Spielman, L.J., Milgroom, M. G. and Drenth, A.
1992. Population genetics and intercontinental migrations of Phytophthora infestans.
Annual Review of Phytopathology, 30: 107 - 129.
Fry, W. and Goodwin. S. 1997. Re-emergence of potato and tomato late blight in the United
States. Plant Disease, 81:1349 – 1357.
Fry, W. 2008. Phytophthora infestans: the plant (and R gene) destroyer. Molecular Plant
Pathology, 9 (3): 385.
Fry, W.E., Grunwald, N.J., Cooke, D.E.L., Mcleod, A., Forbes, G.A. and Cao, K. 2009.
Population genetics and population diversity of Phytophthora infestans. pp. 139 - 164. In:
Lamour, K. and Kamoun, S. (eds.). Oomycete genetics and genomics: diversity,
interactions, and research tools, Wiley-Blackwell.
Getachew Tabor, Selamawit Ketama, Yosef Alemu, Mohammed Yusuf and Gashawbeza
Ayalew. 2014. Guide to major vegetable crops production and protection. Amharic
Version. Addis Ababa, Ethiopia.
65
Gisi, U. and Cohen, Y. 1996. Resistance to phenylamide fungicides: A case study with Phytophthora
infestans involving mating type and race structure. Phytopathology, 34: 549 – 572.
Gomez, K.A. and Gomez, A.A. 1984. Statistical Procedures for Agricultural Research. 2nd ed.
John Wiley and Sons, Inc., New York, USA. 680 pp.
Gomez-Alpizar, L; Carbone, I. and Ristaino, J.B. 2007. An Andean origin of Phytophthora
infestans inferred from mitochondrial and nuclear gene genealogies. Proceeding of
National Academic Sciences, USA, 104: 3306 – 3311.
Gondal, A.S., Ijaz, M., Riaz, K. and Khan, A.R. 2012. Effect of different doses of fungicide
(Mancozeb) against alternaria leaf blight of tomato in tunnel. Journal of Plant Pathology
and Microbiology, 3: 125.
Goodwin, S.B., Cohen, B.A., Deahl, K.L. and Fry, W.E. 1994. Migration from Northern Mexico
as the probable cause of recent genetic changes in populations of Phytophthora infestans
in the US and Canada. Phytopathology, 84(6): 553 - 558.
Goss, E.M., Tabima, J.F., Cooke, D.E.L., Restrepo, S., Fry, W.E., Forbes, G.A., Fieland, V. J.,
Cardenas, M. and Grünwald, N.J. 2014. The Irish potato famine pathogen Phytophthora
infestans originated in central Mexico rather than the Andes. Proceedings of the National
Academy of Sciences, 111(24): 8791 - 8796.
Green, M.B., Le Baron, H.M. and Moberg, W.K. 1990. Managing resistance to agrochemicals:
from fundamental research to practical strategies. American chemical society symposium
series number 421. American Chemical Society, 496 pp.
Gretna, W. 1983. Population dynamics and survival of Phytophthora . In: Erwin, D.C.,
Bartnicki-Garcia, S. and Tsao, P.H. (eds), Phytophthora: its biology, taxonomy, ecology
and pathology. American Phytopathological Society, pp: 237 - 257.
Grünwald, N.J., Montes, G.R., Saldana, H.L., Covarrubias, O.A.R. and Fry, W.E. 2002. Potato
late blight management in the Toluca valley: field validation of SimCast modified for
cultivars with high field resistance. Plant Disease, 86: 1163 – 1168.
Grünwald, N.J. and Flier, W.G. 2005. The biology of Phytophthora infestans at its center of
origin. Annual Review of Phytopathology 43: 171 – 90.
Guenthner, J.F., Michael, K.C. and Nolte. P. 2001. The economic impact of potato late blight
on USA growers. Potato Research, 44 (5): 121 - 125.
66
Gwary, D.M. and Nahunnaro, H. 1998. Epiphytotics of early blight of tomatoes in Northeastern
Nigeria. Crop Protection, 17: 619 - 624.
Hansen, J.G., Lassen, P., Koppel, M., Valskyte, A., Turka, I. and Kapsa J. 2003. Web-blight
regional late blight monitoring and variety resistance. Journal Plant Protection
Researches, 43: 263 – 273.
Haverkort, A.J. 1990. Ecology of potato cropping systems in relation to latitude and altitude.
Agricultural Systems, 32: 251 – 272.
Haverkort, A. J., Boonekamp, Hutten, P.M.R., Jacobsen E., Lotz, L.A.P., Kessel, G.J.T.,
Visser,G.F.E. and Van der Vossen, A.G. 2008. Societal costs of late blight in potato and
prospects of durable resistance through cisgenic modification. Potato Research, 51(11):
47 - 57.
Hohl, H.R. and Iselin, K. 1984. Strains of Phytophthora infestans from Switzerland with A2
mating types behaviour. Transactions of the British Mycological Society, 83: 526 - 530.
Horneburg, B. and Becker, H.C. 2011. Selection for Phytophthora field resistance in the F2
generation of organic outdoor tomatoes. Euphytica, 180: 357 - 367.
Horsfall, J.G. and Barratt, R.W. 1945. An improved grading system for measuring plant disease.
Phytopathology, 35: 655.
Jarvis, W.R. and McKeen, C.D. 2013. Tomato Diseases, Hydro-Gardens. Agriculture Canada
Publication, 75(1): 37 – 114.
Jiregna Tasisa. 2014. Field, greenhouse and detached-leaf evaluation of tomato (Lycopersicon
esculentum Mill.) genotypes for late blight resistance. World Journal of Agricultural
Sciences, 10(2): 76 - 80.
Jones, D.G., 1998. The Epidemiology of Plant Diseases. Kluwer Academic Publishers.
Dordrecht, 460 pp.
Jones, J.B., Jones, J.P., Stall, R.E. and Zitter, T.A. 1997. Compendium of tomato diseases.
American Phytopathology Society, pp: 28 - 29.
Jones, J.B. 2007. Tomato plant culture in the field, greenhouse and home garden. Chemical
Rubber Company Press. USA, 420 pp.
Judelson, H. S. 1997. The genetics and biology of Phytophthora infestans: Modern approaches to
a historical challenge. Fungal Genetics and Biology, 22: 65 – 76.
67
Judelson, H.S. and Blanco, F.A. 2005. The spores of Phytophthora: weapons of the plant
destroyer. Nature Microbiology, 3: 47 - 58.
Kassa Bekele, Woldegiorgis Gebre-Medhin, Tesfaye Atsede, Lemaga Berga. and Olanya, O.M.
2002. Economic implications of late blight management in tropical highlands of Ethiopia
(abs). pp:161 In: Lizárraga, C. (ed.), Late blight: Managing the global threat.
Proceedings of the global Initiative on late blight conference, Hamburg, Germany, 11–13
July 2002. International Potato Center, Peru, pp. 161.
Kato, M., Sato, M.A.A., Kobayashi, K. and Ogoshi, A. 1992. Cultural features associated with
mating types of Phytophthora infestans isolates from potato crops in Japan. Annals of the
Phytopathological Society of Japan, 58: 267 - 275.
Kaushik, S.K, Tomar, D.S. and Dixit, A.k. 2011. Genetics of fruit yield and its contributing
characters in tomato. Sustainable Development. Journal of Agricultural Biotechnology,
310: 209 - 213.
Kawchuk, L.M., Howard, R.J., Peters, R.D. and Al-Mughrabi, K.I. 2011. First report of
Phytophthora infestans genotype US23 causing late blight in Canada. Plant Disease, 95: 873.
Ketema Balcha Debela, Derbew Belew. and Jima Nego. 2016. Evaluation of tomato
(Lycopersicon Esculentum Mill.) varieties for growth and seed quality under Jimma
condition, Southwestern Ethiopia. International Journal of Crop Science and
Technology, 2(2): 69 - 77.
Kirk,W.W., Felcher, K.J., Douches, D.S., Niemira, B.A. and Hammerschmidt, R. 2001.
Susceptibility of potato (Solanum tuberosum L.) foliage and tubers to the US8 genotype
of Phytophthora infestans. American Journal of Potato Research, 78: 319 – 322.
Kirk, W.W., Abu-Al Samen, F.M., Muhinyuza, J.B., Hammerschmidt, R., Douches, D.S., Thill,
C.A., Groza, H. and Thompson, A.L. 2005. Evaluation of potato late blight management
utilizing host plant resistance and reduced rates and frequencies of fungicide applications.
Crop Protection, 24: 961 - 970.
Koepsell, P.A. and Pscheidt, J.W. 1994. Pacific northwest plant disease control handbook,
Corvallis: Oregon State University Press, pp.165.
Lamour, K.H., Win, J. and Kamoun, S. 2007. Oomycete genomics: new insights and future
directions. Fems Microbiological Letters, 274: 1 – 8.
68
Lehtinen, A. and Hannukkala, A. 2004. Oospores of Phytophthora infestans in soil provide an
important new source of primary inoculum in Finland. Agricultural and Food Science,
13: 399 – 410.
Lemma Desalegn. 2002. Tomatoes; research experiences and production prospects. EARO
Report. No. 43. Addis Ababa, Ethiopia.
MAFRI (Manitoba Agriculture, Food and Rural Initiatives). 2002. Integrated management of
late blight in potatoes. Importance of potato late blight in Argentina, and the effect of
fungicide treatments on yield increments over twenty years. Ciencias investigation
agrarias. Pest Management Regulatory Agency, 36(1): 115 - 122.
Majid, R.F., Heather L.M. and Hamid, A. 2008. Genetics, genomics and breeding of late blight
and early blight resistance in tomato. Plant Sciences, 27:75 – 107.
Macleod, B. and Sweetingham, M. 1999. Plant research and development service. Northam and
South Perth. Available at htmihttp://www.agric.wa.gov.au.
Madden, L.V., Hughes, G. and Van den Bosch, F. 2008. The Study of Plant Disease Epidemics.
American Phytopathological Society press. St. Paul, Minnesota, USA.
Mantecon, J.D. 2007. Potato yield increases due to fungicide treatment in Argentinian early
blight (Alternaria solani) and late blight (Phytophthora infestans) field trials. Plant
Health Progress, doi:10.1094/PHP-2007-0202-01-RS.
McBeath, J.H., Mao, W., and Nguyen, C. 2000. Evaluation of in-furrow application of
Trichoderma atroviride on the germination and growth of cotton seedlings. In: Huber,
D.M. (Ed), Biocontrol in a new millennium, Proceedings of the 3rd joint national
biocontrol conference, pp: 84 - 87.
McGrath, M.T., Menasha, S.R. and LaMarsh, K.A. 2014. Evaluation of late blight resistant
tomato cultivars on Long Island. Plant disease management reports, 8:V195. Cornell
University and Cornell Cooprative Extention, LIHREC, SA 3019, NY 11901.
McGrath, M.T. 2016. Apsnet education center introductory topics. What are Fungicides? Cornell
University. USA, doi: 10.1094/PHI-I-2004-0825-01.
Meseret Degefa Regassa, Ali Mohammed. and Kassahun Bantte. 2012. Evaluation of tomato
(Lycopersicon esculentum L.) genotypes for yield and yield component. The African
Journal of Plant Science and Biotechnology, pp: 45 - 49.
69
Mesfin Tesserra. and Gebre-Medhin Weldegiorgis. 2007. Impact of farmers’ selected IDM options
on potato late blight control and yield. African Crop Science Society, 8: 2091 - 2094.
MoA (Ministry of Agriculture). 2012. Animal and plant health regulatory directorate crop variety
register. Issue No. 15. Addis Ababa, Ethiopia, pp: 180.
MoARD (Ministry of Agriculture and Rural Development). 2005. Crop development department
crop variety register. Issue No. 8. Addis Ababa, Ethiopia. pp: 143.
Mizubuti, E.S.G., Batista, D.C., Lima, M.A., Haddad, F. and Maffia, L.A. 2006. Validation of
decision support systems for tomato early blight and potato late blight, under Brazilian
conditions. Crop Protection, 25 (7): 664 - 670.
Moraru, C., Logendra, L., Lee, T. and Janes, H. 2004. Characteristics of 10 processing tomato
cultivars grown hydroponically for the NASA advanced life support (ALS) program.
Journal of Food Composition and Analysis, 17:141 – 154.
Mosa, A.A., Kobayashi K., Ogoshi A., Kato, M. and Sato, N., 1991. Formation of Oospores by
Phytophthora infestans in inoculated potato tissues. Annals of the Phytopathological
Society in Japan, 57:334 - 338.
Mukalazi, J., Adipala, E., Ssengooba, T., Hakiza, J.J., Olanya, M. and Kidanemariam, H.M.
2001. Variability in potato late severity and its effect on tuber yield in Uganda. Africa
Crop Science Journal, 9: 195 – 201.
Mutschler, M., Zitter, T. and Bornt, C. 2006. Tomato lines for the northeast combining early
blight and late blight resistance. Vegetable Program. New York: 14853.
Naterstad, R., Hermansen, A. and Bjor, T. 2007. Exploiting host resistance to reduce the use of
fungicides to control potato late blight. Plant Pathology, 56: 156 – 166.
Naveenkumar, S., Saxena, R.P., Pathak, S.P. and Chauhan, S.K.S. 2001. Management of
Alternaria leaf disease of tomato. Indian phytopathology, 54: 508.
Nowakowska, M. 2014. Appraisal of artificial screening techniques of tomato to accurately reflect field
performance of the late blight resistance, Vol: 9, doi: 10.1371/ journal. pone. 0109328.
Nowicki, M. 2013. Late blight of tomato. In: Translational genomics for crop breeding. Biotic
Stress, 1: 241 - 265.
Nowicki, M., Lichocka, M., Nowakowska, M., Kłosińska, U., Golik P. and Kozik, E.U. 2013.
A simple dual stain for detailed investigations of plant-fungal pathogen interactions.
Vegetable crops research bulletin, 77: 61 - 74.
70
Nyakanga, R.O., Wien, H.C., Olanya, O.M. and Ojiambo, P.S. 2004. Farmers' cultural practices
and management of potato late blight in Kenya highlands: Implications for development of
integrated disease management. International Journal of Pest Management, 50(2): 135 - 144.
Olanya, O.M., E. Adipala, J.J. Hakiza, J.C. Kedera, P. Ojiambo, J.M. Mukalazi, G. and Forbes,
R. 2001. Epidemiology and population dynamics of Phytophthora infestans in Sub-
Saharan Africa: progress and constraints. African Crop Science Journal, 9: 181 - 193.
Ojiewo, C.O., Swai, I.S., Oluoch, M.O., Silué, D., Nono-Wondim, R., Hanson, P., Black L. and
Wang T.C. 2010. Development and release of late blight-resistant tomato varieties
‘Meru’ and ‘Kiboko’. International Journal of Vegetable Science, 16(2): 134 - 147.
Phillips, S.L. Shaw, M.W. and Wolfe, M.S. 2005. The effect of potato variety mixtures on
epidemics of late blight in relation to plot size and level of resistance. Annals of Applied
Biology, 147(3): 245 - 252.
Pittis, J.E. and Shattock, R.C., 1994. Viability, germination and infection potential of oospores of
Phytophthora infestans. Plant Pathology. 43: 387 - 396.
Reching, N.A. and Reching, J.E. 1997. Environmental safe approaches to crop disease control.
Chemical Rubber Company. Lewis Publisher. New York.
Reis, A., Ribeiro, F.H.S., Maffia, L.A. and Mizubuti, E.S.G. 2005. Sensitivity of Brazilian
isolates of Phytophthora infestans to commonly used fungicides in tomato and potato
crops. Plant Disease, 89: 1279 – 1284.
Rice, L.W. and Rice J.R.P. 2000. Practical Horticulture. ISBN-13: 978-0135038666, ISBN-10:
0135038669.
Robert, G.D., and James, H.T. 1991. A Biomerical approach. Principles of statistics 2nd ed. New
York.USA.
Roy, S., Singh, B.P. and Bhattacharyya, S.K. 1991. Biocontrol of late blight of potato.
Phytopathology, 1: 17 - 18.
Rubatzky, V.E. and Yamaguchi, M. 1997. World Vegetables; Principles, production and
nutritive values 2nd ed. ISBN-13: 978-1461377566, ISBN-10: 1461377560.
Rubin, E., Baider, A. and Cohen, Y. 2001. Phytophthora infestans produces oospores in fruits
and seeds of tomato. Phytopathology, 91: 1074 – 1080.
Rubin, E. and Cohen, Y. 2004. Oospores associated with tomato seed may lead to seedborne
transmission of Phytophthora infestans. Phytoparasitica, 32: 237 – 245.
71
Sakhuja, P.K., Amare Ayalew and Rananjia, K.R. 2004. Diseases and insect pests of agricultural
and horticultural crops in Jijiga and Gode area of Somali region. A Status Report. College
of Agriculture, Alemaya University. 35 pp.
SAS Institute Inc., 2009. SAS/ Stat Guide for Personal Computers, Version 9.1 edition. SAS
Institute Inc., Cary, North Carolina. USA.
Schiessendoppler, E. and Molnar, O. 2002. Characterization of Phytophthora infestans
populations in sub-saharan Africa as a basis for simulation modeling and integrated
disease management. pp 140 In: Lizárraga, C. (ed.), Late blight: Managing the global
threat. Proceedings of the Global Initiative on Late Blight Conference, Hamburg,
Germany, 11–13 July 2002. International Potato Center, Lima, Peru.
Schumann, G.L. and D’Arcy, C.J. 2000. Late Blight of potato and tomato. American
Phytopathological Society. doi: 10.1094/PHI-I-2000-0724-01.
Shattock, R.C. 1976. Winter survival of field isolates of Phytophthora infestans in seed tubers and
development of primarily infected plants. Annals of Applied Biology, 84 (2): 273 - 274.
Shattock, R.C., 1995. Variation and its origins in Phytophthora infestans and consequences for
late blight control in potato and tomato. Manejo Integrado de Plagas, 37: 43 - 48.
Shaw, D.S., Fyfe, A.M., Hibberd, P.G. and Abdel-Sattar, M.A. 1985. Occurrence of the rare A2
mating types of Phytophthora infestans on imported Egyptian potatoes and the production of
sexual progeny with A1 mating types from the U.K. Plant Pathology, 34: 552 - 554.
Sherf, A.F. and MacNab, A.A. 1986. Vegetable diseases and their control. John Wiley and Sons,
New York, pp: 634 - 640.
Shtienberg, D., Raposo, R., Bergeron, S.N., Legard, D.E., Dyer, A.T. and Fry, W.E. 1994.
Incorporation of cultivar resistance in a reduced-sprays strategy to suppress early and late
blights on potato. Plant Disease, 78: 23 – 26.
Shushay Chernet. and Haile Zibelo. 2014. Evaluation of tomato varieties for fruit yield and yield
components Northern Ethiopia. International Journal of Agricultural Researc, 10: 23 - 39.
Smart, C.D. and Fry, W.E. 2001: Invasions by the late blight pathogen: Renewed sex and
enhanced fitness. Biological Invasions, 3: 235 – 243.
Sogni, M.L. and Silberman, J.D. 1998. Evaluation of the protists and protistan parasites from the
perspective of molecular systematics. International Journal for parasitology, 28: 11 - 20.
72
Sommer, N.F. 1985. Strategies for control of post-harvest diseases of selected commodities. pp: 83 - 98.
In: Post-harvest technology of horticultural crops. University of California Press. USA.
Stevenson, W.R., James, R.V., Inglis, D.A., Johnson, D.A., Schotzko, R.T. and Thornton, R E.
2007. Fungicide spray programs for defender, a new potato cultivar with resistance to late
blight and early blight. Plant Disease, 91:1327–1336.
Stevenson, W.R. 2009. Late blight control strategies in the United States. Acta Horticulturae,
834: 83 - 86.
Stone, A. 2010. Organic management of late blight of potato and tomato (Phytophthora
infestans). Available at http://www.nysaes.cornell.edu/pp/resourceguide.
Stone, A. 2014. Organic management of late blight of potato and tomato (Phytophthora
infestans). Sustainable agriculture research and extention. Oregon State University, USA.
Available: http://www.extension.org/pages/18361/organic-management-of-late-blight-of-
potato-and-tomato-phytophthora-infestans#.VBnA7WO4Jq0./02-03-2017.
Tadele Shiberu. 2016. Evaluation of improved tomato varieties (Lycopersicon Esculentum Mill.)
performance against major insect pests under open field and glasshouse conditions.
International Journal of Research Studies in Agricultural Sciences, 2: 1 – 7.
Tantius, P.H., Fyfe, A.M., Shaw, D.S. and Shattock, R.C., 1986. Occurrence of the A2 mating
types and self fertile isolates of Phytophthora infestans in England and Wales. Plant
Pathology, 35: 578 - 581.
Tesfaye Tedla and Habtu Assefa. 1985. A review of vegetable disease research in Ethiopia. pp
495 – 518. In: Tsedeke Abate (ed.). Proceedings of the 1st Crop Protection Symposium.
Addis Ababa, Ethiopia.
Thind, T.S., Chander, M., Bedi, J.S., Grewal, R.K. and Sokhi, S.S. 1989. Role of application time
of fungicides in the control of late blight of potato. Plant Disease Research, 4(2): 113- 117.
Tindall, H.D. 1988. Vegetables in the tropics. MacMillan education ltd. London, UK.
ISBN:0333242688.
Tsedeke Abate. 2007. Focusing on agricultural research to address development needs: Direction
for agricultural research in Ethiopia. Addis Ababa, Ethiopia.
Tumwine, J., Frinking, H.D. and Jegger, M.J. 2002. Integrating cultural control methods for
tomato late blight (Phytophthora infestans) in Uganda. Applied Biology, 141: 225 – 236.
73
Turner, R.S. 2005. After the famine: Plant pathology, phytophthora infestans, and the late blight
of potatoes, 1845 - 1960. Historical studies in the physical and biological science.
University of California press, 35 (2): 341 - 370.
Tymčenko, V. and Jefronovová, T. 1987: Guide of pests and diseases of vegetable and potato.
Praha.181.
USDA (United States Department of Agriculture). 2005. Agricultural research service, nutrient
database for standard reference, Release 18. http: //usda.res. Data accessed on Jun 2005.
Vega-Sânchez, M.E., Erseus, L.J., Rodriguez, A.M., Bastidas, O., Hohl, H.R., Ojiambo, P.S.,
Mukalazi, J., Vermeulen, T., Fry, W.E. and Forbes, G. A. 2000. Host adaptation to potato
and tomato within the US-1 clonal lineage of Phytophthora infestans in Uganda and
Kenya. Plant Pathology, 49: 531- 539.
Waiganjo, M.M., Wabule, N.M., Nyongesa, D., Kibaki, J.M., Onyango, I., Wepukhulu, S.B. and
Muthoka, N.M. 2006. Tomato production in Kirinyaga district, Kenya; a baseline survey
report. Kenya agricultural research institute, Kenya. London W1T 3JH, UK.
Wheeler, B.J. 1969. An Introduction to Plant Diseases. John Wiley and Sons, Ltd.
Whitehead, R. 2006. The UK Pesticide Guide 2006. CAB International: Wallingford/BCPC:
Alton. ISBN: 1-84593-045-2. 637 pp.
WHO (World Health Organization). 2004. The who recommended classification of pesticides by
hazard and guidelines to classification: 2004. ISSN: 1684-1042; ISBN: 9241546638.
Geneva, Switzerland. 60 pp.
Ye Guang, Ji., Sun, H., Zhou, Y., Yang, Y. and Wang, J. 2008. Composition and distribution of
physiological race of Phytophthora infestans in the Haidong region of Qinghai province.
Acta Phytopathologica Sinica, 38(5): 553 - 556.
Yoshida, K., Schuenemann, V. J., Cano, L. M., Pais, M., Mishra, B., Sharma, R., Lanz, C.,
Martin, F. N., Kamoun, S., Krause, J., Thines, M., Weigel, D. and Burbano, H. A. 2013.
The rise and fall of the Phytophthora infestans lineage that triggered the Irish potato
famine. eLife 2:e00731. doi: org/10.7554/eLife.00731.
Zwankhuizen, M.J, Govers, F. and Zadoks, J.C. 2000. Inoculum sources and genotypic diversity
of Phytophthora infestans in Southern Flevoland, the Netherlands. European Journal of
Plant Pathology, 106: 667 - 680.
74
7. APPENDICES
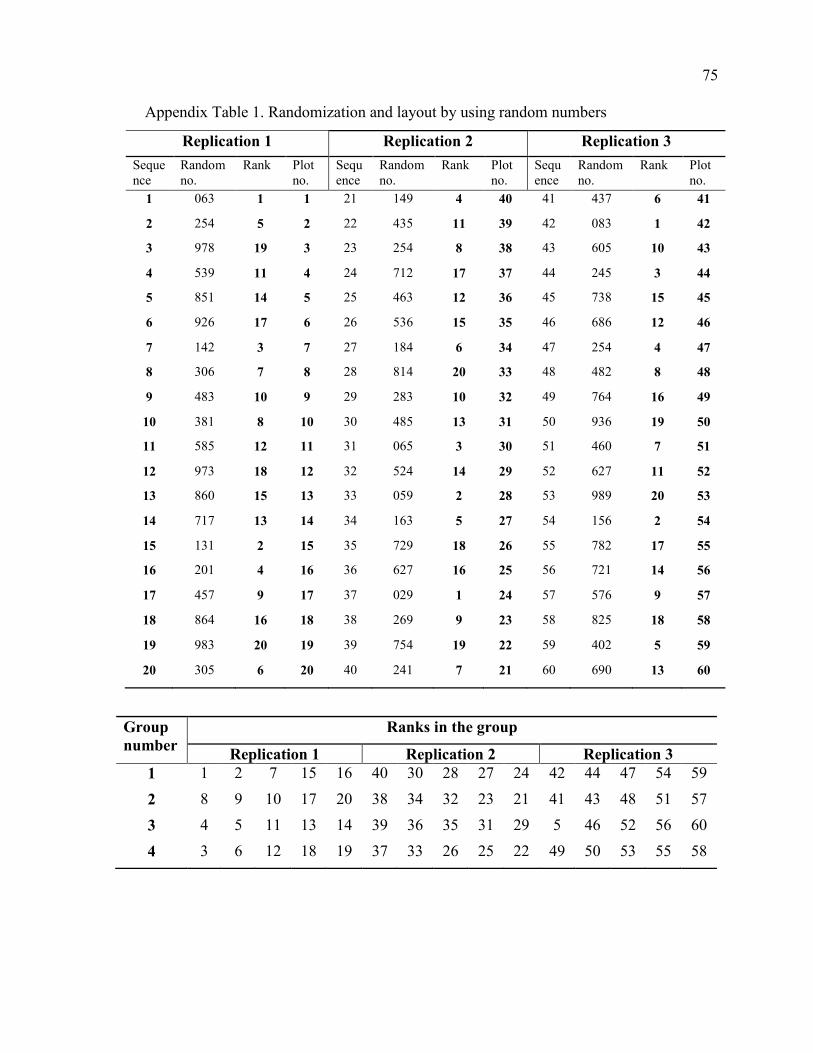
75
Appendix Table 1. Randomization and layout by using random numbers
Replication 1 Replication 2 Replication 3
Sequence
Random no.
Rank Plot no.
Sequence
Random no.
Rank Plot no.
Sequence
Random no.
Rank Plot no.
1 063 1 1 21 149 4 40 41 437 6 41
2 254 5 2 22 435 11 39 42 083 1 42
3 978 19 3 23 254 8 38 43 605 10 43
4 539 11 4 24 712 17 37 44 245 3 44
5 851 14 5 25 463 12 36 45 738 15 45
6 926 17 6 26 536 15 35 46 686 12 46
7 142 3 7 27 184 6 34 47 254 4 47
8 306 7 8 28 814 20 33 48 482 8 48
9 483 10 9 29 283 10 32 49 764 16 49
10 381 8 10 30 485 13 31 50 936 19 50
11 585 12 11 31 065 3 30 51 460 7 51
12 973 18 12 32 524 14 29 52 627 11 52
13 860 15 13 33 059 2 28 53 989 20 53
14 717 13 14 34 163 5 27 54 156 2 54
15 131 2 15 35 729 18 26 55 782 17 55
16 201 4 16 36 627 16 25 56 721 14 56
17 457 9 17 37 029 1 24 57 576 9 57
18 864 16 18 38 269 9 23 58 825 18 58
19 983 20 19 39 754 19 22 59 402 5 59
20 305 6 20 40 241 7 21 60 690 13 60
Group number
Ranks in the group
Replication 1 Replication 2 Replication 3 1 1 2 7 15 16 40 30 28 27 24 42 44 47 54 59
2 8 9 10 17 20 38 34 32 23 21 41 43 48 51 57
3 4 5 11 13 14 39 36 35 31 29 5 46 52 56 60
4 3 6 12 18 19 37 33 26 25 22 49 50 53 55 58
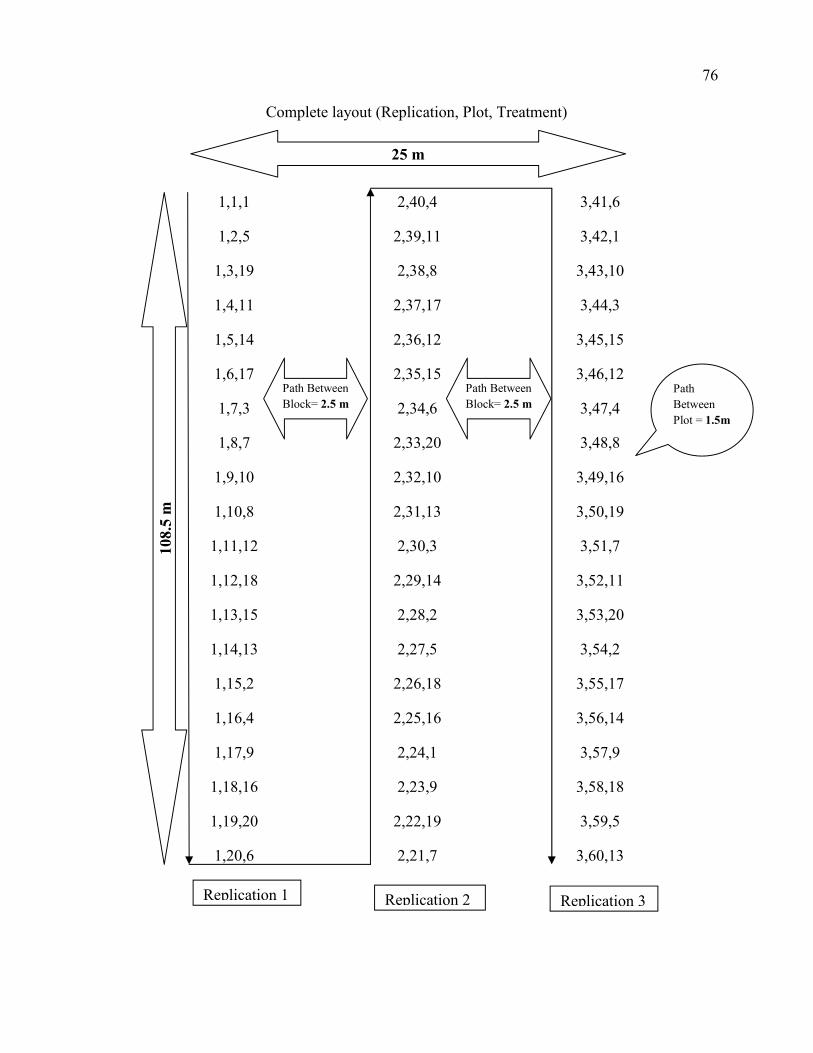
76
Complete layout (Replication, Plot, Treatment)
1,1,1
1,2,5
1,3,19
1,4,11
1,5,14
1,6,17
1,7,3
1,8,7
1,9,10
1,10,8
1,11,12
1,12,18
1,13,15
1,14,13
1,15,2
1,16,4
1,17,9
1,18,16
1,19,20
1,20,6
2,40,4
2,39,11
2,38,8
2,37,17
2,36,12
2,35,15
2,34,6
2,33,20
2,32,10
2,31,13
2,30,3
2,29,14
2,28,2
2,27,5
2,26,18
2,25,16
2,24,1
2,23,9
2,22,19
2,21,7
3,41,6
3,42,1
3,43,10
3,44,3
3,45,15
3,46,12
3,47,4
3,48,8
3,49,16
3,50,19
3,51,7
3,52,11
3,53,20
3,54,2
3,55,17
3,56,14
3,57,9
3,58,18
3,59,5
3,60,13
25 m
Replication 3 Replication 2 Replication 1
108.
5 m
Path Between
Block= 2.5 m
Path Between
Block= 2.5 m
Path
Between
Plot = 1.5m
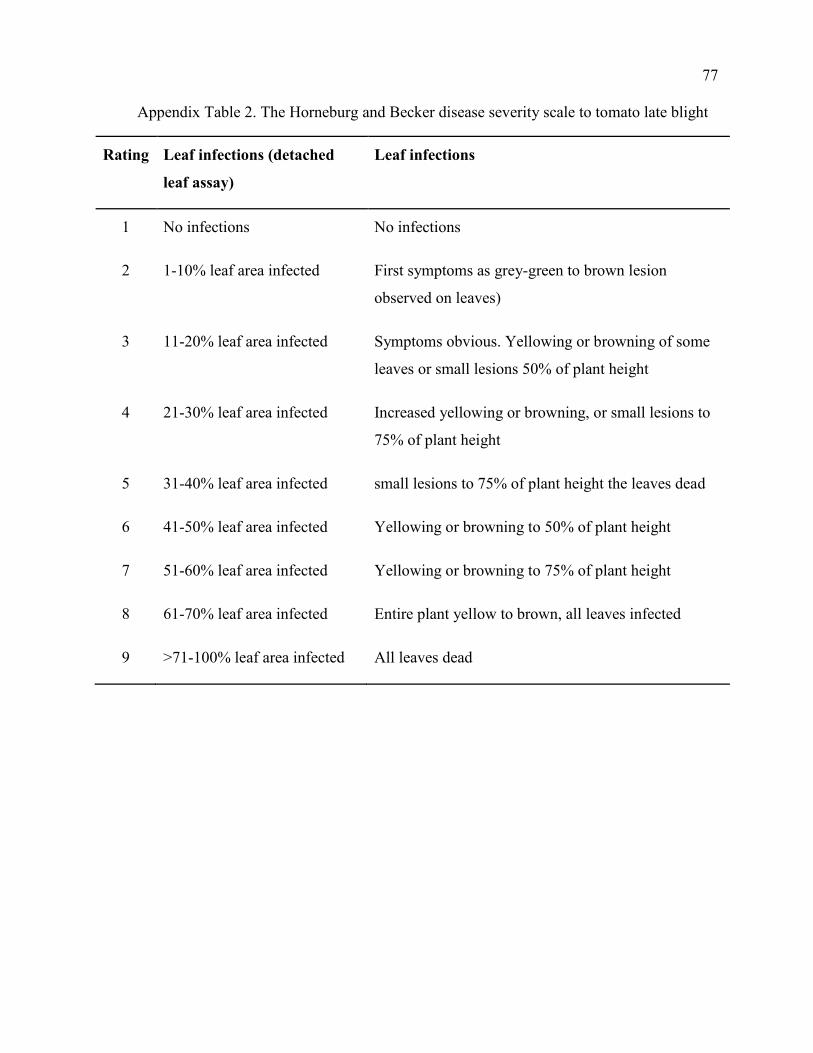
77
Appendix Table 2. The Horneburg and Becker disease severity scale to tomato late blight
Rating Leaf infections (detached
leaf assay)
Leaf infections
1 No infections No infections
2 1-10% leaf area infected First symptoms as grey-green to brown lesion
observed on leaves)
3 11-20% leaf area infected Symptoms obvious. Yellowing or browning of some
leaves or small lesions 50% of plant height
4 21-30% leaf area infected Increased yellowing or browning, or small lesions to
75% of plant height
5 31-40% leaf area infected small lesions to 75% of plant height the leaves dead
6 41-50% leaf area infected Yellowing or browning to 50% of plant height
7 51-60% leaf area infected Yellowing or browning to 75% of plant height
8 61-70% leaf area infected Entire plant yellow to brown, all leaves infected
9 >71-100% leaf area infected All leaves dead
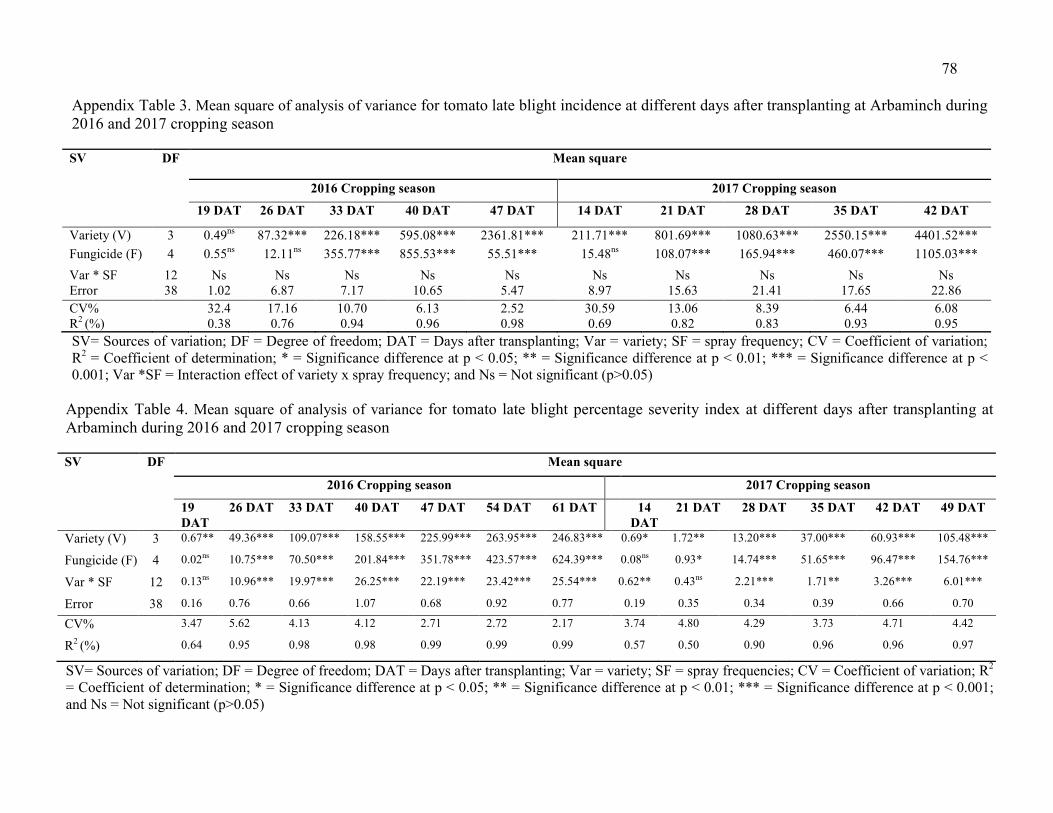
78
Appendix Table 3. Mean square of analysis of variance for tomato late blight incidence at different days after transplanting at Arbaminch during 2016 and 2017 cropping season
SV DF Mean square
2016 Cropping season 2017 Cropping season
19 DAT 26 DAT 33 DAT 40 DAT 47 DAT 14 DAT 21 DAT 28 DAT 35 DAT 42 DAT
Variety (V) 3 0.49ns 87.32*** 226.18*** 595.08*** 2361.81*** 211.71*** 801.69*** 1080.63*** 2550.15*** 4401.52***
Fungicide (F) 4 0.55ns 12.11ns 355.77*** 855.53*** 55.51*** 15.48ns 108.07*** 165.94*** 460.07*** 1105.03***
Var * SF 12 Ns Ns Ns Ns Ns Ns Ns Ns Ns Ns Error 38 1.02 6.87 7.17 10.65 5.47 8.97 15.63 21.41 17.65 22.86
CV% 32.4 17.16 10.70 6.13 2.52 30.59 13.06 8.39 6.44 6.08 R2 (%) 0.38 0.76 0.94 0.96 0.98 0.69 0.82 0.83 0.93 0.95
SV= Sources of variation; DF = Degree of freedom; DAT = Days after transplanting; Var = variety; SF = spray frequency; CV = Coefficient of variation; R2 = Coefficient of determination; * = Significance difference at p < 0.05; ** = Significance difference at p < 0.01; *** = Significance difference at p < 0.001; Var *SF = Interaction effect of variety x spray frequency; and Ns = Not significant (p>0.05)
Appendix Table 4. Mean square of analysis of variance for tomato late blight percentage severity index at different days after transplanting at Arbaminch during 2016 and 2017 cropping season
SV DF Mean square
2016 Cropping season 2017 Cropping season
19 DAT
26 DAT 33 DAT 40 DAT 47 DAT 54 DAT 61 DAT 14 DAT
21 DAT 28 DAT 35 DAT 42 DAT 49 DAT
Variety (V) 3 0.67** 49.36*** 109.07*** 158.55*** 225.99*** 263.95*** 246.83*** 0.69* 1.72** 13.20*** 37.00*** 60.93*** 105.48***
Fungicide (F) 4 0.02ns 10.75*** 70.50*** 201.84*** 351.78*** 423.57*** 624.39*** 0.08ns 0.93* 14.74*** 51.65*** 96.47*** 154.76***
Var * SF 12 0.13ns 10.96*** 19.97*** 26.25*** 22.19*** 23.42*** 25.54*** 0.62** 0.43ns 2.21*** 1.71** 3.26*** 6.01***
Error 38 0.16 0.76 0.66 1.07 0.68 0.92 0.77 0.19 0.35 0.34 0.39 0.66 0.70
CV% 3.47 5.62 4.13 4.12 2.71 2.72 2.17 3.74 4.80 4.29 3.73 4.71 4.42
R2 (%) 0.64 0.95 0.98 0.98 0.99 0.99 0.99 0.57 0.50 0.90 0.96 0.96 0.97
SV= Sources of variation; DF = Degree of freedom; DAT = Days after transplanting; Var = variety; SF = spray frequencies; CV = Coefficient of variation; R2 = Coefficient of determination; * = Significance difference at p < 0.05; ** = Significance difference at p < 0.01; *** = Significance difference at p < 0.001; and Ns = Not significant (p>0.05)
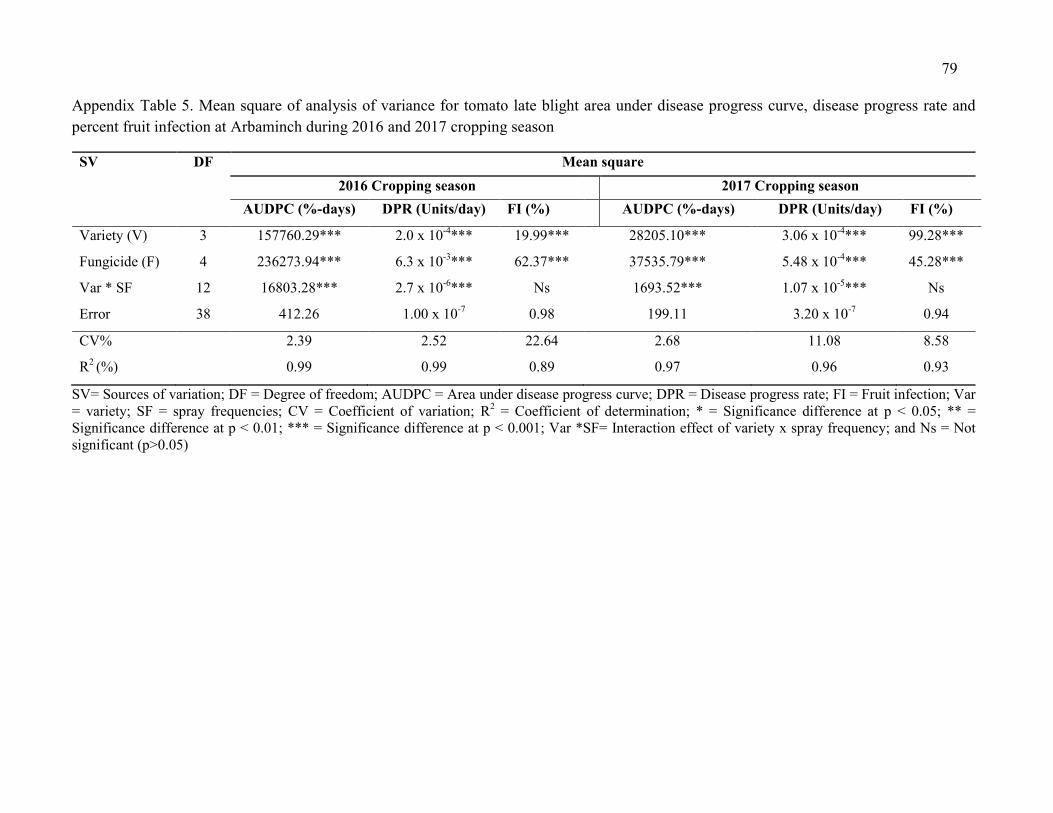
79
Appendix Table 5. Mean square of analysis of variance for tomato late blight area under disease progress curve, disease progress rate and
percent fruit infection at Arbaminch during 2016 and 2017 cropping season
SV DF Mean square
2016 Cropping season 2017 Cropping season
AUDPC (%-days) DPR (Units/day) FI (%) AUDPC (%-days) DPR (Units/day) FI (%)
Variety (V) 3 157760.29*** 2.0 x 10⁻⁴*** 19.99*** 28205.10*** 3.06 x 10⁻⁴*** 99.28***
Fungicide (F) 4 236273.94*** 6.3 x 10⁻³*** 62.37*** 37535.79*** 5.48 x 10⁻⁴*** 45.28***
Var * SF 12 16803.28*** 2.7 x 10⁻⁶*** Ns 1693.52*** 1.07 x 10⁻⁵*** Ns
Error 38 412.26 1.00 x 10⁻⁷ 0.98 199.11 3.20 x 10⁻⁷ 0.94
CV% 2.39 2.52 22.64 2.68 11.08 8.58
R2 (%) 0.99 0.99 0.89 0.97 0.96 0.93
SV= Sources of variation; DF = Degree of freedom; AUDPC = Area under disease progress curve; DPR = Disease progress rate; FI = Fruit infection; Var = variety; SF = spray frequencies; CV = Coefficient of variation; R2 = Coefficient of determination; * = Significance difference at p < 0.05; ** = Significance difference at p < 0.01; *** = Significance difference at p < 0.001; Var *SF= Interaction effect of variety x spray frequency; and Ns = Not significant (p>0.05)
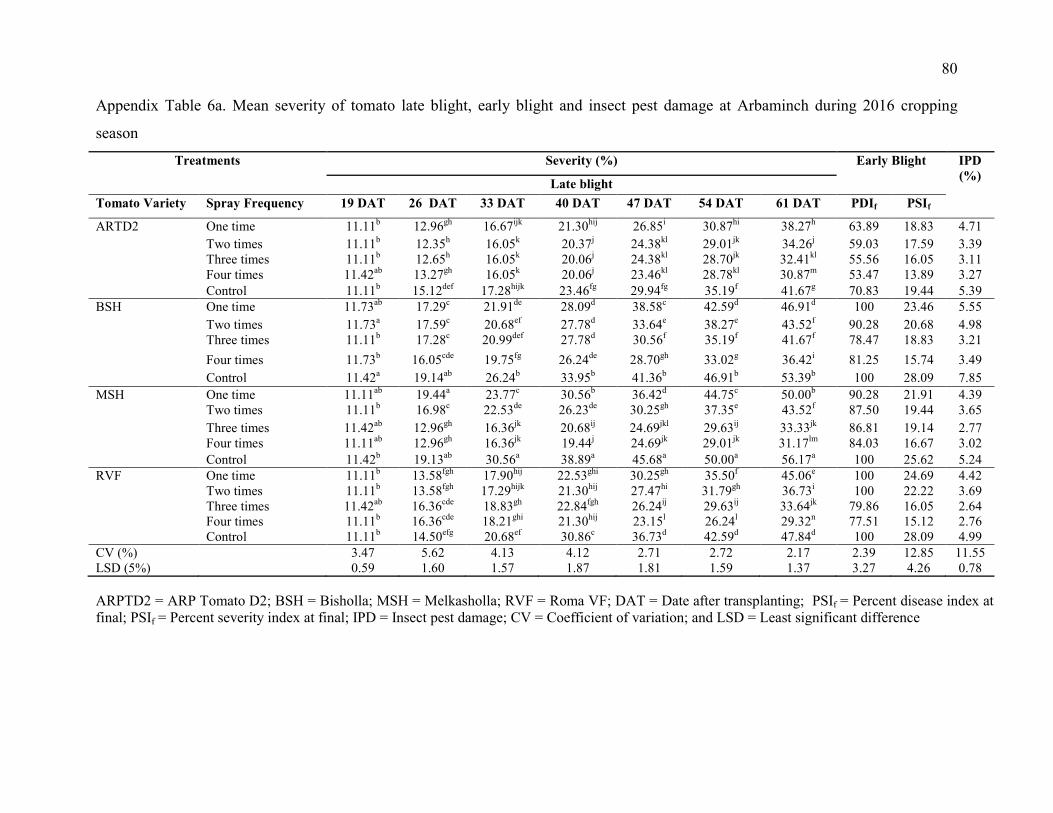
80
Appendix Table 6a. Mean severity of tomato late blight, early blight and insect pest damage at Arbaminch during 2016 cropping
season
ARPTD2 = ARP Tomato D2; BSH = Bisholla; MSH = Melkasholla; RVF = Roma VF; DAT = Date after transplanting; PSIf = Percent disease index at final; PSIf = Percent severity index at final; IPD = Insect pest damage; CV = Coefficient of variation; and LSD = Least significant difference
Treatments Severity (%) Early Blight IPD (%)
Late blight
Tomato Variety Spray Frequency 19 DAT 26 DAT 33 DAT 40 DAT 47 DAT 54 DAT 61 DAT PDIf PSIf
ARTD2 One time 11.11b 12.96gh 16.67ijk 21.30hij 26.85i 30.87hi 38.27h 63.89 18.83 4.71
Two times 11.11b 12.35h 16.05k 20.37j 24.38kl 29.01jk 34.26j 59.03 17.59 3.39 Three times 11.11b 12.65h 16.05k 20.06j 24.38kl 28.70jk 32.41kl 55.56 16.05 3.11 Four times 11.42ab 13.27gh 16.05k 20.06j 23.46kl 28.78kl 30.87m 53.47 13.89 3.27 Control 11.11b 15.12def 17.28hijk 23.46fg 29.94fg 35.19f 41.67g 70.83 19.44 5.39 BSH One time 11.73ab 17.29c 21.91de 28.09d 38.58c 42.59d 46.91d 100 23.46 5.55
Two times 11.73a 17.59c 20.68ef 27.78d 33.64e 38.27e 43.52f 90.28 20.68 4.98 Three times 11.11b 17.28c 20.99def 27.78d 30.56f 35.19f 41.67f 78.47 18.83 3.21
Four times 11.73b 16.05cde 19.75fg 26.24de 28.70gh 33.02g 36.42i 81.25 15.74 3.49
Control 11.42a 19.14ab 26.24b 33.95b 41.36b 46.91b 53.39b 100 28.09 7.85
MSH One time 11.11ab 19.44a 23.77c 30.56b 36.42d 44.75c 50.00b 90.28 21.91 4.39 Two times 11.11b 16.98c 22.53de 26.23de 30.25gh 37.35e 43.52f 87.50 19.44 3.65
Three times 11.42ab 12.96gh 16.36jk 20.68ij 24.69jkl 29.63ij 33.33jk 86.81 19.14 2.77 Four times 11.11ab 12.96gh 16.36jk 19.44j 24.69jk 29.01jk 31.17lm 84.03 16.67 3.02
Control 11.42b 19.13ab 30.56a 38.89a 45.68a 50.00a 56.17a 100 25.62 5.24 RVF One time 11.11b 13.58fgh 17.90hij 22.53ghi 30.25gh 35.50f 45.06e 100 24.69 4.42 Two times 11.11b 13.58fgh 17.29hijk 21.30hij 27.47hi 31.79gh 36.73i 100 22.22 3.69 Three times 11.42ab 16.36cde 18.83gh 22.84fgh 26.24ij 29.63ij 33.64jk 79.86 16.05 2.64 Four times 11.11b 16.36cde 18.21ghi 21.30hij 23.15l 26.24l 29.32n 77.51 15.12 2.76 Control 11.11b 14.50efg 20.68ef 30.86c 36.73d 42.59d 47.84d 100 28.09 4.99 CV (%) 3.47 5.62 4.13 4.12 2.71 2.72 2.17 2.39 12.85 11.55 LSD (5%) 0.59 1.60 1.57 1.87 1.81 1.59 1.37 3.27 4.26 0.78
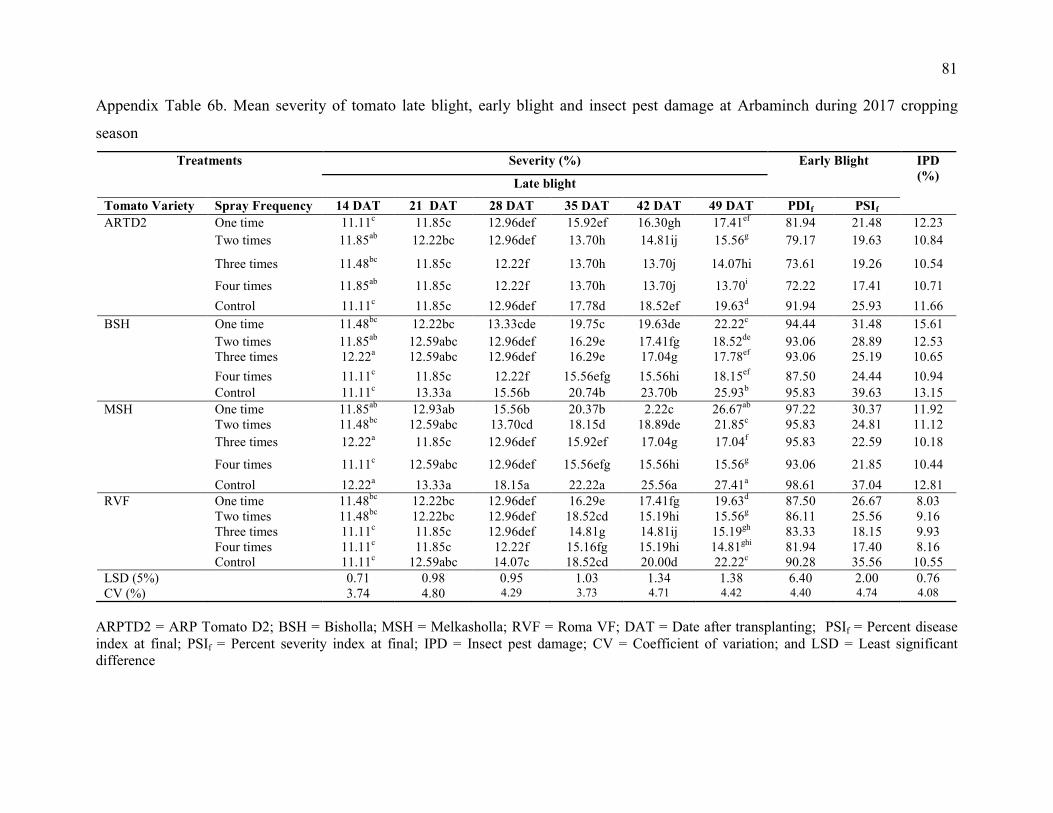
81
Appendix Table 6b. Mean severity of tomato late blight, early blight and insect pest damage at Arbaminch during 2017 cropping
season
Treatments Severity (%) Early Blight IPD (%)
Late blight
Tomato Variety Spray Frequency 14 DAT 21 DAT 28 DAT 35 DAT 42 DAT 49 DAT PDIf PSIf
ARTD2 One time 11.11c 11.85c 12.96def 15.92ef 16.30gh 17.41ef 81.94 21.48 12.23
Two times 11.85ab 12.22bc 12.96def 13.70h 14.81ij 15.56g 79.17 19.63 10.84
Three times 11.48bc 11.85c 12.22f 13.70h 13.70j 14.07hi 73.61 19.26 10.54
Four times 11.85ab 11.85c 12.22f 13.70h 13.70j 13.70i 72.22 17.41 10.71
Control 11.11c 11.85c 12.96def 17.78d 18.52ef 19.63d 91.94 25.93 11.66
BSH One time 11.48bc 12.22bc 13.33cde 19.75c 19.63de 22.22c 94.44 31.48 15.61
Two times 11.85ab 12.59abc 12.96def 16.29e 17.41fg 18.52de 93.06 28.89 12.53 Three times 12.22a 12.59abc 12.96def 16.29e 17.04g 17.78ef 93.06 25.19 10.65
Four times 11.11c 11.85c 12.22f 15.56efg 15.56hi 18.15ef 87.50 24.44 10.94 Control 11.11c 13.33a 15.56b 20.74b 23.70b 25.93b 95.83 39.63 13.15
MSH One time 11.85ab 12.93ab 15.56b 20.37b 2.22c 26.67ab 97.22 30.37 11.92 Two times 11.48bc 12.59abc 13.70cd 18.15d 18.89de 21.85c 95.83 24.81 11.12
Three times 12.22a 11.85c 12.96def 15.92ef 17.04g 17.04f 95.83 22.59 10.18
Four times 11.11c 12.59abc 12.96def 15.56efg 15.56hi 15.56g 93.06 21.85 10.44
Control 12.22a 13.33a 18.15a 22.22a 25.56a 27.41a 98.61 37.04 12.81 RVF One time 11.48bc 12.22bc 12.96def 16.29e 17.41fg 19.63d 87.50 26.67 8.03 Two times 11.48bc 12.22bc 12.96def 18.52cd 15.19hi 15.56g 86.11 25.56 9.16 Three times 11.11c 11.85c 12.96def 14.81g 14.81ij 15.19gh 83.33 18.15 9.93 Four times 11.11c 11.85c 12.22f 15.16fg 15.19hi 14.81ghi 81.94 17.40 8.16 Control 11.11c 12.59abc 14.07c 18.52cd 20.00d 22.22c 90.28 35.56 10.55 LSD (5%) 0.71 0.98 0.95 1.03 1.34 1.38 6.40 2.00 0.76 CV (%) 3.74 4.80 4.29 3.73 4.71 4.42 4.40 4.74 4.08
ARPTD2 = ARP Tomato D2; BSH = Bisholla; MSH = Melkasholla; RVF = Roma VF; DAT = Date after transplanting; PSIf = Percent disease index at final; PSIf = Percent severity index at final; IPD = Insect pest damage; CV = Coefficient of variation; and LSD = Least significant difference
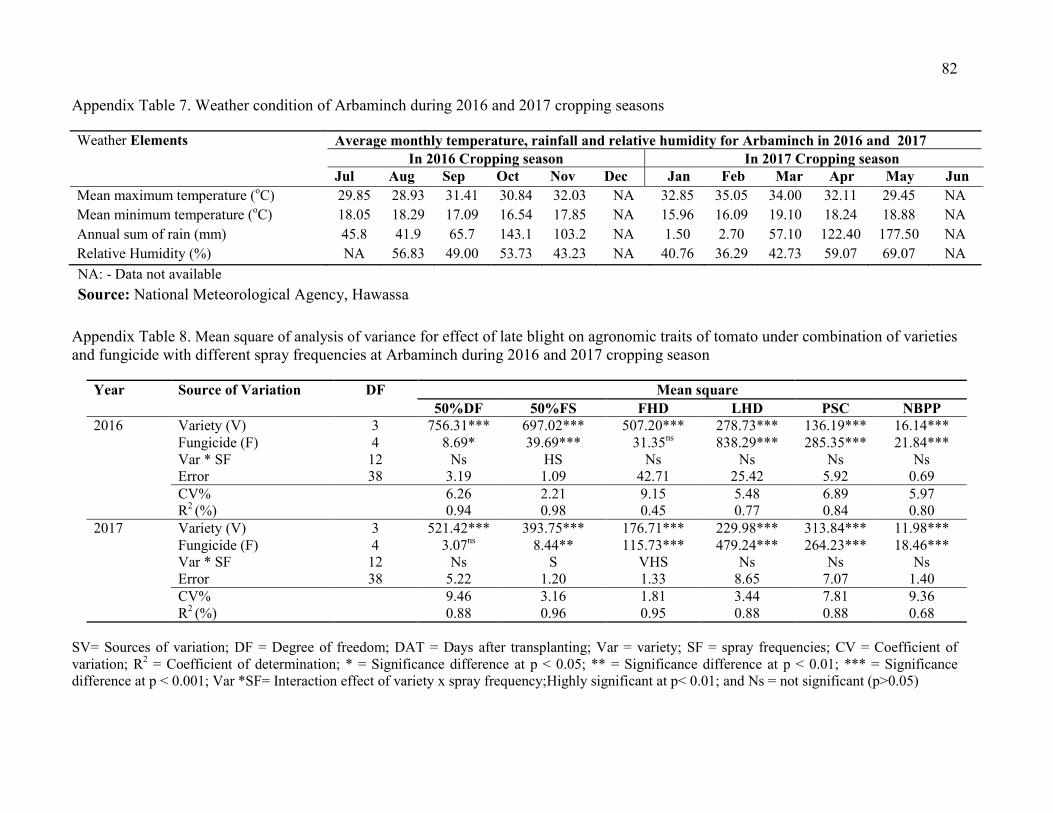
82
Appendix Table 7. Weather condition of Arbaminch during 2016 and 2017 cropping seasons
Weather Elements Average monthly temperature, rainfall and relative humidity for Arbaminch in 2016 and 2017 In 2016 Cropping season In 2017 Cropping season
Jul Aug Sep Oct Nov Dec Jan Feb Mar Apr May Jun
Mean maximum temperature (oC) 29.85 28.93 31.41 30.84 32.03 NA 32.85 35.05 34.00 32.11 29.45 NA
Mean minimum temperature (oC) 18.05 18.29 17.09 16.54 17.85 NA 15.96 16.09 19.10 18.24 18.88 NA
Annual sum of rain (mm) 45.8 41.9 65.7 143.1 103.2 NA 1.50 2.70 57.10 122.40 177.50 NA
Relative Humidity (%) NA 56.83 49.00 53.73 43.23 NA 40.76 36.29 42.73 59.07 69.07 NA
NA: - Data not available
Source: National Meteorological Agency, Hawassa
Appendix Table 8. Mean square of analysis of variance for effect of late blight on agronomic traits of tomato under combination of varieties and fungicide with different spray frequencies at Arbaminch during 2016 and 2017 cropping season
Year Source of Variation DF Mean square
50%DF 50%FS FHD LHD PSC NBPP 2016 Variety (V) 3 756.31*** 697.02*** 507.20*** 278.73*** 136.19*** 16.14***
Fungicide (F) 4 8.69* 39.69*** 31.35ns 838.29*** 285.35*** 21.84*** Var * SF 12 Ns HS Ns Ns Ns Ns Error 38 3.19 1.09 42.71 25.42 5.92 0.69 CV% 6.26 2.21 9.15 5.48 6.89 5.97 R2 (%) 0.94 0.98 0.45 0.77 0.84 0.80
2017 Variety (V) 3 521.42*** 393.75*** 176.71*** 229.98*** 313.84*** 11.98*** Fungicide (F) 4 3.07ns 8.44** 115.73*** 479.24*** 264.23*** 18.46*** Var * SF 12 Ns S VHS Ns Ns Ns Error 38 5.22 1.20 1.33 8.65 7.07 1.40 CV% 9.46 3.16 1.81 3.44 7.81 9.36 R2 (%) 0.88 0.96 0.95 0.88 0.88 0.68
SV= Sources of variation; DF = Degree of freedom; DAT = Days after transplanting; Var = variety; SF = spray frequencies; CV = Coefficient of variation; R2 = Coefficient of determination; * = Significance difference at p < 0.05; ** = Significance difference at p < 0.01; *** = Significance difference at p < 0.001; Var *SF= Interaction effect of variety x spray frequency;Highly significant at p< 0.01; and Ns = not significant (p>0.05)
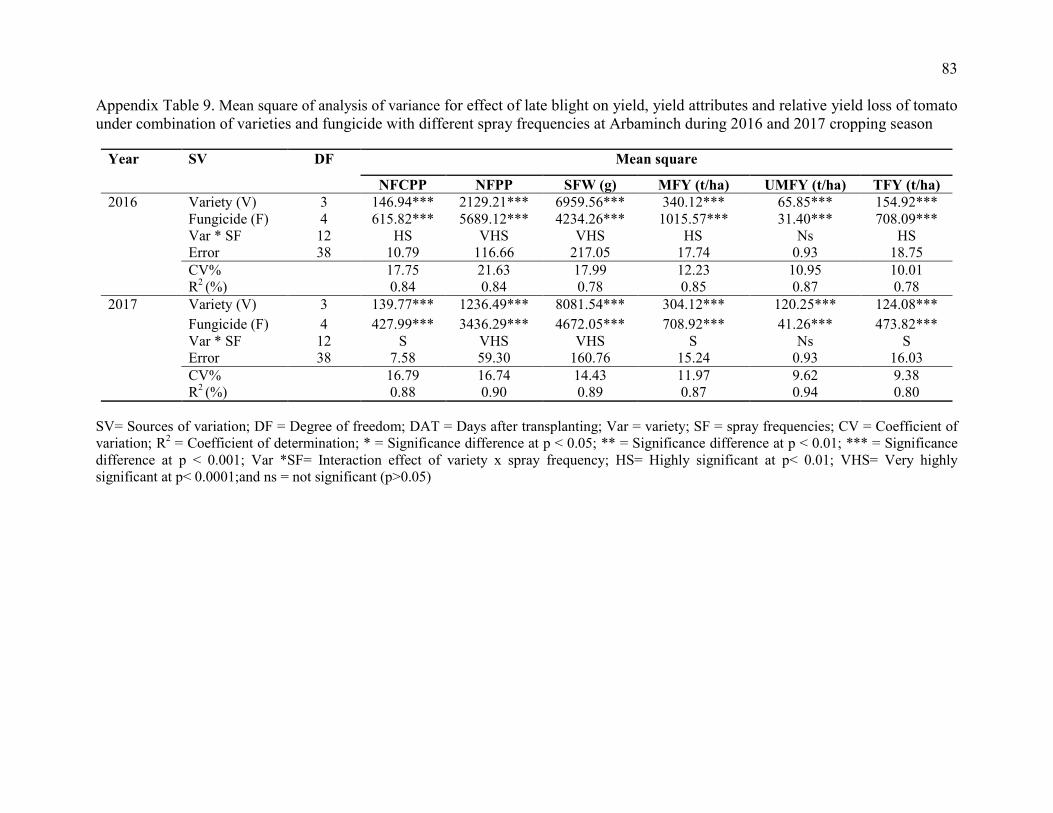
83
Appendix Table 9. Mean square of analysis of variance for effect of late blight on yield, yield attributes and relative yield loss of tomato under combination of varieties and fungicide with different spray frequencies at Arbaminch during 2016 and 2017 cropping season
Year SV DF Mean square
NFCPP NFPP SFW (g) MFY (t/ha) UMFY (t/ha) TFY (t/ha) 2016 Variety (V) 3 146.94*** 2129.21*** 6959.56*** 340.12*** 65.85*** 154.92***
Fungicide (F) 4 615.82*** 5689.12*** 4234.26*** 1015.57*** 31.40*** 708.09*** Var * SF 12 HS VHS VHS HS Ns HS Error 38 10.79 116.66 217.05 17.74 0.93 18.75 CV% 17.75 21.63 17.99 12.23 10.95 10.01 R2 (%) 0.84 0.84 0.78 0.85 0.87 0.78
2017 Variety (V) 3 139.77*** 1236.49*** 8081.54*** 304.12*** 120.25*** 124.08***
Fungicide (F) 4 427.99*** 3436.29*** 4672.05*** 708.92*** 41.26*** 473.82*** Var * SF 12 S VHS VHS S Ns S Error 38 7.58 59.30 160.76 15.24 0.93 16.03 CV% 16.79 16.74 14.43 11.97 9.62 9.38 R2 (%) 0.88 0.90 0.89 0.87 0.94 0.80
SV= Sources of variation; DF = Degree of freedom; DAT = Days after transplanting; Var = variety; SF = spray frequencies; CV = Coefficient of variation; R2 = Coefficient of determination; * = Significance difference at p < 0.05; ** = Significance difference at p < 0.01; *** = Significance difference at p < 0.001; Var *SF= Interaction effect of variety x spray frequency; HS= Highly significant at p< 0.01; VHS= Very highly significant at p< 0.0001;and ns = not significant (p>0.05)