institute of hospitality management in prague
TRANSCRIPT

Institute of Hospitality Management in Prague
Zdeněk Juráň
Menu Engineering and Its Use in Gastronomy
Bachelor’s Thesis
2019
Bachelor’s Thesis
Menu Engineering and Its Use in Gastronomy
Zdeněk Juráň
Institute of Hospitality Management in Prague 8, Ltd.
Department of Hospitality Management
Bachelor´s degree program: Gastronomy, Hospitality and Tourism
Major field of study: Hospitality management
Thesis Advisor: Ing. Štěpán Chalupa
Prague 2019

Oath
I swear
that the bachelor dissertation titled Menu engineering and its use in gastronomy was
written by me independently, and that all literature and additional material used are
cited in the bibliography and that this version is exactly the same as the work
submitted electronically.
In accordance with §47b law no. 111/1998 coll. on higher education institutions, I
agree to my dissertation being published in its complete form in the publicly
accessible electronic database of the Institute of Hospitality Management in Prague.
Signature
……………………………………
Zdeněk Juráň
In Prague on

My enduring appreciation goes to my supervisor Ing. Štěpán Chalupa for his guidance
and valuable advice throughout writing of the bachelor dissertation. Special thanks go
to my sister Michaela and my partner Veronika who had the patience and time to assist
me in completing this thesis.
Abstract
Juráň, Zdeněk. Menu engineering and its use in gastronomy. [Bachelor‟s thesis]
Institute of Hospitality Management in Prague. Prague: 2019. Number of pages: 46.
This dissertation deals with, as the title of the thesis suggests, the use of menu engineering
within gastronomy in order to maximize the potential of the menu. Creating an attractive
menu is crucial for an establishment as it gives the guest the options to choose from. The
thesis is divided into three parts. The first part is theoretical, discussing the beginnings of
gastronomy, trends in gastronomy and different kinds of menu. The second part, analytical,
is where the actual menu engineering analysis is done using primary data from the selected
restaurant. The data consists of all the food items on the menu, names, the cost of
production, the selling price and the amount of unit sales of each item. The time period
during which the data has been collected is from the entire calendar year of 2018. The data
is then processed to receive the proper results. Based on these results it is possible to place
all of the menu items into one of the four quadrants of the BCG Matrix which are: stars,
plowhorses, puzzles and dogs. The selected restaurant offers thirty five items which are
separated into nine categories, based on the type of food they are. The third and final part
of this thesis describes the result of the menu engineering analysis and proposes different
ways of increasing popularity and profitability of the menu by modifying prices,
promoting, improving or removing certain items.
Keywords: Analysis, BCG Matrix, contribution margin, establishment, food, menu, menu
engineering, restaurant, popularity, profitability
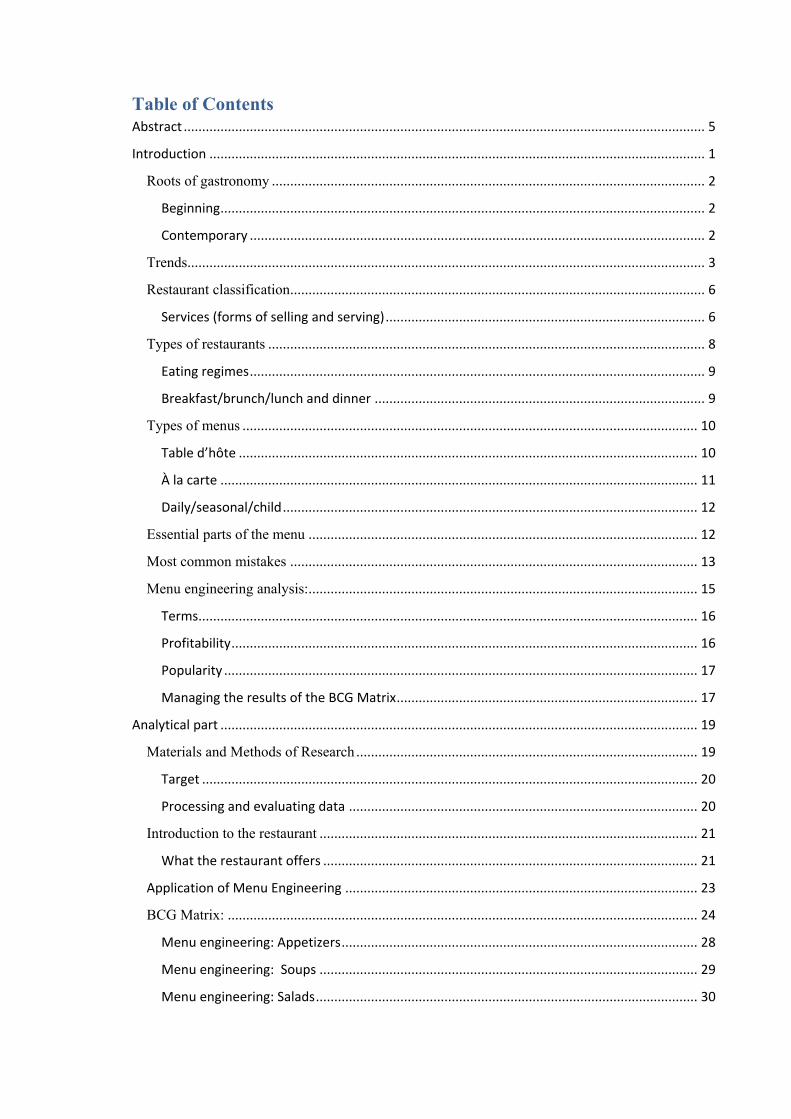
Table of Contents Abstract .............................................................................................................................................. 5
Introduction ....................................................................................................................................... 1
Roots of gastronomy ...................................................................................................................... 2
Beginning .................................................................................................................................... 2
Contemporary ............................................................................................................................ 2
Trends............................................................................................................................................. 3
Restaurant classification................................................................................................................. 6
Services (forms of selling and serving) ....................................................................................... 6
Types of restaurants ....................................................................................................................... 8
Eating regimes ............................................................................................................................ 9
Breakfast/brunch/lunch and dinner .......................................................................................... 9
Types of menus ............................................................................................................................ 10
Table d’hôte ............................................................................................................................. 10
À la carte .................................................................................................................................. 11
Daily/seasonal/child ................................................................................................................. 12
Essential parts of the menu .......................................................................................................... 12
Most common mistakes ............................................................................................................... 13
Menu engineering analysis: .......................................................................................................... 15
Terms........................................................................................................................................ 16
Profitability ............................................................................................................................... 16
Popularity ................................................................................................................................. 17
Managing the results of the BCG Matrix .................................................................................. 17
Analytical part .................................................................................................................................. 19
Materials and Methods of Research ............................................................................................. 19
Target ....................................................................................................................................... 20
Processing and evaluating data ............................................................................................... 20
Introduction to the restaurant ....................................................................................................... 21
What the restaurant offers ...................................................................................................... 21
Application of Menu Engineering ................................................................................................ 23
BCG Matrix: ................................................................................................................................ 24
Menu engineering: Appetizers ................................................................................................. 28
Menu engineering: Soups ....................................................................................................... 29
Menu engineering: Salads ........................................................................................................ 30
Menu engineering: Noodles ..................................................................................................... 31
Menu engineering: Chicken ..................................................................................................... 33
Menu engineering: Pork .......................................................................................................... 34
Menu engineering: Beef ........................................................................................................... 35
Menu engineering: Duck .......................................................................................................... 36
Menu engineering: Sushi ......................................................................................................... 37
Suggestions ...................................................................................................................................... 38
Appetizers .................................................................................................................................... 39
Soups ............................................................................................................................................ 39
Salads ........................................................................................................................................... 40
Noodles ........................................................................................................................................ 40
Chicken ........................................................................................................................................ 41
Beef .............................................................................................................................................. 42
Duck ............................................................................................................................................. 42
Sushi ............................................................................................................................................. 43
Conclusion ........................................................................................................................................ 44
List of references .............................................................................................................................. 45
Table of figures Figure 1: percentage of unit sales ..................................................................................................... 22 Figure 2: Comparison between the menu cost and the menu contribution margin .......................... 23 Figure 3: BCG Matrix eample.......................................................................................................... 24 Figure 4: BCG Matrix of all items ................................................................................................... 25 Figure 5: Appetizers BCG Matrix .................................................................................................... 28 Figure 6: Soups BCG Matrix ........................................................................................................... 29 Figure 7: Salads BCG Matrix ........................................................................................................... 31 Figure 8: Noodles BCG Matrix ........................................................................................................ 32 Figure 9: Chicken BCG Matrix ........................................................................................................ 33 Figure 10: Pork BCG Matrix ........................................................................................................... 34 Figure 11: Beef BCG Matrix............................................................................................................ 35 Figure 12: Duck BCG Matrix .......................................................................................................... 36 Figure 13: Sushi BCG Matrix .......................................................................................................... 38
Table 1 ............................................................................................................................................. 21 Table 2: Appetizers table ................................................................................................................. 28 Table 3: Soups table ......................................................................................................................... 29 Table 4: Salads table ........................................................................................................................ 30 Table 5: Noodles table ..................................................................................................................... 32 Table 6: Chicken .............................................................................................................................. 33 Table 7: Pork table ........................................................................................................................... 34 Table 8: Beef table ........................................................................................................................... 35 Table 9: Duck table .......................................................................................................................... 36 Table 10: Sushi table ........................................................................................................................ 37
1
Introduction
The author of this thesis chose this topic because of his passion towards dining
establishments, not just in the Czech Republic but all over the world. The author has
always been curious about how a menu is designed, how the prices are calculated and how
to update and change a menu to create a successful dining establishment. The experience
and knowledge gained throughout the writing of this thesis has helped the author
understand how to successfully perform the menu engineering analysis and how to work
with the results.
The thesis focuses on a selected restaurant in the south of Moravia, Czech Republic. The
goal is to perform the menu engineering analysis and prove how the establishment can
benefit from it.
The author, in the thesis analyses primary data provided by the restaurant owner/manager
about the menu, more specifically the amount of units sold, the production cost and the
selling price in the timespan of one year.
The thesis contains three parts, the theoretical, analytical and the conclusion. The first part
discusses the beginnings of gastronomy, the trends, the function of the menu and the menu
engineering analysis together with the BCG Matrix. The second part focuses on the
analysis of the selected restaurant and its results. Lastly, the third part focuses on the
author‟s suggestions regarding the menu items to improve popularity and profitability and
the conclusion of the thesis.
2
Roots of gastronomy
Beginning
The development of gastronomy is strongly linked to the development of humans as a
whole. Unlike some animals, humans have the capability of surviving on more than one
source of food. Humans can adapt to their surroundings, and therefore eat a wide variety of
foods to stay alive. Having this ability civilizations can populate, survive, adapt and grow
in almost every corner of our planet.
Food gained a whole new meaning other than just satisfying a basic human need - hunger.
It became a source of pleasure. As time passed and various cultures came to life and
further developed, so did the trade between them. The merchants began to travel more and
therefore the demand for catering services grew. This also brought development to the
culinary art, namely in China, Egypt, Greece and Rome. (Burešová et al. 2014,)
Contemporary
In contemporary gastronomy we see an extensive variety and combination of all tastes and
cuisines. With the advances of technology, traveling and education, more information is
available to us. For example, ingredients used in the Japanese cuisine are available in
stores around Europe and vice-versa. Cuisines that were previously unobtainable unless a
person visited the specific country, are becoming not only available to the wider public but
also increasingly popular, which is a big change because previously traditional cuisines
were relying heavily on the ingredients in their immediate vicinity. Meaning that a town in
the Czech Republic near a lake would have recipes containing fish in them while other
cities with forests nearby would have more recipes oriented towards mushrooms and wild
berries. Nowadays it is not only about the food anymore, food now means more than just
3
sustenance, it has become about the overall experience. In order to have the full experience
of a foreign cuisine people also tend to use the utensils of the specific cuisine, meaning that
for example for most Asian cuisines they use chopsticks. In some cultures it is traditional
to eat the food by hand or with the help of bread, eg. naan, this practice however is not
very popular. (Burešová et al. 2014)
Trends
In the last couple of years there has been an increase in new trends. The increase is a direct
consequence of technological advancements. The kitchens of a few decades ago and their
equipment share almost no similarities with the kitchens of today. With a larger variability
of equipment and preparation methods it is possible to create a larger variety of food in a
much smaller area as well as create food that would not be possible without such
equipment. This kind of equipment also allows home cooks to prepare certain foods that
they would not otherwise be able to prepare without the access to a professional kitchen.
Some of the examples of such equipment are the air fryer, slow cooker or the sous vide
machine.
These are not the only differences, high quality of food has become a standard rather than a
rarity. The possibility of ordering various ingredients from halfway across the world and
receiving them the next day, improving the taste and freshness has had a great effect on
food quality, especially regarding ingredients where the freshness is an essential aspect,
such as fish and sea food. Smaller portions with more intensive aromas are more common.
These are usually accompanied by more colors and decorations in order to improve the
aesthetic aspect of food and the overall experience. Specific styles of plating could be
considered art, for example molecular gastronomy tends to play with the visual aspect of
food and our preconceived taste expectations of certain textures and ingredients.
Attempting to create as little food waste as possible is also a new and a very positive one
that is usually closely connected with using ingredients that are locally and ethically
sourced. Green spices, herbs, plant ingredients such as, soy and vegetable oil are being
used more often with, a wider selection of pastry. More recipes contain less meat as the
main ingredient, some restaurants opt to offer only grass fed meat and many restaurants try
to offer at least some vegetarian or even vegan options. Beverages have become healthier
4
as well, with freshly squeezed juices and mineral waters as an example. Open kitchen
space where customers have the chance to witness everything that is usually behind closed
doors in a restaurant has become quite a famous trend as well, making a meal even more of
an experience. Specifically this trend requires great responsibility, skill, order and hygiene.
As far as hygiene goes, it was the French Marie-Antoine Careme that was responsible for
taking the aspect of hygiene seriously, described in his book called “L‟Art de la Cuisine
Francais”. An example is the introduction of wearing hats in the kitchen. (Burešová et al.
2014, Zimáková 2004)
In the present day, we tend to be on-line throughout the majority of the day. We are always
connected somehow, mostly through our mobile phones and this leads us to a trend called
“food in hand”. The world of gastronomy is always evolving and with it come new trends
with new terminology, as noted by Burešová et al. (2014). Some of the new trends
regarding what and the way we eat that have become popular lately are:
- Amuse bouche, small portions of food, made to encourage appetite. Often created
with untraditional combination of tastes and ingredients.
- Organic food, food that is created using ingredients produced without any use of
chemicals, antibiotics, artificial coloring or anything that could somehow modify
the food are used. Organic food is popular among health conscious individuals.
- Brain food, food that is made to increase our concentration, improve our memory,
fill us with positive energy and good mood. Its aim is to increase our overall
performance.
- Convenience food, semi-finished food, pre-prepared food made to simplify our
work in the kitchen. Often used by students or people with a limited amount of
time. Most of the time this type of food is heavily processed and is high in added
sugar, salt, fat and artificial ingredients.
- Culinary art, the combination of the aesthetic, aromatic and taste factors while
preparing any type of food.
- Enogastronomy, combining wine with food. This can be done in two different
ways. Based on whether we are choosing wine to go with the food or food to go
with the wine. This process requires the cooperation between the head-chef,
sommelier and the individual customer. In either case there is always great
emphasis on the year/region of the wine.
5
- Ethnic food, meals prepared in the traditional way of the specific region using
regional and fresh ingredients.
- Fast food, fast service and fast consumption of food. A trend which is very popular
in today‟s fast paced culture and is often consumed on the move. This food usually
tends to be highly processed containing high levels of added sugar, salt and fat
while at the same time having low nutritional value.
- Finger food, meals that are consumed by hand. Amouse bouche is a kind of finger
food, other examples include Spanish Tapas and American appetizers.
- Functional food, healthy foods with high nutritional value fortified with vitamins,
fiber and probiotics.
- Fun/fancy food, food that is made to impress. Aesthetics along with extremely
high quality ingredients are the priority.
- Fusion cuisine, fusion of two or more cuisines that would normally not be
combined, usually mixing different kinds of ethnic food. This type of cuisine
requires extraordinary skill, knowledge and experience.
- Glocal cuisine, a new trend which involves local gastronomy (recipes and
traditions) made with global ingredients and modern technologies.
- Hand-held food, easy and simple way to eat food with a simple cover, it is also
considered a form of fast food. Most often used during sporting events around
stadiums.
- Instinct food, food and beverages that we select based on our instincts and bodily
needs. This trend derives from the belief that our bodies know best what they need
and will create cravings according to these needs. Based on aspects such as looks,
aromas and tastes people can either be attracted or repelled by certain foods.
- Junk food, a type of food with little or no nutritional value, often deep fried and
containing a high amount of calories. Some well-known examples are McDonald‟s,
KFC, Burger King. The majority of fast food also falls under the category of junk
food.
- Lego food and Puzzle food, most often sweets created by combining small and
precisely shaped pieces.
- LOHAS, stands for Lifestyles of Health and Sustainability. This trend has gained
massive popularity in recent years and revolves around consuming food made from
6
locally produced ingredients. Sustainability is an important aspect which means
that the food is packed and distributed all in an ecological way.
- Molecular gastronomy, is a study aimed at ingredients and the transformation
(chemical and physical) they go through while cooking, often focusing on the
visual aspect of the meals.
- Novel food, a trend in which food is prepared in a way which has not been
previously used.
Slow food, a “movement” in which the aim is to enjoy and experience a true local
cuisine, the opposite of fast food.
- Sous-vide, a modern method of food preparation inside a vacuum to retain the taste
and juices of the ingredients. In addition to the taste being richer, compared to a
more regular method of preparing food, it stays fresh for an extended amount of
time. Not only does it fulfill all the hygienic requirements but it is also easier to
prepare. The disadvantage of this method of preparation is that it tends to be
considerably lengthier than the traditional way of cooking said meal.
- Street food, foods that are found in food carts or stands. In western countries
usually found at festivals and markets rather than actual streets, more common in
developing countries, street food is considered a type of fast food.
- Traditional regional gastronomy, food that reflects the traditions of a given
region regarding the methods of preparation and the ingredients used.
(Burešová et al. 2014)
Extremely wide array of trends are coming to life. These trends originate in technological
advancements as well as in longing for a reconnection with traditions. Many trends also
focus on the health and nutritional aspect while others concentrate on a cruelty free and
sustainable approach. (Burešová et al. 2014)
Restaurant classification
Services (forms of selling and serving)
- Services and gastronomy are two inseparable components of a food and beverage
establishment. One cannot function without the other. Most of the money brought
in goes through the hands of the servers/waiters and therefore their role is crucial.
7
The service staff must fulfil the wants, needs, desires and expectations of the guest
from the moment they step into the restaurant to the moment they leave. Waiters
are also the salesmen and must be able to read the guest and figure out whether they
are in a hurry or have time to spare, as stated by Zimáková (2004). Each member of
the service staff should:
- Be reliable, accurate and loyal
- Be perceptive, predictive and be able to “read” the guest
- Have general oversight and capability of organizing and adapting to each situation
- Have personal discipline
- Be rigorous, calm and not show any change of mood
- Be friendly and able to take care of their guest
These points are crucial since the guest often comes into contact only with the service staff.
The image of the restaurant is directly correlated with the skills and behavior of its staff.
As mentioned before, the service staff is essential to the food and beverage business,
however there are different types of service classifications where the roles of the service
staff are slightly different. (Metz, Grunes & Kessler 2003, Zimáková 2004)
Self service
In a self-service establishment, the role of the service staff is reduced, this does not mean
that the productivity of the business itself is any lower. In a self-service operation, the
requirements are lower on the waiters, since the customer is in charge of not only choosing
but also serving their own food. Communication between the guest and the staff is mostly
limited to just paying. This type of service is most common in breakfast buffets or all you
can eat restaurants with a large variety of dishes.
Full service
The full service is very time demanding, requires great knowledge and skill of the staff.
The guest is taken care of from the moment they walk in the door until the moment they
leave as the staff is always standing nearby prepared to fulfill any needs that the guest
might have. This type of service is prevalent among high end establishments.
8
Over the counter: food stands / food festivals
Over the counter is a form of quick selling with low requirements for the number of
working staff. Most commonly used in fast food chains such as McDonald‟s, KFC, Burger
King, etc., in schools/hospitals/workplaces canteens. This type of service is popular during
food festivals and other big social events such as markets and concerts where there is a
large amount of people that need to be served in a timely manner.
Other: vending machines
Vending machines do not require any waiting staff, just a regular replenishment. Snacks,
cold and warm beverages are sold. Often they are placed in locations with a high density of
potential buyers, such as schools, airports, hospitals and around stadiums.
Choice of the service type depends on the type of restaurant/operation and the type of
equipment available. (Zimáková 2004, Burešová et al. 2014, Petzuch, 1995, Burešová et al.
2014)
Types of restaurants
Restaurant type will depend mainly on what the target customer is as well as the location
of the establishment. Questions that help determining the target customer are:
- Are the surroundings of the restaurant residential or business-focused?
- Is the population density high or low?
- What are the most common professions and lifestyles?
- What is the most common age category?
- What is the most common mode of transportation?
- What is the average income of the locals?
- What are the future developmental plans for the location?
- Are there lunch/dinner rush hours?
All of these questions will give valuable information on how to decide what type of
restaurant the owner wants/should set up. In order to run a successful restaurant, the owner
must know both the exact primary and secondary target customer. The needs of the
customer should be identified and the product should be built around those needs. Failing
to acknowledge these aspects does not necessarily mean that the owner will have an
unsuccessful business but it will mean that the potential of the business will not be fully
9
utilized. (Nienemeier 2001, Restaurant Engine, 2019)
Eating regimes
Today there are establishments focusing on various types of service/eating regimes which
gain new costumers thanks to their uniqueness. The establishments can specialize in
breakfasts, brunches, lunches, dinners and any other types of foods.
Breakfast/brunch/lunch and dinner
- Breakfast: It is the first meal of the day and it should contain all of the important
nutritional components for the body to function properly throughout the day. In the
past, breakfasts were divided by the national customs such as the English breakfast,
however now we can divide breakfasts into two main types, continental breakfast
and full breakfast. Continental breakfast usually consists of butter, marmalade or
honey with some bread and a warm beverage. Occasionally eggs, cheese and yogurt
are also part of the continental breakfast.
Full breakfast is more complex containing more meat such as sausages, bacon and
ham.
Breakfast can also be served as Table d‟hôte where the guest can choose from a
wide array of foods. The guests serve themselves and bring their food to their table.
The breakfast contains all kinds of fruits, vegetables, cheeses and overall fresh
ingredients which are periodically refilled by the chefs.
- Brunch: The word “Brunch” is the combination of the words “breakfast” and
“lunch”. Brunch is usually served in hotels from 11:00 to 15:00. Due to its
popularity there is an increasing amount of establishments that offer brunches on
the weekends. Brunches are favored by families with children, by people who like
to sleep late or by people who deliberately skip breakfast.
Brunch has lately also become popular not only for hotel guests but also for walk-
ins and for less formal business meetings.
- Lunch: is considered the most important meal of the day. Usually served between
11:30 and 14:30. Often containing a soup, a main dish and a beverage sometimes it
is complemented by a dessert or coffee. A popular beverage served with lunch in
10
the Czech Republic is beer (both alcoholic and non-alcoholic) or lemonade, while
in Italy, France and Spain it is wine.
- Dinner: Served between 18:00-21:00. The dinner menu is similar to the lunch
menu. The difference is that the soup is substituted with a cold appetizer. Dinner
also often begins with an aperitif. A popular beverage to complement dinner is
either beer or wine. Lately it has become more common for dinner to contain more
than one course, this is also known as a degustation menu. (Burešová et al. 2014)
Types of menus
The menu is the image and selling point of the restaurant and it shows the customer what
the restaurant has to offer, what ingredients and methods will be used to prepare the meals
and what the skill level of the employees should be. If done correctly, the menu can be
used as a tool to “manipulate” the guest into ordering something that the restaurant wants,
perhaps the daily menu or the more expensive/popular items. The menu design also
stimulates revenue because when the menu is handed over to the guest, a transaction
begins. Types of menus can be divided into two main categories, the Table d‟hôt menu and
the À la carte menu. These two types of menu can be used in all kinds of establishments
regardless of what type of cuisine they are focused on. (Burešová et al. 2014, Nienemeier
2001)
Table d’hôte
The Table d‟hôte menu is classified by:
- Being a limited menu
- Offering a small amount of courses, most commonly three or four
- A limited amount of choices in each course
- A fixed selling price
- All the dishes being ready at the same time
The Table d‟hôte menu generally offers popular dishes and is easier to work with
compared to the á la carte menu due to the fact that it contains less items and the prices are
fixed. In many restaurants it is normal for the Table d‟hôte menu to be given to the
11
customer together with an á la carte menu. The Table d‟hôte menu can be used for many
occasions such as breakfasts, lunches, dinners, and many more such as:
- Banquets: a banquet menu is fixed at a certain price and generally does not give
the guest any choice unless there has been a special request made in advance, for
example a vegetarian or kosher meal. (Burešová et al. 2014, Nienemeier 2001)
- Buffets: a buffet can be considered as Table d‟hôte because it offers a limited
choice of foods at a fixed price, all ready and available at a set time. Buffets are
often used for occasions where there is a large amount of guests that need to be
served at the same time such as weddings, conferences, receptions and press
conferences. (Burešová et al. 2014)
- Coffee houses: A coffee house menu is a rather modern way of presenting the
Table d‟hôte menu and is most commonly used in hotels and restaurants, it is
defined by being a set menu offered for up to eighteen hours a day. During rush
hours when the restaurant needs to serve as many people as possible, for example
during breakfast, it can be substituted by a menu with a smaller selection of items.
It can also offer a range of small foods, snacks and meals that are pre-cooked and
require little to no preparation time such as omelets and hamburgers. (Nienemeier
2001, Burešová et al. 2014)
- Cyclical menus: these are a collection of table d‟hôte menus, used for example for
three weeks which are repeated for a set amount of months. Most often used in
hospitals and industrial catering to facilitate the prediction of the number of meals
to prepare. (Nienemeier 2001, Burešová et al. 2014)
À la carte
Contrary to the Table d‟hôte menu the À la carte menu is often distinguished by being a
larger and a more complex menu, offering a wider selection of products. All of the
available to the guest are listed on the menu. Each dish is priced separately and is
commonly more expensive than a Table d‟hôte menu. Often more exotic and high cost
seasonal dishes are offered on an À la carte menu. (Nienemeier 2001)
12
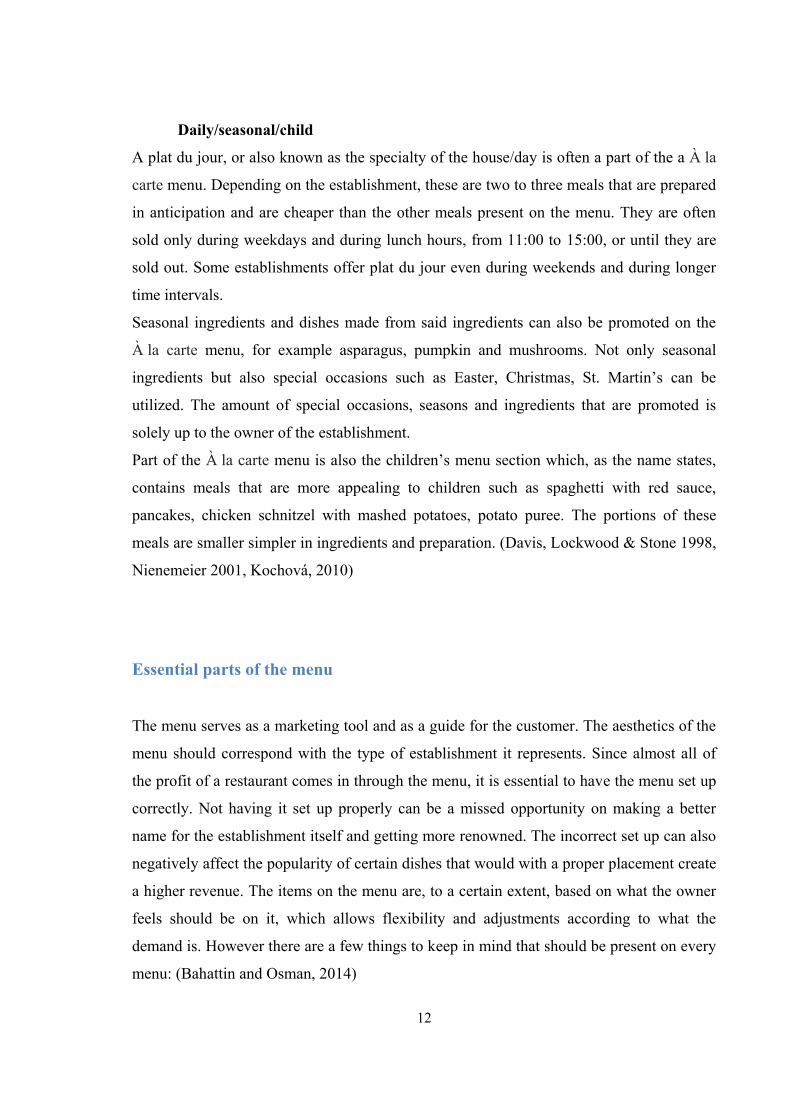
Daily/seasonal/child
A plat du jour, or also known as the specialty of the house/day is often a part of the a À la
carte menu. Depending on the establishment, these are two to three meals that are prepared
in anticipation and are cheaper than the other meals present on the menu. They are often
sold only during weekdays and during lunch hours, from 11:00 to 15:00, or until they are
sold out. Some establishments offer plat du jour even during weekends and during longer
time intervals.
Seasonal ingredients and dishes made from said ingredients can also be promoted on the
À la carte menu, for example asparagus, pumpkin and mushrooms. Not only seasonal
ingredients but also special occasions such as Easter, Christmas, St. Martin‟s can be
utilized. The amount of special occasions, seasons and ingredients that are promoted is
solely up to the owner of the establishment.
Part of the À la carte menu is also the children‟s menu section which, as the name states,
contains meals that are more appealing to children such as spaghetti with red sauce,
pancakes, chicken schnitzel with mashed potatoes, potato puree. The portions of these
meals are smaller simpler in ingredients and preparation. (Davis, Lockwood & Stone 1998,
Nienemeier 2001, Kochová, 2010)
Essential parts of the menu
The menu serves as a marketing tool and as a guide for the customer. The aesthetics of the
menu should correspond with the type of establishment it represents. Since almost all of
the profit of a restaurant comes in through the menu, it is essential to have the menu set up
correctly. Not having it set up properly can be a missed opportunity on making a better
name for the establishment itself and getting more renowned. The incorrect set up can also
negatively affect the popularity of certain dishes that would with a proper placement create
a higher revenue. The items on the menu are, to a certain extent, based on what the owner
feels should be on it, which allows flexibility and adjustments according to what the
demand is. However there are a few things to keep in mind that should be present on every
menu: (Bahattin and Osman, 2014)
13
- Name and address of the establishment, contacts, reservations, opening/closing
hours
- List of items that are being offered, often accompanied by a brief description, main
ingredients, pictures
- Pricing of each item (including VAT)
- Weight of each item, information about the weight does not necessarily have to be
written there but the staff must know if they are asked about it
- The type of menu, from and until when it is valid
- Numbering of the items for easier communication between customer and waiter
- Types of payment available (cash/card/food stamps)
- Promotion of upcoming specialties/seasonal dishes
- Information about diet/child meals
- Invitation to other establishments of the same chain (if there are any)
- Wishing to enjoy their stay
- Any other useful/interesting information regarding the history of the establishment,
location, famous people that have visited the establishment, etc.
(Zimáková 2004)
Most common mistakes
Mistakes that may seem trivial could make a big difference and therefore should not be
underestimated. When it comes to writing the price of the items available on the menu, the
title should always be on the left and the price on the right as the majority of the world
population reads from left to right and not vice versa. The customer should always read
what is available to order first before reading the price. If the price is placed on the left, it
could give the wrong impression to the customer and it may lead them to the conclusion
that making a profit is more important to the establishment than focusing on the customer.
Another misconception in the restaurant business is that if the menu contains more items it
is more profitable, however this could not be any further from the truth. Having a lengthy
menu means that the restaurant must keep more kinds of ingredients in stock, this also
makes the decision-making process more complicated for the customer. Furthermore, this
means the restaurant needs a more knowledgeable chef so that the quality of all the dishes
is on the same level. This however does not mean that having one or two dishes on the
menu is the best choice due to the fact that this restricts the customer too much and they
14
will most probably not come back for more. Exception to this rule are specialized
restaurants, which offer multiple variations on a certain type of food, examples of these
restaurants in Prague are Miska ramen bar specializing in ramen, Café Palanda focusing
on burgers, Wings point serving, as the name suggests, primarily chicken wings, and many
others.
As technology evolves, the gastronomy sector must keep up with it. A research done by
statista.com shows us that “In 2018, 52.2 percent of all website traffic worldwide was
generated through mobile phones, up from 50.3 percent in the previous year. Mobile
currently accounts for half of all global web pages served”. This means that although it has
become standard for a restaurant to have its own website or at least a social media profile,
it is necessary for said website to be mobile friendly since mobile phone users are starting
to be more prevalent compared to PC users. (Statista, 2019)
As aforementioned above, the menu reflects the image of the restaurant, as a consequence
it must be kept in perfect condition at all times. Depending on the size of the business, the
menu can go through as many as a hundred hands throughout the day. This means it will be
inevitably falling on the ground and be stepped on, children will be fighting over it, drinks
will be spilled on it. The menu will essentially go through all the abuse that one can think
of and therefore it must be taken care of. In order to protect the menu, it can be laminated
in plastic, have a wooden or metallic design, the possibilities of a protective design are
almost endless as long as it stays clean. If dirty, it can misrepresent the establishment and
give the customer the impression that the restaurant itself is dirty and cheap.
Frequent pricing changes also come to mind when speaking of common mistakes within
the menu. An analysis of the prices should be done frequently, at least twice a year, due to
the prices of ingredients changing all the time. Inflation itself could make a significant
difference in the income margin. If this update of the menu is not done regularly, then the
business could be losing considerable amounts of money.
The menu items should also be subject to updates twice a year. After going through a
thorough analysis, the business should be able to remove the least profitable and the least
popular items and freshen up the menu with some new ideas instead.
Keeping up with trends is another important aspect of running a successful restaurant.
Dishes that were popular ten, twenty, fifty years ago should not be on the menu. Some of
these items might have an added value to them, but they should not be prevailing. With the
world of gastronomy being explored into more depths, there are endless opportunities and
15
chances to bring something new to the table. The customers will appreciate the fact that the
restaurant is trying to be creative and open to new ideas.
Another concept that many businesses miss out on are limited time offers. These limited
time offers can be based on seasonality, availability of ingredients and local traditions such
as Easter, Saint Martin and Christmas. Customers feel a certain pressure to order from
these menus because they are aware of fact that they are available only for a limited
amount of time.
Knowledge and training of the staff is a critical aspect of running a profitable restaurant.
An inexperienced waiter or waitress can ruin the whole experience for the customer and
certain mistakes may even be life threatening. The staff must always know how every meal
tastes, what the main ingredients are and how it is prepared. Often a customer will ask for a
recommendation from the waiter. In this case if the waiter does not know all the
ingredients of the suggested dish they might endanger the customer by suggesting a dish
that contains an ingredient that the customer is allergic to.
(Davis, Lockwood & Stone 1998, Nienemeier 2001, Burešová et al. 2014)
Menu engineering analysis:
Every single establishment applies some sort of menu engineering on their offer in order to
establish the items that make profit versus the ones that cause loss. Menu engineering
analysis has become an integral part of every successful establishment. The analysis is
done on every single item on the menu to see whether or not said item is worth investing
in, should be improved and promoted or whether it should be removed altogether. This
analysis should be done on every item at least twice a year along with the regular revision
of the menu. This analysis will yield two kinds of results. The most/least popular items and
the most/least profitable items. A popular item is such that is ordered frequently by
customers but not necessarily creating positive revenue. A profitable item on the other
hand is such that generates a high contribution margin while not always being popular.
(Bahattin and Osman, 2014, Luptáková, 2018)
16
Terms
As Nienemier (2001) states, in order to successfully complete the analysis of a menu, it is
necessary to obtain the amount of times each item has been sold during a specific time
period, the production cost and the selling price. It is also important to calculate the
following data:
- Menu mix: The menu mix is the percentage of units sold represented by each item
on the menu.
- Item food cost: The item‟s food cost is the cost of all the ingredients necessary to
create one portion. This information is obtained from the restaurant
owner/manager.
- Item selling price: The price at which an item is sold to the guest. This information
is taken directly from the menu of the restaurant.
- Item contribution margin: Calculated by subtracting the item‟s food cost from the
item‟s selling price.
- Menu costs: are calculated by multiplying the number of individual items by their
food cost.
- Menu revenues: are calculated by multiplying the number of individual items sold
by their selling price.
- Menu contribution margin: is calculated by subtracting the menu costs from the
menu revenues.
Profitability
For a manager to be able to define profitability, they will need two figures to do the
calculations. The food cost of an item and its selling price. Simply subtract the food cost
from the selling price and the difference is the contribution margin. This easy calculation
should be done with all the items on a menu. For an item to be considered profitable, it
must have an equal or higher contribution margin than the average of all the menu items.
To calculate the average, simply subtract the food cost from the selling price of all items
and divide it by the number of items on the menu. Once this is done, it is easy to see which
items are profitable and which ones are not and should either be removed or adjusted.
(Nienemeier 2001)
17
Popularity
Defining popularity, as written by Nienemier (2001), is based on the popularity index. For
the purpose of analysis, all of the items on a menu are expected to be equally popular. To
give an example, if there are four items on a menu, all of the four items are expected to sell
the same amount of times, so 25%. If there are 10 items on a menu, each item would
represent 10%. According to Nienemier, in Menu engineering an item is popular if its unit
sales are 70% of what is expected. This means that on a four item menu, an item would be
popular if its unit sales represented 17.5% of all unit sales (100% † 4 = 25% x 70% =
17.5%). However on a ten item menu, an item would be popular if its unit sales
represented 7% of all unit sales (100% † 10 = 10% x 70% = 7%). This is a way how
managers can use menu engineering to determine which items are popular and which items
are not and consequently distribute them into the four quadrants of the BCG Matrix
(plowhorses, puzzles, dogs or stars). It is an extremely useful tool to help improve the
menu. (Nienemeier 2001)
Managing the results of the BCG Matrix
Once the analysis of the menu is complete and the results regarding the popularity and
profitability are calculated, the BCG Matrix analysis can be done. According to the BCG
Matrix all the items on a menu are divided into four categories. These categories are:
Plowhorses: items which have a low contribution margin but are high in popularity. They
are popular amongst guests but unfortunately they do not add much in regards of the
contribution margin. There are many strategies on how to approach a plowhorse item, such
as:
- A careful increase in prices. The item may be popular because it represents a great
value for money or because it cannot be obtained anywhere else. A careful price
increase could generate a higher contribution margin and it could still remain a
good value for money, therefore should continue to be popular.
18
- Testing for demand. If there is no resistance to the increase of the price, it could be
a good idea to reposition the item on the menu, placing it in a different category or
closer to the top of the list, making it seem like a better choice.
- Putting focus on more desirable items. Make servers recommend stars instead of
plowhorses. Promote the star and puzzle items using table tents.
- Combination with lower cost production items. If lower cost meal accompaniments
are offered together with the plowhorse, such as higher priced vegetables and
desserts, the contribution margin could be increased without lowering the item‟s
popularity.
- Reducing portion size. If the size of the portion is reduced, the product cost will
decrease and this will lead to the increase of the contribution margin. This should,
however, be done carefully as the guest may feel that the value is decreased with
the reduction of the portion size.
Puzzles are items that are not very popular but have a high contribution margin. The
general idea is to increase the popularity of the puzzle, which would consequently lead to
the item becoming a star.
- Increasing demand can be done by renaming the items, moving them to a more
visible spot on the menu, focus advertisement on these items, place them on table
tents, make servers recommend them more, advertise them on the entrance of the
restaurant. All of the above are strategies to make the puzzles more visible and
more desirable.
- Decreasing the price slightly and still maintaining its contribution margin above the
average could increase the item‟s popularity as the guests will see the value for
their money increase.
19
- Improve the item by preparing the meal with better/more expensive ingredients or
adding more expensive meal accompaniments could be a way of increasing the
value. This could help increase the item popularity.
Stars are the items every manager wants to have. They represent a high contribution
margin and are popular. Recommendations to the managers regarding stars are:
- Maintaining a high standard. Do not try to increase the item cost just to increase the
contribution margin. Leave the item as is, unchanged to maintain its high demand.
- Must be placed in a well visible spot on the menu. Stars are items that every
manager wants to sell and therefore should always be promoted to the guest.
Dogs are items that are both unpopular and are low in the contribution margin. They are
items that can be revised but more often than not should be removed from the menu as they
do not help the restaurant revenue. (Nienemeier 2001)
Analytical part
In this chapter the menu engineering analysis and the BCG Matrix is done using the data
provide by the restaurant owner/manager. Consequently, the results are reviewed,
described and are given suggestions on how to improve the product portfolio of the
establishment.
Materials and Methods of Research
20
As the title of this Bachelor‟s thesis suggests, this part of the thesis will be dedicated to the
menu engineering analysis of the product portfolio of a Vietnamese restaurant in the
southern part of Moravia, in the Czech Republic. Since the analysis is done using sensitive
data which could be exploited to damage the establishment in any way and therefore it will
not be named nor will the exact location be stated throughout the entirety of this thesis.
The analysis will be done using the data from the date collected from 1.1.2018 to
31.12.2018.
To successfully complete the aim of this thesis, primary data is used which has been
provided by the manager/owner of the establishment. After using the Menu Engineering
analysis and the BCG Matrix, all of the thirty five food items are then categorized into the
four quadrants.
Target
The target of this thesis is to demonstrate how the use of the menu engineering analysis in
gastronomy can serve as a fundamental way to improve the product portfolio of an
establishment by increasing popularity and profitability with different approaches to each
product depending on its current popularity percentage and contribution margin and where
it is placed in the BCG Matrix.
Processing and evaluating data
To achieve the results to successfully complete the menu engineering, I will calculate the
popularity and profitability of each item and consequently compare it with all the other
items on the menu. After using the BCG Matrix and separating all of the items into one of
the four quadrants I will be able to understand which items should be improved, remain
unaltered or removed altogether from the menu. An example of a table where the
popularity and profitability has been calculated and all the items put into one of the four
categories to show how the rest of the analysis will be done:
21
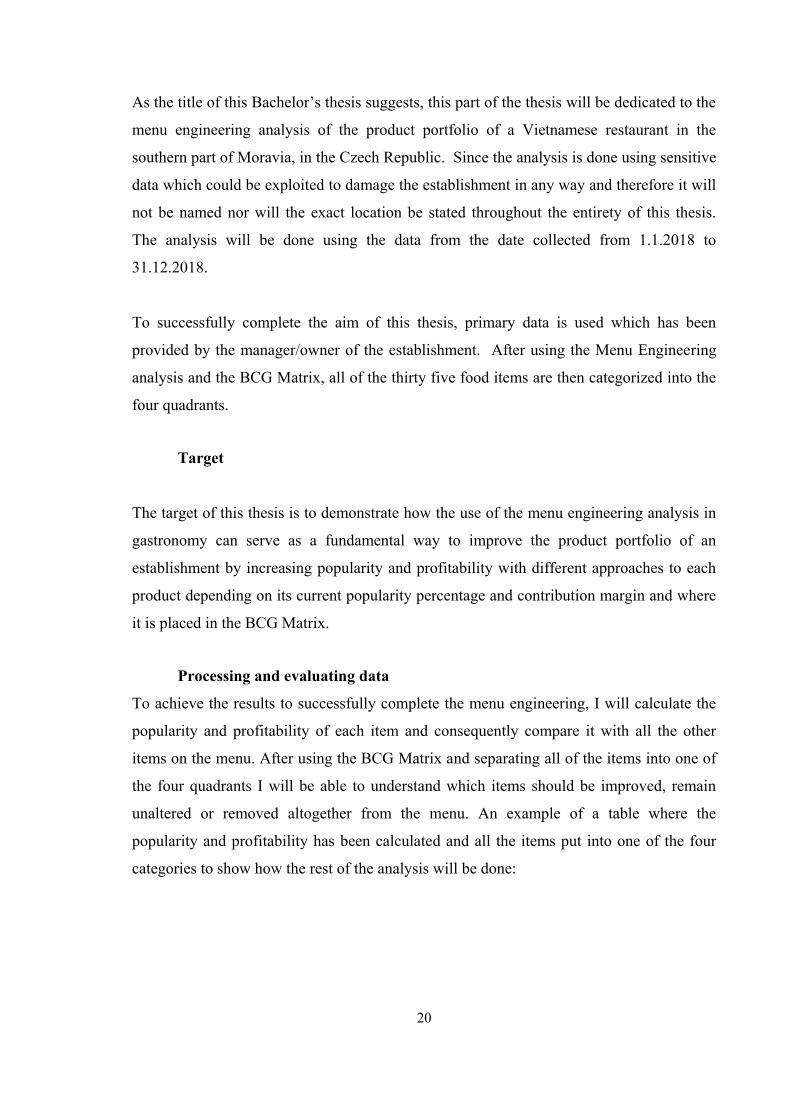
Table 1:Example
Source: own elaboration
Separating the items into one of the four categories in (in the table above there are three)
depends on the item popularity (must be higher than 70% of the unit sales) and item
profitability (must have the same or higher than average contribution margin of all the
items on the menu).
Once the menu engineering table is complete, it is also possible to demonstrate the results
in a matrix graph.
Introduction to the restaurant
The analysis is done on a Vietnamese restaurant located in the south of Moravia, in the
Czech Republic. Opened in 2011, it is a family owned business focusing on satisfying the
customer at the highest level.
It offers a wide range of Asian meals but focuses mainly on Vietnamese food made from
fresh vegetables and spices. An open-kitchen space allows the guests to witness the
preparation of each meal, which according to the owner/manager increases the chances of a
guest coming back in the future. Large groups of people and families with children are
welcome as the restaurant has one hundred seats. However, the restaurant also offers a
romantic experience for couples in an Asian-style garden.
Southern Moravia was the choice due to the fact that most of the Vietnamese restaurants in
the Czech Republic are located near or in Prague, said the owner. Making the Vietnamese
cuisine accessible to people outside of Prague is a priority for the owner, as the family is
planning to open a fourth restaurant in the near future.
What the restaurant offers
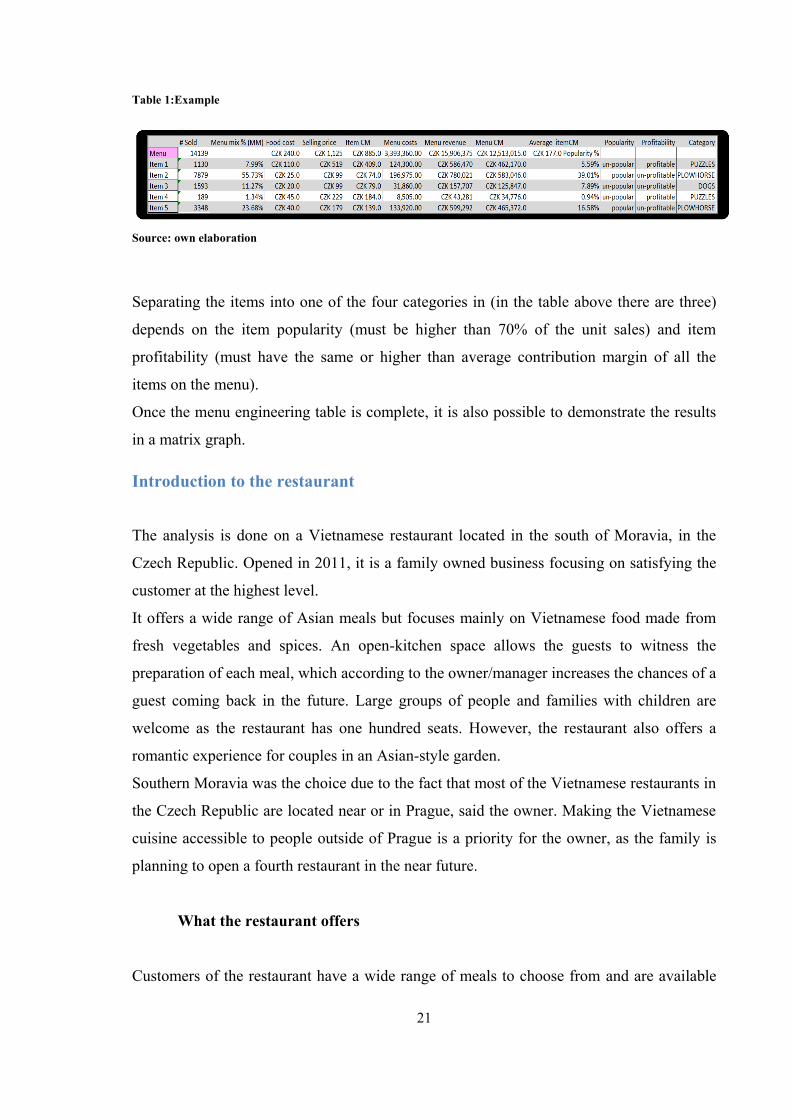
Customers of the restaurant have a wide range of meals to choose from and are available
22
all year long. These categories are:
- Soups (5 items)
- Salads (4 items)
- Appetizers (4 items)
- Beef (3 items)
- Pork (4 items)
- Chicken (3 items)
- Duck (3 items)
- Noodles (3 items)
- Sushi (5 items)
Figure 1: percentage of unit sales
Source: own elaboration
During the analyzed period, from 1.1.2018 to 31.12.2018, the restaurant has sold 94,711
meals. The total food cost of the menu was CZK 13,674,531.50. Total menu revenue
without subtracting the food costs was CZK 54,619,306. With the food cost subtracted, the
menu contribution margin was CZK 40,944,744.50.
23
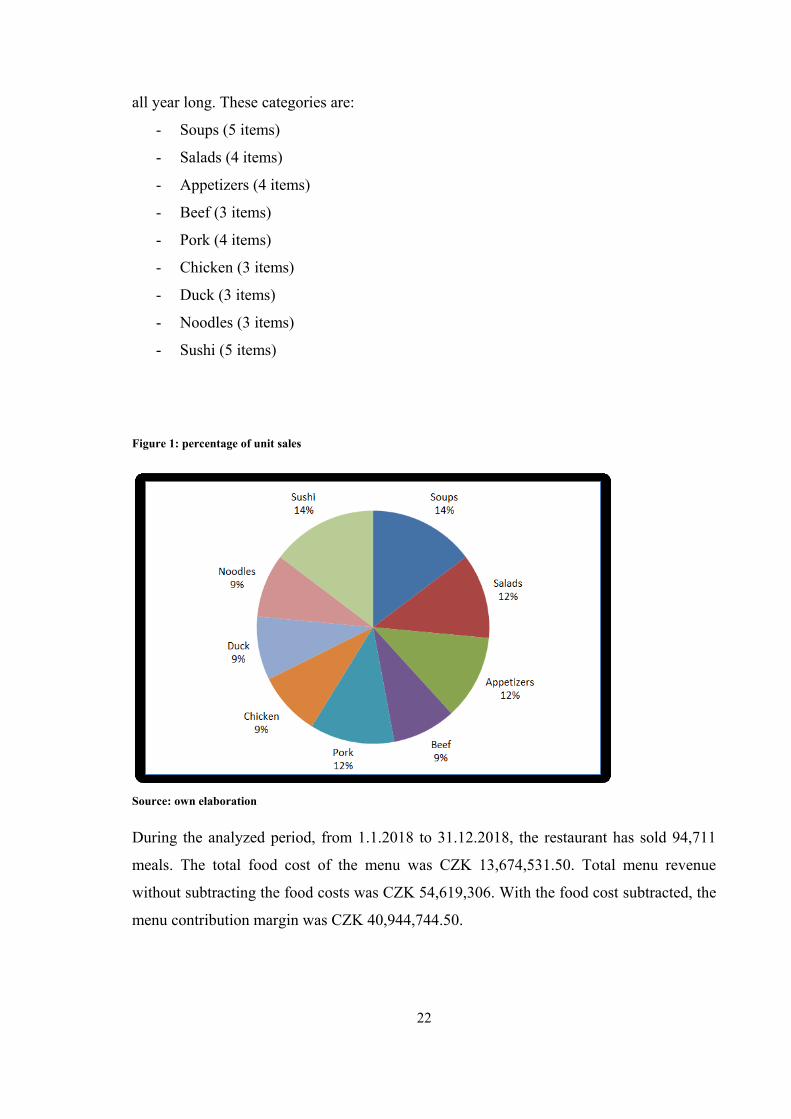
Figure 2: Comparison between the menu cost and the menu contribution margin
Source: own elaboration
Graph 2 shows that the total menu cost is 25.03% of the total menu revenue, meanwhile
the Menu contribution margin is the remaining 74.96% of the total menu revenue. The total
menu cost is made up of the cost of ingredients used to create each meal. The analysis does
not take into consideration certain costs such as energy, workforce and rent.
Application of Menu Engineering
In the following chapter, the menu engineering analysis is done by analyzing all the data of
the food menu from the Vietnamese restaurant in the time period of the one calendar year
from 1.1.2018 to 31.12.2018. All of the data is calculated and reviewed in tables which can
be found in the list of figures. In the analysis only the key tables/graphs will be shown for
the results to be clear.
During the time period of twelve months, as mentioned before, the restaurant offers thirty
four items (meals) which are separated into nine categories, depending on the type of food.
To be able to understand which items were profitable for the restaurant, it was important to
calculate the contribution margin of each item, which is different depending on which of
the 9 categories is being analyzed. As mentioned before, calculations of the profitability of
each item are based on the average contribution of all of the items in the specific category,
24
while the popularity is based on the popularity index which assumes that an item is popular
when total unit sales are equal to or above 70%.
BCG Matrix:
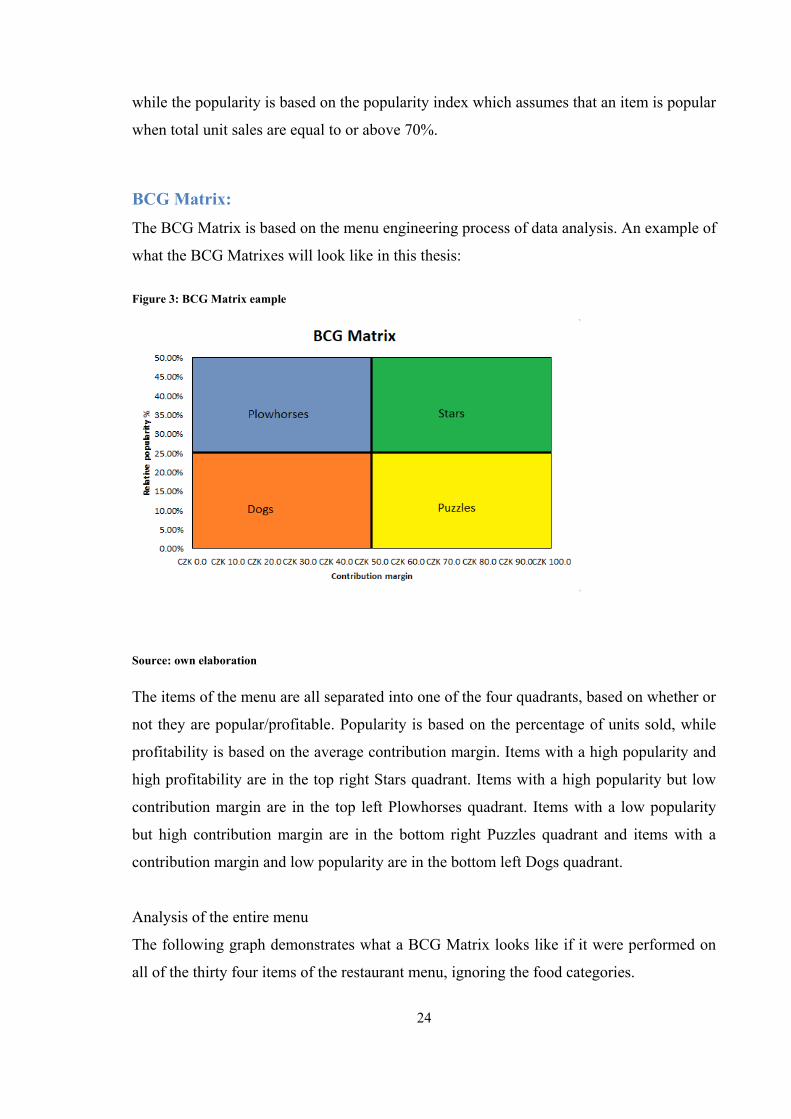
The BCG Matrix is based on the menu engineering process of data analysis. An example of
what the BCG Matrixes will look like in this thesis:
Figure 3: BCG Matrix eample
Source: own elaboration
The items of the menu are all separated into one of the four quadrants, based on whether or
not they are popular/profitable. Popularity is based on the percentage of units sold, while
profitability is based on the average contribution margin. Items with a high popularity and
high profitability are in the top right Stars quadrant. Items with a high popularity but low
contribution margin are in the top left Plowhorses quadrant. Items with a low popularity
but high contribution margin are in the bottom right Puzzles quadrant and items with a
contribution margin and low popularity are in the bottom left Dogs quadrant.
Analysis of the entire menu
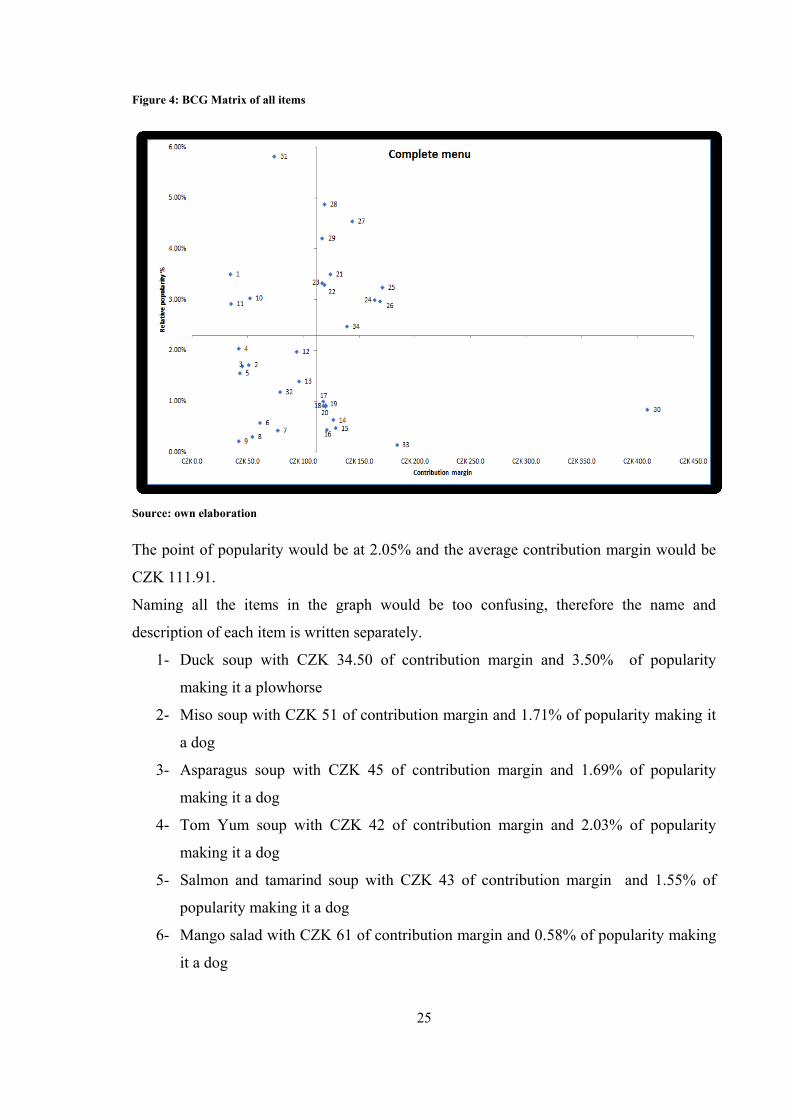
The following graph demonstrates what a BCG Matrix looks like if it were performed on
all of the thirty four items of the restaurant menu, ignoring the food categories.
25
Figure 4: BCG Matrix of all items
Source: own elaboration
The point of popularity would be at 2.05% and the average contribution margin would be
CZK 111.91.
Naming all the items in the graph would be too confusing, therefore the name and
description of each item is written separately.
1- Duck soup with CZK 34.50 of contribution margin and 3.50% of popularity
making it a plowhorse
2- Miso soup with CZK 51 of contribution margin and 1.71% of popularity making it
a dog
3- Asparagus soup with CZK 45 of contribution margin and 1.69% of popularity
making it a dog
4- Tom Yum soup with CZK 42 of contribution margin and 2.03% of popularity
making it a dog
5- Salmon and tamarind soup with CZK 43 of contribution margin and 1.55% of
popularity making it a dog
6- Mango salad with CZK 61 of contribution margin and 0.58% of popularity making
it a dog
26
7- Tuna salad with CZK 77 of contribution margin and 0.43% of popularity making it
a dog
8- Shrimp and avocado salad with CZK 54 of contribution margin and 0.30% of
popularity making it a dog
9- Mix vegetables salad with CZK 42 of contribution margin and 0.22% of popularity
making it a dog
10- Summer roll (fried) with CZK 52 of contribution margin and 3.03% of popularity
making it a plowhorse
11- Spring roll (unfried) with CZK 35 of contribution margin and 2.92% of popularity
making it a plowhorse
12- Grilled salmon with CZK 94 of contribution margin and 1.97% of popularity
making it a dog
13- Grilled shrimp with CZK 96 of contribution margin and 1.39% of popularity
making it a dog
14- Beef Kung Pao with CZK 127 of contribution margin and 0.63% of popularity
making it a puzzle
15- Pepper steak with CZK 129 of contribution margin and 0.47 of popularity making it
a puzzle
16- Beef with bamboo sprouts and hoisin sauce with CZK 121 of contribution margin
and 0.44% of popularity making it a puzzle
17- Caramelized pork with CZK 118 of contribution margin and 1.0% of popularity
making it a puzzle
18- Pork Kung Pao with CZK 120 of contribution margin and 0.92% of popularity
making it a puzzle
19- Pork steak with champignons and soy sauce with CZK 120 and 0.90% of popularity
making it a puzzle
20- Sweet and pork with CZK 118 of contribution margin and 0.91% of popularity
making it a puzzle
21- Spicy chicken with CZK 124 of contribution margin and 3.50% of popularity
making it a star
22- Grilled breasts with peanut sauce with CZK 117 of contribution margin and 3.32%
of popularity making it a star
27
23- Roasted chicken with CZK 119 of contribution margin and 3.29% of popularity
making it a star
24- Grilled duck on hoisin sauce with CZK 164 of contribution margin and 2.99% of
popularity making it a star
25- Grilled duck on sweet and sour sauce with CZK 171 of contribution margin and
3.24% of popularity making it a star
26- Grilled duck on oyster sauce with CZK 169 of contribution margin and 2.96% of
popularity making it a star
27- Bun Bo nam Bo with CZK 144 of contribution margin and 4.54% of popularity
making it a star
28- Grilled beef (Bun Cha)(noodles) with CZK 119 of contribution margin and 4.87%
of popularity making it a star
29- Bun Nem rolls (noodles) with CZK 117 of contribution margin and 4.21% of
popularity making it a star
30- Sushi menu 16 pcs with CZK 409 of contribution margin and 0.84% of popularity
making it a puzzle
31- Maki with CZK 74 of contribution margin and 5.82% of popularity making it a
plowhorse
32- Nigiri with CZK 79 of contribution margin and 1.18% of popularity making it a
dog
33- Sashimi with CZK 184 of contribution margin and 0.14% of popularity making it a
puzzle
34- Special rolls with CZK 139 of contribution margin and popularity of 2.47% making
it a star
After processing the results of the menu engineering analysis and the BCG Matrix of the
entire menu as a whole, the results are eleven dogs, nine puzzles, four plowhorses and ten
stars.
28
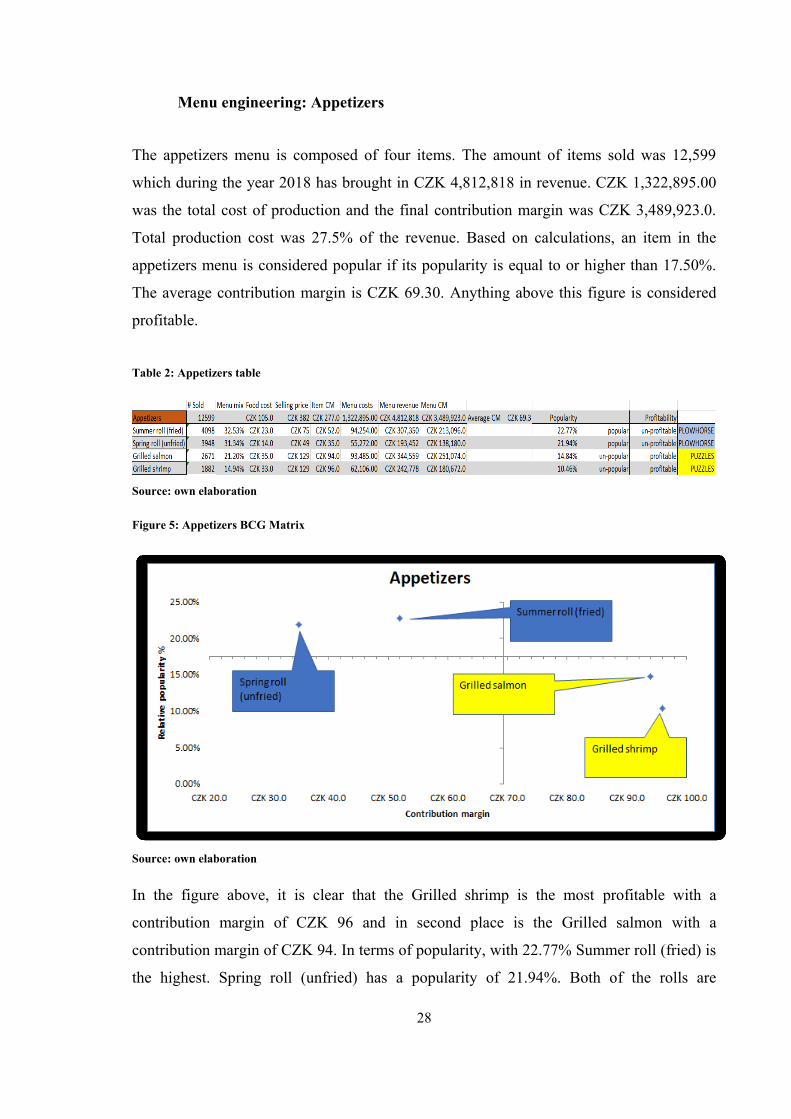
Menu engineering: Appetizers
The appetizers menu is composed of four items. The amount of items sold was 12,599
which during the year 2018 has brought in CZK 4,812,818 in revenue. CZK 1,322,895.00
was the total cost of production and the final contribution margin was CZK 3,489,923.0.
Total production cost was 27.5% of the revenue. Based on calculations, an item in the
appetizers menu is considered popular if its popularity is equal to or higher than 17.50%.
The average contribution margin is CZK 69.30. Anything above this figure is considered
profitable.
Table 2: Appetizers table
Source: own elaboration
Figure 5: Appetizers BCG Matrix
Source: own elaboration
In the figure above, it is clear that the Grilled shrimp is the most profitable with a
contribution margin of CZK 96 and in second place is the Grilled salmon with a
contribution margin of CZK 94. In terms of popularity, with 22.77% Summer roll (fried) is
the highest. Spring roll (unfried) has a popularity of 21.94%. Both of the rolls are
29
categorized as plowhorses while the Grilled salmon and shrimp both fall into the category
of puzzles.
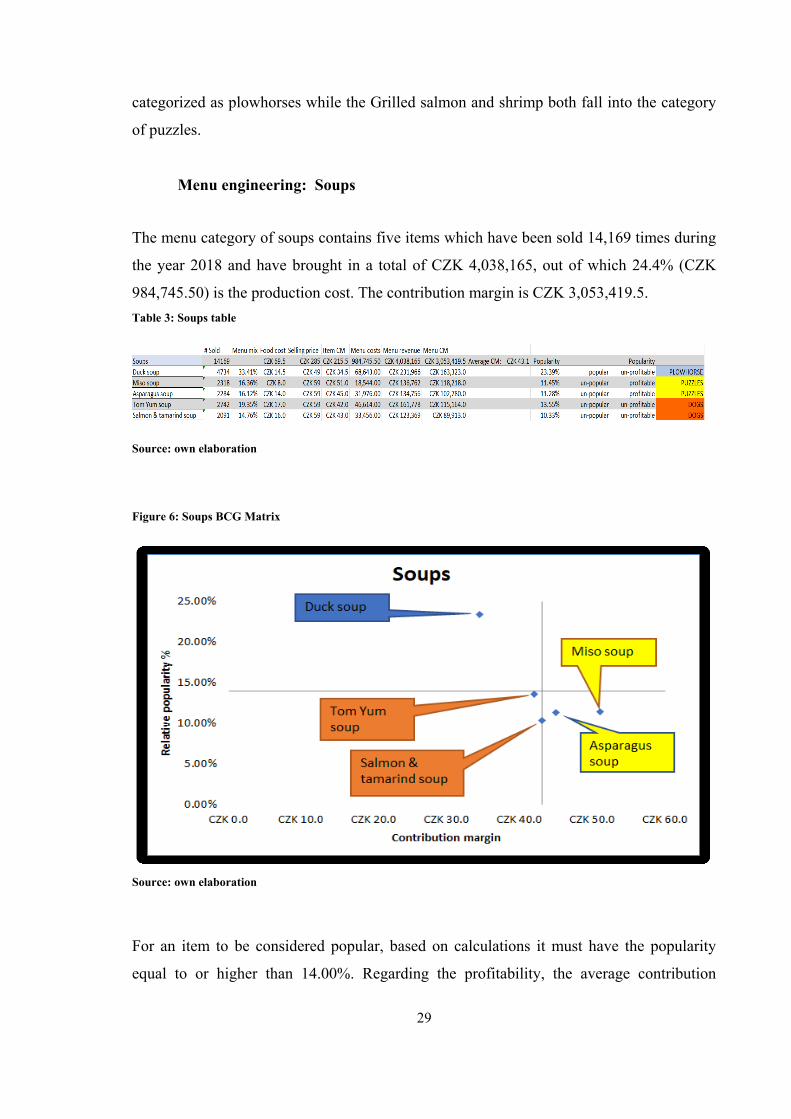
Menu engineering: Soups
The menu category of soups contains five items which have been sold 14,169 times during
the year 2018 and have brought in a total of CZK 4,038,165, out of which 24.4% (CZK
984,745.50) is the production cost. The contribution margin is CZK 3,053,419.5.
Table 3: Soups table
Source: own elaboration
Figure 6: Soups BCG Matrix
Source: own elaboration
For an item to be considered popular, based on calculations it must have the popularity
equal to or higher than 14.00%. Regarding the profitability, the average contribution
30
margin in this menu is CZK 43.10.
As shown in the BCG Matrix, the most profitable item on the soup menu is the Miso soup
with a contribution margin of CZK 51, however the popularity of said item is only 11.45%
and is therefore considered as unpopular and consequently placed into the puzzle category.
Highest popularity of the soup menu is seen in the Duck soup with 23.39%, passing the
line of popularity by 9.39%. It falls into the category of plowhorses due to the fact that it
is considered unprofitable as it has an item contribution of CZK 34.50, CZK 8.60 less than
the average CM. The second item in the plowhorses category is Asparagus soup with a
contribution margin of CZK 45 and a popularity of 11.28%. Regarding the dogs quadrant,
it is made up of the two remaining items, Tom Yum soup with a contribution margin of
CZK 42 and popularity of 13.55% and Salmon and tamarind soup which misses out on
being in the plowhorse quadrant by only CZK 0.10 and with the popularity at 10.33%.
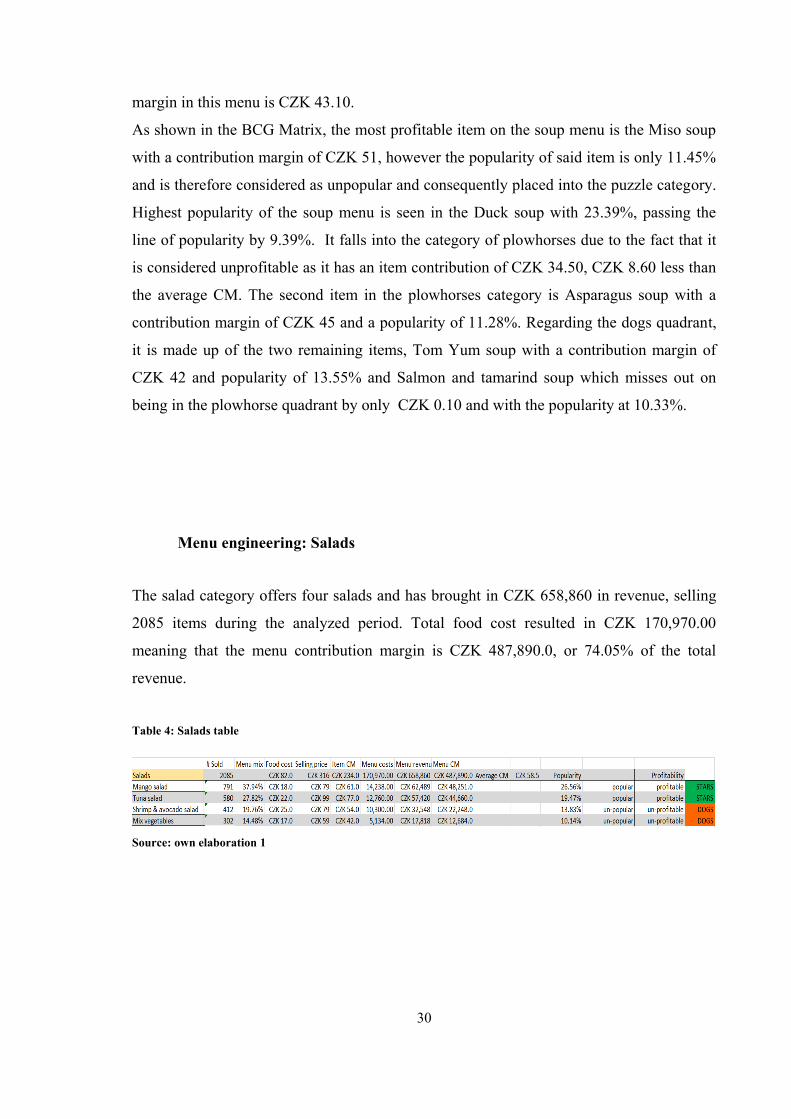
Menu engineering: Salads
The salad category offers four salads and has brought in CZK 658,860 in revenue, selling
2085 items during the analyzed period. Total food cost resulted in CZK 170,970.00
meaning that the menu contribution margin is CZK 487,890.0, or 74.05% of the total
revenue.
Table 4: Salads table
Source: own elaboration 1
31
Figure 7: Salads BCG Matrix
Source: own elaboration
Average contribution margin of the salad category is CZK 58.50, and the line of popularity
is at 17.50% meaning that both Mango salad and the Tuna salad are in the stars quadrant.
Contribution margin of Mango salad is CZK 61 and popularity is 26.56% while the
contribution margin of the Tuna salad is CZK 77, much higher than the Mango salad,
however the popularity of the Tuna salad is lower at 19.47%. Dogs quadrant is where the
remaining two salads are placed, with Mixed vegetable having a contribution margin of
CZK 42 and popularity of 10.14% while the Shrimp & avocado salad has a slightly higher
contribution margin of CZK 54, and a slightly higher popularity of 13.83%.
Menu engineering: Noodles
The restaurant has sold 18,445 items from on the Noodles menu during the year 2018,
which accounts for 19.47% of all items sold from all the menus, making it the highest
selling menu and second highest in terms of contribution margin of the restaurant, with
revenue of CZK 9,167,165, total production costs of CZK 2,158,065.0 and menu
contribution margin of CZK 7,009,100.
32
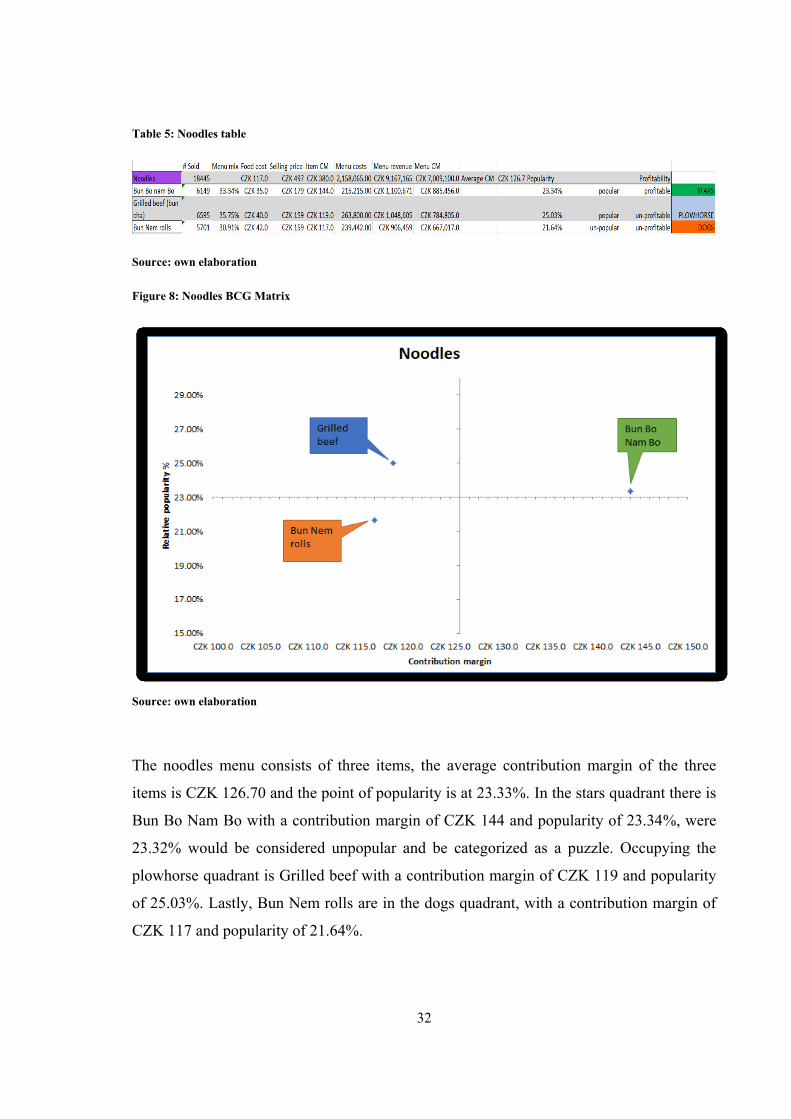
Table 5: Noodles table
Source: own elaboration
Figure 8: Noodles BCG Matrix
Source: own elaboration
The noodles menu consists of three items, the average contribution margin of the three
items is CZK 126.70 and the point of popularity is at 23.33%. In the stars quadrant there is
Bun Bo Nam Bo with a contribution margin of CZK 144 and popularity of 23.34%, were
23.32% would be considered unpopular and be categorized as a puzzle. Occupying the
plowhorse quadrant is Grilled beef with a contribution margin of CZK 119 and popularity
of 25.03%. Lastly, Bun Nem rolls are in the dogs quadrant, with a contribution margin of
CZK 117 and popularity of 21.64%.
33
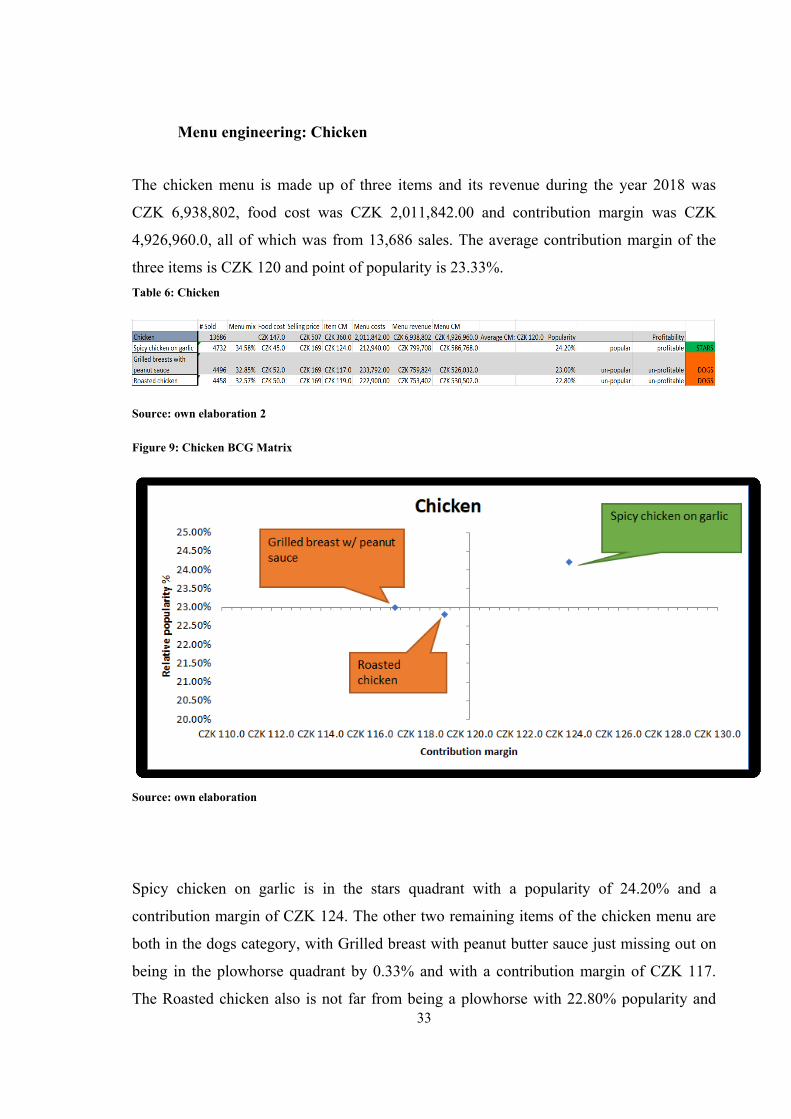
Menu engineering: Chicken
The chicken menu is made up of three items and its revenue during the year 2018 was
CZK 6,938,802, food cost was CZK 2,011,842.00 and contribution margin was CZK
4,926,960.0, all of which was from 13,686 sales. The average contribution margin of the
three items is CZK 120 and point of popularity is 23.33%.
Table 6: Chicken
Source: own elaboration 2
Figure 9: Chicken BCG Matrix
Source: own elaboration
Spicy chicken on garlic is in the stars quadrant with a popularity of 24.20% and a
contribution margin of CZK 124. The other two remaining items of the chicken menu are
both in the dogs category, with Grilled breast with peanut butter sauce just missing out on
being in the plowhorse quadrant by 0.33% and with a contribution margin of CZK 117.
The Roasted chicken also is not far from being a plowhorse with 22.80% popularity and
34
CZK 119 of contribution margin.
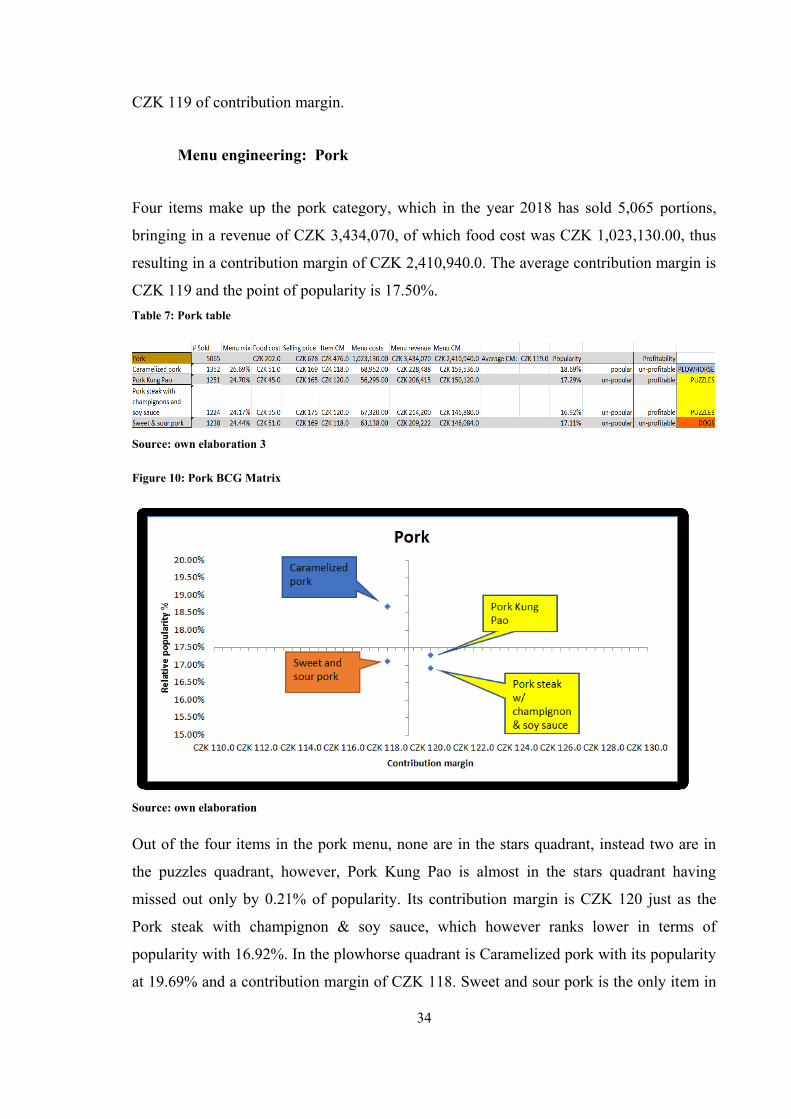
Menu engineering: Pork
Four items make up the pork category, which in the year 2018 has sold 5,065 portions,
bringing in a revenue of CZK 3,434,070, of which food cost was CZK 1,023,130.00, thus
resulting in a contribution margin of CZK 2,410,940.0. The average contribution margin is
CZK 119 and the point of popularity is 17.50%.
Table 7: Pork table
Source: own elaboration 3
Figure 10: Pork BCG Matrix
Source: own elaboration
Out of the four items in the pork menu, none are in the stars quadrant, instead two are in
the puzzles quadrant, however, Pork Kung Pao is almost in the stars quadrant having
missed out only by 0.21% of popularity. Its contribution margin is CZK 120 just as the
Pork steak with champignon & soy sauce, which however ranks lower in terms of
popularity with 16.92%. In the plowhorse quadrant is Caramelized pork with its popularity
at 19.69% and a contribution margin of CZK 118. Sweet and sour pork is the only item in
35
the dogs quadrant with a contribution margin of CZK 118 and popularity of 17.11%.
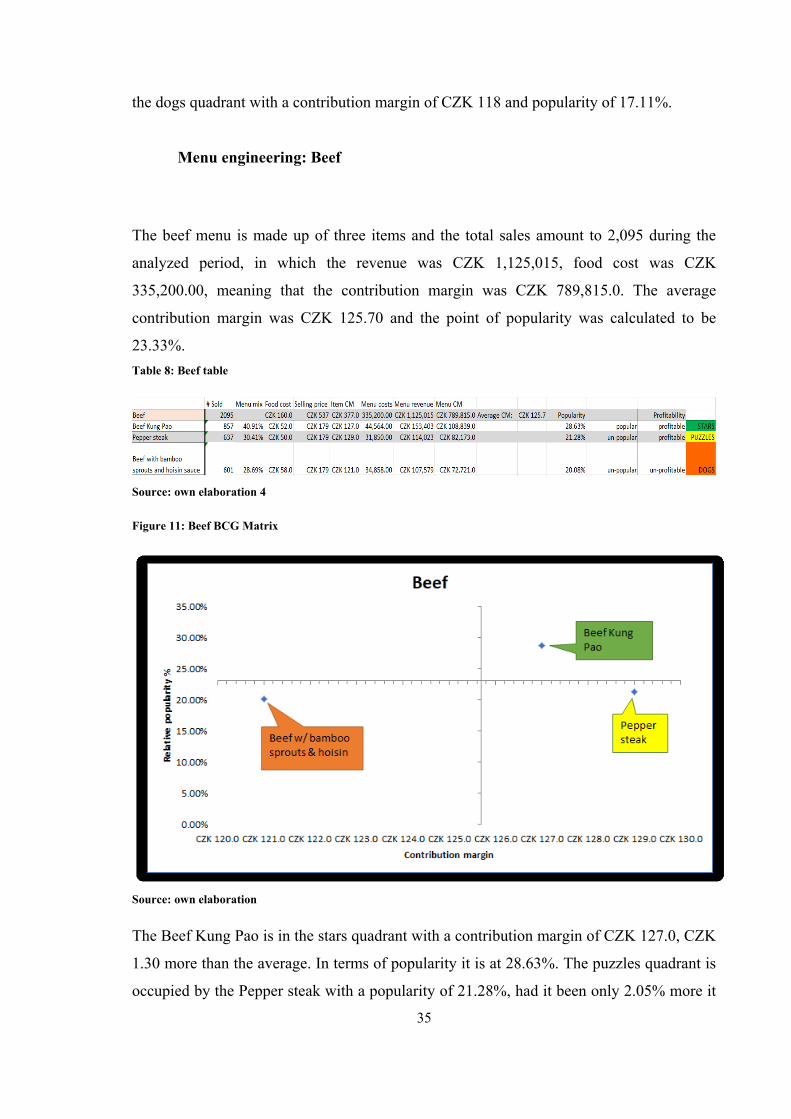
Menu engineering: Beef
The beef menu is made up of three items and the total sales amount to 2,095 during the
analyzed period, in which the revenue was CZK 1,125,015, food cost was CZK
335,200.00, meaning that the contribution margin was CZK 789,815.0. The average
contribution margin was CZK 125.70 and the point of popularity was calculated to be
23.33%.
Table 8: Beef table
Source: own elaboration 4
Figure 11: Beef BCG Matrix
Source: own elaboration
The Beef Kung Pao is in the stars quadrant with a contribution margin of CZK 127.0, CZK
1.30 more than the average. In terms of popularity it is at 28.63%. The puzzles quadrant is
occupied by the Pepper steak with a popularity of 21.28%, had it been only 2.05% more it
36
could have been in the stars quadrant. Regarding the contribution margin, it is CZK 129,
CZK 2 more than the Beef Kung Pao. The last item on the menu, the Beef with bamboo
sprouts and hoisin is in the dogs quadrant with a contribution margin of only CZK 121 and
a popularity of 20.08%.
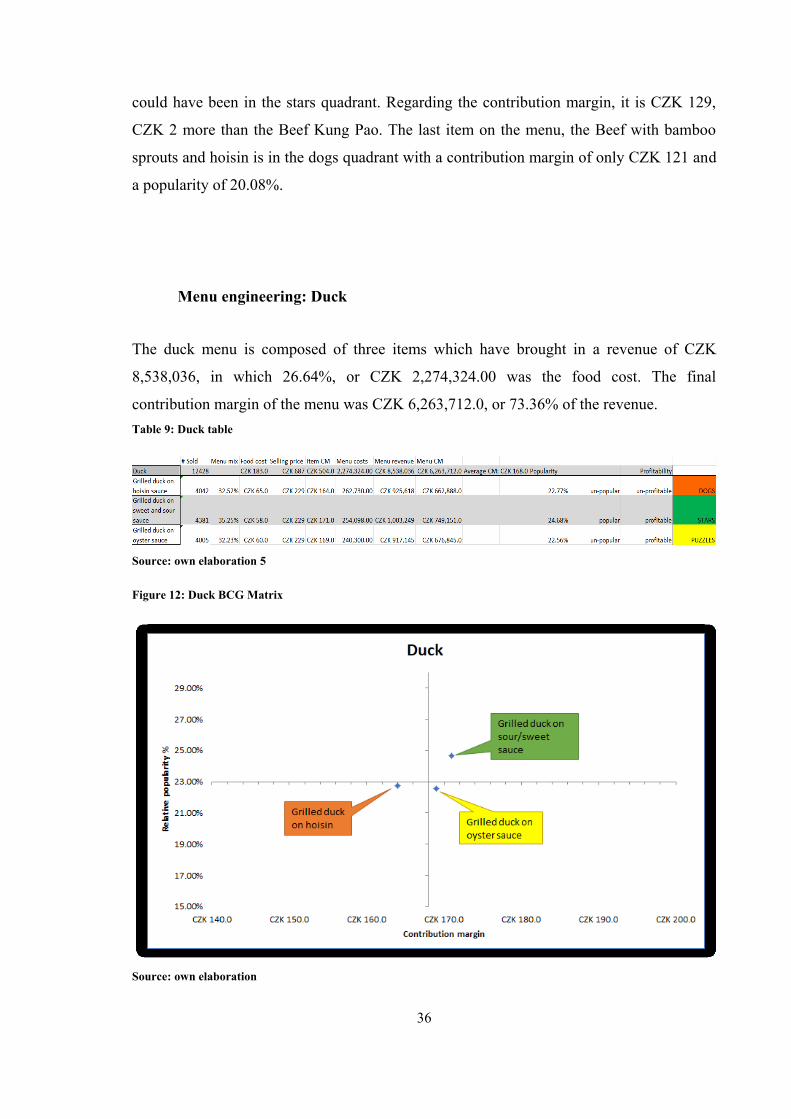
Menu engineering: Duck
The duck menu is composed of three items which have brought in a revenue of CZK
8,538,036, in which 26.64%, or CZK 2,274,324.00 was the food cost. The final
contribution margin of the menu was CZK 6,263,712.0, or 73.36% of the revenue.
Table 9: Duck table
Source: own elaboration 5
Figure 12: Duck BCG Matrix
Source: own elaboration
37
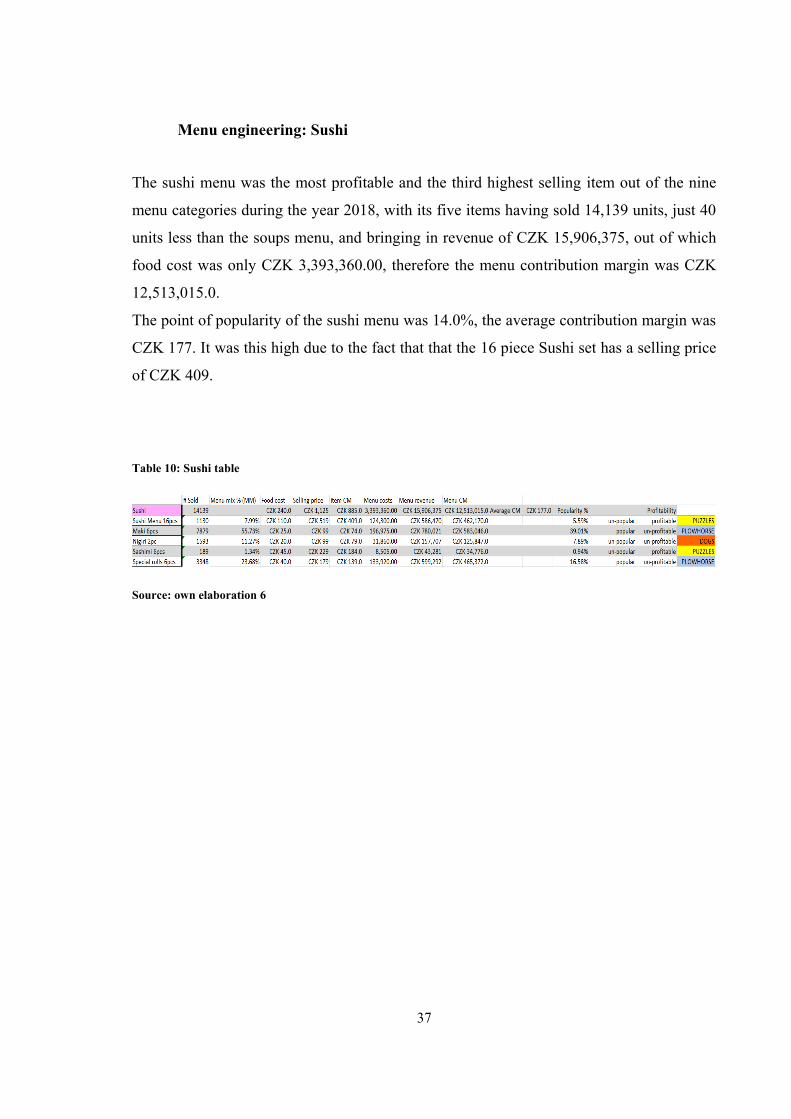
Menu engineering: Sushi
The sushi menu was the most profitable and the third highest selling item out of the nine
menu categories during the year 2018, with its five items having sold 14,139 units, just 40
units less than the soups menu, and bringing in revenue of CZK 15,906,375, out of which
food cost was only CZK 3,393,360.00, therefore the menu contribution margin was CZK
12,513,015.0.
The point of popularity of the sushi menu was 14.0%, the average contribution margin was
CZK 177. It was this high due to the fact that that the 16 piece Sushi set has a selling price
of CZK 409.
Table 10: Sushi table
Source: own elaboration 6
38
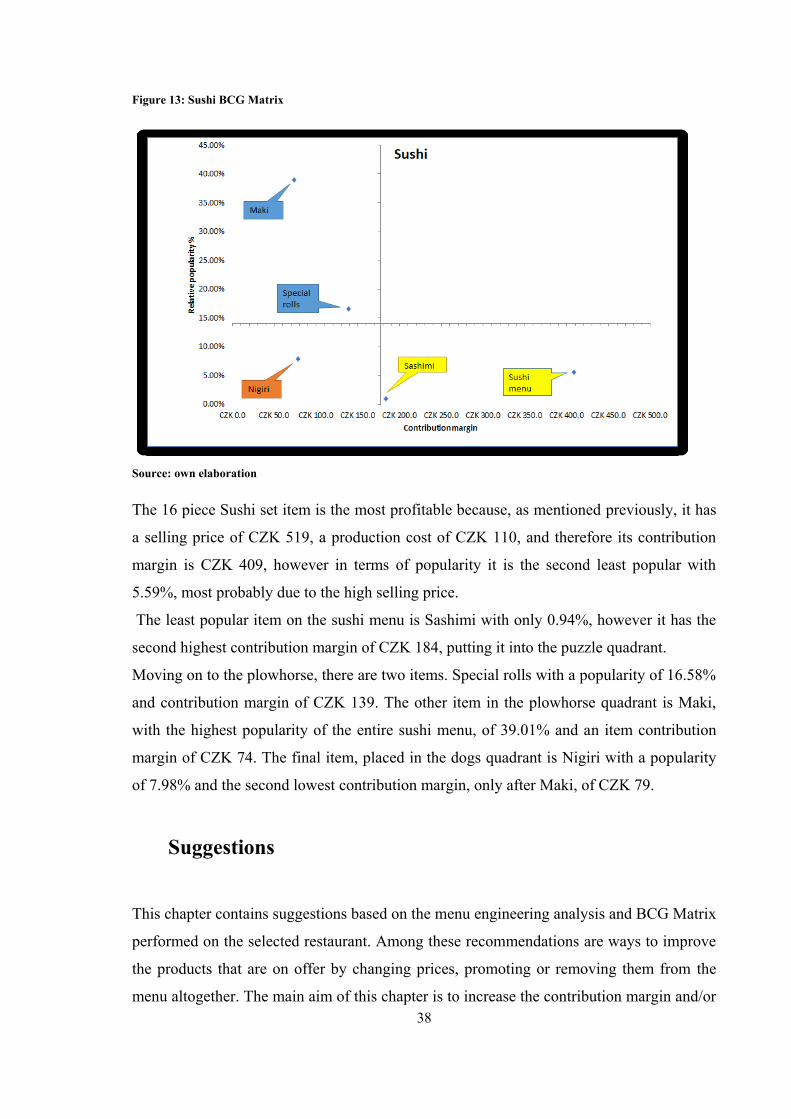
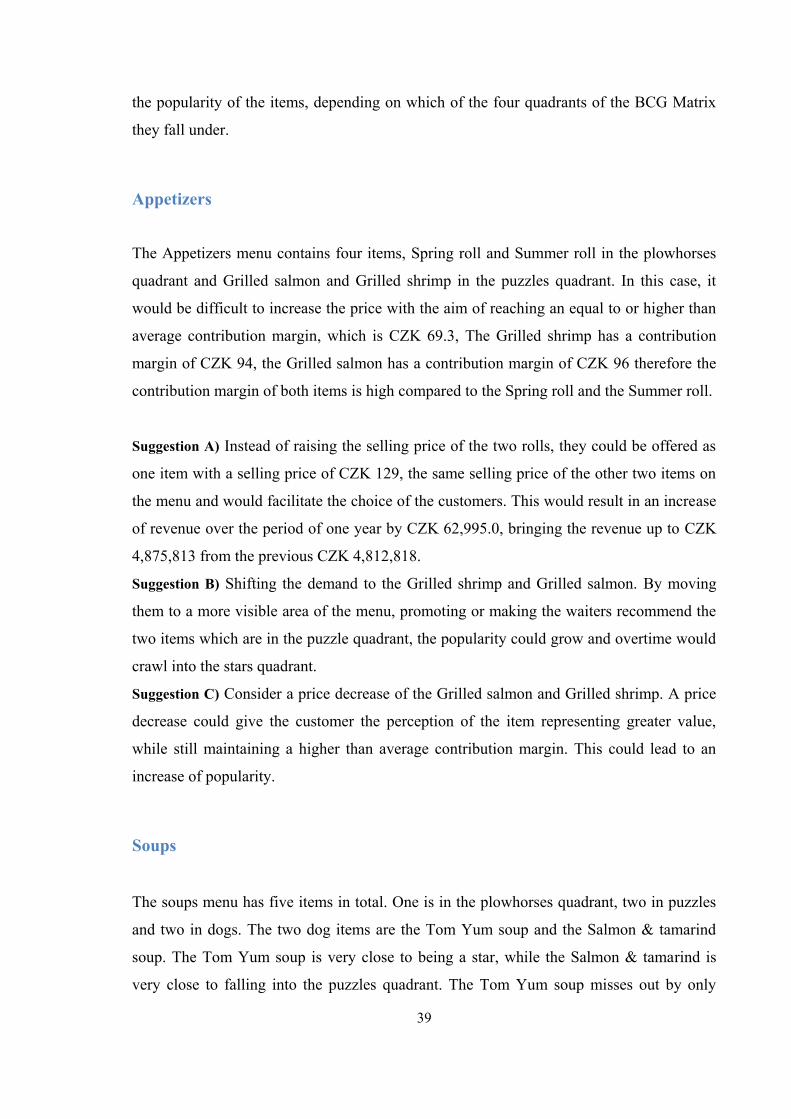
Figure 13: Sushi BCG Matrix
Source: own elaboration
The 16 piece Sushi set item is the most profitable because, as mentioned previously, it has
a selling price of CZK 519, a production cost of CZK 110, and therefore its contribution
margin is CZK 409, however in terms of popularity it is the second least popular with
5.59%, most probably due to the high selling price.
The least popular item on the sushi menu is Sashimi with only 0.94%, however it has the
second highest contribution margin of CZK 184, putting it into the puzzle quadrant.
Moving on to the plowhorse, there are two items. Special rolls with a popularity of 16.58%
and contribution margin of CZK 139. The other item in the plowhorse quadrant is Maki,
with the highest popularity of the entire sushi menu, of 39.01% and an item contribution
margin of CZK 74. The final item, placed in the dogs quadrant is Nigiri with a popularity
of 7.98% and the second lowest contribution margin, only after Maki, of CZK 79.
Suggestions
This chapter contains suggestions based on the menu engineering analysis and BCG Matrix
performed on the selected restaurant. Among these recommendations are ways to improve
the products that are on offer by changing prices, promoting or removing them from the
menu altogether. The main aim of this chapter is to increase the contribution margin and/or
39
the popularity of the items, depending on which of the four quadrants of the BCG Matrix
they fall under.
Appetizers
The Appetizers menu contains four items, Spring roll and Summer roll in the plowhorses
quadrant and Grilled salmon and Grilled shrimp in the puzzles quadrant. In this case, it
would be difficult to increase the price with the aim of reaching an equal to or higher than
average contribution margin, which is CZK 69.3, The Grilled shrimp has a contribution
margin of CZK 94, the Grilled salmon has a contribution margin of CZK 96 therefore the
contribution margin of both items is high compared to the Spring roll and the Summer roll.
Suggestion A) Instead of raising the selling price of the two rolls, they could be offered as
one item with a selling price of CZK 129, the same selling price of the other two items on
the menu and would facilitate the choice of the customers. This would result in an increase
of revenue over the period of one year by CZK 62,995.0, bringing the revenue up to CZK
4,875,813 from the previous CZK 4,812,818.
Suggestion B) Shifting the demand to the Grilled shrimp and Grilled salmon. By moving
them to a more visible area of the menu, promoting or making the waiters recommend the
two items which are in the puzzle quadrant, the popularity could grow and overtime would
crawl into the stars quadrant.
Suggestion C) Consider a price decrease of the Grilled salmon and Grilled shrimp. A price
decrease could give the customer the perception of the item representing greater value,
while still maintaining a higher than average contribution margin. This could lead to an
increase of popularity.
Soups
The soups menu has five items in total. One is in the plowhorses quadrant, two in puzzles
and two in dogs. The two dog items are the Tom Yum soup and the Salmon & tamarind
soup. The Tom Yum soup is very close to being a star, while the Salmon & tamarind is
very close to falling into the puzzles quadrant. The Tom Yum soup misses out by only
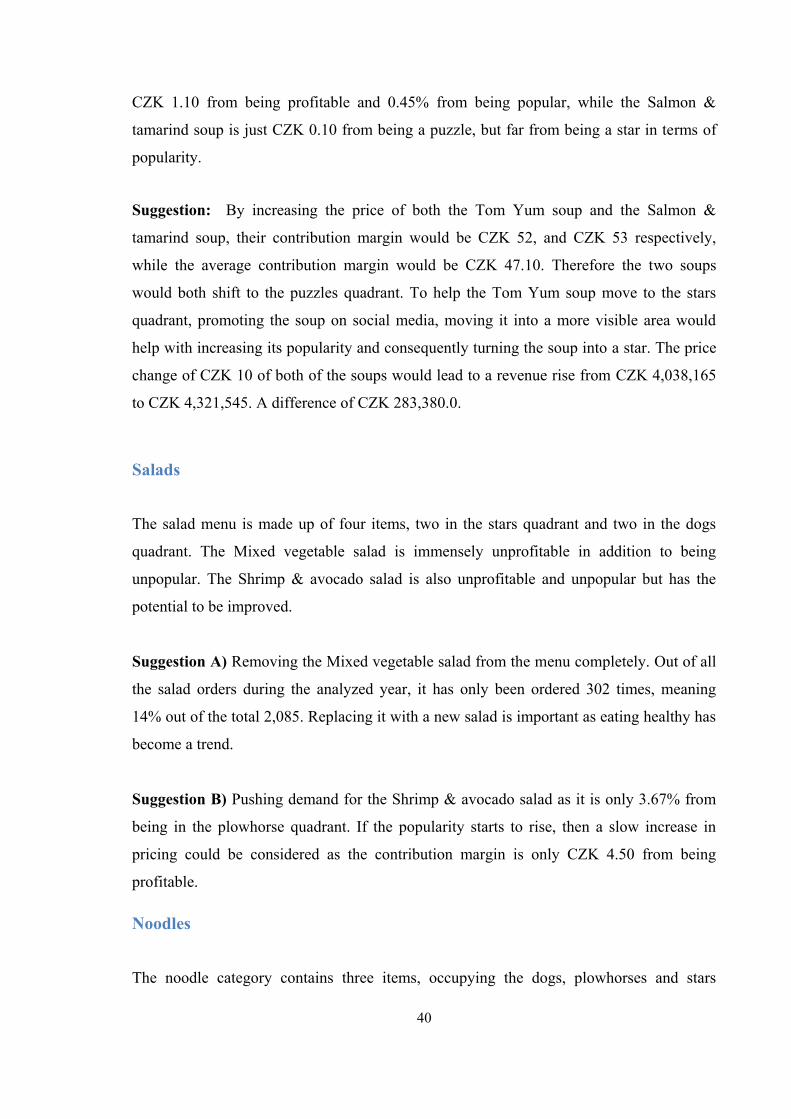
40
CZK 1.10 from being profitable and 0.45% from being popular, while the Salmon &
tamarind soup is just CZK 0.10 from being a puzzle, but far from being a star in terms of
popularity.
Suggestion: By increasing the price of both the Tom Yum soup and the Salmon &
tamarind soup, their contribution margin would be CZK 52, and CZK 53 respectively,
while the average contribution margin would be CZK 47.10. Therefore the two soups
would both shift to the puzzles quadrant. To help the Tom Yum soup move to the stars
quadrant, promoting the soup on social media, moving it into a more visible area would
help with increasing its popularity and consequently turning the soup into a star. The price
change of CZK 10 of both of the soups would lead to a revenue rise from CZK 4,038,165
to CZK 4,321,545. A difference of CZK 283,380.0.
Salads
The salad menu is made up of four items, two in the stars quadrant and two in the dogs
quadrant. The Mixed vegetable salad is immensely unprofitable in addition to being
unpopular. The Shrimp & avocado salad is also unprofitable and unpopular but has the
potential to be improved.
Suggestion A) Removing the Mixed vegetable salad from the menu completely. Out of all
the salad orders during the analyzed year, it has only been ordered 302 times, meaning
14% out of the total 2,085. Replacing it with a new salad is important as eating healthy has
become a trend.
Suggestion B) Pushing demand for the Shrimp & avocado salad as it is only 3.67% from
being in the plowhorse quadrant. If the popularity starts to rise, then a slow increase in
pricing could be considered as the contribution margin is only CZK 4.50 from being
profitable.
Noodles
The noodle category contains three items, occupying the dogs, plowhorses and stars
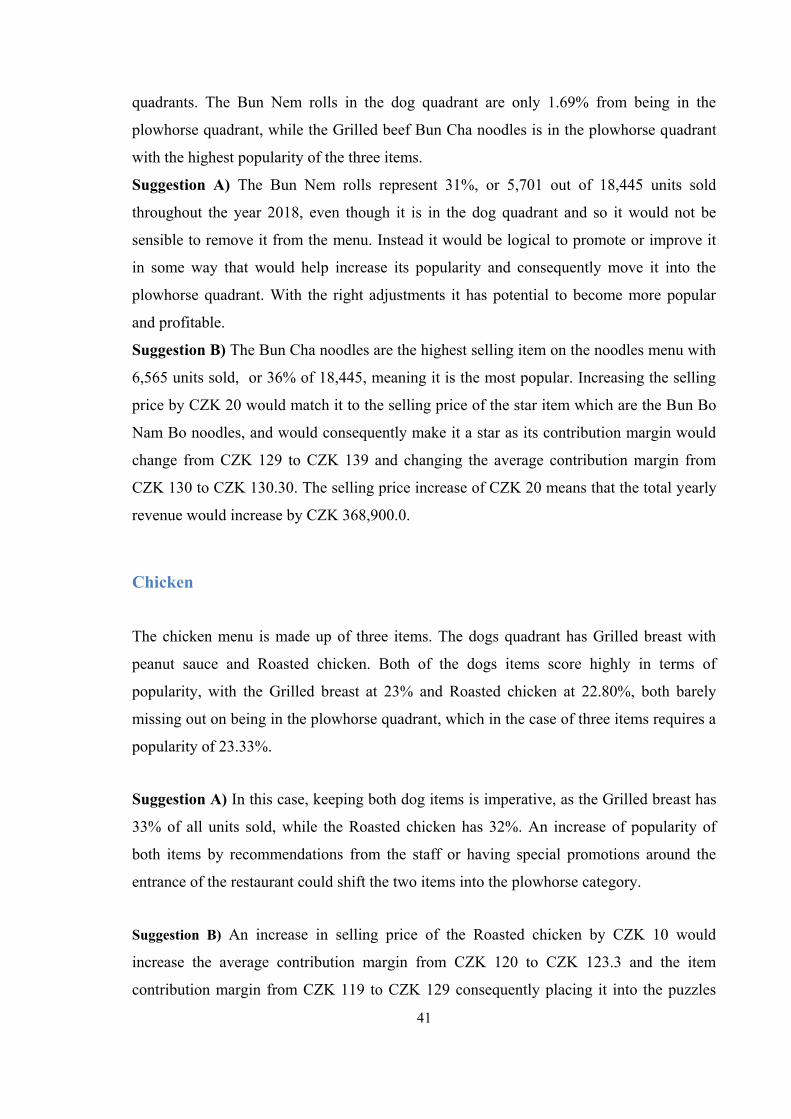
41
quadrants. The Bun Nem rolls in the dog quadrant are only 1.69% from being in the
plowhorse quadrant, while the Grilled beef Bun Cha noodles is in the plowhorse quadrant
with the highest popularity of the three items.
Suggestion A) The Bun Nem rolls represent 31%, or 5,701 out of 18,445 units sold
throughout the year 2018, even though it is in the dog quadrant and so it would not be
sensible to remove it from the menu. Instead it would be logical to promote or improve it
in some way that would help increase its popularity and consequently move it into the
plowhorse quadrant. With the right adjustments it has potential to become more popular
and profitable.
Suggestion B) The Bun Cha noodles are the highest selling item on the noodles menu with
6,565 units sold, or 36% of 18,445, meaning it is the most popular. Increasing the selling
price by CZK 20 would match it to the selling price of the star item which are the Bun Bo
Nam Bo noodles, and would consequently make it a star as its contribution margin would
change from CZK 129 to CZK 139 and changing the average contribution margin from
CZK 130 to CZK 130.30. The selling price increase of CZK 20 means that the total yearly
revenue would increase by CZK 368,900.0.
Chicken
The chicken menu is made up of three items. The dogs quadrant has Grilled breast with
peanut sauce and Roasted chicken. Both of the dogs items score highly in terms of
popularity, with the Grilled breast at 23% and Roasted chicken at 22.80%, both barely
missing out on being in the plowhorse quadrant, which in the case of three items requires a
popularity of 23.33%.
Suggestion A) In this case, keeping both dog items is imperative, as the Grilled breast has
33% of all units sold, while the Roasted chicken has 32%. An increase of popularity of
both items by recommendations from the staff or having special promotions around the
entrance of the restaurant could shift the two items into the plowhorse category.
Suggestion B) An increase in selling price of the Roasted chicken by CZK 10 would
increase the average contribution margin from CZK 120 to CZK 123.3 and the item
contribution margin from CZK 119 to CZK 129 consequently placing it into the puzzles
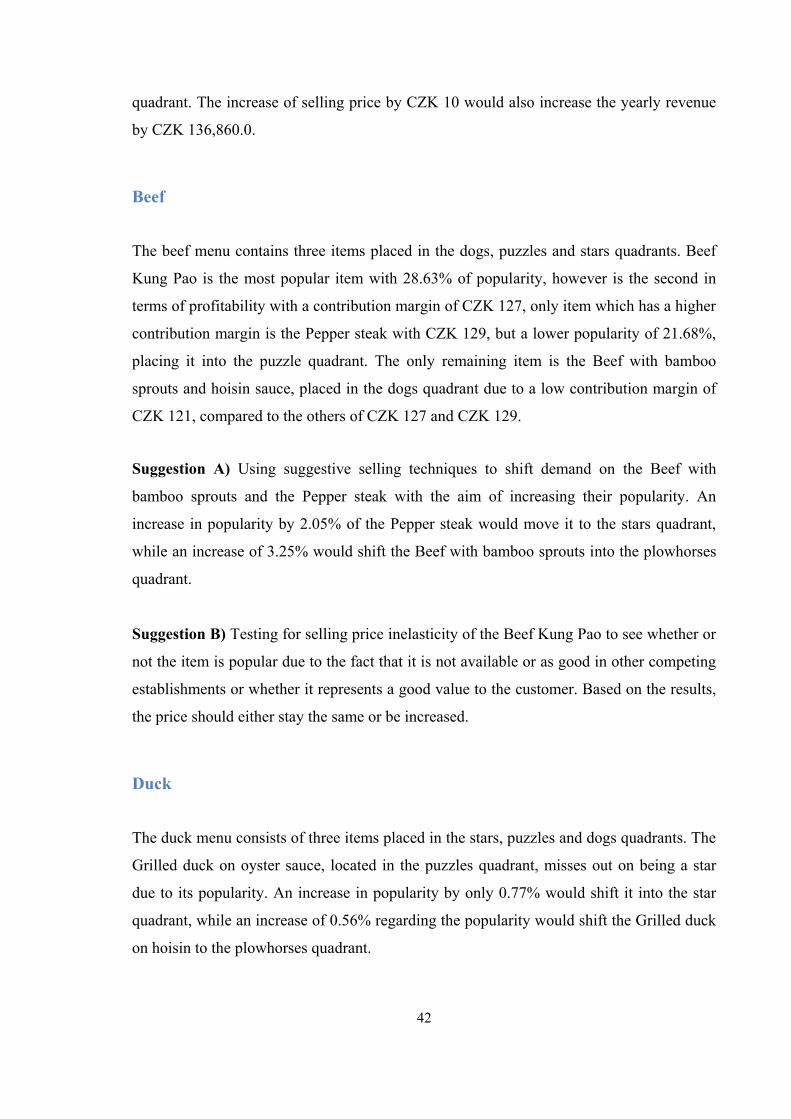
42
quadrant. The increase of selling price by CZK 10 would also increase the yearly revenue
by CZK 136,860.0.
Beef
The beef menu contains three items placed in the dogs, puzzles and stars quadrants. Beef
Kung Pao is the most popular item with 28.63% of popularity, however is the second in
terms of profitability with a contribution margin of CZK 127, only item which has a higher
contribution margin is the Pepper steak with CZK 129, but a lower popularity of 21.68%,
placing it into the puzzle quadrant. The only remaining item is the Beef with bamboo
sprouts and hoisin sauce, placed in the dogs quadrant due to a low contribution margin of
CZK 121, compared to the others of CZK 127 and CZK 129.
Suggestion A) Using suggestive selling techniques to shift demand on the Beef with
bamboo sprouts and the Pepper steak with the aim of increasing their popularity. An
increase in popularity by 2.05% of the Pepper steak would move it to the stars quadrant,
while an increase of 3.25% would shift the Beef with bamboo sprouts into the plowhorses
quadrant.
Suggestion B) Testing for selling price inelasticity of the Beef Kung Pao to see whether or
not the item is popular due to the fact that it is not available or as good in other competing
establishments or whether it represents a good value to the customer. Based on the results,
the price should either stay the same or be increased.
Duck
The duck menu consists of three items placed in the stars, puzzles and dogs quadrants. The
Grilled duck on oyster sauce, located in the puzzles quadrant, misses out on being a star
due to its popularity. An increase in popularity by only 0.77% would shift it into the star
quadrant, while an increase of 0.56% regarding the popularity would shift the Grilled duck
on hoisin to the plowhorses quadrant.
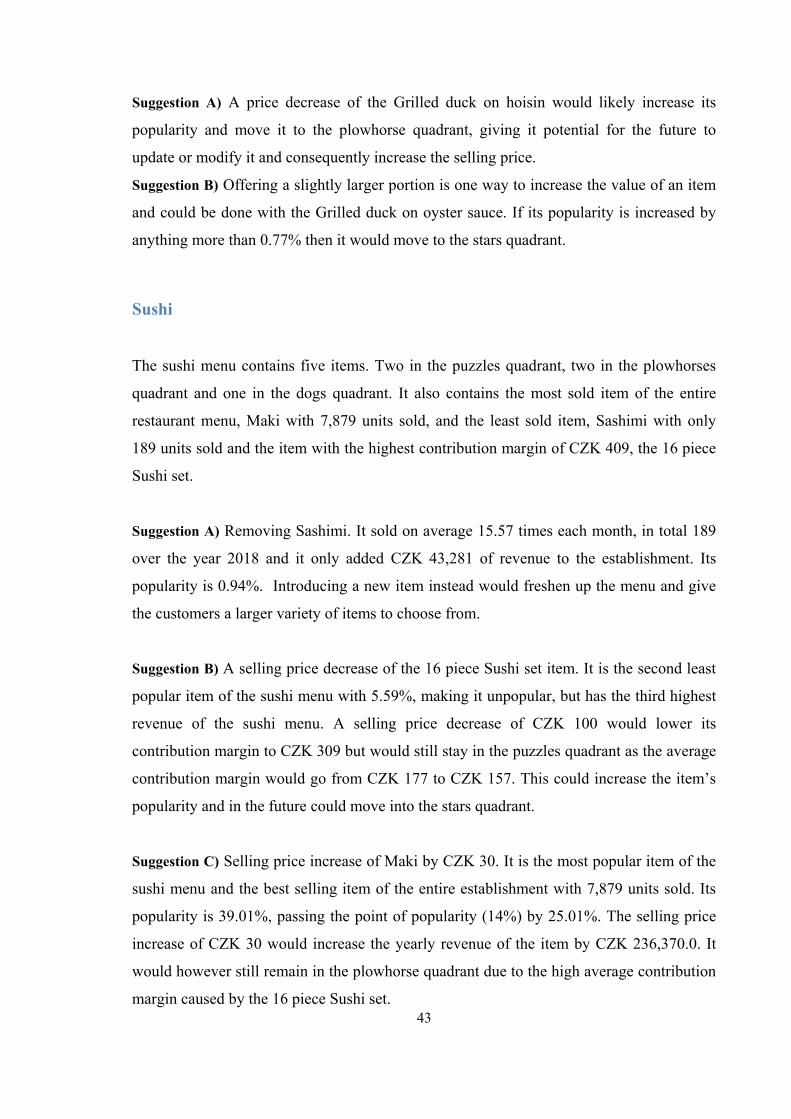
43
Suggestion A) A price decrease of the Grilled duck on hoisin would likely increase its
popularity and move it to the plowhorse quadrant, giving it potential for the future to
update or modify it and consequently increase the selling price.
Suggestion B) Offering a slightly larger portion is one way to increase the value of an item
and could be done with the Grilled duck on oyster sauce. If its popularity is increased by
anything more than 0.77% then it would move to the stars quadrant.
Sushi
The sushi menu contains five items. Two in the puzzles quadrant, two in the plowhorses
quadrant and one in the dogs quadrant. It also contains the most sold item of the entire
restaurant menu, Maki with 7,879 units sold, and the least sold item, Sashimi with only
189 units sold and the item with the highest contribution margin of CZK 409, the 16 piece
Sushi set.
Suggestion A) Removing Sashimi. It sold on average 15.57 times each month, in total 189
over the year 2018 and it only added CZK 43,281 of revenue to the establishment. Its
popularity is 0.94%. Introducing a new item instead would freshen up the menu and give
the customers a larger variety of items to choose from.
Suggestion B) A selling price decrease of the 16 piece Sushi set item. It is the second least
popular item of the sushi menu with 5.59%, making it unpopular, but has the third highest
revenue of the sushi menu. A selling price decrease of CZK 100 would lower its
contribution margin to CZK 309 but would still stay in the puzzles quadrant as the average
contribution margin would go from CZK 177 to CZK 157. This could increase the item‟s
popularity and in the future could move into the stars quadrant.
Suggestion C) Selling price increase of Maki by CZK 30. It is the most popular item of the
sushi menu and the best selling item of the entire establishment with 7,879 units sold. Its
popularity is 39.01%, passing the point of popularity (14%) by 25.01%. The selling price
increase of CZK 30 would increase the yearly revenue of the item by CZK 236,370.0. It
would however still remain in the plowhorse quadrant due to the high average contribution
margin caused by the 16 piece Sushi set.
44
Conclusion
The title of the thesis is “Menu engineering and its use in gastronomy”. The menu is an
inseparable part of any dining establishment and is one of the key elements of running a
successful business.
The first part of the thesis is theoretical, discussing the roots of gastronomy, trends and the
menu, explaining the function and what it should and should not contain and the menu
engineering process with the Boston Consulting Group Matrix. The second part of the
thesis, the analytical part, is dedicated to the analysis of the product portfolio a selected
restaurant in the Czech Republic. Using the menu engineering method and consequently
the Boston Consulting Group Matrix, all the items were separated into one of the four
quadrants and described. To successfully perform the analysis, primary data was used,
consisting of all the item names, units sold, production costs and selling price. The data
used to analyze was collected during the entire year of 2018. Due to large amounts of data
provided, only the food items were selected for the analysis. All the data used in this thesis
has been provided by the owner/manager of the selected restaurant, under the condition the
restaurant remains anonymous and therefore throughout the entirety of this thesis there are
no mentions of the name or exact location of the restaurant. The third and final part of the
thesis is dedicated to suggestions based on the analysis, the items and in which of the four
BCG Matrix quadrants they are in. The suggestions are on the basis of whether or not the
item is popular/unpopular or profitable/unprofitable.
Based on the analysis and by calculating the point of popularity and the average
contribution margin of each item I was able to understand which items were profitable and
popular. Depending on which of the four quadrants the items were allocated to, I came up
with suggestions and conclusions on how to improve the items. Among the suggestions
were removing, promoting, pushing for demand, increasing or decreasing the selling price
and combining two separate items into one.
If the suggestions that came from the analysis were successful, it would be necessary to
repeat the same process the following year.
45
List of references
Books:
Bahattin, O. and Osman, C. (2014). A review of literature on restaurant menus: Specifying
the managerial issues. International Journal of Gastronomy and Food Science.
BÉ HÀ NGUYEN, Vietnamská kuchařka od Bé Há a její maminky, Brno, 2018, ISBN 978-80-264-
2229-7
BUREŠOVÁ, P.et al. Vybrané kapitoly z hotelnictví a gastronomie. Praha: Wolters Kluwer, 2014.
ISBN 978-80-7478-498-9.
DAVIS, LOCKWOOD & STONE, Food and Beverage Management, Burlington, 1998, ISBN 0-
7506-3286-0
Hegyesné Görgényi, É., Máté, B., Fekete Farkas, M. and Amir Vafaei, S. (2017). THE
ROLE OF SOCIAL MEDIA IN GASTRONOMY INDUSTRY.
KOCHOVÁ, Velká kniha o Vánocích, Praha, 2010, ISBN 978-80-204-2375-7
Luptáková, A. (2018). BCG matica a jej aplikácia vo vybraných gastronomických
prevádzkach.
NIENEMIER, PLANNING and CONTROL for FOOD and BEVERAGE OPERATIONS,
Michigan, 2001. ISBN 0-86612-231-1
METZ, GRÜNER & KESSLER, Restaurace a host – Základní odborné vědomosti restaurace-hotel-
kuchyně, Gruiten (Germany), 2003, ISBN 978-80-86706-18-4
PETZUCH, Gastronomický lexikon, Opava, 1995, ISBN 80-85819-39-2
Websites and further reading:
46
20 Most Common Restaurant Menu Design Mistakes, Aaron Allen & Associates, Global
Restaurant Consultants, https://aaronallen.com/blog/restaurant-menu-design-mistakes
(Accessed: 26 March 2019)
Mobile share of website visits worldwide 2018 | Statistic, Statista,
https://www.statista.com/statistics/241462/global-mobile-phone-website-traffic-share/
(Accessed: 20 March 2019)
How to Define Your Exact Target Restaurant Customer, Restaurant Engine,
https://restaurantengine.com/target-restaurant-customer/ (Accessed: 5 May 2019)
The Principles of Menu Engineering – Basic Kitchen and Food Service Management,
Opentextbc.ca,
https://opentextbc.ca/basickitchenandfoodservicemanagement/chapter/describe-the-
principles-of-menu-engineering/ (Accessed: 23 May 2019)
Raab, C. et al. (2006) „Activity-Based Costing Menu Engineering: A New and More
Accurate Way to Maximize Profits from Your Restaurant Menu‟, Journal of Foodservice
Business Research, 9(1), pp. 77–96. Available at:
https://search.ebscohost.com/login.aspx?direct=true&db=hjh&AN=24615309&lang=cs&si
te=ehost-live (Accessed: 9 May 2019)