inside stories - rrfinance.com
TRANSCRIPT

The Complete Magazine for Indian Investors September 2012
Inside Stories
Mutual Fund
Equity Stock Ideas
Cover Story
Industry Analysis
www.rrfcl.com www.rrfinance.com Volume: XIII Issue: (9)
14
12
34
44

TM
1 Sept 2012 Investment Montor
Contents
CONTENTS | September 2012
Investment Monitor MonitorVolume: XIII Issue :(9) September 2012
Editor: Rajat Prasad
Head Office : 47 MM Road, Rani Jhansi Marg, Jhandewalan, New Delhi -110055, Tel : 011-23636363/62,Ahmedabad Office : 401 , Abhijit-1 , Opp. Bhuj Mercantile Bank, Mithakhali 6 Road, Navrangpura, Ahmedabad-09 Bangalore Office : S-111, Manipal Centre, 47 Deckinson Road, Bangalore-560042, Tel:080-09343795727 Chennai Office : 3rd Floor, Precision Plaza, New # 397, Teynampet, Anna Salai, Chennai - 600 018, Tel : 044 - 42077370, 42077371, 09382330263,Chandigarh Office : SCO 222-223, Ground Floor, Sector 34-A, Opp. State Library, Chandigarh, Tel :0172-2624896, Dehradun Office : 56 first floor, Rajpur Road, Opp. Madhuban, Dehradun, Uttranchal- 248001, Tel : 0135-3258181, Jaipur Office : 7, Katewa Bhawan, Opp. Ganpati Plaza , M.I. Road, Jaipur -302001, Tel : 0141-3235456, 5113317, Kolkata Office : 704, Krishna Building, 224 AJC Bose Road, Kolkata-700017, Tel : 033-22802963, 30974687, Lucknow Office : G-32, Shriram Tower, 13-A, Ashok Marg, Lucknow-226001, Tel : 0522-2286518, 2286110, Mumbai Office : 133A, Mittal Towers, A Wing, 13th Floor, Nariman Point, Mumbai 400021, Tel : 9324804084, Vadodara Office : 222, Siddharth Complex, 2nd floor, RC Dutt Road, Alkapuri, Vadodara - 390007, Tel : 09327037108,
Delhi Associate division :Connaught Place : N-24, Connaught Place, New Delhi-110001, Tel :011 41523306, 41523229, 9350316008Faridabad Office : 55, 1st Floor, Near Flyover, Neelam Chowk, NIT, Faridabad -121001 Tel : 95129-2427367, 2427361, Ghaziabad Office : 114, Satyam Complex, Raj Nagar D C, Raj Nagar, Ghaziabad- 201002 Tel : 9312940453, 9312056336Janakpuri Office : 111, Jyotishikar, 8 Distt. Centre, Janakpuri, New Delhi-110018 Tel :011-25617654, 09310684750Noida Office : P-5, UGF, Ocean Plaza, Sector-18, Noida-201301 Tel : 95120-4336992, 2513989, 9312940493Pitampura Office : Shop No. 24, FD Market, Nr. Madhuban Chowk, Pitampura, Delhi-110034, Tel : 011-273114419, Preet Vihar Office : 106 Pankaj Chambers, Preet Vihar Community Centre, Delhi-110092 Tel : 42421238-39Rajendra Place : 118, Gagandeep Building , Rajendra Place, New Delhi-110008 Tel : 011-41538956, 41537856 ITO Office : 105, Pratap Bhawan, Bahdur Shah Zafar Marg, New Delhi-110001 Tel : 011-41509018, 42512404Vasant Kunj Office : 105, Anchal Plaza, Nelson Mandela Road, Vasant Kunj New Delhi-110070, Tel : 26891262,Research Head Satyendra Kumar Tiwari [email protected] Team Charu Mittal [email protected] Pradhan [email protected] Arun Rana [email protected] Vibhav [email protected] by Md.Imran Khan [email protected] Manoj Thapliyal [email protected]
Published by Raghunandan Prasad on behalf of RR Information & Investment Research (P) Ltd.,412-422, Indraprakash Building,21, Barakhamba Road, New Delhi-110001.This publication is for informational purposes only and contains information, opinion, material obtained from reliable sources and efforts have been made to avoid errors and omissions and is not to be construed as an advice or an offer to act on views expressed therein or an offer to buy and/or sell any securities or related financial instruments and the publisher shall not be responsible and/or liable to anyone for any direct or consequential use of the contents thereof. The reproduction of the contents of this magazine in any form or by any means without prior written permission of the publisher is prohibited.All advertisements appearing in this publication are at the sole risk & responsibility of the advertiser.All disputes shall be subject to the exclusive jurisdiction of Delhi courts only.
Inside Story
News Bytes.......................................04
Global Outlook.................................10
Market Commentary.........................09
Indian Economy................................11
Stock Market Monitor.......................20
Currency ..........................................42Mutual Fund.....................................44Insurance..........................................46
Commodity ......................................38Equity Technical...............................36
Query Time.......................................50Investor Education............................48
Review & Analysis...........................06
Economic Indicators.........................08
Industry Analysis..............................12Cover Story.......................................14
Equity Stock Ideas............................34
Mail Box...........................................51
Editor’s Desk....................................03
Monitor

2 Investment Monitor Sept 2012
TM
3 Sept 2012 Investment Montor
Editor Desk
Despite political uncertainty over coal block allocations, initiating reforms or raise diesel prices,
Foreign Institutional Investors (FIIs) have pumped $3 billion and Sensex rises almost 10% in last
two months.
India’s industrial production contracted 1.8 percent in June, driven down by a slowdown in
manufacturing & it’s creating pressure on Govt to start the reform process and revive investment
interest.
Overall inflation scenario still remained way above the RBI’s comfort level as Wholesale price
index, stood at 6.87% for July, compared to 7.25% with food inflation in double digits for the
fifth consecutive month.
Monsoon improved during August, the rain deficiency has dropped to a great extent reviving
hopes of making up for the losses that some crops were estimated to suffer. In this scenario, we
expect RBI may cut 50 basis point in coming days to boost the economic sentiment.
Hopes for a new round of U.S. monetary stimulus and news that Spain is negotiating conditions
for a possible aid package, Gold rose to a four-month high above $1,670 an ounce. It’s debatable
how much Fed action would help the market or the economy, Fed Chairman will clarify the
things on his scheduled meeting on Aug.31.
Government is yet to delivery on key reforms, any positive development would further boost the
sentiments, therefore we recommend on sector specific investment such as Retail, Banking &
Infrastructure.
This is going to be a choppy period for the stock markets and only long term investors should
enter in small lot buying. The market is expected to be flooded with Bond issues of four NBFCs
which will provide attractive returns for medium term. We recommend investors in fixed income
to invest in these issues.
RAJAT PRASAD
Editor’s
Desk
4 Investment Monitor Sept 2012
News Bytes
Gulf Oil Corporation enters into JDA to develop 76 acres of Hyderabad landGulf Oil Corporation, the Hinduja group Company, has entered into a joint development agreement (JDA) for development of approximately 76 acres of the company’s land located at Kukatpally in Hyderabad. The company has entered into JDA with Hinduja Estates after several discussions on July 30, 2012.Federal Bank to offer special deposit schemeFederal Bank, a Kerala-based private sector bank is planning to provide special rate of 10% for resident and non-resident deposits of 1,000 days’ maturity. The bank is going to offer this rate for a limited period only that is between July 30 and August 17.ONGC reverses its blanket ban order on all Essar Group entitiesState-run energy explorer, Oil and Natural Gas Corporation (ONGC) has reversed its earlier blanket ban order on all Essar Group entities from participating in its tenders, by issuing an amendment that bars only one entity in the Essar group - Essar Oilfield Services India (EOSIL). FIIs were net buyers of Rs 1140.15 crore in index futures and options segments on July 30 According to the data released by NSE, the Foreign Institutional Investors (FIIs) were net buyers of Rs 1140.15 crore in index futures and options segments on Monday, July 30, 2012.FIIs were sellers of index futures to the tune of Rs 28.85 crore and they bought index options worth Rs 1169.00 crore. In the stock segment, FII’s were net buyers of stock futures worth Rs 911.97 crore while they also bought stock options worth Rs 122.55 crore. Union Bank of India to expand network to 3,500 branches by 2013Public sector lender Union Bank of India (UBI) is planning to increase its network to 3,500 branches and 5,000 ATMs across the country by March 2013. In this regard the bank will set up 300 new branches 800 ATMs across India, besides 100 money vending machines catering to banking needs of blinds.KNR Constructions’ JV bags order worth Rs 49.25 croreKNR Constructions 51:49 joint venture (JV) with SLMI Infra Projects (SLMI) has been awarded an order worth Rs 49.25 crore by Hyderabad Growth Corridor towards strengthening and widening of radial roads in and around Hyderabad city with loan assistance of JICA under loan agreement no. ID-P: 198: Radial Road No 16 from ECIL X Road to Cherial X Road in the stretch from Km 7.0 to 17.180.Gold extends gains to a fourth straight session Gold prices edged higher on Monday trade, posting a fourth straight day of gain on hightened hopes for new accommodative measures from central banks of Europe and USA, ahead of their
meeting this week. The yellow metal had gained 2.5 % last week, recording sharpest weekly gain since eight amid weak US economic data and as ECB president Mario Draghi pledged to take necessary steps to protect euro.HCL Tech moves up as its arm achieves large-scale implementation of SAP Solutions HCL Technologies is currently trading at Rs. 517.50, up by 0.85 points or 0.16% from its previous closing of Rs. 516.65 on the BSE.The scrip opened at Rs. 518.00 and has touched a high and low of Rs. 519.35 and Rs. 511.00 respectively. So far 8143 shares were traded on the counter.Tamboli Capital announces AGMTamboli Capital has informed that the 4th annual general meeting (AGM) of the company was held on July 30, 2012.The above information is a part of company’s filings submitted to BSE.Tilaknagar Industries approves allotment of sharesTilaknagar Industries has informed that the board of directors has vide its circular resolution passed on July 30, 2012 approved the allotment of 1,68,964 equity shares to the option grantees on exercise of vested options under ESOP Scheme, 2008.The above information is a part of company’s filings submitted to BSE.Ushdev International’s 9.9 MW Wind Power Project gets registered for CDM activityUshdev International’s 9.9 MW Wind Power Project located at Theni in Tamil Nadu has been registered by the United Nations Framework Convention on Climate Change (UNFCCC) for clean development mechanism (CDM) activity.Reliance Infrastructure’s SPV commences seventh road project in Tamil NaduReliance Infrastructure (RInfra), part of Reliance Group, through its special purpose vehicle (SPV) - SU Toll Road, has commenced its seventh road project from Salem to Ulundurpet in Tamil Nadu. The four lanning of Salem-Ulundurpet (SU) road has been completed and toll collection started.PGCIL inks SHA to set up two joint venture companiesPower Grid Corporation of India (PGCIL) has signed share holders agreement (SHA) to set up two joint venture companies. The company has inked SHA on July 09, 2012 for implementation of 400 kv D/C transmission line between Muzaffarpur (India) and Dhalkebar (Nepal).Ashok Leyland to sign three overseas joint ventures this yearAshok Leyland, India’s second-biggest maker of trucks and buses is likely to sign at least three overseas joint ventures in the next
5 Sept 2012 Investment Montor
News Bytes
two to three months. The company is planning to do so for consolidating its presence in new geographies. It is in the final stages of inking joint ventures in Indonesia, Chile and Nigeria, keeping the majority holding in each of these partnerships.
Dhunseri Petrochem & Tea to acquire companies in AfricaDhunseri Petrochem & Tea through its wholly owned subsidiary has agreed to acquire 100% share capital of Africa based Makandi Tea & Coffee Estates (Makandi Tea) and Kawalazi Estate Company (Kawalazi Estate) from Global Tea & Commodities by executing a share purchase agreement (SPA) with Global Tea & Commodities, Makandi Tea and Kawalazi Estate. Banco Products (India) commences commercial production of radiatorsBanco Products (India) has started the commercial production of radiators from its manufacturing facilities located at the company’s export oriented unit (EOU) at Synefra Special Economic Zone in Vadodara. The company has started the production with effect from July 20, 2012.Syndicate Bank reports 28% jump in Q1 net profitSyndicate Bank has reported results for first quarter ended June 30, 2012.The bank has registered a rise of 28.38% in its net profit at Rs 440.22 crore for the quarter under review as compared to Rs 342.91 crore for the same quarter in the previous year. Total income of the bank has increased by 21.36% at Rs 4478.06 crore for Q1FY13 as compared Rs 3689.92 crore for the corresponding quarter previous year.
Bharat Electronics reports 84% fall in Q1 net profitBharat Electronics has reported results for first quarter ended June 30, 2012.On standalone basis, the company has posted a fall of 84.27% in its net profit at Rs 19.32 crore for the quarter ended June 30, 2012 as compared to Rs 122.80 crore for the same quarter in the previous year. Total income has decreased by 11.51% to Rs 960.16 crore for quarter under review as compared to Rs 1084.99 crore for the quarter ended June 30, 2011.Bharat Electronics (BEL) was set up at Bangalore by the Government of India under the Ministry of Defence in 1954 to meet the specialised electronic needs of the Indian defence services. Over the years, it has grown into a multi-product, multi-technology, multi-unit company serving the needs of customers in diverse fields in India and abroad.CII rings alarm bell of bad monsoon on industry growthDeficient rains have became a matter of serious concern, since the onset of monsoon, the country has received 22 per cent less rainfall than predicted with northwest region being the most affected with a deficiency reaching almost 42 per cent. Apart from the government and political leaders, the industry body CII too has expressed concern over the impact of deficient rainfall on the broader economy, at a time when there is already a sharp slowdown on account of various domestic and global factors.Ashok Leyland shines on plan to sign three overseas joint ventures this year Ashok Leyland is currently trading at Rs. 21.70, up by 0.40 points or 1.88% from its previous closing of Rs. 21.30 on the BSE.The scrip opened at Rs. 21.60 and has touched a high and low of Rs. 21.75 and Rs. 21.45 respectively. So far 350604 shares were traded on the counter.
Allahabad Bank zooms on reporting 23% surge in Q1 net profit Allahabad Bank is currently trading at Rs. 135.60, up by 6.60 points or 5.12% from its previous closing of Rs. 129.00 on the BSE.The scrip opened at Rs. 130.00 and has touched a high and low of Rs. 136.20 and Rs. 127.50 respectively. So far 415676 shares were traded on the counter.Banco Products trades higher on commencing commercial production of radiators Banco Products is currently trading at Rs. 59.90, up by 0.90 points or 1.53% from its previous closing of Rs. 59.00 on the BSE.The scrip opened at Rs. 58.50 and has touched a high and low of Rs. 60.50 and Rs. 58.00
Bourses trade near intra-day’s high; positive European markets provide the require fillipAmassing strength slowly and steadily, Indian equity markets are now trading near intra-day’s high level, led by prominent gains of Bankex, Realty and Capital Goods counters. The global risk-on sentiment seems to buoying the sentiment at Dalal Street combined with the optimism ahead of RBI’s crucial quarterly policy review, doing the needful to sustain the gains of the bourses. 30 share barometer index of BSE, Sensex, is currently floating above the 17,000 psychological level, with gains of over a percentage, while the widely followed 50 share barometer index of NSE, Nifty, added a percentage points, to surpass the 5150 bastion. The broader indices, too enticed additional traction.Sumeet Industries board to consider financial resultsSumeet Industries has informed that a meeting of the board of directors of the company will be held on August 06, 2012, to consider and take on record the audited financial results of the company for the year ended on March 31, 2012, the un-audited financial results of the company for the quarter ended on June 30, 2012 and to recommend dividend for the financial year 2011-12.The above information is a part of company’s filings submitted to BSE.Duncans Industries accepts resignation of directorDuncans Industries has informed that the board of directors of the company at its meeting held on July 27, 2012, has accepted the resignation of S. P. Gupta, executive director from the board of the companyThe above information is a part of company’s filings submitted to BSE.Ion Exchange India announces book closureIon Exchange India has informed that the register of members & share transfer books of the company will remain closed from September 13, 2012 to September 26, 2012 for the purpose of payment of dividend.The above information is a part of company’s filings submitted to BSE.
Alka Diamond Industries appoints directorAlka Diamond Industries has informed that Sanat Upadhyay have been appointed by the board of directors in its meeting held on July 28, 2012 as independent director of the company and Mukesh Kumar has retired as director of the company.]The above information is a part of company’s filings submitted to BSE.
6 Investment Monitor Sept 2012
Review & Review & Review & Analysis
Company Name CMP (27/07/12) CMP (27/08/12) (%) Change
A’ GROUP GMR Infrastructure L 24.05 18.2 -24.32IFCI Ltd. 36.05 27.45 -23.86Indiabulls Real Esta 56.8 44.2 -22.18Suzlon Energy Ltd. 19.1 14.95 -21.73Bharti Airtel 308.7 241.95 -21.62Opto Circuits India 152.75 120.7 -20.98IndiabullsFinService 231.40 184.30 -20.35Jaypee Infratech Ltd 51.80 42.35 -18.24Jaiprakash Power Ven 31.55 26.7 -15.37Pantaloon Retail 162.4 138.9 -14.47
B’ GROUP VTM Ltd. 131.25 12.35 -90.59Kemrock Indus. 400.55 129.15 -67.76Glodyne Technoserve 208 74.95 -63.97S. E. Power L 31.65 12.15 -61.61Reliance Chemote 87.7 42.3 -51.77KCL Infra Projects 15.3 7.76 -49.28Popular Estate Manag 46.35 24 -48.22KMF Builders & D 7.77 4.1 -47.23Golden Goenka Fin 27.9 15.05 -46.06Neha Internation 29.9 16.6 -44.48
T’ GROUP Drillco Metal 499 22.7 -95.45Vandana Knitwear 100.05 9.9 -90.1Parikh Herbals L 502.2 54.9 -89.07Ishan Dyes & Che 40 19.05 -52.38Trans Asia Corporati 4.48 2.26 -49.55Kalptaru Papers 18.5 9.7 -47.57Finalysis Credit 61.05 32.5 -46.76Finaventure Capital 46.85 25 -46.64Ashnoor Textile 6.47 3.47 -46.37Invicta Meditek Ltd. 36.8 19.85 -46.06
WORST PERFORMERS IN THE MONTH BEST PERFORMERS IN THE MONTHCompany Name CMP (27/07/12) CMP (27/08/12) (%) Change
A' GROUPUnited Spirits Ltd. 771.05 971.1 25.95Wockhardt Ltd. 957.90 1,180.00 23.19Tech Mahindra Ltd. 714.50 842.8 17.96Strides Arcolab 717.15 840.5 17.2United Breweries Ltd 551.15 644 16.85Coromandel Internati 242 282 16.53Financial Technolog. 707.5 818.85 15.74AstraZeneca Pharma I 1,593.85 1,836.00 15.19MothersonSumiSystems162.55 186.25 14.58Apollo Tyres 79.8 91.2 14.29
B' GROUPSantaram Spinner 3.5 6.64 89.71SIP Industries 3.40 6.2 82.35Technocraft Industri 40.05 71.25 77.9Archana Software 2.09 3.71 77.51Inani Marbles & 212 359.25 69.46High Energy Bat. 91.5 152.55 66.72Prime Property Devel 10.85 17.5 61.29Suven Life Sciences 14.65 23.2 58.36Neo Corp Internation 24.25 37.75 55.67Vadilal Indus. 119 184.95 55.42
T' GROUPUrja Global 22 50 127.27Vikalp Securitie 2.49 5.36 115.26Thana Electric 5.80 11.48 97.93Ranjeev Alloys L 5.31 10.20 92.09Welterman Intl. 3.4 6.44 89.41Morgan Ventures Ltd. 4 7.54 88.5IFM Impex Glob 5.75 10.45 81.74Mount Shivalik I 24.25 43.95 81.24Parth Aluminium 5.94 10.71 80.30Superior Industrial 15.04 26.95 79.19
Index Close (27/07/12) Close (27/08/12) Points Chg (%) ChgSENSEX 16,855.00 17,631.71 776.7 4.61%BSE-MIDCAP 5,891.00 5,974.89 83.9 1.42%BSE-SMALLCAP 6,359.00 6,390.88 31.9 0.50%BSE-100 5,104.00 5,277.28 173.3 3.39%BSE-200 2,064.00 2,132.53 68.5 3.32%BSE-500 6,455.00 6,655.09 200.1 3.10%BSE Auto 8,873.00 9,473.88 600.9 6.77%BANKEX 11,665.00 11,544.33 -120.7 -1.03%BSE CD INDEX 6255.0 6256.1 1.1 100.02%CAPITAL GOODS 9,315.00 9,606.91 291.9 3.13%BSE FMCG INDEX 4,982.00 5,348.61 366.6 7.36%BSE HEALTHCARE 6,973.00 7,396.84 423.8 6.08%BSE IT INDEX 5,220.00 5,797.71 577.7 11.07%BSE Metal 10,218.00 10,026.60 -191.4 -1.87%BSE Oil & Gas 7,906.00 8,403.45 497.5 6.29%BSE PSU INDEX 6,940.00 7,030.36 90.4 1.30%BSE TECk INDEX 3,106.00 3,285.54 179.5 5.78%BSE REALTY 1,572.00 1,545.29 -26.7 -1.70%BSE IPO 1,453.00 1,458.25 5.3 0.36%DOLLEX-30 2,494.00 2,599.79 105.8 4.24%DOLLEX-100 952.00 986.26 34.3 3.60%DOLLEX-200 619.00 641.20 22.2 3.59%S&P CNX NIFTY 5,099.00 5,334.60 235.6 4.62%S&P CNX DEFTY 3,187.00 3,320.85 133.9 4.20%S&P CNX 500 4,028.00 4,176.35 148.4 3.68%CNX NIFTY JR 9,783.00 9,915.35 132.4 1.35%CNX Midcap 7,023.00 7,083.10 60.1 0.86%CNX IT 5,099.00 5,334.60 235.6 4.62%CNX 100 4,986.00 5,191.25 205.3 4.12%BANK Nifty 10,140.00 10,059.40 -80.6 -0.79%CNX Reality 208.00 205.60 -2.4 -1.15%Nifty Midcap 50 2,002.00 2,014.75 12.8 0.64%CNX Infra. 2,289.00 2,272.50 -16.5 -0.72%
WORLD MARKET INDICES PERFORMANCE INDICES PERFORMANCE (27/07/12 TO 27/08/12) Index Close (27/07/12) Close (27/08/12) Points Chg (%)Chg US
DJIA 13075 13102.99 27.99 0.21%
S&P 500 1385 1409.35 24.35 1.76%
NASDAQ 100 USA 2958 3077.14 119.14 4.03%
EUROPE
Frankfurt (DAX 30) 6689 6972.28 283.28 4.24%
London (FTSE) 5627 5743.95 116.95 2.08%
Paris (CAC 40) 3280 3414.72 134.72 4.11%
ASIA
Hang Seng Index 19274 19778 504.00 2.61%
Japan NIKKEI 8566 9069.81 503.81 5.88%
Shanghai Comp 2128 2053.24 (74.76) -3.51%
7 Sept 2012 Investment Montor
AnalysisAnalysisReview & Analysis
DIVIDENDS (27/07/2012 to 27/08/2012) Company Name Ex- Date BC/RD Date Div (%)ABG Shipyard Ltd. Winsome Diamonds and Jewellery Ltd.
Shiv-Vani Oil & Gas Exploration Services Ltd. PG Foils Ltd. JVL Agro Industries Ltd Akar Tools Ltd. Country Club (India) Ltd. Epic Energy Ltd. OCL Iron and Steel Ltd Vaarad Ventures Ltd. Kilitch Drugs (India) Ltd. Eldeco Housing & Inds. Ltd. APL Apollo Tubes Ltd. Parekh Aluminex Ltd. 20-Sep-12 24-Sep-12 40.00Veljan Denison Ltd. Jindal Poly Films Ltd. Murli Industries Ltd. Rishabh Digha Steel & Allied Products Ltd. Brels Infotech Ltd IKF Finance Ltd. Kallam Spinning Mills Ltd. Computer Point Ltd. Motor & General Finance Ltd. Kaycee Industries Ltd. Patel Integrated Logistics Ltd. Mediaone Global Entertainment Ltd. Jindal Photo Ltd. Paramount Cosmetics (India) Ltd. Usher Agro Ltd. Marg Ltd. Sri Adhikari Brothers Television Network Ltd. Metal Coatings (India) Ltd. 21-Sep-12 25-Sep-12 10.00Essel Propack Ltd. Winsome Diamonds and Jewellery Ltd. Navneet Publications (India) Ltd. 20-Sep-12 22-Sep-12 40.00S Mobility Ltd. 50.00Deep Industries Ltd. Priti Mercantile Co Ltd. C Mahendra Exports Ltd. SRS Real Infrastructure Ltd. Aurionpro Solutions Ltd. Cura Technologies Ltd. Ad-Manum Finance Ltd. Midfield Industries Ltd. 25.00RPP Infra Projects Ltd. Madhucon Projects Ltd. Bharat Rasayan Ltd. Siddheswari Garments Ltd. Kalpena Industries Ltd 22.00Haryana Leather Chemicals Ltd. Patel Engineering Ltd. Hindustan Dorr-Oliver Ltd. Competent Automobiles Company Ltd. BLB Ltd. IMP Powers Ltd. Ballarpur Industries Ltd. Vimal Oil & Foods Ltd. Procter & Gamble Hygiene & Health Care Ltd. 225.00AK Capital Services Ltd. 25-Sep-12 27-Sep-12 60.00Karur KCP Packkagings Ltd. 20-Sep-12 24-Sep-12 10.00Daikaffil Chemicals India Ltd. 5.00IVRCL Ltd. ITL Industries Ltd. 20-Sep-12 24-Sep-12 10.00Veer Energy & Infrastructure Ltd. 20-Sep-12 22-Sep-12 6.00Solid Stone Co Ltd 17-Sep-12 19-Sep-12 HCL Infosystems Ltd. Inter State Oil Carrier Ltd. Intellivate Capital Ventures Ltd Sika Interplant Systems Ltd. 21-Sep-12 25-Sep-12 6.00Tera Software Ltd. 20.00Mohit Industries Ltd. 15.00Ashish Polyplast Ltd. 17-Aug-12 22-Aug-12 16.50Chaman Lal Setia Exports Ltd. 16.00Brels Infotech Ltd Gillette India Ltd. 150.00Rolta India Ltd. 30.00Computer Point Ltd. Easun Reyrolle Ltd. 10.00KGN Industries Ltd. 20-Sep-12 23-Sep-12 1.00
Intrasoft Technologies Ltd. 10.00Kakatiya Cement Sugar & Industries Ltd. 18-Sep-12 21-Sep-12 27.00Weizmann Ltd. 21-Sep-12 25-Sep-12 5.00KGN Enterprises Ltd. Panoramic Universal Ltd. Leena Consultancy Ltd. 06-Sep-12 20-Sep-12 Swan Energy Ltd 10-Sep-12 12-Sep-12 15.00GATI Ltd. 25.00Hester Biosciences Ltd. 27-Aug-12 28-Aug-12 10.00Fiem Industries Ltd. 20-Sep-12 22-Sep-12 30.00Amarjothi Spinning Mills Ltd. 20-Sep-12 22-Sep-12 15.00Hanung Toys & Textiles Ltd. 06-Sep-12 08-Sep-12 20.00Hind Industries Ltd. 13-Sep-12 17-Sep-12 3.00Ansal Buildwell Ltd. 18-Sep-12 21-Sep-12 15.00Alchemist Ltd. 20.00Techtran Polylenses Ltd. Aarvee Denims & Exports Ltd. 30-Aug-12 01-Sep-12 5.00SKS Logistics Ltd. 17-Sep-12 20-Sep-12 1.00Zodiac-Jrd-Mkj Ltd. 13-Sep-12 17-Sep-12 5.00Medi-Caps Ltd. 15.00Syncom Formulations (India) Ltd. 6.00Motor & General Finance Ltd. SMS Pharmaceuticals Ltd. Choice International Ltd. 21-Sep-12 25-Sep-12 10.00Ruchi Infrastructure Ltd. 20-Sep-12 22-Sep-12 6.00Kwality Dairy (India) Ltd. 20-Sep-12 22-Sep-12 10.00Jain Irrigation Systems Ltd. 50.00MMTC Ltd. Ganesh Housing Corpn. Ltd. 13-Sep-12 15-Sep-12 12.00Era Infra Engg. Ltd. 20-Sep-12 22-Sep-12 20.00Gravita India Ltd. 05-Sep-12 06-Sep-12 10.00Acrow India Ltd. Empee Distilleries Ltd Metroglobal Ltd. 20-Sep-12 24-Sep-12 20.00Sakuma Exports Ltd. 20-Sep-12 22-Sep-12 10.00M AND B Switchgears Ltd. 28-Aug-12 30-Aug-12 5.00Adhunik Metaliks Ltd.
RECENTLY ANNOUNCED BONUS
RECENTLY ANNOUNCED RIGHTS
Company Name Annc. Date BC/RD Date RatioCastrol India Ltd. 24-Aug-12 05-Sep-12 1:01
Bilpower Ltd. 16-Aug-12 1:01
Acrysil Ltd. 14-Aug-12 1:02
Hester Biosciences Ltd. 14-Aug-12 1:02
Anil Special Steel Inds. Ltd. 14-Aug-12 1:10
Setco Automotive Ltd. 07-Aug-12 17-Aug-12 1:02
Lifeline Drugs & Pharma Ltd. 06-Aug-12 16-Aug-12 4:01
Orissa Minerals Development Co Ltd. 02-Aug-12
Annc. Date BC/RD Date RatioNew Earth Alternate Technologies Ltd. 24-Aug-12
Kesar Enterprises Ltd. 14-Aug-12
Sun Pharma Advanced Research Company Ltd. 13-Aug-12 25-Aug-12 1:07
RECENTLY ANNOUNCED SPLITS
Company Name Rec. Date Old Face Value New Face Value
VTM Ltd. 17-Aug-12 10.00 1.00
Parikh Herbals Ltd. 10-Aug-12 10.00 1.00
Ajanta Pharma Ltd. 10-Aug-12 10.00 5.00
KMF Builders & Developers Ltd. 21-Aug-12 10.00 5.00
Vandana Knitwear Ltd. 03-Aug-12 10.00 1.00
Mutual Fund Activity -1046.2 16054.7FII Activity 6,791.70 1,897.40
Month (till Aug. 28, 2012) Equity (Rs. Cr) Debt (Rs. Cr)
FII/MF ACTIVITY
8 Investment Monitor Sept 2012
Economic IndicatorsEconomic Indicators
Economic Indicators
9 Sept 2012 Investment Montor
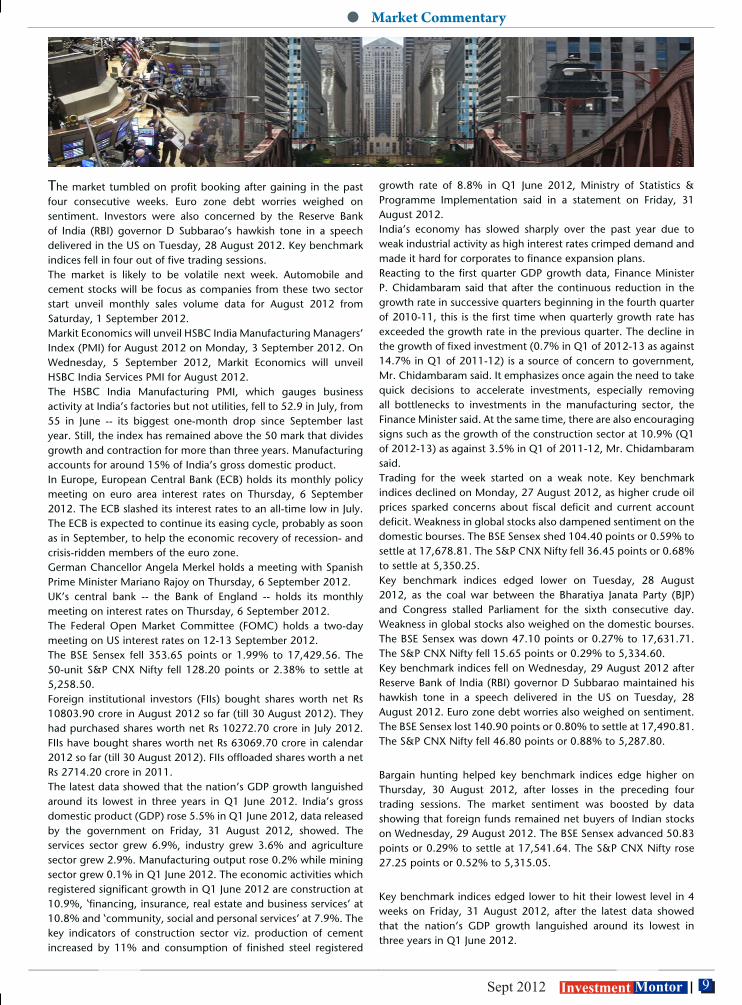
The market tumbled on profit booking after gaining in the past four consecutive weeks. Euro zone debt worries weighed on sentiment. Investors were also concerned by the Reserve Bank of India (RBI) governor D Subbarao’s hawkish tone in a speech delivered in the US on Tuesday, 28 August 2012. Key benchmark indices fell in four out of five trading sessions.The market is likely to be volatile next week. Automobile and cement stocks will be focus as companies from these two sector start unveil monthly sales volume data for August 2012 from Saturday, 1 September 2012.Markit Economics will unveil HSBC India Manufacturing Managers’ Index (PMI) for August 2012 on Monday, 3 September 2012. On Wednesday, 5 September 2012, Markit Economics will unveil HSBC India Services PMI for August 2012.The HSBC India Manufacturing PMI, which gauges business activity at India’s factories but not utilities, fell to 52.9 in July, from 55 in June -- its biggest one-month drop since September last year. Still, the index has remained above the 50 mark that divides growth and contraction for more than three years. Manufacturing accounts for around 15% of India’s gross domestic product.In Europe, European Central Bank (ECB) holds its monthly policy meeting on euro area interest rates on Thursday, 6 September 2012. The ECB slashed its interest rates to an all-time low in July. The ECB is expected to continue its easing cycle, probably as soon as in September, to help the economic recovery of recession- and crisis-ridden members of the euro zone.German Chancellor Angela Merkel holds a meeting with Spanish Prime Minister Mariano Rajoy on Thursday, 6 September 2012.UK’s central bank -- the Bank of England -- holds its monthly meeting on interest rates on Thursday, 6 September 2012.The Federal Open Market Committee (FOMC) holds a two-day meeting on US interest rates on 12-13 September 2012.The BSE Sensex fell 353.65 points or 1.99% to 17,429.56. The 50-unit S&P CNX Nifty fell 128.20 points or 2.38% to settle at 5,258.50.Foreign institutional investors (FIIs) bought shares worth net Rs 10803.90 crore in August 2012 so far (till 30 August 2012). They had purchased shares worth net Rs 10272.70 crore in July 2012. FIIs have bought shares worth net Rs 63069.70 crore in calendar 2012 so far (till 30 August 2012). FIIs offloaded shares worth a net Rs 2714.20 crore in 2011.The latest data showed that the nation’s GDP growth languished around its lowest in three years in Q1 June 2012. India’s gross domestic product (GDP) rose 5.5% in Q1 June 2012, data released by the government on Friday, 31 August 2012, showed. The services sector grew 6.9%, industry grew 3.6% and agriculture sector grew 2.9%. Manufacturing output rose 0.2% while mining sector grew 0.1% in Q1 June 2012. The economic activities which registered significant growth in Q1 June 2012 are construction at 10.9%, ‘financing, insurance, real estate and business services’ at 10.8% and ‘community, social and personal services’ at 7.9%. The key indicators of construction sector viz. production of cement increased by 11% and consumption of finished steel registered
Market Commentary
growth rate of 8.8% in Q1 June 2012, Ministry of Statistics & Programme Implementation said in a statement on Friday, 31 August 2012.India’s economy has slowed sharply over the past year due to weak industrial activity as high interest rates crimped demand and made it hard for corporates to finance expansion plans.Reacting to the first quarter GDP growth data, Finance Minister P. Chidambaram said that after the continuous reduction in the growth rate in successive quarters beginning in the fourth quarter of 2010-11, this is the first time when quarterly growth rate has exceeded the growth rate in the previous quarter. The decline in the growth of fixed investment (0.7% in Q1 of 2012-13 as against 14.7% in Q1 of 2011-12) is a source of concern to government, Mr. Chidambaram said. It emphasizes once again the need to take quick decisions to accelerate investments, especially removing all bottlenecks to investments in the manufacturing sector, the Finance Minister said. At the same time, there are also encouraging signs such as the growth of the construction sector at 10.9% (Q1 of 2012-13) as against 3.5% in Q1 of 2011-12, Mr. Chidambaram said.Trading for the week started on a weak note. Key benchmark indices declined on Monday, 27 August 2012, as higher crude oil prices sparked concerns about fiscal deficit and current account deficit. Weakness in global stocks also dampened sentiment on the domestic bourses. The BSE Sensex shed 104.40 points or 0.59% to settle at 17,678.81. The S&P CNX Nifty fell 36.45 points or 0.68% to settle at 5,350.25.Key benchmark indices edged lower on Tuesday, 28 August 2012, as the coal war between the Bharatiya Janata Party (BJP) and Congress stalled Parliament for the sixth consecutive day. Weakness in global stocks also weighed on the domestic bourses. The BSE Sensex was down 47.10 points or 0.27% to 17,631.71. The S&P CNX Nifty fell 15.65 points or 0.29% to 5,334.60.Key benchmark indices fell on Wednesday, 29 August 2012 after Reserve Bank of India (RBI) governor D Subbarao maintained his hawkish tone in a speech delivered in the US on Tuesday, 28 August 2012. Euro zone debt worries also weighed on sentiment. The BSE Sensex lost 140.90 points or 0.80% to settle at 17,490.81. The S&P CNX Nifty fell 46.80 points or 0.88% to 5,287.80.
Bargain hunting helped key benchmark indices edge higher on Thursday, 30 August 2012, after losses in the preceding four trading sessions. The market sentiment was boosted by data showing that foreign funds remained net buyers of Indian stocks on Wednesday, 29 August 2012. The BSE Sensex advanced 50.83 points or 0.29% to settle at 17,541.64. The S&P CNX Nifty rose 27.25 points or 0.52% to 5,315.05.
Key benchmark indices edged lower to hit their lowest level in 4 weeks on Friday, 31 August 2012, after the latest data showed that the nation’s GDP growth languished around its lowest in three years in Q1 June 2012.
10 Investment Monitor Sept 2012
Global Outlook
Europe:
The euro area crisis has reached a new, critical levelMarket tensions have increased further. Still-pressing banking problems and continuing sovereign funding concerns in some euro area countries have raised doubts about the viability of the monetary union itself. This has driven sovereign borrowing costs and risk premiums to very high levels in several countries, adding to the already-severe pressures on many bank and sovereign balance sheets in an environment of very low confidence and growth.
The adverse bank-sovereign feedback loops at the heart of the crisis have intensified.Concerns about banks’ solvency have increased because of large sovereign exposures, particularly in periphery countries. Some sovereigns, in turn, are struggling to backstop weak banks on their own. Depositor confidence is increasingly fragile. As investors have moved capital “north” and abroad to perceived safer assets, official financing—including in the form of programs and ECB liquidity support—has become more important. This is largely mirrored in widening Target 2 balances between euro area national central banks.
And the single financial market has become increasingly fragmented.Despite low policy rates, credit conditions vary widely among euro area countries. This is mainly due to starkly diverging perceptions of sovereign and banking risks, as well as a drastic decline in interbank activity (as banks reduce cross-border funding, shore up capital and liquidity buffers in their home jurisdiction, and accumulate overnight deposits at the ECB). As a consequence, financing conditions are now the least supportive in countries where the crisis is the most acute.
Against this backdrop, the real economy has been weak, reinforcing adverse bank sovereign feedback loops.GDP was flat in the first quarter of 2012, after contracting at an annualized rate of almost 1 percent in the last quarter of 2011. Demand was depressed, particularly in the periphery countries (Figure 1). Tightening financing conditions and weak confidence held back private investment and consumption, and fiscal consolidation dampened demand further. Consequently, the euro area unemployment rate increased further, to over 11 percent in May, its highest level since the start of EMU. In turn, the weakness in real activity has added to budgetary pressures and the deterioration in banks’ loan portfolios
WEAK OUTLOOK WITH SUBSTANTIAL RISKSWith the crisis deepening, the outlook remains for very low growth. After averaging 1.5 percent in 2011, euro area GD`P growth is expected to be -0.3 and 0.7 percent in 2012 and 2013. A number of factors will weigh on the outlook.
ASIAAsia’s Economic Resilience and AdaptabilityIn the face of this global crisis, we have seen Asia emerge; not just with its global economic standing intact, but with its standing strengthened. It is useful to explore why this is the case and the useful lessons for other regions, including Europe.
The courage and commitment of Thailand and the rest of Asia to undertake extensive reforms, many of them not an easy sell to their people, is an example that others should follow. By reducing corporate, financial, and external vulnerabilities, these reforms helped position Asia as a major engine for global growth. Let me cite two concrete examples:
One, the aggressive restructuring of the nonperforming loans of Asian banks that began a decade or so ago, produced much healthier financial sector balance sheets.
Two, Asia’s vastly improved fiscal positions, both debts and deficits, ensured that countries were able to take a strong policy response, when needed.
So when the financial crisis touched Asian shores in 2008-2009, the region were well prepared. Sure, the crisis hit Asia hard—not surprising for a region that is so well integrated into the global economy. But as a testament to the region’s resilience, Asia bounced back quickly to be a leader of global growth.
This positive story has parallels elsewhere in the region. Since 2009, growth across Asia and the Pacific has been nearly twice as fast as global growth—an average of almost 6 percent a year compared to around 3 percent for the world.And the contrast becomes even starker compared to the astonishing 8 percent growth in emerging and developing Asia. If there is such a thing as economic growth envy, others must have it! Asia is the only region in the world where policymakers fret when growth slows, as it has in some countries, to 6 percent.Taken together, stronger bank balance sheets and stronger fiscal positions have allowed Asia to avoid the downward spiral of weak sovereigns and weak banks that is threatening Europe. I hasten to add that this does not mean that Asia is immune to fresh turbulence in the global economy. In today’s interconnected world, as we well know, crisis does not recognize borders.The main near-term challenge across the region is for policymakers—especially central bankers—to determine how much to loosen policies to support growth, without unleashing domestic vulnerabilities. While the balance naturally varies from country to country, overall there would seem to be ample policy space.
11 Sept 2012 Investment Montor
Indian Economy
Inflation: Inflation is likely to remain sticky around 7 per cent with upside risks emanating from a deficient monsoon. The most serious consequence of inflation is its adverse distributional impact on the poor, people without social security and pensioners. Poor households are unable to maintain the consumption levels at current prices and therefore, they are particularly worse off in an inflationary situation. During 2011-12, growth also slowed down, in part because of high inflation.
Growth: The RBI annual report makes 76 references to growth. The growth outlook for 2012-13 remains weak as combination of global and domestic macroeconomic factors that slowed down growth in the preceding year have persisted and show no signs of getting resolved. Growth during the year is likely to stay below potential for the second consecutive year. The Reserve Bank in its First Quarter Review of Monetary Policy on July 31, 2012, revised downwards its growth projection for 2012-13 to 6.5 per cent from 7.3 per cent.
Government finances: With growth remaining slow, budgetary targets are at risk. On the receipts side, shortfall in indirect tax revenue is possible if growth remains low. With decline in corporate earnings, non-tax revenues from the earnings of public sector units (PSUs) could also fall short of the target. It would be hard to meet the divestment target in current market conditions. More importantly, expenditure overshooting arising from under-provision of petroleum subsidies is likely to put fiscal position under pressure.
India’s trade imbalance: Even though merchandise trade balance in Q1 of 2012-13 narrowed, trends in services trade in Q1 of 2012-13 are disconcerting. Preliminary estimates for Q1 of 2012-13 show services exports at US$33.4 billion, contracting 2 per cent over the year ago period. Services imports at US$20.5 billion, increased by 16 per cent. In net terms, services exports at around US$ 12.9 billion in Q1 of 2012-13 were lower by 22 per cent as compared with those in Q1 of 2011-12. This indicates that the current account deficit (excess imports over exports) CAD risks are maintained in 2012-13.
Monsoon: Newer uncertainties for growth in 2012-13 have emerged from the unsatisfactory progress of monsoon so far which is likely to result in a contraction in food grains output during 2012-13. Despite the recent revival, cumulative rainfall up to August 16, 2012 was 16 per cent deficient. The spatial pattern of monsoon suggests that output losses could be substantial for coarse cereals and pulses, While this year the drought conditions in parts of country are marginally less severe than that during the 2009 drought, the monsoon has been unsatisfactory to a degree that has dampened the prospects for agriculture during 2012-13. During 2009-10, Rabi crop reached record levels, while the Rabi prospects this year remain uncertain and would depend crucially on September rains that will determine the soil moisture content and the reservoir levels.
Investment: New investments have slowed down substantially and existing investments are at risk with elongated gestations and input supply shortages affecting viabilities of projects going on-stream. Reserve Bank’s collation from banks and financial institutions show that envisaged total fixed investment by large firms in new projects which were sanctioned financial assistance during 2011- 12 dropped by 46 per cent to about Rs 2.1 trillion from Rs 3.9 trillion a year ago. Power sector and coal supply: Lower coal production and supply shortages emerged as a major bottleneck in infrastructure sector. As much as 54 giga watts of new power capacity was created during 11th five year plan and another 60-75 GW of capacity may be planned during the 12th five year plan backed in part by Ultra Mega Power Projects (UMPPs). A large part of this new capacity is facing coal linkage issues. It is an anomaly that India with proven coal reserves of 114 billion tonnes has to import about 70 million tonnes of coal. A major investment initiative in India’s mining sector is necessary. Steps to attract FDI in this sector would be helpful in this context. Road sector: Road projects have slowed down due to issues in land acquisition and problems with legal, procedural and environmental clearances. More lately, availability of finance has emerged as an added constraint. Financial conditions have tightened as road construction firms are already leveraged and are unable to raise more debt in absence of fresh equity. In current market conditions these firms are unable to raise new equity. Credit to road sector shows a deceleration in Q1 of 2012-13.
Economic recovery: In absence of signs of global conditions improving, the burden of adjustment would have to be borne by domestic policies. Structural impediments impacting business confidence need to be addressed immediately. This is particularly true of the mining and infrastructure sectors. Such an action would also provide some space for monetary policy, but, importantly, lower interest rates alone are unlikely to jumpstart the investment cycle. Fast-tracking of infrastructure projects and pending regulatory clearances will help to boost investments. The Government has initiated some steps to augment the production potential of core sectors, in particular mining, in the recent period. lot more needs to be done to boost the performance of core industries and lead revival of industrial growth.
Financial inclusion: India scores rather poorly on financial inclusion parameters than the global average, according to a survey. In India, only 35 per cent of people had formal accounts versus an average of 41 per cent in developing economies. India also scored poorly in respect of credit cards, outstanding mortgage, health insurance, adult origination of new loans and mobile banking. The number of no-frills accounts by banks had increased to 103 million by March 2012. However, over three-fourths of such accounts are dormant.
12 Investment Monitor Sept 2012
Industry Analysis
Dismal Performance of PSU banks • In Q1 FY13, private sector banks demonstrated better performance on balance-sheet expansion, stability of margin and asset quality fronts. On deposit mobilization front, each of the private sector banks under coverage (barring ICICI Bank) recorded higher deposit growth than the industry and state-owned banks. Smaller private sector posted much higher expansion in deposit base; among state-owned banks, IOB, PNB and Andhra Bank were ahead of its peers.• Overall, banks’ deposit profile demonstrated weakening with decrease in CASA share. KVB and Andhra Bank surprised with increase in CASA share even in such tight liquidity condition; in case of KVB, current deposit mobilization significantly aided CASA share• Private sector banks under coverage outshined state-owned banks and industry overall in credit disbursements. Smaller private sector banks under coverage were better off due to their lower bases. State-owned banks (under coverage) recorded lesser credit book expansion than the industry overall. Canara Bank moderated its credit growth to further reduce dependence on wholesale advances and short-term corporate loans on unsecured basis• On asset quality front, PSU banks performance was quite dismal with sharp jump in gross slippage ratio. SBI, UBI, Andhra Bank and BoI posted highest increase in slippages ratio on sequential basis. IOB and OBC recorded sequential decline with higher base in Q4 FY12. Private sector banks were better off on this front as well in our coverage universe Though, some of the state-owned banks (under coverage) reported higher credit cost on sequential basis but not enough to maintain PCR. Most of banks under coverage reported sequential decrease in PCR except for OBC, Syndicate Bank and ICICI Bank
Financial Sector Overview
• Most of banks under coverage posted further increase in outstanding restructured loan book except SBI, HDBK, ICICI Bank and KVB. Overall, on asset quality fronts, incrementally PSU banks were further hit with increase in gross slippage ratio, outstanding restructured loan book and decrease in PCR• On margin front, most of banks witnessed sequential fall in margin except for OBC and PNB. Syndicate Bank and BoI reported biggest fall in margin on sequential basis mainly due to larger fall in credit yield on the back of downward revision in rates, much higher slippages and loan restructuring at lesser rates• Sequential decrease in C-D ratio with downward revision in lending rates, re-pricing of liabilities with a lag had negative impact on banks’ margin. Among PSU Banks, Syndicate Bank and Andhra Bank recorded sequential increase in C-D ratio and among private sector banks, HDBK and ICICI Bank posted further
expansion in C-D ratio• On fee income front, most of banks recorded healthy growth on YoY basis; SBI, Syndicate Bank and ICICI Bank were outliers with relatively lesser traction in our coverage universe• Overall, banks under our coverage took a beating on profitability level on sequential basis. OBC, Syndicate Bank, SBI and Andhra Bank recorded improvement in RoA on sequential basis. OBC’s performance was robust all along and could report better performance, but in case of SBI and Andhra Bank, in spite of much higher additions to GNPL, these banks made lesser NPL provisions and took a dent on their PCR. In case of Syndicate Bank, high tax credit succored the profitability Financials - TOP PICKS
ICICI Bank (CMP: Rs. 956, Buy)• ICICI Bank’s traction in business expansion, improvement in margin, reduction in credit cost and decrease in leverage (with expansion in balance-sheet size) would yield higher return ratios going forward• We expect credit book to expand in high teens (e e pec c ed boo o e pa d g ee s 20% CAGR during FY12-14E) driven by SME, retail & working capital requirements• The bank would record NIM in a range of 2.8-2.9% on the back of higher yield on investments, reduction in losses on securitized book, traction in overseas business and stability in CASA deposit share• We expect that the bank’s other income to grow by 17% CAGR over FY12-14E on the back of healthy core fee income• With tier I capital of 12.8% (as on end-June’12), the bank is adequately capitalized. The bank would not be required to raise equity capital in near future• The bank quotes at cheap valuations, hence offer an opportunity to add to the positions. At current price, the stock quotes at 1.8x and 1.7x adjusted book value (ABV) FY13 and FY14 respectively. Based on our price target of ̀ 1,323, the stock will trade at 2.6x and 2.3x ABV FY13 and FY14 respectively
Financials - TOP PICKS
HDFC Bank (CMP: Rs. 596)• HDBK’s diversified credit book with prudent expansion strategy has led to healthy yield and minimal delinquencies. High low-cost deposits share contain erosion in margin and also aides the bank to cross-sale its other products to huge low-cost depositors base. We expect credit to expand faster than the system at CAGR of 21% over FY12-14• Slight re-balancing in credit book in favor of high-yielding assets
13 Sept 2012 Investment Montor
Industry Analysis
aided yield on advances (mainly due to higher composition of retail loan book). Higher asset yield and expansion in CD ratio aided margin. Going forward, we expect NIM to stabilize at 4.2% on yearly average basis• Majority of fee income comes from various retail segment and is quite diversified. Incremental adverse impact on the bank’s fee income would be muted• HDBK demonstrated robust performance on asset quality front; GNPA & restructured loan book remained almost stagnant. The bank has been maintaining most comfortable asset quality amongst the peer group with GNPA at 0.97% and NNPA at 0.2%. Total restructured assets were 0.3% of the bank’s gross advances as of Q1 FY13• At current price, the stock quotes at 4.0x and 3.4x adjusted book value (ABV) FY13E and FY14E respectively. Based on our target price of ̀ 627, the stock would trade at 4.2x and 3.6x ABV FY13E and FY14E respectively
Financials - TOP PICKS
Karur Vysya Bank (CMP: Rs. 401, Buy)• Karur Vysya Bank’s better understanding of clienteles’ business domain and widespread regional presence are the key strengths. Continued robust credit book expansion and contained delinquencies have been key outcomes of the bank’s strengths• We expect the bank’s credit book to expand e e pec e ba s c ed boo o e pa d by 28% cagr in FY12-14 much higher than the industry. Key focus area would be retail trade, SME and agriculture sectors• In Q1 FY13, KVB’s margin drifted by 22bps QoQ to 2.82% on higher cost of funds, however going forward, moderation in deposit growth and increase in credit-deposit ratio would protect erosion in margin. Though, the decline in CASA share remain our near term concern. We factor margin to drift by 26bps to 2.62% (on yearly average basis), as a conservative stance• We expect GNPA to hold in the current level even as the marginal pressure on asset quality would be mitigated by higher recoveries and upgradations• At current price, the stock quotes at 1.4x and 1.3x adjusted book value (ABV) FY13 and FY14 respectively. Based on our price target of ` 512, the stock will trade at 1.8x and 1.6x ABV FY13 and FY14 respectively
Financials - TOP PICKS
Syndicate Bank (CMP: Rs. 95, Buy)• Syndicate Bank’s management plans to expand credit book faster than the industry, in the range of 18-19% and retail credit book would grow at even faster pace of 22%. Key focus area for credit growth would be retail, MSME and mid-corporate. We expect credit book to grow 17.4% CAGR in FY12-14. Faster expansion in retail and MSME books would aid asset yield and margin• The bank plans to increase its CASA share by 100-125 bps to 32% mark. Also, re-pricing of bulk deposits and CD at lesser rated would aid margin erosion in declining interest rate scenario. • The bank’s management expects 15bps decline in margin to 3.25% from 3.4% in FY12. We factor in 10 bps decline in margin to 2.96% (on yearly average basis) primarily due to decline in interest rates and re-pricing lag of liabilities• On the back of higher loan growth and alignment of processing charges with peers, fee income is expected to revive. We expect
the bank’s other income to grow by 13% YoY in FY13• As on June’12, the bank’s asset quality improved on sequential basis; further higher PCR provides comfort for future NPL provisioning. The bank’s management expects to do a substantial recoveries in FY13• At current price, the stock quotes at 0.65x and 0.56x adjusted book value (ABV) FY13 and FY14 respectively. Based on our price target of ̀ 145, the stock will trade at 1.0x and 0.9x ABV FY13 and FY14 respectively
Financials- Q1FY13 Result Analysis
• In Q1FY13, Majority of state-owned banks under coverage recorded healthy credit book expansion. They grew higher than industry barring few names likes OBC, Syndicate Bank, Andhra Bank and Canara Bank. Canara Bank decided to moderate its pace in order to reduce the dependence for growth on wholesale advances and short-term corporate loans on unsecured basis and thereby maintain its asset quality• In the quarter, SCBs’ investment expanded at a pace of 16.7% YoY, while our coverage universe reported 13.6% growth on an average. Majority of growth was contributed by addition of N-SLR investments.• In the quarter, most of banks under coverage recorded much higher traction barring BoI. Slackness in credit demand and banks’ higher base rate led corporates to go for investments. With continuous rise in NPLs, banks are finding investments instruments relatively safer asset on risk-adjusted basis. • In Q1FY13, SCBs’ deposits base expanded by 16.1% YoY and our coverage universe grew at 16.6% on an average. Majority of banks under coverage recorded higher growth than industry barring OBC, Canara Bank, Union Bank and BOI. Smaller private sector banks could report better traction due to base effect. Majority of banks under coverage witnessed sequential decline in their CASA deposits; whereas on YoY basis, most the of banks reported 10-18% growth. On CASA ratio front, all banks under coverage witnessed sequential decline in their CASA ratio except KVB and Andhra Bank
Financials- Q1FY13 Result Analysis (Continued)
• In Q1FY13, considering lack of genuine credit demand, majority of banks was not able to deploy their incremental funds towards credit. Consequently banks’ incremental credit deposit ratio declined on sequential basis. Few banks like OBC, Axis Bank, CUB, PNB, and ICICI Bank recorded expansion in incremental CD ratio. Higher deposit rate, subdued credit demand and diversion of banks’ assets towards investments reflected into slight moderation or decline in CD ratio in majority of the banks• Majority of the banks under coverage recorded robust growth on NII front on yearly basis barring Andhra Bank and Canara Bank which reported single digit growth. Andhra Bank reported merely 3% YoY growth in NII which was mainly due to interest income losses due to restructuring and high slippages. Canara Bank reported lesser growth in NII mainly due to moderation in balance-sheet expansion and difficulty in passing on higher liabilities cost.• On margin front, majority of banks under coverage reported decrease in margin. OBC and PNB recorded improvement in margin on QoQ basis. On YoY basis, most of banks under coverage reported decline in margin except for ICICI Bank, Axis Bank, BOI, HDBK and Syndicate Bank
14 Investment Monitor Sept 2012
Cover Story
COVER
STORY
15 Sept 2012 Investment Montor
Cover Story
COAL SECTORIn India’s energy sector, coal accounts for over 50% of primary commercial energy supply. With the economy poised to grow at the rate of 8–10% per annum, energy requirements will also rise at a level of 6% (approx.). Coal will continue to be a dominant commercial fuel two decades from now and beyond, despite our nuclear energy programme, development of natural gas supplies, increased hydropower generation, and emphasis on renewable. There are many issues with regard to domestic coal production, including its quality, beneficiation of lower grades, transportation to distant consumers, environment impacts (both in mining and burning of coal), efficiency of thermal power plants, and so on. This policy brief, however, focuses on our domestic coal inventories. In other words, how much coal is there underground, how much of it can be extracted, how much do we need to import, and what are the associated energy security implications? India is already considerably short of coking coal for steel plants.
Coal Mining in India: The Past
India has a long history of commercial coal mining covering nearly 220 years starting from 1774 by M/s Sumner and Heatly of East India Company in the Raniganj Coalfield along the Western bank of river Damodar. However, for about a century the growth of Indian coal mining remained sluggish for want of demand but the introduction of steam locomotives in 1853 gave a fillip to it. Within a short span, production rose to an annual average of 1 million tonne (mt) and India could produce 6.12 mts. per year by 1900 and 18 mts per year by 1920. The production got a sudden boost from the First World War but went through a slump in the early thirties. The production reached a level of 29 mts. by 1942 and 30 mts. by 1946.
With the advent of Independence, the country embarked upon the 5-year development plans. At the beginning of the 1st Plan, annual production went upto 33 mts. During the 1st Plan period itself, the need for increasing coal production efficiently by systematic and scientific development of the coal industry was being felt. Setting up of the National Coal Development Corporation (NCDC), a Government of India Undertaking in 1956 with the collieries owned by the railways as its nucleus was the first major step towards planned development of Indian Coal Industry. Along with the Singareni Collieries Company Ltd. (SCCL) which was already in operation since 1945 and which became a Government company under the control of Government of Andhra Pradesh in 1956, India thus had two Government coal companies in the fifties. SCCL is
now a joint undertaking of Government of Andhra Pradesh and Government of India sharing its equity in 51:49 ratio.
Current Issue of Coal Scam in India
After coal nationalization in 1973, public sector Coal India Limited was accorded sole rights to extract coal. But CIL has been failing to supply coal in the required quantities to end users
Hence, to augment production of coal, UPA-I government decided to go for allocation of some coal blocks to a few major end users for captive use (that is, no outside sale permitted), starting 2004.
However, instead of competitive bidding, the government went for selective allocation by a ‘screening committee’, largely comprising government officials, on the basis of recommendations by various ministries and State governments.
CAG considers this method of allocation ‘non-transparent’, as it provides exclusive access to coal blocks to only a few favored parties. According to the CAG, competitive auction of coal could have fetched an additional INR 1.86 lakh crore of revenue to the government. Thus, the nation lost and the favored private players gained that amount.
The opposition parties allege corruption on the part of the government in choosing this method of allocation. The government, on the other hand, argues that the Coal Nationalization Act does not leave any scope for open bidding for commercial purposes by private parties.
Without the Act being amended, only captive allocation is possible, it argues. But the Act could not be modified in the face of strong opposition from the Left parties and trade unions. The legal position on whether open bidding for captive allocation was permissible under the Act was not clear in 2004.
In India, 80% of mining is in coal and the balance 20% is in various metals and other raw materials such as gold, copper, iron, lead, bauxite, zinc and uranium. Coal has been a major contributor in providing energy security during the past century. But it is not a renewable resource, one day it will exhaust. It is possible that this pattern may change and there could be emphasis on uranium and thorium based power plants during the later part of the 21st century in addition to the emphasis on renewable energy sources.
Nationalization of Coal Mines
Right from its genesis, the commercial coal mining in modern times in India has been dictated by the needs of the domestic consumption. On account of the growing needs of the steel industry,
16 Investment Monitor Sept 2012
Cover Story
a thrust had to be given on systematic exploitation of coking coal reserves in Jharia Coalfield. Adequate capital investment to meet the burgeoning energy needs of the country was not forthcoming from the private coal mine owners. Unscientific mining practices adopted by some of them and poor working conditions of labour in some of the private coal mines became matters of concern for the Government. On account of these reasons, the Central Government took a decision to nationalize the private coal mines. The nationalization was done in two phases, the first with the coking coal mines in 1971-72 and then with the non-coking coal mines in 1973. In October, 1971, the Coking Coal Mines (Emergency Provisions) Act, 1971 provided for taking over in public interest of the management of coking coal mines and coke oven plants pending nationalization. This was followed by the Coking Coal Mines (Nationalization) Act, 1972 under which the coking coal mines and the coke oven plants other than those with the Tata Iron & Steel Company Limited and Indian Iron & Steel Company Limited, were nationalized on 1.5.1972 and brought under the Bharat Coking Coal Limited (BCCL), a new Central Government Undertaking. Another enactment, namely the Coal Mines (Taking Over of Management) Act, 1973, extended the right of the Government of India to take over the management of the coking and non-coking coal mines in seven States including the coking coal mines taken over in 1971. This was followed by the nationalization of all these mines on 1.5.1973 with the enactment of the Coal Mines (Nationalization Right from its genesis, the commercial coal mining in modern times in India has been dictated by the needs of the domestic consumption. On account of the growing needs of the steel industry, a thrust had to be given on systematic exploitation of coking coal reserves in Jharia Coalfield. Adequate capital investment to meet the burgeoning energy needs of the country was not forthcoming from the private coal mine owners. Unscientific mining practices adopted by some of them and poor working conditions of labour in some of the private coal mines became matters of concern for the Government. On account of these reasons, the Central Government took a decision to nationalize the private coal mines. The nationalization was done in two phases, the first with the coking coal mines in 1971-72 and then with the non-coking coal mines in 1973. In October, 1971, the Coking Coal Mines (Emergency Provisions) Act, 1971 provided for taking over in public interest of the management of coking coal mines and coke oven plants pending nationalization. This was followed by the Coking Coal Mines (Nationalization) Act, 1972 under which the coking coal mines and the coke oven plants other than those with
the Tata Iron & Steel Company Limited and Indian Iron & Steel Company Limited, were nationalized on 1.5.1972 and brought under the Bharat Coking Coal Limited (BCCL), a new Central Government Undertaking. Another enactment, namely the Coal Mines (Taking Over of Management) Act, 1973, extended the right of the Government of India to take over the management of the coking and non-coking coal mines in seven States including the coking coal mines taken over in 1971. This was followed by the nationalization of all these mines on 1.5.1973 with the enactment of the Coal Mines (Nationalization Right from its genesis, the commercial coal mining in modern times in India has been dictated by the needs of the domestic consumption. On account of the growing needs of the steel industry, a thrust had to be given on systematic exploitation of coking coal reserves in Jharia Coalfield. Adequate capital investment to meet the burgeoning energy needs of the country was not forthcoming from the private coal mine owners. Unscientific mining practices adopted by some of them and poor working conditions of labour in some of the private coal mines became matters of concern for the Government. On account of these reasons, the Central Government took a decision to nationalize the private coal mines. The nationalization was done in two phases, the first with the coking coal mines in 1971-72 and then with the non-coking coal mines in 1973. In October, 1971, the Coking Coal Mines (Emergency Provisions) Act, 1971 provided for taking over in public interest of the management of coking coal mines and coke oven plants pending nationalization. This was followed by the Coking Coal Mines (Nationalization) Act, 1972 under which the coking coal mines and the coke oven plants other than those with the Tata Iron & Steel Company Limited and Indian Iron & Steel Company Limited, were nationalized on 1.5.1972 and brought under the Bharat Coking Coal Limited (BCCL), a new Central Government Undertaking. Another enactment, namely the Coal Mines (Taking Over of Management) Act, 1973, extended the right of the Government of India to take over the management of the coking and non-coking coal mines in seven States including the coking coal mines taken over in 1971. This was followed by the nationalization Right from its genesis, the commercial coal mining in modern times in India has been dictated by the needs of the domestic consumption. On account of the growing needs of the steel industry, a thrust had to be given on systematic exploitation of coking coal reserves in Jharia Coalfield. Adequate capital investment to meet the burgeoning energy needs of the country was not forthcoming from the private coal mine owners. Unscientific mining practices
17 Sept 2012 Investment Montor
Cover Story
adopted by some of them and poor working conditions of labour in some of the private coal mines became matters of concern for the Government. On account of these reasons, the Central Government took a decision to nationalize the private coal mines. The nationalization was done in two phases, the first with the coking coal mines in 1971-72 and then with the non-coking coal mines in 1973. In October, 1971, the Coking Coal Mines (Emergency Provisions) Act, 1971 provided for taking over in public interest of the management of coking coal mines and coke oven plants pending nationalization. This was followed by the Coking Coal Mines (Nationalization) Act, 1972 under which the coking coal mines and the coke oven plants other than those with the Tata Iron & Steel Company Limited and Indian Iron & Steel Company Limited, were nationalized on 1.5.1972 and brought under the Bharat Coking Coal Limited (BCCL), a new Central Government Undertaking. Another enactment, namely the Coal Mines (Taking Over of Management) Act, 1973, extended the right of the Government of India to take over the management of the coking and non-coking coal mines in seven States including the coking coal mines taken over in 1971. This was followed by the nationalization of all these mines on 1.5.1973 with the enactment of the Coal Mines (Nationalization) Act, 1973 which now is the piece of Central legislation determining the eligibility of coal mining in India.sation of all these mines on 1.5.1973 with the enactment of the Coal Mines (Nationalization) Act, 1973 which now is the piece of Central legislation determining the eligibility of coal mining in India.on) Act, 1973 which now is the piece of Central legislation determining the eligibility of coal mining in India. On) Act, 1973 which now is the piece of Central legislation determining the eligibility of coal mining in India.
Coal imports and its energy security implications
The quantities required under different scenarios vis-à-vis current internationally traded volumes as projected by the IEP report are significant. If our coal production gets further curtailed due to paucity of reserves, then the need for imports increases correspondingly. In recent years, several countries (such as Germany, UK, Poland) have downgraded their reserve base, with overall world reserves of coal having reduced from 10,000 BT to 4,200 BT over 25 years (till 2007). The ability to import large quantities of coal is therefore getting increasingly restricted, and thereby impacting our energy security. This is being mitigated to some extent by the acquisition of coal mines abroad. Nonetheless, coal security needs to be given the same—if not higher—importance as oil security, as the sources of imported
coal, are limited to just three or four countries, unlike oil. Also large imports by China will tighten supplies and prices.
Coal: Choice for Indian Energy
Coal is the most important & abundant fossil fuel in India and accounts for 55% of India’s energy need. India’s industrial heritage was built upon indigenous coal largely mined in the eastern and the central regions of the country. India is, however, poorly endowed with oil assets and has to depend on crude imports to meet a major share of its needs (around 70 percent). A large population of India in the rural areas depends on traditional sources of energy such as firewood, animal dung and biomass. The usage of such sources of energy is estimated at around 155 mtoe per annum or approximately 47 percent of total primary energy use.
Coal has been recognized as the most important source of energy for electricity generation in India. About 75% of the coal in India is consumed in the power sector. In addition, other industries like steel, cement, fertilizers, chemicals, paper and thousands of medium and small-scale industries are also dependent on coal for their process and energy requirements. In the transport sector, though direct consumption of coal by the Railways is almost negligible on account of phasing out of steam locomotives, the energy requirement for electric traction is still dependent on coal converted into electric power.
The coal reserves of India up to the depth of 1200 m have been estimated by the Geological Survey of India at 247.85 billion tonnes as on January 1, 2005 of which 92 billion tonnes are proven. Hard coal deposits spread over 27 major coalfields are mainly confined to eastern and south central parts of India.
The lignite reserves in India are estimated at around 36 billion tonnes, of which 90% occur in the southern State of Tamil Nadu. 4150 million tonnes (mt) spread over 480 sq km is in the Neyveli Lignite fields in Cuddalore District of which around 2360 Mt have been proved. Geological reserves of about 1168 mof lignite have been identified in Jayamkondacholapuram of Trichy District of Tamilnadu. In Mannargudi and East of Veeranam, geological reserves of around 22661.62 Mt and 1342.45 mt of lignite have been estimated respectively. Other states where lignite deposits have been located are Rajasthan, Gujarat, Kerala, Jammu and Kashmir and Union Territory of Pondicherry.
Inspite of various policy initiatives to diversify the fuel mix but considering the limited reserve potentiality of petroleum & natural gas, eco-conservation restriction on hydel project and geo-
18 Investment Monitor Sept 2012
Cover Story
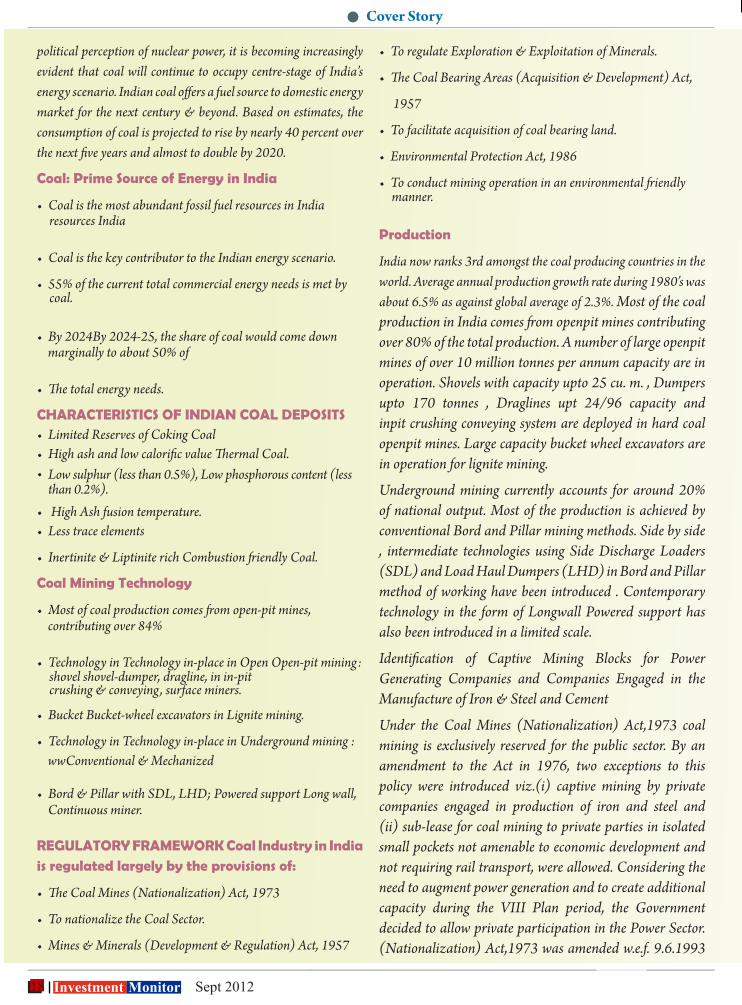
political perception of nuclear power, it is becoming increasingly evident that coal will continue to occupy centre-stage of India’s energy scenario. Indian coal offers a fuel source to domestic energy market for the next century & beyond. Based on estimates, the consumption of coal is projected to rise by nearly 40 percent over the next five years and almost to double by 2020.
Coal: Prime Source of Energy in India
• Coal is the most abundant fossil fuel resources in India
• Coal is the key contributor to the Indian energy scenario.
• 55% of the current total commercial energy needs is met by
• By 2024By 2024-25, the share of coal would come down
• The total energy needs.
CHARACTERISTICS OF INDIAN COAL DEPOSITS• Limited Reserves of Coking Coal• High ash and low calorific value Thermal Coal.• Low sulphur (less than 0.5%), Low phosphorous content (less
• High Ash fusion temperature.• Less trace elements
• Inertinite & Liptinite rich Combustion friendly Coal.
Coal Mining Technology
• Most of coal production comes from open-pit mines,
• Technology in Technology in-place in Open Open-pit mining:
• Bucket Bucket-wheel excavators in Lignite mining.
• Technology in Technology in-place in Underground mining :
• Bord & Pillar with SDL, LHD; Powered support Long wall,
REGULATORY FRAMEWORK Coal Industry in India is regulated largely by the provisions of:
• The Coal Mines (Nationalization) Act, 1973
• To nationalize the Coal Sector.
• Mines & Minerals (Development & Regulation) Act, 1957
• To regulate Exploration & Exploitation of Minerals.
• The Coal Bearing Areas (Acquisition & Development) Act,
1957
• To facilitate acquisition of coal bearing land.
• Environmental Protection Act, 1986
• To conduct mining operation in an environmental friendly
Production
India now ranks 3rd amongst the coal producing countries in the world. Average annual production growth rate during 1980’s was about 6.5% as against global average of 2.3%. Most of the coal production in India comes from openpit mines contributing over 80% of the total production. A number of large openpit mines of over 10 million tonnes per annum capacity are in operation. Shovels with capacity upto 25 cu. m. , Dumpers upto 170 tonnes , Draglines upt 24/96 capacity and inpit crushing conveying system are deployed in hard coal openpit mines. Large capacity bucket wheel excavators are in operation for lignite mining.
Underground mining currently accounts for around 20% of national output. Most of the production is achieved by conventional Bord and Pillar mining methods. Side by side , intermediate technologies using Side Discharge Loaders (SDL) and Load Haul Dumpers (LHD) in Bord and Pillar method of working have been introduced . Contemporary technology in the form of Longwall Powered support has also been introduced in a limited scale.
Identification of Captive Mining Blocks for Power Generating Companies and Companies Engaged in the Manufacture of Iron & Steel and Cement
Under the Coal Mines (Nationalization) Act,1973 coal mining is exclusively reserved for the public sector. By an amendment to the Act in 1976, two exceptions to this policy were introduced viz.(i) captive mining by private companies engaged in production of iron and steel and (ii) sub-lease for coal mining to private parties in isolated small pockets not amenable to economic development and not requiring rail transport, were allowed. Considering the need to augment power generation and to create additional capacity during the VIII Plan period, the Government decided to allow private participation in the Power Sector. (Nationalization) Act,1973 was amended w.e.f. 9.6.1993
than 0.2%).
resources India
coal.
marginally to about 50% of
contributing over 84%
shovel shovel-dumper, dragline, in in-pit crushing & conveying, surface miners.
wwConventional & Mechanized
Continuous miner.
manner.

19 Aug 2012 Investment Montor
Visit us at : www.rrfinance.com www.rrfcl.com
JUST A FEW MOMENTS OF YOURS…1. The financial magazine(s) I read regularly are .....................................…..2. I came to know about “Investment Monitor “from:
A) Financial Advisor b) Newstands c) Friends/Colleague d) Advertise-ment
3. I am Subscribing to the “Investment Monitor” Because......................................................................................................................................................................................................................................................................4. In Investment Monitor” the section I like most ....................................................................................................................................................................................................................................................................................5. This Magazine has helped me in investing in: a) Fixed Deposits b) Mutual Funds c) Shares d) Insurance e) Tax Planning f) Commodities g) Derivatives6. For Improvement of this magazine, my suggestion are:..................................................................................................................
HELP US TO SERVE YOU BETTER
20 Investment Monitor Sept 2012
Stock Market Monitor
In Stock Market Monitor we have covered over 1200 companies appropriately classified into various sectors (109 in numbers). Each sector is given an unique code. The data aims to provide an insight into the financial health of the companies.
The data of each sector is divided into 3 portions - Full year, Latest Quarter and Current data. This database is packed with powerful features necessary for fundament research on any company.
The fields that we have covered are explained below:
Year End• Year End - The first two digits show the year while the last 2 digits show the calendar month. E.g. 0903 show March 2009 results. Equity - The latest fully paid equity capital of the company. • Net Sales - Net revenue earned by the company during the year.• Net sales growth – YoY Sales growth reported by the company during the year.• EBITDA - Operating profit earned during the year.• EBITDA % - Operating profit margin.• PAT - Net Profit reported by the company.• EPS - Earning per share during the year.• RONW (%) - Return on net worth. • ROCE (%) - Return on Capital Employed
Quarter End• Qtr End - The first two digits show the year while the last 2 digits show the ncalendar month. E.g. 0903 show March 2009 results.• Net Sales - Net revenue earned by the company during the quarter.• Net sales growth - YoY Sales growth reported by the company during the quarter.• EBITDA % - Operating profit margin.• PAT % Profit after tax margin.• EPS Un-annualised earning per share during the quarter.Current Data• CMP - Current market price is the closing price as on the particular day. • 52 W H - 52 high price of the stock on BSE.• 52W L - 52 low price of the stock on BSE.• Market Cap. - Market Capitalization is calculated by multiplying the number of equity shares outstanding by the current market price. • Promoters Holding Latest Promoter’s holding
LEG
END
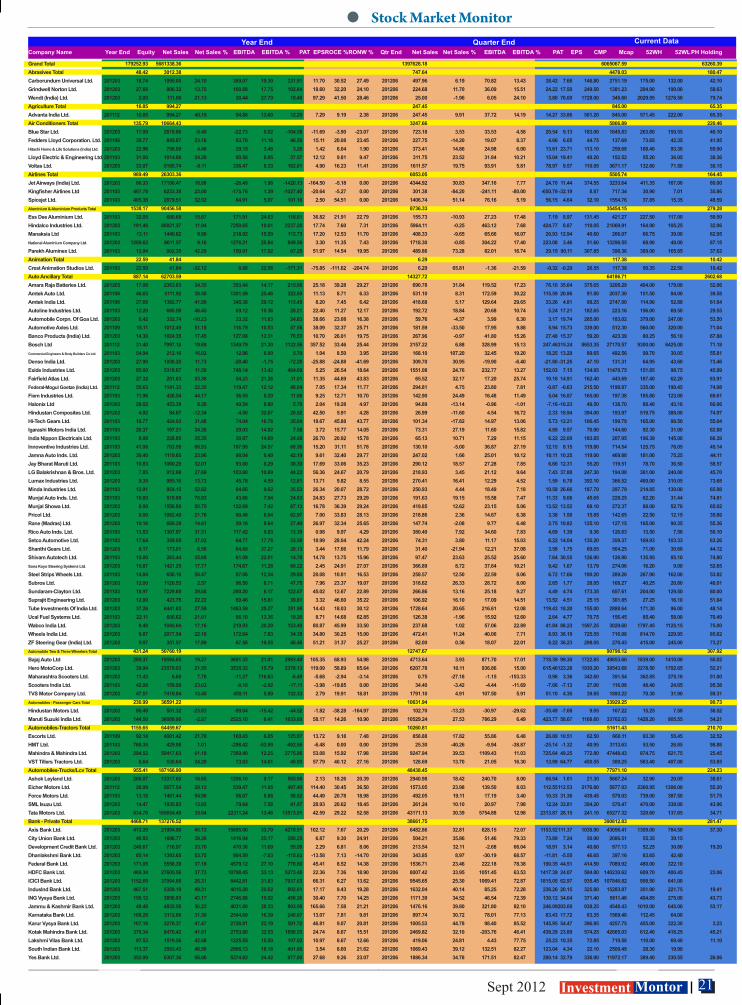
21 Sept 2012 Investment Montor
Stock Market Monitor
Company Name Year End Equity Net Sales Net Sales % EBITDA EBITDA % PAT EPS ROCE % RONW % Qtr End Net Sales Net Sales % EBITDA EBITDA % PAT EPS CMP Mcap 52WH 52WL PH Holding
Grand Total 179252.93 5681338.36 1397628.18 6065067.59 63260.39Abrasives Total 48.42 3012.38 747.64 4478.03 180.47Carborundum Universal Ltd. 201203 18.74 1995.00 24.10 389.07 19.30 231.91 11.70 30.52 27.49 201206 497.96 6.19 70.82 13.43 38.42 7.66 146.80 2751.19 175.00 132.00 42.10Grindwell Norton Ltd. 201203 27.68 906.32 13.75 160.68 17.75 102.84 18.60 32.20 24.10 201206 224.68 11.70 36.09 15.51 24.22 17.50 249.50 1381.23 294.90 190.00 58.63Wendt (India) Ltd. 201203 2.00 111.06 21.13 30.44 27.70 19.46 97.29 41.50 28.46 201206 25.00 -1.96 6.05 24.10 3.80 76.00 1728.00 345.60 2029.95 1278.50 79.74Agriculture Total 16.85 994.27 247.45 845.00 65.35Advanta India Ltd. 201112 16.85 994.27 40.19 94.88 13.60 12.29 7.29 9.19 2.38 201206 247.45 9.91 37.72 14.19 14.27 33.86 501.20 845.00 571.45 222.00 65.35Air Conditioners Total 135.79 10664.43 3247.66 5866.89 220.46Blue Star Ltd. 201203 17.99 2819.86 -5.40 -22.73 0.02 -104.58 -11.69 -3.90 -23.07 201206 723.18 3.53 33.53 4.58 20.54 9.13 183.00 1645.83 263.80 150.55 40.10Fedders Lloyd Corporation. Ltd. 201106 30.77 845.87 23.16 93.70 11.16 46.50 15.11 20.08 23.45 201206 227.75 -14.20 19.07 8.37 4.66 6.05 44.75 137.69 73.65 42.35 41.95Hitachi Home & Life Solutions (India) Ltd. 201203 22.96 798.09 4.46 29.15 3.46 3.26 1.42 6.04 1.90 201206 373.41 14.86 24.98 6.00 13.61 23.71 113.10 259.68 188.40 93.30 69.90Lloyd Electric & Engineering Ltd. 201103 31.00 1014.88 24.20 90.58 8.95 37.57 12.12 9.81 9.47 201206 311.75 23.52 31.84 10.21 15.04 19.41 49.20 152.52 55.20 36.05 38.36Voltas Ltd. 201203 33.07 5185.74 -0.11 336.47 8.33 162.01 4.90 16.23 11.41 201206 1611.57 19.75 93.91 5.81 78.97 9.57 110.95 3671.17 132.60 71.50 30.15Airlines Total 989.49 26303.36 6053.05 5505.74 164.45Jet Airways (India) Ltd. 201203 86.33 17190.47 16.88 -26.49 1.96 -1420.13 -164.50 -5.18 0.00 201206 4344.92 30.83 347.16 7.77 24.70 11.44 374.55 3233.64 411.35 167.00 80.00Kingfisher Airlines Ltd 201103 497.78 6233.38 23.00 -175.76 1.39 -1027.40 -20.64 -5.27 0.00 201206 301.38 -84.20 -241.11 -80.00 -650.79 -32.19 8.87 717.34 30.90 7.01 35.86Spicejet Ltd. 201103 405.38 2879.51 32.02 64.91 5.07 101.16 2.50 54.51 0.00 201206 1406.74 51.14 76.16 5.19 56.15 4.64 32.10 1554.76 37.85 15.35 48.59Aluminium & Aluminium Products Total 1538.17 90456.58 8736.33 35454.15 279.28Ess Dee Aluminium Ltd. 201103 32.05 680.68 15.67 171.91 24.63 118.01 36.82 21.91 22.79 201206 155.73 -10.93 27.23 17.48 7.19 8.97 131.45 421.27 227.50 117.00 59.50Hindalco Industries Ltd. 201203 191.46 80821.37 11.94 7250.65 10.61 2237.20 17.74 7.60 7.31 201206 5964.11 -0.25 463.12 7.68 424.77 8.87 110.05 21069.91 164.90 105.25 32.06Manaksia Ltd 201103 13.11 1440.62 9.90 218.92 15.59 112.73 17.20 12.53 11.70 201206 408.33 -9.65 65.66 16.07 20.93 12.94 40.60 266.07 66.75 39.00 62.95National Aluminium Company Ltd. 201203 1288.62 6611.57 9.16 1276.21 25.84 849.50 3.30 11.35 7.43 201206 1718.30 -0.85 304.22 17.40 223.08 3.46 51.60 13298.55 68.90 48.00 87.15Parekh Aluminex Ltd. 201103 12.94 902.35 42.29 159.91 17.92 67.25 51.97 14.54 19.95 201206 489.86 73.28 82.01 16.74 29.15 90.11 307.85 398.36 389.00 165.85 37.62Animation Total 22.59 41.84 6.29 117.38 10.42Crest Animation Studios Ltd. 201103 22.59 41.84 -32.12 8.88 22.56 -171.31 -75.85 -111.62 -204.74 201206 6.29 65.81 -1.36 -21.59 -0.32 -0.29 26.55 117.38 50.35 22.50 10.42Auto Ancillary Total 887.14 62703.59 14327.72 64186.71 2602.68Amara Raja Batteries Ltd. 201203 17.08 2363.83 34.35 353.44 14.17 215.06 25.18 39.28 29.27 201206 690.78 31.84 119.52 17.23 76.10 35.64 375.65 3208.29 404.00 179.00 52.06Amtek Auto Ltd. 201106 46.63 5111.92 38.50 1301.59 25.46 322.60 11.13 8.71 6.33 201206 531.10 8.31 172.59 30.22 115.59 20.96 91.80 2037.30 151.50 84.00 39.58Amtek India Ltd. 201106 27.68 1382.77 41.90 348.38 29.12 113.45 8.20 7.45 6.42 201206 418.68 5.17 129.64 29.65 33.26 4.81 99.25 2747.00 114.90 52.88 61.64Autoline Industries Ltd. 201103 12.20 660.59 46.45 69.12 10.36 28.21 22.40 11.27 12.17 201206 192.72 18.84 20.68 10.74 5.24 17.21 182.65 223.16 196.00 69.50 29.55Automobile Corpn. Of Goa Ltd. 201203 6.42 332.74 -10.23 33.32 11.63 24.83 38.66 23.08 16.38 201206 59.76 -4.37 3.99 6.30 3.17 19.74 285.00 183.02 379.00 247.00 53.50Automotive Axles Ltd. 201109 15.11 1012.49 51.18 116.79 10.53 57.56 38.09 32.37 25.71 201206 181.59 -33.50 17.95 9.88 5.94 15.73 339.00 512.30 560.00 320.00 71.04Banco Products (India) Ltd. 201203 14.30 1024.35 17.45 127.08 12.31 76.53 10.70 26.01 19.75 201206 267.96 -0.97 41.80 15.26 27.48 15.37 59.20 423.39 80.25 56.10 67.88Bosch Ltd 201112 31.40 7997.18 19.69 1349.79 21.30 1122.56 357.52 33.46 25.44 201206 2157.22 6.88 328.99 15.13 247.46 315.24 8653.35 27170.57 9300.00 6425.00 71.18Commercial Engineers & Body Builders Co Ltd. 201103 54.94 212.16 16.02 12.96 6.90 5.70 1.04 8.50 3.95 201206 168.10 107.20 32.45 19.20 18.25 13.29 89.65 492.56 99.70 30.05 55.81Denso India Ltd. 201203 27.90 1036.20 11.73 -28.40 -1.75 -72.20 -25.88 -24.88 -41.69 201206 309.70 30.95 -19.90 -6.40 -21.80 -31.25 47.10 131.31 64.95 43.60 73.46Exide Industries Ltd. 201203 85.00 5318.67 11.59 748.14 13.42 464.69 5.25 26.54 18.64 201206 1551.08 24.76 232.77 13.27 152.03 7.15 134.95 11470.75 151.85 98.75 45.99Fairfield Atlas Ltd. 201203 27.32 251.63 53.36 54.23 21.26 31.01 11.35 44.69 43.83 201206 65.52 32.17 17.20 25.74 10.18 14.91 162.40 443.69 187.40 62.20 83.91Federal-Mogul Goetze (India) Ltd. 201112 55.63 1141.33 22.35 119.47 12.12 48.04 7.05 17.34 11.77 201206 294.81 4.75 23.80 7.81 -0.87 -0.63 215.50 1198.87 335.00 190.45 74.98Fiem Industries Ltd. 201103 11.96 426.54 44.17 36.55 8.20 11.06 9.25 12.71 10.70 201206 142.90 24.49 16.48 11.49 5.04 16.87 165.00 197.38 185.80 123.00 69.61Halonix Ltd 201203 28.02 453.39 8.26 40.54 8.80 5.70 2.04 19.28 4.97 201206 94.89 -13.14 -0.96 -1.01 -7.16 -10.23 49.50 138.70 88.40 43.10 66.06Hindustan Composites Ltd. 201203 4.92 84.67 -12.34 -4.50 32.67 20.92 42.50 5.91 4.28 201206 26.99 -11.60 4.54 16.72 2.33 18.94 394.00 193.97 519.75 388.00 74.97Hi-Tech Gears Ltd. 201103 18.77 424.93 31.68 74.04 16.76 35.04 18.67 45.88 43.77 201206 101.34 -17.82 14.97 13.06 5.73 12.21 106.45 199.79 165.00 98.50 55.04Igarashi Motors India Ltd. 201103 20.37 197.21 24.26 29.03 14.92 7.58 3.72 15.77 14.05 201206 73.31 27.19 11.60 15.82 4.89 9.57 70.90 144.60 92.30 31.00 62.88India Nippon Electricals Ltd. 201103 8.08 228.85 35.35 30.87 14.69 24.68 26.70 20.92 15.78 201206 65.13 10.71 7.29 11.15 6.22 22.00 183.85 207.95 196.39 145.00 66.39Innoventive Industries Ltd. 201103 41.06 703.58 66.93 167.95 24.57 68.36 15.20 31.11 51.78 201206 130.10 -5.00 36.87 27.19 12.15 8.15 119.80 714.54 125.75 76.05 45.14Jamna Auto Inds. Ltd. 201203 39.40 1119.65 23.96 98.04 8.49 42.19 9.61 32.40 29.77 201206 247.02 1.66 25.01 10.12 10.11 10.25 119.00 469.88 181.00 75.25 44.11Jay Bharat Maruti Ltd. 201103 10.83 1060.29 32.01 93.00 8.29 38.30 17.69 33.06 35.23 201206 290.12 18.57 27.28 7.85 6.66 12.31 55.20 119.51 78.70 36.50 58.57LG Balakrishnan & Bros. Ltd. 201203 7.85 912.68 27.69 103.60 10.69 44.23 56.36 24.67 20.79 201206 218.93 3.45 21.12 9.64 7.43 37.88 247.30 194.08 361.00 240.00 45.70Lumax Industries Ltd. 201203 9.35 985.16 13.73 45.78 4.59 12.81 13.71 9.82 8.55 201206 270.41 16.41 12.29 4.52 1.59 6.78 392.10 366.52 460.00 310.05 73.68Minda Industries Ltd. 201103 12.91 954.15 52.62 84.66 9.62 35.53 26.34 20.07 28.72 201206 250.93 4.44 18.49 7.18 10.58 26.66 187.70 297.79 214.85 130.00 65.98Munjal Auto Inds. Ltd. 201103 10.00 519.89 78.83 43.66 7.94 24.83 24.83 27.73 29.29 201206 191.63 19.15 15.58 7.47 11.33 9.06 45.65 228.25 62.20 31.44 74.81Munjal Showa Ltd. 201203 8.00 1556.88 20.75 122.69 7.42 67.13 16.78 36.39 29.24 201206 419.85 12.62 23.15 5.06 13.52 13.52 68.10 272.37 88.00 52.70 65.02Pricol Ltd. 201203 9.00 1082.49 21.76 90.48 8.04 62.97 7.00 33.83 28.13 201206 218.86 2.36 14.67 6.38 3.38 1.50 15.85 142.65 22.50 12.15 35.66Rane (Madras) Ltd. 201203 10.16 669.29 14.61 59.16 8.64 27.40 26.97 32.34 25.65 201206 147.74 -2.08 9.77 6.48 2.75 10.82 125.10 127.15 165.00 90.35 55.36Rico Auto Inds. Ltd. 201103 13.53 1307.97 31.51 117.42 9.93 13.30 0.98 9.97 4.29 201206 380.40 7.92 34.60 7.83 4.69 1.39 9.36 126.63 13.50 7.56 50.10Setco Automotive Ltd. 201103 17.64 359.05 37.02 64.77 17.78 33.50 18.99 28.04 42.24 201206 74.31 3.80 11.17 15.03 6.22 14.04 135.20 359.37 169.93 103.33 63.26Shanthi Gears Ltd. 201203 8.17 173.01 6.56 64.89 37.27 28.13 3.44 17.66 11.79 201206 31.40 -21.94 12.21 37.08 3.58 1.75 69.05 564.25 71.00 30.60 44.12Shivam Autotech Ltd. 201103 10.00 263.44 35.68 61.09 22.01 14.78 14.78 13.75 15.96 201206 97.47 23.63 25.52 25.60 7.64 30.55 126.90 126.90 135.95 85.10 74.80Sona Koyo Steering Systems Ltd. 201203 19.87 1421.25 17.77 174.67 11.28 60.22 2.45 24.91 27.07 201206 366.89 8.72 37.64 10.21 9.42 1.67 13.79 274.06 16.20 9.00 52.65Steel Strips Wheels Ltd. 201103 14.84 656.16 56.47 87.06 12.34 29.80 20.08 10.81 16.53 201206 258.57 12.50 22.59 8.06 6.72 17.66 190.20 289.26 267.90 162.00 53.82Subros Ltd. 201203 12.00 1120.53 2.57 96.50 8.71 47.75 7.96 23.37 19.07 201206 318.62 26.33 28.72 8.00 2.65 1.77 28.05 168.27 40.25 20.80 40.01Sundaram-Clayton Ltd. 201103 18.97 7229.68 39.68 290.20 6.17 122.67 45.02 12.67 22.89 201206 266.86 13.16 25.18 9.27 4.49 4.74 173.35 657.61 204.00 129.50 80.00Suprajit Engineering Ltd. 201203 12.00 423.75 22.22 69.46 15.81 39.81 3.32 46.60 35.22 201206 106.92 16.10 17.09 14.51 13.52 4.51 25.15 301.85 27.25 16.10 51.84Tube Investments Of India Ltd. 201203 37.26 6441.83 27.59 1463.59 25.27 351.98 14.43 18.03 30.12 201206 1728.64 20.65 216.61 12.08 119.43 18.20 155.00 2888.64 171.30 96.00 48.14Ucal Fuel Systems Ltd. 201103 22.11 606.62 21.01 86.10 13.36 19.26 8.71 14.68 62.85 201206 126.38 -1.96 15.92 12.60 2.64 4.77 70.75 156.45 85.40 58.00 70.49Wabco India Ltd. 201203 9.48 1045.64 17.16 219.93 20.29 153.40 80.87 45.99 33.50 201206 237.68 1.02 57.06 22.89 41.84 88.23 1597.25 3029.60 1797.45 1125.15 75.00Wheels India Ltd. 201203 9.87 2077.54 22.16 172.64 7.83 34.35 34.80 30.25 15.00 201206 472.41 11.24 40.06 7.71 8.93 36.19 725.55 716.08 814.70 229.95 85.62ZF Steering Gear (India) Ltd. 201203 9.07 351.57 17.89 67.58 19.55 46.46 51.21 31.37 25.27 201206 82.00 0.36 18.07 22.01 8.22 36.23 298.05 270.43 415.00 245.00 73.27Automobile Two & Three Wheelers Total 431.24 50760.19 12747.67 90798.12 307.92Bajaj Auto Ltd 201203 289.37 19594.65 19.27 3691.33 21.01 2993.40 105.35 68.93 54.98 201206 4713.64 3.93 871.70 17.01 718.39 99.30 1722.85 49853.60 1839.00 1410.00 50.02Hero MotoCorp Ltd. 201203 39.94 23579.03 21.55 3535.32 15.79 2378.13 119.09 58.89 65.64 201206 6207.78 10.11 936.86 15.00 615.46 123.28 1930.20 38543.68 2278.50 1702.65 52.21Maharashtra Scooters Ltd. 201203 11.43 6.68 7.78 -11.27 716.63 -6.49 -5.68 -2.94 -3.14 201206 0.75 -27.18 -1.15 -153.33 0.96 3.36 342.60 391.54 362.85 275.10 51.00Scooters India Ltd. 201103 42.99 159.99 23.03 -8.10 -2.92 -17.11 -3.98 -19.85 0.00 201206 34.40 -3.42 -4.44 -11.69 -7.66 -7.13 27.00 116.08 48.40 24.65 95.38TVS Motor Company Ltd. 201203 47.51 7419.84 13.40 459.11 5.89 132.33 2.79 19.91 18.81 201206 1791.10 4.91 107.50 5.91 51.10 4.30 39.85 1893.22 70.30 31.90 59.31Automobiles - Passenger Cars Total 230.99 36591.22 10631.94 33929.25 90.73Hindustan Motors Ltd. 201203 86.49 501.32 -23.83 -99.04 -15.42 -44.52 -1.82 -38.28 -164.97 201206 102.70 -13.23 -30.97 -29.62 -35.49 -7.68 9.05 167.22 15.25 7.58 36.52Maruti Suzuki India Ltd. 201203 144.50 36089.90 -2.87 2525.10 8.41 1633.60 58.17 14.26 10.90 201206 10529.24 27.53 786.29 6.49 423.77 58.67 1168.60 33762.03 1428.20 905.55 54.21Automobiles-Tractors Total 1155.65 64459.67 10260.81 51611.43 210.70Escorts Ltd. 201109 92.14 4081.42 21.78 160.43 6.05 125.07 13.72 9.18 7.48 201206 858.88 17.82 55.86 6.48 26.89 10.51 62.50 660.11 93.30 55.45 32.52HMT Ltd. 201103 760.35 429.98 1.01 -298.42 -53.99 -492.56 -6.48 0.00 0.00 201206 25.30 -40.26 -9.94 -38.87 -25.14 -1.32 40.95 3113.63 53.50 26.85 98.88Mahindra & Mahindra Ltd. 201203 294.52 59417.63 61.18 7369.40 12.25 2775.96 53.08 15.92 17.98 201206 9247.94 39.53 1109.43 11.03 725.64 49.25 772.80 47448.43 874.75 621.75 25.45VST Tillers Tractors Ltd. 201203 8.64 530.64 24.20 73.03 14.61 49.93 57.79 40.12 27.16 201206 128.69 13.70 21.05 16.30 13.99 64.77 450.55 389.25 563.40 407.00 53.85Automobiles-Trucks/Lcv Total 955.41 187166.90 48438.45 77971.10 224.23Ashok Leyland Ltd. 201203 266.07 13317.60 16.65 1256.10 9.17 565.98 2.13 18.26 20.39 201206 2940.98 18.42 240.70 8.00 66.94 1.01 21.30 5667.24 32.90 20.05 38.61Eicher Motors Ltd. 201112 26.99 5677.54 29.12 539.47 11.95 497.40 114.40 30.45 36.50 201206 1573.05 23.98 139.50 8.03 112.55 112.53 2176.80 5877.03 2360.95 1306.00 55.20Force Motors Ltd. 201103 13.18 1481.44 54.96 56.67 8.88 58.62 44.49 20.78 18.98 201206 492.05 19.11 17.19 3.40 10.33 31.36 439.45 579.03 739.00 387.50 51.75SML Isuzu Ltd. 201203 14.47 1035.83 13.83 79.64 7.58 41.87 28.93 20.62 18.45 201206 261.24 10.10 20.97 7.98 12.24 33.81 394.20 570.47 470.00 338.00 43.96Tata Motors Ltd. 201203 634.70 165654.49 35.64 22311.24 13.46 13573.91 42.59 29.22 52.58 201206 43171.13 30.39 5754.88 12.98 2313.87 28.15 241.10 65277.32 320.60 137.65 34.71Bank - Private Total 4468.71 137276.52 38661.75 390812.83 281.47Axis Bank Ltd. 201203 413.20 21994.90 45.13 15895.00 33.70 4218.51 102.12 7.67 20.29 201206 6482.86 32.81 628.15 72.07 1153.52 111.37 1038.90 43056.41 1309.00 784.50 37.30City Union Bank Ltd. 201203 40.82 1696.77 39.26 1416.94 25.17 280.25 6.87 9.30 24.91 201206 504.21 35.86 51.46 79.33 73.89 7.24 50.90 2086.51 55.35 39.15 Development Credit Bank Ltd. 201203 240.67 716.97 33.70 470.36 11.69 55.08 2.29 6.81 8.06 201206 213.54 32.11 -2.68 66.04 18.91 3.14 40.60 977.13 52.25 30.80 19.20Dhanlakshmi Bank Ltd. 201203 85.14 1393.65 53.75 904.59 -7.03 -115.63 -13.58 7.13 -14.70 201206 343.85 8.97 -30.19 68.57 -11.81 -5.55 46.65 397.16 83.65 42.40 Federal Bank Ltd. 201203 171.05 5558.39 37.18 4579.12 27.10 776.80 45.41 8.52 14.38 201206 1536.71 23.46 222.18 78.38 190.35 44.51 414.50 7089.92 480.00 322.10 HDFC Bank Ltd. 201203 469.34 27605.56 37.73 18798.45 33.13 5273.40 22.36 7.36 18.90 201206 8007.42 33.95 1051.45 63.53 1417.39 24.07 594.80 140230.62 609.70 400.45 23.06ICICI Bank Ltd. 201203 1152.69 37994.86 26.31 8442.81 31.83 7937.63 66.31 6.27 13.62 201206 9545.65 25.30 1069.41 72.87 1815.05 62.97 935.45 107846.82 998.50 641.00 IndusInd Bank Ltd. 201203 467.51 5359.19 49.31 4016.20 25.62 802.61 17.17 9.43 19.28 201206 1632.04 40.14 85.25 72.28 236.26 20.15 325.80 15283.87 351.90 221.75 19.41ING Vysya Bank Ltd. 201203 150.12 3856.93 43.17 2746.86 19.92 456.36 30.40 7.70 14.25 201206 1171.39 34.52 46.54 72.39 130.12 34.64 371.40 5611.46 404.85 275.00 43.73Jammu & Kashmir Bank Ltd. 201203 48.48 4835.58 30.23 4031.80 28.33 803.08 165.66 7.58 21.21 201206 1476.16 39.80 321.80 82.10 246.09 203.00 938.25 4548.43 1010.00 645.00 53.17Karnataka Bank Ltd. 201203 188.28 3112.88 31.30 2544.69 16.39 246.07 13.07 7.81 9.81 201206 897.74 30.72 78.01 77.13 83.43 17.72 83.35 1569.48 112.45 64.00 Karur Vysya Bank Ltd. 201203 107.18 3270.37 47.47 2728.81 22.19 501.72 46.81 9.07 20.81 201206 1005.53 44.78 98.40 85.52 145.95 54.47 396.95 4257.75 455.00 322.30 3.23Kotak Mahindra Bank Ltd. 201203 370.34 8470.42 41.81 2753.80 32.53 1850.53 24.74 8.67 15.51 201206 2469.82 32.10 -203.76 46.41 438.29 23.89 574.25 42665.03 612.40 418.25 45.21Lakshmi Vilas Bank Ltd. 201203 97.53 1519.26 42.68 1225.55 15.50 107.02 10.97 8.67 12.66 201206 419.06 24.81 4.43 77.75 25.23 10.35 72.85 710.58 110.00 69.40 11.10South Indian Bank Ltd. 201203 113.37 3583.43 46.50 2966.13 18.18 401.66 3.54 8.60 21.62 201206 1069.43 39.12 132.51 82.27 123.04 4.34 22.10 2509.49 28.30 19.90 Yes Bank Ltd. 201203 352.99 6307.36 56.06 5374.82 24.42 977.00 27.68 9.26 23.07 201206 1886.34 34.78 171.51 82.47 290.14 32.79 336.90 11972.17 389.40 230.55 26.06
Year End Quarter End Current Data
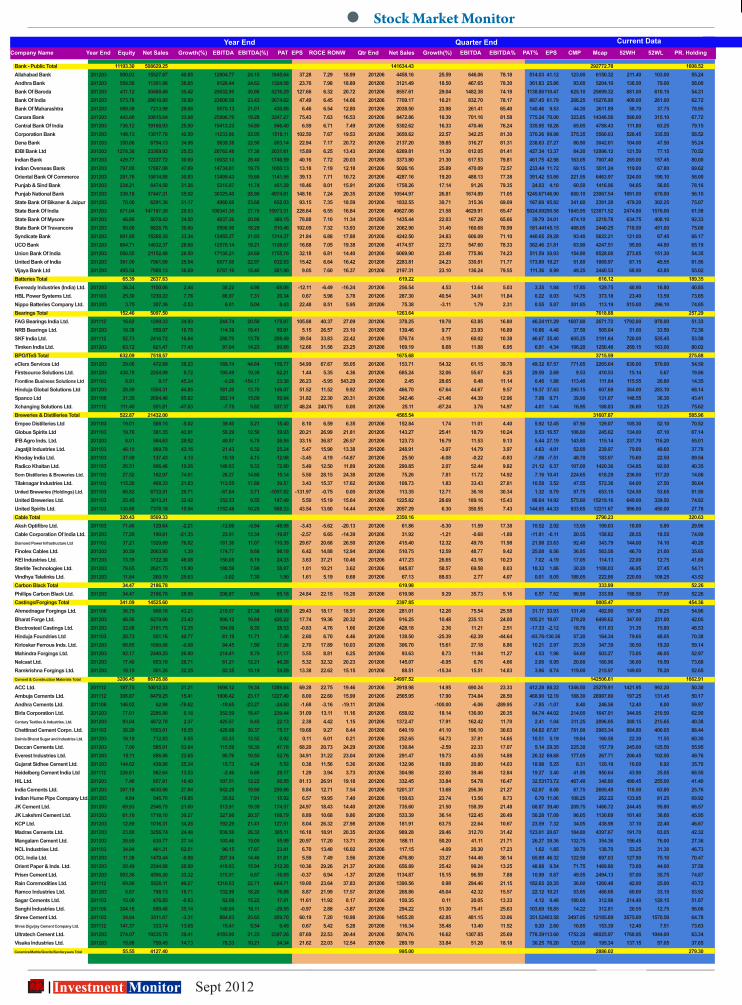
22 Investment Monitor Sept 2012
Company Name Year End Equity Net Sales Growth(%) EBITDA EBITDA(%) PAT EPS ROCE RONW Qtr End Net Sales Growth(%) EBITDA EBITDA% PAT% EPS CMP Mcap 52WH 52WL PR. Holding
Stock Market Monitor
Bank - Public Total 11193.30 508629.25 141634.43 292772.78 1608.52Allahabad Bank 201203 500.03 15527.67 40.85 12804.77 24.15 1845.64 37.28 7.29 18.99 201206 4458.16 25.59 646.06 78.18 514.03 41.12 123.00 6150.32 211.40 103.00 55.24Andhra Bank 201203 559.58 11361.88 36.85 9128.44 24.62 1324.58 23.76 7.98 18.89 201206 3121.49 18.50 467.65 78.30 361.83 25.86 93.00 5204.10 138.50 79.00 58.00Bank Of Baroda 201203 411.12 30488.49 35.42 25032.95 30.86 5216.29 127.66 6.32 20.72 201206 8557.61 29.04 1482.38 74.18 1138.86 110.47 625.10 25699.32 881.00 610.15 54.31Bank Of India 201203 573.78 28610.95 30.89 23600.59 23.43 2674.62 47.49 6.45 14.66 201206 7709.17 16.21 832.70 78.17 887.45 61.79 266.25 15276.90 408.00 261.00 62.72Bank Of Maharashtra 201203 589.59 7213.99 29.68 5570.13 21.01 430.88 6.46 6.54 12.80 201206 2038.50 23.98 261.41 65.40 140.46 9.53 44.30 2611.89 58.70 37.75 78.95Canara Bank 201203 443.00 30815.64 33.98 25996.76 19.28 3247.27 75.43 7.63 16.53 201206 8472.86 18.39 701.16 81.58 775.24 70.00 323.85 14346.56 566.00 315.10 67.72Central Bank Of India 201203 736.12 19168.93 25.50 15413.23 14.80 546.40 6.59 6.71 7.49 201206 5302.62 16.33 470.46 76.24 335.95 18.26 65.05 4788.43 111.80 63.25 79.15Corporation Bank 201203 148.13 13017.78 42.50 11233.86 22.05 1518.11 102.50 7.67 19.53 201206 3650.62 22.57 342.25 81.30 370.26 99.98 375.35 5560.03 528.45 335.50 58.52Dena Bank 201203 350.06 6794.13 34.98 5639.38 22.50 803.14 22.94 7.17 20.72 201206 2137.20 39.85 316.27 81.31 238.63 27.27 86.90 3042.01 104.00 47.50 55.24IDBI Bank Ltd 201203 1278.38 23369.93 25.53 20762.48 17.36 2031.61 15.89 6.25 13.43 201206 6269.81 11.39 612.05 81.41 427.34 13.37 84.20 12996.12 121.50 77.15 70.52Indian Bank 201203 429.77 12227.72 30.60 10032.13 28.40 1746.59 40.16 7.72 20.03 201206 3373.80 21.30 617.53 79.81 461.75 42.98 163.05 7007.40 265.00 157.45 80.00Indian Overseas Bank 201203 797.00 17897.08 47.89 14734.01 19.75 1050.13 13.18 7.19 12.18 201206 5026.16 25.89 470.09 72.57 233.44 11.72 69.15 5511.24 119.00 67.80 69.62Oriental Bank Of Commerce 201203 291.76 15814.88 30.83 13499.43 19.86 1141.56 39.13 7.71 10.72 201206 4287.16 19.20 488.13 77.38 391.42 53.66 221.55 6463.97 324.00 190.10 58.00Punjab & Sind Bank 201203 234.21 6474.50 31.26 5315.97 11.74 451.29 18.46 8.01 15.91 201206 1758.26 17.14 91.26 79.35 24.03 4.10 60.50 1416.96 94.65 56.05 78.16Punjab National Bank 201203 339.18 37447.31 35.92 30325.40 28.90 4974.81 148.16 7.24 20.35 201206 10544.97 26.81 1674.89 71.05 1245.67 146.90 680.10 23067.54 1091.00 670.00 56.10State Bank Of Bikaner & Jaipur 201203 70.00 6291.36 31.17 4960.60 23.68 652.03 93.15 7.35 18.59 201206 1832.55 30.71 315.36 69.09 167.69 95.82 341.60 2391.20 479.20 302.25 75.07State Bank Of India 201203 671.04 147197.39 29.53 100341.35 27.76 15973.31 228.64 6.55 16.84 201206 40627.06 21.58 4629.91 65.47 5024.99 290.58 1845.95 123871.52 2474.80 1576.00 61.58State Bank Of Mysore 201203 46.80 5078.43 24.50 4037.36 20.86 369.15 78.88 7.10 11.34 201206 1435.44 22.03 167.29 65.66 39.79 34.01 474.10 2218.78 634.75 408.10 92.33State Bank Of Travancore 201203 50.00 6828.76 30.60 5598.90 18.29 510.46 102.09 7.32 13.93 201206 2062.90 31.40 160.68 78.99 181.44 145.15 488.05 2440.25 718.50 451.00 75.00Syndicate Bank 201203 601.95 15268.35 33.34 12455.27 21.93 1314.37 21.84 6.88 17.88 201206 4242.50 24.83 606.09 71.10 440.65 29.28 93.40 5622.21 121.00 67.45 66.17UCO Bank 201203 664.71 14632.37 28.68 12576.14 19.21 1108.67 16.68 7.05 19.38 201206 4174.57 22.73 547.60 78.33 362.46 21.81 63.90 4247.51 95.00 44.80 65.19Union Bank Of India 201203 550.55 21152.48 28.50 17136.21 24.69 1755.76 32.18 6.81 14.40 201206 6069.90 23.48 775.86 74.23 511.59 30.93 154.90 8528.00 273.85 151.30 54.35United Bank of India 201203 361.00 7961.09 25.54 6577.80 22.97 632.53 15.42 6.64 16.42 201206 2283.81 24.23 330.81 71.77 173.89 19.27 51.80 1869.97 87.15 45.55 81.56Vijaya Bank Ltd 201203 495.54 7988.13 36.69 6787.16 15.40 581.00 9.05 7.60 16.37 201206 2197.31 23.10 136.24 79.55 111.36 8.99 49.25 2440.53 68.90 43.85 55.02Batteries Total 65.39 2637.63 619.22 616.12 189.35Eveready Industries (India) Ltd. 201203 36.34 1100.06 2.44 38.22 4.98 -88.06 -12.11 -6.49 -16.24 201206 256.54 4.53 13.64 5.03 3.35 1.84 17.85 129.75 40.90 16.80 40.85HBL Power Systems Ltd. 201103 25.30 1230.22 7.76 86.97 7.31 20.34 0.67 5.98 3.78 201206 287.30 40.54 34.01 11.84 0.22 0.03 14.75 373.18 23.40 13.59 73.65Nippo Batteries Company Ltd. 201203 3.75 307.36 -2.53 6.01 5.04 8.43 22.48 8.51 5.95 201206 75.38 -3.11 1.79 2.31 0.55 5.87 301.85 113.19 515.00 296.10 74.85Bearings Total 152.46 5097.50 1263.64 7618.88 257.29FAG Bearings India Ltd. 201112 16.62 1299.33 24.93 244.74 20.50 175.97 105.88 40.37 27.09 201206 378.25 19.78 63.85 16.80 46.24 111.29 1607.80 2671.72 1792.00 978.00 51.33NRB Bearings Ltd. 201203 19.38 559.97 16.76 114.39 19.41 50.91 5.15 26.57 23.10 201206 139.46 9.77 23.93 16.89 10.86 4.48 37.50 505.04 51.00 33.50 72.36SKF India Ltd. 201112 52.73 2416.72 16.84 280.70 13.76 208.49 39.54 33.83 22.42 201206 576.74 -3.19 60.02 10.38 46.67 35.40 605.25 3191.64 728.00 535.45 53.58Timken India Ltd. 201203 63.72 821.47 77.45 97.04 14.23 80.66 12.66 31.56 23.25 201206 169.19 8.68 11.88 6.95 6.91 4.34 196.20 1250.48 269.15 163.00 80.02BPO/ITeS Total 632.09 7518.57 1675.68 3715.59 275.88eClerx Services Ltd 201203 29.06 472.89 38.23 189.74 44.84 159.77 54.99 67.67 55.05 201206 153.71 54.32 61.15 39.78 49.32 67.57 771.65 2265.64 830.00 570.00 54.50Firstsource Solutions Ltd. 201203 430.78 2254.99 9.72 195.49 10.39 62.21 1.44 5.35 4.36 201206 685.24 32.06 55.67 8.25 29.50 2.69 9.53 410.53 15.14 5.67 19.86Frontline Business Solutions Ltd 201103 8.91 0.17 45.34 -0.26 -154.17 23.38 26.23 -5.95 543.29 201206 2.45 28.65 0.48 11.14 0.46 1.88 113.40 111.84 115.55 20.80 14.35Hinduja Global Solutions Ltd 201203 20.59 1554.31 44.85 181.20 13.70 106.07 51.52 11.52 9.92 201206 466.70 67.64 44.67 9.57 19.37 37.63 295.15 607.69 364.00 283.10 68.14Spanco Ltd 201109 31.35 2684.40 95.82 382.14 15.09 99.84 31.82 22.30 20.31 201206 342.46 -21.46 44.39 12.96 7.98 9.71 39.90 131.07 148.55 36.30 43.41Xchanging Solutions Ltd. 201112 111.40 551.81 -47.83 -7.75 5.82 537.37 48.24 240.75 0.00 201206 25.11 -87.24 3.76 14.97 4.01 1.44 16.95 188.83 26.80 12.25 75.62Breweries & Distilleries Total 522.87 21432.00 4565.54 31607.87 585.96Empee Distilleries Ltd 201103 19.01 588.15 -5.02 39.40 5.21 15.40 8.10 6.59 6.35 201206 152.84 1.74 11.01 4.40 5.92 12.45 67.90 129.07 105.30 52.10 70.52Globus Spirits Ltd 201103 19.76 381.35 43.91 59.29 12.50 39.93 20.21 26.99 21.81 201206 143.27 25.41 18.79 10.24 9.53 16.57 106.80 245.62 134.00 87.10 67.14IFB Agro Inds. Ltd. 201203 8.01 584.63 29.92 49.07 6.78 26.55 33.15 36.87 26.57 201206 123.73 16.79 11.53 9.13 5.44 27.19 143.80 115.14 237.70 116.20 55.01Jagatjit Industries Ltd. 201103 46.15 969.79 43.16 21.43 6.32 25.24 5.47 15.90 13.38 201206 248.91 -3.97 14.79 3.97 4.63 4.01 52.00 239.97 79.00 49.60 37.78Khoday India Ltd. 201103 37.59 137.43 4.13 10.10 4.15 -12.98 -3.45 4.19 -14.87 201206 25.50 -6.08 -0.22 -0.83 -7.06 -7.51 48.70 183.07 75.60 22.50 89.54Radico Khaitan Ltd. 201103 26.51 996.46 19.26 148.63 9.33 72.80 5.49 12.50 11.89 201206 290.85 2.07 52.44 9.82 21.12 6.37 107.00 1420.36 134.85 92.00 40.35Som Distilleries & Breweries Ltd. 201103 27.52 182.97 74.61 26.27 14.88 15.14 5.50 28.15 24.38 201206 75.26 7.81 11.72 14.92 7.16 10.41 224.65 618.29 236.00 117.20 14.88Tilaknagar Industries Ltd. 201103 115.26 468.33 21.83 113.55 17.88 39.57 3.43 15.37 17.62 201206 108.73 1.83 33.43 27.81 10.58 3.52 47.55 572.36 64.00 27.50 56.64United Breweries (Holdings) Ltd. 201103 66.82 6733.51 20.71 -67.64 3.71 -1057.82 -131.97 -0.75 0.00 201206 113.35 12.71 36.18 30.34 1.32 0.79 97.75 653.15 124.50 53.65 51.50United Breweries Ltd. 201103 25.45 3013.21 32.42 352.53 9.55 147.49 5.50 15.19 15.64 201206 1225.82 28.69 189.16 15.43 98.64 14.92 575.60 15219.16 649.00 339.50 74.82United Spirits Ltd. 201103 130.80 7376.18 15.94 1152.48 10.25 568.33 43.54 13.60 14.44 201206 2057.29 6.30 350.55 7.43 144.95 44.33 933.65 12211.67 996.00 450.00 27.78Cable Total 320.43 8509.33 2350.16 2790.23 320.63Aksh Optifibre Ltd. 201103 71.46 129.64 -2.21 -12.66 -5.94 -48.98 -3.43 -5.62 -20.13 201206 61.86 -5.30 11.59 17.38 10.52 2.92 13.55 199.03 18.00 5.80 29.96Cable Corporation Of India Ltd. 201203 77.29 190.61 -21.35 23.91 13.34 -19.87 -2.57 6.65 -14.39 201206 31.92 -1.21 -0.68 -1.88 -11.81 -6.11 20.55 158.82 28.55 18.55 74.99Diamond Power Infrastructure Ltd 201103 37.21 1520.89 76.82 181.36 11.07 110.39 29.67 20.68 26.50 201206 415.40 12.32 49.78 11.98 21.98 23.63 92.40 343.79 144.00 74.10 40.20Finolex Cables Ltd. 201203 30.59 2063.95 1.39 174.77 9.68 98.19 6.42 14.88 12.94 201206 510.75 12.59 48.77 9.42 25.08 6.56 36.85 563.58 46.70 21.00 35.65KEI Industries Ltd. 201203 13.39 1722.30 48.08 150.08 8.19 24.33 3.63 37.21 10.46 201206 417.23 26.65 43.16 10.23 7.02 4.19 17.05 114.13 22.00 12.75 41.60Sterlite Technologies Ltd. 201203 78.65 2621.75 15.90 188.59 7.99 38.87 1.01 10.21 3.62 201206 845.87 58.57 69.58 8.03 18.33 1.86 30.20 1188.03 46.95 27.45 54.71Vindhya Telelinks Ltd. 201203 11.84 260.19 25.63 -3.02 7.30 1.90 1.61 5.19 0.68 201206 67.13 88.03 2.77 4.07 0.01 0.05 188.05 222.86 220.00 108.25 43.52Carbon Black Total 34.47 2186.78 619.98 333.99 52.26Phillips Carbon Black Ltd. 201203 34.47 2186.78 28.96 206.87 9.06 85.18 24.84 22.15 15.26 201206 619.98 9.29 35.73 5.16 6.57 7.62 96.90 333.99 158.50 77.05 52.26Castings/Forgings Total 341.09 14525.60 2397.85 9005.47 454.36Ahmednagar Forgings Ltd. 201106 36.75 908.16 43.21 219.57 27.38 108.16 29.43 18.17 18.91 201206 281.01 12.26 75.54 25.58 31.17 33.93 131.40 482.90 197.50 78.25 54.96Bharat Forge Ltd. 201203 46.56 6279.06 23.43 996.12 16.84 420.22 17.74 19.36 20.32 201206 916.25 10.48 235.13 24.00 105.21 18.07 279.20 6499.62 347.00 231.00 42.05Electrosteel Castings Ltd. 201203 32.68 2101.75 12.35 104.69 8.35 28.53 -0.83 4.76 1.66 201206 428.18 2.36 11.21 2.51 -17.33 -2.12 18.70 611.03 31.35 15.80 48.53Hinduja Foundries Ltd 201103 28.73 551.16 40.77 61.19 11.71 7.48 2.60 6.70 4.46 201206 138.50 -25.39 -62.39 -44.64 -93.76 -130.36 57.20 164.34 79.65 48.05 70.38Kirloskar Ferrous Inds. Ltd. 201203 68.65 1090.86 -0.08 94.45 7.90 37.08 2.70 17.89 10.03 201206 306.70 15.61 27.18 8.86 10.21 2.97 25.30 347.39 30.50 19.20 59.14Mahindra Forgings Ltd. 201203 92.17 2440.25 26.80 214.41 8.79 51.17 5.55 8.81 6.25 201206 93.63 8.73 11.84 11.27 4.53 1.96 54.60 503.27 73.05 46.05 52.97Nelcast Ltd. 201203 17.40 653.10 28.71 81.21 12.21 46.28 5.32 32.32 20.23 201206 145.07 -6.95 6.76 4.66 2.06 0.95 20.80 180.96 36.00 19.50 73.68Ramkrishna Forgings Ltd. 201203 18.15 501.26 22.35 82.35 15.19 24.29 13.38 22.62 15.15 201206 88.51 -15.34 15.51 14.83 3.96 8.74 119.00 215.97 149.00 78.20 52.65Cement & Construction Materials Total 3206.45 86726.88 24997.52 142506.61 1662.91ACC Ltd. 201112 187.75 10012.33 21.21 1696.12 19.34 1289.84 69.28 22.75 19.46 201206 2918.98 14.95 690.24 23.33 412.28 88.22 1346.50 25279.91 1421.95 992.20 50.30Ambuja Cements Ltd. 201112 306.87 8479.25 15.41 1906.42 23.17 1227.49 8.00 22.60 15.99 201206 2565.95 17.90 734.84 28.50 468.90 12.19 188.30 28987.80 197.25 131.45 50.17Andhra Cements Ltd. 201106 146.02 62.98 -78.62 -19.65 -23.27 -24.60 -1.68 -3.16 -19.11 201206 -100.00 -6.06 -289.95 -7.85 -1.07 8.40 246.56 12.40 8.00 59.97Birla Corporation Ltd. 201203 77.01 2286.90 6.18 352.59 18.47 239.44 31.09 13.11 11.16 201206 658.02 18.14 136.00 20.35 84.74 44.02 214.00 1647.91 344.95 210.50 62.90Century Textiles & Industries. Ltd. 201203 93.04 4872.78 2.37 425.57 8.43 22.13 2.38 4.42 1.15 201206 1372.47 17.91 162.42 11.70 2.41 1.04 311.25 2896.05 388.15 215.65 40.38Chettinad Cement Corpn. Ltd. 201103 38.20 1503.01 10.55 420.98 30.37 75.17 19.68 9.27 8.44 201206 640.19 41.10 196.10 30.63 64.82 67.87 781.00 2983.34 884.80 400.05 88.44Dalmia Bharat Sugar and Industries Ltd. 201203 16.19 712.83 6.55 63.33 12.52 0.92 0.11 6.01 0.21 201206 252.65 54.73 37.81 14.65 10.51 5.19 19.84 160.58 22.30 11.55 60.30Deccan Cements Ltd. 201203 7.00 585.01 53.64 115.59 18.30 47.76 68.20 20.73 24.29 201206 130.84 -2.59 22.33 17.07 5.14 29.35 225.30 157.79 245.00 125.50 55.95Everest Industries Ltd. 201203 15.11 886.86 22.65 80.76 10.55 52.76 34.91 31.22 23.04 201206 291.47 19.73 43.55 14.88 26.32 69.68 177.05 267.71 206.45 102.50 49.76Gujarat Sidhee Cement Ltd. 201203 144.62 438.96 25.34 15.73 4.24 5.52 0.38 11.56 5.36 201206 132.98 18.09 20.80 14.03 18.98 5.25 8.31 120.18 10.09 6.92 35.70Heidelberg Cement India Ltd 201112 226.61 982.64 13.53 -2.46 6.89 29.17 1.29 3.94 3.73 201206 304.98 22.60 39.46 12.84 19.27 3.40 41.95 950.64 43.90 25.05 68.55HIL Ltd. 201203 7.46 857.81 18.40 107.51 12.22 60.55 81.13 26.91 19.18 201206 332.45 33.84 54.78 16.47 32.53 173.72 467.40 348.80 498.45 255.00 41.40India Cements Ltd. 201203 307.18 4630.86 27.84 942.29 18.60 259.86 8.84 12.71 7.54 201206 1201.37 13.68 256.36 21.27 62.07 8.08 87.75 2695.49 118.50 63.80 25.76Indian Hume Pipe Company Ltd. 201203 4.84 546.70 -19.85 35.62 7.91 15.92 6.57 19.95 7.40 201206 150.63 23.74 13.56 8.73 6.70 11.06 108.25 262.22 133.95 81.25 69.92JK Cement Ltd. 201203 69.93 2546.79 21.60 513.91 19.39 174.57 24.97 18.43 14.40 201206 735.60 21.50 158.39 21.48 68.87 39.40 209.75 1466.72 244.45 95.80 66.57JK Lakshmi Cement Ltd. 201203 61.18 1718.10 30.27 327.98 20.37 108.79 8.89 10.68 9.86 201206 533.39 36.14 122.45 20.49 50.28 17.09 96.05 1130.69 101.40 36.60 45.95KCP Ltd. 201203 12.89 1016.31 54.28 192.29 21.41 127.51 8.04 26.32 27.98 201206 181.91 63.75 22.64 10.67 23.59 7.32 34.05 438.98 37.10 22.40 46.67Madras Cements Ltd. 201203 23.80 3256.74 24.48 939.56 26.32 385.11 16.18 18.91 20.35 201206 989.28 29.46 312.70 31.42 123.01 20.67 184.80 4397.67 191.70 83.05 42.32Mangalam Cement Ltd. 201203 26.69 630.77 27.14 103.46 15.09 55.99 20.97 17.20 13.71 201206 188.11 50.20 41.11 21.71 26.27 39.36 132.75 354.36 156.45 76.00 27.36NCL Industries Ltd. 201103 34.94 461.31 62.51 96.15 17.97 23.41 6.70 13.40 16.02 201206 117.15 -4.09 20.30 17.23 1.62 1.85 39.70 138.70 53.25 31.30 46.73OCL India Ltd. 201203 11.38 1470.44 -0.98 207.34 14.46 31.81 5.59 7.49 3.56 201206 476.80 33.27 144.46 30.14 65.89 46.32 122.50 697.03 127.90 75.10 70.47Orient Paper & Inds. Ltd. 201203 20.49 2544.98 26.09 419.83 15.94 212.28 10.36 29.26 21.37 201206 656.89 25.42 99.24 13.25 48.88 9.54 71.75 1469.80 73.00 44.00 37.50Prism Cement Ltd. 201203 503.36 4596.20 33.32 315.91 6.67 -16.85 -0.37 6.94 -1.37 201206 1134.87 15.15 96.59 7.88 10.99 0.87 49.55 2494.13 57.00 35.75 74.87Rain Commodities Ltd. 201112 69.90 5620.11 49.27 1310.63 22.71 664.71 19.00 23.64 37.83 201206 1390.56 0.98 294.46 21.15 182.65 20.35 36.60 1260.48 42.00 25.00 43.72Ramco Industries Ltd. 201203 8.67 798.13 18.71 132.99 18.20 76.88 8.87 21.99 17.57 201206 268.86 45.04 42.32 15.57 22.12 10.21 53.85 466.68 60.60 33.15 53.92Sagar Cements Ltd. 201103 15.00 476.85 -0.83 62.09 15.22 17.41 11.61 11.92 8.17 201206 150.35 0.11 20.05 13.33 4.12 9.48 180.00 312.98 214.40 129.15 51.87Sanghi Industries Ltd. 201106 304.16 899.48 35.14 149.04 16.11 -29.55 -0.97 2.88 -3.87 201206 294.22 51.30 75.41 25.63 103.69 18.85 14.22 312.81 20.55 12.75 56.06Shree Cement Ltd. 201103 34.84 3511.87 -3.31 884.83 25.65 209.70 60.19 7.20 10.98 201206 1455.28 42.85 481.15 33.06 351.52 403.58 3497.95 12185.89 3575.00 1570.50 64.78Shree Digvijay Cement Company Ltd. 201112 141.37 333.74 13.65 15.41 5.54 9.45 0.67 5.42 5.28 201206 116.34 35.48 13.40 11.52 9.20 2.60 10.85 153.39 12.40 7.51 73.63Ultratech Cement Ltd. 201203 274.07 19235.70 39.41 4193.90 21.23 2397.26 87.69 22.53 20.44 201206 5074.76 16.62 1307.85 25.69 778.39 113.60 1752.20 48025.97 1768.95 1044.00 63.34Visaka Industries Ltd. 201203 15.88 750.45 14.73 78.33 10.21 34.34 21.62 22.03 12.54 201206 280.19 33.84 51.28 18.18 30.25 76.20 123.00 195.34 137.15 57.05 37.65Ceramics/Marble/Granite/Sanitaryware Total 55.55 4127.40 995.00 2886.02 279.30
Year End Quarter End Current Data
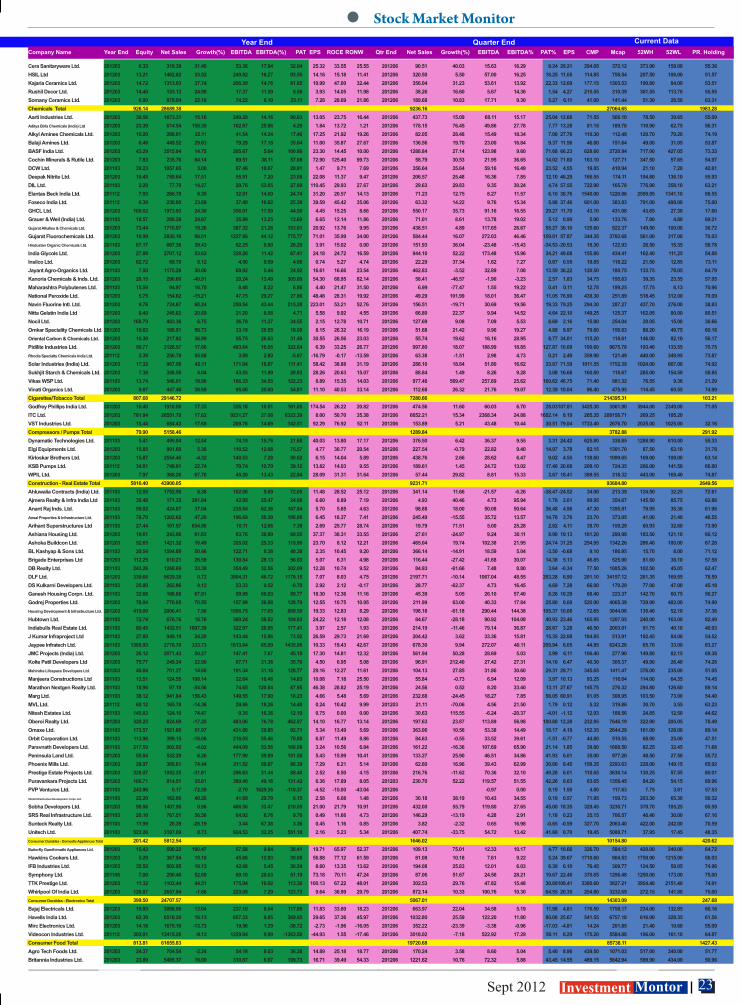
23 Sept 2012 Investment Montor
Company Name Year End Equity Net Sales Growth(%) EBITDA EBITDA(%) PAT EPS ROCE RONW Qtr End Net Sales Growth(%) EBITDA EBITDA% PAT% EPS CMP Mcap 52WH 52WL PR. Holding
Bank - Public Total 11193.30 508629.25 141634.43 292772.78 1608.52Allahabad Bank 201203 500.03 15527.67 40.85 12804.77 24.15 1845.64 37.28 7.29 18.99 201206 4458.16 25.59 646.06 78.18 514.03 41.12 123.00 6150.32 211.40 103.00 55.24Andhra Bank 201203 559.58 11361.88 36.85 9128.44 24.62 1324.58 23.76 7.98 18.89 201206 3121.49 18.50 467.65 78.30 361.83 25.86 93.00 5204.10 138.50 79.00 58.00Bank Of Baroda 201203 411.12 30488.49 35.42 25032.95 30.86 5216.29 127.66 6.32 20.72 201206 8557.61 29.04 1482.38 74.18 1138.86 110.47 625.10 25699.32 881.00 610.15 54.31Bank Of India 201203 573.78 28610.95 30.89 23600.59 23.43 2674.62 47.49 6.45 14.66 201206 7709.17 16.21 832.70 78.17 887.45 61.79 266.25 15276.90 408.00 261.00 62.72Bank Of Maharashtra 201203 589.59 7213.99 29.68 5570.13 21.01 430.88 6.46 6.54 12.80 201206 2038.50 23.98 261.41 65.40 140.46 9.53 44.30 2611.89 58.70 37.75 78.95Canara Bank 201203 443.00 30815.64 33.98 25996.76 19.28 3247.27 75.43 7.63 16.53 201206 8472.86 18.39 701.16 81.58 775.24 70.00 323.85 14346.56 566.00 315.10 67.72Central Bank Of India 201203 736.12 19168.93 25.50 15413.23 14.80 546.40 6.59 6.71 7.49 201206 5302.62 16.33 470.46 76.24 335.95 18.26 65.05 4788.43 111.80 63.25 79.15Corporation Bank 201203 148.13 13017.78 42.50 11233.86 22.05 1518.11 102.50 7.67 19.53 201206 3650.62 22.57 342.25 81.30 370.26 99.98 375.35 5560.03 528.45 335.50 58.52Dena Bank 201203 350.06 6794.13 34.98 5639.38 22.50 803.14 22.94 7.17 20.72 201206 2137.20 39.85 316.27 81.31 238.63 27.27 86.90 3042.01 104.00 47.50 55.24IDBI Bank Ltd 201203 1278.38 23369.93 25.53 20762.48 17.36 2031.61 15.89 6.25 13.43 201206 6269.81 11.39 612.05 81.41 427.34 13.37 84.20 12996.12 121.50 77.15 70.52Indian Bank 201203 429.77 12227.72 30.60 10032.13 28.40 1746.59 40.16 7.72 20.03 201206 3373.80 21.30 617.53 79.81 461.75 42.98 163.05 7007.40 265.00 157.45 80.00Indian Overseas Bank 201203 797.00 17897.08 47.89 14734.01 19.75 1050.13 13.18 7.19 12.18 201206 5026.16 25.89 470.09 72.57 233.44 11.72 69.15 5511.24 119.00 67.80 69.62Oriental Bank Of Commerce 201203 291.76 15814.88 30.83 13499.43 19.86 1141.56 39.13 7.71 10.72 201206 4287.16 19.20 488.13 77.38 391.42 53.66 221.55 6463.97 324.00 190.10 58.00Punjab & Sind Bank 201203 234.21 6474.50 31.26 5315.97 11.74 451.29 18.46 8.01 15.91 201206 1758.26 17.14 91.26 79.35 24.03 4.10 60.50 1416.96 94.65 56.05 78.16Punjab National Bank 201203 339.18 37447.31 35.92 30325.40 28.90 4974.81 148.16 7.24 20.35 201206 10544.97 26.81 1674.89 71.05 1245.67 146.90 680.10 23067.54 1091.00 670.00 56.10State Bank Of Bikaner & Jaipur 201203 70.00 6291.36 31.17 4960.60 23.68 652.03 93.15 7.35 18.59 201206 1832.55 30.71 315.36 69.09 167.69 95.82 341.60 2391.20 479.20 302.25 75.07State Bank Of India 201203 671.04 147197.39 29.53 100341.35 27.76 15973.31 228.64 6.55 16.84 201206 40627.06 21.58 4629.91 65.47 5024.99 290.58 1845.95 123871.52 2474.80 1576.00 61.58State Bank Of Mysore 201203 46.80 5078.43 24.50 4037.36 20.86 369.15 78.88 7.10 11.34 201206 1435.44 22.03 167.29 65.66 39.79 34.01 474.10 2218.78 634.75 408.10 92.33State Bank Of Travancore 201203 50.00 6828.76 30.60 5598.90 18.29 510.46 102.09 7.32 13.93 201206 2062.90 31.40 160.68 78.99 181.44 145.15 488.05 2440.25 718.50 451.00 75.00Syndicate Bank 201203 601.95 15268.35 33.34 12455.27 21.93 1314.37 21.84 6.88 17.88 201206 4242.50 24.83 606.09 71.10 440.65 29.28 93.40 5622.21 121.00 67.45 66.17UCO Bank 201203 664.71 14632.37 28.68 12576.14 19.21 1108.67 16.68 7.05 19.38 201206 4174.57 22.73 547.60 78.33 362.46 21.81 63.90 4247.51 95.00 44.80 65.19Union Bank Of India 201203 550.55 21152.48 28.50 17136.21 24.69 1755.76 32.18 6.81 14.40 201206 6069.90 23.48 775.86 74.23 511.59 30.93 154.90 8528.00 273.85 151.30 54.35United Bank of India 201203 361.00 7961.09 25.54 6577.80 22.97 632.53 15.42 6.64 16.42 201206 2283.81 24.23 330.81 71.77 173.89 19.27 51.80 1869.97 87.15 45.55 81.56Vijaya Bank Ltd 201203 495.54 7988.13 36.69 6787.16 15.40 581.00 9.05 7.60 16.37 201206 2197.31 23.10 136.24 79.55 111.36 8.99 49.25 2440.53 68.90 43.85 55.02Batteries Total 65.39 2637.63 619.22 616.12 189.35Eveready Industries (India) Ltd. 201203 36.34 1100.06 2.44 38.22 4.98 -88.06 -12.11 -6.49 -16.24 201206 256.54 4.53 13.64 5.03 3.35 1.84 17.85 129.75 40.90 16.80 40.85HBL Power Systems Ltd. 201103 25.30 1230.22 7.76 86.97 7.31 20.34 0.67 5.98 3.78 201206 287.30 40.54 34.01 11.84 0.22 0.03 14.75 373.18 23.40 13.59 73.65Nippo Batteries Company Ltd. 201203 3.75 307.36 -2.53 6.01 5.04 8.43 22.48 8.51 5.95 201206 75.38 -3.11 1.79 2.31 0.55 5.87 301.85 113.19 515.00 296.10 74.85Bearings Total 152.46 5097.50 1263.64 7618.88 257.29FAG Bearings India Ltd. 201112 16.62 1299.33 24.93 244.74 20.50 175.97 105.88 40.37 27.09 201206 378.25 19.78 63.85 16.80 46.24 111.29 1607.80 2671.72 1792.00 978.00 51.33NRB Bearings Ltd. 201203 19.38 559.97 16.76 114.39 19.41 50.91 5.15 26.57 23.10 201206 139.46 9.77 23.93 16.89 10.86 4.48 37.50 505.04 51.00 33.50 72.36SKF India Ltd. 201112 52.73 2416.72 16.84 280.70 13.76 208.49 39.54 33.83 22.42 201206 576.74 -3.19 60.02 10.38 46.67 35.40 605.25 3191.64 728.00 535.45 53.58Timken India Ltd. 201203 63.72 821.47 77.45 97.04 14.23 80.66 12.66 31.56 23.25 201206 169.19 8.68 11.88 6.95 6.91 4.34 196.20 1250.48 269.15 163.00 80.02BPO/ITeS Total 632.09 7518.57 1675.68 3715.59 275.88eClerx Services Ltd 201203 29.06 472.89 38.23 189.74 44.84 159.77 54.99 67.67 55.05 201206 153.71 54.32 61.15 39.78 49.32 67.57 771.65 2265.64 830.00 570.00 54.50Firstsource Solutions Ltd. 201203 430.78 2254.99 9.72 195.49 10.39 62.21 1.44 5.35 4.36 201206 685.24 32.06 55.67 8.25 29.50 2.69 9.53 410.53 15.14 5.67 19.86Frontline Business Solutions Ltd 201103 8.91 0.17 45.34 -0.26 -154.17 23.38 26.23 -5.95 543.29 201206 2.45 28.65 0.48 11.14 0.46 1.88 113.40 111.84 115.55 20.80 14.35Hinduja Global Solutions Ltd 201203 20.59 1554.31 44.85 181.20 13.70 106.07 51.52 11.52 9.92 201206 466.70 67.64 44.67 9.57 19.37 37.63 295.15 607.69 364.00 283.10 68.14Spanco Ltd 201109 31.35 2684.40 95.82 382.14 15.09 99.84 31.82 22.30 20.31 201206 342.46 -21.46 44.39 12.96 7.98 9.71 39.90 131.07 148.55 36.30 43.41Xchanging Solutions Ltd. 201112 111.40 551.81 -47.83 -7.75 5.82 537.37 48.24 240.75 0.00 201206 25.11 -87.24 3.76 14.97 4.01 1.44 16.95 188.83 26.80 12.25 75.62Breweries & Distilleries Total 522.87 21432.00 4565.54 31607.87 585.96Empee Distilleries Ltd 201103 19.01 588.15 -5.02 39.40 5.21 15.40 8.10 6.59 6.35 201206 152.84 1.74 11.01 4.40 5.92 12.45 67.90 129.07 105.30 52.10 70.52Globus Spirits Ltd 201103 19.76 381.35 43.91 59.29 12.50 39.93 20.21 26.99 21.81 201206 143.27 25.41 18.79 10.24 9.53 16.57 106.80 245.62 134.00 87.10 67.14IFB Agro Inds. Ltd. 201203 8.01 584.63 29.92 49.07 6.78 26.55 33.15 36.87 26.57 201206 123.73 16.79 11.53 9.13 5.44 27.19 143.80 115.14 237.70 116.20 55.01Jagatjit Industries Ltd. 201103 46.15 969.79 43.16 21.43 6.32 25.24 5.47 15.90 13.38 201206 248.91 -3.97 14.79 3.97 4.63 4.01 52.00 239.97 79.00 49.60 37.78Khoday India Ltd. 201103 37.59 137.43 4.13 10.10 4.15 -12.98 -3.45 4.19 -14.87 201206 25.50 -6.08 -0.22 -0.83 -7.06 -7.51 48.70 183.07 75.60 22.50 89.54Radico Khaitan Ltd. 201103 26.51 996.46 19.26 148.63 9.33 72.80 5.49 12.50 11.89 201206 290.85 2.07 52.44 9.82 21.12 6.37 107.00 1420.36 134.85 92.00 40.35Som Distilleries & Breweries Ltd. 201103 27.52 182.97 74.61 26.27 14.88 15.14 5.50 28.15 24.38 201206 75.26 7.81 11.72 14.92 7.16 10.41 224.65 618.29 236.00 117.20 14.88Tilaknagar Industries Ltd. 201103 115.26 468.33 21.83 113.55 17.88 39.57 3.43 15.37 17.62 201206 108.73 1.83 33.43 27.81 10.58 3.52 47.55 572.36 64.00 27.50 56.64United Breweries (Holdings) Ltd. 201103 66.82 6733.51 20.71 -67.64 3.71 -1057.82 -131.97 -0.75 0.00 201206 113.35 12.71 36.18 30.34 1.32 0.79 97.75 653.15 124.50 53.65 51.50United Breweries Ltd. 201103 25.45 3013.21 32.42 352.53 9.55 147.49 5.50 15.19 15.64 201206 1225.82 28.69 189.16 15.43 98.64 14.92 575.60 15219.16 649.00 339.50 74.82United Spirits Ltd. 201103 130.80 7376.18 15.94 1152.48 10.25 568.33 43.54 13.60 14.44 201206 2057.29 6.30 350.55 7.43 144.95 44.33 933.65 12211.67 996.00 450.00 27.78Cable Total 320.43 8509.33 2350.16 2790.23 320.63Aksh Optifibre Ltd. 201103 71.46 129.64 -2.21 -12.66 -5.94 -48.98 -3.43 -5.62 -20.13 201206 61.86 -5.30 11.59 17.38 10.52 2.92 13.55 199.03 18.00 5.80 29.96Cable Corporation Of India Ltd. 201203 77.29 190.61 -21.35 23.91 13.34 -19.87 -2.57 6.65 -14.39 201206 31.92 -1.21 -0.68 -1.88 -11.81 -6.11 20.55 158.82 28.55 18.55 74.99Diamond Power Infrastructure Ltd 201103 37.21 1520.89 76.82 181.36 11.07 110.39 29.67 20.68 26.50 201206 415.40 12.32 49.78 11.98 21.98 23.63 92.40 343.79 144.00 74.10 40.20Finolex Cables Ltd. 201203 30.59 2063.95 1.39 174.77 9.68 98.19 6.42 14.88 12.94 201206 510.75 12.59 48.77 9.42 25.08 6.56 36.85 563.58 46.70 21.00 35.65KEI Industries Ltd. 201203 13.39 1722.30 48.08 150.08 8.19 24.33 3.63 37.21 10.46 201206 417.23 26.65 43.16 10.23 7.02 4.19 17.05 114.13 22.00 12.75 41.60Sterlite Technologies Ltd. 201203 78.65 2621.75 15.90 188.59 7.99 38.87 1.01 10.21 3.62 201206 845.87 58.57 69.58 8.03 18.33 1.86 30.20 1188.03 46.95 27.45 54.71Vindhya Telelinks Ltd. 201203 11.84 260.19 25.63 -3.02 7.30 1.90 1.61 5.19 0.68 201206 67.13 88.03 2.77 4.07 0.01 0.05 188.05 222.86 220.00 108.25 43.52Carbon Black Total 34.47 2186.78 619.98 333.99 52.26Phillips Carbon Black Ltd. 201203 34.47 2186.78 28.96 206.87 9.06 85.18 24.84 22.15 15.26 201206 619.98 9.29 35.73 5.16 6.57 7.62 96.90 333.99 158.50 77.05 52.26Castings/Forgings Total 341.09 14525.60 2397.85 9005.47 454.36Ahmednagar Forgings Ltd. 201106 36.75 908.16 43.21 219.57 27.38 108.16 29.43 18.17 18.91 201206 281.01 12.26 75.54 25.58 31.17 33.93 131.40 482.90 197.50 78.25 54.96Bharat Forge Ltd. 201203 46.56 6279.06 23.43 996.12 16.84 420.22 17.74 19.36 20.32 201206 916.25 10.48 235.13 24.00 105.21 18.07 279.20 6499.62 347.00 231.00 42.05Electrosteel Castings Ltd. 201203 32.68 2101.75 12.35 104.69 8.35 28.53 -0.83 4.76 1.66 201206 428.18 2.36 11.21 2.51 -17.33 -2.12 18.70 611.03 31.35 15.80 48.53Hinduja Foundries Ltd 201103 28.73 551.16 40.77 61.19 11.71 7.48 2.60 6.70 4.46 201206 138.50 -25.39 -62.39 -44.64 -93.76 -130.36 57.20 164.34 79.65 48.05 70.38Kirloskar Ferrous Inds. Ltd. 201203 68.65 1090.86 -0.08 94.45 7.90 37.08 2.70 17.89 10.03 201206 306.70 15.61 27.18 8.86 10.21 2.97 25.30 347.39 30.50 19.20 59.14Mahindra Forgings Ltd. 201203 92.17 2440.25 26.80 214.41 8.79 51.17 5.55 8.81 6.25 201206 93.63 8.73 11.84 11.27 4.53 1.96 54.60 503.27 73.05 46.05 52.97Nelcast Ltd. 201203 17.40 653.10 28.71 81.21 12.21 46.28 5.32 32.32 20.23 201206 145.07 -6.95 6.76 4.66 2.06 0.95 20.80 180.96 36.00 19.50 73.68Ramkrishna Forgings Ltd. 201203 18.15 501.26 22.35 82.35 15.19 24.29 13.38 22.62 15.15 201206 88.51 -15.34 15.51 14.83 3.96 8.74 119.00 215.97 149.00 78.20 52.65Cement & Construction Materials Total 3206.45 86726.88 24997.52 142506.61 1662.91ACC Ltd. 201112 187.75 10012.33 21.21 1696.12 19.34 1289.84 69.28 22.75 19.46 201206 2918.98 14.95 690.24 23.33 412.28 88.22 1346.50 25279.91 1421.95 992.20 50.30Ambuja Cements Ltd. 201112 306.87 8479.25 15.41 1906.42 23.17 1227.49 8.00 22.60 15.99 201206 2565.95 17.90 734.84 28.50 468.90 12.19 188.30 28987.80 197.25 131.45 50.17Andhra Cements Ltd. 201106 146.02 62.98 -78.62 -19.65 -23.27 -24.60 -1.68 -3.16 -19.11 201206 -100.00 -6.06 -289.95 -7.85 -1.07 8.40 246.56 12.40 8.00 59.97Birla Corporation Ltd. 201203 77.01 2286.90 6.18 352.59 18.47 239.44 31.09 13.11 11.16 201206 658.02 18.14 136.00 20.35 84.74 44.02 214.00 1647.91 344.95 210.50 62.90Century Textiles & Industries. Ltd. 201203 93.04 4872.78 2.37 425.57 8.43 22.13 2.38 4.42 1.15 201206 1372.47 17.91 162.42 11.70 2.41 1.04 311.25 2896.05 388.15 215.65 40.38Chettinad Cement Corpn. Ltd. 201103 38.20 1503.01 10.55 420.98 30.37 75.17 19.68 9.27 8.44 201206 640.19 41.10 196.10 30.63 64.82 67.87 781.00 2983.34 884.80 400.05 88.44Dalmia Bharat Sugar and Industries Ltd. 201203 16.19 712.83 6.55 63.33 12.52 0.92 0.11 6.01 0.21 201206 252.65 54.73 37.81 14.65 10.51 5.19 19.84 160.58 22.30 11.55 60.30Deccan Cements Ltd. 201203 7.00 585.01 53.64 115.59 18.30 47.76 68.20 20.73 24.29 201206 130.84 -2.59 22.33 17.07 5.14 29.35 225.30 157.79 245.00 125.50 55.95Everest Industries Ltd. 201203 15.11 886.86 22.65 80.76 10.55 52.76 34.91 31.22 23.04 201206 291.47 19.73 43.55 14.88 26.32 69.68 177.05 267.71 206.45 102.50 49.76Gujarat Sidhee Cement Ltd. 201203 144.62 438.96 25.34 15.73 4.24 5.52 0.38 11.56 5.36 201206 132.98 18.09 20.80 14.03 18.98 5.25 8.31 120.18 10.09 6.92 35.70Heidelberg Cement India Ltd 201112 226.61 982.64 13.53 -2.46 6.89 29.17 1.29 3.94 3.73 201206 304.98 22.60 39.46 12.84 19.27 3.40 41.95 950.64 43.90 25.05 68.55HIL Ltd. 201203 7.46 857.81 18.40 107.51 12.22 60.55 81.13 26.91 19.18 201206 332.45 33.84 54.78 16.47 32.53 173.72 467.40 348.80 498.45 255.00 41.40India Cements Ltd. 201203 307.18 4630.86 27.84 942.29 18.60 259.86 8.84 12.71 7.54 201206 1201.37 13.68 256.36 21.27 62.07 8.08 87.75 2695.49 118.50 63.80 25.76Indian Hume Pipe Company Ltd. 201203 4.84 546.70 -19.85 35.62 7.91 15.92 6.57 19.95 7.40 201206 150.63 23.74 13.56 8.73 6.70 11.06 108.25 262.22 133.95 81.25 69.92JK Cement Ltd. 201203 69.93 2546.79 21.60 513.91 19.39 174.57 24.97 18.43 14.40 201206 735.60 21.50 158.39 21.48 68.87 39.40 209.75 1466.72 244.45 95.80 66.57JK Lakshmi Cement Ltd. 201203 61.18 1718.10 30.27 327.98 20.37 108.79 8.89 10.68 9.86 201206 533.39 36.14 122.45 20.49 50.28 17.09 96.05 1130.69 101.40 36.60 45.95KCP Ltd. 201203 12.89 1016.31 54.28 192.29 21.41 127.51 8.04 26.32 27.98 201206 181.91 63.75 22.64 10.67 23.59 7.32 34.05 438.98 37.10 22.40 46.67Madras Cements Ltd. 201203 23.80 3256.74 24.48 939.56 26.32 385.11 16.18 18.91 20.35 201206 989.28 29.46 312.70 31.42 123.01 20.67 184.80 4397.67 191.70 83.05 42.32Mangalam Cement Ltd. 201203 26.69 630.77 27.14 103.46 15.09 55.99 20.97 17.20 13.71 201206 188.11 50.20 41.11 21.71 26.27 39.36 132.75 354.36 156.45 76.00 27.36NCL Industries Ltd. 201103 34.94 461.31 62.51 96.15 17.97 23.41 6.70 13.40 16.02 201206 117.15 -4.09 20.30 17.23 1.62 1.85 39.70 138.70 53.25 31.30 46.73OCL India Ltd. 201203 11.38 1470.44 -0.98 207.34 14.46 31.81 5.59 7.49 3.56 201206 476.80 33.27 144.46 30.14 65.89 46.32 122.50 697.03 127.90 75.10 70.47Orient Paper & Inds. Ltd. 201203 20.49 2544.98 26.09 419.83 15.94 212.28 10.36 29.26 21.37 201206 656.89 25.42 99.24 13.25 48.88 9.54 71.75 1469.80 73.00 44.00 37.50Prism Cement Ltd. 201203 503.36 4596.20 33.32 315.91 6.67 -16.85 -0.37 6.94 -1.37 201206 1134.87 15.15 96.59 7.88 10.99 0.87 49.55 2494.13 57.00 35.75 74.87Rain Commodities Ltd. 201112 69.90 5620.11 49.27 1310.63 22.71 664.71 19.00 23.64 37.83 201206 1390.56 0.98 294.46 21.15 182.65 20.35 36.60 1260.48 42.00 25.00 43.72Ramco Industries Ltd. 201203 8.67 798.13 18.71 132.99 18.20 76.88 8.87 21.99 17.57 201206 268.86 45.04 42.32 15.57 22.12 10.21 53.85 466.68 60.60 33.15 53.92Sagar Cements Ltd. 201103 15.00 476.85 -0.83 62.09 15.22 17.41 11.61 11.92 8.17 201206 150.35 0.11 20.05 13.33 4.12 9.48 180.00 312.98 214.40 129.15 51.87Sanghi Industries Ltd. 201106 304.16 899.48 35.14 149.04 16.11 -29.55 -0.97 2.88 -3.87 201206 294.22 51.30 75.41 25.63 103.69 18.85 14.22 312.81 20.55 12.75 56.06Shree Cement Ltd. 201103 34.84 3511.87 -3.31 884.83 25.65 209.70 60.19 7.20 10.98 201206 1455.28 42.85 481.15 33.06 351.52 403.58 3497.95 12185.89 3575.00 1570.50 64.78Shree Digvijay Cement Company Ltd. 201112 141.37 333.74 13.65 15.41 5.54 9.45 0.67 5.42 5.28 201206 116.34 35.48 13.40 11.52 9.20 2.60 10.85 153.39 12.40 7.51 73.63Ultratech Cement Ltd. 201203 274.07 19235.70 39.41 4193.90 21.23 2397.26 87.69 22.53 20.44 201206 5074.76 16.62 1307.85 25.69 778.39 113.60 1752.20 48025.97 1768.95 1044.00 63.34Visaka Industries Ltd. 201203 15.88 750.45 14.73 78.33 10.21 34.34 21.62 22.03 12.54 201206 280.19 33.84 51.28 18.18 30.25 76.20 123.00 195.34 137.15 57.05 37.65Ceramics/Marble/Granite/Sanitaryware Total 55.55 4127.40 995.00 2886.02 279.30
Stock Market Monitor
Company Name Year End Equity Net Sales Growth(%) EBITDA EBITDA(%) PAT EPS ROCE RONW Qtr End Net Sales Growth(%) EBITDA EBITDA% PAT% EPS CMP Mcap 52WH 52WL PR. Holding
Cera Sanitaryware Ltd. 201203 6.33 319.39 31.46 53.36 17.94 32.04 25.32 33.55 25.55 201206 90.51 40.03 15.63 16.29 9.24 29.21 294.05 372.12 373.90 158.00 55.36HSIL Ltd 201203 13.21 1462.82 33.52 249.82 16.27 93.55 14.16 15.18 11.41 201206 320.50 5.50 57.00 16.25 18.25 11.05 114.85 758.54 207.50 106.00 51.57Kajaria Ceramics Ltd. 201203 14.72 1313.03 37.74 206.39 14.76 81.85 10.99 47.00 32.44 201206 356.04 31.23 53.61 13.92 22.33 12.09 177.15 1303.53 190.80 84.00 53.51Rushil Decor Ltd. 201203 14.40 153.13 24.90 17.37 11.59 5.66 3.93 14.05 11.98 201206 38.26 16.60 5.67 14.36 1.54 4.27 215.55 310.39 301.55 113.70 55.55Somany Ceramics Ltd. 201203 6.90 879.04 22.10 74.22 8.10 25.11 7.28 28.69 21.86 201206 189.68 10.83 17.71 9.30 5.27 6.11 41.00 141.44 51.30 28.50 63.31Chemicals Total 926.14 28689.38 9236.16 27064.65 1983.28Aarti Industries Ltd. 201203 39.56 1673.31 15.16 249.28 14.16 90.03 13.05 23.75 16.44 201206 437.73 15.09 68.11 15.17 25.04 12.66 71.55 566.10 78.50 39.65 55.09Aditya Birla Chemicals (India) Ltd 201203 23.39 614.54 158.39 162.87 25.96 4.29 1.84 13.72 1.21 201206 178.15 76.45 49.86 27.78 7.77 13.28 81.15 189.78 110.90 62.75 56.31Alkyl Amines Chemicals Ltd. 201203 10.20 288.01 22.11 41.54 14.24 17.46 17.25 21.92 19.26 201206 82.05 28.48 15.49 18.34 7.08 27.76 110.30 112.49 120.70 70.20 74.19Balaji Amines Ltd. 201203 6.48 449.52 29.63 79.29 17.18 35.64 11.00 35.87 27.67 201206 136.56 19.70 23.00 16.84 9.37 11.56 46.80 151.64 49.00 31.05 53.87BASF India Ltd. 201203 43.29 3515.94 14.75 205.87 5.64 100.86 23.30 14.45 10.00 201206 1288.84 27.14 123.98 9.60 71.68 66.23 628.60 2720.94 717.00 427.05 73.33Cochin Minerals & Rutile Ltd. 201203 7.83 235.76 84.14 89.51 38.11 57.08 72.90 125.40 99.73 201206 58.79 30.53 21.95 36.65 14.02 71.60 163.10 127.71 347.50 57.65 54.97DCW Ltd. 201103 39.23 1057.65 3.00 97.46 10.07 28.91 1.47 9.71 7.69 201206 356.64 35.64 59.16 16.49 23.52 4.55 19.85 410.94 21.10 7.20 42.61Deepak Nitrite Ltd. 201203 10.45 789.64 17.51 55.91 7.20 23.08 22.08 11.37 9.47 201206 206.57 25.48 16.36 7.85 12.10 46.29 166.55 174.11 194.80 136.10 55.93DIL Ltd. 201103 2.29 77.70 14.27 20.76 53.05 27.99 110.45 29.93 27.67 201206 29.63 29.83 9.35 30.24 4.74 57.55 722.90 165.78 776.90 358.10 63.21Elantas Beck India Ltd. 201112 7.93 266.78 6.30 32.81 14.00 24.74 31.20 20.57 14.13 201206 71.23 12.75 8.27 11.57 6.10 30.76 1540.00 1220.86 2599.95 1341.10 88.55Foseco India Ltd. 201112 6.39 230.00 23.69 37.40 16.62 25.28 39.59 45.42 35.06 201206 63.32 14.22 9.76 15.34 5.98 37.46 601.00 383.83 791.00 498.00 75.00GHCL Ltd. 201203 100.02 1973.93 24.30 356.01 17.59 44.50 4.45 15.25 8.66 201206 550.17 35.73 91.16 16.55 29.27 11.70 43.10 431.08 43.65 27.30 17.60Grauer & Weil (India) Ltd. 201103 18.57 280.28 24.87 35.99 13.25 13.69 6.65 12.14 11.86 201206 71.01 8.61 13.78 19.02 5.12 0.90 5.90 133.76 7.80 4.80 69.21Gujarat Alkalies & Chemicals Ltd. 201203 73.44 1710.97 19.26 387.32 21.28 153.61 20.92 13.76 9.95 201206 438.51 4.89 117.65 26.67 55.27 30.10 125.60 922.37 149.50 100.00 36.72Gujarat Fluorochemicals Ltd. 201203 10.99 2830.16 96.01 1227.86 44.12 775.77 71.01 35.99 34.00 201206 584.44 16.07 272.03 46.46 159.01 57.87 344.35 3782.68 561.00 317.00 70.03Hindustan Organic Chemicals Ltd. 201103 67.17 667.36 39.43 62.25 9.80 26.29 3.91 15.02 0.00 201206 151.93 36.04 -23.48 -15.43 -34.53 -20.53 18.30 122.93 26.50 15.35 58.78India Glycols Ltd. 201203 27.88 2707.12 53.63 328.26 11.42 67.41 24.18 24.72 16.59 201206 944.10 52.22 173.48 15.96 34.21 49.08 155.80 434.41 162.40 111.25 54.88Insilco Ltd. 201203 62.72 69.70 8.12 4.50 9.59 4.66 0.74 5.27 4.74 201206 22.29 37.34 1.62 7.27 0.87 0.55 18.85 118.22 21.50 12.85 73.11Jayant Agro-Organics Ltd. 201103 7.50 1175.26 30.00 60.92 5.44 24.92 16.61 16.66 23.54 201206 462.83 -3.52 32.89 7.08 13.59 36.22 120.50 180.75 133.75 78.05 64.79Kanoria Chemicals & Inds. Ltd. 201203 28.15 290.60 -40.91 20.24 13.49 305.69 54.30 68.95 82.14 201206 58.41 -46.57 -1.90 -3.23 2.57 1.83 34.75 195.63 39.35 23.55 57.05Maharashtra Polybutenes Ltd. 201103 15.59 94.97 16.70 8.48 8.22 6.86 4.40 21.47 31.50 201206 6.99 -77.47 1.55 19.22 0.41 0.11 12.78 199.25 17.75 6.13 70.96National Peroxide Ltd. 201203 5.75 154.62 -15.21 47.75 29.27 27.86 48.48 28.31 19.92 201206 49.29 101.99 18.01 36.47 11.05 76.90 438.30 251.89 518.45 312.00 70.09Navin Fluorine Intl. Ltd. 201203 9.76 724.67 68.24 250.54 43.44 215.28 223.01 53.21 52.76 201206 156.51 -19.71 30.69 19.56 19.33 79.25 294.30 287.27 437.70 276.00 38.83Nitta Gelatin India Ltd 201203 8.40 245.82 20.69 21.20 8.98 4.71 5.58 9.92 4.55 201206 66.80 22.37 9.94 14.52 4.64 22.10 149.25 125.37 162.05 80.00 80.51Nocil Ltd. 201203 160.79 483.36 6.75 36.79 11.27 34.55 2.15 12.78 10.71 201206 127.69 9.08 7.09 5.53 8.69 2.16 15.80 254.04 20.05 15.00 36.66Omkar Speciality Chemicals Ltd. 201203 19.63 166.91 56.73 33.19 20.55 16.00 8.15 26.32 16.19 201206 51.68 21.42 9.96 19.27 4.89 9.97 79.80 156.63 88.20 49.75 60.16Oriental Carbon & Chemicals Ltd. 201203 10.30 217.82 36.99 55.75 26.63 31.46 30.55 26.56 23.03 201206 55.74 19.62 16.16 28.95 8.77 34.01 115.20 118.61 146.00 82.10 56.17Pidilite Industries Ltd. 201203 50.77 3126.57 17.66 483.64 16.05 322.64 6.39 33.25 26.77 201206 997.80 18.07 188.99 18.85 127.87 10.09 190.60 9675.78 193.40 133.55 70.75Rhodia Specialty Chemicals India Ltd. 201112 3.38 250.78 55.68 3.89 2.80 -5.67 -16.79 -0.17 -13.59 201206 63.38 -1.51 2.98 4.73 0.21 2.49 359.90 121.49 440.00 349.95 73.87Solar Industries (India) Ltd. 201203 17.32 967.58 42.11 171.04 18.87 111.41 58.42 38.88 31.19 201206 288.10 18.84 51.80 16.62 33.87 71.59 1011.55 1752.39 1024.00 667.00 74.92Sukhjit Starch & Chemicals Ltd. 201203 7.38 358.58 4.04 43.55 11.99 20.83 28.26 20.63 15.07 201206 88.84 1.49 8.26 9.28 3.08 16.68 160.80 118.67 285.00 154.50 58.85Vikas WSP Ltd. 201103 13.74 546.01 18.96 186.33 34.55 122.23 8.89 15.35 14.03 201206 977.48 569.47 257.89 25.62 160.62 46.75 71.40 981.32 76.55 9.36 21.29Vinati Organics Ltd. 201203 9.87 447.46 38.68 95.00 20.60 54.81 11.10 40.53 33.14 201206 112.68 26.32 21.76 19.07 12.39 10.04 96.40 475.95 114.45 60.55 74.99Cigarettes/Tobacco Total 807.68 29146.72 7280.66 214395.31 103.21Godfrey Phillips India Ltd. 201203 10.40 1910.50 17.33 326.16 10.51 181.05 174.54 26.22 20.82 201206 474.56 11.60 60.03 6.70 28.03 107.81 3425.30 3561.90 3944.00 2349.00 71.05ITC Ltd. 201203 781.84 26551.79 17.62 9231.27 27.08 6322.39 8.00 50.70 35.38 201206 6652.21 15.34 2368.34 24.88 1602.14 8.19 265.35 208156.71 269.25 185.20 VST Industries Ltd. 201203 15.44 684.43 17.69 209.76 14.69 142.51 92.29 76.92 52.11 201206 153.89 5.21 43.48 10.44 30.51 79.04 1733.40 2676.70 2025.00 1025.00 32.16Compressors / Pumps Total 79.90 5158.46 1289.84 3782.88 291.92Dynamatic Technologies Ltd. 201103 5.41 495.04 12.54 74.19 15.76 21.68 40.03 13.80 17.17 201206 376.50 6.42 36.37 9.55 3.31 24.42 625.80 338.85 1288.90 610.00 55.33Elgi Equipments Ltd. 201203 15.85 991.69 5.38 110.52 12.08 75.57 4.77 30.77 20.54 201206 227.54 -0.79 22.82 9.40 14.97 3.78 82.15 1301.70 87.50 63.10 31.78Kirloskar Brothers Ltd. 201203 15.87 2554.46 -4.32 140.53 7.28 50.62 6.15 14.04 5.89 201206 438.76 2.66 28.62 6.47 9.02 4.55 138.60 1099.65 169.00 108.00 63.14KSB Pumps Ltd. 201112 34.81 749.01 22.74 70.74 10.70 39.12 13.82 14.03 9.55 201206 189.61 1.45 24.72 13.02 17.46 20.06 208.10 724.35 266.00 141.50 66.80WPIL Ltd. 201203 7.97 368.26 67.78 45.20 13.43 22.94 28.09 31.31 31.64 201206 57.44 29.82 8.81 15.33 3.67 18.41 399.55 318.32 443.00 169.40 74.87Construction - Real Estate Total 5816.40 43900.05 9231.71 93684.80 2649.56Ahluwalia Contracts (India) Ltd. 201103 12.55 1752.98 8.38 162.06 9.69 72.05 11.48 28.52 25.12 201206 341.14 11.66 -21.57 -6.26 -38.47 -24.52 34.00 213.39 124.50 32.25 72.61Ajmera Realty & Infra India Ltd 201103 35.48 171.35 281.84 42.95 25.47 24.88 6.60 8.89 7.19 201206 4.93 40.46 4.73 95.94 1.78 2.01 99.95 354.67 145.50 85.75 62.86Anant Raj Inds. Ltd. 201103 59.02 424.07 37.04 235.54 62.36 167.84 5.70 5.85 4.63 201206 98.88 18.00 50.08 50.64 36.48 4.96 47.30 1395.81 79.95 35.30 61.96Ansal Properties & Infrastructure Ltd. 201103 78.70 1202.62 47.20 196.69 50.39 108.06 6.45 18.37 7.41 201206 245.49 -15.55 35.72 13.57 14.78 3.76 23.70 373.05 41.00 21.40 46.55Arihant Superstructures Ltd 201103 27.44 101.57 654.86 10.11 12.66 7.38 2.69 25.77 28.74 201206 19.79 71.51 5.00 25.28 2.82 4.11 38.70 159.29 60.93 32.60 73.90Ashiana Housing Ltd. 201203 18.61 243.06 61.83 83.76 36.89 69.55 37.37 38.31 33.55 201206 27.61 -24.97 9.24 30.11 8.90 19.13 161.20 299.99 183.50 121.10 66.12Ashoka Buildcon Ltd. 201203 52.65 1421.32 16.49 325.02 25.33 115.90 23.70 8.12 12.21 201206 465.04 19.74 102.38 21.95 24.74 31.25 254.95 1342.26 286.40 180.00 67.28BL Kashyap & Sons Ltd. 201103 20.54 1594.88 50.46 122.71 8.38 48.38 2.35 10.45 9.20 201206 366.14 -14.91 18.59 5.04 -3.50 -0.68 9.10 186.95 15.70 8.00 71.12Brigade Enterprises Ltd 201203 112.25 610.21 26.59 130.84 28.13 56.93 5.07 6.31 4.98 201206 116.44 -27.42 41.68 30.07 14.38 5.13 46.85 525.90 81.60 38.10 57.58DB Realty Ltd. 201103 243.26 1268.69 33.38 354.49 32.56 302.09 12.28 10.74 9.52 201206 84.93 -61.66 7.48 8.80 3.64 -0.34 77.50 1885.26 102.50 45.05 62.47DLF Ltd. 201203 339.68 9629.38 0.72 3904.31 46.72 1178.15 7.07 8.03 4.75 201206 2197.71 -10.14 1067.04 48.55 283.28 6.90 201.10 34157.12 261.35 169.55 78.59DS Kulkarni Developers Ltd. 201103 25.80 262.86 9.12 23.33 9.52 -0.70 2.92 2.12 -0.17 201206 28.77 -62.37 4.73 16.45 4.69 7.28 66.00 170.29 77.00 47.00 45.18Ganesh Housing Corpn. Ltd. 201103 32.66 168.88 67.91 99.99 60.03 59.77 18.30 12.36 11.16 201206 45.39 5.05 26.10 57.40 8.26 10.29 68.40 223.37 142.70 60.75 56.27Godrej Properties Ltd. 201203 78.04 770.05 70.55 157.99 26.98 128.79 12.55 10.75 10.95 201206 211.99 63.00 40.33 17.84 25.80 0.00 520.90 4065.39 729.90 482.00 74.99Housing Development & Infrastructure Ltd. 201203 419.00 2006.41 7.56 1506.75 77.65 809.50 19.33 12.83 8.29 201206 198.18 -61.18 290.44 144.38 105.37 10.06 72.65 3044.06 135.40 52.10 37.36Hubtown Ltd. 201103 72.74 676.76 16.76 360.24 58.02 184.83 24.22 12.18 12.08 201206 84.67 -28.18 90.92 104.08 40.93 23.46 165.95 1207.05 240.00 163.00 82.49Indiabulls Real Estate Ltd. 201103 80.45 1432.51 1007.39 322.97 26.95 177.41 3.97 2.57 1.93 201206 214.19 -11.46 79.14 36.87 28.67 3.28 46.50 2003.01 91.75 40.10 40.93J Kumar Infraproject Ltd 201103 27.80 949.19 24.20 143.44 15.86 73.92 26.59 29.73 21.69 201206 204.42 3.62 33.36 15.81 15.35 22.08 184.85 513.91 192.45 84.00 54.52Jaypee Infratech Ltd. 201103 1388.93 2778.70 333.73 1813.64 65.99 1435.06 10.33 19.43 42.67 201206 678.30 9.94 272.07 40.11 209.94 6.05 44.95 6243.26 65.70 33.00 83.27JMC Projects (India) Ltd. 201203 26.12 2071.43 50.27 147.41 7.67 45.18 17.30 14.81 12.32 201206 561.94 50.28 28.69 5.03 3.99 6.11 106.40 277.90 149.80 82.15 69.38Kolte Patil Developers Ltd 201203 75.77 249.24 22.90 67.71 31.36 35.76 4.50 6.95 5.08 201206 96.91 212.40 27.42 27.31 14.16 6.47 40.30 305.37 49.90 26.40 74.28Mahindra Lifespace Developers Ltd. 201203 40.84 701.27 14.60 191.34 31.16 128.77 29.16 12.27 11.61 201206 104.13 27.85 31.86 30.60 29.31 28.71 345.65 1411.47 376.00 235.00 51.05Manjeera Constructions Ltd 201103 12.51 124.55 108.14 22.64 18.46 14.83 10.08 7.18 25.50 201206 55.84 -0.73 6.94 12.09 3.97 10.13 93.25 116.64 114.00 64.35 74.45Marathon Nextgen Realty Ltd. 201103 18.96 97.19 -54.56 74.65 120.84 87.95 46.38 28.82 25.19 201206 24.56 0.52 8.20 33.40 13.11 27.67 145.75 276.32 294.80 126.60 89.14Marg Ltd. 201103 38.12 941.84 158.43 149.55 17.90 18.23 4.66 5.48 5.69 201206 232.68 -24.45 18.27 7.85 58.05 60.91 81.05 308.95 103.50 73.00 54.40MVL Ltd. 201112 60.12 165.78 -14.36 29.86 18.26 14.40 0.24 10.42 9.99 201203 21.11 -70.06 4.56 21.50 1.79 0.12 5.32 319.86 30.70 3.55 63.23Nitesh Estates Ltd. 201103 145.83 124.10 74.47 0.35 16.36 12.19 0.75 0.00 0.00 201206 30.63 115.55 -6.24 -20.37 -4.01 -1.12 12.93 188.56 24.85 12.50 44.62Oberoi Realty Ltd. 201203 328.23 824.69 -17.20 483.06 76.78 462.87 14.10 16.77 13.14 201206 197.63 23.87 113.89 56.98 100.80 12.28 232.95 7646.19 322.90 205.05 78.49Omaxe Ltd. 201103 173.57 1521.60 51.97 431.06 29.85 92.71 5.34 13.49 5.69 201206 363.06 10.56 53.38 14.49 18.17 4.19 152.35 2644.29 161.00 128.00 89.14Orbit Corporation Ltd. 201103 113.96 399.15 -18.06 216.05 55.46 78.88 6.87 11.49 8.86 201206 84.63 -0.55 33.52 39.61 -1.51 -0.77 44.80 510.55 68.90 25.00 47.51Parsvnath Developers Ltd. 201103 217.59 902.92 -4.02 444.09 53.56 168.08 3.24 10.56 6.84 201206 161.22 -16.36 107.69 65.90 21.14 1.85 38.80 1688.50 82.25 32.45 71.68Peninsula Land Ltd. 201203 55.84 532.29 6.26 177.90 59.89 151.50 5.43 15.99 10.41 201206 133.27 25.90 46.51 34.86 41.93 6.01 35.00 977.20 48.50 27.50 55.72Phoenix Mills Ltd. 201203 28.97 366.61 74.44 211.52 69.87 86.39 7.29 6.21 5.14 201206 62.60 16.96 39.43 62.99 30.60 8.45 158.35 2293.63 228.00 149.15 65.92Prestige Estate Projects Ltd. 201203 328.07 1052.25 -31.81 296.63 31.44 88.40 2.52 8.50 4.15 201206 216.76 -11.62 70.36 32.10 49.28 6.01 110.65 3630.14 130.25 57.55 80.01Puravankara Projects Ltd. 201203 106.71 814.51 35.81 389.40 49.16 131.42 6.36 17.89 8.05 201203 230.70 52.22 119.57 51.55 42.26 8.63 63.65 1358.45 84.20 54.15 89.96PVP Ventures Ltd. 201103 243.96 0.17 -72.59 -2.70 1629.35 -110.37 -4.52 -15.00 -43.04 201206 -0.97 0.00 9.19 1.50 4.80 117.63 7.75 3.81 57.53Shristi Infrastructure Development. Corpn. Ltd. 201103 22.20 162.06 40.26 41.69 29.70 6.15 2.58 6.08 1.48 201206 30.18 38.19 10.43 34.55 0.19 0.57 71.95 159.73 203.30 65.30 50.32Sobha Developers Ltd. 201203 98.06 1407.90 0.96 466.56 33.47 210.05 21.00 21.79 10.91 201206 432.00 55.79 119.80 27.65 45.00 18.35 329.45 3230.71 370.70 185.25 60.58SRS Real Infrastructure Ltd. 201103 20.10 767.51 56.58 64.92 8.76 9.76 0.49 11.66 4.73 201206 146.29 -13.19 4.28 2.91 1.18 0.23 35.15 706.57 46.40 30.00 67.16Sunteck Realty Ltd. 201103 11.99 20.39 -28.19 3.44 67.38 3.36 0.45 1.16 0.85 201206 3.82 -2.32 0.65 16.98 -0.65 -0.59 327.70 2063.40 422.00 242.00 70.59Unitech Ltd. 201103 523.26 3187.09 8.73 924.53 32.25 581.18 2.16 5.23 5.34 201206 407.74 -33.75 54.72 13.42 41.60 0.70 19.45 5088.71 37.95 17.45 48.35Consumer Durables - Domestic Appliances Total 201.42 5812.54 1646.02 10154.80 420.62Butterfly Gandhimathi Appliances Ltd. 201203 15.43 590.22 190.47 57.58 9.84 30.41 19.71 65.97 52.37 201206 109.13 75.01 12.33 10.17 4.77 10.66 326.70 584.12 420.00 240.00 64.72Hawkins Cookers Ltd. 201203 5.29 367.54 10.10 45.86 12.93 30.08 56.88 77.12 61.59 201206 81.08 10.18 7.61 9.22 5.24 39.67 1710.60 904.53 1759.90 1215.00 56.03IFB Industries Ltd. 201203 35.52 802.95 18.13 42.68 5.45 30.54 8.60 13.35 13.62 201206 194.08 25.83 12.01 6.03 6.30 6.10 76.45 309.77 124.50 58.05 74.96Symphony Ltd. 201106 7.00 290.46 52.69 69.10 28.03 51.19 73.18 70.11 47.24 201206 87.06 51.67 24.56 28.21 19.67 22.48 370.65 1296.48 1250.00 173.00 75.00TTK Prestige Ltd. 201203 11.32 1103.44 44.51 175.94 16.02 113.36 100.13 67.22 48.01 201206 302.53 29.76 47.82 15.48 30.68 108.41 3380.60 3827.21 3954.40 2151.40 74.91Whirlpool Of India Ltd. 201203 126.87 2657.94 -1.66 223.09 7.29 123.73 9.64 36.99 29.79 201206 872.14 10.33 100.76 10.30 64.55 20.35 254.80 3232.69 272.15 141.80 75.00Consumer Durables - Electronics Total 399.50 24707.57 5067.01 14303.09 247.68Bajaj Electricals Ltd. 201203 19.93 3098.96 13.04 237.10 8.04 117.88 11.83 33.80 18.23 201206 663.97 22.04 34.58 5.19 11.98 4.81 176.50 1759.17 234.00 132.85 66.16Havells India Ltd. 201203 62.39 6518.20 16.13 657.33 9.85 369.92 29.65 37.36 45.97 201206 1032.80 25.59 122.20 11.80 80.08 25.67 541.55 6757.18 616.00 328.35 61.56Mirc Electronics Ltd. 201203 14.18 1675.16 -13.73 19.56 1.29 -38.72 -2.73 -1.96 -16.05 201206 352.22 -23.39 -3.38 -0.96 -17.03 -4.81 14.24 201.85 21.40 10.60 55.09Videocon Industries Ltd. 201112 303.01 13415.26 -9.13 1229.84 9.99 -1363.50 -44.93 1.55 -17.46 201206 3018.02 -7.18 522.92 17.29 50.11 6.29 175.20 5584.88 196.00 161.10 64.87Consumer Food Total 813.81 61655.83 19720.68 85738.11 1427.43Agro Tech Foods Ltd. 201203 24.37 704.54 -2.24 54.18 8.03 36.28 14.89 25.18 18.77 201206 170.24 3.58 8.60 5.04 5.46 8.96 439.50 1071.03 517.00 340.00 51.77Britannia Industries Ltd. 201203 23.89 5485.37 19.00 310.87 6.67 199.73 16.71 39.49 54.33 201206 1221.62 10.76 72.32 5.88 43.45 14.55 489.15 5842.94 599.90 434.00 50.96
Year End Quarter End Current Data
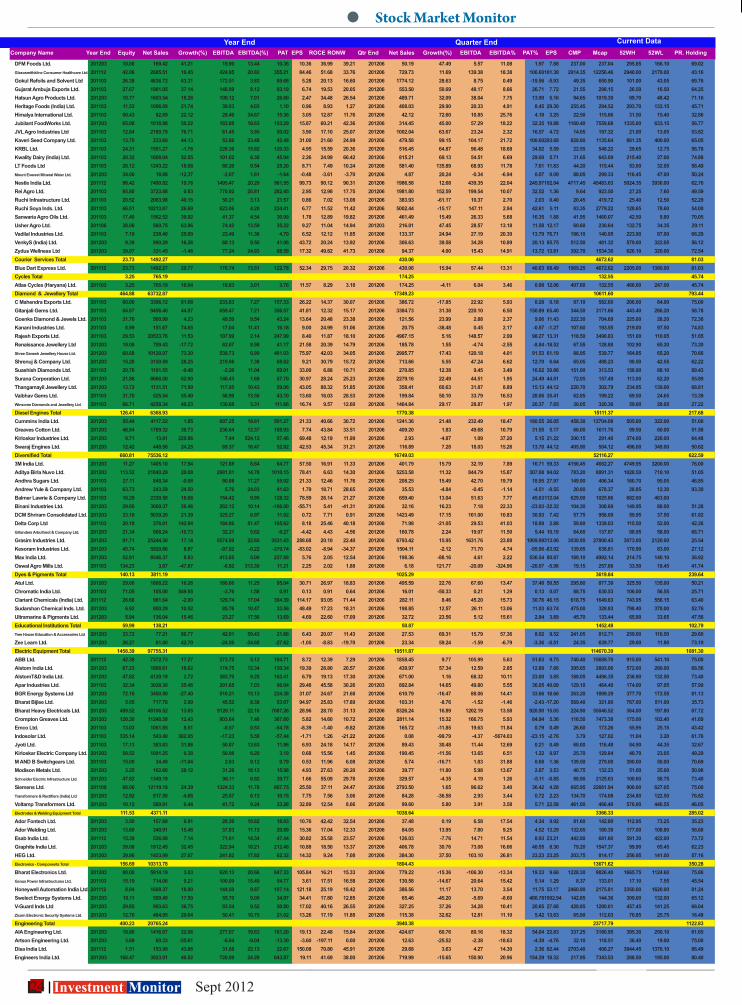
24 Investment Monitor Sept 2012
Year End Quarter End Current Data
Stock Market Monitor
Company Name Year End Equity Net Sales Growth(%) EBITDA EBITDA(%) PAT EPS ROCE RONW Qtr End Net Sales Growth(%) EBITDA EBITDA% PAT% EPS CMP Mcap 52WH 52WL PR. Holding
DFM Foods Ltd. 201203 10.00 169.42 41.21 19.90 13.44 10.36 10.36 36.99 39.21 201206 50.19 47.49 5.57 11.08 1.97 7.88 237.00 237.04 295.85 166.10 69.02Glaxosmithkline Consumer Healthcare Ltd. 201112 42.06 2685.51 16.45 424.95 20.82 355.21 84.46 51.68 33.76 201206 729.73 11.69 139.38 18.38 106.60 101.38 2914.35 12256.46 2940.00 2179.00 43.16Gokul Refoils and Solvent Ltd 201103 26.38 4836.72 63.31 172.51 3.83 69.68 5.28 20.13 16.60 201206 1774.12 28.63 8.75 0.49 -19.56 -5.93 49.35 650.90 101.00 43.05 69.76Gujarat Ambuja Exports Ltd. 201103 27.67 1961.05 37.14 148.09 8.12 93.19 6.74 19.53 20.05 201206 553.50 50.69 48.17 8.66 26.71 7.72 21.55 298.15 26.50 16.50 64.25Hatsun Agro Products Ltd. 201203 10.77 1603.54 18.28 109.12 7.01 26.60 2.47 34.48 26.54 201206 489.71 32.09 38.04 7.75 13.90 5.16 94.65 1019.30 99.70 48.42 71.16Heritage Foods (India) Ltd. 201103 11.53 1096.09 21.74 39.03 4.03 1.10 0.96 8.93 1.27 201206 408.03 29.90 20.33 4.91 8.45 29.30 255.45 294.52 293.70 133.15 45.71Himalya International Ltd. 201103 50.43 82.89 22.12 28.46 34.67 15.36 3.05 12.87 11.76 201206 42.12 72.60 10.85 25.76 4.18 3.25 22.50 115.66 31.50 15.40 32.86Jubilant FoodWorks Ltd. 201203 65.08 1018.88 50.22 183.88 18.63 103.29 15.87 60.21 42.36 201206 314.45 45.00 57.29 18.22 32.35 19.88 1160.40 7559.68 1335.00 633.15 56.77JVL Agro Industries Ltd 201103 12.84 2180.79 76.71 61.45 3.95 50.02 3.90 17.10 25.07 201206 1002.04 63.67 23.24 2.32 16.57 4.72 14.05 197.32 21.00 13.05 53.82Kaveri Seed Company Ltd. 201103 13.70 233.69 44.13 53.86 23.48 42.48 31.00 21.60 24.99 201206 479.58 99.15 104.17 21.72 100.60 293.68 828.80 1135.64 861.35 400.00 65.05KRBL Ltd. 201103 24.31 1551.27 -1.76 226.30 15.82 120.33 4.95 15.59 20.36 201206 516.45 64.87 96.48 18.68 34.02 5.59 22.55 548.22 29.65 12.75 56.78Kwality Dairy (India) Ltd. 201103 20.32 1608.04 52.55 101.02 6.30 45.94 2.26 24.99 66.42 201206 815.21 69.13 54.51 6.69 29.00 5.71 31.65 643.09 215.40 27.00 74.88LT Foods Ltd 201103 26.12 1243.22 18.08 80.20 9.54 25.20 8.71 7.49 10.24 201206 581.40 135.89 68.93 11.78 7.61 11.83 44.20 115.44 53.00 32.05 58.49Mount Everest Mineral Water Ltd. 201203 34.00 18.88 -12.37 -2.67 1.61 -1.64 -0.48 -3.61 -3.70 201206 4.87 20.24 -0.34 -6.94 0.07 0.09 88.05 299.33 116.45 47.00 50.24Nestle India Ltd. 201112 96.42 7490.82 19.76 1495.47 20.20 961.55 99.73 90.12 90.31 201206 1986.58 12.68 439.35 22.04 245.97 102.04 4717.45 45483.63 5024.35 3930.00 62.76Rei Agro Ltd. 201103 95.80 3723.88 0.83 770.92 20.81 282.45 2.95 12.98 17.75 201206 1981.80 152.59 199.54 10.07 32.52 1.36 9.64 923.50 27.25 7.60 49.59Ruchi Infrastructure Ltd. 201103 20.52 2063.98 40.15 50.21 3.13 21.57 0.86 7.02 13.08 201206 383.93 -61.17 10.37 2.70 2.03 0.40 20.45 419.72 25.40 12.50 52.29Ruchi Soya Inds. Ltd. 201103 66.51 18213.87 26.69 623.06 4.20 234.41 6.77 11.52 11.42 201206 5002.44 -15.17 147.11 2.94 42.61 5.11 83.35 2779.22 128.65 78.60 54.00Sanwaria Agro Oils Ltd. 201103 17.40 1562.52 39.92 41.37 4.54 30.99 1.78 12.89 19.82 201206 461.49 15.49 26.33 5.68 16.35 1.88 41.95 1460.07 42.50 9.80 70.05Usher Agro Ltd. 201106 38.06 560.75 63.96 74.42 13.59 35.22 9.27 11.04 14.94 201203 216.81 47.45 28.57 13.18 11.58 12.17 60.60 230.64 132.75 34.35 29.11Vadilal Industries Ltd. 201103 7.19 238.40 25.00 23.49 11.36 4.70 6.52 12.12 11.85 201206 133.37 24.94 27.19 20.30 13.79 76.71 196.10 140.95 223.90 87.00 66.29VenkyS (India) Ltd. 201203 9.39 990.29 16.26 68.13 8.50 41.06 43.72 20.24 13.92 201206 306.63 39.58 34.28 10.89 20.13 85.75 512.50 481.32 579.00 322.05 56.12Zydus Wellness Ltd 201203 39.07 331.45 -1.46 77.24 24.93 68.59 17.32 49.82 41.73 201206 94.37 4.00 15.43 14.91 13.72 13.81 392.70 1534.36 626.10 320.00 72.54Courier Services Total 23.73 1492.27 430.06 4672.62 81.03Blue Dart Express Ltd. 201112 23.73 1492.27 29.77 176.74 13.51 122.78 52.34 29.75 20.32 201206 430.06 15.94 57.44 13.31 40.63 68.49 1969.25 4672.62 2205.00 1380.00 81.03Cycles Total 3.25 765.19 174.25 132.55 45.74Atlas Cycles (Haryana) Ltd. 201103 3.25 765.19 16.94 19.83 3.01 3.76 11.57 8.29 3.18 201206 174.25 -4.11 6.04 3.46 0.98 12.06 407.60 132.55 466.60 247.00 45.74Diamond & Jewellery Total 464.88 63732.87 17349.23 10611.60 793.44C Mahendra Exports Ltd. 201103 60.00 3366.12 81.68 233.83 7.27 157.33 26.22 14.37 30.07 201206 386.72 -17.85 22.92 5.93 0.28 0.18 97.10 582.60 206.00 84.00 75.00Gitanjali Gems Ltd. 201103 84.87 9456.40 44.87 659.47 7.21 356.57 41.81 12.32 15.17 201206 3384.73 31.38 220.10 6.50 150.89 65.40 344.50 3171.66 443.40 286.20 58.78Goenka Diamond & Jewels Ltd. 201103 31.70 560.99 4.23 49.50 9.54 43.24 13.64 20.48 23.38 201206 121.56 23.99 2.88 2.37 9.06 11.43 222.30 704.69 225.00 28.20 72.36Kanani Industries Ltd. 201103 8.99 151.67 74.65 17.04 11.41 16.18 9.00 24.99 51.06 201206 20.75 -38.48 0.45 2.17 -0.57 -1.27 107.60 193.55 219.00 97.50 74.83Rajesh Exports Ltd. 201103 29.53 20533.76 11.53 107.99 2.14 247.99 8.40 11.87 18.10 201206 4967.15 5.16 148.57 2.99 98.27 13.31 118.50 3498.83 151.00 110.05 51.65Renaissance Jewellery Ltd 201203 19.08 709.43 -17.72 62.67 8.98 41.17 21.58 20.39 14.79 201206 185.78 1.55 -4.74 -2.55 -8.84 -18.52 67.55 128.88 102.90 65.20 73.20Shree Ganesh Jewellery House Ltd. 201203 60.68 10120.97 73.30 539.73 6.99 461.03 75.97 42.03 34.05 201206 2995.77 17.43 120.18 4.01 91.53 61.19 88.95 539.77 164.85 65.20 70.66Shrenuj & Company Ltd. 201203 15.28 3150.59 28.25 219.06 7.38 68.62 9.21 30.79 15.72 201206 713.66 5.55 47.24 6.62 12.70 6.64 65.05 498.23 90.50 42.55 62.22Suashish Diamonds Ltd. 201103 20.76 1101.55 -9.48 -2.20 11.04 69.91 33.00 6.88 10.71 201206 270.85 12.38 9.45 3.49 16.02 30.86 151.00 313.53 158.90 88.10 89.43Surana Corporation Ltd. 201203 21.86 8666.00 62.90 146.43 1.69 67.70 30.97 28.24 25.23 201206 2279.16 22.49 44.51 1.95 24.49 44.81 72.05 157.49 113.00 62.20 55.89Thangamayil Jewellery Ltd. 201203 13.72 1131.51 71.99 117.95 10.43 59.06 43.05 88.32 51.85 201206 358.41 60.63 31.87 8.89 15.13 44.12 220.70 302.79 234.95 139.00 68.81Vaibhav Gems Ltd. 201103 31.70 525.54 55.40 58.99 13.50 43.10 13.60 16.03 28.53 201206 199.84 50.10 33.79 16.53 28.06 35.41 62.85 199.22 69.50 24.65 13.39Winsome Diamonds and Jewellery Ltd. 201103 66.71 4258.34 40.23 130.68 3.31 111.66 16.74 9.57 12.60 201206 1464.84 29.17 28.87 1.97 20.37 7.65 30.05 320.36 59.00 28.05 27.22Diesel Engines Total 126.41 6368.93 1770.38 15111.37 217.68Cummins India Ltd. 201203 55.44 4117.22 1.85 697.25 18.61 591.27 21.33 40.66 30.72 201206 1241.36 21.48 232.49 18.47 180.55 26.05 458.30 12704.08 505.00 322.00 51.00Greaves Cotton Ltd. 201203 48.84 1789.32 39.73 236.64 12.37 188.93 7.74 43.84 33.51 201206 409.20 1.83 49.68 10.79 31.55 5.17 66.00 1611.76 99.50 60.00 51.58Kirloskar Industries Ltd. 201203 9.71 13.81 229.86 7.44 524.12 67.46 69.48 12.19 11.99 201206 2.93 -4.87 1.09 37.20 5.15 21.22 300.15 291.40 374.00 226.00 64.48Swaraj Engines Ltd. 201203 12.42 448.58 24.25 69.37 16.47 52.82 42.53 45.34 31.21 201206 116.89 7.28 18.03 15.26 13.70 44.12 405.90 504.12 496.00 349.00 50.62Diversified Total 660.81 75536.12 16749.03 52116.27 622.593M India Ltd. 201203 11.27 1405.10 17.94 121.88 8.64 64.77 57.50 16.91 11.33 201206 401.79 15.79 32.19 7.89 16.71 59.33 4156.45 4682.27 4749.95 3200.00 76.00Aditya Birla Nuvo Ltd. 201203 113.52 21840.29 20.08 2981.01 14.78 1010.15 78.41 6.63 14.30 201206 5253.58 11.32 844.79 15.87 307.08 94.02 783.20 8891.31 1028.50 710.10 51.05Andhra Sugars Ltd. 201103 27.11 848.34 -0.08 90.88 17.27 55.92 21.33 12.46 11.76 201206 208.25 15.49 42.70 19.79 18.95 27.97 149.90 406.34 160.70 95.05 46.85Andrew Yule & Company Ltd. 201103 63.73 243.59 24.50 5.76 24.03 41.63 1.79 18.71 28.65 201206 35.53 -4.84 -0.45 -1.14 -4.51 -0.55 20.80 678.37 28.85 12.30 93.30Balmer Lawrie & Company Ltd. 201103 16.29 2330.58 18.68 154.42 9.95 128.32 78.59 26.14 21.27 201206 659.40 13.04 51.63 7.77 45.63 112.04 629.90 1025.86 682.00 463.00 Binani Industries Ltd. 201203 29.60 3069.37 26.46 262.12 10.14 -166.00 -55.71 5.41 -41.31 201206 32.16 16.23 7.18 22.33 -23.93 -32.32 104.30 308.69 149.95 88.00 51.28DCM Shriram Consolidated Ltd. 201203 33.18 5039.20 21.39 325.27 6.97 11.92 0.72 7.71 0.91 201206 1423.49 17.15 161.00 10.83 30.93 7.42 57.75 958.09 59.95 37.50 61.82Delta Corp Ltd 201103 20.18 376.01 142.94 184.86 51.47 165.62 8.18 25.46 40.18 201206 71.98 -21.05 29.53 41.03 18.89 2.88 59.80 1339.03 115.50 52.00 42.26Gillanders Arbuthnot & Company Ltd. 201203 21.34 668.24 -10.73 32.21 5.62 -9.27 -4.42 4.43 -4.56 201206 160.78 2.24 19.07 11.50 5.44 10.19 64.60 137.87 98.95 58.00 68.71Grasim Industries Ltd. 201203 91.71 25244.30 17.14 5574.89 22.65 3531.43 288.68 20.10 22.40 201206 6793.42 15.95 1631.76 23.88 1009.99 313.06 3030.95 27800.43 3073.00 2120.00 25.54Kesoram Industries Ltd. 201203 45.74 5920.86 8.87 -97.92 -0.22 -379.74 -83.02 -8.94 -34.37 201206 1504.11 -2.12 71.70 4.74 -95.96 -83.92 139.65 638.81 170.90 83.00 27.12Max India Ltd. 201203 52.91 8546.37 8.83 413.85 5.00 237.88 5.76 2.05 12.54 201206 198.36 -88.16 4.61 2.22 536.54 80.87 188.10 4992.14 214.75 140.10 36.92Oswal Agro Mills Ltd. 201103 134.23 3.87 -47.87 -0.92 313.30 11.21 2.25 2.02 1.88 201206 6.18 121.77 -20.09 -324.96 -20.07 -5.98 19.15 257.06 33.50 18.45 41.74Dyes & Pigments Total 140.13 3811.19 1025.29 3619.84 239.64Atul Ltd. 201203 29.66 1808.22 16.26 188.66 11.25 95.04 30.71 26.97 18.83 201206 495.59 22.76 67.60 13.47 37.48 50.55 295.80 877.39 325.50 135.00 50.21Chromatic India Ltd. 201103 71.05 105.00 549.95 -3.76 1.58 0.91 0.13 0.91 0.64 201206 16.01 -50.33 0.21 1.29 0.13 0.07 88.75 630.53 106.00 56.55 25.71Clariant Chemicals (India) Ltd. 201112 26.66 961.64 -2.00 129.74 17.04 304.39 114.17 93.05 71.44 201206 282.11 8.46 45.20 15.73 30.76 46.15 618.75 1649.63 743.95 556.15 63.40Sudarshan Chemical Inds. Ltd. 201203 6.92 800.29 10.52 85.76 10.47 33.56 48.49 17.23 18.31 201206 198.85 12.57 26.11 13.06 11.03 63.74 475.00 328.83 798.40 370.00 52.76Ultramarine & Pigments Ltd. 201203 5.84 136.04 15.46 23.27 17.56 13.69 4.69 22.60 17.09 201206 32.72 23.56 5.12 15.61 2.84 3.89 45.70 133.44 65.90 33.65 47.56Educational Institutions Total 59.99 138.21 50.87 1452.48 102.79Tree House Education & Accessories Ltd 201203 33.72 77.21 96.77 42.01 59.43 21.66 6.43 20.07 11.43 201206 27.53 69.31 15.79 57.36 8.02 9.52 241.05 812.71 259.00 110.50 29.60Zee Learn Ltd. 201203 26.27 61.00 42.70 -24.56 -34.68 -27.62 -1.05 -8.83 -19.70 201206 23.34 59.24 -1.59 -6.79 -3.36 -0.51 24.35 639.77 29.00 11.80 73.19Electric Equipment Total 1458.39 97755.31 19511.87 114670.39 1081.30ABB Ltd. 201112 42.38 7372.73 17.27 273.72 5.12 184.71 8.72 12.39 7.29 201206 1858.45 9.77 105.99 5.63 51.63 9.75 740.40 15689.70 915.00 541.10 75.00Alstom India Ltd. 201203 67.23 1868.61 18.62 174.75 12.34 130.34 19.39 28.80 20.57 201206 439.97 57.34 12.59 2.85 12.88 7.66 395.65 2893.06 572.00 280.00 68.56AlstomT&D India Ltd. 201203 47.82 4129.19 2.72 383.70 9.25 162.41 6.79 19.13 17.30 201206 671.00 1.16 68.32 10.11 23.00 3.85 188.05 4496.35 236.90 132.50 73.40Apar Industries Ltd. 201103 32.34 3028.30 35.46 201.85 7.03 96.04 29.48 45.58 30.26 201203 892.84 14.65 49.80 5.55 36.05 40.09 129.10 464.40 174.00 97.05 57.99BGR Energy Systems Ltd 201203 72.16 3450.50 -27.40 510.21 15.13 224.38 31.07 24.67 21.68 201206 610.79 -16.47 88.06 14.41 33.66 18.66 263.20 1899.29 377.70 172.55 81.13Bharat Bijlee Ltd. 201203 5.65 717.78 2.09 45.52 8.38 53.67 94.97 25.83 17.89 201206 103.31 -8.76 -1.52 -1.46 -2.43 -17.20 569.40 321.80 767.00 511.00 35.73Bharat Heavy Electricals Ltd. 201203 489.52 48106.52 13.65 9126.11 22.16 7087.26 28.96 28.70 31.13 201206 8326.24 16.89 1202.19 13.58 920.90 15.05 224.90 55046.52 364.00 197.80 67.72Crompton Greaves Ltd. 201203 128.30 11248.58 12.43 803.64 7.46 367.60 5.82 14.60 10.72 201206 2811.14 15.32 166.75 5.93 84.94 5.36 116.50 7473.38 175.00 102.40 41.69Emco Ltd. 201103 13.03 1061.85 8.51 -0.57 0.53 -54.78 -8.39 -1.40 -9.82 201206 165.72 -11.85 19.63 11.84 0.79 0.49 26.60 173.26 55.95 25.15 43.42Indosolar Ltd. 201103 335.14 543.40 382.95 -17.23 5.59 -57.44 -1.71 1.26 -21.22 201206 0.08 -99.79 -4.37 -5674.03 -23.15 -2.76 3.79 127.02 11.04 3.20 61.76Jyoti Ltd. 201103 17.13 383.83 31.86 50.87 13.63 11.86 6.93 24.18 14.17 201206 89.43 30.48 11.44 12.69 0.21 0.49 68.00 116.48 84.90 44.35 32.67Kirloskar Electric Company Ltd. 201203 50.52 1091.25 0.38 50.98 6.20 3.19 0.68 15.56 1.45 201206 190.45 -11.56 13.65 6.51 1.22 0.97 25.70 129.84 40.70 23.05 49.29M AND B Switchgears Ltd. 201103 15.00 34.49 -11.04 2.63 9.12 0.79 0.53 11.96 6.08 201206 5.74 -16.71 1.83 31.88 0.68 1.36 139.50 279.00 390.00 50.00 70.69Modison Metals Ltd. 201203 3.25 162.60 28.12 31.28 18.12 15.98 4.93 27.63 20.20 201206 39.77 11.80 5.98 13.67 2.87 3.53 40.75 132.23 51.00 25.00 50.98Schneider Electric Infrastructure Ltd. 201203 47.82 1349.19 96.11 6.92 39.77 1.66 55.09 29.78 201206 329.57 -4.35 4.19 1.26 -5.11 -0.85 88.90 2125.63 100.60 58.75 73.40Siemens Ltd. 201109 68.06 12119.18 24.39 1324.33 11.78 867.75 25.50 37.11 24.47 201206 2793.50 1.65 96.62 3.40 36.42 4.28 665.95 22661.94 900.00 627.05 75.00Transformers & Rectifiers (India) Ltd 201203 12.92 517.50 -4.68 25.67 6.13 10.15 7.75 7.56 3.06 201206 84.28 -36.58 2.93 3.44 0.72 2.23 134.70 174.08 234.80 122.50 76.82Voltamp Transformers Ltd. 201203 10.12 569.81 6.44 41.72 9.24 33.28 32.89 12.54 8.66 201206 99.60 5.80 3.91 3.58 5.71 22.58 461.00 466.40 576.00 440.55 46.05Electrodes & Welding Equipment Total 111.53 4371.11 1038.64 3366.33 285.02Ador Fontech Ltd. 201203 3.50 157.68 6.91 28.36 18.82 18.83 10.76 42.42 32.54 201206 37.48 0.19 6.58 17.54 4.34 9.92 81.60 142.80 112.95 73.25 35.23Ador Welding Ltd. 201203 13.60 340.91 15.48 37.93 11.13 20.89 15.36 17.04 12.33 201206 84.05 13.95 7.80 9.25 4.52 13.29 132.65 180.38 177.00 108.80 56.68Esab India Ltd. 201112 15.39 536.08 7.14 71.61 14.34 47.44 30.82 35.58 23.57 201206 126.03 -7.76 14.71 11.54 8.93 23.21 442.80 681.60 591.30 422.00 73.72Graphite India Ltd. 201203 39.08 1912.45 32.45 322.94 18.21 212.48 10.88 18.50 13.37 201206 406.78 30.76 73.08 16.66 40.55 8.30 79.20 1547.37 99.90 65.45 62.23HEG Ltd. 201203 39.96 1423.99 27.87 241.82 17.82 62.32 14.32 9.24 7.08 201206 384.30 37.50 103.10 26.81 23.23 23.25 203.75 814.17 256.95 141.00 57.16Electronics - Components Total 156.69 10313.78 1804.43 13671.62 350.28Bharat Electronics Ltd. 201203 80.00 5914.19 3.03 620.13 20.66 847.33 105.84 16.21 15.33 201206 779.22 -15.36 -106.30 -13.34 19.33 9.66 1228.30 9826.40 1665.75 1124.60 75.86Genus Power Infrastructures Ltd. 201103 15.19 714.06 9.21 100.09 15.49 54.77 3.61 17.51 16.58 201206 130.58 -14.67 20.64 15.42 5.14 1.29 8.37 133.01 17.10 7.55 45.54Honeywell Automation India Ltd. 201112 8.84 1608.37 18.90 144.50 9.87 107.14 121.18 25.19 18.42 201206 386.56 11.17 13.70 3.54 11.75 53.17 2460.90 2175.81 3350.00 1620.00 81.24Swelect Energy Systems Ltd. 201203 10.11 599.49 17.50 55.70 9.00 34.97 34.41 17.80 12.85 201206 65.46 -45.20 -5.69 -8.60 480.78 1902.94 142.85 144.36 309.00 132.00 65.12V-Guard Inds Ltd 201203 29.85 993.63 36.75 93.54 9.52 50.80 17.02 40.16 26.55 201206 327.25 37.26 34.28 10.41 20.65 27.68 428.85 1280.01 457.45 141.25 66.04Zicom Electronic Security Systems Ltd. 201203 12.70 484.05 29.64 50.41 10.75 21.02 13.26 17.19 11.88 201206 115.38 32.62 12.81 11.10 5.42 13.63 65.90 112.03 70.85 25.75 16.48Engineering Total 400.23 20765.24 3940.38 23717.79 1122.83AIA Engineering Ltd. 201203 18.86 1416.67 22.06 277.07 19.63 181.20 19.13 22.48 15.84 201206 424.67 60.76 80.16 18.32 54.04 22.83 337.25 3180.95 395.30 250.10 61.65Artson Engineering Ltd. 201203 3.69 60.33 -55.61 -6.04 -9.04 -13.30 -3.60 -197.11 0.00 201206 12.63 -25.52 -2.38 -18.63 -4.39 -4.76 32.10 118.51 36.40 19.00 75.00Disa India Ltd. 201112 1.51 153.99 43.06 31.88 22.13 22.67 150.08 70.80 45.91 201206 29.68 3.63 4.27 14.30 2.36 62.44 2703.40 408.27 3944.45 1370.10 86.49Engineers India Ltd. 201203 168.47 3923.01 46.52 720.09 24.28 643.87 19.11 41.69 38.00 201206 719.99 -15.65 150.90 20.96 154.29 18.32 217.95 7343.53 288.50 195.00 80.40
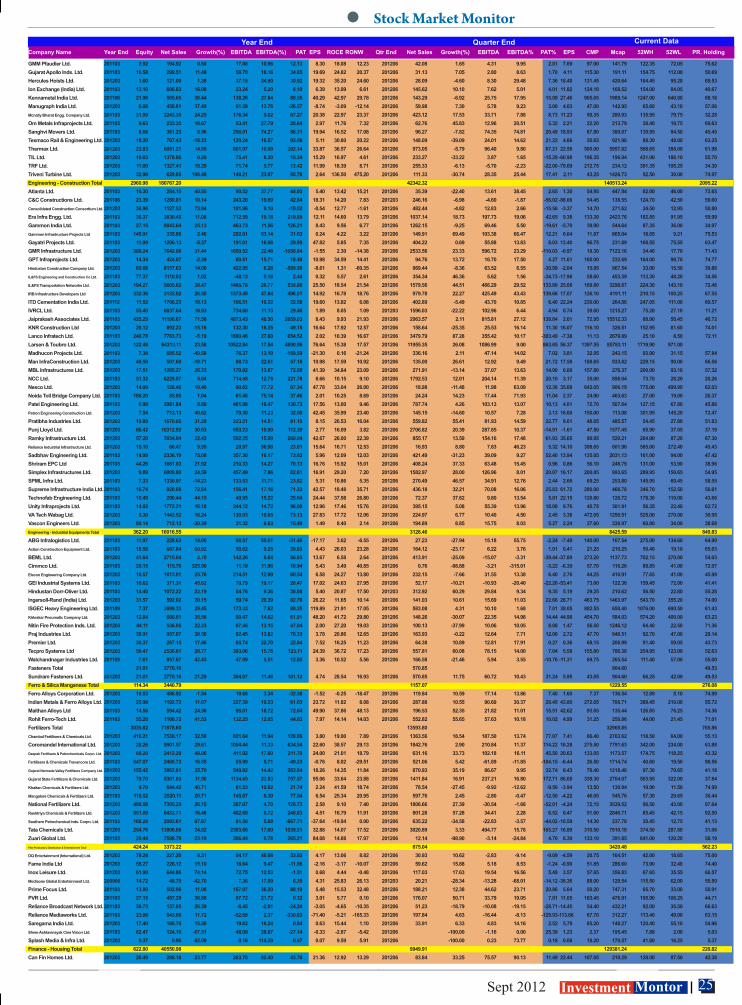
25 Sept 2012 Investment Montor
Company Name Year End Equity Net Sales Growth(%) EBITDA EBITDA(%) PAT EPS ROCE RONW Qtr End Net Sales Growth(%) EBITDA EBITDA% PAT% EPS CMP Mcap 52WH 52WL PR. Holding
DFM Foods Ltd. 201203 10.00 169.42 41.21 19.90 13.44 10.36 10.36 36.99 39.21 201206 50.19 47.49 5.57 11.08 1.97 7.88 237.00 237.04 295.85 166.10 69.02Glaxosmithkline Consumer Healthcare Ltd. 201112 42.06 2685.51 16.45 424.95 20.82 355.21 84.46 51.68 33.76 201206 729.73 11.69 139.38 18.38 106.60 101.38 2914.35 12256.46 2940.00 2179.00 43.16Gokul Refoils and Solvent Ltd 201103 26.38 4836.72 63.31 172.51 3.83 69.68 5.28 20.13 16.60 201206 1774.12 28.63 8.75 0.49 -19.56 -5.93 49.35 650.90 101.00 43.05 69.76Gujarat Ambuja Exports Ltd. 201103 27.67 1961.05 37.14 148.09 8.12 93.19 6.74 19.53 20.05 201206 553.50 50.69 48.17 8.66 26.71 7.72 21.55 298.15 26.50 16.50 64.25Hatsun Agro Products Ltd. 201203 10.77 1603.54 18.28 109.12 7.01 26.60 2.47 34.48 26.54 201206 489.71 32.09 38.04 7.75 13.90 5.16 94.65 1019.30 99.70 48.42 71.16Heritage Foods (India) Ltd. 201103 11.53 1096.09 21.74 39.03 4.03 1.10 0.96 8.93 1.27 201206 408.03 29.90 20.33 4.91 8.45 29.30 255.45 294.52 293.70 133.15 45.71Himalya International Ltd. 201103 50.43 82.89 22.12 28.46 34.67 15.36 3.05 12.87 11.76 201206 42.12 72.60 10.85 25.76 4.18 3.25 22.50 115.66 31.50 15.40 32.86Jubilant FoodWorks Ltd. 201203 65.08 1018.88 50.22 183.88 18.63 103.29 15.87 60.21 42.36 201206 314.45 45.00 57.29 18.22 32.35 19.88 1160.40 7559.68 1335.00 633.15 56.77JVL Agro Industries Ltd 201103 12.84 2180.79 76.71 61.45 3.95 50.02 3.90 17.10 25.07 201206 1002.04 63.67 23.24 2.32 16.57 4.72 14.05 197.32 21.00 13.05 53.82Kaveri Seed Company Ltd. 201103 13.70 233.69 44.13 53.86 23.48 42.48 31.00 21.60 24.99 201206 479.58 99.15 104.17 21.72 100.60 293.68 828.80 1135.64 861.35 400.00 65.05KRBL Ltd. 201103 24.31 1551.27 -1.76 226.30 15.82 120.33 4.95 15.59 20.36 201206 516.45 64.87 96.48 18.68 34.02 5.59 22.55 548.22 29.65 12.75 56.78Kwality Dairy (India) Ltd. 201103 20.32 1608.04 52.55 101.02 6.30 45.94 2.26 24.99 66.42 201206 815.21 69.13 54.51 6.69 29.00 5.71 31.65 643.09 215.40 27.00 74.88LT Foods Ltd 201103 26.12 1243.22 18.08 80.20 9.54 25.20 8.71 7.49 10.24 201206 581.40 135.89 68.93 11.78 7.61 11.83 44.20 115.44 53.00 32.05 58.49Mount Everest Mineral Water Ltd. 201203 34.00 18.88 -12.37 -2.67 1.61 -1.64 -0.48 -3.61 -3.70 201206 4.87 20.24 -0.34 -6.94 0.07 0.09 88.05 299.33 116.45 47.00 50.24Nestle India Ltd. 201112 96.42 7490.82 19.76 1495.47 20.20 961.55 99.73 90.12 90.31 201206 1986.58 12.68 439.35 22.04 245.97 102.04 4717.45 45483.63 5024.35 3930.00 62.76Rei Agro Ltd. 201103 95.80 3723.88 0.83 770.92 20.81 282.45 2.95 12.98 17.75 201206 1981.80 152.59 199.54 10.07 32.52 1.36 9.64 923.50 27.25 7.60 49.59Ruchi Infrastructure Ltd. 201103 20.52 2063.98 40.15 50.21 3.13 21.57 0.86 7.02 13.08 201206 383.93 -61.17 10.37 2.70 2.03 0.40 20.45 419.72 25.40 12.50 52.29Ruchi Soya Inds. Ltd. 201103 66.51 18213.87 26.69 623.06 4.20 234.41 6.77 11.52 11.42 201206 5002.44 -15.17 147.11 2.94 42.61 5.11 83.35 2779.22 128.65 78.60 54.00Sanwaria Agro Oils Ltd. 201103 17.40 1562.52 39.92 41.37 4.54 30.99 1.78 12.89 19.82 201206 461.49 15.49 26.33 5.68 16.35 1.88 41.95 1460.07 42.50 9.80 70.05Usher Agro Ltd. 201106 38.06 560.75 63.96 74.42 13.59 35.22 9.27 11.04 14.94 201203 216.81 47.45 28.57 13.18 11.58 12.17 60.60 230.64 132.75 34.35 29.11Vadilal Industries Ltd. 201103 7.19 238.40 25.00 23.49 11.36 4.70 6.52 12.12 11.85 201206 133.37 24.94 27.19 20.30 13.79 76.71 196.10 140.95 223.90 87.00 66.29VenkyS (India) Ltd. 201203 9.39 990.29 16.26 68.13 8.50 41.06 43.72 20.24 13.92 201206 306.63 39.58 34.28 10.89 20.13 85.75 512.50 481.32 579.00 322.05 56.12Zydus Wellness Ltd 201203 39.07 331.45 -1.46 77.24 24.93 68.59 17.32 49.82 41.73 201206 94.37 4.00 15.43 14.91 13.72 13.81 392.70 1534.36 626.10 320.00 72.54Courier Services Total 23.73 1492.27 430.06 4672.62 81.03Blue Dart Express Ltd. 201112 23.73 1492.27 29.77 176.74 13.51 122.78 52.34 29.75 20.32 201206 430.06 15.94 57.44 13.31 40.63 68.49 1969.25 4672.62 2205.00 1380.00 81.03Cycles Total 3.25 765.19 174.25 132.55 45.74Atlas Cycles (Haryana) Ltd. 201103 3.25 765.19 16.94 19.83 3.01 3.76 11.57 8.29 3.18 201206 174.25 -4.11 6.04 3.46 0.98 12.06 407.60 132.55 466.60 247.00 45.74Diamond & Jewellery Total 464.88 63732.87 17349.23 10611.60 793.44C Mahendra Exports Ltd. 201103 60.00 3366.12 81.68 233.83 7.27 157.33 26.22 14.37 30.07 201206 386.72 -17.85 22.92 5.93 0.28 0.18 97.10 582.60 206.00 84.00 75.00Gitanjali Gems Ltd. 201103 84.87 9456.40 44.87 659.47 7.21 356.57 41.81 12.32 15.17 201206 3384.73 31.38 220.10 6.50 150.89 65.40 344.50 3171.66 443.40 286.20 58.78Goenka Diamond & Jewels Ltd. 201103 31.70 560.99 4.23 49.50 9.54 43.24 13.64 20.48 23.38 201206 121.56 23.99 2.88 2.37 9.06 11.43 222.30 704.69 225.00 28.20 72.36Kanani Industries Ltd. 201103 8.99 151.67 74.65 17.04 11.41 16.18 9.00 24.99 51.06 201206 20.75 -38.48 0.45 2.17 -0.57 -1.27 107.60 193.55 219.00 97.50 74.83Rajesh Exports Ltd. 201103 29.53 20533.76 11.53 107.99 2.14 247.99 8.40 11.87 18.10 201206 4967.15 5.16 148.57 2.99 98.27 13.31 118.50 3498.83 151.00 110.05 51.65Renaissance Jewellery Ltd 201203 19.08 709.43 -17.72 62.67 8.98 41.17 21.58 20.39 14.79 201206 185.78 1.55 -4.74 -2.55 -8.84 -18.52 67.55 128.88 102.90 65.20 73.20Shree Ganesh Jewellery House Ltd. 201203 60.68 10120.97 73.30 539.73 6.99 461.03 75.97 42.03 34.05 201206 2995.77 17.43 120.18 4.01 91.53 61.19 88.95 539.77 164.85 65.20 70.66Shrenuj & Company Ltd. 201203 15.28 3150.59 28.25 219.06 7.38 68.62 9.21 30.79 15.72 201206 713.66 5.55 47.24 6.62 12.70 6.64 65.05 498.23 90.50 42.55 62.22Suashish Diamonds Ltd. 201103 20.76 1101.55 -9.48 -2.20 11.04 69.91 33.00 6.88 10.71 201206 270.85 12.38 9.45 3.49 16.02 30.86 151.00 313.53 158.90 88.10 89.43Surana Corporation Ltd. 201203 21.86 8666.00 62.90 146.43 1.69 67.70 30.97 28.24 25.23 201206 2279.16 22.49 44.51 1.95 24.49 44.81 72.05 157.49 113.00 62.20 55.89Thangamayil Jewellery Ltd. 201203 13.72 1131.51 71.99 117.95 10.43 59.06 43.05 88.32 51.85 201206 358.41 60.63 31.87 8.89 15.13 44.12 220.70 302.79 234.95 139.00 68.81Vaibhav Gems Ltd. 201103 31.70 525.54 55.40 58.99 13.50 43.10 13.60 16.03 28.53 201206 199.84 50.10 33.79 16.53 28.06 35.41 62.85 199.22 69.50 24.65 13.39Winsome Diamonds and Jewellery Ltd. 201103 66.71 4258.34 40.23 130.68 3.31 111.66 16.74 9.57 12.60 201206 1464.84 29.17 28.87 1.97 20.37 7.65 30.05 320.36 59.00 28.05 27.22Diesel Engines Total 126.41 6368.93 1770.38 15111.37 217.68Cummins India Ltd. 201203 55.44 4117.22 1.85 697.25 18.61 591.27 21.33 40.66 30.72 201206 1241.36 21.48 232.49 18.47 180.55 26.05 458.30 12704.08 505.00 322.00 51.00Greaves Cotton Ltd. 201203 48.84 1789.32 39.73 236.64 12.37 188.93 7.74 43.84 33.51 201206 409.20 1.83 49.68 10.79 31.55 5.17 66.00 1611.76 99.50 60.00 51.58Kirloskar Industries Ltd. 201203 9.71 13.81 229.86 7.44 524.12 67.46 69.48 12.19 11.99 201206 2.93 -4.87 1.09 37.20 5.15 21.22 300.15 291.40 374.00 226.00 64.48Swaraj Engines Ltd. 201203 12.42 448.58 24.25 69.37 16.47 52.82 42.53 45.34 31.21 201206 116.89 7.28 18.03 15.26 13.70 44.12 405.90 504.12 496.00 349.00 50.62Diversified Total 660.81 75536.12 16749.03 52116.27 622.593M India Ltd. 201203 11.27 1405.10 17.94 121.88 8.64 64.77 57.50 16.91 11.33 201206 401.79 15.79 32.19 7.89 16.71 59.33 4156.45 4682.27 4749.95 3200.00 76.00Aditya Birla Nuvo Ltd. 201203 113.52 21840.29 20.08 2981.01 14.78 1010.15 78.41 6.63 14.30 201206 5253.58 11.32 844.79 15.87 307.08 94.02 783.20 8891.31 1028.50 710.10 51.05Andhra Sugars Ltd. 201103 27.11 848.34 -0.08 90.88 17.27 55.92 21.33 12.46 11.76 201206 208.25 15.49 42.70 19.79 18.95 27.97 149.90 406.34 160.70 95.05 46.85Andrew Yule & Company Ltd. 201103 63.73 243.59 24.50 5.76 24.03 41.63 1.79 18.71 28.65 201206 35.53 -4.84 -0.45 -1.14 -4.51 -0.55 20.80 678.37 28.85 12.30 93.30Balmer Lawrie & Company Ltd. 201103 16.29 2330.58 18.68 154.42 9.95 128.32 78.59 26.14 21.27 201206 659.40 13.04 51.63 7.77 45.63 112.04 629.90 1025.86 682.00 463.00 Binani Industries Ltd. 201203 29.60 3069.37 26.46 262.12 10.14 -166.00 -55.71 5.41 -41.31 201206 32.16 16.23 7.18 22.33 -23.93 -32.32 104.30 308.69 149.95 88.00 51.28DCM Shriram Consolidated Ltd. 201203 33.18 5039.20 21.39 325.27 6.97 11.92 0.72 7.71 0.91 201206 1423.49 17.15 161.00 10.83 30.93 7.42 57.75 958.09 59.95 37.50 61.82Delta Corp Ltd 201103 20.18 376.01 142.94 184.86 51.47 165.62 8.18 25.46 40.18 201206 71.98 -21.05 29.53 41.03 18.89 2.88 59.80 1339.03 115.50 52.00 42.26Gillanders Arbuthnot & Company Ltd. 201203 21.34 668.24 -10.73 32.21 5.62 -9.27 -4.42 4.43 -4.56 201206 160.78 2.24 19.07 11.50 5.44 10.19 64.60 137.87 98.95 58.00 68.71Grasim Industries Ltd. 201203 91.71 25244.30 17.14 5574.89 22.65 3531.43 288.68 20.10 22.40 201206 6793.42 15.95 1631.76 23.88 1009.99 313.06 3030.95 27800.43 3073.00 2120.00 25.54Kesoram Industries Ltd. 201203 45.74 5920.86 8.87 -97.92 -0.22 -379.74 -83.02 -8.94 -34.37 201206 1504.11 -2.12 71.70 4.74 -95.96 -83.92 139.65 638.81 170.90 83.00 27.12Max India Ltd. 201203 52.91 8546.37 8.83 413.85 5.00 237.88 5.76 2.05 12.54 201206 198.36 -88.16 4.61 2.22 536.54 80.87 188.10 4992.14 214.75 140.10 36.92Oswal Agro Mills Ltd. 201103 134.23 3.87 -47.87 -0.92 313.30 11.21 2.25 2.02 1.88 201206 6.18 121.77 -20.09 -324.96 -20.07 -5.98 19.15 257.06 33.50 18.45 41.74Dyes & Pigments Total 140.13 3811.19 1025.29 3619.84 239.64Atul Ltd. 201203 29.66 1808.22 16.26 188.66 11.25 95.04 30.71 26.97 18.83 201206 495.59 22.76 67.60 13.47 37.48 50.55 295.80 877.39 325.50 135.00 50.21Chromatic India Ltd. 201103 71.05 105.00 549.95 -3.76 1.58 0.91 0.13 0.91 0.64 201206 16.01 -50.33 0.21 1.29 0.13 0.07 88.75 630.53 106.00 56.55 25.71Clariant Chemicals (India) Ltd. 201112 26.66 961.64 -2.00 129.74 17.04 304.39 114.17 93.05 71.44 201206 282.11 8.46 45.20 15.73 30.76 46.15 618.75 1649.63 743.95 556.15 63.40Sudarshan Chemical Inds. Ltd. 201203 6.92 800.29 10.52 85.76 10.47 33.56 48.49 17.23 18.31 201206 198.85 12.57 26.11 13.06 11.03 63.74 475.00 328.83 798.40 370.00 52.76Ultramarine & Pigments Ltd. 201203 5.84 136.04 15.46 23.27 17.56 13.69 4.69 22.60 17.09 201206 32.72 23.56 5.12 15.61 2.84 3.89 45.70 133.44 65.90 33.65 47.56Educational Institutions Total 59.99 138.21 50.87 1452.48 102.79Tree House Education & Accessories Ltd 201203 33.72 77.21 96.77 42.01 59.43 21.66 6.43 20.07 11.43 201206 27.53 69.31 15.79 57.36 8.02 9.52 241.05 812.71 259.00 110.50 29.60Zee Learn Ltd. 201203 26.27 61.00 42.70 -24.56 -34.68 -27.62 -1.05 -8.83 -19.70 201206 23.34 59.24 -1.59 -6.79 -3.36 -0.51 24.35 639.77 29.00 11.80 73.19Electric Equipment Total 1458.39 97755.31 19511.87 114670.39 1081.30ABB Ltd. 201112 42.38 7372.73 17.27 273.72 5.12 184.71 8.72 12.39 7.29 201206 1858.45 9.77 105.99 5.63 51.63 9.75 740.40 15689.70 915.00 541.10 75.00Alstom India Ltd. 201203 67.23 1868.61 18.62 174.75 12.34 130.34 19.39 28.80 20.57 201206 439.97 57.34 12.59 2.85 12.88 7.66 395.65 2893.06 572.00 280.00 68.56AlstomT&D India Ltd. 201203 47.82 4129.19 2.72 383.70 9.25 162.41 6.79 19.13 17.30 201206 671.00 1.16 68.32 10.11 23.00 3.85 188.05 4496.35 236.90 132.50 73.40Apar Industries Ltd. 201103 32.34 3028.30 35.46 201.85 7.03 96.04 29.48 45.58 30.26 201203 892.84 14.65 49.80 5.55 36.05 40.09 129.10 464.40 174.00 97.05 57.99BGR Energy Systems Ltd 201203 72.16 3450.50 -27.40 510.21 15.13 224.38 31.07 24.67 21.68 201206 610.79 -16.47 88.06 14.41 33.66 18.66 263.20 1899.29 377.70 172.55 81.13Bharat Bijlee Ltd. 201203 5.65 717.78 2.09 45.52 8.38 53.67 94.97 25.83 17.89 201206 103.31 -8.76 -1.52 -1.46 -2.43 -17.20 569.40 321.80 767.00 511.00 35.73Bharat Heavy Electricals Ltd. 201203 489.52 48106.52 13.65 9126.11 22.16 7087.26 28.96 28.70 31.13 201206 8326.24 16.89 1202.19 13.58 920.90 15.05 224.90 55046.52 364.00 197.80 67.72Crompton Greaves Ltd. 201203 128.30 11248.58 12.43 803.64 7.46 367.60 5.82 14.60 10.72 201206 2811.14 15.32 166.75 5.93 84.94 5.36 116.50 7473.38 175.00 102.40 41.69Emco Ltd. 201103 13.03 1061.85 8.51 -0.57 0.53 -54.78 -8.39 -1.40 -9.82 201206 165.72 -11.85 19.63 11.84 0.79 0.49 26.60 173.26 55.95 25.15 43.42Indosolar Ltd. 201103 335.14 543.40 382.95 -17.23 5.59 -57.44 -1.71 1.26 -21.22 201206 0.08 -99.79 -4.37 -5674.03 -23.15 -2.76 3.79 127.02 11.04 3.20 61.76Jyoti Ltd. 201103 17.13 383.83 31.86 50.87 13.63 11.86 6.93 24.18 14.17 201206 89.43 30.48 11.44 12.69 0.21 0.49 68.00 116.48 84.90 44.35 32.67Kirloskar Electric Company Ltd. 201203 50.52 1091.25 0.38 50.98 6.20 3.19 0.68 15.56 1.45 201206 190.45 -11.56 13.65 6.51 1.22 0.97 25.70 129.84 40.70 23.05 49.29M AND B Switchgears Ltd. 201103 15.00 34.49 -11.04 2.63 9.12 0.79 0.53 11.96 6.08 201206 5.74 -16.71 1.83 31.88 0.68 1.36 139.50 279.00 390.00 50.00 70.69Modison Metals Ltd. 201203 3.25 162.60 28.12 31.28 18.12 15.98 4.93 27.63 20.20 201206 39.77 11.80 5.98 13.67 2.87 3.53 40.75 132.23 51.00 25.00 50.98Schneider Electric Infrastructure Ltd. 201203 47.82 1349.19 96.11 6.92 39.77 1.66 55.09 29.78 201206 329.57 -4.35 4.19 1.26 -5.11 -0.85 88.90 2125.63 100.60 58.75 73.40Siemens Ltd. 201109 68.06 12119.18 24.39 1324.33 11.78 867.75 25.50 37.11 24.47 201206 2793.50 1.65 96.62 3.40 36.42 4.28 665.95 22661.94 900.00 627.05 75.00Transformers & Rectifiers (India) Ltd 201203 12.92 517.50 -4.68 25.67 6.13 10.15 7.75 7.56 3.06 201206 84.28 -36.58 2.93 3.44 0.72 2.23 134.70 174.08 234.80 122.50 76.82Voltamp Transformers Ltd. 201203 10.12 569.81 6.44 41.72 9.24 33.28 32.89 12.54 8.66 201206 99.60 5.80 3.91 3.58 5.71 22.58 461.00 466.40 576.00 440.55 46.05Electrodes & Welding Equipment Total 111.53 4371.11 1038.64 3366.33 285.02Ador Fontech Ltd. 201203 3.50 157.68 6.91 28.36 18.82 18.83 10.76 42.42 32.54 201206 37.48 0.19 6.58 17.54 4.34 9.92 81.60 142.80 112.95 73.25 35.23Ador Welding Ltd. 201203 13.60 340.91 15.48 37.93 11.13 20.89 15.36 17.04 12.33 201206 84.05 13.95 7.80 9.25 4.52 13.29 132.65 180.38 177.00 108.80 56.68Esab India Ltd. 201112 15.39 536.08 7.14 71.61 14.34 47.44 30.82 35.58 23.57 201206 126.03 -7.76 14.71 11.54 8.93 23.21 442.80 681.60 591.30 422.00 73.72Graphite India Ltd. 201203 39.08 1912.45 32.45 322.94 18.21 212.48 10.88 18.50 13.37 201206 406.78 30.76 73.08 16.66 40.55 8.30 79.20 1547.37 99.90 65.45 62.23HEG Ltd. 201203 39.96 1423.99 27.87 241.82 17.82 62.32 14.32 9.24 7.08 201206 384.30 37.50 103.10 26.81 23.23 23.25 203.75 814.17 256.95 141.00 57.16Electronics - Components Total 156.69 10313.78 1804.43 13671.62 350.28Bharat Electronics Ltd. 201203 80.00 5914.19 3.03 620.13 20.66 847.33 105.84 16.21 15.33 201206 779.22 -15.36 -106.30 -13.34 19.33 9.66 1228.30 9826.40 1665.75 1124.60 75.86Genus Power Infrastructures Ltd. 201103 15.19 714.06 9.21 100.09 15.49 54.77 3.61 17.51 16.58 201206 130.58 -14.67 20.64 15.42 5.14 1.29 8.37 133.01 17.10 7.55 45.54Honeywell Automation India Ltd. 201112 8.84 1608.37 18.90 144.50 9.87 107.14 121.18 25.19 18.42 201206 386.56 11.17 13.70 3.54 11.75 53.17 2460.90 2175.81 3350.00 1620.00 81.24Swelect Energy Systems Ltd. 201203 10.11 599.49 17.50 55.70 9.00 34.97 34.41 17.80 12.85 201206 65.46 -45.20 -5.69 -8.60 480.78 1902.94 142.85 144.36 309.00 132.00 65.12V-Guard Inds Ltd 201203 29.85 993.63 36.75 93.54 9.52 50.80 17.02 40.16 26.55 201206 327.25 37.26 34.28 10.41 20.65 27.68 428.85 1280.01 457.45 141.25 66.04Zicom Electronic Security Systems Ltd. 201203 12.70 484.05 29.64 50.41 10.75 21.02 13.26 17.19 11.88 201206 115.38 32.62 12.81 11.10 5.42 13.63 65.90 112.03 70.85 25.75 16.48Engineering Total 400.23 20765.24 3940.38 23717.79 1122.83AIA Engineering Ltd. 201203 18.86 1416.67 22.06 277.07 19.63 181.20 19.13 22.48 15.84 201206 424.67 60.76 80.16 18.32 54.04 22.83 337.25 3180.95 395.30 250.10 61.65Artson Engineering Ltd. 201203 3.69 60.33 -55.61 -6.04 -9.04 -13.30 -3.60 -197.11 0.00 201206 12.63 -25.52 -2.38 -18.63 -4.39 -4.76 32.10 118.51 36.40 19.00 75.00Disa India Ltd. 201112 1.51 153.99 43.06 31.88 22.13 22.67 150.08 70.80 45.91 201206 29.68 3.63 4.27 14.30 2.36 62.44 2703.40 408.27 3944.45 1370.10 86.49Engineers India Ltd. 201203 168.47 3923.01 46.52 720.09 24.28 643.87 19.11 41.69 38.00 201206 719.99 -15.65 150.90 20.96 154.29 18.32 217.95 7343.53 288.50 195.00 80.40
Year End Quarter End Current Data
Stock Market Monitor
Company Name Year End Equity Net Sales Growth(%) EBITDA EBITDA(%) PAT EPS ROCE RONW Qtr End Net Sales Growth(%) EBITDA EBITDA% PAT% EPS CMP Mcap 52WH 52WL PR. Holding
GMM Pfaudler Ltd. 201103 2.92 194.92 0.60 17.08 10.96 12.13 8.30 18.08 12.23 201206 42.08 1.65 4.31 9.95 2.81 7.69 97.00 141.79 122.35 72.05 75.62Gujarat Apollo Inds. Ltd. 201103 16.58 299.51 11.49 58.70 18.16 34.85 19.69 24.82 20.37 201206 31.13 7.05 2.80 8.63 1.70 4.11 115.30 191.11 154.75 112.00 50.69Hercules Hoists Ltd. 201203 1.60 121.00 1.38 37.15 34.90 30.92 19.32 35.20 24.60 201206 28.09 -4.60 8.30 29.48 7.36 18.40 131.45 420.64 164.45 95.28 69.53Ion Exchange (India) Ltd. 201103 13.10 606.83 16.08 23.24 5.20 8.10 6.39 13.99 6.61 201206 145.62 10.10 7.62 5.01 4.01 11.82 124.10 168.52 154.00 84.05 40.67Kennametal India Ltd. 201106 21.98 505.65 36.44 138.26 27.84 88.55 40.29 42.97 29.78 201206 143.29 -6.92 25.75 17.95 15.09 27.46 905.05 1989.14 1247.00 640.80 88.16Manugraph India Ltd. 201203 6.08 450.61 37.49 61.59 13.76 -26.57 -8.74 -3.09 -12.14 201206 59.98 7.30 5.78 9.23 3.06 4.03 47.00 142.95 65.60 43.10 57.06Mcnally Bharat Engg. Company Ltd. 201103 31.09 2243.35 24.25 176.34 9.02 67.27 20.38 22.97 23.37 201206 423.12 17.53 33.71 7.88 8.73 11.23 90.35 280.93 135.95 79.75 32.28Om Metals Infraprojects Ltd. 201103 9.63 233.35 18.67 53.41 27.79 28.64 2.97 11.76 7.32 201206 62.76 45.83 12.96 20.51 5.32 2.21 22.20 213.79 38.40 19.75 69.63Sanghvi Movers Ltd. 201103 8.66 361.25 8.96 256.01 74.27 86.31 19.94 16.52 17.08 201206 96.27 -7.82 74.35 74.81 20.49 18.93 87.80 380.07 130.95 84.50 45.45Texmaco Rail & Engineering Ltd. 201203 18.20 767.43 -18.23 129.24 16.57 93.06 5.11 30.80 20.22 201206 148.09 -39.09 24.01 14.62 21.22 4.66 50.65 921.96 88.30 48.00 63.25Thermax Ltd. 201203 23.83 6091.21 14.95 601.97 10.99 392.14 33.87 36.57 26.64 201206 973.05 -5.79 96.40 9.80 67.21 22.56 500.00 5957.82 568.65 388.00 61.98TIL Ltd. 201203 10.03 1378.86 0.20 75.41 6.30 15.34 15.29 16.97 4.61 201206 233.27 -33.22 3.87 1.65 -15.29 -60.98 196.35 196.94 431.00 186.10 55.70TRF Ltd. 201203 11.00 1327.41 19.20 71.74 5.77 13.42 11.99 18.39 8.71 201206 255.33 -6.13 -5.70 -2.23 -22.00 -79.69 212.75 234.12 391.35 195.25 34.30Triveni Turbine Ltd. 201203 32.99 629.85 106.48 148.21 23.07 85.78 2.64 136.50 475.20 201206 111.33 -30.74 28.35 25.44 17.41 2.11 43.25 1426.73 52.50 30.00 74.97Engineering - Construction Total 2960.98 180767.20 42342.32 140513.24 2095.22Atlanta Ltd. 201103 16.30 284.15 40.55 90.52 37.77 44.00 5.40 13.42 15.21 201206 35.39 -22.40 13.61 38.45 2.65 1.30 54.95 447.84 82.00 46.00 73.65C&C Constructions Ltd. 201106 23.39 1280.01 10.14 243.20 19.69 42.84 18.31 14.20 7.83 201203 246.16 -6.98 -4.60 -1.87 -56.02 -88.06 54.45 138.55 124.70 42.50 59.60Consolidated Construction Consortium Ltd. 201203 36.96 1127.53 73.94 101.96 9.10 -10.02 -0.54 12.77 -1.61 201206 482.44 -4.82 12.83 2.66 -15.56 -3.37 14.70 271.62 24.50 12.95 50.80Era Infra Engg. Ltd. 201103 36.37 3830.48 11.08 712.59 19.18 219.89 12.11 14.60 13.79 201206 1037.14 18.73 197.73 19.06 42.65 9.38 133.30 2423.76 182.85 91.95 59.99Gammon India Ltd. 201103 27.15 8843.64 25.13 463.73 11.56 126.21 8.43 9.56 6.77 201206 1262.15 -9.25 69.46 5.50 -19.61 -5.70 39.90 544.64 87.35 36.00 34.97Gammon Infrastructure Projects Ltd 201103 145.91 335.86 2.46 202.01 63.14 21.63 0.24 4.22 3.22 201206 149.91 69.49 103.38 66.47 12.21 0.64 11.87 865.04 18.05 9.21 75.53Gayatri Projects Ltd. 201103 11.99 1206.13 -5.37 191.01 16.66 29.99 47.82 5.85 7.35 201206 404.22 0.69 55.88 13.83 8.03 13.40 96.75 231.89 168.55 75.55 63.47GMR Infrastructure Ltd. 201203 389.24 7642.06 31.44 1659.52 22.46 -1058.84 -1.55 2.30 -14.38 201206 2533.56 23.33 596.72 23.29 -110.03 -0.97 18.30 7123.16 34.40 17.70 71.43GPT Infraprojects Ltd. 201203 14.34 424.07 -2.39 60.81 15.71 18.48 10.98 34.59 14.41 201206 94.76 13.72 16.70 17.50 4.27 11.61 160.00 232.69 164.00 98.70 74.77Hindustan Construction Company Ltd. 201203 60.66 8157.63 14.00 422.95 6.28 -589.90 -8.61 1.31 -60.35 201206 969.44 -8.36 63.52 6.55 -30.99 -2.04 15.95 967.54 33.00 15.50 39.86IL&FS Engineering and Construction Co Ltd. 201103 77.37 1110.03 1.02 -48.13 0.18 2.44 0.32 5.57 2.61 201206 354.34 46.36 5.62 1.56 -34.73 -17.96 58.60 453.39 113.30 48.20 34.56IL&FS Transportation Networks Ltd. 201203 194.27 5605.62 38.47 1488.78 28.77 538.88 25.50 18.54 21.54 201206 1579.56 44.51 466.29 29.52 133.80 25.06 169.80 3298.67 224.30 143.10 72.46IRB Infrastructure Developers Ltd 201203 332.36 3133.02 28.50 1373.49 47.84 496.01 14.92 16.78 18.76 201206 979.78 22.27 425.49 43.43 139.66 17.07 126.10 4191.11 210.15 100.25 67.55ITD Cementation India Ltd. 201112 11.52 1706.23 19.13 166.51 10.32 22.58 19.60 13.82 6.08 201206 402.89 -5.49 43.70 10.85 6.40 22.24 230.00 264.86 247.05 111.00 69.57IVRCL Ltd. 201103 53.40 6837.64 16.93 734.60 11.13 29.46 1.89 8.05 1.09 201203 1596.03 -22.22 102.96 6.44 4.94 0.74 39.60 1215.27 75.20 27.10 11.21Jaiprakash Associates Ltd. 201103 425.29 11196.67 71.58 4873.43 48.50 2059.03 8.43 9.93 21.93 201206 2963.57 2.11 815.81 27.12 138.84 2.61 72.95 15512.33 88.90 50.45 46.72KNR Construction Ltd 201203 28.12 892.23 -15.16 132.30 16.35 49.15 16.64 17.92 12.57 201206 158.64 -25.35 25.53 16.14 11.30 16.07 116.10 326.51 152.95 81.60 74.01Lanco Infratech Ltd. 201103 240.78 7783.73 -5.19 1890.46 27.60 654.52 2.02 10.39 16.67 201206 3479.79 87.28 355.42 10.17 -383.49 -7.38 11.13 2679.89 25.10 8.50 72.11Larsen & Toubro Ltd. 201203 122.48 64313.11 23.58 10522.84 17.54 4690.96 76.64 15.38 17.57 201206 11955.35 26.08 1086.99 9.00 863.65 56.37 1397.55 85783.11 1719.90 971.00 Madhucon Projects Ltd. 201103 7.38 685.52 -49.58 76.37 13.19 -159.59 -21.30 0.16 -21.24 201206 336.16 2.11 47.14 14.02 7.02 3.81 32.95 243.15 93.90 31.15 57.84Man InfraConstruction Ltd. 201203 49.50 507.60 -18.71 88.73 22.61 57.18 10.98 17.59 10.92 201206 135.00 26.61 12.92 9.49 21.72 17.58 188.65 933.82 229.15 90.00 66.56MBL Infrastructures Ltd. 201203 17.51 1265.27 26.33 170.82 13.67 72.50 41.39 34.84 23.09 201206 271.91 -13.14 37.07 13.63 14.90 0.00 157.80 276.37 200.00 93.10 57.32NCC Ltd. 201103 51.32 6229.87 5.64 714.98 12.75 221.78 8.66 10.15 9.10 201206 1792.53 12.01 204.14 11.39 20.10 3.17 35.00 898.04 73.70 28.20 20.26Nesco Ltd. 201203 14.09 128.46 10.40 90.62 77.72 67.34 47.78 33.04 26.00 201206 18.98 -11.48 11.98 63.09 12.36 35.08 643.05 906.19 775.00 499.90 62.03Noida Toll Bridge Company Ltd. 201103 186.20 85.85 1.04 61.46 75.14 37.46 2.01 10.25 8.69 201206 24.24 14.23 17.44 71.93 11.04 2.37 24.90 463.63 27.00 19.00 26.37Patel Engineering Ltd. 201103 6.98 2981.84 8.80 461.98 18.47 130.73 17.56 13.00 9.46 201206 787.74 4.26 103.13 13.07 10.13 4.01 72.70 507.64 127.15 67.80 45.86Petron Engineering Construction Ltd. 201203 7.54 713.13 40.62 79.30 11.23 32.00 42.45 35.99 23.40 201206 145.15 -14.60 10.57 7.28 3.13 16.60 150.00 113.08 351.95 145.20 72.47Pratibha Industries Ltd. 201203 19.89 1670.05 31.29 223.51 14.51 81.10 8.15 26.53 16.04 201206 559.82 55.41 81.93 14.59 22.77 9.01 48.05 485.57 54.45 27.80 51.83Punj Lloyd Ltd. 201203 66.42 10312.92 30.63 653.23 10.90 112.39 2.77 16.09 3.82 201206 2706.82 20.39 287.85 10.37 -14.91 -1.61 47.50 1577.45 65.90 37.05 37.19Ramky Infrastructure Ltd. 201203 57.20 3934.04 22.42 592.25 15.99 260.04 42.67 26.00 22.39 201206 855.17 13.59 154.16 17.48 61.93 35.65 90.95 520.21 264.90 87.20 67.30Reliance Industrial Infrastructure Ltd. 201203 15.10 66.47 9.95 28.97 56.98 23.61 15.64 16.71 12.53 201206 16.93 8.80 7.83 46.23 5.32 14.10 398.65 601.96 565.00 272.40 45.43Sadbhav Engineering Ltd. 201103 14.99 2336.19 75.08 357.30 16.17 73.63 5.96 12.09 12.03 201206 421.49 -31.23 39.09 9.27 52.40 13.94 135.05 2031.13 161.00 94.00 47.42Shriram EPC Ltd 201103 44.26 1661.03 21.92 210.33 14.27 70.13 16.76 15.92 15.01 201206 408.24 37.33 63.48 15.45 0.96 0.86 56.10 248.79 131.00 53.90 38.96Simplex Infrastructures Ltd. 201203 9.89 6009.80 24.59 457.49 7.96 82.61 16.91 29.20 7.20 201206 1582.97 28.00 126.96 8.01 20.07 16.17 200.85 993.65 289.95 156.65 54.95SPML Infra Ltd. 201103 7.33 1330.97 -14.23 133.53 11.71 23.82 5.31 10.86 5.35 201206 270.49 46.57 34.91 12.76 2.44 2.66 69.25 253.80 145.95 60.45 58.55Supreme Infrastructure India Ltd. 201103 16.74 920.08 72.54 156.41 17.16 71.33 42.57 18.48 35.71 201206 436.18 32.21 70.08 16.06 25.83 61.72 280.00 468.78 346.70 152.50 56.61Technofab Engineering Ltd. 201103 10.49 290.44 44.15 40.95 15.22 25.64 24.44 37.98 26.80 201206 72.37 37.62 9.80 13.54 5.81 22.15 120.80 126.72 178.30 110.00 43.66Unity Infraprojects Ltd. 201103 14.82 1772.21 16.18 244.12 14.72 96.00 12.96 17.46 15.76 201206 395.15 5.08 55.39 13.96 18.08 9.76 40.75 301.91 56.35 22.40 62.72VA Tech Wabag Ltd. 201203 5.30 1443.52 16.24 130.03 10.05 73.13 27.83 17.72 12.06 201206 224.97 6.77 10.40 4.50 2.45 3.38 472.05 1250.51 525.00 270.00 30.95Vascon Engineers Ltd. 201203 90.14 712.12 -30.39 31.32 6.63 15.49 1.49 8.40 2.14 201206 194.89 8.85 15.75 8.03 5.27 2.24 37.60 338.97 60.80 34.00 38.68Engineering - Industrial Equipments Total 362.20 16016.55 3128.46 8425.59 849.83ABG Infralogistics Ltd. 201103 11.97 228.63 14.06 98.57 50.61 -31.46 -17.17 3.62 -6.55 201206 27.23 -27.94 15.18 55.75 -2.24 -7.49 140.00 167.54 275.00 134.60 64.90Action Construction Equipment Ltd. 201103 18.58 687.84 60.92 50.62 9.25 39.93 4.43 26.03 23.28 201206 164.12 -23.17 6.22 3.76 1.01 0.41 21.25 210.25 50.40 19.10 65.63BEML Ltd. 201203 41.64 2715.04 2.70 142.26 6.64 56.93 13.67 6.58 2.64 201206 413.91 -25.09 -15.07 -3.31 -39.44 -37.89 273.20 1137.73 702.15 270.00 54.03Cimmco Ltd. 201103 20.15 115.76 325.90 11.19 11.96 10.94 5.43 3.49 40.85 201206 0.76 -98.88 -3.21 -315.01 -3.22 -6.39 57.70 116.26 88.85 41.00 72.07Elecon Engineering Company Ltd. 201203 18.57 1613.01 25.76 214.51 12.99 60.54 6.58 24.27 13.80 201206 232.15 -7.66 31.55 13.38 6.40 2.76 44.25 410.91 77.65 41.00 45.99GEI Industrial Systems Ltd. 201103 16.62 371.31 45.62 70.79 19.17 28.47 17.02 24.63 27.95 201206 52.17 -10.21 -10.93 -20.40 -22.20 -53.41 73.60 122.36 159.45 72.00 41.41Hindustan Dorr-Oliver Ltd. 201103 14.40 1072.22 22.19 84.76 9.36 38.88 5.40 20.87 17.50 201203 312.92 60.29 29.84 9.34 9.35 5.19 29.25 210.62 56.50 22.80 55.28Ingersoll-Rand (India) Ltd. 201203 31.57 592.02 20.15 59.74 20.39 82.76 26.22 11.65 10.14 201206 141.03 10.61 15.69 11.03 22.66 28.71 463.75 1463.97 543.70 355.20 74.00ISGEC Heavy Engineering Ltd. 201109 7.37 2699.33 29.45 173.33 7.62 88.35 119.89 21.91 17.05 201206 583.08 4.31 10.10 1.68 7.01 38.05 882.55 650.40 1076.00 690.50 61.43Kirloskar Pneumatic Company Ltd. 201203 12.84 666.61 35.56 90.47 14.62 61.91 48.20 41.72 29.80 201206 148.26 -30.07 22.35 14.98 14.44 44.98 454.70 584.03 574.20 400.00 63.23Nitin Fire Protection Inds. Ltd. 201203 44.11 536.05 22.33 67.46 13.15 47.04 2.00 27.20 19.03 201206 100.13 -37.99 10.06 10.05 8.08 1.47 56.50 1246.12 64.40 22.50 71.36Praj Industries Ltd. 201203 35.91 957.07 38.50 92.45 13.82 70.33 3.78 20.86 12.65 201206 163.93 -0.22 12.64 7.71 12.06 2.72 47.70 846.51 92.70 47.00 29.14Premier Ltd. 201203 30.37 267.15 17.46 65.74 22.70 22.84 7.52 16.25 11.23 201206 64.38 10.89 12.81 17.91 0.27 0.36 68.15 206.99 91.40 59.05 43.73Tecpro Systems Ltd 201203 50.47 2536.81 28.77 393.06 15.76 123.11 24.39 36.72 17.23 201206 557.81 60.08 78.15 14.00 7.04 5.58 155.80 786.38 254.95 123.00 52.63Walchandnagar Industries Ltd. 201109 7.61 957.67 42.43 47.09 5.51 12.80 3.36 10.52 5.56 201206 166.58 -21.46 5.94 3.55 -10.76 -11.31 69.75 265.54 111.40 57.00 55.00Fasteners Total 21.01 2770.16 570.85 904.60 49.53Sundram Fasteners Ltd. 201203 21.01 2770.16 21.29 304.97 11.46 101.12 4.74 28.54 16.93 201206 570.85 11.75 60.72 10.43 31.24 5.95 43.05 904.60 66.25 42.00 49.53Ferro & Silica Manganese Total 114.34 3440.79 1157.07 1229.55 276.08Ferro Alloys Corporation Ltd. 201203 18.53 486.92 -1.54 10.68 3.34 -32.58 -1.52 -0.25 -18.47 201206 119.84 10.59 17.14 13.86 7.40 1.60 7.37 136.54 12.89 5.10 74.99Indian Metals & Ferro Alloys Ltd. 201203 25.98 1192.73 11.67 227.39 19.23 61.63 23.72 11.82 8.08 201206 287.88 10.55 90.69 30.37 28.45 43.80 272.05 706.71 389.45 210.00 55.72Maithan Alloys Ltd 201103 14.56 594.42 24.36 95.01 18.72 72.64 49.90 37.86 48.13 201206 196.53 52.35 21.82 11.01 15.51 42.62 93.05 135.44 126.85 76.25 74.36Rohit Ferro-Tech Ltd. 201103 55.28 1166.72 41.53 132.25 12.05 44.03 7.97 14.14 14.03 201206 552.82 55.65 57.63 10.18 10.02 4.99 31.25 250.86 44.00 21.45 71.01Fertilizers Total 3035.82 71878.60 13593.80 32968.85 765.86Chambal Fertilisers & Chemicals Ltd. 201203 416.21 7538.17 32.58 821.64 11.94 128.86 3.80 19.90 7.89 201206 1363.56 18.54 187.50 13.74 77.07 7.41 66.40 2763.62 118.50 64.00 55.13Coromandel International Ltd. 201203 28.26 9901.57 29.61 1054.44 11.33 634.54 22.60 38.57 29.13 201206 1842.76 2.90 210.84 11.37 114.22 16.28 275.50 7791.63 342.00 234.00 63.88Deepak Fertilisers & Petrochemicals Corpn. Ltd. 201203 88.20 2412.29 48.06 411.92 17.60 211.70 24.00 21.01 18.79 201206 631.16 33.73 102.18 16.11 45.50 20.63 133.05 1173.57 174.75 118.25 43.32Fertilisers & Chemicals Travancore Ltd. 201103 647.07 2460.73 16.85 85.99 5.71 -49.33 -0.76 8.02 -29.51 201206 521.06 5.42 -61.89 -11.85 -104.15 -6.44 26.50 1714.74 40.60 19.50 98.56Gujarat Narmada Valley Fertilizers Company Ltd. 201203 155.42 3862.01 35.70 549.82 14.42 283.84 18.26 14.35 11.84 201206 870.93 35.19 86.67 9.95 32.74 8.43 78.40 1218.48 97.30 70.65 41.18Gujarat State Fertilizers & Chemicals Ltd. 201203 79.70 5301.83 11.50 1134.65 23.53 757.57 95.06 33.64 23.88 201206 1411.84 16.91 237.21 16.80 172.71 86.68 339.30 2704.07 503.95 322.00 37.84Khaitan Chemicals & Fertilizers Ltd. 201203 9.70 644.42 40.71 61.53 10.02 21.74 2.24 41.59 18.74 201206 78.54 -27.45 -9.92 -12.62 -9.56 -3.94 13.50 130.94 19.90 11.50 74.99Mangalore Chemicals & Fertilizers Ltd. 201103 118.52 2520.11 20.71 145.87 6.30 77.54 6.54 25.34 20.95 201206 597.76 2.45 -2.80 -0.47 -12.50 -4.22 46.05 545.76 57.30 29.65 30.44National Fertilizers Ltd. 201203 490.58 7305.29 26.15 307.67 4.70 126.73 2.58 9.10 7.40 201206 1806.66 27.39 -30.54 -1.68 -52.01 -4.24 72.15 3539.52 96.50 43.00 97.64Rashtriya Chemicals & Fertilizers Ltd. 201203 551.69 6433.71 16.46 402.69 8.72 248.83 4.51 16.79 11.91 201206 801.28 57.28 34.41 2.28 6.52 0.47 51.60 2846.71 85.45 42.15 92.50Southern Petrochemical Inds. Corpn. Ltd. 201103 166.28 2093.61 87.87 81.50 5.68 -667.71 -37.64 -19.94 0.00 201206 635.22 -34.58 -22.83 -3.57 -44.02 -10.59 14.30 237.78 30.45 12.75 41.13Tata Chemicals Ltd. 201203 254.76 13806.06 24.82 2303.66 17.60 1039.51 32.88 14.07 17.52 201206 3020.89 3.33 494.77 15.78 165.27 16.89 310.50 7910.18 374.50 287.80 31.06Zuari Global Ltd. 201103 29.44 7598.79 23.18 366.44 6.78 265.21 84.08 14.88 17.97 201206 12.14 -98.90 -3.14 -24.84 4.70 6.39 133.10 391.85 641.00 120.20 58.19Film Production, Distribution & Entertainment Total 424.24 3373.22 875.04 3420.48 562.23DQ Entertainment (International) Ltd. 201203 79.28 227.20 9.31 94.17 46.08 33.02 4.17 13.06 8.82 201206 30.93 10.62 -2.83 -9.14 -9.09 -4.59 20.75 164.51 42.00 18.65 75.00Fame India Ltd 201203 55.27 226.12 15.10 18.64 9.47 -11.96 -2.16 -3.17 -10.07 201206 59.62 15.88 5.18 8.53 -1.24 -0.90 51.85 286.60 73.90 32.48 74.40Inox Leisure Ltd. 201203 61.90 644.86 74.14 72.75 12.53 -1.51 0.68 4.44 -0.48 201206 117.03 17.63 19.54 16.56 5.49 3.57 57.65 356.83 67.65 35.55 66.57Mediaone Global Entertainment Ltd. 200906 14.72 48.79 -42.70 7.36 17.09 6.35 4.31 25.83 26.13 201203 20.21 -28.34 -13.28 -68.01 -14.12 -38.36 88.00 129.54 115.50 62.00 55.50Prime Focus Ltd. 201103 13.89 502.96 11.08 167.07 36.20 88.19 5.48 15.53 32.48 201206 188.21 12.38 44.62 23.71 20.86 5.64 50.20 747.31 65.70 33.00 50.91PVR Ltd. 201103 27.15 457.29 36.86 87.72 21.72 0.32 3.01 5.77 0.10 201206 176.07 50.71 33.79 19.05 7.81 11.65 183.45 476.91 195.90 108.25 44.71Reliance Broadcast Network Ltd. 201103 39.73 137.05 26.39 -6.45 -2.01 -24.24 -3.05 -4.65 -10.35 201206 51.23 -18.79 -10.08 -19.15 -28.71 -14.45 54.40 432.21 92.00 35.50 66.63Reliance Mediaworks Ltd. 201103 23.06 843.06 11.72 -52.68 2.37 -330.83 -71.40 -5.21 -165.33 201206 197.84 4.63 -16.44 -8.13 -129.93 -113.86 67.70 312.27 113.40 49.00 63.15Saregama India Ltd. 201203 17.40 160.78 15.58 19.63 16.24 0.84 0.63 15.44 1.10 201206 33.91 6.33 4.83 14.16 2.52 5.79 85.20 148.27 120.40 55.10 54.96Shree Ashtavinayak Cine Vision Ltd. 201103 82.47 124.16 -67.51 48.09 38.87 -27.14 -0.33 -2.87 -5.42 201206 -100.00 -1.16 0.00 25.39 1.23 2.37 195.45 7.88 2.00 5.03Splash Media & Infra Ltd. 201203 9.37 0.96 -82.09 0.16 114.29 0.67 0.07 9.59 5.91 201206 -100.00 0.23 73.77 0.18 0.08 18.20 170.57 41.80 16.25 5.37Finance - Housing Total 622.80 40550.98 9949.91 129381.24 220.82Can Fin Homes Ltd. 201203 20.49 286.18 23.77 263.78 92.40 43.76 21.36 12.92 13.29 201206 83.84 33.25 75.57 90.13 11.49 22.44 107.05 219.29 128.00 87.50 42.38
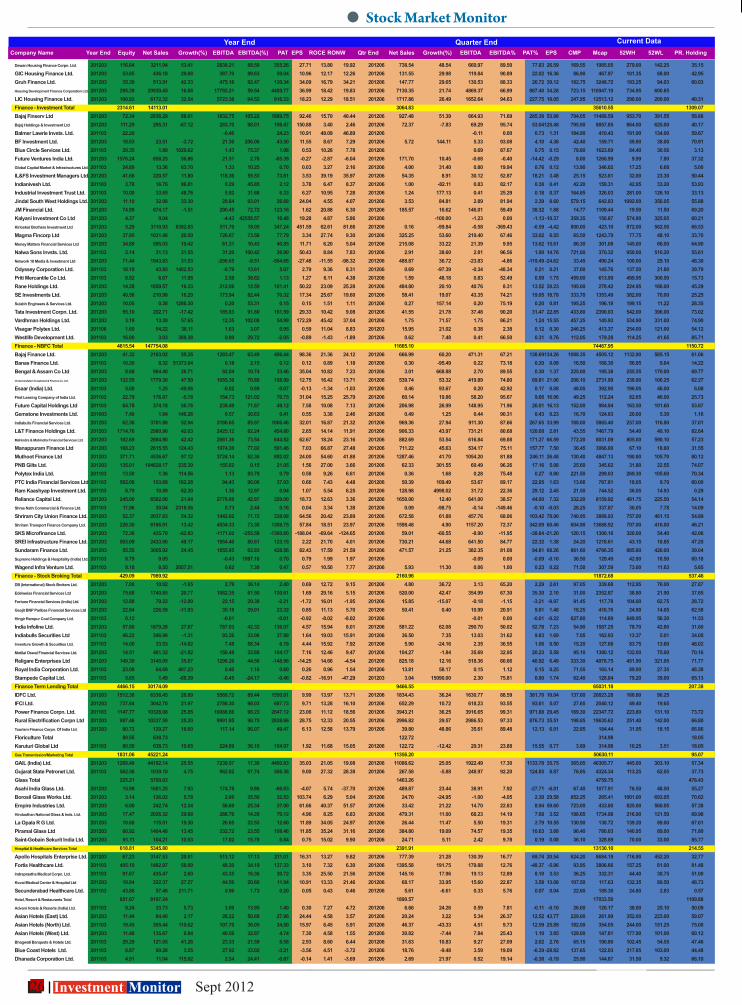
26 Investment Monitor Sept 2012
Year End Quarter End Current Data
Stock Market Monitor
Company Name Year End Equity Net Sales Growth(%) EBITDA EBITDA(%) PAT EPS ROCE RONW Qtr End Net Sales Growth(%) EBITDA EBITDA% PAT% EPS CMP Mcap 52WH 52WL PR. Holding
Dewan Housing Finance Corpn. Ltd. 201203 116.84 3211.94 53.41 2838.21 88.50 355.26 27.71 13.80 19.92 201206 738.54 48.54 660.97 89.50 77.83 26.59 169.55 1985.05 279.00 142.25 35.15GIC Housing Finance Ltd. 201203 53.85 436.18 29.68 387.70 89.63 59.04 10.96 12.17 12.26 201206 131.55 29.98 119.84 90.89 22.02 16.36 86.90 467.97 101.35 68.00 42.95Gruh Finance Ltd. 201203 35.30 513.91 42.33 475.16 92.47 120.34 34.09 16.79 34.21 201206 147.77 29.65 130.53 88.33 26.72 30.12 182.75 3248.72 193.25 94.03 60.03Housing Development Finance Corporation Ltd. 201203 295.39 29930.45 16.08 17792.21 59.54 4489.77 36.99 18.42 19.83 201206 7130.35 21.74 4869.37 66.99 987.40 34.28 723.15 110947.10 734.95 600.85 LIC Housing Finance Ltd. 201203 100.93 6172.32 32.54 5723.38 94.52 916.33 18.23 12.29 18.51 201206 1717.86 26.49 1652.64 94.63 227.75 18.05 247.95 12513.12 290.00 200.00 40.31Finance - Investment Total 2314.61 14113.01 3064.83 35610.55 1309.07Bajaj Finserv Ltd 201203 72.34 2836.29 88.01 1832.75 105.22 1889.75 92.46 15.70 40.44 201206 927.48 51.39 664.93 71.69 285.38 53.98 794.05 11488.59 953.70 391.55 58.88Bajaj Holdings & Investment Ltd 201203 111.29 295.31 -67.12 283.70 98.01 198.47 150.88 3.40 2.46 201206 72.37 -7.83 69.29 95.74 53.04 125.48 795.90 8857.85 864.00 625.00 40.17Balmer Lawrie Invsts. Ltd. 201103 22.20 -0.46 24.23 10.91 48.09 46.89 201206 -0.11 0.00 0.73 1.31 184.90 410.43 191.90 134.00 59.67BF Investment Ltd. 201203 18.83 23.51 -3.72 21.36 206.06 43.50 11.55 8.67 7.29 201206 5.72 144.11 5.33 93.08 4.10 4.36 42.40 159.71 59.80 38.00 70.91Blue Circle Services Ltd. 201103 20.35 1.89 1029.62 1.43 75.37 1.08 0.53 10.28 7.78 201206 0.69 87.67 0.75 0.15 79.80 1623.69 84.40 30.56 3.13Future Ventures India Ltd. 201203 1576.24 858.25 56.86 21.51 2.76 -65.39 -0.27 -2.87 -6.04 201206 171.70 10.45 -0.68 -0.40 -14.42 -0.29 8.00 1260.99 9.99 7.80 37.32Global Capital Market & Infrastructures Ltd. 201103 24.89 13.36 63.70 1.33 10.25 0.70 0.03 3.27 2.16 201206 4.00 31.40 0.80 19.94 0.76 0.12 13.90 346.02 17.25 6.68 5.00IL&FS Investment Managers Ltd. 201203 41.66 220.57 11.80 118.36 55.53 73.81 3.53 39.19 35.97 201206 54.35 8.91 30.12 52.87 18.21 3.48 25.15 523.81 32.00 23.30 50.44Indianivesh Ltd. 201103 3.78 16.76 96.81 0.29 45.85 2.12 3.78 6.47 8.37 201206 1.00 -82.11 0.83 82.17 0.38 0.41 42.20 159.31 42.95 33.20 53.93Industrial Investment Trust Ltd. 201103 10.00 33.65 48.76 5.92 31.68 6.33 6.27 10.95 7.28 201206 1.24 177.13 0.41 25.29 0.18 0.37 164.85 326.03 281.00 126.10 33.13Jindal South West Holdings Ltd. 201203 11.10 32.08 33.30 29.84 93.01 26.68 24.04 4.55 4.07 201206 3.53 84.81 2.89 81.94 2.39 8.60 579.15 642.83 1092.00 356.05 55.88JM Financial Ltd. 201203 74.99 674.17 -1.51 290.45 72.72 123.16 1.62 20.88 6.30 201206 185.57 16.62 146.01 59.49 38.32 1.88 14.77 1109.44 19.50 11.50 69.20Kalyani Investment Co Ltd 201203 4.37 0.04 -4.43 42558.57 16.48 19.28 4.87 5.86 201206 -100.00 -1.23 0.00 -1.13 -10.37 359.35 156.87 574.90 325.05 60.21Kirloskar Brothers Investment Ltd 201203 5.29 3110.93 8392.83 511.79 18.05 347.24 451.59 62.61 81.66 201206 0.16 -99.84 -0.58 -369.43 -0.59 -4.42 800.00 423.10 872.00 562.50 66.53Magma Fincorp Ltd 201203 37.95 1031.48 20.50 726.67 73.56 77.79 3.34 27.74 9.30 201206 325.25 53.60 219.40 67.46 33.02 6.55 65.50 1243.79 77.75 48.10 33.70Money Matters Financial Services Ltd 201203 34.89 595.03 19.42 61.31 10.43 40.85 11.71 6.20 5.04 201206 215.08 33.22 21.39 9.95 13.62 15.61 86.30 301.08 145.00 66.00 64.90Nalwa Sons Invsts. Ltd. 201103 5.14 31.13 31.55 31.20 100.42 26.90 50.43 8.84 7.83 201206 2.91 38.60 2.81 96.56 1.90 14.76 721.00 370.32 950.00 510.20 55.61Network 18 Media & Investment Ltd 201203 71.44 1943.83 31.53 -298.65 -8.51 -504.68 -27.48 -11.55 -98.32 201206 488.87 36.72 -23.83 -4.86 -119.49 -24.62 33.45 490.24 100.00 29.10 48.30Odyssey Corporation Ltd. 201103 18.19 43.85 1402.53 -0.79 13.61 5.07 2.79 9.36 8.31 201206 0.69 -97.39 -0.34 -48.34 0.21 0.21 37.00 145.76 137.50 21.80 39.79Priti Mercantile Co Ltd. 201103 8.92 6.67 11.95 2.58 38.62 1.13 1.27 6.11 4.38 201206 1.59 48.18 0.83 52.49 0.59 1.75 459.00 613.99 499.95 300.50 15.73Rane Holdings Ltd. 201203 14.28 1859.57 16.33 212.06 12.59 101.41 50.22 23.09 25.28 201206 484.80 20.10 40.76 8.31 13.52 30.23 195.00 278.42 224.95 166.00 45.29SE Investments Ltd. 201203 40.56 210.98 16.29 173.94 82.44 70.32 17.34 25.67 19.60 201206 58.41 19.07 43.35 74.21 19.05 18.78 333.70 1353.49 382.00 70.00 25.25Sulabh Engineers & Services Ltd. 201203 10.05 0.38 1286.30 0.20 53.31 0.15 0.15 1.51 1.11 201206 0.27 157.14 0.20 75.19 0.20 0.81 195.25 196.18 199.15 11.22 28.35Tata Investment Corpn. Ltd. 201203 55.10 202.71 -17.42 185.83 91.80 161.59 29.33 10.42 9.08 201206 41.55 21.78 37.48 90.20 31.47 22.85 433.80 2390.03 542.00 396.00 73.02Vardhman Holdings Ltd. 201203 3.19 13.30 57.65 12.35 102.08 54.99 172.29 45.42 37.04 201206 1.75 71.57 1.75 86.21 1.24 15.55 457.25 145.93 534.90 331.00 74.90Visagar Polytex Ltd. 201106 1.60 54.22 36.11 1.63 3.07 0.95 0.59 11.04 8.83 201203 15.95 21.02 0.38 2.38 0.12 0.30 246.25 413.37 254.00 121.00 54.12Westlife Development Ltd. 201103 16.00 3.03 388.38 0.90 29.72 -2.05 -0.89 -1.43 -1.89 201206 0.62 7.48 0.41 66.50 0.31 0.76 112.05 179.28 114.25 41.65 85.71Finance - NBFC Total 4615.54 147754.08 11665.10 74467.95 1150.72Bajaj Finance Ltd. 201203 41.32 2163.02 55.35 1283.47 63.49 406.44 98.36 21.36 24.12 201206 666.99 60.20 471.31 67.21 138.69 134.26 1088.35 4505.12 1132.90 585.15 61.06Banas Finance Ltd. 201103 10.20 8.32 51373.04 0.18 2.15 0.12 0.12 0.89 1.18 201206 0.30 -95.49 0.22 73.18 0.20 0.08 16.50 168.30 56.85 9.64 14.22Bengal & Assam Co Ltd 201203 8.68 984.40 26.71 92.04 10.74 33.46 35.04 10.82 7.23 201206 3.01 668.88 2.70 89.55 0.30 1.37 225.00 195.38 255.55 170.00 69.77Cholamandalam Investment & Finance Co. Ltd. 201203 132.55 1779.30 47.50 1055.30 70.80 168.99 12.75 16.42 13.71 201206 539.74 53.32 419.89 74.80 69.81 21.06 206.10 2731.99 238.90 106.25 62.27Esaar (India) Ltd. 201103 5.00 1.25 -49.06 -0.02 0.89 -0.07 -0.13 -1.34 -1.03 201206 0.46 93.67 0.20 42.92 0.17 0.08 48.05 392.90 196.05 46.00 6.08First Leasing Company of India Ltd. 201103 22.79 176.87 -5.78 154.73 121.02 70.75 31.04 15.25 25.79 201206 60.14 19.86 58.20 95.67 9.66 16.96 49.25 112.24 82.65 46.00 25.73Future Capital Holdings Ltd 201103 64.78 374.18 56.76 239.49 71.67 49.12 7.58 10.08 7.13 201206 206.98 26.99 148.95 71.96 26.01 16.13 152.00 984.94 163.50 101.60 53.67Gemstone Investments Ltd. 201003 7.48 1.84 146.26 0.57 30.83 0.41 0.55 3.38 2.46 201206 0.49 1.25 0.44 90.31 0.43 0.23 16.70 124.83 20.00 5.30 1.16Indiabulls Financial Services Ltd. 201203 62.36 3781.88 52.94 3186.65 85.97 1006.46 32.01 16.87 21.32 201206 969.36 27.94 911.30 87.66 267.65 33.99 188.00 5865.40 257.00 116.80 37.01L&T Finance Holdings Ltd. 201203 1714.76 2980.90 42.03 2425.12 82.24 454.80 2.65 14.14 11.91 201206 906.33 43.97 731.21 80.68 120.68 2.81 43.55 7467.79 54.40 40.10 82.64Mahindra & Mahindra Financial Services Ltd. 201203 102.69 2884.90 42.42 2061.36 73.54 644.52 62.67 18.24 23.16 201206 882.69 53.54 616.84 69.88 171.27 66.59 772.20 8031.09 805.00 590.10 57.23Manappuram Finance Ltd 201203 168.23 2615.55 124.43 1974.30 77.02 591.46 7.03 66.87 27.48 201206 711.22 45.63 534.17 75.11 157.77 7.50 36.45 3066.00 67.10 18.60 31.55Muthoot Finance Ltd 201203 371.71 4536.67 97.12 3724.14 82.36 892.02 24.00 54.60 41.88 201206 1287.46 41.70 1054.20 81.88 246.11 26.48 130.40 4847.13 190.80 105.70 80.12PNB Gilts Ltd. 201203 135.01 104628.17 235.39 155.62 0.15 21.05 1.56 27.00 3.66 201206 62.33 301.55 60.49 96.26 17.16 5.08 25.60 345.62 31.80 22.55 74.07Polytex India Ltd. 201103 13.50 1.36 114.56 1.13 83.79 0.79 0.58 9.26 6.61 201206 0.36 1.68 0.28 75.48 0.27 0.80 221.50 299.03 269.30 105.60 70.34PTC India Financial Services Ltd 201103 562.08 103.69 162.28 94.43 96.06 37.03 0.66 7.43 4.48 201206 50.39 109.49 53.67 89.17 22.95 1.63 13.66 767.81 18.05 9.70 60.00Ram Kaashyap Investment Ltd. 201103 8.79 10.89 82.30 1.30 12.97 0.94 1.07 5.54 6.25 201206 128.98 4998.02 31.72 22.36 29.12 2.45 21.50 744.52 36.05 14.93 0.29Reliance Capital Ltd. 201203 245.00 6582.00 21.04 2778.00 42.97 329.00 18.73 12.63 3.36 201206 1650.00 12.40 641.00 38.57 44.00 7.32 332.20 8159.92 481.75 225.50 54.14Shree Nath Commercial & Finance Ltd. 201103 11.96 30.04 2318.56 0.73 2.44 0.16 0.04 3.34 1.38 201206 0.09 -98.75 -0.14 -149.46 -0.10 -0.03 28.25 337.87 30.05 7.78 14.09Shriram City Union Finance Ltd. 201203 52.37 2037.83 54.32 1442.62 71.72 338.08 64.56 20.42 23.89 201206 672.58 61.88 457.76 68.06 103.42 78.90 740.95 3888.93 757.00 461.15 54.89Shriram Transport Finance Company Ltd. 201203 226.30 6186.91 13.42 4534.33 73.30 1308.75 57.84 18.51 23.97 201206 1598.48 4.90 1157.20 72.37 342.09 60.46 604.90 13688.92 707.00 416.00 46.21SKS Microfinance Ltd. 201203 72.36 435.70 -62.93 -1171.02 -255.58 -1360.60 -188.04 -69.64 -124.65 201206 59.01 -60.55 -8.90 -11.95 -38.84 -21.20 120.15 1300.16 320.00 54.40 42.06SREI Infrastructure Finance Ltd. 201203 503.09 2433.90 49.17 1954.40 80.81 123.15 2.22 21.70 4.01 201206 730.21 44.68 641.50 84.77 22.32 1.38 24.20 1218.61 43.15 18.85 47.25Sundaram Finance Ltd. 201203 55.55 3005.92 24.45 1855.95 62.93 428.56 82.43 17.59 21.59 201206 471.57 21.25 382.35 81.08 94.81 68.26 861.60 4786.35 885.80 420.00 39.04Supreme Holdings & Hospitality (India) Ltd. 201103 8.79 0.05 -0.43 1987.16 0.70 0.79 1.99 1.97 201206 -0.09 0.00 -0.09 -0.10 36.50 129.49 42.80 18.50 60.18Wagend Infra Venture Ltd. 201103 8.18 8.55 2057.51 0.62 7.39 0.47 0.57 10.50 7.77 201206 5.93 11.30 0.06 1.00 0.23 0.22 71.50 307.59 73.00 11.63 5.65Finance - Stock Broking Total 429.09 7989.92 2160.96 11872.68 537.46DB (International) Stock Brokers Ltd. 201203 7.00 10.92 -1.65 2.79 36.14 2.40 0.69 12.72 9.15 201206 4.80 36.72 3.13 65.20 2.29 2.61 97.05 339.68 112.95 76.00 27.87Edelweiss Financial Services Ltd 201203 75.68 1740.85 20.77 1062.35 61.50 130.61 1.69 29.16 5.15 201206 520.00 42.47 354.99 67.30 35.30 2.10 31.00 2352.87 38.80 21.90 37.65Fortune Financial Services (India) Ltd. 201203 12.88 79.22 -12.09 22.15 29.38 -2.21 -1.72 16.01 -1.95 201206 15.85 -15.07 -0.18 -1.15 -3.21 -9.97 91.45 117.78 104.00 62.75 28.72Geojit BNP Paribas Financial Services Ltd 201203 22.84 226.59 -11.93 35.18 29.01 23.32 0.85 11.13 5.70 201206 50.41 0.40 10.99 20.91 9.81 1.48 18.25 416.76 24.90 14.05 62.58Hingir Rampur Coal Company Ltd. 201103 0.12 -0.01 -0.01 -0.92 -8.02 -8.02 201206 -0.01 0.00 -0.01 -0.22 627.80 114.89 649.95 56.20 11.53India Infoline Ltd. 201203 57.80 1879.28 27.67 787.93 42.32 136.07 4.57 15.94 8.01 201206 581.22 62.08 290.70 50.02 52.78 7.23 54.90 1587.25 78.70 42.80 31.60Indiabulls Securities Ltd 201103 46.22 346.99 -1.31 93.26 33.06 37.88 1.64 19.03 15.91 201206 36.50 7.35 13.03 31.62 9.83 1.69 7.05 162.93 13.37 5.01 34.05Inventure Growth & Securities Ltd. 201103 14.00 33.53 -14.62 7.48 56.34 6.19 4.44 15.92 7.92 201206 5.90 -24.16 2.35 36.55 1.06 0.50 15.20 127.68 83.75 13.60 48.02Motilal Oswal Financial Services Ltd. 201203 14.51 461.32 -21.82 150.48 33.88 104.17 7.16 12.46 9.47 201206 104.27 -1.84 35.69 32.95 20.23 5.58 95.10 1380.12 132.00 75.00 70.16Religare Enterprises Ltd 201203 149.30 3145.05 35.67 1298.26 44.56 -148.96 -14.25 14.66 -4.54 201206 825.18 12.16 518.36 60.66 40.92 6.49 333.30 4978.75 451.90 321.05 71.77Royal India Corporation Ltd. 201103 23.08 64.69 407.23 0.40 1.16 0.60 0.26 0.96 1.54 201206 13.81 58.17 0.15 1.12 0.15 0.25 71.55 165.14 89.90 27.35 48.38Stampede Capital Ltd. 201103 5.65 1.49 -88.39 -0.45 -24.17 -0.46 -0.82 -16.91 -47.29 201203 3.04 15090.00 2.30 75.81 0.90 1.74 62.40 128.84 79.20 39.00 65.13Finance Term Lending Total 4466.15 30174.09 9466.55 65031.18 207.38IDFC Ltd. 201203 1512.36 6336.45 28.89 5568.72 89.44 1550.81 9.99 13.97 13.71 201206 1834.43 36.24 1630.77 88.59 381.70 10.04 137.60 20823.28 160.80 90.25 IFCI Ltd. 201203 737.84 3042.70 21.97 2786.30 98.03 687.73 9.71 13.28 16.10 201206 652.29 10.72 618.23 93.55 93.61 5.07 27.65 2040.12 49.40 19.65 Power Finance Corpn. Ltd. 201103 1147.77 10328.08 25.85 10088.66 98.23 2647.12 23.06 11.12 18.56 201206 3943.21 36.25 3916.65 99.31 971.88 29.45 169.30 22347.72 223.80 131.10 73.72Rural Electrification Corpn Ltd 201203 987.46 10337.59 25.20 9991.95 98.75 2838.66 28.75 12.33 20.55 201206 2996.82 29.57 2986.53 97.33 876.73 35.51 198.85 19635.62 251.40 142.00 66.80Tourism Finance Corpn. Of India Ltd. 201203 80.72 129.27 18.60 117.14 96.07 49.47 6.13 12.58 13.79 201206 39.80 48.86 35.61 89.48 12.13 6.01 22.85 184.44 31.95 18.15 66.86Floriculture Total 80.55 638.73 122.72 314.98 18.05Karuturi Global Ltd 201103 80.55 638.73 19.65 224.09 36.10 154.97 1.92 11.68 15.05 201206 122.72 -12.42 29.31 23.88 15.55 0.77 3.89 314.98 10.25 3.51 18.05Gas Transmission/Marketing Total 1831.06 45221.24 11356.20 50630.11 95.07GAIL (India) Ltd. 201203 1268.48 44182.14 25.55 7239.57 17.30 4400.83 35.03 21.05 19.08 201206 11088.62 25.05 1922.49 17.30 1133.78 35.75 365.05 46305.77 445.00 303.10 57.34Gujarat State Petronet Ltd. 201103 562.58 1039.10 4.75 962.82 97.74 506.38 9.00 27.32 28.38 201206 267.58 -5.88 248.97 92.20 124.85 8.87 76.85 4324.34 113.25 62.05 37.73Glass Total 225.21 5700.03 1463.26 4759.75 478.43Asahi India Glass Ltd. 201203 15.99 1681.25 7.93 174.78 9.86 -66.83 -4.07 5.74 -37.70 201206 489.87 23.44 38.91 7.92 -27.71 -6.81 67.40 1077.91 76.50 48.50 55.27Borosil Glass Works Ltd. 201203 3.14 126.02 5.78 2.66 35.50 32.53 103.74 6.29 5.04 201206 24.70 -24.95 -1.00 -4.05 2.30 29.58 852.25 265.41 1001.00 693.05 70.62Empire Industries Ltd. 201203 6.00 242.74 12.34 58.69 25.34 37.00 61.66 40.37 51.57 201206 33.42 21.22 14.70 22.83 8.94 59.60 723.00 433.80 825.00 560.05 57.38Hindusthan National Glass & Inds. Ltd. 201203 17.47 2026.32 29.68 288.76 14.29 70.12 4.96 8.25 6.83 201206 479.31 11.00 68.23 14.19 7.68 3.52 198.65 1734.98 216.90 121.50 69.98La Opala R G Ltd. 201203 10.60 115.01 19.30 26.65 22.53 12.60 11.89 34.05 24.97 201206 26.44 11.47 5.50 19.31 2.79 10.55 130.90 138.72 139.20 89.00 67.61Piramal Glass Ltd 201203 80.92 1404.48 13.45 332.72 23.55 108.46 11.85 35.24 31.16 201206 384.80 19.09 74.57 19.35 10.63 3.68 96.40 780.03 140.95 89.00 71.80Saint-Gobain Sekurit India Ltd. 201203 91.11 104.21 10.93 17.02 15.78 6.84 0.75 15.02 9.90 201206 24.71 5.11 2.42 9.78 0.19 0.08 36.10 328.89 70.00 33.00 85.77Hospital & Healthcare Services Total 618.81 5345.80 2391.91 13130.10 214.55Apollo Hospitals Enterprise Ltd. 201203 67.23 3147.53 20.81 513.12 17.13 211.01 16.31 13.27 9.82 201206 777.39 21.28 130.39 16.77 69.74 20.54 624.20 8684.19 716.90 452.20 32.77Fortis Healthcare Ltd. 201103 405.10 1482.97 58.09 48.30 34.19 137.33 3.10 7.32 6.30 201206 1395.58 191.75 179.88 12.76 -48.37 -5.96 93.95 3806.66 157.25 81.00 81.48Indraprastha Medical Corpn. Ltd. 201103 91.67 435.47 2.60 43.35 16.36 30.72 3.35 25.50 21.56 201206 145.16 17.96 19.13 12.89 8.10 3.53 36.25 332.31 44.40 30.75 51.00Kovai Medical Center & Hospital Ltd 201203 10.94 222.37 27.27 44.56 20.60 11.94 10.91 13.33 21.46 201206 68.17 33.95 15.60 22.87 3.58 13.08 107.50 117.63 132.35 89.50 48.73Secunderabad Healthcare Ltd. 201103 43.86 57.46 211.71 0.96 1.73 0.20 0.05 0.43 0.46 201206 5.61 -6.61 0.33 5.76 0.07 0.04 22.60 189.30 24.80 2.83 0.57Hotel, Resort & Restaurants Total 651.67 8197.24 1890.57 17033.50 1109.88Advani Hotels & Resorts (India) Ltd. 201103 9.24 33.73 5.73 3.09 13.95 1.40 0.30 7.27 4.72 201206 6.66 24.26 0.59 7.81 -0.11 -0.10 26.00 120.17 38.00 25.10 50.09Asian Hotels (East) Ltd. 201203 11.44 84.40 2.17 26.22 50.69 27.96 24.44 4.58 3.57 201206 20.24 3.22 5.34 26.37 12.52 43.77 229.00 261.99 352.00 223.00 59.07Asian Hotels (North) Ltd. 201103 19.45 305.44 110.62 107.70 36.05 34.50 15.97 6.45 5.91 201206 46.37 -43.33 4.51 9.73 12.59 25.89 182.00 354.05 244.00 151.25 75.00Asian Hotels (West) Ltd. 201203 11.46 135.67 0.84 40.56 32.97 4.74 7.30 4.58 1.55 201206 30.82 -7.44 7.84 25.43 1.10 3.85 129.00 147.81 177.90 101.00 60.12Bhagwati Banquets & Hotels Ltd. 201103 29.29 121.05 41.26 23.33 21.59 8.58 2.93 8.60 6.44 201206 31.63 10.83 9.27 27.09 2.02 2.76 65.15 190.80 102.45 54.55 47.46Blue Coast Hotels Ltd. 201103 8.87 90.28 3.55 27.92 33.02 -3.21 -3.56 4.51 -3.72 201206 18.76 -9.48 3.59 19.09 -6.39 -28.82 137.65 122.03 217.85 103.00 44.48Dhanada Corporation Ltd. 201103 4.91 11.04 115.92 2.54 24.41 -0.87 -0.14 1.41 -3.69 201206 2.69 21.97 0.52 19.14 -0.38 -0.19 25.90 144.87 31.50 9.32 66.10
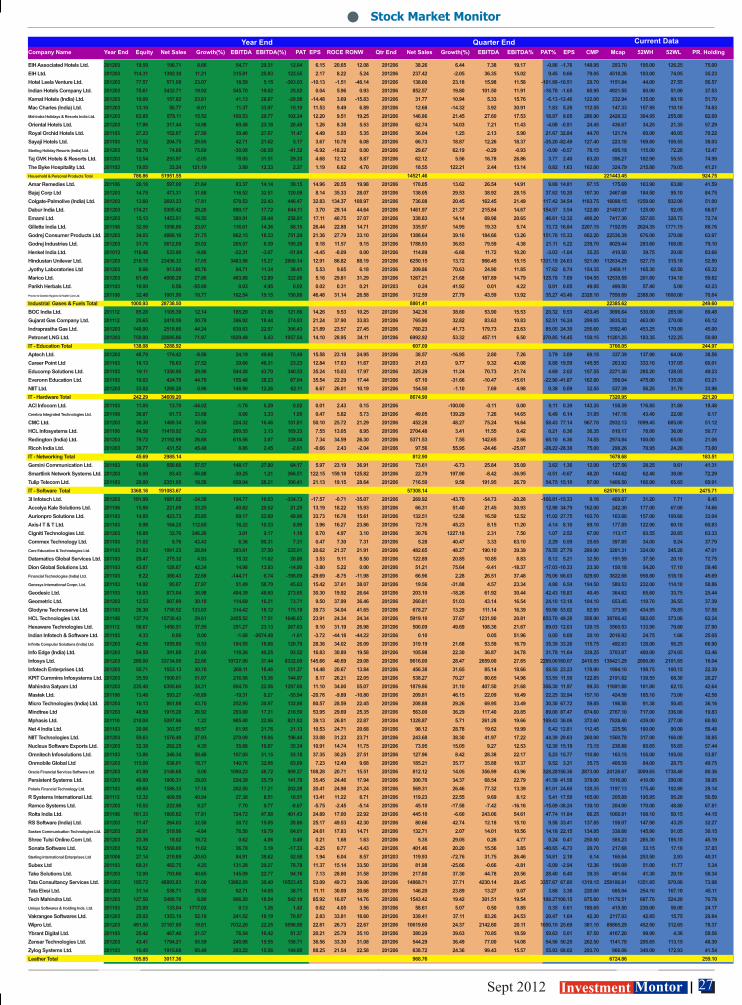
27 Sept 2012 Investment Montor
Company Name Year End Equity Net Sales Growth(%) EBITDA EBITDA(%) PAT EPS ROCE RONW Qtr End Net Sales Growth(%) EBITDA EBITDA% PAT% EPS CMP Mcap 52WH 52WL PR. Holding
Dewan Housing Finance Corpn. Ltd. 201203 116.84 3211.94 53.41 2838.21 88.50 355.26 27.71 13.80 19.92 201206 738.54 48.54 660.97 89.50 77.83 26.59 169.55 1985.05 279.00 142.25 35.15GIC Housing Finance Ltd. 201203 53.85 436.18 29.68 387.70 89.63 59.04 10.96 12.17 12.26 201206 131.55 29.98 119.84 90.89 22.02 16.36 86.90 467.97 101.35 68.00 42.95Gruh Finance Ltd. 201203 35.30 513.91 42.33 475.16 92.47 120.34 34.09 16.79 34.21 201206 147.77 29.65 130.53 88.33 26.72 30.12 182.75 3248.72 193.25 94.03 60.03Housing Development Finance Corporation Ltd. 201203 295.39 29930.45 16.08 17792.21 59.54 4489.77 36.99 18.42 19.83 201206 7130.35 21.74 4869.37 66.99 987.40 34.28 723.15 110947.10 734.95 600.85 LIC Housing Finance Ltd. 201203 100.93 6172.32 32.54 5723.38 94.52 916.33 18.23 12.29 18.51 201206 1717.86 26.49 1652.64 94.63 227.75 18.05 247.95 12513.12 290.00 200.00 40.31Finance - Investment Total 2314.61 14113.01 3064.83 35610.55 1309.07Bajaj Finserv Ltd 201203 72.34 2836.29 88.01 1832.75 105.22 1889.75 92.46 15.70 40.44 201206 927.48 51.39 664.93 71.69 285.38 53.98 794.05 11488.59 953.70 391.55 58.88Bajaj Holdings & Investment Ltd 201203 111.29 295.31 -67.12 283.70 98.01 198.47 150.88 3.40 2.46 201206 72.37 -7.83 69.29 95.74 53.04 125.48 795.90 8857.85 864.00 625.00 40.17Balmer Lawrie Invsts. Ltd. 201103 22.20 -0.46 24.23 10.91 48.09 46.89 201206 -0.11 0.00 0.73 1.31 184.90 410.43 191.90 134.00 59.67BF Investment Ltd. 201203 18.83 23.51 -3.72 21.36 206.06 43.50 11.55 8.67 7.29 201206 5.72 144.11 5.33 93.08 4.10 4.36 42.40 159.71 59.80 38.00 70.91Blue Circle Services Ltd. 201103 20.35 1.89 1029.62 1.43 75.37 1.08 0.53 10.28 7.78 201206 0.69 87.67 0.75 0.15 79.80 1623.69 84.40 30.56 3.13Future Ventures India Ltd. 201203 1576.24 858.25 56.86 21.51 2.76 -65.39 -0.27 -2.87 -6.04 201206 171.70 10.45 -0.68 -0.40 -14.42 -0.29 8.00 1260.99 9.99 7.80 37.32Global Capital Market & Infrastructures Ltd. 201103 24.89 13.36 63.70 1.33 10.25 0.70 0.03 3.27 2.16 201206 4.00 31.40 0.80 19.94 0.76 0.12 13.90 346.02 17.25 6.68 5.00IL&FS Investment Managers Ltd. 201203 41.66 220.57 11.80 118.36 55.53 73.81 3.53 39.19 35.97 201206 54.35 8.91 30.12 52.87 18.21 3.48 25.15 523.81 32.00 23.30 50.44Indianivesh Ltd. 201103 3.78 16.76 96.81 0.29 45.85 2.12 3.78 6.47 8.37 201206 1.00 -82.11 0.83 82.17 0.38 0.41 42.20 159.31 42.95 33.20 53.93Industrial Investment Trust Ltd. 201103 10.00 33.65 48.76 5.92 31.68 6.33 6.27 10.95 7.28 201206 1.24 177.13 0.41 25.29 0.18 0.37 164.85 326.03 281.00 126.10 33.13Jindal South West Holdings Ltd. 201203 11.10 32.08 33.30 29.84 93.01 26.68 24.04 4.55 4.07 201206 3.53 84.81 2.89 81.94 2.39 8.60 579.15 642.83 1092.00 356.05 55.88JM Financial Ltd. 201203 74.99 674.17 -1.51 290.45 72.72 123.16 1.62 20.88 6.30 201206 185.57 16.62 146.01 59.49 38.32 1.88 14.77 1109.44 19.50 11.50 69.20Kalyani Investment Co Ltd 201203 4.37 0.04 -4.43 42558.57 16.48 19.28 4.87 5.86 201206 -100.00 -1.23 0.00 -1.13 -10.37 359.35 156.87 574.90 325.05 60.21Kirloskar Brothers Investment Ltd 201203 5.29 3110.93 8392.83 511.79 18.05 347.24 451.59 62.61 81.66 201206 0.16 -99.84 -0.58 -369.43 -0.59 -4.42 800.00 423.10 872.00 562.50 66.53Magma Fincorp Ltd 201203 37.95 1031.48 20.50 726.67 73.56 77.79 3.34 27.74 9.30 201206 325.25 53.60 219.40 67.46 33.02 6.55 65.50 1243.79 77.75 48.10 33.70Money Matters Financial Services Ltd 201203 34.89 595.03 19.42 61.31 10.43 40.85 11.71 6.20 5.04 201206 215.08 33.22 21.39 9.95 13.62 15.61 86.30 301.08 145.00 66.00 64.90Nalwa Sons Invsts. Ltd. 201103 5.14 31.13 31.55 31.20 100.42 26.90 50.43 8.84 7.83 201206 2.91 38.60 2.81 96.56 1.90 14.76 721.00 370.32 950.00 510.20 55.61Network 18 Media & Investment Ltd 201203 71.44 1943.83 31.53 -298.65 -8.51 -504.68 -27.48 -11.55 -98.32 201206 488.87 36.72 -23.83 -4.86 -119.49 -24.62 33.45 490.24 100.00 29.10 48.30Odyssey Corporation Ltd. 201103 18.19 43.85 1402.53 -0.79 13.61 5.07 2.79 9.36 8.31 201206 0.69 -97.39 -0.34 -48.34 0.21 0.21 37.00 145.76 137.50 21.80 39.79Priti Mercantile Co Ltd. 201103 8.92 6.67 11.95 2.58 38.62 1.13 1.27 6.11 4.38 201206 1.59 48.18 0.83 52.49 0.59 1.75 459.00 613.99 499.95 300.50 15.73Rane Holdings Ltd. 201203 14.28 1859.57 16.33 212.06 12.59 101.41 50.22 23.09 25.28 201206 484.80 20.10 40.76 8.31 13.52 30.23 195.00 278.42 224.95 166.00 45.29SE Investments Ltd. 201203 40.56 210.98 16.29 173.94 82.44 70.32 17.34 25.67 19.60 201206 58.41 19.07 43.35 74.21 19.05 18.78 333.70 1353.49 382.00 70.00 25.25Sulabh Engineers & Services Ltd. 201203 10.05 0.38 1286.30 0.20 53.31 0.15 0.15 1.51 1.11 201206 0.27 157.14 0.20 75.19 0.20 0.81 195.25 196.18 199.15 11.22 28.35Tata Investment Corpn. Ltd. 201203 55.10 202.71 -17.42 185.83 91.80 161.59 29.33 10.42 9.08 201206 41.55 21.78 37.48 90.20 31.47 22.85 433.80 2390.03 542.00 396.00 73.02Vardhman Holdings Ltd. 201203 3.19 13.30 57.65 12.35 102.08 54.99 172.29 45.42 37.04 201206 1.75 71.57 1.75 86.21 1.24 15.55 457.25 145.93 534.90 331.00 74.90Visagar Polytex Ltd. 201106 1.60 54.22 36.11 1.63 3.07 0.95 0.59 11.04 8.83 201203 15.95 21.02 0.38 2.38 0.12 0.30 246.25 413.37 254.00 121.00 54.12Westlife Development Ltd. 201103 16.00 3.03 388.38 0.90 29.72 -2.05 -0.89 -1.43 -1.89 201206 0.62 7.48 0.41 66.50 0.31 0.76 112.05 179.28 114.25 41.65 85.71Finance - NBFC Total 4615.54 147754.08 11665.10 74467.95 1150.72Bajaj Finance Ltd. 201203 41.32 2163.02 55.35 1283.47 63.49 406.44 98.36 21.36 24.12 201206 666.99 60.20 471.31 67.21 138.69 134.26 1088.35 4505.12 1132.90 585.15 61.06Banas Finance Ltd. 201103 10.20 8.32 51373.04 0.18 2.15 0.12 0.12 0.89 1.18 201206 0.30 -95.49 0.22 73.18 0.20 0.08 16.50 168.30 56.85 9.64 14.22Bengal & Assam Co Ltd 201203 8.68 984.40 26.71 92.04 10.74 33.46 35.04 10.82 7.23 201206 3.01 668.88 2.70 89.55 0.30 1.37 225.00 195.38 255.55 170.00 69.77Cholamandalam Investment & Finance Co. Ltd. 201203 132.55 1779.30 47.50 1055.30 70.80 168.99 12.75 16.42 13.71 201206 539.74 53.32 419.89 74.80 69.81 21.06 206.10 2731.99 238.90 106.25 62.27Esaar (India) Ltd. 201103 5.00 1.25 -49.06 -0.02 0.89 -0.07 -0.13 -1.34 -1.03 201206 0.46 93.67 0.20 42.92 0.17 0.08 48.05 392.90 196.05 46.00 6.08First Leasing Company of India Ltd. 201103 22.79 176.87 -5.78 154.73 121.02 70.75 31.04 15.25 25.79 201206 60.14 19.86 58.20 95.67 9.66 16.96 49.25 112.24 82.65 46.00 25.73Future Capital Holdings Ltd 201103 64.78 374.18 56.76 239.49 71.67 49.12 7.58 10.08 7.13 201206 206.98 26.99 148.95 71.96 26.01 16.13 152.00 984.94 163.50 101.60 53.67Gemstone Investments Ltd. 201003 7.48 1.84 146.26 0.57 30.83 0.41 0.55 3.38 2.46 201206 0.49 1.25 0.44 90.31 0.43 0.23 16.70 124.83 20.00 5.30 1.16Indiabulls Financial Services Ltd. 201203 62.36 3781.88 52.94 3186.65 85.97 1006.46 32.01 16.87 21.32 201206 969.36 27.94 911.30 87.66 267.65 33.99 188.00 5865.40 257.00 116.80 37.01L&T Finance Holdings Ltd. 201203 1714.76 2980.90 42.03 2425.12 82.24 454.80 2.65 14.14 11.91 201206 906.33 43.97 731.21 80.68 120.68 2.81 43.55 7467.79 54.40 40.10 82.64Mahindra & Mahindra Financial Services Ltd. 201203 102.69 2884.90 42.42 2061.36 73.54 644.52 62.67 18.24 23.16 201206 882.69 53.54 616.84 69.88 171.27 66.59 772.20 8031.09 805.00 590.10 57.23Manappuram Finance Ltd 201203 168.23 2615.55 124.43 1974.30 77.02 591.46 7.03 66.87 27.48 201206 711.22 45.63 534.17 75.11 157.77 7.50 36.45 3066.00 67.10 18.60 31.55Muthoot Finance Ltd 201203 371.71 4536.67 97.12 3724.14 82.36 892.02 24.00 54.60 41.88 201206 1287.46 41.70 1054.20 81.88 246.11 26.48 130.40 4847.13 190.80 105.70 80.12PNB Gilts Ltd. 201203 135.01 104628.17 235.39 155.62 0.15 21.05 1.56 27.00 3.66 201206 62.33 301.55 60.49 96.26 17.16 5.08 25.60 345.62 31.80 22.55 74.07Polytex India Ltd. 201103 13.50 1.36 114.56 1.13 83.79 0.79 0.58 9.26 6.61 201206 0.36 1.68 0.28 75.48 0.27 0.80 221.50 299.03 269.30 105.60 70.34PTC India Financial Services Ltd 201103 562.08 103.69 162.28 94.43 96.06 37.03 0.66 7.43 4.48 201206 50.39 109.49 53.67 89.17 22.95 1.63 13.66 767.81 18.05 9.70 60.00Ram Kaashyap Investment Ltd. 201103 8.79 10.89 82.30 1.30 12.97 0.94 1.07 5.54 6.25 201206 128.98 4998.02 31.72 22.36 29.12 2.45 21.50 744.52 36.05 14.93 0.29Reliance Capital Ltd. 201203 245.00 6582.00 21.04 2778.00 42.97 329.00 18.73 12.63 3.36 201206 1650.00 12.40 641.00 38.57 44.00 7.32 332.20 8159.92 481.75 225.50 54.14Shree Nath Commercial & Finance Ltd. 201103 11.96 30.04 2318.56 0.73 2.44 0.16 0.04 3.34 1.38 201206 0.09 -98.75 -0.14 -149.46 -0.10 -0.03 28.25 337.87 30.05 7.78 14.09Shriram City Union Finance Ltd. 201203 52.37 2037.83 54.32 1442.62 71.72 338.08 64.56 20.42 23.89 201206 672.58 61.88 457.76 68.06 103.42 78.90 740.95 3888.93 757.00 461.15 54.89Shriram Transport Finance Company Ltd. 201203 226.30 6186.91 13.42 4534.33 73.30 1308.75 57.84 18.51 23.97 201206 1598.48 4.90 1157.20 72.37 342.09 60.46 604.90 13688.92 707.00 416.00 46.21SKS Microfinance Ltd. 201203 72.36 435.70 -62.93 -1171.02 -255.58 -1360.60 -188.04 -69.64 -124.65 201206 59.01 -60.55 -8.90 -11.95 -38.84 -21.20 120.15 1300.16 320.00 54.40 42.06SREI Infrastructure Finance Ltd. 201203 503.09 2433.90 49.17 1954.40 80.81 123.15 2.22 21.70 4.01 201206 730.21 44.68 641.50 84.77 22.32 1.38 24.20 1218.61 43.15 18.85 47.25Sundaram Finance Ltd. 201203 55.55 3005.92 24.45 1855.95 62.93 428.56 82.43 17.59 21.59 201206 471.57 21.25 382.35 81.08 94.81 68.26 861.60 4786.35 885.80 420.00 39.04Supreme Holdings & Hospitality (India) Ltd. 201103 8.79 0.05 -0.43 1987.16 0.70 0.79 1.99 1.97 201206 -0.09 0.00 -0.09 -0.10 36.50 129.49 42.80 18.50 60.18Wagend Infra Venture Ltd. 201103 8.18 8.55 2057.51 0.62 7.39 0.47 0.57 10.50 7.77 201206 5.93 11.30 0.06 1.00 0.23 0.22 71.50 307.59 73.00 11.63 5.65Finance - Stock Broking Total 429.09 7989.92 2160.96 11872.68 537.46DB (International) Stock Brokers Ltd. 201203 7.00 10.92 -1.65 2.79 36.14 2.40 0.69 12.72 9.15 201206 4.80 36.72 3.13 65.20 2.29 2.61 97.05 339.68 112.95 76.00 27.87Edelweiss Financial Services Ltd 201203 75.68 1740.85 20.77 1062.35 61.50 130.61 1.69 29.16 5.15 201206 520.00 42.47 354.99 67.30 35.30 2.10 31.00 2352.87 38.80 21.90 37.65Fortune Financial Services (India) Ltd. 201203 12.88 79.22 -12.09 22.15 29.38 -2.21 -1.72 16.01 -1.95 201206 15.85 -15.07 -0.18 -1.15 -3.21 -9.97 91.45 117.78 104.00 62.75 28.72Geojit BNP Paribas Financial Services Ltd 201203 22.84 226.59 -11.93 35.18 29.01 23.32 0.85 11.13 5.70 201206 50.41 0.40 10.99 20.91 9.81 1.48 18.25 416.76 24.90 14.05 62.58Hingir Rampur Coal Company Ltd. 201103 0.12 -0.01 -0.01 -0.92 -8.02 -8.02 201206 -0.01 0.00 -0.01 -0.22 627.80 114.89 649.95 56.20 11.53India Infoline Ltd. 201203 57.80 1879.28 27.67 787.93 42.32 136.07 4.57 15.94 8.01 201206 581.22 62.08 290.70 50.02 52.78 7.23 54.90 1587.25 78.70 42.80 31.60Indiabulls Securities Ltd 201103 46.22 346.99 -1.31 93.26 33.06 37.88 1.64 19.03 15.91 201206 36.50 7.35 13.03 31.62 9.83 1.69 7.05 162.93 13.37 5.01 34.05Inventure Growth & Securities Ltd. 201103 14.00 33.53 -14.62 7.48 56.34 6.19 4.44 15.92 7.92 201206 5.90 -24.16 2.35 36.55 1.06 0.50 15.20 127.68 83.75 13.60 48.02Motilal Oswal Financial Services Ltd. 201203 14.51 461.32 -21.82 150.48 33.88 104.17 7.16 12.46 9.47 201206 104.27 -1.84 35.69 32.95 20.23 5.58 95.10 1380.12 132.00 75.00 70.16Religare Enterprises Ltd 201203 149.30 3145.05 35.67 1298.26 44.56 -148.96 -14.25 14.66 -4.54 201206 825.18 12.16 518.36 60.66 40.92 6.49 333.30 4978.75 451.90 321.05 71.77Royal India Corporation Ltd. 201103 23.08 64.69 407.23 0.40 1.16 0.60 0.26 0.96 1.54 201206 13.81 58.17 0.15 1.12 0.15 0.25 71.55 165.14 89.90 27.35 48.38Stampede Capital Ltd. 201103 5.65 1.49 -88.39 -0.45 -24.17 -0.46 -0.82 -16.91 -47.29 201203 3.04 15090.00 2.30 75.81 0.90 1.74 62.40 128.84 79.20 39.00 65.13Finance Term Lending Total 4466.15 30174.09 9466.55 65031.18 207.38IDFC Ltd. 201203 1512.36 6336.45 28.89 5568.72 89.44 1550.81 9.99 13.97 13.71 201206 1834.43 36.24 1630.77 88.59 381.70 10.04 137.60 20823.28 160.80 90.25 IFCI Ltd. 201203 737.84 3042.70 21.97 2786.30 98.03 687.73 9.71 13.28 16.10 201206 652.29 10.72 618.23 93.55 93.61 5.07 27.65 2040.12 49.40 19.65 Power Finance Corpn. Ltd. 201103 1147.77 10328.08 25.85 10088.66 98.23 2647.12 23.06 11.12 18.56 201206 3943.21 36.25 3916.65 99.31 971.88 29.45 169.30 22347.72 223.80 131.10 73.72Rural Electrification Corpn Ltd 201203 987.46 10337.59 25.20 9991.95 98.75 2838.66 28.75 12.33 20.55 201206 2996.82 29.57 2986.53 97.33 876.73 35.51 198.85 19635.62 251.40 142.00 66.80Tourism Finance Corpn. Of India Ltd. 201203 80.72 129.27 18.60 117.14 96.07 49.47 6.13 12.58 13.79 201206 39.80 48.86 35.61 89.48 12.13 6.01 22.85 184.44 31.95 18.15 66.86Floriculture Total 80.55 638.73 122.72 314.98 18.05Karuturi Global Ltd 201103 80.55 638.73 19.65 224.09 36.10 154.97 1.92 11.68 15.05 201206 122.72 -12.42 29.31 23.88 15.55 0.77 3.89 314.98 10.25 3.51 18.05Gas Transmission/Marketing Total 1831.06 45221.24 11356.20 50630.11 95.07GAIL (India) Ltd. 201203 1268.48 44182.14 25.55 7239.57 17.30 4400.83 35.03 21.05 19.08 201206 11088.62 25.05 1922.49 17.30 1133.78 35.75 365.05 46305.77 445.00 303.10 57.34Gujarat State Petronet Ltd. 201103 562.58 1039.10 4.75 962.82 97.74 506.38 9.00 27.32 28.38 201206 267.58 -5.88 248.97 92.20 124.85 8.87 76.85 4324.34 113.25 62.05 37.73Glass Total 225.21 5700.03 1463.26 4759.75 478.43Asahi India Glass Ltd. 201203 15.99 1681.25 7.93 174.78 9.86 -66.83 -4.07 5.74 -37.70 201206 489.87 23.44 38.91 7.92 -27.71 -6.81 67.40 1077.91 76.50 48.50 55.27Borosil Glass Works Ltd. 201203 3.14 126.02 5.78 2.66 35.50 32.53 103.74 6.29 5.04 201206 24.70 -24.95 -1.00 -4.05 2.30 29.58 852.25 265.41 1001.00 693.05 70.62Empire Industries Ltd. 201203 6.00 242.74 12.34 58.69 25.34 37.00 61.66 40.37 51.57 201206 33.42 21.22 14.70 22.83 8.94 59.60 723.00 433.80 825.00 560.05 57.38Hindusthan National Glass & Inds. Ltd. 201203 17.47 2026.32 29.68 288.76 14.29 70.12 4.96 8.25 6.83 201206 479.31 11.00 68.23 14.19 7.68 3.52 198.65 1734.98 216.90 121.50 69.98La Opala R G Ltd. 201203 10.60 115.01 19.30 26.65 22.53 12.60 11.89 34.05 24.97 201206 26.44 11.47 5.50 19.31 2.79 10.55 130.90 138.72 139.20 89.00 67.61Piramal Glass Ltd 201203 80.92 1404.48 13.45 332.72 23.55 108.46 11.85 35.24 31.16 201206 384.80 19.09 74.57 19.35 10.63 3.68 96.40 780.03 140.95 89.00 71.80Saint-Gobain Sekurit India Ltd. 201203 91.11 104.21 10.93 17.02 15.78 6.84 0.75 15.02 9.90 201206 24.71 5.11 2.42 9.78 0.19 0.08 36.10 328.89 70.00 33.00 85.77Hospital & Healthcare Services Total 618.81 5345.80 2391.91 13130.10 214.55Apollo Hospitals Enterprise Ltd. 201203 67.23 3147.53 20.81 513.12 17.13 211.01 16.31 13.27 9.82 201206 777.39 21.28 130.39 16.77 69.74 20.54 624.20 8684.19 716.90 452.20 32.77Fortis Healthcare Ltd. 201103 405.10 1482.97 58.09 48.30 34.19 137.33 3.10 7.32 6.30 201206 1395.58 191.75 179.88 12.76 -48.37 -5.96 93.95 3806.66 157.25 81.00 81.48Indraprastha Medical Corpn. Ltd. 201103 91.67 435.47 2.60 43.35 16.36 30.72 3.35 25.50 21.56 201206 145.16 17.96 19.13 12.89 8.10 3.53 36.25 332.31 44.40 30.75 51.00Kovai Medical Center & Hospital Ltd 201203 10.94 222.37 27.27 44.56 20.60 11.94 10.91 13.33 21.46 201206 68.17 33.95 15.60 22.87 3.58 13.08 107.50 117.63 132.35 89.50 48.73Secunderabad Healthcare Ltd. 201103 43.86 57.46 211.71 0.96 1.73 0.20 0.05 0.43 0.46 201206 5.61 -6.61 0.33 5.76 0.07 0.04 22.60 189.30 24.80 2.83 0.57Hotel, Resort & Restaurants Total 651.67 8197.24 1890.57 17033.50 1109.88Advani Hotels & Resorts (India) Ltd. 201103 9.24 33.73 5.73 3.09 13.95 1.40 0.30 7.27 4.72 201206 6.66 24.26 0.59 7.81 -0.11 -0.10 26.00 120.17 38.00 25.10 50.09Asian Hotels (East) Ltd. 201203 11.44 84.40 2.17 26.22 50.69 27.96 24.44 4.58 3.57 201206 20.24 3.22 5.34 26.37 12.52 43.77 229.00 261.99 352.00 223.00 59.07Asian Hotels (North) Ltd. 201103 19.45 305.44 110.62 107.70 36.05 34.50 15.97 6.45 5.91 201206 46.37 -43.33 4.51 9.73 12.59 25.89 182.00 354.05 244.00 151.25 75.00Asian Hotels (West) Ltd. 201203 11.46 135.67 0.84 40.56 32.97 4.74 7.30 4.58 1.55 201206 30.82 -7.44 7.84 25.43 1.10 3.85 129.00 147.81 177.90 101.00 60.12Bhagwati Banquets & Hotels Ltd. 201103 29.29 121.05 41.26 23.33 21.59 8.58 2.93 8.60 6.44 201206 31.63 10.83 9.27 27.09 2.02 2.76 65.15 190.80 102.45 54.55 47.46Blue Coast Hotels Ltd. 201103 8.87 90.28 3.55 27.92 33.02 -3.21 -3.56 4.51 -3.72 201206 18.76 -9.48 3.59 19.09 -6.39 -28.82 137.65 122.03 217.85 103.00 44.48Dhanada Corporation Ltd. 201103 4.91 11.04 115.92 2.54 24.41 -0.87 -0.14 1.41 -3.69 201206 2.69 21.97 0.52 19.14 -0.38 -0.19 25.90 144.87 31.50 9.32 66.10
Year End Quarter End Current Data
Stock Market Monitor
Company Name Year End Equity Net Sales Growth(%) EBITDA EBITDA(%) PAT EPS ROCE RONW Qtr End Net Sales Growth(%) EBITDA EBITDA% PAT% EPS CMP Mcap 52WH 52WL PR. Holding
EIH Associated Hotels Ltd. 201203 19.59 196.71 8.66 54.77 29.31 12.04 6.15 20.65 12.08 201206 38.26 6.44 7.38 19.17 -0.86 -1.76 149.95 293.70 195.00 126.25 75.00EIH Ltd. 201203 114.31 1392.30 11.21 315.81 25.83 122.55 2.17 8.22 5.24 201206 237.42 -2.05 36.35 15.02 9.45 0.66 79.05 4518.26 103.00 74.05 35.23Hotel Leela Venture Ltd. 201203 77.57 571.09 23.07 18.59 5.15 -393.03 -10.13 -1.51 -46.14 201206 138.00 23.18 15.98 11.58 -101.88 -10.51 29.70 1151.84 44.00 27.55 56.57Indian Hotels Company Ltd. 201203 75.61 3432.71 19.92 545.70 19.02 25.82 0.04 5.96 0.93 201206 852.57 19.80 101.50 11.91 -18.78 -1.65 60.95 4921.55 80.00 51.00 37.53Kamat Hotels (India) Ltd. 201203 19.09 157.82 23.61 41.13 28.87 -29.58 -14.48 3.69 -15.83 201206 31.77 10.94 5.33 15.76 -6.13 -12.46 122.00 232.94 135.00 80.10 51.70Mac Charles (India) Ltd. 201203 13.10 50.77 -8.01 11.37 33.97 15.10 11.53 9.49 6.89 201206 12.68 -14.32 3.92 30.91 1.83 5.28 112.55 147.33 157.95 110.10 74.63Mahindra Holidays & Resorts India Ltd. 201203 83.85 578.11 15.52 100.53 29.77 102.34 12.20 9.51 19.25 201206 146.86 21.45 27.60 17.53 18.97 9.05 286.90 2428.32 364.95 255.00 82.69Oriental Hotels Ltd. 201203 17.86 317.44 14.98 69.48 23.18 20.49 1.26 8.38 5.53 201206 62.74 14.03 7.21 11.43 -4.08 -0.91 24.45 436.67 34.25 21.35 57.29Royal Orchid Hotels Ltd. 201103 27.23 152.07 27.50 39.40 27.67 11.47 4.49 5.93 5.35 201206 36.04 1.25 2.13 5.90 21.67 32.84 44.70 121.74 60.00 40.05 70.22Sayaji Hotels Ltd. 201103 17.52 204.75 29.65 42.71 21.62 5.17 3.67 10.78 6.08 201206 66.73 18.87 12.26 18.37 -35.20 -82.49 127.40 223.18 169.80 108.55 38.03Sterling Holiday Resorts (India) Ltd. 201203 59.70 74.66 75.69 -30.08 -36.58 -41.32 -6.92 -18.22 0.00 201206 29.67 62.19 -0.29 -0.93 -0.90 -0.57 78.15 495.19 115.00 72.20 12.47Taj GVK Hotels & Resorts Ltd. 201203 12.54 253.97 -2.05 78.05 31.51 29.33 4.68 12.12 8.87 201206 62.12 5.56 16.78 26.86 3.77 2.40 63.20 396.27 102.90 55.55 74.99The Byke Hospitality Ltd. 201103 19.05 33.24 121.19 3.89 12.33 2.27 1.19 6.62 4.70 201206 18.55 122.21 2.44 13.14 0.82 1.63 162.00 324.79 215.80 79.05 41.21Household & Personal Products Total 786.86 51951.55 14521.46 221443.45 924.75Amar Remedies Ltd. 201106 26.16 597.00 21.64 83.37 14.14 39.15 14.96 20.55 19.98 201206 178.05 13.62 26.54 14.91 9.69 14.81 67.15 175.69 163.90 63.80 41.59Bajaj Corp Ltd 201203 14.75 473.31 31.68 116.52 32.51 120.08 8.14 35.33 28.07 201206 138.05 29.53 38.92 28.15 37.62 10.20 167.30 2467.68 184.50 95.10 84.75Colgate-Palmolive (India) Ltd. 201203 13.60 2693.23 17.81 578.53 22.43 446.47 32.83 134.37 108.97 201206 736.08 20.45 162.45 21.49 117.42 34.54 1183.75 16098.15 1250.00 932.00 51.00Dabur India Ltd. 201203 174.21 5305.42 29.26 890.17 17.72 644.11 3.70 29.14 44.64 201206 1461.97 21.37 215.84 14.67 154.57 3.54 122.80 21403.07 125.00 92.05 68.67Emami Ltd. 201203 15.13 1453.51 16.55 380.91 29.44 258.81 17.11 40.75 37.07 201206 338.83 14.14 69.98 20.65 46.61 12.32 490.20 7417.30 557.65 320.75 72.74Gillette India Ltd. 201106 32.59 1056.86 23.97 116.61 14.36 86.15 26.44 22.88 14.71 201206 335.97 14.95 19.33 5.74 13.72 16.84 2207.15 7192.05 2624.35 1771.15 88.76Godrej Consumer Products Ltd. 201203 34.03 4866.16 31.75 862.15 18.33 751.24 21.36 27.79 33.10 201206 1388.64 39.16 184.66 13.26 151.78 15.33 662.20 22536.39 676.00 370.00 63.97Godrej Industries Ltd. 201203 31.76 5612.09 29.02 265.57 6.39 195.26 9.18 11.57 9.15 201206 1788.93 36.83 79.59 4.38 21.11 5.22 239.70 8029.44 283.60 168.00 79.10Henkel India Ltd. 201012 116.46 533.90 -9.86 -22.31 -3.07 -51.84 -4.45 -8.09 0.00 201206 114.89 -6.68 11.72 10.20 -3.03 -1.04 35.25 410.50 39.75 20.00 83.66Hindustan Unilever Ltd. 201203 216.15 23436.33 17.05 3483.56 15.27 2800.14 12.91 86.82 88.19 201206 6250.15 13.72 966.45 15.15 1331.19 24.63 521.00 112634.29 527.75 315.10 52.50Jyothy Laboratories Ltd 201203 8.06 913.00 45.76 84.71 11.34 38.41 5.53 9.65 6.18 201206 209.86 70.63 24.90 11.85 17.62 8.74 154.35 2489.11 165.30 62.50 65.32Marico Ltd. 201203 61.49 4008.28 27.86 483.88 12.89 322.06 5.16 29.81 31.29 201206 1267.21 21.68 187.89 14.79 125.78 7.69 194.55 12539.59 201.80 134.10 59.82Parikh Herbals Ltd. 201103 10.00 0.56 -55.69 0.03 4.95 0.02 0.02 0.31 0.21 201203 0.24 41.92 0.01 4.22 0.01 0.05 49.95 499.50 57.40 5.00 42.23Procter & Gamble Hygiene & Health Care Ltd. 201106 32.46 1001.90 10.77 162.54 19.15 150.88 46.48 31.14 26.58 201206 312.59 27.79 43.59 13.92 35.27 43.46 2326.10 7550.69 2388.00 1600.00 70.64Industrial Gases & Fuels Total 1000.93 28738.50 8861.41 22385.62 249.60BOC India Ltd. 201112 85.28 1105.39 12.14 185.29 21.08 121.66 14.26 9.53 10.25 201206 342.36 38.60 53.90 15.53 20.32 9.53 433.45 3696.64 530.00 265.00 89.48Gujarat Gas Company Ltd. 201112 25.65 2418.59 30.78 396.92 18.44 274.83 21.24 37.90 33.83 201206 765.90 32.82 83.63 10.83 52.51 16.24 299.05 3835.32 463.00 270.00 65.12Indraprastha Gas Ltd. 201203 140.00 2518.66 44.24 639.63 22.97 306.43 21.89 23.57 27.45 201206 760.23 41.73 179.73 23.63 85.05 24.30 256.60 3592.40 453.25 170.00 45.00Petronet LNG Ltd. 201203 750.00 22695.86 71.97 1829.49 8.43 1057.54 14.10 28.95 34.11 201206 6992.92 53.32 457.11 6.50 270.85 14.45 150.15 11261.25 183.35 122.25 50.00IT - Education Total 138.08 3288.92 607.09 3766.05 244.97Aptech Ltd. 201203 48.79 174.42 -8.56 24.19 49.68 75.49 15.58 23.18 24.95 201206 38.57 -16.95 2.80 7.26 3.79 3.09 69.15 337.39 137.90 64.00 38.56Career Point Ltd 201103 18.13 78.63 27.52 29.66 46.31 23.23 12.84 17.63 11.67 201203 21.63 9.77 9.32 43.08 8.88 19.59 145.55 263.92 333.10 137.05 60.01Educomp Solutions Ltd. 201103 19.11 1350.90 29.96 544.28 43.70 340.53 35.24 15.03 17.97 201206 325.29 11.24 70.73 21.74 4.69 2.02 157.55 2271.30 285.20 128.05 49.23Everonn Education Ltd. 201103 19.03 424.70 44.70 155.48 38.23 67.64 35.54 22.29 17.44 201206 67.10 -31.66 -10.47 -15.61 -22.90 -41.87 162.80 356.04 475.00 135.00 63.21NIIT Ltd. 201203 33.02 1260.28 0.96 146.90 12.26 62.11 6.67 26.01 10.19 201206 154.50 -1.10 7.69 4.98 0.38 0.09 32.55 537.39 56.25 31.70 33.96IT - Hardware Total 242.29 34609.20 8674.90 7320.95 221.20ACI Infocom Ltd. 201103 11.05 13.70 -44.02 -1.76 5.29 0.02 0.01 2.43 0.15 201206 -100.00 -0.11 0.00 0.11 0.39 143.35 158.39 176.85 31.80 18.48Cerebra Integrated Technologies Ltd. 201109 36.87 81.73 33.68 0.66 3.33 1.95 0.47 5.82 5.73 201206 49.05 139.29 7.26 14.65 6.49 6.14 31.95 147.16 43.40 22.00 6.17CMC Ltd. 201203 30.30 1469.34 35.50 224.32 16.46 151.81 50.10 25.72 21.29 201206 452.28 48.27 75.24 16.64 58.43 77.14 967.70 2932.13 1099.45 685.00 51.12HCL Infosystems Ltd. 201106 44.58 11419.92 -5.23 260.55 3.13 169.33 7.55 13.05 8.95 201206 2704.48 3.41 11.55 0.42 0.21 0.36 36.35 810.17 70.00 36.00 50.77Redington (India) Ltd. 201203 79.72 21192.99 26.88 615.56 3.07 339.04 7.34 34.59 26.30 201206 5371.53 7.55 142.65 2.66 68.10 6.36 74.55 2974.84 100.00 65.00 21.06Ricoh India Ltd. 201203 39.77 431.52 45.48 8.86 2.45 -2.61 -0.66 2.43 -2.04 201206 97.56 55.95 -24.46 -25.07 -28.22 -28.38 75.00 298.26 78.95 24.20 73.60IT - Networking Total 45.69 2985.14 812.90 1678.68 183.51Gemini Communication Ltd. 201103 10.69 550.66 57.57 148.17 27.90 64.17 5.97 23.19 36.91 201206 73.61 -6.73 25.84 35.09 3.62 1.36 12.00 127.56 28.25 9.61 41.31Smartlink Network Systems Ltd. 201203 6.00 83.43 -56.88 -30.25 1.21 366.51 122.15 159.18 125.82 201206 22.79 197.90 -8.42 -36.95 -0.51 -0.67 48.20 144.62 62.40 38.00 72.29Tulip Telecom Ltd. 201103 29.00 2351.05 19.56 659.04 28.21 306.41 21.13 19.15 28.64 201206 716.50 9.58 191.95 26.79 54.75 15.10 97.00 1406.50 166.90 65.65 69.91IT - Software Total 3368.16 191083.67 57308.14 625761.51 2475.713I Infotech Ltd. 201203 191.99 1681.02 -34.58 194.77 16.03 -334.73 -17.57 -0.71 -35.07 201206 269.92 -43.70 -54.73 -20.28 -166.81 -15.33 8.16 409.67 31.20 7.71 8.45Accelya Kale Solutions Ltd. 201106 15.88 221.09 33.25 40.82 20.52 21.25 13.19 18.22 15.93 201206 66.31 51.40 21.45 30.93 12.98 34.79 162.00 242.30 177.00 67.00 74.66Aurionpro Solutions Ltd. 201103 14.85 423.73 25.85 89.17 22.60 49.96 33.73 16.78 15.61 201206 132.51 12.58 16.59 12.52 11.02 27.75 102.70 163.66 157.00 100.60 33.04Axis-I T & T Ltd. 201103 9.98 164.25 112.65 16.22 10.33 8.99 3.96 16.27 23.86 201206 72.76 45.23 8.15 11.20 4.14 8.10 89.10 177.85 122.90 60.10 60.83Cigniti Technologies Ltd. 201203 16.89 33.76 346.26 3.01 9.17 1.18 0.70 4.97 3.10 201206 30.76 1227.18 2.31 7.50 1.07 2.52 67.00 113.17 93.55 20.85 63.33Commex Technology Ltd. 201103 31.02 9.76 43.43 6.36 90.31 7.31 0.47 7.30 7.31 201206 5.28 40.47 3.33 63.10 2.29 0.59 25.65 397.85 34.00 9.24 37.79Core Education & Technologies Ltd. 201103 21.83 1091.23 28.84 393.61 37.50 225.01 20.62 21.37 21.91 201206 482.65 48.27 190.10 39.39 78.55 27.79 289.90 3281.31 324.00 245.20 47.01Datamatics Global Services Ltd. 201103 29.47 275.32 4.93 15.32 11.62 20.80 3.53 9.11 8.50 201206 122.89 20.85 10.85 8.83 8.12 5.21 32.50 191.59 37.50 20.10 72.75Dion Global Solutions Ltd. 201103 43.87 128.87 42.34 14.98 13.93 -14.90 -3.80 5.22 0.00 201206 51.21 75.64 -9.41 -18.37 -17.03 -10.33 23.30 150.18 54.20 17.10 59.46Financial Technologies (India) Ltd. 201103 9.22 380.43 22.68 -144.71 6.74 -198.09 -29.69 -8.75 -11.98 201206 66.96 2.28 26.51 37.48 76.06 66.03 829.60 3822.68 958.80 518.10 45.69Genesys International Corpn. Ltd. 201103 14.92 95.07 27.97 51.49 58.70 45.63 15.42 37.61 38.07 201206 19.56 -31.88 4.57 23.34 4.88 6.54 194.50 580.53 232.00 114.10 58.86Geodesic Ltd. 201103 18.03 873.04 36.98 404.39 48.60 273.65 30.30 19.92 26.64 201206 203.10 -18.26 61.92 30.44 42.43 18.83 40.45 364.62 65.60 33.75 25.44Geometric Ltd. 201203 12.53 807.89 30.18 114.69 16.21 73.71 9.50 37.99 36.46 201206 260.81 51.03 43.14 16.54 24.10 13.18 104.10 653.45 110.70 36.55 37.39Glodyne Technoserve Ltd. 201103 26.30 1750.52 133.63 314.42 18.12 175.19 39.73 34.04 41.65 201206 678.27 13.29 111.14 16.39 59.90 53.02 82.95 373.95 434.95 78.85 57.58HCL Technologies Ltd. 201106 137.74 15730.43 29.61 2455.52 17.51 1646.63 23.91 24.34 24.34 201206 5919.10 37.67 1231.90 20.81 853.70 49.28 558.90 38766.42 562.05 373.00 62.24Hexaware Technologies Ltd. 201112 58.67 1450.51 37.55 251.27 23.13 267.03 9.10 31.19 26.98 201206 500.09 49.69 108.36 21.67 89.03 12.03 120.15 3560.53 133.90 70.60 27.90Indian Infotech & Software Ltd. 201103 4.33 0.06 0.00 -1.68 -2674.48 -1.61 -3.72 -44.18 -44.22 201206 0.10 0.05 51.96 0.05 0.00 20.10 2016.92 24.75 1.66 25.05Infinite Computer Solutions (India) Ltd. 201203 42.56 1055.80 19.53 184.55 18.66 120.70 28.36 34.02 26.09 201206 319.19 21.68 53.59 16.79 35.39 33.26 115.75 492.63 128.00 56.25 66.90Info Edge (India) Ltd. 201203 54.59 391.88 21.60 118.26 40.25 93.52 16.83 30.89 19.58 201206 105.98 22.30 36.87 34.78 31.78 11.64 339.25 3703.97 400.00 274.05 53.46Infosys Ltd. 201203 286.00 33734.00 22.66 10727.00 37.44 8332.00 145.66 40.69 29.08 201206 9616.00 28.47 2659.00 27.65 2289.00 160.07 2410.55 138421.29 2990.00 2101.65 16.04Infotech Enterprises Ltd. 201203 55.71 1553.13 30.70 269.11 18.46 151.37 14.48 20.67 13.84 201206 456.38 31.65 85.14 18.66 58.55 23.23 178.90 1994.10 198.75 100.15 22.39KPIT Cummins Infosystems Ltd. 201203 35.59 1500.01 51.97 216.58 15.36 144.97 8.17 26.21 22.05 201206 538.27 70.27 80.65 14.98 53.55 11.50 122.85 2191.62 139.55 68.30 26.27Mahindra Satyam Ltd 201203 235.40 6395.60 24.31 954.70 22.56 1297.60 11.10 34.00 55.07 201206 1879.86 31.10 407.50 21.68 356.30 11.97 99.35 11691.88 101.80 62.15 42.64Mastek Ltd. 201106 13.48 593.27 -16.89 -19.31 0.27 -55.94 -20.76 -9.89 -10.80 201206 209.81 46.15 22.09 10.49 22.25 32.94 157.10 424.58 185.10 73.00 42.58Micro Technologies (India) Ltd. 201203 16.13 861.88 43.70 252.95 30.97 132.98 80.57 28.59 22.45 201206 208.88 29.26 69.95 33.49 30.30 67.72 59.85 198.58 91.38 50.45 36.16Mindtree Ltd 201203 40.50 1915.20 26.92 293.00 17.31 218.50 53.95 29.69 25.35 201206 563.00 36.29 117.40 20.85 89.00 87.47 674.60 2767.10 717.00 336.00 19.83Mphasis Ltd. 201110 210.04 5097.96 1.22 985.40 22.86 821.82 39.13 26.81 22.87 201204 1328.87 5.71 261.28 19.66 189.43 36.06 372.60 7828.40 439.00 277.00 60.50Net 4 India Ltd. 201103 20.06 303.57 55.57 61.95 21.76 21.13 10.53 24.71 20.68 201206 98.12 28.78 19.62 19.99 6.42 12.81 112.45 225.56 180.00 90.00 59.48NIIT Technologies Ltd. 201203 59.63 1576.48 27.93 270.09 19.06 196.44 33.08 31.23 23.71 201206 243.68 38.30 41.97 17.22 44.39 29.63 260.00 1560.78 317.00 166.00 38.85Nucleus Software Exports Ltd. 201203 32.38 282.25 4.35 35.88 19.87 35.34 10.91 14.74 11.75 201206 73.95 15.05 9.27 12.53 12.30 15.19 73.15 236.88 85.65 55.65 57.44Omnitech Infosolutions Ltd. 201103 13.86 346.34 58.48 107.05 31.15 53.18 37.35 30.25 27.51 201206 127.96 8.42 28.38 22.17 5.23 15.77 110.80 163.15 155.00 105.05 53.87Onmobile Global Ltd 201203 115.00 638.01 18.77 140.76 32.66 83.09 7.23 12.49 9.68 201206 185.21 35.77 35.88 19.37 9.52 3.31 35.75 408.59 84.00 28.75 49.75Oracle Financial Services Software Ltd 201203 41.99 3146.68 5.00 1090.23 48.72 909.27 108.28 20.71 15.51 201206 812.12 14.05 356.99 43.96 328.28 156.36 2873.00 24128.67 3009.65 1738.40 80.36Persistent Systems Ltd. 201203 40.00 1000.31 28.93 224.39 25.79 141.78 35.45 24.46 17.94 201206 300.70 34.37 68.54 22.79 41.58 41.58 379.00 1516.00 410.00 290.00 38.95Polaris Financial Technology Ltd. 201103 49.60 1586.33 17.18 202.50 17.21 202.28 20.41 24.98 21.24 201206 569.31 26.46 77.32 13.39 61.01 24.60 120.35 1197.13 175.40 102.80 29.14R Systems International Ltd. 201112 12.32 409.50 40.94 27.38 8.51 16.51 13.41 11.22 8.71 201206 119.23 22.55 9.69 8.12 5.41 17.50 165.00 205.89 195.95 95.20 50.59Ramco Systems Ltd. 201203 15.52 222.98 9.27 7.70 9.77 -8.67 -5.75 -2.45 -5.14 201206 45.10 -17.58 -7.42 -16.16 -15.09 -38.24 130.10 204.00 170.00 48.80 67.81Rolta India Ltd. 201106 161.33 1805.62 17.81 724.72 47.58 401.43 24.89 17.00 22.92 201206 445.10 -6.60 243.06 54.61 47.74 11.84 66.25 1068.81 108.10 50.15 44.15RS Software (India) Ltd. 201203 11.47 264.03 32.50 38.72 15.05 28.86 25.17 49.53 42.30 201206 80.66 42.74 12.18 15.10 9.58 33.41 137.85 158.07 147.90 43.25 32.27Sasken Communication Technologies Ltd. 201203 26.01 519.96 -4.84 76.50 19.79 64.01 24.61 17.83 14.71 201206 132.71 2.07 14.01 10.56 14.18 22.15 134.95 338.66 145.90 91.05 30.15Shree Tulsi Online.Com Ltd. 201203 23.36 18.02 18.72 0.62 4.06 0.49 0.21 1.68 1.63 201206 5.35 29.05 0.26 4.77 0.24 0.41 250.50 585.23 285.30 185.10 45.19Sonata Software Ltd. 201203 10.52 1568.00 11.62 36.78 3.18 -17.33 -0.25 0.77 -4.43 201206 401.46 20.20 15.56 3.85 -40.65 -6.73 20.70 217.68 33.15 17.10 37.83Sterling International Enterprises Ltd 201006 27.14 219.89 -20.63 84.91 38.62 52.58 1.94 6.04 8.57 201203 119.93 -72.76 31.75 26.46 14.81 2.18 6.14 166.64 253.50 2.93 40.31Subex Ltd 201103 69.31 482.75 4.25 131.28 29.27 78.78 11.37 15.14 33.50 201206 81.98 -25.66 -0.66 -0.81 -5.09 -2.94 12.36 196.09 51.00 11.77 5.34Take Solutions Ltd. 201203 12.00 703.66 40.65 145.09 22.77 94.16 7.13 28.80 31.58 201206 217.80 37.30 44.78 20.56 28.40 8.40 39.35 481.64 41.30 20.10 58.34Tata Consultancy Services Ltd. 201203 195.72 48893.83 31.00 13982.20 30.40 10523.45 53.09 49.73 39.06 201206 14868.71 37.71 4230.14 28.45 3357.67 67.80 1319.15 258186.81 1351.95 970.00 73.98Tata Elxsi Ltd. 201203 31.14 538.71 29.52 62.71 14.65 38.71 11.11 30.09 20.68 201206 146.20 23.89 13.27 9.07 3.68 3.36 220.00 685.04 254.10 167.10 45.11Tech Mahindra Ltd. 201203 127.50 5489.70 6.80 906.20 18.54 542.10 85.92 16.07 14.76 201206 1543.42 19.42 301.51 19.54 188.27 106.15 875.80 11176.51 887.70 524.20 70.78Unisys Softwares & Holding Inds. Ltd. 201103 23.00 133.04 1717.02 0.13 1.26 1.42 0.62 4.05 3.56 201206 58.61 5.07 0.50 0.85 0.35 0.61 180.65 415.50 230.00 56.00 24.17Vakrangee Softwares Ltd. 201203 25.02 1353.19 52.10 241.52 18.19 70.87 2.83 33.81 18.60 201206 339.41 37.11 83.26 24.53 20.47 1.64 42.30 2117.03 42.85 15.75 29.84Wipro Ltd. 201203 491.50 37187.80 19.81 7032.20 22.25 5596.90 22.81 26.73 22.67 201206 10619.60 24.37 2142.60 20.11 1600.10 25.69 361.10 88865.29 452.50 312.65 78.37Ybrant Digital Ltd. 201103 25.42 467.40 21.57 76.54 16.42 51.37 20.21 25.79 35.10 201206 380.29 39.63 70.85 18.59 59.63 5.01 87.50 4167.20 99.90 4.36 59.56Zensar Technologies Ltd. 201203 43.41 1794.21 55.59 248.98 15.55 158.71 36.56 33.30 31.08 201206 544.29 36.49 77.00 14.08 54.56 50.25 262.50 1141.78 295.65 113.15 48.30Zylog Systems Ltd. 201103 16.45 1915.68 95.49 293.22 15.56 144.90 88.25 21.54 22.58 201206 638.72 24.36 99.43 15.57 55.93 68.02 293.70 966.06 340.00 172.93 41.54Leather Total 105.85 3017.36 968.76 6724.86 259.10
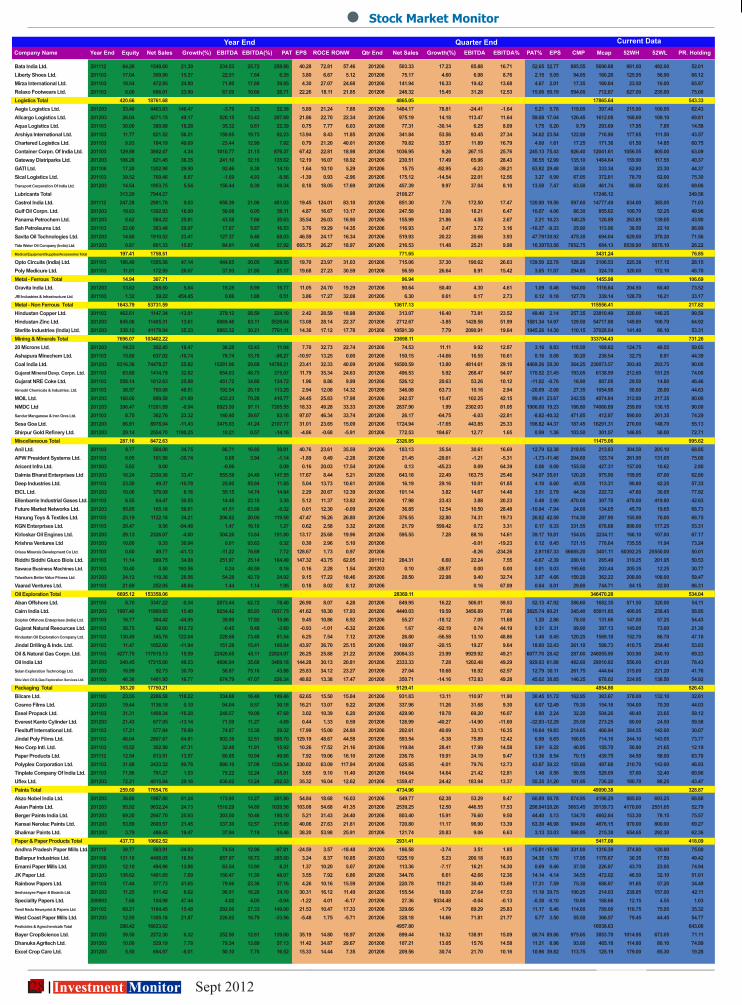
28 Investment Monitor Sept 2012
Year End Quarter End Current Data
Stock Market Monitor
Company Name Year End Equity Net Sales Growth(%) EBITDA EBITDA(%) PAT EPS ROCE RONW Qtr End Net Sales Growth(%) EBITDA EBITDA% PAT% EPS CMP Mcap 52WH 52WL PR. Holding
Bata India Ltd. 201112 64.26 1548.60 21.39 234.53 25.72 258.86 40.28 72.81 57.46 201206 503.33 17.23 85.88 16.71 52.65 32.77 885.55 5690.88 981.00 492.00 52.01Liberty Shoes Ltd. 201103 17.04 309.90 15.37 22.51 7.64 6.35 3.80 6.67 5.12 201206 75.17 4.60 6.98 8.76 2.15 5.05 94.05 160.26 125.95 56.90 66.12Mirza International Ltd. 201103 18.54 472.85 24.80 71.80 17.89 39.85 4.30 27.07 24.68 201206 141.94 16.33 19.42 13.68 4.67 2.01 17.35 160.84 23.50 16.00 65.97Relaxo Footwears Ltd. 201103 6.00 686.01 23.90 67.09 10.66 26.71 22.26 18.11 21.85 201206 248.32 15.45 31.28 12.53 15.06 50.19 594.00 712.87 627.00 235.00 75.00Logistics Total 420.66 18761.68 4865.05 17865.64 543.33Aegis Logistics Ltd. 201203 33.40 4463.83 146.47 -3.79 2.25 22.38 5.89 21.24 7.88 201206 1484.17 78.81 -24.41 -1.64 5.21 5.76 119.00 397.46 215.90 100.05 62.43Allcargo Logistics Ltd. 201203 26.04 4271.15 49.17 520.15 13.43 297.69 21.86 22.70 22.34 201206 975.19 14.18 113.47 11.64 59.08 17.04 126.45 1612.08 160.00 109.10 69.81Aqua Logistics Ltd. 201103 30.00 380.88 18.28 35.32 9.61 22.39 0.75 7.77 6.03 201206 77.31 -30.14 6.25 8.09 1.75 0.20 9.79 293.69 17.95 7.85 14.58Arshiya International Ltd. 201103 11.77 821.52 56.21 159.05 19.73 82.23 13.94 8.43 11.85 201206 341.84 53.56 93.45 27.34 34.62 23.54 122.80 716.90 177.65 111.50 43.57Chartered Logistics Ltd. 201103 9.93 184.19 49.09 23.44 12.99 7.82 0.79 21.20 40.01 201206 70.82 33.57 11.89 16.79 4.00 1.61 17.25 171.36 61.50 14.85 60.75Container Corpn. Of India Ltd. 201103 129.98 3892.47 4.34 1010.77 31.15 876.37 67.42 22.81 18.98 201206 1036.95 9.26 267.15 25.76 245.13 75.43 926.40 12041.61 1056.55 805.00 63.09Gateway Distriparks Ltd. 201203 108.28 821.45 36.35 241.10 32.16 135.62 12.19 16.07 18.92 201206 230.51 17.49 65.96 28.43 36.55 12.99 135.10 1464.64 159.90 117.55 40.37GATI Ltd. 201106 17.20 1202.98 29.90 92.46 8.38 14.10 1.64 10.10 5.29 201206 15.75 -92.95 -6.23 -39.21 63.82 29.48 38.50 333.34 62.80 23.30 44.37Sical Logistics Ltd. 201103 39.52 769.46 6.57 -1.69 4.93 -8.56 -1.39 0.93 -2.96 201206 175.12 -14.54 22.01 12.56 3.27 0.99 67.05 372.81 78.70 62.00 75.30Transport Corporation Of India Ltd. 201203 14.54 1953.75 5.54 156.44 8.30 59.34 8.18 18.05 17.69 201206 457.39 9.97 37.04 8.10 13.58 7.47 63.50 461.74 88.50 52.05 69.06Lubricants Total 313.20 7944.27 2108.27 17246.12 349.56Castrol India Ltd. 201112 247.28 2981.78 9.03 658.39 21.06 481.03 19.45 124.01 83.10 201206 851.30 7.76 172.50 17.47 120.90 19.56 597.60 14777.49 634.00 385.05 71.03Gulf Oil Corpn. Ltd. 201203 19.83 1302.93 18.00 59.08 6.05 50.11 4.87 16.67 13.17 201206 247.58 12.08 18.21 6.47 10.07 4.06 86.30 855.62 100.70 52.25 49.96Panama Petrochem Ltd. 201203 8.62 584.22 25.81 43.58 7.66 30.63 35.54 26.03 16.90 201206 155.99 21.86 4.55 2.67 2.21 10.23 140.25 120.89 263.85 139.05 43.90Sah Petroleums Ltd. 201103 22.00 363.48 29.97 17.87 5.87 16.53 3.76 19.29 14.35 201206 116.93 2.47 3.72 3.16 -10.27 -9.33 25.90 113.96 38.50 22.10 86.89Savita Oil Technologies Ltd. 201203 14.60 1910.52 23.41 127.37 6.46 68.03 46.59 24.17 16.34 201206 519.93 20.22 20.66 3.93 47.79 130.92 475.30 694.04 629.00 370.20 71.56Tide Water Oil Company (India) Ltd. 201203 0.87 801.33 15.87 84.91 9.48 57.92 665.75 26.27 18.97 201206 216.53 11.48 25.21 9.98 16.39 753.56 7852.75 684.13 8539.90 5676.10 26.22Medical Equipment/Supplies/Accessories Total 197.41 1758.51 771.65 3431.24 76.85Opto Circuits (India) Ltd. 201103 186.40 1585.56 47.14 444.85 30.05 368.55 19.70 23.97 31.03 201206 715.06 37.30 190.62 26.63 139.50 22.78 128.20 3106.53 225.38 117.15 28.15Poly Medicure Ltd. 201103 11.01 172.95 26.07 37.93 21.95 21.17 19.68 27.23 30.59 201206 56.59 26.64 8.91 15.42 3.05 11.07 294.85 324.70 320.00 172.10 48.70Metal - Ferrous Total 14.94 307.71 96.94 1455.98 106.69Gravita India Ltd. 201203 13.62 268.50 5.84 19.28 8.99 15.77 11.05 24.70 19.29 201206 90.64 50.40 4.30 4.61 1.09 0.46 164.00 1116.84 204.50 60.40 73.52JRI Industries & Infrastructure Ltd. 201103 1.32 39.22 454.45 0.66 1.88 0.51 3.86 17.27 32.08 201206 6.30 0.61 0.17 2.73 0.12 0.18 127.70 339.14 128.70 16.21 33.17Metal - Non Ferrous Total 1643.79 53731.59 13617.13 115556.41 217.82Hindustan Copper Ltd. 201103 462.61 1147.34 -13.01 279.12 28.50 224.10 2.42 28.59 18.98 201206 313.07 16.40 73.81 23.52 49.40 2.14 257.35 23810.49 320.00 146.25 99.59Hindustan Zinc Ltd. 201203 845.06 11405.31 13.61 6069.46 63.11 5526.04 13.08 28.14 22.37 201206 2712.67 -3.85 1428.56 51.99 1581.34 14.97 129.50 54717.88 149.80 106.70 64.92Sterlite Industries (India) Ltd. 201203 336.12 41178.94 35.33 9863.32 30.21 7761.11 14.36 17.12 17.78 201206 10591.39 7.79 2090.91 19.64 1945.26 14.30 110.15 37028.04 141.40 86.10 53.31Mining & Minerals Total 7696.07 103402.22 23698.11 333704.43 731.2620 Microns Ltd. 201203 14.33 302.45 18.47 36.28 12.43 11.04 7.70 32.73 22.74 201206 74.53 11.11 9.92 12.87 3.16 8.83 118.50 169.82 124.75 49.55 59.65Ashapura Minechem Ltd. 201103 15.80 637.02 -10.74 78.74 13.78 -86.27 -10.97 13.25 0.00 201206 150.15 -14.66 16.55 10.61 0.16 0.08 30.20 238.54 32.75 8.91 44.39Coal India Ltd. 201203 6316.36 74478.27 25.82 15281.06 29.69 14788.21 23.41 32.33 40.09 201206 16500.59 13.80 4814.61 29.18 4469.26 28.30 364.25 230073.57 393.40 293.75 90.00Gujarat Mineral Devp. Corpn. Ltd. 201103 63.60 1414.79 32.82 654.03 48.75 375.07 11.79 35.34 24.63 201206 496.53 5.92 268.47 54.07 170.52 21.45 193.05 6138.99 212.60 151.25 74.00Gujarat NRE Coke Ltd. 201103 558.14 1812.63 25.88 451.72 34.80 134.72 1.96 8.86 9.99 201206 526.12 20.63 53.26 10.12 -11.02 -0.76 16.90 887.05 29.50 14.80 46.46Himadri Chemicals & Industries. Ltd. 201103 38.57 700.08 48.51 192.54 26.15 113.25 2.94 12.08 14.32 201206 346.08 63.73 10.16 2.94 -20.09 -2.08 27.35 1054.98 58.60 26.00 44.63MOIL Ltd. 201203 168.00 899.58 -21.09 433.23 70.28 410.77 24.45 25.83 17.98 201206 242.57 15.47 102.25 42.15 99.41 23.67 242.55 4074.84 312.00 217.35 80.00NMDC Ltd 201203 396.47 11261.89 -0.94 8923.50 97.11 7265.55 18.33 49.28 33.33 201206 2837.90 1.99 2302.03 81.05 1906.00 19.23 186.80 74060.89 259.00 136.15 90.00Sandur Manganese & Iron Ores Ltd. 201103 8.75 362.76 23.32 140.40 39.67 83.16 97.07 46.34 33.74 201206 26.17 -64.75 -6.03 -22.81 -8.82 -40.32 471.85 412.87 590.00 261.35 74.29Sesa Goa Ltd. 201203 86.91 8978.04 -11.43 3475.03 41.24 2107.77 31.01 23.65 15.09 201206 1724.94 -17.65 443.85 25.33 198.82 44.37 187.45 16291.31 270.00 148.70 55.13Shirpur Gold Refinery Ltd. 201203 29.14 2554.70 1190.25 10.21 0.57 -14.16 -4.86 -0.68 -5.91 201206 772.53 184.67 12.77 1.65 0.99 1.36 103.50 301.57 146.85 58.00 72.71Miscellaneous Total 287.16 8472.63 2326.85 11475.06 995.62Anil Ltd. 201103 9.77 504.08 34.75 86.71 16.92 39.81 40.76 23.61 35.59 201206 183.13 35.54 30.61 16.69 12.79 52.38 218.95 213.83 304.50 205.10 68.85APW President Systems Ltd. 201103 6.05 101.50 -30.74 0.08 3.94 -1.14 -1.89 0.49 -2.28 201206 21.45 -20.61 -1.21 -5.31 -1.73 -11.46 204.60 123.74 261.90 131.05 75.00Aricent Infra Ltd. 201003 5.62 0.00 -0.06 0.09 0.16 20.03 17.54 201206 0.13 -45.23 0.09 64.39 0.06 0.09 155.50 427.31 157.00 10.62 2.80Dalmia Bharat Enterprises Ltd 201203 16.24 2330.36 33.47 555.58 24.49 147.55 17.67 8.44 5.21 201206 643.18 22.49 163.75 25.46 54.07 35.61 120.20 975.90 159.95 87.00 62.80Deep Industries Ltd. 201103 23.50 49.37 -10.78 25.80 55.94 11.85 5.04 13.73 10.61 201206 16.19 29.16 10.01 61.85 4.10 6.60 45.55 113.31 90.80 42.25 57.33EICL Ltd. 201203 10.06 378.09 6.16 55.15 14.74 14.84 2.29 20.67 12.39 201206 101.14 3.82 14.67 14.48 3.51 2.79 44.30 222.72 47.60 30.05 77.92Ellenbarrie Industrial Gases Ltd. 201103 6.55 64.47 30.55 14.45 23.10 3.35 5.12 11.37 13.82 201206 17.98 23.43 3.88 20.23 0.48 2.90 470.00 307.70 470.00 419.80 42.63Future Market Networks Ltd. 201203 55.85 165.18 58.61 41.51 63.89 -0.32 0.01 12.30 -0.09 201206 36.85 12.54 10.50 28.48 -10.94 -7.94 24.00 134.05 45.70 19.65 68.73Hanung Toys & Textiles Ltd. 201103 25.19 1122.18 34.21 206.82 20.00 119.58 47.47 16.26 26.80 201206 376.55 32.80 74.31 19.73 26.82 42.59 114.30 287.90 155.90 76.00 68.75KGN Enterprises Ltd. 201103 20.47 9.56 -94.48 1.47 16.16 1.27 0.62 2.58 3.32 201206 21.79 599.42 0.72 3.31 0.17 0.33 331.55 678.68 898.00 177.25 53.31Kirloskar Oil Engines Ltd. 201203 29.13 2326.07 -4.00 304.26 13.64 191.80 13.17 25.68 19.96 201206 595.55 7.28 88.16 14.61 39.17 10.81 154.05 2234.11 166.10 107.00 67.17Krishna Ventures Ltd 201203 10.80 0.35 30.94 0.01 93.63 0.32 0.30 2.96 5.10 201206 -0.01 -19.23 0.12 0.45 721.15 778.84 735.55 11.94 73.24Orissa Minerals Development Co Ltd. 201103 0.60 49.77 -41.13 -11.22 76.69 7.72 128.67 1.73 0.97 201206 -8.26 -234.26 2.81 187.33 56685.20 3401.11 60392.25 25550.00 50.01Riddhi Siddhi Gluco Biols Ltd. 201103 11.14 999.75 34.08 251.97 25.14 164.49 147.32 43.75 62.05 201112 284.31 6.60 22.24 7.55 -0.67 -2.39 280.10 265.49 319.25 201.95 50.53Sawaca Business Machines Ltd. 201103 10.40 0.50 193.56 0.24 48.59 0.16 0.16 2.28 1.54 201203 0.10 -28.57 0.00 0.00 0.01 0.03 195.60 203.44 205.35 12.25 30.77Talwalkars Better Value Fitness Ltd. 201203 24.12 119.36 28.56 54.28 42.79 24.92 9.15 17.22 18.46 201206 28.50 22.98 9.40 32.74 3.07 4.66 150.20 362.22 208.90 108.00 59.47Vaarad Ventures Ltd. 201103 21.69 252.05 48.84 1.44 1.14 1.95 0.18 8.02 8.12 201206 0.16 67.09 0.04 0.01 29.80 744.71 84.15 22.00 86.31Oil Exploration Total 6695.12 153358.06 28369.11 346470.28 534.04Aban Offshore Ltd. 201103 8.70 3347.22 -0.34 2073.44 62.72 78.40 26.90 8.07 4.28 201206 849.95 16.22 506.01 59.53 52.13 47.92 386.60 1682.35 571.50 320.00 54.11Cairn India Ltd. 201203 1907.40 11860.65 15.40 9254.42 85.93 7937.75 41.62 18.30 17.93 201206 4440.03 19.59 3456.89 77.86 3825.74 80.21 345.40 65911.85 400.95 258.45 58.85Dolphin Offshore Enterprises (India) Ltd. 201103 16.77 304.42 -44.95 39.90 17.92 15.86 9.45 10.86 6.92 201206 55.27 -18.12 7.05 11.68 1.20 2.86 78.50 131.66 147.00 57.25 54.43Gujarat Natural Resources Ltd. 201103 38.75 62.60 912.72 -0.45 0.49 -3.60 -0.93 -1.01 -6.32 201206 1.67 -92.19 0.74 44.19 0.31 0.31 99.90 387.13 145.00 73.00 21.30Hindustan Oil Exploration Company Ltd. 201103 130.49 345.76 122.04 228.68 73.48 81.54 6.25 7.54 7.12 201206 26.80 -56.58 13.10 48.86 1.48 0.45 120.25 1569.18 152.70 86.70 47.18Jindal Drilling & Inds. Ltd. 201103 11.47 1052.60 -11.94 151.28 15.41 100.84 43.97 36.70 25.15 201206 199.97 -20.15 19.27 9.64 18.60 32.43 261.10 598.73 410.75 254.40 53.83Oil & Natural Gas Corpn. Ltd. 201103 4277.75 117615.13 15.59 22426.65 45.11 22824.97 26.25 25.88 21.22 201206 20084.33 23.99 9929.92 49.21 6077.70 28.42 287.60 246055.90 303.90 240.10 69.23Oil India Ltd 201203 240.45 17215.00 48.23 4696.94 35.68 3469.18 144.28 30.13 20.81 201206 2333.33 7.28 1202.48 49.29 929.93 61.88 482.60 29010.82 556.00 431.00 78.43Selan Exploration Technology Ltd. 201203 16.99 92.73 30.70 58.87 75.16 43.88 25.83 34.12 23.27 201206 27.04 10.68 16.92 62.57 12.79 30.11 261.75 444.64 315.00 221.20 41.76Shiv-Vani Oil & Gas Exploration Services Ltd. 201103 46.36 1461.95 16.77 674.79 47.07 226.34 48.82 13.38 17.47 201206 350.71 -14.16 172.83 49.28 45.02 38.85 146.25 678.02 224.95 138.50 54.92Packaging Total 363.20 17750.21 5129.41 4854.86 526.43Bilcare Ltd. 201103 23.55 2286.58 118.22 334.68 16.48 149.46 62.65 15.50 15.84 201206 931.83 13.11 110.97 11.90 30.45 51.72 162.95 383.67 378.00 132.10 32.61Cosmo Films Ltd. 201203 19.44 1136.18 0.10 94.04 8.57 30.18 16.21 13.07 9.22 201206 337.96 11.26 31.68 9.30 6.07 12.49 79.30 154.16 104.00 70.30 44.03Essel Propack Ltd. 201103 31.31 1408.34 -16.28 248.57 19.09 47.68 3.02 10.39 6.20 201206 429.90 19.78 69.20 16.07 8.80 2.24 32.20 504.26 40.40 23.65 59.12Everest Kanto Cylinder Ltd. 201203 21.43 677.05 -13.14 71.59 11.27 4.69 0.44 1.33 0.59 201206 126.99 -40.27 -14.90 -11.60 -32.93 -12.29 25.50 273.25 80.00 24.50 59.58Flexituff International Ltd. 201103 17.21 577.94 79.99 74.87 13.30 29.32 17.99 15.00 24.80 201206 202.61 40.09 33.13 16.35 10.64 19.83 214.65 466.94 384.55 142.00 30.07Jindal Poly Films Ltd. 201103 46.04 2807.67 64.81 902.39 32.51 595.70 129.19 48.67 44.58 201206 593.54 -5.38 75.89 12.42 6.99 6.65 166.05 714.16 244.10 143.05 73.77Neo Corp Intl. Ltd. 201103 15.52 302.50 47.31 32.48 11.91 15.92 10.26 17.52 21.16 201206 119.84 28.41 17.99 14.58 5.91 6.22 40.95 155.70 50.90 21.65 12.19Paper Products Ltd. 201112 12.54 813.51 13.57 80.85 10.94 49.66 7.92 19.06 16.10 201206 236.78 19.91 24.19 9.47 13.36 8.54 70.15 439.75 84.50 58.00 63.70Polyplex Corporation Ltd. 201103 31.98 2433.32 99.78 886.10 37.08 1336.54 330.02 63.09 117.94 201206 625.85 -6.01 79.76 12.73 43.67 30.22 155.60 497.68 210.70 143.00 46.93Tinplate Company Of India Ltd. 201103 71.96 791.27 1.53 79.22 12.24 35.81 3.65 9.10 11.40 201206 164.64 14.64 21.42 12.81 1.48 0.56 50.55 529.09 57.60 32.40 60.96Uflex Ltd. 201203 72.21 4515.84 29.16 636.02 13.24 252.53 35.32 16.04 12.62 201206 1359.47 24.42 183.94 13.37 55.35 31.20 101.95 736.20 180.70 98.25 43.47Paints Total 259.60 17654.76 4734.96 49090.38 328.87Akzo Nobel India Ltd. 201203 36.80 1987.80 81.24 173.90 13.27 201.80 54.84 18.68 16.03 201206 549.77 62.38 53.29 9.47 60.89 50.78 874.95 4196.29 985.00 693.25 68.88Asian Paints Ltd. 201203 95.92 9632.24 24.73 1510.29 14.89 1020.58 103.08 54.68 41.35 201206 2539.25 12.50 446.55 17.53 298.94 120.26 3663.45 35139.73 4170.00 2551.05 52.79Berger Paints India Ltd. 201203 69.20 2947.70 25.93 303.50 10.46 180.10 5.21 31.43 24.40 201206 803.40 15.91 76.60 9.50 44.40 5.13 134.70 4662.84 153.30 78.15 75.57Kansai Nerolac Paints Ltd. 201203 53.89 2600.57 21.45 337.30 12.57 215.89 40.06 27.63 21.81 201206 720.80 11.17 96.90 13.39 63.30 46.98 904.80 4876.15 970.00 800.00 69.27Shalimar Paints Ltd. 201203 3.79 486.45 19.47 37.94 7.19 14.46 38.20 53.98 25.91 201206 121.74 20.83 9.06 6.63 3.13 33.03 568.95 215.38 654.65 292.30 62.36Paper & Paper Products Total 437.73 10662.52 2931.41 5417.08 418.09Andhra Pradesh Paper Mills Ltd. 201112 39.77 593.91 -24.03 74.54 12.96 -97.81 -24.59 3.57 -18.48 201206 186.58 -3.74 3.51 1.85 -15.81 -15.90 331.00 1316.39 374.80 120.00 75.00Ballarpur Industries Ltd. 201106 131.10 4498.05 18.54 857.97 18.72 265.60 3.24 8.37 10.85 201203 1225.19 5.23 200.18 16.03 34.35 1.70 17.95 1176.67 30.35 17.50 49.42Emami Paper Mills Ltd. 201203 12.10 494.96 13.86 63.54 13.90 8.31 1.37 10.20 5.07 201206 113.36 -7.17 16.21 14.30 0.69 0.46 37.50 226.87 43.70 23.05 74.94JK Paper Ltd. 201203 136.62 1491.85 7.69 156.47 11.30 48.07 3.55 7.92 6.86 201206 344.76 6.61 42.66 12.36 14.14 4.14 34.55 472.02 46.50 32.10 51.01Rainbow Papers Ltd. 201103 17.44 377.73 41.65 79.66 23.36 37.16 4.26 10.16 15.59 201206 220.78 110.21 30.40 13.69 17.31 7.59 75.30 686.87 91.65 57.20 34.49Seshasayee Paper & Boards Ltd. 201203 11.25 611.42 6.62 98.91 16.20 34.10 30.31 16.12 11.49 201206 155.54 18.09 27.64 17.53 11.18 39.75 190.25 214.03 239.85 157.00 42.11Speciality Papers Ltd. 200903 7.68 104.98 47.44 4.02 4.05 -0.94 -1.22 4.01 -6.17 201206 27.36 9334.48 -0.04 -0.13 -0.38 -0.10 10.80 168.66 12.15 4.55 1.03Tamil Nadu Newsprint & Papers Ltd. 201103 69.21 1184.45 15.48 292.00 27.33 149.00 21.53 10.47 17.33 201206 329.66 -1.79 89.29 25.83 11.17 6.46 114.00 789.00 118.75 75.95 35.32West Coast Paper Mills Ltd. 201203 12.55 1305.18 21.87 226.02 16.79 -33.56 -5.48 1.75 -5.71 201206 328.18 14.66 71.81 21.77 5.77 3.50 55.50 366.57 79.45 44.45 54.77Pesticides & Agrochemicals Total 280.42 16623.62 4957.80 16038.63 643.00Bayer CropScience Ltd. 201203 39.50 2272.30 6.32 252.50 12.61 139.00 35.19 14.80 18.97 201206 899.44 16.32 138.91 15.09 88.74 89.86 975.65 3853.70 1014.95 673.05 71.11Dhanuka Agritech Ltd. 201203 10.00 529.19 7.78 79.34 13.89 57.13 11.42 34.87 29.67 201206 107.21 13.05 15.76 14.58 11.21 8.96 93.00 465.18 114.80 80.10 74.99Excel Crop Care Ltd. 201203 5.50 694.97 -6.01 50.10 7.76 16.52 15.33 14.44 7.35 201206 209.56 30.74 21.70 10.16 10.96 39.82 113.75 125.19 179.00 85.30 19.28
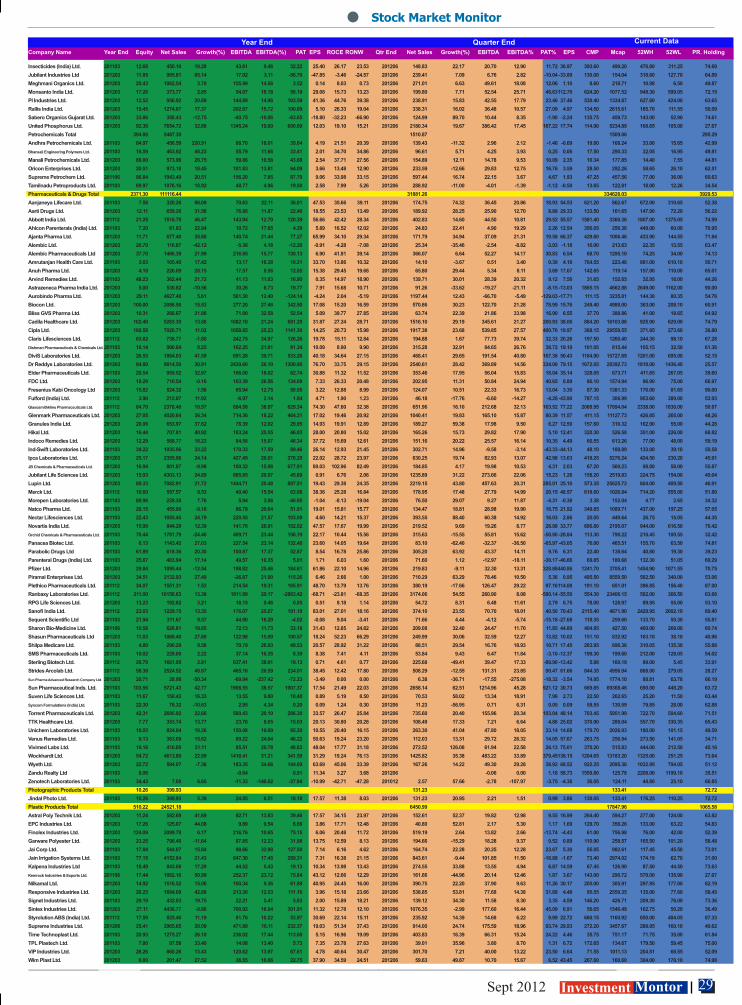
29 Sept 2012 Investment Montor
Company Name Year End Equity Net Sales Growth(%) EBITDA EBITDA(%) PAT EPS ROCE RONW Qtr End Net Sales Growth(%) EBITDA EBITDA% PAT% EPS CMP Mcap 52WH 52WL PR. Holding
Bata India Ltd. 201112 64.26 1548.60 21.39 234.53 25.72 258.86 40.28 72.81 57.46 201206 503.33 17.23 85.88 16.71 52.65 32.77 885.55 5690.88 981.00 492.00 52.01Liberty Shoes Ltd. 201103 17.04 309.90 15.37 22.51 7.64 6.35 3.80 6.67 5.12 201206 75.17 4.60 6.98 8.76 2.15 5.05 94.05 160.26 125.95 56.90 66.12Mirza International Ltd. 201103 18.54 472.85 24.80 71.80 17.89 39.85 4.30 27.07 24.68 201206 141.94 16.33 19.42 13.68 4.67 2.01 17.35 160.84 23.50 16.00 65.97Relaxo Footwears Ltd. 201103 6.00 686.01 23.90 67.09 10.66 26.71 22.26 18.11 21.85 201206 248.32 15.45 31.28 12.53 15.06 50.19 594.00 712.87 627.00 235.00 75.00Logistics Total 420.66 18761.68 4865.05 17865.64 543.33Aegis Logistics Ltd. 201203 33.40 4463.83 146.47 -3.79 2.25 22.38 5.89 21.24 7.88 201206 1484.17 78.81 -24.41 -1.64 5.21 5.76 119.00 397.46 215.90 100.05 62.43Allcargo Logistics Ltd. 201203 26.04 4271.15 49.17 520.15 13.43 297.69 21.86 22.70 22.34 201206 975.19 14.18 113.47 11.64 59.08 17.04 126.45 1612.08 160.00 109.10 69.81Aqua Logistics Ltd. 201103 30.00 380.88 18.28 35.32 9.61 22.39 0.75 7.77 6.03 201206 77.31 -30.14 6.25 8.09 1.75 0.20 9.79 293.69 17.95 7.85 14.58Arshiya International Ltd. 201103 11.77 821.52 56.21 159.05 19.73 82.23 13.94 8.43 11.85 201206 341.84 53.56 93.45 27.34 34.62 23.54 122.80 716.90 177.65 111.50 43.57Chartered Logistics Ltd. 201103 9.93 184.19 49.09 23.44 12.99 7.82 0.79 21.20 40.01 201206 70.82 33.57 11.89 16.79 4.00 1.61 17.25 171.36 61.50 14.85 60.75Container Corpn. Of India Ltd. 201103 129.98 3892.47 4.34 1010.77 31.15 876.37 67.42 22.81 18.98 201206 1036.95 9.26 267.15 25.76 245.13 75.43 926.40 12041.61 1056.55 805.00 63.09Gateway Distriparks Ltd. 201203 108.28 821.45 36.35 241.10 32.16 135.62 12.19 16.07 18.92 201206 230.51 17.49 65.96 28.43 36.55 12.99 135.10 1464.64 159.90 117.55 40.37GATI Ltd. 201106 17.20 1202.98 29.90 92.46 8.38 14.10 1.64 10.10 5.29 201206 15.75 -92.95 -6.23 -39.21 63.82 29.48 38.50 333.34 62.80 23.30 44.37Sical Logistics Ltd. 201103 39.52 769.46 6.57 -1.69 4.93 -8.56 -1.39 0.93 -2.96 201206 175.12 -14.54 22.01 12.56 3.27 0.99 67.05 372.81 78.70 62.00 75.30Transport Corporation Of India Ltd. 201203 14.54 1953.75 5.54 156.44 8.30 59.34 8.18 18.05 17.69 201206 457.39 9.97 37.04 8.10 13.58 7.47 63.50 461.74 88.50 52.05 69.06Lubricants Total 313.20 7944.27 2108.27 17246.12 349.56Castrol India Ltd. 201112 247.28 2981.78 9.03 658.39 21.06 481.03 19.45 124.01 83.10 201206 851.30 7.76 172.50 17.47 120.90 19.56 597.60 14777.49 634.00 385.05 71.03Gulf Oil Corpn. Ltd. 201203 19.83 1302.93 18.00 59.08 6.05 50.11 4.87 16.67 13.17 201206 247.58 12.08 18.21 6.47 10.07 4.06 86.30 855.62 100.70 52.25 49.96Panama Petrochem Ltd. 201203 8.62 584.22 25.81 43.58 7.66 30.63 35.54 26.03 16.90 201206 155.99 21.86 4.55 2.67 2.21 10.23 140.25 120.89 263.85 139.05 43.90Sah Petroleums Ltd. 201103 22.00 363.48 29.97 17.87 5.87 16.53 3.76 19.29 14.35 201206 116.93 2.47 3.72 3.16 -10.27 -9.33 25.90 113.96 38.50 22.10 86.89Savita Oil Technologies Ltd. 201203 14.60 1910.52 23.41 127.37 6.46 68.03 46.59 24.17 16.34 201206 519.93 20.22 20.66 3.93 47.79 130.92 475.30 694.04 629.00 370.20 71.56Tide Water Oil Company (India) Ltd. 201203 0.87 801.33 15.87 84.91 9.48 57.92 665.75 26.27 18.97 201206 216.53 11.48 25.21 9.98 16.39 753.56 7852.75 684.13 8539.90 5676.10 26.22Medical Equipment/Supplies/Accessories Total 197.41 1758.51 771.65 3431.24 76.85Opto Circuits (India) Ltd. 201103 186.40 1585.56 47.14 444.85 30.05 368.55 19.70 23.97 31.03 201206 715.06 37.30 190.62 26.63 139.50 22.78 128.20 3106.53 225.38 117.15 28.15Poly Medicure Ltd. 201103 11.01 172.95 26.07 37.93 21.95 21.17 19.68 27.23 30.59 201206 56.59 26.64 8.91 15.42 3.05 11.07 294.85 324.70 320.00 172.10 48.70Metal - Ferrous Total 14.94 307.71 96.94 1455.98 106.69Gravita India Ltd. 201203 13.62 268.50 5.84 19.28 8.99 15.77 11.05 24.70 19.29 201206 90.64 50.40 4.30 4.61 1.09 0.46 164.00 1116.84 204.50 60.40 73.52JRI Industries & Infrastructure Ltd. 201103 1.32 39.22 454.45 0.66 1.88 0.51 3.86 17.27 32.08 201206 6.30 0.61 0.17 2.73 0.12 0.18 127.70 339.14 128.70 16.21 33.17Metal - Non Ferrous Total 1643.79 53731.59 13617.13 115556.41 217.82Hindustan Copper Ltd. 201103 462.61 1147.34 -13.01 279.12 28.50 224.10 2.42 28.59 18.98 201206 313.07 16.40 73.81 23.52 49.40 2.14 257.35 23810.49 320.00 146.25 99.59Hindustan Zinc Ltd. 201203 845.06 11405.31 13.61 6069.46 63.11 5526.04 13.08 28.14 22.37 201206 2712.67 -3.85 1428.56 51.99 1581.34 14.97 129.50 54717.88 149.80 106.70 64.92Sterlite Industries (India) Ltd. 201203 336.12 41178.94 35.33 9863.32 30.21 7761.11 14.36 17.12 17.78 201206 10591.39 7.79 2090.91 19.64 1945.26 14.30 110.15 37028.04 141.40 86.10 53.31Mining & Minerals Total 7696.07 103402.22 23698.11 333704.43 731.2620 Microns Ltd. 201203 14.33 302.45 18.47 36.28 12.43 11.04 7.70 32.73 22.74 201206 74.53 11.11 9.92 12.87 3.16 8.83 118.50 169.82 124.75 49.55 59.65Ashapura Minechem Ltd. 201103 15.80 637.02 -10.74 78.74 13.78 -86.27 -10.97 13.25 0.00 201206 150.15 -14.66 16.55 10.61 0.16 0.08 30.20 238.54 32.75 8.91 44.39Coal India Ltd. 201203 6316.36 74478.27 25.82 15281.06 29.69 14788.21 23.41 32.33 40.09 201206 16500.59 13.80 4814.61 29.18 4469.26 28.30 364.25 230073.57 393.40 293.75 90.00Gujarat Mineral Devp. Corpn. Ltd. 201103 63.60 1414.79 32.82 654.03 48.75 375.07 11.79 35.34 24.63 201206 496.53 5.92 268.47 54.07 170.52 21.45 193.05 6138.99 212.60 151.25 74.00Gujarat NRE Coke Ltd. 201103 558.14 1812.63 25.88 451.72 34.80 134.72 1.96 8.86 9.99 201206 526.12 20.63 53.26 10.12 -11.02 -0.76 16.90 887.05 29.50 14.80 46.46Himadri Chemicals & Industries. Ltd. 201103 38.57 700.08 48.51 192.54 26.15 113.25 2.94 12.08 14.32 201206 346.08 63.73 10.16 2.94 -20.09 -2.08 27.35 1054.98 58.60 26.00 44.63MOIL Ltd. 201203 168.00 899.58 -21.09 433.23 70.28 410.77 24.45 25.83 17.98 201206 242.57 15.47 102.25 42.15 99.41 23.67 242.55 4074.84 312.00 217.35 80.00NMDC Ltd 201203 396.47 11261.89 -0.94 8923.50 97.11 7265.55 18.33 49.28 33.33 201206 2837.90 1.99 2302.03 81.05 1906.00 19.23 186.80 74060.89 259.00 136.15 90.00Sandur Manganese & Iron Ores Ltd. 201103 8.75 362.76 23.32 140.40 39.67 83.16 97.07 46.34 33.74 201206 26.17 -64.75 -6.03 -22.81 -8.82 -40.32 471.85 412.87 590.00 261.35 74.29Sesa Goa Ltd. 201203 86.91 8978.04 -11.43 3475.03 41.24 2107.77 31.01 23.65 15.09 201206 1724.94 -17.65 443.85 25.33 198.82 44.37 187.45 16291.31 270.00 148.70 55.13Shirpur Gold Refinery Ltd. 201203 29.14 2554.70 1190.25 10.21 0.57 -14.16 -4.86 -0.68 -5.91 201206 772.53 184.67 12.77 1.65 0.99 1.36 103.50 301.57 146.85 58.00 72.71Miscellaneous Total 287.16 8472.63 2326.85 11475.06 995.62Anil Ltd. 201103 9.77 504.08 34.75 86.71 16.92 39.81 40.76 23.61 35.59 201206 183.13 35.54 30.61 16.69 12.79 52.38 218.95 213.83 304.50 205.10 68.85APW President Systems Ltd. 201103 6.05 101.50 -30.74 0.08 3.94 -1.14 -1.89 0.49 -2.28 201206 21.45 -20.61 -1.21 -5.31 -1.73 -11.46 204.60 123.74 261.90 131.05 75.00Aricent Infra Ltd. 201003 5.62 0.00 -0.06 0.09 0.16 20.03 17.54 201206 0.13 -45.23 0.09 64.39 0.06 0.09 155.50 427.31 157.00 10.62 2.80Dalmia Bharat Enterprises Ltd 201203 16.24 2330.36 33.47 555.58 24.49 147.55 17.67 8.44 5.21 201206 643.18 22.49 163.75 25.46 54.07 35.61 120.20 975.90 159.95 87.00 62.80Deep Industries Ltd. 201103 23.50 49.37 -10.78 25.80 55.94 11.85 5.04 13.73 10.61 201206 16.19 29.16 10.01 61.85 4.10 6.60 45.55 113.31 90.80 42.25 57.33EICL Ltd. 201203 10.06 378.09 6.16 55.15 14.74 14.84 2.29 20.67 12.39 201206 101.14 3.82 14.67 14.48 3.51 2.79 44.30 222.72 47.60 30.05 77.92Ellenbarrie Industrial Gases Ltd. 201103 6.55 64.47 30.55 14.45 23.10 3.35 5.12 11.37 13.82 201206 17.98 23.43 3.88 20.23 0.48 2.90 470.00 307.70 470.00 419.80 42.63Future Market Networks Ltd. 201203 55.85 165.18 58.61 41.51 63.89 -0.32 0.01 12.30 -0.09 201206 36.85 12.54 10.50 28.48 -10.94 -7.94 24.00 134.05 45.70 19.65 68.73Hanung Toys & Textiles Ltd. 201103 25.19 1122.18 34.21 206.82 20.00 119.58 47.47 16.26 26.80 201206 376.55 32.80 74.31 19.73 26.82 42.59 114.30 287.90 155.90 76.00 68.75KGN Enterprises Ltd. 201103 20.47 9.56 -94.48 1.47 16.16 1.27 0.62 2.58 3.32 201206 21.79 599.42 0.72 3.31 0.17 0.33 331.55 678.68 898.00 177.25 53.31Kirloskar Oil Engines Ltd. 201203 29.13 2326.07 -4.00 304.26 13.64 191.80 13.17 25.68 19.96 201206 595.55 7.28 88.16 14.61 39.17 10.81 154.05 2234.11 166.10 107.00 67.17Krishna Ventures Ltd 201203 10.80 0.35 30.94 0.01 93.63 0.32 0.30 2.96 5.10 201206 -0.01 -19.23 0.12 0.45 721.15 778.84 735.55 11.94 73.24Orissa Minerals Development Co Ltd. 201103 0.60 49.77 -41.13 -11.22 76.69 7.72 128.67 1.73 0.97 201206 -8.26 -234.26 2.81 187.33 56685.20 3401.11 60392.25 25550.00 50.01Riddhi Siddhi Gluco Biols Ltd. 201103 11.14 999.75 34.08 251.97 25.14 164.49 147.32 43.75 62.05 201112 284.31 6.60 22.24 7.55 -0.67 -2.39 280.10 265.49 319.25 201.95 50.53Sawaca Business Machines Ltd. 201103 10.40 0.50 193.56 0.24 48.59 0.16 0.16 2.28 1.54 201203 0.10 -28.57 0.00 0.00 0.01 0.03 195.60 203.44 205.35 12.25 30.77Talwalkars Better Value Fitness Ltd. 201203 24.12 119.36 28.56 54.28 42.79 24.92 9.15 17.22 18.46 201206 28.50 22.98 9.40 32.74 3.07 4.66 150.20 362.22 208.90 108.00 59.47Vaarad Ventures Ltd. 201103 21.69 252.05 48.84 1.44 1.14 1.95 0.18 8.02 8.12 201206 0.16 67.09 0.04 0.01 29.80 744.71 84.15 22.00 86.31Oil Exploration Total 6695.12 153358.06 28369.11 346470.28 534.04Aban Offshore Ltd. 201103 8.70 3347.22 -0.34 2073.44 62.72 78.40 26.90 8.07 4.28 201206 849.95 16.22 506.01 59.53 52.13 47.92 386.60 1682.35 571.50 320.00 54.11Cairn India Ltd. 201203 1907.40 11860.65 15.40 9254.42 85.93 7937.75 41.62 18.30 17.93 201206 4440.03 19.59 3456.89 77.86 3825.74 80.21 345.40 65911.85 400.95 258.45 58.85Dolphin Offshore Enterprises (India) Ltd. 201103 16.77 304.42 -44.95 39.90 17.92 15.86 9.45 10.86 6.92 201206 55.27 -18.12 7.05 11.68 1.20 2.86 78.50 131.66 147.00 57.25 54.43Gujarat Natural Resources Ltd. 201103 38.75 62.60 912.72 -0.45 0.49 -3.60 -0.93 -1.01 -6.32 201206 1.67 -92.19 0.74 44.19 0.31 0.31 99.90 387.13 145.00 73.00 21.30Hindustan Oil Exploration Company Ltd. 201103 130.49 345.76 122.04 228.68 73.48 81.54 6.25 7.54 7.12 201206 26.80 -56.58 13.10 48.86 1.48 0.45 120.25 1569.18 152.70 86.70 47.18Jindal Drilling & Inds. Ltd. 201103 11.47 1052.60 -11.94 151.28 15.41 100.84 43.97 36.70 25.15 201206 199.97 -20.15 19.27 9.64 18.60 32.43 261.10 598.73 410.75 254.40 53.83Oil & Natural Gas Corpn. Ltd. 201103 4277.75 117615.13 15.59 22426.65 45.11 22824.97 26.25 25.88 21.22 201206 20084.33 23.99 9929.92 49.21 6077.70 28.42 287.60 246055.90 303.90 240.10 69.23Oil India Ltd 201203 240.45 17215.00 48.23 4696.94 35.68 3469.18 144.28 30.13 20.81 201206 2333.33 7.28 1202.48 49.29 929.93 61.88 482.60 29010.82 556.00 431.00 78.43Selan Exploration Technology Ltd. 201203 16.99 92.73 30.70 58.87 75.16 43.88 25.83 34.12 23.27 201206 27.04 10.68 16.92 62.57 12.79 30.11 261.75 444.64 315.00 221.20 41.76Shiv-Vani Oil & Gas Exploration Services Ltd. 201103 46.36 1461.95 16.77 674.79 47.07 226.34 48.82 13.38 17.47 201206 350.71 -14.16 172.83 49.28 45.02 38.85 146.25 678.02 224.95 138.50 54.92Packaging Total 363.20 17750.21 5129.41 4854.86 526.43Bilcare Ltd. 201103 23.55 2286.58 118.22 334.68 16.48 149.46 62.65 15.50 15.84 201206 931.83 13.11 110.97 11.90 30.45 51.72 162.95 383.67 378.00 132.10 32.61Cosmo Films Ltd. 201203 19.44 1136.18 0.10 94.04 8.57 30.18 16.21 13.07 9.22 201206 337.96 11.26 31.68 9.30 6.07 12.49 79.30 154.16 104.00 70.30 44.03Essel Propack Ltd. 201103 31.31 1408.34 -16.28 248.57 19.09 47.68 3.02 10.39 6.20 201206 429.90 19.78 69.20 16.07 8.80 2.24 32.20 504.26 40.40 23.65 59.12Everest Kanto Cylinder Ltd. 201203 21.43 677.05 -13.14 71.59 11.27 4.69 0.44 1.33 0.59 201206 126.99 -40.27 -14.90 -11.60 -32.93 -12.29 25.50 273.25 80.00 24.50 59.58Flexituff International Ltd. 201103 17.21 577.94 79.99 74.87 13.30 29.32 17.99 15.00 24.80 201206 202.61 40.09 33.13 16.35 10.64 19.83 214.65 466.94 384.55 142.00 30.07Jindal Poly Films Ltd. 201103 46.04 2807.67 64.81 902.39 32.51 595.70 129.19 48.67 44.58 201206 593.54 -5.38 75.89 12.42 6.99 6.65 166.05 714.16 244.10 143.05 73.77Neo Corp Intl. Ltd. 201103 15.52 302.50 47.31 32.48 11.91 15.92 10.26 17.52 21.16 201206 119.84 28.41 17.99 14.58 5.91 6.22 40.95 155.70 50.90 21.65 12.19Paper Products Ltd. 201112 12.54 813.51 13.57 80.85 10.94 49.66 7.92 19.06 16.10 201206 236.78 19.91 24.19 9.47 13.36 8.54 70.15 439.75 84.50 58.00 63.70Polyplex Corporation Ltd. 201103 31.98 2433.32 99.78 886.10 37.08 1336.54 330.02 63.09 117.94 201206 625.85 -6.01 79.76 12.73 43.67 30.22 155.60 497.68 210.70 143.00 46.93Tinplate Company Of India Ltd. 201103 71.96 791.27 1.53 79.22 12.24 35.81 3.65 9.10 11.40 201206 164.64 14.64 21.42 12.81 1.48 0.56 50.55 529.09 57.60 32.40 60.96Uflex Ltd. 201203 72.21 4515.84 29.16 636.02 13.24 252.53 35.32 16.04 12.62 201206 1359.47 24.42 183.94 13.37 55.35 31.20 101.95 736.20 180.70 98.25 43.47Paints Total 259.60 17654.76 4734.96 49090.38 328.87Akzo Nobel India Ltd. 201203 36.80 1987.80 81.24 173.90 13.27 201.80 54.84 18.68 16.03 201206 549.77 62.38 53.29 9.47 60.89 50.78 874.95 4196.29 985.00 693.25 68.88Asian Paints Ltd. 201203 95.92 9632.24 24.73 1510.29 14.89 1020.58 103.08 54.68 41.35 201206 2539.25 12.50 446.55 17.53 298.94 120.26 3663.45 35139.73 4170.00 2551.05 52.79Berger Paints India Ltd. 201203 69.20 2947.70 25.93 303.50 10.46 180.10 5.21 31.43 24.40 201206 803.40 15.91 76.60 9.50 44.40 5.13 134.70 4662.84 153.30 78.15 75.57Kansai Nerolac Paints Ltd. 201203 53.89 2600.57 21.45 337.30 12.57 215.89 40.06 27.63 21.81 201206 720.80 11.17 96.90 13.39 63.30 46.98 904.80 4876.15 970.00 800.00 69.27Shalimar Paints Ltd. 201203 3.79 486.45 19.47 37.94 7.19 14.46 38.20 53.98 25.91 201206 121.74 20.83 9.06 6.63 3.13 33.03 568.95 215.38 654.65 292.30 62.36Paper & Paper Products Total 437.73 10662.52 2931.41 5417.08 418.09Andhra Pradesh Paper Mills Ltd. 201112 39.77 593.91 -24.03 74.54 12.96 -97.81 -24.59 3.57 -18.48 201206 186.58 -3.74 3.51 1.85 -15.81 -15.90 331.00 1316.39 374.80 120.00 75.00Ballarpur Industries Ltd. 201106 131.10 4498.05 18.54 857.97 18.72 265.60 3.24 8.37 10.85 201203 1225.19 5.23 200.18 16.03 34.35 1.70 17.95 1176.67 30.35 17.50 49.42Emami Paper Mills Ltd. 201203 12.10 494.96 13.86 63.54 13.90 8.31 1.37 10.20 5.07 201206 113.36 -7.17 16.21 14.30 0.69 0.46 37.50 226.87 43.70 23.05 74.94JK Paper Ltd. 201203 136.62 1491.85 7.69 156.47 11.30 48.07 3.55 7.92 6.86 201206 344.76 6.61 42.66 12.36 14.14 4.14 34.55 472.02 46.50 32.10 51.01Rainbow Papers Ltd. 201103 17.44 377.73 41.65 79.66 23.36 37.16 4.26 10.16 15.59 201206 220.78 110.21 30.40 13.69 17.31 7.59 75.30 686.87 91.65 57.20 34.49Seshasayee Paper & Boards Ltd. 201203 11.25 611.42 6.62 98.91 16.20 34.10 30.31 16.12 11.49 201206 155.54 18.09 27.64 17.53 11.18 39.75 190.25 214.03 239.85 157.00 42.11Speciality Papers Ltd. 200903 7.68 104.98 47.44 4.02 4.05 -0.94 -1.22 4.01 -6.17 201206 27.36 9334.48 -0.04 -0.13 -0.38 -0.10 10.80 168.66 12.15 4.55 1.03Tamil Nadu Newsprint & Papers Ltd. 201103 69.21 1184.45 15.48 292.00 27.33 149.00 21.53 10.47 17.33 201206 329.66 -1.79 89.29 25.83 11.17 6.46 114.00 789.00 118.75 75.95 35.32West Coast Paper Mills Ltd. 201203 12.55 1305.18 21.87 226.02 16.79 -33.56 -5.48 1.75 -5.71 201206 328.18 14.66 71.81 21.77 5.77 3.50 55.50 366.57 79.45 44.45 54.77Pesticides & Agrochemicals Total 280.42 16623.62 4957.80 16038.63 643.00Bayer CropScience Ltd. 201203 39.50 2272.30 6.32 252.50 12.61 139.00 35.19 14.80 18.97 201206 899.44 16.32 138.91 15.09 88.74 89.86 975.65 3853.70 1014.95 673.05 71.11Dhanuka Agritech Ltd. 201203 10.00 529.19 7.78 79.34 13.89 57.13 11.42 34.87 29.67 201206 107.21 13.05 15.76 14.58 11.21 8.96 93.00 465.18 114.80 80.10 74.99Excel Crop Care Ltd. 201203 5.50 694.97 -6.01 50.10 7.76 16.52 15.33 14.44 7.35 201206 209.56 30.74 21.70 10.16 10.96 39.82 113.75 125.19 179.00 85.30 19.28
Year End Quarter End Current Data
Stock Market Monitor
Company Name Year End Equity Net Sales Growth(%) EBITDA EBITDA(%) PAT EPS ROCE RONW Qtr End Net Sales Growth(%) EBITDA EBITDA% PAT% EPS CMP Mcap 52WH 52WL PR. Holding
Insecticides (India) Ltd. 201103 12.68 450.10 19.28 43.61 9.46 32.22 25.40 26.17 23.53 201206 148.83 22.17 20.70 12.90 11.72 36.97 393.60 499.20 476.80 311.25 74.69Jubilant Industries Ltd 201203 11.85 995.81 85.14 17.02 3.11 -56.70 -47.85 -3.46 -24.57 201206 239.41 7.09 6.76 2.82 -10.04 -33.89 130.00 154.04 318.60 127.70 64.89Meghmani Organics Ltd. 201203 25.43 1062.54 3.70 155.99 14.56 3.52 0.14 8.03 0.73 201206 271.01 6.63 49.61 18.08 12.06 1.10 8.60 218.71 10.98 6.50 49.87Monsanto India Ltd. 201203 17.26 373.77 2.85 54.87 18.18 50.19 29.08 15.73 13.23 201206 199.80 7.71 52.54 25.71 48.63 112.70 624.20 1077.52 948.30 599.05 72.15PI Industries Ltd. 201203 12.52 956.92 20.89 144.89 14.96 103.59 41.36 44.76 39.38 201206 238.91 15.83 42.55 17.79 23.46 37.46 530.40 1334.87 627.80 424.00 63.65Rallis India Ltd. 201203 19.45 1274.87 17.37 202.67 15.72 100.69 5.10 26.33 19.04 201206 338.31 16.02 36.48 10.57 27.09 4.97 134.50 2615.61 185.70 111.55 50.09Sabero Organics Gujarat Ltd. 201203 33.86 358.43 -12.75 -40.75 -10.06 -63.65 -18.80 -32.23 -66.90 201206 124.99 89.70 10.44 8.35 -1.90 -2.24 135.75 459.73 143.00 52.90 74.61United Phosphorus Ltd. 201203 92.36 7654.72 32.88 1345.24 19.00 600.69 12.03 19.10 15.21 201206 2180.34 19.67 386.42 17.45 167.22 17.74 114.90 5234.89 168.65 105.00 27.67Petrochemicals Total 394.88 5487.30 1510.87 1509.06 295.29Andhra Petrochemicals Ltd. 201103 84.97 456.59 220.91 88.70 18.01 35.64 4.19 21.51 20.39 201206 139.43 -11.32 2.96 2.12 -1.46 -0.69 19.80 168.24 33.00 15.65 42.99Bhansali Engineering Polymers Ltd. 201103 16.59 463.92 48.23 55.79 11.66 33.41 2.01 34.70 34.86 201206 96.61 5.71 4.25 3.93 0.25 0.06 17.50 290.33 32.05 16.95 49.81Manali Petrochemicals Ltd. 201203 86.00 573.96 26.75 59.86 10.58 43.68 2.54 37.71 27.56 201206 154.89 12.11 14.78 9.53 10.09 2.35 10.34 177.85 14.40 7.55 44.81Oricon Enterprises Ltd. 201203 20.51 973.18 18.45 101.83 13.81 64.09 3.66 13.48 12.90 201206 233.59 -12.66 29.83 12.75 16.76 3.59 28.50 292.26 58.65 26.10 62.51Supreme Petrochem Ltd. 201106 96.84 1943.49 20.51 156.20 7.85 87.70 9.06 33.98 33.15 201206 597.44 16.74 22.15 3.67 4.67 1.93 47.25 457.56 77.00 36.00 60.63Tamilnadu Petroproducts Ltd. 201103 89.97 1076.16 18.92 48.77 4.96 19.50 2.58 7.99 5.26 201206 288.92 -11.00 -4.01 -1.39 -1.12 -0.50 13.65 122.81 18.00 12.26 34.54Pharmaceuticals & Drugs Total 2371.30 111116.44 31881.26 334628.03 3929.53Aanjaneya Lifecare Ltd. 201103 7.58 320.26 98.09 70.63 22.11 36.01 47.53 35.66 39.11 201206 174.75 74.32 36.45 20.86 18.93 54.53 621.20 862.67 672.00 310.65 52.38Aarti Drugs Ltd. 201203 12.11 659.26 31.58 76.86 11.87 22.46 18.55 23.53 13.49 201206 189.92 28.25 25.90 12.70 8.88 29.33 133.50 161.65 147.90 72.20 56.22Abbott India Ltd. 201112 21.25 1518.75 46.47 143.94 12.70 120.39 56.66 42.42 28.34 201206 402.83 14.60 44.50 10.81 29.52 55.57 1581.40 3360.36 1807.00 1375.05 74.99Ahlcon Parenterals (India) Ltd. 201103 7.20 61.83 22.94 10.72 17.65 4.29 5.89 16.52 12.02 201206 24.83 22.41 4.90 19.29 2.26 12.54 356.05 256.36 449.00 60.00 70.95Ajanta Pharma Ltd. 201203 11.71 677.40 35.80 140.74 21.44 77.27 65.99 34.10 29.34 201206 171.79 34.94 37.09 21.31 19.58 66.37 429.80 1006.46 433.90 144.55 71.84Alembic Ltd. 201203 26.70 116.87 -42.12 -5.36 4.18 -12.20 -0.91 -4.28 -7.08 201206 25.34 -35.46 -2.54 -8.82 -3.93 -1.18 16.00 213.63 22.35 13.55 63.47Alembic Pharmaceuticals Ltd 201203 37.70 1466.39 21.99 216.85 15.77 130.13 6.90 41.81 39.14 201206 366.07 6.64 52.27 14.17 30.83 6.54 68.70 1295.10 74.25 34.00 74.13Amrutanjan Health Care Ltd. 201103 3.03 105.40 17.42 13.17 16.38 10.21 33.70 13.86 10.32 201206 14.10 -3.67 0.51 3.40 0.30 4.16 764.55 223.48 881.00 610.10 50.71Anuh Pharma Ltd. 201203 4.18 226.09 28.15 17.57 8.56 12.85 15.38 29.45 19.68 201206 65.80 29.44 5.34 8.11 3.69 17.67 142.65 119.14 157.00 110.00 65.01Arvind Remedies Ltd. 201103 48.23 362.44 21.72 41.13 11.03 16.90 0.35 14.97 18.90 201206 139.71 30.01 28.39 20.32 9.12 7.56 31.65 152.65 32.95 18.00 44.26Astrazeneca Pharma India Ltd. 201203 5.00 530.82 -10.56 30.26 6.73 19.77 7.91 15.68 10.71 201206 91.26 -33.62 -19.27 -21.11 -8.15 -13.03 1865.15 4662.88 2649.00 1162.00 90.00Aurobindo Pharma Ltd. 201203 29.11 4627.40 5.61 561.30 12.40 -124.14 -4.24 2.04 -5.19 201206 1197.44 12.43 -66.70 -5.49 -129.03 -17.71 111.15 3235.81 144.30 80.35 54.76Biocon Ltd. 201203 100.00 2086.50 15.53 277.20 27.46 342.50 17.08 15.20 16.59 201206 570.86 30.23 122.70 21.28 78.99 15.76 249.40 4988.00 363.00 208.10 60.91Bliss GVS Pharma Ltd. 201203 10.31 266.67 21.86 71.00 32.58 52.54 5.09 39.77 27.85 201206 63.74 22.39 21.86 33.98 16.90 6.55 37.70 388.86 41.00 18.65 64.92Cadila Healthcare Ltd. 201203 102.40 5263.30 13.66 1082.10 21.24 681.20 31.87 27.24 28.71 201206 1516.10 29.19 345.61 21.27 200.93 38.06 884.20 18103.86 925.90 629.00 74.79Cipla Ltd. 201203 160.58 7020.71 11.02 1658.85 25.23 1141.30 14.25 20.73 15.98 201206 1917.38 23.68 539.85 27.57 400.76 19.97 368.15 29559.55 371.95 273.60 36.80Claris Lifesciences Ltd. 201112 63.82 738.77 -1.80 242.75 34.97 126.26 19.78 15.11 12.84 201206 194.88 1.67 77.73 39.74 32.33 20.26 197.50 1260.40 244.30 98.10 67.28Dishman Pharmaceuticals & Chemicals Ltd. 201103 16.14 990.84 8.25 162.25 21.61 81.34 10.09 8.90 9.90 201206 315.28 32.91 84.65 26.76 38.72 19.19 101.05 815.44 105.15 32.50 61.36DiviS Laboratories Ltd. 201203 26.55 1864.03 41.59 691.28 39.71 533.26 40.18 34.64 27.15 201206 468.41 29.65 191.54 40.80 167.38 50.43 1184.90 15727.69 1201.00 695.00 52.15Dr Reddys Laboratories Ltd. 201203 84.80 9814.50 30.91 2439.60 26.10 1300.90 76.70 33.75 29.15 201206 2540.61 28.42 369.89 14.56 334.08 79.15 1672.05 28392.73 1818.00 1436.40 25.57Elder Pharmaceuticals Ltd. 201103 20.54 959.52 32.97 166.00 18.02 62.74 30.88 11.32 11.52 201206 353.46 17.95 56.04 15.83 18.04 35.14 328.05 673.71 411.65 267.05 39.60FDC Ltd. 201203 18.29 710.54 -0.16 163.39 26.56 134.09 7.33 26.33 20.48 201206 202.95 11.31 50.84 24.94 40.65 8.89 86.10 1574.94 96.90 75.00 66.97Fresenius Kabi Oncology Ltd 201203 15.82 524.32 1.58 65.94 12.75 50.95 3.22 12.88 8.99 201206 124.07 10.51 22.33 16.73 13.04 3.30 87.30 1381.33 176.00 81.65 90.00Fulford (India) Ltd. 201112 3.90 212.87 11.92 -6.97 2.14 1.84 4.71 1.90 1.23 201206 46.18 -17.76 -6.60 -14.27 -4.28 -43.90 787.15 306.99 953.60 389.00 53.93Glaxosmithkline Pharmaceuticals Ltd. 201112 84.70 2378.48 10.57 684.58 38.97 629.34 74.30 47.60 32.38 201206 651.96 16.10 212.68 32.13 163.52 77.22 2088.95 17694.04 2338.00 1830.00 50.67Glenmark Pharmaceuticals Ltd. 201203 27.05 4020.64 36.34 714.36 18.22 464.31 17.02 19.46 20.92 201206 1040.41 19.83 165.10 15.87 80.39 11.57 411.15 11127.73 426.85 265.00 48.26Granules India Ltd. 201203 20.06 653.97 37.62 78.39 12.02 29.95 14.93 19.91 12.89 201206 189.27 59.38 17.98 9.50 6.27 12.50 157.60 316.32 162.90 55.00 44.28Hikal Ltd. 201203 16.44 707.81 40.92 183.24 25.55 46.03 28.00 20.80 15.02 201206 165.26 15.73 29.82 17.90 5.10 12.41 320.30 526.58 351.00 226.00 68.82Indoco Remedies Ltd. 201203 12.29 568.77 18.23 84.58 15.07 46.34 37.72 15.69 12.61 201206 151.16 20.22 25.57 16.14 10.35 4.49 66.55 613.26 77.00 48.00 59.19Ind-Swift Laboratories Ltd. 201103 34.22 1035.06 33.22 170.33 17.59 89.46 26.14 12.93 21.45 201206 302.71 14.96 -9.58 -3.14 -43.33 -44.13 48.10 188.89 133.00 39.10 50.58Ipca Laboratories Ltd. 201203 25.17 2355.96 24.14 427.49 20.01 276.20 22.02 28.72 23.97 201206 630.25 19.74 82.93 13.07 42.98 13.63 418.25 5276.24 424.50 230.20 45.91JB Chemicals & Pharmaceuticals Ltd. 201203 16.94 801.87 -9.98 100.32 15.98 677.91 80.03 102.96 82.49 201206 184.85 4.17 19.98 10.53 4.31 2.03 67.20 569.23 98.80 58.00 55.87Jubilant Life Sciences Ltd. 201203 15.93 4303.13 24.89 885.85 20.97 45.69 0.91 6.76 2.06 201206 1235.89 31.22 273.66 22.06 15.23 1.26 158.20 2519.83 224.75 154.00 49.04Lupin Ltd. 201203 89.33 7082.91 21.72 1444.71 20.48 887.51 19.43 29.38 24.35 201206 2219.15 43.80 457.63 20.31 285.01 25.10 573.35 25625.72 604.00 409.50 46.91Merck Ltd. 201112 16.60 557.57 9.53 40.40 15.54 63.68 38.36 25.28 16.84 201206 178.95 17.48 27.79 14.99 20.15 48.57 618.60 1026.84 714.20 555.00 51.80Morepen Laboratories Ltd. 201103 89.96 228.30 7.76 5.94 3.06 -46.95 -1.04 -8.13 -19.04 201206 76.50 29.07 9.27 11.87 -4.31 -0.38 3.38 152.04 4.77 2.65 34.32Natco Pharma Ltd. 201103 28.15 455.90 -0.18 86.79 20.64 51.91 19.01 15.81 15.77 201206 134.47 18.81 28.98 19.90 16.75 21.92 349.85 1089.71 437.00 197.25 57.05Nectar Lifesciences Ltd. 201103 22.43 1055.45 24.79 220.55 21.57 103.09 4.60 14.21 15.37 201206 393.55 88.40 60.38 14.92 16.03 2.86 20.05 449.64 26.75 15.05 44.35Novartis India Ltd. 201203 15.98 844.29 12.39 141.76 26.91 152.02 47.57 17.67 19.99 201206 219.52 9.69 19.26 8.77 26.98 33.77 686.80 2195.07 944.00 616.50 76.42Orchid Chemicals & Pharmaceuticals Ltd. 201103 70.44 1781.79 -24.46 409.71 23.44 156.19 22.17 10.44 15.56 201206 315.63 -15.55 55.81 15.62 -50.80 -28.84 113.30 798.22 210.45 100.55 32.42Panacea Biotec Ltd. 201103 6.13 1143.42 27.03 227.54 23.14 132.48 23.60 14.05 19.64 201206 83.10 -62.40 -32.37 -36.50 -65.97 -43.05 76.00 465.51 155.70 63.50 74.81Parabolic Drugs Ltd 201103 61.89 618.36 20.30 100.87 17.37 52.87 8.54 16.78 25.86 201206 305.20 63.92 43.37 14.11 9.76 6.31 22.40 138.64 40.80 19.30 39.23Parenteral Drugs (India) Ltd. 201103 25.87 483.94 17.14 49.57 10.35 5.01 1.71 6.03 1.60 201206 71.60 1.12 -12.97 -18.11 -30.17 -46.66 69.85 180.68 132.30 51.05 69.29Pfizer Ltd. 201203 29.84 1095.44 -12.54 198.82 25.46 184.61 61.86 22.10 14.96 201206 219.83 -9.11 32.30 13.31 328.88 440.86 1241.70 3705.41 1454.90 1071.55 70.75Piramal Enterprises Ltd. 201203 34.51 2132.93 27.49 -26.87 21.90 115.26 6.46 2.66 1.00 201206 710.29 63.29 78.46 10.50 5.36 0.95 495.50 8550.50 562.50 340.00 53.06Plethico Pharmaceuticals Ltd. 201112 34.07 1551.31 1.52 214.54 19.31 165.91 48.70 13.79 13.76 201206 380.19 -17.66 126.47 29.22 97.16 114.08 191.10 651.01 396.85 156.40 87.00Ranbaxy Laboratories Ltd. 201112 211.00 10156.63 13.38 1611.99 20.17 -2883.42 -68.71 -23.81 -68.35 201206 3174.06 54.55 260.90 8.08 -580.14 -55.50 554.30 23406.15 562.00 366.50 63.66RPG Life Sciences Ltd. 201203 13.23 192.82 3.21 18.15 9.46 0.85 0.51 8.18 1.14 201206 54.72 8.31 6.48 11.61 2.79 6.75 78.00 128.97 89.95 55.00 53.10Sanofi India Ltd. 201112 23.03 1229.75 13.35 176.07 25.07 191.19 83.01 27.01 18.16 201206 374.10 23.55 70.70 18.01 40.50 70.43 2115.40 4871.90 2429.95 2002.10 60.40Sequent Scientific Ltd 201103 21.94 311.67 9.57 44.90 16.29 -4.02 -0.08 9.04 -3.41 201206 71.66 4.44 -4.12 -5.74 -15.18 -27.68 118.35 259.60 133.70 50.30 55.81Sharon Bio-Medicine Ltd. 201106 10.56 626.81 19.85 72.13 11.73 33.18 31.43 12.85 24.82 201206 209.08 32.40 24.47 11.70 11.85 44.89 404.95 427.50 460.00 268.00 60.74Shasun Pharmaceuticals Ltd 201203 11.03 1066.40 27.80 122.98 15.09 100.57 18.24 52.23 66.29 201206 249.99 30.06 32.59 12.27 13.82 10.02 151.10 832.92 163.10 38.10 40.96Shilpa Medicare Ltd. 201103 4.80 290.29 9.58 70.79 26.93 49.53 20.57 28.92 31.22 201206 88.51 29.54 16.76 18.93 10.71 17.45 283.95 696.36 310.05 135.30 55.88SMS Pharmaceuticals Ltd. 201103 10.02 228.00 2.22 37.14 16.35 8.39 8.38 7.41 4.11 201206 53.84 9.43 6.47 11.84 -3.10 -12.37 199.30 199.60 212.00 128.05 54.02Sterling Biotech Ltd. 201112 26.79 1661.95 2.81 637.41 38.91 19.13 0.71 4.61 0.77 201206 225.68 -49.41 39.47 17.33 -89.90 -13.42 5.98 160.19 89.00 5.45 33.91Strides Arcolab Ltd. 201112 58.38 2524.52 48.87 465.16 20.59 234.01 38.45 12.42 17.80 201206 508.29 -12.55 131.31 23.85 90.47 61.66 844.35 4956.04 868.00 279.05 28.27Sun Pharma Advanced Research Company Ltd. 201203 20.71 28.98 -50.34 -69.94 -237.42 -72.23 -3.49 0.00 0.00 201206 6.38 -36.71 -17.55 -275.08 -18.32 -3.54 74.95 1774.10 88.81 63.78 66.19Sun Pharmaceutical Inds. Ltd. 201103 103.56 5721.43 42.77 1968.55 38.57 1907.37 17.54 21.49 22.03 201206 2658.14 62.51 1214.96 45.28 921.12 30.73 669.85 69368.46 690.00 448.20 63.72Suven Life Sciences Ltd. 201103 11.67 150.43 16.33 13.55 9.80 10.40 0.89 5.19 8.50 201206 70.53 58.02 13.34 18.91 7.96 2.73 22.50 262.65 25.20 11.50 63.44Syncom Formulations (India) Ltd. 201103 22.30 76.32 -10.63 2.95 4.34 0.20 0.09 1.24 0.30 201206 11.23 -56.95 0.71 6.31 0.05 0.09 58.55 130.59 79.85 28.00 62.88Torrent Pharmaceuticals Ltd. 201203 42.31 2695.92 22.66 500.43 20.19 286.30 33.57 26.47 25.84 201206 735.60 20.40 155.96 20.34 103.04 48.14 703.45 5951.99 722.70 504.60 71.51TTK Healthcare Ltd. 201203 7.77 353.74 13.77 23.76 8.05 15.63 20.13 30.80 20.28 201206 108.49 17.33 7.21 6.64 4.86 25.02 370.90 288.04 557.70 330.35 65.43Unichem Laboratories Ltd. 201103 18.05 824.04 10.26 150.08 19.09 95.20 10.55 20.40 16.15 201206 263.30 41.04 47.80 18.05 33.14 14.68 170.70 2026.93 180.00 101.15 49.59Venus Remedies Ltd. 201103 9.13 363.09 15.62 89.22 24.64 46.22 50.63 19.24 23.20 201206 112.03 13.31 29.72 26.32 14.05 57.67 263.75 256.94 273.50 141.05 34.71Vivimed Labs Ltd. 201103 10.16 416.00 21.11 85.51 20.78 48.83 48.04 17.77 31.18 201206 272.52 126.08 61.94 22.58 26.13 75.01 370.20 515.83 444.00 212.50 45.16Wockhardt Ltd. 201203 54.72 4613.80 22.99 1418.41 31.21 341.59 31.29 19.24 76.13 201206 1425.82 35.38 483.22 33.89 379.45 138.15 1204.65 13183.20 1325.00 251.25 73.64Wyeth Ltd. 201203 22.72 594.07 -7.36 183.35 34.66 144.69 63.69 45.06 33.39 201206 167.26 14.22 49.30 29.28 38.92 68.52 922.25 2095.36 1032.95 794.05 51.12Zandu Realty Ltd 201103 8.06 -0.64 0.91 11.34 3.27 3.68 201206 -0.06 0.00 1.18 58.73 1559.80 125.78 2208.00 1199.10 35.51Zenotech Laboratories Ltd. 201103 34.43 7.00 6.65 -11.33 -146.02 -37.84 -10.99 -42.71 -47.28 201012 2.57 57.66 -2.78 -107.97 -3.75 -4.36 36.05 124.11 44.80 25.10 66.85Photographic Products Total 10.26 399.93 131.23 133.41 72.72Jindal Photo Ltd. 201103 10.26 399.93 5.39 24.85 6.51 18.18 17.57 11.38 8.03 201206 131.23 20.95 2.21 1.51 0.99 3.86 130.05 133.41 176.25 110.25 72.72Plastic Products Total 510.22 24521.18 6450.99 17847.96 1065.58Astral Poly Technik Ltd. 201203 11.24 582.69 41.69 82.71 13.83 39.46 17.57 34.15 23.97 201206 152.61 52.37 19.82 12.98 9.55 16.99 264.40 594.27 277.00 124.00 63.82EPC Industries Ltd. 201203 17.26 125.07 44.08 9.89 9.54 6.66 3.86 17.71 12.48 201206 40.80 52.81 2.17 5.30 1.17 1.69 129.70 358.26 133.00 63.22 54.83Finolex Industries Ltd. 201203 124.09 2099.78 6.17 216.76 10.65 75.15 6.06 20.48 11.72 201206 519.19 2.64 13.82 2.66 -13.74 -4.43 61.00 756.98 76.00 42.00 52.39Garware Polyester Ltd. 201203 23.25 796.40 -11.64 87.85 12.23 31.98 13.75 12.59 8.13 201206 194.66 -15.29 18.28 9.37 0.52 0.89 110.90 258.57 165.50 101.20 58.48Jai Corp Ltd. 201103 17.84 544.07 15.84 98.66 32.98 127.50 7.14 6.16 4.62 201206 164.74 22.28 20.25 12.28 23.67 5.30 55.05 982.61 117.45 45.50 73.01Jain Irrigation Systems Ltd. 201103 77.15 4152.84 21.43 647.30 17.45 289.31 7.31 16.38 21.15 201206 843.61 -9.44 101.85 11.50 -16.88 -1.67 73.40 2974.02 174.19 62.70 31.00Kalpena Industries Ltd 201103 18.49 843.06 17.29 44.52 5.43 19.13 10.34 13.98 13.43 201206 274.55 33.88 13.55 4.94 6.87 14.59 67.45 126.90 87.50 44.50 73.63Kemrock Industries & Exports Ltd. 201106 17.44 1082.16 50.99 252.37 23.72 75.84 43.12 12.66 12.29 201206 161.66 -44.96 20.14 12.46 1.87 3.67 143.00 290.72 570.00 135.90 27.07Nilkamal Ltd. 201203 14.92 1516.52 15.06 160.34 9.36 61.89 40.95 24.45 16.00 201206 390.75 22.20 37.90 9.63 11.26 30.17 205.00 305.91 297.95 177.00 62.19Responsive Industries Ltd. 201203 26.25 1684.09 42.88 213.30 12.53 111.16 3.96 15.18 23.66 201206 538.85 53.81 77.68 14.38 31.68 4.48 95.55 2550.35 135.00 77.60 58.45Signet Industries Ltd. 201103 29.19 432.03 19.75 22.21 5.41 5.83 2.00 15.89 18.21 201206 139.12 34.30 11.58 8.30 3.35 4.59 146.20 426.71 209.30 76.00 73.36Sintex Industries Ltd. 201203 27.11 4436.77 -0.86 700.92 16.94 301.91 11.32 12.78 12.10 201206 1076.35 -2.99 177.60 16.44 45.09 6.91 56.65 1546.49 162.75 50.20 36.49Styrolution ABS (India) Ltd. 201112 17.59 825.46 11.19 81.76 10.22 53.97 30.69 22.14 15.11 201206 235.92 14.39 14.68 6.22 9.99 22.72 660.15 1160.92 850.00 484.05 87.33Supreme Industries Ltd. 201206 25.41 2965.65 20.09 471.89 16.11 232.37 19.03 51.34 37.43 201206 914.00 24.74 175.59 18.96 93.74 29.93 272.20 3457.67 288.95 160.10 49.62Time Technoplast Ltd. 201103 20.93 1275.27 26.10 236.02 17.44 113.60 5.15 16.96 19.09 201206 403.83 16.39 66.31 15.24 24.22 4.46 35.75 751.17 71.75 35.00 61.84TPL Plastech Ltd. 201103 7.80 97.58 33.40 14.08 13.40 5.73 7.35 23.78 27.63 201206 39.01 35.96 3.80 8.70 1.31 6.72 172.65 134.67 179.50 59.45 75.00VIP Industries Ltd. 201203 28.26 860.26 13.43 120.62 13.97 67.61 4.78 40.64 30.47 201206 301.70 7.21 40.00 13.22 23.50 6.64 71.55 1011.13 204.51 68.55 52.09Wim Plast Ltd. 201203 6.00 201.47 27.52 36.55 16.66 22.75 37.90 34.59 24.51 201206 59.63 49.87 10.70 15.67 6.52 43.45 267.60 160.60 304.00 170.10 74.98
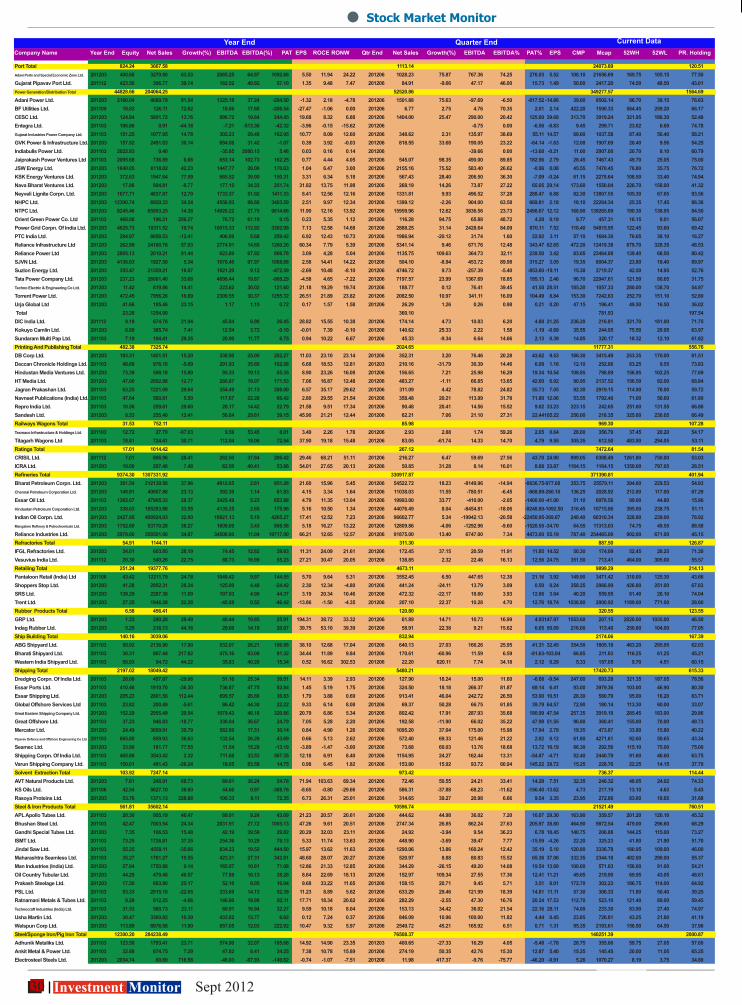
30 Investment Monitor Sept 2012
Stock Market Monitor
Company Name Year End Equity Net Sales Growth(%) EBITDA EBITDA(%) PAT EPS ROCE RONW Qtr End Net Sales Growth(%) EBITDA EBITDA% PAT% EPS CMP Mcap 52WH 52WL PR. Holding
Port Total 824.24 3667.58 1113.14 24073.89 120.51Adani Ports and Special Economic Zone Ltd. 201203 400.68 3270.80 63.53 2065.25 64.97 1092.68 5.50 11.94 24.22 201206 1028.23 75.87 767.36 74.25 276.03 5.52 108.10 21656.69 169.75 105.15 77.50Gujarat Pipavav Port Ltd. 201112 423.56 396.77 39.74 182.52 49.92 57.10 1.35 9.48 7.47 201206 84.91 -9.66 47.17 46.00 15.73 1.49 50.00 2417.20 74.50 48.50 43.01Power Generation/Distribution Total 44828.66 204064.25 52520.86 349277.57 1564.69Adani Power Ltd. 201203 2180.04 4089.79 91.54 1325.18 37.24 -294.50 -1.32 2.18 -4.78 201206 1501.88 75.63 -97.69 -6.50 -817.52 -14.86 39.00 8502.14 96.70 38.15 76.63BF Utilities Ltd. 201109 18.83 126.11 72.62 18.06 17.60 -206.54 -27.47 -1.06 0.00 201206 6.77 2.75 4.76 70.35 2.01 2.14 422.20 1590.33 564.45 259.20 66.17CESC Ltd. 201203 124.94 5891.72 13.76 996.72 19.84 244.45 19.68 8.32 6.88 201206 1404.00 25.47 290.00 20.42 125.00 39.68 313.70 3919.24 321.95 186.30 52.48Entegra Ltd. 201103 106.86 0.91 -44.18 -7.21 -513.36 -42.32 -3.96 -0.15 -15.62 201206 -0.75 0.00 -6.56 -0.83 9.45 299.71 23.02 6.69 74.78Gujarat Industries Power Company Ltd. 201103 151.25 1077.95 14.78 302.23 29.48 162.95 10.77 8.09 12.60 201206 348.62 2.31 135.97 38.69 55.11 14.57 68.60 1037.58 87.40 56.40 58.21GVK Power & Infrastructure Ltd. 201203 157.92 2491.83 30.14 694.08 31.42 -1.07 0.39 3.92 -0.03 201206 818.55 33.68 190.05 23.22 -64.14 -1.63 12.08 1907.69 20.40 9.56 54.25Indiabulls Power Ltd. 201103 2022.93 0.40 -35.85 2080.15 5.46 0.03 0.16 0.14 201206 -39.66 0.00 -13.68 -0.21 11.00 2907.00 20.70 8.10 60.79Jaiprakash Power Ventures Ltd 201103 2095.68 736.89 6.68 653.14 102.73 162.25 0.77 4.44 4.05 201206 545.07 98.35 490.00 89.85 182.96 2.79 28.45 7467.43 49.70 25.05 75.00JSW Energy Ltd. 201203 1640.05 6118.82 42.23 1447.77 26.06 170.63 1.04 6.47 3.00 201206 2155.16 75.52 583.40 26.62 -0.96 0.08 45.55 7470.45 76.80 35.75 76.72KSK Energy Ventures Ltd. 201203 372.63 1947.64 77.59 665.52 39.90 150.31 3.31 6.34 5.18 201206 567.43 28.40 206.50 36.30 -7.09 -0.24 61.15 2278.64 108.50 33.40 74.94Nava Bharat Ventures Ltd. 201203 17.86 994.81 -8.77 177.15 34.33 251.74 31.82 13.75 11.98 201206 268.19 14.26 73.87 27.22 65.05 29.14 173.60 1550.04 226.70 158.00 41.32Neyveli Lignite Corpn. Ltd. 201203 1677.71 4837.87 12.70 1733.37 51.02 1411.33 8.41 12.56 12.16 201206 1331.81 9.93 496.52 37.28 288.47 6.88 82.30 13807.55 105.30 67.65 93.56NHPC Ltd. 201203 12300.74 6920.33 34.54 4556.93 86.80 3403.59 2.51 9.97 12.34 201206 1399.12 -2.26 904.00 63.58 669.81 2.18 18.10 22264.34 25.35 17.45 86.36NTPC Ltd. 201203 8245.46 65893.25 14.38 14920.22 27.75 9814.66 11.90 12.16 13.92 201206 15959.96 12.62 3836.56 23.73 2498.67 12.12 168.90 139265.89 190.30 138.95 84.50Orient Green Power Co. Ltd 201103 468.08 196.21 256.27 76.72 61.19 9.15 0.23 5.35 1.12 201206 116.28 94.75 65.88 48.72 4.28 0.19 9.77 457.31 16.15 8.01 56.07Power Grid Corpn. Of India Ltd. 201203 4629.73 10311.52 19.74 10015.33 112.92 3302.99 7.13 12.58 14.68 201206 2888.25 31.14 2428.64 84.09 870.11 7.52 118.40 54815.95 122.45 93.60 69.42PTC India Ltd. 201203 294.97 8058.53 -12.41 406.09 5.68 259.42 6.92 12.43 10.73 201206 1986.94 -20.12 31.74 1.60 22.92 3.11 57.10 1684.30 76.65 38.10 16.27Reliance Infrastructure Ltd 201203 262.99 24180.76 57.93 2774.91 14.65 1260.26 60.34 7.79 5.39 201206 5341.14 9.46 671.76 12.48 343.47 62.65 472.20 12419.38 679.70 328.35 48.53Reliance Power Ltd 201203 2805.13 2019.21 91.44 623.89 67.92 866.78 3.09 4.28 5.04 201206 1135.75 109.63 364.73 32.11 239.50 3.42 83.65 23464.88 139.40 68.50 80.42SJVN Ltd. 201203 4136.63 1927.50 5.34 1678.46 97.97 1068.68 2.58 14.41 14.22 201206 504.10 -8.94 453.72 89.98 315.27 3.05 19.35 8004.37 23.80 18.40 89.97Suzlon Energy Ltd. 201203 355.47 21359.21 18.07 1821.20 9.12 -472.59 -2.69 10.48 -8.10 201206 4746.72 9.73 -257.39 -5.40 -853.60 -19.11 15.30 2719.37 42.50 14.95 52.76Tata Power Company Ltd. 201203 237.23 26001.40 33.68 4698.44 19.87 -968.29 -4.58 4.65 -7.22 201206 7197.57 23.99 1367.69 18.85 195.13 2.46 96.70 22947.61 121.50 80.65 31.75Techno Electric & Engineering Co Ltd. 201203 11.42 819.86 14.41 223.62 30.02 121.60 21.18 19.29 19.74 201206 188.77 0.12 76.41 39.45 41.50 28.51 185.20 1057.33 280.00 138.70 54.97Torrent Power Ltd. 201203 472.45 7956.26 16.69 2309.55 30.37 1255.32 26.51 21.89 23.82 201206 2082.50 10.97 341.11 16.09 104.49 8.84 153.30 7242.63 252.70 151.10 52.80Urja Global Ltd 201203 41.66 105.46 23.15 1.17 1.15 0.72 0.17 1.57 1.58 201206 26.29 1.26 0.26 0.98 0.21 0.20 47.15 196.41 49.50 16.50 36.02 Total 23.26 1254.90 360.10 781.93 197.54DIC India Ltd. 201112 9.18 674.76 21.94 45.84 6.90 26.45 28.82 15.55 10.38 201206 174.14 4.73 10.83 6.20 4.88 21.25 236.20 216.81 321.70 181.00 71.75Kokuyo Camlin Ltd. 201203 6.89 385.74 7.41 12.54 3.72 -0.10 -0.01 7.39 -0.10 201206 140.62 25.33 2.22 1.58 -1.19 -0.69 35.55 244.95 75.50 29.95 63.97Sundaram Multi Pap Ltd. 201103 7.19 194.41 29.35 20.90 11.77 6.75 0.94 10.22 6.67 201206 45.33 -9.34 6.64 14.66 2.13 0.39 14.85 320.17 18.32 12.10 61.82Printing And Publishing Total 482.38 7325.74 2024.65 11777.31 556.76DB Corp Ltd. 201203 183.31 1451.51 15.20 338.90 25.00 202.27 11.03 23.10 23.14 201206 352.31 3.20 76.46 20.28 43.62 9.53 186.30 3415.49 253.35 170.00 81.51Deccan Chronicle Holdings Ltd. 201103 48.69 976.16 -5.69 291.93 35.60 162.58 6.68 18.53 12.81 201203 210.16 -31.79 30.39 14.46 6.08 1.16 12.10 252.86 63.25 9.55 73.83Hindustan Media Ventures Ltd. 201203 73.39 598.18 15.89 95.33 19.13 65.35 8.90 23.26 16.08 201206 156.65 7.21 25.98 16.29 19.34 10.54 108.85 798.89 156.95 102.25 77.69HT Media Ltd. 201203 47.00 2002.98 12.77 286.87 18.07 171.53 7.06 16.87 12.48 201206 483.27 -1.11 66.85 13.65 42.60 6.92 90.95 2137.52 156.50 82.00 68.84Jagran Prakashan Ltd. 201103 63.25 1221.09 29.64 354.49 31.13 208.00 6.57 35.17 29.62 201206 311.09 4.42 78.82 24.82 55.73 7.05 92.30 2919.15 114.90 78.00 59.72Navneet Publications (India) Ltd. 201103 47.64 560.81 5.50 117.67 22.28 66.42 2.80 29.55 21.54 201206 358.48 20.21 113.99 31.78 71.80 12.06 53.55 1792.40 71.00 50.60 61.80Repro India Ltd. 201103 10.56 259.61 29.60 28.17 14.42 22.79 21.58 9.51 17.34 201206 90.48 20.41 14.56 15.52 9.02 33.23 223.15 242.65 251.60 131.55 66.88Sandesh Ltd. 201203 8.53 255.40 12.41 56.64 29.61 39.15 45.90 21.21 12.44 201206 62.21 7.06 21.10 27.31 22.44 105.22 256.00 218.35 325.00 230.05 66.49Railways Wagons Total 31.53 752.11 85.98 969.30 107.28Texmaco Infrastructure & Holdings Ltd. 201103 12.72 27.70 -97.03 9.58 53.45 8.01 3.49 2.26 1.78 201206 2.93 2.88 1.74 59.26 2.05 0.64 28.00 356.79 37.45 20.20 54.17Titagarh Wagons Ltd 201103 18.81 724.41 30.71 112.04 18.06 72.54 37.90 19.18 15.48 201206 83.05 -61.74 14.33 14.70 4.79 9.55 305.35 612.50 483.90 294.05 53.11Ratings Total 17.01 1014.42 267.12 7472.64 81.54CRISIL Ltd. 201112 7.01 806.96 28.41 262.50 37.84 206.42 29.46 68.21 51.11 201206 216.27 6.47 59.69 27.56 43.70 24.90 899.05 6308.49 1261.80 750.00 53.03ICRA Ltd. 201203 10.00 207.46 7.48 62.50 40.41 53.86 54.01 27.65 20.13 201206 50.85 31.28 8.14 16.01 8.68 33.87 1164.15 1164.15 1350.00 797.05 28.51Refineries Total 9374.30 1307331.92 330917.87 371390.81 401.94Bharat Petroleum Corpn. Ltd. 201203 361.54 212139.56 37.96 4812.65 2.81 851.28 21.60 15.96 5.45 201206 54522.72 18.23 -8149.96 -14.94 -8836.75 -977.68 353.75 25579.11 394.60 229.53 54.93Chennai Petroleum Corporation Ltd. 201203 148.91 40807.86 23.13 392.39 1.14 61.83 4.15 3.34 1.64 201206 11038.03 11.55 -780.51 -6.45 -968.89 -260.10 136.25 2028.92 212.80 117.00 67.29Essar Oil Ltd. 201103 1365.67 47905.33 28.37 2425.49 5.23 653.88 4.79 11.35 13.04 201206 19993.00 33.77 -410.00 -2.05 -1400.00 -41.00 51.10 6978.56 99.00 44.80 15.96Hindustan Petroleum Corporation Ltd. 201203 338.63 185283.86 33.55 4135.25 2.65 175.96 5.16 10.50 1.34 201206 44076.49 8.04 -8454.81 -18.06 -9248.80 -1092.50 316.45 10715.86 395.00 238.75 51.11Indian Oil Corpn. Ltd. 201203 2427.95 408924.03 32.00 18821.13 5.19 4265.27 17.41 12.52 7.23 201206 96602.77 5.34 -19942.13 -20.58 -22450.95 -369.87 248.40 60310.34 328.80 239.00 78.92Mangalore Refinery & Petrochemicals Ltd. 201203 1752.60 53770.28 38.27 1609.09 3.43 908.58 5.18 16.27 13.22 201206 12809.86 -4.06 -1292.96 -9.60 -1520.55 -34.70 64.55 11313.03 74.75 49.55 88.58Reliance Industries Ltd. 201203 2979.00 358501.00 34.87 34508.00 11.04 19717.00 66.21 12.65 12.57 201206 91875.00 13.40 6747.00 7.34 4473.00 55.19 787.40 254465.00 902.00 671.00 45.15Refractories Total 54.91 1144.11 311.30 887.50 126.87IFGL Refractories Ltd. 201203 34.61 603.85 28.19 74.45 12.62 39.83 11.31 24.09 21.61 201206 172.45 37.15 20.59 11.91 11.85 14.52 50.30 174.09 52.45 28.25 71.30Vesuvius India Ltd. 201112 20.30 540.26 22.75 88.73 16.99 55.23 27.21 30.47 20.05 201206 138.85 2.32 22.46 16.13 12.56 24.75 351.50 713.41 464.00 305.00 55.57Retailing Total 251.24 19377.76 4673.11 9899.29 214.13Pantaloon Retail (India) Ltd 201106 43.42 12211.79 24.78 1049.42 9.97 144.55 5.70 9.64 5.31 201206 3552.45 6.50 447.65 12.38 21.16 3.92 149.90 3471.42 310.00 125.30 43.66Shoppers Stop Ltd. 201203 41.28 2952.31 28.34 125.00 4.48 -24.42 2.30 12.34 -4.80 201206 441.24 -24.11 13.79 3.09 0.50 0.24 358.25 2966.99 426.80 251.00 67.83SRS Ltd. 201203 139.29 2267.38 11.09 107.93 4.90 44.37 3.19 20.34 10.46 201206 472.32 -22.17 18.60 3.93 12.66 3.64 40.20 559.95 61.40 26.10 74.04Trent Ltd. 201203 27.25 1946.28 22.28 -45.88 0.52 -46.42 -13.86 -1.50 -4.35 201206 207.10 22.37 10.28 4.70 12.76 18.74 1036.80 2900.92 1189.00 771.00 28.60Rubber Products Total 6.58 456.41 120.80 320.55 123.55GRP Ltd. 201203 1.33 240.28 29.49 40.44 19.85 25.91 194.31 38.72 33.32 201206 61.89 14.71 10.73 16.99 4.93 147.97 1553.60 207.15 2020.00 1035.00 46.50Indag Rubber Ltd. 201203 5.25 216.13 44.16 29.60 14.19 20.87 39.75 53.10 39.39 201206 58.91 22.38 9.21 15.62 6.65 50.69 216.00 113.40 250.80 104.00 77.05Ship Building Total 140.16 3039.06 832.94 2174.06 167.39ABG Shipyard Ltd. 201103 50.92 2136.90 17.90 532.07 26.21 196.88 38.10 12.68 17.04 201206 640.13 27.03 166.26 25.95 41.31 32.45 354.50 1805.18 463.20 295.95 62.03Bharati Shipyard Ltd. 201103 30.31 807.44 217.82 475.16 63.08 91.32 34.44 11.89 9.84 201206 170.61 -60.96 11.59 6.59 -81.63 -103.04 66.85 211.83 116.25 61.25 45.21Western India Shipyard Ltd. 201103 58.93 94.72 44.22 35.83 40.20 15.34 0.52 16.62 302.53 201206 22.20 620.11 7.74 34.18 2.12 0.29 5.33 157.05 9.70 4.51 60.15Shipping Total 2197.02 18049.42 5480.21 17420.73 615.33Dredging Corpn. Of India Ltd. 201103 28.00 457.87 -29.06 51.16 25.34 39.51 14.11 3.39 2.93 201206 127.90 18.24 15.00 11.60 -6.68 -9.54 247.60 693.28 321.35 187.05 78.56Essar Ports Ltd. 201103 410.46 1910.70 -36.30 736.87 47.75 82.84 1.45 5.19 1.75 201206 324.50 18.18 266.37 81.87 69.14 6.41 93.00 3979.36 103.00 46.90 80.30Essar Shipping Ltd. 201203 205.23 2801.58 112.44 699.57 26.86 36.83 1.79 3.88 0.69 201206 913.41 46.04 242.72 26.50 53.90 10.51 28.30 580.79 95.00 16.20 83.71Global Offshore Services Ltd 201103 23.82 200.49 -5.61 86.42 44.30 22.22 9.33 6.14 8.08 201206 69.37 50.28 66.75 61.85 39.79 64.57 72.90 180.14 113.30 60.00 33.07Great Eastern Shipping Company Ltd. 201203 152.29 2955.49 20.54 1079.43 46.18 320.86 20.79 6.86 5.34 201206 802.42 17.91 287.93 35.68 180.99 47.54 257.35 3919.18 285.45 183.00 29.86Great Offshore Ltd. 201103 37.23 946.83 -18.77 338.04 36.67 24.79 7.05 5.28 2.20 201206 192.58 -11.90 66.02 35.22 47.98 51.55 96.80 360.41 155.00 70.00 49.73Mercator Ltd. 201203 24.49 3699.91 30.79 582.60 17.51 30.14 0.84 4.90 1.26 201206 1095.20 37.04 175.00 15.98 17.94 2.79 19.35 473.87 33.80 15.80 40.22Pipavav Defence and Offshore Engineering Co Ltd. 201103 665.80 859.93 36.63 132.54 26.20 43.69 0.66 5.13 2.62 201206 572.40 69.33 121.46 21.22 2.02 0.12 61.80 4271.61 92.60 50.65 43.34Seamec Ltd. 201203 33.90 181.77 77.55 11.54 15.29 -13.19 -3.89 -1.47 -3.00 201206 73.68 60.03 13.76 18.68 13.72 16.19 86.30 292.56 115.10 75.00 75.00Shipping Corpn. Of India Ltd. 201103 465.80 3543.42 2.32 711.68 33.53 567.35 12.18 6.91 8.40 201206 1154.95 24.27 162.44 13.31 -54.87 -4.71 52.40 2440.79 91.60 46.60 63.75Varun Shipping Company Ltd. 201103 150.01 491.43 -26.24 18.05 83.58 14.75 0.98 6.45 1.82 201206 153.80 15.92 93.72 60.94 145.22 38.72 15.25 228.76 22.25 14.15 37.79Solvent Extraction Total 103.92 7247.14 973.42 736.37 114.44AVT Natural Products Ltd. 201203 7.61 248.91 68.73 89.61 36.24 54.78 71.94 103.63 69.34 201206 72.46 50.55 24.21 33.41 14.28 7.51 32.35 246.32 48.05 24.02 74.33KS Oils Ltd. 201106 42.54 5627.10 38.60 44.66 0.97 -368.76 -8.65 -0.80 -29.66 201206 586.31 -37.88 -68.23 -11.62 -156.40 -13.62 4.73 217.19 13.10 4.63 8.43Rasoya Proteins Ltd. 201203 53.76 1371.13 228.88 100.33 8.11 72.35 6.73 26.31 25.01 201206 314.65 39.27 20.98 6.66 9.54 3.35 23.95 272.86 83.00 18.65 31.68Steel & Iron Products Total 561.81 35602.14 10596.74 21521.49 760.51APL Apollo Tubes Ltd. 201103 20.30 905.19 46.47 89.01 9.24 43.09 21.23 20.57 20.61 201206 444.62 44.98 36.02 7.20 16.07 29.30 163.90 359.57 201.20 120.10 45.32Bhushan Steel Ltd. 201103 42.47 7003.54 24.34 2031.91 27.72 1005.13 47.26 9.61 20.51 201206 2747.34 26.85 862.24 27.63 205.97 38.80 464.90 9872.54 479.00 296.60 68.29Gandhi Special Tubes Ltd. 201203 7.35 106.53 15.48 42.19 39.59 29.82 20.29 32.03 23.11 201206 24.92 -3.94 9.54 36.23 6.78 18.45 140.75 206.88 144.25 115.00 73.27ISMT Ltd. 201103 73.25 1726.81 37.35 254.36 10.29 78.13 5.33 11.74 13.63 201206 448.90 -3.69 39.47 7.77 -15.59 -4.26 22.20 325.23 41.80 21.90 51.70Jindal Saw Ltd. 201103 55.25 4559.11 -35.66 834.23 19.52 444.50 15.97 13.62 11.63 201206 1290.06 13.86 160.24 12.42 35.19 5.10 120.80 3336.78 180.95 109.00 46.00Maharashtra Seamless Ltd. 201103 35.27 1761.27 10.55 423.31 27.31 342.81 48.60 28.07 20.27 201206 520.97 8.88 80.83 15.52 65.36 37.06 332.35 2344.18 402.00 290.00 55.37Man Industries (India) Ltd. 201203 27.64 1750.86 9.14 165.07 10.61 71.08 12.86 21.33 12.85 201206 344.29 -26.15 49.20 14.08 19.54 13.69 100.00 571.03 156.00 91.00 54.21Oil Country Tubular Ltd. 201203 44.29 479.48 46.57 77.88 16.13 38.28 8.64 22.69 18.13 201206 152.97 109.34 27.55 17.36 12.41 11.21 49.65 219.90 69.95 43.05 48.61Prakash Steelage Ltd. 201203 17.50 683.80 25.17 52.10 8.05 16.94 9.68 33.22 11.65 201206 158.15 20.71 9.45 5.71 3.51 8.01 172.70 302.23 186.75 114.00 64.92PSL Ltd. 201103 53.33 2915.16 -22.65 333.69 14.13 52.39 11.23 8.89 5.62 201206 633.29 29.46 121.99 18.39 14.81 11.11 57.30 306.33 71.80 50.40 39.25Ratnamani Metals & Tubes Ltd. 201103 9.28 812.25 -4.66 146.90 18.98 82.11 17.71 18.34 20.62 201206 282.29 -2.55 47.30 16.76 20.34 17.53 112.70 523.10 121.40 89.00 59.45Technocraft Industries (India) Ltd. 201103 31.53 560.73 23.11 60.91 16.94 32.27 9.59 10.18 8.04 201206 153.13 34.42 36.02 21.54 22.16 28.11 74.00 233.30 83.90 27.40 74.97Usha Martin Ltd. 201203 30.47 3360.82 10.39 433.82 13.77 6.62 0.12 7.24 0.37 201206 846.09 10.96 100.00 11.82 4.44 0.45 23.85 726.81 43.25 21.80 41.19Welspun Corp Ltd. 201203 113.89 8976.58 11.90 857.05 12.03 222.92 10.47 9.32 5.97 201206 2549.72 45.21 165.92 6.51 0.71 1.31 95.35 2193.61 156.50 64.50 37.96Steel/Sponge Iron/Pig Iron Total 12300.20 284238.49 76508.37 140251.39 2000.87Adhunik Metaliks Ltd. 201103 123.50 1793.41 23.71 574.90 32.07 185.68 14.92 14.90 23.35 201203 400.65 -27.33 16.29 4.05 -5.48 -1.78 28.75 355.06 59.75 27.05 57.60Ankit Metal & Power Ltd. 201103 32.88 674.75 7.29 47.82 8.41 24.25 7.38 10.78 15.89 201206 274.19 50.35 42.76 15.30 12.87 5.40 15.25 145.45 20.00 11.05 65.25Electrosteel Steels Ltd. 201203 2034.74 60.69 716.58 -46.03 -67.93 -149.82 -0.74 -1.07 -7.51 201206 11.98 417.37 -9.76 -75.77 -46.20 -0.91 5.26 1070.27 8.19 3.75 34.80
Year End Quarter End Current Data
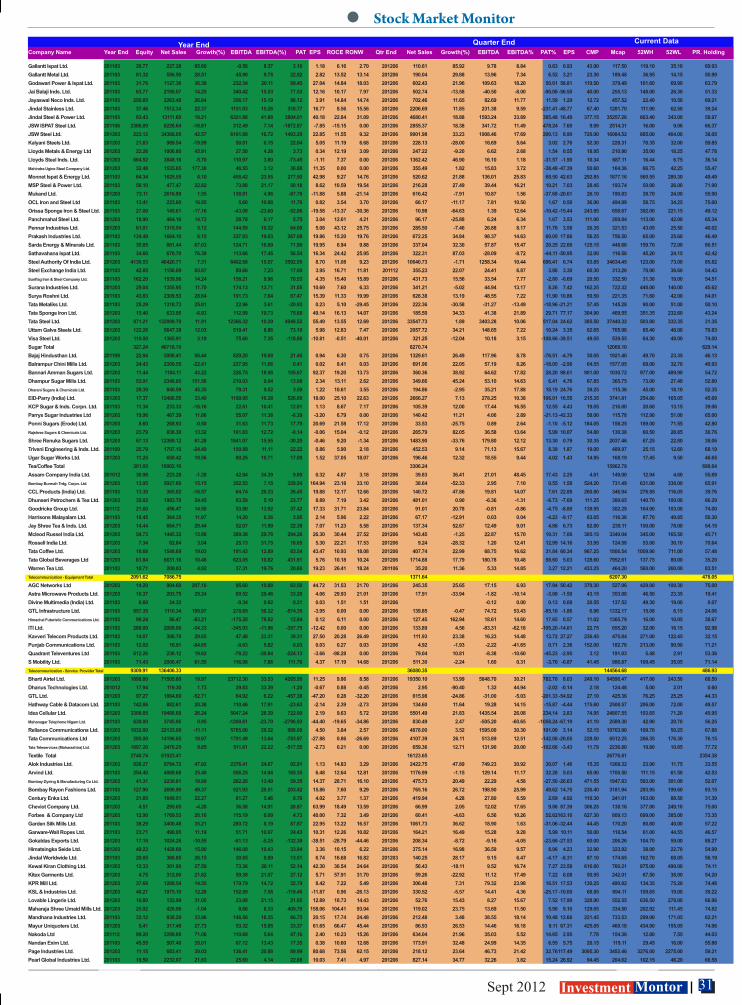
31 Sept 2012 Investment Montor
Company Name Year End Equity Net Sales Growth(%) EBITDA EBITDA(%) PAT EPS ROCE RONW Qtr End Net Sales Growth(%) EBITDA EBITDA% PAT% EPS CMP Mcap 52WH 52WL PR. Holding
Port Total 824.24 3667.58 1113.14 24073.89 120.51Adani Ports and Special Economic Zone Ltd. 201203 400.68 3270.80 63.53 2065.25 64.97 1092.68 5.50 11.94 24.22 201206 1028.23 75.87 767.36 74.25 276.03 5.52 108.10 21656.69 169.75 105.15 77.50Gujarat Pipavav Port Ltd. 201112 423.56 396.77 39.74 182.52 49.92 57.10 1.35 9.48 7.47 201206 84.91 -9.66 47.17 46.00 15.73 1.49 50.00 2417.20 74.50 48.50 43.01Power Generation/Distribution Total 44828.66 204064.25 52520.86 349277.57 1564.69Adani Power Ltd. 201203 2180.04 4089.79 91.54 1325.18 37.24 -294.50 -1.32 2.18 -4.78 201206 1501.88 75.63 -97.69 -6.50 -817.52 -14.86 39.00 8502.14 96.70 38.15 76.63BF Utilities Ltd. 201109 18.83 126.11 72.62 18.06 17.60 -206.54 -27.47 -1.06 0.00 201206 6.77 2.75 4.76 70.35 2.01 2.14 422.20 1590.33 564.45 259.20 66.17CESC Ltd. 201203 124.94 5891.72 13.76 996.72 19.84 244.45 19.68 8.32 6.88 201206 1404.00 25.47 290.00 20.42 125.00 39.68 313.70 3919.24 321.95 186.30 52.48Entegra Ltd. 201103 106.86 0.91 -44.18 -7.21 -513.36 -42.32 -3.96 -0.15 -15.62 201206 -0.75 0.00 -6.56 -0.83 9.45 299.71 23.02 6.69 74.78Gujarat Industries Power Company Ltd. 201103 151.25 1077.95 14.78 302.23 29.48 162.95 10.77 8.09 12.60 201206 348.62 2.31 135.97 38.69 55.11 14.57 68.60 1037.58 87.40 56.40 58.21GVK Power & Infrastructure Ltd. 201203 157.92 2491.83 30.14 694.08 31.42 -1.07 0.39 3.92 -0.03 201206 818.55 33.68 190.05 23.22 -64.14 -1.63 12.08 1907.69 20.40 9.56 54.25Indiabulls Power Ltd. 201103 2022.93 0.40 -35.85 2080.15 5.46 0.03 0.16 0.14 201206 -39.66 0.00 -13.68 -0.21 11.00 2907.00 20.70 8.10 60.79Jaiprakash Power Ventures Ltd 201103 2095.68 736.89 6.68 653.14 102.73 162.25 0.77 4.44 4.05 201206 545.07 98.35 490.00 89.85 182.96 2.79 28.45 7467.43 49.70 25.05 75.00JSW Energy Ltd. 201203 1640.05 6118.82 42.23 1447.77 26.06 170.63 1.04 6.47 3.00 201206 2155.16 75.52 583.40 26.62 -0.96 0.08 45.55 7470.45 76.80 35.75 76.72KSK Energy Ventures Ltd. 201203 372.63 1947.64 77.59 665.52 39.90 150.31 3.31 6.34 5.18 201206 567.43 28.40 206.50 36.30 -7.09 -0.24 61.15 2278.64 108.50 33.40 74.94Nava Bharat Ventures Ltd. 201203 17.86 994.81 -8.77 177.15 34.33 251.74 31.82 13.75 11.98 201206 268.19 14.26 73.87 27.22 65.05 29.14 173.60 1550.04 226.70 158.00 41.32Neyveli Lignite Corpn. Ltd. 201203 1677.71 4837.87 12.70 1733.37 51.02 1411.33 8.41 12.56 12.16 201206 1331.81 9.93 496.52 37.28 288.47 6.88 82.30 13807.55 105.30 67.65 93.56NHPC Ltd. 201203 12300.74 6920.33 34.54 4556.93 86.80 3403.59 2.51 9.97 12.34 201206 1399.12 -2.26 904.00 63.58 669.81 2.18 18.10 22264.34 25.35 17.45 86.36NTPC Ltd. 201203 8245.46 65893.25 14.38 14920.22 27.75 9814.66 11.90 12.16 13.92 201206 15959.96 12.62 3836.56 23.73 2498.67 12.12 168.90 139265.89 190.30 138.95 84.50Orient Green Power Co. Ltd 201103 468.08 196.21 256.27 76.72 61.19 9.15 0.23 5.35 1.12 201206 116.28 94.75 65.88 48.72 4.28 0.19 9.77 457.31 16.15 8.01 56.07Power Grid Corpn. Of India Ltd. 201203 4629.73 10311.52 19.74 10015.33 112.92 3302.99 7.13 12.58 14.68 201206 2888.25 31.14 2428.64 84.09 870.11 7.52 118.40 54815.95 122.45 93.60 69.42PTC India Ltd. 201203 294.97 8058.53 -12.41 406.09 5.68 259.42 6.92 12.43 10.73 201206 1986.94 -20.12 31.74 1.60 22.92 3.11 57.10 1684.30 76.65 38.10 16.27Reliance Infrastructure Ltd 201203 262.99 24180.76 57.93 2774.91 14.65 1260.26 60.34 7.79 5.39 201206 5341.14 9.46 671.76 12.48 343.47 62.65 472.20 12419.38 679.70 328.35 48.53Reliance Power Ltd 201203 2805.13 2019.21 91.44 623.89 67.92 866.78 3.09 4.28 5.04 201206 1135.75 109.63 364.73 32.11 239.50 3.42 83.65 23464.88 139.40 68.50 80.42SJVN Ltd. 201203 4136.63 1927.50 5.34 1678.46 97.97 1068.68 2.58 14.41 14.22 201206 504.10 -8.94 453.72 89.98 315.27 3.05 19.35 8004.37 23.80 18.40 89.97Suzlon Energy Ltd. 201203 355.47 21359.21 18.07 1821.20 9.12 -472.59 -2.69 10.48 -8.10 201206 4746.72 9.73 -257.39 -5.40 -853.60 -19.11 15.30 2719.37 42.50 14.95 52.76Tata Power Company Ltd. 201203 237.23 26001.40 33.68 4698.44 19.87 -968.29 -4.58 4.65 -7.22 201206 7197.57 23.99 1367.69 18.85 195.13 2.46 96.70 22947.61 121.50 80.65 31.75Techno Electric & Engineering Co Ltd. 201203 11.42 819.86 14.41 223.62 30.02 121.60 21.18 19.29 19.74 201206 188.77 0.12 76.41 39.45 41.50 28.51 185.20 1057.33 280.00 138.70 54.97Torrent Power Ltd. 201203 472.45 7956.26 16.69 2309.55 30.37 1255.32 26.51 21.89 23.82 201206 2082.50 10.97 341.11 16.09 104.49 8.84 153.30 7242.63 252.70 151.10 52.80Urja Global Ltd 201203 41.66 105.46 23.15 1.17 1.15 0.72 0.17 1.57 1.58 201206 26.29 1.26 0.26 0.98 0.21 0.20 47.15 196.41 49.50 16.50 36.02 Total 23.26 1254.90 360.10 781.93 197.54DIC India Ltd. 201112 9.18 674.76 21.94 45.84 6.90 26.45 28.82 15.55 10.38 201206 174.14 4.73 10.83 6.20 4.88 21.25 236.20 216.81 321.70 181.00 71.75Kokuyo Camlin Ltd. 201203 6.89 385.74 7.41 12.54 3.72 -0.10 -0.01 7.39 -0.10 201206 140.62 25.33 2.22 1.58 -1.19 -0.69 35.55 244.95 75.50 29.95 63.97Sundaram Multi Pap Ltd. 201103 7.19 194.41 29.35 20.90 11.77 6.75 0.94 10.22 6.67 201206 45.33 -9.34 6.64 14.66 2.13 0.39 14.85 320.17 18.32 12.10 61.82Printing And Publishing Total 482.38 7325.74 2024.65 11777.31 556.76DB Corp Ltd. 201203 183.31 1451.51 15.20 338.90 25.00 202.27 11.03 23.10 23.14 201206 352.31 3.20 76.46 20.28 43.62 9.53 186.30 3415.49 253.35 170.00 81.51Deccan Chronicle Holdings Ltd. 201103 48.69 976.16 -5.69 291.93 35.60 162.58 6.68 18.53 12.81 201203 210.16 -31.79 30.39 14.46 6.08 1.16 12.10 252.86 63.25 9.55 73.83Hindustan Media Ventures Ltd. 201203 73.39 598.18 15.89 95.33 19.13 65.35 8.90 23.26 16.08 201206 156.65 7.21 25.98 16.29 19.34 10.54 108.85 798.89 156.95 102.25 77.69HT Media Ltd. 201203 47.00 2002.98 12.77 286.87 18.07 171.53 7.06 16.87 12.48 201206 483.27 -1.11 66.85 13.65 42.60 6.92 90.95 2137.52 156.50 82.00 68.84Jagran Prakashan Ltd. 201103 63.25 1221.09 29.64 354.49 31.13 208.00 6.57 35.17 29.62 201206 311.09 4.42 78.82 24.82 55.73 7.05 92.30 2919.15 114.90 78.00 59.72Navneet Publications (India) Ltd. 201103 47.64 560.81 5.50 117.67 22.28 66.42 2.80 29.55 21.54 201206 358.48 20.21 113.99 31.78 71.80 12.06 53.55 1792.40 71.00 50.60 61.80Repro India Ltd. 201103 10.56 259.61 29.60 28.17 14.42 22.79 21.58 9.51 17.34 201206 90.48 20.41 14.56 15.52 9.02 33.23 223.15 242.65 251.60 131.55 66.88Sandesh Ltd. 201203 8.53 255.40 12.41 56.64 29.61 39.15 45.90 21.21 12.44 201206 62.21 7.06 21.10 27.31 22.44 105.22 256.00 218.35 325.00 230.05 66.49Railways Wagons Total 31.53 752.11 85.98 969.30 107.28Texmaco Infrastructure & Holdings Ltd. 201103 12.72 27.70 -97.03 9.58 53.45 8.01 3.49 2.26 1.78 201206 2.93 2.88 1.74 59.26 2.05 0.64 28.00 356.79 37.45 20.20 54.17Titagarh Wagons Ltd 201103 18.81 724.41 30.71 112.04 18.06 72.54 37.90 19.18 15.48 201206 83.05 -61.74 14.33 14.70 4.79 9.55 305.35 612.50 483.90 294.05 53.11Ratings Total 17.01 1014.42 267.12 7472.64 81.54CRISIL Ltd. 201112 7.01 806.96 28.41 262.50 37.84 206.42 29.46 68.21 51.11 201206 216.27 6.47 59.69 27.56 43.70 24.90 899.05 6308.49 1261.80 750.00 53.03ICRA Ltd. 201203 10.00 207.46 7.48 62.50 40.41 53.86 54.01 27.65 20.13 201206 50.85 31.28 8.14 16.01 8.68 33.87 1164.15 1164.15 1350.00 797.05 28.51Refineries Total 9374.30 1307331.92 330917.87 371390.81 401.94Bharat Petroleum Corpn. Ltd. 201203 361.54 212139.56 37.96 4812.65 2.81 851.28 21.60 15.96 5.45 201206 54522.72 18.23 -8149.96 -14.94 -8836.75 -977.68 353.75 25579.11 394.60 229.53 54.93Chennai Petroleum Corporation Ltd. 201203 148.91 40807.86 23.13 392.39 1.14 61.83 4.15 3.34 1.64 201206 11038.03 11.55 -780.51 -6.45 -968.89 -260.10 136.25 2028.92 212.80 117.00 67.29Essar Oil Ltd. 201103 1365.67 47905.33 28.37 2425.49 5.23 653.88 4.79 11.35 13.04 201206 19993.00 33.77 -410.00 -2.05 -1400.00 -41.00 51.10 6978.56 99.00 44.80 15.96Hindustan Petroleum Corporation Ltd. 201203 338.63 185283.86 33.55 4135.25 2.65 175.96 5.16 10.50 1.34 201206 44076.49 8.04 -8454.81 -18.06 -9248.80 -1092.50 316.45 10715.86 395.00 238.75 51.11Indian Oil Corpn. Ltd. 201203 2427.95 408924.03 32.00 18821.13 5.19 4265.27 17.41 12.52 7.23 201206 96602.77 5.34 -19942.13 -20.58 -22450.95 -369.87 248.40 60310.34 328.80 239.00 78.92Mangalore Refinery & Petrochemicals Ltd. 201203 1752.60 53770.28 38.27 1609.09 3.43 908.58 5.18 16.27 13.22 201206 12809.86 -4.06 -1292.96 -9.60 -1520.55 -34.70 64.55 11313.03 74.75 49.55 88.58Reliance Industries Ltd. 201203 2979.00 358501.00 34.87 34508.00 11.04 19717.00 66.21 12.65 12.57 201206 91875.00 13.40 6747.00 7.34 4473.00 55.19 787.40 254465.00 902.00 671.00 45.15Refractories Total 54.91 1144.11 311.30 887.50 126.87IFGL Refractories Ltd. 201203 34.61 603.85 28.19 74.45 12.62 39.83 11.31 24.09 21.61 201206 172.45 37.15 20.59 11.91 11.85 14.52 50.30 174.09 52.45 28.25 71.30Vesuvius India Ltd. 201112 20.30 540.26 22.75 88.73 16.99 55.23 27.21 30.47 20.05 201206 138.85 2.32 22.46 16.13 12.56 24.75 351.50 713.41 464.00 305.00 55.57Retailing Total 251.24 19377.76 4673.11 9899.29 214.13Pantaloon Retail (India) Ltd 201106 43.42 12211.79 24.78 1049.42 9.97 144.55 5.70 9.64 5.31 201206 3552.45 6.50 447.65 12.38 21.16 3.92 149.90 3471.42 310.00 125.30 43.66Shoppers Stop Ltd. 201203 41.28 2952.31 28.34 125.00 4.48 -24.42 2.30 12.34 -4.80 201206 441.24 -24.11 13.79 3.09 0.50 0.24 358.25 2966.99 426.80 251.00 67.83SRS Ltd. 201203 139.29 2267.38 11.09 107.93 4.90 44.37 3.19 20.34 10.46 201206 472.32 -22.17 18.60 3.93 12.66 3.64 40.20 559.95 61.40 26.10 74.04Trent Ltd. 201203 27.25 1946.28 22.28 -45.88 0.52 -46.42 -13.86 -1.50 -4.35 201206 207.10 22.37 10.28 4.70 12.76 18.74 1036.80 2900.92 1189.00 771.00 28.60Rubber Products Total 6.58 456.41 120.80 320.55 123.55GRP Ltd. 201203 1.33 240.28 29.49 40.44 19.85 25.91 194.31 38.72 33.32 201206 61.89 14.71 10.73 16.99 4.93 147.97 1553.60 207.15 2020.00 1035.00 46.50Indag Rubber Ltd. 201203 5.25 216.13 44.16 29.60 14.19 20.87 39.75 53.10 39.39 201206 58.91 22.38 9.21 15.62 6.65 50.69 216.00 113.40 250.80 104.00 77.05Ship Building Total 140.16 3039.06 832.94 2174.06 167.39ABG Shipyard Ltd. 201103 50.92 2136.90 17.90 532.07 26.21 196.88 38.10 12.68 17.04 201206 640.13 27.03 166.26 25.95 41.31 32.45 354.50 1805.18 463.20 295.95 62.03Bharati Shipyard Ltd. 201103 30.31 807.44 217.82 475.16 63.08 91.32 34.44 11.89 9.84 201206 170.61 -60.96 11.59 6.59 -81.63 -103.04 66.85 211.83 116.25 61.25 45.21Western India Shipyard Ltd. 201103 58.93 94.72 44.22 35.83 40.20 15.34 0.52 16.62 302.53 201206 22.20 620.11 7.74 34.18 2.12 0.29 5.33 157.05 9.70 4.51 60.15Shipping Total 2197.02 18049.42 5480.21 17420.73 615.33Dredging Corpn. Of India Ltd. 201103 28.00 457.87 -29.06 51.16 25.34 39.51 14.11 3.39 2.93 201206 127.90 18.24 15.00 11.60 -6.68 -9.54 247.60 693.28 321.35 187.05 78.56Essar Ports Ltd. 201103 410.46 1910.70 -36.30 736.87 47.75 82.84 1.45 5.19 1.75 201206 324.50 18.18 266.37 81.87 69.14 6.41 93.00 3979.36 103.00 46.90 80.30Essar Shipping Ltd. 201203 205.23 2801.58 112.44 699.57 26.86 36.83 1.79 3.88 0.69 201206 913.41 46.04 242.72 26.50 53.90 10.51 28.30 580.79 95.00 16.20 83.71Global Offshore Services Ltd 201103 23.82 200.49 -5.61 86.42 44.30 22.22 9.33 6.14 8.08 201206 69.37 50.28 66.75 61.85 39.79 64.57 72.90 180.14 113.30 60.00 33.07Great Eastern Shipping Company Ltd. 201203 152.29 2955.49 20.54 1079.43 46.18 320.86 20.79 6.86 5.34 201206 802.42 17.91 287.93 35.68 180.99 47.54 257.35 3919.18 285.45 183.00 29.86Great Offshore Ltd. 201103 37.23 946.83 -18.77 338.04 36.67 24.79 7.05 5.28 2.20 201206 192.58 -11.90 66.02 35.22 47.98 51.55 96.80 360.41 155.00 70.00 49.73Mercator Ltd. 201203 24.49 3699.91 30.79 582.60 17.51 30.14 0.84 4.90 1.26 201206 1095.20 37.04 175.00 15.98 17.94 2.79 19.35 473.87 33.80 15.80 40.22Pipavav Defence and Offshore Engineering Co Ltd. 201103 665.80 859.93 36.63 132.54 26.20 43.69 0.66 5.13 2.62 201206 572.40 69.33 121.46 21.22 2.02 0.12 61.80 4271.61 92.60 50.65 43.34Seamec Ltd. 201203 33.90 181.77 77.55 11.54 15.29 -13.19 -3.89 -1.47 -3.00 201206 73.68 60.03 13.76 18.68 13.72 16.19 86.30 292.56 115.10 75.00 75.00Shipping Corpn. Of India Ltd. 201103 465.80 3543.42 2.32 711.68 33.53 567.35 12.18 6.91 8.40 201206 1154.95 24.27 162.44 13.31 -54.87 -4.71 52.40 2440.79 91.60 46.60 63.75Varun Shipping Company Ltd. 201103 150.01 491.43 -26.24 18.05 83.58 14.75 0.98 6.45 1.82 201206 153.80 15.92 93.72 60.94 145.22 38.72 15.25 228.76 22.25 14.15 37.79Solvent Extraction Total 103.92 7247.14 973.42 736.37 114.44AVT Natural Products Ltd. 201203 7.61 248.91 68.73 89.61 36.24 54.78 71.94 103.63 69.34 201206 72.46 50.55 24.21 33.41 14.28 7.51 32.35 246.32 48.05 24.02 74.33KS Oils Ltd. 201106 42.54 5627.10 38.60 44.66 0.97 -368.76 -8.65 -0.80 -29.66 201206 586.31 -37.88 -68.23 -11.62 -156.40 -13.62 4.73 217.19 13.10 4.63 8.43Rasoya Proteins Ltd. 201203 53.76 1371.13 228.88 100.33 8.11 72.35 6.73 26.31 25.01 201206 314.65 39.27 20.98 6.66 9.54 3.35 23.95 272.86 83.00 18.65 31.68Steel & Iron Products Total 561.81 35602.14 10596.74 21521.49 760.51APL Apollo Tubes Ltd. 201103 20.30 905.19 46.47 89.01 9.24 43.09 21.23 20.57 20.61 201206 444.62 44.98 36.02 7.20 16.07 29.30 163.90 359.57 201.20 120.10 45.32Bhushan Steel Ltd. 201103 42.47 7003.54 24.34 2031.91 27.72 1005.13 47.26 9.61 20.51 201206 2747.34 26.85 862.24 27.63 205.97 38.80 464.90 9872.54 479.00 296.60 68.29Gandhi Special Tubes Ltd. 201203 7.35 106.53 15.48 42.19 39.59 29.82 20.29 32.03 23.11 201206 24.92 -3.94 9.54 36.23 6.78 18.45 140.75 206.88 144.25 115.00 73.27ISMT Ltd. 201103 73.25 1726.81 37.35 254.36 10.29 78.13 5.33 11.74 13.63 201206 448.90 -3.69 39.47 7.77 -15.59 -4.26 22.20 325.23 41.80 21.90 51.70Jindal Saw Ltd. 201103 55.25 4559.11 -35.66 834.23 19.52 444.50 15.97 13.62 11.63 201206 1290.06 13.86 160.24 12.42 35.19 5.10 120.80 3336.78 180.95 109.00 46.00Maharashtra Seamless Ltd. 201103 35.27 1761.27 10.55 423.31 27.31 342.81 48.60 28.07 20.27 201206 520.97 8.88 80.83 15.52 65.36 37.06 332.35 2344.18 402.00 290.00 55.37Man Industries (India) Ltd. 201203 27.64 1750.86 9.14 165.07 10.61 71.08 12.86 21.33 12.85 201206 344.29 -26.15 49.20 14.08 19.54 13.69 100.00 571.03 156.00 91.00 54.21Oil Country Tubular Ltd. 201203 44.29 479.48 46.57 77.88 16.13 38.28 8.64 22.69 18.13 201206 152.97 109.34 27.55 17.36 12.41 11.21 49.65 219.90 69.95 43.05 48.61Prakash Steelage Ltd. 201203 17.50 683.80 25.17 52.10 8.05 16.94 9.68 33.22 11.65 201206 158.15 20.71 9.45 5.71 3.51 8.01 172.70 302.23 186.75 114.00 64.92PSL Ltd. 201103 53.33 2915.16 -22.65 333.69 14.13 52.39 11.23 8.89 5.62 201206 633.29 29.46 121.99 18.39 14.81 11.11 57.30 306.33 71.80 50.40 39.25Ratnamani Metals & Tubes Ltd. 201103 9.28 812.25 -4.66 146.90 18.98 82.11 17.71 18.34 20.62 201206 282.29 -2.55 47.30 16.76 20.34 17.53 112.70 523.10 121.40 89.00 59.45Technocraft Industries (India) Ltd. 201103 31.53 560.73 23.11 60.91 16.94 32.27 9.59 10.18 8.04 201206 153.13 34.42 36.02 21.54 22.16 28.11 74.00 233.30 83.90 27.40 74.97Usha Martin Ltd. 201203 30.47 3360.82 10.39 433.82 13.77 6.62 0.12 7.24 0.37 201206 846.09 10.96 100.00 11.82 4.44 0.45 23.85 726.81 43.25 21.80 41.19Welspun Corp Ltd. 201203 113.89 8976.58 11.90 857.05 12.03 222.92 10.47 9.32 5.97 201206 2549.72 45.21 165.92 6.51 0.71 1.31 95.35 2193.61 156.50 64.50 37.96Steel/Sponge Iron/Pig Iron Total 12300.20 284238.49 76508.37 140251.39 2000.87Adhunik Metaliks Ltd. 201103 123.50 1793.41 23.71 574.90 32.07 185.68 14.92 14.90 23.35 201203 400.65 -27.33 16.29 4.05 -5.48 -1.78 28.75 355.06 59.75 27.05 57.60Ankit Metal & Power Ltd. 201103 32.88 674.75 7.29 47.82 8.41 24.25 7.38 10.78 15.89 201206 274.19 50.35 42.76 15.30 12.87 5.40 15.25 145.45 20.00 11.05 65.25Electrosteel Steels Ltd. 201203 2034.74 60.69 716.58 -46.03 -67.93 -149.82 -0.74 -1.07 -7.51 201206 11.98 417.37 -9.76 -75.77 -46.20 -0.91 5.26 1070.27 8.19 3.75 34.80
Stock Market Monitor
Company Name Year End Equity Net Sales Growth(%) EBITDA EBITDA(%) PAT EPS ROCE RONW Qtr End Net Sales Growth(%) EBITDA EBITDA% PAT% EPS CMP Mcap 52WH 52WL PR. Holding
Gallantt Ispat Ltd. 201103 26.77 227.28 85.60 -0.56 8.37 3.16 1.18 6.16 2.70 201206 110.61 85.92 9.78 8.84 0.63 0.93 43.90 117.50 119.10 35.10 69.93Gallantt Metal Ltd. 201103 81.32 556.59 28.51 45.90 9.75 22.92 2.82 13.52 13.14 201206 190.04 29.88 13.96 7.34 6.52 3.21 23.30 189.48 36.95 14.15 50.99Godawari Power & Ispat Ltd. 201103 31.76 1127.36 36.39 232.34 20.11 99.45 27.04 14.84 18.03 201206 602.43 21.96 109.63 18.20 50.61 58.81 119.50 379.49 161.60 69.90 63.79Jai Balaji Inds. Ltd. 201103 63.77 2195.07 14.25 340.42 15.53 77.53 12.16 10.17 7.97 201206 502.74 -13.58 -40.50 -8.00 -90.08 -56.50 40.00 255.13 148.00 26.30 51.33Jayaswal Neco Inds. Ltd. 201103 250.85 2263.48 26.64 356.17 15.19 98.12 3.91 14.84 14.74 201206 702.46 11.65 82.69 11.77 11.59 1.29 12.72 457.52 22.40 10.50 69.21Jindal Stainless Ltd. 201103 37.46 7512.34 22.37 1151.03 15.26 318.77 16.77 8.56 15.56 201206 2206.69 11.85 231.38 9.59 -231.41 -48.77 67.40 1281.70 111.90 62.50 39.24Jindal Steel & Power Ltd. 201103 93.43 13111.60 18.21 6321.88 41.88 3804.01 40.18 22.84 31.09 201206 4680.41 18.88 1593.24 33.89 385.48 16.49 377.15 35257.26 663.40 343.00 58.97JSW ISPAT Steel Ltd. 201106 2386.09 8226.64 -18.81 312.49 7.14 -1872.87 -7.85 -15.15 0.00 201206 2855.37 18.38 341.72 11.49 478.24 7.60 9.99 2514.31 16.00 9.06 66.37JSW Steel Ltd. 201203 223.12 34368.05 42.57 6101.89 16.72 1493.20 22.85 11.55 9.32 201206 9901.98 33.23 1908.46 17.69 200.13 8.90 720.90 16084.52 885.00 464.00 38.05Kalyani Steels Ltd. 201203 21.83 989.54 -19.99 50.81 6.15 22.04 5.05 11.19 6.68 201206 228.13 -28.00 16.69 5.64 3.02 2.76 52.30 228.31 70.35 32.00 59.85Lloyds Metals & Energy Ltd 201203 22.26 1006.80 45.91 27.50 4.28 3.73 0.34 12.19 3.09 201206 247.22 -9.20 6.62 2.68 1.54 0.55 18.95 210.90 35.00 18.25 47.78Lloyds Steel Inds. Ltd. 201203 664.52 3848.16 -5.70 110.97 3.80 -73.45 -1.11 7.37 0.00 201206 1362.42 46.90 16.10 1.18 -31.57 -1.90 10.34 687.11 16.44 6.75 36.14Mahindra Ugine Steel Company Ltd. 201203 32.48 1535.65 177.30 46.55 3.12 36.88 11.35 0.00 0.00 201206 355.49 1.82 15.83 3.72 -38.48 -47.39 50.60 164.36 66.75 42.25 55.47Monnet Ispat & Energy Ltd. 201103 64.34 1625.55 6.10 458.42 23.55 277.50 42.98 9.27 14.76 201206 520.62 21.88 136.01 25.83 68.50 42.63 292.85 1877.16 560.55 280.30 49.49MSP Steel & Power Ltd. 201103 58.10 477.47 22.82 73.88 21.17 50.18 8.62 10.59 19.54 201206 216.28 27.49 39.44 16.21 10.21 7.03 28.45 193.74 50.00 26.00 71.90Mukand Ltd. 201203 73.11 2616.99 1.55 138.81 4.96 -87.78 -11.88 5.88 -21.14 201206 616.42 -7.91 10.87 1.56 -37.68 -20.61 26.10 190.83 38.70 24.00 55.90OCL Iron and Steel Ltd 201103 13.41 223.60 16.95 5.60 10.88 11.76 0.82 3.54 3.70 201206 66.17 -11.17 7.81 10.50 1.67 0.50 36.90 494.99 58.75 34.25 75.00Orissa Sponge Iron & Steel Ltd. 201103 27.00 145.61 -17.16 -43.08 -23.60 -52.86 -19.58 -13.37 -30.36 201206 10.98 -64.63 1.39 12.64 -10.42 -15.44 243.95 658.67 392.00 221.15 49.12Panchmahal Steel Ltd. 201203 18.90 464.16 14.72 28.78 6.17 5.75 3.04 12.61 4.21 201206 96.17 -25.88 6.24 6.34 1.67 3.53 111.00 209.84 113.00 42.00 65.34Pennar Industries Ltd. 201203 61.01 1315.54 5.12 144.59 10.32 64.69 5.08 43.12 25.75 201206 285.50 -7.46 26.88 8.17 11.76 3.58 26.35 321.53 43.05 25.50 40.02Prakash Industries Ltd. 201103 134.49 1664.10 6.15 337.83 19.03 267.08 19.86 15.20 19.76 201206 672.25 34.84 98.37 14.63 60.05 17.86 56.25 756.50 65.00 25.60 46.49Sarda Energy & Minerals Ltd. 201103 35.85 881.44 67.03 124.71 16.89 71.99 19.95 6.94 9.88 201206 337.04 32.30 57.87 15.47 20.25 22.60 125.15 448.66 159.70 72.00 66.51Sathavahana Ispat Ltd. 201103 34.60 678.70 76.39 113.66 17.45 56.54 16.34 24.42 25.95 201206 322.31 87.03 -28.09 -8.72 -44.11 -50.95 32.00 116.58 45.20 24.15 42.42Steel Authority Of India Ltd. 201203 4130.53 46420.71 7.31 6402.68 15.57 3592.95 8.70 11.08 9.23 201206 10640.73 -1.71 1258.34 10.44 696.41 6.74 83.85 34634.45 123.00 73.00 85.82Steel Exchange India Ltd. 201103 42.85 1156.09 65.87 80.66 7.23 17.00 3.95 16.71 11.81 201112 355.23 22.07 24.41 6.87 3.86 3.30 60.30 313.26 70.90 36.60 54.43Sunflag Iron & Steel Company Ltd. 201103 162.20 1539.98 14.24 158.21 9.96 70.53 4.35 15.40 15.89 201206 431.73 15.56 33.54 7.77 -2.80 -0.69 20.50 332.50 31.30 19.00 54.51Surana Industries Ltd. 201203 29.04 1355.95 11.70 174.13 13.71 31.05 10.69 7.60 6.33 201206 341.21 -5.02 44.94 13.17 8.26 7.42 162.25 722.32 448.00 140.00 45.62Surya Roshni Ltd. 201103 43.83 2309.53 28.64 191.73 7.64 67.47 15.39 11.33 19.99 201206 628.38 13.19 48.55 7.22 11.90 10.86 50.50 221.35 71.60 42.00 64.01Tata Metaliks Ltd. 201103 25.29 1318.73 25.81 22.96 3.61 -20.93 0.23 5.10 -29.45 201206 222.36 -30.58 -31.27 -13.49 -18.96 -21.21 57.45 145.28 90.00 51.00 50.10Tata Sponge Iron Ltd. 201203 15.40 633.95 -6.93 112.99 19.73 75.68 49.14 16.13 14.07 201206 185.50 34.33 41.38 21.89 29.71 77.17 304.90 469.55 351.35 232.60 43.24Tata Steel Ltd. 201203 971.21 132899.70 11.91 12366.32 10.29 4948.52 55.49 13.55 12.69 201206 33547.73 1.89 3403.28 10.06 517.04 24.62 385.50 37440.32 503.80 332.35 31.35Uttam Galva Steels Ltd. 201203 122.26 5647.38 12.03 519.41 8.86 73.10 5.98 12.83 7.47 201206 2057.72 34.21 148.65 7.22 10.24 3.35 62.65 765.96 85.40 48.00 70.83Visa Steel Ltd. 201203 110.00 1365.91 3.19 75.60 7.35 -118.88 -10.81 -0.51 -40.01 201206 321.25 -12.04 10.18 3.15 -108.66 -39.51 49.05 539.55 64.30 48.00 74.00Sugar Total 327.24 40718.70 8270.74 12068.10 629.14Bajaj Hindusthan Ltd. 201109 22.84 5008.41 56.44 829.20 19.68 21.45 0.94 6.30 0.75 201206 1329.61 26.49 117.96 8.78 -76.51 -4.79 30.05 1921.40 49.70 23.35 46.13Balrampur Chini Mills Ltd. 201203 24.43 2309.55 -22.41 237.95 11.06 0.41 0.02 8.41 0.03 201206 691.96 22.05 57.19 8.26 -18.05 -2.96 64.55 1577.05 69.00 32.70 40.93Bannari Amman Sugars Ltd. 201203 11.44 1184.11 43.22 226.75 18.98 105.67 92.37 19.20 13.73 201206 360.36 38.92 64.62 17.82 28.20 98.61 901.00 1030.72 977.00 489.90 54.72Dhampur Sugar Mills Ltd. 201103 53.91 2348.85 151.56 210.03 9.94 13.08 2.34 13.11 2.62 201206 349.66 45.24 53.10 14.63 6.41 4.76 67.85 365.75 73.00 27.40 52.80Dharani Sugars & Chemicals Ltd. 201103 29.39 840.59 45.35 79.31 9.52 3.59 1.22 10.61 3.55 201206 194.86 -2.95 35.21 17.88 18.19 24.76 39.25 115.36 45.00 18.10 52.35EID-Parry (India) Ltd. 201203 17.37 12486.55 33.40 1199.95 10.38 526.60 18.00 25.10 22.63 201206 2666.27 7.13 278.25 10.38 106.01 16.55 215.35 3741.81 254.80 165.05 45.69KCP Sugar & Inds. Corpn. Ltd. 201103 11.34 233.33 -16.16 22.61 10.41 12.81 1.13 8.67 7.17 201206 105.39 12.00 17.44 16.55 12.55 4.43 19.05 216.00 20.60 13.15 39.06Parrys Sugar Industries Ltd 201203 19.96 467.39 11.86 55.07 11.38 -6.39 -3.20 6.79 0.00 201206 140.42 11.21 4.06 2.89 -21.13 -42.33 58.00 115.78 112.90 51.00 65.00Ponni Sugars (Erode) Ltd. 201203 8.60 268.93 -0.50 31.63 11.73 17.79 20.69 21.58 17.12 201206 33.53 -25.75 0.89 2.64 -1.10 -5.12 184.05 158.25 189.00 71.55 42.80Rajshree Sugars & Chemicals Ltd. 201203 23.79 836.30 13.32 101.83 12.72 -0.14 -0.06 15.04 -0.12 201206 265.79 82.05 36.58 13.64 5.99 10.07 54.80 130.38 60.50 28.85 36.76Shree Renuka Sugars Ltd. 201203 67.13 12369.12 61.28 1841.07 15.55 -30.20 -0.46 9.20 -1.34 201206 1483.90 -33.76 179.80 12.12 13.30 0.79 30.35 2037.46 67.25 22.80 38.06Triveni Engineering & Inds. Ltd. 201109 25.79 1707.15 -24.49 150.89 11.11 22.22 0.86 5.90 2.18 201206 452.53 9.14 71.13 15.67 8.39 1.87 19.00 489.97 25.15 12.60 68.19Ugar Sugar Works Ltd. 201203 11.25 658.42 10.56 80.25 10.71 17.09 1.52 37.05 18.07 201206 196.46 12.32 18.55 9.44 4.02 1.43 14.95 168.19 17.45 9.50 46.65Tea/Coffee Total 301.05 19902.16 3306.24 15962.79 698.64Assam Company India Ltd. 201012 30.98 223.28 -1.28 42.84 34.39 9.89 0.32 4.87 3.18 201206 39.83 36.41 21.01 48.45 17.43 2.25 4.81 149.00 12.94 4.60 55.69Bombay Burmah Trdg. Corpn. Ltd. 201203 13.95 5927.60 15.15 352.53 7.15 329.54 164.94 23.18 33.10 201206 38.64 -52.33 2.95 7.10 0.55 1.58 524.20 731.49 631.00 338.00 65.91CCL Products (India) Ltd. 201103 13.30 365.02 -16.57 64.74 20.33 26.45 19.88 12.17 12.66 201206 140.72 47.86 19.81 14.07 7.61 22.88 260.80 346.94 276.95 116.05 39.76Dhunseri Petrochem & Tea Ltd. 201203 35.02 1983.70 24.45 83.59 5.10 23.77 8.89 7.19 3.42 201206 481.01 0.90 -6.36 -1.31 -6.73 -7.69 111.25 389.65 140.70 100.00 66.29Goodricke Group Ltd. 201112 21.60 456.47 14.50 53.80 13.92 37.42 17.33 31.71 23.84 201206 91.01 20.78 -0.81 -0.86 -4.75 -8.80 139.95 302.29 164.90 103.00 74.00Harrisons Malayalam Ltd. 201103 18.45 364.35 11.97 14.20 6.36 3.95 2.14 5.96 2.22 201206 67.17 -12.91 0.03 0.04 -4.23 -9.17 63.05 116.36 87.70 49.85 50.30Jay Shree Tea & Inds. Ltd. 201203 14.44 664.71 29.44 52.07 11.99 22.38 7.07 11.23 5.58 201206 137.34 52.67 12.49 9.01 4.86 6.73 82.80 239.11 150.00 78.00 54.15Mcleod Russel India Ltd. 201203 54.73 1445.32 13.88 389.38 29.78 294.26 26.30 30.44 27.52 201206 143.45 -1.25 22.87 15.70 19.31 7.06 305.15 3340.04 345.00 165.50 45.71Rossell India Ltd. 201203 7.34 82.84 3.04 25.13 31.75 18.65 5.30 22.21 17.53 201206 9.24 -28.32 1.20 12.41 12.99 14.16 33.95 124.58 53.00 30.10 70.64Tata Coffee Ltd. 201203 18.68 1548.69 19.03 191.43 12.89 83.54 43.47 10.93 18.08 201206 407.74 22.99 68.75 16.62 31.84 60.34 967.25 1806.54 1009.90 711.00 57.48Tata Global Beverages Ltd 201203 61.84 6631.16 10.46 623.05 10.82 431.91 5.76 10.18 10.24 201206 1714.88 17.79 180.78 10.48 98.60 5.03 128.60 7952.61 137.75 80.00 35.20Warren Tea Ltd. 201103 10.71 209.03 4.92 37.31 19.76 20.60 19.23 26.41 18.24 201106 35.20 11.36 5.33 14.85 3.27 12.21 433.25 464.20 560.00 260.00 83.51Telecommunication - Equipment Total 2091.62 7086.75 1371.64 6207.30 478.05AGC Networks Ltd 201203 14.20 994.60 207.16 95.60 10.88 63.50 44.72 31.53 21.70 201206 245.35 25.65 17.15 6.93 17.94 50.42 370.30 527.06 429.00 100.30 75.00Astra Microwave Products Ltd. 201203 16.37 203.75 25.24 60.52 29.46 33.20 4.06 29.93 21.01 201206 17.91 -33.94 -1.82 -10.14 -3.08 -1.50 43.15 353.08 46.50 23.35 19.41Divine Multimedia (India) Ltd. 201103 6.69 24.32 -0.34 0.92 0.21 0.03 1.51 1.51 201206 -0.12 0.00 0.13 0.08 20.55 137.52 49.30 19.00 0.07GTL Infrastructure Ltd. 201103 957.35 1110.34 189.97 278.65 58.32 -574.35 -3.95 0.00 0.00 201206 139.85 -0.47 74.72 53.43 -85.16 -1.86 6.98 1332.17 15.08 6.15 24.06Himachal Futuristic Communications Ltd. 201103 99.24 86.47 -83.21 -175.20 78.82 12.84 0.12 6.11 0.00 201206 127.45 162.94 18.61 14.60 17.65 0.57 11.02 1365.79 16.00 10.05 38.67ITI Ltd. 201103 288.00 2099.06 -54.33 -345.93 -11.96 -357.75 -12.42 0.00 0.00 201206 133.89 4.56 -83.31 -62.18 -105.20 -14.61 22.75 655.20 32.00 16.15 92.98Kavveri Telecom Products Ltd. 201103 14.07 308.70 29.65 47.48 23.31 39.31 27.50 20.28 26.49 201206 111.93 23.38 16.23 14.48 13.72 27.27 236.45 475.84 271.00 122.45 32.15Punjab Communications Ltd. 201103 12.02 16.91 -84.65 -8.63 5.82 0.03 0.03 0.27 0.03 201206 4.92 -1.93 -2.22 -41.65 0.71 2.36 152.00 182.76 213.00 90.90 71.21Quadrant Televentures Ltd 201103 612.26 236.12 19.62 -78.22 -30.84 -224.13 -3.66 -98.28 0.00 201206 79.04 10.81 -8.38 -10.60 -45.23 -2.95 3.12 191.03 5.48 2.91 53.36S Mobility Ltd. 201103 71.43 2006.47 61.55 116.08 7.86 111.76 4.37 17.19 14.68 201206 511.30 -2.24 1.60 0.31 -3.70 -0.87 41.45 986.87 109.45 35.05 71.14Telecommunication - Service Provider Total 9309.91 136406.33 36080.35 144564.68 486.93Bharti Airtel Ltd. 201203 1898.80 71505.80 19.97 23712.30 33.53 4265.50 11.25 9.86 8.58 201206 19350.10 13.99 5848.70 30.21 782.70 8.03 249.10 94596.47 417.00 243.50 68.50Dhanus Technologies Ltd. 201012 17.94 119.30 1.73 39.83 33.39 -1.20 -0.67 0.88 -0.45 201206 2.95 -90.40 1.32 44.94 -2.02 -0.14 2.18 124.48 5.00 2.01 0.60GTL Ltd. 201203 97.27 1864.69 -52.71 64.92 6.22 -457.38 -47.20 0.28 -32.20 201206 615.98 -24.86 -31.00 -5.03 -201.33 -54.92 27.10 425.36 76.25 25.25 44.33Hathway Cable & Datacom Ltd. 201103 142.86 882.61 20.38 110.46 17.91 -23.63 -2.14 2.39 -2.73 201206 134.60 11.64 19.28 14.15 -15.87 -4.44 175.60 2508.57 206.00 72.00 49.57Idea Cellular Ltd. 201203 3308.85 19488.69 26.24 5047.24 26.39 722.99 2.19 9.63 5.72 201206 5501.49 21.83 1435.54 26.08 234.14 2.83 74.95 24807.55 103.65 71.20 45.95Mahanagar Telephone Nigam Ltd. 201103 630.00 3745.95 0.95 -1208.61 -23.70 -2796.93 -44.40 -19.65 -34.86 201206 830.49 2.47 -505.20 -60.65 -1058.24 -67.19 41.10 2589.30 42.90 20.70 56.25Reliance Communications Ltd. 201203 1032.00 22133.00 -11.11 5785.00 29.32 988.00 4.50 3.84 2.57 201206 4878.00 3.52 1595.00 30.30 191.00 3.14 52.15 10763.90 109.70 50.25 67.86Tata Communications Ltd 201203 285.00 14196.05 18.97 1791.49 13.64 -783.97 -27.88 0.86 -26.69 201206 4107.39 26.11 513.89 12.51 -142.08 -20.05 228.50 6512.25 266.35 176.30 76.15Tata Teleservices (Maharashtra) Ltd. 201203 1897.20 2470.25 9.85 511.61 22.22 -517.55 -2.73 0.21 0.00 201206 659.36 12.71 131.90 20.00 -162.66 -3.43 11.79 2236.80 19.80 10.85 77.72Textile Total 2740.74 61923.41 16123.65 26776.81 2354.38Alok Industries Ltd. 201203 826.27 9784.72 47.92 2376.41 24.67 92.91 1.13 14.83 3.29 201206 2422.75 47.89 749.23 30.92 30.07 1.46 15.35 1268.32 23.90 11.75 33.55Arvind Ltd. 201103 254.40 4089.68 25.40 556.25 14.94 165.35 6.48 12.64 12.81 201206 1176.99 -1.15 129.14 11.17 32.28 5.03 65.90 1700.50 111.15 61.50 42.53Bombay Dyeing & Manufacturing Co Ltd. 201203 41.31 2230.81 19.99 262.26 13.49 59.35 14.37 28.71 16.10 201206 475.73 20.49 22.29 4.58 -27.50 -26.63 471.55 1947.83 593.00 301.00 52.07Bombay Rayon Fashions Ltd. 201103 127.90 2690.90 49.37 521.93 20.51 203.42 15.86 7.60 9.29 201206 765.16 26.72 198.90 25.99 49.62 14.75 236.40 3181.94 293.95 199.60 93.15Century Enka Ltd. 201203 21.85 1649.51 22.27 81.27 5.46 8.78 4.02 3.77 1.37 201206 419.94 4.28 27.80 6.59 2.69 4.92 110.30 241.01 163.00 88.50 31.39Cheviot Company Ltd. 201203 4.51 295.05 -4.28 36.58 14.91 28.87 63.99 18.49 13.59 201206 66.99 2.05 12.02 17.65 9.86 87.39 306.25 138.16 377.00 249.10 75.00Forbes & Company Ltd 201203 12.90 1769.53 20.16 115.19 8.09 4.73 40.00 7.32 3.49 201206 60.41 -4.63 6.56 10.26 52.62 163.16 627.30 809.13 699.00 385.00 73.35Garden Silk Mills Ltd. 201103 38.29 3400.48 35.21 280.72 8.19 87.87 22.95 13.22 16.57 201206 1061.73 36.62 18.90 1.63 -31.06 -32.44 44.45 170.20 80.80 40.00 57.22Garware-Wall Ropes Ltd. 201103 23.71 498.95 11.19 51.71 10.97 24.43 10.31 12.26 10.82 201206 164.21 16.49 15.28 9.28 5.99 10.11 50.00 118.54 61.00 44.55 46.57Gokaldas Exports Ltd. 201203 17.19 1024.26 -10.55 -61.13 -5.25 -132.38 -38.51 -28.79 -44.46 201206 208.34 -8.72 -9.16 -4.05 -23.66 -27.53 60.00 206.26 104.70 59.00 88.27Himatsingka Seide Ltd. 201203 49.23 1428.69 15.90 146.09 10.43 33.94 3.36 10.15 6.22 201206 375.14 16.98 36.59 9.57 8.96 4.23 32.90 323.92 38.00 22.70 54.99Jindal Worldwide Ltd. 201103 20.05 366.85 26.15 30.65 9.89 13.51 6.74 16.68 16.82 201203 140.25 28.17 9.15 6.47 -4.17 -8.31 87.10 174.65 162.70 68.05 56.19Kewal Kiran Clothing Ltd. 201203 12.33 301.90 27.59 73.36 26.11 52.14 42.30 36.54 24.64 201206 56.43 -18.11 9.52 16.74 7.27 23.58 616.80 760.21 875.00 490.00 74.11Kitex Garments Ltd. 201203 4.75 312.00 21.82 59.38 21.07 27.12 5.71 57.91 31.70 201206 59.26 -22.92 11.12 17.49 7.22 6.08 50.95 242.01 67.50 38.00 54.20KPR Mill Ltd. 201203 37.68 1268.54 14.55 179.79 14.72 32.79 8.42 7.22 5.49 201206 306.48 7.31 79.32 23.98 16.51 17.53 130.25 490.82 134.35 75.20 74.48KSL & Industries Ltd. 201203 40.27 1975.10 12.28 152.89 7.58 -119.46 -11.87 0.96 -26.13 201206 330.52 -5.57 14.41 4.36 -25.17 -10.00 68.95 694.11 109.65 19.00 39.22Lovable Lingerie Ltd. 201203 16.80 132.99 31.05 23.08 21.15 21.65 12.89 18.73 14.43 201206 52.76 15.43 8.27 15.67 7.52 17.90 328.90 552.55 636.50 278.00 66.96Maharaja Shree Umaid Mills Ltd. 201203 25.92 426.96 -1.04 8.66 8.33 409.70 158.06 104.41 93.04 201206 119.02 23.75 13.69 11.50 5.90 9.10 129.05 334.50 202.92 111.45 74.82Mandhana Industries Ltd. 201103 33.12 838.29 33.96 146.56 18.35 66.75 20.15 17.74 24.48 201206 212.48 3.48 38.55 18.14 10.48 12.66 221.45 733.53 299.00 171.05 62.21Mayur Uniquoters Ltd. 201203 5.41 317.48 27.73 53.32 15.95 33.37 61.65 66.47 45.44 201206 86.93 26.53 14.46 16.18 9.11 67.31 425.05 460.18 434.90 155.05 74.96Nakoda Ltd 201112 99.20 2299.88 71.06 110.69 5.64 47.16 2.40 10.23 15.26 201206 634.04 21.96 35.03 5.52 14.65 2.95 7.78 154.36 12.80 7.55 44.03Nandan Exim Ltd. 201103 45.55 507.40 35.01 67.12 13.43 17.35 0.38 10.60 12.68 201206 173.91 32.48 24.99 14.35 6.55 5.75 26.15 119.11 29.45 16.00 55.88Page Industries Ltd. 201203 11.15 683.41 39.03 136.41 20.88 89.99 80.68 73.56 62.15 201206 218.12 23.64 46.73 21.42 32.76 117.49 3095.30 3452.46 3276.00 2275.00 59.21Pearl Global Industries Ltd. 201103 19.50 2232.07 21.83 25.69 4.14 22.88 10.03 7.41 4.97 201206 827.14 34.77 32.26 3.82 15.24 26.92 94.45 204.62 102.15 46.20 66.58
Quarter End Current DataYear End
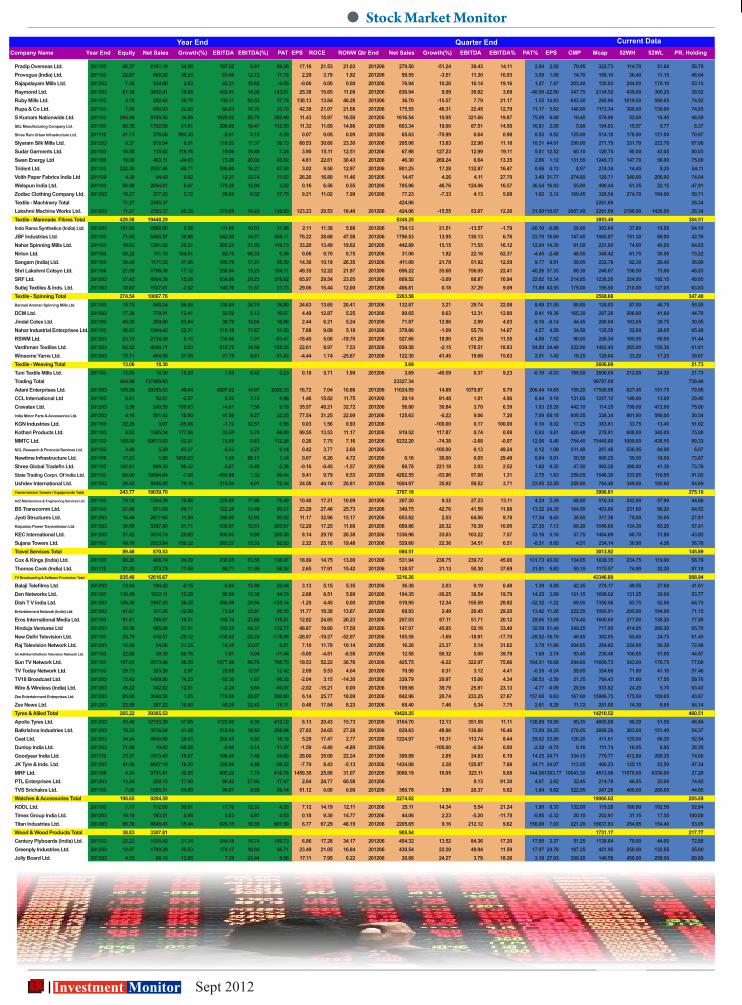
32 Investment Monitor Sept 2012
Stock Market Monitor
Company Name Year End Equity Net Sales Growth(%) EBITDA EBITDA(%) PAT EPS ROCE RONW Qtr End Net Sales Growth(%) EBITDA EBITDA% PAT% EPS CMP Mcap 52WH 52WL PR. Holding
Pradip Overseas Ltd. 201103 40.37 2161.19 34.58 197.52 9.91 69.26 17.16 21.53 21.03 201206 279.50 -51.24 39.43 14.11 2.04 2.02 79.95 322.73 114.70 51.60 58.79Provogue (India) Ltd. 201103 22.87 686.92 39.25 63.49 12.72 17.79 2.29 3.79 1.92 201206 99.55 -3.51 11.30 10.93 3.08 1.08 14.70 168.10 36.40 11.15 46.64Rajapalayam Mills Ltd. 201203 7.38 334.60 2.63 43.21 18.82 -0.05 -0.06 0.00 0.00 201206 76.94 10.26 16.14 19.16 1.47 7.97 203.40 150.03 244.00 170.10 53.15Raymond Ltd. 201203 61.38 3642.41 19.68 452.41 14.30 143.01 25.38 15.65 11.08 201206 836.94 9.99 30.92 3.69 -40.99 -22.80 347.75 2134.52 439.00 300.25 39.52Ruby Mills Ltd. 201103 4.18 202.42 30.79 100.11 50.53 57.74 138.13 13.84 46.28 201206 36.70 -15.57 7.79 21.17 1.55 14.83 643.30 268.90 1019.50 590.05 74.92Rupa & Co Ltd. 201103 7.95 650.03 22.08 68.63 10.76 33.70 42.38 21.07 21.68 201206 175.55 46.31 22.45 12.79 11.17 5.62 140.00 1113.34 300.00 130.00 74.93S Kumars Nationwide Ltd. 201103 284.98 5180.55 34.99 1029.52 20.70 392.49 11.43 15.97 16.50 201206 1616.54 10.95 321.66 19.87 75.09 8.68 19.40 576.96 52.00 18.45 48.59SEL Manufacturing Company Ltd. 201103 99.35 1702.69 81.61 290.80 18.47 112.55 11.32 11.69 14.86 201206 603.34 19.00 87.51 14.50 16.81 2.05 5.88 194.83 15.57 5.77 8.37Shree Ram Urban Infrastructure Ltd. 201112 41.13 378.66 994.30 -2.61 0.15 0.29 0.07 0.05 0.09 201206 65.63 -75.99 0.64 0.98 0.53 0.52 125.00 514.18 178.90 121.00 70.67Siyaram Silk Mills Ltd. 201203 9.37 915.54 6.51 116.53 11.37 56.73 60.53 30.60 23.30 201206 205.06 13.83 22.98 11.18 10.31 44.01 290.00 271.79 331.70 223.70 67.06Sudar Garments Ltd. 201103 18.55 115.62 119.16 19.06 16.49 7.24 3.90 15.11 12.51 201206 67.98 127.23 12.99 19.11 5.81 12.52 65.10 120.74 90.00 43.05 50.03Swan Energy Ltd 201103 19.00 403.11 -24.63 73.20 20.02 43.82 4.61 22.61 30.43 201206 46.30 269.24 6.64 13.35 2.66 1.12 131.55 1249.73 147.70 56.00 75.00Trident Ltd. 201103 222.30 2537.46 40.71 395.60 16.27 67.08 3.02 9.50 12.97 201206 801.25 17.28 132.87 16.47 0.96 0.13 8.97 274.34 14.45 8.25 54.11Voith Paper Fabrics India Ltd 201109 4.39 54.43 6.02 12.31 32.74 11.53 26.26 16.80 11.46 201206 14.47 4.26 4.11 27.70 3.49 31.77 274.80 120.71 340.00 206.00 74.04Welspun India Ltd. 201103 88.98 2054.81 6.07 170.28 12.94 3.22 0.16 6.56 0.55 201206 705.96 46.76 124.06 16.57 36.54 16.93 55.00 490.44 61.35 22.15 47.91Zodiac Clothing Company Ltd. 201203 19.27 377.53 5.72 28.04 8.52 17.75 9.21 11.02 7.99 201206 77.23 -7.33 4.13 5.08 1.02 2.12 169.45 326.54 274.70 164.90 59.71Textile - Machinery Total 11.27 2305.37 424.06 2261.69 28.34Lakshmi Machine Works Ltd. 201203 11.27 2305.37 26.38 270.95 14.23 138.83 123.23 20.53 16.40 201206 424.06 -15.55 53.07 12.26 31.00 110.07 2007.45 2261.69 2198.90 1426.00 28.34Textile - Manmade Fibres Total 428.58 19448.29 5348.25 3853.49 384.51Indo Rama Synthetics (India) Ltd. 201203 151.82 2968.80 5.36 111.80 10.03 31.96 2.11 11.38 5.88 201206 754.13 21.51 -13.57 -1.79 -26.10 -6.88 20.00 303.64 37.80 19.55 64.10JBF Industries Ltd. 201103 71.65 6465.57 30.86 942.50 14.31 546.11 76.22 28.68 47.58 201206 1796.53 12.95 130.13 6.76 33.70 18.69 147.45 1065.07 151.30 89.00 42.76Nahar Spinning Mills Ltd. 201103 18.03 1391.52 25.31 285.23 21.55 119.73 33.20 13.49 19.62 201206 442.89 15.15 71.55 16.12 12.94 14.35 61.50 221.80 74.00 45.05 64.83Nirlon Ltd. 201103 58.22 111.10 104.91 62.75 96.33 0.36 0.06 9.70 0.75 201206 31.06 1.92 22.16 62.37 -4.45 -2.48 48.55 348.42 61.75 30.50 13.22Sangam (India) Ltd. 201103 39.42 1171.52 37.46 195.79 17.21 56.59 14.36 15.19 26.35 201206 411.09 21.78 51.92 12.59 9.77 9.91 59.05 232.78 62.30 26.45 36.99Shri Lakshmi Cotsyn Ltd. 201106 21.09 1798.38 17.12 258.94 15.23 104.11 49.35 12.22 21.97 201206 696.22 35.68 156.05 22.41 40.26 57.33 88.30 248.07 156.50 75.00 48.83SRF Ltd. 201203 57.42 4004.38 15.28 834.80 20.23 378.82 65.97 29.54 23.05 201206 809.52 -3.09 88.87 10.94 22.02 15.34 214.85 1238.20 324.90 192.15 49.95Sutlej Textiles & Inds. Ltd. 201203 10.92 1537.01 -2.82 146.76 11.57 31.73 29.06 15.44 12.00 201206 406.81 0.18 37.29 9.09 11.89 43.55 179.00 195.50 210.00 127.05 63.83Textile - Spinning Total 274.54 10067.76 2263.58 2568.68 347.40Bannari Amman Spinning Mills Ltd. 201103 15.75 549.24 54.58 130.84 26.76 38.80 24.63 13.65 20.41 201206 132.87 3.21 29.74 22.08 8.49 21.55 80.00 126.03 87.00 46.75 55.55DCM Ltd. 201203 17.38 770.91 12.41 32.59 5.13 10.07 4.49 12.87 5.25 201206 90.65 0.63 12.31 12.80 8.41 19.36 165.30 287.28 206.80 41.60 44.70Jindal Cotex Ltd. 201103 45.00 269.00 83.84 30.79 12.64 10.98 2.44 6.21 5.24 201206 71.87 12.86 2.89 4.03 -9.16 -8.14 44.45 200.04 103.65 39.75 30.55Nahar Industrial Enterprises Ltd. 201103 40.03 1244.42 22.31 215.18 17.67 31.53 7.88 9.09 5.18 201206 378.66 -1.09 55.79 14.67 4.57 4.59 34.50 135.50 52.80 28.05 65.48RSWM Ltd. 201203 23.15 2138.89 0.15 130.66 7.01 -53.47 -18.45 5.00 -19.70 201206 527.66 18.90 61.29 11.55 4.06 7.02 90.00 208.34 105.95 60.00 51.44Vardhman Textiles Ltd. 201203 62.52 4640.71 5.03 615.79 14.58 168.35 22.61 8.97 7.53 201206 939.58 -2.15 178.51 18.83 54.89 34.49 232.90 1482.45 265.00 155.30 61.01Winsome Yarns Ltd. 201203 70.71 454.59 37.55 21.78 6.61 -31.43 -4.44 1.74 -25.67 201206 122.30 41.45 19.68 15.63 2.51 1.42 18.25 129.04 33.20 17.25 38.67Textile - Weaving Total 13.06 18.30 3.69 2606.09 21.73Tuni Textile Mills Ltd. 201103 13.06 18.30 15.20 1.05 6.42 0.23 0.18 5.71 1.99 201206 3.69 -40.59 0.37 9.23 -0.10 -0.03 199.50 2606.09 212.00 24.20 21.73Trading Total 464.98 137989.83 23327.34 99787.09 739.46Adani Enterprises Ltd. 201203 109.98 39355.63 49.04 4997.82 14.07 2020.33 16.72 7.04 10.86 201206 11024.59 14.89 1079.87 9.79 206.44 14.65 159.20 17508.98 627.45 151.75 79.96CCL International Ltd 201103 6.61 52.61 -2.57 0.32 3.15 0.96 1.46 15.82 11.75 201206 20.14 91.48 1.01 4.96 0.44 0.18 131.00 1257.12 140.00 13.00 29.40Cravatex Ltd. 201203 2.58 240.55 159.83 14.01 7.58 9.19 35.57 48.21 32.72 201206 56.80 30.84 3.70 6.39 1.63 25.26 442.10 114.25 799.00 412.00 75.00India Motor Parts & Accessories Ltd. 201203 4.16 501.42 16.80 41.89 9.27 32.25 77.54 31.25 22.09 201206 125.63 -0.22 9.06 7.20 7.09 68.18 808.55 336.34 901.80 590.00 30.54KGN Industries Ltd. 201103 22.25 3.07 -95.06 -1.72 32.57 0.56 0.03 1.56 0.93 201206 -100.00 0.17 100.00 0.10 0.02 17.25 383.81 33.75 13.40 51.02Kothari Products Ltd. 201103 6.63 1585.34 177.06 33.50 5.78 66.00 99.55 13.53 11.17 201206 919.52 117.87 0.74 0.08 0.93 5.61 420.40 278.81 608.00 345.05 75.00MMTC Ltd. 201103 100.00 69613.03 52.61 70.68 0.83 112.26 0.26 7.75 7.16 201206 5232.20 -74.38 -3.68 -0.07 12.06 0.48 754.45 75445.00 1009.00 438.55 99.33NCL Research & Financial Services Ltd. 201103 3.40 5.29 43.37 -0.03 4.27 0.14 0.42 3.77 2.60 201206 -100.00 0.13 49.24 0.12 1.08 511.40 297.48 536.95 94.90 6.07Newtime Infrastructure Ltd. 201106 17.03 1.88 1658.03 1.65 88.17 1.14 0.07 6.26 4.72 201206 0.16 30.00 0.05 29.49 0.04 0.01 50.50 860.25 59.50 18.00 73.67Shree Global Tradefin Ltd. 201103 102.91 699.33 98.42 -3.87 -0.48 -3.38 -0.16 -0.45 -1.57 201206 80.78 221.18 2.03 2.52 1.68 0.32 47.50 992.28 398.90 41.30 73.76State Trading Corpn. Of India Ltd. 201103 60.00 19984.84 -7.08 -499.88 1.32 56.44 9.41 9.79 8.53 201206 4262.55 -53.96 57.66 1.31 2.75 1.83 258.05 1548.30 333.95 110.95 91.02Ushdev International Ltd. 201203 29.43 5946.85 79.16 215.54 4.01 72.34 24.58 44.10 20.81 201206 1604.97 35.92 59.52 3.71 23.95 32.55 259.80 764.48 349.00 185.60 54.69Transmission Towers / Equipments Total 243.77 18039.70 3767.18 3996.81 275.10A2Z Maintenance & Engineering Services Ltd. 201103 74.18 1344.39 10.66 225.89 17.96 79.40 10.40 17.21 10.09 201206 207.20 9.32 27.23 13.11 4.24 2.29 68.80 510.34 242.90 57.90 44.68BS Transcomm Ltd. 201103 21.88 871.69 68.71 122.26 13.49 50.97 23.29 27.48 25.73 201206 349.75 42.76 41.56 11.88 13.32 24.35 184.50 403.66 231.80 86.20 64.52Jyoti Structures Ltd. 201203 16.44 2677.65 11.59 346.00 12.93 93.02 11.17 32.96 15.17 201206 653.82 2.53 64.06 9.78 17.34 8.43 38.60 317.38 79.00 35.05 27.81Kalpataru Power Transmission Ltd. 201203 30.69 5307.60 21.71 530.61 10.51 203.97 12.29 17.25 11.68 201206 689.86 20.32 70.39 10.06 27.35 7.13 68.20 1046.60 134.30 65.20 57.41KEC International Ltd. 201203 51.42 5814.74 29.89 505.93 9.88 209.30 8.14 29.78 20.38 201206 1336.96 33.03 103.22 7.57 33.16 5.16 57.75 1484.69 68.70 31.80 43.92Sujana Towers Ltd. 201103 49.16 2023.64 159.32 265.27 13.33 92.83 2.22 25.16 19.48 201206 529.60 22.36 34.51 6.51 -0.31 0.02 4.51 234.14 30.90 4.26 36.76Travel Services Total 89.46 870.53 660.51 3013.92 145.89Cox & Kings (India) Ltd. 201103 68.26 496.74 24.29 230.05 53.56 130.47 18.89 14.75 13.00 201206 531.94 238.75 239.72 45.06 131.73 43.02 134.65 1838.35 234.75 119.00 58.79Thomas Cook (India) Ltd. 201112 21.20 373.79 17.56 88.71 31.59 56.24 2.65 17.91 15.42 201206 128.57 21.13 50.30 37.69 31.01 5.83 55.15 1175.57 74.90 32.20 87.10TV Broadcasting & Software Production Total 935.46 12616.67 3216.26 43346.89 908.94Balaji Telefilms Ltd. 201203 13.04 194.42 -0.15 -8.94 13.80 20.44 3.13 5.15 5.35 201206 36.38 2.03 0.19 0.48 1.39 0.85 42.35 276.17 49.55 27.60 41.61Den Networks Ltd. 201103 130.49 1022.11 12.28 90.54 12.38 44.33 2.88 8.51 5.89 201206 194.35 -30.25 38.54 19.78 14.25 3.69 121.15 1608.02 131.25 39.00 53.77Dish T V India Ltd. 201203 106.36 1957.93 36.28 495.99 28.94 -133.14 -1.25 4.45 0.00 201206 519.95 12.34 155.59 29.92 -32.32 -1.22 69.05 7350.56 83.75 52.00 64.75Entertainment Network (India) Ltd. 201203 47.67 311.05 -32.90 73.64 35.97 56.10 11.77 18.38 13.67 201206 69.93 2.49 20.45 29.20 13.42 11.26 222.55 1060.91 295.00 194.00 71.15Eros International Media Ltd. 201103 91.41 706.97 10.31 156.14 23.80 118.21 12.82 24.65 26.23 201206 257.03 67.11 51.71 20.12 29.66 13.69 174.40 1600.60 277.00 158.20 77.80Hinduja Ventures Ltd 201203 20.56 495.08 27.61 125.22 44.37 122.77 48.87 19.60 17.50 201206 147.07 45.95 52.16 33.40 32.59 51.44 349.25 717.90 414.95 286.20 65.70New Delhi Television Ltd. 201103 25.79 418.57 -29.12 -156.82 -28.29 -178.99 -26.97 -19.27 -52.07 201206 105.58 -1.69 -18.91 -17.70 -28.52 -16.19 46.85 302.05 65.00 24.75 61.45Raj Television Network Ltd. 201203 12.98 54.06 21.35 14.35 25.07 9.21 7.10 11.79 10.14 201206 16.26 23.37 5.14 31.62 3.78 11.66 204.05 264.82 224.90 50.30 72.48Sri Adhikari Brothers Television Network Ltd. 201103 22.88 49.35 66.76 1.01 3.04 -11.44 -5.00 -4.81 -8.55 201206 12.58 50.32 5.00 39.78 1.69 2.74 93.45 230.48 100.65 51.00 44.57Sun TV Network Ltd. 201103 197.04 2013.46 38.59 1577.86 80.78 760.75 19.53 52.22 36.76 201206 425.75 -6.22 322.97 75.86 164.31 16.68 294.60 11609.73 343.00 176.75 77.00TV Today Network Ltd. 201103 29.73 293.26 2.97 25.85 12.07 12.42 2.09 5.53 4.04 201206 70.58 0.31 3.12 4.41 -0.35 -0.24 59.65 354.66 71.90 41.10 57.46TV18 Broadcast Ltd. 201203 72.42 1409.86 74.23 -62.30 1.67 -96.22 -2.04 3.15 -14.30 201206 339.79 29.97 15.06 4.34 -28.53 -2.59 21.25 769.42 51.80 17.50 59.76Wire & Wireless (India) Ltd. 201203 45.22 342.82 12.01 -2.24 5.60 -94.87 -2.02 -15.21 0.00 201206 109.66 39.79 25.81 23.13 -4.77 -0.09 20.65 933.82 24.20 5.70 63.43Zee Entertainment Enterprises Ltd. 201203 95.90 3040.50 1.05 719.00 28.87 590.60 6.14 25.77 18.09 201206 842.96 20.74 233.25 27.67 157.00 6.63 167.60 15986.75 175.50 109.65 43.87Zee News Ltd. 201203 23.98 307.22 10.99 49.25 22.43 15.11 0.48 17.84 8.23 201206 68.40 7.46 5.34 7.75 2.61 0.29 11.72 281.00 14.30 8.65 54.14Tyres & Allied Total 265.22 39365.53 10420.25 14210.52 460.51Apollo Tyres Ltd. 201203 50.40 12153.29 37.05 1122.69 9.36 412.12 8.13 20.43 15.73 201206 3164.70 12.13 351.59 11.11 138.89 10.95 95.35 4805.88 98.20 51.95 46.94Balkrishna Industries Ltd. 201203 19.33 3016.64 41.48 512.04 16.92 268.94 27.82 24.65 27.28 201206 829.63 48.96 136.80 16.46 73.09 30.25 276.05 2668.26 303.00 151.40 54.37Ceat Ltd. 201203 34.24 4649.00 28.03 282.45 5.92 18.18 5.29 17.47 2.77 201206 1224.97 10.31 113.74 8.44 29.02 33.89 120.20 411.61 125.00 66.20 52.54Dunlop India Ltd. 201203 71.98 19.83 -88.58 -0.90 -3.14 -11.47 -1.59 -0.40 -4.89 201206 -100.00 -0.54 0.00 -2.28 -0.75 9.16 111.74 16.95 8.85 38.35Goodyear India Ltd. 201112 23.07 1513.43 16.67 108.84 7.49 64.60 28.00 35.00 22.24 201206 399.89 2.85 24.83 6.19 14.25 24.71 334.15 770.77 412.80 269.25 74.00JK Tyre & Inds. Ltd. 201203 41.06 6947.10 16.20 328.86 4.46 -38.22 -7.79 8.43 -5.13 201206 1434.08 2.28 125.87 7.88 24.71 24.07 113.55 466.23 125.15 53.50 47.34MRF Ltd. 201109 4.24 9751.81 30.55 805.22 7.79 618.78 1459.36 25.88 31.07 201206 3006.19 16.95 323.11 9.68 144.56 1363.77 10643.30 4513.98 11570.00 6330.00 27.20PTL Enterprises Ltd. 201203 13.24 229.13 17.90 60.42 27.65 17.47 2.64 24.77 60.58 201206 9.13 91.30 4.67 2.82 32.45 214.78 46.85 25.00 74.92TVS Srichakra Ltd. 201103 7.66 1085.31 54.89 90.67 8.69 39.14 51.12 0.00 0.00 201206 360.78 3.98 20.37 5.62 1.84 9.62 322.95 247.28 400.00 260.05 44.85Watches & Accessories Total 106.65 9204.59 2274.82 19960.02 205.89KDDL Ltd. 201103 7.77 172.65 39.81 17.70 12.33 4.35 7.12 14.19 12.11 201206 25.11 14.34 5.54 21.24 1.90 8.33 132.00 119.28 160.80 102.50 52.84Timex Group India Ltd. 201203 10.10 183.51 5.98 8.83 4.97 4.53 0.18 9.30 14.77 201206 44.06 2.23 -5.20 -11.78 -5.85 -2.32 20.10 202.91 31.15 17.50 100.00Titan Industries Ltd. 201203 88.78 8848.43 35.44 828.15 10.35 601.50 6.77 67.29 48.19 201206 2205.65 9.16 212.12 9.62 156.09 7.03 221.20 19637.83 254.95 154.40 53.05Wood & Wood Products Total 38.83 3307.81 905.54 1731.17 217.77Century Plyboards (India) Ltd. 201103 22.22 1530.42 21.24 249.18 15.74 189.73 6.96 17.28 34.17 201206 454.32 13.52 84.36 17.20 17.95 2.37 51.25 1138.64 70.00 44.00 72.88Greenply Industries Ltd. 201203 12.07 1709.29 35.53 176.17 10.02 56.71 23.49 21.05 16.84 201206 430.54 22.20 49.94 11.59 17.97 29.78 187.25 451.95 250.00 132.55 55.00Jolly Board Ltd. 201203 4.55 68.10 12.05 7.29 22.44 8.06 17.11 7.95 6.22 201206 20.68 24.27 3.78 18.26 3.18 27.93 309.20 140.58 450.00 258.00 89.89
Quarter End Current DataYear End

33 Sept 2012 Investment Montor
Company Name Year End Equity Net Sales Growth(%) EBITDA EBITDA(%) PAT EPS ROCE RONW Qtr End Net Sales Growth(%) EBITDA EBITDA% PAT% EPS CMP Mcap 52WH 52WL PR. Holding
Pradip Overseas Ltd. 201103 40.37 2161.19 34.58 197.52 9.91 69.26 17.16 21.53 21.03 201206 279.50 -51.24 39.43 14.11 2.04 2.02 79.95 322.73 114.70 51.60 58.79Provogue (India) Ltd. 201103 22.87 686.92 39.25 63.49 12.72 17.79 2.29 3.79 1.92 201206 99.55 -3.51 11.30 10.93 3.08 1.08 14.70 168.10 36.40 11.15 46.64Rajapalayam Mills Ltd. 201203 7.38 334.60 2.63 43.21 18.82 -0.05 -0.06 0.00 0.00 201206 76.94 10.26 16.14 19.16 1.47 7.97 203.40 150.03 244.00 170.10 53.15Raymond Ltd. 201203 61.38 3642.41 19.68 452.41 14.30 143.01 25.38 15.65 11.08 201206 836.94 9.99 30.92 3.69 -40.99 -22.80 347.75 2134.52 439.00 300.25 39.52Ruby Mills Ltd. 201103 4.18 202.42 30.79 100.11 50.53 57.74 138.13 13.84 46.28 201206 36.70 -15.57 7.79 21.17 1.55 14.83 643.30 268.90 1019.50 590.05 74.92Rupa & Co Ltd. 201103 7.95 650.03 22.08 68.63 10.76 33.70 42.38 21.07 21.68 201206 175.55 46.31 22.45 12.79 11.17 5.62 140.00 1113.34 300.00 130.00 74.93S Kumars Nationwide Ltd. 201103 284.98 5180.55 34.99 1029.52 20.70 392.49 11.43 15.97 16.50 201206 1616.54 10.95 321.66 19.87 75.09 8.68 19.40 576.96 52.00 18.45 48.59SEL Manufacturing Company Ltd. 201103 99.35 1702.69 81.61 290.80 18.47 112.55 11.32 11.69 14.86 201206 603.34 19.00 87.51 14.50 16.81 2.05 5.88 194.83 15.57 5.77 8.37Shree Ram Urban Infrastructure Ltd. 201112 41.13 378.66 994.30 -2.61 0.15 0.29 0.07 0.05 0.09 201206 65.63 -75.99 0.64 0.98 0.53 0.52 125.00 514.18 178.90 121.00 70.67Siyaram Silk Mills Ltd. 201203 9.37 915.54 6.51 116.53 11.37 56.73 60.53 30.60 23.30 201206 205.06 13.83 22.98 11.18 10.31 44.01 290.00 271.79 331.70 223.70 67.06Sudar Garments Ltd. 201103 18.55 115.62 119.16 19.06 16.49 7.24 3.90 15.11 12.51 201206 67.98 127.23 12.99 19.11 5.81 12.52 65.10 120.74 90.00 43.05 50.03Swan Energy Ltd 201103 19.00 403.11 -24.63 73.20 20.02 43.82 4.61 22.61 30.43 201206 46.30 269.24 6.64 13.35 2.66 1.12 131.55 1249.73 147.70 56.00 75.00Trident Ltd. 201103 222.30 2537.46 40.71 395.60 16.27 67.08 3.02 9.50 12.97 201206 801.25 17.28 132.87 16.47 0.96 0.13 8.97 274.34 14.45 8.25 54.11Voith Paper Fabrics India Ltd 201109 4.39 54.43 6.02 12.31 32.74 11.53 26.26 16.80 11.46 201206 14.47 4.26 4.11 27.70 3.49 31.77 274.80 120.71 340.00 206.00 74.04Welspun India Ltd. 201103 88.98 2054.81 6.07 170.28 12.94 3.22 0.16 6.56 0.55 201206 705.96 46.76 124.06 16.57 36.54 16.93 55.00 490.44 61.35 22.15 47.91Zodiac Clothing Company Ltd. 201203 19.27 377.53 5.72 28.04 8.52 17.75 9.21 11.02 7.99 201206 77.23 -7.33 4.13 5.08 1.02 2.12 169.45 326.54 274.70 164.90 59.71Textile - Machinery Total 11.27 2305.37 424.06 2261.69 28.34Lakshmi Machine Works Ltd. 201203 11.27 2305.37 26.38 270.95 14.23 138.83 123.23 20.53 16.40 201206 424.06 -15.55 53.07 12.26 31.00 110.07 2007.45 2261.69 2198.90 1426.00 28.34Textile - Manmade Fibres Total 428.58 19448.29 5348.25 3853.49 384.51Indo Rama Synthetics (India) Ltd. 201203 151.82 2968.80 5.36 111.80 10.03 31.96 2.11 11.38 5.88 201206 754.13 21.51 -13.57 -1.79 -26.10 -6.88 20.00 303.64 37.80 19.55 64.10JBF Industries Ltd. 201103 71.65 6465.57 30.86 942.50 14.31 546.11 76.22 28.68 47.58 201206 1796.53 12.95 130.13 6.76 33.70 18.69 147.45 1065.07 151.30 89.00 42.76Nahar Spinning Mills Ltd. 201103 18.03 1391.52 25.31 285.23 21.55 119.73 33.20 13.49 19.62 201206 442.89 15.15 71.55 16.12 12.94 14.35 61.50 221.80 74.00 45.05 64.83Nirlon Ltd. 201103 58.22 111.10 104.91 62.75 96.33 0.36 0.06 9.70 0.75 201206 31.06 1.92 22.16 62.37 -4.45 -2.48 48.55 348.42 61.75 30.50 13.22Sangam (India) Ltd. 201103 39.42 1171.52 37.46 195.79 17.21 56.59 14.36 15.19 26.35 201206 411.09 21.78 51.92 12.59 9.77 9.91 59.05 232.78 62.30 26.45 36.99Shri Lakshmi Cotsyn Ltd. 201106 21.09 1798.38 17.12 258.94 15.23 104.11 49.35 12.22 21.97 201206 696.22 35.68 156.05 22.41 40.26 57.33 88.30 248.07 156.50 75.00 48.83SRF Ltd. 201203 57.42 4004.38 15.28 834.80 20.23 378.82 65.97 29.54 23.05 201206 809.52 -3.09 88.87 10.94 22.02 15.34 214.85 1238.20 324.90 192.15 49.95Sutlej Textiles & Inds. Ltd. 201203 10.92 1537.01 -2.82 146.76 11.57 31.73 29.06 15.44 12.00 201206 406.81 0.18 37.29 9.09 11.89 43.55 179.00 195.50 210.00 127.05 63.83Textile - Spinning Total 274.54 10067.76 2263.58 2568.68 347.40Bannari Amman Spinning Mills Ltd. 201103 15.75 549.24 54.58 130.84 26.76 38.80 24.63 13.65 20.41 201206 132.87 3.21 29.74 22.08 8.49 21.55 80.00 126.03 87.00 46.75 55.55DCM Ltd. 201203 17.38 770.91 12.41 32.59 5.13 10.07 4.49 12.87 5.25 201206 90.65 0.63 12.31 12.80 8.41 19.36 165.30 287.28 206.80 41.60 44.70Jindal Cotex Ltd. 201103 45.00 269.00 83.84 30.79 12.64 10.98 2.44 6.21 5.24 201206 71.87 12.86 2.89 4.03 -9.16 -8.14 44.45 200.04 103.65 39.75 30.55Nahar Industrial Enterprises Ltd. 201103 40.03 1244.42 22.31 215.18 17.67 31.53 7.88 9.09 5.18 201206 378.66 -1.09 55.79 14.67 4.57 4.59 34.50 135.50 52.80 28.05 65.48RSWM Ltd. 201203 23.15 2138.89 0.15 130.66 7.01 -53.47 -18.45 5.00 -19.70 201206 527.66 18.90 61.29 11.55 4.06 7.02 90.00 208.34 105.95 60.00 51.44Vardhman Textiles Ltd. 201203 62.52 4640.71 5.03 615.79 14.58 168.35 22.61 8.97 7.53 201206 939.58 -2.15 178.51 18.83 54.89 34.49 232.90 1482.45 265.00 155.30 61.01Winsome Yarns Ltd. 201203 70.71 454.59 37.55 21.78 6.61 -31.43 -4.44 1.74 -25.67 201206 122.30 41.45 19.68 15.63 2.51 1.42 18.25 129.04 33.20 17.25 38.67Textile - Weaving Total 13.06 18.30 3.69 2606.09 21.73Tuni Textile Mills Ltd. 201103 13.06 18.30 15.20 1.05 6.42 0.23 0.18 5.71 1.99 201206 3.69 -40.59 0.37 9.23 -0.10 -0.03 199.50 2606.09 212.00 24.20 21.73Trading Total 464.98 137989.83 23327.34 99787.09 739.46Adani Enterprises Ltd. 201203 109.98 39355.63 49.04 4997.82 14.07 2020.33 16.72 7.04 10.86 201206 11024.59 14.89 1079.87 9.79 206.44 14.65 159.20 17508.98 627.45 151.75 79.96CCL International Ltd 201103 6.61 52.61 -2.57 0.32 3.15 0.96 1.46 15.82 11.75 201206 20.14 91.48 1.01 4.96 0.44 0.18 131.00 1257.12 140.00 13.00 29.40Cravatex Ltd. 201203 2.58 240.55 159.83 14.01 7.58 9.19 35.57 48.21 32.72 201206 56.80 30.84 3.70 6.39 1.63 25.26 442.10 114.25 799.00 412.00 75.00India Motor Parts & Accessories Ltd. 201203 4.16 501.42 16.80 41.89 9.27 32.25 77.54 31.25 22.09 201206 125.63 -0.22 9.06 7.20 7.09 68.18 808.55 336.34 901.80 590.00 30.54KGN Industries Ltd. 201103 22.25 3.07 -95.06 -1.72 32.57 0.56 0.03 1.56 0.93 201206 -100.00 0.17 100.00 0.10 0.02 17.25 383.81 33.75 13.40 51.02Kothari Products Ltd. 201103 6.63 1585.34 177.06 33.50 5.78 66.00 99.55 13.53 11.17 201206 919.52 117.87 0.74 0.08 0.93 5.61 420.40 278.81 608.00 345.05 75.00MMTC Ltd. 201103 100.00 69613.03 52.61 70.68 0.83 112.26 0.26 7.75 7.16 201206 5232.20 -74.38 -3.68 -0.07 12.06 0.48 754.45 75445.00 1009.00 438.55 99.33NCL Research & Financial Services Ltd. 201103 3.40 5.29 43.37 -0.03 4.27 0.14 0.42 3.77 2.60 201206 -100.00 0.13 49.24 0.12 1.08 511.40 297.48 536.95 94.90 6.07Newtime Infrastructure Ltd. 201106 17.03 1.88 1658.03 1.65 88.17 1.14 0.07 6.26 4.72 201206 0.16 30.00 0.05 29.49 0.04 0.01 50.50 860.25 59.50 18.00 73.67Shree Global Tradefin Ltd. 201103 102.91 699.33 98.42 -3.87 -0.48 -3.38 -0.16 -0.45 -1.57 201206 80.78 221.18 2.03 2.52 1.68 0.32 47.50 992.28 398.90 41.30 73.76State Trading Corpn. Of India Ltd. 201103 60.00 19984.84 -7.08 -499.88 1.32 56.44 9.41 9.79 8.53 201206 4262.55 -53.96 57.66 1.31 2.75 1.83 258.05 1548.30 333.95 110.95 91.02Ushdev International Ltd. 201203 29.43 5946.85 79.16 215.54 4.01 72.34 24.58 44.10 20.81 201206 1604.97 35.92 59.52 3.71 23.95 32.55 259.80 764.48 349.00 185.60 54.69Transmission Towers / Equipments Total 243.77 18039.70 3767.18 3996.81 275.10A2Z Maintenance & Engineering Services Ltd. 201103 74.18 1344.39 10.66 225.89 17.96 79.40 10.40 17.21 10.09 201206 207.20 9.32 27.23 13.11 4.24 2.29 68.80 510.34 242.90 57.90 44.68BS Transcomm Ltd. 201103 21.88 871.69 68.71 122.26 13.49 50.97 23.29 27.48 25.73 201206 349.75 42.76 41.56 11.88 13.32 24.35 184.50 403.66 231.80 86.20 64.52Jyoti Structures Ltd. 201203 16.44 2677.65 11.59 346.00 12.93 93.02 11.17 32.96 15.17 201206 653.82 2.53 64.06 9.78 17.34 8.43 38.60 317.38 79.00 35.05 27.81Kalpataru Power Transmission Ltd. 201203 30.69 5307.60 21.71 530.61 10.51 203.97 12.29 17.25 11.68 201206 689.86 20.32 70.39 10.06 27.35 7.13 68.20 1046.60 134.30 65.20 57.41KEC International Ltd. 201203 51.42 5814.74 29.89 505.93 9.88 209.30 8.14 29.78 20.38 201206 1336.96 33.03 103.22 7.57 33.16 5.16 57.75 1484.69 68.70 31.80 43.92Sujana Towers Ltd. 201103 49.16 2023.64 159.32 265.27 13.33 92.83 2.22 25.16 19.48 201206 529.60 22.36 34.51 6.51 -0.31 0.02 4.51 234.14 30.90 4.26 36.76Travel Services Total 89.46 870.53 660.51 3013.92 145.89Cox & Kings (India) Ltd. 201103 68.26 496.74 24.29 230.05 53.56 130.47 18.89 14.75 13.00 201206 531.94 238.75 239.72 45.06 131.73 43.02 134.65 1838.35 234.75 119.00 58.79Thomas Cook (India) Ltd. 201112 21.20 373.79 17.56 88.71 31.59 56.24 2.65 17.91 15.42 201206 128.57 21.13 50.30 37.69 31.01 5.83 55.15 1175.57 74.90 32.20 87.10TV Broadcasting & Software Production Total 935.46 12616.67 3216.26 43346.89 908.94Balaji Telefilms Ltd. 201203 13.04 194.42 -0.15 -8.94 13.80 20.44 3.13 5.15 5.35 201206 36.38 2.03 0.19 0.48 1.39 0.85 42.35 276.17 49.55 27.60 41.61Den Networks Ltd. 201103 130.49 1022.11 12.28 90.54 12.38 44.33 2.88 8.51 5.89 201206 194.35 -30.25 38.54 19.78 14.25 3.69 121.15 1608.02 131.25 39.00 53.77Dish T V India Ltd. 201203 106.36 1957.93 36.28 495.99 28.94 -133.14 -1.25 4.45 0.00 201206 519.95 12.34 155.59 29.92 -32.32 -1.22 69.05 7350.56 83.75 52.00 64.75Entertainment Network (India) Ltd. 201203 47.67 311.05 -32.90 73.64 35.97 56.10 11.77 18.38 13.67 201206 69.93 2.49 20.45 29.20 13.42 11.26 222.55 1060.91 295.00 194.00 71.15Eros International Media Ltd. 201103 91.41 706.97 10.31 156.14 23.80 118.21 12.82 24.65 26.23 201206 257.03 67.11 51.71 20.12 29.66 13.69 174.40 1600.60 277.00 158.20 77.80Hinduja Ventures Ltd 201203 20.56 495.08 27.61 125.22 44.37 122.77 48.87 19.60 17.50 201206 147.07 45.95 52.16 33.40 32.59 51.44 349.25 717.90 414.95 286.20 65.70New Delhi Television Ltd. 201103 25.79 418.57 -29.12 -156.82 -28.29 -178.99 -26.97 -19.27 -52.07 201206 105.58 -1.69 -18.91 -17.70 -28.52 -16.19 46.85 302.05 65.00 24.75 61.45Raj Television Network Ltd. 201203 12.98 54.06 21.35 14.35 25.07 9.21 7.10 11.79 10.14 201206 16.26 23.37 5.14 31.62 3.78 11.66 204.05 264.82 224.90 50.30 72.48Sri Adhikari Brothers Television Network Ltd. 201103 22.88 49.35 66.76 1.01 3.04 -11.44 -5.00 -4.81 -8.55 201206 12.58 50.32 5.00 39.78 1.69 2.74 93.45 230.48 100.65 51.00 44.57Sun TV Network Ltd. 201103 197.04 2013.46 38.59 1577.86 80.78 760.75 19.53 52.22 36.76 201206 425.75 -6.22 322.97 75.86 164.31 16.68 294.60 11609.73 343.00 176.75 77.00TV Today Network Ltd. 201103 29.73 293.26 2.97 25.85 12.07 12.42 2.09 5.53 4.04 201206 70.58 0.31 3.12 4.41 -0.35 -0.24 59.65 354.66 71.90 41.10 57.46TV18 Broadcast Ltd. 201203 72.42 1409.86 74.23 -62.30 1.67 -96.22 -2.04 3.15 -14.30 201206 339.79 29.97 15.06 4.34 -28.53 -2.59 21.25 769.42 51.80 17.50 59.76Wire & Wireless (India) Ltd. 201203 45.22 342.82 12.01 -2.24 5.60 -94.87 -2.02 -15.21 0.00 201206 109.66 39.79 25.81 23.13 -4.77 -0.09 20.65 933.82 24.20 5.70 63.43Zee Entertainment Enterprises Ltd. 201203 95.90 3040.50 1.05 719.00 28.87 590.60 6.14 25.77 18.09 201206 842.96 20.74 233.25 27.67 157.00 6.63 167.60 15986.75 175.50 109.65 43.87Zee News Ltd. 201203 23.98 307.22 10.99 49.25 22.43 15.11 0.48 17.84 8.23 201206 68.40 7.46 5.34 7.75 2.61 0.29 11.72 281.00 14.30 8.65 54.14Tyres & Allied Total 265.22 39365.53 10420.25 14210.52 460.51Apollo Tyres Ltd. 201203 50.40 12153.29 37.05 1122.69 9.36 412.12 8.13 20.43 15.73 201206 3164.70 12.13 351.59 11.11 138.89 10.95 95.35 4805.88 98.20 51.95 46.94Balkrishna Industries Ltd. 201203 19.33 3016.64 41.48 512.04 16.92 268.94 27.82 24.65 27.28 201206 829.63 48.96 136.80 16.46 73.09 30.25 276.05 2668.26 303.00 151.40 54.37Ceat Ltd. 201203 34.24 4649.00 28.03 282.45 5.92 18.18 5.29 17.47 2.77 201206 1224.97 10.31 113.74 8.44 29.02 33.89 120.20 411.61 125.00 66.20 52.54Dunlop India Ltd. 201203 71.98 19.83 -88.58 -0.90 -3.14 -11.47 -1.59 -0.40 -4.89 201206 -100.00 -0.54 0.00 -2.28 -0.75 9.16 111.74 16.95 8.85 38.35Goodyear India Ltd. 201112 23.07 1513.43 16.67 108.84 7.49 64.60 28.00 35.00 22.24 201206 399.89 2.85 24.83 6.19 14.25 24.71 334.15 770.77 412.80 269.25 74.00JK Tyre & Inds. Ltd. 201203 41.06 6947.10 16.20 328.86 4.46 -38.22 -7.79 8.43 -5.13 201206 1434.08 2.28 125.87 7.88 24.71 24.07 113.55 466.23 125.15 53.50 47.34MRF Ltd. 201109 4.24 9751.81 30.55 805.22 7.79 618.78 1459.36 25.88 31.07 201206 3006.19 16.95 323.11 9.68 144.56 1363.77 10643.30 4513.98 11570.00 6330.00 27.20PTL Enterprises Ltd. 201203 13.24 229.13 17.90 60.42 27.65 17.47 2.64 24.77 60.58 201206 9.13 91.30 4.67 2.82 32.45 214.78 46.85 25.00 74.92TVS Srichakra Ltd. 201103 7.66 1085.31 54.89 90.67 8.69 39.14 51.12 0.00 0.00 201206 360.78 3.98 20.37 5.62 1.84 9.62 322.95 247.28 400.00 260.05 44.85Watches & Accessories Total 106.65 9204.59 2274.82 19960.02 205.89KDDL Ltd. 201103 7.77 172.65 39.81 17.70 12.33 4.35 7.12 14.19 12.11 201206 25.11 14.34 5.54 21.24 1.90 8.33 132.00 119.28 160.80 102.50 52.84Timex Group India Ltd. 201203 10.10 183.51 5.98 8.83 4.97 4.53 0.18 9.30 14.77 201206 44.06 2.23 -5.20 -11.78 -5.85 -2.32 20.10 202.91 31.15 17.50 100.00Titan Industries Ltd. 201203 88.78 8848.43 35.44 828.15 10.35 601.50 6.77 67.29 48.19 201206 2205.65 9.16 212.12 9.62 156.09 7.03 221.20 19637.83 254.95 154.40 53.05Wood & Wood Products Total 38.83 3307.81 905.54 1731.17 217.77Century Plyboards (India) Ltd. 201103 22.22 1530.42 21.24 249.18 15.74 189.73 6.96 17.28 34.17 201206 454.32 13.52 84.36 17.20 17.95 2.37 51.25 1138.64 70.00 44.00 72.88Greenply Industries Ltd. 201203 12.07 1709.29 35.53 176.17 10.02 56.71 23.49 21.05 16.84 201206 430.54 22.20 49.94 11.59 17.97 29.78 187.25 451.95 250.00 132.55 55.00Jolly Board Ltd. 201203 4.55 68.10 12.05 7.29 22.44 8.06 17.11 7.95 6.22 201206 20.68 24.27 3.78 18.26 3.18 27.93 309.20 140.58 450.00 258.00 89.89
Visit us at : www.rrfinance.com www.rrfcl.comVisit us at : www.rrfinance.com www.rrfcl.com
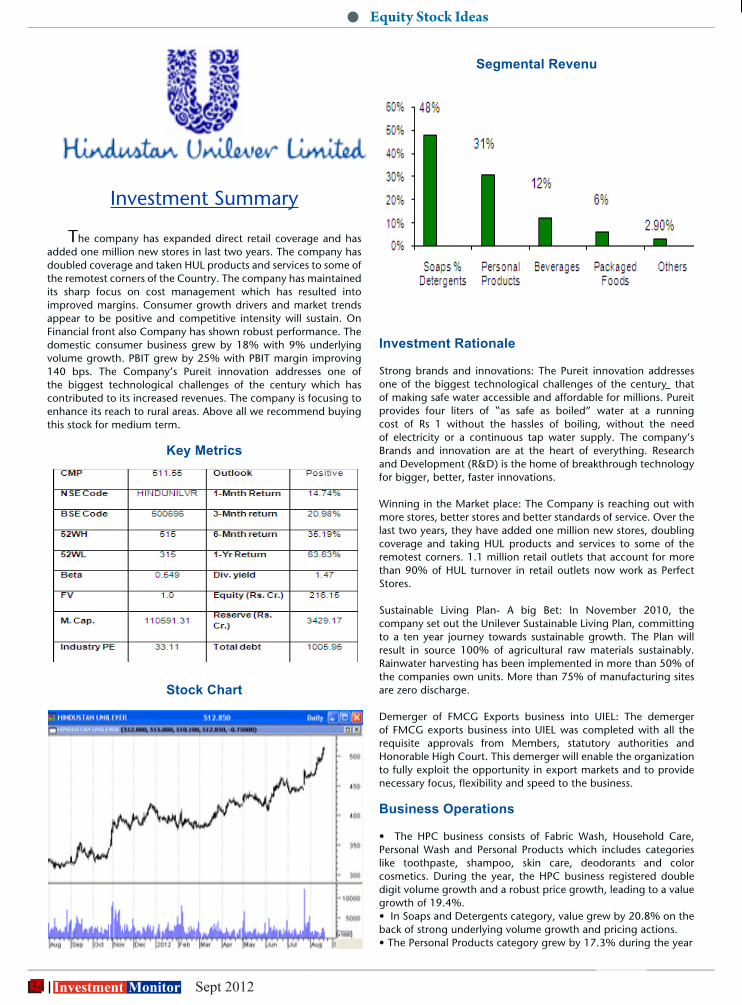
34 Investment Monitor Sept 2012
Equity Stock Ideas
Segmental Revenu
Investment Rationale
Strong brands and innovations: The Pureit innovation addresses one of the biggest technological challenges of the century – that of making safe water accessible and affordable for millions. Pureit provides four liters of “as safe as boiled” water at a running cost of Rs 1 without the hassles of boiling, without the need of electricity or a continuous tap water supply. The company’s Brands and innovation are at the heart of everything. Research and Development (R&D) is the home of breakthrough technology for bigger, better, faster innovations.
Winning in the Market place: The Company is reaching out with more stores, better stores and better standards of service. Over the last two years, they have added one million new stores, doubling coverage and taking HUL products and services to some of the remotest corners. 1.1 million retail outlets that account for more than 90% of HUL turnover in retail outlets now work as Perfect Stores.
Sustainable Living Plan- A big Bet: In November 2010, the company set out the Unilever Sustainable Living Plan, committing to a ten year journey towards sustainable growth. The Plan will result in source 100% of agricultural raw materials sustainably. Rainwater harvesting has been implemented in more than 50% of the companies own units. More than 75% of manufacturing sites are zero discharge.
Demerger of FMCG Exports business into UIEL: The demerger of FMCG exports business into UIEL was completed with all the requisite approvals from Members, statutory authorities and Honorable High Court. This demerger will enable the organization to fully exploit the opportunity in export markets and to provide necessary focus, flexibility and speed to the business.
Business Operations
• The HPC business consists of Fabric Wash, Household Care, Personal Wash and Personal Products which includes categories like toothpaste, shampoo, skin care, deodorants and color cosmetics. During the year, the HPC business registered double digit volume growth and a robust price growth, leading to a value growth of 19.4%.• In Soaps and Detergents category, value grew by 20.8% on the back of strong underlying volume growth and pricing actions.• The Personal Products category grew by 17.3% during the year
Investment Summary
The company has expanded direct retail coverage and has added one million new stores in last two years. The company has doubled coverage and taken HUL products and services to some of the remotest corners of the Country. The company has maintained its sharp focus on cost management which has resulted into improved margins. Consumer growth drivers and market trends appear to be positive and competitive intensity will sustain. On Financial front also Company has shown robust performance. The domestic consumer business grew by 18% with 9% underlying volume growth. PBIT grew by 25% with PBIT margin improving 140 bps. The Company’s Pureit innovation addresses one of the biggest technological challenges of the century which has contributed to its increased revenues. The company is focusing to enhance its reach to rural areas. Above all we recommend buying this stock for medium term.
Key Metrics
Stock Chart
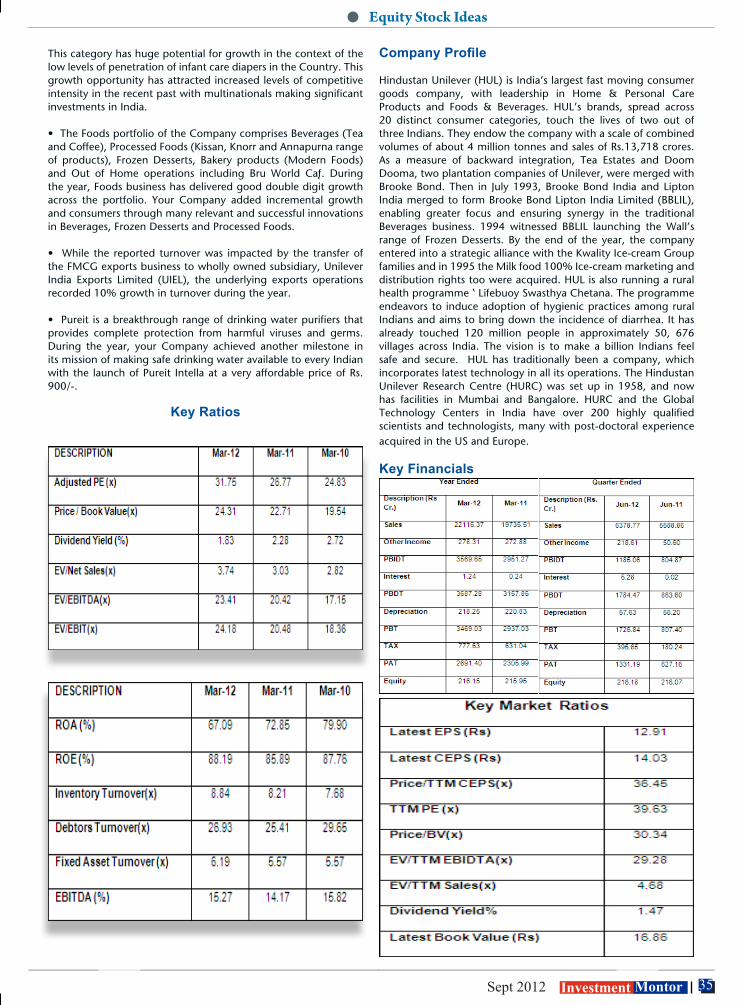
35 Sept 2012 Investment Montor
Equity Stock Ideas
This category has huge potential for growth in the context of the low levels of penetration of infant care diapers in the Country. This growth opportunity has attracted increased levels of competitive intensity in the recent past with multinationals making significant investments in India.
• The Foods portfolio of the Company comprises Beverages (Tea and Coffee), Processed Foods (Kissan, Knorr and Annapurna range of products), Frozen Desserts, Bakery products (Modern Foods) and Out of Home operations including Bru World Café. During the year, Foods business has delivered good double digit growth across the portfolio. Your Company added incremental growth and consumers through many relevant and successful innovations in Beverages, Frozen Desserts and Processed Foods.
• While the reported turnover was impacted by the transfer of the FMCG exports business to wholly owned subsidiary, Unilever India Exports Limited (UIEL), the underlying exports operations recorded 10% growth in turnover during the year.
• Pureit is a breakthrough range of drinking water purifiers that provides complete protection from harmful viruses and germs. During the year, your Company achieved another milestone in its mission of making safe drinking water available to every Indian with the launch of Pureit Intella at a very affordable price of Rs. 900/-.
Key Ratios
Company Profile
Hindustan Unilever (HUL) is India’s largest fast moving consumer goods company, with leadership in Home & Personal Care Products and Foods & Beverages. HUL’s brands, spread across 20 distinct consumer categories, touch the lives of two out of three Indians. They endow the company with a scale of combined volumes of about 4 million tonnes and sales of Rs.13,718 crores. As a measure of backward integration, Tea Estates and Doom Dooma, two plantation companies of Unilever, were merged with Brooke Bond. Then in July 1993, Brooke Bond India and Lipton India merged to form Brooke Bond Lipton India Limited (BBLIL), enabling greater focus and ensuring synergy in the traditional Beverages business. 1994 witnessed BBLIL launching the Wall’s range of Frozen Desserts. By the end of the year, the company entered into a strategic alliance with the Kwality Ice-cream Group families and in 1995 the Milk food 100% Ice-cream marketing and distribution rights too were acquired. HUL is also running a rural health programme ‘ Lifebuoy Swasthya Chetana. The programme endeavors to induce adoption of hygienic practices among rural Indians and aims to bring down the incidence of diarrhea. It has already touched 120 million people in approximately 50, 676 villages across India. The vision is to make a billion Indians feel safe and secure. HUL has traditionally been a company, which incorporates latest technology in all its operations. The Hindustan Unilever Research Centre (HURC) was set up in 1958, and now has facilities in Mumbai and Bangalore. HURC and the Global Technology Centers in India have over 200 highly qualified scientists and technologists, many with post-doctoral experience acquired in the US and Europe.
Key Financials
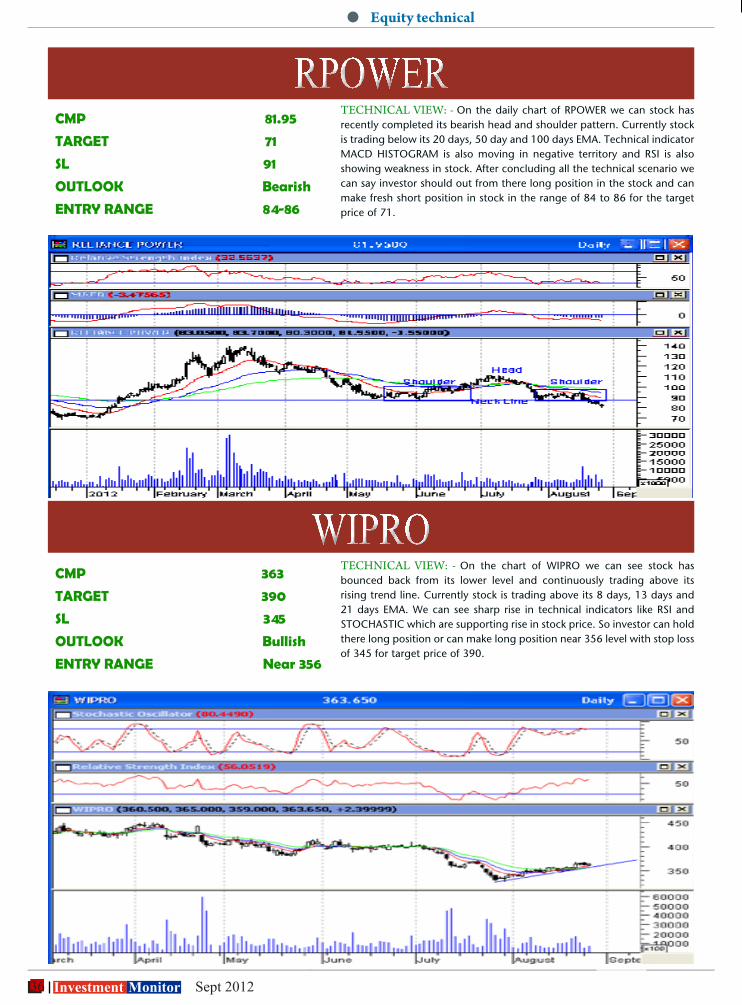
36 Investment Monitor Sept 2012
Equity technical
TECHNICAL VIEW: - On the daily chart of RPOWER we can stock has recently completed its bearish head and shoulder pattern. Currently stock is trading below its 20 days, 50 day and 100 days EMA. Technical indicator MACD HISTOGRAM is also moving in negative territory and RSI is also showing weakness in stock. After concluding all the technical scenario we can say investor should out from there long position in the stock and can make fresh short position in stock in the range of 84 to 86 for the target price of 71.
TECHNICAL VIEW: - On the chart of WIPRO we can see stock has bounced back from its lower level and continuously trading above its rising trend line. Currently stock is trading above its 8 days, 13 days and 21 days EMA. We can see sharp rise in technical indicators like RSI and STOCHASTIC which are supporting rise in stock price. So investor can hold there long position or can make long position near 356 level with stop loss of 345 for target price of 390.
WIPRO
RPOWER CMP 81.95
TARGET 71
SL 91
OUTLOOK Bearish
ENTRY RANGE 84-86
CMP 363
TARGET 390
SL 345
OUTLOOK Bullish
ENTRY RANGE Near 356
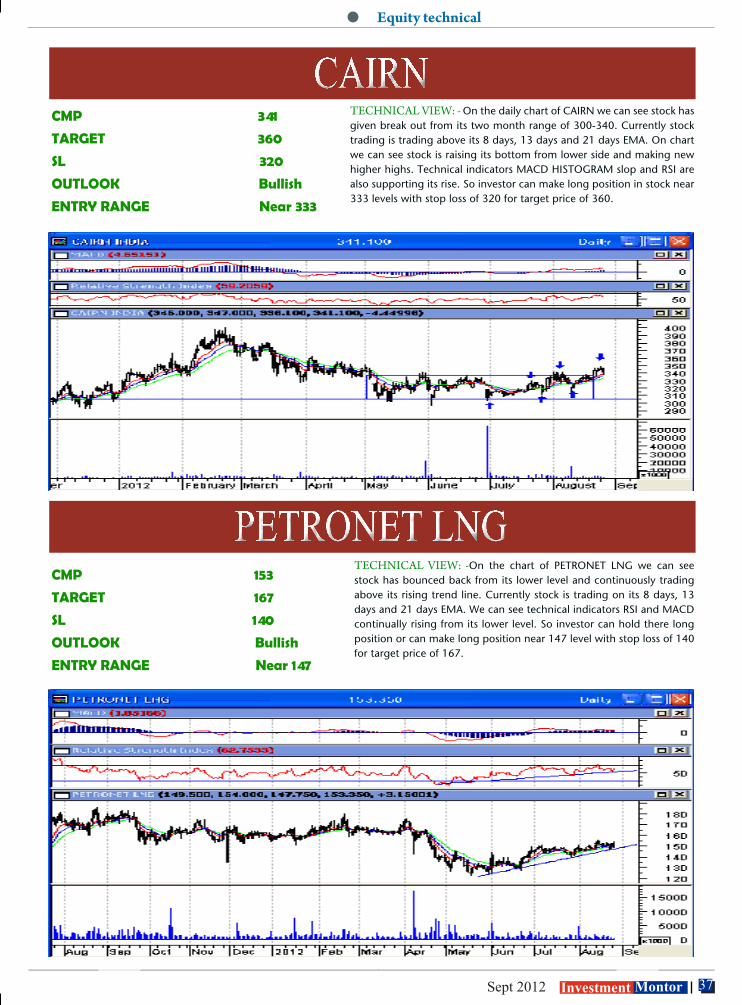
37 Sept 2012 Investment Montor
Equity technical
CAIRN
PETRONET LNG
TECHNICAL VIEW: - On the daily chart of CAIRN we can see stock has given break out from its two month range of 300-340. Currently stock trading is trading above its 8 days, 13 days and 21 days EMA. On chart we can see stock is raising its bottom from lower side and making new higher highs. Technical indicators MACD HISTOGRAM slop and RSI are also supporting its rise. So investor can make long position in stock near 333 levels with stop loss of 320 for target price of 360.
TECHNICAL VIEW: -On the chart of PETRONET LNG we can see stock has bounced back from its lower level and continuously trading above its rising trend line. Currently stock is trading on its 8 days, 13 days and 21 days EMA. We can see technical indicators RSI and MACD continually rising from its lower level. So investor can hold there long position or can make long position near 147 level with stop loss of 140 for target price of 167.
CMP 153
TARGET 167
SL 140
OUTLOOK Bullish
ENTRY RANGE Near 147
CMP 341
TARGET 360
SL 320
OUTLOOK Bullish
ENTRY RANGE Near 333
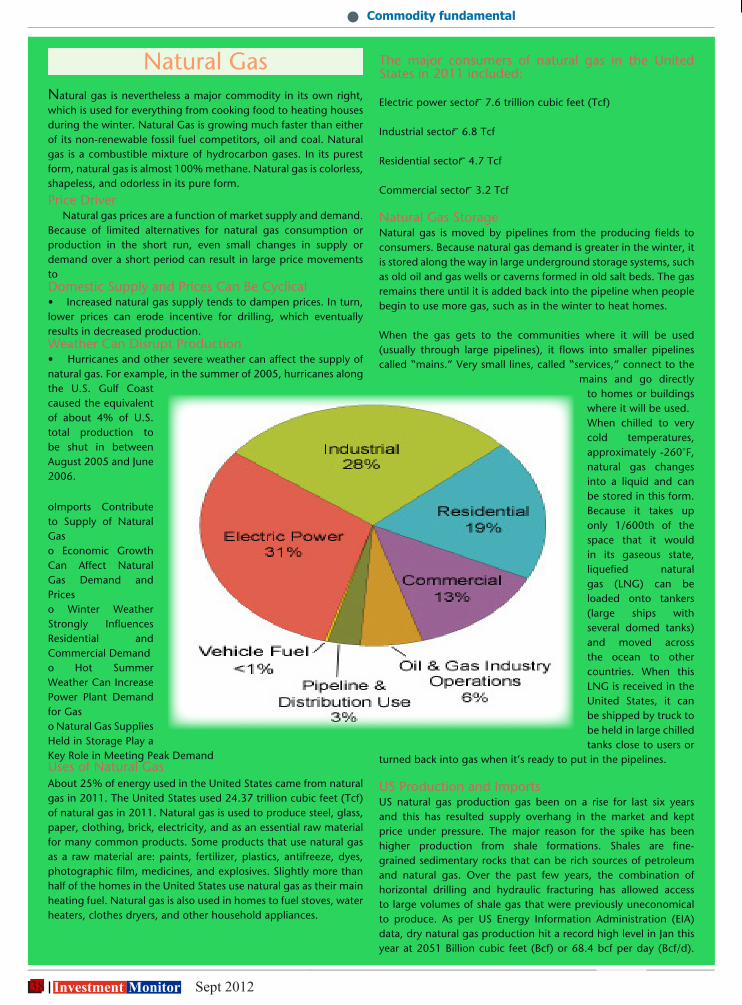
38 Investment Monitor Sept 2012
Natural GasNatural gas is nevertheless a major commodity in its own right, which is used for everything from cooking food to heating houses during the winter. Natural Gas is growing much faster than either of its non-renewable fossil fuel competitors, oil and coal. Natural gas is a combustible mixture of hydrocarbon gases. In its purest form, natural gas is almost 100% methane. Natural gas is colorless, shapeless, and odorless in its pure form.
Price Driver Natural gas prices are a function of market supply and demand. Because of limited alternatives for natural gas consumption or production in the short run, even small changes in supply or demand over a short period can result in large price movements to Domestic Supply and Prices Can Be Cyclical• Increased natural gas supply tends to dampen prices. In turn, lower prices can erode incentive for drilling, which eventually results in decreased production.Weather Can Disrupt Production• Hurricanes and other severe weather can affect the supply of natural gas. For example, in the summer of 2005, hurricanes along the U.S. Gulf Coast caused the equivalent of about 4% of U.S. total production to be shut in between August 2005 and June 2006.
oImports Contribute to Supply of Natural Gas o Economic Growth Can Affect Natural Gas Demand and Prices o Winter Weather Strongly Influences Residential and Commercial Demand o Hot Summer Weather Can Increase Power Plant Demand for Gas o Natural Gas Supplies Held in Storage Play a Key Role in Meeting Peak Demand Uses of Natural GasAbout 25% of energy used in the United States came from natural gas in 2011. The United States used 24.37 trillion cubic feet (Tcf) of natural gas in 2011. Natural gas is used to produce steel, glass, paper, clothing, brick, electricity, and as an essential raw material for many common products. Some products that use natural gas as a raw material are: paints, fertilizer, plastics, antifreeze, dyes, photographic film, medicines, and explosives. Slightly more than half of the homes in the United States use natural gas as their main heating fuel. Natural gas is also used in homes to fuel stoves, water heaters, clothes dryers, and other household appliances.
Commodity fundamental
The major consumers of natural gas in the United States in 2011 included:
Electric power sector — 7.6 trillion cubic feet (Tcf)
Industrial sector — 6.8 Tcf
Residential sector — 4.7 Tcf
Commercial sector — 3.2 Tcf
Natural Gas StorageNatural gas is moved by pipelines from the producing fields to consumers. Because natural gas demand is greater in the winter, it is stored along the way in large underground storage systems, such as old oil and gas wells or caverns formed in old salt beds. The gas remains there until it is added back into the pipeline when people begin to use more gas, such as in the winter to heat homes.
When the gas gets to the communities where it will be used (usually through large pipelines), it flows into smaller pipelines called “mains.” Very small lines, called “services,” connect to the
mains and go directly to homes or buildings where it will be used.When chilled to very cold temperatures, approximately -260°F, natural gas changes into a liquid and can be stored in this form. Because it takes up only 1/600th of the space that it would in its gaseous state, liquefied natural gas (LNG) can be loaded onto tankers (large ships with several domed tanks) and moved across the ocean to other countries. When this LNG is received in the United States, it can be shipped by truck to be held in large chilled tanks close to users or
turned back into gas when it’s ready to put in the pipelines.
US Production and ImportsUS natural gas production gas been on a rise for last six years and this has resulted supply overhang in the market and kept price under pressure. The major reason for the spike has been higher production from shale formations. Shales are fine-grained sedimentary rocks that can be rich sources of petroleum and natural gas. Over the past few years, the combination of horizontal drilling and hydraulic fracturing has allowed access to large volumes of shale gas that were previously uneconomical to produce. As per US Energy Information Administration (EIA) data, dry natural gas production hit a record high level in Jan this year at 2051 Billion cubic feet (Bcf) or 68.4 bcf per day (Bcf/d).
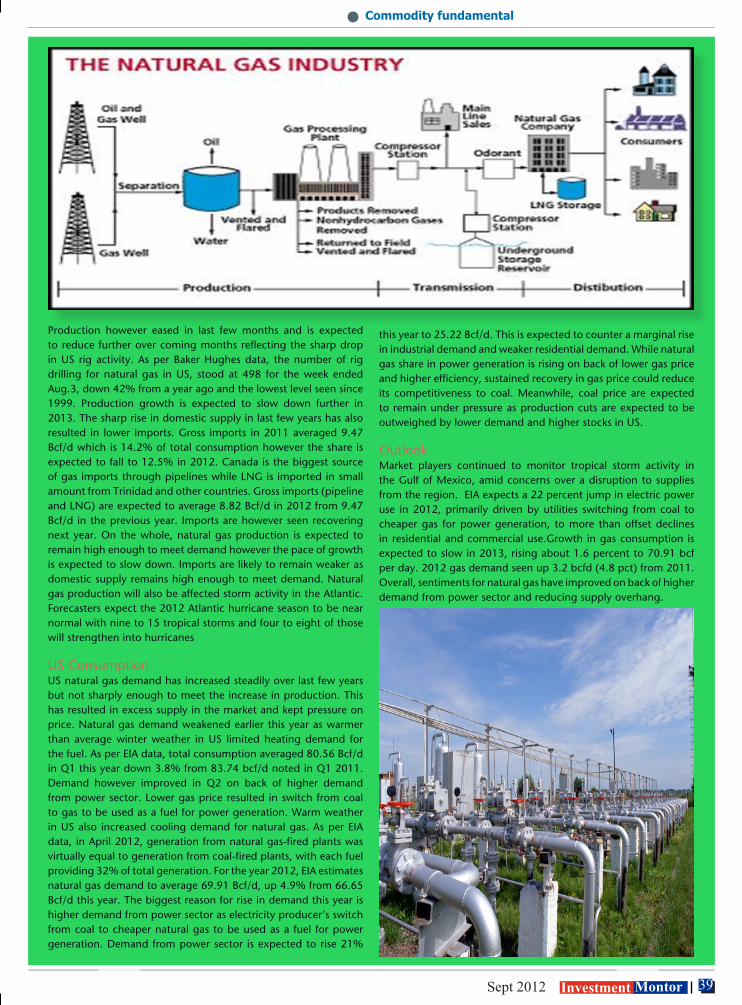
39 Sept 2012 Investment Montor
Commodity fundamental
Production however eased in last few months and is expected to reduce further over coming months reflecting the sharp drop in US rig activity. As per Baker Hughes data, the number of rig drilling for natural gas in US, stood at 498 for the week ended Aug.3, down 42% from a year ago and the lowest level seen since 1999. Production growth is expected to slow down further in 2013. The sharp rise in domestic supply in last few years has also resulted in lower imports. Gross imports in 2011 averaged 9.47 Bcf/d which is 14.2% of total consumption however the share is expected to fall to 12.5% in 2012. Canada is the biggest source of gas imports through pipelines while LNG is imported in small amount from Trinidad and other countries. Gross imports (pipeline and LNG) are expected to average 8.82 Bcf/d in 2012 from 9.47 Bcf/d in the previous year. Imports are however seen recovering next year. On the whole, natural gas production is expected to remain high enough to meet demand however the pace of growth is expected to slow down. Imports are likely to remain weaker as domestic supply remains high enough to meet demand. Natural gas production will also be affected storm activity in the Atlantic. Forecasters expect the 2012 Atlantic hurricane season to be near normal with nine to 15 tropical storms and four to eight of those will strengthen into hurricanes
US ConsumptionUS natural gas demand has increased steadily over last few years but not sharply enough to meet the increase in production. This has resulted in excess supply in the market and kept pressure on price. Natural gas demand weakened earlier this year as warmer than average winter weather in US limited heating demand for the fuel. As per EIA data, total consumption averaged 80.56 Bcf/d in Q1 this year down 3.8% from 83.74 bcf/d noted in Q1 2011. Demand however improved in Q2 on back of higher demand from power sector. Lower gas price resulted in switch from coal to gas to be used as a fuel for power generation. Warm weather in US also increased cooling demand for natural gas. As per EIA data, in April 2012, generation from natural gas-fired plants was virtually equal to generation from coal-fired plants, with each fuel providing 32% of total generation. For the year 2012, EIA estimates natural gas demand to average 69.91 Bcf/d, up 4.9% from 66.65 Bcf/d this year. The biggest reason for rise in demand this year is higher demand from power sector as electricity producer’s switch from coal to cheaper natural gas to be used as a fuel for power generation. Demand from power sector is expected to rise 21%
this year to 25.22 Bcf/d. This is expected to counter a marginal rise in industrial demand and weaker residential demand. While natural gas share in power generation is rising on back of lower gas price and higher efficiency, sustained recovery in gas price could reduce its competitiveness to coal. Meanwhile, coal price are expected to remain under pressure as production cuts are expected to be outweighed by lower demand and higher stocks in US.
OutlookMarket players continued to monitor tropical storm activity in the Gulf of Mexico, amid concerns over a disruption to supplies from the region. EIA expects a 22 percent jump in electric power use in 2012, primarily driven by utilities switching from coal to cheaper gas for power generation, to more than offset declines in residential and commercial use.Growth in gas consumption is expected to slow in 2013, rising about 1.6 percent to 70.91 bcf per day. 2012 gas demand seen up 3.2 bcfd (4.8 pct) from 2011.Overall, sentiments for natural gas have improved on back of higher demand from power sector and reducing supply overhang.
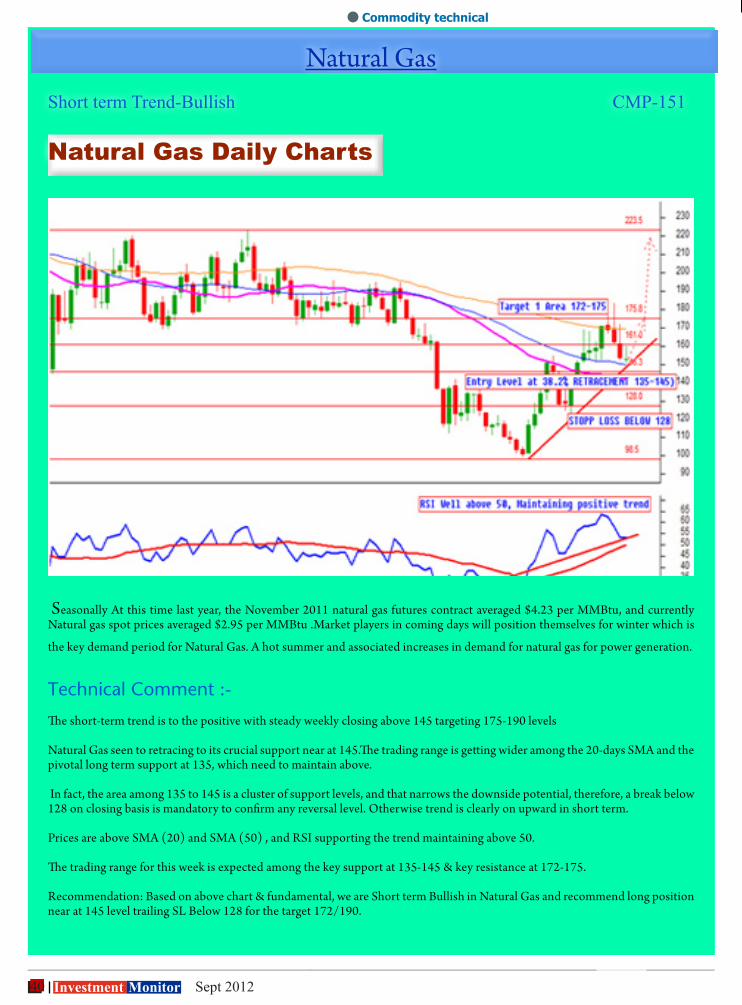
40 Investment Monitor Sept 2012
Commodity technical
Seasonally At this time last year, the November 2011 natural gas futures contract averaged $4.23 per MMBtu, and currently Natural gas spot prices averaged $2.95 per MMBtu .Market players in coming days will position themselves for winter which is
the key demand period for Natural Gas. A hot summer and associated increases in demand for natural gas for power generation.
Technical Comment :-
The short-term trend is to the positive with steady weekly closing above 145 targeting 175-190 levels
Natural Gas seen to retracing to its crucial support near at 145.The trading range is getting wider among the 20-days SMA and the pivotal long term support at 135, which need to maintain above.
In fact, the area among 135 to 145 is a cluster of support levels, and that narrows the downside potential, therefore, a break below 128 on closing basis is mandatory to confirm any reversal level. Otherwise trend is clearly on upward in short term.
Prices are above SMA (20) and SMA (50) , and RSI supporting the trend maintaining above 50.
The trading range for this week is expected among the key support at 135-145 & key resistance at 172-175.
Recommendation: Based on above chart & fundamental, we are Short term Bullish in Natural Gas and recommend long position near at 145 level trailing SL Below 128 for the target 172/190.
Natural GasShort term Trend-Bullish CMP-151
Natural Gas Daily Charts
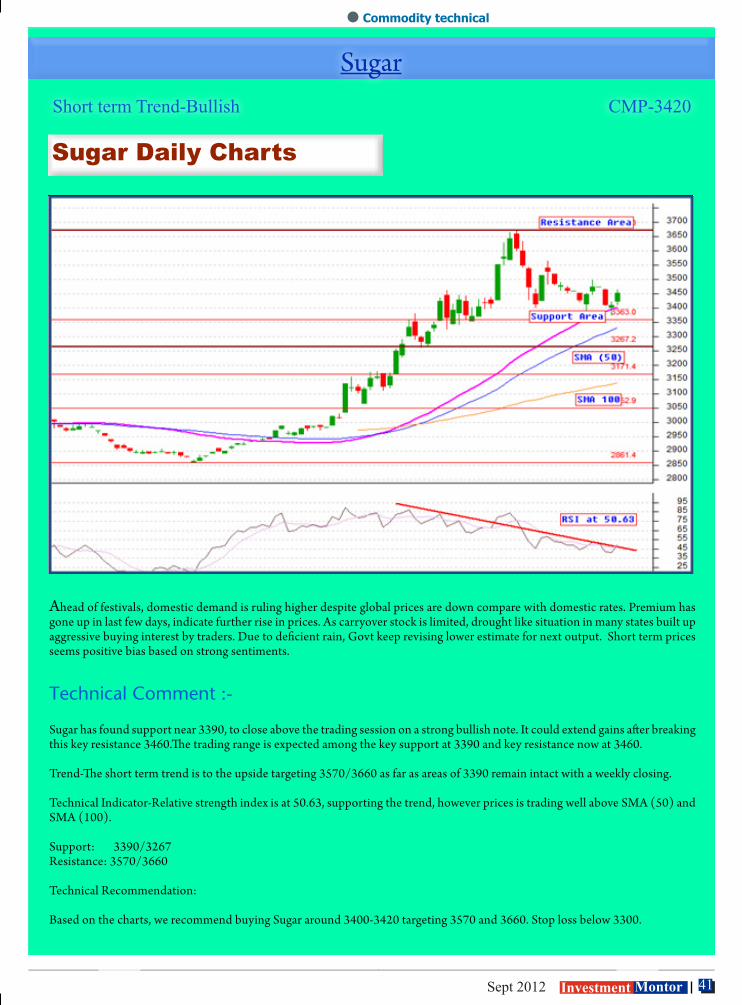
41 Sept 2012 Investment Montor
Commodity technical
Sugar Short term Trend-Bullish CMP-3420
Ahead of festivals, domestic demand is ruling higher despite global prices are down compare with domestic rates. Premium has gone up in last few days, indicate further rise in prices. As carryover stock is limited, drought like situation in many states built up aggressive buying interest by traders. Due to deficient rain, Govt keep revising lower estimate for next output. Short term prices seems positive bias based on strong sentiments.
Technical Comment :-
Sugar has found support near 3390, to close above the trading session on a strong bullish note. It could extend gains after breaking this key resistance 3460.The trading range is expected among the key support at 3390 and key resistance now at 3460.
Trend-The short term trend is to the upside targeting 3570/3660 as far as areas of 3390 remain intact with a weekly closing.
Technical Indicator-Relative strength index is at 50.63, supporting the trend, however prices is trading well above SMA (50) and SMA (100).
Support: 3390/3267Resistance: 3570/3660
Technical Recommendation:
Based on the charts, we recommend buying Sugar around 3400-3420 targeting 3570 and 3660. Stop loss below 3300.
Sugar Daily Charts
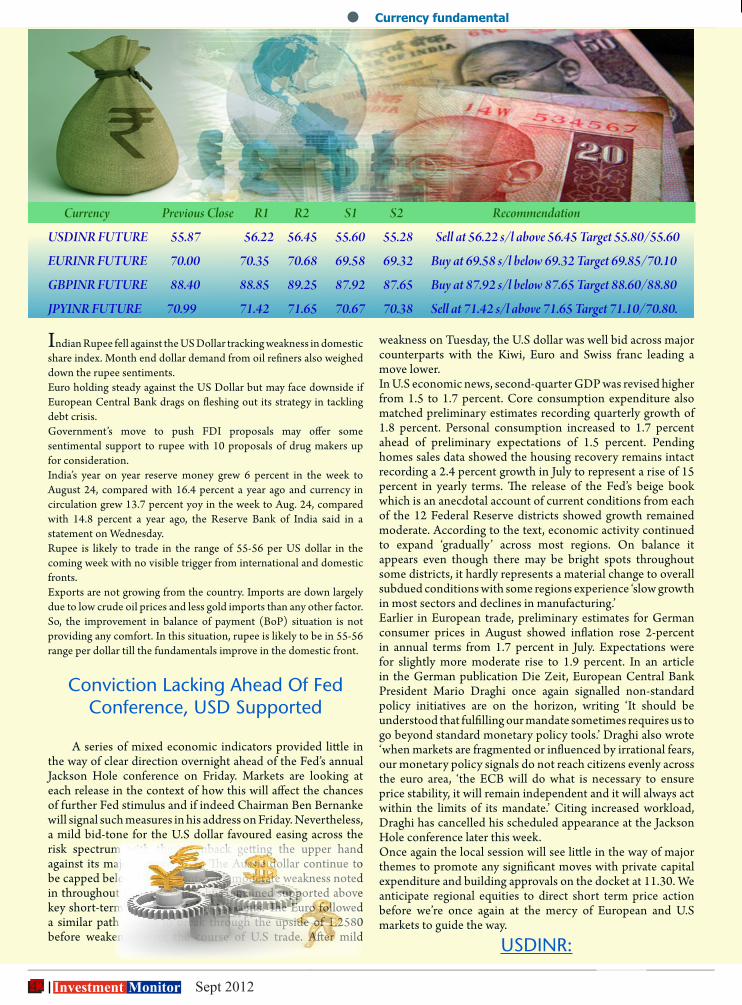
42 Investment Monitor Sept 2012
Indian Rupee fell against the US Dollar tracking weakness in domestic share index. Month end dollar demand from oil refiners also weighed down the rupee sentiments. Euro holding steady against the US Dollar but may face downside if European Central Bank drags on fleshing out its strategy in tackling debt crisis.Government’s move to push FDI proposals may offer some sentimental support to rupee with 10 proposals of drug makers up for consideration.India’s year on year reserve money grew 6 percent in the week to August 24, compared with 16.4 percent a year ago and currency in circulation grew 13.7 percent yoy in the week to Aug. 24, compared with 14.8 percent a year ago, the Reserve Bank of India said in a statement on Wednesday.Rupee is likely to trade in the range of 55-56 per US dollar in the coming week with no visible trigger from international and domestic fronts.Exports are not growing from the country. Imports are down largely due to low crude oil prices and less gold imports than any other factor. So, the improvement in balance of payment (BoP) situation is not providing any comfort. In this situation, rupee is likely to be in 55-56 range per dollar till the fundamentals improve in the domestic front.
Conviction Lacking Ahead Of Fed Conference, USD Supported
A series of mixed economic indicators provided little in the way of clear direction overnight ahead of the Fed’s annual Jackson Hole conference on Friday. Markets are looking at each release in the context of how this will affect the chances of further Fed stimulus and if indeed Chairman Ben Bernanke will signal such measures in his address on Friday. Nevertheless, a mild bid-tone for the U.S dollar favoured easing across the risk spectrum with the greenback getting the upper hand against its major counterparts. The Aussie dollar continue to be capped below 104 US cents with moderate weakness noted in throughout the U.S session but remained supported above key short-term support at 103.4 US cents. The Euro followed a similar path unable to break through the upside of 1.2580 before weakening over the course of U.S trade. After mild
weakness on Tuesday, the U.S dollar was well bid across major counterparts with the Kiwi, Euro and Swiss franc leading a move lower.In U.S economic news, second-quarter GDP was revised higher from 1.5 to 1.7 percent. Core consumption expenditure also matched preliminary estimates recording quarterly growth of 1.8 percent. Personal consumption increased to 1.7 percent ahead of preliminary expectations of 1.5 percent. Pending homes sales data showed the housing recovery remains intact recording a 2.4 percent growth in July to represent a rise of 15 percent in yearly terms. The release of the Fed’s beige book which is an anecdotal account of current conditions from each of the 12 Federal Reserve districts showed growth remained moderate. According to the text, economic activity continued to expand ‘gradually’ across most regions. On balance it appears even though there may be bright spots throughout some districts, it hardly represents a material change to overall subdued conditions with some regions experience ‘slow growth in most sectors and declines in manufacturing.’Earlier in European trade, preliminary estimates for German consumer prices in August showed inflation rose 2-percent in annual terms from 1.7 percent in July. Expectations were for slightly more moderate rise to 1.9 percent. In an article in the German publication Die Zeit, European Central Bank President Mario Draghi once again signalled non-standard policy initiatives are on the horizon, writing ‘It should be understood that fulfilling our mandate sometimes requires us to go beyond standard monetary policy tools.’ Draghi also wrote ‘when markets are fragmented or influenced by irrational fears, our monetary policy signals do not reach citizens evenly across the euro area, ‘the ECB will do what is necessary to ensure price stability, it will remain independent and it will always act within the limits of its mandate.’ Citing increased workload, Draghi has cancelled his scheduled appearance at the Jackson Hole conference later this week.Once again the local session will see little in the way of major themes to promote any significant moves with private capital expenditure and building approvals on the docket at 11.30. We anticipate regional equities to direct short term price action before we’re once again at the mercy of European and U.S markets to guide the way.
USDINR:
Currency fundamental
Currency Previous Close R1 R2 S1 S2 Recommendation
USDINR FUTURE 55.87 56.22 56.45 55.60 55.28 Sell at 56.22 s/l above 56.45 Target 55.80/55.60
EURINR FUTURE 70.00 70.35 70.68 69.58 69.32 Buy at 69.58 s/l below 69.32 Target 69.85/70.10
GBPINR FUTURE 88.40 88.85 89.25 87.92 87.65 Buy at 87.92 s/l below 87.65 Target 88.60/88.80
JPYINR FUTURE 70.99 71.42 71.65 70.67 70.38 Sell at 71.42 s/l above 71.65 Target 71.10/70.80.
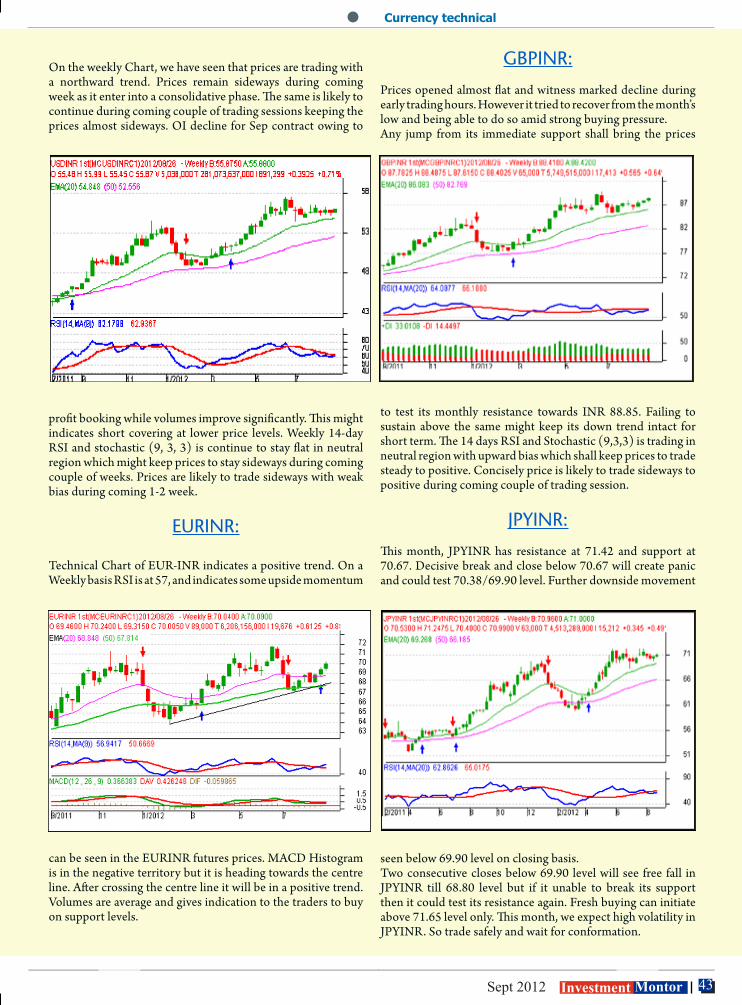
43 Sept 2012 Investment Montor
On the weekly Chart, we have seen that prices are trading with a northward trend. Prices remain sideways during coming week as it enter into a consolidative phase. The same is likely to continue during coming couple of trading sessions keeping the prices almost sideways. OI decline for Sep contract owing to
profit booking while volumes improve significantly. This might indicates short covering at lower price levels. Weekly 14-day RSI and stochastic (9, 3, 3) is continue to stay flat in neutral region which might keep prices to stay sideways during coming couple of weeks. Prices are likely to trade sideways with weak bias during coming 1-2 week.
EURINR:
Technical Chart of EUR-INR indicates a positive trend. On a Weekly basis RSI is at 57, and indicates some upside momentum
can be seen in the EURINR futures prices. MACD Histogram is in the negative territory but it is heading towards the centre line. After crossing the centre line it will be in a positive trend. Volumes are average and gives indication to the traders to buy on support levels.
GBPINR:
Prices opened almost flat and witness marked decline during early trading hours. However it tried to recover from the month’s low and being able to do so amid strong buying pressure. Any jump from its immediate support shall bring the prices
to test its monthly resistance towards INR 88.85. Failing to sustain above the same might keep its down trend intact for short term. The 14 days RSI and Stochastic (9,3,3) is trading in neutral region with upward bias which shall keep prices to trade steady to positive. Concisely price is likely to trade sideways to positive during coming couple of trading session.
JPYINR:
This month, JPYINR has resistance at 71.42 and support at 70.67. Decisive break and close below 70.67 will create panic and could test 70.38/69.90 level. Further downside movement
seen below 69.90 level on closing basis.Two consecutive closes below 69.90 level will see free fall in JPYINR till 68.80 level but if it unable to break its support then it could test its resistance again. Fresh buying can initiate above 71.65 level only. This month, we expect high volatility in JPYINR. So trade safely and wait for conformation.
Currency technical
44 Investment Monitor Sept 2012
Mutual Fund
At the beginning of the year, we came with our equity outlook for 2012, wherein we said i) the current phase of the market and economy is similar to the period 2001 to 2003 and we are closer to the midpoint; ii) market will be range bound with an upward bias in 2H as some of the negatives turn into positives; iii) stock picking rather than any major sector themes will drive outperformance. Most of those assumptions and predictions remain intact. However, what took us by surprise was the upfront rally in market between Jan – Feb on the back of surge in global liquidity due to LTRO2. Subsequently, the Eurozone crisis has again resurfaced and the market is closer to where it was at the beginning of the year. The way things are unfolding, the 2001 – 2003 scenario playing out is more likely and we have traversed some more distance in that journey. On the domestic side, the growth slowdown which we feared has manifested in the latest quarterly GDP print of 5.3%. As we stand today, the investor mood about equities is very pessimistic. Markets are grappling with multitude of factors, weighing down sentiments, viz. governance deficit, stubborn inflation, high current account deficit & falling currency, European financial crisis and the resultant domestic growth slowdown. As is customary, falling markets lend credence to all such concerns. If we look at India’s economic growth post liberalization, there have been four occasions where growth has slowed down significantly (below 5%). This has been accompanied by major international developments affecting world economy. Each time the growth has recovered from the lows and has averaged 6.5%. It is reasonable to assume that this is India’s growth potential if not higher. The period also includes the effect of various Governments and coalitions at the centre. India’s dependence on global capital flows combined with persistent negative current account balance has led to significant depreciation in the domestic currency. It may look worrisome on the surface, however there is an involuntary stimulus provided by the falling Rupee. A lower INR is likely to provide huge incentives to exporters and for import substitution, in turn helping domestic business activity. Brent oil has corrected from $127/bbl to $ 98 /bbl. A $30 fall in oil prices for the full year benefits the current account balance by $26 billion = 1.5% of GDP. While the outlook for European financial system remains clouded and the path to resolving the crisis is a long winding one, the political leadership in the region is working to find a solution. The effect of mismanaging the situations are reasonably well understood. Fallouts of Lehman Bros’ collapse in 2008 provides good indication of the wide ranging impact. However, over time we would assign a low probability to break down of coordination and a financial contagion. Greece is now at the crossroads and by next week we shall know whether it stays within the Eurozone or exits. FY12 saw a massive downgrade in corporate earnings
estimates from where it was at the beginning of the year due to a combination on lower margins and higher interest cost. We feel analysts have largely factored in slower economic growth and further risk of significant earnings downgrades in FY13 is low. This is also reflected in the abating of negative trend in earnings revisions by analysts. Amidst the poor sentiments, valuations have hit a low ebb with Sensex P/E ratio at 13x one year forward earnings (significantly below the long term average). Even, the Price to Book multiple indicates many companies available at bargains. There are already signs of smart money starting to move into equities as is reflected in the sharp increase in the amount of company buybacks and insider buying trades. Typically, retail investors wait for a sustained rally behind them to gain confidence to enter the markets, but as Warren Buffet says “being greedy when everyone is fearful” provides the best entry point for long-term investors. Even when compared to other alternate asset class like gold and real estate, equity on a historical relationship appears to be attractively valued and is likely to outpace in returns over the long-term. It is well known fact that as the investment time horizon increases, the volatility and possibility of loss decreases significantly. In the last four and half years since the market peaked in Jan 2008, it is down 22%, while the GDP has grown at an average of 7.7pa during the same period. If we assume market were to generate the average return that it has delivered in any block of ten years since liberalisation (which is 12.2% pa), then likely return in the remaining five and half years is about 28% per annum. On a fundamental basis, assuming 6% GDP growth in the next five years and 7% inflation, the market can return 20% per annum if PE multiples converge to the long-term average. Clearly, the risk reward is in favour of serious long-term equity investors with a high probability of generating above average returns over the next 3-5 years. While we feel the market is closer to its bottom and discounts most of the negatives, investors should be prepared to wither a 8-10% correction arising out ay tail risk event (global or domestic). Volatility is here to stay but it can be used to our advantage as Warren Buffet says “Look at market fluctuations as your friend rather than your enemy; profit from folly rather than participate in it.” On portfolio strategy, we continue to remain bottom-up focused in a largely range bound market, but increasingly our bias is shifting to domestic rate cyclical and away from defensives.
Romit Bhatia | Channel Manager - Tier I National Distributors | Birla Sun Life Asset Management Co. Ltd.One Indiabulls Centre,Tower-1, 17th floor, Jupiter Mills Compound, 841, S.B. Marg , Elphinstone Road, Mumbai 400 013.| Tel: +91 22 43568029 | Mob: +91 9702909222

45 Sept 2012 Investment Montor
Visit us at : www.rrfinance.com www.rrfcl.com
JUST A FEW MOMENTS OF YOURS…1. The financial magazine(s) I read regularly are .....................................…..2. I came to know about “Investment Monitor “from:
A) Financial Advisor b) Newstands c) Friends/Colleague d) Advertise-ment
3. I am Subscribing to the “Investment Monitor” Because......................................................................................................................................................................................................................................................................4. In Investment Monitor” the section I like most ....................................................................................................................................................................................................................................................................................5. This Magazine has helped me in investing in: a) Fixed Deposits b) Mutual Funds c) Shares d) Insurance e) Tax Planning f) Commodities g) Derivatives6. For Improvement of this magazine, my suggestion are:..................................................................................................................
HELP US TO SERVE YOU BETTER

46 Investment Monitor Sept 2012
Insurance
Let’s take the case of Mr. Sharma who decides to buy a Bajaj Allianz CashRich Insurance Plan when he is 35 yrs old with the objective of getting Rs. 27 lacs plus when he retires. So, he opts to pay premium for 25 years so that when he retires at 60 all premium payments have been paid. On basis of his retirement objective he opts to pay a premium of Rs. 12,036 monthly for which he gets a sum assured of Rs. 20 lacs.
When Mr. Sharma retires at 60 he will receive Rs. 27,26,490 as an accrued bonus and thereafter every year, till he attains the age of 95 years, he will receive cash back of Rs. 1,22,000.
(Out of this Rs. 1,22,000, Rs. 1 lac is guaranteed and Rs. 22,000 is non-guaranteed.) Mr. Sharma continues to get this cash back as regular income for 35 yrs of his retired life. When Mr. Sharma turns 95 i.e. the end of his cask back period - he gets the sum assured of Rs. 20 lacs under the plan as a maturity benefit. Further more, during the cash back period of 35 years, Mr. Sharma will continue to have a life cover of Rs. 20 lacs, thus offering financial security to his dependents.
How much money will I need at retirement ?
Retirement, it is often said, is the golden era of one’s life. And rightly so, after all the retirement planning gives you the freedom to live your life your way. And for a completely peaceful retirement, one needs to start planning as early as possible.
• Consider your present age, retirement age and age till when you would want to receive pension income. • Calculate monthly expenses, income and expected rate of inflation to get a picture of your expenses at retirement. • Evaluate all your current assets like bank deposits, investments, gold and other precious items and so on. Assess how much these would grow over the years to ascertain your future asset value. • Deduct the expenditure calculated from the future asset value. What you will get is the actual pension plan required.
It is recommended to start at younger years, since the premium payable will be less.
Why do I need a Retirement Plan?
We work hard throughout our lives so that we can live comfortably during the best years of our life . Actually the best years begin when we are through with all our responsibilities of life
After retirement ,your regular income may stop but your expenses would not . Infact they might increase
Imagine a situation where you have a regular flow of income, even after retirement. A retirement solution would not only help you with a regular inflow of money but would also maintain your existing lifestyle so that you can Retire Rich
Why Cash Rich is a Retirement Solution ?At retirement what we look at is financial security. A flow of guaranteed income provides that financial security.Bajaj Allianz CashRich plan offers guaranteed cash back of 5% of sum assured per year along with a cash bonus, which would be your regular income.
KEY FEATURES • Accumulated compound reversionary bonus on completion of premium payment term.
• Cash Back benefit of 5% of the sum assured plus cash bonus, if any declared every year, during the cash back period end. • Sum Assured plus terminal bonus, if any on maturity of the policy.
• Select your policy term from 10 years to 65 years depending on your financial need.
• Select your limited premium paying term (PPT) from 5 years to 30 years, in multiple of 5 only.
• Pay your future premiums in advance and get benefit of appropriate discounts.
How does the plan work ?
Cash Rich is a retirement solution to help you with a regular inflow of money and also maintain your existing lifestyle
47 Sept 2012 Investment Montor
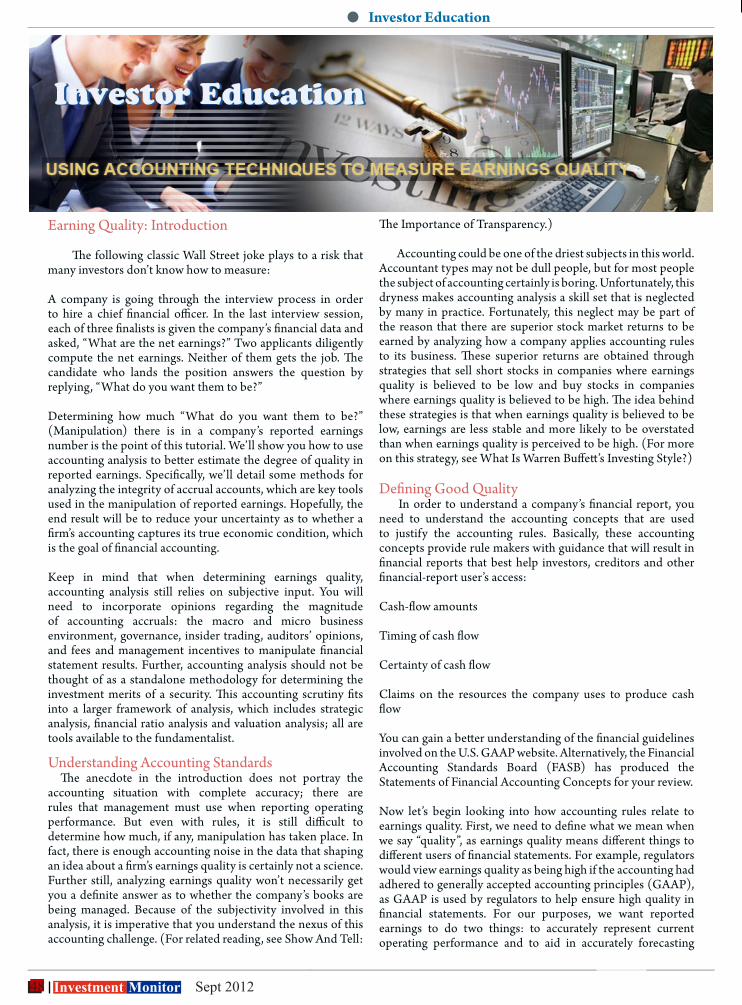
48 Investment Monitor Sept 2012
The Importance of Transparency.)
Accounting could be one of the driest subjects in this world. Accountant types may not be dull people, but for most people the subject of accounting certainly is boring. Unfortunately, this dryness makes accounting analysis a skill set that is neglected by many in practice. Fortunately, this neglect may be part of the reason that there are superior stock market returns to be earned by analyzing how a company applies accounting rules to its business. These superior returns are obtained through strategies that sell short stocks in companies where earnings quality is believed to be low and buy stocks in companies where earnings quality is believed to be high. The idea behind these strategies is that when earnings quality is believed to be low, earnings are less stable and more likely to be overstated than when earnings quality is perceived to be high. (For more on this strategy, see What Is Warren Buffett’s Investing Style?)
Defining Good Quality In order to understand a company’s financial report, you need to understand the accounting concepts that are used to justify the accounting rules. Basically, these accounting concepts provide rule makers with guidance that will result in financial reports that best help investors, creditors and other financial-report user’s access:
Cash-flow amounts
Timing of cash flow
Certainty of cash flow
Claims on the resources the company uses to produce cash flow
You can gain a better understanding of the financial guidelines involved on the U.S. GAAP website. Alternatively, the Financial Accounting Standards Board (FASB) has produced the Statements of Financial Accounting Concepts for your review.
Now let’s begin looking into how accounting rules relate to earnings quality. First, we need to define what we mean when we say “quality”, as earnings quality means different things to different users of financial statements. For example, regulators would view earnings quality as being high if the accounting had adhered to generally accepted accounting principles (GAAP), as GAAP is used by regulators to help ensure high quality in financial statements. For our purposes, we want reported earnings to do two things: to accurately represent current operating performance and to aid in accurately forecasting
Earning Quality: Introduction
The following classic Wall Street joke plays to a risk that many investors don’t know how to measure:
A company is going through the interview process in order to hire a chief financial officer. In the last interview session, each of three finalists is given the company’s financial data and asked, “What are the net earnings?” Two applicants diligently compute the net earnings. Neither of them gets the job. The candidate who lands the position answers the question by replying, “What do you want them to be?”
Determining how much “What do you want them to be?” (Manipulation) there is in a company’s reported earnings number is the point of this tutorial. We’ll show you how to use accounting analysis to better estimate the degree of quality in reported earnings. Specifically, we’ll detail some methods for analyzing the integrity of accrual accounts, which are key tools used in the manipulation of reported earnings. Hopefully, the end result will be to reduce your uncertainty as to whether a firm’s accounting captures its true economic condition, which is the goal of financial accounting.
Keep in mind that when determining earnings quality, accounting analysis still relies on subjective input. You will need to incorporate opinions regarding the magnitude of accounting accruals: the macro and micro business environment, governance, insider trading, auditors’ opinions, and fees and management incentives to manipulate financial statement results. Further, accounting analysis should not be thought of as a standalone methodology for determining the investment merits of a security. This accounting scrutiny fits into a larger framework of analysis, which includes strategic analysis, financial ratio analysis and valuation analysis; all are tools available to the fundamentalist.
Understanding Accounting Standards The anecdote in the introduction does not portray the accounting situation with complete accuracy; there are rules that management must use when reporting operating performance. But even with rules, it is still difficult to determine how much, if any, manipulation has taken place. In fact, there is enough accounting noise in the data that shaping an idea about a firm’s earnings quality is certainly not a science. Further still, analyzing earnings quality won’t necessarily get you a definite answer as to whether the company’s books are being managed. Because of the subjectivity involved in this analysis, it is imperative that you understand the nexus of this accounting challenge. (For related reading, see Show And Tell:
Investor Education
49 Sept 2012 Investment Montor
Investor Education
future operating performance. These requirements for high-quality earnings mean that the reported earnings amounts for a particular period should:Represent the underlying economics of the business.Be both persistent and predictable (the metric should be stable over time).If the reported earnings keep true to these two concerns, this information will provide a reasonable basis for valuing the company. Thus, we should see a high correlation between the prices calculated by valuation models using the reported earnings amount and actual stock prices.
Methods for Measuring Earnings QualityIn order to develop a way to measure earnings that meets our criteria for high quality, we need a metric that honors the fundamental qualities of GAAP. These features are reliability and relevance.
Reliability - The metric is verifiable, free from error or bias and accurately represents the transaction.
Relevance - The metric is timely and has predictive power; it can confirm or reject prior predictions and has value when making new predictions.There are two basic ways to present a company’s operating performance and measure earnings during a given period - cash accounting and accrual accounting. If you haven’t already guessed, each has tradeoffs in terms of relevance and reliability. Furthermore, there is debate as to whether the increased relevance produced by accrual accounting is sufficient to overcome its relative lack of reliability.
Cash AccountingThe first method for measuring operating performance is based on cash accounting. Cash accounting involves recording transactions whenever cash enters or leaves the firm. The advantage of this accounting method is that the transactions recorded have been completed and the amounts involved are certain, making it highly reliable. The downside to cash accounting is that the earnings measurement is not very stable, which gives it low relevance.
Accrual AccountingIn order to create an accounting method that has higher relevance than cash accounting, accrual accounting introduces the idea of periodicity. Periodicity states that each transaction should be assigned to a given period and split accordingly if it covers several periods. This is an attempt to recognize revenues in the period in which they were actually earned (GAAP’s revenue-recognition principle) as well as to match the related expenses to the earned revenue (GAAP’s matching principle).
Investigating the Financing of AccrualsAlong with the time-series plots above, which illustrated
scenarios where a firm experiences a large jump for two operating-assets accruals, investigation into the financing of these asset accruals will provide insights as to the quality of earnings. In addition, determining how efficiently the firm is employing these assets will be helpful. Recall that a large jump in these two asset accruals may be a harbinger of poor earnings quality or a large jump in economic performance of the firm.The reason financing operating assets with operating liabilities is better than financing operating assets with non-operating liabilities is twofold. A company that is financing an inventory glut, versus a healthy inventory expansion, will have little cash from sales to extinguish payables. The firm may eventually extinguish payables by taking on debt or selling financial assets or stock. Further, trade creditors are motivated to continuously verify the quality of the debtor’s operating assets that are available to satisfy their claims. The inability to rapidly increase accounts payable in the face of rapidly increasing operating accrual assets may be a reflection of suppliers’ negative assessment of the quality of these assets and may be a sign that the company is carrying these assets at greater than their true value.
Conclusion
A firm’s reported earnings number has typically been the focus of Wall Street, Main Street and the media. Other aspects of financial statements get overlooked, even though these items may provide information about the quality of firms’ reported earnings. This tutorial describes a process that will assist you in determining to what degree the reported earnings have been manipulated by management. The results of the analysis won’t deliver a definitive thumbs-up or thumbs-down regarding the quality of earnings, but it will enable you to better understand the risks in the firm’s accounting for earnings.Here, we’ve examined key issues relating to earnings quality, including the attributes of a high-quality earnings number and the tradeoff between relevance and reliability. The discussion noted that earnings quality will vary even when managers follow GAAP with the best intentions. Furthermore, not every change in accounting policy and accruals signals an attempt to manipulate reported earnings.In order to determine the degree of earnings quality, investors must look at factors outside the financial reporting system that can affect earnings quality. Investors must also identify the types of accounts companies are most likely to manage and the circumstances in which earnings management is most likely to occur. Finally, investors can use metrics to quantify the degree of earnings management and some methods used to compare these metrics over time and across firms.

50 Investment Monitor Sept 2012
Q. What are the future prospects of SBI? I am having 50 shares @ 1800, should I
hold or book profit? Aman, Calcutta
ASBI with a face value of Rs. 10 is currently trading at Rs.1837.35. Although, you are
already earning good profits still we expect this share to perform well in near term. The company has good fundamentals and shown better second quarter numbers. So, we suggest holding this share for more profits.
Q . I want to short TVS motors; please suggest can I short the stock at this level?
Rahul, Agra
A TVS motors with a face value of Rs 1 are trading at 38.70 Company is having good
fundamentals and plans for future expansion which will have positive impact on this share. So we won’t suggest going short at this level.
Q .Hi sir what is your advice on Tata Power? Can I invest in this stock?
Priya, Aligarh
ATata Power with a face value of Rs. 1 is currently trading at Rs.99.5. We are bullish
on this stock in near term so we suggest you to buy the stock at current level for 20-25 % returns in near term
ASuzlon with a face value of Rs 2 is trading at Rs. 15.15 and we are bullish on this
stock. So, you can hold this share for near to long term gains.
Q.What are the future prospects of Hind Zinc? What do you suggest?
Tushar, Aligarh
AHind Zinc with a face value of Rs.2 is trading at Rs. 123.35. The company is
having good fundamentals and Hind zinc’s expansion in silver-rich Sindesar Khurd mine should result in robust bottom-line growth. We suggest keeping long on this stock
Q.Hi sir I want to take long positions in Hero Honda. What are your views on
this stock?
Anuj , Faridabad
AHero Honda with a face value of Rs. 2 is trading at Rs. 2010. Company is having
good fundamentals and has showed good profit margins for this quarter. But it is trading at 1763.00, so may be it get back before touching its 52 week high. So You better wait for it to buy at low rate..
Query Time
Q .Hi Sir what are the future prospects of Exide Industries? Can I do fresh
buying in it?
Shruti, Jalandhar
AThe stock has corrected from its earlier level of Rs 13 and now trading at 133.90,
following the disappointment for Q1. We expect that in few of the next quarters the company would slowly regain its margin because its capacities will increase and the replacement market sales should improve. So we suggest to buy this stock at its weakness.
Q.Q. Hi sir, what is your advice on piramal Healthcare? Can I hold this
stock?
Rohan, New Delhi
A Piramal Healthcare with a face value of Rs. 5 is trading at Rs. 17.10. Although,
piramal has reported dismayed set of numbers for the quarter ended June’11 after a strong performance in FY11, yet it belongs to defensive pharma sector so at this price level you can continue holding in your portfolio.
Q. I am having a position in suzlon. What do you suggest in near term?
Priya, Ajmer

51 Sept 2012 Investment Montor
Mailbox
Cover story –“Monsoon Failing” This season monsoon had a taken huge attention. It had great impact on market. If that shortfall was evenly spread across the country, the impact on the nation’s agricultural output and the farmers would have been limited. To present such an exhaustive story on this topic is really appreciable. We hope that you will be providing such cover stories in future also. We wish you all the best for your magazine.
Market commentary Through this section you can come to know about the movements in all the sectors. It has covered whole story of the month. You can update yourself with all the current happenings in market with this section. All I can say, it is a very good initiative from your team side.
Stocks & Technicals.I really appreciate the technical calls you gave. I really gained out of them. The calls
you gave for HDFC Ltd. and Axis Bank really worked. Thanks for your calls and I suppose more such calls at your end. All the very best for your magazine.
Commodity Analysis.The way you have covered technical and fundamental aspects of natural gas is really impressive and interesting. Thanks for your tips.
Stock MonitorStock monitor provides insights into the financial health of companies. It has covered information of sector as well as of company. It has helped me a lot. It has almost 1200 companies which help me analyze the companies fundamentally. Thanks for providing such a comprehensive data. I just hope that will keep on providing data on companies like this.
Investor Education
Your article on “Profitability indicator ratios” was awesome. It traced all the concepts that make me realize about some different means of making investment. Please contribute more such articles.
InsuranceYour article on Life Insurance was quite resourceful and exhaustive; it is very nice on your part to provide such articles. All the very best for your magazine.
Currency Analysis:This is a section where you can get knowledge about currency market and coverage of currency in Investment monitor was of much help. I really appreciate your coverage that gave me great insights.
“This monsoon season we are likely to get up to 10% less rain than a normal year, according to the latest indications from the Met department. “
States is that the world’s largest economy and India’s biggest trading partner is teetering on the brink of a recession. Americans don’t see new jobs come their way over the next two quarters and their economy’s growth prospects will only get subdued as Washington gets into the thick of presidential election.

52 Investment Monitor Sept 2012
TM