initial study - fairfield inn & suites 405 martin
TRANSCRIPT
INITIAL STUDY FAIRFIELD INN & SUITES
405 MARTIN AVENUE, ROHNERT PARK
City of Rohnert Park Development Services
130 Avram Avenue Rohnert Park, CA 94928-2486
AUGUST 2017

Printed on 30% post-consumer recycled material.
Fairfield Inn & Suites Initial Study
Fairfield Inn & Suites i August 2017
TABLE OF CONTENTS
Section Page No.
1 INTRODUCTION..............................................................................................................1 1.1 Project Overview and Location .............................................................................. 1 1.2 California Environmental Quality Act Compliance ............................................... 1 1.3 Public Review Process ............................................................................................ 1
2 INITIAL STUDY CHECKLIST ......................................................................................3 2.1 Aesthetics .............................................................................................................. 13 2.2 Agriculture and Forestry Resources...................................................................... 16 2.3 Air Quality ............................................................................................................ 18 2.4 Biological Resources ............................................................................................ 27 2.5 Cultural Resources ................................................................................................ 35 2.6 Geology and Soils ................................................................................................. 38 2.7 Greenhouse Gas Emissions ................................................................................... 42 2.8 Hazards and Hazardous Materials ........................................................................ 48 2.9 Hydrology and Water Quality ............................................................................... 52 2.10 Land Use and Planning ......................................................................................... 59 2.11 Mineral Resources ................................................................................................ 60 2.12 Noise ..................................................................................................................... 61 2.13 Population and Housing ........................................................................................ 67 2.14 Public Services ...................................................................................................... 69 2.15 Recreation ............................................................................................................. 70 2.16 Transportation and Traffic .................................................................................... 71 2.17 Tribal Cultural Resources ..................................................................................... 84 2.18 Utilities and Service Systems................................................................................ 85 2.19 Mandatory Findings of Significance ..................................................................... 90
3 REFERENCES .................................................................................................................92 3.1 References Cited ................................................................................................... 92
APPENDICES
A Air Quality and Greenhouse Gas Emissions Calculations B Biological Studies C Traffic Impact Study
FIGURES
1 Regional Location Map........................................................................................................4
Initial Study
TABLE OF CONTENTS (CONTINUED)
Page No.
Fairfield Inn & Suites ii August 2017
2 Aerial Photo Map .................................................................................................................6 3 Site Plan ...............................................................................................................................7
TABLES
Table 2.3-1 Thresholds of Significance .........................................................................................19 Table 2.3-2 Average Daily Unmitigated Construction Emissions.................................................22 Table 2.3-3 Daily Unmitigated Operational Emissions .................................................................24 Table 2.7-1 Estimated Annual Operational Greenhouse Gas Emissions .......................................45 Table 2.16-1 Intersection Level of Service Criteria .......................................................................75 Table 2.16-2 Existing Peak Hour Intersection Levels of Service ..................................................76 Table 2.16-3 Baseline Peak Hour Intersection Levels of Service .................................................78 Table 2.16-4 Trip Generation Summary ........................................................................................79 Table 2.16-6 Trip Distribution Assumptions for New Trips .........................................................79 Table 2.16-7 Existing and Existing Plus Project Peak Hour Intersection Levels of
Service................................................................................................................................80 Table 2.16-8 Baseline and Baseline plus Project Peak Hour Intersection Levels of
Service................................................................................................................................80
Initial Study
Fairfield Inn & Suites iii August 2017
INTENTIONALLY LEFT BLANK
Initial Study
Fairfield Inn & Suites 1 August 2017
1 INTRODUCTION
1.1 Project Overview and Location
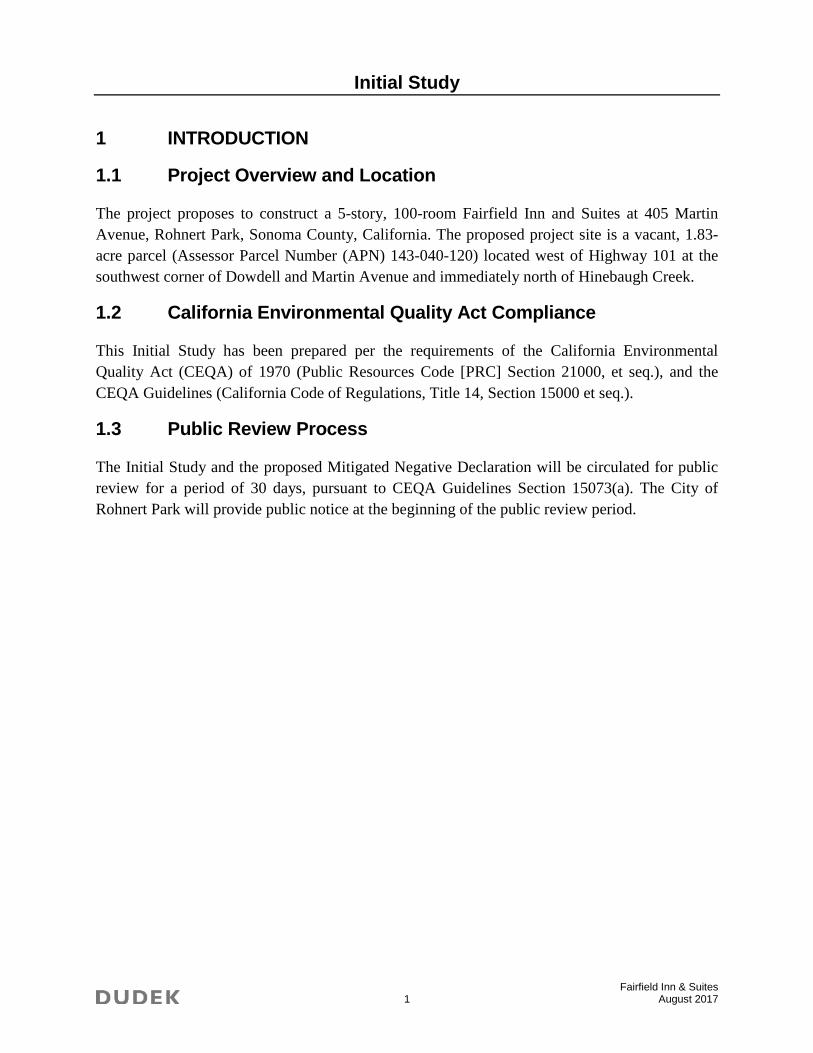
The project proposes to construct a 5-story, 100-room Fairfield Inn and Suites at 405 Martin Avenue, Rohnert Park, Sonoma County, California. The proposed project site is a vacant, 1.83-acre parcel (Assessor Parcel Number (APN) 143-040-120) located west of Highway 101 at the southwest corner of Dowdell and Martin Avenue and immediately north of Hinebaugh Creek.
1.2 California Environmental Quality Act Compliance
This Initial Study has been prepared per the requirements of the California Environmental Quality Act (CEQA) of 1970 (Public Resources Code [PRC] Section 21000, et seq.), and the CEQA Guidelines (California Code of Regulations, Title 14, Section 15000 et seq.).
1.3 Public Review Process
The Initial Study and the proposed Mitigated Negative Declaration will be circulated for public review for a period of 30 days, pursuant to CEQA Guidelines Section 15073(a). The City of Rohnert Park will provide public notice at the beginning of the public review period.
Initial Study
Fairfield Inn & Suites 2 August 2017
INTENTIONALLY LEFT BLANK
Initial Study
Fairfield Inn & Suites 3 August 2017
2 INITIAL STUDY CHECKLIST
Project title:
Fairfield Inn & Suites
Lead agency name and address:
City of Rohnert Park Development Services 130 Avram Avenue Rohnert Park, CA 94928-2486
Contact person and phone number:
Jeffrey Beiswenger, Planning Manager (707) 588-2253
Project location:
405 Martin Avenue, Rohnert Park, CA APN: 143-040-120
Project sponsor’s name and address:
Tejal Patel Rohnert Park Lodging, LLC 13486 Melody Road
Chino Hills, CA 91709
General plan and zoning designations:
Project Parcel General Plan Designation Zoning Designation
Fairfield Inn & Suites APN 143-040-120, +/- 1.83 acres
Commercial – R (Regional) C-R: Regional Commercial
Description of project and environmental setting:
The proposed project would construct a 5-story, 100-room hotel on a vacant, 1.83-acre site located at 405 Martin Avenue in the City of Rohnert Park.
Project Location and Site Characteristics
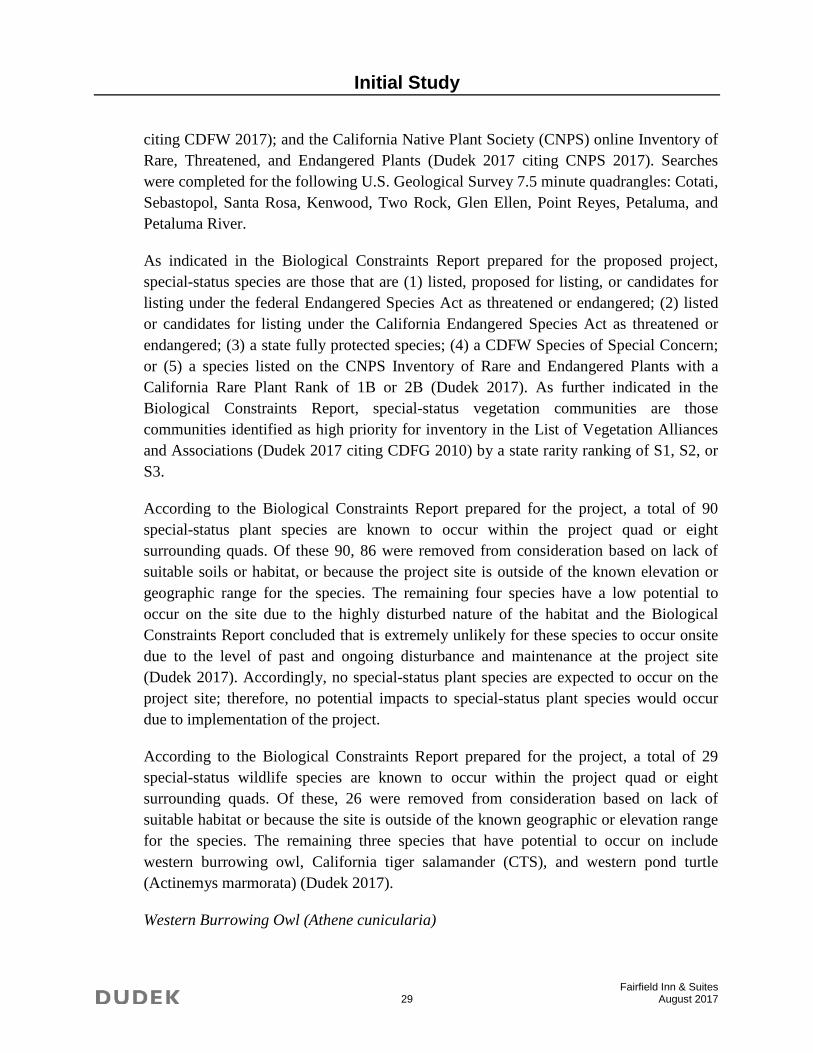
As shown on Figure 1 Regional Location Map, the project site is located in the City of Rohnert Park, Sonoma County, California. The project parcel is approximately 1.83 acres
MoragaTown
AlamoOrinda
LafayetteWalnutCreek
PleasantHill
Concord
SanFrancisco
Fairview
SanLeandro
CastroValley
Alameda
Oakland
Berkeley
VineHill
Richmond
MartinezPinole
Rodeo
Hercules
Mill Valley
SanRafael
Lagunitas-ForestKnolls
Lucas Valley-Marinwood
Inverness
Novato
Benicia
Vallejo
Fairfield
AmericanCanyon
Napa
St.Helena
DeerPark
Angwin
Petaluma
BodegaBay
Occidental
SantaRosa
RohnertPark
SouthSanta Rosa
SouthSantaRosa
Forestville
Larkfield-Wikiup
Windsor
HiddenValley Lake
Cobb
LowerLake
ClearlakeKelseyville
San Francisco County
MarinCounty
Solano County
Marin County
Sonoma County
Napa County
Colusa County
Lake County
Mendocino County
San Mateo County
Yolo County
Napa County
Napa CountySonoma County
Sonoma County Sonoma CountyLake County
P a c i f i c O c e a n
?221
?281
?253
?24
?131
?29
?16
?123
?53
?13
?37
?4
?121
?175
?20
?12
?116
?128
?1£¤101
§̈¦80
§̈¦5
§̈¦680
§̈¦880 §̈¦580
Regional Map Sonoma County, CaliforniaInitial Study for the Fairfield Inn Site in Rohnert Park
Date
: 8/8
/201
7 -
Las
t sav
ed b
y: rs
trobr
idge
- P
ath:
Z:\P
rojec
ts\j98
1000
\MAP
DOC\
DOCU
MEN
T\Fa
irfiel
dInn\
IS\F
igure
1_Re
giona
l.mxd
0 105Milesn
FIGURE 1
Project Site!̂
Initial Study
Fairfield Inn & Suites 5 August 2017
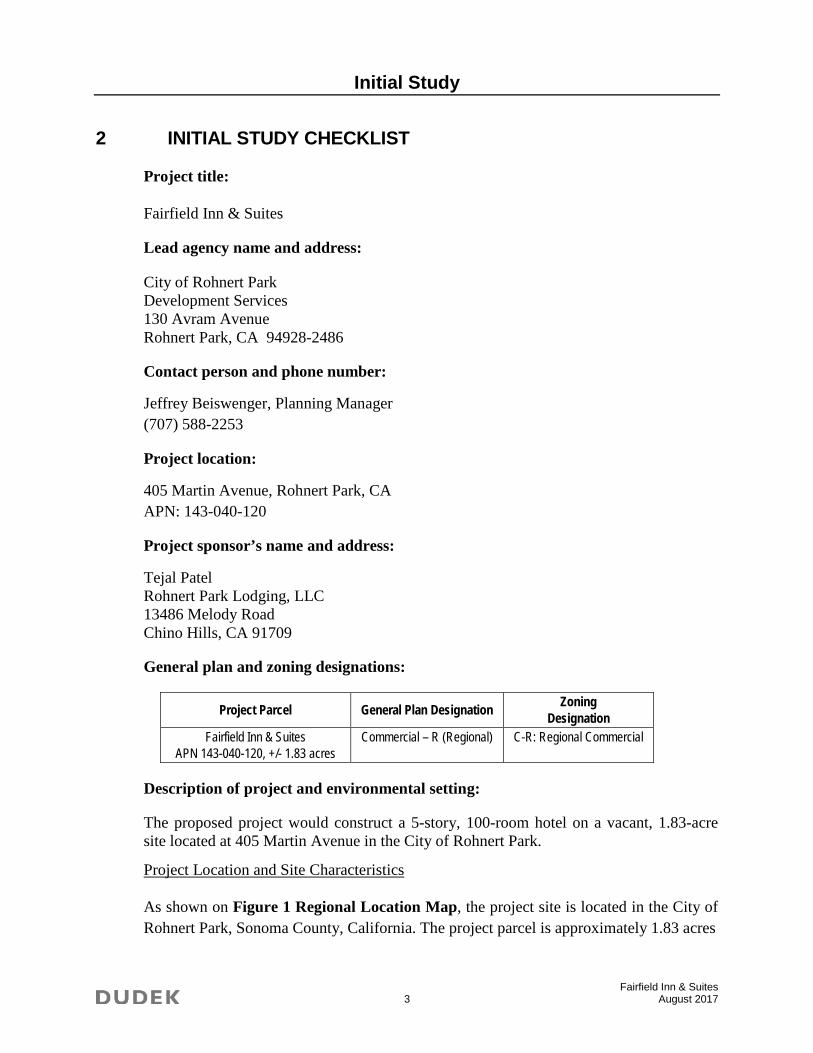
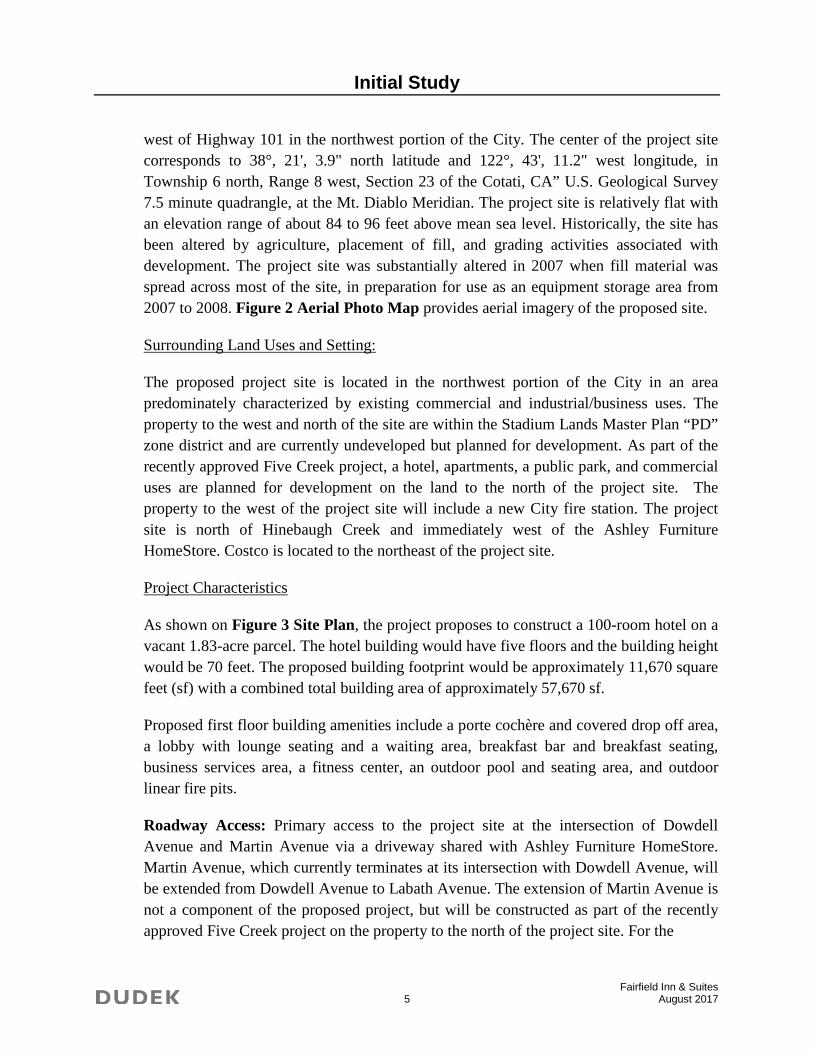
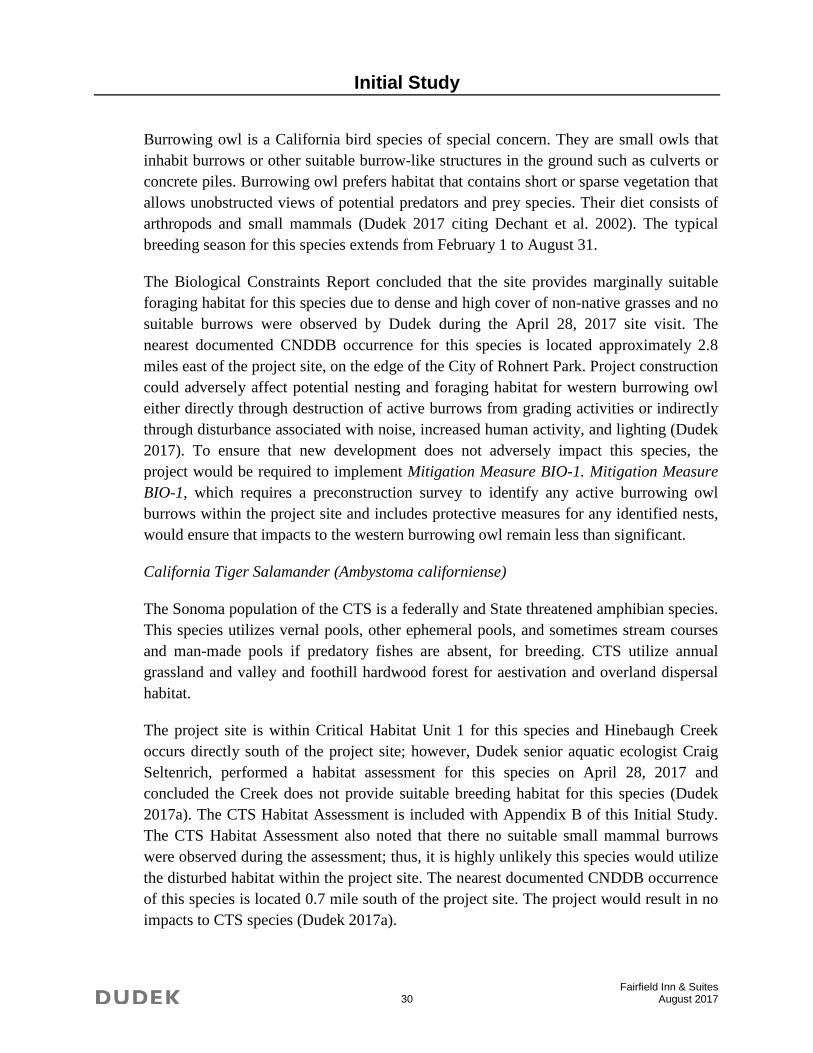
west of Highway 101 in the northwest portion of the City. The center of the project site corresponds to 38°, 21', 3.9" north latitude and 122°, 43', 11.2" west longitude, in Township 6 north, Range 8 west, Section 23 of the Cotati, CA” U.S. Geological Survey 7.5 minute quadrangle, at the Mt. Diablo Meridian. The project site is relatively flat with an elevation range of about 84 to 96 feet above mean sea level. Historically, the site has been altered by agriculture, placement of fill, and grading activities associated with development. The project site was substantially altered in 2007 when fill material was spread across most of the site, in preparation for use as an equipment storage area from 2007 to 2008. Figure 2 Aerial Photo Map provides aerial imagery of the proposed site.
Surrounding Land Uses and Setting:
The proposed project site is located in the northwest portion of the City in an area predominately characterized by existing commercial and industrial/business uses. The property to the west and north of the site are within the Stadium Lands Master Plan “PD” zone district and are currently undeveloped but planned for development. As part of the recently approved Five Creek project, a hotel, apartments, a public park, and commercial uses are planned for development on the land to the north of the project site. The property to the west of the project site will include a new City fire station. The project site is north of Hinebaugh Creek and immediately west of the Ashley Furniture HomeStore. Costco is located to the northeast of the project site.
Project Characteristics
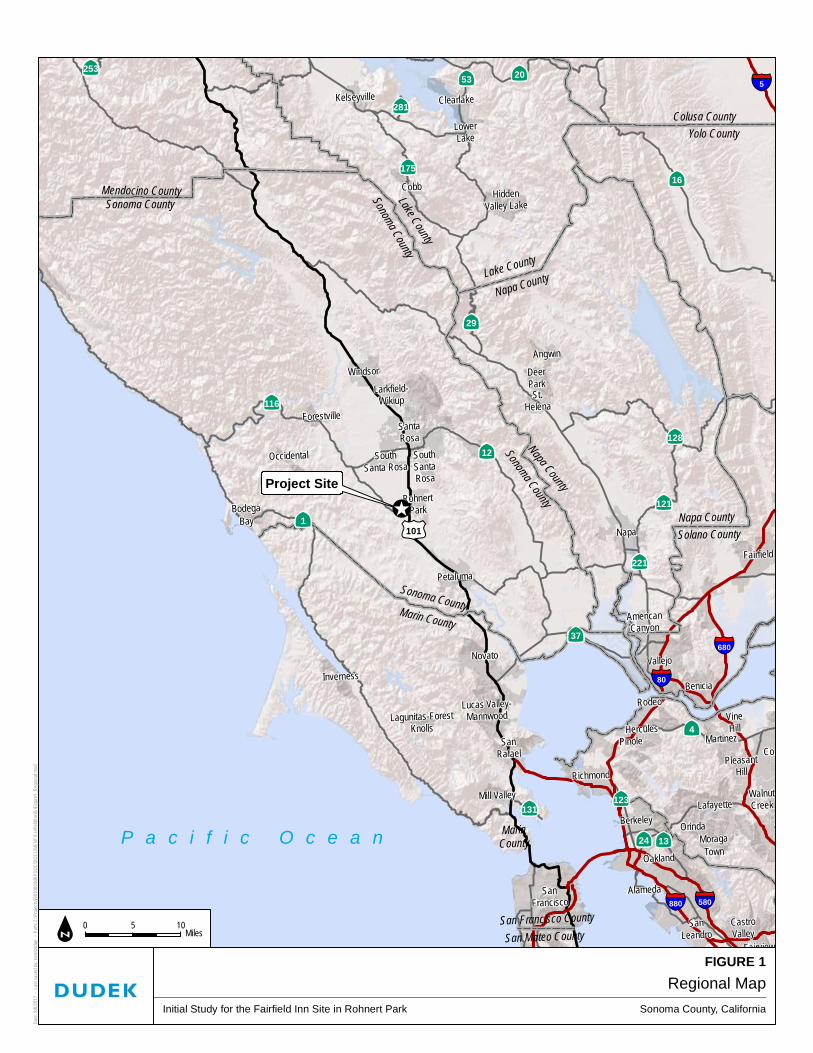
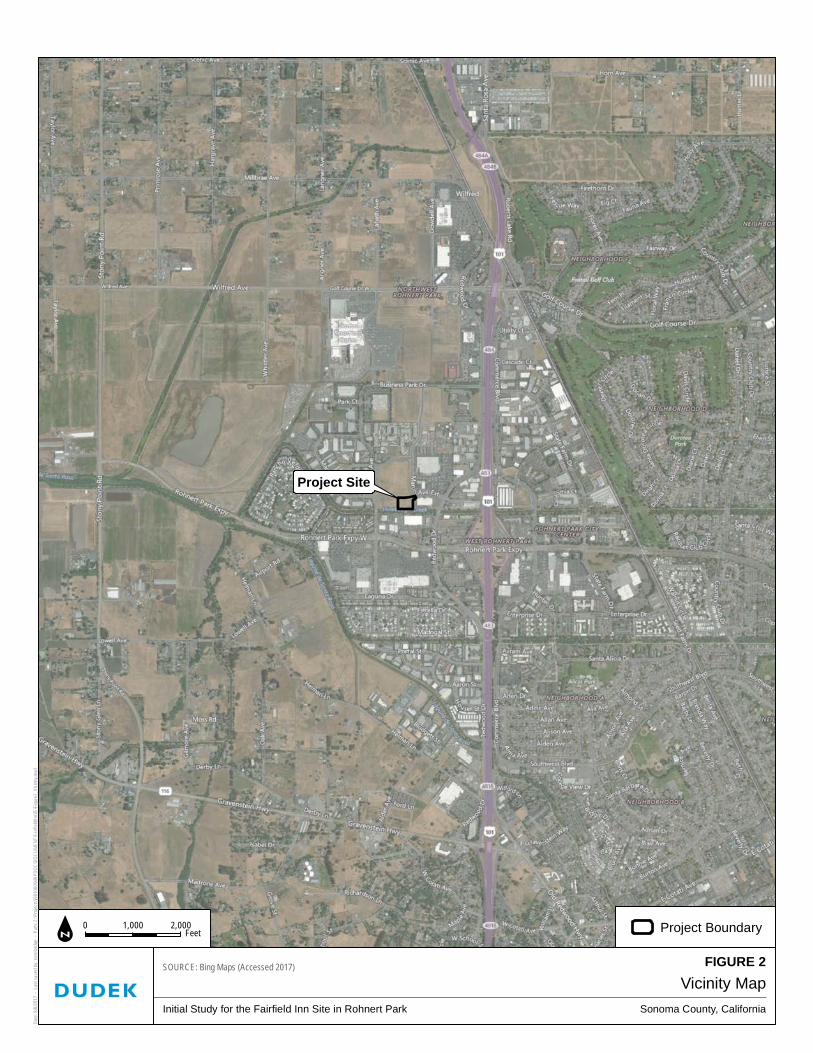
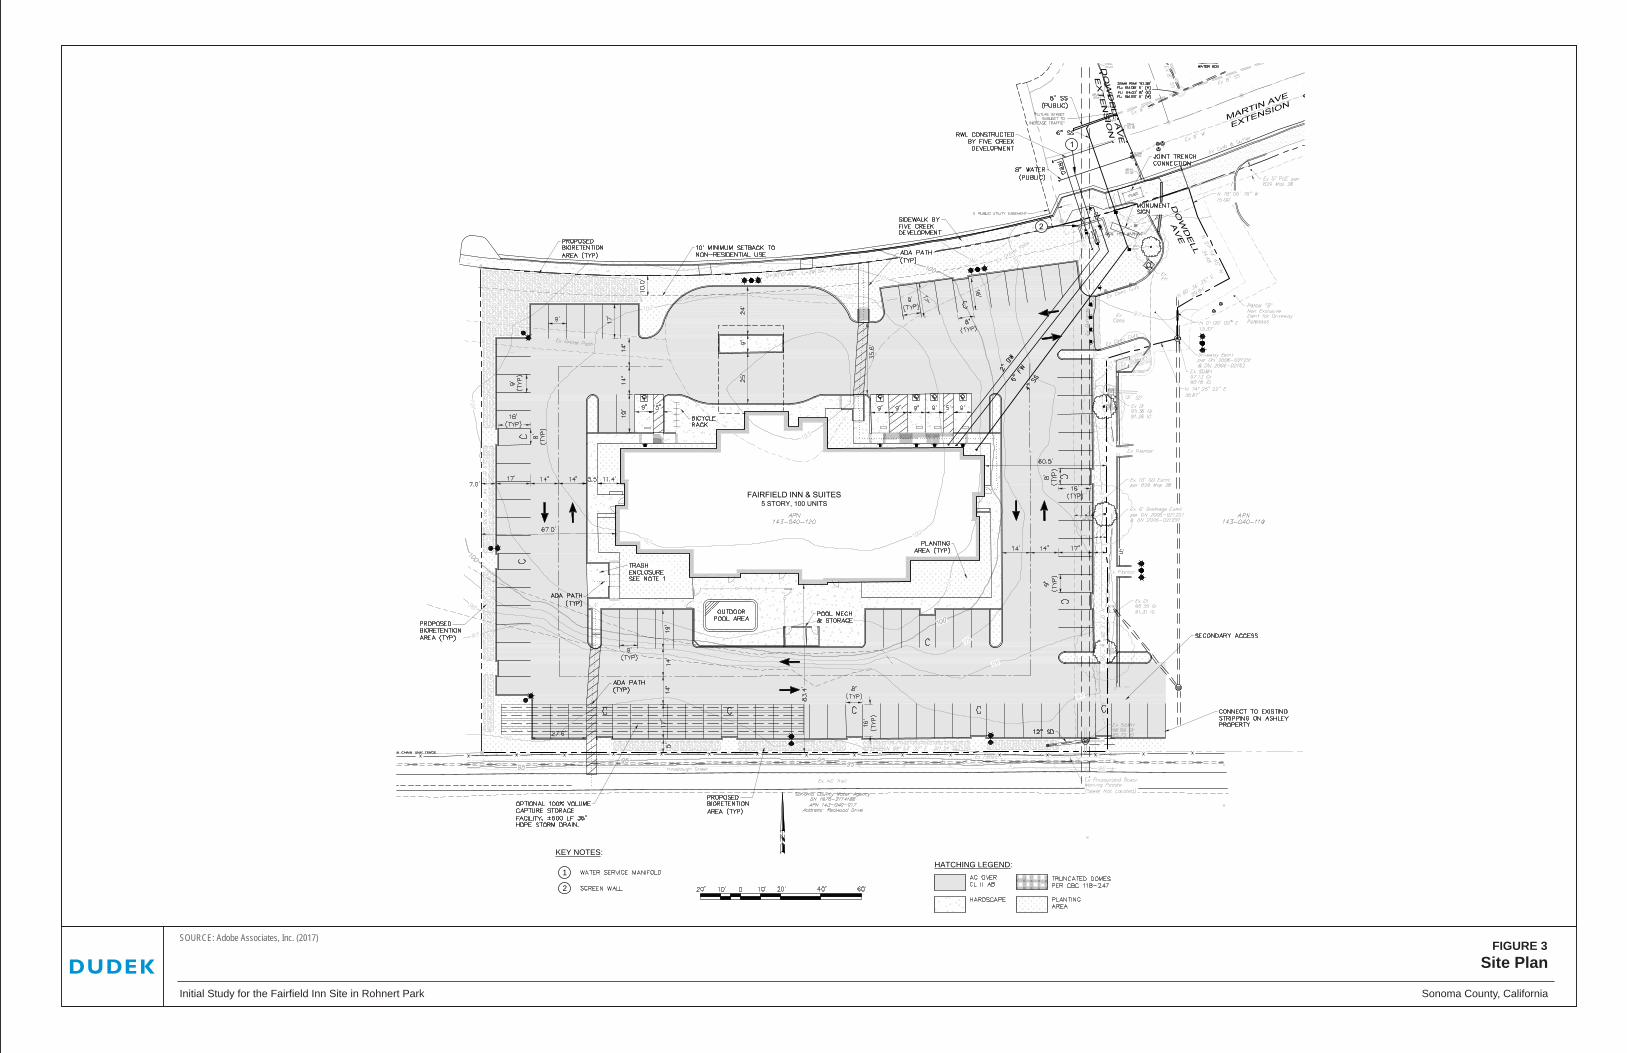
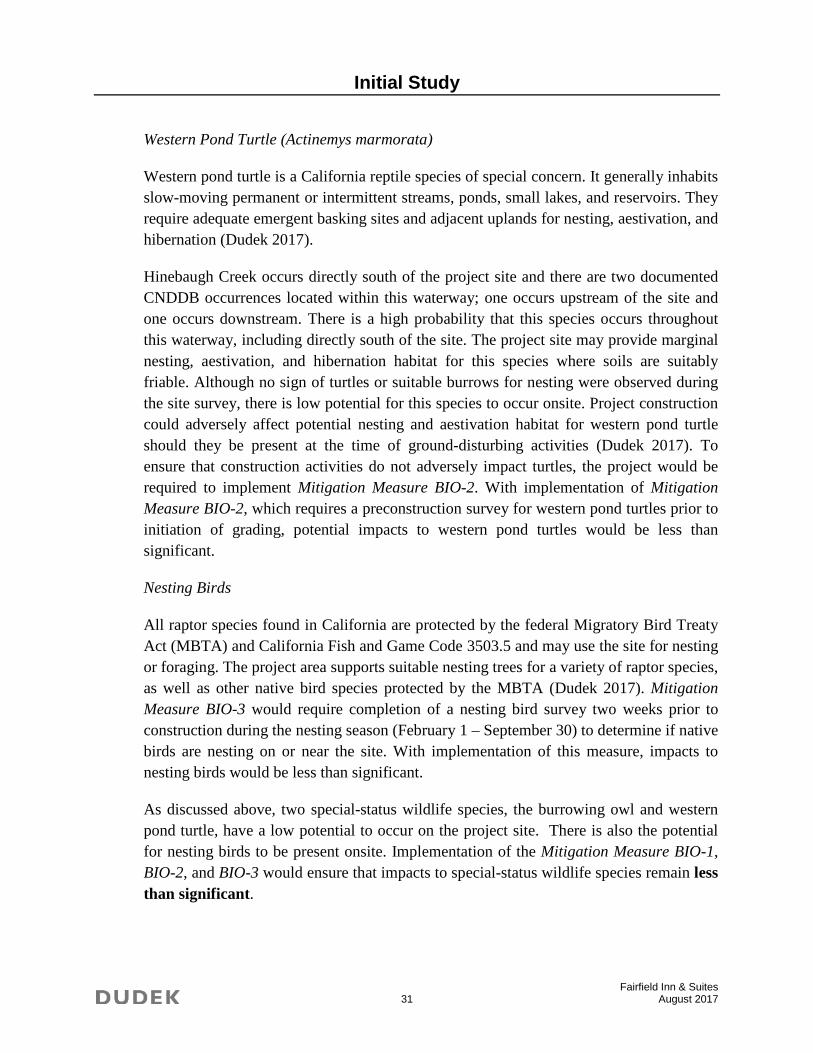
As shown on Figure 3 Site Plan, the project proposes to construct a 100-room hotel on a vacant 1.83-acre parcel. The hotel building would have five floors and the building height would be 70 feet. The proposed building footprint would be approximately 11,670 square feet (sf) with a combined total building area of approximately 57,670 sf.
Proposed first floor building amenities include a porte cochère and covered drop off area, a lobby with lounge seating and a waiting area, breakfast bar and breakfast seating, business services area, a fitness center, an outdoor pool and seating area, and outdoor linear fire pits.
Roadway Access: Primary access to the project site at the intersection of Dowdell Avenue and Martin Avenue via a driveway shared with Ashley Furniture HomeStore. Martin Avenue, which currently terminates at its intersection with Dowdell Avenue, will be extended from Dowdell Avenue to Labath Avenue. The extension of Martin Avenue is not a component of the proposed project, but will be constructed as part of the recently approved Five Creek project on the property to the north of the project site. For the
Vicinity MapSonoma County, CaliforniaInitial Study for the Fairfield Inn Site in Rohnert Park
SOURCE: Bing Maps (Accessed 2017)
Date
: 8/8
/201
7 -
Las
t sav
ed b
y: rs
trobr
idge
- P
ath:
Z:\P
rojec
ts\j98
1000
\MAP
DOC\
DOCU
MEN
T\Fa
irfiel
dInn\
IS\F
igure
2_Vi
cinity
.mxd
0 2,0001,000Feetn Project Boundary
FIGURE 2
Project Site
HATCHING LEGEND:KEY NOTES:
1
2
Site PlanFIGURE 3
Initial Study for the Fairfield Inn Site in Rohnert Park Sonoma County, California
SOURCE: Adobe Associates, Inc. (2017)
Initial Study
Fairfield Inn & Suites 8 August 2017
proposed project, secondary access for emergency vehicles would be provided at the southeast corner of the project site to the Ashley Furniture HomeStore parking lot on the adjacent parcel. The project would not reconfigure any existing roadways.
Parking: The project includes a parking lot with 105 parking spaces, including four accessible spaces and one van accessible space. Electric vehicle spaces would be provided in compliance with Building Code requirements. A designated area for bicycle parking would be provided at the front of the hotel.
Water and Recycled Water: The City’s water system would provide domestic, fire protection, and irrigation demands for the project. The project would tie in to the existing 8-inch water line in Martin Avenue adjacent to the project site.
Wastewater: To serve wastewater demands, the project would tie into the City’s sanitary sewer system. The project would connect to an existing 8-inch sewer line located within Martin Avenue via 6-inch main that would traverse from Martin Avenue through the proposed entry driveway area and connect to a 4-inch main that would continue southwest to the project site.
Stormwater: The Five Creek project will construct a new storm drain system with a 36” storm water outfall to Hinebaugh Creek, just west of the existing Labath Avenue Bridge. This new storm drain system is designed to accommodate the 10-year storm event and to accept runoff from 15.25 acres of the Five Creek site, the City Public Safety and Public Works site, and the proposed project site, for a total tributary area of 17.08 acres.
In addition to flood control, the City of Rohnert Park has adopted the City of Santa Rosa and County of Sonoma Storm Water Low Impact Design Technical Design Manual to address stormwater runoff quality and quantity from new development and redevelopment projects. To meet the design goal, the project would implement permanent storm water best management practices (BMPs) designed in accordance with the County of Sonoma Storm Water Low Impact Design Technical Design Manual.
The project proposes to meet design requirements by treating 100 percent of the flow generated by the 85th percentile 24 hour storm event and capturing the resulting increase in stormwater volume (due to project development) generated by the 85th percentile 24 hour storm event.
Grading: Due to placement of fill from a project in the past, it is anticipated that approximately 4000 cubic yards would be off-hauled from the site.
Initial Study
Fairfield Inn & Suites 9 August 2017
Sustainability Features: The project would include the following energy, water conservation, and solid waste diversion features to minimize greenhouse gas emissions and to promote more sustainable practices:
• The project proposes to utilize modular building units for construction that would be completely finished with paint, carpets, doors/locks, furniture, and other features. Proposed modular construction would serve to reduce construction material waste.
• Solar energy generation is proposed for the project. Approximately 60 percent of the roof area, or 7000 square feet, would be available for solar energy generation equipment. At 22.2 square feet of area for one panel, approximately 315 panels could be installed on the building. At 325 watts per panel, this project would generate approximately 110 to 120 kW of energy per day through photovoltaic means.
• The project would be required to be constructed in compliance with state or local green building standards in effect at the time of building construction.
• The project would comply with current Title 24, Part 6, of the California Code of Regulations energy efficiency standards for electrical and natural gas appliances and other devices at the time of building construction. The project would use LED lighting for outdoor areas.
• During both construction and operation of the project, the project would comply with all state regulations related to solid waste generation, storage, and disposal, including the California Integrated Waste Management Act, as amended. During construction, all wastes would be recycled to the maximum extent possible.
The proposed project would be constructed in a single phase that would take approximately 9 months to complete.
Entitlements and required approvals:
The project would require the following approvals:
• Site Plan and Architectural Review; and • California Department of Fish and Wildlife and U.S. Fish and Wildlife Service
review and concurrence with findings of the California Tiger Salamander Habitat Assessment for the Fairfield Inn Site
Initial Study
Fairfield Inn & Suites 10 August 2017
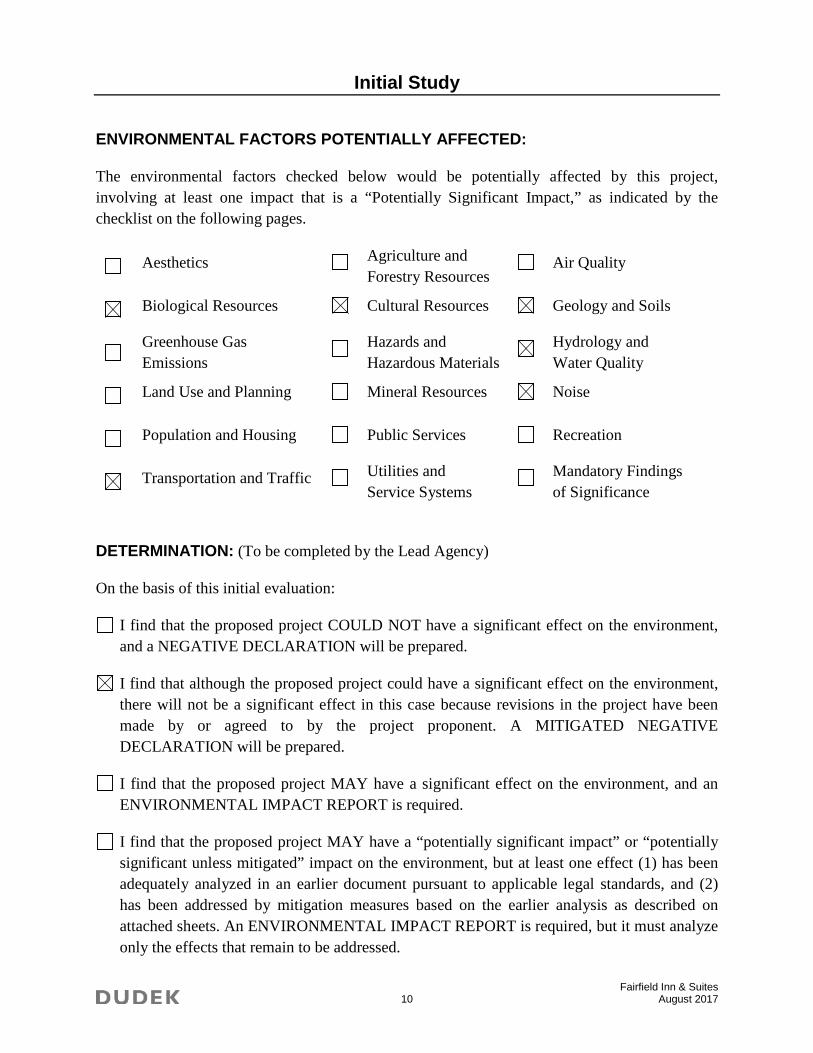
ENVIRONMENTAL FACTORS POTENTIALLY AFFECTED:
The environmental factors checked below would be potentially affected by this project, involving at least one impact that is a “Potentially Significant Impact,” as indicated by the checklist on the following pages.
Aesthetics Agriculture and Forestry Resources
Air Quality
Biological Resources Cultural Resources Geology and Soils
Greenhouse Gas Emissions
Hazards and Hazardous Materials
Hydrology and Water Quality
Land Use and Planning Mineral Resources Noise
Population and Housing Public Services Recreation
Transportation and Traffic Utilities and Service Systems
Mandatory Findings of Significance
DETERMINATION: (To be completed by the Lead Agency)
On the basis of this initial evaluation:
I find that the proposed project COULD NOT have a significant effect on the environment, and a NEGATIVE DECLARATION will be prepared.
I find that although the proposed project could have a significant effect on the environment, there will not be a significant effect in this case because revisions in the project have been made by or agreed to by the project proponent. A MITIGATED NEGATIVE DECLARATION will be prepared.
I find that the proposed project MAY have a significant effect on the environment, and an ENVIRONMENTAL IMPACT REPORT is required.
I find that the proposed project MAY have a “potentially significant impact” or “potentially significant unless mitigated” impact on the environment, but at least one effect (1) has been adequately analyzed in an earlier document pursuant to applicable legal standards, and (2) has been addressed by mitigation measures based on the earlier analysis as described on attached sheets. An ENVIRONMENTAL IMPACT REPORT is required, but it must analyze only the effects that remain to be addressed.
Initial Study
Fairfield Inn & Suites 12 August 2017
EVALUATION OF ENVIRONMENTAL IMPACTS:
• A brief explanation is required for all answers except “No Impact” answers that are adequately supported by the information sources a lead agency cites in the parentheses following each question. A “No Impact” answer is adequately supported if the referenced information sources show that the impact simply does not apply to projects like the one involved (e.g., the project falls outside a fault rupture zone). A “No Impact” answer should be explained where it is based on project-specific factors as well as general standards (e.g., the project will not expose sensitive receptors to pollutants, based on a project-specific screening analysis).
• All answers must take account of the whole action involved, including off-site as well as on-site, cumulative as well as project-level, indirect as well as direct, and construction as well as operational impacts.
• Once the lead agency has determined that a particular physical impact may occur, then the checklist answers must indicate whether the impact is potentially significant, less than significant with mitigation, or less than significant. “Potentially Significant Impact” is appropriate if there is substantial evidence that an effect may be significant. If there are one or more “Potentially Significant Impact” entries when the determination is made, an Environmental Impact Report (EIR) is required.
• “Negative Declaration: Less Than Significant With Mitigation Incorporated” applies where the incorporation of mitigation measures has reduced an effect from “Potentially Significant Impact” to a “Less Than Significant Impact.” The lead agency must describe the mitigation measures, and briefly explain how they reduce the effect to a less than significant level (mitigation measures from “Earlier Analyses,” as described in (5) below, may be cross-referenced).
• Earlier analyses may be used where, pursuant to the tiering, program EIR, or other CEQA process, an effect has been adequately analyzed in an earlier EIR or negative declaration. Section 15063(c)(3)(D). In this case, a brief discussion should identify the following:
a. Earlier Analysis Used. Identify and state where they are available for review.
b. Impacts Adequately Addressed. Identify which effects from the above checklist were within the scope of and adequately analyzed in an earlier document pursuant to applicable legal standards, and state whether such effects were addressed by mitigation measures based on the earlier analysis.
c. Mitigation Measures. For effects that are “Less than Significant with Mitigation Measures Incorporated,” describe the mitigation measures which were incorporated
Initial Study
Fairfield Inn & Suites 13 August 2017
or refined from the earlier document and the extent to which they address site-specific conditions for the project.
• Lead agencies are encouraged to incorporate into the checklist references to information sources for potential impacts (e.g., general plans, zoning ordinances). Reference to a previously prepared or outside document should, where appropriate, include a reference to the page or pages where the statement is substantiated.
• Supporting Information Sources: A source list should be attached, and other sources used or individuals contacted should be cited in the discussion.
• This is only a suggested form, and lead agencies are free to use different formats; however, lead agencies should normally address the questions from this checklist that are relevant to a project’s environmental effects in whatever format is selected.
• The explanation of each issue should identify:
a. The significance criteria or threshold, if any, used to evaluate each question; and
b. The mitigation measure identified, if any, to reduce the impact to less than significance.
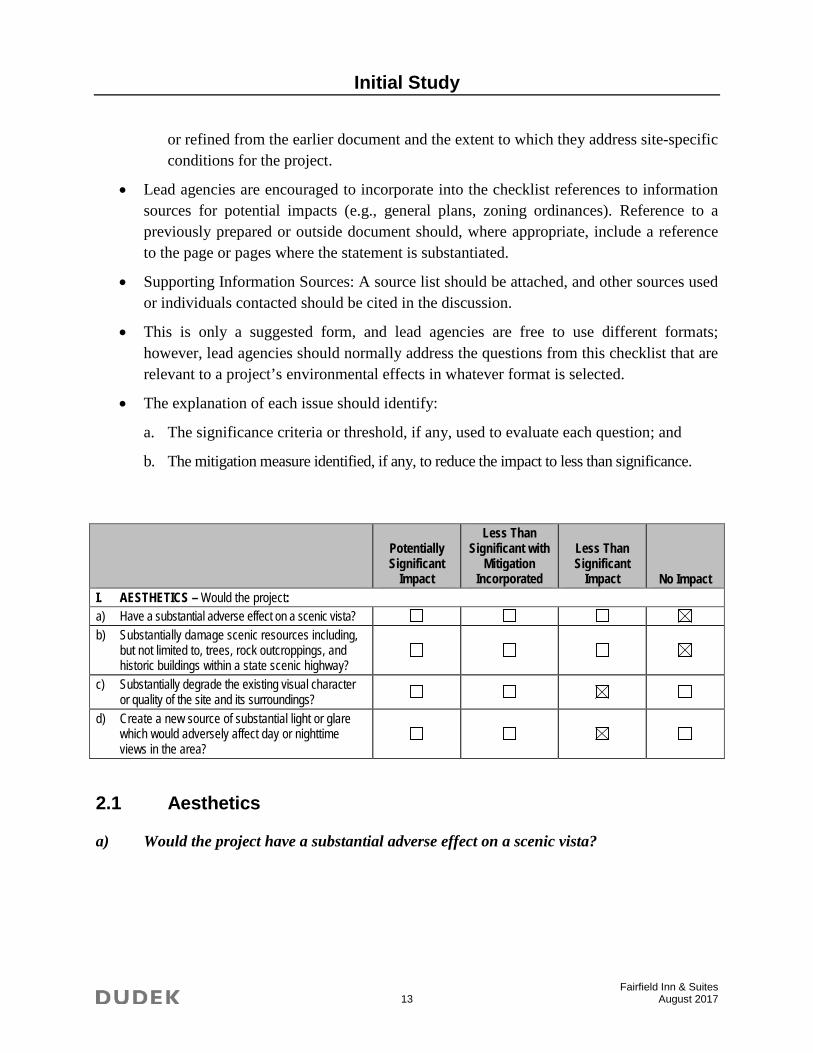
Potentially Significant
Impact
Less Than Significant with
Mitigation Incorporated
Less Than Significant
Impact No Impact I. AESTHETICS – Would the project: a) Have a substantial adverse effect on a scenic vista? b) Substantially damage scenic resources including,
but not limited to, trees, rock outcroppings, and historic buildings within a state scenic highway?
c) Substantially degrade the existing visual character or quality of the site and its surroundings?
d) Create a new source of substantial light or glare which would adversely affect day or nighttime views in the area?
2.1 Aesthetics
a) Would the project have a substantial adverse effect on a scenic vista?
Initial Study
Fairfield Inn & Suites 14 August 2017
For purposes of this analysis, a scenic vista is defined as an expansive view of highly valued landscape feature (e.g. a mountain range, lake or coastline) observable from a publicly accessible vantage point. In the project vicinity, publically accessible vantage points are limited to public roads. The project site is located in an urban area that contains a mixture of existing regional commercial, public/institutional, and industrial uses. The project site is comprised of vacant and previously graded land, which is void of scenic resources and unique natural features. The site is not designated, nor is it adjacent to, a designated scenic vista or a state scenic highway (City of Rohnert Park 2015). The Sonoma County General Plan identifies U.S. 101 and Petaluma Hill Road as designated scenic corridors (City of Rohnert Park 2007). However, the project site is not visible from either of those corridors. Accordingly, development of the project would result in no impacts to scenic vistas nor result in damage to scenic resources.
b) Would the project substantially damage scenic resources including, but not limited to, trees, rock outcroppings, and historic buildings within a state scenic highway?
Refer to answer provided in ‘a’ above.
c) Would the project substantially degrade the existing visual character or quality of the site and its surroundings?
For the purposes of this analysis, a substantial degradation of the existing visual character or quality would occur if the project would introduce a new visible element that would be inconsistent with the overall quality, scale, and character of the surrounding development. As previously discussed, the site is located in a developed, urban area that contains a mixture of existing regional commercial, residential, public/institutional, and industrial park land uses.
The project site is presently undeveloped and previously disturbed. The existing conditions of the site do not provide substantial scenic value because the site is an undeveloped, generally flat parcel with little vegetation, trees or greenery surrounded by regional commercial, public/institutional, and light industrial buildings and development. While the project site is located adjacent to the Hinebaugh Creek corridor which supports riparian vegetation and trees, the proposed development would not include alterations within the Creek area.
The project would replace the undeveloped site with a hotel building and enhanced landscaping and amenities that would complement the existing development in the direct vicinity of the project site. The land use and zoning designation for the project site currently allow for hotel uses, as proposed. The proposed building would be required to
Initial Study
Fairfield Inn & Suites 15 August 2017
comply with City design standards and reflect a similar architectural design that would be consistent with the nature of the surrounding area. Therefore, while development of the project site with a hotel would change the visual character of the site, impacts would be less than significant.
d) Would the project create a new source of substantial light or glare which would adversely affect day or nighttime views in the area?
Exterior lighting would be added to the proposed building and parking lot on a parcel of land upon which there is currently no lighting. The project would increase nighttime lighting from vehicles, the interior streets, parking and buildings. However, due to the urbanized nature of the surrounding area, a significant amount of ambient nighttime lighting currently exists, which affects nighttime views in the area. Despite that, the project would introduce new sources of light in the area, all future development on the project site must comply with the City of Rohnert Park’s lighting and glare standards (Municipal Code Section 17.12.050). Accordingly, impacts associated with lighting and glare would be less than significant.
Mitigation Measures
No mitigation measures are necessary.
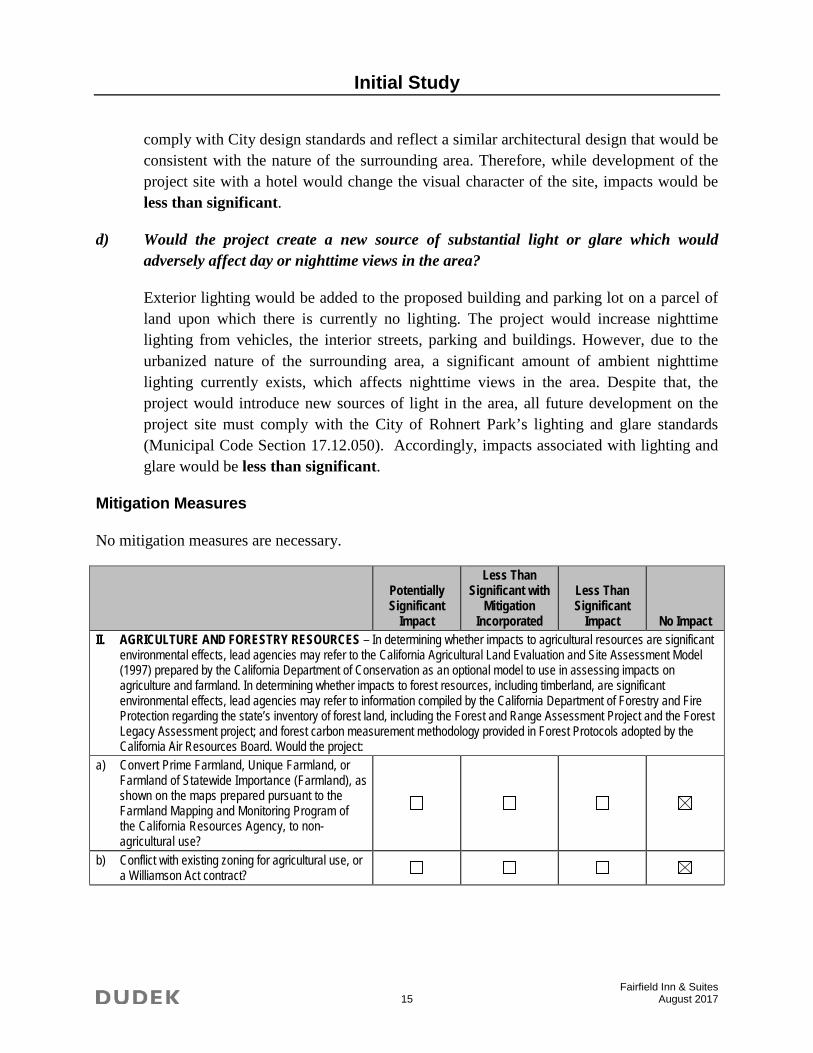
Potentially Significant
Impact
Less Than Significant with
Mitigation Incorporated
Less Than Significant
Impact No Impact II. AGRICULTURE AND FORESTRY RESOURCES – In determining whether impacts to agricultural resources are significant
environmental effects, lead agencies may refer to the California Agricultural Land Evaluation and Site Assessment Model (1997) prepared by the California Department of Conservation as an optional model to use in assessing impacts on agriculture and farmland. In determining whether impacts to forest resources, including timberland, are significant environmental effects, lead agencies may refer to information compiled by the California Department of Forestry and Fire Protection regarding the state’s inventory of forest land, including the Forest and Range Assessment Project and the Forest Legacy Assessment project; and forest carbon measurement methodology provided in Forest Protocols adopted by the California Air Resources Board. Would the project:
a) Convert Prime Farmland, Unique Farmland, or Farmland of Statewide Importance (Farmland), as shown on the maps prepared pursuant to the Farmland Mapping and Monitoring Program of the California Resources Agency, to non-agricultural use?
b) Conflict with existing zoning for agricultural use, or a Williamson Act contract?
Initial Study
Fairfield Inn & Suites 16 August 2017
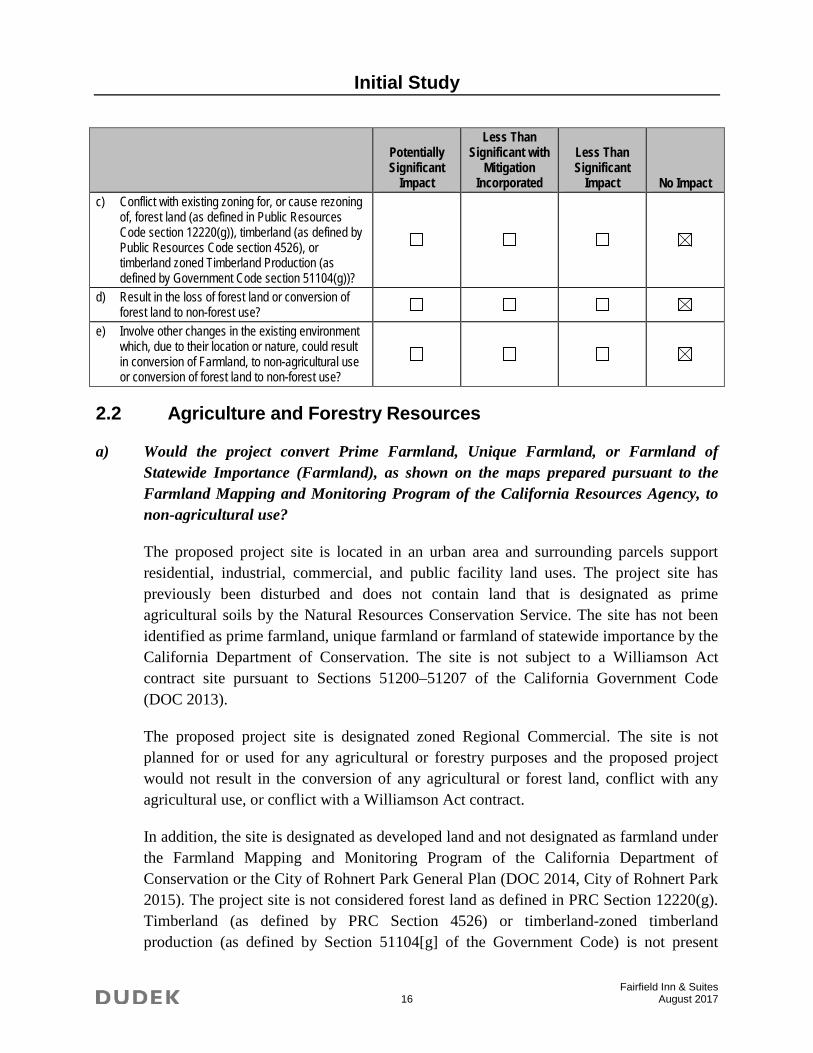
Potentially Significant
Impact
Less Than Significant with
Mitigation Incorporated
Less Than Significant
Impact No Impact c) Conflict with existing zoning for, or cause rezoning
of, forest land (as defined in Public Resources Code section 12220(g)), timberland (as defined by Public Resources Code section 4526), or timberland zoned Timberland Production (as defined by Government Code section 51104(g))?
d) Result in the loss of forest land or conversion of forest land to non-forest use?
e) Involve other changes in the existing environment which, due to their location or nature, could result in conversion of Farmland, to non-agricultural use or conversion of forest land to non-forest use?
2.2 Agriculture and Forestry Resources
a) Would the project convert Prime Farmland, Unique Farmland, or Farmland of Statewide Importance (Farmland), as shown on the maps prepared pursuant to the Farmland Mapping and Monitoring Program of the California Resources Agency, to non-agricultural use?
The proposed project site is located in an urban area and surrounding parcels support residential, industrial, commercial, and public facility land uses. The project site has previously been disturbed and does not contain land that is designated as prime agricultural soils by the Natural Resources Conservation Service. The site has not been identified as prime farmland, unique farmland or farmland of statewide importance by the California Department of Conservation. The site is not subject to a Williamson Act contract site pursuant to Sections 51200–51207 of the California Government Code (DOC 2013).
The proposed project site is designated zoned Regional Commercial. The site is not planned for or used for any agricultural or forestry purposes and the proposed project would not result in the conversion of any agricultural or forest land, conflict with any agricultural use, or conflict with a Williamson Act contract.
In addition, the site is designated as developed land and not designated as farmland under the Farmland Mapping and Monitoring Program of the California Department of Conservation or the City of Rohnert Park General Plan (DOC 2014, City of Rohnert Park 2015). The project site is not considered forest land as defined in PRC Section 12220(g). Timberland (as defined by PRC Section 4526) or timberland-zoned timberland production (as defined by Section 51104[g] of the Government Code) is not present
Initial Study
Fairfield Inn & Suites 17 August 2017
onsite, nor are any active or potential commercial timber operations present in the area. Therefore, no impact associated with agriculture and forestry resources would result from implementation of the proposed project.
b) Would the project conflict with existing zoning for agricultural use, or a Williamson Act contract?
Refer to answer provided in ‘a’ above.
c) Would the project conflict with existing zoning for, or cause rezoning of, forest land (as defined in Public Resources Code section 12220(g)), timberland (as defined by Public Resources Code section 4526), or timberland zoned Timberland Production (as defined by Government Code section 51104(g))?
Refer to answer provided in ‘a’ above.
d) Would the project result in the loss of forest land or conversion of forest land to non-forest use?
Refer to answer provided in ‘a’ above.
e) Would the project involve other changes in the existing environment which, due to their location or nature, could result in conversion of Farmland, to non-agricultural use or conversion of forest land to non-forest use?
Refer to answer provided in ‘a’ above.
Mitigation Measures
No mitigation measures are necessary.
Potentially Significant
Impact
Less Than Significant with
Mitigation Incorporated
Less Than Significant
Impact No Impact III. AIR QUALITY – Where available, the significance criteria established by the applicable air quality management or air
pollution control district may be relied upon to make the following determinations. Would the project: a) Conflict with or obstruct implementation of the
applicable air quality plan?
b) Violate any air quality standard or contribute substantially to an existing or projected air quality violation?
Initial Study
Fairfield Inn & Suites 18 August 2017
Potentially Significant
Impact
Less Than Significant with
Mitigation Incorporated
Less Than Significant
Impact No Impact c) Result in a cumulatively considerable net increase of
any criteria pollutant for which the project region is non-attainment under an applicable federal or state ambient air quality standard (including releasing emissions which exceed quantitative thresholds for ozone precursors)?
d) Expose sensitive receptors to substantial pollutant concentrations?
e) Create objectionable odors affecting a substantial number of people?
2.3 Air Quality
The Bay Area Air Quality Management District (BAAQMD) adopted updated CEQA Air Quality Guidelines, including new thresholds of significance, in June 2010 (BAAQMD 2010), and revised them in May 2011. The CEQA Air Quality Guidelines advise lead agencies on how to evaluate potential air quality impacts, including establishing quantitative and qualitative thresholds of significance. The BAAQMD resolutions adopting and revising the significance thresholds in 2011 were set aside by a judicial writ of mandate on March 5, 2012. In May 2012, the BAAQMD updated its CEQA Air Quality Guidelines to continue to provide direction on recommended analysis methodologies, but without recommended quantitative significance thresholds (BAAQMD 2012). On August 13, 2013, the First District Court of Appeal ordered the trial court to reverse the judgment and upheld the BAAQMD’s CEQA thresholds. The BAAQMD CEQA Air Quality Guidelines were recently re-released in May 2017 and include the same thresholds as in the 2010 and 2011 Guidelines for criteria air pollutants, TACs, and greenhouse gases (BAAQMD 2017a). The Guidelines also address the December 2015 Supreme Court’s opinion (California Building Industry Association v. Bay Area Air Quality Management District (2015) 62 Cal. 4th 369). These BAAQMD significance thresholds are summarized in Table 2.3-1.
In general, the BAAQMD significance thresholds for reactive organic gases (ROG), oxides of nitrogen (NOx), particulate matter with an aerodynamic resistance diameter of 10 micrometers or less (PM10), particulate matter with an aerodynamic resistance diameter of 2.5 micrometers or less (PM2.5), and carbon monoxide (CO) address the first three air quality significance criteria. The BAAQMD maintains that these thresholds are intended to maintain ambient air quality concentrations of these criteria air pollutants below state and federal standards and to prevent a cumulatively considerable contribution to regional nonattainment with ambient air quality standards. The toxic air contaminant (TAC) thresholds (cancer and noncancer risks) and local
Initial Study
Fairfield Inn & Suites 19 August 2017
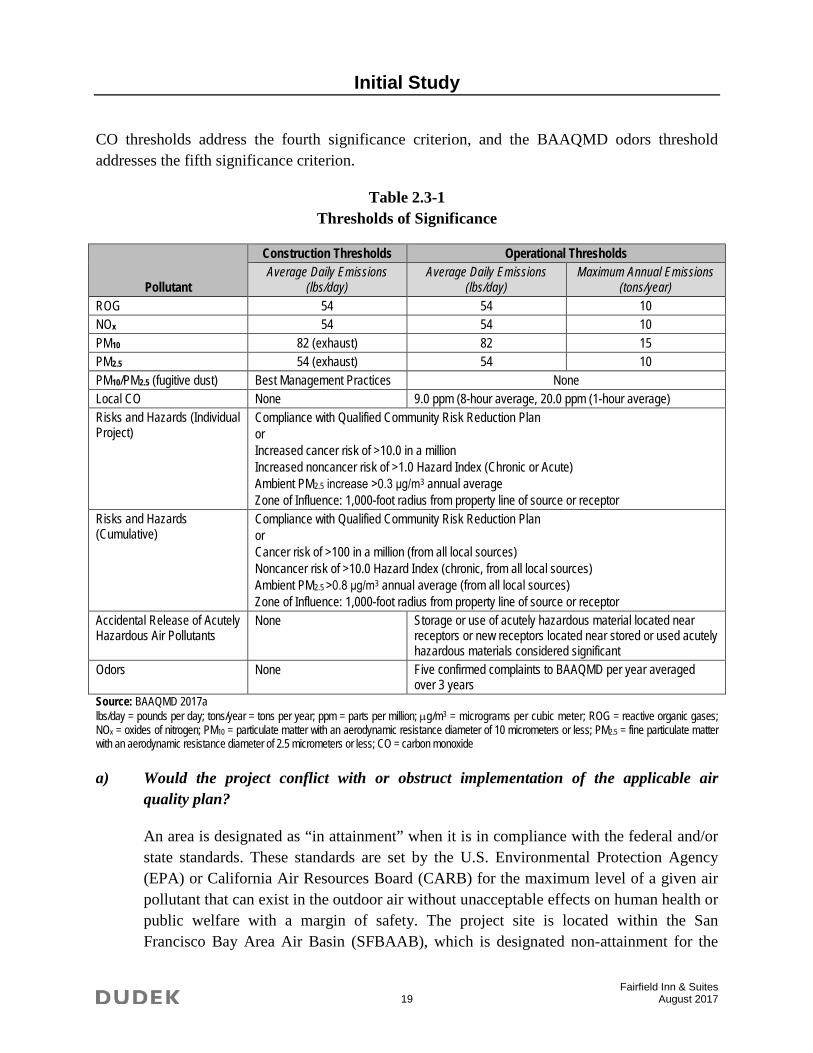
CO thresholds address the fourth significance criterion, and the BAAQMD odors threshold addresses the fifth significance criterion.
Table 2.3-1 Thresholds of Significance
Pollutant
Construction Thresholds Operational Thresholds Average Daily Emissions
(lbs/day) Average Daily Emissions
(lbs/day) Maximum Annual Emissions
(tons/year) ROG 54 54 10 NOx 54 54 10 PM10 82 (exhaust) 82 15 PM2.5 54 (exhaust) 54 10 PM10/PM2.5 (fugitive dust) Best Management Practices None Local CO None 9.0 ppm (8-hour average, 20.0 ppm (1-hour average) Risks and Hazards (Individual Project)
Compliance with Qualified Community Risk Reduction Plan or Increased cancer risk of >10.0 in a million Increased noncancer risk of >1.0 Hazard Index (Chronic or Acute) Ambient PM2.5 increase >0.3 μg/m3 annual average Zone of Influence: 1,000-foot radius from property line of source or receptor
Risks and Hazards (Cumulative)
Compliance with Qualified Community Risk Reduction Plan or Cancer risk of >100 in a million (from all local sources) Noncancer risk of >10.0 Hazard Index (chronic, from all local sources) Ambient PM2.5 >0.8 μg/m3 annual average (from all local sources) Zone of Influence: 1,000-foot radius from property line of source or receptor
Accidental Release of Acutely Hazardous Air Pollutants
None Storage or use of acutely hazardous material located near receptors or new receptors located near stored or used acutely hazardous materials considered significant
Odors None Five confirmed complaints to BAAQMD per year averaged over 3 years
Source: BAAQMD 2017a lbs/day = pounds per day; tons/year = tons per year; ppm = parts per million; µg/m3 = micrograms per cubic meter; ROG = reactive organic gases; NOx = oxides of nitrogen; PM10 = particulate matter with an aerodynamic resistance diameter of 10 micrometers or less; PM2.5 = fine particulate matter with an aerodynamic resistance diameter of 2.5 micrometers or less; CO = carbon monoxide
a) Would the project conflict with or obstruct implementation of the applicable air quality plan?
An area is designated as “in attainment” when it is in compliance with the federal and/or state standards. These standards are set by the U.S. Environmental Protection Agency (EPA) or California Air Resources Board (CARB) for the maximum level of a given air pollutant that can exist in the outdoor air without unacceptable effects on human health or public welfare with a margin of safety. The project site is located within the San Francisco Bay Area Air Basin (SFBAAB), which is designated non-attainment for the
Initial Study
Fairfield Inn & Suites 20 August 2017
federal 8-hour ozone (O3) and 24-hour PM2.5 standards. The area is in attainment or unclassified for all other federal standards. The area is designated non-attainment for state standards for 1-hour and 8-hour O3, 24-hour PM10, annual PM10, and annual PM2.5.
On April 19, 2017, the BAAQMD adopted the Spare the Air: Cool The Climate Final 2017 Clean Air Plan (BAAQMD 2017b). The 2017 Clean Air Plan provides a regional strategy to protect public health and protect the climate. To protect public health, the 2017 Clean Air Plan includes all feasible measures to reduce emissions of O3 precursors (ROG and NOx) and reduce O3 transport to neighboring air basins. In addition, the 2017 Clean Air Plan builds upon the BAAQMD efforts to reduce fine particulate matter (PM) and TACs. To protect the climate, the plan defines a vision for transitioning the region to a post-carbon economy needed to achieve ambitious greenhouse gas (GHG) reduction targets for 2030 and 2050, and provides a regional climate protection strategy that will put the Bay Area on a pathway to achieve those GHG reduction targets.
The BAAQMD Guidelines identify a three-step methodology for determining a project’s consistency with the current Clean Air Plan. If the responses to these three questions can be concluded in the affirmative and those conclusions are supported by substantial evidence, then the BAAQMD considers the project to be consistent with air quality plans prepared for the Bay Area.
The first question to be assessed in this methodology is “does the project support the goals of the Air Quality Plan”? The BAAQMD-recommended measure for determining project support for these goals is consistency with BAAQMD thresholds of significance. If a project would not result in significant and unavoidable air quality impacts, after the application of all feasible mitigation measures, the project would be consistent with the goals of the 2017 Clean Air Plan. As indicated in the following discussion with regard to air quality impact questions b) and c), the project would result in less than significant construction emissions and would not result in long-term adverse air quality impacts. Therefore, the project would be considered to support the primary goals of the 2017 Clean Air Plan and, therefore, consistent with the current Clean Air Plan.
The second question to be assessed in this consistency methodology is “does the project include applicable control measures from the Clean Air Plan?” The 2017 Clean Air Plan contains 85 control measures aimed at reducing air pollution in the Bay Area. Projects that incorporate all feasible air quality plan control measures are considered consistent with the Clean Air Plan. The project includes plans for a 100-room, 57,670 square-foot hotel and associated above ground parking. The control strategies of the 2017 Clean Air Plan include measures in the categories of stationary sources, the transportation sector, the buildings sector, the energy sector, the agriculture sector, natural and working lands, the waste sector,
Initial Study
Fairfield Inn & Suites 21 August 2017
the water sector, and super-GHG pollutant measures. Depending on the control measure, the tools for implementation include leveraging the BAAQMD rules and permitting authority, regional coordination and funding, working with local governments to facilitate best policies in building codes, outreach and education, and advocacy strategies. Since the proposed project would comply with all applicable BAAQMD rules and would incorporate energy efficiency and green building measures in compliance with state standards and/or local building codes, the project would include applicable control measures from the 2017 Clean Air Plan.
The third question to be assessed in this consistency methodology is “does the project disrupt or hinder implementation of any control measures from the Clean Air Plan?” Examples of how a project may cause the disruption or delay of control measures include a project that precludes an extension of a transit line or bike path, or proposes excessive parking beyond parking requirements. The proposed project would not create any barriers or impediments to planned or future improvements to transit or bicycle facilities in the area, nor would it include excessive parking. Therefore, the project would not hinder implementation of 2017 Clean Air Plan control measures.
In summary, the responses to all three of the questions with regard to Clean Air Plan consistency are affirmative and the proposed project would not conflict with or obstruct implementation of the 2017 Clean Air Plan. This is a less than significant impact.
b) Would the project violate any air quality standard or contribute substantially to an existing or projected air quality violation?
The California Emissions Estimator Model (CalEEMod) Version 2016.3.1 was used to estimate emissions from construction and operation of the proposed project. CalEEMod is a statewide computer model developed in cooperation with air districts throughout the state to quantify criteria air pollutant and GHG emissions associated with the construction and operational activities from a variety of land use projects, such as residential, commercial, and industrial facilities. CalEEMod input parameters, including the proposed project land use type and size, construction schedule, and anticipated construction equipment utilization, were based on information provided by the project applicant, or default model assumptions if project specifics were unavailable.
Construction. Construction of the proposed project would involve construction and operation of a 100-room, 57,670 square-foot hotel and associated above ground parking on a 1.83-acre site. Construction is anticipated to begin in 2017 and take approximately 9 months to complete. Construction would involve site preparation and grading of the site. The proposed earthwork would export approximately 4,000-cubic yards of soil for the
Initial Study
Fairfield Inn & Suites 22 August 2017
project site. The building would be delivered in modular units, completely finished with paint, carpets, doors/locks, and furniture, which is anticipated to reduce onsite equipment usage by approximately 75 percent of model defaults for a site built hotel of this magnitude. It was assumed that 60 haul trucks would be needed to transport the modular units, with a conservative trip length of 60-miles each way. Notably, low-volatile organic compound (VOC) coatings were assumed per applicant input. Sources of emissions would include: off-road construction equipment exhaust, on-road vehicles exhaust and entrained road dust (i.e., haul trucks for soil export and modular unit import, material delivery trucks, and worker vehicles), fugitive dust associated with site preparation and grading activities, and paving and architectural coating activities. Detailed assumptions associated with project construction are included in Appendix A.
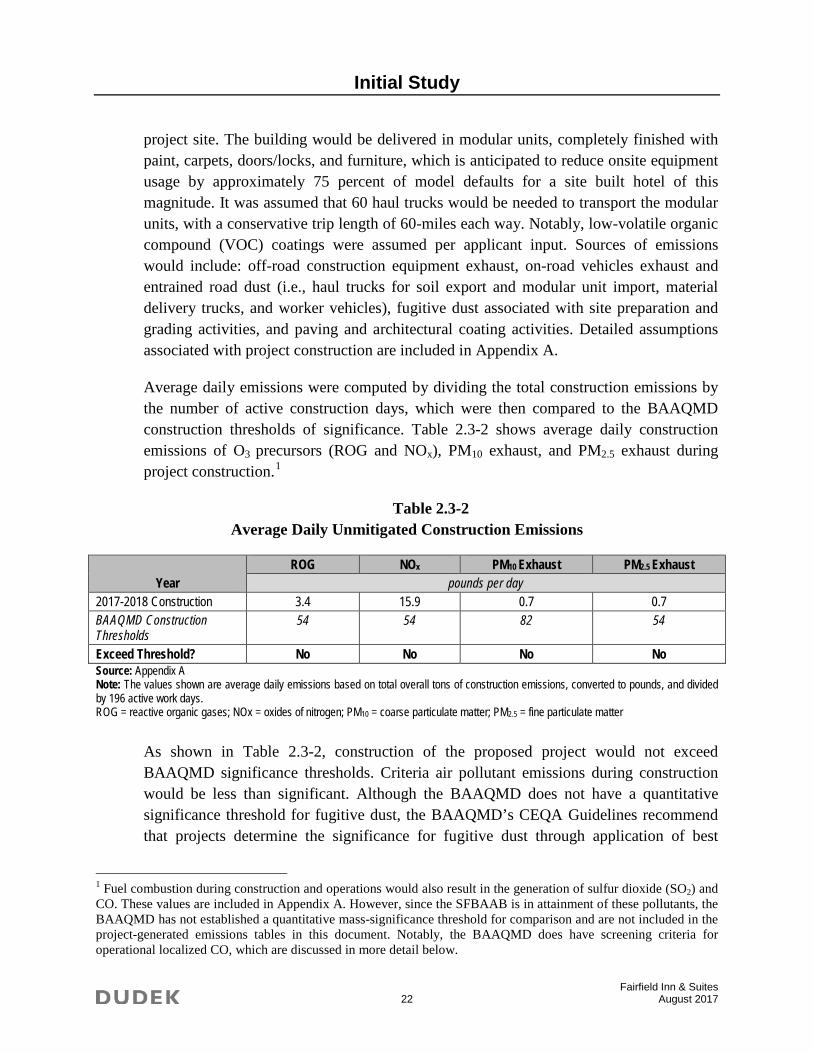
Average daily emissions were computed by dividing the total construction emissions by the number of active construction days, which were then compared to the BAAQMD construction thresholds of significance. Table 2.3-2 shows average daily construction emissions of O3 precursors (ROG and NOx), PM10 exhaust, and PM2.5 exhaust during project construction.1
Table 2.3-2 Average Daily Unmitigated Construction Emissions
Year ROG NOx PM10 Exhaust PM2.5 Exhaust
pounds per day 2017-2018 Construction 3.4 15.9 0.7 0.7 BAAQMD Construction Thresholds
54 54 82 54
Exceed Threshold? No No No No Source: Appendix A Note: The values shown are average daily emissions based on total overall tons of construction emissions, converted to pounds, and divided by 196 active work days. ROG = reactive organic gases; NOx = oxides of nitrogen; PM10 = coarse particulate matter; PM2.5 = fine particulate matter
As shown in Table 2.3-2, construction of the proposed project would not exceed BAAQMD significance thresholds. Criteria air pollutant emissions during construction would be less than significant. Although the BAAQMD does not have a quantitative significance threshold for fugitive dust, the BAAQMD’s CEQA Guidelines recommend that projects determine the significance for fugitive dust through application of best
1 Fuel combustion during construction and operations would also result in the generation of sulfur dioxide (SO2) and CO. These values are included in Appendix A. However, since the SFBAAB is in attainment of these pollutants, the BAAQMD has not established a quantitative mass-significance threshold for comparison and are not included in the project-generated emissions tables in this document. Notably, the BAAQMD does have screening criteria for operational localized CO, which are discussed in more detail below.
Initial Study
Fairfield Inn & Suites 23 August 2017
management practices (BMPs). The project contractor would be required as conditions of approval to implement the following BMPs that are required of all projects:
1. All exposed surfaces (e.g., parking areas, staging areas, soil piles, graded areas, and unpaved access roads) shall be watered two times per day.
2. All haul trucks transporting soil, sand, or other loose material off site shall be covered.
3. All visible mud or dirt track-out onto adjacent public roads shall be removed using wet power vacuum street sweepers at least once per day. The use of dry power sweeping is prohibited.
4. All vehicle speeds on unpaved roads shall be limited to 15 miles per hour (mph).
5. All roadways, driveways, and sidewalks to be paved shall be completed as soon as possible. Building pads shall be laid as soon as possible after grading unless seeding or soil binders are used.
6. Idling times shall be minimized either by shutting equipment off when not in use or reducing the maximum idling time to 5 minutes (as required by the California Airborne Toxics Control Measure Title 13, Section 2485 of California Code of Regulations [CCR]). Clear signage shall be provided for construction workers at all access points.
7. All construction equipment shall be maintained and properly tuned in accordance with manufacturer’s specifications. All equipment shall be checked by a certified mechanic and determined to be running in proper condition prior to operation.
8. Post a publicly visible sign with the telephone number and person to contact at the Lead Agency regarding dust complaints. This person shall respond and take corrective action within 48 hours. The BAAQMD’s phone number shall also be visible to ensure compliance with applicable regulations.
Implementation of the required fugitive dust control measures would ensure air quality and fugitive dust-related impacts associated with construction would remain less than significant.
Operations. Operation of the project would generate criteria pollutant (including ROG, NOx, PM10, and PM2.5) emissions from mobile sources (vehicular traffic), area sources (consumer products, architectural coatings, landscaping equipment), and energy sources (natural gas appliances, space and water heating). CalEEMod was used to estimate daily emissions from the operational sources. The CalEEMod default trip rate was used, which matched the Traffic Impact Study for the project (W-Trans 2017). Table 2.3-3 summarizes the daily mobile, energy, and area emissions of criteria pollutants that would
Initial Study
Fairfield Inn & Suites 24 August 2017
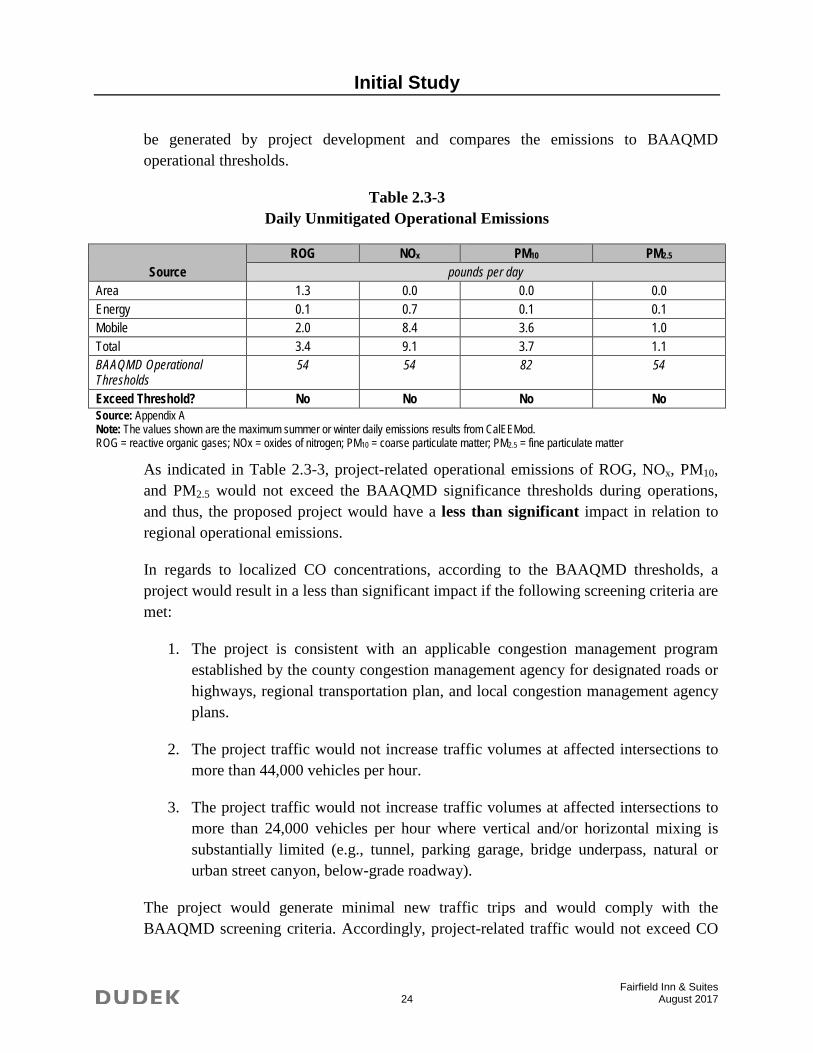
be generated by project development and compares the emissions to BAAQMD operational thresholds.
Table 2.3-3 Daily Unmitigated Operational Emissions
Source ROG NOx PM10 PM2.5
pounds per day Area 1.3 0.0 0.0 0.0 Energy 0.1 0.7 0.1 0.1 Mobile 2.0 8.4 3.6 1.0 Total 3.4 9.1 3.7 1.1 BAAQMD Operational Thresholds
54 54 82 54
Exceed Threshold? No No No No Source: Appendix A Note: The values shown are the maximum summer or winter daily emissions results from CalEEMod. ROG = reactive organic gases; NOx = oxides of nitrogen; PM10 = coarse particulate matter; PM2.5 = fine particulate matter
As indicated in Table 2.3-3, project-related operational emissions of ROG, NOx, PM10, and PM2.5 would not exceed the BAAQMD significance thresholds during operations, and thus, the proposed project would have a less than significant impact in relation to regional operational emissions.
In regards to localized CO concentrations, according to the BAAQMD thresholds, a project would result in a less than significant impact if the following screening criteria are met:
1. The project is consistent with an applicable congestion management program established by the county congestion management agency for designated roads or highways, regional transportation plan, and local congestion management agency plans.
2. The project traffic would not increase traffic volumes at affected intersections to more than 44,000 vehicles per hour.
3. The project traffic would not increase traffic volumes at affected intersections to more than 24,000 vehicles per hour where vertical and/or horizontal mixing is substantially limited (e.g., tunnel, parking garage, bridge underpass, natural or urban street canyon, below-grade roadway).
The project would generate minimal new traffic trips and would comply with the BAAQMD screening criteria. Accordingly, project-related traffic would not exceed CO
Initial Study
Fairfield Inn & Suites 25 August 2017
standards and therefore, no further analysis was conducted for CO impacts. This CO emissions impact would be considered less than significant on a project-level and cumulative basis.
c) Would the project result in a cumulatively considerable net increase of any criteria pollutant for which the project region is non-attainment under an applicable federal or state ambient air quality standard (including releasing emissions which exceed quantitative thresholds for ozone precursors)?
Past, present, and future development projects may contribute to the region’s adverse air quality impacts on a cumulative basis. Per BAAQMD’s CEQA Guidelines, by its nature air pollution is largely a cumulative impact; no single project is sufficient in size to, by itself, result in nonattainment of ambient air quality standards. In developing thresholds of significance for air pollutants, BAAQMD considered the emission levels for which a project’s individual emissions would be cumulatively considerable. If a project exceeds the identified significance thresholds, its emissions would be considered cumulatively considerable, resulting in significant adverse air quality impacts to the region’s existing air quality conditions. Therefore, if the proposed project’s emissions are below the BAAQMD thresholds or screening criteria, then the proposed project’s cumulative impact would be considered to be less than significant.
As described in criterion “b” above, criteria pollutant emissions generated by short-term construction and long-term operations of the project would not exceed the BAAQMD significance thresholds. Thus, the project would have a less than significant cumulative impact in relation to regional emissions. In addition, project-related traffic would not exceed the BAAQMD CO screening criteria and would result in a less than significant cumulative impact in relation to localized CO.
d) Would the project expose sensitive receptors to substantial pollutant concentrations?
The BAAQMD has adopted project and cumulative thresholds for three risk-related air quality indicators for sensitive receptors: cancer risks, noncancer health effects, and increases in ambient air concentrations of PM2.5. These impacts are addressed on a localized rather than regional basis and are specific to the sensitive receptors identified for the project. Sensitive receptors are groups of individuals, including children, the elderly, the acutely ill, and the chronically ill, that may be more susceptible to health risks due to chemical exposure, and sensitive-receptor population groups are likely to be located at hospitals, medical clinics, schools, playgrounds, childcare centers, residences, and retirement homes (BAAQMD 2017a). The closest sensitive receptors are existing
Initial Study
Fairfield Inn & Suites 26 August 2017
multi-family apartments located approximately 550 feet west of the project across Labath Avenue.
“Incremental cancer risk” is the net increased likelihood that a person continuously exposed to concentrations of TACs resulting from a project over a 9-, 30-, and 70-year exposure period would contract cancer based on the use of standard Office of Environmental Health Hazard Assessment (OEHHA) risk-assessment methodology (OEHHA 2015). In addition, some TACs have non-carcinogenic effects. TACs that would potentially be emitted during construction activities would be diesel particulate matter, emitted from heavy-duty construction equipment and heavy-duty trucks. Heavy-duty construction equipment and diesel trucks are subject to CARB air toxic control measures to reduce diesel particulate matter emissions. According to the OEHHA, health risk assessments, which determine the exposure of sensitive receptors to toxic emissions, should be based on a 30-year exposure period for the maximally exposed individual resident; however, such assessments should be limited to the period/duration of activities associated with the project (OEHHA 2015). Thus, the duration of proposed construction activities (approximately 9-months) would only constitute a small percentage of the total 30-year exposure period. Regarding long-term operations, the proposed project would not result in non-permitted stationary sources that would emit air pollutants or TACs.
In summary, the project would not expose sensitive receptors to substantial, long-term pollutant concentrations or health risk during construction or operations, and this impact would be less than significant on a project-level and cumulative basis.
e) Would the project create objectionable odors affecting a substantial number of people?
BAAQMD has identified typical sources of odor in the CEQA Air Quality Guidelines, a few examples of which include manufacturing plants, rendering plants, coffee roasters, wastewater treatment plants, sanitary landfills, and solid waste transfer stations. While sources that generate objectionable odors must comply with air quality regulations, the public’s sensitivity to locally produced odors often exceeds regulatory thresholds. The project would not include uses that have been identified by BAAQMD as potential sources of objectionable odors. Potential odor impacts would be less than significant.
Mitigation Measures
No mitigation measures are necessary.
Initial Study
Fairfield Inn & Suites 27 August 2017
Potentially Significant
Impact
Less Than Significant with
Mitigation Incorporated
Less Than Significant
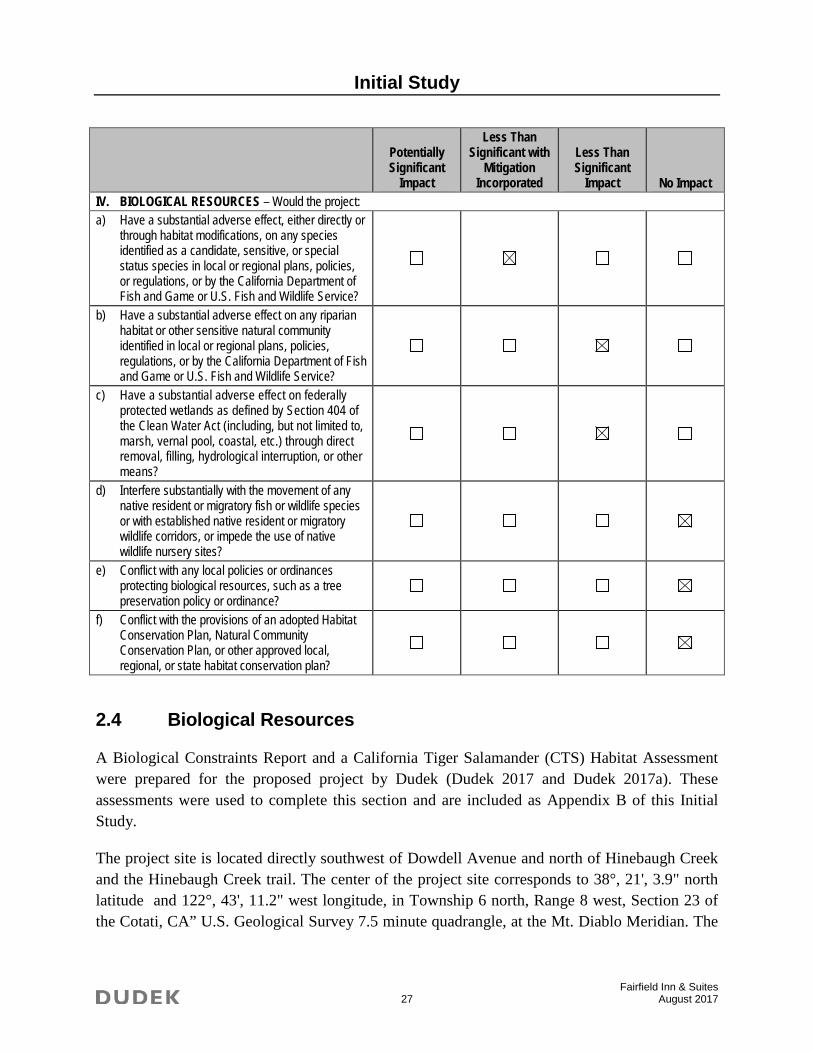
Impact No Impact IV. BIOLOGICAL RESOURCES – Would the project: a) Have a substantial adverse effect, either directly or
through habitat modifications, on any species identified as a candidate, sensitive, or special status species in local or regional plans, policies, or regulations, or by the California Department of Fish and Game or U.S. Fish and Wildlife Service?
b) Have a substantial adverse effect on any riparian habitat or other sensitive natural community identified in local or regional plans, policies, regulations, or by the California Department of Fish and Game or U.S. Fish and Wildlife Service?
c) Have a substantial adverse effect on federally protected wetlands as defined by Section 404 of the Clean Water Act (including, but not limited to, marsh, vernal pool, coastal, etc.) through direct removal, filling, hydrological interruption, or other means?
d) Interfere substantially with the movement of any native resident or migratory fish or wildlife species or with established native resident or migratory wildlife corridors, or impede the use of native wildlife nursery sites?
e) Conflict with any local policies or ordinances protecting biological resources, such as a tree preservation policy or ordinance?
f) Conflict with the provisions of an adopted Habitat Conservation Plan, Natural Community Conservation Plan, or other approved local, regional, or state habitat conservation plan?
2.4 Biological Resources
A Biological Constraints Report and a California Tiger Salamander (CTS) Habitat Assessment were prepared for the proposed project by Dudek (Dudek 2017 and Dudek 2017a). These assessments were used to complete this section and are included as Appendix B of this Initial Study.
The project site is located directly southwest of Dowdell Avenue and north of Hinebaugh Creek and the Hinebaugh Creek trail. The center of the project site corresponds to 38°, 21', 3.9" north latitude and 122°, 43', 11.2" west longitude, in Township 6 north, Range 8 west, Section 23 of the Cotati, CA” U.S. Geological Survey 7.5 minute quadrangle, at the Mt. Diablo Meridian. The
Initial Study
Fairfield Inn & Suites 28 August 2017
project site is located within the planning area of the Santa Rosa Plain Conservation Strategy, a comprehensive plan for management and development in sensitive habitat within the region.
The project site is relatively flat with an elevation range of about 84 to 96 feet above mean sea level. Historically, the site has been altered by agriculture, placement of fill, and grading activities associated with development. The project site was substantially altered in 2007 when fill material was spread across most of the site, in preparation for use as an equipment storage area from 2007 to 2008. Additionally, portions of the site appear to have been maintained by mowing in the late spring/early summer in 2007, 2008, 2011, and 2012, as shown on historic aerial imagery.
One soil type is mapped on the project site: Clear Lake clay, sandy substratum, drained, 0 to 2 percent slopes, MLRA 14. The Clear Lake soil series consist of sandy, poorly drained alluvium derived from volcanic and sedimentary rock (Dudek 2017 citing USDA 2017). Although Clear Lake clay soil represents the native soils in the area, the project site has been extensively disturbed and fill material has been deposited throughout the site.
A review of historic aerial photography of the study area dating back to 1952 indicates that land use on the project site was primarily agricultural prior to conversion to residential and recreation uses (including a baseball diamond) prior to the 1990s (Dudek 2017 citing HistoricAerials.com 2017). Additionally, the project site showed no evidence of aquatic resources in historic aerials.
Currently, two non-natural land cover types were classified for the project site: disturbed and developed. The majority of the project site is comprised of disturbed land. The vegetation within this land cover type is typical of non-native species found in previously graded lots and include species such as Italian ryegrass (Festuca perennis), bulbous canary-grass (Phalaris aquatica), English plantain (Plantago lanceolata), spring vetch (Vicia sativa), wild radish (Raphanus sativus), black mustard (Brassica nigra), prickly lettuce (Lactuca serriola), fennel (Foeniculum vulgare), and field bindweed (Convolvulus arvensis) (Dudek 2017).
a) Would the project have a substantial adverse effect, either directly or through habitat modifications, on any species identified as a candidate, sensitive, or special status species in local or regional plans, policies, or regulations, or by the California Department of Fish and Game or U.S. Fish and Wildlife Service?
Special-status biological resources present or potentially present on the project site were identified through a literature search using the following sources: the U.S. Fish and Wildlife Service (USFWS) Information, Planning and Conservation (IPaC) Trust Resource Report (Dudek 2017 citing USFWS 2017); the California Department of Fish and Wildlife (CDFW) California Natural Diversity Database (CNDDB) (Dudek 2017
Initial Study
Fairfield Inn & Suites 29 August 2017
citing CDFW 2017); and the California Native Plant Society (CNPS) online Inventory of Rare, Threatened, and Endangered Plants (Dudek 2017 citing CNPS 2017). Searches were completed for the following U.S. Geological Survey 7.5 minute quadrangles: Cotati, Sebastopol, Santa Rosa, Kenwood, Two Rock, Glen Ellen, Point Reyes, Petaluma, and Petaluma River.
As indicated in the Biological Constraints Report prepared for the proposed project, special-status species are those that are (1) listed, proposed for listing, or candidates for listing under the federal Endangered Species Act as threatened or endangered; (2) listed or candidates for listing under the California Endangered Species Act as threatened or endangered; (3) a state fully protected species; (4) a CDFW Species of Special Concern; or (5) a species listed on the CNPS Inventory of Rare and Endangered Plants with a California Rare Plant Rank of 1B or 2B (Dudek 2017). As further indicated in the Biological Constraints Report, special-status vegetation communities are those communities identified as high priority for inventory in the List of Vegetation Alliances and Associations (Dudek 2017 citing CDFG 2010) by a state rarity ranking of S1, S2, or S3.
According to the Biological Constraints Report prepared for the project, a total of 90 special-status plant species are known to occur within the project quad or eight surrounding quads. Of these 90, 86 were removed from consideration based on lack of suitable soils or habitat, or because the project site is outside of the known elevation or geographic range for the species. The remaining four species have a low potential to occur on the site due to the highly disturbed nature of the habitat and the Biological Constraints Report concluded that is extremely unlikely for these species to occur onsite due to the level of past and ongoing disturbance and maintenance at the project site (Dudek 2017). Accordingly, no special-status plant species are expected to occur on the project site; therefore, no potential impacts to special-status plant species would occur due to implementation of the project.
According to the Biological Constraints Report prepared for the project, a total of 29 special-status wildlife species are known to occur within the project quad or eight surrounding quads. Of these, 26 were removed from consideration based on lack of suitable habitat or because the site is outside of the known geographic or elevation range for the species. The remaining three species that have potential to occur on include western burrowing owl, California tiger salamander (CTS), and western pond turtle (Actinemys marmorata) (Dudek 2017).
Western Burrowing Owl (Athene cunicularia)
Initial Study
Fairfield Inn & Suites 30 August 2017
Burrowing owl is a California bird species of special concern. They are small owls that inhabit burrows or other suitable burrow-like structures in the ground such as culverts or concrete piles. Burrowing owl prefers habitat that contains short or sparse vegetation that allows unobstructed views of potential predators and prey species. Their diet consists of arthropods and small mammals (Dudek 2017 citing Dechant et al. 2002). The typical breeding season for this species extends from February 1 to August 31.
The Biological Constraints Report concluded that the site provides marginally suitable foraging habitat for this species due to dense and high cover of non-native grasses and no suitable burrows were observed by Dudek during the April 28, 2017 site visit. The nearest documented CNDDB occurrence for this species is located approximately 2.8 miles east of the project site, on the edge of the City of Rohnert Park. Project construction could adversely affect potential nesting and foraging habitat for western burrowing owl either directly through destruction of active burrows from grading activities or indirectly through disturbance associated with noise, increased human activity, and lighting (Dudek 2017). To ensure that new development does not adversely impact this species, the project would be required to implement Mitigation Measure BIO-1. Mitigation Measure BIO-1, which requires a preconstruction survey to identify any active burrowing owl burrows within the project site and includes protective measures for any identified nests, would ensure that impacts to the western burrowing owl remain less than significant.
California Tiger Salamander (Ambystoma californiense)
The Sonoma population of the CTS is a federally and State threatened amphibian species. This species utilizes vernal pools, other ephemeral pools, and sometimes stream courses and man-made pools if predatory fishes are absent, for breeding. CTS utilize annual grassland and valley and foothill hardwood forest for aestivation and overland dispersal habitat.
The project site is within Critical Habitat Unit 1 for this species and Hinebaugh Creek occurs directly south of the project site; however, Dudek senior aquatic ecologist Craig Seltenrich, performed a habitat assessment for this species on April 28, 2017 and concluded the Creek does not provide suitable breeding habitat for this species (Dudek 2017a). The CTS Habitat Assessment is included with Appendix B of this Initial Study. The CTS Habitat Assessment also noted that there no suitable small mammal burrows were observed during the assessment; thus, it is highly unlikely this species would utilize the disturbed habitat within the project site. The nearest documented CNDDB occurrence of this species is located 0.7 mile south of the project site. The project would result in no impacts to CTS species (Dudek 2017a).
Initial Study
Fairfield Inn & Suites 31 August 2017
Western Pond Turtle (Actinemys marmorata)
Western pond turtle is a California reptile species of special concern. It generally inhabits slow-moving permanent or intermittent streams, ponds, small lakes, and reservoirs. They require adequate emergent basking sites and adjacent uplands for nesting, aestivation, and hibernation (Dudek 2017).
Hinebaugh Creek occurs directly south of the project site and there are two documented CNDDB occurrences located within this waterway; one occurs upstream of the site and one occurs downstream. There is a high probability that this species occurs throughout this waterway, including directly south of the site. The project site may provide marginal nesting, aestivation, and hibernation habitat for this species where soils are suitably friable. Although no sign of turtles or suitable burrows for nesting were observed during the site survey, there is low potential for this species to occur onsite. Project construction could adversely affect potential nesting and aestivation habitat for western pond turtle should they be present at the time of ground-disturbing activities (Dudek 2017). To ensure that construction activities do not adversely impact turtles, the project would be required to implement Mitigation Measure BIO-2. With implementation of Mitigation Measure BIO-2, which requires a preconstruction survey for western pond turtles prior to initiation of grading, potential impacts to western pond turtles would be less than significant.
Nesting Birds
All raptor species found in California are protected by the federal Migratory Bird Treaty Act (MBTA) and California Fish and Game Code 3503.5 and may use the site for nesting or foraging. The project area supports suitable nesting trees for a variety of raptor species, as well as other native bird species protected by the MBTA (Dudek 2017). Mitigation Measure BIO-3 would require completion of a nesting bird survey two weeks prior to construction during the nesting season (February 1 – September 30) to determine if native birds are nesting on or near the site. With implementation of this measure, impacts to nesting birds would be less than significant.
As discussed above, two special-status wildlife species, the burrowing owl and western pond turtle, have a low potential to occur on the project site. There is also the potential for nesting birds to be present onsite. Implementation of the Mitigation Measure BIO-1, BIO-2, and BIO-3 would ensure that impacts to special-status wildlife species remain less than significant.
Initial Study
Fairfield Inn & Suites 32 August 2017
b) Would the project have a substantial adverse effect on any riparian habitat or other sensitive natural community identified in local or regional plans, policies, regulations, or by the California Department of Fish and Game or U.S. Fish and Wildlife Service?
There are no riparian areas located within the project site. The Hinebaugh Creek Flood Channel is located immediately south of the project site, but the proposed project does not include alterations within the adjacent Creek area.
Due to the highly disturbed nature of the project site, no potentially jurisdictional wetlands or waters are present (Dudek 2017). Indirect effects may occur to Hinebaugh Creek, which is likely a jurisdictional feature, in the form of sedimentation or runoff from development of the site. However, as discussed further in Section 2.9 Hydrology and Water Quality, the project would be required to implement Mitigation Measure HYDRO-1, which requires compliance with Waste Discharge Requirements issued by the North Coast Regional Water Quality Control Board (RWQCB). During construction, the project would be required to implement a Stormwater Pollution Prevention Plan (SWPPP) to ensure that runoff from the site does not violate any water quality standards or waste discharge requirements. The RWQCB must approve the SWPPP and issue Waste Discharge Requirements for the project before a grading permit is issued by the City. Upon completion of the project, runoff generated from the developed site would be treated on-site. Compliance with stormwater permit requirements through the implementation of site-specific stormwater capture and treatment Best Management Practices (BMPs), as well as maintenance and inspection requirements for those BMPs would ensure that sedimentation or runoff impacts to Hinebaugh Creek are reduced to a less than significant level.
c) Would the project have a substantial adverse effect on federally protected wetlands as defined by Section 404 of the Clean Water Act (including, but not limited to, marsh, vernal pool, coastal, etc.) through direct removal, filling, hydrological interruption, or other means?
Refer to answer provided in ‘b’ above.
d) Would the project interfere substantially with the movement of any native resident or migratory fish or wildlife species or with established native resident or migratory wildlife corridors, or impede the use of native wildlife nursery sites?
The project site does not function as a wildlife corridor and does not support any wildlife nursery sites. As a result, implementation of the proposed project would result in no impacts to these resources.
Initial Study
Fairfield Inn & Suites 33 August 2017
e) Would the project conflict with any local policies or ordinances protecting biological resources, such as a tree preservation policy or ordinance?
The project site is located within the area covered by the Santa Rosa Plain Conservation Strategy (USFWS 2005). The purpose of the Conservation Strategy is to create a long-term conservation program to assist in the recovery of CTS and four listed plant species. The project site is identified on the Conservation Strategy Map as “Areas Within 1.3 Miles of Known CTS Breeding.” As identified in the Conservation Strategy, impact to CTS is not likely on some lands within 1.3 miles from breeding sites that are surrounded by significant barriers or are otherwise unsuitable CTS habitat (USFWS 2005). As discussed in criterion ‘a’ above, no CTS have been identified on the project site and it is highly unlikely this species would utilize the disturbed habitat within the project site. In addition, the CTS Habitat Assessment concluded that the adjacent Hinebaugh Creek does not provide suitable breeding habitat for this species (Dudek 2017a). Prior to issuance of grading permits, the project would be required to implement Mitigation Measure BIO-4, which requires submission of the CTS Habitat Assessment (Dudek 2017a) to the USFWS and CDFW for their concurrence with the report findings. Implementation of Mitigation Measure BIO-4 would ensure that impacts related to possible conflicts with the Conservation Strategy remain less than significant.
The site is not included in any other local, regional, or state habitat conservation plan, and there are no protected trees (i.e., oaks and other native trees of significant size) located on the project site. No impacts to other local policies, ordinances or plans would be expected to occur from implementation of the project.
f) Would the project conflict with the provisions of an adopted Habitat Conservation Plan, Natural Community Conservation Plan, or other approved local, regional, or state habitat conservation plan?
Refer to the answer in ‘e’ above.
Mitigation Measures
Mitigation Measure BIO-1: A preconstruction survey shall be conducted by a qualified biologist no more than 10 days prior to the onset of construction to identify active burrowing owl burrows. If active burrows are detected, the following shall be implemented:
• Occupied burrows shall not be disturbed during the breeding season (February 1 to August 31).
Initial Study
Fairfield Inn & Suites 34 August 2017
• No disturbance should occur within 160 feet of occupied burrows during the non-breeding season (September 1 to January 31). If avoidance of occupied burrows during the non-breeding season is not feasible, consultation with CDFW will be necessary. Measures that may be approved through consultation with CDFW may include passive relocation methods, such as installation of one-way doors.
• Any destruction of active burrows shall be mitigated by preservation or creation of suitable burrows at a mitigation ratio no less than 2:1 (impacted habitat: preserved/restored habitat) on protected lands approved by CDFW.
If no active burrows are detected, no further measures are necessary.
Mitigation Measure BIO-2: A preconstruction survey for western pond turtles and potential western pond turtle nest sites shall be conducted within two weeks prior to initiation of grading. A buffer of 100 feet around any active nests shall be flagged with high visibility flagging and avoided by construction activities until young have hatched and moved from the site of their own volition. Any western pond turtle found within the construction area shall be avoided and allowed to leave of its own volition, or alternatively and with CDFW approval, it will be captured by a qualified biologist and relocated out of harm’s way to the nearest suitable habitat immediately upstream or downstream from the project site.
Mitigation Measure BIO-3: Project construction could result in impacts to nesting birds, including the loss of nests, eggs, and fledglings if vegetation clearing and ground-disturbing activities occur during the nesting season (generally February 1 through September 30). All native migratory bird species are protected by the federal Migratory Bird Treaty Act and California Fish and Game Code 3503.5 (which specifically protects raptors). A preconstruction nesting bird survey should be conducted by a qualified biologist no sooner than 10 days prior to construction activities to determine if any native birds are nesting on or near the site (including a 250-foot buffer for raptors). If any active nests are observed during surveys, a suitable avoidance buffer will be determined and flagged by the qualified biologist based on species, location and planned construction activity. These nests would be avoided until the chicks have fledged and the nests are no longer active. It is also recommended that the removal of any habitat (i.e. trees) occur outside of the breeding bird season.
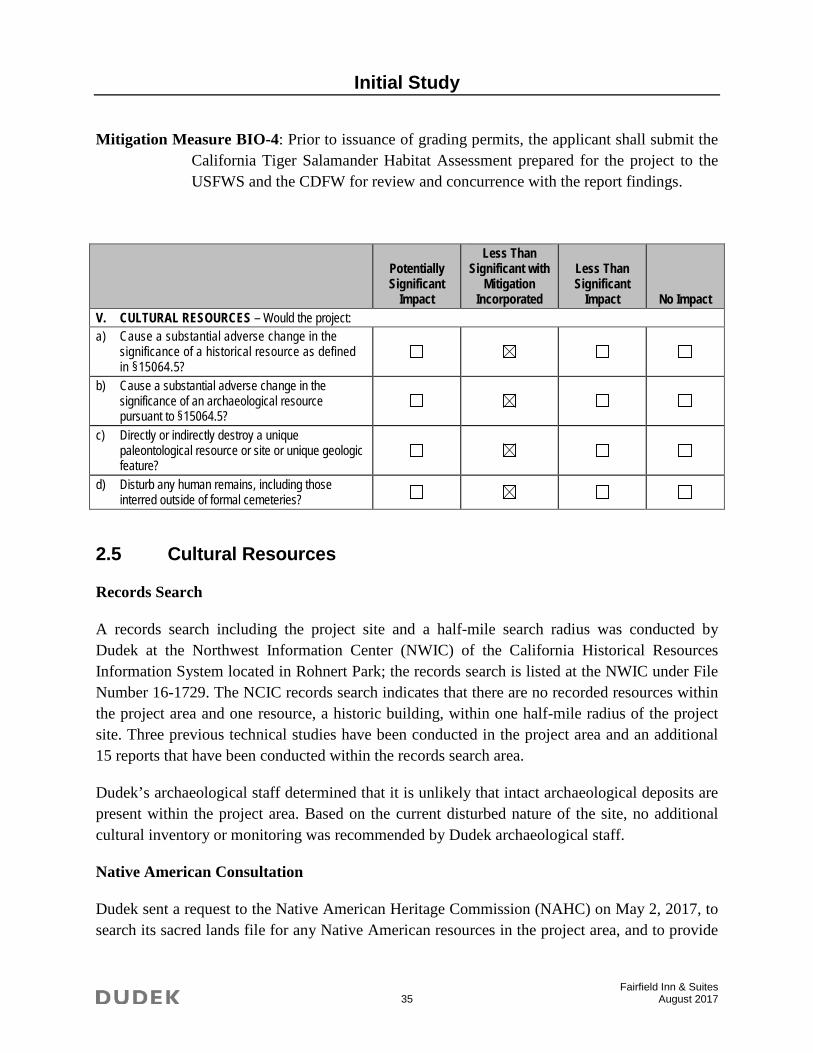
Initial Study
Fairfield Inn & Suites 35 August 2017
Mitigation Measure BIO-4: Prior to issuance of grading permits, the applicant shall submit the California Tiger Salamander Habitat Assessment prepared for the project to the USFWS and the CDFW for review and concurrence with the report findings.
Potentially Significant
Impact
Less Than Significant with
Mitigation Incorporated
Less Than Significant
Impact No Impact V. CULTURAL RESOURCES – Would the project: a) Cause a substantial adverse change in the
significance of a historical resource as defined in §15064.5?
b) Cause a substantial adverse change in the significance of an archaeological resource pursuant to §15064.5?
c) Directly or indirectly destroy a unique paleontological resource or site or unique geologic feature?
d) Disturb any human remains, including those interred outside of formal cemeteries?
2.5 Cultural Resources
Records Search
A records search including the project site and a half-mile search radius was conducted by Dudek at the Northwest Information Center (NWIC) of the California Historical Resources Information System located in Rohnert Park; the records search is listed at the NWIC under File Number 16-1729. The NCIC records search indicates that there are no recorded resources within the project area and one resource, a historic building, within one half-mile radius of the project site. Three previous technical studies have been conducted in the project area and an additional 15 reports that have been conducted within the records search area.
Dudek’s archaeological staff determined that it is unlikely that intact archaeological deposits are present within the project area. Based on the current disturbed nature of the site, no additional cultural inventory or monitoring was recommended by Dudek archaeological staff.
Native American Consultation
Dudek sent a request to the Native American Heritage Commission (NAHC) on May 2, 2017, to search its sacred lands file for any Native American resources in the project area, and to provide
Initial Study
Fairfield Inn & Suites 36 August 2017
a list of Native American representatives who may have knowledge of Native American cultural resources in the project area. The NAHC responded stating that the sacred lands file search did not indicate the presence of Native American cultural resources in the immediate project area. The NAHC also provided a list of individuals who may have knowledge of cultural resources in the project area. Pursuant to Assembly Bill (AB) 52 (Public Resources Code [PRC] Section 21082.3[d][3]), the City of Rohnert Park sent notification about the project to the tribes that have requested notification of projects subject to CEQA. The City received a response from the Federated Indians of Graton Rancheria indicating they had no comments to provide at that time. The City now considers its Native American tribal consultation complete.
a) Would the project cause a substantial adverse change in the significance of a historical resource as defined in §15064.5?
Historical resource is a term with a defined statutory meaning. (See Public Resources Code § 21084.1 and CEQA Guidelines §§ 15064.5(a), (b)). The term embraces any resource listed or determined to be eligible for listing in the NRHP, as well as some California State Landmarks and Points of Historical Interest. In addition, historical resources are evaluated against the CRHR criteria prior to making a finding as to the project’s impacts on historical resources.
Generally, resources must be at least 50 years old to be considered for the listing in the California Register. There are no structures or built-features on the project site and as such, there are no historical resources to be impacted. The project’s impact on historic resources would be less than significant.
There are no known historic, archaeological, or paleontological resources or human remains onsite. It is unlikely that previously unknown cultural resources would be encountered during future site grading and construction. However, to ensure that impacts to cultural resources remain less than significant, should any such resources be encountered during project grading and construction, the project would be required to implement Mitigation Measures CUL-1, CUL-2, and CUL-3. These mitigation measures were also included in the City of Rohnert Park General Plan EIR. With implementation of the aforementioned mitigation measures, impacts to cultural resources would be less than significant.
b) Would the project cause a substantial adverse change in the significance of an archaeological resource pursuant to §15064.5?
Refer to the answer provided in ‘a’ above.
Initial Study
Fairfield Inn & Suites 37 August 2017
c) Would the project directly or indirectly destroy a unique paleontological resource or site or unique geologic feature?
Refer to the answer provided in ‘a’ above.
d) Would the project disturb any human remains, including those interred outside of formal cemeteries?
Refer to the answer provided in ‘a’ above.
Mitigation Measures
Mitigation Measure CUL-1: If at any time during earth disturbing activities a concentration of artifacts or a cultural deposit is encountered, work shall cease in the immediate area and a qualified archeologist shall be contacted by the construction manager to evaluate the find and make further recommendations. Construction crews should be alerted to cultural resources which could consist of, but not be limited to, artifacts of stone, bone, wood, shell, or other materials; features, including hearths, structural remains, or dumps; areas of discolored soil indicating the location of fire pits, post molds, or living area surfaces.
Mitigation Measure CUL-2: If human remains are encountered anywhere on the project site, all work shall stop in the immediate vicinity of the discovered remains. Both the County Coroner and a qualified archeologist shall be notified by the construction manager immediately so that an evaluation can be performed. If the remains are deemed to be Native American and prehistoric, the Native American Heritage Commission shall be contacted by the Coroner so that a “Most Likely Descendant” can be designated and recommendations for treatment solicited pursuant to CEQA Section 15064.5(e).
Mitigation Measure CUL-3: Per state law, in the event that paleontological resources or unique geologic features are encountered during construction, all earthwork within a 50 meter radius of the find will be stopped, the City of Rohnert Park notified, and a paleontologist retained to examine the find and make appropriate recommendations.
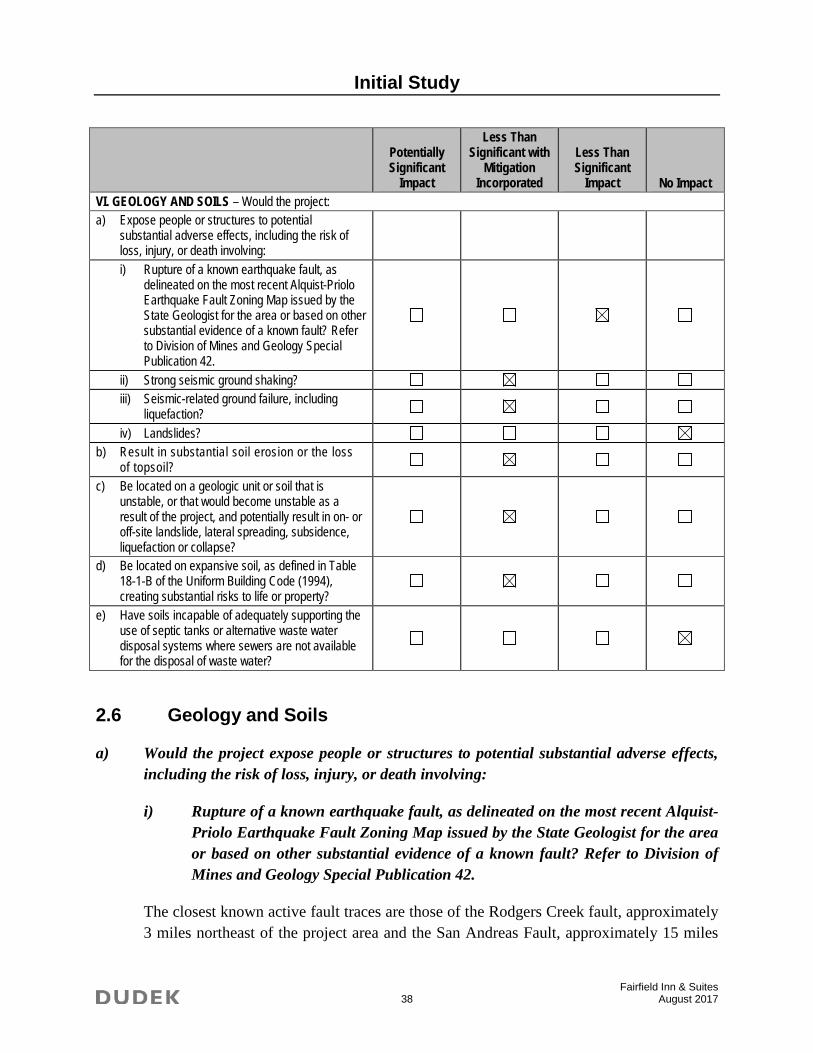
Initial Study
Fairfield Inn & Suites 38 August 2017
Potentially Significant
Impact
Less Than Significant with
Mitigation Incorporated
Less Than Significant
Impact No Impact VI. GEOLOGY AND SOILS – Would the project: a) Expose people or structures to potential
substantial adverse effects, including the risk of loss, injury, or death involving:
i) Rupture of a known earthquake fault, as delineated on the most recent Alquist-Priolo Earthquake Fault Zoning Map issued by the State Geologist for the area or based on other substantial evidence of a known fault? Refer to Division of Mines and Geology Special Publication 42.
ii) Strong seismic ground shaking? iii) Seismic-related ground failure, including
liquefaction?
iv) Landslides? b) Result in substantial soil erosion or the loss
of topsoil?
c) Be located on a geologic unit or soil that is unstable, or that would become unstable as a result of the project, and potentially result in on- or off-site landslide, lateral spreading, subsidence, liquefaction or collapse?
d) Be located on expansive soil, as defined in Table 18-1-B of the Uniform Building Code (1994), creating substantial risks to life or property?
e) Have soils incapable of adequately supporting the use of septic tanks or alternative waste water disposal systems where sewers are not available for the disposal of waste water?
2.6 Geology and Soils
a) Would the project expose people or structures to potential substantial adverse effects, including the risk of loss, injury, or death involving:
i) Rupture of a known earthquake fault, as delineated on the most recent Alquist-Priolo Earthquake Fault Zoning Map issued by the State Geologist for the area or based on other substantial evidence of a known fault? Refer to Division of Mines and Geology Special Publication 42.
The closest known active fault traces are those of the Rodgers Creek fault, approximately 3 miles northeast of the project area and the San Andreas Fault, approximately 15 miles
Initial Study
Fairfield Inn & Suites 39 August 2017
west of the City (City of Rohnert Park 2015). Because the project area is located approximately 3 miles from traces of any potentially active fault and from known traces the nearest zoned active fault (the Rodgers Creek fault) and it not located within an Alquist-Priolo Fault Zone, fault-line surface rupture would not be a hazard within the project area. Impacts related to fault rupture potential would be less than significant.
ii) Strong seismic ground shaking?
The intensity of ground shaking depends on the distance from the earthquake epicenter to the site, the magnitude of the earthquake, site soil conditions, and the characteristics of the source. As the project site is within the proximity of two active faults, the project could potentially result in exposure of people or structures to substantial adverse effects, including the risk of loss, injury, or death involving seismic ground shaking. This impact can be mitigated to a less than significant level though implementation of Mitigation Measure GEO-1 which requires preparation of a site-specific geotechnical report.
iii) Seismic-related ground failure, including liquefaction?
Soil liquefaction most commonly occurs when ground shaking from an earthquake causes a sediment layer saturated with groundwater to lose strength and take on the characteristics of a fluid, thus becoming similar to quicksand. Liquefaction may also occur in the absence of a seismic event, when unconsolidated soil above a hardpan becomes saturated with water. Factors determining the liquefaction potential are the level and duration of seismic ground motions, the type and consistency of soils, and the depth to groundwater. Loose sands and peat deposits; uncompacted fill and other Holocene materials deposited by sedimentation in rivers and lakes (fluvial or alluvial deposits); and debris or eroded material (colluvial deposits) are the most susceptible to liquefaction. The project area is classified as having moderate to high liquefaction hazard (City of Rohnert Park 2015). Mitigation Measure GEO-1, which requires preparation of site-specific geotechnical reports and implementation of site-specific design recommendations, would ensure impacts related to seismic related ground failure remain less than significant.
iv) Landslides?
No landslide deposits have been mapped within the immediate vicinity of the project site. The California Geological Survey slope stability map of southern Sonoma County categorizes the project area as being of the greatest relative stability because there are no slopes steeper than 1 percent (City of Rohnert Park 2007). Therefore, impacts associated with landslides would be less than significant.
b) Would the project result in substantial soil erosion or the loss of topsoil?
Initial Study
Fairfield Inn & Suites 40 August 2017
The existence of expansive soils within the project area makes necessitates determination that the soils used for foundation support are sound (City of Rohnert Park 2015). An acceptable degree of soil stability can be achieved by the required incorporation of soil treatment programs (e.g. grouting, compaction, drainage control, lime treatment) in the excavation and construction plans to address site-specific soil conditions. The site-specific analysis is necessary for foundation support design in areas where unsuitable conditions are suspected. To ensure that the future development at the project site is not adversely affected by unstable soil conditions, the project would be required to implement Mitigation Measure GEO-1. Implementation of Mitigation Measure GEO-1, which requires preparation of a site-specific soil analysis, including site-specific recommendations, would ensure that impacts related to expansive soils would remain less than significant.
c) Would the project be located on a geologic unit or soil that is unstable, or that would become unstable as a result of the project, and potentially result in on- or off-site landslide, lateral spreading, subsidence, liquefaction or collapse?
Unstable geologic units or soils are characterized by materials lacking in sufficient integrity to support urban development (e.g., poorly consolidated fill). The project area supports development, which indicates that geologic conditions in the area are capable of supporting the proposed development. As previously discussed, the project would be required to implement Mitigation Measure GEO-1, which requires preparation of a site-specific geotechnical report and implementation of site-specific design recommendations. Prior to issuance of grading permits, the City Engineer would review and approve all grading and structural foundation plans to verify that recommendations of the geotechnical report have been followed and to provide supplemental recommendations, if necessary. The City Engineer, or a representative thereof, would also inspect and approve all grading and site preparation prior to construction of improvements to ensure compliance with Uniform Building Code and local codes. With implementation of Mitigation Measure GEO-1, the project would have less than significant impacts associated with unstable geologic units or soils.
d) Would the project be located on expansive soil, as defined in Table 18-1-B of the Uniform Building Code (1994), creating substantial risks to life or property?
Expansive soils shrink and swell as a result of moisture change. These volume changes can result in damage over time to building foundations, underground utilities, and other subsurface facilities and infrastructure if they are not designed and constructed appropriately to resist the damage associated with changing soil conditions. A review of NRCS (2014) soil survey data indicates that the project area is composed of Clear Lake
Initial Study
Fairfield Inn & Suites 41 August 2017
Clay, which has a high shrink-swell potential. Implementation of Mitigation Measure GEO-1, which requires preparation of a site-specific geotechnical report and implementation of site-specific design recommendations, would ensure that this impact remains less than significant.
e) Would the project have soils incapable of adequately supporting the use of septic tanks or alternative waste water disposal systems where sewers are not available for the disposal of waste water?
No septic tanks or alternative wastewater disposal systems are proposed and the project would have no impact related to these types of wastewater disposal.
Mitigation Measures
Mitigation Measure GEO-1: The project applicant shall retain a licensed geotechnical engineer to prepare a final geotechnical report per California Building Standards Code and City requirements for the proposed facilities that shall be submitted for review and approved by the City of Rohnert Park prior to issuance of a grading permit. The final geotechnical engineering report shall address and make recommendations on the following:
o seismic design parameters;
o seismic ground shaking;
o liquefaction;
o expansive/unstable soils;
o site preparation;
o soil bearing capacity;
o structural foundations, including retaining-wall design;
o grading practices; and
o soil corrosion of concrete and steel.
In addition to the recommendations for the conditions listed above, the geotechnical investigation shall include subsurface testing of soil and groundwater conditions (as appropriate), and shall determine appropriate foundation designs that are consistent with the version of the CBC that is applicable at the time building and grading permits are applied for. All recommendations contained in the final geotechnical engineering report shall be implemented by the project applicant. Design and construction of all new project
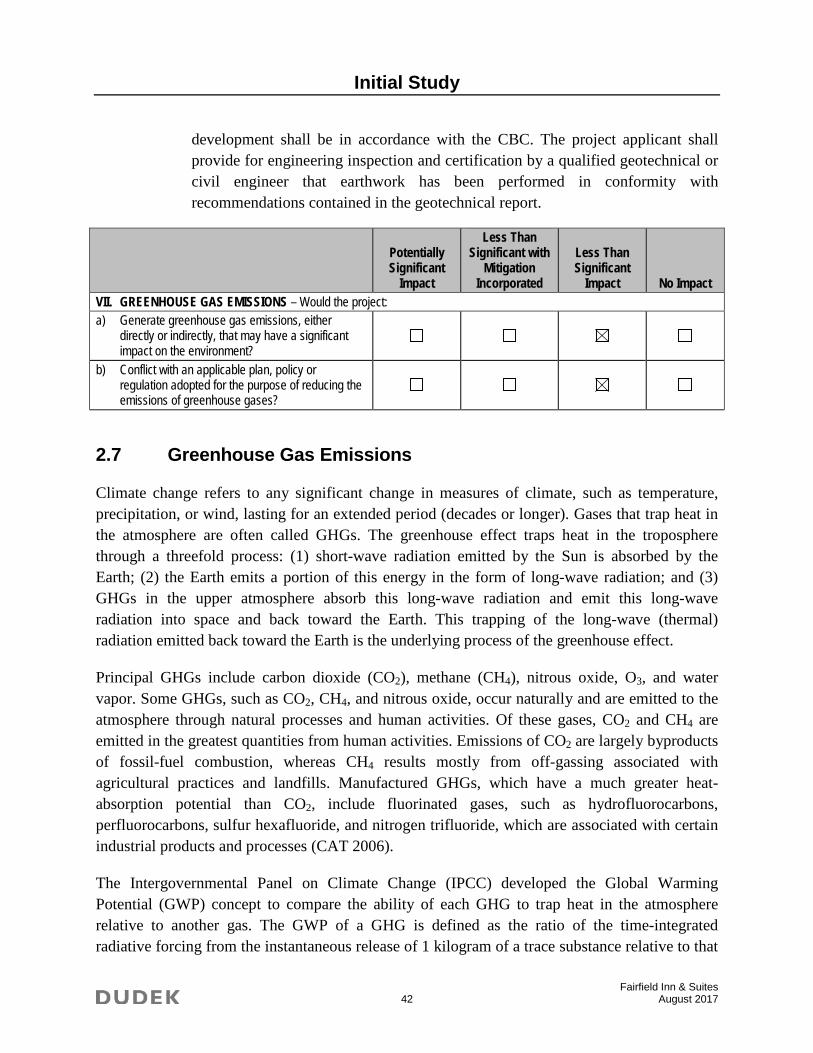
Initial Study
Fairfield Inn & Suites 42 August 2017
development shall be in accordance with the CBC. The project applicant shall provide for engineering inspection and certification by a qualified geotechnical or civil engineer that earthwork has been performed in conformity with recommendations contained in the geotechnical report.
Potentially Significant
Impact
Less Than Significant with
Mitigation Incorporated
Less Than Significant
Impact No Impact VII. GREENHOUSE GAS EMISSIONS – Would the project: a) Generate greenhouse gas emissions, either
directly or indirectly, that may have a significant impact on the environment?
b) Conflict with an applicable plan, policy or regulation adopted for the purpose of reducing the emissions of greenhouse gases?
2.7 Greenhouse Gas Emissions
Climate change refers to any significant change in measures of climate, such as temperature, precipitation, or wind, lasting for an extended period (decades or longer). Gases that trap heat in the atmosphere are often called GHGs. The greenhouse effect traps heat in the troposphere through a threefold process: (1) short-wave radiation emitted by the Sun is absorbed by the Earth; (2) the Earth emits a portion of this energy in the form of long-wave radiation; and (3) GHGs in the upper atmosphere absorb this long-wave radiation and emit this long-wave radiation into space and back toward the Earth. This trapping of the long-wave (thermal) radiation emitted back toward the Earth is the underlying process of the greenhouse effect.
Principal GHGs include carbon dioxide (CO2), methane (CH4), nitrous oxide, O3, and water vapor. Some GHGs, such as CO2, CH4, and nitrous oxide, occur naturally and are emitted to the atmosphere through natural processes and human activities. Of these gases, CO2 and CH4 are emitted in the greatest quantities from human activities. Emissions of CO2 are largely byproducts of fossil-fuel combustion, whereas CH4 results mostly from off-gassing associated with agricultural practices and landfills. Manufactured GHGs, which have a much greater heat-absorption potential than CO2, include fluorinated gases, such as hydrofluorocarbons, perfluorocarbons, sulfur hexafluoride, and nitrogen trifluoride, which are associated with certain industrial products and processes (CAT 2006).
The Intergovernmental Panel on Climate Change (IPCC) developed the Global Warming Potential (GWP) concept to compare the ability of each GHG to trap heat in the atmosphere relative to another gas. The GWP of a GHG is defined as the ratio of the time-integrated radiative forcing from the instantaneous release of 1 kilogram of a trace substance relative to that
Initial Study
Fairfield Inn & Suites 43 August 2017
of 1 kilogram of a reference gas (IPCC 2014). The reference gas used is CO2; therefore, GWP-weighted emissions are measured in metric tons of CO2 equivalent (MT CO2E).
Regarding impacts from GHGs, both BAAQMD and the California Air Pollution Control Officers Association (CAPCOA) consider GHG impacts to be exclusively cumulative impacts (BAAQMD 2017a; CAPCOA 2008); therefore, assessment of significance is based on a determination of whether the GHG emissions from a project represent a cumulatively considerable contribution to the global atmosphere. This analysis uses both a quantitative and a qualitative approach. The quantitative approach is used to address the first significance criterion: “Would the Project generate GHG emissions, either directly or indirectly, that may have a significant impact on the environment?” This analysis considers that, because the quantifiable thresholds developed by BAAQMD were formulated based on AB 32 and California Climate Change Scoping Plan reduction targets for which its set of strategies were developed to reduce GHG emissions statewide, a project cannot exceed a numeric BAAQMD threshold without also conflicting with an applicable plan, policy, or regulation adopted for the purpose of reducing the emissions of GHGs. Therefore, if a project exceeds a numeric threshold and results in a significant cumulative impact, it would also result in a significant cumulative impact with respect to plan, policy, or regulation consistency, even though the project may incorporate measures and have features that would reduce its contribution to cumulative GHG emissions.
Separate thresholds of significance are established by the BAAQMD for operational emissions from stationary sources (such as generators, furnaces, and boilers) and nonstationary sources (such as on-road vehicles) (BAAQMD 2017a). The threshold for stationary sources is 10,000 MT CO2E per year (i.e., emissions above this level may be considered significant). For nonstationary sources, the following three separate thresholds have been established:
• Compliance with a Qualified Greenhouse Gas Reduction Strategy (i.e., if a project is found to be out of compliance with a Qualified Greenhouse Gas Reduction Strategy, its GHG emissions may be considered significant).
• 1,100 MT CO2E per year (i.e., emissions above this level may be considered significant).
• 4.6 MT CO2E per service population per year (i.e., emissions above this level may be considered significant). (Service population is the sum of residents plus employees expected for a development project.)
The quantitative threshold of 1,100 metric tons of CO2E annually adopted by BAAQMD is applied to this analysis. If the project GHG emissions would exceed this threshold then, consistent with BAAQMD Guidelines, it would be considered to have a cumulatively considerable contribution of GHG emissions and a cumulatively significant impact on climate change.
Initial Study
Fairfield Inn & Suites 44 August 2017
a) Generate greenhouse gas emissions, either directly or indirectly, that may have a significant impact on the environment?
Construction. Construction of the proposed project would result in GHG emissions, which are primarily associated with use of off-road construction equipment, on-road hauling and vendor (material delivery) trucks, and worker vehicles. Since the BAAQMD has not established construction-phase GHG thresholds, construction GHG emissions were amortized assuming a 30-year development life after completion of construction and added to operational emissions to compare to the BAAQMD operational GHG threshold. Amortized GHG emissions associated with project construction would result in annualized generation of 7 MT CO2E.
A detailed depiction of the construction schedule—including information regarding phasing, equipment utilized during each phase, haul trucks, vendor trucks, and worker vehicles—is included in Appendix A.
Operations. Long-term operational emissions would occur over the life of the project. CalEEMod was used to estimate GHG emissions from motor vehicle trips, grid electricity usage, solid waste, and other sources (including area sources, natural gas combustion, and water/wastewater conveyance).
CalEEMod default mobile source data, including temperature, trip characteristics, variable start information, emission factors, and trip distances, were conservatively used for the model inputs. Project-related traffic was assumed to be comprised of a mixture of vehicles in accordance with the model defaults for traffic. The CalEEMod default trip rate was used, which matched the Traffic Impact Study for the project (W-Trans 2017). It is assumed that the first full year of project operation would be in the year 2019.
CalEEMod was also used to estimate emissions from the project’s area sources, which includes operation of gasoline-powered landscape maintenance equipment, which produce minimal GHG emissions.
The estimation of operational energy emissions was based on CalEEMod land use defaults and total area (i.e., square footage) of the proposed project. Annual natural gas (non-hearth) and electricity emissions were estimated in CalEEMod using the emissions factors for PG&E as a conservative estimate and adjusted to account for 25 percent renewable portfolio standard by 2016. In addition, solar photovoltaic panels would be part of the project, with a total 110 to 120 kW power capacity anticipated to be installed. As a conservative estimate, 110 kW per day was assumed, which would equate to 156,465 kWh per year based on the project location (NREL 2017). This system
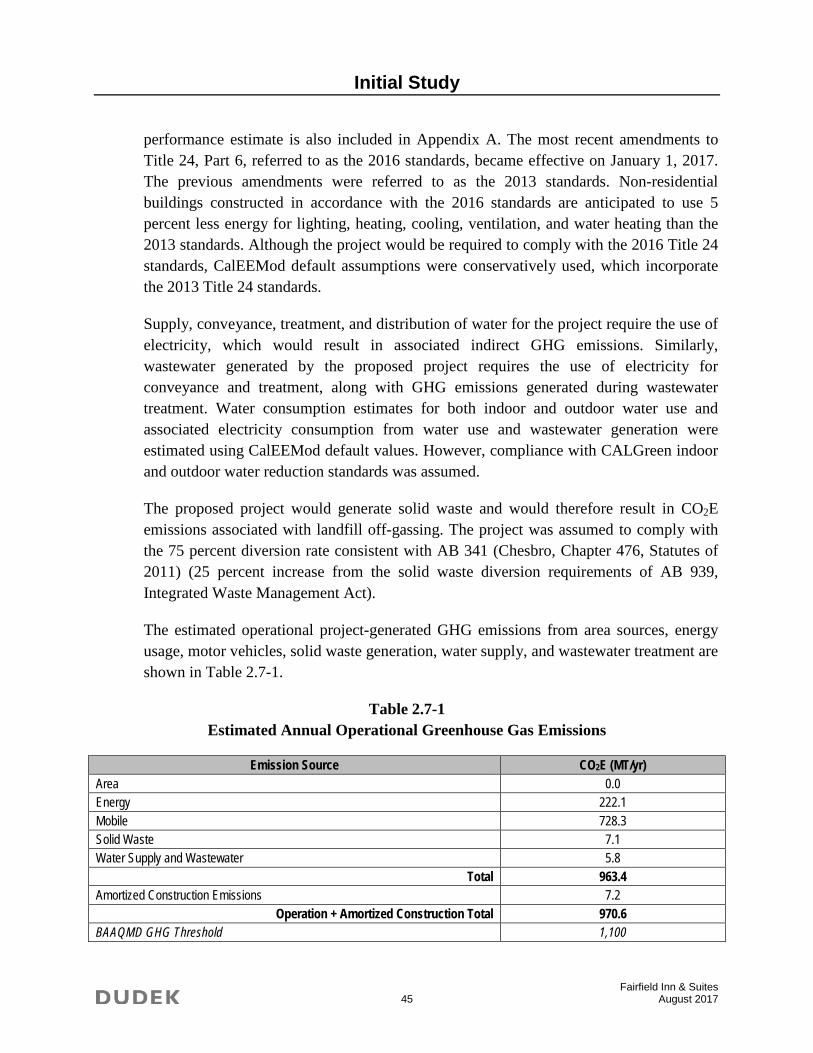
Initial Study
Fairfield Inn & Suites 45 August 2017
performance estimate is also included in Appendix A. The most recent amendments to Title 24, Part 6, referred to as the 2016 standards, became effective on January 1, 2017. The previous amendments were referred to as the 2013 standards. Non-residential buildings constructed in accordance with the 2016 standards are anticipated to use 5 percent less energy for lighting, heating, cooling, ventilation, and water heating than the 2013 standards. Although the project would be required to comply with the 2016 Title 24 standards, CalEEMod default assumptions were conservatively used, which incorporate the 2013 Title 24 standards.
Supply, conveyance, treatment, and distribution of water for the project require the use of electricity, which would result in associated indirect GHG emissions. Similarly, wastewater generated by the proposed project requires the use of electricity for conveyance and treatment, along with GHG emissions generated during wastewater treatment. Water consumption estimates for both indoor and outdoor water use and associated electricity consumption from water use and wastewater generation were estimated using CalEEMod default values. However, compliance with CALGreen indoor and outdoor water reduction standards was assumed.
The proposed project would generate solid waste and would therefore result in CO2E emissions associated with landfill off-gassing. The project was assumed to comply with the 75 percent diversion rate consistent with AB 341 (Chesbro, Chapter 476, Statutes of 2011) (25 percent increase from the solid waste diversion requirements of AB 939, Integrated Waste Management Act).
The estimated operational project-generated GHG emissions from area sources, energy usage, motor vehicles, solid waste generation, water supply, and wastewater treatment are shown in Table 2.7-1.
Table 2.7-1 Estimated Annual Operational Greenhouse Gas Emissions
Emission Source CO2E (MT/yr) Area 0.0 Energy 222.1 Mobile 728.3 Solid Waste 7.1 Water Supply and Wastewater 5.8
Total 963.4 Amortized Construction Emissions 7.2
Operation + Amortized Construction Total 970.6 BAAQMD GHG Threshold 1,100
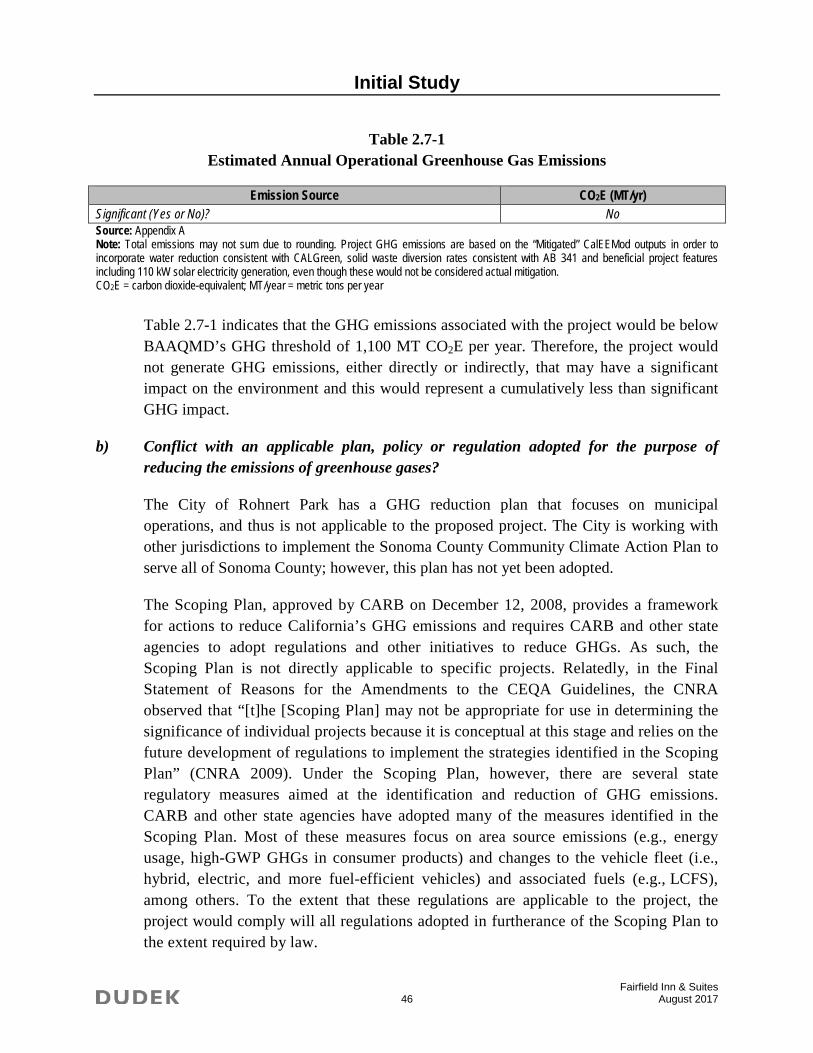
Initial Study
Fairfield Inn & Suites 46 August 2017
Table 2.7-1 Estimated Annual Operational Greenhouse Gas Emissions
Emission Source CO2E (MT/yr) Significant (Yes or No)? No Source: Appendix A Note: Total emissions may not sum due to rounding. Project GHG emissions are based on the “Mitigated” CalEEMod outputs in order to incorporate water reduction consistent with CALGreen, solid waste diversion rates consistent with AB 341 and beneficial project features including 110 kW solar electricity generation, even though these would not be considered actual mitigation. CO2E = carbon dioxide-equivalent; MT/year = metric tons per year
Table 2.7-1 indicates that the GHG emissions associated with the project would be below BAAQMD’s GHG threshold of 1,100 MT CO2E per year. Therefore, the project would not generate GHG emissions, either directly or indirectly, that may have a significant impact on the environment and this would represent a cumulatively less than significant GHG impact.
b) Conflict with an applicable plan, policy or regulation adopted for the purpose of reducing the emissions of greenhouse gases?
The City of Rohnert Park has a GHG reduction plan that focuses on municipal operations, and thus is not applicable to the proposed project. The City is working with other jurisdictions to implement the Sonoma County Community Climate Action Plan to serve all of Sonoma County; however, this plan has not yet been adopted.
The Scoping Plan, approved by CARB on December 12, 2008, provides a framework for actions to reduce California’s GHG emissions and requires CARB and other state agencies to adopt regulations and other initiatives to reduce GHGs. As such, the Scoping Plan is not directly applicable to specific projects. Relatedly, in the Final Statement of Reasons for the Amendments to the CEQA Guidelines, the CNRA observed that “[t]he [Scoping Plan] may not be appropriate for use in determining the significance of individual projects because it is conceptual at this stage and relies on the future development of regulations to implement the strategies identified in the Scoping Plan” (CNRA 2009). Under the Scoping Plan, however, there are several state regulatory measures aimed at the identification and reduction of GHG emissions. CARB and other state agencies have adopted many of the measures identified in the Scoping Plan. Most of these measures focus on area source emissions (e.g., energy usage, high-GWP GHGs in consumer products) and changes to the vehicle fleet (i.e., hybrid, electric, and more fuel-efficient vehicles) and associated fuels (e.g., LCFS), among others. To the extent that these regulations are applicable to the project, the project would comply will all regulations adopted in furtherance of the Scoping Plan to the extent required by law.
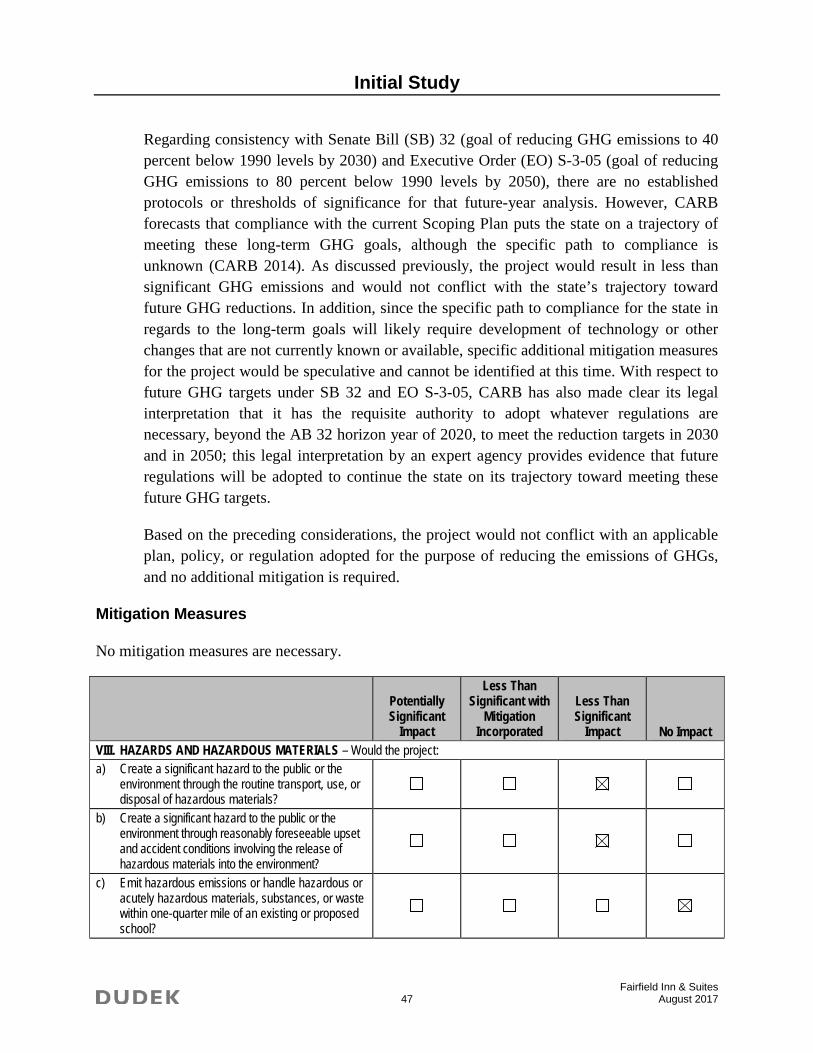
Initial Study
Fairfield Inn & Suites 47 August 2017
Regarding consistency with Senate Bill (SB) 32 (goal of reducing GHG emissions to 40 percent below 1990 levels by 2030) and Executive Order (EO) S-3-05 (goal of reducing GHG emissions to 80 percent below 1990 levels by 2050), there are no established protocols or thresholds of significance for that future-year analysis. However, CARB forecasts that compliance with the current Scoping Plan puts the state on a trajectory of meeting these long-term GHG goals, although the specific path to compliance is unknown (CARB 2014). As discussed previously, the project would result in less than significant GHG emissions and would not conflict with the state’s trajectory toward future GHG reductions. In addition, since the specific path to compliance for the state in regards to the long-term goals will likely require development of technology or other changes that are not currently known or available, specific additional mitigation measures for the project would be speculative and cannot be identified at this time. With respect to future GHG targets under SB 32 and EO S-3-05, CARB has also made clear its legal interpretation that it has the requisite authority to adopt whatever regulations are necessary, beyond the AB 32 horizon year of 2020, to meet the reduction targets in 2030 and in 2050; this legal interpretation by an expert agency provides evidence that future regulations will be adopted to continue the state on its trajectory toward meeting these future GHG targets.
Based on the preceding considerations, the project would not conflict with an applicable plan, policy, or regulation adopted for the purpose of reducing the emissions of GHGs, and no additional mitigation is required.
Mitigation Measures
No mitigation measures are necessary.
Potentially Significant
Impact
Less Than Significant with
Mitigation Incorporated
Less Than Significant
Impact No Impact VIII. HAZARDS AND HAZARDOUS MATERIALS – Would the project: a) Create a significant hazard to the public or the
environment through the routine transport, use, or disposal of hazardous materials?
b) Create a significant hazard to the public or the environment through reasonably foreseeable upset and accident conditions involving the release of hazardous materials into the environment?
c) Emit hazardous emissions or handle hazardous or acutely hazardous materials, substances, or waste within one-quarter mile of an existing or proposed school?
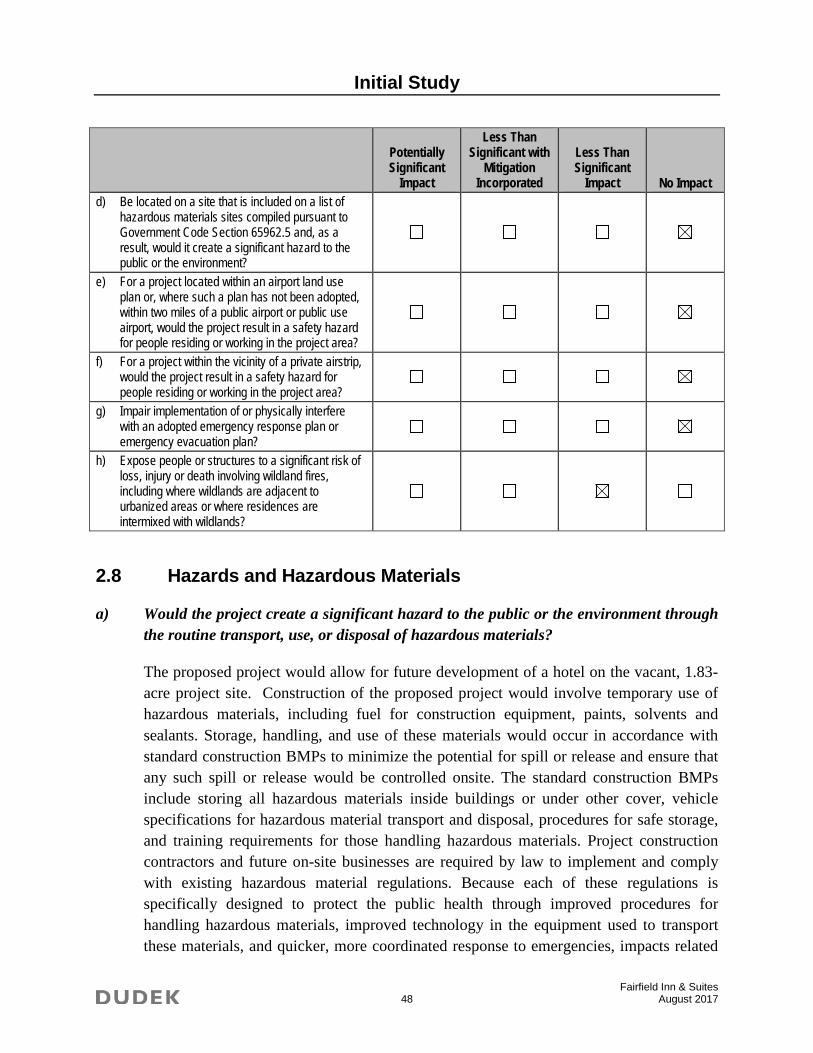
Initial Study
Fairfield Inn & Suites 48 August 2017
Potentially Significant
Impact
Less Than Significant with
Mitigation Incorporated
Less Than Significant
Impact No Impact d) Be located on a site that is included on a list of
hazardous materials sites compiled pursuant to Government Code Section 65962.5 and, as a result, would it create a significant hazard to the public or the environment?
e) For a project located within an airport land use plan or, where such a plan has not been adopted, within two miles of a public airport or public use airport, would the project result in a safety hazard for people residing or working in the project area?
f) For a project within the vicinity of a private airstrip, would the project result in a safety hazard for people residing or working in the project area?
g) Impair implementation of or physically interfere with an adopted emergency response plan or emergency evacuation plan?
h) Expose people or structures to a significant risk of loss, injury or death involving wildland fires, including where wildlands are adjacent to urbanized areas or where residences are intermixed with wildlands?
2.8 Hazards and Hazardous Materials
a) Would the project create a significant hazard to the public or the environment through the routine transport, use, or disposal of hazardous materials?
The proposed project would allow for future development of a hotel on the vacant, 1.83-acre project site. Construction of the proposed project would involve temporary use of hazardous materials, including fuel for construction equipment, paints, solvents and sealants. Storage, handling, and use of these materials would occur in accordance with standard construction BMPs to minimize the potential for spill or release and ensure that any such spill or release would be controlled onsite. The standard construction BMPs include storing all hazardous materials inside buildings or under other cover, vehicle specifications for hazardous material transport and disposal, procedures for safe storage, and training requirements for those handling hazardous materials. Project construction contractors and future on-site businesses are required by law to implement and comply with existing hazardous material regulations. Because each of these regulations is specifically designed to protect the public health through improved procedures for handling hazardous materials, improved technology in the equipment used to transport these materials, and quicker, more coordinated response to emergencies, impacts related
Initial Study
Fairfield Inn & Suites 49 August 2017
to the creation of significant hazards to the public through routine transport, use, disposal, and risk of upset during construction would be less than significant.
It is anticipated that hazardous materials used during long-term operation of the proposed project could include building maintenance and cleaning chemicals, as well as other landscaping and pool chemicals. These materials are commonly used across all types of land uses, and the proposed project is not expected to present any significant risks associated with their use. During operation, the proposed project would be required to use, store, and transport hazardous materials in compliance with applicable federal, state, and local regulations during project operation. Each of these regulations is specifically designed to protect the public health through improved procedures for the handling of hazardous materials, better technology in the equipment used to transport these materials, and a more coordinated, quicker response to emergencies. Therefore, impacts related to the creation of significant hazards to the public through routine transport, use, disposal, and risk of upset during project operations would be less than significant.
b) Would the project create a significant hazard to the public or the environment through reasonably foreseeable upset and accident conditions involving the release of hazardous materials into the environment?
Refer to the answer provided in ‘a’ above.
c) Would the project emit hazardous emissions or handle hazardous or acutely hazardous materials, substances, or waste within one-quarter mile of an existing or proposed school?
The Bergin University of Canine Studies is located at 5860 Labath Avenue, immediately north of Carlson Avenue and northwest of the project site. However, the project would not create hazardous emissions or hazardous waste and would not handle hazardous materials or substances. The project would have no impact related to exposure of the project site to hazards and hazardous materials.
d) Would the project be located on a site that is included on a list of hazardous materials sites compiled pursuant to Government Code Section 65962.5 and, as a result, would it create a significant hazard to the public or the environment?
A search of federal, state, and local databases regarding hazardous material releases and site cleanup lists was conducted for the project site (DTSC 2017). The project area was not identified in any of the records, is not included on the Department of Toxic Substance Control’s site cleanup list, and is not expected to be affected by any offsite spill incidents. The project would have no impact related to the site being included on or affected by
Initial Study
Fairfield Inn & Suites 50 August 2017
other sites that are included on a hazardous material release site.
e) For a project located within an airport land use plan or, where such a plan has not been adopted, within two miles of a public airport or public use airport, would the project result in a safety hazard for people residing or working in the project area?
There are no airports or airstrips within 2 miles of the project area. Therefore, the project would have no impact related to airport safety.
f) For a project within the vicinity of a private airstrip, would the project result in a safety hazard for people residing or working in the project area?
Refer to the answer provided in ‘e’ above.
g) Would the project impair implementation of or physically interfere with an adopted emergency response plan or emergency evacuation plan?
The project would not interfere with any adopted emergency or evacuation plans. The City recently approved the development of a new Public Safety facility (fire station) on the property immediately west of the project site. Upon completion of the new fire station, response times in the project area would be reduced. Therefore, the project would have no impact related to implementation of emergency plans.
h) Would the project expose people or structures to a significant risk of loss, injury or death involving wildland fires, including where wildlands are adjacent to urbanized areas or where residences are intermixed with wildlands?
The City of Rohnert Park General Plan states that the potential for wildland fires varies within the City (City of Rohnert Park, 2000). The project area is in a local responsibility area (LRA) that does not contain any very high fire hazard severity zones. Most of the area surrounding the project site is already developed with urban land uses. Fire suppression services in the project area are currently and would continue to be provided by the City of Rohnert Park. Because the project area is not in or near an area of high fire hazard severity, and because adequate fire protection services would be provided by a local fire protection district, this impact would be less than significant.
Mitigation Measures
No mitigation measures are necessary.
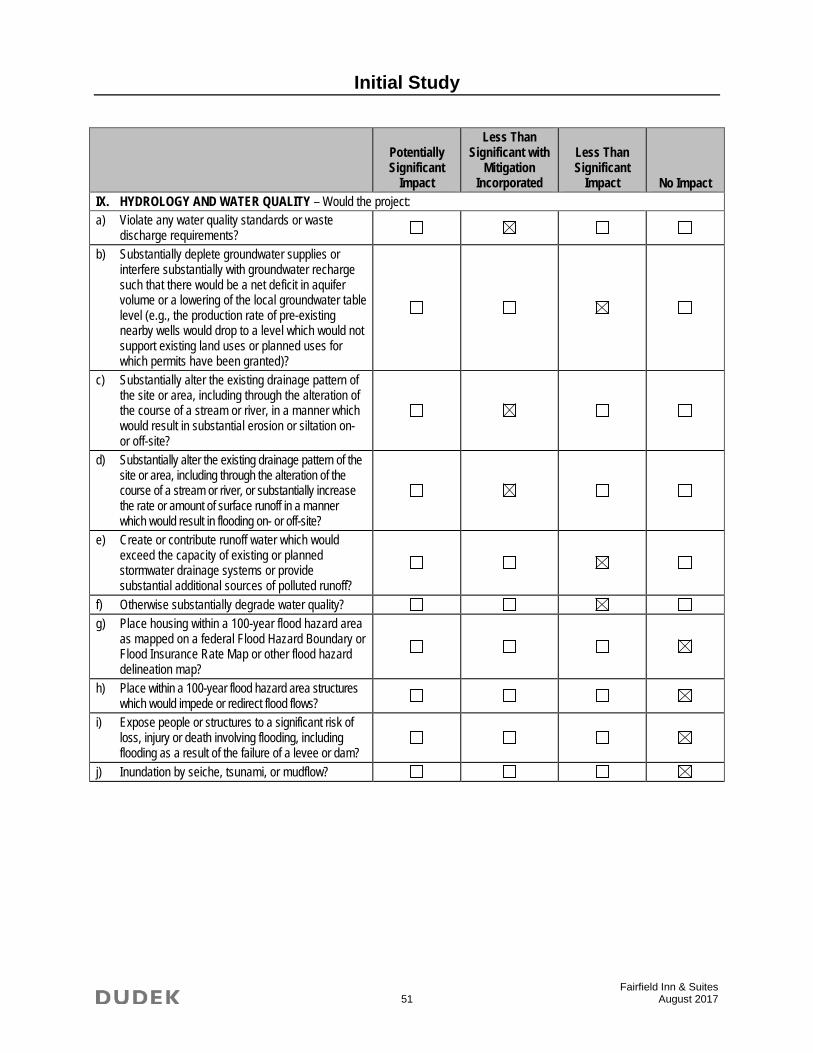
Initial Study
Fairfield Inn & Suites 51 August 2017
Potentially Significant
Impact
Less Than Significant with
Mitigation Incorporated
Less Than Significant
Impact No Impact IX. HYDROLOGY AND WATER QUALITY – Would the project: a) Violate any water quality standards or waste
discharge requirements?
b) Substantially deplete groundwater supplies or interfere substantially with groundwater recharge such that there would be a net deficit in aquifer volume or a lowering of the local groundwater table level (e.g., the production rate of pre-existing nearby wells would drop to a level which would not support existing land uses or planned uses for which permits have been granted)?
c) Substantially alter the existing drainage pattern of the site or area, including through the alteration of the course of a stream or river, in a manner which would result in substantial erosion or siltation on- or off-site?
d) Substantially alter the existing drainage pattern of the site or area, including through the alteration of the course of a stream or river, or substantially increase the rate or amount of surface runoff in a manner which would result in flooding on- or off-site?
e) Create or contribute runoff water which would exceed the capacity of existing or planned stormwater drainage systems or provide substantial additional sources of polluted runoff?
f) Otherwise substantially degrade water quality? g) Place housing within a 100-year flood hazard area
as mapped on a federal Flood Hazard Boundary or Flood Insurance Rate Map or other flood hazard delineation map?
h) Place within a 100-year flood hazard area structures which would impede or redirect flood flows?
i) Expose people or structures to a significant risk of loss, injury or death involving flooding, including flooding as a result of the failure of a levee or dam?
j) Inundation by seiche, tsunami, or mudflow?
Initial Study
Fairfield Inn & Suites 52 August 2017
2.9 Hydrology and Water Quality
a) Would the project violate any water quality standards or waste discharge requirements?
The largest concentration of impervious surface in the northwest area of Rohnert Park occurs in the existing commercial/industrial areas to the west, south, and east of the project area. The Stadium Area, which is adjacent to the north and west boundaries of the project site, contains large areas of vacant or undeveloped land approved for development. The project site is currently vacant, as well, and the project would allow for future development of a hotel.
Development at the project site would include earth-disturbing activities, grading, and trenching that could expose disturbed areas and stockpiled soils to winter rainfall and stormwater runoff. Areas of exposed or stockpiled soils could be subject to sheet erosion during short periods of peak stormwater runoff, allowing temporary discharges of sediment to Hinebaugh Creek, which empties into Laguna de Santa Rosa. If not managed properly, water used for dust suppression during construction could also enter drainage systems or creeks and ultimately into Laguna de Santa Rosa. Accidental spills of construction-related contaminants (e.g., fuels, oils, paints, solvents, cleaners, and concrete) could also occur during construction, resulting in releases to nearby surface water, and thereby degrading water quality. Implementation of Mitigation Measures HYDRO-1 and HYDRO-2 would require adherence to applicable local regulations, and compliance with grading plan requirements would adequately avoid violations of water quality standards and would reduce construction-related impacts on water quality to a less than significant level.
The proposed project could result in changes to drainage patterns and water quality associated with the altered use of the site. Stormwater that drains from the site would potentially carry different or possibly higher concentrations of pollutants into receiving waters. Water used for irrigation of landscaped areas may encounter pesticides, herbicides, and fertilizer. Water that encounters these chemicals but is not absorbed by plants and soil could enter the storm drain system and be conveyed to receiving waters. The potential discharges of contaminated urban runoff from paved and landscaped areas with implementation of the proposed project could contribute to adverse effects on aquatic organisms in receiving waters.
Water quality and stormwater runoff is regulated under a National Pollutant Discharge Elimination System (NPDES) municipal separate storm sewer system (MS4) stormwater permit with the North Coast Regional Water Quality Control Board (RWQCB). As of
Initial Study
Fairfield Inn & Suites 53 August 2017
2014, the Storm Drain Design Standards reference the City of Santa Rosa and Sonoma County 2011 LID Manual, as required by the City’s MS4 permit. The manual provides technical guidance for project designs that require the implementation of permanent LID features and stormwater BMPs. The design goal stated in the LID Manual requires that 100 percent of the design storm event (85th percentile, 24 hour) runoff generated from the developed site be treated on-site, and that any increase in runoff volume caused by development or redevelopment for the design storm be infiltrated and/or reused on-site. To meet the design goal, the project would include gravel storage zones under vegetated areas within the site. The total volume of storage required for the project would be reduced based on the use of pollution prevention measures.
Design and construction of drainage systems per the Sonoma County Water Agency (SCWA) Flood Control Design Criteria would ensure that storm drainage systems are adequately sized. Implementation of post-construction BMPs would reduce pollutants in stormwater runoff. With implementation of Mitigation Measures HYDRO-1 and HYDRO 2, which include post-construction BMPs, as well as adherence to the City’s SWMP and to state and local regulatory requirements, potential water quality and runoff impacts from development at the project site would be reduced to a less than significant level.
b) Would the project substantially deplete groundwater supplies or interfere substantially with groundwater recharge such that there would be a net deficit in aquifer volume or a lowering of the local groundwater table level (i.e., the production rate of pre-existing nearby wells would drop to a level that would not support existing land uses or planned uses for which permits have been granted)?
Implementation of the proposed project would result in impervious surfaces that would interfere with on-site groundwater recharge. Development associated with the project would be required to comply with the City’s standards and current stormwater BMPs. Furthermore, the project would be required to comply with the City’s stormwater drainage standards and the City of Santa Rosa and Sonoma County LID Manual. Design requirements include the treatment of all runoff generated by an 85th percentile, 24-hour storm event and specify that new development or redevelopment must not increase the volume of runoff in an 85th percentile, 24-hour storm event. The LID Manual also includes a menu of BMPs that can be used to capture, infiltrate, and/or reuse stormwater on-site. Therefore, this impact would be less than significant.
c) Would the project substantially alter the existing drainage pattern of the site or area, including through the alteration of the course of a stream or river, in a manner which would result in substantial erosion or siltation on- or off-site?
Initial Study
Fairfield Inn & Suites 54 August 2017
Future development at the project site would require vegetation removal, grading, trenching, and soil movement for the placement of new structures on-site, which would alter drainage courses and runoff patterns from existing conditions. Alterations to existing drainage patterns or flow velocities could result in a short-term increase in erosion or siltation that may have substantial adverse effects on water quality.
Implementation of Measures HYDRO-1 and HYDRO-2 would prescribe specific construction BMPs as part of the SWPPP and ECP, which would reduce the effects of ground disturbance at the site during construction, which in turn would reduce the impact on drainage, erosion, and sedimentation during construction to less than significant level.
Once completed, the project could result in altered drainage patterns that could increase the potential for erosion, siltation, and associated adverse water quality effects on- or off-site. As previously discussed, the City requires all new development projects to design and construct storm drainage systems in accordance with the City of Rohnert Park Storm Drain Design Standards, which includes the City of Santa Rosa and Sonoma County’s Manual and associated LID requirements. Adherence to the City’s SWMP would provide for compliance with the City’s MS4 NPDES stormwater permit requirements through the implementation of site-specific stormwater capture and treatment BMPs, as well as maintenance and inspection requirements for those BMPs. Implementation of Mitigation Measures HYDRO-1 and HYDRO-2 would also include post-construction stormwater pollution prevention BMPs. In addition, SCWA reviews project drainage system plans for compliance with its Flood Control Design Criteria. Compliance with these regulations would ensure that storm drainage systems are adequately sized to convey post-development runoff. Implementation of Mitigation Measures HYDRO-1 and HYDRO-2, adherence to the City’s SWMP, and compliance with SCWA’s design criteria would reduce impacts from erosion and siltation caused by changes in existing drainage patterns to a less than significant level.
d) Would the project substantially alter the existing drainage pattern of the site or area, including through the alteration of the course of a stream or river, or substantially increase the rate or amount of surface runoff in a manner which would result in flooding on- or off-site?
Construction. Construction of the project would require grading and soil disturbance for placement of a new structure on-site, which could substantially alter drainage courses and runoff patterns from existing conditions, and could result in flooding on- or off-site. Implementation of Mitigation Measures HYDRO-1 and HYDRO-2 would prescribe specific construction BMPs as part of project-specific SWPPPs, which would reduce the
Initial Study
Fairfield Inn & Suites 55 August 2017
impact of ground disturbance and would reduce the impact on drainage and the rate or amount of surface runoff during construction to less than significant level.
Operations. As described above, the proposed project would not result in a net increase of impervious surfaces. The City requires all new development projects to design and construct storm drainage systems in accordance with the City of Rohnert Park Storm Drain Design Standards, which includes the City of Santa Rosa and Sonoma County’s Manual. The design goal stated in the manual requires that any increase in runoff volume from development or redevelopment for the design storm (85th percentile, 24 hour storm event) be infiltrated and/or reused on-site (City of Santa Rosa and County of Sonoma, 2011). Through compliance with the MS4 Permit requirements, which would include adherence to the City’s SWMP, the proposed project would not result in any increase in runoff volume in comparison to existing conditions, because 100 percent of any increase in stormwater volume would be required to be infiltrated and/or reused on-site.
In addition, SCWA reviews project drainage system plans for compliance with its Flood Control Design Criteria. Compliance with these regulations would ensure that storm drainage systems are adequately sized to convey post-development runoff. With implementation of Mitigation Measures HYDRO-1 and HYDRO-2 and adherence to the City’s SWMP, in addition to compliance with SCWA’s design criteria, the proposed plan would not result in flooding or exceed the capacity of existing or planned stormwater drainage systems. Accordingly, this impact would be less than significant.
e) Would the project create or contribute runoff water which would exceed the capacity of existing or planned stormwater drainage systems or provide substantial additional sources of polluted runoff?
The project site is primarily undeveloped, vacant land. Future development of the site would involve covering the site with impervious surfaces such as driveways, parking lot, and buildings. The surfaces would be graded to direct drainage away from structures. The impervious surfaces would reduce surface water infiltration and increase the rate and volume of surface runoff leaving the site.
The existing topography is relatively flat, gently sloping westerly toward Labath Avenue. This project was included as a tributary to the storm drain system within Labath Avenue, where the site currently drains. An existing 30-inch and 36-inch storm drains collect runoff and convey flows westerly down Martin and Carlson Avenues, respectively. These storm drains ultimately converge and outlet into Hinebaugh Creek.
Initial Study
Fairfield Inn & Suites 56 August 2017
As part of the Five Creek project, a new outfall to Hinebaugh Creek, just west of the existing Labath Avenue Bridge, will be constructed. The new storm drain system is designed to accept runoff from the Residence at Five Creek site, the City Public Safety and Public Works site, and the project site, for a total tributary area of 17.08 acres. The tributary area is less than one square mile and is classified as a minor waterway. The storm drain system is designed to accommodate the 10-year storm event.
Construction of the new storm drain system will be completed in compliance with the Stormwater Phase II regulations administered by the North Coast Regional Water Quality Control Board through permits to the City. With project-specific stormwater detention measures in place and operative, there would be no increase in the runoff rate that leaves the site over the existing site level. Accordingly, impacts related to surface runoff or flooding would be less than significant.
f) Would the project otherwise substantially degrade water quality?
Increased runoff from the construction of impermeable surfaces on the project site could lower the quality of stormwater runoff and infiltrating groundwater. The major contributor of contaminants to runoff and infiltrating groundwater is the land surface over which the water passes.
In developed areas, driveways, parking lots, sidewalks, streets and gutters are connected directly to storm drains that collect and guide stormwater runoff. Between rainstorms, materials accumulate on these surfaces from debris dropped or scattered by individuals, street sweepings, debris and other particulate matter washed into roadways from adjacent areas, wastes and dirt from construction and renovation or demolition, fecal droppings from animals, remnants of household refuse dropped during collection or scattered by animals or wind, oil and various residues contributed by automobiles, and fallout of air-borne particles.
During rainfall, stormwater may take several paths when it reaches the ground surface. As water fills surface depressions, it seeps into the ground where the ground is permeable. Where the rate of rain reaching the ground exceeds the rate of infiltration, a film of water builds up on the ground surface. Once this film is of sufficient depth (about 0.1 inch), the water collecting on the ground surface begins to flow. The initial flow of each storm often contains the highest concentrations of pollutants, but this is not always the case because the phenomenon is dependent on the duration of the preceding dry weather period, rainfall patterns, rainfall intensity, the chemistry of individual pollutants, and other site-specific conditions.
Initial Study
Fairfield Inn & Suites 57 August 2017
If uncontrolled, the accumulation of urban pollutants could have a detrimental cumulative effect because overland flow from paved surfaces and landscaped areas carries many of the above-listed contaminants, thereby contributing to the deterioration of the quality of stormwater runoff and infiltrating groundwater. The eventual result would be the deterioration of water quality in downstream receiving waters. Reaches of drainage-ways downstream from the project site would carry stormwater runoff to Hinebaugh Creek and Laguna de Santa Rosa and, eventually, to the Russian River, which would be subject to water quality deterioration.
The previous discussions of erosion and sedimentation control and storm-drainage system design provide documentation of the requirements to reduce turbidity and capacity effects. The City’s General Plan Policy HS-5 encourages the use of environmentally sensitive drainage improvements to ensure the protection of surface water quality and stream integrity. There would be a less than significant impact regarding pollution from surface water runoff.
g) Would the project place housing within a 100-year flood hazard area as mapped on a federal Flood Hazard Boundary or Flood Insurance Rate Map or other flood hazard delineation map?
Section 7.2, Drainage, Erosion, Stormwater, and Flooding of the City’s General Plan and Community Panel Number 06097C0877E of FEMA’s Flood Insurance Rate Maps for Sonoma County both place the project site outside the 500-year zone and the 100-year flood hazard area. There are no dams or levees in the vicinity of the project site. The project would not expose people or structures to significant loss related to flooding. The project site is physically removed from any large body of water and is not subject to inundation by seiche, tsunami, or mudflow. The project would have no impact related to flooding or other water-related hazards.
h) Would the project place within a 100-year flood hazard area structures which would impede or redirect flood flows?
Refer to the answer provided in ‘g’ above.
i) Would the project expose people or structures to a significant risk of loss, injury or death involving flooding, including flooding as a result of the failure of a levee or dam?
Refer to the answer provided in ‘g’ above.
j) Inundation by seiche, tsunami, or mudflow?
Initial Study
Fairfield Inn & Suites 58 August 2017
Refer to the answer provided in ‘g’ above.
Mitigation Measures
Mitigation Measure HYDRO-1: The applicant or its consultant shall apply to the North Coast RWQCB for coverage under the Construction General Permit and prepare a site-specific SWPPP for approval by the North Coast RWQCB before any onsite demolition, grading, or construction activities begin. The SWPPP shall cover pre- and post- construction activities and describe site-specific and construction phase-specific activities detailing the following:
o activities that may cause pollutant discharge (including sediment);
o BMPs, consistent with the requirements of the NPDES permit, to reduce the potential for contaminated runoff, such as limiting ground-disturbing activities during the winter rainfall period, minimizing exposure of disturbed areas and soil stockpiles to rainfall, and minimizing construction activities near or within drainage facilities;
o erosion and sedimentation control measures to be implemented, such as soil stabilization, mulching, silt fencing, or temporary desilting basins; good housekeeping practices, such as road sweeping and dust control; and diversion measures, such as the use of berms to prevent clear runoff from contacting disturbed areas; and
o hazardous materials spill prevention and response measure requirements, including lists of materials proposed for use, handling and storage practices, identification of spill response equipment, spill containment and cleanup procedures, and identification of regulatory notification protocols and contact phone numbers to be used in the event of a spill.
The applicant shall implement the SWPPP, monitoring all BMPs and the parties responsible for them, in conformance with the guidelines set forth in the Construction General Permit.
Mitigation Measure HYDRO-2: The project applicant shall submit a site- specific erosion control plan (ECP) to the City of Rohnert Park City Engineer prior to issuance of a grading permit. All sites that will have grading activities are required to submit an ECP. The ECP shall include the placement of structural and nonstructural stormwater pollution prevention controls that prevent erosion during and after construction. Proper soil stabilization shall be required for all graded areas. A grading permit shall not be issued until all of the required data, including the ECP,
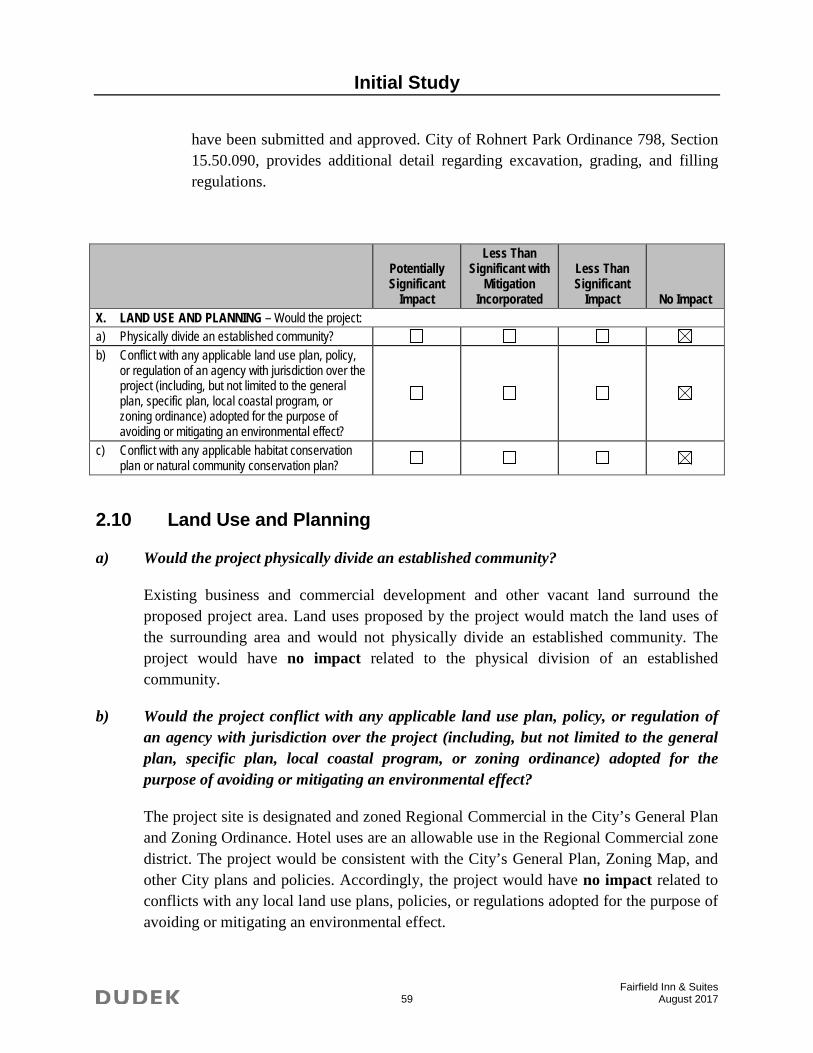
Initial Study
Fairfield Inn & Suites 59 August 2017
have been submitted and approved. City of Rohnert Park Ordinance 798, Section 15.50.090, provides additional detail regarding excavation, grading, and filling regulations.
Potentially Significant
Impact
Less Than Significant with
Mitigation Incorporated
Less Than Significant
Impact No Impact X. LAND USE AND PLANNING – Would the project: a) Physically divide an established community? b) Conflict with any applicable land use plan, policy,
or regulation of an agency with jurisdiction over the project (including, but not limited to the general plan, specific plan, local coastal program, or zoning ordinance) adopted for the purpose of avoiding or mitigating an environmental effect?
c) Conflict with any applicable habitat conservation plan or natural community conservation plan?
2.10 Land Use and Planning
a) Would the project physically divide an established community?
Existing business and commercial development and other vacant land surround the proposed project area. Land uses proposed by the project would match the land uses of the surrounding area and would not physically divide an established community. The project would have no impact related to the physical division of an established community.
b) Would the project conflict with any applicable land use plan, policy, or regulation of an agency with jurisdiction over the project (including, but not limited to the general plan, specific plan, local coastal program, or zoning ordinance) adopted for the purpose of avoiding or mitigating an environmental effect?
The project site is designated and zoned Regional Commercial in the City’s General Plan and Zoning Ordinance. Hotel uses are an allowable use in the Regional Commercial zone district. The project would be consistent with the City’s General Plan, Zoning Map, and other City plans and policies. Accordingly, the project would have no impact related to conflicts with any local land use plans, policies, or regulations adopted for the purpose of avoiding or mitigating an environmental effect.
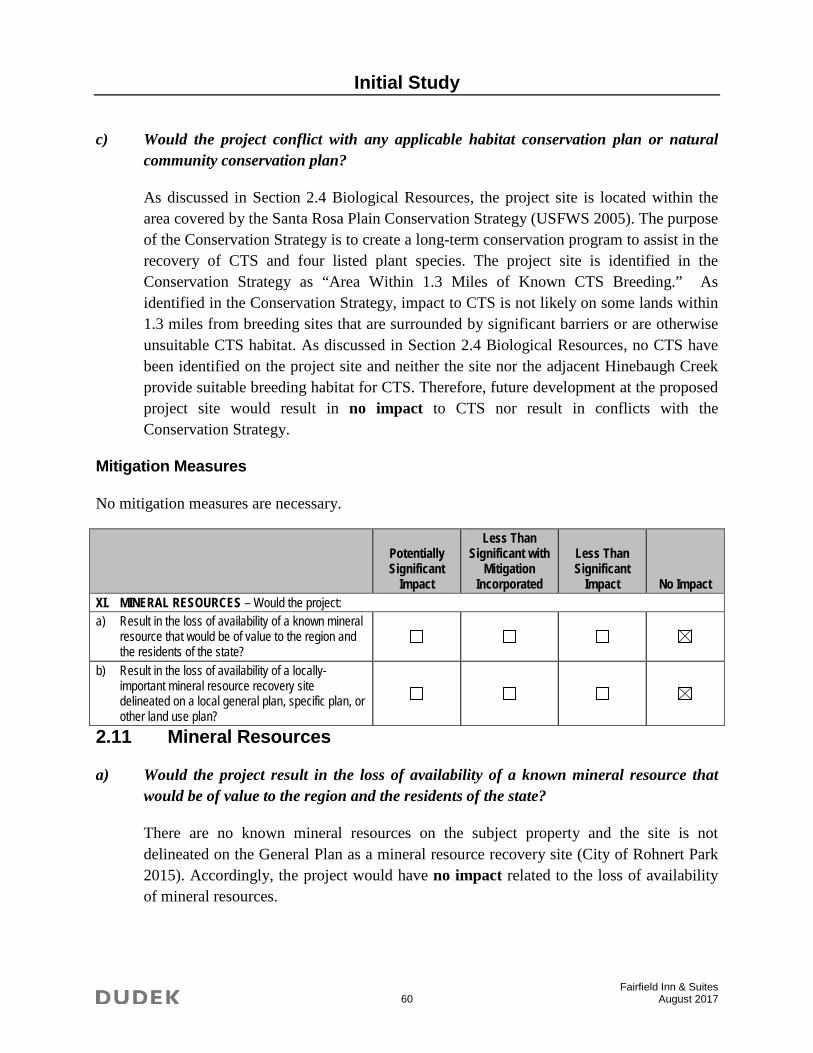
Initial Study
Fairfield Inn & Suites 60 August 2017
c) Would the project conflict with any applicable habitat conservation plan or natural community conservation plan?
As discussed in Section 2.4 Biological Resources, the project site is located within the area covered by the Santa Rosa Plain Conservation Strategy (USFWS 2005). The purpose of the Conservation Strategy is to create a long-term conservation program to assist in the recovery of CTS and four listed plant species. The project site is identified in the Conservation Strategy as “Area Within 1.3 Miles of Known CTS Breeding.” As identified in the Conservation Strategy, impact to CTS is not likely on some lands within 1.3 miles from breeding sites that are surrounded by significant barriers or are otherwise unsuitable CTS habitat. As discussed in Section 2.4 Biological Resources, no CTS have been identified on the project site and neither the site nor the adjacent Hinebaugh Creek provide suitable breeding habitat for CTS. Therefore, future development at the proposed project site would result in no impact to CTS nor result in conflicts with the Conservation Strategy.
Mitigation Measures
No mitigation measures are necessary.
Potentially Significant
Impact
Less Than Significant with
Mitigation Incorporated
Less Than Significant
Impact No Impact XI. MINERAL RESOURCES – Would the project: a) Result in the loss of availability of a known mineral
resource that would be of value to the region and the residents of the state?
b) Result in the loss of availability of a locally-important mineral resource recovery site delineated on a local general plan, specific plan, or other land use plan?
2.11 Mineral Resources
a) Would the project result in the loss of availability of a known mineral resource that would be of value to the region and the residents of the state?
There are no known mineral resources on the subject property and the site is not delineated on the General Plan as a mineral resource recovery site (City of Rohnert Park 2015). Accordingly, the project would have no impact related to the loss of availability of mineral resources.
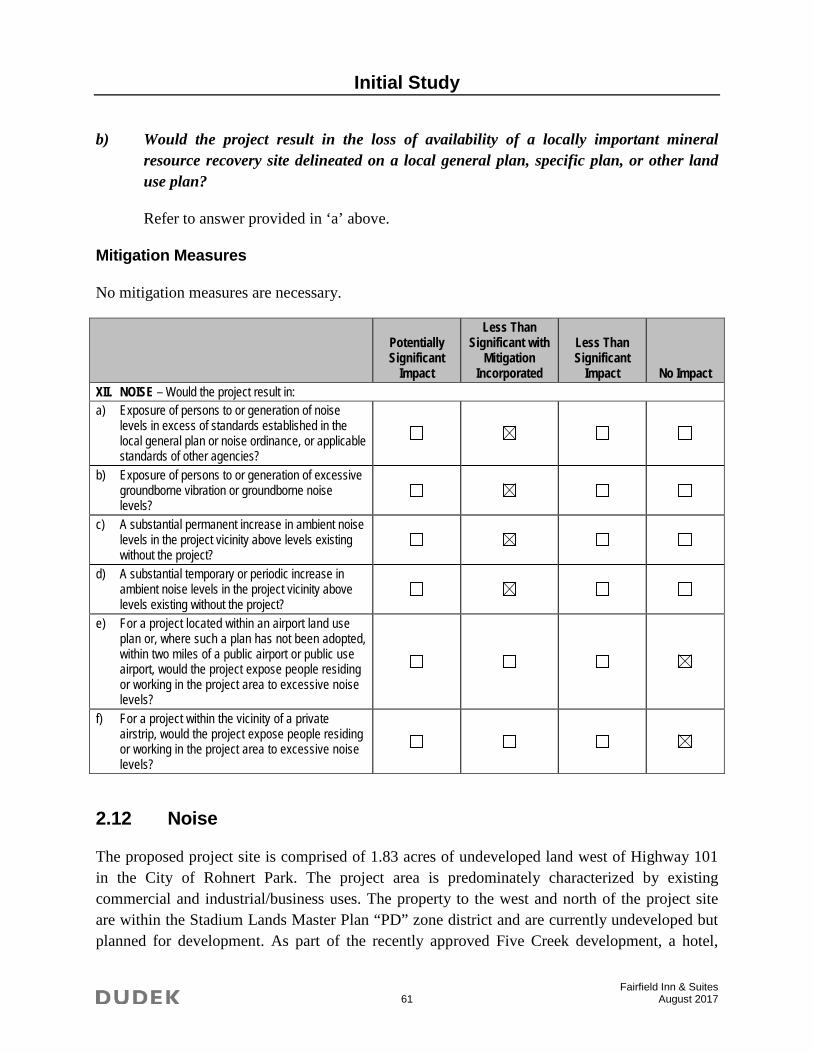
Initial Study
Fairfield Inn & Suites 61 August 2017
b) Would the project result in the loss of availability of a locally important mineral resource recovery site delineated on a local general plan, specific plan, or other land use plan?
Refer to answer provided in ‘a’ above.
Mitigation Measures
No mitigation measures are necessary.
Potentially Significant
Impact
Less Than Significant with
Mitigation Incorporated
Less Than Significant
Impact No Impact XII. NOISE – Would the project result in: a) Exposure of persons to or generation of noise
levels in excess of standards established in the local general plan or noise ordinance, or applicable standards of other agencies?
b) Exposure of persons to or generation of excessive groundborne vibration or groundborne noise levels?
c) A substantial permanent increase in ambient noise levels in the project vicinity above levels existing without the project?
d) A substantial temporary or periodic increase in ambient noise levels in the project vicinity above levels existing without the project?
e) For a project located within an airport land use plan or, where such a plan has not been adopted, within two miles of a public airport or public use airport, would the project expose people residing or working in the project area to excessive noise levels?
f) For a project within the vicinity of a private airstrip, would the project expose people residing or working in the project area to excessive noise levels?
2.12 Noise
The proposed project site is comprised of 1.83 acres of undeveloped land west of Highway 101 in the City of Rohnert Park. The project area is predominately characterized by existing commercial and industrial/business uses. The property to the west and north of the project site are within the Stadium Lands Master Plan “PD” zone district and are currently undeveloped but planned for development. As part of the recently approved Five Creek development, a hotel,
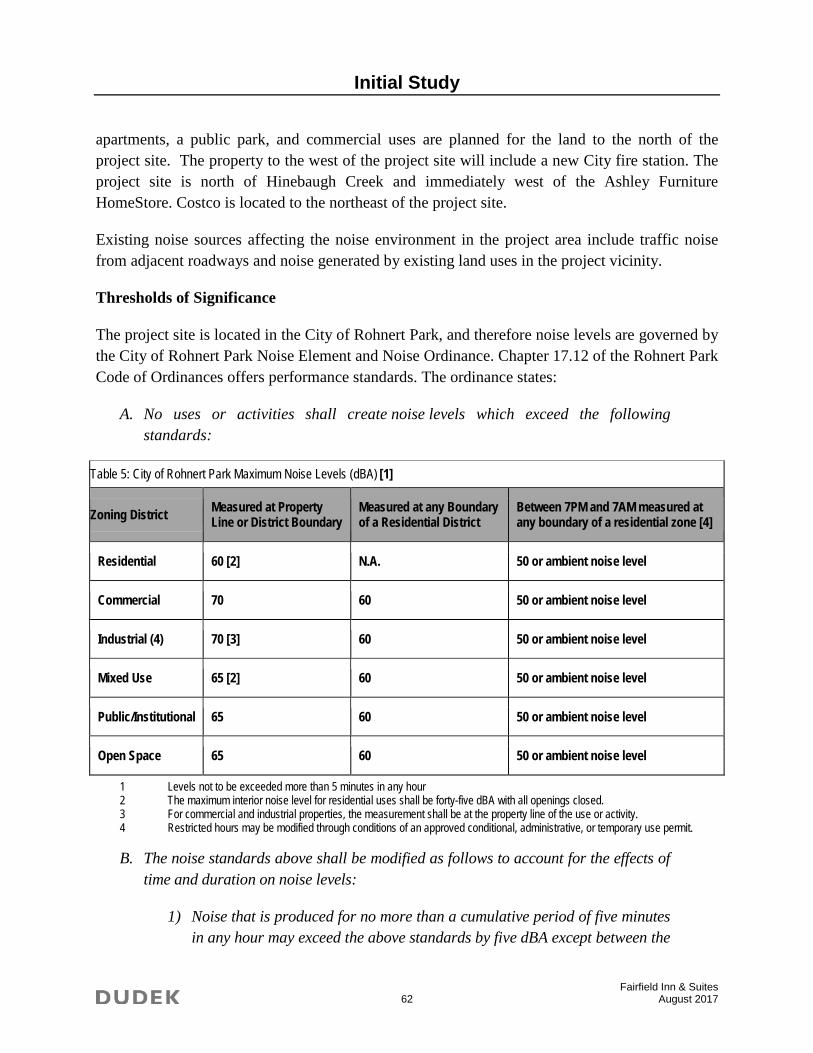
Initial Study
Fairfield Inn & Suites 62 August 2017
apartments, a public park, and commercial uses are planned for the land to the north of the project site. The property to the west of the project site will include a new City fire station. The project site is north of Hinebaugh Creek and immediately west of the Ashley Furniture HomeStore. Costco is located to the northeast of the project site.
Existing noise sources affecting the noise environment in the project area include traffic noise from adjacent roadways and noise generated by existing land uses in the project vicinity.
Thresholds of Significance
The project site is located in the City of Rohnert Park, and therefore noise levels are governed by the City of Rohnert Park Noise Element and Noise Ordinance. Chapter 17.12 of the Rohnert Park Code of Ordinances offers performance standards. The ordinance states:
A. No uses or activities shall create noise levels which exceed the following standards:
Table 5: City of Rohnert Park Maximum Noise Levels (dBA) [1]
Zoning District Measured at Property Line or District Boundary
Measured at any Boundary of a Residential District
Between 7PM and 7AM measured at any boundary of a residential zone [4]
Residential 60 [2] N.A. 50 or ambient noise level
Commercial 70 60 50 or ambient noise level
Industrial (4) 70 [3] 60 50 or ambient noise level
Mixed Use 65 [2] 60 50 or ambient noise level
Public/Institutional 65 60 50 or ambient noise level
Open Space 65 60 50 or ambient noise level
1 Levels not to be exceeded more than 5 minutes in any hour 2 The maximum interior noise level for residential uses shall be forty-five dBA with all openings closed. 3 For commercial and industrial properties, the measurement shall be at the property line of the use or activity. 4 Restricted hours may be modified through conditions of an approved conditional, administrative, or temporary use permit.
B. The noise standards above shall be modified as follows to account for the effects of time and duration on noise levels:
1) Noise that is produced for no more than a cumulative period of five minutes in any hour may exceed the above standards by five dBA except between the
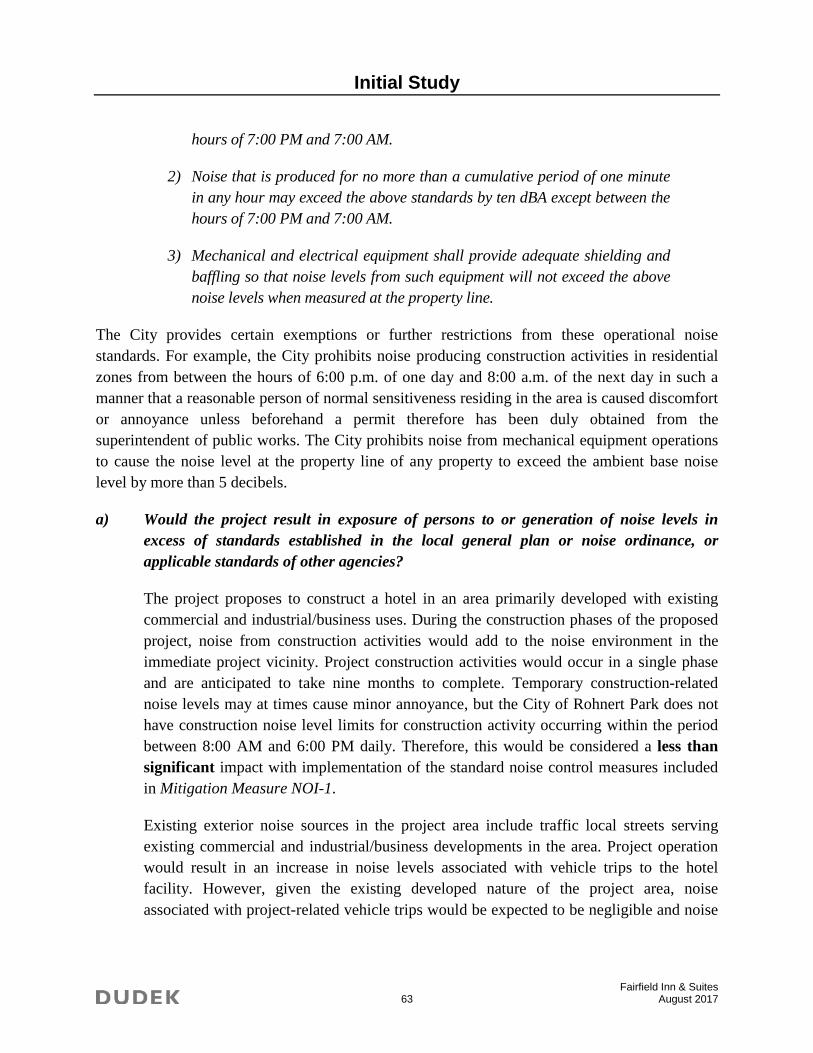
Initial Study
Fairfield Inn & Suites 63 August 2017
hours of 7:00 PM and 7:00 AM.
2) Noise that is produced for no more than a cumulative period of one minute in any hour may exceed the above standards by ten dBA except between the hours of 7:00 PM and 7:00 AM.
3) Mechanical and electrical equipment shall provide adequate shielding and baffling so that noise levels from such equipment will not exceed the above noise levels when measured at the property line.
The City provides certain exemptions or further restrictions from these operational noise standards. For example, the City prohibits noise producing construction activities in residential zones from between the hours of 6:00 p.m. of one day and 8:00 a.m. of the next day in such a manner that a reasonable person of normal sensitiveness residing in the area is caused discomfort or annoyance unless beforehand a permit therefore has been duly obtained from the superintendent of public works. The City prohibits noise from mechanical equipment operations to cause the noise level at the property line of any property to exceed the ambient base noise level by more than 5 decibels.
a) Would the project result in exposure of persons to or generation of noise levels in excess of standards established in the local general plan or noise ordinance, or applicable standards of other agencies?
The project proposes to construct a hotel in an area primarily developed with existing commercial and industrial/business uses. During the construction phases of the proposed project, noise from construction activities would add to the noise environment in the immediate project vicinity. Project construction activities would occur in a single phase and are anticipated to take nine months to complete. Temporary construction-related noise levels may at times cause minor annoyance, but the City of Rohnert Park does not have construction noise level limits for construction activity occurring within the period between 8:00 AM and 6:00 PM daily. Therefore, this would be considered a less than significant impact with implementation of the standard noise control measures included in Mitigation Measure NOI-1.
Existing exterior noise sources in the project area include traffic local streets serving existing commercial and industrial/business developments in the area. Project operation would result in an increase in noise levels associated with vehicle trips to the hotel facility. However, given the existing developed nature of the project area, noise associated with project-related vehicle trips would be expected to be negligible and noise
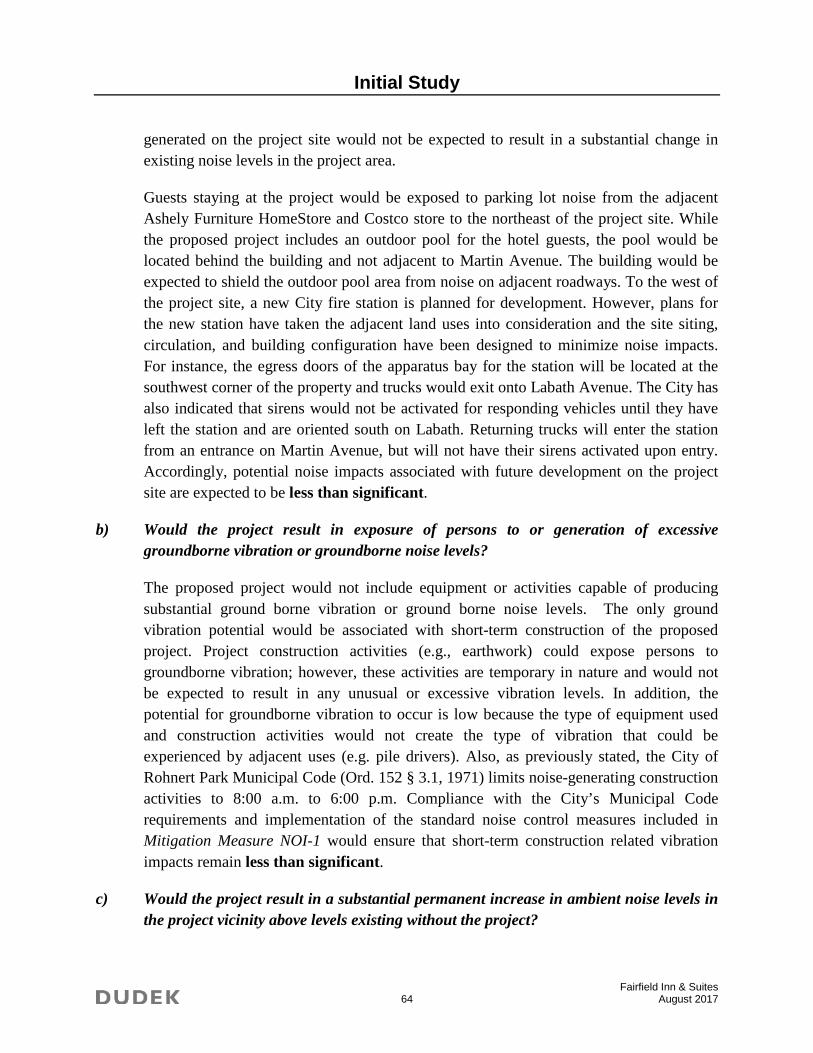
Initial Study
Fairfield Inn & Suites 64 August 2017
generated on the project site would not be expected to result in a substantial change in existing noise levels in the project area.
Guests staying at the project would be exposed to parking lot noise from the adjacent Ashely Furniture HomeStore and Costco store to the northeast of the project site. While the proposed project includes an outdoor pool for the hotel guests, the pool would be located behind the building and not adjacent to Martin Avenue. The building would be expected to shield the outdoor pool area from noise on adjacent roadways. To the west of the project site, a new City fire station is planned for development. However, plans for the new station have taken the adjacent land uses into consideration and the site siting, circulation, and building configuration have been designed to minimize noise impacts. For instance, the egress doors of the apparatus bay for the station will be located at the southwest corner of the property and trucks would exit onto Labath Avenue. The City has also indicated that sirens would not be activated for responding vehicles until they have left the station and are oriented south on Labath. Returning trucks will enter the station from an entrance on Martin Avenue, but will not have their sirens activated upon entry. Accordingly, potential noise impacts associated with future development on the project site are expected to be less than significant.
b) Would the project result in exposure of persons to or generation of excessive groundborne vibration or groundborne noise levels?
The proposed project would not include equipment or activities capable of producing substantial ground borne vibration or ground borne noise levels. The only ground vibration potential would be associated with short-term construction of the proposed project. Project construction activities (e.g., earthwork) could expose persons to groundborne vibration; however, these activities are temporary in nature and would not be expected to result in any unusual or excessive vibration levels. In addition, the potential for groundborne vibration to occur is low because the type of equipment used and construction activities would not create the type of vibration that could be experienced by adjacent uses (e.g. pile drivers). Also, as previously stated, the City of Rohnert Park Municipal Code (Ord. 152 § 3.1, 1971) limits noise-generating construction activities to 8:00 a.m. to 6:00 p.m. Compliance with the City’s Municipal Code requirements and implementation of the standard noise control measures included in Mitigation Measure NOI-1 would ensure that short-term construction related vibration impacts remain less than significant.
c) Would the project result in a substantial permanent increase in ambient noise levels in the project vicinity above levels existing without the project?
Initial Study
Fairfield Inn & Suites 65 August 2017
After construction of the proposed project, vehicle traffic to and from the site and guest activities onsite would result in a permanent increase in noise levels in the project vicinity. However, project-related operational noise would be similar to and consistent with existing uses within the project vicinity. Noise generated on the project site would not be expected to result in a substantial change in existing noise levels in the project area. This impact would be less than significant.
Area noise levels are not expected to increase significantly due to HVAC or mechanical equipment servicing the project. However, details regarding mechanical equipment are not yet available for review. The City’s Noise Ordinance states that mechanical and electrical equipment shall have adequate shielding and baffling to meet the noise standards. Implementation of Mitigation Measure NOI-2 would ensure that impacts associated with mechanical noise remain less than significant.
d) Would the project result in a substantial temporary or periodic increase in ambient noise levels in the project vicinity above levels existing without the project?
Short-term noise would be associated with heavy equipment used for the grading and construction of the project. Daytime construction noise levels at the closest residences to the proposed project could at times cause minor annoyance, but the City of Rohnert Park does not have construction noise level limits for construction activity occurring within the period between 8:00 AM and 6:00 PM daily. Therefore, this would be considered a less than significant impact provided that the standard noise control measures included in Mitigation Measure NOI-1 are implemented.
e) Would the project be located within an airport land use plan or, where such a plan has not been adopted, within two miles of a public airport or public use airport, would the project expose people residing or working in the project area to excessive noise levels?
The proposed project is not located near a public airport or public use airport. Petaluma Municipal Airport is the closes airport and located approximately over 10 miles away from the proposed project location. There would be no impact associated with airport noise.
f) Would the project be within the vicinity of a private airstrip, would the project expose people residing or working in the project area to excessive noise levels?
The proposed project is not located near a private airstrip. Graywood Ranch Airport in Santa Rosa is the closest private airstrip and located over 10 miles away from the proposed project location. Accordingly, there would be no impact related to airstrip noise exposure.
Initial Study
Fairfield Inn & Suites 66 August 2017
Mitigation Measures
Mitigation Measure NOI-1: Noise-generating activities at the construction site or in areas adjacent to the construction site associated with the project in any way shall be restricted to the hours of 8:00 a.m. to 6:00 p.m. In addition, all construction activity shall comply with the following requirements:
1. Use available noise suppression devices and properly maintain and muffle loud construction equipment.
2. Avoid the unnecessary idling of equipment and stage construction equipment as far as reasonable from residences.
3. Notify adjacent uses of the construction schedule.
4. Designate a “noise disturbance coordinator” who would be responsible for responding to any local complaints about construction noise. The disturbance coordinator would determine the cause of the noise complaints (e.g., starting too early, bad muffler, etc.) and would require that reasonable measures warranted to correct the problem be implemented. Conspicuously post a telephone number for the disturbance coordinator at the construction site and include it in the notice sent to neighbors regarding the construction schedule.
5. All noise-producing project equipment and vehicles using internal combustion engines shall be equipped with mufflers, air-inlet silencers where appropriate, and any other shrouds, shields, or other noise-reducing features in good operating condition that meet or exceed original factory specification. Mobile or fixed “package” equipment (e.g., arc-welders, air compressors) shall be equipped with shrouds and noise control features that are readily available for that type of equipment.
6. All mobile or fixed noise-producing equipment used on the Project that are regulated for noise output by a local, state, or federal agency shall comply with such regulation while in the course of Project activity.
7. Construction site and access road speed limits shall be established and enforced during the construction period.
8. The use of noise-producing signals, including horns, whistles, alarms, and bells, shall be for safety warning purposes only.
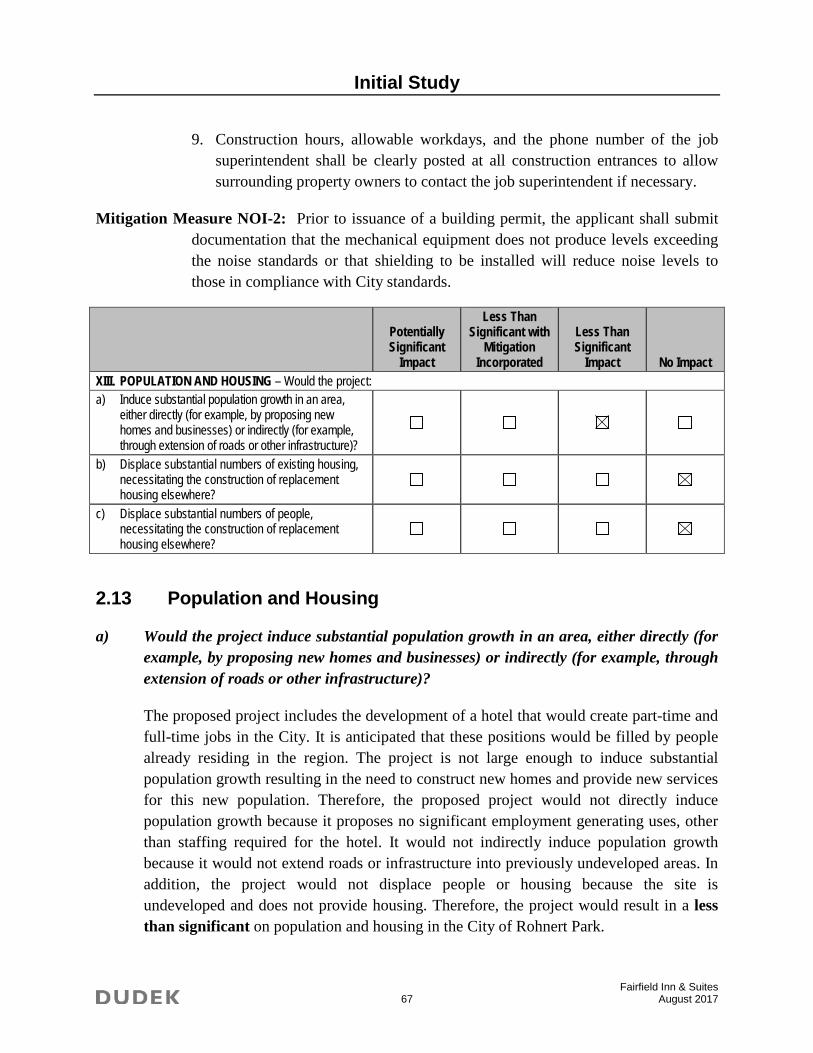
Initial Study
Fairfield Inn & Suites 67 August 2017
9. Construction hours, allowable workdays, and the phone number of the job superintendent shall be clearly posted at all construction entrances to allow surrounding property owners to contact the job superintendent if necessary.
Mitigation Measure NOI-2: Prior to issuance of a building permit, the applicant shall submit documentation that the mechanical equipment does not produce levels exceeding the noise standards or that shielding to be installed will reduce noise levels to those in compliance with City standards.
Potentially Significant
Impact
Less Than Significant with
Mitigation Incorporated
Less Than Significant
Impact No Impact XIII. POPULATION AND HOUSING – Would the project: a) Induce substantial population growth in an area,
either directly (for example, by proposing new homes and businesses) or indirectly (for example, through extension of roads or other infrastructure)?
b) Displace substantial numbers of existing housing, necessitating the construction of replacement housing elsewhere?
c) Displace substantial numbers of people, necessitating the construction of replacement housing elsewhere?
2.13 Population and Housing
a) Would the project induce substantial population growth in an area, either directly (for example, by proposing new homes and businesses) or indirectly (for example, through extension of roads or other infrastructure)?
The proposed project includes the development of a hotel that would create part-time and full-time jobs in the City. It is anticipated that these positions would be filled by people already residing in the region. The project is not large enough to induce substantial population growth resulting in the need to construct new homes and provide new services for this new population. Therefore, the proposed project would not directly induce population growth because it proposes no significant employment generating uses, other than staffing required for the hotel. It would not indirectly induce population growth because it would not extend roads or infrastructure into previously undeveloped areas. In addition, the project would not displace people or housing because the site is undeveloped and does not provide housing. Therefore, the project would result in a less than significant on population and housing in the City of Rohnert Park.
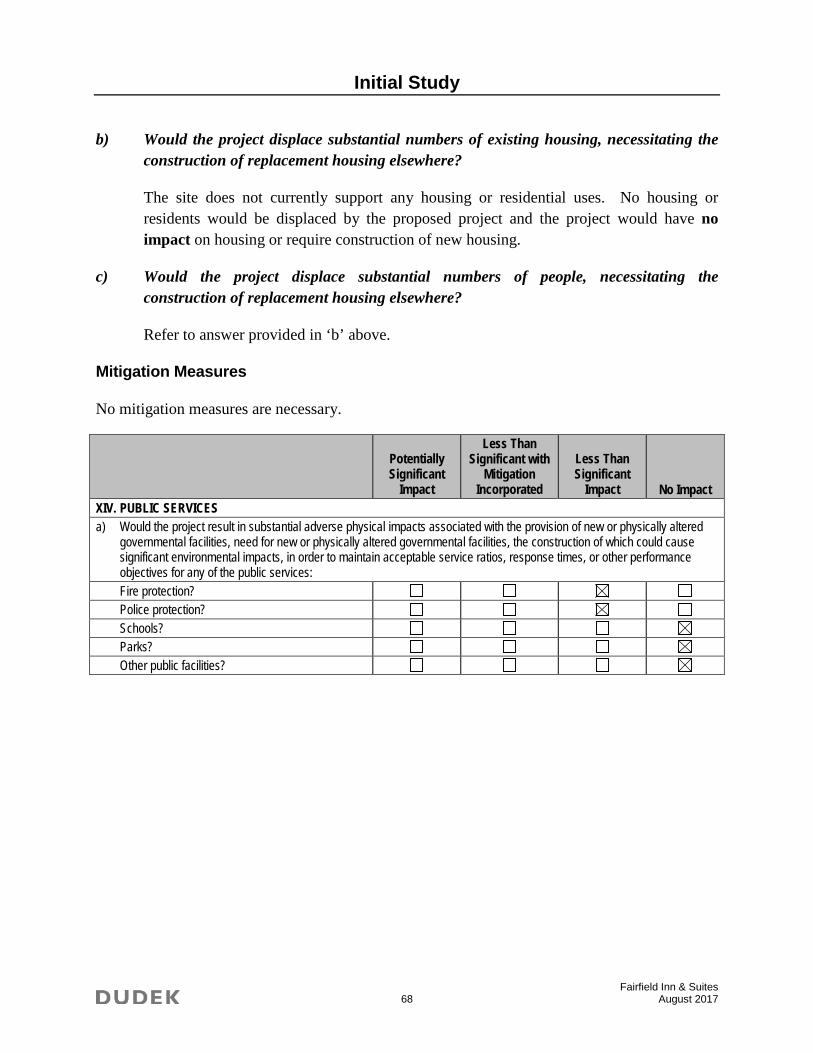
Initial Study
Fairfield Inn & Suites 68 August 2017
b) Would the project displace substantial numbers of existing housing, necessitating the construction of replacement housing elsewhere?
The site does not currently support any housing or residential uses. No housing or residents would be displaced by the proposed project and the project would have no impact on housing or require construction of new housing.
c) Would the project displace substantial numbers of people, necessitating the construction of replacement housing elsewhere?
Refer to answer provided in ‘b’ above.
Mitigation Measures
No mitigation measures are necessary.
Potentially Significant
Impact
Less Than Significant with
Mitigation Incorporated
Less Than Significant
Impact No Impact XIV. PUBLIC SERVICES a) Would the project result in substantial adverse physical impacts associated with the provision of new or physically altered
governmental facilities, need for new or physically altered governmental facilities, the construction of which could cause significant environmental impacts, in order to maintain acceptable service ratios, response times, or other performance objectives for any of the public services: Fire protection? Police protection? Schools? Parks? Other public facilities?
Initial Study
Fairfield Inn & Suites 69 August 2017
2.14 Public Services
a) Would the project result in substantial adverse physical impacts associated with the provision of new or physically altered governmental facilities, need for new or physically altered governmental facilities, the construction of which could cause significant environmental impacts, in order to maintain acceptable service ratios, response times, or other performance objectives for any of the public services:
Fire and police protection?
The City of Rohnert Park Department of Public Safety provides police and fire protection services within the City. Employees and guests of the project may require the services of the City of Rohnert Park Department of Public Safety in the event of an emergency.
The nearest fire station is 500 City Center Drive, located approximately 1.2 miles from project site. The project has been designed in compliance with the Uniform Fire and Building Codes to ensure adequate water pressure and water is available in the event of a fire. The hotel would also include fire sprinklers in the event of a fire, per the Uniform Fire Code. The City’s General Plan includes policies and implementation measures that serve to mitigate impacts to the provision of fire services within the City. As previously mentioned, a new Public Safety Facility (fire station) will be constructed on the property to the west of the project site. Once constructed, response times to the project site would be further reduced. The project would not require an expansion of the existing fire station or the construction of a new one. For these reasons, the project would result in a less than significant impact on the City’s fire protection services.
Schools?
The proposed project does not include any residential uses; therefore, the project would not result in a population increase that would require new schools to serve new City residents. For this reason, no impacts on schools would result with development of the proposed project.
Parks and other public facilities?
The proposed project would not introduce a new population to the City needing access to parks or other public facilities or services. Therefore, no impact on other public facilities would occur.
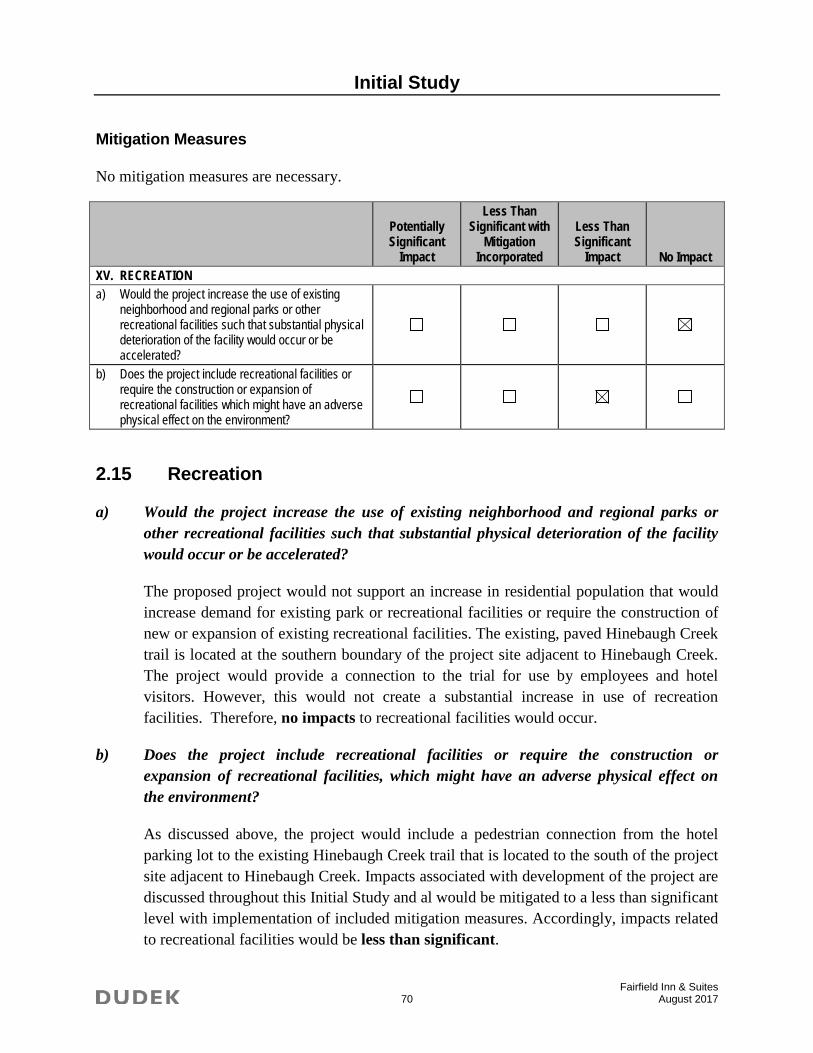
Initial Study
Fairfield Inn & Suites 70 August 2017
Mitigation Measures
No mitigation measures are necessary.
Potentially Significant
Impact
Less Than Significant with
Mitigation Incorporated
Less Than Significant
Impact No Impact XV. RECREATION a) Would the project increase the use of existing
neighborhood and regional parks or other recreational facilities such that substantial physical deterioration of the facility would occur or be accelerated?
b) Does the project include recreational facilities or require the construction or expansion of recreational facilities which might have an adverse physical effect on the environment?
2.15 Recreation
a) Would the project increase the use of existing neighborhood and regional parks or other recreational facilities such that substantial physical deterioration of the facility would occur or be accelerated?
The proposed project would not support an increase in residential population that would increase demand for existing park or recreational facilities or require the construction of new or expansion of existing recreational facilities. The existing, paved Hinebaugh Creek trail is located at the southern boundary of the project site adjacent to Hinebaugh Creek. The project would provide a connection to the trial for use by employees and hotel visitors. However, this would not create a substantial increase in use of recreation facilities. Therefore, no impacts to recreational facilities would occur.
b) Does the project include recreational facilities or require the construction or expansion of recreational facilities, which might have an adverse physical effect on the environment?
As discussed above, the project would include a pedestrian connection from the hotel parking lot to the existing Hinebaugh Creek trail that is located to the south of the project site adjacent to Hinebaugh Creek. Impacts associated with development of the project are discussed throughout this Initial Study and al would be mitigated to a less than significant level with implementation of included mitigation measures. Accordingly, impacts related to recreational facilities would be less than significant.
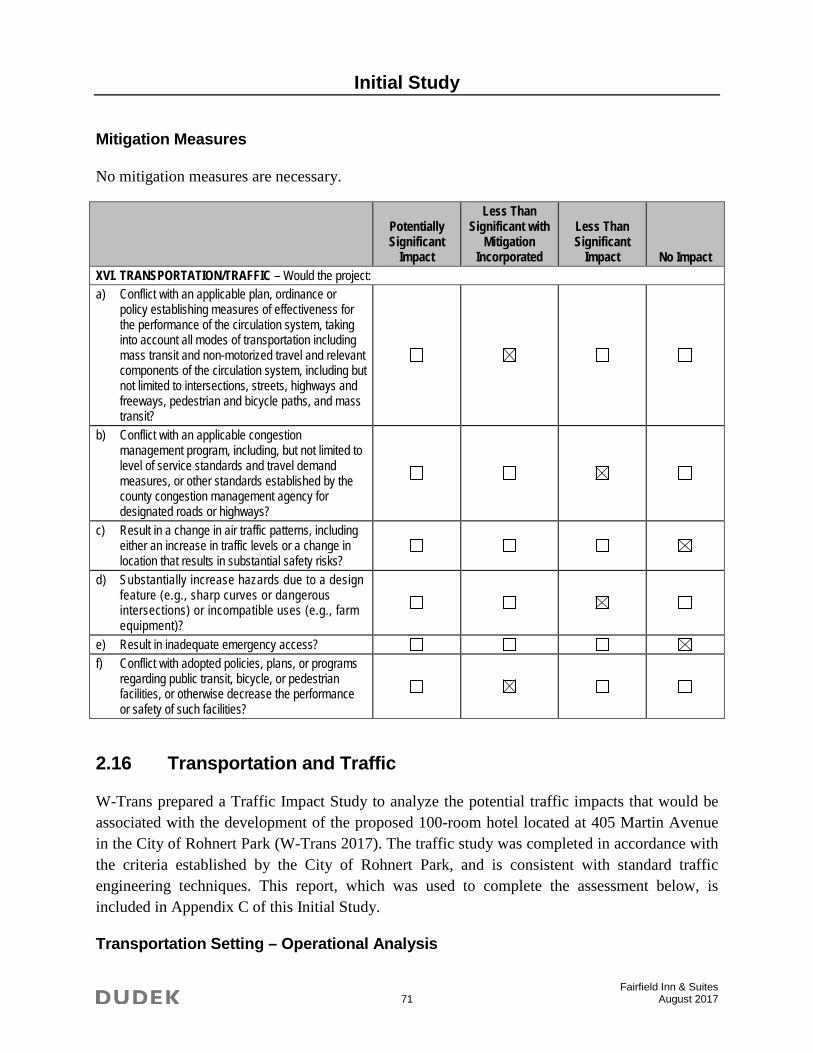
Initial Study
Fairfield Inn & Suites 71 August 2017
Mitigation Measures
No mitigation measures are necessary.
Potentially Significant
Impact
Less Than Significant with
Mitigation Incorporated
Less Than Significant
Impact No Impact XVI. TRANSPORTATION/TRAFFIC – Would the project: a) Conflict with an applicable plan, ordinance or
policy establishing measures of effectiveness for the performance of the circulation system, taking into account all modes of transportation including mass transit and non-motorized travel and relevant components of the circulation system, including but not limited to intersections, streets, highways and freeways, pedestrian and bicycle paths, and mass transit?
b) Conflict with an applicable congestion management program, including, but not limited to level of service standards and travel demand measures, or other standards established by the county congestion management agency for designated roads or highways?
c) Result in a change in air traffic patterns, including either an increase in traffic levels or a change in location that results in substantial safety risks?
d) Substantially increase hazards due to a design feature (e.g., sharp curves or dangerous intersections) or incompatible uses (e.g., farm equipment)?
e) Result in inadequate emergency access? f) Conflict with adopted policies, plans, or programs
regarding public transit, bicycle, or pedestrian facilities, or otherwise decrease the performance or safety of such facilities?
2.16 Transportation and Traffic
W-Trans prepared a Traffic Impact Study to analyze the potential traffic impacts that would be associated with the development of the proposed 100-room hotel located at 405 Martin Avenue in the City of Rohnert Park (W-Trans 2017). The traffic study was completed in accordance with the criteria established by the City of Rohnert Park, and is consistent with standard traffic engineering techniques. This report, which was used to complete the assessment below, is included in Appendix C of this Initial Study.
Transportation Setting – Operational Analysis
Initial Study
Fairfield Inn & Suites 72 August 2017
The project study area consists of the following intersections:
1. Redwood Drive/Business Park Drive 2. Labath Avenue/Martin Avenue 3. Dowdell Avenue/Martin Avenue 4. Redwood Drive/Martin Avenue 5. Labath Avenue/Rohnert Park Expressway 6. Redwood Drive/Rohnert Park Expressway
Operating conditions during the a.m. and p.m. peak periods were evaluated to determine highest potential impacts for the proposed project as well as the highest volumes on the local transportation network. The morning peak hour occurs between 7:00 and 9:00 a.m. and reflects conditions during the home to work or school commute, while the p.m. peak hour occurs between 4:00 and 6:00 p.m. and typically reflects the highest level of congestion during the homeward bound commute.
Study Intersections
Redwood Drive/Business Park Drive is a signalized “tee” intersection with protected left-turn phasing on the northbound approach. The eastbound approach includes a right-turn overlap signal phase. A marked crosswalk is provided across the west leg of the intersection.
Labath Avenue/Martin Avenue is an unsignalized “tee” intersection with stop controls on the terminating eastbound approach.
Dowdell Avenue/Martin Avenue currently serves as a through street for vehicles traveling from westbound Martin Avenue to northbound Dowdell Avenue. The southern leg is a driveway serving Ashley Furniture. The recently approved “Residences at Five Creek” project will extend Martin Avenue to Labath Avenue, adding a new western leg at the intersection, resulting in a four-legged, all-way stop-controlled intersection at Dowdell Avenue/Martin Avenue.
Redwood Drive/Martin Avenue is a four-legged signalized intersection with protected left-turn phasing on the northbound and southbound Redwood Drive approaches. The eastbound Martin Avenue approach includes a right-turn overlap signal phase. Marked crosswalks and pedestrian phasing are provided at each leg of the intersection.
Labath Avenue/Rohnert Park Expressway is a signalized, four-legged intersection, with protected left-turn phasing on all approaches, and right-turn overlap signal phases on the eastbound and westbound approaches. Crosswalks with pedestrian phasing are present on all legs of the intersection.
Initial Study
Fairfield Inn & Suites 73 August 2017
Redwood Drive/Rohnert Park Expressway is a four-legged signalized intersection with protected left-turn phasing on all approaches. The northbound and eastbound approaches include right-turn overlap signal phases. Marked crosswalks and pedestrian phasing are provided at each leg.
The locations of the study intersections and the existing lane configurations and controls are shown Figure 1 of the Traffic Impact Study (included as Appendix C of this Initial Study).
Alternative Modes
Pedestrian Facilities
Pedestrian facilities include sidewalks, crosswalks, pedestrian signal phases, curb ramps, curb extensions, and various streetscape amenities such as lighting, benches, etc. In general, a network of sidewalks, crosswalks, pedestrian signals, and curb ramps provide access for pedestrians in the vicinity of the proposed project site; however, sidewalk gaps, obstacles, and barriers can be found along some or all of the roadways connecting to the project site. Existing gaps and obstacles along the connecting roadways impact convenient and continuous access for pedestrians and present safety concerns in those locations where appropriate pedestrian infrastructure would address potential conflict points.
Continuous sidewalk coverage is provided along Martin Avenue, which currently terminates at the northwestern corner of the project site. Sidewalks also exist on the west side of Labath Avenue, north of the project site. On the east side of Labath Avenue there are no sidewalks, apart from a small section spanning 360 feet adjacent to a parking lot on the northwest corner of the project site. A pedestrian crosswalk exists on the south leg of the intersection of Dowdell Avenue/Carlson Court. Though there is only one crosswalk, the intersections of Dowdell Avenue/Carlson Court, Labath Avenue/Carlson Court, and Labath Avenue/Martin Avenue have curb ramps at each leg. Continuous sidewalk is also provided on the west side of Redwood Drive, bordering the existing Costco store northeast of the project site, which connects to Martin Avenue.
Bicycle Facilities
The Highway Design Manual, California Department of Transportation (Caltrans), 2012, classifies bikeways into three categories:
• Class I Multi-Use Path – a completely separated right-of-way for the exclusive use of bicycles and pedestrians with cross flows of motorized traffic minimized.

Initial Study
Fairfield Inn & Suites 74 August 2017
• Class II Bike Lane – a striped and signed lane for one-way bike travel on a street or highway.
• Class III Bike Route – signing only for shared use with motor vehicles within the same travel lane on a street or highway.
In the project area, Class II bike lanes exist on Dowdell Avenue, as well as along Redwood Drive and Rohnert Park Expressway. The Santa Rosa De Laguna Trail runs along the southern boundary of the site which extends from the western City limits to Redwood Drive. There are no other existing bicycle facilities present within the study area. However, Class II bike lanes are planned for both Labath Avenue and Martin Avenue, and the City is currently considering options to fill a short gap in the bike lane system on Redwood Drive near Martin Avenue.
Transit Facilities
Sonoma County Transit (SCT) provides regional transit service between Rohnert Park and surrounding Sonoma County communities. SCT Route 44 provides service to the project area and has four stops on Labath Avenue. One northbound and one southbound stop are located on Labath Avenue near the Hinebaugh Creek trailhead, southwest of the project site, and across form North Bay Industries, which is northwest of the project site.
Route 44 operates Monday through Friday with approximately one-hour headways between 5:30 a.m. and 10:30 p.m. Weekend service for Route 44 does not operate within the project area.
Two to three bicycles can be carried on most SCT buses. Bike rack space is on a first come, first served basis. Additional bicycles are allowed on SCT buses at the discretion of the driver.
Dial-a-ride, also known as paratransit, or door-to-door service, is available for those who are unable to independently use the transit system due to a physical or mental disability. SCT Paratransit is designed to serve the needs of individuals with disabilities within Rohnert Park and Sonoma County.
Capacity Analysis
Intersection Level of Service Methodologies
Level of Service (LOS) is used to rank traffic operation on various types of facilities based on traffic volumes and roadway capacity using a series of letter designations ranging from A to F. Generally, Level of Service A represents free flow conditions and Level of Service F represents forced flow or breakdown conditions. A unit of measure that indicates a level of delay generally accompanies the LOS designation.
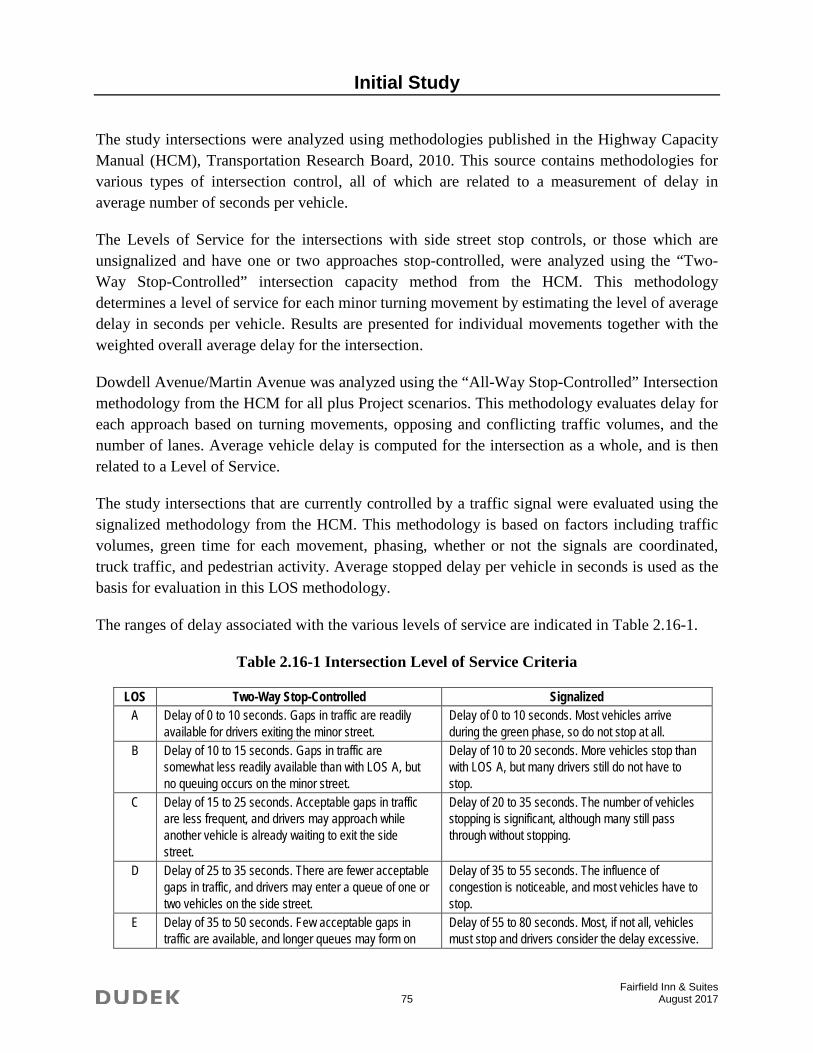
Initial Study
Fairfield Inn & Suites 75 August 2017
The study intersections were analyzed using methodologies published in the Highway Capacity Manual (HCM), Transportation Research Board, 2010. This source contains methodologies for various types of intersection control, all of which are related to a measurement of delay in average number of seconds per vehicle.
The Levels of Service for the intersections with side street stop controls, or those which are unsignalized and have one or two approaches stop-controlled, were analyzed using the “Two-Way Stop-Controlled” intersection capacity method from the HCM. This methodology determines a level of service for each minor turning movement by estimating the level of average delay in seconds per vehicle. Results are presented for individual movements together with the weighted overall average delay for the intersection.
Dowdell Avenue/Martin Avenue was analyzed using the “All-Way Stop-Controlled” Intersection methodology from the HCM for all plus Project scenarios. This methodology evaluates delay for each approach based on turning movements, opposing and conflicting traffic volumes, and the number of lanes. Average vehicle delay is computed for the intersection as a whole, and is then related to a Level of Service.
The study intersections that are currently controlled by a traffic signal were evaluated using the signalized methodology from the HCM. This methodology is based on factors including traffic volumes, green time for each movement, phasing, whether or not the signals are coordinated, truck traffic, and pedestrian activity. Average stopped delay per vehicle in seconds is used as the basis for evaluation in this LOS methodology.
The ranges of delay associated with the various levels of service are indicated in Table 2.16-1.
Table 2.16-1 Intersection Level of Service Criteria
LOS Two-Way Stop-Controlled Signalized A Delay of 0 to 10 seconds. Gaps in traffic are readily
available for drivers exiting the minor street. Delay of 0 to 10 seconds. Most vehicles arrive during the green phase, so do not stop at all.
B Delay of 10 to 15 seconds. Gaps in traffic are somewhat less readily available than with LOS A, but no queuing occurs on the minor street.
Delay of 10 to 20 seconds. More vehicles stop than with LOS A, but many drivers still do not have to stop.
C Delay of 15 to 25 seconds. Acceptable gaps in traffic are less frequent, and drivers may approach while another vehicle is already waiting to exit the side street.
Delay of 20 to 35 seconds. The number of vehicles stopping is significant, although many still pass through without stopping.
D Delay of 25 to 35 seconds. There are fewer acceptable gaps in traffic, and drivers may enter a queue of one or two vehicles on the side street.
Delay of 35 to 55 seconds. The influence of congestion is noticeable, and most vehicles have to stop.
E Delay of 35 to 50 seconds. Few acceptable gaps in traffic are available, and longer queues may form on
Delay of 55 to 80 seconds. Most, if not all, vehicles must stop and drivers consider the delay excessive.
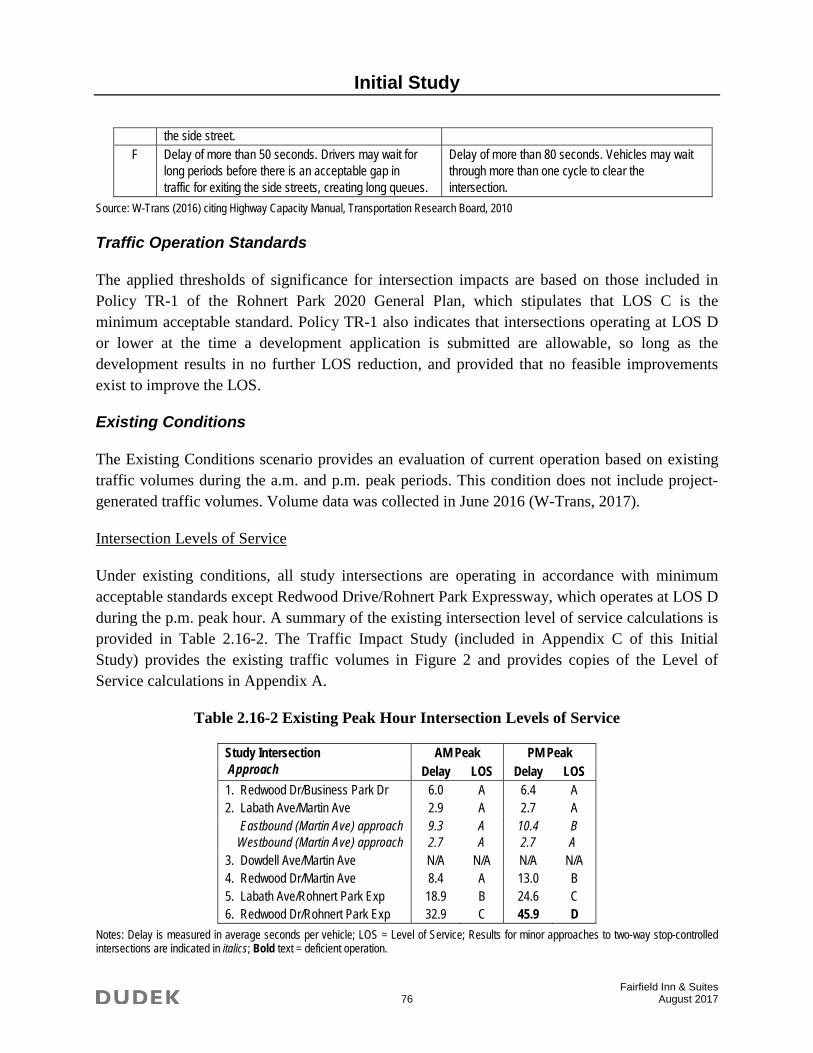
Initial Study
Fairfield Inn & Suites 76 August 2017
the side street. F Delay of more than 50 seconds. Drivers may wait for
long periods before there is an acceptable gap in traffic for exiting the side streets, creating long queues.
Delay of more than 80 seconds. Vehicles may wait through more than one cycle to clear the intersection.
Source: W-Trans (2016) citing Highway Capacity Manual, Transportation Research Board, 2010
Traffic Operation Standards
The applied thresholds of significance for intersection impacts are based on those included in Policy TR-1 of the Rohnert Park 2020 General Plan, which stipulates that LOS C is the minimum acceptable standard. Policy TR-1 also indicates that intersections operating at LOS D or lower at the time a development application is submitted are allowable, so long as the development results in no further LOS reduction, and provided that no feasible improvements exist to improve the LOS.
Existing Conditions
The Existing Conditions scenario provides an evaluation of current operation based on existing traffic volumes during the a.m. and p.m. peak periods. This condition does not include project-generated traffic volumes. Volume data was collected in June 2016 (W-Trans, 2017).
Intersection Levels of Service
Under existing conditions, all study intersections are operating in accordance with minimum acceptable standards except Redwood Drive/Rohnert Park Expressway, which operates at LOS D during the p.m. peak hour. A summary of the existing intersection level of service calculations is provided in Table 2.16-2. The Traffic Impact Study (included in Appendix C of this Initial Study) provides the existing traffic volumes in Figure 2 and provides copies of the Level of Service calculations in Appendix A.
Table 2.16-2 Existing Peak Hour Intersection Levels of Service
Study Intersection Approach
AM Peak PM Peak Delay LOS Delay LOS
1. Redwood Dr/Business Park Dr 6.0 A 6.4 A 2. Labath Ave/Martin Ave 2.9 A 2.7 A Eastbound (Martin Ave) approach Westbound (Martin Ave) approach
9.3 2.7
A A
10.4 2.7
B A
3. Dowdell Ave/Martin Ave N/A N/A N/A N/A 4. Redwood Dr/Martin Ave 8.4 A 13.0 B 5. Labath Ave/Rohnert Park Exp 18.9 B 24.6 C 6. Redwood Dr/Rohnert Park Exp 32.9 C 45.9 D
Notes: Delay is measured in average seconds per vehicle; LOS = Level of Service; Results for minor approaches to two-way stop-controlled intersections are indicated in italics; Bold text = deficient operation.
Initial Study
Fairfield Inn & Suites 77 August 2017
Source: W-Trans 2017
Baseline Conditions
Baseline operating conditions were developed to include trips from the approved projects in the area including:
• “The Reserve,” north of the project site, includes plans for 84 apartment units
• “The Residences at Five Creek,” located just north of the project site, includes 135 apartment units, 34,000 square feet of retail space, a 132-room hotel, and 0.65-acre park
• New buildings for City of Rohnert Park Public Safety and Public Works institutional uses, neighboring the west side of the proposed project, located just south of the Five Creek. 2
Upon the construction of the proposed Residences at Five Creek and the proposed project, Martin Avenue will be extended westward to Labath Avenue. With the extension of Martin Avenue, the intersection of Dowdell Avenue/Martin Avenue will be reconfigured to an all-way stop controlled intersection.
Additionally, in order to accommodate planned bike facilities on Martin Avenue and to fill a short gap in the adjacent bike lane network on Redwood Drive, a new configuration of the Redwood Drive/Martin Avenue intersection was determined to be necessary. As it currently exists, the south leg of Redwood Drive/Martin Avenue has two northbound left turn lanes, which requires two eastbound travel lanes on Martin Avenue. This configuration does not provide sufficient width to accommodate continuous bike lanes on Martin Avenue and Redwood Drive. The new intersection configuration would eliminate one of the two left-turn lanes on the northbound approach at Redwood Drive/Martin Avenue and adjust the signal phasing to accommodate a longer green time to serve the northbound left-turn movement. The new configurations of both Dowdell Avenue/Martin Avenue and Redwood Drive/Martin Avenue are explained in greater detail in the Draft Bike Lane Assessment for Redwood Drive and Martin Avenue, February 2017, produced for the City of Rohnert Park by W-Trans. These new configurations were assumed to be in place in the Baseline conditions of this analysis (W-Trans, 2017).
Under these conditions, all study intersections are expected to operate acceptably, except Redwood Drive/ Rohnert Park Expressway, which would continue to operate unacceptably at LOS D during the p.m. peak hour. These results are summarized in Table 2.16-3 below.
2 The new City Public Works facility is no longer being planned for development at the referenced site. The Traffic Impact Analysis for the Fairfield Inn project has included the assumed buildout of the Public Works facility in the baseline conditions; thus, the results of the impact analysis are conservative.
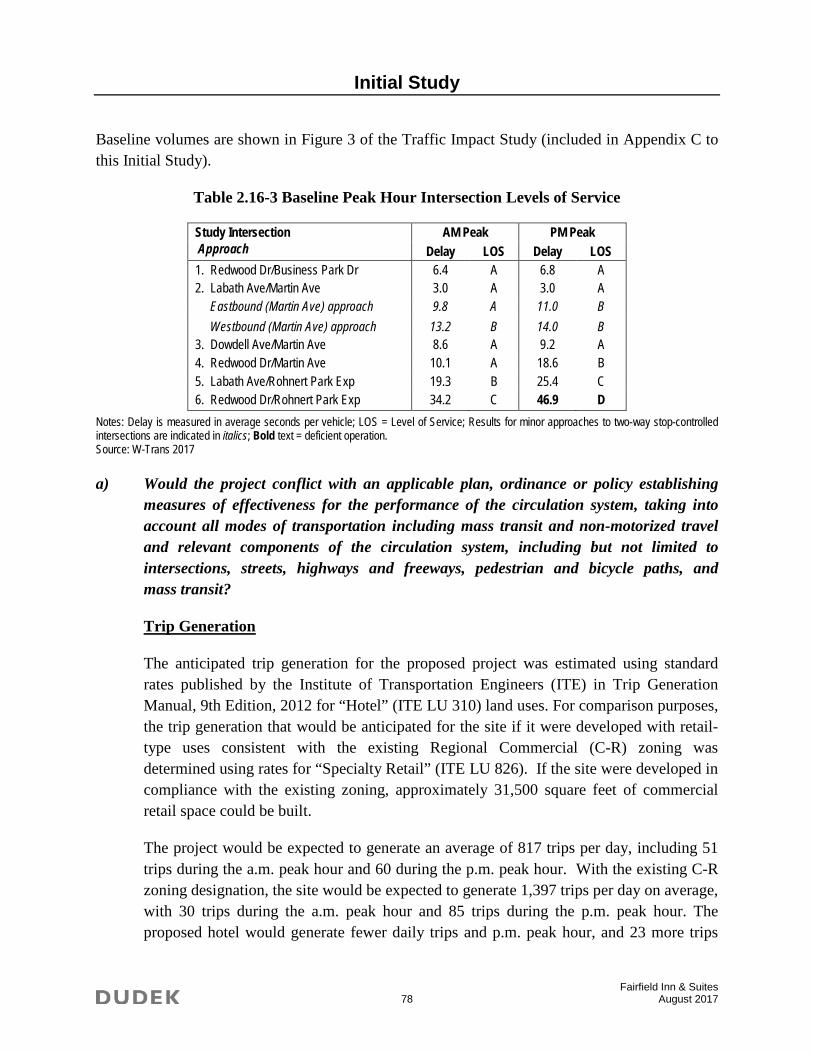
Initial Study
Fairfield Inn & Suites 78 August 2017
Baseline volumes are shown in Figure 3 of the Traffic Impact Study (included in Appendix C to this Initial Study).
Table 2.16-3 Baseline Peak Hour Intersection Levels of Service
Study Intersection Approach
AM Peak PM Peak Delay LOS Delay LOS
1. Redwood Dr/Business Park Dr 6.4 A 6.8 A 2. Labath Ave/Martin Ave 3.0 A 3.0 A Eastbound (Martin Ave) approach 9.8 A 11.0 B Westbound (Martin Ave) approach 13.2 B 14.0 B 3. Dowdell Ave/Martin Ave 8.6 A 9.2 A 4. Redwood Dr/Martin Ave 10.1 A 18.6 B 5. Labath Ave/Rohnert Park Exp 19.3 B 25.4 C 6. Redwood Dr/Rohnert Park Exp 34.2 C 46.9 D
Notes: Delay is measured in average seconds per vehicle; LOS = Level of Service; Results for minor approaches to two-way stop-controlled intersections are indicated in italics; Bold text = deficient operation. Source: W-Trans 2017
a) Would the project conflict with an applicable plan, ordinance or policy establishing measures of effectiveness for the performance of the circulation system, taking into account all modes of transportation including mass transit and non-motorized travel and relevant components of the circulation system, including but not limited to intersections, streets, highways and freeways, pedestrian and bicycle paths, and mass transit?
Trip Generation
The anticipated trip generation for the proposed project was estimated using standard rates published by the Institute of Transportation Engineers (ITE) in Trip Generation Manual, 9th Edition, 2012 for “Hotel” (ITE LU 310) land uses. For comparison purposes, the trip generation that would be anticipated for the site if it were developed with retail-type uses consistent with the existing Regional Commercial (C-R) zoning was determined using rates for “Specialty Retail” (ITE LU 826). If the site were developed in compliance with the existing zoning, approximately 31,500 square feet of commercial retail space could be built.
The project would be expected to generate an average of 817 trips per day, including 51 trips during the a.m. peak hour and 60 during the p.m. peak hour. With the existing C-R zoning designation, the site would be expected to generate 1,397 trips per day on average, with 30 trips during the a.m. peak hour and 85 trips during the p.m. peak hour. The proposed hotel would generate fewer daily trips and p.m. peak hour, and 23 more trips
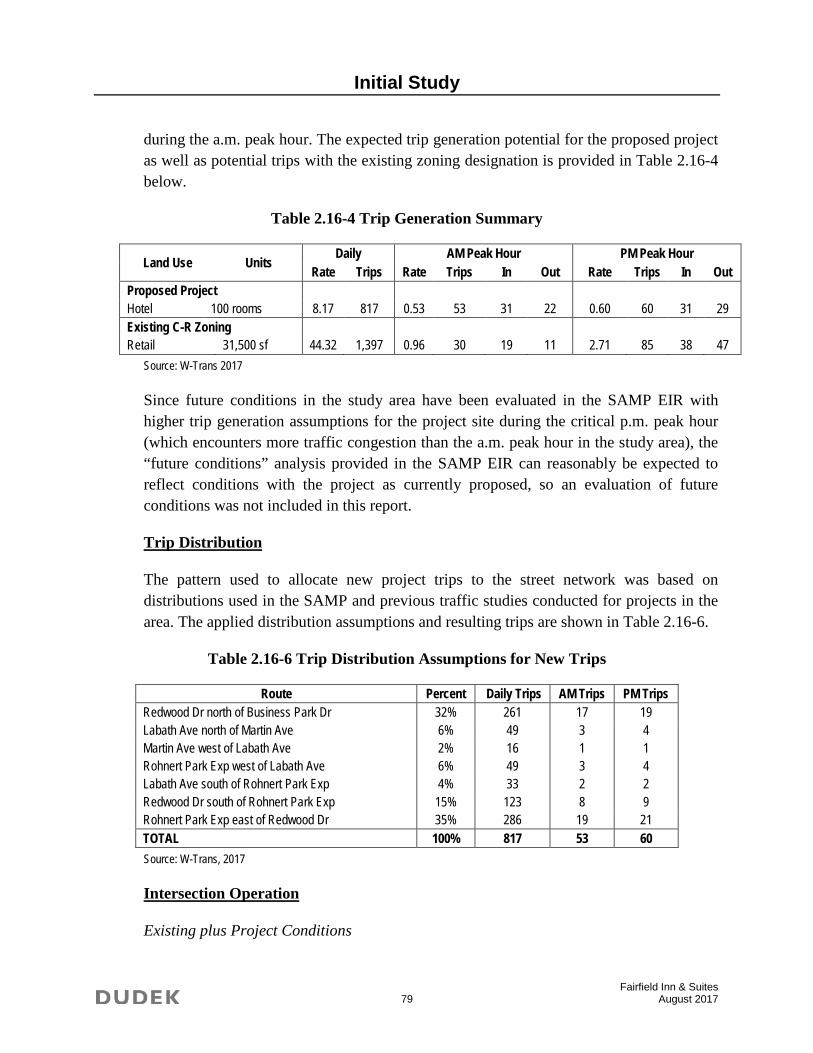
Initial Study
Fairfield Inn & Suites 79 August 2017
during the a.m. peak hour. The expected trip generation potential for the proposed project as well as potential trips with the existing zoning designation is provided in Table 2.16-4 below.
Table 2.16-4 Trip Generation Summary
Land Use Units Daily AM Peak Hour PM Peak Hour
Rate Trips Rate Trips In Out Rate Trips In Out Proposed Project Hotel 100 rooms 8.17 817 0.53 53 31 22 0.60 60 31 29 Existing C-R Zoning Retail 31,500 sf 44.32 1,397 0.96 30 19 11 2.71 85 38 47
Source: W-Trans 2017
Since future conditions in the study area have been evaluated in the SAMP EIR with higher trip generation assumptions for the project site during the critical p.m. peak hour (which encounters more traffic congestion than the a.m. peak hour in the study area), the “future conditions” analysis provided in the SAMP EIR can reasonably be expected to reflect conditions with the project as currently proposed, so an evaluation of future conditions was not included in this report.
Trip Distribution
The pattern used to allocate new project trips to the street network was based on distributions used in the SAMP and previous traffic studies conducted for projects in the area. The applied distribution assumptions and resulting trips are shown in Table 2.16-6.
Table 2.16-6 Trip Distribution Assumptions for New Trips
Route Percent Daily Trips AM Trips PM Trips Redwood Dr north of Business Park Dr 32% 261 17 19 Labath Ave north of Martin Ave 6% 49 3 4 Martin Ave west of Labath Ave 2% 16 1 1 Rohnert Park Exp west of Labath Ave 6% 49 3 4 Labath Ave south of Rohnert Park Exp 4% 33 2 2 Redwood Dr south of Rohnert Park Exp 15% 123 8 9 Rohnert Park Exp east of Redwood Dr 35% 286 19 21 TOTAL 100% 817 53 60 Source: W-Trans, 2017
Intersection Operation
Existing plus Project Conditions
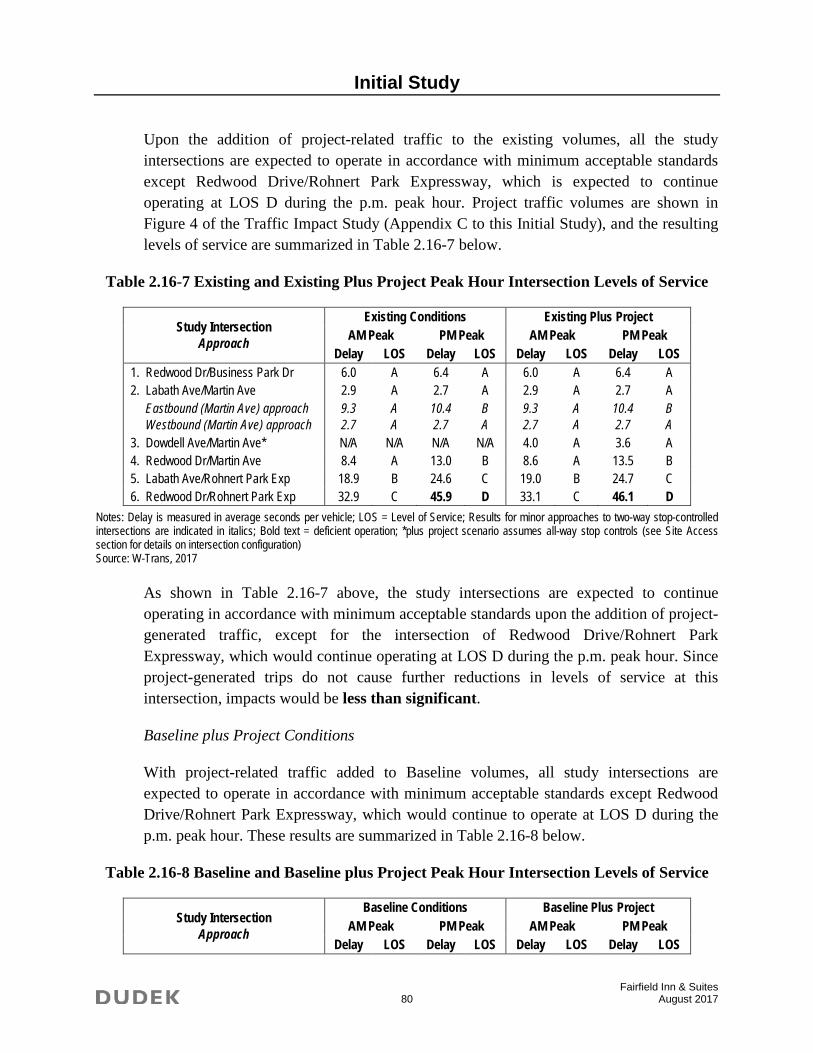
Initial Study
Fairfield Inn & Suites 80 August 2017
Upon the addition of project-related traffic to the existing volumes, all the study intersections are expected to operate in accordance with minimum acceptable standards except Redwood Drive/Rohnert Park Expressway, which is expected to continue operating at LOS D during the p.m. peak hour. Project traffic volumes are shown in Figure 4 of the Traffic Impact Study (Appendix C to this Initial Study), and the resulting levels of service are summarized in Table 2.16-7 below.
Table 2.16-7 Existing and Existing Plus Project Peak Hour Intersection Levels of Service
Study Intersection Approach
Existing Conditions Existing Plus Project AM Peak PM Peak AM Peak PM Peak
Delay LOS Delay LOS Delay LOS Delay LOS 1. Redwood Dr/Business Park Dr 6.0 A 6.4 A 6.0 A 6.4 A 2. Labath Ave/Martin Ave 2.9 A 2.7 A 2.9 A 2.7 A Eastbound (Martin Ave) approach Westbound (Martin Ave) approach
9.3 2.7
A A
10.4 2.7
B A
9.3 2.7
A A
10.4 2.7
B A
3. Dowdell Ave/Martin Ave* N/A N/A N/A N/A 4.0 A 3.6 A 4. Redwood Dr/Martin Ave 8.4 A 13.0 B 8.6 A 13.5 B 5. Labath Ave/Rohnert Park Exp 18.9 B 24.6 C 19.0 B 24.7 C 6. Redwood Dr/Rohnert Park Exp 32.9 C 45.9 D 33.1 C 46.1 D
Notes: Delay is measured in average seconds per vehicle; LOS = Level of Service; Results for minor approaches to two-way stop-controlled intersections are indicated in italics; Bold text = deficient operation; *plus project scenario assumes all-way stop controls (see Site Access section for details on intersection configuration) Source: W-Trans, 2017
As shown in Table 2.16-7 above, the study intersections are expected to continue operating in accordance with minimum acceptable standards upon the addition of project-generated traffic, except for the intersection of Redwood Drive/Rohnert Park Expressway, which would continue operating at LOS D during the p.m. peak hour. Since project-generated trips do not cause further reductions in levels of service at this intersection, impacts would be less than significant.
Baseline plus Project Conditions
With project-related traffic added to Baseline volumes, all study intersections are expected to operate in accordance with minimum acceptable standards except Redwood Drive/Rohnert Park Expressway, which would continue to operate at LOS D during the p.m. peak hour. These results are summarized in Table 2.16-8 below.
Table 2.16-8 Baseline and Baseline plus Project Peak Hour Intersection Levels of Service
Study Intersection Approach
Baseline Conditions Baseline Plus Project AM Peak PM Peak AM Peak PM Peak
Delay LOS Delay LOS Delay LOS Delay LOS
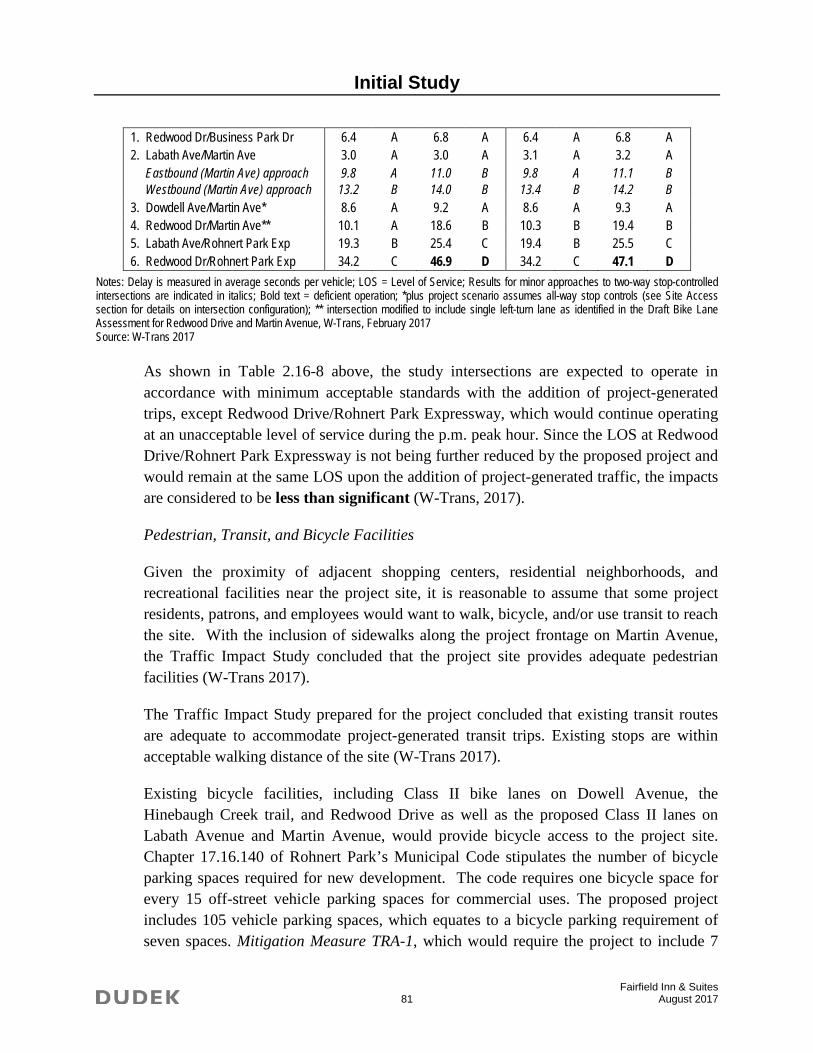
Initial Study
Fairfield Inn & Suites 81 August 2017
1. Redwood Dr/Business Park Dr 6.4 A 6.8 A 6.4 A 6.8 A 2. Labath Ave/Martin Ave 3.0 A 3.0 A 3.1 A 3.2 A Eastbound (Martin Ave) approach Westbound (Martin Ave) approach
9.8 13.2
A B
11.0 14.0
B B
9.8 13.4
A B
11.1 14.2
B B
3. Dowdell Ave/Martin Ave* 8.6 A 9.2 A 8.6 A 9.3 A 4. Redwood Dr/Martin Ave** 10.1 A 18.6 B 10.3 B 19.4 B 5. Labath Ave/Rohnert Park Exp 19.3 B 25.4 C 19.4 B 25.5 C 6. Redwood Dr/Rohnert Park Exp 34.2 C 46.9 D 34.2 C 47.1 D
Notes: Delay is measured in average seconds per vehicle; LOS = Level of Service; Results for minor approaches to two-way stop-controlled intersections are indicated in italics; Bold text = deficient operation; *plus project scenario assumes all-way stop controls (see Site Access section for details on intersection configuration); ** intersection modified to include single left-turn lane as identified in the Draft Bike Lane Assessment for Redwood Drive and Martin Avenue, W-Trans, February 2017 Source: W-Trans 2017
As shown in Table 2.16-8 above, the study intersections are expected to operate in accordance with minimum acceptable standards with the addition of project-generated trips, except Redwood Drive/Rohnert Park Expressway, which would continue operating at an unacceptable level of service during the p.m. peak hour. Since the LOS at Redwood Drive/Rohnert Park Expressway is not being further reduced by the proposed project and would remain at the same LOS upon the addition of project-generated traffic, the impacts are considered to be less than significant (W-Trans, 2017).
Pedestrian, Transit, and Bicycle Facilities
Given the proximity of adjacent shopping centers, residential neighborhoods, and recreational facilities near the project site, it is reasonable to assume that some project residents, patrons, and employees would want to walk, bicycle, and/or use transit to reach the site. With the inclusion of sidewalks along the project frontage on Martin Avenue, the Traffic Impact Study concluded that the project site provides adequate pedestrian facilities (W-Trans 2017).
The Traffic Impact Study prepared for the project concluded that existing transit routes are adequate to accommodate project-generated transit trips. Existing stops are within acceptable walking distance of the site (W-Trans 2017).
Existing bicycle facilities, including Class II bike lanes on Dowell Avenue, the Hinebaugh Creek trail, and Redwood Drive as well as the proposed Class II lanes on Labath Avenue and Martin Avenue, would provide bicycle access to the project site. Chapter 17.16.140 of Rohnert Park’s Municipal Code stipulates the number of bicycle parking spaces required for new development. The code requires one bicycle space for every 15 off-street vehicle parking spaces for commercial uses. The proposed project includes 105 vehicle parking spaces, which equates to a bicycle parking requirement of seven spaces. Mitigation Measure TRA-1, which would require the project to include 7
Initial Study
Fairfield Inn & Suites 82 August 2017
onsite bicycle spaces, would ensure that the project complies with the City zoning code and this impact remains less than significant.
b) Would the project conflict with an applicable congestion management program, including, but not limited to level of service standards and travel demand measures, or other standards established by the county congestion management agency for designated roads or highways?
No applicable congestion management plan exists. Therefore, the proposed plan would not conflict with an applicable congestion management program for designated roads or highways. Therefore, this impact would be less than significant.
c) Would the project result in a change in air traffic patterns, including either an increase in traffic levels or a change in location that results in substantial safety risks?
The proposed project would not result in a change in air traffic patterns, including either an increase in air traffic levels or a change in location that would result in substantial safety risks during construction or operation. The closest airports are the Sonoma County Airport and Petaluma Municipal Airport, both more than 10 miles from the project area. There would be no safety risks associated with proximity to airports; therefore, no impact would occur.
d) Would the project substantially increase hazards due to a design feature (e.g., sharp curves or dangerous intersections) or incompatible uses (e.g., farm equipment)?
The site would be accessed via a new driveway located at the northwest corner of the existing parking lot of Ashley Furniture Store at the intersection of Dowdell Avenue/Martin Avenue. In addition to the primary site access located at the Martin Avenue and Dowdell Avenue intersection, the project would provide an additional secondary access for emergency vehicles at the southeast corner of the project site from a connection to the Ashley Furniture HomeStore parking lot on the adjacent parcel. There are no anticipated conflicts with the planned access points. Further, there are no barriers to the lines of sight for entering and exiting vehicles.
Given the proposed design and surrounding conditions, the access as proposed is expected to operate acceptably and impacts related to design features or incompatible uses would be less than significant.
e) Would the project result in inadequate emergency access?
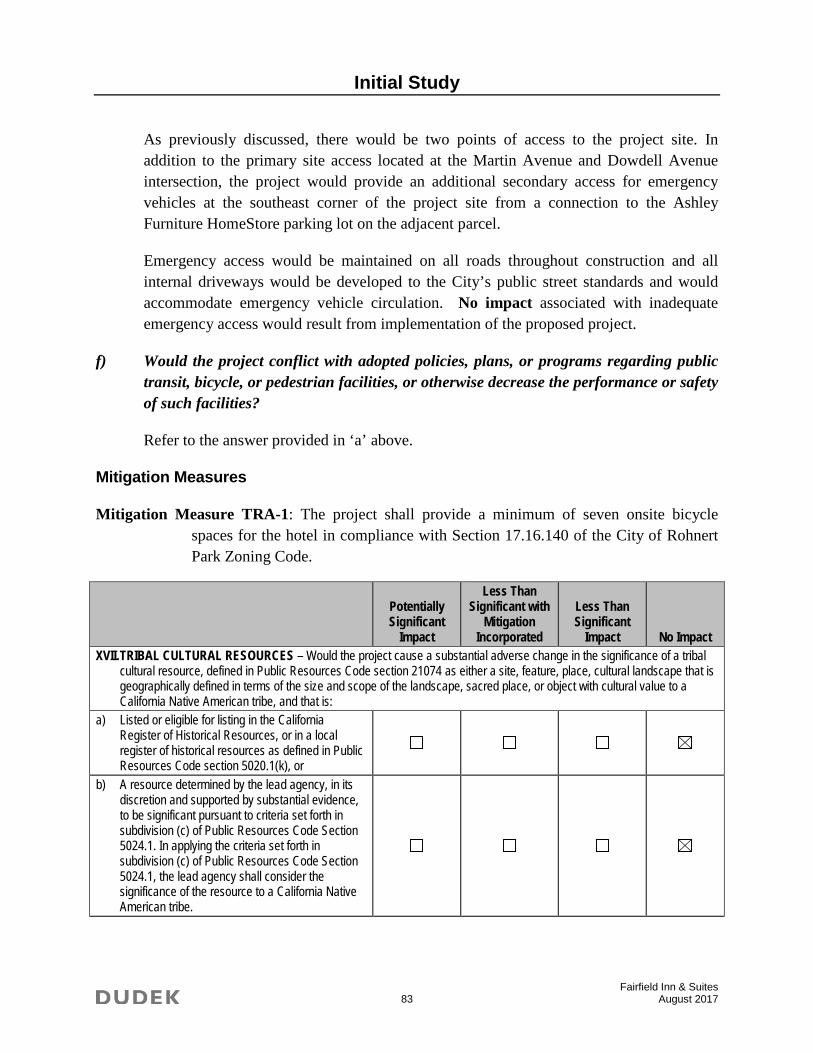
Initial Study
Fairfield Inn & Suites 83 August 2017
As previously discussed, there would be two points of access to the project site. In addition to the primary site access located at the Martin Avenue and Dowdell Avenue intersection, the project would provide an additional secondary access for emergency vehicles at the southeast corner of the project site from a connection to the Ashley Furniture HomeStore parking lot on the adjacent parcel.
Emergency access would be maintained on all roads throughout construction and all internal driveways would be developed to the City’s public street standards and would accommodate emergency vehicle circulation. No impact associated with inadequate emergency access would result from implementation of the proposed project.
f) Would the project conflict with adopted policies, plans, or programs regarding public transit, bicycle, or pedestrian facilities, or otherwise decrease the performance or safety of such facilities?
Refer to the answer provided in ‘a’ above.
Mitigation Measures
Mitigation Measure TRA-1: The project shall provide a minimum of seven onsite bicycle spaces for the hotel in compliance with Section 17.16.140 of the City of Rohnert Park Zoning Code.
Potentially Significant
Impact
Less Than Significant with
Mitigation Incorporated
Less Than Significant
Impact No Impact XVII. TRIBAL CULTURAL RESOURCES – Would the project cause a substantial adverse change in the significance of a tribal
cultural resource, defined in Public Resources Code section 21074 as either a site, feature, place, cultural landscape that is geographically defined in terms of the size and scope of the landscape, sacred place, or object with cultural value to a California Native American tribe, and that is:
a) Listed or eligible for listing in the California Register of Historical Resources, or in a local register of historical resources as defined in Public Resources Code section 5020.1(k), or
b) A resource determined by the lead agency, in its discretion and supported by substantial evidence, to be significant pursuant to criteria set forth in subdivision (c) of Public Resources Code Section 5024.1. In applying the criteria set forth in subdivision (c) of Public Resources Code Section 5024.1, the lead agency shall consider the significance of the resource to a California Native American tribe.

Initial Study
Fairfield Inn & Suites 84 August 2017
2.17 Tribal Cultural Resources
Would the project cause a substantial adverse change in the significance of a tribal cultural resource, defined in Public Resources Code section 21074 as either a site, feature, place, cultural landscape that is geographically defined in terms of the size and scope of the landscape, sacred place, or object with cultural value to a California Native American tribe, and that is:
a) Listed or eligible for listing in the California Register of Historical Resources, or in a local register of historical resources as defined in Public Resources Code section 5020.1(k), or
The proposed project would construct a hotel on vacant, previously disturbed property. No tribal cultural resources are known to be present at the site. The Native American Heritage Commission (NAHC) provided a review of their Sacred Lands files on May 5, 2017, which indicated that there is no specific information on the site in the NAHC’s Sacred Lands File.
Assembly Bill (AB) 52 requires lead agencies to consult with California Native American Tribes that request such consultation prior to the agency’s release of a Notice of Preparation (NOP) of an EIR, or notice of an MND, or Negative Declaration (ND) on or after July 1, 2015. The City of Rohnert Park sent AB 52 letters to Native American tribes in the area to inform them about the project and to offer an opportunity to consult or comment prior to the public circulation of the Notice of Intent. The City received a response from the Federated Indians of Graton Rancheria, indicating they had no comments to provide at that time..
Since there are no known tribal cultural resources on the site, no impacts to these resources would occur with the project.
b) A resource determined by the lead agency, in its discretion and supported by substantial evidence, to be significant pursuant to criteria set forth in subdivision (c) of Public Resources Code Section 5024.1. In applying the criteria set forth in subdivision (c) of Public Resources Code Section 5024.1, the lead agency shall consider the significance of the resource to a California Native American tribe.
Refer to the answer provided in ‘a’ above.
Mitigation Measures
No mitigation measures are necessary.
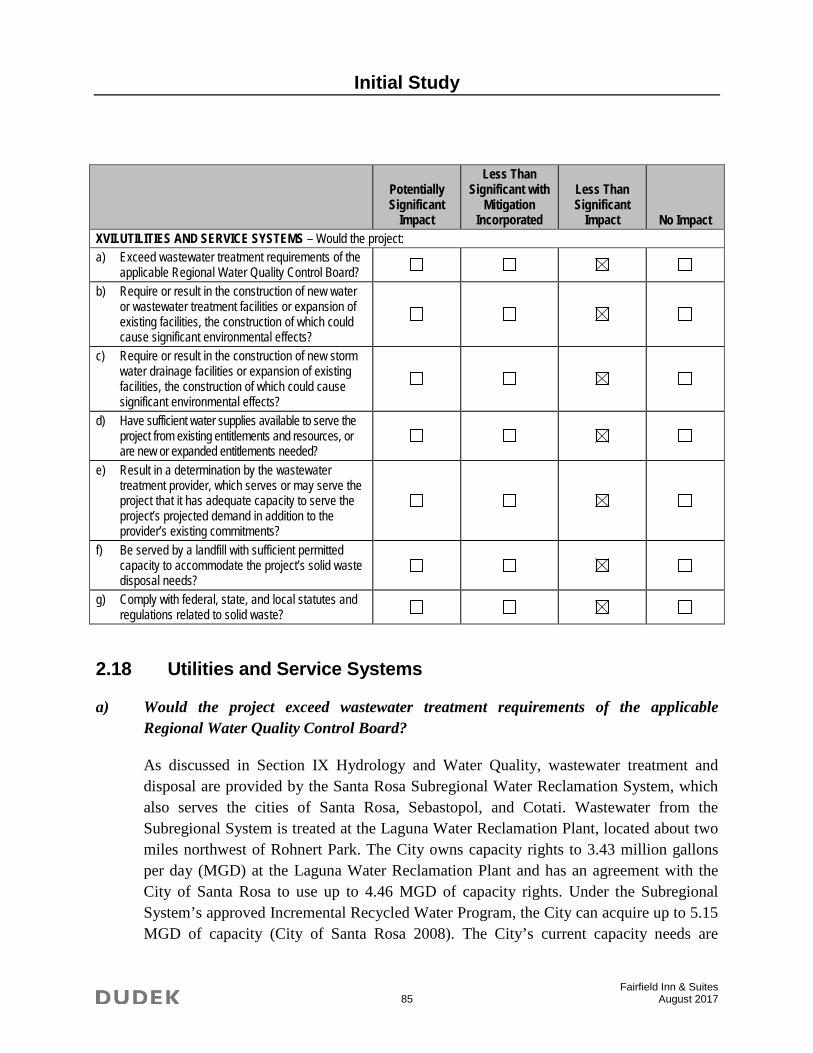
Initial Study
Fairfield Inn & Suites 85 August 2017
Potentially Significant
Impact
Less Than Significant with
Mitigation Incorporated
Less Than Significant
Impact No Impact XVII. UTILITIES AND SERVICE SYSTEMS – Would the project: a) Exceed wastewater treatment requirements of the
applicable Regional Water Quality Control Board?
b) Require or result in the construction of new water or wastewater treatment facilities or expansion of existing facilities, the construction of which could cause significant environmental effects?
c) Require or result in the construction of new storm water drainage facilities or expansion of existing facilities, the construction of which could cause significant environmental effects?
d) Have sufficient water supplies available to serve the project from existing entitlements and resources, or are new or expanded entitlements needed?
e) Result in a determination by the wastewater treatment provider, which serves or may serve the project that it has adequate capacity to serve the project’s projected demand in addition to the provider’s existing commitments?
f) Be served by a landfill with sufficient permitted capacity to accommodate the project’s solid waste disposal needs?
g) Comply with federal, state, and local statutes and regulations related to solid waste?
2.18 Utilities and Service Systems
a) Would the project exceed wastewater treatment requirements of the applicable Regional Water Quality Control Board?
As discussed in Section IX Hydrology and Water Quality, wastewater treatment and disposal are provided by the Santa Rosa Subregional Water Reclamation System, which also serves the cities of Santa Rosa, Sebastopol, and Cotati. Wastewater from the Subregional System is treated at the Laguna Water Reclamation Plant, located about two miles northwest of Rohnert Park. The City owns capacity rights to 3.43 million gallons per day (MGD) at the Laguna Water Reclamation Plant and has an agreement with the City of Santa Rosa to use up to 4.46 MGD of capacity rights. Under the Subregional System’s approved Incremental Recycled Water Program, the City can acquire up to 5.15 MGD of capacity (City of Santa Rosa 2008). The City’s current capacity needs are
Initial Study
Fairfield Inn & Suites 86 August 2017
approximately 3.0 MGD, meaning that up to 2.15 MGD of capacity is available to serve new development.
The project applicant has indicated that the project would be expected to generate 12,500 gallons per day GPD) or .012 MGD of wastewater. Because the capacity required to serve the proposed project would be accommodated by the City’s existing approved wastewater capacity and would not result in the need for any new off-site wastewater system expansions, this impact would be less than significant.
b) Would the project require or result in the construction of new water or wastewater treatment facilities or expansion of existing facilities, the construction of which could cause significant environmental effects?
The existing water supply facilities are expected to be sufficient to provide an adequate supply of water to meet the current and future demand of the project. The proposed project alone would not require SCWA to increase its existing water entitlements; as discussed in criterion ‘d’ below, SCWA has an adequate supply to meet the demands associated with the project area. Therefore, the water supply and related facility impacts would be less than significant.
Wastewater treatment and disposal is provided by the Santa Rosa Subregional Water Reclamation System. Wastewater from the Subregional System is treated at the Laguna Water Reclamation Plant, located about two miles northwest of Rohnert Park. As discussed in criterion ‘a’ above, the capacity required to serve the project site could be accommodated by the City’s existing approved wastewater capacity and would not result in the need for any new off-site wastewater system expansions. Accordingly, wastewater facility impacts would be less than significant.
c) Would the project require or result in the construction of new storm water drainage facilities or expansion of existing facilities, the construction of which could cause significant environmental effects?
The project site is undeveloped, consisting of vacant land. The existing topography is relatively flat, gently sloping westerly toward the adjacent parcel. This project was included as a tributary to the storm drain system within Labath Avenue, where the site currently drains. An existing 30-inch and 36-inch storm drains collect runoff and convey flows westerly down Martin and Carlson Avenues, respectively. These storm drains ultimately converge and outlet into Hinebaugh Creek. The recently approved Five Creek project on the adjacent parcels includes construction of a new system and outlet at Hinebaugh Creek to drain on-site runoff for 15.25 acres from the Five Creek site, the
Initial Study
Fairfield Inn & Suites 87 August 2017
City’s Public Safety Facility parcel, and the project site for a total tributary area of 17.08 acres. The tributary area is less than one square mile, and would be classified as a minor waterway. Impacts associated with construction of the new storm drain outlet were previously assessed in the Mitigated Negative Declaration prepared for the Five Creek project.
The proposed project would be required comply with the City’s storm drain standards, including the City of Santa Rosa and County of Sonoma’s Low Impact Development Technical Design Manual (LID Manual). Design requirements include the requirements to treat all runoff generated by the 85th percentile, 24-hour storm and to ensure that the volume of runoff from the site in the 85th percentile, 24-hour storm does not increase as a result of development or redevelopment. The LID Manual includes best management practices that can be used to capture, infiltrate, and/or reuse stormwater on-site. Because the existing stormwater system provides adequate protection to the project area and because existing design requirements minimize any increases in stormwater runoff or changes in stormwater quality, the stormwater-related impacts associated with development of the proposed project would be less than significant.
d) Would the project have sufficient water supplies available to serve the project from existing entitlements and resources, or are new or expanded entitlements needed?
The City has three water sources: Sonoma County Water Agency (SCWA) supply, local groundwater, and recycled water. The City manages these supplies using a “conjunctive use” strategy, drawing on SCWA and recycled-water supplies first and using its local groundwater to manage peak demands. The total supply available to the City through these three sources is 11,427 AFY, including 10,077 AFY of potable water and 1,350 AFY of recycled water (City of Rohnert Park 2016).
Under its contract with SCWA, the City has access to as much as 7,500 AFY, although a number of conditions can limit the SCWA supply. Because of these limitations, the City uses 6,372 AFY as its reliable supply from SCWA under all hydrologic conditions. Over the past 10 years, the City has used between 2,500 and 5,000 AFY of SCWA supply, which is significantly less than its maximum allocation (City of Rohnert Park 2016).
The City’s local groundwater supply is from the Santa Rosa Plain Subbasin of the Santa Rosa Valley Groundwater Basin. The City manages its groundwater supply in accordance with its 2004 Water Policy Resolution, which limits groundwater pumping to 2,577 AFY. The City’s 2004 City-wide Water Supply Assessment provides the technical support for this maximum pumping rate. The City participates actively in the implementation of the Santa Rosa Plain Watershed Groundwater Management Plan and is currently working
Initial Study
Fairfield Inn & Suites 88 August 2017
with other water suppliers in the basin to implement the requirements of the Groundwater Sustainability Act of 2014. Modeling and monitoring data collected by the City and others indicate that groundwater levels are generally rising around the City’s well field, an indication of stable supply. Over the past 10 years the City has used between 350 and 1,600 AFY of groundwater, significantly less than its policy limitation on groundwater use (City of Rohnert Park 2016).
As previously discussed, the City’s tertiary-treated recycled-water supply is produced by the Santa Rosa Subregional Water Reclamation System. The City and the Subregional System have recently entered into a producer/distributor agreement that provides the City with access to 1,350 AFY of recycled water. The City uses recycled water primarily for irrigation purposes; demand for recycled water has varied between 800 and 1,100 AFY over the past 10 years (City of Rohnert Park 2016).
The City completed its 2015 Urban Water Management Plan Water Demand and Water Conservation Measures Update. This analysis, which is based on Association of Bay Area Governments (ABAG) population and job projections, projects the City’s potable water demands through 2040. This demand is expected to range between 5,600 and 6,100 AFY, depending on the level of water conservation undertaken by the City. This projected demand is significantly less than the City’s available water supplies. This analysis also indicates that the City has the potential to secure approximately 500 AFY (the difference between 5,600 and 6,100 AFY) by undertaking more aggressive water conservation activities (City of Rohnert Park 2016).
The existing water supply sources are expected to be sufficient to provide an adequate supply of water for the project. Development at the project site would not require SCWA to increase its existing water entitlements; as discussed above, SCWA has an adequate supply to meet the demands associated with the proposed project. Impacts associated the water supply for the project would be less than significant.
e) Would the project result in a determination by the wastewater treatment provider, which serves or may serve the project that it has adequate capacity to serve the project’s projected demand in addition to the provider’s existing commitments?
Refer to the answer provided in ‘b’ above.
f) Would the project be served by a landfill with sufficient permitted capacity to accommodate the project’s solid waste disposal needs?
The proposed project, consisting of a 100 room hotel development, would generate solid waste. The North Bay Corporation provides solid waste disposal and composting of
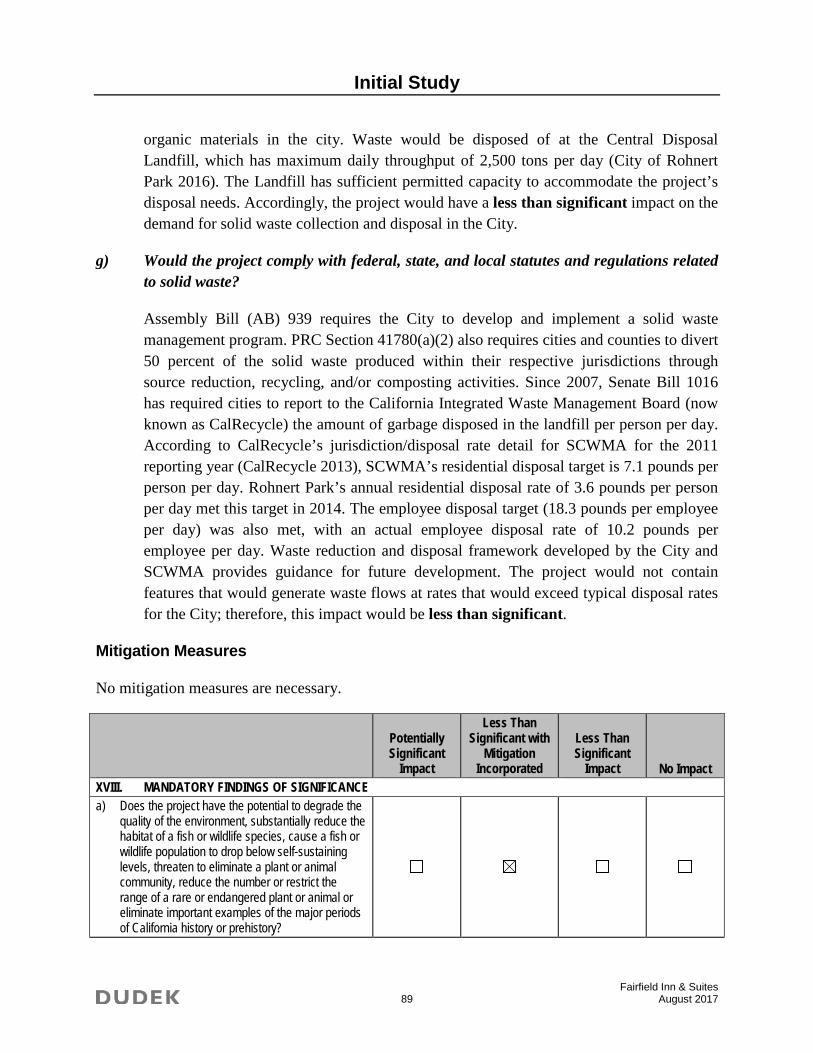
Initial Study
Fairfield Inn & Suites 89 August 2017
organic materials in the city. Waste would be disposed of at the Central Disposal Landfill, which has maximum daily throughput of 2,500 tons per day (City of Rohnert Park 2016). The Landfill has sufficient permitted capacity to accommodate the project’s disposal needs. Accordingly, the project would have a less than significant impact on the demand for solid waste collection and disposal in the City.
g) Would the project comply with federal, state, and local statutes and regulations related to solid waste?
Assembly Bill (AB) 939 requires the City to develop and implement a solid waste management program. PRC Section 41780(a)(2) also requires cities and counties to divert 50 percent of the solid waste produced within their respective jurisdictions through source reduction, recycling, and/or composting activities. Since 2007, Senate Bill 1016 has required cities to report to the California Integrated Waste Management Board (now known as CalRecycle) the amount of garbage disposed in the landfill per person per day. According to CalRecycle’s jurisdiction/disposal rate detail for SCWMA for the 2011 reporting year (CalRecycle 2013), SCWMA’s residential disposal target is 7.1 pounds per person per day. Rohnert Park’s annual residential disposal rate of 3.6 pounds per person per day met this target in 2014. The employee disposal target (18.3 pounds per employee per day) was also met, with an actual employee disposal rate of 10.2 pounds per employee per day. Waste reduction and disposal framework developed by the City and SCWMA provides guidance for future development. The project would not contain features that would generate waste flows at rates that would exceed typical disposal rates for the City; therefore, this impact would be less than significant.
Mitigation Measures
No mitigation measures are necessary.
Potentially Significant
Impact
Less Than Significant with
Mitigation Incorporated
Less Than Significant
Impact No Impact XVIII. MANDATORY FINDINGS OF SIGNIFICANCE a) Does the project have the potential to degrade the
quality of the environment, substantially reduce the habitat of a fish or wildlife species, cause a fish or wildlife population to drop below self-sustaining levels, threaten to eliminate a plant or animal community, reduce the number or restrict the range of a rare or endangered plant or animal or eliminate important examples of the major periods of California history or prehistory?
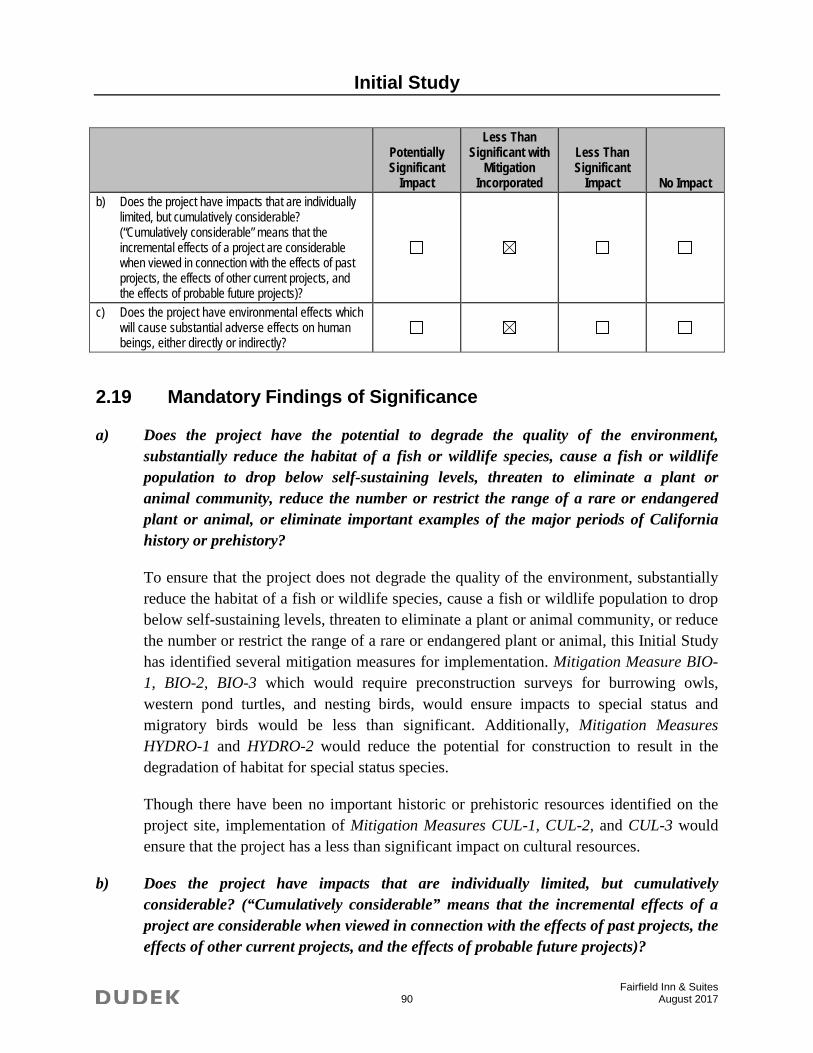
Initial Study
Fairfield Inn & Suites 90 August 2017
Potentially Significant
Impact
Less Than Significant with
Mitigation Incorporated
Less Than Significant
Impact No Impact b) Does the project have impacts that are individually
limited, but cumulatively considerable? (“Cumulatively considerable” means that the incremental effects of a project are considerable when viewed in connection with the effects of past projects, the effects of other current projects, and the effects of probable future projects)?
c) Does the project have environmental effects which will cause substantial adverse effects on human beings, either directly or indirectly?
2.19 Mandatory Findings of Significance
a) Does the project have the potential to degrade the quality of the environment, substantially reduce the habitat of a fish or wildlife species, cause a fish or wildlife population to drop below self-sustaining levels, threaten to eliminate a plant or animal community, reduce the number or restrict the range of a rare or endangered plant or animal, or eliminate important examples of the major periods of California history or prehistory?
To ensure that the project does not degrade the quality of the environment, substantially reduce the habitat of a fish or wildlife species, cause a fish or wildlife population to drop below self-sustaining levels, threaten to eliminate a plant or animal community, or reduce the number or restrict the range of a rare or endangered plant or animal, this Initial Study has identified several mitigation measures for implementation. Mitigation Measure BIO-1, BIO-2, BIO-3 which would require preconstruction surveys for burrowing owls, western pond turtles, and nesting birds, would ensure impacts to special status and migratory birds would be less than significant. Additionally, Mitigation Measures HYDRO-1 and HYDRO-2 would reduce the potential for construction to result in the degradation of habitat for special status species.
Though there have been no important historic or prehistoric resources identified on the project site, implementation of Mitigation Measures CUL-1, CUL-2, and CUL-3 would ensure that the project has a less than significant impact on cultural resources.
b) Does the project have impacts that are individually limited, but cumulatively considerable? (“Cumulatively considerable” means that the incremental effects of a project are considerable when viewed in connection with the effects of past projects, the effects of other current projects, and the effects of probable future projects)?
Initial Study
Fairfield Inn & Suites 91 August 2017
The analysis provided throughout this Initial Study demonstrates that the project’s contribution to cumulative impacts would be reduced to less than significant levels through mitigation. As such, a finding of “less than significant impact with mitigation,” is appropriate for mandatory findings of significance.
c) Does the project have environmental effects which will cause substantial adverse effects on human beings, either directly or indirectly?
The analysis provided throughout this Initial Study identifies project impacts that may be potentially significant and identifies mitigation measures that would reduce each impact to a less than significant level. As such, a finding of “less than significant impact with mitigation,” is appropriate for mandatory findings of significance.
Initial Study
Fairfield Inn & Suites 92 August 2017
3 REFERENCES
3.1 References Cited
14 CCR 15000–15387 and Appendices A through L. Guidelines for Implementation of the California Environmental Quality Act, as amended.
BAAQMD (Bay Area Air Quality Management District). 2009. Revised Draft Options and Justification Report California Environmental Quality Act Thresholds of Significance, October 2009. Available at: http://www.baaqmd.gov/~/media/files/planning-and-research/ceqa/revised-draft-ceqa-thresholds-justification-report-oct-2009.pdf?la=en.
BAAQMD. 2010. Bay Area 2010 Clean Air Plan, adopted September 15, 2010. Available at: http://www.baaqmd.gov/plans-and-climate/air-quality-plans/current-plans.
BAAQMD. 2010. California Environmental Quality Act Air Quality Guidelines. May 2010. Available at: http://www.baaqmd.gov/~/media/files/planning-and-research/ceqa/draft_baaqmd_ceqa_guidelines_may_2010_final.pdf?la=en.
BAAQMD. 2012, California Environmental Quality Act Air Quality Guidelines. Updated May 2012. http://www.baaqmd.gov/~/media/Files/Planning%20and%20Research/CEQA/BAAQMD%20CEQA%20Guidelines_Final_May%202012.ashx?la=en.
BAAQMD (Bay Area Air Quality Management District). 2017a. California Environmental Quality Act Air Quality Guidelines. Updated May 2017. http://www.baaqmd.gov/~/media/files/planning-and-research/ceqa/ceqa_guidelines_may2017-pdf.pdf?la=en.
BAAQMD. 2017b. Spare the Air: Cool the Climate - Final 2017 Clean Air Plan. April 19, 2017. http://www.baaqmd.gov/~/media/files/planning-and-research/plans/2017-clean-air-plan/attachment-a_-proposed-final-cap-vol-1-pdf.pdf?la=en.
California Public Resources Code, Section 21000–21177. California Environmental Quality Act, as amended.
CalRecycle (California Department of Resources Recycling and Recovery). 2013. Jurisdiction Diversion/Disposal Rate Detail for Sonoma County Waste Management Agency, Reporting Year 2011. Available: http://www.calrecycle.ca.gov/LGCentral/Reports/DiversionProgram/JurisdictionDiversionDetail.aspx?JurisdictionID=503&Year=2011. Accessed August 6, 2016.
Initial Study
Fairfield Inn & Suites 93 August 2017
CAPCOA (California Air Pollution Control Officers Association). 2008. CEQA & Climate Change: Evaluating and Addressing Greenhouse Gas Emissions from Projects Subject to the California Environmental Quality Act. January 2008.
CARB (California Air Resources Board). 2008. Climate Change Proposed Scoping Plan: A Framework for Change. December 12, 2008. http://www.arb.ca.gov/cc/scopingplan/document/psp.pdf.Accessed August 2016.
CARB. 2014. First Update to the Climate Change Scoping Plan Building on the Framework Pursuant to AB 32 – The California Global Warming Solutions Act of 2006. May 2014. http://www.arb.ca.gov/cc/scopingplan/2013_update/first_update_ climate_change_scoping_plan.pdf.
CAT (California Climate Action Team). 2006. Climate Action Team Report to the Governor Schwarzenegger and the Legislature. Sacramento, California. March 2006. http://www.climatechange.ca.gov/climate_action_team/reports/2006report/2006-04-03_FINAL_CAT_REPORT.PDF.
City of Rohnert Park. 2007. Stadium Area Master Plan Final Environmental Impact Report. October.
City of Rohnert Park. 2008. Stadium Area Master Plan Final Development Plan. February.
City of Rohnert Park. 2015 (May) (originally adopted 2000). City of Rohnert Park General Plan. Our Place . . . Rohnert Park 2020, A Plan for the Future. Adopted in July 2000; seventh edition printed May 2015. Rohnert Park, CA. Prepared by Dyett & Bhatia Urban and Regional Planners.
City of Rohnert Park. 2016 (February). Central Rohnert Park Priority Development Plan Final Environmental Impact Report. Certified March 22, 2016 . Prepared by AECOM.
City of Santa Rosa. 2008 (November 18). Proposed Fifth Amendment to the Subregional Agreement for Operation of the Laguna Treatment Plant and Water Reclamation System. Agenda Item #10.5 for Council Meeting of 11/18/2008. Available: http://ci.santa-rosa.ca.us/doclib/agendas_packets_minutes/Documents/20081118_CC_Item10.5.pdf. Accessed July 26, 2017.
CNRA (California Natural Resources Agency). 2009. Final Statement of Reasons for Regulatory Action: Amendments to the State CEQA Guidelines Addressing Analysis and Mitigation of Greenhouse Gas Emissions Pursuant to SB 97. December 2009.
Initial Study
Fairfield Inn & Suites 94 August 2017
DOC (California Department of Conservation). 2014. Farmland Mapping and Monitoring Program. Sonoma County data. ftp://ftp.consrv.ca.gov/pub/dlrp/FMMP/pdf/2014/son14.pdf. Accessed June 26, 2017.
DOC. 2013. Sonoma County Williamson Act FY 2013/2014. Sonoma County data. ftp://ftp.consrv.ca.gov/pub/dlrp/wa/Sonoma_13_14_WA.pdf. Accessed June 26, 2017.
DTSC (California Department of Toxic Substances Control). 2017. EnviroStor. http://www.envirostor.dtsc.ca.gov/public/. Accessed July 27, 2017.
Dudek. 2017. Biological Constraints Report for the proposed Fairfield Inn Site in Rohnert Park, Sonoma County, California. July 7, 2017.
Dudek. 2017a. Preliminary California Tiger Salamander Habitat Assessment for the Proposed Fairfield Inn Site Located in Rohnert Park, Sonoma County, California. May 16, 2017.
EPA. 2016. “EPA Region 9 Air Quality Maps and Geographic Information.” Last updated April 27, 2016. http://www.epa.gov/region9/air/maps/.
IPCC (Intergovernmental Panel on Climate Change). 1995. IPCC Second Assessment Synthesis of Scientific-Technical Information Relevant to Interpreting Article 2 of the U.N. Framework Convention on Climate Change.
IPCC (Intergovernmental Panel on Climate Change). 2007. IPCC Fourth Assessment Synthesis of Scientific-Technical Information Relevant to Interpreting Article 2 of the U.N. Framework Convention on Climate Change.
IPCC. 2014. Climate Change 2014 Synthesis Report: A Report of the Intergovernmental Panel on Climate Change. Contribution of Working Groups I, II and III to the Fifth Assessment Report of the Intergovernmental Panel on Climate Change. http://www.ipcc.ch/report/ar5/syr/. Accessed August 2016.
NRCS (U.S. Natural Resources Conservation Service). 2014. Web Soil Survey. Available: http://websoilsurvey.sc.egov.usda.gov/App/WebSoilSurvey.aspx. Last updated September 2014. Accessed July 27, 2017.
NREL (National Renewable Energy Laboratory). 2017. PVWatts Calculator. Accessed April 2017. http://pvwatts.nrel.gov/pvwatts.php.
OEHHA (Office of Environmental Health Hazard Assessment). 2015. Air Toxics Hot Spot Program – Risk Assessment Guidelines – Guidance Manual for Preparation of Health
Initial Study
Fairfield Inn & Suites 95 August 2017
Risk Assessments. February 2015. Available at: http://oehha.ca.gov/media/downloads/crnr/2015guidancemanual.pdf.
USFWS (U.S. Fish and Wildlife Service). 2005. Santa Rosa Plain Conservation Strategy. December 1.
W-Trans. 2017. Traffic Impact Study for the Fairfield Inn & Suites Project. April 4, 2017.
APPENDIX A Air Quality and Greenhouse Gas Emissions
Calculations

CalEEMod Version 2016.3.1 Outputs Annual, Summer, Winter, Mitigation Report

Off-road Equipment - Building would be modular and shipped to site. Assumed 25% of typical equipment needed (adjusted hrs/day) for building construction based on applicant inputOff-road Equipment - Default equipment for Paving
Off-road Equipment - Default equipment for Architectural Coating
Grading - 4,000 CY of soil exported
1.3 User Entered Comments & Non-Default Data
Project Characteristics - CO2 intensity adjusted based on 25% RPS
Land Use - Land uses: 100-room hotel with a 350 sf swimming pool and 104-space above ground parking lot
Construction Phase - Adjusted default construction schedule based on applicant input
Off-road Equipment - Default equipment for Site Preparation
Off-road Equipment - Default equipment for Grading
CO2 Intensity (lb/MWhr)
559.32 CH4 Intensity (lb/MWhr)
0.029 N2O Intensity (lb/MWhr)
0.006
75
Climate Zone 4 Operational Year 2019
Utility Company Pacific Gas & Electric Company
1.2 Other Project Characteristics
Urbanization Rural Wind Speed (m/s) 2.2 Precipitation Freq (Days)
Recreational Swimming Pool 0.35 1000sqft 0.01 350.00 0
Parking Lot 104.00 Space 1.00 43,905.00 0
Floor Surface Area Population
Hotel 100.00 Room 0.72 57,670.00 0
1.0 Project Characteristics
1.1 Land Usage
Land Uses Size Metric Lot Acreage
CalEEMod Version: CalEEMod.2016.3.1 Page 1 of 1 Date: 4/28/2017 11:39 AM
Fairfield Inn & Suites - Sonoma-San Francisco County, Annual
Fairfield Inn & SuitesSonoma-San Francisco County, Annual

tblConstructionPhase PhaseStartDate 7/7/2017 6/1/2017
tblConstructionPhase PhaseStartDate 7/1/2017 6/1/2017
tblConstructionPhase PhaseEndDate 6/30/2017 6/15/2017
tblConstructionPhase PhaseStartDate 4/27/2018 11/1/2017
tblConstructionPhase PhaseEndDate 7/6/2017 8/1/2017
tblConstructionPhase PhaseEndDate 4/26/2018 8/31/2017
tblConstructionPhase PhaseEndDate 5/10/2018 2/28/2018
tblConstructionPhase PhaseEndDate 4/12/2018 3/1/2018
tblConstructionPhase NumDays 10.00 13.00
tblConstructionPhase NumDays 2.00 11.00
tblConstructionPhase NumDays 200.00 196.00
tblConstructionPhase NumDays 4.00 44.00
tblConstDustMitigation WaterUnpavedRoadVehicleSpeed 40 15
tblConstructionPhase NumDays 10.00 86.00
tblAreaCoating Area_EF_Nonresidential_Exterior 150 50
tblAreaCoating Area_EF_Nonresidential_Interior 100 50
tblArchitecturalCoating EF_Nonresidential_Exterior 150.00 50.00
tblArchitecturalCoating EF_Nonresidential_Interior 100.00 50.00
Energy Mitigation - 110 kW of solar power assumed per applicant input, estimated generation of 156,465 kWh/year based on PVWatts Calculator
Water Mitigation - 20% indoor/outdoor reduction in water assumed for CALGreen compliance
Waste Mitigation - 75% waste diversion consistent with AB 341
Table Name Column Name Default Value New Value
Vehicle Trips - Default traffic trip generation assumed based on TIS
Area Coating - Low-VOC coatings assumed per applicant input
Energy Use - Default energy use intensity
Water And Wastewater - Default water and wastewater
Solid Waste - Default solid waste
Construction Off-road Equipment Mitigation - Basic control measures - water exposed area 2x per day and 15mph vehicle speed on unpaved areas
Trips and VMT - Building would be modular and shipped to site on 60 trucks (120 one-way trips) -- assumed 60 mile triplength to account for potential travel from Bay AreaArchitectural Coating - Low-VOC coatings will be used per applicant input
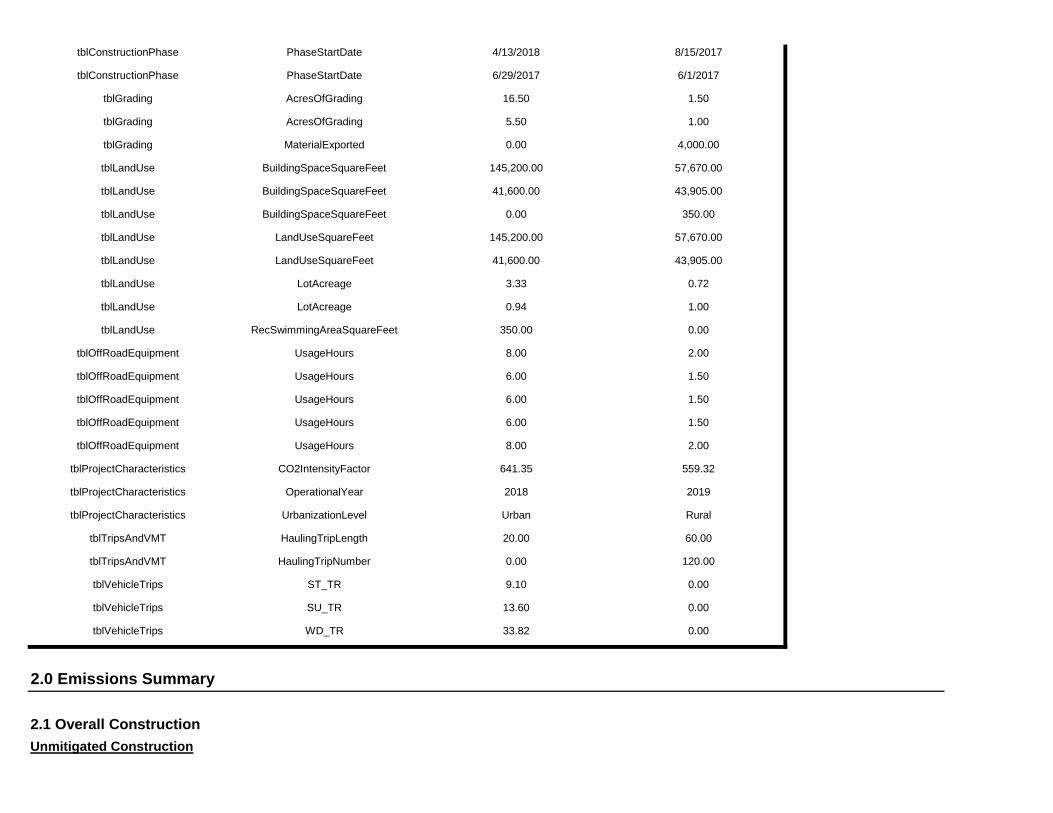
2.0 Emissions Summary
2.1 Overall ConstructionUnmitigated Construction
tblVehicleTrips SU_TR 13.60 0.00
tblVehicleTrips WD_TR 33.82 0.00
tblTripsAndVMT HaulingTripNumber 0.00 120.00
tblVehicleTrips ST_TR 9.10 0.00
tblProjectCharacteristics UrbanizationLevel Urban Rural
tblTripsAndVMT HaulingTripLength 20.00 60.00
tblProjectCharacteristics CO2IntensityFactor 641.35 559.32
tblProjectCharacteristics OperationalYear 2018 2019
tblOffRoadEquipment UsageHours 6.00 1.50
tblOffRoadEquipment UsageHours 8.00 2.00
tblOffRoadEquipment UsageHours 6.00 1.50
tblOffRoadEquipment UsageHours 6.00 1.50
tblLandUse RecSwimmingAreaSquareFeet 350.00 0.00
tblOffRoadEquipment UsageHours 8.00 2.00
tblLandUse LotAcreage 3.33 0.72
tblLandUse LotAcreage 0.94 1.00
tblLandUse LandUseSquareFeet 145,200.00 57,670.00
tblLandUse LandUseSquareFeet 41,600.00 43,905.00
tblLandUse BuildingSpaceSquareFeet 41,600.00 43,905.00
tblLandUse BuildingSpaceSquareFeet 0.00 350.00
tblGrading MaterialExported 0.00 4,000.00
tblLandUse BuildingSpaceSquareFeet 145,200.00 57,670.00
tblGrading AcresOfGrading 16.50 1.50
tblGrading AcresOfGrading 5.50 1.00
tblConstructionPhase PhaseStartDate 4/13/2018 8/15/2017
tblConstructionPhase PhaseStartDate 6/29/2017 6/1/2017
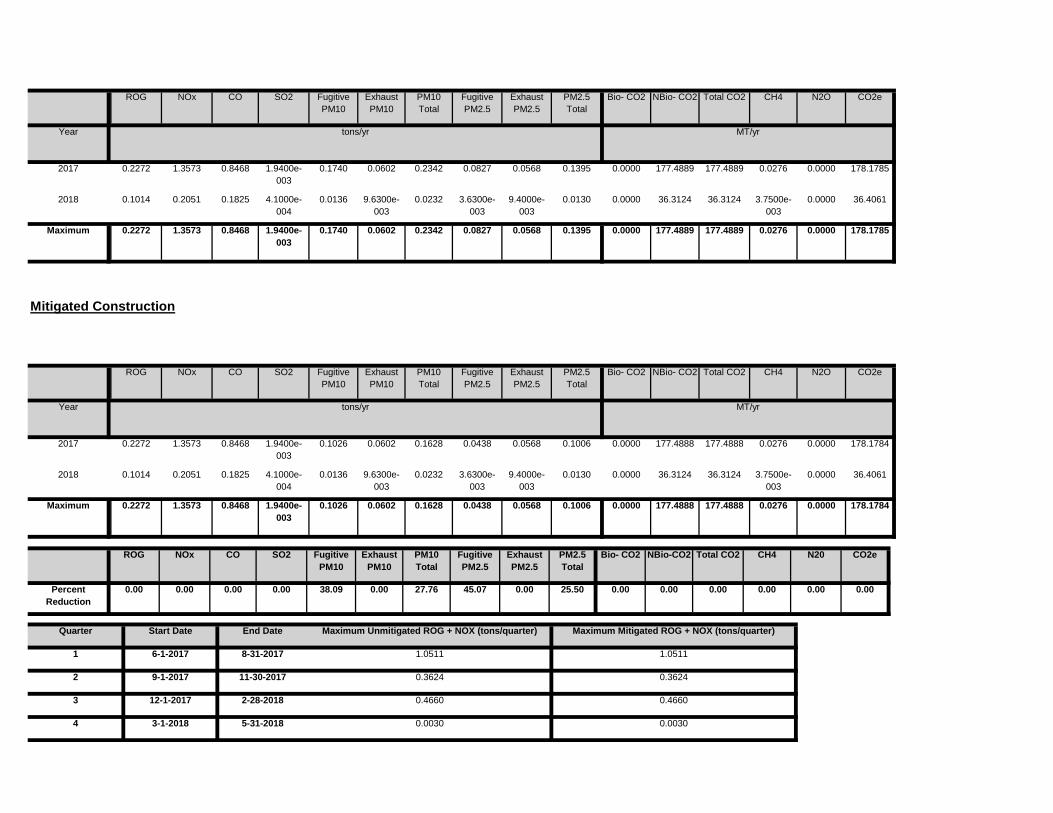
4 3-1-2018 5-31-2018 0.0030 0.0030
2 9-1-2017 11-30-2017 0.3624 0.3624
3 12-1-2017 2-28-2018 0.4660 0.4660
Quarter Start Date End Date Maximum Unmitigated ROG + NOX (tons/quarter) Maximum Mitigated ROG + NOX (tons/quarter)
1 6-1-2017 8-31-2017 1.0511 1.0511
0.00 0.00 0.00 0.00 0.00 0.0038.09 0.00 27.76 45.07 0.00 25.50
NBio-CO2 Total CO2 CH4 N20 CO2e
Percent Reduction
0.00 0.00 0.00 0.00
Exhaust PM10
PM10 Total
Fugitive PM2.5
Exhaust PM2.5
PM2.5 Total
Bio- CO2ROG NOx CO SO2 Fugitive PM10
0.0000 177.4888 177.4888 0.0276 0.0000 178.17840.1026 0.0602 0.1628 0.0438 0.0568 0.1006Maximum 0.2272 1.3573 0.8468 1.9400e-003
0.0000 36.3124 36.3124 3.7500e-003
0.0000 36.40610.0136 9.6300e-003
0.0232 3.6300e-003
9.4000e-003
0.01302018 0.1014 0.2051 0.1825 4.1000e-004
0.0000 177.4888 177.4888 0.0276 0.0000 178.17840.1026 0.0602 0.1628 0.0438 0.0568 0.10062017 0.2272 1.3573 0.8468 1.9400e-003
Total CO2 CH4 N2O CO2e
Year tons/yr MT/yr
PM10 Total
Fugitive PM2.5
Exhaust PM2.5
PM2.5 Total
Bio- CO2 NBio- CO2
Mitigated Construction
ROG NOx CO SO2 Fugitive PM10
Exhaust PM10
0.0000 177.4889 177.4889 0.0276 0.0000 178.17850.1740 0.0602 0.2342 0.0827 0.0568 0.1395Maximum 0.2272 1.3573 0.8468 1.9400e-003
0.0000 36.3124 36.3124 3.7500e-003
0.0000 36.40610.0136 9.6300e-003
0.0232 3.6300e-003
9.4000e-003
0.01302018 0.1014 0.2051 0.1825 4.1000e-004
0.0000 177.4889 177.4889 0.0276 0.0000 178.17850.1740 0.0602 0.2342 0.0827 0.0568 0.13952017 0.2272 1.3573 0.8468 1.9400e-003
NBio- CO2 Total CO2 CH4 N2O CO2e
Year tons/yr MT/yr
Exhaust PM10
PM10 Total
Fugitive PM2.5
Exhaust PM2.5
PM2.5 Total
Bio- CO2ROG NOx CO SO2 Fugitive PM10
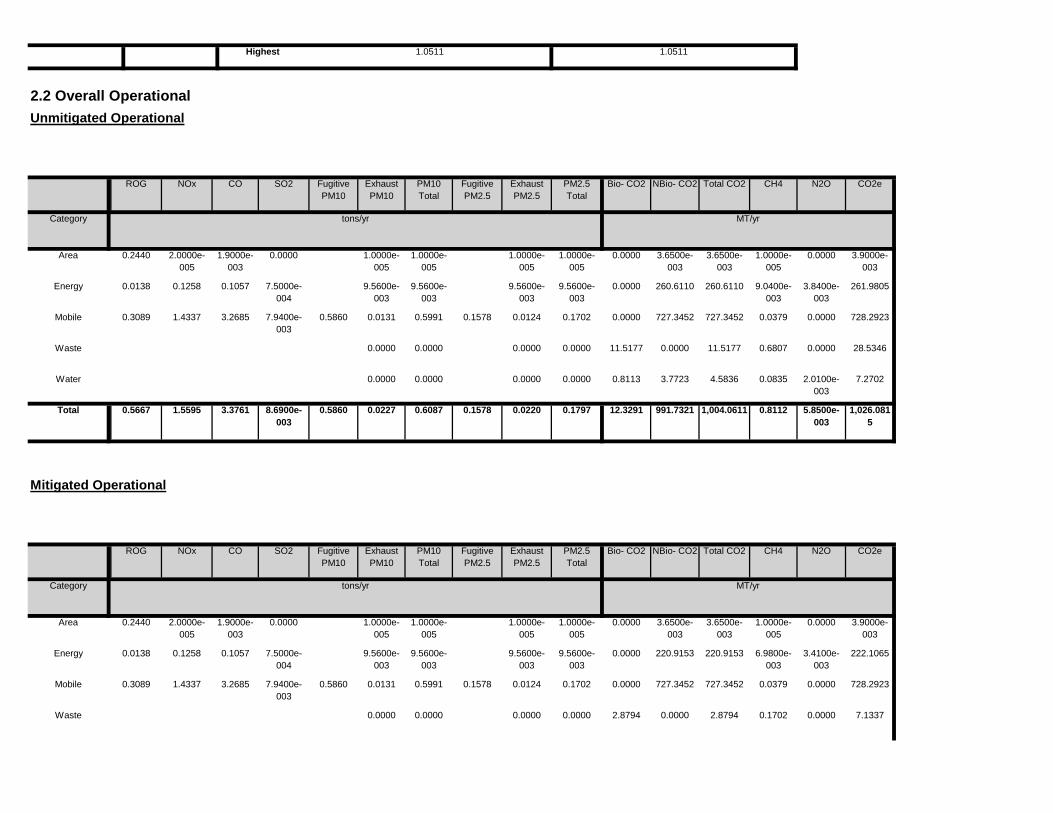
2.8794 0.0000 2.8794 0.1702 0.0000 7.13370.0000 0.0000 0.0000 0.0000Waste
0.0000 727.3452 727.3452 0.0379 0.0000 728.29230.5860 0.0131 0.5991 0.1578 0.0124 0.1702Mobile 0.3089 1.4337 3.2685 7.9400e-003
0.0000 220.9153 220.9153 6.9800e-003
3.4100e-003
222.10659.5600e-003
9.5600e-003
9.5600e-003
9.5600e-003
Energy 0.0138 0.1258 0.1057 7.5000e-004
0.0000 3.6500e-003
3.6500e-003
1.0000e-005
0.0000 3.9000e-003
1.0000e-005
1.0000e-005
1.0000e-005
1.0000e-005
Area 0.2440 2.0000e-005
1.9000e-003
0.0000
Total CO2 CH4 N2O CO2e
Category tons/yr MT/yr
PM10 Total
Fugitive PM2.5
Exhaust PM2.5
PM2.5 Total
Bio- CO2 NBio- CO2
Mitigated Operational
ROG NOx CO SO2 Fugitive PM10
Exhaust PM10
12.3291 991.7321 1,004.0611 0.8112 5.8500e-003
1,026.0815
0.5860 0.0227 0.6087 0.1578 0.0220 0.1797Total 0.5667 1.5595 3.3761 8.6900e-003
0.8113 3.7723 4.5836 0.0835 2.0100e-003
7.27020.0000 0.0000 0.0000 0.0000Water
11.5177 0.0000 11.5177 0.6807 0.0000 28.53460.0000 0.0000 0.0000 0.0000Waste
0.0000 727.3452 727.3452 0.0379 0.0000 728.29230.5860 0.0131 0.5991 0.1578 0.0124 0.1702Mobile 0.3089 1.4337 3.2685 7.9400e-003
0.0000 260.6110 260.6110 9.0400e-003
3.8400e-003
261.98059.5600e-003
9.5600e-003
9.5600e-003
9.5600e-003
Energy 0.0138 0.1258 0.1057 7.5000e-004
0.0000 3.6500e-003
3.6500e-003
1.0000e-005
0.0000 3.9000e-003
1.0000e-005
1.0000e-005
1.0000e-005
1.0000e-005
Area 0.2440 2.0000e-005
1.9000e-003
0.0000
Total CO2 CH4 N2O CO2e
Category tons/yr MT/yr
PM10 Total
Fugitive PM2.5
Exhaust PM2.5
PM2.5 Total
Bio- CO2 NBio- CO2
2.2 Overall OperationalUnmitigated Operational
ROG NOx CO SO2 Fugitive PM10
Exhaust PM10
Highest 1.0511 1.0511
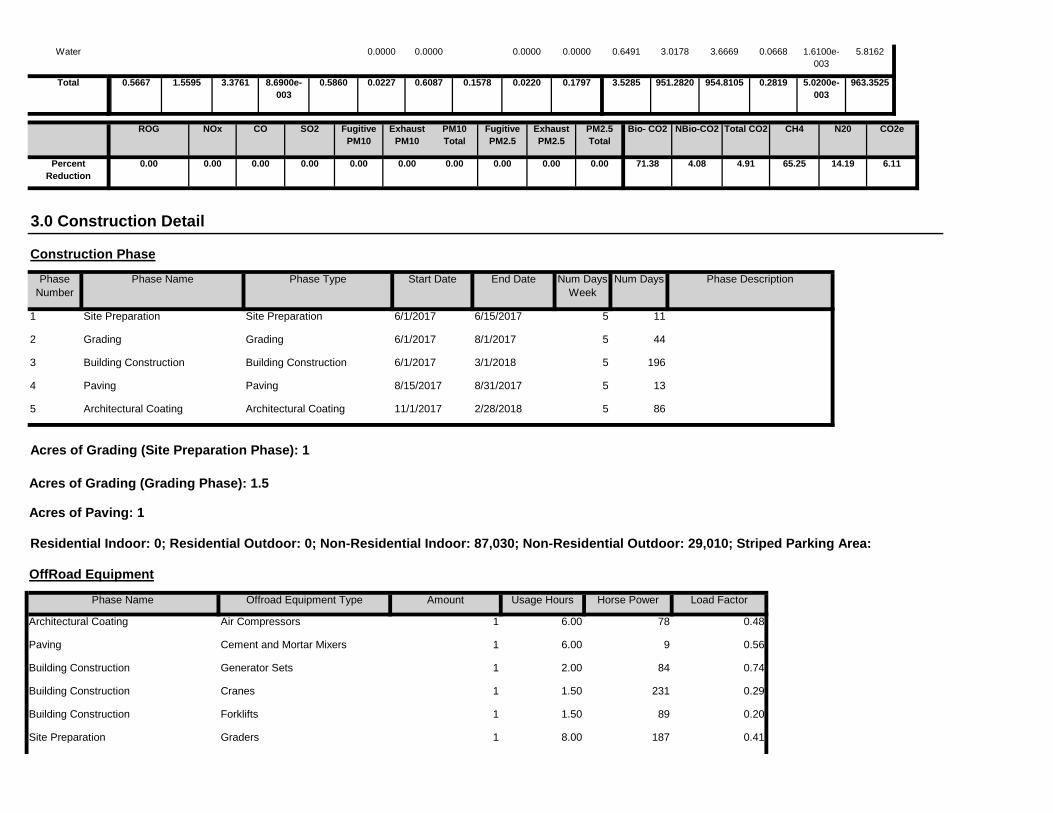
Site Preparation Graders 1 8.00 187 0.41
Building Construction Forklifts 1 1.50 89 0.20
Building Construction Cranes 1 1.50 231 0.29
Building Construction Generator Sets 1 2.00 84 0.74
Paving Cement and Mortar Mixers 1 6.00 9 0.56
Load Factor
Architectural Coating Air Compressors 1 6.00 78 0.48
OffRoad Equipment
Phase Name Offroad Equipment Type Amount Usage Hours Horse Power
86
Acres of Grading (Site Preparation Phase): 1
Acres of Grading (Grading Phase): 1.5
Acres of Paving: 1
Residential Indoor: 0; Residential Outdoor: 0; Non-Residential Indoor: 87,030; Non-Residential Outdoor: 29,010; Striped Parking Area:
5 Architectural Coating Architectural Coating 11/1/2017 2/28/2018 5
196
4 Paving Paving 8/15/2017 8/31/2017 5 13
3 Building Construction Building Construction 6/1/2017 3/1/2018 5
11
2 Grading Grading 6/1/2017 8/1/2017 5 44
End Date Num Days Week
Num Days Phase Description
1 Site Preparation Site Preparation 6/1/2017 6/15/2017 5
3.0 Construction Detail
Construction Phase
Phase Number
Phase Name Phase Type Start Date
71.38 4.08 4.91 65.25 14.19 6.110.00 0.00 0.00 0.00 0.00 0.00
NBio-CO2 Total CO2 CH4 N20 CO2e
Percent Reduction
0.00 0.00 0.00 0.00
Exhaust PM10
PM10 Total
Fugitive PM2.5
Exhaust PM2.5
PM2.5 Total
Bio- CO2ROG NOx CO SO2 Fugitive PM10
3.5285 951.2820 954.8105 0.2819 5.0200e-003
963.35250.5860 0.0227 0.6087 0.1578 0.0220 0.1797Total 0.5667 1.5595 3.3761 8.6900e-003
0.6491 3.0178 3.6669 0.0668 1.6100e-003
5.81620.0000 0.0000 0.0000 0.0000Water
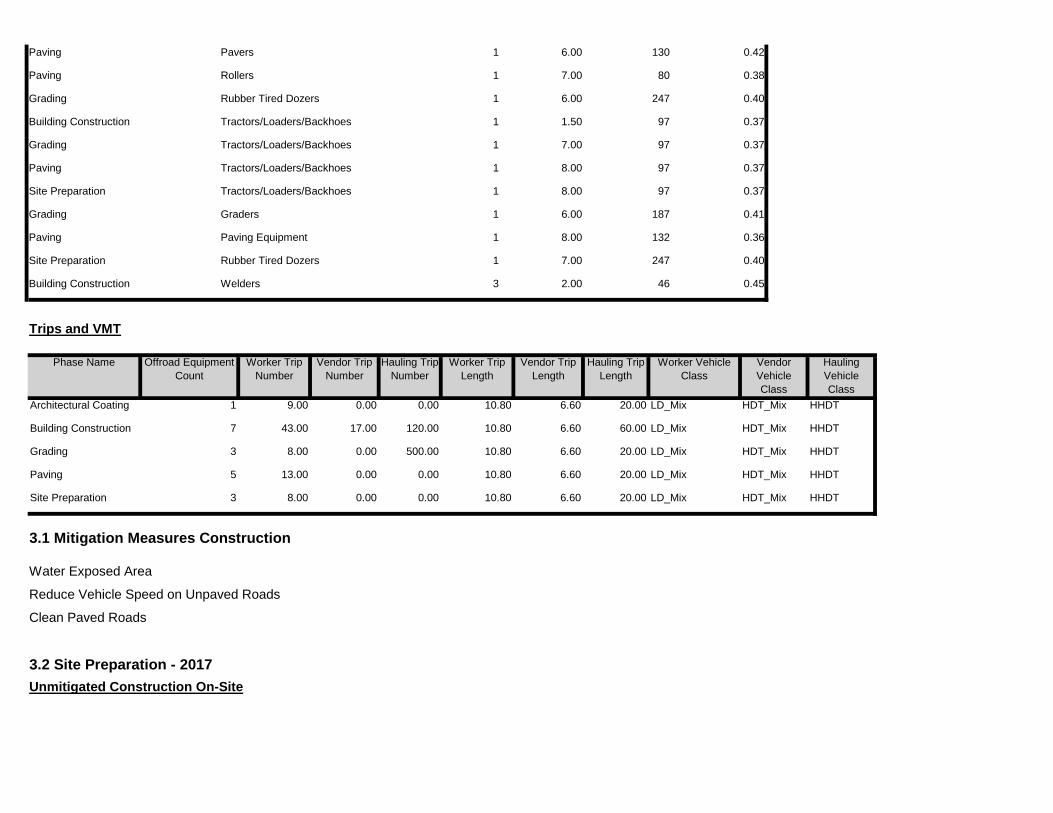
Water Exposed Area
Reduce Vehicle Speed on Unpaved Roads
Clean Paved Roads
3.2 Site Preparation - 2017Unmitigated Construction On-Site
6.60 20.00 LD_Mix HDT_Mix HHDT
3.1 Mitigation Measures Construction
Site Preparation 3 8.00 0.00 0.00 10.80
10.80 6.60 20.00 LD_Mix HDT_Mix HHDT
6.60 20.00 LD_Mix HDT_Mix HHDT
Paving 5 13.00 0.00 0.00
Grading 3 8.00 0.00 500.00 10.80
10.80 6.60 60.00 LD_Mix HDT_Mix HHDT
6.60 20.00 LD_Mix HDT_Mix HHDT
Building Construction 7 43.00 17.00 120.00
Architectural Coating 1 9.00 0.00 0.00 10.80
Worker Trip Length
Vendor Trip Length
Hauling Trip Length
Worker Vehicle Class
Vendor Vehicle Class
Hauling Vehicle Class
Trips and VMT
Phase Name Offroad Equipment Count
Worker Trip Number
Vendor Trip Number
Hauling Trip Number
Building Construction Welders 3 2.00 46 0.45
Site Preparation Rubber Tired Dozers 1 7.00 247 0.40
Paving Paving Equipment 1 8.00 132 0.36
Grading Graders 1 6.00 187 0.41
Site Preparation Tractors/Loaders/Backhoes 1 8.00 97 0.37
Paving Tractors/Loaders/Backhoes 1 8.00 97 0.37
Grading Tractors/Loaders/Backhoes 1 7.00 97 0.37
Building Construction Tractors/Loaders/Backhoes 1 1.50 97 0.37
Grading Rubber Tired Dozers 1 6.00 247 0.40
Paving Rollers 1 7.00 80 0.38
Paving Pavers 1 6.00 130 0.42
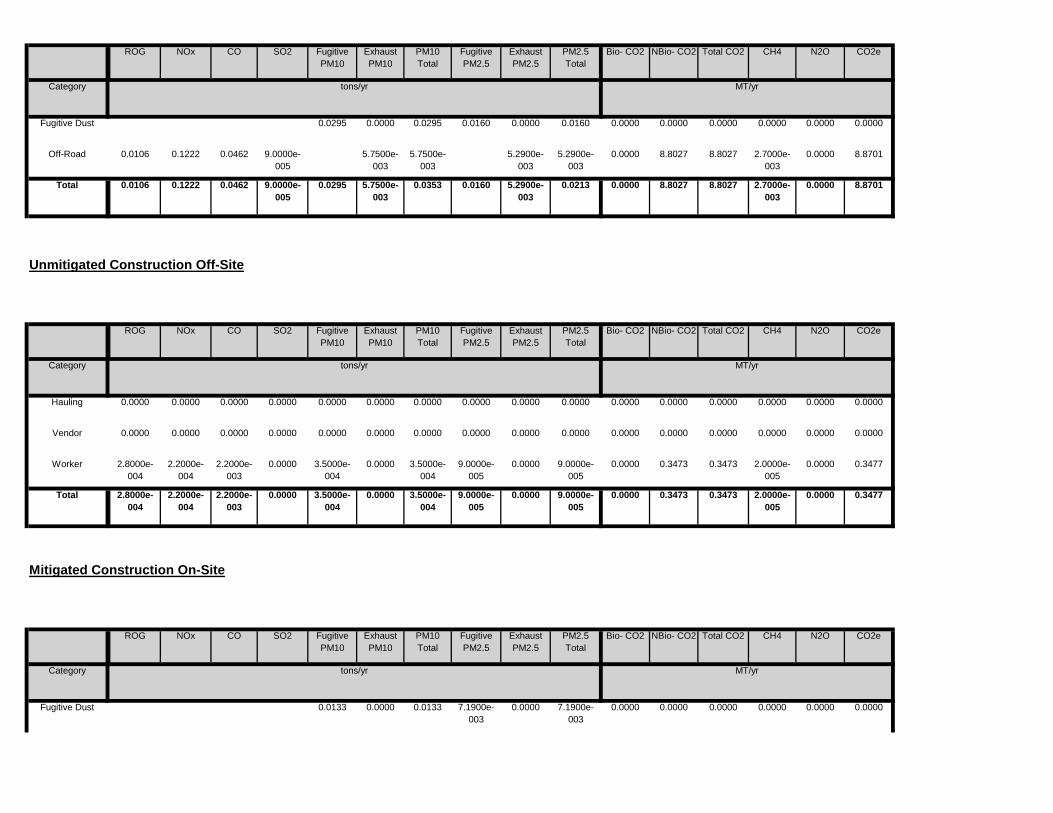
0.0000 0.0000 0.0000 0.0000 0.0000 0.00000.0133 0.0000 0.0133 7.1900e-003
0.0000 7.1900e-003
Fugitive Dust
Total CO2 CH4 N2O CO2e
Category tons/yr MT/yr
PM10 Total
Fugitive PM2.5
Exhaust PM2.5
PM2.5 Total
Bio- CO2 NBio- CO2
Mitigated Construction On-Site
ROG NOx CO SO2 Fugitive PM10
Exhaust PM10
0.0000 0.3473 0.3473 2.0000e-005
0.0000 0.34773.5000e-004
0.0000 3.5000e-004
9.0000e-005
0.0000 9.0000e-005
Total 2.8000e-004
2.2000e-004
2.2000e-003
0.0000
0.0000 0.3473 0.3473 2.0000e-005
0.0000 0.34773.5000e-004
0.0000 3.5000e-004
9.0000e-005
0.0000 9.0000e-005
Worker 2.8000e-004
2.2000e-004
2.2000e-003
0.0000
0.0000 0.0000 0.0000 0.0000 0.0000 0.00000.0000 0.0000 0.0000 0.0000 0.0000 0.0000Vendor 0.0000 0.0000 0.0000 0.0000
0.0000 0.0000 0.0000 0.0000 0.0000 0.00000.0000 0.0000 0.0000 0.0000 0.0000 0.0000Hauling 0.0000 0.0000 0.0000 0.0000
Total CO2 CH4 N2O CO2e
Category tons/yr MT/yr
PM10 Total
Fugitive PM2.5
Exhaust PM2.5
PM2.5 Total
Bio- CO2 NBio- CO2
Unmitigated Construction Off-Site
ROG NOx CO SO2 Fugitive PM10
Exhaust PM10
0.0000 8.8027 8.8027 2.7000e-003
0.0000 8.87010.0295 5.7500e-003
0.0353 0.0160 5.2900e-003
0.0213Total 0.0106 0.1222 0.0462 9.0000e-005
0.0000 8.8027 8.8027 2.7000e-003
0.0000 8.87015.7500e-003
5.7500e-003
5.2900e-003
5.2900e-003
Off-Road 0.0106 0.1222 0.0462 9.0000e-005
0.0000 0.0000 0.0000 0.0000 0.0000 0.00000.0295 0.0000 0.0295 0.0160 0.0000 0.0160
CO2e
Category tons/yr MT/yr
Fugitive Dust
PM2.5 Total
Bio- CO2 NBio- CO2 Total CO2 CH4 N2OSO2 Fugitive PM10
Exhaust PM10
PM10 Total
Fugitive PM2.5
Exhaust PM2.5
ROG NOx CO
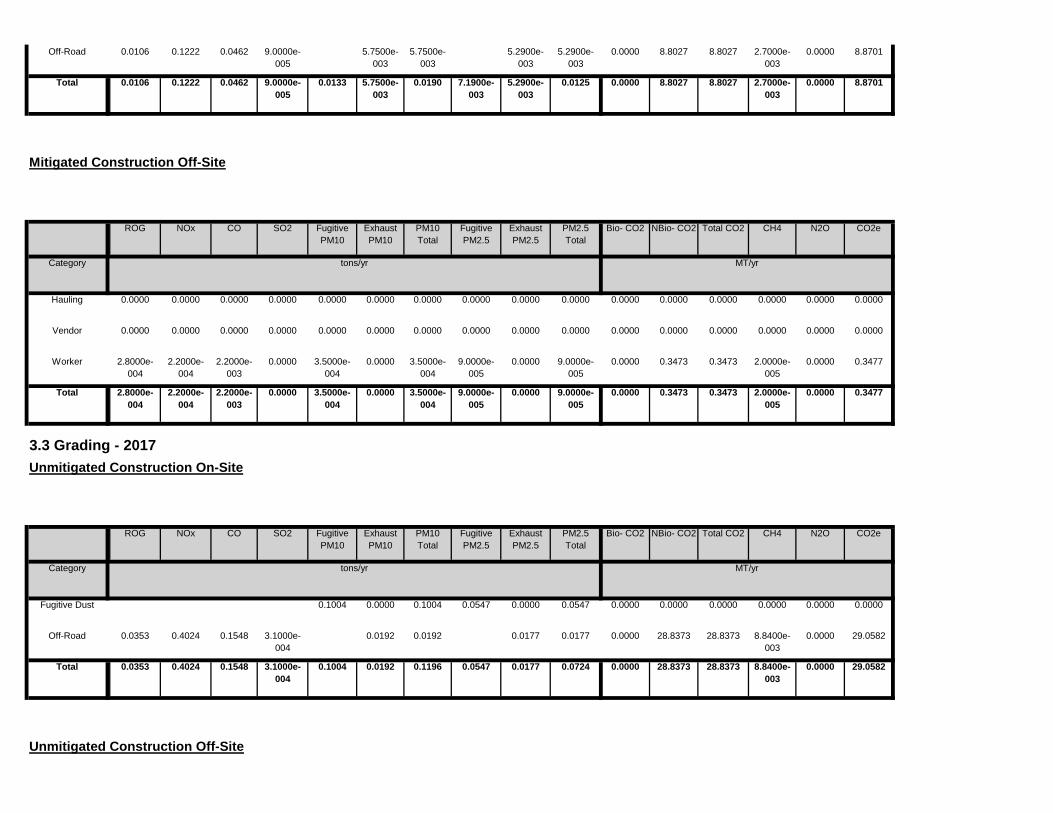
Unmitigated Construction Off-Site
0.0000 28.8373 28.8373 8.8400e-003
0.0000 29.05820.1004 0.0192 0.1196 0.0547 0.0177 0.0724Total 0.0353 0.4024 0.1548 3.1000e-004
0.0000 28.8373 28.8373 8.8400e-003
0.0000 29.05820.0192 0.0192 0.0177 0.0177Off-Road 0.0353 0.4024 0.1548 3.1000e-004
0.0000 0.0000 0.0000 0.0000 0.0000 0.00000.1004 0.0000 0.1004 0.0547 0.0000 0.0547Fugitive Dust
Total CO2 CH4 N2O CO2e
Category tons/yr MT/yr
PM10 Total
Fugitive PM2.5
Exhaust PM2.5
PM2.5 Total
Bio- CO2 NBio- CO2
3.3 Grading - 2017Unmitigated Construction On-Site
ROG NOx CO SO2 Fugitive PM10
Exhaust PM10
0.0000 0.3473 0.3473 2.0000e-005
0.0000 0.34773.5000e-004
0.0000 3.5000e-004
9.0000e-005
0.0000 9.0000e-005
Total 2.8000e-004
2.2000e-004
2.2000e-003
0.0000
0.0000 0.3473 0.3473 2.0000e-005
0.0000 0.34773.5000e-004
0.0000 3.5000e-004
9.0000e-005
0.0000 9.0000e-005
Worker 2.8000e-004
2.2000e-004
2.2000e-003
0.0000
0.0000 0.0000 0.0000 0.0000 0.0000 0.00000.0000 0.0000 0.0000 0.0000 0.0000 0.0000Vendor 0.0000 0.0000 0.0000 0.0000
0.0000 0.0000 0.0000 0.0000 0.0000 0.00000.0000 0.0000 0.0000 0.0000 0.0000 0.0000Hauling 0.0000 0.0000 0.0000 0.0000
Total CO2 CH4 N2O CO2e
Category tons/yr MT/yr
PM10 Total
Fugitive PM2.5
Exhaust PM2.5
PM2.5 Total
Bio- CO2 NBio- CO2
Mitigated Construction Off-Site
ROG NOx CO SO2 Fugitive PM10
Exhaust PM10
0.0000 8.8027 8.8027 2.7000e-003
0.0000 8.87010.0133 5.7500e-003
0.0190 7.1900e-003
5.2900e-003
0.0125Total 0.0106 0.1222 0.0462 9.0000e-005
0.0000 8.8027 8.8027 2.7000e-003
0.0000 8.87015.7500e-003
5.7500e-003
5.2900e-003
5.2900e-003
Off-Road 0.0106 0.1222 0.0462 9.0000e-005
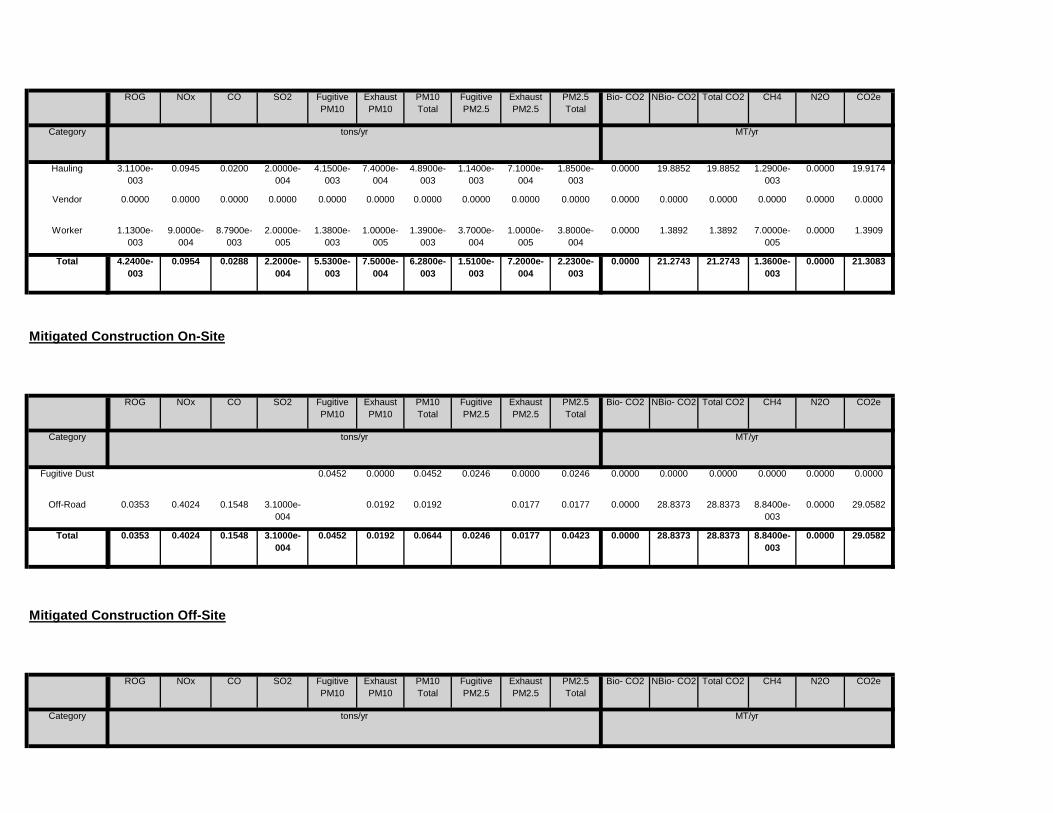
Total CO2 CH4 N2O CO2e
Category tons/yr MT/yr
PM10 Total
Fugitive PM2.5
Exhaust PM2.5
PM2.5 Total
Bio- CO2 NBio- CO2
Mitigated Construction Off-Site
ROG NOx CO SO2 Fugitive PM10
Exhaust PM10
0.0000 28.8373 28.8373 8.8400e-003
0.0000 29.05820.0452 0.0192 0.0644 0.0246 0.0177 0.0423Total 0.0353 0.4024 0.1548 3.1000e-004
0.0000 28.8373 28.8373 8.8400e-003
0.0000 29.05820.0192 0.0192 0.0177 0.0177Off-Road 0.0353 0.4024 0.1548 3.1000e-004
0.0000 0.0000 0.0000 0.0000 0.0000 0.00000.0452 0.0000 0.0452 0.0246 0.0000 0.0246Fugitive Dust
Total CO2 CH4 N2O CO2e
Category tons/yr MT/yr
PM10 Total
Fugitive PM2.5
Exhaust PM2.5
PM2.5 Total
Bio- CO2 NBio- CO2
Mitigated Construction On-Site
ROG NOx CO SO2 Fugitive PM10
Exhaust PM10
0.0000 21.2743 21.2743 1.3600e-003
0.0000 21.30835.5300e-003
7.5000e-004
6.2800e-003
1.5100e-003
7.2000e-004
2.2300e-003
Total 4.2400e-003
0.0954 0.0288 2.2000e-004
0.0000 1.3892 1.3892 7.0000e-005
0.0000 1.39091.3800e-003
1.0000e-005
1.3900e-003
3.7000e-004
1.0000e-005
3.8000e-004
Worker 1.1300e-003
9.0000e-004
8.7900e-003
2.0000e-005
0.0000 0.0000 0.0000 0.0000 0.0000 0.00000.0000 0.0000 0.0000 0.0000 0.0000 0.0000Vendor 0.0000 0.0000 0.0000 0.0000
0.0000 19.8852 19.8852 1.2900e-003
0.0000 19.91744.1500e-003
7.4000e-004
4.8900e-003
1.1400e-003
7.1000e-004
1.8500e-003
Hauling 3.1100e-003
0.0945 0.0200 2.0000e-004
Total CO2 CH4 N2O CO2e
Category tons/yr MT/yr
PM10 Total
Fugitive PM2.5
Exhaust PM2.5
PM2.5 Total
Bio- CO2 NBio- CO2ROG NOx CO SO2 Fugitive PM10
Exhaust PM10
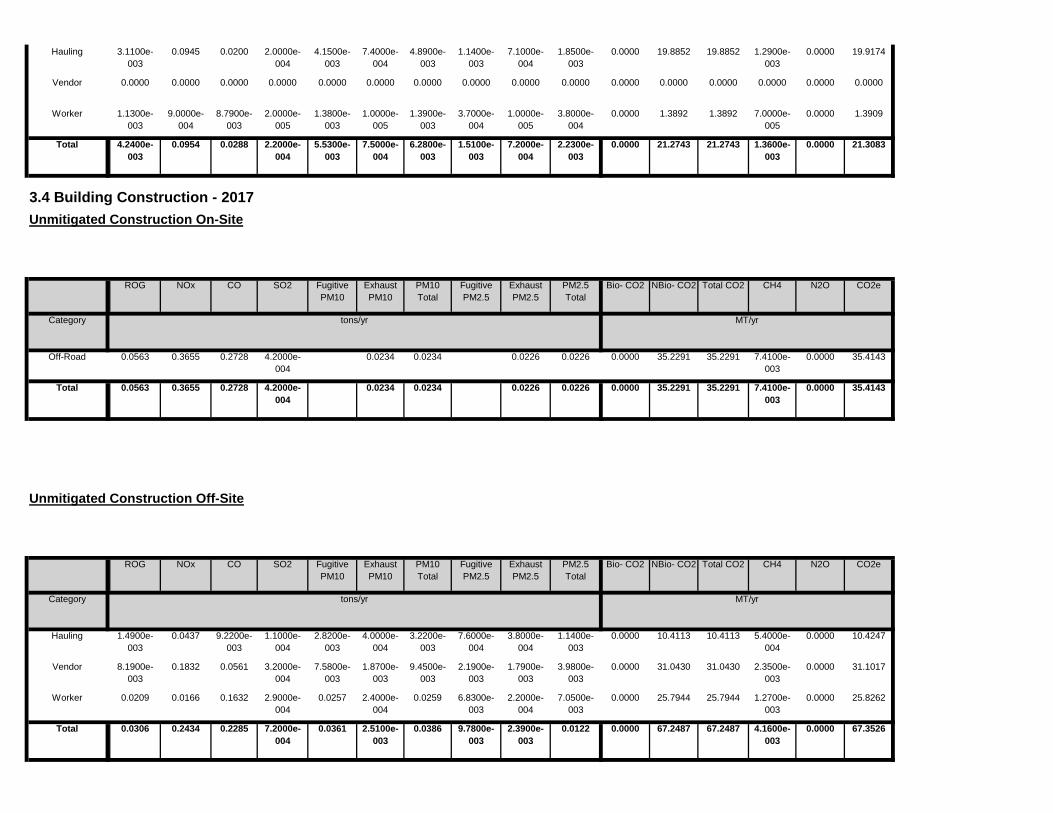
0.0000 67.2487 67.2487 4.1600e-003
0.0000 67.35260.0361 2.5100e-003
0.0386 9.7800e-003
2.3900e-003
0.0122Total 0.0306 0.2434 0.2285 7.2000e-004
0.0000 25.7944 25.7944 1.2700e-003
0.0000 25.82620.0257 2.4000e-004
0.0259 6.8300e-003
2.2000e-004
7.0500e-003
Worker 0.0209 0.0166 0.1632 2.9000e-004
0.0000 31.0430 31.0430 2.3500e-003
0.0000 31.10177.5800e-003
1.8700e-003
9.4500e-003
2.1900e-003
1.7900e-003
3.9800e-003
Vendor 8.1900e-003
0.1832 0.0561 3.2000e-004
0.0000 10.4113 10.4113 5.4000e-004
0.0000 10.42472.8200e-003
4.0000e-004
3.2200e-003
7.6000e-004
3.8000e-004
1.1400e-003
Hauling 1.4900e-003
0.0437 9.2200e-003
1.1000e-004
Total CO2 CH4 N2O CO2e
Category tons/yr MT/yr
PM10 Total
Fugitive PM2.5
Exhaust PM2.5
PM2.5 Total
Bio- CO2 NBio- CO2
Unmitigated Construction Off-Site
ROG NOx CO SO2 Fugitive PM10
Exhaust PM10
0.0000 35.2291 35.2291 7.4100e-003
0.0000 35.41430.0234 0.0234 0.0226 0.0226Total 0.0563 0.3655 0.2728 4.2000e-004
0.0000 35.2291 35.2291 7.4100e-003
0.0000 35.41430.0234 0.0234 0.0226 0.0226Off-Road 0.0563 0.3655 0.2728 4.2000e-004
Total CO2 CH4 N2O CO2e
Category tons/yr MT/yr
PM10 Total
Fugitive PM2.5
Exhaust PM2.5
PM2.5 Total
Bio- CO2 NBio- CO2
3.4 Building Construction - 2017Unmitigated Construction On-Site
ROG NOx CO SO2 Fugitive PM10
Exhaust PM10
0.0000 21.2743 21.2743 1.3600e-003
0.0000 21.30835.5300e-003
7.5000e-004
6.2800e-003
1.5100e-003
7.2000e-004
2.2300e-003
Total 4.2400e-003
0.0954 0.0288 2.2000e-004
0.0000 1.3892 1.3892 7.0000e-005
0.0000 1.39091.3800e-003
1.0000e-005
1.3900e-003
3.7000e-004
1.0000e-005
3.8000e-004
Worker 1.1300e-003
9.0000e-004
8.7900e-003
2.0000e-005
0.0000 0.0000 0.0000 0.0000 0.0000 0.00000.0000 0.0000 0.0000 0.0000 0.0000 0.0000Vendor 0.0000 0.0000 0.0000 0.0000
0.0000 19.8852 19.8852 1.2900e-003
0.0000 19.91744.1500e-003
7.4000e-004
4.8900e-003
1.1400e-003
7.1000e-004
1.8500e-003
Hauling 3.1100e-003
0.0945 0.0200 2.0000e-004
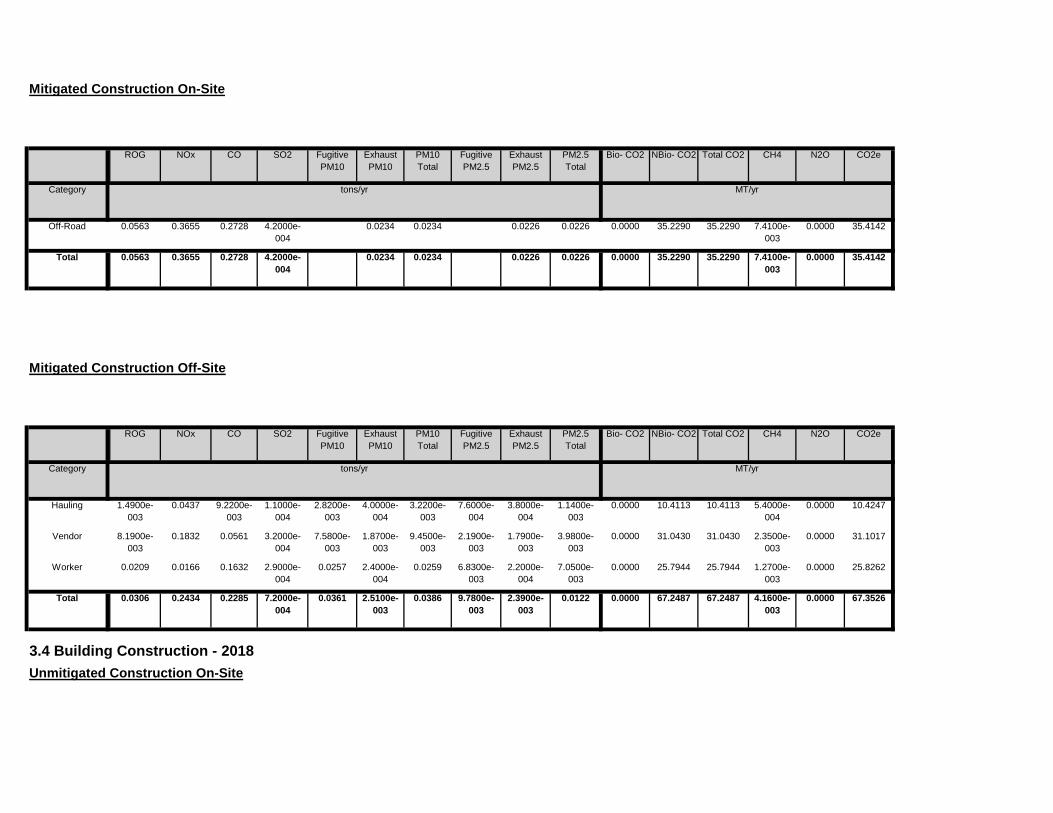
3.4 Building Construction - 2018Unmitigated Construction On-Site
0.0000 67.2487 67.2487 4.1600e-003
0.0000 67.35260.0361 2.5100e-003
0.0386 9.7800e-003
2.3900e-003
0.0122Total 0.0306 0.2434 0.2285 7.2000e-004
0.0000 25.7944 25.7944 1.2700e-003
0.0000 25.82620.0257 2.4000e-004
0.0259 6.8300e-003
2.2000e-004
7.0500e-003
Worker 0.0209 0.0166 0.1632 2.9000e-004
0.0000 31.0430 31.0430 2.3500e-003
0.0000 31.10177.5800e-003
1.8700e-003
9.4500e-003
2.1900e-003
1.7900e-003
3.9800e-003
Vendor 8.1900e-003
0.1832 0.0561 3.2000e-004
0.0000 10.4113 10.4113 5.4000e-004
0.0000 10.42472.8200e-003
4.0000e-004
3.2200e-003
7.6000e-004
3.8000e-004
1.1400e-003
Hauling 1.4900e-003
0.0437 9.2200e-003
1.1000e-004
Total CO2 CH4 N2O CO2e
Category tons/yr MT/yr
PM10 Total
Fugitive PM2.5
Exhaust PM2.5
PM2.5 Total
Bio- CO2 NBio- CO2
Mitigated Construction Off-Site
ROG NOx CO SO2 Fugitive PM10
Exhaust PM10
0.0000 35.2290 35.2290 7.4100e-003
0.0000 35.41420.0234 0.0234 0.0226 0.0226Total 0.0563 0.3655 0.2728 4.2000e-004
0.0000 35.2290 35.2290 7.4100e-003
0.0000 35.41420.0234 0.0234 0.0226 0.0226Off-Road 0.0563 0.3655 0.2728 4.2000e-004
Total CO2 CH4 N2O CO2e
Category tons/yr MT/yr
PM10 Total
Fugitive PM2.5
Exhaust PM2.5
PM2.5 Total
Bio- CO2 NBio- CO2
Mitigated Construction On-Site
ROG NOx CO SO2 Fugitive PM10
Exhaust PM10

0.0000 10.1329 10.1329 2.0400e-003
0.0000 10.18395.8200e-003
5.8200e-003
5.6200e-003
5.6200e-003
Off-Road 0.0143 0.0959 0.0763 1.2000e-004
Total CO2 CH4 N2O CO2e
Category tons/yr MT/yr
PM10 Total
Fugitive PM2.5
Exhaust PM2.5
PM2.5 Total
Bio- CO2 NBio- CO2
Mitigated Construction On-Site
ROG NOx CO SO2 Fugitive PM10
Exhaust PM10
0.0000 19.2034 19.2034 1.1100e-003
0.0000 19.23140.0120 5.6000e-004
0.0126 3.2200e-003
5.3000e-004
3.7600e-003
Total 7.7700e-003
0.0652 0.0578 2.0000e-004
0.0000 7.2679 7.2679 3.2000e-004
0.0000 7.27607.4200e-003
7.0000e-005
7.4900e-003
1.9800e-003
6.0000e-005
2.0400e-003
Worker 5.4200e-003
4.2100e-003
0.0415 8.0000e-005
0.0000 8.9612 8.9612 6.4000e-004
0.0000 8.97722.1900e-003
4.2000e-004
2.6100e-003
6.3000e-004
4.0000e-004
1.0400e-003
Vendor 2.0000e-003
0.0498 0.0140 9.0000e-005
0.0000 2.9744 2.9744 1.5000e-004
0.0000 2.97822.4200e-003
7.0000e-005
2.4900e-003
6.1000e-004
7.0000e-005
6.8000e-004
Hauling 3.5000e-004
0.0113 2.3200e-003
3.0000e-005
Total CO2 CH4 N2O CO2e
Category tons/yr MT/yr
PM10 Total
Fugitive PM2.5
Exhaust PM2.5
PM2.5 Total
Bio- CO2 NBio- CO2
Unmitigated Construction Off-Site
ROG NOx CO SO2 Fugitive PM10
Exhaust PM10
0.0000 10.1329 10.1329 2.0400e-003
0.0000 10.18395.8200e-003
5.8200e-003
5.6200e-003
5.6200e-003
Total 0.0143 0.0959 0.0763 1.2000e-004
0.0000 10.1329 10.1329 2.0400e-003
0.0000 10.18395.8200e-003
5.8200e-003
5.6200e-003
5.6200e-003
Off-Road 0.0143 0.0959 0.0763 1.2000e-004
Total CO2 CH4 N2O CO2e
Category tons/yr MT/yr
PM10 Total
Fugitive PM2.5
Exhaust PM2.5
PM2.5 Total
Bio- CO2 NBio- CO2ROG NOx CO SO2 Fugitive PM10
Exhaust PM10
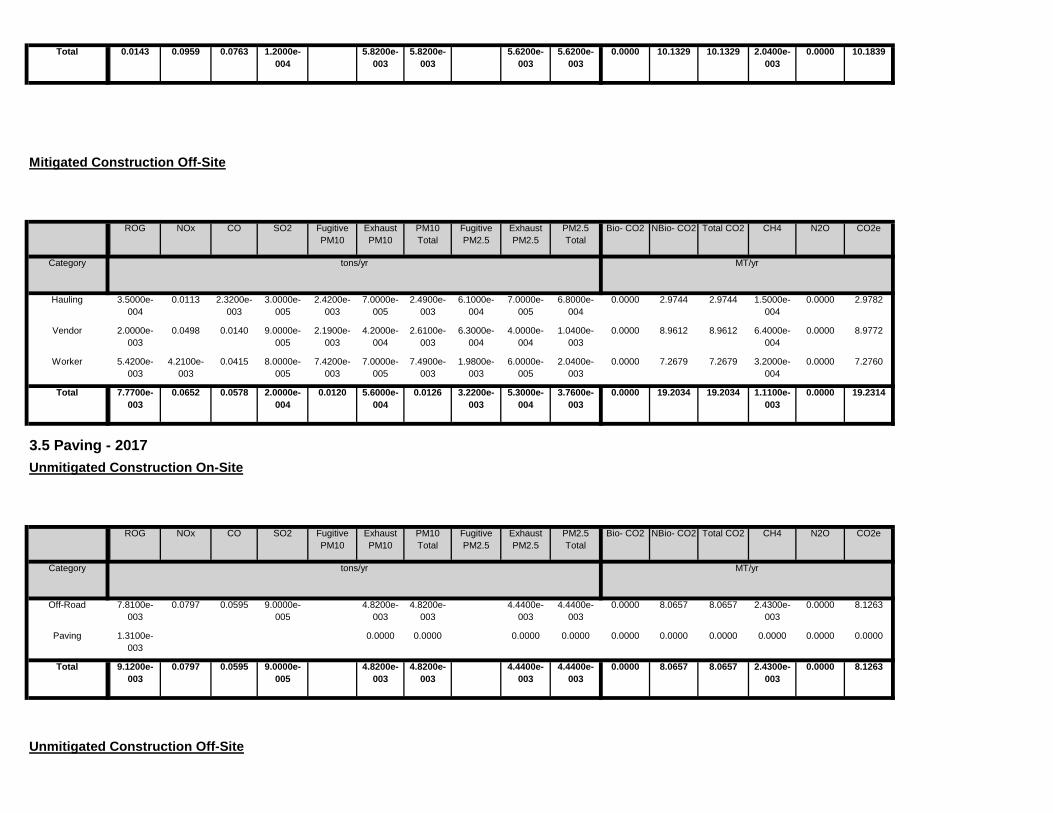
Unmitigated Construction Off-Site
0.0000 8.0657 8.0657 2.4300e-003
0.0000 8.12634.8200e-003
4.8200e-003
4.4400e-003
4.4400e-003
Total 9.1200e-003
0.0797 0.0595 9.0000e-005
0.0000 0.0000 0.0000 0.0000 0.0000 0.00000.0000 0.0000 0.0000 0.0000Paving 1.3100e-003
0.0000 8.0657 8.0657 2.4300e-003
0.0000 8.12634.8200e-003
4.8200e-003
4.4400e-003
4.4400e-003
Off-Road 7.8100e-003
0.0797 0.0595 9.0000e-005
Total CO2 CH4 N2O CO2e
Category tons/yr MT/yr
PM10 Total
Fugitive PM2.5
Exhaust PM2.5
PM2.5 Total
Bio- CO2 NBio- CO2
3.5 Paving - 2017Unmitigated Construction On-Site
ROG NOx CO SO2 Fugitive PM10
Exhaust PM10
0.0000 19.2034 19.2034 1.1100e-003
0.0000 19.23140.0120 5.6000e-004
0.0126 3.2200e-003
5.3000e-004
3.7600e-003
Total 7.7700e-003
0.0652 0.0578 2.0000e-004
0.0000 7.2679 7.2679 3.2000e-004
0.0000 7.27607.4200e-003
7.0000e-005
7.4900e-003
1.9800e-003
6.0000e-005
2.0400e-003
Worker 5.4200e-003
4.2100e-003
0.0415 8.0000e-005
0.0000 8.9612 8.9612 6.4000e-004
0.0000 8.97722.1900e-003
4.2000e-004
2.6100e-003
6.3000e-004
4.0000e-004
1.0400e-003
Vendor 2.0000e-003
0.0498 0.0140 9.0000e-005
0.0000 2.9744 2.9744 1.5000e-004
0.0000 2.97822.4200e-003
7.0000e-005
2.4900e-003
6.1000e-004
7.0000e-005
6.8000e-004
Hauling 3.5000e-004
0.0113 2.3200e-003
3.0000e-005
Total CO2 CH4 N2O CO2e
Category tons/yr MT/yr
PM10 Total
Fugitive PM2.5
Exhaust PM2.5
PM2.5 Total
Bio- CO2 NBio- CO2
Mitigated Construction Off-Site
ROG NOx CO SO2 Fugitive PM10
Exhaust PM10
0.0000 10.1329 10.1329 2.0400e-003
0.0000 10.18395.8200e-003
5.8200e-003
5.6200e-003
5.6200e-003
Total 0.0143 0.0959 0.0763 1.2000e-004
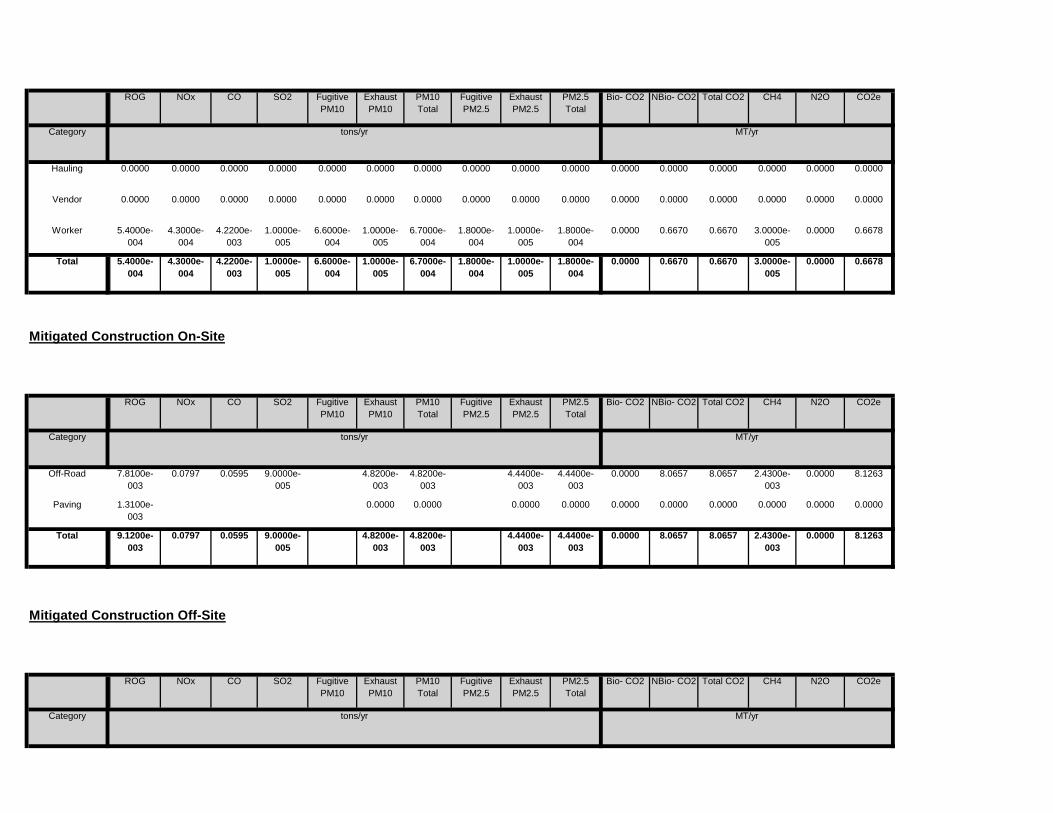
Total CO2 CH4 N2O CO2e
Category tons/yr MT/yr
PM10 Total
Fugitive PM2.5
Exhaust PM2.5
PM2.5 Total
Bio- CO2 NBio- CO2
Mitigated Construction Off-Site
ROG NOx CO SO2 Fugitive PM10
Exhaust PM10
0.0000 8.0657 8.0657 2.4300e-003
0.0000 8.12634.8200e-003
4.8200e-003
4.4400e-003
4.4400e-003
Total 9.1200e-003
0.0797 0.0595 9.0000e-005
0.0000 0.0000 0.0000 0.0000 0.0000 0.00000.0000 0.0000 0.0000 0.0000Paving 1.3100e-003
0.0000 8.0657 8.0657 2.4300e-003
0.0000 8.12634.8200e-003
4.8200e-003
4.4400e-003
4.4400e-003
Off-Road 7.8100e-003
0.0797 0.0595 9.0000e-005
Total CO2 CH4 N2O CO2e
Category tons/yr MT/yr
PM10 Total
Fugitive PM2.5
Exhaust PM2.5
PM2.5 Total
Bio- CO2 NBio- CO2
Mitigated Construction On-Site
ROG NOx CO SO2 Fugitive PM10
Exhaust PM10
0.0000 0.6670 0.6670 3.0000e-005
0.0000 0.66786.6000e-004
1.0000e-005
6.7000e-004
1.8000e-004
1.0000e-005
1.8000e-004
Total 5.4000e-004
4.3000e-004
4.2200e-003
1.0000e-005
0.0000 0.6670 0.6670 3.0000e-005
0.0000 0.66786.6000e-004
1.0000e-005
6.7000e-004
1.8000e-004
1.0000e-005
1.8000e-004
Worker 5.4000e-004
4.3000e-004
4.2200e-003
1.0000e-005
0.0000 0.0000 0.0000 0.0000 0.0000 0.00000.0000 0.0000 0.0000 0.0000 0.0000 0.0000Vendor 0.0000 0.0000 0.0000 0.0000
0.0000 0.0000 0.0000 0.0000 0.0000 0.00000.0000 0.0000 0.0000 0.0000 0.0000 0.0000Hauling 0.0000 0.0000 0.0000 0.0000
Total CO2 CH4 N2O CO2e
Category tons/yr MT/yr
PM10 Total
Fugitive PM2.5
Exhaust PM2.5
PM2.5 Total
Bio- CO2 NBio- CO2ROG NOx CO SO2 Fugitive PM10
Exhaust PM10
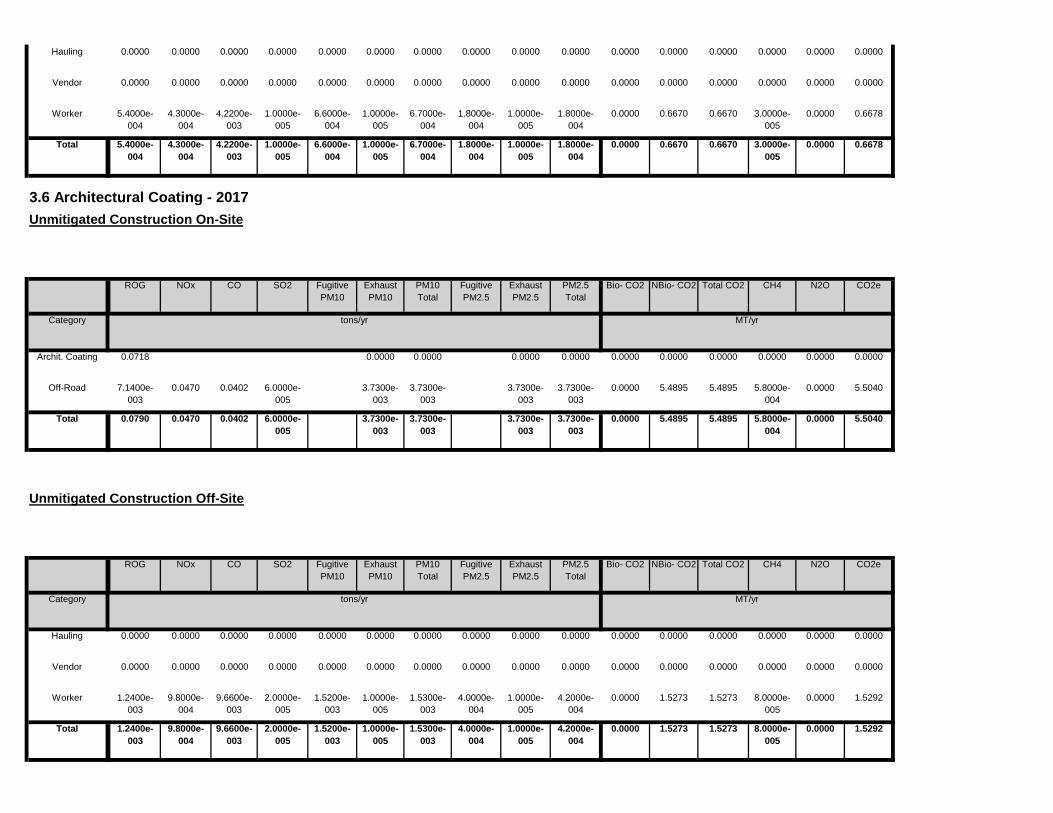
0.0000 1.5273 1.5273 8.0000e-005
0.0000 1.52921.5200e-003
1.0000e-005
1.5300e-003
4.0000e-004
1.0000e-005
4.2000e-004
Total 1.2400e-003
9.8000e-004
9.6600e-003
2.0000e-005
0.0000 1.5273 1.5273 8.0000e-005
0.0000 1.52921.5200e-003
1.0000e-005
1.5300e-003
4.0000e-004
1.0000e-005
4.2000e-004
Worker 1.2400e-003
9.8000e-004
9.6600e-003
2.0000e-005
0.0000 0.0000 0.0000 0.0000 0.0000 0.00000.0000 0.0000 0.0000 0.0000 0.0000 0.0000Vendor 0.0000 0.0000 0.0000 0.0000
0.0000 0.0000 0.0000 0.0000 0.0000 0.00000.0000 0.0000 0.0000 0.0000 0.0000 0.0000Hauling 0.0000 0.0000 0.0000 0.0000
Total CO2 CH4 N2O CO2e
Category tons/yr MT/yr
PM10 Total
Fugitive PM2.5
Exhaust PM2.5
PM2.5 Total
Bio- CO2 NBio- CO2
Unmitigated Construction Off-Site
ROG NOx CO SO2 Fugitive PM10
Exhaust PM10
0.0000 5.4895 5.4895 5.8000e-004
0.0000 5.50403.7300e-003
3.7300e-003
3.7300e-003
3.7300e-003
Total 0.0790 0.0470 0.0402 6.0000e-005
0.0000 5.4895 5.4895 5.8000e-004
0.0000 5.50403.7300e-003
3.7300e-003
3.7300e-003
3.7300e-003
Off-Road 7.1400e-003
0.0470 0.0402 6.0000e-005
0.0000 0.0000 0.0000 0.0000 0.0000 0.00000.0000 0.0000 0.0000 0.0000Archit. Coating 0.0718
Total CO2 CH4 N2O CO2e
Category tons/yr MT/yr
PM10 Total
Fugitive PM2.5
Exhaust PM2.5
PM2.5 Total
Bio- CO2 NBio- CO2
3.6 Architectural Coating - 2017Unmitigated Construction On-Site
ROG NOx CO SO2 Fugitive PM10
Exhaust PM10
0.0000 0.6670 0.6670 3.0000e-005
0.0000 0.66786.6000e-004
1.0000e-005
6.7000e-004
1.8000e-004
1.0000e-005
1.8000e-004
Total 5.4000e-004
4.3000e-004
4.2200e-003
1.0000e-005
0.0000 0.6670 0.6670 3.0000e-005
0.0000 0.66786.6000e-004
1.0000e-005
6.7000e-004
1.8000e-004
1.0000e-005
1.8000e-004
Worker 5.4000e-004
4.3000e-004
4.2200e-003
1.0000e-005
0.0000 0.0000 0.0000 0.0000 0.0000 0.00000.0000 0.0000 0.0000 0.0000 0.0000 0.0000Vendor 0.0000 0.0000 0.0000 0.0000
0.0000 0.0000 0.0000 0.0000 0.0000 0.00000.0000 0.0000 0.0000 0.0000 0.0000 0.0000Hauling 0.0000 0.0000 0.0000 0.0000

3.6 Architectural Coating - 2018Unmitigated Construction On-Site
0.0000 1.5273 1.5273 8.0000e-005
0.0000 1.52921.5200e-003
1.0000e-005
1.5300e-003
4.0000e-004
1.0000e-005
4.2000e-004
Total 1.2400e-003
9.8000e-004
9.6600e-003
2.0000e-005
0.0000 1.5273 1.5273 8.0000e-005
0.0000 1.52921.5200e-003
1.0000e-005
1.5300e-003
4.0000e-004
1.0000e-005
4.2000e-004
Worker 1.2400e-003
9.8000e-004
9.6600e-003
2.0000e-005
0.0000 0.0000 0.0000 0.0000 0.0000 0.00000.0000 0.0000 0.0000 0.0000 0.0000 0.0000Vendor 0.0000 0.0000 0.0000 0.0000
0.0000 0.0000 0.0000 0.0000 0.0000 0.00000.0000 0.0000 0.0000 0.0000 0.0000 0.0000Hauling 0.0000 0.0000 0.0000 0.0000
Total CO2 CH4 N2O CO2e
Category tons/yr MT/yr
PM10 Total
Fugitive PM2.5
Exhaust PM2.5
PM2.5 Total
Bio- CO2 NBio- CO2
Mitigated Construction Off-Site
ROG NOx CO SO2 Fugitive PM10
Exhaust PM10
0.0000 5.4895 5.4895 5.8000e-004
0.0000 5.50403.7300e-003
3.7300e-003
3.7300e-003
3.7300e-003
Total 0.0790 0.0470 0.0402 6.0000e-005
0.0000 5.4895 5.4895 5.8000e-004
0.0000 5.50403.7300e-003
3.7300e-003
3.7300e-003
3.7300e-003
Off-Road 7.1400e-003
0.0470 0.0402 6.0000e-005
0.0000 0.0000 0.0000 0.0000 0.0000 0.00000.0000 0.0000 0.0000 0.0000Archit. Coating 0.0718
Total CO2 CH4 N2O CO2e
Category tons/yr MT/yr
PM10 Total
Fugitive PM2.5
Exhaust PM2.5
PM2.5 Total
Bio- CO2 NBio- CO2
Mitigated Construction On-Site
ROG NOx CO SO2 Fugitive PM10
Exhaust PM10
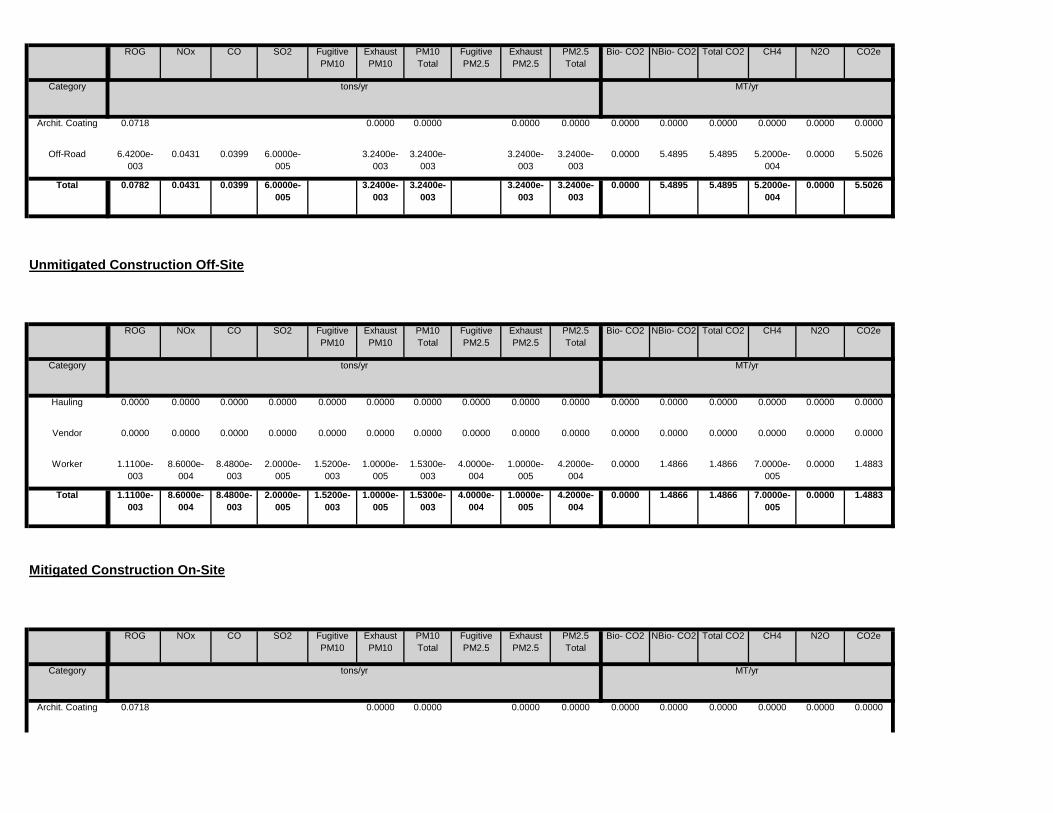
0.0000 0.0000 0.0000 0.0000 0.0000 0.00000.0000 0.0000 0.0000 0.0000Archit. Coating 0.0718
Total CO2 CH4 N2O CO2e
Category tons/yr MT/yr
PM10 Total
Fugitive PM2.5
Exhaust PM2.5
PM2.5 Total
Bio- CO2 NBio- CO2
Mitigated Construction On-Site
ROG NOx CO SO2 Fugitive PM10
Exhaust PM10
0.0000 1.4866 1.4866 7.0000e-005
0.0000 1.48831.5200e-003
1.0000e-005
1.5300e-003
4.0000e-004
1.0000e-005
4.2000e-004
Total 1.1100e-003
8.6000e-004
8.4800e-003
2.0000e-005
0.0000 1.4866 1.4866 7.0000e-005
0.0000 1.48831.5200e-003
1.0000e-005
1.5300e-003
4.0000e-004
1.0000e-005
4.2000e-004
Worker 1.1100e-003
8.6000e-004
8.4800e-003
2.0000e-005
0.0000 0.0000 0.0000 0.0000 0.0000 0.00000.0000 0.0000 0.0000 0.0000 0.0000 0.0000Vendor 0.0000 0.0000 0.0000 0.0000
0.0000 0.0000 0.0000 0.0000 0.0000 0.00000.0000 0.0000 0.0000 0.0000 0.0000 0.0000Hauling 0.0000 0.0000 0.0000 0.0000
Total CO2 CH4 N2O CO2e
Category tons/yr MT/yr
PM10 Total
Fugitive PM2.5
Exhaust PM2.5
PM2.5 Total
Bio- CO2 NBio- CO2
Unmitigated Construction Off-Site
ROG NOx CO SO2 Fugitive PM10
Exhaust PM10
0.0000 5.4895 5.4895 5.2000e-004
0.0000 5.50263.2400e-003
3.2400e-003
3.2400e-003
3.2400e-003
Total 0.0782 0.0431 0.0399 6.0000e-005
0.0000 5.4895 5.4895 5.2000e-004
0.0000 5.50263.2400e-003
3.2400e-003
3.2400e-003
3.2400e-003
Off-Road 6.4200e-003
0.0431 0.0399 6.0000e-005
0.0000 0.0000 0.0000 0.0000 0.0000 0.00000.0000 0.0000 0.0000 0.0000Archit. Coating 0.0718
Total CO2 CH4 N2O CO2e
Category tons/yr MT/yr
PM10 Total
Fugitive PM2.5
Exhaust PM2.5
PM2.5 Total
Bio- CO2 NBio- CO2ROG NOx CO SO2 Fugitive PM10
Exhaust PM10
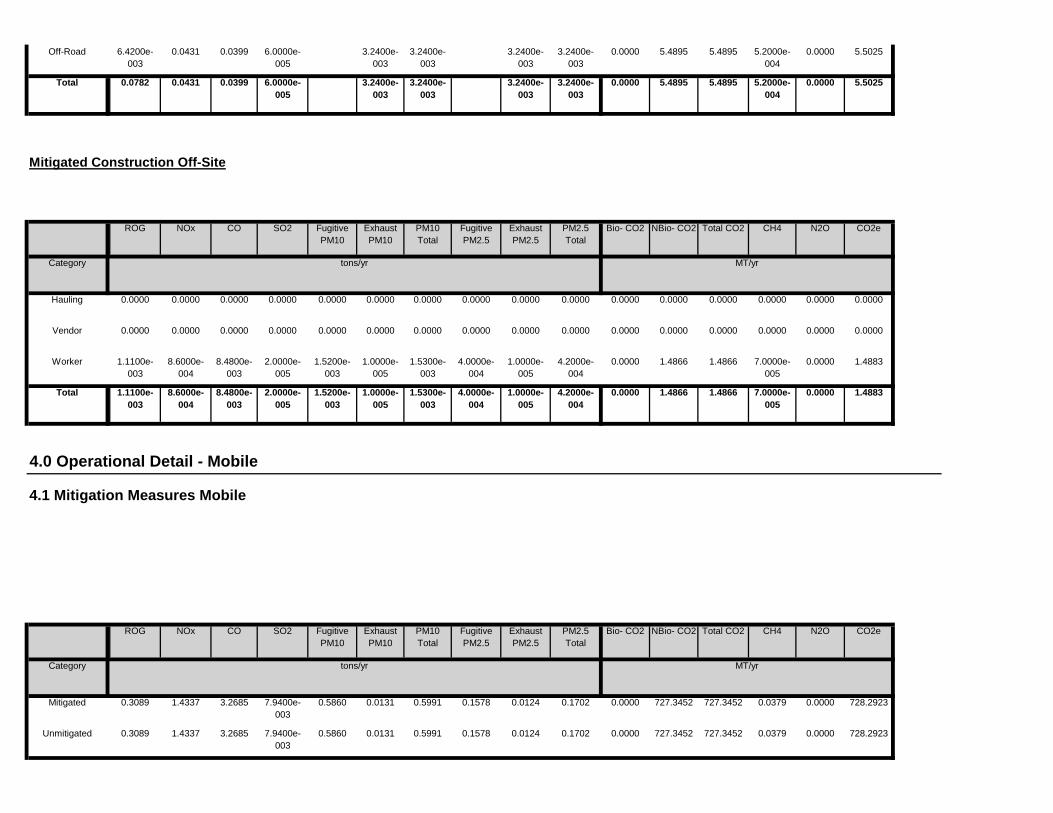
0.0000 727.3452 727.3452 0.0379 0.0000 728.29230.5860 0.0131 0.5991 0.1578 0.0124 0.1702Unmitigated 0.3089 1.4337 3.2685 7.9400e-003
0.0000 727.3452 727.3452 0.0379 0.0000 728.29230.5860 0.0131 0.5991 0.1578 0.0124 0.1702Mitigated 0.3089 1.4337 3.2685 7.9400e-003
NBio- CO2 Total CO2 CH4 N2O CO2e
Category tons/yr MT/yr
Exhaust PM10
PM10 Total
Fugitive PM2.5
Exhaust PM2.5
PM2.5 Total
Bio- CO2
4.0 Operational Detail - Mobile
4.1 Mitigation Measures Mobile
ROG NOx CO SO2 Fugitive PM10
0.0000 1.4866 1.4866 7.0000e-005
0.0000 1.48831.5200e-003
1.0000e-005
1.5300e-003
4.0000e-004
1.0000e-005
4.2000e-004
Total 1.1100e-003
8.6000e-004
8.4800e-003
2.0000e-005
0.0000 1.4866 1.4866 7.0000e-005
0.0000 1.48831.5200e-003
1.0000e-005
1.5300e-003
4.0000e-004
1.0000e-005
4.2000e-004
Worker 1.1100e-003
8.6000e-004
8.4800e-003
2.0000e-005
0.0000 0.0000 0.0000 0.0000 0.0000 0.00000.0000 0.0000 0.0000 0.0000 0.0000 0.0000Vendor 0.0000 0.0000 0.0000 0.0000
0.0000 0.0000 0.0000 0.0000 0.0000 0.00000.0000 0.0000 0.0000 0.0000 0.0000 0.0000Hauling 0.0000 0.0000 0.0000 0.0000
Total CO2 CH4 N2O CO2e
Category tons/yr MT/yr
PM10 Total
Fugitive PM2.5
Exhaust PM2.5
PM2.5 Total
Bio- CO2 NBio- CO2
Mitigated Construction Off-Site
ROG NOx CO SO2 Fugitive PM10
Exhaust PM10
0.0000 5.4895 5.4895 5.2000e-004
0.0000 5.50253.2400e-003
3.2400e-003
3.2400e-003
3.2400e-003
Total 0.0782 0.0431 0.0399 6.0000e-005
0.0000 5.4895 5.4895 5.2000e-004
0.0000 5.50253.2400e-003
3.2400e-003
3.2400e-003
3.2400e-003
Off-Road 6.4200e-003
0.0431 0.0399 6.0000e-005
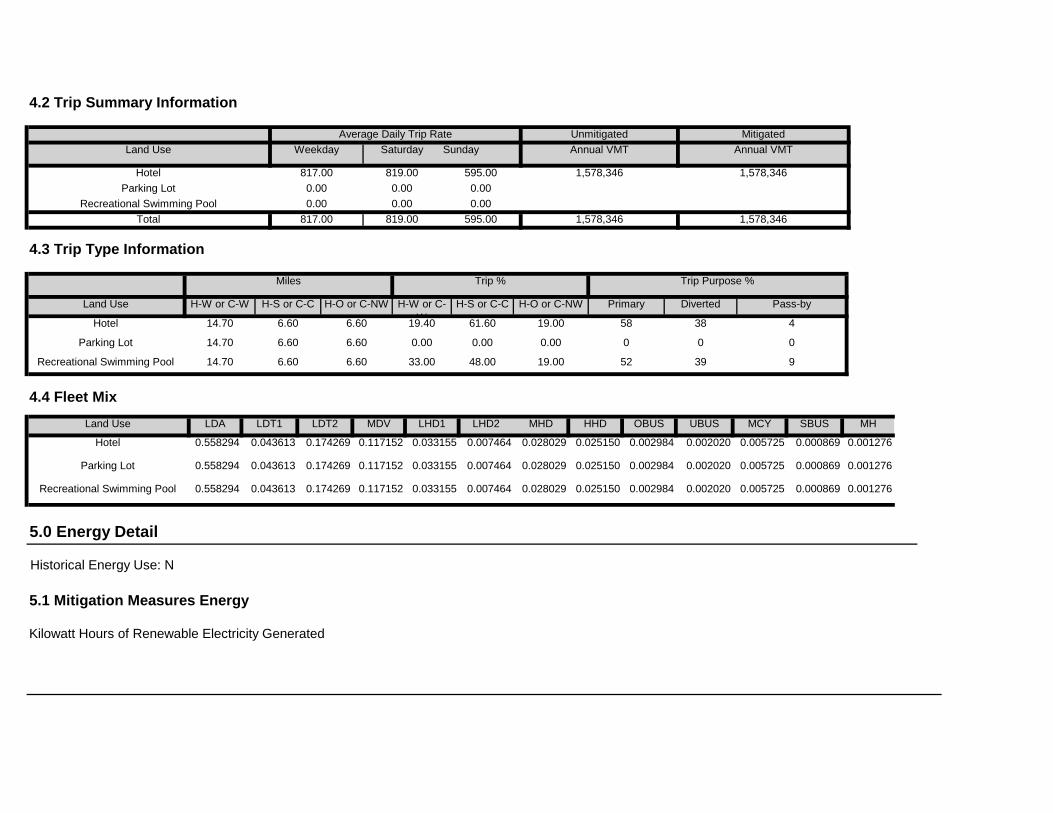
5.0 Energy Detail
Historical Energy Use: N
5.1 Mitigation Measures Energy
Kilowatt Hours of Renewable Electricity Generated
0.025150 0.002984 0.002020 0.005725 0.000869 0.001276
0.000869 0.001276
Recreational Swimming Pool 0.558294 0.043613 0.174269 0.117152 0.033155 0.007464 0.028029
0.007464 0.028029 0.025150 0.002984 0.002020 0.005725Parking Lot 0.558294 0.043613 0.174269 0.117152 0.033155
0.025150 0.002984 0.002020 0.005725 0.000869 0.001276
SBUS MH
Hotel 0.558294 0.043613 0.174269 0.117152 0.033155 0.007464 0.028029
LHD2 MHD HHD OBUS UBUS MCYLand Use LDA LDT1 LDT2 MDV LHD1
48.00 19.00 52 39 9
4.4 Fleet Mix
0.00 0.00 0 0 0
Recreational Swimming Pool 14.70 6.60 6.60 33.00
61.60 19.00 58 38 4
Parking Lot 14.70 6.60 6.60 0.00
H-S or C-C H-O or C-NW Primary Diverted Pass-by
Hotel 14.70 6.60 6.60 19.40
4.3 Trip Type Information
Miles Trip % Trip Purpose %
Land Use H-W or C-W H-S or C-C H-O or C-NW H-W or C-W
Total 817.00 819.00 595.00 1,578,346 1,578,346Recreational Swimming Pool 0.00 0.00 0.00
Parking Lot 0.00 0.00 0.00
Annual VMT
Hotel 817.00 819.00 595.00 1,578,346 1,578,346
4.2 Trip Summary Information
Average Daily Trip Rate Unmitigated MitigatedLand Use Weekday Saturday Sunday Annual VMT
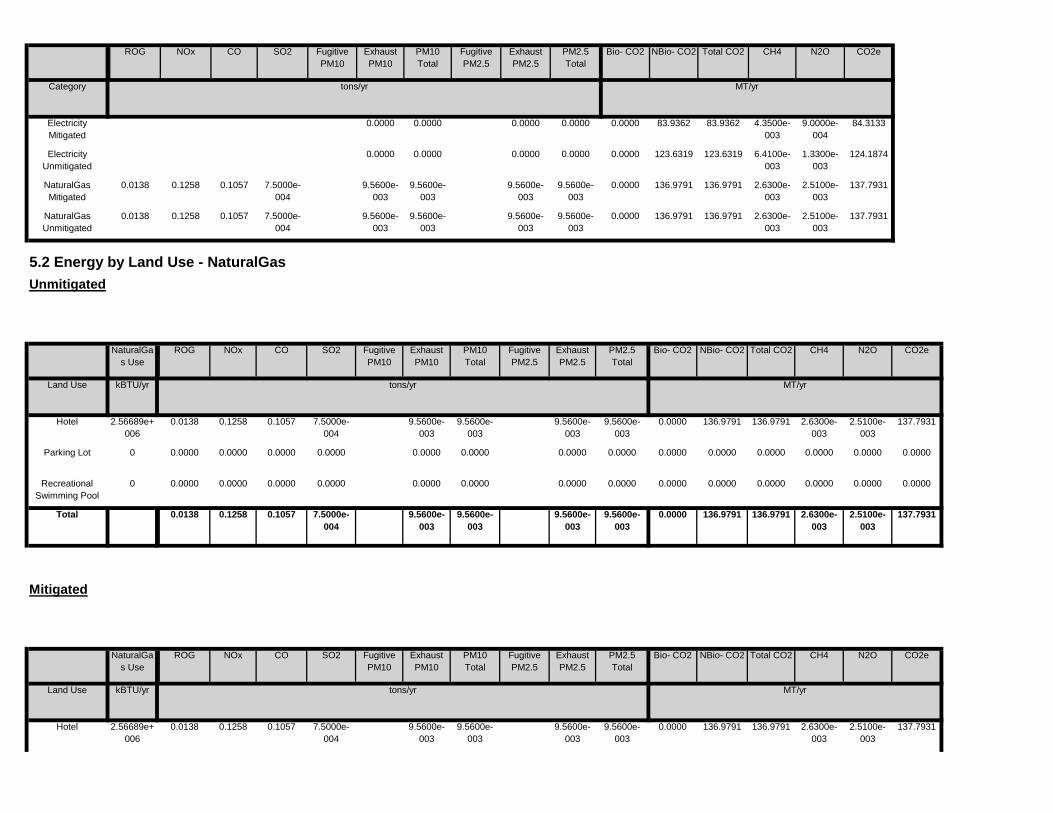
2.5100e-003
137.79319.5600e-003
9.5600e-003
0.0000 136.9791 136.9791 2.6300e-003
0.1057 7.5000e-004
9.5600e-003
9.5600e-003
CO2e
Land Use kBTU/yr tons/yr MT/yr
Hotel 2.56689e+006
0.0138 0.1258
PM2.5 Total
Bio- CO2 NBio- CO2 Total CO2 CH4 N2OSO2 Fugitive PM10
Exhaust PM10
PM10 Total
Fugitive PM2.5
Exhaust PM2.5
NaturalGas Use
ROG NOx CO
136.9791 2.6300e-003
2.5100e-003
137.7931
Mitigated
9.5600e-003
9.5600e-003
9.5600e-003
0.0000 136.9791
0.0000
Total 0.0138 0.1258 0.1057 7.5000e-004
9.5600e-003
0.0000 0.0000 0.0000 0.0000 0.0000 0.00000.0000 0.0000 0.0000 0.0000
0.0000 0.0000 0.0000 0.0000
Recreational Swimming Pool
0 0.0000 0.0000 0.0000
0.0000 0.0000 0.0000 0.0000 0.0000
137.7931
Parking Lot 0 0.0000 0.0000 0.0000 0.0000 0.0000
9.5600e-003
0.0000 136.9791 136.9791 2.6300e-003
2.5100e-003
7.5000e-004
9.5600e-003
9.5600e-003
9.5600e-003
Hotel 2.56689e+006
0.0138 0.1258 0.1057
Total CO2 CH4 N2O CO2e
Land Use kBTU/yr tons/yr MT/yr
PM10 Total
Fugitive PM2.5
Exhaust PM2.5
PM2.5 Total
Bio- CO2 NBio- CO2
Unmitigated
NaturalGas Use
ROG NOx CO SO2 Fugitive PM10
Exhaust PM10
136.9791 136.9791 2.6300e-003
2.5100e-003
137.7931
5.2 Energy by Land Use - NaturalGas
9.5600e-003
9.5600e-003
9.5600e-003
9.5600e-003
0.0000
2.6300e-003
2.5100e-003
137.7931
NaturalGas Unmitigated
0.0138 0.1258 0.1057 7.5000e-004
9.5600e-003
9.5600e-003
0.0000 136.9791 136.9791
124.1874
NaturalGas Mitigated
0.0138 0.1258 0.1057 7.5000e-004
9.5600e-003
9.5600e-003
0.0000 0.0000 123.6319 123.6319 6.4100e-003
1.3300e-003
0.0000 0.0000 0.0000
83.9362 83.9362 4.3500e-003
9.0000e-004
84.3133
Electricity Unmitigated
0.0000 0.0000 0.0000 0.0000 0.0000
Category tons/yr MT/yr
Electricity Mitigated
Bio- CO2 NBio- CO2 Total CO2 CH4 N2O CO2eFugitive PM10
Exhaust PM10
PM10 Total
Fugitive PM2.5
Exhaust PM2.5
PM2.5 Total
ROG NOx CO SO2
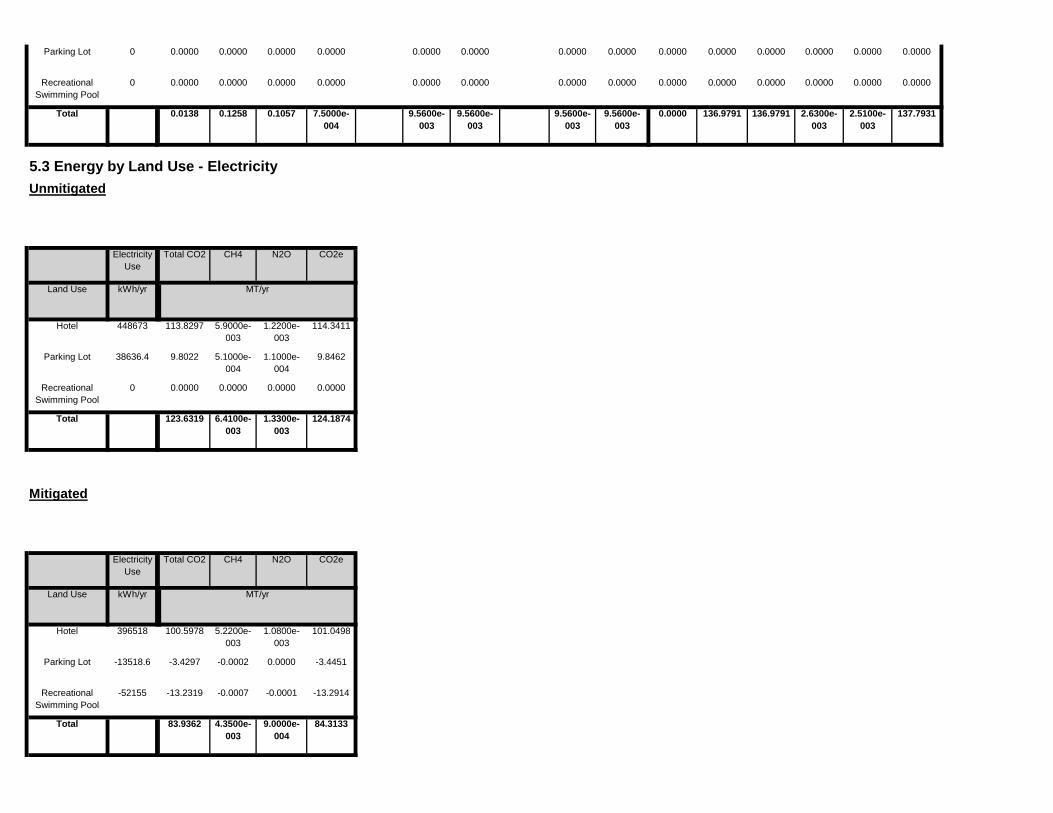
-13.2914
Total 83.9362 4.3500e-003
9.0000e-004
84.3133
Recreational Swimming Pool
-52155 -13.2319 -0.0007 -0.0001
101.0498
Parking Lot -13518.6 -3.4297 -0.0002 0.0000 -3.4451
Land Use kWh/yr ton
MT/yr
Hotel 396518 100.5978 5.2200e-003
1.0800e-003
Mitigated
Electricity Use
Total CO2 CH4 N2O CO2e
0.0000
Total 123.6319 6.4100e-003
1.3300e-003
124.1874
Recreational Swimming Pool
0 0.0000 0.0000 0.0000
114.3411
Parking Lot 38636.4 9.8022 5.1000e-004
1.1000e-004
9.8462
Land Use kWh/yr ton
MT/yr
Hotel 448673 113.8297 5.9000e-003
1.2200e-003
Unmitigated
Electricity Use
Total CO2 CH4 N2O CO2e
136.9791 136.9791 2.6300e-003
2.5100e-003
137.7931
5.3 Energy by Land Use - Electricity
9.5600e-003
9.5600e-003
9.5600e-003
9.5600e-003
0.0000
0.0000 0.0000
Total 0.0138 0.1258 0.1057 7.5000e-004
0.0000 0.0000 0.0000 0.0000 0.0000 0.00000.0000 0.0000 0.0000 0.0000
0.0000 0.0000 0.0000 0.0000 0.0000
Recreational Swimming Pool
0 0.0000 0.0000
0.0000 0.0000 0.0000 0.0000 0.0000Parking Lot 0 0.0000 0.0000 0.0000 0.0000
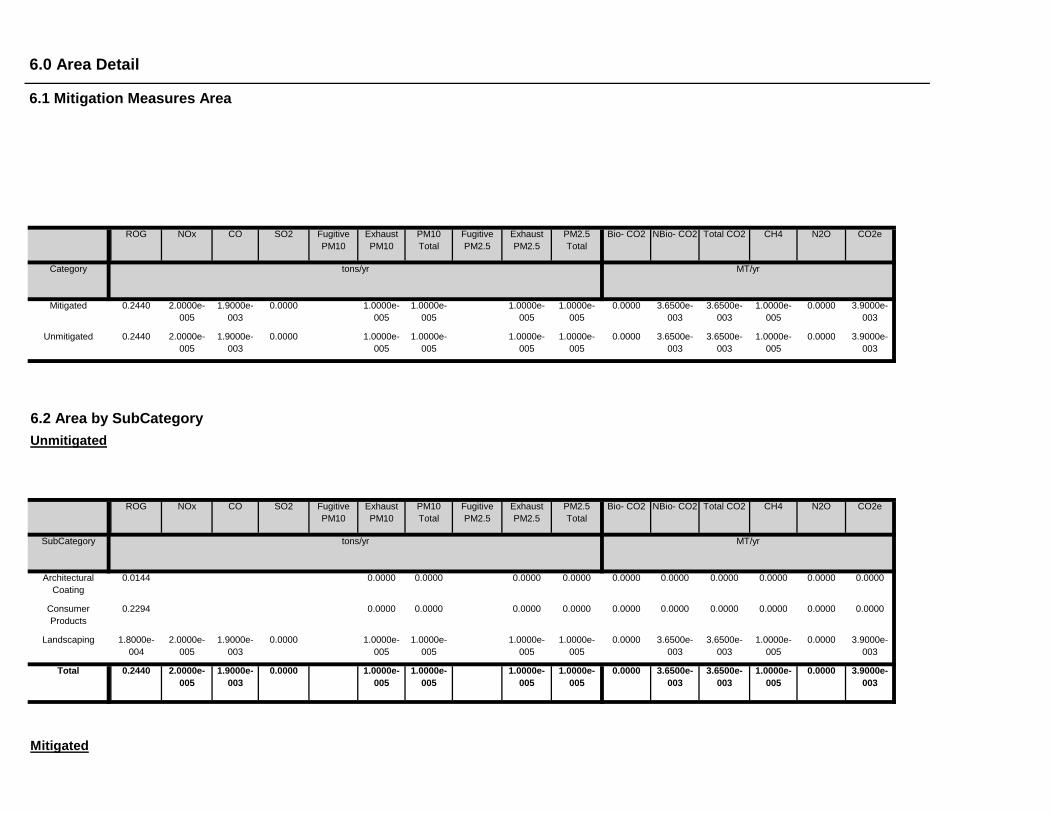
Mitigated
0.0000 3.6500e-003
3.6500e-003
1.0000e-005
0.0000 3.9000e-003
1.0000e-005
1.0000e-005
1.0000e-005
1.0000e-005
Total 0.2440 2.0000e-005
1.9000e-003
0.0000
0.0000 3.6500e-003
3.6500e-003
1.0000e-005
0.0000 3.9000e-003
1.0000e-005
1.0000e-005
1.0000e-005
1.0000e-005
Landscaping 1.8000e-004
2.0000e-005
1.9000e-003
0.0000
0.0000 0.0000 0.0000 0.0000 0.0000 0.00000.0000 0.0000 0.0000 0.0000Consumer Products
0.2294
0.0000 0.0000 0.0000 0.0000 0.0000 0.00000.0000 0.0000 0.0000 0.0000Architectural Coating
0.0144
Total CO2 CH4 N2O CO2e
SubCategory tons/yr MT/yr
PM10 Total
Fugitive PM2.5
Exhaust PM2.5
PM2.5 Total
Bio- CO2 NBio- CO2
6.2 Area by SubCategoryUnmitigated
ROG NOx CO SO2 Fugitive PM10
Exhaust PM10
0.0000 3.6500e-003
3.6500e-003
1.0000e-005
0.0000 3.9000e-003
1.0000e-005
1.0000e-005
1.0000e-005
1.0000e-005
Unmitigated 0.2440 2.0000e-005
1.9000e-003
0.0000
0.0000 3.6500e-003
3.6500e-003
1.0000e-005
0.0000 3.9000e-003
1.0000e-005
1.0000e-005
1.0000e-005
1.0000e-005
Mitigated 0.2440 2.0000e-005
1.9000e-003
0.0000
NBio- CO2 Total CO2 CH4 N2O CO2e
Category tons/yr MT/yr
Exhaust PM10
PM10 Total
Fugitive PM2.5
Exhaust PM2.5
PM2.5 Total
Bio- CO2
6.0 Area Detail
6.1 Mitigation Measures Area
ROG NOx CO SO2 Fugitive PM10
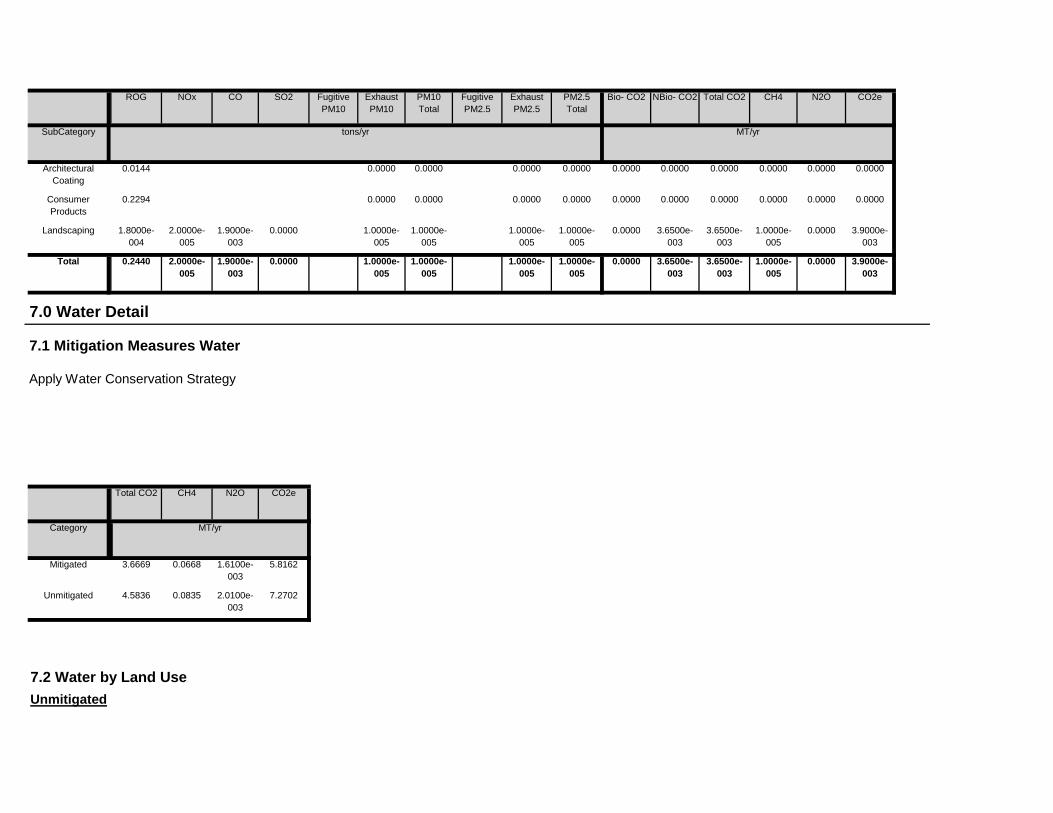
7.2 Water by Land UseUnmitigated
Unmitigated 4.5836 0.0835 2.0100e-003
7.2702
Category ton
MT/yr
Mitigated 3.6669 0.0668 1.6100e-003
5.8162
7.0 Water Detail
7.1 Mitigation Measures Water
Apply Water Conservation Strategy
Total CO2 CH4 N2O CO2e
0.0000 3.6500e-003
3.6500e-003
1.0000e-005
0.0000 3.9000e-003
1.0000e-005
1.0000e-005
1.0000e-005
1.0000e-005
Total 0.2440 2.0000e-005
1.9000e-003
0.0000
0.0000 3.6500e-003
3.6500e-003
1.0000e-005
0.0000 3.9000e-003
1.0000e-005
1.0000e-005
1.0000e-005
1.0000e-005
Landscaping 1.8000e-004
2.0000e-005
1.9000e-003
0.0000
0.0000 0.0000 0.0000 0.0000 0.0000 0.00000.0000 0.0000 0.0000 0.0000Consumer Products
0.2294
0.0000 0.0000 0.0000 0.0000 0.0000 0.00000.0000 0.0000 0.0000 0.0000Architectural Coating
0.0144
Total CO2 CH4 N2O CO2e
SubCategory tons/yr MT/yr
PM10 Total
Fugitive PM2.5
Exhaust PM2.5
PM2.5 Total
Bio- CO2 NBio- CO2ROG NOx CO SO2 Fugitive PM10
Exhaust PM10
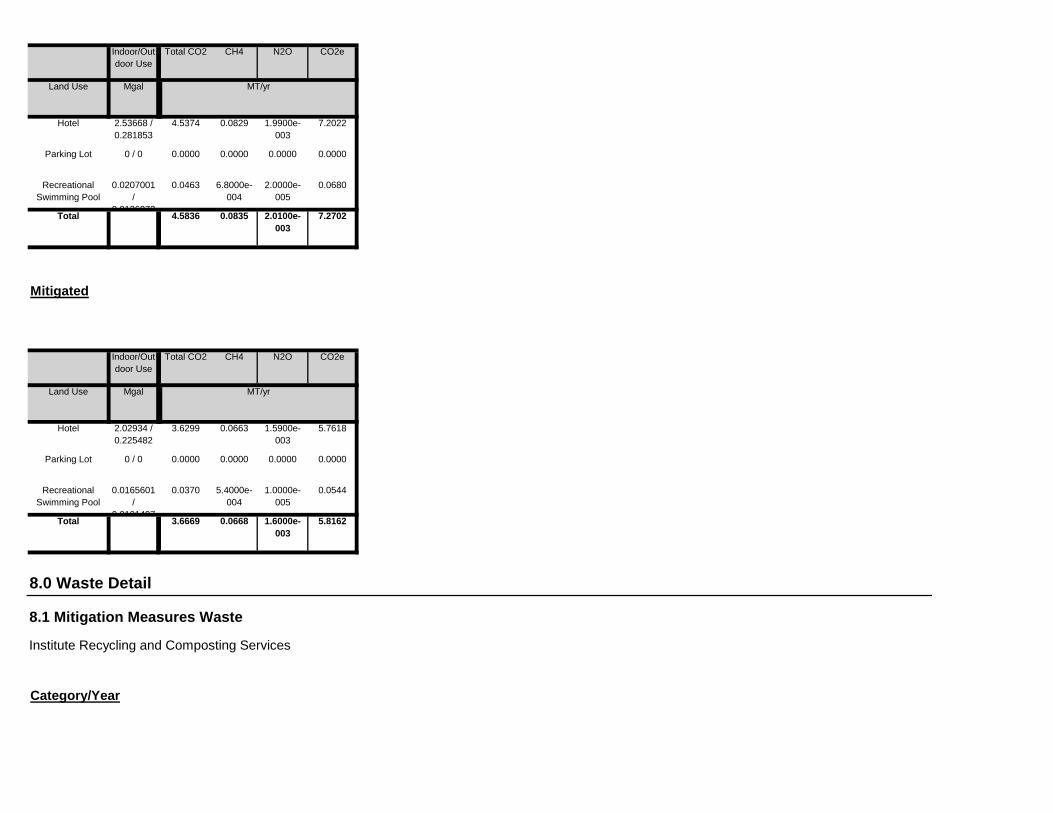
8.0 Waste Detail
8.1 Mitigation Measures Waste
Institute Recycling and Composting Services
Category/Year
0.0544
Total 3.6669 0.0668 1.6000e-003
5.8162
Recreational Swimming Pool
0.0165601 /
0 0101497
0.0370 5.4000e-004
1.0000e-005
5.7618
Parking Lot 0 / 0 0.0000 0.0000 0.0000 0.0000
Land Use Mgal ton
MT/yr
Hotel 2.02934 / 0.225482
3.6299 0.0663 1.5900e-003
Mitigated
Indoor/Outdoor Use
Total CO2 CH4 N2O CO2e
0.0680
Total 4.5836 0.0835 2.0100e-003
7.2702
Recreational Swimming Pool
0.0207001 /
0 0126872
0.0463 6.8000e-004
2.0000e-005
7.2022
Parking Lot 0 / 0 0.0000 0.0000 0.0000 0.0000
Land Use Mgal ton
MT/yr
Hotel 2.53668 / 0.281853
4.5374 0.0829 1.9900e-003
Indoor/Outdoor Use
Total CO2 CH4 N2O CO2e
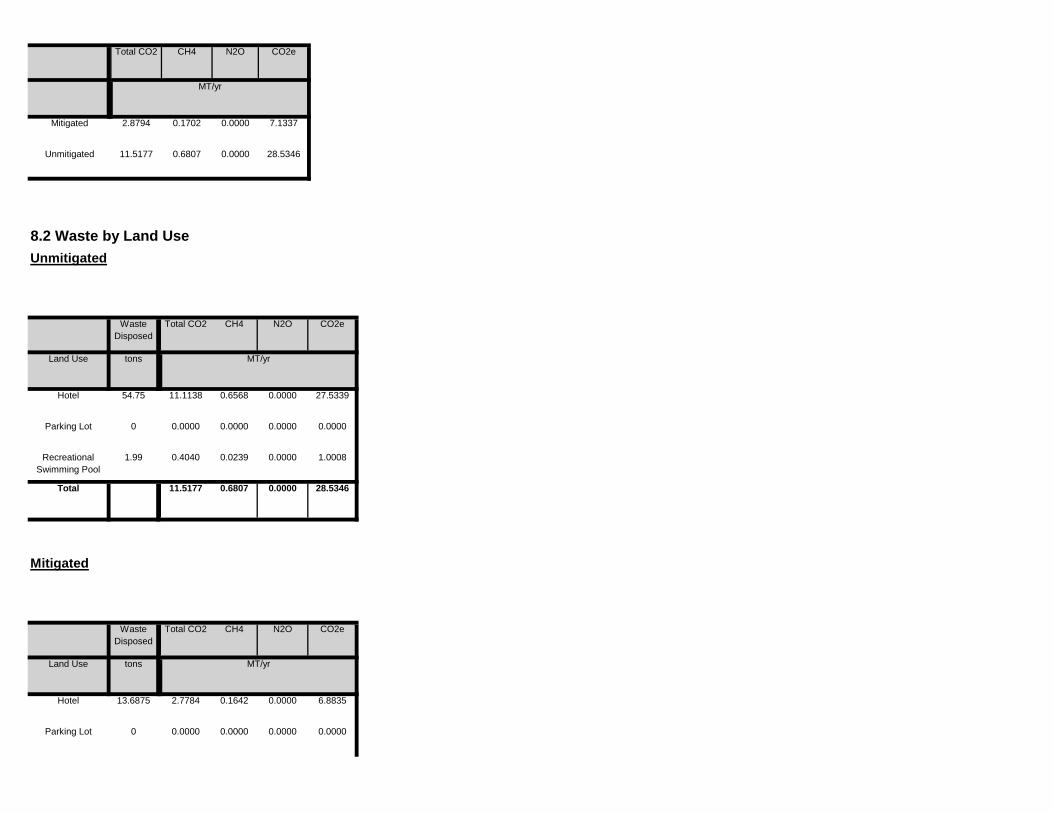
6.8835
Parking Lot 0 0.0000 0.0000 0.0000 0.0000
Land Use tons ton
MT/yr
Hotel 13.6875 2.7784 0.1642 0.0000
Mitigated
Waste Disposed
Total CO2 CH4 N2O CO2e
1.0008
Total 11.5177 0.6807 0.0000 28.5346
Recreational Swimming Pool
1.99 0.4040 0.0239 0.0000
27.5339
Parking Lot 0 0.0000 0.0000 0.0000 0.0000
Land Use tons ton
MT/yr
Hotel 54.75 11.1138 0.6568 0.0000
8.2 Waste by Land UseUnmitigated
Waste Disposed
Total CO2 CH4 N2O CO2e
Unmitigated 11.5177 0.6807 0.0000 28.5346
ton
MT/yr
Mitigated 2.8794 0.1702 0.0000 7.1337
Total CO2 CH4 N2O CO2e
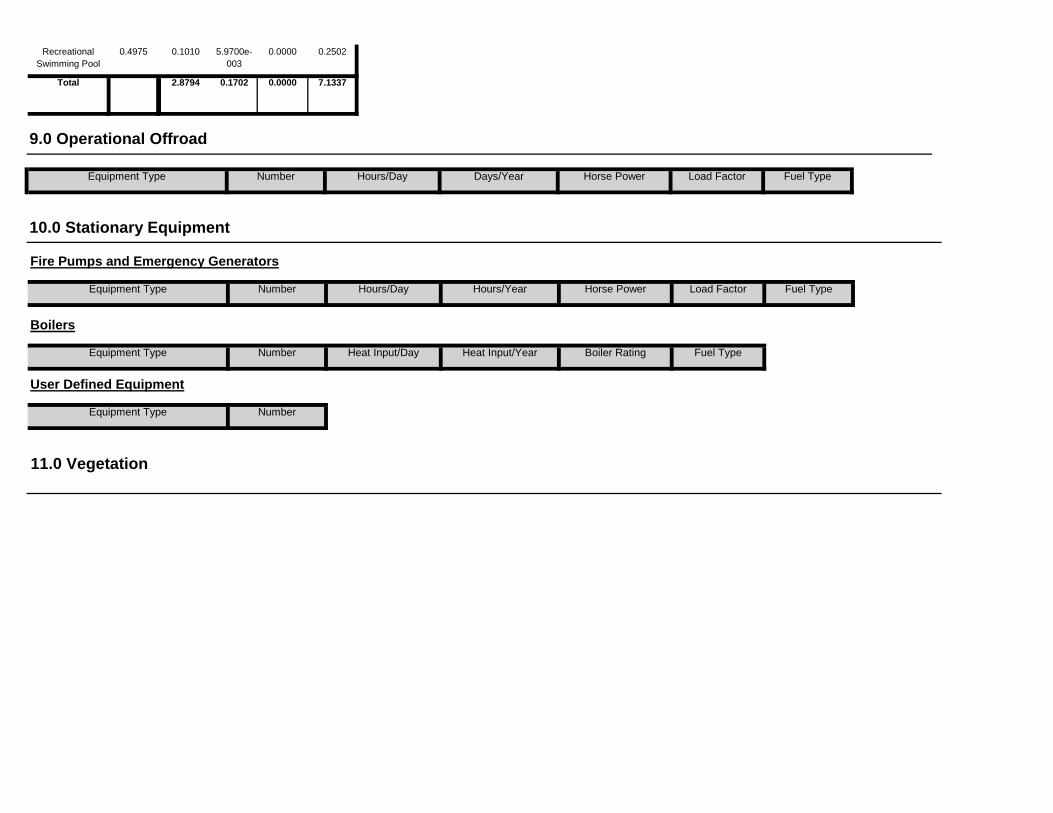
User Defined Equipment
Equipment Type Number
11.0 Vegetation
Fuel Type
Boilers
Equipment Type Number Heat Input/Day Heat Input/Year Boiler Rating Fuel Type
Load Factor Fuel Type
10.0 Stationary Equipment
Fire Pumps and Emergency Generators
Equipment Type Number Hours/Day Hours/Year Horse Power Load Factor
9.0 Operational Offroad
Equipment Type Number Hours/Day Days/Year Horse Power
0.2502
Total 2.8794 0.1702 0.0000 7.1337
Recreational Swimming Pool
0.4975 0.1010 5.9700e-003
0.0000

Off-road Equipment - Building would be modular and shipped to site. Assumed 25% of typical equipment needed (adjusted hrs/day) for building construction based on applicant inputOff-road Equipment - Default equipment for Paving
Off-road Equipment - Default equipment for Architectural Coating
Grading - 4,000 CY of soil exported
1.3 User Entered Comments & Non-Default Data
Project Characteristics - CO2 intensity adjusted based on 25% RPS
Land Use - Land uses: 100-room hotel with a 350 sf swimming pool and 104-space above ground parking lot
Construction Phase - Adjusted default construction schedule based on applicant input
Off-road Equipment - Default equipment for Site Preparation
Off-road Equipment - Default equipment for Grading
CO2 Intensity (lb/MWhr)
559.32 CH4 Intensity (lb/MWhr)
0.029 N2O Intensity (lb/MWhr)
0.006
75
Climate Zone 4 Operational Year 2019
Utility Company Pacific Gas & Electric Company
1.2 Other Project Characteristics
Urbanization Rural Wind Speed (m/s) 2.2 Precipitation Freq (Days)
Recreational Swimming Pool 0.35 1000sqft 0.01 350.00 0
Parking Lot 104.00 Space 1.00 43,905.00 0
Floor Surface Area Population
Hotel 100.00 Room 0.72 57,670.00 0
1.0 Project Characteristics
1.1 Land Usage
Land Uses Size Metric Lot Acreage
CalEEMod Version: CalEEMod.2016.3.1 Page 1 of 1 Date: 4/28/2017 11:40 AM
Fairfield Inn & Suites - Sonoma-San Francisco County, Summer
Fairfield Inn & SuitesSonoma-San Francisco County, Summer

tblConstructionPhase PhaseStartDate 7/7/2017 6/1/2017
tblConstructionPhase PhaseStartDate 7/1/2017 6/1/2017
tblConstructionPhase PhaseEndDate 6/30/2017 6/15/2017
tblConstructionPhase PhaseStartDate 4/27/2018 11/1/2017
tblConstructionPhase PhaseEndDate 7/6/2017 8/1/2017
tblConstructionPhase PhaseEndDate 4/26/2018 8/31/2017
tblConstructionPhase PhaseEndDate 5/10/2018 2/28/2018
tblConstructionPhase PhaseEndDate 4/12/2018 3/1/2018
tblConstructionPhase NumDays 10.00 13.00
tblConstructionPhase NumDays 2.00 11.00
tblConstructionPhase NumDays 200.00 196.00
tblConstructionPhase NumDays 4.00 44.00
tblConstDustMitigation WaterUnpavedRoadVehicleSpeed 40 15
tblConstructionPhase NumDays 10.00 86.00
tblAreaCoating Area_EF_Nonresidential_Exterior 150 50
tblAreaCoating Area_EF_Nonresidential_Interior 100 50
tblArchitecturalCoating EF_Nonresidential_Exterior 150.00 50.00
tblArchitecturalCoating EF_Nonresidential_Interior 100.00 50.00
Energy Mitigation - 110 kW of solar power assumed per applicant input, estimated generation of 156,465 kWh/year based on PVWatts Calculator
Water Mitigation - 20% indoor/outdoor reduction in water assumed for CALGreen compliance
Waste Mitigation - 75% waste diversion consistent with AB 341
Table Name Column Name Default Value New Value
Vehicle Trips - Default traffic trip generation assumed based on TIS
Area Coating - Low-VOC coatings assumed per applicant input
Energy Use - Default energy use intensity
Water And Wastewater - Default water and wastewater
Solid Waste - Default solid waste
Construction Off-road Equipment Mitigation - Basic control measures - water exposed area 2x per day and 15mph vehicle speed on unpaved areas
Trips and VMT - Building would be modular and shipped to site on 60 trucks (120 one-way trips) -- assumed 60 mile triplength to account for potential travel from Bay AreaArchitectural Coating - Low-VOC coatings will be used per applicant input
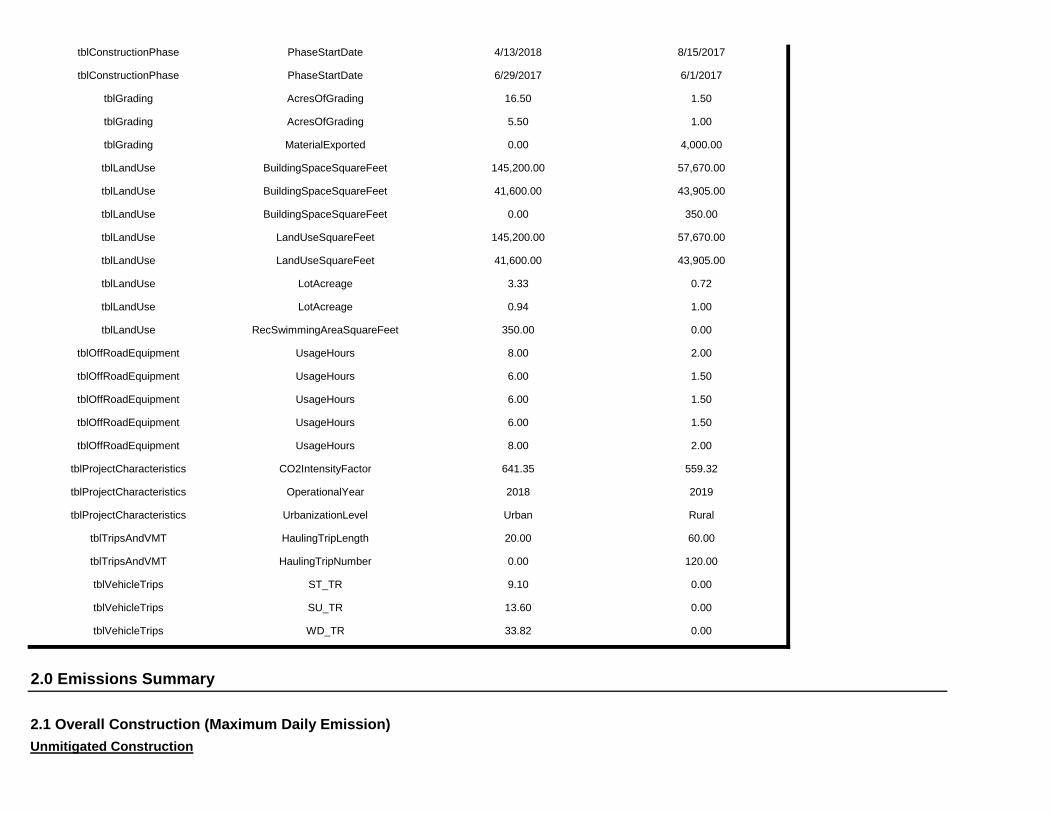
2.0 Emissions Summary
2.1 Overall Construction (Maximum Daily Emission)Unmitigated Construction
tblVehicleTrips SU_TR 13.60 0.00
tblVehicleTrips WD_TR 33.82 0.00
tblTripsAndVMT HaulingTripNumber 0.00 120.00
tblVehicleTrips ST_TR 9.10 0.00
tblProjectCharacteristics UrbanizationLevel Urban Rural
tblTripsAndVMT HaulingTripLength 20.00 60.00
tblProjectCharacteristics CO2IntensityFactor 641.35 559.32
tblProjectCharacteristics OperationalYear 2018 2019
tblOffRoadEquipment UsageHours 6.00 1.50
tblOffRoadEquipment UsageHours 8.00 2.00
tblOffRoadEquipment UsageHours 6.00 1.50
tblOffRoadEquipment UsageHours 6.00 1.50
tblLandUse RecSwimmingAreaSquareFeet 350.00 0.00
tblOffRoadEquipment UsageHours 8.00 2.00
tblLandUse LotAcreage 3.33 0.72
tblLandUse LotAcreage 0.94 1.00
tblLandUse LandUseSquareFeet 145,200.00 57,670.00
tblLandUse LandUseSquareFeet 41,600.00 43,905.00
tblLandUse BuildingSpaceSquareFeet 41,600.00 43,905.00
tblLandUse BuildingSpaceSquareFeet 0.00 350.00
tblGrading MaterialExported 0.00 4,000.00
tblLandUse BuildingSpaceSquareFeet 145,200.00 57,670.00
tblGrading AcresOfGrading 16.50 1.50
tblGrading AcresOfGrading 5.50 1.00
tblConstructionPhase PhaseStartDate 4/13/2018 8/15/2017
tblConstructionPhase PhaseStartDate 6/29/2017 6/1/2017
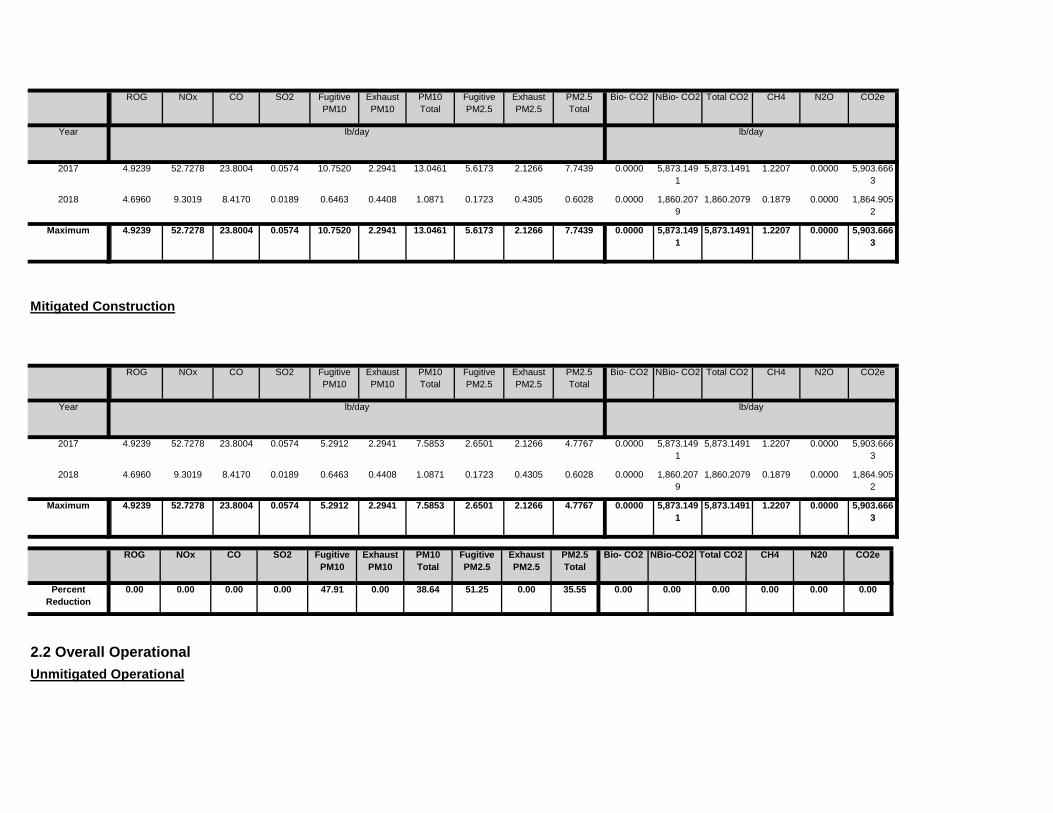
2.2 Overall OperationalUnmitigated Operational
0.00 0.00 0.00 0.00 0.00 0.0047.91 0.00 38.64 51.25 0.00 35.55
NBio-CO2 Total CO2 CH4 N20 CO2e
Percent Reduction
0.00 0.00 0.00 0.00
Exhaust PM10
PM10 Total
Fugitive PM2.5
Exhaust PM2.5
PM2.5 Total
Bio- CO2ROG NOx CO SO2 Fugitive PM10
0.0000 5,873.1491
5,873.1491 1.2207 0.0000 5,903.6663
5.2912 2.2941 7.5853 2.6501 2.1266 4.7767Maximum 4.9239 52.7278 23.8004 0.0574
0.0000 1,860.2079
1,860.2079 0.1879 0.0000 1,864.9052
0.6463 0.4408 1.0871 0.1723 0.4305 0.60282018 4.6960 9.3019 8.4170 0.0189
0.0000 5,873.1491
5,873.1491 1.2207 0.0000 5,903.6663
5.2912 2.2941 7.5853 2.6501 2.1266 4.77672017 4.9239 52.7278 23.8004 0.0574
Total CO2 CH4 N2O CO2e
Year lb/day lb/day
PM10 Total
Fugitive PM2.5
Exhaust PM2.5
PM2.5 Total
Bio- CO2 NBio- CO2
Mitigated Construction
ROG NOx CO SO2 Fugitive PM10
Exhaust PM10
0.0000 5,873.1491
5,873.1491 1.2207 0.0000 5,903.6663
10.7520 2.2941 13.0461 5.6173 2.1266 7.7439Maximum 4.9239 52.7278 23.8004 0.0574
0.0000 1,860.2079
1,860.2079 0.1879 0.0000 1,864.9052
0.6463 0.4408 1.0871 0.1723 0.4305 0.60282018 4.6960 9.3019 8.4170 0.0189
0.0000 5,873.1491
5,873.1491 1.2207 0.0000 5,903.6663
10.7520 2.2941 13.0461 5.6173 2.1266 7.74392017 4.9239 52.7278 23.8004 0.0574
NBio- CO2 Total CO2 CH4 N2O CO2e
Year lb/day lb/day
Exhaust PM10
PM10 Total
Fugitive PM2.5
Exhaust PM2.5
PM2.5 Total
Bio- CO2ROG NOx CO SO2 Fugitive PM10
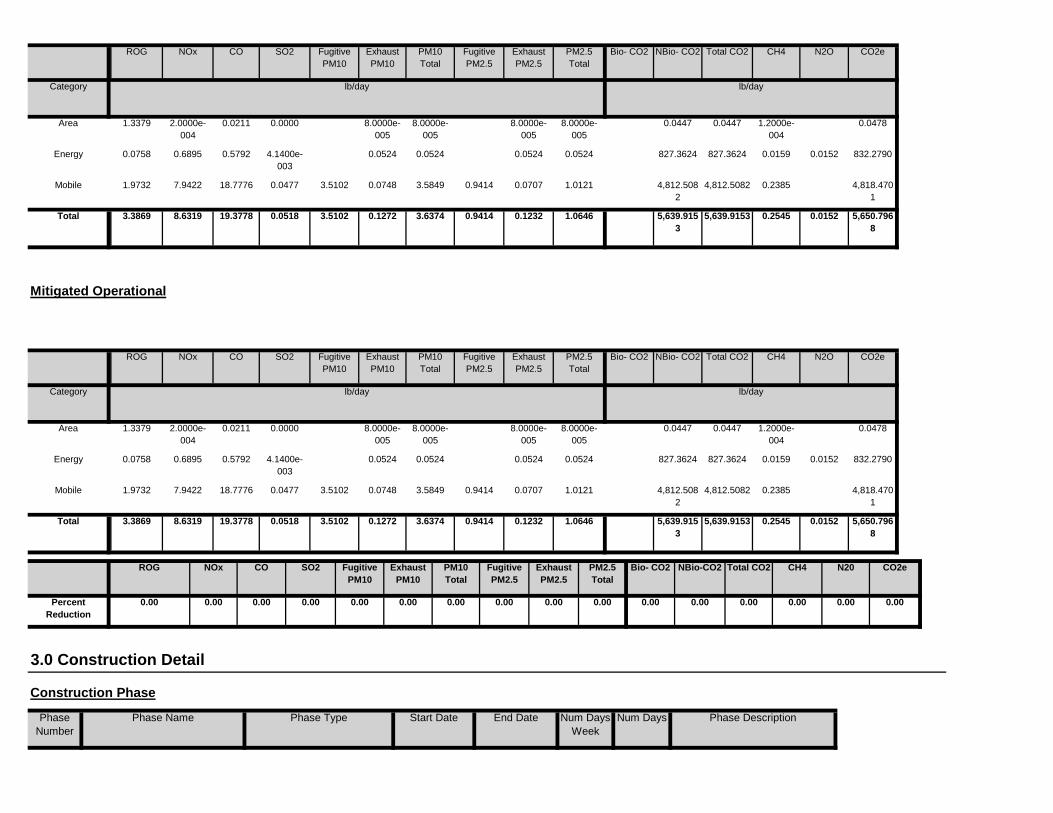
End Date Num Days Week
Num Days Phase Description
3.0 Construction Detail
Construction Phase
Phase Number
Phase Name Phase Type Start Date
0.00 0.00 0.00 0.00 0.00 0.000.00 0.00 0.00 0.00 0.00 0.00
NBio-CO2 Total CO2 CH4 N20 CO2e
Percent Reduction
0.00 0.00 0.00 0.00
Exhaust PM10
PM10 Total
Fugitive PM2.5
Exhaust PM2.5
PM2.5 Total
Bio- CO2ROG NOx CO SO2 Fugitive PM10
5,639.9153
5,639.9153 0.2545 0.0152 5,650.7968
3.5102 0.1272 3.6374 0.9414 0.1232 1.0646Total 3.3869 8.6319 19.3778 0.0518
4,812.5082
4,812.5082 0.2385 4,818.4701
3.5102 0.0748 3.5849 0.9414 0.0707 1.0121Mobile 1.9732 7.9422 18.7776 0.0477
827.3624 827.3624 0.0159 0.0152 832.27900.0524 0.0524 0.0524 0.0524Energy 0.0758 0.6895 0.5792 4.1400e-003
0.0447 0.0447 1.2000e-004
0.04788.0000e-005
8.0000e-005
8.0000e-005
8.0000e-005
Area 1.3379 2.0000e-004
0.0211 0.0000
Total CO2 CH4 N2O CO2e
Category lb/day lb/day
PM10 Total
Fugitive PM2.5
Exhaust PM2.5
PM2.5 Total
Bio- CO2 NBio- CO2
Mitigated Operational
ROG NOx CO SO2 Fugitive PM10
Exhaust PM10
5,639.9153
5,639.9153 0.2545 0.0152 5,650.7968
3.5102 0.1272 3.6374 0.9414 0.1232 1.0646Total 3.3869 8.6319 19.3778 0.0518
4,812.5082
4,812.5082 0.2385 4,818.4701
3.5102 0.0748 3.5849 0.9414 0.0707 1.0121Mobile 1.9732 7.9422 18.7776 0.0477
827.3624 827.3624 0.0159 0.0152 832.27900.0524 0.0524 0.0524 0.0524Energy 0.0758 0.6895 0.5792 4.1400e-003
0.0447 0.0447 1.2000e-004
0.04788.0000e-005
8.0000e-005
8.0000e-005
8.0000e-005
Area 1.3379 2.0000e-004
0.0211 0.0000
Total CO2 CH4 N2O CO2e
Category lb/day lb/day
PM10 Total
Fugitive PM2.5
Exhaust PM2.5
PM2.5 Total
Bio- CO2 NBio- CO2ROG NOx CO SO2 Fugitive PM10
Exhaust PM10
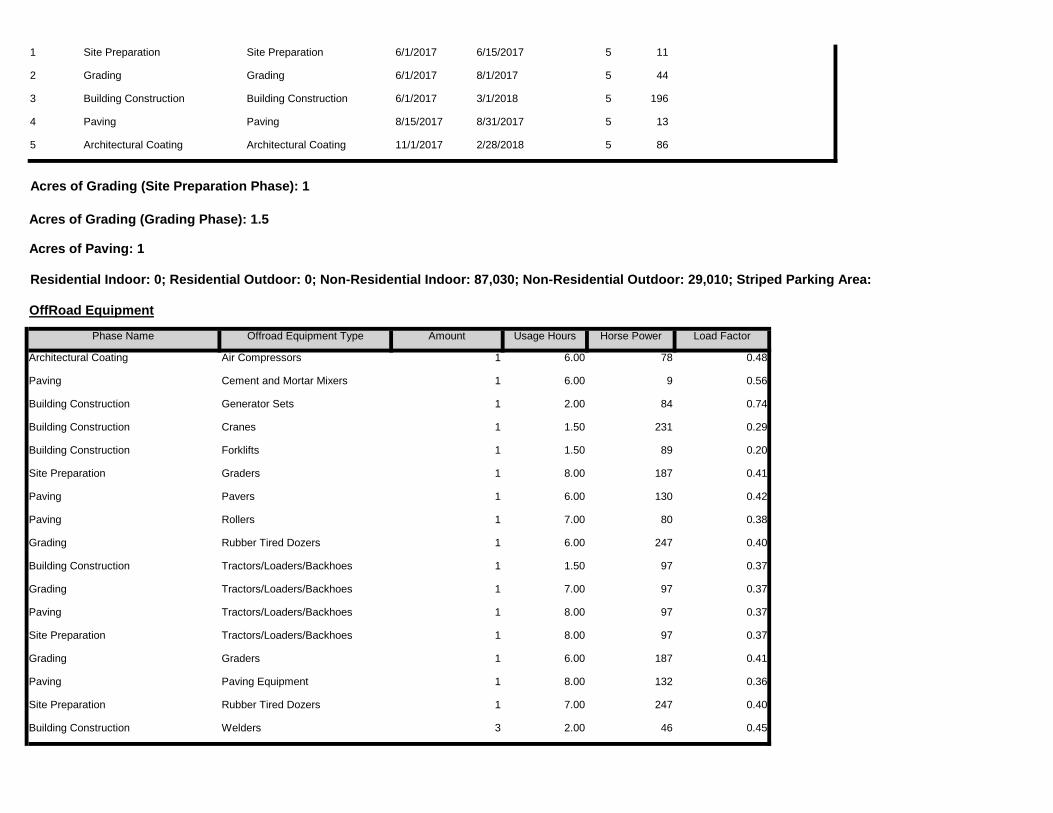
Building Construction Welders 3 2.00 46 0.45
Site Preparation Rubber Tired Dozers 1 7.00 247 0.40
Paving Paving Equipment 1 8.00 132 0.36
Grading Graders 1 6.00 187 0.41
Site Preparation Tractors/Loaders/Backhoes 1 8.00 97 0.37
Paving Tractors/Loaders/Backhoes 1 8.00 97 0.37
Grading Tractors/Loaders/Backhoes 1 7.00 97 0.37
Building Construction Tractors/Loaders/Backhoes 1 1.50 97 0.37
Grading Rubber Tired Dozers 1 6.00 247 0.40
Paving Rollers 1 7.00 80 0.38
Paving Pavers 1 6.00 130 0.42
Site Preparation Graders 1 8.00 187 0.41
Building Construction Forklifts 1 1.50 89 0.20
Building Construction Cranes 1 1.50 231 0.29
Building Construction Generator Sets 1 2.00 84 0.74
Paving Cement and Mortar Mixers 1 6.00 9 0.56
Load Factor
Architectural Coating Air Compressors 1 6.00 78 0.48
OffRoad Equipment
Phase Name Offroad Equipment Type Amount Usage Hours Horse Power
86
Acres of Grading (Site Preparation Phase): 1
Acres of Grading (Grading Phase): 1.5
Acres of Paving: 1
Residential Indoor: 0; Residential Outdoor: 0; Non-Residential Indoor: 87,030; Non-Residential Outdoor: 29,010; Striped Parking Area:
5 Architectural Coating Architectural Coating 11/1/2017 2/28/2018 5
196
4 Paving Paving 8/15/2017 8/31/2017 5 13
3 Building Construction Building Construction 6/1/2017 3/1/2018 5
11
2 Grading Grading 6/1/2017 8/1/2017 5 44
1 Site Preparation Site Preparation 6/1/2017 6/15/2017 5

Unmitigated Construction Off-Site
1,764.2381
1,764.2381 0.5406 1,777.7521
5.3657 1.0451 6.4108 2.9069 0.9615 3.8683Total 1.9297 22.2106 8.4016 0.0172
1,764.2381
1,764.2381 0.5406 1,777.7521
1.0451 1.0451 0.9615 0.9615Off-Road 1.9297 22.2106 8.4016 0.0172
0.0000 0.00005.3657 0.0000 5.3657 2.9069 0.0000 2.9069
CO2e
Category lb/day lb/day
Fugitive Dust
PM2.5 Total
Bio- CO2 NBio- CO2 Total CO2 CH4 N2OSO2 Fugitive PM10
Exhaust PM10
PM10 Total
Fugitive PM2.5
Exhaust PM2.5
Water Exposed Area
Reduce Vehicle Speed on Unpaved Roads
Clean Paved Roads
3.2 Site Preparation - 2017Unmitigated Construction On-Site
ROG NOx CO
6.60 20.00 LD_Mix HDT_Mix HHDT
3.1 Mitigation Measures Construction
Site Preparation 3 8.00 0.00 0.00 10.80
10.80 6.60 20.00 LD_Mix HDT_Mix HHDT
6.60 20.00 LD_Mix HDT_Mix HHDT
Paving 5 13.00 0.00 0.00
Grading 3 8.00 0.00 500.00 10.80
10.80 6.60 60.00 LD_Mix HDT_Mix HHDT
6.60 20.00 LD_Mix HDT_Mix HHDT
Building Construction 7 43.00 17.00 120.00
Architectural Coating 1 9.00 0.00 0.00 10.80
Worker Trip Length
Vendor Trip Length
Hauling Trip Length
Worker Vehicle Class
Vendor Vehicle Class
Hauling Vehicle Class
Trips and VMT
Phase Name Offroad Equipment Count
Worker Trip Number
Vendor Trip Number
Hauling Trip Number

Total CO2 CH4 N2O CO2e
Category lb/day lb/day
PM10 Total
Fugitive PM2.5
Exhaust PM2.5
PM2.5 Total
Bio- CO2 NBio- CO2
Mitigated Construction Off-Site
ROG NOx CO SO2 Fugitive PM10
Exhaust PM10
0.0000 1,764.2381
1,764.2381 0.5406 1,777.7521
2.4146 1.0451 3.4596 1.3081 0.9615 2.2696Total 1.9297 22.2106 8.4016 0.0172
0.0000 1,764.2381
1,764.2381 0.5406 1,777.7521
1.0451 1.0451 0.9615 0.9615Off-Road 1.9297 22.2106 8.4016 0.0172
0.0000 0.00002.4146 0.0000 2.4146 1.3081 0.0000 1.3081Fugitive Dust
Total CO2 CH4 N2O CO2e
Category lb/day lb/day
PM10 Total
Fugitive PM2.5
Exhaust PM2.5
PM2.5 Total
Bio- CO2 NBio- CO2
Mitigated Construction On-Site
ROG NOx CO SO2 Fugitive PM10
Exhaust PM10
74.0414 74.0414 3.5600e-003
74.13040.0657 5.8000e-004
0.0663 0.0174 5.4000e-004
0.0180Total 0.0523 0.0363 0.4178 7.5000e-004
74.0414 74.0414 3.5600e-003
74.13040.0657 5.8000e-004
0.0663 0.0174 5.4000e-004
0.0180Worker 0.0523 0.0363 0.4178 7.5000e-004
0.0000 0.0000 0.0000 0.00000.0000 0.0000 0.0000 0.0000 0.0000 0.0000Vendor 0.0000 0.0000 0.0000 0.0000
0.0000 0.0000 0.0000 0.00000.0000 0.0000 0.0000 0.0000 0.0000 0.0000Hauling 0.0000 0.0000 0.0000 0.0000
Total CO2 CH4 N2O CO2e
Category lb/day lb/day
PM10 Total
Fugitive PM2.5
Exhaust PM2.5
PM2.5 Total
Bio- CO2 NBio- CO2ROG NOx CO SO2 Fugitive PM10
Exhaust PM10
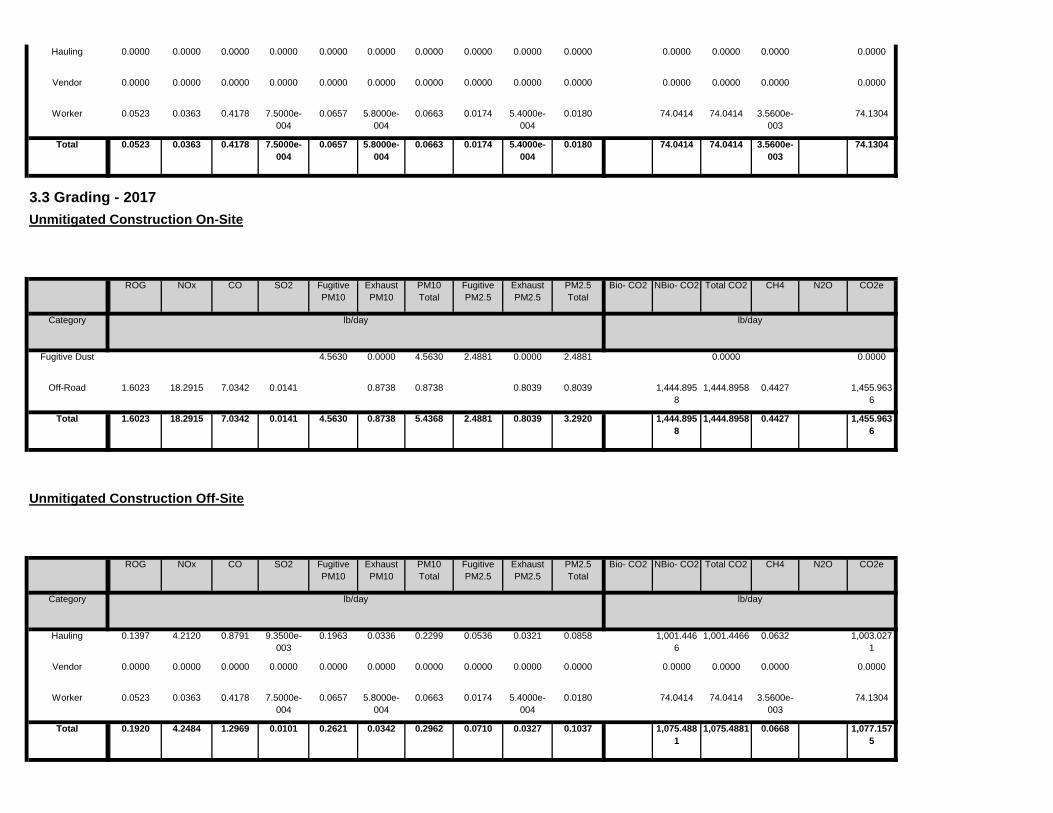
1,075.4881
1,075.4881 0.0668 1,077.1575
0.2621 0.0342 0.2962 0.0710 0.0327 0.1037Total 0.1920 4.2484 1.2969 0.0101
74.0414 74.0414 3.5600e-003
74.13040.0657 5.8000e-004
0.0663 0.0174 5.4000e-004
0.0180Worker 0.0523 0.0363 0.4178 7.5000e-004
0.0000 0.0000 0.0000 0.00000.0000 0.0000 0.0000 0.0000 0.0000 0.0000Vendor 0.0000 0.0000 0.0000 0.0000
1,001.4466
1,001.4466 0.0632 1,003.0271
0.1963 0.0336 0.2299 0.0536 0.0321 0.0858Hauling 0.1397 4.2120 0.8791 9.3500e-003
Total CO2 CH4 N2O CO2e
Category lb/day lb/day
PM10 Total
Fugitive PM2.5
Exhaust PM2.5
PM2.5 Total
Bio- CO2 NBio- CO2
Unmitigated Construction Off-Site
ROG NOx CO SO2 Fugitive PM10
Exhaust PM10
1,444.8958
1,444.8958 0.4427 1,455.9636
4.5630 0.8738 5.4368 2.4881 0.8039 3.2920Total 1.6023 18.2915 7.0342 0.0141
1,444.8958
1,444.8958 0.4427 1,455.9636
0.8738 0.8738 0.8039 0.8039Off-Road 1.6023 18.2915 7.0342 0.0141
0.0000 0.00004.5630 0.0000 4.5630 2.4881 0.0000 2.4881Fugitive Dust
Total CO2 CH4 N2O CO2e
Category lb/day lb/day
PM10 Total
Fugitive PM2.5
Exhaust PM2.5
PM2.5 Total
Bio- CO2 NBio- CO2
3.3 Grading - 2017Unmitigated Construction On-Site
ROG NOx CO SO2 Fugitive PM10
Exhaust PM10
74.0414 74.0414 3.5600e-003
74.13040.0657 5.8000e-004
0.0663 0.0174 5.4000e-004
0.0180Total 0.0523 0.0363 0.4178 7.5000e-004
74.0414 74.0414 3.5600e-003
74.13040.0657 5.8000e-004
0.0663 0.0174 5.4000e-004
0.0180Worker 0.0523 0.0363 0.4178 7.5000e-004
0.0000 0.0000 0.0000 0.00000.0000 0.0000 0.0000 0.0000 0.0000 0.0000Vendor 0.0000 0.0000 0.0000 0.0000
0.0000 0.0000 0.0000 0.00000.0000 0.0000 0.0000 0.0000 0.0000 0.0000Hauling 0.0000 0.0000 0.0000 0.0000
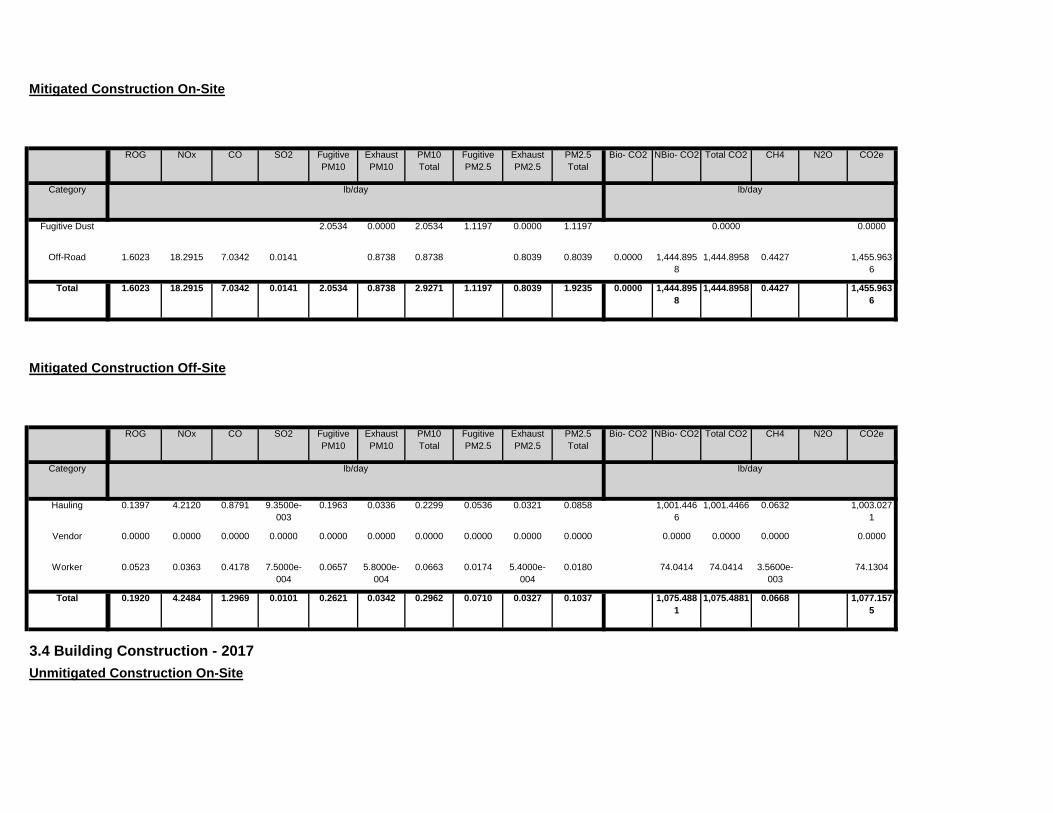
3.4 Building Construction - 2017Unmitigated Construction On-Site
1,075.4881
1,075.4881 0.0668 1,077.1575
0.2621 0.0342 0.2962 0.0710 0.0327 0.1037Total 0.1920 4.2484 1.2969 0.0101
74.0414 74.0414 3.5600e-003
74.13040.0657 5.8000e-004
0.0663 0.0174 5.4000e-004
0.0180Worker 0.0523 0.0363 0.4178 7.5000e-004
0.0000 0.0000 0.0000 0.00000.0000 0.0000 0.0000 0.0000 0.0000 0.0000Vendor 0.0000 0.0000 0.0000 0.0000
1,001.4466
1,001.4466 0.0632 1,003.0271
0.1963 0.0336 0.2299 0.0536 0.0321 0.0858Hauling 0.1397 4.2120 0.8791 9.3500e-003
Total CO2 CH4 N2O CO2e
Category lb/day lb/day
PM10 Total
Fugitive PM2.5
Exhaust PM2.5
PM2.5 Total
Bio- CO2 NBio- CO2
Mitigated Construction Off-Site
ROG NOx CO SO2 Fugitive PM10
Exhaust PM10
0.0000 1,444.8958
1,444.8958 0.4427 1,455.9636
2.0534 0.8738 2.9271 1.1197 0.8039 1.9235Total 1.6023 18.2915 7.0342 0.0141
0.0000 1,444.8958
1,444.8958 0.4427 1,455.9636
0.8738 0.8738 0.8039 0.8039Off-Road 1.6023 18.2915 7.0342 0.0141
0.0000 0.00002.0534 0.0000 2.0534 1.1197 0.0000 1.1197Fugitive Dust
Total CO2 CH4 N2O CO2e
Category lb/day lb/day
PM10 Total
Fugitive PM2.5
Exhaust PM2.5
PM2.5 Total
Bio- CO2 NBio- CO2
Mitigated Construction On-Site
ROG NOx CO SO2 Fugitive PM10
Exhaust PM10
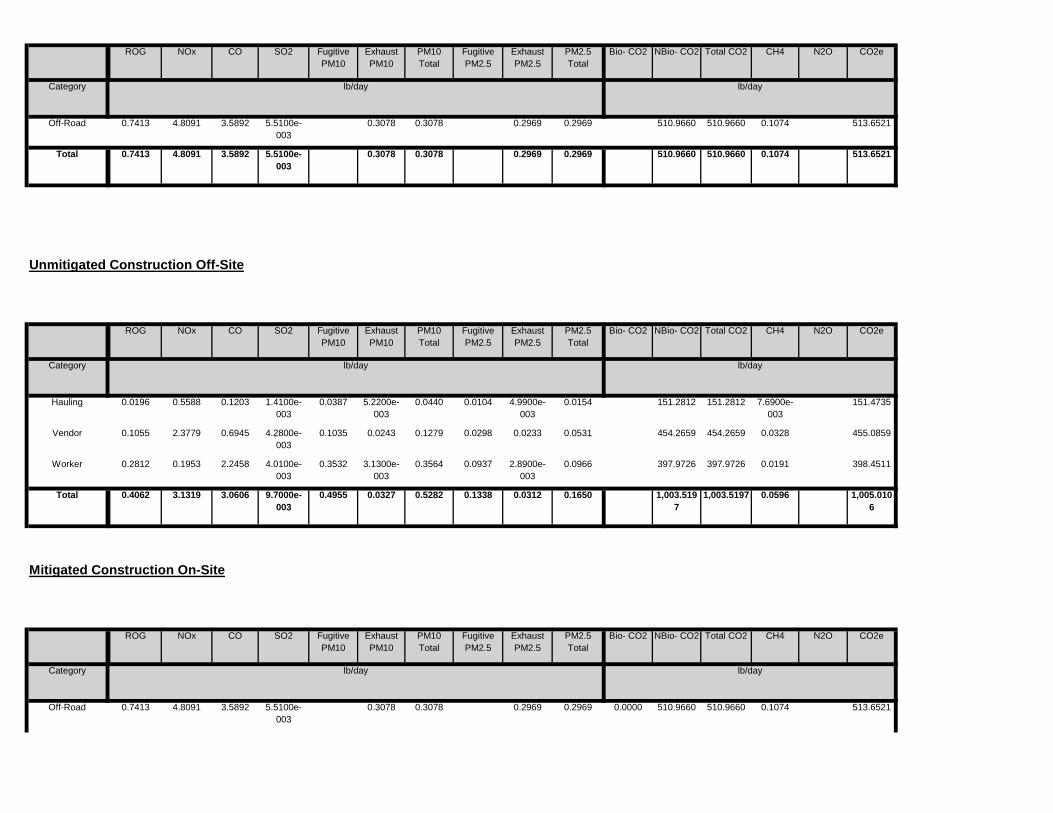
0.0000 510.9660 510.9660 0.1074 513.65210.3078 0.3078 0.2969 0.2969Off-Road 0.7413 4.8091 3.5892 5.5100e-003
Total CO2 CH4 N2O CO2e
Category lb/day lb/day
PM10 Total
Fugitive PM2.5
Exhaust PM2.5
PM2.5 Total
Bio- CO2 NBio- CO2
Mitigated Construction On-Site
ROG NOx CO SO2 Fugitive PM10
Exhaust PM10
1,003.5197
1,003.5197 0.0596 1,005.0106
0.4955 0.0327 0.5282 0.1338 0.0312 0.1650Total 0.4062 3.1319 3.0606 9.7000e-003
397.9726 397.9726 0.0191 398.45110.3532 3.1300e-003
0.3564 0.0937 2.8900e-003
0.0966Worker 0.2812 0.1953 2.2458 4.0100e-003
454.2659 454.2659 0.0328 455.08590.1035 0.0243 0.1279 0.0298 0.0233 0.0531Vendor 0.1055 2.3779 0.6945 4.2800e-003
151.2812 151.2812 7.6900e-003
151.47350.0387 5.2200e-003
0.0440 0.0104 4.9900e-003
0.0154Hauling 0.0196 0.5588 0.1203 1.4100e-003
Total CO2 CH4 N2O CO2e
Category lb/day lb/day
PM10 Total
Fugitive PM2.5
Exhaust PM2.5
PM2.5 Total
Bio- CO2 NBio- CO2
Unmitigated Construction Off-Site
ROG NOx CO SO2 Fugitive PM10
Exhaust PM10
510.9660 510.9660 0.1074 513.65210.3078 0.3078 0.2969 0.2969Total 0.7413 4.8091 3.5892 5.5100e-003
510.9660 510.9660 0.1074 513.65210.3078 0.3078 0.2969 0.2969Off-Road 0.7413 4.8091 3.5892 5.5100e-003
Total CO2 CH4 N2O CO2e
Category lb/day lb/day
PM10 Total
Fugitive PM2.5
Exhaust PM2.5
PM2.5 Total
Bio- CO2 NBio- CO2ROG NOx CO SO2 Fugitive PM10
Exhaust PM10

Unmitigated Construction Off-Site
507.7097 507.7097 0.1022 510.26490.2645 0.2645 0.2554 0.2554Total 0.6480 4.3570 3.4692 5.5100e-003
507.7097 507.7097 0.1022 510.26490.2645 0.2645 0.2554 0.2554Off-Road 0.6480 4.3570 3.4692 5.5100e-003
Total CO2 CH4 N2O CO2e
Category lb/day lb/day
PM10 Total
Fugitive PM2.5
Exhaust PM2.5
PM2.5 Total
Bio- CO2 NBio- CO2
3.4 Building Construction - 2018Unmitigated Construction On-Site
ROG NOx CO SO2 Fugitive PM10
Exhaust PM10
1,003.5197
1,003.5197 0.0596 1,005.0106
0.4955 0.0327 0.5282 0.1338 0.0312 0.1650Total 0.4062 3.1319 3.0606 9.7000e-003
397.9726 397.9726 0.0191 398.45110.3532 3.1300e-003
0.3564 0.0937 2.8900e-003
0.0966Worker 0.2812 0.1953 2.2458 4.0100e-003
454.2659 454.2659 0.0328 455.08590.1035 0.0243 0.1279 0.0298 0.0233 0.0531Vendor 0.1055 2.3779 0.6945 4.2800e-003
151.2812 151.2812 7.6900e-003
151.47350.0387 5.2200e-003
0.0440 0.0104 4.9900e-003
0.0154Hauling 0.0196 0.5588 0.1203 1.4100e-003
Total CO2 CH4 N2O CO2e
Category lb/day lb/day
PM10 Total
Fugitive PM2.5
Exhaust PM2.5
PM2.5 Total
Bio- CO2 NBio- CO2
Mitigated Construction Off-Site
ROG NOx CO SO2 Fugitive PM10
Exhaust PM10
0.0000 510.9660 510.9660 0.1074 513.65210.3078 0.3078 0.2969 0.2969Total 0.7413 4.8091 3.5892 5.5100e-003
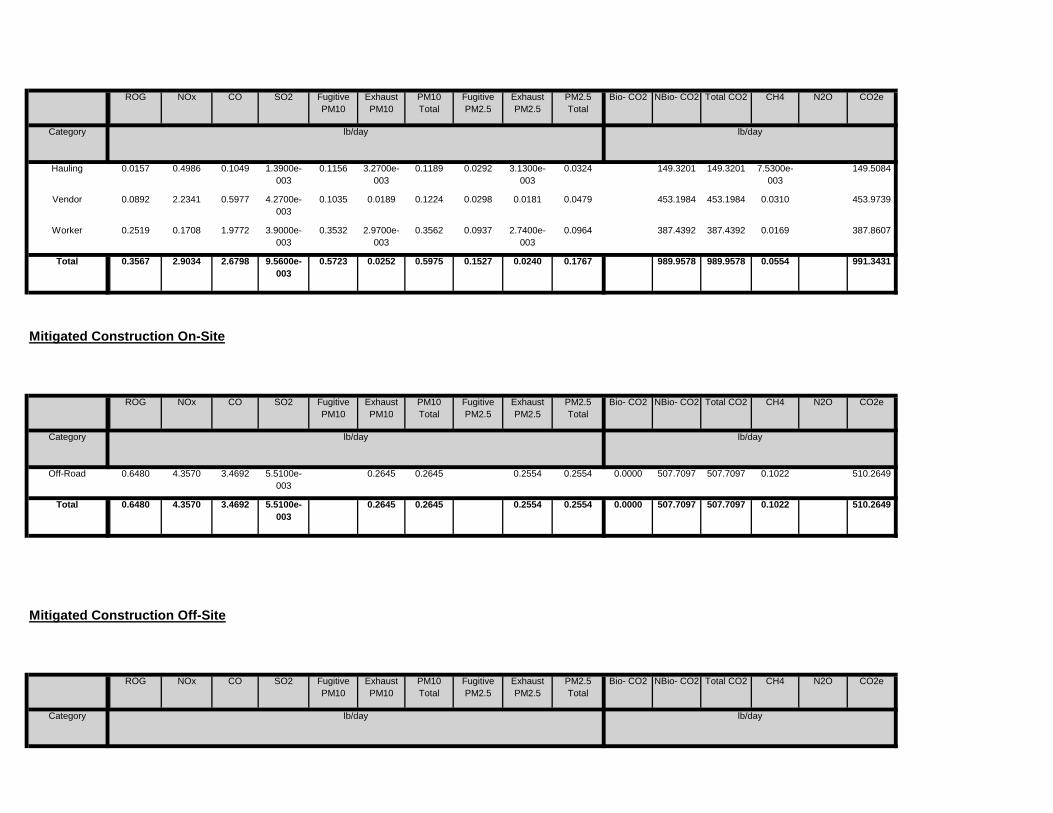
Total CO2 CH4 N2O CO2e
Category lb/day lb/day
PM10 Total
Fugitive PM2.5
Exhaust PM2.5
PM2.5 Total
Bio- CO2 NBio- CO2
Mitigated Construction Off-Site
ROG NOx CO SO2 Fugitive PM10
Exhaust PM10
0.0000 507.7097 507.7097 0.1022 510.26490.2645 0.2645 0.2554 0.2554Total 0.6480 4.3570 3.4692 5.5100e-003
0.0000 507.7097 507.7097 0.1022 510.26490.2645 0.2645 0.2554 0.2554Off-Road 0.6480 4.3570 3.4692 5.5100e-003
Total CO2 CH4 N2O CO2e
Category lb/day lb/day
PM10 Total
Fugitive PM2.5
Exhaust PM2.5
PM2.5 Total
Bio- CO2 NBio- CO2
Mitigated Construction On-Site
ROG NOx CO SO2 Fugitive PM10
Exhaust PM10
989.9578 989.9578 0.0554 991.34310.5723 0.0252 0.5975 0.1527 0.0240 0.1767Total 0.3567 2.9034 2.6798 9.5600e-003
387.4392 387.4392 0.0169 387.86070.3532 2.9700e-003
0.3562 0.0937 2.7400e-003
0.0964Worker 0.2519 0.1708 1.9772 3.9000e-003
453.1984 453.1984 0.0310 453.97390.1035 0.0189 0.1224 0.0298 0.0181 0.0479Vendor 0.0892 2.2341 0.5977 4.2700e-003
149.3201 149.3201 7.5300e-003
149.50840.1156 3.2700e-003
0.1189 0.0292 3.1300e-003
0.0324Hauling 0.0157 0.4986 0.1049 1.3900e-003
Total CO2 CH4 N2O CO2e
Category lb/day lb/day
PM10 Total
Fugitive PM2.5
Exhaust PM2.5
PM2.5 Total
Bio- CO2 NBio- CO2ROG NOx CO SO2 Fugitive PM10
Exhaust PM10

120.3173 120.3173 5.7900e-003
120.46200.1068 9.5000e-004
0.1077 0.0283 8.7000e-004
0.0292Total 0.0850 0.0590 0.6790 1.2100e-003
120.3173 120.3173 5.7900e-003
120.46200.1068 9.5000e-004
0.1077 0.0283 8.7000e-004
0.0292Worker 0.0850 0.0590 0.6790 1.2100e-003
0.0000 0.0000 0.0000 0.00000.0000 0.0000 0.0000 0.0000 0.0000 0.0000Vendor 0.0000 0.0000 0.0000 0.0000
0.0000 0.0000 0.0000 0.00000.0000 0.0000 0.0000 0.0000 0.0000 0.0000Hauling 0.0000 0.0000 0.0000 0.0000
Total CO2 CH4 N2O CO2e
Category lb/day lb/day
PM10 Total
Fugitive PM2.5
Exhaust PM2.5
PM2.5 Total
Bio- CO2 NBio- CO2
Unmitigated Construction Off-Site
ROG NOx CO SO2 Fugitive PM10
Exhaust PM10
1,367.8311
1,367.8311 0.4114 1,378.1167
0.7417 0.7417 0.6832 0.6832Total 1.4024 12.2685 9.1549 0.0135
0.0000 0.00000.0000 0.0000 0.0000 0.0000Paving 0.2015
1,367.8311
1,367.8311 0.4114 1,378.1167
0.7417 0.7417 0.6832 0.6832Off-Road 1.2008 12.2685 9.1549 0.0135
Total CO2 CH4 N2O CO2e
Category lb/day lb/day
PM10 Total
Fugitive PM2.5
Exhaust PM2.5
PM2.5 Total
Bio- CO2 NBio- CO2
3.5 Paving - 2017Unmitigated Construction On-Site
ROG NOx CO SO2 Fugitive PM10
Exhaust PM10
989.9578 989.9578 0.0554 991.34310.5723 0.0252 0.5975 0.1527 0.0240 0.1767Total 0.3567 2.9034 2.6798 9.5600e-003
387.4392 387.4392 0.0169 387.86070.3532 2.9700e-003
0.3562 0.0937 2.7400e-003
0.0964Worker 0.2519 0.1708 1.9772 3.9000e-003
453.1984 453.1984 0.0310 453.97390.1035 0.0189 0.1224 0.0298 0.0181 0.0479Vendor 0.0892 2.2341 0.5977 4.2700e-003
149.3201 149.3201 7.5300e-003
149.50840.1156 3.2700e-003
0.1189 0.0292 3.1300e-003
0.0324Hauling 0.0157 0.4986 0.1049 1.3900e-003

3.6 Architectural Coating - 2017Unmitigated Construction On-Site
120.3173 120.3173 5.7900e-003
120.46200.1068 9.5000e-004
0.1077 0.0283 8.7000e-004
0.0292Total 0.0850 0.0590 0.6790 1.2100e-003
120.3173 120.3173 5.7900e-003
120.46200.1068 9.5000e-004
0.1077 0.0283 8.7000e-004
0.0292Worker 0.0850 0.0590 0.6790 1.2100e-003
0.0000 0.0000 0.0000 0.00000.0000 0.0000 0.0000 0.0000 0.0000 0.0000Vendor 0.0000 0.0000 0.0000 0.0000
0.0000 0.0000 0.0000 0.00000.0000 0.0000 0.0000 0.0000 0.0000 0.0000Hauling 0.0000 0.0000 0.0000 0.0000
Total CO2 CH4 N2O CO2e
Category lb/day lb/day
PM10 Total
Fugitive PM2.5
Exhaust PM2.5
PM2.5 Total
Bio- CO2 NBio- CO2
Mitigated Construction Off-Site
ROG NOx CO SO2 Fugitive PM10
Exhaust PM10
0.0000 1,367.8311
1,367.8311 0.4114 1,378.1167
0.7417 0.7417 0.6832 0.6832Total 1.4024 12.2685 9.1549 0.0135
0.0000 0.00000.0000 0.0000 0.0000 0.0000Paving 0.2015
0.0000 1,367.8311
1,367.8311 0.4114 1,378.1167
0.7417 0.7417 0.6832 0.6832Off-Road 1.2008 12.2685 9.1549 0.0135
Total CO2 CH4 N2O CO2e
Category lb/day lb/day
PM10 Total
Fugitive PM2.5
Exhaust PM2.5
PM2.5 Total
Bio- CO2 NBio- CO2
Mitigated Construction On-Site
ROG NOx CO SO2 Fugitive PM10
Exhaust PM10
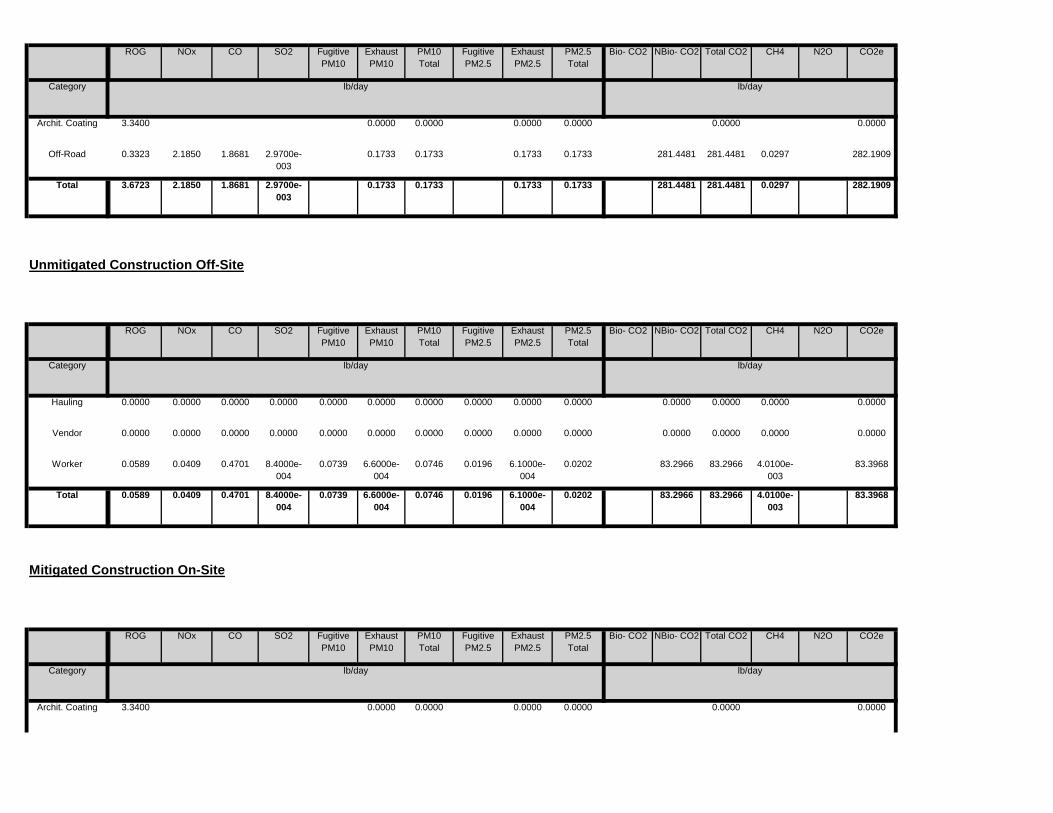
0.0000 0.00000.0000 0.0000 0.0000 0.0000Archit. Coating 3.3400
Total CO2 CH4 N2O CO2e
Category lb/day lb/day
PM10 Total
Fugitive PM2.5
Exhaust PM2.5
PM2.5 Total
Bio- CO2 NBio- CO2
Mitigated Construction On-Site
ROG NOx CO SO2 Fugitive PM10
Exhaust PM10
83.2966 83.2966 4.0100e-003
83.39680.0739 6.6000e-004
0.0746 0.0196 6.1000e-004
0.0202Total 0.0589 0.0409 0.4701 8.4000e-004
83.2966 83.2966 4.0100e-003
83.39680.0739 6.6000e-004
0.0746 0.0196 6.1000e-004
0.0202Worker 0.0589 0.0409 0.4701 8.4000e-004
0.0000 0.0000 0.0000 0.00000.0000 0.0000 0.0000 0.0000 0.0000 0.0000Vendor 0.0000 0.0000 0.0000 0.0000
0.0000 0.0000 0.0000 0.00000.0000 0.0000 0.0000 0.0000 0.0000 0.0000Hauling 0.0000 0.0000 0.0000 0.0000
Total CO2 CH4 N2O CO2e
Category lb/day lb/day
PM10 Total
Fugitive PM2.5
Exhaust PM2.5
PM2.5 Total
Bio- CO2 NBio- CO2
Unmitigated Construction Off-Site
ROG NOx CO SO2 Fugitive PM10
Exhaust PM10
281.4481 281.4481 0.0297 282.19090.1733 0.1733 0.1733 0.1733Total 3.6723 2.1850 1.8681 2.9700e-003
281.4481 281.4481 0.0297 282.19090.1733 0.1733 0.1733 0.1733Off-Road 0.3323 2.1850 1.8681 2.9700e-003
0.0000 0.00000.0000 0.0000 0.0000 0.0000Archit. Coating 3.3400
Total CO2 CH4 N2O CO2e
Category lb/day lb/day
PM10 Total
Fugitive PM2.5
Exhaust PM2.5
PM2.5 Total
Bio- CO2 NBio- CO2ROG NOx CO SO2 Fugitive PM10
Exhaust PM10
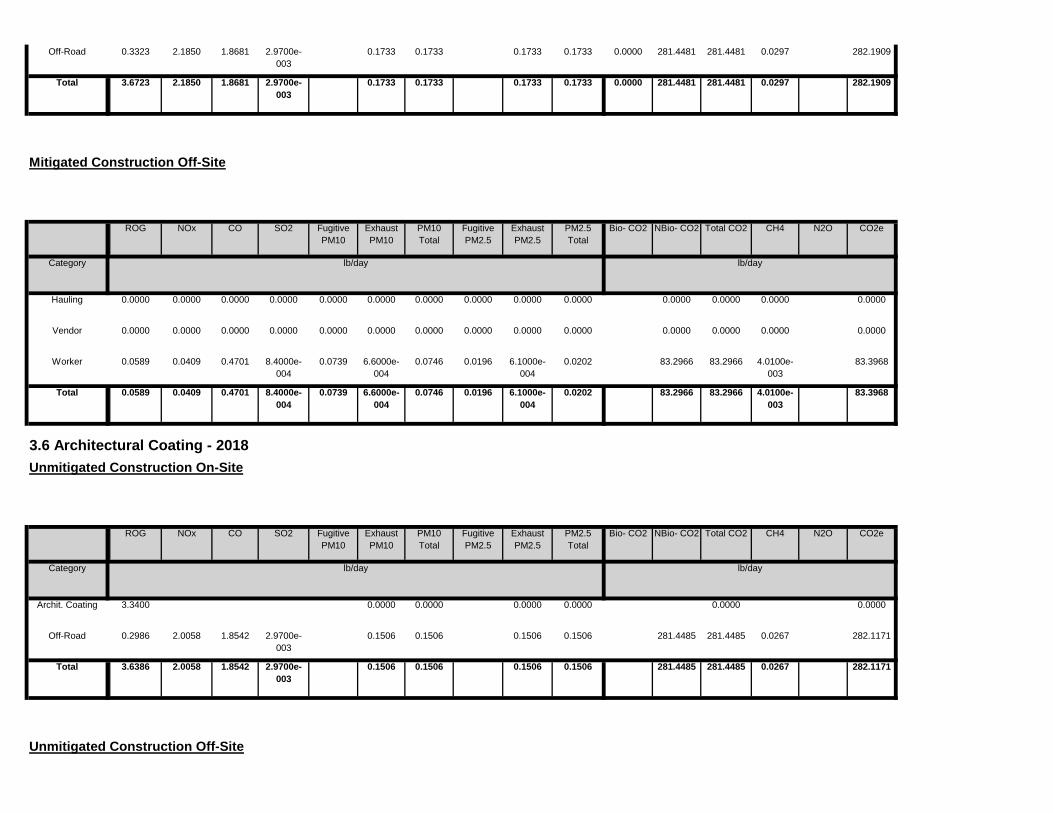
Unmitigated Construction Off-Site
281.4485 281.4485 0.0267 282.11710.1506 0.1506 0.1506 0.1506Total 3.6386 2.0058 1.8542 2.9700e-003
281.4485 281.4485 0.0267 282.11710.1506 0.1506 0.1506 0.1506Off-Road 0.2986 2.0058 1.8542 2.9700e-003
0.0000 0.00000.0000 0.0000 0.0000 0.0000Archit. Coating 3.3400
Total CO2 CH4 N2O CO2e
Category lb/day lb/day
PM10 Total
Fugitive PM2.5
Exhaust PM2.5
PM2.5 Total
Bio- CO2 NBio- CO2
3.6 Architectural Coating - 2018Unmitigated Construction On-Site
ROG NOx CO SO2 Fugitive PM10
Exhaust PM10
83.2966 83.2966 4.0100e-003
83.39680.0739 6.6000e-004
0.0746 0.0196 6.1000e-004
0.0202Total 0.0589 0.0409 0.4701 8.4000e-004
83.2966 83.2966 4.0100e-003
83.39680.0739 6.6000e-004
0.0746 0.0196 6.1000e-004
0.0202Worker 0.0589 0.0409 0.4701 8.4000e-004
0.0000 0.0000 0.0000 0.00000.0000 0.0000 0.0000 0.0000 0.0000 0.0000Vendor 0.0000 0.0000 0.0000 0.0000
0.0000 0.0000 0.0000 0.00000.0000 0.0000 0.0000 0.0000 0.0000 0.0000Hauling 0.0000 0.0000 0.0000 0.0000
Total CO2 CH4 N2O CO2e
Category lb/day lb/day
PM10 Total
Fugitive PM2.5
Exhaust PM2.5
PM2.5 Total
Bio- CO2 NBio- CO2
Mitigated Construction Off-Site
ROG NOx CO SO2 Fugitive PM10
Exhaust PM10
0.0000 281.4481 281.4481 0.0297 282.19090.1733 0.1733 0.1733 0.1733Total 3.6723 2.1850 1.8681 2.9700e-003
0.0000 281.4481 281.4481 0.0297 282.19090.1733 0.1733 0.1733 0.1733Off-Road 0.3323 2.1850 1.8681 2.9700e-003
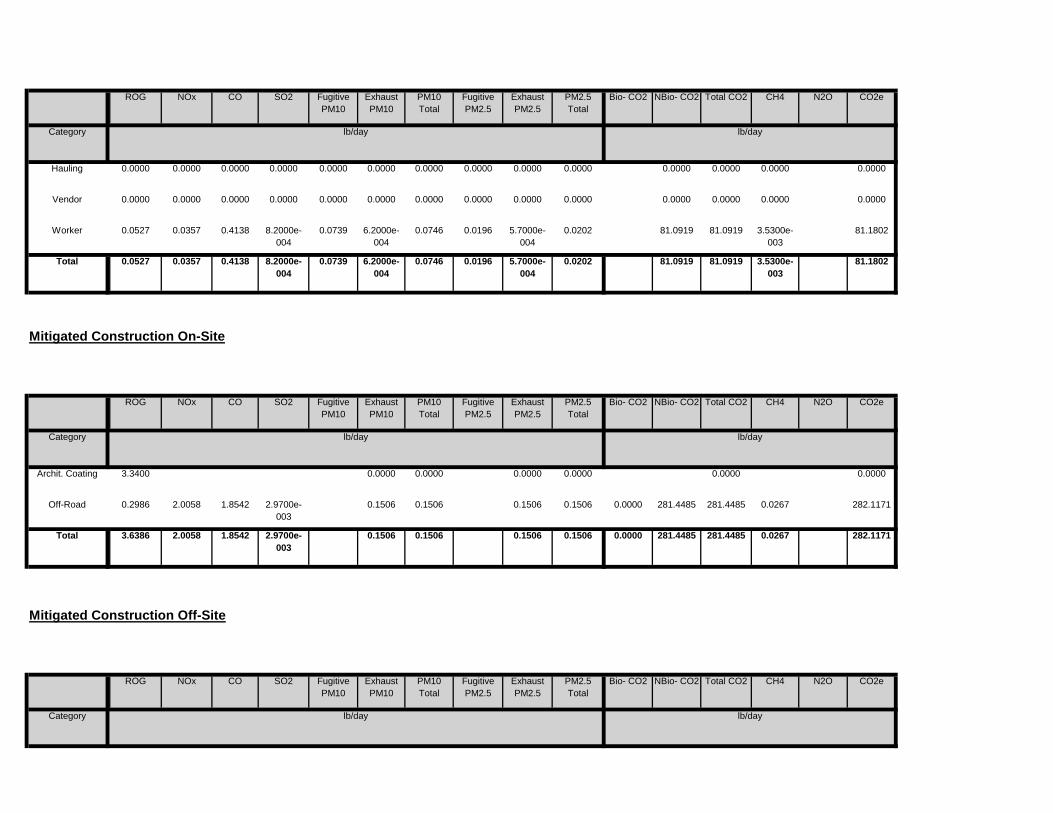
Total CO2 CH4 N2O CO2e
Category lb/day lb/day
PM10 Total
Fugitive PM2.5
Exhaust PM2.5
PM2.5 Total
Bio- CO2 NBio- CO2
Mitigated Construction Off-Site
ROG NOx CO SO2 Fugitive PM10
Exhaust PM10
0.0000 281.4485 281.4485 0.0267 282.11710.1506 0.1506 0.1506 0.1506Total 3.6386 2.0058 1.8542 2.9700e-003
0.0000 281.4485 281.4485 0.0267 282.11710.1506 0.1506 0.1506 0.1506Off-Road 0.2986 2.0058 1.8542 2.9700e-003
0.0000 0.00000.0000 0.0000 0.0000 0.0000Archit. Coating 3.3400
Total CO2 CH4 N2O CO2e
Category lb/day lb/day
PM10 Total
Fugitive PM2.5
Exhaust PM2.5
PM2.5 Total
Bio- CO2 NBio- CO2
Mitigated Construction On-Site
ROG NOx CO SO2 Fugitive PM10
Exhaust PM10
81.0919 81.0919 3.5300e-003
81.18020.0739 6.2000e-004
0.0746 0.0196 5.7000e-004
0.0202Total 0.0527 0.0357 0.4138 8.2000e-004
81.0919 81.0919 3.5300e-003
81.18020.0739 6.2000e-004
0.0746 0.0196 5.7000e-004
0.0202Worker 0.0527 0.0357 0.4138 8.2000e-004
0.0000 0.0000 0.0000 0.00000.0000 0.0000 0.0000 0.0000 0.0000 0.0000Vendor 0.0000 0.0000 0.0000 0.0000
0.0000 0.0000 0.0000 0.00000.0000 0.0000 0.0000 0.0000 0.0000 0.0000Hauling 0.0000 0.0000 0.0000 0.0000
Total CO2 CH4 N2O CO2e
Category lb/day lb/day
PM10 Total
Fugitive PM2.5
Exhaust PM2.5
PM2.5 Total
Bio- CO2 NBio- CO2ROG NOx CO SO2 Fugitive PM10
Exhaust PM10
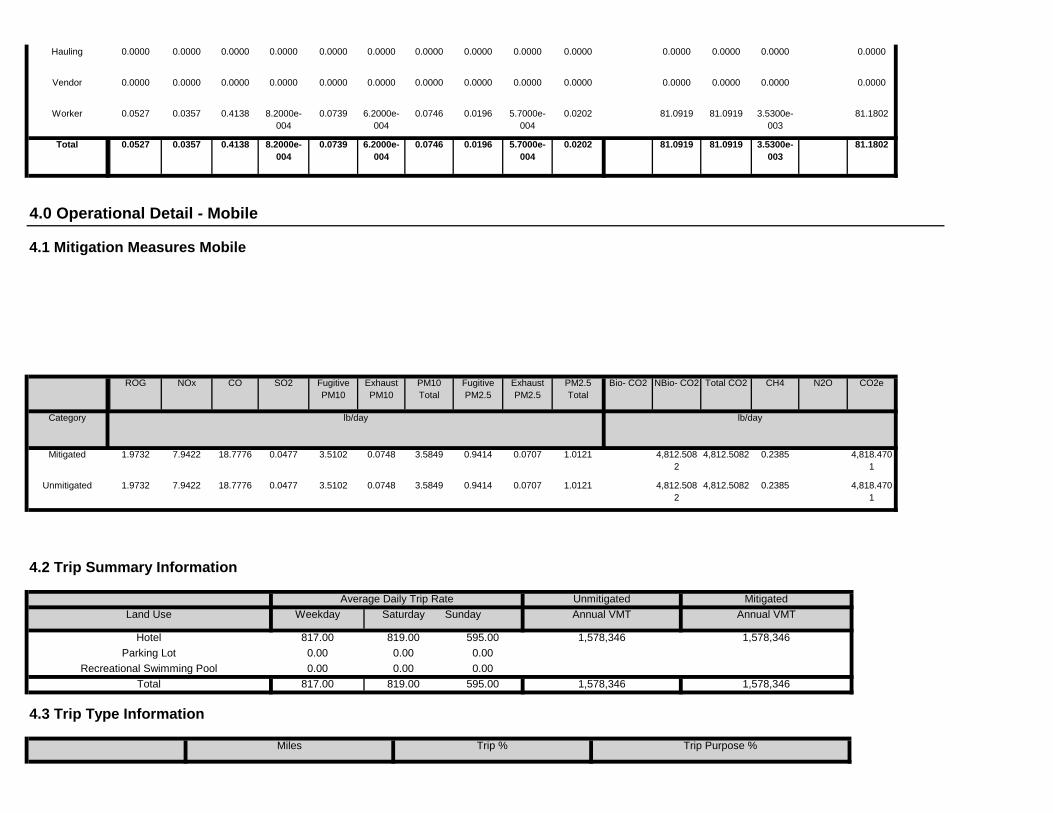
4.3 Trip Type Information
Miles Trip % Trip Purpose %
Total 817.00 819.00 595.00 1,578,346 1,578,346Recreational Swimming Pool 0.00 0.00 0.00
Parking Lot 0.00 0.00 0.00
Annual VMT
Hotel 817.00 819.00 595.00 1,578,346 1,578,346
4.2 Trip Summary Information
Average Daily Trip Rate Unmitigated MitigatedLand Use Weekday Saturday Sunday Annual VMT
4,812.5082
4,812.5082 0.2385 4,818.4701
3.5102 0.0748 3.5849 0.9414 0.0707 1.0121Unmitigated 1.9732 7.9422 18.7776 0.0477
4,812.5082
4,812.5082 0.2385 4,818.4701
3.5102 0.0748 3.5849 0.9414 0.0707 1.0121Mitigated 1.9732 7.9422 18.7776 0.0477
NBio- CO2 Total CO2 CH4 N2O CO2e
Category lb/day lb/day
Exhaust PM10
PM10 Total
Fugitive PM2.5
Exhaust PM2.5
PM2.5 Total
Bio- CO2
4.0 Operational Detail - Mobile
4.1 Mitigation Measures Mobile
ROG NOx CO SO2 Fugitive PM10
81.0919 81.0919 3.5300e-003
81.18020.0739 6.2000e-004
0.0746 0.0196 5.7000e-004
0.0202Total 0.0527 0.0357 0.4138 8.2000e-004
81.0919 81.0919 3.5300e-003
81.18020.0739 6.2000e-004
0.0746 0.0196 5.7000e-004
0.0202Worker 0.0527 0.0357 0.4138 8.2000e-004
0.0000 0.0000 0.0000 0.00000.0000 0.0000 0.0000 0.0000 0.0000 0.0000Vendor 0.0000 0.0000 0.0000 0.0000
0.0000 0.0000 0.0000 0.00000.0000 0.0000 0.0000 0.0000 0.0000 0.0000Hauling 0.0000 0.0000 0.0000 0.0000
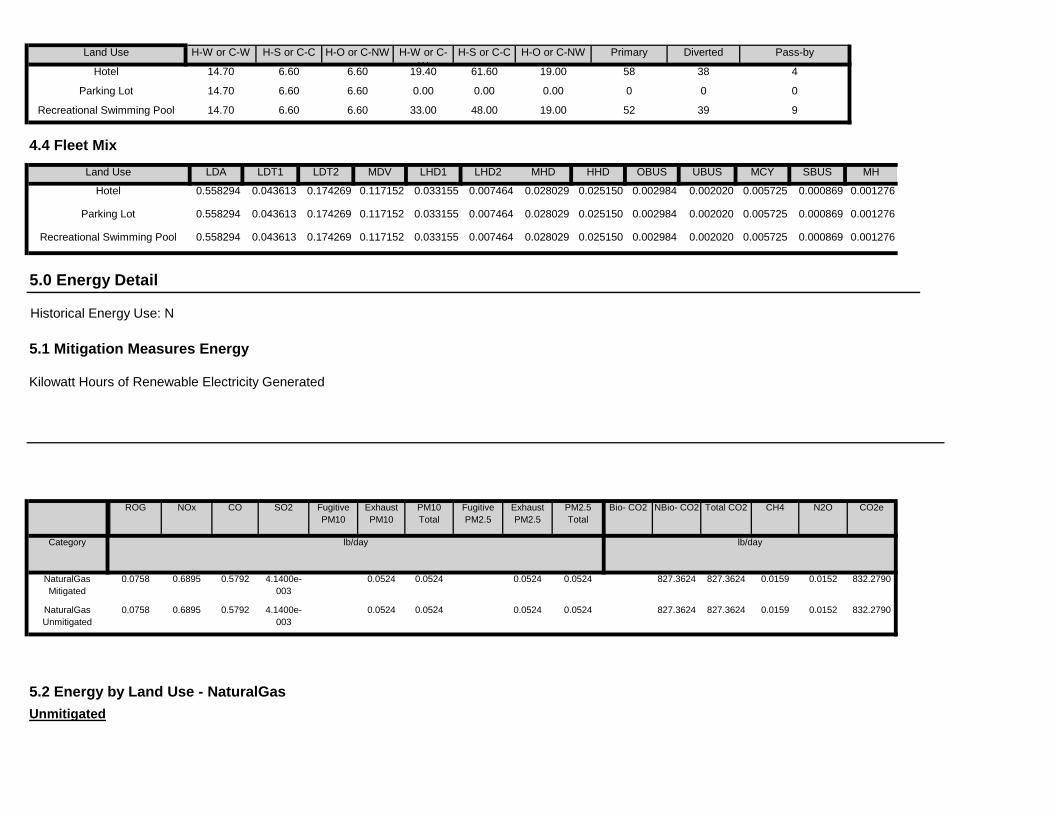
832.2790
5.2 Energy by Land Use - NaturalGasUnmitigated
0.0524 827.3624 827.3624 0.0159 0.01524.1400e-003
0.0524 0.0524 0.0524
827.3624 827.3624 0.0159 0.0152 832.2790
NaturalGas Unmitigated
0.0758 0.6895 0.5792
0.0524 0.0524 0.0524 0.0524
Category lb/day lb/day
NaturalGas Mitigated
0.0758 0.6895 0.5792 4.1400e-003
Bio- CO2 NBio- CO2 Total CO2 CH4 N2O CO2eFugitive PM10
Exhaust PM10
PM10 Total
Fugitive PM2.5
Exhaust PM2.5
PM2.5 Total
5.0 Energy Detail
Historical Energy Use: N
5.1 Mitigation Measures Energy
Kilowatt Hours of Renewable Electricity Generated
ROG NOx CO SO2
0.025150 0.002984 0.002020 0.005725 0.000869 0.001276
0.000869 0.001276
Recreational Swimming Pool 0.558294 0.043613 0.174269 0.117152 0.033155 0.007464 0.028029
0.007464 0.028029 0.025150 0.002984 0.002020 0.005725Parking Lot 0.558294 0.043613 0.174269 0.117152 0.033155
0.025150 0.002984 0.002020 0.005725 0.000869 0.001276
SBUS MH
Hotel 0.558294 0.043613 0.174269 0.117152 0.033155 0.007464 0.028029
LHD2 MHD HHD OBUS UBUS MCYLand Use LDA LDT1 LDT2 MDV LHD1
48.00 19.00 52 39 9
4.4 Fleet Mix
0.00 0.00 0 0 0
Recreational Swimming Pool 14.70 6.60 6.60 33.00
61.60 19.00 58 38 4
Parking Lot 14.70 6.60 6.60 0.00
H-S or C-C H-O or C-NW Primary Diverted Pass-by
Hotel 14.70 6.60 6.60 19.40
Land Use H-W or C-W H-S or C-C H-O or C-NW H-W or C-W

6.0 Area Detail
6.1 Mitigation Measures Area
827.3624 827.3624 0.0159 0.0152 832.27900.0524 0.0524 0.0524 0.0524Total 0.0758 0.6895 0.5792 4.1400e-003
0.0000 0.0000 0.0000 0.0000 0.00000.0000 0.0000 0.0000 0.0000Recreational Swimming Pool
0 0.0000 0.0000 0.0000 0.0000
0.0000 0.0000 0.0000 0.0000 0.00000.0000 0.0000 0.0000 0.0000Parking Lot 0 0.0000 0.0000 0.0000 0.0000
827.3624 827.3624 0.0159 0.0152 832.27900.0524 0.0524 0.0524 0.0524Hotel 7.03258 0.0758 0.6895 0.5792 4.1400e-003
Total CO2 CH4 N2O CO2e
Land Use kBTU/yr lb/day lb/day
PM10 Total
Fugitive PM2.5
Exhaust PM2.5
PM2.5 Total
Bio- CO2 NBio- CO2
Mitigated
NaturalGas Use
ROG NOx CO SO2 Fugitive PM10
Exhaust PM10
827.3624 827.3624 0.0159 0.0152 832.27900.0524 0.0524 0.0524 0.0524Total 0.0758 0.6895 0.5792 4.1400e-003
0.0000 0.0000 0.0000 0.0000 0.00000.0000 0.0000 0.0000 0.0000Recreational Swimming Pool
0 0.0000 0.0000 0.0000 0.0000
0.0000 0.0000 0.0000 0.0000 0.00000.0000 0.0000 0.0000 0.0000Parking Lot 0 0.0000 0.0000 0.0000 0.0000
827.3624 827.3624 0.0159 0.0152 832.27900.0524 0.0524 0.0524 0.0524Hotel 7032.58 0.0758 0.6895 0.5792 4.1400e-003
NBio- CO2 Total CO2 CH4 N2O CO2e
Land Use kBTU/yr lb/day lb/day
Exhaust PM10
PM10 Total
Fugitive PM2.5
Exhaust PM2.5
PM2.5 Total
Bio- CO2NaturalGas Use
ROG NOx CO SO2 Fugitive PM10

Total CO2 CH4 N2O CO2ePM10 Total
Fugitive PM2.5
Exhaust PM2.5
PM2.5 Total
Bio- CO2 NBio- CO2
Mitigated
ROG NOx CO SO2 Fugitive PM10
Exhaust PM10
0.0447 0.0447 1.2000e-004
0.04788.0000e-005
8.0000e-005
8.0000e-005
8.0000e-005
Total 1.3379 2.0000e-004
0.0211 0.0000
0.0447 0.0447 1.2000e-004
0.04788.0000e-005
8.0000e-005
8.0000e-005
8.0000e-005
Landscaping 2.0000e-003
2.0000e-004
0.0211 0.0000
0.0000 0.00000.0000 0.0000 0.0000 0.0000Consumer Products
1.2572
0.0000 0.00000.0000 0.0000 0.0000 0.0000Architectural Coating
0.0787
Total CO2 CH4 N2O CO2e
SubCategory lb/day lb/day
PM10 Total
Fugitive PM2.5
Exhaust PM2.5
PM2.5 Total
Bio- CO2 NBio- CO2
6.2 Area by SubCategoryUnmitigated
ROG NOx CO SO2 Fugitive PM10
Exhaust PM10
0.0447 0.0447 1.2000e-004
0.04788.0000e-005
8.0000e-005
8.0000e-005
8.0000e-005
Unmitigated 1.3379 2.0000e-004
0.0211 0.0000
0.0447 0.0447 1.2000e-004
0.04788.0000e-005
8.0000e-005
8.0000e-005
8.0000e-005
Mitigated 1.3379 2.0000e-004
0.0211 0.0000
NBio- CO2 Total CO2 CH4 N2O CO2e
Category lb/day lb/day
Exhaust PM10
PM10 Total
Fugitive PM2.5
Exhaust PM2.5
PM2.5 Total
Bio- CO2ROG NOx CO SO2 Fugitive PM10

User Defined Equipment
Equipment Type Number
Fuel Type
Boilers
Equipment Type Number Heat Input/Day Heat Input/Year Boiler Rating Fuel Type
Load Factor Fuel Type
10.0 Stationary Equipment
Fire Pumps and Emergency Generators
Equipment Type Number Hours/Day Hours/Year Horse Power Load Factor
9.0 Operational Offroad
Equipment Type Number Hours/Day Days/Year Horse Power
7.0 Water Detail
7.1 Mitigation Measures Water
Apply Water Conservation Strategy
8.0 Waste Detail
8.1 Mitigation Measures Waste
Institute Recycling and Composting Services
0.0447 0.0447 1.2000e-004
0.04788.0000e-005
8.0000e-005
8.0000e-005
8.0000e-005
Total 1.3379 2.0000e-004
0.0211 0.0000
0.0447 0.0447 1.2000e-004
0.04788.0000e-005
8.0000e-005
8.0000e-005
8.0000e-005
Landscaping 2.0000e-003
2.0000e-004
0.0211 0.0000
0.0000 0.00000.0000 0.0000 0.0000 0.0000Consumer Products
1.2572
0.0000 0.00000.0000 0.0000 0.0000 0.0000Architectural Coating
0.0787
SubCategory lb/day lb/day
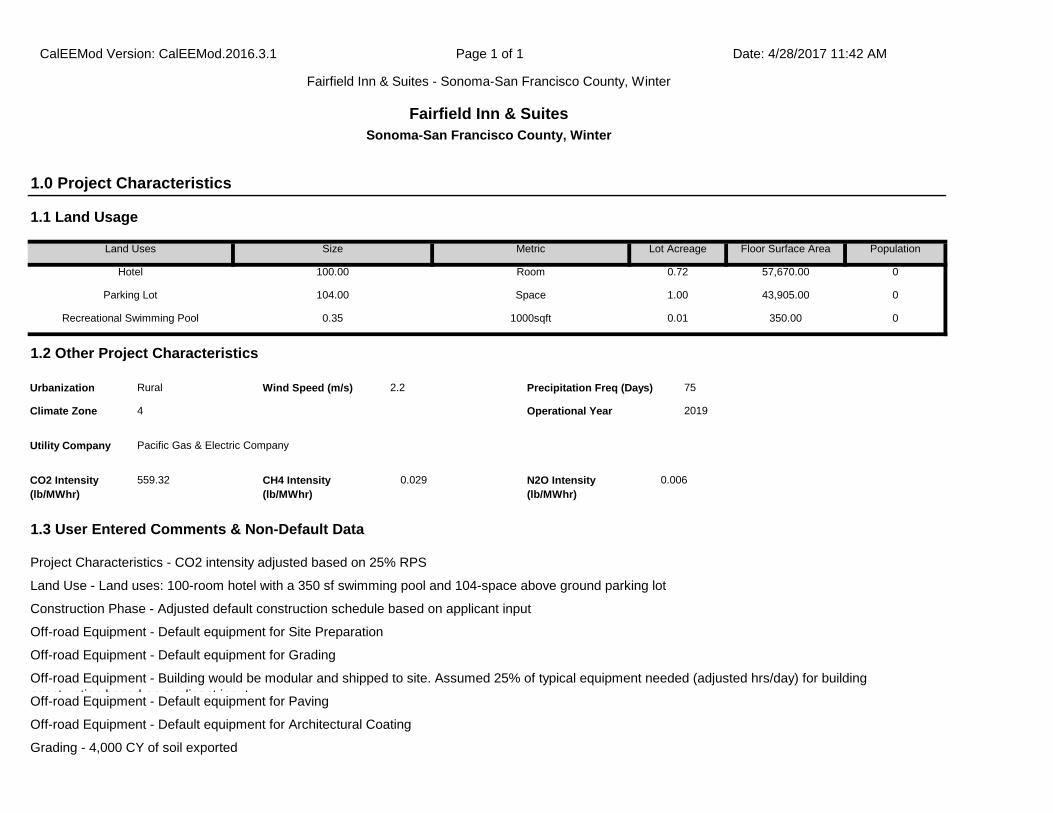
Off-road Equipment - Building would be modular and shipped to site. Assumed 25% of typical equipment needed (adjusted hrs/day) for building construction based on applicant inputOff-road Equipment - Default equipment for Paving
Off-road Equipment - Default equipment for Architectural Coating
Grading - 4,000 CY of soil exported
1.3 User Entered Comments & Non-Default Data
Project Characteristics - CO2 intensity adjusted based on 25% RPS
Land Use - Land uses: 100-room hotel with a 350 sf swimming pool and 104-space above ground parking lot
Construction Phase - Adjusted default construction schedule based on applicant input
Off-road Equipment - Default equipment for Site Preparation
Off-road Equipment - Default equipment for Grading
CO2 Intensity (lb/MWhr)
559.32 CH4 Intensity (lb/MWhr)
0.029 N2O Intensity (lb/MWhr)
0.006
75
Climate Zone 4 Operational Year 2019
Utility Company Pacific Gas & Electric Company
1.2 Other Project Characteristics
Urbanization Rural Wind Speed (m/s) 2.2 Precipitation Freq (Days)
Recreational Swimming Pool 0.35 1000sqft 0.01 350.00 0
Parking Lot 104.00 Space 1.00 43,905.00 0
Floor Surface Area Population
Hotel 100.00 Room 0.72 57,670.00 0
1.0 Project Characteristics
1.1 Land Usage
Land Uses Size Metric Lot Acreage
CalEEMod Version: CalEEMod.2016.3.1 Page 1 of 1 Date: 4/28/2017 11:42 AM
Fairfield Inn & Suites - Sonoma-San Francisco County, Winter
Fairfield Inn & SuitesSonoma-San Francisco County, Winter
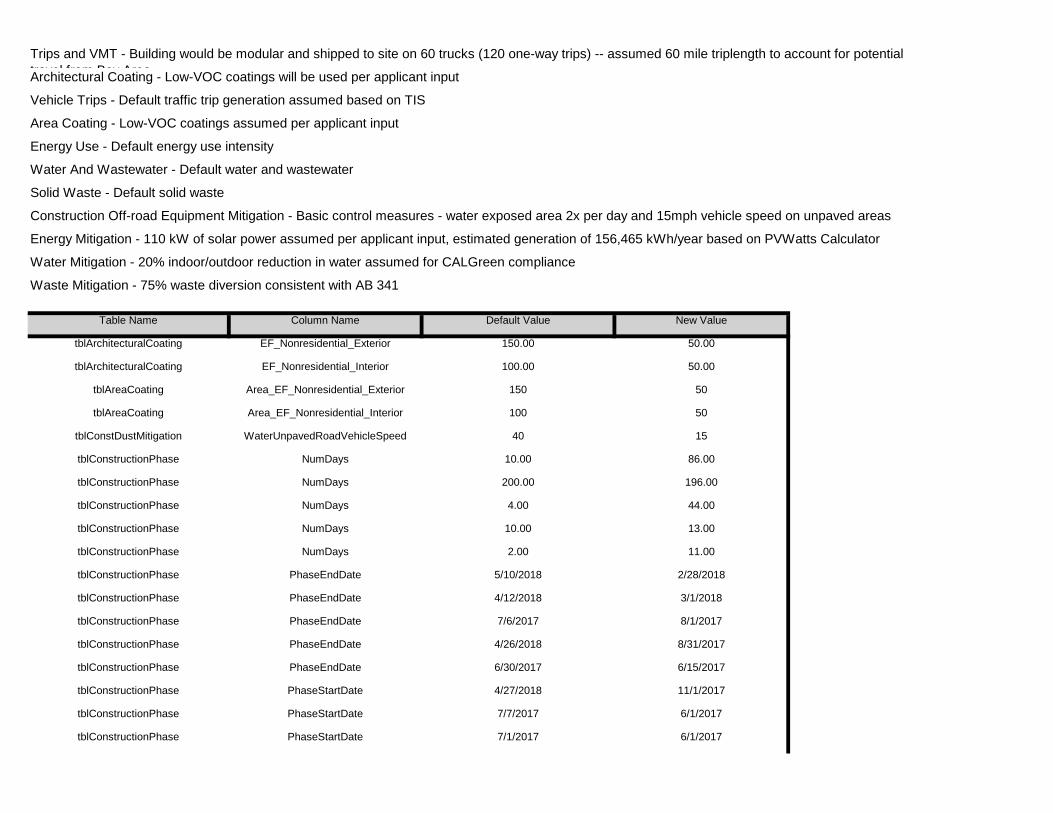
tblConstructionPhase PhaseStartDate 7/7/2017 6/1/2017
tblConstructionPhase PhaseStartDate 7/1/2017 6/1/2017
tblConstructionPhase PhaseEndDate 6/30/2017 6/15/2017
tblConstructionPhase PhaseStartDate 4/27/2018 11/1/2017
tblConstructionPhase PhaseEndDate 7/6/2017 8/1/2017
tblConstructionPhase PhaseEndDate 4/26/2018 8/31/2017
tblConstructionPhase PhaseEndDate 5/10/2018 2/28/2018
tblConstructionPhase PhaseEndDate 4/12/2018 3/1/2018
tblConstructionPhase NumDays 10.00 13.00
tblConstructionPhase NumDays 2.00 11.00
tblConstructionPhase NumDays 200.00 196.00
tblConstructionPhase NumDays 4.00 44.00
tblConstDustMitigation WaterUnpavedRoadVehicleSpeed 40 15
tblConstructionPhase NumDays 10.00 86.00
tblAreaCoating Area_EF_Nonresidential_Exterior 150 50
tblAreaCoating Area_EF_Nonresidential_Interior 100 50
tblArchitecturalCoating EF_Nonresidential_Exterior 150.00 50.00
tblArchitecturalCoating EF_Nonresidential_Interior 100.00 50.00
Energy Mitigation - 110 kW of solar power assumed per applicant input, estimated generation of 156,465 kWh/year based on PVWatts Calculator
Water Mitigation - 20% indoor/outdoor reduction in water assumed for CALGreen compliance
Waste Mitigation - 75% waste diversion consistent with AB 341
Table Name Column Name Default Value New Value
Vehicle Trips - Default traffic trip generation assumed based on TIS
Area Coating - Low-VOC coatings assumed per applicant input
Energy Use - Default energy use intensity
Water And Wastewater - Default water and wastewater
Solid Waste - Default solid waste
Construction Off-road Equipment Mitigation - Basic control measures - water exposed area 2x per day and 15mph vehicle speed on unpaved areas
Trips and VMT - Building would be modular and shipped to site on 60 trucks (120 one-way trips) -- assumed 60 mile triplength to account for potential travel from Bay AreaArchitectural Coating - Low-VOC coatings will be used per applicant input

2.0 Emissions Summary
2.1 Overall Construction (Maximum Daily Emission)Unmitigated Construction
tblVehicleTrips SU_TR 13.60 0.00
tblVehicleTrips WD_TR 33.82 0.00
tblTripsAndVMT HaulingTripNumber 0.00 120.00
tblVehicleTrips ST_TR 9.10 0.00
tblProjectCharacteristics UrbanizationLevel Urban Rural
tblTripsAndVMT HaulingTripLength 20.00 60.00
tblProjectCharacteristics CO2IntensityFactor 641.35 559.32
tblProjectCharacteristics OperationalYear 2018 2019
tblOffRoadEquipment UsageHours 6.00 1.50
tblOffRoadEquipment UsageHours 8.00 2.00
tblOffRoadEquipment UsageHours 6.00 1.50
tblOffRoadEquipment UsageHours 6.00 1.50
tblLandUse RecSwimmingAreaSquareFeet 350.00 0.00
tblOffRoadEquipment UsageHours 8.00 2.00
tblLandUse LotAcreage 3.33 0.72
tblLandUse LotAcreage 0.94 1.00
tblLandUse LandUseSquareFeet 145,200.00 57,670.00
tblLandUse LandUseSquareFeet 41,600.00 43,905.00
tblLandUse BuildingSpaceSquareFeet 41,600.00 43,905.00
tblLandUse BuildingSpaceSquareFeet 0.00 350.00
tblGrading MaterialExported 0.00 4,000.00
tblLandUse BuildingSpaceSquareFeet 145,200.00 57,670.00
tblGrading AcresOfGrading 16.50 1.50
tblGrading AcresOfGrading 5.50 1.00
tblConstructionPhase PhaseStartDate 4/13/2018 8/15/2017
tblConstructionPhase PhaseStartDate 6/29/2017 6/1/2017

2.2 Overall OperationalUnmitigated Operational
0.00 0.00 0.00 0.00 0.00 0.0047.91 0.00 38.63 51.25 0.00 35.54
NBio-CO2 Total CO2 CH4 N20 CO2e
Percent Reduction
0.00 0.00 0.00 0.00
Exhaust PM10
PM10 Total
Fugitive PM2.5
Exhaust PM2.5
PM2.5 Total
Bio- CO2ROG NOx CO SO2 Fugitive PM10
0.0000 5,812.4326
5,812.4326 1.2264 0.0000 5,843.0915
5.2912 2.2953 7.5865 2.6501 2.1277 4.7778Maximum 4.9665 52.9751 23.9475 0.0568
0.0000 1,816.5220
1,816.5220 0.1901 0.0000 1,821.2746
0.6463 0.4413 1.0876 0.1723 0.4309 0.60332018 4.7257 9.4029 8.4719 0.0184
0.0000 5,812.4326
5,812.4326 1.2264 0.0000 5,843.0915
5.2912 2.2953 7.5865 2.6501 2.1277 4.77782017 4.9665 52.9751 23.9475 0.0568
Total CO2 CH4 N2O CO2e
Year lb/day lb/day
PM10 Total
Fugitive PM2.5
Exhaust PM2.5
PM2.5 Total
Bio- CO2 NBio- CO2
Mitigated Construction
ROG NOx CO SO2 Fugitive PM10
Exhaust PM10
0.0000 5,812.4326
5,812.4326 1.2264 0.0000 5,843.0915
10.7520 2.2953 13.0473 5.6173 2.1277 7.7450Maximum 4.9665 52.9751 23.9475 0.0568
0.0000 1,816.5220
1,816.5220 0.1901 0.0000 1,821.2746
0.6463 0.4413 1.0876 0.1723 0.4309 0.60332018 4.7257 9.4029 8.4719 0.0184
0.0000 5,812.4326
5,812.4326 1.2264 0.0000 5,843.0915
10.7520 2.2953 13.0473 5.6173 2.1277 7.74502017 4.9665 52.9751 23.9475 0.0568
NBio- CO2 Total CO2 CH4 N2O CO2e
Year lb/day lb/day
Exhaust PM10
PM10 Total
Fugitive PM2.5
Exhaust PM2.5
PM2.5 Total
Bio- CO2ROG NOx CO SO2 Fugitive PM10
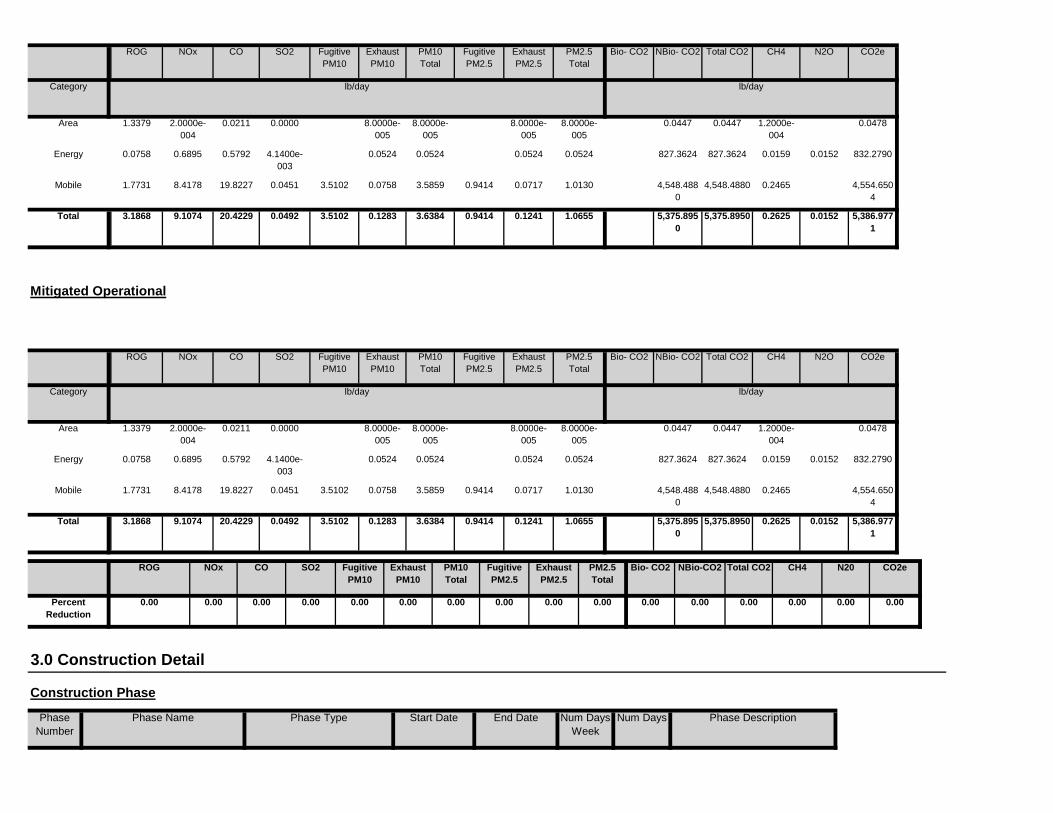
End Date Num Days Week
Num Days Phase Description
3.0 Construction Detail
Construction Phase
Phase Number
Phase Name Phase Type Start Date
0.00 0.00 0.00 0.00 0.00 0.000.00 0.00 0.00 0.00 0.00 0.00
NBio-CO2 Total CO2 CH4 N20 CO2e
Percent Reduction
0.00 0.00 0.00 0.00
Exhaust PM10
PM10 Total
Fugitive PM2.5
Exhaust PM2.5
PM2.5 Total
Bio- CO2ROG NOx CO SO2 Fugitive PM10
5,375.8950
5,375.8950 0.2625 0.0152 5,386.9771
3.5102 0.1283 3.6384 0.9414 0.1241 1.0655Total 3.1868 9.1074 20.4229 0.0492
4,548.4880
4,548.4880 0.2465 4,554.6504
3.5102 0.0758 3.5859 0.9414 0.0717 1.0130Mobile 1.7731 8.4178 19.8227 0.0451
827.3624 827.3624 0.0159 0.0152 832.27900.0524 0.0524 0.0524 0.0524Energy 0.0758 0.6895 0.5792 4.1400e-003
0.0447 0.0447 1.2000e-004
0.04788.0000e-005
8.0000e-005
8.0000e-005
8.0000e-005
Area 1.3379 2.0000e-004
0.0211 0.0000
Total CO2 CH4 N2O CO2e
Category lb/day lb/day
PM10 Total
Fugitive PM2.5
Exhaust PM2.5
PM2.5 Total
Bio- CO2 NBio- CO2
Mitigated Operational
ROG NOx CO SO2 Fugitive PM10
Exhaust PM10
5,375.8950
5,375.8950 0.2625 0.0152 5,386.9771
3.5102 0.1283 3.6384 0.9414 0.1241 1.0655Total 3.1868 9.1074 20.4229 0.0492
4,548.4880
4,548.4880 0.2465 4,554.6504
3.5102 0.0758 3.5859 0.9414 0.0717 1.0130Mobile 1.7731 8.4178 19.8227 0.0451
827.3624 827.3624 0.0159 0.0152 832.27900.0524 0.0524 0.0524 0.0524Energy 0.0758 0.6895 0.5792 4.1400e-003
0.0447 0.0447 1.2000e-004
0.04788.0000e-005
8.0000e-005
8.0000e-005
8.0000e-005
Area 1.3379 2.0000e-004
0.0211 0.0000
Total CO2 CH4 N2O CO2e
Category lb/day lb/day
PM10 Total
Fugitive PM2.5
Exhaust PM2.5
PM2.5 Total
Bio- CO2 NBio- CO2ROG NOx CO SO2 Fugitive PM10
Exhaust PM10

Building Construction Welders 3 2.00 46 0.45
Site Preparation Rubber Tired Dozers 1 7.00 247 0.40
Paving Paving Equipment 1 8.00 132 0.36
Grading Graders 1 6.00 187 0.41
Site Preparation Tractors/Loaders/Backhoes 1 8.00 97 0.37
Paving Tractors/Loaders/Backhoes 1 8.00 97 0.37
Grading Tractors/Loaders/Backhoes 1 7.00 97 0.37
Building Construction Tractors/Loaders/Backhoes 1 1.50 97 0.37
Grading Rubber Tired Dozers 1 6.00 247 0.40
Paving Rollers 1 7.00 80 0.38
Paving Pavers 1 6.00 130 0.42
Site Preparation Graders 1 8.00 187 0.41
Building Construction Forklifts 1 1.50 89 0.20
Building Construction Cranes 1 1.50 231 0.29
Building Construction Generator Sets 1 2.00 84 0.74
Paving Cement and Mortar Mixers 1 6.00 9 0.56
Load Factor
Architectural Coating Air Compressors 1 6.00 78 0.48
OffRoad Equipment
Phase Name Offroad Equipment Type Amount Usage Hours Horse Power
86
Acres of Grading (Site Preparation Phase): 1
Acres of Grading (Grading Phase): 1.5
Acres of Paving: 1
Residential Indoor: 0; Residential Outdoor: 0; Non-Residential Indoor: 87,030; Non-Residential Outdoor: 29,010; Striped Parking Area:
5 Architectural Coating Architectural Coating 11/1/2017 2/28/2018 5
196
4 Paving Paving 8/15/2017 8/31/2017 5 13
3 Building Construction Building Construction 6/1/2017 3/1/2018 5
11
2 Grading Grading 6/1/2017 8/1/2017 5 44
1 Site Preparation Site Preparation 6/1/2017 6/15/2017 5
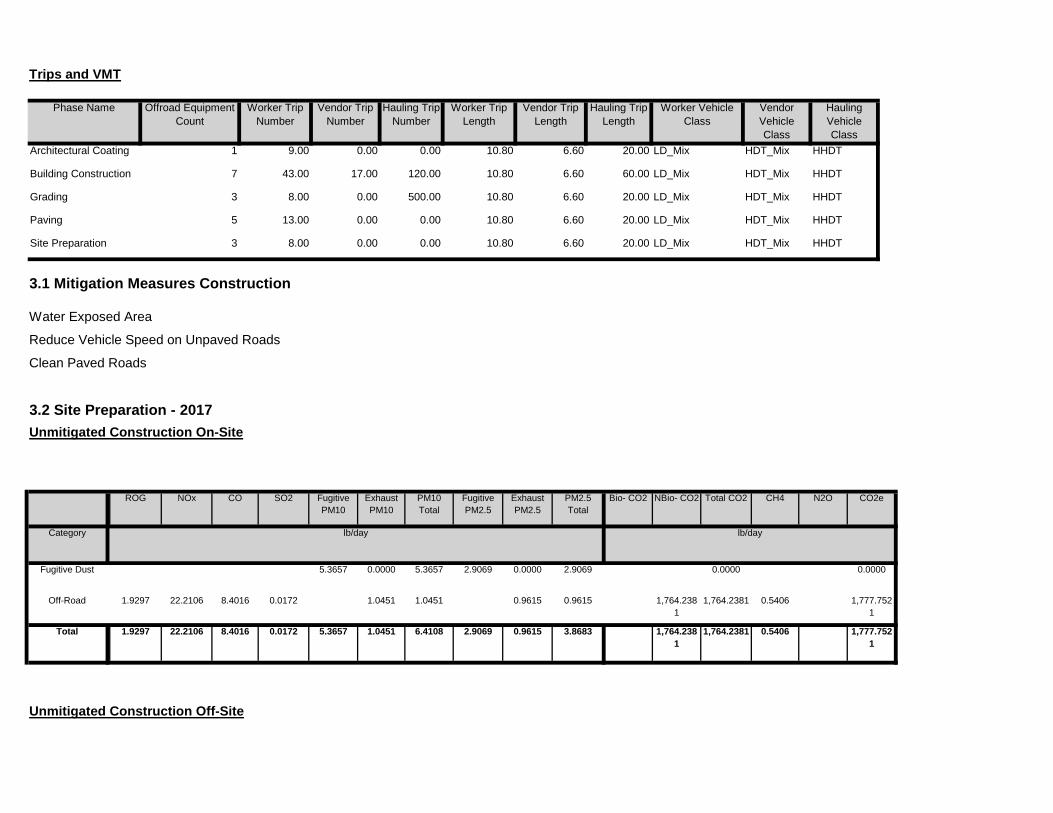
Unmitigated Construction Off-Site
1,764.2381
1,764.2381 0.5406 1,777.7521
5.3657 1.0451 6.4108 2.9069 0.9615 3.8683Total 1.9297 22.2106 8.4016 0.0172
1,764.2381
1,764.2381 0.5406 1,777.7521
1.0451 1.0451 0.9615 0.9615Off-Road 1.9297 22.2106 8.4016 0.0172
0.0000 0.00005.3657 0.0000 5.3657 2.9069 0.0000 2.9069
CO2e
Category lb/day lb/day
Fugitive Dust
PM2.5 Total
Bio- CO2 NBio- CO2 Total CO2 CH4 N2OSO2 Fugitive PM10
Exhaust PM10
PM10 Total
Fugitive PM2.5
Exhaust PM2.5
Water Exposed Area
Reduce Vehicle Speed on Unpaved Roads
Clean Paved Roads
3.2 Site Preparation - 2017Unmitigated Construction On-Site
ROG NOx CO
6.60 20.00 LD_Mix HDT_Mix HHDT
3.1 Mitigation Measures Construction
Site Preparation 3 8.00 0.00 0.00 10.80
10.80 6.60 20.00 LD_Mix HDT_Mix HHDT
6.60 20.00 LD_Mix HDT_Mix HHDT
Paving 5 13.00 0.00 0.00
Grading 3 8.00 0.00 500.00 10.80
10.80 6.60 60.00 LD_Mix HDT_Mix HHDT
6.60 20.00 LD_Mix HDT_Mix HHDT
Building Construction 7 43.00 17.00 120.00
Architectural Coating 1 9.00 0.00 0.00 10.80
Worker Trip Length
Vendor Trip Length
Hauling Trip Length
Worker Vehicle Class
Vendor Vehicle Class
Hauling Vehicle Class
Trips and VMT
Phase Name Offroad Equipment Count
Worker Trip Number
Vendor Trip Number
Hauling Trip Number
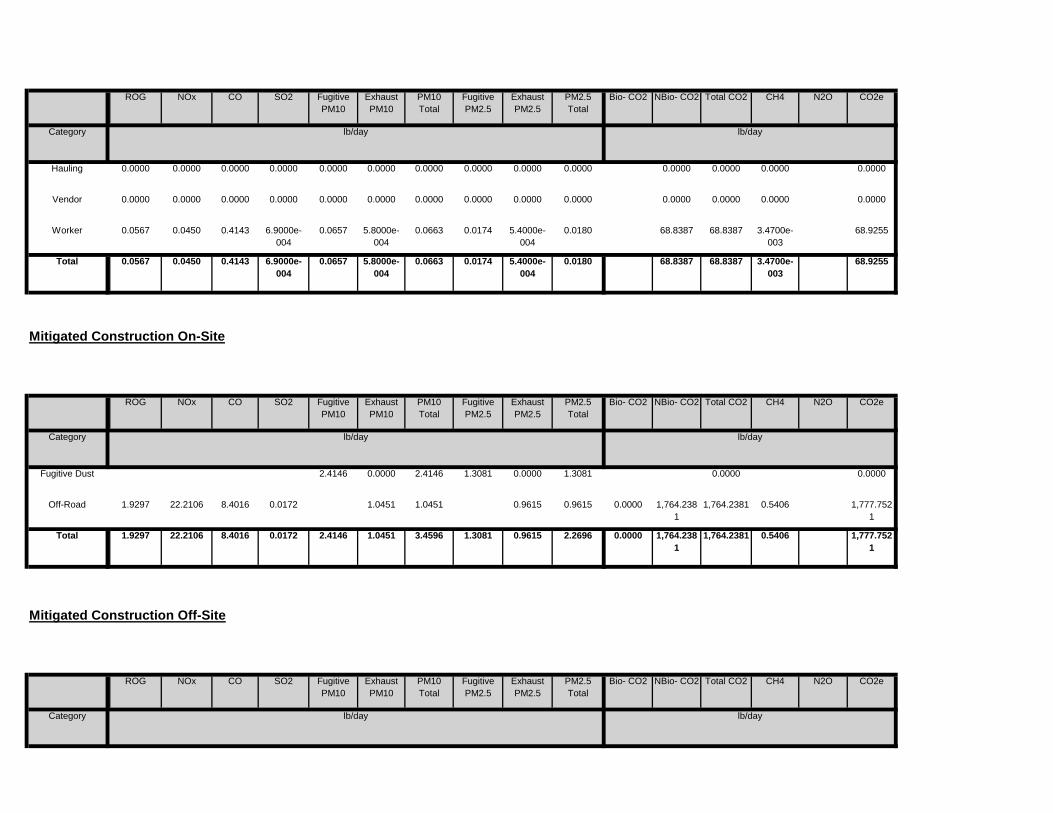
Total CO2 CH4 N2O CO2e
Category lb/day lb/day
PM10 Total
Fugitive PM2.5
Exhaust PM2.5
PM2.5 Total
Bio- CO2 NBio- CO2
Mitigated Construction Off-Site
ROG NOx CO SO2 Fugitive PM10
Exhaust PM10
0.0000 1,764.2381
1,764.2381 0.5406 1,777.7521
2.4146 1.0451 3.4596 1.3081 0.9615 2.2696Total 1.9297 22.2106 8.4016 0.0172
0.0000 1,764.2381
1,764.2381 0.5406 1,777.7521
1.0451 1.0451 0.9615 0.9615Off-Road 1.9297 22.2106 8.4016 0.0172
0.0000 0.00002.4146 0.0000 2.4146 1.3081 0.0000 1.3081Fugitive Dust
Total CO2 CH4 N2O CO2e
Category lb/day lb/day
PM10 Total
Fugitive PM2.5
Exhaust PM2.5
PM2.5 Total
Bio- CO2 NBio- CO2
Mitigated Construction On-Site
ROG NOx CO SO2 Fugitive PM10
Exhaust PM10
68.8387 68.8387 3.4700e-003
68.92550.0657 5.8000e-004
0.0663 0.0174 5.4000e-004
0.0180Total 0.0567 0.0450 0.4143 6.9000e-004
68.8387 68.8387 3.4700e-003
68.92550.0657 5.8000e-004
0.0663 0.0174 5.4000e-004
0.0180Worker 0.0567 0.0450 0.4143 6.9000e-004
0.0000 0.0000 0.0000 0.00000.0000 0.0000 0.0000 0.0000 0.0000 0.0000Vendor 0.0000 0.0000 0.0000 0.0000
0.0000 0.0000 0.0000 0.00000.0000 0.0000 0.0000 0.0000 0.0000 0.0000Hauling 0.0000 0.0000 0.0000 0.0000
Total CO2 CH4 N2O CO2e
Category lb/day lb/day
PM10 Total
Fugitive PM2.5
Exhaust PM2.5
PM2.5 Total
Bio- CO2 NBio- CO2ROG NOx CO SO2 Fugitive PM10
Exhaust PM10
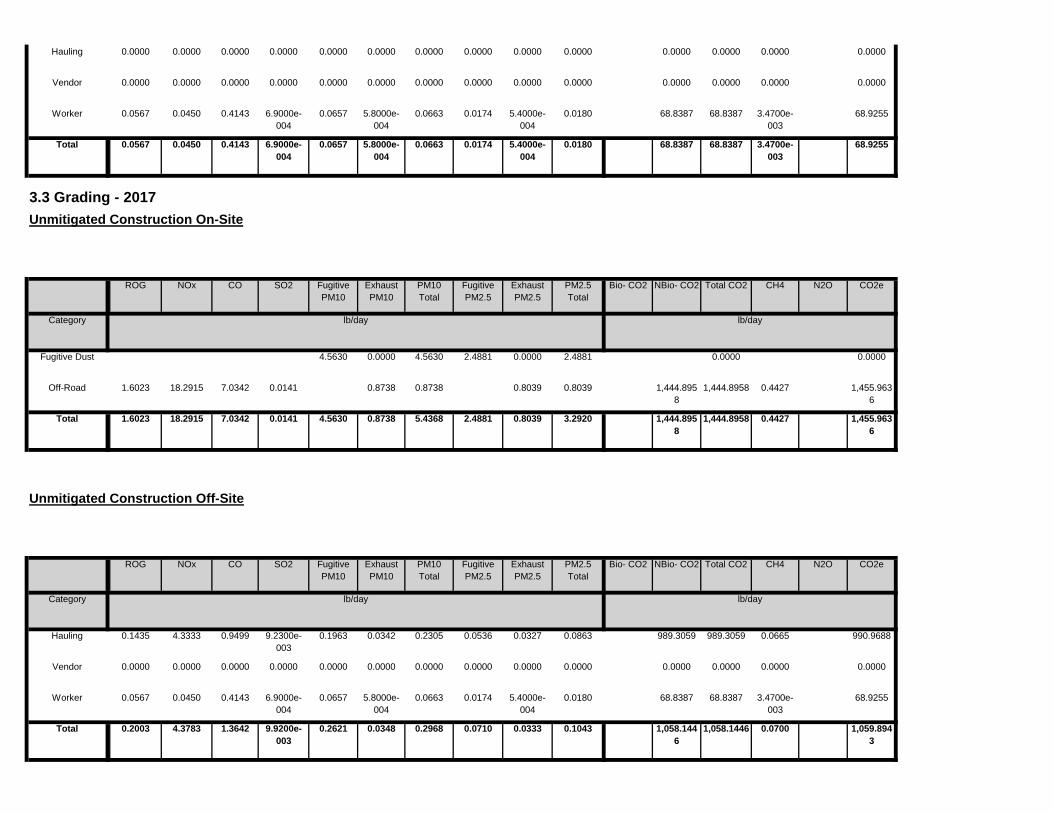
1,058.1446
1,058.1446 0.0700 1,059.8943
0.2621 0.0348 0.2968 0.0710 0.0333 0.1043Total 0.2003 4.3783 1.3642 9.9200e-003
68.8387 68.8387 3.4700e-003
68.92550.0657 5.8000e-004
0.0663 0.0174 5.4000e-004
0.0180Worker 0.0567 0.0450 0.4143 6.9000e-004
0.0000 0.0000 0.0000 0.00000.0000 0.0000 0.0000 0.0000 0.0000 0.0000Vendor 0.0000 0.0000 0.0000 0.0000
989.3059 989.3059 0.0665 990.96880.1963 0.0342 0.2305 0.0536 0.0327 0.0863Hauling 0.1435 4.3333 0.9499 9.2300e-003
Total CO2 CH4 N2O CO2e
Category lb/day lb/day
PM10 Total
Fugitive PM2.5
Exhaust PM2.5
PM2.5 Total
Bio- CO2 NBio- CO2
Unmitigated Construction Off-Site
ROG NOx CO SO2 Fugitive PM10
Exhaust PM10
1,444.8958
1,444.8958 0.4427 1,455.9636
4.5630 0.8738 5.4368 2.4881 0.8039 3.2920Total 1.6023 18.2915 7.0342 0.0141
1,444.8958
1,444.8958 0.4427 1,455.9636
0.8738 0.8738 0.8039 0.8039Off-Road 1.6023 18.2915 7.0342 0.0141
0.0000 0.00004.5630 0.0000 4.5630 2.4881 0.0000 2.4881Fugitive Dust
Total CO2 CH4 N2O CO2e
Category lb/day lb/day
PM10 Total
Fugitive PM2.5
Exhaust PM2.5
PM2.5 Total
Bio- CO2 NBio- CO2
3.3 Grading - 2017Unmitigated Construction On-Site
ROG NOx CO SO2 Fugitive PM10
Exhaust PM10
68.8387 68.8387 3.4700e-003
68.92550.0657 5.8000e-004
0.0663 0.0174 5.4000e-004
0.0180Total 0.0567 0.0450 0.4143 6.9000e-004
68.8387 68.8387 3.4700e-003
68.92550.0657 5.8000e-004
0.0663 0.0174 5.4000e-004
0.0180Worker 0.0567 0.0450 0.4143 6.9000e-004
0.0000 0.0000 0.0000 0.00000.0000 0.0000 0.0000 0.0000 0.0000 0.0000Vendor 0.0000 0.0000 0.0000 0.0000
0.0000 0.0000 0.0000 0.00000.0000 0.0000 0.0000 0.0000 0.0000 0.0000Hauling 0.0000 0.0000 0.0000 0.0000
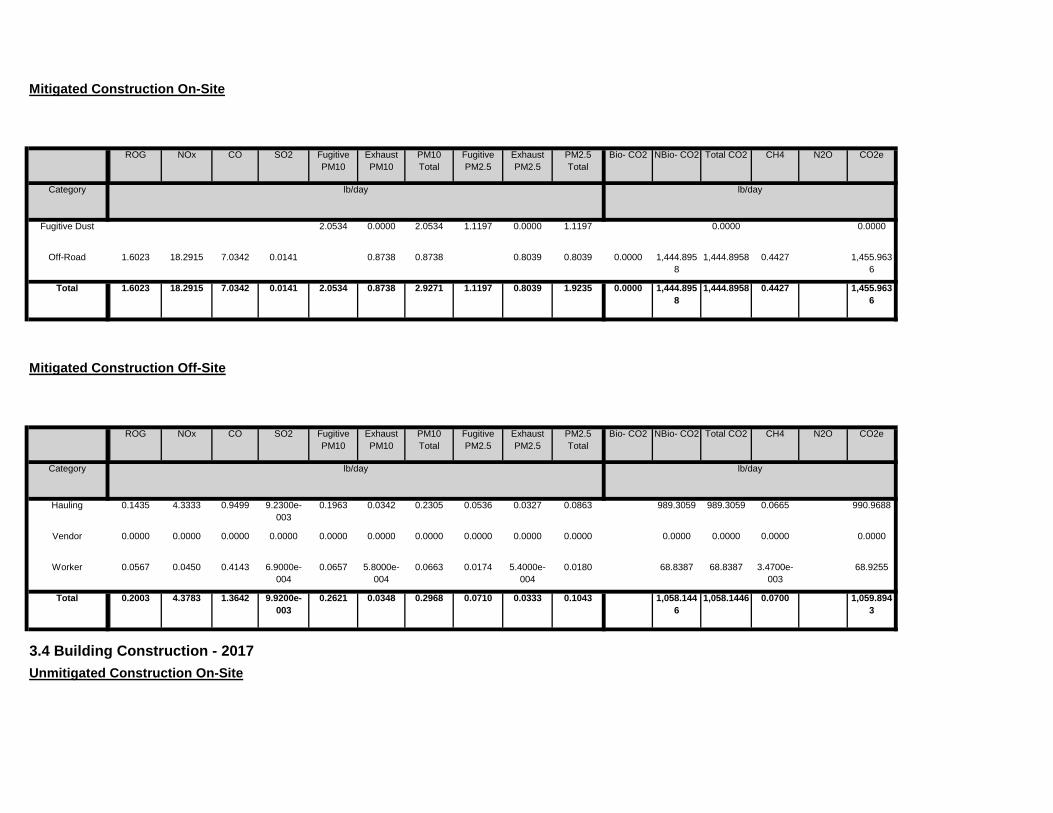
3.4 Building Construction - 2017Unmitigated Construction On-Site
1,058.1446
1,058.1446 0.0700 1,059.8943
0.2621 0.0348 0.2968 0.0710 0.0333 0.1043Total 0.2003 4.3783 1.3642 9.9200e-003
68.8387 68.8387 3.4700e-003
68.92550.0657 5.8000e-004
0.0663 0.0174 5.4000e-004
0.0180Worker 0.0567 0.0450 0.4143 6.9000e-004
0.0000 0.0000 0.0000 0.00000.0000 0.0000 0.0000 0.0000 0.0000 0.0000Vendor 0.0000 0.0000 0.0000 0.0000
989.3059 989.3059 0.0665 990.96880.1963 0.0342 0.2305 0.0536 0.0327 0.0863Hauling 0.1435 4.3333 0.9499 9.2300e-003
Total CO2 CH4 N2O CO2e
Category lb/day lb/day
PM10 Total
Fugitive PM2.5
Exhaust PM2.5
PM2.5 Total
Bio- CO2 NBio- CO2
Mitigated Construction Off-Site
ROG NOx CO SO2 Fugitive PM10
Exhaust PM10
0.0000 1,444.8958
1,444.8958 0.4427 1,455.9636
2.0534 0.8738 2.9271 1.1197 0.8039 1.9235Total 1.6023 18.2915 7.0342 0.0141
0.0000 1,444.8958
1,444.8958 0.4427 1,455.9636
0.8738 0.8738 0.8039 0.8039Off-Road 1.6023 18.2915 7.0342 0.0141
0.0000 0.00002.0534 0.0000 2.0534 1.1197 0.0000 1.1197Fugitive Dust
Total CO2 CH4 N2O CO2e
Category lb/day lb/day
PM10 Total
Fugitive PM2.5
Exhaust PM2.5
PM2.5 Total
Bio- CO2 NBio- CO2
Mitigated Construction On-Site
ROG NOx CO SO2 Fugitive PM10
Exhaust PM10

0.0000 510.9660 510.9660 0.1074 513.65210.3078 0.3078 0.2969 0.2969Off-Road 0.7413 4.8091 3.5892 5.5100e-003
Total CO2 CH4 N2O CO2e
Category lb/day lb/day
PM10 Total
Fugitive PM2.5
Exhaust PM2.5
PM2.5 Total
Bio- CO2 NBio- CO2
Mitigated Construction On-Site
ROG NOx CO SO2 Fugitive PM10
Exhaust PM10
965.3494 965.3494 0.0622 966.90400.4955 0.0332 0.5288 0.1338 0.0317 0.1656Total 0.4362 3.2406 3.1441 9.3400e-003
370.0081 370.0081 0.0187 370.47450.3532 3.1300e-003
0.3564 0.0937 2.8900e-003
0.0966Worker 0.3050 0.2417 2.2267 3.7300e-003
444.7142 444.7142 0.0357 445.60590.1035 0.0249 0.1284 0.0298 0.0238 0.0536Vendor 0.1114 2.4159 0.7941 4.2000e-003
150.6271 150.6271 7.8600e-003
150.82360.0387 5.2500e-003
0.0440 0.0104 5.0200e-003
0.0154Hauling 0.0198 0.5830 0.1233 1.4100e-003
Total CO2 CH4 N2O CO2e
Category lb/day lb/day
PM10 Total
Fugitive PM2.5
Exhaust PM2.5
PM2.5 Total
Bio- CO2 NBio- CO2
Unmitigated Construction Off-Site
ROG NOx CO SO2 Fugitive PM10
Exhaust PM10
510.9660 510.9660 0.1074 513.65210.3078 0.3078 0.2969 0.2969Total 0.7413 4.8091 3.5892 5.5100e-003
510.9660 510.9660 0.1074 513.65210.3078 0.3078 0.2969 0.2969Off-Road 0.7413 4.8091 3.5892 5.5100e-003
Total CO2 CH4 N2O CO2e
Category lb/day lb/day
PM10 Total
Fugitive PM2.5
Exhaust PM2.5
PM2.5 Total
Bio- CO2 NBio- CO2ROG NOx CO SO2 Fugitive PM10
Exhaust PM10
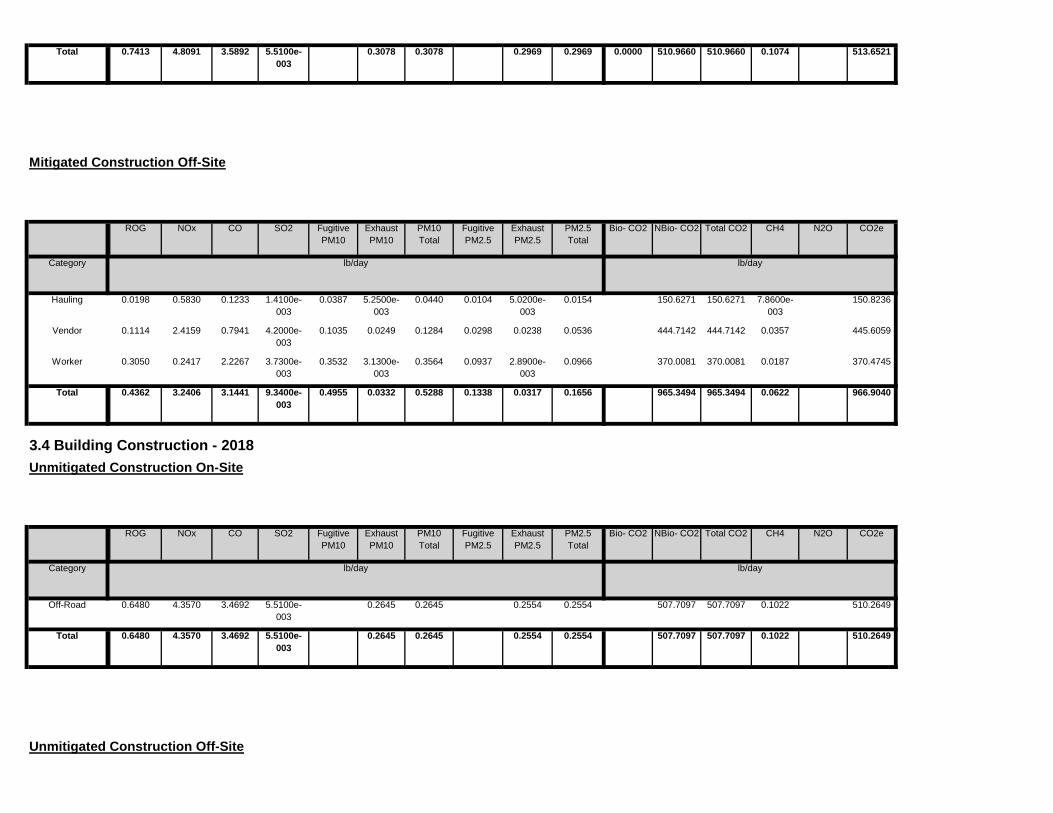
Unmitigated Construction Off-Site
507.7097 507.7097 0.1022 510.26490.2645 0.2645 0.2554 0.2554Total 0.6480 4.3570 3.4692 5.5100e-003
507.7097 507.7097 0.1022 510.26490.2645 0.2645 0.2554 0.2554Off-Road 0.6480 4.3570 3.4692 5.5100e-003
Total CO2 CH4 N2O CO2e
Category lb/day lb/day
PM10 Total
Fugitive PM2.5
Exhaust PM2.5
PM2.5 Total
Bio- CO2 NBio- CO2
3.4 Building Construction - 2018Unmitigated Construction On-Site
ROG NOx CO SO2 Fugitive PM10
Exhaust PM10
965.3494 965.3494 0.0622 966.90400.4955 0.0332 0.5288 0.1338 0.0317 0.1656Total 0.4362 3.2406 3.1441 9.3400e-003
370.0081 370.0081 0.0187 370.47450.3532 3.1300e-003
0.3564 0.0937 2.8900e-003
0.0966Worker 0.3050 0.2417 2.2267 3.7300e-003
444.7142 444.7142 0.0357 445.60590.1035 0.0249 0.1284 0.0298 0.0238 0.0536Vendor 0.1114 2.4159 0.7941 4.2000e-003
150.6271 150.6271 7.8600e-003
150.82360.0387 5.2500e-003
0.0440 0.0104 5.0200e-003
0.0154Hauling 0.0198 0.5830 0.1233 1.4100e-003
Total CO2 CH4 N2O CO2e
Category lb/day lb/day
PM10 Total
Fugitive PM2.5
Exhaust PM2.5
PM2.5 Total
Bio- CO2 NBio- CO2
Mitigated Construction Off-Site
ROG NOx CO SO2 Fugitive PM10
Exhaust PM10
0.0000 510.9660 510.9660 0.1074 513.65210.3078 0.3078 0.2969 0.2969Total 0.7413 4.8091 3.5892 5.5100e-003

Total CO2 CH4 N2O CO2e
Category lb/day lb/day
PM10 Total
Fugitive PM2.5
Exhaust PM2.5
PM2.5 Total
Bio- CO2 NBio- CO2
Mitigated Construction Off-Site
ROG NOx CO SO2 Fugitive PM10
Exhaust PM10
0.0000 507.7097 507.7097 0.1022 510.26490.2645 0.2645 0.2554 0.2554Total 0.6480 4.3570 3.4692 5.5100e-003
0.0000 507.7097 507.7097 0.1022 510.26490.2645 0.2645 0.2554 0.2554Off-Road 0.6480 4.3570 3.4692 5.5100e-003
Total CO2 CH4 N2O CO2e
Category lb/day lb/day
PM10 Total
Fugitive PM2.5
Exhaust PM2.5
PM2.5 Total
Bio- CO2 NBio- CO2
Mitigated Construction On-Site
ROG NOx CO SO2 Fugitive PM10
Exhaust PM10
951.9855 951.9855 0.0577 953.42870.5723 0.0256 0.5980 0.1527 0.0244 0.1771Total 0.3822 2.9959 2.7407 9.2000e-003
360.1407 360.1407 0.0164 360.54980.3532 2.9700e-003
0.3562 0.0937 2.7400e-003
0.0964Worker 0.2723 0.2115 1.9486 3.6300e-003
443.2095 443.2095 0.0337 444.05140.1035 0.0194 0.1229 0.0298 0.0185 0.0483Vendor 0.0940 2.2647 0.6849 4.1800e-003
148.6354 148.6354 7.6900e-003
148.82760.1156 3.2900e-003
0.1189 0.0292 3.1500e-003
0.0324Hauling 0.0159 0.5197 0.1073 1.3900e-003
Total CO2 CH4 N2O CO2e
Category lb/day lb/day
PM10 Total
Fugitive PM2.5
Exhaust PM2.5
PM2.5 Total
Bio- CO2 NBio- CO2ROG NOx CO SO2 Fugitive PM10
Exhaust PM10
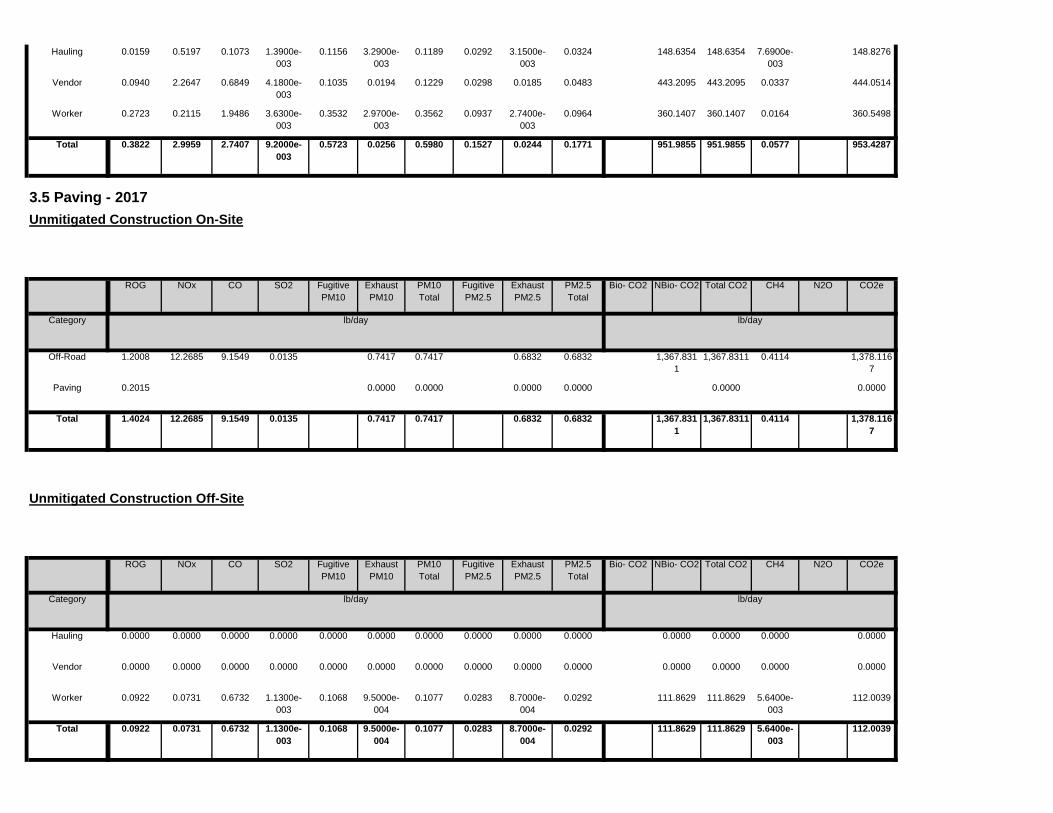
111.8629 111.8629 5.6400e-003
112.00390.1068 9.5000e-004
0.1077 0.0283 8.7000e-004
0.0292Total 0.0922 0.0731 0.6732 1.1300e-003
111.8629 111.8629 5.6400e-003
112.00390.1068 9.5000e-004
0.1077 0.0283 8.7000e-004
0.0292Worker 0.0922 0.0731 0.6732 1.1300e-003
0.0000 0.0000 0.0000 0.00000.0000 0.0000 0.0000 0.0000 0.0000 0.0000Vendor 0.0000 0.0000 0.0000 0.0000
0.0000 0.0000 0.0000 0.00000.0000 0.0000 0.0000 0.0000 0.0000 0.0000Hauling 0.0000 0.0000 0.0000 0.0000
Total CO2 CH4 N2O CO2e
Category lb/day lb/day
PM10 Total
Fugitive PM2.5
Exhaust PM2.5
PM2.5 Total
Bio- CO2 NBio- CO2
Unmitigated Construction Off-Site
ROG NOx CO SO2 Fugitive PM10
Exhaust PM10
1,367.8311
1,367.8311 0.4114 1,378.1167
0.7417 0.7417 0.6832 0.6832Total 1.4024 12.2685 9.1549 0.0135
0.0000 0.00000.0000 0.0000 0.0000 0.0000Paving 0.2015
1,367.8311
1,367.8311 0.4114 1,378.1167
0.7417 0.7417 0.6832 0.6832Off-Road 1.2008 12.2685 9.1549 0.0135
Total CO2 CH4 N2O CO2e
Category lb/day lb/day
PM10 Total
Fugitive PM2.5
Exhaust PM2.5
PM2.5 Total
Bio- CO2 NBio- CO2
3.5 Paving - 2017Unmitigated Construction On-Site
ROG NOx CO SO2 Fugitive PM10
Exhaust PM10
951.9855 951.9855 0.0577 953.42870.5723 0.0256 0.5980 0.1527 0.0244 0.1771Total 0.3822 2.9959 2.7407 9.2000e-003
360.1407 360.1407 0.0164 360.54980.3532 2.9700e-003
0.3562 0.0937 2.7400e-003
0.0964Worker 0.2723 0.2115 1.9486 3.6300e-003
443.2095 443.2095 0.0337 444.05140.1035 0.0194 0.1229 0.0298 0.0185 0.0483Vendor 0.0940 2.2647 0.6849 4.1800e-003
148.6354 148.6354 7.6900e-003
148.82760.1156 3.2900e-003
0.1189 0.0292 3.1500e-003
0.0324Hauling 0.0159 0.5197 0.1073 1.3900e-003
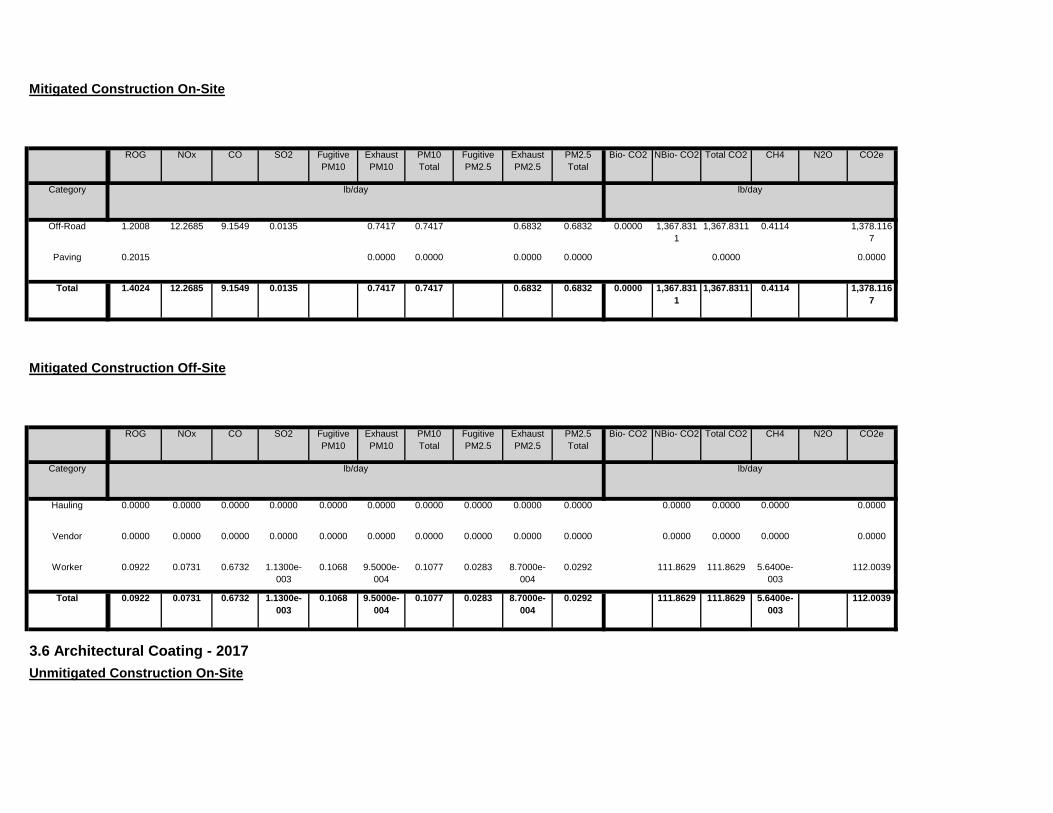
3.6 Architectural Coating - 2017Unmitigated Construction On-Site
111.8629 111.8629 5.6400e-003
112.00390.1068 9.5000e-004
0.1077 0.0283 8.7000e-004
0.0292Total 0.0922 0.0731 0.6732 1.1300e-003
111.8629 111.8629 5.6400e-003
112.00390.1068 9.5000e-004
0.1077 0.0283 8.7000e-004
0.0292Worker 0.0922 0.0731 0.6732 1.1300e-003
0.0000 0.0000 0.0000 0.00000.0000 0.0000 0.0000 0.0000 0.0000 0.0000Vendor 0.0000 0.0000 0.0000 0.0000
0.0000 0.0000 0.0000 0.00000.0000 0.0000 0.0000 0.0000 0.0000 0.0000Hauling 0.0000 0.0000 0.0000 0.0000
Total CO2 CH4 N2O CO2e
Category lb/day lb/day
PM10 Total
Fugitive PM2.5
Exhaust PM2.5
PM2.5 Total
Bio- CO2 NBio- CO2
Mitigated Construction Off-Site
ROG NOx CO SO2 Fugitive PM10
Exhaust PM10
0.0000 1,367.8311
1,367.8311 0.4114 1,378.1167
0.7417 0.7417 0.6832 0.6832Total 1.4024 12.2685 9.1549 0.0135
0.0000 0.00000.0000 0.0000 0.0000 0.0000Paving 0.2015
0.0000 1,367.8311
1,367.8311 0.4114 1,378.1167
0.7417 0.7417 0.6832 0.6832Off-Road 1.2008 12.2685 9.1549 0.0135
Total CO2 CH4 N2O CO2e
Category lb/day lb/day
PM10 Total
Fugitive PM2.5
Exhaust PM2.5
PM2.5 Total
Bio- CO2 NBio- CO2
Mitigated Construction On-Site
ROG NOx CO SO2 Fugitive PM10
Exhaust PM10
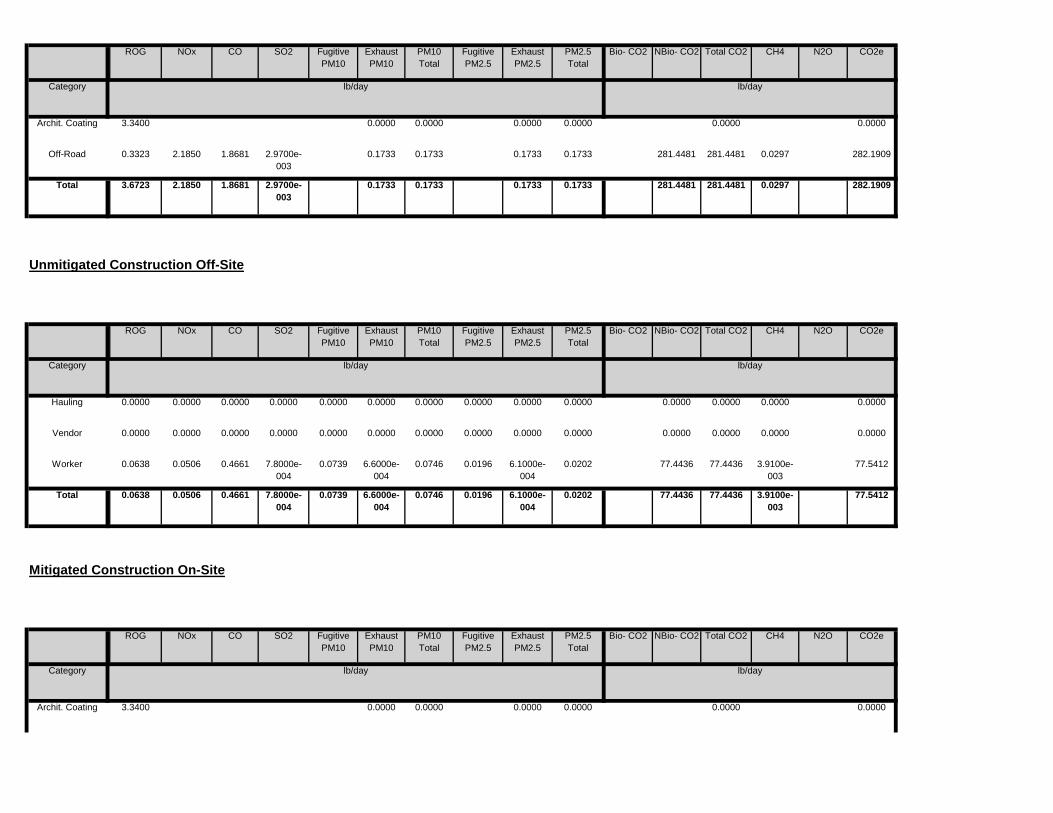
0.0000 0.00000.0000 0.0000 0.0000 0.0000Archit. Coating 3.3400
Total CO2 CH4 N2O CO2e
Category lb/day lb/day
PM10 Total
Fugitive PM2.5
Exhaust PM2.5
PM2.5 Total
Bio- CO2 NBio- CO2
Mitigated Construction On-Site
ROG NOx CO SO2 Fugitive PM10
Exhaust PM10
77.4436 77.4436 3.9100e-003
77.54120.0739 6.6000e-004
0.0746 0.0196 6.1000e-004
0.0202Total 0.0638 0.0506 0.4661 7.8000e-004
77.4436 77.4436 3.9100e-003
77.54120.0739 6.6000e-004
0.0746 0.0196 6.1000e-004
0.0202Worker 0.0638 0.0506 0.4661 7.8000e-004
0.0000 0.0000 0.0000 0.00000.0000 0.0000 0.0000 0.0000 0.0000 0.0000Vendor 0.0000 0.0000 0.0000 0.0000
0.0000 0.0000 0.0000 0.00000.0000 0.0000 0.0000 0.0000 0.0000 0.0000Hauling 0.0000 0.0000 0.0000 0.0000
Total CO2 CH4 N2O CO2e
Category lb/day lb/day
PM10 Total
Fugitive PM2.5
Exhaust PM2.5
PM2.5 Total
Bio- CO2 NBio- CO2
Unmitigated Construction Off-Site
ROG NOx CO SO2 Fugitive PM10
Exhaust PM10
281.4481 281.4481 0.0297 282.19090.1733 0.1733 0.1733 0.1733Total 3.6723 2.1850 1.8681 2.9700e-003
281.4481 281.4481 0.0297 282.19090.1733 0.1733 0.1733 0.1733Off-Road 0.3323 2.1850 1.8681 2.9700e-003
0.0000 0.00000.0000 0.0000 0.0000 0.0000Archit. Coating 3.3400
Total CO2 CH4 N2O CO2e
Category lb/day lb/day
PM10 Total
Fugitive PM2.5
Exhaust PM2.5
PM2.5 Total
Bio- CO2 NBio- CO2ROG NOx CO SO2 Fugitive PM10
Exhaust PM10
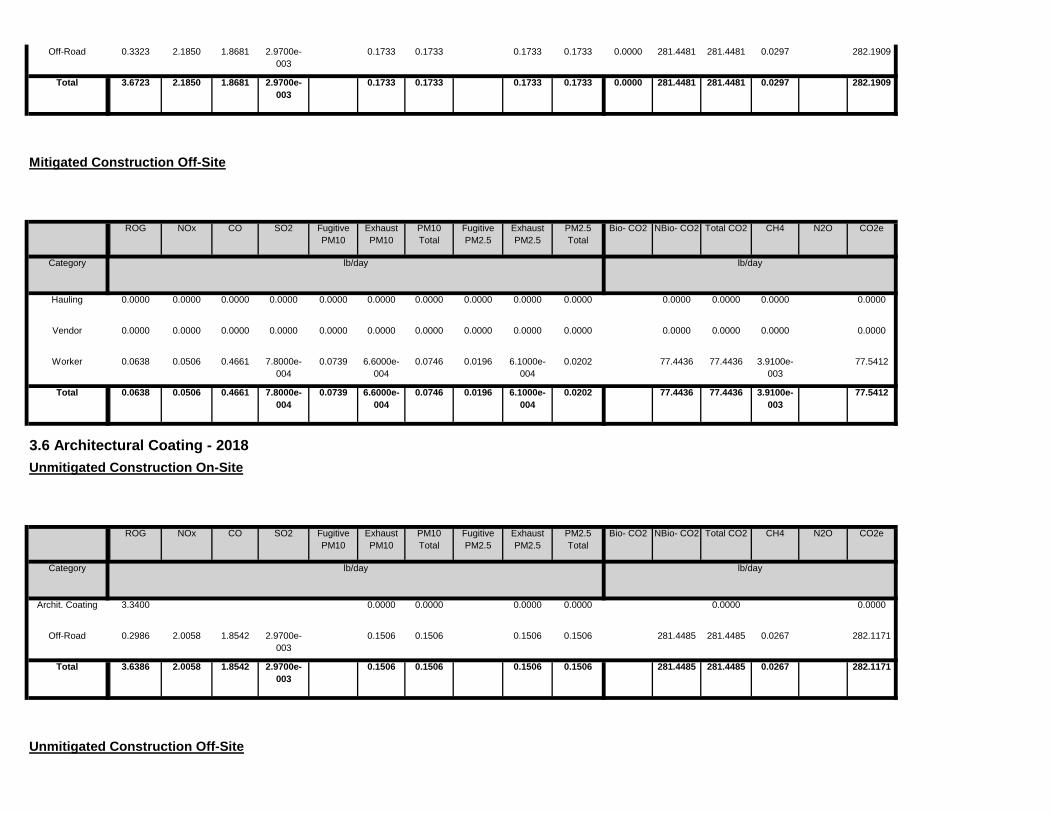
Unmitigated Construction Off-Site
281.4485 281.4485 0.0267 282.11710.1506 0.1506 0.1506 0.1506Total 3.6386 2.0058 1.8542 2.9700e-003
281.4485 281.4485 0.0267 282.11710.1506 0.1506 0.1506 0.1506Off-Road 0.2986 2.0058 1.8542 2.9700e-003
0.0000 0.00000.0000 0.0000 0.0000 0.0000Archit. Coating 3.3400
Total CO2 CH4 N2O CO2e
Category lb/day lb/day
PM10 Total
Fugitive PM2.5
Exhaust PM2.5
PM2.5 Total
Bio- CO2 NBio- CO2
3.6 Architectural Coating - 2018Unmitigated Construction On-Site
ROG NOx CO SO2 Fugitive PM10
Exhaust PM10
77.4436 77.4436 3.9100e-003
77.54120.0739 6.6000e-004
0.0746 0.0196 6.1000e-004
0.0202Total 0.0638 0.0506 0.4661 7.8000e-004
77.4436 77.4436 3.9100e-003
77.54120.0739 6.6000e-004
0.0746 0.0196 6.1000e-004
0.0202Worker 0.0638 0.0506 0.4661 7.8000e-004
0.0000 0.0000 0.0000 0.00000.0000 0.0000 0.0000 0.0000 0.0000 0.0000Vendor 0.0000 0.0000 0.0000 0.0000
0.0000 0.0000 0.0000 0.00000.0000 0.0000 0.0000 0.0000 0.0000 0.0000Hauling 0.0000 0.0000 0.0000 0.0000
Total CO2 CH4 N2O CO2e
Category lb/day lb/day
PM10 Total
Fugitive PM2.5
Exhaust PM2.5
PM2.5 Total
Bio- CO2 NBio- CO2
Mitigated Construction Off-Site
ROG NOx CO SO2 Fugitive PM10
Exhaust PM10
0.0000 281.4481 281.4481 0.0297 282.19090.1733 0.1733 0.1733 0.1733Total 3.6723 2.1850 1.8681 2.9700e-003
0.0000 281.4481 281.4481 0.0297 282.19090.1733 0.1733 0.1733 0.1733Off-Road 0.3323 2.1850 1.8681 2.9700e-003

Total CO2 CH4 N2O CO2e
Category lb/day lb/day
PM10 Total
Fugitive PM2.5
Exhaust PM2.5
PM2.5 Total
Bio- CO2 NBio- CO2
Mitigated Construction Off-Site
ROG NOx CO SO2 Fugitive PM10
Exhaust PM10
0.0000 281.4485 281.4485 0.0267 282.11710.1506 0.1506 0.1506 0.1506Total 3.6386 2.0058 1.8542 2.9700e-003
0.0000 281.4485 281.4485 0.0267 282.11710.1506 0.1506 0.1506 0.1506Off-Road 0.2986 2.0058 1.8542 2.9700e-003
0.0000 0.00000.0000 0.0000 0.0000 0.0000Archit. Coating 3.3400
Total CO2 CH4 N2O CO2e
Category lb/day lb/day
PM10 Total
Fugitive PM2.5
Exhaust PM2.5
PM2.5 Total
Bio- CO2 NBio- CO2
Mitigated Construction On-Site
ROG NOx CO SO2 Fugitive PM10
Exhaust PM10
75.3783 75.3783 3.4300e-003
75.46390.0739 6.2000e-004
0.0746 0.0196 5.7000e-004
0.0202Total 0.0570 0.0443 0.4078 7.6000e-004
75.3783 75.3783 3.4300e-003
75.46390.0739 6.2000e-004
0.0746 0.0196 5.7000e-004
0.0202Worker 0.0570 0.0443 0.4078 7.6000e-004
0.0000 0.0000 0.0000 0.00000.0000 0.0000 0.0000 0.0000 0.0000 0.0000Vendor 0.0000 0.0000 0.0000 0.0000
0.0000 0.0000 0.0000 0.00000.0000 0.0000 0.0000 0.0000 0.0000 0.0000Hauling 0.0000 0.0000 0.0000 0.0000
Total CO2 CH4 N2O CO2e
Category lb/day lb/day
PM10 Total
Fugitive PM2.5
Exhaust PM2.5
PM2.5 Total
Bio- CO2 NBio- CO2ROG NOx CO SO2 Fugitive PM10
Exhaust PM10

4.3 Trip Type Information
Miles Trip % Trip Purpose %
Total 817.00 819.00 595.00 1,578,346 1,578,346Recreational Swimming Pool 0.00 0.00 0.00
Parking Lot 0.00 0.00 0.00
Annual VMT
Hotel 817.00 819.00 595.00 1,578,346 1,578,346
4.2 Trip Summary Information
Average Daily Trip Rate Unmitigated MitigatedLand Use Weekday Saturday Sunday Annual VMT
4,548.4880
4,548.4880 0.2465 4,554.6504
3.5102 0.0758 3.5859 0.9414 0.0717 1.0130Unmitigated 1.7731 8.4178 19.8227 0.0451
4,548.4880
4,548.4880 0.2465 4,554.6504
3.5102 0.0758 3.5859 0.9414 0.0717 1.0130Mitigated 1.7731 8.4178 19.8227 0.0451
NBio- CO2 Total CO2 CH4 N2O CO2e
Category lb/day lb/day
Exhaust PM10
PM10 Total
Fugitive PM2.5
Exhaust PM2.5
PM2.5 Total
Bio- CO2
4.0 Operational Detail - Mobile
4.1 Mitigation Measures Mobile
ROG NOx CO SO2 Fugitive PM10
75.3783 75.3783 3.4300e-003
75.46390.0739 6.2000e-004
0.0746 0.0196 5.7000e-004
0.0202Total 0.0570 0.0443 0.4078 7.6000e-004
75.3783 75.3783 3.4300e-003
75.46390.0739 6.2000e-004
0.0746 0.0196 5.7000e-004
0.0202Worker 0.0570 0.0443 0.4078 7.6000e-004
0.0000 0.0000 0.0000 0.00000.0000 0.0000 0.0000 0.0000 0.0000 0.0000Vendor 0.0000 0.0000 0.0000 0.0000
0.0000 0.0000 0.0000 0.00000.0000 0.0000 0.0000 0.0000 0.0000 0.0000Hauling 0.0000 0.0000 0.0000 0.0000

832.2790
5.2 Energy by Land Use - NaturalGasUnmitigated
0.0524 827.3624 827.3624 0.0159 0.01524.1400e-003
0.0524 0.0524 0.0524
827.3624 827.3624 0.0159 0.0152 832.2790
NaturalGas Unmitigated
0.0758 0.6895 0.5792
0.0524 0.0524 0.0524 0.0524
Category lb/day lb/day
NaturalGas Mitigated
0.0758 0.6895 0.5792 4.1400e-003
Bio- CO2 NBio- CO2 Total CO2 CH4 N2O CO2eFugitive PM10
Exhaust PM10
PM10 Total
Fugitive PM2.5
Exhaust PM2.5
PM2.5 Total
5.0 Energy Detail
Historical Energy Use: N
5.1 Mitigation Measures Energy
Kilowatt Hours of Renewable Electricity Generated
ROG NOx CO SO2
0.025150 0.002984 0.002020 0.005725 0.000869 0.001276
0.000869 0.001276
Recreational Swimming Pool 0.558294 0.043613 0.174269 0.117152 0.033155 0.007464 0.028029
0.007464 0.028029 0.025150 0.002984 0.002020 0.005725Parking Lot 0.558294 0.043613 0.174269 0.117152 0.033155
0.025150 0.002984 0.002020 0.005725 0.000869 0.001276
SBUS MH
Hotel 0.558294 0.043613 0.174269 0.117152 0.033155 0.007464 0.028029
LHD2 MHD HHD OBUS UBUS MCYLand Use LDA LDT1 LDT2 MDV LHD1
48.00 19.00 52 39 9
4.4 Fleet Mix
0.00 0.00 0 0 0
Recreational Swimming Pool 14.70 6.60 6.60 33.00
61.60 19.00 58 38 4
Parking Lot 14.70 6.60 6.60 0.00
H-S or C-C H-O or C-NW Primary Diverted Pass-by
Hotel 14.70 6.60 6.60 19.40
Land Use H-W or C-W H-S or C-C H-O or C-NW H-W or C-W
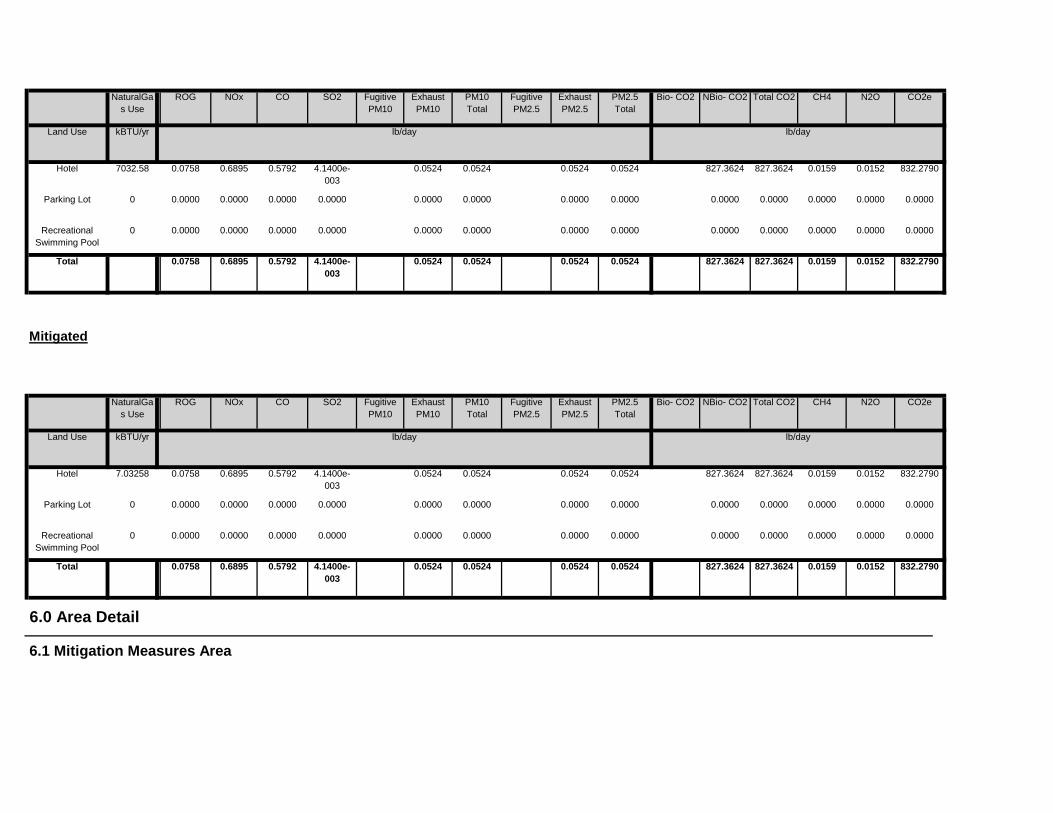
6.0 Area Detail
6.1 Mitigation Measures Area
827.3624 827.3624 0.0159 0.0152 832.27900.0524 0.0524 0.0524 0.0524Total 0.0758 0.6895 0.5792 4.1400e-003
0.0000 0.0000 0.0000 0.0000 0.00000.0000 0.0000 0.0000 0.0000Recreational Swimming Pool
0 0.0000 0.0000 0.0000 0.0000
0.0000 0.0000 0.0000 0.0000 0.00000.0000 0.0000 0.0000 0.0000Parking Lot 0 0.0000 0.0000 0.0000 0.0000
827.3624 827.3624 0.0159 0.0152 832.27900.0524 0.0524 0.0524 0.0524Hotel 7.03258 0.0758 0.6895 0.5792 4.1400e-003
Total CO2 CH4 N2O CO2e
Land Use kBTU/yr lb/day lb/day
PM10 Total
Fugitive PM2.5
Exhaust PM2.5
PM2.5 Total
Bio- CO2 NBio- CO2
Mitigated
NaturalGas Use
ROG NOx CO SO2 Fugitive PM10
Exhaust PM10
827.3624 827.3624 0.0159 0.0152 832.27900.0524 0.0524 0.0524 0.0524Total 0.0758 0.6895 0.5792 4.1400e-003
0.0000 0.0000 0.0000 0.0000 0.00000.0000 0.0000 0.0000 0.0000Recreational Swimming Pool
0 0.0000 0.0000 0.0000 0.0000
0.0000 0.0000 0.0000 0.0000 0.00000.0000 0.0000 0.0000 0.0000Parking Lot 0 0.0000 0.0000 0.0000 0.0000
827.3624 827.3624 0.0159 0.0152 832.27900.0524 0.0524 0.0524 0.0524Hotel 7032.58 0.0758 0.6895 0.5792 4.1400e-003
NBio- CO2 Total CO2 CH4 N2O CO2e
Land Use kBTU/yr lb/day lb/day
Exhaust PM10
PM10 Total
Fugitive PM2.5
Exhaust PM2.5
PM2.5 Total
Bio- CO2NaturalGas Use
ROG NOx CO SO2 Fugitive PM10
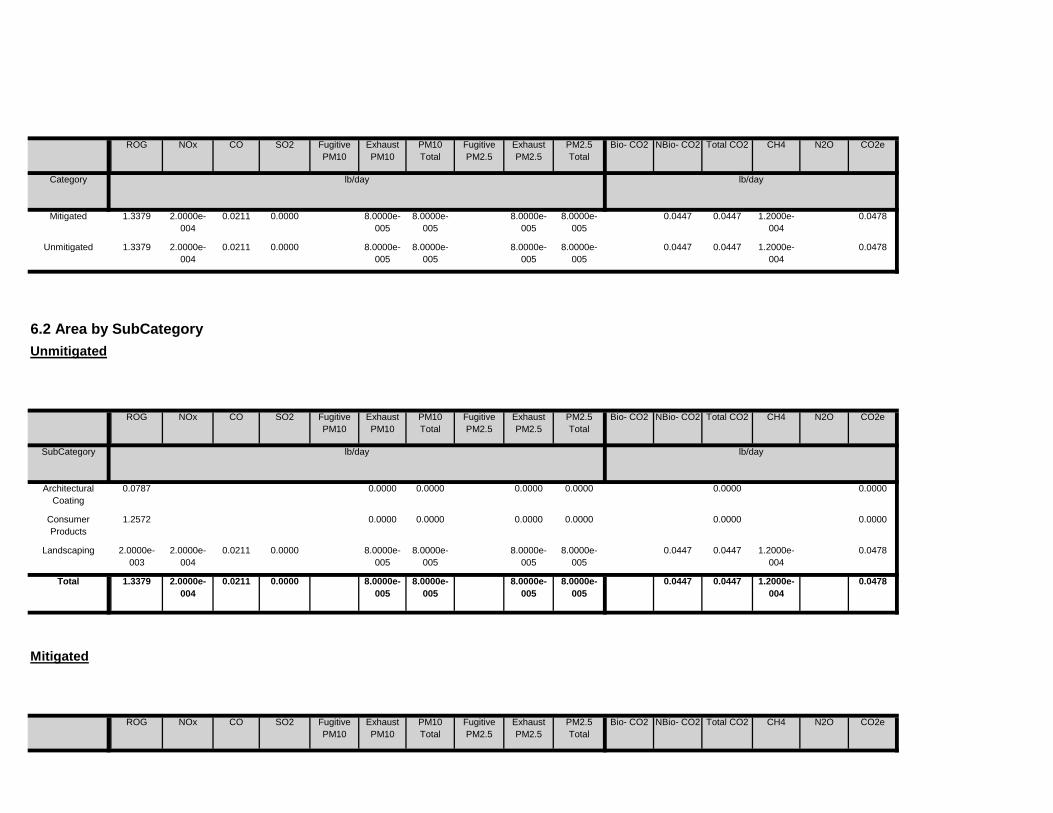
Total CO2 CH4 N2O CO2ePM10 Total
Fugitive PM2.5
Exhaust PM2.5
PM2.5 Total
Bio- CO2 NBio- CO2
Mitigated
ROG NOx CO SO2 Fugitive PM10
Exhaust PM10
0.0447 0.0447 1.2000e-004
0.04788.0000e-005
8.0000e-005
8.0000e-005
8.0000e-005
Total 1.3379 2.0000e-004
0.0211 0.0000
0.0447 0.0447 1.2000e-004
0.04788.0000e-005
8.0000e-005
8.0000e-005
8.0000e-005
Landscaping 2.0000e-003
2.0000e-004
0.0211 0.0000
0.0000 0.00000.0000 0.0000 0.0000 0.0000Consumer Products
1.2572
0.0000 0.00000.0000 0.0000 0.0000 0.0000Architectural Coating
0.0787
Total CO2 CH4 N2O CO2e
SubCategory lb/day lb/day
PM10 Total
Fugitive PM2.5
Exhaust PM2.5
PM2.5 Total
Bio- CO2 NBio- CO2
6.2 Area by SubCategoryUnmitigated
ROG NOx CO SO2 Fugitive PM10
Exhaust PM10
0.0447 0.0447 1.2000e-004
0.04788.0000e-005
8.0000e-005
8.0000e-005
8.0000e-005
Unmitigated 1.3379 2.0000e-004
0.0211 0.0000
0.0447 0.0447 1.2000e-004
0.04788.0000e-005
8.0000e-005
8.0000e-005
8.0000e-005
Mitigated 1.3379 2.0000e-004
0.0211 0.0000
NBio- CO2 Total CO2 CH4 N2O CO2e
Category lb/day lb/day
Exhaust PM10
PM10 Total
Fugitive PM2.5
Exhaust PM2.5
PM2.5 Total
Bio- CO2ROG NOx CO SO2 Fugitive PM10
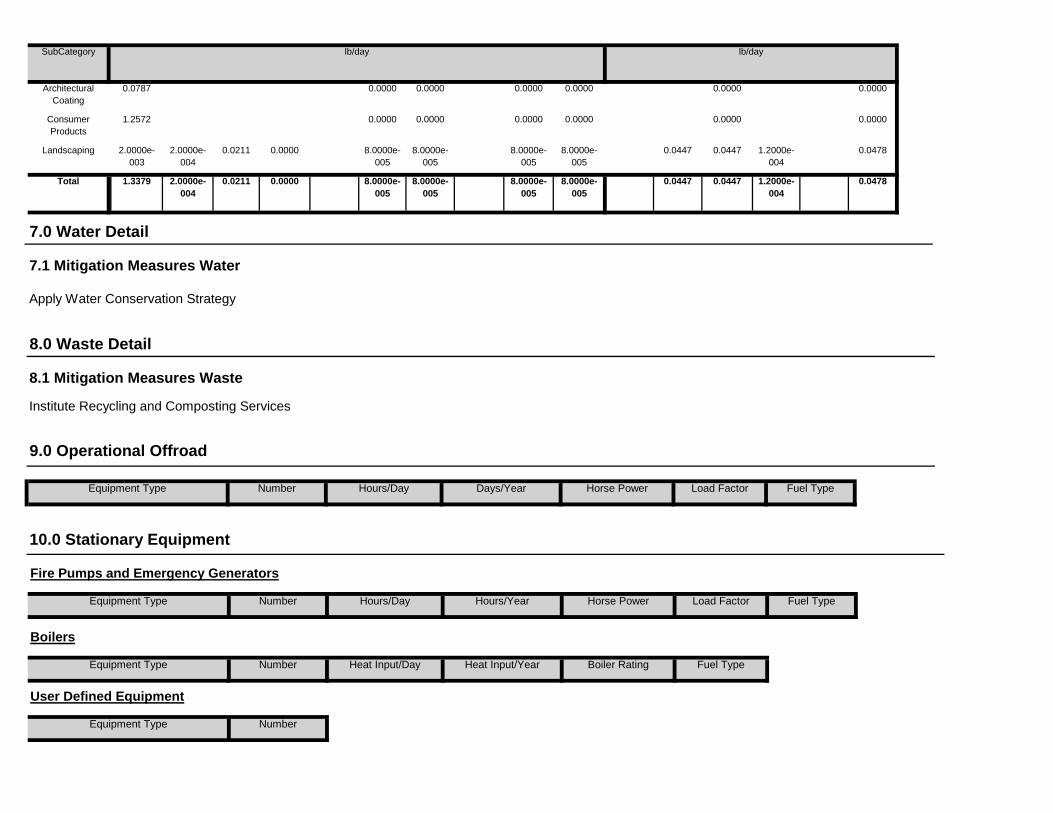
User Defined Equipment
Equipment Type Number
Fuel Type
Boilers
Equipment Type Number Heat Input/Day Heat Input/Year Boiler Rating Fuel Type
Load Factor Fuel Type
10.0 Stationary Equipment
Fire Pumps and Emergency Generators
Equipment Type Number Hours/Day Hours/Year Horse Power Load Factor
9.0 Operational Offroad
Equipment Type Number Hours/Day Days/Year Horse Power
7.0 Water Detail
7.1 Mitigation Measures Water
Apply Water Conservation Strategy
8.0 Waste Detail
8.1 Mitigation Measures Waste
Institute Recycling and Composting Services
0.0447 0.0447 1.2000e-004
0.04788.0000e-005
8.0000e-005
8.0000e-005
8.0000e-005
Total 1.3379 2.0000e-004
0.0211 0.0000
0.0447 0.0447 1.2000e-004
0.04788.0000e-005
8.0000e-005
8.0000e-005
8.0000e-005
Landscaping 2.0000e-003
2.0000e-004
0.0211 0.0000
0.0000 0.00000.0000 0.0000 0.0000 0.0000Consumer Products
1.2572
0.0000 0.00000.0000 0.0000 0.0000 0.0000Architectural Coating
0.0787
SubCategory lb/day lb/day
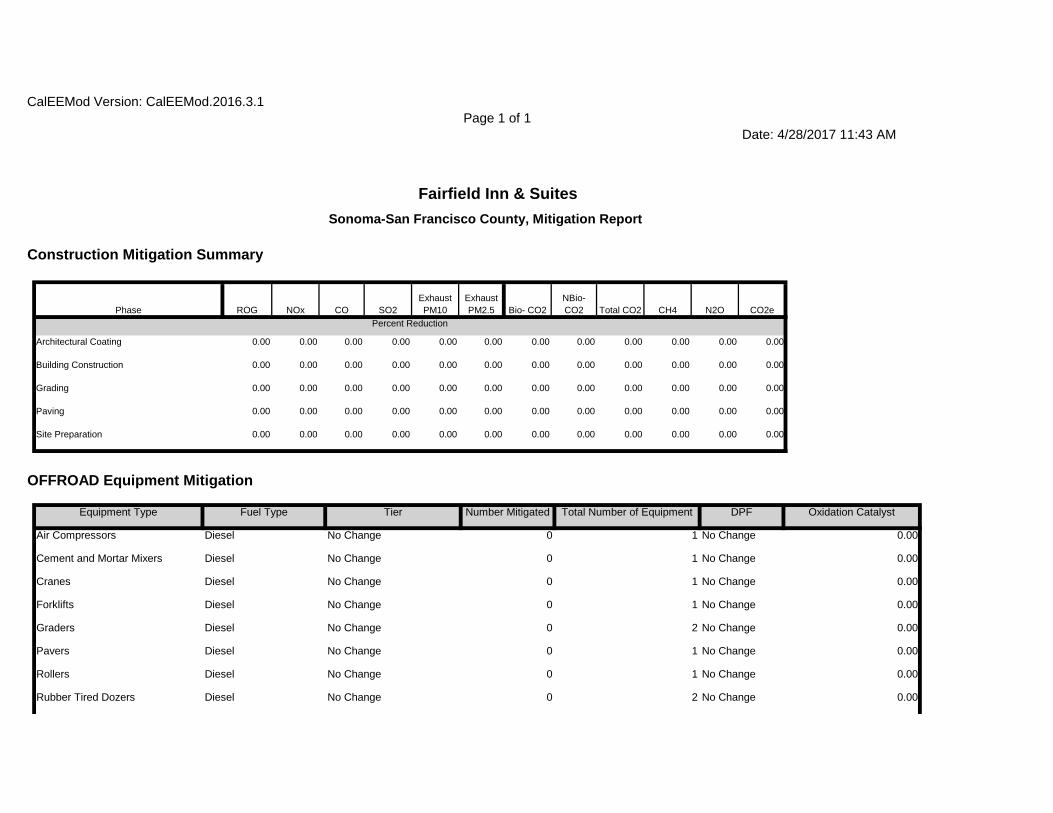
0.00Rubber Tired Dozers Diesel No Change 0 2 No Change
0.00
Rollers Diesel No Change 0 1 No Change 0.00
Pavers Diesel No Change 0 1 No Change
0.00
Graders Diesel No Change 0 2 No Change 0.00
Forklifts Diesel No Change 0 1 No Change
0.00
Cranes Diesel No Change 0 1 No Change 0.00
Cement and Mortar Mixers Diesel No Change 0 1 No Change
Oxidation Catalyst
Air Compressors Diesel No Change 0 1 No Change 0.00
Equipment Type Fuel Type Tier Number Mitigated Total Number of Equipment DPF
0.00 0.00 0.00 0.00 0.00
OFFROAD Equipment Mitigation
0.00 0.00
Site Preparation 0.00 0.00 0.00 0.00 0.00 0.00 0.00
0.00 0.00 0.00 0.00 0.00 0.00
0.00 0.00 0.00 0.00 0.00
Paving 0.00 0.00 0.00 0.00
0.00 0.00
Grading 0.00 0.00 0.00 0.00 0.00 0.00 0.00
0.00 0.00 0.00 0.00 0.00 0.00
0.00 0.00 0.00 0.00 0.00
Building Construction 0.00 0.00 0.00 0.00
CO2ePercent Reduction
Architectural Coating 0.00 0.00 0.00 0.00 0.00 0.00 0.00
Exhaust PM2.5 Bio- CO2
NBio- CO2 Total CO2 CH4 N2OPhase ROG NOx CO SO2
Exhaust PM10
CalEEMod Version: CalEEMod.2016.3.1Page 1 of 1
Date: 4/28/2017 11:43 AM
Fairfield Inn & SuitesSonoma-San Francisco County, Mitigation Report
Construction Mitigation Summary
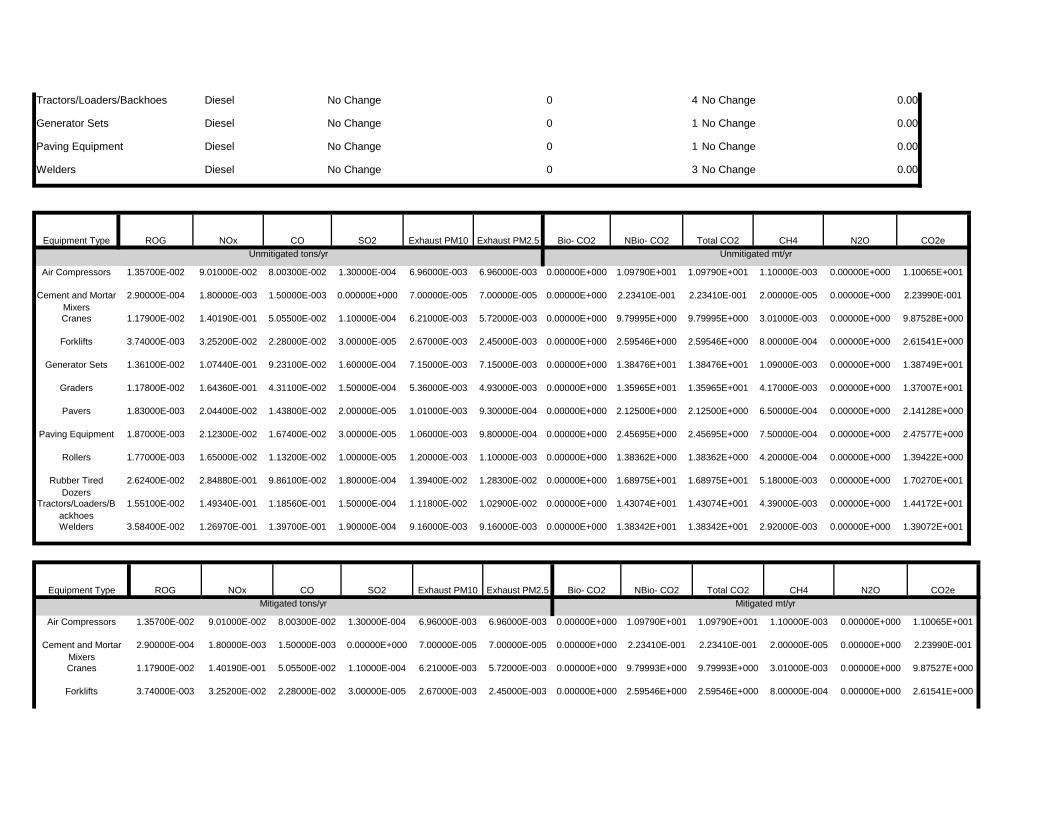
2.61541E+0002.45000E-003 0.00000E+000 2.59546E+000 2.59546E+000 8.00000E-004 0.00000E+000
9.79993E+000 3.01000E-003 0.00000E+000 9.87527E+000
Forklifts 3.74000E-003 3.25200E-002 2.28000E-002 3.00000E-005 2.67000E-003
2.23990E-001
Cranes 1.17900E-002 1.40190E-001 5.05500E-002 1.10000E-004 6.21000E-003 5.72000E-003 0.00000E+000 9.79993E+000
7.00000E-005 0.00000E+000 2.23410E-001 2.23410E-001 2.00000E-005 0.00000E+000Cement and Mortar Mixers
2.90000E-004 1.80000E-003 1.50000E-003 0.00000E+000 7.00000E-005
0.00000E+000 1.09790E+001 1.09790E+001 1.10000E-003 0.00000E+000 1.10065E+001
CO2eMitigated tons/yr Mitigated mt/yr
Air Compressors 1.35700E-002 9.01000E-002 8.00300E-002 1.30000E-004 6.96000E-003 6.96000E-003
Exhaust PM2.5 Bio- CO2 NBio- CO2 Total CO2 CH4 N2O
1.38342E+001 2.92000E-003 0.00000E+000 1.39072E+001
Equipment Type ROG NOx CO SO2 Exhaust PM10
1.44172E+001
Welders 3.58400E-002 1.26970E-001 1.39700E-001 1.90000E-004 9.16000E-003 9.16000E-003 0.00000E+000 1.38342E+001
1.02900E-002 0.00000E+000 1.43074E+001 1.43074E+001 4.39000E-003 0.00000E+000
1.68975E+001 5.18000E-003 0.00000E+000 1.70270E+001
Tractors/Loaders/Backhoes
1.55100E-002 1.49340E-001 1.18560E-001 1.50000E-004 1.11800E-002
1.39422E+000
Rubber Tired Dozers
2.62400E-002 2.84880E-001 9.86100E-002 1.80000E-004 1.39400E-002 1.28300E-002 0.00000E+000 1.68975E+001
1.10000E-003 0.00000E+000 1.38362E+000 1.38362E+000 4.20000E-004 0.00000E+000
2.45695E+000 7.50000E-004 0.00000E+000 2.47577E+000
Rollers 1.77000E-003 1.65000E-002 1.13200E-002 1.00000E-005 1.20000E-003
2.14128E+000
Paving Equipment 1.87000E-003 2.12300E-002 1.67400E-002 3.00000E-005 1.06000E-003 9.80000E-004 0.00000E+000 2.45695E+000
9.30000E-004 0.00000E+000 2.12500E+000 2.12500E+000 6.50000E-004 0.00000E+000
1.35965E+001 4.17000E-003 0.00000E+000 1.37007E+001
Pavers 1.83000E-003 2.04400E-002 1.43800E-002 2.00000E-005 1.01000E-003
1.38749E+001
Graders 1.17800E-002 1.64360E-001 4.31100E-002 1.50000E-004 5.36000E-003 4.93000E-003 0.00000E+000 1.35965E+001
7.15000E-003 0.00000E+000 1.38476E+001 1.38476E+001 1.09000E-003 0.00000E+000
2.59546E+000 8.00000E-004 0.00000E+000 2.61541E+000
Generator Sets 1.36100E-002 1.07440E-001 9.23100E-002 1.60000E-004 7.15000E-003
9.87528E+000
Forklifts 3.74000E-003 3.25200E-002 2.28000E-002 3.00000E-005 2.67000E-003 2.45000E-003 0.00000E+000 2.59546E+000
5.72000E-003 0.00000E+000 9.79995E+000 9.79995E+000 3.01000E-003 0.00000E+000
2.23410E-001 2.00000E-005 0.00000E+000 2.23990E-001
Cranes 1.17900E-002 1.40190E-001 5.05500E-002 1.10000E-004 6.21000E-003
1.10065E+001
Cement and Mortar Mixers
2.90000E-004 1.80000E-003 1.50000E-003 0.00000E+000 7.00000E-005 7.00000E-005 0.00000E+000 2.23410E-001
6.96000E-003 0.00000E+000 1.09790E+001 1.09790E+001 1.10000E-003 0.00000E+000Air Compressors 1.35700E-002 9.01000E-002 8.00300E-002 1.30000E-004 6.96000E-003
Total CO2 CH4 N2O CO2eUnmitigated tons/yr Unmitigated mt/yr
0.00
Equipment Type ROG NOx CO SO2 Exhaust PM10 Exhaust PM2.5 Bio- CO2 NBio- CO2
Welders Diesel No Change 0 3 No Change
0.00
Paving Equipment Diesel No Change 0 1 No Change 0.00
Generator Sets Diesel No Change 0 1 No Change
Tractors/Loaders/Backhoes Diesel No Change 0 4 No Change 0.00
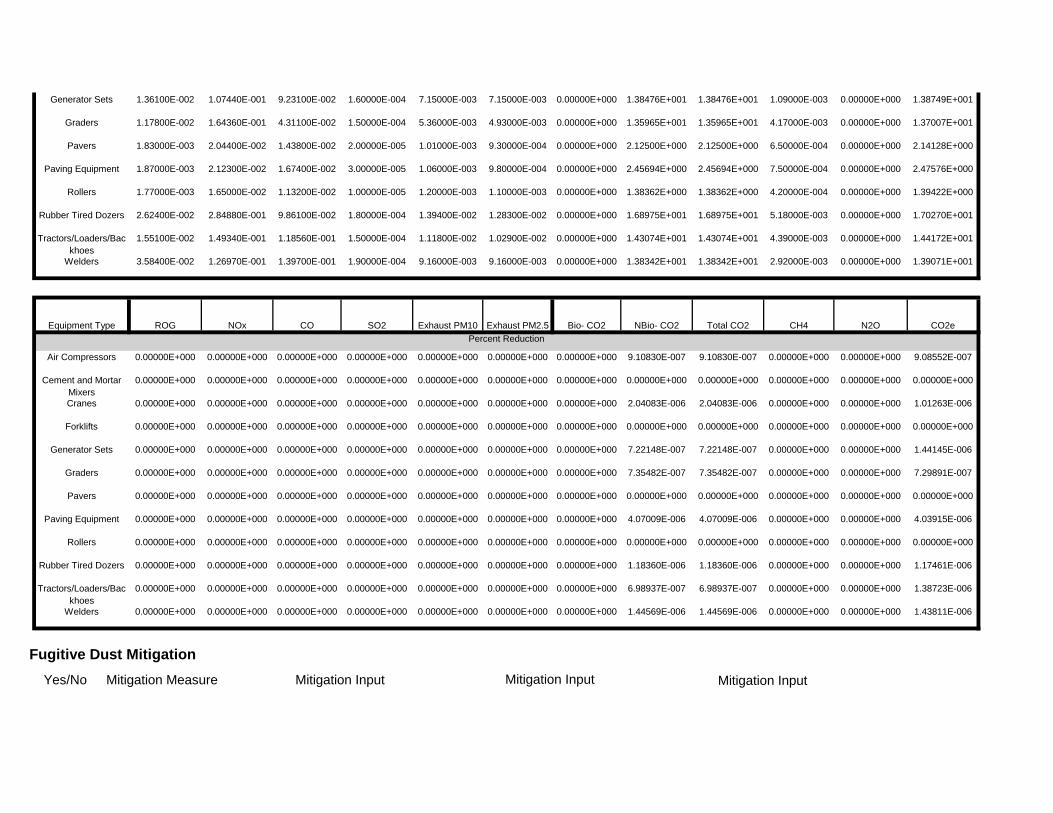
Mitigation InputYes/No Mitigation Measure Mitigation Input Mitigation Input
1.44569E-006 1.44569E-006 0.00000E+000 0.00000E+000 1.43811E-006
Fugitive Dust Mitigation
0.00000E+000 1.38723E-006
Welders 0.00000E+000 0.00000E+000 0.00000E+000 0.00000E+000 0.00000E+000 0.00000E+000 0.00000E+000
0.00000E+000 0.00000E+000 0.00000E+000 6.98937E-007 6.98937E-007 0.00000E+000
1.18360E-006 1.18360E-006 0.00000E+000 0.00000E+000 1.17461E-006
Tractors/Loaders/Backhoes
0.00000E+000 0.00000E+000 0.00000E+000 0.00000E+000
0.00000E+000 0.00000E+000
Rubber Tired Dozers 0.00000E+000 0.00000E+000 0.00000E+000 0.00000E+000 0.00000E+000 0.00000E+000 0.00000E+000
0.00000E+000 0.00000E+000 0.00000E+000 0.00000E+000 0.00000E+000 0.00000E+000
4.07009E-006 4.07009E-006 0.00000E+000 0.00000E+000 4.03915E-006
Rollers 0.00000E+000 0.00000E+000 0.00000E+000 0.00000E+000
0.00000E+000 0.00000E+000
Paving Equipment 0.00000E+000 0.00000E+000 0.00000E+000 0.00000E+000 0.00000E+000 0.00000E+000 0.00000E+000
0.00000E+000 0.00000E+000 0.00000E+000 0.00000E+000 0.00000E+000 0.00000E+000
7.35482E-007 7.35482E-007 0.00000E+000 0.00000E+000 7.29891E-007
Pavers 0.00000E+000 0.00000E+000 0.00000E+000 0.00000E+000
0.00000E+000 1.44145E-006
Graders 0.00000E+000 0.00000E+000 0.00000E+000 0.00000E+000 0.00000E+000 0.00000E+000 0.00000E+000
0.00000E+000 0.00000E+000 0.00000E+000 7.22148E-007 7.22148E-007 0.00000E+000
0.00000E+000 0.00000E+000 0.00000E+000 0.00000E+000 0.00000E+000
Generator Sets 0.00000E+000 0.00000E+000 0.00000E+000 0.00000E+000
0.00000E+000 1.01263E-006
Forklifts 0.00000E+000 0.00000E+000 0.00000E+000 0.00000E+000 0.00000E+000 0.00000E+000 0.00000E+000
0.00000E+000 0.00000E+000 0.00000E+000 2.04083E-006 2.04083E-006 0.00000E+000
0.00000E+000 0.00000E+000 0.00000E+000 0.00000E+000 0.00000E+000
Cranes 0.00000E+000 0.00000E+000 0.00000E+000 0.00000E+000
0.00000E+000 9.08552E-007
Cement and Mortar Mixers
0.00000E+000 0.00000E+000 0.00000E+000 0.00000E+000 0.00000E+000 0.00000E+000 0.00000E+000
0.00000E+000 0.00000E+000 0.00000E+000 9.10830E-007 9.10830E-007 0.00000E+000
Total CO2 CH4 N2O CO2ePercent Reduction
Air Compressors 0.00000E+000 0.00000E+000 0.00000E+000 0.00000E+000
1.39071E+001
Equipment Type ROG NOx CO SO2 Exhaust PM10 Exhaust PM2.5 Bio- CO2 NBio- CO2
9.16000E-003 0.00000E+000 1.38342E+001 1.38342E+001 2.92000E-003 0.00000E+000
1.43074E+001 4.39000E-003 0.00000E+000 1.44172E+001
Welders 3.58400E-002 1.26970E-001 1.39700E-001 1.90000E-004 9.16000E-003
1.70270E+001
Tractors/Loaders/Backhoes
1.55100E-002 1.49340E-001 1.18560E-001 1.50000E-004 1.11800E-002 1.02900E-002 0.00000E+000 1.43074E+001
1.28300E-002 0.00000E+000 1.68975E+001 1.68975E+001 5.18000E-003 0.00000E+000
1.38362E+000 4.20000E-004 0.00000E+000 1.39422E+000
Rubber Tired Dozers 2.62400E-002 2.84880E-001 9.86100E-002 1.80000E-004 1.39400E-002
2.47576E+000
Rollers 1.77000E-003 1.65000E-002 1.13200E-002 1.00000E-005 1.20000E-003 1.10000E-003 0.00000E+000 1.38362E+000
9.80000E-004 0.00000E+000 2.45694E+000 2.45694E+000 7.50000E-004 0.00000E+000
2.12500E+000 6.50000E-004 0.00000E+000 2.14128E+000
Paving Equipment 1.87000E-003 2.12300E-002 1.67400E-002 3.00000E-005 1.06000E-003
1.37007E+001
Pavers 1.83000E-003 2.04400E-002 1.43800E-002 2.00000E-005 1.01000E-003 9.30000E-004 0.00000E+000 2.12500E+000
4.93000E-003 0.00000E+000 1.35965E+001 1.35965E+001 4.17000E-003 0.00000E+000
1.38476E+001 1.09000E-003 0.00000E+000 1.38749E+001
Graders 1.17800E-002 1.64360E-001 4.31100E-002 1.50000E-004 5.36000E-003
Generator Sets 1.36100E-002 1.07440E-001 9.23100E-002 1.60000E-004 7.15000E-003 7.15000E-003 0.00000E+000 1.38476E+001
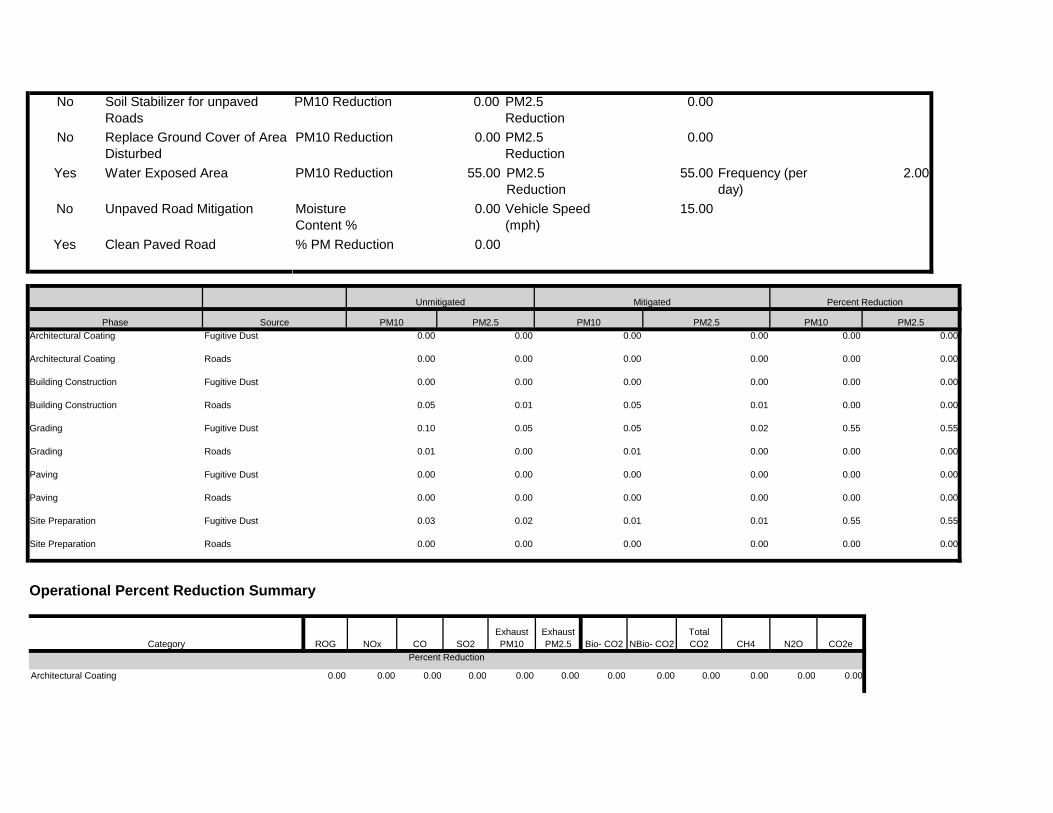
0.00 0.00 0.00 0.00 0.00 0.00
N2O CO2ePercent Reduction
Architectural Coating 0.00 0.00 0.00 0.00 0.00 0.00
Exhaust PM10
Exhaust PM2.5 Bio- CO2 NBio- CO2
Total CO2 CH4
Operational Percent Reduction Summary
Category ROG NOx CO SO2
0.55 0.55
Site Preparation Roads 0.00 0.00 0.00 0.00 0.00 0.00
Site Preparation Fugitive Dust 0.03 0.02 0.01 0.01
0.00 0.00
Paving Roads 0.00 0.00 0.00 0.00 0.00 0.00
Paving Fugitive Dust 0.00 0.00 0.00 0.00
0.55 0.55
Grading Roads 0.01 0.00 0.01 0.00 0.00 0.00
Grading Fugitive Dust 0.10 0.05 0.05 0.02
0.00 0.00
Building Construction Roads 0.05 0.01 0.05 0.01 0.00 0.00
Building Construction Fugitive Dust 0.00 0.00 0.00 0.00
0.00
Architectural Coating Roads 0.00 0.00 0.00 0.00 0.00 0.00
PM2.5 PM10 PM2.5Architectural Coating Fugitive Dust 0.00 0.00 0.00 0.00 0.00
Unmitigated Mitigated Percent Reduction
Phase Source PM10 PM2.5 PM10
Yes Clean Paved Road % PM Reduction 0.00
No Unpaved Road Mitigation Moisture Content %
0.00 Vehicle Speed (mph)
15.00
Yes Water Exposed Area PM10 Reduction 55.00 PM2.5 Reduction
55.00 Frequency (per day)
2.00
0.00
No Replace Ground Cover of Area Disturbed
PM10 Reduction 0.00 PM2.5 Reduction
0.00
No Soil Stabilizer for unpaved Roads
PM10 Reduction 0.00 PM2.5 Reduction
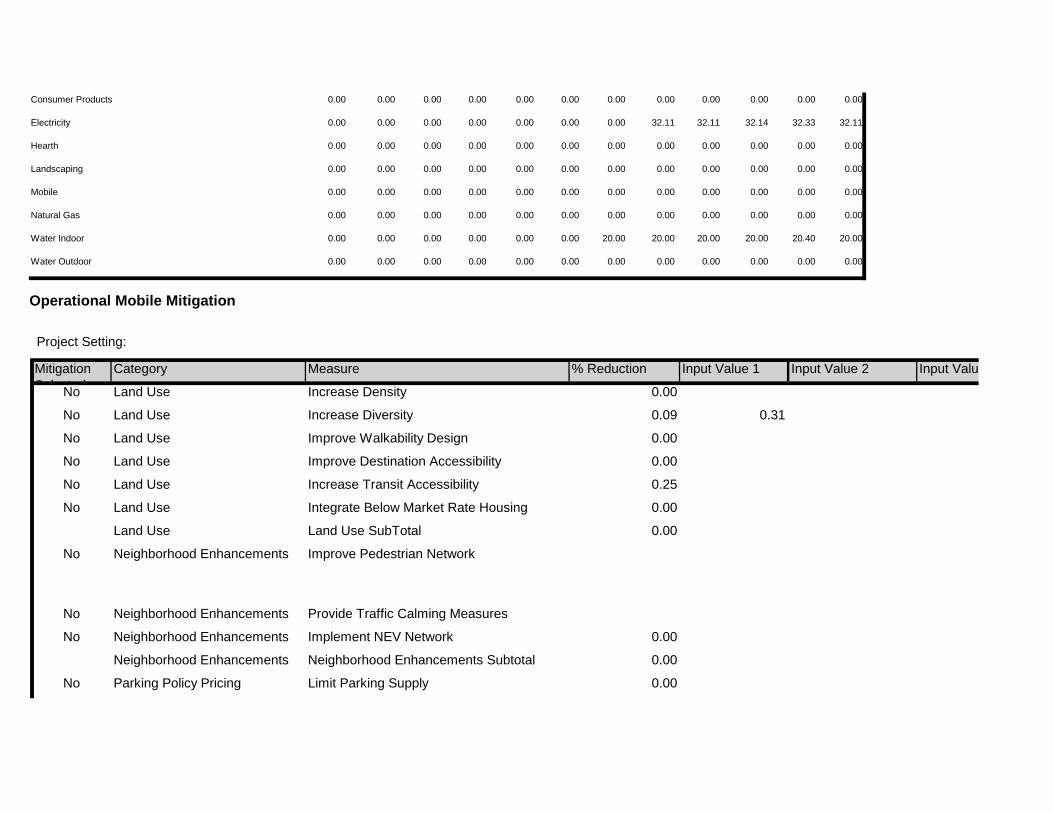
No Parking Policy Pricing Limit Parking Supply 0.00
Neighborhood Enhancements Neighborhood Enhancements Subtotal 0.00
No Neighborhood Enhancements Implement NEV Network 0.00
No Neighborhood Enhancements Provide Traffic Calming Measures
No Neighborhood Enhancements Improve Pedestrian Network
Land Use Land Use SubTotal 0.00
No Land Use Integrate Below Market Rate Housing 0.00
No Land Use Increase Transit Accessibility 0.25
No Land Use Improve Destination Accessibility 0.00
No Land Use Improve Walkability Design 0.00
No Land Use Increase Diversity 0.09 0.31
Input Value
No Land Use Increase Density 0.00
Mitigation Selected
Category Measure % Reduction Input Value 1 Input Value 2
0.00 0.00 0.00 0.00
Operational Mobile Mitigation
Project Setting:
20.00
Water Outdoor 0.00 0.00 0.00 0.00 0.00 0.00 0.00 0.00
0.00 20.00 20.00 20.00 20.00 20.40
0.00 0.00 0.00 0.00
Water Indoor 0.00 0.00 0.00 0.00 0.00
0.00
Natural Gas 0.00 0.00 0.00 0.00 0.00 0.00 0.00 0.00
0.00 0.00 0.00 0.00 0.00 0.00
0.00 0.00 0.00 0.00
Mobile 0.00 0.00 0.00 0.00 0.00
0.00
Landscaping 0.00 0.00 0.00 0.00 0.00 0.00 0.00 0.00
0.00 0.00 0.00 0.00 0.00 0.00
32.11 32.14 32.33 32.11
Hearth 0.00 0.00 0.00 0.00 0.00
0.00
Electricity 0.00 0.00 0.00 0.00 0.00 0.00 0.00 32.11
0.00 0.00 0.00 0.00 0.00 0.00Consumer Products 0.00 0.00 0.00 0.00 0.00
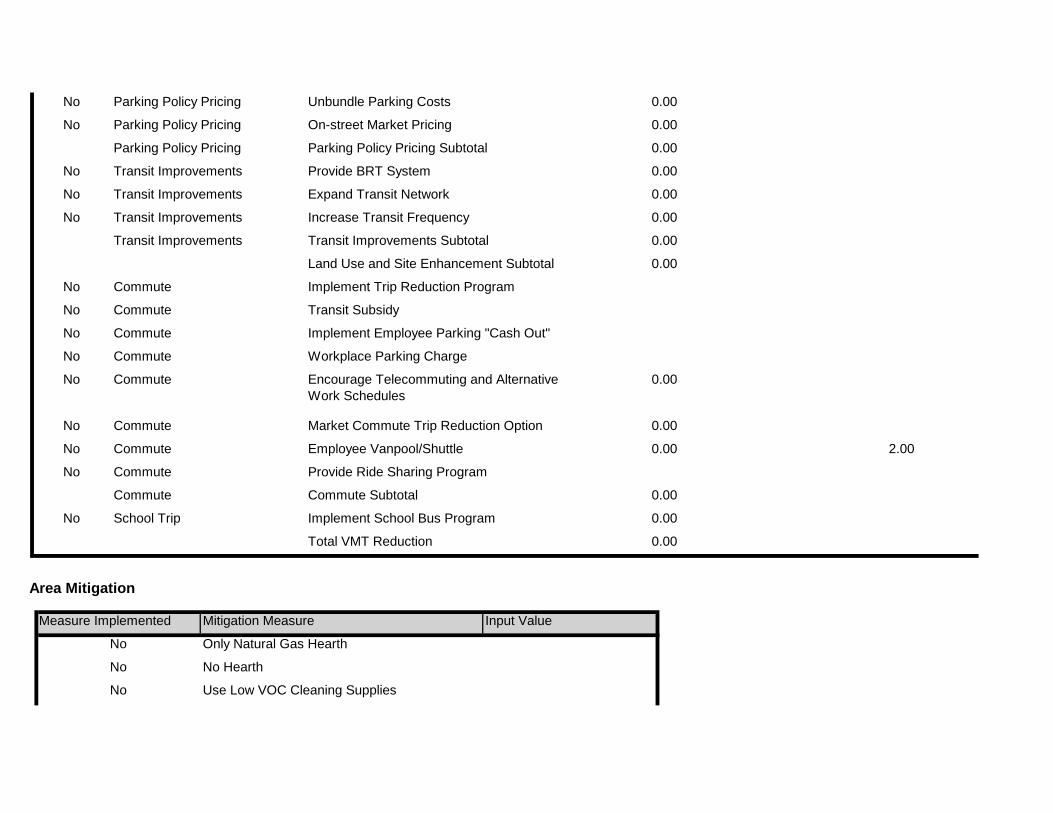
No No Hearth
No Use Low VOC Cleaning Supplies
Area Mitigation
Measure Implemented Mitigation Measure Input Value
No Only Natural Gas Hearth
Total VMT Reduction 0.00
No School Trip Implement School Bus Program 0.00
Commute Commute Subtotal 0.00
No Commute Provide Ride Sharing Program
No Commute Employee Vanpool/Shuttle 0.00 2.00
No Commute Market Commute Trip Reduction Option 0.00
No Commute Encourage Telecommuting and Alternative Work Schedules
0.00
No Commute Workplace Parking Charge
No Commute Implement Employee Parking "Cash Out"
No Commute Transit Subsidy
No Commute Implement Trip Reduction Program
Land Use and Site Enhancement Subtotal 0.00
Transit Improvements Transit Improvements Subtotal 0.00
No Transit Improvements Increase Transit Frequency 0.00
No Transit Improvements Expand Transit Network 0.00
No Transit Improvements Provide BRT System 0.00
Parking Policy Pricing Parking Policy Pricing Subtotal 0.00
No Parking Policy Pricing On-street Market Pricing 0.00
No Parking Policy Pricing Unbundle Parking Costs 0.00
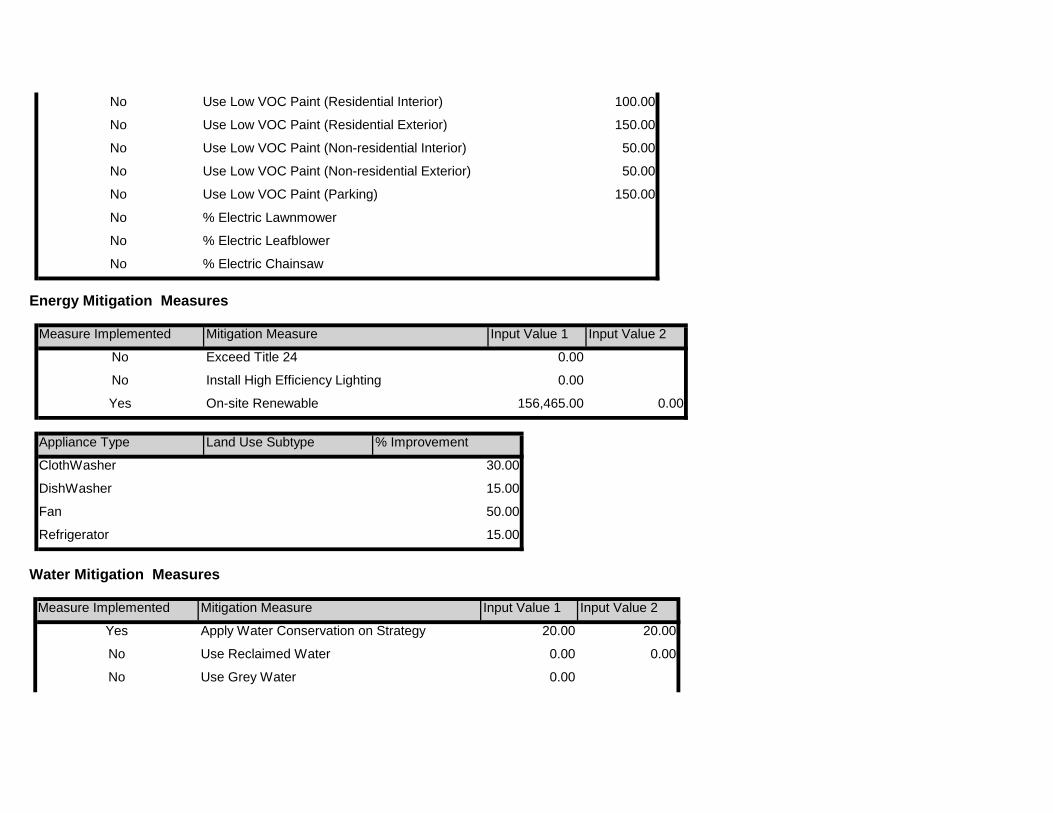
No Use Grey Water 0.00
Input Value 2
Yes Apply Water Conservation on Strategy 20.00 20.00
No Use Reclaimed Water 0.00 0.00
Refrigerator 15.00
Water Mitigation Measures
Measure Implemented Mitigation Measure Input Value 1
DishWasher 15.00
Fan 50.00
Appliance Type Land Use Subtype % Improvement
ClothWasher 30.00
No Install High Efficiency Lighting 0.00
Yes On-site Renewable 156,465.00 0.00
Energy Mitigation Measures
Measure Implemented Mitigation Measure Input Value 1 Input Value 2
No Exceed Title 24 0.00
No % Electric Leafblower
No % Electric Chainsaw
No Use Low VOC Paint (Parking) 150.00
No % Electric Lawnmower
No Use Low VOC Paint (Non-residential Interior) 50.00
No Use Low VOC Paint (Non-residential Exterior) 50.00
No Use Low VOC Paint (Residential Interior) 100.00
No Use Low VOC Paint (Residential Exterior) 150.00
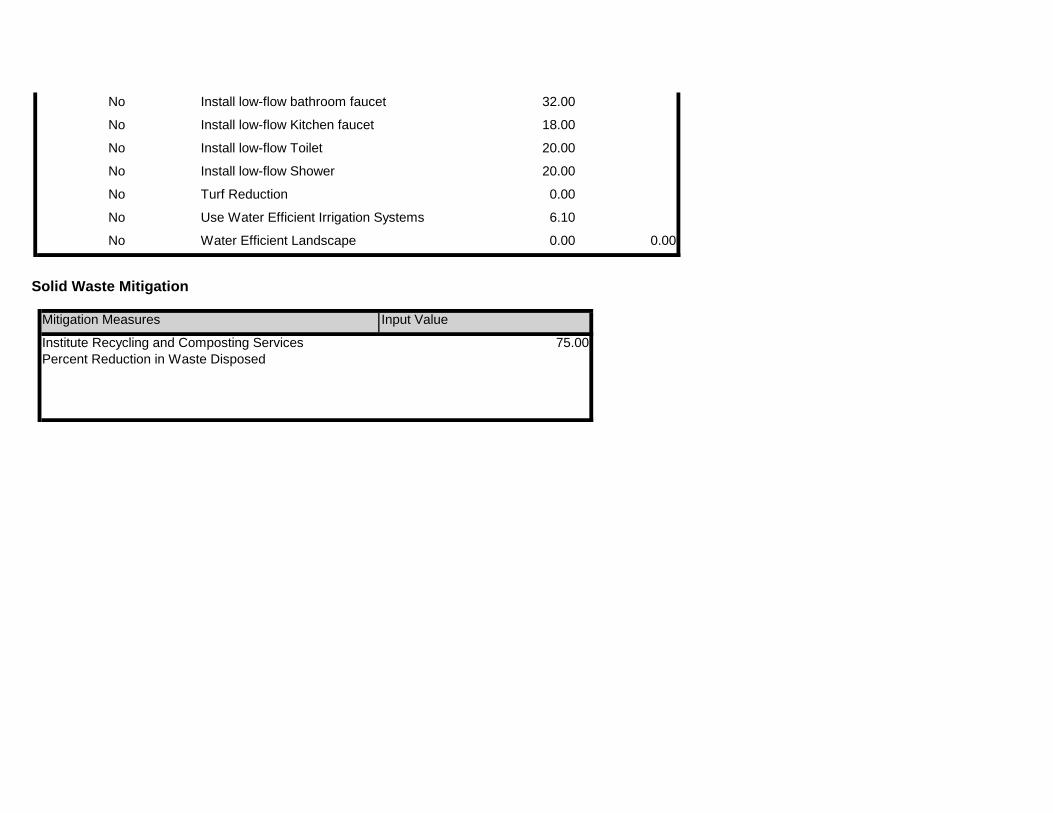
Solid Waste Mitigation
Mitigation Measures Input Value
Institute Recycling and Composting ServicesPercent Reduction in Waste Disposed
75.00
No Use Water Efficient Irrigation Systems 6.10
No Water Efficient Landscape 0.00 0.00
No Install low-flow Shower 20.00
No Turf Reduction 0.00
No Install low-flow Kitchen faucet 18.00
No Install low-flow Toilet 20.00
No Install low-flow bathroom faucet 32.00

Photovoltaic System Performance Estimate PVWatts Calculator
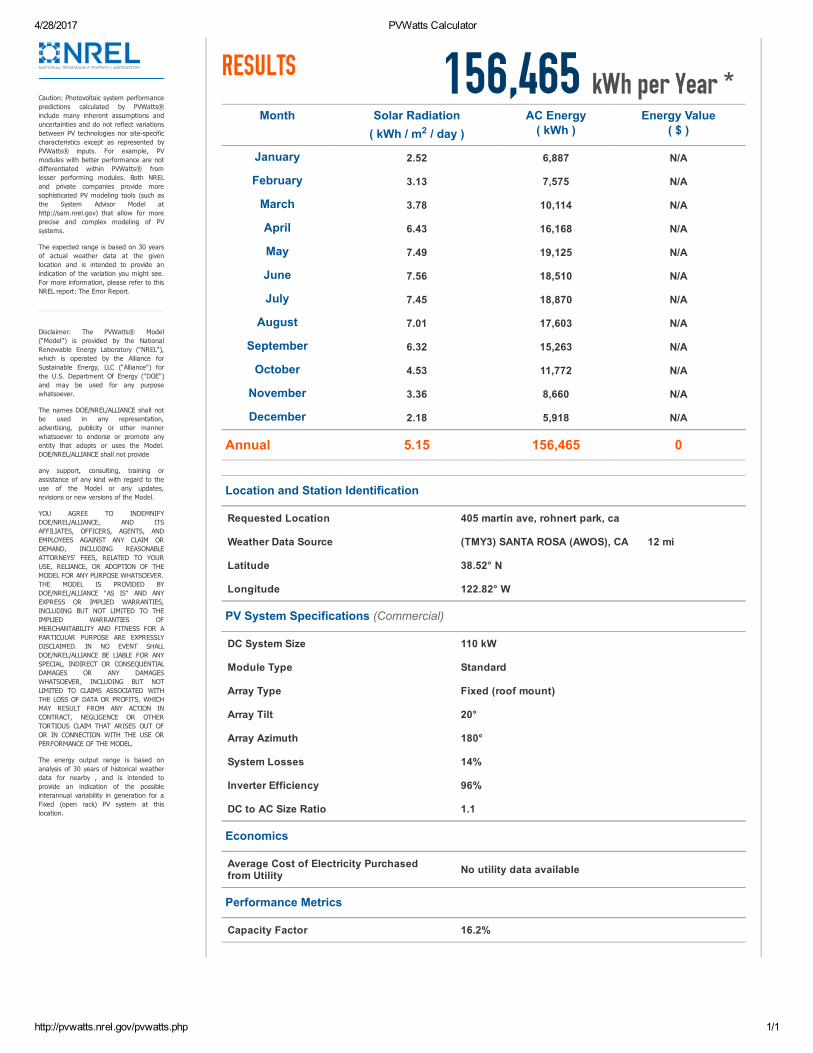
4/28/2017 PVWatts Calculator
http://pvwatts.nrel.gov/pvwatts.php 1/1
Caution: Photovoltaic system performancepredictions calculated by PVWatts®include many inherent assumptions anduncertainties and do not reflect variationsbetween PV technologies nor sitespecificcharacteristics except as represented byPVWatts® inputs. For example, PVmodules with better performance are notdifferentiated within PVWatts® fromlesser performing modules. Both NRELand private companies provide moresophisticated PV modeling tools (such asthe System Advisor Model athttp://sam.nrel.gov) that allow for moreprecise and complex modeling of PVsystems.
The expected range is based on 30 yearsof actual weather data at the givenlocation and is intended to provide anindication of the variation you might see.For more information, please refer to thisNREL report: The Error Report.
Disclaimer: The PVWatts® Model("Model") is provided by the NationalRenewable Energy Laboratory ("NREL"),which is operated by the Alliance forSustainable Energy, LLC ("Alliance") forthe U.S. Department Of Energy ("DOE")and may be used for any purposewhatsoever.
The names DOE/NREL/ALLIANCE shall notbe used in any representation,advertising, publicity or other mannerwhatsoever to endorse or promote anyentity that adopts or uses the Model.DOE/NREL/ALLIANCE shall not provide
any support, consulting, training orassistance of any kind with regard to theuse of the Model or any updates,revisions or new versions of the Model.
YOU AGREE TO INDEMNIFYDOE/NREL/ALLIANCE, AND ITSAFFILIATES, OFFICERS, AGENTS, ANDEMPLOYEES AGAINST ANY CLAIM ORDEMAND, INCLUDING REASONABLEATTORNEYS' FEES, RELATED TO YOURUSE, RELIANCE, OR ADOPTION OF THEMODEL FOR ANY PURPOSE WHATSOEVER.THE MODEL IS PROVIDED BYDOE/NREL/ALLIANCE "AS IS" AND ANYEXPRESS OR IMPLIED WARRANTIES,INCLUDING BUT NOT LIMITED TO THEIMPLIED WARRANTIES OFMERCHANTABILITY AND FITNESS FOR APARTICULAR PURPOSE ARE EXPRESSLYDISCLAIMED. IN NO EVENT SHALLDOE/NREL/ALLIANCE BE LIABLE FOR ANYSPECIAL, INDIRECT OR CONSEQUENTIALDAMAGES OR ANY DAMAGESWHATSOEVER, INCLUDING BUT NOTLIMITED TO CLAIMS ASSOCIATED WITHTHE LOSS OF DATA OR PROFITS, WHICHMAY RESULT FROM ANY ACTION INCONTRACT, NEGLIGENCE OR OTHERTORTIOUS CLAIM THAT ARISES OUT OFOR IN CONNECTION WITH THE USE ORPERFORMANCE OF THE MODEL.
The energy output range is based onanalysis of 30 years of historical weatherdata for nearby , and is intended toprovide an indication of the possibleinterannual variability in generation for aFixed (open rack) PV system at thislocation.
156,465 kWh per Year *RESULTS
Month Solar Radiation( kWh / m2 / day )
AC Energy( kWh )
Energy Value( $ )
January 2.52 6,887 N/A
February 3.13 7,575 N/A
March 3.78 10,114 N/A
April 6.43 16,168 N/A
May 7.49 19,125 N/A
June 7.56 18,510 N/A
July 7.45 18,870 N/A
August 7.01 17,603 N/A
September 6.32 15,263 N/A
October 4.53 11,772 N/A
November 3.36 8,660 N/A
December 2.18 5,918 N/A
Annual 5.15 156,465 0
Location and Station Identification
Requested Location 405 martin ave, rohnert park, ca
Weather Data Source (TMY3) SANTA ROSA (AWOS), CA 12 mi
Latitude 38.52° N
Longitude 122.82° W
PV System Specifications (Commercial)
DC System Size 110 kW
Module Type Standard
Array Type Fixed (roof mount)
Array Tilt 20°
Array Azimuth 180°
System Losses 14%
Inverter Efficiency 96%
DC to AC Size Ratio 1.1
Economics
Average Cost of Electricity Purchased from Utility No utility data available
Performance Metrics
Capacity Factor 16.2%
APPENDIX B Biological Studies
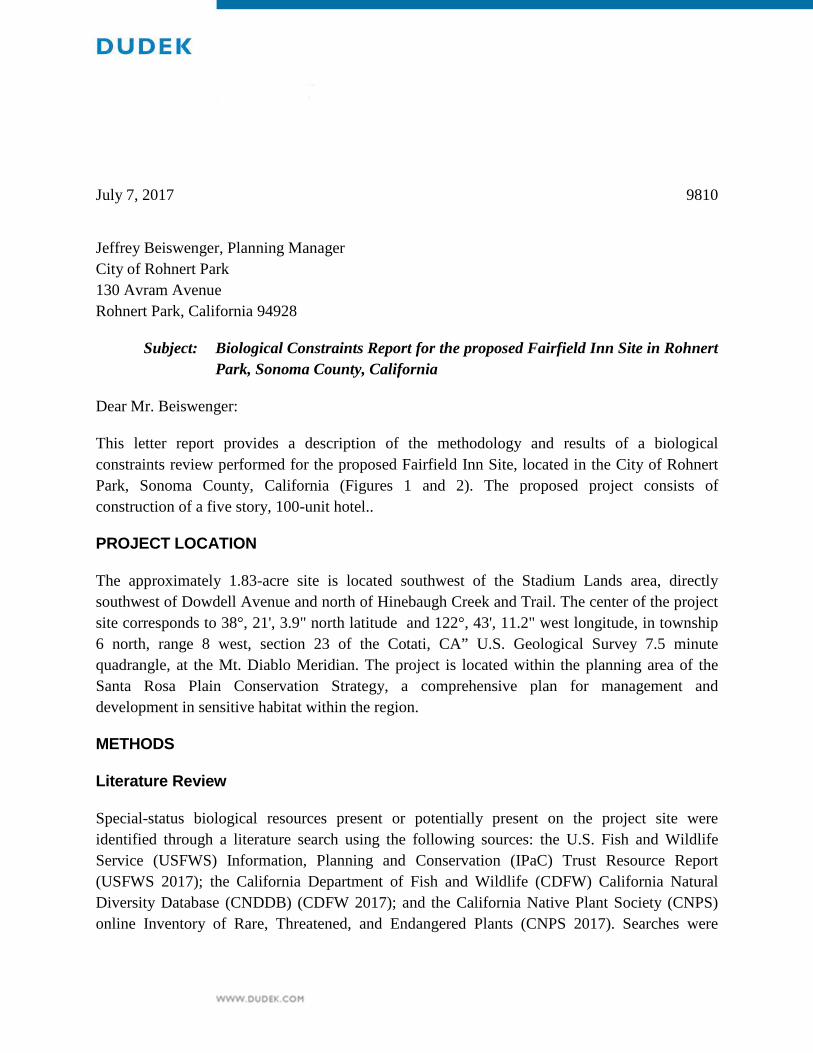
July 7, 2017 9810
Jeffrey Beiswenger, Planning Manager City of Rohnert Park 130 Avram Avenue Rohnert Park, California 94928
Subject: Biological Constraints Report for the proposed Fairfield Inn Site in Rohnert Park, Sonoma County, California
Dear Mr. Beiswenger:
This letter report provides a description of the methodology and results of a biological constraints review performed for the proposed Fairfield Inn Site, located in the City of Rohnert Park, Sonoma County, California (Figures 1 and 2). The proposed project consists of construction of a five story, 100-unit hotel..
PROJECT LOCATION
The approximately 1.83-acre site is located southwest of the Stadium Lands area, directly southwest of Dowdell Avenue and north of Hinebaugh Creek and Trail. The center of the project site corresponds to 38°, 21', 3.9" north latitude and 122°, 43', 11.2" west longitude, in township 6 north, range 8 west, section 23 of the Cotati, CA” U.S. Geological Survey 7.5 minute quadrangle, at the Mt. Diablo Meridian. The project is located within the planning area of the Santa Rosa Plain Conservation Strategy, a comprehensive plan for management and development in sensitive habitat within the region.
METHODS
Literature Review
Special-status biological resources present or potentially present on the project site were identified through a literature search using the following sources: the U.S. Fish and Wildlife Service (USFWS) Information, Planning and Conservation (IPaC) Trust Resource Report (USFWS 2017); the California Department of Fish and Wildlife (CDFW) California Natural Diversity Database (CNDDB) (CDFW 2017); and the California Native Plant Society (CNPS) online Inventory of Rare, Threatened, and Endangered Plants (CNPS 2017). Searches were
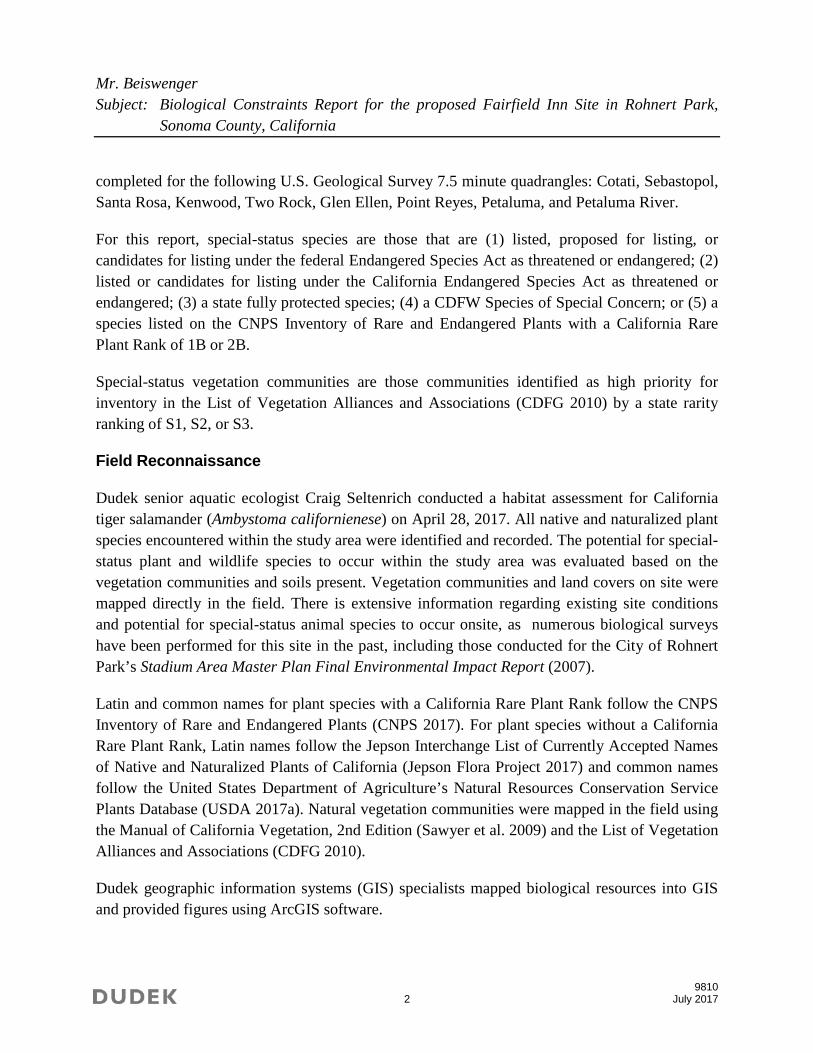
Mr. Beiswenger Subject: Biological Constraints Report for the proposed Fairfield Inn Site in Rohnert Park,
Sonoma County, California
9810 2 July 2017
completed for the following U.S. Geological Survey 7.5 minute quadrangles: Cotati, Sebastopol, Santa Rosa, Kenwood, Two Rock, Glen Ellen, Point Reyes, Petaluma, and Petaluma River.
For this report, special-status species are those that are (1) listed, proposed for listing, or candidates for listing under the federal Endangered Species Act as threatened or endangered; (2) listed or candidates for listing under the California Endangered Species Act as threatened or endangered; (3) a state fully protected species; (4) a CDFW Species of Special Concern; or (5) a species listed on the CNPS Inventory of Rare and Endangered Plants with a California Rare Plant Rank of 1B or 2B.
Special-status vegetation communities are those communities identified as high priority for inventory in the List of Vegetation Alliances and Associations (CDFG 2010) by a state rarity ranking of S1, S2, or S3.
Field Reconnaissance
Dudek senior aquatic ecologist Craig Seltenrich conducted a habitat assessment for California tiger salamander (Ambystoma californienese) on April 28, 2017. All native and naturalized plant species encountered within the study area were identified and recorded. The potential for special-status plant and wildlife species to occur within the study area was evaluated based on the vegetation communities and soils present. Vegetation communities and land covers on site were mapped directly in the field. There is extensive information regarding existing site conditions and potential for special-status animal species to occur onsite, as numerous biological surveys have been performed for this site in the past, including those conducted for the City of Rohnert Park’s Stadium Area Master Plan Final Environmental Impact Report (2007).
Latin and common names for plant species with a California Rare Plant Rank follow the CNPS Inventory of Rare and Endangered Plants (CNPS 2017). For plant species without a California Rare Plant Rank, Latin names follow the Jepson Interchange List of Currently Accepted Names of Native and Naturalized Plants of California (Jepson Flora Project 2017) and common names follow the United States Department of Agriculture’s Natural Resources Conservation Service Plants Database (USDA 2017a). Natural vegetation communities were mapped in the field using the Manual of California Vegetation, 2nd Edition (Sawyer et al. 2009) and the List of Vegetation Alliances and Associations (CDFG 2010).
Dudek geographic information systems (GIS) specialists mapped biological resources into GIS and provided figures using ArcGIS software.
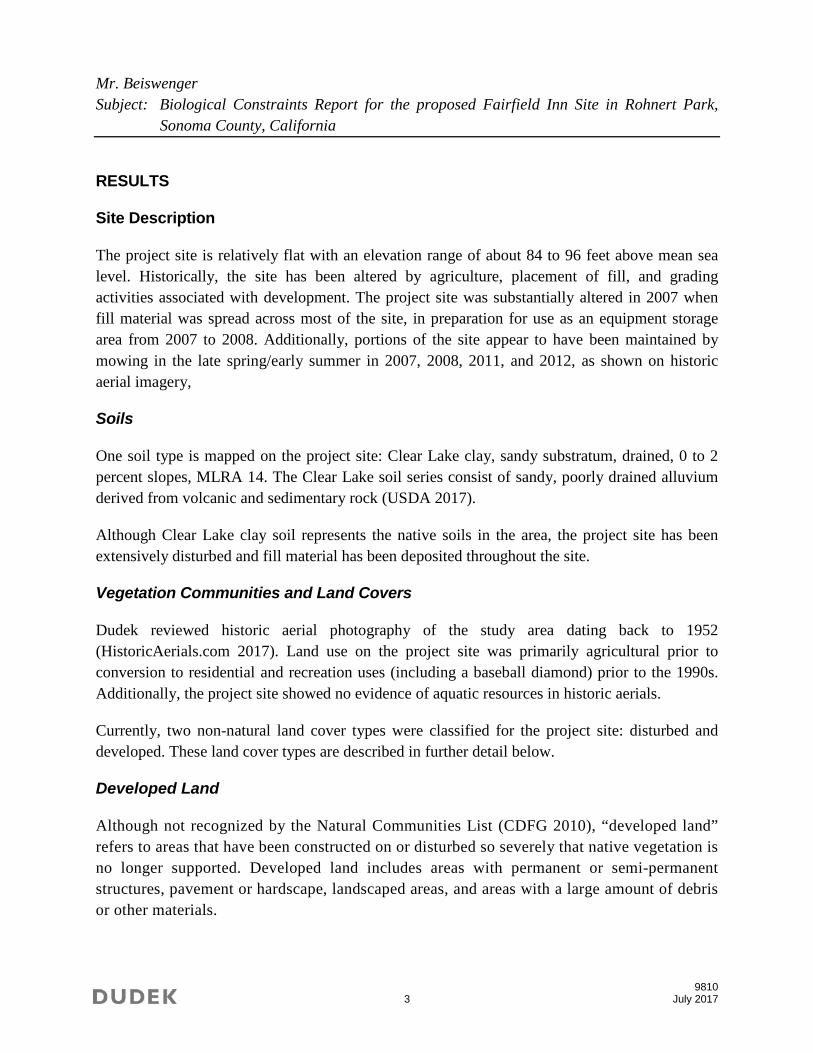
Mr. Beiswenger Subject: Biological Constraints Report for the proposed Fairfield Inn Site in Rohnert Park,
Sonoma County, California
9810 3 July 2017
RESULTS
Site Description
The project site is relatively flat with an elevation range of about 84 to 96 feet above mean sea level. Historically, the site has been altered by agriculture, placement of fill, and grading activities associated with development. The project site was substantially altered in 2007 when fill material was spread across most of the site, in preparation for use as an equipment storage area from 2007 to 2008. Additionally, portions of the site appear to have been maintained by mowing in the late spring/early summer in 2007, 2008, 2011, and 2012, as shown on historic aerial imagery,
Soils
One soil type is mapped on the project site: Clear Lake clay, sandy substratum, drained, 0 to 2 percent slopes, MLRA 14. The Clear Lake soil series consist of sandy, poorly drained alluvium derived from volcanic and sedimentary rock (USDA 2017).
Although Clear Lake clay soil represents the native soils in the area, the project site has been extensively disturbed and fill material has been deposited throughout the site.
Vegetation Communities and Land Covers
Dudek reviewed historic aerial photography of the study area dating back to 1952 (HistoricAerials.com 2017). Land use on the project site was primarily agricultural prior to conversion to residential and recreation uses (including a baseball diamond) prior to the 1990s. Additionally, the project site showed no evidence of aquatic resources in historic aerials.
Currently, two non-natural land cover types were classified for the project site: disturbed and developed. These land cover types are described in further detail below.
Developed Land
Although not recognized by the Natural Communities List (CDFG 2010), “developed land” refers to areas that have been constructed on or disturbed so severely that native vegetation is no longer supported. Developed land includes areas with permanent or semi-permanent structures, pavement or hardscape, landscaped areas, and areas with a large amount of debris or other materials.
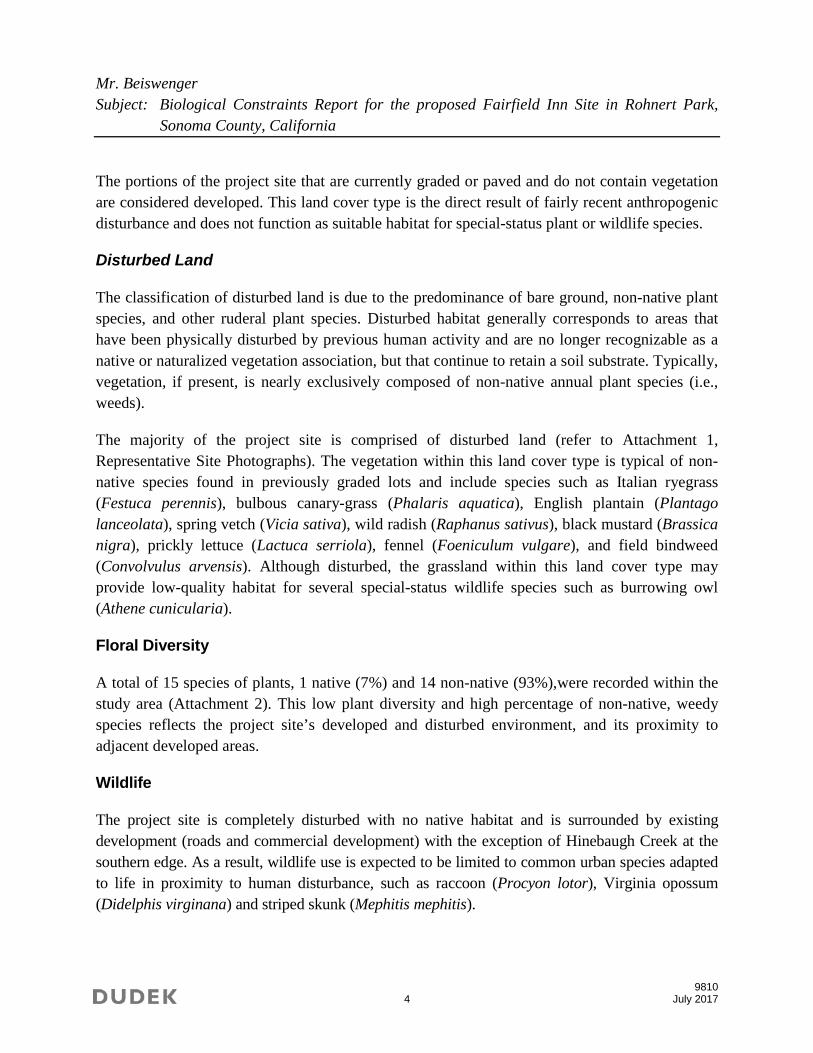
Mr. Beiswenger Subject: Biological Constraints Report for the proposed Fairfield Inn Site in Rohnert Park,
Sonoma County, California
9810 4 July 2017
The portions of the project site that are currently graded or paved and do not contain vegetation are considered developed. This land cover type is the direct result of fairly recent anthropogenic disturbance and does not function as suitable habitat for special-status plant or wildlife species.
Disturbed Land
The classification of disturbed land is due to the predominance of bare ground, non-native plant species, and other ruderal plant species. Disturbed habitat generally corresponds to areas that have been physically disturbed by previous human activity and are no longer recognizable as a native or naturalized vegetation association, but that continue to retain a soil substrate. Typically, vegetation, if present, is nearly exclusively composed of non-native annual plant species (i.e., weeds).
The majority of the project site is comprised of disturbed land (refer to Attachment 1, Representative Site Photographs). The vegetation within this land cover type is typical of non-native species found in previously graded lots and include species such as Italian ryegrass (Festuca perennis), bulbous canary-grass (Phalaris aquatica), English plantain (Plantago lanceolata), spring vetch (Vicia sativa), wild radish (Raphanus sativus), black mustard (Brassica nigra), prickly lettuce (Lactuca serriola), fennel (Foeniculum vulgare), and field bindweed (Convolvulus arvensis). Although disturbed, the grassland within this land cover type may provide low-quality habitat for several special-status wildlife species such as burrowing owl (Athene cunicularia).
Floral Diversity
A total of 15 species of plants, 1 native (7%) and 14 non-native (93%),were recorded within the study area (Attachment 2). This low plant diversity and high percentage of non-native, weedy species reflects the project site’s developed and disturbed environment, and its proximity to adjacent developed areas.
Wildlife
The project site is completely disturbed with no native habitat and is surrounded by existing development (roads and commercial development) with the exception of Hinebaugh Creek at the southern edge. As a result, wildlife use is expected to be limited to common urban species adapted to life in proximity to human disturbance, such as raccoon (Procyon lotor), Virginia opossum (Didelphis virginana) and striped skunk (Mephitis mephitis).
Mr. Beiswenger Subject: Biological Constraints Report for the proposed Fairfield Inn Site in Rohnert Park,
Sonoma County, California
9810 5 July 2017
Special-Status Plant Species
A total of 90 special-status plant species are known to occur within the project quad or eight surrounding quads. Of these 90, 86 were removed from consideration based on lack of suitable soils or habitat, or because the project site is outside of the known elevation or geographic range for the species (Attachment 3). These species are not discussed further in this document. The remaining four species have a low potential to occur on the site due to the highly disturbed nature of the habitat. It is extremely unlikely for these species to occur onsite due to the level of past and ongoing disturbance and maintenance at the project site.
Special-Status Wildlife Species
A total of 29 special-status wildlife species are known to occur within the project quad or eight surrounding quads. Of these, 26 were removed from consideration based on lack of suitable habitat or because the site is outside of the known geographic or elevation range for the species (Attachment 3). These species are not discussed further in this document. The remaining three species that have potential to occur on include western burrowing owl, California tiger salamander, and western pond turtle (Actinemys marmorata). These species are discussed in further detail below.
Western Burrowing Owl (Athene cunicularia)
Burrowing owl (BUOW) is a California bird species of special concern. They are small owls that inhabit burrows or other suitable burrow-like structures in the ground such as culverts or concrete piles. BUOW prefers habitat that contains short or sparse vegetation that allows unobstructed views of potential predators and prey species. Their diet consists of arthropods and small mammals (Dechant et al. 2002). The typical breeding season for this species extends from February 1 to August 31.
The site provides marginally suitable foraging habitat for this species due to dense and high cover of non-native grasses and no suitable burrows were observed during the April 28, 2017 site visit. The nearest documented CNDDB occurrence for this species is located approximately 2.8 miles east of the project site, on the edge of the City of Rohnert Park.
California Tiger Salamander (Ambystoma californiense)
The Sonoma population of the California tiger salamander (CTS) is a federally and State threatened amphibian species. This species utilizes vernal pools, other ephemeral pools, and sometimes stream courses and man-made pools if predatory fishes are absent, for breeding. They
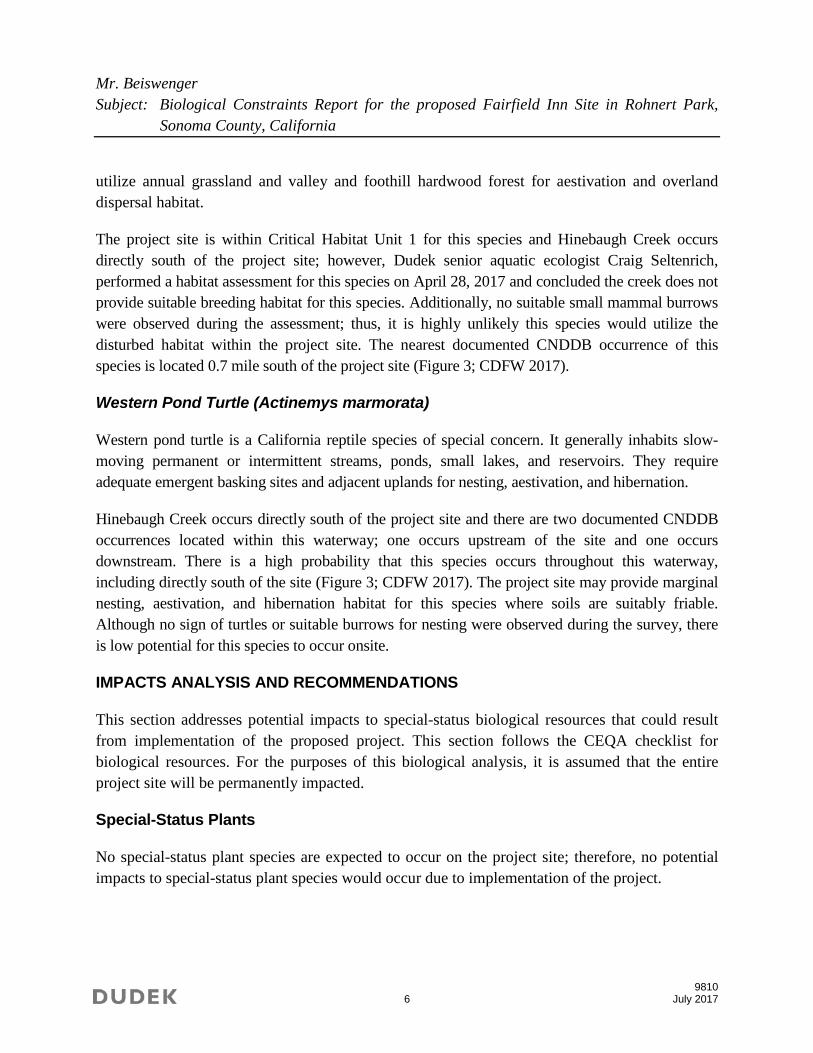
Mr. Beiswenger Subject: Biological Constraints Report for the proposed Fairfield Inn Site in Rohnert Park,
Sonoma County, California
9810 6 July 2017
utilize annual grassland and valley and foothill hardwood forest for aestivation and overland dispersal habitat.
The project site is within Critical Habitat Unit 1 for this species and Hinebaugh Creek occurs directly south of the project site; however, Dudek senior aquatic ecologist Craig Seltenrich, performed a habitat assessment for this species on April 28, 2017 and concluded the creek does not provide suitable breeding habitat for this species. Additionally, no suitable small mammal burrows were observed during the assessment; thus, it is highly unlikely this species would utilize the disturbed habitat within the project site. The nearest documented CNDDB occurrence of this species is located 0.7 mile south of the project site (Figure 3; CDFW 2017).
Western Pond Turtle (Actinemys marmorata)
Western pond turtle is a California reptile species of special concern. It generally inhabits slow-moving permanent or intermittent streams, ponds, small lakes, and reservoirs. They require adequate emergent basking sites and adjacent uplands for nesting, aestivation, and hibernation.
Hinebaugh Creek occurs directly south of the project site and there are two documented CNDDB occurrences located within this waterway; one occurs upstream of the site and one occurs downstream. There is a high probability that this species occurs throughout this waterway, including directly south of the site (Figure 3; CDFW 2017). The project site may provide marginal nesting, aestivation, and hibernation habitat for this species where soils are suitably friable. Although no sign of turtles or suitable burrows for nesting were observed during the survey, there is low potential for this species to occur onsite.
IMPACTS ANALYSIS AND RECOMMENDATIONS
This section addresses potential impacts to special-status biological resources that could result from implementation of the proposed project. This section follows the CEQA checklist for biological resources. For the purposes of this biological analysis, it is assumed that the entire project site will be permanently impacted.
Special-Status Plants
No special-status plant species are expected to occur on the project site; therefore, no potential impacts to special-status plant species would occur due to implementation of the project.
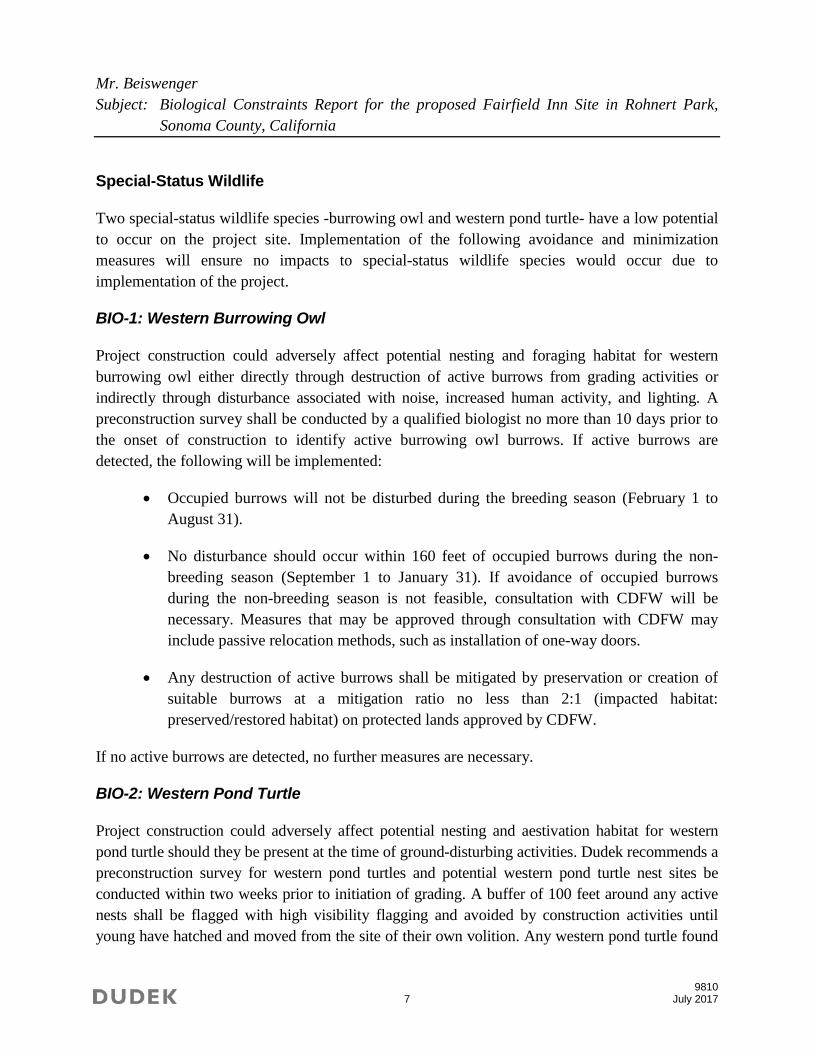
Mr. Beiswenger Subject: Biological Constraints Report for the proposed Fairfield Inn Site in Rohnert Park,
Sonoma County, California
9810 7 July 2017
Special-Status Wildlife
Two special-status wildlife species -burrowing owl and western pond turtle- have a low potential to occur on the project site. Implementation of the following avoidance and minimization measures will ensure no impacts to special-status wildlife species would occur due to implementation of the project.
BIO-1: Western Burrowing Owl
Project construction could adversely affect potential nesting and foraging habitat for western burrowing owl either directly through destruction of active burrows from grading activities or indirectly through disturbance associated with noise, increased human activity, and lighting. A preconstruction survey shall be conducted by a qualified biologist no more than 10 days prior to the onset of construction to identify active burrowing owl burrows. If active burrows are detected, the following will be implemented:
• Occupied burrows will not be disturbed during the breeding season (February 1 to August 31).
• No disturbance should occur within 160 feet of occupied burrows during the non-breeding season (September 1 to January 31). If avoidance of occupied burrows during the non-breeding season is not feasible, consultation with CDFW will be necessary. Measures that may be approved through consultation with CDFW may include passive relocation methods, such as installation of one-way doors.
• Any destruction of active burrows shall be mitigated by preservation or creation of suitable burrows at a mitigation ratio no less than 2:1 (impacted habitat: preserved/restored habitat) on protected lands approved by CDFW.
If no active burrows are detected, no further measures are necessary.
BIO-2: Western Pond Turtle
Project construction could adversely affect potential nesting and aestivation habitat for western pond turtle should they be present at the time of ground-disturbing activities. Dudek recommends a preconstruction survey for western pond turtles and potential western pond turtle nest sites be conducted within two weeks prior to initiation of grading. A buffer of 100 feet around any active nests shall be flagged with high visibility flagging and avoided by construction activities until young have hatched and moved from the site of their own volition. Any western pond turtle found
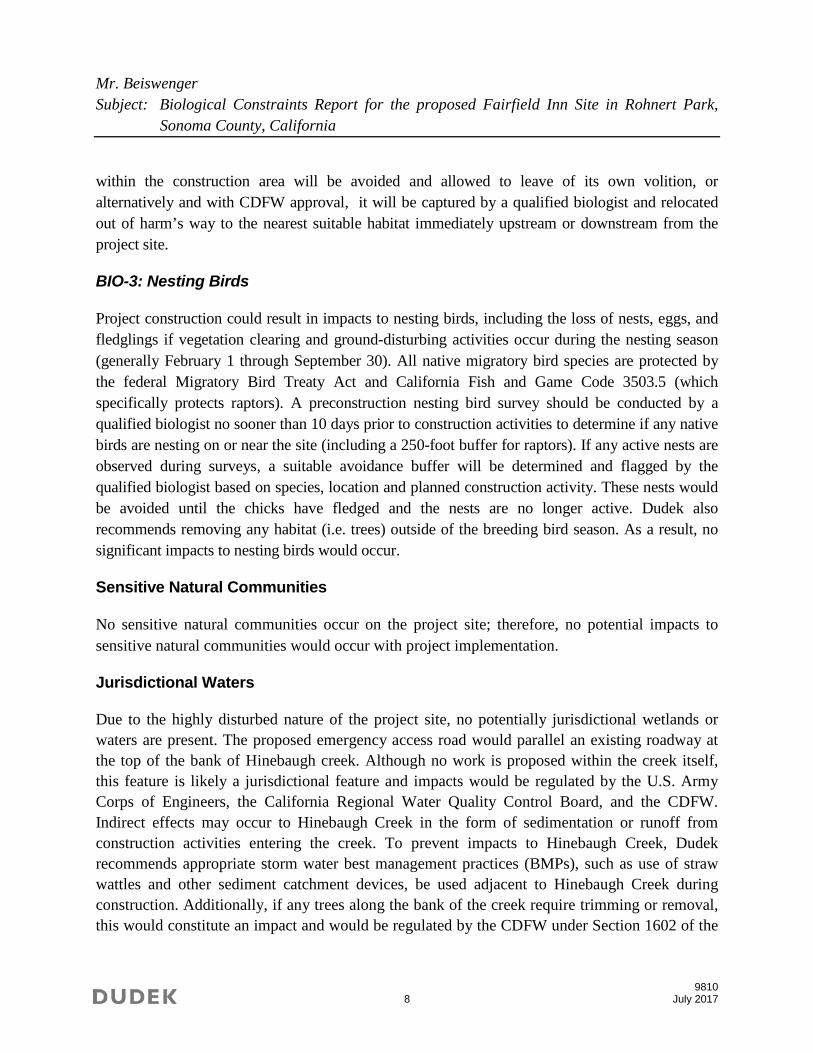
Mr. Beiswenger Subject: Biological Constraints Report for the proposed Fairfield Inn Site in Rohnert Park,
Sonoma County, California
9810 8 July 2017
within the construction area will be avoided and allowed to leave of its own volition, or alternatively and with CDFW approval, it will be captured by a qualified biologist and relocated out of harm’s way to the nearest suitable habitat immediately upstream or downstream from the project site.
BIO-3: Nesting Birds
Project construction could result in impacts to nesting birds, including the loss of nests, eggs, and fledglings if vegetation clearing and ground-disturbing activities occur during the nesting season (generally February 1 through September 30). All native migratory bird species are protected by the federal Migratory Bird Treaty Act and California Fish and Game Code 3503.5 (which specifically protects raptors). A preconstruction nesting bird survey should be conducted by a qualified biologist no sooner than 10 days prior to construction activities to determine if any native birds are nesting on or near the site (including a 250-foot buffer for raptors). If any active nests are observed during surveys, a suitable avoidance buffer will be determined and flagged by the qualified biologist based on species, location and planned construction activity. These nests would be avoided until the chicks have fledged and the nests are no longer active. Dudek also recommends removing any habitat (i.e. trees) outside of the breeding bird season. As a result, no significant impacts to nesting birds would occur.
Sensitive Natural Communities
No sensitive natural communities occur on the project site; therefore, no potential impacts to sensitive natural communities would occur with project implementation.
Jurisdictional Waters
Due to the highly disturbed nature of the project site, no potentially jurisdictional wetlands or waters are present. The proposed emergency access road would parallel an existing roadway at the top of the bank of Hinebaugh creek. Although no work is proposed within the creek itself, this feature is likely a jurisdictional feature and impacts would be regulated by the U.S. Army Corps of Engineers, the California Regional Water Quality Control Board, and the CDFW. Indirect effects may occur to Hinebaugh Creek in the form of sedimentation or runoff from construction activities entering the creek. To prevent impacts to Hinebaugh Creek, Dudek recommends appropriate storm water best management practices (BMPs), such as use of straw wattles and other sediment catchment devices, be used adjacent to Hinebaugh Creek during construction. Additionally, if any trees along the bank of the creek require trimming or removal, this would constitute an impact and would be regulated by the CDFW under Section 1602 of the
Mr. Beiswenger Subject: Biological Constraints Report for the proposed Fairfield Inn Site in Rohnert Park,
Sonoma County, California
9810 9 July 2017
California Fish and Game Code; therefore, Dudek recommends obtaining a Streambed Alteration Agreement from the CDFW prior to any tree trimming or removal.
Wildlife Corridors and Nursery Sites
The project site does not function as a wildlife corridor and does not support any wildlife nursery sites. As a result, implementation of the proposed project would not result in impacts to these resources.
City of Rohnert Park Tree Ordinance
The Rohnert Park Code of Ordinances, Title 17, Chapter 17.15 provides regulation for development around trees within the city of Rohnert Park. If any trees on the periphery of the project site are to be removed or trimmed, an application for a tree removal permit should be submitted to the City. Tree replacement shall occur either by depositing an in-lieu fee or by planting an equivalent number of new trees.
Other Recommendations
In addition, Dudek recommends avoiding the use of any invasive, non-native plant species rated as “high” or “moderate” by the California Invasive Plant Council’s Invasive Plant Inventory (Cal-IPC 2017) for future landscaping of the site.
If you have any questions or concerns regarding the content of this letter report, please contact me at 916.835.9671 or [email protected].
Sincerely,
_______________________ Laura Burris Biologist
Att.: Figures Figure 1 – Regional Map Figure 2 – Site and Vicinity Figure 3 – CNDDB 5-Mile Radius Map Att. 1 – Representative Site Photographs Att. 2 – Vascular Plant Species Observed Onsite Att. 3 – Table of Potentially Occurring Species
Mr. Beiswenger Subject: Biological Constraints Report for the proposed Fairfield Inn Site in Rohnert Park,
Sonoma County, California
9810 10 July 2017
REFERENCES CITED
AOU (American Ornithologists’ Union). 2015. Checklist of North and Middle American Birds (7th Edition and Supplements). http://checklist.aou.org/taxa/.
Cal-IPC (California Invasive Plant Council). 2017. California Invasive Plant Inventory Database. http://www.cal-ipc.org/paf/.
CDFG (California Department of Fish and Game). 2010. List of Vegetation Alliances and Associations: Natural Communities List Arranged Alphabetically by Life Form. September 2010. http://www.dfg.ca.gov/biogeodata/vegcamp/natural_comm_list.asp.
CDFW (California Department of Fish and Wildlife). 2017. RareFind 5. California Natural Diversity Database. CDFW, Biogeographic Data Branch. Accessed June 2017. https://www.dfg.ca.gov/biogeodata/cnddb/mapsanddata.asp.
CNPS (California Native Plant Society). 2017. Inventory of Rare and Endangered Plants (online edition, v8-02). Sacramento, California: California Native Plant Society. Accessed June 2017. http://www.rareplants.cnps.org.
Crother, B.I. 2012. Scientific and Standard English Names of Amphibians and Reptiles of North America North of Mexico, with Comments Regarding Confidence in our Understanding, edited by J.J. Moriarty. 7th ed. Society for the Study of Amphibians and Reptiles; Herpetological Circular no. 39. August 2012. http://home.gwu.edu/~rpyron/publications/ Crother_et_al_2012.pdf.
Dechant, J.A., M.L. Sondreal, D. H. Johnson, L.D. Igl, C.M. Goldade, P.A. Rabie, and B.R. Euliss. 2002. “Effects of Management Practices on Grassland Birds: Burrowing Owl.” USGS Northern Prairie Wildlife Research Center. January 1, 2002.
Gervais, J.A., D.K. Rosenberg, and L.A. Comrack. 2008. “Burrowing owl (Athene cunicularia).” In California Bird Species of Special Concern: A Ranked Assessment of Species, Subspecies, and Distinct Populations of Birds of Immediate Conservation Concern in California, edited by W.D. Shuford and T. Gardali, 218–226. Studies of Western Birds no. 1. California: Western Field Ornithologists (Camarillo), and California Department of Fish and Game (Sacramento). February 4, 2008. http://www.dfg.ca.gov/wildlife/ nongame/ssc/birds.html.
Haug, E.A., B.A. Millsap, and M.S. Martell. 1993. “The Burrowing Owl (Speotyto cunicularia).” In The Birds of North America, edited by A. Poole and F. Gill. Philadelphia,
Mr. Beiswenger Subject: Biological Constraints Report for the proposed Fairfield Inn Site in Rohnert Park,
Sonoma County, California
9810 11 July 2017
Pennsylvania: The Academy of Natural Sciences, and Washington, D.C.: The American Ornithologists’ Union.
HistoricAerials.com. 2017. Accessed March 8, 2017. https://www.historicaerials.com/.
Jepson Flora Project. 2017. Jepson eFlora. Berkeley, California: University of California. http://ucjeps.berkeley.edu/IJM.html.
Lantz, S. J., H. Smith, and D.A. Keinath. 2004. Species Assessment for Western Burrowing Owl (Athene cunicularia hypugaea) in Wyoming. Prepared for the U.S. Department of Interior and Bureau of Land Management.
Moyle, P.B. 2002. Inland Fishes of California. Revised and Expanded. Berkeley, California: University of California Press.
NABA (North American Butterfly Association). 2001. “Checklist of North American Butterflies Occurring North of Mexico.” Adapted from North American Butterfly Association (NABA) Checklist and English Names of North American Butterflies, eds. B. Cassie, J. Glassberg, A. Swengel, and G. Tudor. 2nd ed. Morristown, New Jersey: NABA. http://www.naba.org/pubs/enames2.html.
Sawyer, J., T. Keeler-Wolf., and J.M. Evens. 2009. A Manual of California Vegetation. 2nd ed. California Native Plant Society.
USDA (U.S. Department of Agriculture). 2017a. “California.” State PLANTS Checklist. http://plants.usda.gov/dl_state.html.
USDA. 2017b. Web Soil Survey. USDA, Natural Resources Conservation Service, Soil Survey Staff. http://websoilsurvey.nrcs.usda.gov/.
USFWS (U.S. Fish and Wildlife Service). 2017. Critical Habitat and Occurrence Data. Accessed June 2017. http://fws.maps.arcgis.com/home/webmap/viewer.html?webmap= 9d8de5e265ad4fe09893cf75b8dbfb77.
Wilson, D.E., and D.M. Reeder, eds. 2005. Mammal Species of the World: A Taxonomic and Geographic Reference. 3rd ed. Baltimore, Maryland: Johns Hopkins University Press.
Zeiner, D.C., W.F. Laudenslayer Jr., K.E. Mayer, and M. White, eds. 1990. California’s Wildlife: Volume III. Mammals. Sacramento, California: California Department of Fish and Game.
ATTACHMENT 1
Representative Site Photographs
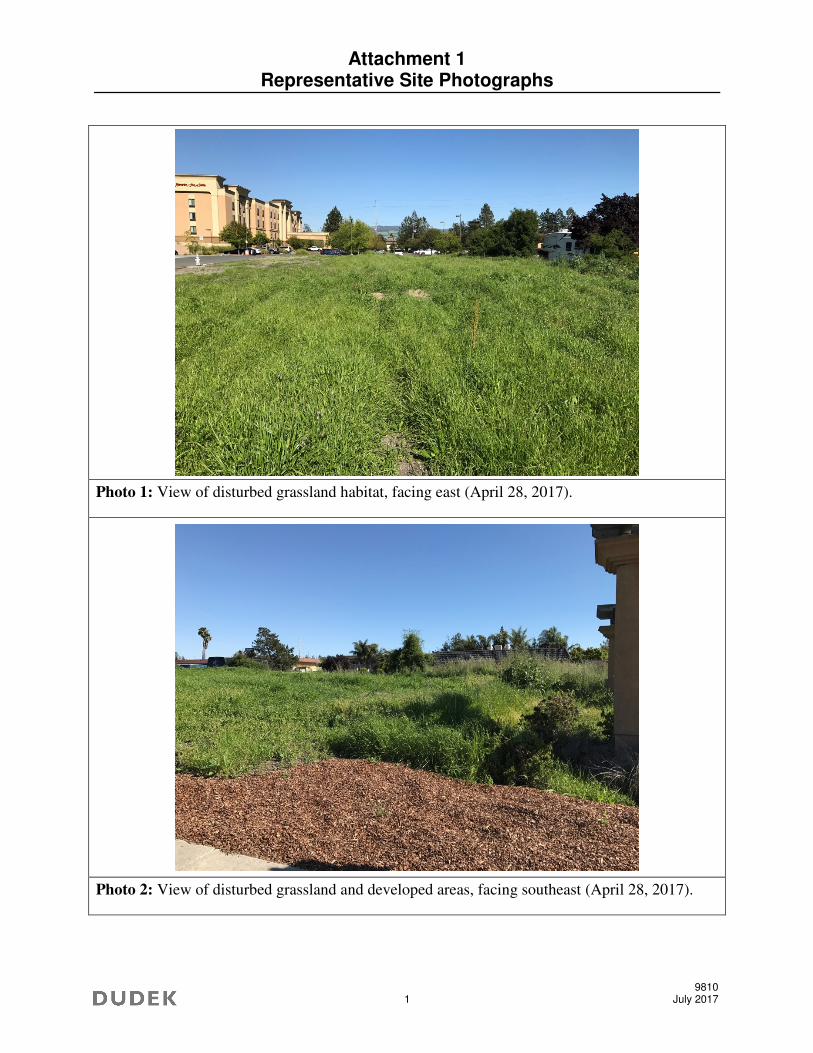
Attachment 1 Representative Site Photographs
9810 1 July 2017
Photo 1: View of disturbed grassland habitat, facing east (April 28, 2017).
Photo 2: View of disturbed grassland and developed areas, facing southeast (April 28, 2017).
ATTACHMENT 2
Vascular Plant Species Observed Onsite
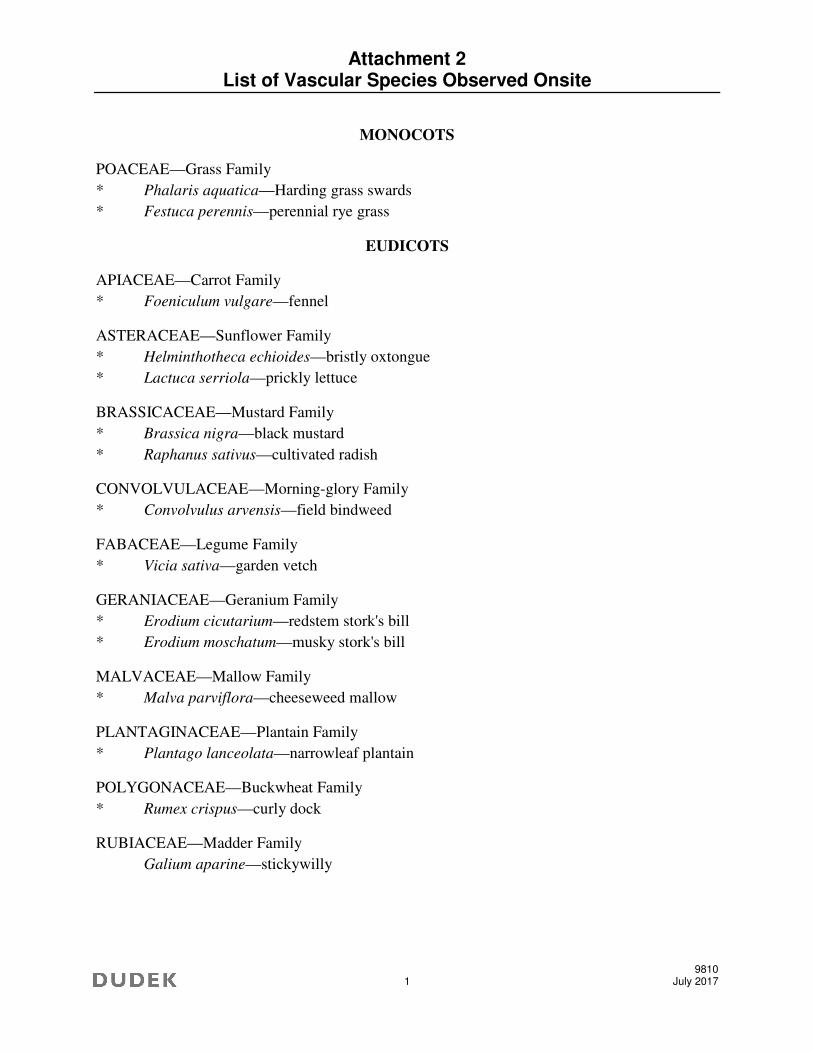
Attachment 2 List of Vascular Species Observed Onsite
9810 1 July 2017
MONOCOTS
POACEAE—Grass Family
* Phalaris aquatica—Harding grass swards
* Festuca perennis—perennial rye grass
EUDICOTS
APIACEAE—Carrot Family
* Foeniculum vulgare—fennel
ASTERACEAE—Sunflower Family
* Helminthotheca echioides—bristly oxtongue
* Lactuca serriola—prickly lettuce
BRASSICACEAE—Mustard Family
* Brassica nigra—black mustard
* Raphanus sativus—cultivated radish
CONVOLVULACEAE—Morning-glory Family
* Convolvulus arvensis—field bindweed
FABACEAE—Legume Family
* Vicia sativa—garden vetch
GERANIACEAE—Geranium Family
* Erodium cicutarium—redstem stork's bill
* Erodium moschatum—musky stork's bill
MALVACEAE—Mallow Family
* Malva parviflora—cheeseweed mallow
PLANTAGINACEAE—Plantain Family
* Plantago lanceolata—narrowleaf plantain
POLYGONACEAE—Buckwheat Family
* Rumex crispus—curly dock
RUBIACEAE—Madder Family
Galium aparine—stickywilly
ATTACHMENT 3
Table of Potentially Occurring Special-status
Species
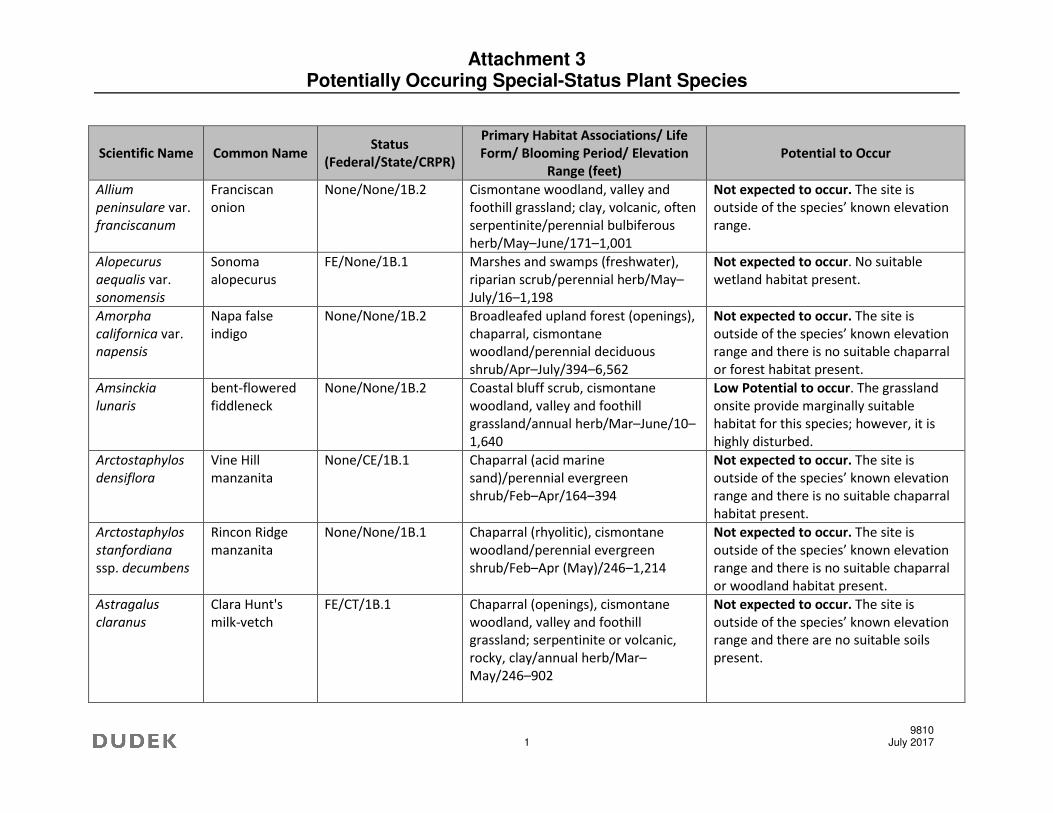
Attachment 3 Potentially Occuring Special-Status Plant Species
9810 1 July 2017
Scientific Name Common Name Status
(Federal/State/CRPR)
Primary Habitat Associations/ Life
Form/ Blooming Period/ Elevation
Range (feet)
Potential to Occur
Allium
peninsulare var.
franciscanum
Franciscan
onion
None/None/1B.2 Cismontane woodland, valley and
foothill grassland; clay, volcanic, often
serpentinite/perennial bulbiferous
herb/May–June/171–1,001
Not expected to occur. The site is
outside of the species’ known elevation
range.
Alopecurus
aequalis var.
sonomensis
Sonoma
alopecurus
FE/None/1B.1 Marshes and swamps (freshwater),
riparian scrub/perennial herb/May–
July/16–1,198
Not expected to occur. No suitable
wetland habitat present.
Amorpha
californica var.
napensis
Napa false
indigo
None/None/1B.2 Broadleafed upland forest (openings),
chaparral, cismontane
woodland/perennial deciduous
shrub/Apr–July/394–6,562
Not expected to occur. The site is
outside of the species’ known elevation
range and there is no suitable chaparral
or forest habitat present.
Amsinckia
lunaris
bent-flowered
fiddleneck
None/None/1B.2 Coastal bluff scrub, cismontane
woodland, valley and foothill
grassland/annual herb/Mar–June/10–
1,640
Low Potential to occur. The grassland
onsite provide marginally suitable
habitat for this species; however, it is
highly disturbed.
Arctostaphylos
densiflora
Vine Hill
manzanita
None/CE/1B.1 Chaparral (acid marine
sand)/perennial evergreen
shrub/Feb–Apr/164–394
Not expected to occur. The site is
outside of the species’ known elevation
range and there is no suitable chaparral
habitat present.
Arctostaphylos
stanfordiana
ssp. decumbens
Rincon Ridge
manzanita
None/None/1B.1 Chaparral (rhyolitic), cismontane
woodland/perennial evergreen
shrub/Feb–Apr (May)/246–1,214
Not expected to occur. The site is
outside of the species’ known elevation
range and there is no suitable chaparral
or woodland habitat present.
Astragalus
claranus
Clara Hunt's
milk-vetch
FE/CT/1B.1 Chaparral (openings), cismontane
woodland, valley and foothill
grassland; serpentinite or volcanic,
rocky, clay/annual herb/Mar–
May/246–902
Not expected to occur. The site is
outside of the species’ known elevation
range and there are no suitable soils
present.
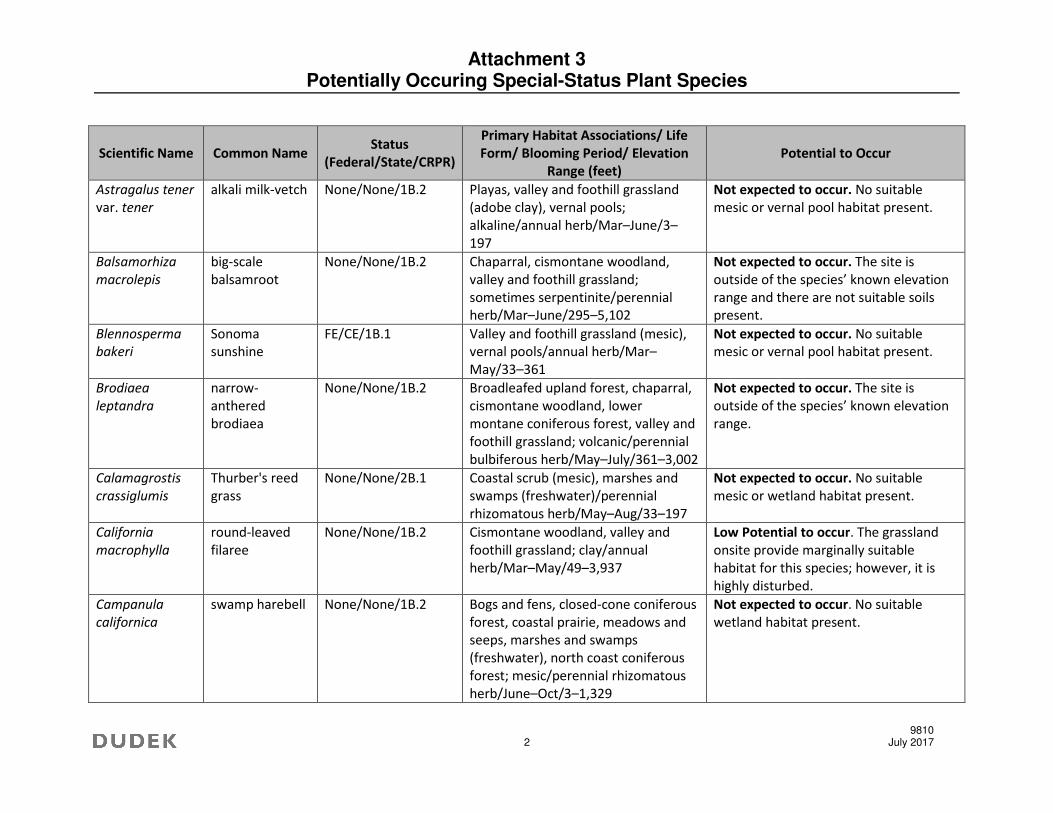
Attachment 3 Potentially Occuring Special-Status Plant Species
9810 2 July 2017
Scientific Name Common Name Status
(Federal/State/CRPR)
Primary Habitat Associations/ Life
Form/ Blooming Period/ Elevation
Range (feet)
Potential to Occur
Astragalus tener
var. tener
alkali milk-vetch None/None/1B.2 Playas, valley and foothill grassland
(adobe clay), vernal pools;
alkaline/annual herb/Mar–June/3–
197
Not expected to occur. No suitable
mesic or vernal pool habitat present.
Balsamorhiza
macrolepis
big-scale
balsamroot
None/None/1B.2 Chaparral, cismontane woodland,
valley and foothill grassland;
sometimes serpentinite/perennial
herb/Mar–June/295–5,102
Not expected to occur. The site is
outside of the species’ known elevation
range and there are not suitable soils
present.
Blennosperma
bakeri
Sonoma
sunshine
FE/CE/1B.1 Valley and foothill grassland (mesic),
vernal pools/annual herb/Mar–
May/33–361
Not expected to occur. No suitable
mesic or vernal pool habitat present.
Brodiaea
leptandra
narrow-
anthered
brodiaea
None/None/1B.2 Broadleafed upland forest, chaparral,
cismontane woodland, lower
montane coniferous forest, valley and
foothill grassland; volcanic/perennial
bulbiferous herb/May–July/361–3,002
Not expected to occur. The site is
outside of the species’ known elevation
range.
Calamagrostis
crassiglumis
Thurber's reed
grass
None/None/2B.1 Coastal scrub (mesic), marshes and
swamps (freshwater)/perennial
rhizomatous herb/May–Aug/33–197
Not expected to occur. No suitable
mesic or wetland habitat present.
California
macrophylla
round-leaved
filaree
None/None/1B.2 Cismontane woodland, valley and
foothill grassland; clay/annual
herb/Mar–May/49–3,937
Low Potential to occur. The grassland
onsite provide marginally suitable
habitat for this species; however, it is
highly disturbed.
Campanula
californica
swamp harebell None/None/1B.2 Bogs and fens, closed-cone coniferous
forest, coastal prairie, meadows and
seeps, marshes and swamps
(freshwater), north coast coniferous
forest; mesic/perennial rhizomatous
herb/June–Oct/3–1,329
Not expected to occur. No suitable
wetland habitat present.
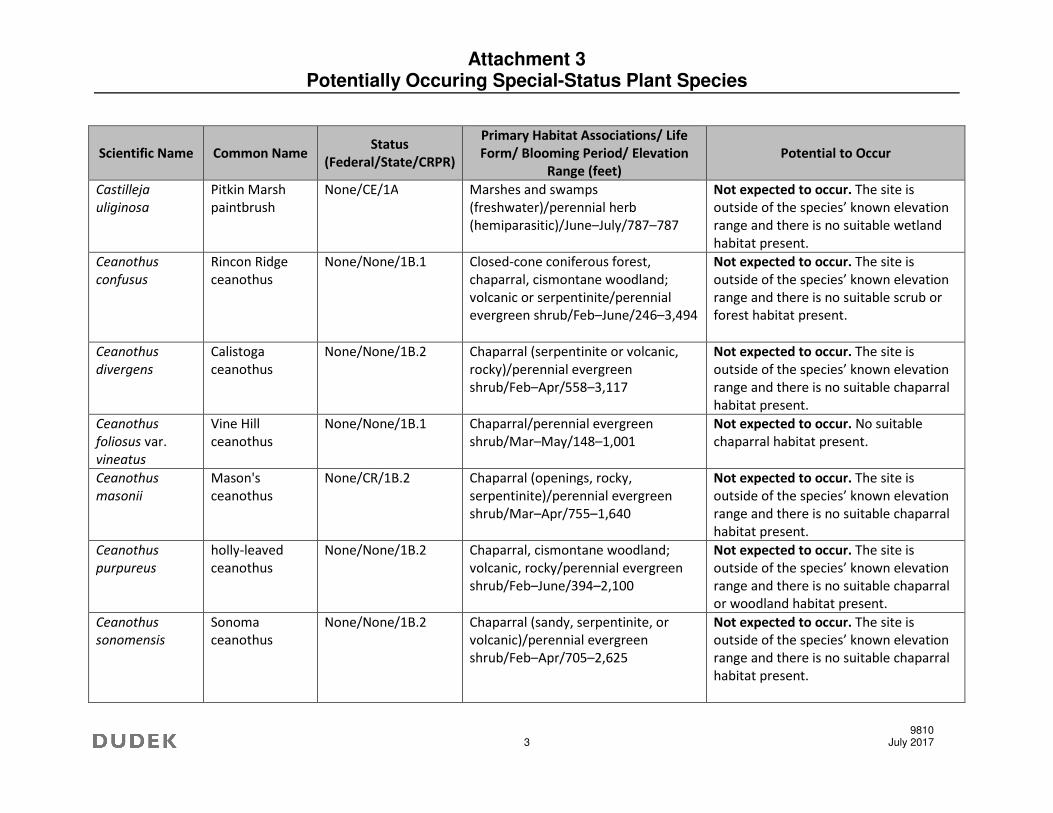
Attachment 3 Potentially Occuring Special-Status Plant Species
9810 3 July 2017
Scientific Name Common Name Status
(Federal/State/CRPR)
Primary Habitat Associations/ Life
Form/ Blooming Period/ Elevation
Range (feet)
Potential to Occur
Castilleja
uliginosa
Pitkin Marsh
paintbrush
None/CE/1A Marshes and swamps
(freshwater)/perennial herb
(hemiparasitic)/June–July/787–787
Not expected to occur. The site is
outside of the species’ known elevation
range and there is no suitable wetland
habitat present.
Ceanothus
confusus
Rincon Ridge
ceanothus
None/None/1B.1 Closed-cone coniferous forest,
chaparral, cismontane woodland;
volcanic or serpentinite/perennial
evergreen shrub/Feb–June/246–3,494
Not expected to occur. The site is
outside of the species’ known elevation
range and there is no suitable scrub or
forest habitat present.
Ceanothus
divergens
Calistoga
ceanothus
None/None/1B.2 Chaparral (serpentinite or volcanic,
rocky)/perennial evergreen
shrub/Feb–Apr/558–3,117
Not expected to occur. The site is
outside of the species’ known elevation
range and there is no suitable chaparral
habitat present.
Ceanothus
foliosus var.
vineatus
Vine Hill
ceanothus
None/None/1B.1 Chaparral/perennial evergreen
shrub/Mar–May/148–1,001
Not expected to occur. No suitable
chaparral habitat present.
Ceanothus
masonii
Mason's
ceanothus
None/CR/1B.2 Chaparral (openings, rocky,
serpentinite)/perennial evergreen
shrub/Mar–Apr/755–1,640
Not expected to occur. The site is
outside of the species’ known elevation
range and there is no suitable chaparral
habitat present.
Ceanothus
purpureus
holly-leaved
ceanothus
None/None/1B.2 Chaparral, cismontane woodland;
volcanic, rocky/perennial evergreen
shrub/Feb–June/394–2,100
Not expected to occur. The site is
outside of the species’ known elevation
range and there is no suitable chaparral
or woodland habitat present.
Ceanothus
sonomensis
Sonoma
ceanothus
None/None/1B.2 Chaparral (sandy, serpentinite, or
volcanic)/perennial evergreen
shrub/Feb–Apr/705–2,625
Not expected to occur. The site is
outside of the species’ known elevation
range and there is no suitable chaparral
habitat present.
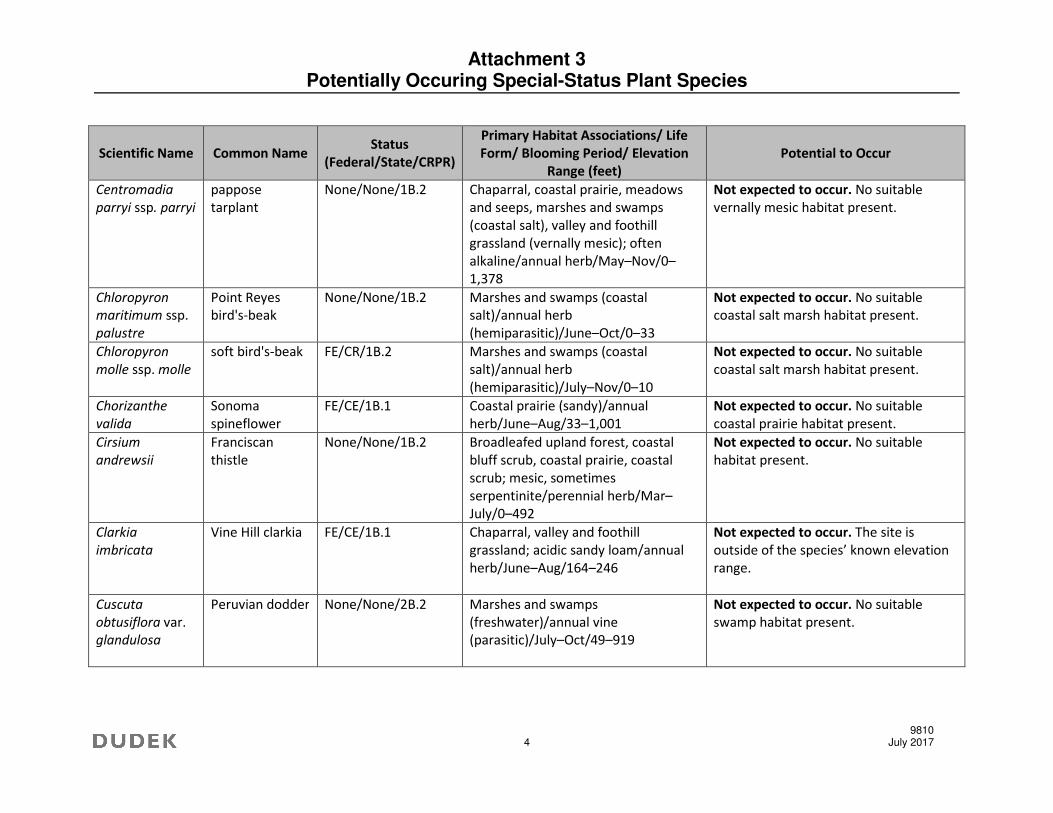
Attachment 3 Potentially Occuring Special-Status Plant Species
9810 4 July 2017
Scientific Name Common Name Status
(Federal/State/CRPR)
Primary Habitat Associations/ Life
Form/ Blooming Period/ Elevation
Range (feet)
Potential to Occur
Centromadia
parryi ssp. parryi
pappose
tarplant
None/None/1B.2 Chaparral, coastal prairie, meadows
and seeps, marshes and swamps
(coastal salt), valley and foothill
grassland (vernally mesic); often
alkaline/annual herb/May–Nov/0–
1,378
Not expected to occur. No suitable
vernally mesic habitat present.
Chloropyron
maritimum ssp.
palustre
Point Reyes
bird's-beak
None/None/1B.2 Marshes and swamps (coastal
salt)/annual herb
(hemiparasitic)/June–Oct/0–33
Not expected to occur. No suitable
coastal salt marsh habitat present.
Chloropyron
molle ssp. molle
soft bird's-beak FE/CR/1B.2 Marshes and swamps (coastal
salt)/annual herb
(hemiparasitic)/July–Nov/0–10
Not expected to occur. No suitable
coastal salt marsh habitat present.
Chorizanthe
valida
Sonoma
spineflower
FE/CE/1B.1 Coastal prairie (sandy)/annual
herb/June–Aug/33–1,001
Not expected to occur. No suitable
coastal prairie habitat present.
Cirsium
andrewsii
Franciscan
thistle
None/None/1B.2 Broadleafed upland forest, coastal
bluff scrub, coastal prairie, coastal
scrub; mesic, sometimes
serpentinite/perennial herb/Mar–
July/0–492
Not expected to occur. No suitable
habitat present.
Clarkia
imbricata
Vine Hill clarkia FE/CE/1B.1 Chaparral, valley and foothill
grassland; acidic sandy loam/annual
herb/June–Aug/164–246
Not expected to occur. The site is
outside of the species’ known elevation
range.
Cuscuta
obtusiflora var.
glandulosa
Peruvian dodder None/None/2B.2 Marshes and swamps
(freshwater)/annual vine
(parasitic)/July–Oct/49–919
Not expected to occur. No suitable
swamp habitat present.
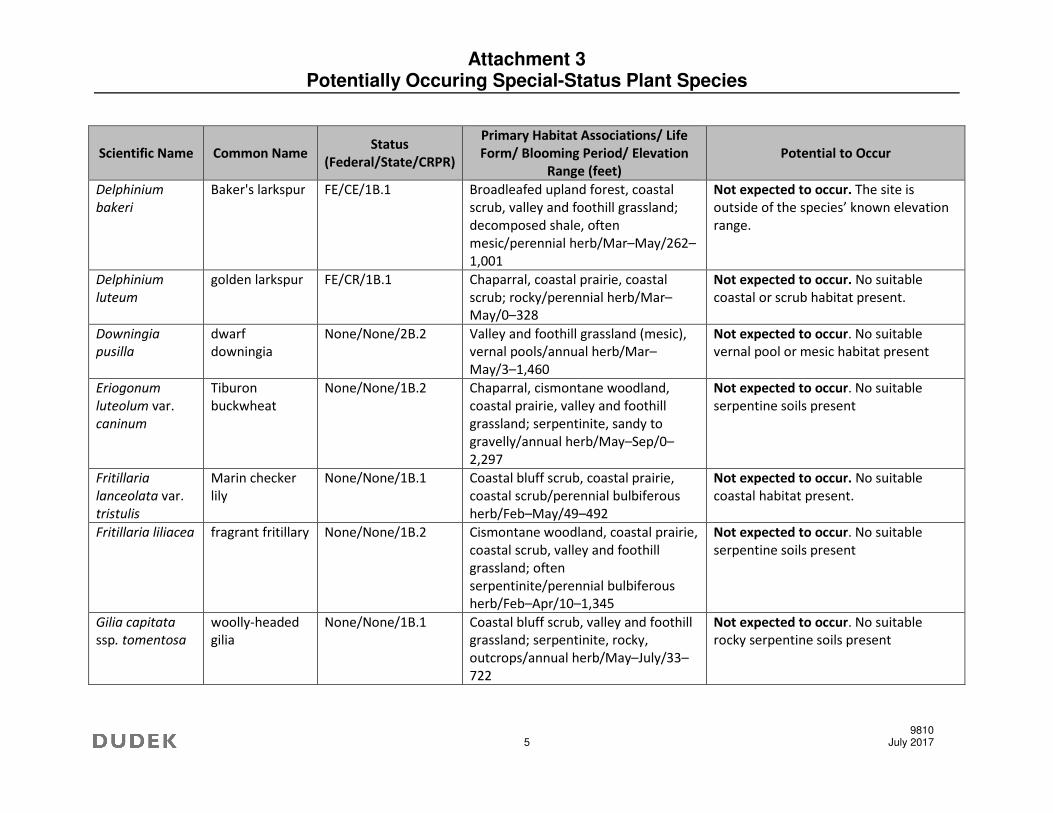
Attachment 3 Potentially Occuring Special-Status Plant Species
9810 5 July 2017
Scientific Name Common Name Status
(Federal/State/CRPR)
Primary Habitat Associations/ Life
Form/ Blooming Period/ Elevation
Range (feet)
Potential to Occur
Delphinium
bakeri
Baker's larkspur FE/CE/1B.1 Broadleafed upland forest, coastal
scrub, valley and foothill grassland;
decomposed shale, often
mesic/perennial herb/Mar–May/262–
1,001
Not expected to occur. The site is
outside of the species’ known elevation
range.
Delphinium
luteum
golden larkspur FE/CR/1B.1 Chaparral, coastal prairie, coastal
scrub; rocky/perennial herb/Mar–
May/0–328
Not expected to occur. No suitable
coastal or scrub habitat present.
Downingia
pusilla
dwarf
downingia
None/None/2B.2 Valley and foothill grassland (mesic),
vernal pools/annual herb/Mar–
May/3–1,460
Not expected to occur. No suitable
vernal pool or mesic habitat present
Eriogonum
luteolum var.
caninum
Tiburon
buckwheat
None/None/1B.2 Chaparral, cismontane woodland,
coastal prairie, valley and foothill
grassland; serpentinite, sandy to
gravelly/annual herb/May–Sep/0–
2,297
Not expected to occur. No suitable
serpentine soils present
Fritillaria
lanceolata var.
tristulis
Marin checker
lily
None/None/1B.1 Coastal bluff scrub, coastal prairie,
coastal scrub/perennial bulbiferous
herb/Feb–May/49–492
Not expected to occur. No suitable
coastal habitat present.
Fritillaria liliacea fragrant fritillary None/None/1B.2 Cismontane woodland, coastal prairie,
coastal scrub, valley and foothill
grassland; often
serpentinite/perennial bulbiferous
herb/Feb–Apr/10–1,345
Not expected to occur. No suitable
serpentine soils present
Gilia capitata
ssp. tomentosa
woolly-headed
gilia
None/None/1B.1 Coastal bluff scrub, valley and foothill
grassland; serpentinite, rocky,
outcrops/annual herb/May–July/33–
722
Not expected to occur. No suitable
rocky serpentine soils present
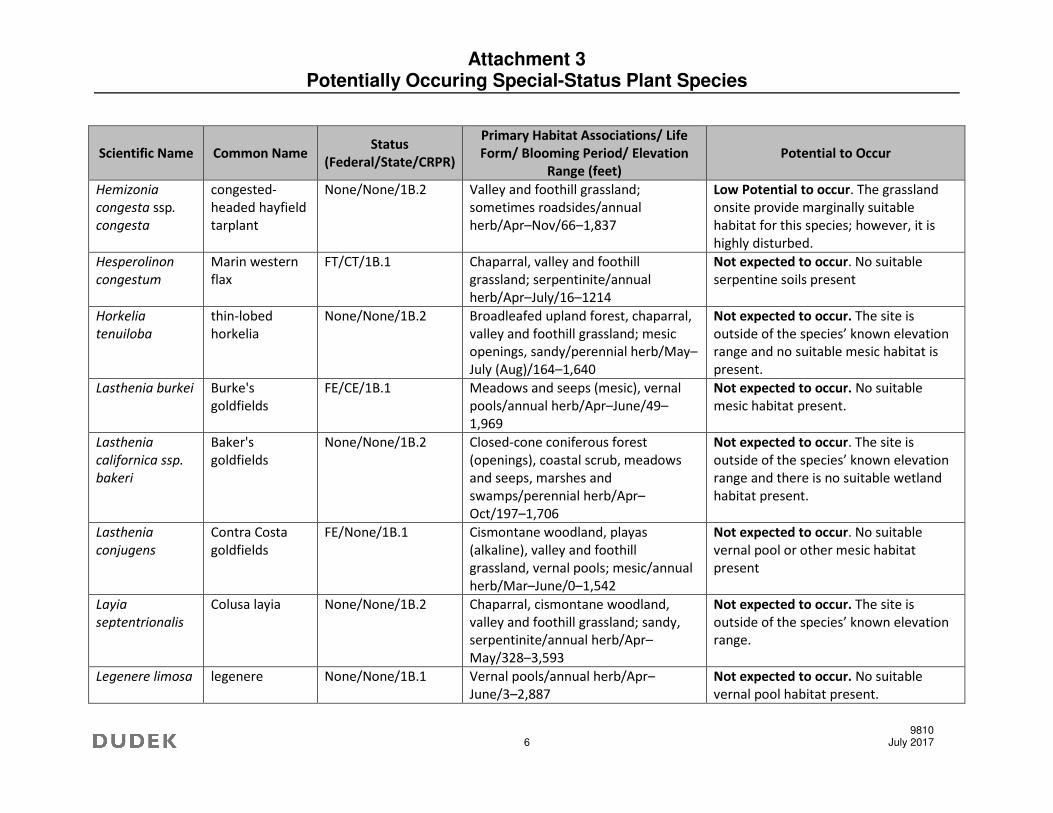
Attachment 3 Potentially Occuring Special-Status Plant Species
9810 6 July 2017
Scientific Name Common Name Status
(Federal/State/CRPR)
Primary Habitat Associations/ Life
Form/ Blooming Period/ Elevation
Range (feet)
Potential to Occur
Hemizonia
congesta ssp.
congesta
congested-
headed hayfield
tarplant
None/None/1B.2 Valley and foothill grassland;
sometimes roadsides/annual
herb/Apr–Nov/66–1,837
Low Potential to occur. The grassland
onsite provide marginally suitable
habitat for this species; however, it is
highly disturbed.
Hesperolinon
congestum
Marin western
flax
FT/CT/1B.1 Chaparral, valley and foothill
grassland; serpentinite/annual
herb/Apr–July/16–1214
Not expected to occur. No suitable
serpentine soils present
Horkelia
tenuiloba
thin-lobed
horkelia
None/None/1B.2 Broadleafed upland forest, chaparral,
valley and foothill grassland; mesic
openings, sandy/perennial herb/May–
July (Aug)/164–1,640
Not expected to occur. The site is
outside of the species’ known elevation
range and no suitable mesic habitat is
present.
Lasthenia burkei Burke's
goldfields
FE/CE/1B.1 Meadows and seeps (mesic), vernal
pools/annual herb/Apr–June/49–
1,969
Not expected to occur. No suitable
mesic habitat present.
Lasthenia
californica ssp.
bakeri
Baker's
goldfields
None/None/1B.2 Closed-cone coniferous forest
(openings), coastal scrub, meadows
and seeps, marshes and
swamps/perennial herb/Apr–
Oct/197–1,706
Not expected to occur. The site is
outside of the species’ known elevation
range and there is no suitable wetland
habitat present.
Lasthenia
conjugens
Contra Costa
goldfields
FE/None/1B.1 Cismontane woodland, playas
(alkaline), valley and foothill
grassland, vernal pools; mesic/annual
herb/Mar–June/0–1,542
Not expected to occur. No suitable
vernal pool or other mesic habitat
present
Layia
septentrionalis
Colusa layia None/None/1B.2 Chaparral, cismontane woodland,
valley and foothill grassland; sandy,
serpentinite/annual herb/Apr–
May/328–3,593
Not expected to occur. The site is
outside of the species’ known elevation
range.
Legenere limosa legenere None/None/1B.1 Vernal pools/annual herb/Apr–
June/3–2,887
Not expected to occur. No suitable
vernal pool habitat present.
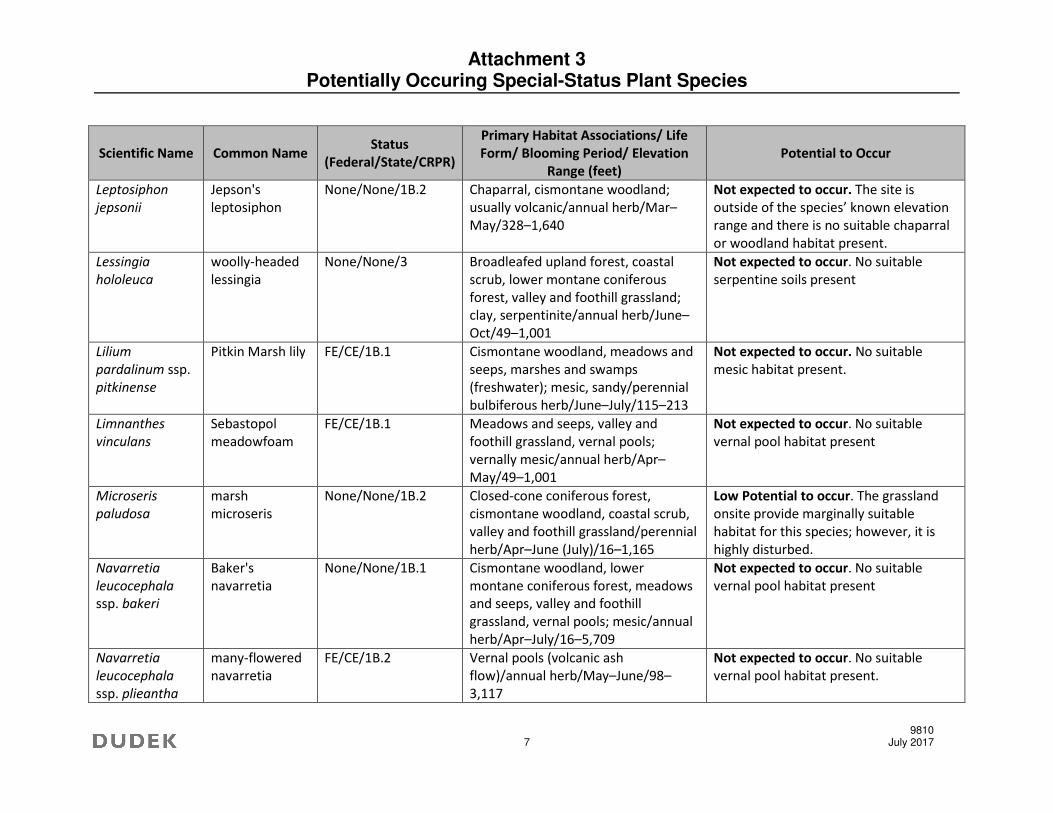
Attachment 3 Potentially Occuring Special-Status Plant Species
9810 7 July 2017
Scientific Name Common Name Status
(Federal/State/CRPR)
Primary Habitat Associations/ Life
Form/ Blooming Period/ Elevation
Range (feet)
Potential to Occur
Leptosiphon
jepsonii
Jepson's
leptosiphon
None/None/1B.2 Chaparral, cismontane woodland;
usually volcanic/annual herb/Mar–
May/328–1,640
Not expected to occur. The site is
outside of the species’ known elevation
range and there is no suitable chaparral
or woodland habitat present.
Lessingia
hololeuca
woolly-headed
lessingia
None/None/3 Broadleafed upland forest, coastal
scrub, lower montane coniferous
forest, valley and foothill grassland;
clay, serpentinite/annual herb/June–
Oct/49–1,001
Not expected to occur. No suitable
serpentine soils present
Lilium
pardalinum ssp.
pitkinense
Pitkin Marsh lily FE/CE/1B.1 Cismontane woodland, meadows and
seeps, marshes and swamps
(freshwater); mesic, sandy/perennial
bulbiferous herb/June–July/115–213
Not expected to occur. No suitable
mesic habitat present.
Limnanthes
vinculans
Sebastopol
meadowfoam
FE/CE/1B.1 Meadows and seeps, valley and
foothill grassland, vernal pools;
vernally mesic/annual herb/Apr–
May/49–1,001
Not expected to occur. No suitable
vernal pool habitat present
Microseris
paludosa
marsh
microseris
None/None/1B.2 Closed-cone coniferous forest,
cismontane woodland, coastal scrub,
valley and foothill grassland/perennial
herb/Apr–June (July)/16–1,165
Low Potential to occur. The grassland
onsite provide marginally suitable
habitat for this species; however, it is
highly disturbed.
Navarretia
leucocephala
ssp. bakeri
Baker's
navarretia
None/None/1B.1 Cismontane woodland, lower
montane coniferous forest, meadows
and seeps, valley and foothill
grassland, vernal pools; mesic/annual
herb/Apr–July/16–5,709
Not expected to occur. No suitable
vernal pool habitat present
Navarretia
leucocephala
ssp. plieantha
many-flowered
navarretia
FE/CE/1B.2 Vernal pools (volcanic ash
flow)/annual herb/May–June/98–
3,117
Not expected to occur. No suitable
vernal pool habitat present.
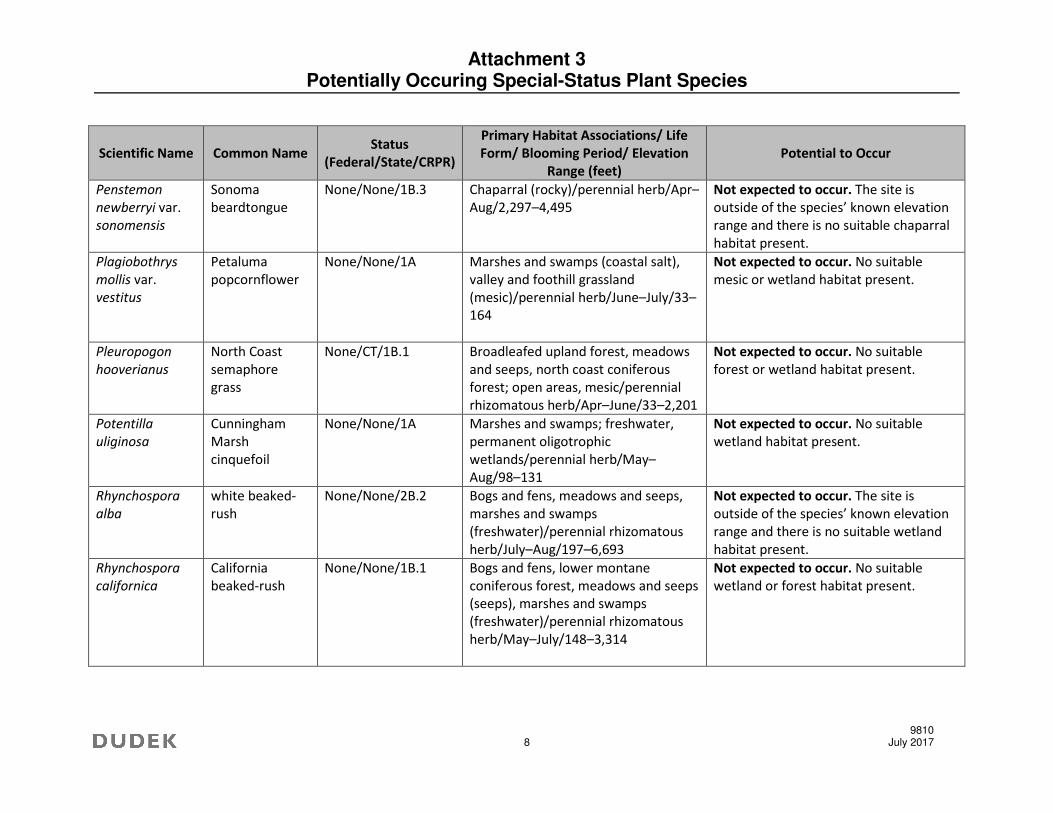
Attachment 3 Potentially Occuring Special-Status Plant Species
9810 8 July 2017
Scientific Name Common Name Status
(Federal/State/CRPR)
Primary Habitat Associations/ Life
Form/ Blooming Period/ Elevation
Range (feet)
Potential to Occur
Penstemon
newberryi var.
sonomensis
Sonoma
beardtongue
None/None/1B.3 Chaparral (rocky)/perennial herb/Apr–
Aug/2,297–4,495
Not expected to occur. The site is
outside of the species’ known elevation
range and there is no suitable chaparral
habitat present.
Plagiobothrys
mollis var.
vestitus
Petaluma
popcornflower
None/None/1A Marshes and swamps (coastal salt),
valley and foothill grassland
(mesic)/perennial herb/June–July/33–
164
Not expected to occur. No suitable
mesic or wetland habitat present.
Pleuropogon
hooverianus
North Coast
semaphore
grass
None/CT/1B.1 Broadleafed upland forest, meadows
and seeps, north coast coniferous
forest; open areas, mesic/perennial
rhizomatous herb/Apr–June/33–2,201
Not expected to occur. No suitable
forest or wetland habitat present.
Potentilla
uliginosa
Cunningham
Marsh
cinquefoil
None/None/1A Marshes and swamps; freshwater,
permanent oligotrophic
wetlands/perennial herb/May–
Aug/98–131
Not expected to occur. No suitable
wetland habitat present.
Rhynchospora
alba
white beaked-
rush
None/None/2B.2 Bogs and fens, meadows and seeps,
marshes and swamps
(freshwater)/perennial rhizomatous
herb/July–Aug/197–6,693
Not expected to occur. The site is
outside of the species’ known elevation
range and there is no suitable wetland
habitat present.
Rhynchospora
californica
California
beaked-rush
None/None/1B.1 Bogs and fens, lower montane
coniferous forest, meadows and seeps
(seeps), marshes and swamps
(freshwater)/perennial rhizomatous
herb/May–July/148–3,314
Not expected to occur. No suitable
wetland or forest habitat present.
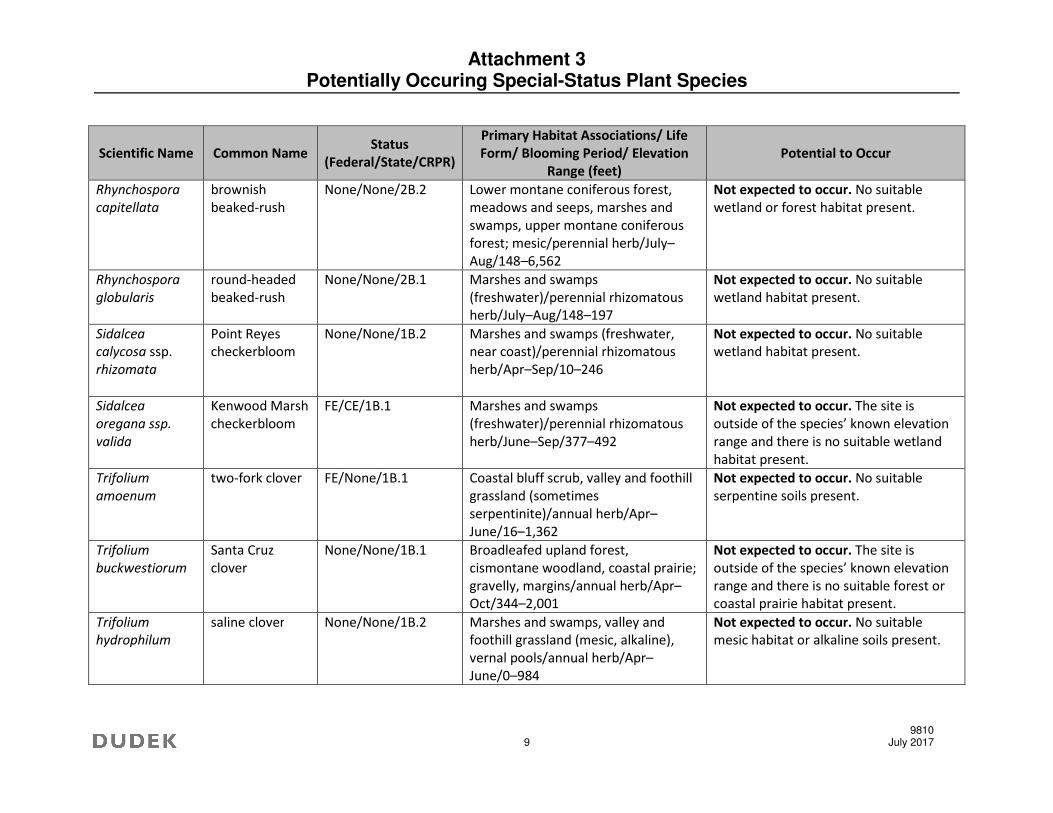
Attachment 3 Potentially Occuring Special-Status Plant Species
9810 9 July 2017
Scientific Name Common Name Status
(Federal/State/CRPR)
Primary Habitat Associations/ Life
Form/ Blooming Period/ Elevation
Range (feet)
Potential to Occur
Rhynchospora
capitellata
brownish
beaked-rush
None/None/2B.2 Lower montane coniferous forest,
meadows and seeps, marshes and
swamps, upper montane coniferous
forest; mesic/perennial herb/July–
Aug/148–6,562
Not expected to occur. No suitable
wetland or forest habitat present.
Rhynchospora
globularis
round-headed
beaked-rush
None/None/2B.1 Marshes and swamps
(freshwater)/perennial rhizomatous
herb/July–Aug/148–197
Not expected to occur. No suitable
wetland habitat present.
Sidalcea
calycosa ssp.
rhizomata
Point Reyes
checkerbloom
None/None/1B.2 Marshes and swamps (freshwater,
near coast)/perennial rhizomatous
herb/Apr–Sep/10–246
Not expected to occur. No suitable
wetland habitat present.
Sidalcea
oregana ssp.
valida
Kenwood Marsh
checkerbloom
FE/CE/1B.1 Marshes and swamps
(freshwater)/perennial rhizomatous
herb/June–Sep/377–492
Not expected to occur. The site is
outside of the species’ known elevation
range and there is no suitable wetland
habitat present.
Trifolium
amoenum
two-fork clover FE/None/1B.1 Coastal bluff scrub, valley and foothill
grassland (sometimes
serpentinite)/annual herb/Apr–
June/16–1,362
Not expected to occur. No suitable
serpentine soils present.
Trifolium
buckwestiorum
Santa Cruz
clover
None/None/1B.1 Broadleafed upland forest,
cismontane woodland, coastal prairie;
gravelly, margins/annual herb/Apr–
Oct/344–2,001
Not expected to occur. The site is
outside of the species’ known elevation
range and there is no suitable forest or
coastal prairie habitat present.
Trifolium
hydrophilum
saline clover None/None/1B.2 Marshes and swamps, valley and
foothill grassland (mesic, alkaline),
vernal pools/annual herb/Apr–
June/0–984
Not expected to occur. No suitable
mesic habitat or alkaline soils present.
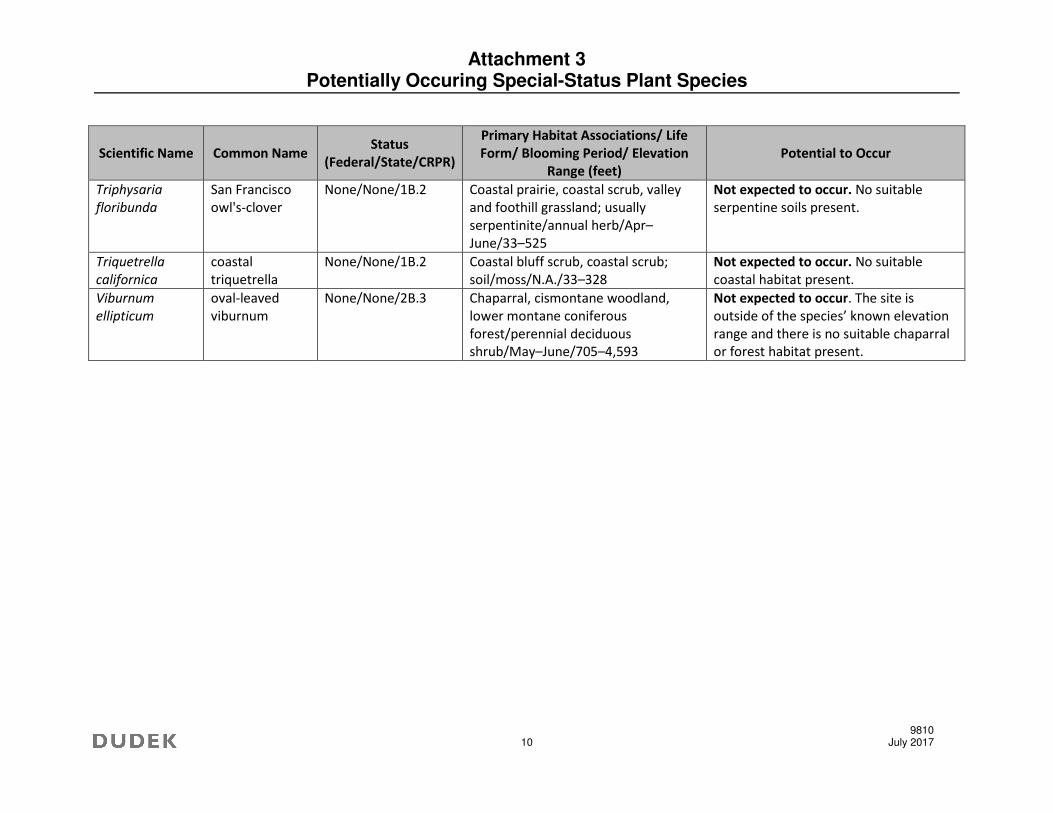
Attachment 3 Potentially Occuring Special-Status Plant Species
9810 10 July 2017
Scientific Name Common Name Status
(Federal/State/CRPR)
Primary Habitat Associations/ Life
Form/ Blooming Period/ Elevation
Range (feet)
Potential to Occur
Triphysaria
floribunda
San Francisco
owl's-clover
None/None/1B.2 Coastal prairie, coastal scrub, valley
and foothill grassland; usually
serpentinite/annual herb/Apr–
June/33–525
Not expected to occur. No suitable
serpentine soils present.
Triquetrella
californica
coastal
triquetrella
None/None/1B.2 Coastal bluff scrub, coastal scrub;
soil/moss/N.A./33–328
Not expected to occur. No suitable
coastal habitat present.
Viburnum
ellipticum
oval-leaved
viburnum
None/None/2B.3 Chaparral, cismontane woodland,
lower montane coniferous
forest/perennial deciduous
shrub/May–June/705–4,593
Not expected to occur. The site is
outside of the species’ known elevation
range and there is no suitable chaparral
or forest habitat present.
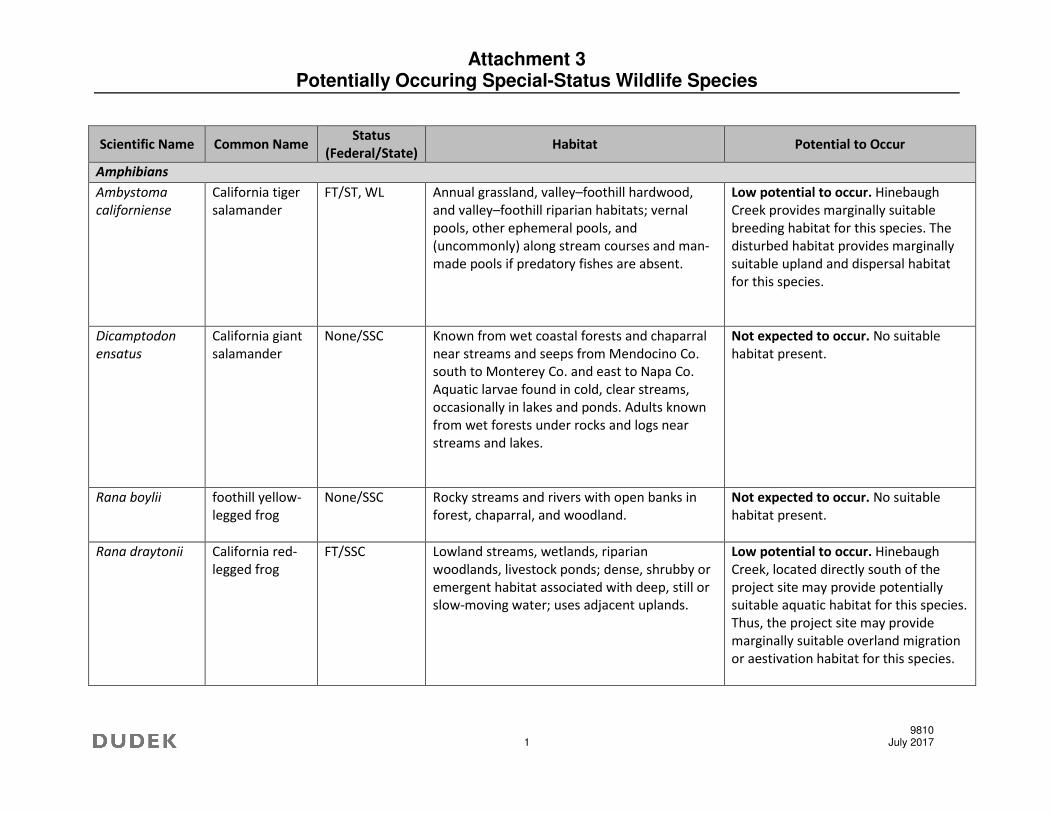
Attachment 3 Potentially Occuring Special-Status Wildlife Species
9810 1 July 2017
Scientific Name Common Name Status
(Federal/State) Habitat Potential to Occur
Amphibians
Ambystoma
californiense
California tiger
salamander
FT/ST, WL Annual grassland, valley–foothill hardwood,
and valley–foothill riparian habitats; vernal
pools, other ephemeral pools, and
(uncommonly) along stream courses and man-
made pools if predatory fishes are absent.
Low potential to occur. Hinebaugh
Creek provides marginally suitable
breeding habitat for this species. The
disturbed habitat provides marginally
suitable upland and dispersal habitat
for this species.
Dicamptodon
ensatus
California giant
salamander
None/SSC Known from wet coastal forests and chaparral
near streams and seeps from Mendocino Co.
south to Monterey Co. and east to Napa Co.
Aquatic larvae found in cold, clear streams,
occasionally in lakes and ponds. Adults known
from wet forests under rocks and logs near
streams and lakes.
Not expected to occur. No suitable
habitat present.
Rana boylii foothill yellow-
legged frog
None/SSC Rocky streams and rivers with open banks in
forest, chaparral, and woodland.
Not expected to occur. No suitable
habitat present.
Rana draytonii California red-
legged frog
FT/SSC Lowland streams, wetlands, riparian
woodlands, livestock ponds; dense, shrubby or
emergent habitat associated with deep, still or
slow-moving water; uses adjacent uplands.
Low potential to occur. Hinebaugh
Creek, located directly south of the
project site may provide potentially
suitable aquatic habitat for this species.
Thus, the project site may provide
marginally suitable overland migration
or aestivation habitat for this species.
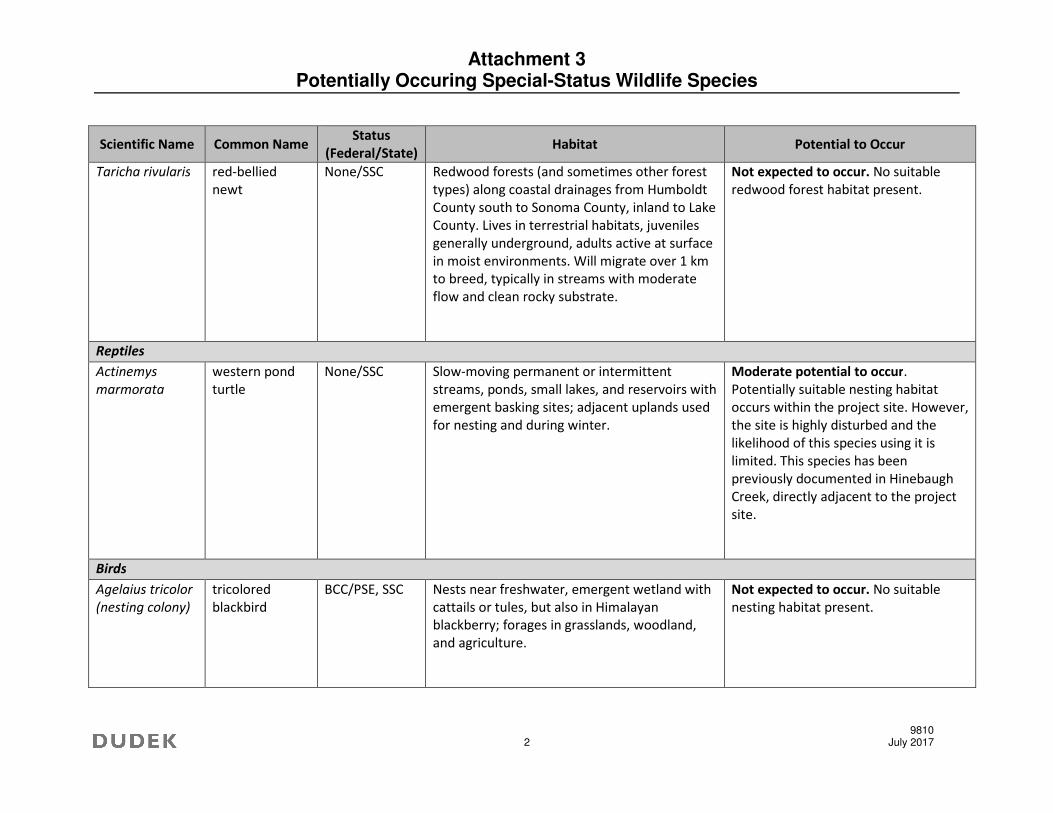
Attachment 3 Potentially Occuring Special-Status Wildlife Species
9810 2 July 2017
Scientific Name Common Name Status
(Federal/State) Habitat Potential to Occur
Taricha rivularis red-bellied
newt
None/SSC Redwood forests (and sometimes other forest
types) along coastal drainages from Humboldt
County south to Sonoma County, inland to Lake
County. Lives in terrestrial habitats, juveniles
generally underground, adults active at surface
in moist environments. Will migrate over 1 km
to breed, typically in streams with moderate
flow and clean rocky substrate.
Not expected to occur. No suitable
redwood forest habitat present.
Reptiles
Actinemys
marmorata
western pond
turtle
None/SSC Slow-moving permanent or intermittent
streams, ponds, small lakes, and reservoirs with
emergent basking sites; adjacent uplands used
for nesting and during winter.
Moderate potential to occur.
Potentially suitable nesting habitat
occurs within the project site. However,
the site is highly disturbed and the
likelihood of this species using it is
limited. This species has been
previously documented in Hinebaugh
Creek, directly adjacent to the project
site.
Birds
Agelaius tricolor
(nesting colony)
tricolored
blackbird
BCC/PSE, SSC Nests near freshwater, emergent wetland with
cattails or tules, but also in Himalayan
blackberry; forages in grasslands, woodland,
and agriculture.
Not expected to occur. No suitable
nesting habitat present.
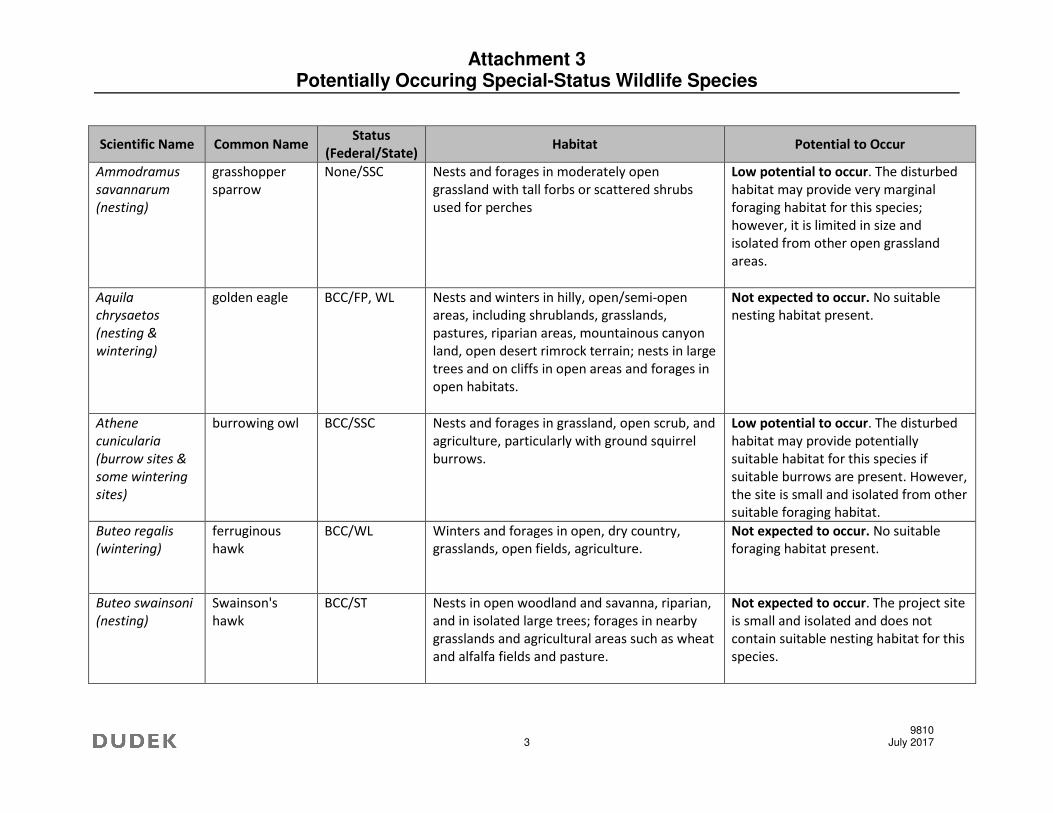
Attachment 3 Potentially Occuring Special-Status Wildlife Species
9810 3 July 2017
Scientific Name Common Name Status
(Federal/State) Habitat Potential to Occur
Ammodramus
savannarum
(nesting)
grasshopper
sparrow
None/SSC Nests and forages in moderately open
grassland with tall forbs or scattered shrubs
used for perches
Low potential to occur. The disturbed
habitat may provide very marginal
foraging habitat for this species;
however, it is limited in size and
isolated from other open grassland
areas.
Aquila
chrysaetos
(nesting &
wintering)
golden eagle BCC/FP, WL Nests and winters in hilly, open/semi-open
areas, including shrublands, grasslands,
pastures, riparian areas, mountainous canyon
land, open desert rimrock terrain; nests in large
trees and on cliffs in open areas and forages in
open habitats.
Not expected to occur. No suitable
nesting habitat present.
Athene
cunicularia
(burrow sites &
some wintering
sites)
burrowing owl BCC/SSC Nests and forages in grassland, open scrub, and
agriculture, particularly with ground squirrel
burrows.
Low potential to occur. The disturbed
habitat may provide potentially
suitable habitat for this species if
suitable burrows are present. However,
the site is small and isolated from other
suitable foraging habitat.
Buteo regalis
(wintering)
ferruginous
hawk
BCC/WL Winters and forages in open, dry country,
grasslands, open fields, agriculture.
Not expected to occur. No suitable
foraging habitat present.
Buteo swainsoni
(nesting)
Swainson's
hawk
BCC/ST Nests in open woodland and savanna, riparian,
and in isolated large trees; forages in nearby
grasslands and agricultural areas such as wheat
and alfalfa fields and pasture.
Not expected to occur. The project site
is small and isolated and does not
contain suitable nesting habitat for this
species.
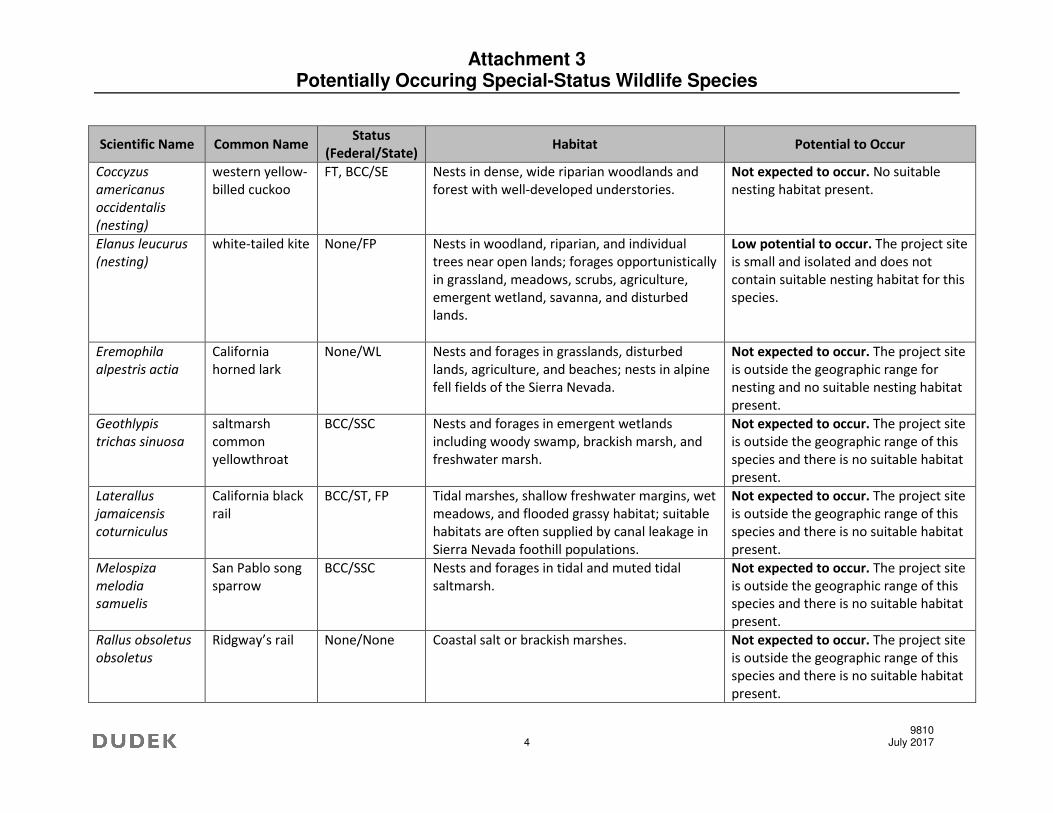
Attachment 3 Potentially Occuring Special-Status Wildlife Species
9810 4 July 2017
Scientific Name Common Name Status
(Federal/State) Habitat Potential to Occur
Coccyzus
americanus
occidentalis
(nesting)
western yellow-
billed cuckoo
FT, BCC/SE Nests in dense, wide riparian woodlands and
forest with well-developed understories.
Not expected to occur. No suitable
nesting habitat present.
Elanus leucurus
(nesting)
white-tailed kite None/FP Nests in woodland, riparian, and individual
trees near open lands; forages opportunistically
in grassland, meadows, scrubs, agriculture,
emergent wetland, savanna, and disturbed
lands.
Low potential to occur. The project site
is small and isolated and does not
contain suitable nesting habitat for this
species.
Eremophila
alpestris actia
California
horned lark
None/WL Nests and forages in grasslands, disturbed
lands, agriculture, and beaches; nests in alpine
fell fields of the Sierra Nevada.
Not expected to occur. The project site
is outside the geographic range for
nesting and no suitable nesting habitat
present.
Geothlypis
trichas sinuosa
saltmarsh
common
yellowthroat
BCC/SSC Nests and forages in emergent wetlands
including woody swamp, brackish marsh, and
freshwater marsh.
Not expected to occur. The project site
is outside the geographic range of this
species and there is no suitable habitat
present.
Laterallus
jamaicensis
coturniculus
California black
rail
BCC/ST, FP Tidal marshes, shallow freshwater margins, wet
meadows, and flooded grassy habitat; suitable
habitats are often supplied by canal leakage in
Sierra Nevada foothill populations.
Not expected to occur. The project site
is outside the geographic range of this
species and there is no suitable habitat
present.
Melospiza
melodia
samuelis
San Pablo song
sparrow
BCC/SSC Nests and forages in tidal and muted tidal
saltmarsh.
Not expected to occur. The project site
is outside the geographic range of this
species and there is no suitable habitat
present.
Rallus obsoletus
obsoletus
Ridgway’s rail None/None Coastal salt or brackish marshes. Not expected to occur. The project site
is outside the geographic range of this
species and there is no suitable habitat
present.
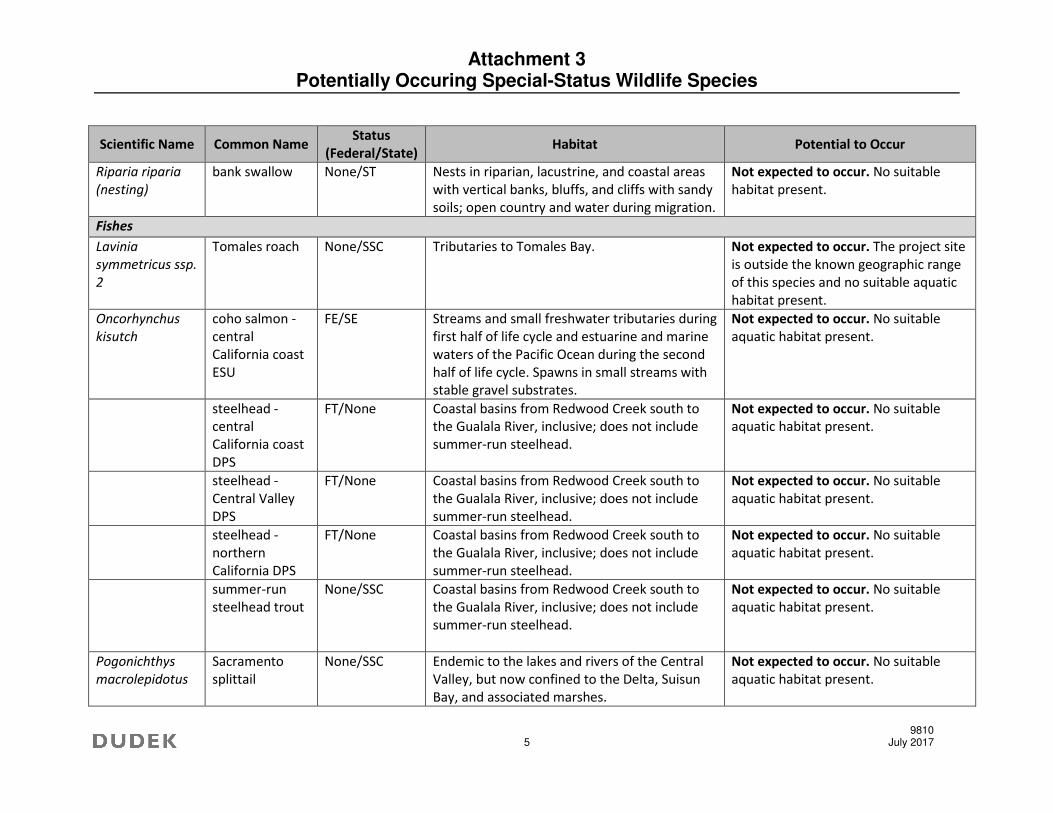
Attachment 3 Potentially Occuring Special-Status Wildlife Species
9810 5 July 2017
Scientific Name Common Name Status
(Federal/State) Habitat Potential to Occur
Riparia riparia
(nesting)
bank swallow None/ST Nests in riparian, lacustrine, and coastal areas
with vertical banks, bluffs, and cliffs with sandy
soils; open country and water during migration.
Not expected to occur. No suitable
habitat present.
Fishes
Lavinia
symmetricus ssp.
2
Tomales roach None/SSC Tributaries to Tomales Bay. Not expected to occur. The project site
is outside the known geographic range
of this species and no suitable aquatic
habitat present.
Oncorhynchus
kisutch
coho salmon -
central
California coast
ESU
FE/SE Streams and small freshwater tributaries during
first half of life cycle and estuarine and marine
waters of the Pacific Ocean during the second
half of life cycle. Spawns in small streams with
stable gravel substrates.
Not expected to occur. No suitable
aquatic habitat present.
steelhead -
central
California coast
DPS
FT/None Coastal basins from Redwood Creek south to
the Gualala River, inclusive; does not include
summer-run steelhead.
Not expected to occur. No suitable
aquatic habitat present.
steelhead -
Central Valley
DPS
FT/None Coastal basins from Redwood Creek south to
the Gualala River, inclusive; does not include
summer-run steelhead.
Not expected to occur. No suitable
aquatic habitat present.
steelhead -
northern
California DPS
FT/None Coastal basins from Redwood Creek south to
the Gualala River, inclusive; does not include
summer-run steelhead.
Not expected to occur. No suitable
aquatic habitat present.
summer-run
steelhead trout
None/SSC Coastal basins from Redwood Creek south to
the Gualala River, inclusive; does not include
summer-run steelhead.
Not expected to occur. No suitable
aquatic habitat present.
Pogonichthys
macrolepidotus
Sacramento
splittail
None/SSC Endemic to the lakes and rivers of the Central
Valley, but now confined to the Delta, Suisun
Bay, and associated marshes.
Not expected to occur. No suitable
aquatic habitat present.
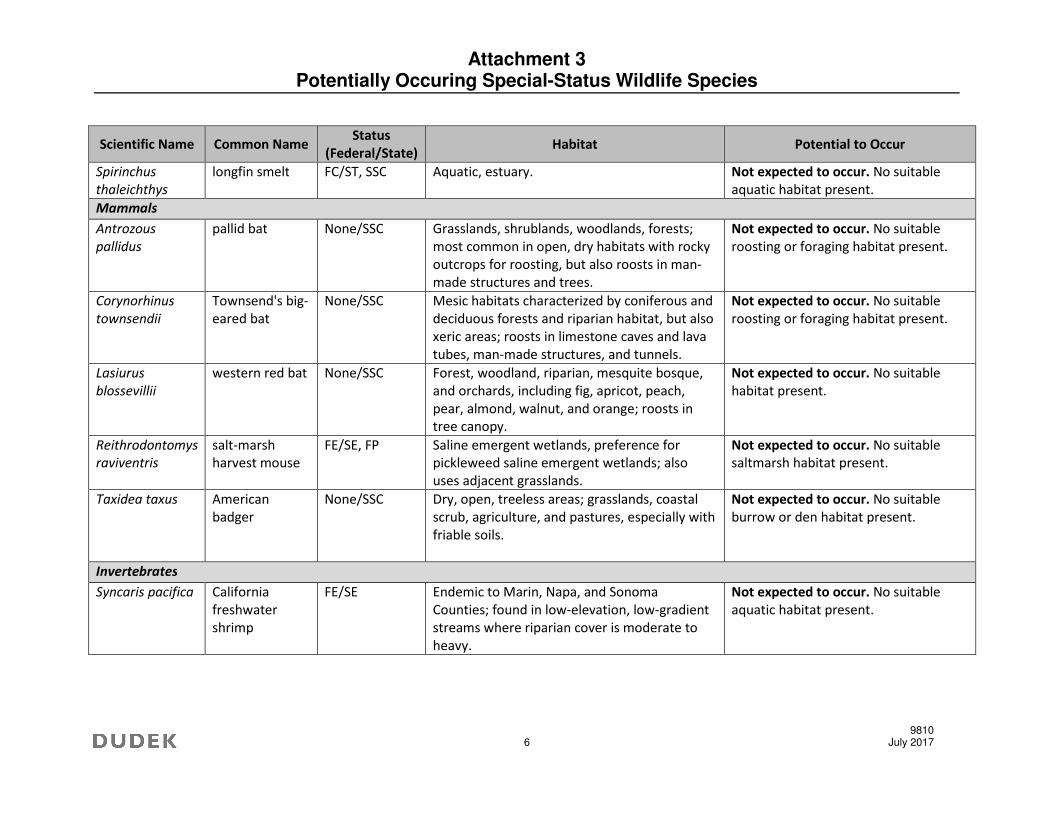
Attachment 3 Potentially Occuring Special-Status Wildlife Species
9810 6 July 2017
Scientific Name Common Name Status
(Federal/State) Habitat Potential to Occur
Spirinchus
thaleichthys
longfin smelt FC/ST, SSC Aquatic, estuary. Not expected to occur. No suitable
aquatic habitat present.
Mammals
Antrozous
pallidus
pallid bat None/SSC Grasslands, shrublands, woodlands, forests;
most common in open, dry habitats with rocky
outcrops for roosting, but also roosts in man-
made structures and trees.
Not expected to occur. No suitable
roosting or foraging habitat present.
Corynorhinus
townsendii
Townsend's big-
eared bat
None/SSC Mesic habitats characterized by coniferous and
deciduous forests and riparian habitat, but also
xeric areas; roosts in limestone caves and lava
tubes, man-made structures, and tunnels.
Not expected to occur. No suitable
roosting or foraging habitat present.
Lasiurus
blossevillii
western red bat None/SSC Forest, woodland, riparian, mesquite bosque,
and orchards, including fig, apricot, peach,
pear, almond, walnut, and orange; roosts in
tree canopy.
Not expected to occur. No suitable
habitat present.
Reithrodontomys
raviventris
salt-marsh
harvest mouse
FE/SE, FP Saline emergent wetlands, preference for
pickleweed saline emergent wetlands; also
uses adjacent grasslands.
Not expected to occur. No suitable
saltmarsh habitat present.
Taxidea taxus American
badger
None/SSC Dry, open, treeless areas; grasslands, coastal
scrub, agriculture, and pastures, especially with
friable soils.
Not expected to occur. No suitable
burrow or den habitat present.
Invertebrates
Syncaris pacifica California
freshwater
shrimp
FE/SE Endemic to Marin, Napa, and Sonoma
Counties; found in low-elevation, low-gradient
streams where riparian cover is moderate to
heavy.
Not expected to occur. No suitable
aquatic habitat present.
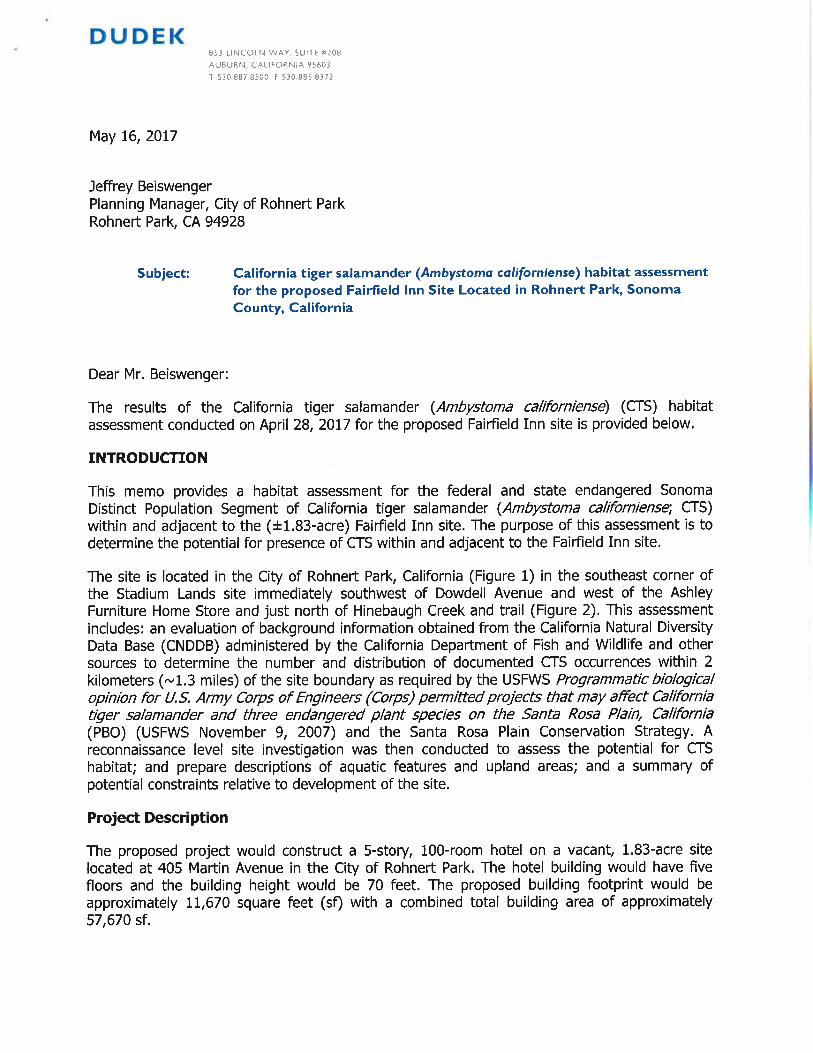

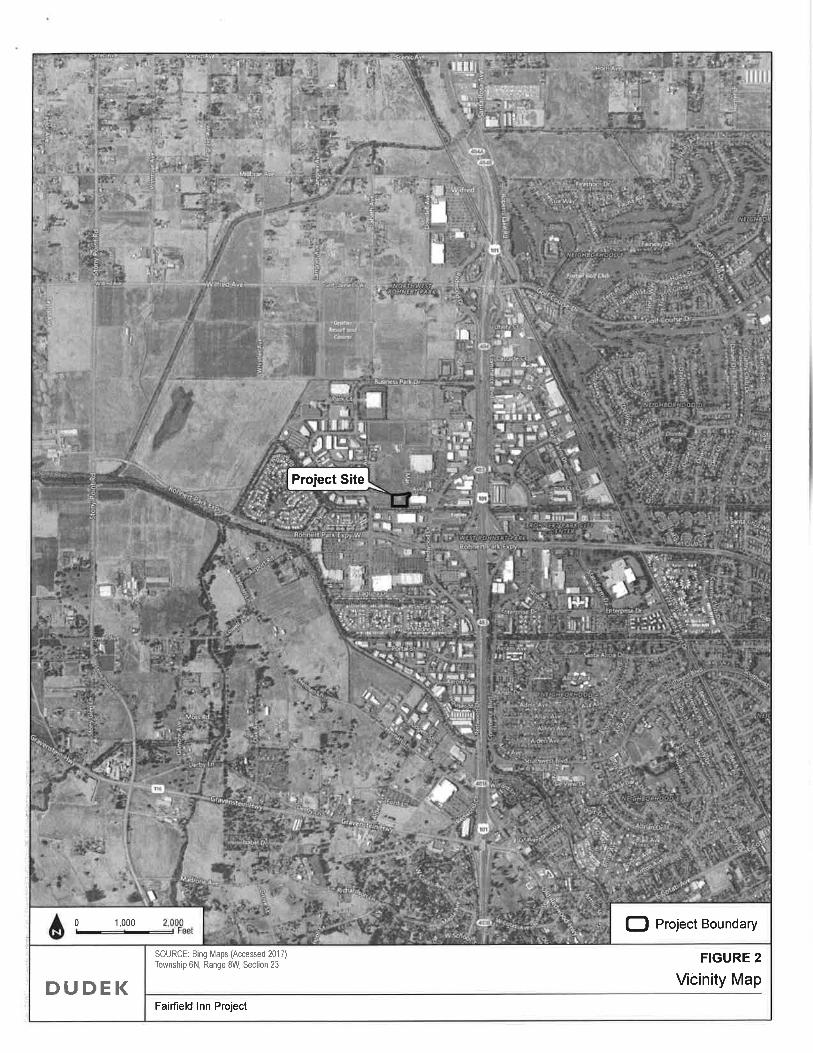
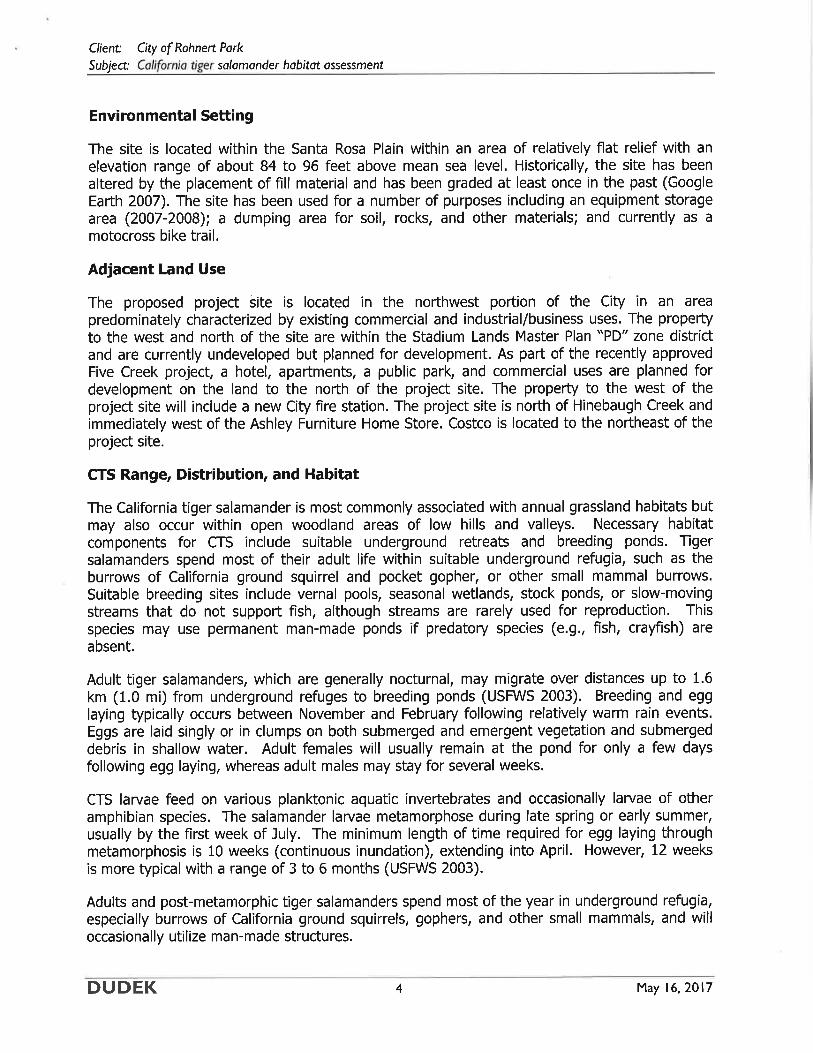
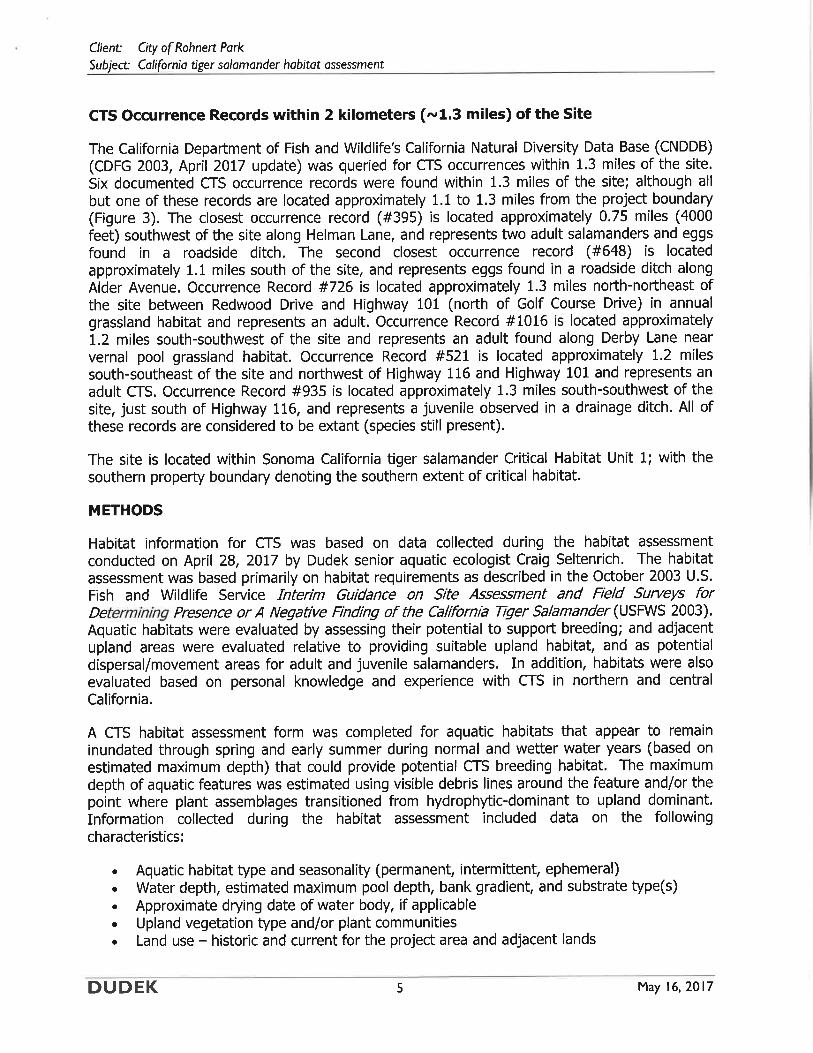
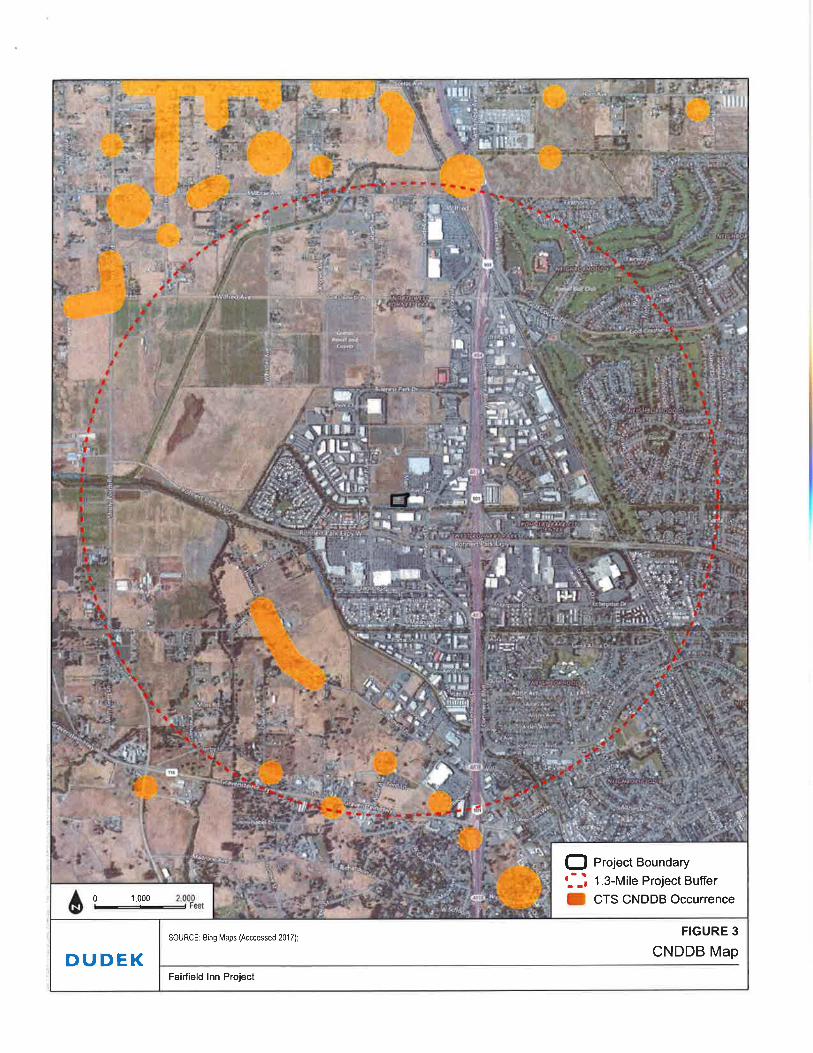
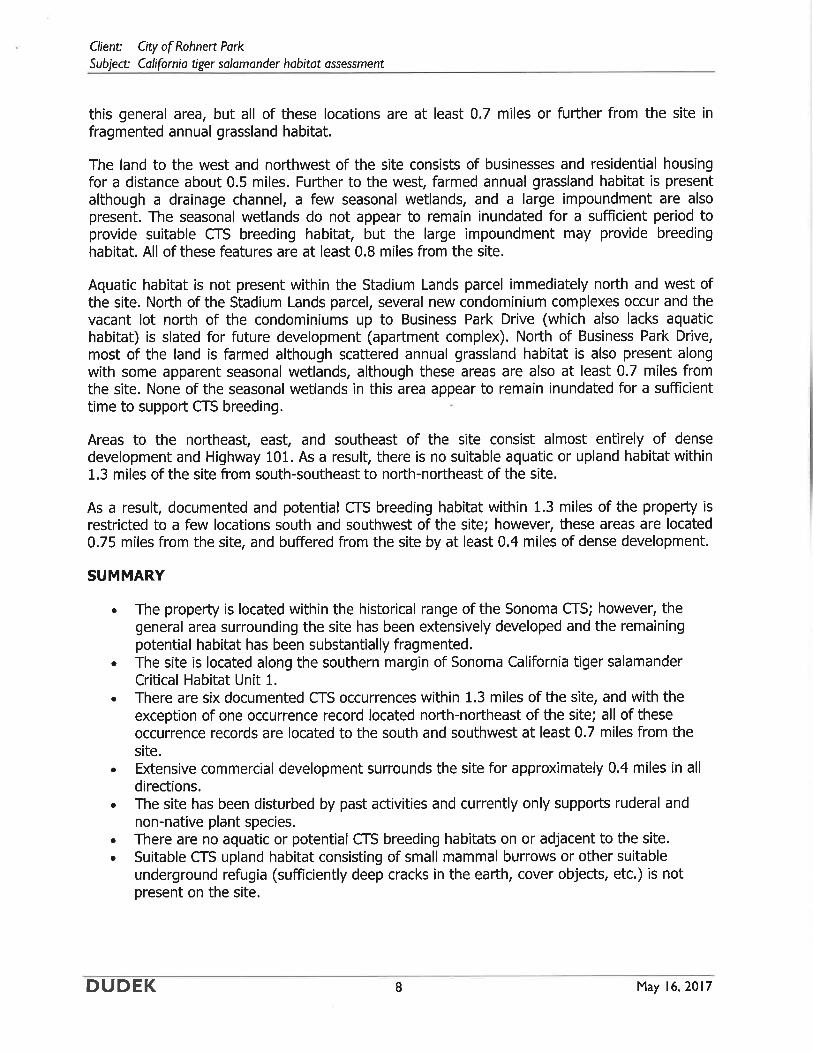
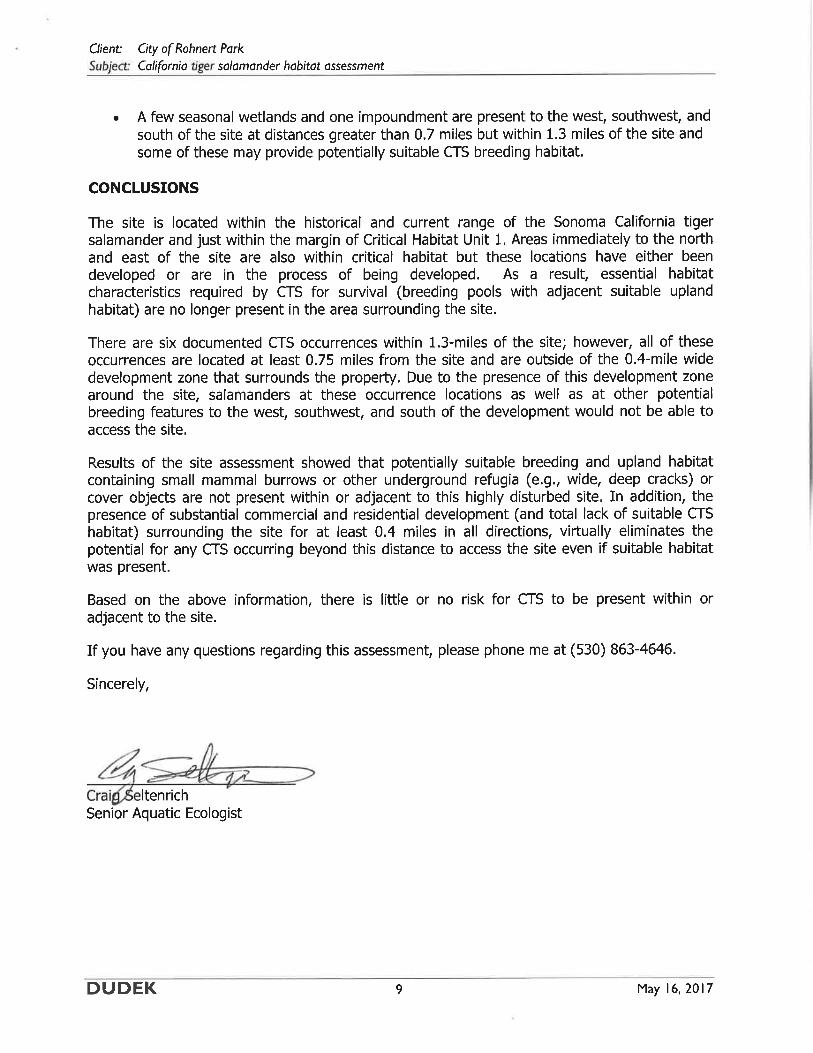
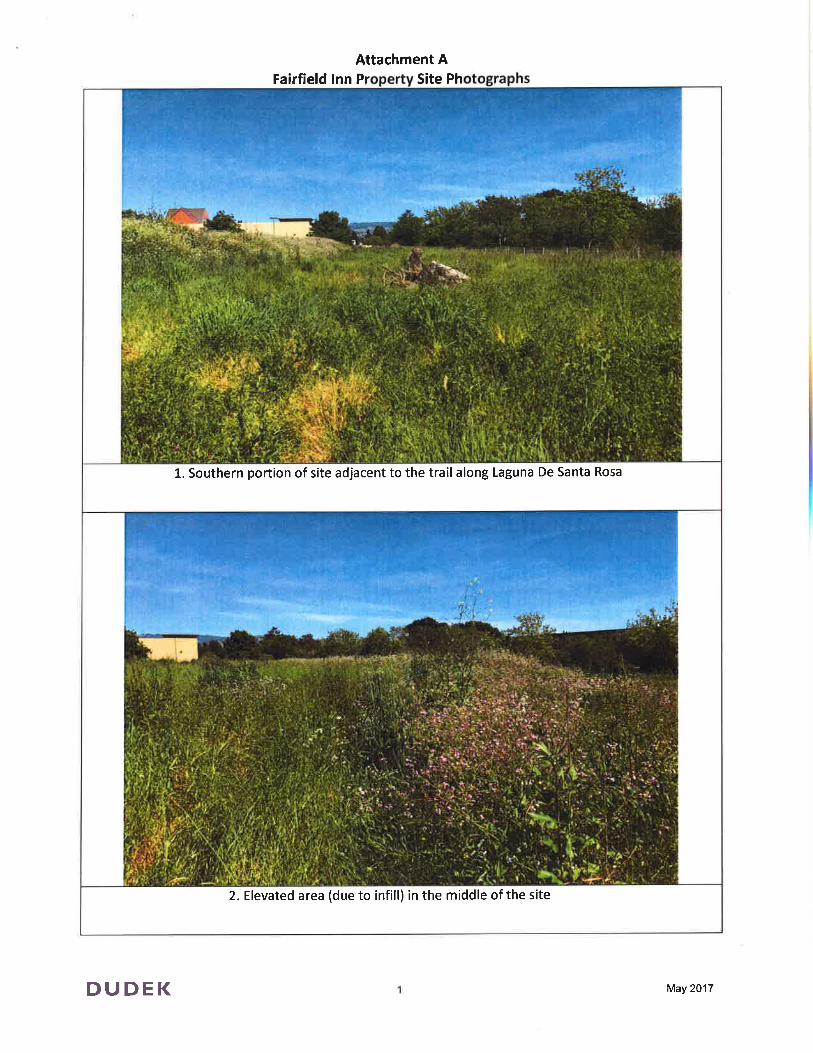
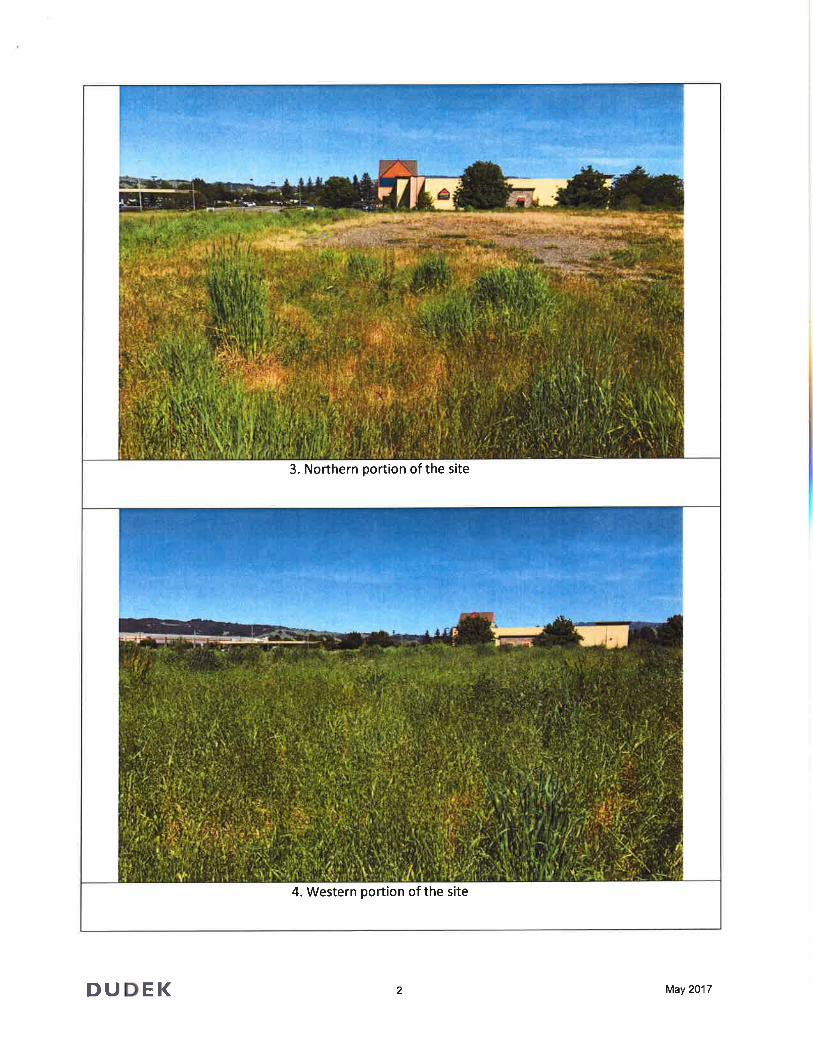

APPENDIX C Traffic Impact Study
Balancing Functionality and Livability since 1995w-trans.com
TRAFFIC ENGINEERINGTRANSPORTATION PLANNING
250 Qty.
April 4, 2017
Prepared for the City of Rohnert Park
Submitted byW-Trans
Traffic Impact Study forThe Fairfield Inn & Suites Project

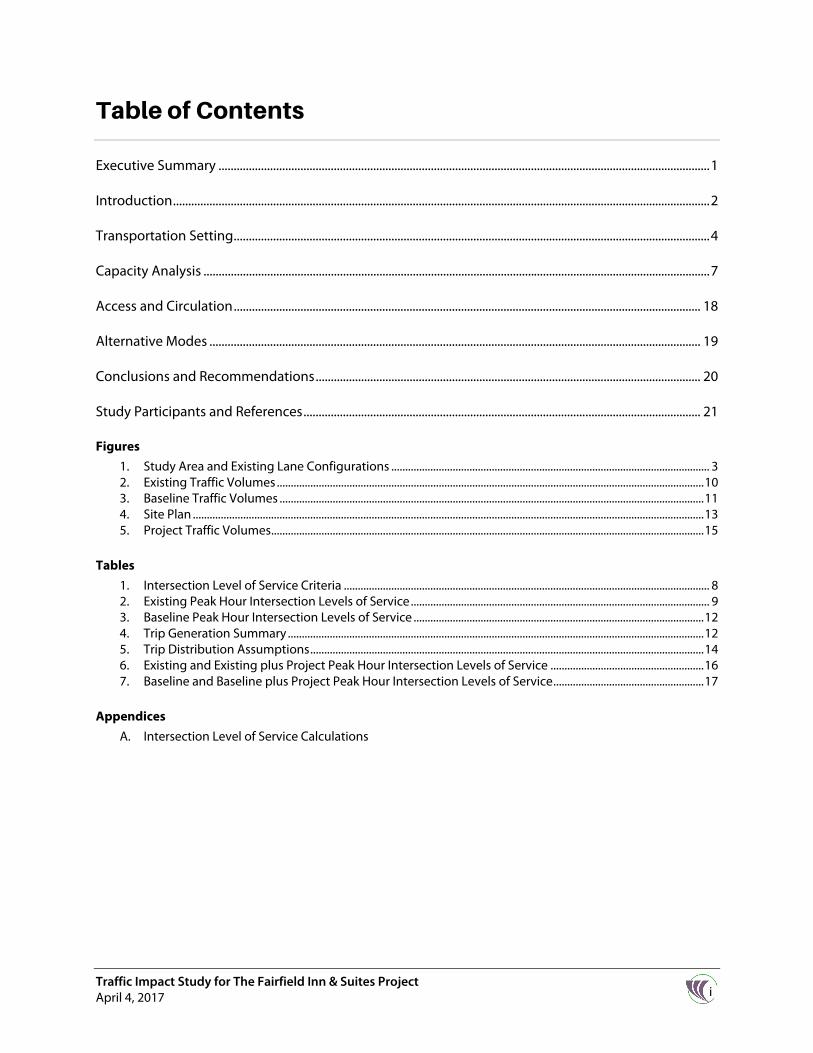
i Traffic Impact Study for The Fairfield Inn & Suites Project April 4, 2017
Table of Contents
Executive Summary .................................................................................................................................................................. 1
Introduction ................................................................................................................................................................................. 2
Transportation Setting ............................................................................................................................................................. 4
Capacity Analysis ....................................................................................................................................................................... 7
Access and Circulation .......................................................................................................................................................... 18
Alternative Modes .................................................................................................................................................................. 19
Conclusions and Recommendations ............................................................................................................................... 20
Study Participants and References ................................................................................................................................... 21
Figures 1. Study Area and Existing Lane Configurations .................................................................................................................. 3 2. Existing Traffic Volumes ......................................................................................................................................................... 10 3. Baseline Traffic Volumes ........................................................................................................................................................ 11 4. Site Plan ....................................................................................................................................................................................... 13 5. Project Traffic Volumes ........................................................................................................................................................... 15
Tables 1. Intersection Level of Service Criteria ................................................................................................................................... 8 2. Existing Peak Hour Intersection Levels of Service ........................................................................................................... 9 3. Baseline Peak Hour Intersection Levels of Service ........................................................................................................ 12 4. Trip Generation Summary ..................................................................................................................................................... 12 5. Trip Distribution Assumptions ............................................................................................................................................. 14 6. Existing and Existing plus Project Peak Hour Intersection Levels of Service ....................................................... 16 7. Baseline and Baseline plus Project Peak Hour Intersection Levels of Service ...................................................... 17
Appendices A. Intersection Level of Service Calculations

1 Traffic Impact Study for The Fairfield Inn & Suites Project April 4, 2017
Executive Summary
The proposed project includes a new 100-room hotel on a currently vacant site located at 405 Martin Avenue, near the southwestern corner of the Martin Avenue/Dowdell Avenue intersection.
Peak hour traffic conditions at six nearby intersections were evaluated to determine the potential impacts associated with development of the project. Under existing conditions, as well as baseline conditions, which includes the development of nearby projects that are under construction or undergoing City entitlement review, all six intersections are or are expected to be operating acceptably except for Redwood Drive/Rohnert Park Expressway. This intersection is operating at LOS D during the p.m. peak hour, which exceeds the LOS C standard set by the City’s General Plan. With the addition of project-generated trips, all study intersections are expected to operate acceptably except Redwood Drive/Rohnert Park Expressway, which is anticipated to continue operating at the same unacceptable level of service during the p.m. peak hour. Since level of service at Redwood Drive/Rohnert Park Expressway is not being further reduced by the proposed project, the impacts are considered to be less-than-significant.
The anticipated trip generation of the project was compared to the trip generation potential associated with the site’s existing C-R zoning designation, which envisions retail-type uses as assumed in prior environmental analyses including the Stadium Area Master Plan (SAMP) Draft Environmental Impact Report. The proposed hotel would produce fewer daily and p.m. peak hour trips than typical C-R retail uses. Trips during the a.m. peak hour would be somewhat higher, though would not be expected to cause any impacts beyond those identified in the more critical p.m. peak hour analysis.
Continuous pedestrian facilities exist beyond the project site, though the project should also be conditioned to include sidewalks along all public street frontages, including the extension of Martin Avenue bordering the project site. Transit access to the site would be adequate as long as the onsite sidewalk network is complete. The project should provide a minimum of seven bicycle parking spaces.
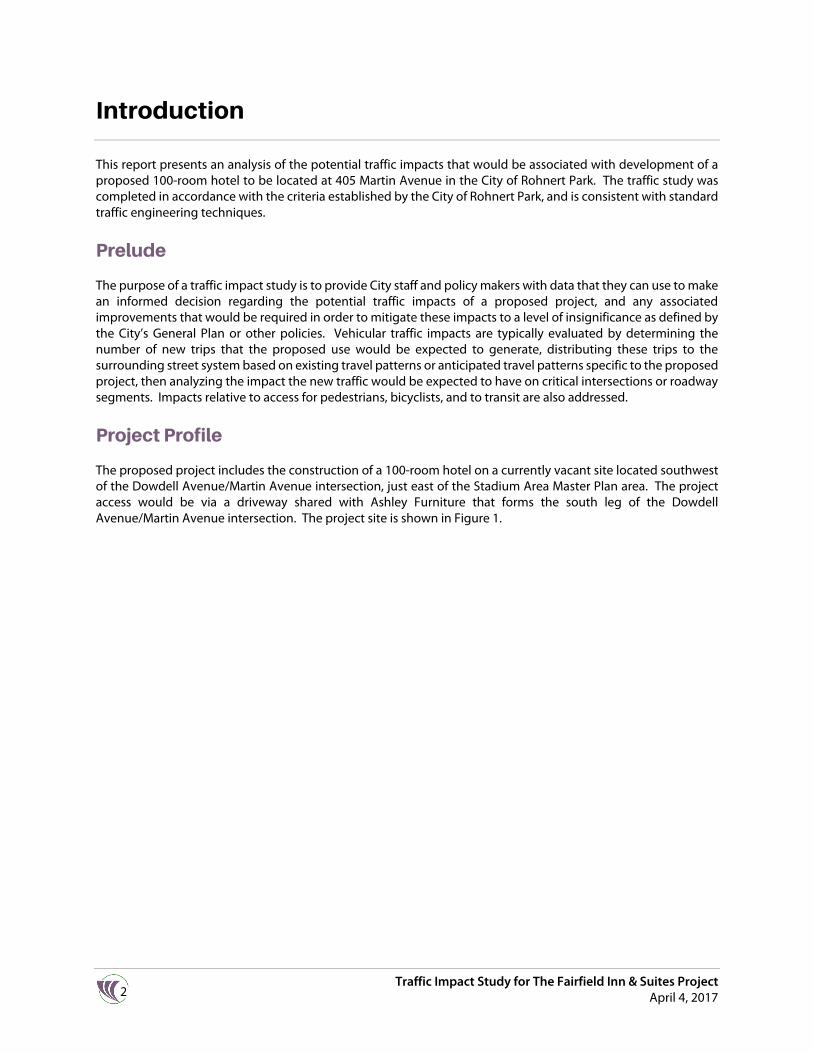
2 Traffic Impact Study for The Fairfield Inn & Suites Project
April 4, 2017
Introduction
This report presents an analysis of the potential traffic impacts that would be associated with development of a proposed 100-room hotel to be located at 405 Martin Avenue in the City of Rohnert Park. The traffic study was completed in accordance with the criteria established by the City of Rohnert Park, and is consistent with standard traffic engineering techniques.
Prelude
The purpose of a traffic impact study is to provide City staff and policy makers with data that they can use to make an informed decision regarding the potential traffic impacts of a proposed project, and any associated improvements that would be required in order to mitigate these impacts to a level of insignificance as defined by the City’s General Plan or other policies. Vehicular traffic impacts are typically evaluated by determining the number of new trips that the proposed use would be expected to generate, distributing these trips to the surrounding street system based on existing travel patterns or anticipated travel patterns specific to the proposed project, then analyzing the impact the new traffic would be expected to have on critical intersections or roadway segments. Impacts relative to access for pedestrians, bicyclists, and to transit are also addressed.
Project Profile
The proposed project includes the construction of a 100-room hotel on a currently vacant site located southwest of the Dowdell Avenue/Martin Avenue intersection, just east of the Stadium Area Master Plan area. The project access would be via a driveway shared with Ashley Furniture that forms the south leg of the Dowdell Avenue/Martin Avenue intersection. The project site is shown in Figure 1.
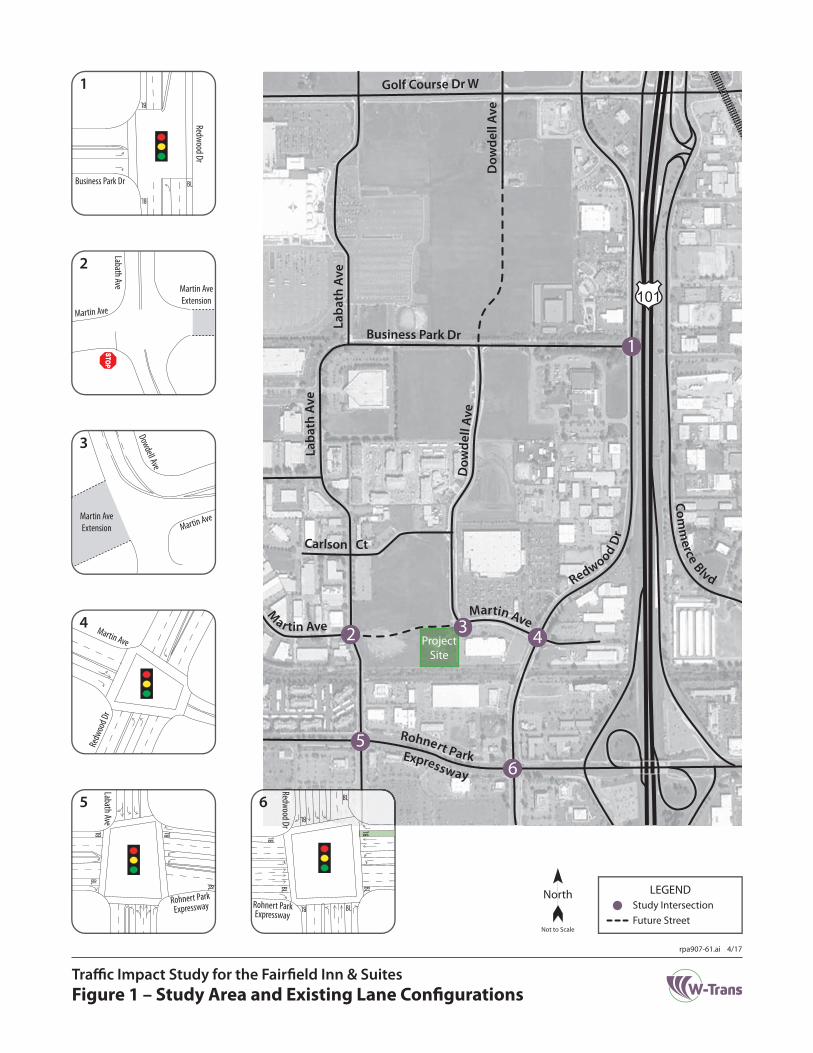
Project Site
Comm
erce Blvd
Dow
dell
Ave
Rohnert Park
Redwood Dr
Carlson Ct
Golf Course Dr W
Martin Ave
M
ar tin Ave
Laba
th A
ve
Business Park Dr
Dow
dell
Ave
Laba
th A
ve
Expressway
101
1
2 3 4
56
BL
BL
BL
Business Park Dr
Redwood Dr
1
Martin Ave
Martin AveExtension
Labath Ave
2
Dowdell Ave
Martin AveExtension Martin Ave
3
Redw
ood D
r
Martin Ave
4
BL BL
BL BL
Labath Ave
ExpresswayRohnert Park
5
BL
BL
BL BL
BL
BL
BLBLRohnert ParkExpressway
Redwood Dr
6
Figure 1 – Study Area and Existing Lane ConfigurationsTraffic Impact Study for the Fairfield Inn & Suites
rpa907-61.ai 4/17
North
Not to Scale
LEGEND
Future StreetStudy Intersection

4 Traffic Impact Study for The Fairfield Inn & Suites Project
April 4, 2017
Transportation Setting
Operational Analysis
Study Area and Periods
The study area consists of the following intersections:
1. Redwood Drive/Business Park Drive 2. Labath Avenue/Martin Avenue 3. Dowdell Avenue/Martin Avenue 4. Redwood Drive/Martin Avenue 5. Labath Avenue/Rohnert Park Expressway 6. Redwood Drive/Rohnert Park Expressway
Operating conditions during the a.m. and p.m. peak periods were evaluated to capture the highest volumes on the local transportation network. The morning peak hour occurs between 7:00 and 9:00 a.m. and reflects conditions during the home to work or school commute, while the p.m. peak hour occurs between 4:00 and 6:00 p.m. and typically reflects the highest level of congestion during the homeward bound commute.
Study Intersections
Redwood Drive/Business Park Drive is a signalized “tee” intersection with protected left-turn phasing on the northbound approach. The eastbound approach includes a right-turn overlap signal phase. A marked crosswalk is provided across the west leg of the intersection.
Labath Avenue/Martin Avenue is an unsignalized “tee” intersection with stop controls on the terminating eastbound approach.
Dowdell Avenue/Martin Avenue currently serves as a through street for vehicles traveling from westbound Martin Avenue to northbound Dowdell Avenue. The southern leg is a driveway serving Ashley Furniture. The proposed “Residences at Five Creek” project would extend Martin Avenue to Labath Avenue, adding a new western leg at the intersection, resulting in a four-legged, all-way stop-controlled intersection at Dowdell Avenue/Martin Avenue.
Redwood Drive/Martin Avenue is a four-legged signalized intersection with protected left-turn phasing on the northbound and southbound Redwood Drive approaches. The eastbound Martin Avenue approach includes a right-turn overlap signal phase. Marked crosswalks and pedestrian phasing are provided at each leg of the intersection.
Labath Avenue/Rohnert Park Expressway is a signalized, four-legged intersection, with protected left-turn phasing on all approaches, and right-turn overlap signal phases on the eastbound and westbound approaches. Crosswalks with pedestrian phasing are present on all legs of the intersection.
Redwood Drive/Rohnert Park Expressway is a four-legged signalized intersection with protected left-turn phasing on all approaches. The northbound and westbound approaches include right-turn overlap signal phases. Marked crosswalks and pedestrian phasing are provided at each leg.
The locations of the study intersections and the existing lane configurations and controls are shown in Figure 1.
5 Traffic Impact Study for The Fairfield Inn & Suites Project April 4, 2017
Alternative Modes
Pedestrian Facilities
Pedestrian facilities include sidewalks, crosswalks, pedestrian signal phases, curb ramps, curb extensions, and various streetscape amenities such as lighting, benches, etc. In general, a network of sidewalks, crosswalks, pedestrian signals, and curb ramps provide access for pedestrians in the vicinity of the proposed project site; however, sidewalk gaps, obstacles, and barriers can be found along some or all of the roadways connecting to the project site. Existing gaps and obstacles along the connecting roadways impact convenient and continuous access for pedestrians and present safety concerns in those locations where appropriate pedestrian infrastructure would address potential conflict points.
Continuous sidewalk coverage is provided along Martin Avenue, which currently terminates at the northwestern corner of the project site. Sidewalks also exist on the west side of Labath Avenue, north of the project site. On the east side of Labath Avenue there are no sidewalks, apart from a small section spanning 360 feet adjacent to a parking lot on the northwest corner of the project site. A pedestrian crosswalk exists on the south leg of the intersection of Dowdell Avenue/Carlson Court. Though there is only one crosswalk, the intersections of Dowdell Avenue/Carlson Court, Labath Avenue/Carlson Court, and Labath Avenue/Martin Avenue have curb ramps at each leg. Continuous sidewalk is also provided on the west side of Redwood Drive, bordering the existing Costco store northeast of the project site, which connects to Martin Avenue.
Bicycle Facilities
The Highway Design Manual, California Department of Transportation (Caltrans), 2012, classifies bikeways into three categories:
Class I Multi-Use Path – a completely separated right-of-way for the exclusive use of bicycles and pedestrians with cross flows of motorized traffic minimized.
Class II Bike Lane – a striped and signed lane for one-way bike travel on a street or highway.
Class III Bike Route – signing only for shared use with motor vehicles within the same travel lane on a street or highway.
In the project area, Class II bike lanes exist on Dowdell Avenue, as well as along Redwood Drive and Rohnert Park Expressway. The Santa Rosa De Laguna Trail runs along the southern boundary of the site which extends from the western City limits to Redwood Drive. There are no other existing bicycle facilities present within the study area. However, Class II bike lanes are planned for both Labath Avenue and Martin Avenue, and the City is currently considering options to fill a short gap in the bike lane system on Redwood Drive near Martin Avenue.
Transit Facilities
Sonoma County Transit (SCT) provides regional transit service between Rohnert Park and surrounding Sonoma County communities. SCT Route 44 provides service to the project area and has four stops on Labath Avenue. One stop northbound and one southbound are located on Labath Avenue near the Hinebaugh Creek trailhead, southwest of the project site, and across from North Bay Industries, which is northwest of the project site.
Route 44 operates Monday through Friday with approximately one-hour headways between 5:30 a.m. and 10:30 p.m. Weekend service for Route 44 does not operate within the project area.
6 Traffic Impact Study for The Fairfield Inn & Suites Project
April 4, 2017
Two to three bicycles can be carried on most SCT buses. Bike rack space is on a first come, first served basis. Additional bicycles are allowed on SCT buses at the discretion of the driver.
Dial-a-ride, also known as paratransit, or door-to-door service, is available for those who are unable to independently use the transit system due to a physical or mental disability. SCT Paratransit is designed to serve the needs of individuals with disabilities within Rohnert Park and Sonoma County.
7 Traffic Impact Study for The Fairfield Inn & Suites Project April 4, 2017
Capacity Analysis
Intersection Level of Service Methodologies
Level of Service (LOS) is used to rank traffic operation on various types of facilities based on traffic volumes and roadway capacity using a series of letter designations ranging from A to F. Generally, Level of Service A represents free flow conditions and Level of Service F represents forced flow or breakdown conditions. A unit of measure that indicates a level of delay generally accompanies the LOS designation.
The study intersections were analyzed using methodologies published in the Highway Capacity Manual (HCM), Transportation Research Board, 2010. This source contains methodologies for various types of intersection control, all of which are related to a measurement of delay in average number of seconds per vehicle.
The Levels of Service for the intersections with side-street stop controls, or those which are unsignalized and have one or two approaches stop-controlled, were analyzed using the “Two-Way Stop-Controlled” intersection capacity method from the HCM. This methodology determines a level of service for each minor turning movement by estimating the level of average delay in seconds per vehicle. Results are presented for individual movements together with the weighted overall average delay for the intersection.
Dowdell Avenue/Martin Avenue was analyzed using the “All-Way Stop-Controlled” Intersection methodology from the HCM for all “plus Project” scenarios. This methodology evaluates delay for each approach based on turning movements, opposing and conflicting traffic volumes, and the number of lanes. Average vehicle delay is computed for the intersection as a whole, and is then related to a Level of Service.
The study intersections that are controlled by a traffic signal were evaluated using the signalized methodology from the HCM. This methodology is based on factors including traffic volumes, green time for each movement, phasing, whether or not the signals are coordinated, truck traffic, and pedestrian activity. Average stopped delay per vehicle in seconds is used as the basis for evaluation in this LOS methodology.
The ranges of delay associated with the various levels of service are indicated in Table 1.
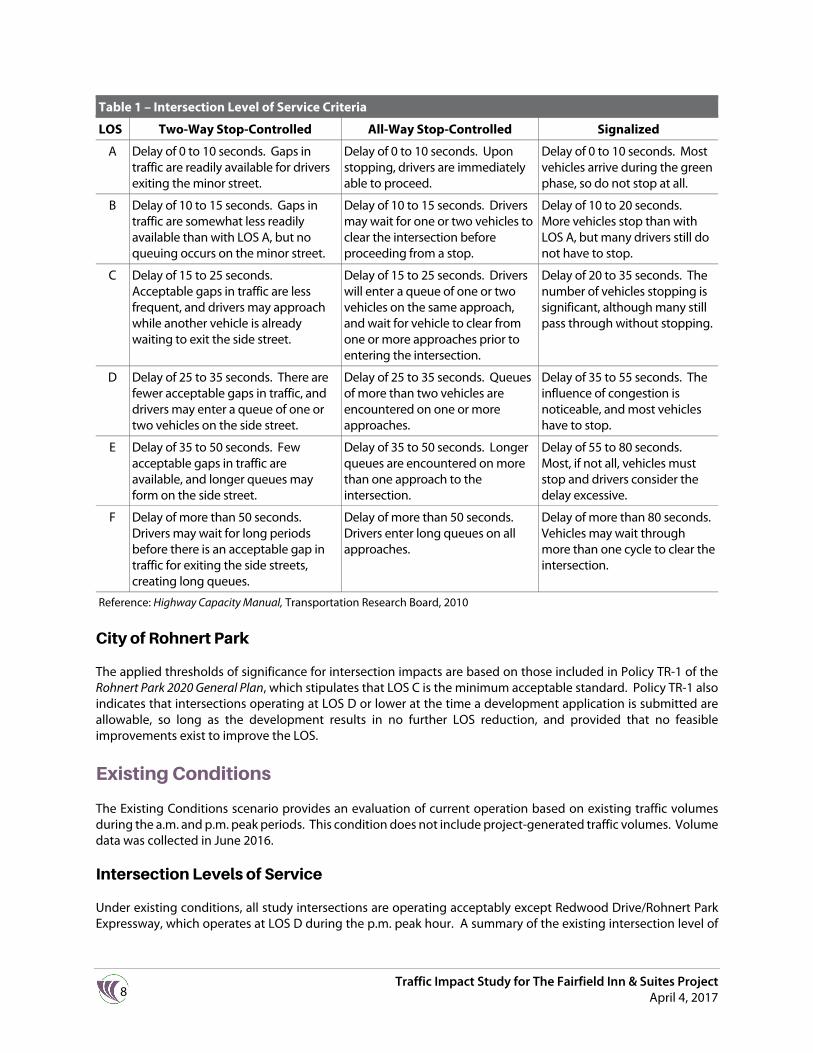
8 Traffic Impact Study for The Fairfield Inn & Suites Project
April 4, 2017
Table 1 – Intersection Level of Service Criteria
LOS Two-Way Stop-Controlled All-Way Stop-Controlled Signalized
A Delay of 0 to 10 seconds. Gaps in traffic are readily available for drivers exiting the minor street.
Delay of 0 to 10 seconds. Upon stopping, drivers are immediately able to proceed.
Delay of 0 to 10 seconds. Most vehicles arrive during the green phase, so do not stop at all.
B Delay of 10 to 15 seconds. Gaps in traffic are somewhat less readily available than with LOS A, but no queuing occurs on the minor street.
Delay of 10 to 15 seconds. Drivers may wait for one or two vehicles to clear the intersection before proceeding from a stop.
Delay of 10 to 20 seconds. More vehicles stop than with LOS A, but many drivers still do not have to stop.
C Delay of 15 to 25 seconds. Acceptable gaps in traffic are less frequent, and drivers may approach while another vehicle is already waiting to exit the side street.
Delay of 15 to 25 seconds. Drivers will enter a queue of one or two vehicles on the same approach, and wait for vehicle to clear from one or more approaches prior to entering the intersection.
Delay of 20 to 35 seconds. The number of vehicles stopping is significant, although many still pass through without stopping.
D Delay of 25 to 35 seconds. There are fewer acceptable gaps in traffic, and drivers may enter a queue of one or two vehicles on the side street.
Delay of 25 to 35 seconds. Queues of more than two vehicles are encountered on one or more approaches.
Delay of 35 to 55 seconds. The influence of congestion is noticeable, and most vehicles have to stop.
E Delay of 35 to 50 seconds. Few acceptable gaps in traffic are available, and longer queues may form on the side street.
Delay of 35 to 50 seconds. Longer queues are encountered on more than one approach to the intersection.
Delay of 55 to 80 seconds. Most, if not all, vehicles must stop and drivers consider the delay excessive.
F Delay of more than 50 seconds. Drivers may wait for long periods before there is an acceptable gap in traffic for exiting the side streets, creating long queues.
Delay of more than 50 seconds. Drivers enter long queues on all approaches.
Delay of more than 80 seconds. Vehicles may wait through more than one cycle to clear the intersection.
Reference: Highway Capacity Manual, Transportation Research Board, 2010
City of Rohnert Park
The applied thresholds of significance for intersection impacts are based on those included in Policy TR-1 of the Rohnert Park 2020 General Plan, which stipulates that LOS C is the minimum acceptable standard. Policy TR-1 also indicates that intersections operating at LOS D or lower at the time a development application is submitted are allowable, so long as the development results in no further LOS reduction, and provided that no feasible improvements exist to improve the LOS.
Existing Conditions
The Existing Conditions scenario provides an evaluation of current operation based on existing traffic volumes during the a.m. and p.m. peak periods. This condition does not include project-generated traffic volumes. Volume data was collected in June 2016.
Intersection Levels of Service
Under existing conditions, all study intersections are operating acceptably except Redwood Drive/Rohnert Park Expressway, which operates at LOS D during the p.m. peak hour. A summary of the existing intersection level of

9 Traffic Impact Study for The Fairfield Inn & Suites Project April 4, 2017
service calculations is contained in Table 2, the existing traffic volumes are shown in Figure 2, and copies of the Level of Service calculations are provided in Appendix A.
Table 2 – Existing Peak Hour Intersection Levels of Service
Study Intersection Approach
AM Peak PM Peak
Delay LOS Delay LOS
1. Redwood Dr/Business Park Dr 6.0 A 6.4 A
2. Labath Ave/Martin Ave 2.9 A 2.7 A
Eastbound (Martin Ave) approach 9.3 A 10.4 B
Westbound (Martin Ave) approach 2.7 A 2.7 A
3. Dowdell Ave/Martin Ave N/A N/A N/A N/A
4. Redwood Dr/Martin Ave 8.4 A 13.0 B
5. Labath Ave/Rohnert Park Exp 18.9 B 24.6 C
6. Redwood Dr/Rohnert Park Exp 32.9 C 45.9 D
Notes: Delay is measured in average seconds per vehicle; LOS = Level of Service; Results for minor approaches to two-way stop-controlled intersections are indicated in italics; Bold text = deficient operation
Baseline Conditions
Baseline operating conditions were developed to include trips from approved projects in the area including:
“The Reserve,” north of the project site, includes plans for 84 apartment units “The Residences at Five Creek,” located just north of the project site, includes 135 apartment units, 34,000
square feet of retail space, a 132-room hotel, and 0.65-acre park New buildings for City of Rohnert Park Public Safety and Public Works institutional uses, neighboring the west
side of the proposed project, located just south of the Five Creek project
Upon the construction of the proposed “Residences at Five Creek” and the proposed Fairfield Inn project, Martin Avenue will be extended westward to Labath Avenue. With the extension of Martin Avenue, the intersection of Dowdell Avenue/Martin Avenue will be reconfigured to an all-way stop controlled intersection.
Additionally, in order to accommodate planned bike facilities on Martin Avenue and to fill a short gap in the adjacent bike lane network on Redwood Drive, a new configuration of the Redwood Drive/Martin Avenue intersection was determined to be necessary. As it currently exists, the south leg of Redwood Drive/Martin Avenue has two northbound left turn lanes, which requires two eastbound travel lanes on Martin Avenue. This configuration does not provide sufficient width to accommodate continuous bike lanes on Martin Avenue and Redwood Drive. The new intersection configuration would eliminate one of the two left-turn lanes on the northbound approach at Redwood Drive/Martin Avenue and adjust the signal phasing to accommodate a longer green time to serve the northbound left-turn movement. The new configurations of both Dowdell Avenue/Martin Avenue and Redwood Drive/Martin Avenue are explained in greater detail in the Draft Bike Lane Assessment for Redwood Drive and Martin Avenue, February 2017, produced for the City of Rohnert Park by W-Trans. These new configurations were assumed to be in place in the Baseline conditions of this analysis.
Under these conditions, all study intersections are expected to operate acceptably, except Redwood Drive/ Rohnert Park Expressway, which would continue to operate unacceptably at LOS D during the p.m. peak hour. These results are summarized in Table 3 and Baseline volumes are shown in Figure 3.
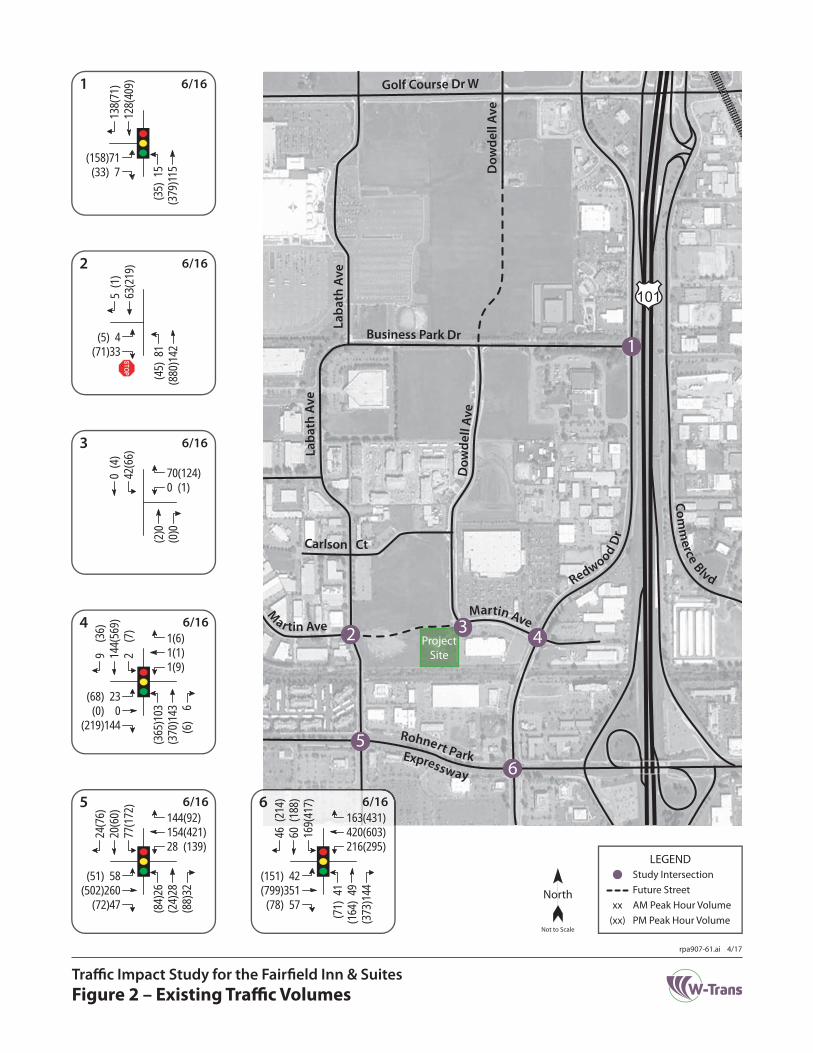
Project Site
Comm
erce Blvd
Dow
dell
Ave
Rohnert Park
Redwood Dr
Carlson Ct
Golf Course Dr W
Martin Ave
M
ar tin Ave
Laba
th A
ve
Business Park Dr
Dow
dell
Ave
Laba
th A
ve
Expressway
101
1
2 3 4
56
138(
71)
128(
409)
(158)71(33) 7
(35)
15
(379
)115
6/161
5 (1
)63
(219
)
(5) 4(71)33
(45)
81
(880
)142
6/162
70(124)0 (1)
0 (4
)42
(66)
(2)0
(0)0
6/163
9 (
36)
144(
569)
2 (
7)
(68) 23(0) 0
(219)144
(365
)103
(370
)143
(6)
6
1(6)1(1)1(9)
6/164
24(7
6)20
(60)
77(1
72)
(51) 58(502)260
(72)47 (84)
26(2
4)28
(88)
32
144(92)154(421)28 (139)
6/165
46 (
214)
60 (
188)
169(
417)
(151) 42(799)351
(78) 57
(71)
41
(164
) 49
(373
)144
163(431)420(603)216(295)
6/166
Figure 2 – Existing Traffic VolumesTraffic Impact Study for the Fairfield Inn & Suites
rpa907-61.ai 4/17
LEGEND
Future Streetxx AM Peak Hour Volume
(xx) PM Peak Hour Volume
Study Intersection
North
Not to Scale
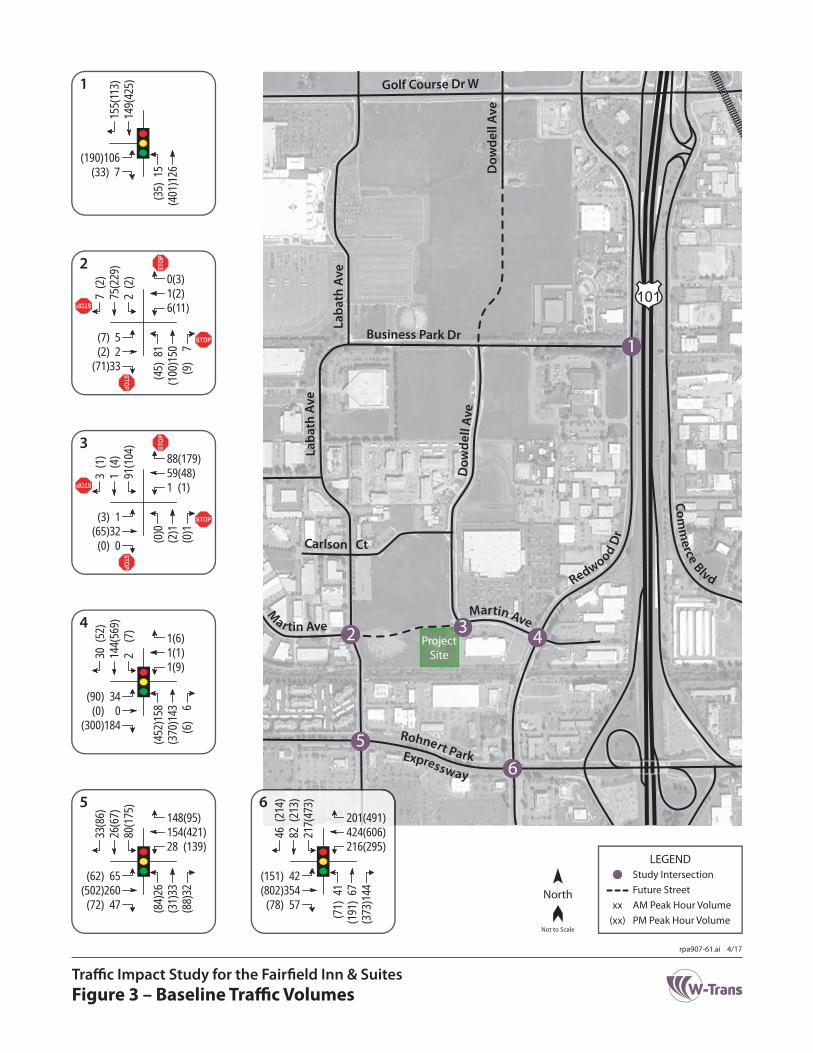
Project Site
Comm
erce Blvd
Dow
dell
Ave
Rohnert Park
Redwood Dr
Carlson Ct
Golf Course Dr W
Martin Ave
M
ar tin Ave
Laba
th A
ve
Business Park Dr
Dow
dell
Ave
Laba
th A
ve
Expressway
101
1
2 3 4
56
155(
113)
149(
425)
(190)106(33) 7
(35)
15
(401
)126
17
(2)
75(2
29)
2 (2
)
(7) 5(2) 2
(71)33
(45)
81
(100
)150
(9)
7
0(3)1(2)6(11)
2
3 (1
)1
(4)
91(1
04)
(3) 1(65)32
(0) 0 (0)0
(2)1
(0)1
88(179)59(48)1 (1)
3
30 (
52)
144(
569)
2 (
7)
(90) 34(0) 0
(300)184
(452
)158
(370
)143
(6)
6
1(6)1(1)1(9)
4
33(8
6)26
(67)
80(1
75)
(62) 65(502)260
(72) 47 (84)
26(3
1)33
(88)
32
148(95)154(421)28 (139)
5
46 (
214)
82 (
213)
217(
473)
(151) 42(802)354
(78) 57
(71)
41
(191
) 67
(373
)144
201(491)424(606)216(295)
6
Figure 3 – Baseline Traffic VolumesTraffic Impact Study for the Fairfield Inn & Suites
rpa907-61.ai 4/17
LEGEND
Future Streetxx AM Peak Hour Volume
(xx) PM Peak Hour Volume
Study Intersection
North
Not to Scale
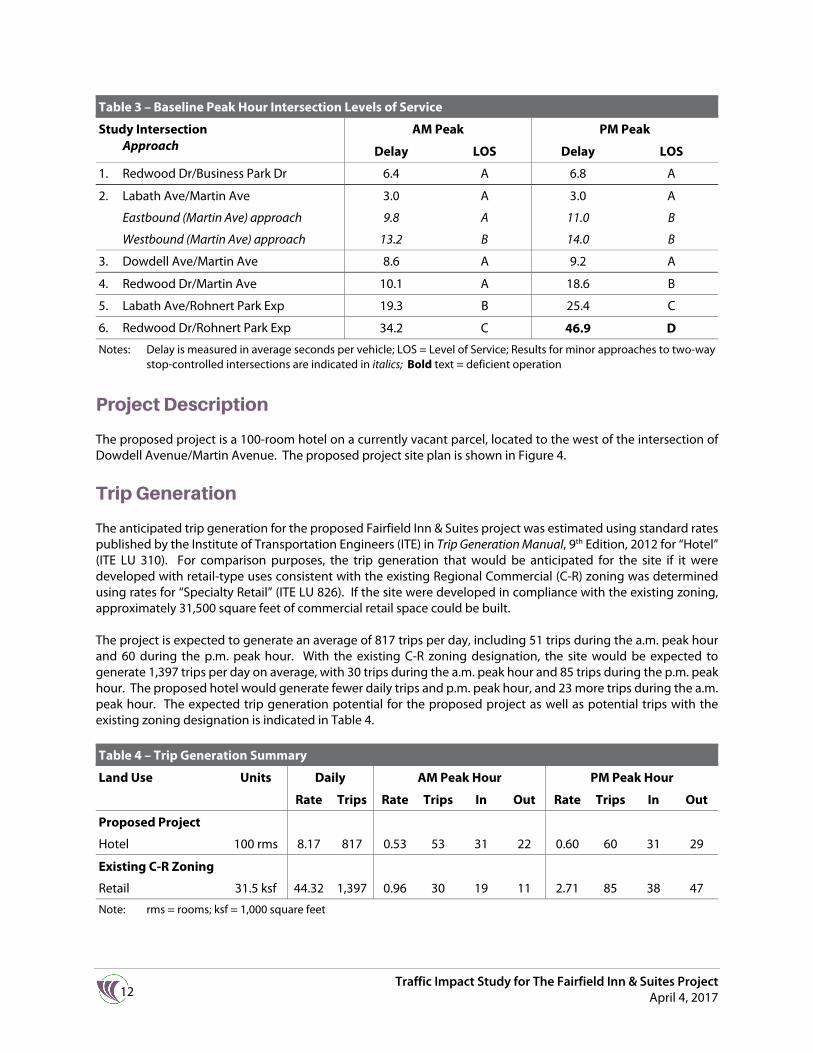
12 Traffic Impact Study for The Fairfield Inn & Suites Project
April 4, 2017
Table 3 – Baseline Peak Hour Intersection Levels of Service
Study Intersection Approach
AM Peak PM Peak
Delay LOS Delay LOS
1. Redwood Dr/Business Park Dr 6.4 A 6.8 A
2. Labath Ave/Martin Ave 3.0 A 3.0 A
Eastbound (Martin Ave) approach 9.8 A 11.0 B
Westbound (Martin Ave) approach 13.2 B 14.0 B
3. Dowdell Ave/Martin Ave 8.6 A 9.2 A
4. Redwood Dr/Martin Ave 10.1 A 18.6 B
5. Labath Ave/Rohnert Park Exp 19.3 B 25.4 C
6. Redwood Dr/Rohnert Park Exp 34.2 C 46.9 D
Notes: Delay is measured in average seconds per vehicle; LOS = Level of Service; Results for minor approaches to two-way stop-controlled intersections are indicated in italics; Bold text = deficient operation
Project Description
The proposed project is a 100-room hotel on a currently vacant parcel, located to the west of the intersection of Dowdell Avenue/Martin Avenue. The proposed project site plan is shown in Figure 4.
Trip Generation
The anticipated trip generation for the proposed Fairfield Inn & Suites project was estimated using standard rates published by the Institute of Transportation Engineers (ITE) in Trip Generation Manual, 9th Edition, 2012 for “Hotel” (ITE LU 310). For comparison purposes, the trip generation that would be anticipated for the site if it were developed with retail-type uses consistent with the existing Regional Commercial (C-R) zoning was determined using rates for “Specialty Retail” (ITE LU 826). If the site were developed in compliance with the existing zoning, approximately 31,500 square feet of commercial retail space could be built.
The project is expected to generate an average of 817 trips per day, including 51 trips during the a.m. peak hour and 60 during the p.m. peak hour. With the existing C-R zoning designation, the site would be expected to generate 1,397 trips per day on average, with 30 trips during the a.m. peak hour and 85 trips during the p.m. peak hour. The proposed hotel would generate fewer daily trips and p.m. peak hour, and 23 more trips during the a.m. peak hour. The expected trip generation potential for the proposed project as well as potential trips with the existing zoning designation is indicated in Table 4.
Table 4 – Trip Generation Summary
Land Use Units Daily AM Peak Hour PM Peak Hour
Rate Trips Rate Trips In Out Rate Trips In Out
Proposed Project
Hotel 100 rms 8.17 817 0.53 53 31 22 0.60 60 31 29
Existing C-R Zoning
Retail 31.5 ksf 44.32 1,397 0.96 30 19 11 2.71 85 38 47
Note: rms = rooms; ksf = 1,000 square feet
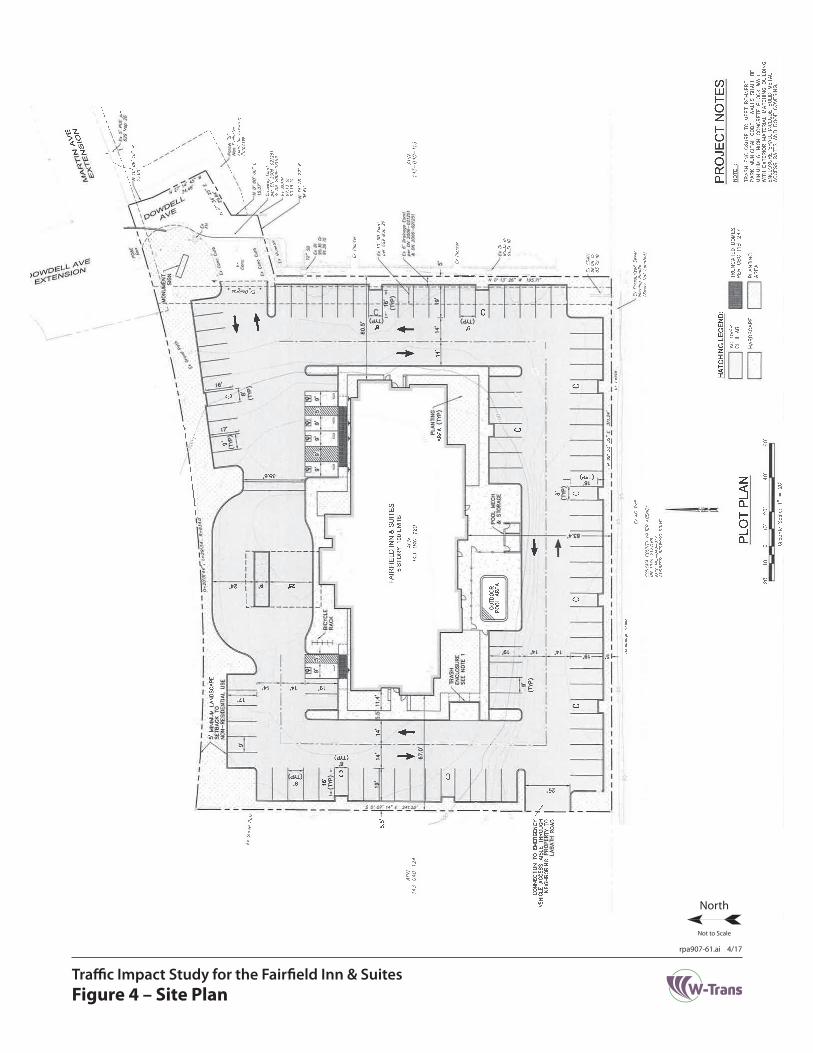
Figure 4 – Site PlanTraffic Impact Study for the Fairfield Inn & Suites
rpa907-61.ai 4/17
North
Not to Scale
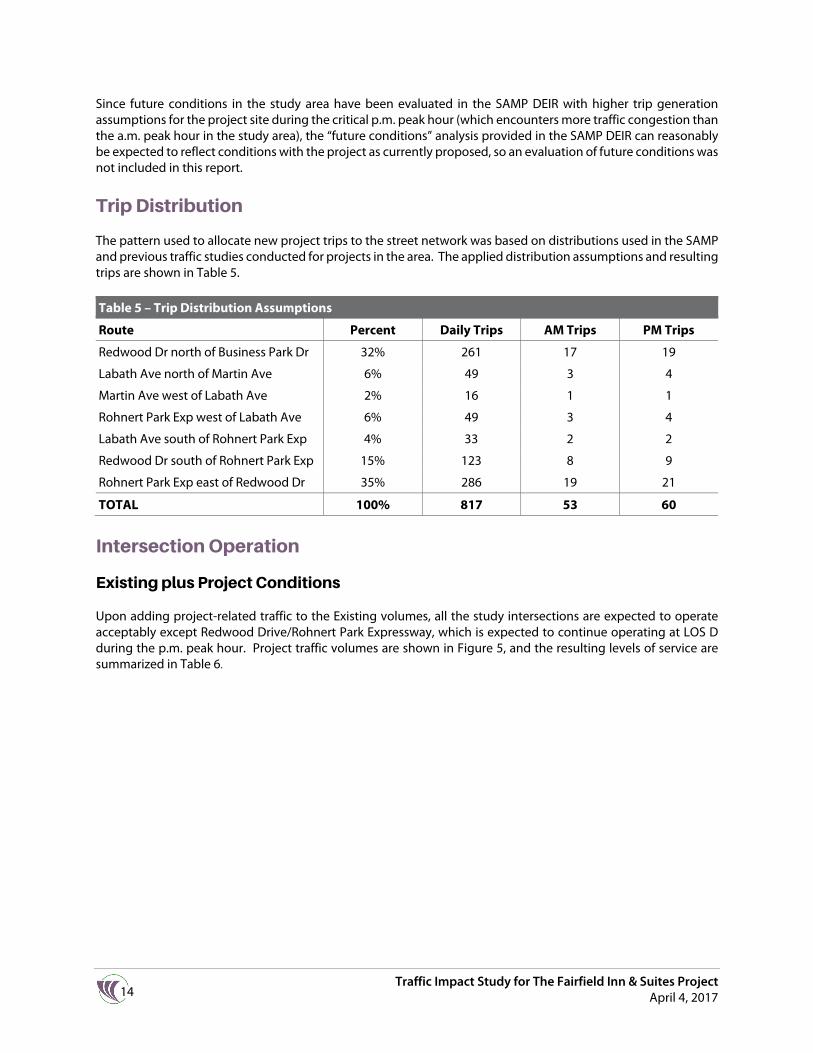
14 Traffic Impact Study for The Fairfield Inn & Suites Project
April 4, 2017
Since future conditions in the study area have been evaluated in the SAMP DEIR with higher trip generation assumptions for the project site during the critical p.m. peak hour (which encounters more traffic congestion than the a.m. peak hour in the study area), the “future conditions” analysis provided in the SAMP DEIR can reasonably be expected to reflect conditions with the project as currently proposed, so an evaluation of future conditions was not included in this report.
Trip Distribution
The pattern used to allocate new project trips to the street network was based on distributions used in the SAMP and previous traffic studies conducted for projects in the area. The applied distribution assumptions and resulting trips are shown in Table 5.
Table 5 – Trip Distribution Assumptions
Route Percent Daily Trips AM Trips PM Trips
Redwood Dr north of Business Park Dr 32% 261 17 19
Labath Ave north of Martin Ave 6% 49 3 4
Martin Ave west of Labath Ave 2% 16 1 1
Rohnert Park Exp west of Labath Ave 6% 49 3 4
Labath Ave south of Rohnert Park Exp 4% 33 2 2
Redwood Dr south of Rohnert Park Exp 15% 123 8 9
Rohnert Park Exp east of Redwood Dr 35% 286 19 21
TOTAL 100% 817 53 60
Intersection Operation
Existing plus Project Conditions
Upon adding project-related traffic to the Existing volumes, all the study intersections are expected to operate acceptably except Redwood Drive/Rohnert Park Expressway, which is expected to continue operating at LOS D during the p.m. peak hour. Project traffic volumes are shown in Figure 5, and the resulting levels of service are summarized in Table 6.

Project Site
Comm
erce Blvd
Dow
dell
Ave
Rohnert Park
Redwood Dr
Carlson Ct
Golf Course Dr W
Martin Ave
M
ar tin Ave
Laba
th A
ve
Business Park Dr
Dow
dell
Ave
Laba
th A
ve
Expressway
101
1
2 3 4
56
2(2)
7(7)
(2)2(0)0 (0
)0(7
)5
10(
0)0(
0)1(
1)
(0)0(1)1(0)0 (0
)0(1
)0(3
)3
1(1)0(1)2(3)
2
0(0)
3(3)
0(0)
(0)0(0)0(5)5 (4
) 3
(3)
2(2
1)16
0 (0)0 (0)23(23)
3
7(7)
0(0)
0(0)
(7) 5(0) 0
(15)11 (16)
16(0
) 0
(0)
0
0(0)0(0)0(0)
4
1(2)
1(1)
0(0)
(0)0(0)0(0)0 (0
)0(1
)1(0
)0
0(0)0(0)0(0)
5
0(0)
3(4)
8(10
)
(0)0(0)0(0)0 (0
)0(5
)5(0
)0
11(11)0 (0)0 (0)
6
Figure 5 – Project Traffic VolumesTraffic Impact Study for the Fairfield Inn & Suites
rpa907-61.ai 4/17
LEGEND
Future Streetxx AM Peak Hour Volume
(xx) PM Peak Hour Volume
Study Intersection
North
Not to Scale
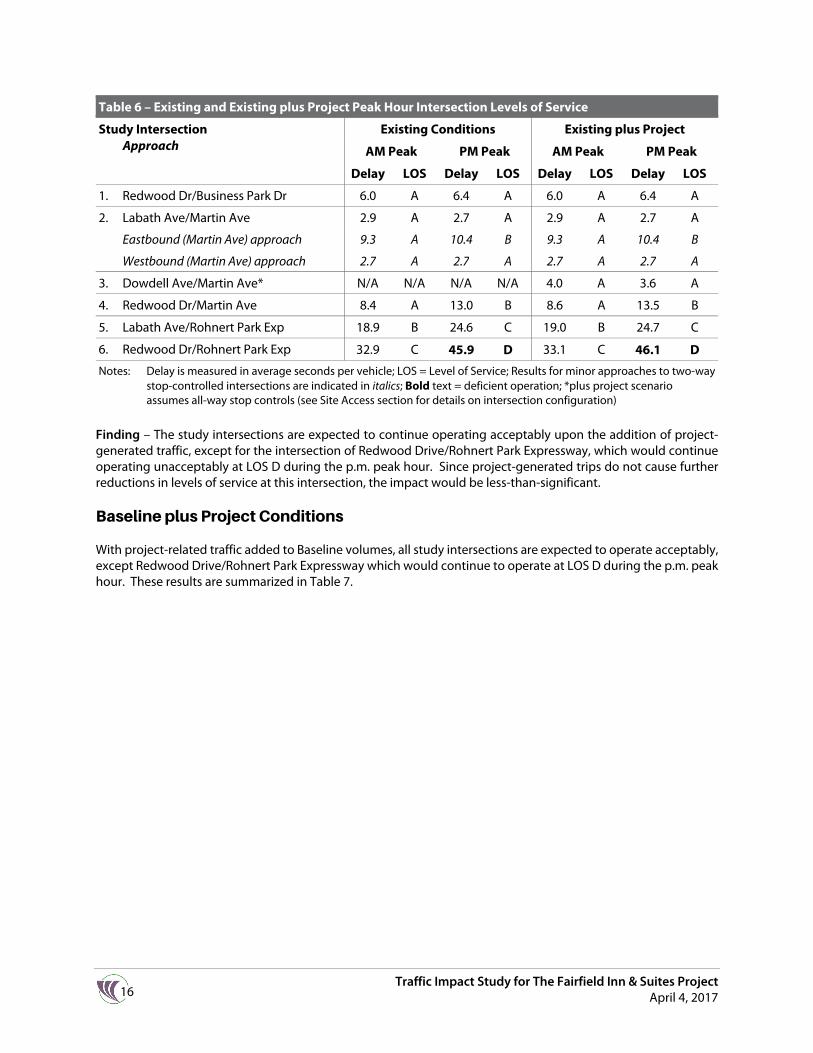
16 Traffic Impact Study for The Fairfield Inn & Suites Project
April 4, 2017
Table 6 – Existing and Existing plus Project Peak Hour Intersection Levels of Service
Study Intersection Approach
Existing Conditions Existing plus Project
AM Peak PM Peak AM Peak PM Peak
Delay LOS Delay LOS Delay LOS Delay LOS
1. Redwood Dr/Business Park Dr 6.0 A 6.4 A 6.0 A 6.4 A
2. Labath Ave/Martin Ave 2.9 A 2.7 A 2.9 A 2.7 A
Eastbound (Martin Ave) approach 9.3 A 10.4 B 9.3 A 10.4 B
Westbound (Martin Ave) approach 2.7 A 2.7 A 2.7 A 2.7 A
3. Dowdell Ave/Martin Ave* N/A N/A N/A N/A 4.0 A 3.6 A
4. Redwood Dr/Martin Ave 8.4 A 13.0 B 8.6 A 13.5 B
5. Labath Ave/Rohnert Park Exp 18.9 B 24.6 C 19.0 B 24.7 C
6. Redwood Dr/Rohnert Park Exp 32.9 C 45.9 D 33.1 C 46.1 D
Notes: Delay is measured in average seconds per vehicle; LOS = Level of Service; Results for minor approaches to two-way stop-controlled intersections are indicated in italics; Bold text = deficient operation; *plus project scenario assumes all-way stop controls (see Site Access section for details on intersection configuration)
Finding – The study intersections are expected to continue operating acceptably upon the addition of project-generated traffic, except for the intersection of Redwood Drive/Rohnert Park Expressway, which would continue operating unacceptably at LOS D during the p.m. peak hour. Since project-generated trips do not cause further reductions in levels of service at this intersection, the impact would be less-than-significant.
Baseline plus Project Conditions
With project-related traffic added to Baseline volumes, all study intersections are expected to operate acceptably, except Redwood Drive/Rohnert Park Expressway which would continue to operate at LOS D during the p.m. peak hour. These results are summarized in Table 7.
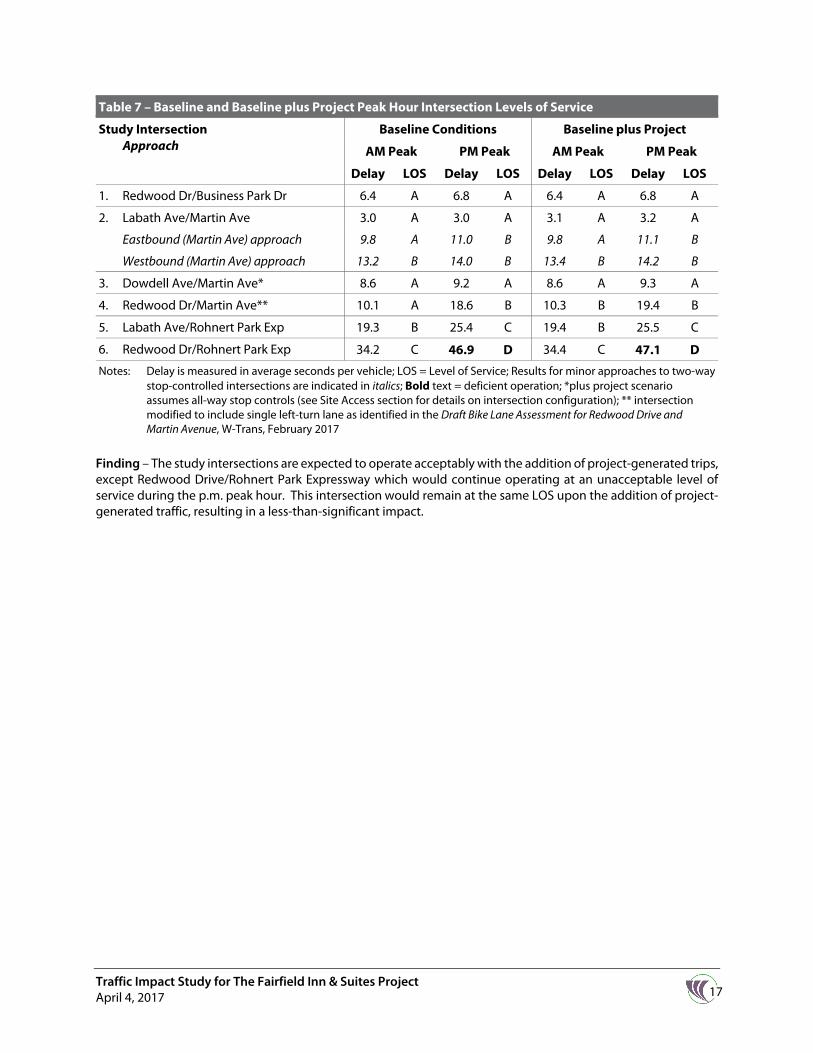
17 Traffic Impact Study for The Fairfield Inn & Suites Project April 4, 2017
Table 7 – Baseline and Baseline plus Project Peak Hour Intersection Levels of Service
Study Intersection Approach
Baseline Conditions Baseline plus Project
AM Peak PM Peak AM Peak PM Peak
Delay LOS Delay LOS Delay LOS Delay LOS
1. Redwood Dr/Business Park Dr 6.4 A 6.8 A 6.4 A 6.8 A
2. Labath Ave/Martin Ave 3.0 A 3.0 A 3.1 A 3.2 A
Eastbound (Martin Ave) approach 9.8 A 11.0 B 9.8 A 11.1 B
Westbound (Martin Ave) approach 13.2 B 14.0 B 13.4 B 14.2 B
3. Dowdell Ave/Martin Ave* 8.6 A 9.2 A 8.6 A 9.3 A
4. Redwood Dr/Martin Ave** 10.1 A 18.6 B 10.3 B 19.4 B
5. Labath Ave/Rohnert Park Exp 19.3 B 25.4 C 19.4 B 25.5 C
6. Redwood Dr/Rohnert Park Exp 34.2 C 46.9 D 34.4 C 47.1 D
Notes: Delay is measured in average seconds per vehicle; LOS = Level of Service; Results for minor approaches to two-way stop-controlled intersections are indicated in italics; Bold text = deficient operation; *plus project scenario assumes all-way stop controls (see Site Access section for details on intersection configuration); ** intersection modified to include single left-turn lane as identified in the Draft Bike Lane Assessment for Redwood Drive and Martin Avenue, W-Trans, February 2017
Finding – The study intersections are expected to operate acceptably with the addition of project-generated trips, except Redwood Drive/Rohnert Park Expressway which would continue operating at an unacceptable level of service during the p.m. peak hour. This intersection would remain at the same LOS upon the addition of project-generated traffic, resulting in a less-than-significant impact.
18 Traffic Impact Study for The Fairfield Inn & Suites Project
April 4, 2017
Access and Circulation
Site Access and Sight Distance
The site would be accessed via a new driveway located at the northwest corner of the existing parking lot of Ashley Furniture Store, accessing the south leg at the intersection of Dowdell Avenue/Martin Avenue. There are no anticipated conflicts with the planned access points of the Five Creek development or with the planned access point being located within an existing parking lot. Further, there are no barriers to the lines of sight for entering and exiting vehicles. However, any new landscaping should be installed to ensure that plantings at the project driveway do not exceed three feet in height to maximize sight lines.
Onsite Circulation
Onsite circulation would consist of a conventional parking lot around the entire periphery of the hotel, consistent with the circulation system found at many suburban hotels. Vehicular access to the hotel would interface with the Ashley Furniture store’s parking lot just south of Martin Avenue. Given the relatively low traffic volumes associated with the hotel and furniture store uses, no adverse conflicts or queuing issues would be expected to occur.
Finding – There are no anticipated conflicts with the planned access points of the Five Creek development and the proposed project. Sight distance is also adequate as there are no barriers to the lines of sight for entering and exiting vehicles.
Recommendation – Any new landscaping should be installed in such a way as to ensure that plantings at the project driveway do not exceed three feet in height to maximize sight lines.
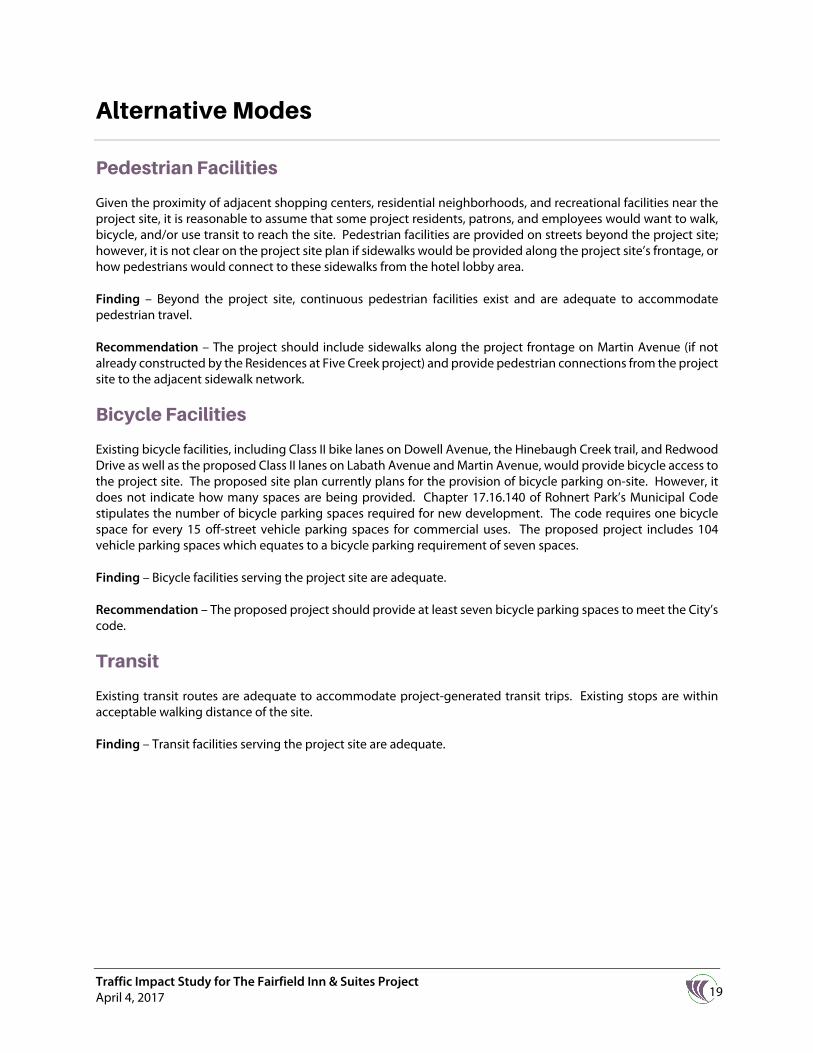
19 Traffic Impact Study for The Fairfield Inn & Suites Project April 4, 2017
Alternative Modes
Pedestrian Facilities
Given the proximity of adjacent shopping centers, residential neighborhoods, and recreational facilities near the project site, it is reasonable to assume that some project residents, patrons, and employees would want to walk, bicycle, and/or use transit to reach the site. Pedestrian facilities are provided on streets beyond the project site; however, it is not clear on the project site plan if sidewalks would be provided along the project site’s frontage, or how pedestrians would connect to these sidewalks from the hotel lobby area.
Finding – Beyond the project site, continuous pedestrian facilities exist and are adequate to accommodate pedestrian travel.
Recommendation – The project should include sidewalks along the project frontage on Martin Avenue (if not already constructed by the Residences at Five Creek project) and provide pedestrian connections from the project site to the adjacent sidewalk network.
Bicycle Facilities
Existing bicycle facilities, including Class II bike lanes on Dowell Avenue, the Hinebaugh Creek trail, and Redwood Drive as well as the proposed Class II lanes on Labath Avenue and Martin Avenue, would provide bicycle access to the project site. The proposed site plan currently plans for the provision of bicycle parking on-site. However, it does not indicate how many spaces are being provided. Chapter 17.16.140 of Rohnert Park’s Municipal Code stipulates the number of bicycle parking spaces required for new development. The code requires one bicycle space for every 15 off-street vehicle parking spaces for commercial uses. The proposed project includes 104 vehicle parking spaces which equates to a bicycle parking requirement of seven spaces.
Finding – Bicycle facilities serving the project site are adequate.
Recommendation – The proposed project should provide at least seven bicycle parking spaces to meet the City’s code.
Transit
Existing transit routes are adequate to accommodate project-generated transit trips. Existing stops are within acceptable walking distance of the site.
Finding – Transit facilities serving the project site are adequate.
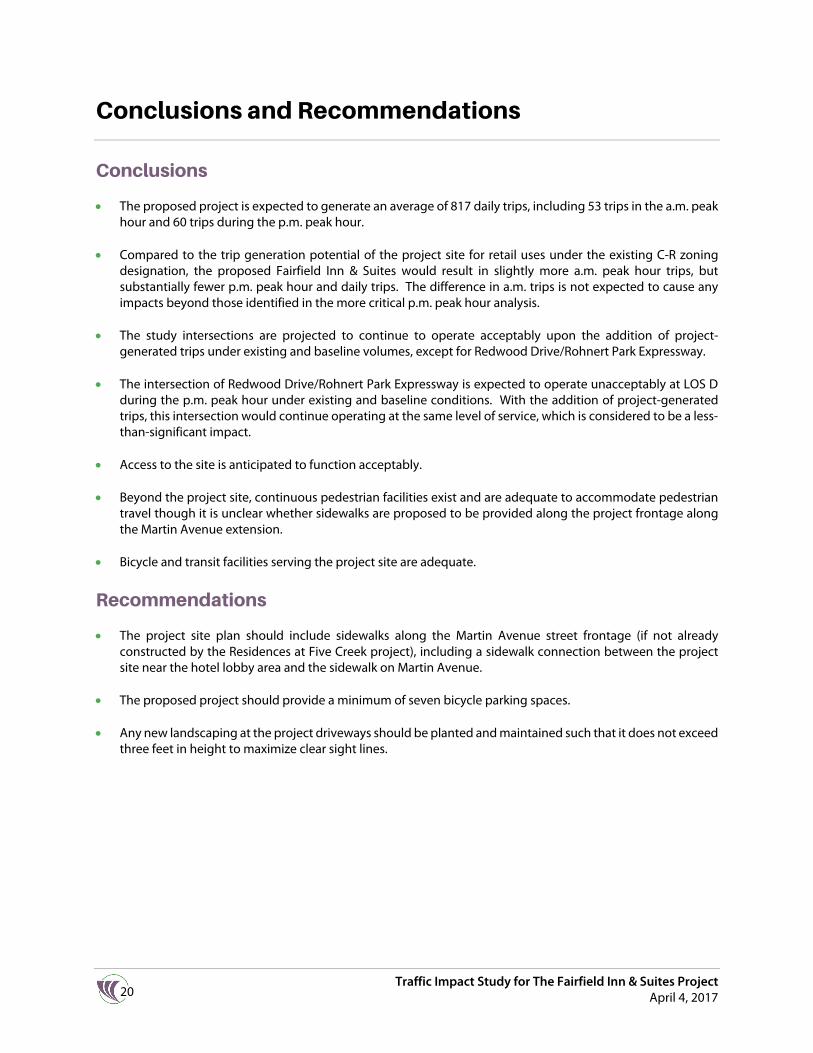
20 Traffic Impact Study for The Fairfield Inn & Suites Project
April 4, 2017
Conclusions and Recommendations
Conclusions
The proposed project is expected to generate an average of 817 daily trips, including 53 trips in the a.m. peak hour and 60 trips during the p.m. peak hour.
Compared to the trip generation potential of the project site for retail uses under the existing C-R zoning designation, the proposed Fairfield Inn & Suites would result in slightly more a.m. peak hour trips, but substantially fewer p.m. peak hour and daily trips. The difference in a.m. trips is not expected to cause any impacts beyond those identified in the more critical p.m. peak hour analysis.
The study intersections are projected to continue to operate acceptably upon the addition of project-generated trips under existing and baseline volumes, except for Redwood Drive/Rohnert Park Expressway.
The intersection of Redwood Drive/Rohnert Park Expressway is expected to operate unacceptably at LOS D during the p.m. peak hour under existing and baseline conditions. With the addition of project-generated trips, this intersection would continue operating at the same level of service, which is considered to be a less-than-significant impact.
Access to the site is anticipated to function acceptably.
Beyond the project site, continuous pedestrian facilities exist and are adequate to accommodate pedestrian travel though it is unclear whether sidewalks are proposed to be provided along the project frontage along the Martin Avenue extension.
Bicycle and transit facilities serving the project site are adequate.
Recommendations
The project site plan should include sidewalks along the Martin Avenue street frontage (if not already constructed by the Residences at Five Creek project), including a sidewalk connection between the project site near the hotel lobby area and the sidewalk on Martin Avenue.
The proposed project should provide a minimum of seven bicycle parking spaces.
Any new landscaping at the project driveways should be planted and maintained such that it does not exceed three feet in height to maximize clear sight lines.
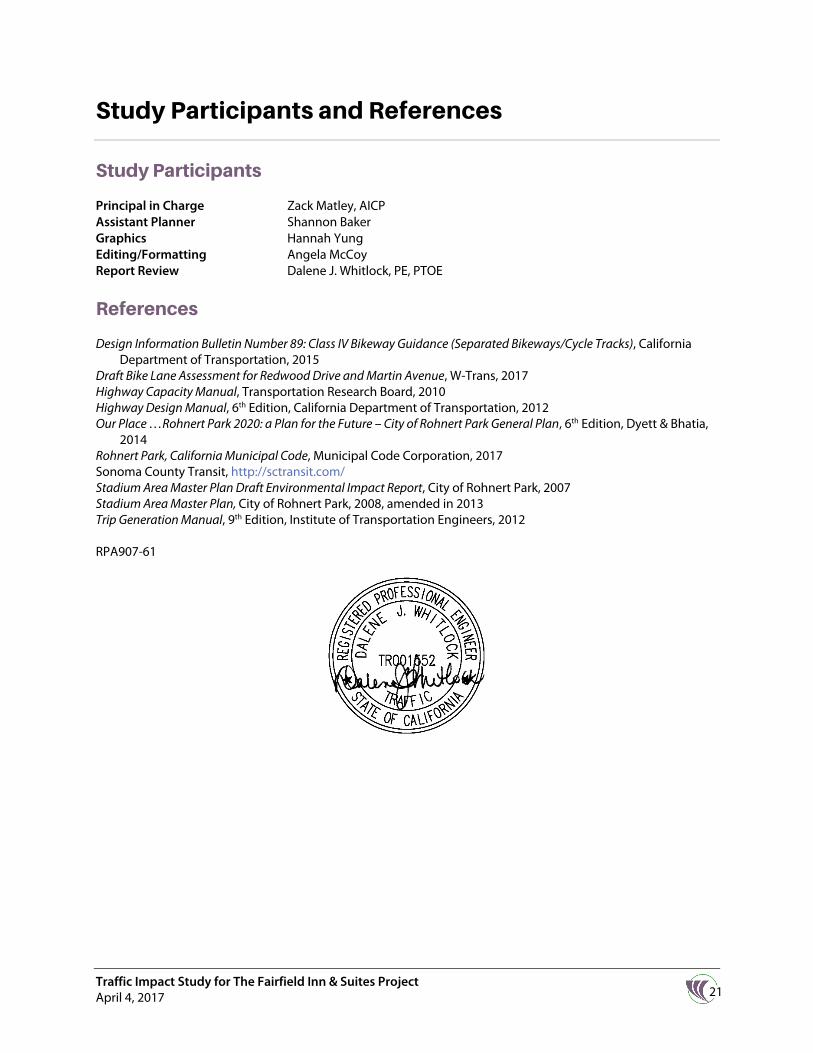
21 Traffic Impact Study for The Fairfield Inn & Suites Project April 4, 2017
Study Participants and References
Study Participants
Principal in Charge Zack Matley, AICP Assistant Planner Shannon Baker Graphics Hannah Yung Editing/Formatting Angela McCoy Report Review Dalene J. Whitlock, PE, PTOE
References
Design Information Bulletin Number 89: Class IV Bikeway Guidance (Separated Bikeways/Cycle Tracks), California Department of Transportation, 2015
Draft Bike Lane Assessment for Redwood Drive and Martin Avenue, W-Trans, 2017 Highway Capacity Manual, Transportation Research Board, 2010 Highway Design Manual, 6th Edition, California Department of Transportation, 2012 Our Place …Rohnert Park 2020: a Plan for the Future – City of Rohnert Park General Plan, 6th Edition, Dyett & Bhatia,
2014 Rohnert Park, California Municipal Code, Municipal Code Corporation, 2017 Sonoma County Transit, http://sctransit.com/ Stadium Area Master Plan Draft Environmental Impact Report, City of Rohnert Park, 2007 Stadium Area Master Plan, City of Rohnert Park, 2008, amended in 2013 Trip Generation Manual, 9th Edition, Institute of Transportation Engineers, 2012
RPA907-61

A Traffic Impact Study for The Fairfield Inn & Suites Project April 2017
Appendix A
Intersection Level of Service Calculations


03/14
/2017
The F
airfie
ld Inn
& S
uites
Sync
hro 9
Rep
ort
AM E
xistin
gW
-Tra
ns
Move
ment
EBL
EBR
NBL
NBT
SBT
SBR
Lane
Con
figur
ation
sTr
affic
Volum
e (ve
h/h)
717
1511
512
813
8Fu
ture V
olume
(veh
/h)71
715
115
128
138
Numb
er7
145
26
16Ini
tial Q
(Qb)
, veh
00
00
00
Ped-
Bike
Adj(
A_pb
T)1.0
01.0
01.0
01.0
0Pa
rking
Bus
, Adj
1.00
1.00
1.00
1.00
1.00
1.00
Adj S
at Flo
w, ve
h/h/ln
1863
1863
1863
1863
1863
1900
Adj F
low R
ate, v
eh/h
815
1713
114
514
5Ad
j No.
of La
nes
11
12
20
Peak
Hou
r Fac
tor0.8
80.8
80.8
80.8
80.8
80.8
8Pe
rcent
Heav
y Veh
, %2
22
22
2Ca
p, ve
h/h13
814
928
1658
400
358
Arriv
e On G
reen
0.08
0.08
0.02
0.47
0.23
0.23
Sat F
low, v
eh/h
1774
1583
1774
3632
1863
1583
Grp V
olume
(v), v
eh/h
815
1713
114
514
5Gr
p Sat
Flow(
s),ve
h/h/ln
1774
1583
1774
1770
1770
1583
Q Se
rve(g
_s),
s0.8
0.10.2
0.41.2
1.4Cy
cle Q
Clea
r(g_c
), s
0.80.1
0.20.4
1.21.4
Prop
In La
ne1.0
01.0
01.0
01.0
0La
ne G
rp C
ap(c)
, veh
/h13
814
928
1658
400
358
V/C
Ratio
(X)
0.59
0.03
0.60
0.08
0.36
0.41
Avail
Cap
(c_a)
, veh
/h32
1928
9814
0812
039
4214
3770
HCM
Plato
on R
atio
1.00
1.00
1.00
1.00
1.00
1.00
Upstr
eam
Filter
(I)1.0
01.0
01.0
01.0
01.0
01.0
0Un
iform
Dela
y (d)
, s/ve
h7.9
7.38.6
2.65.8
5.8Inc
r Dela
y (d2
), s/v
eh1.5
0.07.5
0.00.2
0.3Ini
tial Q
Dela
y(d3)
,s/ve
h0.0
0.00.0
0.00.0
0.0%
ile B
ackO
fQ(5
0%),v
eh/ln
0.40.0
0.10.2
0.60.6
LnGr
p Dela
y(d),s
/veh
9.37.3
16.1
2.66.0
6.1Ln
Grp L
OSA
AB
AA
AAp
proa
ch V
ol, ve
h/h86
148
290
Appr
oach
Dela
y, s/v
eh9.2
4.16.0
Appr
oach
LOS
AA
A
Timer
12
34
56
78
Assig
ned P
hs2
45
6Ph
s Dur
ation
(G+Y
+Rc),
s12
.35.4
4.38.0
Chan
ge P
eriod
(Y+R
c), s
4.04.0
4.04.0
Max G
reen
Sett
ing (G
max),
s60
.032
.014
.042
.0Ma
x Q C
lear T
ime (
g_c+
I1), s
2.42.8
2.23.4
Gree
n Ext
Time (
p_c),
s1.2
0.00.0
1.2
Inter
secti
on S
umma
ryHC
M 20
10 C
trl De
lay6.0
HCM
2010
LOS
A
03/14
/2017
The F
airfie
ld Inn
& S
uites
Sy
nchr
o 9 R
epor
tPM
Exis
ting
W-T
rans
Move
ment
EBL
EBR
NBL
NBT
SBT
SBR
Lane
Con
figur
ation
sTr
affic
Volum
e (ve
h/h)
158
3335
379
409
71Fu
ture V
olume
(veh
/h)15
833
3537
940
971
Numb
er7
145
26
16Ini
tial Q
(Qb)
, veh
00
00
00
Ped-
Bike
Adj(
A_pb
T)1.0
01.0
01.0
01.0
0Pa
rking
Bus
, Adj
1.00
1.00
1.00
1.00
1.00
1.00
Adj S
at Flo
w, ve
h/h/ln
1863
1863
1863
1863
1863
1900
Adj F
low R
ate, v
eh/h
174
3338
416
449
66Ad
j No.
of La
nes
11
12
20
Peak
Hou
r Fac
tor0.9
10.9
10.9
10.9
10.9
10.9
1Pe
rcent
Heav
y Veh
, %2
22
22
2Ca
p, ve
h/h24
026
658
1850
988
144
Arriv
e On G
reen
0.14
0.14
0.03
0.52
0.32
0.32
Sat F
low, v
eh/h
1774
1583
1774
3632
3192
453
Grp V
olume
(v), v
eh/h
174
3338
416
255
260
Grp S
at Flo
w(s),
veh/h
/ln17
7415
8317
7417
7017
7017
83Q
Serve
(g_s
), s
2.20.4
0.51.5
2.72.7
Cycle
Q C
lear(g
_c),
s2.2
0.40.5
1.52.7
2.7Pr
op In
Lane
1.00
1.00
1.00
0.25
Lane
Grp
Cap
(c), v
eh/h
240
266
5818
5056
456
8V/
C Ra
tio(X
)0.7
30.1
20.6
50.2
20.4
50.4
6Av
ail C
ap(c_
a), v
eh/h
2428
2218
1062
9080
3178
3202
HCM
Plato
on R
atio
1.00
1.00
1.00
1.00
1.00
1.00
Upstr
eam
Filter
(I)1.0
01.0
01.0
01.0
01.0
01.0
0Un
iform
Dela
y (d)
, s/ve
h9.7
8.311
.23.0
6.36.3
Incr D
elay (
d2),
s/veh
1.60.1
4.60.0
0.20.2
Initia
l Q D
elay(d
3),s/
veh
0.00.0
0.00.0
0.00.0
%ile
Bac
kOfQ
(50%
),veh
/ln1.2
0.40.3
0.71.3
1.3Ln
Grp D
elay(d
),s/ve
h11
.38.3
15.7
3.06.5
6.6Ln
Grp L
OSB
AB
AA
AAp
proa
ch V
ol, ve
h/h20
745
451
5Ap
proa
ch D
elay,
s/veh
10.8
4.16.6
Appr
oach
LOS
BA
A
Timer
12
34
56
78
Assig
ned P
hs2
45
6Ph
s Dur
ation
(G+Y
+Rc),
s16
.27.2
4.811
.5Ch
ange
Per
iod (Y
+Rc),
s4.0
4.04.0
4.0Ma
x Gre
en S
etting
(Gma
x), s
60.0
32.0
14.0
42.0
Max Q
Clea
r Tim
e (g_
c+I1)
, s3.5
4.22.5
4.7Gr
een E
xt Tim
e (p_
c), s
2.80.1
0.02.8
Inter
secti
on S
umma
ryHC
M 20
10 C
trl De
lay6.4
HCM
2010
LOS
A
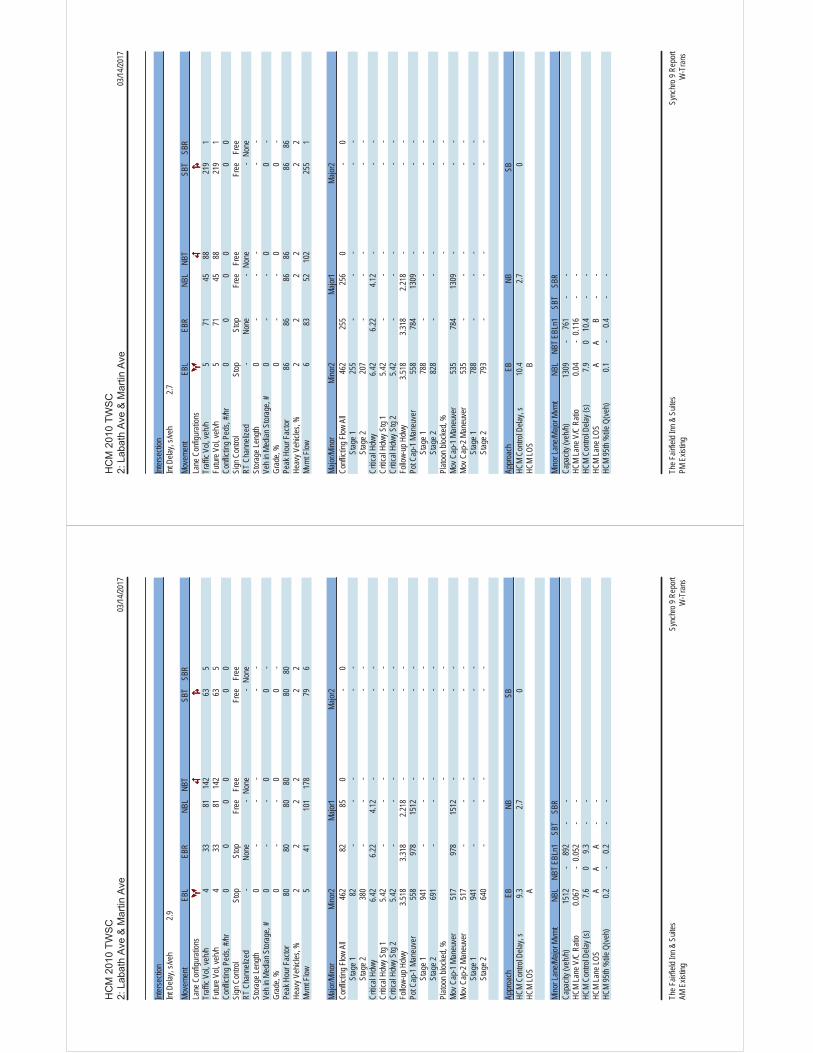
03/14
/2017
The F
airfie
ld Inn
& S
uites
Sync
hro 9
Rep
ort
AM E
xistin
gW
-Tra
ns
Inter
secti
onInt
Dela
y, s/v
eh2.9
Move
ment
EBL
EBR
NBL
NBT
SBT
SBR
Lane
Con
figur
ation
sTr
affic
Vol, v
eh/h
433
8114
263
5Fu
ture V
ol, ve
h/h4
3381
142
635
Confl
icting
Ped
s, #/h
r0
00
00
0Si
gn C
ontro
l St
opSt
opFr
eeFr
eeFr
eeFr
eeRT
Cha
nneli
zed
-No
ne-
None
-No
neSt
orag
e Len
gth0
--
--
-Ve
h in M
edian
Stor
age,
#0
--
00
-Gr
ade,
%0
--
00
-Pe
ak H
our F
actor
8080
8080
8080
Heav
y Veh
icles
, %2
22
22
2Mv
mt F
low5
4110
117
879
6
Major
/Mino
rMi
nor2
Major
1Ma
jor2
Confl
icting
Flow
All
462
8285
0-
0
S
tage 1
82-
--
--
Stag
e 238
0-
--
--
Critic
al Hd
wy6.4
26.2
24.1
2-
--
Critic
al Hd
wy S
tg 1
5.42
--
--
-Cr
itical
Hdwy
Stg
25.4
2-
--
--
Follo
w-up
Hdw
y3.5
183.3
182.2
18-
--
Pot C
ap-1
Man
euve
r55
897
815
12-
--
Stag
e 194
1-
--
--
Stag
e 269
1-
--
--
Plato
on bl
ocke
d, %
--
-Mo
v Cap
-1 M
aneu
ver
517
978
1512
--
-Mo
v Cap
-2 M
aneu
ver
517
--
--
-
S
tage 1
941
--
--
-
S
tage 2
640
--
--
-
Appr
oach
EBNB
SBHC
M Co
ntrol
Delay
, s9.3
2.70
HCM
LOS
A
Mino
r Lan
e/Majo
r Mvm
tNB
LNB
TEBL
n1SB
TSB
RCa
pacit
y (ve
h/h)
1512
-89
2-
-HC
M La
ne V
/C R
atio
0.067
-0.0
52-
-HC
M Co
ntrol
Delay
(s)
7.60
9.3-
-HC
M La
ne LO
SA
AA
--
HCM
95th
%tile
Q(ve
h)0.2
-0.2
--
03/14
/2017
The F
airfie
ld Inn
& S
uites
Sy
nchr
o 9 R
epor
tPM
Exis
ting
W-T
rans
Inter
secti
onInt
Dela
y, s/v
eh2.7
Move
ment
EBL
EBR
NBL
NBT
SBT
SBR
Lane
Con
figur
ation
sTr
affic
Vol, v
eh/h
571
4588
219
1Fu
ture V
ol, ve
h/h5
7145
8821
91
Confl
icting
Ped
s, #/h
r0
00
00
0Si
gn C
ontro
l St
opSt
opFr
eeFr
eeFr
eeFr
eeRT
Cha
nneli
zed
-No
ne-
None
-No
neSt
orag
e Len
gth0
--
--
-Ve
h in M
edian
Stor
age,
#0
--
00
-Gr
ade,
%0
--
00
-Pe
ak H
our F
actor
8686
8686
8686
Heav
y Veh
icles
, %2
22
22
2Mv
mt F
low6
8352
102
255
1
Major
/Mino
rMi
nor2
Major
1Ma
jor2
Confl
icting
Flow
All
462
255
256
0-
0
S
tage 1
255
--
--
-
S
tage 2
207
--
--
-Cr
itical
Hdwy
6.42
6.22
4.12
--
-Cr
itical
Hdwy
Stg
15.4
2-
--
--
Critic
al Hd
wy S
tg 2
5.42
--
--
-Fo
llow-
up H
dwy
3.518
3.318
2.218
--
-Po
t Cap
-1 M
aneu
ver
558
784
1309
--
-
S
tage 1
788
--
--
-
S
tage 2
828
--
--
-Pl
atoon
bloc
ked,
%-
--
Mov C
ap-1
Man
euve
r53
578
413
09-
--
Mov C
ap-2
Man
euve
r53
5-
--
--
Stag
e 178
8-
--
--
Stag
e 279
3-
--
--
Appr
oach
EBNB
SBHC
M Co
ntrol
Delay
, s10
.42.7
0HC
M LO
SB
Mino
r Lan
e/Majo
r Mvm
tNB
LNB
TEBL
n1SB
TSB
RCa
pacit
y (ve
h/h)
1309
-76
1-
-HC
M La
ne V
/C R
atio
0.04
-0.1
16-
-HC
M Co
ntrol
Delay
(s)
7.90
10.4
--
HCM
Lane
LOS
AA
B-
-HC
M 95
th %
tile Q
(veh)
0.1-
0.4-
-
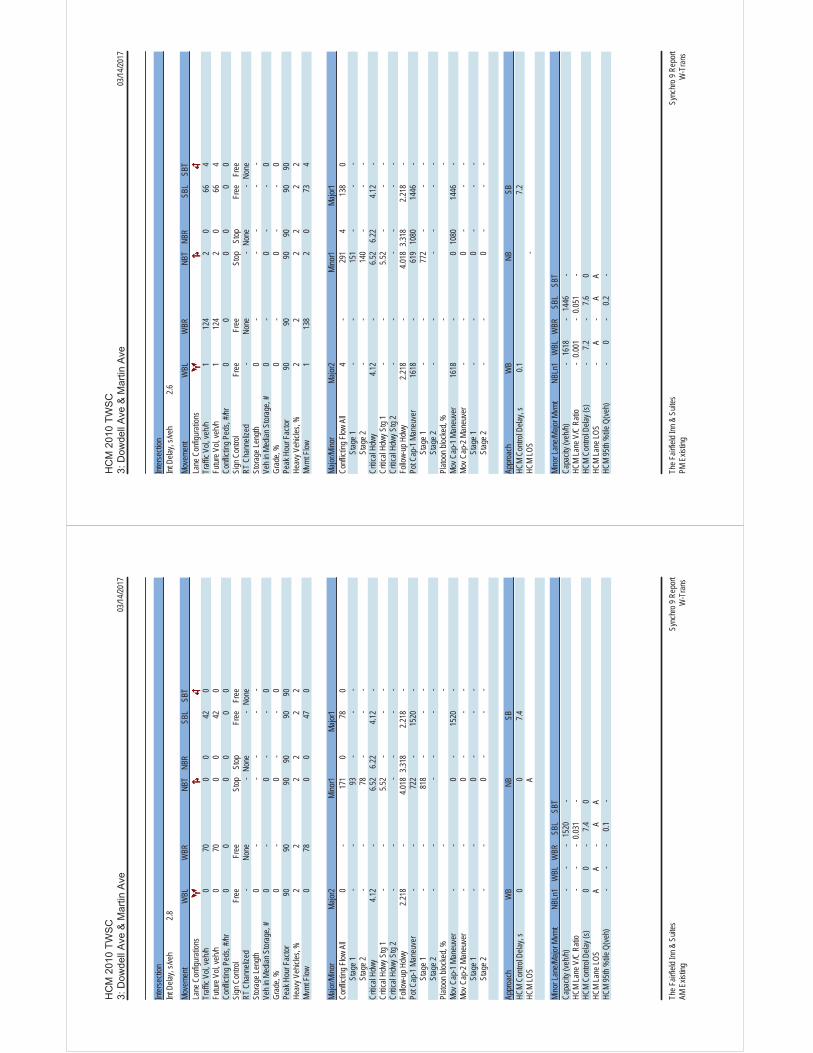
03/14
/2017
The F
airfie
ld Inn
& S
uites
Sync
hro 9
Rep
ort
AM E
xistin
gW
-Tra
ns
Inter
secti
onInt
Dela
y, s/v
eh2.8
Move
ment
WBL
WBR
NBT
NBR
SBL
SBT
Lane
Con
figur
ation
sTr
affic
Vol, v
eh/h
070
00
420
Futur
e Vol,
veh/h
070
00
420
Confl
icting
Ped
s, #/h
r0
00
00
0Si
gn C
ontro
l Fr
eeFr
eeSt
opSt
opFr
eeFr
eeRT
Cha
nneli
zed
-No
ne-
None
-No
neSt
orag
e Len
gth0
--
--
-Ve
h in M
edian
Stor
age,
#0
-0
--
0Gr
ade,
%0
-0
--
0Pe
ak H
our F
actor
9090
9090
9090
Heav
y Veh
icles
, %2
22
22
2Mv
mt F
low0
780
047
0
Major
/Mino
rMa
jor2
Mino
r1Ma
jor1
Confl
icting
Flow
All
0-
171
078
0
S
tage 1
--
93-
--
Stag
e 2-
-78
--
-Cr
itical
Hdwy
4.12
-6.5
26.2
24.1
2-
Critic
al Hd
wy S
tg 1
--
5.52
--
-Cr
itical
Hdwy
Stg
2-
--
--
-Fo
llow-
up H
dwy
2.218
-4.0
183.3
182.2
18-
Pot C
ap-1
Man
euve
r-
-72
2-
1520
-
S
tage 1
--
818
--
-
S
tage 2
--
--
--
Plato
on bl
ocke
d, %
--
Mov C
ap-1
Man
euve
r-
-0
-15
20-
Mov C
ap-2
Man
euve
r-
-0
--
-
S
tage 1
--
0-
--
Stag
e 2-
-0
--
-
Appr
oach
WB
NBSB
HCM
Contr
ol De
lay, s
00
7.4HC
M LO
SA
Mino
r Lan
e/Majo
r Mvm
tNB
Ln1
WBL
WBR
SBL
SBT
Capa
city (
veh/h
)-
--
1520
-HC
M La
ne V
/C R
atio
--
-0.0
31-
HCM
Contr
ol De
lay (s
)0
0-
7.40
HCM
Lane
LOS
AA
-A
AHC
M 95
th %
tile Q
(veh)
--
-0.1
-
03/14
/2017
The F
airfie
ld Inn
& S
uites
Sy
nchr
o 9 R
epor
tPM
Exis
ting
W-T
rans
Inter
secti
onInt
Dela
y, s/v
eh2.6
Move
ment
WBL
WBR
NBT
NBR
SBL
SBT
Lane
Con
figur
ation
sTr
affic
Vol, v
eh/h
112
42
066
4Fu
ture V
ol, ve
h/h1
124
20
664
Confl
icting
Ped
s, #/h
r0
00
00
0Si
gn C
ontro
l Fr
eeFr
eeSt
opSt
opFr
eeFr
eeRT
Cha
nneli
zed
-No
ne-
None
-No
neSt
orag
e Len
gth0
--
--
-Ve
h in M
edian
Stor
age,
#0
-0
--
0Gr
ade,
%0
-0
--
0Pe
ak H
our F
actor
9090
9090
9090
Heav
y Veh
icles
, %2
22
22
2Mv
mt F
low1
138
20
734
Major
/Mino
rMa
jor2
Mino
r1Ma
jor1
Confl
icting
Flow
All
4-
291
413
80
Stag
e 1-
-15
1-
--
Stag
e 2-
-14
0-
--
Critic
al Hd
wy4.1
2-
6.52
6.22
4.12
-Cr
itical
Hdwy
Stg
1-
-5.5
2-
--
Critic
al Hd
wy S
tg 2
--
--
--
Follo
w-up
Hdw
y2.2
18-
4.018
3.318
2.218
-Po
t Cap
-1 M
aneu
ver
1618
-61
910
8014
46-
Stag
e 1-
-77
2-
--
Stag
e 2-
--
--
-Pl
atoon
bloc
ked,
%-
-Mo
v Cap
-1 M
aneu
ver
1618
-0
1080
1446
-Mo
v Cap
-2 M
aneu
ver
--
0-
--
Stag
e 1-
-0
--
-
S
tage 2
--
0-
--
Appr
oach
WB
NBSB
HCM
Contr
ol De
lay, s
0.17.2
HCM
LOS
-
Mino
r Lan
e/Majo
r Mvm
tNB
Ln1
WBL
WBR
SBL
SBT
Capa
city (
veh/h
)-
1618
-14
46-
HCM
Lane
V/C
Rati
o-
0.001
-0.0
51-
HCM
Contr
ol De
lay (s
)-
7.2-
7.60
HCM
Lane
LOS
-A
-A
AHC
M 95
th %
tile Q
(veh)
-0
-0.2
-
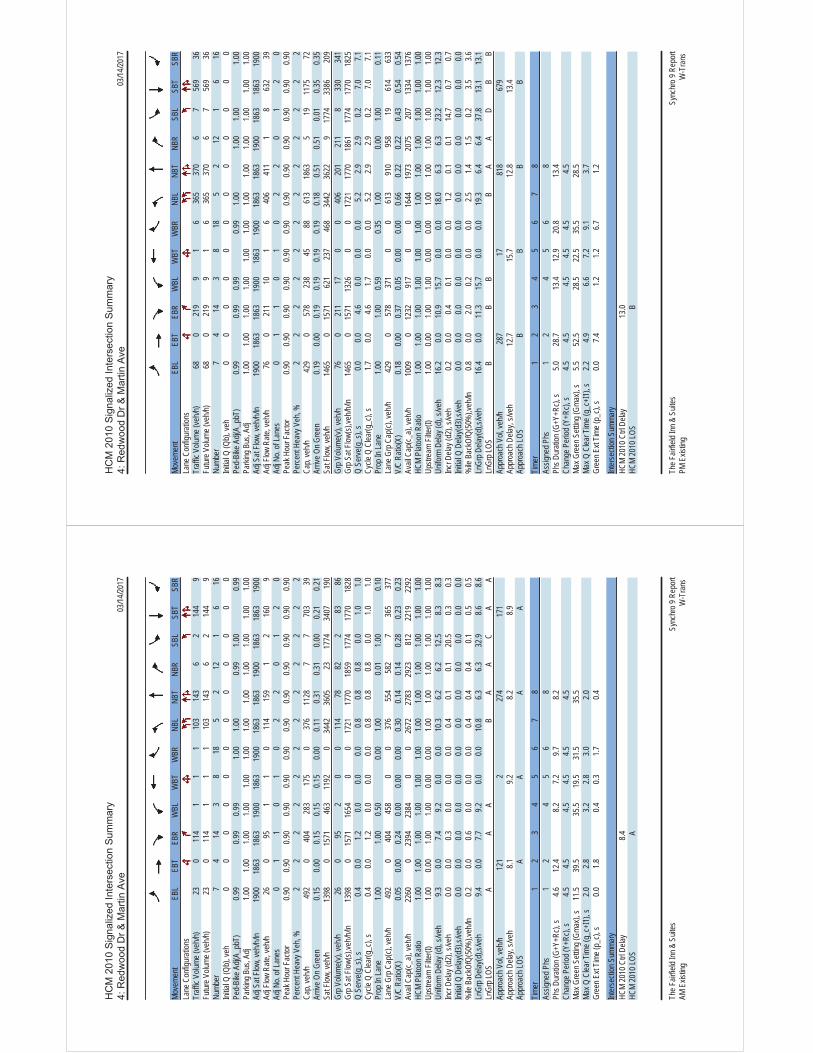
03/14
/2017
The F
airfie
ld Inn
& S
uites
Sync
hro 9
Rep
ort
AM E
xistin
gW
-Tra
ns
Move
ment
EBL
EBT
EBR
WBL
WBT
WBR
NBL
NBT
NBR
SBL
SBT
SBR
Lane
Con
figur
ation
sTr
affic
Volum
e (ve
h/h)
230
114
11
110
314
36
214
49
Futur
e Volu
me (v
eh/h)
230
114
11
110
314
36
214
49
Numb
er7
414
38
185
212
16
16Ini
tial Q
(Qb)
, veh
00
00
00
00
00
00
Ped-
Bike
Adj(
A_pb
T)0.9
90.9
90.9
91.0
01.0
00.9
91.0
00.9
9Pa
rking
Bus
, Adj
1.00
1.00
1.00
1.00
1.00
1.00
1.00
1.00
1.00
1.00
1.00
1.00
Adj S
at Flo
w, ve
h/h/ln
1900
1863
1863
1900
1863
1900
1863
1863
1900
1863
1863
1900
Adj F
low R
ate, v
eh/h
260
951
10
114
159
12
160
9Ad
j No.
of La
nes
01
10
10
22
01
20
Peak
Hou
r Fac
tor0.9
00.9
00.9
00.9
00.9
00.9
00.9
00.9
00.9
00.9
00.9
00.9
0Pe
rcent
Heav
y Veh
, %2
22
22
22
22
22
2Ca
p, ve
h/h49
20
404
283
175
037
611
287
770
339
Arriv
e On G
reen
0.15
0.00
0.15
0.15
0.15
0.00
0.11
0.31
0.31
0.00
0.21
0.21
Sat F
low, v
eh/h
1398
015
7146
311
920
3442
3605
2317
7434
0719
0Gr
p Volu
me(v)
, veh
/h26
095
20
011
478
822
8386
Grp S
at Flo
w(s),
veh/h
/ln13
980
1571
1654
00
1721
1770
1859
1774
1770
1828
Q Se
rve(g
_s),
s0.4
0.01.2
0.00.0
0.00.8
0.80.8
0.01.0
1.0Cy
cle Q
Clea
r(g_c
), s
0.40.0
1.20.0
0.00.0
0.80.8
0.80.0
1.01.0
Prop
In La
ne1.0
01.0
00.5
00.0
01.0
00.0
11.0
00.1
0La
ne G
rp C
ap(c)
, veh
/h49
20
404
458
00
376
554
582
736
537
7V/
C Ra
tio(X
)0.0
50.0
00.2
40.0
00.0
00.0
00.3
00.1
40.1
40.2
80.2
30.2
3Av
ail C
ap(c_
a), v
eh/h
2260
023
9423
840
026
7227
8329
2381
222
1922
92HC
M Pl
atoon
Rati
o1.0
01.0
01.0
01.0
01.0
01.0
01.0
01.0
01.0
01.0
01.0
01.0
0Up
strea
m Fil
ter(I)
1.00
0.00
1.00
1.00
0.00
0.00
1.00
1.00
1.00
1.00
1.00
1.00
Unifo
rm D
elay (
d), s
/veh
9.30.0
7.49.2
0.00.0
10.3
6.26.2
12.5
8.38.3
Incr D
elay (
d2),
s/veh
0.00.0
0.30.0
0.00.0
0.40.1
0.120
.50.3
0.3Ini
tial Q
Dela
y(d3)
,s/ve
h0.0
0.00.0
0.00.0
0.00.0
0.00.0
0.00.0
0.0%
ile B
ackO
fQ(5
0%),v
eh/ln
0.20.0
0.60.0
0.00.0
0.40.4
0.40.1
0.50.5
LnGr
p Dela
y(d),s
/veh
9.40.0
7.79.2
0.00.0
10.8
6.36.3
32.9
8.68.6
LnGr
p LOS
AA
AB
AA
CA
AAp
proa
ch V
ol, ve
h/h12
12
274
171
Appr
oach
Dela
y, s/v
eh8.1
9.28.2
8.9Ap
proa
ch LO
SA
AA
A
Timer
12
34
56
78
Assig
ned P
hs1
24
56
8Ph
s Dur
ation
(G+Y
+Rc),
s4.6
12.4
8.27.2
9.78.2
Chan
ge P
eriod
(Y+R
c), s
4.54.5
4.54.5
4.54.5
Max G
reen
Sett
ing (G
max),
s11
.539
.535
.519
.531
.535
.5Ma
x Q C
lear T
ime (
g_c+
I1), s
2.02.8
3.22.8
3.02.0
Gree
n Ext
Time (
p_c),
s0.0
1.80.4
0.31.7
0.4
Inter
secti
on S
umma
ryHC
M 20
10 C
trl De
lay8.4
HCM
2010
LOS
A
03/14
/2017
The F
airfie
ld Inn
& S
uites
Sy
nchr
o 9 R
epor
tPM
Exis
ting
W-T
rans
Move
ment
EBL
EBT
EBR
WBL
WBT
WBR
NBL
NBT
NBR
SBL
SBT
SBR
Lane
Con
figur
ation
sTr
affic
Volum
e (ve
h/h)
680
219
91
636
537
06
756
936
Futur
e Volu
me (v
eh/h)
680
219
91
636
537
06
756
936
Numb
er7
414
38
185
212
16
16Ini
tial Q
(Qb)
, veh
00
00
00
00
00
00
Ped-
Bike
Adj(
A_pb
T)0.9
90.9
90.9
90.9
91.0
01.0
01.0
01.0
0Pa
rking
Bus
, Adj
1.00
1.00
1.00
1.00
1.00
1.00
1.00
1.00
1.00
1.00
1.00
1.00
Adj S
at Flo
w, ve
h/h/ln
1900
1863
1863
1900
1863
1900
1863
1863
1900
1863
1863
1900
Adj F
low R
ate, v
eh/h
760
211
101
640
641
11
863
239
Adj N
o. of
Lane
s0
11
01
02
20
12
0Pe
ak H
our F
actor
0.90
0.90
0.90
0.90
0.90
0.90
0.90
0.90
0.90
0.90
0.90
0.90
Perce
nt He
avy V
eh, %
22
22
22
22
22
22
Cap,
veh/h
429
057
823
845
8861
318
635
1911
7572
Arriv
e On G
reen
0.19
0.00
0.19
0.19
0.19
0.19
0.18
0.51
0.51
0.01
0.35
0.35
Sat F
low, v
eh/h
1465
015
7162
123
746
834
4236
229
1774
3386
209
Grp V
olume
(v), v
eh/h
760
211
170
040
620
121
18
330
341
Grp S
at Flo
w(s),
veh/h
/ln14
650
1571
1326
00
1721
1770
1861
1774
1770
1825
Q Se
rve(g
_s),
s0.0
0.04.6
0.00.0
0.05.2
2.92.9
0.27.0
7.1Cy
cle Q
Clea
r(g_c
), s
1.70.0
4.61.7
0.00.0
5.22.9
2.90.2
7.07.1
Prop
In La
ne1.0
01.0
00.5
90.3
51.0
00.0
01.0
00.1
1La
ne G
rp C
ap(c)
, veh
/h42
90
578
371
00
613
910
958
1961
463
3V/
C Ra
tio(X
)0.1
80.0
00.3
70.0
50.0
00.0
00.6
60.2
20.2
20.4
30.5
40.5
4Av
ail C
ap(c_
a), v
eh/h
1009
012
3291
70
016
4419
7320
7520
713
3413
76HC
M Pl
atoon
Rati
o1.0
01.0
01.0
01.0
01.0
01.0
01.0
01.0
01.0
01.0
01.0
01.0
0Up
strea
m Fil
ter(I)
1.00
0.00
1.00
1.00
0.00
0.00
1.00
1.00
1.00
1.00
1.00
1.00
Unifo
rm D
elay (
d), s
/veh
16.2
0.010
.915
.70.0
0.018
.06.3
6.323
.212
.312
.3Inc
r Dela
y (d2
), s/v
eh0.2
0.00.4
0.10.0
0.01.2
0.10.1
14.7
0.70.7
Initia
l Q D
elay(d
3),s/
veh
0.00.0
0.00.0
0.00.0
0.00.0
0.00.0
0.00.0
%ile
Bac
kOfQ
(50%
),veh
/ln0.8
0.02.0
0.20.0
0.02.5
1.41.5
0.23.5
3.6Ln
Grp D
elay(d
),s/ve
h16
.40.0
11.3
15.7
0.00.0
19.3
6.46.4
37.8
13.1
13.1
LnGr
p LOS
BB
BB
AA
DB
BAp
proa
ch V
ol, ve
h/h28
717
818
679
Appr
oach
Dela
y, s/v
eh12
.715
.712
.813
.4Ap
proa
ch LO
SB
BB
B
Timer
12
34
56
78
Assig
ned P
hs1
24
56
8Ph
s Dur
ation
(G+Y
+Rc),
s5.0
28.7
13.4
12.9
20.8
13.4
Chan
ge P
eriod
(Y+R
c), s
4.54.5
4.54.5
4.54.5
Max G
reen
Sett
ing (G
max),
s5.5
52.5
28.5
22.5
35.5
28.5
Max Q
Clea
r Tim
e (g_
c+I1)
, s2.2
4.96.6
7.29.1
3.7Gr
een E
xt Tim
e (p_
c), s
0.07.4
1.21.2
6.71.2
Inter
secti
on S
umma
ryHC
M 20
10 C
trl De
lay13
.0HC
M 20
10 LO
SB
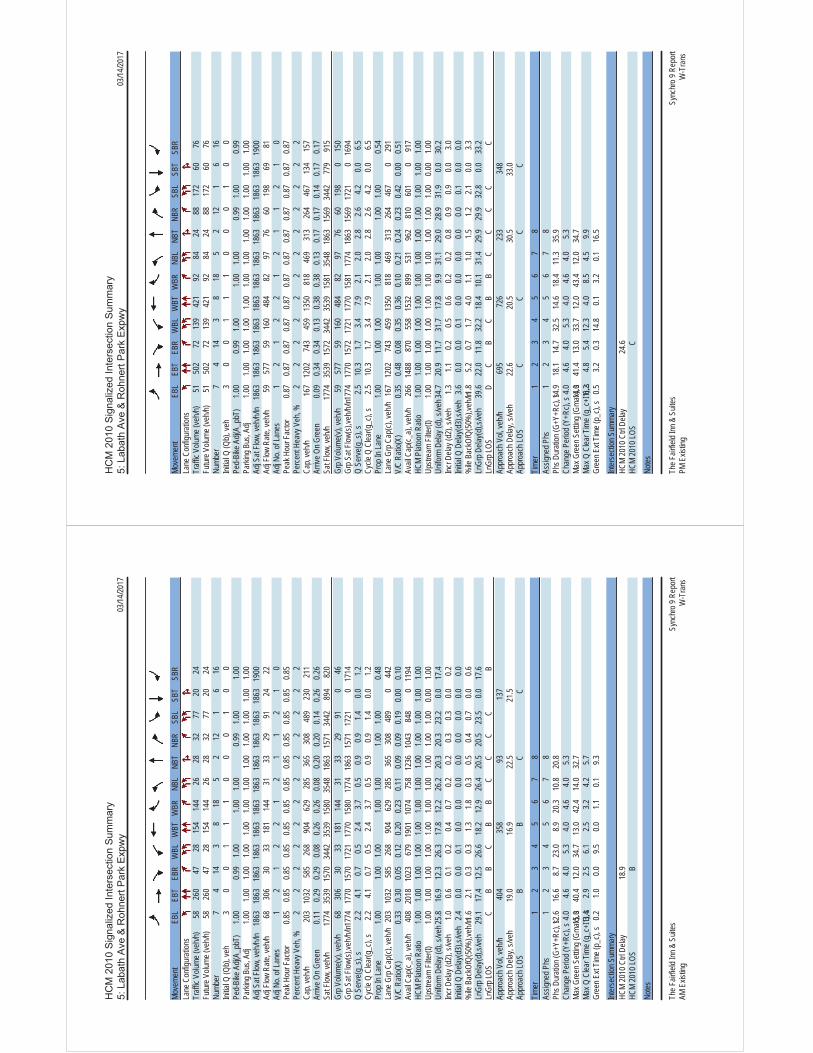
03/14
/2017
The F
airfie
ld Inn
& S
uites
Sync
hro 9
Rep
ort
AM E
xistin
gW
-Tra
ns
Move
ment
EBL
EBT
EBR
WBL
WBT
WBR
NBL
NBT
NBR
SBL
SBT
SBR
Lane
Con
figur
ation
sTr
affic
Volum
e (ve
h/h)
5826
047
2815
414
426
2832
7720
24Fu
ture V
olume
(veh
/h)58
260
4728
154
144
2628
3277
2024
Numb
er7
414
38
185
212
16
16Ini
tial Q
(Qb)
, veh
30
01
11
00
01
00
Ped-
Bike
Adj(
A_pb
T)1.0
00.9
91.0
01.0
01.0
00.9
91.0
01.0
0Pa
rking
Bus
, Adj
1.00
1.00
1.00
1.00
1.00
1.00
1.00
1.00
1.00
1.00
1.00
1.00
Adj S
at Flo
w, ve
h/h/ln
1863
1863
1863
1863
1863
1863
1863
1863
1863
1863
1863
1900
Adj F
low R
ate, v
eh/h
6830
630
3318
114
431
3329
9124
22Ad
j No.
of La
nes
12
12
21
21
12
10
Peak
Hou
r Fac
tor0.8
50.8
50.8
50.8
50.8
50.8
50.8
50.8
50.8
50.8
50.8
50.8
5Pe
rcent
Heav
y Veh
, %2
22
22
22
22
22
2Ca
p, ve
h/h20
310
3258
526
890
462
928
536
530
848
923
021
1Ar
rive O
n Gre
en0.1
10.2
90.2
90.0
80.2
60.2
60.0
80.2
00.2
00.1
40.2
60.2
6Sa
t Flow
, veh
/h17
7435
3915
7034
4235
3915
8035
4818
6315
7134
4289
482
0Gr
p Volu
me(v)
, veh
/h68
306
3033
181
144
3133
2991
046
Grp S
at Flo
w(s),
veh/h
/ln17
7417
7015
7017
2117
7015
8017
7418
6315
7117
210
1714
Q Se
rve(g
_s),
s2.2
4.10.7
0.52.4
3.70.5
0.90.9
1.40.0
1.2Cy
cle Q
Clea
r(g_c
), s
2.24.1
0.70.5
2.43.7
0.50.9
0.91.4
0.01.2
Prop
In La
ne1.0
01.0
01.0
01.0
01.0
01.0
01.0
00.4
8La
ne G
rp C
ap(c)
, veh
/h20
310
3258
526
890
462
928
536
530
848
90
442
V/C
Ratio
(X)
0.33
0.30
0.05
0.12
0.20
0.23
0.11
0.09
0.09
0.19
0.00
0.10
Avail
Cap
(c_a)
, veh
/h40
820
1810
2367
919
0110
7475
812
3610
4384
80
1194
HCM
Plato
on R
atio
1.00
1.00
1.00
1.00
1.00
1.00
1.00
1.00
1.00
1.00
1.00
1.00
Upstr
eam
Filter
(I)1.0
01.0
01.0
01.0
01.0
01.0
01.0
01.0
01.0
01.0
00.0
01.0
0Un
iform
Dela
y (d)
, s/ve
h25.8
16.9
12.3
26.3
17.8
12.2
26.2
20.3
20.3
23.2
0.017
.4Inc
r Dela
y (d2
), s/v
eh1.0
0.60.1
0.20.4
0.70.2
0.20.3
0.30.0
0.2Ini
tial Q
Dela
y(d3)
,s/ve
h2.4
0.00.0
0.10.0
0.00.0
0.00.0
0.00.0
0.0%
ile B
ackO
fQ(5
0%),v
eh/ln1
.62.1
0.30.3
1.31.8
0.30.5
0.40.7
0.00.6
LnGr
p Dela
y(d),s
/veh
29.1
17.4
12.5
26.6
18.2
12.9
26.4
20.5
20.5
23.5
0.017
.6Ln
Grp L
OSC
BB
CB
BC
CC
CB
Appr
oach
Vol,
veh/h
404
358
9313
7Ap
proa
ch D
elay,
s/veh
19.0
16.9
22.5
21.5
Appr
oach
LOS
BB
CC
Timer
12
34
56
78
Assig
ned P
hs1
23
45
67
8Ph
s Dur
ation
(G+Y
+Rc),
s12.6
16.6
8.723
.08.9
20.3
10.8
20.8
Chan
ge P
eriod
(Y+R
c), s
4.04.6
4.05.3
4.04.6
4.05.3
Max G
reen
Sett
ing (G
max),
s15
.040
.412
.034
.713
.042
.414
.032
.7Ma
x Q C
lear T
ime (
g_c+
I1), s3.4
2.92.5
6.12.5
3.24.2
5.7Gr
een E
xt Tim
e (p_
c), s
0.21.0
0.09.5
0.01.1
0.19.3
Inter
secti
on S
umma
ryHC
M 20
10 C
trl De
lay18
.9HC
M 20
10 LO
SB
Notes
03/14
/2017
The F
airfie
ld Inn
& S
uites
Sy
nchr
o 9 R
epor
tPM
Exis
ting
W-T
rans
Move
ment
EBL
EBT
EBR
WBL
WBT
WBR
NBL
NBT
NBR
SBL
SBT
SBR
Lane
Con
figur
ation
sTr
affic
Volum
e (ve
h/h)
5150
272
139
421
9284
2488
172
6076
Futur
e Volu
me (v
eh/h)
5150
272
139
421
9284
2488
172
6076
Numb
er7
414
38
185
212
16
16Ini
tial Q
(Qb)
, veh
30
01
11
00
01
00
Ped-
Bike
Adj(
A_pb
T)1.0
00.9
91.0
01.0
01.0
00.9
91.0
00.9
9Pa
rking
Bus
, Adj
1.00
1.00
1.00
1.00
1.00
1.00
1.00
1.00
1.00
1.00
1.00
1.00
Adj S
at Flo
w, ve
h/h/ln
1863
1863
1863
1863
1863
1863
1863
1863
1863
1863
1863
1900
Adj F
low R
ate, v
eh/h
5957
759
160
484
8297
7660
198
6981
Adj N
o. of
Lane
s1
21
22
12
11
21
0Pe
ak H
our F
actor
0.87
0.87
0.87
0.87
0.87
0.87
0.87
0.87
0.87
0.87
0.87
0.87
Perce
nt He
avy V
eh, %
22
22
22
22
22
22
Cap,
veh/h
167
1202
743
459
1350
818
469
313
264
467
134
157
Arriv
e On G
reen
0.09
0.34
0.34
0.13
0.38
0.38
0.13
0.17
0.17
0.14
0.17
0.17
Sat F
low, v
eh/h
1774
3539
1572
3442
3539
1581
3548
1863
1569
3442
779
915
Grp V
olume
(v), v
eh/h
5957
759
160
484
8297
7660
198
015
0Gr
p Sat
Flow(
s),ve
h/h/ln
1774
1770
1572
1721
1770
1581
1774
1863
1569
1721
016
94Q
Serve
(g_s
), s
2.510
.31.7
3.47.9
2.12.0
2.82.6
4.20.0
6.5Cy
cle Q
Clea
r(g_c
), s
2.510
.31.7
3.47.9
2.12.0
2.82.6
4.20.0
6.5Pr
op In
Lane
1.00
1.00
1.00
1.00
1.00
1.00
1.00
0.54
Lane
Grp
Cap
(c), v
eh/h
167
1202
743
459
1350
818
469
313
264
467
029
1V/
C Ra
tio(X
)0.3
50.4
80.0
80.3
50.3
60.1
00.2
10.2
40.2
30.4
20.0
00.5
1Av
ail C
ap(c_
a), v
eh/h
266
1488
870
558
1532
899
531
962
810
601
091
7HC
M Pl
atoon
Rati
o1.0
01.0
01.0
01.0
01.0
01.0
01.0
01.0
01.0
01.0
01.0
01.0
0Up
strea
m Fil
ter(I)
1.00
1.00
1.00
1.00
1.00
1.00
1.00
1.00
1.00
1.00
0.00
1.00
Unifo
rm D
elay (
d), s
/veh3
4.720
.911
.731
.717
.89.9
31.1
29.0
28.9
31.9
0.030
.2Inc
r Dela
y (d2
), s/v
eh1.3
1.10.2
0.50.6
0.20.2
0.80.9
0.90.0
3.0Ini
tial Q
Dela
y(d3)
,s/ve
h3.6
0.00.0
0.10.0
0.00.0
0.00.0
0.10.0
0.0%
ile B
ackO
fQ(5
0%),v
eh/ln1
.85.2
0.71.7
4.01.1
1.01.5
1.22.1
0.03.3
LnGr
p Dela
y(d),s
/veh
39.6
22.0
11.8
32.2
18.4
10.1
31.4
29.9
29.9
32.8
0.033
.2Ln
Grp L
OSD
CB
CB
BC
CC
CC
Appr
oach
Vol,
veh/h
695
726
233
348
Appr
oach
Dela
y, s/v
eh22
.620
.530
.533
.0Ap
proa
ch LO
SC
CC
C
Timer
12
34
56
78
Assig
ned P
hs1
23
45
67
8Ph
s Dur
ation
(G+Y
+Rc),
s14.9
18.1
14.7
32.5
14.6
18.4
11.3
35.9
Chan
ge P
eriod
(Y+R
c), s
4.04.6
4.05.3
4.04.6
4.05.3
Max G
reen
Sett
ing (G
max),
s14
.041
.413
.033
.712
.043
.412
.034
.7Ma
x Q C
lear T
ime (
g_c+
I1), s6.2
4.85.4
12.3
4.08.5
4.59.9
Gree
n Ext
Time (
p_c),
s0.5
3.20.3
14.8
0.13.2
0.116
.5
Inter
secti
on S
umma
ryHC
M 20
10 C
trl De
lay24
.6HC
M 20
10 LO
SC
Notes
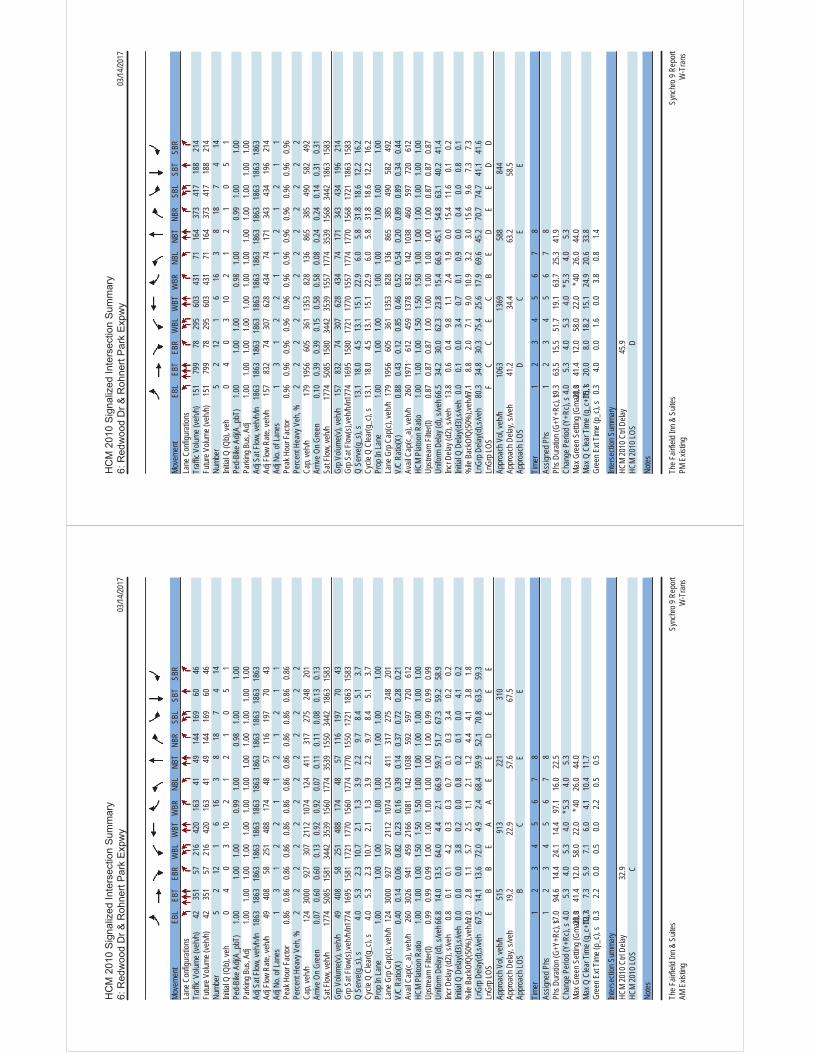
03/14
/2017
The F
airfie
ld Inn
& S
uites
Sync
hro 9
Rep
ort
AM E
xistin
gW
-Tra
ns
Move
ment
EBL
EBT
EBR
WBL
WBT
WBR
NBL
NBT
NBR
SBL
SBT
SBR
Lane
Con
figur
ation
sTr
affic
Volum
e (ve
h/h)
4235
157
216
420
163
4149
144
169
6046
Futur
e Volu
me (v
eh/h)
4235
157
216
420
163
4149
144
169
6046
Numb
er5
212
16
163
818
74
14Ini
tial Q
(Qb)
, veh
04
03
102
12
10
51
Ped-
Bike
Adj(
A_pb
T)1.0
01.0
01.0
00.9
91.0
00.9
81.0
01.0
0Pa
rking
Bus
, Adj
1.00
1.00
1.00
1.00
1.00
1.00
1.00
1.00
1.00
1.00
1.00
1.00
Adj S
at Flo
w, ve
h/h/ln
1863
1863
1863
1863
1863
1863
1863
1863
1863
1863
1863
1863
Adj F
low R
ate, v
eh/h
4940
858
251
488
174
4857
116
197
7043
Adj N
o. of
Lane
s1
31
22
11
21
21
1Pe
ak H
our F
actor
0.86
0.86
0.86
0.86
0.86
0.86
0.86
0.86
0.86
0.86
0.86
0.86
Perce
nt He
avy V
eh, %
22
22
22
22
22
22
Cap,
veh/h
124
3000
927
307
2112
1074
124
411
317
275
248
201
Arriv
e On G
reen
0.07
0.60
0.60
0.13
0.92
0.92
0.07
0.11
0.11
0.08
0.13
0.13
Sat F
low, v
eh/h
1774
5085
1581
3442
3539
1560
1774
3539
1550
3442
1863
1583
Grp V
olume
(v), v
eh/h
4940
858
251
488
174
4857
116
197
7043
Grp S
at Flo
w(s),
veh/h
/ln17
7416
9515
8117
2117
7015
6017
7417
7015
5017
2118
6315
83Q
Serve
(g_s
), s
4.05.3
2.310
.72.1
1.33.9
2.29.7
8.45.1
3.7Cy
cle Q
Clea
r(g_c
), s
4.05.3
2.310
.72.1
1.33.9
2.29.7
8.45.1
3.7Pr
op In
Lane
1.00
1.00
1.00
1.00
1.00
1.00
1.00
1.00
Lane
Grp
Cap
(c), v
eh/h
124
3000
927
307
2112
1074
124
411
317
275
248
201
V/C
Ratio
(X)
0.40
0.14
0.06
0.82
0.23
0.16
0.39
0.14
0.37
0.72
0.28
0.21
Avail
Cap
(c_a)
, veh
/h26
030
2694
145
921
6610
8114
210
3859
259
772
061
2HC
M Pl
atoon
Rati
o1.0
01.0
01.0
01.5
01.5
01.5
01.0
01.0
01.0
01.0
01.0
01.0
0Up
strea
m Fil
ter(I)
0.99
0.99
0.99
1.00
1.00
1.00
1.00
1.00
1.00
0.99
0.99
0.99
Unifo
rm D
elay (
d), s
/veh6
6.814
.013
.564
.04.4
2.166
.959
.751
.767
.359
.258
.9Inc
r Dela
y (d2
), s/v
eh0.8
0.10.1
4.20.3
0.30.7
0.10.3
3.40.2
0.2Ini
tial Q
Dela
y(d3)
,s/ve
h0.0
0.00.0
3.80.2
0.00.8
0.20.1
0.04.1
0.2%
ile B
ackO
fQ(5
0%),v
eh/ln2
.02.8
1.15.7
2.51.1
2.11.2
4.44.1
3.81.8
LnGr
p Dela
y(d),s
/veh
67.5
14.1
13.6
72.0
4.92.4
68.4
59.9
52.1
70.8
63.5
59.3
LnGr
p LOS
EB
BE
AA
EE
DE
EE
Appr
oach
Vol,
veh/h
515
913
221
310
Appr
oach
Dela
y, s/v
eh19
.222
.957
.667
.5Ap
proa
ch LO
SB
CE
E
Timer
12
34
56
78
Assig
ned P
hs1
23
45
67
8Ph
s Dur
ation
(G+Y
+Rc),
s17.0
94.6
14.4
24.1
14.4
97.1
16.0
22.5
Chan
ge P
eriod
(Y+R
c), s
4.05.3
4.05.3
4.0* 5
.34.0
5.3Ma
x Gre
en S
etting
(Gma
x), s
20.0
41.4
12.0
58.0
22.0
* 40
26.0
44.0
Max Q
Clea
r Tim
e (g_
c+I1)
, s12
.77.3
5.97.1
6.04.1
10.4
11.7
Gree
n Ext
Time (
p_c),
s0.3
2.20.0
0.50.0
2.20.5
0.5
Inter
secti
on S
umma
ryHC
M 20
10 C
trl De
lay32
.9HC
M 20
10 LO
SC
Notes
03/14
/2017
The F
airfie
ld Inn
& S
uites
Sy
nchr
o 9 R
epor
tPM
Exis
ting
W-T
rans
Move
ment
EBL
EBT
EBR
WBL
WBT
WBR
NBL
NBT
NBR
SBL
SBT
SBR
Lane
Con
figur
ation
sTr
affic
Volum
e (ve
h/h)
151
799
7829
560
343
171
164
373
417
188
214
Futur
e Volu
me (v
eh/h)
151
799
7829
560
343
171
164
373
417
188
214
Numb
er5
212
16
163
818
74
14Ini
tial Q
(Qb)
, veh
04
03
102
12
10
51
Ped-
Bike
Adj(
A_pb
T)1.0
01.0
01.0
00.9
81.0
00.9
91.0
01.0
0Pa
rking
Bus
, Adj
1.00
1.00
1.00
1.00
1.00
1.00
1.00
1.00
1.00
1.00
1.00
1.00
Adj S
at Flo
w, ve
h/h/ln
1863
1863
1863
1863
1863
1863
1863
1863
1863
1863
1863
1863
Adj F
low R
ate, v
eh/h
157
832
7430
762
843
474
171
343
434
196
214
Adj N
o. of
Lane
s1
31
22
11
21
21
1Pe
ak H
our F
actor
0.96
0.96
0.96
0.96
0.96
0.96
0.96
0.96
0.96
0.96
0.96
0.96
Perce
nt He
avy V
eh, %
22
22
22
22
22
22
Cap,
veh/h
179
1956
605
361
1353
828
136
865
385
490
582
492
Arriv
e On G
reen
0.10
0.39
0.39
0.15
0.58
0.58
0.08
0.24
0.24
0.14
0.31
0.31
Sat F
low, v
eh/h
1774
5085
1580
3442
3539
1557
1774
3539
1568
3442
1863
1583
Grp V
olume
(v), v
eh/h
157
832
7430
762
843
474
171
343
434
196
214
Grp S
at Flo
w(s),
veh/h
/ln17
7416
9515
8017
2117
7015
5717
7417
7015
6817
2118
6315
83Q
Serve
(g_s
), s
13.1
18.0
4.513
.115
.122
.96.0
5.831
.818
.612
.216
.2Cy
cle Q
Clea
r(g_c
), s
13.1
18.0
4.513
.115
.122
.96.0
5.831
.818
.612
.216
.2Pr
op In
Lane
1.00
1.00
1.00
1.00
1.00
1.00
1.00
1.00
Lane
Grp
Cap
(c), v
eh/h
179
1956
605
361
1353
828
136
865
385
490
582
492
V/C
Ratio
(X)
0.88
0.43
0.12
0.85
0.46
0.52
0.54
0.20
0.89
0.89
0.34
0.44
Avail
Cap
(c_a)
, veh
/h26
019
7161
245
913
7883
214
210
3846
059
772
061
2HC
M Pl
atoon
Rati
o1.0
01.0
01.0
01.5
01.5
01.5
01.0
01.0
01.0
01.0
01.0
01.0
0Up
strea
m Fil
ter(I)
0.87
0.87
0.87
1.00
1.00
1.00
1.00
1.00
1.00
0.87
0.87
0.87
Unifo
rm D
elay (
d), s
/veh6
6.534
.230
.062
.323
.815
.466
.945
.154
.863
.140
.241
.4Inc
r Dela
y (d2
), s/v
eh13
.80.6
0.49.8
1.12.4
1.90.0
15.4
11.6
0.10.2
Initia
l Q D
elay(d
3),s/
veh
0.00.1
0.03.4
0.70.1
0.90.0
0.40.0
0.80.1
%ile
Bac
kOfQ
(50%
),veh
/ln7.1
8.82.0
7.19.0
10.9
3.23.0
15.6
9.67.3
7.3Ln
Grp D
elay(d
),s/ve
h80
.334
.830
.375
.425
.617
.969
.645
.270
.774
.741
.141
.6Ln
Grp L
OSF
CC
EC
BE
DE
ED
DAp
proa
ch V
ol, ve
h/h10
6313
6958
884
4Ap
proa
ch D
elay,
s/veh
41.2
34.4
63.2
58.5
Appr
oach
LOS
DC
EE
Timer
12
34
56
78
Assig
ned P
hs1
23
45
67
8Ph
s Dur
ation
(G+Y
+Rc),
s19.3
63.5
15.5
51.7
19.1
63.7
25.3
41.9
Chan
ge P
eriod
(Y+R
c), s
4.05.3
4.05.3
4.0* 5
.34.0
5.3Ma
x Gre
en S
etting
(Gma
x), s
20.0
41.4
12.0
58.0
22.0
* 40
26.0
44.0
Max Q
Clea
r Tim
e (g_
c+I1)
, s15
.120
.08.0
18.2
15.1
24.9
20.6
33.8
Gree
n Ext
Time (
p_c),
s0.3
4.00.0
1.60.0
3.80.8
1.4
Inter
secti
on S
umma
ryHC
M 20
10 C
trl De
lay45
.9HC
M 20
10 LO
SD
Notes
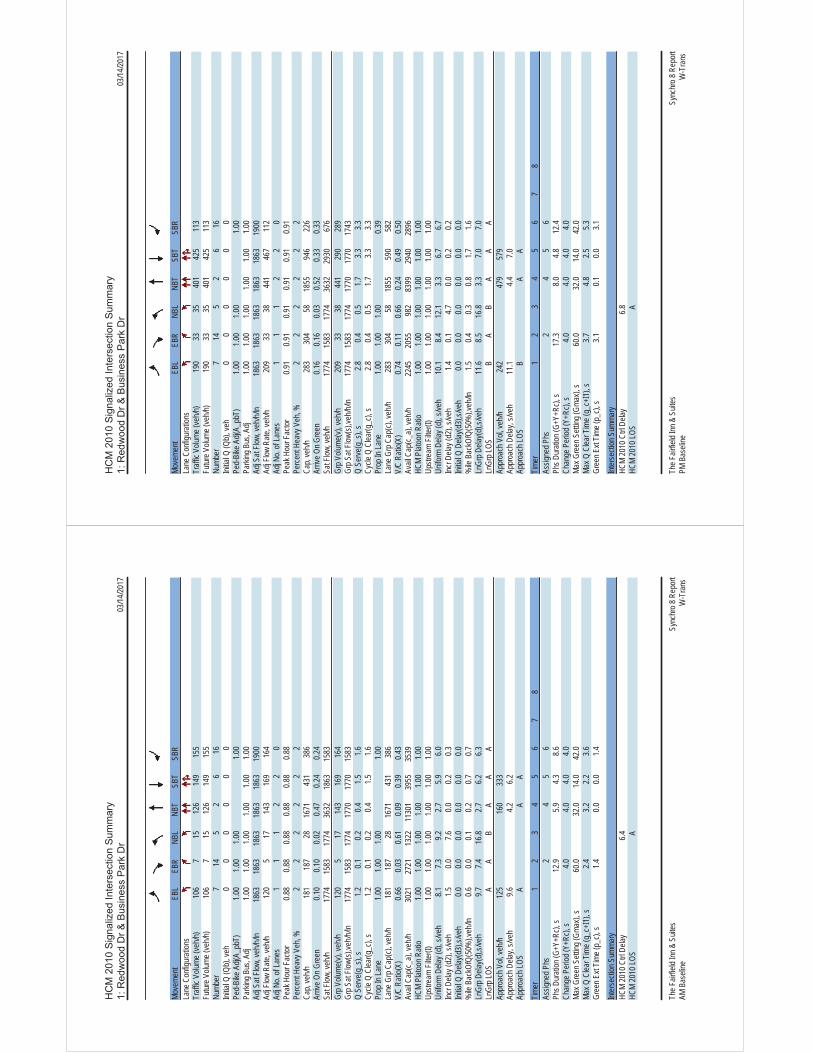
03/14
/2017
The F
airfie
ld Inn
& S
uites
Sync
hro 8
Rep
ort
AM B
aseli
neW
-Tra
ns
Move
ment
EBL
EBR
NBL
NBT
SBT
SBR
Lane
Con
figur
ation
sTr
affic
Volum
e (ve
h/h)
106
715
126
149
155
Futur
e Volu
me (v
eh/h)
106
715
126
149
155
Numb
er7
145
26
16Ini
tial Q
(Qb)
, veh
00
00
00
Ped-
Bike
Adj(
A_pb
T)1.0
01.0
01.0
01.0
0Pa
rking
Bus
, Adj
1.00
1.00
1.00
1.00
1.00
1.00
Adj S
at Flo
w, ve
h/h/ln
1863
1863
1863
1863
1863
1900
Adj F
low R
ate, v
eh/h
120
517
143
169
164
Adj N
o. of
Lane
s1
11
22
0Pe
ak H
our F
actor
0.88
0.88
0.88
0.88
0.88
0.88
Perce
nt He
avy V
eh, %
22
22
22
Cap,
veh/h
181
187
2816
7143
138
6Ar
rive O
n Gre
en0.1
00.1
00.0
20.4
70.2
40.2
4Sa
t Flow
, veh
/h17
7415
8317
7436
3218
6315
83Gr
p Volu
me(v)
, veh
/h12
05
1714
316
916
4Gr
p Sat
Flow(
s),ve
h/h/ln
1774
1583
1774
1770
1770
1583
Q Se
rve(g
_s),
s1.2
0.10.2
0.41.5
1.6Cy
cle Q
Clea
r(g_c
), s
1.20.1
0.20.4
1.51.6
Prop
In La
ne1.0
01.0
01.0
01.0
0La
ne G
rp C
ap(c)
, veh
/h18
118
728
1671
431
386
V/C
Ratio
(X)
0.66
0.03
0.61
0.09
0.39
0.43
Avail
Cap
(c_a)
, veh
/h30
2127
2113
2211
301
3955
3539
HCM
Plato
on R
atio
1.00
1.00
1.00
1.00
1.00
1.00
Upstr
eam
Filter
(I)1.0
01.0
01.0
01.0
01.0
01.0
0Un
iform
Dela
y (d)
, s/ve
h8.1
7.39.2
2.75.9
6.0Inc
r Dela
y (d2
), s/v
eh1.5
0.07.6
0.00.2
0.3Ini
tial Q
Dela
y(d3)
,s/ve
h0.0
0.00.0
0.00.0
0.0%
ile B
ackO
fQ(5
0%),v
eh/ln
0.60.0
0.10.2
0.70.7
LnGr
p Dela
y(d),s
/veh
9.77.4
16.8
2.76.2
6.3Ln
Grp L
OSA
AB
AA
AAp
proa
ch V
ol, ve
h/h12
516
033
3Ap
proa
ch D
elay,
s/veh
9.64.2
6.2Ap
proa
ch LO
SA
AA
Timer
12
34
56
78
Assig
ned P
hs2
45
6Ph
s Dur
ation
(G+Y
+Rc),
s12
.95.9
4.38.6
Chan
ge P
eriod
(Y+R
c), s
4.04.0
4.04.0
Max G
reen
Sett
ing (G
max),
s60
.032
.014
.042
.0Ma
x Q C
lear T
ime (
g_c+
I1), s
2.43.2
2.23.6
Gree
n Ext
Time (
p_c),
s1.4
0.00.0
1.4
Inter
secti
on S
umma
ryHC
M 20
10 C
trl De
lay6.4
HCM
2010
LOS
A
03/14
/2017
The F
airfie
ld Inn
& S
uites
Sync
hro 8
Rep
ort
PM B
aseli
neW
-Tra
ns
Move
ment
EBL
EBR
NBL
NBT
SBT
SBR
Lane
Con
figur
ation
sTr
affic
Volum
e (ve
h/h)
190
3335
401
425
113
Futur
e Volu
me (v
eh/h)
190
3335
401
425
113
Numb
er7
145
26
16Ini
tial Q
(Qb)
, veh
00
00
00
Ped-
Bike
Adj(
A_pb
T)1.0
01.0
01.0
01.0
0Pa
rking
Bus
, Adj
1.00
1.00
1.00
1.00
1.00
1.00
Adj S
at Flo
w, ve
h/h/ln
1863
1863
1863
1863
1863
1900
Adj F
low R
ate, v
eh/h
209
3338
441
467
112
Adj N
o. of
Lane
s1
11
22
0Pe
ak H
our F
actor
0.91
0.91
0.91
0.91
0.91
0.91
Perce
nt He
avy V
eh, %
22
22
22
Cap,
veh/h
283
304
5818
5594
622
6Ar
rive O
n Gre
en0.1
60.1
60.0
30.5
20.3
30.3
3Sa
t Flow
, veh
/h17
7415
8317
7436
3229
3067
6Gr
p Volu
me(v)
, veh
/h20
933
3844
129
028
9Gr
p Sat
Flow(
s),ve
h/h/ln
1774
1583
1774
1770
1770
1743
Q Se
rve(g
_s),
s2.8
0.40.5
1.73.3
3.3Cy
cle Q
Clea
r(g_c
), s
2.80.4
0.51.7
3.33.3
Prop
In La
ne1.0
01.0
01.0
00.3
9La
ne G
rp C
ap(c)
, veh
/h28
330
458
1855
590
582
V/C
Ratio
(X)
0.74
0.11
0.66
0.24
0.49
0.50
Avail
Cap
(c_a)
, veh
/h22
4520
5598
283
9929
4028
96HC
M Pl
atoon
Rati
o1.0
01.0
01.0
01.0
01.0
01.0
0Up
strea
m Fil
ter(I)
1.00
1.00
1.00
1.00
1.00
1.00
Unifo
rm D
elay (
d), s
/veh
10.1
8.412
.13.3
6.76.7
Incr D
elay (
d2),
s/veh
1.40.1
4.70.0
0.20.2
Initia
l Q D
elay(d
3),s/
veh
0.00.0
0.00.0
0.00.0
%ile
Bac
kOfQ
(50%
),veh
/ln1.5
0.40.3
0.81.7
1.6Ln
Grp D
elay(d
),s/ve
h11
.68.5
16.8
3.37.0
7.0Ln
Grp L
OSB
AB
AA
AAp
proa
ch V
ol, ve
h/h24
247
957
9Ap
proa
ch D
elay,
s/veh
11.1
4.47.0
Appr
oach
LOS
BA
A
Timer
12
34
56
78
Assig
ned P
hs2
45
6Ph
s Dur
ation
(G+Y
+Rc),
s17
.38.0
4.812
.4Ch
ange
Per
iod (Y
+Rc),
s4.0
4.04.0
4.0Ma
x Gre
en S
etting
(Gma
x), s
60.0
32.0
14.0
42.0
Max Q
Clea
r Tim
e (g_
c+I1)
, s3.7
4.82.5
5.3Gr
een E
xt Tim
e (p_
c), s
3.10.1
0.03.1
Inter
secti
on S
umma
ryHC
M 20
10 C
trl De
lay6.8
HCM
2010
LOS
A
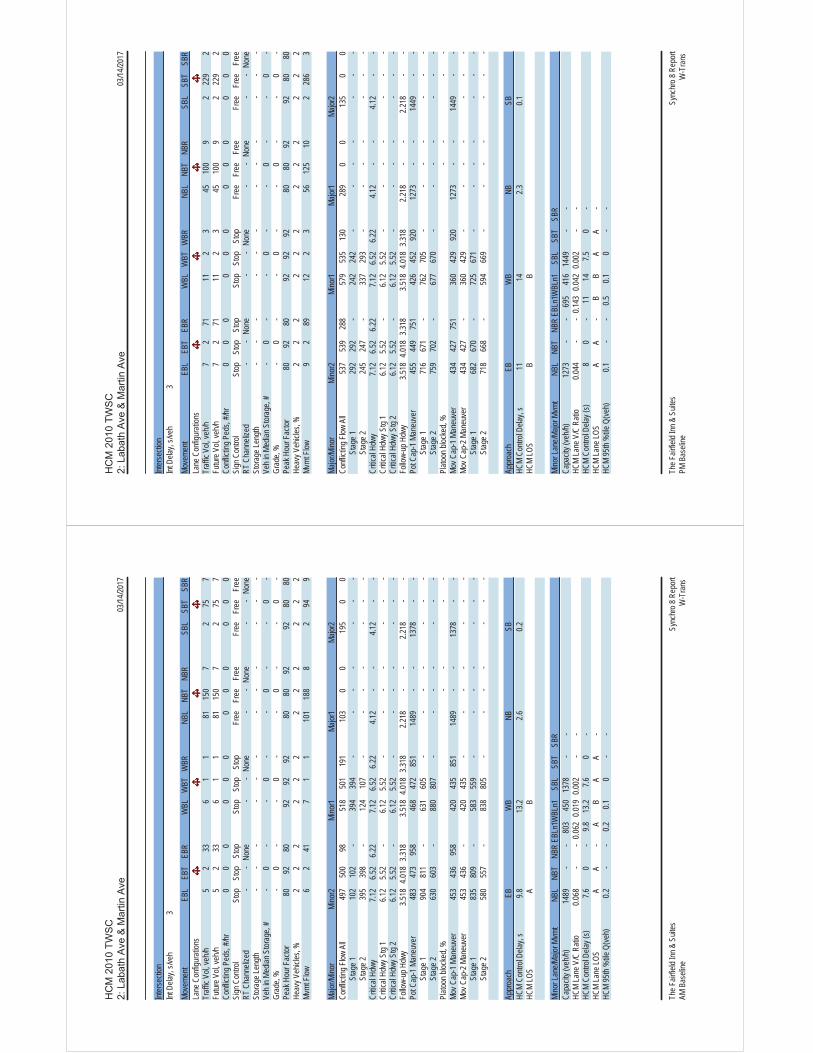
03/14
/2017
The F
airfie
ld Inn
& S
uites
Sync
hro 8
Rep
ort
AM B
aseli
neW
-Tra
ns
Inter
secti
onInt
Dela
y, s/v
eh3
Move
ment
EBL
EBT
EBR
WBL
WBT
WBR
NBL
NBT
NBR
SBL
SBT
SBR
Lane
Con
figur
ation
sTr
affic
Vol, v
eh/h
52
336
11
8115
07
275
7Fu
ture V
ol, ve
h/h5
233
61
181
150
72
757
Confl
icting
Ped
s, #/h
r0
00
00
00
00
00
0Si
gn C
ontro
l St
opSt
opSt
opSt
opSt
opSt
opFr
eeFr
eeFr
eeFr
eeFr
eeFr
eeRT
Cha
nneli
zed
--
None
--
None
--
None
--
None
Stor
age L
ength
--
--
--
--
--
--
Veh i
n Med
ian S
torag
e, #
-0
--
0-
-0
--
0-
Grad
e, %
-0
--
0-
-0
--
0-
Peak
Hou
r Fac
tor80
9280
9292
9280
8092
9280
80He
avy V
ehicl
es, %
22
22
22
22
22
22
Mvmt
Flow
62
417
11
101
188
82
949
Major
/Mino
rMi
nor2
Mino
r1Ma
jor1
Major
2Co
nflict
ing F
low A
ll49
750
098
518
501
191
103
00
195
00
Stag
e 110
210
2-
394
394
--
--
--
-
S
tage 2
395
398
-12
410
7-
--
--
--
Critic
al Hd
wy7.1
26.5
26.2
27.1
26.5
26.2
24.1
2-
-4.1
2-
-Cr
itical
Hdwy
Stg
16.1
25.5
2-
6.12
5.52
--
--
--
-Cr
itical
Hdwy
Stg
26.1
25.5
2-
6.12
5.52
--
--
--
-Fo
llow-
up H
dwy
3.518
4.018
3.318
3.518
4.018
3.318
2.218
--
2.218
--
Pot C
ap-1
Man
euve
r48
347
395
846
847
285
114
89-
-13
78-
-
S
tage 1
904
811
-63
160
5-
--
--
--
Stag
e 263
060
3-
880
807
--
--
--
-Pl
atoon
bloc
ked,
%-
--
-Mo
v Cap
-1 M
aneu
ver
453
436
958
420
435
851
1489
--
1378
--
Mov C
ap-2
Man
euve
r45
343
6-
420
435
--
--
--
-
S
tage 1
835
809
-58
355
9-
--
--
--
Stag
e 258
055
7-
838
805
--
--
--
-
Appr
oach
EBW
BNB
SBHC
M Co
ntrol
Delay
, s9.8
13.2
2.60.2
HCM
LOS
AB
Mino
r Lan
e/Majo
r Mvm
tNB
LNB
TNB
REB
Ln1W
BLn1
SBL
SBT
SBR
Capa
city (
veh/h
)14
89-
-80
345
013
78-
-HC
M La
ne V
/C R
atio
0.068
--
0.062
0.019
0.002
--
HCM
Contr
ol De
lay (s
)7.6
0-
9.813
.27.6
0-
HCM
Lane
LOS
AA
-A
BA
A-
HCM
95th
%tile
Q(ve
h)0.2
--
0.20.1
0-
-
03/14
/2017
The F
airfie
ld Inn
& S
uites
Sync
hro 8
Rep
ort
PM B
aseli
neW
-Tra
ns
Inter
secti
onInt
Dela
y, s/v
eh3
Move
ment
EBL
EBT
EBR
WBL
WBT
WBR
NBL
NBT
NBR
SBL
SBT
SBR
Lane
Con
figur
ation
sTr
affic
Vol, v
eh/h
72
7111
23
4510
09
222
92
Futur
e Vol,
veh/h
72
7111
23
4510
09
222
92
Confl
icting
Ped
s, #/h
r0
00
00
00
00
00
0Si
gn C
ontro
l St
opSt
opSt
opSt
opSt
opSt
opFr
eeFr
eeFr
eeFr
eeFr
eeFr
eeRT
Cha
nneli
zed
--
None
--
None
--
None
--
None
Stor
age L
ength
--
--
--
--
--
--
Veh i
n Med
ian S
torag
e, #
-0
--
0-
-0
--
0-
Grad
e, %
-0
--
0-
-0
--
0-
Peak
Hou
r Fac
tor80
9280
9292
9280
8092
9280
80He
avy V
ehicl
es, %
22
22
22
22
22
22
Mvmt
Flow
92
8912
23
5612
510
228
63
Major
/Mino
rMi
nor2
Mino
r1Ma
jor1
Major
2Co
nflict
ing F
low A
ll53
753
928
857
953
513
028
90
013
50
0
S
tage 1
292
292
-24
224
2-
--
--
--
Stag
e 224
524
7-
337
293
--
--
--
-Cr
itical
Hdwy
7.12
6.52
6.22
7.12
6.52
6.22
4.12
--
4.12
--
Critic
al Hd
wy S
tg 1
6.12
5.52
-6.1
25.5
2-
--
--
--
Critic
al Hd
wy S
tg 2
6.12
5.52
-6.1
25.5
2-
--
--
--
Follo
w-up
Hdw
y3.5
184.0
183.3
183.5
184.0
183.3
182.2
18-
-2.2
18-
-Po
t Cap
-1 M
aneu
ver
455
449
751
426
452
920
1273
--
1449
--
Stag
e 171
667
1-
762
705
--
--
--
-
S
tage 2
759
702
-67
767
0-
--
--
--
Plato
on bl
ocke
d, %
--
--
Mov C
ap-1
Man
euve
r43
442
775
136
042
992
012
73-
-14
49-
-Mo
v Cap
-2 M
aneu
ver
434
427
-36
042
9-
--
--
--
Stag
e 168
267
0-
725
671
--
--
--
-
S
tage 2
718
668
-59
466
9-
--
--
--
Appr
oach
EBW
BNB
SBHC
M Co
ntrol
Delay
, s11
142.3
0.1HC
M LO
SB
B
Mino
r Lan
e/Majo
r Mvm
tNB
LNB
TNB
REB
Ln1W
BLn1
SBL
SBT
SBR
Capa
city (
veh/h
)12
73-
-69
541
614
49-
-HC
M La
ne V
/C R
atio
0.044
--
0.143
0.042
0.002
--
HCM
Contr
ol De
lay (s
)8
0-
1114
7.50
-HC
M La
ne LO
SA
A-
BB
AA
-HC
M 95
th %
tile Q
(veh)
0.1-
-0.5
0.10
--
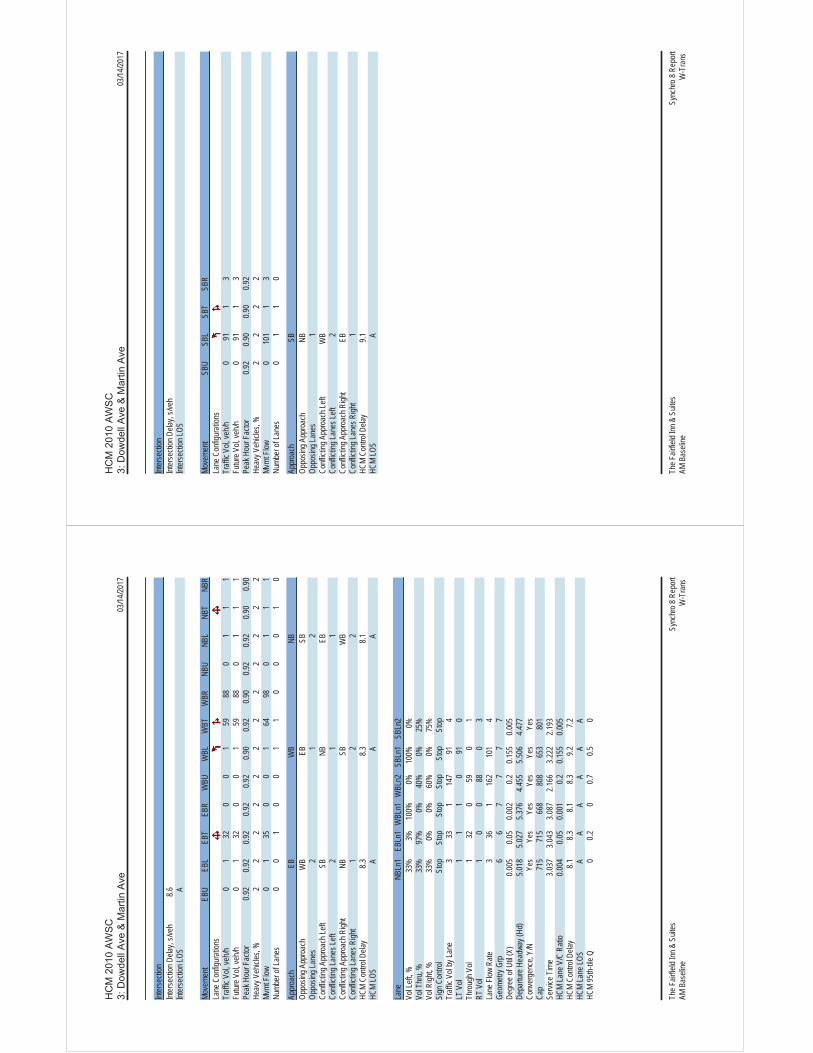
03/14
/2017
The F
airfie
ld Inn
& S
uites
Sync
hro 8
Rep
ort
AM B
aseli
neW
-Tra
ns
Inter
secti
onInt
erse
ction
Dela
y, s/v
eh8.6
Inter
secti
on LO
SA
Move
ment
EBU
EBL
EBT
EBR
WBU
WBL
WBT
WBR
NBU
NBL
NBT
NBR
Lane
Con
figur
ation
sTr
affic
Vol, v
eh/h
01
320
01
5988
01
11
Futur
e Vol,
veh/h
01
320
01
5988
01
11
Peak
Hou
r Fac
tor0.9
20.9
20.9
20.9
20.9
20.9
00.9
20.9
00.9
20.9
20.9
00.9
0He
avy V
ehicl
es, %
22
22
22
22
22
22
Mvmt
Flow
01
350
01
6498
01
11
Numb
er of
Lane
s0
01
00
11
00
01
0
Appr
oach
EBW
BNB
Oppo
sing A
ppro
ach
WB
EBSB
Oppo
sing L
anes
21
2Co
nflict
ing A
ppro
ach L
eftSB
NBEB
Confl
icting
Lane
s Left
21
1Co
nflict
ing A
ppro
ach R
ight
NBSB
WB
Confl
icting
Lane
s Righ
t1
22
HCM
Contr
ol De
lay8.3
8.38.1
HCM
LOS
AA
A
Lane
NBLn
1EB
Ln1
WBL
n1W
BLn2
SBLn
1SB
Ln2
Vol L
eft, %
33%
3%10
0%0%
100%
0%Vo
l Thr
u, %
33%
97%
0%40
%0%
25%
Vol R
ight, %
33%
0%0%
60%
0%75
%Si
gn C
ontro
lSt
opSt
opSt
opSt
opSt
opSt
opTr
affic
Vol b
y Lan
e3
331
147
914
LT V
ol1
11
091
0Th
roug
h Vol
132
059
01
RT V
ol1
00
880
3La
ne F
low R
ate3
361
162
101
4Ge
ometr
y Grp
66
77
77
Degr
ee of
Util
(X)
0.005
0.05
0.002
0.20.1
550.0
05De
partu
re H
eadw
ay (H
d)5.0
185.0
275.3
764.4
555.5
064.4
77Co
nver
genc
e, Y/
NYe
sYe
sYe
sYe
sYe
sYe
sCa
p71
571
566
880
865
380
1Se
rvice
Tim
e3.0
373.0
433.0
872.1
663.2
222.1
93HC
M La
ne V
/C R
atio
0.004
0.05
0.001
0.20.1
550.0
05HC
M Co
ntrol
Delay
8.18.3
8.18.3
9.27.2
HCM
Lane
LOS
AA
AA
AA
HCM
95th-
tile Q
00.2
00.7
0.50
03/14
/2017
The F
airfie
ld Inn
& S
uites
Sync
hro 8
Rep
ort
AM B
aseli
neW
-Tra
ns
Inter
secti
onInt
erse
ction
Dela
y, s/v
ehInt
erse
ction
LOS
Move
ment
SBU
SBL
SBT
SBR
Lane
Con
figur
ation
sTr
affic
Vol, v
eh/h
091
13
Futur
e Vol,
veh/h
091
13
Peak
Hou
r Fac
tor0.9
20.9
00.9
00.9
2He
avy V
ehicl
es, %
22
22
Mvmt
Flow
010
11
3Nu
mber
of La
nes
01
10
Appr
oach
SBOp
posin
g App
roac
hNB
Oppo
sing L
anes
1Co
nflict
ing A
ppro
ach L
eftW
BCo
nflict
ing La
nes L
eft2
Confl
icting
App
roac
h Righ
tEB
Confl
icting
Lane
s Righ
t1
HCM
Contr
ol De
lay9.1
HCM
LOS
A
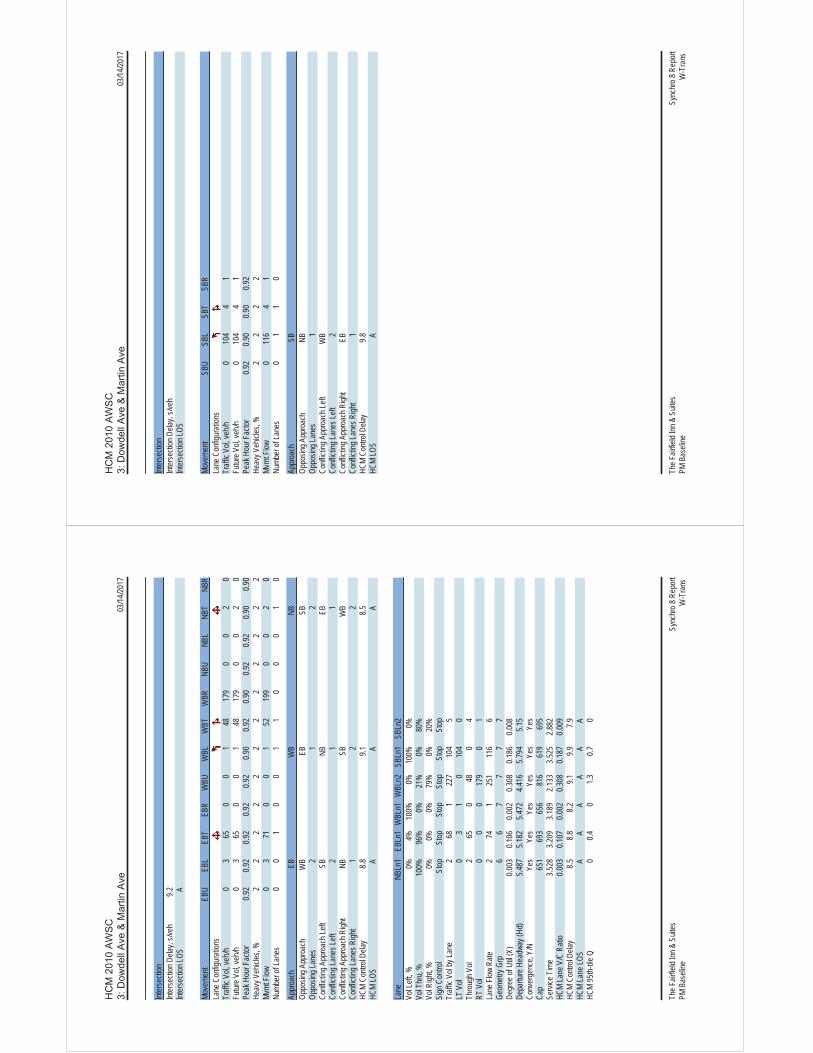
03/14
/2017
The F
airfie
ld Inn
& S
uites
Sync
hro 8
Rep
ort
PM B
aseli
neW
-Tra
ns
Inter
secti
onInt
erse
ction
Dela
y, s/v
eh9.2
Inter
secti
on LO
SA
Move
ment
EBU
EBL
EBT
EBR
WBU
WBL
WBT
WBR
NBU
NBL
NBT
NBR
Lane
Con
figur
ation
sTr
affic
Vol, v
eh/h
03
650
01
4817
90
02
0Fu
ture V
ol, ve
h/h0
365
00
148
179
00
20
Peak
Hou
r Fac
tor0.9
20.9
20.9
20.9
20.9
20.9
00.9
20.9
00.9
20.9
20.9
00.9
0He
avy V
ehicl
es, %
22
22
22
22
22
22
Mvmt
Flow
03
710
01
5219
90
02
0Nu
mber
of La
nes
00
10
01
10
00
10
Appr
oach
EBW
BNB
Oppo
sing A
ppro
ach
WB
EBSB
Oppo
sing L
anes
21
2Co
nflict
ing A
ppro
ach L
eftSB
NBEB
Confl
icting
Lane
s Left
21
1Co
nflict
ing A
ppro
ach R
ight
NBSB
WB
Confl
icting
Lane
s Righ
t1
22
HCM
Contr
ol De
lay8.8
9.18.5
HCM
LOS
AA
A
Lane
NBLn
1EB
Ln1
WBL
n1W
BLn2
SBLn
1SB
Ln2
Vol L
eft, %
0%4%
100%
0%10
0%0%
Vol T
hru,
%10
0%96
%0%
21%
0%80
%Vo
l Righ
t, %0%
0%0%
79%
0%20
%Si
gn C
ontro
lSt
opSt
opSt
opSt
opSt
opSt
opTr
affic
Vol b
y Lan
e2
681
227
104
5LT
Vol
03
10
104
0Th
roug
h Vol
265
048
04
RT V
ol0
00
179
01
Lane
Flow
Rate
274
125
111
66
Geom
etry G
rp6
67
77
7De
gree
of U
til (X
)0.0
030.1
060.0
020.3
080.1
860.0
08De
partu
re H
eadw
ay (H
d)5.4
875.1
825.4
724.4
165.7
945.1
5Co
nver
genc
e, Y/
NYe
sYe
sYe
sYe
sYe
sYe
sCa
p65
169
365
681
661
969
5Se
rvice
Tim
e3.5
283.2
093.1
892.1
333.5
252.8
82HC
M La
ne V
/C R
atio
0.003
0.107
0.002
0.308
0.187
0.009
HCM
Contr
ol De
lay8.5
8.88.2
9.19.9
7.9HC
M La
ne LO
SA
AA
AA
AHC
M 95
th-tile
Q0
0.40
1.30.7
0
03/14
/2017
The F
airfie
ld Inn
& S
uites
Sync
hro 8
Rep
ort
PM B
aseli
neW
-Tra
ns
Inter
secti
onInt
erse
ction
Dela
y, s/v
ehInt
erse
ction
LOS
Move
ment
SBU
SBL
SBT
SBR
Lane
Con
figur
ation
sTr
affic
Vol, v
eh/h
010
44
1Fu
ture V
ol, ve
h/h0
104
41
Peak
Hou
r Fac
tor0.9
20.9
00.9
00.9
2He
avy V
ehicl
es, %
22
22
Mvmt
Flow
011
64
1Nu
mber
of La
nes
01
10
Appr
oach
SBOp
posin
g App
roac
hNB
Oppo
sing L
anes
1Co
nflict
ing A
ppro
ach L
eftW
BCo
nflict
ing La
nes L
eft2
Confl
icting
App
roac
h Righ
tEB
Confl
icting
Lane
s Righ
t1
HCM
Contr
ol De
lay9.8
HCM
LOS
A
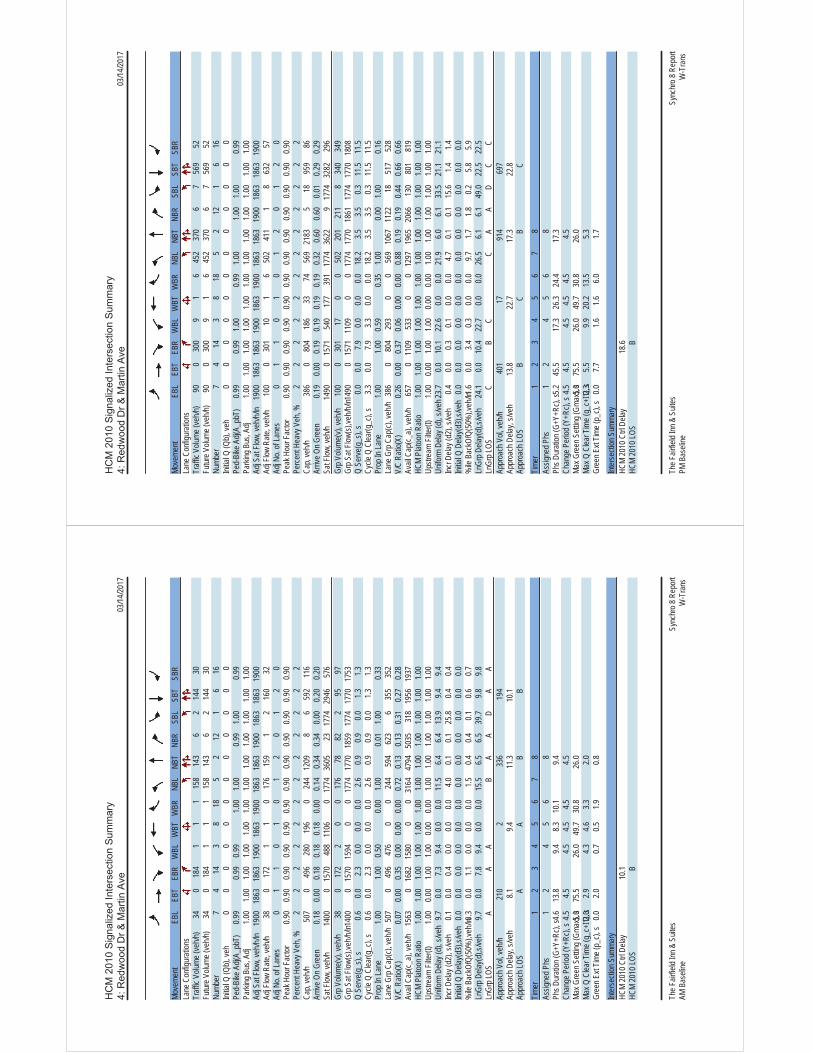
03/14
/2017
The F
airfie
ld Inn
& S
uites
Sync
hro 8
Rep
ort
AM B
aseli
neW
-Tra
ns
Move
ment
EBL
EBT
EBR
WBL
WBT
WBR
NBL
NBT
NBR
SBL
SBT
SBR
Lane
Con
figur
ation
sTr
affic
Volum
e (ve
h/h)
340
184
11
115
814
36
214
430
Futur
e Volu
me (v
eh/h)
340
184
11
115
814
36
214
430
Numb
er7
414
38
185
212
16
16Ini
tial Q
(Qb)
, veh
00
00
00
00
00
00
Ped-
Bike
Adj(
A_pb
T)0.9
90.9
90.9
91.0
01.0
00.9
91.0
00.9
9Pa
rking
Bus
, Adj
1.00
1.00
1.00
1.00
1.00
1.00
1.00
1.00
1.00
1.00
1.00
1.00
Adj S
at Flo
w, ve
h/h/ln
1900
1863
1863
1900
1863
1900
1863
1863
1900
1863
1863
1900
Adj F
low R
ate, v
eh/h
380
172
11
017
615
91
216
032
Adj N
o. of
Lane
s0
11
01
01
20
12
0Pe
ak H
our F
actor
0.90
0.90
0.90
0.90
0.90
0.90
0.90
0.90
0.90
0.90
0.90
0.90
Perce
nt He
avy V
eh, %
22
22
22
22
22
22
Cap,
veh/h
507
049
628
019
60
244
1209
86
592
116
Arriv
e On G
reen
0.18
0.00
0.18
0.18
0.18
0.00
0.14
0.34
0.34
0.00
0.20
0.20
Sat F
low, v
eh/h
1400
015
7048
811
060
1774
3605
2317
7429
4657
6Gr
p Volu
me(v)
, veh
/h38
017
22
00
176
7882
295
97Gr
p Sat
Flow(
s),ve
h/h/ln
1400
015
7015
940
017
7417
7018
5917
7417
7017
53Q
Serve
(g_s
), s
0.60.0
2.30.0
0.00.0
2.60.9
0.90.0
1.31.3
Cycle
Q C
lear(g
_c),
s0.6
0.02.3
0.00.0
0.02.6
0.90.9
0.01.3
1.3Pr
op In
Lane
1.00
1.00
0.50
0.00
1.00
0.01
1.00
0.33
Lane
Grp
Cap
(c), v
eh/h
507
049
647
60
024
459
462
36
355
352
V/C
Ratio
(X)
0.07
0.00
0.35
0.00
0.00
0.00
0.72
0.13
0.13
0.31
0.27
0.28
Avail
Cap
(c_a)
, veh
/h15
630
1682
1580
00
3164
4794
5035
318
1956
1937
HCM
Plato
on R
atio
1.00
1.00
1.00
1.00
1.00
1.00
1.00
1.00
1.00
1.00
1.00
1.00
Upstr
eam
Filter
(I)1.0
00.0
01.0
01.0
00.0
00.0
01.0
01.0
01.0
01.0
01.0
01.0
0Un
iform
Dela
y (d)
, s/ve
h9.7
0.07.3
9.40.0
0.011
.56.4
6.413
.99.4
9.4Inc
r Dela
y (d2
), s/v
eh0.1
0.00.4
0.00.0
0.04.0
0.10.1
25.8
0.40.4
Initia
l Q D
elay(d
3),s/
veh
0.00.0
0.00.0
0.00.0
0.00.0
0.00.0
0.00.0
%ile
Bac
kOfQ
(50%
),veh
/ln0.3
0.01.1
0.00.0
0.01.5
0.40.4
0.10.6
0.7Ln
Grp D
elay(d
),s/ve
h9.7
0.07.8
9.40.0
0.015
.56.5
6.539
.79.8
9.8Ln
Grp L
OSA
AA
BA
AD
AA
Appr
oach
Vol,
veh/h
210
233
619
4Ap
proa
ch D
elay,
s/veh
8.19.4
11.3
10.1
Appr
oach
LOS
AA
BB
Timer
12
34
56
78
Assig
ned P
hs1
24
56
8Ph
s Dur
ation
(G+Y
+Rc),
s4.6
13.8
9.48.3
10.1
9.4Ch
ange
Per
iod (Y
+Rc),
s4.5
4.54.5
4.54.5
4.5Ma
x Gre
en S
etting
(Gma
x), s5.0
75.5
26.0
49.7
30.8
26.0
Max Q
Clea
r Tim
e (g_
c+I1)
, s2.02.9
4.34.6
3.32.0
Gree
n Ext
Time (
p_c),
s0.0
2.00.7
0.51.9
0.8
Inter
secti
on S
umma
ryHC
M 20
10 C
trl De
lay10
.1HC
M 20
10 LO
SB
03/14
/2017
The F
airfie
ld Inn
& S
uites
Sync
hro 8
Rep
ort
PM B
aseli
neW
-Tra
ns
Move
ment
EBL
EBT
EBR
WBL
WBT
WBR
NBL
NBT
NBR
SBL
SBT
SBR
Lane
Con
figur
ation
sTr
affic
Volum
e (ve
h/h)
900
300
91
645
237
06
756
952
Futur
e Volu
me (v
eh/h)
900
300
91
645
237
06
756
952
Numb
er7
414
38
185
212
16
16Ini
tial Q
(Qb)
, veh
00
00
00
00
00
00
Ped-
Bike
Adj(
A_pb
T)0.9
90.9
91.0
00.9
91.0
01.0
01.0
00.9
9Pa
rking
Bus
, Adj
1.00
1.00
1.00
1.00
1.00
1.00
1.00
1.00
1.00
1.00
1.00
1.00
Adj S
at Flo
w, ve
h/h/ln
1900
1863
1863
1900
1863
1900
1863
1863
1900
1863
1863
1900
Adj F
low R
ate, v
eh/h
100
030
110
16
502
411
18
632
57Ad
j No.
of La
nes
01
10
10
12
01
20
Peak
Hou
r Fac
tor0.9
00.9
00.9
00.9
00.9
00.9
00.9
00.9
00.9
00.9
00.9
00.9
0Pe
rcent
Heav
y Veh
, %2
22
22
22
22
22
2Ca
p, ve
h/h38
60
804
186
3374
569
2183
518
959
86Ar
rive O
n Gre
en0.1
90.0
00.1
90.1
90.1
90.1
90.3
20.6
00.6
00.0
10.2
90.2
9Sa
t Flow
, veh
/h14
900
1571
540
177
391
1774
3622
917
7432
8229
6Gr
p Volu
me(v)
, veh
/h10
00
301
170
050
220
121
18
340
349
Grp S
at Flo
w(s),
veh/h
/ln14
900
1571
1109
00
1774
1770
1861
1774
1770
1808
Q Se
rve(g
_s),
s0.0
0.07.9
0.00.0
0.018
.23.5
3.50.3
11.5
11.5
Cycle
Q C
lear(g
_c),
s3.3
0.07.9
3.30.0
0.018
.23.5
3.50.3
11.5
11.5
Prop
In La
ne1.0
01.0
00.5
90.3
51.0
00.0
01.0
00.1
6La
ne G
rp C
ap(c)
, veh
/h38
60
804
293
00
569
1067
1122
1851
752
8V/
C Ra
tio(X
)0.2
60.0
00.3
70.0
60.0
00.0
00.8
80.1
90.1
90.4
40.6
60.6
6Av
ail C
ap(c_
a), v
eh/h
657
011
0953
30
012
9719
6520
6613
080
181
9HC
M Pl
atoon
Rati
o1.0
01.0
01.0
01.0
01.0
01.0
01.0
01.0
01.0
01.0
01.0
01.0
0Up
strea
m Fil
ter(I)
1.00
0.00
1.00
1.00
0.00
0.00
1.00
1.00
1.00
1.00
1.00
1.00
Unifo
rm D
elay (
d), s
/veh2
3.70.0
10.1
22.6
0.00.0
21.9
6.06.1
33.5
21.1
21.1
Incr D
elay (
d2),
s/veh
0.40.0
0.30.1
0.00.0
4.70.1
0.115
.61.4
1.4Ini
tial Q
Dela
y(d3)
,s/ve
h0.0
0.00.0
0.00.0
0.00.0
0.00.0
0.00.0
0.0%
ile B
ackO
fQ(5
0%),v
eh/ln1
.60.0
3.40.3
0.00.0
9.71.7
1.80.2
5.85.9
LnGr
p Dela
y(d),s
/veh
24.1
0.010
.422
.70.0
0.026
.56.1
6.149
.022
.522
.5Ln
Grp L
OSC
BC
CA
AD
CC
Appr
oach
Vol,
veh/h
401
1791
469
7Ap
proa
ch D
elay,
s/veh
13.8
22.7
17.3
22.8
Appr
oach
LOS
BC
BC
Timer
12
34
56
78
Assig
ned P
hs1
24
56
8Ph
s Dur
ation
(G+Y
+Rc),
s5.2
45.5
17.3
26.3
24.4
17.3
Chan
ge P
eriod
(Y+R
c), s
4.54.5
4.54.5
4.54.5
Max G
reen
Sett
ing (G
max),
s5.075
.526
.049
.730
.826
.0Ma
x Q C
lear T
ime (
g_c+
I1), s2.3
5.59.9
20.2
13.5
5.3Gr
een E
xt Tim
e (p_
c), s
0.07.7
1.61.6
6.01.7
Inter
secti
on S
umma
ryHC
M 20
10 C
trl De
lay18
.6HC
M 20
10 LO
SB
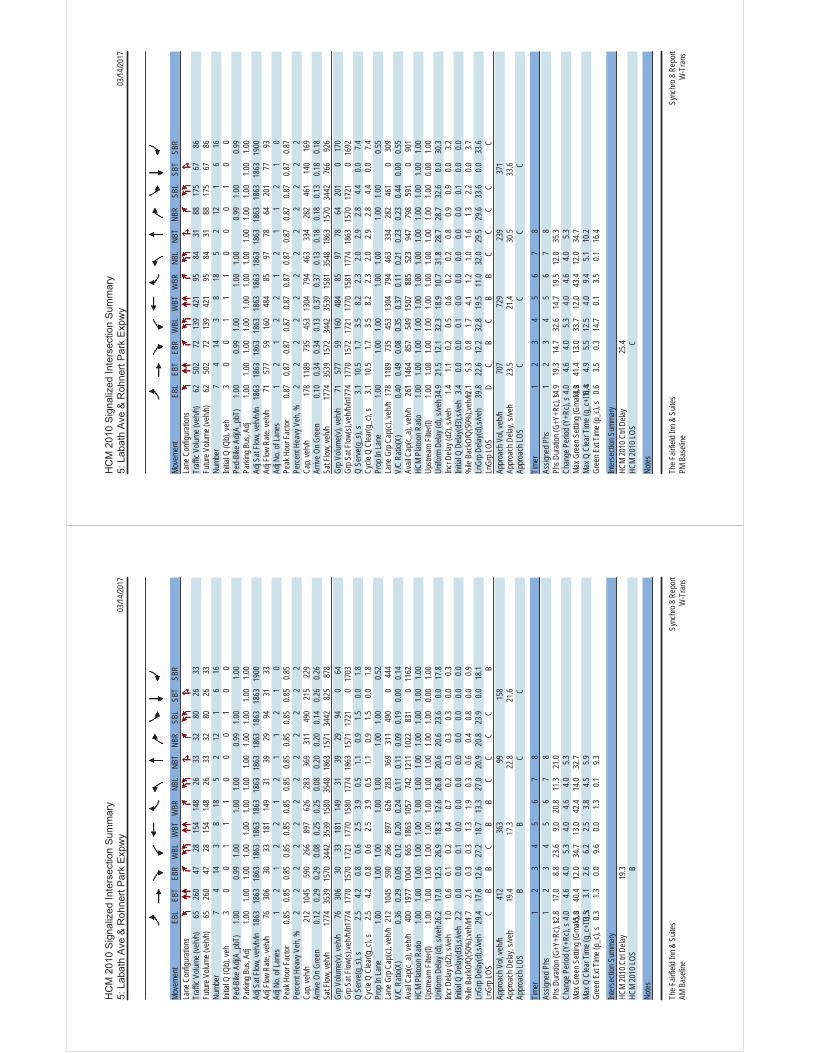
03/14
/2017
The F
airfie
ld Inn
& S
uites
Sync
hro 8
Rep
ort
AM B
aseli
neW
-Tra
ns
Move
ment
EBL
EBT
EBR
WBL
WBT
WBR
NBL
NBT
NBR
SBL
SBT
SBR
Lane
Con
figur
ation
sTr
affic
Volum
e (ve
h/h)
6526
047
2815
414
826
3332
8026
33Fu
ture V
olume
(veh
/h)65
260
4728
154
148
2633
3280
2633
Numb
er7
414
38
185
212
16
16Ini
tial Q
(Qb)
, veh
30
01
11
00
01
00
Ped-
Bike
Adj(
A_pb
T)1.0
00.9
91.0
01.0
01.0
00.9
91.0
01.0
0Pa
rking
Bus
, Adj
1.00
1.00
1.00
1.00
1.00
1.00
1.00
1.00
1.00
1.00
1.00
1.00
Adj S
at Flo
w, ve
h/h/ln
1863
1863
1863
1863
1863
1863
1863
1863
1863
1863
1863
1900
Adj F
low R
ate, v
eh/h
7630
630
3318
114
931
3929
9431
33Ad
j No.
of La
nes
12
12
21
21
12
10
Peak
Hou
r Fac
tor0.8
50.8
50.8
50.8
50.8
50.8
50.8
50.8
50.8
50.8
50.8
50.8
5Pe
rcent
Heav
y Veh
, %2
22
22
22
22
22
2Ca
p, ve
h/h21
210
4559
026
689
762
628
336
931
149
021
522
9Ar
rive O
n Gre
en0.1
20.2
90.2
90.0
80.2
50.2
50.0
80.2
00.2
00.1
40.2
60.2
6Sa
t Flow
, veh
/h17
7435
3915
7034
4235
3915
8035
4818
6315
7134
4282
587
8Gr
p Volu
me(v)
, veh
/h76
306
3033
181
149
3139
2994
064
Grp S
at Flo
w(s),
veh/h
/ln17
7417
7015
7017
2117
7015
8017
7418
6315
7117
210
1703
Q Se
rve(g
_s),
s2.5
4.20.8
0.62.5
3.90.5
1.10.9
1.50.0
1.8Cy
cle Q
Clea
r(g_c
), s
2.54.2
0.80.6
2.53.9
0.51.1
0.91.5
0.01.8
Prop
In La
ne1.0
01.0
01.0
01.0
01.0
01.0
01.0
00.5
2La
ne G
rp C
ap(c)
, veh
/h21
210
4559
026
689
762
628
336
931
149
00
444
V/C
Ratio
(X)
0.36
0.29
0.05
0.12
0.20
0.24
0.11
0.11
0.09
0.19
0.00
0.14
Avail
Cap
(c_a)
, veh
/h40
019
7710
0466
518
6310
5774
212
1110
2283
10
1162
HCM
Plato
on R
atio
1.00
1.00
1.00
1.00
1.00
1.00
1.00
1.00
1.00
1.00
1.00
1.00
Upstr
eam
Filter
(I)1.0
01.0
01.0
01.0
01.0
01.0
01.0
01.0
01.0
01.0
00.0
01.0
0Un
iform
Dela
y (d)
, s/ve
h26.2
17.0
12.5
26.9
18.3
12.6
26.8
20.6
20.6
23.6
0.017
.8Inc
r Dela
y (d2
), s/v
eh1.0
0.60.1
0.20.4
0.70.2
0.30.3
0.30.0
0.3Ini
tial Q
Dela
y(d3)
,s/ve
h2.2
0.00.0
0.10.0
0.00.0
0.00.0
0.00.0
0.0%
ile B
ackO
fQ(5
0%),v
eh/ln1
.72.1
0.30.3
1.31.9
0.30.6
0.40.8
0.00.9
LnGr
p Dela
y(d),s
/veh
29.4
17.6
12.6
27.2
18.7
13.3
27.0
20.9
20.8
23.9
0.018
.1Ln
Grp L
OSC
BB
CB
BC
CC
CB
Appr
oach
Vol,
veh/h
412
363
9915
8Ap
proa
ch D
elay,
s/veh
19.4
17.3
22.8
21.6
Appr
oach
LOS
BB
CC
Timer
12
34
56
78
Assig
ned P
hs1
23
45
67
8Ph
s Dur
ation
(G+Y
+Rc),
s12.8
17.0
8.823
.69.0
20.8
11.3
21.0
Chan
ge P
eriod
(Y+R
c), s
4.04.6
4.05.3
4.04.6
4.05.3
Max G
reen
Sett
ing (G
max),
s15
.040
.412
.034
.713
.042
.414
.032
.7Ma
x Q C
lear T
ime (
g_c+
I1), s3.5
3.12.6
6.22.5
3.84.5
5.9Gr
een E
xt Tim
e (p_
c), s
0.31.3
0.09.6
0.01.3
0.19.3
Inter
secti
on S
umma
ryHC
M 20
10 C
trl De
lay19
.3HC
M 20
10 LO
SB
Notes
03/14
/2017
The F
airfie
ld Inn
& S
uites
Sync
hro 8
Rep
ort
PM B
aseli
neW
-Tra
ns
Move
ment
EBL
EBT
EBR
WBL
WBT
WBR
NBL
NBT
NBR
SBL
SBT
SBR
Lane
Con
figur
ation
sTr
affic
Volum
e (ve
h/h)
6250
272
139
421
9584
3188
175
6786
Futur
e Volu
me (v
eh/h)
6250
272
139
421
9584
3188
175
6786
Numb
er7
414
38
185
212
16
16Ini
tial Q
(Qb)
, veh
30
01
11
00
01
00
Ped-
Bike
Adj(
A_pb
T)1.0
00.9
91.0
01.0
01.0
00.9
91.0
00.9
9Pa
rking
Bus
, Adj
1.00
1.00
1.00
1.00
1.00
1.00
1.00
1.00
1.00
1.00
1.00
1.00
Adj S
at Flo
w, ve
h/h/ln
1863
1863
1863
1863
1863
1863
1863
1863
1863
1863
1863
1900
Adj F
low R
ate, v
eh/h
7157
759
160
484
8597
7864
201
7793
Adj N
o. of
Lane
s1
21
22
12
11
21
0Pe
ak H
our F
actor
0.87
0.87
0.87
0.87
0.87
0.87
0.87
0.87
0.87
0.87
0.87
0.87
Perce
nt He
avy V
eh, %
22
22
22
22
22
22
Cap,
veh/h
178
1189
735
453
1304
794
463
334
282
461
140
169
Arriv
e On G
reen
0.10
0.34
0.34
0.13
0.37
0.37
0.13
0.18
0.18
0.13
0.18
0.18
Sat F
low, v
eh/h
1774
3539
1572
3442
3539
1581
3548
1863
1570
3442
766
926
Grp V
olume
(v), v
eh/h
7157
759
160
484
8597
7864
201
017
0Gr
p Sat
Flow(
s),ve
h/h/ln
1774
1770
1572
1721
1770
1581
1774
1863
1570
1721
016
92Q
Serve
(g_s
), s
3.110
.51.7
3.58.2
2.32.0
2.92.8
4.40.0
7.4Cy
cle Q
Clea
r(g_c
), s
3.110
.51.7
3.58.2
2.32.0
2.92.8
4.40.0
7.4Pr
op In
Lane
1.00
1.00
1.00
1.00
1.00
1.00
1.00
0.55
Lane
Grp
Cap
(c), v
eh/h
178
1189
735
453
1304
794
463
334
282
461
030
9V/
C Ra
tio(X
)0.4
00.4
90.0
80.3
50.3
70.1
10.2
10.2
30.2
30.4
40.0
00.5
5Av
ail C
ap(c_
a), v
eh/h
261
1464
857
549
1507
885
523
947
798
591
090
1HC
M Pl
atoon
Rati
o1.0
01.0
01.0
01.0
01.0
01.0
01.0
01.0
01.0
01.0
01.0
01.0
0Up
strea
m Fil
ter(I)
1.00
1.00
1.00
1.00
1.00
1.00
1.00
1.00
1.00
1.00
0.00
1.00
Unifo
rm D
elay (
d), s
/veh3
4.921
.512
.132
.318
.910
.731
.828
.728
.732
.60.0
30.3
Incr D
elay (
d2),
s/veh
1.41.1
0.20.5
0.60.2
0.20.8
0.90.9
0.03.2
Initia
l Q D
elay(d
3),s/
veh
3.40.0
0.00.1
0.00.0
0.00.0
0.00.1
0.00.0
%ile
Bac
kOfQ
(50%
),veh
/ln2.1
5.30.8
1.74.1
1.21.0
1.61.3
2.20.0
3.7Ln
Grp D
elay(d
),s/ve
h39
.822
.612
.232
.819
.511
.032
.029
.529
.633
.60.0
33.6
LnGr
p LOS
DC
BC
BB
CC
CC
CAp
proa
ch V
ol, ve
h/h70
772
923
937
1Ap
proa
ch D
elay,
s/veh
23.5
21.4
30.5
33.6
Appr
oach
LOS
CC
CC
Timer
12
34
56
78
Assig
ned P
hs1
23
45
67
8Ph
s Dur
ation
(G+Y
+Rc),
s14.9
19.3
14.7
32.6
14.7
19.5
12.0
35.3
Chan
ge P
eriod
(Y+R
c), s
4.04.6
4.05.3
4.04.6
4.05.3
Max G
reen
Sett
ing (G
max),
s14
.041
.413
.033
.712
.043
.412
.034
.7Ma
x Q C
lear T
ime (
g_c+
I1), s6.4
4.95.5
12.5
4.09.4
5.110
.2Gr
een E
xt Tim
e (p_
c), s
0.63.5
0.314
.70.1
3.50.1
16.4
Inter
secti
on S
umma
ryHC
M 20
10 C
trl De
lay25
.4HC
M 20
10 LO
SC
Notes

03/14
/2017
The F
airfie
ld Inn
& S
uites
Sync
hro 8
Rep
ort
AM B
aseli
neW
-Tra
ns
Move
ment
EBL
EBT
EBR
WBL
WBT
WBR
NBL
NBT
NBR
SBL
SBT
SBR
Lane
Con
figur
ation
sTr
affic
Volum
e (ve
h/h)
4235
457
216
424
201
4167
144
217
8246
Futur
e Volu
me (v
eh/h)
4235
457
216
424
201
4167
144
217
8246
Numb
er5
212
16
163
818
74
14Ini
tial Q
(Qb)
, veh
04
03
102
12
10
51
Ped-
Bike
Adj(
A_pb
T)1.0
01.0
01.0
00.9
91.0
00.9
81.0
01.0
0Pa
rking
Bus
, Adj
1.00
1.00
1.00
1.00
1.00
1.00
1.00
1.00
1.00
1.00
1.00
1.00
Adj S
at Flo
w, ve
h/h/ln
1863
1863
1863
1863
1863
1863
1863
1863
1863
1863
1863
1863
Adj F
low R
ate, v
eh/h
4941
258
251
493
218
4878
116
252
9543
Adj N
o. of
Lane
s1
31
22
11
21
21
1Pe
ak H
our F
actor
0.86
0.86
0.86
0.86
0.86
0.86
0.86
0.86
0.86
0.86
0.86
0.86
Perce
nt He
avy V
eh, %
22
22
22
22
22
22
Cap,
veh/h
124
2948
911
307
2077
1073
124
413
318
309
268
218
Arriv
e On G
reen
0.07
0.58
0.58
0.13
0.90
0.90
0.07
0.12
0.12
0.09
0.14
0.14
Sat F
low, v
eh/h
1774
5085
1581
3442
3539
1560
1774
3539
1550
3442
1863
1583
Grp V
olume
(v), v
eh/h
4941
258
251
493
218
4878
116
252
9543
Grp S
at Flo
w(s),
veh/h
/ln17
7416
9515
8117
2117
7015
6017
7417
7015
5017
2118
6315
83Q
Serve
(g_s
), s
4.05.5
2.410
.72.6
2.03.9
3.09.7
10.8
7.03.6
Cycle
Q C
lear(g
_c),
s4.0
5.52.4
10.7
2.62.0
3.93.0
9.710
.87.0
3.6Pr
op In
Lane
1.00
1.00
1.00
1.00
1.00
1.00
1.00
1.00
Lane
Grp
Cap
(c), v
eh/h
124
2948
911
307
2077
1073
124
413
318
309
268
218
V/C
Ratio
(X)
0.40
0.14
0.06
0.82
0.24
0.20
0.39
0.19
0.36
0.82
0.35
0.20
Avail
Cap
(c_a)
, veh
/h26
029
7492
445
921
2910
8014
210
3859
259
772
061
2HC
M Pl
atoon
Rati
o1.0
01.0
01.0
01.5
01.5
01.5
01.0
01.0
01.0
01.0
01.0
01.0
0Up
strea
m Fil
ter(I)
0.99
0.99
0.99
1.00
1.00
1.00
1.00
1.00
1.00
0.98
0.98
0.98
Unifo
rm D
elay (
d), s
/veh6
6.814
.714
.264
.04.9
2.466
.960
.051
.667
.158
.657
.5Inc
r Dela
y (d2
), s/v
eh0.8
0.10.1
4.20.3
0.40.7
0.10.3
5.20.3
0.2Ini
tial Q
Dela
y(d3)
,s/ve
h0.0
0.00.0
3.80.2
0.00.8
0.20.1
0.03.9
0.2%
ile B
ackO
fQ(5
0%),v
eh/ln2
.02.9
1.15.7
2.71.4
2.11.6
4.45.4
4.71.8
LnGr
p Dela
y(d),s
/veh
67.5
14.8
14.3
72.0
5.42.8
68.4
60.3
52.0
72.2
62.8
57.9
LnGr
p LOS
EB
BE
AA
EE
DE
EE
Appr
oach
Vol,
veh/h
519
962
242
390
Appr
oach
Dela
y, s/v
eh19
.722
.257
.968
.4Ap
proa
ch LO
SB
CE
E
Timer
12
34
56
78
Assig
ned P
hs1
23
45
67
8Ph
s Dur
ation
(G+Y
+Rc),
s17.0
93.0
14.4
25.6
14.4
95.5
17.5
22.6
Chan
ge P
eriod
(Y+R
c), s
4.05.3
4.05.3
4.0* 5
.34.0
5.3Ma
x Gre
en S
etting
(Gma
x), s
20.0
41.4
12.0
58.0
22.0
* 40
26.0
44.0
Max Q
Clea
r Tim
e (g_
c+I1)
, s12
.77.5
5.99.0
6.04.6
12.8
11.7
Gree
n Ext
Time (
p_c),
s0.3
2.20.0
0.60.0
2.20.7
0.6
Inter
secti
on S
umma
ryHC
M 20
10 C
trl De
lay34
.2HC
M 20
10 LO
SC
Notes
03/14
/2017
The F
airfie
ld Inn
& S
uites
Sync
hro 8
Rep
ort
PM B
aseli
neW
-Tra
ns
Move
ment
EBL
EBT
EBR
WBL
WBT
WBR
NBL
NBT
NBR
SBL
SBT
SBR
Lane
Con
figur
ation
sTr
affic
Volum
e (ve
h/h)
151
802
7829
560
649
171
191
373
473
213
214
Futur
e Volu
me (v
eh/h)
151
802
7829
560
649
171
191
373
473
213
214
Numb
er5
212
16
163
818
74
14Ini
tial Q
(Qb)
, veh
04
03
102
12
10
51
Ped-
Bike
Adj(
A_pb
T)1.0
01.0
01.0
00.9
81.0
00.9
91.0
01.0
0Pa
rking
Bus
, Adj
1.00
1.00
1.00
1.00
1.00
1.00
1.00
1.00
1.00
1.00
1.00
1.00
Adj S
at Flo
w, ve
h/h/ln
1863
1863
1863
1863
1863
1863
1863
1863
1863
1863
1863
1863
Adj F
low R
ate, v
eh/h
157
835
7430
763
149
674
199
343
493
222
214
Adj N
o. of
Lane
s1
31
22
11
21
21
1Pe
ak H
our F
actor
0.96
0.96
0.96
0.96
0.96
0.96
0.96
0.96
0.96
0.96
0.96
0.96
Perce
nt He
avy V
eh, %
22
22
22
22
22
22
Cap,
veh/h
179
1875
580
361
1301
828
136
867
386
543
612
517
Arriv
e On G
reen
0.10
0.37
0.37
0.15
0.56
0.56
0.08
0.24
0.24
0.16
0.33
0.33
Sat F
low, v
eh/h
1774
5085
1579
3442
3539
1557
1774
3539
1568
3442
1863
1583
Grp V
olume
(v), v
eh/h
157
835
7430
763
149
674
199
343
493
222
214
Grp S
at Flo
w(s),
veh/h
/ln17
7416
9515
7917
2117
7015
5717
7417
7015
6817
2118
6315
83Q
Serve
(g_s
), s
13.1
18.5
4.613
.116
.130
.16.0
6.831
.721
.113
.715
.8Cy
cle Q
Clea
r(g_c
), s
13.1
18.5
4.613
.116
.130
.16.0
6.831
.721
.113
.715
.8Pr
op In
Lane
1.00
1.00
1.00
1.00
1.00
1.00
1.00
1.00
Lane
Grp
Cap
(c), v
eh/h
179
1875
580
361
1301
828
136
867
386
543
612
517
V/C
Ratio
(X)
0.88
0.45
0.13
0.85
0.49
0.60
0.54
0.23
0.89
0.91
0.36
0.41
Avail
Cap
(c_a)
, veh
/h26
018
8958
745
913
2083
114
210
3846
059
772
061
2HC
M Pl
atoon
Rati
o1.0
01.0
01.0
01.5
01.5
01.5
01.0
01.0
01.0
01.0
01.0
01.0
0Up
strea
m Fil
ter(I)
0.87
0.87
0.87
1.00
1.00
1.00
1.00
1.00
1.00
0.80
0.80
0.80
Unifo
rm D
elay (
d), s
/veh6
6.536
.031
.562
.325
.617
.166
.945
.454
.762
.139
.039
.5Inc
r Dela
y (d2
), s/v
eh13
.70.7
0.49.8
1.33.2
1.90.0
15.2
14.1
0.10.2
Initia
l Q D
elay(d
3),s/
veh
0.00.1
0.03.4
0.80.1
0.90.0
0.40.0
0.80.0
%ile
Bac
kOfQ
(50%
),veh
/ln7.1
9.12.1
7.19.4
14.2
3.23.5
15.6
11.1
8.17.1
LnGr
p Dela
y(d),s
/veh
80.3
36.7
31.9
75.4
27.8
20.4
69.6
45.5
70.4
76.1
39.9
39.7
LnGr
p LOS
FD
CE
CC
ED
EE
DD
Appr
oach
Vol,
veh/h
1066
1434
616
929
Appr
oach
Dela
y, s/v
eh42
.835
.462
.359
.1Ap
proa
ch LO
SD
DE
E
Timer
12
34
56
78
Assig
ned P
hs1
23
45
67
8Ph
s Dur
ation
(G+Y
+Rc),
s19.3
61.0
15.5
54.2
19.1
61.3
27.7
41.9
Chan
ge P
eriod
(Y+R
c), s
4.05.3
4.05.3
4.0* 5
.34.0
5.3Ma
x Gre
en S
etting
(Gma
x), s
20.0
41.4
12.0
58.0
22.0
* 40
26.0
44.0
Max Q
Clea
r Tim
e (g_
c+I1)
, s15
.120
.58.0
17.8
15.1
32.1
23.1
33.7
Gree
n Ext
Time (
p_c),
s0.3
4.10.0
1.80.0
3.00.6
1.5
Inter
secti
on S
umma
ryHC
M 20
10 C
trl De
lay46
.9HC
M 20
10 LO
SD
Notes
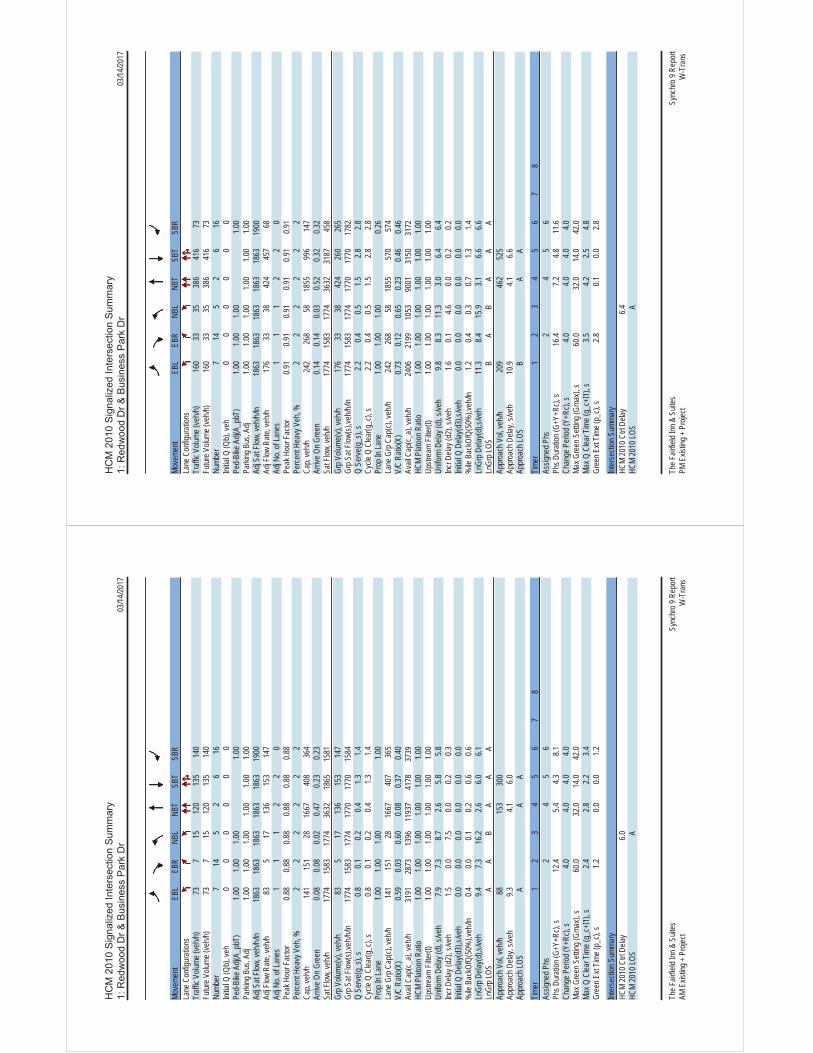
03/14
/2017
The F
airfie
ld Inn
& S
uites
Sy
nchr
o 9 R
epor
tAM
Exis
ting +
Pro
ject
W-T
rans
Move
ment
EBL
EBR
NBL
NBT
SBT
SBR
Lane
Con
figur
ation
sTr
affic
Volum
e (ve
h/h)
737
1512
013
514
0Fu
ture V
olume
(veh
/h)73
715
120
135
140
Numb
er7
145
26
16Ini
tial Q
(Qb)
, veh
00
00
00
Ped-
Bike
Adj(
A_pb
T)1.0
01.0
01.0
01.0
0Pa
rking
Bus
, Adj
1.00
1.00
1.00
1.00
1.00
1.00
Adj S
at Flo
w, ve
h/h/ln
1863
1863
1863
1863
1863
1900
Adj F
low R
ate, v
eh/h
835
1713
615
314
7Ad
j No.
of La
nes
11
12
20
Peak
Hou
r Fac
tor0.8
80.8
80.8
80.8
80.8
80.8
8Pe
rcent
Heav
y Veh
, %2
22
22
2Ca
p, ve
h/h14
115
128
1667
408
364
Arriv
e On G
reen
0.08
0.08
0.02
0.47
0.23
0.23
Sat F
low, v
eh/h
1774
1583
1774
3632
1865
1581
Grp V
olume
(v), v
eh/h
835
1713
615
314
7Gr
p Sat
Flow(
s),ve
h/h/ln
1774
1583
1774
1770
1770
1584
Q Se
rve(g
_s),
s0.8
0.10.2
0.41.3
1.4Cy
cle Q
Clea
r(g_c
), s
0.80.1
0.20.4
1.31.4
Prop
In La
ne1.0
01.0
01.0
01.0
0La
ne G
rp C
ap(c)
, veh
/h14
115
128
1667
407
365
V/C
Ratio
(X)
0.59
0.03
0.60
0.08
0.37
0.40
Avail
Cap
(c_a)
, veh
/h31
9128
7313
9611
937
4178
3739
HCM
Plato
on R
atio
1.00
1.00
1.00
1.00
1.00
1.00
Upstr
eam
Filter
(I)1.0
01.0
01.0
01.0
01.0
01.0
0Un
iform
Dela
y (d)
, s/ve
h7.9
7.38.7
2.65.8
5.8Inc
r Dela
y (d2
), s/v
eh1.5
0.07.5
0.00.2
0.3Ini
tial Q
Dela
y(d3)
,s/ve
h0.0
0.00.0
0.00.0
0.0%
ile B
ackO
fQ(5
0%),v
eh/ln
0.40.0
0.10.2
0.60.6
LnGr
p Dela
y(d),s
/veh
9.47.3
16.2
2.66.0
6.1Ln
Grp L
OSA
AB
AA
AAp
proa
ch V
ol, ve
h/h88
153
300
Appr
oach
Dela
y, s/v
eh9.3
4.16.0
Appr
oach
LOS
AA
A
Timer
12
34
56
78
Assig
ned P
hs2
45
6Ph
s Dur
ation
(G+Y
+Rc),
s12
.45.4
4.38.1
Chan
ge P
eriod
(Y+R
c), s
4.04.0
4.04.0
Max G
reen
Sett
ing (G
max),
s60
.032
.014
.042
.0Ma
x Q C
lear T
ime (
g_c+
I1), s
2.42.8
2.23.4
Gree
n Ext
Time (
p_c),
s1.2
0.00.0
1.2
Inter
secti
on S
umma
ryHC
M 20
10 C
trl De
lay6.0
HCM
2010
LOS
A
03/14
/2017
The F
airfie
ld Inn
& S
uites
Sy
nchr
o 9 R
epor
tPM
Exis
ting +
Pro
ject
W-T
rans
Move
ment
EBL
EBR
NBL
NBT
SBT
SBR
Lane
Con
figur
ation
sTr
affic
Volum
e (ve
h/h)
160
3335
386
416
73Fu
ture V
olume
(veh
/h)16
033
3538
641
673
Numb
er7
145
26
16Ini
tial Q
(Qb)
, veh
00
00
00
Ped-
Bike
Adj(
A_pb
T)1.0
01.0
01.0
01.0
0Pa
rking
Bus
, Adj
1.00
1.00
1.00
1.00
1.00
1.00
Adj S
at Flo
w, ve
h/h/ln
1863
1863
1863
1863
1863
1900
Adj F
low R
ate, v
eh/h
176
3338
424
457
68Ad
j No.
of La
nes
11
12
20
Peak
Hou
r Fac
tor0.9
10.9
10.9
10.9
10.9
10.9
1Pe
rcent
Heav
y Veh
, %2
22
22
2Ca
p, ve
h/h24
226
858
1855
996
147
Arriv
e On G
reen
0.14
0.14
0.03
0.52
0.32
0.32
Sat F
low, v
eh/h
1774
1583
1774
3632
3187
458
Grp V
olume
(v), v
eh/h
176
3338
424
260
265
Grp S
at Flo
w(s),
veh/h
/ln17
7415
8317
7417
7017
7017
82Q
Serve
(g_s
), s
2.20.4
0.51.5
2.82.8
Cycle
Q C
lear(g
_c),
s2.2
0.40.5
1.52.8
2.8Pr
op In
Lane
1.00
1.00
1.00
0.26
Lane
Grp
Cap
(c), v
eh/h
242
268
5818
5557
057
4V/
C Ra
tio(X
)0.7
30.1
20.6
50.2
30.4
60.4
6Av
ail C
ap(c_
a), v
eh/h
2406
2199
1053
9001
3150
3172
HCM
Plato
on R
atio
1.00
1.00
1.00
1.00
1.00
1.00
Upstr
eam
Filter
(I)1.0
01.0
01.0
01.0
01.0
01.0
0Un
iform
Dela
y (d)
, s/ve
h9.8
8.311
.33.0
6.46.4
Incr D
elay (
d2),
s/veh
1.60.1
4.60.0
0.20.2
Initia
l Q D
elay(d
3),s/
veh
0.00.0
0.00.0
0.00.0
%ile
Bac
kOfQ
(50%
),veh
/ln1.2
0.40.3
0.71.3
1.4Ln
Grp D
elay(d
),s/ve
h11
.38.4
15.9
3.16.6
6.6Ln
Grp L
OSB
AB
AA
AAp
proa
ch V
ol, ve
h/h20
946
252
5Ap
proa
ch D
elay,
s/veh
10.9
4.16.6
Appr
oach
LOS
BA
A
Timer
12
34
56
78
Assig
ned P
hs2
45
6Ph
s Dur
ation
(G+Y
+Rc),
s16
.47.2
4.811
.6Ch
ange
Per
iod (Y
+Rc),
s4.0
4.04.0
4.0Ma
x Gre
en S
etting
(Gma
x), s
60.0
32.0
14.0
42.0
Max Q
Clea
r Tim
e (g_
c+I1)
, s3.5
4.22.5
4.8Gr
een E
xt Tim
e (p_
c), s
2.80.1
0.02.8
Inter
secti
on S
umma
ryHC
M 20
10 C
trl De
lay6.4
HCM
2010
LOS
A
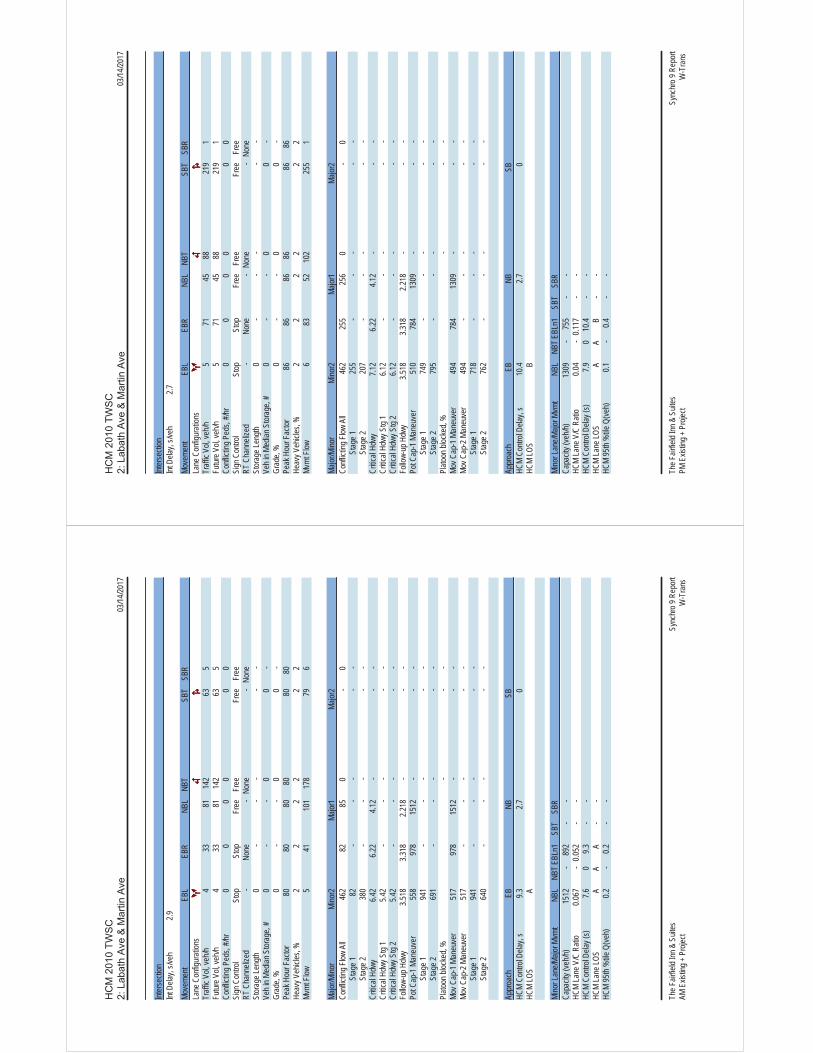
03/14
/2017
The F
airfie
ld Inn
& S
uites
Sy
nchr
o 9 R
epor
tAM
Exis
ting +
Pro
ject
W-T
rans
Inter
secti
onInt
Dela
y, s/v
eh2.9
Move
ment
EBL
EBR
NBL
NBT
SBT
SBR
Lane
Con
figur
ation
sTr
affic
Vol, v
eh/h
433
8114
263
5Fu
ture V
ol, ve
h/h4
3381
142
635
Confl
icting
Ped
s, #/h
r0
00
00
0Si
gn C
ontro
l St
opSt
opFr
eeFr
eeFr
eeFr
eeRT
Cha
nneli
zed
-No
ne-
None
-No
neSt
orag
e Len
gth0
--
--
-Ve
h in M
edian
Stor
age,
#0
--
00
-Gr
ade,
%0
--
00
-Pe
ak H
our F
actor
8080
8080
8080
Heav
y Veh
icles
, %2
22
22
2Mv
mt F
low5
4110
117
879
6
Major
/Mino
rMi
nor2
Major
1Ma
jor2
Confl
icting
Flow
All
462
8285
0-
0
S
tage 1
82-
--
--
Stag
e 238
0-
--
--
Critic
al Hd
wy6.4
26.2
24.1
2-
--
Critic
al Hd
wy S
tg 1
5.42
--
--
-Cr
itical
Hdwy
Stg
25.4
2-
--
--
Follo
w-up
Hdw
y3.5
183.3
182.2
18-
--
Pot C
ap-1
Man
euve
r55
897
815
12-
--
Stag
e 194
1-
--
--
Stag
e 269
1-
--
--
Plato
on bl
ocke
d, %
--
-Mo
v Cap
-1 M
aneu
ver
517
978
1512
--
-Mo
v Cap
-2 M
aneu
ver
517
--
--
-
S
tage 1
941
--
--
-
S
tage 2
640
--
--
-
Appr
oach
EBNB
SBHC
M Co
ntrol
Delay
, s9.3
2.70
HCM
LOS
A
Mino
r Lan
e/Majo
r Mvm
tNB
LNB
TEBL
n1SB
TSB
RCa
pacit
y (ve
h/h)
1512
-89
2-
-HC
M La
ne V
/C R
atio
0.067
-0.0
52-
-HC
M Co
ntrol
Delay
(s)
7.60
9.3-
-HC
M La
ne LO
SA
AA
--
HCM
95th
%tile
Q(ve
h)0.2
-0.2
--
03/14
/2017
The F
airfie
ld Inn
& S
uites
Sy
nchr
o 9 R
epor
tPM
Exis
ting +
Pro
ject
W-T
rans
Inter
secti
onInt
Dela
y, s/v
eh2.7
Move
ment
EBL
EBR
NBL
NBT
SBT
SBR
Lane
Con
figur
ation
sTr
affic
Vol, v
eh/h
571
4588
219
1Fu
ture V
ol, ve
h/h5
7145
8821
91
Confl
icting
Ped
s, #/h
r0
00
00
0Si
gn C
ontro
l St
opSt
opFr
eeFr
eeFr
eeFr
eeRT
Cha
nneli
zed
-No
ne-
None
-No
neSt
orag
e Len
gth0
--
--
-Ve
h in M
edian
Stor
age,
#0
--
00
-Gr
ade,
%0
--
00
-Pe
ak H
our F
actor
8686
8686
8686
Heav
y Veh
icles
, %2
22
22
2Mv
mt F
low6
8352
102
255
1
Major
/Mino
rMi
nor2
Major
1Ma
jor2
Confl
icting
Flow
All
462
255
256
0-
0
S
tage 1
255
--
--
-
S
tage 2
207
--
--
-Cr
itical
Hdwy
7.12
6.22
4.12
--
-Cr
itical
Hdwy
Stg
16.1
2-
--
--
Critic
al Hd
wy S
tg 2
6.12
--
--
-Fo
llow-
up H
dwy
3.518
3.318
2.218
--
-Po
t Cap
-1 M
aneu
ver
510
784
1309
--
-
S
tage 1
749
--
--
-
S
tage 2
795
--
--
-Pl
atoon
bloc
ked,
%-
--
Mov C
ap-1
Man
euve
r49
478
413
09-
--
Mov C
ap-2
Man
euve
r49
4-
--
--
Stag
e 171
8-
--
--
Stag
e 276
2-
--
--
Appr
oach
EBNB
SBHC
M Co
ntrol
Delay
, s10
.42.7
0HC
M LO
SB
Mino
r Lan
e/Majo
r Mvm
tNB
LNB
TEBL
n1SB
TSB
RCa
pacit
y (ve
h/h)
1309
-75
5-
-HC
M La
ne V
/C R
atio
0.04
-0.1
17-
-HC
M Co
ntrol
Delay
(s)
7.90
10.4
--
HCM
Lane
LOS
AA
B-
-HC
M 95
th %
tile Q
(veh)
0.1-
0.4-
-
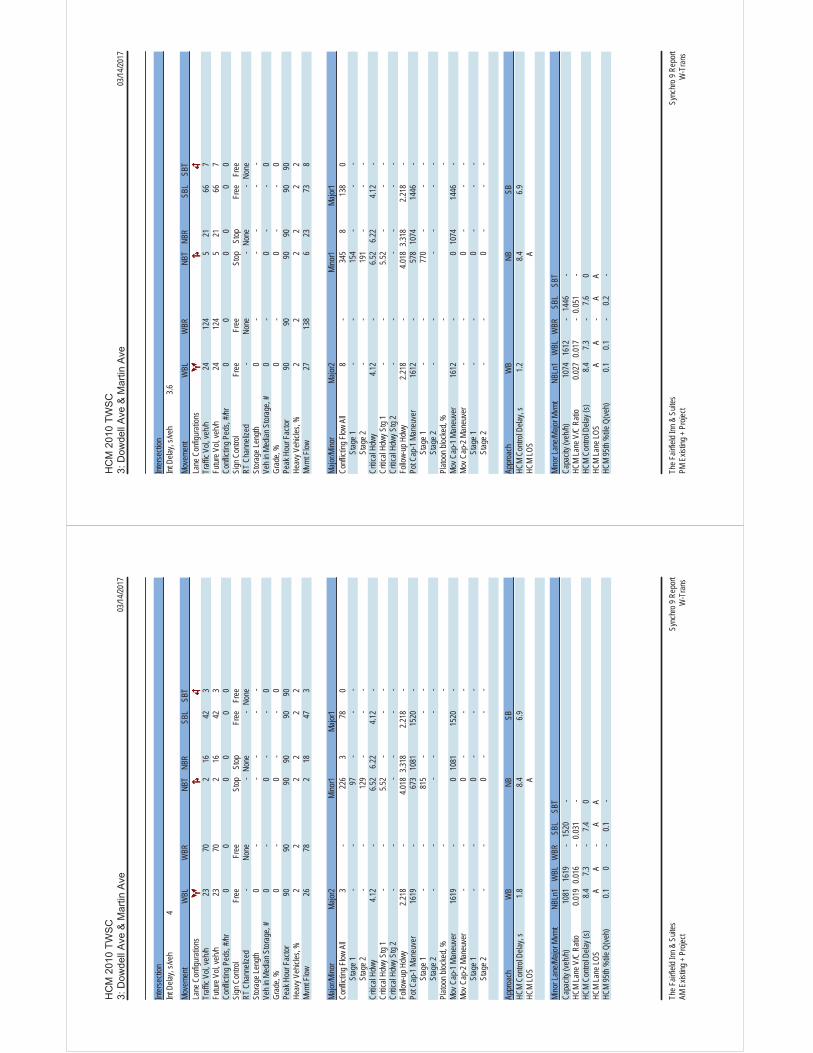
03/14
/2017
The F
airfie
ld Inn
& S
uites
Sy
nchr
o 9 R
epor
tAM
Exis
ting +
Pro
ject
W-T
rans
Inter
secti
onInt
Dela
y, s/v
eh4
Move
ment
WBL
WBR
NBT
NBR
SBL
SBT
Lane
Con
figur
ation
sTr
affic
Vol, v
eh/h
2370
216
423
Futur
e Vol,
veh/h
2370
216
423
Confl
icting
Ped
s, #/h
r0
00
00
0Si
gn C
ontro
l Fr
eeFr
eeSt
opSt
opFr
eeFr
eeRT
Cha
nneli
zed
-No
ne-
None
-No
neSt
orag
e Len
gth0
--
--
-Ve
h in M
edian
Stor
age,
#0
-0
--
0Gr
ade,
%0
-0
--
0Pe
ak H
our F
actor
9090
9090
9090
Heav
y Veh
icles
, %2
22
22
2Mv
mt F
low26
782
1847
3
Major
/Mino
rMa
jor2
Mino
r1Ma
jor1
Confl
icting
Flow
All
3-
226
378
0
S
tage 1
--
97-
--
Stag
e 2-
-12
9-
--
Critic
al Hd
wy4.1
2-
6.52
6.22
4.12
-Cr
itical
Hdwy
Stg
1-
-5.5
2-
--
Critic
al Hd
wy S
tg 2
--
--
--
Follo
w-up
Hdw
y2.2
18-
4.018
3.318
2.218
-Po
t Cap
-1 M
aneu
ver
1619
-67
310
8115
20-
Stag
e 1-
-81
5-
--
Stag
e 2-
--
--
-Pl
atoon
bloc
ked,
%-
-Mo
v Cap
-1 M
aneu
ver
1619
-0
1081
1520
-Mo
v Cap
-2 M
aneu
ver
--
0-
--
Stag
e 1-
-0
--
-
S
tage 2
--
0-
--
Appr
oach
WB
NBSB
HCM
Contr
ol De
lay, s
1.88.4
6.9HC
M LO
SA
Mino
r Lan
e/Majo
r Mvm
tNB
Ln1
WBL
WBR
SBL
SBT
Capa
city (
veh/h
)10
8116
19-
1520
-HC
M La
ne V
/C R
atio
0.019
0.016
-0.0
31-
HCM
Contr
ol De
lay (s
)8.4
7.3-
7.40
HCM
Lane
LOS
AA
-A
AHC
M 95
th %
tile Q
(veh)
0.10
-0.1
-
03/14
/2017
The F
airfie
ld Inn
& S
uites
Sy
nchr
o 9 R
epor
tPM
Exis
ting +
Pro
ject
W-T
rans
Inter
secti
onInt
Dela
y, s/v
eh3.6
Move
ment
WBL
WBR
NBT
NBR
SBL
SBT
Lane
Con
figur
ation
sTr
affic
Vol, v
eh/h
2412
45
2166
7Fu
ture V
ol, ve
h/h24
124
521
667
Confl
icting
Ped
s, #/h
r0
00
00
0Si
gn C
ontro
l Fr
eeFr
eeSt
opSt
opFr
eeFr
eeRT
Cha
nneli
zed
-No
ne-
None
-No
neSt
orag
e Len
gth0
--
--
-Ve
h in M
edian
Stor
age,
#0
-0
--
0Gr
ade,
%0
-0
--
0Pe
ak H
our F
actor
9090
9090
9090
Heav
y Veh
icles
, %2
22
22
2Mv
mt F
low27
138
623
738
Major
/Mino
rMa
jor2
Mino
r1Ma
jor1
Confl
icting
Flow
All
8-
345
813
80
Stag
e 1-
-15
4-
--
Stag
e 2-
-19
1-
--
Critic
al Hd
wy4.1
2-
6.52
6.22
4.12
-Cr
itical
Hdwy
Stg
1-
-5.5
2-
--
Critic
al Hd
wy S
tg 2
--
--
--
Follo
w-up
Hdw
y2.2
18-
4.018
3.318
2.218
-Po
t Cap
-1 M
aneu
ver
1612
-57
810
7414
46-
Stag
e 1-
-77
0-
--
Stag
e 2-
--
--
-Pl
atoon
bloc
ked,
%-
-Mo
v Cap
-1 M
aneu
ver
1612
-0
1074
1446
-Mo
v Cap
-2 M
aneu
ver
--
0-
--
Stag
e 1-
-0
--
-
S
tage 2
--
0-
--
Appr
oach
WB
NBSB
HCM
Contr
ol De
lay, s
1.28.4
6.9HC
M LO
SA
Mino
r Lan
e/Majo
r Mvm
tNB
Ln1
WBL
WBR
SBL
SBT
Capa
city (
veh/h
)10
7416
12-
1446
-HC
M La
ne V
/C R
atio
0.027
0.017
-0.0
51-
HCM
Contr
ol De
lay (s
)8.4
7.3-
7.60
HCM
Lane
LOS
AA
-A
AHC
M 95
th %
tile Q
(veh)
0.10.1
-0.2
-
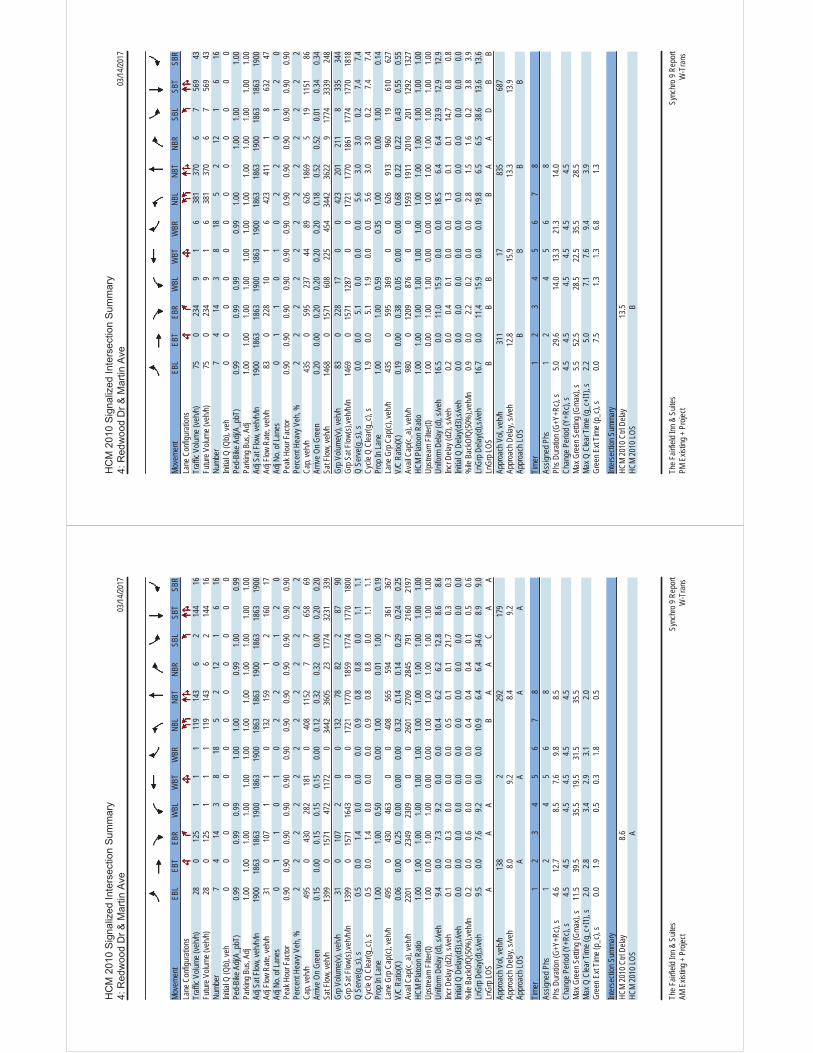
03/14
/2017
The F
airfie
ld Inn
& S
uites
Sy
nchr
o 9 R
epor
tAM
Exis
ting +
Pro
ject
W-T
rans
Move
ment
EBL
EBT
EBR
WBL
WBT
WBR
NBL
NBT
NBR
SBL
SBT
SBR
Lane
Con
figur
ation
sTr
affic
Volum
e (ve
h/h)
280
125
11
111
914
36
214
416
Futur
e Volu
me (v
eh/h)
280
125
11
111
914
36
214
416
Numb
er7
414
38
185
212
16
16Ini
tial Q
(Qb)
, veh
00
00
00
00
00
00
Ped-
Bike
Adj(
A_pb
T)0.9
90.9
90.9
91.0
01.0
00.9
91.0
00.9
9Pa
rking
Bus
, Adj
1.00
1.00
1.00
1.00
1.00
1.00
1.00
1.00
1.00
1.00
1.00
1.00
Adj S
at Flo
w, ve
h/h/ln
1900
1863
1863
1900
1863
1900
1863
1863
1900
1863
1863
1900
Adj F
low R
ate, v
eh/h
310
107
11
013
215
91
216
017
Adj N
o. of
Lane
s0
11
01
02
20
12
0Pe
ak H
our F
actor
0.90
0.90
0.90
0.90
0.90
0.90
0.90
0.90
0.90
0.90
0.90
0.90
Perce
nt He
avy V
eh, %
22
22
22
22
22
22
Cap,
veh/h
495
043
028
218
10
408
1152
77
658
69Ar
rive O
n Gre
en0.1
50.0
00.1
50.1
50.1
50.0
00.1
20.3
20.3
20.0
00.2
00.2
0Sa
t Flow
, veh
/h13
990
1571
472
1172
034
4236
0523
1774
3231
339
Grp V
olume
(v), v
eh/h
310
107
20
013
278
822
8790
Grp S
at Flo
w(s),
veh/h
/ln13
990
1571
1643
00
1721
1770
1859
1774
1770
1800
Q Se
rve(g
_s),
s0.5
0.01.4
0.00.0
0.00.9
0.80.8
0.01.1
1.1Cy
cle Q
Clea
r(g_c
), s
0.50.0
1.40.0
0.00.0
0.90.8
0.80.0
1.11.1
Prop
In La
ne1.0
01.0
00.5
00.0
01.0
00.0
11.0
00.1
9La
ne G
rp C
ap(c)
, veh
/h49
50
430
463
00
408
565
594
736
136
7V/
C Ra
tio(X
)0.0
60.0
00.2
50.0
00.0
00.0
00.3
20.1
40.1
40.2
90.2
40.2
5Av
ail C
ap(c_
a), v
eh/h
2201
023
4923
090
026
0127
0928
4579
121
6021
97HC
M Pl
atoon
Rati
o1.0
01.0
01.0
01.0
01.0
01.0
01.0
01.0
01.0
01.0
01.0
01.0
0Up
strea
m Fil
ter(I)
1.00
0.00
1.00
1.00
0.00
0.00
1.00
1.00
1.00
1.00
1.00
1.00
Unifo
rm D
elay (
d), s
/veh
9.40.0
7.39.2
0.00.0
10.4
6.26.2
12.8
8.68.6
Incr D
elay (
d2),
s/veh
0.10.0
0.30.0
0.00.0
0.50.1
0.121
.70.3
0.3Ini
tial Q
Dela
y(d3)
,s/ve
h0.0
0.00.0
0.00.0
0.00.0
0.00.0
0.00.0
0.0%
ile B
ackO
fQ(5
0%),v
eh/ln
0.20.0
0.60.0
0.00.0
0.40.4
0.40.1
0.50.6
LnGr
p Dela
y(d),s
/veh
9.50.0
7.69.2
0.00.0
10.9
6.46.4
34.6
8.99.0
LnGr
p LOS
AA
AB
AA
CA
AAp
proa
ch V
ol, ve
h/h13
82
292
179
Appr
oach
Dela
y, s/v
eh8.0
9.28.4
9.2Ap
proa
ch LO
SA
AA
A
Timer
12
34
56
78
Assig
ned P
hs1
24
56
8Ph
s Dur
ation
(G+Y
+Rc),
s4.6
12.7
8.57.6
9.88.5
Chan
ge P
eriod
(Y+R
c), s
4.54.5
4.54.5
4.54.5
Max G
reen
Sett
ing (G
max),
s11
.539
.535
.519
.531
.535
.5Ma
x Q C
lear T
ime (
g_c+
I1), s
2.02.8
3.42.9
3.12.0
Gree
n Ext
Time (
p_c),
s0.0
1.90.5
0.31.8
0.5
Inter
secti
on S
umma
ryHC
M 20
10 C
trl De
lay8.6
HCM
2010
LOS
A
03/14
/2017
The F
airfie
ld Inn
& S
uites
Sy
nchr
o 9 R
epor
tPM
Exis
ting +
Pro
ject
W-T
rans
Move
ment
EBL
EBT
EBR
WBL
WBT
WBR
NBL
NBT
NBR
SBL
SBT
SBR
Lane
Con
figur
ation
sTr
affic
Volum
e (ve
h/h)
750
234
91
638
137
06
756
943
Futur
e Volu
me (v
eh/h)
750
234
91
638
137
06
756
943
Numb
er7
414
38
185
212
16
16Ini
tial Q
(Qb)
, veh
00
00
00
00
00
00
Ped-
Bike
Adj(
A_pb
T)0.9
90.9
90.9
90.9
91.0
01.0
01.0
01.0
0Pa
rking
Bus
, Adj
1.00
1.00
1.00
1.00
1.00
1.00
1.00
1.00
1.00
1.00
1.00
1.00
Adj S
at Flo
w, ve
h/h/ln
1900
1863
1863
1900
1863
1900
1863
1863
1900
1863
1863
1900
Adj F
low R
ate, v
eh/h
830
228
101
642
341
11
863
247
Adj N
o. of
Lane
s0
11
01
02
20
12
0Pe
ak H
our F
actor
0.90
0.90
0.90
0.90
0.90
0.90
0.90
0.90
0.90
0.90
0.90
0.90
Perce
nt He
avy V
eh, %
22
22
22
22
22
22
Cap,
veh/h
435
059
523
744
8962
618
695
1911
5186
Arriv
e On G
reen
0.20
0.00
0.20
0.20
0.20
0.20
0.18
0.52
0.52
0.01
0.34
0.34
Sat F
low, v
eh/h
1468
015
7160
822
545
434
4236
229
1774
3339
248
Grp V
olume
(v), v
eh/h
830
228
170
042
320
121
18
335
344
Grp S
at Flo
w(s),
veh/h
/ln14
690
1571
1287
00
1721
1770
1861
1774
1770
1818
Q Se
rve(g
_s),
s0.0
0.05.1
0.00.0
0.05.6
3.03.0
0.27.4
7.4Cy
cle Q
Clea
r(g_c
), s
1.90.0
5.11.9
0.00.0
5.63.0
3.00.2
7.47.4
Prop
In La
ne1.0
01.0
00.5
90.3
51.0
00.0
01.0
00.1
4La
ne G
rp C
ap(c)
, veh
/h43
50
595
369
00
626
913
960
1961
062
7V/
C Ra
tio(X
)0.1
90.0
00.3
80.0
50.0
00.0
00.6
80.2
20.2
20.4
30.5
50.5
5Av
ail C
ap(c_
a), v
eh/h
980
012
0987
60
015
9319
1120
1020
112
9213
27HC
M Pl
atoon
Rati
o1.0
01.0
01.0
01.0
01.0
01.0
01.0
01.0
01.0
01.0
01.0
01.0
0Up
strea
m Fil
ter(I)
1.00
0.00
1.00
1.00
0.00
0.00
1.00
1.00
1.00
1.00
1.00
1.00
Unifo
rm D
elay (
d), s
/veh
16.5
0.011
.015
.90.0
0.018
.56.4
6.423
.912
.912
.9Inc
r Dela
y (d2
), s/v
eh0.2
0.00.4
0.10.0
0.01.3
0.10.1
14.7
0.80.8
Initia
l Q D
elay(d
3),s/
veh
0.00.0
0.00.0
0.00.0
0.00.0
0.00.0
0.00.0
%ile
Bac
kOfQ
(50%
),veh
/ln0.9
0.02.2
0.20.0
0.02.8
1.51.6
0.23.8
3.9Ln
Grp D
elay(d
),s/ve
h16
.70.0
11.4
15.9
0.00.0
19.8
6.56.5
38.6
13.6
13.6
LnGr
p LOS
BB
BB
AA
DB
BAp
proa
ch V
ol, ve
h/h31
117
835
687
Appr
oach
Dela
y, s/v
eh12
.815
.913
.313
.9Ap
proa
ch LO
SB
BB
B
Timer
12
34
56
78
Assig
ned P
hs1
24
56
8Ph
s Dur
ation
(G+Y
+Rc),
s5.0
29.6
14.0
13.3
21.3
14.0
Chan
ge P
eriod
(Y+R
c), s
4.54.5
4.54.5
4.54.5
Max G
reen
Sett
ing (G
max),
s5.5
52.5
28.5
22.5
35.5
28.5
Max Q
Clea
r Tim
e (g_
c+I1)
, s2.2
5.07.1
7.69.4
3.9Gr
een E
xt Tim
e (p_
c), s
0.07.5
1.31.3
6.81.3
Inter
secti
on S
umma
ryHC
M 20
10 C
trl De
lay13
.5HC
M 20
10 LO
SB
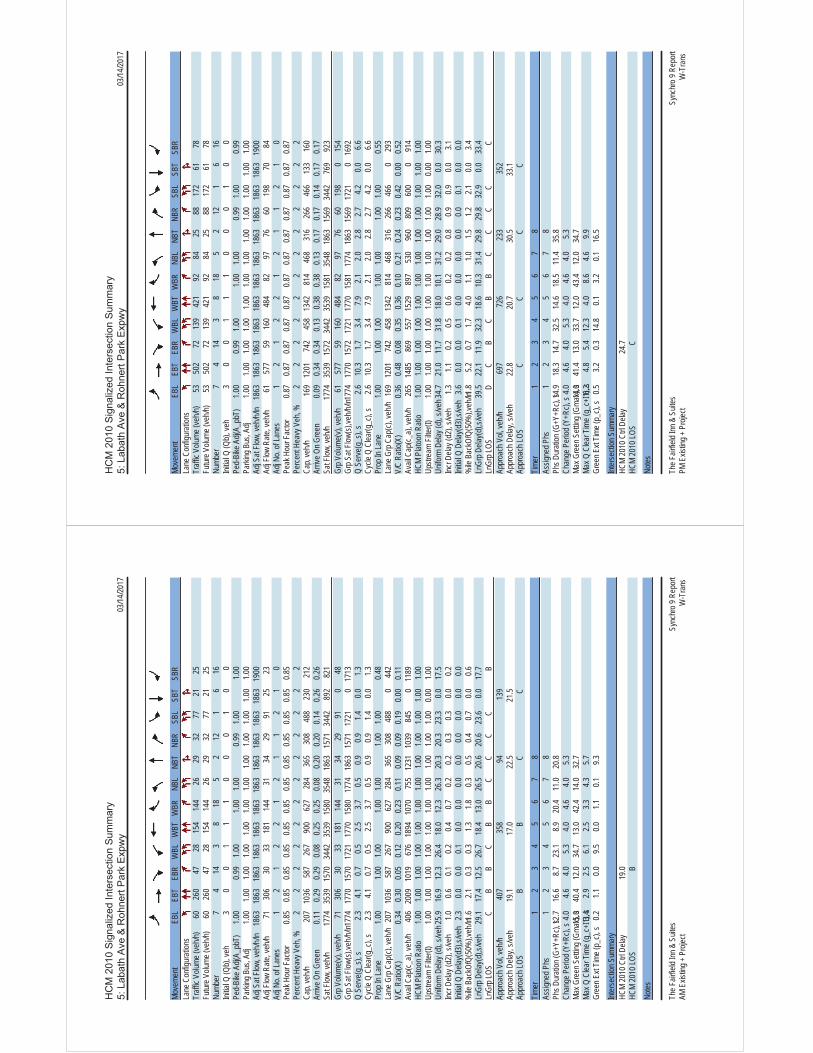
03/14
/2017
The F
airfie
ld Inn
& S
uites
Sy
nchr
o 9 R
epor
tAM
Exis
ting +
Pro
ject
W-T
rans
Move
ment
EBL
EBT
EBR
WBL
WBT
WBR
NBL
NBT
NBR
SBL
SBT
SBR
Lane
Con
figur
ation
sTr
affic
Volum
e (ve
h/h)
6026
047
2815
414
426
2932
7721
25Fu
ture V
olume
(veh
/h)60
260
4728
154
144
2629
3277
2125
Numb
er7
414
38
185
212
16
16Ini
tial Q
(Qb)
, veh
30
01
11
00
01
00
Ped-
Bike
Adj(
A_pb
T)1.0
00.9
91.0
01.0
01.0
00.9
91.0
01.0
0Pa
rking
Bus
, Adj
1.00
1.00
1.00
1.00
1.00
1.00
1.00
1.00
1.00
1.00
1.00
1.00
Adj S
at Flo
w, ve
h/h/ln
1863
1863
1863
1863
1863
1863
1863
1863
1863
1863
1863
1900
Adj F
low R
ate, v
eh/h
7130
630
3318
114
431
3429
9125
23Ad
j No.
of La
nes
12
12
21
21
12
10
Peak
Hou
r Fac
tor0.8
50.8
50.8
50.8
50.8
50.8
50.8
50.8
50.8
50.8
50.8
50.8
5Pe
rcent
Heav
y Veh
, %2
22
22
22
22
22
2Ca
p, ve
h/h20
710
3658
726
790
062
728
436
530
848
823
021
2Ar
rive O
n Gre
en0.1
10.2
90.2
90.0
80.2
50.2
50.0
80.2
00.2
00.1
40.2
60.2
6Sa
t Flow
, veh
/h17
7435
3915
7034
4235
3915
8035
4818
6315
7134
4289
282
1Gr
p Volu
me(v)
, veh
/h71
306
3033
181
144
3134
2991
048
Grp S
at Flo
w(s),
veh/h
/ln17
7417
7015
7017
2117
7015
8017
7418
6315
7117
210
1713
Q Se
rve(g
_s),
s2.3
4.10.7
0.52.5
3.70.5
0.90.9
1.40.0
1.3Cy
cle Q
Clea
r(g_c
), s
2.34.1
0.70.5
2.53.7
0.50.9
0.91.4
0.01.3
Prop
In La
ne1.0
01.0
01.0
01.0
01.0
01.0
01.0
00.4
8La
ne G
rp C
ap(c)
, veh
/h20
710
3658
726
790
062
728
436
530
848
80
442
V/C
Ratio
(X)
0.34
0.30
0.05
0.12
0.20
0.23
0.11
0.09
0.09
0.19
0.00
0.11
Avail
Cap
(c_a)
, veh
/h40
620
0910
1967
618
9410
7075
512
3110
3984
50
1189
HCM
Plato
on R
atio
1.00
1.00
1.00
1.00
1.00
1.00
1.00
1.00
1.00
1.00
1.00
1.00
Upstr
eam
Filter
(I)1.0
01.0
01.0
01.0
01.0
01.0
01.0
01.0
01.0
01.0
00.0
01.0
0Un
iform
Dela
y (d)
, s/ve
h25.9
16.9
12.3
26.4
18.0
12.3
26.3
20.3
20.3
23.3
0.017
.5Inc
r Dela
y (d2
), s/v
eh1.0
0.60.1
0.20.4
0.70.2
0.20.3
0.30.0
0.2Ini
tial Q
Dela
y(d3)
,s/ve
h2.3
0.00.0
0.10.0
0.00.0
0.00.0
0.00.0
0.0%
ile B
ackO
fQ(5
0%),v
eh/ln1
.62.1
0.30.3
1.31.8
0.30.5
0.40.7
0.00.6
LnGr
p Dela
y(d),s
/veh
29.1
17.4
12.5
26.7
18.4
13.0
26.5
20.6
20.6
23.6
0.017
.7Ln
Grp L
OSC
BB
CB
BC
CC
CB
Appr
oach
Vol,
veh/h
407
358
9413
9Ap
proa
ch D
elay,
s/veh
19.1
17.0
22.5
21.5
Appr
oach
LOS
BB
CC
Timer
12
34
56
78
Assig
ned P
hs1
23
45
67
8Ph
s Dur
ation
(G+Y
+Rc),
s12.7
16.6
8.723
.18.9
20.4
11.0
20.8
Chan
ge P
eriod
(Y+R
c), s
4.04.6
4.05.3
4.04.6
4.05.3
Max G
reen
Sett
ing (G
max),
s15
.040
.412
.034
.713
.042
.414
.032
.7Ma
x Q C
lear T
ime (
g_c+
I1), s3.4
2.92.5
6.12.5
3.34.3
5.7Gr
een E
xt Tim
e (p_
c), s
0.21.1
0.09.5
0.01.1
0.19.3
Inter
secti
on S
umma
ryHC
M 20
10 C
trl De
lay19
.0HC
M 20
10 LO
SB
Notes
03/14
/2017
The F
airfie
ld Inn
& S
uites
Sy
nchr
o 9 R
epor
tPM
Exis
ting +
Pro
ject
W-T
rans
Move
ment
EBL
EBT
EBR
WBL
WBT
WBR
NBL
NBT
NBR
SBL
SBT
SBR
Lane
Con
figur
ation
sTr
affic
Volum
e (ve
h/h)
5350
272
139
421
9284
2588
172
6178
Futur
e Volu
me (v
eh/h)
5350
272
139
421
9284
2588
172
6178
Numb
er7
414
38
185
212
16
16Ini
tial Q
(Qb)
, veh
30
01
11
00
01
00
Ped-
Bike
Adj(
A_pb
T)1.0
00.9
91.0
01.0
01.0
00.9
91.0
00.9
9Pa
rking
Bus
, Adj
1.00
1.00
1.00
1.00
1.00
1.00
1.00
1.00
1.00
1.00
1.00
1.00
Adj S
at Flo
w, ve
h/h/ln
1863
1863
1863
1863
1863
1863
1863
1863
1863
1863
1863
1900
Adj F
low R
ate, v
eh/h
6157
759
160
484
8297
7660
198
7084
Adj N
o. of
Lane
s1
21
22
12
11
21
0Pe
ak H
our F
actor
0.87
0.87
0.87
0.87
0.87
0.87
0.87
0.87
0.87
0.87
0.87
0.87
Perce
nt He
avy V
eh, %
22
22
22
22
22
22
Cap,
veh/h
169
1201
742
458
1342
814
468
316
266
466
133
160
Arriv
e On G
reen
0.09
0.34
0.34
0.13
0.38
0.38
0.13
0.17
0.17
0.14
0.17
0.17
Sat F
low, v
eh/h
1774
3539
1572
3442
3539
1581
3548
1863
1569
3442
769
923
Grp V
olume
(v), v
eh/h
6157
759
160
484
8297
7660
198
015
4Gr
p Sat
Flow(
s),ve
h/h/ln
1774
1770
1572
1721
1770
1581
1774
1863
1569
1721
016
92Q
Serve
(g_s
), s
2.610
.31.7
3.47.9
2.12.0
2.82.7
4.20.0
6.6Cy
cle Q
Clea
r(g_c
), s
2.610
.31.7
3.47.9
2.12.0
2.82.7
4.20.0
6.6Pr
op In
Lane
1.00
1.00
1.00
1.00
1.00
1.00
1.00
0.55
Lane
Grp
Cap
(c), v
eh/h
169
1201
742
458
1342
814
468
316
266
466
029
3V/
C Ra
tio(X
)0.3
60.4
80.0
80.3
50.3
60.1
00.2
10.2
40.2
30.4
20.0
00.5
2Av
ail C
ap(c_
a), v
eh/h
265
1485
869
557
1529
897
530
960
809
600
091
4HC
M Pl
atoon
Rati
o1.0
01.0
01.0
01.0
01.0
01.0
01.0
01.0
01.0
01.0
01.0
01.0
0Up
strea
m Fil
ter(I)
1.00
1.00
1.00
1.00
1.00
1.00
1.00
1.00
1.00
1.00
0.00
1.00
Unifo
rm D
elay (
d), s
/veh3
4.721
.011
.731
.818
.010
.131
.229
.028
.932
.00.0
30.3
Incr D
elay (
d2),
s/veh
1.31.1
0.20.5
0.60.2
0.20.8
0.90.9
0.03.1
Initia
l Q D
elay(d
3),s/
veh
3.60.0
0.00.1
0.00.0
0.00.0
0.00.1
0.00.0
%ile
Bac
kOfQ
(50%
),veh
/ln1.8
5.20.7
1.74.0
1.11.0
1.51.2
2.10.0
3.4Ln
Grp D
elay(d
),s/ve
h39
.522
.111
.932
.318
.610
.331
.429
.829
.832
.90.0
33.4
LnGr
p LOS
DC
BC
BB
CC
CC
CAp
proa
ch V
ol, ve
h/h69
772
623
335
2Ap
proa
ch D
elay,
s/veh
22.8
20.7
30.5
33.1
Appr
oach
LOS
CC
CC
Timer
12
34
56
78
Assig
ned P
hs1
23
45
67
8Ph
s Dur
ation
(G+Y
+Rc),
s14.9
18.3
14.7
32.5
14.6
18.5
11.4
35.8
Chan
ge P
eriod
(Y+R
c), s
4.04.6
4.05.3
4.04.6
4.05.3
Max G
reen
Sett
ing (G
max),
s14
.041
.413
.033
.712
.043
.412
.034
.7Ma
x Q C
lear T
ime (
g_c+
I1), s6.2
4.85.4
12.3
4.08.6
4.69.9
Gree
n Ext
Time (
p_c),
s0.5
3.20.3
14.8
0.13.2
0.116
.5
Inter
secti
on S
umma
ryHC
M 20
10 C
trl De
lay24
.7HC
M 20
10 LO
SC
Notes

03/14
/2017
The F
airfie
ld Inn
& S
uites
Sy
nchr
o 9 R
epor
tAM
Exis
ting +
Pro
ject
W-T
rans
Move
ment
EBL
EBT
EBR
WBL
WBT
WBR
NBL
NBT
NBR
SBL
SBT
SBR
Lane
Con
figur
ation
sTr
affic
Volum
e (ve
h/h)
4235
157
216
420
174
4154
144
177
6346
Futur
e Volu
me (v
eh/h)
4235
157
216
420
174
4154
144
177
6346
Numb
er5
212
16
163
818
74
14Ini
tial Q
(Qb)
, veh
04
03
102
12
10
51
Ped-
Bike
Adj(
A_pb
T)1.0
01.0
01.0
00.9
91.0
00.9
81.0
01.0
0Pa
rking
Bus
, Adj
1.00
1.00
1.00
1.00
1.00
1.00
1.00
1.00
1.00
1.00
1.00
1.00
Adj S
at Flo
w, ve
h/h/ln
1863
1863
1863
1863
1863
1863
1863
1863
1863
1863
1863
1863
Adj F
low R
ate, v
eh/h
4940
858
251
488
186
4863
116
206
7343
Adj N
o. of
Lane
s1
31
22
11
21
21
1Pe
ak H
our F
actor
0.86
0.86
0.86
0.86
0.86
0.86
0.86
0.86
0.86
0.86
0.86
0.86
Perce
nt He
avy V
eh, %
22
22
22
22
22
22
Cap,
veh/h
124
3000
927
307
2111
1074
124
412
317
275
249
202
Arriv
e On G
reen
0.07
0.59
0.59
0.13
0.92
0.92
0.07
0.11
0.11
0.08
0.13
0.13
Sat F
low, v
eh/h
1774
5085
1581
3442
3539
1560
1774
3539
1550
3442
1863
1583
Grp V
olume
(v), v
eh/h
4940
858
251
488
186
4863
116
206
7343
Grp S
at Flo
w(s),
veh/h
/ln17
7416
9515
8117
2117
7015
6017
7417
7015
5017
2118
6315
83Q
Serve
(g_s
), s
4.05.3
2.310
.72.1
1.43.9
2.49.7
8.85.4
3.7Cy
cle Q
Clea
r(g_c
), s
4.05.3
2.310
.72.1
1.43.9
2.49.7
8.85.4
3.7Pr
op In
Lane
1.00
1.00
1.00
1.00
1.00
1.00
1.00
1.00
Lane
Grp
Cap
(c), v
eh/h
124
3000
927
307
2111
1074
124
412
317
275
249
202
V/C
Ratio
(X)
0.40
0.14
0.06
0.82
0.23
0.17
0.39
0.15
0.37
0.75
0.29
0.21
Avail
Cap
(c_a)
, veh
/h26
030
2694
145
921
6510
8114
210
3859
259
772
061
2HC
M Pl
atoon
Rati
o1.0
01.0
01.0
01.5
01.5
01.5
01.0
01.0
01.0
01.0
01.0
01.0
0Up
strea
m Fil
ter(I)
0.99
0.99
0.99
1.00
1.00
1.00
1.00
1.00
1.00
0.99
0.99
0.99
Unifo
rm D
elay (
d), s
/veh6
6.814
.013
.564
.04.4
2.166
.959
.851
.767
.559
.358
.9Inc
r Dela
y (d2
), s/v
eh0.8
0.10.1
4.20.3
0.40.7
0.10.3
4.00.2
0.2Ini
tial Q
Dela
y(d3)
,s/ve
h0.0
0.00.0
3.80.2
0.00.8
0.20.1
0.04.1
0.2%
ile B
ackO
fQ(5
0%),v
eh/ln2
.02.8
1.15.7
2.51.2
2.11.4
4.44.3
3.91.8
LnGr
p Dela
y(d),s
/veh
67.5
14.1
13.6
72.0
4.92.5
68.4
60.0
52.0
71.5
63.6
59.3
LnGr
p LOS
EB
BE
AA
EE
DE
EE
Appr
oach
Vol,
veh/h
515
925
227
322
Appr
oach
Dela
y, s/v
eh19
.222
.657
.768
.1Ap
proa
ch LO
SB
CE
E
Timer
12
34
56
78
Assig
ned P
hs1
23
45
67
8Ph
s Dur
ation
(G+Y
+Rc),
s17.0
94.5
14.4
24.1
14.4
97.1
16.0
22.5
Chan
ge P
eriod
(Y+R
c), s
4.05.3
4.05.3
4.0* 5
.34.0
5.3Ma
x Gre
en S
etting
(Gma
x), s
20.0
41.4
12.0
58.0
22.0
* 40
26.0
44.0
Max Q
Clea
r Tim
e (g_
c+I1)
, s12
.77.3
5.97.4
6.04.1
10.8
11.7
Gree
n Ext
Time (
p_c),
s0.3
2.20.0
0.50.0
2.20.6
0.5
Inter
secti
on S
umma
ryHC
M 20
10 C
trl De
lay33
.1HC
M 20
10 LO
SC
Notes
03/14
/2017
The F
airfie
ld Inn
& S
uites
Sy
nchr
o 9 R
epor
tPM
Exis
ting +
Pro
ject
W-T
rans
Move
ment
EBL
EBT
EBR
WBL
WBT
WBR
NBL
NBT
NBR
SBL
SBT
SBR
Lane
Con
figur
ation
sTr
affic
Volum
e (ve
h/h)
151
799
7829
560
344
271
169
373
427
192
214
Futur
e Volu
me (v
eh/h)
151
799
7829
560
344
271
169
373
427
192
214
Numb
er5
212
16
163
818
74
14Ini
tial Q
(Qb)
, veh
04
03
102
12
10
51
Ped-
Bike
Adj(
A_pb
T)1.0
01.0
01.0
00.9
81.0
00.9
91.0
01.0
0Pa
rking
Bus
, Adj
1.00
1.00
1.00
1.00
1.00
1.00
1.00
1.00
1.00
1.00
1.00
1.00
Adj S
at Flo
w, ve
h/h/ln
1863
1863
1863
1863
1863
1863
1863
1863
1863
1863
1863
1863
Adj F
low R
ate, v
eh/h
157
832
7430
762
844
574
176
343
445
200
214
Adj N
o. of
Lane
s1
31
22
11
21
21
1Pe
ak H
our F
actor
0.96
0.96
0.96
0.96
0.96
0.96
0.96
0.96
0.96
0.96
0.96
0.96
Perce
nt He
avy V
eh, %
22
22
22
22
22
22
Cap,
veh/h
179
1940
601
361
1343
828
136
865
385
500
588
496
Arriv
e On G
reen
0.10
0.38
0.38
0.15
0.58
0.58
0.08
0.24
0.24
0.15
0.31
0.31
Sat F
low, v
eh/h
1774
5085
1580
3442
3539
1557
1774
3539
1568
3442
1863
1583
Grp V
olume
(v), v
eh/h
157
832
7430
762
844
574
176
343
445
200
214
Grp S
at Flo
w(s),
veh/h
/ln17
7416
9515
8017
2117
7015
5717
7417
7015
6817
2118
6315
83Q
Serve
(g_s
), s
13.1
18.1
4.513
.115
.324
.16.0
5.931
.819
.012
.416
.1Cy
cle Q
Clea
r(g_c
), s
13.1
18.1
4.513
.115
.324
.16.0
5.931
.819
.012
.416
.1Pr
op In
Lane
1.00
1.00
1.00
1.00
1.00
1.00
1.00
1.00
Lane
Grp
Cap
(c), v
eh/h
179
1940
601
361
1343
828
136
865
385
500
588
496
V/C
Ratio
(X)
0.88
0.43
0.12
0.85
0.47
0.54
0.54
0.20
0.89
0.89
0.34
0.43
Avail
Cap
(c_a)
, veh
/h26
019
5660
745
913
6783
214
210
3846
059
772
061
2HC
M Pl
atoon
Rati
o1.0
01.0
01.0
01.5
01.5
01.5
01.0
01.0
01.0
01.0
01.0
01.0
0Up
strea
m Fil
ter(I)
0.87
0.87
0.87
1.00
1.00
1.00
1.00
1.00
1.00
0.84
0.84
0.84
Unifo
rm D
elay (
d), s
/veh6
6.534
.530
.362
.324
.115
.766
.945
.254
.862
.939
.941
.0Inc
r Dela
y (d2
), s/v
eh13
.80.6
0.49.8
1.22.5
1.90.0
15.4
11.9
0.10.2
Initia
l Q D
elay(d
3),s/
veh
0.00.1
0.03.4
0.70.1
0.90.0
0.40.0
0.80.1
%ile
Bac
kOfQ
(50%
),veh
/ln7.1
8.92.1
7.19.1
11.4
3.23.1
15.6
9.97.4
7.2Ln
Grp D
elay(d
),s/ve
h80
.335
.230
.675
.426
.018
.369
.645
.370
.674
.840
.841
.2Ln
Grp L
OSF
DC
EC
BE
DE
ED
DAp
proa
ch V
ol, ve
h/h10
6313
8059
385
9Ap
proa
ch D
elay,
s/veh
41.5
34.5
63.0
58.5
Appr
oach
LOS
DC
EE
Timer
12
34
56
78
Assig
ned P
hs1
23
45
67
8Ph
s Dur
ation
(G+Y
+Rc),
s19.3
63.0
15.5
52.2
19.1
63.2
25.8
41.9
Chan
ge P
eriod
(Y+R
c), s
4.05.3
4.05.3
4.0* 5
.34.0
5.3Ma
x Gre
en S
etting
(Gma
x), s
20.0
41.4
12.0
58.0
22.0
* 40
26.0
44.0
Max Q
Clea
r Tim
e (g_
c+I1)
, s15
.120
.18.0
18.1
15.1
26.1
21.0
33.8
Gree
n Ext
Time (
p_c),
s0.3
4.00.0
1.70.0
3.70.8
1.4
Inter
secti
on S
umma
ryHC
M 20
10 C
trl De
lay46
.1HC
M 20
10 LO
SD
Notes
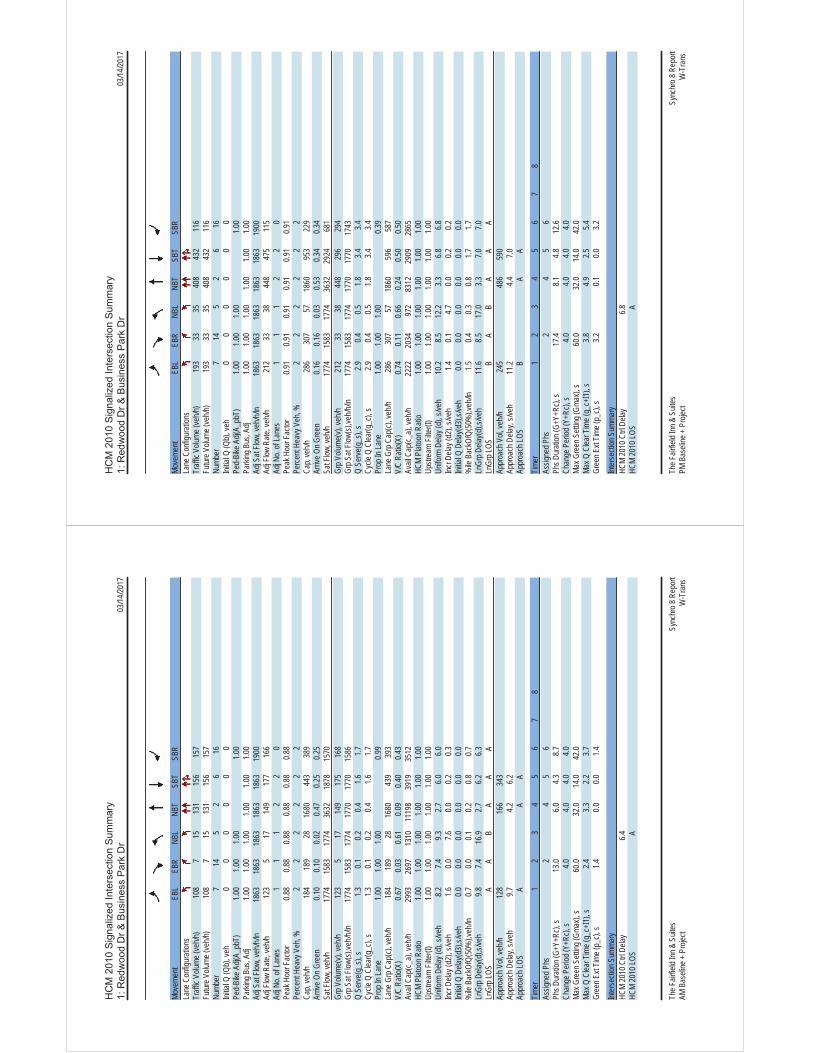
03/14
/2017
The F
airfie
ld Inn
& S
uites
Sync
hro 8
Rep
ort
AM B
aseli
ne +
Pro
ject
W-T
rans
Move
ment
EBL
EBR
NBL
NBT
SBT
SBR
Lane
Con
figur
ation
sTr
affic
Volum
e (ve
h/h)
108
715
131
156
157
Futur
e Volu
me (v
eh/h)
108
715
131
156
157
Numb
er7
145
26
16Ini
tial Q
(Qb)
, veh
00
00
00
Ped-
Bike
Adj(
A_pb
T)1.0
01.0
01.0
01.0
0Pa
rking
Bus
, Adj
1.00
1.00
1.00
1.00
1.00
1.00
Adj S
at Flo
w, ve
h/h/ln
1863
1863
1863
1863
1863
1900
Adj F
low R
ate, v
eh/h
123
517
149
177
166
Adj N
o. of
Lane
s1
11
22
0Pe
ak H
our F
actor
0.88
0.88
0.88
0.88
0.88
0.88
Perce
nt He
avy V
eh, %
22
22
22
Cap,
veh/h
184
189
2816
8044
338
9Ar
rive O
n Gre
en0.1
00.1
00.0
20.4
70.2
50.2
5Sa
t Flow
, veh
/h17
7415
8317
7436
3218
7815
70Gr
p Volu
me(v)
, veh
/h12
35
1714
917
516
8Gr
p Sat
Flow(
s),ve
h/h/ln
1774
1583
1774
1770
1770
1586
Q Se
rve(g
_s),
s1.3
0.10.2
0.41.6
1.7Cy
cle Q
Clea
r(g_c
), s
1.30.1
0.20.4
1.61.7
Prop
In La
ne1.0
01.0
01.0
00.9
9La
ne G
rp C
ap(c)
, veh
/h18
418
928
1680
439
393
V/C
Ratio
(X)
0.67
0.03
0.61
0.09
0.40
0.43
Avail
Cap
(c_a)
, veh
/h29
9326
9713
1011
198
3919
3512
HCM
Plato
on R
atio
1.00
1.00
1.00
1.00
1.00
1.00
Upstr
eam
Filter
(I)1.0
01.0
01.0
01.0
01.0
01.0
0Un
iform
Dela
y (d)
, s/ve
h8.2
7.49.3
2.76.0
6.0Inc
r Dela
y (d2
), s/v
eh1.6
0.07.6
0.00.2
0.3Ini
tial Q
Dela
y(d3)
,s/ve
h0.0
0.00.0
0.00.0
0.0%
ile B
ackO
fQ(5
0%),v
eh/ln
0.70.0
0.10.2
0.80.7
LnGr
p Dela
y(d),s
/veh
9.87.4
16.9
2.76.2
6.3Ln
Grp L
OSA
AB
AA
AAp
proa
ch V
ol, ve
h/h12
816
634
3Ap
proa
ch D
elay,
s/veh
9.74.2
6.2Ap
proa
ch LO
SA
AA
Timer
12
34
56
78
Assig
ned P
hs2
45
6Ph
s Dur
ation
(G+Y
+Rc),
s13
.06.0
4.38.7
Chan
ge P
eriod
(Y+R
c), s
4.04.0
4.04.0
Max G
reen
Sett
ing (G
max),
s60
.032
.014
.042
.0Ma
x Q C
lear T
ime (
g_c+
I1), s
2.43.3
2.23.7
Gree
n Ext
Time (
p_c),
s1.4
0.00.0
1.4
Inter
secti
on S
umma
ryHC
M 20
10 C
trl De
lay6.4
HCM
2010
LOS
A
03/14
/2017
The F
airfie
ld Inn
& S
uites
Sync
hro 8
Rep
ort
PM B
aseli
ne +
Pro
ject
W-T
rans
Move
ment
EBL
EBR
NBL
NBT
SBT
SBR
Lane
Con
figur
ation
sTr
affic
Volum
e (ve
h/h)
193
3335
408
432
116
Futur
e Volu
me (v
eh/h)
193
3335
408
432
116
Numb
er7
145
26
16Ini
tial Q
(Qb)
, veh
00
00
00
Ped-
Bike
Adj(
A_pb
T)1.0
01.0
01.0
01.0
0Pa
rking
Bus
, Adj
1.00
1.00
1.00
1.00
1.00
1.00
Adj S
at Flo
w, ve
h/h/ln
1863
1863
1863
1863
1863
1900
Adj F
low R
ate, v
eh/h
212
3338
448
475
115
Adj N
o. of
Lane
s1
11
22
0Pe
ak H
our F
actor
0.91
0.91
0.91
0.91
0.91
0.91
Perce
nt He
avy V
eh, %
22
22
22
Cap,
veh/h
286
307
5718
6095
322
9Ar
rive O
n Gre
en0.1
60.1
60.0
30.5
30.3
40.3
4Sa
t Flow
, veh
/h17
7415
8317
7436
3229
2468
1Gr
p Volu
me(v)
, veh
/h21
233
3844
829
629
4Gr
p Sat
Flow(
s),ve
h/h/ln
1774
1583
1774
1770
1770
1743
Q Se
rve(g
_s),
s2.9
0.40.5
1.83.4
3.4Cy
cle Q
Clea
r(g_c
), s
2.90.4
0.51.8
3.43.4
Prop
In La
ne1.0
01.0
01.0
00.3
9La
ne G
rp C
ap(c)
, veh
/h28
630
757
1860
596
587
V/C
Ratio
(X)
0.74
0.11
0.66
0.24
0.50
0.50
Avail
Cap
(c_a)
, veh
/h22
2220
3497
283
1229
0928
65HC
M Pl
atoon
Rati
o1.0
01.0
01.0
01.0
01.0
01.0
0Up
strea
m Fil
ter(I)
1.00
1.00
1.00
1.00
1.00
1.00
Unifo
rm D
elay (
d), s
/veh
10.2
8.512
.23.3
6.86.8
Incr D
elay (
d2),
s/veh
1.40.1
4.70.0
0.20.2
Initia
l Q D
elay(d
3),s/
veh
0.00.0
0.00.0
0.00.0
%ile
Bac
kOfQ
(50%
),veh
/ln1.5
0.40.3
0.81.7
1.7Ln
Grp D
elay(d
),s/ve
h11
.68.5
17.0
3.37.0
7.0Ln
Grp L
OSB
AB
AA
AAp
proa
ch V
ol, ve
h/h24
548
659
0Ap
proa
ch D
elay,
s/veh
11.2
4.47.0
Appr
oach
LOS
BA
A
Timer
12
34
56
78
Assig
ned P
hs2
45
6Ph
s Dur
ation
(G+Y
+Rc),
s17
.48.1
4.812
.6Ch
ange
Per
iod (Y
+Rc),
s4.0
4.04.0
4.0Ma
x Gre
en S
etting
(Gma
x), s
60.0
32.0
14.0
42.0
Max Q
Clea
r Tim
e (g_
c+I1)
, s3.8
4.92.5
5.4Gr
een E
xt Tim
e (p_
c), s
3.20.1
0.03.2
Inter
secti
on S
umma
ryHC
M 20
10 C
trl De
lay6.8
HCM
2010
LOS
A
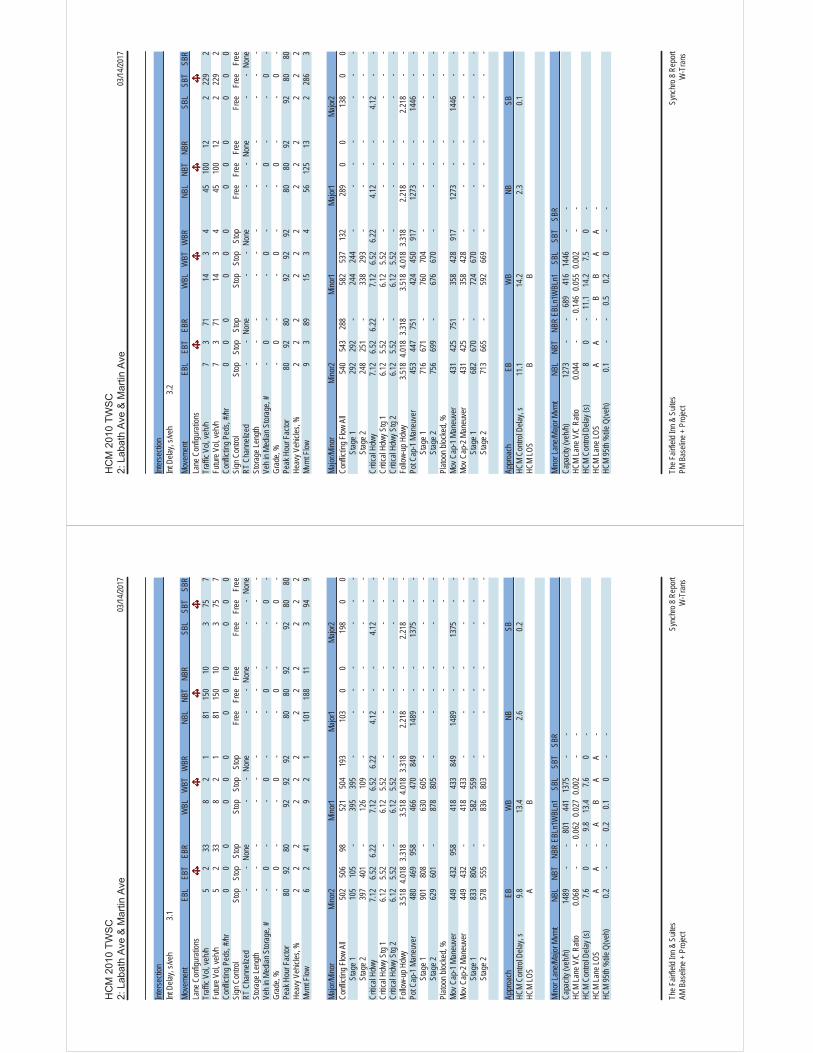
03/14
/2017
The F
airfie
ld Inn
& S
uites
Sync
hro 8
Rep
ort
AM B
aseli
ne +
Pro
ject
W-T
rans
Inter
secti
onInt
Dela
y, s/v
eh3.1
Move
ment
EBL
EBT
EBR
WBL
WBT
WBR
NBL
NBT
NBR
SBL
SBT
SBR
Lane
Con
figur
ation
sTr
affic
Vol, v
eh/h
52
338
21
8115
010
375
7Fu
ture V
ol, ve
h/h5
233
82
181
150
103
757
Confl
icting
Ped
s, #/h
r0
00
00
00
00
00
0Si
gn C
ontro
l St
opSt
opSt
opSt
opSt
opSt
opFr
eeFr
eeFr
eeFr
eeFr
eeFr
eeRT
Cha
nneli
zed
--
None
--
None
--
None
--
None
Stor
age L
ength
--
--
--
--
--
--
Veh i
n Med
ian S
torag
e, #
-0
--
0-
-0
--
0-
Grad
e, %
-0
--
0-
-0
--
0-
Peak
Hou
r Fac
tor80
9280
9292
9280
8092
9280
80He
avy V
ehicl
es, %
22
22
22
22
22
22
Mvmt
Flow
62
419
21
101
188
113
949
Major
/Mino
rMi
nor2
Mino
r1Ma
jor1
Major
2Co
nflict
ing F
low A
ll50
250
698
521
504
193
103
00
198
00
Stag
e 110
510
5-
395
395
--
--
--
-
S
tage 2
397
401
-12
610
9-
--
--
--
Critic
al Hd
wy7.1
26.5
26.2
27.1
26.5
26.2
24.1
2-
-4.1
2-
-Cr
itical
Hdwy
Stg
16.1
25.5
2-
6.12
5.52
--
--
--
-Cr
itical
Hdwy
Stg
26.1
25.5
2-
6.12
5.52
--
--
--
-Fo
llow-
up H
dwy
3.518
4.018
3.318
3.518
4.018
3.318
2.218
--
2.218
--
Pot C
ap-1
Man
euve
r48
046
995
846
647
084
914
89-
-13
75-
-
S
tage 1
901
808
-63
060
5-
--
--
--
Stag
e 262
960
1-
878
805
--
--
--
-Pl
atoon
bloc
ked,
%-
--
-Mo
v Cap
-1 M
aneu
ver
449
432
958
418
433
849
1489
--
1375
--
Mov C
ap-2
Man
euve
r44
943
2-
418
433
--
--
--
-
S
tage 1
833
806
-58
255
9-
--
--
--
Stag
e 257
855
5-
836
803
--
--
--
-
Appr
oach
EBW
BNB
SBHC
M Co
ntrol
Delay
, s9.8
13.4
2.60.2
HCM
LOS
AB
Mino
r Lan
e/Majo
r Mvm
tNB
LNB
TNB
REB
Ln1W
BLn1
SBL
SBT
SBR
Capa
city (
veh/h
)14
89-
-80
144
113
75-
-HC
M La
ne V
/C R
atio
0.068
--
0.062
0.027
0.002
--
HCM
Contr
ol De
lay (s
)7.6
0-
9.813
.47.6
0-
HCM
Lane
LOS
AA
-A
BA
A-
HCM
95th
%tile
Q(ve
h)0.2
--
0.20.1
0-
-
03/14
/2017
The F
airfie
ld Inn
& S
uites
Sync
hro 8
Rep
ort
PM B
aseli
ne +
Pro
ject
W-T
rans
Inter
secti
onInt
Dela
y, s/v
eh3.2
Move
ment
EBL
EBT
EBR
WBL
WBT
WBR
NBL
NBT
NBR
SBL
SBT
SBR
Lane
Con
figur
ation
sTr
affic
Vol, v
eh/h
73
7114
34
4510
012
222
92
Futur
e Vol,
veh/h
73
7114
34
4510
012
222
92
Confl
icting
Ped
s, #/h
r0
00
00
00
00
00
0Si
gn C
ontro
l St
opSt
opSt
opSt
opSt
opSt
opFr
eeFr
eeFr
eeFr
eeFr
eeFr
eeRT
Cha
nneli
zed
--
None
--
None
--
None
--
None
Stor
age L
ength
--
--
--
--
--
--
Veh i
n Med
ian S
torag
e, #
-0
--
0-
-0
--
0-
Grad
e, %
-0
--
0-
-0
--
0-
Peak
Hou
r Fac
tor80
9280
9292
9280
8092
9280
80He
avy V
ehicl
es, %
22
22
22
22
22
22
Mvmt
Flow
93
8915
34
5612
513
228
63
Major
/Mino
rMi
nor2
Mino
r1Ma
jor1
Major
2Co
nflict
ing F
low A
ll54
054
328
858
253
713
228
90
013
80
0
S
tage 1
292
292
-24
424
4-
--
--
--
Stag
e 224
825
1-
338
293
--
--
--
-Cr
itical
Hdwy
7.12
6.52
6.22
7.12
6.52
6.22
4.12
--
4.12
--
Critic
al Hd
wy S
tg 1
6.12
5.52
-6.1
25.5
2-
--
--
--
Critic
al Hd
wy S
tg 2
6.12
5.52
-6.1
25.5
2-
--
--
--
Follo
w-up
Hdw
y3.5
184.0
183.3
183.5
184.0
183.3
182.2
18-
-2.2
18-
-Po
t Cap
-1 M
aneu
ver
453
447
751
424
450
917
1273
--
1446
--
Stag
e 171
667
1-
760
704
--
--
--
-
S
tage 2
756
699
-67
667
0-
--
--
--
Plato
on bl
ocke
d, %
--
--
Mov C
ap-1
Man
euve
r43
142
575
135
842
891
712
73-
-14
46-
-Mo
v Cap
-2 M
aneu
ver
431
425
-35
842
8-
--
--
--
Stag
e 168
267
0-
724
670
--
--
--
-
S
tage 2
713
665
-59
266
9-
--
--
--
Appr
oach
EBW
BNB
SBHC
M Co
ntrol
Delay
, s11
.114
.22.3
0.1HC
M LO
SB
B
Mino
r Lan
e/Majo
r Mvm
tNB
LNB
TNB
REB
Ln1W
BLn1
SBL
SBT
SBR
Capa
city (
veh/h
)12
73-
-68
941
614
46-
-HC
M La
ne V
/C R
atio
0.044
--
0.146
0.055
0.002
--
HCM
Contr
ol De
lay (s
)8
0-
11.1
14.2
7.50
-HC
M La
ne LO
SA
A-
BB
AA
-HC
M 95
th %
tile Q
(veh)
0.1-
-0.5
0.20
--
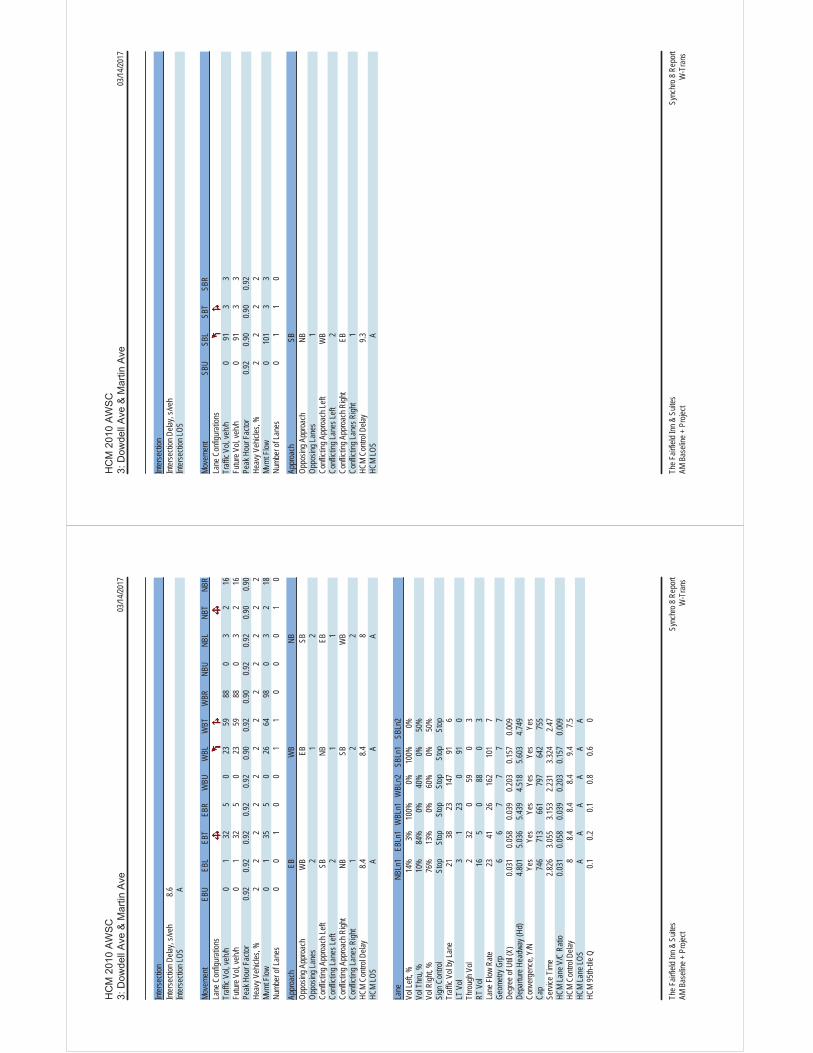
03/14
/2017
The F
airfie
ld Inn
& S
uites
Sync
hro 8
Rep
ort
AM B
aseli
ne +
Pro
ject
W-T
rans
Inter
secti
onInt
erse
ction
Dela
y, s/v
eh8.6
Inter
secti
on LO
SA
Move
ment
EBU
EBL
EBT
EBR
WBU
WBL
WBT
WBR
NBU
NBL
NBT
NBR
Lane
Con
figur
ation
sTr
affic
Vol, v
eh/h
01
325
023
5988
03
216
Futur
e Vol,
veh/h
01
325
023
5988
03
216
Peak
Hou
r Fac
tor0.9
20.9
20.9
20.9
20.9
20.9
00.9
20.9
00.9
20.9
20.9
00.9
0He
avy V
ehicl
es, %
22
22
22
22
22
22
Mvmt
Flow
01
355
026
6498
03
218
Numb
er of
Lane
s0
01
00
11
00
01
0
Appr
oach
EBW
BNB
Oppo
sing A
ppro
ach
WB
EBSB
Oppo
sing L
anes
21
2Co
nflict
ing A
ppro
ach L
eftSB
NBEB
Confl
icting
Lane
s Left
21
1Co
nflict
ing A
ppro
ach R
ight
NBSB
WB
Confl
icting
Lane
s Righ
t1
22
HCM
Contr
ol De
lay8.4
8.48
HCM
LOS
AA
A
Lane
NBLn
1EB
Ln1
WBL
n1W
BLn2
SBLn
1SB
Ln2
Vol L
eft, %
14%
3%10
0%0%
100%
0%Vo
l Thr
u, %
10%
84%
0%40
%0%
50%
Vol R
ight, %
76%
13%
0%60
%0%
50%
Sign
Con
trol
Stop
Stop
Stop
Stop
Stop
Stop
Traff
ic Vo
l by L
ane
2138
2314
791
6LT
Vol
31
230
910
Thro
ugh V
ol2
320
590
3RT
Vol
165
088
03
Lane
Flow
Rate
2341
2616
210
17
Geom
etry G
rp6
67
77
7De
gree
of U
til (X
)0.0
310.0
580.0
390.2
030.1
570.0
09De
partu
re H
eadw
ay (H
d)4.8
015.0
365.4
394.5
185.6
034.7
49Co
nver
genc
e, Y/
NYe
sYe
sYe
sYe
sYe
sYe
sCa
p74
671
366
179
764
275
5Se
rvice
Tim
e2.8
263.0
553.1
532.2
313.3
242.4
7HC
M La
ne V
/C R
atio
0.031
0.058
0.039
0.203
0.157
0.009
HCM
Contr
ol De
lay8
8.48.4
8.49.4
7.5HC
M La
ne LO
SA
AA
AA
AHC
M 95
th-tile
Q0.1
0.20.1
0.80.6
0
03/14
/2017
The F
airfie
ld Inn
& S
uites
Sync
hro 8
Rep
ort
AM B
aseli
ne +
Pro
ject
W-T
rans
Inter
secti
onInt
erse
ction
Dela
y, s/v
ehInt
erse
ction
LOS
Move
ment
SBU
SBL
SBT
SBR
Lane
Con
figur
ation
sTr
affic
Vol, v
eh/h
091
33
Futur
e Vol,
veh/h
091
33
Peak
Hou
r Fac
tor0.9
20.9
00.9
00.9
2He
avy V
ehicl
es, %
22
22
Mvmt
Flow
010
13
3Nu
mber
of La
nes
01
10
Appr
oach
SBOp
posin
g App
roac
hNB
Oppo
sing L
anes
1Co
nflict
ing A
ppro
ach L
eftW
BCo
nflict
ing La
nes L
eft2
Confl
icting
App
roac
h Righ
tEB
Confl
icting
Lane
s Righ
t1
HCM
Contr
ol De
lay9.3
HCM
LOS
A

03/14
/2017
The F
airfie
ld Inn
& S
uites
Sync
hro 8
Rep
ort
PM B
aseli
ne +
Pro
ject
W-T
rans
Inter
secti
onInt
erse
ction
Dela
y, s/v
eh9.3
Inter
secti
on LO
SA
Move
ment
EBU
EBL
EBT
EBR
WBU
WBL
WBT
WBR
NBU
NBL
NBT
NBR
Lane
Con
figur
ation
sTr
affic
Vol, v
eh/h
03
655
024
4817
90
45
21Fu
ture V
ol, ve
h/h0
365
50
2448
179
04
521
Peak
Hou
r Fac
tor0.9
20.9
20.9
20.9
20.9
20.9
00.9
20.9
00.9
20.9
20.9
00.9
0He
avy V
ehicl
es, %
22
22
22
22
22
22
Mvmt
Flow
03
715
027
5219
90
46
23Nu
mber
of La
nes
00
10
01
10
00
10
Appr
oach
EBW
BNB
Oppo
sing A
ppro
ach
WB
EBSB
Oppo
sing L
anes
21
2Co
nflict
ing A
ppro
ach L
eftSB
NBEB
Confl
icting
Lane
s Left
21
1Co
nflict
ing A
ppro
ach R
ight
NBSB
WB
Confl
icting
Lane
s Righ
t1
22
HCM
Contr
ol De
lay9
9.28.5
HCM
LOS
AA
A
Lane
NBLn
1EB
Ln1
WBL
n1W
BLn2
SBLn
1SB
Ln2
Vol L
eft, %
13%
4%10
0%0%
100%
0%Vo
l Thr
u, %
17%
89%
0%21
%0%
88%
Vol R
ight, %
70%
7%0%
79%
0%12
%Si
gn C
ontro
lSt
opSt
opSt
opSt
opSt
opSt
opTr
affic
Vol b
y Lan
e30
7324
227
104
8LT
Vol
43
240
104
0Th
roug
h Vol
565
048
07
RT V
ol21
50
179
01
Lane
Flow
Rate
3379
2725
111
69
Geom
etry G
rp6
67
77
7De
gree
of U
til (X
)0.0
480.1
160.0
410.3
150.1
90.0
13De
partu
re H
eadw
ay (H
d)5.1
755.2
685.5
714.5
155.9
135.3
21Co
nver
genc
e, Y/
NYe
sYe
sYe
sYe
sYe
sYe
sCa
p68
967
964
379
660
767
1Se
rvice
Tim
e3.2
263.3
073.2
992.2
423.6
553.0
64HC
M La
ne V
/C R
atio
0.048
0.116
0.042
0.315
0.191
0.013
HCM
Contr
ol De
lay8.5
98.5
9.310
8.1HC
M La
ne LO
SA
AA
AA
AHC
M 95
th-tile
Q0.2
0.40.1
1.40.7
0
03/14
/2017
The F
airfie
ld Inn
& S
uites
Sync
hro 8
Rep
ort
PM B
aseli
ne +
Pro
ject
W-T
rans
Inter
secti
onInt
erse
ction
Dela
y, s/v
ehInt
erse
ction
LOS
Move
ment
SBU
SBL
SBT
SBR
Lane
Con
figur
ation
sTr
affic
Vol, v
eh/h
010
47
1Fu
ture V
ol, ve
h/h0
104
71
Peak
Hou
r Fac
tor0.9
20.9
00.9
00.9
2He
avy V
ehicl
es, %
22
22
Mvmt
Flow
011
68
1Nu
mber
of La
nes
01
10
Appr
oach
SBOp
posin
g App
roac
hNB
Oppo
sing L
anes
1Co
nflict
ing A
ppro
ach L
eftW
BCo
nflict
ing La
nes L
eft2
Confl
icting
App
roac
h Righ
tEB
Confl
icting
Lane
s Righ
t1
HCM
Contr
ol De
lay9.9
HCM
LOS
A
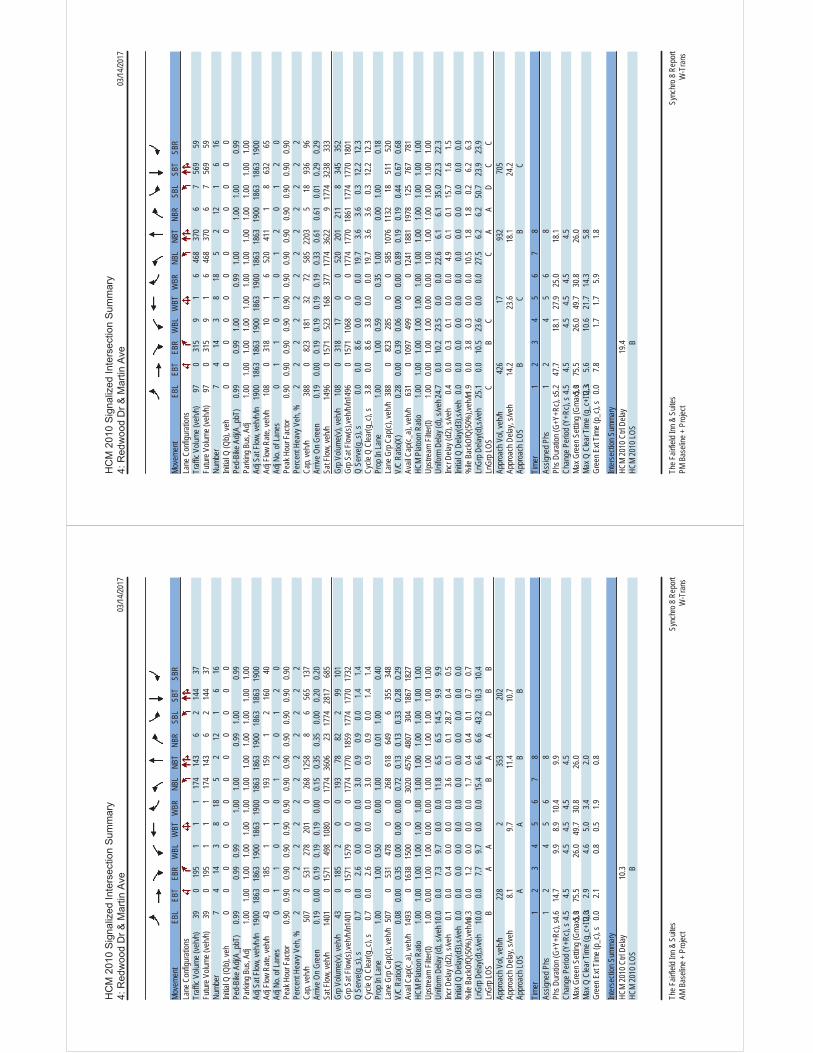
03/14
/2017
The F
airfie
ld Inn
& S
uites
Sync
hro 8
Rep
ort
AM B
aseli
ne +
Pro
ject
W-T
rans
Move
ment
EBL
EBT
EBR
WBL
WBT
WBR
NBL
NBT
NBR
SBL
SBT
SBR
Lane
Con
figur
ation
sTr
affic
Volum
e (ve
h/h)
390
195
11
117
414
36
214
437
Futur
e Volu
me (v
eh/h)
390
195
11
117
414
36
214
437
Numb
er7
414
38
185
212
16
16Ini
tial Q
(Qb)
, veh
00
00
00
00
00
00
Ped-
Bike
Adj(
A_pb
T)0.9
90.9
90.9
91.0
01.0
00.9
91.0
00.9
9Pa
rking
Bus
, Adj
1.00
1.00
1.00
1.00
1.00
1.00
1.00
1.00
1.00
1.00
1.00
1.00
Adj S
at Flo
w, ve
h/h/ln
1900
1863
1863
1900
1863
1900
1863
1863
1900
1863
1863
1900
Adj F
low R
ate, v
eh/h
430
185
11
019
315
91
216
040
Adj N
o. of
Lane
s0
11
01
01
20
12
0Pe
ak H
our F
actor
0.90
0.90
0.90
0.90
0.90
0.90
0.90
0.90
0.90
0.90
0.90
0.90
Perce
nt He
avy V
eh, %
22
22
22
22
22
22
Cap,
veh/h
507
053
127
820
10
268
1258
86
565
137
Arriv
e On G
reen
0.19
0.00
0.19
0.19
0.19
0.00
0.15
0.35
0.35
0.00
0.20
0.20
Sat F
low, v
eh/h
1401
015
7149
810
800
1774
3606
2317
7428
1768
5Gr
p Volu
me(v)
, veh
/h43
018
52
00
193
7882
299
101
Grp S
at Flo
w(s),
veh/h
/ln14
010
1571
1579
00
1774
1770
1859
1774
1770
1732
Q Se
rve(g
_s),
s0.7
0.02.6
0.00.0
0.03.0
0.90.9
0.01.4
1.4Cy
cle Q
Clea
r(g_c
), s
0.70.0
2.60.0
0.00.0
3.00.9
0.90.0
1.41.4
Prop
In La
ne1.0
01.0
00.5
00.0
01.0
00.0
11.0
00.4
0La
ne G
rp C
ap(c)
, veh
/h50
70
531
478
00
268
618
649
635
534
8V/
C Ra
tio(X
)0.0
80.0
00.3
50.0
00.0
00.0
00.7
20.1
30.1
30.3
30.2
80.2
9Av
ail C
ap(c_
a), v
eh/h
1493
016
3815
000
030
2045
7648
0730
418
6718
27HC
M Pl
atoon
Rati
o1.0
01.0
01.0
01.0
01.0
01.0
01.0
01.0
01.0
01.0
01.0
01.0
0Up
strea
m Fil
ter(I)
1.00
0.00
1.00
1.00
0.00
0.00
1.00
1.00
1.00
1.00
1.00
1.00
Unifo
rm D
elay (
d), s
/veh1
0.00.0
7.39.7
0.00.0
11.8
6.56.5
14.5
9.99.9
Incr D
elay (
d2),
s/veh
0.10.0
0.40.0
0.00.0
3.60.1
0.128
.70.4
0.5Ini
tial Q
Dela
y(d3)
,s/ve
h0.0
0.00.0
0.00.0
0.00.0
0.00.0
0.00.0
0.0%
ile B
ackO
fQ(5
0%),v
eh/ln0
.30.0
1.20.0
0.00.0
1.70.4
0.40.1
0.70.7
LnGr
p Dela
y(d),s
/veh
10.0
0.07.7
9.70.0
0.015
.46.6
6.643
.210
.310
.4Ln
Grp L
OSB
AA
BA
AD
BB
Appr
oach
Vol,
veh/h
228
235
320
2Ap
proa
ch D
elay,
s/veh
8.19.7
11.4
10.7
Appr
oach
LOS
AA
BB
Timer
12
34
56
78
Assig
ned P
hs1
24
56
8Ph
s Dur
ation
(G+Y
+Rc),
s4.6
14.7
9.98.9
10.4
9.9Ch
ange
Per
iod (Y
+Rc),
s4.5
4.54.5
4.54.5
4.5Ma
x Gre
en S
etting
(Gma
x), s5.0
75.5
26.0
49.7
30.8
26.0
Max Q
Clea
r Tim
e (g_
c+I1)
, s2.02.9
4.65.0
3.42.0
Gree
n Ext
Time (
p_c),
s0.0
2.10.8
0.51.9
0.8
Inter
secti
on S
umma
ryHC
M 20
10 C
trl De
lay10
.3HC
M 20
10 LO
SB
03/14
/2017
The F
airfie
ld Inn
& S
uites
Sync
hro 8
Rep
ort
PM B
aseli
ne +
Pro
ject
W-T
rans
Move
ment
EBL
EBT
EBR
WBL
WBT
WBR
NBL
NBT
NBR
SBL
SBT
SBR
Lane
Con
figur
ation
sTr
affic
Volum
e (ve
h/h)
970
315
91
646
837
06
756
959
Futur
e Volu
me (v
eh/h)
970
315
91
646
837
06
756
959
Numb
er7
414
38
185
212
16
16Ini
tial Q
(Qb)
, veh
00
00
00
00
00
00
Ped-
Bike
Adj(
A_pb
T)0.9
90.9
91.0
00.9
91.0
01.0
01.0
00.9
9Pa
rking
Bus
, Adj
1.00
1.00
1.00
1.00
1.00
1.00
1.00
1.00
1.00
1.00
1.00
1.00
Adj S
at Flo
w, ve
h/h/ln
1900
1863
1863
1900
1863
1900
1863
1863
1900
1863
1863
1900
Adj F
low R
ate, v
eh/h
108
031
810
16
520
411
18
632
65Ad
j No.
of La
nes
01
10
10
12
01
20
Peak
Hou
r Fac
tor0.9
00.9
00.9
00.9
00.9
00.9
00.9
00.9
00.9
00.9
00.9
00.9
0Pe
rcent
Heav
y Veh
, %2
22
22
22
22
22
2Ca
p, ve
h/h38
80
823
181
3272
585
2203
518
936
96Ar
rive O
n Gre
en0.1
90.0
00.1
90.1
90.1
90.1
90.3
30.6
10.6
10.0
10.2
90.2
9Sa
t Flow
, veh
/h14
960
1571
523
168
377
1774
3622
917
7432
3833
3Gr
p Volu
me(v)
, veh
/h10
80
318
170
052
020
121
18
345
352
Grp S
at Flo
w(s),
veh/h
/ln14
960
1571
1068
00
1774
1770
1861
1774
1770
1801
Q Se
rve(g
_s),
s0.0
0.08.6
0.00.0
0.019
.73.6
3.60.3
12.2
12.3
Cycle
Q C
lear(g
_c),
s3.8
0.08.6
3.80.0
0.019
.73.6
3.60.3
12.2
12.3
Prop
In La
ne1.0
01.0
00.5
90.3
51.0
00.0
01.0
00.1
8La
ne G
rp C
ap(c)
, veh
/h38
80
823
285
00
585
1076
1132
1851
152
0V/
C Ra
tio(X
)0.2
80.0
00.3
90.0
60.0
00.0
00.8
90.1
90.1
90.4
40.6
70.6
8Av
ail C
ap(c_
a), v
eh/h
631
010
9749
90
012
4118
8119
7812
576
778
1HC
M Pl
atoon
Rati
o1.0
01.0
01.0
01.0
01.0
01.0
01.0
01.0
01.0
01.0
01.0
01.0
0Up
strea
m Fil
ter(I)
1.00
0.00
1.00
1.00
0.00
0.00
1.00
1.00
1.00
1.00
1.00
1.00
Unifo
rm D
elay (
d), s
/veh2
4.70.0
10.2
23.5
0.00.0
22.6
6.16.1
35.0
22.3
22.3
Incr D
elay (
d2),
s/veh
0.40.0
0.30.1
0.00.0
4.90.1
0.115
.71.6
1.5Ini
tial Q
Dela
y(d3)
,s/ve
h0.0
0.00.0
0.00.0
0.00.0
0.00.0
0.00.0
0.0%
ile B
ackO
fQ(5
0%),v
eh/ln1
.90.0
3.80.3
0.00.0
10.5
1.81.8
0.26.2
6.3Ln
Grp D
elay(d
),s/ve
h25
.10.0
10.5
23.6
0.00.0
27.5
6.26.2
50.7
23.9
23.9
LnGr
p LOS
CB
CC
AA
DC
CAp
proa
ch V
ol, ve
h/h42
617
932
705
Appr
oach
Dela
y, s/v
eh14
.223
.618
.124
.2Ap
proa
ch LO
SB
CB
C
Timer
12
34
56
78
Assig
ned P
hs1
24
56
8Ph
s Dur
ation
(G+Y
+Rc),
s5.2
47.7
18.1
27.9
25.0
18.1
Chan
ge P
eriod
(Y+R
c), s
4.54.5
4.54.5
4.54.5
Max G
reen
Sett
ing (G
max),
s5.075
.526
.049
.730
.826
.0Ma
x Q C
lear T
ime (
g_c+
I1), s2.3
5.610
.621
.714
.35.8
Gree
n Ext
Time (
p_c),
s0.0
7.81.7
1.75.9
1.8
Inter
secti
on S
umma
ryHC
M 20
10 C
trl De
lay19
.4HC
M 20
10 LO
SB

03/14
/2017
The F
airfie
ld Inn
& S
uites
Sync
hro 8
Rep
ort
AM B
aseli
ne +
Pro
ject
W-T
rans
Move
ment
EBL
EBT
EBR
WBL
WBT
WBR
NBL
NBT
NBR
SBL
SBT
SBR
Lane
Con
figur
ation
sTr
affic
Volum
e (ve
h/h)
6726
047
2815
414
826
3432
8027
34Fu
ture V
olume
(veh
/h)67
260
4728
154
148
2634
3280
2734
Numb
er7
414
38
185
212
16
16Ini
tial Q
(Qb)
, veh
30
01
11
00
01
00
Ped-
Bike
Adj(
A_pb
T)1.0
00.9
91.0
01.0
01.0
00.9
91.0
01.0
0Pa
rking
Bus
, Adj
1.00
1.00
1.00
1.00
1.00
1.00
1.00
1.00
1.00
1.00
1.00
1.00
Adj S
at Flo
w, ve
h/h/ln
1863
1863
1863
1863
1863
1863
1863
1863
1863
1863
1863
1900
Adj F
low R
ate, v
eh/h
7930
630
3318
114
931
4029
9432
34Ad
j No.
of La
nes
12
12
21
21
12
10
Peak
Hou
r Fac
tor0.8
50.8
50.8
50.8
50.8
50.8
50.8
50.8
50.8
50.8
50.8
50.8
5Pe
rcent
Heav
y Veh
, %2
22
22
22
22
22
2Ca
p, ve
h/h21
610
5059
226
689
562
528
336
931
148
921
522
9Ar
rive O
n Gre
en0.1
20.3
00.3
00.0
80.2
50.2
50.0
80.2
00.2
00.1
40.2
60.2
6Sa
t Flow
, veh
/h17
7435
3915
7034
4235
3915
8035
4818
6315
7134
4282
687
7Gr
p Volu
me(v)
, veh
/h79
306
3033
181
149
3140
2994
066
Grp S
at Flo
w(s),
veh/h
/ln17
7417
7015
7017
2117
7015
8017
7418
6315
7117
210
1703
Q Se
rve(g
_s),
s2.6
4.20.8
0.62.5
3.90.5
1.10.9
1.50.0
1.9Cy
cle Q
Clea
r(g_c
), s
2.64.2
0.80.6
2.53.9
0.51.1
0.91.5
0.01.9
Prop
In La
ne1.0
01.0
01.0
01.0
01.0
01.0
01.0
00.5
2La
ne G
rp C
ap(c)
, veh
/h21
610
5059
226
689
562
528
336
931
148
90
444
V/C
Ratio
(X)
0.37
0.29
0.05
0.12
0.20
0.24
0.11
0.11
0.09
0.19
0.00
0.15
Avail
Cap
(c_a)
, veh
/h39
819
7010
0166
218
5610
5374
012
0710
1882
80
1158
HCM
Plato
on R
atio
1.00
1.00
1.00
1.00
1.00
1.00
1.00
1.00
1.00
1.00
1.00
1.00
Upstr
eam
Filter
(I)1.0
01.0
01.0
01.0
01.0
01.0
01.0
01.0
01.0
01.0
00.0
01.0
0Un
iform
Dela
y (d)
, s/ve
h26.2
17.0
12.5
27.0
18.4
12.7
26.9
20.7
20.6
23.7
0.017
.9Inc
r Dela
y (d2
), s/v
eh1.0
0.60.1
0.20.4
0.70.2
0.30.3
0.30.0
0.3Ini
tial Q
Dela
y(d3)
,s/ve
h2.2
0.00.0
0.10.0
0.00.0
0.00.0
0.00.0
0.0%
ile B
ackO
fQ(5
0%),v
eh/ln1
.82.1
0.30.3
1.31.9
0.30.6
0.40.8
0.00.9
LnGr
p Dela
y(d),s
/veh
29.5
17.6
12.6
27.3
18.8
13.4
27.1
21.0
20.9
24.0
0.018
.2Ln
Grp L
OSC
BB
CB
BC
CC
CB
Appr
oach
Vol,
veh/h
415
363
100
160
Appr
oach
Dela
y, s/v
eh19
.517
.422
.821
.7Ap
proa
ch LO
SB
BC
C
Timer
12
34
56
78
Assig
ned P
hs1
23
45
67
8Ph
s Dur
ation
(G+Y
+Rc),
s12.8
17.0
8.823
.79.0
20.9
11.5
21.0
Chan
ge P
eriod
(Y+R
c), s
4.04.6
4.05.3
4.04.6
4.05.3
Max G
reen
Sett
ing (G
max),
s15
.040
.412
.034
.713
.042
.414
.032
.7Ma
x Q C
lear T
ime (
g_c+
I1), s3.5
3.12.6
6.22.5
3.94.6
5.9Gr
een E
xt Tim
e (p_
c), s
0.31.4
0.09.6
0.01.4
0.19.3
Inter
secti
on S
umma
ryHC
M 20
10 C
trl De
lay19
.4HC
M 20
10 LO
SB
Notes
03/14
/2017
The F
airfie
ld Inn
& S
uites
Sync
hro 8
Rep
ort
PM B
aseli
ne +
Pro
ject
W-T
rans
Move
ment
EBL
EBT
EBR
WBL
WBT
WBR
NBL
NBT
NBR
SBL
SBT
SBR
Lane
Con
figur
ation
sTr
affic
Volum
e (ve
h/h)
6450
272
139
421
9584
3288
175
6888
Futur
e Volu
me (v
eh/h)
6450
272
139
421
9584
3288
175
6888
Numb
er7
414
38
185
212
16
16Ini
tial Q
(Qb)
, veh
30
01
11
00
01
00
Ped-
Bike
Adj(
A_pb
T)1.0
00.9
91.0
01.0
01.0
00.9
91.0
00.9
9Pa
rking
Bus
, Adj
1.00
1.00
1.00
1.00
1.00
1.00
1.00
1.00
1.00
1.00
1.00
1.00
Adj S
at Flo
w, ve
h/h/ln
1863
1863
1863
1863
1863
1863
1863
1863
1863
1863
1863
1900
Adj F
low R
ate, v
eh/h
7457
759
160
484
8597
7864
201
7895
Adj N
o. of
Lane
s1
21
22
12
11
21
0Pe
ak H
our F
actor
0.87
0.87
0.87
0.87
0.87
0.87
0.87
0.87
0.87
0.87
0.87
0.87
Perce
nt He
avy V
eh, %
22
22
22
22
22
22
Cap,
veh/h
181
1187
734
452
1296
790
463
337
284
459
141
171
Arriv
e On G
reen
0.10
0.33
0.33
0.13
0.37
0.37
0.13
0.18
0.18
0.13
0.18
0.18
Sat F
low, v
eh/h
1774
3539
1572
3442
3539
1581
3548
1863
1570
3442
763
929
Grp V
olume
(v), v
eh/h
7457
759
160
484
8597
7864
201
017
3Gr
p Sat
Flow(
s),ve
h/h/ln
1774
1770
1572
1721
1770
1581
1774
1863
1570
1721
016
92Q
Serve
(g_s
), s
3.210
.61.7
3.58.2
2.32.0
2.92.8
4.40.0
7.6Cy
cle Q
Clea
r(g_c
), s
3.210
.61.7
3.58.2
2.32.0
2.92.8
4.40.0
7.6Pr
op In
Lane
1.00
1.00
1.00
1.00
1.00
1.00
1.00
0.55
Lane
Grp
Cap
(c), v
eh/h
181
1187
734
452
1296
790
463
337
284
459
031
2V/
C Ra
tio(X
)0.4
10.4
90.0
80.3
50.3
70.1
10.2
10.2
30.2
30.4
40.0
00.5
5Av
ail C
ap(c_
a), v
eh/h
261
1460
855
548
1504
883
521
944
796
590
089
9HC
M Pl
atoon
Rati
o1.0
01.0
01.0
01.0
01.0
01.0
01.0
01.0
01.0
01.0
01.0
01.0
0Up
strea
m Fil
ter(I)
1.00
1.00
1.00
1.00
1.00
1.00
1.00
1.00
1.00
1.00
0.00
1.00
Unifo
rm D
elay (
d), s
/veh3
5.021
.612
.132
.419
.110
.931
.828
.728
.632
.70.0
30.4
Incr D
elay (
d2),
s/veh
1.51.1
0.20.5
0.60.2
0.20.7
0.80.9
0.03.3
Initia
l Q D
elay(d
3),s/
veh
3.40.0
0.00.1
0.00.0
0.00.0
0.00.1
0.00.0
%ile
Bac
kOfQ
(50%
),veh
/ln2.1
5.30.8
1.74.1
1.21.0
1.61.3
2.20.0
3.9Ln
Grp D
elay(d
),s/ve
h39
.822
.712
.333
.019
.711
.132
.129
.429
.533
.70.0
33.6
LnGr
p LOS
DC
BC
BB
CC
CC
CAp
proa
ch V
ol, ve
h/h71
072
923
937
4Ap
proa
ch D
elay,
s/veh
23.7
21.6
30.5
33.6
Appr
oach
LOS
CC
CC
Timer
12
34
56
78
Assig
ned P
hs1
23
45
67
8Ph
s Dur
ation
(G+Y
+Rc),
s14.9
19.5
14.7
32.6
14.7
19.7
12.1
35.2
Chan
ge P
eriod
(Y+R
c), s
4.04.6
4.05.3
4.04.6
4.05.3
Max G
reen
Sett
ing (G
max),
s14
.041
.413
.033
.712
.043
.412
.034
.7Ma
x Q C
lear T
ime (
g_c+
I1), s6.4
4.95.5
12.6
4.09.6
5.210
.2Gr
een E
xt Tim
e (p_
c), s
0.63.6
0.314
.70.1
3.50.1
16.4
Inter
secti
on S
umma
ryHC
M 20
10 C
trl De
lay25
.5HC
M 20
10 LO
SC
Notes
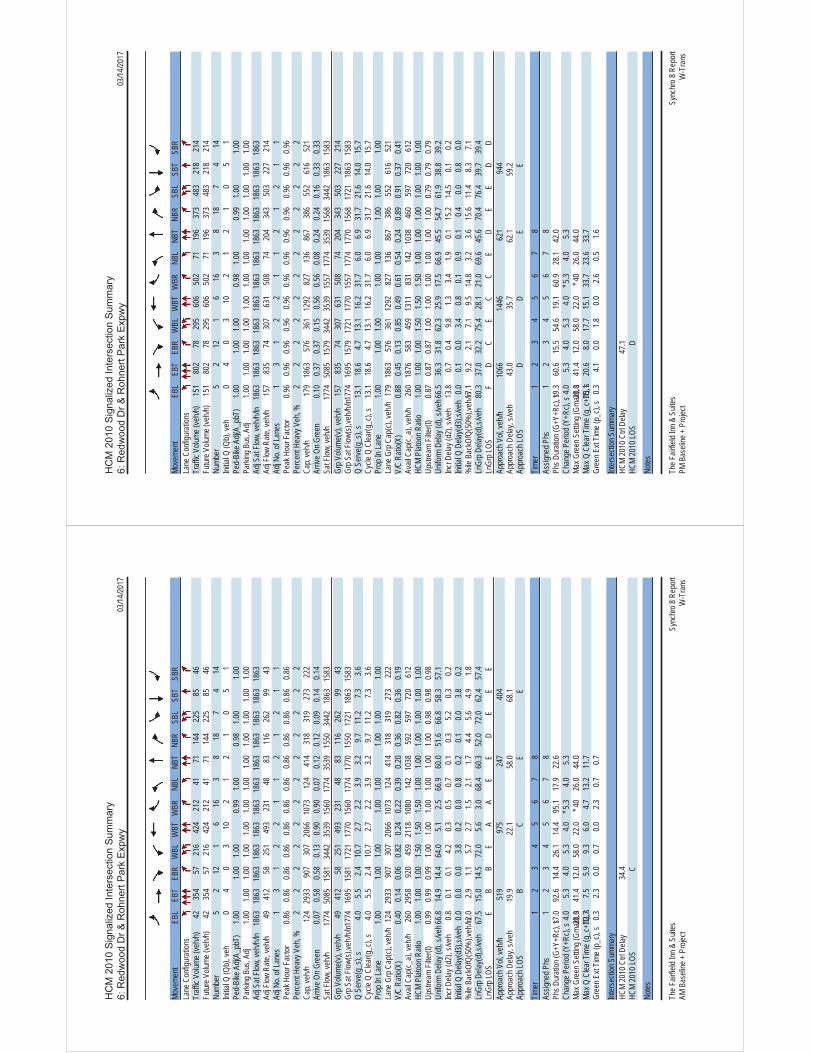
03/14
/2017
The F
airfie
ld Inn
& S
uites
Sync
hro 8
Rep
ort
AM B
aseli
ne +
Pro
ject
W-T
rans
Move
ment
EBL
EBT
EBR
WBL
WBT
WBR
NBL
NBT
NBR
SBL
SBT
SBR
Lane
Con
figur
ation
sTr
affic
Volum
e (ve
h/h)
4235
457
216
424
212
4171
144
225
8546
Futur
e Volu
me (v
eh/h)
4235
457
216
424
212
4171
144
225
8546
Numb
er5
212
16
163
818
74
14Ini
tial Q
(Qb)
, veh
04
03
102
12
10
51
Ped-
Bike
Adj(
A_pb
T)1.0
01.0
01.0
00.9
91.0
00.9
81.0
01.0
0Pa
rking
Bus
, Adj
1.00
1.00
1.00
1.00
1.00
1.00
1.00
1.00
1.00
1.00
1.00
1.00
Adj S
at Flo
w, ve
h/h/ln
1863
1863
1863
1863
1863
1863
1863
1863
1863
1863
1863
1863
Adj F
low R
ate, v
eh/h
4941
258
251
493
231
4883
116
262
9943
Adj N
o. of
Lane
s1
31
22
11
21
21
1Pe
ak H
our F
actor
0.86
0.86
0.86
0.86
0.86
0.86
0.86
0.86
0.86
0.86
0.86
0.86
Perce
nt He
avy V
eh, %
22
22
22
22
22
22
Cap,
veh/h
124
2933
907
307
2066
1073
124
414
318
319
273
222
Arriv
e On G
reen
0.07
0.58
0.58
0.13
0.90
0.90
0.07
0.12
0.12
0.09
0.14
0.14
Sat F
low, v
eh/h
1774
5085
1581
3442
3539
1560
1774
3539
1550
3442
1863
1583
Grp V
olume
(v), v
eh/h
4941
258
251
493
231
4883
116
262
9943
Grp S
at Flo
w(s),
veh/h
/ln17
7416
9515
8117
2117
7015
6017
7417
7015
5017
2118
6315
83Q
Serve
(g_s
), s
4.05.5
2.410
.72.7
2.23.9
3.29.7
11.2
7.33.6
Cycle
Q C
lear(g
_c),
s4.0
5.52.4
10.7
2.72.2
3.93.2
9.711
.27.3
3.6Pr
op In
Lane
1.00
1.00
1.00
1.00
1.00
1.00
1.00
1.00
Lane
Grp
Cap
(c), v
eh/h
124
2933
907
307
2066
1073
124
414
318
319
273
222
V/C
Ratio
(X)
0.40
0.14
0.06
0.82
0.24
0.22
0.39
0.20
0.36
0.82
0.36
0.19
Avail
Cap
(c_a)
, veh
/h26
029
5892
045
921
1810
8014
210
3859
259
772
061
2HC
M Pl
atoon
Rati
o1.0
01.0
01.0
01.5
01.5
01.5
01.0
01.0
01.0
01.0
01.0
01.0
0Up
strea
m Fil
ter(I)
0.99
0.99
0.99
1.00
1.00
1.00
1.00
1.00
1.00
0.98
0.98
0.98
Unifo
rm D
elay (
d), s
/veh6
6.814
.914
.464
.05.1
2.566
.960
.051
.666
.858
.357
.1Inc
r Dela
y (d2
), s/v
eh0.8
0.10.1
4.20.3
0.50.7
0.10.3
5.20.3
0.2Ini
tial Q
Dela
y(d3)
,s/ve
h0.0
0.00.0
3.80.2
0.00.8
0.20.1
0.03.8
0.2%
ile B
ackO
fQ(5
0%),v
eh/ln2
.02.9
1.15.7
2.71.5
2.11.7
4.45.6
4.91.8
LnGr
p Dela
y(d),s
/veh
67.5
15.0
14.5
72.0
5.63.0
68.4
60.3
52.0
72.0
62.4
57.4
LnGr
p LOS
EB
BE
AA
EE
DE
EE
Appr
oach
Vol,
veh/h
519
975
247
404
Appr
oach
Dela
y, s/v
eh19
.922
.158
.068
.1Ap
proa
ch LO
SB
CE
E
Timer
12
34
56
78
Assig
ned P
hs1
23
45
67
8Ph
s Dur
ation
(G+Y
+Rc),
s17.0
92.6
14.4
26.1
14.4
95.1
17.9
22.6
Chan
ge P
eriod
(Y+R
c), s
4.05.3
4.05.3
4.0* 5
.34.0
5.3Ma
x Gre
en S
etting
(Gma
x), s
20.0
41.4
12.0
58.0
22.0
* 40
26.0
44.0
Max Q
Clea
r Tim
e (g_
c+I1)
, s12
.77.5
5.99.3
6.04.7
13.2
11.7
Gree
n Ext
Time (
p_c),
s0.3
2.30.0
0.70.0
2.30.7
0.7
Inter
secti
on S
umma
ryHC
M 20
10 C
trl De
lay34
.4HC
M 20
10 LO
SC
Notes
03/14
/2017
The F
airfie
ld Inn
& S
uites
Sync
hro 8
Rep
ort
PM B
aseli
ne +
Pro
ject
W-T
rans
Move
ment
EBL
EBT
EBR
WBL
WBT
WBR
NBL
NBT
NBR
SBL
SBT
SBR
Lane
Con
figur
ation
sTr
affic
Volum
e (ve
h/h)
151
802
7829
560
650
271
196
373
483
218
214
Futur
e Volu
me (v
eh/h)
151
802
7829
560
650
271
196
373
483
218
214
Numb
er5
212
16
163
818
74
14Ini
tial Q
(Qb)
, veh
04
03
102
12
10
51
Ped-
Bike
Adj(
A_pb
T)1.0
01.0
01.0
00.9
81.0
00.9
91.0
01.0
0Pa
rking
Bus
, Adj
1.00
1.00
1.00
1.00
1.00
1.00
1.00
1.00
1.00
1.00
1.00
1.00
Adj S
at Flo
w, ve
h/h/ln
1863
1863
1863
1863
1863
1863
1863
1863
1863
1863
1863
1863
Adj F
low R
ate, v
eh/h
157
835
7430
763
150
874
204
343
503
227
214
Adj N
o. of
Lane
s1
31
22
11
21
21
1Pe
ak H
our F
actor
0.96
0.96
0.96
0.96
0.96
0.96
0.96
0.96
0.96
0.96
0.96
0.96
Perce
nt He
avy V
eh, %
22
22
22
22
22
22
Cap,
veh/h
179
1863
576
361
1292
827
136
867
386
552
616
521
Arriv
e On G
reen
0.10
0.37
0.37
0.15
0.56
0.56
0.08
0.24
0.24
0.16
0.33
0.33
Sat F
low, v
eh/h
1774
5085
1579
3442
3539
1557
1774
3539
1568
3442
1863
1583
Grp V
olume
(v), v
eh/h
157
835
7430
763
150
874
204
343
503
227
214
Grp S
at Flo
w(s),
veh/h
/ln17
7416
9515
7917
2117
7015
5717
7417
7015
6817
2118
6315
83Q
Serve
(g_s
), s
13.1
18.6
4.713
.116
.231
.76.0
6.931
.721
.614
.015
.7Cy
cle Q
Clea
r(g_c
), s
13.1
18.6
4.713
.116
.231
.76.0
6.931
.721
.614
.015
.7Pr
op In
Lane
1.00
1.00
1.00
1.00
1.00
1.00
1.00
1.00
Lane
Grp
Cap
(c), v
eh/h
179
1863
576
361
1292
827
136
867
386
552
616
521
V/C
Ratio
(X)
0.88
0.45
0.13
0.85
0.49
0.61
0.54
0.24
0.89
0.91
0.37
0.41
Avail
Cap
(c_a)
, veh
/h26
018
7658
345
913
1183
114
210
3846
059
772
061
2HC
M Pl
atoon
Rati
o1.0
01.0
01.0
01.5
01.5
01.5
01.0
01.0
01.0
01.0
01.0
01.0
0Up
strea
m Fil
ter(I)
0.87
0.87
0.87
1.00
1.00
1.00
1.00
1.00
1.00
0.79
0.79
0.79
Unifo
rm D
elay (
d), s
/veh6
6.536
.331
.862
.325
.917
.566
.945
.554
.761
.938
.839
.2Inc
r Dela
y (d2
), s/v
eh13
.80.7
0.49.8
1.33.4
1.90.1
15.2
14.5
0.10.2
Initia
l Q D
elay(d
3),s/
veh
0.00.1
0.03.4
0.80.1
0.90.1
0.40.0
0.80.0
%ile
Bac
kOfQ
(50%
),veh
/ln7.1
9.22.1
7.19.5
14.8
3.23.6
15.6
11.4
8.37.1
LnGr
p Dela
y(d),s
/veh
80.3
37.0
32.2
75.4
28.1
21.0
69.6
45.6
70.4
76.4
39.7
39.4
LnGr
p LOS
FD
CE
CC
ED
EE
DD
Appr
oach
Vol,
veh/h
1066
1446
621
944
Appr
oach
Dela
y, s/v
eh43
.035
.762
.159
.2Ap
proa
ch LO
SD
DE
E
Timer
12
34
56
78
Assig
ned P
hs1
23
45
67
8Ph
s Dur
ation
(G+Y
+Rc),
s19.3
60.6
15.5
54.6
19.1
60.9
28.1
42.0
Chan
ge P
eriod
(Y+R
c), s
4.05.3
4.05.3
4.0* 5
.34.0
5.3Ma
x Gre
en S
etting
(Gma
x), s
20.0
41.4
12.0
58.0
22.0
* 40
26.0
44.0
Max Q
Clea
r Tim
e (g_
c+I1)
, s15
.120
.68.0
17.7
15.1
33.7
23.6
33.7
Gree
n Ext
Time (
p_c),
s0.3
4.10.0
1.80.0
2.60.5
1.6
Inter
secti
on S
umma
ryHC
M 20
10 C
trl De
lay47
.1HC
M 20
10 LO
SD
Notes