inhibition of mtor-dependent autophagy sensitizes leukemic cells to cytarabine-induced apoptotic...
TRANSCRIPT
Inhibition of mTOR-Dependent Autophagy SensitizesLeukemic Cells to Cytarabine-Induced Apoptotic DeathMihajlo Bosnjak1., Biljana Ristic2., Katarina Arsikin2, Aleksandar Mircic1, Violeta Suzin-Zivkovic1,
Vladimir Perovic2, Andrija Bogdanovic3, Verica Paunovic2, Ivanka Markovic4, Vladimir Bumbasirevic1,
Vladimir Trajkovic2*, Ljubica Harhaji-Trajkovic5*
1 Institute of Histology and Embryology, School of Medicine, University of Belgrade, Belgrade, Serbia, 2 Institute of Microbiology and Immunology, School of Medicine,
University of Belgrade, Dr. Subotica 1, Belgrade, Serbia, 3 Clinic of Hematology, Clinical Center of Serbia, School of Medicine, University of Belgrade, Belgrade, Serbia,
4 Institute of Medical and Clinical Biochemistry, School of Medicine, University of Belgrade, Belgrade, Serbia, 5 Institute for Biological Research, University of Belgrade,
Belgrade, Serbia
Abstract
The present study investigated the role of autophagy, a cellular self-digestion process, in the cytotoxicity of antileukemicdrug cytarabine towards human leukemic cell lines (REH, HL-60, MOLT-4) and peripheral blood mononuclear cells fromleukemic patients. The induction of autophagy was confirmed by acridine orange staining of intracellular acidic vesicles,electron microscopy visualization of autophagic vacuoles, as well as by the increase in autophagic proteolysis andautophagic flux, demonstrated by immunoblot analysis of p62 downregulation and LC3-I conversion to autophagosome-associated LC3-II in the presence of proteolysis inhibitors, respectively. Moreover, the expression of autophagy-relatedgenes Atg4, Atg5 and Atg7 was stimulated by cytarabine in REH cells. Cytarabine reduced the phosphorylation of the majornegative regulator of autophagy, mammalian target of rapamycin (mTOR), and its downstream target p70S6 kinase in REHcells, which was associated with downregulation of mTOR activator Akt and activation of extracellular signal- regulatedkinase. Cytarabine had no effect on the activation of mTOR inhibitor AMP-activated protein kinase. Leucine, an mTORactivator, reduced both cytarabine-induced autophagy and cytotoxicity. Accordingly, pharmacological downregulation ofautophagy with bafilomycin A1 and chloroquine, or RNA interference-mediated knockdown of LC3b or p62, markedlyincreased oxidative stress, mitochondrial depolarization, caspase activation and subsequent DNA fragmentation andapoptotic death in cytarabine-treated REH cells. Cytarabine also induced mTOR-dependent cytoprotective autophagy in HL-60 and MOLT-4 leukemic cell lines, as well as primary leukemic cells, but not normal leukocytes. These data suggest that thetherapeutic efficiency of cytarabine in leukemic patients could be increased by the inhibition of the mTOR-dependentautophagic response.
Citation: Bosnjak M, Ristic B, Arsikin K, Mircic A, Suzin-Zivkovic V, et al. (2014) Inhibition of mTOR-Dependent Autophagy Sensitizes Leukemic Cells to Cytarabine-Induced Apoptotic Death. PLoS ONE 9(4): e94374. doi:10.1371/journal.pone.0094374
Editor: Guillermo Velasco, Complutense University, Spain
Received October 4, 2013; Accepted March 14, 2014; Published April 8, 2014
Copyright: � 2014 Bosnjak et al. This is an open-access article distributed under the terms of the Creative Commons Attribution License, which permitsunrestricted use, distribution, and reproduction in any medium, provided the original author and source are credited.
Funding: The study was supported by the grants 173053 and 41025 from the Ministry of Science and Technological Development of the Republic of Serbia(http://www.mpn.gov.rs). The funders had no role in study design, data collection and analysis, decision to publish, or preparation of the manuscript.
Competing Interests: The authors would like to note that co-author Vladimir Trajkovic is a PLOS ONE Editorial Board member. This does not alter the authors’adherence to all the PLOS ONE policies on sharing data and materials.
* E-mail: [email protected] (VT); [email protected] (LHT)
. These authors contributed equally to this work.
Introduction
Cytarabine (cytosine arabinoside, arabinofuranosyl cytidine) is a
chemotherapeutic drug used alone or in combination with other
antineoplastic agents to treat different forms of leukemia. As an
analog of deoxycytidine, this antimetabolite drug incorporates into
human DNA and consequently kills leukemic cells by interfering
with DNA and RNA synthesis [1]. Low permeability of cytarabine
across the cell membrane, need for biological activation through
phosphorylation and rapid deamination into inactive 1-b-d-
arabinofuranosyluracil require high cytarabine doses in order to
achieve satisfactory antileukemic effect [2]. However, treatment
with high doses of the drug has been associated with severe side
effects including cerebellar toxicity, leukopenia, thrombocytope-
nia, anemia, gastrointestinal disturbances and fatal toxicities [3].
To prevent the adverse effects and improve sensitivity of leukemia
cells, cytarabine has been combined with different agents capable
of modulating its stability, lipophilicity or apoptotic response of
cancer cells [2].
The induction of macroautophagy (referred to hereafter as
autophagy), a catabolic process for degradation and recycling of
the cell’s own unnecessary or dysfunctional components [4], has
recently been implicated in regulation of leukemic cell death
triggered by anticancer drugs [5–15]. Autophagy involves
sequestration of intracellular content in double-membraned
autophagosomes, followed by their fusion with lysosomes and
formation of single-membraned autophagolysosomes, in which the
internal content is degraded by acidic lysosomal hydrolases [4].
Autophagy depends on the hierarchically ordered activity of
autophagy-related (Atg) proteins, controlled by the main autoph-
agy repressor, mammalian target of rapamycin (mTOR) [4]. This
serine/threonine kinase is activated by phosphoinositide 3-kinase
PLOS ONE | www.plosone.org 1 April 2014 | Volume 9 | Issue 4 | e94374
(PI3K)/Akt pathway and inhibited by the intracellular energy
sensor AMP-activated protein kinase (AMPK) [4]. In addition, the
activation of extracellular signal-regulated kinase (ERK) has been
described as a non-canonical signal downstream of AMPK that
contributes to mTOR-dependent induction of autophagy in
certain conditions [16]. Under stress conditions such as nutrient
deprivation, hypoxia, oxidative stress and DNA damage, autoph-
agy could provide energy for maintaining essential cellular
metabolism and/or directly interfere with apoptotic/necrotic cell
death pathways [17]. However, in certain conditions, autophagy
can also stimulate apoptosis [18] or function as an alternative cell-
death pathway (programmed cell death type II) [19]. Accordingly,
autophagy can either promote cell death or serve as a survival
mechanism in leukemic cells treated with different anticancer
drugs [20,21]. It has recently been reported that tyrosine kinase
inhibitor imatinib mesylate and high-mobility group protein B1
promote resistance of cytarabine-treated leukemic cells through
induction of autophagy [22,23]. However, to the best of our
knowledge, no study so far has investigated the ability of
cytarabine to induce autophagic response in cancer cells, or the
possible role of cytarabine-triggered autophagy in regulation of
cancer cell death.
In the present study, we demonstrate that cytarabine induces
autophagy in leukemic cell lines and primary leukemic cells, but
not healthy leukocytes, by inhibiting the main negative autophagy
regulator, mammalian target of rapamycin (mTOR) [4]. More-
over, pharmacological and genetic inhibition of autophagy
sensitized leukemic cells to cytarabine-induced apoptosis.
Materials and Methods
Cell cultureHuman lymphoblastic leukemia cell line REH (ATCC CRL-
8286) was obtained from American Type Culture Collection
(Manassas, VA), while human promyelocytic leukemia cell line
HL-60 (ECACC 98070106) was purchased from the European
Collection of Animal Cell Cultures (Salisbury, UK). Peripheral
blood mononuclear cells (PBMC) were obtained from venous
blood of three patients with blastic transformation as the first
presentation of the chronic myeloid leukemia (CML), with more
than 108/l WBC count and myeloblast/promyelocyte count
. 50%. The diagnosis was established at the Outpatient Clinic
of the Outpatient & Diagnostic Department, Clinic of Hematol-
ogy, Clinical Centre of Serbia (Serbia, Belgrade), according to the
diagnostic criteria for classification of tumors of hematopoietic and
lymphoid tissue [24]. Control PBMC were obtained from three
healthy volunteers, age- and sex-matched with leukemic patients.
The study was conducted in accordance with the Declaration of
Helsinki and approved by the Ethical Committee of the Clinical
Centre of Serbia and the Ethical Committee of the School of
Medicine, University of Belgrade. Each volunteer provided a
written consent for participation in the study after being informed
about all the details of the study. All patients provided two
informed written consents, one general concerning diagnostic
procedures, and another one concerning the scientific analysis,
because the samples were taken during regular diagnostic workup.
Blood draws were conducted with syringes containing 10% (v/v)
of 3.8% sodium citrate as an anticoagulant. PBMC were isolated
by density gradient centrifugation using LymphoPrep (Axis Shield,
Oslo, Norway) and immediately used for experiments. The cell
lines and PBMC were incubated at 37uC in a humidified
atmosphere with 5% CO2, in a HEPES (20 mM)-buffered RPMI
1640 cell culture medium supplemented with 10% fetal bovine
serum, 1 mM sodium pyruvate 10 ml/l penicillin/streptomycin
(all from Sigma-Aldrich, St. Louis, MO). Cells were incubated in
96-well flat-bottom plates (46104 or 1.26105 cells/well for the cell
lines or PBMC, respectively) for the viability assessment, 24-well
plates (36105 cells/well for the cell lines) for the flow cytometry
analysis or in 100 mm cell culture dishes (2.56107 or 16108 cells/
well for the cell lines or PBMC, respectively) for the immunoblot-
ting and electron microscopy. Cells were rested for 2 h and then
treated with cytarabine in the absence or presence of the
autophagy inhibitors bafilomycin A1, chloroquine and 3-methy-
ladenine, or mTOR activator leucine (all from Sigma-Aldrich), as
described in Results and Figure legends.
Cell viability determinationCell viability was determined by measuring the cellular acid
phosphatase activity [25]. At the end of the incubation period (24
or 48 h), culture medium was removed and the acid phosphatase
substrate p-nitrophenyl phosphate (10 mM; Sigma-Aldrich) was
added. The reaction was stopped after incubation at 37uC for 1 h
by addition of 0.1 M NaOH. Color development, corresponding
to the number of viable cells, was monitored by automated
microplate reader at 405 nm. After subtracting the background
value of the cell culture medium, the results were presented
relative to untreated control (100% viability).
Apoptosis analysisApoptosis was analyzed by cytometry following double staining
with annexin V-FITC and propidium iodide (PI) (BD Pharmingen,
San Diego, CA), in which annexin V binds to phosphatidylserine
at the surface of apoptotic cells, while PI labels the necrotic cells
with membrane damage. Staining was performed according to the
manufacturer’s instructions and the green (FL1, annexin) and red
(FL2, PI) fluorescence was analyzed to evaluate the numbers of
viable (annexin2/PI2), apoptotic (annexin+/PI2) and necrotic
(annexin+/PI+) cells. DNA fragmentation associated with apoptot-
ic cell death was analyzed by flow cytometry following staining of
ethanol-fixed cell with the DNA-binding dye PI, as previously
described [26]. The proportion of hypodyploid, apoptotic cells
with fragmented DNA (sub-G compartment) was determined after
excluding cell aggregates by using a peak fluorescence gate.
Caspase activation, as another marker of apoptosis [27], was
measured by flow cytometry after labeling the cells with a cell-
permeable, FITC-conjugated pan-caspase inhibitor (ApoStat;
R&D Systems, Minneapolis, MN) according to the manufacturer’s
instructions. Caspase activity was assessed by measuring the
increase in green fluorescence (FL1). Based on preliminary time-
dependence experiments, the flow cytometry analysis of apoptotic
changes was performed after 24 h of incubation with cytarabine,
using a FACSCalibur flow cytometer and Cell Quest Pro software
(BD).
Measurement of mitochondrial membrane potential andsuperoxide production
Mitochondrial membrane potential was assessed using DePsi-
pher (R&D Systems), a lipophilic cation that has the property of
aggregating upon membrane polarization, forming an orange-red
fluorescent compound. If the potential is disturbed, the dye cannot
access the transmembrane space and remains or reverts to its
green monomeric form. The cells were stained with DePsipher as
described by the manufacturer, and the green monomer and red
aggregates were detected using a FACSCalibur flow cytometer
and Cell Quest Pro software. The results are presented as a green/
red fluorescence ratio (FL1/FL2, arbitrarily set to 1 in control
samples), the increase of which reflects mitochondrial depolarization.
Autophagy Protects Leukemic Cells from Cytarabine
PLOS ONE | www.plosone.org 2 April 2014 | Volume 9 | Issue 4 | e94374
The production of superoxide radical was measured using a
superoxide-selective fluorochrome dihydroethidium (DHE) (Life
Technologies, Carlsbad, CA). DHE (20 mM) was incubated with
the cells for the last 30 min of the treatment and the mean
intensity of red fluorescence (FL2), corresponding to superoxide
levels, was determined using a FACSCalibur flow cytometer and
Cell Quest Pro software. Based on preliminary time-dependence
experiments, both mitochondrial membrane potential and
superoxide production were analyzed after 24 h of treatment
with cytarabine.
Detection of acidic intracellular vesiclesThe acidic vesicles (i.e. lysosomes, autophagolysosomes) were
visualized by supravital staining with acridine orange (1 mM;
Sigma-Aldrich) for 15 min at 37uC. Cells were analyzed under the
inverted fluorescent microscope (Leica Microsystems DMIL,
Wetzlar, Germany) using Leica Microsystems DFC320 camera
and Leica Application Suite software (version 2.8.1). Depending
on their acidity, autophagolysosomes and lysosomes appeared as
orange/red fluorescent cytoplasmic vesicles, while nuclei were
stained green. Alternatively, acridine orange-stained cells were
analyzed on a FACSCalibur flow cytometer using Cell Quest Pro
software. Accumulation of acidic vesicles was quantified as red/
green fluorescence ratio (mean FL3/FL1). Based on preliminary
time-dependence experiments, the analysis was performed after
24 h of treatment with cytarabine.
ImmunoblottingThe cells were lysed in lysis buffer (30 mM Tris-HCl pH 8.0,
150 mM NaCl, 1% NP-40) containing 1 mM phenylmethylsulfo-
nylfluoride and protease/phosphatase inhibitor cocktail (Sigma-
Aldrich) on ice for 30 min, centrifuged at 14000 g for 15 min at
4uC, and the supernatants were collected. Equal amounts of
protein from each sample were separated by SDS-PAGE and
transferred to nitrocellulose membranes (Bio-Rad, Marnes-la-
Coquette, France). Following incubation with antibodies against
microtubule-associated protein 1 light-chain 3b (LC3b), p62,
beclin-1, AMPKa, phospho-AMPKa (Thr172), Akt, phospho-Akt
(Ser473), mTOR, phospho-mTOR (Ser2448), p70S6 kinase
(p70S6K), phospho-p70S6K (Thr389), ERK, phospho-ERK
(Thr202/Tyr204), and actin (all from Cell Signaling Technology,
Beverly, MA) as primary antibodies and peroxidase-conjugated
goat anti-rabbit IgG (Jackson IP Laboratories, West Grove, PA) as
a secondary antibody, specific protein bands were visualized using
enhanced chemiluminescence reagent (GE Healthcare, Little
Chalfont, UK). The protein levels were quantified by densitometry
using ImageJ software and expressed relative to actin (LC3-II,
beclin-1, p62) or corresponding total protein signals (phospho-
AMPK, phospho-Akt, phospho-mTOR, phospho-p70S6K, phos-
pho-ERK). The results are presented as the fold change in signal
intensity compared to that of the untreated control, which was
arbitrarily set to 1.
Transmission electron microscopyCells were fixed with 2.5% glutaraldehyde in phosphate-
buffered saline, followed by 2% OsO4. The thin sections were
stained with uranyl acetate and examined using a Morgagni 268D
electron microscope (FEI, Hillsboro, OR).
RNA interferenceThe transfection of REH cells with small interfering RNA
(siRNA) targeting human LC3b, p62, beclin-1 or scrambled
control siRNA (all from Qiagen, Valencia, CA), was performed
using Lipofectamine 2000 (Life Technologies) according to the
manufacturer’s instructions. After transfection, cells were allowed
to grow 24 h before used for experiments.
Real-time RT-PCRTotal RNA was extracted with TRIZOL reagent (Life
Technologies) and reverse transcribed using MuLV Reverse
Transcriptase reverse transcriptase with random hexamer primers
(both from Life Technologies) according to the manufacturer’s
instructions. Real-time RT-PCR was performed in a Realplex2
Mastercycler (Eppendorf, Hamburg, Germany) using 96-well
reaction plates (Applied Biosystems, Cheshire, UK), TaqMan
Universal PCR Master Mix (Applied Biosystems) and TaqMan
primers/probes for human Atg4B (Hs00367088_m1), Atg5
(Hs00169468_m1), Atg7 (Hs00197348_m1), Atg12 (Hs00740818_
m1), p62 (Hs00177654_m1) and b2-microglobulin (Hs00984230_
m1) as a house-keeping gene (all from Applied Biosystems). The
amplification conditions were 50uC for 2 min and 95uC for
10 min, followed by 40 cycles of 15 s at 95uC and 1 min at 60uC.
All assays were performed in triplicates. Averaged cycle of threshold
(Ct) values of b2-microglobulin triplicates were subtracted from Ct
values of target genes to obtain DCt, and relative gene expression
was determined as 22DCt. The results were presented relative to the
control value, which was arbitrarily set to 1.
Statistical analysisThe statistical significance of the differences was analyzed by
one-way analysis of variance (ANOVA) followed by Student-
Newman-Keuls test. A p value less than 0.05 was considered
statistically significant.
Results
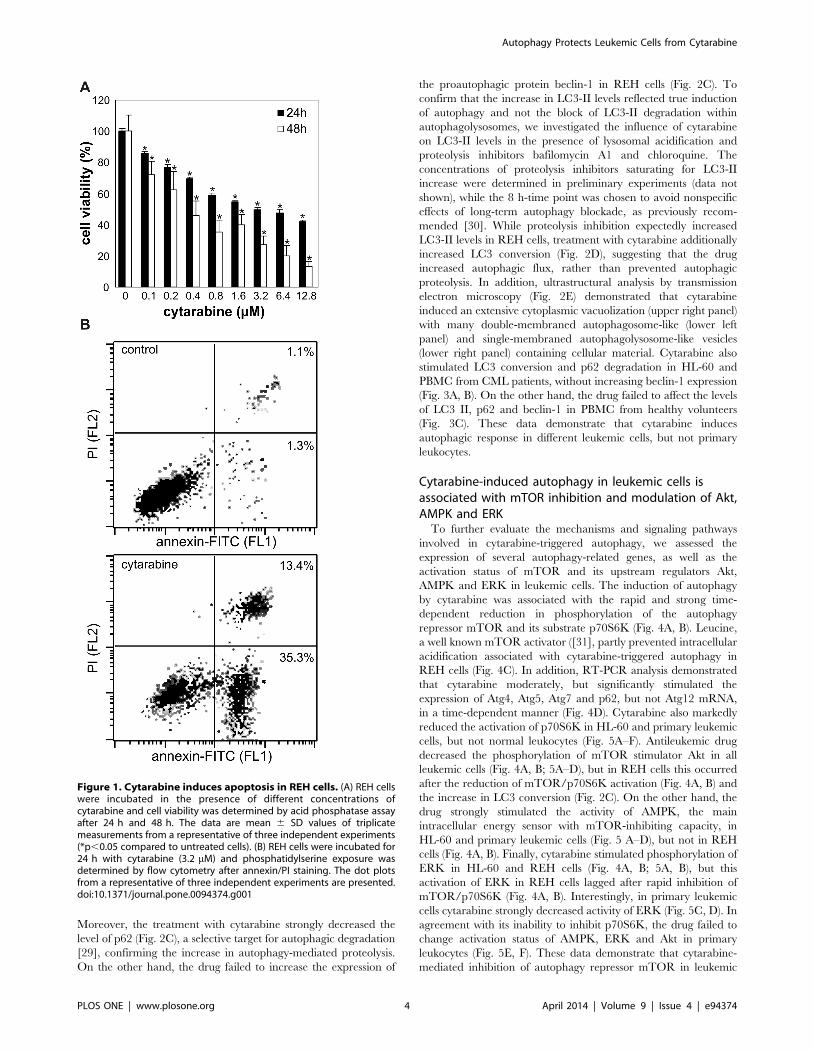
Cytarabine induces apoptosis in REH leukemic cellsWe first investigated the cytotoxicity of cytarabine towards
human lymphocytic leukemia REH cell line. The acid phospha-
tase activity assay revealed that cytarabine reduced the viability of
REH cells in a dose-dependent manner, with the IC50 concen-
trations of approximately 3.2 and 0.4 mM after 24 and 48 h,
respectively (Fig. 1A). Consequently, 3.2 mM of leukemic drug was
used in further experiments. Flow cytometric analysis of cells
stained with annexin-FITC and PI demonstrated a significant
increase in the proportion of both early apoptotic (annexin+/PI2)
and late apoptotic/necrotic (annexin+/PI+) cells in cytarabine-
treated REH cultures (Fig. 1B). Further analysis of cytarabine-
exposed cells confirmed the induction of DNA fragmentation (Fig.
S1A) and caspase activation (Fig. S1B), as well as mitochondrial
depolarization (Fig. S1C) and oxidative stress (Fig. S1D), which are
frequently associated with the initiation of apoptotic cell death
[28]. Similar results were obtained with HL-60 (human acute
promyelocytic leukemia) and peripheral blood mononuclear cells
(PBMC) from CML patients, while PBMC from healthy controls
were almost completely insensitive to cytarabine (not shown).
Cytarabine induces autophagy in leukemic cellsWe next assessed the ability of cytarabine to induce autophagy
in leukemic cells. Both flow cytometry and fluorescent microscopy
demonstrated an increase in red fluorescence in cytarabine-treated
REH cells stained with acridine orange (Fig. 2A, B), indicating the
presence of intracellular acidification as one of the hallmarks of
autophagic response. This was associated with rapid conversion of
LC3-I protein to lipidated, autophagosome-associated LC3-II,
which peaked at 2 h and then gradually declined (Fig. 2C), in
accordance with its degradation within autophagosomes [4].
Autophagy Protects Leukemic Cells from Cytarabine
PLOS ONE | www.plosone.org 3 April 2014 | Volume 9 | Issue 4 | e94374
Moreover, the treatment with cytarabine strongly decreased the
level of p62 (Fig. 2C), a selective target for autophagic degradation
[29], confirming the increase in autophagy-mediated proteolysis.
On the other hand, the drug failed to increase the expression of
the proautophagic protein beclin-1 in REH cells (Fig. 2C). To
confirm that the increase in LC3-II levels reflected true induction
of autophagy and not the block of LC3-II degradation within
autophagolysosomes, we investigated the influence of cytarabine
on LC3-II levels in the presence of lysosomal acidification and
proteolysis inhibitors bafilomycin A1 and chloroquine. The
concentrations of proteolysis inhibitors saturating for LC3-II
increase were determined in preliminary experiments (data not
shown), while the 8 h-time point was chosen to avoid nonspecific
effects of long-term autophagy blockade, as previously recom-
mended [30]. While proteolysis inhibition expectedly increased
LC3-II levels in REH cells, treatment with cytarabine additionally
increased LC3 conversion (Fig. 2D), suggesting that the drug
increased autophagic flux, rather than prevented autophagic
proteolysis. In addition, ultrastructural analysis by transmission
electron microscopy (Fig. 2E) demonstrated that cytarabine
induced an extensive cytoplasmic vacuolization (upper right panel)
with many double-membraned autophagosome-like (lower left
panel) and single-membraned autophagolysosome-like vesicles
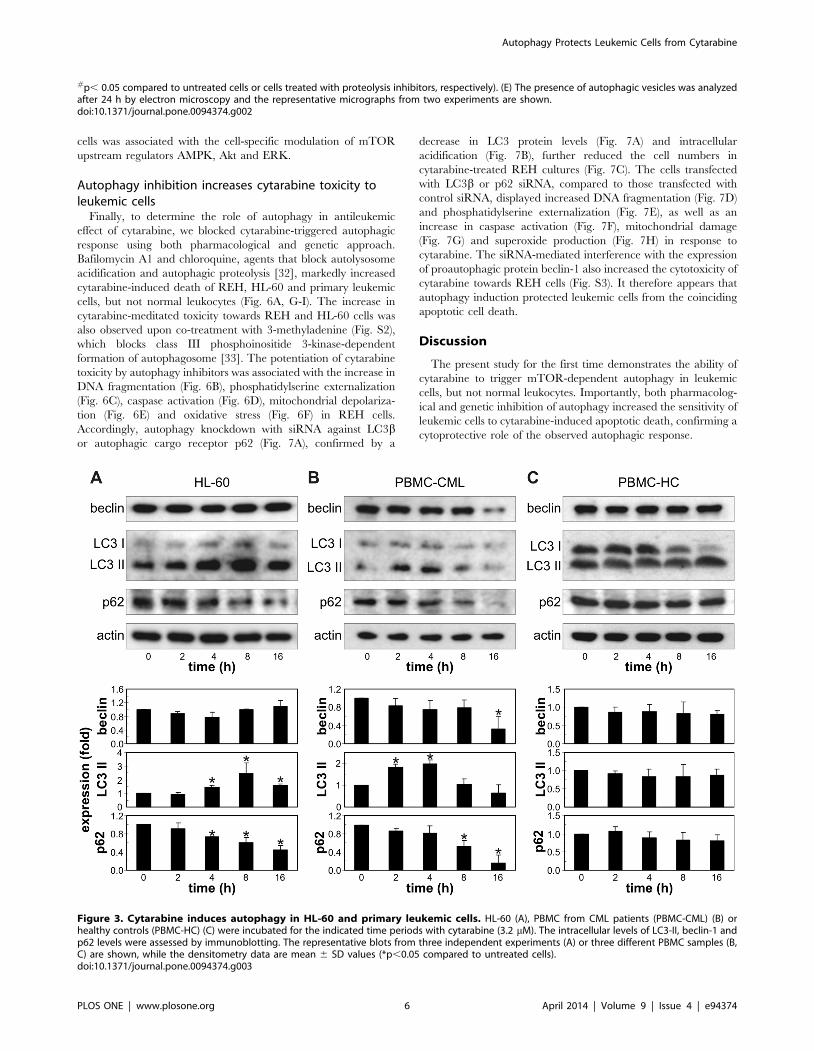
(lower right panel) containing cellular material. Cytarabine also
stimulated LC3 conversion and p62 degradation in HL-60 and
PBMC from CML patients, without increasing beclin-1 expression
(Fig. 3A, B). On the other hand, the drug failed to affect the levels
of LC3 II, p62 and beclin-1 in PBMC from healthy volunteers
(Fig. 3C). These data demonstrate that cytarabine induces
autophagic response in different leukemic cells, but not primary
leukocytes.
Cytarabine-induced autophagy in leukemic cells isassociated with mTOR inhibition and modulation of Akt,AMPK and ERK
To further evaluate the mechanisms and signaling pathways
involved in cytarabine-triggered autophagy, we assessed the
expression of several autophagy-related genes, as well as the
activation status of mTOR and its upstream regulators Akt,
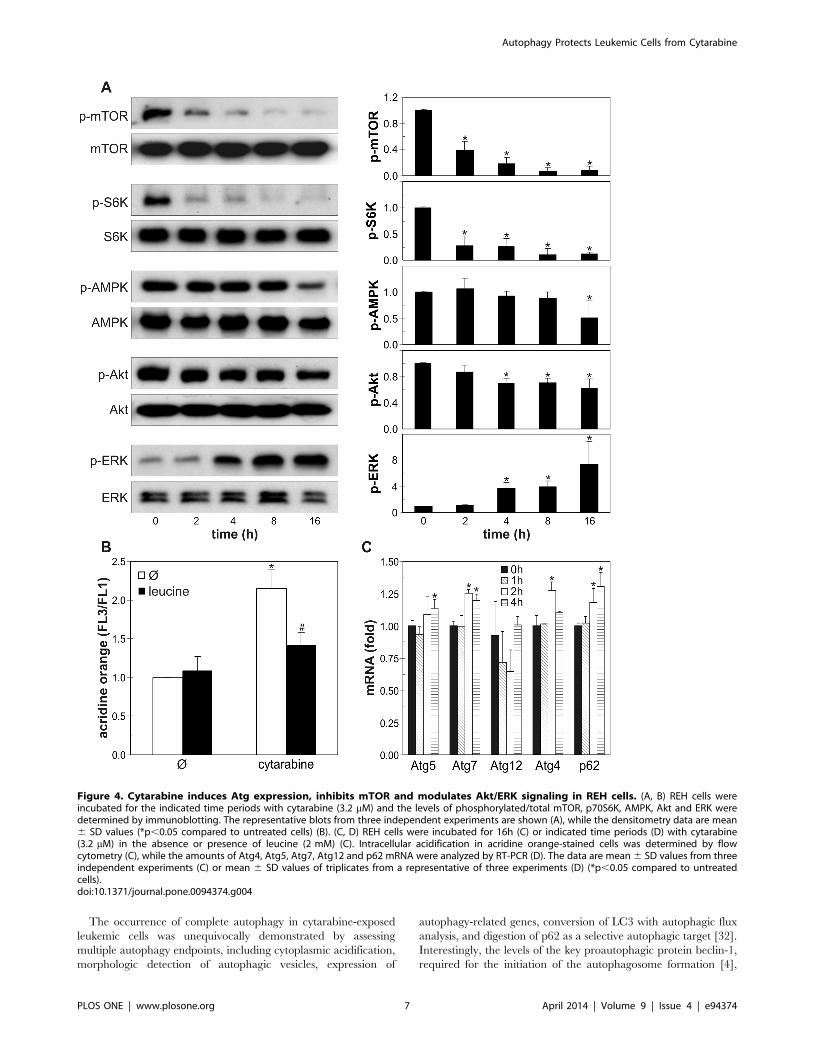
AMPK and ERK in leukemic cells. The induction of autophagy
by cytarabine was associated with the rapid and strong time-
dependent reduction in phosphorylation of the autophagy
repressor mTOR and its substrate p70S6K (Fig. 4A, B). Leucine,
a well known mTOR activator ([31], partly prevented intracellular
acidification associated with cytarabine-triggered autophagy in
REH cells (Fig. 4C). In addition, RT-PCR analysis demonstrated
that cytarabine moderately, but significantly stimulated the
expression of Atg4, Atg5, Atg7 and p62, but not Atg12 mRNA,
in a time-dependent manner (Fig. 4D). Cytarabine also markedly
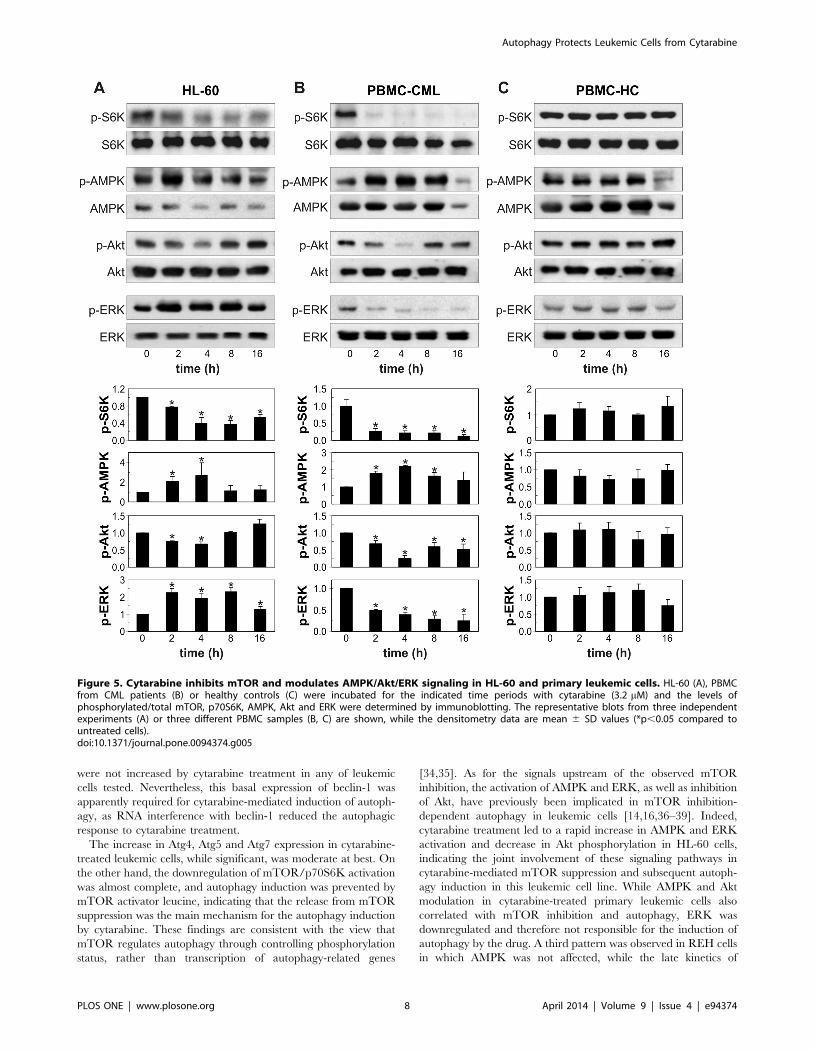
reduced the activation of p70S6K in HL-60 and primary leukemic
cells, but not normal leukocytes (Fig. 5A–F). Antileukemic drug
decreased the phosphorylation of mTOR stimulator Akt in all
leukemic cells (Fig. 4A, B; 5A–D), but in REH cells this occurred
after the reduction of mTOR/p70S6K activation (Fig. 4A, B) and
the increase in LC3 conversion (Fig. 2C). On the other hand, the
drug strongly stimulated the activity of AMPK, the main
intracellular energy sensor with mTOR-inhibiting capacity, in
HL-60 and primary leukemic cells (Fig. 5 A–D), but not in REH
cells (Fig. 4A, B). Finally, cytarabine stimulated phosphorylation of
ERK in HL-60 and REH cells (Fig. 4A, B; 5A, B), but this
activation of ERK in REH cells lagged after rapid inhibition of
mTOR/p70S6K (Fig. 4A, B). Interestingly, in primary leukemic
cells cytarabine strongly decreased activity of ERK (Fig. 5C, D). In
agreement with its inability to inhibit p70S6K, the drug failed to
change activation status of AMPK, ERK and Akt in primary
leukocytes (Fig. 5E, F). These data demonstrate that cytarabine-
mediated inhibition of autophagy repressor mTOR in leukemic
Figure 1. Cytarabine induces apoptosis in REH cells. (A) REH cellswere incubated in the presence of different concentrations ofcytarabine and cell viability was determined by acid phosphatase assayafter 24 h and 48 h. The data are mean 6 SD values of triplicatemeasurements from a representative of three independent experiments(*p,0.05 compared to untreated cells). (B) REH cells were incubated for24 h with cytarabine (3.2 mM) and phosphatidylserine exposure wasdetermined by flow cytometry after annexin/PI staining. The dot plotsfrom a representative of three independent experiments are presented.doi:10.1371/journal.pone.0094374.g001
Autophagy Protects Leukemic Cells from Cytarabine
PLOS ONE | www.plosone.org 4 April 2014 | Volume 9 | Issue 4 | e94374
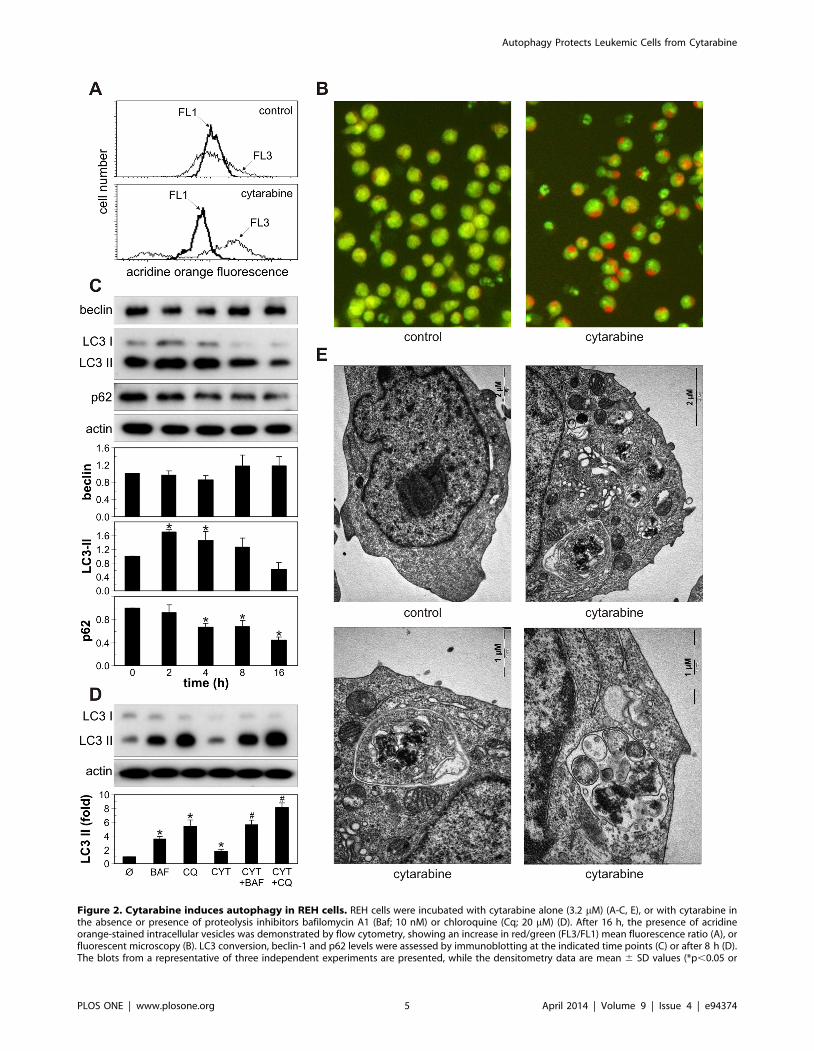
Figure 2. Cytarabine induces autophagy in REH cells. REH cells were incubated with cytarabine alone (3.2 mM) (A-C, E), or with cytarabine inthe absence or presence of proteolysis inhibitors bafilomycin A1 (Baf; 10 nM) or chloroquine (Cq; 20 mM) (D). After 16 h, the presence of acridineorange-stained intracellular vesicles was demonstrated by flow cytometry, showing an increase in red/green (FL3/FL1) mean fluorescence ratio (A), orfluorescent microscopy (B). LC3 conversion, beclin-1 and p62 levels were assessed by immunoblotting at the indicated time points (C) or after 8 h (D).The blots from a representative of three independent experiments are presented, while the densitometry data are mean 6 SD values (*p,0.05 or
Autophagy Protects Leukemic Cells from Cytarabine
PLOS ONE | www.plosone.org 5 April 2014 | Volume 9 | Issue 4 | e94374
cells was associated with the cell-specific modulation of mTOR
upstream regulators AMPK, Akt and ERK.
Autophagy inhibition increases cytarabine toxicity toleukemic cells
Finally, to determine the role of autophagy in antileukemic
effect of cytarabine, we blocked cytarabine-triggered autophagic
response using both pharmacological and genetic approach.
Bafilomycin A1 and chloroquine, agents that block autolysosome
acidification and autophagic proteolysis [32], markedly increased
cytarabine-induced death of REH, HL-60 and primary leukemic
cells, but not normal leukocytes (Fig. 6A, G-I). The increase in
cytarabine-meditated toxicity towards REH and HL-60 cells was
also observed upon co-treatment with 3-methyladenine (Fig. S2),
which blocks class III phosphoinositide 3-kinase-dependent
formation of autophagosome [33]. The potentiation of cytarabine
toxicity by autophagy inhibitors was associated with the increase in
DNA fragmentation (Fig. 6B), phosphatidylserine externalization
(Fig. 6C), caspase activation (Fig. 6D), mitochondrial depolariza-
tion (Fig. 6E) and oxidative stress (Fig. 6F) in REH cells.
Accordingly, autophagy knockdown with siRNA against LC3bor autophagic cargo receptor p62 (Fig. 7A), confirmed by a
decrease in LC3 protein levels (Fig. 7A) and intracellular
acidification (Fig. 7B), further reduced the cell numbers in
cytarabine-treated REH cultures (Fig. 7C). The cells transfected
with LC3b or p62 siRNA, compared to those transfected with
control siRNA, displayed increased DNA fragmentation (Fig. 7D)
and phosphatidylserine externalization (Fig. 7E), as well as an
increase in caspase activation (Fig. 7F), mitochondrial damage
(Fig. 7G) and superoxide production (Fig. 7H) in response to
cytarabine. The siRNA-mediated interference with the expression
of proautophagic protein beclin-1 also increased the cytotoxicity of
cytarabine towards REH cells (Fig. S3). It therefore appears that
autophagy induction protected leukemic cells from the coinciding
apoptotic cell death.
Discussion
The present study for the first time demonstrates the ability of
cytarabine to trigger mTOR-dependent autophagy in leukemic
cells, but not normal leukocytes. Importantly, both pharmacolog-
ical and genetic inhibition of autophagy increased the sensitivity of
leukemic cells to cytarabine-induced apoptotic death, confirming a
cytoprotective role of the observed autophagic response.
#p, 0.05 compared to untreated cells or cells treated with proteolysis inhibitors, respectively). (E) The presence of autophagic vesicles was analyzedafter 24 h by electron microscopy and the representative micrographs from two experiments are shown.doi:10.1371/journal.pone.0094374.g002
Figure 3. Cytarabine induces autophagy in HL-60 and primary leukemic cells. HL-60 (A), PBMC from CML patients (PBMC-CML) (B) orhealthy controls (PBMC-HC) (C) were incubated for the indicated time periods with cytarabine (3.2 mM). The intracellular levels of LC3-II, beclin-1 andp62 levels were assessed by immunoblotting. The representative blots from three independent experiments (A) or three different PBMC samples (B,C) are shown, while the densitometry data are mean 6 SD values (*p,0.05 compared to untreated cells).doi:10.1371/journal.pone.0094374.g003
Autophagy Protects Leukemic Cells from Cytarabine
PLOS ONE | www.plosone.org 6 April 2014 | Volume 9 | Issue 4 | e94374
The occurrence of complete autophagy in cytarabine-exposed
leukemic cells was unequivocally demonstrated by assessing
multiple autophagy endpoints, including cytoplasmic acidification,
morphologic detection of autophagic vesicles, expression of
autophagy-related genes, conversion of LC3 with autophagic flux
analysis, and digestion of p62 as a selective autophagic target [32].
Interestingly, the levels of the key proautophagic protein beclin-1,
required for the initiation of the autophagosome formation [4],
Figure 4. Cytarabine induces Atg expression, inhibits mTOR and modulates Akt/ERK signaling in REH cells. (A, B) REH cells wereincubated for the indicated time periods with cytarabine (3.2 mM) and the levels of phosphorylated/total mTOR, p70S6K, AMPK, Akt and ERK weredetermined by immunoblotting. The representative blots from three independent experiments are shown (A), while the densitometry data are mean6 SD values (*p,0.05 compared to untreated cells) (B). (C, D) REH cells were incubated for 16h (C) or indicated time periods (D) with cytarabine(3.2 mM) in the absence or presence of leucine (2 mM) (C). Intracellular acidification in acridine orange-stained cells was determined by flowcytometry (C), while the amounts of Atg4, Atg5, Atg7, Atg12 and p62 mRNA were analyzed by RT-PCR (D). The data are mean 6 SD values from threeindependent experiments (C) or mean 6 SD values of triplicates from a representative of three experiments (D) (*p,0.05 compared to untreatedcells).doi:10.1371/journal.pone.0094374.g004
Autophagy Protects Leukemic Cells from Cytarabine
PLOS ONE | www.plosone.org 7 April 2014 | Volume 9 | Issue 4 | e94374
were not increased by cytarabine treatment in any of leukemic
cells tested. Nevertheless, this basal expression of beclin-1 was
apparently required for cytarabine-mediated induction of autoph-
agy, as RNA interference with beclin-1 reduced the autophagic
response to cytarabine treatment.
The increase in Atg4, Atg5 and Atg7 expression in cytarabine-
treated leukemic cells, while significant, was moderate at best. On
the other hand, the downregulation of mTOR/p70S6K activation
was almost complete, and autophagy induction was prevented by
mTOR activator leucine, indicating that the release from mTOR
suppression was the main mechanism for the autophagy induction
by cytarabine. These findings are consistent with the view that
mTOR regulates autophagy through controlling phosphorylation
status, rather than transcription of autophagy-related genes
[34,35]. As for the signals upstream of the observed mTOR
inhibition, the activation of AMPK and ERK, as well as inhibition
of Akt, have previously been implicated in mTOR inhibition-
dependent autophagy in leukemic cells [14,16,36–39]. Indeed,
cytarabine treatment led to a rapid increase in AMPK and ERK
activation and decrease in Akt phosphorylation in HL-60 cells,
indicating the joint involvement of these signaling pathways in
cytarabine-mediated mTOR suppression and subsequent autoph-
agy induction in this leukemic cell line. While AMPK and Akt
modulation in cytarabine-treated primary leukemic cells also
correlated with mTOR inhibition and autophagy, ERK was
downregulated and therefore not responsible for the induction of
autophagy by the drug. A third pattern was observed in REH cells
in which AMPK was not affected, while the late kinetics of
Figure 5. Cytarabine inhibits mTOR and modulates AMPK/Akt/ERK signaling in HL-60 and primary leukemic cells. HL-60 (A), PBMCfrom CML patients (B) or healthy controls (C) were incubated for the indicated time periods with cytarabine (3.2 mM) and the levels ofphosphorylated/total mTOR, p70S6K, AMPK, Akt and ERK were determined by immunoblotting. The representative blots from three independentexperiments (A) or three different PBMC samples (B, C) are shown, while the densitometry data are mean 6 SD values (*p,0.05 compared tountreated cells).doi:10.1371/journal.pone.0094374.g005
Autophagy Protects Leukemic Cells from Cytarabine
PLOS ONE | www.plosone.org 8 April 2014 | Volume 9 | Issue 4 | e94374
cytarabine-triggered Akt inhibition and ERK activation indicates
sustaining, rather than causative role in mTOR suppression and
autophagy induction. Another plausible candidate for mediating
cytarabine-triggered autophagy is tumor suppressor p53, which
has been implicated in the induction of mTOR-dependent
autophagic response in stressed cells [40], and is upregulated in
leukemic cells by cytarabine treatment [41]. Therefore, cytara-
bine-induced changes in signaling molecules converging to mTOR
inhibition and subsequent induction of autophagy seem to be
leukemic cell type-specific and require further investigation.
Similarly to previously reported results [42,43], cytarabine-
induced oxidative stress and mitochondrial depolarization in the
present study were associated with several apoptotic markers,
including caspase activation, phosphatidylserine exposure and
DNA fragmentation. However, the causal role of oxidative stress/
mitochondrial depolarization in cytarabine-triggered apoptosis
remains to be directly confirmed, as these events may merely be
reflecting the effects, rather than cause of cell death. Nevertheless,
it is conceivable to assume that oxidative stress was responsible for
autophagy induction by cytarabine, as production of ROS,
particularly superoxide, has been implicated in the activation of
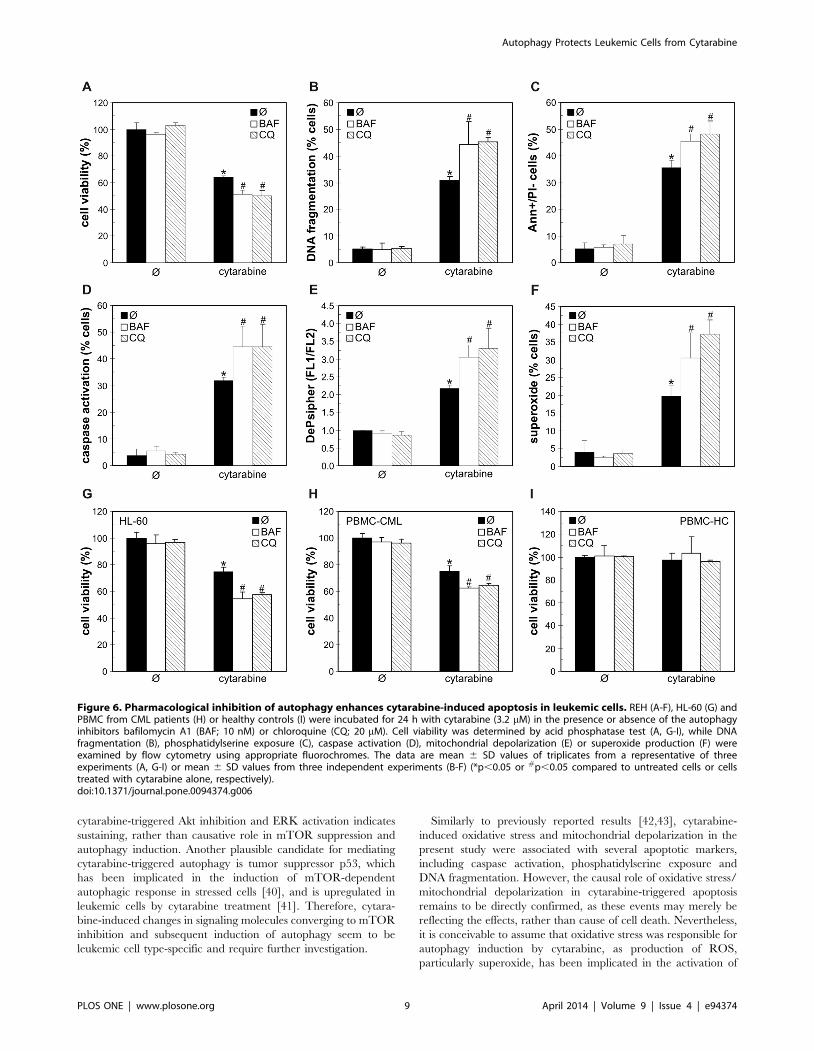
Figure 6. Pharmacological inhibition of autophagy enhances cytarabine-induced apoptosis in leukemic cells. REH (A-F), HL-60 (G) andPBMC from CML patients (H) or healthy controls (I) were incubated for 24 h with cytarabine (3.2 mM) in the presence or absence of the autophagyinhibitors bafilomycin A1 (BAF; 10 nM) or chloroquine (CQ; 20 mM). Cell viability was determined by acid phosphatase test (A, G-I), while DNAfragmentation (B), phosphatidylserine exposure (C), caspase activation (D), mitochondrial depolarization (E) or superoxide production (F) wereexamined by flow cytometry using appropriate fluorochromes. The data are mean 6 SD values of triplicates from a representative of threeexperiments (A, G-I) or mean 6 SD values from three independent experiments (B-F) (*p,0.05 or #p,0.05 compared to untreated cells or cellstreated with cytarabine alone, respectively).doi:10.1371/journal.pone.0094374.g006
Autophagy Protects Leukemic Cells from Cytarabine
PLOS ONE | www.plosone.org 9 April 2014 | Volume 9 | Issue 4 | e94374
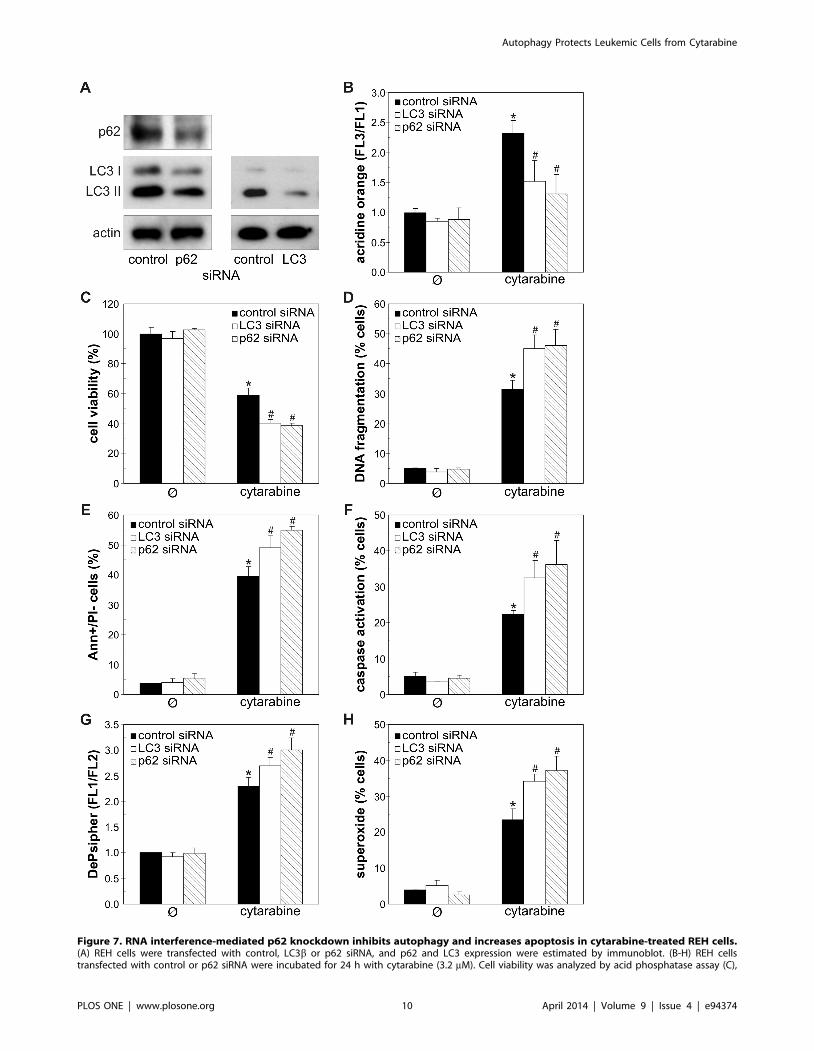
Figure 7. RNA interference-mediated p62 knockdown inhibits autophagy and increases apoptosis in cytarabine-treated REH cells.(A) REH cells were transfected with control, LC3b or p62 siRNA, and p62 and LC3 expression were estimated by immunoblot. (B-H) REH cellstransfected with control or p62 siRNA were incubated for 24 h with cytarabine (3.2 mM). Cell viability was analyzed by acid phosphatase assay (C),
Autophagy Protects Leukemic Cells from Cytarabine
PLOS ONE | www.plosone.org 10 April 2014 | Volume 9 | Issue 4 | e94374
autophagic response [44–46]. To assess the role of cytarabine-
triggered autophagic response in the concomitant induction of
apoptotic death, we employed both pharmacological and genetic
donwregulation of autophagy. In accordance with previous
findings in leukemic cell lines [7,10,47,48], the RNA interference
with beclin-1 and LC3b, which are required for autophagosome
formation, or p62, the cargo receptor delivering ubiquitinated
proteins to autophagic compartments, efficiently impaired au-
tophagy induction in REH cells. The inhibition of early autophagy
events with beclin-1/LC3b/p62 siRNA or 3-methyladenine, as
well as the interference with autophagic digestion with proteolysis
inhibitors, significantly increased cytarabine-induced cell death,
thus indicating a protective role of cytarabine-induced autophagy
in leukemic cell lines (REH, HL-60) and primary leukemic cells.
The inhibition of basal autophagy, on the other hand, was not
overtly detrimental to leukemic cells, probably due to a relatively
short incubation period. Similarly to our results, interference with
the autophagic response increased the cytotoxicity of daunorubi-
cin, flavopiridol, triciribine and tyrosine kinase inhibitors towards
leukemic cells [11–14]. On the other hand, autophagy was
apparently involved in antileukemic effects of arsenic trioxide,
dexamethasone, decitabine and acadesine [6–10], indicating that
the role of autophagy in survival/death of leukemic cells depends
on the cytotoxic agent.
While for the first time demonstrating the cytoprotective
autophagy in leukemic cells exposed to cytarabine alone, our data
are consistent with previous findings that autophagy induced by
high-mobility group protein B1 and imatinib mesylate can reduce
the in vitro antileukemic action of the drug [22,23]. As for the
mechanisms responsible for the cytoprotective effect of autophagy
in the present study, it has been proposed that autophagic response
may act as a negative feedback mechanisms for removal of
oxidized proteins and dysfunctional ROS-producing mitochon-
dria, thus preventing their involvement in cellular injury [49].
Indeed, the inhibition of autophagy in cytarabine-treated leukemic
cells markedly increased superoxide production and subsequent
mitochondrial damage, leading to caspase activation and apoptotic
DNA fragmentation. While this indicates the involvement of
oxidative stress attenuation in autophagy-mediated protection
from cytarabine, the precise mechanisms of autophagy-apoptosis
interplay in the cytarabine cytotoxicity remain to be elucidated.
In conclusion, we demonstrate that inhibition of autophagy
increases apoptotic death of leukemic cells treated with cytarabine
at the dose (3.2 mM) achievable in the blood of leukemic patients
[50]. While the similar response was not observed in healthy blood
leukocytes, it should be noted that normal bone marrow cells,
which are difficult to obtain due to ethical issues, would be more
appropriate controls. Therefore, it remains to be assessed if
protective autophagy is induced similarly in normal blood
progenitor cells treated with cytarabine, since the use of auto-
phagy inhibitors could then be counter-productive. Chloroquine, a
clinically approved autophagy inhibitor that blocks lysosomal
proteolysis [51] is currently in phase II clinical trials for treat-
ment of leukemia and multiple myeloma in combination with
cyclophosphamide, bortezomib or imanitib (Trial #NCT
01438177, ISCRTN No. 61568166), and the in vitro doses of
chloroquine used in the present study are within one order of
magnitude of the peak blood concentrations achievable in humans
[53]. Therefore, our results indicate that a similar approach might
be used to sensitize leukemic cells to cytarabine, thus decreasing its
effective dose and ameliorating side effects. Moreover, in light of
the possible use of mTOR inhibitors as adjuvant therapy in
leukemia [52], our data suggest that their efficiency in combina-
tion with cytarabine might be further improved by inhibition of
the concomitant autophagic response. However, caution is clearly
warranted due to opposing, context-dependent actions of autoph-
agy in regulating leukemic cell death and survival.
Supporting Information
Figure S1 Cytarabine induces apoptosis-related chang-es in REH cells. (A-D) REH cells were incubated for 24 h with
cytarabine (3.2 mM) and DNA fragmentation (A), caspase
activation (B), mitochondrial depolarization (C) or superoxide
production (D) were determined by flow cytometry using
appropriate fluorochromes. The histograms from a representative
of three independent experiments are presented.
(TIF)
Figure S2 3-methyladenine increases the cytotoxicity ofcytarabine towards leukemic cell lines. REH (A) or HL-60
(B) cells were incubated for 24 h with cytarabine (3.2 mM) in the
presence or absence of the autophagy inhibitor 3-methyladenine
(5 mM). Cell viability was determined by acid phosphatase test
and the data are presented as mean 6 SD values of triplicates
from a representative of three experiments (*p,0.05 or #p,0.05
compared to untreated cells or cells treated with cytarabine alone,
respectively).
(TIF)
Figure S3 RNA interference with beclin-1 increases thecytotoxic action of cytarabine in REH cells. (A) REH cells
were transfected with control or beclin-1 siRNA and the decrease
in beclin-1 expression was confirmed by immunoblot. (B) REH
cells transfected with control or beclin-1 were incubated for 24 h
with different concentrations of cytarabine and cell viability was
analyzed by acid phosphatase assay. The data are mean 6 SD
values of triplicates from a representative of three experiments
(*p,0.05 or #p,0.05 compared to untreated or cytarabine-
treated control siRNA-transfected cells, respectively).
(TIF)
Acknowledgments
The authors thank Dr. Urosh Vilimanovich (School of Medicine,
University of Belgrade) for technical support.
Author Contributions
Conceived and designed the experiments: VT LHT. Performed the
experiments: MB BR KA AM VSZ AB V. Paunovic IM LHT. Analyzed
the data: VT LHT. Contributed reagents/materials/analysis tools:
V. Perovic AB VB. Wrote the paper: VT LHT.
while the presence of acridine orange (AO)-stained intracellular vesicles (B), DNA fragmentation (D), phosphatidylserine exposure (E), caspaseactivation (F), mitochondrial depolarization (G) or superoxide production (H) were determined by flow cytometry using appropriate fluorochromes.The data are mean 6 SD values of triplicates from a representative of three experiments (C) or mean 6 SD values from three independentexperiments (B, D-H) (*p , 0.05 or #p , 0.05 compared to untreated or cytarabine-treated control siRNA-transfected cells, respectively).doi:10.1371/journal.pone.0094374.g007
Autophagy Protects Leukemic Cells from Cytarabine
PLOS ONE | www.plosone.org 11 April 2014 | Volume 9 | Issue 4 | e94374
References
1. Lamba JK (2009) Genetic factors influencing cytarabine therapy. Pharmacoge-
nomics 10: 1657–1674.2. Novotny L, Rauko P (2009) Cytarabine conjugates with biologically active
molecules and their potential anticancer activity. Neoplasma 56: 177–186.3. Stentoft J (1990) The toxicity of cytarabine. Drug Saf 5: 7–27.
4. Yang Z, Klionsky DJ (2010) Mammalian autophagy: core molecular machinery
and signaling regulation. Curr Opin Cell Biol 22: 124–131.5. Puissant A, Robert G, Auberger P (2010) Targeting autophagy to fight
hematopoietic malignancies. Cell Cycle 9: 3470–3478.6. Cheng J, Wei HL, Chen J, Xie B (2012) Antitumor effect of arsenic trioxide in
human K562 and K562/ADM cells by autophagy. Toxicol Mech Methods 22:
512–519.7. Grander D, Kharaziha P, Laane E, Pokrovskaja K, Panaretakis T (2009)
Autophagy as the main means of cytotoxicity by glucocorticoids in hematologicalmalignancies. Autophagy 5: 1198–1200.
8. Schnekenburger M, Grandjenette C, Ghelfi J, Karius T, Foliguet B, et al. (2011)Sustained exposure to the DNA demethylating agent, 29-deoxy-5-azacytidine,
leads to apoptotic cell death in chronic myeloid leukemia by promoting
differentiation, senescence, and autophagy. Biochem Pharmacol 81: 364–378.9. Robert G, Ben Sahra I, Puissant A, Colosetti P, Belhacene N, et al. (2009)
Acadesine kills chronic myelogenous leukemia (CML) cells through PKC-dependent induction of autophagic cell death. PLoS One 4: e7889.
10. Puissant A, Robert G, Fenouille N, Luciano F, Cassuto JP, et al. (2010)
Resveratrol promotes autophagic cell death in chronic myelogenous leukemiacells via JNK-mediated p62/SQSTM1 expression and AMPK activation.
Cancer Res 70: 1042–1052.11. Bellodi C, Lidonnici MR, Hamilton A, Helgason GV, Soliera AR, et al. (2009)
Targeting autophagy potentiates tyrosine kinase inhibitor-induced cell death inPhiladelphia chromosome-positive cells, including primary CML stem cells.
J Clin Invest 119: 1109–1123.
12. Han W, Sun J, Feng L, Wang K, Li D, et al. (2011) Autophagy inhibitionenhances daunorubicin-induced apoptosis in K562 cells. PLoS One 6: e28491.
13. Mahoney E, Lucas DM, Gupta SV, Wagner AJ, Herman SE, et al. (2012) ERstress and autophagy: new discoveries in the mechanism of action and drug
resistance of the cyclin-dependent kinase inhibitor flavopiridol. Blood 120:
1262–1273.14. Evangelisti C, Ricci F, Tazzari P, Chiarini F, Battistelli M, et al. (2011)
Preclinical testing of the Akt inhibitor triciribine in T-cell acute lymphoblasticleukemia. J Cell Physiol 226: 822–831.
15. Calabretta B, Salomoni P (2011) Inhibition of autophagy: a new strategy toenhance sensitivity of chronic myeloid leukemia stem cells to tyrosine kinase
inhibitors. Leuk Lymphoma 52 Suppl 1: 54–59.
16. Wang J, Whiteman MW, Lian H, Wang G, Singh A, et al. (2009) A non-canonical MEK/ERK signaling pathway regulates autophagy via regulating
Beclin 1. J Biol Chem 284: 21412–21424.17. Jain MV, Paczulla AM, Klonisch T, Dimgba FN, Rao SB, et al. (2013)
Interconnections between apoptotic, autophagic and necrotic pathways:
implications for cancer therapy development. J Cell Mol Med 17: 12–29.18. Fimia GM, Piacentini M (2010) Regulation of autophagy in mammals and its
interplay with apoptosis. Cell Mol Life Sci 67: 1581–1588.19. Notte A, Leclere L, Michiels C (2011) Autophagy as a mediator of
chemotherapy-induced cell death in cancer. Biochem Pharmacol 82: 427–434.20. Banerji V, Gibson SB (2012) Targeting metabolism and autophagy in the
context of haematologic malignancies. Int J Cell Biol 2012: 595976.
21. Ishdorj G, Li L, Gibson SB (2012) Regulation of autophagy in hematologicalmalignancies: role of reactive oxygen species. Leuk Lymphoma 53: 26–33.
22. Liu L, Yang M, Kang R, Wang Z, Zhao Y, et al. (2011) HMGB1-inducedautophagy promotes chemotherapy resistance in leukemia cells. Leukemia 25:
23–31.
23. Ohtomo T, Miyazawa K, Naito M, Moriya S, Kuroda M, et al. (2010)Cytoprotective effect of imatinib mesylate in non-BCR-ABL-expressing cells
along with autophagosome formation. Biochem Biophys Res Commun 391:310–315.
24. Vardiman JW, Thiele J, Arber DA, Brunning RD, Borowitz MJ, et al. (2009)
The 2008 revision of the World Health Organization (WHO) classification ofmyeloid neoplasms and acute leukemia: rationale and important changes. Blood
114: 937–951.25. Connolly DT, Knight MB, Harakas NK, Wittwer AJ, Feder J (1986)
Determination of the number of endothelial cells in culture using an acidphosphatase assay. Anal Biochem 152: 136–140.
26. Kaludjerovic GN, Miljkovic D, Momcilovic M, Djinovic VM, Mostarica
Stojkovic M, et al. (2005) Novel platinum(IV) complexes induce rapid tumor celldeath in vitro. Int J Cancer 116: 479–486.
27. Sadowski-Debbing K, Coy JF, Mier W, Hug H, Los M (2002) Caspases—theirrole in apoptosis and other physiological processes as revealed by knock-out
studies. Arch Immunol Ther Exp (Warsz) 50: 19–34.
28. Schulze-Osthoff K, Ferrari D, Los M, Wesselborg S, Peter ME (1998) Apoptosis
signaling by death receptors. Eur J Biochem 254: 439–459.
29. Ichimura Y, Kumanomidou T, Sou YS, Mizushima T, Ezaki J, et al. (2008)
Structural basis for sorting mechanism of p62 in selective autophagy. J Biol
Chem 283: 22847–22857.
30. Rubinsztein DC, Cuervo AM, Ravikumar B, Sarkar S, Korolchuk V, et al.
(2009) In search of an ‘‘autophagomometer’’. Autophagy 5: 585–589.
31. Kimball SR, Shantz LM, Horetsky RL, Jefferson LS (1999) Leucine regulates
translation of specific mRNAs in L6 myoblasts through mTOR-mediated
changes in availability of eIF4E and phosphorylation of ribosomal protein S6.
J Biol Chem 274: 11647–11652.
32. Mizushima N, Yoshimori T, Levine B (2010) Methods in mammalian autophagy
research. Cell 140: 313–326.
33. Blommaart EF, Krause U, Schellens JP, Vreeling-Sindelarova H, Meijer AJ
(1997) The phosphatidylinositol 3-kinase inhibitors wortmannin and LY294002
inhibit autophagy in isolated rat hepatocytes. Eur J Biochem 243: 240–246.
34. Alers S, Loffler AS, Wesselborg S, Stork B (2012) Role of AMPK-mTOR-Ulk1/
2 in the regulation of autophagy: cross talk, shortcuts, and feedbacks. Mol Cell
Biol 32: 2–11.
35. Jung CH, Ro SH, Cao J, Otto NM, Kim DH (2010) mTOR regulation of
autophagy. FEBS Lett 584: 1287–1295.
36. Huang Y, Hou JK, Chen TT, Zhao XY, Yan ZW, et al. (2011) PML-RARalpha
enhances constitutive autophagic activity through inhibiting the Akt/mTOR
pathway. Autophagy 7: 1132–1144.
37. Li J, Liu R, Lei Y, Wang K, Lau QC, et al. (2010) Proteomic analysis revealed
association of aberrant ROS signaling with suberoylanilide hydroxamic acid-
induced autophagy in Jurkat T-leukemia cells. Autophagy 6: 711–724.
38. Grimaldi C, Chiarini F, Tabellini G, Ricci F, Tazzari PL, et al. (2012) AMP-
dependent kinase/mammalian target of rapamycin complex 1 signaling in T-cell
acute lymphoblastic leukemia: therapeutic implications. Leukemia 26: 91–100.
39. Martelli AM, Chiarini F, Evangelisti C, Ognibene A, Bressanin D, et al. (2012)
Targeting the liver kinase B1/AMP-activated protein kinase pathway as a
therapeutic strategy for hematological malignancies. Expert Opin Ther Targets
16: 729–742.
40. Maiuri MC, Galluzzi L, Morselli E, Kepp O, Malik SA, et al. Autophagy
regulation by p53. Curr Opin Cell Biol 22: 181–185.
41. Kobayashi T, Ruan S, Jabbur JR, Consoli U, Clodi K, et al. (1998) Differential
p53 phosphorylation and activation of apoptosis-promoting genes Bax and Fas/
APO-1 by irradiation and ara-C treatment. Cell Death Differ 5: 584–591.
42. Bezombes C, Plo I, Mansat-De Mas V, Quillet-Mary A, Negre-Salvayre A, et al.
(2001) Oxidative stress-induced activation of Lyn recruits sphingomyelinase and
is requisite for its stimulation by Ara-C. Faseb J 15: 1583–1585.
43. Pham NA, Hedley DW (2001) Respiratory chain-generated oxidative stress
following treatment of leukemic blasts with DNA-damaging agents. Exp Cell Res
264: 345–352.
44. Chen Y, Azad MB, Gibson SB (2009) Superoxide is the major reactive oxygen
species regulating autophagy. Cell Death Differ 16: 1040–1052.
45. Li L, Chen Y, Gibson SB (2013) Starvation-induced autophagy is regulated by
mitochondrial reactive oxygen species leading to AMPK activation. Cell Signal
25: 50–65.
46. Li L, Ishdorj G, Gibson SB (2012) Reactive oxygen species regulation of
autophagy in cancer: implications for cancer treatment. Free Radic Biol Med 53:
1399–1410.
47. Bjorkoy G, Lamark T, Brech A, Outzen H, Perander M, et al. (2005) p62/
SQSTM1 forms protein aggregates degraded by autophagy and has a protective
effect on huntingtin-induced cell death. J Cell Biol 171: 603–614.
48. Kim PK, Hailey DW, Mullen RT, Lippincott-Schwartz J (2008) Ubiquitin
signals autophagic degradation of cytosolic proteins and peroxisomes. Proc Natl
Acad Sci USA 105: 20567–20574.
49. Kiffin R, Bandyopadhyay U, Cuervo AM (2006) Oxidative stress and
autophagy. Antioxid Redox Signal 8: 152–162.
50. Cros E, Jordheim L, Dumontet C, Galmarini CM (2004) Problems related to
resistance to cytarabine in acute myeloid leukemia. Leuk Lymphoma 45: 1123–
1132.
51. Maycotte P, Aryal S, Cummings CT, Thorburn J, Morgan MJ, et al. (2012)
Chloroquine sensitizes breast cancer cells to chemotherapy independent of
autophagy. Autophagy 8: 200–212.
52. Martelli AM, Evangelisti C, Chappell W, Abrams SL, Basecke J, et al. (2011)
Targeting the translational apparatus to improve leukemia therapy: roles of the
PI3K/PTEN/Akt/mTOR pathway. Leukemia 25: 1064–1079.
53. Tett SE1, Cutler DJ, Day RO, Brown KF (1988) A dose-ranging study of the
pharmacokinetics of hydroxy-chloroquine following intravenous administration
to healthy volunteers. Br J Clin Pharmacol 26: 303–313.
Autophagy Protects Leukemic Cells from Cytarabine
PLOS ONE | www.plosone.org 12 April 2014 | Volume 9 | Issue 4 | e94374