information technology and developing countries
TRANSCRIPT

1
Information Technology and Developing Countries:
Potential and Obstacles
Brigitte Granville, Carol Leonard and Julian Manning1
1 Brigitte Granville is Head of the Economics Program at the Royal Institute of International Affairs, 10 StJames’s Square, SW1 Y4LE, London, UK; Carol S. Leonard is Associate Fellow of the InternationalEconomics Program at the Royal Institute of International Affairs and Lecturer at St Anthony’s College,University of Oxford; Julian Manning is Associate Professor Department of Economics, Norwegian Schoolof Management, Elias Smiths vei 15, PO Box 580, 1302 Sandvika, Norway.
We gratefully acknowledge the comments by Danny Quah and the participants of the Tokyo Club Meetingheld in Munich, Germany on 19-20 October 2000, especially Barry .Bosworth and Robert Litan.

2
Introduction
Diminishing the digital divide between developed and developing countries is the stated
objective of the United Nations (UN) and its agencies:
There are more computers in the US than in the rest of the World combined.There are as many telephones in Tokyo as in all of Africa. The digital dividecan – and will – be bridged.2
To bridge this technological gap, two World Bank experts, Talero and Gaudette
(1996), recommend that “a major agenda of structural adjustment” should take place in
developing countries, otherwise they “risk exclusion from a global economy and severe
disadvantage in the competitiveness of their goods and services.”3 This objective is fully
supported by the leaders of the Group of Eight (G-8) industrialised nations, who promised
at the meeting in July 2000 in Okinawa to create a so-called “Dot.force” – a task force to
share information technology (IT) - with less developed countries.
The assumption underlying such declarations and initiatives is that unless
developing countries catch up with the computer ‘revolution’ by acquiring computer
hardware and software and by improving telecommunications, their overall growth
performance will suffer. Such assumption, however, raises two questions. The first
concerns the evidence of the relation between IT and economic performance; the second
relates to the transferability of such a relation to developing countries.
By information technology is meant the combined utilisation of electronics,
telecommunications, software and decentralised computer workstations, and the
integration of information media (voice, text, data, and image) (Malecki 1991; Frisk
1988). Its penetration means the extent of usage. The penetration of IT into developing
areas is a large topic of which this paper concerns only a few understandings, and these are

3
based on the extent that the penetration of IT, including the spread of the Internet,
constitute infrastructure-related technologies that provide competitive advantage to certain
sectors and communications services across space.
The dual aims of this paper, are, first, to review the literature on the effects of IT on
[labour] productivity, taking the US as a point of departure. Second, the aim is to suggest
by this background statement the implications of the productivity literature for the benefits
of the IT and Internet to economic development. As investment in computers for
developing countries is targeted by policy leaders, obstacles to the diffusion of IT as well
as the costs of overcoming them will be a research agenda.
Economic Benefits in High Income Countries
During the first part of the 1990s, most studies failed to find a relationship of importance
between productivity (the output of the economy per hour of work) and the development
of IT, including the Internet; at most they found a marginal impact.4 Many concurred with
Nobel Laureate Robert Solow (1987), who remarked that “you can see the computer age
everywhere but in the productivity statistics”.5 The remark was used to highlight ‘Solow’s
paradox’ or the ‘productivity paradox’ of information technology, by which IT and the
Internet, although spreading rapidly throughout the US economy, actually failed to
improve productivity growth. The productivity paradox is now an obsolete concept,6
because of revisions of the data as well as the “exploding rates of productivity growth
2 Annan ( 2000), p.32.3 Talero and Gaudette (1996), section 1: How is information shaping the economy and society?4 See for instance Oliner and Sichel (1994).5 Sichel (1999), p.18: “until the mid-1990s, the [US] economy’s productivity performance was lackluster.After rapid growth in labour productivity in the 1950s and 1960s, output per hour increased at an averagepace a bit over 1 percent per year from 1973 to 1995.”6 Gordon (1999), p.2: “Choosing as break points the cyclical neutral quarter at the cusp of the slowdown(1972:2) and the last quarter before the acceleration began (1995:4), there is clear evidence of a productivitygrowth recovery. […] annual growth rates of non farm private businesses (hereafter NFPB) output per hourin the three intervals extending between 1950:2, 1972:2, 1995:4 and 1999:1 were respectively 2.63, 1,13,and 2.15 percent. The recovery over the last three years does not bring the US economy back to the pre-1972

4
registered in 1998 and 1999” in the US.7 Gordon (2000) qualifies this buoyant assessment
by cautioning that the “Solow paradox […] remains intact outside of durable
manufacturing.“8 To that, it can be added that IT reduces market segmentation of services
dramatically. The sustainability of the impact of IT on productivity growth, nevertheless,
remains controversial. For sustainability, the present, “rate of new product and new
technology introductions must be greater than in the past”.9
With this cautionary note, two other major contributors to the discussion of the
weight of IT in post-1995 rates of economic growth in the US are mostly sympathetic to
its further potential. Reviewed in Bosworth and Triplett (2000),10 both, along with
Bosworth and Triplett themselves, find that a contribution of IT lies in capital inputs: two-
thirds of the productivity growth in the US was due to accelerating growth in economic
inputs and the rest to multifactor productivity (MFP). In general, it is well understood that
there are three channels for productivity growth due to IT: direct productivity gains,
capital investment or ‘capital deepening’ (more capital per worker) and spillover effects.
Of these, all authors find for a narrow but visible impact: it is the supply side effects
within the IT producing sector, the technological innovations in the production of IT
capital, which really matter (Bosworth and Tiplett [2000]). In semi-conductors and
computers, there are clear effects of innovation on the productivity of labour through an
increase in the capital labour ratio and price declines in IT capital.11 There is, in fact,
considerable agreement that falling computer prices led to an increase in the stock of
computing capital, with capital deepening affecting labour productivity through
investment, thus accounting for low inflation in the presence of a very tight labour market
“golden age” but appears to recover roughly two-thirds of the lost ground (with a recovery of 1.02 pointsequalling 68 percent of the 1.50 point slowdown between 1950-72 and 1972-95).”7 Gordon ( 2000), p.2.8 Gordon (2000), p.44.9 Triplett (2000), p.326.10 Jorgenson and Stiroh (2000) and Oliner and Sichel (2000).

5
in the 1990s. Of the estimated one percentage point rise in US labour productivity growth
in the second half of the 1990s, IT accounted for about _ to _ percentage point.12 In terms
of MFP, the effect is estimated of up to a _ percentage point. There is not much
measurement, to be sure, of spillover effects to other industries through the role of
intangible capital in the formation of intellectual property.13 This effect could be of any
magnitude. However, Bosworth and Triplett (2000) dominate the thinking, that IT’s
contribution to economic growth and to labour productivity should be measurable to be
embraced, and that this contribution is separable from IT’s contribution to multifactor
productivity or MFP.
The latter has definably increased after 1995, but not necessarily due to the impact
of IT in computer using industries.14 Bosworth and Gordon concur on this important point:
‘computers do not seem to have done much to raise the productivity of the computer-using
industries.’15
Other economists are more optimistic. They consider in their analysis of the
contribution of IT to productivity both difficult to measure factors and a time horizon for
analysis. They look at the impact of IT on the work force over the short and, then, medium
term, since the application of IT requires a learning adjustment. Daniel Sichel (1999)
emphasises that the view of Paul David (1991), regarding the slow appearance of benefits
due to long-learning lags, is now appealing, since finally, US productivity growth began
significantly to improve after the mid- 1990s. Hornstein (1999) agrees, and he notes that
11 Schreyer (1999) finds similar results for OECD countries.12 Quoted in IMF (2000), p.73. The studies mentioned are Jorgenson and Stiroh (2000); Oliner and Sichel(forthcoming); Whelan (2000); Council of Economic Advisors (2000); Gordon (2000).13 See Gordon (1999b), pp.2-3.14 Bosworth and Triplett (2000), p.5. On p.14, the authors make the distinction stronger: “Multifactorproductivity (MFP) is the amount of economic growth that is not explained by growth in the productiveinputs. If all the productive inputs are correctly accounted for and their prices correctly measured, growth ina productive input such as IT capital should not affect multifactor productivity. Whether a technologicalinnovation affects multifactor productivity depends on whether or not a particular innovating activity is or isnot fully paid for, and if it is paid for, whether or not it is measured correctly in economic statistics.”15 Bosworth (2000), p.31.

6
“new technologies diffuse slowly through the economy […] Experts have made this
observation for a wide variety of products from diesel locomotives to DRAM chips.”16 On
a different note, Sichel (1999) recognises the importance of withholding judgment: “the
large gains of the past few years may well turn out to be a transitory response to unusually
rapid declines in computer prices and an unusually robust economic environment.”17 Here
it can be noted that even the optimists and those willing to consider intangibles are
cautious. As Triplett (1999) concluded, it is difficult not to note that the computer may
have simply supplanted older technologies for achieving existing outcomes and not led to
fundamentally new outcomes.
The factors most responsible for improving economic growth rates are well known.
The first objective of this paper is to review how economists have used these factors in
growth to explain the impact of IT and the Internet. Theories of growth generally adopt the
growth accounting method derived from Solow (1957), and the contribution of IT to the
growth rate is mainly assessed in this way. Kiley (1999) incorporates levels of transitional
costs for computers in the form of investment adjustment costs, and he finds definite
evidence of productivity effects.
However, the accounting method raises particular difficulties that present an
important interpretive challenge. Whelan (2000) finds that the US National Income and
Product Accounts fail to measure technological obsolescence, and therefore measures of
the computer capital stock are inappropriate. His conclusion is that “a marked pick up in
the rate of computer capital deepening combined with improved productivity in the
computer-producing industry have accounted for almost all of the recent acceleration in
aggregate productivity.”18 Quah (1997) also cautions that Gross Domestic Product (GDP),
as traditionally divided into agriculture, industry and services, will fail accurately to
16 Hornstein (1999), p.5.17 Sichel (1999), p.22.

7
measure effects of IT which “straddles, among other things, manufacturing under industry,
and transport, storage and communications under services”.19
Another measurement issue is that the service industry - where IT is having an
impact integrating markets - is the least well measured sector in national accounts.20 That
is, as pointed out by Triplett (1999), “even though some sector is measured badly, we
cannot know the sign of the error for sure. ‘Mismeasurement’ does not always mean
upward bias in the price indexes and downward bias in the output and productivity
measures.”21 Still the share of services in the structure of GDP seems to be increasing
(Table 1, Appendix 1), and in transition countries, where services are a start-up sector,
their expansion from a zero base may account for the simultaneous astonishing growth rate
in the expansion of the Internet and IT.22
Still another difficult to measure effect is the possible role of IT in assisting growth
by contribution to inflation control. Bosworth (2000) explains the critical role of inflation
control in the achievement by the US economy in sustaining high growth rates. Naturally,
inflation control is not entirely separate from the main contributors to growth: the first
being the greater efficiency of labour markets. This efficiency was due to institutional
changes, such as the reduction in trade union power and workers sensing the competitive
implications of globalization, requiring the modification of organized labour’s demands.
The second is the favorable external conjuncture reflected in the depressed prices of
commodity and other inputs for much of the past decade. IT effects constitute a third
factor in the controversial issue of productivity gains. To Bosworth, these gains in
18 Whelan (2000), p.26.19 Quah (1997), p.50; see also Grossman and Helpman (1997), p. 6, for a critique of the use of GDP as aperfect measure of output growth.20 See Griliches (1994).21 Triplett (1999), p.319.22 A study by the IDC (International Data Corp.) has positioned the Russian Internet market, for example, ason the eve of massive growth, continuing phenomenal growth in usage up to 6.4 per cent of the population.See Leonard (2000).

8
productivity were realised at least in part through their contribution to the low rate of
aggregate inflation.
To define the link between IT and inflation control more precisely, the decline in
the price of information processing together with the growth of computing power are what
holds down inflation.23 This is only an indirect influence, but it may be powerful enough
to have a strong effect. If this were to be IT’s main effect, contribution to the low rate of
inflation, it was a major contributor to growth, since inflation control was the sine qua non
of recent growth in the US. The evidence has still to be weighed. One word of caution is
that,
[Economists] must be careful in explaining how the benefits of hi-techproducts could have held down measured inflation without boostingmeasured productivity. Any complaint that official price indexes24 miss someof the impact of hi-tech innovation (however justified) cannot be part of theexplanation of a mysterious deceleration in measured inflation.25
Another issue, as discussed by Bosworth and Triplett (2000), is the spread of the
use of hedonic prices, which creates international incompatibility in productivity
measurement. Statistics are not internationally homogenised, and the use of hedonic prices
may artificially increase the rate of price decline of IT capital.
The combined issues of data reliability and measurement prevent anything more
than a preliminary assessment of the direct countable effects of IT. As Gordon (1999a)26
observes, the direct production of computers is far from the only component of hi-tech’s
contribution to national accounts. Although his own measure puts the computer effect at
1.2 per cent of GDP by official definition, among computer-related potential factors
23 Gordon (2000), p.10: the remarkable event which occurred at the end of 1995 was an acceleration of therate of price change in computer hardware (including peripherals) from an average rate of –14.7 percentduring 1987-95 to an average rate of -31.2 percent during 1996-99.24 Whelan (2000), p.5 mentions that since 1985 the US National Income and Product Accounts (NIPAs)defines the real output of the computer industry on a ‘quality-adjusted’ basis, therefore the real investmentseries for computing equipment are based on quality-adjusted prices, constructed from hedonic regressionsthat control for the effects on price of observed characteristics such as memory and processor speed.25 Gordon (1999a), p.32.26 Gordon (1999a), p. 33

9
lowering cost may be other products, including electronic components in automobiles and
supermarket check-out scanners. Where these cost-reducing inputs most hold down prices
in the non-computer economy is no doubt in e-commerce, but there too the effect cannot
be known for sure in that many of these firms survive despite non-sustainable financial
losses.
Regarding spillovers from IT, the key investigations focus on education and the
knowledge base. Most studies treat knowledge as a capital good, and they “miss
important aspects of the growth process both in high and low-income countries.”27 Danny
Quah calls the “weightless economy”28 one, where knowledge not only matters for
economic growth29 but also for “the increasing importance in national income of
knowledge-products – computer software, new media, electronic databases and libraries,
and internet delivery of goods and services.”[…] “the economy is knowledge-intensive,
not just because of the quantity of knowledge used in production, but because of the
quantity of knowledge-products consumed.”30 But whether, in the longer term, spillover
effects will be observed, depends on many interrelated factors. For education to have an
effect on the labour market, it is important that the government and private sector initiate
structural reforms that would ease labour market segmentation and capital constraints on
firm entry as well as general problems of entry in the telecommunications sector.31
To summarise, problems of measurement, including how to assess the changes in
the knowledge base and pricing, leave the state of the literature somewhat speculative.32
27 Aghion and al (2000), p.3.28 Quah (1997), p.49: “By this I mean that greater value, as a fraction of GDP, resides in economiccommodities that have little or no physical manifestation. Another description of such structural change isprogressive dematerialisation.”29 In Quah’s analysis, IT or rather ICT is only one element of four of the weightless economy, the other threeinclude intellectual property, electronic libraries and databases and biotechnology, see Quah (1998), p.3.30 Quah (1999), Nontechnical Summary, p.1.31 IMF (2000), p.78.32 Madrick (1999), p.44 notes, “Also the data have been inflated significantly since 1995 by revisions whichhave reduced consumer prices and therefore raised business output, adding approximately 0.4 percent to

10
There is no way to say, whether by a narrow or wide approach to understanding GDP
growth factors, if US productivity growth will continue at a high rate, or if IT productivity
improvements, observed at the end of the 1990s, are sustainable.
Economic Obstacles: Middle and Low Income Countries (MLICs)
Given the fragility of the data and the caution of the benefits-to-productivity estimates, our
second objective in this paper is to extend a development perspective to the discussion.
Benefits of IT to Low income countries will surely be very limited. Benefits from current
investments in IT will be especially difficult to predict. This means that the investments
should be closely tracked, so that the nature of outcomes and extent of benefits can
continually be adjusted to the long-term development goal.
IT developed from distinct technologies over several decades, and it transformed
those technologies by intensifying a geographic concentration. IT allows firms to provide
global goods and services, but it favours large urban areas, especially those that service as
headquarters of firms and financial capitals, particularly the three major financial centres,
London, New York and Tokyo. IT favours cities where there are corporate operations,
including also Hong Kong, Singapore, and Seoul, and new investments tend to favour
existing concentrations.33 Regulatory regimes and a large number of other factors slow
down diffusion to new locations. One of these factors may be the share of (peasant-based)
agriculture which may hold back national demand for IT (see Appendix, Table 1).
Since IT has a substantial spatial dimension, if funds are spent for geographic
equalisation, will they actually produce any sustainable result? The obstacles to diffusion
confront optimistic views of the potential “revolution” from IT and the Internet both on
the demand and supply side.
reported productivity growth each year. This large adjustment will soon be made to earlier data, making thecurrent performance less strong by comparison.”

11
Demand FactorsExternal demand on the producing side of the IT sector is quite promising. The
share of High Tech products in manufactured exports amounts to 28 percent of in East
Asia and Pacific region. The average for South Asia is 4 percent with India reaching 10
percent of manufactured exports. Software, for example, is a profitable export for India.
India’s software exports will exceed $4 billion in 2000 – about 9 percent of India’s total
exports. In Latin America and the Caribbean, high tech exports amount to 12 percent of
manufactured exports. Costa Rica’s economic growth surged to 8.3 percent in 1999 - the
highest in Latin America, fuelled by exports from the microchip industry, which now
accounts for 38 per cent of all exports. 34
However, obstacles to the development of IT on the demand side remain. The
spread of the Internet across Latin America, Africa and Southeast Asia, where many of the
world’s most impoverished people live, seems at first glance to defy the notion that low
levels of income will inhibit the diffusion of the Internet. Closer inspection leads to
different conclusion.
Low per capita income in developing countries holds back households’ demand for
IT related capital goods and most IT services. The population of low income countries
lived on an average of $400 per annum in 1999; in Sub-Saharan Africa the average income
per capita is slightly higher at $500--average income in South Africa is $3,140--while that
in Mali reach at most $240 (Table 2, Data Appendix). Income in these regions is also
subject to high vulnerability, a vulnerability that can be measured by the frequency with
which a household falls below the poverty line (a critical level of income or consumption
below which poverty is determined).35 Households in low income countries are vulnerable
33 See Moss (1987); Hepworth (1987); Howells (1988); Gillespie and Williams (1988).34 Annan (2000), p.32-3335 See The World Development Report (2001), p.140.

12
due to the lack of savings and insurance. Saving rates are much higher in East Asia with
37 percent of GDP in 1999 compared with 20 percent in Latin America and 14 percent in
Sub Saharan Africa, Mali only reached 8 percent of GDP (Table 3, Data Appendix).
Indicators for private finance (Table 4, Data Appendix) show that high levels of private
sector provision of credit coincide with the spread of computers among households (High
Income Countries and East Asia and the Pacific). Credit provided by the private sector
may be a facilitator in the penetration of IT and the Internet to households and
microfinance can play some role in providing capital. Table 3 in the Appendix shows the
general structure of demand by region of the world. It distinguishes areas of the world
where domestic investment is at levels that support general economic expansion, but it is
important to note that in post-Soviet countries, where investment is low, computers have
spread among households with significant penetration.
In addition to low levels of income, negative demand-side conditions include
patterns of consumption, where subsistence expenditures bulk large in households’
budgets, leaving little for education. Education and training are important not only for
production but also for IT and Internet to secure a strong demand base.36 Regarding firms’
consumption of IT, their use implies an educated workforce. Where labour is not
technologically oriented or educated, skills must be imported and human capital
maintained. In the developing world, systems of education are not adequately funded to
produce a large highly skilled work force. While in high income countries, public
expenditure on education reached 5.4 percent of GDP in 1997, in middle income countries
it reached 4.8 percent and only 3.3 percent in low income countries with only 2.2 percent
in Mali (Table 2, Data Appendix). India ranks even lower than the average Sub Saharan
Africa in level of government expenditures on education with 3.2 percent, marginally
36 See Quah (1999).

13
higher in this category than other Asian countries. Public spending on education is also
frequently regressive. In Nepal the richest quintile receives four times as much public
education spending as the poorest quintile.37
Columns for literacy in Table 2 (Data Appendix) show that the skills, including
language facility, are missing for much of the population and entrepreneurial orientation
required for high Internet usage. The illiteracy rate is especially high among women,
reaching 68 percent in Central African Republic compared to 57 percent in India and 16
percent in South Africa.
In the Middle East and North Africa as elsewhere in the developing world, the
overwhelming number of users, according to a report for 1999, are elites and access
Internet from home (72 per cent), and only 27 per cent of users had only a high school
education or less.38 In Russia, low disposable incomes, particularly outside the leading
urban centres such as Moscow and St Petersburg have added to the logistical difficulties,
while distrust of both banks and officialdom inhibit the online transfer of sensitive
financial information. Since Internet usage is heavily concentrated among young people
(40 per cent of users are people aged from 18 to 24), on the demand side, the ageing
population will limit the growth in the absolute number of users, which raises doubts about
how far or fast electronic commerce will take off.39 Pioneers such as Guta Bank which,
having survived the 1998 crash reasonably well and now focusing on its Internet strategy
have launched online financial services, look likely to remain niche players.
Such results seem to confirm that elites in the developing world are rapidly being
accultured to the Internet, and a world wide knowledge base will develop through elites,
37 The World Development Report (2001), Table 5.1, p.80.38 “DITnet Report, survey of 1000 users: “Report Profiles Usage Patterns in Middle East,” 9 August 1999,www.nua.ie/surveys.39 “Internet Revenues Remain Uncertain: Russian Online by Andrew Jack, Financial Times (UK), 4 October2000.

14
but this may have little relevance to the continued predicament of much of the world’s
population.
Supply Factors
This section discusses the evidence for supply-side constraints on Internet development
and then, potential aids to improvement of the supply–side. Supply side bottlenecks
include primarily a lack of physical and legal infrastructure. The issue of taxation is also
of some concern. Some governments in Africa, for example, impose high import barriers
on computers, treating them as luxury goods rather than as part of the infrastructure for
economic modernisation. Factors on the supply side include political blockages to
liberalising the regulatory environment for the Internet, including the protection of privacy
and entrepreneurial activity.
Infrastructure
The spread of IT requires considerable investment infrastructure. The number of
telephone lines per 1,000 persons shows that IT and Internet are beyond the reach of 80-90
per cent of the population in parts of Africa and South East Asia.
South Asia, including India, and parts of Africa, have the lowest level of IT
infrastructure development in the world, as measured by World Bank Development and
other Data Surveys. The most advanced regions include North Asian developed markets,
which far outpace the other Asian countries in Internet development. 46 per cent of
residents of Singapore were online in August 2000. Behind Singapore, 42 per cent of
Koreans connected, 36.4 per cent of the residents in Taiwan, 29.2 per cent of Hong Kong,
and 23 per cent of the population of Beijing, Guangzhoi and Shanghai. Computers

15
themselves are most widespread in Korea, with 64 per cent of Internet users logging on
from home.
In Africa, there are 14 million telephone lines, a figure roughly comparable to that
of any of the world’s major cities where only South Africa can expect to leap barriers to
achieve faster growth.40. With 11 percent of the world’s population, Sub-Saharan Africa
has 1 percent of its telephone lines. South Africa has 115 telephone mainlines and 56
mobile telephones per 1,000 people while Mali for example has 3 telephone mainlines and
0 mobile telephones per 1,000 people (Table 2, Data Appendix). Meanwhile, the South
African government has the goal of providing 75 per cent of households access to a
telephone and to create Internet linkages for universities, households, high schools and
public libraries; ‘telephone shops’ give rural farmers access to cellular phones.41
For the Middle East and North Africa, the data in Table 2 show that the main
limiting factor in the spread of the Internet is probably low investment by the private
sector. In Saudi Arabia, for example, where roughly 120,000 persons are online,
development of private sector IT is stymied by the government. Although in terms of most
economic indicators, the Middle East has achieved an overall level of development
similar, say, to South Africa, computer ownership and Internet usage are far lower than in
South Africa, East Asia and Latin America. There were 1.9 million Arab Internet users
(of a population of 248 million) in March 2000--this was only 0.7 per cent penetration.42
The areas within the Middle East that are more rapidly developing in IT are the United
Arab Emirates (15 per cent), Qatar (6.1 per cent), Bahrain (6 per cent), Lebanon (5.7 per
cent), and Kuwait (5 per cent). The least developed is Yemen, at 0.07 per cent.
40 Jerylin Eddings, “Promise, shortcomings of online technology for Africa discussed,”www.freedomforum.org/international/1998/11/18afrucaemail,asp.41 See Wilson III (1996).42 “Internet Use Skyrocketing in the Middle East (Survey by the Research Unit of Internet Arab Worldmagazine),” 9 March 2000, www.nua.ie/surveys.

16
Internet development in Latin America seems roughly on the same fast trajectory
as in the Transition country, Russia, (Table 2, Data Appendix). There are country
differences in Latin America, as elsewhere. The most substantial Latin American Internet
penetration is in Brazil, with 41 per cent total users, and then Mexico (21 per cent),
Argentina (10 per cent), Chile and Columbia (6 per cent each), Venezuela (5 per cent).
Users have increased in different countries for different reasons, in large part pricing
differences. In Mexico, PC costs are relatively low; in Brazil, telephone access rates are
low; and in Chile and Argentina, call charges are lower. Mobile Internet access is having
an impact—with Argentina having the highest rate of mobile phone penetration in the
region (12 per cent of the population), and in Mexico, wireless lines are expected soon to
outnumber the country’s 11m fixed lines.43 Computers are found in less than 3 per cent of
the country’s households; most people logon to the Internet from the office. Mexico’s
fragile infrastructure is overwhelmed by explosive growth and insufficient investment,
causing serious problems for cellular reception quality and leading to huge gaps in service.
In Russia, with a strong base in an entirely literate population and fairly extensive
telephone infrastructure, IT technologies have diffused rapidly since the collapse of
Communism. The rate of Internet users has been reported to have increased by 2.5 times to
3 million in 2000.44 Data from the Yandex search engine, which monitors Russian
websites, counts the numbers of servers at nearly 207,000, more than double since the start
of 2000. Although usage figures may be high, however, there are still only some 400,000
paying subscribers. About 35 million people would like to have an access to the Internet
global web but cannot afford it. It is hardly surprising that few Russian websites have
introduced fees and commissions. In Russia, as in Latin America, the gap in infrastructure
43 Financial Times, Tuesday 19 September 2000, Mexico sees online Wave, Andrea Mandel-Campbell.44 Moscow, 3 October 2000, Deputy Minister of Communications and Information Technology AleksandrVolokitin, Internetcom 2000 show. Andrew Jack in the Financial Times of 4 October reports that Spylog, a

17
is computers and home telephones. Poor quality phone lines help explain why the time
spent online is low compared with other countries. Internet use has added extra stresses to
existing capacity. There may be some scope to leapfrog to wireless systems, with the
recent experimental introduction by Russia's leading mobile operators of Wireless
Application Protocol (WAP) mobile services, and of ISDN-speed GPRS (General Packet
Radio Service) in the coming months.
In many regions, there are countries that far outpace others in degrees of
infrastructure acquired. Because of a lack of such leading countries, South Asia, Sub
Saharan Africa and the Middle East require more start-up infrastructure development than
do Latin America and East Asia. It seems to be happening, that due to price declines, the
countries are beginning to benefit from the expansion of the IT and the Internet in
advanced countries simply because they can purchase cheaper infrastructure than was once
required. One example of cost decline is the lack of current need for firms and universities
to set up and run their own LAN for the Internet. Firms can lease server space in ''Internet
Hotels'' located in neighbouring regions.45 In the future it should be possible to create a
''virtual LAN'' for any institution or individual on the servers of one or more ISP's so there
need be no need for in-house servers, in-house server maintenance, and in-house
connectors and switches.
Costs may be coming down for generating the infrastructure required for IT and
the Internet--Local Area Networks, computers and local telephone lines. 46 However, the
Internet is not a free good. Self-sustaining growth of IT – and, according, the benefits of
the Internet to economies - depends on the pricing of the Internet as well as the
web-ranking service, suggests that there are 3.4 m core internet users in Russia, meaning those who havevisited a website at least once a week over the two previous months up to September this year.45 ''Are VLANs on the comeback trail?'' in www.cnn.com 27 October 1999 and ''Internet v's Private Lines'' inwww.cnn.com 2 July 2000.46 McNight and Bailey (1998), p. 5.

18
sustainability of the externalities that IT provides--statistical sharing and interoperability,
and this also requires commitment and investment.
More optimism should come from quick benefits to be obtained from bandwidth
widening. There is a growing acceptance that many of the most useful functions that an
isolated computer can perform - email with attachments, voice mail or even video mail,
banking, file viewing, document editing, calendaring - can be performed by a so called
‘thin client’ server, providing remote access. The ICP (Internet Content Provider) or the
final customer could then rent software or access it free of charge. Thin clients need
minimal processing power, simple or no local information storage (a zip disk might do),
and they may utilise a television for the representation of information, which makes them
cheap. Such thin client servers are only being introduced in the U.S and Canada on a mass
basis as part of ISP access packages. This ‘thin’ segment is growing fast in the developed
North American market suggesting that even with the market for ICP functionality hardly
developed and in the face of a high rate of PC penetration, thin clients can meet most of
the desire for functionality by consumers. With time such clients could be developed for
and sold to developing or underdeveloped countries, massively expanding the set of
consumers with access to the Internet. Moreover, the cost of the broadband facilities
necessary to achieve this outcome is lowest where population density high – as in the
majority of developing countries.
Competition and Regulation
One basic social commitment that seems required is to firm access and ease of entry,
implying laws protecting openness and privacy. Wallsten (1999) studied the effect of
competition on access to telecommunications services. Taking a sample of 30 African and
Latin American countries, he found a positive correlation between competition and per

19
capita figures in mainlines, pay phones and connection capacity. The opening of the
telecommunication state services to private participation is driven not only by the revenues
generated through the sales of stocks but more by the desire to have a more innovative
sector with reduced possibility of charging high prices. More than 90 developing countries
opened their telecommunications sector to private participation in 1990-98. The main
beneficiaries include Argentina, Brazil, Hungary, Indonesia, Malaysia, Mexico and
Thailand. Private participation is also making progress in Sub Saharan Africa. 47 As
Abbott and Brady (1999) mentioned in the wake of privatisation, regulatory reform and
competition followed and the leaders in deregulation in the telecommunications sector
include Chile (1982), and Guatemala (1996).48 Latin America seems among the most
advanced countries of the lower middle income group in preparedness for the potential
revolution.
It is argued that wide economic reform, going beyond specific policies to embrace
institutions, is required from MLIC governments to create a business-friendly environment
and attract more investors into domestic telecommunication and Internet sectors so that
PCs as well as Internet can spread. Serious existing barriers, such as for instance lack of
transparency, mean that the scope for business-to-business services, such as commodity
exchanges, may be limited - or at least that it will not be the ISPs which benefit.
Businesses are suffering from corruption and inefficient distribution channels. Serious
corporate governance violations take place as for example in Russia where the Ministry of
Communication confiscated channels in the GSM 900 frequency band previously used by
MTS and Vimpelcom. The motivation behind such a decision was to give business to
Sonic Duo – a company which in May 2000 was awarded a license without tender to
47 “The transactions involved investment commitments of US$214 Billion. Two thirds of that amount hasbeen invested in expanding and modernising networks; the other third has gone to governments, asdivestiture revenues or license fees.” See Izaguirre (1999), p.1.48 Abbott and Brady (1999), p.66.

20
become the third Moscow GSM operator, and whose Russian partner (Central Telegraph)
is widely linked to senior officials in the telecommunications bureaucracy. However the
Communication Minister had to revoke the decision prompted by investor and public
concern and the implementation of the confiscation was suspended.49 Such example shows
that foreign investors often struggle with red tape and bribery, as well as a legal system
that is exposed to political pressure and vested interests from local established businesses.
Intellectual property rights are vital to the applicability of computers and software
to problems of development in much of the world. They are also only controversial
contributors to productivity. In that sense, it is not clear that restricting property rights of
the Internet, such that ownership of information can provide incentives for economic
development, actually promotes or constrains economic growth. Certainly distributional
aspects of growth are powerfully and negatively affected by intellectual property rights,
and thus economists have not come to a consensus on whether they pose an obstacle or
benefit to Internet as a factor in innovative activity and growth.
The very diversity of languages in the developing world may be a strength for the
distribution of intellectual property on the Internet. Currently, many North American
textbooks are available in India in a black and white form for a substantially lower price.
A US$50 textbook may be available in India for US$5. The assumption is that no one in
the U.S. would be willing to forgo the benefits of superior typesetting and colour and
suffer the shipping costs from India just to read an Indian version of the book. Further,
publishers can localise the content. The Indian version of an Economics textbook may
have Indian and not American examples, so rendering it less appealing to an American
audience, or the text could be translated into Hindi making it valueless for all but a few
American students. So it could go with software. Since replication costs little more than
49 Granville Christopher and Alexei Zabotkine (2000), pp.13-14.
21
the price of the CD's Windows Whistler could be priced at US$150 for the English version
and US$10 for the Hindi version. Reverse and reengineering a Hindi version or Windows
Whistler to endow it with English would be prohibitively expensive, many English
speakers would be unwilling to give up the service that may be packaged with it and any
distributor of reengineered software would have to advertise to sell effectively so ensuring
he is easily found and prosecuted by Microsoft.
Political barriers
The largest bottleneck to benefits from IT are no doubt the regulation of Internet use in
countries where political controls are imposed. In some countries, the undermining of
privacy and insecurity of the Internet is used as coercive state method against opposition,
which may explain the extent of state disregard of international regulations. International
laws and norms recognise privacy as a fundamental human right. Article 12 of the
Universal Declaration of Human Rights, Article 17 of the International Covenant on Civil
and Political Rights, and other international agreements and national laws, protect privacy.
The U.S. Department of State, in its 1996 Country Reports on Human Rights
Practices, reported widespread illegal or uncontrolled use of wiretaps by both government
and private groups in over 90 countries. In Honduras and Paraguay, the state-owned
telecommunications companies were active participants in helping the security services
monitor human rights advocates. These problems are not limited to developing countries.
The government of China limits Internet and technology companies’ through
restraints on foreign investment, upon which they depend, and by the requirement that the
Chinese government own 51 per cent of any Chinese IT company.50 This Chinese
development (2 October 2000) is particularly important as a suggestion of how the supply
50 “Increased Regulation for Chinese Internet Use,” http://www.nua.ie/surveys.

22
side can be restricted by government action. China introduced sweeping new regulations
that limit international investment in the Internet sector, required strict surveillance against
"subversive" content, and threatened to close down any unlicensed firms. The regulations
hold companies responsible for blocking vast categories of illegal content on their Web
sites and chatrooms. The regulations ban any content that subverts state power, supports
cults, "harms the reputation" of China or hurts reunification efforts with Taiwan. Internet
content and service providers are required to keep records of the content that appears on
their Web sites and the users who dial up servers for 60 days, and provide the records to
police on demand. Internet service providers, the firms that connect people to the Internet,
must "record the times users log on to the Internet, users' account numbers, Internet
addresses or domain names and the phone numbers users dial in from.''51
In Russia, as in China, a constraint is the intrusion of government into Internet
exchange. The situation is characterised not by blanket prohibitions but intrusive controls
on the part of security agencies. Heightened control reflects the legacy of state repression
under the Soviet system. In the context of contemporary Russia’s systemic corruption,
control threatens not only the privacy and rights of the individual citizen, but also the
integrity and development of e-commerce. A specialist information service reported that it
will be soon necessary to obtain a State licence in order to publish even the simplest
Internet site. The FSB (the successor to the KGB) is implementing a system called ''Sorm
2''. This includes black boxes that must be installed by Russian ISP's allowing interception
51 From http://www.cnn.com/2000/ASIANOW/east/10/02/china.int.reut/. James Kynge reports in theFinancial Times, “China puts limits on internet”, 3 October 2000, p.12, that the vague content and userrestrictions if enforced would undoubtedly hamper the development of IT in China. More than $1bn inforeign capital is believed to have been invested in Chinese dotcoms by venture capitalists and many of theworld’s largest media companies over the past two years. Internet content providers, the regulations say,must win the approval of the Ministry of Information Industry (MII) before they receive foreign capital, co-operate with foreign businesses or seek stock listings within China or abroad. Many Chinese dotcoms, oftenmajority owned by foreigners have not received the permission for their infusion of foreign capital. It maybe that the MII which has long warned that foreign investment in Internet content providers is illegal untilChina joins the WTO. Beijing has promised to allow 49 per cent foreign ownership in internet contentproviders on entry into the WTO rising to 50 percent two years later.

23
of any subscriber's correspondence. In addition, each ISP must allow for a fibre optic cable
to be run from the black box to the local office of the FSB. The only Russian ISP that has
ignored the interdict lost its licence. It only recently regained its licence through the courts
and appeals to the rights guaranteed by the Russian Constitution. New efforts are being
made to circumvent the courts ruling. 52
To some extent, that government controls over the spread of IT and Internet should
be the primary factor in the failure of IT to spread rapidly in the Middle East, by contrast
with South Africa and Latin America, means that the lifting of controls will produce
certain benefits. In Syria, for example, in May 2000, the government announced a plan,
overturning previous policy, to provide Internet access to every household. Between 1998
and 1999, only private firms and the public sector were online, and only 2000 internet
accounts were in use, but the number of users has increased since the regime opened the
way in the repeal of government intervention.53 Growth to 10,000 out of 17.5 million, of
course, still represents a small percentage of the populace.54
It is important that the wider agenda include common and unrestrained access to
the Internet. That is, firms can prohibit person-to-person communication whether for
personal purposes or for production and consumption of information, for financial
services, and for the distribution of information and other commodities. The freely
available encryption techniques in advanced countries, developed to protect information
being transferred between allied parties, are based on encryption keys, which, selected at
random, are of sufficient length to be almost impregnable. Most countries do not restrict
the domestic use of encryption by their citizens. Of the handful of countries around the
world that do, few are democracies and most have strong authoritarian governments. The
countries include Belarus, China, Israel, Kazakhstan, Pakistan, Russia, Singapore, Tunisia,
52 From http://www.zdnet.co.uk/news/2000/38/ns-18101.html.53 “Syria Announces plans for Universal Access,” 2 May 2000, www.nua.ie/surveys.

24
Vietnam, and Venezuela. For the rest of the world, the Internet has significantly changed
even the effectiveness of export controls. Strong, unbreakable encryption programs can
now be delivered in seconds to anywhere in the world from anywhere with a network
connection. It has been increasingly difficult for countries to limit dissemination, and once
a program is released, it is nearly impossible to stop its re-dissemination, especially if it is
in one of the many countries around the world with no export controls. In the United
States, export controls are used as a justification to limit the availability of encryption on
domestic Internet sites and thus serve as indirect domestic controls on encryption.55
Concluding Remarks
The digital divide is the exclusion of a large part of the world’s population by age, income
and area of residence. To benefit from IT an economy requires more than sophisticated
telecommunications infrastructure. Fundamental development issues of basic literacy and
secondary technical education are pre-conditions for successful technology transfer.
Attempts by governments of some developing countries to censor or to limit the Internet
either by excess taxation and/or limited access provision can seriously hamper long-run
growth prospects.56 It is therefore essential for there to be free transmission of information
across countries and a respect for basic civil liberties.57 The West could do much to help
MLIC by promoting the distribution of easily accessible and easily useable encryption and
stenographic techniques. The gains to civil society and the economy from the diffusion of
these techniques would be significant. The use of such techniques shows a considerable
power in the Internet rapidly to shape institutions and provide a stimulus to growth.
54 “Internet still censored in Saudi Arabia,” AP, 29 September 2000, reported by www.nua.ie/surveys.55 From Cryptography and Liberty, An International Survey of Encryption Policy; Electronic PrivacyInformation Centre (www.epic.org), 1999, Washington, DC56 Quah (1999), gives the example of 14th century China where technology and knowledge were theexclusive domain of the Chinese government and stagnated.57 Rodriguez and Wilson III (2000), pp.28-30.

25
The way to assure positive effects is for international organisations such as the UN
closely to track discrete project outcomes, showing how much investment the public and
private sectors will need before MLIC benefit from the productivity impact seen in the
developed world. Optimal policies should be based on large empirical surveys as well as
detailed smaller estimates. Rather than anticipating direct benefits only on a per-computer
basis in the computer using-industries, policy makers should restore their prior focus on
integrated development, telecommunications infrastructure, and education as the
foundation for gradual technology transfer.
Governance targets for integrated development also apply. Privacy laws, taxation
and openness are important for the development of Internet, as some regional patterns,
above, show. Apart from locating in urban concentrations and spreading outward from
corporate headquarters, it is countries with such laws that have witnessed, despite demand
and supply barriers, the fastest spread of IT and the Internet. Co-signers of international
agreements will be able to benefit early from the spread of Internet and all of the
functionality it implies, although even some wealthy co-signatories have institutions that
seem to inhibit the growth of accessibility. A good example is Britain, where broadband
access, until very recently, was almost unknown. About as wealthy Sweden has an
environment where consumers have many more options.58
There are institutional and political failures, in other words, that will limit the
capacity of developing countries to benefit in the same measure as developed countries,
even once they actually acquire computers in optimal numbers. Because of the lack of
empirical evidence, it cannot be confirmed that the obstacles identified above are binding
58 A good example is www.bredbandsfabrikken.no, a very recent expansion of a Swedish company intoNorway. This company has laid fiber optic cable to 300,000 apartments in Sweden for 2000 SEK per hookupand a monthly fee of 200 SEK (US$23). Individual houses are excluded. Subscribers get 10 Mbps each waybroadband access packaged with access to analog and digital TV and IP telephony (allowing free local andinternational calls). The best on offer from British Telecom at the moment is to put you on the waiting listfor a DSL line.

26
constraints for developing countries in deriving some benefits from investment in
computers and the Internet. However, both tangible and intangible factors give grounds for
caution. The impact of IT on education, for example, is no doubt, positive. Because these
are not immediate effects, however, it is difficult to estimate how much investment and
how long it will take to reap these benefits.59 Other examples include a country the size of
Russia, where the Internet could provide a powerful tool to not only overcome distance,
but also help companies to slim down excessive Soviet-style over-regulation and become
more cost-efficient. Only the potential is clear. The value of the potential investment in
developing economies and societies has yet to be tested.
59 “A positive interpretation of the finding that education is positively correlated with growth is found inLucas (1988), where only the unbounded accumulation of human capital, not its current stock, is meant tosustain growth” Aghion and Alii (2000), p.27.

27
APPENDIX 1 – DATATable 1 – Structure of Output
GDP Agriculture Industry Manuf. Services
Value added value added value added value added
$ millions % of GDP % of GDP % of GDP % of GDP
1980 1998 1980 1998 1980 1998 1980 1998 1980 1998
Low income 811,234 1,880,673 31 23 38 39 27 27 30 38
Excl. China & India 451,833 463,829 29 26 32 33 13 19 39 41
Middle income 2,322,822 4,312,567 12 9 42 33 24 22 46 58
Lower middleincome
.. 1,477,327 15 11 41 34 .. 22 44 54
Upper middle income 1,164,279 2,838,231 11 8 42 32 26 22 47 60
Low & middleincome
3,137,067 6,193,861 18 13 41 35 25 23 42 52
East Asia & Pacific 503,584 1,693,340 24 15 42 45 30 32 33 41
Europe & CentralAsia
.. 1,003,000 .. 12 .. 33 .. .. .. 55
Latin America &Carib.
787,863 2,028,359 10 8 40 29 28 21 50 64
Middle East & N.Africa
409,860 583,374 10 14 53 43 9 14 37 43
South Asia 237,289 565,131 37 28 24 25 16 16 39 47
Sub-Saharan Africa 271,814 333,865 18 17 38 29 16 15 44 54
High income 7,936,135 22,543,577 3 2 37 30 25 21 59 65
Europe EMU .. 6,457,663 .. 2 .. .. .. 21 .. 58
Source: World Development Report (2000), p.188.
28
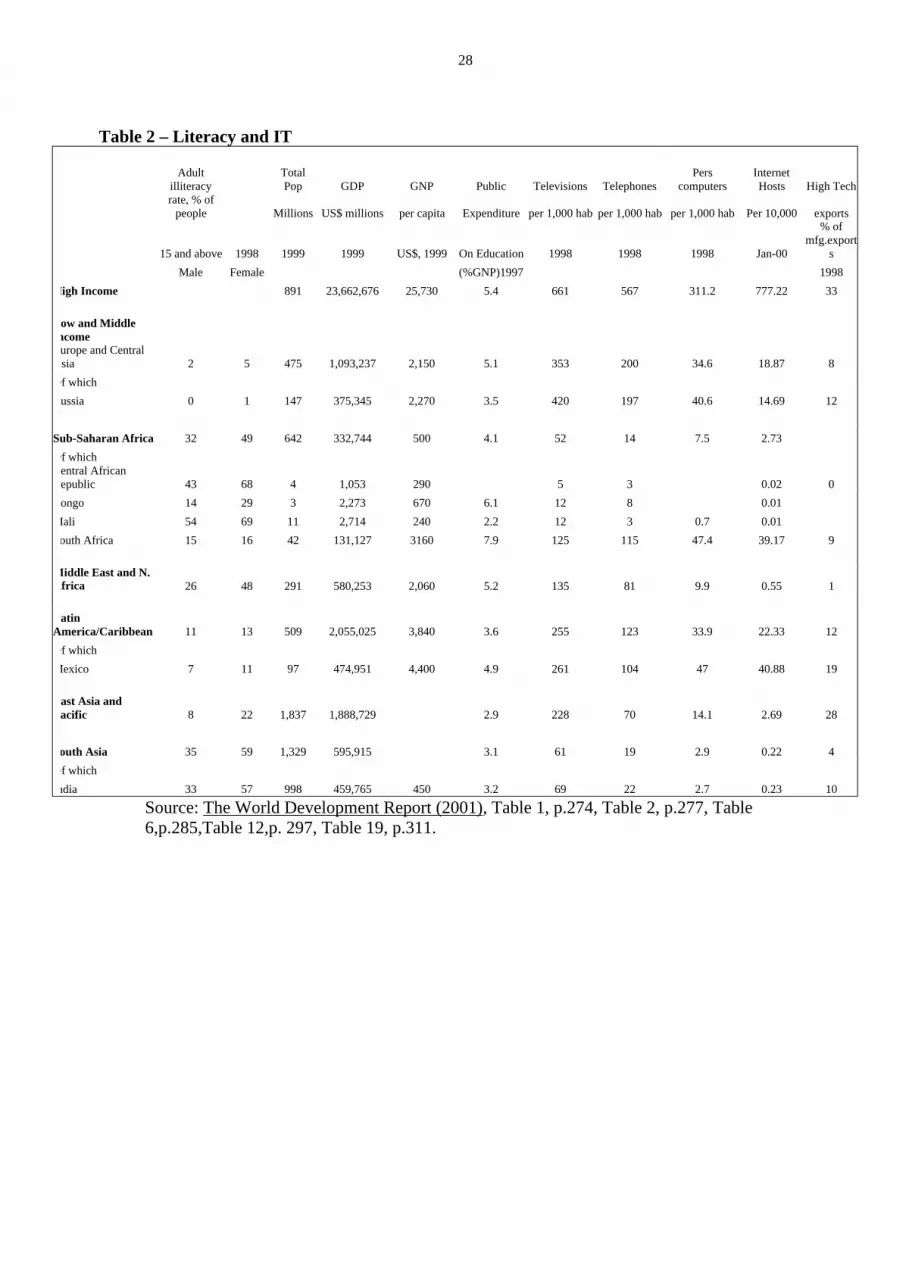
Table 2 – Literacy and IT
Adultilliteracy
TotalPop GDP GNP Public Televisions Telephones
Perscomputers
InternetHosts High Tech
rate, % ofpeople Millions US$ millions per capita Expenditure per 1,000 hab per 1,000 hab per 1,000 hab Per 10,000 exports
15 and above 1998 1999 1999 US$, 1999 On Education 1998 1998 1998 Jan-00
% ofmfg.export
s
Male Female (%GNP)1997 1998
High Income 891 23,662,676 25,730 5.4 661 567 311.2 777.22 33
ow and Middlencomeurope and Central
Asia 2 5 475 1,093,237 2,150 5.1 353 200 34.6 18.87 8
Of which
ussia 0 1 147 375,345 2,270 3.5 420 197 40.6 14.69 12
Sub-Saharan Africa 32 49 642 332,744 500 4.1 52 14 7.5 2.73
Of whichentral Africanepublic 43 68 4 1,053 290 5 3 0.02 0
ongo 14 29 3 2,273 670 6.1 12 8 0.01
Mali 54 69 11 2,714 240 2.2 12 3 0.7 0.01
outh Africa 15 16 42 131,127 3160 7.9 125 115 47.4 39.17 9
Middle East and N.Africa 26 48 291 580,253 2,060 5.2 135 81 9.9 0.55 1
atinAmerica/Caribbean 11 13 509 2,055,025 3,840 3.6 255 123 33.9 22.33 12
Of which
Mexico 7 11 97 474,951 4,400 4.9 261 104 47 40.88 19
ast Asia andacific 8 22 1,837 1,888,729 2.9 228 70 14.1 2.69 28
outh Asia 35 59 1,329 595,915 3.1 61 19 2.9 0.22 4
Of which
ndia 33 57 998 459,765 450 3.2 69 22 2.7 0.23 10
Source: The World Development Report (2001), Table 1, p.274, Table 2, p.277, Table6,p.285,Table 12,p. 297, Table 19, p.311.

29
Table 3 – Structure of Demand% of GDP, 1999Countries
Privateconsumption
Generalgovernmentconsumption
Grossdomestic
investment
GrossdomesticSavings
Exports ofgoods andservices
High Income 62 12 21 22 22
Low and Middle Income 63 12 24 25 26
East Asia and Pacific 53 10 33 37 39Europe and Central Asia 64 12 20 23 38Russia 57 14 14 29 48Latin America and theCaribbean
68 13 21 20 16
Mexico 70 7 24 23 31Middle East and NorthAfrica
60 21 22 19 25
South Asia 71 10 22 19 12Of which India 69 11 24 20 11Sub-Saharan Africa 69 16 17 14 27
Mali 80 12 20 8 22South Africa 63 19 16 18 25
Source: The World Development Report (2001), Table 13, p.299.
Table 4 – Private Sector FinancePrivate investment as Stock market Listed domestic Domestic credit% of gross domestic Capitalisation Companies Provided by
Fixed investment Millions of US$ the banking sector% of GDP
1997 1999 1999 1999High Income 79.2 33,603,476 24,748 139
Low and Middle Income 66.9 2,427,331 24,892 72.2
East Asia and Pacific 56.9 955,379 3,754 112.5Europe and Central Asia 265,207 9,000 33.5Russia 72,205 207 35Latin America and theCaribbean
79.8 584,985 1,938 27.6
Mexico 81.4 154,044 188 29.1Middle East and NorthAfrica
151,562 1,863 72.2
South Asia 68.9 194,475 7,199 44.1India 70.1 184,605 5,863 44.9Sub-Saharan Africa 275,723 1,138 43.2Mali 16.1South Africa 72.7 262,478 668 73.4Source: The World Development Report (2001), Table 16, p. 304.

30
REFERENCESAbbott, Alden and Brady Gordon (1999) “The Liberalisation of the Telecommunications
Sector: A Rent Seeking Perspective”, European Journal of Law and Economics, 8:63-77.
Aghion, Philippe, Cecilia Garcia-Penalosa and Peter Howitt (2000). “Knowledge andDevelopment: A Schumpeterian Approach”, Paper presented at the ABCDEConference jointly organised by the World Bank and the Conseil D’AnalyseEconomique in Paris on 27 June.
Annan, Kofi A. (2000). “We The People, The Role of the United Nations in the 21st
century,” United Nations, Department of Public Information, New York.
Barro, Robert J. (1998) “Determinants of Economic Growth, A Cross Country EmpiricalStudy”, The MIT Press, Cambridge, Massachussets, London, England.
Bosworth, Barry P (2000). “The US Economy in the 1990s: Good Luck or GoodPolicies?” in Essays on the World Economy and its Financial System, Tokyo Club,ed. by B.Granville, published by RIIA distributed by Brookings, October 2000,pp.23 - 35.
Bosworth, Barry P. and Jack E . Triplett (2000). “What’s New About the New Economy?IT, Economic Growth and Productivity”, Paper presented in Munich, Tokyo Club,18-19 October.
Braga Carlos A. (1996), “The Impact of the Internationalization of Services onDeveloping Countries”,http//www.worldbank.org/fandd/english/0396/articles/070396.htm
Chen, Shaohua and Martin Ravallion (2000). “How Did the world’s Poorest Fare in the1990s” Policy Research Working Paper, World Bank, Washington, D.C.
Council of Economic Advisors (2000). Economic Report of the President, Washington,D.C., US Government Printing Office.
Coate, Stephen and Simon P. Anderson (2000). ''Market Provision of Public Goods: TheCase of Broadcasting'', NBER W.P. 7513, January.
Coates, David and Ken Warwick (1999). “The Knowledge Driven Economy: Analysis andBackground”, in The Economics of the Knowledge Driven Economy, Paperspresented at a conference jointly organised by the Department of Trade andIndustry and the Centre for Economic Policy Research, 27 January, London, UK.
David, Paul (1991). “Computer and Dynamo: The Modern Productivity Paradox in a Not-Too-Distant Mirror,” in Technology and Productivity: The Challenge forEconomic Policy. Paris: Organisation for Economic Cooperation andDevelopment, pp.315-47.

31
Frisk, T (1998). “The future state of information technology: a technological assessment,in H. Schutte (ed), Strategic issues in information technology, Maidenhead:Pergamon Infotech, pp. 15-26.
Gillespie, A. and H. Williams (1988). Telecommunications and the reconstruction ofregional comparative advantage,“ in Environment and Planning A 20: 1311-20.
Gordon, Robert (1999a). “Foundations of the Goldilocks Economy: Supply Shocks andthe Time-Varying NAIRU,” February 3, Revision of the paper presented atBrookings Panel on Economic Activity, Washington, D.C., September 4, 1998.
(1999b). “Has the New Economy Rendered the Productivity Slowdown Obsolete?” paperpresented at the CBO panel of economic advisors (Washington, DC: CongressionalBudget Office), revised, June 14.
(2000). “Does the ‘New Economy’ Measure up to the Great Inventions of the Past?” May1 draft of a paper for the Journal of Economic Perspectives,http://faculty_web.at.nwu.edu/economics/gordon/351.html
Granville Christopher and Alexei Zabotkine (2000) “Russia Quarterly Outlook – 4Q000”United Financial Group, 26 September.
Greenspan, Alan (2000). Speech given at the Federal Reserve Bank of Chicago, May 6.
Griliches, Zvi (1994). “Productivity, R&D, and the Data Constraint”, American EconomicReview 84, 1 (March), pp.1-23.
Grossman, Gene M. and Ethanan Helpman (1997). Innovation and Growth in the GlobalEconomy, The MIT Press, Cambridge, Massachussetts, London, England.
Hepworth, M (1987). “Information technology as spatial systems,” in Progress in HumanGeography 11: 157-80.
Hornstein, Andreas. (1999). “Growth Accounting with Technological Revolutions”,Federal Reserve Bank of Richmond, Economic Quarterly, Volume 85/3, Summer.
Howells, J. (1988). Economic, technological and location trends in European services,Avebury: Aldershot.
International Monetary Fund. (2000). “World Economic Outlook”, September,Washington, D.C.
Izaguirre, Ada Karina (1999). “Private Participation in Telecommunications: RecentTrends.” Viewpoint 204. World Bank, Finance, Private Sector, and InfrastructureNetwork, Washington, DC.
Jorgenson, Dale and Kevin Stiroh (2000). “Raising the Speed Limit: US EconomicGrowth in the Information Age,“ Brookings Paper on Economic Activity,Washington, D.C.

32
Kiley, M. T. (1999). “Computers and Growth with Costs of Adjustment: Will the FutureLook like the Past?” Federal Reserve Board.
Leonard, Carol (2000). “The New Economy, Emerging Transition Markets and theService Sector,” paper presented at the Royal Institute for International Affairs, 14November 2000.
Levy, Frank (1999). “The New Dollars and Dreams: American Incomes and EconomicChange,” Russell Stage Foundation.
Lucas, Robert E. (1988). “On the Mechanics of Economic Development.” Journal ofMonetary Economics, 22:1, pp.3-42.
Madrick, Jeff (1999). “How New is the New Economy”, The New York Review of Books,September 23, pp. 42 – 50.
Malecki, Edward J (1991,1996). Technology and Economic Development, Essex,England: Longman.
McNight, Lee W. and Joseph P. Bailey. (1998). An Introduction to Internet economics,” inMcKnight, L. W. and J. P. Bailey, Eds. Internet Economics. Cambridge, MA: MITPress, pp. 3-27.
McKnight, L. W. and J. P. Bailey, Eds. (1998). Internet Economics. Cambridge, MA: MITPress.
Moss, M. L. (1987). “Telecommunications, world cities, and urban policy,” UrbanStudies, 24: 534-546.
Niininen, Petri (1998). “Computers and Economic Growth in Finland”, The UnitedNations University, WIDER, Working Papers No. 148, August.
Oliner, Stephen D. and Daniel E. Sichel (1994). “Computers and Output GrowthRevisited: How Big is the Puzzle?” Brookings Papers on Economic Activity: 2,Brookings Institution, pp.273 –317.
Oliner Stephen D. and Daniel Sichel (forthcoming) “The Resurgence of Growth in theLate 1990s: Is Information Technology the Story?” Journal of EconomicPerspectives.
Quah, Danny T. (1996). “The Invisible Hand and the Weightless Economy”, Centre forEconomic Performance, Occasional Paper No 12, April.
. (1997). “Increasingly weightless economies,” Bank of England Quarterly Bulletin,February, pp.49 - 56.
(1998). “Growth and Wealth Creation in the Weightless Knowledge-Based Economy”,Speech to the Belgian Enterprise Foundation, 7 October,http://econ.lse.ac.uk/~dquah/.

33
(1999). “The Weightless Economy in Economic Development”, LSE EconomicsDepartment, Centre for Economic Performance, Discussion Paper No.417, March.
Rodriguez, Francisco and Ernest J. Wilson III (2000). “Are Poor Countries Losing theInformation Revolution?” INFODEV Working Paper, May.
Schreyer, Paul (1999). “The Contribution of Information and Communication Technologyto Output Growth.” Statistical Working Party (99) 4, OECD, Paris, November.
Sichel, Daniel E. (1999). “Computers and Aggregate Economic Growth: An Update”,Business Economics, 34, No.2:18 - 24.
Solow, Robert (1957). “Technical Change and the Aggregate Production Function,Review of Economics and Statistics 39: 312-320.
(1987). “We’d Better Watch Out”, New York Times Book Review, July 12, p.36.
Talero, Eduardo and Philip Gaudette (1996). “Harnessing Information for Development, AProposal for a World Bank Group Strategy”, World Bank Discussion Paper,Number 313, The World Bank, Finance and Private Sector Development VicePresidency, Industry and Energy Department, Telecommunications andInformatics Division, March, http://www.worldbank.org/html/fpd/harnessing/
Triplett, Jack E. (1999). “The Solow Productivity Paradox: What do Computers do toProductivity?” Canadian Journal of Economics, 32, No.2:309 – 334.
Wallsten, Scott J. (1999). “An Empirical Analysis of Competition, Privatisation, andRegulation in Africa and Latin America.” Policy Research Working Paper 2136.World Bank, Washington, D.C.
Whelan, Karl (2000). “Computers, Obsolescence, and Productivity,” Board of Governorsfor the Federal Reserve Working Paper 2000-6, Washington, Federal ReserveBoard, May.
Wilson III, Ernest J. (1996). “The Information Revolution Comes to Africa”, CSIS AfricaNotes, No 185, June.
(1998). “Wiring the African Economy”, Centre for International Development andConflict Management (CIDCM), Working Research Paper Series, August,http//www.bsos.umd.edu/cidcm/papers/ewilson/wiring.htm.
World Bank (2000). “Entering the 21st century”, World Development Report 1999/2000,Published by the World Bank, Oxford University Press.
World Bank (2001). “Attacking Poverty”, World Development Report 2000/2001,Published by the World Bank, Oxford University Press.