information fusion in biometrics
TRANSCRIPT
Pattern Recognition Letters 24 (2003) 2115–2125
www.elsevier.com/locate/patrec
Information fusion in biometrics
Arun Ross, Anil Jain *
Department of Computer Science and Engineering, Michigan State University, 3115 Engineering Building,
East Lansing, MI 48824, USA
Abstract
User verification systems that use a single biometric indicator often have to contend with noisy sensor data, re-
stricted degrees of freedom, non-universality of the biometric trait and unacceptable error rates. Attempting to improve
the performance of individual matchers in such situations may not prove to be effective because of these inherent
problems. Multibiometric systems seek to alleviate some of these drawbacks by providing multiple evidences of the
same identity. These systems help achieve an increase in performance that may not be possible using a single biometric
indicator. Further, multibiometric systems provide anti-spoofing measures by making it difficult for an intruder to
spoof multiple biometric traits simultaneously. However, an effective fusion scheme is necessary to combine the in-
formation presented by multiple domain experts. This paper addresses the problem of information fusion in biometric
verification systems by combining information at the matching score level. Experimental results on combining three
biometric modalities (face, fingerprint and hand geometry) are presented.
� 2003 Elsevier Science B.V. All rights reserved.
Keywords: Biometrics; Multimodal; Fingerprints; Face; Hand geometry; Verification; Decision tree; Linear discriminant analysis; Sum
rule
1. Introduction
A wide variety of applications require reliable
verification schemes to confirm the identity of an
individual requesting their service. Examples of
such applications include secure access to build-
ings, computer systems, laptops, cellular phonesand ATMs. In the absence of robust verification
schemes, these systems are vulnerable to the wiles
* Corresponding author. Tel.: +1-517-355-9319/6484; fax:
+1-517-432-1061.
E-mail addresses: [email protected] (A. Ross), jain@
cse.msu.edu (A. Jain).
0167-8655/03/$ - see front matter � 2003 Elsevier Science B.V. All r
doi:10.1016/S0167-8655(03)00079-5
of an impostor. Credit card fraud for example,
costs the industry millions of dollars annually,
primarily due to the lack of effective customer
verification techniques (Wallich, 1999).
Traditionally, passwords (knowledge-based se-
curity) and ID cards (token-based security) have
been used to restrict access to applications. How-ever, security can be easily breached in these ap-
plications when a password is divulged to an
unauthorized user or a badge is stolen by an im-
postor. The emergence of biometrics has addressed
the problems that plague traditional verification
methods. Biometrics refers to the automatic iden-
tification (or verification) of an individual (or a
claimed identity) by using certain physiological or
ights reserved.
2116 A. Ross, A. Jain / Pattern Recognition Letters 24 (2003) 2115–2125
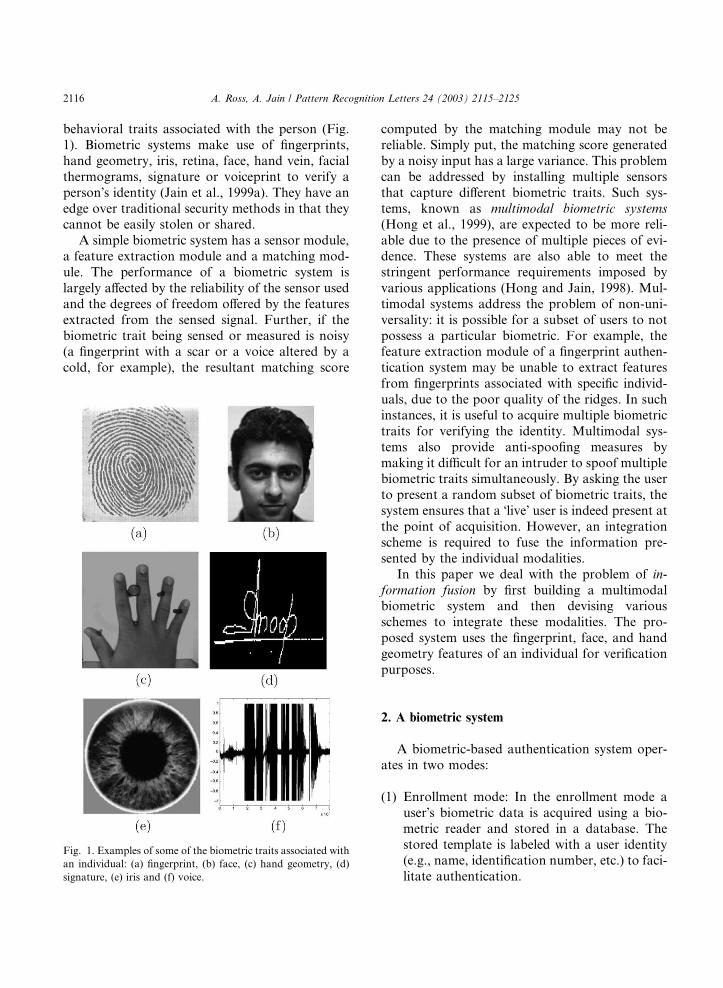
behavioral traits associated with the person (Fig.
1). Biometric systems make use of fingerprints,
hand geometry, iris, retina, face, hand vein, facial
thermograms, signature or voiceprint to verify a
person�s identity (Jain et al., 1999a). They have an
edge over traditional security methods in that theycannot be easily stolen or shared.
A simple biometric system has a sensor module,
a feature extraction module and a matching mod-
ule. The performance of a biometric system is
largely affected by the reliability of the sensor used
and the degrees of freedom offered by the features
extracted from the sensed signal. Further, if the
biometric trait being sensed or measured is noisy(a fingerprint with a scar or a voice altered by a
cold, for example), the resultant matching score
Fig. 1. Examples of some of the biometric traits associated with
an individual: (a) fingerprint, (b) face, (c) hand geometry, (d)
signature, (e) iris and (f) voice.
computed by the matching module may not be
reliable. Simply put, the matching score generated
by a noisy input has a large variance. This problem
can be addressed by installing multiple sensors
that capture different biometric traits. Such sys-
tems, known as multimodal biometric systems
(Hong et al., 1999), are expected to be more reli-
able due to the presence of multiple pieces of evi-
dence. These systems are also able to meet the
stringent performance requirements imposed by
various applications (Hong and Jain, 1998). Mul-
timodal systems address the problem of non-uni-
versality: it is possible for a subset of users to not
possess a particular biometric. For example, thefeature extraction module of a fingerprint authen-
tication system may be unable to extract features
from fingerprints associated with specific individ-
uals, due to the poor quality of the ridges. In such
instances, it is useful to acquire multiple biometric
traits for verifying the identity. Multimodal sys-
tems also provide anti-spoofing measures by
making it difficult for an intruder to spoof multiplebiometric traits simultaneously. By asking the user
to present a random subset of biometric traits, the
system ensures that a �live� user is indeed present atthe point of acquisition. However, an integration
scheme is required to fuse the information pre-
sented by the individual modalities.
In this paper we deal with the problem of in-
formation fusion by first building a multimodalbiometric system and then devising various
schemes to integrate these modalities. The pro-
posed system uses the fingerprint, face, and hand
geometry features of an individual for verification
purposes.
2. A biometric system
A biometric-based authentication system oper-
ates in two modes:
(1) Enrollment mode: In the enrollment mode a
user�s biometric data is acquired using a bio-
metric reader and stored in a database. The
stored template is labeled with a user identity(e.g., name, identification number, etc.) to faci-
litate authentication.
A. Ross, A. Jain / Pattern Recognition Letters 24 (2003) 2115–2125 2117
(2) Authentication mode: In the authentication
mode, a user�s biometric data is once again ac-
quired and the system uses this to either iden-
tify who the user is, or verify the claimed
identity of the user. While identification in-volves comparing the acquired biometric infor-
mation against templates corresponding to all
users in the database, verification involves com-
parison with only those templates correspond-
ing to the claimed identity. Thus, identification
and verification are two distinct problems hav-
ing their own inherent complexities.
A simple biometric system has four important
components:
(1) Sensor module which acquires the biometric
data of an individual. An example is a finger-
print sensor that captures fingerprint impres-
sions of a user.
(2) Feature extraction module in which the ac-quired data is processed to extract feature
values. For example, the position and orienta-
tion of minutiae points in a fingerprint image
would be extracted in the feature extraction
module of a fingerprint system.
(3) Matching module in which the feature values
are compared against those in the template
by generating a matching score. For example,in this module, the number of matching minu-
tiae points between the query and the template
will be computed and treated as a matching
score.
(4) Decision-making module in which the user�sidentity is established or a claimed identity is
either accepted or rejected based on the match-
ing score generated in the matching module.
The performance of a biometric system can be
measured by reporting its false accept rate (FAR)
and false reject rate (FRR) at various thresholds.
These two factors are brought together in a re-
ceiver operating characteristic (ROC) curve that
plots the FRR against the FAR at different
thresholds. (Alternately, the genuine accept rate,which equals 1-FRR, may be plotted against the
FAR.) The FAR and FRR are computed by
generating all possible genuine and impostor
matching scores and then setting a threshold for
deciding whether to accept or reject a match. A
genuine matching score is obtained when two
feature vectors corresponding to the same indi-
vidual are compared, and an impostor matching
score is obtained when feature vectors from twodifferent individuals are compared.
3. Fusion in biometrics
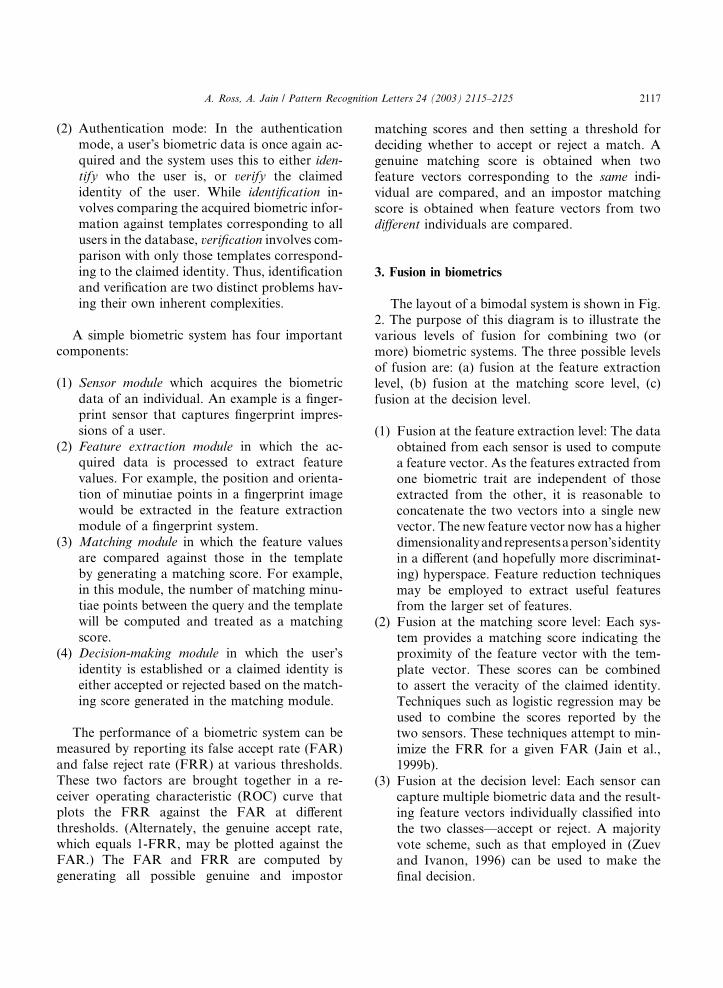
The layout of a bimodal system is shown in Fig.
2. The purpose of this diagram is to illustrate the
various levels of fusion for combining two (ormore) biometric systems. The three possible levels
of fusion are: (a) fusion at the feature extraction
level, (b) fusion at the matching score level, (c)
fusion at the decision level.
(1) Fusion at the feature extraction level: The data
obtained from each sensor is used to compute
a feature vector. As the features extracted fromone biometric trait are independent of those
extracted from the other, it is reasonable to
concatenate the two vectors into a single new
vector. The new feature vector now has a higher
dimensionalityandrepresentsaperson�s identityin a different (and hopefully more discriminat-
ing) hyperspace. Feature reduction techniques
may be employed to extract useful featuresfrom the larger set of features.
(2) Fusion at the matching score level: Each sys-
tem provides a matching score indicating the
proximity of the feature vector with the tem-
plate vector. These scores can be combined
to assert the veracity of the claimed identity.
Techniques such as logistic regression may be
used to combine the scores reported by thetwo sensors. These techniques attempt to min-
imize the FRR for a given FAR (Jain et al.,
1999b).
(3) Fusion at the decision level: Each sensor can
capture multiple biometric data and the result-
ing feature vectors individually classified into
the two classes––accept or reject. A majority
vote scheme, such as that employed in (Zuevand Ivanon, 1996) can be used to make the
final decision.
Fig. 2. A bimodal biometric system showing the three levels of fusion (FU: fusion module, MM: matching module, DM: decision
module).
2118 A. Ross, A. Jain / Pattern Recognition Letters 24 (2003) 2115–2125
Fusion in the context of biometrics can take the
following forms:
(1) Single biometric multiple representation.(2) Single biometric multiple matchers.
(3) Multiple biometric fusion.
3.1. Single biometric multiple representation
This type of fusion involves using multiple
representations on a single biometric indicator.
Typically, each representation has its own classi-fier. The similarity scores reported by these clas-
sifiers are then consolidated. Cappelli et al. (2000)
describe a fingerprint classification system 1 that
1 The system classifies a fingerprint into one of five classes––
Arch, Left loop, Right loop, Whorl and Tented arch. Thus it is
not a biometric system by itself, as it does not perform person
identification or verification.
combines a structural classifier with a KL trans-
form-based classifier by integrating the scores
generated by the two classifiers. This is done by
first mapping the scores (which are distance mea-sures) into a common domain via a double sig-
moid function and then taking a weighted average
in the new domain. Jain et al. (1999c) also use
multiple classifiers for fingerprint indexing. Their
technique uses a K nearest neighbor classifier and a
set of 10 neural network classifiers to classify fin-
gerprints. General strategies for combining multi-
ple classifiers have been suggested in (Ho et al.,1994). All the approaches presented there (the
highest rank method, the Borda count method and
logistic regression) attempt to reduce or rerank a
given set of classes. These techniques are thus
relevant to the identification problem in which a
large number of classes (identities) are present.
The fusion in this approach takes place at the
matching stage, after the classifiers report a simi-larity score for each class. Prabhakar and Jain
A. Ross, A. Jain / Pattern Recognition Letters 24 (2003) 2115–2125 2119
(2002) show that selecting classifiers based on
some ‘‘goodness’’ statistic may be necessary to
avoid performance degradation when using clas-
sifier combination techniques. It should also be
possible to combine (concatenate) the feature
vectors extracted by the individual classifiers.
3.2. Single biometric multiple matchers
It is also possible to incorporate multiple
matching strategies in the matching module of a
biometric system and combine the scores gener-
ated by these strategies. Jain et al. (1999b) use the
logistic function to map the matching scoresobtained from two different fingerprint matching
algorithms into a single score. The authors dem-
onstrate that such an integration strategy improves
the overall performance of a fingerprint verifica-
tion system.
This type of fusion also takes place at the
matching stage of a biometric system. Although
there are multiple matchers in this case, allmatchers operate on the same representation of
the biometric data.
3.3. Multiple biometric fusion
Multibiometric fusion refers to the fusion of
multiple biometric indicators. Such systems seek to
improve the speed and reliability (accuracy) of abiometric system (Hong and Jain, 1998) by inte-
grating matching scores obtained from multiple
biometric sources. A variety of fusion schemes
have been described in the literature to combine
these various scores. These include majority vot-
ing, sum and product rules, k-NN classifiers,
SVMs, decision trees, Bayesian methods, etc. (see
for example Ben-Yacoub et al., 1999; Bigun et al.,1997; Dieckmann et al., 1997; Jain et al., 1999d;
Kittler et al., 1998; Verlinde and Cholet, 1999).
An important aspect that has to be addressed in
fusion at the matching score level is the normal-
ization of the scores obtained from the different
domain experts (Brunelli and Falavigna, 1995).
Normalization typically involves mapping the
scores obtained from multiple domains into acommon domain before combining them. This
could be viewed as a two-step process in which the
distributions of scores for each domain is first
estimated using robust statistical techniques
(Hampel et al., 1986) and these distributions are
then scaled or translated into a common domain.
Besides the techniques described above, other
types of fusion are also possible in biometrics: (i) Afingerprint biometric system may store multiple
templates of a user�s fingerprint (same finger) in itsdatabase. When a fingerprint impression is pre-
sented to the system for verification, it is compared
against each of the templates, and the matching
score generated by these multiple matchings are
integrated. (ii) A system may store a single tem-
plate of a user�s finger, but acquire multiple im-pressions of the finger during verification. (iii)
Another possibility would be to acquire and use
impressions of multiple fingers for every user.
These possibilities have been discussed in (Jain
et al., 1999e).
4. Experiments
A brief description of the three biometric indi-
cators used in our experiments is given below.
4.1. Face verification
Face verification involves extracting a feature
set from a two-dimensional image of the user�s faceand matching it with the template stored in the
database. The feature extraction process is often
preceded by a face detection process during which
the location and spatial extent of the face is de-
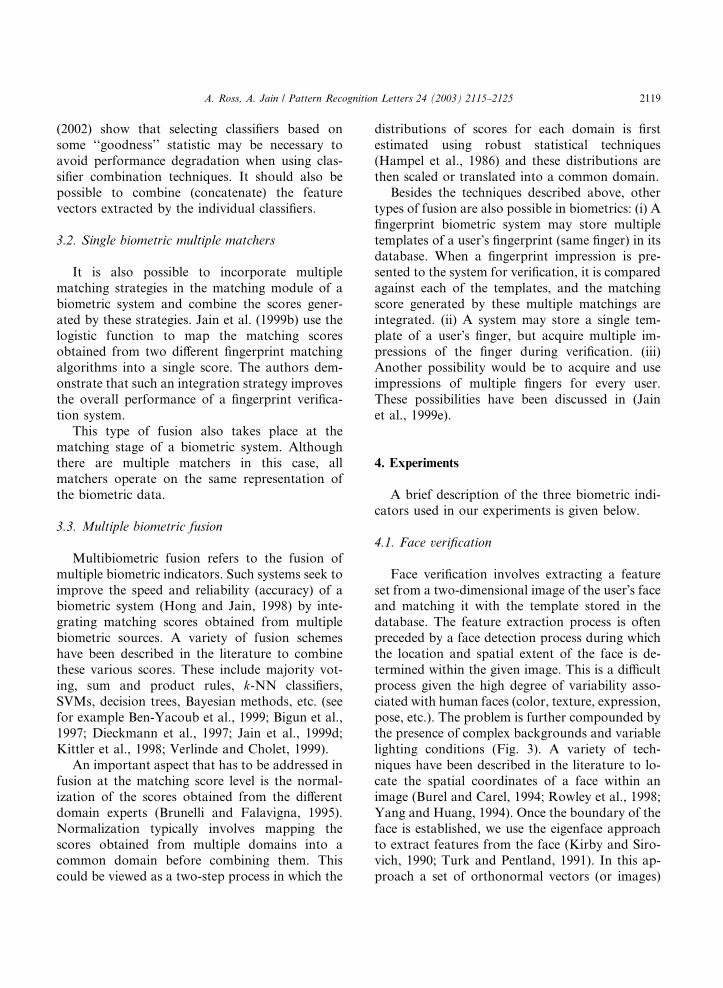
termined within the given image. This is a difficult
process given the high degree of variability asso-
ciated with human faces (color, texture, expression,
pose, etc.). The problem is further compounded bythe presence of complex backgrounds and variable
lighting conditions (Fig. 3). A variety of tech-
niques have been described in the literature to lo-
cate the spatial coordinates of a face within an
image (Burel and Carel, 1994; Rowley et al., 1998;
Yang and Huang, 1994). Once the boundary of the
face is established, we use the eigenface approach
to extract features from the face (Kirby and Siro-vich, 1990; Turk and Pentland, 1991). In this ap-
proach a set of orthonormal vectors (or images)
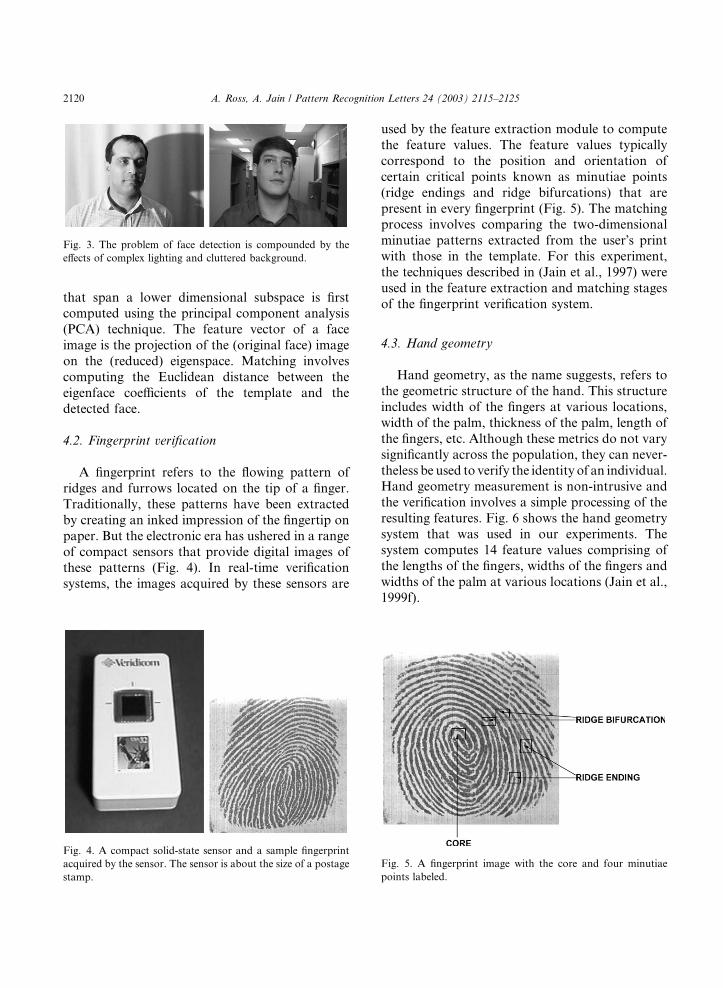
Fig. 3. The problem of face detection is compounded by the
effects of complex lighting and cluttered background.
2120 A. Ross, A. Jain / Pattern Recognition Letters 24 (2003) 2115–2125
that span a lower dimensional subspace is firstcomputed using the principal component analysis
(PCA) technique. The feature vector of a face
image is the projection of the (original face) image
on the (reduced) eigenspace. Matching involves
computing the Euclidean distance between the
eigenface coefficients of the template and the
detected face.
4.2. Fingerprint verification
A fingerprint refers to the flowing pattern of
ridges and furrows located on the tip of a finger.
Traditionally, these patterns have been extracted
by creating an inked impression of the fingertip on
paper. But the electronic era has ushered in a range
of compact sensors that provide digital images ofthese patterns (Fig. 4). In real-time verification
systems, the images acquired by these sensors are
Fig. 4. A compact solid-state sensor and a sample fingerprint
acquired by the sensor. The sensor is about the size of a postage
stamp.
used by the feature extraction module to compute
the feature values. The feature values typically
correspond to the position and orientation of
certain critical points known as minutiae points
(ridge endings and ridge bifurcations) that are
present in every fingerprint (Fig. 5). The matchingprocess involves comparing the two-dimensional
minutiae patterns extracted from the user�s printwith those in the template. For this experiment,
the techniques described in (Jain et al., 1997) were
used in the feature extraction and matching stages
of the fingerprint verification system.
4.3. Hand geometry
Hand geometry, as the name suggests, refers to
the geometric structure of the hand. This structure
includes width of the fingers at various locations,
width of the palm, thickness of the palm, length of
the fingers, etc. Although these metrics do not vary
significantly across the population, they can never-
theless be used to verify the identity of an individual.Hand geometry measurement is non-intrusive and
the verification involves a simple processing of the
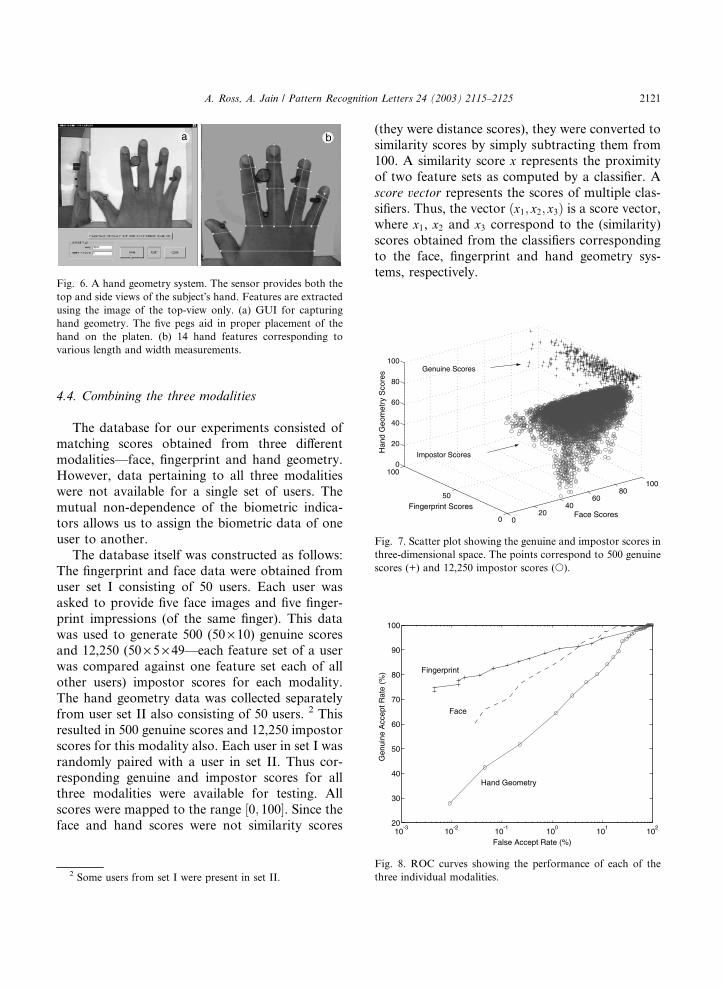
resulting features. Fig. 6 shows the hand geometry
system that was used in our experiments. The
system computes 14 feature values comprising of
the lengths of the fingers, widths of the fingers and
widths of the palm at various locations (Jain et al.,
1999f).
Fig. 5. A fingerprint image with the core and four minutiae
points labeled.
10-3
10-2
10-1
100
101
102
20
30
40
50
60
70
80
90
100
Gen
uine
Acc
ept R
ate
(%)
Hand Geometry
Face
Fingerprint
Fig. 6. A hand geometry system. The sensor provides both the
top and side views of the subject�s hand. Features are extractedusing the image of the top-view only. (a) GUI for capturing
hand geometry. The five pegs aid in proper placement of the
hand on the platen. (b) 14 hand features corresponding to
various length and width measurements.
020
4060
80100
0
50
1000
20
40
60
80
100
Fingerprint ScoresFace Scores
Han
d G
eom
etry
Sco
res Genuine Scores
Impostor Scores
Fig. 7. Scatter plot showing the genuine and impostor scores in
three-dimensional space. The points correspond to 500 genuine
scores (+) and 12,250 impostor scores (s).
A. Ross, A. Jain / Pattern Recognition Letters 24 (2003) 2115–2125 2121
4.4. Combining the three modalities
The database for our experiments consisted of
matching scores obtained from three different
modalities––face, fingerprint and hand geometry.
However, data pertaining to all three modalities
were not available for a single set of users. The
mutual non-dependence of the biometric indica-tors allows us to assign the biometric data of one
user to another.
The database itself was constructed as follows:
The fingerprint and face data were obtained from
user set I consisting of 50 users. Each user was
asked to provide five face images and five finger-
print impressions (of the same finger). This data
was used to generate 500 (50 · 10) genuine scoresand 12,250 (50 · 5 · 49––each feature set of a user
was compared against one feature set each of all
other users) impostor scores for each modality.
The hand geometry data was collected separately
from user set II also consisting of 50 users. 2 This
resulted in 500 genuine scores and 12,250 impostor
scores for this modality also. Each user in set I was
randomly paired with a user in set II. Thus cor-responding genuine and impostor scores for all
three modalities were available for testing. All
scores were mapped to the range ½0; 100�. Since theface and hand scores were not similarity scores
2 Some users from set I were present in set II.
(they were distance scores), they were converted to
similarity scores by simply subtracting them from
100. A similarity score x represents the proximity
of two feature sets as computed by a classifier. A
score vector represents the scores of multiple clas-
sifiers. Thus, the vector ðx1; x2; x3Þ is a score vector,where x1, x2 and x3 correspond to the (similarity)
scores obtained from the classifiers corresponding
to the face, fingerprint and hand geometry sys-
tems, respectively.
False Accept Rate (%)
Fig. 8. ROC curves showing the performance of each of the
three individual modalities.
2122 A. Ross, A. Jain / Pattern Recognition Letters 24 (2003) 2115–2125
The scatter plot of the genuine and impostor
scores is shown in Fig. 7. The plot indicates that
the two classes are reasonably separated in three-
dimensional space; therefore, a relatively simple
classifier should perform well on this dataset. The
ROC curves depicting the performance of the in-dividual modalities are shown in Fig. 8.
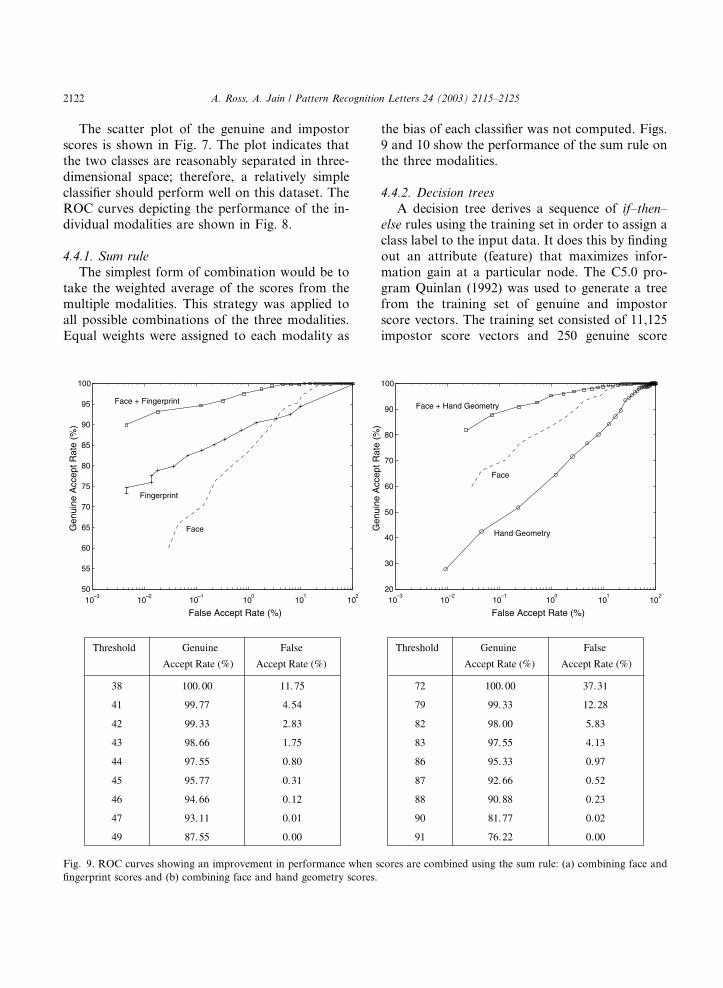
4.4.1. Sum rule
The simplest form of combination would be to
take the weighted average of the scores from the
multiple modalities. This strategy was applied to
all possible combinations of the three modalities.
Equal weights were assigned to each modality as
10–3
10–2
10–1
100
101
102
50
55
60
65
70
75
80
85
90
95
100
Gen
uine
Acc
ept R
ate
(%)
False Accept Rate (%)
Face
Fingerprint
Face + Fingerprint
Threshold Genuine False
Accept Rate (%) Accept Rate (%)
38 100. 00 11.75
41 99.77 4.54
42 99.33 2.83
43 98.66 1.75
44 97.55 0.80
45 95.77 0.31
46 94.66 0.12
47 93.11 0.01
49 87.55 0.00
Fig. 9. ROC curves showing an improvement in performance when s
fingerprint scores and (b) combining face and hand geometry scores.
the bias of each classifier was not computed. Figs.
9 and 10 show the performance of the sum rule on
the three modalities.
4.4.2. Decision trees
A decision tree derives a sequence of if–then–
else rules using the training set in order to assign a
class label to the input data. It does this by finding
out an attribute (feature) that maximizes infor-
mation gain at a particular node. The C5.0 pro-
gram Quinlan (1992) was used to generate a tree
from the training set of genuine and impostor
score vectors. The training set consisted of 11,125
impostor score vectors and 250 genuine score
10–3
10–2
10–1
100
101
102
20
30
40
50
60
70
80
90
100G
enui
ne A
ccep
t Rat
e (%
)
False Accept Rate (%)
Hand Geometry
Face
Face + Hand Geometry
Accept Rate (%) Accept Rate (%)
Threshold Genuine False
72 100. 00 37.31
79 99.33 12.28
82 98.00 5.83
83 97.55 4.13
86 95.33 0.97
87 92.66 0.52
88 90.88 0.23
90 81.77 0.02
91 76.22 0.00
cores are combined using the sum rule: (a) combining face and
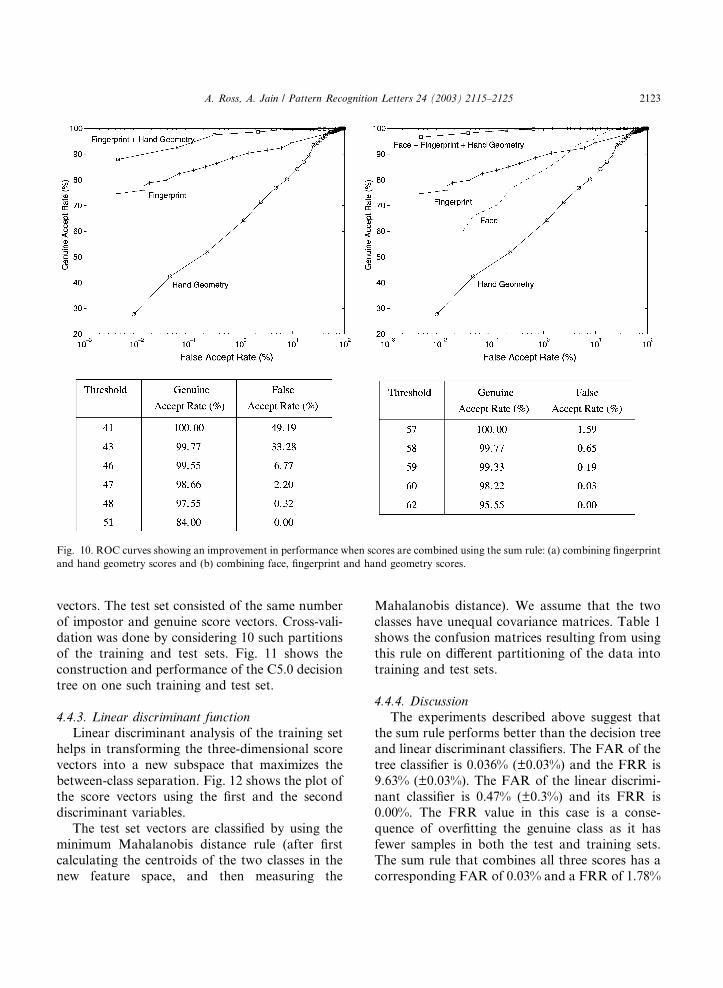
Fig. 10. ROC curves showing an improvement in performance when scores are combined using the sum rule: (a) combining fingerprint
and hand geometry scores and (b) combining face, fingerprint and hand geometry scores.
A. Ross, A. Jain / Pattern Recognition Letters 24 (2003) 2115–2125 2123
vectors. The test set consisted of the same number
of impostor and genuine score vectors. Cross-vali-
dation was done by considering 10 such partitions
of the training and test sets. Fig. 11 shows the
construction and performance of the C5.0 decision
tree on one such training and test set.
4.4.3. Linear discriminant function
Linear discriminant analysis of the training set
helps in transforming the three-dimensional score
vectors into a new subspace that maximizes the
between-class separation. Fig. 12 shows the plot of
the score vectors using the first and the second
discriminant variables.
The test set vectors are classified by using the
minimum Mahalanobis distance rule (after firstcalculating the centroids of the two classes in the
new feature space, and then measuring the
Mahalanobis distance). We assume that the two
classes have unequal covariance matrices. Table 1
shows the confusion matrices resulting from using
this rule on different partitioning of the data into
training and test sets.
4.4.4. Discussion
The experiments described above suggest thatthe sum rule performs better than the decision tree
and linear discriminant classifiers. The FAR of the
tree classifier is 0.036% (±0.03%) and the FRR is
9.63% (±0.03%). The FAR of the linear discrimi-
nant classifier is 0.47% (±0.3%) and its FRR is
0.00%. The FRR value in this case is a conse-
quence of overfitting the genuine class as it has
fewer samples in both the test and training sets.The sum rule that combines all three scores has a
corresponding FAR of 0.03% and a FRR of 1.78%
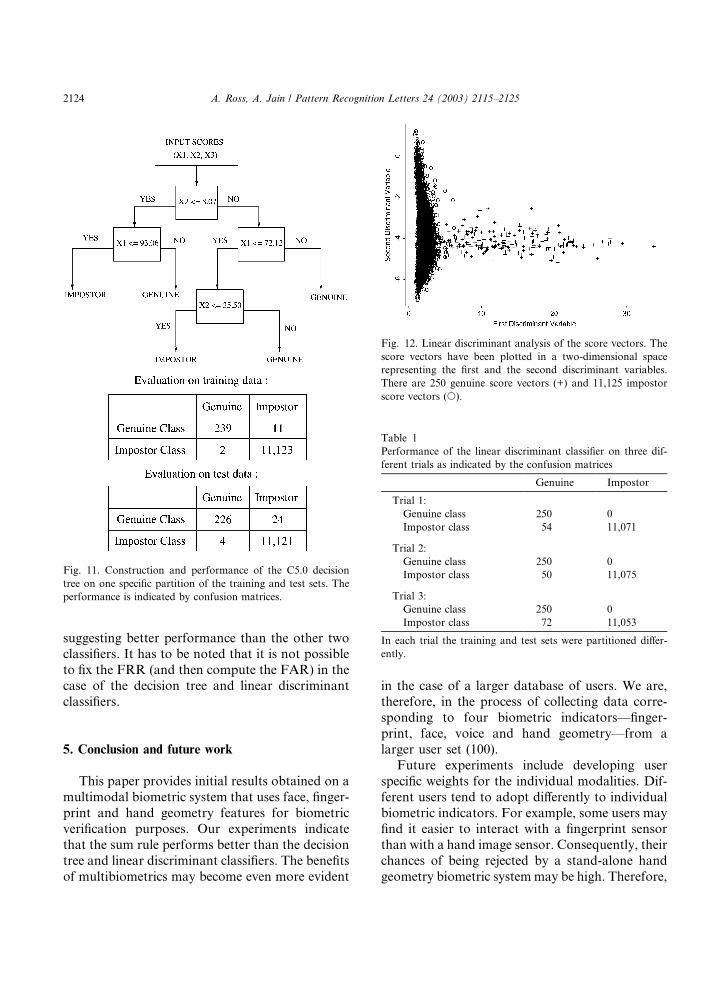
Fig. 11. Construction and performance of the C5.0 decision
tree on one specific partition of the training and test sets. The
performance is indicated by confusion matrices.
Fig. 12. Linear discriminant analysis of the score vectors. The
score vectors have been plotted in a two-dimensional space
representing the first and the second discriminant variables.
There are 250 genuine score vectors (+) and 11,125 impostor
score vectors (s).
Table 1
Performance of the linear discriminant classifier on three dif-
ferent trials as indicated by the confusion matrices
Genuine Impostor
Trial 1:
Genuine class 250 0
Impostor class 54 11,071
Trial 2:
Genuine class 250 0
Impostor class 50 11,075
Trial 3:
Genuine class 250 0
Impostor class 72 11,053
In each trial the training and test sets were partitioned differ-
ently.
2124 A. Ross, A. Jain / Pattern Recognition Letters 24 (2003) 2115–2125
suggesting better performance than the other twoclassifiers. It has to be noted that it is not possible
to fix the FRR (and then compute the FAR) in the
case of the decision tree and linear discriminant
classifiers.
5. Conclusion and future work
This paper provides initial results obtained on a
multimodal biometric system that uses face, finger-
print and hand geometry features for biometric
verification purposes. Our experiments indicate
that the sum rule performs better than the decision
tree and linear discriminant classifiers. The benefits
of multibiometrics may become even more evident
in the case of a larger database of users. We are,therefore, in the process of collecting data corre-
sponding to four biometric indicators––finger-
print, face, voice and hand geometry––from a
larger user set (100).
Future experiments include developing user
specific weights for the individual modalities. Dif-
ferent users tend to adopt differently to individual
biometric indicators. For example, some users mayfind it easier to interact with a fingerprint sensor
than with a hand image sensor. Consequently, their
chances of being rejected by a stand-alone hand
geometry biometric systemmay be high. Therefore,
A. Ross, A. Jain / Pattern Recognition Letters 24 (2003) 2115–2125 2125
it would be appropriate to associate different
weights to the individual modalities based on the
user�s preference or the system�s performance for
that user. These weights can be learnt over time by
examining the stored template of the user, the
query set provided by the user, and the matchingscores for each of the individual modalities. By
doing so, each user is tightly coupled with that
subset of biometric traits that distinguishes her
very well from the rest of the users. User specific
weights also help address the problem of non-uni-
versality of biometric traits by giving less weightage
to those traits that are not easily extracted. We are
also working on designing techniques to automat-ically update the biometric templates of a user.
References
Ben-Yacoub, S., Abdeljaoued, Y., Mayoraz, E., 1999. Fusion
of face and speech data for person identity verification.
Research Paper IDIAP-RR 99-03, IDIAP, CP 592, 1920
Martigny, Switzerland.
Bigun, E., Bigun, J., Duc, B., Fischer, S., 1997. Expert
conciliation for multimodal person authentication systems
using Bayesian statistics. In: First Internat. Conf. on
AVBPA, Crans-Montana, Switzerland. pp. 291–300.
Brunelli, R., Falavigna, D., 1995. Person identification using
multiple cues. IEEE Trans. PAMI 12 (10), 955–966.
Burel, G., Carel, C., 1994. Detection and localization of faces
on digital images. Pattern Recognition Lett. 15, 963–967.
Cappelli, R., Maio, D., Maltoni, D., 2000. Combining finger-
print classifiers. In: First Internat. Workshop on Multiple
Classifier Systems. pp. 351–361.
Dieckmann, U., Plankensteiner, P., Wagner, T., 1997. Sesam: A
biometric person identification system using sensor fusion.
Pattern Recognition Lett. 18 (9), 827–833.
Hampel, F., Rousseeuw, P., Ronchetti, E., Stahel, W., 1986.
Robust Statistics: The Approach Based on Influence Func-
tions. John Wiley & Sons.
Ho, T.K., Hull, J.J., Srihari, S.N., 1994. Decision combination
in multiple classifier systems. IEEE Trans. PAMI 16 (1), 66–
75.
Hong, L., Jain, A.K., 1998. Integrating faces and fingerprints
for personal identification. IEEE Trans. PAMI 20 (12),
1295–1307.
Hong, L., Jain, A.K., Pankanti, S., 1999. Can multibiometrics
improve performance? In: Proc. AutoID�99, Summit, NJ,USA. pp. 59–64.
Jain, A.K., Hong, L., Pankanti, S., Bolle, R., 1997. An identity
authentication system using fingerprints. Proc. IEEE 85 (9),
1365–1388.
Jain, A.K., Bolle, R., Pankanti, S. (Eds.), 1999a. Biometrics:
Personal Identification in Networked Society. Kluwer
Academic Publishers.
Jain, A.K., Prabhakar, S., Chen, S., 1999b. Combining multiple
matchers for a high security fingerprint verification system.
Pattern Recognition Lett. 20, 1371–1379.
Jain, A.K., Prabhakar, S., Hong, L., 1999c. A multichannel
approach to fingerprint classification. IEEE Trans. PAMI
21 (4), 348–359.
Jain, A.K., Hong, L., Kulkarni, Y., 1999d. A multimodal
biometric system using fingerprint, face and speech. In:
Second Internat. Conf. on AVBPA, Washington, DC, USA.
pp. 182–187.
Jain, A.K., Prabhakar, S., Ross, A., 1999e. Fingerprint match-
ing: Data acquisition and performance evaluation. Technical
Report MSU-TR:99-14, Michigan State University.
Jain, A.K., Ross, A., Pankanti, S., 1999f. A prototype hand
geometry-based verification system, in: Second Internat.
Conf. on Audio and Video-based Biometric Person Au-
thentication (AVBPA), Washington, DC, USA. pp. 166–
171.
Kirby, M., Sirovich, L., 1990. Application of the Karhunen–
Loeve procedure for the characterization of human faces.
IEEE Trans. PAMI 12 (1), 103–108.
Kittler, J., Hatef, M., Duin, R.P., Matas, J.G., 1998. On
combining classifiers. IEEE Trans. PAMI 20 (3), 226–
239.
Prabhakar, S., Jain, A.K., 2002. Decision-level fusion in
fingerprint verification. Pattern Recognition 35 (4), 861–
874.
Quinlan, R.J., 1992. C4.5: Programs for Machine Learning. In:
The Morgan Kaufmann Series in Machine Learning.
Morgan Kaufmann Publishers.
Rowley, H., Baluja, S., Kanade, T., 1998. Neural network-
based face detection. IEEE Trans. PAMI 20 (1), 23–38.
Turk, M., Pentland, A., 1991. Eigenfaces for recognition. J
Cognitive Neurosci. 3 (1), 71–86.
Verlinde, P., Cholet, G., 1999. Comparing decision fusion
paradigms using k-NN based classifiers, decision trees and
logistic regression in a multi-modal identity verification
application. In: Second Internat. Conf. on AVBPA, Wash-
ington, DC, USA. pp. 188–193.
Wallich, P., 1999. How to steal millions in chump change.
Scientific American.
Yang, G., Huang, T., 1994. Human face detection in a complex
background. Pattern Recognition 27 (1), 53–63.
Zuev, Y., Ivanon, S., 1996. The voting as a way to increase the
decision reliability. In: Foundations of Information/Deci-
sion Fusion with Applications to Engineering Problems,
Washington, DC, USA. pp. 206–210.