influence of pt, fe/ni/cr-containing intermetallics and deuterium on the oxidation of zr-based...
TRANSCRIPT
Journal of Nuclear Materials 340 (2005) 271–283
www.elsevier.com/locate/jnucmat
Influence of Pt, Fe/Ni/Cr-containing intermetallicsand deuterium on the oxidation of Zr-based materials
Clara Anghel a,*, Gunnar Hultquist a, Magnus Limback b
a Division of Corrosion Science, Department of Materials Science and Engineering, Royal Institute of Technology,
Drottning Kristinas vag 51, S-100 44 Stockholm, Swedenb Westinghouse Electric Sweden AB, S-721 63 Vasteras, Sweden
Received 15 October 2004; accepted 22 December 2004
Abstract
An in situ gas phase analysis technique and the 18O-SIMS technique are used to evaluate the transport of oxygen and
hydrogen in oxidation of Zr-based materials. At 400 �C, it is found that oxygen dissociation efficiency decreases in the
order: Pt > Zr2Fe > Zr2Ni > ZrCr2 P Zircaloy-2. Two Zr-plates partly coated with 200 A porous Pt, with and respec-
tively without D in the substrate, were oxidized in two stages at 400 �C. SIMS depth profiles in the Pt area show that an
enhanced oxidation takes place mainly by inward oxygen transport. A minimum in the oxide thickness was found near
the Pt area on both Zr plates. Two Ar-filled Zircaloy-2 tubes with ZrSn liner were exposed at 370 �C to 22 mbar water,
filled in from one side. Our experimental results suggest that a proper choice of the SPP composition and size distribu-
tion can lead to reduced hydrogen uptake during oxidation of Zr-based materials in water.
� 2005 Elsevier B.V. All rights reserved.
1. Introduction
The corrosion behaviour of Zr-based materials has
been extensively studied during the last decade with a
wide variety of techniques [1–10]. The role of a surface
oxide layer is to protect the metal substrate against the
corrosive environment. A protective metal oxide should
be gas-tight and therefore only ions should be trans-
ported in the oxide. This situation is often assumed
but rarely (if ever) confirmed. It is generally considered
0022-3115/$ - see front matter � 2005 Elsevier B.V. All rights reserv
doi:10.1016/j.jnucmat.2004.12.005
* Corresponding author. Tel.: +46 8 7906670; fax: +46 8
208284.
E-mail address: [email protected] (C. Anghel).
that in the oxidation of the Zr-based materials, the oxide
is growing mainly by inward oxygen transport [1,4,5].
One possible factor related to the transport of molecules
is the existence of pores inside the oxide. It was found
that the zirconium oxide layer is porous not only in
the outer part, but also within the barrier layer [8,11].
The distribution of ZrO2 phases in the oxide layer is also
changing in depth. Tetragonal and monoclinic ZrO2
phases have been reported [3,6,8,12]. The fraction of
tetragonal phase is higher at the oxide/metal, O/M,
interface (stabilized by high compressive stress) and is
irregularly distributed in the oxide [3]. The tetragonal
to monoclinic phase transformation takes place as a re-
sult of stress relief with a volume expansion of 7% and
generates defects like cracks and pores (easy diffusion
pathways) [3]. This transformation can occur inside the
barrier layer, possibly inducing porosity within the
ed.
272 C. Anghel et al. / Journal of Nuclear Materials 340 (2005) 271–283
barrier layer [8]. The porosity development in the zirco-
nium oxide scale is considered to be a main reason that
leads to the transition from parabolic to linear oxide
growth kinetics [5]. Zhilyaev and Szpunar [12] proposed
a model for oxygen diffusion through the oxide scale
considering stress development.
Enhanced oxidation of Zr-based materials in atomic
oxygen enriched gas obtained by microwave discharge
has been reported in the literature [9,10]. This shows that
increased availability of dissociated oxygen at the oxide/
gas, O/G, interface generates enhanced oxidation.
Raspopov and co-workers [9] suggested that oxygen
chemisorption is likely to be a rate-limiting step for
the oxidation process at the early stages of oxidation.
To understand how the dissociation rate of oxygen influ-
ences Zr oxidation at the temperatures relevant for the
nuclear industry, we have to consider in which form oxy-
gen is transported through the oxide layer. For oxygen
dissociation to take place an activation energy has to
be overcome. At 300–400 �C, the thermal energy is low
for oxygen dissociation on ZrO2 but Pt and second-
phase particles, SPP, may catalyze the dissociation.
The presence of SPP incorporated, partly un-oxidized,
in the oxide layer may therefore influence the ratio be-
tween molecular and dissociated oxygen transport
across the oxide. One aim with this paper is to study
O2 dissociation rates on Zr-based materials and their
possible influence on the corrosion rate. The dissociation
of O2 on Pt, pre-oxidized Zircaloy-2 and pre-oxidized
Fe/Ni/Cr containing intermetallics has been measured
and will be discussed in this paper. Also the influence
of Pt, a very effective oxygen dissociating element,
ODE, on the oxidation of Zr is presented here.
Isotope monitoring techniques have been used to
investigate the mechanism of oxygen and hydrogen
incorporation in the growing zirconia layer and sub-
strate [11,13–15]. Many studies related to the influence
of hydrogen on Zr oxidation have been published lately
[3,6,8,11,16,17]. Recent publications dealing with other
metals than Zr [16,18,19] have concluded that the pres-
ence of hydrogen in the metal substrate or in the gas
phase has an effect on oxidation by increasing the metal
outward transport, which eventually can generate voids
at the metal/oxide interface. One possible mechanism is
based on a proton-induced high concentration of metal
ion vacancies in the oxide, which is likely to result in
an increased metal ion transport [19]. Oxidation of Zr
by cation outward diffusion via cation vacancies was al-
ready taken into consideration in early 50s by Gulbran-
sen and Andrew [1]. The Zr-metal and oxygen mobilities
during oxidation of Zircaloy-4 at 633 K in water and in
dry O2 were investigated by Grandjean and Serruys [20]
using Xenon marker atoms implanted into the pre-
formed oxide and the Rutherford backscattering spec-
trometry (RBS) technique. They interpreted their results
that, before transition, the oxide grows only by oxygen
inward transport, both in water and in oxygen expo-
sures. However in their experiments performed in water,
big losses of Xenon occurred, in contrast to the exposure
to dry oxygen when the Xe marker did not move during
exposure [20]. Hultquist et al. [16] indicated that the oxi-
dation rate decreases if a better balance between Zr ion
and oxygen ion transport is obtained, resulting in adher-
ent oxide growth, with low density of pores and other
defects.
In this paper, the effect of deuterium (D) and the
combined effect of Pt and deuterium (D) on the oxida-
tion of Zr at 400 �C in 20 mbar O2 are investigated. This
is done by oxidation of partly Pt coated Zr samples with
600 wtppm D and without D, respectively. Finally,
experiments where Ar-filled Zr-based tubes with ZrSn
liner are exposed to water from one end of the tubings
are presented. The results show that the deuterium (D)
concentration in the oxide and substrate of two Zr-based
tubes varies as well as the oxide thickness upon exposure
in H2O/D2O at 370 �C.
2. Experimental
2.1. Gas phase analysis (GPA) technique
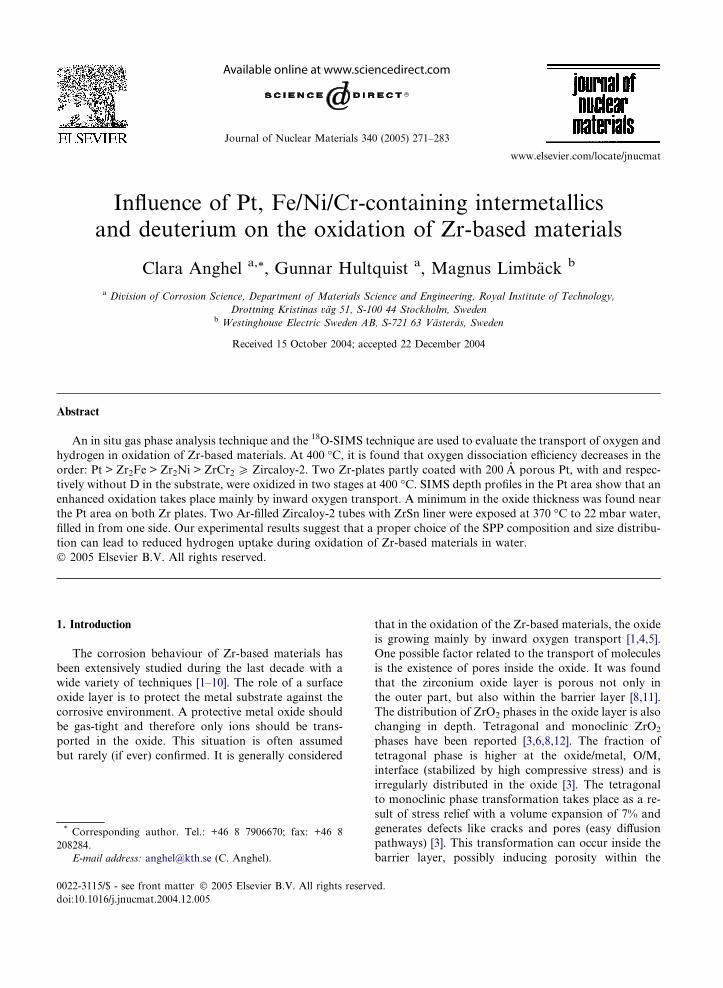
The schematic diagram of the GPA equipment pre-
sented in Fig. 1 consists of:
• A 70 cm3 reaction chamber made of a silica tube and
a stainless steel cross. The reaction chamber is
pumped with an ion pump via a leak valve. In oxida-
tion test of the 1 m long Zr-based tubes, the silica
tube in Fig. 1 is replaced by the Zr-based tube.
• A gas handling system where pressures up to 1 atm
can be used.
• A pressure gauge to measure the total pressure inside
the reaction chamber.
• A mass spectrometer (MS), with a quadruple ana-
lyser, placed in an UHV chamber. Hydrogen and dif-
ferent isotopes can be detected.
• A tube furnace which can be used up to 1200 �C.
The GPA equipment can be used for different types
of measurements: outgassing, hydration, oxidation, dis-
sociation and exchange. These different measurements
are shortly described bellow with some examples.
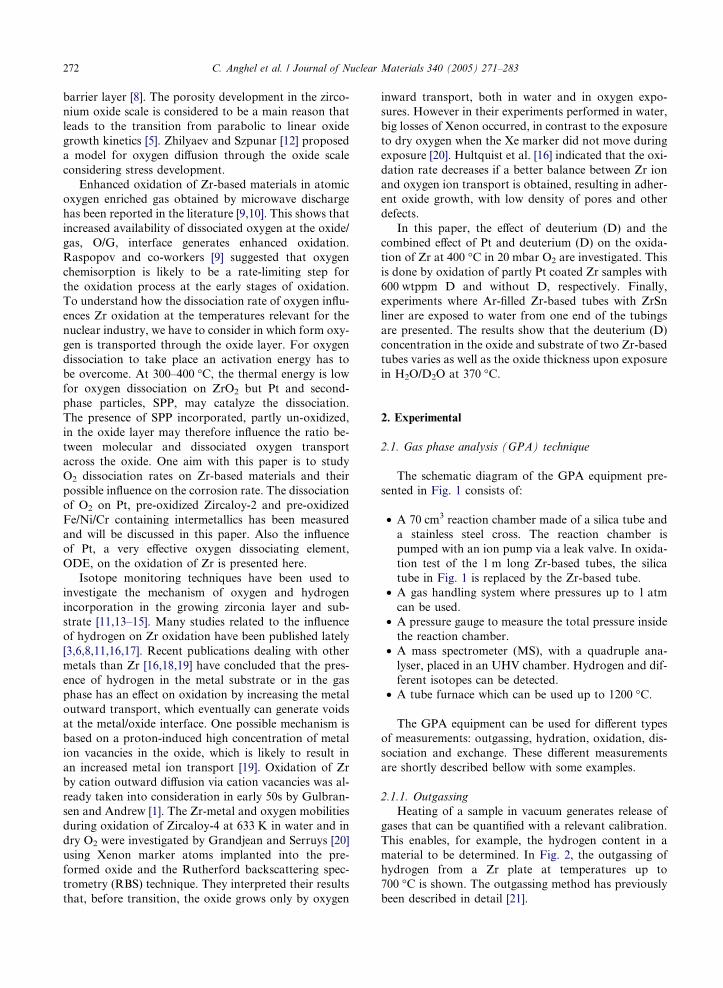
2.1.1. Outgassing
Heating of a sample in vacuum generates release of
gases that can be quantified with a relevant calibration.
This enables, for example, the hydrogen content in a
material to be determined. In Fig. 2, the outgassing of
hydrogen from a Zr plate at temperatures up to
700 �C is shown. The outgassing method has previously
been described in detail [21].
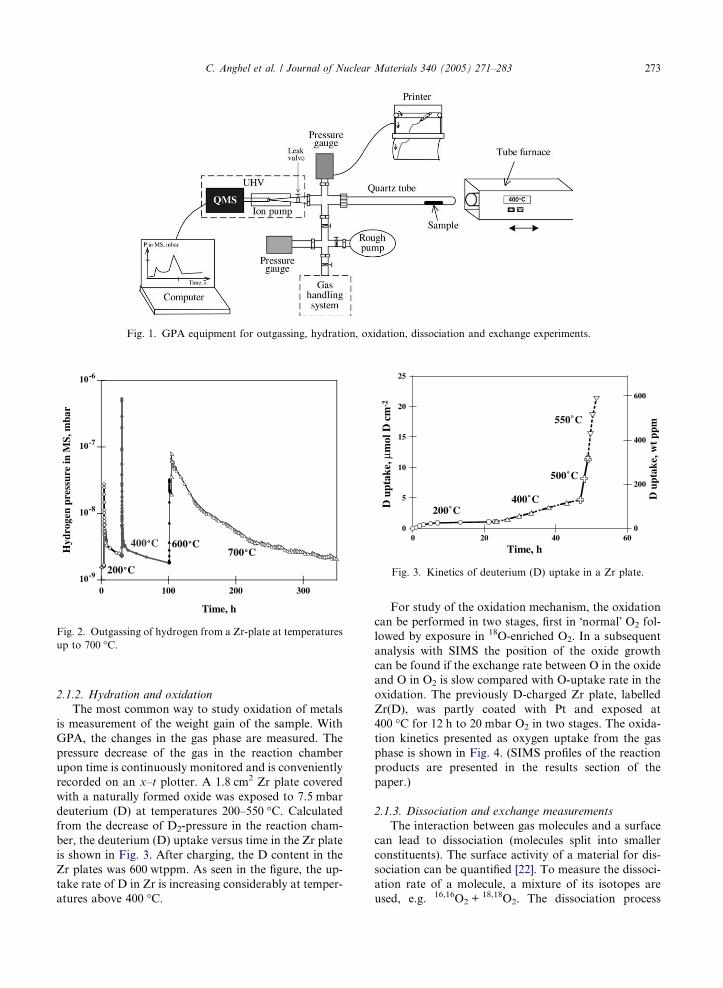
Fig. 1. GPA equipment for outgassing, hydration, oxidation, dissociation and exchange experiments.
10-9
10-8
10-7
10-6
0 100 200 300
Hyd
roge
npr
essu
rein
MS,
mba
r
Time, h
400˚C700˚C
600˚C
200˚C
Fig. 2. Outgassing of hydrogen from a Zr-plate at temperatures
up to 700 �C.
0
5
10
15
20
25
0
200
400
600
0 20 40 60
D u
ptak
e, µ
mol
D c
m-2
D u
ptak
e, w
t ppm
Time, h
200˚C400˚C
500˚C
550˚C
Fig. 3. Kinetics of deuterium (D) uptake in a Zr plate.
C. Anghel et al. / Journal of Nuclear Materials 340 (2005) 271–283 273
2.1.2. Hydration and oxidation
The most common way to study oxidation of metals
is measurement of the weight gain of the sample. With
GPA, the changes in the gas phase are measured. The
pressure decrease of the gas in the reaction chamber
upon time is continuously monitored and is conveniently
recorded on an x–t plotter. A 1.8 cm2 Zr plate covered
with a naturally formed oxide was exposed to 7.5 mbar
deuterium (D) at temperatures 200–550 �C. Calculatedfrom the decrease of D2-pressure in the reaction cham-
ber, the deuterium (D) uptake versus time in the Zr plate
is shown in Fig. 3. After charging, the D content in the
Zr plates was 600 wtppm. As seen in the figure, the up-
take rate of D in Zr is increasing considerably at temper-
atures above 400 �C.
For study of the oxidation mechanism, the oxidation
can be performed in two stages, first in �normal� O2 fol-
lowed by exposure in 18O-enriched O2. In a subsequent
analysis with SIMS the position of the oxide growth
can be found if the exchange rate between O in the oxide
and O in O2 is slow compared with O-uptake rate in the
oxidation. The previously D-charged Zr plate, labelled
Zr(D), was partly coated with Pt and exposed at
400 �C for 12 h to 20 mbar O2 in two stages. The oxida-
tion kinetics presented as oxygen uptake from the gas
phase is shown in Fig. 4. (SIMS profiles of the reaction
products are presented in the results section of the
paper.)
2.1.3. Dissociation and exchange measurements
The interaction between gas molecules and a surface
can lead to dissociation (molecules split into smaller
constituents). The surface activity of a material for dis-
sociation can be quantified [22]. To measure the dissoci-
ation rate of a molecule, a mixture of its isotopes are
used, e.g. 16,16O2 +18,18O2. The dissociation process
0
0.5
1
1.5
2
0
1
2
3
4
5
6
0 200 400 600 800
Oxy
gen
upta
ke,m
bar
Oxy
gen
upta
ke, µµ µµ
mol
Ocm
-2
Time, min.
Adition of 18O
Fig. 4. Oxidation of a partly Pt coated Zr sample containing
600 wtppm D, Zr(D), in 20 mbar O2 at 400 �C.
274 C. Anghel et al. / Journal of Nuclear Materials 340 (2005) 271–283
and a subsequent association of the dissociated species
result in the formation of the mixed molecules 16,18O2.
The partial pressures of the gas components, 16,16O2,16,18O2 and 18,18O2, are obtained via an inlet to the
MS. The inlet is small enough not to influence the total
oxygen pressure in the reaction chamber. By considering
the measured formation rate of the mixed molecules and
the distance from the statistical equilibrium (no more
changes in the gas composition), the dissociation rate
can be calculated. The background dissociation rate of
the silica tube must of course also be taken into account.
A detailed description of the measurements has been
presented elsewhere [22].
Exchange may take place between oxygen in the gas
phase and oxygen in the oxide. This exchange can be
measured in exposure of a 16O-containing oxide to18,18O2. The formation rate of 16,18O2 in the gas phase
will then be a result of exchange between 18O from the
gas phase and 16O from the oxide lattice.
Table 1
Samples, analysis methods with respective figure numbers
Sample Hydrogen content Pt coating
Oxygen dissociation measurements
Zr2Fe <5 wtppm H No
Zr2Ni <5 wtppm H No
ZrCr2 <5 wtppm H No
Zircaloy-2 plate <5 wtppm H No
Pt plate – –
Pt and D influence on Zr oxidation
Zr(D) plate <1 wtppmH + 600 wtppm D Yes
Zr plate <5 wtppm hydrogen Yes
Oxidation of Zr-based tubes in water
Zr-based tube 1 (inside) <1 wtppm H No
Zr-based tube 2 (inside) <1 wtppm H No
2.2. Characterization of the exposed samples
In Table 1 samples and analysis methods used in this
study are collected.
2.2.1. Secondary ion mass spectrometry analyses
SIMS analyses were performed with a Cameca IMS-
6f apparatus, 10 keV, 50–200 nA primary beam of Cs+
ions, which was rastered over 200 · 200 lm2, where ions
where detected from a centered area with a diameter of
70 lm.
2.2.2. X-ray photoelectron spectroscopy, XPS
After oxidation, the outermost layers on the Zr sam-
ples were analyzed with X-ray photoelectron spectro-
scopy, XPS, with Kratos AXIS HS. Detailed scans
(pass energy of 80 eV) of C 1s, Zr 3d, O 1s, Pt 4f were
obtained with a monochromatic AlKa(alfa) X-ray
source (1486.6 eV). The area of analysis was approxi-
mately 0.4 mm2. The binding energies for O 1s and Zr
3d were corrected related to C 1s peak (285 eV).
2.2.3. Scanning Electron Microscopy, SEM
FEG–SEM analysis was performed with a Leo 1530
Field Emission Scanning Electron Microscope equipped
with a GEMINI field emission column.
3. Results and discussion
3.1. Oxygen dissociation on Zr-based materials and Pt
Westinghouse Electric Sweden AB has supplied Zir-
caloy-2 and Zr2Fe, Zr2Ni, ZrCr2-intermetallics used in
this work.
Before dissociation experiments, Zr2Fe, Zr2Ni, ZrCr2intermetallics have been oxidized for 80 min in approxi-
Temperature
(�C)Analysis methods Figure
GPA SEM SIMS XPS
400 · 5, 6
400 · 5, 6
400 · 5, 6
500–700 · 5, 6
400–700 · 5, 6
400 · · · 3, 4, 7, 9–14
400 · · · · 7–10, 12–14
370 · · 15, 16
370 · · 15–17
C. Anghel et al. / Journal of Nuclear Materials 340 (2005) 271–283 275
mately 65 mbar 16,16O2 at 400 �C resulting in 19, 0.8 and
0.4 lm oxide thickness respectively. Zircaloy-2 was oxi-
dized for 90 h in approximately 200 mbar 16,16O2 at 400–
500 �C resulting in 2.5 lm oxide thickness.
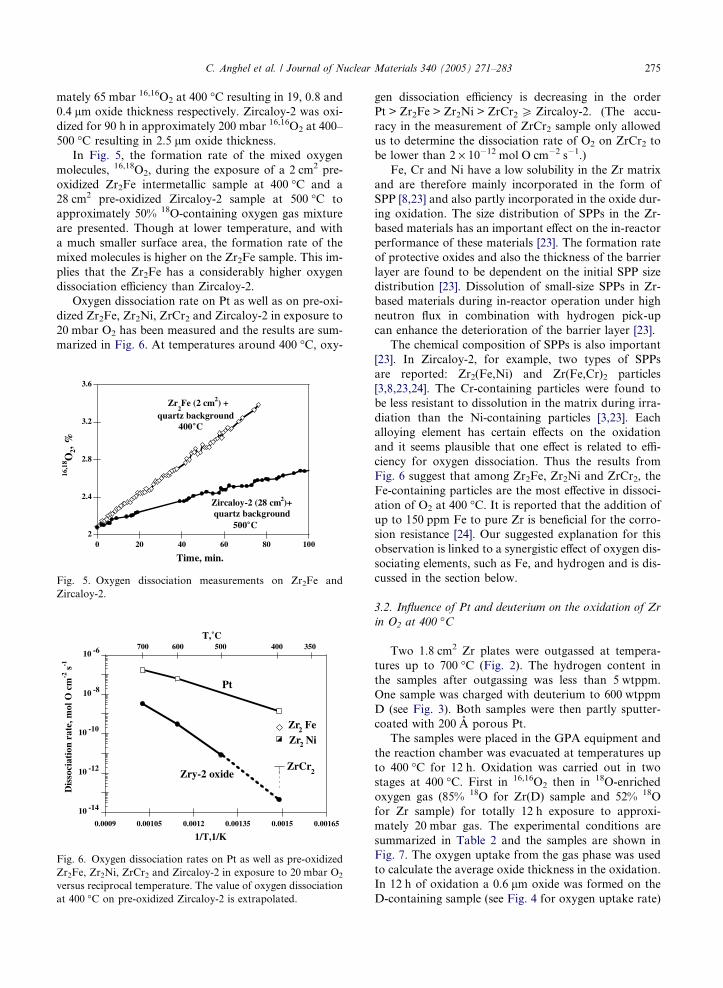
In Fig. 5, the formation rate of the mixed oxygen
molecules, 16,18O2, during the exposure of a 2 cm2 pre-
oxidized Zr2Fe intermetallic sample at 400 �C and a
28 cm2 pre-oxidized Zircaloy-2 sample at 500 �C to
approximately 50% 18O-containing oxygen gas mixture
are presented. Though at lower temperature, and with
a much smaller surface area, the formation rate of the
mixed molecules is higher on the Zr2Fe sample. This im-
plies that the Zr2Fe has a considerably higher oxygen
dissociation efficiency than Zircaloy-2.
Oxygen dissociation rate on Pt as well as on pre-oxi-
dized Zr2Fe, Zr2Ni, ZrCr2 and Zircaloy-2 in exposure to
20 mbar O2 has been measured and the results are sum-
marized in Fig. 6. At temperatures around 400 �C, oxy-
2
2.4
2.8
3.2
3.6
0 20 40 60 80 100
16,1
8 O2,
%
Time, min.
Zr2Fe (2 cm2) +
Zircaloy-2 (28 cm2)+quartz background
quartz background400˚C
500˚C
Fig. 5. Oxygen dissociation measurements on Zr2Fe and
Zircaloy-2.
10 -14
10 -12
10 -10
10 -8
10 -6
0.0009 0.00105 0.0012 0.00135 0.0015 0.00165
Dis
soci
atio
nra
te,m
olO
cm-2
s-1
1/T,1/K
Pt
Zry-2 oxide
Zr2 NiZr2 Fe
ZrCr2
700 600 500 400 350 T,˚C
Fig. 6. Oxygen dissociation rates on Pt as well as pre-oxidized
Zr2Fe, Zr2Ni, ZrCr2 and Zircaloy-2 in exposure to 20 mbar O2
versus reciprocal temperature. The value of oxygen dissociation
at 400 �C on pre-oxidized Zircaloy-2 is extrapolated.
gen dissociation efficiency is decreasing in the order
Pt > Zr2Fe > Zr2Ni > ZrCr2 P Zircaloy-2. (The accu-
racy in the measurement of ZrCr2 sample only allowed
us to determine the dissociation rate of O2 on ZrCr2 to
be lower than 2 · 10�12 mol O cm�2 s�1.)
Fe, Cr and Ni have a low solubility in the Zr matrix
and are therefore mainly incorporated in the form of
SPP [8,23] and also partly incorporated in the oxide dur-
ing oxidation. The size distribution of SPPs in the Zr-
based materials has an important effect on the in-reactor
performance of these materials [23]. The formation rate
of protective oxides and also the thickness of the barrier
layer are found to be dependent on the initial SPP size
distribution [23]. Dissolution of small-size SPPs in Zr-
based materials during in-reactor operation under high
neutron flux in combination with hydrogen pick-up
can enhance the deterioration of the barrier layer [23].
The chemical composition of SPPs is also important
[23]. In Zircaloy-2, for example, two types of SPPs
are reported: Zr2(Fe,Ni) and Zr(Fe,Cr)2 particles
[3,8,23,24]. The Cr-containing particles were found to
be less resistant to dissolution in the matrix during irra-
diation than the Ni-containing particles [3,23]. Each
alloying element has certain effects on the oxidation
and it seems plausible that one effect is related to effi-
ciency for oxygen dissociation. Thus the results from
Fig. 6 suggest that among Zr2Fe, Zr2Ni and ZrCr2, the
Fe-containing particles are the most effective in dissoci-
ation of O2 at 400 �C. It is reported that the addition of
up to 150 ppm Fe to pure Zr is beneficial for the corro-
sion resistance [24]. Our suggested explanation for this
observation is linked to a synergistic effect of oxygen dis-
sociating elements, such as Fe, and hydrogen and is dis-
cussed in the section below.
3.2. Influence of Pt and deuterium on the oxidation of Zr
in O2 at 400 �C
Two 1.8 cm2 Zr plates were outgassed at tempera-
tures up to 700 �C (Fig. 2). The hydrogen content in
the samples after outgassing was less than 5 wtppm.
One sample was charged with deuterium to 600 wtppm
D (see Fig. 3). Both samples were then partly sputter-
coated with 200 A porous Pt.
The samples were placed in the GPA equipment and
the reaction chamber was evacuated at temperatures up
to 400 �C for 12 h. Oxidation was carried out in two
stages at 400 �C. First in 16,16O2 then in 18O-enriched
oxygen gas (85% 18O for Zr(D) sample and 52% 18O
for Zr sample) for totally 12 h exposure to approxi-
mately 20 mbar gas. The experimental conditions are
summarized in Table 2 and the samples are shown in
Fig. 7. The oxygen uptake from the gas phase was used
to calculate the average oxide thickness in the oxidation.
In 12 h of oxidation a 0.6 lm oxide was formed on the
D-containing sample (see Fig. 4 for oxygen uptake rate)
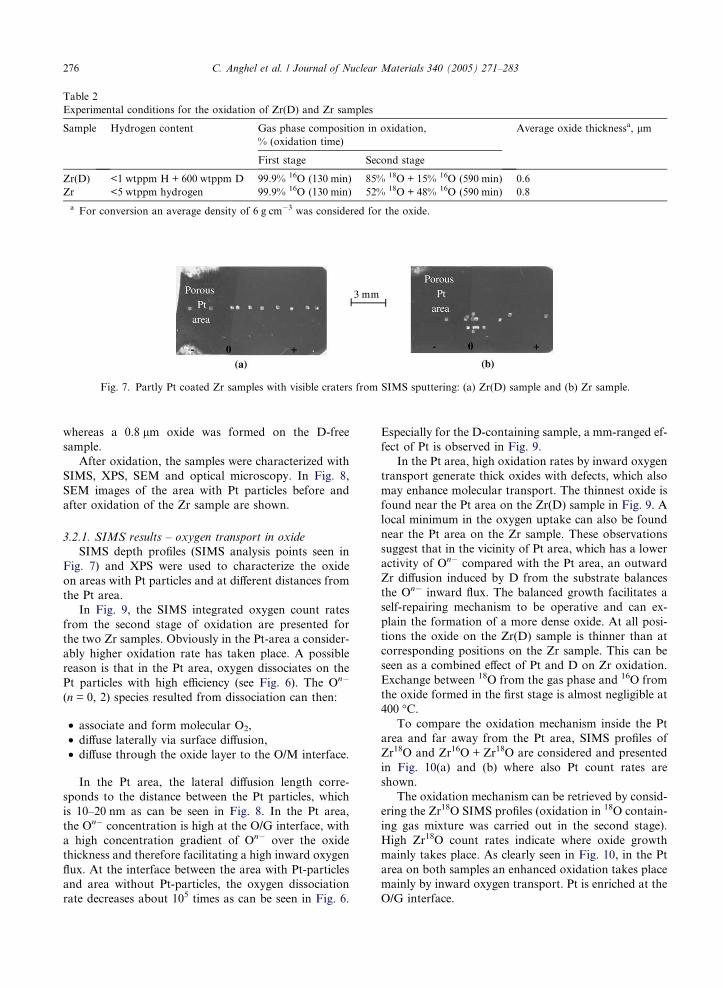
Fig. 7. Partly Pt coated Zr samples with visible craters from SIMS sputtering: (a) Zr(D) sample and (b) Zr sample.
Table 2
Experimental conditions for the oxidation of Zr(D) and Zr samples
Sample Hydrogen content Gas phase composition in oxidation,
% (oxidation time)
Average oxide thicknessa, lm
First stage Second stage
Zr(D) <1 wtppm H + 600 wtppm D 99.9% 16O (130 min) 85% 18O + 15% 16O (590 min) 0.6
Zr <5 wtppm hydrogen 99.9% 16O (130 min) 52% 18O + 48% 16O (590 min) 0.8
a For conversion an average density of 6 g cm�3 was considered for the oxide.
276 C. Anghel et al. / Journal of Nuclear Materials 340 (2005) 271–283
whereas a 0.8 lm oxide was formed on the D-free
sample.
After oxidation, the samples were characterized with
SIMS, XPS, SEM and optical microscopy. In Fig. 8,
SEM images of the area with Pt particles before and
after oxidation of the Zr sample are shown.
3.2.1. SIMS results – oxygen transport in oxide
SIMS depth profiles (SIMS analysis points seen in
Fig. 7) and XPS were used to characterize the oxide
on areas with Pt particles and at different distances from
the Pt area.
In Fig. 9, the SIMS integrated oxygen count rates
from the second stage of oxidation are presented for
the two Zr samples. Obviously in the Pt-area a consider-
ably higher oxidation rate has taken place. A possible
reason is that in the Pt area, oxygen dissociates on the
Pt particles with high efficiency (see Fig. 6). The On�
(n = 0, 2) species resulted from dissociation can then:
• associate and form molecular O2,
• diffuse laterally via surface diffusion,
• diffuse through the oxide layer to the O/M interface.
In the Pt area, the lateral diffusion length corre-
sponds to the distance between the Pt particles, which
is 10–20 nm as can be seen in Fig. 8. In the Pt area,
the On� concentration is high at the O/G interface, with
a high concentration gradient of On� over the oxide
thickness and therefore facilitating a high inward oxygen
flux. At the interface between the area with Pt-particles
and area without Pt-particles, the oxygen dissociation
rate decreases about 105 times as can be seen in Fig. 6.
Especially for the D-containing sample, a mm-ranged ef-
fect of Pt is observed in Fig. 9.
In the Pt area, high oxidation rates by inward oxygen
transport generate thick oxides with defects, which also
may enhance molecular transport. The thinnest oxide is
found near the Pt area on the Zr(D) sample in Fig. 9. A
local minimum in the oxygen uptake can also be found
near the Pt area on the Zr sample. These observations
suggest that in the vicinity of Pt area, which has a lower
activity of On� compared with the Pt area, an outward
Zr diffusion induced by D from the substrate balances
the On� inward flux. The balanced growth facilitates a
self-repairing mechanism to be operative and can ex-
plain the formation of a more dense oxide. At all posi-
tions the oxide on the Zr(D) sample is thinner than at
corresponding positions on the Zr sample. This can be
seen as a combined effect of Pt and D on Zr oxidation.
Exchange between 18O from the gas phase and 16O from
the oxide formed in the first stage is almost negligible at
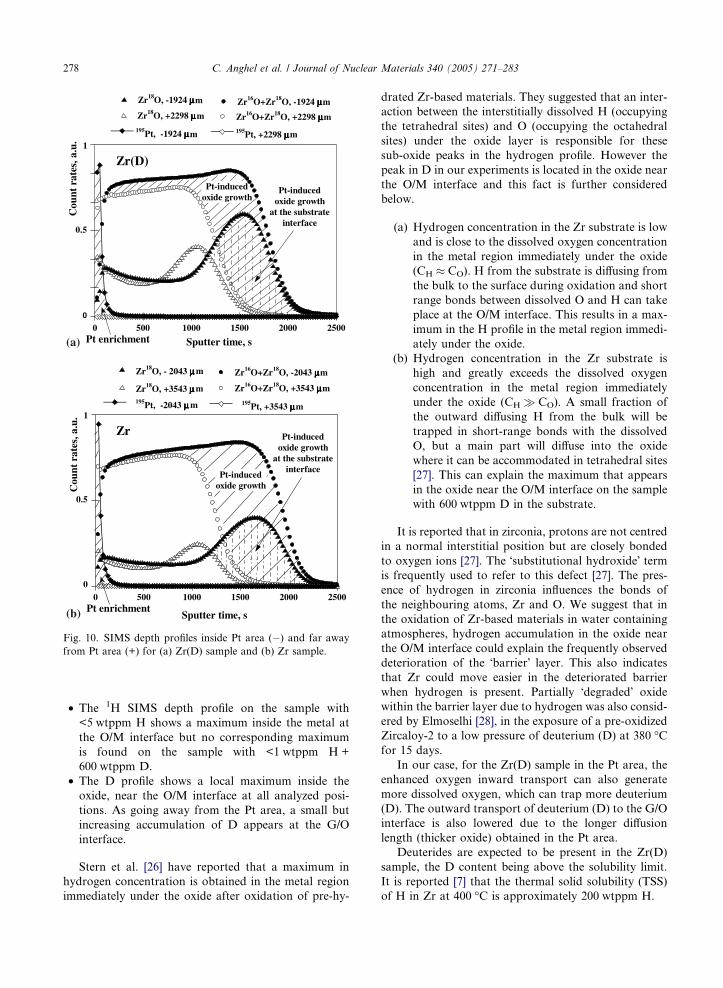
400 �C.To compare the oxidation mechanism inside the Pt
area and far away from the Pt area, SIMS profiles of
Zr18O and Zr16O + Zr18O are considered and presented
in Fig. 10(a) and (b) where also Pt count rates are
shown.
The oxidation mechanism can be retrieved by consid-
ering the Zr18O SIMS profiles (oxidation in 18O contain-
ing gas mixture was carried out in the second stage).
High Zr18O count rates indicate where oxide growth
mainly takes place. As clearly seen in Fig. 10, in the Pt
area on both samples an enhanced oxidation takes place
mainly by inward oxygen transport. Pt is enriched at the
O/G interface.

Fig. 8. SEM images of the area with Pt particles on Zr
substrate: (a) before oxidation and (b) after 12 h oxidation in
O2 at 400 �C.
Effect of Pt onthe oxidation of Zr
Effect of Pt onthe oxidation of
Zr(D)
0
2x10¹¹
4x10¹¹
6x10¹¹
8x10¹¹
1x10¹²
0 2000 4000 6000 8000
Inte
grat
edO
-cou
ntra
tes
from
2ndst
age
ofox
idat
ion
Distance from Pt-area, µµµµm
O-spill over~ 10 nm
Area withPt particles
Zr
Zr(D)
O-spill over~ mm
Fig. 9. SIMS integrated oxygen count rates from second stage
of oxidation on different positions on the two samples after
two-stage oxidation at 400 �C.
C. Anghel et al. / Journal of Nuclear Materials 340 (2005) 271–283 277
Relatively high Zr18O count rates are found for the
Zr(D) sample far away from the Pt area at the O/G
interface, which could be related to a D-induced out-
ward Zr diffusion.
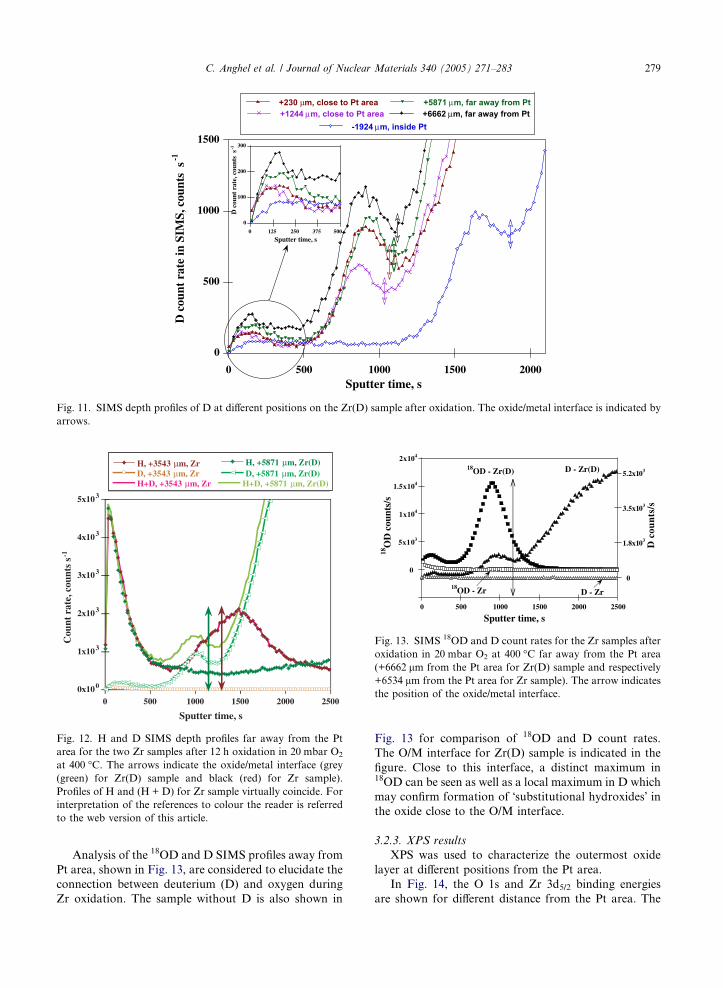
3.2.2. SIMS results – hydrogen transport
The SIMS profiles of deuterium (D) for the Zr(D)
sample in different positions from the Pt area, after
12 h oxidation are shown in Fig. 11. In this figure, ar-
rows indicate the position of the O/M interface based
on sputter time when the 90Zr ion count rate has de-
creased to half of its maximum value.
The area close to the O/G interface is magnified in
Fig. 11 to show the difference between the D maxima
at different distance from Pt area. For all positions ex-
cept in the Pt area a local maximum appears near the
O/G interface. This can result from a suppressed D out-
ward diffusion in the Pt area. A local maximum in the D
count rate appears also near the O/M interface at all
analyzed positions. D outward transport is slightly
increasing as the distance from the Pt area increases.
The highest concentration of D in the oxide is found
at the longest distance away from the Pt area, +6662 lm.
It is reported in the literature [25] that hydrogen
atoms dissolved in the Zr substrate prefer tetrahedral
interstitial sites and they diffuse interstitially. The radius
of these tetrahedral interstitial sites is approximately
0.036 nm [25]. The radius of hydrogen atom is about
0.04 nm [25], which means that the strain induced by
hydrogen dissolution in Zr is negligible [25]. Zhang
et al. [25] have found that hydrogen tends to segregate
to the Zr surface. When dissolved oxygen is present in
the Zr substrate, hydrogen segregation to the Zr surface
is enhanced [25]. The concentration of dissolved oxygen
in Zr varies from the bulk to the surface and is much
higher underneath the oxide, accommodating also more
hydrogen in this area.
In our Zr samples, prior to oxidation the hydro-
gen content was <5 wtppm H and (<1 wtppm H +
600 wtppm D) respectively. SIMS profiles of H, D and
(H + D) are presented in Fig. 12 for the two Zr samples
at +3543 lm, Zr, and +5871 lm, Zr(D), away from
respective Pt area. From Figs. 11 and 12 it is observed
that:
• A high H concentration appears at the G/O interface,
which is likely due to �contamination� and/or 1H
SIMS background.
• D contamination is negligible at the G/O interface,
which indicate that accurate information requires
the use of D instead of H.
Pt-inducedoxide growth
0 500 1000 1500 2000 2500
Zr16O+Zr18O, +2298 µµµµmZr18O, +2298 µµµµm
Zr16O+Zr18O, -1924 µµµµmZr18O, -1924 µµµµm
195Pt, +2298 µµµµm195Pt, -1924 µµµµm
Cou
ntra
tes,
a.u.
Sputter time, s
Pt-inducedoxide growth
at the substrateinterface
Pt enrichment
0.5
1
0
Zr(D)
0 500 1000 1500 2000 2500
Zr16O+Zr18O, +3543 µµµµmZr18O, +3543 µµµµm
Zr16O+Zr18O, -2043 µµµµmZr18O, - 2043 µµµµm
195Pt, +3543 µµµµm195Pt, -2043 µµµµm
Cou
ntra
tes,
a.u.
Sputter time, s
0.5
1
0
Pt-inducedoxide growth
Pt-inducedoxide growth
at the substrateinterface
Pt enrichment
Zr
(a)
(b)
Fig. 10. SIMS depth profiles inside Pt area (�) and far away
from Pt area (+) for (a) Zr(D) sample and (b) Zr sample.
278 C. Anghel et al. / Journal of Nuclear Materials 340 (2005) 271–283
• The 1H SIMS depth profile on the sample with
<5 wtppm H shows a maximum inside the metal at
the O/M interface but no corresponding maximum
is found on the sample with <1 wtppm H +
600 wtppm D.
• The D profile shows a local maximum inside the
oxide, near the O/M interface at all analyzed posi-
tions. As going away from the Pt area, a small but
increasing accumulation of D appears at the G/O
interface.
Stern et al. [26] have reported that a maximum in
hydrogen concentration is obtained in the metal region
immediately under the oxide after oxidation of pre-hy-
drated Zr-based materials. They suggested that an inter-
action between the interstitially dissolved H (occupying
the tetrahedral sites) and O (occupying the octahedral
sites) under the oxide layer is responsible for these
sub-oxide peaks in the hydrogen profile. However the
peak in D in our experiments is located in the oxide near
the O/M interface and this fact is further considered
below.
(a) Hydrogen concentration in the Zr substrate is low
and is close to the dissolved oxygen concentration
in the metal region immediately under the oxide
(CH � CO). H from the substrate is diffusing from
the bulk to the surface during oxidation and short
range bonds between dissolved O and H can take
place at the O/M interface. This results in a max-
imum in the H profile in the metal region immedi-
ately under the oxide.
(b) Hydrogen concentration in the Zr substrate is
high and greatly exceeds the dissolved oxygen
concentration in the metal region immediately
under the oxide (CH � CO). A small fraction of
the outward diffusing H from the bulk will be
trapped in short-range bonds with the dissolved
O, but a main part will diffuse into the oxide
where it can be accommodated in tetrahedral sites
[27]. This can explain the maximum that appears
in the oxide near the O/M interface on the sample
with 600 wtppm D in the substrate.
It is reported that in zirconia, protons are not centred
in a normal interstitial position but are closely bonded
to oxygen ions [27]. The �substitutional hydroxide� termis frequently used to refer to this defect [27]. The pres-
ence of hydrogen in zirconia influences the bonds of
the neighbouring atoms, Zr and O. We suggest that in
the oxidation of Zr-based materials in water containing
atmospheres, hydrogen accumulation in the oxide near
the O/M interface could explain the frequently observed
deterioration of the �barrier� layer. This also indicates
that Zr could move easier in the deteriorated barrier
when hydrogen is present. Partially �degraded� oxide
within the barrier layer due to hydrogen was also consid-
ered by Elmoselhi [28], in the exposure of a pre-oxidized
Zircaloy-2 to a low pressure of deuterium (D) at 380 �Cfor 15 days.
In our case, for the Zr(D) sample in the Pt area, the
enhanced oxygen inward transport can also generate
more dissolved oxygen, which can trap more deuterium
(D). The outward transport of deuterium (D) to the G/O
interface is also lowered due to the longer diffusion
length (thicker oxide) obtained in the Pt area.
Deuterides are expected to be present in the Zr(D)
sample, the D content being above the solubility limit.
It is reported [7] that the thermal solid solubility (TSS)
of H in Zr at 400 �C is approximately 200 wtppm H.
0
500
1000
1500
0 500 1000 1500 2000
+1244 µm, close to Pt area +230 µm, close to Pt area
+6662 µm, far away from Pt +5871 µm, far away from Pt
-1924 µm, inside Pt
D c
ount
rat
e in
SIM
S, c
ount
s s
-1
Sputter time, s
0
100
200
300
0 125 250 375 500D
cou
nt r
ate,
cou
nts
s-1
Sputter time, s
Fig. 11. SIMS depth profiles of D at different positions on the Zr(D) sample after oxidation. The oxide/metal interface is indicated by
arrows.
0x100
1x10³
2x10³
3x10³
4x10³
5x10³
0 500 1000 1500 2000 2500
H, +3543 µm, ZrD, +3543 µm, ZrH+D, +3543 µm, Zr
H, +5871 µm, Zr(D)D, +5871 µm, Zr(D)
H+D, +5871 µm, Zr(D)
Cou
nt r
ate,
cou
nts
s-1
Sputter time, s
Fig. 12. H and D SIMS depth profiles far away from the Pt
area for the two Zr samples after 12 h oxidation in 20 mbar O2
at 400 �C. The arrows indicate the oxide/metal interface (grey
(green) for Zr(D) sample and black (red) for Zr sample).
Profiles of H and (H + D) for Zr sample virtually coincide. For
interpretation of the references to colour the reader is referred
to the web version of this article.
0
5x10³
1x10⁴
1.5x10⁴
2x10⁴
0 500 1000 1500 2000 2500
0
1.8x10³
3.5x10³
5.2x10³
18O
Dco
unts
/s
D c
oun
ts/s
Sputter time, s
18OD - Zr(D) D - Zr(D)
18OD - Zr D - Zr
Fig. 13. SIMS 18OD and D count rates for the Zr samples after
oxidation in 20 mbar O2 at 400 �C far away from the Pt area
(+6662 lm from the Pt area for Zr(D) sample and respectively
+6534 lm from the Pt area for Zr sample). The arrow indicates
the position of the oxide/metal interface.
C. Anghel et al. / Journal of Nuclear Materials 340 (2005) 271–283 279
Analysis of the 18OD and D SIMS profiles away from
Pt area, shown in Fig. 13, are considered to elucidate the
connection between deuterium (D) and oxygen during
Zr oxidation. The sample without D is also shown in
Fig. 13 for comparison of 18OD and D count rates.
The O/M interface for Zr(D) sample is indicated in the
figure. Close to this interface, a distinct maximum in18OD can be seen as well as a local maximum in D which
may confirm formation of �substitutional hydroxides� inthe oxide close to the O/M interface.
3.2.3. XPS results
XPS was used to characterize the outermost oxide
layer at different positions from the Pt area.
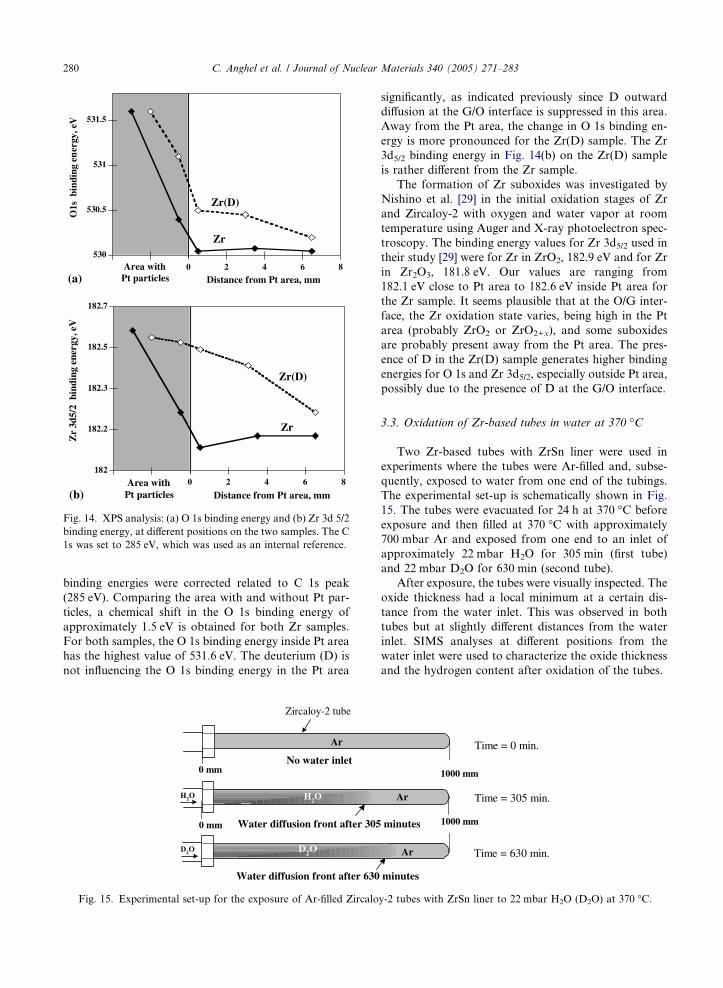
In Fig. 14, the O 1s and Zr 3d5/2 binding energies
are shown for different distance from the Pt area. The
530
530.5
531
531.5
-4 -2 0 2 4 6 8
O1s
bin
ding
en
ergy
, eV
Distance from Pt area, mm
Zr(D)
Zr
Area withPt particles
182
182.2
182.3
182.5
182.7
-4 -2 0 2 4 6 8
Zr
3d5/
2bi
ndin
gen
ergy
,eV
Distance from Pt area, mmArea with
Pt particles
Zr(D)
Zr
(a)
(b)
Fig. 14. XPS analysis: (a) O 1s binding energy and (b) Zr 3d 5/2
binding energy, at different positions on the two samples. The C
1s was set to 285 eV, which was used as an internal reference.
280 C. Anghel et al. / Journal of Nuclear Materials 340 (2005) 271–283
binding energies were corrected related to C 1s peak
(285 eV). Comparing the area with and without Pt par-
ticles, a chemical shift in the O 1s binding energy of
approximately 1.5 eV is obtained for both Zr samples.
For both samples, the O 1s binding energy inside Pt area
has the highest value of 531.6 eV. The deuterium (D) is
not influencing the O 1s binding energy in the Pt area
D2O D2O
Zircaloy-2 tube
Ar
No water inlet0 mm
H2O H2O
0 mm Water diffusion front after 305
Water diffusion front after 630
Fig. 15. Experimental set-up for the exposure of Ar-filled Zircalo
significantly, as indicated previously since D outward
diffusion at the G/O interface is suppressed in this area.
Away from the Pt area, the change in O 1s binding en-
ergy is more pronounced for the Zr(D) sample. The Zr
3d5/2 binding energy in Fig. 14(b) on the Zr(D) sample
is rather different from the Zr sample.
The formation of Zr suboxides was investigated by
Nishino et al. [29] in the initial oxidation stages of Zr
and Zircaloy-2 with oxygen and water vapor at room
temperature using Auger and X-ray photoelectron spec-
troscopy. The binding energy values for Zr 3d5/2 used in
their study [29] were for Zr in ZrO2, 182.9 eV and for Zr
in Zr2O3, 181.8 eV. Our values are ranging from
182.1 eV close to Pt area to 182.6 eV inside Pt area for
the Zr sample. It seems plausible that at the O/G inter-
face, the Zr oxidation state varies, being high in the Pt
area (probably ZrO2 or ZrO2+x), and some suboxides
are probably present away from the Pt area. The pres-
ence of D in the Zr(D) sample generates higher binding
energies for O 1s and Zr 3d5/2, especially outside Pt area,
possibly due to the presence of D at the G/O interface.
3.3. Oxidation of Zr-based tubes in water at 370 �C
Two Zr-based tubes with ZrSn liner were used in
experiments where the tubes were Ar-filled and, subse-
quently, exposed to water from one end of the tubings.
The experimental set-up is schematically shown in Fig.
15. The tubes were evacuated for 24 h at 370 �C before
exposure and then filled at 370 �C with approximately
700 mbar Ar and exposed from one end to an inlet of
approximately 22 mbar H2O for 305 min (first tube)
and 22 mbar D2O for 630 min (second tube).
After exposure, the tubes were visually inspected. The
oxide thickness had a local minimum at a certain dis-
tance from the water inlet. This was observed in both
tubes but at slightly different distances from the water
inlet. SIMS analyses at different positions from the
water inlet were used to characterize the oxide thickness
and the hydrogen content after oxidation of the tubes.
Time = 0 min.
Time = 305 min.
1000 mm
Ar
Time = 630 min.Ar
1000 mm minutes
minutes
y-2 tubes with ZrSn liner to 22 mbar H2O (D2O) at 370 �C.
C. Anghel et al. / Journal of Nuclear Materials 340 (2005) 271–283 281
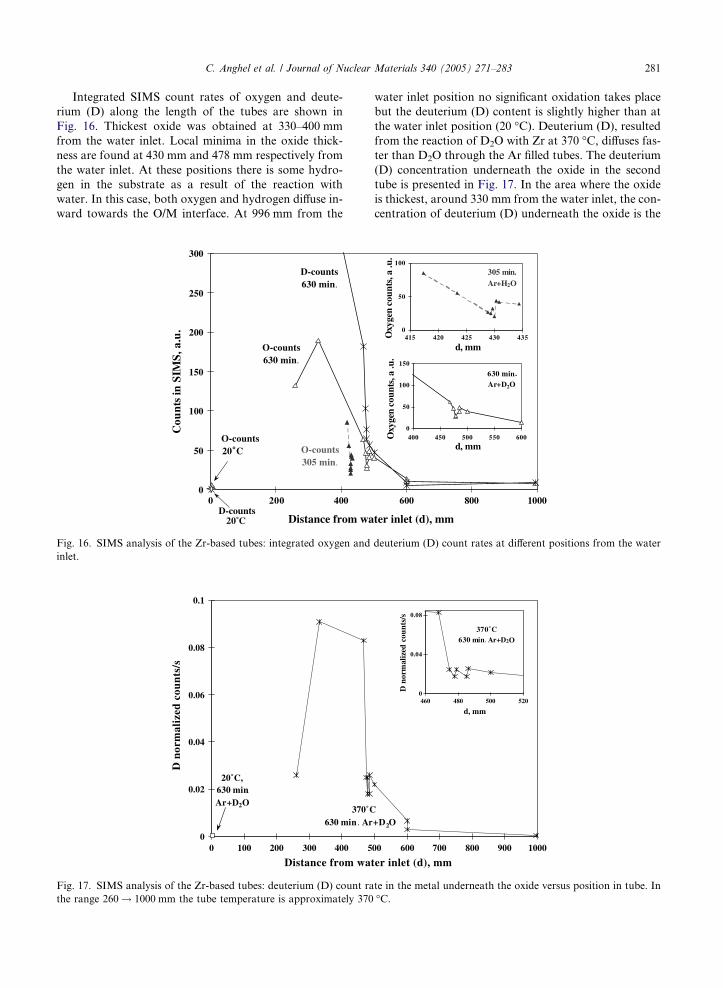
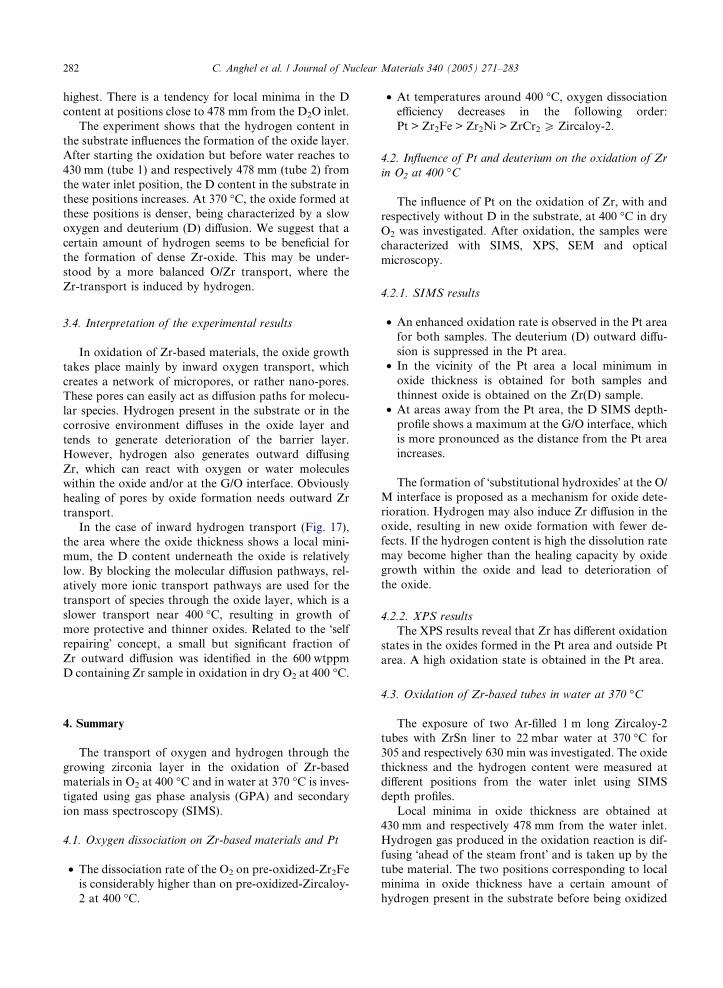
Integrated SIMS count rates of oxygen and deute-
rium (D) along the length of the tubes are shown in
Fig. 16. Thickest oxide was obtained at 330–400 mm
from the water inlet. Local minima in the oxide thick-
ness are found at 430 mm and 478 mm respectively from
the water inlet. At these positions there is some hydro-
gen in the substrate as a result of the reaction with
water. In this case, both oxygen and hydrogen diffuse in-
ward towards the O/M interface. At 996 mm from the
0
50
100
150
200
250
300
0 200 400
Distance from wa
Cou
nts
inSI
MS,
a.u
.
20˚C
O-counts630 min.
D-counts630 min.
O-counts
D-counts
20˚C O-counts305 min.
Fig. 16. SIMS analysis of the Zr-based tubes: integrated oxygen and
inlet.
0
0.02
0.04
0.06
0.08
0.1
0 100 200 300 400 5
Distance from wat
D n
orm
aliz
ed c
oun
ts/s
370˚C630 min . Ar
20˚C,630 min.Ar+D2O
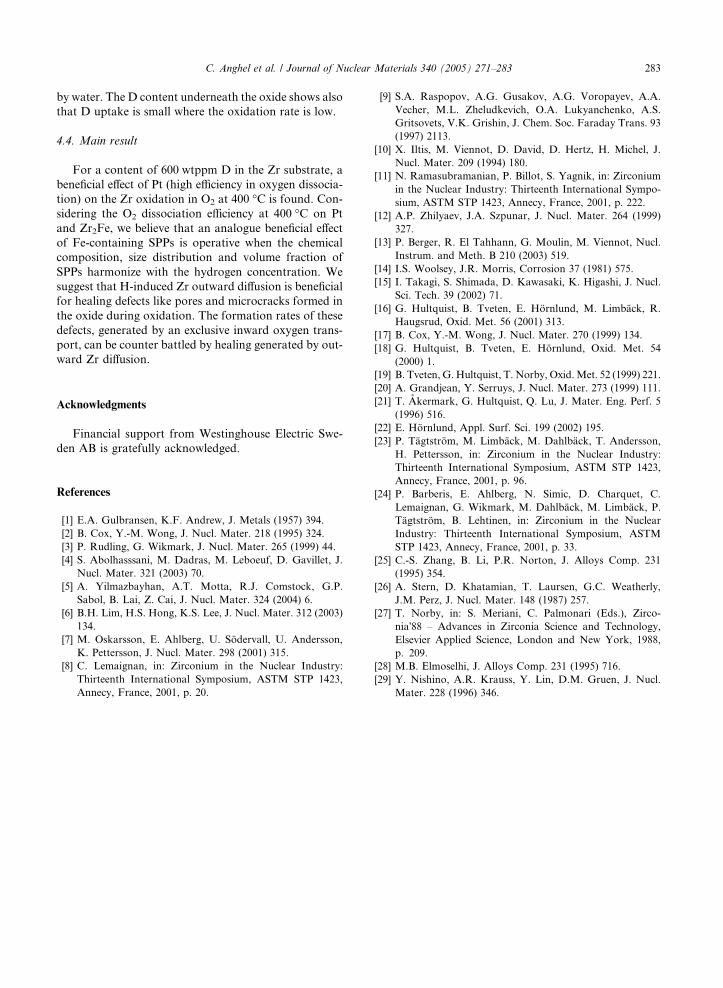
Fig. 17. SIMS analysis of the Zr-based tubes: deuterium (D) count ra
the range 260! 1000 mm the tube temperature is approximately 370
water inlet position no significant oxidation takes place
but the deuterium (D) content is slightly higher than at
the water inlet position (20 �C). Deuterium (D), resulted
from the reaction of D2O with Zr at 370 �C, diffuses fas-ter than D2O through the Ar filled tubes. The deuterium
(D) concentration underneath the oxide in the second
tube is presented in Fig. 17. In the area where the oxide
is thickest, around 330 mm from the water inlet, the con-
centration of deuterium (D) underneath the oxide is the
600 800 1000
ter inlet (d), mm
0
50
100
415 420 425 430 435
d, mm
305 min.Ar+H2O
0
50
100
150
400 450 500 550 600
d, mm
Oxy
gen
coun
ts,a
.u.
Oxy
gen
coun
ts,a
.u.
630 min.Ar+D2O
deuterium (D) count rates at different positions from the water
00 600 700 800 900 1000
er inlet (d), mm
+D2O
0
0.04
0.08
460 480 500 520
d, mm
Dno
rmal
ized
coun
ts/s
370˚C630 min. Ar+D2O
te in the metal underneath the oxide versus position in tube. In
�C.
282 C. Anghel et al. / Journal of Nuclear Materials 340 (2005) 271–283
highest. There is a tendency for local minima in the D
content at positions close to 478 mm from the D2O inlet.
The experiment shows that the hydrogen content in
the substrate influences the formation of the oxide layer.
After starting the oxidation but before water reaches to
430 mm (tube 1) and respectively 478 mm (tube 2) from
the water inlet position, the D content in the substrate in
these positions increases. At 370 �C, the oxide formed at
these positions is denser, being characterized by a slow
oxygen and deuterium (D) diffusion. We suggest that a
certain amount of hydrogen seems to be beneficial for
the formation of dense Zr-oxide. This may be under-
stood by a more balanced O/Zr transport, where the
Zr-transport is induced by hydrogen.
3.4. Interpretation of the experimental results
In oxidation of Zr-based materials, the oxide growth
takes place mainly by inward oxygen transport, which
creates a network of micropores, or rather nano-pores.
These pores can easily act as diffusion paths for molecu-
lar species. Hydrogen present in the substrate or in the
corrosive environment diffuses in the oxide layer and
tends to generate deterioration of the barrier layer.
However, hydrogen also generates outward diffusing
Zr, which can react with oxygen or water molecules
within the oxide and/or at the G/O interface. Obviously
healing of pores by oxide formation needs outward Zr
transport.
In the case of inward hydrogen transport (Fig. 17),
the area where the oxide thickness shows a local mini-
mum, the D content underneath the oxide is relatively
low. By blocking the molecular diffusion pathways, rel-
atively more ionic transport pathways are used for the
transport of species through the oxide layer, which is a
slower transport near 400 �C, resulting in growth of
more protective and thinner oxides. Related to the �selfrepairing� concept, a small but significant fraction of
Zr outward diffusion was identified in the 600 wtppm
D containing Zr sample in oxidation in dry O2 at 400 �C.
4. Summary
The transport of oxygen and hydrogen through the
growing zirconia layer in the oxidation of Zr-based
materials in O2 at 400 �C and in water at 370 �C is inves-
tigated using gas phase analysis (GPA) and secondary
ion mass spectroscopy (SIMS).
4.1. Oxygen dissociation on Zr-based materials and Pt
• The dissociation rate of the O2 on pre-oxidized-Zr2Fe
is considerably higher than on pre-oxidized-Zircaloy-
2 at 400 �C.
• At temperatures around 400 �C, oxygen dissociation
efficiency decreases in the following order:
Pt > Zr2Fe > Zr2Ni > ZrCr2 P Zircaloy-2.
4.2. Influence of Pt and deuterium on the oxidation of Zr
in O2 at 400 �C
The influence of Pt on the oxidation of Zr, with and
respectively without D in the substrate, at 400 �C in dry
O2 was investigated. After oxidation, the samples were
characterized with SIMS, XPS, SEM and optical
microscopy.
4.2.1. SIMS results
• An enhanced oxidation rate is observed in the Pt area
for both samples. The deuterium (D) outward diffu-
sion is suppressed in the Pt area.
• In the vicinity of the Pt area a local minimum in
oxide thickness is obtained for both samples and
thinnest oxide is obtained on the Zr(D) sample.
• At areas away from the Pt area, the D SIMS depth-
profile shows a maximum at the G/O interface, which
is more pronounced as the distance from the Pt area
increases.
The formation of �substitutional hydroxides� at the O/
M interface is proposed as a mechanism for oxide dete-
rioration. Hydrogen may also induce Zr diffusion in the
oxide, resulting in new oxide formation with fewer de-
fects. If the hydrogen content is high the dissolution rate
may become higher than the healing capacity by oxide
growth within the oxide and lead to deterioration of
the oxide.
4.2.2. XPS results
The XPS results reveal that Zr has different oxidation
states in the oxides formed in the Pt area and outside Pt
area. A high oxidation state is obtained in the Pt area.
4.3. Oxidation of Zr-based tubes in water at 370 �C
The exposure of two Ar-filled 1 m long Zircaloy-2
tubes with ZrSn liner to 22 mbar water at 370 �C for
305 and respectively 630 min was investigated. The oxide
thickness and the hydrogen content were measured at
different positions from the water inlet using SIMS
depth profiles.
Local minima in oxide thickness are obtained at
430 mm and respectively 478 mm from the water inlet.
Hydrogen gas produced in the oxidation reaction is dif-
fusing �ahead of the steam front� and is taken up by the
tube material. The two positions corresponding to local
minima in oxide thickness have a certain amount of
hydrogen present in the substrate before being oxidized
C. Anghel et al. / Journal of Nuclear Materials 340 (2005) 271–283 283
by water. The D content underneath the oxide shows also
that D uptake is small where the oxidation rate is low.
4.4. Main result
For a content of 600 wtppm D in the Zr substrate, a
beneficial effect of Pt (high efficiency in oxygen dissocia-
tion) on the Zr oxidation in O2 at 400 �C is found. Con-
sidering the O2 dissociation efficiency at 400 �C on Pt
and Zr2Fe, we believe that an analogue beneficial effect
of Fe-containing SPPs is operative when the chemical
composition, size distribution and volume fraction of
SPPs harmonize with the hydrogen concentration. We
suggest that H-induced Zr outward diffusion is beneficial
for healing defects like pores and microcracks formed in
the oxide during oxidation. The formation rates of these
defects, generated by an exclusive inward oxygen trans-
port, can be counter battled by healing generated by out-
ward Zr diffusion.
Acknowledgments
Financial support from Westinghouse Electric Swe-
den AB is gratefully acknowledged.
References
[1] E.A. Gulbransen, K.F. Andrew, J. Metals (1957) 394.
[2] B. Cox, Y.-M. Wong, J. Nucl. Mater. 218 (1995) 324.
[3] P. Rudling, G. Wikmark, J. Nucl. Mater. 265 (1999) 44.
[4] S. Abolhasssani, M. Dadras, M. Leboeuf, D. Gavillet, J.
Nucl. Mater. 321 (2003) 70.
[5] A. Yilmazbayhan, A.T. Motta, R.J. Comstock, G.P.
Sabol, B. Lai, Z. Cai, J. Nucl. Mater. 324 (2004) 6.
[6] B.H. Lim, H.S. Hong, K.S. Lee, J. Nucl. Mater. 312 (2003)
134.
[7] M. Oskarsson, E. Ahlberg, U. Sodervall, U. Andersson,
K. Pettersson, J. Nucl. Mater. 298 (2001) 315.
[8] C. Lemaignan, in: Zirconium in the Nuclear Industry:
Thirteenth International Symposium, ASTM STP 1423,
Annecy, France, 2001, p. 20.
[9] S.A. Raspopov, A.G. Gusakov, A.G. Voropayev, A.A.
Vecher, M.L. Zheludkevich, O.A. Lukyanchenko, A.S.
Gritsovets, V.K. Grishin, J. Chem. Soc. Faraday Trans. 93
(1997) 2113.
[10] X. Iltis, M. Viennot, D. David, D. Hertz, H. Michel, J.
Nucl. Mater. 209 (1994) 180.
[11] N. Ramasubramanian, P. Billot, S. Yagnik, in: Zirconium
in the Nuclear Industry: Thirteenth International Sympo-
sium, ASTM STP 1423, Annecy, France, 2001, p. 222.
[12] A.P. Zhilyaev, J.A. Szpunar, J. Nucl. Mater. 264 (1999)
327.
[13] P. Berger, R. El Tahhann, G. Moulin, M. Viennot, Nucl.
Instrum. and Meth. B 210 (2003) 519.
[14] I.S. Woolsey, J.R. Morris, Corrosion 37 (1981) 575.
[15] I. Takagi, S. Shimada, D. Kawasaki, K. Higashi, J. Nucl.
Sci. Tech. 39 (2002) 71.
[16] G. Hultquist, B. Tveten, E. Hornlund, M. Limback, R.
Haugsrud, Oxid. Met. 56 (2001) 313.
[17] B. Cox, Y.-M. Wong, J. Nucl. Mater. 270 (1999) 134.
[18] G. Hultquist, B. Tveten, E. Hornlund, Oxid. Met. 54
(2000) 1.
[19] B. Tveten, G.Hultquist, T. Norby, Oxid.Met. 52 (1999) 221.
[20] A. Grandjean, Y. Serruys, J. Nucl. Mater. 273 (1999) 111.
[21] T. Akermark, G. Hultquist, Q. Lu, J. Mater. Eng. Perf. 5
(1996) 516.
[22] E. Hornlund, Appl. Surf. Sci. 199 (2002) 195.
[23] P. Tagtstrom, M. Limback, M. Dahlback, T. Andersson,
H. Pettersson, in: Zirconium in the Nuclear Industry:
Thirteenth International Symposium, ASTM STP 1423,
Annecy, France, 2001, p. 96.
[24] P. Barberis, E. Ahlberg, N. Simic, D. Charquet, C.
Lemaignan, G. Wikmark, M. Dahlback, M. Limback, P.
Tagtstrom, B. Lehtinen, in: Zirconium in the Nuclear
Industry: Thirteenth International Symposium, ASTM
STP 1423, Annecy, France, 2001, p. 33.
[25] C.-S. Zhang, B. Li, P.R. Norton, J. Alloys Comp. 231
(1995) 354.
[26] A. Stern, D. Khatamian, T. Laursen, G.C. Weatherly,
J.M. Perz, J. Nucl. Mater. 148 (1987) 257.
[27] T. Norby, in: S. Meriani, C. Palmonari (Eds.), Zirco-
nia�88 – Advances in Zirconia Science and Technology,
Elsevier Applied Science, London and New York, 1988,
p. 209.
[28] M.B. Elmoselhi, J. Alloys Comp. 231 (1995) 716.
[29] Y. Nishino, A.R. Krauss, Y. Lin, D.M. Gruen, J. Nucl.
Mater. 228 (1996) 346.