influence of constituency development fund on - uon repository
TRANSCRIPT

i
INFLUENCE OF CONSTITUENCY DEVELOPMENT FUND ON
EDUCATION DEVELOPMENT IN THE COUNTIES: A STUDY
OF PUBLIC SECONDARY SCHOOLS IN LIKUYANI
CONSTITUENCY, KAKAMEGA COUNTY, KENYA.
By
Hycinth Nekesa Obwari
A Research Project Report Submitted in Partial Fulfilment of the
Requirements for the award of the Degree of Master of Arts in
Project Planning and Management of the University of Nairobi.
2013

ii
DECLARATION
This research project report is my original work and has not been presented for award of a
degree to any other university.
Hycinth Nekesa Obwari Date
Reg. L50/64362/2011
This project report has been submitted with our approval as university supervisors.
Dr.Anne Aseey
Senior Lecturer, University of Nairobi
Date
Patrick Cheben Simiyu
Lecturer, University of Nairobi
Date

iii
DEDICATION
This research project is dedicated to my late father, Vincent Obwari Orando and my mother,
Jerusha Nduvi Obwari who sowed the seed of education and empowerment to their humble
family of thirteen children. The two have been a great source of inspiration to my education
without whose foresight and support to us I would not have reached this far. I will forever be
grateful to them.

iv
ACKNOWLEDGEMENT
It is with heartfelt appreciation that I wish to acknowledge the following people whose input
made it possible for this study to be a success.
I am sincerely grateful to my two supervisors, Mr. Simiyu Patrick Cheben and Dr Anne
Aseey for their professional guidance, support and commitment towards the successful
completion of this research project.
My very special appreciation also goes to Mr. and Mrs Henry Kazungu whose unconditional
financial and moral support since high school has enabled me reach this far and to my
brother; Tonny Obwari for setting the pace in the quest of education in the family. Thank
you the Obwari’s family for your good will too.
I would also like to appreciate Mr Cornel Okalo for his enormous contribution to the
successful completion of this work. I cannot end this acknowledgement without expressing
my deep gratitude to Mr. Evans Jumba and Madam Branice Jumba for their prayers and
encouragement when the going got too tough.

v
ABSTRACT
The purpose of the study was to determine the influence of Constituency Development Fund (CDF) on Secondary school education development in Likuyani Constituency; Kakamega County in Kenya. The study used descriptive survey research design. The main findings of the study were as follows: most of the students did not receive enough bursaries to enable them pay fee charged by the school. The funds for physical facilities were not enough but projects which benefited most from CDF funds were the school land, science laboratory, administration block. Students’ enrolment, retention and completion rates kept increasing after the introduction of CDF fund although it was still below the expectation and the completion rate stood at 69%.Most respondents agreed that CDF funded bursaries have led to improved learners’ academic performance. Based on the foregoing findings, several conclusions were arrived at: First, very few poor but bright students receive bursary from CDF education fund. Secondly, CDF funds have helped to facilitate the provision of physical facilities in public secondary schools in Likuyani Constituency to a small extent, but facilities were still not enough in spite of the funding. Thirdly, the number of learners’ enrolment, retention and completion rate had significantly gone up with the introduction of CDF funds. Finally, learners’ academic performance improved with the introduction of CDF education funds but they were not enough thus learners’ academic performance in relation to CDF education funding is still low. From the findings and conclusions, the study recommends the following in order to improve the provision and management of CDF funds in education so as to realize significant education development. First, the government should allocate enough funds in time to schools to ensure that the facilities constructed are enough and are completed and adequately equipped for example science and computer laboratories as well as libraries. It should also increase funds allocated to CDF bursary so that the deserving students can fully pay their school fees thus increasing the retention and completion rates. The study established that headteachers are not fully involved in identifying the poor but bright learners thus very few deserving students benefit from the CDF fund bursary. As such, the researcher recommends that head-teachers and teachers be involved to a larger extent in identifying the deserving students. Head teachers should also involve the community around them to aid in school development programmes and projects to supplement CDF education funding. Lastly, schools should initiate income generating projects to subsidize CDF education funding.

vi
Table of Contents
DECLARATION ............................................................................................................................ ii
DEDICATION ............................................................................................................................... iii
ACKNOWLEDGEMENT ............................................................................................................. iv
ABSTRACT .................................................................................................................................... v
LIST OF TABLES .......................................................................................................................... x
ACRONYMS ................................................................................................................................. xi
CHAPTER ONE ............................................................................................................................. 1
INTRODUCTION .......................................................................................................................... 1
1.1 Background of the study 1
1.2 Statement of the problem 3
1.3 Purpose of the study 4
1.4 Research objectives 4
1.5 Research questions 4
1.6 Significance of the study 5
1.7 Limitations of the study 5
1.8 Delimitations of the study 5
1.9 Basic assumptions 6
1.10 Definition of significant terms 7
11.1 Organization of the study 8
CHAPTER TWO ............................................................................................................................ 9
LITERATURE REVIEW ............................................................................................................... 9
2.1 Introduction 9
vii
2.2 Education as a Human Right 9
2.3 The concept of Education Funding 11
2.4 The Constituency Development Fund Act 2003. 13
2.5 Factors that influence students’ enrolment, retention and completion rates 17
2.6. Factors that influence students’ academic performance 20
2.6.1 Socio-Economic Status of Households .............................................................................. 20
2.6.2 Family background and students’ characteristics .............................................................. 21
2.6.3. Adequate teaching staff ..................................................................................................... 23
2.6.4 Availability of physical infrastructure ............................................................................... 24
2.7 Summary of reviewed literature 25
2.8 CONCEPTUAL FRAMEWORK 26
CHAPTER THREE ...................................................................................................................... 28
RESEARCH METHODOLOGY.................................................................................................. 28
3.1 Introduction 28
3.2 Research Design 28
3.3 Target Population 28
3.4 Sampling procedure and sample size. 29
3.5 Research instruments 29
3.5.1 Questionnaire ..................................................................................................................... 29
3.5.2 Interview schedule ............................................................................................................. 30
3.5.3 Document Analysis ............................................................................................................ 30
3.6 Validity of Research Instruments 30
3.7 Reliability of the instruments 31
3.8 Procedure for data collection 31
3.9 Data Analysis 32
3.10 Ethical consideration. 32
CHAPTER FOUR ......................................................................................................................... 33
DATA ANALYSIS, PRESENTATION AND INTERPRETATION ........................................ 33

viii
4.1 Introduction 33
4.2. Response Rate 34
4.3 Profile of respondents 35
4.3.1 Respondents’ age by category............................................................................................ 35
4.3.2 Level of Education of the Respondents ............................................................................. 37
4.3 .3Length of service in the institution .................................................................................... 38
4.4The extent of bursary provision 39
4.5 Extent of CDF funded physical facilities in public secondary schools 42
4.5.1 The extent of adequacy of physical facilities after CDF funding ...................................... 45
4.6 CDF funds and learners’ enrolment, retention and completion rates 46
4.6.1Learners’ retention and completion rate in public secondary schools ................................ 48
4.7 CDF funds and learners’ academic performance. 51
CHAPTER FIVE .......................................................................................................................... 54
SUMMARY OF THE FINDINGS, CONCLUSIONS AND RECOMMENDATIONS .............. 54
5.1 Introduction 54
5.2 Summary of the findings 54
5.2.1 The extent of bursary provision ......................................................................................... 55
5.2.2The extent of CDF funded physical facilities in public secondary schools ........................ 55
5.2.3 CDF funds and learners’ enrolment, retention and completion rates ................................. 56
5.2.4 CDF funds and learners’ academic performance ............................................................... 57
5.3 Conclusions 57
5.4 Recommendations 58
5.5 Suggestions for further Research 59
REFERENCES ............................................................................................................................. 60
APPENDICES .............................................................................................................................. 63
APPENDIX I A letter of transmittal ............................................................................................. 63
APPENDIX II : QUESTIONNAIRE FOR HEAD TEACHERS ................................................ 64
APPENDIX III : QUESTIONNAIRE FOR TEACHERS ........................................................... 73

ix
APPENDIX IV: QUESTIONNAIRE FOR STUDENTS ............................................................. 76
APPENDIX VI: NTERVIEW SCHEDULE FOR THE DISTRICT EDUCATION
OFFICER. ..................................................................................................................................... 78

x
LIST OF TABLES
Table page
Table 4.1 Response rate………………………………………………………………31
Table 4.2 Respondents’ age…………………………………………………………..32
Table 4.2 Respondents’ gender……………………………………………………….35
Table 4.4 Level of education of respondents…………………………………………36
Table 4.5 Respondents’ length of service in the office……………………………….37
Table 4.6 The extent of bursary provision to deserving students……………………..38
Table 4.7 Facilities and their source of funding………………………………………41
Table 4.8Increase of physical facilities as a result of CDF funding………………….43
Table 4.9 Extent of adequacy of facilities after CDF funding……….………………44
Table 4.10Form one school enrolment from 2000-2013 in Likuyani Constituency..47
Table 4.11Learners’ completion rates before and after introduction of CDF funds…49
Table 4.12 CDF funds and learners’ academic performance……………..…………50.

xi
ACRONYMS
CBS Central Bureau of Statistic
CDF Constituency Development Fund
EFA Education for All
FPE Free Primary Education
FPE- Free Primary Education
G O K Government Of Kenya.
KCSE Kenya Certificate of Secondary Education
KSES Kenya School Equipment Scheme
MDG Millennium Development Goal
PTA- Parent Teachers Association Republic Of Kenya
U.S.A- United States of America.
UN United Nations.
UNESCO- United Nations Education Scientific and Cultural Organization.
UNICEF- United Nations International Children Education Fund.
UPE Universal Primary Education

xii
LATF Local Authority transfer Fund

1
CHAPTER ONE
INTRODUCTION
1.1 Background of the study
Education is considered to be a pillar for economic development in both developed and
developing countries. African countries have continuously emphasized the role of
education for its citizenry as a means to social and economic development. Studies
conducted by Psacharopoulus (1994) show that returns of education in Africa are higher than
in other region. Returns of education have been measured in a number of ways.
Economically, it is viewed as an investment in human capital and seen to have strong link to
employment. Education provides the skills and competencies that will allow individuals to
perform productive roles, more literate and skilled labour force is likely to yield more
returns on investment. It also promotes social equality and has strong link to reduction of
poverty. It produces a more informed citizenry, empowers individuals and enables them to
become more proactive, gain control over their lives and broaden the range of available
options.(UNESCO,1997).As such, many states and countries have invested in education as a
pillar for development. Education funding varies from one country or state to another.
In United States of America (USA), education is mainly provided by the public sector with
control and funding coming from three levels: State, local and federal government in that
order. However, federal funding accounts for little of the overall funding schools receive.
The vast majority comes from the state government and in some cases from local property
taxes. Vaillant, D. (2005) observes that education funding in China is a state-run system of
public education run by the Ministry of Education. While the central and provincial
governments provide some funding for education, this varies from province to province, and
2
funding in the rural areas is notably lower than in major urban municipalities .Families must
supplement monies provided to school by government with tuition fees, which means that
some children have much less education than others.
In Africa, Uganda became the first country in sub-Saharan Africa to introduce universal
secondary education in 2007 coming 10 years after it introduced universal primary
education. According to the Government of Uganda (2010) at the time, a United Nations
(UN) report said Africa had the worst secondary school enrolment rates in the world with
only 34% of secondary school-age learners enrolling in class. Girls and poorer young people
comprised the bulk of those locked out of school by financial and cultural constraints.
In Kenya, since independence in 1963; the expansion of learning institutions has been one of
the greatest achievements in education sector. There has been increased adult literacy.
Achievements of access to education during the last four decades have been possible through
the establishment of a network of schools throughout the country. This has resulted in an
increased participation by groups that previously had little or no access to schooling.
Enrolment of a greater percentage of girls and indeed the attainments of Universal Primary
Education (UPE) has been the long-term objective in the primary education sub sector
(Sifuna, 2004).
The introduction of Free Primary Education (FPE) in 2003 and Subsidized Secondary
Education (SSE) was in line with the Millennium Development Goals (MDGs) which call
for attainment of UPE and Education For All (EFA) by the year 2015. (Kinyanjui, 2007). At
the secondary level, the government has introduced bursaries for needy students. Recent
initiatives to improve access to students at this level include subsidizing of school fees by
3
the government under the free secondary education Programme and the establishment of the
Constituency Development Fund (CDF) by the government.
1.2 Statement of the problem
Education is the key to the development of any country and as such a great amount of
budgetary allocation has to be directed to it. With the introduction of CDF in 2003, it was
expected that every constituency would set aside a considerable amount of money from the
CDF kitty to finance education in the respective public schools. The funds are expected to be
used to provide bursaries to students from needy backgrounds that would otherwise not
access education. In addition, physical facilities like science laboratories, classrooms and
libraries need to be constructed or improved upon, if already available, so as to ensure
quality education.
Contrary to the given ideal situation, most of the named services still lack in Likuyani
Constituency. In most schools, many bright and deserving students do not access bursaries
and some of those who benefit from it still drop out of school for lack of consistency in the
allocation of the very bursaries. Most schools do not have sufficient classrooms to provide
ample environment for quality learning. The science and computer laboratories are either
missing or ill-equipped.
The study sets out to determine the impact CDF has had on education because if the
discrepancy between the expected and the reality on the ground is not addressed in good
time, there will be disastrous effect to the residents of Likuyani Constituency. There will be
a high rate of drop-outs from schools and graduates with inferior qualifications. This will
lead to retardation in development of the region and lack of realization of the Kenya Vision
2030.

4
1.3 Purpose of the study
The purpose of the study was to investigate the influence of Constituency Development
Fund on Education Development in public Secondary schools in Likuyani constituency,
Kakamega County in Kenya.
1.4 Research objectives
The study was guided by the following objectives:
1. to determine the extent to which Constituency Development Fund has been used to
provide bursaries to deserving students in public secondary schools in Likuyani
constituency.
2. to establish how constituency development fund has been used to facilitate the provision
of physical facilities in public secondary schools in Likuyani constituency.
3. to establish the effect of Constituency Development Fund on leaners’ enrolment
,retention and completion rates in public secondary schools in Likuyani constituency.
4. to determine the impact of Constituency Development Fund funding in education on
learners’ academic performance in public secondary schools in Likuyani constituency.
1.5 Research questions
1. To what extent has Constituency development Fund been used to provide bursaries to
deserving students in public secondary schools in Likuyani Constituency?
2. How has Constituency Development Fund been used to facilitate the provision of
physical facilities in public secondary schools in Likuyani Constituency?

5
3. What is the effect of Constituency Development Fund on learners’ enrollment, retention
and completion rates in public secondary schools in Likuyani Constituency?
4. What is the impact of Constituency Development Fund funding in education on learners’
academic performance in public secondary schools in Likuyani Constituency?
1.6 Significance of the study
The researcher hopes that the findings of the study may enhance effective and efficient
utilization of the CDF funds by the local community. In addition, it may serve to sensitize
the general public on their need to participate in decision making in matters relating to CDF
and lastly, it may provide a basis for further research on a larger population.
1.7 Limitations of the study
The data collected largely depends on the accuracy of records kept on CDF funded projects
by school headteachers. Where such records are not well maintained will constitute a
challenge which will be dealt with through use of triangulation of data sources. Some
respondents could hold back critical information required for the study. The study limited
itself to only one constituency.
1.8 Delimitations of the study
The study on the impact of Constituency Development Fund on Education Development will
be carried out in ten public secondary schools in Likuyani Constituency, Kakamega County
in Kenya. Likuyani constituency has a total area of 301.8square kilometers. It borders Lugari
to the South, Eldoret West to the East, Bungoma North to the West, and Trans Nzoia West
to North. The constituency consists of one division. It has a population of 125,137; the
constituency has 48 public primary schools and 24 secondary schools, the economic activity

6
of residents is mainly farming. The study will be conducted between May 2013 and June
2013 through case study and descriptive survey research design. A sample size of 5 officers
from the DEO office, 10 headteachers, 50 teachers,60 students will be targeted.
1.9 Basic assumptions
This study assumed that respondents provided unbiased and reliable responses. It also
assumed that the Constituency Development Fund affects Education Development and that
all public secondary schools had at least received CDF funding for physical facilities and
bursaries for students for the past one decade.

7
1.10 Definition of significant terms
Constituency Development Fund: Grants from the government that is used to facilitate
development projects including education development in the constituency. Education
Development: improvement of the teaching and learning resources in order to ensure
sustainable education practices, functions, services and practices.
Impact: The effect of a particular treatment on the desired variable.
County: Region legally identified as a distinct entity for government administrative purpose
and community service.
Physical facilities: Entails resources that enhance learning and teaching which include
classrooms, dormitories, laboratories, libraries and computer laboratories among others.
Public secondary schools: Refers to schools registered and owned by the government
through the ministry of Education.
Secondary Education: Education received after primary education cycle, from 1 to form 4
in the 8-4-4 system of Education.
Bursaries – Funds awarded to the bright and needy students to facilitate payment of
education services.
Enrolment - The process of initiating students for school attendance.
Retention-Keeping enrolled students in school for them to achieve the education goal within
a stipulated period without dropping out of school.
Completion –Successfully undergoing an education process.

8
Academic performance-Refers to how well a student deal with studies and how they
accomplish tasks given to them.
11.1 Organization of the study
This study is divided into five chapters. The first chapter is introduction which comprised
of background of the study, research objectives, research questions, and significance of the
study, limitations of the study, delimitations of the study, basic assumptions and definition
of significant terms. The second chapter is Reviewed Literature. Under this chapter;
objectives of the study were discussed under the following subtopics: Education as a human
right, the concept of Education Funding ,The Constituency Development Act 2003,Factors
that influence student enrollment, retention and completion rates and factors that influence
students’ academic performance .The conceptual frame work was highlighted towards the
end of reviewed literature. The third chapter dealt with research design, target population,
research instruments, validity of research instruments, reliability of research instruments,
procedure of data collection and data analysis. Chapter four presented the findings of the
study under the objectives and variables of the study. On the other hand, chapter five
presented summary, conclusions and recommendations based on the study objectives and
variables.

9
CHAPTER TWO
LITERATURE REVIEW
2.1 Introduction
This section presents literature reviewed which is related to research objectives under the
following titles: Education as a human right, the concept of Education Funding, the
Constituency Development Fund Act 2003, factors that influence student enrollment,
retention and completion rates and factors that promote academic performance.
2.2 Education as a Human Right
The Jomtien Declaration of Education For All (1990), stated that every child is entitled to
basic rights; including education. It further declared education as a basic human right and
stated that education shall be subsidized, at least in the elementary and fundamental stages
and all countries of the world were required to provide it. EFA conference held in Jomtien,
Thailand in 1990, sparked off a new impetus towards basic education especially with the so-
called visions and renewed commitments. It noted that to serve the basic needs for all,
requires more than a recommitment to basic education as now exists. What is needed is an
expanded vision that surpasses resource levels, institutional structures, curriculum and
conventional delivery systems, while building on the best practices (World Declaration on
Education For All, 1990).
The Amman mid-decade review of EFA (1996) reaffirmed its commitment to the Jomtien
resolutions. It observed that the provision of basic education, especially for girls has
remained elusive in many less industrialized countries particularly in Africa, where ethnic
tensions and conflicts have displaced many households, thus denying children opportunities

10
of going to school. The Dakar conference of (2000) reviewed developments in achieving
UPE in African continent. It set UPE as one of the EFA goals to eliminate gender
inequality by 2015. This was further endorsed by the Millennium Development Goals
(MDGs).African countries have continuously emphasized the role of education for its
citizenry as a means to social and economic development. Studies conducted by
Psacharopoulus (1994) show that return of education in Africa are higher than in other
regions. Returns of education have been measured in a number of ways. Economically, it is
viewed as an investment in human capital and seen to have strong link to employment.
Education provides the skills and competencies that will allow individuals to perform
productive roles, more literate and skilled labour force is likely to yield more returns on
investment. Education promotes social equality and has strong link to reduction of poverty.
It produces a more informed citizenry, it empowers individuals and enables them to become
more proactive, gain control over their lives and broaden the range of available
options.(UNESCO,1997).
The Government and the people of Kenya have since independence in 1963,been committed
to expanding education system to enable greater participation. This has been in response to a
number of concerns. Among the main concerns has been the desire to combat ignorance,
disease, poverty and the belief that every Kenyan child has the right of access to basic
welfare provisions, including education. Education has also been seen as a fundamental
factor for human capital development. The effort to expand educational opportunities has
been reflected in the various policy documents and development plans (Okwach, 1999).The
expansion of learning institutions has been one of the greatest achievements in education
sector. Enrolment of a greater percentage of girls and indeed the attainments of UPE has
been the long-term objective in the primary education sub sector. (Sifuna, 2004).Education

11
is therefore one of the children’s right that the government of Kenya has embraced. For
instance in January 2003, the former president; Mwai Kibaki re-introduced free primary
education which previously existed before the mid-80s when the government adopted cost-
sharing measures that led to a minor level of school fees charged by primary schools for text
book, parents teachers association (PTA) and extra-curricular activities. The Kenyan
government has embraced education as a human right as quoted in the constitution, under
economic and social rights.(GOK, 2010).
2.3 The concept of Education Funding
The importance of investing in secondary education cannot be overemphasized. Oyaro
(2008) asserted that investment in secondary education pays off in healthier families, in
better qualified workforce, stronger economies and reduced poverty. Few countries have
made a break through into the middle income status without the majority of their citizens
having access to secondary education. According to UNICEF, girls who finish secondary
school tend to have few and healthier children. Researchers also found out that those girls
who received secondary education in Uganda and Zimbabwe had lower chances of HIV
infection rates than those who attend secondary school (Oyaro, 2008). Oyaro (2008) further
observed that Uganda’s subsidized secondary Education programme is part of its strategy to
dispel poverty. Okao (2007) asserted that USE is taking primary education to higher level
skills and knowledge so that citizens who have better manual, technical and intellectual
ability can be raised to handle advanced production and to understand a wider scope of
economy in Uganda and beyond. UNESCO (2007).
In Kenya, there are more students completing primary schools than can be absorbed in the
secondary schools in the country. The Kenyan government has responded to the problem of

12
human resource development by making a major expansion in secondary education.
Between 1966 and 1970, 58% of Kenya’s education budget was spent on secondary
schooling. But the demand still outstrips the supply. Between 1964 and 1968, Form One
intake doubled from 8,956 to 15,169. In the 1980’s, there was even a higher demand for
space and since then, the Kenyans have experienced a real crisis (Kinyanjui, 2007).
The Ominde commission recommended the establishment of the Kenya School Equipment
Scheme (KSES).The KSES was a government agency that provided educational materials to
all primary schools countrywide. To facilitate this, the education sector has enjoyed a lion’s
share of Kenya’s budgetary allocations (Kinyanjui, 2007).In 2013,the education sector was
allocated KSh 426 .53 billion out of which KSh17 billion would go to annual purchase of
laptops, build computer laboratories and train teachers,( Mutambo, 2013).
Over the years, financing of secondary education has been a collective responsibility of
parents and communities through user charges. The existing physical infrastructure in
secondary schools was put up through communities, except the national schools which were
constructed during the colonial period (Ngware et al., 2006). This implies that with the
escalating poverty levels and governance reforms on abolishing Harambees, it could be
difficult to achieve significant expansion in physical infrastructure in learning institutions
unless feasible measures are identified. These measures may include channeling part of the
CDF funds to education development projects. Strong partnerships are required with
government providing clear guidelines on future plans on secondary education expansion
and strengthening partnerships for efficient resource utilization particularly in rehabilitation
of existing physical facilities and targeted construction of secondary schools (Ngware et al.,
2006; Ohba, 2009).

13
The launch of subsidized secondary education programme marked a very important
milestone in the government of Kenya’s efforts towards securing a bright future for the
children and the youth of Kenya. Since 2003, the Government has also been implementing
Free Primary Education, which has resulted in an increased enrolment of children from 5.9
million in 2002 to 7.6 million in 2007and currently at 8.6 million in 2010 (GOK, 2005). The
number of candidates went up from 587,961 in 2003 to 746,080 in 2010. The effect has been
pressure to secondary schools to increase the physical facilities to match the increased
enrolment.
The introduction of FPE in 2003 and Subsidized Secondary Education is in line with the
MDGs which call for attainment of UPE and EFA by the year 2015, (Ministry of Education,
2004). At the secondary level, the government has introduced bursaries for needy students.
Recent initiatives to improve access to students at this level include subsidizing of school
fees by the government under the free secondary education Programme. The government
also passed an act of parliament that saw introduction of CDF whose main focus is to
promote development at the grass root level and alleviate poverty levels. It is within this
frame work that education is embedded as one of the strategies of development and poverty
reduction thus funding of education is one of the programme that CDF is involved in so as to
adhere to human rights stipulation.
2.4 The Constituency Development Fund Act 2003.
The Constituency Development Fund Act, 2003 (GOK, 2003) became law on 31st
December 2003 upon receiving presidential assent (Ongoya & Lumallas, 2005). The Act
was expected to come into force by Notice. The CDF amendment Act, 2007 (GOK, 2007) is
divided into 10 parts and 53 sections. To the CDF (Amendment) Act, 2007 are also annexed

14
six schedules. Part One of the Act, is the preliminary part setting out the short title, the
interpretation section and the application section. The application section provides that the
provisions of the Act shall ensure that a specific portion of the national annual budget is
devoted to the constituencies for purposes of development and in particular the fight against
poverty at the constituency level.
Part Two of the Act established the Constituency Development Fund, the CDF National
Management Board, functions of the CDF Board, Chief Executive Officer of the Board,
Disbursement from the Fund, funds to be retained in the Fund and the Emergency Reserve.
Part Three deals with submission of constituency project proposals which are to be done by
members of parliament, the submission deadline, submission form, projects descriptions
form and procedure of approval of the proposals. Other sections in this part regard
discretion of Constituency Development Fund, serialization of projects listed for each
constituency, the basis for budget ceiling for each constituency and the criteria for projects
for funding under the Act.
Part Four has sections 21 to 26 and it commences by setting out the type of projects to be
funded as “community based” in order to ensure that the prospective benefits are available to
a widespread cross-section of the inhabitants of a particular area.” Other provisions under
this part relate to the number of projects, the composition of the Constituency Development
Committee, submission of cost estimates that are realistic, exclusion of personal awards, and
permission for counter-part funding.
Part Five has sections 27 to 29.It establishes the Constituencies Fund Committee as a
committee of the National Assembly to consist of a chairman and not more than ten other
members of parliament who are not ministers or assistant ministers of government. Monthly

15
reports on projects and disbursement of the board shall be submitted to the Constituency
Fund Committee as per section 28.Section 29 provides that the board shall ensure that the
list of projects forwarded to it by each constituency is upon approval, funded in accordance
with the Act. Part Six deals with the implementation of projects under the Act, and it covers
sections 30 to 38. Part Seven of the Act establishes District Project Committee, whose
membership consists of members of parliament in the district whether elected or nominated,
all chairmen and mayors of local authorities, district commissioner of the district, District
Development Officer of the district, chairpersons of the Constituencies Development
Committee and the District Accountant of the district. Part Eight is dedicated to the role of
the District Projects Committee whereas part nine deals with finance and administration.
Finally Part Ten which covers Section 48 to the last Section 53 sets out miscellaneous
provisions, particularly finances of the Board and transition from National management
board.
The Act has six schedules. The first schedule has the list of organizations that can nominate
persons to the Board; the second schedule has the standard Constituency projects submission
form; the third schedule sets out the standard projects description form; the fourth schedule
has the standard annual disbursement return form; the fifth schedule sets out re-allocation of
unspent funds form and lastly, the sixth schedule sets out provisions as to the conduct of
business and affairs of the Board.
The CDF programme comprises of an annual budgetary allocation equivalent to 2.5 percent
of the total national revenue. Allocations to the 210 parliamentary jurisdictions are clearly
spelt out where 75 percent of the Fund is allocated equally among all 210 constituencies.
The remaining 25 percent is allocated based on constituency poverty levels, population size

16
and the size of the constituency. A maximum 15 percent of each constituency’s annual
allocation is used for education bursary schemes, mocks and continuous assessment tests.
Since its inception, the CDF kitty has grown from a paltry Ksh 1.26 billion for 2003/04
fiscal year to Ksh 12.3 billion for 2009/2010 fiscal year. Under the Economic Stimulus
Programme (GOK, 2009), a further Ksh 22 billion is to be disbursed to the constituencies
through the line ministries geared towards projects aimed at reversing the current economic
down-turn. Each of the 210 constituencies is to receive Kshs 105 million to finance
infrastructure development, boost education and healthcare and revive other development
projects at the grassroots,(GOK, 2009). In implementing the fiscal stimulus package, focus
will be on the following key sectors of the economy to generate maximum benefit;
Education, Agriculture, Health, Local Authorities, Information, Industrialization and
Communication and Technology. Through the 2009/2010 Medium Term Expenditure
Framework Budget, key objectives of the Economic Stimulus Programme among others is to
improve infrastructure, provide quality education and healthcare for all Kenyans (GOK,
2009). A look at how the CDF funds have been allocated to Lugari Constituency alone over
the last eight fiscal years, it can be discerned that the constituency received a total of Kshs
392.4 million. A further Kshs 105 million was received under the Economic Stimulus
Programme during the fiscal year 2009/2010 giving a combined total of Kshs 497.4
million.Currently,60% of CDF fund is set aside for education development in each
constituency with 15% going for bursary provision and 25 % for physical infrastructure in
public schools,(GOK,2010).

17
2.5 Factors that influence students’ enrolment, retention and completion rates
It was observed that the main factors that influence Hispanic student retention, is financial
aid to students from poor background. A study conducted by (Achilles, 1996), evaluated
whether government and non-government based financial aid influenced Hispanic student
retention at high school level. Both of these factors were found to be significant in retention.
The findings indicate that Hispanic students withdraw from school because of financial
reasons more than for academic reasons. Hispanic students who were enrolled in more
semesters, earned more credits, and received some type of credentials were those that
received higher levels of non-government and government -based financial aid.
Poverty influences student enrollment, retention and completion rate. Poverty has been
defined as the inability of individuals to afford basic necessities (Poverty Reduction Strategy
Paper 2001-2004). It can be observed in relation to access to education, health and even
enjoyment of political rights and representation1. Poverty still remains an impediment for
many Kenyans. In the year 1992, about 44% of the Kenyan population lived under the
poverty line. This figure increased to 52% and 56% in 1997 and 2002 respectively. This has
implications on school enrollment with students from poor household more than those from
non-poor households citing the inability to afford school fees as a reason for non- attendance
of school (30.3% versus 21.8%)According to the Kenya Integrated Household Budget
Survey, basic report ‘there still exists a significant group of people who are not taking
advantage of FPE’, some of the reasons cited for these include incidental cost to schooling
like school uniforms and feeding which present a financial burden to most parents. Children
also supplement parental labor, this is because children are compelled to work or help at

18
home. This is according to a report that was released by the Central Bureau of Statistics
(CBS:2007).
A study conducted by the Republic of Kenya (ROK, 2005) has also indicated that insecurity
has a bearing on the ability of students to enroll for education. Lack of security exacerbates
school dropout rates, repetition and results in waste. It also impacts on the teacher student
ration as teachers move to schools located in safer areas.The students’ personal attributes
can lead to their retention in school. Students’ characteristics and pregnancy have different
effects on various students. Once students are enrolled in school they interact and form peer
groups. Abagi (1997) observed that there is a simple relation between education and gender
equality. Schools act as a site of pervasive gender socialization. This sometimes spurs
students to think beyond the ideological limits laid on them. Okwach (1999) concurs with
Abagi and points out that the students peer groups if not guided can lead to devastating
results like engage in drugs and substance abuse, early sex and then get to dangerous
diseases like Human Immune Deficiency Syndrome and Acquired Immune Deficiency
Syndrome(HIV and AIDS) and early pregnancies. This leads to students dropping out of
school.
Internal and External Factors Affecting Student Motivation have also been highlighted as
factors affecting students’ enrollment, retention and completion rates. The motivating factors
in determining student retention and likelihood of program completion have long been of
interest to academic researchers. The evolution of the student retention movement dates back
several decades. Initial research conducted in the 1970s led to an interactionalist theory for
increasing student retention, which concluded that the degree of student motivation to
complete school was dependent upon a student’s level of commitment to an institution,

19
aspirations or perceived need for attaining a degree, and the overall experience of academic
and social interactions while in attendance at the schools.
Subsidized Secondary Education improves retention and completion rates of students who
because of poverty cannot afford to pay fee. Oyaro (2008) observed that Uganda’s
subsidized secondary Education programme is part of its strategy to dispel poverty. Oyaro
(2007) asserted that UPE is taking primary education to higher level skills and knowledge
so that citizens who have better manual, technical and intellectual ability can be raised to
handle advanced production and to understand a wider scope of economy in Uganda and
beyond. UNESCO (2007) concurred that universal primary education is not useful if the
learners cannot proceed to secondary level or other post-primary training institution. It adds
that young people feel cheated when they excel in national examinations, but find
themselves unable to proceed to secondary education because of inability to pay. It would be
useful for any government to provide subsidized education at secondary level because it
affords the poor an opportunity to move up on the academic ladder. He observed that a lot of
talent had been left out due to high cost of secondary education; providing subsidized
education at secondary level could avail to the nation those lost talents, because their parents
could not afford (Anane, 2008).
The launch of subsidized secondary education programme marked a very important
milestone in the government of Kenya’s efforts towards securing a bright future for the
children and the youth of Kenya, (G.O.K ,2008) asserted that the main objective of
providing Subsidized secondary education is to ensure that children from poor households
acquire quality education that enables them to access opportunities for self-advancement and

20
become productive members of society. The primary education alone is not sufficient to
provide the quality human resources necessary for the country’s sustainable development.
Moreover, primary school pupils complete 8 years of schooling when they are still too
young to engage in productive activities and contribute meaningfully to nation building.
In addition children from poor families who fail to gain secondary education because of lack
of fees often revert back to illiteracy, thus reversing 8 years of investment in their primary
education. Secondary schooling is critical in the sense that it ensure that children leave
school when they are more mature and better prepared to face the challenges of life (G.O.K
2008).
2.6. Factors that influence students’ academic performance
2.6.1 Socio-Economic Status of Households
In most African Countries and the Western World, socio-economic status of a family is
usually linked with the family’s income, parents’ educational level, parents’ occupation and
social status among the kith and kin and even at the global level. Ford and Harris (1997)
followed this logic while examining parental influences on African American students’
school achievement by focusing on specific socio-demographic factors, including parents’
level of education, marital status, and family income. It is generally believed that children
from high and middle socio-economic status parents are better exposed to a learning
environment at home because of provision and availability of success of low-SES students in
Nigeria extra learning facilities. This idea is supported by Becker & Tomes (1979) when
they assert that it has become well recognized that wealthy and well-educated parents ensure
their children’s future earning by providing them a favorable learning environment, better
education, and good jobs. In contrast to this belief, children from low socio-economic status

21
parents do not have access to extra learning facilities; hence, the opportunity to get to the top
of their educational ladder may not be very easy. Drummond & Stipek (2004) while
discussing their “Low-income Parents’ beliefs about their role in children’s academic
learning” mentioned that a few of these parents indicated that their responsibilities were
limited to meeting children’s basic and social-emotional needs, such as providing clothing,
emotional support, and socializing manners . So these parents’ shortsightedness toward their
responsibilities in the educational processes of their children and scarcity of fund to intensify
such processes could be a challenge to their children’s success.
2.6.2 Family background and students’ characteristics
Students’ characteristics which include engagement and students’ overall disposition
towards school also influence students’ academic performance. Resilient children are said to
be those who beat the odds or bounce back under adverse circumstances (Floyd, 1996).
According to their findings, the analysis for resilience status revealed statistically significant
main effects for all four outcomes, student engagement, self-efficacy in mathematics,
positive attitude toward school, and self-esteem, all of which favored resilient
students”.Similar characteristics are identifiable in other studies: individual characteristics of
resilient children typically include high self-esteem, high self-efficacy, and autonomy
(Wang,Haerttel, & Walberg, 1994). While poverty and students’ low SES background could
be considered a concern regarding students’ academic performance, they are not to
belabored because, the individual characteristics are variables that align to students’
performance .There is no doubt that such conditions can impact students negatively, but the
strongly determined and motivated students are likely to beat the odds of greater risk of
academic failure and perform with distinction in school. These students we identify as
resilient children. Resilient children also are actively engaged in school (Finn & Rock,

22
1997), have strong interpersonal skills, and maintain healthy expectations, and have a high
level of activity (Benard, 1991). According to Borman &Overman, (2004) all of these
characteristics highlight the underlying perseverance, strong will, and positive disposition of
the resilient child.
According to Ramberger (1995), student ‘family background is widely recognized as the
most significant important contributor to success in schools’. Rumberger’s position supports
the finding of earlier scholars who argued that the home has a major influence on student
school success and that it is the quality of relationships within the student’s home
environment that has an important effect on school performance. Jacobs &Harvey (2005)
recently established that many variables in the family background have strong (direct and
indirect) associations with students’ success throughout school and in young adults’ eventual
educational and occupational attainment. Such variables include family structure (socio-
economic status and intact/single-parent family status), parent education level, parental
involvement, and parenting style.
According to Evans (2004), lower income children have less stable families, greater
exposure to environmental toxins and violence, and more limited extra-familial social
support networks. There is no doubt that parents in such settings would report lower
educational expectations, less monitoring of children’s school work and less overall
supervision of social activities compared to students from high socio-economic and intact
families. Evans repeatedly discovered that low SES children are less cognitively stimulated
than high SES children, as a result of reading less and being read to less, and experience less
complex communications with parents involving more limited vocabulary.

23
2.6.3. Adequate teaching staff
Studies have been done on the effect of enrolment on learning. One such study is the STAR
project (Kirui, 2007).The project was carried out in America and was initially a statewide,
four year longitudinal study of class size in grade 3; the study involved 42 districts, 79
schools, and over 6,000 learners. After selecting participating districts and schools pupils
and teachers were randomly assigned to class size conditions. There were three class
treatments, Small class (1 teacher:13-17 pupils, Regular 1 teacher:22-26 pupils, Regular (1
teacher full time guide 22-26 pupils, Achilles, 1997) Pupils were to remain in the same class
conditions from kindergarten (nursery) to Grade 3 (class 3).a new teacher was assigned to
the class each year (Finn& Achilles, 1999).All pupils returned to the regular classes in Grade
4 at the end of the study. Researchers did not interfere with normal class teaching except
class size. While pupils and teacher were randomly distributed (Achilles, Zaharias & Fulton,
1996).
The project was designed so that reduced classes would have no disadvantage in terms of
physical space or the quality of teachers. From the analysis of the reports, project STAR
revealed a number of characteristics of small classes. Statistically significant differences
were found among class types on all achievement measures and in all subject areas in every
year of study. No significant difference was found between teachers and regular classes in
the year of study. Pupils in small classes had relatively fewer cases of indiscipline. Teachers
had more on task-time in small classes than in regular classes. Early identification of special
needs in smaller classes seemed to reduce later special education placements (Achilles,
1996).
Floyd (1996) found that, larger class sizes contributed to declining test scores and that one or
two additional students made teaching significantly more difficult. Small classes made it

24
possible for teachers to provide missing care and attention. He found significant differences
in achievement favoring small classes (13-17) over large classes (22-25).Many policy
oriented interventions and research studies considered a 40.1reasonable in developing
countries (Ochenje,2008). The World Bank financed primary education projects were
usually designed with an average pupil teacher ratio of approximately 41.1. Educators in and
administrators of private schools believe that a low pupil teacher ratio, which characterize
their schools boosts pupil performance (Abagi, 1997).
The R O K (1999) noted that the interaction between teachers and students was better where
the class size was between 25 and 35. Against this background and in view of the need to
provide quality secondary education, the Koech commission recommended deployment of
teachers with the view of affecting a pupil-teacher ratio of 35:1 and that the average class
size in the Education task force on Affordable Secondary Education (2007) observed that the
government policy of providing subsidized day secondary education is likely to cause
unprecedented influx into existing day secondary schools. This is likely to cause congestions
and undermine quality of education.
2.6.4 Availability of physical infrastructure
The availability of adequately equipped physical facilities like science laboratories, libraries,
classrooms and sanitation blocks have a positive impact on students’ academic
performance. The Kamunge report (1988) had proposed that rather than over- enrolling
existing classes, extra streams should be established in existing secondary schools and
commensurate resources provided in order to maintain quality, relevance and high standards
of education. As indicated by R.O.K (2008), the number of secondary schools in 2007 was
6,485 with a student population of 1,180,300.This growth in secondary education is due to
the high demand for this level of education by the increased large number of primary school

25
leavers (R.O.K,1988). Consequently, owing to this growing demand for secondary
education there has been a tendency to over-enroll classes beyond the approved 40 pupils
per class. Such over-enrolment stretches the use of available physical and human resources,
thus affecting the quality of teaching and learning.
2.7 Summary of reviewed literature
The four objectives of the research were brought out in this section under the following
topics: Education as a human right, the concept of education funding, the CDF Act 2003,
factors that influence students’ enrollment, retention and completion rates and factors that
influence students’ academic performance..Education was declared as a human right
following various declaration like the Jomtien Declaration (1997).As a result, the Kenyan
government has tried to embrace this by providing FPE and subsidized secondary education
as well as funding education projects through CDF, an Act of parliament that was passed in
2003 whose main objective was to compact poverty through development. Factors that
influence students ’enrollment, retention and completion rates include poverty level,
insecurity, and students’ characteristics among others. This section also discussed factors
that influence the academic performance of students and this include social economic status
of households, family background and students’ characteristics, availability of adequate
teaching staff and physical facilities. Finally, conceptual framework that guides the study
was illustrated.

26
2.8 CONCEPTUAL FRAMEWORK
The study was guided by the following conceptual frame work
CDF funds-Independent Variable Education Development-Dependent Variable
CDF FUNDS EDUCATION DEVELOPMENT
In the conceptual frame work above, the CDF is the independent variable. It is viewed in
terms of bursaries offered to students as school fees and the physical facilities provided by
CDF like classrooms, science laboratories, water, toilets libraries, school land and bus. This
independent variable affects the dependent variable which is education development viewed
• Improved academic
performance
Intervening variables
• Political interference
• Community good will
• CDF funded project management
• Social factors eg early pregnancy
• Health condition of learners
• High enrolment rate
• High retention rate
• High completion rate
• Bursaries
• Physical facilities like
� Science laboratories
� Class rooms
� Library

27
in terms of students’ enrolment, retention and completion rates as well as student academic
performance. However, education development could also be affected by other factors like
political interference from area leaders, Community good will, the management of projects
funded by CDF in schools, social factors like early pregnancy which could led to school
dropout and health status of learners among others. These are captured as intervening
variables.

28
CHAPTER THREE
RESEARCH METHODOLOGY
3.1 Introduction
Methodology is the plan of action that shapes the choice and application of particular
methods and links them to desired outcomes (Kothari, 2008).This section entails; research
design ,target population, sampling procedure and sample size, research instruments, the
validity and reliability of research instruments ,procedure for data collection and data
analysis and interpretation.
3.2 Research Design
The researcher employed descriptive survey research design. The independent variable was
CDF while the dependent variable was Education Development. Surveys are used to
systematically gather factual quantifiable information necessary for decision making. The
information was analyzed using qualitative and quantitative approaches and then interpreted
the data using frequency distribution table and percentages.
3.3 Target Population
This study was conducted in twenty four public secondary schools in Likuyani District,
Kakamega County in Kenya. The researcher purposively targeted a group of people believed
to be reliable for the study (Kombo & Tramp, 2009).This included 10 headteachers, 5
officers the District Education Office, 50 teachers and 60 students from 10 public secondary
schools in Likuyani constituency. These schools were Eshikulu mixed secondary ,St Ann’s
Girls’ High school, Friends school Kongoni mixed secondary ,Matunda S.A mixed

29
secondary, Moi Girls High School Nangili, Binyenya secondary, Henry’s Saisi secondary,
St Joseph Kogo, St Peters Moisbridge mixed secondary and Mbururu mixed secondary
school.
3.4 Sampling procedure and sample size.
Purposive sampling was used to obtain the head teachers of sampled schools to participate in
the study. This allowed the headteachers of sampled school to participate. The study
employed simple random sampling technique to sample the schools that participated in the
study. Random sampling technique was used to get secondary schools targeted. This
technique selects a sample without bias from the target population since each element has
equal known chance of being selected (Oso & Onen, 2008). Its purpose is to collect
representative sample. It also produces a random sample.
3.5 Research instruments
In this study, data was collected by use of questionnaires, and document analysis and
interview schedule. The selection of these tools was guided by the nature of data to be
collected, the time available as well as the objective of the study.
3.5.1 Questionnaire
Kothari (2008) defines a questionnaire as a tool that consists of a number of questions
printed or typed in a definite order on a form or a set of forms. The target population was
largely literate and was unlikely to have difficult responding to questionnaire items. The
questionnaire was both be open ended and closed items. The open ended items gave the
respondent a greater freedom of expression of ideas and opinions and the closed ended items
enabled the researcher get specific responses. The open ended questionnaires were used to
get information on respondents’ opinion on CDF funded projects.
30
3.5.2 Interview schedule
Interview is a method of collecting data that involves presentation of oral verbal
responses,(Oson and Onen 2005).The structured and semi structured interview were
employed. This method of data collection enabled the researcher to get more information
and in greater depth. This technique supplemented the questionnaire technique since it
enabled the researcher to collect information that could not be directly observed and difficult
to put down in writing. The District Education Officer,(D.E.O) was interviewed and gave
expected to respond to items about CDF education funding in his district.
3.5.3 Document Analysis
Document analysis involves critical examination of public or private recorded information
related to the issue under investigation (Oso & Onen, 2005).This technique is used to obtain
information that is not obstructed and out of the pleasure of the researcher without
interrupting the research. This tool enabled the researcher to access data at his convenient
time and the data obtained is thoughtful in that the informants have given attention to
compiling them. It also saved time and expenses in compiling the data. The technique helped
the researcher to collect information on students’ enrolment, retention and completion rate in
the ten schools.
3.6 Validity of Research Instruments
According to (Mugenda, 2011),Validity refers to the accuracy and meaningfulness of
inferences which are based on the research results. It is the degree to which results obtained
from analysis of the data actually represents the phenomenon under study. Validity answers
the question ‘are my findings true’ (Kerlinger, 2006). The content validity of the instrument
was determined by the researcher discussing the items in the instruments with colleagues,
31
experts and specialists in the University of Nairobi in the Department of Extra –Mural
Studies.
3.7 Reliability of the instruments
The reliability of an instrument is the measure of degree to which a research instrument
yields consistent results of data after repeated use, (Sekaran, 2010).According to Kombo
and Tromp (2009), reliability is a measure of how consistent the results from a test are.
Reliability is ascertained when a test retest leads to similar score. To test the reliability of
the instruments, a pilot study was done in 3 public secondary schools which were not used in
the final research. These were St John’s the Baptist Boys’ school, St Jude’s mixed secondary
school and St Stephen’s Lwanda secondary school. This was repeated after two weeks.
Scores obtained from the first and second test will be analyzed. The tools were later refined
in terms of clarity of language and ambiguity detected was corrected. From the two
responses, a Pearson Product Moment formula for test –retest was used to compute
correlation coefficient at 0.05 confident levels.
3.8 Procedure for data collection
After approval of the proposal by the department of Extra –Mural studies, a research permit
was be obtained from the National Council of Science and Technology to undertake the
study. Further authorization was sought from the County Commissioner and Education
County Commissioner. The researcher visited the school first to familiarize herself and
develop a rapport with the study site. She then got consent from the headteacher to give out
questionnaire to him or her and students. Both qualitative and quantitative data were
collected from respondents. After the questionnaires were completed, the coordinator

32
collected and hand them over to the researcher .The researcher administered both structured
and semi-structured interview to the officers from the D.E.O’s office.
3.9 Data Analysis
The data collected was tabulated basing on the research questions and objectives for
analysis. Both qualitative and quantitative approaches were used in the analysis. Quantitative
analysis involves presentation of statistical data in form of frequency distribution tables.
Percentages were used to analyze qualitative data whose explanation was descriptive.
Statistical Package of Social Science (SPSS) was used to analyze data. CDF was observed
in terms of physical facilities funded by CDF and bursaries awarded to students while the
independent variable; Educational Development was looked at in terms of student
enrollment, retention and completion rates as well as academic performance.
3.10 Ethical consideration.
One of the ethical problems in this study was the privacy and confidentiality of the
respondents. Headteachers’ privacy and confidentiality on matters pertaining school was
interfered with. However, this was done cautiously since valid information could not be
obtained if learners and teachers were not interviewed or approached. The respondent had
the freedom to ignore items that they do not wish to respond to. The information gathered
from participants was kept in confidence and was only be used for the purpose of the study.
33
CHAPTER FOUR
DATA ANALYSIS, PRESENTATION AND INTERPRETATION
4.1 Introduction
This chapter begins by presenting the return rate of questionnaires administered by the
researcher as well as the response of interviewees who were subjected to an interview using
an interview schedule. Data is presented, analyzed and discussed in line with research
objectives. These are: to determine the extent to which Constituency Development Fund
has been used in providing bursaries to deserving students, how constituency development
fund has been used to facilitate the provision of physical facilities ,the effect of
Constituency Development Fund on learners’ enrolment ,retention and completion rates and
fourthly to determine the impact of Constituency Development Fund funding in education
on learners’ academic performance in public secondary schools in Likuyani constituency.

34
4.2. Response Rate
Table 4.1 below shows the response rate of the target population issued with questionnaires
and interview schedule.
Table 4.1 Response rate
Frequency Percentage
Number of respondents issued with questionnaires 94 77%
Number of respondents Interviewed 3 2%
Number of spoilt questionnaire 26 21%
Total 123 100
Table 4.1 shows that the total number of respondents was 97 out of 125 targeted population.
The above table indicate response of 78% which is considered satisfactory to make conclusions
for a study,(Mugenda &Mugenda,2003).
From the field out of 120 questionnaires administered,94 questionnaires were filled and
returned. The questionnaire represented 78.3% response rate while in the interview schedule,
out of the 5 targeted, 3 were interviewed representing 60% of the target population. A
response rate of 50% is adequate, 60% good and above 70%is rated very good, (Mugenda &
Mugenda, 2003).

35
4.3 Profile of respondents
In order to determine the impact of CDF on education development, the researcher found it
necessary to establish the demographic details of the respondents. The demographic
information of the respondents sought included: age, marital status and level of education.
Further, the number of years the respondents had worked in the office or school was looked
into.
4.3.1 Respondents’ age by category
The study sought to find out the age of respondents issued with questionnaires .To get this
information, the respondents were asked to indicate their age bracket. Their response was
guided by the following question:
What is your age bracket?
Table4. 2 Respondents’ Age
Age Frequency Percentage
12-25 years 42 43%
26-35 years 16 16%
36-45 years 21 22%
46-55years 15 15%
Over 55 years 3 3 4%

36
Total 97 100%
Table 4.2above shows that respondents aged 15-25 years were 42 (43 %.).On the other hand, head
teachers and teachers between 26- 55 years collectively were 55 (56%) .
Table 4.3 :Respondents’ gender
Respondents were also asked to indicate their gender on the questionnaires administered. This
was important in determining the disparities related to gender in the schools involved in the study.
They were asked to tick one out of the two options given; male or female being guided by the following
question:
‘What is your gender?’
This table ,4.3 presents data on the respondents’ gender.
Table 4.3 shows the responses given.
Respondents’ gender Frequency Percentage
Male 42 43%
Female 55 57%
Total 97 100
Table 4.3 above shows that most of the respondents, 55 (57%) were female while 42 (43%)
were male. The above percentage is so because most of the mixed schools targeted had high

37
number of girls enrolment compared to boys. This observation is important because it is an
indicator of the constituency’s effort in promoting the girl child education although equal
attention should be given to boys too.
4.3.2 Level of Education of the Respondents
The study also sought to establish the respondents’ level of education; the headteachers,
officers from the DEO office and teachers .Respondents were asked to indicate their highest
level of qualification among the options given. The response was guided by the following
question:
What is your highest level of education?
The results regarding this are presented in table 4.3 below:
Table 4.4 Level of Education
Table 4.4 shows the level of education of respondents; students. Teachers and headteachers
Respondents’ Education level Frequency Percentage
A –Level 4 7.7%
Diploma 24 46.2%
Degree 18 34.6 %
Masters 6 11.5 %
Total 52 100%

38
Table 4.3 above shows that teachers and headteachers with diploma qualification were
24(46.2%) representing the highest population. Those with post graduate qualification were
only 6 (11.5%)So, although majority of the teachers are graduates,18( 34.6%) very few of
them, 6 (11.5%) have post-graduate qualifications .This upgrade of skills could be vital for
students’ academic performance as well as in the management of CDF funds in the
education sector and overall management of CDF funded projects for enhanced education
development in Likuyani constituency.
4.3 .3Length of service in the institution
The experience of an employee in any institution is crucial to the gaining of the confidence
of customers and to the performance of the institution. The study thus sought to establish the
length of service of the officers from the DEO’s office, head teachers and teachers. The
following question was paused to respondents:
‘For how long have you worked as a teacher/headteacher/DEO officer?
The results regarding this were presented in table 4.4 below:

39
Table 4.5 Length of respondents’ service in the office/school
Respondents’ length service in office/school Frequency Percentage
Less than 5 years 12 22%
Between 5-10 years 15 28%
Between 11-15years 14 26%
Between 16-20years 9 17%
Over twenty years 4 7%
Total 54 100%
The table above shows that 12 (22%) of the respondents have a working experience of less
than 5years ,15 (28%) have been in service for between 5-10years.Out of the 54
respondents,14 (26%) had serviced for over 11 years. The respondents who had been in
service for a period of between 16-20 years were 9(17%) and those who had been in service
for over 20 years were 4(7%).From these results we can infer that the respondents have
enough experience as per the length of service.
4.4The extent of bursary provision
The first objective of the study was to determine the extent to which CDF fund has been
used to provide bursaries to deserving students in public secondary schools in Likuyani
constituency. To establish this, the respondents were given a table containing five items
measured in a Likert scale in relation to the level of agreement regarding the extent of
40
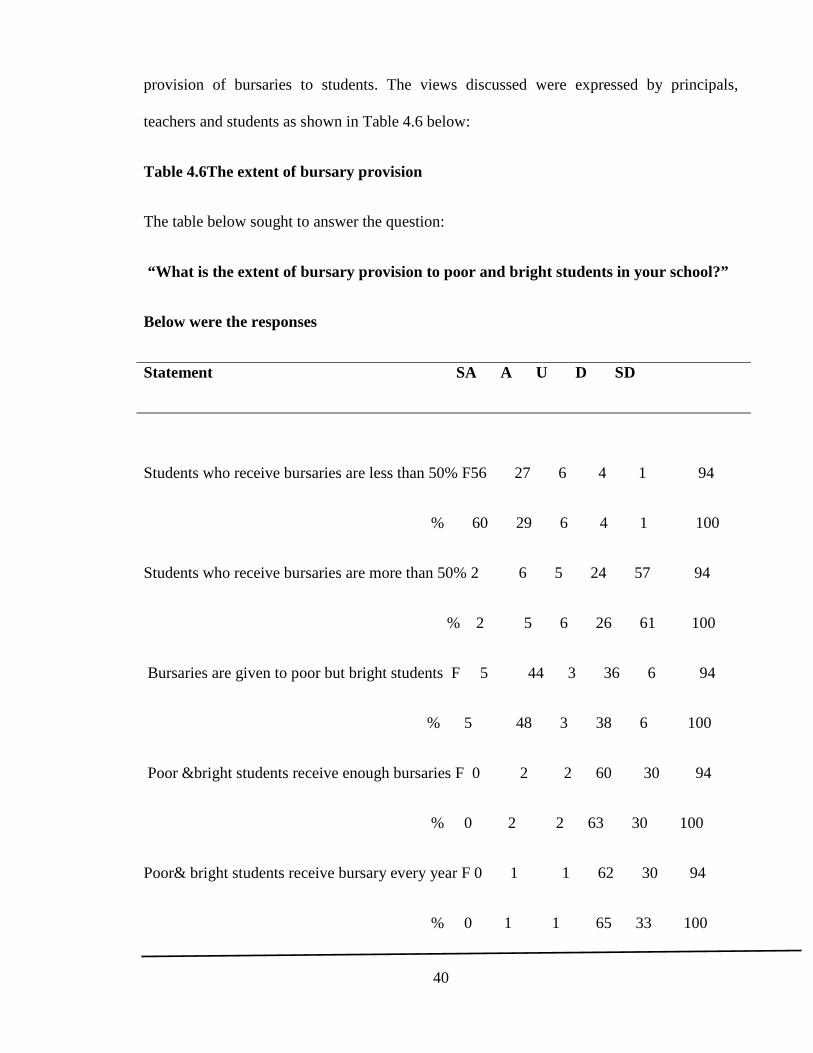
provision of bursaries to students. The views discussed were expressed by principals,
teachers and students as shown in Table 4.6 below:
Table 4.6The extent of bursary provision
The table below sought to answer the question:
“What is the extent of bursary provision to poor and bright students in your school?”
Below were the responses
Statement SA A U D SD
Students who receive bursaries are less than 50% F56 27 6 4 1 94
% 60 29 6 4 1 100
Students who receive bursaries are more than 50% 2 6 5 24 57 94
% 2 5 6 26 61 100
Bursaries are given to poor but bright students F 5 44 3 36 6 94
% 5 48 3 38 6 100
Poor &bright students receive enough bursaries F 0 2 2 60 30 94
% 0 2 2 63 30 100
Poor& bright students receive bursary every year F 0 1 1 62 30 94
% 0 1 1 65 33 100
41
From the findings in table 4.5 above, most respondents;83 in total (89%) said that the
number of students who receive bursary is less than 50% while those who felt that the
number of students who receive bursary is more than 50% a were 8 representing 8%. This
implies that although respondents are in agreement that students receive bursaries, students
who benefit from bursaries are few. Besides this, the researcher found out that indeed poor
and bright students receive bursaries from CDF and the response was 44 (48%).This is
slightly below average.However,3(3%) were not sure while 36 (38%) felt that the CDF
bursary fund did not get to the intended people who are the poor but bright students. To
establish the extent of CDF fund bursary provision, the respondents were asked whether the
bursary given was enough to cater for the school fee of the needy but bright students and90
(96%) of the respondents said that the bursary is hardly enough to pay school fee. These
points at a very significant issue that need to be addressed by the government if CDF
education funds have to have a major impact in education development. On the other hand,
only(2) 2% of respondents felt the CDF bursary fund was enough while2 (2% )were not
sure.
Lastly when respondents were requested to give their level of agreement on how frequent
the poor but bright students receive the CDF bursary funds, only 1 respondent, representing
1% of respondents felt that these students receive CDF bursary fund every year while the
majority; 92 (98%) gave an impression that these students do not receive CDF bursary fund
every year. This means they receive these funds sporadically either once, twice or at most
thrice during the entire secondary education life cycle of four years. This again is a major
setback to the objective of CDF in Education sector that needs argent attention because this
trend could lead to high number of dropout rates.

42
4.5 Extent of CDF funded physical facilities in public secondary schools
As indicated by R.O.K (2008), the number of secondary schools in 2007 was 6,485 with a
student population of 1,180,300.This growth in secondary education is due to the high
demand for this level of education by the increased large number of primary school leavers
(R.O.K,1988). Consequently, owing to this growing demand for secondary education there
has been a tendency to over-enroll classes beyond the approved 40 pupils per class. Such
over-enrolment stretches the use of available physical and human resources, thus affecting
the quality of teaching and learning. The study thus sought to establish how CDF funds
have been used to facilitate the provision of physical facilities in public secondary schools in
Likuyani Constituency so as to cope up with this challenge thus enhancing education
development. Table 4.7shows the source of funding of physical facilities.
Table 4.7: Facilities and their sources of funding
The study sought to find out the source of funding of physical facilities in public secondary
schools thus the following question was paused to respondents in the questionnaire:
“What is the source of funding of physical facilities in your school?’’

43
Table 4.7 gives responses from questionnaires on this question.
Facility CDF PTA GoK LATF Other Sources
F % F % F % F % F %
Classrooms 2 25 3 37.5 1 12.5 1 14.3 1 12.5
Boys’ toilets 2 25 4 50 0 0.0 2 25 0 0.0
Girls toilets 1 12.5 4 50 0 0.0 2 25 1 2.5
Teachers’ toilets 2 25 2 25 1 12.5 3 37.5 0 0.00
Support staff toilets 2 25 2 25 0 0.0 2 25 21 25
School land 4 50 3 37.5 1 12.0. 0 0.0 0.0 0.0
Libraries 2 25 3 37.5 1 0.0 1 12.5 1 12.5
Dormitories 1 50 1 50 0 0.0 0 0.0 0 0.0
Science laboratory 3 37.5 1 12.5 1 12.5 2 25.5 1 12.5
Teachers’ houses 0 0.0 1 50 1 50 0 0.0 0.0 0.0
School vehicles 0 0.0 6 75 0 0.0 0 0.0 0.0 0.0
Computer 2 12.5 3 37.5 1 12.5 0 0.0 2 25
Administration block 4 50 3 37.5 1 12.5 0 0.0 0 0.0
Dining hall 1 12.5 3 37.5 1 12.5 1 12.5 2 25
Home science room 2 25 3 37.5 2 25 1 12.5 0 0.0
Computer laboratory 3 37.5 2 25 1 12.5 1 12.5 1 12.5
Table 4.7 shows that most of the facilities in schools were funded by the PTA. Over 50% of
the headteachers indicated that the projects which most benefited from CDF funds were the
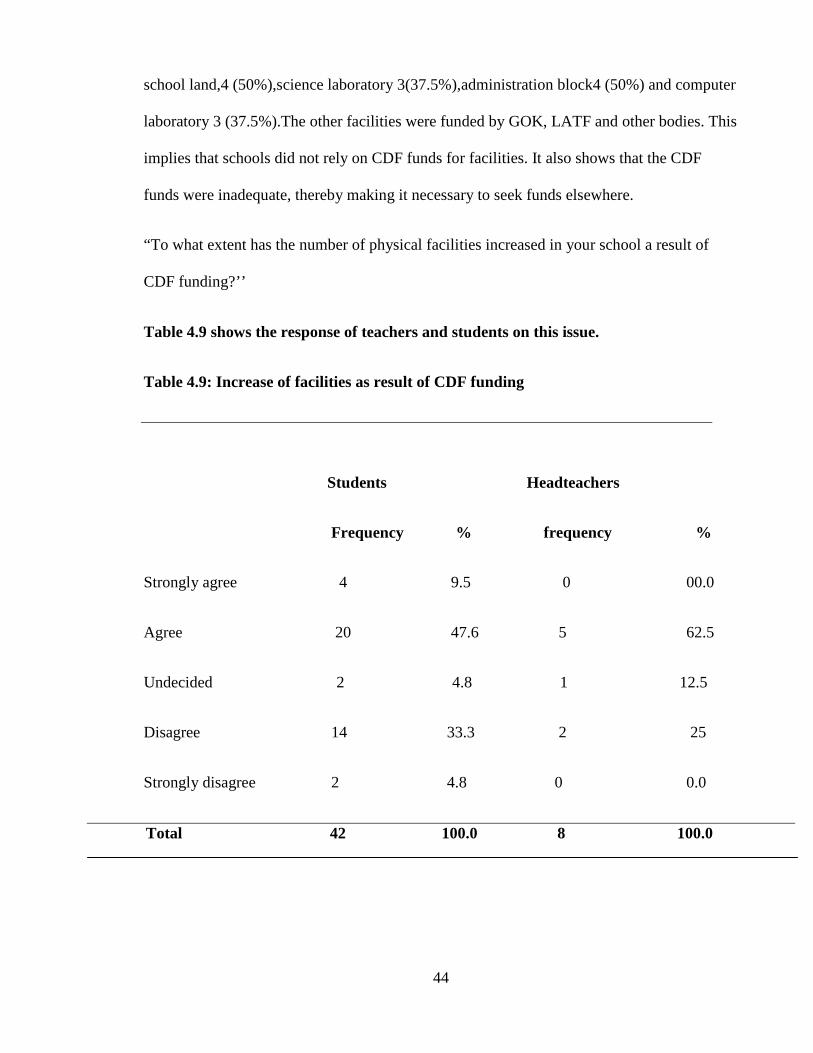
44
school land,4 (50%),science laboratory 3(37.5%),administration block4 (50%) and computer
laboratory 3 (37.5%).The other facilities were funded by GOK, LATF and other bodies. This
implies that schools did not rely on CDF funds for facilities. It also shows that the CDF
funds were inadequate, thereby making it necessary to seek funds elsewhere.
“To what extent has the number of physical facilities increased in your school a result of
CDF funding?’’
Table 4.9 shows the response of teachers and students on this issue.
Table 4.9: Increase of facilities as result of CDF funding
Students Headteachers
Frequency % frequency %
Strongly agree 4 9.5 0 00.0
Agree 20 47.6 5 62.5
Undecided 2 4.8 1 12.5
Disagree 14 33.3 2 25
Strongly disagree 2 4.8 0 0.0
Total 42 100.0 8 100.0
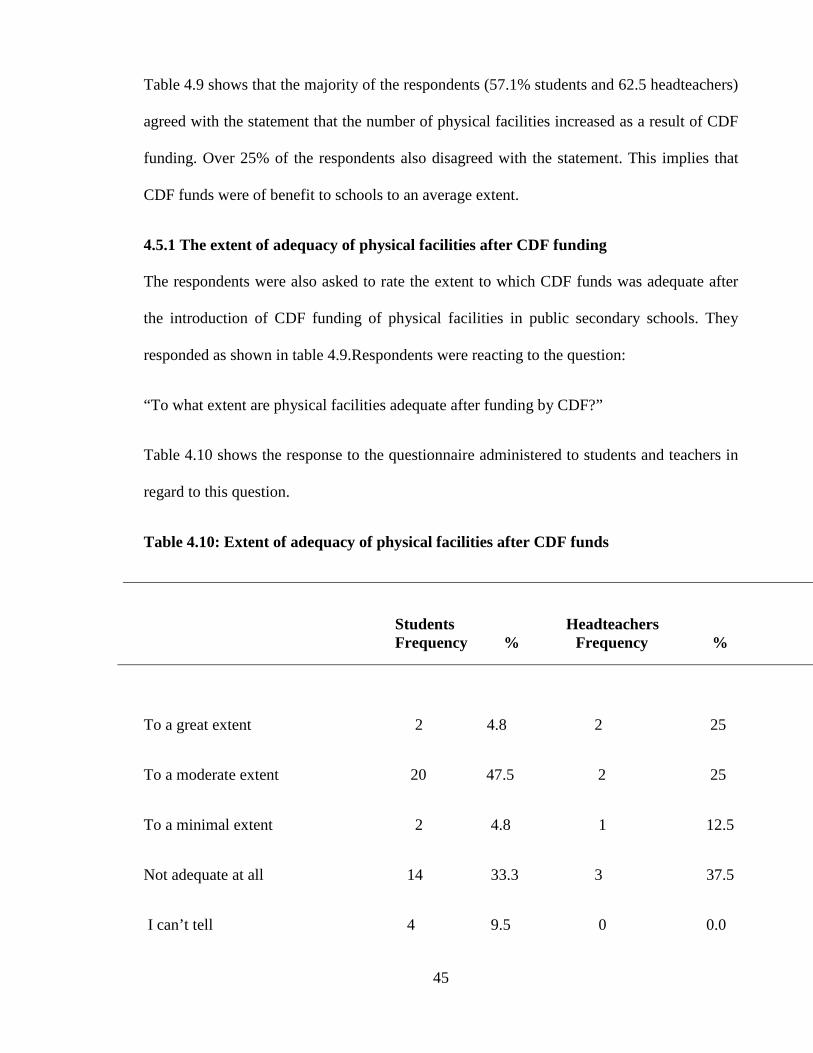
45
Table 4.9 shows that the majority of the respondents (57.1% students and 62.5 headteachers)
agreed with the statement that the number of physical facilities increased as a result of CDF
funding. Over 25% of the respondents also disagreed with the statement. This implies that
CDF funds were of benefit to schools to an average extent.
4.5.1 The extent of adequacy of physical facilities after CDF funding
The respondents were also asked to rate the extent to which CDF funds was adequate after
the introduction of CDF funding of physical facilities in public secondary schools. They
responded as shown in table 4.9.Respondents were reacting to the question:
“To what extent are physical facilities adequate after funding by CDF?”
Table 4.10 shows the response to the questionnaire administered to students and teachers in
regard to this question.
Table 4.10: Extent of adequacy of physical facilities after CDF funds
Students Headteachers Frequency % Frequency %
To a great extent 2 4.8 2 25
To a moderate extent 20 47.5 2 25
To a minimal extent 2 4.8 1 12.5
Not adequate at all 14 33.3 3 37.5
I can’t tell 4 9.5 0 0.0

46
Total 42 100.0 8 100.0
Table 4.10 shows that 2(25%) headteachers indicated that facilities adequacy had increased
with a moderate extent after introduction of CDF, 3(37.5%) indicated they were not
adequate at all, 2(25%) indicated the rate increased to a great extent while 1(12.5%) could
not tell. Out of 42 students, 20(47.5%) indicated that there was a moderate increase of
physical facilities in public schools, 2(4.8%) indicated that the increase rate was minimal,
14(33.3%) indicated they were not adequate at all while 4(9.5%) could not tell.
4.6 CDF funds and learners’ enrolment, retention and completion rates
The third objective of the study was to establish the effect of CDF funds on learners’
retention, enrolment and completion rates. To determine this, the researcher analyzed
academic documents of targeted schools. The trend of learners’ enrolment, retention and
completion population before and after CDF was introduced in 2003 was traced.
The information shown in table 4.11 below answered the question
“What was the enrolment rate of learners before the introduction of CDF funds (before
2003) and after the introduction of CDF (from 2003) to the moment?’’

47
Table 4.11 Form one school enrolment in Likuyani Constituency from 2000-2013
The table below gives a comparison of the rate of enrolment, retention and completion rate
before and after the introduction of CDF funds.
YEAR 2000 2001 2002 2003 2004 2005 2010 2011 2012 2013
St Ann’s Girls’ 87 90 84 87 93 94 102 109 115 120
Binyenya Sec 34 37 33 34 60 75 89 87 94 105
St Henry’s Sec 78 73 74 76 84 89 98 102 101 102
St Peter Machine 54 53 64 65 97 102 98 105 110 120
St Joseph’s Kogo 34 33 40 40 59 65 75 89 102 106
F.S Mbururu Sec 45 47 46 45 68 72 98 101 103 110
F.S Kongoni Sec 78 76 78 79 104 107 104 109 110 112
Eshikulu Sec 78 79 82 84 95 102 105 107 110 112
Moi Girls Nangili 102 108 95 96 120 95 104 105 110 120
Matunda SA sec 84 82 83 84 102 105 120 121 123 120
Source: DEO’s office
48
Table 4.11 shows that the number of form one enrolment for the past years has seen the
number of students on the rise. However a close look at the trend reveals that although the
number of learners increased after the introduction of CDF fund, the pace of increase is very
low for example in St Peters Machine, the number increased from 64 to 65 in 2002-2003
respectively, while in Mbururu, the number remained constant at 40 from 2002-
2003.However,it is important to note that although the CDF act was formed in 2003,it took
roots from 2004 thus the steady rise of numbers from 2004 and not 2003.However,whereas
the study appreciates the increase in enrolment rate as a result of CDF funds, it also reveals
that the enrolment is still below the expectation with all schools enrolling below 200
students ten years down the line.
However the researcher is also conscious of the fact that there are other factors that influence
enrolment rate like number of teachers available in a school, community good will, political
interference, school management among others which in this study are regarded as
intervening variables.
4.6.1Learners’ retention and completion rate in public secondary schools
Secondary education comes to an end when learners sit for their KCSE at the end of four
years in accordance to the 8-4-4 system of education in Kenya. It was assumed that for the
learner to sit for KCSE, he or she must have been retained in school thus the two concepts,
these are retention and completion was investigated concurrently. Retention and completion
of secondary education is a key factor in education development for one cannot proceed to
higher of education without the Secondary school certificate hence the researcher aimed to
find out the retention and completion rate of schools in Likuyani constituency. This was
done by comparing the number of who enrolled and sat for KCSE before CDF funds were

49
introduced with those who enrolled and sat for KCSE after the introduction of CDF funds in
ten public secondary schools in the constituency and table 4.12 gives the results.
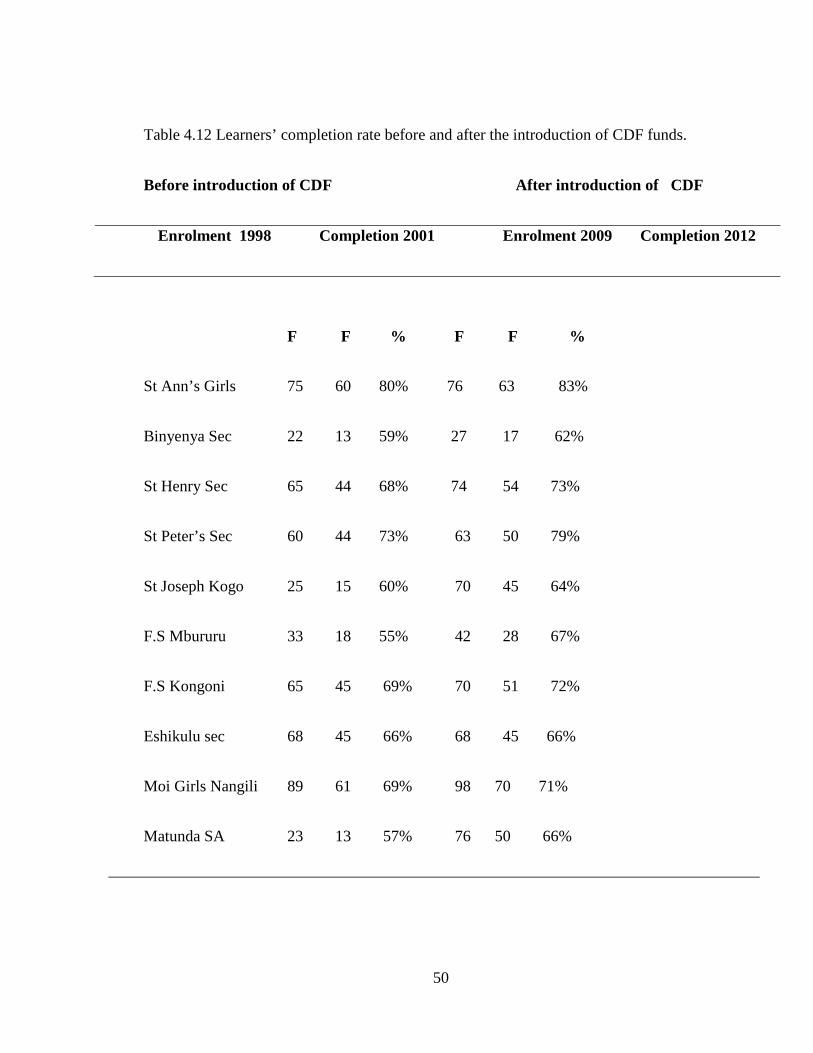
50
Table 4.12 Learners’ completion rate before and after the introduction of CDF funds.
Before introduction of CDF After introduction of CDF
Enrolment 1998 Completion 2001 Enrolment 2009 Completion 2012
F F % F F %
St Ann’s Girls 75 60 80% 76 63 83%
Binyenya Sec 22 13 59% 27 17 62%
St Henry Sec 65 44 68% 74 54 73%
St Peter’s Sec 60 44 73% 63 50 79%
St Joseph Kogo 25 15 60% 70 45 64%
F.S Mbururu 33 18 55% 42 28 67%
F.S Kongoni 65 45 69% 70 51 72%
Eshikulu sec 68 45 66% 68 45 66%
Moi Girls Nangili 89 61 69% 98 70 71%
Matunda SA 23 13 57% 76 50 66%

51
Table 4.12 shows comparison between learners’ enrolment and completion before CDF
funds were introduced in and after its introduction in 2003.From the table ,it is evident that
before introduction of CDF funds ,the enrolment rate was low and so was the completion
rate with most schools registering less than 70%.With the introduction of CDF funds the
enrolment rate went slightly up and so was the retention and consequently completion with
most schools registering a high completion rate of over 70 % .This shows that CDF funds
have led to slightly high enrollment, retention and completion rates but again the rate is still
below the expectation which is 100%.Besides; this rise in completion rate cannot be wholly
attributed to CDF funds since there are other sources of funding like PTA that could have
played an equally important role. There are also other factors that influence learners
retention and completion rates like learners health, social factors like early pregnancy for
girls among others but all factors held constant, CDF funds have enhanced learners
enrolment, retention and completion rates but to a minimal extent.
4.7 CDF funds and learners’ academic performance.
The fourth objective of this study was to determine the impact of CDF funding in education
on learners’ academic performance in public secondary schools in Likuyani Constituency.
The researcher requested principals, teachers and students to give their level of agreement on
project items and bursaries funded by CDF and their effect on students’ academic
performance and table 4.10 gives the findings.
Table 4.13 Impact of physical facilities and bursaries on learners’ academic performance
The table below shows the effect enhanced physical facilities and bursaries on learners’
academic performance. Information on this objective was guided by the following question,

52
‘What is the impact of the following physical facility and bursary funded by CDF on
learners’ academic performance?
Table 4.13 shows the response from students, headteachers and teachers:
STATEMENT SA A U D SD
Facility F % F % F % F % F %
Science laboratory 38 40% 49 53% 4 4% 3 3% 0 0.0%
Construction of classrooms 36 38% 51 55% 3 3% 4 4% 0 0.0%
Provision of Desks and chairs 35 38% 47 50% 4 4% 7 7% 1 1%
Computer laboratory 37 39% 42 45% 9 10% 6 6% 0 0.0%
Home science room 20 23% 26 29% 25 28% 15 17% 3 3%
School library 50 53% 40 43% 3 3% 1 1% 0 0.0%
Provision of computers 51 54% 42 45% 1 1% 0 0.0% 0 0.0%
Provision of bursaries to students 60 67% 32 34% 1 1% 0 0.0% 0 0.0%
KEY
i)SA-Strongly Agree (ii)A- Agree ( iii)U-Undecided ( iv)D-Disagree v) SD-
Strongly disagree

53
Table 4.13 above shows the effect CDF funded physical facilities and bursaries on learners’
academic performance. Most respondents;60 (69%)agreed that bursaries have led to
improved learners’ performance. Those who felt that the construction of classrooms led to
improved learners performance were 87 representing 93% while only 3 (3%) disagreed and
4(4%) were undecided. On the construction of science laboratory, again 87 of the
respondents representing 93% agreed the this has led to improved learners’ academic
performance while 3(3%) were undecided. 90(97%) respondents said that the construction of
libraries has led to improved learners’ academic performance with 3(3%) remaining
undecided and only 1(1%) disagreeing with this view. Regarding CDF provision of desks
and chairs,82 respondents (97%) agreed that this move has had a positive impact on
learners’ academic performance while 4(4%) were undecided and 7(7%) disagreeing. From
this response, it is clear that many responds assert that indeed the funding of physical
facilities and provision of bursaries has had a positive impact on learners’ academic
performance thus contributing to Education development in the county.

54
CHAPTER FIVE
SUMMARY OF THE FINDINGS, CONCLUSIONS AND
RECOMMENDATIONS
5.1 Introduction
This chapter summaries all the findings and results of chapter four as collected and analysed
by the researcher basing on the research questions and are interpreted and compared to
findings in the literature review. It further draws conclusions derived from the findings.
Lastly, the study gives recommendations for improvement of the areas of concern identified
by the findings and conclusions.
5.2 Summary of the findings
The purpose of the study was to determine the influence of CDF on education development
in Likuyani Constituency; Kakamega County in Kenya. The study used the descriptive
survey research design. Using simple random sampling technique, a sample size often (10)
public secondary schools out of twenty four (24) schools were selected. A sample size of
ninety seven (97) respondents from students, teachers, headteachers and officers from the
DEO’s office provided data upon which the research was based. Information was collected
using questionnaire administered to eight (8) headteachers, forty three (43) teachers and
forty three (43) students. An interview schedule was used to collect data from three (3)
officers from the DEO’s office. Instrument validity and reliability was determined through
pilot study. Descriptive statistics was used to analyse and interpret data. The main findings
of the study based on each of the research questions were as follows:

55
5.2.1 The extent of bursary provision
This study observed that the most of the students 90(93%) did not receive enough bursaries
to enable them pay fee charged by the school. The study established that the poor but bright
students who receive CDF bursary funds are few according to the response which stood at44
representing 48%. This is slightly below average. On the other hand, 42 % felt that the CDF
bursary fund did not get to the deserving students. It was also established that 90 (96%) of
the respondents said that the bursary is hardly enough to pay school fees. However, only (2)
2% of respondents felt the CDF bursary fund was enough. The majority; 92 (98%) gave an
impression that poor and bright students do not receive CDF bursary fund every year. This
means they receive these funds sporadically either once, twice or at most thrice during the
entire secondary education life cycle of four years.
5.2.2The extent of CDF funded physical facilities in public secondary schools
Over 50% of the headteachers indicated that the projects which most benefited from CDF
funds were the school land 4 (50%), science laboratory 3(37.5%), administration block 4
(50%) and computer laboratory 3 (37.5%).It was established that most of the facilities in
schools (50%) were funded by the PTA. The other facilities were funded by GOK, LATF
and other bodies. This implies that schools did not rely on CDF funds for facilities. It also
shows that the CDF funds were inadequate, thereby making it necessary to seek funds
elsewhere.
Respondents,24 (48%) agreed that classrooms were enough where as those who felt that
desk ,chairs and lockers were sufficient were 19 (38%).Respondents who agreed that toilets
were adequate were 17 (34%), playing grounds 28 (56%) , laboratory equipment, 25 (50%),
laboratories, 18 (36%), and computers, 17 (34%).
56
The above findings indicate that there are inadequate classrooms, desks, chairs, lockers as
well as other major amenities like laboratories. However, most of the respondents (57.1%
students and 62.5 head teachers) agreed that the number of school facilities increased as a
result of CDF funding.
5.2.3 CDF funds and learners’ enrolment, retention and completion rates
With regard to the effect of CDF funding on learners’ enrolment, retention and completion
rate, the study established that although the number of learners ’enrolment kept increasing
after the introduction of CDF, the pace was very low for example in St Peters Machine, the
number increased from 64 to 65 in 2002-2003 respectively, while in Mbururu, the number
remained constant at 40 from 2002-2003. However, whereas the study appreciates the
increase in enrolment rate as a result of CDF funds, it also reveals that the enrolment is still
below the expectation with all schools enrolling below 200 students ten years down the line.
Comparison was also made between learners’ enrolment and completion before CDF funds
was introduced and after its introduction in 2003.The study found out that before the
introduction of CDF funds ,the enrolment rate was low and so was the completion rate with
most schools registering less than 70%.With the introduction of CDF funds the enrolment
rate went slightly up and so was the retention and consequently completion with most
schools registering a high completion rate of over 70 % .This shows that CDF funds have
led to slightly high enrollment, retention and completion rates but again the rate is still
below the expectation which is 100%.
57
5.2.4 CDF funds and learners’ academic performance
In respect to the impact of CDF funds in education on learners’ academic performance, the
study found out that many respondents;60 (67%)agreed that CDF funded bursaries have led
to improved learners’ academic performance. Those who felt that the construction of
classrooms led to improved learners performance were 87 (93%) while only 3 (3%)
disagreed and 4(4%) were undecided. On the construction of science laboratory, again 87 of
the respondents representing 93% agreed the this has led to improved learners’ academic
performance while 3(3%) were undecided. 90(97%) respondents said that the construction of
libraries has led to improved learners’ academic performance with 3(3%) remaining
undecided and only 1(1%) disagreeing with this view. Regarding CDF provision of desks
and chairs,82 respondents (97%) agreed that this move has had a positive impact on
learners’ academic performance while 4(4%) were undecided and 7(7%) disagreeing.
5.3 Conclusions
Based on the foregoing findings, several conclusions were arrived at;
First, very few poor but bright students receive bursary from CDF education fund and for the
few who receive, it is hardly enough to keep them in school for the whole year in accordance
to the fee charged. Besides, the funding is also not guaranteed on yearly basis for these
deserving students for some are funded only once or twice for the entire secondary education
cycle of four years.
Secondly, CDF funds have indeed helped to facilitate the provision of physical facilities in
public secondary schools in Likuyani Constituency. However, this is only to a small extent,
46.7%. The study established that facilities were still not enough inspite of the CDF funding.
The area’s most affected were science and computer laboratories as well as school buses.

58
Thirdly, the study established that the number of learners’ enrolment ,retention and
completion rate had significantly gone up with the introduction of CDF that offers the poor
but bright students bursary and help in provision of physical facilities in public secondary
schools.
Fourthly, the study also found out that learners’ academic performance improved with the
introduction of CDF education funds. This is as a result of provision of physical facilities but
most significantly the science laboratories that have helped learners to improve in
performance of science subjects. The construction of the libraries and classrooms has also
led to positive impact of learners’ performance. The study also found out that these funds are
not enough thus learners’ academic performance in relation to CDF education funding is still
low.
5.4 Recommendations
From the findings and conclusions, the study recommends the following in order to
improve the provision and management of CDF funds in education so as to realize
significant education development.
1. The government should allocate enough funds in time and resources to schools to ensure
that the facilities constructed are enough and are completed and adequately equipped for
example science and computer laboratories as well as libraries.
2. The government should also increase funds allocated to CDF bursary so that the deserving
students can fully pay their school fees thus increasing the retention and completion rates.
3. The study established that headteachers are not fully involved in identifying the poor but
bright learners thus very few deserving students benefit from the CDF fund bursary. As

59
such, the researcher recommends that headteachers and teachers be involved to a larger
extent in identifying the deserving students.
4. Head teachers should involve the community around them to aid in school development
programmes and projects to supplement CDF education funding. As it is at the moment,
other sources of funding are still low. The schools should also initiate income generating
projects to subsidize CDF education funding.
5.5 Suggestions for further Research
The researcher wishes further studies to be conducted in the following areas
The strategies being employed by school administrators to cope with the challenges faced by
headteachers when implementing CDF funded projects in secondary schools.
The factors affecting the implementation of CDF funded projects in secondary schools.
Effects of lack of adequate facilities on the performance of students in secondary schools in
Kenya.
60
REFERENCES
Abagi, (1997) .,Efficiency of Primary Education techniques: 2nd revised edition New Delhi: New age. International publishers.
Archilles, C. (1990).,Small Classes, Possibilities: The school Administrator, New York .New international publishers.
Becker, G.S., & Tomes, N. (1979). An Equilibrium. Theory of the Distribution of Income and Intergenerational mobility. Journal of Political Economy, 87, 1153-1189.
Borman, G. D., Overman, L. T. (2004) .Academic Resilience in Mathematics among Poor and Minority Students. The Elementary School Journal For Education Planning. vol. 104, No. 3, 177-195.
Children’s Academic Learning. The Elementary School Journal.vol. 104, No. 3, 197- 213
Drummond, K. V., & Stipek, D. (2004). Low- Income Parents’ Beliefs about Their Role in
Education for Action. IPAR CDP No. 005/1997n.
Evans, G. W. (2004). The Environment of Childhood Poverty. American Psychologist,59, 77-92 .
Floyd, C. (1996).Achieving despite the Odds: A study of Resilience Among a Group of African American high school seniors. The Journal of Negro Education,vol. 65,No. 2, 181-189.
Ford and Hams .(1997). A Study of the racial identity and Achievement of Black males and
females. Roeper Rev.20, 105-115.
Government of Kenya (2008)., President Kibaki Launches Subsidized Secondary Education,
Nairobi: Government printer.
Government of Kenya, (2003). The Constituencies Development Fund Act. Nairobi.
Government Printer.
Government of Kenya, (2005). Sessional Paper No.1 of 2005 on “A Policy Framework for
Education, Training and Research”. Government Printer, Nairobi, Kenya.
Government of Kenya, (2008). Economic Stimulus Programme, Kenya 2009/2010.
Overcoming today’s Challenges for a Better Kenya Tomorrow .Nairobi. Government Printer.

61
Government of Kenya, (2009). Ksh 22 Billion to Revive Economic Growth. Daily Nation,
P4.Government printer..
Implications for Education Reform. Discussion paper,No.004/97.Nairobi:IPAR.GoK
Government of Kenya (2005) Development and Targeted Poverty interventions. Nairobi:
Government Printer.
Government of Uganda,(2010).Appraisal report: Updated Education Sector Strategic plan,2010-2015.Kampala.Gorvenment printer.
Jacobs, N., & Harvey, D. (2005). Do parents make a difference to children’s academic
achievement? Differences between parents of higher and lower achieving students.
Educational Studies, Vol. No. 4, 431-448.
Jomtien A.(1994).Years of Learning: Education Development in Eastern and Southern :Kenya Experience .Nairobi: Initiative Ltd.
Kinyanjui, F. (2007). The Missing Link: Interrogating Entry to Kenya’s Secondary School
System. Unpublished Concept Paper. Egerton University, Kenya.
Kirui, K. (2008).,The implementation of the physical education curriculum in secondary
schools: A case of Bomet district in the Rift Valley Province- Kenya, Unpublished M.
Philosophy thesis, Moi University, Eldoret.
Kothari, C.R.(2008).Research Methodology: Methods and techniques: New Delhi: New age
Longman Inc.
Mugenda,G. (20II). Social Science Research Theory and Principles, Nairobi: African center
Mutambo, A.(2013 June 13).Budget allocation. Daily Nation,p.1
Ngware, M.W., Onsomu, E.N., Muthaka, D.I. & Manda, D.K. (2006). Improving Access to
Secondary Education in Kenya: Longman inc.hat.
Okwach, A (1999). Public and private investment in Education in Kenya. An Agenda
or technological studies . IPAR CDP No. 005/1997.
Oso Y.W & Onen. D (2009).A general guide to writing research proposal and report .A
handbook for beginning researchers. Nairobi: Jomo Kenyatta foundation.
62
Oyaro, K. (2008)., Education-Kenya: Students pour in, Teachers drain Away. International press News Agency.http://ipsnews.net/africa/nota.asp?idnews=422667 can be done? Journal Paper, Vol. 25, No.7, 2006,pp.523-543.
Psacharopolus,G.(1989).Why Education Reforms Fail: ‘Comparative analysis’ International
Review Education.Vol.35(No.2)pp.179-1940.
Republic of Kenya, ( 1964). The Kenya commission report: The Ominde report. Nairobi.
Government Printer .
Republic of Kenya. (2007).,Report of the task force on affordable secondary education.
Nairobi. Government Printer.
Republic of Kenya.(2005). Sessional Paper No.1 on Education and Training. Nairobi:
Government Printer.
Rumberger, R. W. (1995). Dropping out of Middle School: a multilevel analysis of students
and schools. American Educational Research Journal, 32, 583-626
Sifuna ,D.(1997).The quality of Primary Education in Kenya: Some Issues In
Watson,.Education dilemmas: Debate and diversity. London: CASSEL ESCO11
UNESCO (1997)., Including the Excluded: Meeting Diversity In Education. Example from
Uganda .Paris. UNESCO.
UNESCO. (2007). Education for All issue 12, http://www.efa.Nairobi-Unesco.org/efaxii/.
World Declaration on Education for All. (1999).,Development of Education in Africa: The
Kenya Experience .Nairobi: Initiative Ltd.
Vaillant.,(2005).Education Reforms and Teachers Union :Avenue For Action ,Paris:
UNESCO,
Walberg, H. J. (1994) .,Educational resilience in inner-cities. Challenges and Prospects (pp.
45-72), Hillsdale, NJ: Erlbaum. .
World Declaration on Education for All. (1990). ,Development of Education in Africa: The
Kenyan Experience.Nairobi.UNESCO.

63
APPENDICES
APPENDIX I A letter of transmittal
Dear Sir/Madam
I am a student in the University of Nairobi pursuing a Master of Arts degree in Project
Planning and Management. I am undertaking research on impact of Constituency
Development Fund (CDF) on Secondary School Education Development in the counties: A
Study of Secondary schools in Likuyani constituency, Kakamega County in Kenya. I
kindly request you to participate in this study and your responses to items in the
questionnaire will be treated with uttermost confidentiality, and will not be used for any
other purposes except this study.
Yours faithfully,
Hycinth Nekesa Obwari.
Reg No.L50/64362/2011
Sign
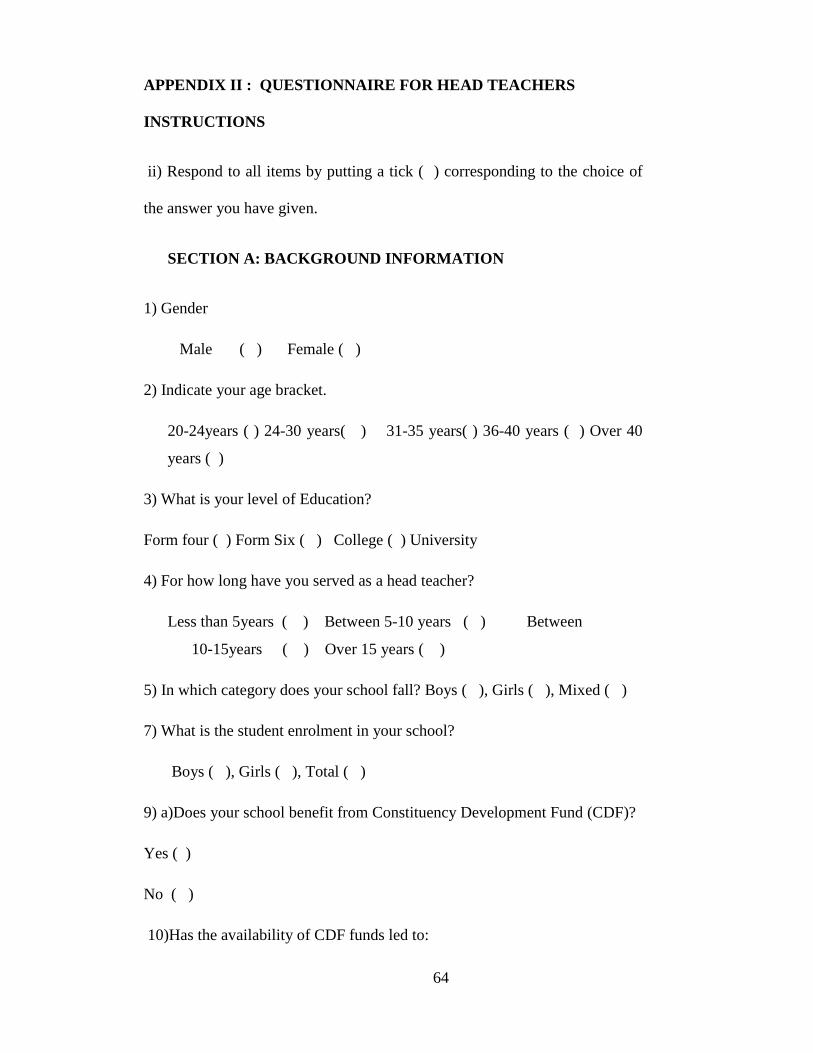
64
APPENDIX II : QUESTIONNAIRE FOR HEAD TEACHERS
INSTRUCTIONS
ii) Respond to all items by putting a tick ( ) corresponding to the choice of
the answer you have given.
SECTION A: BACKGROUND INFORMATION
1) Gender
Male ( ) Female ( )
2) Indicate your age bracket.
20-24years ( ) 24-30 years( ) 31-35 years( ) 36-40 years ( ) Over 40
years ( )
3) What is your level of Education?
Form four ( ) Form Six ( ) College ( ) University
4) For how long have you served as a head teacher?
Less than 5years ( ) Between 5-10 years ( ) Between
10-15years ( ) Over 15 years ( )
5) In which category does your school fall? Boys ( ), Girls ( ), Mixed ( )
7) What is the student enrolment in your school?
Boys ( ), Girls ( ), Total ( )
9) a)Does your school benefit from Constituency Development Fund (CDF)?
Yes ( )
No ( )
10)Has the availability of CDF funds led to:

65
a)An increased retention rate? Yes ( ) No ( ) Not sure ( )
d) Increased transition rate from one class to another? Yes ( ) No ( ) Not sure ( )
SECTION B
The extent of CDF bursary funding in public secondary schools.
1) Indicate your level of agreement on the extent of CDF education bursary funding for the
poor and bright students in public secondary schools.
KEY
i)SA: Strongly Agree ii) A: Agree iii) U:Undecided iv)Disagree v) SD: Strongly
Disagree
Statement SA A U D SD
Poor and bright students who receive bursaries are less than
50%
Poor & bright students who receive bursaries are more than 50%
Bursaries are given to poor and bright students
Poor and bright students receive enough bursaries
Poor and bright students receive bursaries every year
(B)The extent of physical facility provision in public secondary school.
i)Information on CDF funding of physical facilities
1) What is the total number of the following items in your school and what was the source of
funding?

66
Facility Number Source of funding, such as
PTA,LATF,GoK
Classrooms
Boys’ toilets
Girls’ toilets
Teachers’ toilets
Support staff toilets
School land
Libraries
Dormitories
Office furniture
Science laboratories
Teachers’ houses
School vehicle
Computers
Photocopying machines
Administration block
Dining hall
Home science room
Music room
Computer laboratory

67
ii)Availability of physical facilities in public secondary schools
2) Indicate your level of agreement regarding the availability of physical of facilities in your
school.
Availability of physical facilities in school SA A U D SD
Class rooms are enough
Lockers and chairs are enough
Toilets are enough
Playing grounds are enough
There are enough computers
There are enough laboratory equipment
c) Information on increase of physical facilities as a result of funding
3)Indicate your level of agreement on this statement:
iii)The numbers of physical facilities in public secondary schools have increased as a result
of CDF funding.
a) Strongly agree ( )
b) Agree ( )
c) Undecided ( )
d) Disagree ( )
e) Strongly disagree ( )
4) Have you received any CDF funding over the last six years?

68
Yes ( ) No ( ) Not sure ( )
5) If your answer in 9 above is ‘yes’, name the projects for which you received the funding
and the project amount.
a).----------------------------------------
b).----------------------------------------
c).----------------------------------------
d).----------------------------------------
6)Is the CDF funding of physical projects sufficient?
a) Strongly agree ( )
b) Agree ( )
c) Neutral ( )
d) Disagree ( )
e) Strongly disagree ( )
7) Are the facilities adequate after the introduction of CDF funding of educational projects?
a) To a great extend ( )
b) To a moderate extend ( )
c) To a minimal extend ( )
d) Not adequate at all ( )
e) I can’t tell ( )
8). Has the availability of CDF funds led to:
a). Reduced cost of education, especially the PTA levy? Yes ( ) No ( ) Not sure ( )
b). An increased retention rate? Yes ( ) No ( ) Not sure ( )

69
c). Increased access to educational opportunities? Yes ( ) No ( ) Not sure ( )
d). Increased transition rate from one class to another? Yes ( ) No ( ) Not sure ( )
(C)The effect CDF funds on learners’ academic performance
1) Indicate your level of agreement regarding the effect of CDF funds on learners’ academic
performance.
Statement SA A U D SD
Construction of science laboratory by CDF has led to
improved learners’ academic performance
Construction of classrooms by CDF has led to improved
learners’ academic performance
Provision of Desks and chairs by CDF has led to
improved learners academic performance
Construction & equipping of computer laboratory by
CDF has led improved learners ’academic performance
Construction of Home science room by CDF has led to
improved learners academic performance
Construction of library has led to improved learners’
academic performance
Provision of computers by CDF has helped improve
learners’ academic performance
Provision of bursary to poor and bright students by CDF
has led to improved learners academic performance
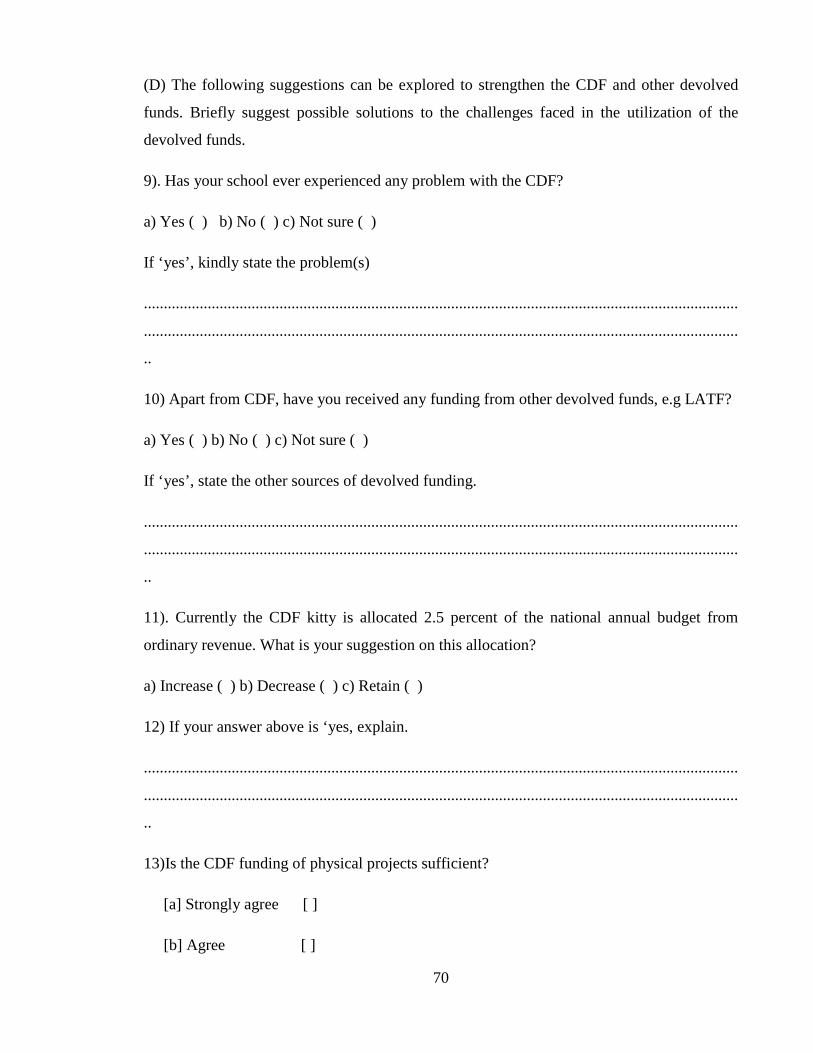
70
(D) The following suggestions can be explored to strengthen the CDF and other devolved
funds. Briefly suggest possible solutions to the challenges faced in the utilization of the
devolved funds.
9). Has your school ever experienced any problem with the CDF?
a) Yes ( ) b) No ( ) c) Not sure ( )
If ‘yes’, kindly state the problem(s)
.....................................................................................................................................................
.....................................................................................................................................................
..
10) Apart from CDF, have you received any funding from other devolved funds, e.g LATF?
a) Yes ( ) b) No ( ) c) Not sure ( )
If ‘yes’, state the other sources of devolved funding.
.....................................................................................................................................................
.....................................................................................................................................................
..
11). Currently the CDF kitty is allocated 2.5 percent of the national annual budget from
ordinary revenue. What is your suggestion on this allocation?
a) Increase ( ) b) Decrease ( ) c) Retain ( )
12) If your answer above is ‘yes, explain.
.....................................................................................................................................................
.....................................................................................................................................................
..
13)Is the CDF funding of physical projects sufficient?
[a] Strongly agree [ ]
[b] Agree [ ]

71
[c] Neutral [ ]
[d] Disagree [ ]
[e] Strongly disagree [ ]
14). Has the number of school facilities increased as a result of CDF funding?
[a] Strongly agree [ ]
[b] Agree [ ]
[c] Neutral [ ]
[d] Disagree [ ]
[e] Strongly disagree [ ]
15). Are the facilities adequate after the introduction of CDF funding of physical facilities in
public secondary schools?
[a] To a great extent [ ]
[b] To a moderate extent [ ]
[c] To a minimal extent [ ]
[d] Not adequate at all [ ]
[e] I can’t tell [ ]
16)Has the availability of CDF funds for physical infrastructure in public secondary schools
led to reduced cost of education, especially the PTA levy?
[a] Yes [ ]
[b] No [ ]
[c] Not sure [ ]
17). List the strengths of CDF in your school.
................................................................................................................................................

72
18).List the weaknesses of CDF in your school
………………………………………………………………………………………………….
.
19) What challenges do you face as a result of CDF funding of school projects?
.....................................................................................................................................
20) What do you recommend as the best way to improve the management and efficiency of
CDF funded projects in schools?

73
APPENDIX III : QUESTIONNAIRE FOR TEACHERS
INSTRUCTIONS
ii) Respond to all items by putting a tick ( ) corresponding to the choice of the answer you
have given.
SECTION A: BACKGROUND INFORMATION OF RESPONDENT
1) Gender
Male ( ) Female ( )
2) Indicate your age bracket.
20-24years ( ) 24-30 years ( ) 31-35 years ( ) 36-40 years ( ) Over 40 years ( )
3) What is your level of Education?
Form four ( ) Form Six ( ) College ( ) University
4) For how long have you served as a head teacher?
Less than 5years ( ) Between 5-10 years ( )Between 10-15years ( ) Over 15 years ( )
5) In which category does your school fall? Boys ( ), Girls ( ), Mixed ( )
7) What is the student enrolment in your school?
Boys ( ), Girls ( ), Total ( )
9) a)Does your school benefit from Constituency Development Fund (CDF)?
Yes ( )
No ( )
10) Has the availability of CDF funds led to:

74
a) An increased retention rate? Yes ( ) No ( ) Not sure ( )
d) Increased transition rate from one class to another? Yes ( ) No ( ) Not sure ( )
c) Information on increase of physical facilities as a result of funding
3)Indicate your level of agreement on this statement:
iii)The numbers of physical facilities in public secondary schools have increased as a result
of CDF funding.
a) Strongly agree ( )
b) Agree ( )
c) Undecided ( )
d) Disagree ( )
e) Strongly disagree ( )
4) Have you received any CDF funding over the last six years?
Yes ( ) No ( ) Not sure ( )
5) If your answer in 9 above is ‘yes’, name the projects for which you received the funding
and the project amount.
a).----------------------------------------
b).----------------------------------------
c).----------------------------------------
d).----------------------------------------
6)Is the CDF funding of physical projects sufficient?
a) Strongly agree ( )
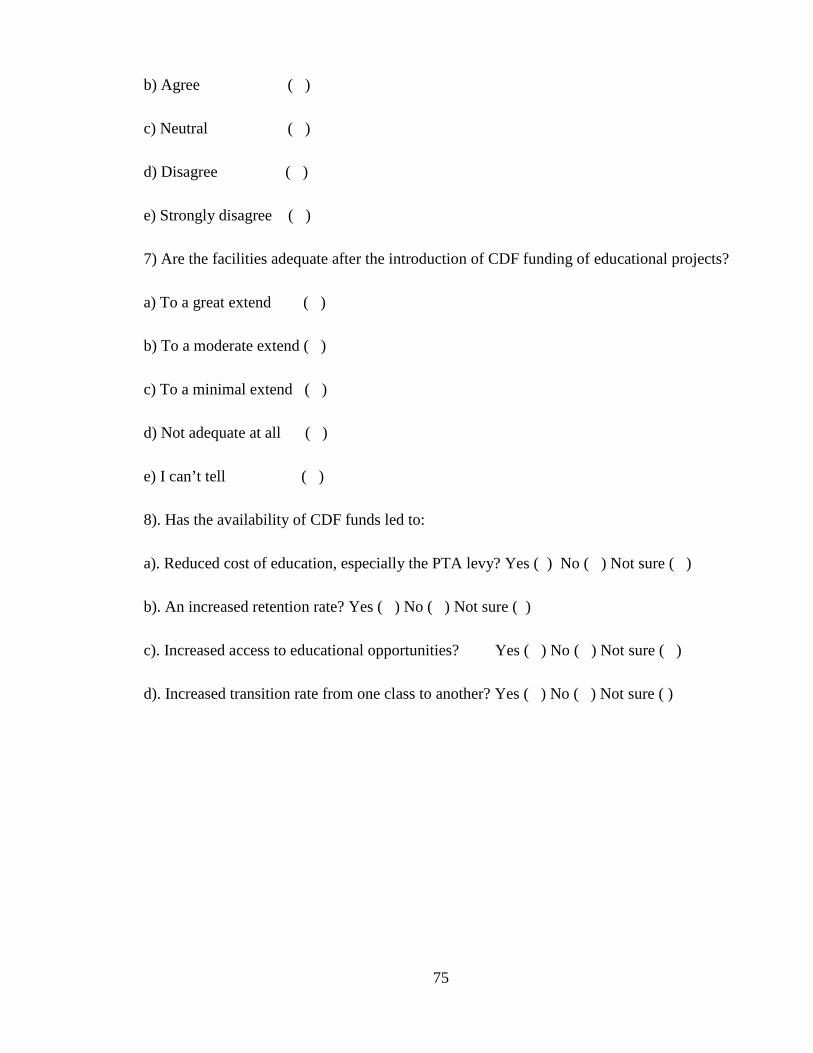
75
b) Agree ( )
c) Neutral ( )
d) Disagree ( )
e) Strongly disagree ( )
7) Are the facilities adequate after the introduction of CDF funding of educational projects?
a) To a great extend ( )
b) To a moderate extend ( )
c) To a minimal extend ( )
d) Not adequate at all ( )
e) I can’t tell ( )
8). Has the availability of CDF funds led to:
a). Reduced cost of education, especially the PTA levy? Yes ( ) No ( ) Not sure ( )
b). An increased retention rate? Yes ( ) No ( ) Not sure ( )
c). Increased access to educational opportunities? Yes ( ) No ( ) Not sure ( )
d). Increased transition rate from one class to another? Yes ( ) No ( ) Not sure ( )

76
APPENDIX IV: QUESTIONNAIRE FOR STUDENTS
Dear student,
I am a student in the University of Nairobi pursuing a Master of Arts degree in Project
Planning and Management. I am undertaking research on impact of Constituency
Development Fund (CDF) on Education development in the counties: A case study of
Likuyani constituency, Kakamega county in Kenya. I kindly request you to participate in
this study and your responses to items in the questionnaire will be treated with uttermost
confidentiality, and will not be used for any other purposes except this study.
Instructions
1) The information you give concerning impact of CDF on Education
development will be confidential..
2) Respond to all questions by putting a tick ( )in brackets corresponding
your answer.
BACKGROUND INFORMATION OF THE RESPONDENT.
Instructions
a)Indicate your gender. Male ( ) Female ( )
b) Indicate your age bracket.
12-15 years ( )16-19years ( )17-20 years( ) 21-24 years ( )Above 24 years
1) In what form are you?
2) Have you ever received CDF bursary?

77
If yes how many times?
If No, explain why you didn’t benefit?
3) Has CDF built any physical facilities in your school like classroom?
(specify)
SECTION B
Using the information given, indicate your level of agreement against each
statement.
Key
i) SA: Strongly Agree ii) A: Agree iii) U: Undecided iv)Disagree v)
SD: Strongly disagree
Statement SA A U D SD
i)CDF bursaries are given to poor and bright students.
ii).CDF bursaries are not given to poor and bright students
iii)CDF has helped to improve learners’ academic performance.
iv)CDF has not helped to improve learners’ academic performance.
There are enough physical facilities in my school
There are no enough physical facilities in my school
CDF funding of physical facilities has helped poor and bright students to stay in school.
CDF funding of physical facilities has not helped poor and bright students to stay in school.

78
APPENDIX VI: NTERVIEW SCHEDULE FOR THE DISTRICT
EDUCATION OFFICER.
QUESTIONS
1).How long have you served as an Education officer?
2).What role do you play in the implementation of government policy Constituency
Development Fund (CDF)?
3) What specific use is CDF committed to in your sector?
4) Do all the schools in your district have adequate school facilities funded by CDF?
5) What percentage of students benefit from CDF bursary scheme in your District?
6) How does CDF influence students’ performance?
7) To what extend is CDF influential in students’ enrolment and retention rate in your
district?
8) Has CDF influenced the provision of quality education as reflected in students’ KCSE
performance?