industry internship and report on
TRANSCRIPT
Industry Internship and Report on
“FINANCIAL STATEMENT ANALYSIS OF HONDA COMPANY LTD”
BY
VARUN KUMAR V
1NZ16MBA71
Submitted to
DEPARTMENT OF MANAGEMENT STUDIES
NEW HORIZON COLLEGE OF ENGINEERING,
OUTER RING ROAD, MARATHALLI,
BANGALORE
In partial fulfillment of the requirements for the award of the degree of
MASTER OF BUSINESS ADMINISTRATION
Under the guidance of
INTERNAL GUIDE EXTERNAL GUIDE
NIVIYA FESTON HEMRAJ
SENIOR ASSISTANT PROFESSOR BRACH MANAGER
2016-18
CERTIFICATE
This is to certify that Varun Kumar V bearing USN 1NZ16MBA71, is a bonafide
student of Master of Business Administration course of the Institute, Batch 2016-18,
autonomous program, affiliated to Visvesvaraya Technological University, Belgaum.
Internship report on “FINANCIAL STATEMENT ANALYSIS OF HONDA
COMPANY LTD” is prepared by him under the guidance of Niviya Feston, in partial
fulfillment of requirements for the award of the degree of Master of Business
Administration of Visvesvaraya Technological University, Belgaum Karnataka.
Signature of Internal Guide Signature of HOD Signature of Principal
DECLARATION
I, Varun Kumar V, hereby declare that the Internship report entitled “FINANCIAL
STATEMENT ANALYSIS OF HONDA COMPANY LTD” with reference to
“HONDA COMPANY LTD, Bangalore” prepared by me under the guidance of Niviya
Feston, Senior Assistant Professor of M.B.A Department, New Horizon College of
Engineering and external assistance by Hemraj, Branch manager, HONDA COMPANY
LTD.
I also declare that this Internship work is towards the partial fulfillment of the university
regulations for the award of the degree of Master of Business Administration by
Visvesvaraya Technological University, Belgaum.
I have undergone a summer project for a period of Eight weeks. I further declare that
this project is based on the original study undertaken by me and has not been submitted
for the award of a degree/diploma from any other University / Institution.
Signature of Student
Place: Bangalore, Karnataka
Date

ACKNOWLEDGEMENT
It is a genuine pleasure to express my deep sense of thanks and gratitude to the Principal
of New Horizon College of Engineering, Dr.Manjunatha for providing us with a
wonderful platform.
I owe a deep sense of gratitude to Dr.Sheelan Misra, Head of Department of
Management Studies for her support and encouragement.
I am extremely thankful to Prof. Niviya Feston, Internal guide who has guided and
corrected me in all the possible ways to get the best results. Her timely suggestions and
enthusiasm has helped me complete the project report.
I profusely thank Mr. HEMRAJ, who helped me explore the real corporate world,
without whom I would not have been able to complete the study.
It is my privilege to thank my family and friends who have constantly encouraged me
throughout my study period and for their co-operation.
Varun Kumar V 1NZ16MBA71
TABLE OF CONTENTS
CHAPTER NO. PARTICUALRS PAGE NO.
Executive Summary
1 Theoretical Background of the Study 1-14
2 Industry Profile and Company Profile 15-33
3 Research Methodology 34-38
4 Data analysis and Interpretation 39-50
5 Summary of Findings, Suggestions and Conclusion 51-52
6 Learning Experience 53

LIST OF TABLES
Table No Particulars Page No
4.1 Showing the net profit turnover 39
4.2 Showing the solvency ratio 41
4.3 Showing the Debt-Equity ratio
43
4.4 Showing the net profit margin
45
4.5 Showing the Return on equity
47
4.6 Showing the cash turnover ratio 49
LIST OF GRAPHS
Table No Particulars Page No
4.1 Showing the net profit turnover 40
4.2 Showing the solvency ratio 42
4.3 Showing the Debt-Equity ratio
44
4.4 Showing the net profit margin
46
4.5 Showing the Return on equity
48
4.6 Showing the cash turnover ratio 50

1
CHAPTER 1
THEORITICAL BACKGROUND OF THE STUDY
INTRODUCTION
Business concern needs finance to meet their requirement in the economic world. Any kind of
business activity depends on the finance. Hence, it is called as lifeblood of business
organization. Whether the business concerns are big or small, they need finance to fulfil their
business activities.
In the modern world, all the activities are concerned with the economic activities and very
particular to earning profit through any venture or activities. The entire business activities are
directly related with making profit. (according to the economic concept of factors of
production, rent given to landlord, wage given to labour interest given to capital and profit
given to shareholders or profiteers), a business concern needs finance to meet all the
requirements. Hence finance may be called as capital, investment, fund etc. but each term is
having different meanings and unique characters. Increasing the profit is the main aim of any
kind of economic activity. Finance is the lifeblood of every business activity without which the
wheels of modern business organization system cannot be greased.
MEANING OF FINANCE
Finance may be defined as the art and science of managing money. It includes financial service
and financial instruments. Finance also is referred as the provision of money at the time when
it is needed. Finance function is the procurement of funds and their effective utilization in
business concerns.
The concept of finance includes capital, funds, money, and amount. But each word is having
unique meaning. Studying and understanding the concept of finance become an important part
of the business concern.
Definition of finance
According to khan and Jain, “finance is the art and science of managing money”.
2
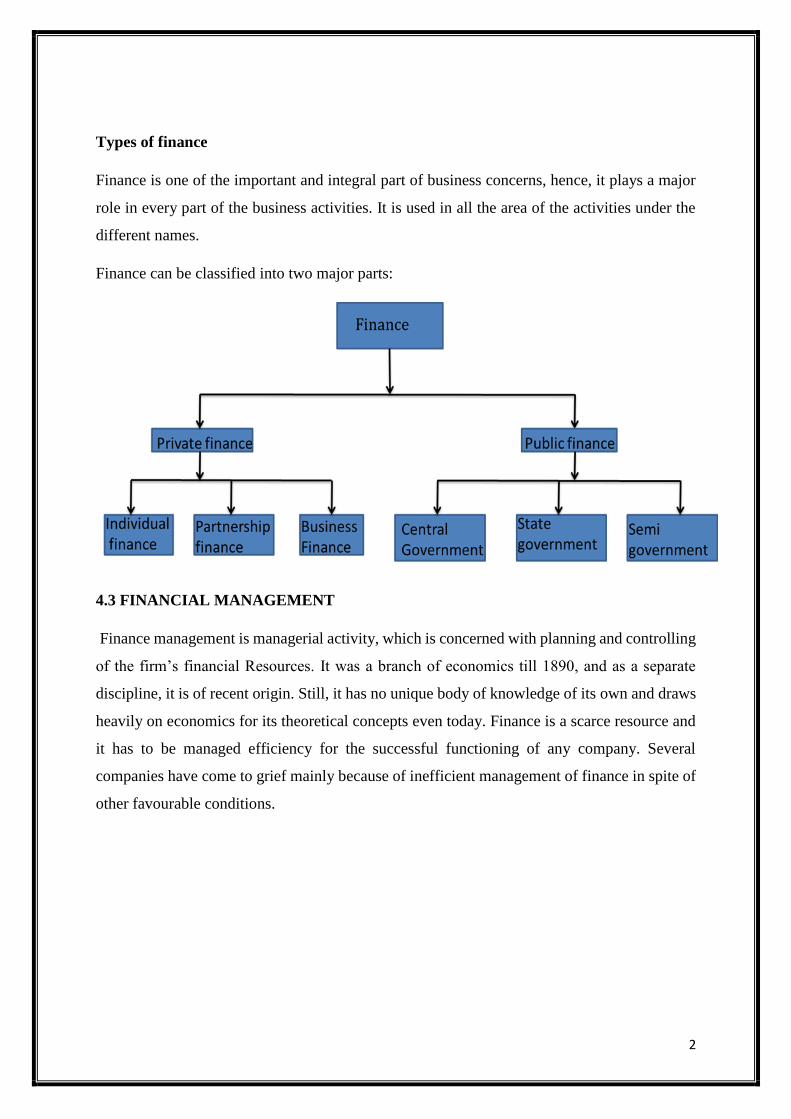
Types of finance
Finance is one of the important and integral part of business concerns, hence, it plays a major
role in every part of the business activities. It is used in all the area of the activities under the
different names.
Finance can be classified into two major parts:
4.3 FINANCIAL MANAGEMENT
Finance management is managerial activity, which is concerned with planning and controlling
of the firm’s financial Resources. It was a branch of economics till 1890, and as a separate
discipline, it is of recent origin. Still, it has no unique body of knowledge of its own and draws
heavily on economics for its theoretical concepts even today. Finance is a scarce resource and
it has to be managed efficiency for the successful functioning of any company. Several
companies have come to grief mainly because of inefficient management of finance in spite of
other favourable conditions.
3
SCOPE OF FINANCIAL MANAGEMENT
Financial management is one of the important part of overall management, which is directly
related with various functional departments like personnel, marketing and production.
Financial management covers wide area with multidimensional approaches. The following are
the important scope of financial management.
➢ Financial management and economics
Economic concepts like micro and macroeconomics are directly applied with the financial
management approaches. Investment decisions, micro and macro environmental factors are
closely associated with the functions of financial manager. Financial management also uses the
economic equations like money value discount factor, economic order quantity etc. financial
economics is one of the emerging area, which provides immense opportunities to finance, and
economical areas.
➢ Financial management and accounting
Accounting records includes the financial information of the business concern. hence, we can
easily understand the relationship between the financial management and accounting. In the
olden periods, both financial management and accounting are treated as a same decision. But
nowadays financial management and accounting discipline are separate and interrelated.
➢ Financial management or mathematics
Modern approaches of the financial management applied large number of mathematical and
statistical tools and techniques. They are also called as econometrics. Economic order quantity,
discount factor, time value of money, present value of money, cost of capital structure theories,
dividend theories, ratio analysis and working capital analysis are used as mathematical and
statistical tools and techniques in the field of financial management.
4
➢ Financial management and production management
Production management is the operational part of the business concern, with helps to multiple
the money into profit. Profit of the concern depends upon the production performance.
Production performance needs finance, because production department requires raw material,
machinery, wages, operating expenses etc. these expenditures are decided and estimated by the
financial department and the financial manager allocates the appropriate finance to production
department. The financial manager must be aware of the operational process and finance
required for each process of production activities.
➢ Financial management and marketing
Produced goods are sold in the market with innovative and modern approaches. For this the
marketing department needs finance to meet their requirements. The financial management is
responsible to allocate the adequate finance to the marketing department. Hence, marketing
and financial management are interrelated and depends on each other’s.
➢ Financial management and human resource
Financial management is also related with human resource department, which provides
manpower to all the functional areas of the management. Financial manager should carefully
evaluate the requirement of manpower to each department and allocate the finance to the human
resource department as wages, salary, remuneration, commission, bonus, pension and other
monetary benefits to the human resource department. Hence, financial management is directly
related with human resource management.
➢ Financial statement analysis
Financial statement analysis is the process of analysing a company's financial statements for
decision-making purposes and to understand the overall health of an organization. Financial
statements record financial data; however, this data must be evaluated through financial
statement analysis to become more useful to investors, shareholders, managers, and other
interested parties.
Financial statement analysis (or financial analysis) is the process of reviewing and analysing a
company's financial statements to make better economic decisions. These statements include
the income statement, balance sheet, statement of cash flows, and a statement of changes in
5
equity. Financial statement analysis is a method or process involving specific techniques for
evaluating risks, performance, financial health, and future prospects of an organization.[1]
It is used by a variety of stakeholders, such as credit and equity investors, the government, the
public, and decision-makers within the organization. These stakeholders have different
interests and apply a variety of different techniques to meet their needs. For example, equity
investors are interested in the long-term earnings power of the organization and perhaps the
sustainability and growth of dividend payments. Creditors want to ensure the interest and
principal is paid on the organizations debt securities (e.g., bonds) when due.
Functional ratio analysis
Liquidity ratios are used to determine how quickly a company can turn its assets into cash if it
experiences financial difficulties or bankruptcy. It essentially is a measure of a company's
ability to remain in business. A few common liquidity ratios are the current ratio and the
liquidity index. The current ratio is current assets/current liabilities and measures how much
liquidity is available to pay for liabilities. The liquidity index shows how quickly a company
can turn assets into cash and is calculated by: (Trade receivables x Days to liquidate) +
(Inventory x Days to liquidate)/Trade Receivables + Inventory.
Profitability ratios are ratios that demonstrate how profitable a company is. A few popular
profitability ratios are the breakeven point and gross profit ratio. The breakeven point calculates
how much cash a company must generate to break even with their start-up costs. The gross
profit ratio is equal to gross profit/revenue. This ratio shows a quick snapshot of expected
revenue.
Activity ratios are meant to show how well management is managing the company's resources.
Two common activity ratios are accounts payable turnover and accounts receivable turnover.
These ratios demonstrate how long it takes for a company to pay off its accounts payable and
how long it takes for a company to receive payments, respectively.
Leverage ratios depict how much a company relies upon its debt to fund operations. A very
common leverage ratio used for financial statement analysis is the debt-to-equity ratio. This
ratio shows the extent to which management is willing to use debt in order to fund operations.
This ratio is calculated as: (Long-term debt + Short-term debt + Leases)/ Equity.
6
FINANCE:
At the season of land of an organisation, the promoters or the faculty in guardianship of the
organization of the clientele must gauge the aggregate sum of Synonyms/Hypernyms
(Ordered by Estimated Frequency) of noun asset, financial matter or capital the business
requires. Decide the author from which the assets must be raised and choose about the correct
time at which, the assets must be gotten through appropriate monetary arranging
National banks, for instance, the Federal Reserve System banks in the United States
Department of State and Bank of England in the United Land, are strong players out in the
out-of-doors backrest, going about as procession pros of last stamping ground and moreover
strong effects on cash related and citation experimental condition in the economy
Spine rest is the craft of welfare organization. The full general geographical zone of back are
business reinforcement, singular store, and open reserve. Back joins saving money and
oftentimes fuses crediting money. The field of back deals with the thoughts of time, money,
danger and how they are interrelated. It is like manner oversees how money is spent and
arranged.
Money related Statement test is an examination, which features fundamental relationship in
the budgetary illuminations. It bases on the estimation of past tense practice session as
uncovered by the examination of key declarations. Financial Statement examination leaves
the frameworks utilized as a bit of scrutinizing and unravelling the deferred outcomes of past
conveying without hesitation and current budgetary stead as they identify with specific
fragment of devotion for meander choice. It is a fundamental procedure for investigating past
execution and in expecting and engineering future execution.
The explanation behind such an examination is to overview an association's cash related
prosperity and execution. Budgetary enunciation examination contains connections for a
comparative association over time periods and for different organization in a comparative
industry or unmistakable ventures.
7
Financial Statement analysis is an analysis, which highlights important relationships in the
financial statements. It focuses on the evaluation of past operations as revealed by the
analysis of basic statements. Financial Statement analysis embarks the methods used in
assessing and interpreting the results of past performance and current financial positions as
they relate to particular factors of interest in investment decisions. It is an important means of
assessing past performance and in forecasting and planning future performance.
The purpose of such an analysis is to assess a company’s financial health and performance.
Financial statement analysis consists of comparisons for the same company over periods of
time and for different companies in the same industry or different industries.
Financial statement analysis enables investors and creditors to
➢ Evaluate past performance and financial position; and
➢ Predict future performance
FINANCIAL STATEMENTS
An organization communicates its financial information to the users through financial
statements and reports. Financial statements contain summarized information of the
organization’s financial affairs, organized systematically. These statements comprise the
income statements or profit and loss account and the position statement or the balance sheet.
To give a full view of the financial affairs of the undertaking it is also necessary to include a
statement of retained earnings, a statement of changes in the financial position and a few
schedules such as schedule of fixed assets and schedule of debtors.
➢ Income Statement – the profit and loss account set out income as well as expenses of the
same period and after matching the two, the difference being the net profit or net loss, is
shown as the difference between the two sides of the account. Thus, the earning capacity
and the potential of an organization are reflected by its profit and loss account.
8
➢ Position Statement – otherwise known as the balance sheet displays the total resources of
a business and the owners and creditor’s equity in these resources. It indicates a statement
of affair of a business at a particular moment of time and thus it is static in nature.
➢ Statement of Retained Earning – also known, as the profit and loss appropriation account,
is generally a part of the profit and loss account. It shows how the profit of the business for
the accounting period is appropriated towards reserve and dividend and how much of the
same is carried forwarded as retained earnings.
➢ Statement of Changes in Financial Position – also known as the fund flow statement,
summarizes the changes in assets, liabilities and the owner’s equity between two balance
sheet dates. Thus, it is a statement of flows, i.e., it measures the changes that have been
taken place in the financial position of a firm between two balance sheet dates. It
summarizes the sources and uses of the funds obtained.
OBJECTIVES OF FINANCIAL STATEMENT ANALYSIS
The major objective of financial statement analysis is to provide decision makers information
about a business enterprise for use in decision making. Users of financial statement
information are the decision makers concerned with evaluating the economic situation of the
firm and predicting its future course. The major groups of users are management for
evaluating the operational and financial efficiency of the enterprise as a whole or of sub-units
(e.g. Departments); lenders and creditors for determining the creditworthiness and solvency
position etc.
Financial statement analysis can be used by different users and decision makers to achieve
the following objectives:
➢ Assessment of past performance and Current Position.
➢ Prediction of Net income and Growth prospects.
➢ Prediction of Bankruptcy and failure.
➢ Load decisions by financial institutions and Banks.
9
TYPES OF FINANCIAL ANALYSIS:
On the basis of the materials used for the analysis or the persons interested in the analysis:
➢ External Analysis: External analysis done by the external parties (i.e., parties who are
outsiders for the business). The external parties include shareholders, investors, lenders,
creditors etc., who have no access to the books of the books of accounts and the internal
records of the concern.
➢ Internal analysis: Internal analysis is the analysis done by internal parties. The internal
analysis is done by persons who have access to the books of accounts and the internal
records of the concern, internal analysis is more detailed than external analysis. Of course,
the exact extent of internal analysis depends upon the objectives to be achieved through the
analysis.
On the basis of MODUS OPERANDI or the method of operation followed in the analysis:
➢ Vertical analysis or structural analysis: When the financial statement is relating to just
one accounting year is analyzed, the analysis is known as vertical analysis. It is a type of
analysis used to study, through ratios, the quantitative relationship of items in the financial
statements on a particular date or for one accounting year.
➢ Horizontal Analysis or trend analysis: when the financial statements of a number of years
are analyzed, the analysis is called horizontal analysis. It is a type of analysis in which there
is comparison of the trend of each item in the financial statements over a number of years.
Tools, Techniques or Methods of financial analysis:
A number of techniques or methods are available for financial analysis. But the financial
statement must be made simpler as far as possible to make the reader understand the
operating result and the financial health of the business. The analysis of financial statement
consists of study of relationships and trends to determine whether or not the financial position
of the concern and its operating efficiency have been satisfying. In the process of this analysis
10
the financial analyst used various techniques or tools or methods. The financial analyst can
adopt one more of the following technique or tools for financial analysis:
➢ Comparative financial statement analysis
➢ Common size financial statement analysis
➢ Comparative trend percentage
➢ Ratio analysis
➢ Fund flow analysis
RATIO ANALYSIS
INTRODUCTION
Ratio Analysis is an important and age-old technique of Financial analysis. It is one of the
Techniques of Financial analysis where ratios are used as Yardstick for evaluating the
financial condition and performance of the firm. Analysis and Interpretation of various
accounting ratios give a skilled and experienced analyst a better understanding of the
financial condition and performance of the firm than what he could have obtained only
through a perusal of financial statements.
MEANING OF RATIO
A ratio is a simple arithmetic expression of the relationship of one number to another. The
term ratio refers to the numerical or quantitative relationship between two figures. A ratio is
the relationship between two figures and obtained by dividing the former by later. Ratios are
designed to show how one number is related to another.
Two companies may have earned the same amount of profit in a year, but unless the profit is
related to sales or total assets, it is not possible to conclude which of them is more profitable.
If used with understanding of industry factors and general economic conditions, it can be a
powerful tool for recognizing a company’s strengths as well as its potential trouble spots.
11
SIGNIFICANCE OF RATIO ANALYSIS
Following are the significance of Ratio Analysis:
1. MANAGERIAL USES OF RATIO ANALYSIS:
➢ Helps in Decision Making: Financial Statements are prepared primarily for decision
making. But the information provided in the financial statements is not and end in itself
and no meaningful conclusion can be drawn from these statements alone. Ratio Analysis
helps in Decision making from the information provided in these financial statements.
➢ Helps in Financial Forecasting and Planning: Ratio analysis is of much help in the
financial forecasting and planning. Planning is looking ahead and the ratios are calculated
for a number of years work as a guide for the future. Meaningful conclusions can be drawn
for future from ratios. Thus, ratio analysis helps in Forecasting and Planning.
➢ Helps in Communicating: The Financial strength and weakness of a firm are
communicated in a more easy and understandable manner by use of Ratios. The
information contained in the financial statements is conveyed in a meaningful manner to
the one for whom it is meant. Thus, Ratios help in communication and enhance the value
of the Financial Statements.
➢ Helps in Co-ordination: Ratios even help in Co-ordination which is of utmost importance
in effective business management. Better communication of efficiency and weakness of an
enterprise results in better co-ordination in enterprise.
➢ Helps in Control: Ratio analysis also helps in making effective control of the business.
Standard ratios can be based on pro-forma financial statements and variances and
deviations, if any, can be found by comparing the actual with the standards so as to take
corrective action at the right time. The weakness or otherwise, if any, come to the
knowledge of the management which helps in effective control of the business.
12
2. UTILITY TO SHAREHOLDERS:
Investors would like to assess the financial position of the concern where he is going to
invest. His first interest will be the security of his investment and then a return in the form of
dividend or interest. For the first purpose he will try to assess the value of fixed assets and the
loan rose against them. The investor will feel satisfied only if the concern has sufficient
amount of assets. Long term solvency ratios, on the other hand will be useful to determine
profitability position. Ratio analysis will be useful to the investor in making up his mind
whether present financial position of the concern warrants further investments or not.
3. UTILITY TO CREDITORS:
The creditors or suppliers extend short term credit to concern. They are interested to know
whether financial position of the concern warrants their payments at a specified time or not.
The concern pays short-term creditors out of its current assets. If the current assets are quite
sufficient to meet current liabilities then the creditors will not hesitate in extending credit
facilities. Current and acid test ratios will give an idea about the current financial position of
a concern.
4. UTILITY TO EMPLOYEES:
The employees are also interested in the financial position of the concern especially
profitability. Their wages increase and amount of fringe benefits are related to the volume of
profits earned by the concern. The employees make use of information in financial
statements. Various profitability ratios relating to gross profit, net profit etc. enable
employees to put forward their view point for the increase of wage of other benefits.
13
5. UTILITY TO GOVERNMENT:
Government is interested to know the overall strength of the industry. Various financial
statements published by industrial units are used to calculate ratios to determine short term,
long term and overall financial position of the concerns. Profitability indexes can also be
prepared with the help of ratios. Government may base its future policies on the basis of
industrial information available from various units. The ratios may be used as indicators of
overall financial strength of public as well as private sector in the absence of reliable
economic information.
6. TAX AUDIT REQUIREMENTS:
The financial act, 1984, introduced section 44AB in the Income Tax Act. Under this section
every assessee engaged in any business having turn over or gross receipts exceeding Rs. 40
lakhs are required to get the accounts audited by a chartered accountant and submits the tax
audit report before the due date of filing return of income under section 139(1). In case of a
professional, a similar report is required if the gross receipts exceed Rs 10 lakhs. Clause 32 of
the Income Tax Act requires that the following accounting ratios should be given:
➢ Gross Profit / Turnover
➢ Net Profit / Turnover
➢ Stock in Trade / Turnover
➢ Material Consumed / Finished Goods Produced
LIMITATIONS OF RATIO ANALYSIS:
The ratio analysis is one of the most powerful tools of financial management. Though ratios
are simple to calculate and easy to understand, they suffer from some serious limitations.
➢ Limited usage of single Ratio: A single ratio, usually, does not convey much of a sense.
To make a better interpretation a number of ratios to be calculated, which is likely to
confuse the analyst than help him in making any meaningful conclusion.
14
➢ Lack of adequate standards: There are no well accepted standards or rules of thumb for
all ratios, which can be accept as norms. It renders interpretation of the ratios difficult.
➢ Interest limitation of accounting: Like financial statements, ratios also suffer from the
inherent weakness of accounting records such as their historical nature. Ratios of the past
are not necessarily true indicators of the future.
➢ Change of accounting procedure: Change in accounting procedure by a firm often makes
ratio analysis misleading, for ex: a change in the valuation of investors (from FIFO to
LIFO) increases the cost of sales and reduces considerably the value of closing stocks
which makes stock turnover ratio to be lucrative and unfavorable gross profit ratio.
➢ Window Dressing: Financial statements can easily be window dressed to present a better
picture of its financial and profitability position to outsiders. Hence one has to be very
careful in making decision from ratios calculated from such financial statements. But it
may be very difficult for an outsider to know about the window dressing made by a firm.
➢ Personal bias: Ratios are only means of financial analysis and not an end in itself. Ratios
have to be interpreted and different people many interpret the same ratio in different ways.
➢ Price level change: While making ratio analysis, no consideration is made to changes in
price levels and this makes interpretation of ratio invalid.
➢ Ratios no substitutes: Ratio analysis is merely a tool of financial statements. Hence, ratios
become useless if separated from statements from which they are computed.
15
CHAPTER 2
INDUSTRY PROFILE AND COMPANY PROFILE
INDUSTRY PROFILE
A bicycle, as often as possible called a bike, motorbike, or cycle, is a couple of wheeled motor
vehicle. Bicycle setup moves tremendously to suit an extent of different purposes: long
detachment travel, driving, cruising, wear including hustling, and road riding. Motorcycling is
riding a cruiser and related social development, for instance, joining a bicycle club and going
to bicycle stimulates.
In 1894, Hildebrand and Wolfmüller transformed into the principle course of action creation
cruiser, and the first to be known as a bicycle. In 2014, the three best cruiser producers all
around by volume were Honda, Yamaha (both from Japan), and Hero MotoCorp (India).
In making countries, cruisers are seen as utilitarian in view of lower expenses and more
conspicuous mileage. Of the extensive number of cruisers on the planet, 58% are in the Asia-
Pacific and Southern and Eastern Asia regions, excepting auto driven Japan.
As showed by the US Department of Transportation the amount of fatalities per vehicle mile
voyaged was 37 times higher for bicycles than for cars.
Concentrate from Motorcycle Manufacturing Industry Profile. Associations in this industry
manufacture cruisers, mopeds, and motor bicycles. Little creators fight by offering especially
changed things. The US business is significantly thought.
16
Bike deals get; bike portion development outpacing the business development After
completion FY2017 with a direct development of 6.9%, the development rate in the bike
business enhanced in 4M FY2018 to 9.2% over the relating past. The business development
rate of 16.0% amid Apr-Oct'16 directed from November 2016 after liquidity emergency post
demonetization and stock revision measures embraced by unique gear producers (OEMs) for
the change from BS III to BS IV standards consequently constraining the general development
for household volumes at 6.9% amid FY2017. Be that as it may, the development rate restored
amid the current monetary, bolstered by channel-filling measures of most OEMs post enormous
reducing done only before the change to BS-IV discharge standards. The main minor hiccup
was in June 2017, as the merchants were de-loading in the pre-GST period. Over the initial
four months of FY2018, the bike portion announced sound development of 18.2% while the
bikes fragment revealed direct development of 6.6%, However, the development in the bike
section enhanced in July 2017, developing at 16.9% and outpacing the bike fragment
development after numerous months, bolstered by stocking up post GST usage. The mopeds
portion detailed de-development of 13.0% out of 4M FY2018, after a fantasy keep running in
FY2017
HISTORY OF BIKES IN INDIA
Flexibility, especially to the extent transportation describes accomplishment of a nation or a
gathering. Preceding the British built up structures for railroad tracks in India to infuse mass
transportation in the country, well-off people had the upside of being driven around in
automobiles and the lower and upwardly compact swarmed were liable to trucks pulled by
bullocks and steed carriages until the introduction of pedal bicycles.
The advancement of pedal controlled cycle into a motor filled bicycle helped people move faster
and further. People could move out of provincial India and move towards the tremendous urban
regions needing to find new vocations and starting new associations in another, creating India.
The chief bike charged in India was the 350-cc controlled Bullet manufactured in England and
assembled in Madras (now Chennai) by the Royal Enfield UK association. In those days Royal
Enfield was a British association. The extreme Bullet was asked for by the Indian Army. The
extraordinary frame quality and wide wheel base helped the Jawans ride through serious scenes
in the north and eastern parts of India no sweat.
17
The organization of Independent India laid outrageous repressions on the remote cruiser
industry by enabling amassing and get together in the country. The organization supported
close-by creators to collaborate with worldwide brands to pass on incredible bicycles to the
Indian masses, it in like manner controlled the number of bicycles brands would convey and the
number of licenses conceded to deliver and gather.
Fact: The Indian government encouraged close-by brands to cooperate with worldwide bike
makers for the utmost of bicycles over the point of confinement of 100 cc.
Among the sorts of bicycles made were the cruisers, mopeds and bicycles. The bicycles on a
very basic level was away to work men, bicycles towards family adaptability and mopeds
inferred straightforward riding for women and the elderly.
Reality: Due to absorb oil costs the late 70s, bicycle age extended by 60% while that of cars saw
a grandiose rot of around 21%
By late 90s the assembly had pushed for composed exertion for vehicles under the 100 cc
constrain which obtained world beating development engine and fuel adequacy to India.
Right when the P.V. Narasimha Rao government opened India to the world, it deregulated the
bicycle business which was a shock to ideate, plan, source, and make top quality bicycles in
India for private use additionally for charges to making economies in Southeast Asian and
African countries. By 1998 India achieved age of 3 million units of bicycles and it has been an
intense ride starting there.
Today the business has flourished with Indian producers achieving colossal fan following
wherever all through the world. Holy person Motorcorp has transformed into the world's greatest
maker of bicycles, while Bajaj India acquired 47% in the inconceivably popular Austrian bike
maker KTM with the purpose of delineating world class bicycles for family unit and abroad
markets. South Indian bicycle maker TVS has tied up with German creature BMW to make
amazing tourers in India. Mahindra and Mahindra are bringing the JAWA check restored.
Besides, who can disregard the ace of Indian streets, the Royal Enfield. This brand is at present
Indian.
18
There are four essential perspectives which incite the accomplishment of the bicycles in India
➢ Top quality, overall standard amassing headways
➢ Upwardly compact, high procuring youth
➢ Easy access to bicycle credits
➢ Reduction in evaluations and commitments
From driving Bike ambulances to bicycle taxis, a making India is encountering a green fix
similarly as new age business contemplation made by Indians for the uncommonly Indian
issues being looked on an ordinary introduce.
Indian makers have fiddled with making bicycles which continue running on all mass market
powers open, for instance, diesel, oil, CNG and now with advances in battery development,
there are two or three brands (adjacent) who will pioneer electric adaptability for the dominant
part.
Indians esteem for the adaptability and transportability the bicycle offers has woven an
energetic bond between the machines and Indian families themselves. We by and large depend
upon those bewildering two wheels to take us from home to office or on cool rides to the
farmland in the midst of finishes of the week and long events. No huge shock there are a
substantial number of biker clubs which cross the length and broadness of the country.
Bicycles address huge motivator for money, prevalently as a result of its simplicity (when
appeared differently in relation to automobiles), in a general sense higher mileage,
straightforward repayment options, and lifted necessity of engine development upgrades life
traverse of the machines. Regardless, favorable care and upgrading is a flat out need to get the
best out of them.
MARKEY SIZE
The industry produced a total 14.25 million vehicles—including passenger vehicles (PV),
commercial vehicles (CV), and three- and two wheelers (3W and 2W)—in April–October
2015, as against 13.83 in April–October 2014, registering a marginal growth of 3.07 per cent,
year-to-year.
19
The sales of PVs grew by 8.51 per cent in April–October 2015 over the same period in the
previous year. The overall CVs segment registered a growth of 8.02 per cent in April–October
2015 as compared to same period last year. Medium- and heavy commercial vehicles (MCV
and HCV) registered very strong growth of 32.3 per cent, while sales of light commercial
vehicles (LCV) declined by 5.24 per cent during April–October 2015, year-to-year.
In April–October 2015, overall automobile exports grew by 5.78 per cent. PVs, CVs, 3Ws, and
2Ws registered growth of 6.34 per cent, 17.95 per cent, 18.59 per cent, and 3.22 per cent,
respectively, in April–October 2015, over April–October 2014.
In order to keep up with the growing demand, several auto makers have started investing
heavily in various segments of the industry during the last few months. The industry has
attracted foreign direct investment (FDI) worth US$17.4 billion during the period April 2000
to June 2017, according to data released by Department of Industrial Policy and Promotion
(DIPP).
INVESTMENTS
Some of the major investments and developments in the automobile sector in India are as
follows:
• Global auto maker Ford plans to manufacture in India two families of engines by 2017, a
2.2 litre diesel engine code-named Panther, and a 1.2 litre petrol engine code-named
Dragon, which are expected to power 270,000 Ford vehicles globally.
• The world's largest air bag suppliers Autoliv Inc, Takata Corp, TRW Automotive Inc and
Toyoda Gosei Co are setting up plants and increasing capacity in India.
• General Motors plans to invest US$1 billion in India by 2020, mainly to increase the
capacity at the Talegaon plant in Maharashtra from 130,000 units a year to 220,000 by
2025.
• US-based car maker Chrysler has planned to invest Rs 3,500 crore (US$525 million) in
Maharashtra, to manufacture Jeep Grand Cherokee model.
• Mercedes Benz has decided to manufacture the GLA entry SUV in India. The company
has doubled its India assembly capacity to 20,000 units per annum.
• Germany-based luxury car maker Bayerische Motoren Werke AG's (BMW) local unit has
announced to procure components from seven India-based auto parts makers.

20
• Mahindra Two Wheelers Limited (MTWL) acquired 51 per cent shares in France-based
Peugeot Motorcycles (PMTC).
21
COMPANY PROFILE
Honda Motor Company, Ltd. is a Japanese open multinational blend association basically
known as a maker of automobiles, flying machine, cruisers, and power equipment
Honda has been the world's greatest cruiser creator since 1959, and the world's greatest maker
of internal start engines evaluated by volume, conveying more than 14 million inside
consuming engines consistently. Honda transformed into the second-greatest Japanese vehicle
producer in 2001. Honda was the eighth greatest auto producer on the planet behind Toyota,
Volkswagen Group, Hyundai Motor Group, General Motors, Ford, Nissan, and Fiat Chrysler
Automobiles in 2015.
Honda was the basic Japanese vehicle creator to discharge a devoted richness check, Acura, in
1986. Close by their centre auto and bike affiliations, Honda additionally makes create gear,
marine motors, solitary watercraft and power generators, and different things. Since 1986,
Honda has been consolidated with counterfeit mindfulness/mechanical development research
and discharged their ASIMO robot in 2000. They have besides wound into flying with the
foundation of GE Honda Aero Engines in 2004 and the Honda HA-420 Honda Jet, which
started age in 2012. Honda has three joint-wanders in China.
In 2013, Honda contributed around 5.7% (US$6.8 billion) of its earnings in creative work.
Furthermore in 2013, Honda transformed into the primary Japanese automaker to be a net
exporter from the United States, conveying 108,705 Honda and Acura models, while getting
only 88,357.
Honda Motor Co., Ltd. makes, makes, and courses cruisers, vehicles, control things, and
distinctive things around the globe. The association works through four bits: Motorcycle
Business, Automobile Business, Financial Services Business, and Power Product and Other
Businesses.
22
Honda Motor Co., Ltd. makes, makes, and disperses cruisers, autos, control things, and diverse
things around the globe. The association works through four parts: Motorcycle Business,
Automobile Business, Financial Services Business, and Power Product and Other Businesses.
The Motorcycle Business segment produces sports models, including trial and adage cross
hustling vehicles; business and suburbanite models; rough terrain vehicles; and one beside
alternate models. The Automobile Business area offers voyager cars, light trucks, and little
vehicles, and furthermore vehicles controlled with elective fuel, for instance, ethanol, battery
electric, and power gadget vehicles.
Honda Motor Company Limited is potentially best known as an automaker- - it is the third
most noteworthy automaker in Japan- - however the affiliation has its central foundations in
bikes and is the world's best bike creator. Its best market is in the United States, where the lion's
offer of its plans is made. Honda's vehicle thing offering addresses around 90 percent of its
game plans and joins in all probability appreciated U.S. top-dealers, for example, the Accord,
Legend, Civic, Prelude, and the extravagance Acura. The Accord is the second most acquired
auto in the United States, regardless of the way that it really positions first on the nation's
outline of most stolen vehicles. Honda in like way passes on cruisers, for example, the Super
Cub, Foresight, and Shadow 750. Also, the affiliation's imperativeness things division makes
unmistakable things that assistance yearly courses of action, for example, developing and
mechanical utilize contraption, littler generators, and detachable engines.
23
HISTORY
• Throughout his life, Honda's founder, Soichiro Honda, had an interest in automobiles. He
worked as a mechanic at the Art Shokai garage, where he tuned cars and entered them in
races. In 1937, with financing from his acquaintance Kato Shichirō, Honda
founded Tōkai Seiki (Eastern Sea Precision Machine Company) to make piston
rings working out of the Art Shokai garage.[10] After initial failures, Tōkai Seiki won a
contract to supply piston rings to Toyota, but lost the contract due to the poor quality of
their products.[10]After attending engineering school without graduating, and visiting
factories around Japan to better understand Toyota's quality control processes, by 1941
Honda was able to mass-produce piston rings acceptable to Toyota, using an automated
process that could employ even unskilled wartime laborers.
• Tōkai Seiki was placed under control of the Ministry of Commerce and Industry (called the
Ministry of Munitions after 1943) at the start of World War II, and Soichiro Honda was
demoted from president to senior managing director after Toyota took a 40% stake in the
company.[10] Honda also aided the war effort by assisting other companies in automating
the production of military aircraft propellers. The relationships Honda cultivated with
personnel at Toyota, Nakajima Aircraft Company and the Imperial Japanese Navy would
be instrumental in the postwar period. A US B-29 bomber attack destroyed Tōkai Seiki's
Yamashita plant in 1944, and the Itawa plant collapsed in the 13 January 1945 Mikawa
earthquake. Soichiro Honda sold the salvageable remains of the company to Toyota after
the war for ¥450,000 and used the proceeds to found the Honda Technical Research
Institute in October 1946.
• With a staff of 12 men working in a 16 m2 (170 sq ft) shack, they built and sold
improvised motorized bicycles, using a supply of 500 two-stroke 50 cc Tohatsu war
surplus radio generator engines. When the engines ran out, Honda began building their own
copy of the Tohatsu engine and supplying these to customers to attach to their
bicycles. This was the Honda A-Type, nicknamed the Bata Bata for the sound the engine
made. In 1949, the Honda Technical Research Institute was liquidated for ¥1,000,000, or
about US$5,000 today; these funds were used to incorporate Honda Motor Co., Ltd. At
about the same time Honda hired engineer Kihachiro Kawashima, and Takeo Fujisawa who
provided indispensable business and marketing expertise to complement Soichiro Honda's
technical bent. The close partnership between Soichiro Honda and Fujisawa lasted until
they stepped down together in October 1973
24
• The first complete motorcycle, with both the frame and engine made by Honda, was the
1949 D-Type, the first Honda to go by the name Dream. Honda Motor Company grew in a
short time to become the world's largest manufacturer of motorcycles by 1964.
• The first production automobile from Honda was the T360 mini pick-up truck, which went
on sale in August 1963. Powered by a small 356-cc straight-4 gasoline engine, it was
classified under the cheaper Kei car tax bracket. The first production car from Honda was
the S500 sports car, which followed the T360 into production in October 1963. Its chain-
driven rear wheels pointed to Honda's motorcycle origins.
• Over the next few decades, Honda worked to expand its product line and expanded
operations and exports to numerous countries around the world. In 1986, Honda introduced
the successful Acura brand to the American market in an attempt to gain ground in
the luxury vehicle market. The year 1991 saw the introduction of the Honda NSX supercar,
the first all-aluminium monocoque vehicle that incorporated a mid-engine V6 with
variable-valve timing.
• CEO Tadashi Kume was succeeded by Nobuhiko Kawamoto in 1990. Kawamoto was
selected over Shoichiro Irimajiri, who oversaw the successful establishment of Honda of
America Manufacturing, Inc. in Marysville, Ohio. Irimajiri and Kawamoto shared a
friendly rivalry within Honda; owing to health issues, Irimajiri would resign in 1992.
• Following the death of Soichiro Honda and the departure of Irimajiri, Honda found itself
quickly being outpaced in product development by other Japanese automakers and was
caught off-guard by the truck and sport utility vehicle boom of the 1990s, all which took a
toll on the profitability of the company. Japanese media reported in 1992 and 1993 that
Honda was at serious risk of an unwanted and hostile takeover by Mitsubishi Motors, which
at the time was a larger automaker by volume and was flush with profits from its
successful Pajero and Diamante models.
• Kawamoto acted quickly to change Honda's corporate culture, rushing through market-
driven product development that resulted in recreational vehicles such as the first-
generation Odyssey and the CR-V, and a refocusing away from some of the numerous
sedans and coupes that were popular with the company's engineers but not with the buying
public. The most shocking change to Honda came when Kawamoto ended the company's
successful participation in Formula One after the 1992 season, citing costs in light of the
takeover threat from Mitsubishi as well as the desire to create a more environmentally
friendly company image.
25
• The Honda Aircraft Company was established in 1995, as a wholly owned subsidiary; its
goal was to produce jet aircraft under Honda's name.
• On 23 February 2015, Honda announced that CEO and President Takanobu Ito would step
down and be replaced by Takahiro Hachigo by June; additional retirements by senior
managers and directors were expected.
• Honda's global line-up consists of the Fit, Civic, Accord, Insight, CR-V, CR-
Z, Legend and two versions of the Odyssey, one for North America, and a smaller
vehicle sold internationally. An early proponent of developing vehicles to cater to different
needs and markets worldwide, Honda's line-up varies by country and may have vehicles
exclusive to that region. A few examples are the latest Honda Odysseyminivan and
the Ridgeline, Honda's first light-duty unit-body pickup truck. Both were designed and
engineered primarily in North America and are produced there. Other example of exclusive
models includes the Honda Civic five-door hatchback sold in Europe.
• Honda's automotive manufacturing ambitions can be traced back to 1963, with the Honda
T360, a kei car truck built for the Japanese market. This was followed by the two-
door roadster, the Honda S500 also introduced in 1963. In 1965, Honda built a two-door
commercial delivery van, called the Honda L700. Honda's first four-door sedan was not the
Accord, but the air-cooled, four-cylinder, gasoline-powered Honda 1300 in 1969. The
Civic was a hatchback that gained wide popularity internationally, but it wasn't the first
two-door hatchback built. That was the Honda N360, another Kei car that was adapted for
international sale as the N600. The Civic, which appeared in 1972 and replaced the N600
also had a smaller sibling that replaced the air-cooled N360, called the Honda Life that was
water-cooled.
• The Honda Life represented Honda's efforts in competing in the kei car segment, offering
sedan, delivery van and small pick-up platforms on a shared chassis. The Life StepVan had
a novel approach that, while not initially a commercial success, appears to be an influence
in vehicles with the front passengers sitting behind the engine, a large cargo area with a flat
roof and a liftgate installed in back, and utilizing a transversely installed engine with a
front-wheel-drive powertrain.
• As Honda entered into automobile manufacturing in the late 1960s, where Japanese
manufacturers such as Toyota and Nissan had been making cars since before WWII, it
appears that Honda instilled a sense of doing things a little differently than its Japanese
competitors. Its mainstay products, like the Accord and Civic (with the exception of its
USA-market 1993–97 Passport which was part of a vehicle exchange program with Isuzu
26
(part of the Subaru-Isuzu joint venture)), have always employed front-wheel-
drive powertrain implementation, which is currently a long held Honda tradition. Honda
also installed new technologies into their products, first as optional equipment, then later
standard, like anti-lock brakes, speed sensitive power steering, and multi-port fuel injection
in the early 1980s. This desire to be the first to try new approaches is evident with the
creation of the first Japanese luxury chain Acura, and was also evident with the all-
aluminium, mid-engine sports car, the Honda NSX, which also introduced variable valve
timing technology, Honda calls VTEC.
• The Civic is a line of compact cars developed and manufactured by Honda. In North
America, the Civic is the second-longest continuously running nameplate from a Japanese
manufacturer; only its perennial rival, the Toyota Corolla, introduced in 1968, has been in
production longer. The Civic, along with the Accord and Prelude, comprised Honda's
vehicles sold in North America until the 1990s, when the model line-up was expanded.
Having gone through several generational changes, the Civic has become larger and
more upmarket, and it currently slots between the Fit and Accord.
• Honda produces Civic hybrid, a hybrid electric vehicle that competes with the Toyota
Prius, and also produces the Insight and CR-Z.
• In 2008, Honda increased global production to meet demand for small cars and hybrids in
the U.S. and emerging markets. The company shuffled U.S. production to keep factories
busy and boost car output, while building fewer minivans and sport utility vehicles as light
truck sales fell.
• Its first entrance into the pickup segment, the light duty Ridgeline, won Truck of the Year
from Motor Trend magazine in 2006. Also in 2006, the redesigned Civic won Car of the
Yearfrom the magazine, giving Honda a rare double win of Motor Trend honours. Honda's
9th generation Civic also won the Car of the Year award based on a public survey held
by Pak Wheels
• It is reported that Honda plans to increase hybrid sales in Japan to more than 20% of its
total sales in fiscal year 2011, from 14.8% in previous year.
Five of United States Environmental Protection Agency's top ten most fuel-efficient cars from
1984 to 2010 comes from Honda, more than any other automakers. The five models are: 2000–
2006 Honda Insight (53 mpg-US or 4.4 L/100 km or 64 mpg-imp combined), 1986–1987 Honda
Civic Coupe HF (46 mpg-US or 5.1 L/100 km or 55 mpg-imp combined), 1994–1995 Honda
Civic hatchback VX (43 mpg-US or 5.5 L/100 km or 52 mpg-imp combined), 2006– Honda Civic

27
Hybrid (42 mpg-US or 5.6 L/100 km or 50 mpg-imp combined), and 2010– Honda Insight
(41 mpg-US or 5.7 L/100 km or 49 mpg-imp combined). The ACEEE has also rated the Civic
GX as the greenest car in America for seven consecutive.
Vision, Mission, Goals and Objectives
Vision
“Seek solution for harmonious environment; shift the social paradigm.”
Mission
“Maintaining a global viewpoint, we are dedicated to supplying products of the highest quality,
yet at a reasonable price for worldwide customer satisfaction.”
Goals and Objectives
The Passion behind the White Coveralls
At Honda's R&D focuses and amassing plants, accessories wear white work pieces of attire
that stain and spread sufficiently, from the reasoning that "mind boggling things concede each
and every work environment." The white outfit besides symbolizes the correspondence of all
that work at Honda, including the CEO. White symbolizes Honda's reasonability for making
things wholeheartedly in its Japanese work environments, and wherever all through the world.
28
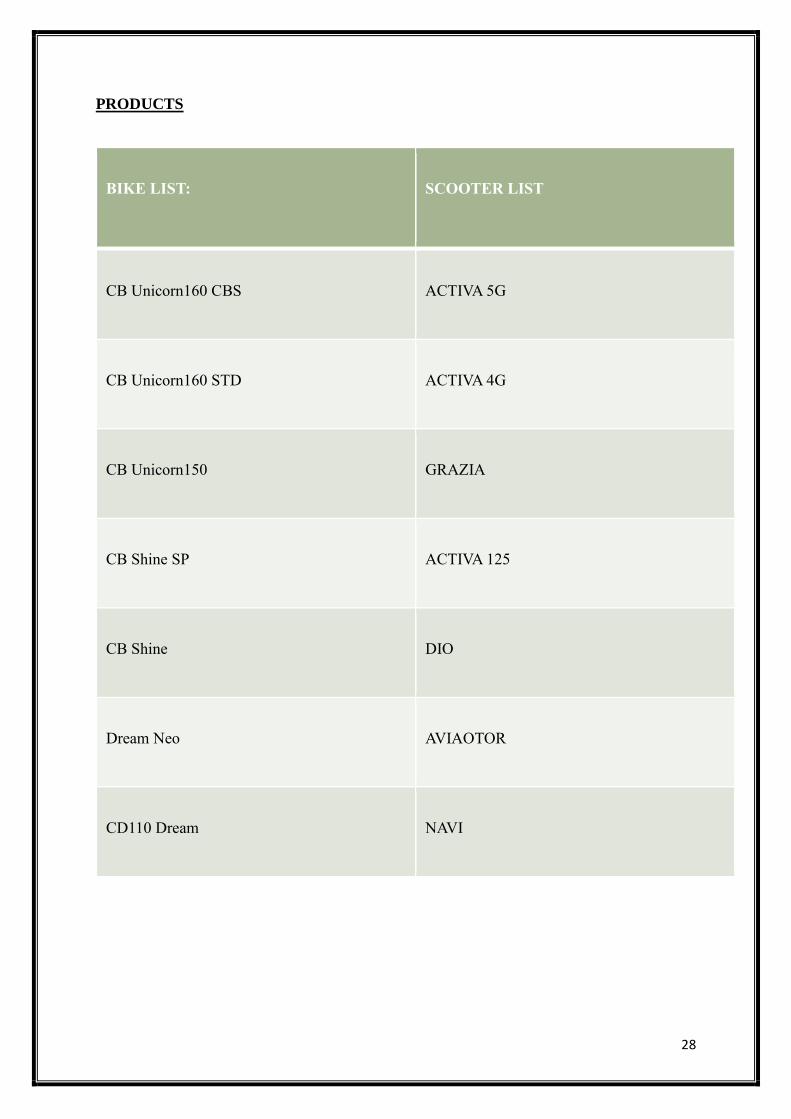
PRODUCTS
BIKE LIST: SCOOTER LIST
CB Unicorn160 CBS ACTIVA 5G
CB Unicorn160 STD ACTIVA 4G
CB Unicorn150 GRAZIA
CB Shine SP ACTIVA 125
CB Shine DIO
Dream Neo AVIAOTOR
CD110 Dream NAVI
29
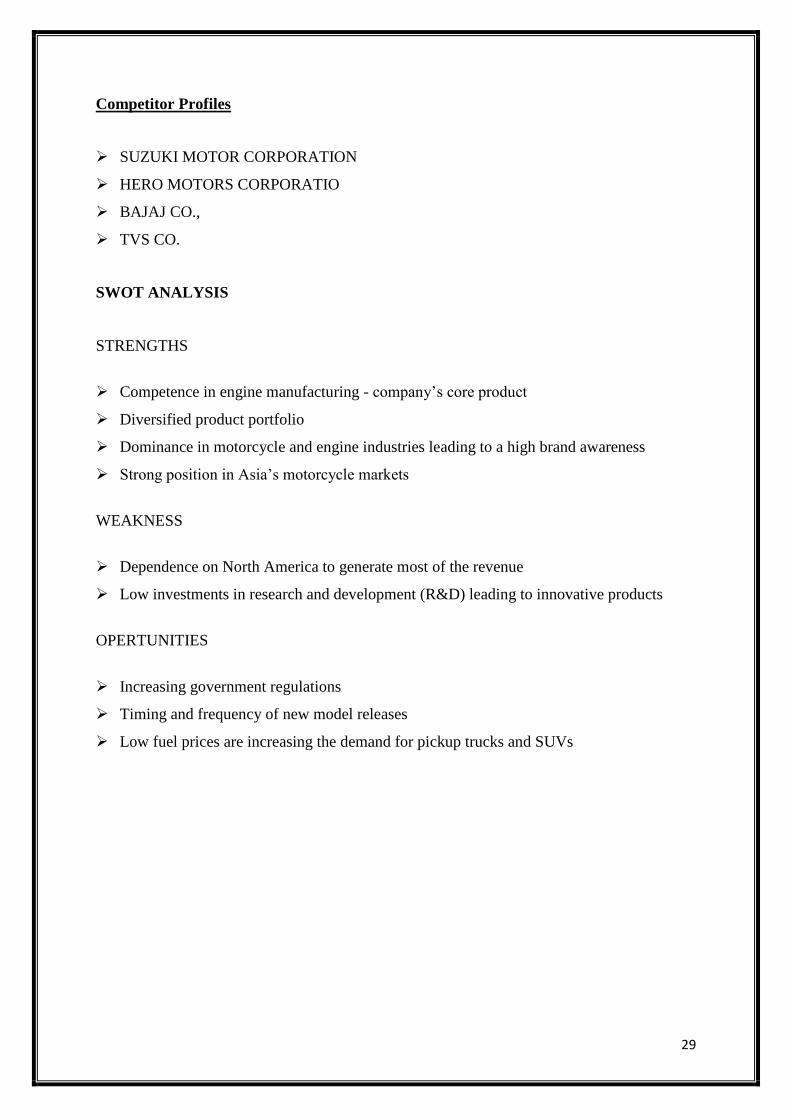
Competitor Profiles
➢ SUZUKI MOTOR CORPORATION
➢ HERO MOTORS CORPORATIO
➢ BAJAJ CO.,
➢ TVS CO.
SWOT ANALYSIS
STRENGTHS
➢ Competence in engine manufacturing - company’s core product
➢ Diversified product portfolio
➢ Dominance in motorcycle and engine industries leading to a high brand awareness
➢ Strong position in Asia’s motorcycle markets
WEAKNESS
➢ Dependence on North America to generate most of the revenue
➢ Low investments in research and development (R&D) leading to innovative products
OPERTUNITIES
➢ Increasing government regulations
➢ Timing and frequency of new model releases
➢ Low fuel prices are increasing the demand for pickup trucks and SUVs
30
THREATS
➢ Increased competition
➢ Natural disasters
Future Growth and Prospects
➢ Honda plans to open 500 new dealerships, 70 per cent of which will be in rural areas.
➢ Honda currently holds the number two position in terms of domestic sales, behind Hero
Moto Corp, and plans to become number one by 2020
➢ For sales, Honda has set a target of adding 500 retail outlets this year, to its existing 5,200
dealerships
Functional Departments of HMC Ltd
DEPARTMENTS
1. Manufacturing Dept
2. Sales and Marketing department
3. Logistics department
4. HR department
5. Finance department
6. R&D department
Manufacturing Department
The Group considered that one of its chief qualities in the business is its demonstrated capacity
to adjust to clients' regularly changing specialized determinations by presenting new items and
redesigning its current items quickly. This quality is owing to the Group's accentuation on
innovative work and its devoted group of research engineers.
Being a part provider, the Group set much accentuation on its products` quality, dependability
and value intensity.
31
The Group's building office is staffed with in excess of 150 architects who are essentially in
charge of the plan and improvement of the Group's items and their generation innovation.
Specifically, they centre around the accompanying territories:
➢ The improvement of new formulae for the creation of ferrite centres;
➢ The outline of melds, metal parts and plastic parts;
➢ The change of collecting techniques; and
➢ The setting of value models.
Sales and Marketing Department
The Group has a different of client benefit groups and deals and advertising groups of high
bore staff in charge of offers support and deals coordination. The groups stay up to date with
the market incline and take in the customers` item prerequisites by keeping standard contacts
with clients, going to presentations, deals meetings and classes. Inferable from its very
vertically coordinated creation process, the deals and showcasing groups have adequate
chances to work intimately with the designing office by giving exceptional data available
patterns and customers` necessities to guarantee that the Group`s items meet the changing
business sector requests.
Keeping in mind the end goal to give more esteem included and solid client benefits and
investigate more business openings, the Group has built up workplaces in real urban areas in
the Asia-Pacific locale, for example, Taipei, Shanghai, Xiamen, Dongguan, Singapore, Tokyo
and Bangalore.
Logistics Department
The collaborations methodology of HMC Ltd involves the system of compromise of a couple
of perspectives, for instance, material dealing with, warehousing, information, transportation,
packaging and stock. The basic commitment is to ensure topographical repositioning of
fragmented stock, and it is in like manner stressed over the finished inventories of the affiliation
being at the required place and no more negligible possible cost.
32
HR Department
The compensation of the representatives is controlled by reference to advertise benchmark,
singular execution, scholastic capability and work understanding, subject to occasional audit.
Other concurred worker benefits incorporate annuity conspire, restorative protection, on-work
preparing, instruction endowment and other standardized savings and paid leaves stipulated
under the pertinent locale of spots of task.
According to the Company's offer choice plan, alternatives might be conceded to qualified
workers to buy in for partakes in the Company
Finance Department
The reserve office is a champion among the most fundamental divisions in a business, as it
gives the financing and accounting information vital to settle on various decisions. In any case,
this office has a section that encompasses different commitments.
The bit of a tie that arrangements with its money the business components of a back office
routinely fuse orchestrating, dealing with, surveying, speaking to and charge its foundation 's
speculation organization is the back office also as a rule makes the association's budgetary
announcement.
The activities expected from a reserve division cover a wide range from major bookkeeping to
offering data to helping supervisory program in subsidence on key decisions. What's in store
from your back office will depend, as it were, on segments, for instance, how much offer the
proprietor/chief has in the affiliation.
At the base level, your shop right hand will be responsible for all the ordinary esteem-based
speaking to the business. This will fuse the accompanying of all trades and the judicature of
any organization specifying. In little proprietor managed constitution, this piece is much of the
time filled by a congener with accounting noesis. An outside accounting firm is regularly used
for yearly budgetary verbalizations and returns. In greater tie-up this part will extend
specifically through to setting up the budgetary decrees with an outside evaluator associated
with for declaration plan.
33
R&D Department
An imaginative work office is responsible for advancements in diagram, things, and style.
This division is accountable for making innovative new things to keep associations a phase
before the restriction.
The Group considered that one of its essential qualities in the business is its demonstrated
capacity to adjust to clients' regularly changing specialized details by presenting new items
and overhauling its current items quickly. This quality is inferable from the Group's
accentuation on innovative work and its devoted group of research engineers.
The Group's building office is staffed with in excess of 150 specialists who are primarily in
charge of the plan and advancement of the Group's items and their generation innovation.
Specifically, they centre around the accompanying territories:
➢ The improvement of new formulae for the generation of ferrite centres;
➢ The outline of melds, metal parts and plastic parts;
➢ The change of collecting strategies;
➢ The setting of value norms
34
CHAPTER 3
RESEARCH METHODOLOGY
RESEARCH METHODOLOGY
Research methodology is a way to systematically solve the research problem. It may be
understood as a science of studying how research is done scientifically. The various steps that
are generally adopted by a researcher in studying research problem along with the logic behind
them. It is necessary for the researcher to know not only the research methods/ techniques but
also the methodology. The project deals with working capital of Tata Steel Ltd and SAIL and
there has been a lot of research already been done on the topic. I have tried to understand the
functioning of working capital and its impact on the company.
TYPE OF RESEARCH
This project “FINACIAL STATEMENT ANALYSIS OF HONDA COMPANY LTD” is
considered as an analytical research.
Analytical research is defined as the research in which, researcher has to use facts or
information already available and analyse these to make a critical evaluation of the facts,
figures, data or material.
STATEMENT OF THE PROBLEM
➢ To analyse the financial position of the company.
➢ Understanding the company’s balance sheet of the Honda company ltd.
OBJECTIVES OF THE STUDY
An objective is the point of something. If you don’t understand the objective of a class, then
you don’t know what you were supposed to learn. The word itself is often used in business or
work.
➢ To understand the financial position of the Honda company Ltd.
➢ To study the concepts of the financial statement analysis.
➢ To analyse the operational efficiency of Honda company ltd.
35
SCOPE OF THE STUDY
➢ This study will help us to know the financial position of the company.
SOURCES OF DATA
Secondary sources: Annual report, company website.
LIMITATIONS:
➢ The biggest limitation with respect to the topic is that the project is based on the secondary
data.
➢ The study is limited to the scope of data provided publicly.
➢ As only secondary data is used in this project, it was difficult to determine the accuracy of
the data.
➢ Company’s financial data is depended upon a given period of demand and supply of
product.
36
REVIEW OF LITERATURE
BEITH AND GOLDREICH (2000): Far reaching monetary arranging is required to screen
money related capacity after some time so as to most beneficially work the association.
Proprietors look to boost benefits paying little heed to the assessment status of the association
not for benefit or speculator claimed. While associations that don't create an arrival on
resources in overabundance of their cost of capital are in risk of monetary disappointment
various zones of money related execution are frequently used to screen resource profitability
One prevalent screen of budgetary execution is return on capital utilized (ROCE) which is
additionally generally utilized as a part of different ventures.
HOGSETT (2018): Numerous vast organizations are utilizing the new or contemporary
money related arranging and control frameworks. Some private venture directors are likewise
searching for data on the most recent administration frameworks since they understand that
they have to build up their abilities and teach themselves. Independent companies that work in
indeterminate and focused situations need to plan and control their activities since this will help
proprietors/administrators to maintain their organizations effectively.
LANGABEER (2008): Capital power, the measure of capital required for tasks was contrarily
identified with money related execution as most associations in beginning times of
advancement required more prominent capital before getting to be set up, and less once they
turned into a develop element. The Monte Carlo hazard Simulation was viewed as a method
for portraying vulnerability anticipating a superior perspective of potential results. It
demonstrated that reproduction examination has application in planning, gauging, and different
zones of budgetary displaying, and ought to be a piece of a far-reaching procedure of monetary
arranging.
37
LOPEZ (2016): One zone that has become little thought in the establishment of techniques,
especially in the examination of scaled down scale, nearly nothing and medium-sized
endeavours, is that of budgetary decisions, in spite of the way that it is a determinant of business
forcefulness. Budgetary examination and organizing, which address crucial features that
assistance progressive strategy, are regardless in every practical sense non-existent in littler
scale and little ventures, which constrain a constraint on the kind of cash related decisions
authorities can take. Budgetary strategy addresses an approach to achieve and keep up business
force and position an association as a world class affiliation. Fiscal methodology are
destinations, cases or decisions planned to improve and update cash related organization with
a particular true objective to achieve corporate results.
SARASON AND TEGARDEN (2013): An investigation on the arrangement hypothesis and
association's asset-based view to comprehend the connection between key monetary arranging
and the association's execution. Their discoveries likewise give fractional help to a positive
connection between key budgetary arranging and execution. Be that as it may, they presumed
that this relationship is directed by authoritative phase of advancement and that it is
advantageous to beginning time firms. The basic start for these conclusions depend on the
advancement upper hands gave by the structure and the future reasoning consolidated into the
vital procedure and the non-supportability and disintegration of these points of interest in late
stage firms, whose procedures are more inclined to impersonation.
BREALEY AND MYERS (2008): It is proposed that a sensibility investigation ought to be
made in the most extraordinary and powerless angles, in which the specialists dissect the
outcomes of the arrangement with the base on the most likely conditions gathering, to proceed
with they do the guises variety, one thus, examining its impact in the aftereffects of the
arrangement. There are even, strategies in light of programming which ascertain the variety
probability for each arrangement segment, with base on the likelihood that every single one of
them could occur.
38
ROSS ETAL (2010): Budgetary system comprises of three interrelated sorts of choices:
speculation, subsidizing and working capital choices. Speculation choices identify with the
distribution of money to complete venture openings that are profitable (bring esteem) to the
organization, considering the size, opportunity and danger without bounds money streams of
venture. Subsidizing choices concern the particular blend of long haul obligation and capital
that the organization uses to back its tasks, i.e., ideal capital structure. Working-capital choices
incorporate the administration of here and now resources and liabilities in a way that guarantees
the ampleness of assets for organization tasks. Expecting the corporate point is to expand
benefits, it is vital for organizations to look for the ideal blend of the three sorts of budgetary
choices.
MCCRILLIS (2011): Amid the 1990s the money related arranging industry became because
of the positive economy and the passage of numerous customary banks and financier’s houses.
The banks and other money related administration organizations started to see the incentive in
contracting budgetary counsellors to advance their items and administrations. This move
obscured the lines between the money related arranging and the much vast monetary
administrations ventures. Amid this time the money related arranging industry developed to
incorporate an expansive assortment of protection, domain arranging, venture and expense
arranging specialists. This helped budgetary arranging develop into a far reaching individual
fund arrangement. Money related arranging later on will be driven by both distinctive
individuals who build up an adoration and friendship for arranging and additionally a pattern
toward bigger firms to the degree that they don't lose their trusted relationship ties with their
customers. One territory that has totally changed money related arranging is innovation as
innovation keeps on developing, it will empower organizers to be proficient, ready to serve
more customers, in an all the more opportune and attentive path, even as the edges of the
business may decay.
39
CHAPTER 4
ANALYSIS AND INTERPRETATION
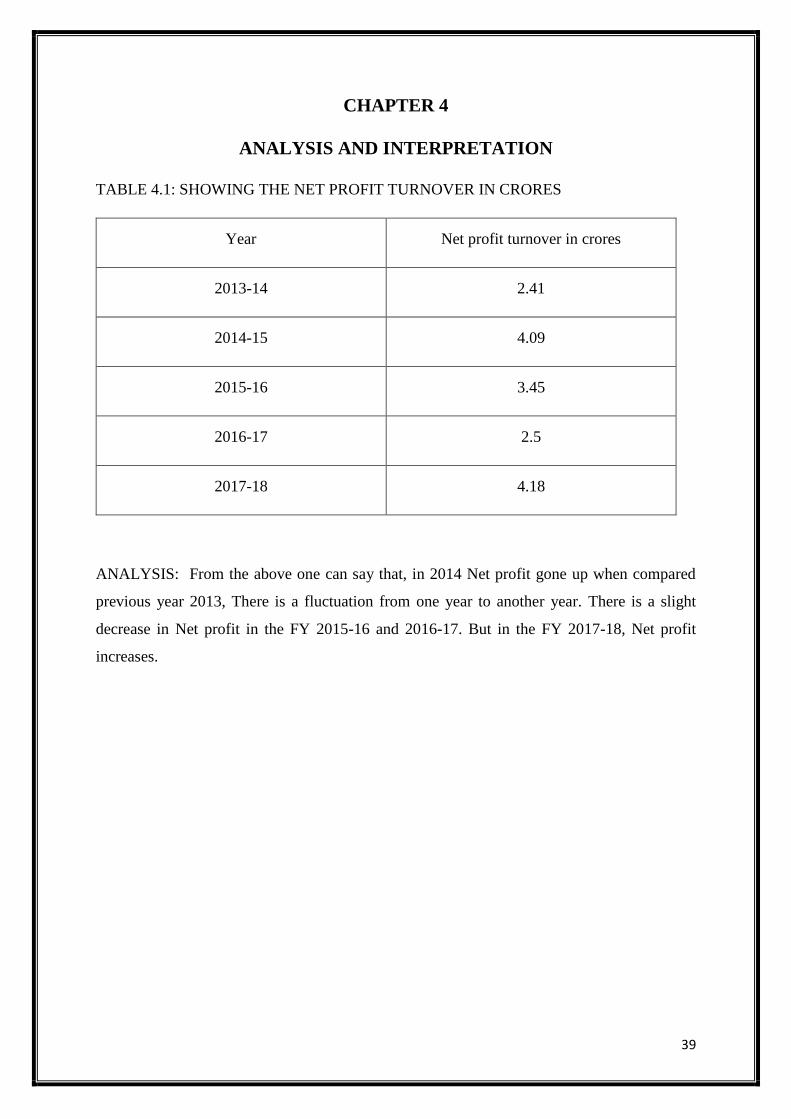
TABLE 4.1: SHOWING THE NET PROFIT TURNOVER IN CRORES
Year Net profit turnover in crores
2013-14 2.41
2014-15 4.09
2015-16 3.45
2016-17 2.5
2017-18 4.18
ANALYSIS: From the above one can say that, in 2014 Net profit gone up when compared
previous year 2013, There is a fluctuation from one year to another year. There is a slight
decrease in Net profit in the FY 2015-16 and 2016-17. But in the FY 2017-18, Net profit
increases.
40
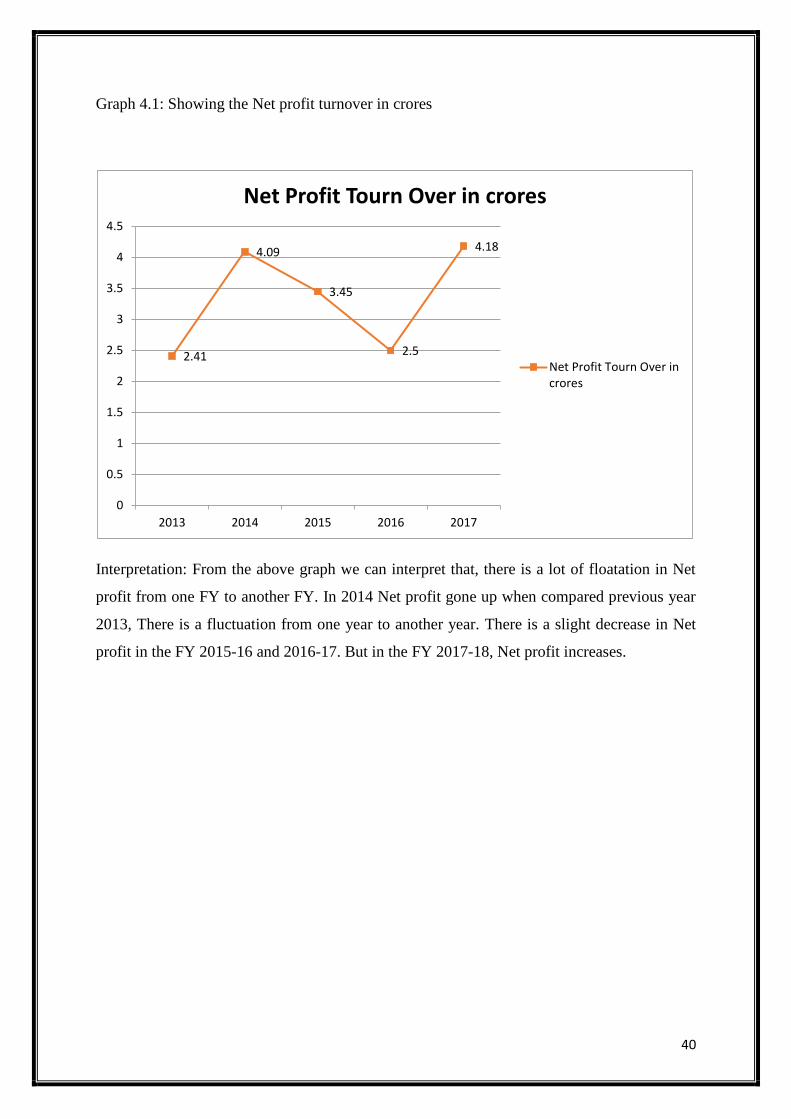
Graph 4.1: Showing the Net profit turnover in crores
Interpretation: From the above graph we can interpret that, there is a lot of floatation in Net
profit from one FY to another FY. In 2014 Net profit gone up when compared previous year
2013, There is a fluctuation from one year to another year. There is a slight decrease in Net
profit in the FY 2015-16 and 2016-17. But in the FY 2017-18, Net profit increases.
2.41
4.09
3.45
2.5
4.18
0
0.5
1
1.5
2
2.5
3
3.5
4
4.5
2013 2014 2015 2016 2017
Net Profit Tourn Over in crores
Net Profit Tourn Over incrores
41
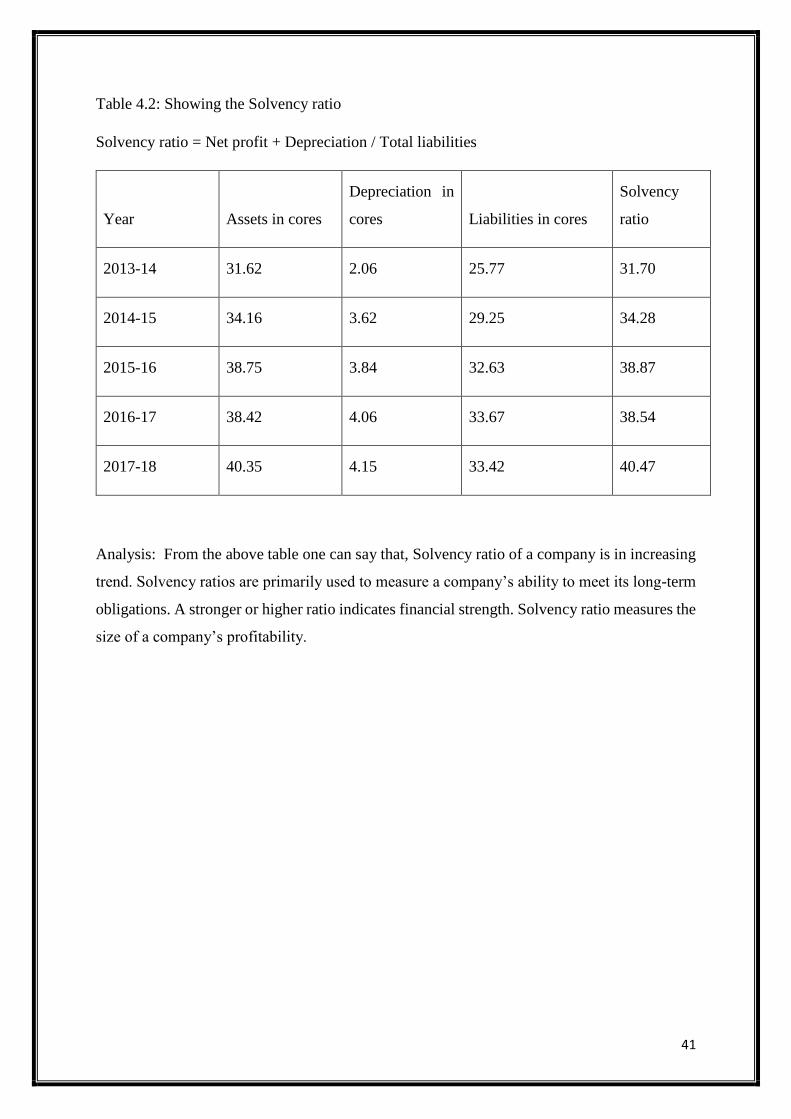
Table 4.2: Showing the Solvency ratio
Solvency ratio = Net profit + Depreciation / Total liabilities
Year Assets in cores
Depreciation in
cores Liabilities in cores
Solvency
ratio
2013-14 31.62 2.06 25.77 31.70
2014-15 34.16 3.62 29.25 34.28
2015-16 38.75 3.84 32.63 38.87
2016-17 38.42 4.06 33.67 38.54
2017-18 40.35 4.15 33.42 40.47
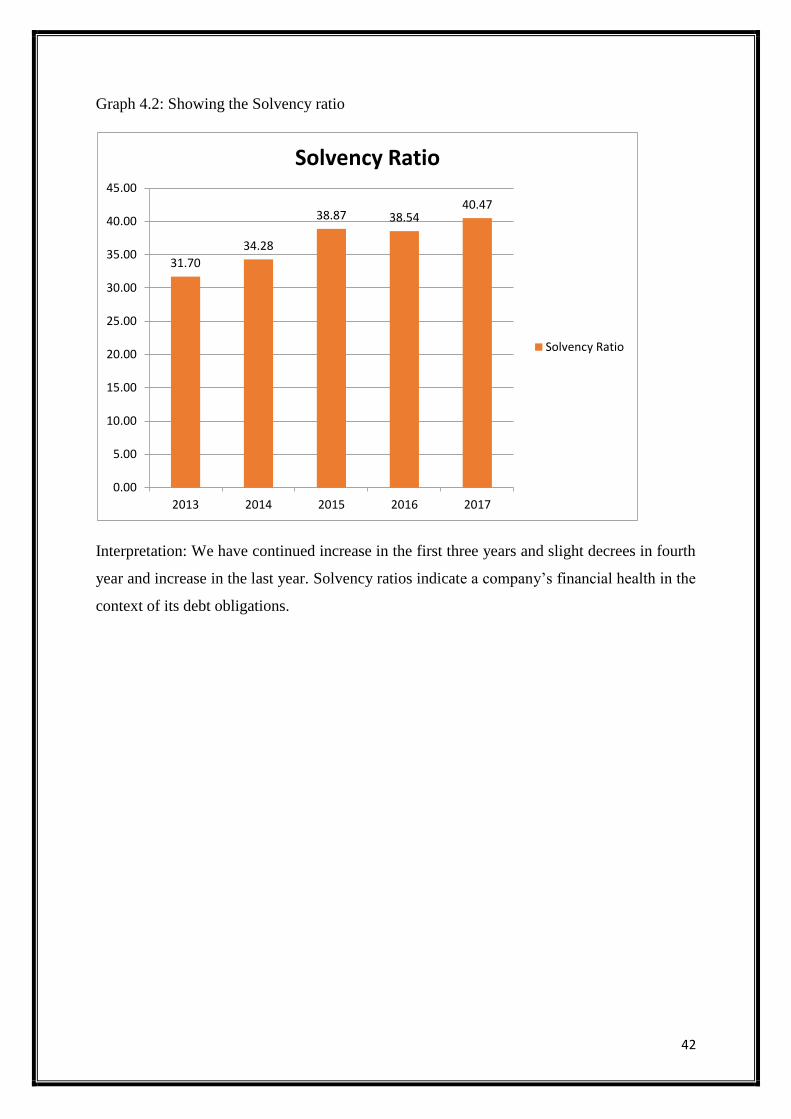
Analysis: From the above table one can say that, Solvency ratio of a company is in increasing
trend. Solvency ratios are primarily used to measure a company’s ability to meet its long-term
obligations. A stronger or higher ratio indicates financial strength. Solvency ratio measures the
size of a company’s profitability.
42
Graph 4.2: Showing the Solvency ratio
Interpretation: We have continued increase in the first three years and slight decrees in fourth
year and increase in the last year. Solvency ratios indicate a company’s financial health in the
context of its debt obligations.
31.70
34.28
38.87 38.5440.47
0.00
5.00
10.00
15.00
20.00
25.00
30.00
35.00
40.00
45.00
2013 2014 2015 2016 2017
Solvency Ratio
Solvency Ratio
43
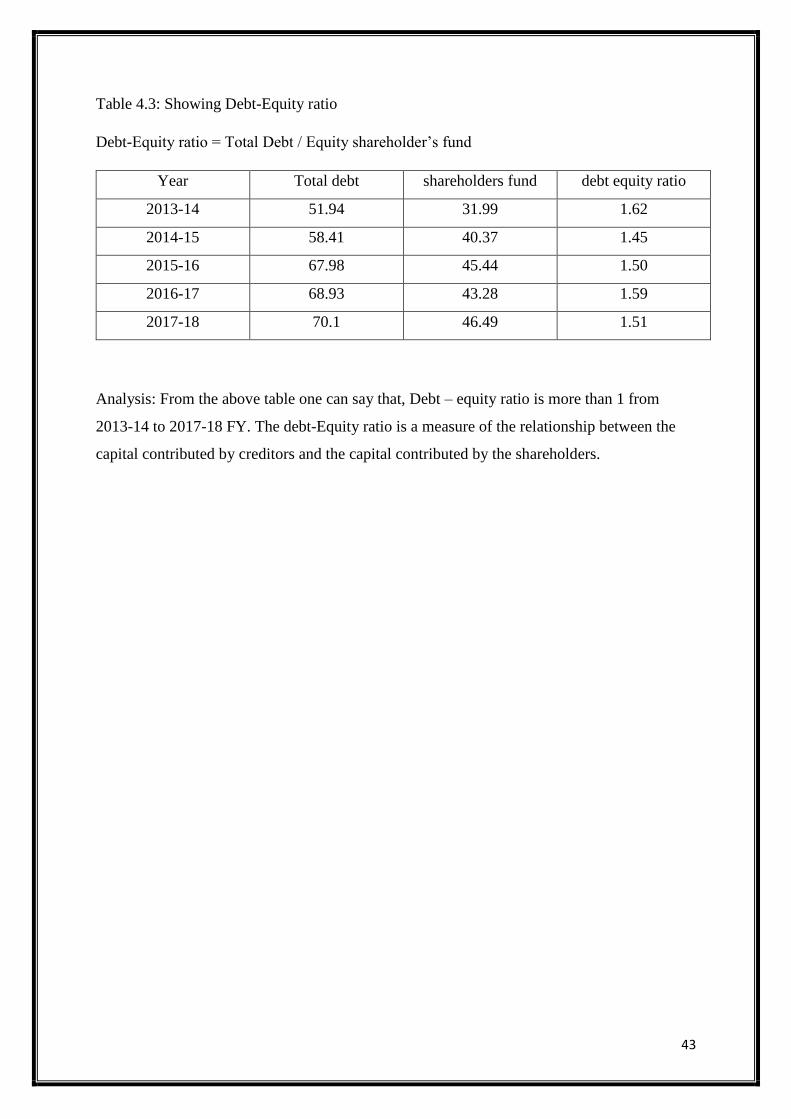
Table 4.3: Showing Debt-Equity ratio
Debt-Equity ratio = Total Debt / Equity shareholder’s fund
Year Total debt shareholders fund debt equity ratio
2013-14 51.94 31.99 1.62
2014-15 58.41 40.37 1.45
2015-16 67.98 45.44 1.50
2016-17 68.93 43.28 1.59
2017-18 70.1 46.49 1.51
Analysis: From the above table one can say that, Debt – equity ratio is more than 1 from
2013-14 to 2017-18 FY. The debt-Equity ratio is a measure of the relationship between the
capital contributed by creditors and the capital contributed by the shareholders.
44
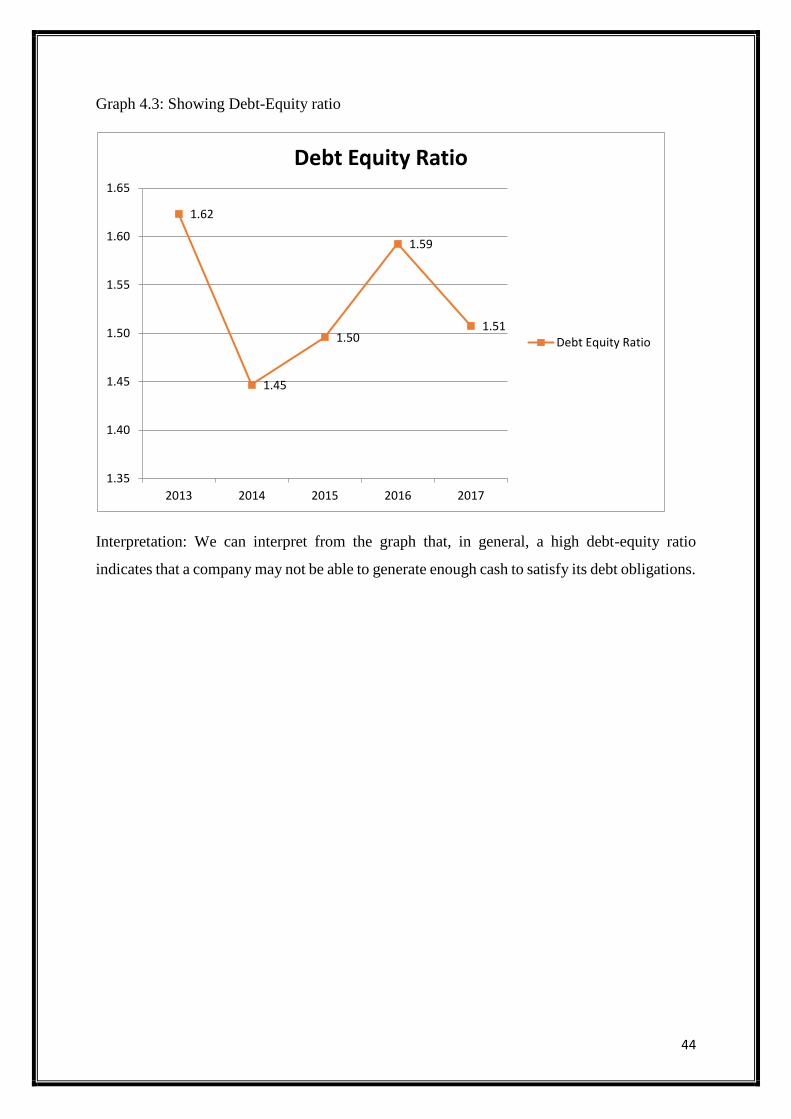
Graph 4.3: Showing Debt-Equity ratio
Interpretation: We can interpret from the graph that, in general, a high debt-equity ratio
indicates that a company may not be able to generate enough cash to satisfy its debt obligations.
1.62
1.45
1.50
1.59
1.51
1.35
1.40
1.45
1.50
1.55
1.60
1.65
2013 2014 2015 2016 2017
Debt Equity Ratio
Debt Equity Ratio
45
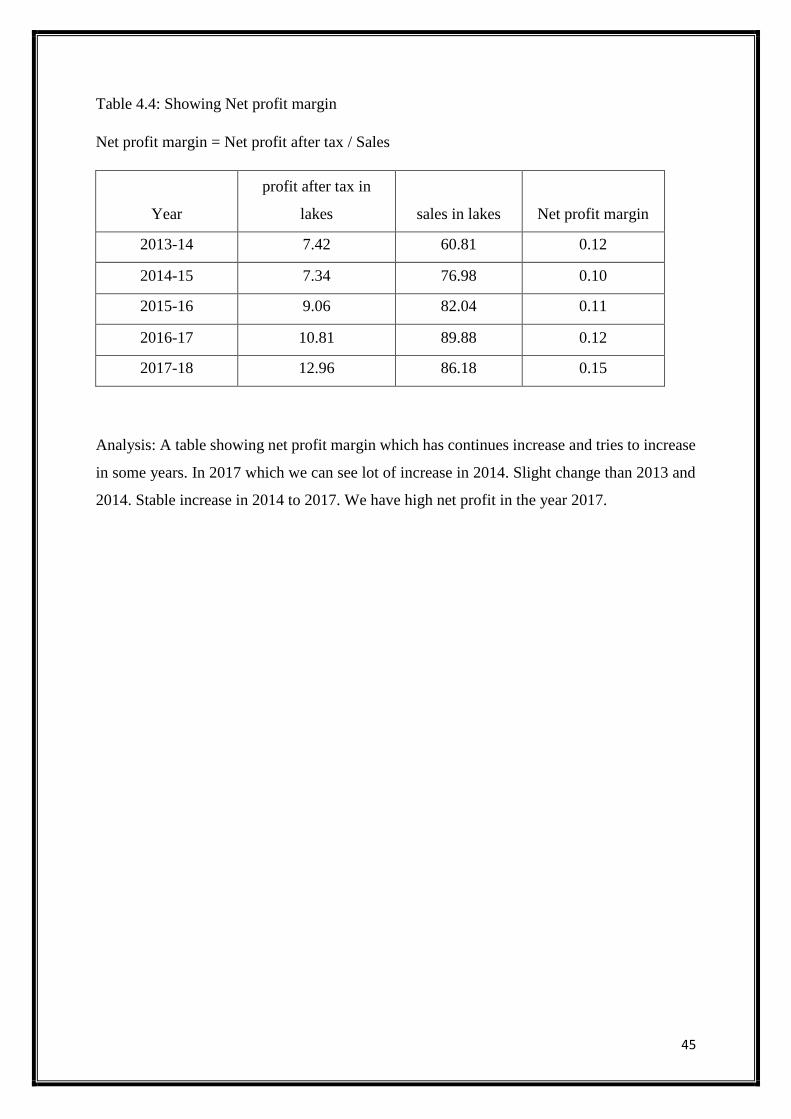
Table 4.4: Showing Net profit margin
Net profit margin = Net profit after tax / Sales
Year
profit after tax in
lakes sales in lakes Net profit margin
2013-14 7.42 60.81 0.12
2014-15 7.34 76.98 0.10
2015-16 9.06 82.04 0.11
2016-17 10.81 89.88 0.12
2017-18 12.96 86.18 0.15
Analysis: A table showing net profit margin which has continues increase and tries to increase
in some years. In 2017 which we can see lot of increase in 2014. Slight change than 2013 and
2014. Stable increase in 2014 to 2017. We have high net profit in the year 2017.
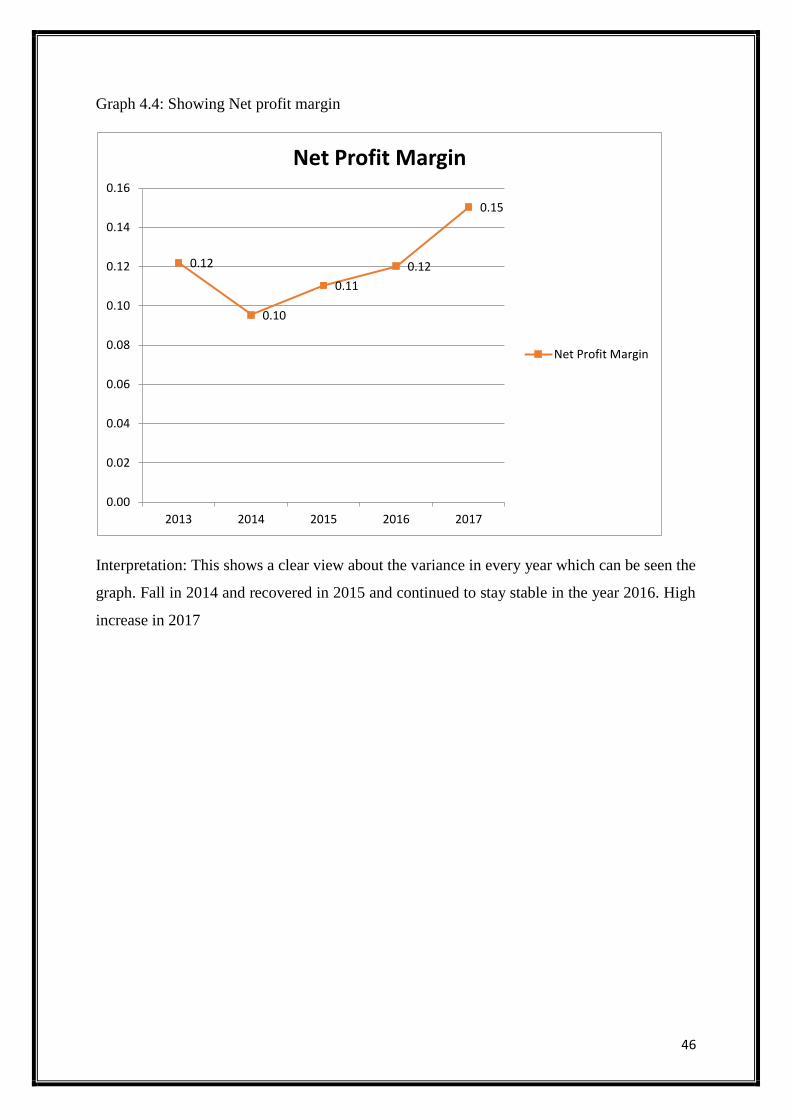
46
Graph 4.4: Showing Net profit margin
Interpretation: This shows a clear view about the variance in every year which can be seen the
graph. Fall in 2014 and recovered in 2015 and continued to stay stable in the year 2016. High
increase in 2017
0.12
0.10
0.11
0.12
0.15
2013 2014 2015 2016 2017
0.00
0.02
0.04
0.06
0.08
0.10
0.12
0.14
0.16
Net Profit Margin
Net Profit Margin
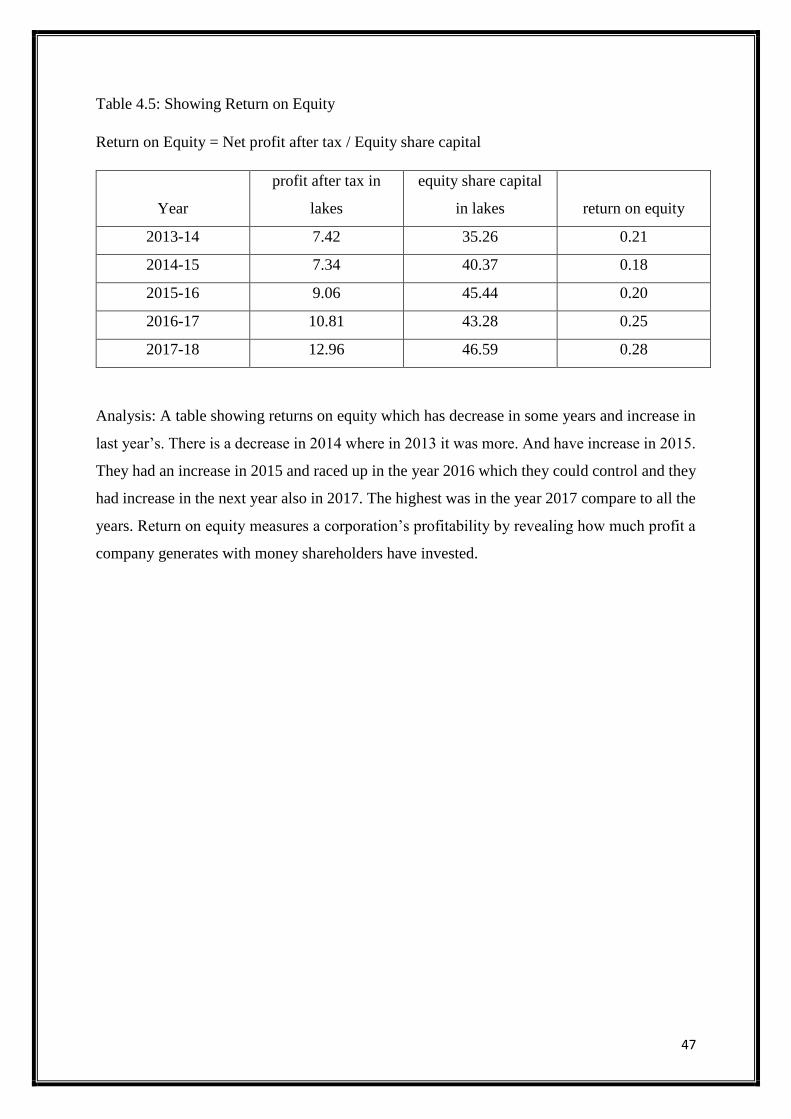
47
Table 4.5: Showing Return on Equity
Return on Equity = Net profit after tax / Equity share capital
Year
profit after tax in
lakes
equity share capital
in lakes return on equity
2013-14 7.42 35.26 0.21
2014-15 7.34 40.37 0.18
2015-16 9.06 45.44 0.20
2016-17 10.81 43.28 0.25
2017-18 12.96 46.59 0.28
Analysis: A table showing returns on equity which has decrease in some years and increase in
last year’s. There is a decrease in 2014 where in 2013 it was more. And have increase in 2015.
They had an increase in 2015 and raced up in the year 2016 which they could control and they
had increase in the next year also in 2017. The highest was in the year 2017 compare to all the
years. Return on equity measures a corporation’s profitability by revealing how much profit a
company generates with money shareholders have invested.
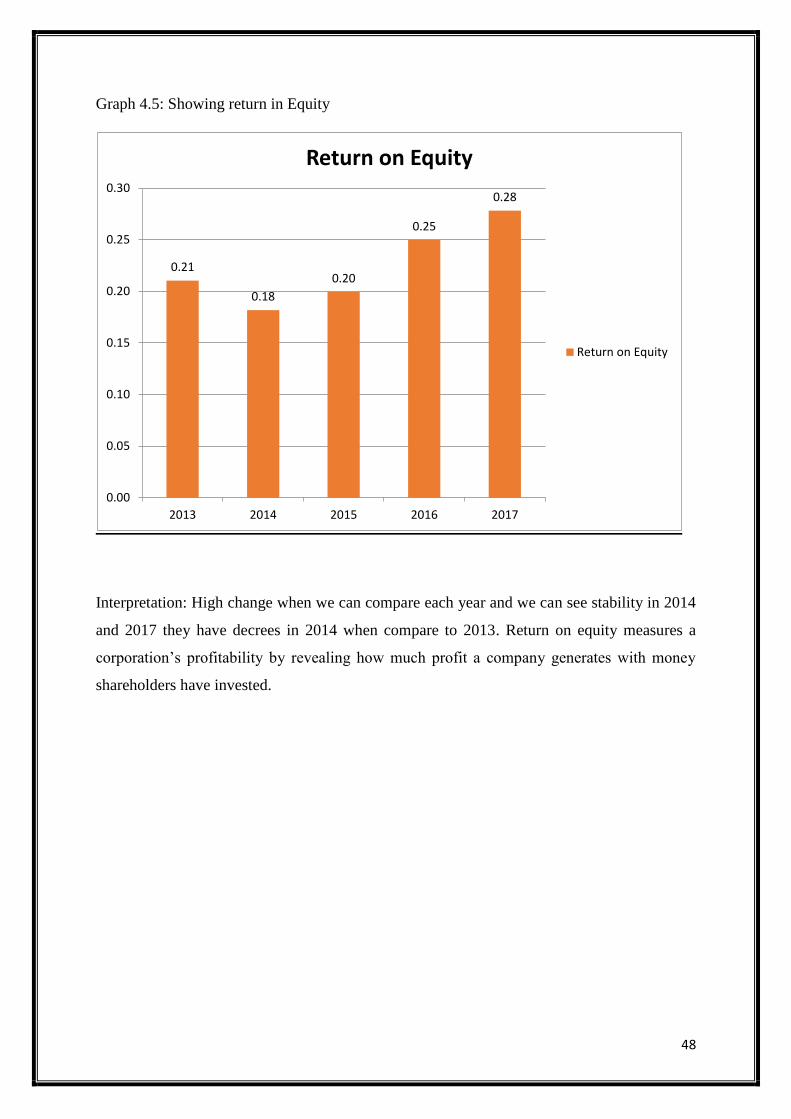
48
Graph 4.5: Showing return in Equity
Interpretation: High change when we can compare each year and we can see stability in 2014
and 2017 they have decrees in 2014 when compare to 2013. Return on equity measures a
corporation’s profitability by revealing how much profit a company generates with money
shareholders have invested.
0.21
0.18
0.20
0.25
0.28
0.00
0.05
0.10
0.15
0.20
0.25
0.30
2013 2014 2015 2016 2017
Return on Equity
Return on Equity
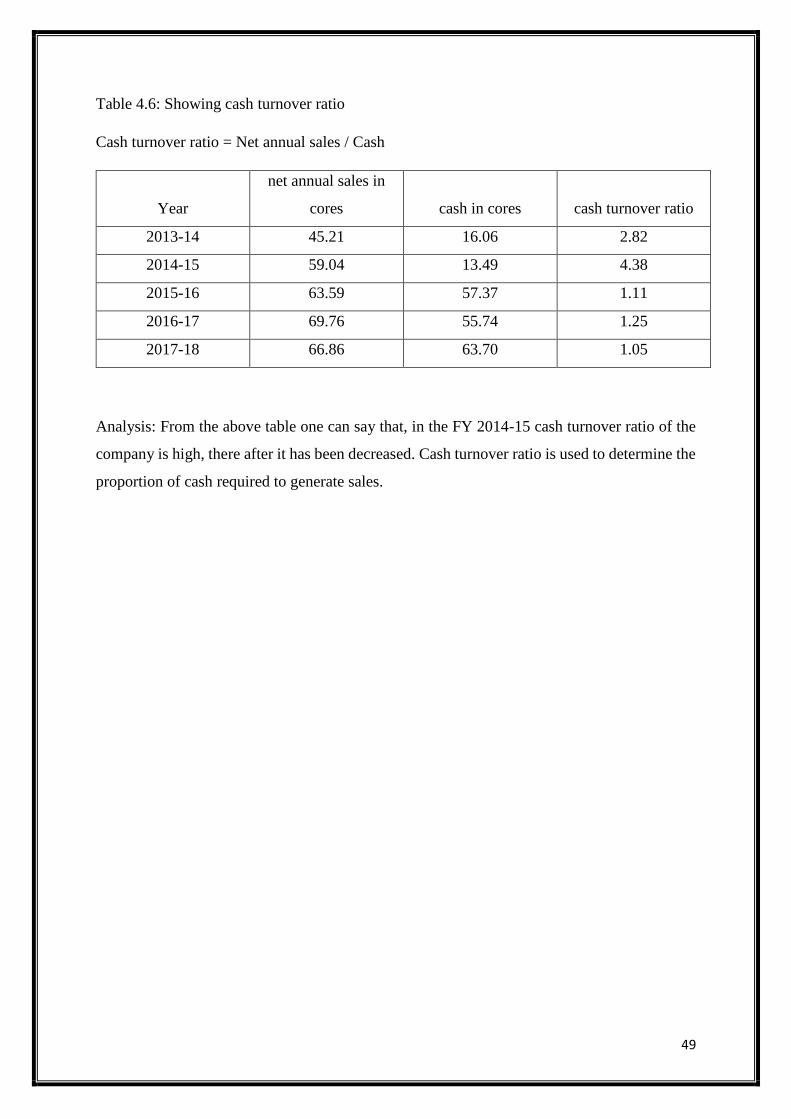
49
Table 4.6: Showing cash turnover ratio
Cash turnover ratio = Net annual sales / Cash
Year
net annual sales in
cores cash in cores cash turnover ratio
2013-14 45.21 16.06 2.82
2014-15 59.04 13.49 4.38
2015-16 63.59 57.37 1.11
2016-17 69.76 55.74 1.25
2017-18 66.86 63.70 1.05
Analysis: From the above table one can say that, in the FY 2014-15 cash turnover ratio of the
company is high, there after it has been decreased. Cash turnover ratio is used to determine the
proportion of cash required to generate sales.
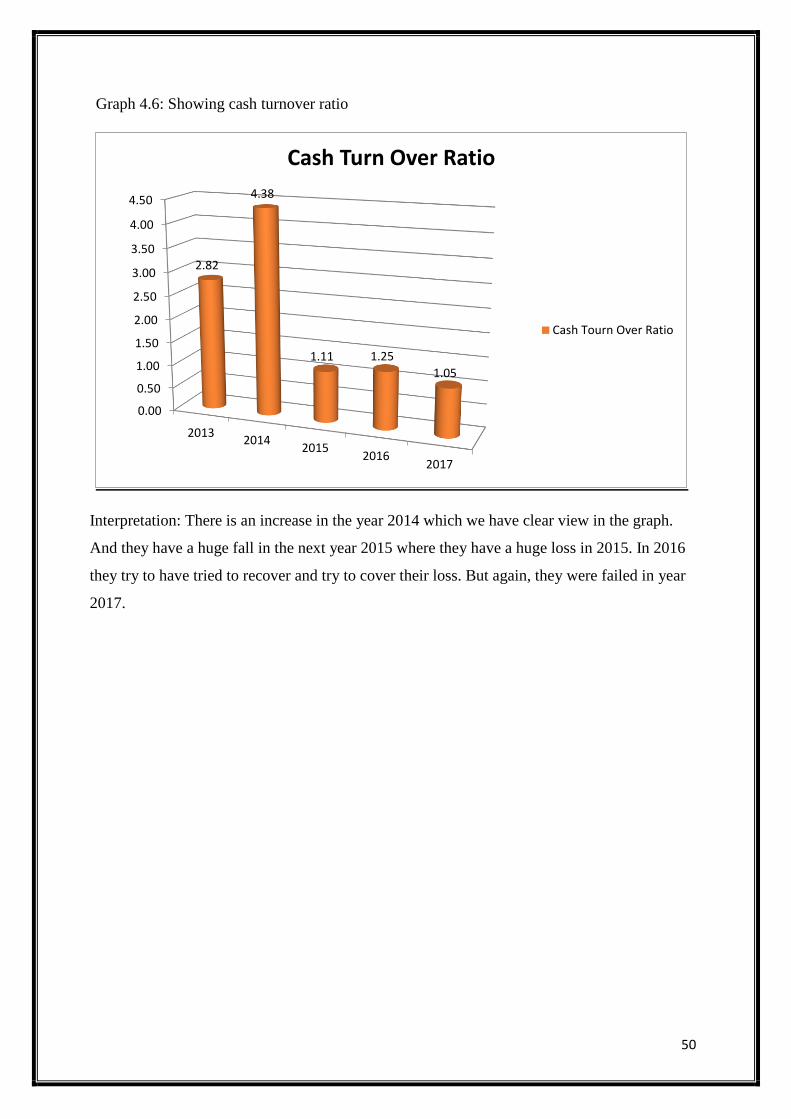
50
Graph 4.6: Showing cash turnover ratio
Interpretation: There is an increase in the year 2014 which we have clear view in the graph.
And they have a huge fall in the next year 2015 where they have a huge loss in 2015. In 2016
they try to have tried to recover and try to cover their loss. But again, they were failed in year
2017.
0.00
0.50
1.00
1.50
2.00
2.50
3.00
3.50
4.00
4.50
20132014
20152016
2017
2.82
4.38
1.11 1.25
1.05
Cash Turn Over Ratio
Cash Tourn Over Ratio
51
CHAPTER 5
SUMMARY OF FINDINGS, SUGGESTIONS AND CONCLUSION
FINDINGS
➢ In 2014 Net profit gone up when compared previous year 2013, There is a fluctuation
from one year to another year. There is a slight decrease in Net profit in the FY 2015-
16 and 2016-17. But in the FY 2017-18, Net profit increases.
➢ Solvency ratio of a company is in increasing trend. Solvency ratios are primarily used
to measure a company’s ability to meet its long-term obligations. A stronger or higher
ratio indicates financial strength. Solvency ratio measures the size of a company’s
profitability.
➢ Debt – equity ratio is more than 1 from 2013-14 to 2017-18 FY. The debt-Equity ratio
is a measure of the relationship between the capital contributed by creditors and the
capital contributed by the shareholders.
➢ Net profit margin which continued to increase and tried to increase in some years. In
2017 which we can see lot of increase in 2014. Slight change than 2013 and 2014.
Stable increase in 2014 to 2017. We have high net profit in the year 2017.
➢ The highest was in the year 2017 compare to all the FYs from 2013-14 to 2017-18.
Return on equity measures a corporation’s profitability by revealing how much profit a
company generates with money shareholders have invested.
➢ In the FY 2014-15 cash turnover ratio of the company is high, there after it has been
decreased. Cash turnover ratio is used to determine the proportion of cash required to
generate sales.
52
SUGGESTIONS
➢ Net profit turnover is more fluctuating from one year to another and it is decreasing trend,
in order to increase the net profit, reduce cost of goods sold, review all of the expenses that
relate to your cost of goods sold. Increase sales revenue.
➢ In order increase the return on equity. Increase profit margins. As profits are in the
numerator of the return on equity ratio, increasing profits relative to equity increases a
company’s return on equity.
➢ Cash turnover ratio should be high, since it is used to determine the proportion of cash
required to generate sales.
CONCLUSION
Financial analysis determines a company’s health and stability, providing an understanding of
how the company conducts its business. But it is important to know that financial statement
analysis has its limitations as well. Different accounting methods adopted by different firms’
changes the visible health and profit levels for either better or worse. Different analysts may
get different results from the same information. Hence, we must conclude that financial
statement analysis is only one of the tools while taking an investment decision.
Financial Statement analysis is an analysis, which highlights important relationships in the
financial statements. It focuses on the evaluation of past operations as revealed by the
analysis of basic statements. Financial Statement analysis embarks the methods used in
assessing and interpreting the results of past performance and current financial positions as
they relate to particular factors of interest in investment decisions. It is an important means of
assessing past performance and in forecasting and planning future performance.

53
CHAPTER 6
LEARNING EXPERIENCE
6.1 LEARNING EXPERIENCE
We all know that practical experience is the best, and Internships give students that hands-on
experience they need. I feel that quality internships are essential to develop key skills that you
can’t get in a classroom. Skills such as multitasking, communicating, learning to deal with
diversity, and dealing with deadlines are different when you are working for someone else, not
yourself like you do in college. Internships are also a great way to network with people in the
Industry. My boss and co-workers were great about giving me contacts and referring me to
open positions in Industry.
I learned that customers service is hard. You cannot please everyone. There are people in this
world that are simply difficult. I have learned that stressing over little things will not get me
anywhere. I have learned to work well as a team. Another aspect of aspect that I learned
throughout my Internship is to never be afraid to ask lots of questions.

BIBLIOGRAPHY
ARTICLES
I M PANDEY (2016) “Financial Management”.
HOGSETT (2018): “Comprehensive financial planning”
LANGABEER (2008) “Contemporary financial planning and control systems”
LOPEZ (2016) “Financial analysis and planning”
SARASON AND TEGARDEN (2008) “Strategic financial planning and performance”
BREALRY AND MYERS (2008) “Financial methodology”
WEBLIOGRAPHY
www.google.com
www.moneycontrol.com