industrialization and growth - world bank documents & reports
TRANSCRIPT
Industrialization and Growth
The Experience of Large Countriest
Hollis B. Chenery SWP539
WORLD BANK STAFF WORKING PAPERSNumber 539
FILE COPY M
Pub
lic D
iscl
osur
e A
utho
rized
Pub
lic D
iscl
osur
e A
utho
rized
Pub
lic D
iscl
osur
e A
utho
rized
Pub
lic D
iscl
osur
e A
utho
rized
Pub
lic D
iscl
osur
e A
utho
rized
Pub
lic D
iscl
osur
e A
utho
rized
Pub
lic D
iscl
osur
e A
utho
rized
Pub
lic D
iscl
osur
e A
utho
rized

WORLD BANK STAFF WORKING PAPERSNumber 539
Industrialization and Growth
The Experience of Large Countries
Hollis B. Chenery
The World BankWashington, D.C., U.S.A.
Copyright 0 1982The International Bank for Reconstructionand Development / THE WORLD BANK1818 H Street, N.W.Washington, D.C. 20433, U.S.A.
All rights reservedManufactured in the United States of America
This is a working document published informally by The World Bank. Topresent the results of research with the least possible delay, the typescript hasnot been prepared in accordance with the procedures appropriate to formalprinted texts, and The World Bank accepts no responsibility for errors. Thepublication is supplied at a token. charge to defray part of the cost ofmanufacture and distribution.
The views and interpretations in this document are those of the author(s) andshould not be attributed to The World Bank, to its affiliated organizations, or toany individual acting on their behalf. Any maps used have been preparedsolely for the convenience of the readers; the denominations used and theboundaries shown do not imply, on the part of The World Bank and itsaffiliates, any judgment on the legal status of any territory or any endorsementor acceptance of such boundaries.
The full range of The World Bank publications is described in the Catalog ofWorld Bank Publications; the continuing research program of the Bank is outlinedin World Bank Research Program: Abstracts of Current Studies. Both booklets areupdated annually; the most recent edition of each is available without chargefrom the Publications Distribution Unit of the Bank in Washington or from theEuropean Office of the Bank, 66, avenue d'Iena, 75116 Paris, France.
Library of Congress Cataloging in Publication Data
Chenery, Hollis Burnley.Industrialization and growth.
(World Bank staff working papers ; no. 539)
Bibliography: p.1. Economic development. 2. Industrialization. I. Title.
II. Series.Hb82.C472 1982 338.9 82-15961ISBN 0-8213-0097-O
This paper discusses common elements of the experience
of large developing countries with industrialization, drawing on
the World Bank's research project on "The Sources of Industrial
Growth and Structural Change." The paper, which was presented to
a conference of the Chinese Academy of Science, is designed to
provide a comparative framework for assessing the performance of
the Chinese economy. It shows that, despite its unique features,
China shares many characteristics with other large semi-
industrial countries. Some implications for trade policy and
future growth are noted.
Formerly vice president for development policy at The World
Bank, the author is now Thomas B. Cabot professor of economics at Harvard
University.

CONTENTS
ABSTRACT
Paize
I. THE STRUCTURAL TRANSFORMATION .................... 3
- Demand Effects of Rising Income ............. 5
- Sectoral Balance ... ........................... 6
- Patterns of Production ...................... 8
- Effects of Large Size ............. 9
II. THE LARGE SEMI-INDUSTRIAL COUNTRIES ............. 13
- The Transformation of Production ............ 14
- Effects of Trade Policies ................... 17
III. GROWTH AND TRANSFORMATION ...................... 18


Comparative studies of countries at different levels of
income have revealed a number of common features of the process
of development. One of the most pervasive is the transformation
of the structure of production, in which the industrial sectors
typically grow more rapidly than agriculture. Associated with
the rise of industry are changes in the composition of demand,
international trade, and the occupation of the labor force.
These changes in the use of economic resources are influenced in
various ways by government policies and constitute the core of a
strategy of development.
Different aspects of development strategies have been
widely studied in order to learn from the experience of other
countries. Although there is no single country that combines the
major features of the Chinese economy, common characteristics can
be found in several groups of developing countries. The purpose
of this paper is to identify a set of countries that provide a
basis for such comparisons and to try to draw some lessons from
their experience that may be helpful to scholars and policy
makers in the People's Republic of China.
The countries that seem to be most useful for this pur-
pose share the following characteristics: a large population,
intermediate income levels, and substantial progress in indus-
trialization. On this basis, a group of sixteen large semi-
- 2 -
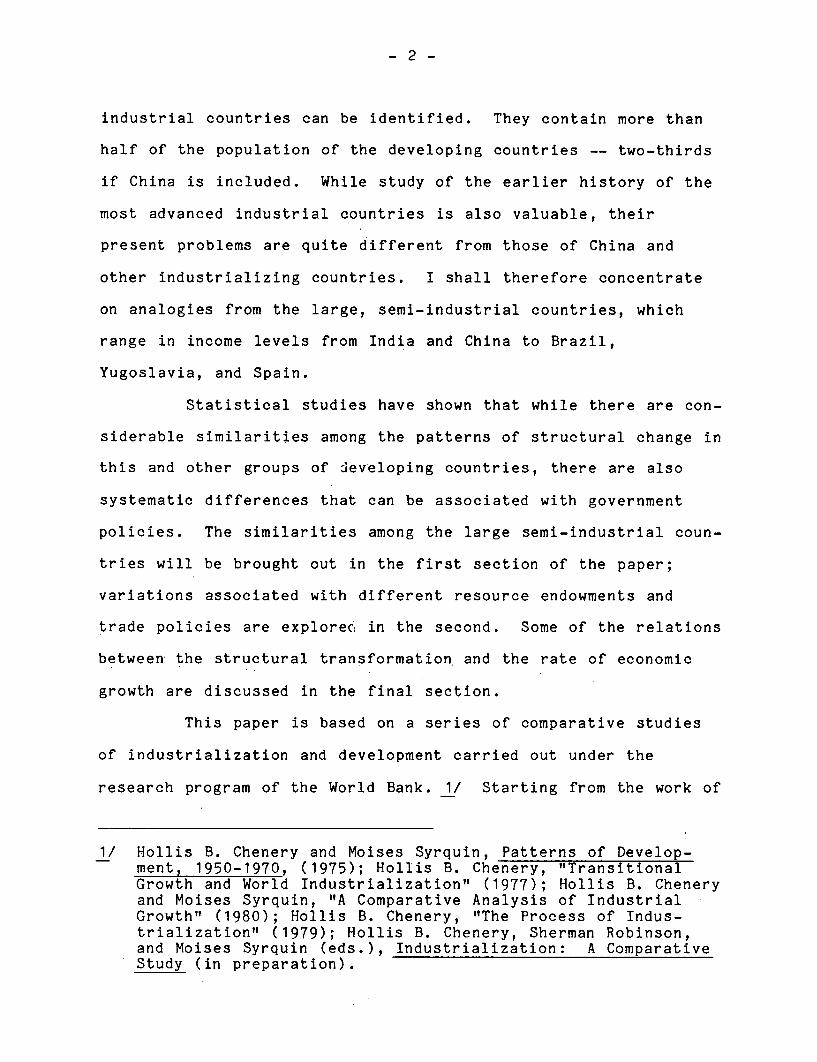
industrial countries can be identified. They contain more than
half of the population of the developing countries -- two-thirds
if China is included. While study of the earlier history of the
most advanced industrial countries is also valuable, their
present problems are quite different from those of China and
other industrializing countries. I shall therefore concentrate
on analogies from the large, semi-industrial countries, which
range in income levels from India and China to Brazil,
Yugoslavia, and Spain.
Statistical studies have shown that while there are con-
siderable similarities among the patterns of structural change in
this and other groups of SIeveloping countries, there are also
systematic differences that can be associated with government
policies. The similarities among the large semi-industrial coun-
tries will be brought out in the first section of the paper;
variations associated with different resource endowments and
trade policies are explorec, in the second. Some of the relations
between the structural transformation and the rate of economic
growth are discussed in the final section.
This paper is based on a series of comparative studies
of industrialization and development carried out under the
research program of the World Bank. 1/ Starting from the work of
1/ Hollis B. Chenery and Moises Syrquin, Patterns of Develop-ment, 1950-1970, (1975); Hollis B. Chenery, "TransitionalGrowth and World Industrialization" (1977); Hollis B. Cheneryand Moises Syrquin, "A Comparative Analysis of IndustrialGrowth" (1980); Hollis B. Chenery, "The Process of Indus-trialization" (1979); Hollis B. Chenery, Sherman Robinson,and Moises Syrquin (eds.), Industrialization: A ComparativeStudy (in preparation).
-3-
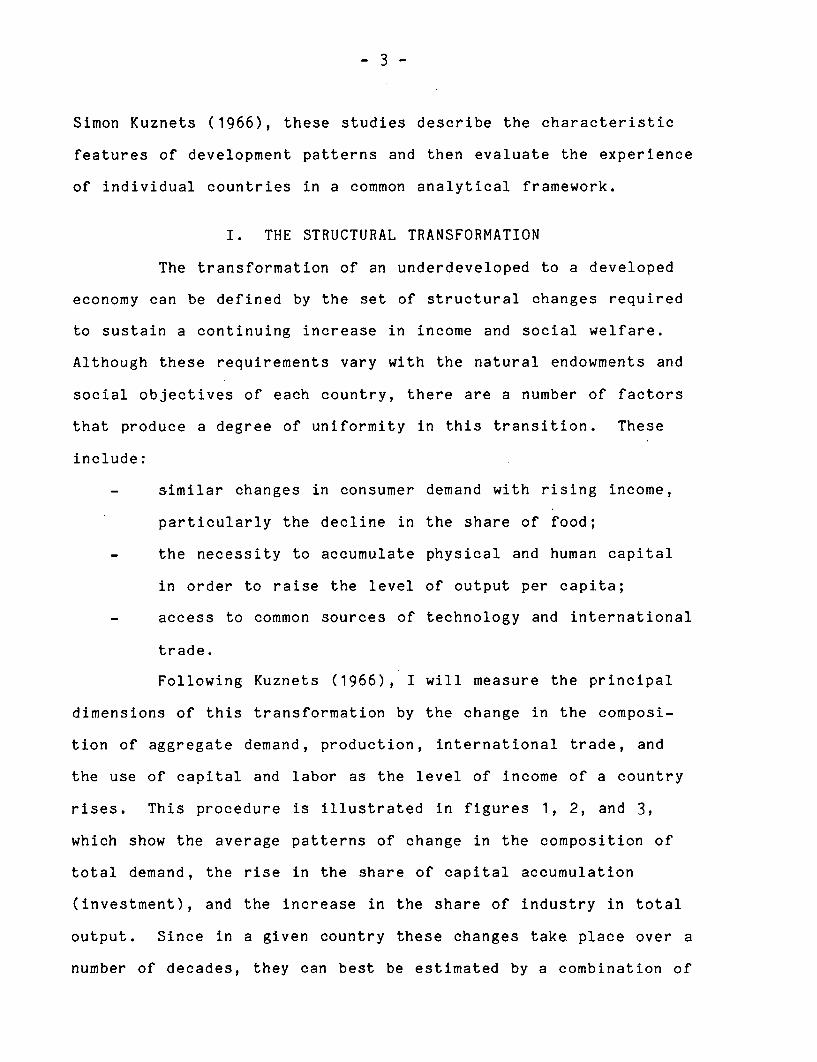
Simon Kuznets (1966), these studies describe the characteristic
features of development patterns and then evaluate the experience
of individual countries in a common analytical framework.
I. THE STRUCTURAL TRANSFORMATION
The transformation of an underdeveloped to a developed
economy can be defined by the set of structural changes required
to sustain a continuing increase in income and social welfare.
Although these requirements vary with the natural endowments and
social objectives of each country, there are a number of factors
that produce a degree of uniformity in this transition. These
include:
similar changes in consumer demand with rising income,
particularly the decline in the share of food;
the necessity to accumulate physical and human capital
in order to raise the level of output per capita;
access to common sources of technology and international
trade.
Following Kuznets (1966), I will measure the principal
dimensions of this transformation by the change in the composi-
tion of aggregate demand, production, international trade, and
the use of capital and labor as the level of income of a country
rises. This procedure is illustrated in figures 1, 2, and 3,
which show the average patterns of change in the composition of
total demand, the rise in the share of capital accumulation
(investment), and the increase in the share of industry in total
output. Since in a given country these changes take place over a
number of decades, they can best be estimated by a combination of
cross-country and time series analysis over the postwar
period. 1/
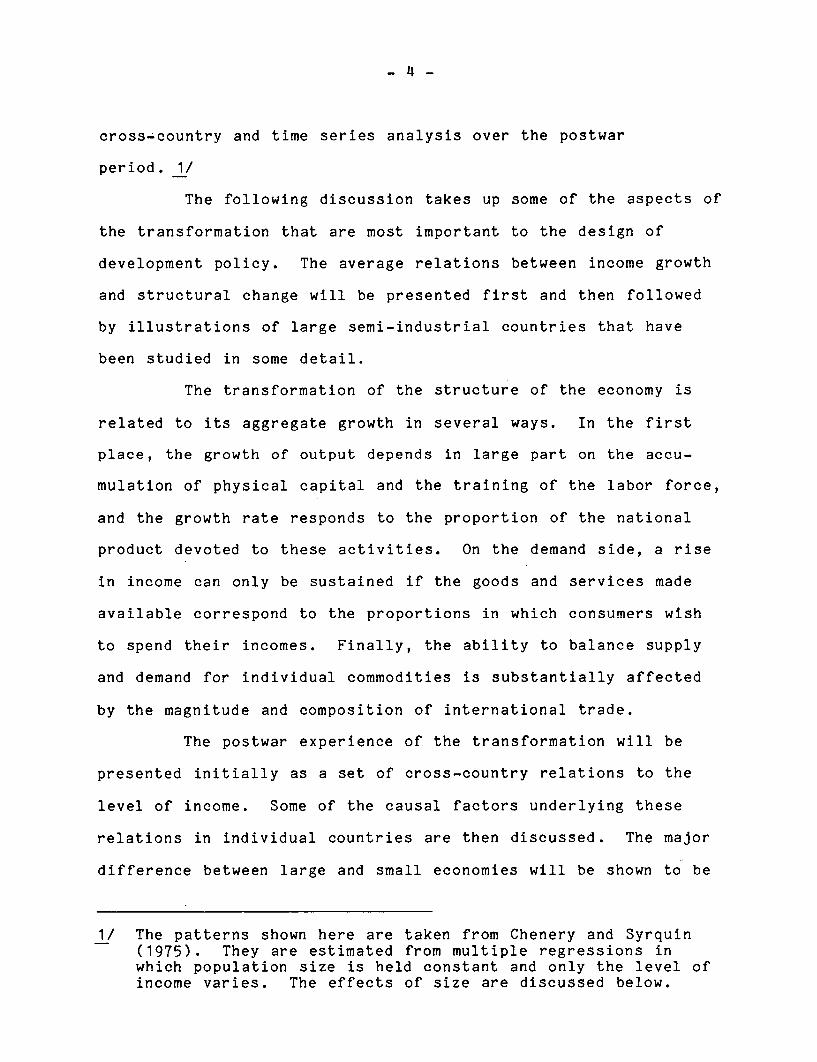
The following discussion takes up some of the aspects of
the transformation that are most important to the design of
development policy. The average relations between income growth
and structural change will be presented first and then followed
by illustrations of large semi-industrial countries that have
been studied in some detail.
The transformation of the structure of the economy is
related to its aggregate growth in several ways. In the first
place, the growth of output depends in large part on the accu-
mulation of physical capital and the training of the labor force,
and the growth rate responds to the proportion of the national
product devoted to these activities. On the demand side, a rise
in income can only be sustained if the goods and services made
available correspond to the proportions in which consumers wish
to spend their incomes. Finally, the ability to balance supply
and demand for individual commodities is substantially affected
by the magnitude and composition of international trade.
The postwar experience of the transformation will be
presented initially as a set of cross-country relations to the
level of income. Some of the causal factors underlying these
relations in individual countries are then discussed. The major
difference between large and small economies will be shown to be
1/ The patterns shown here are taken from Chenery and Syrquin(1975). They are estimated from multiple regressions inwhich population size is held constant and only the level ofincome varies. The effects of size are discussed below.
-5-
the extent of their reliance on international trade, which in
turn affects many other aspects of development strategy.
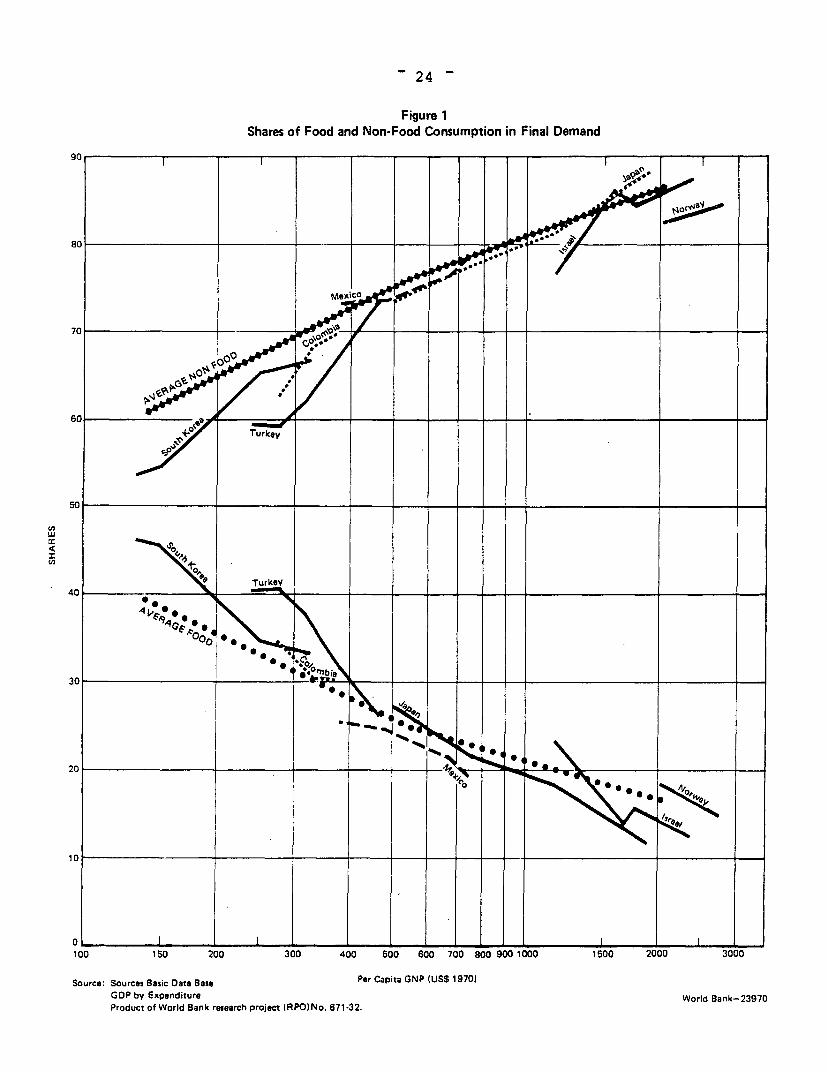
Demand Effects of Rising Income
The most important effect of rising income on demand is
to reduce the share of food in the total, which frees resources
for investment and other forms of consumption. Figure 1 shows
the average division of total demand (including i vestment as
well as consumption) between food and all other u/ses and also
includes historical changes in a set of developinkg countries that
have been studied in detail. At the lowest level'of income, food
accounts for between 40 and 50 percent of total expenditures. By
the middle of the transformation -- which is typically at a per.
capita income of $400 to $500 (dollars of 1970) 1/ -- this share
falls to about 25 percent. This phenomenon is a reflection of
Engel's law, which states that the demand for *food rises less
rapidly than total consumer demand. 2/ In relation to national
income, the implied income elasticity of food demand shown in
figure 1 is about .7. The illustrative countries -- to be
discussed below -- all follow a similar pattern, with more rapid
declines in Korea and Turkey.
1/ The analyses in this paper are based on the conversion oflocal currencies into dollars at average exchange rates, aspublished in the World Bank's World Tables and WorldDevelopment Reports, using prices of 1970.
2/ This relationship has been verified in virtually all studiesof consumer behavior, using both cross-section and timeseries data. See Houthakker (1957) and Lluch, Powell andWilliams (1977).
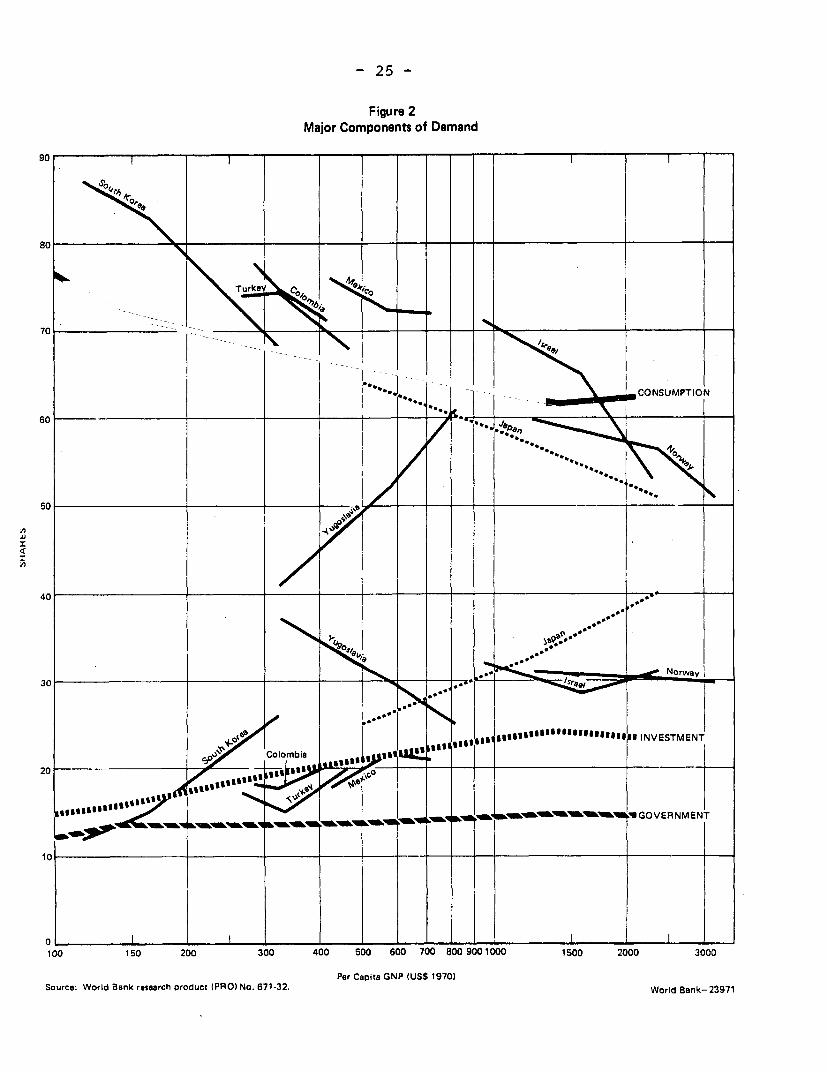
- 6 -
The rise in non-food demand is typically divided fairly
evenly between investment and consumption, as shown in
figure 2. In Japan and Korea (and probably China), most of the
increase went to investment, while Yugoslavia, Colombia, Turkey,
and Mexico were closer to the average cross-country pattern. The
rise in the share of investment typically leads to an accelera-
tion of the rate of growth unless it is offset by an imbalance
between demand and supply, which is then reflected in rising
capital-output ratios.
The size of a country has little relation to the com-
position of domestic demand at a given level of income. This
finding results from econometric tests of large samples of coun-
tries and is illustrated by the selection of countries included
here.
Sectoral Balance
The changes in the composition of demand just described
must be balanced by corresponding changes in the composition of
domestic supply and international trade. These relations can be
specified most simply by a set of input-output or commodity
balance equations of the following form for any given time
period:
Xi = (Ci + Ii) + Wi + (Ei - Mi) (1)
where Xi is the gross output of sector i, Ci is consumption use,
I, is investment use, Wi is intermediate use by other sectors of
the economy, Ei is exports and Mi is imports. These five compo-
nents can be grouped for analytical purposes as shown into three
-7-
factors: domestic final demand (Ci + Ii), domestic inter-
mediate demand (Wi), and net international trade (Ei - Mi).
Total intermediate demand for a commodity, Wi, is
related to the production levels of other sectors by a set of
input-output relations of the form:
ii (2)
where the parameters aij represent the input-output coefficients
measuring the use of input from sector i per unit of output of
sector j. 1/ When equation (2) is substituted into equation (1),
the result is the Leontief open input-output, model, which deter-
mines levels of output in each sector as a function of domestic
final demands and net international trade in all sectors.
To compare the structural transformation experienced by
different countries, this model has been applied to historical
data for a number of industrializing countries over the postwar
period. 2/ While the change in the composition of domestic
demand is the most important factor in explaining the rising
share of industry in all the large countries studied, it accounts
for only half of the total increase. As explained below, changes
1/ The coefficients are assumed to be measured in value terms atconstant prices, although they can be initially stated inphysical units, such as tons of coal required per ton ofsteel produced.
2/ The model and preliminary results of its application tohistorical analysis are given in Chenery and Syrquin (1980)and Chenery (1980). The large countries analyzed under theWorld Bank project include Japan, Yugoslavia, Turkey, Koreaand Mexico.
-8-
in trade patterns -- export expansion and import substitution --
typically account for 25-30 percent of the rise of industry. The
remainder is due to changes in technology, which are reflected in
the increase in intermediate use of commodities per unit of
output.
The main difference between large and small countries
revealed by comparative studies of this kind lies in the role of
international trade. In smaller countries, the degree of
specialization is much greater, and there need not be a close
correspondence between supply and demand in each sector. In
large countries -- defined here as those with more than 20
million inhabitants -- imports are typically only 10-15 percent
of the gross national product, as compared to 20-30 percent for
smaller countries. The effects of this difference in the degree
of openness of the economy are explored in section II.
Patterns of Production
An input-output model similar to that described above
has also been used to explain the average changes that are
observed in the structure of production in a representative
country. Based on generalization from individual country
studies, a prototype developing country has been created by
estimating the relations of each of the exogenous variables in
equation (1) to the level of income. Similarly, a representative
set of input-output coefficients for 23 sectors of the economy is
used in equation (2) to determine the changes in levels of output
that are consistent with average changes in internal and external
- 9 -
demand. Net output (value added) by sector is then measured as a
proportion of gross output.
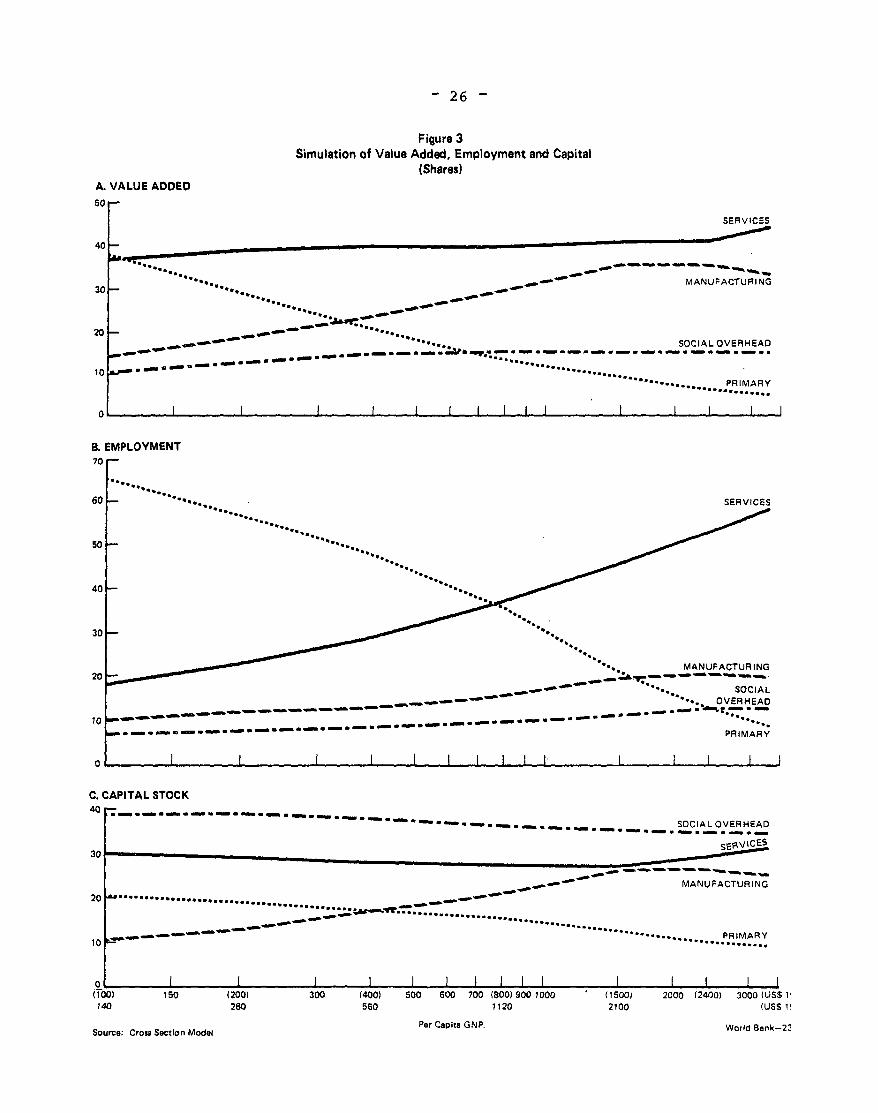
The changes in the composition of net output that are
determined from this simulation of the transformation are shown
in figure 3. Although there are differences of detail, the over-
all results of this experiment are quite close to the pattern
observed directly. 1/ This result permits us to use the cross-
country simulation model as a basis for explaining differences in
the structural transformation that can be associated with
systematic variation in one or more of its components. In
particular, this procedure will be used to explain the distinc-
tive features of the transformation that are observed in large
countries, based on the characteristic trading patterns of this
set of countries. This procedure helps to identify the ways in
which the Chinese economy differs from what might be expected of
a typical large developing country.
Effects of Large Size
There are a number of reasons for the structural trans-
formation of countries with large populations (and usually more
diversified natural resources) to be somewhat different from the
average for all developing countries. Perhaps most important is
the existence of a larger domestic market, which makes it
economical to establish industries having economies of scale at
lower levels of income than is normally the case. This tendency
1/ This cross-country simulation model is described in Cheneryand Syrquin (1980), which also gives a comparison to theobserved patterns.
- 10 -
is reinforced by higher internal transport costs, which have the
same effect as tariffs in favoring local suppliers. It is
therefore logical for countries such as Brazil, India and China
to develop a larger and more diversified industrial structure
than smaller countries at the same level of income.
These natural tendencies are reinforced in almost all
large countries by deliberate government policies of favoring
domestic production over imports in both manufacturing and agri-
culture. Although most developing countries have followed a
policy of import substitution in the early stages of industrial-
ization, the larger countries have tended to maintain it longer
and to extend it to bran&l1es of heavy industry that would not be
feasible for a small economy. The corollary of this policy is to
discriminate against exports through overvalued exchange rates
and direct incentives, and hence to diminish the volume of trade
even more than would result from economies of scale and a large
domestic market. In this respect there were similarities between
the autarkic Chinese policies of the fifties and sixties and
those of some other large countries, such as Brazil, Turkey and
India.
The result of natural forces reinforced by autarkic
policies has been to limit the share of exports in the gross
national product in large countries that are not substantial
mineral exporters to less than half of the levels that are
typical for smaller economies. This effect is particularly
notable in primary exports. In several extreme cases discussed
below -- including China -- exports have been limited to 5-6
- 11 -
percent of GNP. The major exception to this generalization is
the Republic of Korea, which has emphasized manufactured exports
and has a structure typical of a smaller, more specialized
economy.
Before turning to individual country experience, it is
useful to examine the effects of limiting trade in more general
terms. This can be done by simulating alternative trading
patterns in the cross-country model, with the level and composi-
tion of total demand held constant. To abstract from factors
other than trade, I assume the same input-output coefficients as
well as constant demand vectors in equations 1 and 2. The
adjustment to lower levels of exports takes place through pat-
terns of import substitution that are typical of large countries,
with capital inflows held relatively constant.
Following this procedure, I have first simulated the
production levels that are consistent with the average patterns
of exports and imports of large countries and compared them to
the value added by sector in the prototype model at an income
level of $400 -- near the midpoint of the structural transforma-
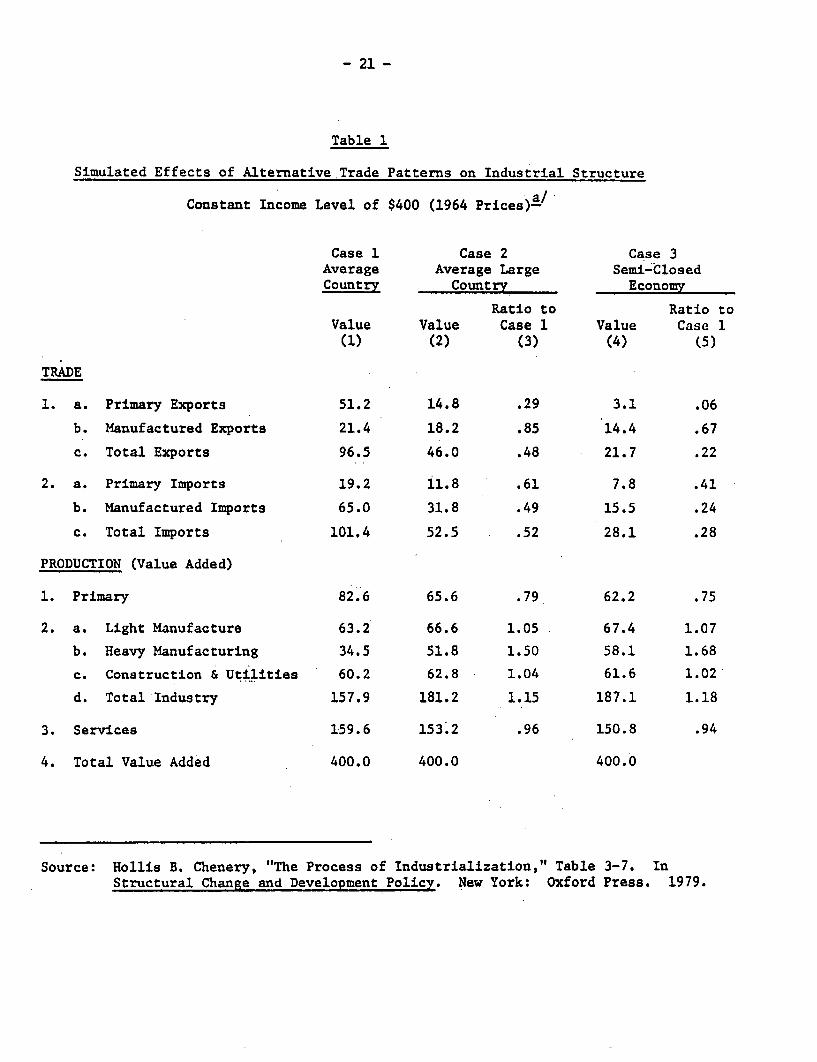
tion. 1/ A summary of the results is given in columns (1) and (2)
of Table 1. Since domestic demand and technology are heid con-
stant, the differences betwen the two solutions are attributable
entirely to the reduction in exports from 25 percent of GNP to 12
percent. The bulk of the reduction in exports in large countries
typically takes place in primary products, while the bulk of the
1/ This simulation experiment is described in Chenery (1979),pp. 90-99.
- 12 -
corresponding adjustment of imports takes place in manufactured
goods.
The main effects of this difference in trade patterns on
production levels are to reduce agriculture by about 25 percent
(or 5 percent of GNP) and to increase heavy industry by 50
percent (4 percent of GNP) in large countries. Light industry is
affected much less, since the scope for further import
substitution at this stage of the transformation is relatively
limited. The remaining nontraded sectors of construction,
utilities and services are little affected in aggregate terms.
The second experiment of simulating a relatively closed
economy was based on the experience in the 1950s and 1960s of the
more autarkic of the large countries discussed below -- India,
Brazil, Turkey, Mexico and Argentina. In the simulation of Table
1 the level of exports was cut further from 12 percent to 6
percent of GNP. However, this additional reduction in trade has
considerably less effect on the structure of production than did
the shift from the average pattern to the typical large-country
pattern because the scope for further import substitution is much
less. The further shift of resources from primary production to
heavy industry in this case is only 1 percent of GNP, as shown in
column (4) of Table 1. At this point the structure of production
corresponds closely to the structure of demand. Even the elimi-
nation of all trade -- assuming it were possible -- would have
little effect on the aggregate composition of value added.
Although the substitution of industrial production for
primary exports has considerable appeal to a large country with
- 13 -
limited agricultural resources, these simulations show that this
type of substitution is already fairly well exhausted in the
typical trading patterns of large countries. A further shift to
the semi-closed structure of case 2 -- which bears a considerable
resemblance to India and China -- requires an increase in capital
per unit of output, both because of the higher capital coeffi-
cients of individual sectors of heavy industry and because of the
greater difficulty of maintaining balance among sectors in a
closed economy.
II. THE LARGE SEMI-INDUSTRIAL COUNTRIES
The great diversity of developing countries makes it
difficult to generalize from their experience. One approach to
this problem has been illustrated in the previous section -- to
identify uniform features of growth processes that are reflected
to some extent in the experience of all countries. This approach
needs to be supplemented, however, by studying individual coun-
tries whose problems are similar, so that the alternative
policies relevant to particular situations can be evaluated.
These two approaches lead to the identification of more homo-
geneous groups of developing countries whose experience can be
compared in more detail.
In the case of China, industrialization has proceeded
much further than is typical for countries of its income level.
The explanation of this phenomenon is largely- provided by the
autarkic policies followed over the past 30 years, whose typical
effects were illustrated in the preceding section. In the

- 14 -
present section China will be compared to other large semi-
industrial countries, which share some of its problems.
Semi-industrial (or "newly industrializing") countries
are usually defined by the share of manufacturing in the gross
national product, which is supplemented by the share of manu-
factured goods in commodity exports. Although the relatively
high prices of manufactured goods in China exaggerate its share
of industry in relation to other countries, China clearly quali-
fies as a semi-industrial country on any of the structural tests
that have been suggested, as shown in Tables 2 and 3 below. As
compared to smaller countries, the large semi-industrial coun-
tries are a relatively homogeneous group because they are less
affected by variations in resources and trade policies.
The Transformation of Production
The transformation of production in the large semi-
industrial countries over the past 20 years is shown in
Table 2. In this table countries are ordered by per capita
income in the terminal year (1977). The group includes 14 large
countries that had a share of industry and utilities of at least
25 percent of GNP by this time but had not completed the trans-
formation prior to 1970. 1/
The general trends in production described in section I
are evident in virtually all but the richest countries in
1/ India is included for comparison to China although it issomewhat below those limits. Japan will be included in somecomparisons even though it completed the structural transfor-mation in the 1950s. Romania and Poland are omitted sincecomparative data are not readily available.
- 15 -
Table 2. At the upper income level, Spain and Yugoslavia had
already reached a high degree of industrialization in 1960 and
showed little further increase thereafter. This is consistent
with the trend in the advanced industrial countries, where the
share of industry in GNP has declined over the past 20 years,
partly as a result of a relative rise in the price of services.
The speed of the transformation from primary production
to industry is related to three factors: (1) the initial devia-
tion in the structure from the average pattern, (2) the rate of
GNP growth, and (3) the trade policy followed. All three com-
bined to produce the very rapid transformation of the South
Korean economy, which is the most drastic observed. As is
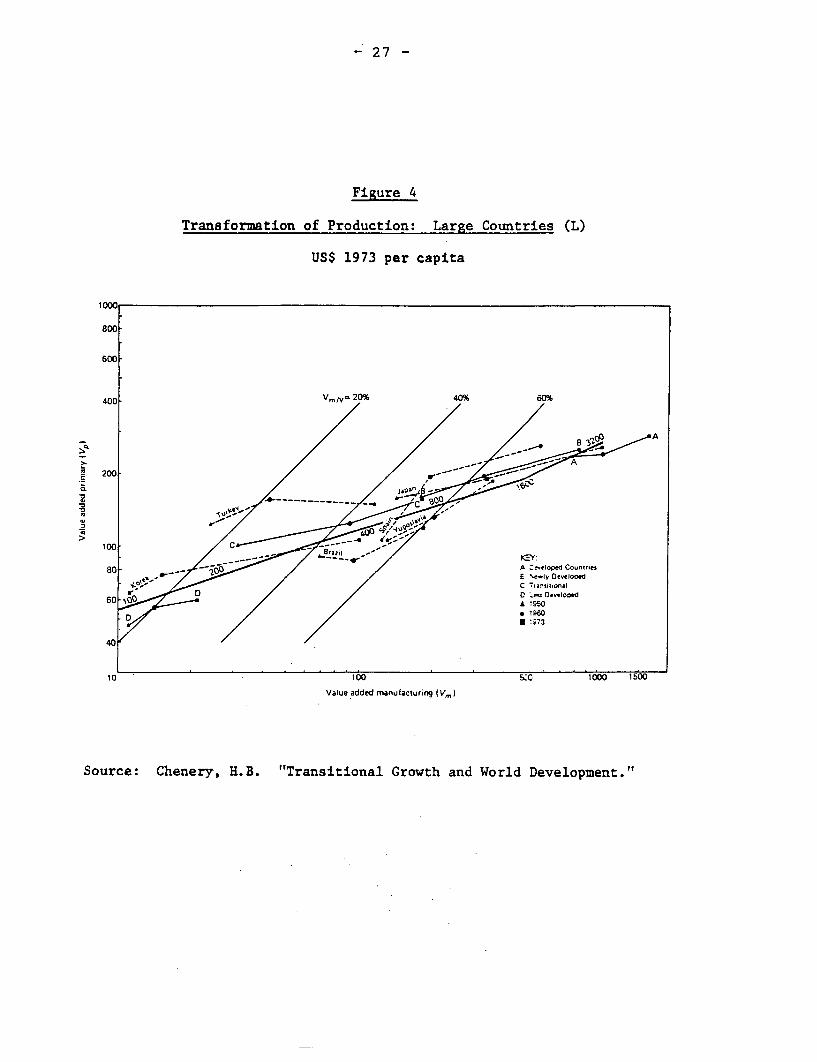
illustrated by the graphical presentation of the transformation
in figure 4, the Republic of Korea followed the normal cross-
country pattern quite closely with an additional shift toward
manufacturing due to the rapid rise of manufactured exports.
More typical examples of the structural transformation
that accompanies growth at rates more comparable to China's are
Mexico, Turkey and Thailand. In these countries the rise in
industry is largely dependent on domestic demand rather than
exports, as discussed below.
Comparison of the transformation of production in China
to that in other countries is complicated by several factors:
(1). difference in accounting conventions (particularly the
omission of non-productive services); (2) the relatively high
prices of manufactured goods and low prices of agricultural
products compared to other countries; (3) the vertical integra-
- 16 -
tion of the economy, which leads to reporting services under
other sectors. The differences in accounting conventions are
allowed for in Table 2, and the effect of more typical price
relations at'e shown in parentheses (as estimated in the World
Bank Report on China). With these adjustments, the share of
industry in GNP in China in 1960 appears to have been some 30
percent higher than India and comparable to Egypt, the
Philippines and other higher income countries.
Table 2 shows that the postwar transformation of
production in China was one of the most rapid among large coun-
tries. The measures of change are less affected by differences
in prices and accounting conventions than are comparisons of
absolute levels. Combining the reduction in primary share (8
percent) and the increase in Industry (12 percent), the total
shift of resources in China (20 percent) was second only to the
Republic of Korea (33 percent) and comparable to Thailand and
Turkey (18 percent).
When the transformation of production is measured by
employment rather than by value added, China is much closer to
the typical pattern for its income level. Agriculture still
accounts for 71 percent of employment, which is approximately the
average for all low-income countries. The share of industry, at
17 percent, compares to 11 percent in India, 17 percent in the
Philippines, and 20 percent in Pakistan. The differences from
the production shares in Table 2 are primarily due to the large
differences in relative prices.
- 17 -
Effects of Trade Policies
A number of statistical studies have shown that higher
export growth is one of the factors contributing to GNP growth,
both as a source of demand and as a means of avoiding bottle-
necks. This relationship is quite pronounced for the group of
semi-industrial countries, both large and small. (See Feder,
Exports and Growth, World Bank, 1982.) The composition and
growth of exports in the large semi-industrial countries is shown
in Table 3.
In most semi-industrial countries, export growth has
been concentrated in manufactured goods and has often led to a
very rapid transformation of the composition of exports. Even
some of the more closed economies -- Argentina, Turkey, Colombia,
the Philippines and India -- have made a substantial move in this
direction with high growth rates of manufactured exports starting
from a very low base.
There is also a notable difference in the composition of
exports between the large and small SICs. While the successful
small countries have continued to specialize in light manu-
factures, the larger countries have tended to diversify their
exports into products having significant economies of scale. The
latter pattern also appears to be promising for India and China
as they increase their efforts to expand exports.
The experience of the past several decades demonstrates
that virtually all semi-industrial countries have been able to
expand the growth of exports more rapidly than the growth of GNP
when they have adopted policies favorable to exporters. (The
- 18 -
policy implications of these comparisons are taken up in other
sessions of this conference.)
III. GROWTH AND TRANSFORMATION
Over the past 25 years there has been a tendency for
middle income countries to grow more rapidly than either the
richer industrial countries or the poorer -- largely agricultural
-countries. The tendency for growth to accelerate in the transi-
tional group of industrializing countries can be attributed to
several factors:
- a rise in the rate of accumulation of physical capital
and skills;
- a shift of labor and capital into sectors where they can
be used more efficiently, and in which demand is
increasing more rapidly; and
- diversification of the economic structure of the semi-
industrial countries, which makes them less vulnerable
to changes in terms of trade or shifts in demand.
China has been quite successful in raising its rate of
accumulation to high levels but less so in allocating resources
to the most productive sectors. Efficient resource allocation
has been hampered by the lack of market signals to identify the
more productive uses, by limited access to modern technology, and
by a trade policy that has discriminated against exports. The
result has been relatively inefficient use of resources, which is
reflected in a very high incremental ratio of capital to
increased output.
In comparison to other poor countries, China's high rate
of investment offsets its inefficient use of resources. Its
- 19 -
growth of per capita GNP of 2.7 percent since 1957 (corrected for
relative price differences) compares favorably to 1.4 percent for
India and 1.6 percent for all low-income countries. However,
much of this improvement is due to the lower rate of population
growth that China has experienced in recent years. Since China
has achieved both the industrial structure and the investment
rate of a middle-income country, it should now be able to attain
higher levels of growth as,,well.
Among the large semi-industrial countries, the ability
to expand exports and avoid bottlenecks has been particularly
important to sustained growth. This is indicated by the distinc-
tion in Table 3 between countries with outward-oriented and
inward-oriented trade policies. The five countries that have
adopted relatively outward looking policies and achieved rapid
export growth -- Spain, Yugoslavia, Brazil, Korea and Thailand --
have also had high growth of per capita GNP of 4.5 - 5.0 per-
cent. The remaining large countries -- of which China is fairly
typical -- have had lower growth rates of 2.5 to 3.0 percent.
More open trade policies have also proved to be more effective in
the past decade in facilitating the adjustments to balance of
payments shocks and worsening terms of trade.
The lack of detailed data on the structural transforma-
tion in China makes it difficult to pursue this type of analysis
much further. However, the relations between growth and
structural change should provide promising topics for future
research.
- 20 -
REFERENCES
Chenery, H.B. 1977. "Transitional Growth and WorldIndustrialization." In The International Allocation ofEconomic Activity, ed. B. Ohlin, P.O. Hesselborn, and P.M.Wijkman. London: Macmillan.
. 1979. "The Process of Industrialization." InStructural Change and Development Policy, Chapter 3. NewYork: Oxford Press.
. 1980. "Interaction Between Industrialization andExports." In Proceedings, American Economic Association,1980. World Bank Reprint Series No. 150, Washington, D.C.:World Bank.
Chenery, H.B., and Syrquin, M. 1975. Patterns of Development,1950-70. London: Oxford University Press.
_ 1980. "A Comparative Analysis of IndustrialGrowth." In Economic Growth and Resources, ed. R.C.O.Matthews. New York: Macmillan.
Chenery, H.B.; Robinson, S.; and Syrquin, M. Industrialization: A Comparative Study. Forthcoming
Feder, G. 1982. "On Exports and Economic Growth." World BankStaff Working Paper No. 508. Washington, D.C.: World Bank.
Houthakker, H.S. 1957. "An International Comparison ofHousehold Expenditure Patterns: Commemorating the Centenaryof Engel's Law." Econometrica 25 (October):532-51.
Kuznets, S. 1966. Modern Economic Growth. New Haven: Yale,University Press.
Lluch, C.; Powell, A.A.; and Williams, R.A. 1977. Patterns inHousehold Demand and Saving. New York: Oxford UniversityPress.
- 21 -
Table 1
Simulated Effects of Alternative Trade Patterns on Industrial Structure
Constant Income Level of $400 (1964 Prices)-
Case 1 Case 2 Case 3Average Average Large Semi-ClosedCountry Country Economy
Ratio to Ratio toValue Value Case 1 Value Case 1
(1) (2) (3) (4) (5)
TRADE
1. a. Primary Exports 51.2 14.8 .29 3.1 .06
b. Manufactured Exports 21.4 18.2 .85 14.4 .67
c. Total Exports 96.5 46.0 .48 21.7 .22
2. a. Primary Imports 19.2 il.8 .61 7.8 .41
b. Manufactured Imports 65.0 31.8 .49 15.5 .24
c. Total Imports 101,4 52.5 .52 28.1 .28
PRODUCTION (Value Added)
1. Primary 82.6 65.6 .79 62.2 .75
2. a. Light Manufacture 63.2 66.6 1.05 67.4 1.07
b. Heavy Manufacturing 34.5 51.8 1.50 58.1 1.68
c. Construction & Utilities 60.2 62.8 1.04 61.6 1.02
d. Total Industry 157.9 181.2 1.15 187.1 1.18
3. Services 159.6 153.2 .96 150.8 .94
4. Total Value Added 400.0 400.0 400.0
Source: Hollis B. Chenery, "The Process of Industrialization," Table 3-7. InStructural Change and Development Policy. New York: Oxford Press. 1979.
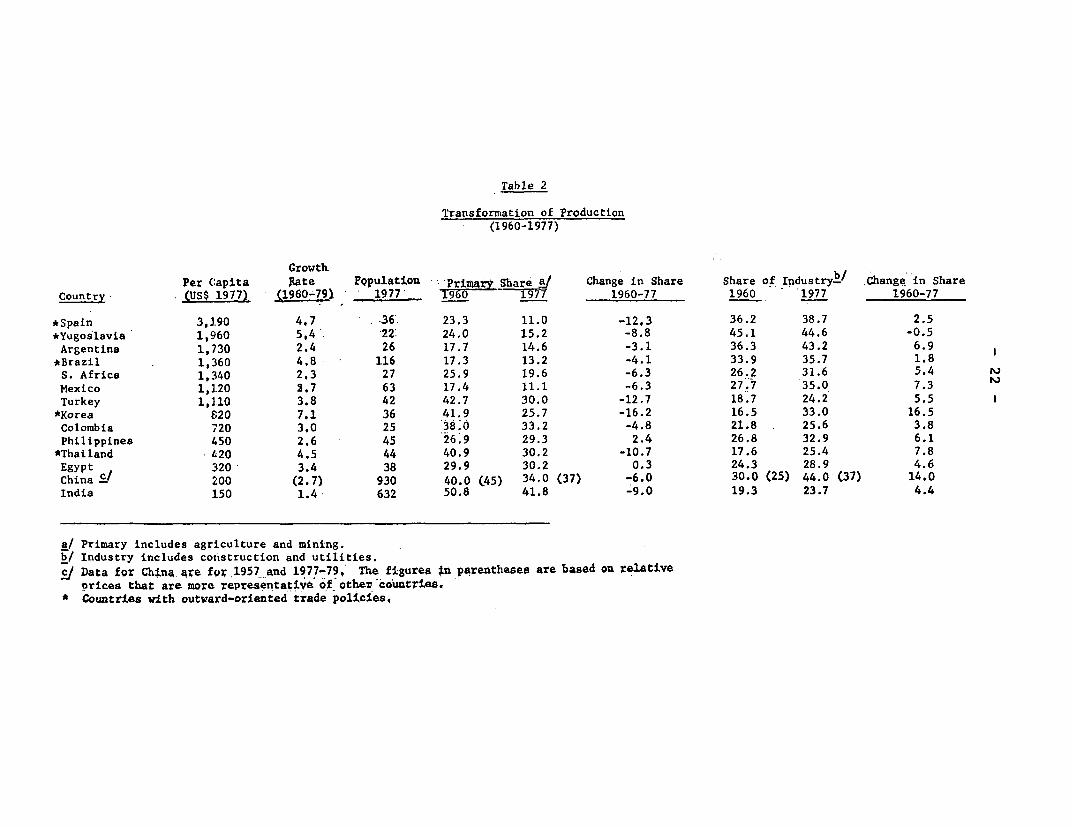
Table 2
Transformation of Production(1960-1977)
Growth.
Per Capita Rate pqpulation primya i zSar Change in Share Share of IndustryŽ/ Change in ShareCountry (us$ 1977) (1960-79 1 1977 1977 1960-77 1960 1977 1960-77
*Spain 3,190 4.7 .36 23.3 11.0 -12,3 36.2 38.7 2.5*Yugoslavia 1,960 5,4 22 24.0 15.2 -8.8 45.1 44.6 -0.5Argentina 1,730 2.4 26 17.7 14.6 -3.1 36.3 43.2 6.9
*Brazil 1,360 4.8 116 17.3 13.2 -4.1 33.9 35.7 1.8S. Africa 1,340 2.3 27 25.9 19.6 -6.3 26.2 31.6 5.4Mexico 1,120 3.7 63 17.4 11.1 -6.3 27.7 35.0 7.3Turkey 1,1.10 3.8 42 42.7 30.0 -12.7 18.7 24.2 5.5*Korea 820 7.1 36 41.9 25.7 -16.2 16.5 33.0 16.5Colombia 720 3.0 25 380 33.2 -4.8 21.8 25.6 3.8Philippines 450 2.6 45 26.9 29.3 2.4 26.8 32.9 6.1*Thailand 420 4.5 44 40.9 30.2 -10.7 17.6 25.4 7.8Egypt 320 3.4 38 29.9 30.2 0.3 24.3 28.9 4.6China c/ 200 (2.7) 930 40.0 (45) 34.0 (37) -6.0 30.0 (25) 44.0 (37) 14.0India 150 1.4 632 50.8 41.8 -9.0 19.3 23.7 4.4
a/ Primary includes agriculture and mining.b/ Industry includes construction and utilities.
/ Data for China are for 1957 and 1977-79, The figures in parentheses are based on relativenricea that are more representative of other'countries,
* Countries with outward-oriented trade pol4cies.
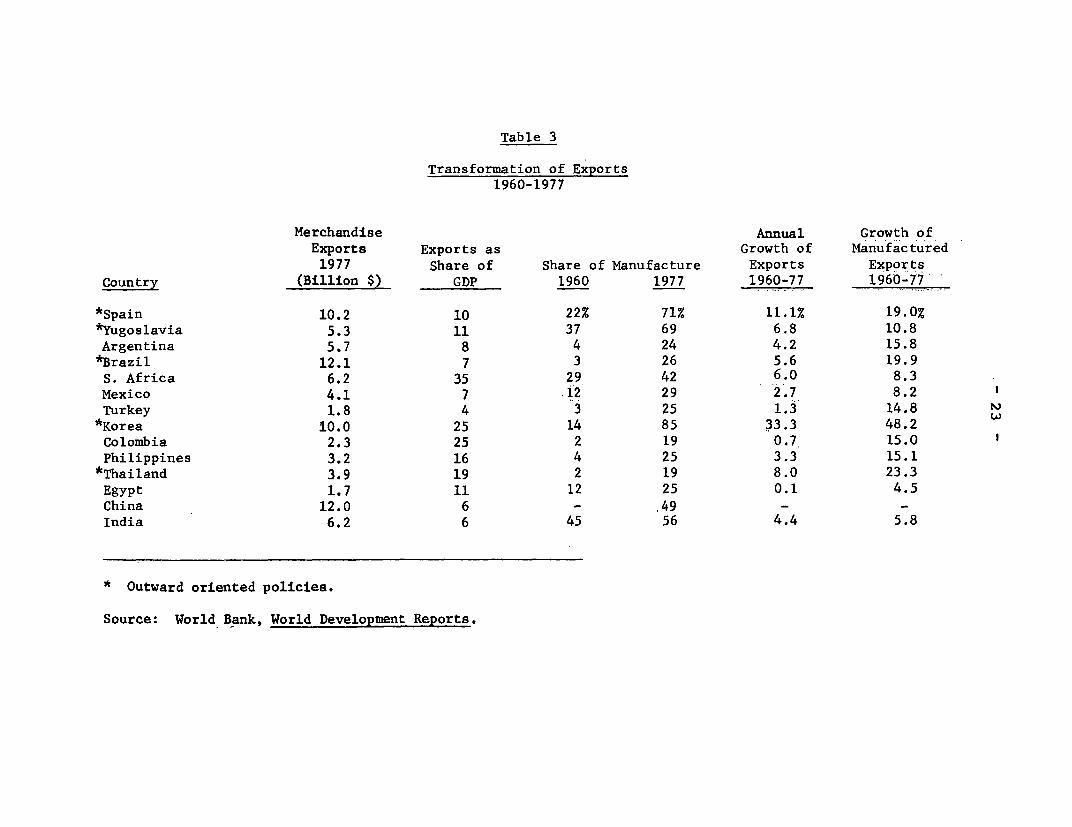
Table 3
Transformation of Exports1960-1977
Merchandise Annual Growth ofExports Exports as Growth of Manufactured
1977 Share of Share of Manufacture Exports ExportsCountry (Billion $) GDP 1960 1977 1960-77 1960-77
*Spain 10.2 10 22% 71% 11.1% 19.0%*Yugoslavia 5.3 11 37 69 6.8 10.8Argentina 5.7 8 4 24 4.2 15.8*Brazil 12.1 7 3 26 5.6 19.9S. Africa 6.2 35 29 42 6.0 8.3Mexico 4.1 7 .12- 29 27 8.2Turkey 1.8 4 3 25 1.3 14.8
*Korea 10.0 25 14 85 33.3 48.2Colombia 2.3 25 2 19 0.7 15.0Philippines 3.2 16 4 25 3.3 15.1
*Thailand 3.9 19 2 19 8.0 23.3Egypt 1.7 11 12 25 0.1 4.5China 12.0 6 - .49 - -India 6.2 6 45 56 4.4 5.8
* Outward oriented policies.
Source: World Bank, World Development Reports.
- 24 -
Figure 1Shares of Food and Non-Food Consumption in Final Demand
90 -
70
10
z
o I_
40
30 _ _ _
20
0l I I- -_
100 150 200 300 400 500 600 700 800 900 1000 1500 2000 3000
Source: Sources Basic Date Base Per Capita GNP (US$ 1970)
GOP by Expenditure World Bank-23970
Product of World Bank research project (RPO)No. 671-32.
- 25 -
Figure 2Major Components of Demand
80 \
Turke') 4% '
70
CONSUMPTION
60 _ l - _
50 . _ ___
40~~~~~~~~~~~~~~~4
. \ 9 2 ,- <wNorway30 - -
I / .,0 * * **** -X I
Colombia 1 1 l l lil20 ij
uuiiuuuuiiiiiigigg jjuuiu£flflh££u,iiiliii{ GOVERNMENT
100 150 200 300 400 500 600 700 800 9001000 1500 2000 3000
Per Capita GNP (USS 1970)Source: World Bank research product (PRO) No. 671-32. World Bank-23971
- 26
Figure 3Simulation of Value Added, Employment and Capital
(Shares)A. VALUE ADDED
50 -
SERVICES
40 -
30 *@ --* __~~ MANU FACTU RI NG
20 _20-- - SOCIAL OVERHEAD
1 0 _ ~ ~ ~ ~ , _, _, _ . _ . _ . _ :::r. _, . .. .. . .
1 0 ...................... PRIMARY
B. EMPLOYMENT70 _
60 - S ER VI CE S
50 -555
40-
MANUFACTURING200 ; ; _ ___ ~ ***SOCIAL
OVERHEAD
10 -- _- - - - - - - - - - - .a.a a . .. . _
_,_"_w_,_^_e_^_" * ............ ~~~~~~PRIMARY
C. CAPITAL STOCK40
SOCIALOVERHEAD
30 ~~~~~~~~~~~~~~~~~~~~~~~~~SEFkVICES
__~~ ~ ~~ MANUFACTURING
20 ................... ze .~*g-s-0a--e
10 * - X 0 * ., * w . * Z ~~~~~~~~~~~~PRI MAR Y
o1 I f .II , I _ I I- I I I - I - I I 1
(10oo 150 (200) 300 (400) 500 600 700 (800) 900 1000 (1500) 2000 (2400i 3000 (US$ 11
140 280 560 1120 2100 (US$ V
Source: Cross Section Model Per Capita GNP. World Bank-23
-. 27 -
Figure 4
Transformation of Production: Large Countries (L)
US$ 1973 per capita
1000i
800.
600
400 .V_/, 20% 40% 60
>200 X= X
80 - ~~~~~~~~~~~~~~~~~~~~~~~~~~A C-..Iop.d C.---rse
10 100 5:C 1000 1500
Value added manufacturing (Vm)
Source: Chenery, H.B. "Transitional Growth and World Development."

- 28 -
manufacturing firms in the Assesses the extent and nature ofWorld Bank Ivory Coast. industrialization in three African
Publications World Bank Staff Working Paper No. countries dSumlompament during the
of Related 465. July 1981. 45 pages. last twenty-five years and exploresStock No. WP-0465. $3.00. some of the issues facing these
Interest countries as they design futureindustrial policies.
Empirical Justification for World Bank Staff Working Paper No.Infant Industry Protection 457. May 1981. 63 pages (includingLarry E. Westphal references, annex).Reviews the empirical evidenceavailable concerning the nature of Stock No. WP-0457. $3.00.the costs and benefits of infantindustry development and formssome hypotheses about policies topromote infant industries. Based on Korean Industrial Compe-research conducted under the tence: Where It Came From'Sources of Industrial Growth and Larry E. Westphal,
Capital Utilization in Structural Change" research project. Yung W. Rhee, andManufacturing in Develop- World Bank Staff Working Paper No. Garry G. Purselling Countries: A Case Study 445. March 1981. 38 pages (including Discusses how Kucessfully an indepen-of Colombia, Israel, re . dent base of technological know-howMalaysia, and Philippines Stock No. WP-0445. $3.00. and marketing expertise in manyRomeo M. Bautista, sectors during the past fifteen yearsHelen Hughes, David Lim, n and suggests how Korea'sDavid Mo z avd IndustLmal Prospects and experiences might be useful inDavid *M.orawetz, and Policies in the Developed programming the development ofFrancisco E. Thoumi other countries that are currently atThe authors surveyed 1,200 Countries earlier stages of industrialization.manufacturing firms in four develop- Bela Balassa eing countries to establish actual Addresses the allegations that World Bank Staff Working Paper No.levels of capital utilization. The infor- increases in the import of manufac- 469. July 1981. 76 pages (includingmation collected was the first and tured goods from developing coun- references).remains the only data base available tries adversely affect the industrial Stock No WP 0469 $5.00for the study of capital utilization. It sector in the developed countrieswas found that capital utilization is and that growing protectionism innot as low as had been supposed. . the developed countries has made itThe study is concerned with factors necessary for developing countries tothat cause differences in levels of turn to domestic markets or to tradecapital utilization and the policies among themselves in order to sell Made in Jamaica:that might be used to increase it. their manufactured goods. Argues The Development of the
that trade with the developing coun- Manufacturing SectorOxford University Press, February 1982. tries actually benefits the developed Mahmood Ali Ayub288 pages (including bibliography, countries, that rates of industrial This book, the first detailed study ofindex). protection should be lowered, and Jamaica's manufacturing sector, pro-
LC 81-9526. ISBN 0-19-520268-6, that an international safeguard code vides a comprehensive assessment$22.00 hardcover. should be instituted to smooth the of the important characteristics of
process of adjustment to freer trade the sector and of its structure. Itin the developed countries. relates the development of the sector
Cost-Benefit Evaluation of World Bank Staff Working Paper No. during the past two decades,
LDC Industrial Sectors 453. April 1981. 30 pages (including provided to the sector in 1978, andWhich Have Foreign appendix). examines the prospects for growth ofOwnership Stock No. WP-0453. $3.00. manufactured exports during theGarry G. Pursell coming years. Policy recommenda-Describes a methodology for treating Indutrial f Lat tions are made on the basis offoreign capital for cross-section cost- Snus ta rategy or ate this analysis.benefit studies when there is invest- Starters: The Experience The Johns Hopkins University Press,ment by foreigners that is specific to of Kenya, Tanzania 1981. 144 pages.a particular activity. Illustrates the and Zambiamethodology by using the results FRavi Gulhati and LC 80-27765. ISBN 0-8018-2568-7,of a larger study of eighty-four Uday Sekhar $6.50 (£4.25) paperback.
- 29 -
Managerial Structures and Automotive Industries in ing countries to assist small
Practices in Manufacturing Developing Countries enterprises and suggests that efTl-
Enterprises: A Yugoslav Jack Baranson cient substitution of labor for capital
Case Study is possible in a broad spectrum ofMartin Schrenk The role of intemational corpora- small-scale manufacturing and other
tions, the adaptation problems of activities that are able to absorb a
Explores the managerial procedures their aiffliates, and the impact of rapidly growing labor force.and practices that have evolved in economic policy on market structure. Sector Policy Paper. February 1978 93Yugoslavia's manufacturing industries The Johns Hopkins University Press, pages (including 3 annexes). English,under the Yugoslav system of "self- 1969. 120 pages (including statistical French, and Spanish.management socialism," discusses annex).the inferences that can be drawn Stock Nos. PP-7803-E, PP-7803-F,from these observations regarding LC 77-85339. ISBN 0-8018-1086-8, PP-7803-S. $5.00.economic efficiency, and concludes $5.00 (£3.00) paperback.with some observations on the Spanish: La industria automotriz en losstrengths and weaknesses of this pafses en desarrollo. Editorial Tecnos, Esoduatingt Growthacnoaparticular pluralistic system. p1971. troductivity Growth in a
World Bank Staff Working Paper No. 320 pesetas. Developing Country455. May 1981. iv + 100 pages Anne 0. Krueger and(including 4 appendixes). The Capital Goods Sector in Baran Tuncer
Stock No. WP-0455. $5.00. LDCs: A Case for State World Bank Staff Working Paper No.
Small Enterprises and Intervention? 422. October 1980. 64 pages (includ-
Development Policy in the Jayati Datta Mitra ing references, appendix).
Philippines: A Case Study World Bank Staff Working Paper No. Stock No. WP-0422. $3.00.
Dennis Anderson and 343. July 1979. II, Lx + 44 pages.Farida Khambata Stock No. WP-0343. $5.00. Fostering the Capital-
Presents an ex post evaluation of the Goods Sector in LDCs: ASmall and Medium Industries Pro- Determinants of Private Survey of Evidence andgram introduced in the Philippines in1974, and reassesSes the assump- Industrial Investment Requirementstions behind the programs. One of a In India Howard Packseries of case studies and surveys Armando Pinell-Siles World Bank Staff Working Paper No.being financed by the World Bank's World Bank Staff Working Paper No. 376. March 1980. v + 59 pages
333. June 1979. vii + 51 pages (including references).World Bank Staff Working Paper No. (including references). Stock No. WP-0376. $5.00.468. July 1981. 239 pages (including Stock No. WP-0333. $3.00.bibliography, annex).Stock No. WP-0468. $5.00. Development Finance Industrialization and
Why the Emperor's New Companies Employml nt: The Role of
Clothes Are N4ot Made In Examines the role of development Smal and Medium SizedColombia: A Case Study In finance companies as major mecha- MLatin American and East nisms for assisting medium-scale Barend A. de VriesAsian Manufactured productive industries, assesses their World Bank Reprint Series: NumberExports potential for aiding small enterprises 116. Reprinted from InternationalDavid Morawetz in meeting socioeconomic objectives Economic Development and Resource
David Morawetz ~~~of developing countries, andeop ntadRsucdiscusses the evolution of World Transfer: Workshop 1978 (19 79):47-62.
Focuses on the exports of a particu- Bank assistance to them. Stock No. RP-0116. Free of charge.lar commodity (clothing) from a par-ticular Latin American country Sector Policy Paper. April 1976. 68(Colombia) in an attempt to under- pages (including 7 annexes). English,stand why Latin America has been so French, German, and Spanish. Industrial Project Analysis:much less successful at exportingmanufactured goods to date than Stock NYos. PP-7601 -E, PP-7601-F, Case StudiesEast Asia. It is the flrst study to go PP-7601-G, PP-7601-S. $5.00. Frank H. Lamson-Scribner, Jr.into great detail in examining the Cases and exercises dealing withprice, and especially the nonprice, financial and economic analysis, anddeterminants of export success. Employment and Develop- project preparation and optimization.
Oxford University Press, 1981. 208 ment of Small Enterprises World Bank (EDI), January 1977, xiiipages (including appendixes, David L. Gordon, + 211 pages. (Available from ILS,bibliography). coordinating author 1715 ConnecticutAvenue, N.W.,
LC 81-9547. ISBN 0-19-520283-X, Examines the potential role of the Washington, D.C. 20009, U.S.A.).$22.00 hardcover. World Bank in encouraging develop- $5.00 paperback.
- 30 -
Interactions between The Planning of Investment Policies for IndustrialIndustrialization Programs Progress In Developingand Exports Alexander Meeraus and CountrieslHollis Chenery Ardy J. Stoutjesdijk, editors John Cody, Helen Hughes,
World Bank Reprint Series: Number Series comprising two volumes that and David Wall, editors150. Reprinted from American describe a systematic approach to Analysis of the principal policy issuesEconomic Review 70, no. 2 (May investment planning, relying pri- -- that influence the course and pace of1980):281 -287. marily on mathematical program- industrialization in the developing
ming techniques. Includes both countries. The text, organized alongStock No. RP-0150. Free of charge. general methodological volumes and lines of governmental administrative
studies dealing with specific responsibility for various industrialMacroeconomic Implica- industrial subsectors. policies, includes chapters on trade,tions of Factor Substitution finance, labor-technology relations,in Industrial Processes taxation, licensing and other directHoward Pack production controls, public
enterprises, infrastructure and loca-World Bank Staff Working Paper Volume 1: The Planning of tion, industry-agriculture linkage,No. 377. March 1980. vii + 60 pages Industrial Investment Pro- and the international environment.(including bibliography). grams: A Methodology Oxford University Press, 1980.Stock No. WP-0377. $5.00. David A. Kendrick and 325 pages (including bibliography,
Manufacture of HeavyArdy J. Stoutjesdijk index).Manufacture of lleavy The analytical approach with special LC 79-24786. ISBN 0-19-520176-0,Electrical Equipment In emphasis on the complications aris- $2.5hrcv;ISN01-017-9Developing Countries ing from economies of scale; a ,2495 b kAyhan Cilingiroglu helpful introduction to linear and $9.95 paperback.Analyzes growth and competitive- ixed-nter og s aciuet The Process of Industrialness, comparing prices and costs ing understanding of subsequent Development andwith thos inteitentoa volumes in the series.wihtoein the international 'MAternative Developmentmarket. The Johns Hopkins University Press, StrategiesThe Johns Hopkins University Press, 1979. 144 pages (including index). Bela Balassa1969. 235 pages (including LC 78-8428. ISBN 0-8018-2139-8, a2 annexes). $18.50 (f9.75) hardcover; ISBN World Bank Staff Working PaperLC 76-89962. ISBN 0-8018-1097-3, 0-8018-2152-5, $12.00 (£4.50) No. 438. October 1980. 42 pages$5 50 (£9.25) paperback. paperback. (including appendix).
Spanish: Fabricaci6n de equipo French: La programmation des Stock No. WP-0438. $5.00.elkctrico pesado en los pafses en investissements industriels: methode et Small Enterprises in Africandesarrollo. Editorial Tecnos, 1971. etude de cas. Economica, 1981. (Com- Development: A Survey
bines translation of this book with330 pesetas. that of the case study of the fertilizer John M. Page, Jr.
The Mining Industry and industry in Volume 2, below.) World Bank Staff Working Paper No.the Developing Countries ISBN 2-7178-0328-9, 65 francs. 363. October 1979. ii +53 pagesRex Bosson and (including footnotes, bibliography).Bension Varon Stock No. WP-0363. $3.00.An overview of the world's nonfuel Volume 2: The Planning of Small-Scale Enterprises inmining industry, its structure and Investment Programs in the Korea and Taiwanoperation, and the major factors Fertilizer Industry Sam P S. Hobearing on them. Armeane M. Choksi, World Bank Staff Working Paper No.
Oxford University Press, 1977; 2nd Alexander Meeraus, and 384.d Bapri 1980. vorin+ 151 ea es .printing, 1978. 304 pages (including Ardy J. StoutjesdUk (including 4 appendixes).12 appendixes, bibliography, index). Discusses the main products andStcNoWP08.$0.LC 77-2983. ISBN 0-19-920096-3, processes of relevance to fertilizer Stock No. WP-0384. $5.00.$29.50 hardcover; ISBN 0-19-920099-8, production and a systematic descrip- State Intervention in the$14.95 paperback. tion of the planning problems that I usraiton of
need to be addressed during the IdsraiainoFrench: L'industrie miniere dans le project identification phase. Developing Countries:tiers monde. Economica, 1978. Th Joh Hok Univit P Selected IssuesISBN 2-7178-0030-1, 49 francs. 1980T 320 pages U Armeane M. Choksi
Spanish: La industria minera y los LC 78-8436. ISBN 0-8018-2138-X, World Bank Staff Working Paper No.parses en desarrollo. Editorial Tecnos, $25.00 (f13.75) hardcover; ISBN 341. July 1979. xx + 193 pages1978. 0-8018-2153-3, $15.00 (£6.25) (including appendix, references).ISBN 84-309-0779-3, 640 pesetas. paperback. Stock No. WP-0341. $5.00.
- 31 -
State ManufacturingEnterprise in a MixedEconomy: The Turkish CaseBertil WaIstedtTraces the historic roots of "etatism"and reviews the performance of sixmajor state industries in Turkey.
The Johns Hopkins University Press,1980. 354 pages (including appen-dixes, index).LC 78-21398. ISBN 0-8018-2226-2,$30.00 (£17.50) hardcover;ISBN 0-8018-2227-0, $13.50 (£7.00)paperback.
A Survey of the FertilizerSector in IndiaBalu Bumb
World Bank Staff Working Paper No.331. June 1979. iv +216 pages(including 111 statistical tables,references).Stock Nlo. WP-0331. $5.00.
Transition toward MoreRapid and Labor-intensiveIndustrial Development:The Case of the PhilippinesBarend A. De Vries
World Bank Staff Working Paper No.424. October 1980. 32 pages (includ-ing references, 12 tables).Stock No. WP-0424. $3.00.


I/
The World BankHeadquaiters:1818 H Street, N.W.EWashington, D.C. 20433, U.S.A.
Telephone: (202) 477-1234Telex: WUI 64145 WORLDBANK
RCA 248423 WORLDBKCable address: INTBAFRAD
WASHINGTONDC
European Office:66, avenue d'lena75116 Paris, France
Telephone: 723.54.21Telex: 842-620628
Tokyo Office:Kokusai Building1-1, Marunouchi 3-chomeChiyoda-ku, Tokyo 100, Japan
Telephone: 214-5001Telex: 781-26838
ISSN 0253-2115/ISBN 0-8213-0097-0