indicator >xx< - architects' council of europe
TRANSCRIPT
Assessment Guideline Version 1.2 New Office Buildings – July 2013
OPEN HOUSE
ASSESSMENT GUIDELINE
Version 1.2 New Office Buildings
July 2013
1
Assessment Guideline Version 1.2 New Office Buildings – July 2013
Table of content
Introduction..................................................................................................3 Technical Information.................................................................................3 Environmental Quality................................................................................11 Social / Functional Quality.........................................................................111 Economic Quality.........................................................................................178 Technical Characteristics.............................................................................196 Process Quality..............................................................................................218 The Location..................................................................................................268
2
Assessment Guideline Version 1.2 New Office Buildings – July 2013
Introduction
The Assessment Guideline is the main assessment document developed by all European partners of the project in a transparent and open process. It is the technical basis and includes the detailed description of each issue assessed.
Technical Information
Evaluation framework
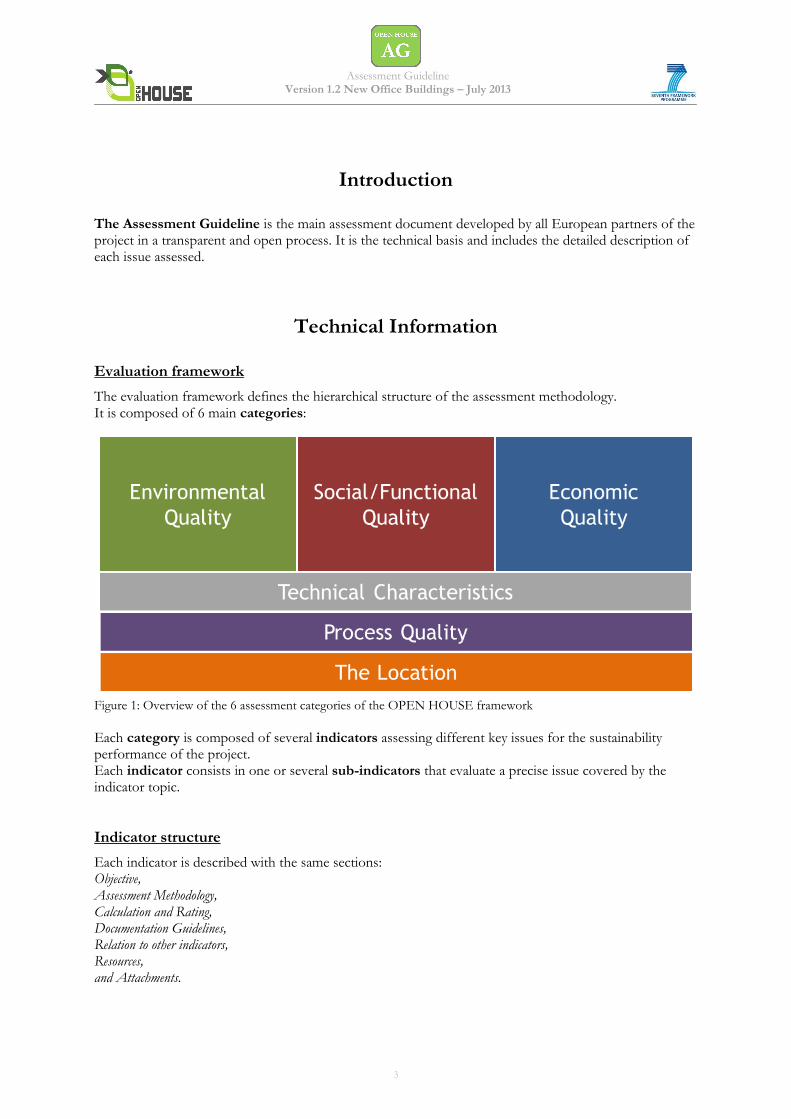
The evaluation framework defines the hierarchical structure of the assessment methodology. It is composed of 6 main categories:
Figure 1: Overview of the 6 assessment categories of the OPEN HOUSE framework
Each category is composed of several indicators assessing different key issues for the sustainability performance of the project. Each indicator consists in one or several sub-indicators that evaluate a precise issue covered by the indicator topic.
Indicator structure
Each indicator is described with the same sections: Objective, Assessment Methodology, Calculation and Rating, Documentation Guidelines, Relation to other indicators, Resources, and Attachments.
3
Assessment Guideline Version 1.2 New Office Buildings – July 2013
Scoring process
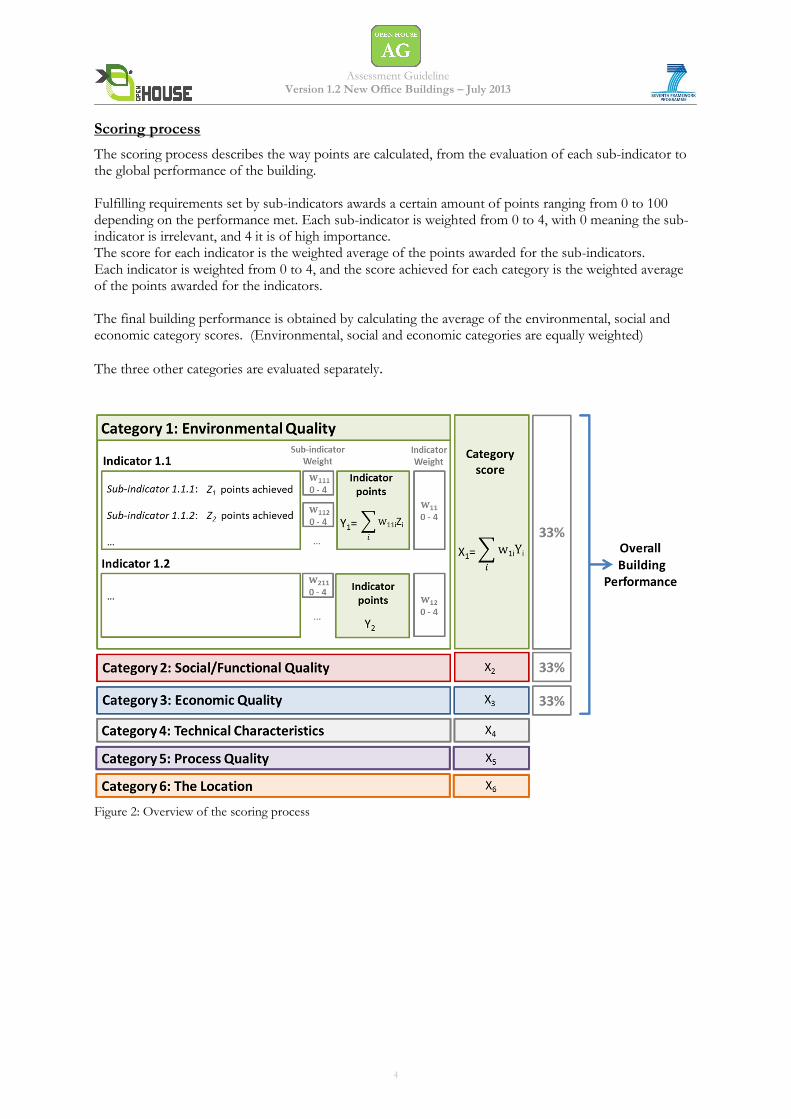
The scoring process describes the way points are calculated, from the evaluation of each sub-indicator to the global performance of the building. Fulfilling requirements set by sub-indicators awards a certain amount of points ranging from 0 to 100 depending on the performance met. Each sub-indicator is weighted from 0 to 4, with 0 meaning the sub-indicator is irrelevant, and 4 it is of high importance. The score for each indicator is the weighted average of the points awarded for the sub-indicators. Each indicator is weighted from 0 to 4, and the score achieved for each category is the weighted average of the points awarded for the indicators. The final building performance is obtained by calculating the average of the environmental, social and economic category scores. (Environmental, social and economic categories are equally weighted)
The three other categories are evaluated separately.
Figure 2: Overview of the scoring process
4
Assessment Guideline Version 1.2 New Office Buildings – July 2013
Scoring card
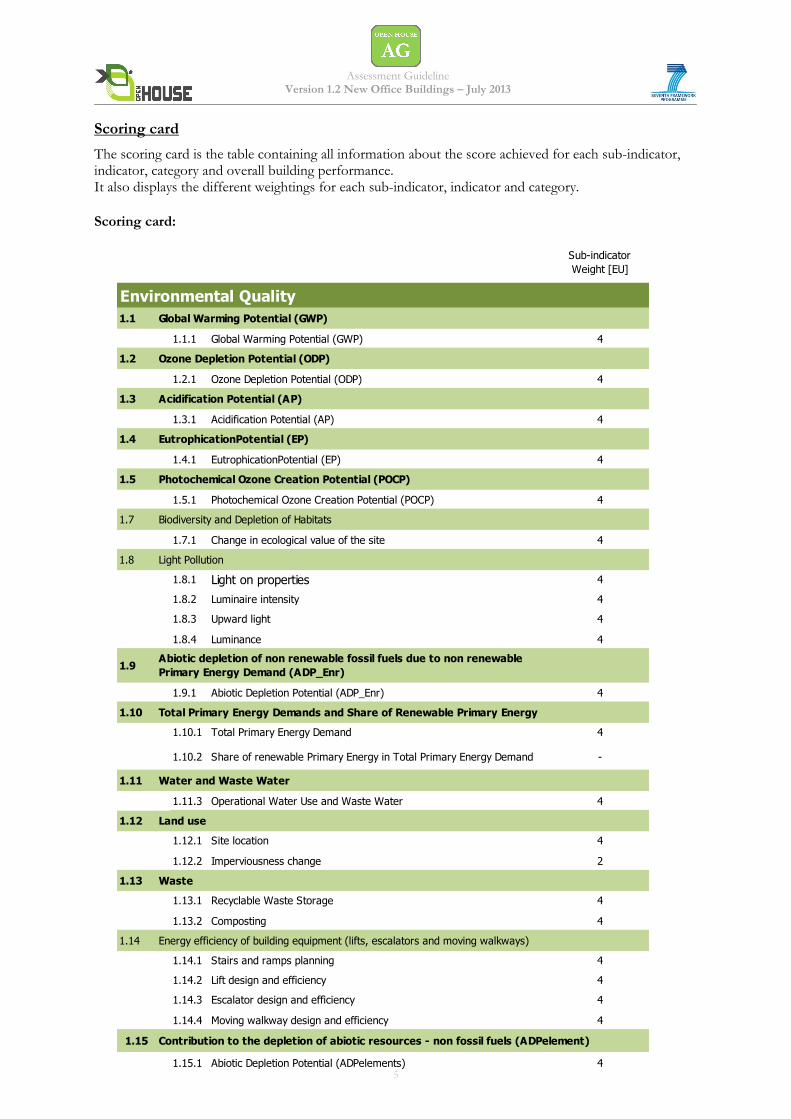
The scoring card is the table containing all information about the score achieved for each sub-indicator, indicator, category and overall building performance. It also displays the different weightings for each sub-indicator, indicator and category.
Scoring card:
Sub-indicator
Weight [EU]
1.1
1.1.1 Global Warming Potential (GWP) 4
1.2
1.2.1 Ozone Depletion Potential (ODP) 4
1.3
1.3.1 Acidification Potential (AP) 4
1.4
1.4.1 EutrophicationPotential (EP) 4
1.5
1.5.1 Photochemical Ozone Creation Potential (POCP) 4
1.7
1.7.1 Change in ecological value of the site 4
1.8
1.8.1 Light on properties 4
1.8.2 Luminaire intensity 4
1.8.3 Upward light 4
1.8.4 Luminance 4
1.9
1.9.1 Abiotic Depletion Potential (ADP_Enr) 4
1.10
1.10.1 Total Primary Energy Demand 4
1.10.2 Share of renewable Primary Energy in Total Primary Energy Demand -
1.11
1.11.3 Operational Water Use and Waste Water 4
1.12
1.12.1 Site location 4
1.12.2 Imperviousness change 2
1.13
1.13.1 Recyclable Waste Storage 4
1.13.2 Composting 4
1.14
1.14.1 Stairs and ramps planning 4
1.14.2 Lift design and efficiency 4
1.14.3 Escalator design and efficiency 4
1.14.4 Moving walkway design and efficiency 4
1.15
1.15.1 Abiotic Depletion Potential (ADPelements) 4
Global Warming Potential (GWP)
Ozone Depletion Potential (ODP)
Photochemical Ozone Creation Potential (POCP)
Biodiversity and Depletion of Habitats
Acidification Potential (AP)
EutrophicationPotential (EP)
Total Primary Energy Demands and Share of Renewable Primary Energy
Light Pollution
Abiotic depletion of non renewable fossil fuels due to non renewable
Primary Energy Demand (ADP_Enr)
Environmental Quality
Land use
Waste
Water and Waste Water
Energy efficiency of building equipment (lifts, escalators and moving walkways)
Contribution to the depletion of abiotic resources - non fossil fuels (ADPelement)
5
Assessment Guideline Version 1.2 New Office Buildings – July 2013
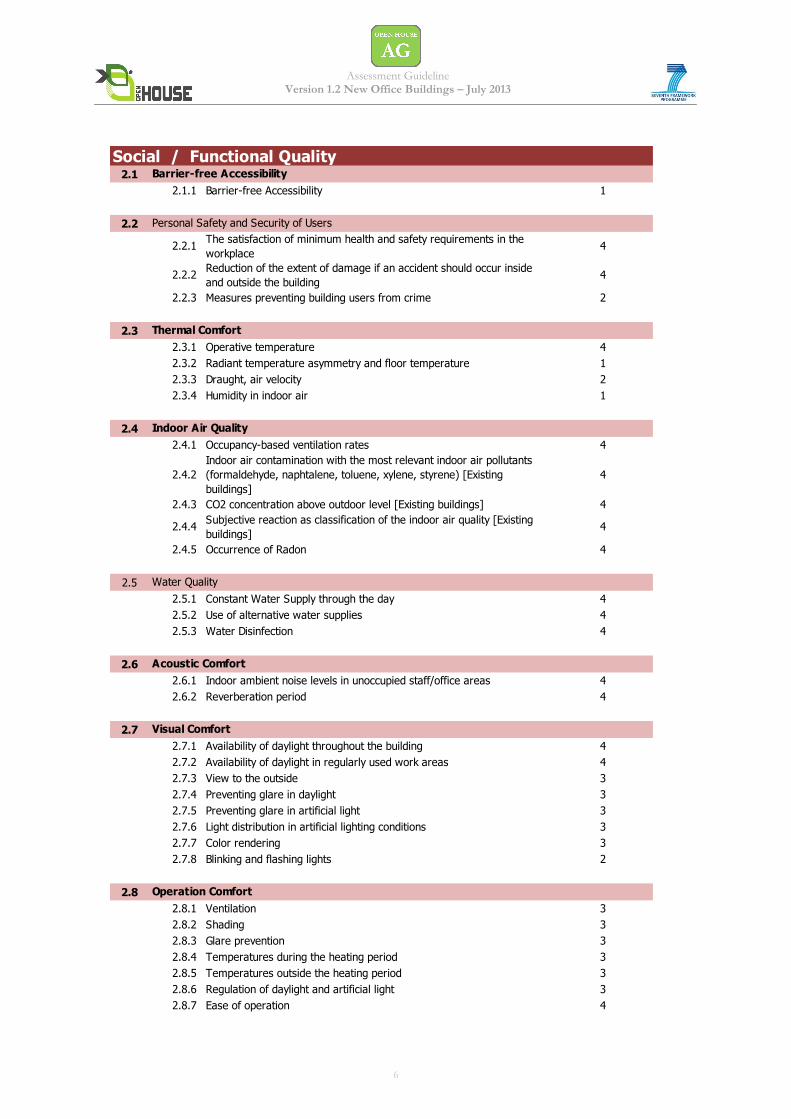
2.1
2.1.1 Barrier-free Accessibility 1
2.2
2.2.1The satisfaction of minimum health and safety requirements in the
workplace4
2.2.2Reduction of the extent of damage if an accident should occur inside
and outside the building4
2.2.3 Measures preventing building users from crime 2
2.3
2.3.1 Operative temperature 4
2.3.2 Radiant temperature asymmetry and floor temperature 1
2.3.3 Draught, air velocity 2
2.3.4 Humidity in indoor air 1
2.4
2.4.1 Occupancy-based ventilation rates 4
2.4.2
Indoor air contamination with the most relevant indoor air pollutants
(formaldehyde, naphtalene, toluene, xylene, styrene) [Existing
buildings]
4
2.4.3 CO2 concentration above outdoor level [Existing buildings] 4
2.4.4Subjective reaction as classification of the indoor air quality [Existing
buildings]4
2.4.5 Occurrence of Radon 4
2.5
2.5.1 Constant Water Supply through the day 4
2.5.2 Use of alternative water supplies 4
2.5.3 Water Disinfection 4
2.6
2.6.1 Indoor ambient noise levels in unoccupied staff/office areas 4
2.6.2 Reverberation period 4
2.7
2.7.1 Availability of daylight throughout the building 4
2.7.2 Availability of daylight in regularly used work areas 4
2.7.3 View to the outside 3
2.7.4 Preventing glare in daylight 3
2.7.5 Preventing glare in artificial light 3
2.7.6 Light distribution in artificial lighting conditions 3
2.7.7 Color rendering 3
2.7.8 Blinking and flashing lights 2
2.8
2.8.1 Ventilation 3
2.8.2 Shading 3
2.8.3 Glare prevention 3
2.8.4 Temperatures during the heating period 3
2.8.5 Temperatures outside the heating period 3
2.8.6 Regulation of daylight and artificial light 3
2.8.7 Ease of operation 4
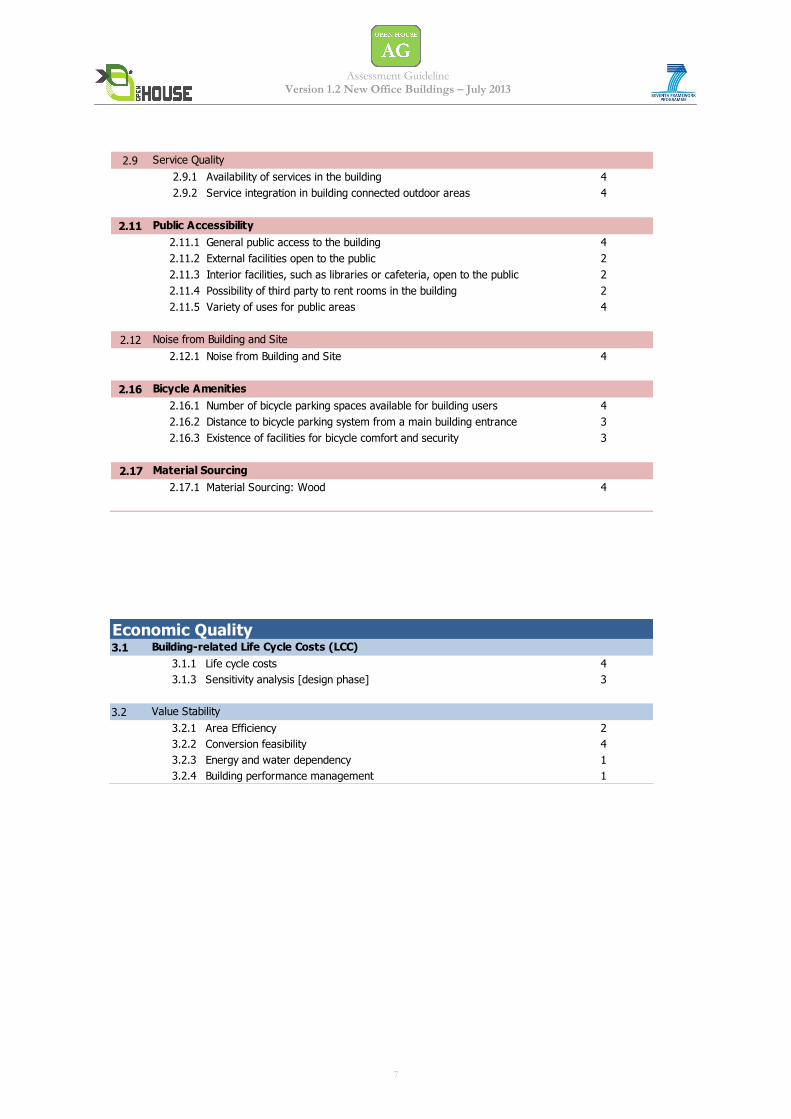
2.9
2.9.1 Availability of services in the building 4
2.9.2 Service integration in building connected outdoor areas 4
2.11
2.11.1 General public access to the building 4
2.11.2 External facilities open to the public 2
2.11.3 Interior facilities, such as libraries or cafeteria, open to the public 2
2.11.4 Possibility of third party to rent rooms in the building 2
2.11.5 Variety of uses for public areas 4
2.12
2.12.1 Noise from Building and Site 4
2.16
2.16.1 Number of bicycle parking spaces available for building users 4
2.16.2 Distance to bicycle parking system from a main building entrance 3
2.16.3 Existence of facilities for bicycle comfort and security 3
2.17
2.17.1 Material Sourcing: Wood 4
Operation Comfort
Social / Functional Quality
Water Quality
Acoustic Comfort
Indoor Air Quality
Thermal Comfort
Service Quality
Public Accessibility
Noise from Building and Site
Bicycle Amenities
Barrier-free Accessibility
Personal Safety and Security of Users
Visual Comfort
Material Sourcing
6
Assessment Guideline Version 1.2 New Office Buildings – July 2013
2.1
2.1.1 Barrier-free Accessibility 1
2.2
2.2.1The satisfaction of minimum health and safety requirements in the
workplace4
2.2.2Reduction of the extent of damage if an accident should occur inside
and outside the building4
2.2.3 Measures preventing building users from crime 2
2.3
2.3.1 Operative temperature 4
2.3.2 Radiant temperature asymmetry and floor temperature 1
2.3.3 Draught, air velocity 2
2.3.4 Humidity in indoor air 1
2.4
2.4.1 Occupancy-based ventilation rates 4
2.4.2
Indoor air contamination with the most relevant indoor air pollutants
(formaldehyde, naphtalene, toluene, xylene, styrene) [Existing
buildings]
4
2.4.3 CO2 concentration above outdoor level [Existing buildings] 4
2.4.4Subjective reaction as classification of the indoor air quality [Existing
buildings]4
2.4.5 Occurrence of Radon 4
2.5
2.5.1 Constant Water Supply through the day 4
2.5.2 Use of alternative water supplies 4
2.5.3 Water Disinfection 4
2.6
2.6.1 Indoor ambient noise levels in unoccupied staff/office areas 4
2.6.2 Reverberation period 4
2.7
2.7.1 Availability of daylight throughout the building 4
2.7.2 Availability of daylight in regularly used work areas 4
2.7.3 View to the outside 3
2.7.4 Preventing glare in daylight 3
2.7.5 Preventing glare in artificial light 3
2.7.6 Light distribution in artificial lighting conditions 3
2.7.7 Color rendering 3
2.7.8 Blinking and flashing lights 2
2.8
2.8.1 Ventilation 3
2.8.2 Shading 3
2.8.3 Glare prevention 3
2.8.4 Temperatures during the heating period 3
2.8.5 Temperatures outside the heating period 3
2.8.6 Regulation of daylight and artificial light 3
2.8.7 Ease of operation 4
2.9
2.9.1 Availability of services in the building 4
2.9.2 Service integration in building connected outdoor areas 4
2.11
2.11.1 General public access to the building 4
2.11.2 External facilities open to the public 2
2.11.3 Interior facilities, such as libraries or cafeteria, open to the public 2
2.11.4 Possibility of third party to rent rooms in the building 2
2.11.5 Variety of uses for public areas 4
2.12
2.12.1 Noise from Building and Site 4
2.16
2.16.1 Number of bicycle parking spaces available for building users 4
2.16.2 Distance to bicycle parking system from a main building entrance 3
2.16.3 Existence of facilities for bicycle comfort and security 3
2.17
2.17.1 Material Sourcing: Wood 4
Operation Comfort
Social / Functional Quality
Water Quality
Acoustic Comfort
Indoor Air Quality
Thermal Comfort
Service Quality
Public Accessibility
Noise from Building and Site
Bicycle Amenities
Barrier-free Accessibility
Personal Safety and Security of Users
Visual Comfort
Material Sourcing
3.1
3.1.1 Life cycle costs 4
3.1.3 Sensitivity analysis [design phase] 3
3.2
3.2.1 Area Efficiency 2
3.2.2 Conversion feasibility 4
3.2.3 Energy and water dependency 1
3.2.4 Building performance management 1
Building-related Life Cycle Costs (LCC)
Value Stability
Economic Quality
7
Assessment Guideline Version 1.2 New Office Buildings – July 2013
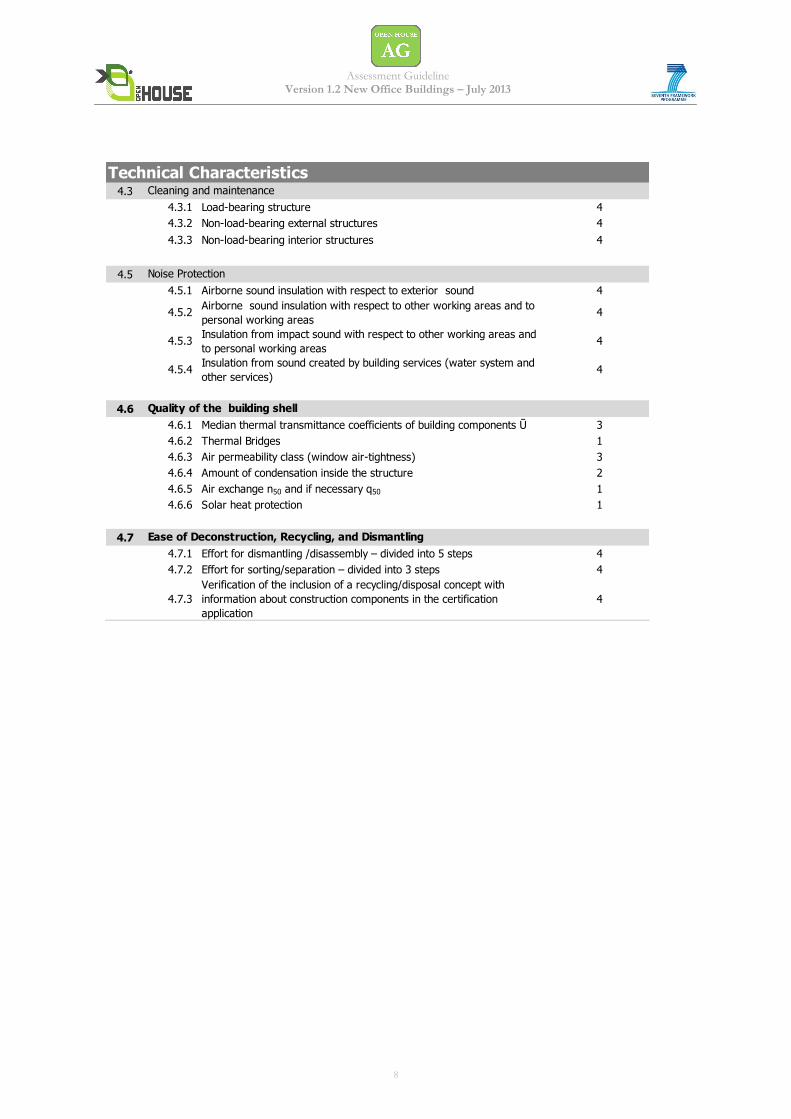
4.3
4.3.1 Load-bearing structure 4
4.3.2 Non-load-bearing external structures 4
4.3.3 Non-load-bearing interior structures 4
4.5
4.5.1 Airborne sound insulation with respect to exterior sound 4
4.5.2Airborne sound insulation with respect to other working areas and to
personal working areas4
4.5.3Insulation from impact sound with respect to other working areas and
to personal working areas4
4.5.4Insulation from sound created by building services (water system and
other services)4
4.6
4.6.1 Median thermal transmittance coefficients of building components Ū 3
4.6.2 Thermal Bridges 1
4.6.3 Air permeability class (window air-tightness) 3
4.6.4 Amount of condensation inside the structure 2
4.6.5 Air exchange n50 and if necessary q50 1
4.6.6 Solar heat protection 1
4.7
4.7.1 Effort for dismantling /disassembly – divided into 5 steps 4
4.7.2 Effort for sorting/separation – divided into 3 steps 4
4.7.3
Verification of the inclusion of a recycling/disposal concept with
information about construction components in the certification
application
4
Technical CharacteristicsCleaning and maintenance
Ease of Deconstruction, Recycling, and Dismantling
Noise Protection
Quality of the building shell
8
Assessment Guideline Version 1.2 New Office Buildings – July 2013
5.1
5.1.1 Project Brief 3
5.1.2 Architectural competition 1
5.2
5.2.1 Multidisciplinary formation of the planning team 4
5.2.2 Qualification of the Integrated Project Team 4
5.2.3 Design Charrette / Preparation of consultation 4
5.2.4 Integrated planning process 4
5.2.5Participation of future building users and other relevant stakeholders /
Community impact consultation4
5.3
5.3.1 Energy target 4
5.3.2 Water target 4
5.3.3 Waste concept 4
5.3.4 Optimization of daylight and artificial lighting 4
5.3.5 Conversion, dismantling and recycling 4
5.3.6 Concept for ease of cleaning and maintenance 4
5.4
5.4.1 Integration of Sustainability Aspects during Bid Invitation 4
5.4.2 Integration of Sustainability Aspects during Awarding 4
5.5
5.5.1 Low-waste and recycling on construction site 4
5.5.2 Low-noise construction site 4
5.5.3 Low-dust construction site 4
5.5.4 Environmental protection at the construction site 4
5.6
5.6.1 Quality of Executing Contractors / Pre-Qualification 4
5.7
5.7.1Documentation of the materials, auxiliary materials, and safety data
sheets4
5.7.2 Measurements for quality control 4
5.8
5.8.1 Commissioning process management and documentation 4
5.9
5.9.1 Handover & Documentation 4
5.9.2 Building Performance Improvement 4
Process QualityProject Brief Strategy
Evidence of Sustainability during Bid Invitation and Awarding
Construction Site impact/ Construction Process
Integrated Planning
Building Performance Targets
Commissioning
Handover and Performance Evaluation
Quality of the Executing Contractors/Pre-Qualification
Quality Assurance of Construction Execution
9
Assessment Guideline Version 1.2 New Office Buildings – July 2013
6.1
6.1.1 Earthquakes 2
6.1.2 Landslides 3
6.1.3 Volcanic eruptions 1
6.1.4 Tsunamis 1
6.1.5 Extreme temperatures 2
6.1.6 Forest fires 2
6.1.7 Drought 1
6.1.8 Floods 2
6.1.9 Storms 3
6.1.10 Avalanches 1
6.1.11 Technological hazard/Chemical plants accidents 2
6.1.12 Technological hazard/Contaminant release and explosions 2
6.1.13Technological hazard/Radioactive contamination from nuclear power
plants accidents2
6.2
6.2.1 Outdoor Air Quality 4
6.2.2 Ambient Noise Level 4
6.2.3 Soil and building plot contamination 4
6.2.5 Urban Heat Island Effect 4
6.2.6 Electromagnetic pollution 4
6.3
6.3.1 Accessibility of the nearest railroad station 3
6.3.2 Accessibility of the nearest public local transportation stop 3
6.3.3
Availability of modern low emission transport options: city bike scheme,
car club scheme, charging infrastructure for electric/hybrid vehicles,
electric/hybrid bus lines
3
6.3.4 Availability of Walking and Bike Path 4
6.5
6.5.1 Vicinity to Gastronomy facilities 4
6.5.2 Vicinity to Local Supply facilities 4
6.5.3 Vicinity to Parks and Open Spaces 4
6.5.4 Vicinity to Education facilities 4
6.5.5 Vicinity to Public Administration facilities 4
6.5.6 Vicinity to Medical Care facilities 4
6.5.7 Vicinity to Sport facilities 3
6.5.8 Vicinity to Leisure facilities 2
6.5.9 Vicinity to Services 4
Access to amenities
The LocationRisks at the Site
Circumstances at the Site
Options for Transportation
10
Assessment Guideline Version 1.2 New Office Buildings – July 2013
OPEN HOUSE
ASSESSMENT GUIDELINE
Environmental Quality
1.1 Global Warming Potential (GWP) 1.2 Ozone Depletion Potential (ODP) 1.3 Acidification Potential (AP) 1.4 Eutrophication Potential (EP) 1.5 Photochemical Ozone Creation Potential (POCP) 1.7 Biodiversity and Depletion of Habitats 1.8 Light Pollution 1.9 Abiotic depletion of non renewable fossil fuels due to non renewable Primary Energy
Demand (ADP_Enr) 1.10 Total Primary Energy Demand and Percentage of Renewable Primary Energy 1.11 Water and Waste Water 1.12 Land use 1.13 Waste 1.14 Energy efficiency of building equipment (lifts, escalators and moving walks) 1.15 Contribution to the depletion of abiotic resources - non fossil fuels (ADPelement) Note: Core indicators are in bold
11

Assessment Guideline Environmental Quality - Indicator 1.1 – Global Warming Potential
Indicator 1.1 Global Warming Potential (GWP) (adapted from DGNB/BNB)
Core Indicator
1. Objective
The Global Warming Potential is a substance`s potential contribution to the global warming of near-ground air layers, also named greenhouse effect.
It is specified as the GWP value in relation to the global warming potential of carbon dioxide (CO2). For evaluation, GWP100 is used, meaning the averaged contribution of a material to the greenhouse effect over one hundred years. For the building assessment, CO2-equivalents per area and year are calculated for the life cycle of the building (construction and operation). The lower the CO2-equivalent result is, the lower is the potential influence on global warming and the related impacts on the environment.
The construction industry is a large contributor to CO2 emissions, with buildings responsible for 40% of the total European energy consumption and a third of CO2 emissions1. At the same time, the construction industry provides work for over 12.7 million people in the EU2 and generates about one fifth (20.3 %) of the combined industrial and construction sectors’ value added3. These circumstances form the basis for different targets and objectives formulated by the European Commission: For example, the 20/20 targets are to reduce energy consumption by 20%, reduce CO2 emissions by 20% compared to 1990s level and provide 20% of the total energy share with renewable energy by the year 20204. Therefore, this indicator, aiming at the reduction of buildings’ global warming performance, highly contributes to the achievement of the EU targets mentioned above.
2. Assessment Methodology
The indicator is mainly based on the method of Life Cycle Assessment (LCA): LCA results of the building to be assessed will be calculated in a standardized way and evaluated against benchmarks. Thus Global Warming Potential is a quantitative indicator.
According to the standards EN ISO 14040 and 14044, the method of Life-Cycle Assessment generally consists of four steps: Definition of goal and scope of the study, inventory analysis, impact assessment and interpretation. The indicators 1.1-1.5, 1.9 and 1.10 are based on LCAs and for all these indicators the same definitions for goal and scope and for the inventory analysis do apply. Goal and scope definition The goal of all LCA studies is to analyse the environmental performance of the respective buildings` life cycles. The scope of the building assessment therefore includes the following life cycle stages:
production: raw material supply, transport to manufacturing, manufacturing and transport to the construction site of products used in the building (Figure 1, modules A1-A4),
use stage: a scenario is defined including use and replacement, including end-of-life of replaced products (Figure 1, modules B1 and B4); in addition the operational energy use is considered (Figure 1, module B6),
end-of-life stage: waste processing and disposal of the building, (Figure 1, modules C3 and C4),
a scenario for potential benefits and loads beyond the system boundaries, including loads for reuse and recycling as well as benefits from recycling potentials (Figure 1, module D).
1 http://www.e2b-ei.eu/default.php 2 http://osha.europa.eu 3 http://epp.eurostat.ec.europa.eu/statistics_explained/index.php/Industry_and_construction_statistics 4 Energy 2020 - A strategy for competitive, sustainable and secure energy
12

Assessment Guideline Environmental Quality - Indicator 1.1 – Global Warming Potential
BUILDING ASSESSMENT INFORMATION
BUILDING LIFE CYCLE INFORMATION
Raw
Mat
eri
als
Sup
ply
Tra
nsp
ort
Man
ufa
ctu
rin
g
PRODUCT STAGE
A1 - 3
A1 - A3
Tran
spo
rt
CONSTRUCTION PROCESS
A4 - 5
A4
Cons
truc
tion
–In
stal
lati
on
proc
ess
A5
Use
USE STAGE
B1 - 7
B1
Mai
nte
nan
ce
B2
Rep
air
Re
plac
em
ent
Re
furb
ish
me
nt
B3 B4 B5
Operational Energy use
Operational Water useB 7
B 6 De
con
stru
ctio
n
END OF LIFE STAGE
C1 - 4
C1
Tran
spor
tC
2
Was
te p
roce
ssin
g fo
r re
use,
re
cove
ry o
r an
d re
cycl
ing
C3
Dis
po
sal
C4
Benefits and loads beyond the system boundary
D
Reuse -Recovery -Recycling -potential
SUPPLEMENTARY INFORMATION BEYOND
THE BUILDING LIFE CYCLE
Figure 1 : Building Life Cycle Phases according to FprEN 15978, adapted
The following processes are not included:
Transport to construction side (Figure 1, module A4),
Construction – Installation process (Figure 1, module A5),
Energy use for user equipment during reference study period,
Operational water use (Figure 1, module B7),
Maintenance, repair and refurbishment during reference study period – (Figure 1, modules B2, B3 and B5),
Deconstruction and transport to waste processing / disposal (Figure 1, modules C1 and C2),
Transport to recycling (Figure 1, module C2). The reference study period is defined with 50 years. The functional equivalent (quantified functional requirements, intended use and/or technical requirements5), which is used as basis for comparison, is defined to be m²NFA*year. Inventory Analysis and Impact Assessment During the inventory analysis of an LCA, emissions and resource consumption are identified, calculated and summed up over the life cycle of a product. Within building LCAs, separate calculations are carried out for the buildings` elements (product and end-of-life stage) and for the determination of emissions and resource uses during operation (see Equations 1, 2 and 3). The inventory analysis of the buildings` elements mainly consists in providing quantitative information on the building elements used (see also Documentation Guidelines). Building compartments to be included are
1. Exterior walls and basement walls incl. windows and coatings, 2. Roof, 3. Ceilings incl. flooring and floor coverings / coatings, 4. Floor slab incl. flooring, floor coverings; floor slab above air, 5. Foundations, 6. Interior walls incl. coatings and supports, 7. Heat generation units.
5 prEN 15643-1:2010: Sustainability of construction works – Sustainability assessment of buildings – Part 1: General framework
13
Assessment Guideline Environmental Quality - Indicator 1.1 – Global Warming Potential
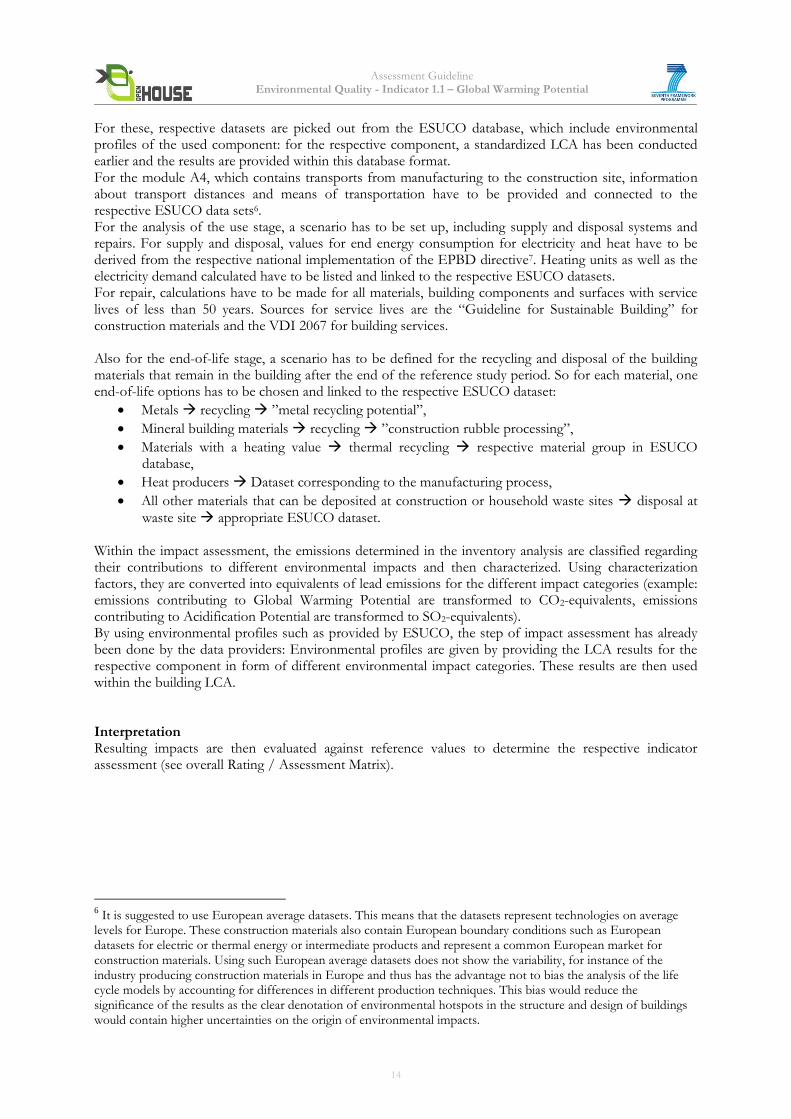
For these, respective datasets are picked out from the ESUCO database, which include environmental profiles of the used component: for the respective component, a standardized LCA has been conducted earlier and the results are provided within this database format. For the module A4, which contains transports from manufacturing to the construction site, information about transport distances and means of transportation have to be provided and connected to the respective ESUCO data sets6. For the analysis of the use stage, a scenario has to be set up, including supply and disposal systems and repairs. For supply and disposal, values for end energy consumption for electricity and heat have to be derived from the respective national implementation of the EPBD directive7. Heating units as well as the electricity demand calculated have to be listed and linked to the respective ESUCO datasets. For repair, calculations have to be made for all materials, building components and surfaces with service lives of less than 50 years. Sources for service lives are the “Guideline for Sustainable Building” for construction materials and the VDI 2067 for building services. Also for the end-of-life stage, a scenario has to be defined for the recycling and disposal of the building materials that remain in the building after the end of the reference study period. So for each material, one end-of-life options has to be chosen and linked to the respective ESUCO dataset:
Metals recycling ”metal recycling potential”,
Mineral building materials recycling ”construction rubble processing”,
Materials with a heating value thermal recycling respective material group in ESUCO database,
Heat producers Dataset corresponding to the manufacturing process,
All other materials that can be deposited at construction or household waste sites disposal at
waste site appropriate ESUCO dataset. Within the impact assessment, the emissions determined in the inventory analysis are classified regarding their contributions to different environmental impacts and then characterized. Using characterization factors, they are converted into equivalents of lead emissions for the different impact categories (example: emissions contributing to Global Warming Potential are transformed to CO2-equivalents, emissions contributing to Acidification Potential are transformed to SO2-equivalents). By using environmental profiles such as provided by ESUCO, the step of impact assessment has already been done by the data providers: Environmental profiles are given by providing the LCA results for the respective component in form of different environmental impact categories. These results are then used within the building LCA. Interpretation Resulting impacts are then evaluated against reference values to determine the respective indicator assessment (see overall Rating / Assessment Matrix).
6 It is suggested to use European average datasets. This means that the datasets represent technologies on average
levels for Europe. These construction materials also contain European boundary conditions such as European datasets for electric or thermal energy or intermediate products and represent a common European market for construction materials. Using such European average datasets does not show the variability, for instance of the industry producing construction materials in Europe and thus has the advantage not to bias the analysis of the life cycle models by accounting for differences in different production techniques. This bias would reduce the significance of the results as the clear denotation of environmental hotspots in the structure and design of buildings would contain higher uncertainties on the origin of environmental impacts.
14
Assessment Guideline Environmental Quality - Indicator 1.1 – Global Warming Potential
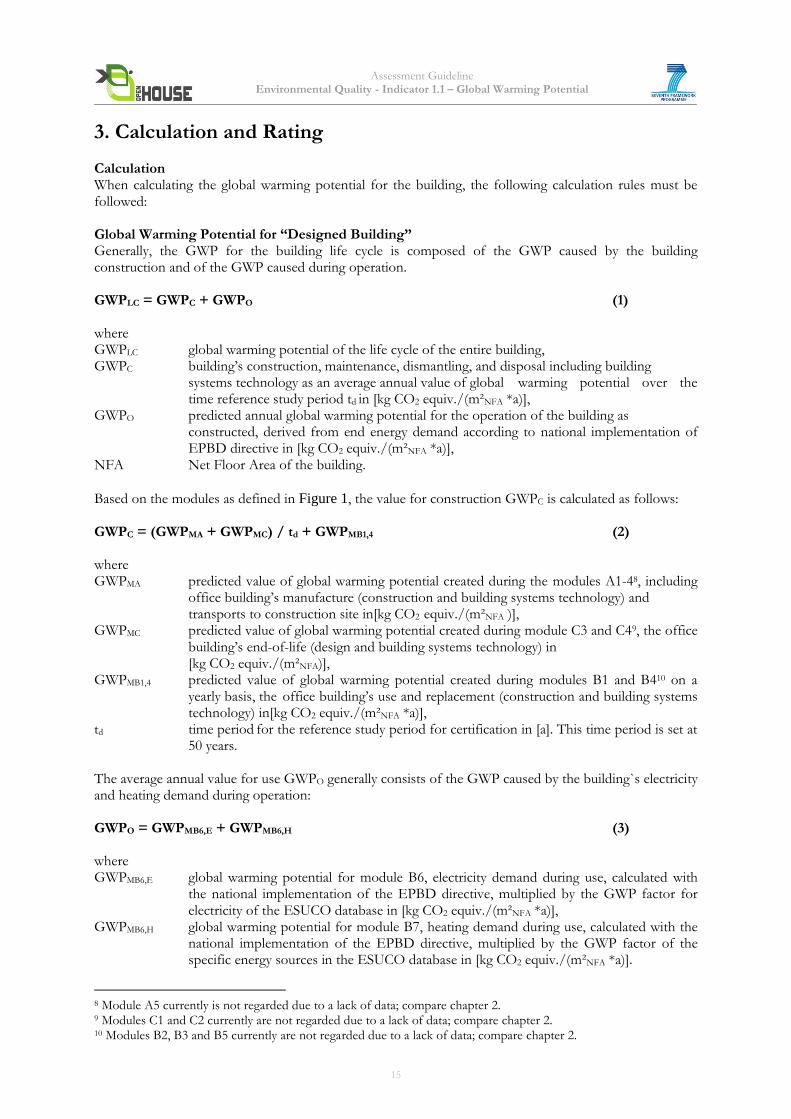
3. Calculation and Rating Calculation When calculating the global warming potential for the building, the following calculation rules must be followed: Global Warming Potential for “Designed Building” Generally, the GWP for the building life cycle is composed of the GWP caused by the building construction and of the GWP caused during operation. GWPLC = GWPC + GWPO (1) where GWPLC global warming potential of the life cycle of the entire building, GWPC building’s construction, maintenance, dismantling, and disposal including building systems technology as an average annual value of global warming potential over the time reference study period td in [kg CO2 equiv./(m²NFA *a)], GWPO predicted annual global warming potential for the operation of the building as constructed, derived from end energy demand according to national implementation of EPBD directive in [kg CO2 equiv./(m²NFA *a)], NFA Net Floor Area of the building.
Based on the modules as defined in Figure 1, the value for construction GWPC is calculated as follows: GWPC = (GWPMA + GWPMC) / td + GWPMB1,4 (2) where GWPMA predicted value of global warming potential created during the modules A1-48, including office building’s manufacture (construction and building systems technology) and transports to construction site in[kg CO2 equiv./(m²NFA )], GWPMC predicted value of global warming potential created during module C3 and C49, the office building’s end-of-life (design and building systems technology) in [kg CO2 equiv./(m²NFA)], GWPMB1,4 predicted value of global warming potential created during modules B1 and B410 on a yearly basis, the office building’s use and replacement (construction and building systems technology) in[kg CO2 equiv./(m²NFA *a)], td time period for the reference study period for certification in [a]. This time period is set at 50 years. The average annual value for use GWPO generally consists of the GWP caused by the building`s electricity and heating demand during operation: GWPO = GWPMB6,E + GWPMB6,H (3) where GWPMB6,E global warming potential for module B6, electricity demand during use, calculated with the national implementation of the EPBD directive, multiplied by the GWP factor for electricity of the ESUCO database in [kg CO2 equiv./(m²NFA *a)], GWPMB6,H global warming potential for module B7, heating demand during use, calculated with the national implementation of the EPBD directive, multiplied by the GWP factor of the specific energy sources in the ESUCO database in [kg CO2 equiv./(m²NFA *a)].
8 Module A5 currently is not regarded due to a lack of data; compare chapter 2. 9 Modules C1 and C2 currently are not regarded due to a lack of data; compare chapter 2. 10 Modules B2, B3 and B5 currently are not regarded due to a lack of data; compare chapter 2.
15
Assessment Guideline Environmental Quality - Indicator 1.1 – Global Warming Potential
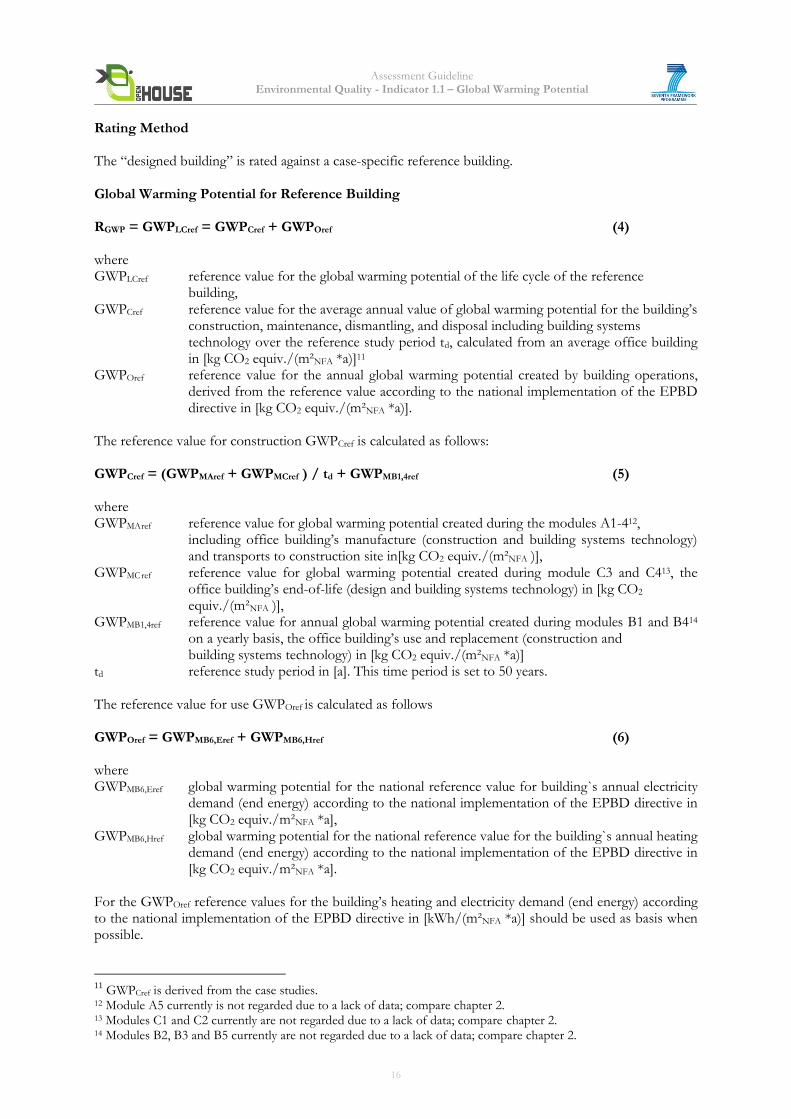
Rating Method The “designed building” is rated against a case-specific reference building. Global Warming Potential for Reference Building RGWP = GWPLCref = GWPCref + GWPOref (4) where GWPLCref reference value for the global warming potential of the life cycle of the reference building, GWPCref reference value for the average annual value of global warming potential for the building’s construction, maintenance, dismantling, and disposal including building systems technology over the reference study period td, calculated from an average office building in [kg CO2 equiv./(m²NFA *a)]11 GWPOref reference value for the annual global warming potential created by building operations, derived from the reference value according to the national implementation of the EPBD directive in [kg CO2 equiv./(m²NFA *a)]. The reference value for construction GWPCref is calculated as follows: GWPCref = (GWPMAref + GWPMCref ) / td + GWPMB1,4ref (5) where GWPMA ref reference value for global warming potential created during the modules A1-412, including office building’s manufacture (construction and building systems technology) and transports to construction site in[kg CO2 equiv./(m²NFA )], GWPMC ref reference value for global warming potential created during module C3 and C413, the office building’s end-of-life (design and building systems technology) in [kg CO2 equiv./(m²NFA )], GWPMB1,4ref reference value for annual global warming potential created during modules B1 and B414 on a yearly basis, the office building’s use and replacement (construction and building systems technology) in [kg CO2 equiv./(m²NFA *a)] td reference study period in [a]. This time period is set to 50 years. The reference value for use GWPOref is calculated as follows GWPOref = GWPMB6,Eref + GWPMB6,Href (6) where GWPMB6,Eref global warming potential for the national reference value for building`s annual electricity demand (end energy) according to the national implementation of the EPBD directive in [kg CO2 equiv./m²NFA *a], GWPMB6,Href global warming potential for the national reference value for the building`s annual heating demand (end energy) according to the national implementation of the EPBD directive in [kg CO2 equiv./m²NFA *a]. For the GWPOref reference values for the building’s heating and electricity demand (end energy) according to the national implementation of the EPBD directive in [kWh/(m²NFA *a)] should be used as basis when possible.
11
GWPCref is derived from the case studies. 12 Module A5 currently is not regarded due to a lack of data; compare chapter 2. 13 Modules C1 and C2 currently are not regarded due to a lack of data; compare chapter 2. 14 Modules B2, B3 and B5 currently are not regarded due to a lack of data; compare chapter 2.
16
Assessment Guideline Environmental Quality - Indicator 1.1 – Global Warming Potential
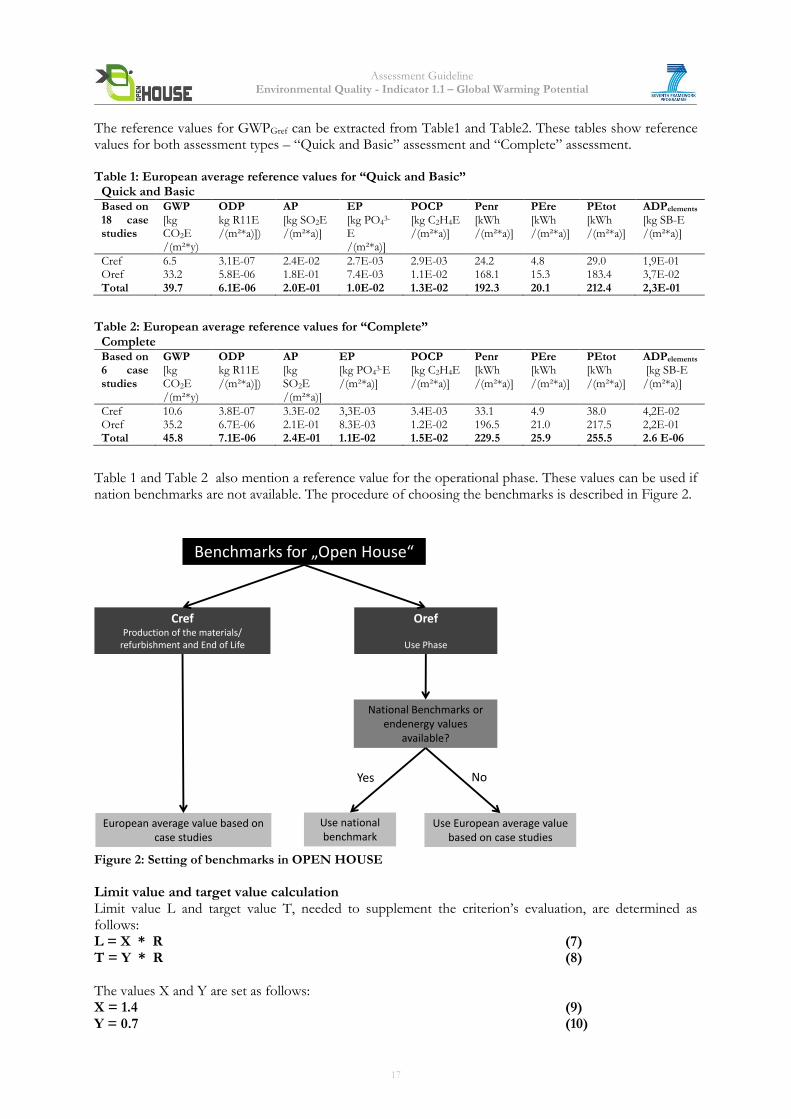
The reference values for GWPGref can be extracted from Table1 and Table2. These tables show reference values for both assessment types – “Quick and Basic” assessment and “Complete” assessment. Table 1: European average reference values for “Quick and Basic”
Quick and Basic Based on 18 case studies
GWP [kg CO2E /(m²*y)
ODP kg R11E /(m²*a)])
AP [kg SO2E /(m²*a)]
EP [kg PO4
3-
E /(m²*a)]
POCP [kg C2H4E /(m²*a)]
Penr [kWh /(m²*a)]
PEre [kWh /(m²*a)]
PEtot [kWh /(m²*a)]
ADPelements [kg SB-E /(m²*a)]
Cref 6.5 3.1E-07 2.4E-02 2.7E-03 2.9E-03 24.2 4.8 29.0 1,9E-01 Oref 33.2 5.8E-06 1.8E-01 7.4E-03 1.1E-02 168.1 15.3 183.4 3,7E-02 Total 39.7 6.1E-06 2.0E-01 1.0E-02 1.3E-02 192.3 20.1 212.4 2,3E-01
Table 2: European average reference values for “Complete”
Complete Based on 6 case studies
GWP [kg CO2E /(m²*y)
ODP kg R11E /(m²*a)])
AP [kg SO2E /(m²*a)]
EP [kg PO4
3-E /(m²*a)]
POCP [kg C2H4E /(m²*a)]
Penr [kWh /(m²*a)]
PEre [kWh /(m²*a)]
PEtot [kWh /(m²*a)]
ADPelements [kg SB-E /(m²*a)]
Cref 10.6 3.8E-07 3.3E-02 3,3E-03 3.4E-03 33.1 4.9 38.0 4,2E-02 Oref 35.2 6.7E-06 2.1E-01 8.3E-03 1.2E-02 196.5 21.0 217.5 2,2E-01 Total 45.8 7.1E-06 2.4E-01 1.1E-02 1.5E-02 229.5 25.9 255.5 2.6 E-06
Table 1 and Table 2 also mention a reference value for the operational phase. These values can be used if nation benchmarks are not available. The procedure of choosing the benchmarks is described in Figure 2.
Benchmarks for „Open House“
CrefProduction of the materials/
refurbishment and End of Life
Oref
Use Phase
European average value based on case studies
National Benchmarks orendenergy values
available?
Use national benchmark
Yes No
Use European average valuebased on case studies
Figure 2: Setting of benchmarks in OPEN HOUSE
Limit value and target value calculation Limit value L and target value T, needed to supplement the criterion’s evaluation, are determined as follows: L = X * R (7) T = Y * R (8) The values X and Y are set as follows: X = 1.4 (9) Y = 0.7 (10)
17
Assessment Guideline Environmental Quality - Indicator 1.1 – Global Warming Potential
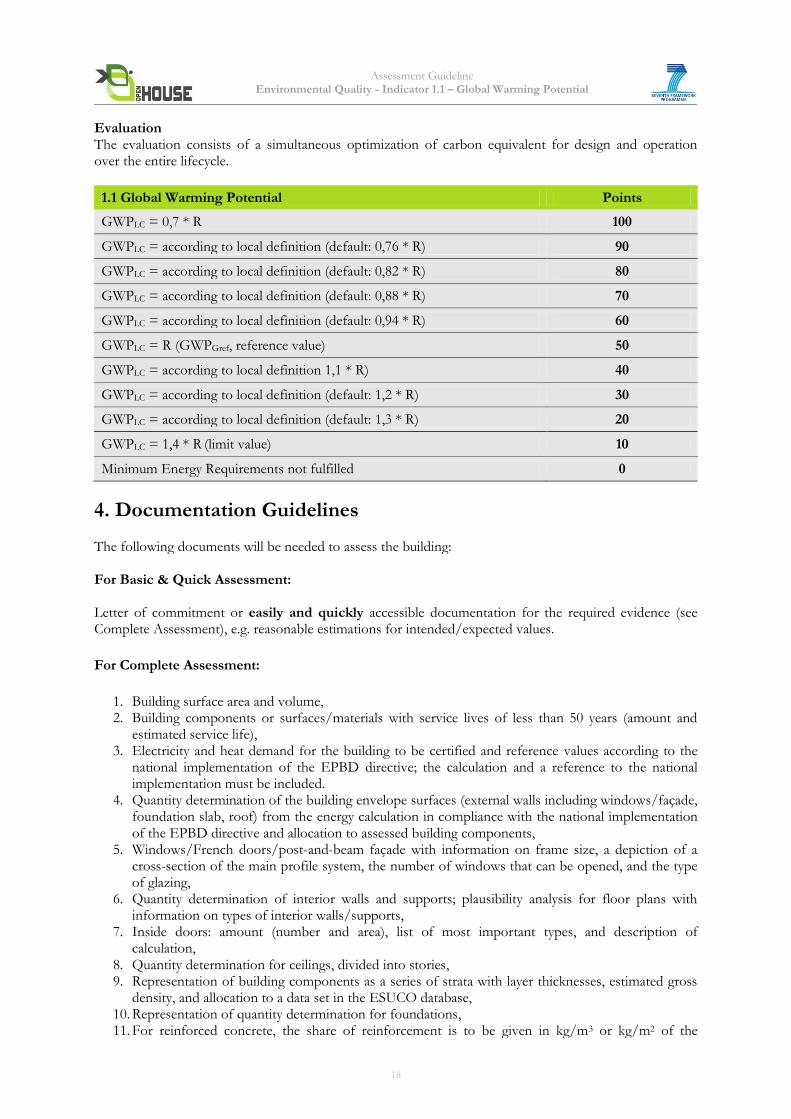
Evaluation The evaluation consists of a simultaneous optimization of carbon equivalent for design and operation over the entire lifecycle.
1.1 Global Warming Potential Points
GWPLC = 0,7 * R 100
GWPLC = according to local definition (default: 0,76 * R) 90
GWPLC = according to local definition (default: 0,82 * R) 80
GWPLC = according to local definition (default: 0,88 * R) 70
GWPLC = according to local definition (default: 0,94 * R) 60
GWPLC = R (GWPGref, reference value) 50
GWPLC = according to local definition 1,1 * R) 40
GWPLC = according to local definition (default: 1,2 * R) 30
GWPLC = according to local definition (default: 1,3 * R) 20
GWPLC = 1,4 * R (limit value) 10
Minimum Energy Requirements not fulfilled 0
4. Documentation Guidelines The following documents will be needed to assess the building: For Basic & Quick Assessment: Letter of commitment or easily and quickly accessible documentation for the required evidence (see Complete Assessment), e.g. reasonable estimations for intended/expected values.
For Complete Assessment:
1. Building surface area and volume, 2. Building components or surfaces/materials with service lives of less than 50 years (amount and
estimated service life), 3. Electricity and heat demand for the building to be certified and reference values according to the
national implementation of the EPBD directive; the calculation and a reference to the national implementation must be included.
4. Quantity determination of the building envelope surfaces (external walls including windows/façade, foundation slab, roof) from the energy calculation in compliance with the national implementation of the EPBD directive and allocation to assessed building components,
5. Windows/French doors/post-and-beam façade with information on frame size, a depiction of a cross-section of the main profile system, the number of windows that can be opened, and the type of glazing,
6. Quantity determination of interior walls and supports; plausibility analysis for floor plans with information on types of interior walls/supports,
7. Inside doors: amount (number and area), list of most important types, and description of calculation,
8. Quantity determination for ceilings, divided into stories, 9. Representation of building components as a series of strata with layer thicknesses, estimated gross
density, and allocation to a data set in the ESUCO database, 10. Representation of quantity determination for foundations, 11. For reinforced concrete, the share of reinforcement is to be given in kg/m3 or kg/m2 of the
18
Assessment Guideline Environmental Quality - Indicator 1.1 – Global Warming Potential
building component. Alternatively, the reinforcing steel can be verified in an overall summary of the project.
12. Documentation of heating unit, 13. Documentation of transport distances and means of transport from manufacturing to construction
site. Most of these requirements can be met by providing a bill of materials (including masses, materials in a hierarchical structure, number of pieces, surface areas and volume of the building).
14. Documentation required for ecological footprint results: Results are to be presented for the entire lifecycle per m2 NFA and year, categorized by:
a. Manufacture b. Use (electricity and heat) c. Use (maintenance) d. End of life (dismantling/recycling/disposal)
5. Relation to other Indicators Data acquisition is the same for the indicators 1.1- 1.5, 1.9, 1.10, 1.15
6. Resources
1. ISO 14040: 2009-11: Environmental management – Life cycle assessment – Principles and framework. International Organization for Standardization.
2. ISO 14044: 2006-10: Environmental management – Life cycle assessment – Requirements and guidelines. International Organization for Standardization.
3. FprEN 15978: 2011: Sustainability of construction works — Assessment of environmental performance of buildings — Calculation method. European Committee for Standardization CEN.
4. prEN 15804: 2010: Sustainability of construction works — Environmental product declarations — Core rules for the product category of construction products. European Committee for Standardization CEN.
5. Directive 2009/28/EC of the European Parliament and of the Council of 23 April 2009 on the promotion of the use of energy from renewable sources and amending and subsequently repealing Directives 2001/77/EC and 2003/30/EC.
6. Kreißig, J., Binder, M. (2007): Methodische Grundlagen- Ökobilanzbasierte Umweltindikatoren im Bauwesen. Methodenbericht zum BMVBS-Projekt „Aktualisieren, Fortschreiben und Harmonisieren von Basisdaten für das nachhaltige Bauen“ (AZ 10.06.03 – 06.119) Mai 2007, www.baufachinformation.de/literatur.isp.
7. United Nations (1998): Kyoto Protocol to the United Nations Framework Convention on Climate Change, 1998, http://unfccc.int/resource/docs/convkp/kpeng.pdf.
8. Bundesministerium für Verkehr, Bau- und Wohnungswesen: Guideline for Sustainable Building. Eigenverlag, 2001.
9. Directive 2002/91/EC of the European Parliament and of the Council of 16 December 2002 on the energy performance of buildings.
10. VDI 2067: Economic efficiency of building installations – Fundamentals and economic calculation. Verein Deutscher Ingenieure, 2000.
7. Attachments
None
19
Assessment Guideline Environmental Quality - Indicator 1.2 – Ozone Depletion Potential
Indicator 1.2 Ozone Depletion Potential (ODP) (adapted from DGNB/BNB)
Core indicator
1. Objective Ozone, which is only existent in low concentration in the atmosphere, has a significant impact on life on earth. It is able to absorb short-wave UV-radiation and to release it, irrespective of direction, with longer wave length. In addition, the ozone layer protects the earth from a large proportion of UV-radiation and therefore prevents the earth surface of an excessive temperature rise and contributes to the protection of man and flora against UV-A and UV-B radiation. The accumulation of R11-equivalents in the atmosphere contributes to the destruction of the ozone layer. As a consequence, amongst others, men and animals can develop tumors as well as the photosynthesis may be disturbed. For the assessment of the ozone depletion potential of a building life cycle (construction and operation), Trichlorofluoromethane-equivalents (R11-eqivalents) per area and year are used. The indicator aims at the reduction of buildings’ Ozone Depletion Potential, thus preventing the environmental impacts described above. It supports the European Commission target of phasing out of Ozone Depletion Substances1.
2. Assessment Methodology The indicator is mainly based on the method of Life Cycle Assessment (LCA): LCA results of the building to be assessed will be calculated in a standardized way and evaluated against benchmarks. Thus Ozone Depletion Potential is a quantitative indicator. According to the standards EN ISO 14040 and 14044, the method of Life-Cycle Assessment generally consists of four steps: Definition of goal and scope of the study, inventory analysis, impact assessment and interpretation. The indicators 1.1-1.5, 1.9, 1.10 and 1.15 are based on LCAs and for all these indicators the same definitions for goal and scope and for the inventory analysis do apply. Goal and scope definition The goal of all LCA studies is to analyze and later benchmark the environmental performance of the respective buildings` life cycles. The scope of the building assessment therefore includes the following life cycle stages:
production: raw material supply, transport to manufacturing, manufacturing and transport to the construction site of products used in the building (Figure 1, modules A1-A4),
use stage: a scenario is defined including use and replacement, including end-of-life of replaced products (Figure 1, modules B1 and B4); in addition the operational energy use is considered (Figure 1, module B6),
end-of-life stage: waste processing and disposal of the building, (Figure 1, modules C3 and C4),
a scenario for potential benefits and loads beyond the system boundaries, including loads for reuse and recycling as well as benefits from recycling potentials (Figure 1, module D).
1 REGULATION (EC) No 1005/2009 on substances that deplete the ozone layer
20

Assessment Guideline Environmental Quality - Indicator 1.2 – Ozone Depletion Potential
BUILDING ASSESSMENT INFORMATION
BUILDING LIFE CYCLE INFORMATION
Raw
Mat
eri
als
Sup
ply
Tra
nsp
ort
Man
ufa
ctu
rin
g
PRODUCT STAGE
A1 - 3
A1 - A3
Tran
spo
rt
CONSTRUCTION PROCESS
A4 - 5
A4
Cons
truc
tion
–In
stal
lati
on
proc
ess
A5
Use
USE STAGE
B1 - 7
B1
Mai
nte
nan
ce
B2
Rep
air
Re
plac
em
ent
Re
furb
ish
me
nt
B3 B4 B5
Operational Energy use
Operational Water useB 7
B 6 De
con
stru
ctio
n
END OF LIFE STAGE
C1 - 4
C1
Tran
spor
tC
2
Was
te p
roce
ssin
g fo
r re
use,
re
cove
ry o
r an
d re
cycl
ing
C3
Dis
po
sal
C4
Benefits and loads beyond the system boundary
D
Reuse -Recovery -Recycling -potential
SUPPLEMENTARY INFORMATION BEYOND
THE BUILDING LIFE CYCLE
Figure 1 Building Life Cycle Phases according to FprEN 15978, adapted
The following processes are not included:
Transport to construction side (Figure 1, module A4)
Construction – Installation process (Figure 1, module A5),
Energy use for user equipment during reference study period,
Operational water use (Figure 1, module B7),
Maintenance, repair and refurbishment during reference study period – (Figure 1, modules B2, B3 and B5),
Deconstruction and transport to waste processing / disposal (Figure 1, modules C1 and C2),
Transport to recycling (Figure 1, module C2). The reference study period is defined with 50 years. The functional equivalent (quantified functional requirements, intended use and/or technical requirements2), which is used as basis for comparison, is defined to be m²NFA*year. Inventory Analysis and Impact Assessment During the inventory analysis of an LCA, emissions and resource consumption are identified, calculated and summed up over the life cycle of a product. Within building LCAs, separate calculations are carried out for the buildings` elements (product and end-of-life stage) and for the determination of emissions and resource uses during operation (see Equations 1, 2 and 3). The inventory analysis of the buildings` elements mainly consists in providing quantitative information on the building elements used (see also Documentation Guidelines). Building compartments to be included are
1. Exterior walls and basement walls incl. windows and coatings, 2. Roof, 3. Ceilings incl. flooring and floor coverings / coatings, 4. Floor slab incl. flooring, floor coverings; floor slab above air, 5. Foundations, 6. Interior walls incl. coatings and supports, 7. Heat generation units.
2 prEN 15643-1:2010: Sustainability of construction works – Sustainability assessment of buildings – Part 1: General framework
21
Assessment Guideline Environmental Quality - Indicator 1.2 – Ozone Depletion Potential
For these, respective datasets are picked out from the ESUCO database, which include environmental profiles of the used component: for the respective component, a standardized LCA has been conducted earlier and the results are provided within this database format. For the module A4, which contains transports from manufacturing to the construction site, information about transport distances and means of transportation have to be provided and connected to the respective ESUCO data sets3. For the analysis of the use stage, a scenario has to be set up, including supply and disposal systems and repairs. For supply and disposal, values for end energy consumption for electricity and heat have to be derived from the respective national implementation of the EPBD directive. Heating units as well as the electricity demand calculated have to be listed and linked to the respective ESUCO datasets. For repair, calculations have to be made for all materials, building components and surfaces with service lives of less than 50 years. Sources for service lives are the “Guideline for Sustainable Building” for construction materials and the VDI 2067 for building services. Also for the end-of-life stage, a scenario has to be defined for the recycling and disposal of the building materials that remain in the building after the end of the reference study period. So for each material, one end-of-life options has to be chosen and linked to the respective ESUCO dataset:
Metals recycling ”metal recycling potential”,
Mineral building materials recycling ”construction rubble processing”,
Materials with a heating value thermal recycling respective material group in ESUCO database,
Heat producers Dataset corresponding to the manufacturing process,
All other materials that can be deposited at construction or household waste sites disposal at
waste site appropriate ESUCO dataset. Within the impact assessment, the emissions determined in the inventory analysis are classified regarding their contributions to different environmental impacts and then characterized. Using characterization factors, they are converted into equivalents of lead emissions for the different impact categories (example: emissions contributing to ozone depletion potential are transformed to R11-equivalents, emissions contributing to Acidification Potential are transformed to SO2-equivalents). By using environmental profiles such as provided by ESUCO, the step of impact assessment has already been done by the data providers: Environmental profiles are given by providing the LCA results for the respective component in form of different environmental impact categories. These results are then used within the building LCA. Interpretation Resulting impacts are then evaluated against reference values to determine the respective indicator assessment (see overall Rating / Assessment Matrix).
3 It is suggested to use European average datasets. This means that the datasets represent technologies on average
levels for Europe. These construction materials also contain European boundary conditions such as European datasets for electric or thermal energy or intermediate products and represent a common European market for construction materials. Using such European average datasets does not show the variability, for instance of the industry producing construction materials in Europe and thus has the advantage not to bias the analysis of the life cycle models by accounting for differences in different production techniques. This bias would reduce the significance of the results as the clear denotation of environmental hotspots in the structure and design of buildings would contain higher uncertainties on the origin of environmental impacts.
22
Assessment Guideline Environmental Quality - Indicator 1.2 – Ozone Depletion Potential
3. Calculation and Rating Calculation When calculating the ozone depletion potential for the building, the following calculation rules must be followed: Ozone Depletion Potential for “Designed Building” Generally, the ODP for the building life cycle is composed of the ODP caused by the building construction and of the ODP caused during operation. ODPLC = ODPC + ODPO (1) where ODPLC ozone depletion potential of the life cycle of the entire building, ODPC building’s construction, maintenance, dismantling, and disposal including building systems technology as an average annual value of ozone depletion potential over the time reference study period td in [kg R11 equiv./(m²NFA *a)], ODPO predicted annual ozone depletion potential for the operation of the building as constructed, derived from end energy demand according to national implementation of EPBD directive in [kg R11 equiv./(m²NFA *a)], NFA Net Floor Area of the building.
Based on the modules as defined in Figure 1, the value for construction ODPC is calculated as follows: ODPC = (ODPMA + ODPMC) / td + ODPMB1,4 (2) where ODPMA predicted value of ozone depletion potential created during the modules A1-44, including office building’s manufacture (construction and building systems technology) and transports to construction site in[kg R11 equiv./(m²NFA )], ODPMC predicted value of ozone depletion potential created during module C3 and C45, the office building’s end-of-life (design and building systems technology) in [kg R11 equiv./(m²NFA)], ODPMB1,4 predicted value of ozone depletion potential created during modules B1 and B46 on a yearly basis, the office building’s use and replacement (construction and building systems technology) in [kg R11 equiv./(m²NFA *a)], td time period for the reference study period for certification in [a]. This time period is set at 50 years. The average annual value for use ODPO generally consists of the ODP caused by the building`s electricity and heating demand during operation: ODPO = ODPMB6,E + ODPMB6,H (3) where ODPMB6,E ozone depletion potential for module B6, electricity demand during use, calculated with the national implementation of the EPBD directive, multiplied by the ODP factor for electricity of the ESUCO database in [kg R11 equiv./(m²NFA *a)], ODPMB6,H ozone depletion potential for module B7, heating demand during use, calculated with the national implementation of the EPBD directive, multiplied by the ODP factor of the specific energy sources in the ESUCO database in [kg R11 equiv./(m²NFA *a)].
4 Module A5 currently is not regarded due to a lack of data; compare chapter 2. 5 Modules C1 and C2 currently are not regarded due to a lack of data; compare chapter 2. 6 Modules B2, B3 and B5 currently are not regarded due to a lack of data; compare chapter 2.
23
Assessment Guideline Environmental Quality - Indicator 1.2 – Ozone Depletion Potential
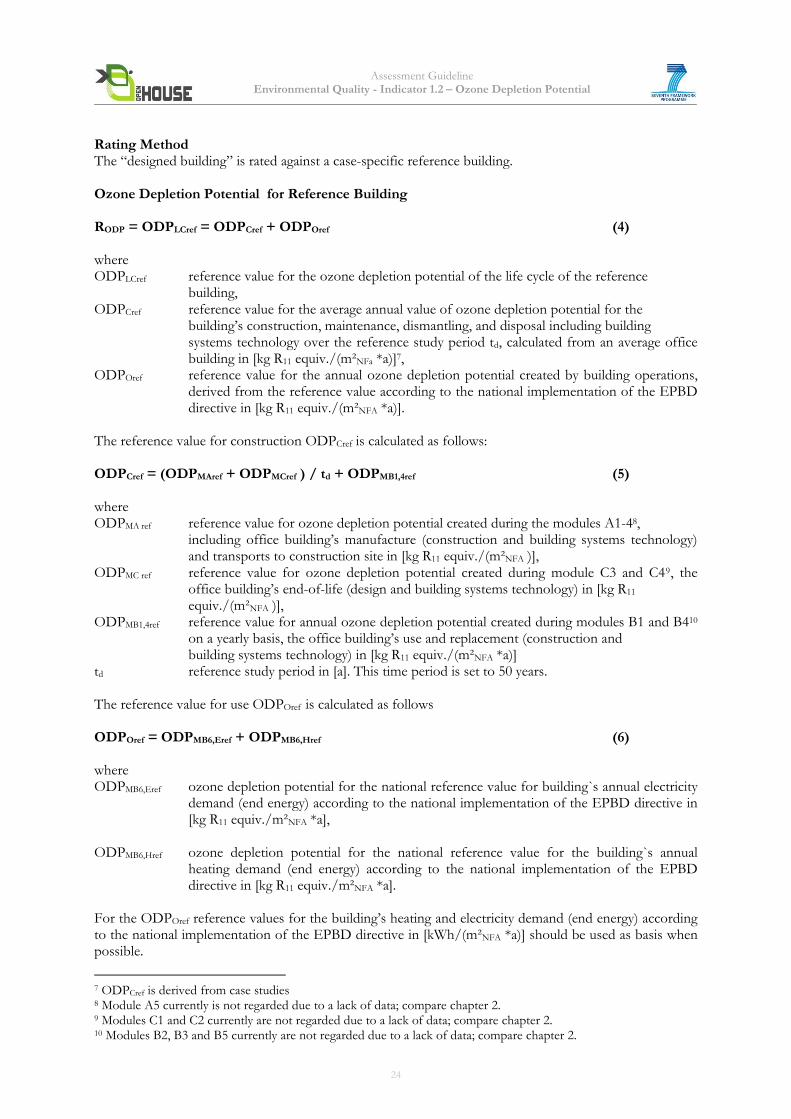
Rating Method The “designed building” is rated against a case-specific reference building. Ozone Depletion Potential for Reference Building RODP = ODPLCref = ODPCref + ODPOref (4) where ODPLCref reference value for the ozone depletion potential of the life cycle of the reference building, ODPCref reference value for the average annual value of ozone depletion potential for the building’s construction, maintenance, dismantling, and disposal including building systems technology over the reference study period td, calculated from an average office building in [kg R11 equiv./(m²NFa *a)]7, ODPOref reference value for the annual ozone depletion potential created by building operations, derived from the reference value according to the national implementation of the EPBD directive in [kg R11 equiv./(m²NFA *a)]. The reference value for construction ODPCref is calculated as follows: ODPCref = (ODPMAref + ODPMCref ) / td + ODPMB1,4ref (5) where ODPMA ref reference value for ozone depletion potential created during the modules A1-48, including office building’s manufacture (construction and building systems technology) and transports to construction site in [kg R11 equiv./(m²NFA )], ODPMC ref reference value for ozone depletion potential created during module C3 and C49, the office building’s end-of-life (design and building systems technology) in [kg R11 equiv./(m²NFA )], ODPMB1,4ref reference value for annual ozone depletion potential created during modules B1 and B410 on a yearly basis, the office building’s use and replacement (construction and building systems technology) in [kg R11 equiv./(m²NFA *a)] td reference study period in [a]. This time period is set to 50 years. The reference value for use ODPOref is calculated as follows ODPOref = ODPMB6,Eref + ODPMB6,Href (6) where ODPMB6,Eref ozone depletion potential for the national reference value for building`s annual electricity demand (end energy) according to the national implementation of the EPBD directive in [kg R11 equiv./m²NFA *a], ODPMB6,Href ozone depletion potential for the national reference value for the building`s annual heating demand (end energy) according to the national implementation of the EPBD directive in [kg R11 equiv./m²NFA *a]. For the ODPOref reference values for the building’s heating and electricity demand (end energy) according to the national implementation of the EPBD directive in [kWh/(m²NFA *a)] should be used as basis when possible.
7 ODPCref is derived from case studies 8 Module A5 currently is not regarded due to a lack of data; compare chapter 2. 9 Modules C1 and C2 currently are not regarded due to a lack of data; compare chapter 2. 10 Modules B2, B3 and B5 currently are not regarded due to a lack of data; compare chapter 2.
24
Assessment Guideline Environmental Quality - Indicator 1.2 – Ozone Depletion Potential
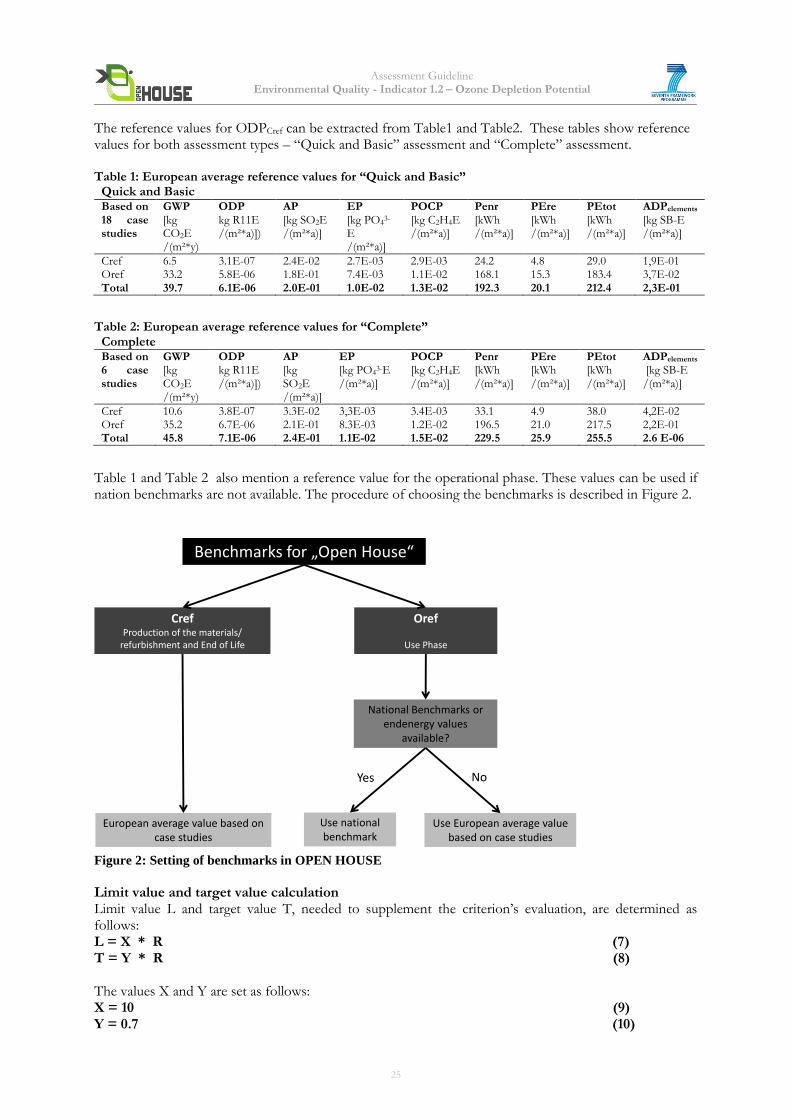
The reference values for ODPCref can be extracted from Table1 and Table2. These tables show reference values for both assessment types – “Quick and Basic” assessment and “Complete” assessment. Table 1: European average reference values for “Quick and Basic”
Quick and Basic Based on 18 case studies
GWP [kg CO2E /(m²*y)
ODP kg R11E /(m²*a)])
AP [kg SO2E /(m²*a)]
EP [kg PO4
3-
E /(m²*a)]
POCP [kg C2H4E /(m²*a)]
Penr [kWh /(m²*a)]
PEre [kWh /(m²*a)]
PEtot [kWh /(m²*a)]
ADPelements [kg SB-E /(m²*a)]
Cref 6.5 3.1E-07 2.4E-02 2.7E-03 2.9E-03 24.2 4.8 29.0 1,9E-01 Oref 33.2 5.8E-06 1.8E-01 7.4E-03 1.1E-02 168.1 15.3 183.4 3,7E-02 Total 39.7 6.1E-06 2.0E-01 1.0E-02 1.3E-02 192.3 20.1 212.4 2,3E-01
Table 2: European average reference values for “Complete”
Complete Based on 6 case studies
GWP [kg CO2E /(m²*y)
ODP kg R11E /(m²*a)])
AP [kg SO2E /(m²*a)]
EP [kg PO4
3-E /(m²*a)]
POCP [kg C2H4E /(m²*a)]
Penr [kWh /(m²*a)]
PEre [kWh /(m²*a)]
PEtot [kWh /(m²*a)]
ADPelements [kg SB-E /(m²*a)]
Cref 10.6 3.8E-07 3.3E-02 3,3E-03 3.4E-03 33.1 4.9 38.0 4,2E-02 Oref 35.2 6.7E-06 2.1E-01 8.3E-03 1.2E-02 196.5 21.0 217.5 2,2E-01 Total 45.8 7.1E-06 2.4E-01 1.1E-02 1.5E-02 229.5 25.9 255.5 2.6 E-06
Table 1 and Table 2 also mention a reference value for the operational phase. These values can be used if nation benchmarks are not available. The procedure of choosing the benchmarks is described in Figure 2.
Benchmarks for „Open House“
CrefProduction of the materials/
refurbishment and End of Life
Oref
Use Phase
European average value based on case studies
National Benchmarks orendenergy values
available?
Use national benchmark
Yes No
Use European average valuebased on case studies
Figure 2: Setting of benchmarks in OPEN HOUSE
Limit value and target value calculation Limit value L and target value T, needed to supplement the criterion’s evaluation, are determined as follows: L = X * R (7) T = Y * R (8) The values X and Y are set as follows: X = 10 (9) Y = 0.7 (10)
25
Assessment Guideline Environmental Quality - Indicator 1.2 – Ozone Depletion Potential
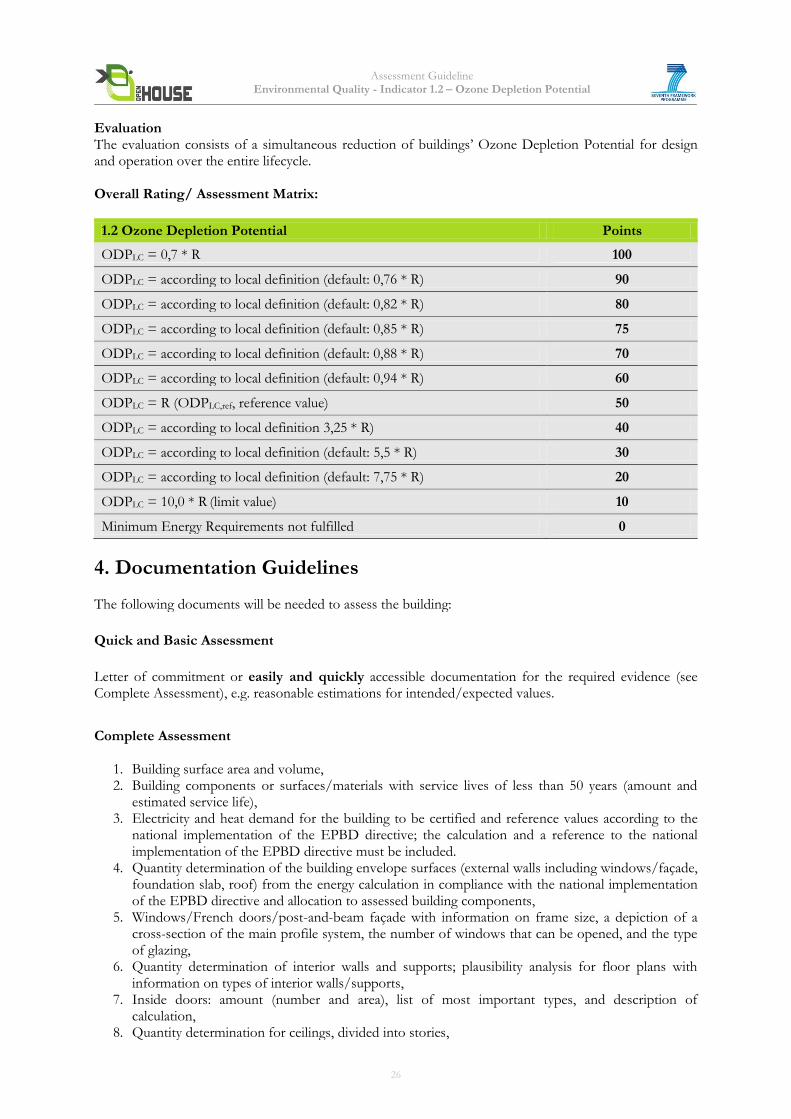
Evaluation The evaluation consists of a simultaneous reduction of buildings’ Ozone Depletion Potential for design and operation over the entire lifecycle. Overall Rating/ Assessment Matrix:
1.2 Ozone Depletion Potential Points
ODPLC = 0,7 * R 100
ODPLC = according to local definition (default: 0,76 * R) 90
ODPLC = according to local definition (default: 0,82 * R) 80
ODPLC = according to local definition (default: 0,85 * R) 75
ODPLC = according to local definition (default: 0,88 * R) 70
ODPLC = according to local definition (default: 0,94 * R) 60
ODPLC = R (ODPLC,ref, reference value) 50
ODPLC = according to local definition 3,25 * R) 40
ODPLC = according to local definition (default: 5,5 * R) 30
ODPLC = according to local definition (default: 7,75 * R) 20
ODPLC = 10,0 * R (limit value) 10
Minimum Energy Requirements not fulfilled 0
4. Documentation Guidelines The following documents will be needed to assess the building:
Quick and Basic Assessment
Letter of commitment or easily and quickly accessible documentation for the required evidence (see Complete Assessment), e.g. reasonable estimations for intended/expected values.
Complete Assessment
1. Building surface area and volume, 2. Building components or surfaces/materials with service lives of less than 50 years (amount and
estimated service life), 3. Electricity and heat demand for the building to be certified and reference values according to the
national implementation of the EPBD directive; the calculation and a reference to the national implementation of the EPBD directive must be included.
4. Quantity determination of the building envelope surfaces (external walls including windows/façade, foundation slab, roof) from the energy calculation in compliance with the national implementation of the EPBD directive and allocation to assessed building components,
5. Windows/French doors/post-and-beam façade with information on frame size, a depiction of a cross-section of the main profile system, the number of windows that can be opened, and the type of glazing,
6. Quantity determination of interior walls and supports; plausibility analysis for floor plans with information on types of interior walls/supports,
7. Inside doors: amount (number and area), list of most important types, and description of calculation,
8. Quantity determination for ceilings, divided into stories,
26
Assessment Guideline Environmental Quality - Indicator 1.2 – Ozone Depletion Potential
9. Representation of building components as a series of strata with layer thicknesses, estimated gross density, and allocation to a data set in the ESUCO database,
10. Representation of quantity determination for foundations, 11. For reinforced concrete, the share of reinforcement is to be given in kg/m3 or kg/m2 of the
building component. Alternatively, the reinforcing steel can be verified in an overall summary of the project.
12. Documentation of heating unit, 13. Documentation of transport distances and means of transport from manufacturing to construction
site. Most of these requirements can be met by providing a bill of materials (including masses, materials in a hierarchical structure, numbers of pieces, surface areas and volume of the building).
14. Documentation required for ecological footprint results: Results are to be presented for the entire lifecycle per m2 NFA and year, categorized by:
a. Manufacture b. Use (electricity and heat) c. Use (maintenance) d. End of life (dismantling/recycling/disposal)
5. Relation to other Indicators Data acquisition is the same for the indicators 1.1- 1.5, 1.9, 1.10, 1.15
6. Resources
1. ISO 14040: 2009-11: Environmental management – Life cycle assessment – Principles and framework. International Organization for Standardization.
2. ISO 14044: 2006-10: Environmental management – Life cycle assessment – Requirements and guidelines. International Organization for Standardization.
3. FprEN 15978: 2011: Sustainability of construction works — Assessment of environmental performance of buildings — Calculation method. European Committee for Standardization CEN.
4. prEN 15804: 2010: Sustainability of construction works — Environmental product declarations — Core rules for the product category of construction products. European Committee for Standardization CEN.
5. Directive 2009/28/EC of the European Parliament and of the Council of 23 April 2009 on the promotion of the use of energy from renewable sources and amending and subsequently repealing Directives 2001/77/EC and 2003/30/EC.
6. Kreißig, J., Binder, M. (2007): Methodische Grundlagen- Ökobilanzbasierte Umweltindikatoren im Bauwesen. Methodenbericht zum BMVBS-Projekt „Aktualisieren, Fortschreiben und Harmonisieren von Basisdaten für das nachhaltige Bauen“ (AZ 10.06.03 – 06.119) Mai 2007, www.baufachinformation.de/literatur.isp.
7. United Nations (1998): Kyoto Protocol to the United Nations Framework Convention on Climate Change, 1998, http://unfccc.int/resource/docs/convkp/kpeng.pdf.
8. Bundesministerium für Verkehr, Bau- und Wohnungswesen: Guideline for Sustainable Building. Eigenverlag, 2001.
9. Directive 2002/91/EC of the European Parliament and of the Council of 16 December 2002 on the energy performance of buildings.
10. VDI 2067: Economic efficiency of building installations – Fundamentals and economic calculation. Verein Deutscher Ingenieure, 2000.
7. Attachments
None
27
Assessment Guideline Environmental Quality - Indicator 1.3 – Acidification Potential
Indicator 1.3 Acidification Potential (AP) (adapted from DGNB/BNB)
Core Indicator
1. Objective Acidification is the increase of the hydrogen ion concentration in air, water and soil. Sulfur and nitrogen compounds from anthropogenic emissions react to sulfuric acid or nitric acid in the air, fall down as “acid rain” and cause damage to soil, water, organisms and buildings. In acidic soils nutrients decompose quickly and can easily be washed out. Furthermore, toxic cations may be released, which affect root systems and cause damage to the nutrient supply of organisms. Another possible effect is the disturbance of the water balance. All in all, the combination of acidification aspects contributes to forest decline. In addition, in surface water bodies with low chemical buffer capacity, fish decline occurs. Acid rain also affects historic buildings (e.g. sandstone). The environmental impacts described above are measured using the acidification potential, which is stated in SO2-equivalents. Acidification causing emissions are e.g. SO2, NOx or H2S. For the assessment of the Acidification Potential (AP) of a building life cycle (construction and operation), SO2-eqivalents per area and year are used. The lower the AP value, the lower is the risk of acid rain and the related environmental damage. The indicator aims at the reduction of buildings’ Acidification Potential, thus preventing the environmental impacts described above. This supports the European Commission target of emission reductions in the EU-25 of 82% for SO2, and 60% for NOx by 2020 compared to 1990s level1. The objective is to reduce the threat to the natural environment from acidification by 55%2.
2. Assessment Methodology
The indicator is mainly based on the method of Life Cycle Assessment (LCA): LCA results of the building to be assessed will be calculated in a standardized way and evaluated against benchmarks. Thus Acidification Potential is a quantitative indicator. According to the standards EN ISO 14040 and 14044, the method of Life-Cycle Assessment generally consists of four steps: Definition of goal and scope of the study, inventory analysis, impact assessment and interpretation. The indicators 1.1-1.5, 1.9, 1.10 and 1.15 are based on LCAs and for all these indicators the same definitions for goal and scope and for the inventory analysis do apply. Goal and scope definition The goal of all LCA studies is to analyze and later benchmark the environmental performance of the respective buildings` life cycles. The scope of the building assessment therefore includes the following life cycle stages:
production: raw material supply, transport to manufacturing, manufacturing and transport to the construction site of products used in the building (Figure 1, modules A1-A4),
use stage: a scenario is defined including use and replacement, including end-of-life of replaced products (Figure 1, modules B1 and B4); in addition the operational energy use is considered (Figure 1, module B6),
end-of-life stage: waste processing and disposal of the building, (Figure 1, modules C3 and C4),
1 Impact Assessment SEC (2005) 1133 2 Thematic Strategy on air pollution COM(2005) 446
28
Assessment Guideline Environmental Quality - Indicator 1.3 – Acidification Potential
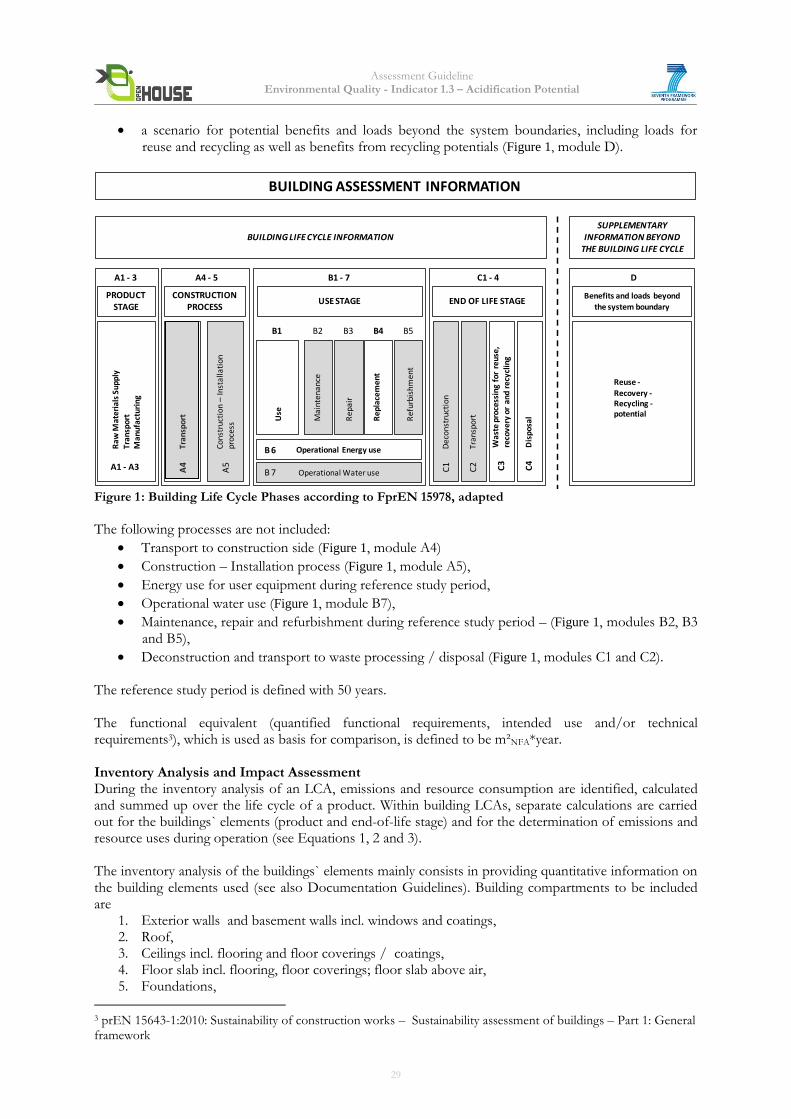
a scenario for potential benefits and loads beyond the system boundaries, including loads for reuse and recycling as well as benefits from recycling potentials (Figure 1, module D).
BUILDING ASSESSMENT INFORMATION
BUILDING LIFE CYCLE INFORMATION
Raw
Mat
eri
als
Sup
ply
Tra
nsp
ort
Man
ufa
ctu
rin
g
PRODUCT STAGE
A1 - 3
A1 - A3
Tran
spo
rt
CONSTRUCTION PROCESS
A4 - 5
A4
Cons
truc
tion
–In
stal
lati
on
proc
ess
A5
Use
USE STAGE
B1 - 7
B1
Mai
nte
nan
ce
B2
Rep
air
Re
plac
em
ent
Re
furb
ish
me
nt
B3 B4 B5
Operational Energy use
Operational Water useB 7
B 6 De
con
stru
ctio
n
END OF LIFE STAGE
C1 - 4
C1
Tran
spor
tC
2
Was
te p
roce
ssin
g fo
r re
use,
re
cove
ry o
r an
d re
cycl
ing
C3
Dis
po
sal
C4
Benefits and loads beyond the system boundary
D
Reuse -Recovery -Recycling -potential
SUPPLEMENTARY INFORMATION BEYOND
THE BUILDING LIFE CYCLE
Figure 1 : Building Life Cycle Phases according to FprEN 15978, adapted
The following processes are not included:
Transport to construction side (Figure 1, module A4)
Construction – Installation process (Figure 1, module A5),
Energy use for user equipment during reference study period,
Operational water use (Figure 1, module B7),
Maintenance, repair and refurbishment during reference study period – (Figure 1, modules B2, B3 and B5),
Deconstruction and transport to waste processing / disposal (Figure 1, modules C1 and C2). The reference study period is defined with 50 years. The functional equivalent (quantified functional requirements, intended use and/or technical requirements3), which is used as basis for comparison, is defined to be m²NFA*year. Inventory Analysis and Impact Assessment During the inventory analysis of an LCA, emissions and resource consumption are identified, calculated and summed up over the life cycle of a product. Within building LCAs, separate calculations are carried out for the buildings` elements (product and end-of-life stage) and for the determination of emissions and resource uses during operation (see Equations 1, 2 and 3). The inventory analysis of the buildings` elements mainly consists in providing quantitative information on the building elements used (see also Documentation Guidelines). Building compartments to be included are
1. Exterior walls and basement walls incl. windows and coatings, 2. Roof, 3. Ceilings incl. flooring and floor coverings / coatings, 4. Floor slab incl. flooring, floor coverings; floor slab above air, 5. Foundations,
3 prEN 15643-1:2010: Sustainability of construction works – Sustainability assessment of buildings – Part 1: General framework
29
Assessment Guideline Environmental Quality - Indicator 1.3 – Acidification Potential
6. Interior walls incl. coatings and supports, 7. Heat generation units. 8. Heat generation units.
For these, respective datasets are picked out from the ESUCO database, which include environmental profiles of the used component: for the respective component, a standardized LCA has been conducted earlier and the results are provided within this database format. For the module A4, which contains transports from manufacturing to the construction site, information about transport distances and means of transportation have to be provided and connected to the respective ESUCO data sets4. For the analysis of the use stage, a scenario has to be set up, including supply and disposal systems and repairs. For supply and disposal, values for end energy consumption for electricity and heat have to be derived from the respective national implementation of the EPBD directive. Heating units as well as the electricity demand calculated have to be listed and linked to the respective ESUCO datasets. For repair, calculations have to be made for all materials, building components and surfaces with service lives of less than 50 years. Sources for service lives are the “Guideline for Sustainable Building” for construction materials and the VDI 2067 for building services. Also for the end-of-life stage, a scenario has to be defined for the recycling and disposal of the building materials that remain in the building after the end of the reference study period. So for each material, one end-of-life options has to be chosen and linked to the respective ESUCO dataset:
Metals recycling ”metal recycling potential”,
Mineral building materials recycling ”construction rubble processing”,
Materials with a heating value thermal recycling respective material group in ESUCO database,
Heat producers Dataset corresponding to the manufacturing process,
All other materials that can be deposited at construction or household waste sites disposal at
waste site appropriate ESUCO dataset. Within the impact assessment, the emissions determined in the inventory analysis are classified regarding their contributions to different environmental impacts and then characterized. Using characterization factors, they are converted into equivalents of lead emissions for the different impact categories (example: emissions contributing to Global Warming Potential are transformed to CO2 equivalents, emissions contributing to Acidification Potential are transformed to SO2 equivalents). By using environmental profiles such as provided by ESUCO, the step of impact assessment has already been done by the data providers: Environmental profiles are given by providing the LCA results for the respective component in form of different environmental impact categories. These results are then used within the building LCA. Interpretation Resulting impacts are then evaluated against reference values to determine the respective indicator assessment (see overall Rating / Assessment Matrix).
4 It is suggested to use European average datasets. This means that the datasets represent technologies on average
levels for Europe. These construction materials also contain European boundary conditions such as European datasets for electric or thermal energy or intermediate products and represent a common European market for construction materials. Using such European average datasets does not show the variability, for instance of the industry producing construction materials in Europe and thus has the advantage not to bias the analysis of the life cycle models by accounting for differences in different production techniques. This bias would reduce the significance of the results as the clear denotation of environmental hotspots in the structure and design of buildings would contain higher uncertainties on the origin of environmental impacts.
30
Assessment Guideline Environmental Quality - Indicator 1.3 – Acidification Potential
3. Calculation and Rating Calculation When calculating the acidification potential for the building, the following calculation rules must be followed: Acidification Potential for “Designed Building” Generally, the AP for the building life cycle is composed of the AP caused by the building construction and of the AP caused during operation. APLC = APC + APO (1) where APLC acidification potential of the life cycle of the entire building, APC building’s construction, maintenance, dismantling, and disposal including building systems technology as an average annual value of acidification potential over the time reference study period td in [kg SO2 equiv./(m²NFA *a)], APO predicted annual acidification potential for the operation of the building as constructed, derived from end energy demand according to national implementation of EPBD directive in [kg SO2 equiv./(m²NFA *a)], NFA Net Floor Area of the building.
Based on the modules as defined in Figure 1, the value for construction APC is calculated as follows: APC = (APMA + APMC) / td + APMB1,4 (2) where APMA predicted value of acidification potential created during the modules A1-45, including office building’s manufacture (construction and building systems technology) and transports to construction site in[kg SO2 equiv./(m²NFA )], APMC predicted value of acidification potential created during module C3 and C46, the office building’s end-of-life (design and building systems technology) in [kg SO2 equiv./(m²NFA)], APMB1,4 predicted value of acidification potential created during modules B1 and B47 on a yearly basis, the office building’s use and replacement (construction and building systems technology) in[kg SO2 equiv./(m²NFA *a)], td time period for the reference study period for certification in [a]. This time period is set at 50 years. The average annual value for use APO generally consists of the AP caused by the building`s electricity and heating demand during operation: APO = APMB6,E + APMB6,H (3) where APMB6,E acidification potential for module B6, electricity demand during use, calculated with the national implementation of the EPBD directive, multiplied by the AP factor for electricity of the ESUCO database in [kg SO2 equiv./(m²NFA *a)], APMB6,H acidification potential for module B7, heating demand during use, calculated with the national implementation of the EPBD directive, multiplied by the AP factor of the specific energy sources in the ESUCO database in [kg SO2 equiv./(m²NFA *a)].
5 Module A5 currently is not regarded due to a lack of data; compare chapter 2. 6 Modules C1 and C2 currently are not regarded due to a lack of data; compare chapter 2. 7 Modules B2, B3 and B5 currently are not regarded due to a lack of data; compare chapter 2.
31
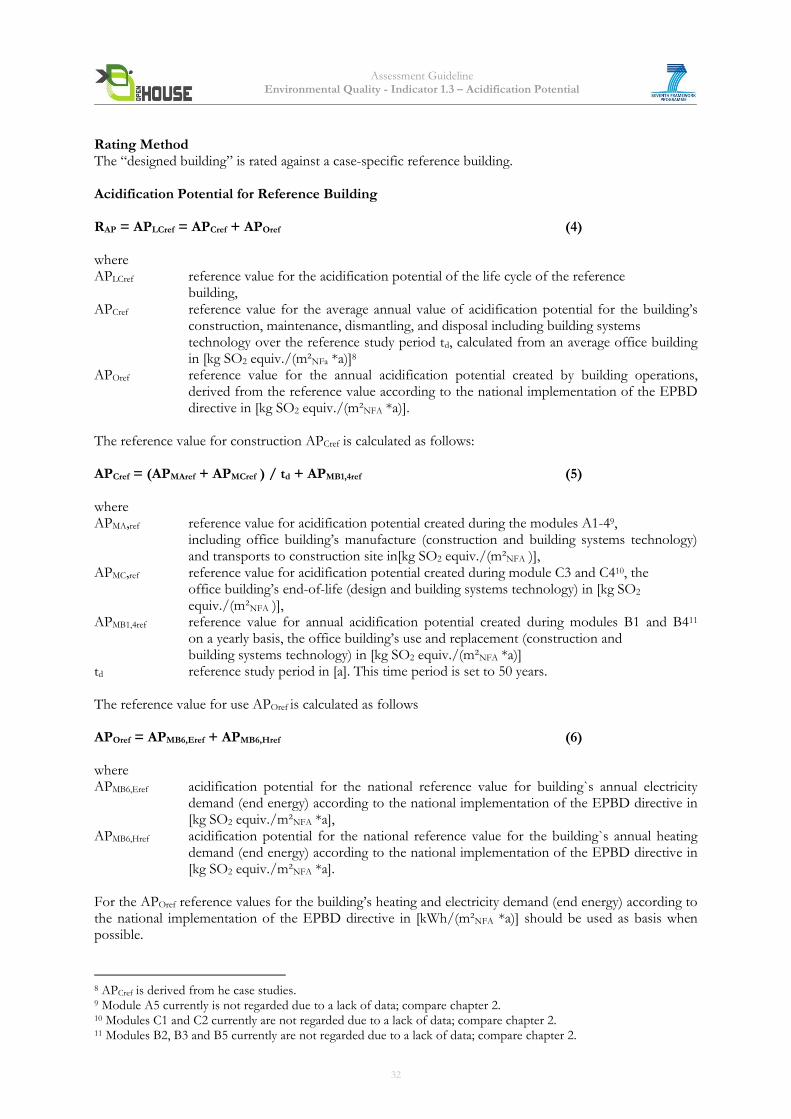
Assessment Guideline Environmental Quality - Indicator 1.3 – Acidification Potential
Rating Method The “designed building” is rated against a case-specific reference building. Acidification Potential for Reference Building RAP = APLCref = APCref + APOref (4) where APLCref reference value for the acidification potential of the life cycle of the reference building, APCref reference value for the average annual value of acidification potential for the building’s construction, maintenance, dismantling, and disposal including building systems technology over the reference study period td, calculated from an average office building in [kg SO2 equiv./(m²NFa *a)]8 APOref reference value for the annual acidification potential created by building operations, derived from the reference value according to the national implementation of the EPBD directive in [kg SO2 equiv./(m²NFA *a)]. The reference value for construction APCref is calculated as follows: APCref = (APMAref + APMCref ) / td + APMB1,4ref (5) where APMA,ref reference value for acidification potential created during the modules A1-49, including office building’s manufacture (construction and building systems technology) and transports to construction site in[kg SO2 equiv./(m²NFA )], APMC,ref reference value for acidification potential created during module C3 and C410, the office building’s end-of-life (design and building systems technology) in [kg SO2 equiv./(m²NFA )], APMB1,4ref reference value for annual acidification potential created during modules B1 and B411 on a yearly basis, the office building’s use and replacement (construction and building systems technology) in [kg SO2 equiv./(m²NFA *a)] td reference study period in [a]. This time period is set to 50 years. The reference value for use APOref is calculated as follows APOref = APMB6,Eref + APMB6,Href (6) where APMB6,Eref acidification potential for the national reference value for building`s annual electricity demand (end energy) according to the national implementation of the EPBD directive in [kg SO2 equiv./m²NFA *a], APMB6,Href acidification potential for the national reference value for the building`s annual heating demand (end energy) according to the national implementation of the EPBD directive in [kg SO2 equiv./m²NFA *a]. For the APOref reference values for the building’s heating and electricity demand (end energy) according to the national implementation of the EPBD directive in [kWh/(m²NFA *a)] should be used as basis when possible.
8 APCref is derived from he case studies. 9 Module A5 currently is not regarded due to a lack of data; compare chapter 2. 10 Modules C1 and C2 currently are not regarded due to a lack of data; compare chapter 2. 11 Modules B2, B3 and B5 currently are not regarded due to a lack of data; compare chapter 2.
32

Assessment Guideline Environmental Quality - Indicator 1.3 – Acidification Potential
The reference values for APCref can be extracted from Table1 and Table2. These tables show reference values for both assessment types – “Quick and Basic” assessment and “Complete” assessment. Table 1: European average reference values for “Quick and Basic”
Quick and Basic Based on 18 case studies
GWP [kg CO2E /(m²*y)
ODP kg R11E /(m²*a)])
AP [kg SO2E /(m²*a)]
EP [kg PO4
3-
E /(m²*a)]
POCP [kg C2H4E /(m²*a)]
Penr [kWh /(m²*a)]
PEre [kWh /(m²*a)]
PEtot [kWh /(m²*a)]
ADPelements [kg SB-E /(m²*a)]
Cref 6.5 3.1E-07 2.4E-02 2.7E-03 2.9E-03 24.2 4.8 29.0 1,9E-01 Oref 33.2 5.8E-06 1.8E-01 7.4E-03 1.1E-02 168.1 15.3 183.4 3,7E-02 Total 39.7 6.1E-06 2.0E-01 1.0E-02 1.3E-02 192.3 20.1 212.4 2,3E-01
Table 2: European average reference values for “Complete”
Complete Based on 6 case studies
GWP [kg CO2E /(m²*y)
ODP kg R11E /(m²*a)])
AP [kg SO2E /(m²*a)]
EP [kg PO4
3-E /(m²*a)]
POCP [kg C2H4E /(m²*a)]
Penr [kWh /(m²*a)]
PEre [kWh /(m²*a)]
PEtot [kWh /(m²*a)]
ADPelements [kg SB-E /(m²*a)]
Cref 10.6 3.8E-07 3.3E-02 3,3E-03 3.4E-03 33.1 4.9 38.0 4,2E-02 Oref 35.2 6.7E-06 2.1E-01 8.3E-03 1.2E-02 196.5 21.0 217.5 2,2E-01 Total 45.8 7.1E-06 2.4E-01 1.1E-02 1.5E-02 229.5 25.9 255.5 2.6 E-06
Table1 and Table2 also mention a reference value for the operational phase. These values can be used if nation benchmarks are not available. The procedure of choosing the benchmarks is described in Figure 2.
Benchmarks for „Open House“
CrefProduction of the materials/
refurbishment and End of Life
Oref
Use Phase
European average value based on case studies
National Benchmarks orendenergy values
available?
Use national benchmark
Yes No
Use European average valuebased on case studies
Figure 2: Setting of benchmarks in OPEN HOUSE
Limit value and target value calculation Limit value L and target value T, needed to supplement the criterion’s evaluation, are determined as follows: L = X * R (7) T = Y * R (8) The values X and Y are set as follows: X = 1.7 (9) Y = 0.7 (10)
33
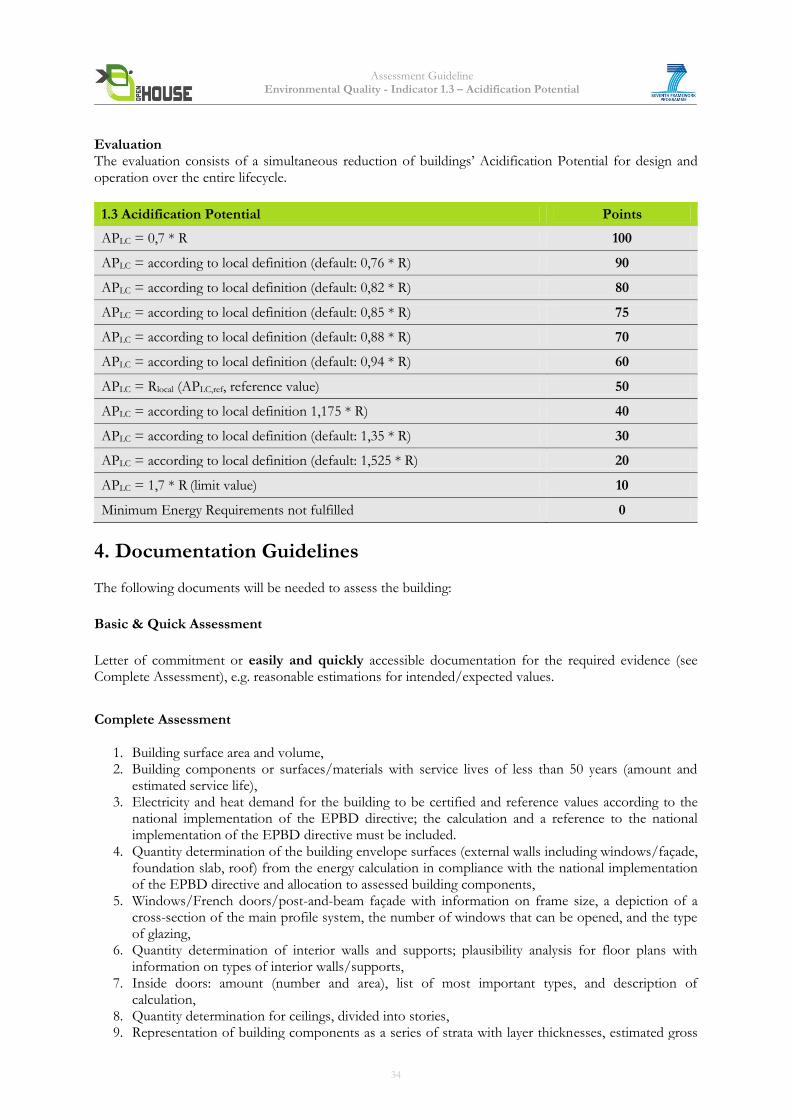
Assessment Guideline Environmental Quality - Indicator 1.3 – Acidification Potential
Evaluation The evaluation consists of a simultaneous reduction of buildings’ Acidification Potential for design and operation over the entire lifecycle.
1.3 Acidification Potential Points
APLC = 0,7 * R 100
APLC = according to local definition (default: 0,76 * R) 90
APLC = according to local definition (default: 0,82 * R) 80
APLC = according to local definition (default: 0,85 * R) 75
APLC = according to local definition (default: 0,88 * R) 70
APLC = according to local definition (default: 0,94 * R) 60
APLC = Rlocal (APLC,ref, reference value) 50
APLC = according to local definition 1,175 * R) 40
APLC = according to local definition (default: 1,35 * R) 30
APLC = according to local definition (default: 1,525 * R) 20
APLC = 1,7 * R (limit value) 10
Minimum Energy Requirements not fulfilled 0
4. Documentation Guidelines The following documents will be needed to assess the building:
Basic & Quick Assessment
Letter of commitment or easily and quickly accessible documentation for the required evidence (see Complete Assessment), e.g. reasonable estimations for intended/expected values.
Complete Assessment
1. Building surface area and volume, 2. Building components or surfaces/materials with service lives of less than 50 years (amount and
estimated service life), 3. Electricity and heat demand for the building to be certified and reference values according to the
national implementation of the EPBD directive; the calculation and a reference to the national implementation of the EPBD directive must be included.
4. Quantity determination of the building envelope surfaces (external walls including windows/façade, foundation slab, roof) from the energy calculation in compliance with the national implementation of the EPBD directive and allocation to assessed building components,
5. Windows/French doors/post-and-beam façade with information on frame size, a depiction of a cross-section of the main profile system, the number of windows that can be opened, and the type of glazing,
6. Quantity determination of interior walls and supports; plausibility analysis for floor plans with information on types of interior walls/supports,
7. Inside doors: amount (number and area), list of most important types, and description of calculation,
8. Quantity determination for ceilings, divided into stories, 9. Representation of building components as a series of strata with layer thicknesses, estimated gross
34
Assessment Guideline Environmental Quality - Indicator 1.3 – Acidification Potential
density, and allocation to a data set in the ESUCO database, 10. Representation of quantity determination for foundations, 11. For reinforced concrete, the share of reinforcement is to be given in kg/m3 or kg/m2 of the
building component. Alternatively, the reinforcing steel can be verified in an overall summary of the project.
12. Documentation of heating unit, 13. Documentation of transport distances and means of transport from manufacturing to construction
site. Most of these requirements can be met by providing a bill of materials (including masses, materials in a hierarchical structure, numbers of pieces, surface areas and volume of the building).
14. Documentation required for ecological footprint results: Results are to be presented for the entire lifecycle per m2 NFA and year, categorized by:
a. Manufacture b. Use (electricity and heat) c. Use (maintenance) d. End of life (dismantling/recycling/disposal)
5. Relation to other Indicators Data acquisition is the same for the indicators 1.1- 1.5, 1.9, 1.10, 1.15
6. Resources
1. ISO 14040: 2009-11: Environmental management – Life cycle assessment – Principles and framework. International Organization for Standardization.
2. ISO 14044: 2006-10: Environmental management – Life cycle assessment – Requirements and guidelines. International Organization for Standardization.
3. FprEN 15978: 2011: Sustainability of construction works — Assessment of environmental performance of buildings — Calculation method. European Committee for Standardization CEN.
4. prEN 15804: 2010: Sustainability of construction works — Environmental product declarations — Core rules for the product category of construction products. European Committee for Standardization CEN.
5. Directive 2009/28/EC of the European Parliament and of the Council of 23 April 2009 on the promotion of the use of energy from renewable sources and amending and subsequently repealing Directives 2001/77/EC and 2003/30/EC.
6. Kreißig, J., Binder, M. (2007): Methodische Grundlagen- Ökobilanzbasierte Umweltindikatoren im Bauwesen. Methodenbericht zum BMVBS-Projekt „Aktualisieren, Fortschreiben und Harmonisieren von Basisdaten für das nachhaltige Bauen“ (AZ 10.06.03 – 06.119) Mai 2007, www.baufachinformation.de/literatur.isp.
7. United Nations (1998): Kyoto Protocol to the United Nations Framework Convention on Climate Change, 1998, http://unfccc.int/resource/docs/convkp/kpeng.pdf.
8. Bundesministerium für Verkehr, Bau- und Wohnungswesen: Guideline for Sustainable Building. Eigenverlag, 2001.
9. Directive 2002/91/EC of the European Parliament and of the Council of 16 December 2002 on the energy performance of buildings.
10. VDI 2067: Economic efficiency of building installations – Fundamentals and economic calculation. Verein Deutscher Ingenieure, 2000.
7. Attachments
None
35
Assessment Guideline Environmental Quality - Indicator 1.4 – Eutrophication Potential
Indicator 1.4 Eutrophication Potential (EP) (adapted from DGNB/BNB)
Core Indicator
1. Objective Over-fertilization (eutrophication) is the transition of water or soils from a nutrient-poor to a nutrient-rich state. This is caused by supply of nutrients, especially phosphor and nitrogen compounds. The nutrients can emerge from the manufacturing of building products, but mainly from the wash-out of emissions into the environment. The resulting changes in the nutrient supply manifests e.g. in water in the form of an increased algae appearance, which again may cause fish decline. For the assessment of the Eutrophication Potential (EP) of a building life cycle (construction and operation), PO4 equivalents per area and year are used. The lower the PO4-eqivalent value, the lower is the potential of negative side effects on men and the environment. The indicator aims at the reduction of buildings` Eutrophication Potential, thus preventing the environmental impacts described above. This supports the European Commission target of emission reductions in the EU-25 of 27% for Ammonia NH3 (responsible for eutrophication). by 2020 compared to 1990s level1. The objective is to reduce the threat to the natural environment from eutrophication by 55%2.
2. Assessment Methodology The indicator is mainly based on the method of Life Cycle Assessment (LCA): LCA results of the building to be assessed will be calculated in a standardized way and evaluated against benchmarks. Thus Eutrophication Potential is a quantitative indicator. According to the standards EN ISO 14040 and 14044, the method of Life-Cycle Assessment generally consists of four steps: Definition of goal and scope of the study, inventory analysis, impact assessment and interpretation. The indicators 1.1-1.5, 1.9 and 1.10 are based on LCAs and for all these indicators the same definitions for goal and scope and for the inventory analysis do apply. Goal and scope definition The goal of all LCA studies is to analyze and later benchmark the environmental performance of the respective buildings` life cycles. The scope of the building assessment therefore includes the following life cycle stages:
production: raw material supply, transport to manufacturing, manufacturing and transport to the construction site of products used in the building (Figure 1, modules A1-A4),
use stage: a scenario is defined including use and replacement, including end-of-life of replaced products (Figure 1, modules B1 and B4); in addition the operational energy use is considered (Figure 1, module B6),
end-of-life stage: waste processing and disposal of the building, (Figure 1, modules C3 and C4),
a scenario for potential benefits and loads beyond the system boundaries, including loads for reuse and recycling as well as benefits from recycling potentials (Figure 1, module D).
1 Impact Assessment SEC (2005) 1133 2 Thematic Strategy on air pollution COM(2005) 446
36

Assessment Guideline Environmental Quality - Indicator 1.4 – Eutrophication Potential
BUILDING ASSESSMENT INFORMATION
BUILDING LIFE CYCLE INFORMATION
Raw
Mat
eri
als
Sup
ply
Tra
nsp
ort
Man
ufa
ctu
rin
g
PRODUCT STAGE
A1 - 3
A1 - A3
Tran
spo
rt
CONSTRUCTION PROCESS
A4 - 5
A4
Cons
truc
tion
–In
stal
lati
on
proc
ess
A5
Use
USE STAGE
B1 - 7
B1
Mai
nte
nan
ce
B2
Rep
air
Re
plac
em
ent
Re
furb
ish
me
nt
B3 B4 B5
Operational Energy use
Operational Water useB 7
B 6 De
con
stru
ctio
n
END OF LIFE STAGE
C1 - 4
C1
Tran
spor
tC
2
Was
te p
roce
ssin
g fo
r re
use,
re
cove
ry o
r an
d re
cycl
ing
C3
Dis
po
sal
C4
Benefits and loads beyond the system boundary
D
Reuse -Recovery -Recycling -potential
SUPPLEMENTARY INFORMATION BEYOND
THE BUILDING LIFE CYCLE
Figure 1 Building Life Cycle Phases according to FprEN 15978, adapted
The following processes are not included:
Transport to construction side (Figure 1, module A4)
Construction – Installation process (Figure 1, module A5),
Energy use for user equipment during reference study period,
Operational water use (Figure 1, module B7),
Maintenance, repair and refurbishment during reference study period – (Figure 1, modules B2, B3 and B5),
Deconstruction and transport to waste processing / disposal (Figure 1, modules C1 and C2),
Transport to recycling (Figure 1, module C2). The reference study period is defined with 50 years. The functional equivalent (quantified functional requirements, intended use and/or technical requirements3), which is used as basis for comparison, is defined to be m²NFA*year. Inventory Analysis and Impact Assessment During the inventory analysis of an LCA, emissions and resource consumption are identified, calculated and summed up over the life cycle of a product. Within building LCAs, separate calculations are carried out for the buildings` elements (product and end-of-life stage) and for the determination of emissions and resource uses during operation (see Equations 1, 2 and 3). The inventory analysis of the buildings` elements mainly consists in providing quantitative information on the building elements used (see also Documentation Guidelines). Building compartments to be included are
1. Exterior walls and basement walls incl. windows and coatings, 2. Roof, 3. Ceilings incl. flooring and floor coverings / coatings, 4. Floor slab incl. flooring, floor coverings; floor slab above air, 5. Foundations, 6. Interior walls incl. coatings and supports, 7. Heat generation units.
3 prEN 15643-1:2010: Sustainability of construction works – Sustainability assessment of buildings – Part 1: General framework
37

Assessment Guideline Environmental Quality - Indicator 1.4 – Eutrophication Potential
For these, respective datasets are picked out from the ESUCO database, which include environmental profiles of the used component: for the respective component, a standardized LCA has been conducted earlier and the results are provided within this database format. For the module A4, which contains transports from manufacturing to the construction site, information about transport distances and means of transportation have to be provided and connected to the respective ESUCO data sets4. For the analysis of the use stage, a scenario has to be set up, including supply and disposal systems and repairs. For supply and disposal, values for end energy consumption for electricity and heat have to be derived from the respective national implementation of the EPBD directive. Heating units as well as the electricity demand calculated have to be listed and linked to the respective ESUCO datasets. For repair, calculations have to be made for all materials, building components and surfaces with service lives of less than 50 years. Sources for service lives are the “Guideline for Sustainable Building” for construction materials and the VDI 2067 for building services. Also for the end-of-life stage, a scenario has to be defined for the recycling and disposal of the building materials that remain in the building after the end of the reference study period. So for each material, one end-of-life options has to be chosen and linked to the respective ESUCO dataset:
Metals recycling ”metal recycling potential”,
Mineral building materials recycling ”construction rubble processing”,
Materials with a heating value thermal recycling respective material group in ESUCO database,
Heat producers Dataset corresponding to the manufacturing process,
All other materials that can be deposited at construction or household waste sites disposal at
waste site appropriate ESUCO dataset. Within the impact assessment, the emissions determined in the inventory analysis are classified regarding their contributions to different environmental impacts and then characterized. Using characterization factors, they are converted into equivalents of lead emissions for the different impact categories (example: emissions contributing to Eutrophication Potential are transformed to PO4 equivalents, emissions contributing to Acidification Potential are transformed to SO2 equivalents). By using environmental profiles such as provided by ESUCO, the step of impact assessment has already been done by the data providers: Environmental profiles are given by providing the LCA results for the respective component in form of different environmental impact categories. These results are then used within the building LCA. Interpretation Resulting impacts are then evaluated against reference values to determine the respective indicator assessment (see overall Rating / Assessment Matrix).
4 It is suggested to use European average datasets. This means that the datasets represent technologies on average
levels for Europe. These construction materials also contain European boundary conditions such as European datasets for electric or thermal energy or intermediate products and represent a common European market for construction materials. Using such European average datasets does not show the variability, for instance of the industry producing construction materials in Europe and thus has the advantage not to bias the analysis of the life cycle models by accounting for differences in different production techniques. This bias would reduce the significance of the results as the clear denotation of environmental hotspots in the structure and design of buildings would contain higher uncertainties on the origin of environmental impacts.
38
Assessment Guideline Environmental Quality - Indicator 1.4 – Eutrophication Potential
3. Calculation and Rating Calculation the following calculation rules must be followed: Eutrophication Potential for “Designed Building” Generally, the EP for the building life cycle is composed of the EP caused by the building construction and of the EP caused during operation. EPLC = EPC + EPO (1) where EPLC eutrophication potential of the life cycle of the entire building, EPC building’s construction, maintenance, dismantling, and disposal including building systems technology as an average annual value of eutrophication potential over the time reference study period td in [kg PO4 equiv./(m²NFA *a)], EPO predicted annual eutrophication potential for the operation of the building as constructed, derived from end energy demand according to national implementation of EPBD directive in [kg PO4 equiv./(m²NFA *a)], NFA Net Floor Area of the building.
Based on the modules as defined in Figure 1, the value for construction EPC is calculated as follows: EPC = (EPMA + EPMC) / td + EPMB1,4 (2) where EPMA predicted value of eutrophication potential created during the modules A1-45, including office building’s manufacture (construction and building systems technology) and transports to construction site in [kg PO4 equiv./(m²NFA )], EPMC predicted value of eutrophication potential created during module C3 and C46, the office building’s end-of-life (design and building systems technology) in [kg PO4 equiv./(m²NFA)], EPMB1,4 predicted value of eutrophication potential created during modules B1 and B47 on a yearly basis, the office building’s use and replacement (construction and building systems technology) in [kg PO4 equiv./(m²NFA *a)], td time period for the reference study period for certification in [a]. This time period is set at 50 years. The average annual value for use EPO generally consists of the EP caused by the building`s electricity and heating demand during operation: EPO = EPMB6,E + EPMB6,H (3) where EPMB6,E eutrophication potential for module B6, electricity demand during use, calculated with the national implementation of the EPBD directive, multiplied by the EP factor for electricity of the ESUCO database in [kg PO4 equiv./(m²NFA *a)], EPMB6,H eutrophication potential for module B7, heating demand during use, calculated with the national implementation of the EPBD directive, multiplied by the EP factor of the specific energy sources in the ESUCO database in [kg PO4 equiv./(m²NFA *a)].
5 Module A5 currently is not regarded due to a lack of data; compare chapter 2. 6 Modules C1 and C2 currently are not regarded due to a lack of data; compare chapter 2. 7 Modules B2, B3 and B5 currently are not regarded due to a lack of data; compare chapter 2.
39
Assessment Guideline Environmental Quality - Indicator 1.4 – Eutrophication Potential
Rating Method The “designed building” is rated against a case-specific reference building. Eutrophication Potential for Reference Building REP = EPLCref = EPCref + EPOref (4) where EPLCref reference value for the eutrophication potential of the life cycle of the reference building, EPCref reference value for the average annual value of eutrophication potential for the building’s construction, maintenance, dismantling, and disposal including building systems technology over the reference study period td, calculated from an average office building in [kg PO4 equiv./(m²NFA *a)]8, EPOref reference value for the annual eutrophication potential created by building operations, derived from the reference value according to the national implementation of the EPBD directive in [kg PO4 equiv./(m²NFA *a)]. The reference value for construction EPCref is calculated as follows: EPCref = (EPMAref + EPMCref ) / td + EPMB1,4ref (5) where EPMA ref reference value for eutrophication potential created during the modules A1-49, including office building’s manufacture (construction and building systems technology) and transports to construction site in[kg PO4 equiv./(m²NFA )], EPMC ref reference value for eutrophication potential created during module C3 and C410, the office building’s end-of-life (design and building systems technology) in [kg PO4 equiv./(m²NFA )], EPMB1,4ref reference value for annual eutrophication potential created during modules B1 and B411 on a yearly basis, the office building’s use and replacement (construction and building systems technology) in [kg PO4 equiv./(m²NFA *a)] td reference study period in [a]. This time period is set to 50 years. The reference value for use EPOref is calculated as follows EPOref = EPMB6,Eref + EPMB6,Href (6) where EPMB6,Eref eutrophication potential for the national reference value for building`s annual electricity demand (end energy) according to the national implementation of the EPBD directive in [kg PO4 equiv./m²NFA *a], EPMB6,Href eutrophication potential for the national reference value for the building`s annual heating demand (end energy) according to the national implementation of the EPBD directive in [kg PO4 equiv./m²NFA *a]. For the EPOref reference values for the building’s heating and electricity demand (end energy) according to the national implementation of the EPBD directive in [kWh/(m²NFA *a)] should be used as basis when possible.
8 EPCref will be derived from the case studies 9 Module A5 currently is not regarded due to a lack of data; compare chapter 2. 10 Modules C1 and C2 currently are not regarded due to a lack of data; compare chapter 2. 11 Modules B2, B3 and B5 currently are not regarded due to a lack of data; compare chapter 2.
40
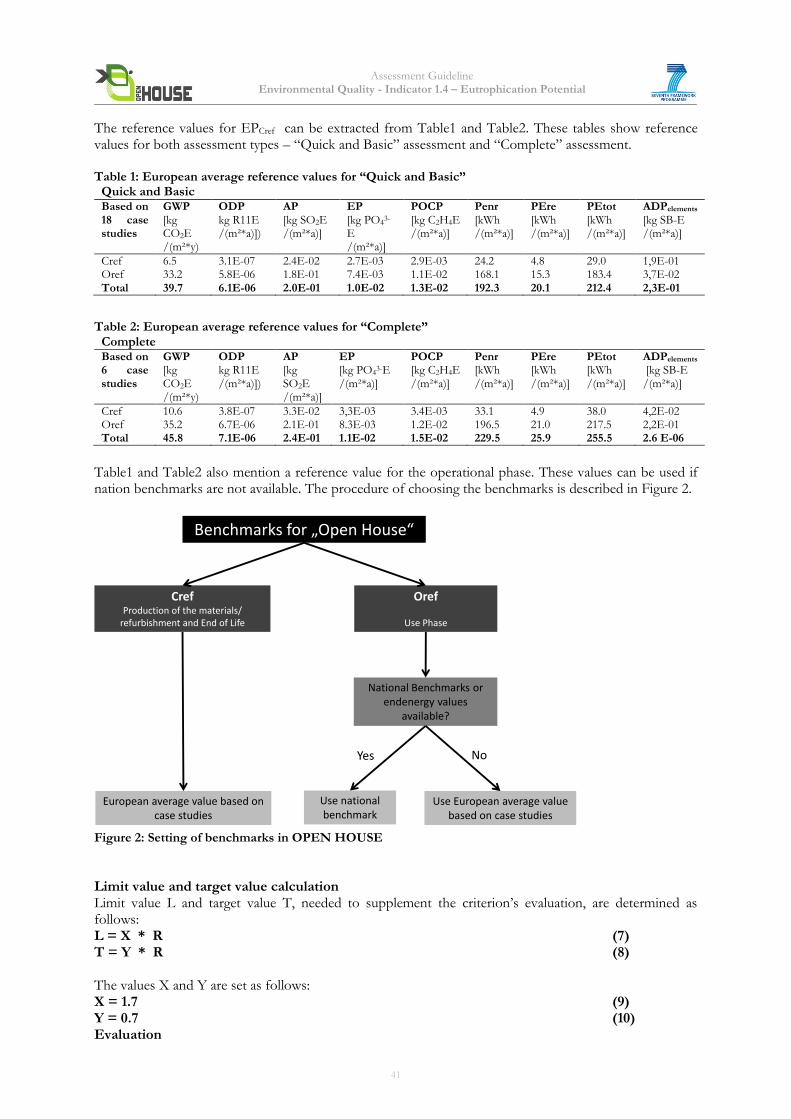
Assessment Guideline Environmental Quality - Indicator 1.4 – Eutrophication Potential
The reference values for EPCref can be extracted from Table1 and Table2. These tables show reference values for both assessment types – “Quick and Basic” assessment and “Complete” assessment. Table 1: European average reference values for “Quick and Basic”
Quick and Basic Based on 18 case studies
GWP [kg CO2E /(m²*y)
ODP kg R11E /(m²*a)])
AP [kg SO2E /(m²*a)]
EP [kg PO4
3-
E /(m²*a)]
POCP [kg C2H4E /(m²*a)]
Penr [kWh /(m²*a)]
PEre [kWh /(m²*a)]
PEtot [kWh /(m²*a)]
ADPelements [kg SB-E /(m²*a)]
Cref 6.5 3.1E-07 2.4E-02 2.7E-03 2.9E-03 24.2 4.8 29.0 1,9E-01 Oref 33.2 5.8E-06 1.8E-01 7.4E-03 1.1E-02 168.1 15.3 183.4 3,7E-02 Total 39.7 6.1E-06 2.0E-01 1.0E-02 1.3E-02 192.3 20.1 212.4 2,3E-01
Table 2: European average reference values for “Complete”
Complete Based on 6 case studies
GWP [kg CO2E /(m²*y)
ODP kg R11E /(m²*a)])
AP [kg SO2E /(m²*a)]
EP [kg PO4
3-E /(m²*a)]
POCP [kg C2H4E /(m²*a)]
Penr [kWh /(m²*a)]
PEre [kWh /(m²*a)]
PEtot [kWh /(m²*a)]
ADPelements [kg SB-E /(m²*a)]
Cref 10.6 3.8E-07 3.3E-02 3,3E-03 3.4E-03 33.1 4.9 38.0 4,2E-02 Oref 35.2 6.7E-06 2.1E-01 8.3E-03 1.2E-02 196.5 21.0 217.5 2,2E-01 Total 45.8 7.1E-06 2.4E-01 1.1E-02 1.5E-02 229.5 25.9 255.5 2.6 E-06
Table1 and Table2 also mention a reference value for the operational phase. These values can be used if nation benchmarks are not available. The procedure of choosing the benchmarks is described in Figure 2.
Benchmarks for „Open House“
CrefProduction of the materials/
refurbishment and End of Life
Oref
Use Phase
European average value based on case studies
National Benchmarks orendenergy values
available?
Use national benchmark
Yes No
Use European average valuebased on case studies
Figure 2: Setting of benchmarks in OPEN HOUSE
Limit value and target value calculation Limit value L and target value T, needed to supplement the criterion’s evaluation, are determined as follows: L = X * R (7) T = Y * R (8) The values X and Y are set as follows: X = 1.7 (9) Y = 0.7 (10) Evaluation
41
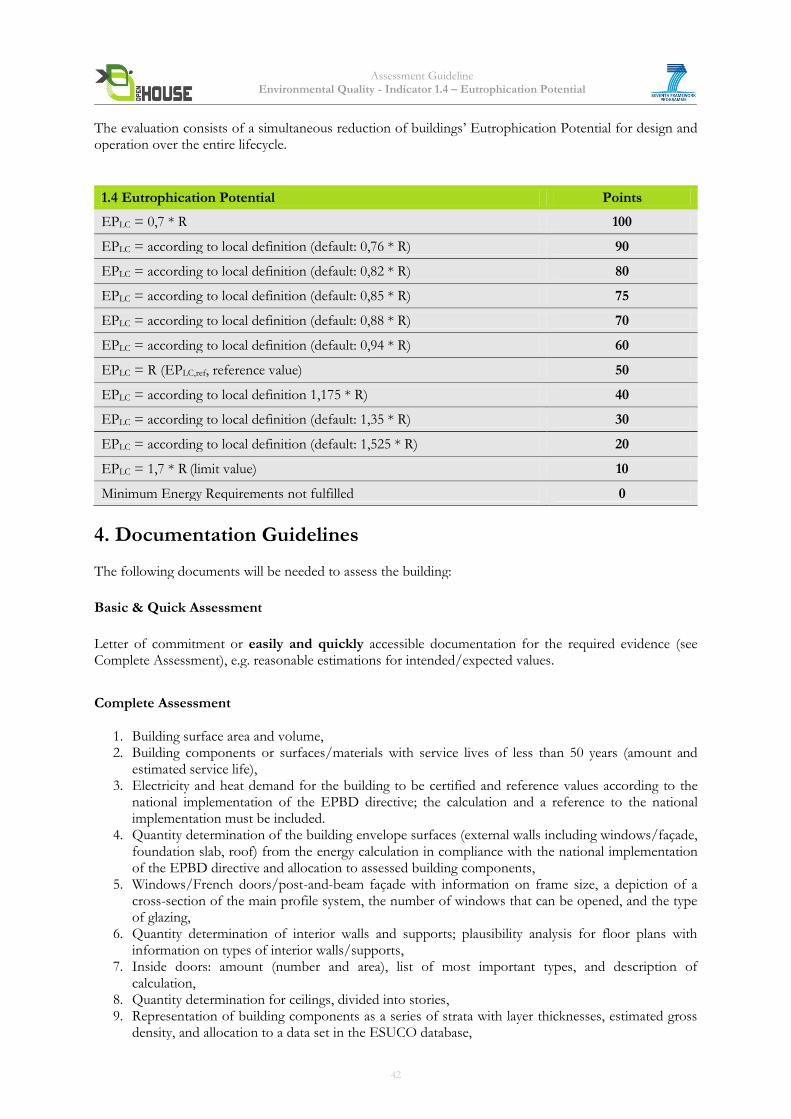
Assessment Guideline Environmental Quality - Indicator 1.4 – Eutrophication Potential
The evaluation consists of a simultaneous reduction of buildings’ Eutrophication Potential for design and operation over the entire lifecycle.
1.4 Eutrophication Potential Points
EPLC = 0,7 * R 100
EPLC = according to local definition (default: 0,76 * R) 90
EPLC = according to local definition (default: 0,82 * R) 80
EPLC = according to local definition (default: 0,85 * R) 75
EPLC = according to local definition (default: 0,88 * R) 70
EPLC = according to local definition (default: 0,94 * R) 60
EPLC = R (EPLC,ref, reference value) 50
EPLC = according to local definition 1,175 * R) 40
EPLC = according to local definition (default: 1,35 * R) 30
EPLC = according to local definition (default: 1,525 * R) 20
EPLC = 1,7 * R (limit value) 10
Minimum Energy Requirements not fulfilled 0
4. Documentation Guidelines The following documents will be needed to assess the building:
Basic & Quick Assessment
Letter of commitment or easily and quickly accessible documentation for the required evidence (see Complete Assessment), e.g. reasonable estimations for intended/expected values.
Complete Assessment
1. Building surface area and volume, 2. Building components or surfaces/materials with service lives of less than 50 years (amount and
estimated service life), 3. Electricity and heat demand for the building to be certified and reference values according to the
national implementation of the EPBD directive; the calculation and a reference to the national implementation must be included.
4. Quantity determination of the building envelope surfaces (external walls including windows/façade, foundation slab, roof) from the energy calculation in compliance with the national implementation of the EPBD directive and allocation to assessed building components,
5. Windows/French doors/post-and-beam façade with information on frame size, a depiction of a cross-section of the main profile system, the number of windows that can be opened, and the type of glazing,
6. Quantity determination of interior walls and supports; plausibility analysis for floor plans with information on types of interior walls/supports,
7. Inside doors: amount (number and area), list of most important types, and description of calculation,
8. Quantity determination for ceilings, divided into stories, 9. Representation of building components as a series of strata with layer thicknesses, estimated gross
density, and allocation to a data set in the ESUCO database,
42
Assessment Guideline Environmental Quality - Indicator 1.4 – Eutrophication Potential
10. Representation of quantity determination for foundations, 11. For reinforced concrete, the share of reinforcement is to be given in kg/m3 or kg/m2 of the
building component. Alternatively, the reinforcing steel can be verified in an overall summary of the project.
12. Documentation of heating unit, 13. Documentation of transport distances and means of transport from manufacturing to construction
site. Most of these requirements can be met by providing a bill of materials (including masses, materials in a hierarchical structure, numbers of pieces, surface areas and volume of the building).
14. Documentation required for ecological footprint results: Results are to be presented for the entire lifecycle per m2 NFA and year, categorized by:
a. Manufacture b. Use (electricity and heat) c. Use (maintenance) d. End of life (dismantling/recycling/disposal)
5. Relation to other Indicators Data acquisition is the same for the indicators 1.1- 1.5, 1.9, 1.10, 1.15
6. Resources
1. ISO 14040: 2009-11: Environmental management – Life cycle assessment – Principles and framework. International Organization for Standardization.
2. ISO 14044: 2006-10: Environmental management – Life cycle assessment – Requirements and guidelines. International Organization for Standardization.
3. FprEN 15978: 2011: Sustainability of construction works — Assessment of environmental performance of buildings — Calculation method. European Committee for Standardization CEN.
4. prEN 15804: 2010: Sustainability of construction works — Environmental product declarations — Core rules for the product category of construction products. European Committee for Standardization CEN.
5. Directive 2009/28/EC of the European Parliament and of the Council of 23 April 2009 on the promotion of the use of energy from renewable sources and amending and subsequently repealing Directives 2001/77/EC and 2003/30/EC.
6. Kreißig, J., Binder, M. (2007): Methodische Grundlagen- Ökobilanzbasierte Umweltindikatoren im Bauwesen. Methodenbericht zum BMVBS-Projekt „Aktualisieren, Fortschreiben und Harmonisieren von Basisdaten für das nachhaltige Bauen“ (AZ 10.06.03 – 06.119) Mai 2007, www.baufachinformation.de/literatur.isp.
7. United Nations (1998): Kyoto Protocol to the United Nations Framework Convention on Climate Change, 1998, http://unfccc.int/resource/docs/convkp/kpeng.pdf.
8. Bundesministerium für Verkehr, Bau- und Wohnungswesen: Guideline for Sustainable Building. Eigenverlag, 2001.
9. Directive 2002/91/EC of the European Parliament and of the Council of 16 December 2002 on the energy performance of buildings.
10. VDI 2067: Economic efficiency of building installations – Fundamentals and economic calculation. Verein Deutscher Ingenieure, 2000.
7. Attachments
None
43
Assessment Guideline Environmental Quality - Indicator 1.5 – Photochemical Ozone Creation Potential
Indicator 1.5 Photochemical Ozone Creation Potential (POCP) (adapted from DGNB/BNB)
Core Indicator
1. Objective Radiation from the sun and the presence of nitrogen oxides and hydrocarbons incur different chemical reactions, producing aggressive reaction products, one of which is ozone. Such near-ground ozone also known as summer smog is suspected to damage vegetation and material. High concentrations of ozone are toxic to humans.1 A substance`s contribution is indicated relatively to the Photochemical Ozone Creation Potential of C2H4. The indicator aims at the reduction of buildings` Photochemical Ozone Creation Potential, thus preventing the environmental impacts described above. This supports the European Commission target of emission reductions in the EU-25 of 60% for NOx and 51% for VOCs (responsible for ozone creation) by 2020 compared to 1990s level2.
2. Assessment Methodology The indicator is mainly based on the method of Life Cycle Assessment (LCA): LCA results of the building to be assessed will be calculated in a standardized way and evaluated against benchmarks. Thus Photochemical Ozone Creation Potential is a quantitative indicator. According to the standards EN ISO 14040 and 14044, the method of Life-Cycle Assessment generally consists of four steps: Definition of goal and scope of the study, inventory analysis, impact assessment and interpretation. The indicators 1.1-1.5, 1.9 and 1.10 are based on LCAs and for all these indicators the same definitions for goal and scope and for the inventory analysis do apply. Goal and scope definition The goal of all LCA studies is to analyze and later benchmark the environmental performance of the respective buildings` life cycles. The scope of the building assessment therefore includes the following life cycle stages:
production: raw material supply, transport to manufacturing, manufacturing and transport to the construction site of products used in the building (Figure 1, modules A1-A4),
use stage: a scenario is defined including use and replacement, including end-of-life of replaced products (Figure 1, modules B1 and B4); in addition the operational energy use is considered (Figure 1, module B6),
end-of-life stage: waste processing and disposal of the building, (Figure 1, modules C3 and C4),
a scenario for potential benefits and loads beyond the system boundaries, including loads for reuse and recycling as well as benefits from recycling potentials (Figure 1, module D).
1 http://www.leonardo-energy.org 2 Impact Assessment SEC (2005) 1133
44
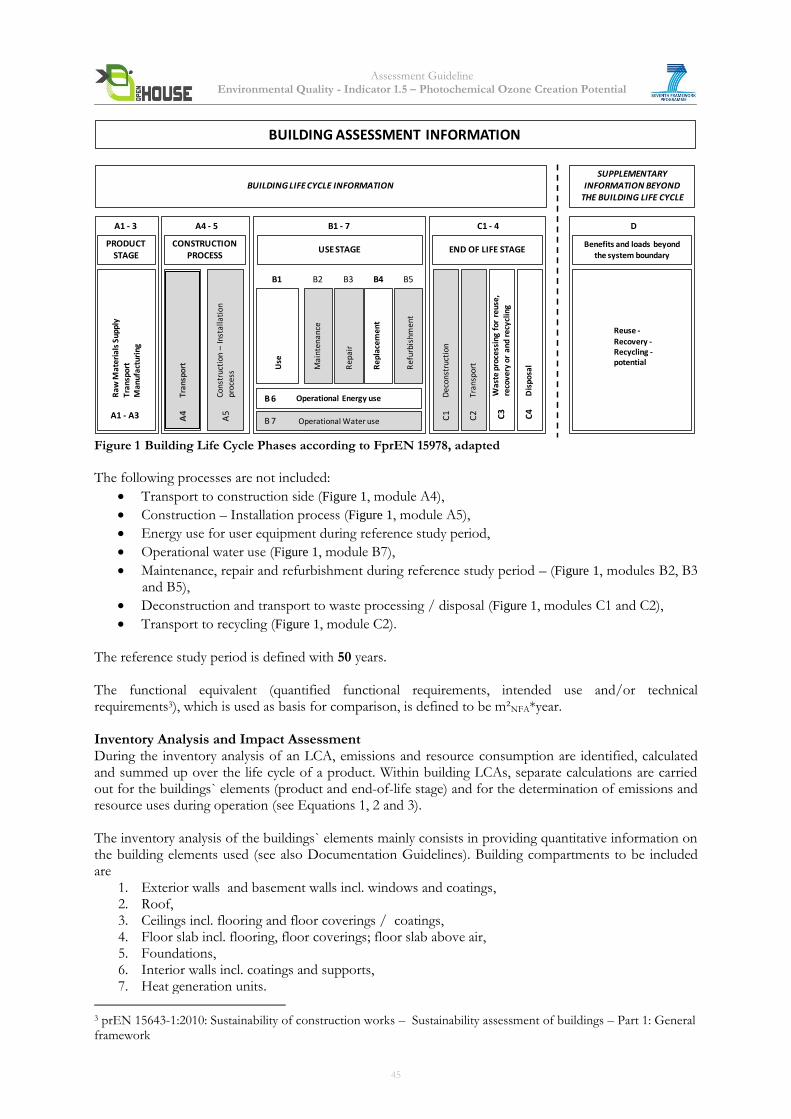
Assessment Guideline Environmental Quality - Indicator 1.5 – Photochemical Ozone Creation Potential
BUILDING ASSESSMENT INFORMATION
BUILDING LIFE CYCLE INFORMATION
Raw
Mat
eri
als
Sup
ply
Tra
nsp
ort
Man
ufa
ctu
rin
g
PRODUCT STAGE
A1 - 3
A1 - A3
Tran
spo
rt
CONSTRUCTION PROCESS
A4 - 5
A4
Cons
truc
tion
–In
stal
lati
on
proc
ess
A5
Use
USE STAGE
B1 - 7
B1
Mai
nte
nan
ce
B2
Rep
air
Re
plac
em
ent
Re
furb
ish
me
nt
B3 B4 B5
Operational Energy use
Operational Water useB 7
B 6 De
con
stru
ctio
n
END OF LIFE STAGE
C1 - 4
C1
Tran
spor
tC
2
Was
te p
roce
ssin
g fo
r re
use,
re
cove
ry o
r an
d re
cycl
ing
C3
Dis
po
sal
C4
Benefits and loads beyond the system boundary
D
Reuse -Recovery -Recycling -potential
SUPPLEMENTARY INFORMATION BEYOND
THE BUILDING LIFE CYCLE
Figure 1 Building Life Cycle Phases according to FprEN 15978, adapted
The following processes are not included:
Transport to construction side (Figure 1, module A4),
Construction – Installation process (Figure 1, module A5),
Energy use for user equipment during reference study period,
Operational water use (Figure 1, module B7),
Maintenance, repair and refurbishment during reference study period – (Figure 1, modules B2, B3 and B5),
Deconstruction and transport to waste processing / disposal (Figure 1, modules C1 and C2),
Transport to recycling (Figure 1, module C2). The reference study period is defined with 50 years. The functional equivalent (quantified functional requirements, intended use and/or technical requirements3), which is used as basis for comparison, is defined to be m²NFA*year. Inventory Analysis and Impact Assessment During the inventory analysis of an LCA, emissions and resource consumption are identified, calculated and summed up over the life cycle of a product. Within building LCAs, separate calculations are carried out for the buildings` elements (product and end-of-life stage) and for the determination of emissions and resource uses during operation (see Equations 1, 2 and 3). The inventory analysis of the buildings` elements mainly consists in providing quantitative information on the building elements used (see also Documentation Guidelines). Building compartments to be included are
1. Exterior walls and basement walls incl. windows and coatings, 2. Roof, 3. Ceilings incl. flooring and floor coverings / coatings, 4. Floor slab incl. flooring, floor coverings; floor slab above air, 5. Foundations, 6. Interior walls incl. coatings and supports, 7. Heat generation units.
3 prEN 15643-1:2010: Sustainability of construction works – Sustainability assessment of buildings – Part 1: General framework
45
Assessment Guideline Environmental Quality - Indicator 1.5 – Photochemical Ozone Creation Potential
For these, respective datasets are picked out from the ESUCO database, which include environmental profiles of the used component: for the respective component, a standardized LCA has been conducted earlier and the results are provided within this database format. For the module A4, which contains transports from manufacturing to the construction site, information about transport distances and means of transportation have to be provided and connected to the respective ESUCO data sets4. For the analysis of the use stage, a scenario has to be set up, including supply and disposal systems and repairs. For supply and disposal, values for end energy consumption for electricity and heat have to be derived from the respective national implementation of the EPBD directive. Heating units as well as the electricity demand calculated have to be listed and linked to the respective ESUCO datasets. For repair, calculations have to be made for all materials, building components and surfaces with service lives of less than 50 years. Sources for service lives are the “Guideline for Sustainable Building” for construction materials and the VDI 2067 for building services. Also for the end-of-life stage, a scenario has to be defined for the recycling and disposal of the building materials that remain in the building after the end of the reference study period. So for each material, one end-of-life options has to be chosen and linked to the respective ESUCO dataset:
Metals recycling ”metal recycling potential”,
Mineral building materials recycling ”construction rubble processing”,
Materials with a heating value thermal recycling respective material group in ESUCO database,
Heat producers Dataset corresponding to the manufacturing process,
All other materials that can be deposited at construction or household waste sites disposal at
waste site appropriate ESUCO dataset. Within the impact assessment, the emissions determined in the inventory analysis are classified regarding their contributions to different environmental impacts and then characterized. Using characterization factors, they are converted into equivalents of lead emissions for the different impact categories (example: emissions contributing to Photochemical Ozone Creation Potential are transformed to C2H4-equivalents, emissions contributing to Acidification Potential are transformed to SO2-equivalents). By using environmental profiles such as provided by ESUCO, the step of impact assessment has already been done by the data providers: Environmental profiles are given by providing the LCA results for the respective component in form of different environmental impact categories. These results are then used within the building LCA. Interpretation Resulting impacts are then evaluated against reference values to determine the respective indicator assessment (see overall Rating / Assessment Matrix).
4 It is suggested to use European average datasets. This means that the datasets represent technologies on average
levels for Europe. These construction materials also contain European boundary conditions such as European datasets for electric or thermal energy or intermediate products and represent a common European market for construction materials. Using such European average datasets does not show the variability, for instance of the industry producing construction materials in Europe and thus has the advantage not to bias the analysis of the life cycle models by accounting for differences in different production techniques. This bias would reduce the significance of the results as the clear denotation of environmental hotspots in the structure and design of buildings would contain higher uncertainties on the origin of environmental impacts.
46
Assessment Guideline Environmental Quality - Indicator 1.5 – Photochemical Ozone Creation Potential
3. Calculation and Rating Calculation The following calculation rules must be followed: Photochemical Ozone Creation Potential for “Designed Building” Generally, the POCP for the building life cycle is composed of the POCP caused by the building construction and of the POCP caused during operation. POCPLC = POCPC + POCPO (1) where POCPLC photochemical ozone creation potential of the life cycle of the entire building, POCPC building’s construction, maintenance, dismantling, and disposal including building systems technology as an average annual value of photochemical ozone creation potential over the time reference study period td in [kg C2H4 equiv./(m²NFA *a)], POCPO predicted annual photochemical ozone creation potential for the operation of the building as constructed, derived from end energy demand according to national implementation of EPBD directive in [kg C2H4 equiv./(m²NFA *a)], NFA Net Floor Area of the building.
Based on the modules as defined in Figure 1, the value for construction POCPC is calculated as follows: POCPC = (POCPMA + POCPMC) / td + POCPMB1,4 (2) where POCPMA predicted value of photochemical ozone creation potential created during the modules A1-45, including office building’s manufacture (construction and building systems technology) and transports to construction site in[kg C2H4 equiv./(m²NFA )], POCPMC predicted value of photochemical ozone creation potential created during module C3 and C46, the office building’s end-of-life (design and building systems technology) in [kg C2H4 equiv./(m²NFA)], POCPMB1,4 predicted value of photochemical ozone creation potential created during modules B1 and B47 on a yearly basis, the office building’s use and replacement (construction and building systems technology) in[kg C2H4 equiv./(m²NFA *a)], td time period for the reference study period for certification in [a]. This time period is set at 50 years. The average annual value for use POCPO generally consists of the POCP caused by the building`s electricity and heating demand during operation: POCPO = POCPMB6,E + POCPMB6,H (3) where POCPMB6,E photochemical ozone creation potential for module B6, electricity demand during use, calculated with the national implementation of the EPBD directive, multiplied by the POCP factor for electricity of the ESUCO database in [kg C2H4 equiv./(m²NFA *a)], POCPMB6,H photochemical ozone creation potential for module B7, heating demand during use, calculated with the national implementation of the EPBD directive, multiplied by the POCP factor of the specific energy sources in the ESUCO database in [kg C2H4 equiv./(m²NFA *a)].
5 Module A5 currently is not regarded due to a lack of data; compare chapter 2. 6 Modules C1 and C2 currently are not regarded due to a lack of data; compare chapter 2. 7 Modules B2, B3 and B5 currently are not regarded due to a lack of data; compare chapter 2.
47
Assessment Guideline Environmental Quality - Indicator 1.5 – Photochemical Ozone Creation Potential
Rating Method The “designed building” is rated against a case-specific reference building. Photochemical Ozone Creation Potential for Reference Building RPOCP = POCPLCref = POCPCref + POCPOref (4) where POCPLCref reference value for the photochemical ozone creation potential of the life cycle of the reference building, POCPCref reference value for the average annual value of photochemical ozone creation potential for the building’s construction, maintenance, dismantling, and disposal including building systems technology over the reference study period td, calculated from an average office building in [kg C2H4 equiv./(m²NFA *a)]8, POCPOref reference value for the annual photochemical ozone creation potential created by building operations, derived from the reference value according to the national implementation of the EPBD directive in [kg C2H4 equiv./(m²NFA *a)]. The reference value for construction POCPCref is calculated as follows: POCPCref = (POCPMAref + POCPMCref ) / td + POCPMB1,4ref (5) where POCPMAref reference value for photochemical ozone creation potential created during the modules A1-49, including office building’s manufacture (construction and building systems technology) and transports to construction site in [kg C2H4 equiv./(m²NFA )], POCPMCref reference value for photochemical ozone creation potential created during module C3 and C410, the office building’s end-of-life (design and building systems technology) in [kg C2H4 equiv./(m²NFA )], POCPMB1,4ref reference value for annual photochemical ozone creation potential created during modules B1 and B411 on a yearly basis, the office building’s use and replacement (construction and building systems technology) in [kg C2H4 equiv./(m²NFA *a)] td reference study period in [a]. This time period is set to 50 years. The reference value for use POCPOref is calculated as follows POCPOref = POCPMB6,Eref + POCPMB6,Href (6) where POCPMB6,Eref photochemical ozone creation potential for the national reference value for building`s annual electricity demand (end energy) according to the national implementation of the EPBD directive in [kg C2H4 equiv./m²NFA *a], POCPMB6,Href photochemical ozone creation potential vfor the national reference value for the building`s annual heating demand (end energy) according to the national implementation of the EPBD directive in [kg C2H4 equiv./m²NFA *a]. For the POCPOref reference values for the building’s heating and electricity demand (end energy) according to the national implementation of the EPBD directive in [kWh/(m²NFA *a)] should be used as basis when possible.
8 POCPCref will be derived from case studies 9 Module A5 currently is not regarded due to a lack of data; compare chapter 2. 10 Modules C1 and C2 currently are not regarded due to a lack of data; compare chapter 2. 11 Modules B2, B3 and B5 currently are not regarded due to a lack of data; compare chapter 2.
48
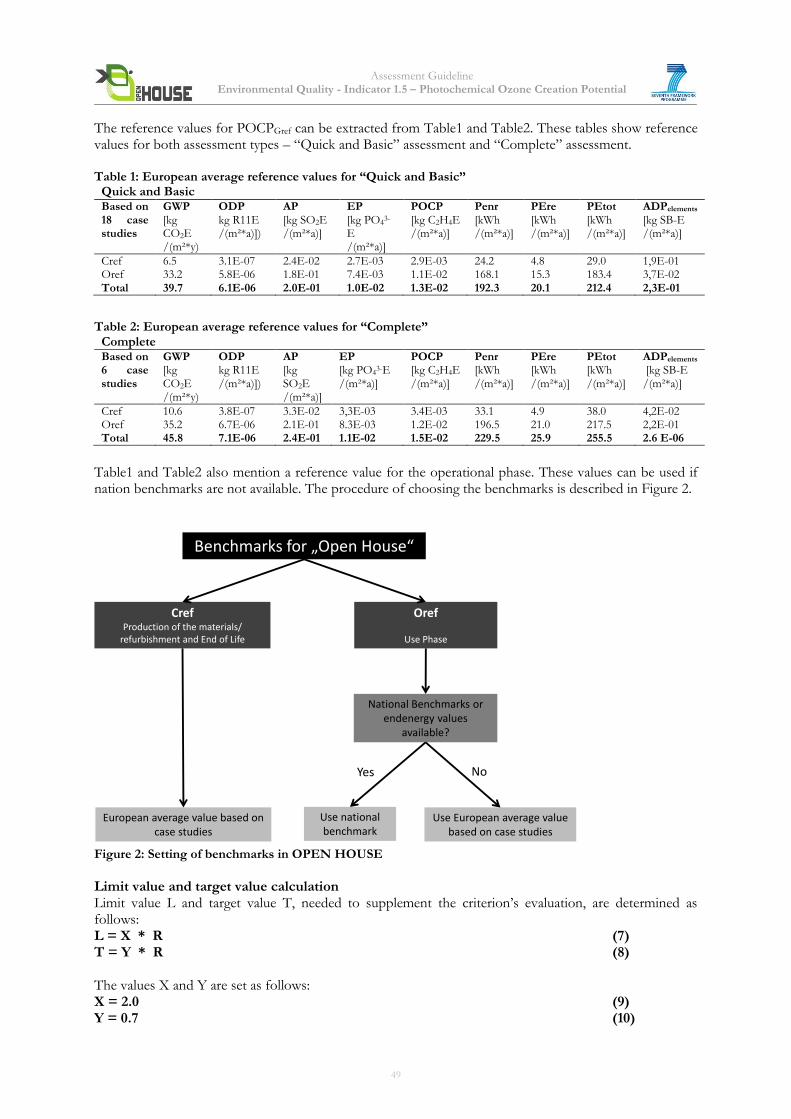
Assessment Guideline Environmental Quality - Indicator 1.5 – Photochemical Ozone Creation Potential
The reference values for POCPGref can be extracted from Table1 and Table2. These tables show reference values for both assessment types – “Quick and Basic” assessment and “Complete” assessment. Table 1: European average reference values for “Quick and Basic”
Quick and Basic Based on 18 case studies
GWP [kg CO2E /(m²*y)
ODP kg R11E /(m²*a)])
AP [kg SO2E /(m²*a)]
EP [kg PO4
3-
E /(m²*a)]
POCP [kg C2H4E /(m²*a)]
Penr [kWh /(m²*a)]
PEre [kWh /(m²*a)]
PEtot [kWh /(m²*a)]
ADPelements [kg SB-E /(m²*a)]
Cref 6.5 3.1E-07 2.4E-02 2.7E-03 2.9E-03 24.2 4.8 29.0 1,9E-01 Oref 33.2 5.8E-06 1.8E-01 7.4E-03 1.1E-02 168.1 15.3 183.4 3,7E-02 Total 39.7 6.1E-06 2.0E-01 1.0E-02 1.3E-02 192.3 20.1 212.4 2,3E-01
Table 2: European average reference values for “Complete”
Complete Based on 6 case studies
GWP [kg CO2E /(m²*y)
ODP kg R11E /(m²*a)])
AP [kg SO2E /(m²*a)]
EP [kg PO4
3-E /(m²*a)]
POCP [kg C2H4E /(m²*a)]
Penr [kWh /(m²*a)]
PEre [kWh /(m²*a)]
PEtot [kWh /(m²*a)]
ADPelements [kg SB-E /(m²*a)]
Cref 10.6 3.8E-07 3.3E-02 3,3E-03 3.4E-03 33.1 4.9 38.0 4,2E-02 Oref 35.2 6.7E-06 2.1E-01 8.3E-03 1.2E-02 196.5 21.0 217.5 2,2E-01 Total 45.8 7.1E-06 2.4E-01 1.1E-02 1.5E-02 229.5 25.9 255.5 2.6 E-06
Table1 and Table2 also mention a reference value for the operational phase. These values can be used if nation benchmarks are not available. The procedure of choosing the benchmarks is described in Figure 2.
Benchmarks for „Open House“
CrefProduction of the materials/
refurbishment and End of Life
Oref
Use Phase
European average value based on case studies
National Benchmarks orendenergy values
available?
Use national benchmark
Yes No
Use European average valuebased on case studies
Figure 2: Setting of benchmarks in OPEN HOUSE
Limit value and target value calculation Limit value L and target value T, needed to supplement the criterion’s evaluation, are determined as follows: L = X * R (7) T = Y * R (8) The values X and Y are set as follows: X = 2.0 (9) Y = 0.7 (10)
49
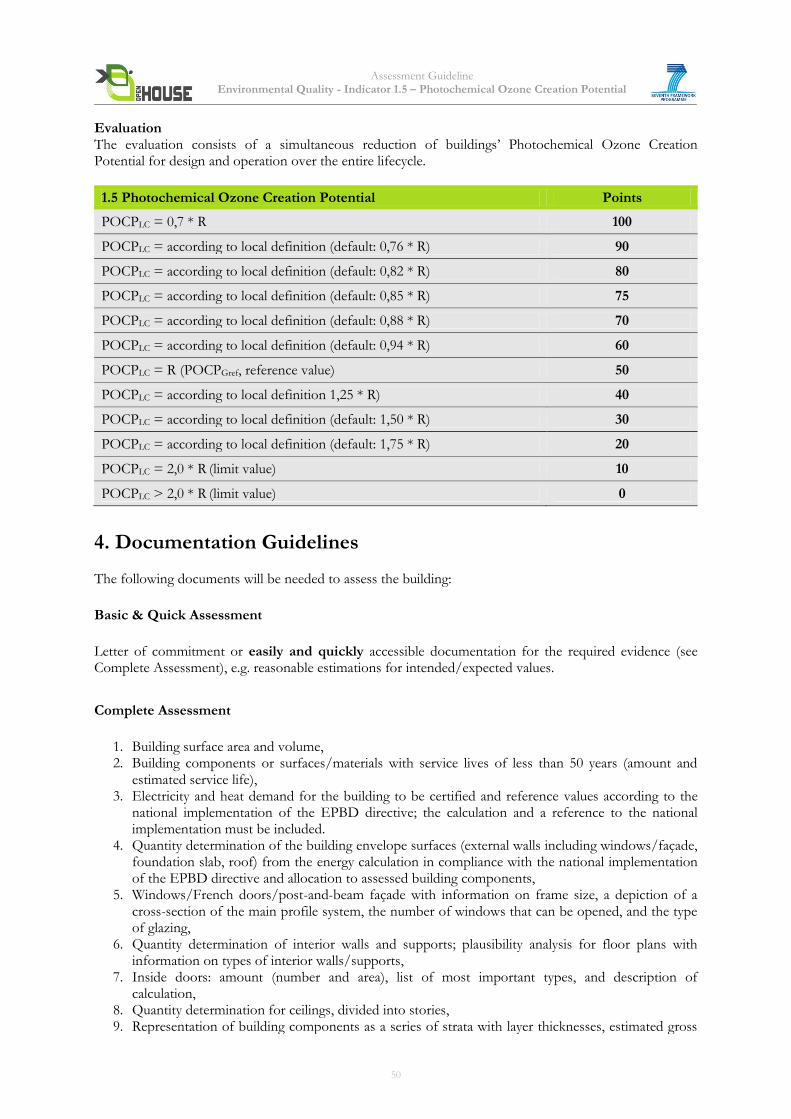
Assessment Guideline Environmental Quality - Indicator 1.5 – Photochemical Ozone Creation Potential
Evaluation The evaluation consists of a simultaneous reduction of buildings’ Photochemical Ozone Creation Potential for design and operation over the entire lifecycle.
1.5 Photochemical Ozone Creation Potential Points
POCPLC = 0,7 * R 100
POCPLC = according to local definition (default: 0,76 * R) 90
POCPLC = according to local definition (default: 0,82 * R) 80
POCPLC = according to local definition (default: 0,85 * R) 75
POCPLC = according to local definition (default: 0,88 * R) 70
POCPLC = according to local definition (default: 0,94 * R) 60
POCPLC = R (POCPGref, reference value) 50
POCPLC = according to local definition 1,25 * R) 40
POCPLC = according to local definition (default: 1,50 * R) 30
POCPLC = according to local definition (default: 1,75 * R) 20
POCPLC = 2,0 * R (limit value) 10
POCPLC > 2,0 * R (limit value) 0
4. Documentation Guidelines The following documents will be needed to assess the building:
Basic & Quick Assessment
Letter of commitment or easily and quickly accessible documentation for the required evidence (see Complete Assessment), e.g. reasonable estimations for intended/expected values.
Complete Assessment
1. Building surface area and volume, 2. Building components or surfaces/materials with service lives of less than 50 years (amount and
estimated service life), 3. Electricity and heat demand for the building to be certified and reference values according to the
national implementation of the EPBD directive; the calculation and a reference to the national implementation must be included.
4. Quantity determination of the building envelope surfaces (external walls including windows/façade, foundation slab, roof) from the energy calculation in compliance with the national implementation of the EPBD directive and allocation to assessed building components,
5. Windows/French doors/post-and-beam façade with information on frame size, a depiction of a cross-section of the main profile system, the number of windows that can be opened, and the type of glazing,
6. Quantity determination of interior walls and supports; plausibility analysis for floor plans with information on types of interior walls/supports,
7. Inside doors: amount (number and area), list of most important types, and description of calculation,
8. Quantity determination for ceilings, divided into stories, 9. Representation of building components as a series of strata with layer thicknesses, estimated gross
50
Assessment Guideline Environmental Quality - Indicator 1.5 – Photochemical Ozone Creation Potential
density, and allocation to a data set in the ESUCO database, 10. Representation of quantity determination for foundations, 11. For reinforced concrete, the share of reinforcement is to be given in kg/m3 or kg/m2 of the
building component. Alternatively, the reinforcing steel can be verified in an overall summary of the project.
12. Documentation of heating unit, 13. Documentation of transport distances and means of transport from manufacturing to construction
site.
Most of these requirements can be met by providing a bill of materials (including masses, materials in a hierarchical structure, numbers of pieces, surface areas and volume of the building).
14. Documentation required for ecological footprint results: Results are to be presented for the entire lifecycle per m2 NFA and year, categorized by:
a. Manufacture b. Use (electricity and heat) c. Use (maintenance) d. End of life (dismantling/recycling/disposal)
5. Relation to other Indicators Data acquisition is the same for the indicators 1.1- 1.5, 1.9, 1.10, 1.15
6. Resources
1. ISO 14040: 2009-11: Environmental management – Life cycle assessment – Principles and framework. International Organization for Standardization.
2. ISO 14044: 2006-10: Environmental management – Life cycle assessment – Requirements and guidelines. International Organization for Standardization.
3. FprEN 15978: 2011: Sustainability of construction works — Assessment of environmental performance of buildings — Calculation method. European Committee for Standardization CEN.
4. prEN 15804: 2010: Sustainability of construction works — Environmental product declarations — Core rules for the product category of construction products. European Committee for Standardization CEN.
5. Directive 2009/28/EC of the European Parliament and of the Council of 23 April 2009 on the promotion of the use of energy from renewable sources and amending and subsequently repealing Directives 2001/77/EC and 2003/30/EC.
6. Kreißig, J., Binder, M. (2007): Methodische Grundlagen- Ökobilanzbasierte Umweltindikatoren im Bauwesen. Methodenbericht zum BMVBS-Projekt „Aktualisieren, Fortschreiben und Harmonisieren von Basisdaten für das nachhaltige Bauen“ (AZ 10.06.03 – 06.119) Mai 2007, www.baufachinformation.de/literatur.isp.
7. United Nations (1998): Kyoto Protocol to the United Nations Framework Convention on Climate Change, 1998, http://unfccc.int/resource/docs/convkp/kpeng.pdf.
8. Bundesministerium für Verkehr, Bau- und Wohnungswesen: Guideline for Sustainable Building. Eigenverlag, 2001.
9. Directive 2002/91/EC of the European Parliament and of the Council of 16 December 2002 on the energy performance of buildings.
10. VDI 2067: Economic efficiency of building installations – Fundamentals and economic calculation. Verein Deutscher Ingenieure, 2000.
7. Attachments
None
51
Assessment Guideline Environmental - Indicator 1.7. - Biodiversity and depletion of habitats
Indicator 1.7 Biodiversity and depletion of habitats (adapted from BREEAM)
1. Objective The goal is to assess the ecological value of the site prior to and after the development of the case-study building in order to minimize the impact of the building development on existing site ecology enhancing the ecological value of the site and increasing biodiversity. This indicator supports the European Commission headline target of halting the loss of biodiversity and the degradation of ecosystem services in the EU by 2020, and restoring them in so far as feasible, while stepping up the EU contribution to averting global biodiversity loss1.
2. Assessment Methodology This indicator is evaluated by assessing the change in ecological value of the site. The following sub-indicator will be assessed: 1.7.1. Change in ecological value of the site: enhancement of biodiversity
1 Our life insurance, our natural capital: an EU biodiversity strategy to 2020
52
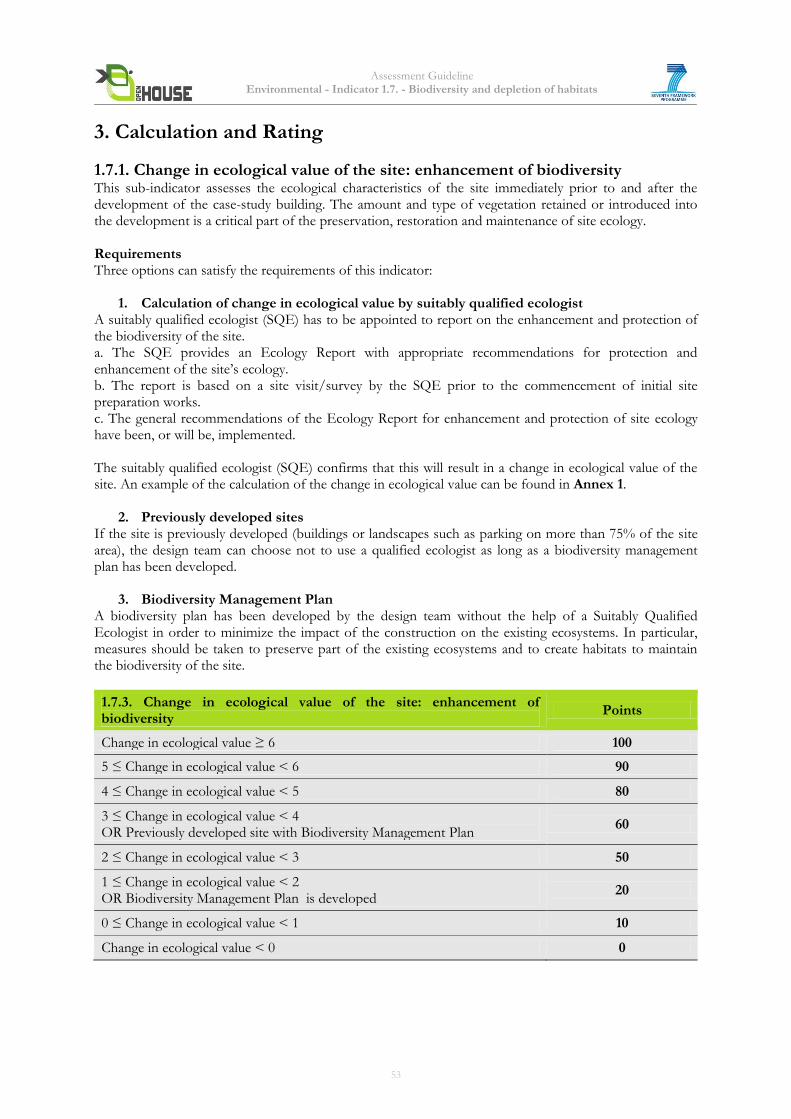
Assessment Guideline Environmental - Indicator 1.7. - Biodiversity and depletion of habitats
3. Calculation and Rating
1.7.1. Change in ecological value of the site: enhancement of biodiversity This sub-indicator assesses the ecological characteristics of the site immediately prior to and after the development of the case-study building. The amount and type of vegetation retained or introduced into the development is a critical part of the preservation, restoration and maintenance of site ecology. Requirements Three options can satisfy the requirements of this indicator:
1. Calculation of change in ecological value by suitably qualified ecologist A suitably qualified ecologist (SQE) has to be appointed to report on the enhancement and protection of the biodiversity of the site. a. The SQE provides an Ecology Report with appropriate recommendations for protection and enhancement of the site’s ecology. b. The report is based on a site visit/survey by the SQE prior to the commencement of initial site preparation works. c. The general recommendations of the Ecology Report for enhancement and protection of site ecology have been, or will be, implemented. The suitably qualified ecologist (SQE) confirms that this will result in a change in ecological value of the site. An example of the calculation of the change in ecological value can be found in Annex 1.
2. Previously developed sites If the site is previously developed (buildings or landscapes such as parking on more than 75% of the site area), the design team can choose not to use a qualified ecologist as long as a biodiversity management plan has been developed.
3. Biodiversity Management Plan A biodiversity plan has been developed by the design team without the help of a Suitably Qualified Ecologist in order to minimize the impact of the construction on the existing ecosystems. In particular, measures should be taken to preserve part of the existing ecosystems and to create habitats to maintain the biodiversity of the site.
1.7.3. Change in ecological value of the site: enhancement of biodiversity
Points
Change in ecological value ≥ 6 100
5 ≤ Change in ecological value < 6 90
4 ≤ Change in ecological value < 5 80
3 ≤ Change in ecological value < 4 OR Previously developed site with Biodiversity Management Plan
60
2 ≤ Change in ecological value < 3 50
1 ≤ Change in ecological value < 2 OR Biodiversity Management Plan is developed
20
0 ≤ Change in ecological value < 1 10
Change in ecological value < 0 0
53
Assessment Guideline Environmental - Indicator 1.7. - Biodiversity and depletion of habitats
4. Documentation Guidelines The following documents will be needed to assess the building: Basic & Quick Assessment Letter of commitment or easily and quickly accessible documentation for the required evidence (see Complete Assessment), e.g. reasonable estimations for intended/expected values. Complete Assessment
1.7.1. Change in ecological value of the site: enhancement of biodiversity 1. Calculation of change in ecological value by suitably qualified ecologist - A copy of the ecologist’s report containing: · Details and scope of the site survey. · Calculations of the change in ecological value - A copy of the relevant section of the specification requiring the main contractor to implement the suitably qualified ecologist’s recommendations for protection and enhancement - Assessor site inspection report and photographic evidence confirming that the ecologist’s recommendations have been implemented. For large mixed-use/multi-building developments, where the whole site has not been completed and ecological enhancements have not been added, or where features are being added at a later date in an appropriate planting season: · A copy of the contract/specification or a letter from the main contractor confirming when the planting will be complete. This must be within 18 months from completion of the development. 2. Previously developed sites - Proof of the state of development of the site - Biodiversity Management Plan Report 3. Biodiversity Management Plan Biodiversity Management Plan Report with measures to preserve part of the existing ecosystems and to create habitats to maintain the biodiversity of the site
5. Relation to other Indicators Indicator 1.12 Land Use Indicator 5.5 Construction site impact/Construction process
6. Resources BREEAM: LE 4 Mitigating Ecological Impact
54
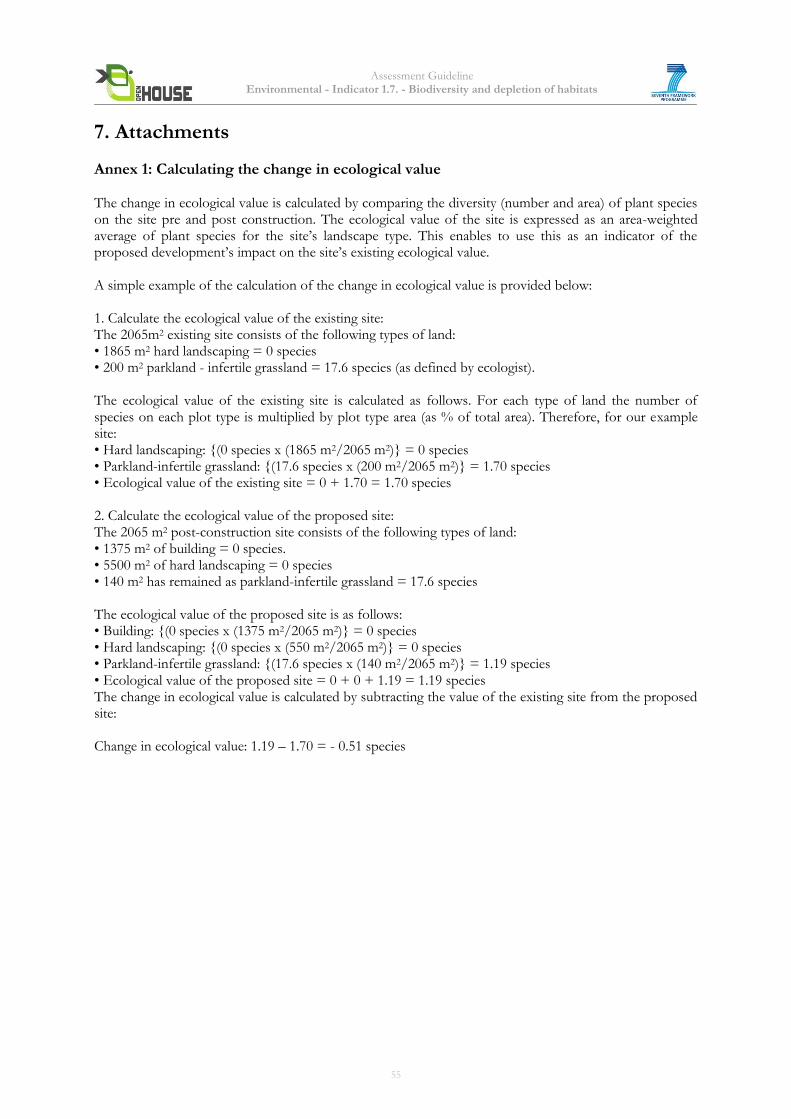
Assessment Guideline Environmental - Indicator 1.7. - Biodiversity and depletion of habitats
7. Attachments
Annex 1: Calculating the change in ecological value
The change in ecological value is calculated by comparing the diversity (number and area) of plant species on the site pre and post construction. The ecological value of the site is expressed as an area-weighted average of plant species for the site’s landscape type. This enables to use this as an indicator of the proposed development’s impact on the site’s existing ecological value. A simple example of the calculation of the change in ecological value is provided below: 1. Calculate the ecological value of the existing site: The 2065m2 existing site consists of the following types of land: • 1865 m2 hard landscaping = 0 species • 200 m2 parkland - infertile grassland = 17.6 species (as defined by ecologist). The ecological value of the existing site is calculated as follows. For each type of land the number of species on each plot type is multiplied by plot type area (as % of total area). Therefore, for our example site: • Hard landscaping: {(0 species x (1865 m2/2065 m2)} = 0 species • Parkland-infertile grassland: {(17.6 species x (200 m2/2065 m2)} = 1.70 species • Ecological value of the existing site = 0 + 1.70 = 1.70 species 2. Calculate the ecological value of the proposed site: The 2065 m2 post-construction site consists of the following types of land: • 1375 m2 of building = 0 species. • 5500 m2 of hard landscaping = 0 species • 140 m2 has remained as parkland-infertile grassland = 17.6 species The ecological value of the proposed site is as follows: • Building: {(0 species x (1375 m2/2065 m2)} = 0 species • Hard landscaping: {(0 species x (550 m2/2065 m2)} = 0 species • Parkland-infertile grassland: {(17.6 species x (140 m2/2065 m2)} = 1.19 species • Ecological value of the proposed site = 0 + 0 + 1.19 = 1.19 species The change in ecological value is calculated by subtracting the value of the existing site from the proposed site: Change in ecological value: 1.19 – 1.70 = - 0.51 species
55
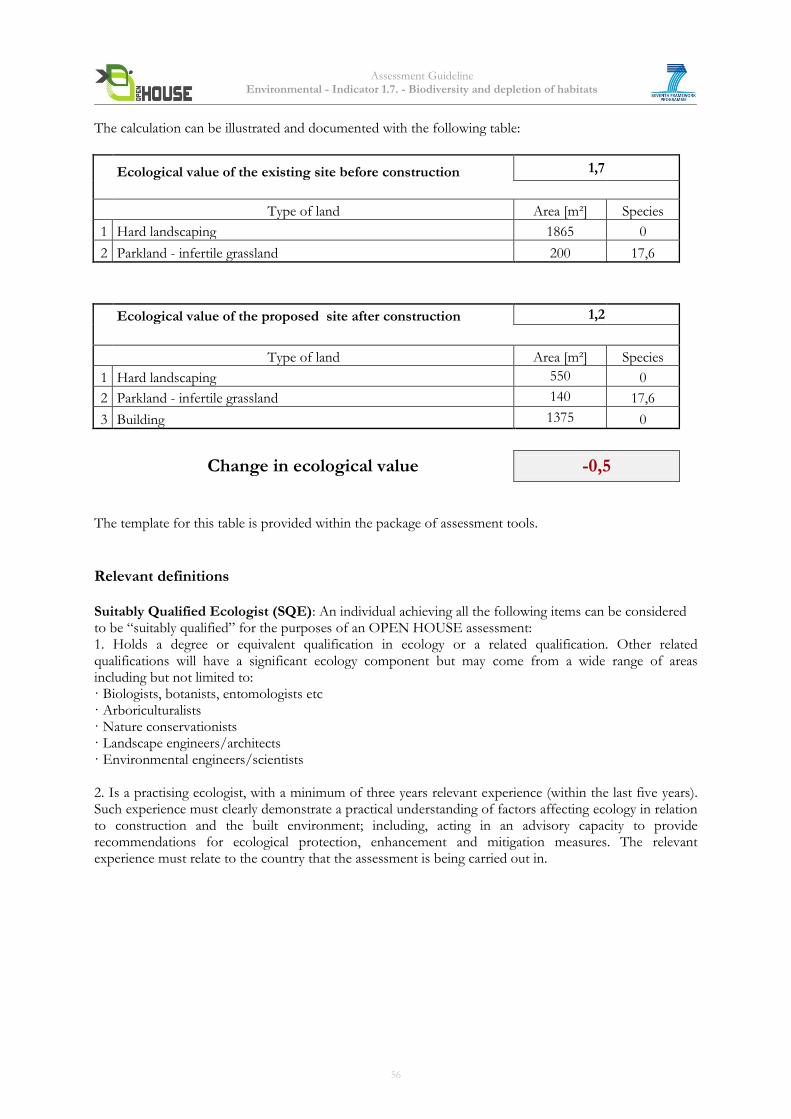
Assessment Guideline Environmental - Indicator 1.7. - Biodiversity and depletion of habitats
The calculation can be illustrated and documented with the following table:
Ecological value of the existing site before construction 1,7
Type of land Area [m²] Species
1 Hard landscaping 1865 0
2 Parkland - infertile grassland 200 17,6
Ecological value of the proposed site after construction 1,2
Type of land Area [m²] Species
1 Hard landscaping 550 0
2 Parkland - infertile grassland 140 17,6
3 Building 1375 0
Change in ecological value -0,5
The template for this table is provided within the package of assessment tools.
Relevant definitions Suitably Qualified Ecologist (SQE): An individual achieving all the following items can be considered to be “suitably qualified” for the purposes of an OPEN HOUSE assessment: 1. Holds a degree or equivalent qualification in ecology or a related qualification. Other related qualifications will have a significant ecology component but may come from a wide range of areas including but not limited to: · Biologists, botanists, entomologists etc · Arboriculturalists · Nature conservationists · Landscape engineers/architects · Environmental engineers/scientists 2. Is a practising ecologist, with a minimum of three years relevant experience (within the last five years). Such experience must clearly demonstrate a practical understanding of factors affecting ecology in relation to construction and the built environment; including, acting in an advisory capacity to provide recommendations for ecological protection, enhancement and mitigation measures. The relevant experience must relate to the country that the assessment is being carried out in.
56
Assessment Guideline Environmental Quality - Indicator 1.8 – Light pollution
Indicator 1.8 Light Pollution (adapted from LEED, BREEAM, HQE, EN 12464-2)
1. Objective Although outdoor lighting is imperative to illuminate sidewalks, parking lots and driveways for safety and convenience reasons, it can alter a site’s nocturnal ecosystem and limit sky observations. The objectives of this indicator are listed below:
To design only the strict necessary external lighting and to ensure that external lighting is concentrated in the appropriate areas,
To avoid disturbance on animal and human health and psychology,
To avoid disruption of ecosystems,
To reduce sky glow and glare,
To improve nocturnal sky observations (effects on astronomy).
2. Assessment Methodology
Projects should illuminate areas only as required for safety and comfort, provide only the light levels necessary to meet the design intent, and select efficient fixtures using efficient sources to meet the lighting requirements of the site while minimizing light pollution (LEED, SSc8). Therefore, the installed lighting power densities including emergency lighting is compared to maximal acceptable values. High illuminance at a site boundary can affect neighbouring areas and buildings and impact surrounding ecosystems or neighbourhoods. The goal is to retain the emitted light within the site boundaries and the horizontal and vertical illuminance values at the site boundary are thus assessed. Light sources pointing directly towards the sky cover have a critical impact in terms of night-time sky glow and glare, thus limiting the potential for night sky observations. The goal is to limit the amount of light pointing directly towards the sky cover and this is assessed with the percentage of luminaries with lumens emitted at 90° or higher from nadir (nadir is the direction pointing directly below a particular point). The assessment is based on the guidance provided in the European standard EN 12464-2. The following sub-indicators will be assessed: 1.8.1. Light on properties 1.8.2 Luminaire intensity 1.8.3 Upward light 1.8.4 Luminance
57
Assessment Guideline Environmental Quality - Indicator 1.8 – Light pollution
3. Calculation and Rating
The location has to be classified in one of the four environmental zones defined in EN 12464-2:
Zone Lighting Environment Characterization
E1 Intrinsically dark Developed areas within national parks or protected sites
E2 Low district brightness Primarily residential zones, neighbourhood business districts, light industrial with limited night-time use and residential mixed-use areas)
E3 Medium district brightness All other areas not included in E1, E2 or E4, such as commercial/industrial, and high-density residential
E4 High district brightness High activity commercial districts in major metropolitan areas and town centres
1.8.1. Light on properties The maximum value of vertical illuminance on properties Ev given in EN 12464-2 should be respected:
Zone Light on Properties Ev [lx]
Pre-curfew* Post-curfew
E1 2 0
E2 5 1
E3 10 2
E4 25 5
* In case no curfew regulations are available, the higher values shall not be exceeded and the lower values should be taken as preferable limits
1.8.1. Light on properties Points
The maximum value of vertical illuminance on properties is lower than the EN 12464-2 value for the classified zone
100
The maximum value of vertical illuminance on properties is higher than the EN 12464-2 value for the classified zone
0
1.8.2. Luminaire intensity The light intensity of each source in the potentially obtrusive direction given in EN 12464-2 should be respected:
Zone Luminaire intensity l [cd]
Pre-curfew* Post-curfew
E1 2500 0
E2 7500 500
E3 10000 1000
E4 25000 2500
* In case no curfew regulations are available, the higher values shall not be exceeded and the lower values should be taken as preferable limits
58
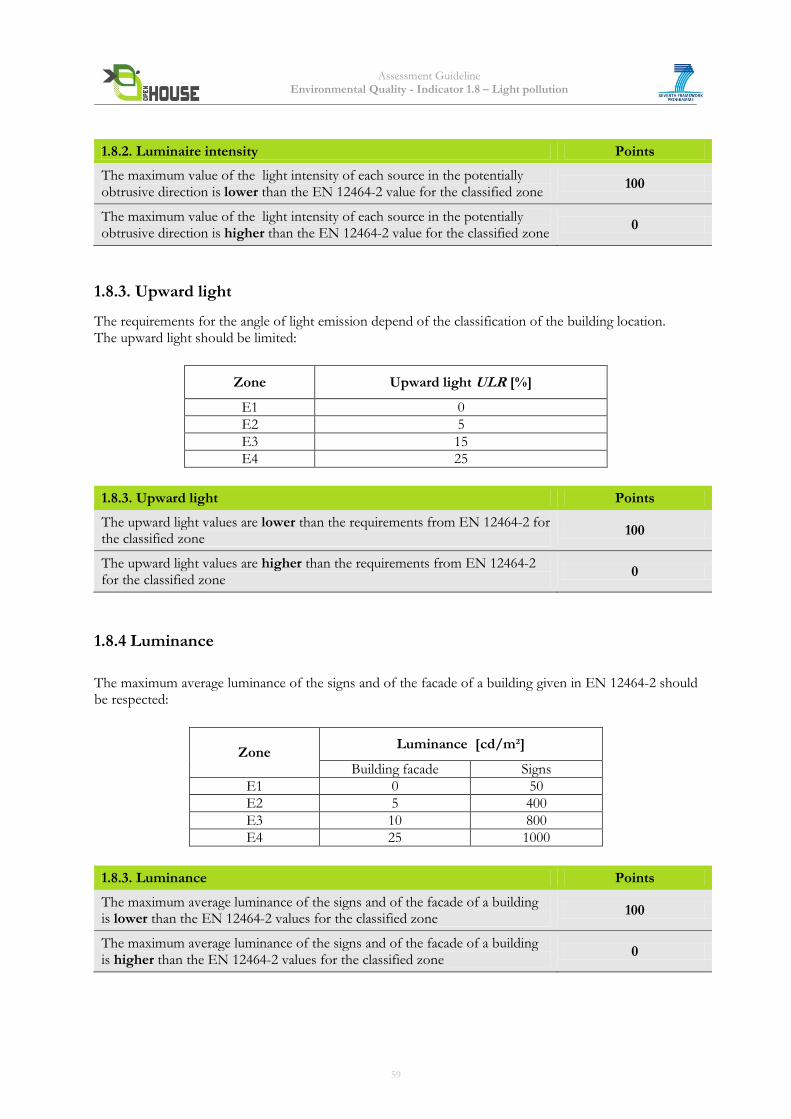
Assessment Guideline Environmental Quality - Indicator 1.8 – Light pollution
1.8.2. Luminaire intensity Points
The maximum value of the light intensity of each source in the potentially obtrusive direction is lower than the EN 12464-2 value for the classified zone
100
The maximum value of the light intensity of each source in the potentially obtrusive direction is higher than the EN 12464-2 value for the classified zone
0
1.8.3. Upward light
The requirements for the angle of light emission depend of the classification of the building location. The upward light should be limited:
Zone Upward light ULR [%]
E1 0
E2 5
E3 15
E4 25
1.8.3. Upward light Points
The upward light values are lower than the requirements from EN 12464-2 for the classified zone
100
The upward light values are higher than the requirements from EN 12464-2 for the classified zone
0
1.8.4 Luminance
The maximum average luminance of the signs and of the facade of a building given in EN 12464-2 should be respected:
Zone Luminance [cd/m²]
Building facade Signs
E1 0 50
E2 5 400
E3 10 800
E4 25 1000
1.8.3. Luminance Points
The maximum average luminance of the signs and of the facade of a building is lower than the EN 12464-2 values for the classified zone
100
The maximum average luminance of the signs and of the facade of a building is higher than the EN 12464-2 values for the classified zone
0
59
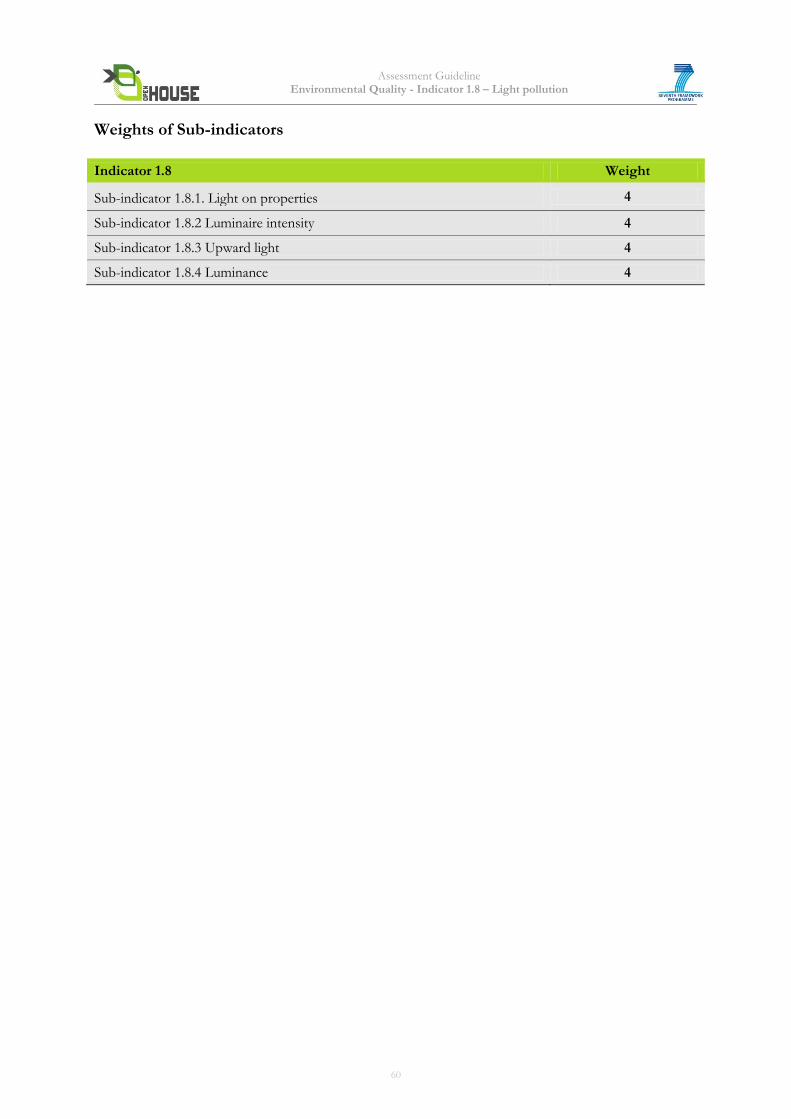
Assessment Guideline Environmental Quality - Indicator 1.8 – Light pollution
Weights of Sub-indicators
Indicator 1.8 Weight
Sub-indicator 1.8.1. Light on properties 4
Sub-indicator 1.8.2 Luminaire intensity 4
Sub-indicator 1.8.3 Upward light 4
Sub-indicator 1.8.4 Luminance 4
60
Assessment Guideline Environmental Quality - Indicator 1.8 – Light pollution
4. Documentation Guidelines The following documents are required to assess the building: Basic & Quick Assessment Letter of commitment or easily and quickly accessible documentation for the required evidence (see Complete Assessment), e.g. reasonable estimations for intended/expected values. Complete Assessment The classification for a project site is necessary for all sub-indicators. 1.8.1. Light on properties
Description of the calculation of the vertical illuminance 1.8.2 Luminaire intensity
Technical data sheet of lighting fixtures,
Manufacturer’s data for lamps used on a project site, 1.8.3 Upward light
Description of installed fixtures
Pictures of installed fixtures showing the angle of light emission 1.8.4 Luminance
Technical data sheet of lighting fixtures
5. Relation to other Indicators Indicator 2.7 Visual comfort Indicator 1.9 Non-Renewable Primary Energy Demand (PEnr) Indicator 1.10 Total Primary Energy demand and Share of renewable Primary Energy Indicator 2.2 Personal safety of users
6. Resources BREEAM 2009: Pol4 Reduction of night time light pollution
LEED 2009: Site 8 Light Pollution Reduction
HQE 2012: 1.3. Impacts of the building on the local residents
ANSI/ASHRAE/IESNA Standard 90.1-2007, Energy Standard for Buildings Except Low-Rise
Residential Lighting, Section 9 (without amendments)
Lighting for Exterior Environments RP-33-99, by the Outdoor Environment Lighting Committee of
Illuminating Engineering Society of North America (www.iesna.org) (IESNA, 1999)
International Dark-Sky Association (www.darksky.org)
EN 12464-2, Light and lighting — Lighting of work places — Part 2 : Outdoor work places.
7. Attachments None
61
Assessment Guideline Environmental Quality - Indicator 1.9 – Abiotic depletion of non renewable fossil
fuels due to non renewable Primary Energy Demand (ADP_Enr)
Indicator 1.9 Abiotic depletion of non renewable fossil fuels due to non renewable Primary Energy Demand (ADP_Enr) (adapted from EN 15978)
Core Indicator
1. Objective Primary energy is energy found in nature that has not been subjected to any conversion or transformation process. It is energy contained in raw fuels as well as other forms of energy received as input to a system. The indicator Non-Renewable Primary Energy Demand aims at the reduction of the share of primary energy demand provided by fossil and therefore limited fuels. This supports the European Commission target to reach a 20% share of renewable energies in EU energy consumption by 20201.
2. Assessment Methodology The indicator is mainly based on the method of Life Cycle Assessment (LCA): LCA results of the building to be assessed will be calculated in a standardized way and evaluated against benchmarks. Thus Non-Renewable Primary Energy Demand is a quantitative indicator. According to the standards EN ISO 14040 and 14044, the method of Life-Cycle Assessment generally consists of four steps: Definition of goal and scope of the study, inventory analysis, impact assessment and interpretation. The indicators 1.1-1.5, 1.9 and 1.10 are based on LCAs and for all these indicators the same definitions for goal and scope and for the inventory analysis do apply. Goal and scope definition The goal of all LCA studies is to analyze and later benchmark the environmental performance of the respective buildings` life cycles. The scope of the building assessment therefore includes the following life cycle stages:
production: raw material supply, transport to manufacturing, manufacturing and transport to the construction site of products used in the building (Figure 1, modules A1-A4),
use stage: a scenario is defined including use and replacement, including end-of-life of replaced products (Figure 1, modules B1 and B4); in addition the operational energy use is considered (Figure 1, module B6),
end-of-life stage: waste processing and disposal of the building, (Figure 1, modules C3 and C4),
a scenario for potential benefits and loads beyond the system boundaries, including loads for reuse and recycling as well as benefits from recycling potentials (Figure 1, module D).
1 Energy 2020 - A strategy for competitive, sustainable and secure energy
62
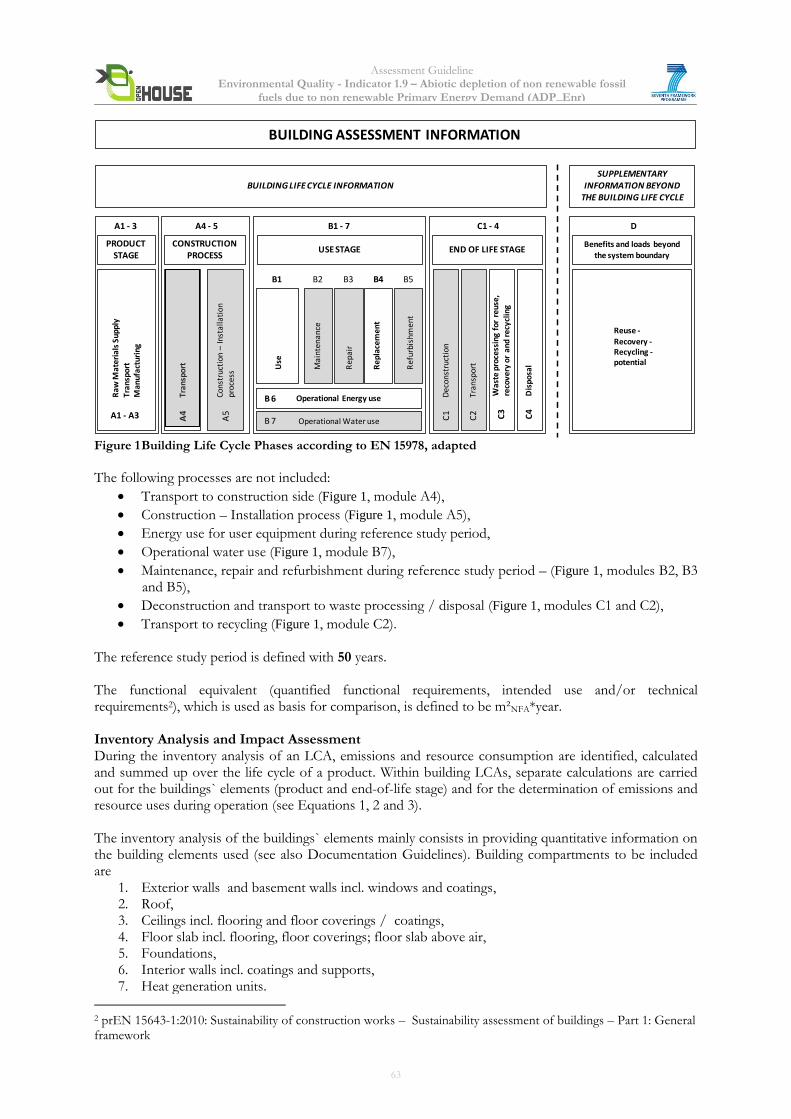
Assessment Guideline Environmental Quality - Indicator 1.9 – Abiotic depletion of non renewable fossil
fuels due to non renewable Primary Energy Demand (ADP_Enr)
BUILDING ASSESSMENT INFORMATION
BUILDING LIFE CYCLE INFORMATION
Raw
Mat
eri
als
Sup
ply
Tra
nsp
ort
Man
ufa
ctu
rin
g
PRODUCT STAGE
A1 - 3
A1 - A3
Tran
spo
rt
CONSTRUCTION PROCESS
A4 - 5
A4
Cons
truc
tion
–In
stal
lati
on
proc
ess
A5
Use
USE STAGE
B1 - 7
B1
Mai
nte
nan
ce
B2
Rep
air
Re
plac
em
ent
Re
furb
ish
me
nt
B3 B4 B5
Operational Energy use
Operational Water useB 7
B 6 De
con
stru
ctio
n
END OF LIFE STAGE
C1 - 4
C1
Tran
spor
tC
2
Was
te p
roce
ssin
g fo
r re
use,
re
cove
ry o
r an
d re
cycl
ing
C3
Dis
po
sal
C4
Benefits and loads beyond the system boundary
D
Reuse -Recovery -Recycling -potential
SUPPLEMENTARY INFORMATION BEYOND
THE BUILDING LIFE CYCLE
Figure 1 Building Life Cycle Phases according to EN 15978, adapted
The following processes are not included:
Transport to construction side (Figure 1, module A4),
Construction – Installation process (Figure 1, module A5),
Energy use for user equipment during reference study period,
Operational water use (Figure 1, module B7),
Maintenance, repair and refurbishment during reference study period – (Figure 1, modules B2, B3 and B5),
Deconstruction and transport to waste processing / disposal (Figure 1, modules C1 and C2),
Transport to recycling (Figure 1, module C2). The reference study period is defined with 50 years. The functional equivalent (quantified functional requirements, intended use and/or technical requirements2), which is used as basis for comparison, is defined to be m²NFA*year. Inventory Analysis and Impact Assessment During the inventory analysis of an LCA, emissions and resource consumption are identified, calculated and summed up over the life cycle of a product. Within building LCAs, separate calculations are carried out for the buildings` elements (product and end-of-life stage) and for the determination of emissions and resource uses during operation (see Equations 1, 2 and 3). The inventory analysis of the buildings` elements mainly consists in providing quantitative information on the building elements used (see also Documentation Guidelines). Building compartments to be included are
1. Exterior walls and basement walls incl. windows and coatings, 2. Roof, 3. Ceilings incl. flooring and floor coverings / coatings, 4. Floor slab incl. flooring, floor coverings; floor slab above air, 5. Foundations, 6. Interior walls incl. coatings and supports, 7. Heat generation units.
2 prEN 15643-1:2010: Sustainability of construction works – Sustainability assessment of buildings – Part 1: General framework
63
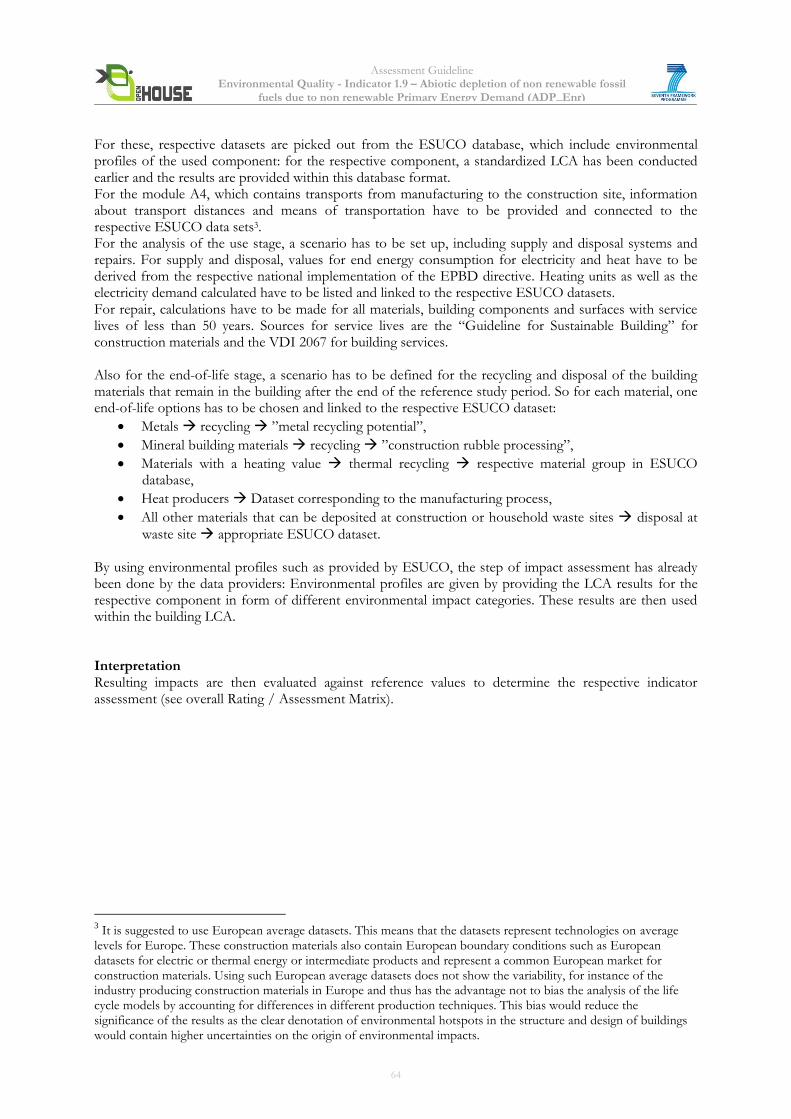
Assessment Guideline Environmental Quality - Indicator 1.9 – Abiotic depletion of non renewable fossil
fuels due to non renewable Primary Energy Demand (ADP_Enr)
For these, respective datasets are picked out from the ESUCO database, which include environmental profiles of the used component: for the respective component, a standardized LCA has been conducted earlier and the results are provided within this database format. For the module A4, which contains transports from manufacturing to the construction site, information about transport distances and means of transportation have to be provided and connected to the respective ESUCO data sets3. For the analysis of the use stage, a scenario has to be set up, including supply and disposal systems and repairs. For supply and disposal, values for end energy consumption for electricity and heat have to be derived from the respective national implementation of the EPBD directive. Heating units as well as the electricity demand calculated have to be listed and linked to the respective ESUCO datasets. For repair, calculations have to be made for all materials, building components and surfaces with service lives of less than 50 years. Sources for service lives are the “Guideline for Sustainable Building” for construction materials and the VDI 2067 for building services. Also for the end-of-life stage, a scenario has to be defined for the recycling and disposal of the building materials that remain in the building after the end of the reference study period. So for each material, one end-of-life options has to be chosen and linked to the respective ESUCO dataset:
Metals recycling ”metal recycling potential”,
Mineral building materials recycling ”construction rubble processing”,
Materials with a heating value thermal recycling respective material group in ESUCO database,
Heat producers Dataset corresponding to the manufacturing process,
All other materials that can be deposited at construction or household waste sites disposal at
waste site appropriate ESUCO dataset. By using environmental profiles such as provided by ESUCO, the step of impact assessment has already been done by the data providers: Environmental profiles are given by providing the LCA results for the respective component in form of different environmental impact categories. These results are then used within the building LCA. Interpretation Resulting impacts are then evaluated against reference values to determine the respective indicator assessment (see overall Rating / Assessment Matrix).
3 It is suggested to use European average datasets. This means that the datasets represent technologies on average
levels for Europe. These construction materials also contain European boundary conditions such as European datasets for electric or thermal energy or intermediate products and represent a common European market for construction materials. Using such European average datasets does not show the variability, for instance of the industry producing construction materials in Europe and thus has the advantage not to bias the analysis of the life cycle models by accounting for differences in different production techniques. This bias would reduce the significance of the results as the clear denotation of environmental hotspots in the structure and design of buildings would contain higher uncertainties on the origin of environmental impacts.
64
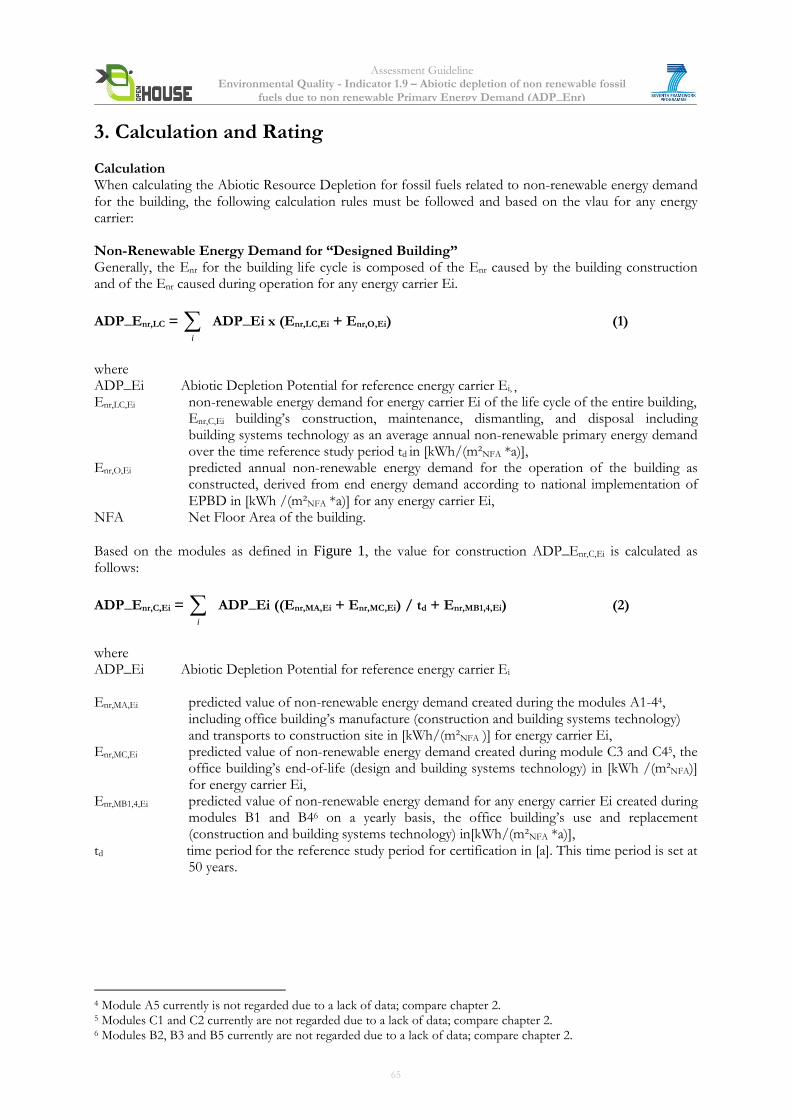
Assessment Guideline Environmental Quality - Indicator 1.9 – Abiotic depletion of non renewable fossil
fuels due to non renewable Primary Energy Demand (ADP_Enr)
3. Calculation and Rating Calculation When calculating the Abiotic Resource Depletion for fossil fuels related to non-renewable energy demand for the building, the following calculation rules must be followed and based on the vlau for any energy carrier: Non-Renewable Energy Demand for “Designed Building” Generally, the Enr for the building life cycle is composed of the Enr caused by the building construction and of the Enr caused during operation for any energy carrier Ei.
ADP_Enr,LC = i
ADP_Ei x (Enr,LC,Ei + Enr,O,Ei) (1)
where ADP_Ei Abiotic Depletion Potential for reference energy carrier Ei, , Enr,LC,Ei non-renewable energy demand for energy carrier Ei of the life cycle of the entire building,
Enr,C,Ei building’s construction, maintenance, dismantling, and disposal including building systems technology as an average annual non-renewable primary energy demand over the time reference study period td in [kWh/(m²NFA *a)],
Enr,O,Ei predicted annual non-renewable energy demand for the operation of the building as constructed, derived from end energy demand according to national implementation of EPBD in [kWh /(m²NFA *a)] for any energy carrier Ei,
NFA Net Floor Area of the building.
Based on the modules as defined in Figure 1, the value for construction ADP_Enr,C,Ei is calculated as follows:
ADP_Enr,C,Ei = i
ADP_Ei ((Enr,MA,Ei + Enr,MC,Ei) / td + Enr,MB1,4,Ei) (2)
where ADP_Ei Abiotic Depletion Potential for reference energy carrier Ei Enr,MA,Ei predicted value of non-renewable energy demand created during the modules A1-44,
including office building’s manufacture (construction and building systems technology) and transports to construction site in [kWh/(m²NFA )] for energy carrier Ei,
Enr,MC,Ei predicted value of non-renewable energy demand created during module C3 and C45, the office building’s end-of-life (design and building systems technology) in [kWh /(m²NFA)] for energy carrier Ei,
Enr,MB1,4,Ei predicted value of non-renewable energy demand for any energy carrier Ei created during modules B1 and B46 on a yearly basis, the office building’s use and replacement (construction and building systems technology) in[kWh/(m²NFA *a)],
td time period for the reference study period for certification in [a]. This time period is set at 50 years.
4 Module A5 currently is not regarded due to a lack of data; compare chapter 2. 5 Modules C1 and C2 currently are not regarded due to a lack of data; compare chapter 2. 6 Modules B2, B3 and B5 currently are not regarded due to a lack of data; compare chapter 2.
65
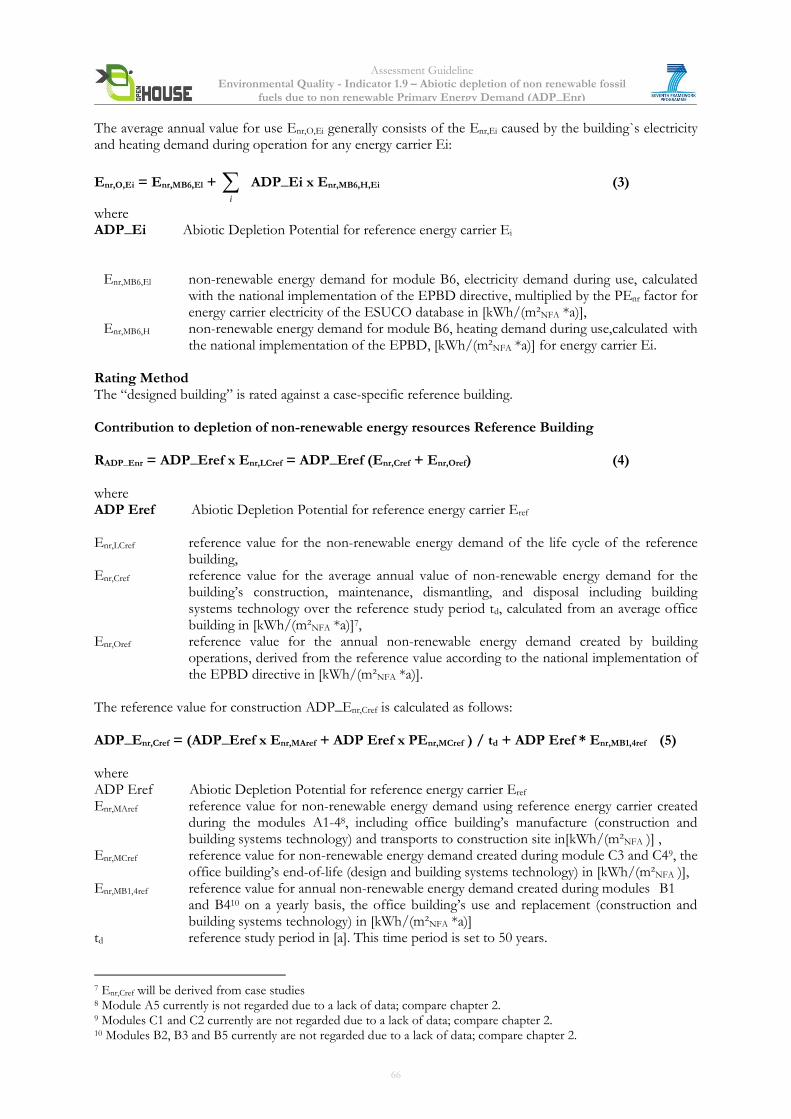
Assessment Guideline Environmental Quality - Indicator 1.9 – Abiotic depletion of non renewable fossil
fuels due to non renewable Primary Energy Demand (ADP_Enr) The average annual value for use Enr,O,Ei generally consists of the Enr,Ei caused by the building`s electricity and heating demand during operation for any energy carrier Ei:
Enr,O,Ei = Enr,MB6,El + i
ADP_Ei x Enr,MB6,H,Ei (3)
where ADP_Ei Abiotic Depletion Potential for reference energy carrier Ei
Enr,MB6,El non-renewable energy demand for module B6, electricity demand during use, calculated with the national implementation of the EPBD directive, multiplied by the PEnr factor for energy carrier electricity of the ESUCO database in [kWh/(m²NFA *a)],
Enr,MB6,H non-renewable energy demand for module B6, heating demand during use, calculated with the national implementation of the EPBD, [kWh/(m²NFA *a)] for energy carrier Ei.
Rating Method The “designed building” is rated against a case-specific reference building. Contribution to depletion of non-renewable energy resources Reference Building RADP_Enr = ADP_Eref x Enr,LCref = ADP_Eref (Enr,Cref + Enr,Oref) (4) where ADP Eref Abiotic Depletion Potential for reference energy carrier Eref Enr,LCref reference value for the non-renewable energy demand of the life cycle of the reference
building, Enr,Cref reference value for the average annual value of non-renewable energy demand for the
building’s construction, maintenance, dismantling, and disposal including building systems technology over the reference study period td, calculated from an average office building in [kWh/(m²NFA *a)]7,
Enr,Oref reference value for the annual non-renewable energy demand created by building operations, derived from the reference value according to the national implementation of the EPBD directive in [kWh/(m²NFA *a)].
The reference value for construction ADP_Enr,Cref is calculated as follows: ADP_Enr,Cref = (ADP_Eref x Enr,MAref + ADP Eref x PEnr,MCref ) / td + ADP Eref * Enr,MB1,4ref (5) where ADP Eref Abiotic Depletion Potential for reference energy carrier Eref Enr,MAref reference value for non-renewable energy demand using reference energy carrier created
during the modules A1-48, including office building’s manufacture (construction and building systems technology) and transports to construction site in[kWh/(m²NFA )] ,
Enr,MCref reference value for non-renewable energy demand created during module C3 and C49, the office building’s end-of-life (design and building systems technology) in [kWh/(m²NFA )],
Enr,MB1,4ref reference value for annual non-renewable energy demand created during modules B1 and B410 on a yearly basis, the office building’s use and replacement (construction and building systems technology) in [kWh/(m²NFA *a)]
td reference study period in [a]. This time period is set to 50 years.
7 Enr,Cref will be derived from case studies 8 Module A5 currently is not regarded due to a lack of data; compare chapter 2. 9 Modules C1 and C2 currently are not regarded due to a lack of data; compare chapter 2. 10 Modules B2, B3 and B5 currently are not regarded due to a lack of data; compare chapter 2.
66
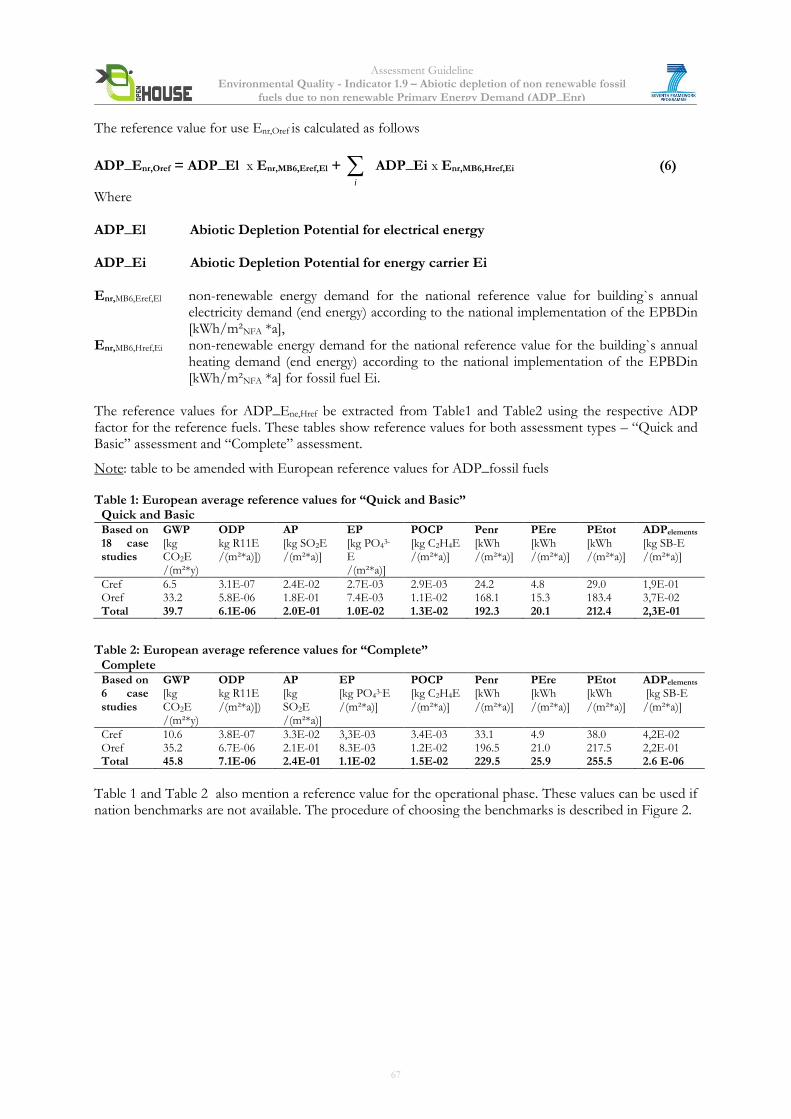
Assessment Guideline Environmental Quality - Indicator 1.9 – Abiotic depletion of non renewable fossil
fuels due to non renewable Primary Energy Demand (ADP_Enr) The reference value for use Enr,Oref is calculated as follows
ADP_Enr,Oref = ADP_El x Enr,MB6,Eref,El + i
ADP_Ei x Enr,MB6,Href,Ei (6)
Where ADP_El Abiotic Depletion Potential for electrical energy ADP_Ei Abiotic Depletion Potential for energy carrier Ei Enr,MB6,Eref,El non-renewable energy demand for the national reference value for building`s annual
electricity demand (end energy) according to the national implementation of the EPBDin [kWh/m²NFA *a],
Enr,MB6,Href,Ei non-renewable energy demand for the national reference value for the building`s annual heating demand (end energy) according to the national implementation of the EPBDin [kWh/m²NFA *a] for fossil fuel Ei.
The reference values for ADP_Ene,Href be extracted from Table1 and Table2 using the respective ADP factor for the reference fuels. These tables show reference values for both assessment types – “Quick and Basic” assessment and “Complete” assessment.
Note: table to be amended with European reference values for ADP_fossil fuels Table 1: European average reference values for “Quick and Basic”
Quick and Basic Based on 18 case studies
GWP [kg CO2E /(m²*y)
ODP kg R11E /(m²*a)])
AP [kg SO2E /(m²*a)]
EP [kg PO4
3-
E /(m²*a)]
POCP [kg C2H4E /(m²*a)]
Penr [kWh /(m²*a)]
PEre [kWh /(m²*a)]
PEtot [kWh /(m²*a)]
ADPelements [kg SB-E /(m²*a)]
Cref 6.5 3.1E-07 2.4E-02 2.7E-03 2.9E-03 24.2 4.8 29.0 1,9E-01 Oref 33.2 5.8E-06 1.8E-01 7.4E-03 1.1E-02 168.1 15.3 183.4 3,7E-02 Total 39.7 6.1E-06 2.0E-01 1.0E-02 1.3E-02 192.3 20.1 212.4 2,3E-01
Table 2: European average reference values for “Complete”
Complete Based on 6 case studies
GWP [kg CO2E /(m²*y)
ODP kg R11E /(m²*a)])
AP [kg SO2E /(m²*a)]
EP [kg PO4
3-E /(m²*a)]
POCP [kg C2H4E /(m²*a)]
Penr [kWh /(m²*a)]
PEre [kWh /(m²*a)]
PEtot [kWh /(m²*a)]
ADPelements [kg SB-E /(m²*a)]
Cref 10.6 3.8E-07 3.3E-02 3,3E-03 3.4E-03 33.1 4.9 38.0 4,2E-02 Oref 35.2 6.7E-06 2.1E-01 8.3E-03 1.2E-02 196.5 21.0 217.5 2,2E-01 Total 45.8 7.1E-06 2.4E-01 1.1E-02 1.5E-02 229.5 25.9 255.5 2.6 E-06
Table 1 and Table 2 also mention a reference value for the operational phase. These values can be used if nation benchmarks are not available. The procedure of choosing the benchmarks is described in Figure 2.
67
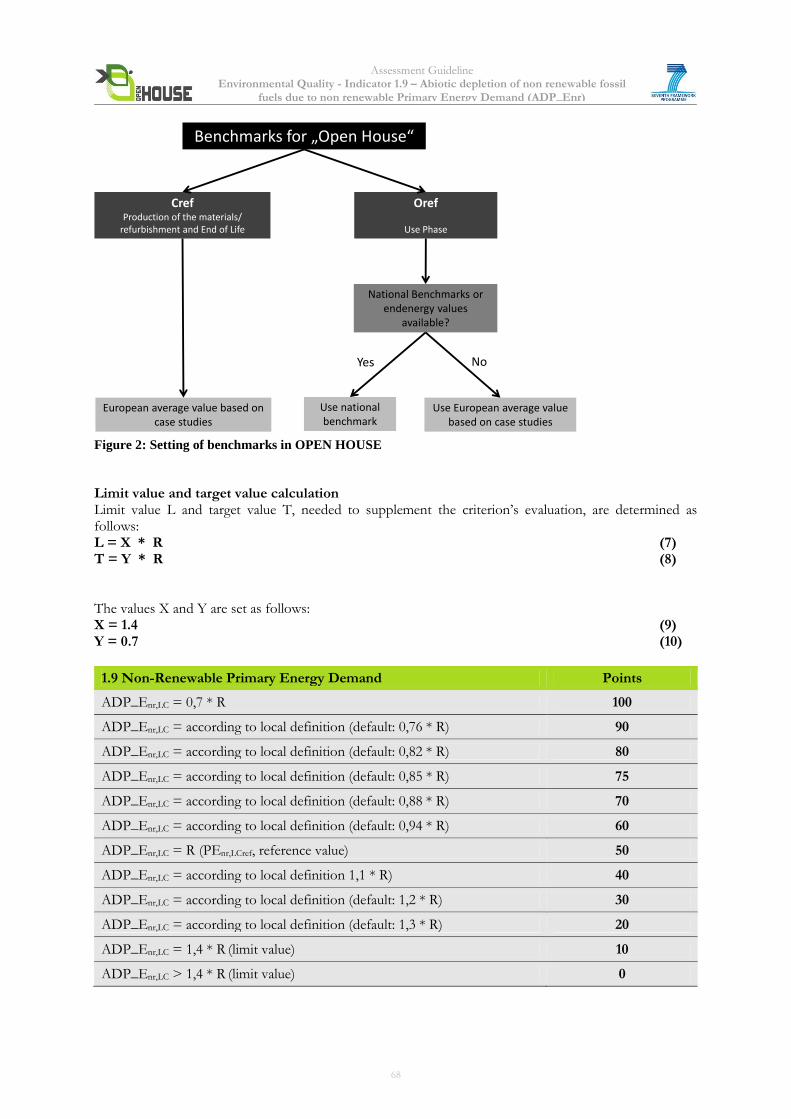
Assessment Guideline Environmental Quality - Indicator 1.9 – Abiotic depletion of non renewable fossil
fuels due to non renewable Primary Energy Demand (ADP_Enr)
Benchmarks for „Open House“
CrefProduction of the materials/
refurbishment and End of Life
Oref
Use Phase
European average value based on case studies
National Benchmarks orendenergy values
available?
Use national benchmark
Yes No
Use European average valuebased on case studies
Figure 2: Setting of benchmarks in OPEN HOUSE
Limit value and target value calculation Limit value L and target value T, needed to supplement the criterion’s evaluation, are determined as follows: L = X * R (7) T = Y * R (8) The values X and Y are set as follows: X = 1.4 (9) Y = 0.7 (10)
1.9 Non-Renewable Primary Energy Demand Points
ADP_Enr,LC = 0,7 * R 100
ADP_Enr,LC = according to local definition (default: 0,76 * R) 90
ADP_Enr,LC = according to local definition (default: 0,82 * R) 80
ADP_Enr,LC = according to local definition (default: 0,85 * R) 75
ADP_Enr,LC = according to local definition (default: 0,88 * R) 70
ADP_Enr,LC = according to local definition (default: 0,94 * R) 60
ADP_Enr,LC = R (PEnr,LCref, reference value) 50
ADP_Enr,LC = according to local definition 1,1 * R) 40
ADP_Enr,LC = according to local definition (default: 1,2 * R) 30
ADP_Enr,LC = according to local definition (default: 1,3 * R) 20
ADP_Enr,LC = 1,4 * R (limit value) 10
ADP_Enr,LC > 1,4 * R (limit value) 0
68
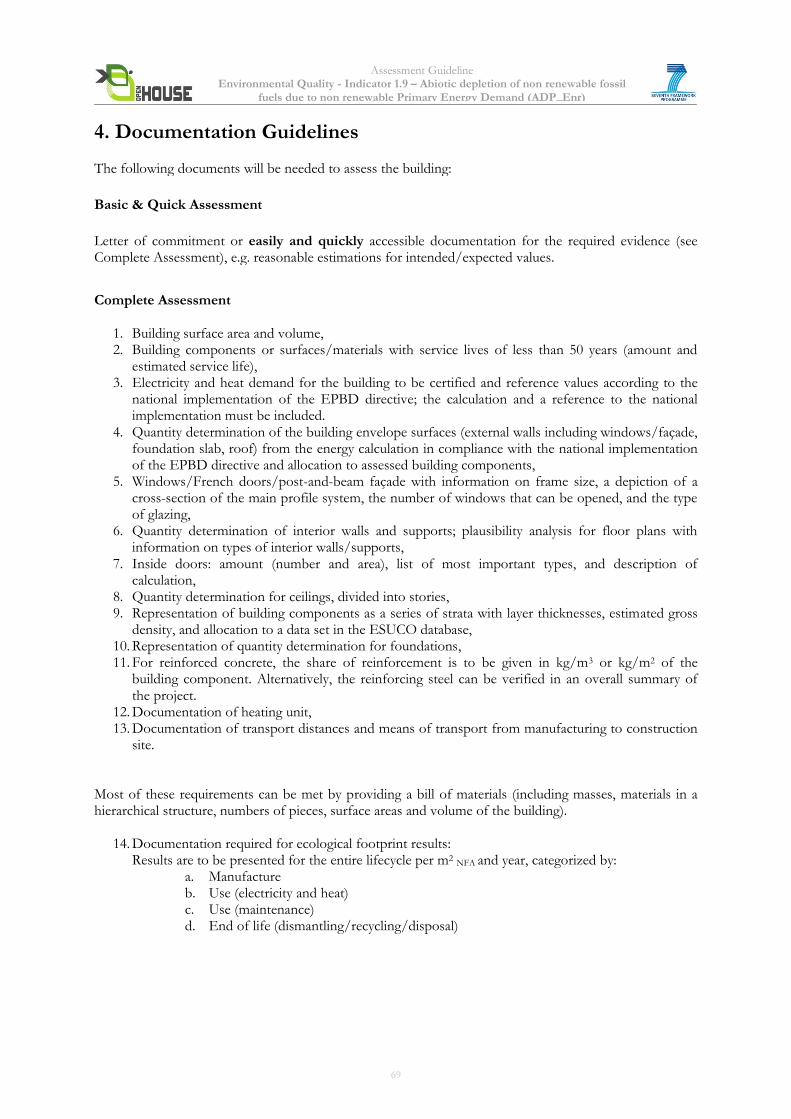
Assessment Guideline Environmental Quality - Indicator 1.9 – Abiotic depletion of non renewable fossil
fuels due to non renewable Primary Energy Demand (ADP_Enr)
4. Documentation Guidelines The following documents will be needed to assess the building:
Basic & Quick Assessment
Letter of commitment or easily and quickly accessible documentation for the required evidence (see Complete Assessment), e.g. reasonable estimations for intended/expected values.
Complete Assessment
1. Building surface area and volume, 2. Building components or surfaces/materials with service lives of less than 50 years (amount and
estimated service life), 3. Electricity and heat demand for the building to be certified and reference values according to the
national implementation of the EPBD directive; the calculation and a reference to the national implementation must be included.
4. Quantity determination of the building envelope surfaces (external walls including windows/façade, foundation slab, roof) from the energy calculation in compliance with the national implementation of the EPBD directive and allocation to assessed building components,
5. Windows/French doors/post-and-beam façade with information on frame size, a depiction of a cross-section of the main profile system, the number of windows that can be opened, and the type of glazing,
6. Quantity determination of interior walls and supports; plausibility analysis for floor plans with information on types of interior walls/supports,
7. Inside doors: amount (number and area), list of most important types, and description of calculation,
8. Quantity determination for ceilings, divided into stories, 9. Representation of building components as a series of strata with layer thicknesses, estimated gross
density, and allocation to a data set in the ESUCO database, 10. Representation of quantity determination for foundations, 11. For reinforced concrete, the share of reinforcement is to be given in kg/m3 or kg/m2 of the
building component. Alternatively, the reinforcing steel can be verified in an overall summary of the project.
12. Documentation of heating unit, 13. Documentation of transport distances and means of transport from manufacturing to construction
site.
Most of these requirements can be met by providing a bill of materials (including masses, materials in a hierarchical structure, numbers of pieces, surface areas and volume of the building).
14. Documentation required for ecological footprint results: Results are to be presented for the entire lifecycle per m2 NFA and year, categorized by:
a. Manufacture b. Use (electricity and heat) c. Use (maintenance) d. End of life (dismantling/recycling/disposal)
69
Assessment Guideline Environmental Quality - Indicator 1.9 – Abiotic depletion of non renewable fossil
fuels due to non renewable Primary Energy Demand (ADP_Enr)
5. Relation to other Indicators Data acquisition is the same for the indicators of
1.1 Global Warming Potential
1.2 Ozone Depletion Potential
1.3 Acidification Potential
1.4 Eutrophication Potential
1.5 Photochemical Ozone Creation Potential
1.9 Abiotic depletion of non renewable fossil fuels due to non renewable Primary Energy Demand (ADP_Enr)1.10 Total Primary Energy Demands and Percentage of Renewable Primary Energy
1.15 Abiotic Depletion Potential for non fossil fuels (ADP_element)
6. Resources
1. ISO 14040: 2009-11: Environmental management – Life cycle assessment – Principles and framework. International Organization for Standardization.
2. ISO 14044: 2006-10: Environmental management – Life cycle assessment – Requirements and guidelines. International Organization for Standardization.
3. EN 15978: 2011: Sustainability of construction works — Assessment of environmental performance of buildings — Calculation method. European Committee for Standardization CEN.
4. EN 15804: 2010: Sustainability of construction works — Environmental product declarations — Core rules for the product category of construction products. European Committee for Standardization CEN.
5. Directive 2009/28/EC of the European Parliament and of the Council of 23 April 2009 on the promotion of the use of energy from renewable sources and amending and subsequently repealing Directives 2001/77/EC and 2003/30/EC.
6. Kreißig, J., Binder, M. (2007): Methodische Grundlagen- Ökobilanzbasierte Umweltindikatoren im Bauwesen. Methodenbericht zum BMVBS-Projekt „Aktualisieren, Fortschreiben und Harmonisieren von Basisdaten für das nachhaltige Bauen“ (AZ 10.06.03 – 06.119) Mai 2007, www.baufachinformation.de/literatur.isp.
7. United Nations (1998): Kyoto Protocol to the United Nations Framework Convention on Climate Change, 1998, http://unfccc.int/resource/docs/convkp/kpeng.pdf.
8. Bundesministerium für Verkehr, Bau- und Wohnungswesen: Guideline for Sustainable Building. Eigenverlag, 2001.
9. Directive 2002/91/EC of the European Parliament and of the Council of 16 December 2002 on the energy performance of buildings.
10. VDI 2067: Economic efficiency of building installations – Fundamentals and economic calculation. Verein Deutscher Ingenieure, 2000.
7. Attachments
None
70
Assessment Guideline Environmental Quality - Indicator 1.10
Total Primary Energy demand and Share of renewable Primary Energy
Indicator 1.10 Total Primary Energy demand and Share of renewable Primary Energy (adapted from DGNB/BNB)
Core Indicator
1. Objective Primary energy is energy found in nature that has not been subjected to any conversion or transformation process. It is energy contained in raw fuels as well as other forms of energy received as input to a system. The indicator Total Primary Energy Demand and Share of renewable Primary Energy aims at the reduction of the Total Primary Energy Demand and at the increase of the share of renewable Primary Energy Demand. This supports the European Commission target to reach a 20% improvement in energy efficiency as well as a 20% share of renewable energies in EU energy consumption by 20201.
2. Assessment Methodology
The indicator is mainly based on the method of Life Cycle Assessment (LCA): LCA results of the building to be assessed will be calculated in a standardized way and evaluated against benchmarks. Thus Total Primary Energy demand and Share of renewable Primary Energy is a quantitative indicator. According to the standards EN ISO 14040 and 14044, the method of Life-Cycle Assessment generally consists of four steps: Definition of goal and scope of the study, inventory analysis, impact assessment and interpretation. The indicators 1.1-1.5, 1.9-1.10 and 1.15 are based on LCAs and for all these indicators the same definitions for goal and scope and for the inventory analysis do apply. Goal and scope definition The goal of all LCA studies is to analyze and later benchmark the environmental performance of the respective buildings` life cycles. The scope of the building assessment therefore includes the following life cycle stages:
production: raw material supply, transport to manufacturing, manufacturing and transport to the construction site of products used in the building (Figure 1, modules A1-A4),
use stage: a scenario is defined including use and replacement, including end-of-life of replaced products (Figure 1, modules B1 and B4); in addition the operational energy use is considered (Figure 1, module B6),
end-of-life stage: waste processing and disposal of the building, (Figure 1, modules C3 and C4),
a scenario for potential benefits and loads beyond the system boundaries, including loads for reuse and recycling as well as benefits from recycling potentials (Figure 1, module D).
1 Energy 2020 - A strategy for competitive, sustainable and secure energy
71
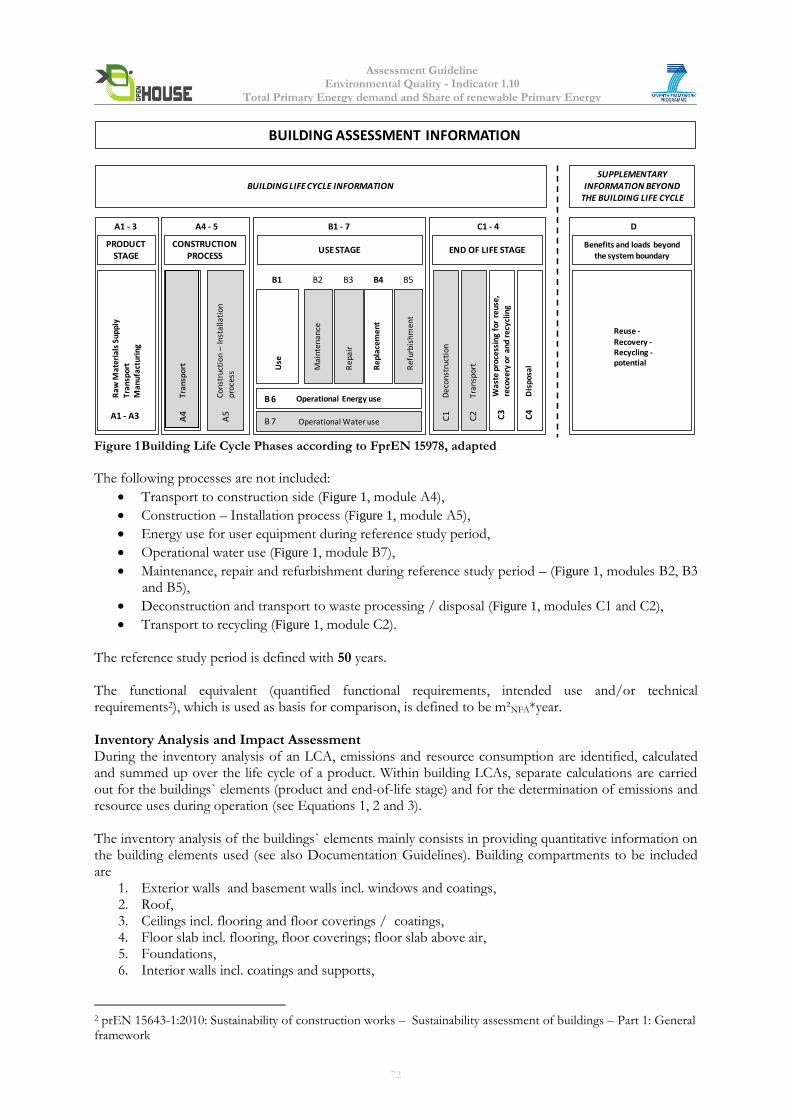
Assessment Guideline Environmental Quality - Indicator 1.10
Total Primary Energy demand and Share of renewable Primary Energy
BUILDING ASSESSMENT INFORMATION
BUILDING LIFE CYCLE INFORMATION
Raw
Mat
eri
als
Sup
ply
Tra
nsp
ort
Man
ufa
ctu
rin
g
PRODUCT STAGE
A1 - 3
A1 - A3
Tran
spo
rt
CONSTRUCTION PROCESS
A4 - 5
A4
Cons
truc
tion
–In
stal
lati
on
proc
ess
A5
Use
USE STAGE
B1 - 7
B1
Mai
nte
nan
ce
B2
Rep
air
Re
plac
em
ent
Re
furb
ish
me
nt
B3 B4 B5
Operational Energy use
Operational Water useB 7
B 6 De
con
stru
ctio
n
END OF LIFE STAGE
C1 - 4
C1
Tran
spor
tC
2
Was
te p
roce
ssin
g fo
r re
use,
re
cove
ry o
r an
d re
cycl
ing
C3
Dis
po
sal
C4
Benefits and loads beyond the system boundary
D
Reuse -Recovery -Recycling -potential
SUPPLEMENTARY INFORMATION BEYOND
THE BUILDING LIFE CYCLE
Figure 1 Building Life Cycle Phases according to FprEN 15978, adapted
The following processes are not included:
Transport to construction side (Figure 1, module A4),
Construction – Installation process (Figure 1, module A5),
Energy use for user equipment during reference study period,
Operational water use (Figure 1, module B7),
Maintenance, repair and refurbishment during reference study period – (Figure 1, modules B2, B3 and B5),
Deconstruction and transport to waste processing / disposal (Figure 1, modules C1 and C2),
Transport to recycling (Figure 1, module C2). The reference study period is defined with 50 years. The functional equivalent (quantified functional requirements, intended use and/or technical requirements2), which is used as basis for comparison, is defined to be m²NFA*year. Inventory Analysis and Impact Assessment During the inventory analysis of an LCA, emissions and resource consumption are identified, calculated and summed up over the life cycle of a product. Within building LCAs, separate calculations are carried out for the buildings` elements (product and end-of-life stage) and for the determination of emissions and resource uses during operation (see Equations 1, 2 and 3). The inventory analysis of the buildings` elements mainly consists in providing quantitative information on the building elements used (see also Documentation Guidelines). Building compartments to be included are
1. Exterior walls and basement walls incl. windows and coatings, 2. Roof, 3. Ceilings incl. flooring and floor coverings / coatings, 4. Floor slab incl. flooring, floor coverings; floor slab above air, 5. Foundations, 6. Interior walls incl. coatings and supports,
2 prEN 15643-1:2010: Sustainability of construction works – Sustainability assessment of buildings – Part 1: General framework
72
Assessment Guideline Environmental Quality - Indicator 1.10
Total Primary Energy demand and Share of renewable Primary Energy
7. Heat generation units.
For these, respective datasets are picked out from the ESUCO database, which include environmental profiles of the used component: for the respective component, a standardized LCA has been conducted earlier and the results are provided within this database format. For the module A4, which contains transports from manufacturing to the construction site, information about transport distances and means of transportation have to be provided and connected to the respective ESUCO data sets3. For the analysis of the use stage, a scenario has to be set up, including supply and disposal systems and repairs. For supply and disposal, values for end energy consumption for electricity and heat have to be derived from the respective national implementation of the EPBD directive. Heating units as well as the electricity demand calculated have to be listed and linked to the respective ESUCO datasets. For repair, calculations have to be made for all materials, building components and surfaces with service lives of less than 50 years. Sources for service lives are the “Guideline for Sustainable Building” for construction materials and the VDI 2067 for building services. Also for the end-of-life stage, a scenario has to be defined for the recycling and disposal of the building materials that remain in the building after the end of the reference study period. So for each material, one end-of-life options has to be chosen and linked to the respective ESUCO dataset:
Metals recycling ”metal recycling potential”,
Mineral building materials recycling ”construction rubble processing”,
Materials with a heating value thermal recycling respective material group in ESUCO database,
Heat producers Dataset corresponding to the manufacturing process,
All other materials that can be deposited at construction or household waste sites disposal at
waste site appropriate ESUCO dataset. By using environmental profiles such as provided by ESUCO, the step of impact assessment has already been done by the data providers: Environmental profiles are given by providing the LCA results for the respective component in form of different environmental impact categories. These results are then used within the building LCA. Interpretation Resulting impacts are then evaluated against reference values to determine the respective indicator assessment (see overall Rating / Assessment Matrix). The following sub-indicators will be assessed: 1.10.1 Total Primary Energy Demand 1.10.2 Share of renewable Primary Energy in Total Primary Energy Demand
3 It is suggested to use European average datasets. This means that the datasets represent technologies on average
levels for Europe. These construction materials also contain European boundary conditions such as European datasets for electric or thermal energy or intermediate products and represent a common European market for construction materials. Using such European average datasets does not show the variability, for instance of the industry producing construction materials in Europe and thus has the advantage not to bias the analysis of the life cycle models by accounting for differences in different production techniques. This bias would reduce the significance of the results as the clear denotation of environmental hotspots in the structure and design of buildings would contain higher uncertainties on the origin of environmental impacts.
73
Assessment Guideline Environmental Quality - Indicator 1.10
Total Primary Energy demand and Share of renewable Primary Energy
3. Calculation and Rating Calculation The total primary energy demand over the building life cycle, PEtot, LC, is calculated as follows: PEtot, LC = PEnr, LC + PEren, LC
where PEnr, LC result from indicator Non-renewable Primary Energy Demand: Non-Renewable Primary Energy Demand of the entire life cycle of the entire building as an average annual value over the time reference study period td in [kWh/(m²NFA*a)], PEren, LC renewable primary energy demand of the entire life cycle of the entire building as an average annual value over the time reference study period td in [kWh/(m²NFA*a)]; also calculated according to the equations given for Non-renewable Primary Energy Demand but using the ESUCO dataset for renewable primary energy demand. To assess the sub-indicator “Share of renewable Primary Energy Demand PEren,LC“, the ratio of renewable primary energy to total primary energy use PEren, LC / PEnr, LC must be presented as a percent.
1.10.1 Total Primary Energy Demand
Rating Method The “designed building” is rated against a case-specific reference building. Total Primary Energy Demand for Reference Building PEtot,LC,ref =PEtot,Cref + PEtot,Oref (4) where PEtot,LCref Reference value for the for the total primary energy demand of the life cycle of the reference building in [kWh/(m²NFA*a)], PEtot,Cref reference value for the average annual value of total primary energy demand for the building’s construction, maintenance, dismantling, and disposal including building systems technology over the reference study period td, calculated from an average office building in [kWh/(m²NFA*a)]4, PEtot,Oref reference value for the annual total primary energy demand created by building operations, derived from the reference value according to the national implementation of the EPBD directive in [kWh/(m²NFA*a)]. The reference value for construction PEtot,Cref is calculated as follows: PEtot,Cref = (PEtot,MAref + PEtot,MCref ) / td + PEtot,MB1,4ref (5) where PEtot,MA ref reference value for total primary energy demand created during the modules A1-45, including office building’s manufacture (construction and building systems technology) and transports to construction site in [kWh/(m²NFA*a)], PEtot,MC ref reference value for total primary energy demand created during module C3 and C46, the office building’s end-of-life (design and building systems technology) in [kWh/(m²NFA*a)], PEtot,MB1,4ref reference value for total primary energy demand created during modules B1 and B47 on a yearly basis, the office building’s use and replacement (construction and building systems technology) in [kWh/(m²NFA*a)]. td reference study period in [a]. This time period is set to 50 years.
4 PEtot,Cref is derived from the case studies. 5 Module A5 currently is not regarded due to a lack of data; compare chapter 2. 6 Modules C1 and C2 currently are not regarded due to a lack of data; compare chapter 2. 7 Modules B2, B3 and B5 currently are not regarded due to a lack of data; compare chapter 2.
74
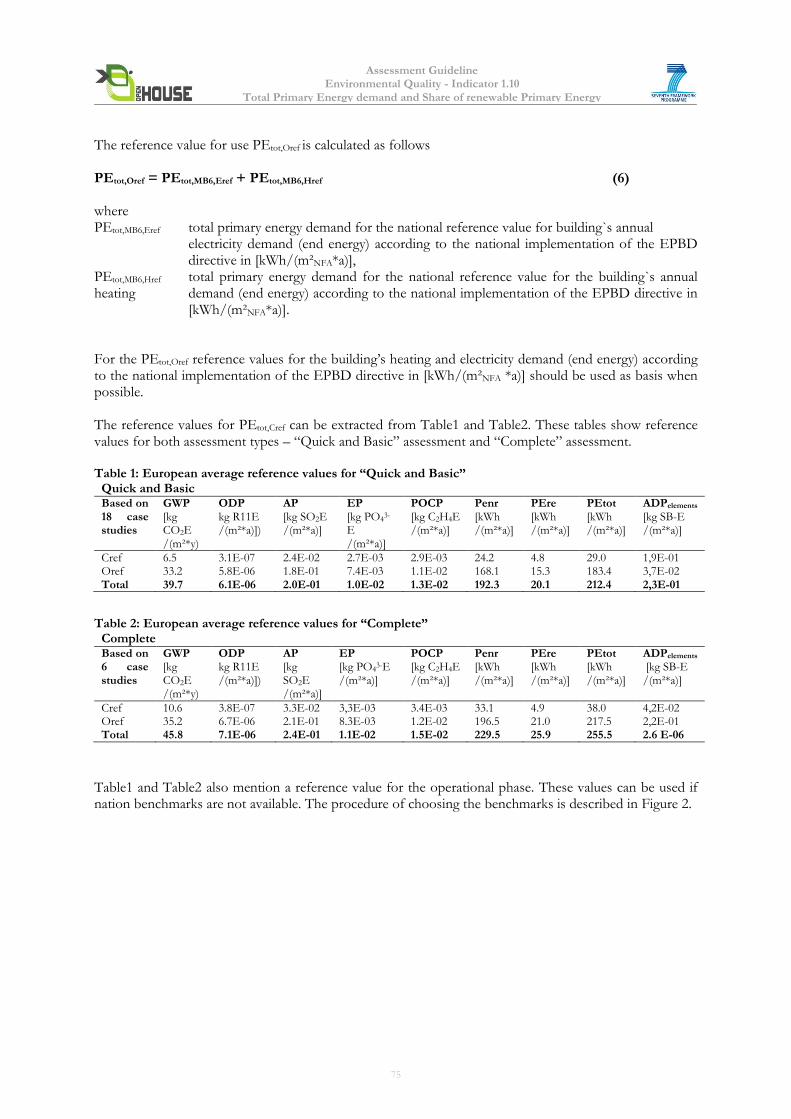
Assessment Guideline Environmental Quality - Indicator 1.10
Total Primary Energy demand and Share of renewable Primary Energy
The reference value for use PEtot,Oref is calculated as follows PEtot,Oref = PEtot,MB6,Eref + PEtot,MB6,Href (6) where PEtot,MB6,Eref total primary energy demand for the national reference value for building`s annual electricity demand (end energy) according to the national implementation of the EPBD directive in [kWh/(m²NFA*a)], PEtot,MB6,Href total primary energy demand for the national reference value for the building`s annual heating demand (end energy) according to the national implementation of the EPBD directive in [kWh/(m²NFA*a)]. For the PEtot,Oref reference values for the building’s heating and electricity demand (end energy) according to the national implementation of the EPBD directive in [kWh/(m²NFA *a)] should be used as basis when possible. The reference values for PEtot,Cref can be extracted from Table1 and Table2. These tables show reference values for both assessment types – “Quick and Basic” assessment and “Complete” assessment. Table 1: European average reference values for “Quick and Basic”
Quick and Basic Based on 18 case studies
GWP [kg CO2E /(m²*y)
ODP kg R11E /(m²*a)])
AP [kg SO2E /(m²*a)]
EP [kg PO4
3-
E /(m²*a)]
POCP [kg C2H4E /(m²*a)]
Penr [kWh /(m²*a)]
PEre [kWh /(m²*a)]
PEtot [kWh /(m²*a)]
ADPelements [kg SB-E /(m²*a)]
Cref 6.5 3.1E-07 2.4E-02 2.7E-03 2.9E-03 24.2 4.8 29.0 1,9E-01 Oref 33.2 5.8E-06 1.8E-01 7.4E-03 1.1E-02 168.1 15.3 183.4 3,7E-02 Total 39.7 6.1E-06 2.0E-01 1.0E-02 1.3E-02 192.3 20.1 212.4 2,3E-01
Table 2: European average reference values for “Complete”
Complete Based on 6 case studies
GWP [kg CO2E /(m²*y)
ODP kg R11E /(m²*a)])
AP [kg SO2E /(m²*a)]
EP [kg PO4
3-E /(m²*a)]
POCP [kg C2H4E /(m²*a)]
Penr [kWh /(m²*a)]
PEre [kWh /(m²*a)]
PEtot [kWh /(m²*a)]
ADPelements [kg SB-E /(m²*a)]
Cref 10.6 3.8E-07 3.3E-02 3,3E-03 3.4E-03 33.1 4.9 38.0 4,2E-02 Oref 35.2 6.7E-06 2.1E-01 8.3E-03 1.2E-02 196.5 21.0 217.5 2,2E-01 Total 45.8 7.1E-06 2.4E-01 1.1E-02 1.5E-02 229.5 25.9 255.5 2.6 E-06
Table1 and Table2 also mention a reference value for the operational phase. These values can be used if nation benchmarks are not available. The procedure of choosing the benchmarks is described in Figure 2.
75
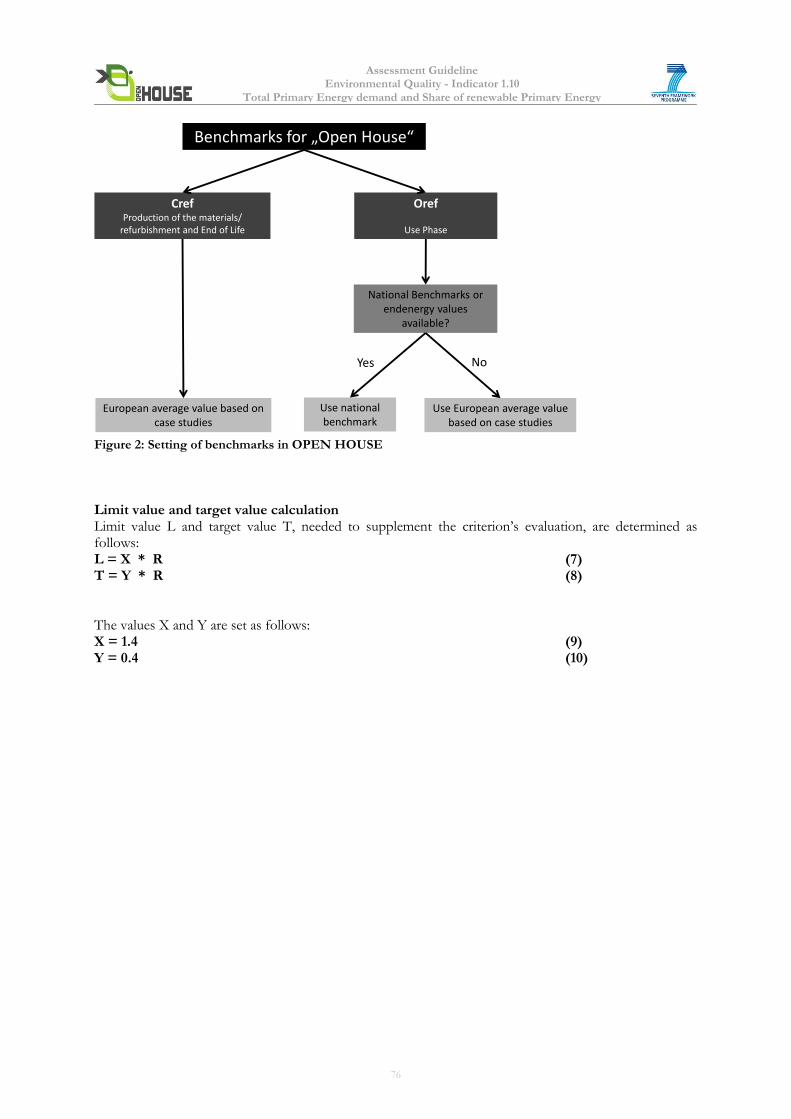
Assessment Guideline Environmental Quality - Indicator 1.10
Total Primary Energy demand and Share of renewable Primary Energy
Benchmarks for „Open House“
CrefProduction of the materials/
refurbishment and End of Life
Oref
Use Phase
European average value based on case studies
National Benchmarks orendenergy values
available?
Use national benchmark
Yes No
Use European average valuebased on case studies
Figure 2: Setting of benchmarks in OPEN HOUSE
Limit value and target value calculation Limit value L and target value T, needed to supplement the criterion’s evaluation, are determined as follows: L = X * R (7) T = Y * R (8) The values X and Y are set as follows: X = 1.4 (9) Y = 0.4 (10)
76
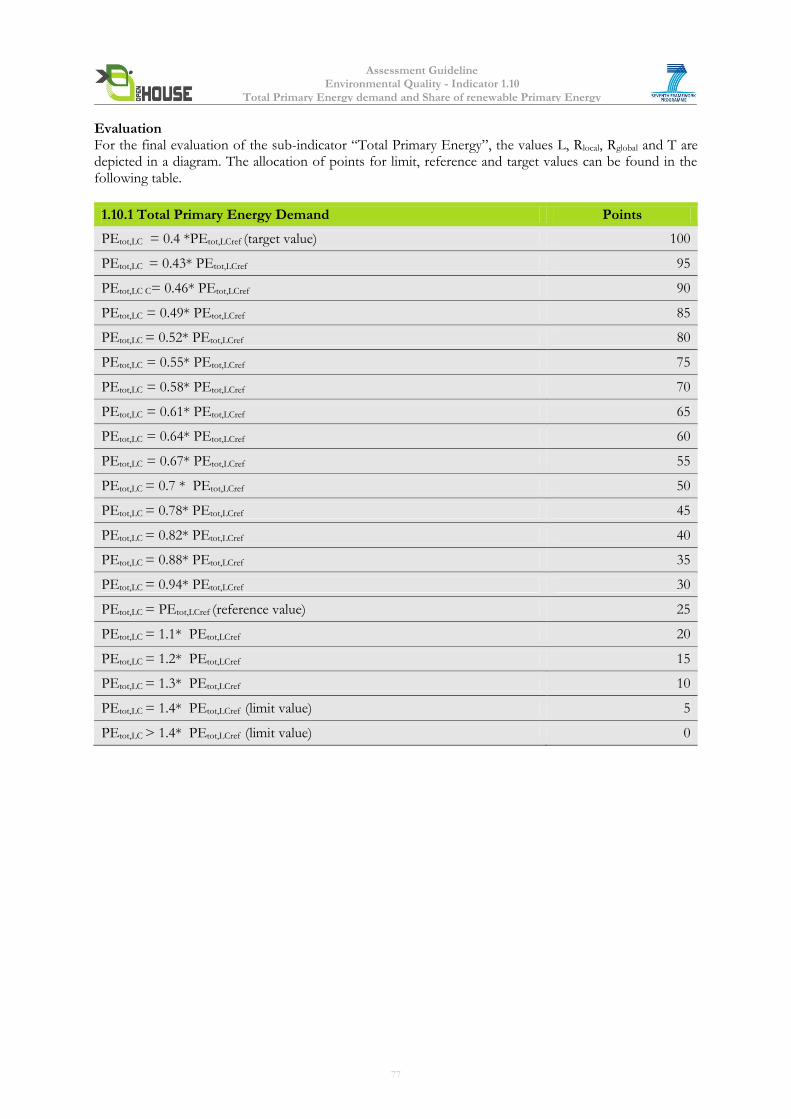
Assessment Guideline Environmental Quality - Indicator 1.10
Total Primary Energy demand and Share of renewable Primary Energy
Evaluation For the final evaluation of the sub-indicator “Total Primary Energy”, the values L, Rlocal, Rglobal and T are depicted in a diagram. The allocation of points for limit, reference and target values can be found in the following table.
1.10.1 Total Primary Energy Demand Points
PEtot,LC = 0.4 *PEtot,LCref (target value) 100
PEtot,LC = 0.43* PEtot,LCref 95
PEtot,LC C= 0.46* PEtot,LCref 90
PEtot,LC = 0.49* PEtot,LCref 85
PEtot,LC = 0.52* PEtot,LCref 80
PEtot,LC = 0.55* PEtot,LCref 75
PEtot,LC = 0.58* PEtot,LCref 70
PEtot,LC = 0.61* PEtot,LCref 65
PEtot,LC = 0.64* PEtot,LCref 60
PEtot,LC = 0.67* PEtot,LCref 55
PEtot,LC = 0.7 * PEtot,LCref 50
PEtot,LC = 0.78* PEtot,LCref 45
PEtot,LC = 0.82* PEtot,LCref 40
PEtot,LC = 0.88* PEtot,LCref 35
PEtot,LC = 0.94* PEtot,LCref 30
PEtot,LC = PEtot,LCref (reference value) 25
PEtot,LC = 1.1* PEtot,LCref 20
PEtot,LC = 1.2* PEtot,LCref 15
PEtot,LC = 1.3* PEtot,LCref 10
PEtot,LC = 1.4* PEtot,LCref (limit value) 5
PEtot,LC > 1.4* PEtot,LCref (limit value) 0
77
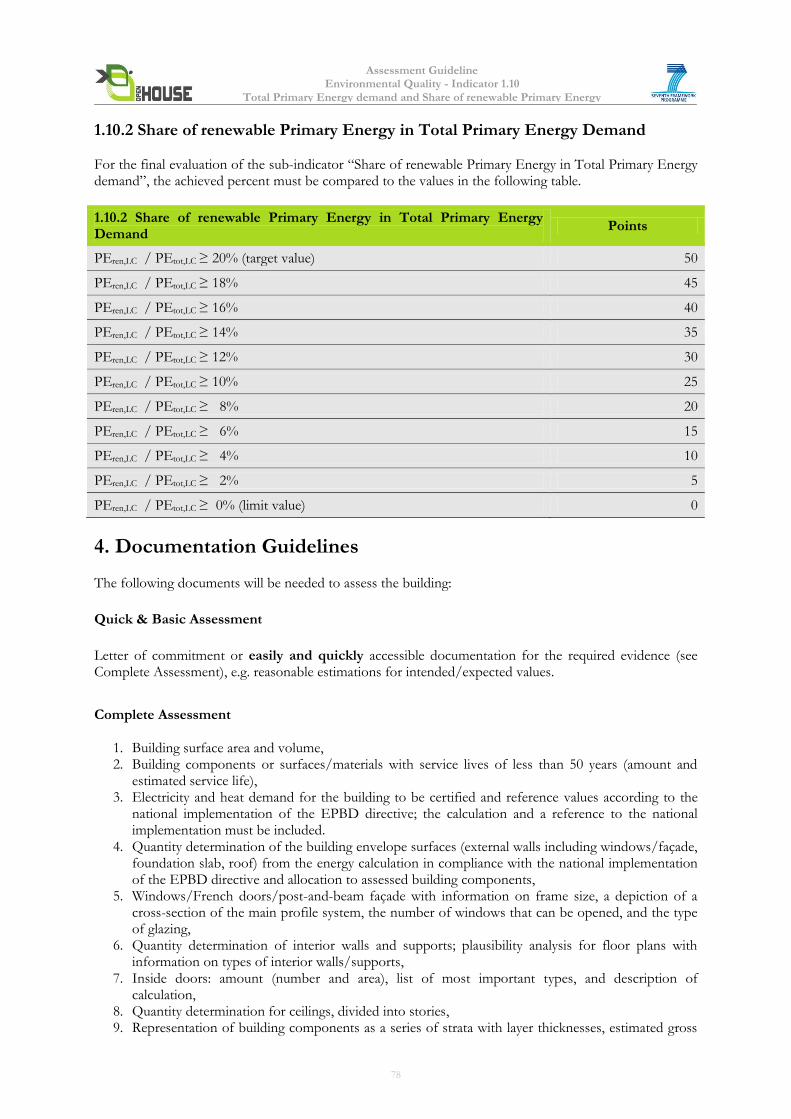
Assessment Guideline Environmental Quality - Indicator 1.10
Total Primary Energy demand and Share of renewable Primary Energy
1.10.2 Share of renewable Primary Energy in Total Primary Energy Demand
For the final evaluation of the sub-indicator “Share of renewable Primary Energy in Total Primary Energy demand”, the achieved percent must be compared to the values in the following table.
1.10.2 Share of renewable Primary Energy in Total Primary Energy Demand
Points
PEren,LC / PEtot,LC ≥ 20% (target value) 50
PEren,LC / PEtot,LC ≥ 18% 45
PEren,LC / PEtot,LC ≥ 16% 40
PEren,LC / PEtot,LC ≥ 14% 35
PEren,LC / PEtot,LC ≥ 12% 30
PEren,LC / PEtot,LC ≥ 10% 25
PEren,LC / PEtot,LC ≥ 8% 20
PEren,LC / PEtot,LC ≥ 6% 15
PEren,LC / PEtot,LC ≥ 4% 10
PEren,LC / PEtot,LC ≥ 2% 5
PEren,LC / PEtot,LC ≥ 0% (limit value) 0
4. Documentation Guidelines The following documents will be needed to assess the building:
Quick & Basic Assessment
Letter of commitment or easily and quickly accessible documentation for the required evidence (see Complete Assessment), e.g. reasonable estimations for intended/expected values.
Complete Assessment
1. Building surface area and volume, 2. Building components or surfaces/materials with service lives of less than 50 years (amount and
estimated service life), 3. Electricity and heat demand for the building to be certified and reference values according to the
national implementation of the EPBD directive; the calculation and a reference to the national implementation must be included.
4. Quantity determination of the building envelope surfaces (external walls including windows/façade, foundation slab, roof) from the energy calculation in compliance with the national implementation of the EPBD directive and allocation to assessed building components,
5. Windows/French doors/post-and-beam façade with information on frame size, a depiction of a cross-section of the main profile system, the number of windows that can be opened, and the type of glazing,
6. Quantity determination of interior walls and supports; plausibility analysis for floor plans with information on types of interior walls/supports,
7. Inside doors: amount (number and area), list of most important types, and description of calculation,
8. Quantity determination for ceilings, divided into stories, 9. Representation of building components as a series of strata with layer thicknesses, estimated gross
78
Assessment Guideline Environmental Quality - Indicator 1.10
Total Primary Energy demand and Share of renewable Primary Energy
density, and allocation to a data set in the ESUCO database,
10. Representation of quantity determination for foundations, 11. For reinforced concrete, the share of reinforcement is to be given in kg/m3 or kg/m2 of the
building component. Alternatively, the reinforcing steel can be verified in an overall summary of the project.
12. Documentation of heating unit, 13. Documentation of transport distances and means of transport from manufacturing to construction
site.
Most of these requirements can be met by providing a bill of materials (including masses, materials in a hierarchical structure, numbers of pieces, surface areas and volume of the building).
14. Documentation required for ecological footprint results: Results are to be presented for the entire lifecycle per m2 NFA and year, categorized by:
a. Manufacture b. Use (electricity and heat) c. Use (maintenance) d. End of life (dismantling/recycling/disposal)
5. Relation to other Indicators Data acquisition is the same for the indicators 1.1- 1.5, 1.9, 1.10, 1.15
6. Resources
1. ISO 14040: 2009-11: Environmental management – Life cycle assessment – Principles and framework. International Organization for Standardization.
2. ISO 14044: 2006-10: Environmental management – Life cycle assessment – Requirements and guidelines. International Organization for Standardization.
3. FprEN 15978: 2011: Sustainability of construction works — Assessment of environmental performance of buildings — Calculation method. European Committee for Standardization CEN.
4. prEN 15804: 2010: Sustainability of construction works — Environmental product declarations — Core rules for the product category of construction products. European Committee for Standardization CEN.
5. Directive 2009/28/EC of the European Parliament and of the Council of 23 April 2009 on the promotion of the use of energy from renewable sources and amending and subsequently repealing Directives 2001/77/EC and 2003/30/EC.
6. Kreißig, J., Binder, M. (2007): Methodische Grundlagen- Ökobilanzbasierte Umweltindikatoren im Bauwesen. Methodenbericht zum BMVBS-Projekt „Aktualisieren, Fortschreiben und Harmonisieren von Basisdaten für das nachhaltige Bauen“ (AZ 10.06.03 – 06.119) Mai 2007, www.baufachinformation.de/literatur.isp.
7. United Nations (1998): Kyoto Protocol to the United Nations Framework Convention on Climate Change, 1998, http://unfccc.int/resource/docs/convkp/kpeng.pdf.
8. Bundesministerium für Verkehr, Bau- und Wohnungswesen: Guideline for Sustainable Building. Eigenverlag, 2001.
9. Directive 2002/91/EC of the European Parliament and of the Council of 16 December 2002 on the energy performance of buildings.
10. VDI 2067: Economic efficiency of building installations – Fundamentals and economic calculation. Verein Deutscher Ingenieure, 2000.
7. Attachments
None
79
Assessment Guideline Environmental Quality - Indicator 1.11 – Water and Waste Water
Indicator 1.11 Water and Waste Water (adapted from DGNB/BNB)
Core Indicator
1. Objective Potable water consumption and sewage generation shall be reduced within the Life Cycle of a building. Aspects to be regarded are water embodied in building materials in the Product stage, water used in the Construction and Deconstruction Processes and operational water use during the Use stage. A further objective is to limit disruption and pollution of natural water flows by managing stormwater runoff. This indicator aims at the reduction of comsumption of freshwater and supports the European Commission objective to make water saving measures and increasing water efficiency a priority1, in order to ensure that water is available in sufficient quantities in European countries.
2. Assessment Methodology The following subindicators should be assessed in order to take in account the freshwater demand over the whole life cycle of the building: 1.11.1 Embodied water in building materials 1.11.2 Embodied water in construction and deconstruction processes 1.11.3 Operational Water Use and Waste Water
However, due to data issues in materials production as well as building construction and deconstruction processes, only the operational water use will be assessed in this veriosn of the OPEN HOUSE methodology.
1 European Commission: A resource-efficient Europe – Flagship initiative under the Europe 2020 Strategy
80
Assessment Guideline Environmental Quality - Indicator 1.11 – Water and Waste Water
3. Calculation and Rating Regarding a complete water use of a building`s Life Cycle, embodied water from building materials and construction / deconstruction procresses should be considered. The subindicators 1.11.1 and 1.11.2 should be included into calculations as soons as respective data is available. 1.11.1 Embodied water in building materials (NOT ASSESSED) To calculate the embodied water in building materials, the same system boundaries as in the LCA-based indicators do apply. As far as possible, respective data provided by LCA databases is used. The indicator should be expressed in [m³/(m²NFA*a)]. Due to these data issues, assessment and rating can not be determined at this stage. 1.11.2 Embodied water in construction and deconstruction processes (NOT ASSESSED) As far as possible, embodied water in construction and decosntruction processes should be collected and summed up. The indicator should be expressed in [m³/(m²NFA*a)]. Due to data issues, assessment and rating can not be determined at this stage. 1.11.3 Operational Water Use and Waste Water Operational Water Use is assessed using the »water use value« Wuv, which takes into consideration the potable water demand and the volume of waste water. For the calculation, the folowing items are taken into consideration:
Potable water consumed by staff for bathrooms, sinks, toilets, urinals, showers and kitchen sinks and respective waste water. Dish washers and washing machines are not included.
Potable water consumed for cleaning, based on the surfaces of washable floors and glass, and respective waste water.
Potable water consumed for watering plants. This can be reduced by using rainwater, plants that are well adapted to the location, or intelligent watering systems. In the current state of the assessment system, watering plants is not calculated, since outdoor facilities are not included, but this may be changed in future versions.
Rainwater that is not drained into the soil but is diverted to the technical drain system is considered as waste water. Due to rainwater`s low degree of pollution compared to other waste water from the building, a corrective reduction factor is used. If rainwater diverted to the drain system is used to replace potable water (e.g. for flushing toilets), this amount is subtracted from the total potable water demand, but not from the volume of waste water.
If gray water from the building is not led directly to the drain system but is reused, it both replaces potable water and is no longer considered waste water. Waste water purified on site is subtracted from the volume of waste water.
81
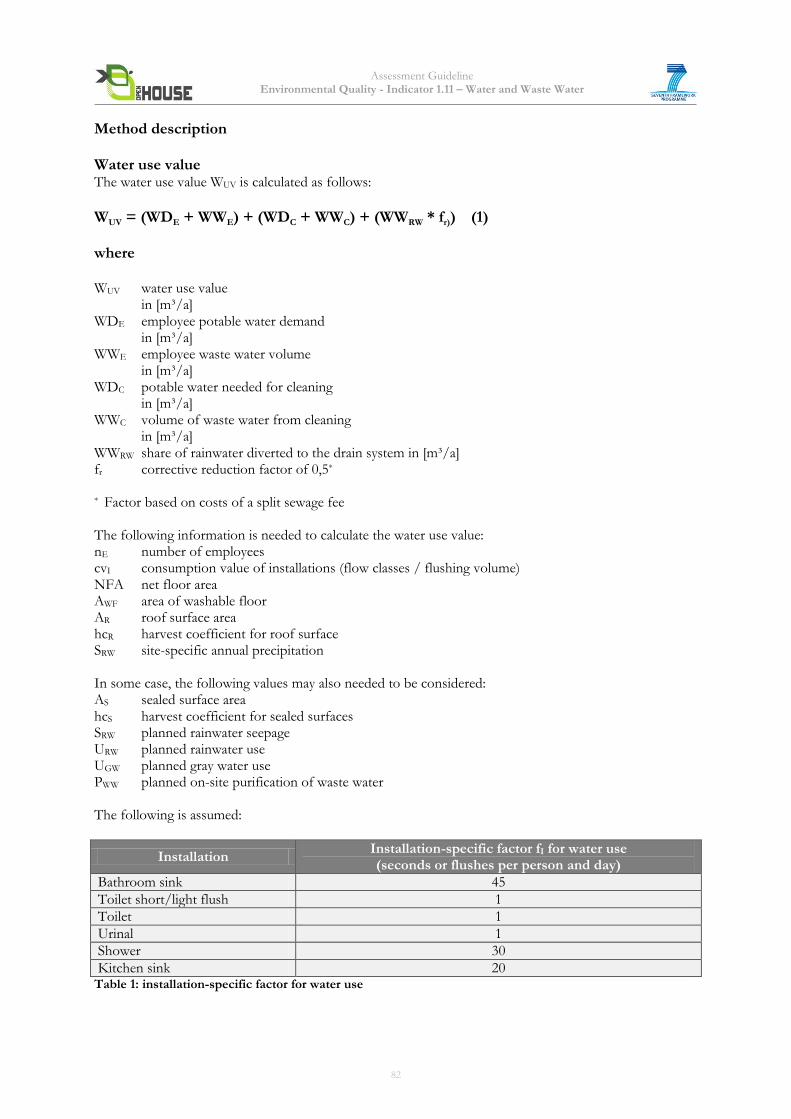
Assessment Guideline Environmental Quality - Indicator 1.11 – Water and Waste Water
Method description Water use value The water use value WUV is calculated as follows:
WUV = (WDE + WWE) + (WDC + WWC) + (WWRW * fr)) (1) where WUV water use value in [m³/a] WDE employee potable water demand in [m³/a] WWE employee waste water volume in [m³/a] WDC potable water needed for cleaning in [m³/a] WWC volume of waste water from cleaning in [m³/a] WWRW share of rainwater diverted to the drain system in [m³/a] fr corrective reduction factor of 0,5* * Factor based on costs of a split sewage fee The following information is needed to calculate the water use value: nE number of employees cvI consumption value of installations (flow classes / flushing volume) NFA net floor area AWF area of washable floor AR roof surface area hcR harvest coefficient for roof surface SRW site-specific annual precipitation In some case, the following values may also needed to be considered: AS sealed surface area hcS harvest coefficient for sealed surfaces SRW planned rainwater seepage URW planned rainwater use UGW planned gray water use PWW planned on-site purification of waste water The following is assumed:
Installation Installation-specific factor fI for water use (seconds or flushes per person and day)
Bathroom sink 45
Toilet short/light flush 1
Toilet 1
Urinal 1
Shower 30
Kitchen sink 20 Table 1: installation-specific factor for water use
82
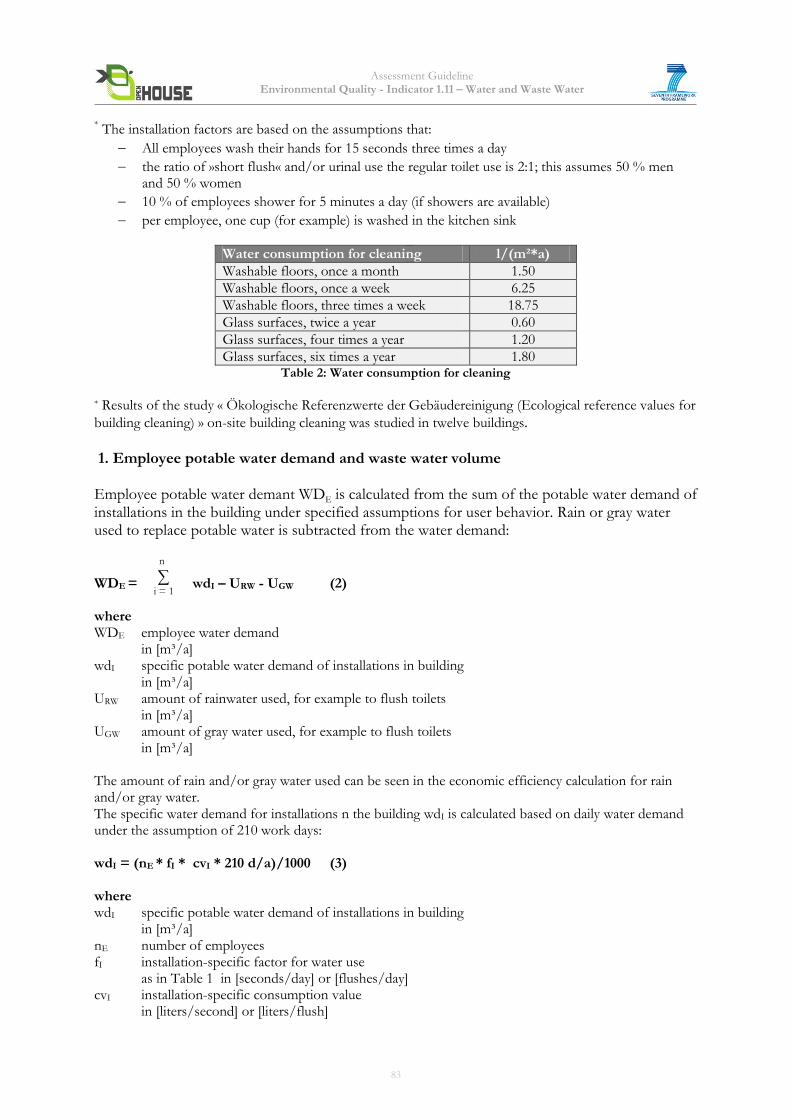
Assessment Guideline Environmental Quality - Indicator 1.11 – Water and Waste Water
* The installation factors are based on the assumptions that:
All employees wash their hands for 15 seconds three times a day
the ratio of »short flush« and/or urinal use the regular toilet use is 2:1; this assumes 50 % men and 50 % women
10 % of employees shower for 5 minutes a day (if showers are available)
per employee, one cup (for example) is washed in the kitchen sink
Water consumption for cleaning l/(m²*a)
Washable floors, once a month 1.50
Washable floors, once a week 6.25
Washable floors, three times a week 18.75
Glass surfaces, twice a year 0.60
Glass surfaces, four times a year 1.20
Glass surfaces, six times a year 1.80 Table 2: Water consumption for cleaning
* Results of the study « Ökologische Referenzwerte der Gebäudereinigung (Ecological reference values for
building cleaning) » on-site building cleaning was studied in twelve buildings. 1. Employee potable water demand and waste water volume Employee potable water demant WDE is calculated from the sum of the potable water demand of installations in the building under specified assumptions for user behavior. Rain or gray water used to replace potable water is subtracted from the water demand: WDE = wdI – URW - UGW (2) where WDE employee water demand in [m³/a] wdI specific potable water demand of installations in building in [m³/a] URW amount of rainwater used, for example to flush toilets in [m³/a] UGW amount of gray water used, for example to flush toilets in [m³/a] The amount of rain and/or gray water used can be seen in the economic efficiency calculation for rain and/or gray water. The specific water demand for installations n the building wdI is calculated based on daily water demand under the assumption of 210 work days: wdI = (nE * fI * cvI * 210 d/a)/1000 (3) where wdI specific potable water demand of installations in building in [m³/a] nE number of employees fI installation-specific factor for water use as in Table 1 in [seconds/day] or [flushes/day] cvI installation-specific consumption value in [liters/second] or [liters/flush]
n
∑ i = 1
83
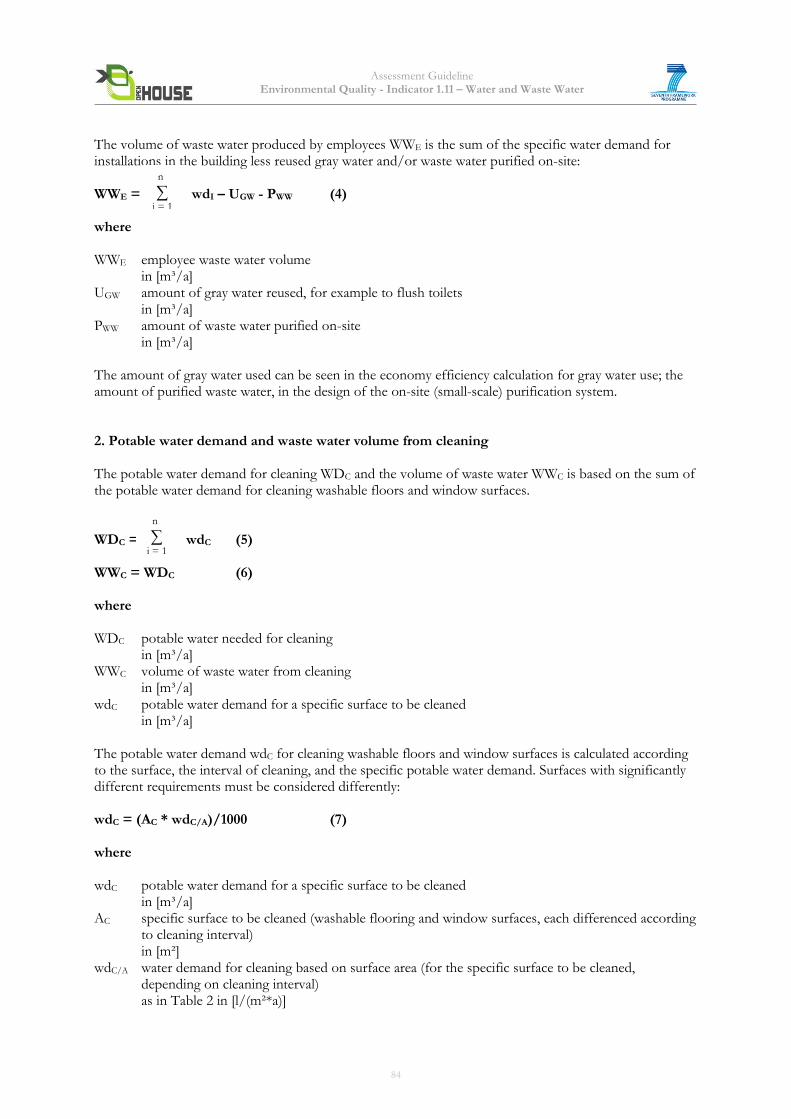
Assessment Guideline Environmental Quality - Indicator 1.11 – Water and Waste Water
The volume of waste water produced by employees WWE is the sum of the specific water demand for installations in the building less reused gray water and/or waste water purified on-site: WWE = wdI – UGW - PWW (4) where WWE employee waste water volume in [m³/a] UGW amount of gray water reused, for example to flush toilets in [m³/a] PWW amount of waste water purified on-site in [m³/a] The amount of gray water used can be seen in the economy efficiency calculation for gray water use; the amount of purified waste water, in the design of the on-site (small-scale) purification system. 2. Potable water demand and waste water volume from cleaning The potable water demand for cleaning WDC and the volume of waste water WWC is based on the sum of the potable water demand for cleaning washable floors and window surfaces. WDC = wdC (5) WWC = WDC (6) where WDC potable water needed for cleaning in [m³/a] WWC volume of waste water from cleaning in [m³/a] wdC potable water demand for a specific surface to be cleaned
in [m³/a] The potable water demand wdC for cleaning washable floors and window surfaces is calculated according to the surface, the interval of cleaning, and the specific potable water demand. Surfaces with significantly different requirements must be considered differently: wdC = (AC * wdC/A)/1000 (7) where wdC potable water demand for a specific surface to be cleaned in [m³/a] AC specific surface to be cleaned (washable flooring and window surfaces, each differenced according to cleaning interval) in [m²] wdC/A water demand for cleaning based on surface area (for the specific surface to be cleaned, depending on cleaning interval) as in Table 2 in [l/(m²*a)]
n
∑ i = 1
n
∑ i = 1
84
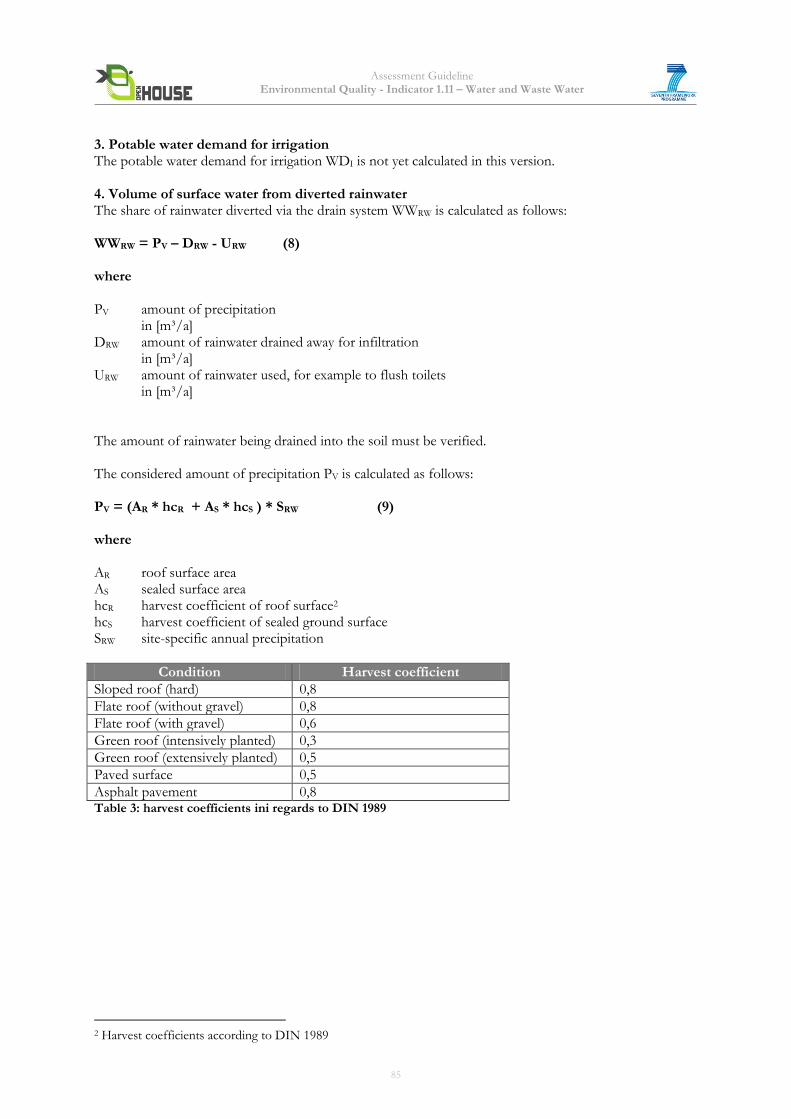
Assessment Guideline Environmental Quality - Indicator 1.11 – Water and Waste Water
3. Potable water demand for irrigation The potable water demand for irrigation WDI is not yet calculated in this version. 4. Volume of surface water from diverted rainwater The share of rainwater diverted via the drain system WWRW is calculated as follows: WWRW = PV – DRW - URW (8) where PV amount of precipitation in [m³/a] DRW amount of rainwater drained away for infiltration in [m³/a] URW amount of rainwater used, for example to flush toilets in [m³/a] The amount of rainwater being drained into the soil must be verified. The considered amount of precipitation PV is calculated as follows: PV = (AR * hcR + AS * hcS ) * SRW (9) where AR roof surface area AS sealed surface area hcR harvest coefficient of roof surface2 hcS harvest coefficient of sealed ground surface SRW site-specific annual precipitation
Condition Harvest coefficient
Sloped roof (hard) 0,8
Flate roof (without gravel) 0,8
Flate roof (with gravel) 0,6
Green roof (intensively planted) 0,3
Green roof (extensively planted) 0,5
Paved surface 0,5
Asphalt pavement 0,8 Table 3: harvest coefficients ini regards to DIN 1989
2 Harvest coefficients according to DIN 1989
85
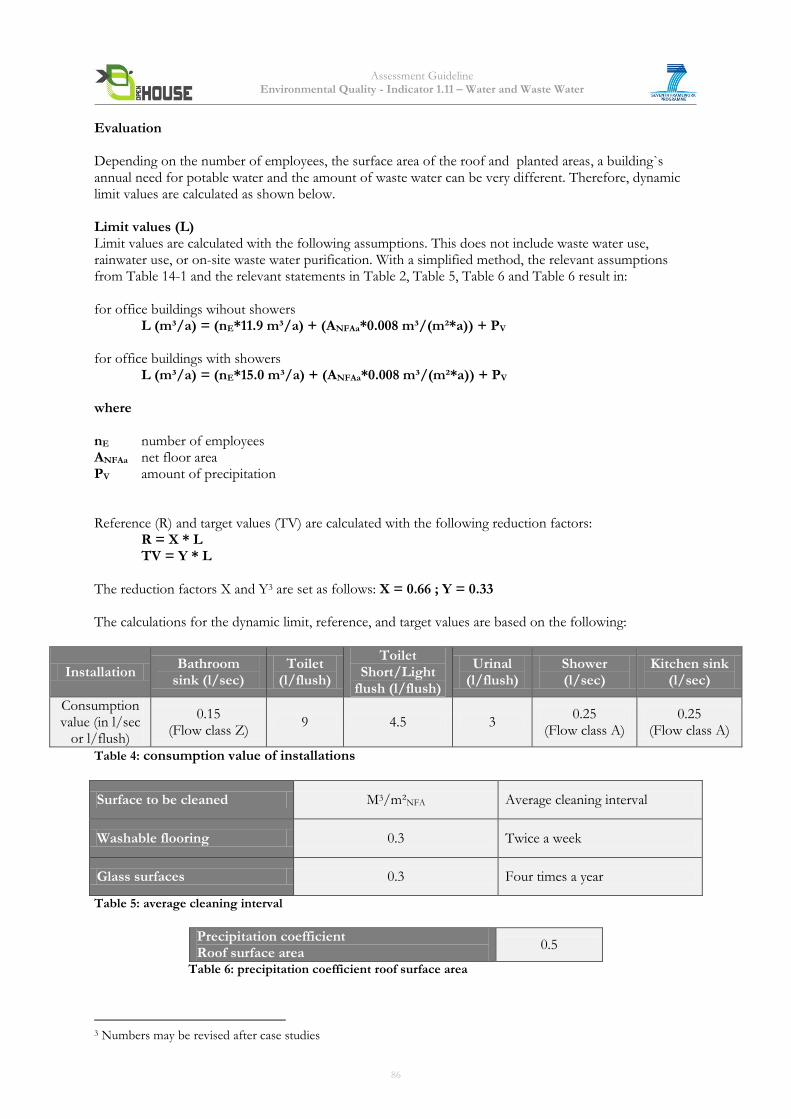
Assessment Guideline Environmental Quality - Indicator 1.11 – Water and Waste Water
Evaluation Depending on the number of employees, the surface area of the roof and planted areas, a building`s annual need for potable water and the amount of waste water can be very different. Therefore, dynamic limit values are calculated as shown below. Limit values (L) Limit values are calculated with the following assumptions. This does not include waste water use, rainwater use, or on-site waste water purification. With a simplified method, the relevant assumptions from Table 14-1 and the relevant statements in Table 2, Table 5, Table 6 and Table 6 result in: for office buildings wihout showers L (m³/a) = (nE*11.9 m³/a) + (ANFAa*0.008 m³/(m²*a)) + PV for office buildings with showers
L (m³/a) = (nE*15.0 m³/a) + (ANFAa*0.008 m³/(m²*a)) + PV where nE number of employees ANFAa net floor area PV amount of precipitation Reference (R) and target values (TV) are calculated with the following reduction factors: R = X * L TV = Y * L The reduction factors X and Y3 are set as follows: X = 0.66 ; Y = 0.33 The calculations for the dynamic limit, reference, and target values are based on the following:
Installation Bathroom
sink (l/sec) Toilet
(l/flush)
Toilet Short/Light
flush (l/flush)
Urinal (l/flush)
Shower (l/sec)
Kitchen sink (l/sec)
Consumption value (in l/sec
or l/flush)
0.15 (Flow class Z)
9 4.5 3 0.25
(Flow class A) 0.25
(Flow class A)
Table 4: consumption value of installations
Surface to be cleaned M3/m²NFA Average cleaning interval
Washable flooring 0.3 Twice a week
Glass surfaces 0.3 Four times a year
Table 5: average cleaning interval
Precipitation coefficient Roof surface area
0.5
Table 6: precipitation coefficient roof surface area
3 Numbers may be revised after case studies
86
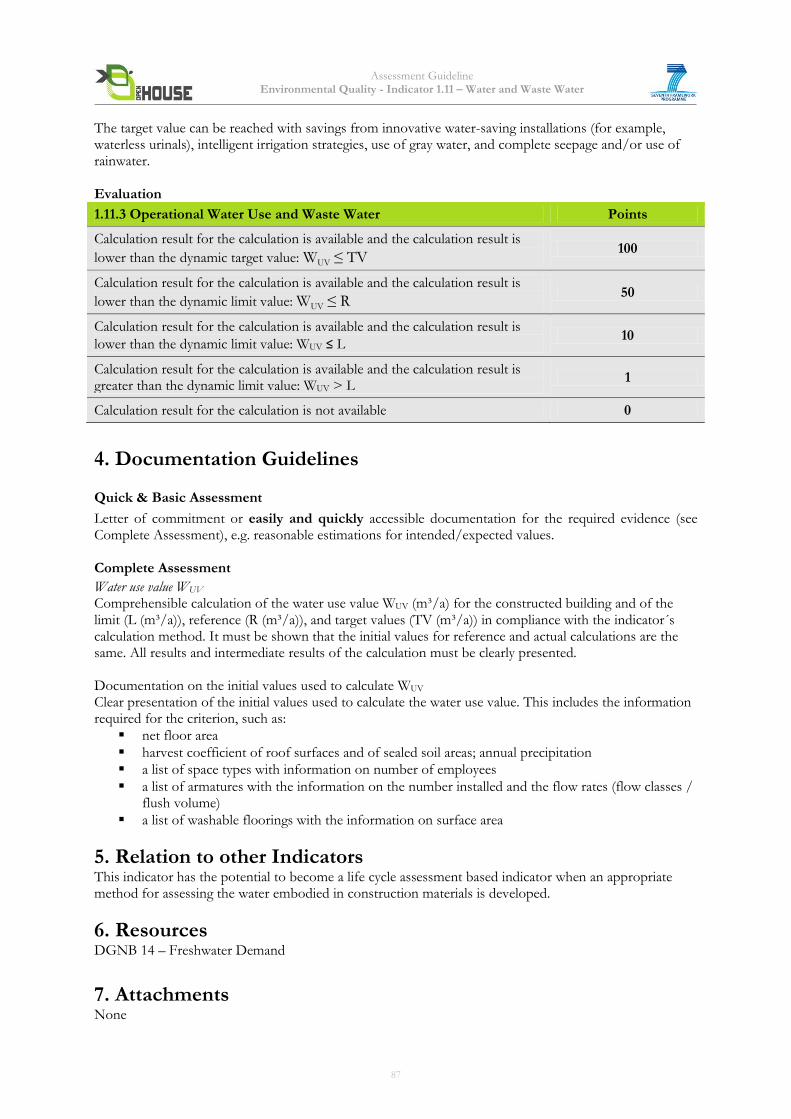
Assessment Guideline Environmental Quality - Indicator 1.11 – Water and Waste Water
The target value can be reached with savings from innovative water-saving installations (for example, waterless urinals), intelligent irrigation strategies, use of gray water, and complete seepage and/or use of rainwater. Evaluation
1.11.3 Operational Water Use and Waste Water Points
Calculation result for the calculation is available and the calculation result is
lower than the dynamic target value: WUV ≤ TV 100
Calculation result for the calculation is available and the calculation result is
lower than the dynamic limit value: WUV ≤ R 50
Calculation result for the calculation is available and the calculation result is
lower than the dynamic limit value: WUV ≤ L 10
Calculation result for the calculation is available and the calculation result is greater than the dynamic limit value: WUV > L
1
Calculation result for the calculation is not available 0
4. Documentation Guidelines
Quick & Basic Assessment
Letter of commitment or easily and quickly accessible documentation for the required evidence (see Complete Assessment), e.g. reasonable estimations for intended/expected values. Complete Assessment
Water use value WUV Comprehensible calculation of the water use value WUV (m³/a) for the constructed building and of the limit (L (m³/a)), reference (R (m³/a)), and target values (TV (m³/a)) in compliance with the indicator´s calculation method. It must be shown that the initial values for reference and actual calculations are the same. All results and intermediate results of the calculation must be clearly presented. Documentation on the initial values used to calculate WUV Clear presentation of the initial values used to calculate the water use value. This includes the information required for the criterion, such as:
net floor area
harvest coefficient of roof surfaces and of sealed soil areas; annual precipitation
a list of space types with information on number of employees
a list of armatures with the information on the number installed and the flow rates (flow classes / flush volume)
a list of washable floorings with the information on surface area
5. Relation to other Indicators This indicator has the potential to become a life cycle assessment based indicator when an appropriate method for assessing the water embodied in construction materials is developed.
6. Resources DGNB 14 – Freshwater Demand
7. Attachments None
87
Assessment Guideline Environmental Quality - Indicator 1.12 - Land use
Indicator 1.12 Land use (adapted from LEED, BREEAM, DGNB/BNB)
Core Indicator
1. Objective The constant increase in traffic and settlement areas shall be reduced. Preferably, areas shall be used that are already assigned as traffic or settlement areas or that are allocated for the recovery of contaminated locations. This indicator supports the European Commission target to achieve a more rational use of soil, requiring Member States to take appropriate measures to limit sealing by rehabilitating brownfield sites and to mitigate its effects by using construction techniques that allow maintaining as many soil functions as possible. 1
2. Assessment Methodology Based on the existing situation of the site prior to construction, the impact that the project has on the environment can vary from a positive change (remediation of brownfield) to a negative change (depletion of prime farmland or greenfield) Increasing the imperviousness of the site can have major repercussions on the site and its surroundings through the increase of water run-off. Strategies such as green roofs, pervious surfaces and reduction of hardscapes can be used to minimize the volume and rates of storm water run-off from the site. The overall permeability of the site can be determined by weighting the permeability of each area on the site. The following sub-indicator will be assessed: 1.12.1: Site location 1.12.2: Imperviousness changes
1 European Commission: Thematic Strategy for Soil Protection COM(2006)231
88
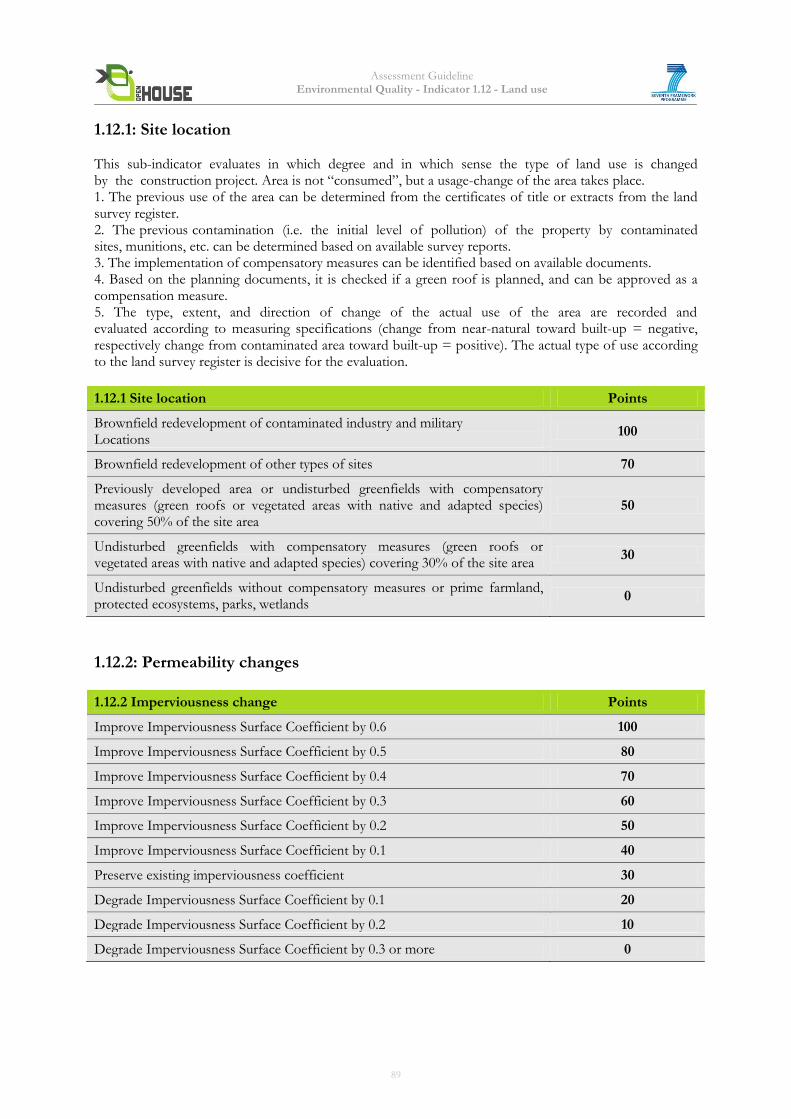
Assessment Guideline Environmental Quality - Indicator 1.12 - Land use
1.12.1: Site location This sub-indicator evaluates in which degree and in which sense the type of land use is changed by the construction project. Area is not “consumed”, but a usage-change of the area takes place. 1. The previous use of the area can be determined from the certificates of title or extracts from the land survey register. 2. The previous contamination (i.e. the initial level of pollution) of the property by contaminated sites, munitions, etc. can be determined based on available survey reports. 3. The implementation of compensatory measures can be identified based on available documents. 4. Based on the planning documents, it is checked if a green roof is planned, and can be approved as a compensation measure. 5. The type, extent, and direction of change of the actual use of the area are recorded and evaluated according to measuring specifications (change from near-natural toward built-up = negative, respectively change from contaminated area toward built-up = positive). The actual type of use according to the land survey register is decisive for the evaluation.
1.12.1 Site location Points
Brownfield redevelopment of contaminated industry and military Locations
100
Brownfield redevelopment of other types of sites 70
Previously developed area or undisturbed greenfields with compensatory measures (green roofs or vegetated areas with native and adapted species) covering 50% of the site area
50
Undisturbed greenfields with compensatory measures (green roofs or vegetated areas with native and adapted species) covering 30% of the site area
30
Undisturbed greenfields without compensatory measures or prime farmland, protected ecosystems, parks, wetlands
0
1.12.2: Permeability changes
1.12.2 Imperviousness change Points
Improve Imperviousness Surface Coefficient by 0.6 100
Improve Imperviousness Surface Coefficient by 0.5 80
Improve Imperviousness Surface Coefficient by 0.4 70
Improve Imperviousness Surface Coefficient by 0.3 60
Improve Imperviousness Surface Coefficient by 0.2 50
Improve Imperviousness Surface Coefficient by 0.1 40
Preserve existing imperviousness coefficient 30
Degrade Imperviousness Surface Coefficient by 0.1 20
Degrade Imperviousness Surface Coefficient by 0.2 10
Degrade Imperviousness Surface Coefficient by 0.3 or more 0
89
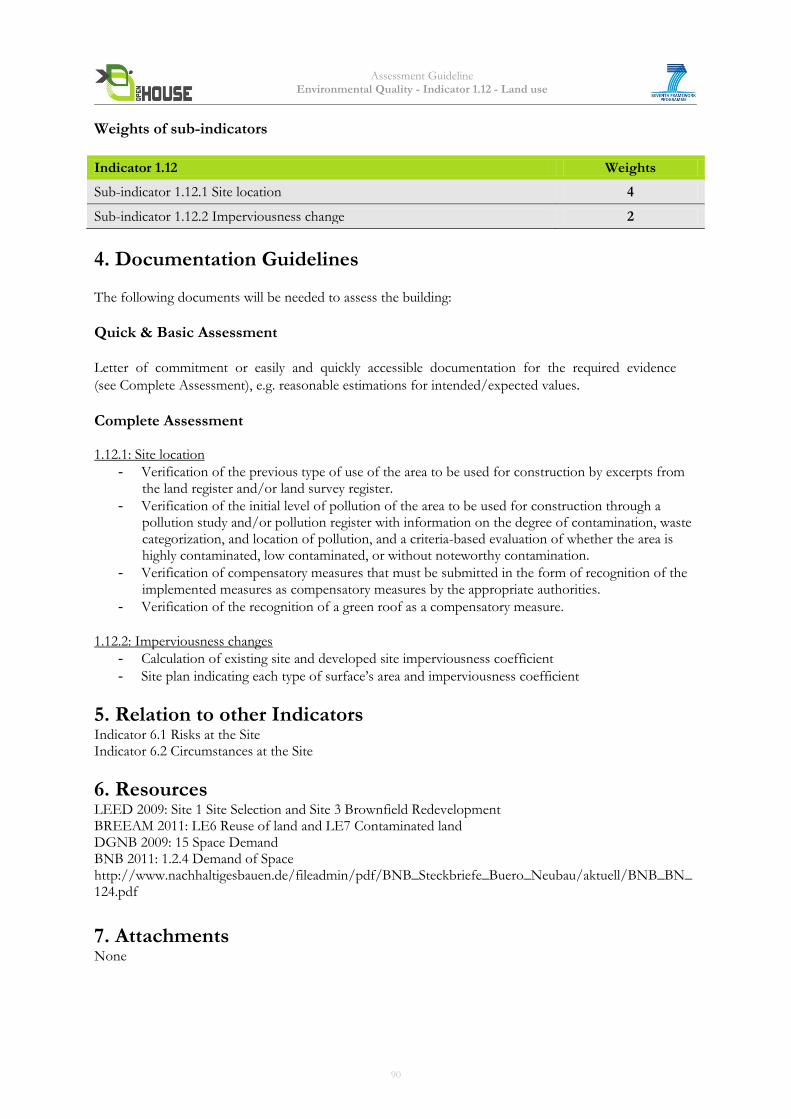
Assessment Guideline Environmental Quality - Indicator 1.12 - Land use
Weights of sub-indicators
Indicator 1.12 Weights
Sub-indicator 1.12.1 Site location 4
Sub-indicator 1.12.2 Imperviousness change 2
4. Documentation Guidelines The following documents will be needed to assess the building:
Quick & Basic Assessment Letter of commitment or easily and quickly accessible documentation for the required evidence
(see Complete Assessment), e.g. reasonable estimations for intended/expected values. Complete Assessment 1.12.1: Site location
- Verification of the previous type of use of the area to be used for construction by excerpts from the land register and/or land survey register.
- Verification of the initial level of pollution of the area to be used for construction through a pollution study and/or pollution register with information on the degree of contamination, waste categorization, and location of pollution, and a criteria-based evaluation of whether the area is highly contaminated, low contaminated, or without noteworthy contamination.
- Verification of compensatory measures that must be submitted in the form of recognition of the implemented measures as compensatory measures by the appropriate authorities.
- Verification of the recognition of a green roof as a compensatory measure.
1.12.2: Imperviousness changes
- Calculation of existing site and developed site imperviousness coefficient
- Site plan indicating each type of surface’s area and imperviousness coefficient
5. Relation to other Indicators Indicator 6.1 Risks at the Site Indicator 6.2 Circumstances at the Site
6. Resources LEED 2009: Site 1 Site Selection and Site 3 Brownfield Redevelopment BREEAM 2011: LE6 Reuse of land and LE7 Contaminated land DGNB 2009: 15 Space Demand BNB 2011: 1.2.4 Demand of Space http://www.nachhaltigesbauen.de/fileadmin/pdf/BNB_Steckbriefe_Buero_Neubau/aktuell/BNB_BN_124.pdf
7. Attachments None
90
Assessment Guideline Environmental Quality - Indicator 1.13 – Operational Waste Management
Indicator 1.13 Operational Waste Management (adapted from BREEAM, LEED, HQE) Core Indicator
1. Objective To recognise the provision of dedicated storage facilities for a building’s operational-related recyclable waste streams, so that such waste is diverted from landfill or incineration. To encourage the provision of facilities that help facilitate the reduction in volume of compostable organic waste going directly to landfill during the building’s operation. This supports the objectives of current EU waste policy: to prevent waste and promote re-use, recycling and recovery so as to reduce the negative environmental impact1. The targets for the recycling of waste are: 50% of household waste and 70% for construction and demolition waste recycled by 20202.
2. Assessment Methodology This indicator assesses the provision of space for sorting and storage of solid wastes within the case-study building, which will likely affect the success of waste-minimization programs during operation. The following sub-indicators will be assessed:
1.13.1 Recyclable Waste Storage 1.13.2 Composting
1 Taking sustainable use of resources forward: A Thematic Strategy on the prevention and recycling of waste COM(2005)666 2 Directive 2008/98/EC on Waste
91
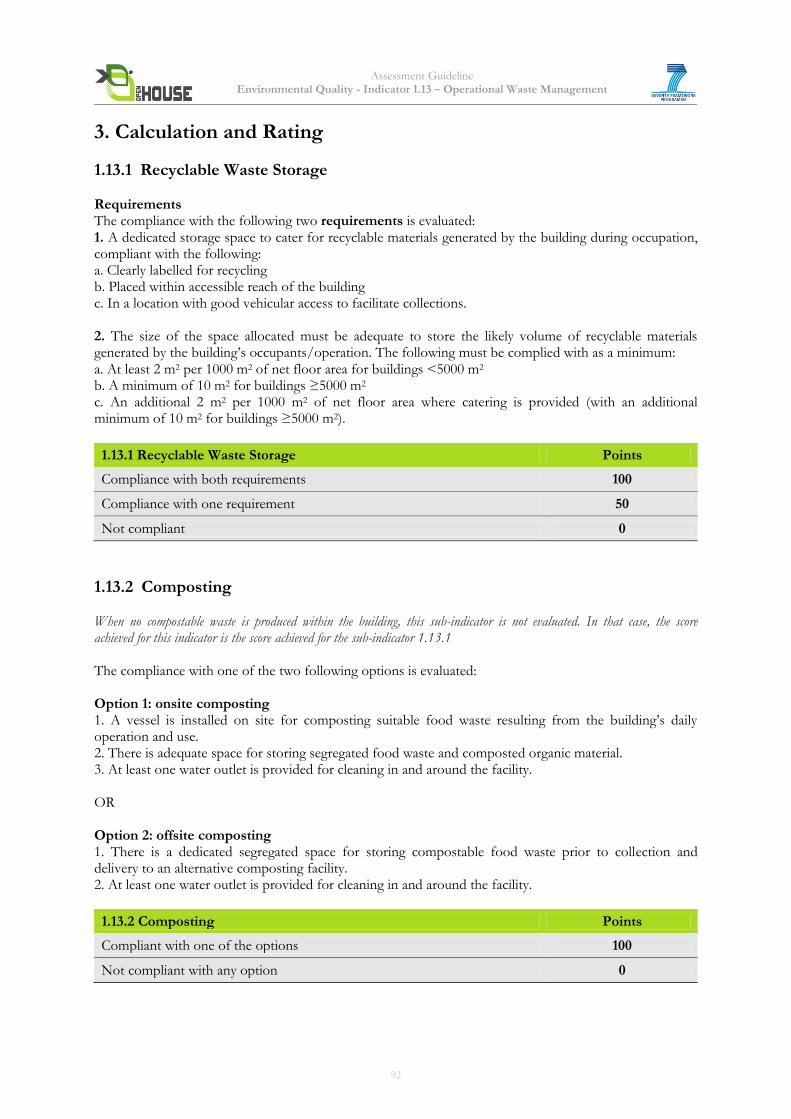
Assessment Guideline Environmental Quality - Indicator 1.13 – Operational Waste Management
3. Calculation and Rating
1.13.1 Recyclable Waste Storage Requirements The compliance with the following two requirements is evaluated: 1. A dedicated storage space to cater for recyclable materials generated by the building during occupation, compliant with the following: a. Clearly labelled for recycling b. Placed within accessible reach of the building c. In a location with good vehicular access to facilitate collections. 2. The size of the space allocated must be adequate to store the likely volume of recyclable materials generated by the building’s occupants/operation. The following must be complied with as a minimum: a. At least 2 m2 per 1000 m2 of net floor area for buildings <5000 m2 b. A minimum of 10 m2 for buildings ≥5000 m2 c. An additional 2 m2 per 1000 m2 of net floor area where catering is provided (with an additional minimum of 10 m2 for buildings ≥5000 m2).
1.13.1 Recyclable Waste Storage Points
Compliance with both requirements 100
Compliance with one requirement 50
Not compliant 0
1.13.2 Composting When no compostable waste is produced within the building, this sub-indicator is not evaluated. In that case, the score achieved for this indicator is the score achieved for the sub-indicator 1.13.1 The compliance with one of the two following options is evaluated: Option 1: onsite composting 1. A vessel is installed on site for composting suitable food waste resulting from the building’s daily operation and use. 2. There is adequate space for storing segregated food waste and composted organic material. 3. At least one water outlet is provided for cleaning in and around the facility. OR Option 2: offsite composting 1. There is a dedicated segregated space for storing compostable food waste prior to collection and delivery to an alternative composting facility. 2. At least one water outlet is provided for cleaning in and around the facility.
1.13.2 Composting Points
Compliant with one of the options 100
Not compliant with any option 0
92
Assessment Guideline Environmental Quality - Indicator 1.13 – Operational Waste Management
Weights of sub-indicators
Indicator 1.13 Weights
Sub-indicator 1.13.1 Recyclable Waste Storage 4
Sub-indicator 1.13.2 Composting 4
4. Documentation Guidelines The following documents will be needed to assess the building: Quick & Basic Assessment Letter of commitment or easily and quickly accessible documentation for the required evidence (see Complete Assessment), e.g. reasonable estimations for intended/expected values.
Complete Assessment 1.13.1 Recyclable Waste Storage Marked-up building/site plan and/or copy of the specification confirming: · The location of the dedicated recyclable storage area · Storage area for general waste · The area (m2) of the storage space(s) · Description of the labelling. Where applicable, information from the local waste collection scheme confirming the types of recyclable materials to be separated and stored. After construction, building/site inspection and photographic evidence confirming: · The location, size and capacity of the storage provision · Labelling of the dedicated facilities 1.13.2 Composting In case no compostable waste is produced, a letter from the occupier or a study confirming the absence of production of compostable waste is required. Option 1: onsite composting Marked-up design plan and/or a copy of the specification confirming (as appropriate): · Specification of composting vessel · Location and size of space for vessel and storage of waste/compost · Water outlet. After construction, building/site inspection and photographic evidence confirming: · The installation of the vessel · The provision of adequate storage space/facilities · Installation of a water outlet Option 2: offsite composting If appropriate, a letter from the occupier or service provider confirming: • Location of the off-site facility where compostable material will be delivered. • The procedure and frequency for collecting the compostable material. Marked-up design plan and/or a copy of the specification confirming (as appropriate): • Location and size of space for storing compostable waste • Water outlet.
93
Assessment Guideline Environmental Quality - Indicator 1.13 – Operational Waste Management
After construction, building/site inspection and photographic evidence confirming: · The provision of adequate storage space/facilities · Installation of a water outlet
5. Relation to other Indicators None.
6. Resources BREEAM 2011: Wst 3 - Recyclable Waste Storage and Wst 5 – Composting LEED 2009: Materials Pre 1 Storage and Collection of Recyclables HQE 2012: 6.1. Optimising the recycling of operational waste and 6.2. Quality of the operational waste management system
7. Attachments
Relevant Definitions Typically ‘accessible reach’ is defined as within 20m of a building entrance. In some circumstances, depending on the size of the building, site restrictions or tenancy arrangements, it may not be possible to meet a 20m requirement. If it is the opinion of the assessor that it is not feasible to meet this 20m requirement then they can use their judgement to determine if the facility is in an easily accessible location for building occupants and vehicle collection and to state their reasons in the assessment report. The following footprint dimensions can act as a guide when determining size and accessibility criteria for the recyclable storage space: · Compactor dimensions: about the size of one car parking bay; 4.8 x 2.4 m · Skip: The footprint of an 8 and 12 cubic yard skip measures 3.4 m x 1.8 m, therefore allow a minimum of 2.0 m width and 4.0 m length or 8 m2 area for the storage and access of such containers · Wheeled bins: 360 litre = 0.86 m x 0.62 / 660 L= 1.2 m x 0.7 m / 1100 L = 1.28 m x 0.98 m · Roll-on-roll-off containers: allow a minimum of 6.1 m x 2.4 m. · Vehicle access: The following are dimensions for lorry types that are typically used to collect waste. Therefore gate height/widths should not be smaller than these measurements:
o Dustcart: medium capacity; length = 7.4 m Height = 4 m width 3.1 m o Skip lorry: length = 7 m Height = 3.35 m width 3.1 m
Consideration must also be given to any other types of vehicle requiring access to this area, e.g. lorries for roll on/off containers.
94
Assessment Guideline Environmental Quality - Indicator 1.14 - Energy efficiency of building equipment
Indicator 1.14 Energy efficiency of building equipment (lifts, escalators and moving walks) (adapted from BREEAM, EN ISO 25745)
1. Objective There is already about 4,8 million lifts, as well as about 75 thousand escalators and moving walks installed
in the EU‐27. Their energy consumption adds up to 3 to 5 % of the overall consumption of a building.
The objective is to reduce the energy consumption of the vertical transportation systems through: - encouraging the use of stairs and ramps in preference to lifts, escalators and moving walks - encouraging the specification of energy efficient lifts, escalators and moving walks This indicator supports the objective of the European Commission to improve the energy efficiency by 20% by 20201.
2. Assessment Methodology The planning of the building to encourage the use of stairs and ramps will be assessed, as well as the design and efficiency of the lifts, escalators and moving walks. Buildings where none of these systems are present meet the requirements of this indicator by default as there is no energy consumption associated with them. If no lifts or escalators are present then this indicator is not assessed and full points are given. The following sub-indicators will be assessed:
1.14.1 Stairs and ramps planning 1.14.2 Lifts design and efficiency 1.14.3 Escalators and moving walks design and efficiency
1 Energy 2020 - A strategy for competitive, sustainable and secure energy
95
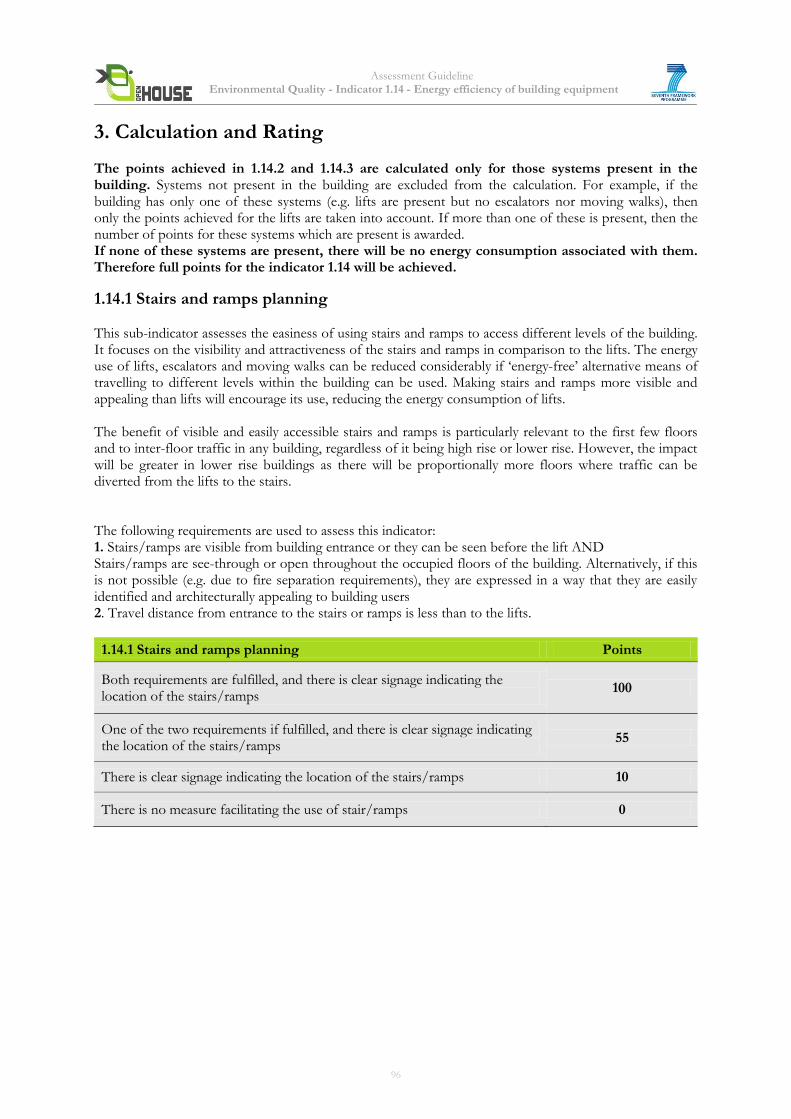
Assessment Guideline Environmental Quality - Indicator 1.14 - Energy efficiency of building equipment
3. Calculation and Rating The points achieved in 1.14.2 and 1.14.3 are calculated only for those systems present in the building. Systems not present in the building are excluded from the calculation. For example, if the building has only one of these systems (e.g. lifts are present but no escalators nor moving walks), then only the points achieved for the lifts are taken into account. If more than one of these is present, then the number of points for these systems which are present is awarded. If none of these systems are present, there will be no energy consumption associated with them. Therefore full points for the indicator 1.14 will be achieved.
1.14.1 Stairs and ramps planning This sub-indicator assesses the easiness of using stairs and ramps to access different levels of the building. It focuses on the visibility and attractiveness of the stairs and ramps in comparison to the lifts. The energy use of lifts, escalators and moving walks can be reduced considerably if ‘energy-free’ alternative means of travelling to different levels within the building can be used. Making stairs and ramps more visible and appealing than lifts will encourage its use, reducing the energy consumption of lifts. The benefit of visible and easily accessible stairs and ramps is particularly relevant to the first few floors and to inter-floor traffic in any building, regardless of it being high rise or lower rise. However, the impact will be greater in lower rise buildings as there will be proportionally more floors where traffic can be diverted from the lifts to the stairs. The following requirements are used to assess this indicator: 1. Stairs/ramps are visible from building entrance or they can be seen before the lift AND Stairs/ramps are see-through or open throughout the occupied floors of the building. Alternatively, if this is not possible (e.g. due to fire separation requirements), they are expressed in a way that they are easily identified and architecturally appealing to building users 2. Travel distance from entrance to the stairs or ramps is less than to the lifts.
1.14.1 Stairs and ramps planning Points
Both requirements are fulfilled, and there is clear signage indicating the location of the stairs/ramps
100
One of the two requirements if fulfilled, and there is clear signage indicating the location of the stairs/ramps
55
There is clear signage indicating the location of the stairs/ramps 10
There is no measure facilitating the use of stair/ramps 0
96
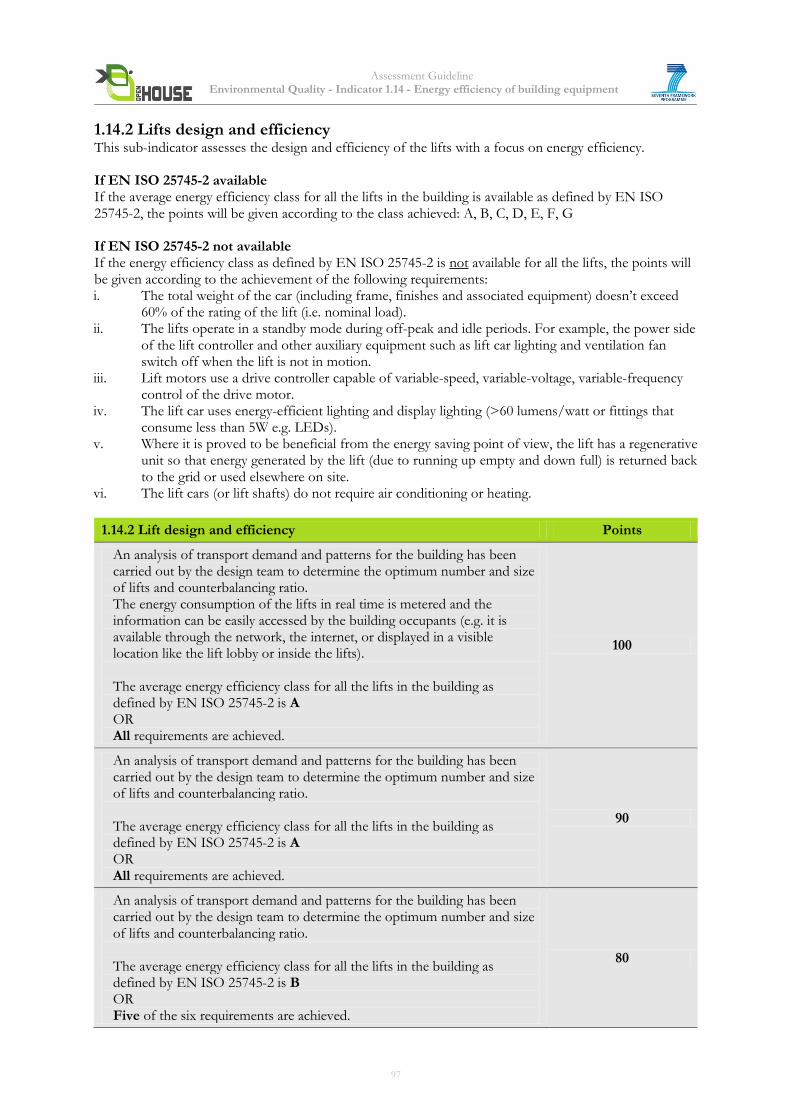
Assessment Guideline Environmental Quality - Indicator 1.14 - Energy efficiency of building equipment
1.14.2 Lifts design and efficiency This sub-indicator assesses the design and efficiency of the lifts with a focus on energy efficiency. If EN ISO 25745-2 available If the average energy efficiency class for all the lifts in the building is available as defined by EN ISO 25745-2, the points will be given according to the class achieved: A, B, C, D, E, F, G If EN ISO 25745-2 not available If the energy efficiency class as defined by EN ISO 25745-2 is not available for all the lifts, the points will be given according to the achievement of the following requirements: i. The total weight of the car (including frame, finishes and associated equipment) doesn’t exceed
60% of the rating of the lift (i.e. nominal load). ii. The lifts operate in a standby mode during off-peak and idle periods. For example, the power side
of the lift controller and other auxiliary equipment such as lift car lighting and ventilation fan switch off when the lift is not in motion.
iii. Lift motors use a drive controller capable of variable-speed, variable-voltage, variable-frequency control of the drive motor.
iv. The lift car uses energy-efficient lighting and display lighting (>60 lumens/watt or fittings that consume less than 5W e.g. LEDs).
v. Where it is proved to be beneficial from the energy saving point of view, the lift has a regenerative unit so that energy generated by the lift (due to running up empty and down full) is returned back to the grid or used elsewhere on site.
vi. The lift cars (or lift shafts) do not require air conditioning or heating.
1.14.2 Lift design and efficiency Points
An analysis of transport demand and patterns for the building has been carried out by the design team to determine the optimum number and size of lifts and counterbalancing ratio. The energy consumption of the lifts in real time is metered and the information can be easily accessed by the building occupants (e.g. it is available through the network, the internet, or displayed in a visible location like the lift lobby or inside the lifts). The average energy efficiency class for all the lifts in the building as defined by EN ISO 25745-2 is A OR All requirements are achieved.
100
An analysis of transport demand and patterns for the building has been carried out by the design team to determine the optimum number and size of lifts and counterbalancing ratio. The average energy efficiency class for all the lifts in the building as defined by EN ISO 25745-2 is A OR All requirements are achieved.
90
An analysis of transport demand and patterns for the building has been carried out by the design team to determine the optimum number and size of lifts and counterbalancing ratio. The average energy efficiency class for all the lifts in the building as defined by EN ISO 25745-2 is B OR Five of the six requirements are achieved.
80
97
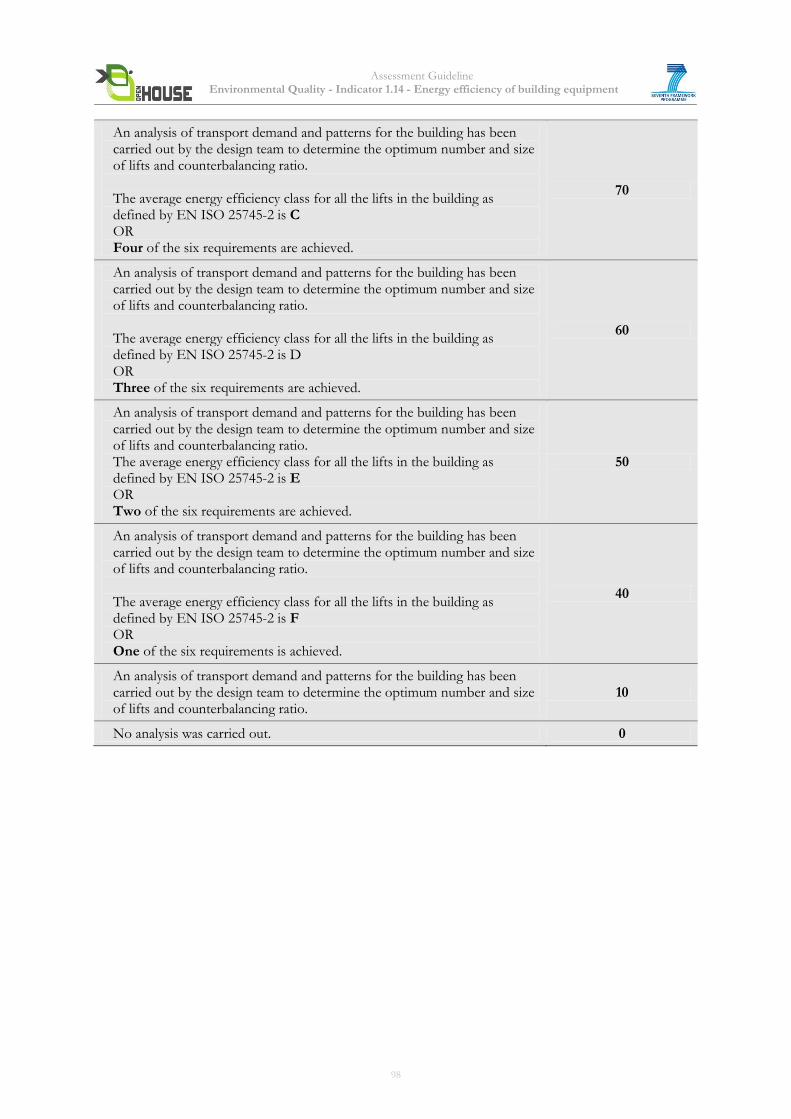
Assessment Guideline Environmental Quality - Indicator 1.14 - Energy efficiency of building equipment
An analysis of transport demand and patterns for the building has been carried out by the design team to determine the optimum number and size of lifts and counterbalancing ratio. The average energy efficiency class for all the lifts in the building as defined by EN ISO 25745-2 is C OR Four of the six requirements are achieved.
70
An analysis of transport demand and patterns for the building has been carried out by the design team to determine the optimum number and size of lifts and counterbalancing ratio. The average energy efficiency class for all the lifts in the building as defined by EN ISO 25745-2 is D OR Three of the six requirements are achieved.
60
An analysis of transport demand and patterns for the building has been carried out by the design team to determine the optimum number and size of lifts and counterbalancing ratio. The average energy efficiency class for all the lifts in the building as defined by EN ISO 25745-2 is E OR Two of the six requirements are achieved.
50
An analysis of transport demand and patterns for the building has been carried out by the design team to determine the optimum number and size of lifts and counterbalancing ratio. The average energy efficiency class for all the lifts in the building as defined by EN ISO 25745-2 is F OR One of the six requirements is achieved.
40
An analysis of transport demand and patterns for the building has been carried out by the design team to determine the optimum number and size of lifts and counterbalancing ratio.
10
No analysis was carried out. 0
98
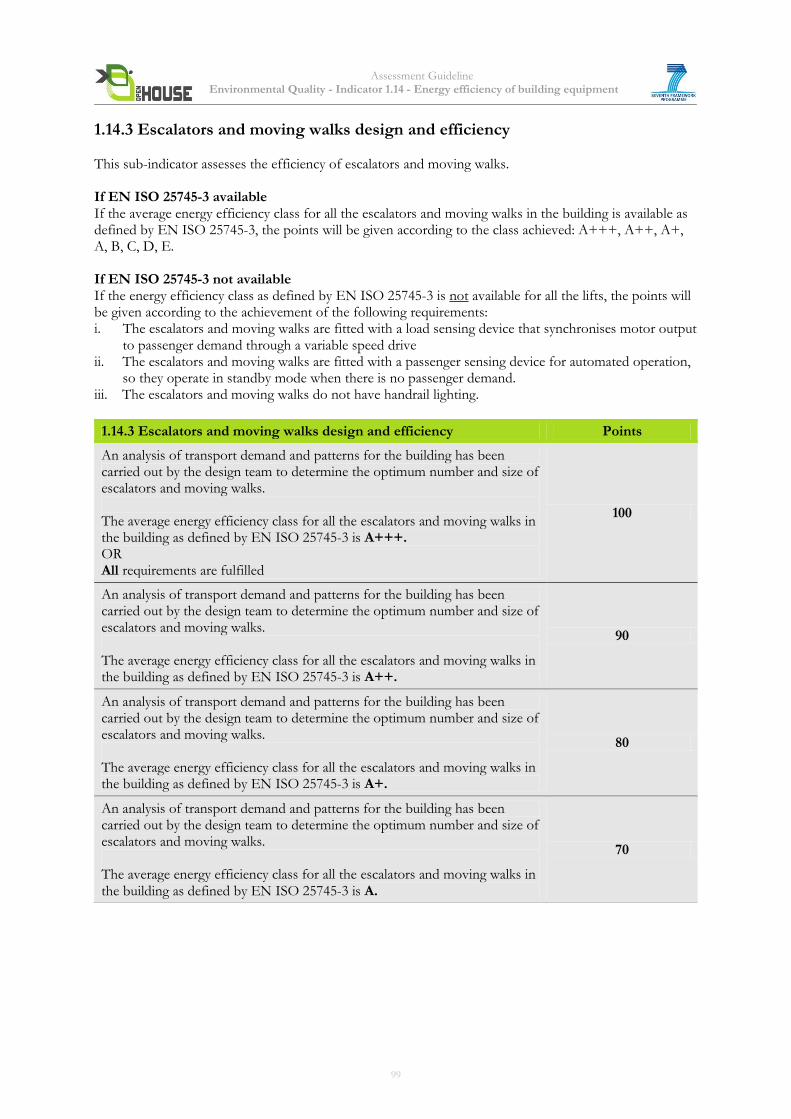
Assessment Guideline Environmental Quality - Indicator 1.14 - Energy efficiency of building equipment
1.14.3 Escalators and moving walks design and efficiency This sub-indicator assesses the efficiency of escalators and moving walks. If EN ISO 25745-3 available If the average energy efficiency class for all the escalators and moving walks in the building is available as defined by EN ISO 25745-3, the points will be given according to the class achieved: A+++, A++, A+, A, B, C, D, E. If EN ISO 25745-3 not available If the energy efficiency class as defined by EN ISO 25745-3 is not available for all the lifts, the points will be given according to the achievement of the following requirements: i. The escalators and moving walks are fitted with a load sensing device that synchronises motor output
to passenger demand through a variable speed drive ii. The escalators and moving walks are fitted with a passenger sensing device for automated operation,
so they operate in standby mode when there is no passenger demand. iii. The escalators and moving walks do not have handrail lighting.
1.14.3 Escalators and moving walks design and efficiency Points
An analysis of transport demand and patterns for the building has been carried out by the design team to determine the optimum number and size of escalators and moving walks. The average energy efficiency class for all the escalators and moving walks in the building as defined by EN ISO 25745-3 is A+++. OR All requirements are fulfilled
100
An analysis of transport demand and patterns for the building has been carried out by the design team to determine the optimum number and size of escalators and moving walks. The average energy efficiency class for all the escalators and moving walks in the building as defined by EN ISO 25745-3 is A++.
90
An analysis of transport demand and patterns for the building has been carried out by the design team to determine the optimum number and size of escalators and moving walks. The average energy efficiency class for all the escalators and moving walks in the building as defined by EN ISO 25745-3 is A+.
80
An analysis of transport demand and patterns for the building has been carried out by the design team to determine the optimum number and size of escalators and moving walks. The average energy efficiency class for all the escalators and moving walks in the building as defined by EN ISO 25745-3 is A.
70
99
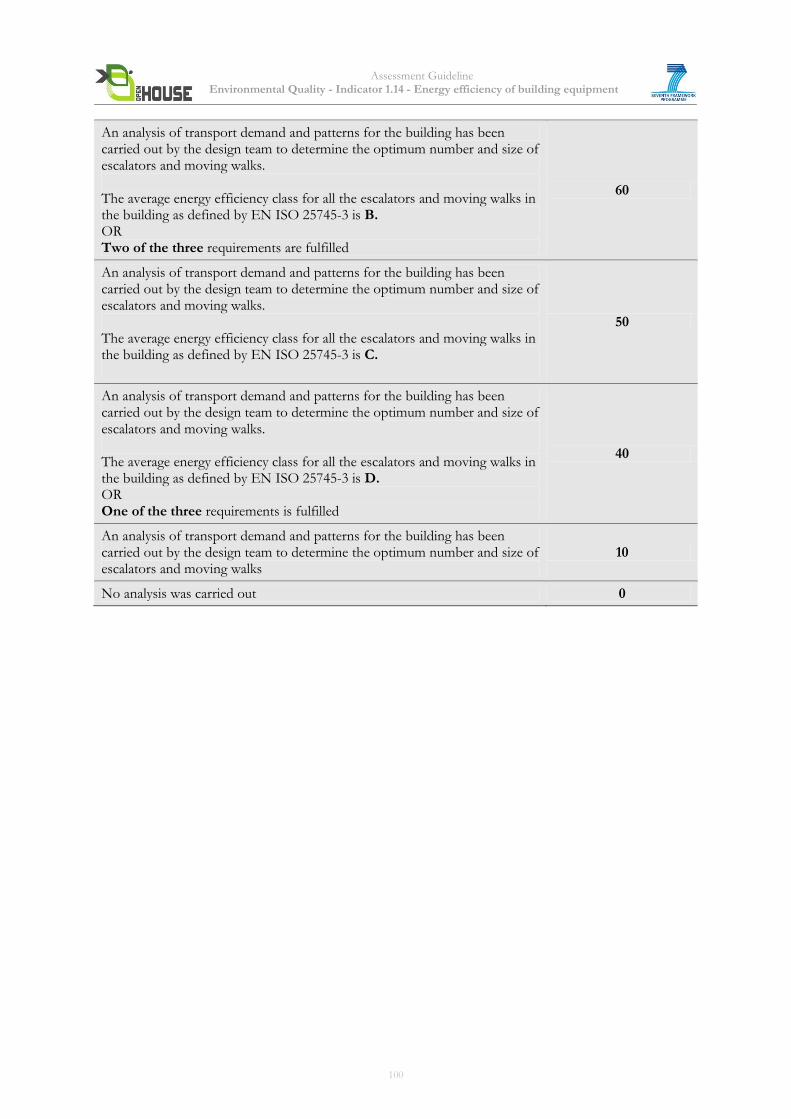
Assessment Guideline Environmental Quality - Indicator 1.14 - Energy efficiency of building equipment
An analysis of transport demand and patterns for the building has been carried out by the design team to determine the optimum number and size of escalators and moving walks. The average energy efficiency class for all the escalators and moving walks in the building as defined by EN ISO 25745-3 is B. OR Two of the three requirements are fulfilled
60
An analysis of transport demand and patterns for the building has been carried out by the design team to determine the optimum number and size of escalators and moving walks. The average energy efficiency class for all the escalators and moving walks in the building as defined by EN ISO 25745-3 is C.
50
An analysis of transport demand and patterns for the building has been carried out by the design team to determine the optimum number and size of escalators and moving walks. The average energy efficiency class for all the escalators and moving walks in the building as defined by EN ISO 25745-3 is D. OR One of the three requirements is fulfilled
40
An analysis of transport demand and patterns for the building has been carried out by the design team to determine the optimum number and size of escalators and moving walks
10
No analysis was carried out 0
100
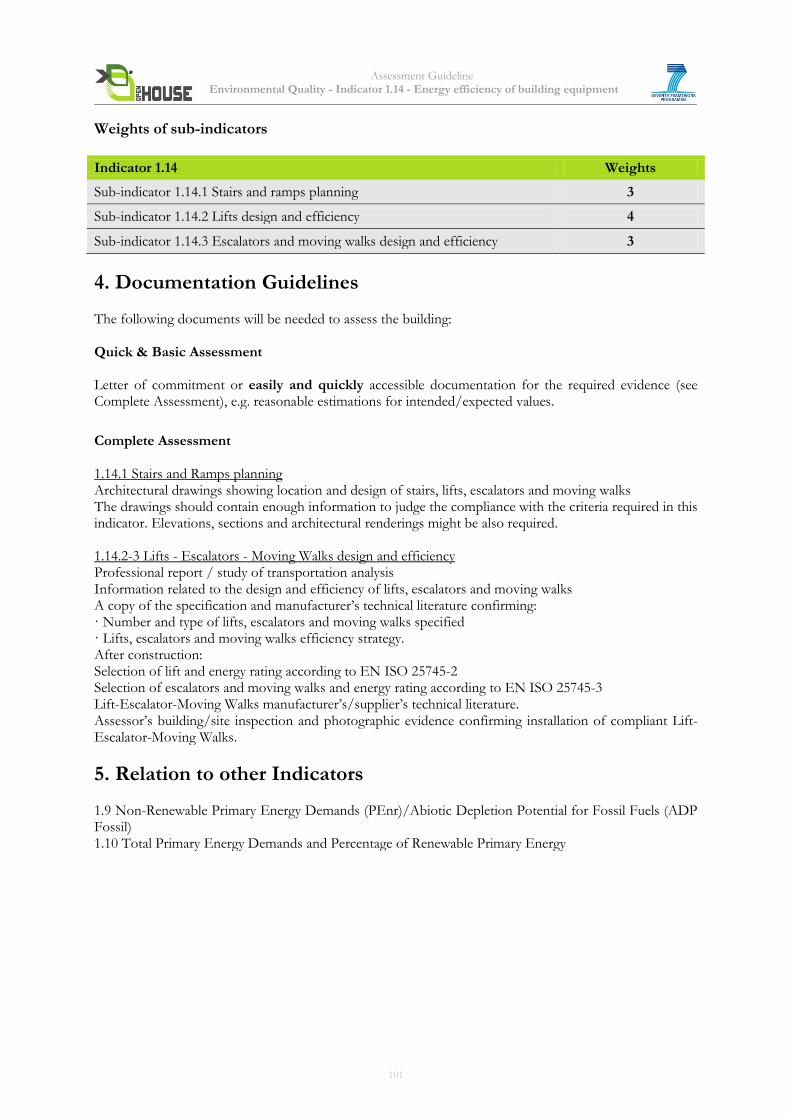
Assessment Guideline Environmental Quality - Indicator 1.14 - Energy efficiency of building equipment
Weights of sub-indicators
Indicator 1.14 Weights
Sub-indicator 1.14.1 Stairs and ramps planning 3
Sub-indicator 1.14.2 Lifts design and efficiency 4
Sub-indicator 1.14.3 Escalators and moving walks design and efficiency 3
4. Documentation Guidelines The following documents will be needed to assess the building: Quick & Basic Assessment Letter of commitment or easily and quickly accessible documentation for the required evidence (see Complete Assessment), e.g. reasonable estimations for intended/expected values.
Complete Assessment 1.14.1 Stairs and Ramps planning Architectural drawings showing location and design of stairs, lifts, escalators and moving walks The drawings should contain enough information to judge the compliance with the criteria required in this indicator. Elevations, sections and architectural renderings might be also required. 1.14.2-3 Lifts - Escalators - Moving Walks design and efficiency Professional report / study of transportation analysis Information related to the design and efficiency of lifts, escalators and moving walks A copy of the specification and manufacturer’s technical literature confirming: · Number and type of lifts, escalators and moving walks specified · Lifts, escalators and moving walks efficiency strategy. After construction: Selection of lift and energy rating according to EN ISO 25745-2 Selection of escalators and moving walks and energy rating according to EN ISO 25745-3 Lift-Escalator-Moving Walks manufacturer’s/supplier’s technical literature. Assessor’s building/site inspection and photographic evidence confirming installation of compliant Lift-Escalator-Moving Walks.
5. Relation to other Indicators 1.9 Non-Renewable Primary Energy Demands (PEnr)/Abiotic Depletion Potential for Fossil Fuels (ADP Fossil) 1.10 Total Primary Energy Demands and Percentage of Renewable Primary Energy
101
Assessment Guideline Environmental Quality - Indicator 1.14 - Energy efficiency of building equipment
6. Resources 1. 1. 1. EN ISO 25745: Energy performance of lifts, escalators and moving walks (joint standardisation work
between ISO and CEN). Part 1 defines the measurement and verification method and related tools for energy consumption. Part 2 covers the energy efficiency for lifts, including energy classification for lifts. Part 2 covers the energy efficiency for escalators and moving walks, including energy classification for escalators and moving walks.
2. BREEAM Europe Commercial 2009: Ene 8 - Lifts and Ene 9 - Escalators and travelling walks
7. Attachments
Counterbalancing ratio: Traction lifts may use a counterweight to balance the weight of the car plus a proportion of the rated load; this reduces the size of the drive motor required for the lift. Lowering the counterbalancing ratio means a smaller motor and controlling drive unit are required, thus saving energy. Counterbalancing ratios are normally provided in the range of 40-50% for safety reasons. Any other values should be carefully considered. Hydraulic lifts may use a balance weight to balance out a proportion of the weight of the car; this reduces the size of the drive motor required for the lift.
102
Assessment Guideline Environmental Quality - Indicator 1.15 –
Contribution to the depletion of abiotic resources - non fossil fuels (ADPelement)
Indicator 1.15 Contribution to the depletion of abiotic resources - non fossil fuels (ADPelement) (adapted from EN 15978)
Core Indicator
1. Objective Abiotic resources are found in nature that has not been subjected to any mining or transformation process into final products. The indicator Contribution to the depletion of abiotic resources - non fossil fuels, figures the contribution of the building to reducing the quantity of mineral resources available. This supports the European Commission strategy for resource efficiency1.
2. Assessment Methodology The indicator is mainly based on the method of Life Cycle Assessment (LCA): LCA results of the building to be assessed will be calculated in a standardized way and evaluated against benchmarks. Thus Abiotic Depletion Potential for non-renewable resources is a quantitative indicator. According to the standards EN 15804 and EN 15978, the method of Life-Cycle Assessment generally consists of four steps: Definition of goal and scope of the study, inventory analysis, impact assessment and interpretation. The indicators 1.1-1.5, 1.9-1.10 and 1.15 are based on LCAs and for all these indicators the same definitions for goal and scope and for the inventory analysis do apply. Goal and scope definition The goal of all LCA studies is to analyze and later benchmark the environmental performance of the respective buildings` life cycles. The scope of the building assessment therefore includes the following life cycle stages:
production: raw material supply, transport to manufacturing, manufacturing and transport to the construction site of products used in the building (Figure 1, modules A1-A4),
use stage: a scenario is defined including use and replacement, including end-of-life of replaced products (Figure 1, modules B1 and B4); in addition the operational energy use is considered (Figure 1, module B6),
end-of-life stage: waste processing and disposal of the building, (Figure 1, modules C3 and C4),
a scenario for potential benefits and loads beyond the system boundaries, including loads for reuse and recycling as well as benefits from recycling potentials (Figure 1, module D).
1 A resource-efficient Europe – flagship initiative under the Europe 2020 strategy
103

Assessment Guideline Environmental Quality - Indicator 1.15 –
Contribution to the depletion of abiotic resources - non fossil fuels (ADPelement)
Figure 1 Building Life Cycle Phases according to EN 15978, adapted
The following processes are not included:
Transport to construction side (Figure 1, module A4),
Construction – Installation process (Figure 1, module A5),
Energy use for user equipment during reference study period,
Operational water use (Figure 1, module B7),
Maintenance, repair and refurbishment during reference study period – (Figure 1, modules B2, B3 and B5),
Deconstruction and transport to waste processing / disposal (Figure 1, modules C1 and C2),
Transport to recycling (Figure 1, module C2). The reference study period is defined with 50 years. The functional equivalent (quantified functional requirements, intended use and/or technical requirements2), which is used as basis for comparison, is defined to be m²NFA*year. Inventory Analysis and Impact Assessment During the inventory analysis of an LCA, emissions and resource consumption are identified, calculated and summed up over the life cycle of a product. Within building LCAs, separate calculations are carried out for the buildings` elements (product and end-of-life stage) and for the determination of emissions and resource uses during operation (see Equations 1, 2 and 3). The inventory analysis of the buildings` elements mainly consists in providing quantitative information on the building elements used (see also Documentation Guidelines). Building compartments to be included are
1. Exterior walls and basement walls incl. windows and coatings, 2. Roof, 3. Ceilings incl. flooring and floor coverings / coatings, 4. Floor slab incl. flooring, floor coverings; floor slab above air, 5. Foundations, 6. Interior walls incl. coatings and supports, 7. Heat generation units.
2 prEN 15643-1:2010: Sustainability of construction works – Sustainability assessment of buildings – Part 1: General framework
BUILDING ASSESSMENT INFORMATION
BUILDING LIFE CYCLE INFORMATION
Raw
Mat
eri
als
Supp
lyT
ran
spo
rtM
anuf
actu
ring
PRODUCT STAGE
A1 - 3
A1 - A3
Tran
spor
t
CONSTRUCTION PROCESS
A4 - 5
A4
Cons
truc
tion
–In
stal
lati
on
proc
ess
A5
Use
USE STAGE
B1 - 7
B1
Mai
nten
ance
B2
Rep
air
Re
plac
em
ent
Re
furb
ish
me
nt
B3 B4 B5
Operational Energy use
Operational Water useB 7
B 6 De
con
stru
ctio
n
END OF LIFE STAGE
C1 - 4
C1
Tran
spor
tC
2
Was
te p
roce
ssin
g fo
r re
use,
re
cove
ry o
r an
d re
cycl
ing
C3
Dis
posa
lC
4
Benefits and loads beyond the system boundary
D
Reuse -Recovery -Recycling -potential
SUPPLEMENTARY INFORMATION BEYOND
THE BUILDING LIFE CYCLE
104
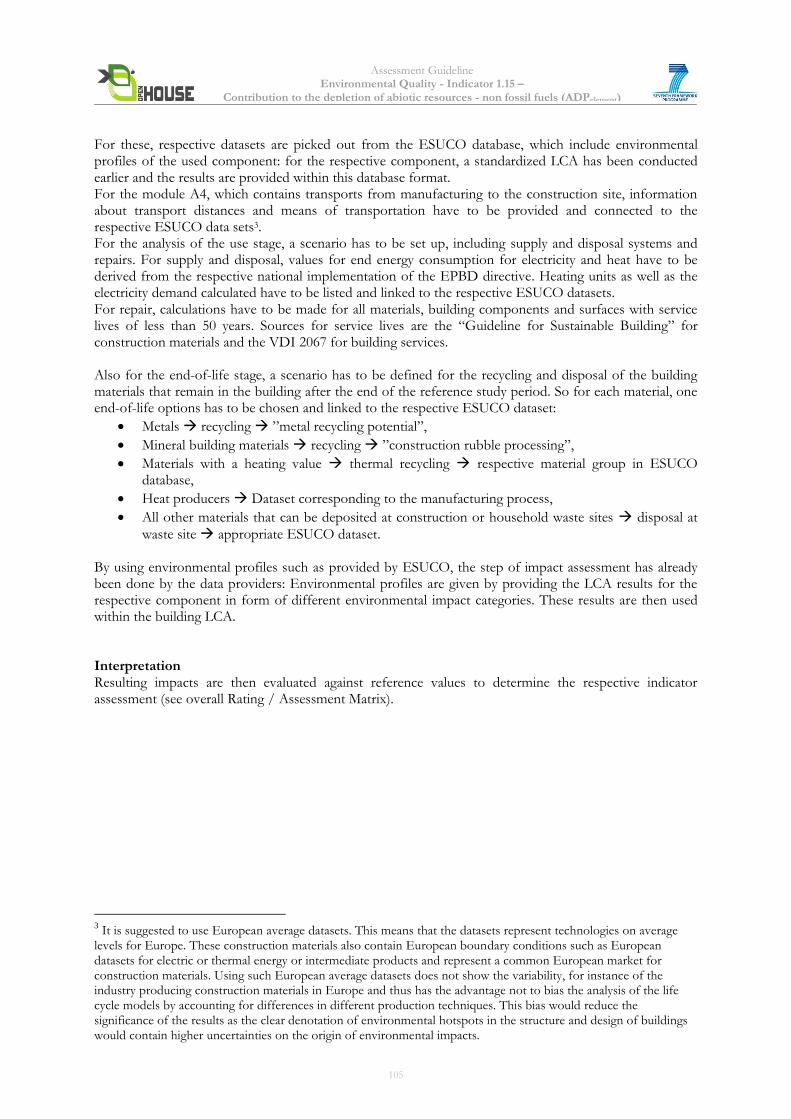
Assessment Guideline Environmental Quality - Indicator 1.15 –
Contribution to the depletion of abiotic resources - non fossil fuels (ADPelement)
For these, respective datasets are picked out from the ESUCO database, which include environmental profiles of the used component: for the respective component, a standardized LCA has been conducted earlier and the results are provided within this database format. For the module A4, which contains transports from manufacturing to the construction site, information about transport distances and means of transportation have to be provided and connected to the respective ESUCO data sets3. For the analysis of the use stage, a scenario has to be set up, including supply and disposal systems and repairs. For supply and disposal, values for end energy consumption for electricity and heat have to be derived from the respective national implementation of the EPBD directive. Heating units as well as the electricity demand calculated have to be listed and linked to the respective ESUCO datasets. For repair, calculations have to be made for all materials, building components and surfaces with service lives of less than 50 years. Sources for service lives are the “Guideline for Sustainable Building” for construction materials and the VDI 2067 for building services. Also for the end-of-life stage, a scenario has to be defined for the recycling and disposal of the building materials that remain in the building after the end of the reference study period. So for each material, one end-of-life options has to be chosen and linked to the respective ESUCO dataset:
Metals recycling ”metal recycling potential”,
Mineral building materials recycling ”construction rubble processing”,
Materials with a heating value thermal recycling respective material group in ESUCO database,
Heat producers Dataset corresponding to the manufacturing process,
All other materials that can be deposited at construction or household waste sites disposal at
waste site appropriate ESUCO dataset. By using environmental profiles such as provided by ESUCO, the step of impact assessment has already been done by the data providers: Environmental profiles are given by providing the LCA results for the respective component in form of different environmental impact categories. These results are then used within the building LCA. Interpretation Resulting impacts are then evaluated against reference values to determine the respective indicator assessment (see overall Rating / Assessment Matrix).
3 It is suggested to use European average datasets. This means that the datasets represent technologies on average
levels for Europe. These construction materials also contain European boundary conditions such as European datasets for electric or thermal energy or intermediate products and represent a common European market for construction materials. Using such European average datasets does not show the variability, for instance of the industry producing construction materials in Europe and thus has the advantage not to bias the analysis of the life cycle models by accounting for differences in different production techniques. This bias would reduce the significance of the results as the clear denotation of environmental hotspots in the structure and design of buildings would contain higher uncertainties on the origin of environmental impacts.
105
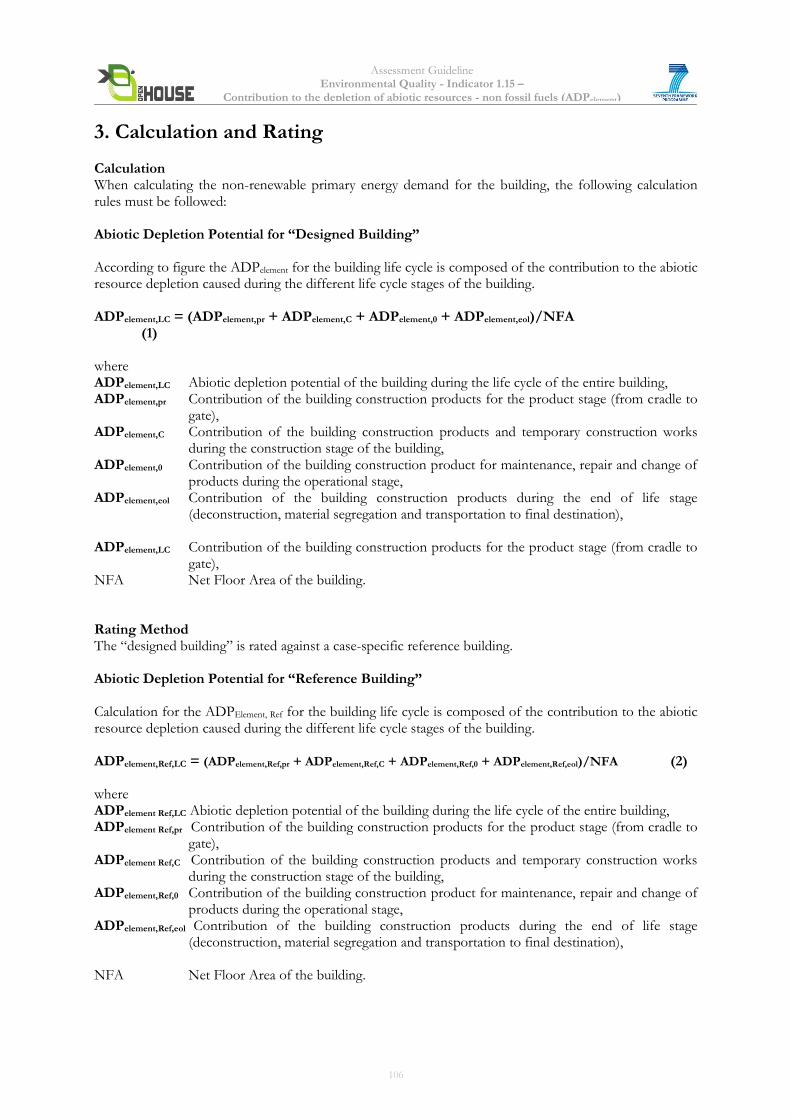
Assessment Guideline Environmental Quality - Indicator 1.15 –
Contribution to the depletion of abiotic resources - non fossil fuels (ADPelement)
3. Calculation and Rating Calculation When calculating the non-renewable primary energy demand for the building, the following calculation rules must be followed: Abiotic Depletion Potential for “Designed Building” According to figure the ADPelement for the building life cycle is composed of the contribution to the abiotic resource depletion caused during the different life cycle stages of the building. ADPelement,LC = (ADPelement,pr + ADPelement,C + ADPelement,0 + ADPelement,eol)/NFA (1) where ADPelement,LC Abiotic depletion potential of the building during the life cycle of the entire building, ADPelement,pr Contribution of the building construction products for the product stage (from cradle to
gate), ADPelement,C Contribution of the building construction products and temporary construction works
during the construction stage of the building, ADPelement,0 Contribution of the building construction product for maintenance, repair and change of
products during the operational stage, ADPelement,eol Contribution of the building construction products during the end of life stage
(deconstruction, material segregation and transportation to final destination), ADPelement,LC Contribution of the building construction products for the product stage (from cradle to
gate), NFA Net Floor Area of the building. Rating Method The “designed building” is rated against a case-specific reference building. Abiotic Depletion Potential for “Reference Building” Calculation for the ADPElement, Ref for the building life cycle is composed of the contribution to the abiotic resource depletion caused during the different life cycle stages of the building. ADPelement,Ref,LC = (ADPelement,Ref,pr + ADPelement,Ref,C + ADPelement,Ref,0 + ADPelement,Ref,eol)/NFA (2) where ADPelement Ref,LC Abiotic depletion potential of the building during the life cycle of the entire building, ADPelement Ref,pr Contribution of the building construction products for the product stage (from cradle to
gate), ADPelement Ref,C Contribution of the building construction products and temporary construction works
during the construction stage of the building, ADPelement,Ref,0 Contribution of the building construction product for maintenance, repair and change of
products during the operational stage, ADPelement,Ref,eol Contribution of the building construction products during the end of life stage
(deconstruction, material segregation and transportation to final destination), NFA Net Floor Area of the building.
106
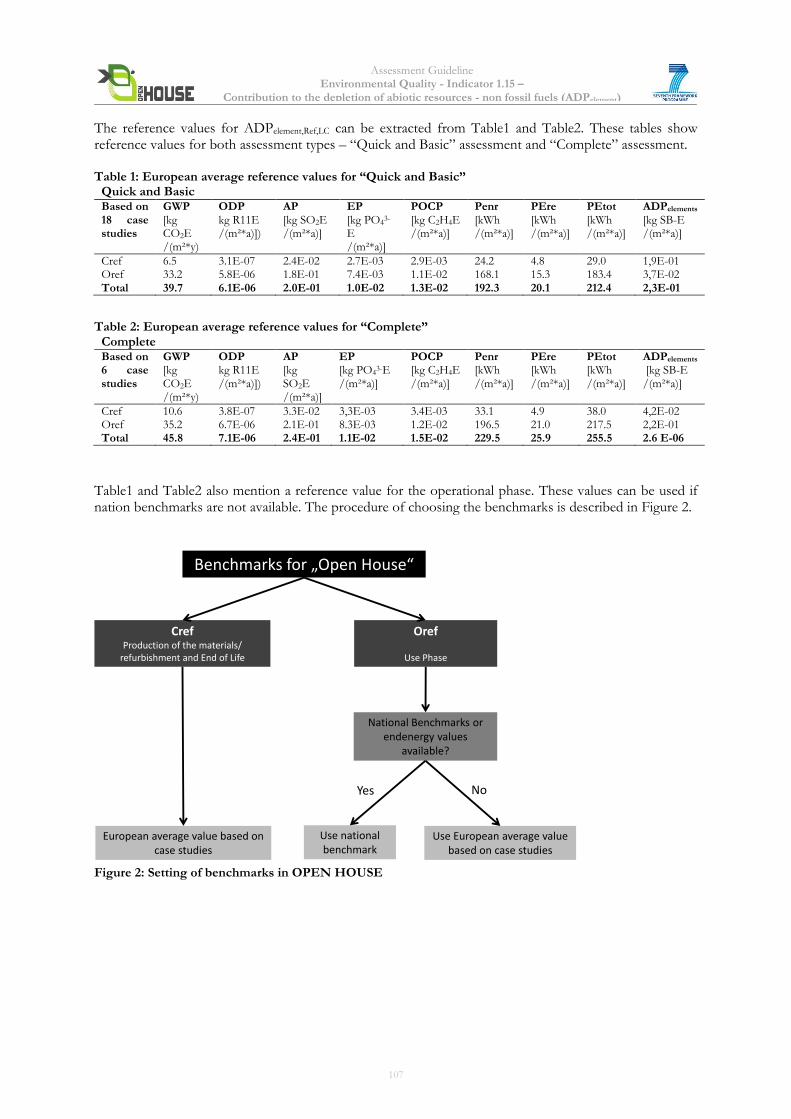
Assessment Guideline Environmental Quality - Indicator 1.15 –
Contribution to the depletion of abiotic resources - non fossil fuels (ADPelement) The reference values for ADPelement,Ref,LC can be extracted from Table1 and Table2. These tables show reference values for both assessment types – “Quick and Basic” assessment and “Complete” assessment. Table 1: European average reference values for “Quick and Basic”
Quick and Basic Based on 18 case studies
GWP [kg CO2E /(m²*y)
ODP kg R11E /(m²*a)])
AP [kg SO2E /(m²*a)]
EP [kg PO4
3-
E /(m²*a)]
POCP [kg C2H4E /(m²*a)]
Penr [kWh /(m²*a)]
PEre [kWh /(m²*a)]
PEtot [kWh /(m²*a)]
ADPelements [kg SB-E /(m²*a)]
Cref 6.5 3.1E-07 2.4E-02 2.7E-03 2.9E-03 24.2 4.8 29.0 1,9E-01 Oref 33.2 5.8E-06 1.8E-01 7.4E-03 1.1E-02 168.1 15.3 183.4 3,7E-02 Total 39.7 6.1E-06 2.0E-01 1.0E-02 1.3E-02 192.3 20.1 212.4 2,3E-01
Table 2: European average reference values for “Complete”
Complete Based on 6 case studies
GWP [kg CO2E /(m²*y)
ODP kg R11E /(m²*a)])
AP [kg SO2E /(m²*a)]
EP [kg PO4
3-E /(m²*a)]
POCP [kg C2H4E /(m²*a)]
Penr [kWh /(m²*a)]
PEre [kWh /(m²*a)]
PEtot [kWh /(m²*a)]
ADPelements [kg SB-E /(m²*a)]
Cref 10.6 3.8E-07 3.3E-02 3,3E-03 3.4E-03 33.1 4.9 38.0 4,2E-02 Oref 35.2 6.7E-06 2.1E-01 8.3E-03 1.2E-02 196.5 21.0 217.5 2,2E-01 Total 45.8 7.1E-06 2.4E-01 1.1E-02 1.5E-02 229.5 25.9 255.5 2.6 E-06
Table1 and Table2 also mention a reference value for the operational phase. These values can be used if nation benchmarks are not available. The procedure of choosing the benchmarks is described in Figure 2.
Figure 2: Setting of benchmarks in OPEN HOUSE
Benchmarks for „Open House“
CrefProduction of the materials/
refurbishment and End of Life
Oref
Use Phase
European average value based on case studies
National Benchmarks orendenergy values
available?
Use national benchmark
Yes No
Use European average valuebased on case studies
107
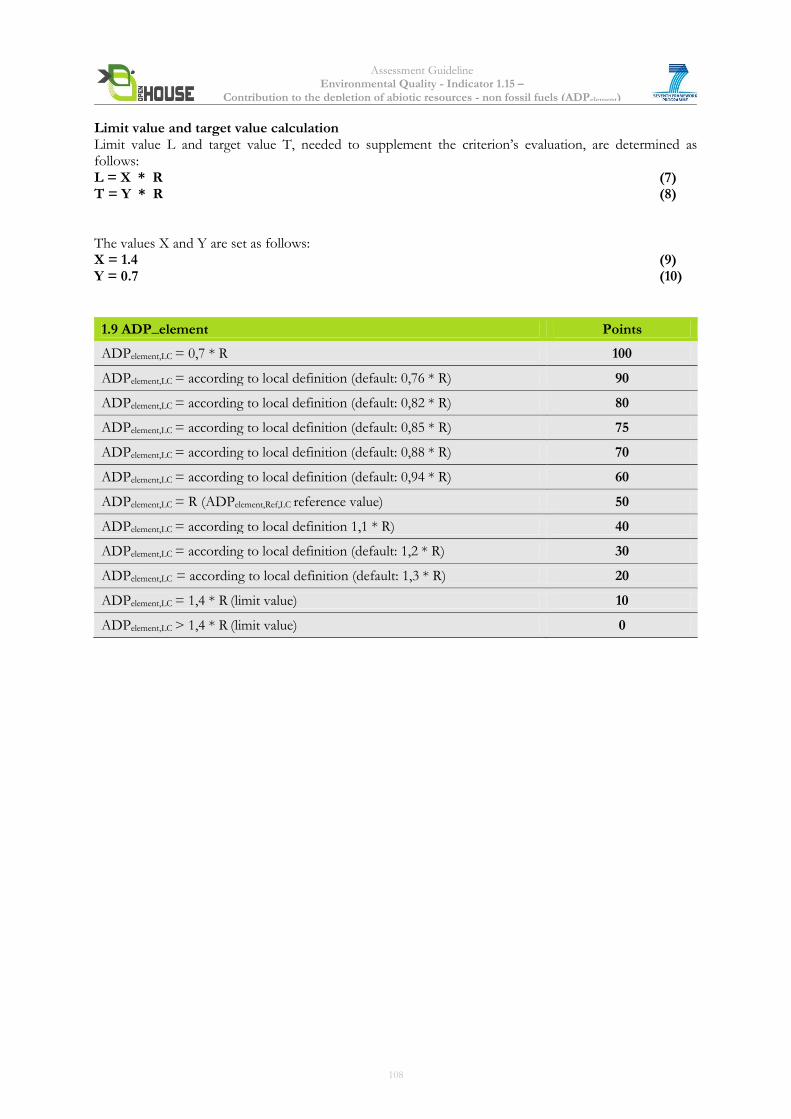
Assessment Guideline Environmental Quality - Indicator 1.15 –
Contribution to the depletion of abiotic resources - non fossil fuels (ADPelement) Limit value and target value calculation Limit value L and target value T, needed to supplement the criterion’s evaluation, are determined as follows: L = X * R (7) T = Y * R (8) The values X and Y are set as follows: X = 1.4 (9) Y = 0.7 (10)
1.9 ADP_element Points
ADPelement,LC = 0,7 * R 100
ADPelement,LC = according to local definition (default: 0,76 * R) 90
ADPelement,LC = according to local definition (default: 0,82 * R) 80
ADPelement,LC = according to local definition (default: 0,85 * R) 75
ADPelement,LC = according to local definition (default: 0,88 * R) 70
ADPelement,LC = according to local definition (default: 0,94 * R) 60
ADPelement,LC = R (ADPelement,Ref,LC reference value) 50
ADPelement,LC = according to local definition 1,1 * R) 40
ADPelement,LC = according to local definition (default: 1,2 * R) 30
ADPelement,LC = according to local definition (default: 1,3 * R) 20
ADPelement,LC = 1,4 * R (limit value) 10
ADPelement,LC > 1,4 * R (limit value) 0
108

Assessment Guideline Environmental Quality - Indicator 1.15 –
Contribution to the depletion of abiotic resources - non fossil fuels (ADPelement)
4. Documentation Guidelines The following documents will be needed to assess the building:
Basic & Quick Assessment
Letter of commitment or easily and quickly accessible documentation for the required evidence (see Complete Assessment), e.g. reasonable estimations for intended/expected values.
Complete Assessment
1. Building surface area and volume, 2. Building components or surfaces/materials with service lives of less than 50 years (amount and
estimated service life), 3. Electricity and heat demand for the building to be certified and reference values according to the
national implementation of the EPBD directive; the calculation and a reference to the national implementation must be included.
4. Quantity determination of the building envelope surfaces (external walls including windows/façade, foundation slab, roof) from the energy calculation in compliance with the national implementation of the EPBD directive and allocation to assessed building components,
5. Windows/French doors/post-and-beam façade with information on frame size, a depiction of a cross-section of the main profile system, the number of windows that can be opened, and the type of glazing,
6. Quantity determination of interior walls and supports; plausibility analysis for floor plans with information on types of interior walls/supports,
7. Inside doors: amount (number and area), list of most important types, and description of calculation,
8. Quantity determination for ceilings, divided into stories, 9. Representation of building components as a series of strata with layer thicknesses, estimated gross
density, and allocation to a data set in the ESUCO database, 10. Representation of quantity determination for foundations, 11. For reinforced concrete, the share of reinforcement is to be given in kg/m3 or kg/m2 of the
building component. Alternatively, the reinforcing steel can be verified in an overall summary of the project.
12. Documentation of heating unit, 13. Documentation of transport distances and means of transport from manufacturing to construction
site.
Most of these requirements can be met by providing a bill of materials (including masses, materials in a hierarchical structure, numbers of pieces, surface areas and volume of the building).
14. Documentation required for ecological footprint results: Results are to be presented for the entire lifecycle per m2 NFA and year, categorized by:
a. Manufacture b. Use (electricity and heat) c. Use (maintenance) d. End of life (dismantling/recycling/disposal)
109
Assessment Guideline Environmental Quality - Indicator 1.15 –
Contribution to the depletion of abiotic resources - non fossil fuels (ADPelement)
5. Relation to other Indicators Data acquisition is the same for the indicators of
1.1 Global Warming Potential
1.2 Ozone Depletion Potential
1.3 Acidification Potential
1.4 Eutrophication Potential
1.5 Photochemical Ozone Creation Potential
1.9 Non-Renewable Primary Energy Demands (PEnr)
1.10 Total Primary Energy Demands and Percentage of Renewable Primary Energy
6. Resources
1. ISO 14040: 2009-11: Environmental management – Life cycle assessment – Principles and framework. International Organization for Standardization.
2. ISO 14044: 2006-10: Environmental management – Life cycle assessment – Requirements and guidelines. International Organization for Standardization.
3. EN 15978: 2011: Sustainability of construction works — Assessment of environmental performance of buildings — Calculation method. European Committee for Standardization CEN.
4. EN 15804: 2010: Sustainability of construction works — Environmental product declarations — Core rules for the product category of construction products. European Committee for Standardization CEN.
5. Directive 2009/28/EC of the European Parliament and of the Council of 23 April 2009 on the promotion of the use of energy from renewable sources and amending and subsequently repealing Directives 2001/77/EC and 2003/30/EC.
6. Kreißig, J., Binder, M. (2007): Methodische Grundlagen- Ökobilanzbasierte Umweltindikatoren im Bauwesen. Methodenbericht zum BMVBS-Projekt „Aktualisieren, Fortschreiben und Harmonisieren von Basisdaten für das nachhaltige Bauen“ (AZ 10.06.03 – 06.119) Mai 2007, www.baufachinformation.de/literatur.isp.
7. United Nations (1998): Kyoto Protocol to the United Nations Framework Convention on Climate Change, 1998, http://unfccc.int/resource/docs/convkp/kpeng.pdf.
8. Bundesministerium für Verkehr, Bau- und Wohnungswesen: Guideline for Sustainable Building. Eigenverlag, 2001.
9. Directive 2002/91/EC of the European Parliament and of the Council of 16 December 2002 on the energy performance of buildings.
10. VDI 2067: Economic efficiency of building installations – Fundamentals and economic calculation. Verein Deutscher Ingenieure, 2000.
7. Attachments
None
110
Assessment Guideline Version 1.2 New Office Buildings – July 2013
OPEN HOUSE
ASSESSMENT GUIDELINE
Social / Functional Quality
2.1 Barrier-free Accessibility 2.2 Personal Safety and Security of Users 2.3 Thermal Comfort 2.4 Indoor Air Quality 2.5 Water Quality 2.6 Acoustic Comfort 2.7 Visual Comfort 2.8 Operation Comfort 2.9 Service Quality 2.11 Public Accessibility 2.12 Noise from Building and Site 2.16 Bicycle Amenities 2.17 Material Sourcing Note: Core indicators are in bold
111
Assessment Guideline Social / Functional Quality - Indicator 2.1 - Barrier-free Accessibility
Indicator 2.1 Barrier-free Accessibility (adapted from DGNB/BNB)
Core indicator
1. Objective Around 80 million Europeans have a disability, representing one out of six people in the EU. They have the right to participate fully and equally in all aspects of life, both in the economy and society as a whole, but in practice continue to face barriers in everyday life, both physical and in terms of attitudes. People with disabilities are on average poorer than other Europeans, are less likely to have a job, and face more limited access to goods and services such as education, healthcare, transport, housing and technology. There are three major types of barriers to access: social barriers, psychological barriers and structural barriers. These barriers are found in buildings, the space between and around buildings, and in the ‘virtual environment’. Also older people have similar problems. In regard to the demographic change (people in Europe getting older: 1990 - 18 % of the Europeans have been older than 60 years, and until 2030 more than 30 % will be older than 60 years). In the context of buildings, freedom from barriers means: eliminating obstacles in the built environment and making information and communication services suitable for use by all. Accessibility to the built infrastructure is essential for people with disabilities to be able to exercise their rights and participate fully in society. The right to education, to engage in work can only be exercised if people with disabilities are able to enter, leave and use the place where those activities take place (schools, work environment). Furthermore, accessibility to the built environment is essential to ensure access to transport (stations, airports, harbours) and to leisure and cultural facilities (libraries, museums, theatres, cultural centres, concert halls, hotels, restaurants etc). The main goal is to plan and construct buildings which have the best accessibility for people with physical, sensorical and cognitiv disabilities (“Design for all”). This indicator supports the objective of the European Commission, which aims at eliminating barriers to access that people with disabilities are facing. Key areas for action include the built environment, transport, information and communication, and services.1 Moreover, workplaces must be organized to take account of workers with disabilities, if necessary. This provision applies in particular to the doors, passageways, staircases, showers, washbasins, lavatories and workstations used or occupied directly by people with disability2.
1 European Disability Strategy 2010-2020: A Renewed Commitment to a Barrier-Free Europe COM(2010) 636 2 DIRECTIVE 89/654/EC
112
Assessment Guideline Social / Functional Quality - Indicator 2.1 - Barrier-free Accessibility
2. Assessment Methodology The criteria address the needs of people with disabilities, as well as the needs of older persons. People with walking disabilities, palsies or missing extremities need special additives, like wheel chairs, walking frames or handles. Therefore the buidling must provide enough free places, areaways with special width and length, planar movement areas and ramps(entrance etc.). People with sensoric limitations need tactile elements or inductive audio systems. Barrier-free accessibility of an office building should be possible in:
all publically accessible areas (local public infrastructure) and
the areas required for work (offices, toilets, kitchen etc.) The evaluation is qualitative. Points will be given to which extent the use of the building is possible for all people. An important aspect is the basic access and the compliance with the national building standard. If these standards are not observed, no points can be achieved. The larger areas of the building are accessible for all people, the better the building will be evaluated. The following indicator will be assessed: 2.1.1 Barrier-free Accessibility
3. Calculation and Rating The assessment of the barrier free accessibility of a building is measured in the way how much percent of the net floor area of the public spaces and working areas could be used by all people (“Design for all”). The assessment is based on existing international and European building standards for barrier free accessibility of buildings. At the moment no European Building Standard has been developed to address the accessibility of buildings. The EU directive 2000/78/EC “General framework for equal treatment in employment and occupation”establishes conditions for a reasonable accomodation of employees with disabilities, which means that people with disability have a right to get adaptations to the workplace in order to be able to fulfil their job. The EU directive 89/654/EC mentions that workplaces must be organized to take account of workers with disabilities
These directives have to be adapted in the national disability policy of each Member State. Therefore the assessment is based on the national standards for accessibility. If there is no national building standard for barrier free accessibility, requirements from the ISO 21542:2011 should be respected. Public places of office buildings are:
Entrance
Lobby (desk officer etc.)
Cafeteria
Public sanitary rooms Working areas of office buildings are:
Working rooms (offices, conference rooms etc.)
Infrastructure (doors, stairways, lifts, emergency exit etc.)
Secondary rooms (rooms for printing etc.)
Sanitary rooms (toilets, changing rooms etc.)
Kitchen and break rooms
113
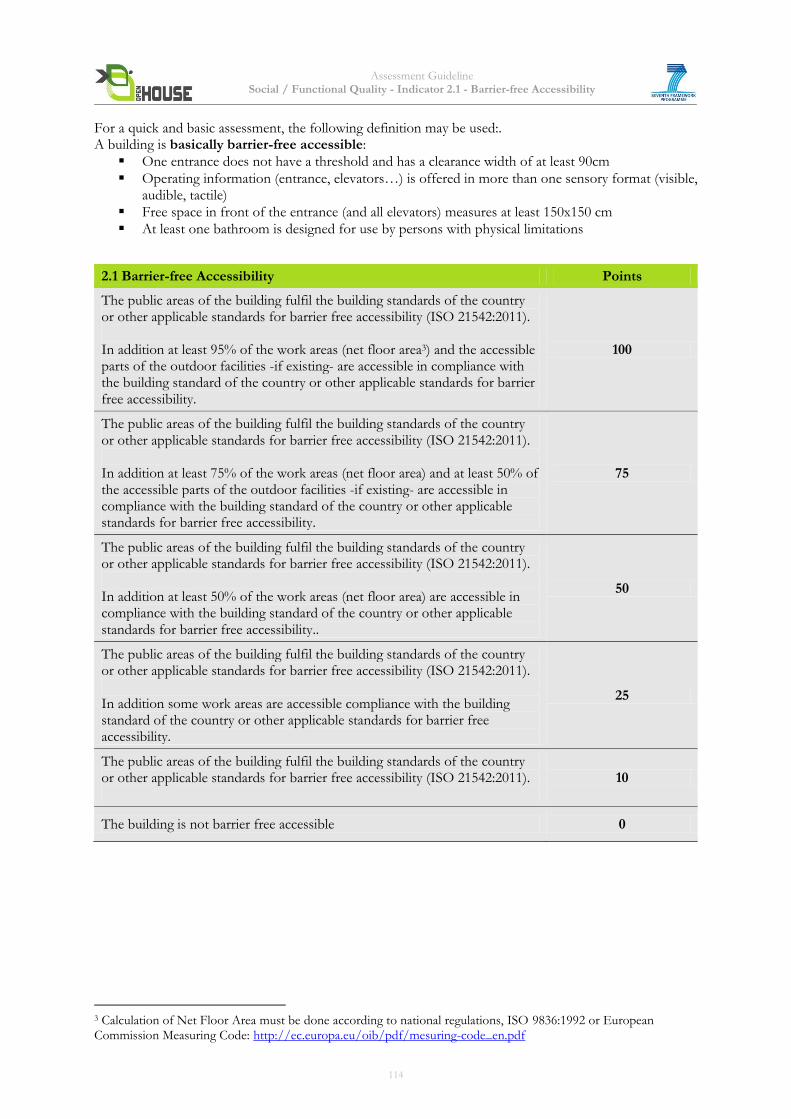
Assessment Guideline Social / Functional Quality - Indicator 2.1 - Barrier-free Accessibility
For a quick and basic assessment, the following definition may be used:. A building is basically barrier-free accessible:
One entrance does not have a threshold and has a clearance width of at least 90cm
Operating information (entrance, elevators…) is offered in more than one sensory format (visible, audible, tactile)
Free space in front of the entrance (and all elevators) measures at least 150x150 cm
At least one bathroom is designed for use by persons with physical limitations
2.1 Barrier-free Accessibility Points
The public areas of the building fulfil the building standards of the country or other applicable standards for barrier free accessibility (ISO 21542:2011). In addition at least 95% of the work areas (net floor area3) and the accessible parts of the outdoor facilities -if existing- are accessible in compliance with the building standard of the country or other applicable standards for barrier free accessibility.
100
The public areas of the building fulfil the building standards of the country or other applicable standards for barrier free accessibility (ISO 21542:2011). In addition at least 75% of the work areas (net floor area) and at least 50% of the accessible parts of the outdoor facilities -if existing- are accessible in compliance with the building standard of the country or other applicable standards for barrier free accessibility.
75
The public areas of the building fulfil the building standards of the country or other applicable standards for barrier free accessibility (ISO 21542:2011). In addition at least 50% of the work areas (net floor area) are accessible in compliance with the building standard of the country or other applicable standards for barrier free accessibility..
50
The public areas of the building fulfil the building standards of the country or other applicable standards for barrier free accessibility (ISO 21542:2011). In addition some work areas are accessible compliance with the building standard of the country or other applicable standards for barrier free accessibility.
25
The public areas of the building fulfil the building standards of the country or other applicable standards for barrier free accessibility (ISO 21542:2011).
10
The building is not barrier free accessible 0
3 Calculation of Net Floor Area must be done according to national regulations, ISO 9836:1992 or European Commission Measuring Code: http://ec.europa.eu/oib/pdf/mesuring-code_en.pdf
114
Assessment Guideline Social / Functional Quality - Indicator 2.1 - Barrier-free Accessibility
4. Documentation Guidelines The following documents will be needed to assess the building: Quick & Basic Assessment Letter of commitment or easily and quickly accessible documentation for the required evidence (see Complete Assessment), e.g. reasonable estimations for intended/expected values.
Complete Assessment
Before Construction:
Floor plan of the entrance level with outdoor facilities and illustration of connection to public spaces
Floor plans
Plans of the parking lots
Relevant sections that demonstrates the stories heights
Declaration of intent or specifications for measures for barrier free accessibility After Construction
Relevant details and photos (front door, room entrances, lifts, stairways, handrail, parking lots etc.)
5. Relation to other Indicators Indicator 2.8: Operation Comfort
6. Resources 1. DGNB International Criterion 26: Barrier-free accessibility 2. BNB: Bewertungssystem Nachhaltiges Bauen (Germany) Criterion 3.2.1: Barrierefreiheit http://www.nachhaltigesbauen.de/fileadmin/pdf/BNB_Steckbriefe_Buero_Neubau/aktuell/BNB_BN_321.pdf 3. European Commission: European Disability Strategy 2010-2010 http://www.internationaldisabilityalliance.org/.../European-Disability-Strategy-2010-2020; 2011-04-04 4. International Convention on the rights of persons with disabilities http://www.un.org/disabilities/convention/conventionfull.shtml; 2011-04-04 5. European Commission, M/420, Public procurement in the built environment – Mandate 420 http://www.cen.eu/cen/Sectors/Sectors/Accessibility/Guidance/Pages/default.aspx 6. Council Directive 2000/78/EC of 27 November 2000 establishing a general framework for equal treatment in employment and occupation http://eur-lex.europa.eu/LexUriServ/LexUriServ.do?uri=OJ:L:2000:303:0016:0022:EN:PDF 7. ISO/FDIS 21542:2011 Building construction — Accessibility and usability of the built environment
115

Assessment Guideline Social / Functional Quality - Indicator 2.1 - Barrier-free Accessibility
Example of national standards related to accessibility:
Germany:
DIN 18024-1: 1998-01: Barrierefreies Bauen - Teil 1: Straßen, Plätze, Wege, öffentliche Verkehrs- und Grünanlagen sowie Spielplätze; Planungsgrundlagen (zukünftig DIN 18070)
DIN 18040-1: 2010-10: Barrierefreies Bauen - Teil 1: Öffentlich zugängliche Gebäude (Erstz für DIN 18024-2: 1996-11: Öffentlich zugängige Gebäude und Arbeitsstätten)
DIN 18041: 2004-05: Hörsamkeit in kleinen bis mittelgroßen Räumen Austria
ÖNORM B 1600:1994 Barrierefreies Bauen: Planungsgrundsätze.
ÖNORM B 1601:1994 Spezielle Baulichkeiten für behinderte und alte Menschen: Planungsgrundsätze.
7. Attachments
None
116
Assessment Guideline Social / Functional Quality - Indicator 2.2 – Personal Safety and Security of Users
Indicator 2.2 Personal Safety and Security of Users (adapted from DGNB/BNB, Directive 89/654/EEC)
1. Objective
Personal Safety and Security of Users aims at assessing the prevention strategies and the preparedness of a building against accidents, disasters, users' health issues, damages and losses of building items. Danger, accidents and catastrophes shall be avoided; safety shall be assured as far as possible if accidents or catastrophes happen. Insecurity and anxiety can constrain the movement of humans. The subjective sensation of safety contributes basically to the comfort of humans. Objective safety is present if actual dangers are avoided or for example with accidents if the extent of damage can be reduced as far as possible. This supports the objectives of the European Directive 89/654/EEC on minimum safety and health requirements for the workplace.
2. Assessment Methodology
This criterion is assessed qualitatively by taking into account three aspects: 1.Satisfaction of minimum health and safety requirements at the workplace Appropriate measures have to be taken in order to avoid physical injuries, electricity risks, dangers from building components or traffic routes (vehicles, pedestrians, escalators, ramps etc) integrated in the building and to ensure a safe design of first aid rooms, rest, personnel changing and sanitary areas. All these issues are covered by the Council Directive 89/654/EEC of 30 November 1989 concerning the minimum safety and health requirements for the workplace. Other issues addressed in the same Directive, such as fire prevention, protection of workers with special needs, health issues due to bad indoor air quality and lighting, are reflected by other OPEN HOUSE indicators. 2. Reduction of damage if an accident should occur inside and outside the building: Appropriate measures have to be taken to reduce the extent of damage as much as possible in case an accident should occur. Issues affecting emergency routes and emergency exits are addressed in Directive 89/654/EEC. 3. Measures preventing building users from crime The existence and performance of a monitoring or alarm system should be checked. Note: For the purposes of Directive 89/654/EEC, 'workplace' means the place intended to house workstations on the premises of the undertaking and/or establishment and any other place within the area of the undertaking and/or establishment to which the employee has access in the course of his employment. In the current context of OPEN HOUSE, 'workplace' is focused on office buildings intended to house “office” type workstations, storage rooms, meeting areas, printing rooms, etc. and therefore no manufacturing areas. According to the Directive 89/654/EEC, workplaces used for the first time after 31 December 1992 must satisfy the minimum safety and health requirements laid down in Annex I of the Directive. The ones affecting office spaces are included in the next paragraphs.
The three sub-indicators presented below will be assessed: 2.2.1 Satisfaction of minimum health and safety requirements at the workplace 2.2.2 Reduction of damage if an accident should occur 2.2.3 Measures preventing building users from crime
117
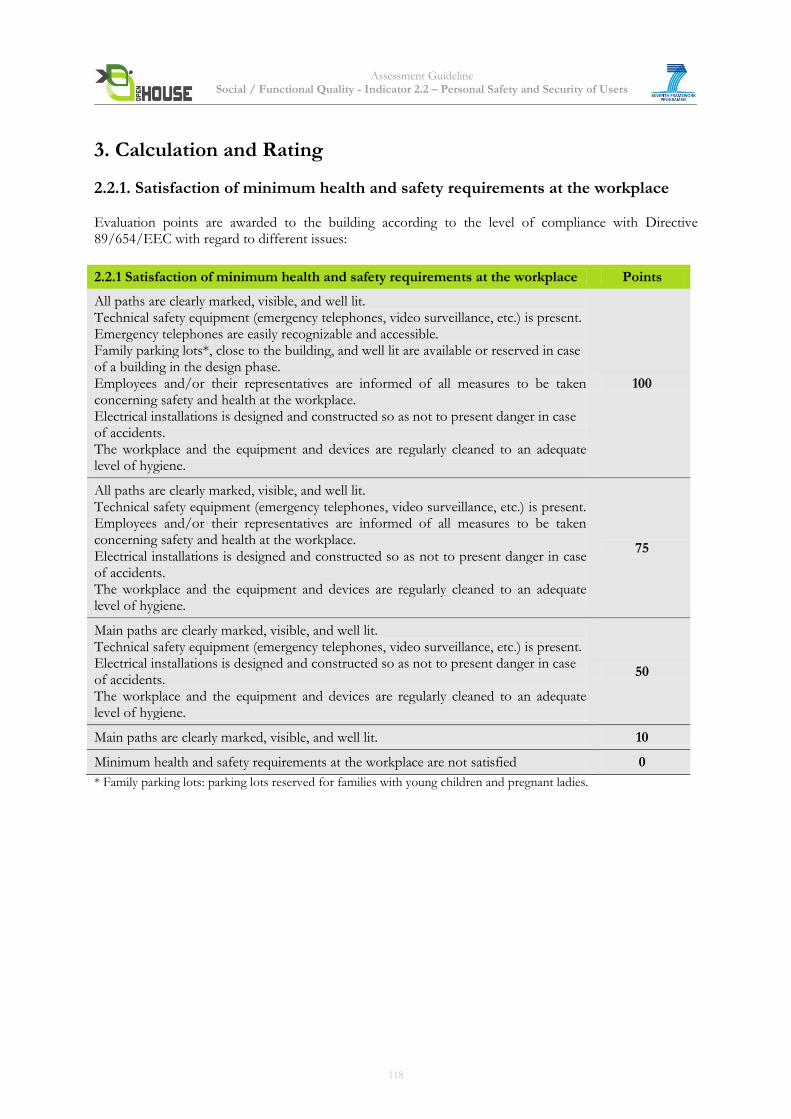
Assessment Guideline Social / Functional Quality - Indicator 2.2 – Personal Safety and Security of Users
3. Calculation and Rating
2.2.1. Satisfaction of minimum health and safety requirements at the workplace Evaluation points are awarded to the building according to the level of compliance with Directive 89/654/EEC with regard to different issues:
2.2.1 Satisfaction of minimum health and safety requirements at the workplace Points
All paths are clearly marked, visible, and well lit. Technical safety equipment (emergency telephones, video surveillance, etc.) is present. Emergency telephones are easily recognizable and accessible. Family parking lots*, close to the building, and well lit are available or reserved in case of a building in the design phase. Employees and/or their representatives are informed of all measures to be taken concerning safety and health at the workplace. Electrical installations is designed and constructed so as not to present danger in case of accidents. The workplace and the equipment and devices are regularly cleaned to an adequate level of hygiene.
100
All paths are clearly marked, visible, and well lit. Technical safety equipment (emergency telephones, video surveillance, etc.) is present. Employees and/or their representatives are informed of all measures to be taken concerning safety and health at the workplace. Electrical installations is designed and constructed so as not to present danger in case of accidents. The workplace and the equipment and devices are regularly cleaned to an adequate level of hygiene.
75
Main paths are clearly marked, visible, and well lit. Technical safety equipment (emergency telephones, video surveillance, etc.) is present. Electrical installations is designed and constructed so as not to present danger in case of accidents. The workplace and the equipment and devices are regularly cleaned to an adequate level of hygiene.
50
Main paths are clearly marked, visible, and well lit. 10
Minimum health and safety requirements at the workplace are not satisfied 0
* Family parking lots: parking lots reserved for families with young children and pregnant ladies.
118
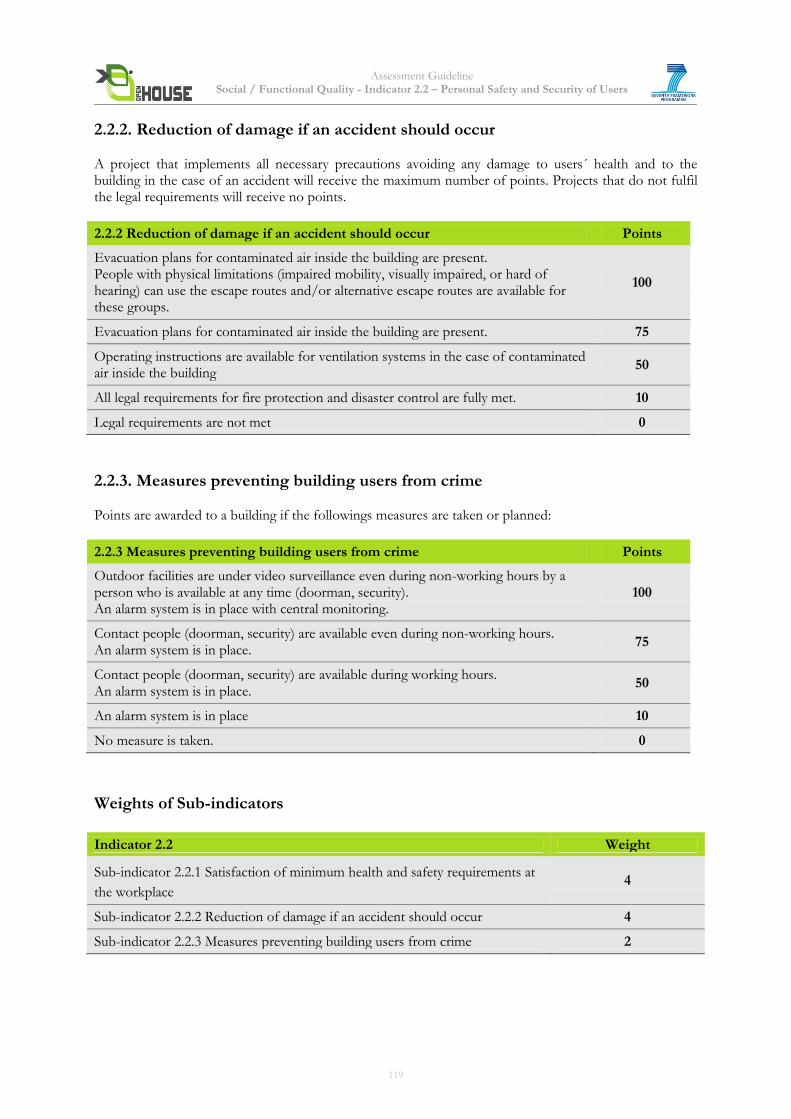
Assessment Guideline Social / Functional Quality - Indicator 2.2 – Personal Safety and Security of Users
2.2.2. Reduction of damage if an accident should occur A project that implements all necessary precautions avoiding any damage to users´ health and to the building in the case of an accident will receive the maximum number of points. Projects that do not fulfil the legal requirements will receive no points.
2.2.2 Reduction of damage if an accident should occur Points
Evacuation plans for contaminated air inside the building are present. People with physical limitations (impaired mobility, visually impaired, or hard of hearing) can use the escape routes and/or alternative escape routes are available for these groups.
100
Evacuation plans for contaminated air inside the building are present. 75
Operating instructions are available for ventilation systems in the case of contaminated air inside the building
50
All legal requirements for fire protection and disaster control are fully met. 10
Legal requirements are not met 0
2.2.3. Measures preventing building users from crime Points are awarded to a building if the followings measures are taken or planned:
2.2.3 Measures preventing building users from crime Points
Outdoor facilities are under video surveillance even during non-working hours by a person who is available at any time (doorman, security). An alarm system is in place with central monitoring.
100
Contact people (doorman, security) are available even during non-working hours. An alarm system is in place.
75
Contact people (doorman, security) are available during working hours. An alarm system is in place.
50
An alarm system is in place 10
No measure is taken. 0
Weights of Sub-indicators
Indicator 2.2 Weight
Sub-indicator 2.2.1 Satisfaction of minimum health and safety requirements at
the workplace 4
Sub-indicator 2.2.2 Reduction of damage if an accident should occur 4
Sub-indicator 2.2.3 Measures preventing building users from crime 2
119
Assessment Guideline Social / Functional Quality - Indicator 2.2 – Personal Safety and Security of Users
4. Documentation Guidelines The following documents will be needed to assess the building: Quick & Basic Assessment Letter of commitment or easily and quickly accessible documentation for the required evidence (see Complete Assessment), e.g. reasonable estimations for intended/expected values. Complete Assessment 2.2.1 Satisfaction of minimum health and safety requirements at the workplace
Demonstration of visible paths on the grounds and in the building via relevant planning documents (plan of the ground floor with outdoor facilities and a typical floor plan). Excerpts from plans and texts from the implementation planning stage, which include the following information:
- location of family’s parking lots relative to the main entrance;
- illumination concept for the parking lots and the paths between the lots and the main entrance. Information on the predicted technical safety equipment, such as emergency telephones, video surveillance, etc., with site maps to assess their accessibility. Specification for the safety of electrical installations. Specification for the regular cleaning of the workplaces. After Construction: Report based on building's audit in order to ensure that the basic safety rules are considered (e.g. no emergency exits locked, no obstacles in emergency routes, emergency lights in function, street lighting around the building in function, etc.). Feedback from questionnaire answered by employees, evaluating at what level they are informed on safety and escape measures implemented in the building. 2.2.2 Reduction of damage if an accident should occur Documentation of the building materials, which will be used, must include adequate information about their contents (such as halogen content) to enable an evaluation of the potential fume risk. Relevant excerpts from building plans for escape routes, which include the following information:
- the minimum legal requirement for escape route planning; - the measures that go beyond the minimum legal requirement; - confirmation that the escape routes are also suitable for people with physical limitations.
Evacuation plans in the case of contaminated air inside the building. Operating instructions for predicted ventilation systems in the case of contaminated air inside and outside the building.
2.2.3 Measures preventing building users from crime Demonstration of provisions for security during non-working hours with information on contact people (doorman, security) and their accessibility, video surveillance, and/or other measures.
120
Assessment Guideline Social / Functional Quality - Indicator 2.2 – Personal Safety and Security of Users
5. Relation to other Indicators Indicator 2.1 “Barrier-free Accessibility” Indicator 2.4 “Indoor Air Quality” Indicator 2.17 “Responsible Material Sourcing” Indicator 4.1 “Fire protection” Indicator 6.1 “Risks at the Site” Indicator 6.2 “Circumstances at the Site”
6. Resources Council Directive 89/654/EEC concerning the minimum safety and health requirements for the workplace http://eur-lex.europa.eu/LexUriServ/LexUriServ.do?uri=OJ:L:1989:393:0001:0012:EN:PDF
DGNB 2009 - 25 Safety and Risk of Hazardous Incidents BNB 2011 - 3.1.8 Safety and Incident risks www.nachhaltigesbauen.de/fileadmin/pdf/BNB_Steckbriefe_Buero_Neubau/aktuell/BNB_BN_318.pdf
7. Attachments: Extracts from the Council Directive 89/654/EEC concerning the minimum safety and health requirements for the workplace
Extracts from the Council Directive 89/654/EEC
General requirements 1. Traffic routes to emergency exits and the exits themselves are kept clear at all times (more detailed
requirements for emergency routes and exits are included in the next sub-indicator 2.2.2). 2. Technical maintenance of the workplace and of the equipment and devices is carried out and any faults
found which affect the safety and health of workers are rectified as quickly as possible. 3. The workplace and the equipment and devices are regularly cleaned to an adequate level of hygiene. 4. Safety equipment and devices intended to prevent or eliminate hazards are regularly maintained and
checked.
Information to workers 1. Employees and/or their representatives shall be informed of all measures to be taken concerning
safety and health at the workplace.
Electrical installations 1. Electrical installations must be designed and constructed so as not to present a fire or explosion
hazard; persons must be adequately protected against the risk of accidents caused by direct or indirect contact.
2. The design, construction and choice of material and protection devices must be appropriate to the voltage, external conditions and the competence of persons with access to parts of the installation.
Floors, walls, ceilings and roofs of rooms 1. The floors of workplaces must have no dangerous bumps, holes or slopes and must be fixed, stable
and not slippery. 2. The surfaces of floors, walls and ceilings in rooms must be such that they can be cleaned or
refurbished to an appropriate standard of hygiene. 3. Transparent or translucent walls, in particular all-glass partitions, in rooms or in the vicinity of
workplaces and traffic routes must be clearly indicated and made of safety material or be shielded from such places or traffic routes to prevent workers from coming into contact with walls or being injured should the walls shatter.
4. Access to roofs made of materials of insufficient strength must not be permitted unless equipment is provided to ensure that the work can be carried out in a safe manner.
121
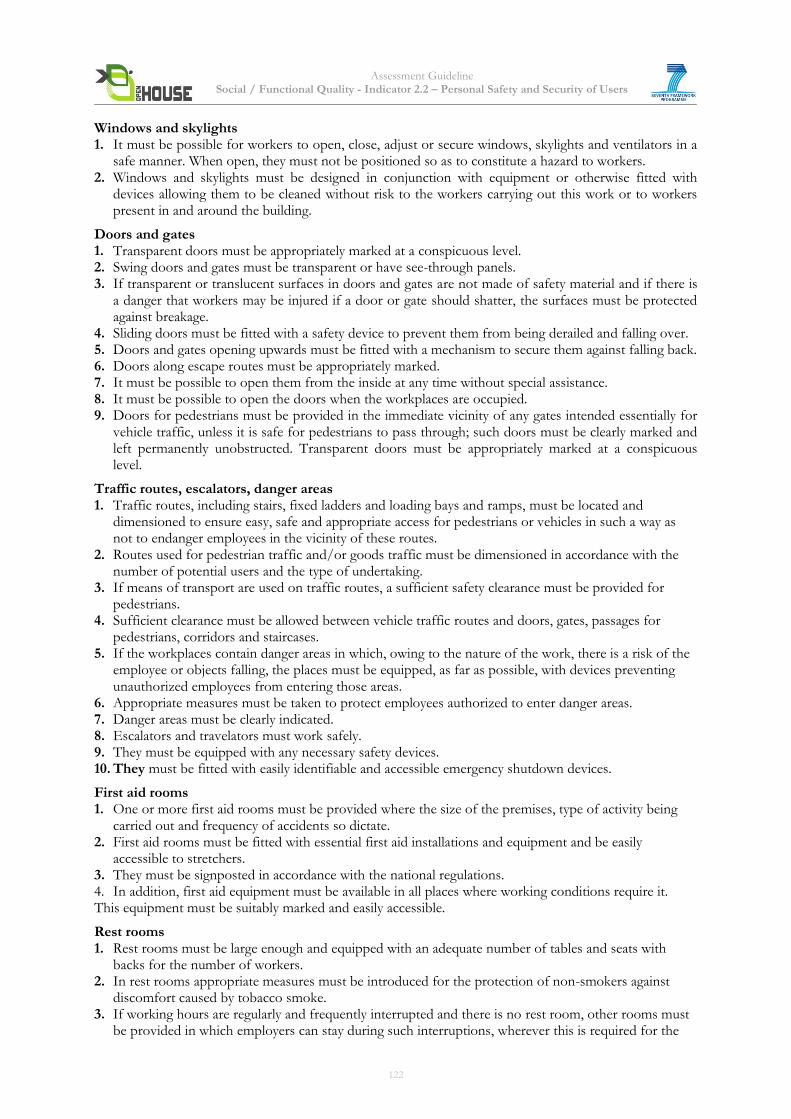
Assessment Guideline Social / Functional Quality - Indicator 2.2 – Personal Safety and Security of Users
Windows and skylights 1. It must be possible for workers to open, close, adjust or secure windows, skylights and ventilators in a
safe manner. When open, they must not be positioned so as to constitute a hazard to workers. 2. Windows and skylights must be designed in conjunction with equipment or otherwise fitted with
devices allowing them to be cleaned without risk to the workers carrying out this work or to workers present in and around the building.
Doors and gates 1. Transparent doors must be appropriately marked at a conspicuous level. 2. Swing doors and gates must be transparent or have see-through panels. 3. If transparent or translucent surfaces in doors and gates are not made of safety material and if there is
a danger that workers may be injured if a door or gate should shatter, the surfaces must be protected against breakage.
4. Sliding doors must be fitted with a safety device to prevent them from being derailed and falling over. 5. Doors and gates opening upwards must be fitted with a mechanism to secure them against falling back. 6. Doors along escape routes must be appropriately marked. 7. It must be possible to open them from the inside at any time without special assistance. 8. It must be possible to open the doors when the workplaces are occupied. 9. Doors for pedestrians must be provided in the immediate vicinity of any gates intended essentially for
vehicle traffic, unless it is safe for pedestrians to pass through; such doors must be clearly marked and left permanently unobstructed. Transparent doors must be appropriately marked at a conspicuous level.
Traffic routes, escalators, danger areas 1. Traffic routes, including stairs, fixed ladders and loading bays and ramps, must be located and
dimensioned to ensure easy, safe and appropriate access for pedestrians or vehicles in such a way as not to endanger employees in the vicinity of these routes.
2. Routes used for pedestrian traffic and/or goods traffic must be dimensioned in accordance with the number of potential users and the type of undertaking.
3. If means of transport are used on traffic routes, a sufficient safety clearance must be provided for pedestrians.
4. Sufficient clearance must be allowed between vehicle traffic routes and doors, gates, passages for pedestrians, corridors and staircases.
5. If the workplaces contain danger areas in which, owing to the nature of the work, there is a risk of the employee or objects falling, the places must be equipped, as far as possible, with devices preventing unauthorized employees from entering those areas.
6. Appropriate measures must be taken to protect employees authorized to enter danger areas. 7. Danger areas must be clearly indicated. 8. Escalators and travelators must work safely. 9. They must be equipped with any necessary safety devices. 10. They must be fitted with easily identifiable and accessible emergency shutdown devices.
First aid rooms 1. One or more first aid rooms must be provided where the size of the premises, type of activity being
carried out and frequency of accidents so dictate. 2. First aid rooms must be fitted with essential first aid installations and equipment and be easily
accessible to stretchers. 3. They must be signposted in accordance with the national regulations. 4. In addition, first aid equipment must be available in all places where working conditions require it. This equipment must be suitably marked and easily accessible.
Rest rooms 1. Rest rooms must be large enough and equipped with an adequate number of tables and seats with
backs for the number of workers. 2. In rest rooms appropriate measures must be introduced for the protection of non-smokers against
discomfort caused by tobacco smoke. 3. If working hours are regularly and frequently interrupted and there is no rest room, other rooms must
be provided in which employers can stay during such interruptions, wherever this is required for the
122
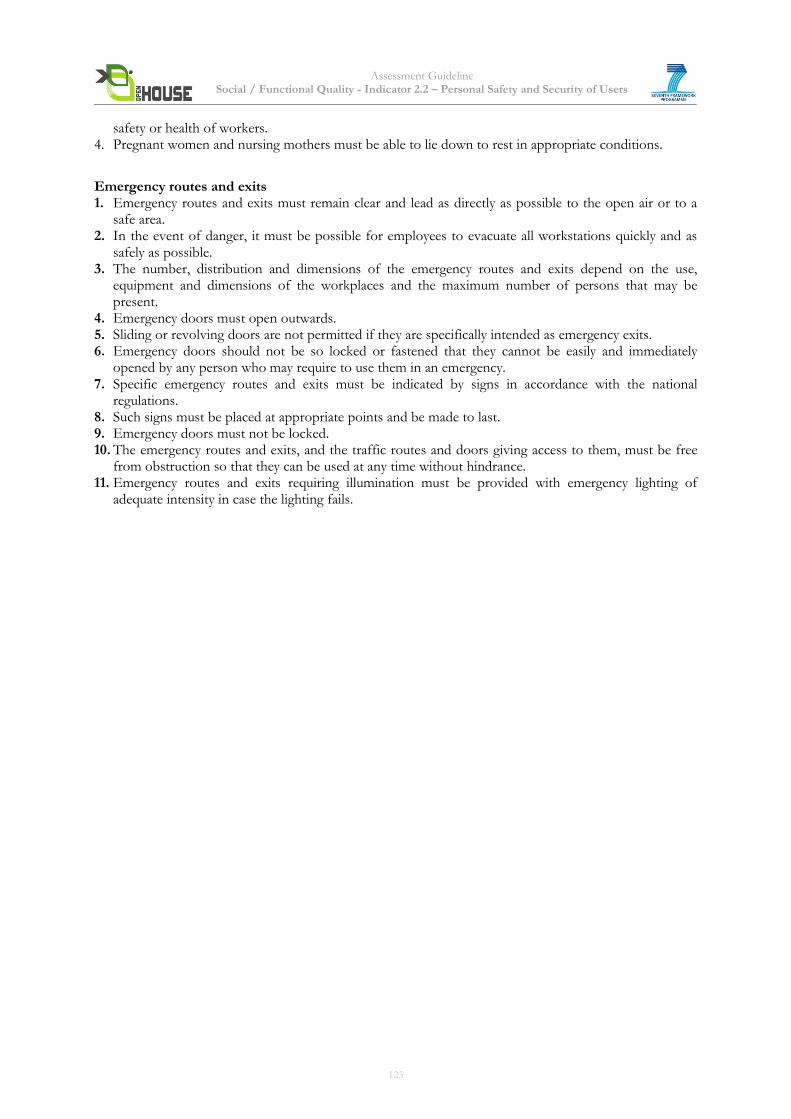
Assessment Guideline Social / Functional Quality - Indicator 2.2 – Personal Safety and Security of Users
safety or health of workers. 4. Pregnant women and nursing mothers must be able to lie down to rest in appropriate conditions.
Emergency routes and exits 1. Emergency routes and exits must remain clear and lead as directly as possible to the open air or to a
safe area. 2. In the event of danger, it must be possible for employees to evacuate all workstations quickly and as
safely as possible. 3. The number, distribution and dimensions of the emergency routes and exits depend on the use,
equipment and dimensions of the workplaces and the maximum number of persons that may be present.
4. Emergency doors must open outwards. 5. Sliding or revolving doors are not permitted if they are specifically intended as emergency exits. 6. Emergency doors should not be so locked or fastened that they cannot be easily and immediately
opened by any person who may require to use them in an emergency. 7. Specific emergency routes and exits must be indicated by signs in accordance with the national
regulations. 8. Such signs must be placed at appropriate points and be made to last. 9. Emergency doors must not be locked. 10. The emergency routes and exits, and the traffic routes and doors giving access to them, must be free
from obstruction so that they can be used at any time without hindrance. 11. Emergency routes and exits requiring illumination must be provided with emergency lighting of
adequate intensity in case the lighting fails.
123
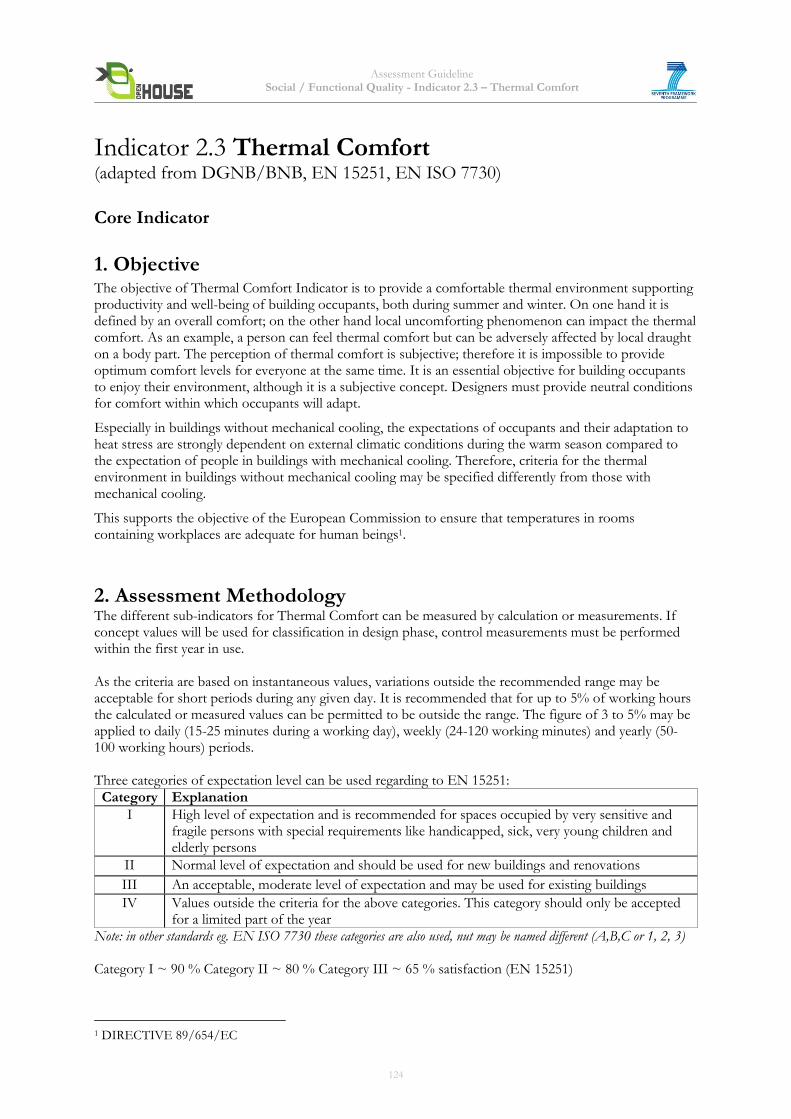
Assessment Guideline Social / Functional Quality - Indicator 2.3 – Thermal Comfort
Indicator 2.3 Thermal Comfort (adapted from DGNB/BNB, EN 15251, EN ISO 7730)
Core Indicator
1. Objective The objective of Thermal Comfort Indicator is to provide a comfortable thermal environment supporting productivity and well-being of building occupants, both during summer and winter. On one hand it is defined by an overall comfort; on the other hand local uncomforting phenomenon can impact the thermal comfort. As an example, a person can feel thermal comfort but can be adversely affected by local draught on a body part. The perception of thermal comfort is subjective; therefore it is impossible to provide optimum comfort levels for everyone at the same time. It is an essential objective for building occupants to enjoy their environment, although it is a subjective concept. Designers must provide neutral conditions for comfort within which occupants will adapt.
Especially in buildings without mechanical cooling, the expectations of occupants and their adaptation to heat stress are strongly dependent on external climatic conditions during the warm season compared to the expectation of people in buildings with mechanical cooling. Therefore, criteria for the thermal environment in buildings without mechanical cooling may be specified differently from those with mechanical cooling.
This supports the objective of the European Commission to ensure that temperatures in rooms containing workplaces are adequate for human beings1.
2. Assessment Methodology
The different sub-indicators for Thermal Comfort can be measured by calculation or measurements. If concept values will be used for classification in design phase, control measurements must be performed within the first year in use. As the criteria are based on instantaneous values, variations outside the recommended range may be acceptable for short periods during any given day. It is recommended that for up to 5% of working hours the calculated or measured values can be permitted to be outside the range. The figure of 3 to 5% may be applied to daily (15-25 minutes during a working day), weekly (24-120 working minutes) and yearly (50-100 working hours) periods. Three categories of expectation level can be used regarding to EN 15251:
Category Explanation
I High level of expectation and is recommended for spaces occupied by very sensitive and fragile persons with special requirements like handicapped, sick, very young children and elderly persons
II Normal level of expectation and should be used for new buildings and renovations
III An acceptable, moderate level of expectation and may be used for existing buildings
IV Values outside the criteria for the above categories. This category should only be accepted for a limited part of the year
Note: in other standards eg. EN ISO 7730 these categories are also used, nut may be named different (A,B,C or 1, 2, 3) Category I ~ 90 % Category II ~ 80 % Category III ~ 65 % satisfaction (EN 15251)
1 DIRECTIVE 89/654/EC
124
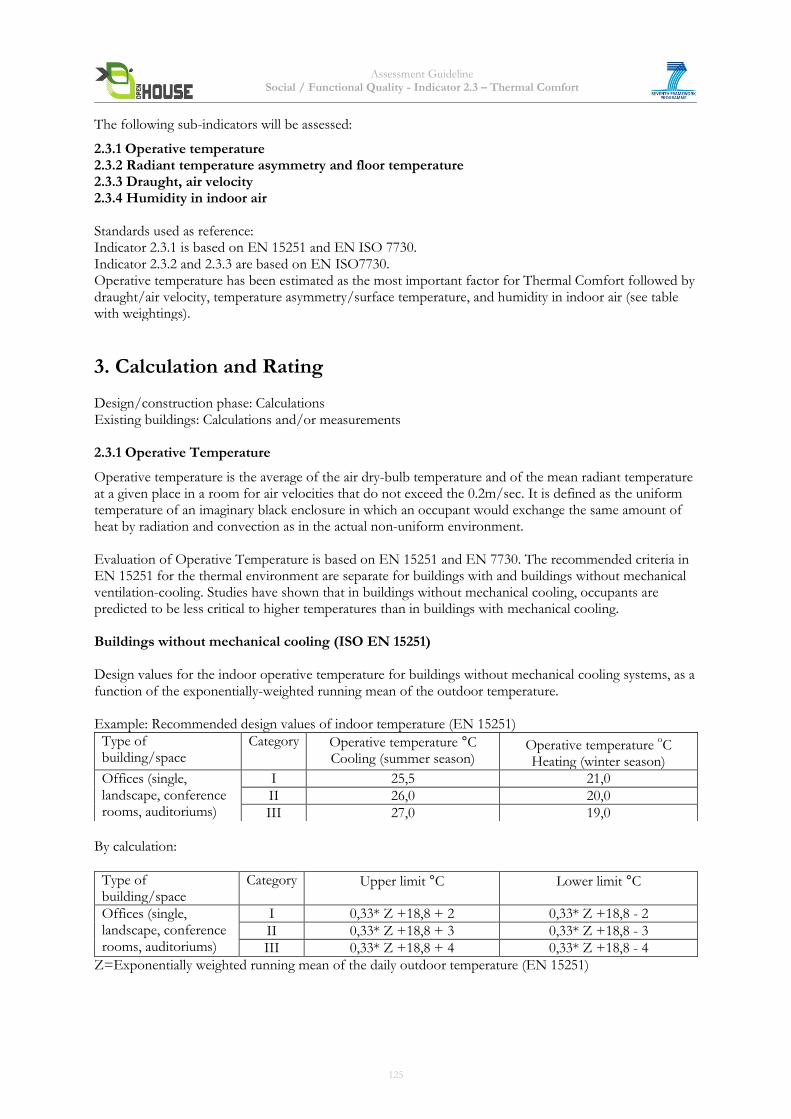
Assessment Guideline Social / Functional Quality - Indicator 2.3 – Thermal Comfort
The following sub-indicators will be assessed:
2.3.1 Operative temperature 2.3.2 Radiant temperature asymmetry and floor temperature 2.3.3 Draught, air velocity 2.3.4 Humidity in indoor air Standards used as reference: Indicator 2.3.1 is based on EN 15251 and EN ISO 7730. Indicator 2.3.2 and 2.3.3 are based on EN ISO7730. Operative temperature has been estimated as the most important factor for Thermal Comfort followed by draught/air velocity, temperature asymmetry/surface temperature, and humidity in indoor air (see table with weightings).
3. Calculation and Rating Design/construction phase: Calculations Existing buildings: Calculations and/or measurements 2.3.1 Operative Temperature
Operative temperature is the average of the air dry-bulb temperature and of the mean radiant temperature at a given place in a room for air velocities that do not exceed the 0.2m/sec. It is defined as the uniform temperature of an imaginary black enclosure in which an occupant would exchange the same amount of heat by radiation and convection as in the actual non-uniform environment. Evaluation of Operative Temperature is based on EN 15251 and EN 7730. The recommended criteria in EN 15251 for the thermal environment are separate for buildings with and buildings without mechanical ventilation-cooling. Studies have shown that in buildings without mechanical cooling, occupants are predicted to be less critical to higher temperatures than in buildings with mechanical cooling. Buildings without mechanical cooling (ISO EN 15251) Design values for the indoor operative temperature for buildings without mechanical cooling systems, as a function of the exponentially-weighted running mean of the outdoor temperature. Example: Recommended design values of indoor temperature (EN 15251)
Type of building/space
Category Operative temperature °C Cooling (summer season)
Operative temperature oC
Heating (winter season)
Offices (single, landscape, conference rooms, auditoriums)
I 25,5 21,0
II 26,0 20,0
III 27,0 19,0
By calculation:
Type of building/space
Category Upper limit °C Lower limit °C
Offices (single, landscape, conference rooms, auditoriums)
I 0,33* Z +18,8 + 2 0,33* Z +18,8 - 2
II 0,33* Z +18,8 + 3 0,33* Z +18,8 - 3
III 0,33* Z +18,8 + 4 0,33* Z +18,8 - 4
Z=Exponentially weighted running mean of the daily outdoor temperature (EN 15251)
125
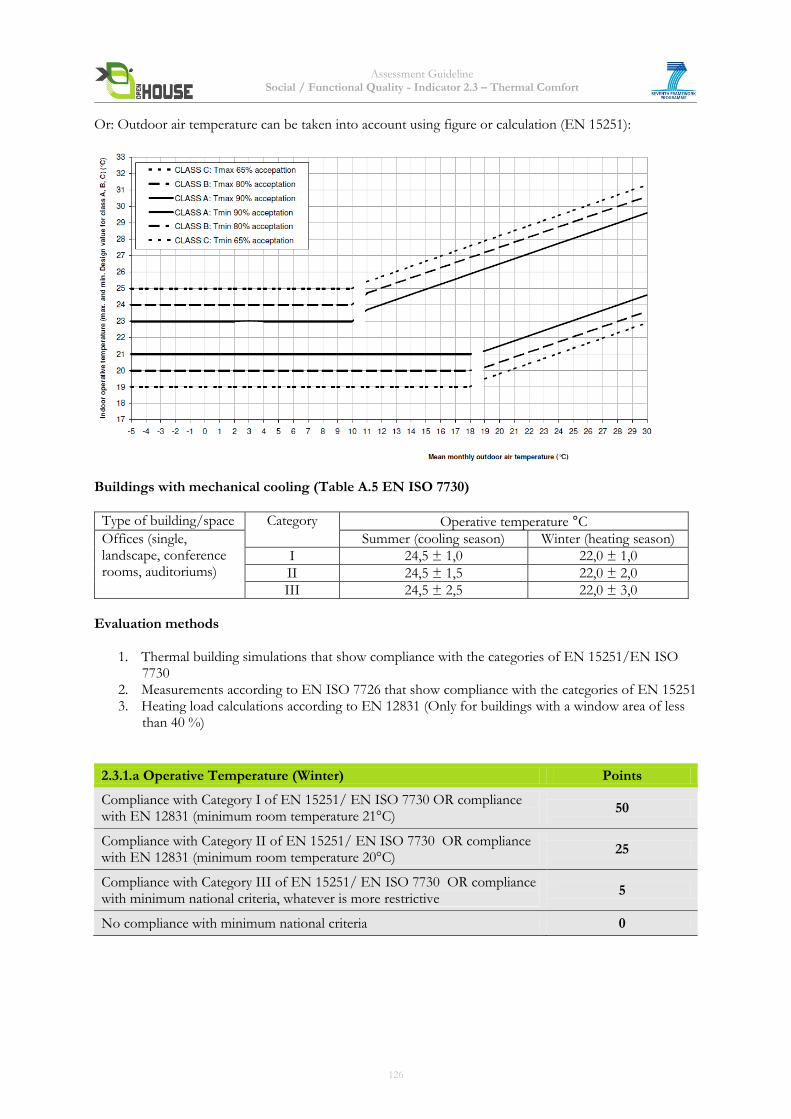
Assessment Guideline Social / Functional Quality - Indicator 2.3 – Thermal Comfort
Or: Outdoor air temperature can be taken into account using figure or calculation (EN 15251):
Buildings with mechanical cooling (Table A.5 EN ISO 7730)
Type of building/space Category Operative temperature °C
Offices (single, landscape, conference rooms, auditoriums)
Summer (cooling season) Winter (heating season)
I 24,5 ± 1,0 22,0 ± 1,0
II 24,5 ± 1,5 22,0 ± 2,0
III 24,5 ± 2,5 22,0 ± 3,0
Evaluation methods
1. Thermal building simulations that show compliance with the categories of EN 15251/EN ISO 7730
2. Measurements according to EN ISO 7726 that show compliance with the categories of EN 15251 3. Heating load calculations according to EN 12831 (Only for buildings with a window area of less
than 40 %)
2.3.1.a Operative Temperature (Winter) Points
Compliance with Category I of EN 15251/ EN ISO 7730 OR compliance with EN 12831 (minimum room temperature 21°C)
50
Compliance with Category II of EN 15251/ EN ISO 7730 OR compliance with EN 12831 (minimum room temperature 20°C)
25
Compliance with Category III of EN 15251/ EN ISO 7730 OR compliance with minimum national criteria, whatever is more restrictive
5
No compliance with minimum national criteria 0
126
Assessment Guideline Social / Functional Quality - Indicator 2.3 – Thermal Comfort
2.3.1.b Operative Temperature (Summer) Points
Compliance with Category I of EN 15251/ EN ISO 7730 AND Compliance with national standards to avoid summerly overheating
50
Compliance with Category III of EN 15251/ EN ISO 7730 AND compliance with national standards to avoid summerly overheating
25
Compliance with Category III of EN 15251/ EN ISO 7730 AND compliance with national standards to avoid summerly overheating
15
Compliance with national standards to avoid summerly overheating 10
No compliance with minimum national criteria 0
2.3.2a Radiant temperature asymmetry
Radiant asymmetry can cause thermal discomfort and people are most sensitive to asymmetry caused by warm ceiling or cool walls (windows).
ISO EN 7730:2005 paragraph A3, Table A4: Radiant temperature asymmetry
Category Radiant temperature asymmetry °C
Warm ceiling Cool wall Cool ceiling Warm wall
A < 5 < 10 < 14 < 23
B < 5 < 10 < 14 < 23
C < 7 < 13 < 18 < 35
2.3.2.b Floor temperature
ISO EN 7730:2005 paragraph A3, Table A3: Range of floor surface temperature
Category Range of floor surface temperature °C
A 19 to 29
B 19 to 29
C 17 to 31
2.3.2 Radiant temperature asymmetry and floor temperature Points
Values are compliant (EN 7730) Category A,B 100
Values are compliant (EN 7730) Category C 50
Values are not compliant (EN 7730) 0
127
Assessment Guideline Social / Functional Quality - Indicator 2.3 – Thermal Comfort
2.3.3 Draught, air velocity Air drafts on part of the body affect the thermal comfort of the occupant. The air velocity has thus to be limited. The method of EN ISO 7730 paragraph A.4 Table A5 can be used to determine the maximum mean air velocity. It is valid within temperature range of 20 to 26°C and a turbulence intensity of approximately 40%. If turbulence intensity is not known, these values can still be used in first approximation. ISO EN 7730:2005 paragraph A4, Table A5: maximum mean air velocity
Category Maximum mean air velocity m/s
Summer (cooling season)
Winter (heating season)
I 0,12 0,10
II 0,19 0,16
III 0,24 0,21
All buildings without HVAC (Heating, Ventilating and Air Conditioning) systems are considered compliant.
2.3.3 Draught, air velocity Points
Compliant with Category I, II EN ISO 7730, paragraph A4, Table A5 100
Compliant with Category III EN ISO 7730, paragraph A4, Table A5 50
Non-compliant with Category I, II, III EN ISO 7730, paragraph A4, Table A5 0
2.3.4 Humidity in indoor air The upper limit for absolute humidity (perceived humidity) of 12 g of water per kg of dry air should not be exceeded (based on EN 15251, appendix B3).
2.3.4 Humidity in indoor air Points
Absolute humidity of 12 g of water per kg of dry air compliant 100
Absolute humidity of 12 g of water per kg of dry air non-compliant 0
Weights of sub-indicators
Indicator 2.3 Weights
Sub-indicator 2.3.1 Operative temperature 4
Sub-indicator 2.3.2 Radiant temperature asymmetry and floor temperature 1
Sub-indicator 2.3.3 Draught, air velocity 2
Sub-indicator 2.3.4 Humidity in indoor air 1
128
Assessment Guideline Social / Functional Quality - Indicator 2.3 – Thermal Comfort
4. Documentation Guidelines The following documents will be needed to assess the building: Quick & Basic Assessment Letter of commitment or easily and quickly accessible documentation for the required evidence (see Complete Assessment), e.g. reasonable estimations for intended/expected values. Complete Assessment Before Construction Stage: 2.3.1 Operative temperature Depending on the method chosen: 1. Thermal building simulations that show compliance with the categories of EN 15251/EN ISO 7730 3. Heating load calculations according to EN 12831 (for buildings with a window area of less than 40 %) 2.3.2 Radiant temperature asymmetry and floor temperature Winter and Summer design temperatures of building components 2.3.3 Draught, air velocity Technical specifications of the air-outlets Evidence of the compliance with EN ISO 7730 2.3.4 Humidity in indoor air Description of HVAC system For Post Construction Stage (Measuring, Assessment): 2.3.1 Operative temperature Depending on the method chosen: 1. Thermal building simulations that show compliance with the categories of EN 15251/EN ISO 7730 2. Measurements according to EN ISO 7726 that show compliance with the categories of EN 15251 3. Heating load calculations according to EN 12831 (for buildings with a window area of less than 40 %) 2.3.2 Radiant temperature asymmetry and floor temperature Winter and Summer design temperatures of building components Assessment of the maximum and minimum surface temperatures of building components with a large surface area:
- Ceiling - Glazed facade/wall surfaces, if glazed surfaces comprise more than 40 % of the interior façade or
wall surface area, - Floor
2.3.3 Draught, air velocity Technical specifications of the air-outlets Evidence of the compliance with EN ISO 7730 2.3.4 Humidity in indoor air Description of HVAC system
5. Relation to other Indicators Indicator 2.4: Indoor Air Quality Indicator 2.8: Operation Comfort Indicator 5.3: Optimization and Complexity of the Approach to Planning
129
Assessment Guideline Social / Functional Quality - Indicator 2.3 – Thermal Comfort
6. Resources 1. Germany
DIN EN 15251 – 2007: Eingangsparameter für das Raumklima zur Auslegung und Bewertung der Energieeffizienz von Gebäuden - Raumluftqualität, Temperatur, Licht und Akustik
VDI 3804 Air-conditioning - Office buildings (VDI ventilation code of practice), 2009-03
Arbeitsstätten-Richtlinie ASR 6 Raumtemperatur, Mai 2001
2. Europe
EN 15251 - Indoor environmental input parameters for design and assessment of energy performance of buildings addressing indoor air quality, thermal environment, lighting and acoustics
EN 12831:2003 - Heating systems in buildings – Method for calculation of the design heat load
ISO 7726 / 1998: Ergonomics of the thermal environment -- Instruments for measuring physical quantities
ISO 7730 /2005 Ergonomics of the thermal environment -- Analytical determination and interpretation of thermal comfort using calculation of the PMV and PPD indices and local thermal comfort criteria
ISO 15099:2003 Thermal performance of windows, doors and shading devices -- Detailed calculations
3. USA
ASHRAE Standard 62.1-2007: Ventilation for Acceptable Indoor Air Quality
ASHRAE Standard 55-2004: Thermal Environmental Conditions for Human Occupancy
Chartered Institute of Building Services Engineers (CIBSE) Applications Manual 10-2005
Center for the Built Environment (www.cbe.berkeley.edu)
Article: “Do Green Buildings Enhance the Well Being of Workers? Yes.” July/August 2000 issue of EBN Magazine. The author, Judith Heerwagen, is an Environmental Psychologist whose research and writing have focused on workplace ecology.
Other relevant literature regarding Thermal Comfort
4. Fergus Nicol, Michael Humphreys, Oliver Sykes, Susan Roaf (1995): “Standards for Thermal Comfort: Indoor Air Temperature Standards for the 21st Century.”
5. Fanger, P. O. (1970). Thermal Comfort. Copenhagen: Danish Technical Press.
6. Nancy B. Solomon: “The Comfort Zone.” Article published in the March/April 2011 issue of GreenSource.
7. Laurent Grignon-Massé, Jérôme Adnot, and Philippe Rivière (2008): Towards Adaptive PMV/PPD Indices for European Climates… Ecole des Mines de Paris, 2008 ACEEE Summer Study on Energy Efficiency in Buildings (http://eec.ucdavis.edu/ACEEE/2008/data/papers/7_693.pdf)
8. Giving Occupants What They Want: Guidelines for Implementing Personal Environmental Control in Your Building Paper by Fred S. Bauman, P.E.; Center for the Built Environment; University of California, Berkeley, CA 94720-1839; Presented at World Workplace 99, October 3-5, 1999, Los Angeles, CA
9. Olesen Bjarne. The philosophy behind EN15251: Indoor environmental criteria for design and calculation of energy performance of buildings. Energy and Buildings Volume 39, Issue 7, July 2007, Pages 740-749
10. Dear de R., Schiller Brager, G. The adaptive model of thermal comfort and energy conservation in the built environment. Int J Biometeorol (2001) 45:100-108
7. Attachments None
130
Assessment Guideline Social / Functional Quality - Indicator 2.4 – Indoor Air Quality
Indicator 2.4 Indoor Air Quality (adapted from EN 15251) Core Indicator
1. Objective Indoor air quality (IAQ) is one of the factor that determine building functionality and economics. IAQ affects building occupants and their ability to conduct their activities, creates positive or negative impressions on citizens, customers, clients and other visitors to the building. When IAQ is good, buildings are more desirable places to live, work, to learn, to conduct business and to rent. IAQ directly affects occupant health, comfort and productivity. The goal is to assure the indoor air quality and to avoid negative impacts on the user´s state of health.
The building is low polluting if the majority of the materials are low polluting. Low polluting materials are
known to be safe with respect to emissions which fulfill the following requirements:
Emission of TVOC (Total Volatile Organic Compound) is below 0,2 mg/m2h
Emission of formaldehyde is below 0,05 mg/m2h
Emission of VOC (Volatile Organic Compound) is below national standard
Emission of carcinogenic compounds IARC (International Agency for Research on Cancer) is
below 0,002 mg/m2h
Material is not odorous (dissatisfaction with the odor is below 15%)
This indicator supports the objective of the European Commission to ensure that enclosed workplaces are
provided with sufficient clean and fresh air1.
2. Assessment Methodology The quality of indoor air climate is affected equally by heating, ventilation and air conditioning equipment, construction engineering, quality of construction work, building materials as well as the operation and maintenance of the building. Good indoor climate requires taking these aspects into consideration during all stages of building life; design, construction and use. Some of the problems may originate from building themselves, some caused by actions of the occupants or operation, some by maintenance. Because of the these multiple origins of the air quality impacts it is important to specify the performance of the building and construction process so that the building industry can prove through accepted procedures that the building meet the agreed performance criteria for health and unnecessary claims are avoided. The following sub-indicators will be assessed: 2.4.1 Occupancy-based ventilation rates 2.4.2 Indoor air contamination with the most relevant indoor air pollutants [existing buildings] 2.4.3 CO2 concentration above outdoor level [existing buildings] 2.4.4 Subjective reaction as classification of the indoor air quality [existing buildings] 2.4.5 Occurrence of Radon [existing buildings]
1 DIRECTIVE 89/654/EC
131
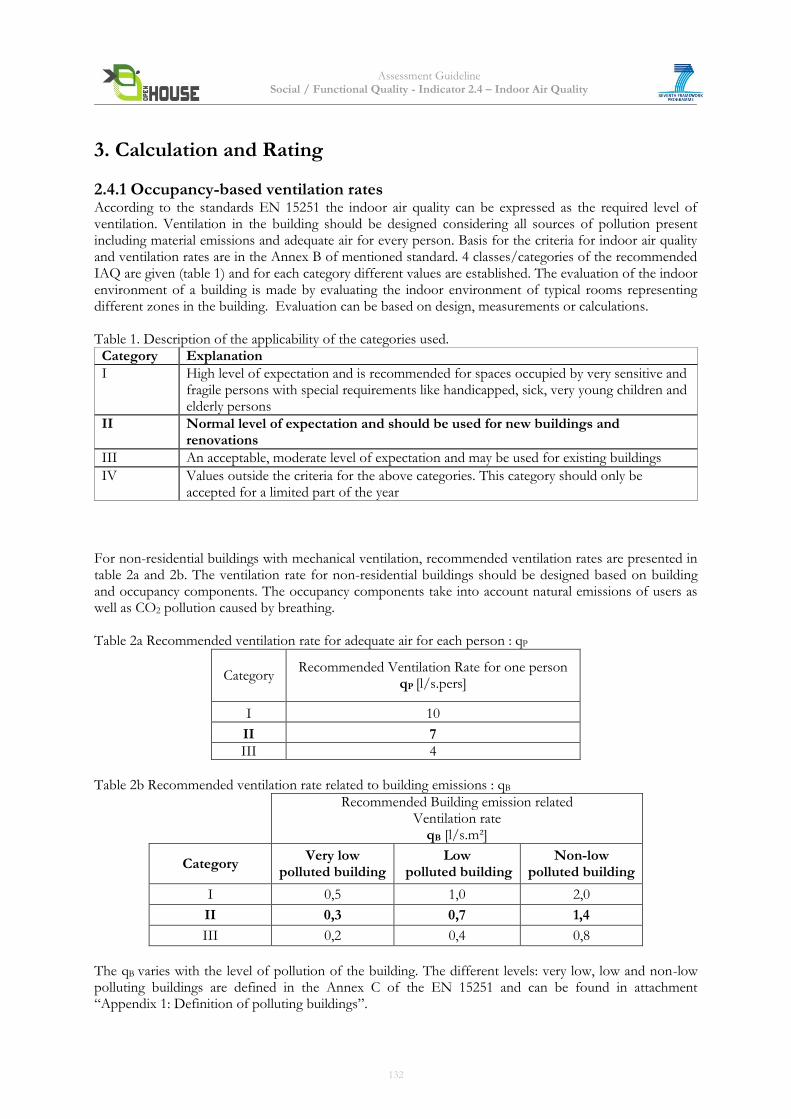
Assessment Guideline Social / Functional Quality - Indicator 2.4 – Indoor Air Quality
3. Calculation and Rating
2.4.1 Occupancy-based ventilation rates According to the standards EN 15251 the indoor air quality can be expressed as the required level of ventilation. Ventilation in the building should be designed considering all sources of pollution present including material emissions and adequate air for every person. Basis for the criteria for indoor air quality and ventilation rates are in the Annex B of mentioned standard. 4 classes/categories of the recommended IAQ are given (table 1) and for each category different values are established. The evaluation of the indoor environment of a building is made by evaluating the indoor environment of typical rooms representing different zones in the building. Evaluation can be based on design, measurements or calculations. Table 1. Description of the applicability of the categories used.
Category Explanation
I High level of expectation and is recommended for spaces occupied by very sensitive and fragile persons with special requirements like handicapped, sick, very young children and elderly persons
II Normal level of expectation and should be used for new buildings and renovations
III An acceptable, moderate level of expectation and may be used for existing buildings
IV Values outside the criteria for the above categories. This category should only be accepted for a limited part of the year
For non-residential buildings with mechanical ventilation, recommended ventilation rates are presented in table 2a and 2b. The ventilation rate for non-residential buildings should be designed based on building and occupancy components. The occupancy components take into account natural emissions of users as well as CO2 pollution caused by breathing.
Table 2a Recommended ventilation rate for adequate air for each person : qP
Category Recommended Ventilation Rate for one person
qP [l/s.pers]
I 10
II 7
III 4
Table 2b Recommended ventilation rate related to building emissions : qB
Recommended Building emission related Ventilation rate
qB [l/s.m²]
Category Very low
polluted building Low
polluted building Non-low
polluted building
I 0,5 1,0 2,0
II 0,3 0,7 1,4
III 0,2 0,4 0,8
The qB varies with the level of pollution of the building. The different levels: very low, low and non-low polluting buildings are defined in the Annex C of the EN 15251 and can be found in attachment “Appendix 1: Definition of polluting buildings”.
132
Assessment Guideline Social / Functional Quality - Indicator 2.4 – Indoor Air Quality
Calculation qtot : total ventilation rate [l/s] qB : recommended ventilation rate for building emissions [l/s.m²]
1. The building level of pollution has to be determined: very low, low or non-low 2. For each room of area A [m²] and each category (I,II or III), calculate:
qcatI, = qtot – A*qBI, qcatII,= qtot – A*qBII qcatIII = qtot – A*qBIII
3. Compare with the recommended ventilation rate for adequate air for each person qP for the corresponding category:
If qcatI,pers> qPI : Category I is achieved If qcatII,pers> qPII : Category II is achieved If qcatIII,pers> qPIII : Category III is achieved
2.4.1 Occupancy-based ventilation rates Points
Category I 100
Category II 75
Category III or national regulations 10
Category IV 0
2.4.2 Indoor air contamination with indoor air pollutants [existing buildings] The substances considered: formaldehyde, naphthalene, toluene, xylenes, styrene were selected from the other indoor air pollutions because of the existence of indoor sources, the availability of toxicological and epidemiological data and exposure levels causing health concerns (WHO 2006, 2010, INDEX, EnVIE, national rules). Problems of indoor air quality are recognized as important risk factors for human health in both low- and middle- and high-income countries. Indoor air is also important because people spend a substantial proportion of their time in buildings. Formaldehyde is classified by IARC as carcinogenic to humans (Group 1). The major exposure rout of formaldehyde is inhalation from indoor sources and indoor exposures are the dominant contributor to personal exposures through inhalation and indoor concentrations may be high enough to cause adverse health effects. The principal health concerns of exposure to naphthalene are respiratory tract lesions, including tumours in the upper respiratory tract demonstrated in animal studies sand hemolytic anemia in humans. Toluene has been used as a solvent in a variety of household products and is almost always present in indoor air in detectable concentrations. Toluene should not be inhaled due to its health effects. Low to moderate levels can cause tiredness, confusion, weakness, drunken-type actions, memory loss, nausea, loss of appetite, and hearing and color vision loss. Xylenes exhibit neurological effects. High levels from exposure for acute or chronic periods can cause headaches, and others illness. Exposure of people to high levels of xylenes for short periods can also cause irritation of the skin, eyes, nose, and throat, difficulty in breathing and other problems with the lungs, delayed reaction time, memory difficulties and stomach discomfort. The International Agency for Research on Cancer considers styrene to be "possibly carcinogenic to humans. Chronic exposure to styrene leads to tiredness/ lethargy memory deficits, headaches. Nowadays, building material including xylene, naphthalene, styrene and toluene are rare. However, even a very limited amount of building material with such contents can affect the indoor air quality.
133
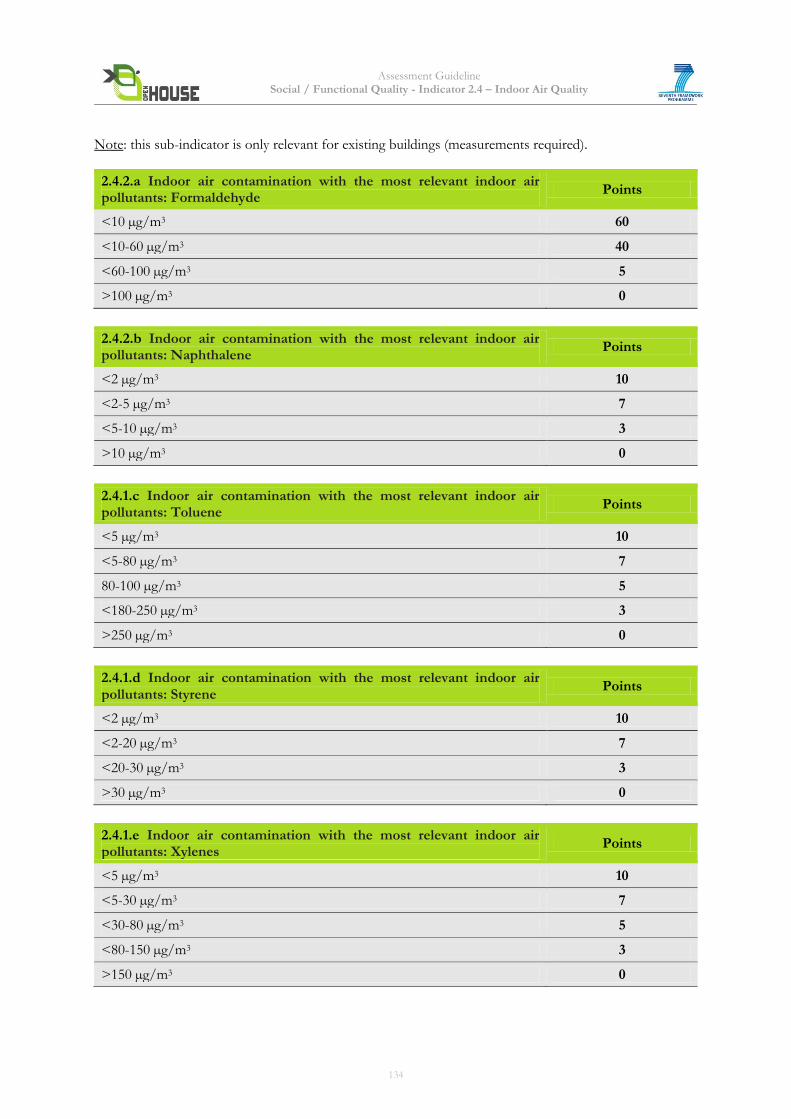
Assessment Guideline Social / Functional Quality - Indicator 2.4 – Indoor Air Quality
Note: this sub-indicator is only relevant for existing buildings (measurements required).
2.4.2.a Indoor air contamination with the most relevant indoor air pollutants: Formaldehyde
Points
<10 µg/m3 60
<10-60 µg/m3 40
<60-100 µg/m3 5
>100 µg/m3 0
2.4.2.b Indoor air contamination with the most relevant indoor air pollutants: Naphthalene
Points
<2 µg/m3 10
<2-5 µg/m3 7
<5-10 µg/m3 3
>10 µg/m3 0
2.4.1.c Indoor air contamination with the most relevant indoor air pollutants: Toluene
Points
<5 µg/m3 10
<5-80 µg/m3 7
80-100 µg/m3 5
<180-250 µg/m3 3
>250 µg/m3 0
2.4.1.d Indoor air contamination with the most relevant indoor air pollutants: Styrene
Points
<2 µg/m3 10
<2-20 µg/m3 7
<20-30 µg/m3 3
>30 µg/m3 0
2.4.1.e Indoor air contamination with the most relevant indoor air pollutants: Xylenes
Points
<5 µg/m3 10
<5-30 µg/m3 7
<30-80 µg/m3 5
<80-150 µg/m3 3
>150 µg/m3 0
134
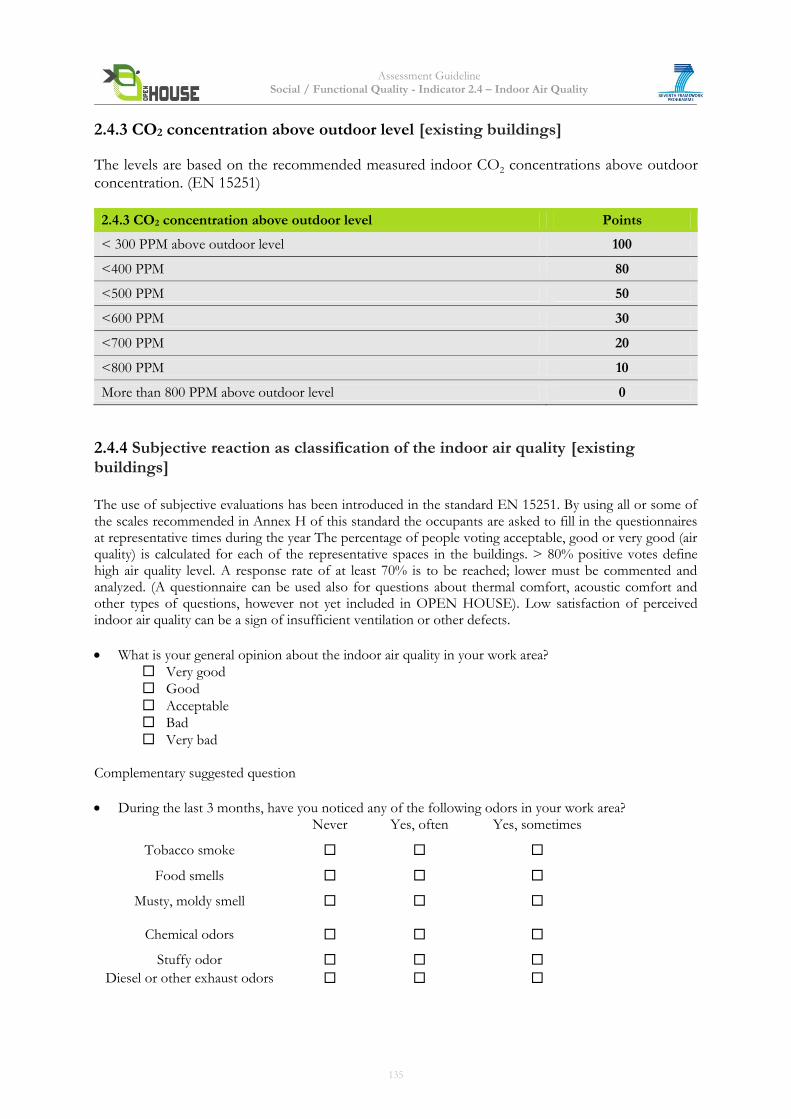
Assessment Guideline Social / Functional Quality - Indicator 2.4 – Indoor Air Quality
2.4.3 CO2 concentration above outdoor level [existing buildings]
The levels are based on the recommended measured indoor CO2 concentrations above outdoor concentration. (EN 15251)
2.4.3 CO2 concentration above outdoor level Points
< 300 PPM above outdoor level 100
<400 PPM 80
<500 PPM 50
<600 PPM 30
<700 PPM 20
<800 PPM 10
More than 800 PPM above outdoor level 0
2.4.4 Subjective reaction as classification of the indoor air quality [existing buildings] The use of subjective evaluations has been introduced in the standard EN 15251. By using all or some of the scales recommended in Annex H of this standard the occupants are asked to fill in the questionnaires at representative times during the year The percentage of people voting acceptable, good or very good (air quality) is calculated for each of the representative spaces in the buildings. > 80% positive votes define high air quality level. A response rate of at least 70% is to be reached; lower must be commented and analyzed. (A questionnaire can be used also for questions about thermal comfort, acoustic comfort and other types of questions, however not yet included in OPEN HOUSE). Low satisfaction of perceived indoor air quality can be a sign of insufficient ventilation or other defects.
What is your general opinion about the indoor air quality in your work area?
Very good
Good
Acceptable
Bad
Very bad Complementary suggested question
During the last 3 months, have you noticed any of the following odors in your work area? Never Yes, often Yes, sometimes
Tobacco smoke
Food smells
Musty, moldy smell
Chemical odors
Stuffy odor
Diesel or other exhaust odors
135
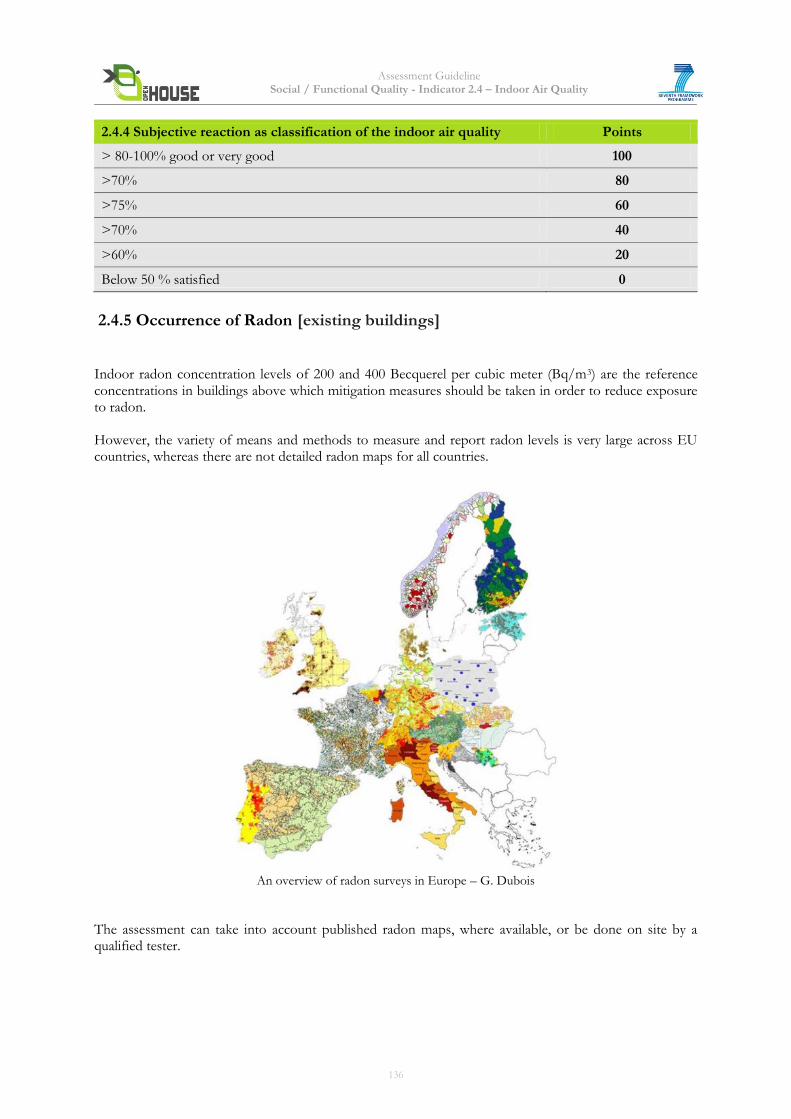
Assessment Guideline Social / Functional Quality - Indicator 2.4 – Indoor Air Quality
2.4.4 Subjective reaction as classification of the indoor air quality Points
> 80-100% good or very good 100
>70% 80
>75% 60
>70% 40
>60% 20
Below 50 % satisfied 0
2.4.5 Occurrence of Radon [existing buildings] Indoor radon concentration levels of 200 and 400 Becquerel per cubic meter (Bq/m3) are the reference concentrations in buildings above which mitigation measures should be taken in order to reduce exposure to radon. However, the variety of means and methods to measure and report radon levels is very large across EU countries, whereas there are not detailed radon maps for all countries.
An overview of radon surveys in Europe – G. Dubois
The assessment can take into account published radon maps, where available, or be done on site by a qualified tester.
136
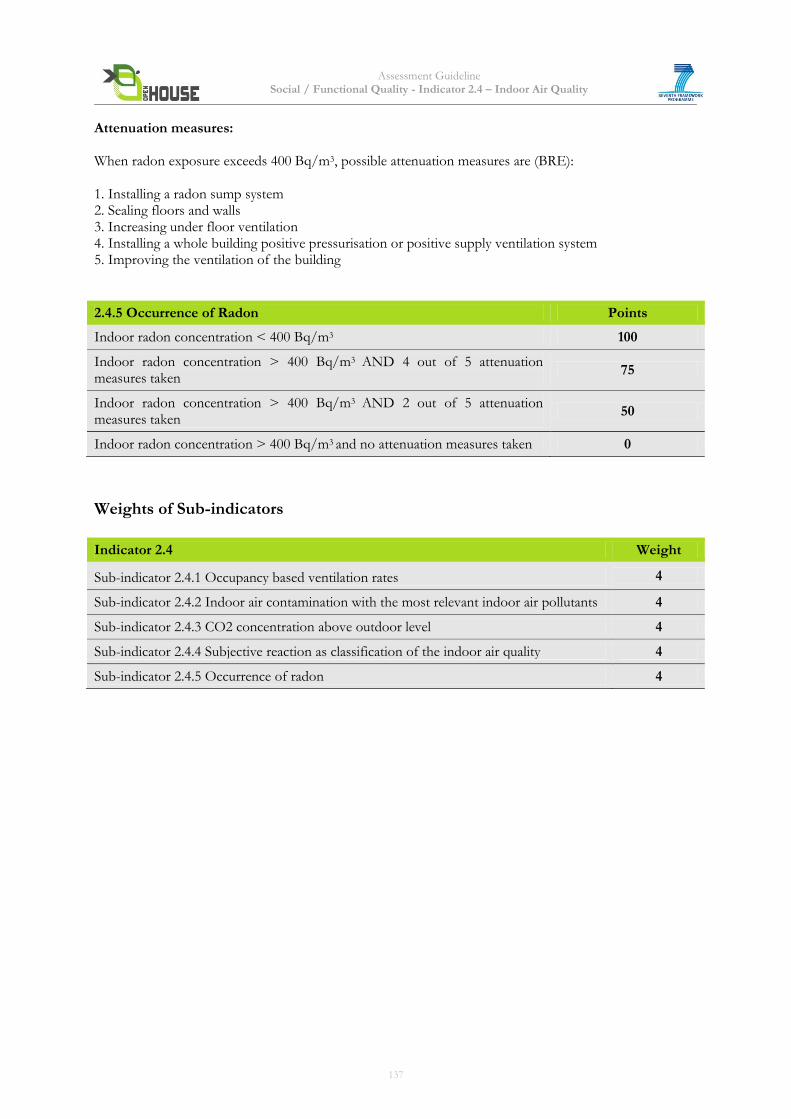
Assessment Guideline Social / Functional Quality - Indicator 2.4 – Indoor Air Quality
Attenuation measures: When radon exposure exceeds 400 Bq/m3, possible attenuation measures are (BRE): 1. Installing a radon sump system 2. Sealing floors and walls 3. Increasing under floor ventilation 4. Installing a whole building positive pressurisation or positive supply ventilation system 5. Improving the ventilation of the building
2.4.5 Occurrence of Radon Points
Indoor radon concentration < 400 Bq/m3 100
Indoor radon concentration > 400 Bq/m3 AND 4 out of 5 attenuation measures taken
75
Indoor radon concentration > 400 Bq/m3 AND 2 out of 5 attenuation measures taken
50
Indoor radon concentration > 400 Bq/m3 and no attenuation measures taken 0
Weights of Sub-indicators
Indicator 2.4 Weight
Sub-indicator 2.4.1 Occupancy based ventilation rates 4
Sub-indicator 2.4.2 Indoor air contamination with the most relevant indoor air pollutants 4
Sub-indicator 2.4.3 CO2 concentration above outdoor level 4
Sub-indicator 2.4.4 Subjective reaction as classification of the indoor air quality 4
Sub-indicator 2.4.5 Occurrence of radon 4
137
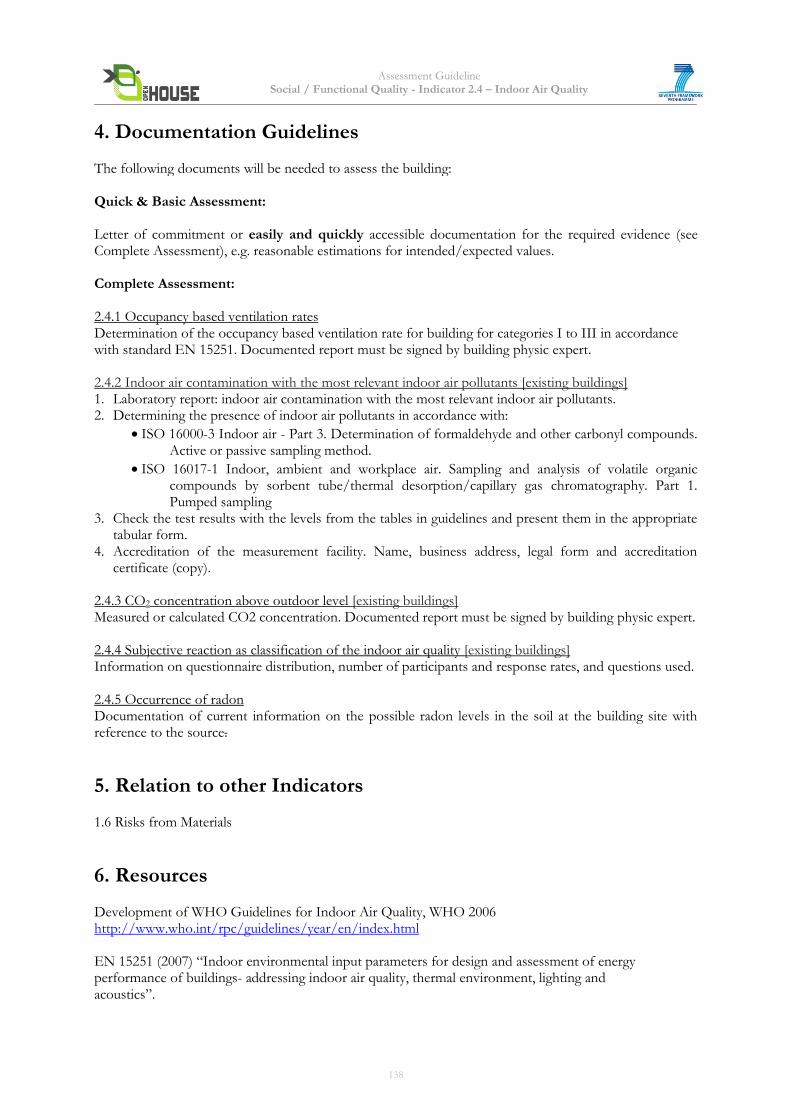
Assessment Guideline Social / Functional Quality - Indicator 2.4 – Indoor Air Quality
4. Documentation Guidelines The following documents will be needed to assess the building: Quick & Basic Assessment: Letter of commitment or easily and quickly accessible documentation for the required evidence (see Complete Assessment), e.g. reasonable estimations for intended/expected values. Complete Assessment: 2.4.1 Occupancy based ventilation rates Determination of the occupancy based ventilation rate for building for categories I to III in accordance with standard EN 15251. Documented report must be signed by building physic expert. 2.4.2 Indoor air contamination with the most relevant indoor air pollutants [existing buildings] 1. Laboratory report: indoor air contamination with the most relevant indoor air pollutants. 2. Determining the presence of indoor air pollutants in accordance with:
ISO 16000-3 Indoor air - Part 3. Determination of formaldehyde and other carbonyl compounds. Active or passive sampling method.
ISO 16017-1 Indoor, ambient and workplace air. Sampling and analysis of volatile organic compounds by sorbent tube/thermal desorption/capillary gas chromatography. Part 1. Pumped sampling
3. Check the test results with the levels from the tables in guidelines and present them in the appropriate tabular form.
4. Accreditation of the measurement facility. Name, business address, legal form and accreditation certificate (copy).
2.4.3 CO2 concentration above outdoor level [existing buildings] Measured or calculated CO2 concentration. Documented report must be signed by building physic expert. 2.4.4 Subjective reaction as classification of the indoor air quality [existing buildings] Information on questionnaire distribution, number of participants and response rates, and questions used. 2.4.5 Occurrence of radon Documentation of current information on the possible radon levels in the soil at the building site with reference to the source.
5. Relation to other Indicators 1.6 Risks from Materials
6. Resources Development of WHO Guidelines for Indoor Air Quality, WHO 2006 http://www.who.int/rpc/guidelines/year/en/index.html EN 15251 (2007) “Indoor environmental input parameters for design and assessment of energy performance of buildings- addressing indoor air quality, thermal environment, lighting and acoustics”.
138

Assessment Guideline Social / Functional Quality - Indicator 2.4 – Indoor Air Quality
EnVIE Co-ordination Action on Indoor Air Quality and Health Effects. www.envie-iaq.eu (Critical Appraisal of the Setting and Implementation of Indoor Exposure Limits in the EU) Summary on recommendations and management options, EC JRC, 2004, http://ec.europa.eu/health/ph_projects/2002/pollution/fp_pollution_2002_exs_02.pdf INDEX (2004) INDEX project (Critical Appraisal of the Setting and Implementation of Indoor Exposure Limits in the EU)Scope of INDEX was to identify priorities and to assess the needs for a Community strategy and action plan in the area of indoor air pollution. http://ec.europa.eu/health/ph_projects/2002/pollution/fp_pollution_2002_exs_02.pdf ISO 16000: http://www.iso.org/iso/iso_catalogue/catalogue_tc/catalogue_detail.htm?csnumber=29049 WHO guidelines for indoor air quality: selected pollutants, WHO 2010, http://www.who.int/rpc/guidelines/year/en/index.html An overview of radon surveys in Europe – G. Dubois. European Commission – DG Joint Research Centre, Institute for Environment and Sustainability. http://ec.europa.eu/dgs/jrc/index.cfm?id=1410&obj_id=5450&dt_code=NWS&lang=en
139
Assessment Guideline Social / Functional Quality - Indicator 2.4 – Indoor Air Quality
7. Attachments Appendix 1: Definition of polluting buildings These definitions are given in Annex C of EN 15251:2007.
Very Low polluting building The building is very low polluting if all of the materials are very low polluting and smoking has never occurred and is not allowed. Very low polluting materials are natural traditional materials, such as stone, glass and metals, which are known to be safe with respect to emissions, and materials which fulfill the following requirements: • The emission of total volatile organic compounds (TVOC) is below 0.1 mg/m²h. • The emission of formaldehyde is below 0.02 mg/m²h. • The emission of ammonia is below 0.01 mg/m²h. • The emission of carcinogenic compounds (IARC) is below 0.002 mg/m²h. • The material is not odorous (dissatisfaction with the odour is below 10 %).
Low polluting building The building is low polluting if the majority of the materials are low polluting. Low polluting materials are natural traditional materials, such as stone and glass, which are known to be safe with respect to emissions, and materials which fulfill the following requirements: • The emission of total volatile organic compounds (TVOC) is below 0.2 mg/m²h. • The emission of formaldehyde is below 0.05 mg/m²h. • The emission of ammonia is below 0.03 mg/m²h. • The emission of carcinogenic compounds (IARC) is below 0.005 mg/m²h. • The material is not odorous (dissatisfaction with the odour is below 15 %).
Non-low polluting building The building is non-low polluting if he exceeds the requirements for a low polluting building.
Appendix 2: More information about radon Radon is considered a significant contaminant that affects indoor air quality worldwide posing a serious health threat that can lead to lung cancer. Radon exposure in buildings may arise from certain subsurface rock formations and also from certain building materials (e.g. some granites); greatest risk of radon exposure arises from buildings that are extremely well insulated and hence offer least air exchange with the atmosphere. Relatively heavier than air, radon shows low concentrations outdoor (the mean annual concentration outdoor is on the order of 10Bq/m3), but tends to be trapped in the basements and the lower floors of buildings. Increased concentration in outdoor air therefore leads to higher concentration indoor, and measurements have to be carried out in order to prevent negative impacts on human health
140
Assessment Guideline
Social / Functional Quality - Indicator 2.5 – Water Quality
Indicator 2.5 Water Quality (adapted from Directive 98/83/EC)
1. Objective The objective of the evaluation of water quality in a building is: 1. to protect building users' health from the adverse effects of any contamination of water intended for
human consumption and produced by water systems installed in the building, by ensuring that it is
wholesome and clean.
2. to ensure a reliable water supply system
Water intended for building users' consumption shall mean:
(a) all water either in its original state or after treatment, intended for drinking, cooking, food preparation
or other domestic purposes, regardless of its origin and whether it is supplied from a distribution
network, from a tanker, or in bottles or containers;
(b) all water used in any food-production undertaking for the manufacture, processing, preservation or
marketing of products or substances intended for human consumption unless the competent national
authorities are satisfied that the quality of the water cannot affect the wholesomeness of the foodstuff
in its finished form.
Water systems installed in a building include domestic hot and cold water systems, evaporative condensers,
cooling towers, other systems containing water which are likely to exceed 20°C and which may release a
spray or aerosol during operation or when being maintained, for example: humidifiers and air washers, spa
baths and pods, car/bus washes, wet scrubbers, indoor fountains.
Member states´ national laws are required to comply with DIRECTIVE 98/83/EC. Below are
requirements for Member states.
Water intended for human consumption, according to the COUNCIL DIRECTIVE 98/83/EC, should be
wholesome and clean. The water is wholesome and clean if:
(a) it is free from any micro-organisms and parasites and from any substances which, in numbers
or concentrations, constitute a potential danger to human health, and
(b) it meets the minimum requirements set out in Annex I, Parts A and B of DIRECTIVE
98/83/EC, as regards to microbiological parameters, chemical parameters, indicator parameters
and radioactivity.
Municipal water supply is a water supply serving a community. Water quality must meet CD 98/83/EC.
Private water supply is not part of the municipal supply. Water quality must meet CD 98/83/EC.
Where alternative water supplies (eg borehole, rainwater use, grey re-use) are used a Water Safety Plan must
be established and operated.
This indicator supports the European Commission objective to ensure that water is available in sufficient
quantities, is of appropriate quality, is used sustainably and with minimum resource input, and is ultimately
returned to the environment with acceptable quality.1
1 European Commission: A resource-efficient Europe – Flagship initiative under the Europe 2020 Strategy
141
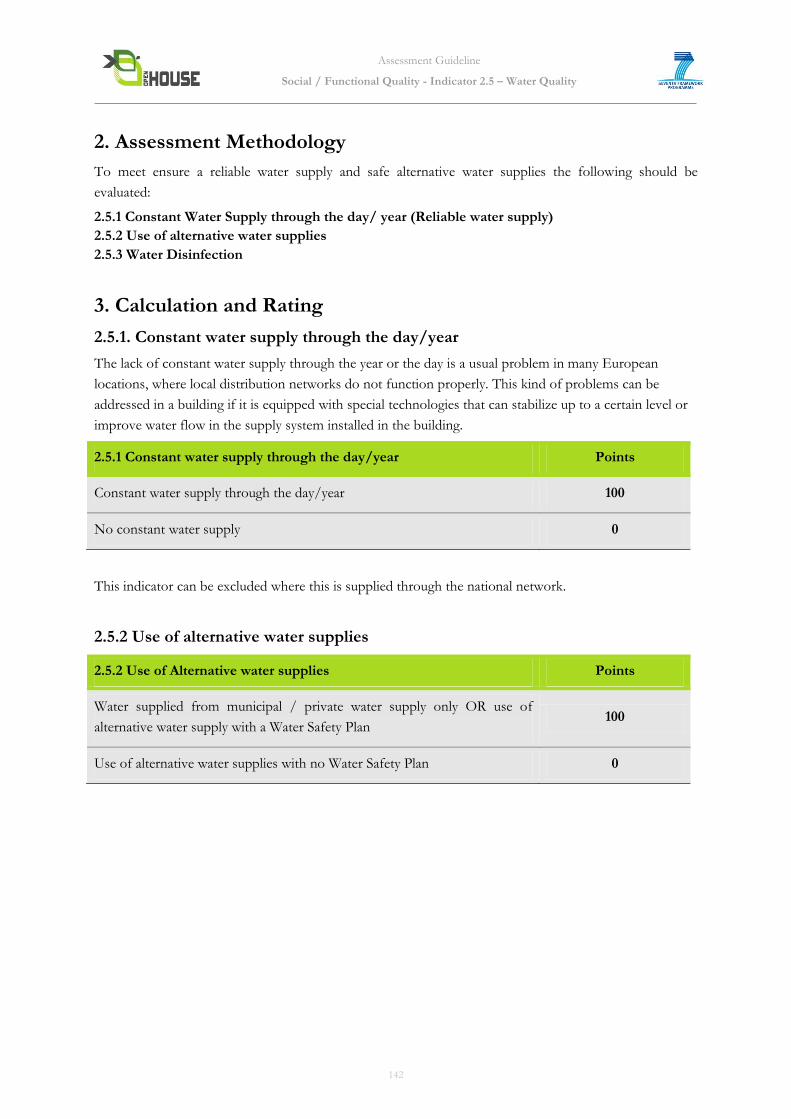
Assessment Guideline
Social / Functional Quality - Indicator 2.5 – Water Quality
2. Assessment Methodology
To meet ensure a reliable water supply and safe alternative water supplies the following should be
evaluated:
2.5.1 Constant Water Supply through the day/ year (Reliable water supply)
2.5.2 Use of alternative water supplies
2.5.3 Water Disinfection
3. Calculation and Rating
2.5.1. Constant water supply through the day/year
The lack of constant water supply through the year or the day is a usual problem in many European
locations, where local distribution networks do not function properly. This kind of problems can be
addressed in a building if it is equipped with special technologies that can stabilize up to a certain level or
improve water flow in the supply system installed in the building.
2.5.1 Constant water supply through the day/year Points
Constant water supply through the day/year 100
No constant water supply 0
This indicator can be excluded where this is supplied through the national network.
2.5.2 Use of alternative water supplies
2.5.2 Use of Alternative water supplies Points
Water supplied from municipal / private water supply only OR use of
alternative water supply with a Water Safety Plan 100
Use of alternative water supplies with no Water Safety Plan 0
142
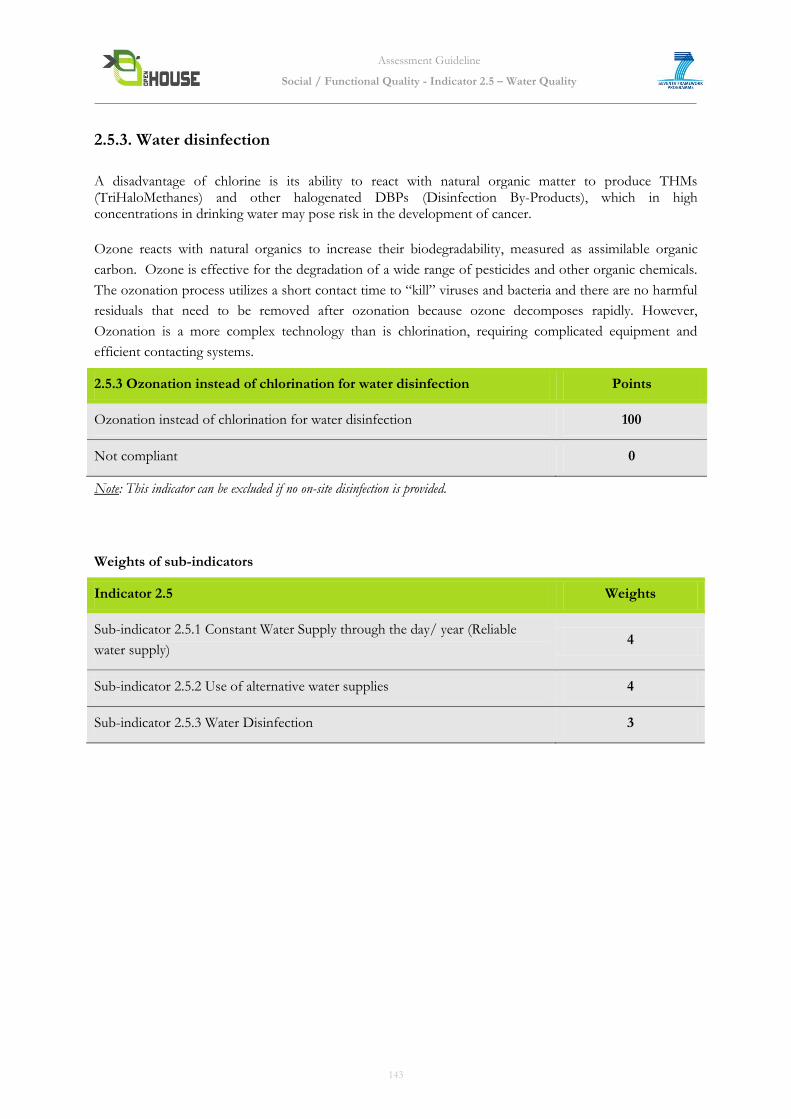
Assessment Guideline
Social / Functional Quality - Indicator 2.5 – Water Quality
2.5.3. Water disinfection
A disadvantage of chlorine is its ability to react with natural organic matter to produce THMs (TriHaloMethanes) and other halogenated DBPs (Disinfection By-Products), which in high concentrations in drinking water may pose risk in the development of cancer.
Ozone reacts with natural organics to increase their biodegradability, measured as assimilable organic
carbon. Ozone is effective for the degradation of a wide range of pesticides and other organic chemicals.
The ozonation process utilizes a short contact time to “kill” viruses and bacteria and there are no harmful
residuals that need to be removed after ozonation because ozone decomposes rapidly. However,
Ozonation is a more complex technology than is chlorination, requiring complicated equipment and
efficient contacting systems.
2.5.3 Ozonation instead of chlorination for water disinfection Points
Ozonation instead of chlorination for water disinfection 100
Not compliant 0
Note: This indicator can be excluded if no on-site disinfection is provided.
Weights of sub-indicators
Indicator 2.5 Weights
Sub-indicator 2.5.1 Constant Water Supply through the day/ year (Reliable
water supply) 4
Sub-indicator 2.5.2 Use of alternative water supplies 4
Sub-indicator 2.5.3 Water Disinfection 3
143
Assessment Guideline
Social / Functional Quality - Indicator 2.5 – Water Quality
4. Documentation Guidelines
The following documents will be needed to assess the building:
Quick & Basic Assessment
Letter of commitment or easily and quickly accessible documentation for the required evidence (see Complete Assessment), e.g. reasonable estimations for intended/expected values.
Complete Assessment
Sub-indicator 2.5.1 Constant Water Supply through the day/ year (Reliable water supply)
- The study report and drawings detailing the water supply system that will be implemented in the
building.
- Invoices proving the purchase of materials and technical equipment selected in the water system study
report.
Sub-indicator 2.5.2 Use of alternative water supplies
- Description of alternative water supply with a Water Safety Plan
Sub-indicator 2.5.3 Water Disinfection
- Documentation proofing the use of ozonation for water disinfection.
5. Relation to other Indicators
Indicator 1.11 “Water and Waste Water”
Indicator 1.12 “Contamination of undisturbed areas”
6. Resources
DIRECTIVE 98/83/EC:
http://europa.eu/legislation_summaries/environment/water_protection_management/l28079_en.htm
GUIDELINES FOR DRINKING-WATER QUALITY, World Health Organization, Geneva 2008
World Health Organisation: Water Safety Plan
http://www.who.int/water_sanitation_health/dwq/wsp0506/en/
7. Attachments None
144
Assessment Guideline Social / Functional Quality - Indicator 2.6 - Acoustic Comfort
Indicator 2.6 Acoustic Comfort (adapted from DGNB/BNB, BREEAM) Core Indicator
1. Objective The aim is to achieve a low level interference and background noise with speech intelligibility in all rooms to avoid affecting use, health and capability of the users. The lower the level of interference and background noises is, the less detraction and detriment to health and capability. High speech intelligibility in communication rooms and high absorbability of sound propagation to restrict the mutual interfering potential is of advantage. This supports the European Commission objective to protect workers from risks to their health and safety arising or likely to arise from exposure to noise and in particular the risk to hearing1.
2. Assessment Methodology For the evaluation of offices different acoustic input parameters are necessary:
2.6.1. Indoor ambient noise levels in unoccupied staff/office areas
2.6.2 Reverberation period Sound level and acoustics for the following rooms’ typologies should be evaluated:
Individual offices and multi-person offices with areas up to 40 m²
Multi-person offices with areas greater than 40 m²
Conference rooms
Cafeterias with areas greater than 50 m²
1 DIRECTIVE 2003/10/EC
145
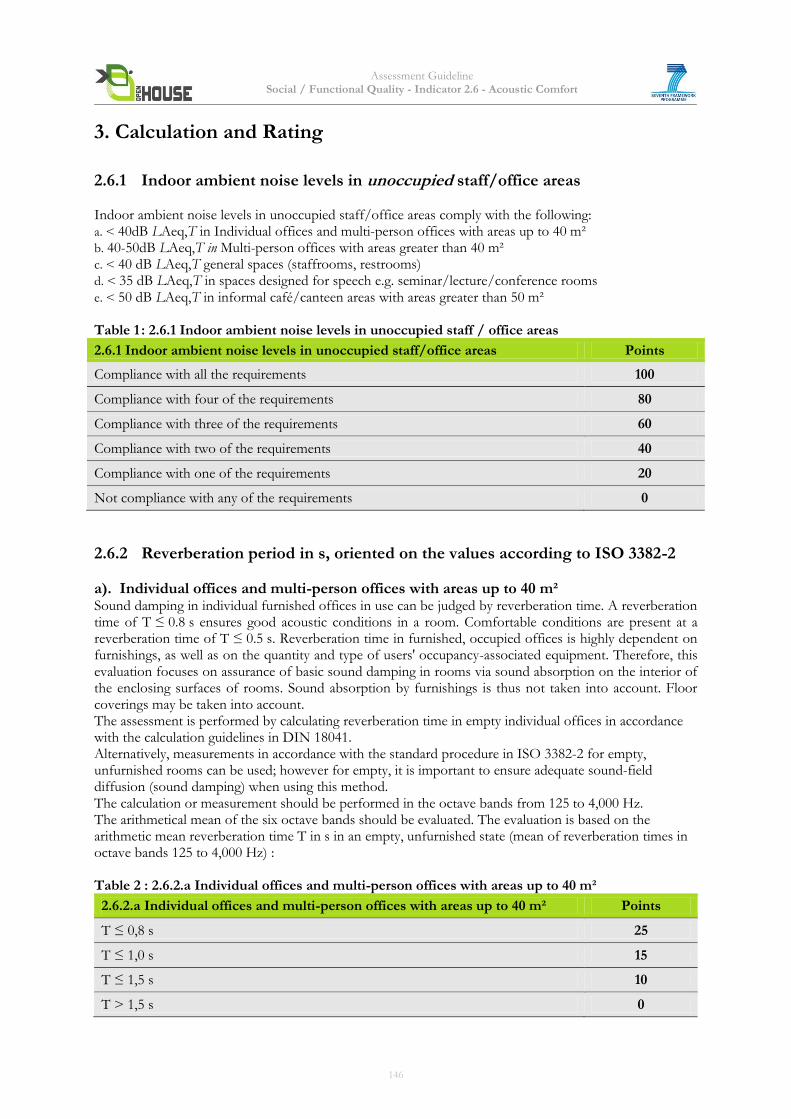
Assessment Guideline Social / Functional Quality - Indicator 2.6 - Acoustic Comfort
3. Calculation and Rating
2.6.1 Indoor ambient noise levels in unoccupied staff/office areas Indoor ambient noise levels in unoccupied staff/office areas comply with the following: a. < 40dB LAeq,T in Individual offices and multi-person offices with areas up to 40 m² b. 40-50dB LAeq,T in Multi-person offices with areas greater than 40 m² c. < 40 dB LAeq,T general spaces (staffrooms, restrooms) d. < 35 dB LAeq,T in spaces designed for speech e.g. seminar/lecture/conference rooms
e. < 50 dB LAeq,T in informal café/canteen areas with areas greater than 50 m² Table 1 : 2.6.1 Indoor ambient noise levels in unoccupied staff / office areas
2.6.1 Indoor ambient noise levels in unoccupied staff/office areas Points
Compliance with all the requirements 100
Compliance with four of the requirements 80
Compliance with three of the requirements 60
Compliance with two of the requirements 40
Compliance with one of the requirements 20
Not compliance with any of the requirements 0
2.6.2 Reverberation period in s, oriented on the values according to ISO 3382-2
a). Individual offices and multi-person offices with areas up to 40 m² Sound damping in individual furnished offices in use can be judged by reverberation time. A reverberation time of T ≤ 0.8 s ensures good acoustic conditions in a room. Comfortable conditions are present at a reverberation time of T ≤ 0.5 s. Reverberation time in furnished, occupied offices is highly dependent on furnishings, as well as on the quantity and type of users' occupancy-associated equipment. Therefore, this evaluation focuses on assurance of basic sound damping in rooms via sound absorption on the interior of the enclosing surfaces of rooms. Sound absorption by furnishings is thus not taken into account. Floor coverings may be taken into account. The assessment is performed by calculating reverberation time in empty individual offices in accordance with the calculation guidelines in DIN 18041. Alternatively, measurements in accordance with the standard procedure in ISO 3382-2 for empty, unfurnished rooms can be used; however for empty, it is important to ensure adequate sound-field diffusion (sound damping) when using this method. The calculation or measurement should be performed in the octave bands from 125 to 4,000 Hz. The arithmetical mean of the six octave bands should be evaluated. The evaluation is based on the arithmetic mean reverberation time T in s in an empty, unfurnished state (mean of reverberation times in octave bands 125 to 4,000 Hz) : Table 2 : 2.6.2.a Individual offices and multi-person offices with areas up to 40 m²
2.6.2.a Individual offices and multi-person offices with areas up to 40 m² Points
T ≤ 0,8 s 25
T ≤ 1,0 s 15
T ≤ 1,5 s 10
T > 1,5 s 0
146
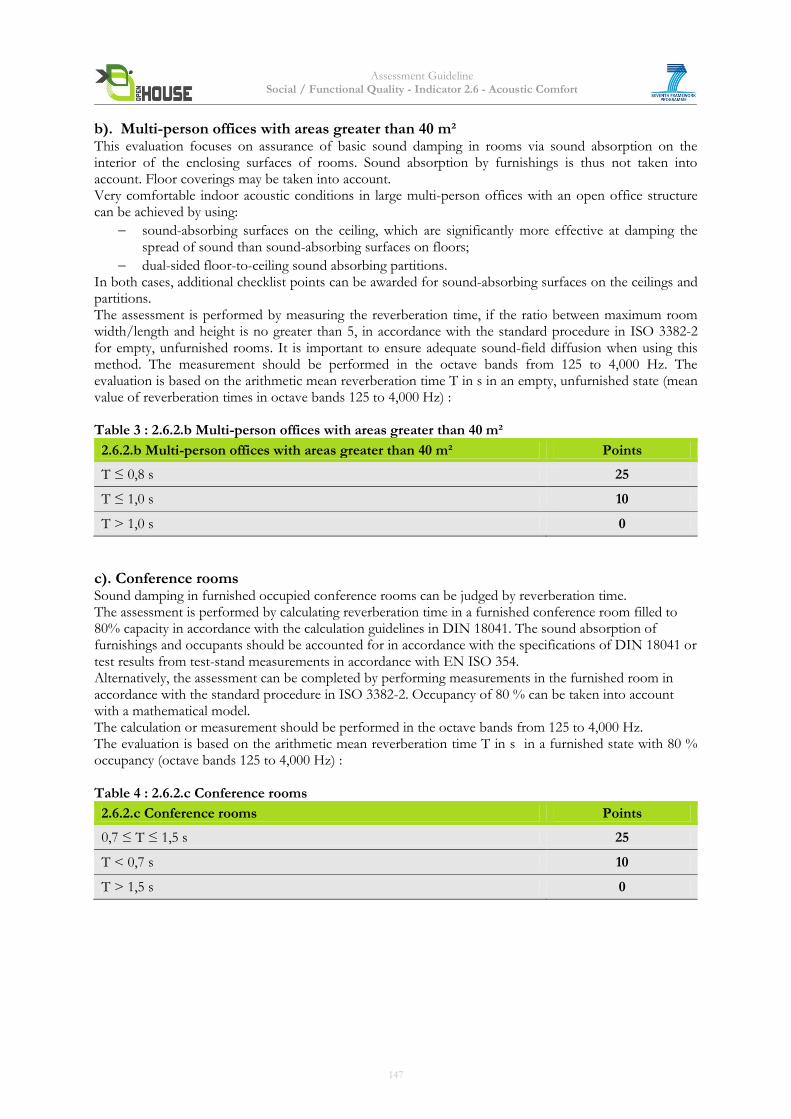
Assessment Guideline Social / Functional Quality - Indicator 2.6 - Acoustic Comfort
b). Multi-person offices with areas greater than 40 m² This evaluation focuses on assurance of basic sound damping in rooms via sound absorption on the interior of the enclosing surfaces of rooms. Sound absorption by furnishings is thus not taken into account. Floor coverings may be taken into account. Very comfortable indoor acoustic conditions in large multi-person offices with an open office structure can be achieved by using:
sound-absorbing surfaces on the ceiling, which are significantly more effective at damping the spread of sound than sound-absorbing surfaces on floors;
dual-sided floor-to-ceiling sound absorbing partitions. In both cases, additional checklist points can be awarded for sound-absorbing surfaces on the ceilings and partitions. The assessment is performed by measuring the reverberation time, if the ratio between maximum room width/length and height is no greater than 5, in accordance with the standard procedure in ISO 3382-2 for empty, unfurnished rooms. It is important to ensure adequate sound-field diffusion when using this method. The measurement should be performed in the octave bands from 125 to 4,000 Hz. The evaluation is based on the arithmetic mean reverberation time T in s in an empty, unfurnished state (mean value of reverberation times in octave bands 125 to 4,000 Hz) : Table 3 : 2.6.2.b Multi-person offices with areas greater than 40 m²
2.6.2.b Multi-person offices with areas greater than 40 m² Points
T ≤ 0,8 s 25
T ≤ 1,0 s 10
T > 1,0 s 0
c). Conference rooms Sound damping in furnished occupied conference rooms can be judged by reverberation time. The assessment is performed by calculating reverberation time in a furnished conference room filled to 80% capacity in accordance with the calculation guidelines in DIN 18041. The sound absorption of furnishings and occupants should be accounted for in accordance with the specifications of DIN 18041 or test results from test-stand measurements in accordance with EN ISO 354. Alternatively, the assessment can be completed by performing measurements in the furnished room in accordance with the standard procedure in ISO 3382-2. Occupancy of 80 % can be taken into account with a mathematical model. The calculation or measurement should be performed in the octave bands from 125 to 4,000 Hz. The evaluation is based on the arithmetic mean reverberation time T in s in a furnished state with 80 % occupancy (octave bands 125 to 4,000 Hz) : Table 4 : 2.6.2.c Conference rooms
2.6.2.c Conference rooms Points
0,7 ≤ T ≤ 1,5 s 25
T < 0,7 s 10
T > 1,5 s 0
147
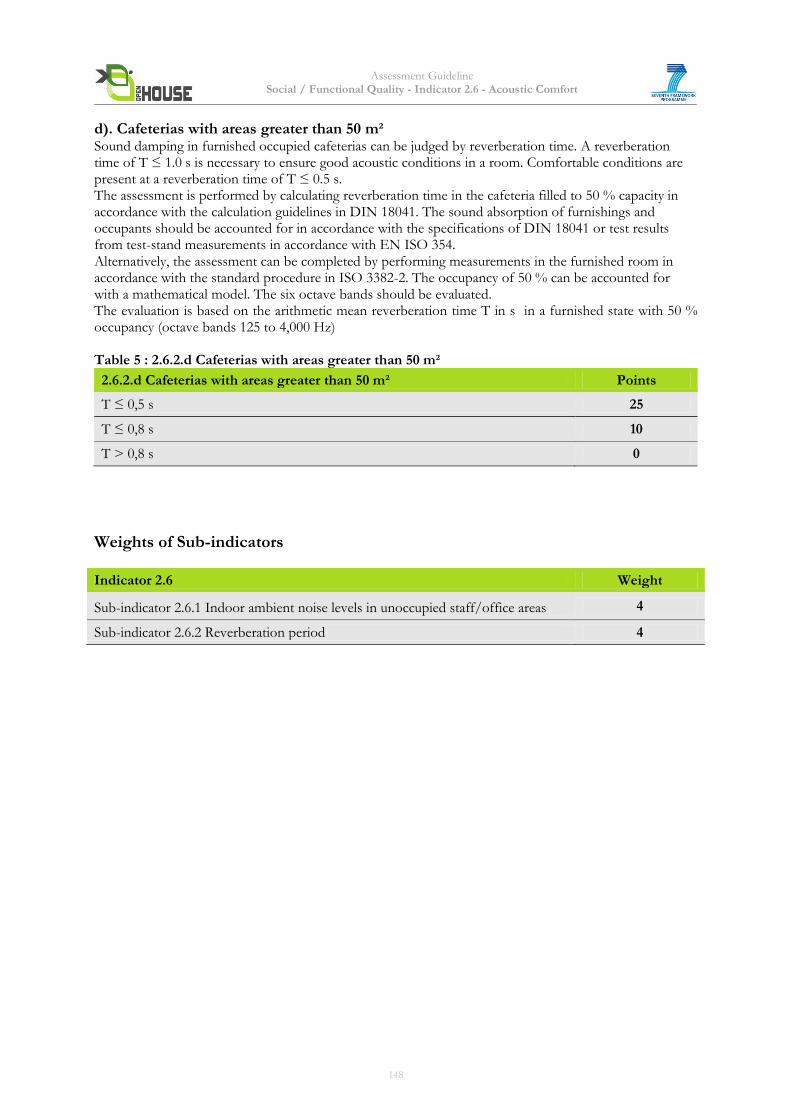
Assessment Guideline Social / Functional Quality - Indicator 2.6 - Acoustic Comfort
d). Cafeterias with areas greater than 50 m² Sound damping in furnished occupied cafeterias can be judged by reverberation time. A reverberation time of T ≤ 1.0 s is necessary to ensure good acoustic conditions in a room. Comfortable conditions are present at a reverberation time of T ≤ 0.5 s. The assessment is performed by calculating reverberation time in the cafeteria filled to 50 % capacity in accordance with the calculation guidelines in DIN 18041. The sound absorption of furnishings and occupants should be accounted for in accordance with the specifications of DIN 18041 or test results from test-stand measurements in accordance with EN ISO 354. Alternatively, the assessment can be completed by performing measurements in the furnished room in accordance with the standard procedure in ISO 3382-2. The occupancy of 50 % can be accounted for with a mathematical model. The six octave bands should be evaluated. The evaluation is based on the arithmetic mean reverberation time T in s in a furnished state with 50 % occupancy (octave bands 125 to 4,000 Hz) Table 5 : 2.6.2.d Cafeterias with areas greater than 50 m²
2.6.2.d Cafeterias with areas greater than 50 m² Points
T ≤ 0,5 s 25
T ≤ 0,8 s 10
T > 0,8 s 0
Weights of Sub-indicators
Indicator 2.6 Weight
Sub-indicator 2.6.1 Indoor ambient noise levels in unoccupied staff/office areas 4
Sub-indicator 2.6.2 Reverberation period 4
148
Assessment Guideline Social / Functional Quality - Indicator 2.6 - Acoustic Comfort
4. Documentation Guidelines The following documents will be needed to assess the building: Quick & Basic Assessment Letter of commitment or easily and quickly accessible documentation for the required evidence (see Complete Assessment), e.g. reasonable estimations for intended/expected values. Complete Assessment 2.6.1 Indoor ambient noise levels in unoccupied staff/office areas
A copy of the design plan for each level of the building with each room/area clearly labelled. A copy of the specification clause or acousticians calculations confirming: · Indoor ambient noise levels in each relevant room/area. · The standards to which calculations/measurements have complied, or are required to comply with.
2.6.2 Reverberation period
a. For individual offices: Depending on the method chosen: Submission of calculated reverberation time in empty individual offices in accordance with the calculation guidelines in DIN 18041 OR Submission of calculated reverberation time in accordance with the standard procedure in ISO 3382-2 for empty, unfurnished rooms. b. For multi-persons offices: Submission of calculated reverberation time in accordance with the standard procedure in ISO 3382-2 for empty, unfurnished rooms. c. For conference rooms: Depending on the method chosen: Submission of the calculations for reverberation time in furnished conference rooms filled to 80 % capacity in accordance with the calculation guidelines in DIN 18041. OR Submission of measured reverberation time in the furnished room in accordance with the standard procedure in ISO 3382-2. d. For cafeterias: Depending on the method chosen: Submission of the calculations for reverberation time in furnished cafeterias filled to 50 % capacity in accordance with the calculation guidelines in DIN 18041 OR Submission of the calculated reverberation time in furnished cafeterias in accordance with the standard procedure in ISO 3382-2.
5. Relation to other Indicators Indicator 2.12: Noise from building and site Indicator 4.5: Noise protection
149
Assessment Guideline Social / Functional Quality - Indicator 2.6 - Acoustic Comfort
6. Resources
DGNB - 21 Acoustic comfort
BNB 2011 - 3.1.4 Acoustic comfort
BREEAM Europe Commercial 2009 - Hea 13 - Acoustic Performance
EU standards ISO 3382-2:2008 specifies methods for the measurement of reverberation time in ordinary rooms. It describes the measurement procedure, the apparatus needed, the required number of measurement positions, and the method for evaluating the data and presenting the test report. The measurement results can be used for correction of other acoustic measurements, e.g. sound pressure level from sound sources or measurements of sound insulation, and for comparison with requirements for reverberation time in rooms. http://www.iso.org/iso/iso_catalogue/catalogue_tc/catalogue_detail.htm?csnumber=36201
7. Attachments
None
150
Assessment Guideline Social / Functional Quality – Indicator 2.7 – Visual Comfort
Indicator 2.7 Visual Comfort (adapted from DGNB/BNB, prEN 16309)
Core Indicator
1. Objective By an early and integral daylight and artificial light planning, a high quality of illumination can be created with low energy demands for illumination and cooling. Furthermore, a high degree of daylight use can enhance workplace capability and health and reduce the operational costs Lighting control integrated with daylighting is recognised as an important and useful strategy in energy-efficient building designs and operations. It is believed that proper daylighting schemes can help reduce the electrical demand and
contribute to achieving environmentally sustainable building development. This supports the European Commission objective to protect workers' safety and health in workplaces, which must as far as possible receive sufficient natural light and be equipped with adequate artificial lighting1.
2. Assessment Methodology Visual comfort shall be achieved by balanced illumination without appreciable interferences such as direct and reflected glare, a sufficient illumination level and the possibility to adjust illumination individually to the particular needs. Vitally important for the workplace contentment is the view that informs about time of day, location, weather conditions etc. Further criteria are non glaring, light distribution and spectral colour in the room. The requirements are valid both for illumination by daylight and artificial light. Also, presence of blinking, flashing, coloured lighting can cause irritation, loss of concentration. The goal is to limit the amount of blinking and flashing lights. In particular for the evaluation of visual comfort within offices different parameters should be considered:
2.7.1 Availability of daylight throughout the building 2.7.2 Availability of daylight in regularly used work areas 2.7.3 View to the outside 2.7.4 Preventing glare in daylight 2.7.5 Preventing glare in artificial light 2.7.6 Light distribution in artificial lighting conditions 2.7.7 Colour rendering 2.7.8 Blinking and flashing lights
1 Directive 89/654/EEC
151
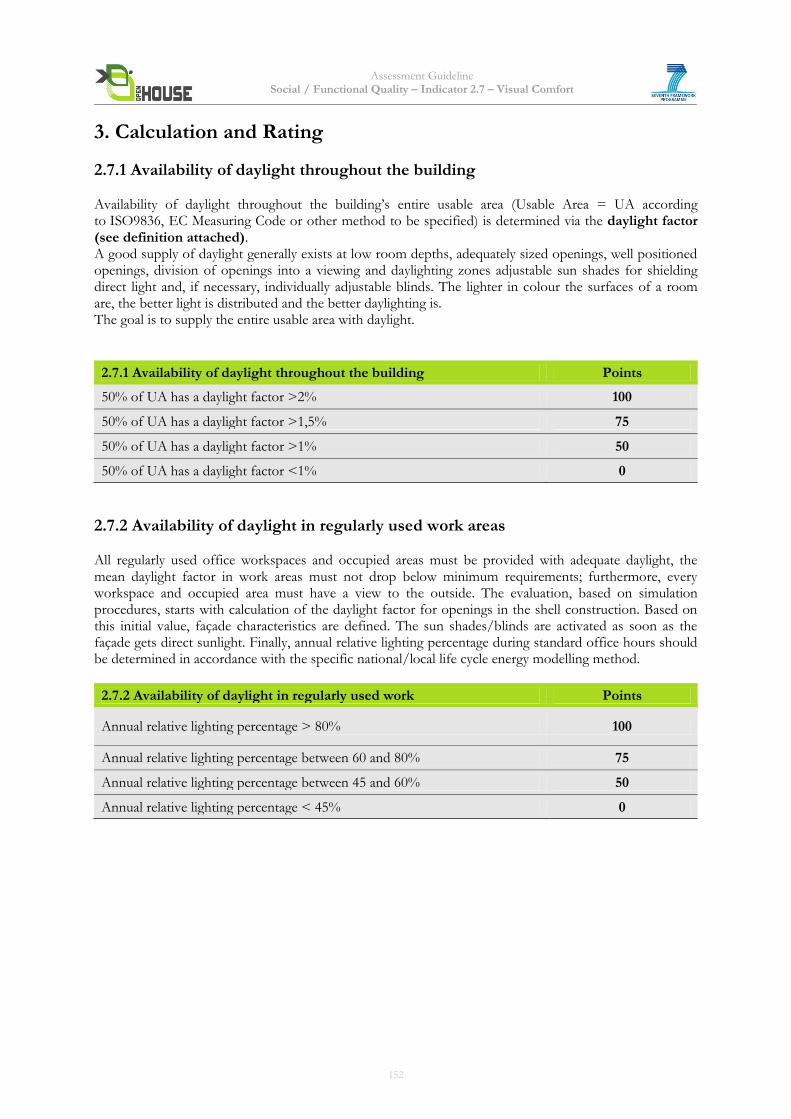
Assessment Guideline Social / Functional Quality – Indicator 2.7 – Visual Comfort
3. Calculation and Rating
2.7.1 Availability of daylight throughout the building Availability of daylight throughout the building’s entire usable area (Usable Area = UA according to ISO9836, EC Measuring Code or other method to be specified) is determined via the daylight factor (see definition attached). A good supply of daylight generally exists at low room depths, adequately sized openings, well positioned openings, division of openings into a viewing and daylighting zones adjustable sun shades for shielding direct light and, if necessary, individually adjustable blinds. The lighter in colour the surfaces of a room are, the better light is distributed and the better daylighting is. The goal is to supply the entire usable area with daylight.
2.7.1 Availability of daylight throughout the building Points
50% of UA has a daylight factor >2% 100
50% of UA has a daylight factor >1,5% 75
50% of UA has a daylight factor >1% 50
50% of UA has a daylight factor <1% 0
2.7.2 Availability of daylight in regularly used work areas All regularly used office workspaces and occupied areas must be provided with adequate daylight, the mean daylight factor in work areas must not drop below minimum requirements; furthermore, every workspace and occupied area must have a view to the outside. The evaluation, based on simulation procedures, starts with calculation of the daylight factor for openings in the shell construction. Based on this initial value, façade characteristics are defined. The sun shades/blinds are activated as soon as the façade gets direct sunlight. Finally, annual relative lighting percentage during standard office hours should be determined in accordance with the specific national/local life cycle energy modelling method.
2.7.2 Availability of daylight in regularly used work Points
Annual relative lighting percentage > 80% 100
Annual relative lighting percentage between 60 and 80% 75
Annual relative lighting percentage between 45 and 60% 50
Annual relative lighting percentage < 45% 0
152
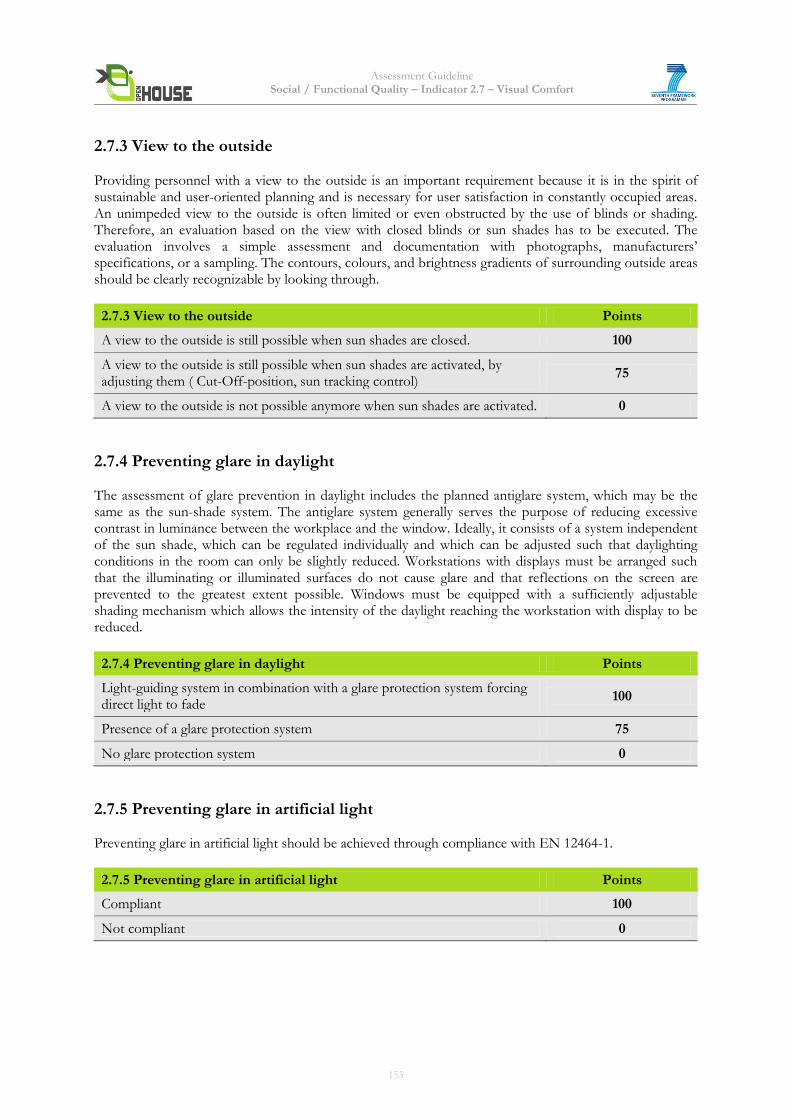
Assessment Guideline Social / Functional Quality – Indicator 2.7 – Visual Comfort
2.7.3 View to the outside Providing personnel with a view to the outside is an important requirement because it is in the spirit of sustainable and user-oriented planning and is necessary for user satisfaction in constantly occupied areas. An unimpeded view to the outside is often limited or even obstructed by the use of blinds or shading. Therefore, an evaluation based on the view with closed blinds or sun shades has to be executed. The evaluation involves a simple assessment and documentation with photographs, manufacturers’ specifications, or a sampling. The contours, colours, and brightness gradients of surrounding outside areas should be clearly recognizable by looking through.
2.7.3 View to the outside Points
A view to the outside is still possible when sun shades are closed. 100
A view to the outside is still possible when sun shades are activated, by adjusting them ( Cut-Off-position, sun tracking control)
75
A view to the outside is not possible anymore when sun shades are activated. 0
2.7.4 Preventing glare in daylight The assessment of glare prevention in daylight includes the planned antiglare system, which may be the same as the sun-shade system. The antiglare system generally serves the purpose of reducing excessive contrast in luminance between the workplace and the window. Ideally, it consists of a system independent of the sun shade, which can be regulated individually and which can be adjusted such that daylighting conditions in the room can only be slightly reduced. Workstations with displays must be arranged such that the illuminating or illuminated surfaces do not cause glare and that reflections on the screen are prevented to the greatest extent possible. Windows must be equipped with a sufficiently adjustable shading mechanism which allows the intensity of the daylight reaching the workstation with display to be reduced.
2.7.4 Preventing glare in daylight Points
Light-guiding system in combination with a glare protection system forcing direct light to fade
100
Presence of a glare protection system 75
No glare protection system 0
2.7.5 Preventing glare in artificial light Preventing glare in artificial light should be achieved through compliance with EN 12464-1.
2.7.5 Preventing glare in artificial light Points
Compliant 100
Not compliant 0
153
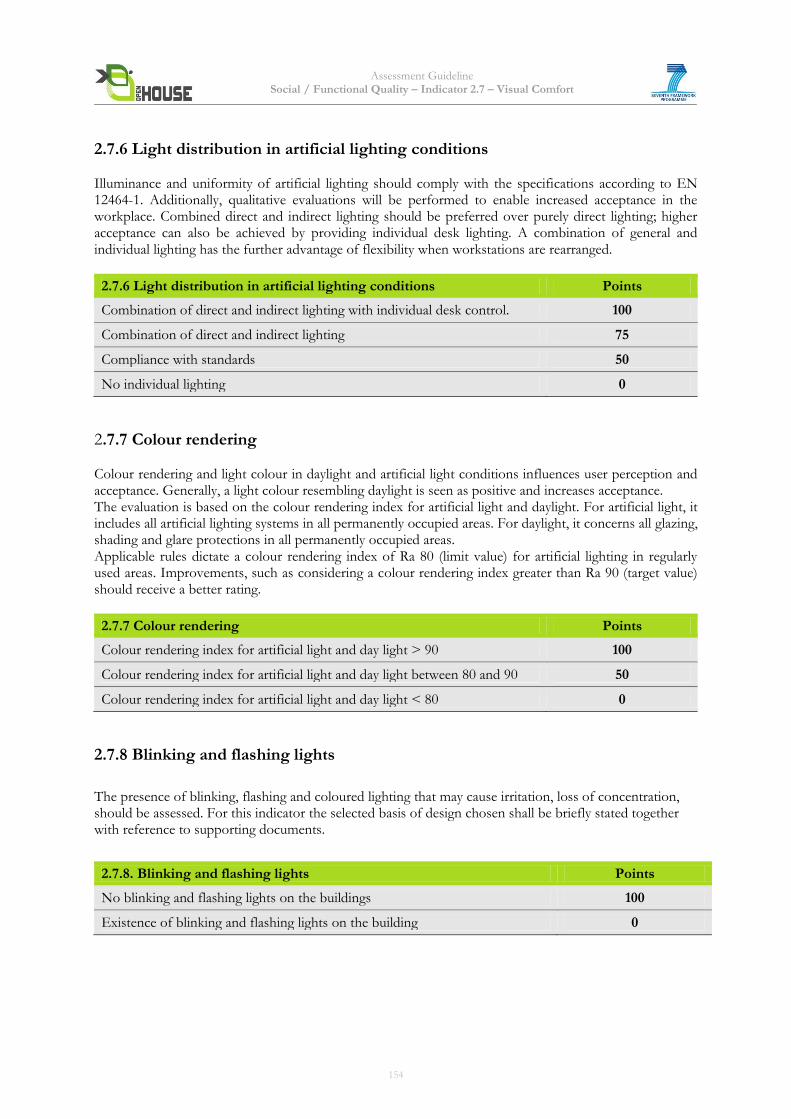
Assessment Guideline Social / Functional Quality – Indicator 2.7 – Visual Comfort
2.7.6 Light distribution in artificial lighting conditions Illuminance and uniformity of artificial lighting should comply with the specifications according to EN 12464-1. Additionally, qualitative evaluations will be performed to enable increased acceptance in the workplace. Combined direct and indirect lighting should be preferred over purely direct lighting; higher acceptance can also be achieved by providing individual desk lighting. A combination of general and individual lighting has the further advantage of flexibility when workstations are rearranged.
2.7.6 Light distribution in artificial lighting conditions Points
Combination of direct and indirect lighting with individual desk control. 100
Combination of direct and indirect lighting 75
Compliance with standards 50
No individual lighting 0
2.7.7 Colour rendering Colour rendering and light colour in daylight and artificial light conditions influences user perception and acceptance. Generally, a light colour resembling daylight is seen as positive and increases acceptance. The evaluation is based on the colour rendering index for artificial light and daylight. For artificial light, it includes all artificial lighting systems in all permanently occupied areas. For daylight, it concerns all glazing, shading and glare protections in all permanently occupied areas. Applicable rules dictate a colour rendering index of Ra 80 (limit value) for artificial lighting in regularly used areas. Improvements, such as considering a colour rendering index greater than Ra 90 (target value) should receive a better rating.
2.7.7 Colour rendering Points
Colour rendering index for artificial light and day light > 90 100
Colour rendering index for artificial light and day light between 80 and 90 50
Colour rendering index for artificial light and day light < 80 0
2.7.8 Blinking and flashing lights The presence of blinking, flashing and coloured lighting that may cause irritation, loss of concentration, should be assessed. For this indicator the selected basis of design chosen shall be briefly stated together with reference to supporting documents.
2.7.8. Blinking and flashing lights Points
No blinking and flashing lights on the buildings 100
Existence of blinking and flashing lights on the building 0
154
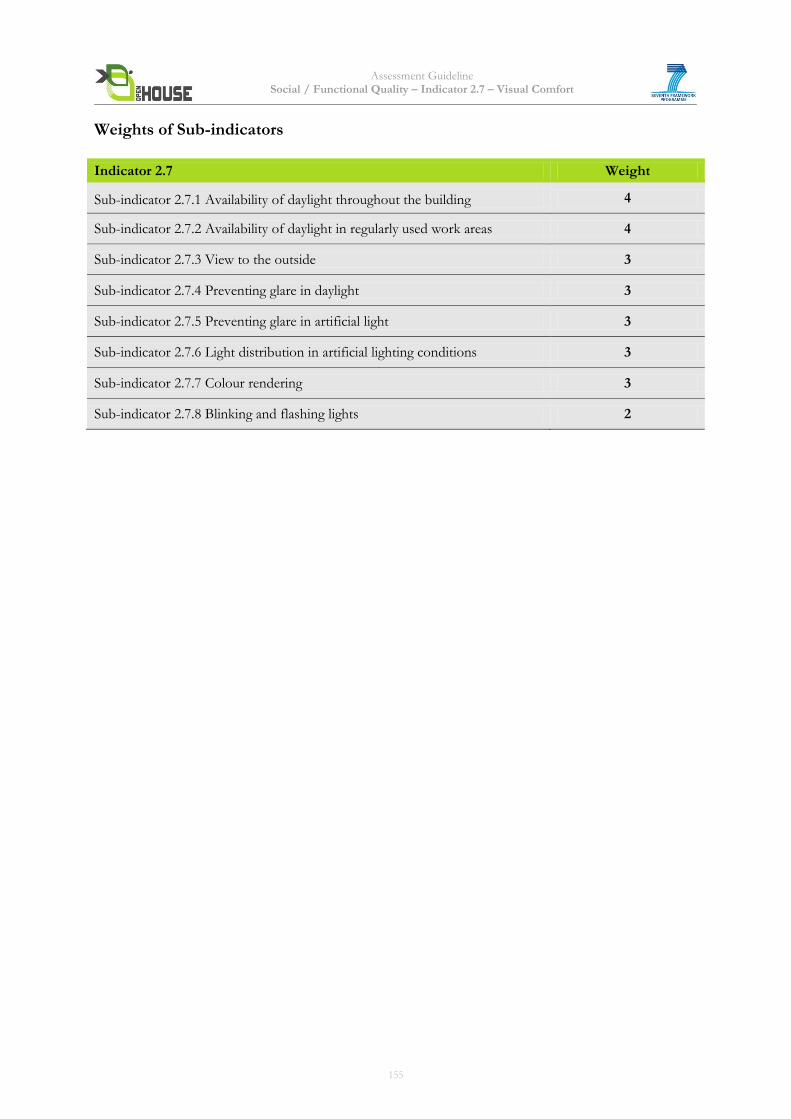
Assessment Guideline Social / Functional Quality – Indicator 2.7 – Visual Comfort
Weights of Sub-indicators
Indicator 2.7 Weight
Sub-indicator 2.7.1 Availability of daylight throughout the building 4
Sub-indicator 2.7.2 Availability of daylight in regularly used work areas 4
Sub-indicator 2.7.3 View to the outside 3
Sub-indicator 2.7.4 Preventing glare in daylight 3
Sub-indicator 2.7.5 Preventing glare in artificial light 3
Sub-indicator 2.7.6 Light distribution in artificial lighting conditions 3
Sub-indicator 2.7.7 Colour rendering 3
Sub-indicator 2.7.8 Blinking and flashing lights 2
155
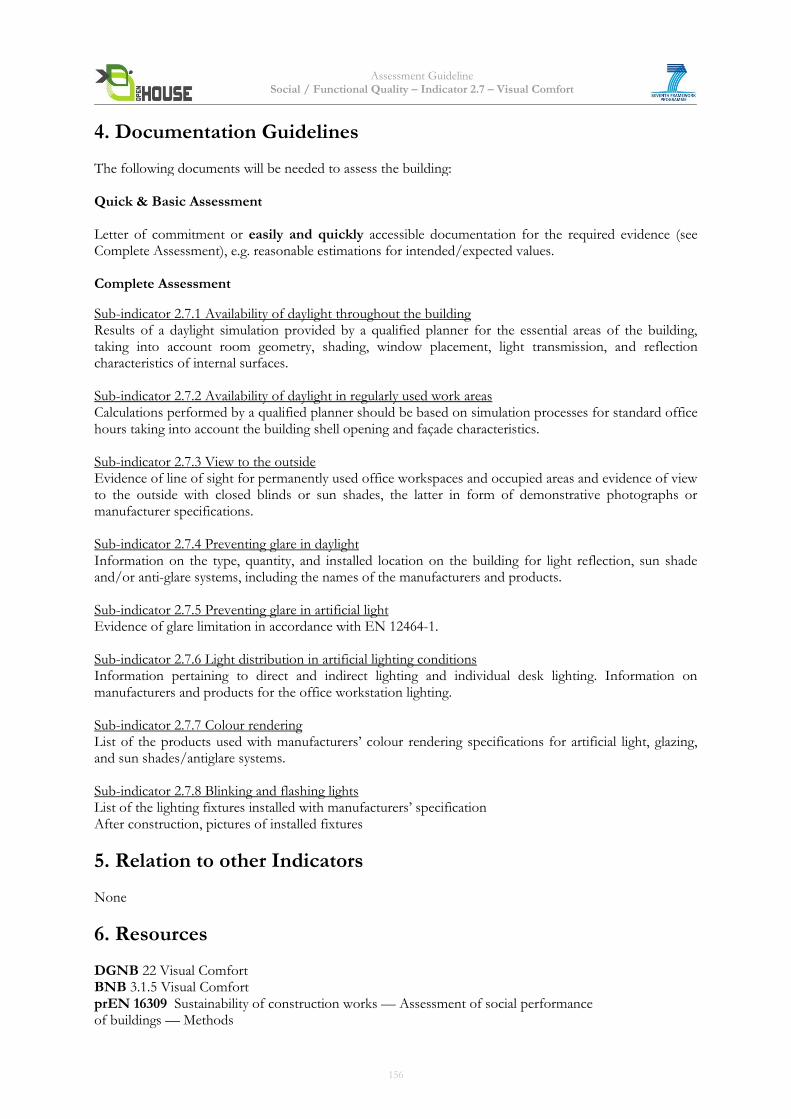
Assessment Guideline Social / Functional Quality – Indicator 2.7 – Visual Comfort
4. Documentation Guidelines The following documents will be needed to assess the building: Quick & Basic Assessment Letter of commitment or easily and quickly accessible documentation for the required evidence (see Complete Assessment), e.g. reasonable estimations for intended/expected values. Complete Assessment
Sub-indicator 2.7.1 Availability of daylight throughout the building Results of a daylight simulation provided by a qualified planner for the essential areas of the building, taking into account room geometry, shading, window placement, light transmission, and reflection characteristics of internal surfaces. Sub-indicator 2.7.2 Availability of daylight in regularly used work areas Calculations performed by a qualified planner should be based on simulation processes for standard office hours taking into account the building shell opening and façade characteristics. Sub-indicator 2.7.3 View to the outside Evidence of line of sight for permanently used office workspaces and occupied areas and evidence of view to the outside with closed blinds or sun shades, the latter in form of demonstrative photographs or manufacturer specifications. Sub-indicator 2.7.4 Preventing glare in daylight Information on the type, quantity, and installed location on the building for light reflection, sun shade and/or anti-glare systems, including the names of the manufacturers and products. Sub-indicator 2.7.5 Preventing glare in artificial light Evidence of glare limitation in accordance with EN 12464-1. Sub-indicator 2.7.6 Light distribution in artificial lighting conditions Information pertaining to direct and indirect lighting and individual desk lighting. Information on manufacturers and products for the office workstation lighting. Sub-indicator 2.7.7 Colour rendering List of the products used with manufacturers’ colour rendering specifications for artificial light, glazing, and sun shades/antiglare systems. Sub-indicator 2.7.8 Blinking and flashing lights List of the lighting fixtures installed with manufacturers’ specification After construction, pictures of installed fixtures
5. Relation to other Indicators None
6. Resources
DGNB 22 Visual Comfort BNB 3.1.5 Visual Comfort prEN 16309 Sustainability of construction works — Assessment of social performance of buildings — Methods
156

Assessment Guideline Social / Functional Quality – Indicator 2.7 – Visual Comfort
7. Attachments
Daylight Factor:
The daylight factor is the ratio of internal light level to external light level and is defined as follows:
DF = (Ei / Eo) x 100% where, Ei = illuminance due to daylight at a point on the indoors working plane, Eo = simultaneous outdoor illuminance on a horizontal plane from an unobstructed hemisphere of overcast sky. (http://en.wikipedia.org/wiki/Daylight_factor)
157
Assessment Guideline Social / Functional Quality - Indicator 2.8 – Operation Comfort
Indicator 2.8 Operation Comfort (adapted from DGNB/BNB)
Core Indicator
1. Objective Operation comfort is an indicator describing the possibilities of the user to control or have an impact on the parameters of the indoor environment. It includes the following factors that affect and determine the living environment: - ventilation, - shading and glare, - temperatures during the heating season, - temperatures outside the heating season, - control of daylight and artificial light, - ease of operation The goal is to assure the indoor environment quality at the workplace by allowing individual/zonal control (in the sectors mentioned above), and to avoid negative impacts on the user’s comfort. However, the individual control aims at meeting individual comfort needs of the users with consideration of the general building performance characteristics targeted by zonal control with automatic steering.
2. Assessment Methodology This indicator is qualitative. Scores for each listed sub-indicator are aggregated; maximum number of points (highest rating) is 100. The maximum points can be reached when all criteria have established the highest level possible, meaning that the operation comfort was taken into account comprehensively. The following sub-indicators will be assessed: 2.8.1 Ventilation 2.8.2 Shading 2.8.3 Glare prevention 2.8.4 Temperatures during the heating period 2.8.5 Temperatures outside the heating period 2.8.6 Regulation of daylight and artificial light 2.8.7 Ease of operation
158
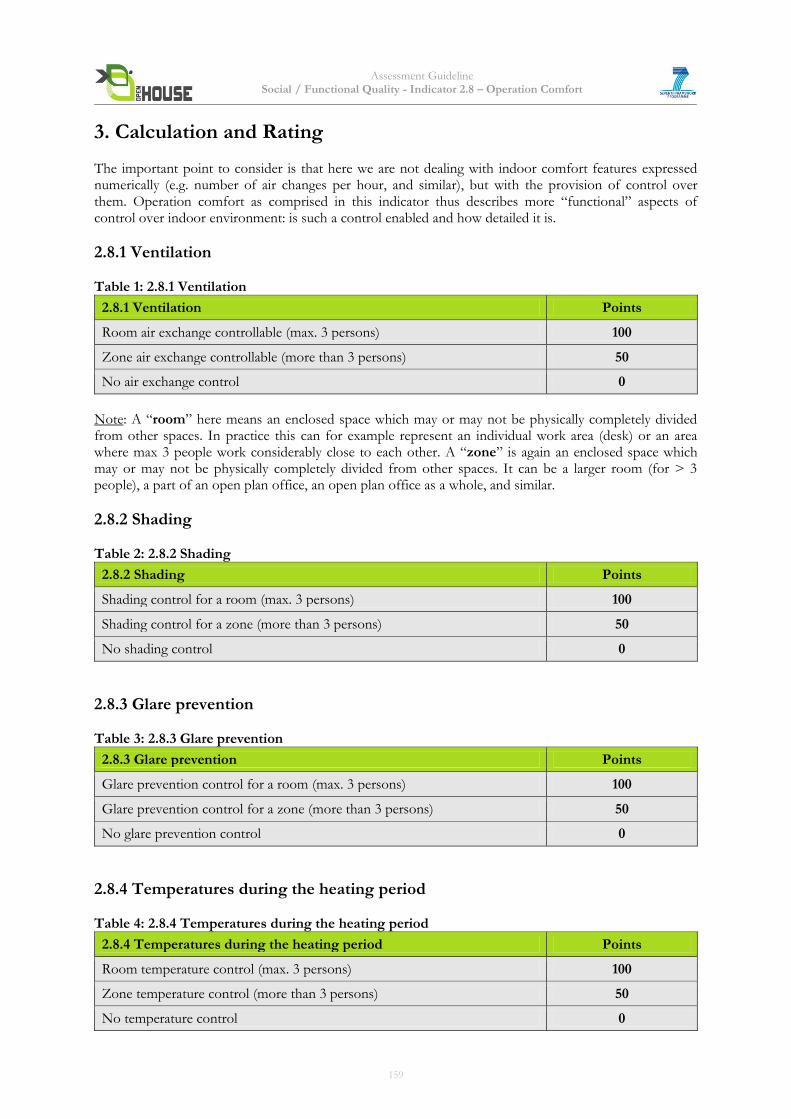
Assessment Guideline Social / Functional Quality - Indicator 2.8 – Operation Comfort
3. Calculation and Rating The important point to consider is that here we are not dealing with indoor comfort features expressed numerically (e.g. number of air changes per hour, and similar), but with the provision of control over them. Operation comfort as comprised in this indicator thus describes more “functional” aspects of control over indoor environment: is such a control enabled and how detailed it is.
2.8.1 Ventilation Table 1: 2.8.1 Ventilation
2.8.1 Ventilation Points
Room air exchange controllable (max. 3 persons) 100
Zone air exchange controllable (more than 3 persons) 50
No air exchange control 0
Note: A “room” here means an enclosed space which may or may not be physically completely divided from other spaces. In practice this can for example represent an individual work area (desk) or an area where max 3 people work considerably close to each other. A “zone” is again an enclosed space which may or may not be physically completely divided from other spaces. It can be a larger room (for > 3 people), a part of an open plan office, an open plan office as a whole, and similar.
2.8.2 Shading Table 2: 2.8.2 Shading
2.8.2 Shading Points
Shading control for a room (max. 3 persons) 100
Shading control for a zone (more than 3 persons) 50
No shading control 0
2.8.3 Glare prevention Table 3: 2.8.3 Glare prevention
2.8.3 Glare prevention Points
Glare prevention control for a room (max. 3 persons) 100
Glare prevention control for a zone (more than 3 persons) 50
No glare prevention control 0
2.8.4 Temperatures during the heating period Table 4: 2.8.4 Temperatures during the heating period
2.8.4 Temperatures during the heating period Points
Room temperature control (max. 3 persons) 100
Zone temperature control (more than 3 persons) 50
No temperature control 0
159
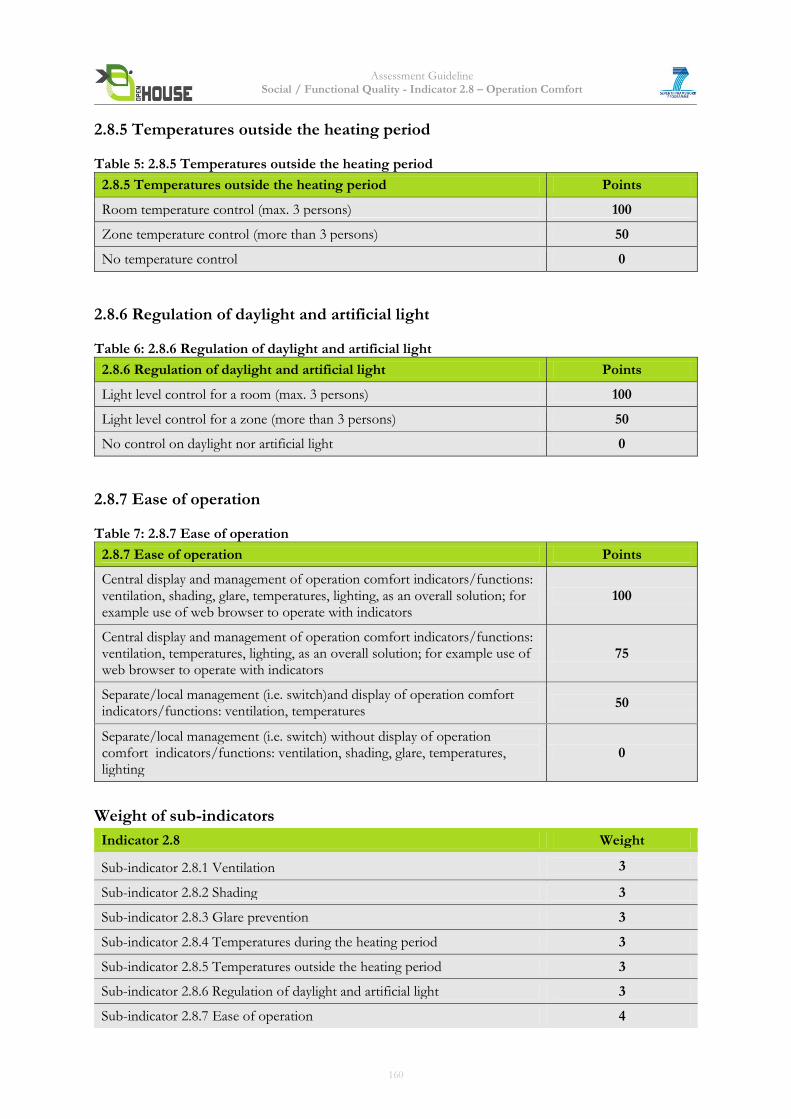
Assessment Guideline Social / Functional Quality - Indicator 2.8 – Operation Comfort
2.8.5 Temperatures outside the heating period Table 5: 2.8.5 Temperatures outside the heating period
2.8.5 Temperatures outside the heating period Points
Room temperature control (max. 3 persons) 100
Zone temperature control (more than 3 persons) 50
No temperature control 0
2.8.6 Regulation of daylight and artificial light Table 6: 2.8.6 Regulation of daylight and artificial light
2.8.6 Regulation of daylight and artificial light Points
Light level control for a room (max. 3 persons) 100
Light level control for a zone (more than 3 persons) 50
No control on daylight nor artificial light 0
2.8.7 Ease of operation Table 7: 2.8.7 Ease of operation
2.8.7 Ease of operation Points
Central display and management of operation comfort indicators/functions: ventilation, shading, glare, temperatures, lighting, as an overall solution; for example use of web browser to operate with indicators
100
Central display and management of operation comfort indicators/functions: ventilation, temperatures, lighting, as an overall solution; for example use of web browser to operate with indicators
75
Separate/local management (i.e. switch)and display of operation comfort indicators/functions: ventilation, temperatures
50
Separate/local management (i.e. switch) without display of operation comfort indicators/functions: ventilation, shading, glare, temperatures, lighting
0
Weight of sub-indicators
Indicator 2.8 Weight
Sub-indicator 2.8.1 Ventilation 3
Sub-indicator 2.8.2 Shading 3
Sub-indicator 2.8.3 Glare prevention 3
Sub-indicator 2.8.4 Temperatures during the heating period 3
Sub-indicator 2.8.5 Temperatures outside the heating period 3
Sub-indicator 2.8.6 Regulation of daylight and artificial light 3
Sub-indicator 2.8.7 Ease of operation 4
160
Assessment Guideline Social / Functional Quality - Indicator 2.8 – Operation Comfort
4. Documentation Guidelines The following documents will be needed to assess the building: Quick & Basic Assessment Letter of commitment or easily and quickly accessible documentation for the required evidence (see Complete Assessment), e.g. reasonable estimations for intended/expected values. Complete Assessment
2.8.1 Ventilation Excerpt from the building’s ventilation concept 2.8.2 Shading Description of shading system including products and manufacturers, with information on type and extent of control possibilities 2.8.3 Glare prevention Description of glare protection system including products and manufacturers, with information on type and extent of control possibilities 2.8.4 Temperatures during the heating period Information on control over indoor temperatures during the heating period in each room or zone 2.8.5 Temperatures outside the heating period Demonstration of possibility of control over ventilation and/or cooling via windows or technical systems in each room or zone 2.8.6 Regulation of daylight and artificial light Information on control over daylight and/or artificial light in each room or zone; product data with functional descriptions 2.8.7 User friendliness Information on the operating and display functions in each room or zone for the available systems for ventilation, shading, glare protection, temperature, and lighting
5. Relation to other Indicators 2.3 Thermal Comfort 2.4 Indoor Air Quality 2.7 Visual Comfort
6. Resources DGNB - 23 User Control Possibilities BNB 2011 - 316 Influence of the user
7. Attachments
None
161
Assessment Guideline
Social / Functional Quality - Indicator 2.9 - Service Quality
Indicator 2.9 Service Quality (adapted from DGNB)
1. Objective Service quality is a measure of how well the service level delivered in a building matches user expectations
and provides functional quality in everyday processes of an office building.
2. Assessment Methodology A number of issues affecting the service quality of the building will be evaluated in order to examine the
availability and quantity of services in it as well as the connected outdoor areas. Services addressed by this
indicator are related to recreational facilities, restaurant/cafeteria facilities, sport facilities and other
amenities potentially present in office buildings. Services with regard to technology equipment (HVAC,
lighting etc) are reflected by other OH indicators.
Another issue which is important as regards the building services is the utilization of building parts and
components, often designed and constructed for other reasons, in order to integrate a number of services.
This mainly refers to the exploitation of outdoor areas connected to the building (roof areas, balconies,
terraces, atria, outdoor seating areas, etc.) for the implementation of services promoting social activities
and enhancing users welfare.
The following sub-indicators will be assessed:
2.9.1 Availability of services in the building or in direct proximity to the building
2.9.2 Service integration in building connected outdoor areas
162
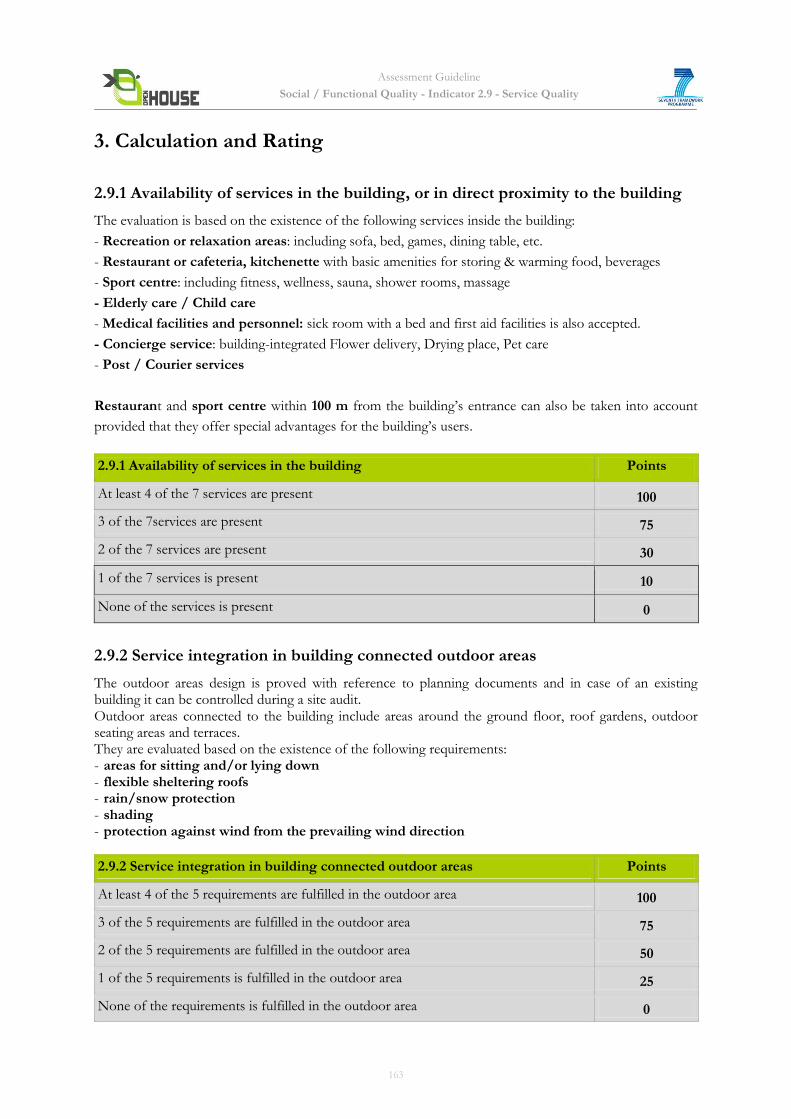
Assessment Guideline
Social / Functional Quality - Indicator 2.9 - Service Quality
3. Calculation and Rating
2.9.1 Availability of services in the building, or in direct proximity to the building
The evaluation is based on the existence of the following services inside the building:
- Recreation or relaxation areas: including sofa, bed, games, dining table, etc.
- Restaurant or cafeteria, kitchenette with basic amenities for storing & warming food, beverages
- Sport centre: including fitness, wellness, sauna, shower rooms, massage
- Elderly care / Child care
- Medical facilities and personnel: sick room with a bed and first aid facilities is also accepted.
- Concierge service: building-integrated Flower delivery, Drying place, Pet care
- Post / Courier services
Restaurant and sport centre within 100 m from the building’s entrance can also be taken into account
provided that they offer special advantages for the building’s users.
2.9.1 Availability of services in the building Points
At least 4 of the 7 services are present 100
3 of the 7services are present 75
2 of the 7 services are present 30
1 of the 7 services is present 10
None of the services is present 0
2.9.2 Service integration in building connected outdoor areas
The outdoor areas design is proved with reference to planning documents and in case of an existing building it can be controlled during a site audit. Outdoor areas connected to the building include areas around the ground floor, roof gardens, outdoor seating areas and terraces. They are evaluated based on the existence of the following requirements: - areas for sitting and/or lying down - flexible sheltering roofs - rain/snow protection - shading - protection against wind from the prevailing wind direction
2.9.2 Service integration in building connected outdoor areas Points
At least 4 of the 5 requirements are fulfilled in the outdoor area 100
3 of the 5 requirements are fulfilled in the outdoor area 75
2 of the 5 requirements are fulfilled in the outdoor area 50
1 of the 5 requirements is fulfilled in the outdoor area 25
None of the requirements is fulfilled in the outdoor area 0
163
Assessment Guideline
Social / Functional Quality - Indicator 2.9 - Service Quality
Weights of Sub-indicators
Indicator 2.9 Weight
Sub-indicator 2.9.1 Availability of services in the building, or in direct proximity to the building
4
Sub-indicator 2.9.2 Service integration in building connected outdoor areas 4
4. Documentation Guidelines
The following documents will be needed to assess the building:
Quick & Basic Assessment
Signed statement verifying the existing services, or easily and quickly accessible documentation for the
required evidence (see Complete Assessment), e.g. reasonable estimations for intended/expected values.
Complete Assessment
2.9.1 Availability of services in the building
Drawings with details on the location, space and furniture arrangement of the existing services.
Narratives with details on the services included
2.9.2 Service integration in building connected outdoor areas
Plan of the building connected outdoor areas
Information on the type and number of outdoor features, including, but not limited to, the following:
◦ areas for sitting and/or lying down,
◦ water features,
◦ flexible sheltering roofs,
◦ rain/snow protection,
◦ shading,
◦ protection against wind from the prevailing wind direction.
5. Relation to other Indicators Indicator 6.5 Vicinity to amenities
6. Resources Architect's Data, 3rd edition, Ernst and Peter Neufert
DGNB - 24 Exterior quality as affected by the building
7. Attachment None
164
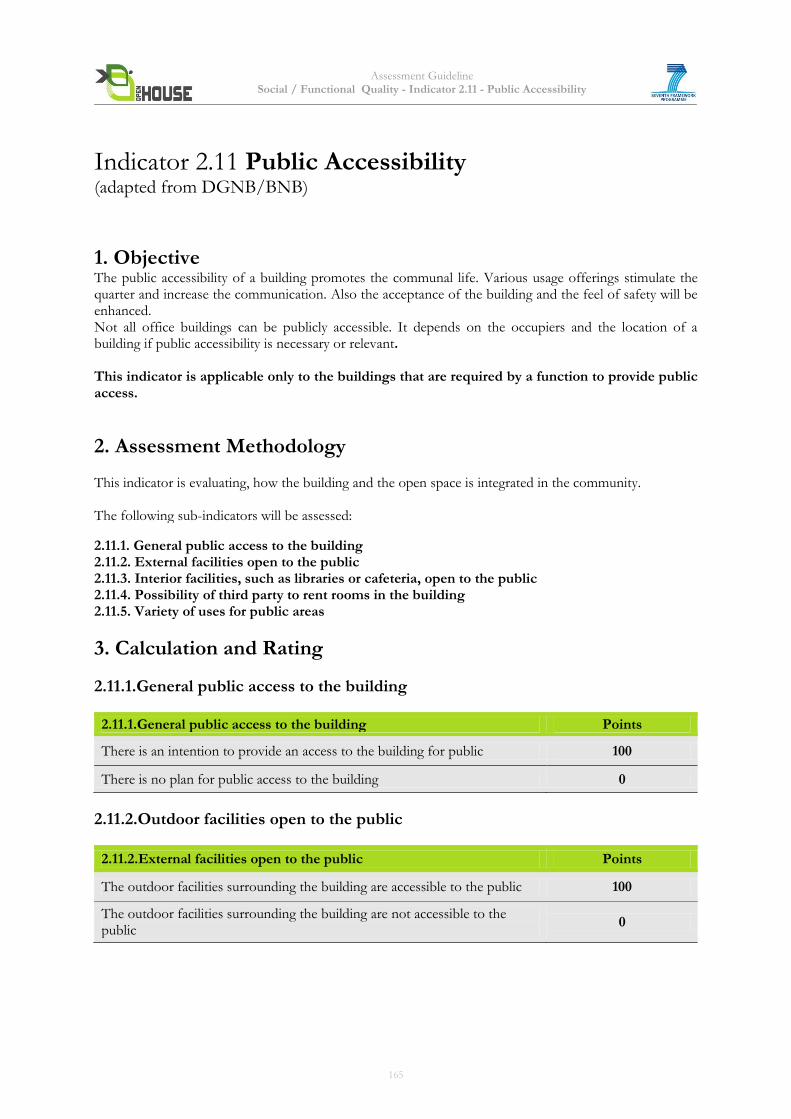
Assessment Guideline Social / Functional Quality - Indicator 2.11 - Public Accessibility
Indicator 2.11 Public Accessibility (adapted from DGNB/BNB)
1. Objective The public accessibility of a building promotes the communal life. Various usage offerings stimulate the quarter and increase the communication. Also the acceptance of the building and the feel of safety will be enhanced. Not all office buildings can be publicly accessible. It depends on the occupiers and the location of a building if public accessibility is necessary or relevant. This indicator is applicable only to the buildings that are required by a function to provide public access.
2. Assessment Methodology This indicator is evaluating, how the building and the open space is integrated in the community. The following sub-indicators will be assessed:
2.11.1. General public access to the building 2.11.2. External facilities open to the public 2.11.3. Interior facilities, such as libraries or cafeteria, open to the public 2.11.4. Possibility of third party to rent rooms in the building 2.11.5. Variety of uses for public areas
3. Calculation and Rating
2.11.1.General public access to the building
2.11.1.General public access to the building Points
There is an intention to provide an access to the building for public 100
There is no plan for public access to the building 0
2.11.2.Outdoor facilities open to the public
2.11.2.External facilities open to the public Points
The outdoor facilities surrounding the building are accessible to the public 100
The outdoor facilities surrounding the building are not accessible to the public
0
165
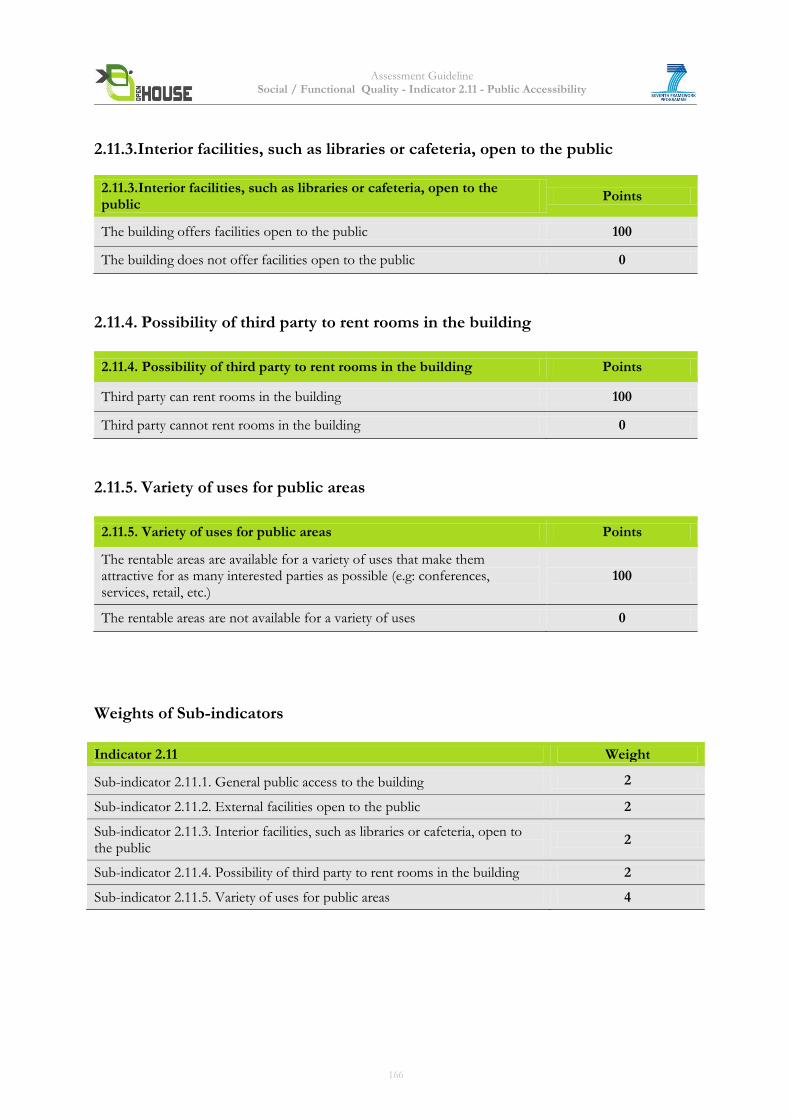
Assessment Guideline Social / Functional Quality - Indicator 2.11 - Public Accessibility
2.11.3.Interior facilities, such as libraries or cafeteria, open to the public
2.11.3.Interior facilities, such as libraries or cafeteria, open to the public
Points
The building offers facilities open to the public 100
The building does not offer facilities open to the public 0
2.11.4. Possibility of third party to rent rooms in the building
2.11.4. Possibility of third party to rent rooms in the building Points
Third party can rent rooms in the building 100
Third party cannot rent rooms in the building 0
2.11.5. Variety of uses for public areas
2.11.5. Variety of uses for public areas Points
The rentable areas are available for a variety of uses that make them attractive for as many interested parties as possible (e.g: conferences, services, retail, etc.)
100
The rentable areas are not available for a variety of uses 0
Weights of Sub-indicators
Indicator 2.11 Weight
Sub-indicator 2.11.1. General public access to the building 2
Sub-indicator 2.11.2. External facilities open to the public 2
Sub-indicator 2.11.3. Interior facilities, such as libraries or cafeteria, open to the public
2
Sub-indicator 2.11.4. Possibility of third party to rent rooms in the building 2
Sub-indicator 2.11.5. Variety of uses for public areas 4
166
Assessment Guideline Social / Functional Quality - Indicator 2.11 - Public Accessibility
4. Documentation Guidelines The following documents will be needed to assess the building: Quick & Basic Assessment Letter of commitment or easily and quickly accessible documentation for the required evidence (see Complete Assessment), e.g. reasonable estimations for intended/expected values. Complete Assessment 2.11.1. General public access to the building Demonstration of free entrance to the building and its reception area 2.11.2. External facilities open to the public Information on accessibility of outdoor facilities Excerpts from illustrated and written specifications for the outdoor facilities that include the type and extent of public use. Plans must also be included for resolving possible conflicts between internal and public use (boundaries, signage, and security in the building and its facilities). 2.11.3.Interior facilities, such as libraries or cafeteria, open to the public Design information on publicly accessible facilities Excerpts from illustrated and written specifications for publically accessible facilities in the building that clearly include the following information: Type and location of facility/facilities Type of access Boundaries, signage, and security in the building and facilities How are conflicts between internal and public use resolved? Information on the facilities that can be used by the public: Accessibility from outside Signs in the building Time period in which the building is accessible to the public Facilities’ opening hours 2.11.4.Possibility of third party to rent rooms in the building Demonstration of rooms that can be rented to third parties 2.11.5.Variety of uses for public areas Demonstration of variety of uses Description of various units of use and their attractiveness for multiple interested parties
5. Relation to other Indicators None
6. Resources 1. DGNB International Criterion 29: Public Access 2. BNB: Bewertungssystem Nachhaltiges Bauen (Germany) Criterion 3.2.4: Zugänglichkeit www.nachhaltigesbauen.de/fileadmin/pdf/BNB_Steckbriefe_Buero_Neubau/aktuell/BNB_BN_324.pdf
7. Attachments
None
167
Assessment Guideline Social / Functional Quality - Indicator 2.12 – Noise from Building and Site
Indicator 2.12 Noise from Building and Site (adapted from BREEAM)
1. Objective This indicator aims at calculating the likelihood of noise from the building and site affecting nearby noise-sensitive buildings.
This supports the European Commission objective to adopt action plans, based upon noise-mapping results, with a view to preventing and reducing environmental noise where necessary and particularly where exposure levels can induce harmful effects on human health and to preserving environmental noise quality where it is good1.
2. Assessment Methodology A noise impact assessment in compliance with ISO 1996 should be carried out and the following noise levels measured/determined:
Existing background noise levels at the nearest or most exposed noise-sensitive development to the proposed development; or at a location where background conditions can be argued to be similar.
The rating noise level resulting from the proposed noise-source. This can be based upon reference to similar installations or sites, or determined by calculation.
The noise impact assessment must be carried out by a suitably qualified acoustic consultant holding a recognised acoustic qualification and membership of an appropriate professional body (see relevant definitions in the attachments section). The following sub-indicator will be assessed: 2.12.1 Noise from Building and Site
1 DIRECTIVE 2002/49/EC
168
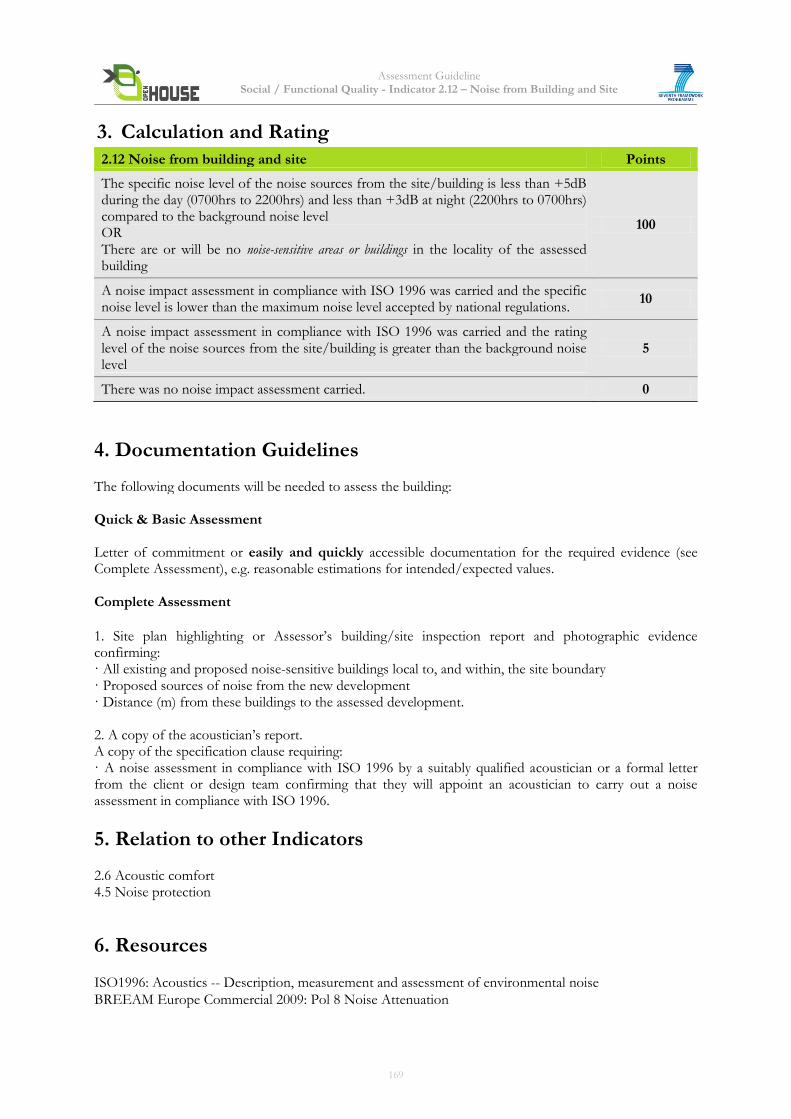
Assessment Guideline Social / Functional Quality - Indicator 2.12 – Noise from Building and Site
3. Calculation and Rating
2.12 Noise from building and site Points
The specific noise level of the noise sources from the site/building is less than +5dB during the day (0700hrs to 2200hrs) and less than +3dB at night (2200hrs to 0700hrs) compared to the background noise level OR There are or will be no noise-sensitive areas or buildings in the locality of the assessed building
100
A noise impact assessment in compliance with ISO 1996 was carried and the specific noise level is lower than the maximum noise level accepted by national regulations.
10
A noise impact assessment in compliance with ISO 1996 was carried and the rating level of the noise sources from the site/building is greater than the background noise level
5
There was no noise impact assessment carried. 0
4. Documentation Guidelines The following documents will be needed to assess the building: Quick & Basic Assessment Letter of commitment or easily and quickly accessible documentation for the required evidence (see Complete Assessment), e.g. reasonable estimations for intended/expected values. Complete Assessment
1. Site plan highlighting or Assessor’s building/site inspection report and photographic evidence confirming: · All existing and proposed noise-sensitive buildings local to, and within, the site boundary · Proposed sources of noise from the new development · Distance (m) from these buildings to the assessed development. 2. A copy of the acoustician’s report. A copy of the specification clause requiring: · A noise assessment in compliance with ISO 1996 by a suitably qualified acoustician or a formal letter from the client or design team confirming that they will appoint an acoustician to carry out a noise assessment in compliance with ISO 1996.
5. Relation to other Indicators 2.6 Acoustic comfort 4.5 Noise protection
6. Resources
ISO1996: Acoustics -- Description, measurement and assessment of environmental noise
BREEAM Europe Commercial 2009: Pol 8 Noise Attenuation
169
Assessment Guideline Social / Functional Quality - Indicator 2.12 – Noise from Building and Site
7. Attachments
Relevant definitions
Ambient noise: totally encompassing sound in a given situation and given time usually composed of sounds from sources near and far.
Background noise level: the A-weighted sound pressure level of the residual noise at the assessment position that is exceeded for 90% of a given time interval.
Noise sensitive area: landscapes or buildings where the occupiers are likely to be sensitive to noise created by the new plant installed in the assessed building, including:
· Residential areas · Hospitals, health centres, care homes, doctor’s surgeries etc. · Schools, colleges and other teaching establishments. · Libraries · Places of worship · Wildlife areas, historic landscapes, parks and gardens. · Located in an area of Outstanding natural beauty or near a Site of Special Scientific Interest (SSSI). · Any other development that can be considered noise sensitive.
Rating noise level: the specific noise level plus any adjustments for characteristics features of the noise (typically 5dB).
Residual noise: the ambient noise remaining at a given position in a given situation when the specific noise source is suppressed to a degree such that it does not contribute to the ambient noise.
Specific noise level: the equivalent continuous A-weighted sound pressure level at the assessment position produced by the specific noise source over a given reference time interval.
Specific noise source: the noise source under investigation for assessing the likelihood of complaints.
Suitably qualified acoustician: an individual achieving all the following items can be considered to be “suitably qualified” for the purposes of an OPEN HOUSE assessment: · Holds a degree, PhD or equivalent qualification in acoustics/sound testing. · Has a minimum of three years relevant experience (within the last five years). Such experience must clearly demonstrate a practical understanding of factors affecting acoustics in relation to construction and the built environment; including, acting in an advisory capacity to provide recommendations for suitable acoustic performance levels and mitigation measures.
170
Assessment Guideline Social / Functional Quality - Indicator 2.16 – Provision for bicycle amenities
Indicator 2.16 Bicycle Amenities (adapted from BREEAM, DGNB/BNB)
Core Indicator
1. Objective
In order to contribute to the development of an environmentally sound and energy-efficient mobility,
people should be motivated and encouraged to modify their transportation habits by constructing new or
improving existing infrastructure for bicycles, such as bike parking in the public space inside or outside of
a building. Cycling is the most low-carbon and the least occupying space mode of transportation other
than walking, thus it should be particularly encouraged.
This supports the European Commission objective to reduce both the CO2 emissions, the noise levels and to maintain good ambient air quality level. Indeed, the EC sees as a priority the adoption of measures which would promote a return to the bicycle as a mode of urban transport1.
2. Assessment Methodology
The bicycle comfort is evaluated by considering availability of bicycle parking spaces for building users, its
distance in respect to the main entrance of a building, the existence of facilities for employees such as
changing rooms and showers.
The following sub-indicators will be assessed:
2.16.1 Number of bicycle parking spaces available for building users
2.16.2 Distance to bicycle parking system from a main building entrance
2.16.3 Existence of facilities for cyclists comfort and security
1 EUROPEAN COMMISSION DG XI — Environment, Nuclear Safety and Civil Protection- Cycling: the way
ahead for towns and cities
171
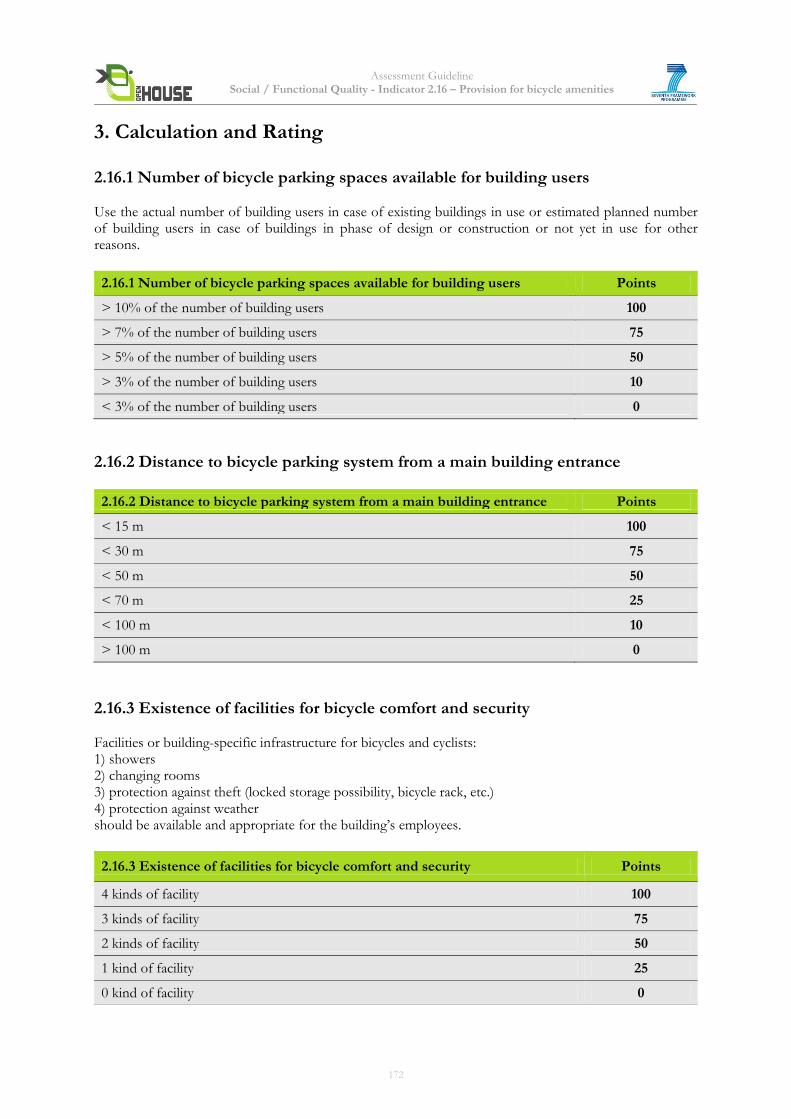
Assessment Guideline Social / Functional Quality - Indicator 2.16 – Provision for bicycle amenities
3. Calculation and Rating 2.16.1 Number of bicycle parking spaces available for building users Use the actual number of building users in case of existing buildings in use or estimated planned number of building users in case of buildings in phase of design or construction or not yet in use for other reasons.
2.16.1 Number of bicycle parking spaces available for building users Points
> 10% of the number of building users 100
> 7% of the number of building users 75
> 5% of the number of building users 50
> 3% of the number of building users 10
< 3% of the number of building users 0
2.16.2 Distance to bicycle parking system from a main building entrance
2.16.2 Distance to bicycle parking system from a main building entrance Points
< 15 m 100
< 30 m 75
< 50 m 50
< 70 m 25
< 100 m 10
> 100 m 0
2.16.3 Existence of facilities for bicycle comfort and security Facilities or building-specific infrastructure for bicycles and cyclists: 1) showers 2) changing rooms 3) protection against theft (locked storage possibility, bicycle rack, etc.) 4) protection against weather should be available and appropriate for the building’s employees.
2.16.3 Existence of facilities for bicycle comfort and security Points
4 kinds of facility 100
3 kinds of facility 75
2 kinds of facility 50
1 kind of facility 25
0 kind of facility 0
172
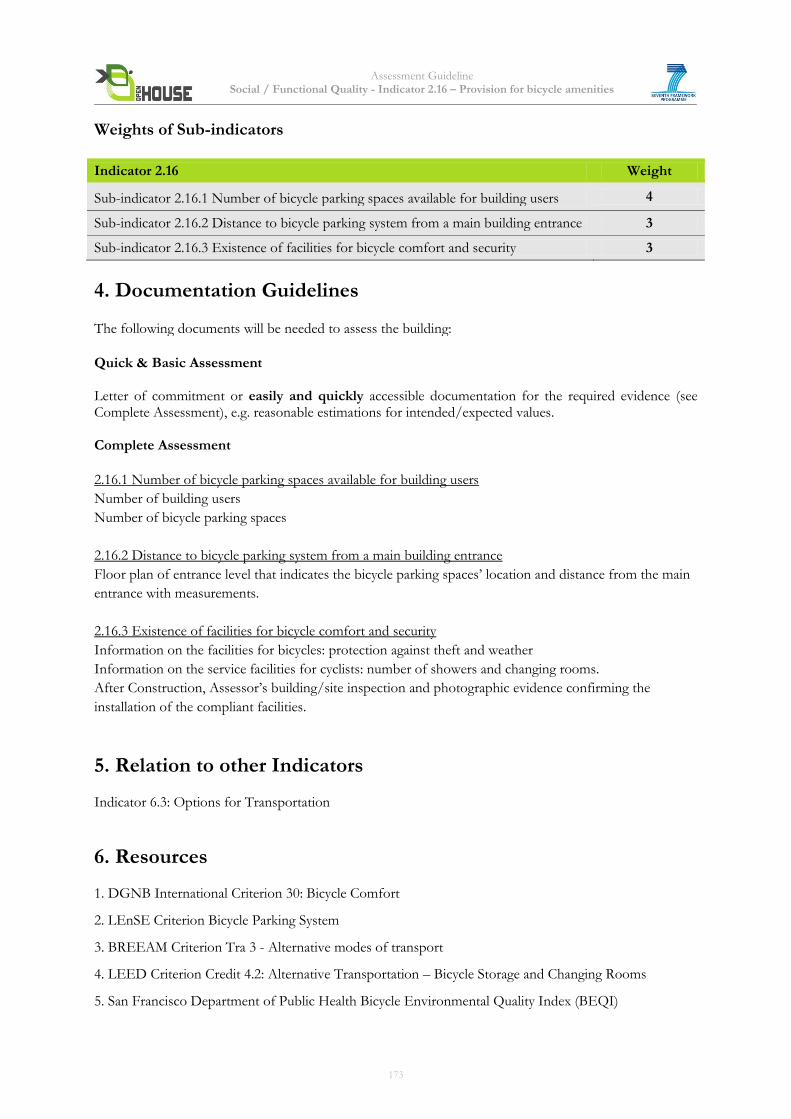
Assessment Guideline Social / Functional Quality - Indicator 2.16 – Provision for bicycle amenities
Weights of Sub-indicators
Indicator 2.16 Weight
Sub-indicator 2.16.1 Number of bicycle parking spaces available for building users 4
Sub-indicator 2.16.2 Distance to bicycle parking system from a main building entrance 3
Sub-indicator 2.16.3 Existence of facilities for bicycle comfort and security 3
4. Documentation Guidelines The following documents will be needed to assess the building: Quick & Basic Assessment Letter of commitment or easily and quickly accessible documentation for the required evidence (see Complete Assessment), e.g. reasonable estimations for intended/expected values. Complete Assessment
2.16.1 Number of bicycle parking spaces available for building users
Number of building users
Number of bicycle parking spaces
2.16.2 Distance to bicycle parking system from a main building entrance
Floor plan of entrance level that indicates the bicycle parking spaces’ location and distance from the main
entrance with measurements.
2.16.3 Existence of facilities for bicycle comfort and security
Information on the facilities for bicycles: protection against theft and weather
Information on the service facilities for cyclists: number of showers and changing rooms.
After Construction, Assessor’s building/site inspection and photographic evidence confirming the
installation of the compliant facilities.
5. Relation to other Indicators Indicator 6.3: Options for Transportation
6. Resources 1. DGNB International Criterion 30: Bicycle Comfort
2. LEnSE Criterion Bicycle Parking System
3. BREEAM Criterion Tra 3 - Alternative modes of transport
4. LEED Criterion Credit 4.2: Alternative Transportation – Bicycle Storage and Changing Rooms
5. San Francisco Department of Public Health Bicycle Environmental Quality Index (BEQI)
173

Assessment Guideline Social / Functional Quality - Indicator 2.16 – Provision for bicycle amenities
7. Attachments Relevant definition: Building users: in an office building, building users include:
- Full-time staff - Part-time staff - Peak Transients (visitors, customers, etc.)
174
Assessment Guideline Social / Functional Quality - Indicator 2.17 – Material Sourcing
Indicator 2.17 Material Sourcing (adapted from DGNB/BNB)
Core Indicator 1. Objective The objective is to recognize and encourage the sourcing of environmentally and socially responsible products. At present the only internationally recognized schemes are for wood products and therefore this indicator is limited to the sourcing of timber for wooden building products and components. It is the expectation that the scope of this indicator will expand to include other material classes beyond timber. The indicator aims at encouraging the specification of timber from sustainably managed sources. It supports the European Commission goal to halt the trade in illegally harvested timber and products made from such timber in the EU and to contribute to stopping deforestation and forest degradation and related carbon emissions and biodiversity loss globally while promoting sustainable economic growth, sustainable human development and respect for indigenous and local people1. It also supports the Roadmap to a Resource Efficient Europe that encourages developing incentives to reward resource efficient buildings, and to promote the sustainable use of wood in construction.2
2. Assessment Methodology
For all timber products used, the supplier must be able to certify the “controlled, sustainable cultivation of the forest of origin”.
Only certificates that are issued by the Forest Stewardship Council (FSC) or certification authorities that are accredited by the Program for Endorsement of Forest Certification Schemes (PEFC) are accepted. The certification criteria of sustainable forestry established by the FSC have international consensus. For the verifiability, the supplier has to declare both the country of origin and the wood species. An FSC/PEFC certificate is only valid in combination with the appropriate “chain-of-custody” certificate.
A minimum of 50% (based on cost) of wooden materials and products certified in accordance with FSC/PEFC principles and criteria should be used for wood building components. These components include, at a minimum, structural framing and general dimensional framing, flooring, sub-flooring, wood doors and finishes. Only materials permanently installed in the project should be included. Wood products purchased for temporary use on the project (e.g., formwork, bracing, scaffolding, sidewalk protection, and guard rails) may be included in the calculation at the project team’s discretion. If any such materials are included, all such materials must be included in the calculation.
If such materials are purchased for use on multiple projects, the applicant may include these materials for each project, at its discretion.
A project goal for certified wood products has to be established and suppliers that can achieve this goal have to be identified. During construction, it should be ensured that the certified wood products are installed and the total percentage of certified wood products installed has to be quantified.
1 European Parliament legislative resolution of 22 April 2009 on the proposal for a regulation of the European Parliament and of the Council laying down the obligations of operators who place timber and timber products on the market (COM(2008)0644 – C6-0373/2008 – 2008/0198(COD)) 2 European Commission Roadmap to a Resource Efficient Europe
175
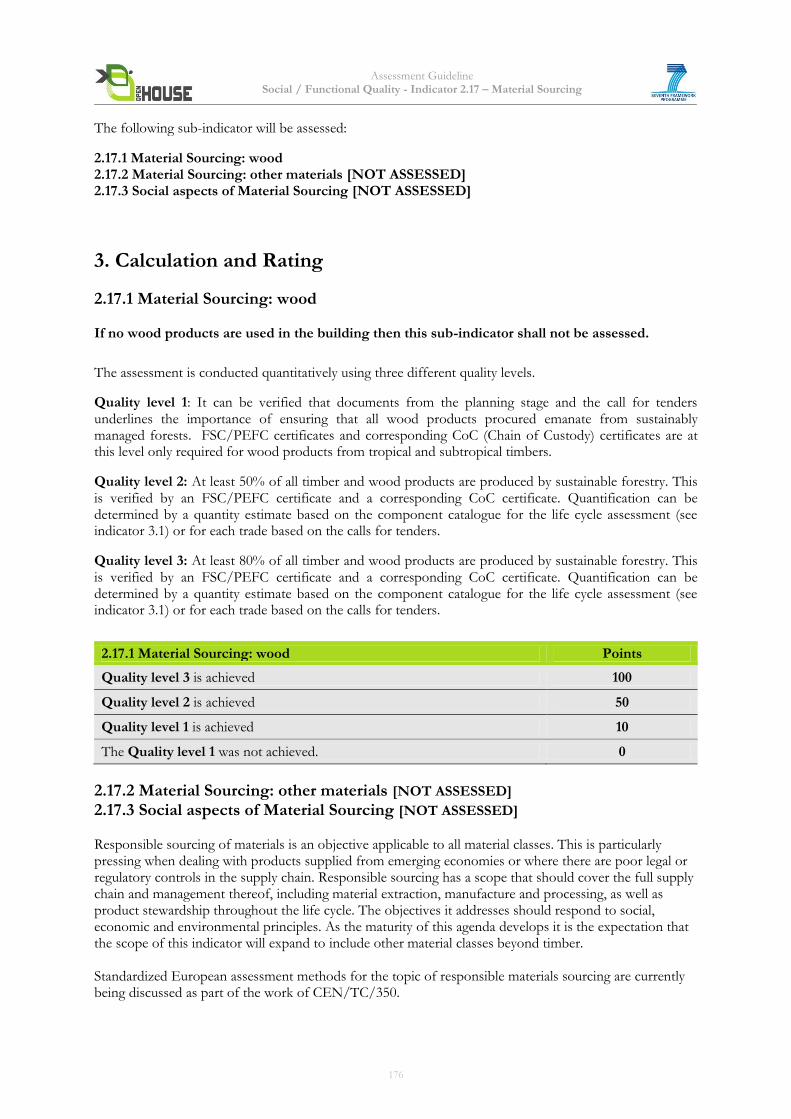
Assessment Guideline Social / Functional Quality - Indicator 2.17 – Material Sourcing
The following sub-indicator will be assessed:
2.17.1 Material Sourcing: wood 2.17.2 Material Sourcing: other materials [NOT ASSESSED] 2.17.3 Social aspects of Material Sourcing [NOT ASSESSED]
3. Calculation and Rating
2.17.1 Material Sourcing: wood If no wood products are used in the building then this sub-indicator shall not be assessed.
The assessment is conducted quantitatively using three different quality levels.
Quality level 1: It can be verified that documents from the planning stage and the call for tenders underlines the importance of ensuring that all wood products procured emanate from sustainably managed forests. FSC/PEFC certificates and corresponding CoC (Chain of Custody) certificates are at this level only required for wood products from tropical and subtropical timbers.
Quality level 2: At least 50% of all timber and wood products are produced by sustainable forestry. This is verified by an FSC/PEFC certificate and a corresponding CoC certificate. Quantification can be determined by a quantity estimate based on the component catalogue for the life cycle assessment (see indicator 3.1) or for each trade based on the calls for tenders.
Quality level 3: At least 80% of all timber and wood products are produced by sustainable forestry. This is verified by an FSC/PEFC certificate and a corresponding CoC certificate. Quantification can be determined by a quantity estimate based on the component catalogue for the life cycle assessment (see indicator 3.1) or for each trade based on the calls for tenders.
2.17.1 Material Sourcing: wood Points
Quality level 3 is achieved 100
Quality level 2 is achieved 50
Quality level 1 is achieved 10
The Quality level 1 was not achieved. 0
2.17.2 Material Sourcing: other materials [NOT ASSESSED] 2.17.3 Social aspects of Material Sourcing [NOT ASSESSED] Responsible sourcing of materials is an objective applicable to all material classes. This is particularly pressing when dealing with products supplied from emerging economies or where there are poor legal or regulatory controls in the supply chain. Responsible sourcing has a scope that should cover the full supply chain and management thereof, including material extraction, manufacture and processing, as well as product stewardship throughout the life cycle. The objectives it addresses should respond to social, economic and environmental principles. As the maturity of this agenda develops it is the expectation that the scope of this indicator will expand to include other material classes beyond timber. Standardized European assessment methods for the topic of responsible materials sourcing are currently being discussed as part of the work of CEN/TC/350.
176
Assessment Guideline Social / Functional Quality - Indicator 2.17 – Material Sourcing
4. Documentation Guidelines The following documents will be needed to assess the building: Quick & Basic Assessment Letter of commitment or easily and quickly accessible documentation for the required evidence (see Complete Assessment), e.g. reasonable estimations for intended/expected values. Complete Assessment 1. Verification of use and certification for timber and wood products. Verification must be provided for all timber and wood products used in non-negligible amounts, exemplified by products in the following (not exhaustive) list:
• frame elements • roof beams, trusses, joists, rafters etc. • cladding • windows and window shutters • doors • flooring • wall panelling • products for construction site equipment and safety
Certification can be verified with the following documents:
• the certificate, which was verifiable issued by a certification authority accredited by the Forest Stewardship Council (FSC) or the Programme for Endorsement of Forest Certification Schemes (PEFC) • the corresponding FSC or PEFC “chain of custody” certificate of trade
2. Mathematical verification of the proportion of FSC or PEFC-certified timber, timber products or timber materials as a percentage of total timber, timber products or timber materials (for example, windows, doors, floors, walls and stairs). Intermediate and final results must be presented separately and clearly. Information must also be given on building elements that include timber products on wood-based materials and the respective amounts.
5. Relation to other Indicators
Indicator 3.1 Building-related Life Cycle Costs (LCC)
6. Resources DGNB 2009: 8 Sustainable use of resources/Wood BNB 2011: 117 Sustainable logging/Wood Forest Stewardship Council (FSC): http://www.fsc.org/107.html Program for Endorsement of Forest Certification Schemes (PEFC): http://www.pefc.org/
7. Attachments
None
177
Assessment Guideline Version 1.2 New Office Buildings – July 2013
OPEN HOUSE
ASSESSMENT GUIDELINE
Economic Quality
3.1 Building-related Life Cycle Costs (LCC) 3.2 Value Stability Note: Core indicator is in bold
178
Assessment Guideline Economic Quality - Indicator 3.1 – Building related Life Cycle Costs (LCC)
Indicator 3.1 Building related Life Cycle Costs (LCC)
(adapted from EN 15459, EN ISO 15686-5)
Core Indicator
1. Objective Life Cycle costing approach is an economic method to assist in the decision making process and to identify cost effectiveness of different design options and sensitivity of the cost resulting of the prices evolutions for products, services, energy and human operation. This indicator supports the European Commission objective to increase the consideration for life-time costs of buildings rather than just the initial costs, including construction and demolition waste.1
2. Assessment Methodology The calculation of Life Cycle Costs (LCC) are presented in different standards EN ISO 15686- 5 introduces main principles and list of costs/benefits related to the buildings EN 15459 describes more precisely the Global costing for the construction and operation stages. This standard provides a calculation method for the economics of heating systems and other systems that are involved in the energy use of the building (building envelope, ventilation, etc.) . This standard applies to all types of buildings. Assessment shall be carried out at any time of the building life cycle (form inception to end of life) Note: EN 15643-3 presents the framework for development of LCC methodology applicable to buildings
The following sub-indicators will be assessed: 3.1.1 Life cycle costs 3.1.2 Whole Life cycle cost including externalities 2(NOT ASSESSED in this version)
1 Roadmap to a Resource Efficient Europe 2 For whole life costs, the methodology to calculated externalities is not yet fully approved for all items (e.g. use of local manpower, environmental costs, …)
179
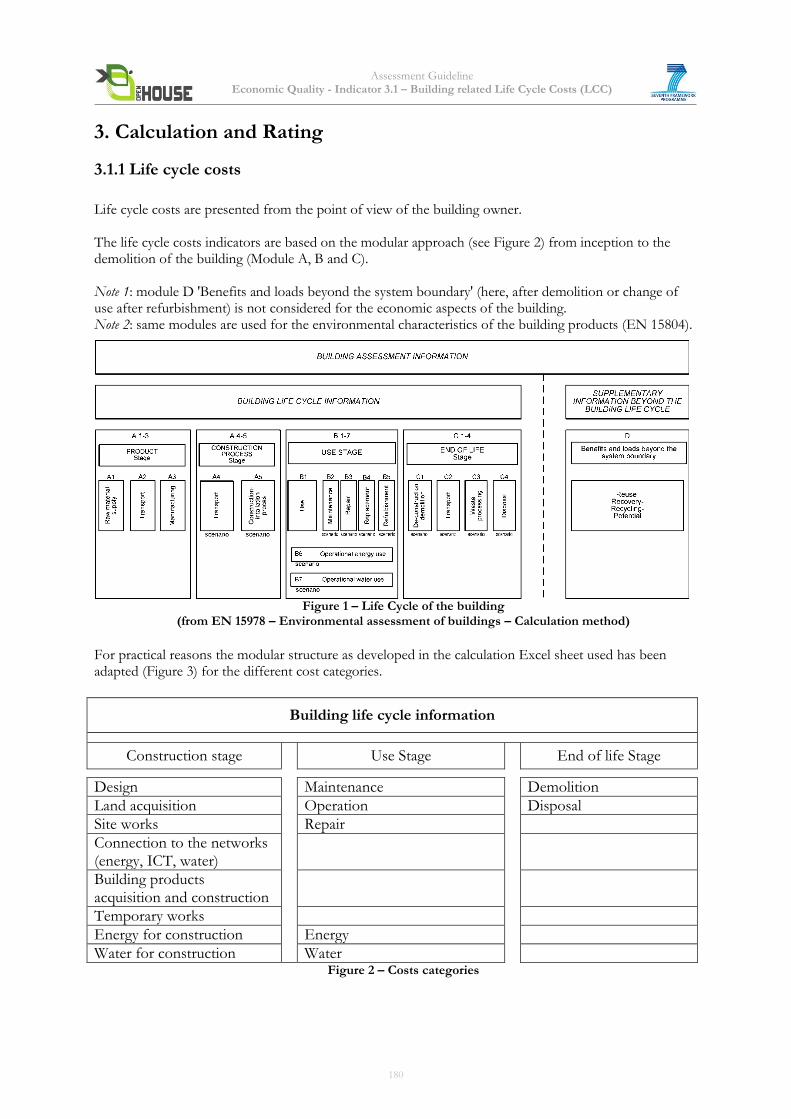
Assessment Guideline Economic Quality - Indicator 3.1 – Building related Life Cycle Costs (LCC)
3. Calculation and Rating
3.1.1 Life cycle costs
Life cycle costs are presented from the point of view of the building owner. The life cycle costs indicators are based on the modular approach (see Figure 2) from inception to the demolition of the building (Module A, B and C). Note 1: module D 'Benefits and loads beyond the system boundary' (here, after demolition or change of use after refurbishment) is not considered for the economic aspects of the building. Note 2: same modules are used for the environmental characteristics of the building products (EN 15804).
Figure 2 – Modules of the life cycle of the building
Figure 1 – Life Cycle of the building (from EN 15978 – Environmental assessment of buildings – Calculation method)
For practical reasons the modular structure as developed in the calculation Excel sheet used has been adapted (Figure 3) for the different cost categories.
Building life cycle information
Construction stage Use Stage End of life Stage Design Maintenance Demolition
Land acquisition Operation Disposal
Site works Repair
Connection to the networks (energy, ICT, water)
Building products acquisition and construction
Temporary works
Energy for construction Energy
Water for construction Water Figure 2 – Costs categories
180
Assessment Guideline Economic Quality - Indicator 3.1 – Building related Life Cycle Costs (LCC)
Construction stage The definition and quantification of the products used for the construction are aligned with these defined for the calculation of the environmental indicators as presented in the OPEN HOUSE methodology and in the European standards developed by CEN TC 350 ( EN 15978:2012; Sustainability in construction works - Environmental performance of buildings – Calculation method and EN 15643-4: 2011 Sustainability in construction works – Assessment of buildings – Part 4 Framework for the assessment of economic performance). Use stage For consistency with the Directive on Energy performance of buildings the incomes due to energy sales are introduced (as a negative cost). Costs for maintenance and cleaning activities shall be aligned with the (scheduled or existing) management system of the building (or available contracts).
End of life stage The costs for disposal are introduced in the calculation as a percentage of the buildings products costs (varying from 2% to 10%, depending on the type of process used for the demolition and the type of construction elements). Lowest rate are used for light structure (wood) and high potential for disassembly and recyclability/reuse of material, whereas higher rate are used for concrete structure in urban area or when hazardous substances (asbestos, etc.) need specific care before disposal.
Data collection and quantification For new buildings the quantification of the building (quantity of products or services) is aligned to the documents issued during the design stage (basic design and final design) and shall be consistent with information used for LCA calculation. For existing building the costs arising from the point of time when the assessment is performed shall be consistent with the management of the building for maintenance and repair.
181
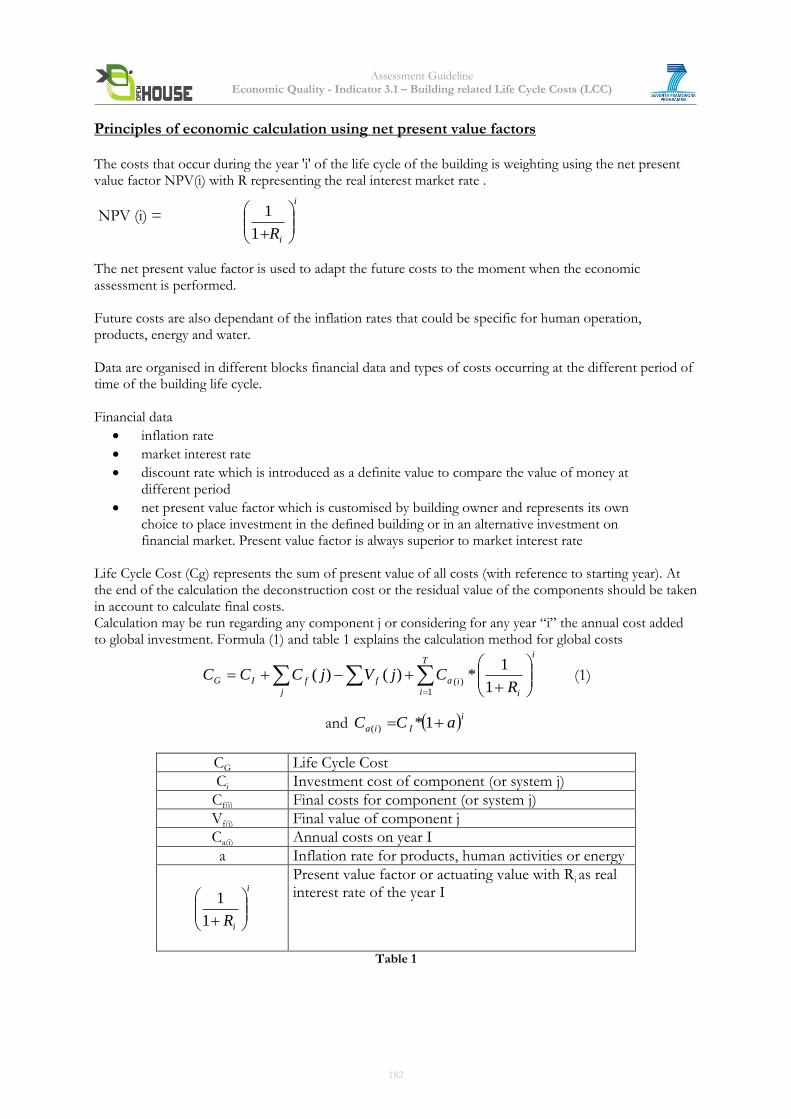
Assessment Guideline Economic Quality - Indicator 3.1 – Building related Life Cycle Costs (LCC)
Principles of economic calculation using net present value factors The costs that occur during the year 'i' of the life cycle of the building is weighting using the net present value factor NPV(i) with R representing the real interest market rate .
NPV (i) = The net present value factor is used to adapt the future costs to the moment when the economic assessment is performed. Future costs are also dependant of the inflation rates that could be specific for human operation, products, energy and water. Data are organised in different blocks financial data and types of costs occurring at the different period of time of the building life cycle. Financial data
inflation rate
market interest rate
discount rate which is introduced as a definite value to compare the value of money at different period
net present value factor which is customised by building owner and represents its own choice to place investment in the defined building or in an alternative investment on financial market. Present value factor is always superior to market interest rate
Life Cycle Cost (Cg) represents the sum of present value of all costs (with reference to starting year). At the end of the calculation the deconstruction cost or the residual value of the components should be taken in account to calculate final costs. Calculation may be run regarding any component j or considering for any year “i” the annual cost added to global investment. Formula (1) and table 1 explains the calculation method for global costs
i
j i
T
iiaffIG
RCjVjCCC
1
1*)()(
1)(
(1)
and iIia aCC 1*)(
CG Life Cycle Cost
Ci Investment cost of component (or system j)
Cf(j) Final costs for component (or system j)
Vf(j) Final value of component j
Ca(i) Annual costs on year I
a Inflation rate for products, human activities or energy
i
iR
1
1
Present value factor or actuating value with Ri as real interest rate of the year I
Table 1
i
iR
1
1
182
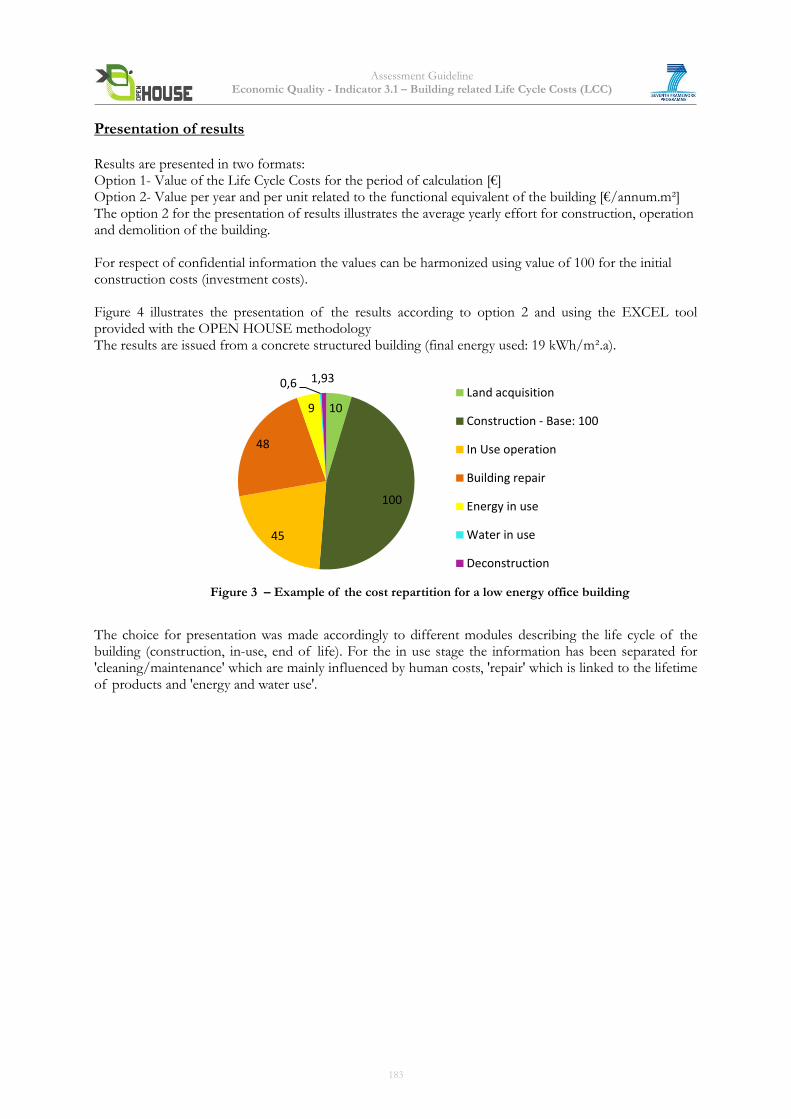
Assessment Guideline Economic Quality - Indicator 3.1 – Building related Life Cycle Costs (LCC)
Presentation of results Results are presented in two formats: Option 1- Value of the Life Cycle Costs for the period of calculation [€] Option 2- Value per year and per unit related to the functional equivalent of the building [€/annum.m²] The option 2 for the presentation of results illustrates the average yearly effort for construction, operation and demolition of the building. For respect of confidential information the values can be harmonized using value of 100 for the initial construction costs (investment costs). Figure 4 illustrates the presentation of the results according to option 2 and using the EXCEL tool provided with the OPEN HOUSE methodology The results are issued from a concrete structured building (final energy used: 19 kWh/m².a). The choice for presentation was made accordingly to different modules describing the life cycle of the building (construction, in-use, end of life). For the in use stage the information has been separated for 'cleaning/maintenance' which are mainly influenced by human costs, 'repair' which is linked to the lifetime of products and 'energy and water use'.
Figure 3 – Example of the cost repartition for a low energy office building
10
100
45
48
9
0,6 1,93 Land acquisition
Construction - Base: 100
In Use operation
Building repair
Energy in use
Water in use
Deconstruction
183
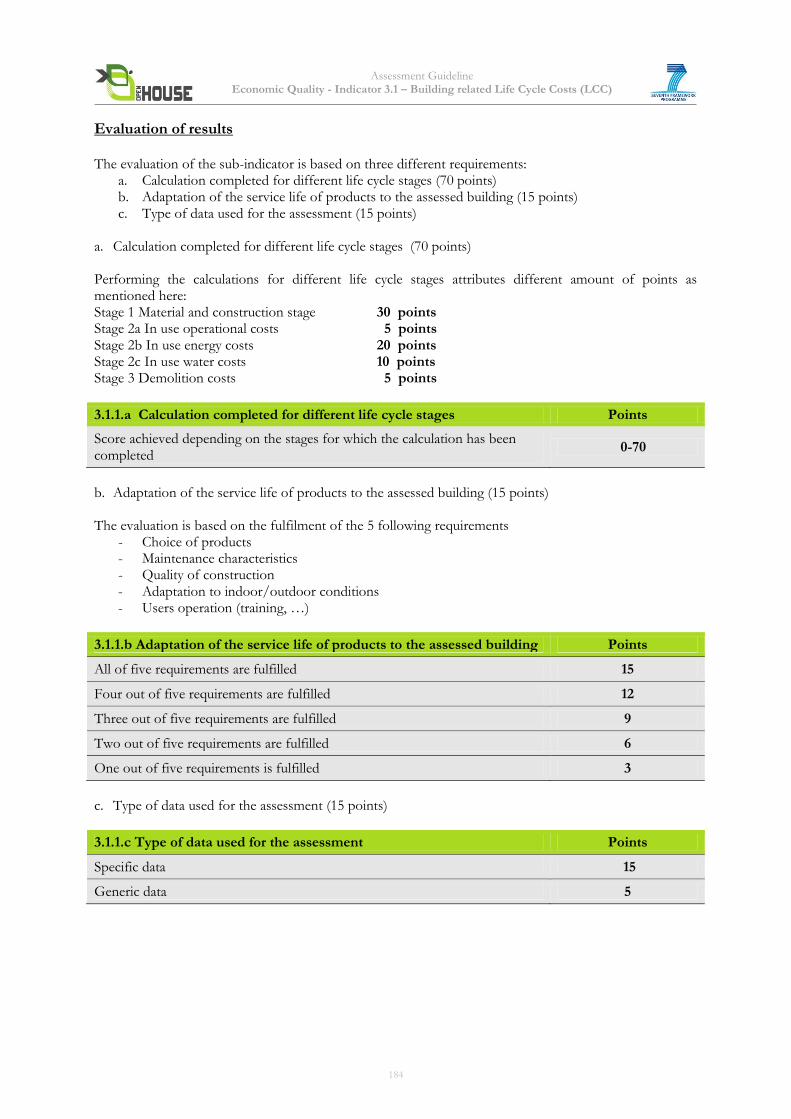
Assessment Guideline Economic Quality - Indicator 3.1 – Building related Life Cycle Costs (LCC)
Evaluation of results The evaluation of the sub-indicator is based on three different requirements:
a. Calculation completed for different life cycle stages (70 points) b. Adaptation of the service life of products to the assessed building (15 points) c. Type of data used for the assessment (15 points)
a. Calculation completed for different life cycle stages (70 points) Performing the calculations for different life cycle stages attributes different amount of points as mentioned here: Stage 1 Material and construction stage 30 points Stage 2a In use operational costs 5 points Stage 2b In use energy costs 20 points Stage 2c In use water costs 10 points Stage 3 Demolition costs 5 points
3.1.1.a Calculation completed for different life cycle stages Points
Score achieved depending on the stages for which the calculation has been completed
0-70
b. Adaptation of the service life of products to the assessed building (15 points) The evaluation is based on the fulfilment of the 5 following requirements
- Choice of products - Maintenance characteristics - Quality of construction - Adaptation to indoor/outdoor conditions - Users operation (training, …)
3.1.1.b Adaptation of the service life of products to the assessed building Points
All of five requirements are fulfilled 15
Four out of five requirements are fulfilled 12
Three out of five requirements are fulfilled 9
Two out of five requirements are fulfilled 6
One out of five requirements is fulfilled 3
c. Type of data used for the assessment (15 points)
3.1.1.c Type of data used for the assessment Points
Specific data 15
Generic data 5
184
Assessment Guideline Economic Quality - Indicator 3.1 – Building related Life Cycle Costs (LCC)
3.1.2 Whole life cycle costs including externalities (NOT ASSESSED in this version) The Whole Life Cycle consider extra information based on the followings - social aspects
The financial social aspects shall consider the impacts due the quality of the building on the performance of the users (productivity), on reduced costs for absenteeism.
- environmental aspects.
The environmental costs shall consider the costs due for CO2 (based on average value of CO2 emission trading) and the costs for selection and transportation of the waste generated based on different values for the inert and dangerous wastes. This last item emphasises the waste management system of the building and the selection of products and constructive solutions to reduce the quantity of waste generated. As an option (if values are known) the assessor shall consider the positive value of the materials exiting the building for recycling, re-use or energy recovery.
4. Documentation Guidelines The following documents will be needed to assess the building: Quick & Basic Assessment Letter of commitment or easily and quickly accessible documentation for the required evidence (see Complete Assessment), e.g. reasonable estimations for intended/expected values. Complete Assessment 3.1.1 Life Cycle Costs 3.1.1.a LCC calculation (Excel sheet or other similar documents) 3.1.1.b List of products with relevant information (costs, service life, technical characteristics..) 3.1.1.c Specification of type of data used
5. Relation to other Indicators LCA indicators
6. Resources 1. VDI 2067 : Economic efficiency of building installations – Fundamentals for economic calculation
2. EN 15459 : Energy performance of buildings – Economic evaluation procedure for energy systems in buildings 3. EN ISO 15686-5 : Buildings and constructed assets — Service life planning - Part 5: Life cycle costing
4 – EN ISO 15686-9 – Buildings and constructed assets – Part 8 Reference service life and service life information
7. Attachments 1. EXCEL sheet for LCC calculation
185
Assessment Guideline Economic Quality - Indicator 3.2–Value Stability
Indicator 3.2 Value Stability
(adapted from DGNB/BNB)
1. Objective The objective is to ensure a high flexibility for different user requirements and future developments. A globalized and international market requires high efficiency, flexibility and adaptability of new and existing construction. Whether a building has a high market value and generates a profit-making investment in the long-term depends on the buildings possibilities of alteration and extensions. To achieve a stable building value in the long-term, it must be possible to adjust the structure of a building regarding changing user demands and future developments (e.g. climate resp. demographic change or rising energy prices) with less effort and low costs. A building designed regarding sustainable criteria can be easily adapted to changing needs.
Flexibility and adaptability of the building structure over the entire lifecycle of a building has therefore a high impact on value stability.
2. Assessment Methodology The assessment focuses on the building independently from the external economic situation. Indeed, the location cannot be influenced by any means from the construction process, and therefore parameters defining location’s value stability are not taken in account here, even if they can play a great role in the sustainable use of the building. Evaluation of location is done separately. The main aspects taken in account here for the value stability are:
- Building adaptability and flexibility - Resources dependency - Building performance management
Building adaptability and flexibility
Firstly, areas should be handled as economical as possible. Area efficiency is an index for the utilization of
floor space inside buildings. A report by the German Society of Real Estate Funds (Deutsche Gesellschaft
für Immobilienfonds) states that 2/3 of the project developers consider the factor area efficiency as a
superior planning item. With reference to the augmentation of area efficiency the following goals for
improvement can be presented:
1. Optimization regarding costs: decrease of construction and operational costs, avoidance of restricted
use areas.
2. Environmental Optimization: reduction of the property environmental impacts during operation, by
reducing the technical equipment required for heating, ventilation, and cooling. With increased area
efficiency the sealing of natural soil can be reduced.
3. Contribution to optimization in the social sector: positive interaction in the working environment with
well-proportioned areas and a clearly arranged design.
Secondly, the better a building can be converted with as little time and effort as possible, the better the attribute “Feasibility of Conversion” is evaluated. The globalized and international market demands high flexibility and adaptability. This is also reflected in the use of a building. A sustainable designed building can easily be adapted to changing requirements. Change of use can result from tenant/user change as well as from user reorganization. A high degree of sustainable building conversion feasibility is present if a change can be realized with low resource consumption
186
Assessment Guideline Economic Quality - Indicator 3.2–Value Stability
Resources dependency
With regard to energy and water dependency, it is a question of seeing how well a property can deal with the consequences of climate change as well as with rising energy and water prices. As far as energy is concerned, on the one hand it is a matter of energy efficiency, i.e. an energy consumption that is as low as possible for heating (heating and hot water) and cooling (on the basis of global warming the demand for cooling will increase in the summer). On the other hand, the dependency on energy sources or the expected energy costs of these will play a role. With regard to water dependency, low water consumption, the disposal of wastewater as well as collecting rain water will increase in importance.1
Building performance management The optimization of the performance of a building during its operation is essential to maintain the value of the building, because reducing running costs and improving its environmental performance. Firstly, the life cycle of the building components can be extended thanks to an improved concept for cleaning and maintenance. Secondly, the optimisation of the building performance requires well-informed facility managers and buildings users as well as monitoring of building performance and target settings for its improvement.
The following sub-indicators will be assessed:
3.2.1 Area efficiency 3.2.2 Conversion feasibility 3.2.3 Energy and water dependency 3.2.4 Building performance management
1Source: Meins, Wallbaum et al. (2010). Sustainability and property valuation: a risk-based approach. Building Research & Information. Building Research & Information 2010, 38(3), 281-301
187
Assessment Guideline Economic Quality - Indicator 3.2–Value Stability
3. Calculation and Rating
3.2.1 Area Efficiency
The evaluation of the area efficiency is based on one sub-indicator which is the space efficiency factor. Its
calculation corresponds to the proportion between usable floor area (UA) to total floor area (TFA) (in
m²/m²).
When there are not existing national standards or methods, the calculation of this proportion will be done
upon the ISO 9836:1992 “Definition and calculation of area and space indicators” (see annex 1 in
attachments) OR European Commission Measuring Code2.
The space efficiency factor Seff is determined as follows:
Seff = UA (of all floor levels) / TFA , where:
Seff Space efficiency factor
UA Usable area in [m²]
TFA Total floor area in [m²]
The result is rounded to the nearest hundredth. As Seff increases, the building's economic, environmental
and social performance ameliorates.
According to its Seff , the building is awarded points, for Area Efficiency 2.14 indicator, as following:
2.14 Area Efficiency Points
Seff ≥ 0,75 100
Seff ≥ 0,72 90
Seff ≥ 0,69 80
Seff ≥ 0,66 70
Seff ≥ 0,63 60
Seff ≥ 0,60 50
Seff ≥ 0,56 40
Seff ≥ 0,52 30
Seff ≥ 0,48 20
Seff ≥ 0,44 10
Seff < 0,44 0
2 European Commission Measuring Code: http://ec.europa.eu/oib/pdf/mesuring-code_en.pdf
188
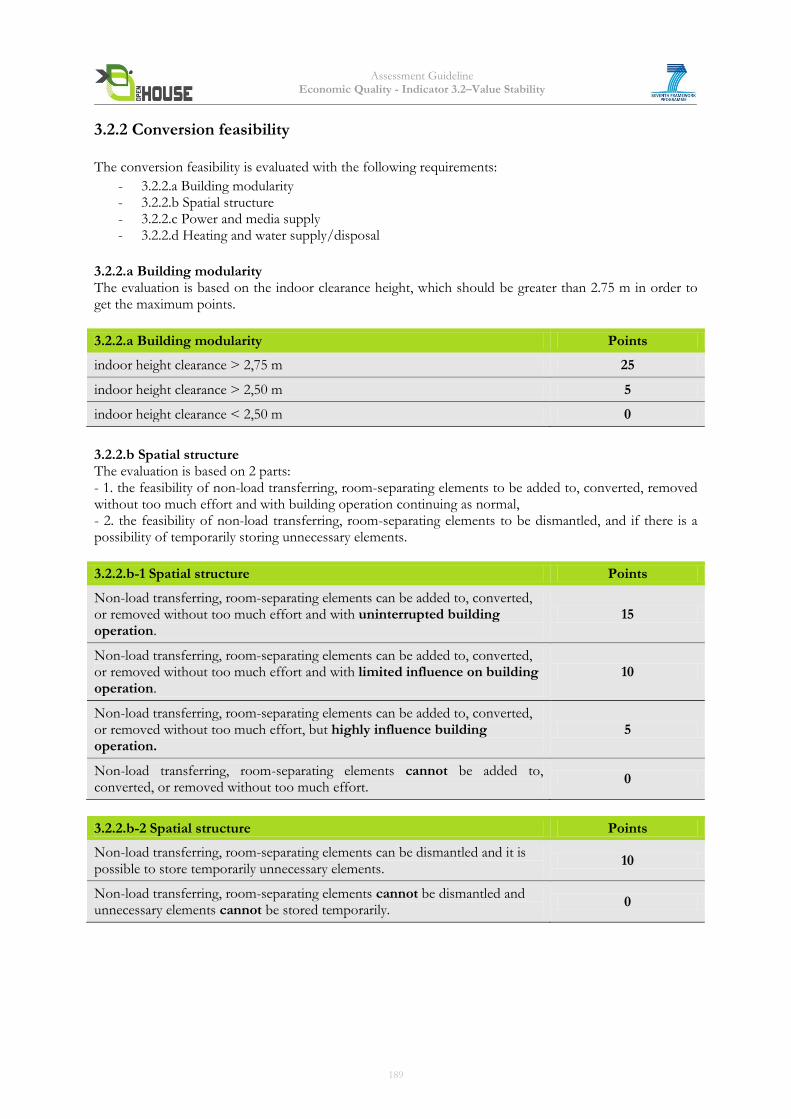
Assessment Guideline Economic Quality - Indicator 3.2–Value Stability
3.2.2 Conversion feasibility The conversion feasibility is evaluated with the following requirements:
- 3.2.2.a Building modularity - 3.2.2.b Spatial structure - 3.2.2.c Power and media supply - 3.2.2.d Heating and water supply/disposal
3.2.2.a Building modularity The evaluation is based on the indoor clearance height, which should be greater than 2.75 m in order to get the maximum points.
3.2.2.a Building modularity Points
indoor height clearance > 2,75 m 25
indoor height clearance > 2,50 m 5
indoor height clearance < 2,50 m 0
3.2.2.b Spatial structure The evaluation is based on 2 parts: - 1. the feasibility of non-load transferring, room-separating elements to be added to, converted, removed without too much effort and with building operation continuing as normal, - 2. the feasibility of non-load transferring, room-separating elements to be dismantled, and if there is a possibility of temporarily storing unnecessary elements.
3.2.2.b-1 Spatial structure Points
Non-load transferring, room-separating elements can be added to, converted, or removed without too much effort and with uninterrupted building operation.
15
Non-load transferring, room-separating elements can be added to, converted, or removed without too much effort and with limited influence on building operation.
10
Non-load transferring, room-separating elements can be added to, converted, or removed without too much effort, but highly influence building operation.
5
Non-load transferring, room-separating elements cannot be added to, converted, or removed without too much effort.
0
3.2.2.b-2 Spatial structure Points
Non-load transferring, room-separating elements can be dismantled and it is possible to store temporarily unnecessary elements.
10
Non-load transferring, room-separating elements cannot be dismantled and unnecessary elements cannot be stored temporarily.
0
189
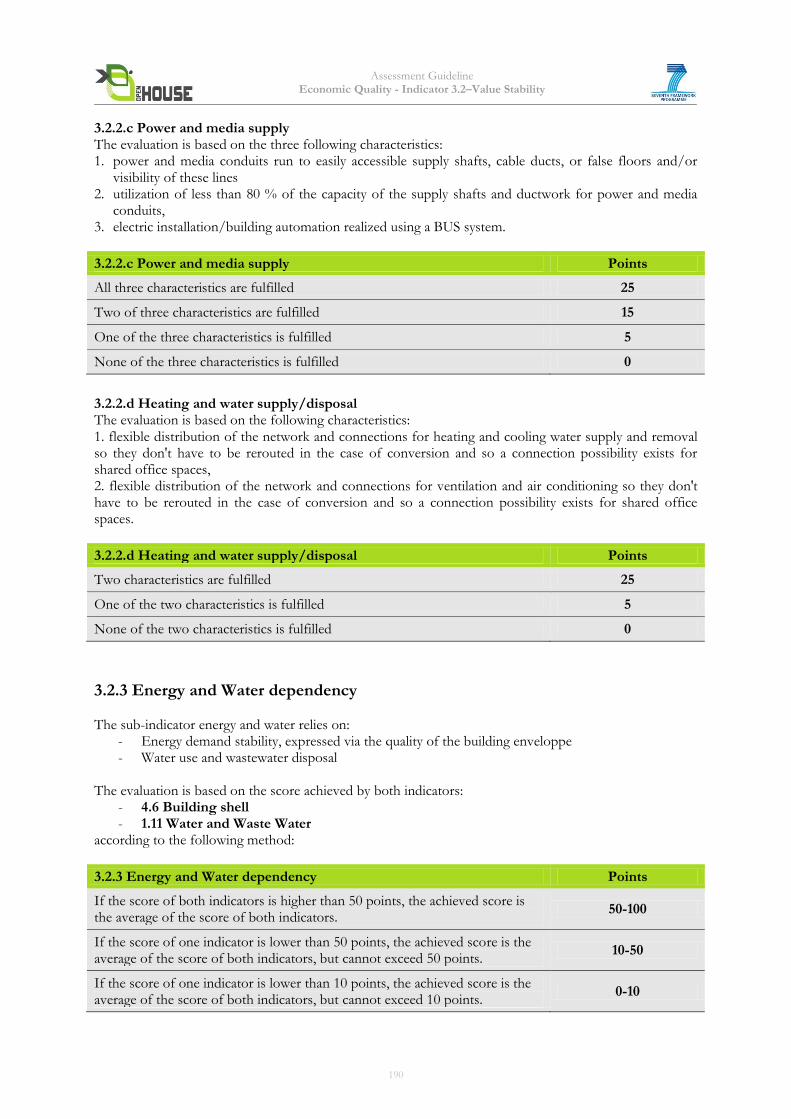
Assessment Guideline Economic Quality - Indicator 3.2–Value Stability
3.2.2.c Power and media supply The evaluation is based on the three following characteristics: 1. power and media conduits run to easily accessible supply shafts, cable ducts, or false floors and/or
visibility of these lines 2. utilization of less than 80 % of the capacity of the supply shafts and ductwork for power and media
conduits, 3. electric installation/building automation realized using a BUS system.
3.2.2.c Power and media supply Points
All three characteristics are fulfilled 25
Two of three characteristics are fulfilled 15
One of the three characteristics is fulfilled 5
None of the three characteristics is fulfilled 0
3.2.2.d Heating and water supply/disposal The evaluation is based on the following characteristics: 1. flexible distribution of the network and connections for heating and cooling water supply and removal so they don't have to be rerouted in the case of conversion and so a connection possibility exists for shared office spaces, 2. flexible distribution of the network and connections for ventilation and air conditioning so they don't have to be rerouted in the case of conversion and so a connection possibility exists for shared office spaces.
3.2.2.d Heating and water supply/disposal Points
Two characteristics are fulfilled 25
One of the two characteristics is fulfilled 5
None of the two characteristics is fulfilled 0
3.2.3 Energy and Water dependency The sub-indicator energy and water relies on:
- Energy demand stability, expressed via the quality of the building enveloppe - Water use and wastewater disposal
The evaluation is based on the score achieved by both indicators:
- 4.6 Building shell - 1.11 Water and Waste Water
according to the following method:
3.2.3 Energy and Water dependency Points
If the score of both indicators is higher than 50 points, the achieved score is the average of the score of both indicators.
50-100
If the score of one indicator is lower than 50 points, the achieved score is the average of the score of both indicators, but cannot exceed 50 points.
10-50
If the score of one indicator is lower than 10 points, the achieved score is the average of the score of both indicators, but cannot exceed 10 points.
0-10
190
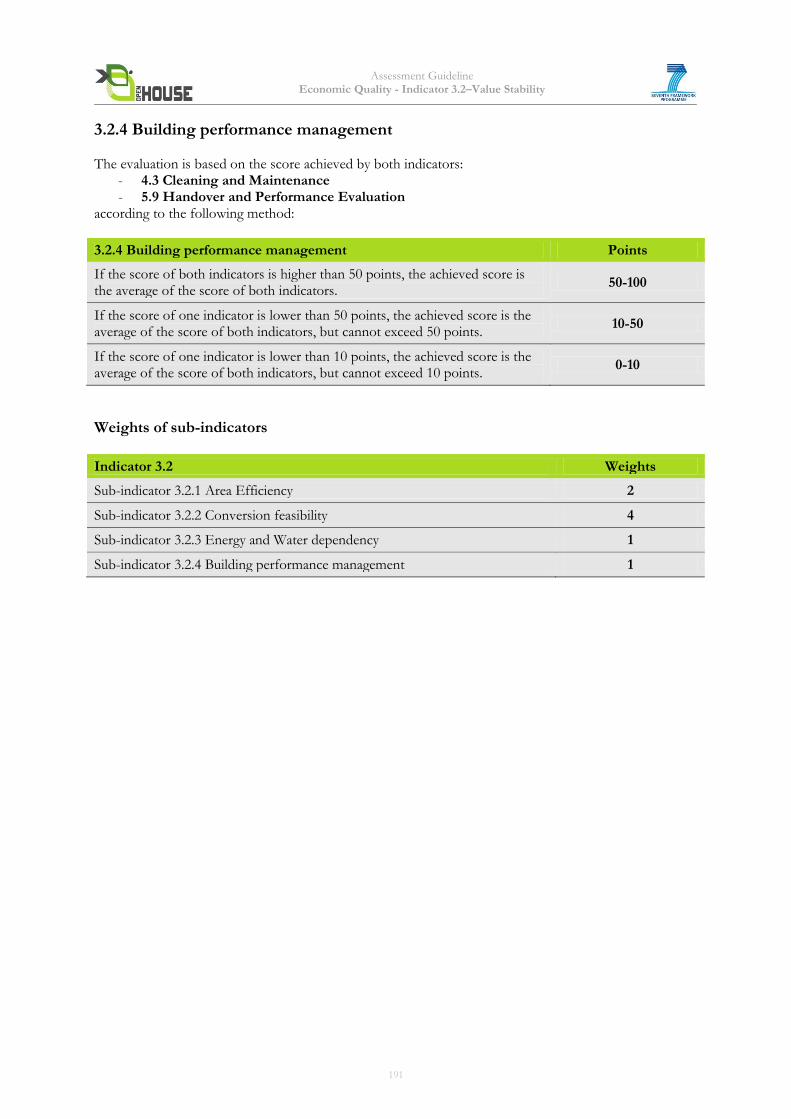
Assessment Guideline Economic Quality - Indicator 3.2–Value Stability
3.2.4 Building performance management The evaluation is based on the score achieved by both indicators:
- 4.3 Cleaning and Maintenance - 5.9 Handover and Performance Evaluation
according to the following method:
3.2.4 Building performance management Points
If the score of both indicators is higher than 50 points, the achieved score is the average of the score of both indicators.
50-100
If the score of one indicator is lower than 50 points, the achieved score is the average of the score of both indicators, but cannot exceed 50 points.
10-50
If the score of one indicator is lower than 10 points, the achieved score is the average of the score of both indicators, but cannot exceed 10 points.
0-10
Weights of sub-indicators
Indicator 3.2 Weights
Sub-indicator 3.2.1 Area Efficiency 2
Sub-indicator 3.2.2 Conversion feasibility 4
Sub-indicator 3.2.3 Energy and Water dependency 1
Sub-indicator 3.2.4 Building performance management 1
191
Assessment Guideline Economic Quality - Indicator 3.2–Value Stability
4. Documentation Guidelines The following documents will be needed to assess the building: Quick & Basic Assessment Letter of commitment or easily and quickly accessible documentation for the required evidence (see Complete Assessment), e.g. reasonable estimations for intended/expected values. Complete Assessment 3.2.1 Area Efficiency
Reproducible calculation of the space efficiency factor as a quotient of usable area (UA) and total floor
area (TFA) in compliance with ISO 9836, European Commission Measuring Code or national
standards/methods/regulations.
Drawings showing in detail the finished state of the building as regards usable area, structure elements,
internal walls, circulation and services area and building envelope.
After construction, building's audit report stating that final design (and approved drawings) has been implemented in the building.
3.2.2 Conversion Feasibility: 3.2.2.a Building modularity
- Information on building modularity from relevant planning documents. This information usually
consists of a typical floor plan and a cross-section of the plans for the supporting structure, including the
following information:
- degree of separation between building’s primary and secondary structures
- degree of floor plans’ and façades’ modularity and of modular structural engineering
- load-transferring elements/systems in building
- clearance height indoors.
- Description of modular structural engineering, e.g. from manufacturer data, and description of specific
convertibility possibilities.
3.2.2.b Spatial structure
- Depiction of variable, non-load bearing, room-separating elements in the building with statements on
possible extent of dismantling and operating expenses during conversion, planned temporary storage.
- Depiction of possibilities for temporarily storing elements. 3.2.2.c Power and media supply
- Information on how the power and media conduits are laid in the building reported in relevant excerpts
from written and illustrated implementation documents.
- Calculation of capacity utilization of vertical and horizontal supply shafts and ductwork for power and
media conduits and of remaining capacity for a representative share of these shafts and ducts.
- Description of electrical installation/building automation areas regulated by a BUS system with product
and manufacturer information for the BUS system. 3.2.2.d Heating and water supply/disposal
- Description of conduit and connection distribution for heat, air conditioning, and water supply and
removal with explanation of how they allow for a floor plan change without needing to be rerouted.
192
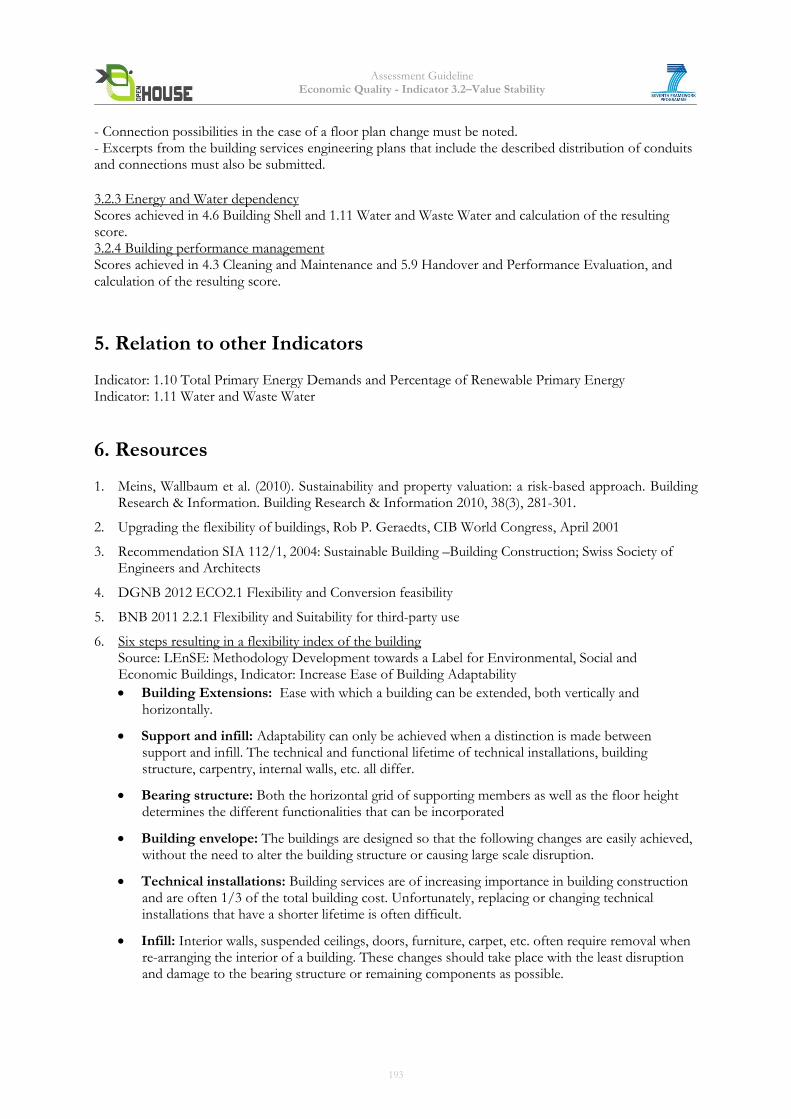
Assessment Guideline Economic Quality - Indicator 3.2–Value Stability
- Connection possibilities in the case of a floor plan change must be noted. - Excerpts from the building services engineering plans that include the described distribution of conduits and connections must also be submitted. 3.2.3 Energy and Water dependency Scores achieved in 4.6 Building Shell and 1.11 Water and Waste Water and calculation of the resulting score. 3.2.4 Building performance management Scores achieved in 4.3 Cleaning and Maintenance and 5.9 Handover and Performance Evaluation, and calculation of the resulting score.
5. Relation to other Indicators Indicator: 1.10 Total Primary Energy Demands and Percentage of Renewable Primary Energy Indicator: 1.11 Water and Waste Water
6. Resources 1. Meins, Wallbaum et al. (2010). Sustainability and property valuation: a risk-based approach. Building
Research & Information. Building Research & Information 2010, 38(3), 281-301.
2. Upgrading the flexibility of buildings, Rob P. Geraedts, CIB World Congress, April 2001
3. Recommendation SIA 112/1, 2004: Sustainable Building –Building Construction; Swiss Society of Engineers and Architects
4. DGNB 2012 ECO2.1 Flexibility and Conversion feasibility
5. BNB 2011 2.2.1 Flexibility and Suitability for third-party use
6. Six steps resulting in a flexibility index of the building Source: LEnSE: Methodology Development towards a Label for Environmental, Social and Economic Buildings, Indicator: Increase Ease of Building Adaptability
Building Extensions: Ease with which a building can be extended, both vertically and horizontally.
Support and infill: Adaptability can only be achieved when a distinction is made between support and infill. The technical and functional lifetime of technical installations, building structure, carpentry, internal walls, etc. all differ.
Bearing structure: Both the horizontal grid of supporting members as well as the floor height determines the different functionalities that can be incorporated
Building envelope: The buildings are designed so that the following changes are easily achieved, without the need to alter the building structure or causing large scale disruption.
Technical installations: Building services are of increasing importance in building construction and are often 1/3 of the total building cost. Unfortunately, replacing or changing technical installations that have a shorter lifetime is often difficult.
Infill: Interior walls, suspended ceilings, doors, furniture, carpet, etc. often require removal when re-arranging the interior of a building. These changes should take place with the least disruption and damage to the bearing structure or remaining components as possible.
193
Assessment Guideline Economic Quality - Indicator 3.2–Value Stability
7. Attachments
Annex 1: Guidelines and definitions for the calculation of areas and space indicators
according to ISO 9836
In defining area measurement, this standard uses the intra-muros and extra-muros concept. The wall
centre method of measurement is not considered in this international standard.
According to ISO9836, horizontal and vertical surface areas are measured by their actual dimensions.
Inclined planes are measured by their vertical projection onto an imaginary horizontal plane. The surface
areas are expressed in square meters, to two decimal places.
Definitions met throughout the calculation are presented below:
Covered area: the area of ground covered by the building in its finished state. The covered area is
determined by the vertical projection of the external dimensions of the building onto the ground.
Constructions or part of constructions not projecting above the surface of the ground, external staircases,
ramps, canopies, horizontal sun-shields, roof overhangs street lighting, area of outdoor facilities such as
greenhouses, outhouses and conservatories are not included in the covered area.
Total floor area: the total floor area of a building is the total area of all floor levels. The total floor area of
each level is obtained from the external dimensions of the enclosing elements, at floor height. Recesses
and projections for structural or aesthetic purposes and profiling are not included if they do not alter the
net floor area (see next). Covered floor areas which are not enclosed or are partially enclosed and have no
enclosing elements are calculated according to the vertical projection of the outer limit of the covering
components.
The total floor area is calculated separately for each floor level. Areas with varying storey height within
one floor level are also calculated separately.
The total floor area is made up of the net floor area and the area taken up by the structure.
Intra-muros area: the intra-muros area is the total floor area less the area taken up by the external walls.
This area is determined separately for each floor level. The intra-muros area includes the net floor area and
the area taken up by the internal walls.
Net floor area: the net floor area is the area between enclosing elements. The net floor area is also
determined separately for each floor level. It is calculated from the clear dimensions of the finished
building at floor height, excluding skertings, thresholds, etc. Covered floor areas which are not enclosed,
or only partially enclosed and have no enclosing elements are determined by the vertical projection of the
outer limit of the covering components. Areas with varying storey height within one floor level(e.g. large
halls, auditoria) are calculated separately.
Demountable components such as partitions, pipes ducts etc are included in the net floor area. The floor
areas of structural elements, door and window recesses, and niches to recesses in the elements enclosing
the spaces are not included in the net floor area.
The net floor area is divided into: (a) usable area, (b) services area, (c ) circulation area
194
Assessment Guideline Economic Quality - Indicator 3.2–Value Stability
Area of structural elements: the area within the total floor area on a horizontal section at floor level of
the enclosing elements (e.g. external and internal load-bearing walls) and the area of columns, pillars, piers,
chimneys, partitions which cannot be entered. The area of structural elements is determined separately for
each floor level. It is calculated from the dimensions of the finished building at floor height excluding
skirtings, thresholds, plinths etc. Also included in the area of structural elements are the floor areas of
door recesses, and recessed and niches in the enclosing elements. The area of structural elements may also
be calculated as the difference between the total floor area and the net floor area.
Usable area: that part of the net floor area which corresponds to the purpose and use of the building.
The usable area is determined separately for each floor level. Usable areas are classified according to the
purpose of the building and the use to which they are put; they are usually divided into main usable areas
and subsidiary usable areas.
Services area: the net floor area which accommodates technical installations, such as: (a) installations and
pipes for the disposal of waste water, (b) water supply, (c ) heating and hot water systems, (d) gas
installations (other than for heating purposes) and installations for liquids, (e) electricity supply,
generators, (f) ventilation, air-conditioning and cooling systems, (g) telephone switchboard apparatus;, (h)
lifts, escalators and conveyors and (i) any other central service installation. This area is also determined
separately for each floor level.
Circulation area: the net area for circulation within the building (e.g. stair wells, corridors, internal ramps,
waiting areas, escape balconies etc). It is determined separately for each floor level.
Building envelope area: this area is obtained from buildings or parts of buildings which are enclosed on
all sides and covered, including those parts of the structure which are above the top level of the ground
and those below it. Glazed areas are specified separately as parts of external wall areas or roof surfaces.
Components of the building which are below the lowest floor level such as parts of the foundation,
recessions and projections for aesthetic purposes such as pavement lights, external staircases, external
ramps, canopies, horizontal sun-shields, roof overhangs, skylights, chimney stacks, etc
195
Assessment Guideline Version 1.2 New Office Buildings – July 2013
OPEN HOUSE
ASSESSMENT GUIDELINE
Technical Characteristics
4.3 Cleaning and maintenance 4.5 Noise Protection 4.6 Quality of the building shell 4.7 Ease of Deconstruction, Recycling, and Dismantling
Note: Core indicators are in bold
196
Assessment Guideline Technical Characteristics - Indicator 4.3 – Cleaning and Maintenance
Indicator 4.3 Cleaning and Maintenance (adapted from DGNB/BNB)
1. Objective With targeted cleaning and maintenance, the used materials can be operated for the maximum useful lifetime. The ease of cleaning and maintenance of the structure has a high impact on the costs and the environment of a building during the operating phase, extending the life cycle of building elements by optimal maintenance. Areas that can be cleaned easily require lower expenditures on cleansers and cause lower cleaning costs and lower environmental impact.
2. Assessment Methodology For the qualitative evaluation based on a checklist, the building is divided into the three following building component types:
- Load-bearing structure - Non-load-bearing external structures, including windows and external doors - Non-load-bearing interior structures
The technical implementation of each section is evaluated. By means of the technical parameters, it shall be identified whether a structure, based on its technical planning and construction, enables efficient cleaning and maintenance. The different sections of the construction are considered separately. Criteria for maintenance and for cleaning are queried. The following sub-indicators will be assessed: 4.3.1 Load-bearing structure 4.3.2 Non-load-bearing external structures 4.3.3 Non-load-bearing interior structures
197
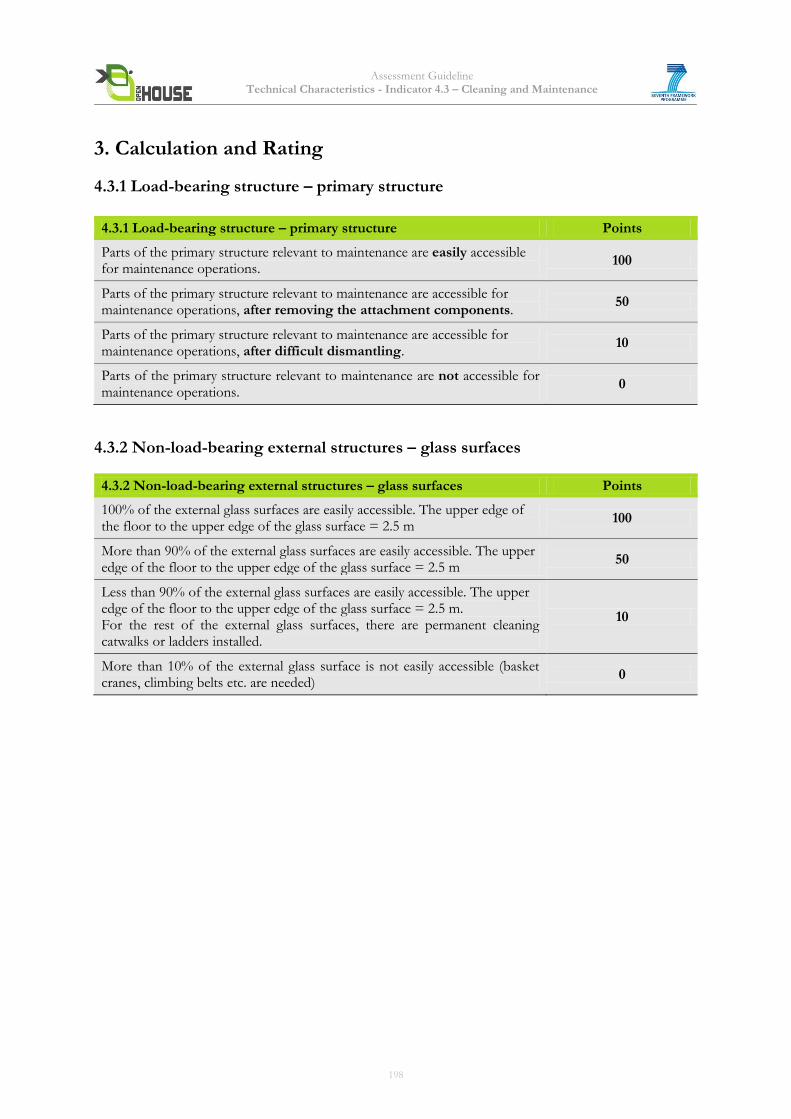
Assessment Guideline Technical Characteristics - Indicator 4.3 – Cleaning and Maintenance
3. Calculation and Rating
4.3.1 Load-bearing structure – primary structure
4.3.1 Load-bearing structure – primary structure Points
Parts of the primary structure relevant to maintenance are easily accessible for maintenance operations.
100
Parts of the primary structure relevant to maintenance are accessible for maintenance operations, after removing the attachment components.
50
Parts of the primary structure relevant to maintenance are accessible for maintenance operations, after difficult dismantling.
10
Parts of the primary structure relevant to maintenance are not accessible for maintenance operations.
0
4.3.2 Non-load-bearing external structures – glass surfaces
4.3.2 Non-load-bearing external structures – glass surfaces Points
100% of the external glass surfaces are easily accessible. The upper edge of the floor to the upper edge of the glass surface = 2.5 m
100
More than 90% of the external glass surfaces are easily accessible. The upper edge of the floor to the upper edge of the glass surface = 2.5 m
50
Less than 90% of the external glass surfaces are easily accessible. The upper edge of the floor to the upper edge of the glass surface = 2.5 m. For the rest of the external glass surfaces, there are permanent cleaning catwalks or ladders installed.
10
More than 10% of the external glass surface is not easily accessible (basket cranes, climbing belts etc. are needed)
0
198
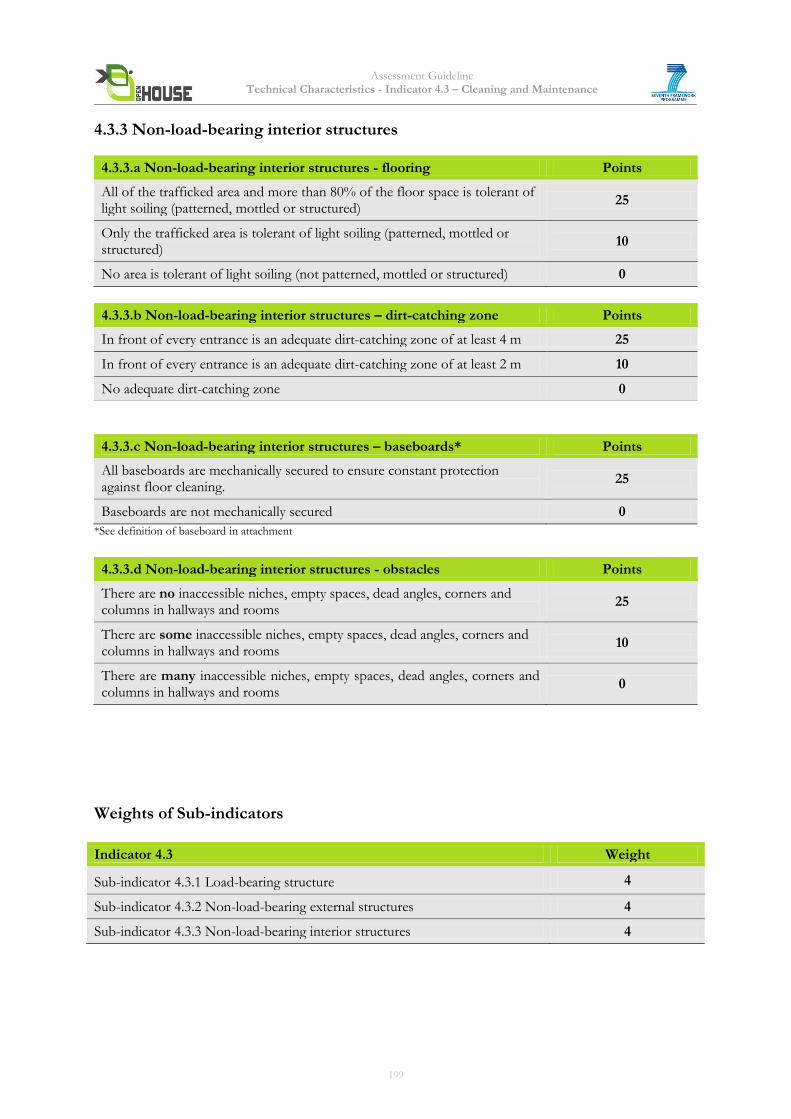
Assessment Guideline Technical Characteristics - Indicator 4.3 – Cleaning and Maintenance
4.3.3 Non-load-bearing interior structures
4.3.3.a Non-load-bearing interior structures - flooring Points
All of the trafficked area and more than 80% of the floor space is tolerant of light soiling (patterned, mottled or structured)
25
Only the trafficked area is tolerant of light soiling (patterned, mottled or structured)
10
No area is tolerant of light soiling (not patterned, mottled or structured) 0
4.3.3.b Non-load-bearing interior structures – dirt-catching zone Points
In front of every entrance is an adequate dirt-catching zone of at least 4 m 25
In front of every entrance is an adequate dirt-catching zone of at least 2 m 10
No adequate dirt-catching zone 0
4.3.3.c Non-load-bearing interior structures – baseboards* Points
All baseboards are mechanically secured to ensure constant protection against floor cleaning.
25
Baseboards are not mechanically secured 0
*See definition of baseboard in attachment
4.3.3.d Non-load-bearing interior structures - obstacles Points
There are no inaccessible niches, empty spaces, dead angles, corners and columns in hallways and rooms
25
There are some inaccessible niches, empty spaces, dead angles, corners and columns in hallways and rooms
10
There are many inaccessible niches, empty spaces, dead angles, corners and columns in hallways and rooms
0
Weights of Sub-indicators
Indicator 4.3 Weight
Sub-indicator 4.3.1 Load-bearing structure 4
Sub-indicator 4.3.2 Non-load-bearing external structures 4
Sub-indicator 4.3.3 Non-load-bearing interior structures 4
199
Assessment Guideline Technical Characteristics - Indicator 4.3 – Cleaning and Maintenance
4. Documentation Guidelines The following documents will be needed to assess the building:
Quick & Basic Assessment Letter of commitment or easily and quickly accessible documentation for the required evidence (see Complete Assessment), e.g. reasonable estimations for intended/expected values. Complete Assessment 4.3.1 Load-bearing structure For the load-bearing structure, an overview of all primary structure components have to be provided, by indicating if these are relevant to maintenance and including a proof of accessibility for example in the form of detailed drawings. 4.3.2 Non-load-bearing external structures For non-load bearing external structures, evidence of accessibility of all external glass surfaces with description of the height and distance from the upper edge of the floor and evidence of cleaning catwalk/ladders with information to the accessibility of glass surfaces from these and their height have to be provided.
4.3.3 Non-load-bearing interior structures For non-load-bearing interior structures, following information have to be made available:
- Demonstration, e.g. in the form of photographs with reference to the floor plan, that the entire
trafficked area and also 80% of the floor space are equipped with a patterned, mottled or structured flooring.
- Floor plan of the ground floor or photographic documentation showing measurements of building entrances and with information about flooring and soil-capture zones, such as grates and synthetic or natural fibre mats.
- Information about the baseboards in the floor area in form of drawings, description of building components, photographic documentation with corresponding tender documents specifying the type of connections (mechanical or glued).
- Evidence of the presence of obstacles, such as inaccessible corners, columns in rooms, niches, etc., on a floor plan.
5. Relation to other Indicators Indicator 3.1 - LCC
6. Resources DGNB - 40 Ease of cleaning and maintenance BNB 2011 - 413 Cleaning and Maintenance
200

Assessment Guideline Technical Characteristics - Indicator 4.3 – Cleaning and Maintenance
7. Attachments
Baseboard Wikipedia: http://en.wikipedia.org/wiki/Baseboard) In architecture, a baseboard (also called skirting board, skirting, mopboard, floor molding, as well as base molding) is a (generally wooden) board covering the lowest part of an interior wall. Its purpose is to cover the joint between the wall surface and the floor. It covers the uneven edge of flooring next to the wall; protects the wall from kicks, abrasion, and furniture; and can serve as a decorative molding.
201
Assessment Guideline Technical characteristics - Indicator 4.5 – Noise Protection
Indicator 4.5 Noise Protection (adapted from DGNB/BNB)
1. Objective Noise has a big impact on the health and comfort of people, so that an appropriate noise protection should be achieved. Benefits of noise protection in office buildings are: avoiding the loss of concentration, protection of privacy and confidentiality, and consideration for people with limited hearing. This supports the European Commission objective of designing construction works in such a way that noise perceived by the occupants or people nearby is kept down to a level that will not threaten their health and will allow them to sleep, rest and work in satisfactory conditions1.
2. Assessment Methodology Measures that exceed the minimum noise protection to the standard requirements lead to a better score. Exceeding of the standards shall be motivated. The quality of noise protection of building parts is determined from the certificate of noise protection or the quality of the specified building parts. Compliance in accordance with the national standards or DIN 4109:1989 and DIN 4109/Supplement 2 are required. The following sub-indicators will be assessed: 4.5.1 Airborne sound insulation with respect to exterior sound 4.5.2 Airborne sound insulation with respect to other working areas and to personal working areas (interior walls, ceilings, stairwell walls) 4.5.3 Insulation from impact sound with respect to other working areas and to personal working areas (ceilings, stairs, and stairway landings) 4.5.4 Insulation from sound created by building services (water system and other services)
1 DIRECTIVE 89/106/EEC and ist Interpretative document No. 5: Protection against noise
202
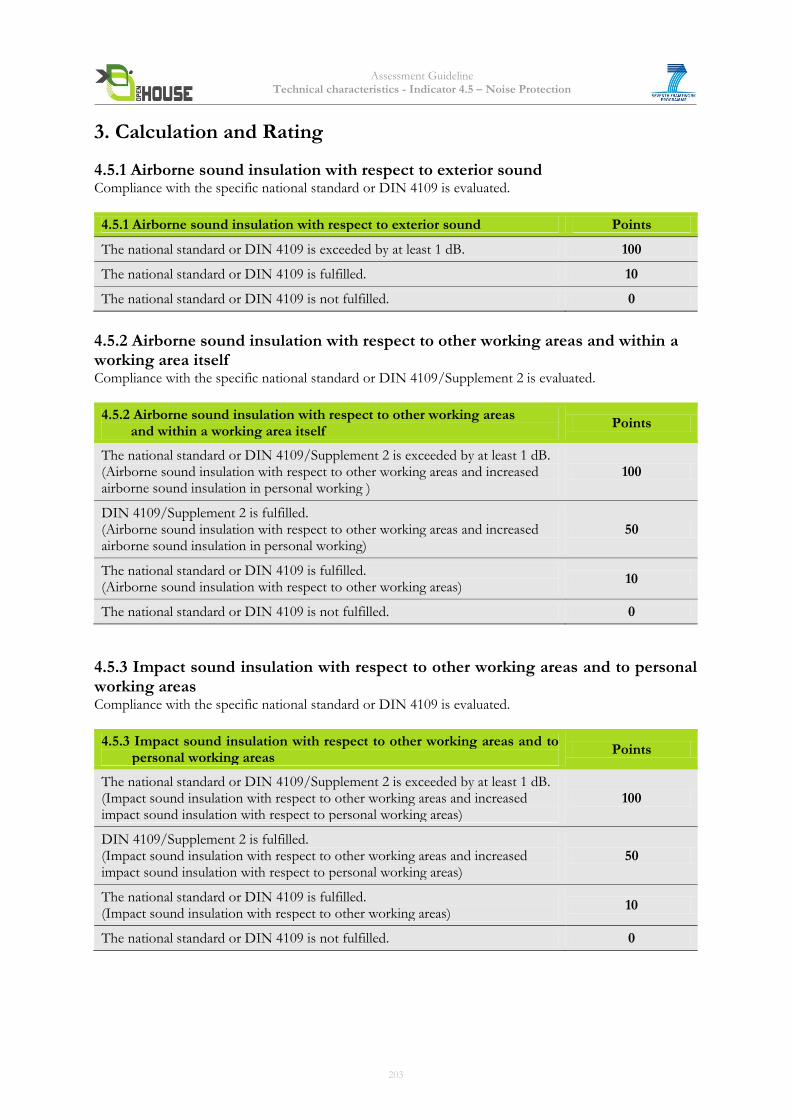
Assessment Guideline Technical characteristics - Indicator 4.5 – Noise Protection
3. Calculation and Rating
4.5.1 Airborne sound insulation with respect to exterior sound Compliance with the specific national standard or DIN 4109 is evaluated.
4.5.1 Airborne sound insulation with respect to exterior sound Points
The national standard or DIN 4109 is exceeded by at least 1 dB. 100
The national standard or DIN 4109 is fulfilled. 10
The national standard or DIN 4109 is not fulfilled. 0
4.5.2 Airborne sound insulation with respect to other working areas and within a working area itself Compliance with the specific national standard or DIN 4109/Supplement 2 is evaluated.
4.5.2 Airborne sound insulation with respect to other working areas and within a working area itself
Points
The national standard or DIN 4109/Supplement 2 is exceeded by at least 1 dB. (Airborne sound insulation with respect to other working areas and increased airborne sound insulation in personal working )
100
DIN 4109/Supplement 2 is fulfilled. (Airborne sound insulation with respect to other working areas and increased airborne sound insulation in personal working)
50
The national standard or DIN 4109 is fulfilled. (Airborne sound insulation with respect to other working areas)
10
The national standard or DIN 4109 is not fulfilled. 0
4.5.3 Impact sound insulation with respect to other working areas and to personal working areas Compliance with the specific national standard or DIN 4109 is evaluated.
4.5.3 Impact sound insulation with respect to other working areas and to personal working areas
Points
The national standard or DIN 4109/Supplement 2 is exceeded by at least 1 dB. (Impact sound insulation with respect to other working areas and increased impact sound insulation with respect to personal working areas)
100
DIN 4109/Supplement 2 is fulfilled. (Impact sound insulation with respect to other working areas and increased impact sound insulation with respect to personal working areas)
50
The national standard or DIN 4109 is fulfilled. (Impact sound insulation with respect to other working areas)
10
The national standard or DIN 4109 is not fulfilled. 0
203
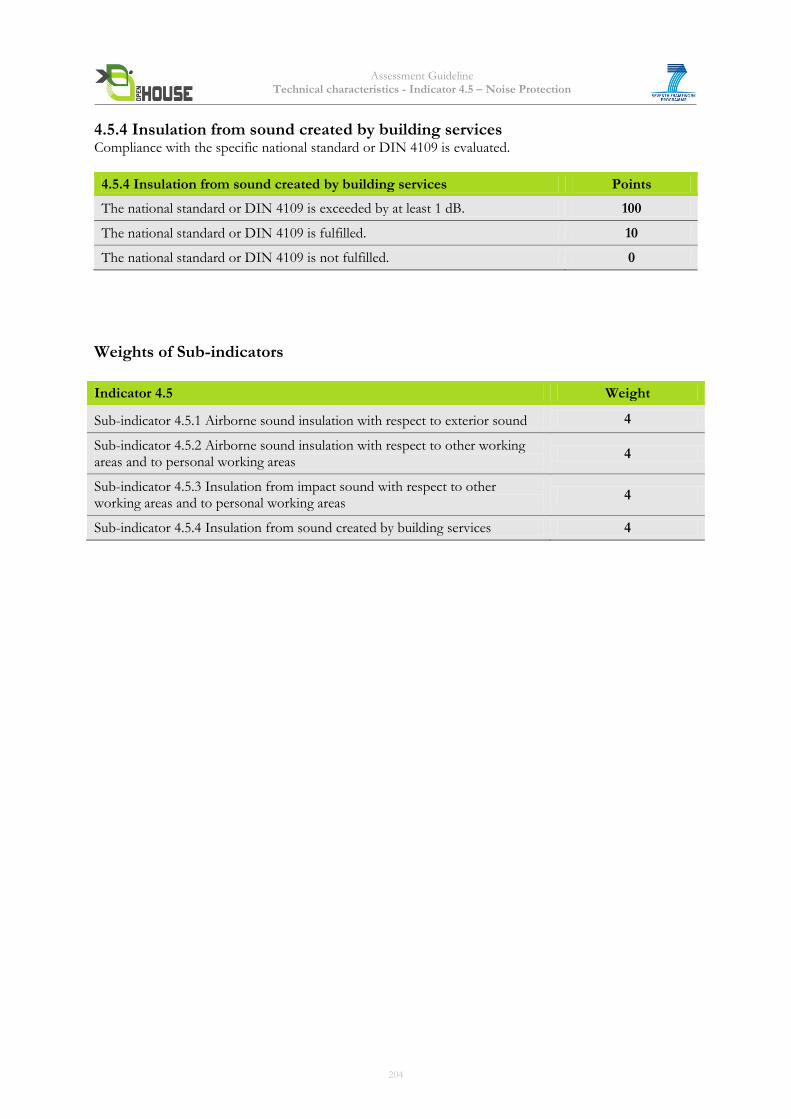
Assessment Guideline Technical characteristics - Indicator 4.5 – Noise Protection
4.5.4 Insulation from sound created by building services
Compliance with the specific national standard or DIN 4109 is evaluated.
4.5.4 Insulation from sound created by building services Points
The national standard or DIN 4109 is exceeded by at least 1 dB. 100
The national standard or DIN 4109 is fulfilled. 10
The national standard or DIN 4109 is not fulfilled. 0
Weights of Sub-indicators
Indicator 4.5 Weight
Sub-indicator 4.5.1 Airborne sound insulation with respect to exterior sound 4
Sub-indicator 4.5.2 Airborne sound insulation with respect to other working areas and to personal working areas
4
Sub-indicator 4.5.3 Insulation from impact sound with respect to other working areas and to personal working areas
4
Sub-indicator 4.5.4 Insulation from sound created by building services 4
204
Assessment Guideline Technical characteristics - Indicator 4.5 – Noise Protection
4. Documentation Guidelines The following documents will be needed to assess the building: Basic and Quick Assessment Letter of commitment or easily and quickly accessible documentation for the required evidence (see Complete Assessment), e.g. reasonable estimations for intended/expected values. Complete Assessment
4.5.1 Airborne sound insulation with respect to exterior sound Proof of surpassed requirements for airborne sound insulation with respect to external noise according to the specific national/local standards, if these are available. For example, in Germany, evidence that the airborne sound insulation values with respect to external noise specified in the national standard or DIN 4109 (English version) have been surpassed by at least 1 dB. 4.5.2 Airborne sound insulation with respect to other working areas and to personal working areas Proof of surpassed requirements for airborne sound insulation according to the specific national/local standards, if these are available. For example, in Germany, evidence that the airborne sound insulation values specified in DIN 4109/Supplement 2 have been surpassed by at least 1 dB. 4.5.3 Insulation from impact sound with respect to other working areas and to personal working areas Evidence that values for impact sound insulation with respect to other work areas have been surpassed according to the specific national/local standards, if these are available. For example, in Germany, separate proof that the values for impact sound insulation with respect to other work areas specified in DIN 4109 supplement 2 have been surpassed by at least 1 dB. 4.5.4 Insulation from sound created by building services (water system and other services) Evidence that building’s insulation from sound created by building services surpasses requirements according to the specific national/local standards, if these are available. For example, in Germany, evidence that the values for structure-borne sound insulation with respect to other works areas and to personal working areas specified in DIN 4109 (English version) have been surpassed by at least 1 dB(A).
5. Relation to other Indicators Indicator 2.6 “Acoustic comfort” Indicator 2.12 “Noise from building and Site”
6. Resources DGNB 2009: 34 Sound Protection BNB 2011: 4.1.1 Sound Insulation DIN 4109:1989 DIN 4109/Supplement 2
7. Attachments
None
205
Assessment Guideline Technical Characteristics - Indicator 4.6 – Building Shell
Indicator 4.6 Building Shell (adapted from DGNB/BNB)
Core Indicator
1. Objective The goal of this indicator is to minimize the heating and cooling demand to condition building areas, simultaneously ensuring a high thermal comfort and avoiding structural damages.
2. Assessment Methodology Various input variables are necessary to evaluate this indicator. These variables are being described using the individual requirements for the components of the building envelope. The following sub-indicators will be assessed: 4.6.1 Median thermal transmittance coefficients of building components Ū 4.6.2 Thermal Bridges 4.6.3 Air permeability class (window air-tightness) 4.6.4 Amount of condensation inside the structure 4.6.5 Air exchange n50 and if necessary q50
4.6.6 Solar heat protection
206
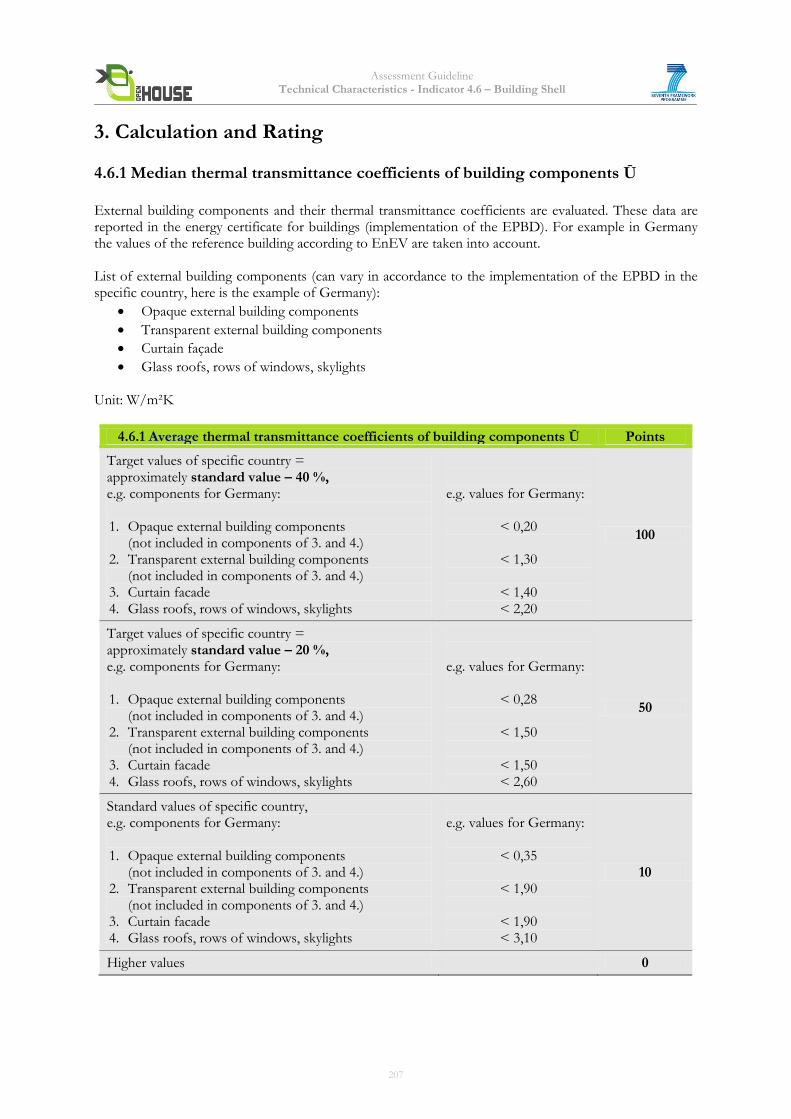
Assessment Guideline Technical Characteristics - Indicator 4.6 – Building Shell
3. Calculation and Rating 4.6.1 Median thermal transmittance coefficients of building components Ū External building components and their thermal transmittance coefficients are evaluated. These data are reported in the energy certificate for buildings (implementation of the EPBD). For example in Germany the values of the reference building according to EnEV are taken into account. List of external building components (can vary in accordance to the implementation of the EPBD in the specific country, here is the example of Germany):
Opaque external building components
Transparent external building components
Curtain façade
Glass roofs, rows of windows, skylights
Unit: W/m²K
4.6.1 Average thermal transmittance coefficients of building components Ū Points
Target values of specific country = approximately standard value – 40 %, e.g. components for Germany:
1. Opaque external building components
(not included in components of 3. and 4.) 2. Transparent external building components
(not included in components of 3. and 4.) 3. Curtain facade 4. Glass roofs, rows of windows, skylights
e.g. values for Germany:
< 0,20
< 1,30
< 1,40 < 2,20
100
Target values of specific country = approximately standard value – 20 %, e.g. components for Germany:
1. Opaque external building components
(not included in components of 3. and 4.) 2. Transparent external building components
(not included in components of 3. and 4.) 3. Curtain facade 4. Glass roofs, rows of windows, skylights
e.g. values for Germany:
< 0,28
< 1,50
< 1,50 < 2,60
50
Standard values of specific country, e.g. components for Germany: 1. Opaque external building components
(not included in components of 3. and 4.) 2. Transparent external building components
(not included in components of 3. and 4.) 3. Curtain facade 4. Glass roofs, rows of windows, skylights
e.g. values for Germany:
< 0,35
< 1,90
< 1,90 < 3,10
10
Higher values 0
207
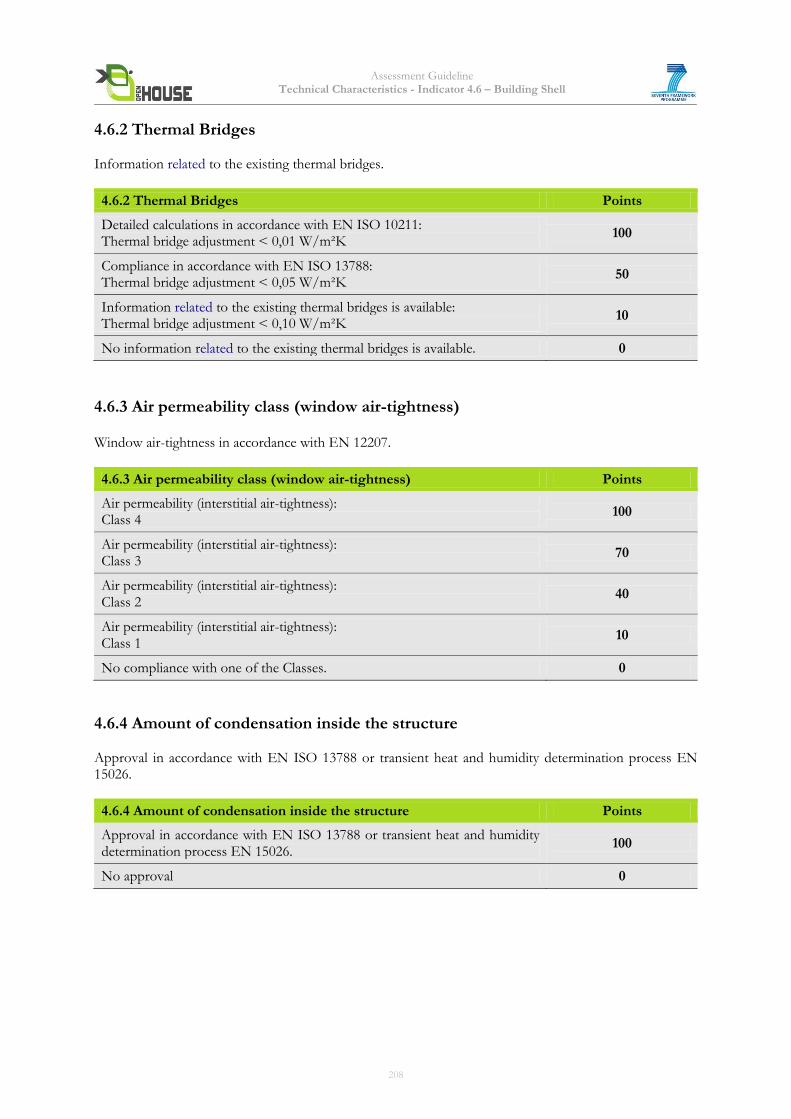
Assessment Guideline Technical Characteristics - Indicator 4.6 – Building Shell
4.6.2 Thermal Bridges Information related to the existing thermal bridges.
4.6.2 Thermal Bridges Points
Detailed calculations in accordance with EN ISO 10211: Thermal bridge adjustment < 0,01 W/m²K
100
Compliance in accordance with EN ISO 13788: Thermal bridge adjustment < 0,05 W/m²K
50
Information related to the existing thermal bridges is available: Thermal bridge adjustment < 0,10 W/m²K
10
No information related to the existing thermal bridges is available. 0
4.6.3 Air permeability class (window air-tightness) Window air-tightness in accordance with EN 12207.
4.6.3 Air permeability class (window air-tightness) Points
Air permeability (interstitial air-tightness): Class 4
100
Air permeability (interstitial air-tightness): Class 3
70
Air permeability (interstitial air-tightness): Class 2
40
Air permeability (interstitial air-tightness): Class 1
10
No compliance with one of the Classes. 0
4.6.4 Amount of condensation inside the structure Approval in accordance with EN ISO 13788 or transient heat and humidity determination process EN 15026.
4.6.4 Amount of condensation inside the structure Points
Approval in accordance with EN ISO 13788 or transient heat and humidity determination process EN 15026.
100
No approval 0
208
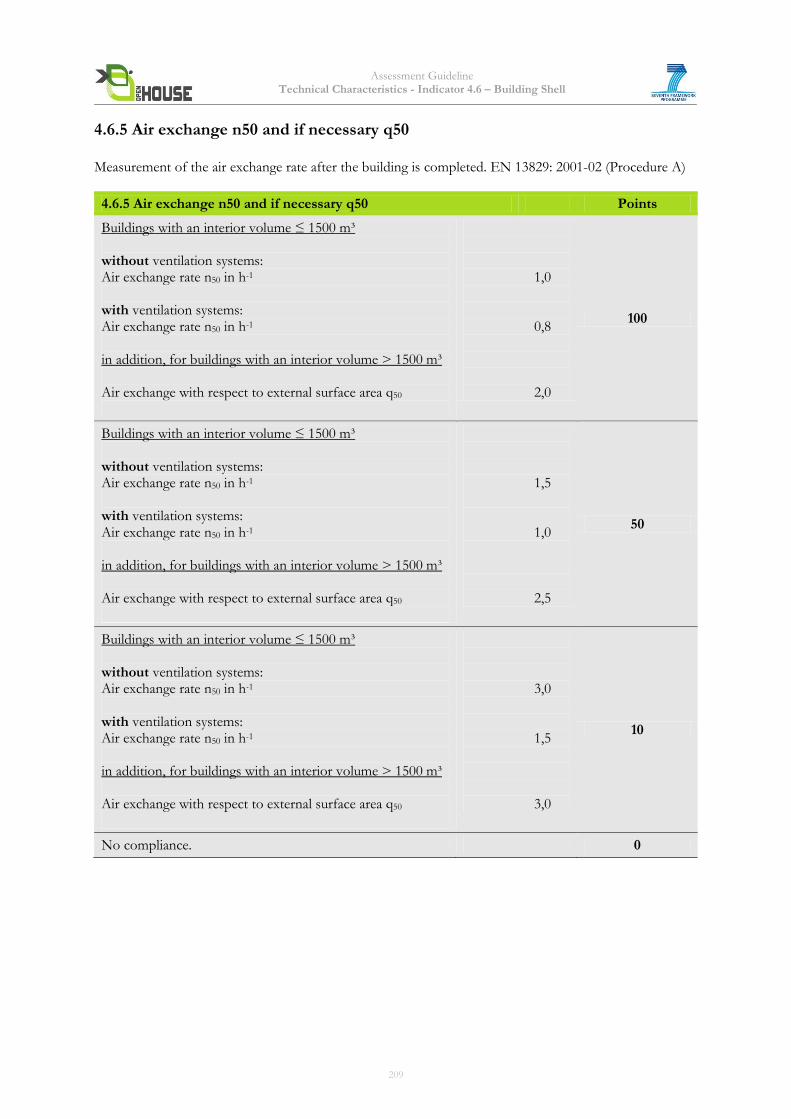
Assessment Guideline Technical Characteristics - Indicator 4.6 – Building Shell
4.6.5 Air exchange n50 and if necessary q50 Measurement of the air exchange rate after the building is completed. EN 13829: 2001-02 (Procedure A)
4.6.5 Air exchange n50 and if necessary q50 Points
Buildings with an interior volume ≤ 1500 m³ without ventilation systems: Air exchange rate n50 in h-1
with ventilation systems: Air exchange rate n50 in h-1
in addition, for buildings with an interior volume > 1500 m³ Air exchange with respect to external surface area q50
1,0
0,8
2,0
100
Buildings with an interior volume ≤ 1500 m³ without ventilation systems: Air exchange rate n50 in h-1
with ventilation systems: Air exchange rate n50 in h-1
in addition, for buildings with an interior volume > 1500 m³ Air exchange with respect to external surface area q50
1,5
1,0
2,5
50
Buildings with an interior volume ≤ 1500 m³ without ventilation systems: Air exchange rate n50 in h-1
with ventilation systems: Air exchange rate n50 in h-1
in addition, for buildings with an interior volume > 1500 m³ Air exchange with respect to external surface area q50
3,0
1,5
3,0
10
No compliance. 0
209
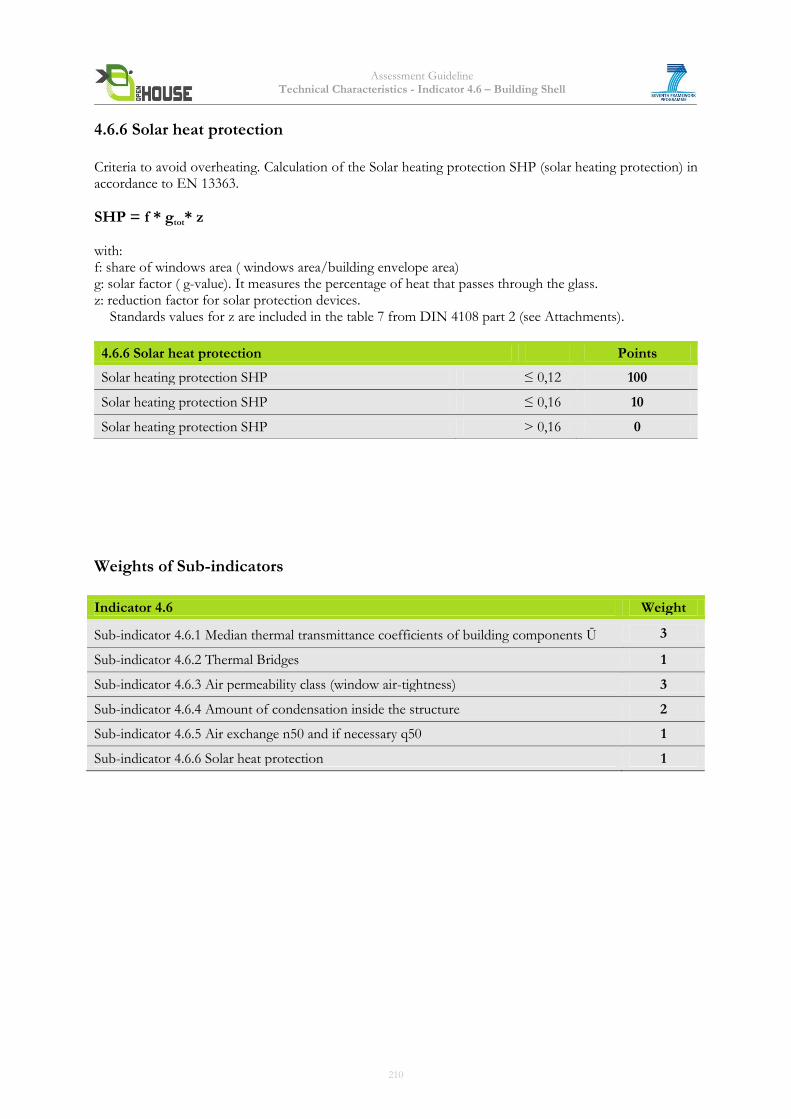
Assessment Guideline Technical Characteristics - Indicator 4.6 – Building Shell
4.6.6 Solar heat protection Criteria to avoid overheating. Calculation of the Solar heating protection SHP (solar heating protection) in accordance to EN 13363.
SHP = f * gtot* z with: f: share of windows area ( windows area/building envelope area) g: solar factor ( g-value). It measures the percentage of heat that passes through the glass. z: reduction factor for solar protection devices. Standards values for z are included in the table 7 from DIN 4108 part 2 (see Attachments).
4.6.6 Solar heat protection Points
Solar heating protection SHP ≤ 0,12 100
Solar heating protection SHP ≤ 0,16 10
Solar heating protection SHP > 0,16 0
Weights of Sub-indicators
Indicator 4.6 Weight
Sub-indicator 4.6.1 Median thermal transmittance coefficients of building components Ū 3
Sub-indicator 4.6.2 Thermal Bridges 1
Sub-indicator 4.6.3 Air permeability class (window air-tightness) 3
Sub-indicator 4.6.4 Amount of condensation inside the structure 2
Sub-indicator 4.6.5 Air exchange n50 and if necessary q50 1
Sub-indicator 4.6.6 Solar heat protection 1
210
Assessment Guideline Technical Characteristics - Indicator 4.6 – Building Shell
4. Documentation Guidelines The following documents will be needed to assess the building: Quick & Basic Assessment Letter of commitment or easily and quickly accessible documentation for the required evidence (see Complete Assessment), e.g. reasonable estimations for intended/expected values. Complete Assessment 4.6.1 Median thermal transmittance coefficients of building components Ū Thermal transmittance coefficients of external building components 4.6.2 Thermal Bridges Approval or calculation of the thermal bridges 4.6.3 Air permeability class (window air-tightness) Certificate of window air-tightness (EN 12207) 4.6.4 Amount of condensation inside the structure Condensation determination (EN ISO 13788 or transient process) 4.6.5 Air exchange n50 and if necessary q50
Documentation of the air-tightness measurements 4.6.6 Solar heat protection Calculation of the SHP (Solar Heat Protection)
5. Relation to other Indicators 2.3 Thermal Comfort 2.4 Indoor Air Quality 5.7 Quality Assurance of Construction Execution 5.8 Commissioning
6. Resources 1. EN ISO 6946 2. EN ISO 10211 3. EN ISO 13788 4. EN 12207 5. EN 15026 6. EN 13829: 2001-02 (Procedure A) 7. DIN 4108-2 8. DGNB 2009: Quality of building envelope’s with regard to heat and humidity 9. BNB 2011: 4.1.2 Heat Insulation and Protection against Condensate
211
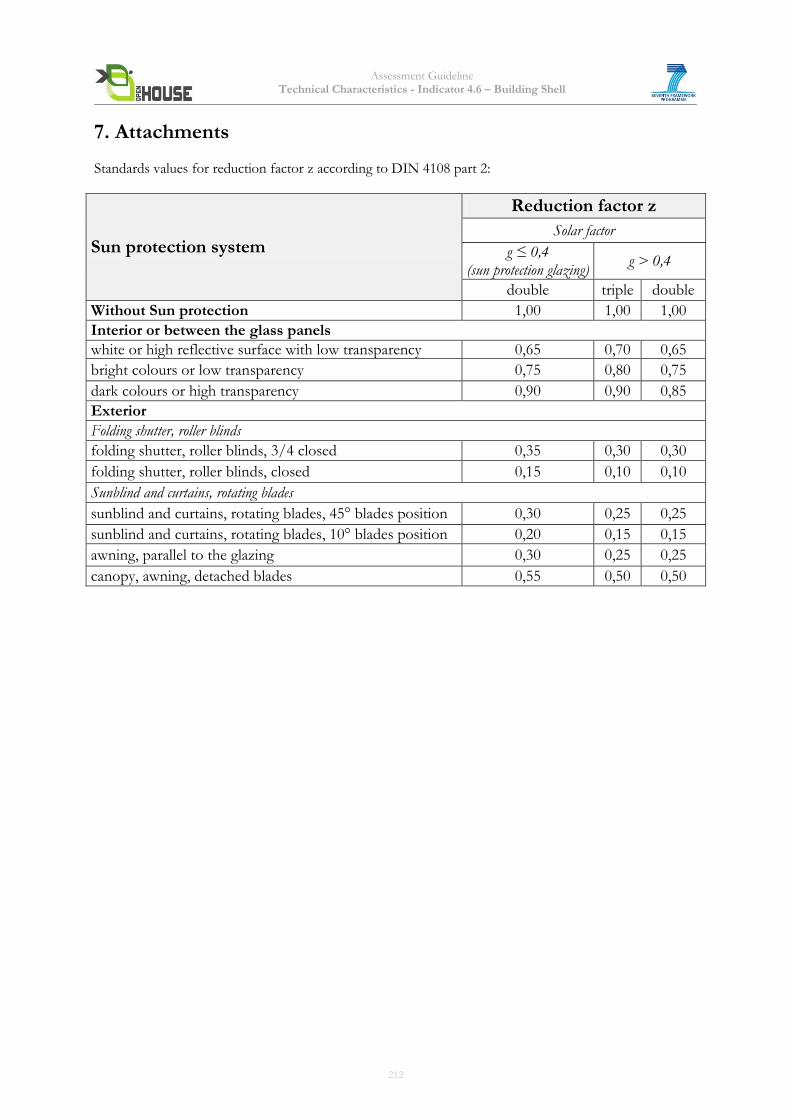
Assessment Guideline Technical Characteristics - Indicator 4.6 – Building Shell
7. Attachments Standards values for reduction factor z according to DIN 4108 part 2:
Sun protection system
Reduction factor z
Solar factor
g ≤ 0,4 (sun protection glazing)
g > 0,4
double triple double
Without Sun protection 1,00 1,00 1,00
Interior or between the glass panels
white or high reflective surface with low transparency 0,65 0,70 0,65
bright colours or low transparency 0,75 0,80 0,75
dark colours or high transparency 0,90 0,90 0,85
Exterior
Folding shutter, roller blinds
folding shutter, roller blinds, 3/4 closed 0,35 0,30 0,30
folding shutter, roller blinds, closed 0,15 0,10 0,10
Sunblind and curtains, rotating blades
sunblind and curtains, rotating blades, 45° blades position 0,30 0,25 0,25
sunblind and curtains, rotating blades, 10° blades position 0,20 0,15 0,15
awning, parallel to the glazing 0,30 0,25 0,25
canopy, awning, detached blades 0,55 0,50 0,50
212
Assessment Guideline Technical Characteristics - Indicator 4.7 –
Ease of Deconstruction, Recycling, and Dismantling
Indicator 4.7 Ease of Deconstruction, Recycling, and Dismantling (adapted from DGNB/BNB)
Core indicator
1. Objective Goal of increasing the ease of deconstruction, recycling, and dismantling is the avoidance of waste, in particular by reducing its amount and hazard. Between 40% and 50% of waste in Europe can be assigned to the building sector. The amount of accumulated waste is to be reduced, and is to be led into recycling system. Due to the comparatively long expected useful lifetime, many of the materials that are used today will not accumulate as deconstruction material or potential waste until 50 or 100 years after construction. These materials can serve as important resources for future construction materials. The ability to recapture homogenous deconstruction materials and extract high-grade recycling materials is very important for the evaluation of ease of deconstruction and ease of recycling. This supports the objectives of current EU waste policy: to prevent waste and promote re-use, recycling and recovery so as to reduce the negative environmental impact1. The targets for the recycling of waste are: 50% of household waste and 70% for construction and demolition waste recycled by 20202.
2. Assessment Methodology The ease of deconstruction, recycling and dismantling is evaluated qualitatively by considering the following characteristics of a building: 1. Building services 2. Non-structural (de)construction parts 3. Non-bearing carcass structure 4. Bearing carcass structure The following sub-indicators will be assessed: 4.7.1 Effort for dismantling /disassembly 4.7.2 Effort for sorting/separation 4.7.3 Verification of the inclusion of a recycling/disposal concept with information about construction components in the certification application
1 Taking sustainable use of resources forward: A Thematic Strategy on the prevention and recycling of waste COM(2005)666 2 Directive 2008/98/EC on Waste
213
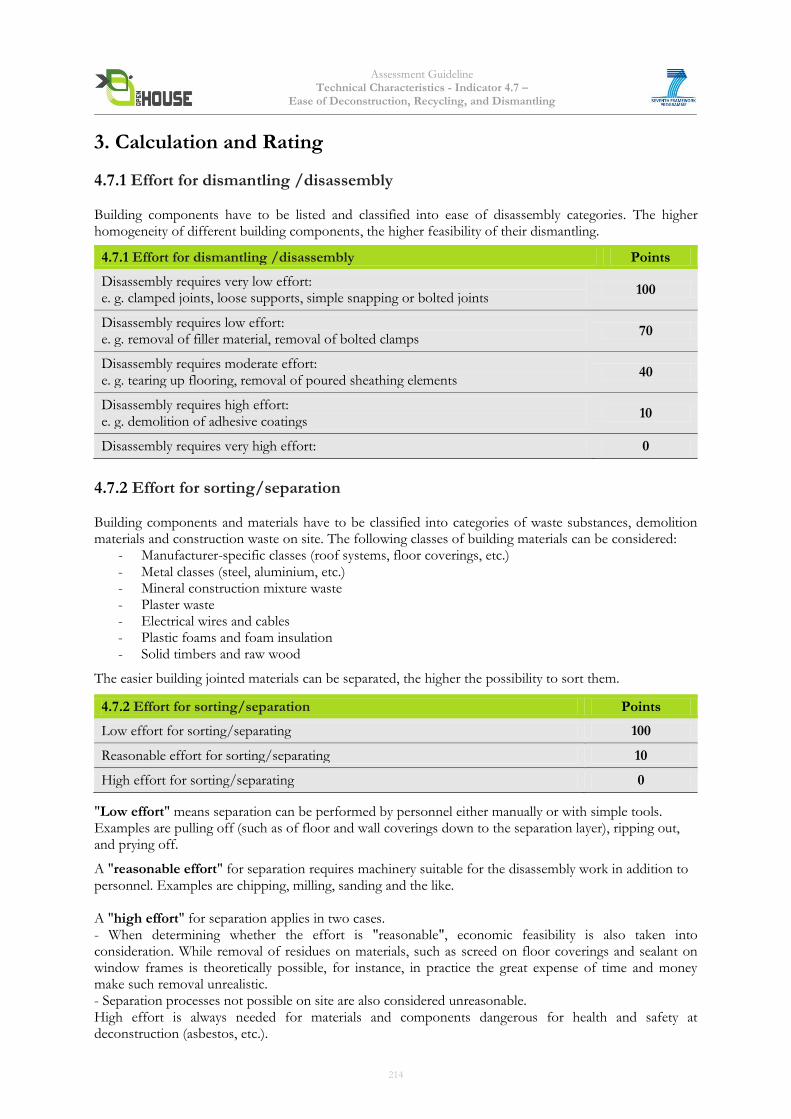
Assessment Guideline Technical Characteristics - Indicator 4.7 –
Ease of Deconstruction, Recycling, and Dismantling
3. Calculation and Rating
4.7.1 Effort for dismantling /disassembly Building components have to be listed and classified into ease of disassembly categories. The higher homogeneity of different building components, the higher feasibility of their dismantling.
4.7.1 Effort for dismantling /disassembly Points
Disassembly requires very low effort: e. g. clamped joints, loose supports, simple snapping or bolted joints
100
Disassembly requires low effort: e. g. removal of filler material, removal of bolted clamps
70
Disassembly requires moderate effort: e. g. tearing up flooring, removal of poured sheathing elements
40
Disassembly requires high effort: e. g. demolition of adhesive coatings
10
Disassembly requires very high effort: 0
4.7.2 Effort for sorting/separation Building components and materials have to be classified into categories of waste substances, demolition materials and construction waste on site. The following classes of building materials can be considered:
- Manufacturer-specific classes (roof systems, floor coverings, etc.) - Metal classes (steel, aluminium, etc.) - Mineral construction mixture waste - Plaster waste - Electrical wires and cables - Plastic foams and foam insulation - Solid timbers and raw wood
The easier building jointed materials can be separated, the higher the possibility to sort them.
4.7.2 Effort for sorting/separation Points
Low effort for sorting/separating 100
Reasonable effort for sorting/separating 10
High effort for sorting/separating 0
"Low effort" means separation can be performed by personnel either manually or with simple tools. Examples are pulling off (such as of floor and wall coverings down to the separation layer), ripping out, and prying off.
A "reasonable effort" for separation requires machinery suitable for the disassembly work in addition to personnel. Examples are chipping, milling, sanding and the like. A "high effort" for separation applies in two cases. - When determining whether the effort is "reasonable", economic feasibility is also taken into consideration. While removal of residues on materials, such as screed on floor coverings and sealant on window frames is theoretically possible, for instance, in practice the great expense of time and money make such removal unrealistic. - Separation processes not possible on site are also considered unreasonable. High effort is always needed for materials and components dangerous for health and safety at deconstruction (asbestos, etc.).
214
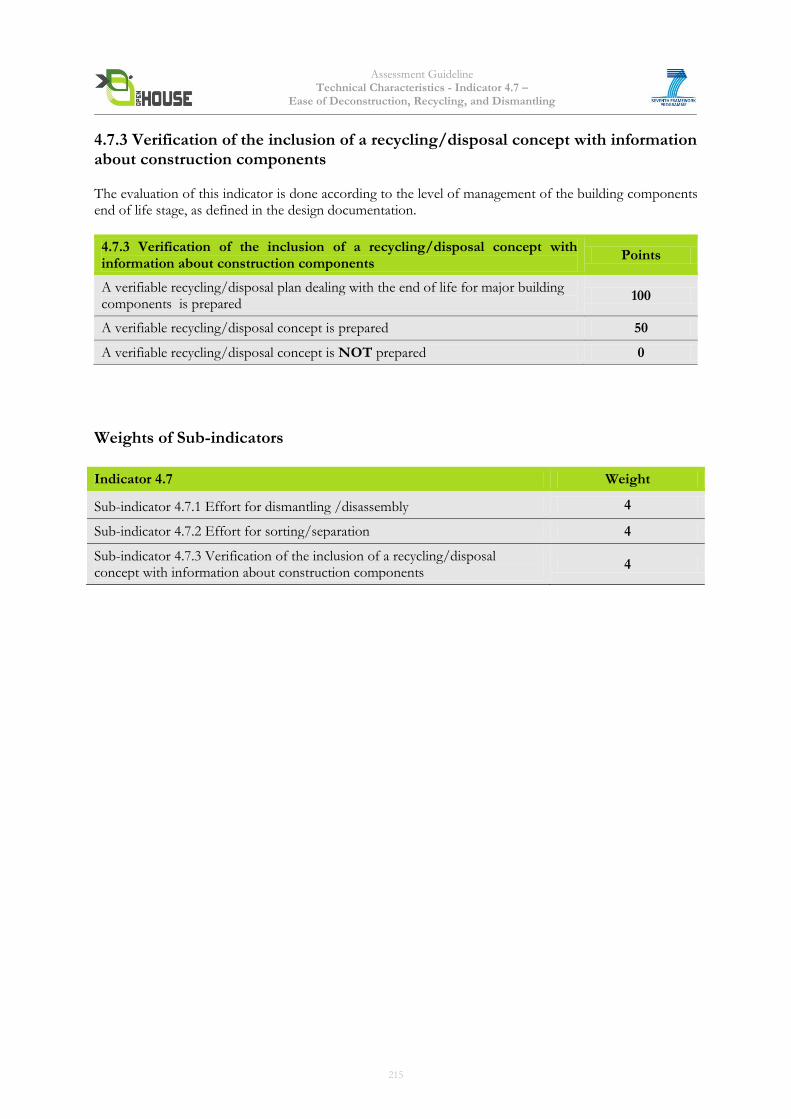
Assessment Guideline Technical Characteristics - Indicator 4.7 –
Ease of Deconstruction, Recycling, and Dismantling
4.7.3 Verification of the inclusion of a recycling/disposal concept with information about construction components The evaluation of this indicator is done according to the level of management of the building components end of life stage, as defined in the design documentation.
4.7.3 Verification of the inclusion of a recycling/disposal concept with information about construction components
Points
A verifiable recycling/disposal plan dealing with the end of life for major building components is prepared
100
A verifiable recycling/disposal concept is prepared 50
A verifiable recycling/disposal concept is NOT prepared 0
Weights of Sub-indicators
Indicator 4.7 Weight
Sub-indicator 4.7.1 Effort for dismantling /disassembly 4
Sub-indicator 4.7.2 Effort for sorting/separation 4
Sub-indicator 4.7.3 Verification of the inclusion of a recycling/disposal concept with information about construction components
4
215
Assessment Guideline Technical Characteristics - Indicator 4.7 –
Ease of Deconstruction, Recycling, and Dismantling
4. Documentation Guidelines The following documents will be needed to assess the building: Quick & Basic Assessment Specific design documentation dealing with end of building`s life, assessment report done by the designer and/or contractor or other easily and quickly accessible documentation for the required evidence (see Complete Assessment), e.g. reasonable estimations for intended/expected values for major building components. Complete Assessment For 4.7.1 and 4.7.2, a copy of the 4.7 Excel tool can be used to document the building components. 4.7.1 Effort for dismantling /disassembly All of the building components and their layers if appropriate have to be accurately listed in a catalogue, by describing the degree of ease of dismantling and recycling in qualitative categories, such as very easily disassembled components, disassembly requires little, moderate, great or very considerable effort. This list should be as complete as possible. 4.7.2 Effort for sorting/separation All of the building components and their layers have to be accurately listed in a catalogue, by describing the degree of ease of separation in qualitative categories, such as easy separation (i.e. performed by personnel either manually or with simple tools) of components, sorting requires reasonable (i.e. machinery required in addition to personnel) or unreasonable (i.e. extremely high expense of time and money) effort. This list should be as complete as possible. 4.7.3 Verification of the inclusion of a recycling/disposal concept with information about construction components Recycling/disposal concept or plan (if available). This concept rules the organization and the financial responsibility for controlled dismantling and disposal throughout the life cycle of the building. In the concept, designers and/or planners estimate the quantity of waste and determine which parts of the construction can:
be dismantled,
be separated and collected on site,
have to go to a sorting machine,
the contractors have to dispose (builder-caused waste),
the owners be legally responsible for disposing of (owner-caused waste).
5. Relation to other Indicators
2.17 Responsible Material Sourcing 2.18 Local material
216
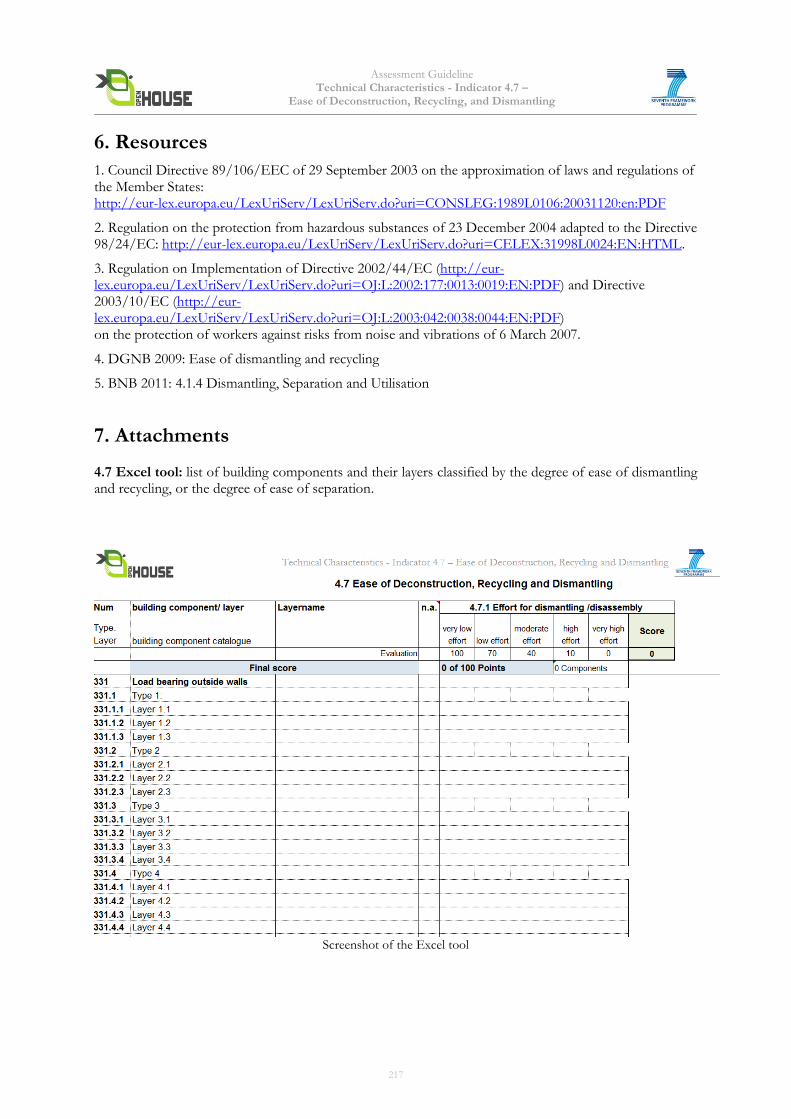
Assessment Guideline Technical Characteristics - Indicator 4.7 –
Ease of Deconstruction, Recycling, and Dismantling
6. Resources
1. Council Directive 89/106/EEC of 29 September 2003 on the approximation of laws and regulations of the Member States: http://eur-lex.europa.eu/LexUriServ/LexUriServ.do?uri=CONSLEG:1989L0106:20031120:en:PDF
2. Regulation on the protection from hazardous substances of 23 December 2004 adapted to the Directive 98/24/EC: http://eur-lex.europa.eu/LexUriServ/LexUriServ.do?uri=CELEX:31998L0024:EN:HTML.
3. Regulation on Implementation of Directive 2002/44/EC (http://eur-lex.europa.eu/LexUriServ/LexUriServ.do?uri=OJ:L:2002:177:0013:0019:EN:PDF) and Directive 2003/10/EC (http://eur-lex.europa.eu/LexUriServ/LexUriServ.do?uri=OJ:L:2003:042:0038:0044:EN:PDF) on the protection of workers against risks from noise and vibrations of 6 March 2007.
4. DGNB 2009: Ease of dismantling and recycling
5. BNB 2011: 4.1.4 Dismantling, Separation and Utilisation
7. Attachments
4.7 Excel tool: list of building components and their layers classified by the degree of ease of dismantling and recycling, or the degree of ease of separation.
Screenshot of the Excel tool
217

Assessment Guideline Version 1.2 New Office Buildings – July 2013
OPEN HOUSE
ASSESSMENT GUIDELINE
Process Quality
5.1 Project Briefing Strategy 5.2 Integral Planning 5.3 Building Performance Targets 5.4 Evidence of Sustainability during Bid Invitation and Awarding 5.5 Construction Site impact/ Construction Process 5.6 Quality of the Executing Contractors/Pre-Qualification 5.7 Quality Assurance of Construction Execution 5.8 Commissioning 5.9 Handover and Performance Evaluation Note: Core indicators are in bold
218
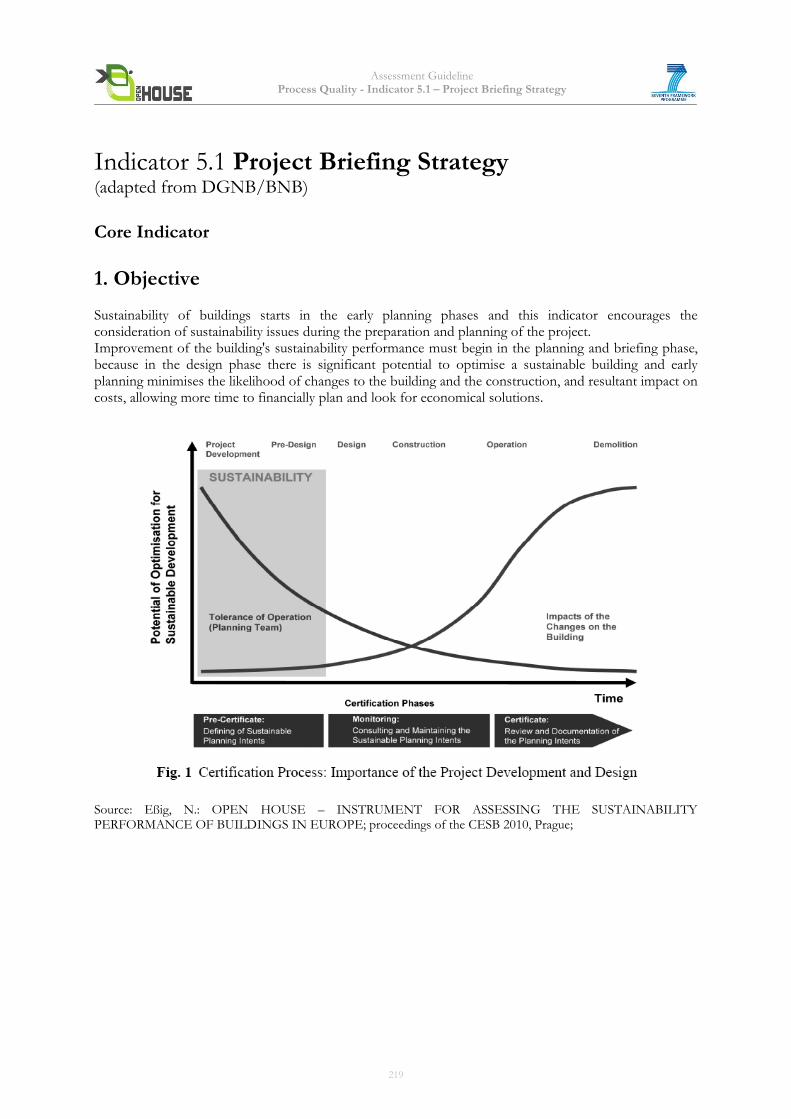
Assessment Guideline Process Quality - Indicator 5.1 – Project Briefing Strategy
Indicator 5.1 Project Briefing Strategy (adapted from DGNB/BNB)
Core Indicator
1. Objective Sustainability of buildings starts in the early planning phases and this indicator encourages the consideration of sustainability issues during the preparation and planning of the project. Improvement of the building's sustainability performance must begin in the planning and briefing phase, because in the design phase there is significant potential to optimise a sustainable building and early planning minimises the likelihood of changes to the building and the construction, and resultant impact on costs, allowing more time to financially plan and look for economical solutions.
Source: Eßig, N.: OPEN HOUSE – INSTRUMENT FOR ASSESSING THE SUSTAINABILITY PERFORMANCE OF BUILDINGS IN EUROPE; proceedings of the CESB 2010, Prague;
219
Assessment Guideline Process Quality - Indicator 5.1 – Project Briefing Strategy
2. Assessment Methodology The indicator assesses the quality of the preparation and planning of the project. It should encourage teams and owners to identify the needs of the building, and its’ owners and users, define targets and their implementation in construction, including aspects like: main goals of the project, time frame, budget frame, size of the building, characteristics of the site. One important resulting step is to define clear and achievable objectives on which all stakeholders agree. In order to ensure a high quality design process, with insurance of execution of an integral and interdisciplinary planning, the planning process should follow the framework of an architectural competition. The following sub-indicators will be assessed: 5.1.1 Project Brief 5.1.2 Architectural competition
220
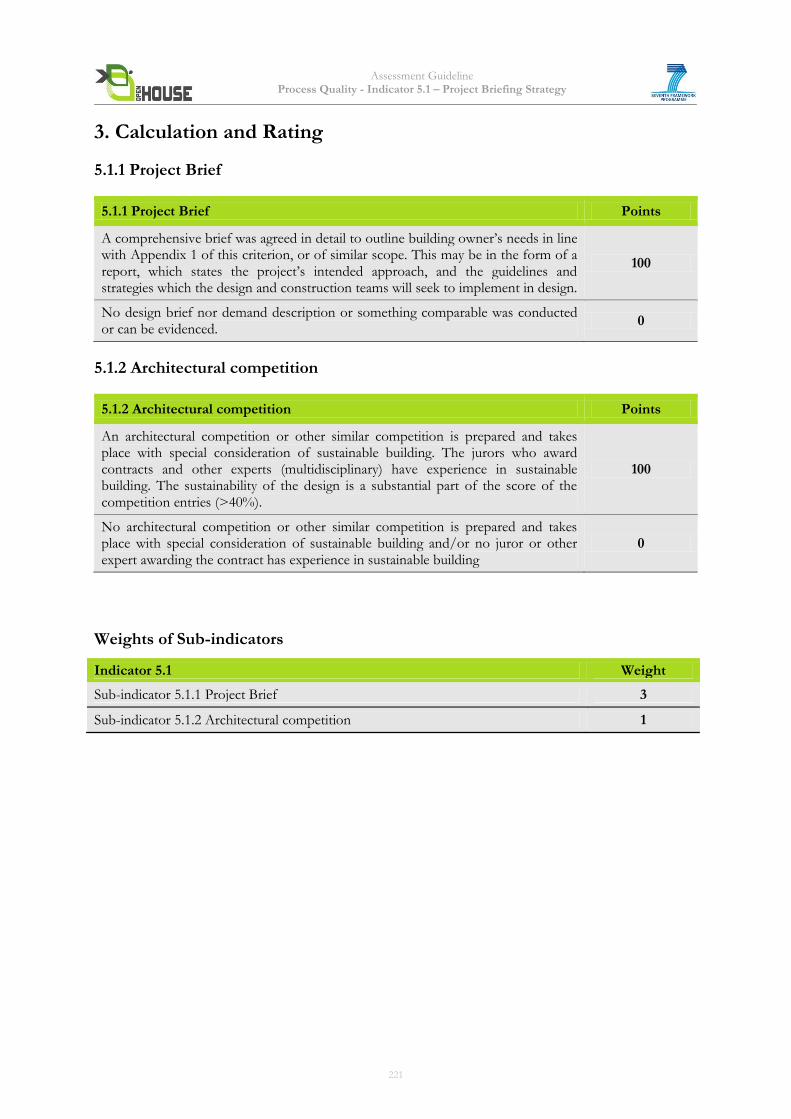
Assessment Guideline Process Quality - Indicator 5.1 – Project Briefing Strategy
3. Calculation and Rating
5.1.1 Project Brief
5.1.1 Project Brief Points
A comprehensive brief was agreed in detail to outline building owner’s needs in line with Appendix 1 of this criterion, or of similar scope. This may be in the form of a report, which states the project’s intended approach, and the guidelines and strategies which the design and construction teams will seek to implement in design.
100
No design brief nor demand description or something comparable was conducted or can be evidenced.
0
5.1.2 Architectural competition
5.1.2 Architectural competition Points
An architectural competition or other similar competition is prepared and takes place with special consideration of sustainable building. The jurors who award contracts and other experts (multidisciplinary) have experience in sustainable building. The sustainability of the design is a substantial part of the score of the competition entries (>40%).
100
No architectural competition or other similar competition is prepared and takes place with special consideration of sustainable building and/or no juror or other expert awarding the contract has experience in sustainable building
0
Weights of Sub-indicators
Indicator 5.1 Weight
Sub-indicator 5.1.1 Project Brief 3
Sub-indicator 5.1.2 Architectural competition 1
221
Assessment Guideline Process Quality - Indicator 5.1 – Project Briefing Strategy
4. Documentation Guidelines The following documents will be needed to assess the building: Quick & Basic Assessment Letter of commitment or easily and quickly accessible documentation for the required evidence (see Complete Assessment), e.g. reasonable estimations for intended/expected values. Complete Assessment 5.1.1 Design Brief
Evidence that the brief was agreed with the design team, owner/occupier and any other relevant consultants. Documentation must be provided, such as a briefing report or a design intent statement, which contains a systematic description of the targets in accordance with any of the following:
o Annex 1 of the BMVBS Guide o RIBA Stage A/B (pre-2013) or Stage 1 (2013) or similar. o Appendix A, listed below (based on OPEN HOUSE requirements)
The report must have been dated previous to the final architectural design 5.1.2 Architectural Competition Documentation of the selection of winner from competition. The documents must make the following clear in addition to providing general information, especially related to sustainable building: • legal ramifications for project, if appropriate (e.g. in Germany GRW95, RPW 2008, etc.) • type of competition (open, invitational, etc.) • jury members and experience (CVs) • proof of scoring/rating of entries
5. Relation to other Indicators See OH indicators noted in the table in Appendix A
6. Resources 1. DGNB International Criterion 43: Quality of project preparation 2. RIBA Stages of Work RIBA Stages A-B Checklists (RIBA Stages 1 Preparation (2013 revision)) 3. BNB: Bewertungssystem Nachhaltiges Bauen (Germany) Criterion 5.1.1: Projektvorbereitung www.nachhaltigesbauen.de/fileadmin/pdf/BNB_Steckbriefe_Buero_Neubau/aktuell/BNB_BN_511.pdf 4. Agreement on objectives: SIA 112-1 www.eco-bau.ch/resources/uploads/SIA_112-1_2005_d-Auszug.pdf 5.Annex 1 of the BMVBS Guide www.nachhaltigesbauen.de/fileadmin/pdf/PDF_Leitfaden_Nachhaltiges_Bauen/Anlage_1.pdf 6. Architectural competition: UIA guide on international competitions: www.uia-architectes.org/texte/england/Menu-7/UIAguideIC.html
222
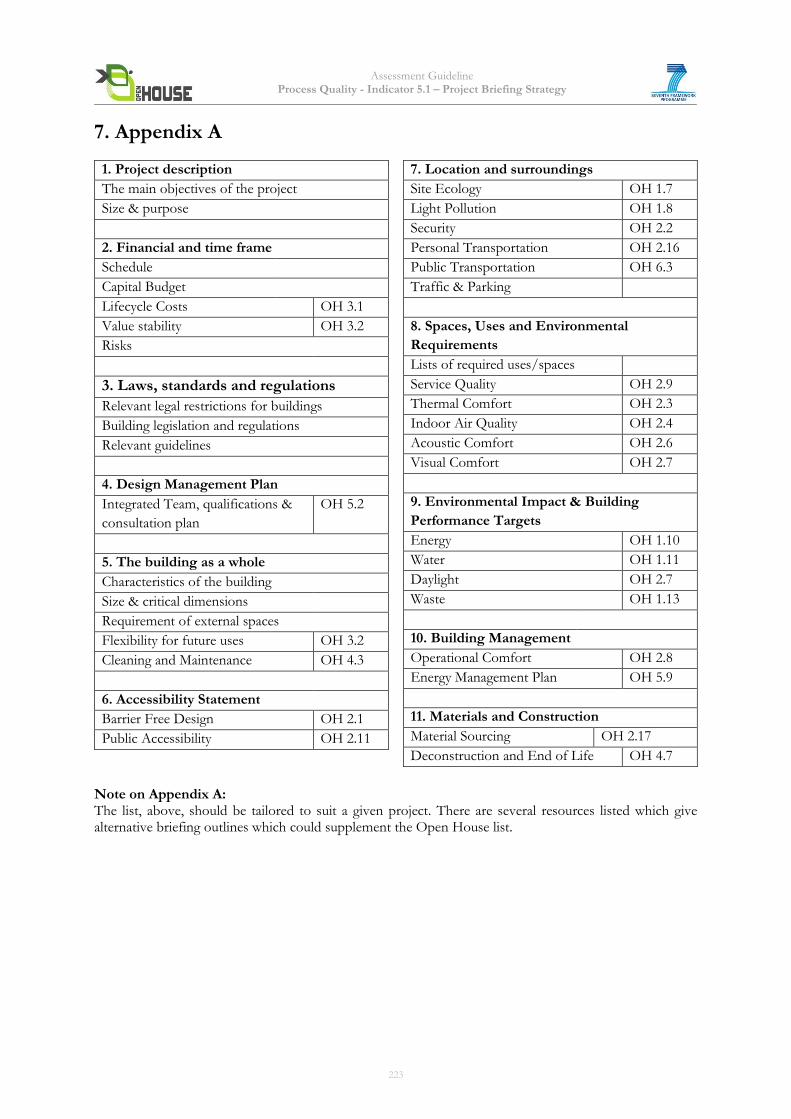
Assessment Guideline Process Quality - Indicator 5.1 – Project Briefing Strategy
7. Appendix A
1. Project description
The main objectives of the project
Size & purpose
2. Financial and time frame
Schedule
Capital Budget
Lifecycle Costs OH 3.1
Value stability OH 3.2
Risks
3. Laws, standards and regulations
Relevant legal restrictions for buildings
Building legislation and regulations
Relevant guidelines
4. Design Management Plan
Integrated Team, qualifications &
consultation plan
OH 5.2
5. The building as a whole
Characteristics of the building
Size & critical dimensions
Requirement of external spaces
Flexibility for future uses OH 3.2
Cleaning and Maintenance OH 4.3
6. Accessibility Statement
Barrier Free Design OH 2.1
Public Accessibility OH 2.11
7. Location and surroundings
Site Ecology OH 1.7
Light Pollution OH 1.8
Security OH 2.2
Personal Transportation OH 2.16
Public Transportation OH 6.3
Traffic & Parking
8. Spaces, Uses and Environmental
Requirements
Lists of required uses/spaces
Service Quality OH 2.9
Thermal Comfort OH 2.3
Indoor Air Quality OH 2.4
Acoustic Comfort OH 2.6
Visual Comfort OH 2.7
9. Environmental Impact & Building
Performance Targets
Energy OH 1.10
Water OH 1.11
Daylight OH 2.7
Waste OH 1.13
10. Building Management
Operational Comfort OH 2.8
Energy Management Plan OH 5.9
11. Materials and Construction
Material Sourcing OH 2.17
Deconstruction and End of Life OH 4.7
Note on Appendix A: The list, above, should be tailored to suit a given project. There are several resources listed which give alternative briefing outlines which could supplement the Open House list.
223
Assessment Guideline Process Quality - Indicator 5.2 - Integrated Planning
Indicator 5.2 Integrated Planning
(adapted from DGNB/BNB, LEED, BREEAM, SuPerBuildings)
1. Objective Integrated Planning requires project management before, during and after design, involving a
multi-disciplinary team, a collaborative and iterative work, aiming at optimising the sustainable
performances of the building. Indeed, the adoption of an integrated design approach is a success
factor for multi-criteria design optimisation and innovation with limited risks, and also makes
operation phase easier and cost- effective.
Integrated planning covers the entire lifecycle of a building; from early project design until building’s
demolition. The realization of sustainable buildings requires improvement of planning quality as well as
optimization of planning process. With conventional design processes there is a series of handoffs from
the owner to the architects, from the architect to the contractor, from the contractor to the user. The
problem with this model is that not relevant parties participate in the planning process and therefore their
needs, areas of expertise or insights are not taken into account. In some cases, incompatible elements of
the design are not discovered until late in the process when any change means additional cost in money
and time. Therefore good communication and interaction between members of the planning team, the
owner, the contractor, the project manager, various experts, the future users, etc is necessary from the
conception to the completion of a project. This can be reached by using the method of participation.
Participation means close cooperation with different target groups and local community already on an
early design stage. With participation a building project can be broad based and increase the acceptance
for a project to a high level. An interdisciplinary design team considers the requirements of future users
and other relevant stakeholders on an early stage on the design process and develops an integrated
concept with a comprehensive sustainability strategy in order to reduce energy consumption and
environmental pollution. Participation of future building users and other stakeholders, design, plan and
deliver sustainable and functional buildings fit for purpose. These activities effect social, ecological as well
as economic benefits.
2. Assessment Methodology
This indicator is made of a list of qualitative sub-indicators covering several phases of the planning
process of a building, from concept design to operation.
The following sub-indicators will be assessed: 5.2.1 Multidisciplinary formation of the planning team 5.2.2 Qualification of the Integrated Project Team 5.2.3 Design Charrette / Preparation of consultation 5.2.4 Integrated planning process 5.2.5 Participation of future building users and other relevant stakeholders / Community impact
consultation
224
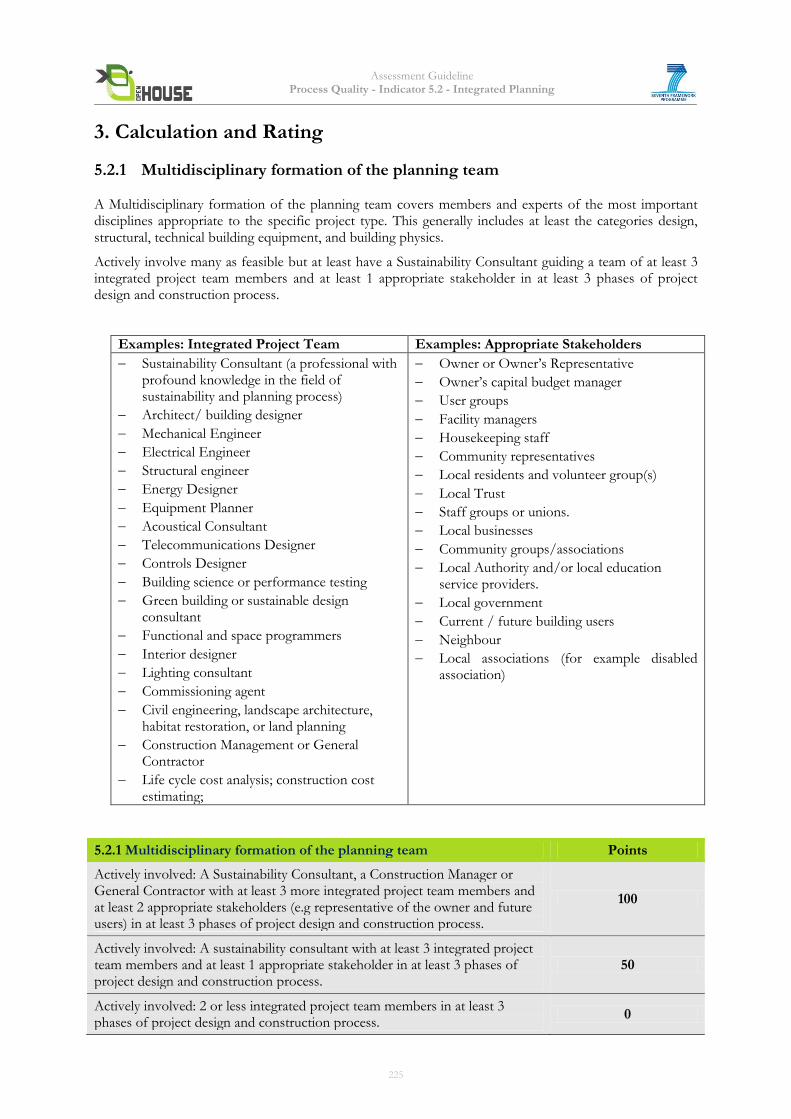
Assessment Guideline Process Quality - Indicator 5.2 - Integrated Planning
3. Calculation and Rating
5.2.1 Multidisciplinary formation of the planning team A Multidisciplinary formation of the planning team covers members and experts of the most important disciplines appropriate to the specific project type. This generally includes at least the categories design, structural, technical building equipment, and building physics.
Actively involve many as feasible but at least have a Sustainability Consultant guiding a team of at least 3 integrated project team members and at least 1 appropriate stakeholder in at least 3 phases of project design and construction process.
Examples: Integrated Project Team Examples: Appropriate Stakeholders
Sustainability Consultant (a professional with profound knowledge in the field of sustainability and planning process)
Architect/ building designer
Mechanical Engineer
Electrical Engineer
Structural engineer
Energy Designer
Equipment Planner
Acoustical Consultant
Telecommunications Designer
Controls Designer
Building science or performance testing
Green building or sustainable design consultant
Functional and space programmers
Interior designer
Lighting consultant
Commissioning agent
Civil engineering, landscape architecture, habitat restoration, or land planning
Construction Management or General Contractor
Life cycle cost analysis; construction cost estimating;
Owner or Owner’s Representative
Owner’s capital budget manager
User groups
Facility managers
Housekeeping staff
Community representatives
Local residents and volunteer group(s)
Local Trust
Staff groups or unions.
Local businesses
Community groups/associations
Local Authority and/or local education service providers.
Local government
Current / future building users
Neighbour
Local associations (for example disabled association)
5.2.1 Multidisciplinary formation of the planning team Points
Actively involved: A Sustainability Consultant, a Construction Manager or General Contractor with at least 3 more integrated project team members and at least 2 appropriate stakeholders (e.g representative of the owner and future users) in at least 3 phases of project design and construction process.
100
Actively involved: A sustainability consultant with at least 3 integrated project team members and at least 1 appropriate stakeholder in at least 3 phases of project design and construction process.
50
Actively involved: 2 or less integrated project team members in at least 3 phases of project design and construction process.
0
225
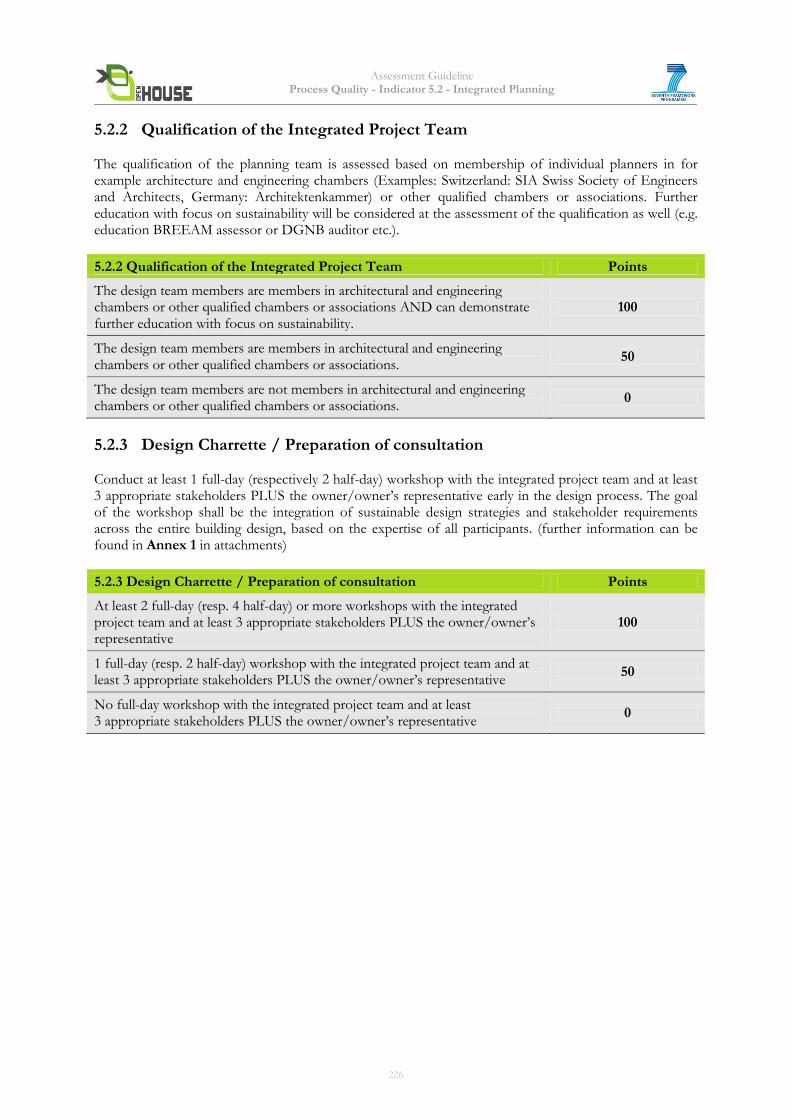
Assessment Guideline Process Quality - Indicator 5.2 - Integrated Planning
5.2.2 Qualification of the Integrated Project Team The qualification of the planning team is assessed based on membership of individual planners in for example architecture and engineering chambers (Examples: Switzerland: SIA Swiss Society of Engineers and Architects, Germany: Architektenkammer) or other qualified chambers or associations. Further education with focus on sustainability will be considered at the assessment of the qualification as well (e.g. education BREEAM assessor or DGNB auditor etc.).
5.2.2 Qualification of the Integrated Project Team Points
The design team members are members in architectural and engineering chambers or other qualified chambers or associations AND can demonstrate further education with focus on sustainability.
100
The design team members are members in architectural and engineering chambers or other qualified chambers or associations.
50
The design team members are not members in architectural and engineering chambers or other qualified chambers or associations.
0
5.2.3 Design Charrette / Preparation of consultation Conduct at least 1 full-day (respectively 2 half-day) workshop with the integrated project team and at least 3 appropriate stakeholders PLUS the owner/owner’s representative early in the design process. The goal of the workshop shall be the integration of sustainable design strategies and stakeholder requirements across the entire building design, based on the expertise of all participants. (further information can be found in Annex 1 in attachments)
5.2.3 Design Charrette / Preparation of consultation Points
At least 2 full-day (resp. 4 half-day) or more workshops with the integrated project team and at least 3 appropriate stakeholders PLUS the owner/owner’s representative
100
1 full-day (resp. 2 half-day) workshop with the integrated project team and at least 3 appropriate stakeholders PLUS the owner/owner’s representative
50
No full-day workshop with the integrated project team and at least 3 appropriate stakeholders PLUS the owner/owner’s representative
0
226
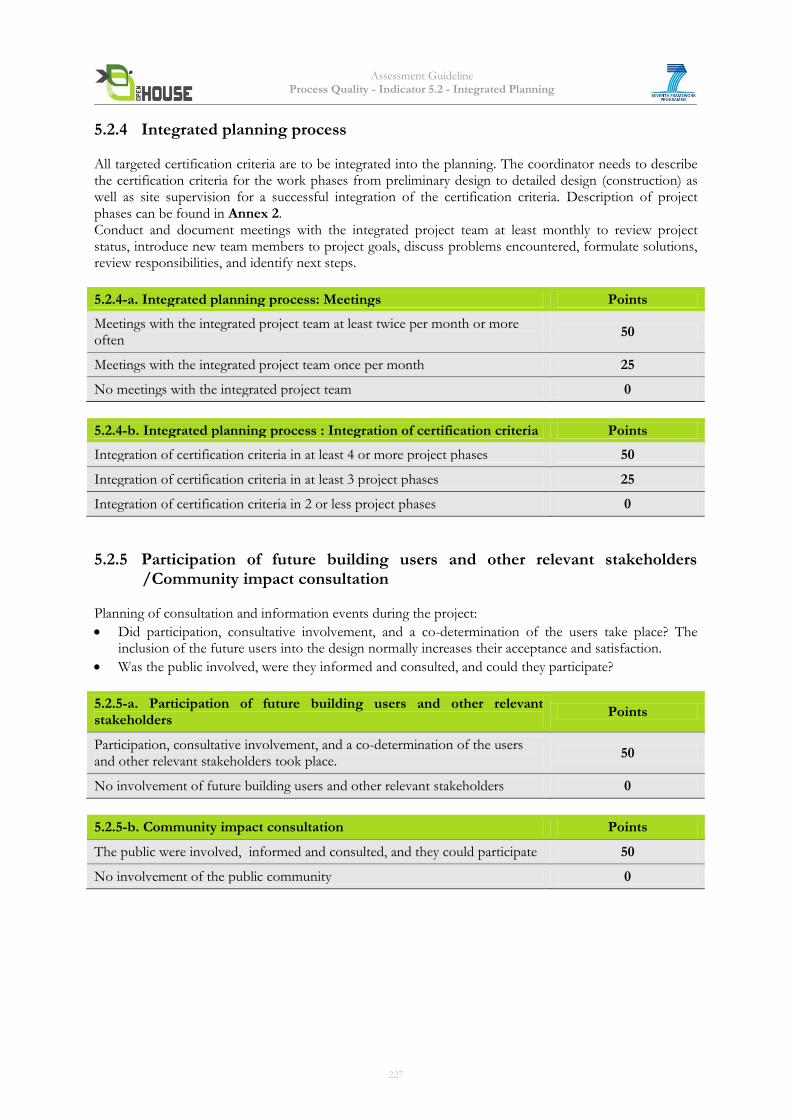
Assessment Guideline Process Quality - Indicator 5.2 - Integrated Planning
5.2.4 Integrated planning process All targeted certification criteria are to be integrated into the planning. The coordinator needs to describe the certification criteria for the work phases from preliminary design to detailed design (construction) as well as site supervision for a successful integration of the certification criteria. Description of project phases can be found in Annex 2. Conduct and document meetings with the integrated project team at least monthly to review project status, introduce new team members to project goals, discuss problems encountered, formulate solutions, review responsibilities, and identify next steps.
5.2.4-a. Integrated planning process: Meetings Points
Meetings with the integrated project team at least twice per month or more often
50
Meetings with the integrated project team once per month 25
No meetings with the integrated project team 0
5.2.4-b. Integrated planning process : Integration of certification criteria Points
Integration of certification criteria in at least 4 or more project phases 50
Integration of certification criteria in at least 3 project phases 25
Integration of certification criteria in 2 or less project phases 0
5.2.5 Participation of future building users and other relevant stakeholders /Community impact consultation
Planning of consultation and information events during the project:
Did participation, consultative involvement, and a co-determination of the users take place? The inclusion of the future users into the design normally increases their acceptance and satisfaction.
Was the public involved, were they informed and consulted, and could they participate?
5.2.5-a. Participation of future building users and other relevant stakeholders
Points
Participation, consultative involvement, and a co-determination of the users and other relevant stakeholders took place.
50
No involvement of future building users and other relevant stakeholders 0
5.2.5-b. Community impact consultation Points
The public were involved, informed and consulted, and they could participate 50
No involvement of the public community 0
227
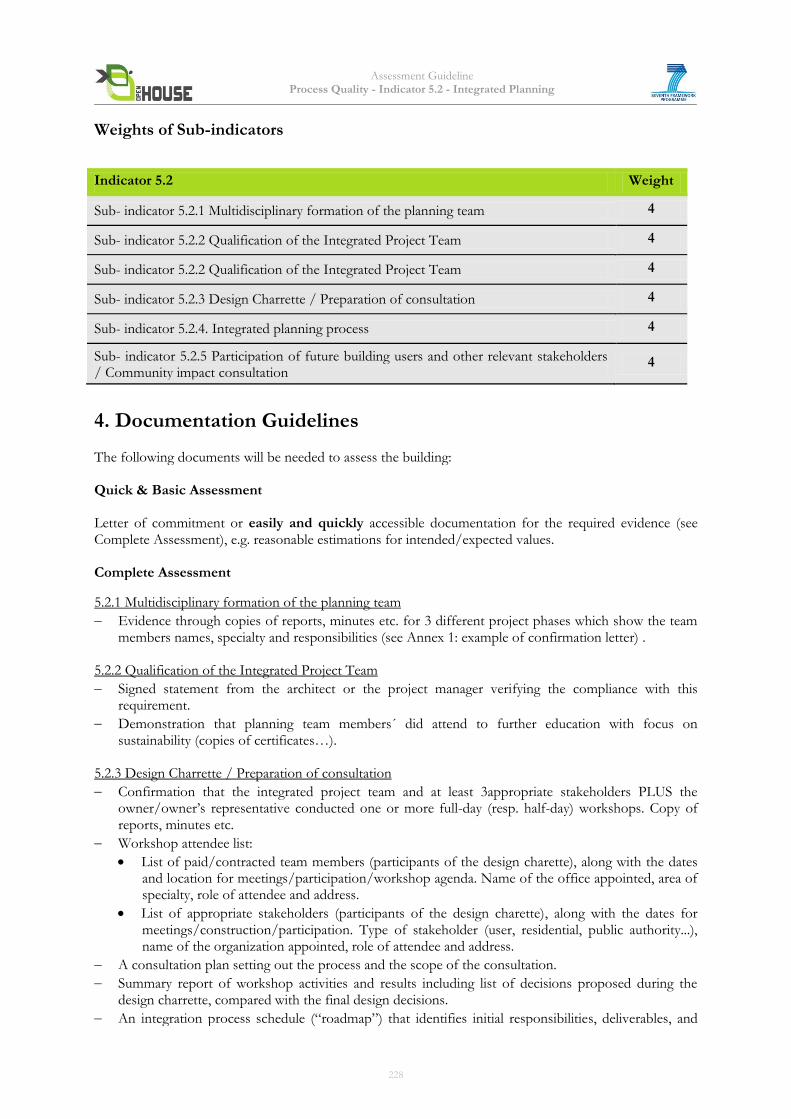
Assessment Guideline Process Quality - Indicator 5.2 - Integrated Planning
Weights of Sub-indicators
Indicator 5.2 Weight
Sub- indicator 5.2.1 Multidisciplinary formation of the planning team 4
Sub- indicator 5.2.2 Qualification of the Integrated Project Team 4
Sub- indicator 5.2.2 Qualification of the Integrated Project Team 4
Sub- indicator 5.2.3 Design Charrette / Preparation of consultation 4
Sub- indicator 5.2.4. Integrated planning process 4
Sub- indicator 5.2.5 Participation of future building users and other relevant stakeholders / Community impact consultation
4
4. Documentation Guidelines The following documents will be needed to assess the building: Quick & Basic Assessment Letter of commitment or easily and quickly accessible documentation for the required evidence (see Complete Assessment), e.g. reasonable estimations for intended/expected values. Complete Assessment
5.2.1 Multidisciplinary formation of the planning team
Evidence through copies of reports, minutes etc. for 3 different project phases which show the team members names, specialty and responsibilities (see Annex 1: example of confirmation letter) .
5.2.2 Qualification of the Integrated Project Team
Signed statement from the architect or the project manager verifying the compliance with this requirement.
Demonstration that planning team members´ did attend to further education with focus on sustainability (copies of certificates…).
5.2.3 Design Charrette / Preparation of consultation
Confirmation that the integrated project team and at least 3appropriate stakeholders PLUS the owner/owner’s representative conducted one or more full-day (resp. half-day) workshops. Copy of reports, minutes etc.
Workshop attendee list:
List of paid/contracted team members (participants of the design charette), along with the dates and location for meetings/participation/workshop agenda. Name of the office appointed, area of specialty, role of attendee and address.
List of appropriate stakeholders (participants of the design charette), along with the dates for meetings/construction/participation. Type of stakeholder (user, residential, public authority...), name of the organization appointed, role of attendee and address.
A consultation plan setting out the process and the scope of the consultation.
Summary report of workshop activities and results including list of decisions proposed during the design charrette, compared with the final design decisions.
An integration process schedule (“roadmap”) that identifies initial responsibilities, deliverables, and
228
Assessment Guideline Process Quality - Indicator 5.2 - Integrated Planning
dates for managing the project scope by defining: what, when, and by whom outputs need to be produced through Schematic Design.
5.2.4 Integrated planning process
Evidence of meetings with the integrated project team. Date, participants and results of meetings. Copy of reports, minutes etc.
Evidence of integration of certification criteria in various project phases with short description of the results in each phase.
5.2.5 Participation of future building users and other relevant stakeholders / Community impact consultation
Demonstration of user co-determination in the form of detailed result logs, comments etc.
Evidence of informational public participation by means of posters, flyers, informational events, publications etc. in the form of excerpts from these publications.
Evidence of consultative public participation in public discussion events, surveys, citizen meetings etc. in the form of detailed event logs, press articles, survey evaluations etc. and a depiction of implementation in the planning stage.
Statistics of the consultation and information process
Results of the consultation process
List of stakeholder and community proposals that have influenced design.
5. Relation to other Indicators 5.1 Project Preparation
6. Resources 1. Switzerland
Recommendation SIA 112/1, 2004: Sustainable Building –Building Construction; Swiss Societyof Engineers and Architects
2. Germany
“BürogebäudemitZukunft”, TÜV-Verlag
HOAI § 15, WPH 2 to 5 and WPH 8
Architektengesetz der einzelnen Länder sowie Satzungen der Architekten- und Ingenieurskammern
www.partizipation.at/handbuch-oeffbet.html
BNB 2011 5.1.2 Integrated Palnning
DGNB 2012 PRO1.2 Integrated planning 3. UK
National Charrette Institute (www.charretteinstitute.org) Non-profit educational institution that help communities achieve healthy transformation through collaborative planning processes that harnesses the talents and energies of all interested parties to create and support a buildable plan.
Planning for Real (www.nifonline.org.uk) Is a participative planning initiative.
For a guide to neighbourhood renewal and various resources see: www.renewal.net
Design Quality Indicator (www.dqi.org.uk) Method to assess the design quality of buildings.
Commission for Architecture and the Built Environment (www.cabe.org.uk) 4. USA
229

Assessment Guideline Process Quality - Indicator 5.2 - Integrated Planning
ANSI/MTS 1.0 Whole Systems Integrated Process Guide (WSIP)-2007 for Sustainable Buildings & Communities©".
Draft ANSI/MTS 2.0 Integrative Process Standard for Design and Construction of Sustainable Buildings and Communities (this document is intended as an updated improvement to Version 1.0 above.)
5. Potential Technologies & Strategies (LEED 2012)
Reinforce corporate/institutional commitments to environmental health and community responsibility.
Use cross discipline design, decision-making, and charrettes. Use goal-setting workshops and build a team approach to the project.
Prepare checklists for points and strategies prior to beginning the design process; refer to the checklist at milestones during the design process.
Engage owner, staff, contractors, user groups and community groups, educating them on the benefits of green design and bringing them into the design process at key points in the decision-making process.
Participate in peer-to-peer information exchange and problem solving.
Consider performance-based incentives in professional contracts that reward achievement of Integrative Design Goals and Project Vision.
Contractually apportion professional fees to create specific line items for the Integrative Design Charrette and subsequent monitoring and follow-up meetings.
Consider seeking foundation support for integrative design initiatives.
6. SuPerBuildings final report – 2012 www.vtt.fi/inf/pdf/technology/2012/T72.pdf
230
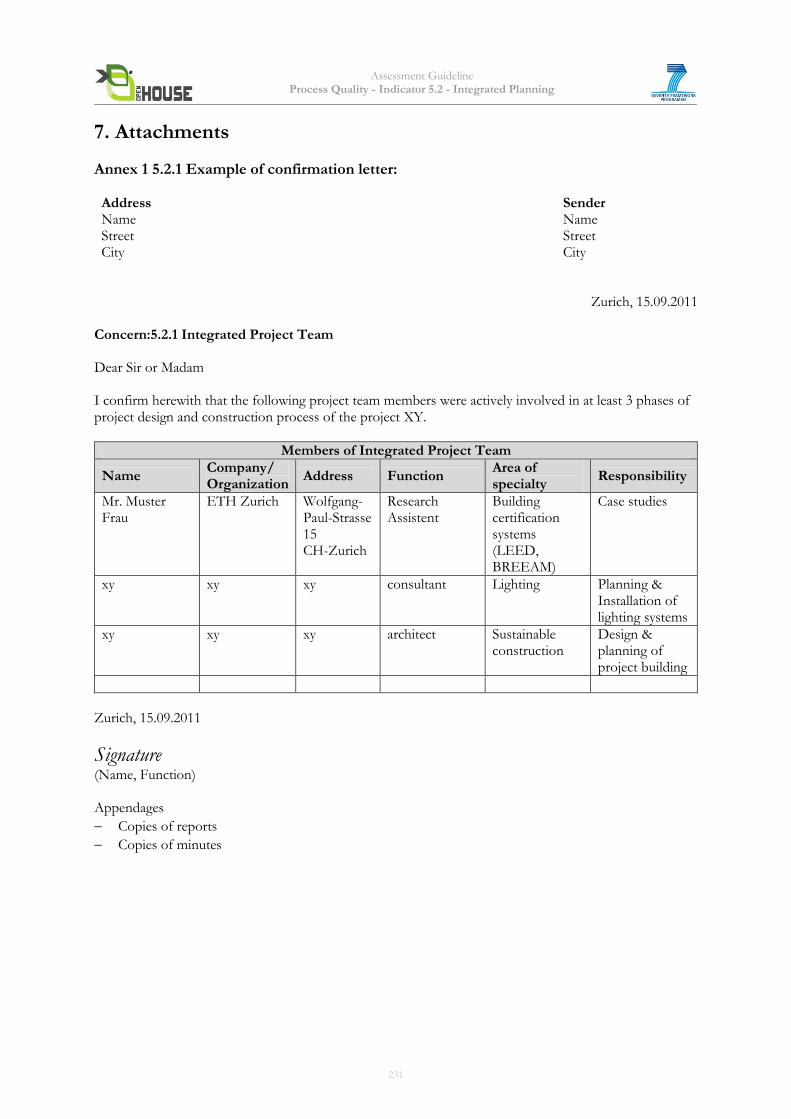
Assessment Guideline Process Quality - Indicator 5.2 - Integrated Planning
7. Attachments
Annex 1 5.2.1 Example of confirmation letter: Address Name Street City
Sender Name Street City
Zurich, 15.09.2011 Concern:5.2.1 Integrated Project Team Dear Sir or Madam I confirm herewith that the following project team members were actively involved in at least 3 phases of project design and construction process of the project XY.
Members of Integrated Project Team
Name Company/ Organization
Address Function Area of specialty
Responsibility
Mr. Muster Frau
ETH Zurich Wolfgang-Paul-Strasse 15 CH-Zurich
Research Assistent
Building certification systems (LEED, BREEAM)
Case studies
xy xy xy consultant Lighting Planning & Installation of lighting systems
xy xy xy architect Sustainable construction
Design & planning of project building
Zurich, 15.09.2011
Signature (Name, Function) Appendages
Copies of reports
Copies of minutes
231
Assessment Guideline Process Quality - Indicator 5.2 - Integrated Planning
Annex 2: 5.2.3 Definition and explanation of the Design Charrette Charrette “Any collaborative session in which a group of designers drafts a solution to a design problem. The charrette has become a technique for consulting with all stakeholders. A charrette typically involves intense meetings, involving municipal officials, developers, and residents. A successful charrette promotes joint ownership of solutions and attempts to defuse typical confrontational attitudes between residents and developers. Charrettes tend to involve small groups, however the residents participating may not represent all the residents nor have the moral authority to represent them. Residents who do participate get early input into the planning process. For developers and municipal officials charrettes achieve community involvement, may satisfy consultation criteria, with the objective of avoiding costly legal battles.” Design Charrettes “A Design Charrette is an intensive, hands-on workshop that brings people from different disciplines and backgrounds together to explore design options for a particular area or site. Design Charrettes are 'a fun and innovative way to engage the public, especially in projects where there is a significant landscape, streetscape, or other interesting design element. Design Charrettes are public workshops that include community members, design professionals, and other project staff. Charrettes can take place in a single session or be spread out among two or three workshops. The goal of the charrette process is to capture the vision, values, and ideas of the community - with designers sketching to create alternatives and ideas as fast as they can be generated by the participants. Design charrettes are a good way to build positive enthusiasm and energy for your project and, at the same time, be responsive to the creativity of the community.' (Source: http://www.contextsensitivesolutions.org )
Used For: To bring citizens, decision-makers and designers together to build a new or alternative vision for an area or site through a creative process of team work and competition.
Suitable participants: Any, although the process relies on working with professional designers, planners or architects.” Example activities during the workshop (Based on LEED):
Introduction of participants to the fundamentals of integrated design.
Align project team around project purpose and goals.
Develop a project management plan that identifies responsibilities, deliverables, and dates for managing the project scope by defining: what, when, and by whom outputs need to be produced.
Initiate documentation of the Owner’s Project Requirements (OPR) for Commissioning Examples of consultation /Design Charrette issues (Based on BREEAM)
Functionality, building quality and local impact (including aesthetics)
Building user satisfaction/productivity
Management and operational implications
Maintenance resources/burdens
Good and bad examples of buildings of the same type.
Local traffic/transport impact.
Opportunities for shared use of facilities and infrastructure with the community/appropriate stakeholders
Consultation with the relevant bodies to confirm whether the building (or site) is classified as any of the following:
A Building of local architectural or historic interest referred to in a local authority development plan
A Building within an area of outstanding natural beauty and national parks
A Building/site that is within the curtilage of, or contains on site, a scheduled ancient monument
Buildings or sites with distinguishing local architectural characteristics
Buildings within areas of archaeological significance.
232
Assessment Guideline Process Quality - Indicator 5.2 - Integrated Planning
Annex 3 5.2.4 Description of the different Construction phases Construction phases (Based on LEED): 1. Pre-design: information gathering, recognizing stakeholder needs, establishing project goals, site
selection
2. Schematic design: explores several design options with the intent to establish an agreed project layout and scope of work.
3. Design development: process of spatial refinement und usually involves the first design of energy systems
4. Construction documents: carry design in detail level for all spaces, systems, and materials
5. Bidding: Establishing of costs and signing of contracts for construction services
6. Construction: Actual construction of the project. Commissioning near the end of construction (if systems are installed and operable).
7. Substantial completion: contractual benchmark that usually point at which a client could occupy a nearly completed space.
8. Final completion
9. Certificate of occupancy: official recognition by a local building department that a building conforms to applicable building and safety codes.
Stages of the project (Based on LEnSE)
1 Preliminary study
2 Preparation of the project
3 Invitation to tender
4 Construction phase
5 Preparation of the use
233
Assessment Guideline Process Quality - Indicator 5.3 Building Performance Targets
Indicator 5.3 Building Performance Targets (adapted from DGNB/BNB)
1. Objective Planning a sustainable building requires a complex approach to set and manage the targets. The definition of targets and strategies needs a consistent, systematic consideration of sustainability throughout the building’s design, construction and management. Optimisation of the design and delivery process is thus very important for the improvement of the building's sustainability performance. It must begin already in the design phase, because at this project development phase, the potential of optimisation for a sustainable building is very high and the impacts of changes of the building and the construction costs are low.
2. Assessment Methodology The optimisation of the planning is done mainly with quality assurance measures such as the examination of planning documents and variant comparisons and considerations of various options. The indicator will be measured qualitatively with sub-indicators. The following subindicators will be assessed:
5.3.1 Energy target 5.3.2 Water target 5.3.3 Waste target 5.3.4 Optimisation of daylight and artificial lighting 5.3.5 Conversion, dismantling and recycling 5.3.6 Concept for ease of cleaning and maintenance
234
Assessment Guideline Process Quality - Indicator 5.3 Building Performance Targets
3. Calculation and Rating The following indicators will be assessed qualitatively:
5.3.1 Energy target Creation and implementation of energy targets, that covers the building operation as outlined in OPEN HOUSE indicators 1.9 & 1.10.
5.3.1 Energy Target Points
Evidence of verifying the in-use energy performance, annually, for a full 3 years after construction
100
Evidence that key requirements have been verified, post-construction, and that work has been completed according to specification or equivalently performing alternatives have been used
75
Evidence that key requirements for meeting the targets are explicit in tender documentation
50
Evidence that the targets have been rechecked and tracked in design 25
A performance target is defined according to the quality requirements of OH 1.9 & 1.10 and is integrated into a project brief (OH 5.1)
10
No creation and implementation of a primary energy target 0
5.3.2 Water target Creation and implementation of a water target, that covers the building operation as outlined in OPEN HOUSE indicator 1.11.
5.3.2 Water target Points
Evidence of verifying the in-use water targets, annually, for a full 3 years after construction
100
Evidence that key requirements have been verified, post-construction, and that work has been completed according to specification or equivalently performing alternatives have been used
75
Evidence that key requirements for meeting the targets are explicit in tender documentation
50
Evidence that the targets/strategies have been rechecked and tracked in design
25
A performance target is defined according to the quality requirements of OH 1.11 and is integrated into a project brief (OH 5.1)
10
No creation and implementation of a water target 0
235
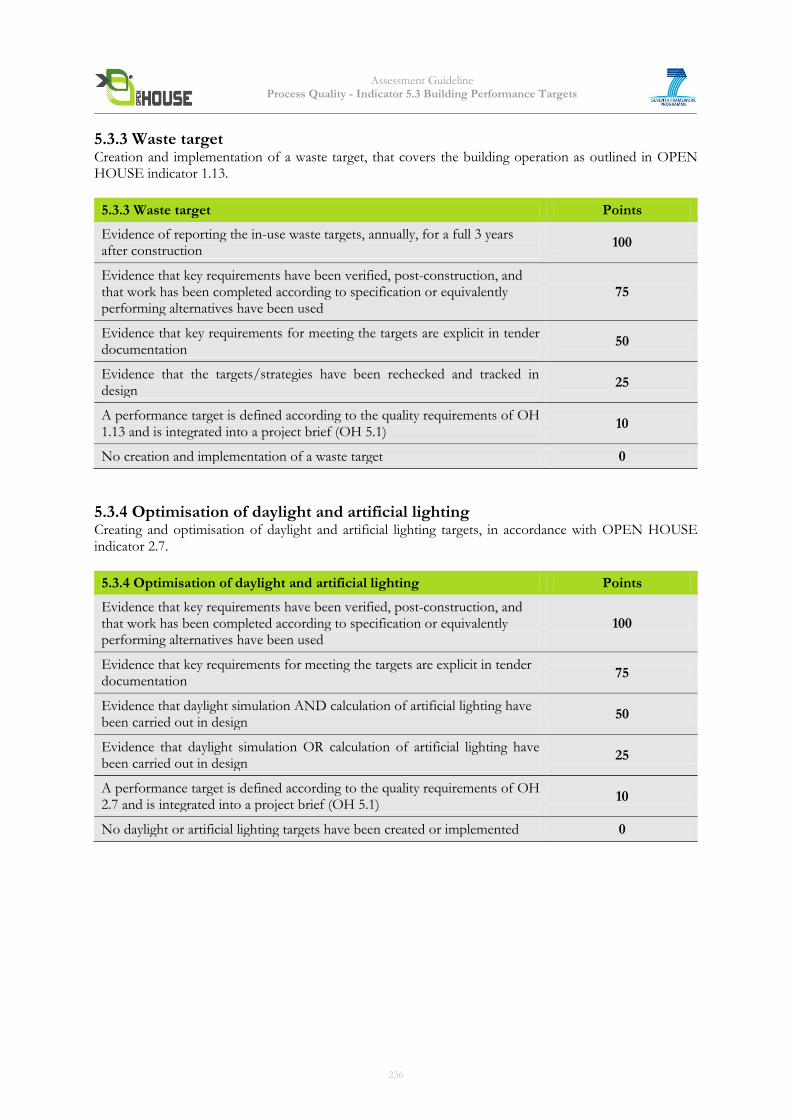
Assessment Guideline Process Quality - Indicator 5.3 Building Performance Targets
5.3.3 Waste target Creation and implementation of a waste target, that covers the building operation as outlined in OPEN HOUSE indicator 1.13.
5.3.3 Waste target Points
Evidence of reporting the in-use waste targets, annually, for a full 3 years after construction
100
Evidence that key requirements have been verified, post-construction, and that work has been completed according to specification or equivalently performing alternatives have been used
75
Evidence that key requirements for meeting the targets are explicit in tender documentation
50
Evidence that the targets/strategies have been rechecked and tracked in design
25
A performance target is defined according to the quality requirements of OH 1.13 and is integrated into a project brief (OH 5.1)
10
No creation and implementation of a waste target 0
5.3.4 Optimisation of daylight and artificial lighting Creating and optimisation of daylight and artificial lighting targets, in accordance with OPEN HOUSE indicator 2.7.
5.3.4 Optimisation of daylight and artificial lighting Points
Evidence that key requirements have been verified, post-construction, and that work has been completed according to specification or equivalently performing alternatives have been used
100
Evidence that key requirements for meeting the targets are explicit in tender documentation
75
Evidence that daylight simulation AND calculation of artificial lighting have been carried out in design
50
Evidence that daylight simulation OR calculation of artificial lighting have been carried out in design
25
A performance target is defined according to the quality requirements of OH 2.7 and is integrated into a project brief (OH 5.1)
10
No daylight or artificial lighting targets have been created or implemented 0
236
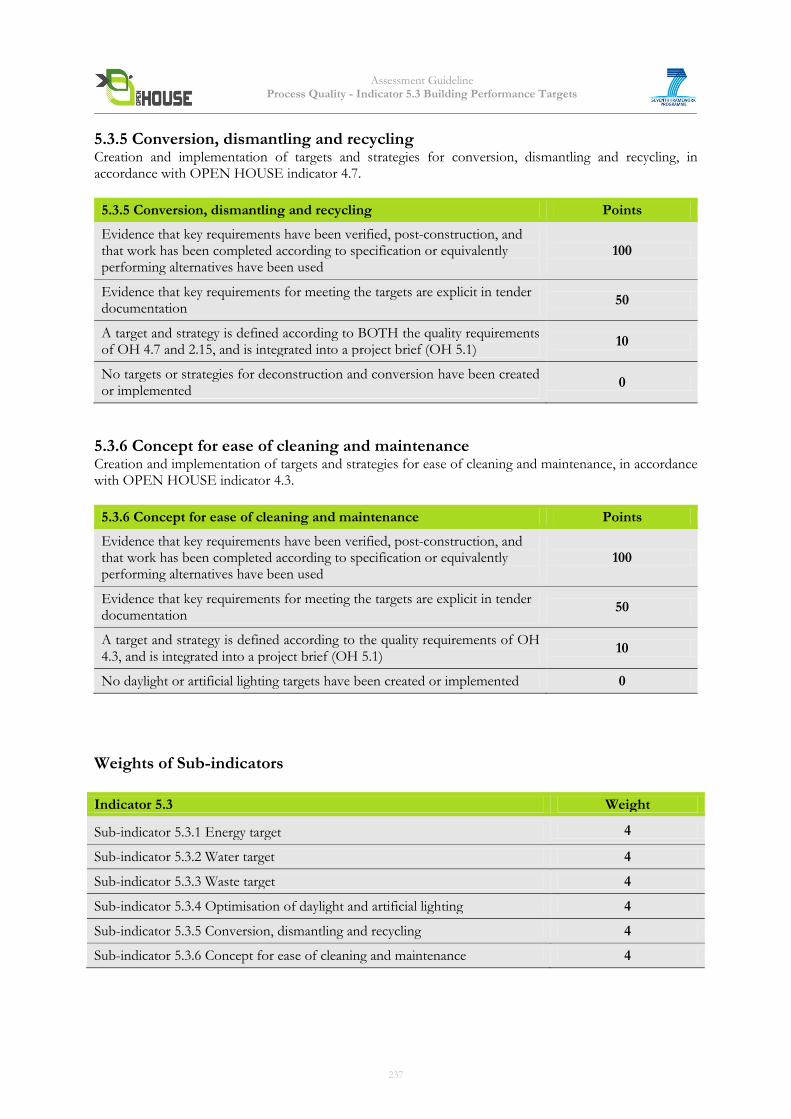
Assessment Guideline Process Quality - Indicator 5.3 Building Performance Targets
5.3.5 Conversion, dismantling and recycling Creation and implementation of targets and strategies for conversion, dismantling and recycling, in accordance with OPEN HOUSE indicator 4.7.
5.3.5 Conversion, dismantling and recycling Points
Evidence that key requirements have been verified, post-construction, and that work has been completed according to specification or equivalently performing alternatives have been used
100
Evidence that key requirements for meeting the targets are explicit in tender documentation
50
A target and strategy is defined according to BOTH the quality requirements of OH 4.7 and 2.15, and is integrated into a project brief (OH 5.1)
10
No targets or strategies for deconstruction and conversion have been created or implemented
0
5.3.6 Concept for ease of cleaning and maintenance Creation and implementation of targets and strategies for ease of cleaning and maintenance, in accordance with OPEN HOUSE indicator 4.3.
5.3.6 Concept for ease of cleaning and maintenance Points
Evidence that key requirements have been verified, post-construction, and that work has been completed according to specification or equivalently performing alternatives have been used
100
Evidence that key requirements for meeting the targets are explicit in tender documentation
50
A target and strategy is defined according to the quality requirements of OH 4.3, and is integrated into a project brief (OH 5.1)
10
No daylight or artificial lighting targets have been created or implemented 0
Weights of Sub-indicators
Indicator 5.3 Weight
Sub-indicator 5.3.1 Energy target 4
Sub-indicator 5.3.2 Water target 4
Sub-indicator 5.3.3 Waste target 4
Sub-indicator 5.3.4 Optimisation of daylight and artificial lighting 4
Sub-indicator 5.3.5 Conversion, dismantling and recycling 4
Sub-indicator 5.3.6 Concept for ease of cleaning and maintenance 4
237
Assessment Guideline Process Quality - Indicator 5.3 Building Performance Targets
4. Documentation Guidelines The following documents will be needed to assess the building: Quick & Basic Assessment Letter of commitment or easily and quickly accessible documentation for the required evidence (see Complete Assessment), e.g. reasonable estimations for intended/expected values. Complete Assessment 5.3.1 Energy target 5.3.2 Water target 5.3.3 Waste target To receive 100 points for all categories:
Evidence of verifying the in-use performance of the key targets, annually, for a full 3 years after construction.
Evidence that a monitoring plan for how to measure and report the waste, water and energy (in-use) was discussed and agreed with the building owners prior to occupation. (OH 5.9.3)
construction. To receive 75 points for all categories:
Evidence that key requirement have been verified, post-construction, and that work has been completed according to specification or equivalently performing alternatives have been used, such as site inspection reports and/or photographs.
To receive 50 points for all categories:
Key specifications which are relevant to the Energy, Water and Waste targets To receive 25 points for all categories:
Interim design reports/drawings comparing initial targets from brief, to estimated performance, based on current design and specification.
To receive 10 points for all categories:
The project brief see requirement for OH 5.1 quality indicator requirements for OH 1.10, 1.11, 1.13. 5.3.4 Optimisation of daylight and artificial lighting To receive 100 points:
Evidence that key requirement have been verified, post-construction, and that work has been completed according to specification or equivalently performing alternatives have been used
To receive 75 points:
Key specifications which are relevant to the lighting and daylighting, including commissioning of electric lighting
To receive 50 points:
Interim design reports/calculations including both daylighting simulation and artificial lighting calculations.
To receive 25 points:
Interim design reports/ calculations including either daylighting simulation or artificial lighting calculations.
To receive 10 points:
The project brief see requirement for OH 5.1, and quality indicator requirements for OH 2.7
238
Assessment Guideline Process Quality - Indicator 5.3 Building Performance Targets
5.3.5 Conversion, dismantling and recycling Proof of documentation that makes it possible dismantle and recycle parts of the building. To receive 100 points:
Evidence that key requirement have been verified, post-construction, and that work has been completed according to specification or equivalently performing alternatives have been used
To receive 50 points:
Key specifications which are relevant to the deconstruction and end of life To receive 10 points:
The project brief see requirement for OH 5.1, and quality indicator requirements for OH 4.7 and 2.15. 5.3.6 Concept for ease of cleaning and maintenance Proof of cleaning and maintenance concept which show practical functions. To receive 100 points:
Evidence that key requirement have been verified, post-construction, and that work has been completed according to specification or equivalently performing alternatives have been used
To receive 50 points:
Key specifications which are relevant to the cleaning and maintenance. To receive 10 points:
The project brief see requirement for OH 5.1, and quality indicator requirements for OH 4.3.
5. Relation to other Indicators 1.9 Non-renewable primary energy demand / Abiotic Depletion Potential for Fossil Fuels 1.10 Total primary energy demand and percentage of renewable primary energy. 1.13 Waste 2.5 Water Quality 2.7 Visual Comfort 4.3 Cleaning and maintenance 2.15 Flexibility for Future Users 4.7 Ease of deconstruction, recycling and dismantling.
6. Resources 1. Soft Landings - http://www.bsria.co.uk/services/design/soft-landings/guidance/ 2. DGNB International Criterion 45: Optimisation and complexity of planning method 3. BNB: Bewertungssystem Nachhaltiges Bauen (Germany) Criterion 5.1.3: Komplexität und Optimierung der Planung http://www.nachhaltigesbauen.de/fileadmin/pdf/BNB_Steckbriefe_Buero_Neubau/aktuell/BNB_BN_513.pdf 4. Council Directive 92/57/EEC of 24 June 1992 on the implementation of minimum safety and health requirements at temporary or mobile constructions sites (eighth individual Directive within the meaning of Article 16 (1) of Directive 89/391/EEC) 5. Construction Design and Management Regulations (UK) 6. Contents of the French Global (PGCSPS) and Particular (PPSPS) Health and Safety Plan
7. Attachments
None
239
Assessment Guideline Process Quality - Indicator 5.4
Evidence of Sustainability during Bid Invitation and Awarding
Indicator 5.4 Evidence of Sustainability during Bid Invitation and Awarding (adapted from DGNB/BNB)
1. Objective This indicator is closely connected to general principles of green and sustainable procurement. The aim is to assess whether the sustainability issues have been (not, partly or comprehensively) specifically addressed through individual or general requirements (must and target values) and integrated in the bid invitation documents (call for tenders). Also, the aim is to asses whether these issues have been taken into account during awarding, i.e. in the process of selection of products and services providers. The target traced here is assuring that the products and services (or, the whole building) will meet also sustainability objectives, being evaluated and awarded (selected) not only on the basis of the lowest price offered.
2. Assessment Methodology This indicator is qualitative. The method of assessment consists of an aggregation of sub-indicator values. The aggregated scoring ranges from 0 to 100. With regard to the actual case assessed further subdivisions (intermediate ranking) within the range of predefined values for sub-indicators are also possible. In this case the assessor must provide own explanation and justification of scoring. The following sub-indicators will be assessed: 5.4.1 Integration of Sustainability Aspects during Bid Invitation 5.4.2 Integration of Sustainability Aspects during Awarding The assessment comprises thorough checking of the documentation prepared for and used in the bid invitation and awarding processes (including the offer(s) delivered by bid participant(s)). Evidence for assessment shall be provided by the investor/bid invitation organiser.
240
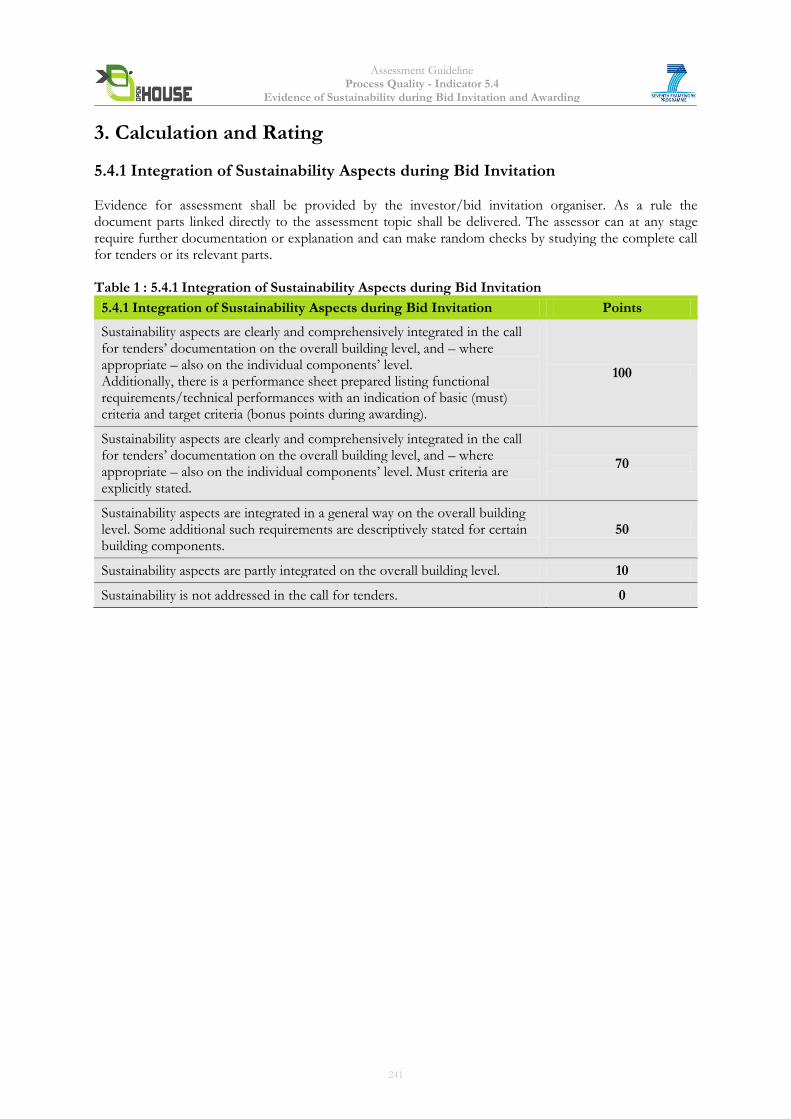
Assessment Guideline Process Quality - Indicator 5.4
Evidence of Sustainability during Bid Invitation and Awarding
3. Calculation and Rating
5.4.1 Integration of Sustainability Aspects during Bid Invitation Evidence for assessment shall be provided by the investor/bid invitation organiser. As a rule the document parts linked directly to the assessment topic shall be delivered. The assessor can at any stage require further documentation or explanation and can make random checks by studying the complete call for tenders or its relevant parts. Table 1 : 5.4.1 Integration of Sustainability Aspects during Bid Invitation
5.4.1 Integration of Sustainability Aspects during Bid Invitation Points
Sustainability aspects are clearly and comprehensively integrated in the call for tenders’ documentation on the overall building level, and – where appropriate – also on the individual components’ level. Additionally, there is a performance sheet prepared listing functional requirements/technical performances with an indication of basic (must) criteria and target criteria (bonus points during awarding).
100
Sustainability aspects are clearly and comprehensively integrated in the call for tenders’ documentation on the overall building level, and – where appropriate – also on the individual components’ level. Must criteria are explicitly stated.
70
Sustainability aspects are integrated in a general way on the overall building level. Some additional such requirements are descriptively stated for certain building components.
50
Sustainability aspects are partly integrated on the overall building level. 10
Sustainability is not addressed in the call for tenders. 0
241
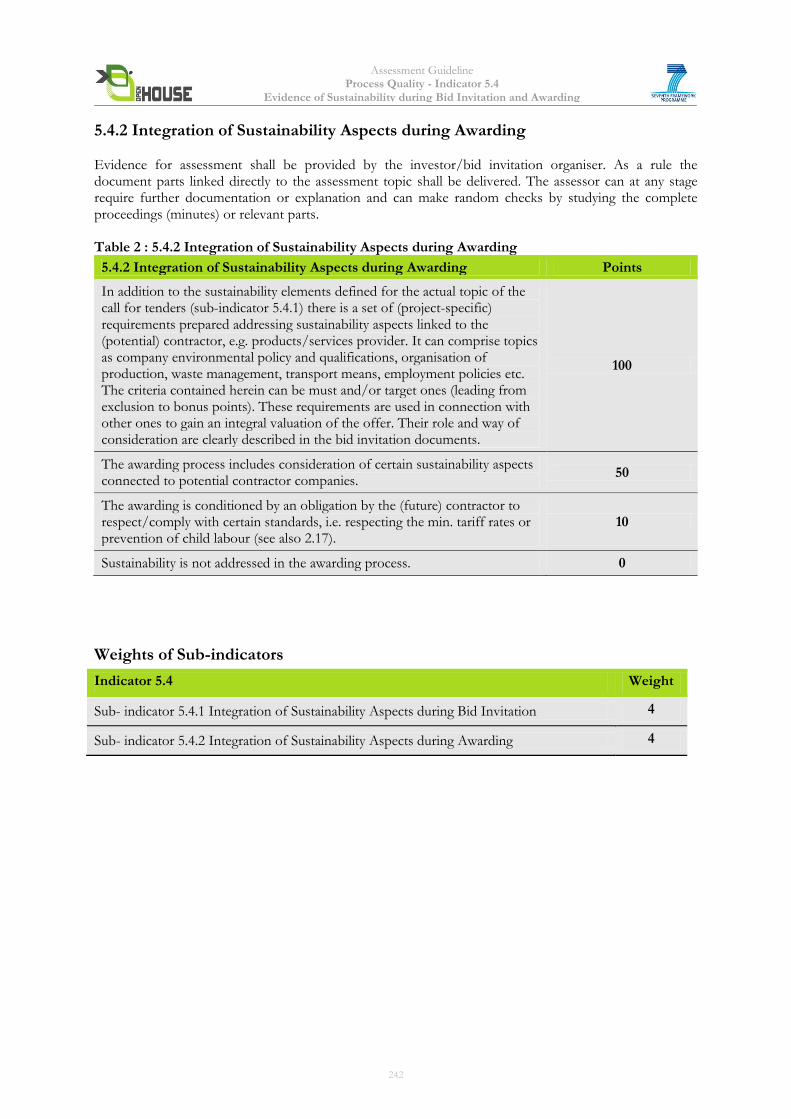
Assessment Guideline Process Quality - Indicator 5.4
Evidence of Sustainability during Bid Invitation and Awarding
5.4.2 Integration of Sustainability Aspects during Awarding Evidence for assessment shall be provided by the investor/bid invitation organiser. As a rule the document parts linked directly to the assessment topic shall be delivered. The assessor can at any stage require further documentation or explanation and can make random checks by studying the complete proceedings (minutes) or relevant parts. Table 2 : 5.4.2 Integration of Sustainability Aspects during Awarding
5.4.2 Integration of Sustainability Aspects during Awarding Points
In addition to the sustainability elements defined for the actual topic of the call for tenders (sub-indicator 5.4.1) there is a set of (project-specific) requirements prepared addressing sustainability aspects linked to the (potential) contractor, e.g. products/services provider. It can comprise topics as company environmental policy and qualifications, organisation of production, waste management, transport means, employment policies etc. The criteria contained herein can be must and/or target ones (leading from exclusion to bonus points). These requirements are used in connection with other ones to gain an integral valuation of the offer. Their role and way of consideration are clearly described in the bid invitation documents.
100
The awarding process includes consideration of certain sustainability aspects connected to potential contractor companies.
50
The awarding is conditioned by an obligation by the (future) contractor to respect/comply with certain standards, i.e. respecting the min. tariff rates or prevention of child labour (see also 2.17).
10
Sustainability is not addressed in the awarding process. 0
Weights of Sub-indicators
Indicator 5.4 Weight
Sub- indicator 5.4.1 Integration of Sustainability Aspects during Bid Invitation 4
Sub- indicator 5.4.2 Integration of Sustainability Aspects during Awarding 4
242
Assessment Guideline Process Quality - Indicator 5.4
Evidence of Sustainability during Bid Invitation and Awarding
4. Documentation Guidelines The following documents will be needed to assess the building: Quick & Basic Assessment Letter of commitment or easily and quickly accessible documentation for the required evidence (see Complete Assessment), e.g. reasonable estimations for intended/expected values. Complete Assessment 5.4.1 Integration of Sustainability Aspects during Bid Invitation Call for tenders and Relevant technical project documentation Pertinent excerpts from calls for tenders, such as texts pertaining to specific services, additional technical preliminary comments, and special contractual terms demonstrating that the required sustainability aspects were integrated 5.4.2 Integration of Sustainability Aspects during Awarding List of requirements (awarding) and Proceedings of the awarding process A description of the way contractors were selected in order to demonstrate how the quality of services, regional added value, local job retention, and the enforcement of environmental and social standards (such
as a ban on child labor) were assessed.
5. Relation to other Indicators None
6. Resources DGNB - 46 Evidence of sustainable aspects in call for and awarding of tenders BNB - 5.1.4 Sustainablity Issues in Tender and Placing http://www.nachhaltigesbauen.de/fileadmin/pdf/BNB_Steckbriefe_Buero_Neubau/aktuell/BNB_BN_514.pdf (in German) EU documents directives and strategies including: European Strategy for Sustainable Development, Lead Market Initiative, Europe 2020 and Energy 2020, Recast of EPBD and Green Public Procurement.
7. Attachments
None
243
Assessment Guideline Process Quality - Indicator 5.5 – Construction Site Impact/Construction Process
Indicator 5.5 Construction Site Impact / Construction Process
(adapted from BREEAM, DGNB/BNB)
Core Indicator
1. Objective
The effects of the construction site on the environment are to be minimized while simultaneously protecting the health of all participants. This indicator supports the European Commission goal to protect workers from harmful levels of noise or to harmful external influences1 (e.g. gases, vapours, dust). It also supports the objective of the increase to a minimum of 70 % by weight of the preparing for re-use, recycling and other material recovery - including backfilling operations using waste to substitute other materials - of non-hazardous construction and demolition waste2.
2. Assessment Methodology The qualitative evaluation of the construction site and construction process includes following criteria: 1. Low-waste and recycling on construction site: When buildings are constructed, altered, or demolished, rubbish, excavated soil, leftover materials, packing materials, old wood, etc. accumulate. This waste is to be avoided or salvaged. Waste that is neither avoidable nor salvageable should be ecologically disposed. Additionally, recycling strategies for the construction waste generated should be adequately considered. 2. Low-noise construction site: Permanent exposure to noise can lead to overstimulation of the nervous-system and, thereby, to health problems. In densely built areas, construction noise, after traffic noise, is the most significant noise source. Therefore, it is to be demonstrated that the construction noise does not exceed the general noise level, or that adequate measures are used to reduce it. 3. Low-dust construction site: Dust is normally generated while handling construction materials during numerous and varied work activities. An important contribution to the protection of persons is achieved by minimizing dust. Furthermore, the environment is to be protected from damages caused by materials. 4. Environmental protection at the construction site: Ecological features (natural areas, trees,..) shall be protected from damage. In addition, soil and groundwater shall be protected from hazardous materials deposits and other forbidden influences during the construction phase. Chemical impacts can occur through products and operating procedures by which gaseous-, liquid, or solid materials can end up in the ground. Further effects, such as excessive compacting, shall be avoided. Announcement and bidding documents, documentations, or measurement records show the execution of the measures and adherence to the limit values defined in sub-indicators. The following sub-indicators will be assessed: 5.5.1 Low-waste and recycling on construction site 5.5.2 Low-noise construction site 5.5.3 Low-dust construction site 5.5.4 Environmental protection at the construction site
1 DIRECTIVE 92/57/EC: implementation of minimum safety and health requirements at temporary or mobile
construction sites 2 DIRECTIVE 2008/98/EC on waste
244
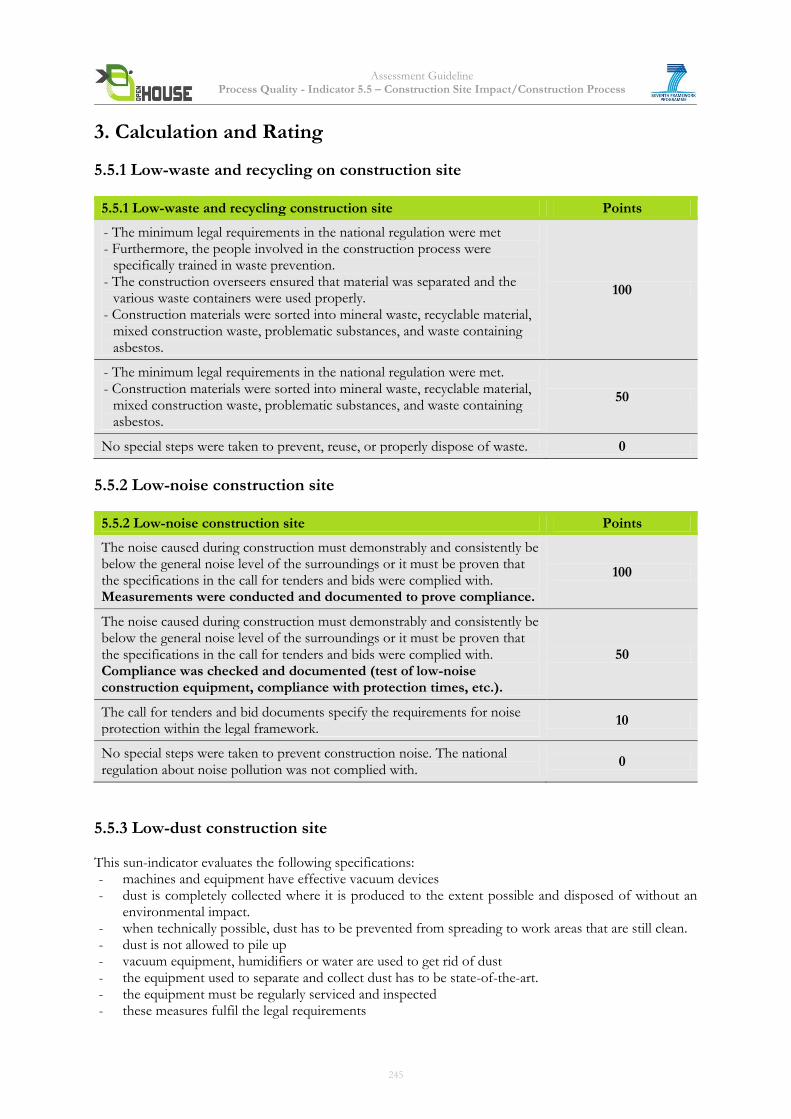
Assessment Guideline Process Quality - Indicator 5.5 – Construction Site Impact/Construction Process
3. Calculation and Rating
5.5.1 Low-waste and recycling on construction site
5.5.1 Low-waste and recycling construction site Points
- The minimum legal requirements in the national regulation were met - Furthermore, the people involved in the construction process were
specifically trained in waste prevention. - The construction overseers ensured that material was separated and the
various waste containers were used properly. - Construction materials were sorted into mineral waste, recyclable material,
mixed construction waste, problematic substances, and waste containing asbestos.
100
- The minimum legal requirements in the national regulation were met. - Construction materials were sorted into mineral waste, recyclable material,
mixed construction waste, problematic substances, and waste containing asbestos.
50
No special steps were taken to prevent, reuse, or properly dispose of waste. 0
5.5.2 Low-noise construction site
5.5.2 Low-noise construction site Points
The noise caused during construction must demonstrably and consistently be below the general noise level of the surroundings or it must be proven that the specifications in the call for tenders and bids were complied with. Measurements were conducted and documented to prove compliance.
100
The noise caused during construction must demonstrably and consistently be below the general noise level of the surroundings or it must be proven that the specifications in the call for tenders and bids were complied with. Compliance was checked and documented (test of low-noise construction equipment, compliance with protection times, etc.).
50
The call for tenders and bid documents specify the requirements for noise protection within the legal framework.
10
No special steps were taken to prevent construction noise. The national regulation about noise pollution was not complied with.
0
5.5.3 Low-dust construction site This sun-indicator evaluates the following specifications: - machines and equipment have effective vacuum devices - dust is completely collected where it is produced to the extent possible and disposed of without an
environmental impact. - when technically possible, dust has to be prevented from spreading to work areas that are still clean. - dust is not allowed to pile up - vacuum equipment, humidifiers or water are used to get rid of dust - the equipment used to separate and collect dust has to be state-of-the-art. - the equipment must be regularly serviced and inspected - these measures fulfil the legal requirements
245
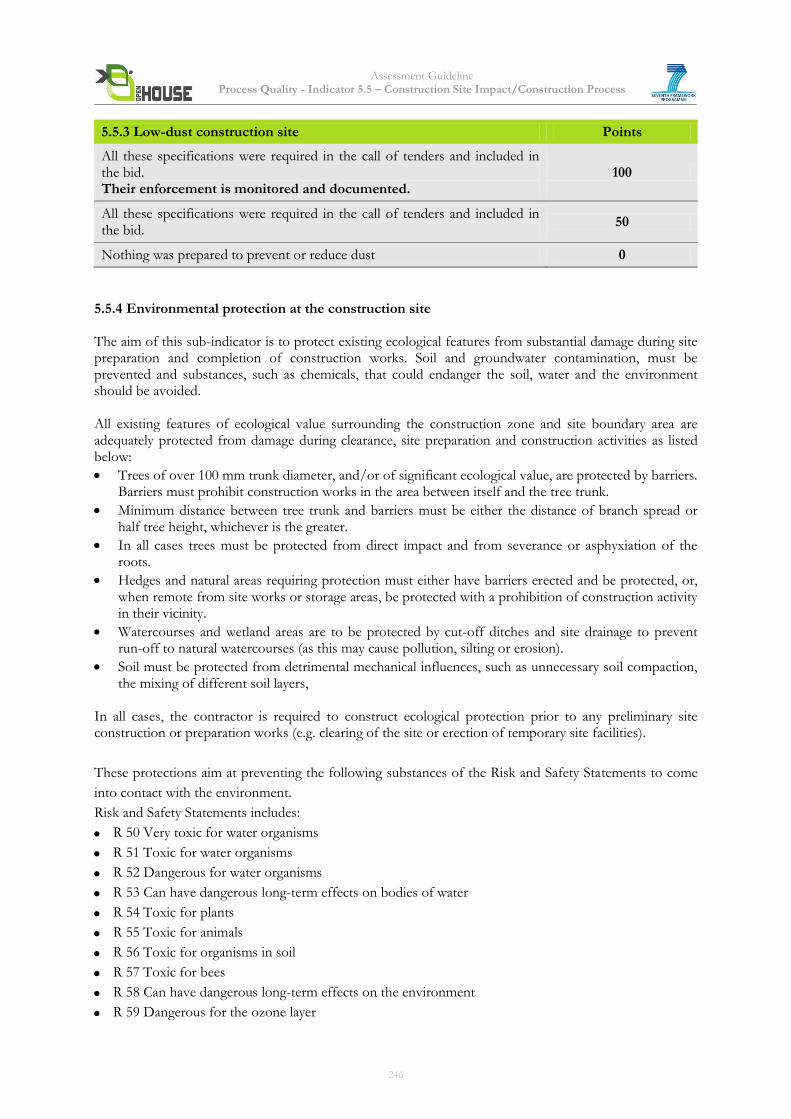
Assessment Guideline Process Quality - Indicator 5.5 – Construction Site Impact/Construction Process
5.5.3 Low-dust construction site Points
All these specifications were required in the call of tenders and included in the bid. Their enforcement is monitored and documented.
100
All these specifications were required in the call of tenders and included in the bid.
50
Nothing was prepared to prevent or reduce dust 0
5.5.4 Environmental protection at the construction site The aim of this sub-indicator is to protect existing ecological features from substantial damage during site preparation and completion of construction works. Soil and groundwater contamination, must be prevented and substances, such as chemicals, that could endanger the soil, water and the environment should be avoided. All existing features of ecological value surrounding the construction zone and site boundary area are adequately protected from damage during clearance, site preparation and construction activities as listed below:
Trees of over 100 mm trunk diameter, and/or of significant ecological value, are protected by barriers. Barriers must prohibit construction works in the area between itself and the tree trunk.
Minimum distance between tree trunk and barriers must be either the distance of branch spread or half tree height, whichever is the greater.
In all cases trees must be protected from direct impact and from severance or asphyxiation of the roots.
Hedges and natural areas requiring protection must either have barriers erected and be protected, or, when remote from site works or storage areas, be protected with a prohibition of construction activity in their vicinity.
Watercourses and wetland areas are to be protected by cut-off ditches and site drainage to prevent run-off to natural watercourses (as this may cause pollution, silting or erosion).
Soil must be protected from detrimental mechanical influences, such as unnecessary soil compaction, the mixing of different soil layers,
In all cases, the contractor is required to construct ecological protection prior to any preliminary site construction or preparation works (e.g. clearing of the site or erection of temporary site facilities).
These protections aim at preventing the following substances of the Risk and Safety Statements to come
into contact with the environment.
Risk and Safety Statements includes:
R 50 Very toxic for water organisms
R 51 Toxic for water organisms
R 52 Dangerous for water organisms
R 53 Can have dangerous long-term effects on bodies of water
R 54 Toxic for plants
R 55 Toxic for animals
R 56 Toxic for organisms in soil
R 57 Toxic for bees
R 58 Can have dangerous long-term effects on the environment
R 59 Dangerous for the ozone layer
246
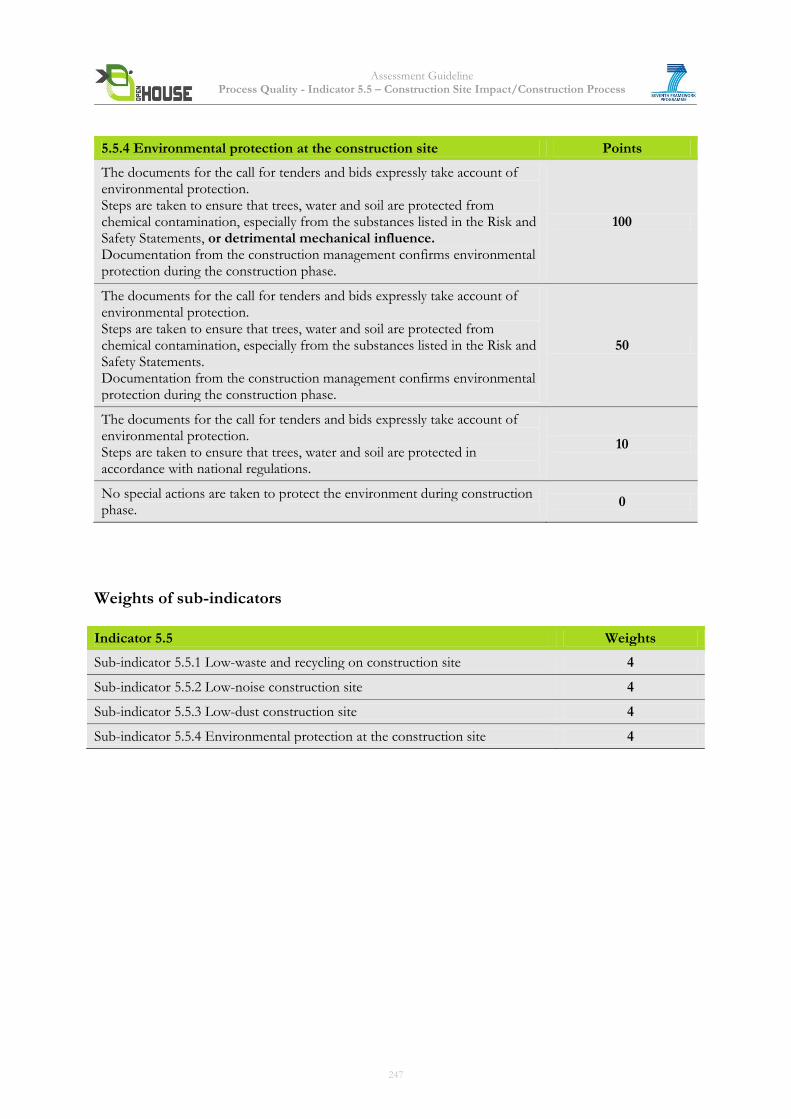
Assessment Guideline Process Quality - Indicator 5.5 – Construction Site Impact/Construction Process
5.5.4 Environmental protection at the construction site Points
The documents for the call for tenders and bids expressly take account of environmental protection. Steps are taken to ensure that trees, water and soil are protected from chemical contamination, especially from the substances listed in the Risk and Safety Statements, or detrimental mechanical influence. Documentation from the construction management confirms environmental protection during the construction phase.
100
The documents for the call for tenders and bids expressly take account of environmental protection. Steps are taken to ensure that trees, water and soil are protected from chemical contamination, especially from the substances listed in the Risk and Safety Statements. Documentation from the construction management confirms environmental protection during the construction phase.
50
The documents for the call for tenders and bids expressly take account of environmental protection. Steps are taken to ensure that trees, water and soil are protected in accordance with national regulations.
10
No special actions are taken to protect the environment during construction phase.
0
Weights of sub-indicators
Indicator 5.5 Weights
Sub-indicator 5.5.1 Low-waste and recycling on construction site 4
Sub-indicator 5.5.2 Low-noise construction site 4
Sub-indicator 5.5.3 Low-dust construction site 4
Sub-indicator 5.5.4 Environmental protection at the construction site 4
247
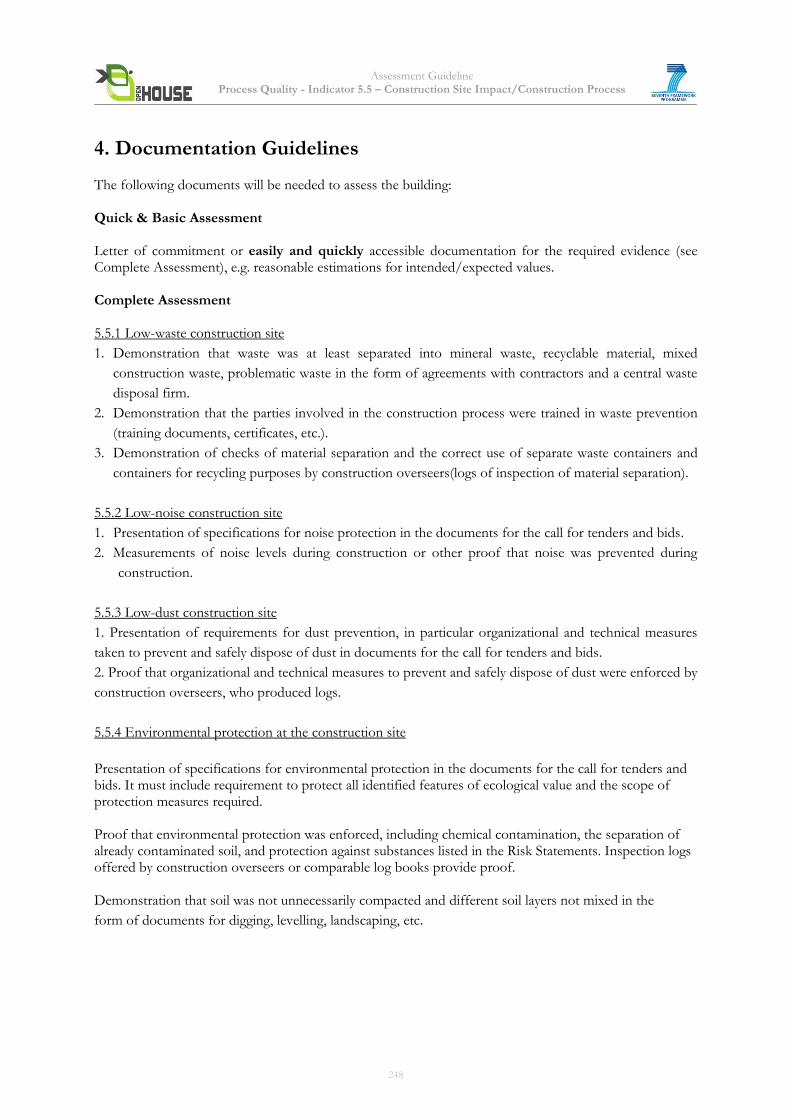
Assessment Guideline Process Quality - Indicator 5.5 – Construction Site Impact/Construction Process
4. Documentation Guidelines The following documents will be needed to assess the building: Quick & Basic Assessment Letter of commitment or easily and quickly accessible documentation for the required evidence (see Complete Assessment), e.g. reasonable estimations for intended/expected values. Complete Assessment 5.5.1 Low-waste construction site
1. Demonstration that waste was at least separated into mineral waste, recyclable material, mixed
construction waste, problematic waste in the form of agreements with contractors and a central waste
disposal firm.
2. Demonstration that the parties involved in the construction process were trained in waste prevention
(training documents, certificates, etc.).
3. Demonstration of checks of material separation and the correct use of separate waste containers and
containers for recycling purposes by construction overseers(logs of inspection of material separation).
5.5.2 Low-noise construction site
1. Presentation of specifications for noise protection in the documents for the call for tenders and bids.
2. Measurements of noise levels during construction or other proof that noise was prevented during
construction.
5.5.3 Low-dust construction site
1. Presentation of requirements for dust prevention, in particular organizational and technical measures
taken to prevent and safely dispose of dust in documents for the call for tenders and bids.
2. Proof that organizational and technical measures to prevent and safely dispose of dust were enforced by
construction overseers, who produced logs.
5.5.4 Environmental protection at the construction site
Presentation of specifications for environmental protection in the documents for the call for tenders and bids. It must include requirement to protect all identified features of ecological value and the scope of protection measures required. Proof that environmental protection was enforced, including chemical contamination, the separation of already contaminated soil, and protection against substances listed in the Risk Statements. Inspection logs offered by construction overseers or comparable log books provide proof. Demonstration that soil was not unnecessarily compacted and different soil layers not mixed in the
form of documents for digging, levelling, landscaping, etc.
248
Assessment Guideline Process Quality - Indicator 5.5 – Construction Site Impact/Construction Process
5. Relation to other Indicators
Indicator 1.7 Biodiversity and depletion of habitats Indicator 4.7 Ease of Deconstruction, Recycling, and Dismantling
6. Resources DGNB 48 Construction Site / Construction Process BREEAM LE 3 - Ecological Value of Site and Protection of Ecological Features Risk and Safety Statements: http://ec.europa.eu/environment/chemicals/dansub/pdfs/annex3_en.pdf Council Directive 92/57/EEC of 24 June 1992 on the implementation of minimum safety and health requirements at temporary or mobile construction sites: http://eurlex.europa.eu/LexUriServ/LexUriServ.do?uri=CONSLEG:1992L0057:20070627:EN:PDF http://www.ekt.bme.hu/CM-BSC-MSC/FIEC-Directive9257EEC.pdf Low-waste construction site Directive 2008/98/EC of the European Parliament and of the Council of 19 November 2008 on waste and repealing certain Directives: http://eur-lex.europa.eu/LexUriServ/LexUriServ.do?uri=OJ:L:2008:312:0003:0030:en:PDF Low-noise construction site Directive 2000/14/EC of the European Parliament and of the Council of 8 May 2000 on the approximation of the laws of the Member States relating to the noise emission in the environment by equipment for use outdoors: http://ec.europa.eu/environment/noise/pdf/d0014_en.pdf Low-dust construction site Council Directive 98/24/EC of 7 April 1998 on the protection of the health and safety of workers from the risks related to chemical agents at work (fourteenth individual Directive within the meaning of Article 16(1) of Directive 89/391/EEC): http://www2.unitar.org/cwm/publications/cbl/ghs/Documents_2ed/C_Regional_Documents/215_EU_Directive9824EC.pdf BRE/EA publications ‘Control of Dust from Construction and Demolition Activities’ (BRE, 2003). Pollution Control Guide Parts 1-5 (BRE, 2003). Environmental protection at the construction site Directive 2008/1/EC of the European Parliament and of the Council of 15 January 2008 concerning integrated pollution prevention and control: http://eur-lex.europa.eu/LexUriServ/LexUriServ.do?uri=OJ:L:2008:024:0008:0029:en:PDF Proposal for a European Parliament and Council Directive of 22 September 2006 setting out a framework for soil protection and amending Council Directive 2004/35/EC: http://eur-lex.europa.eu/LexUriServ/LexUriServ.do?uri=OJ:L:2006:263:0009:0011:EN:PDF
7. Attachments None
249
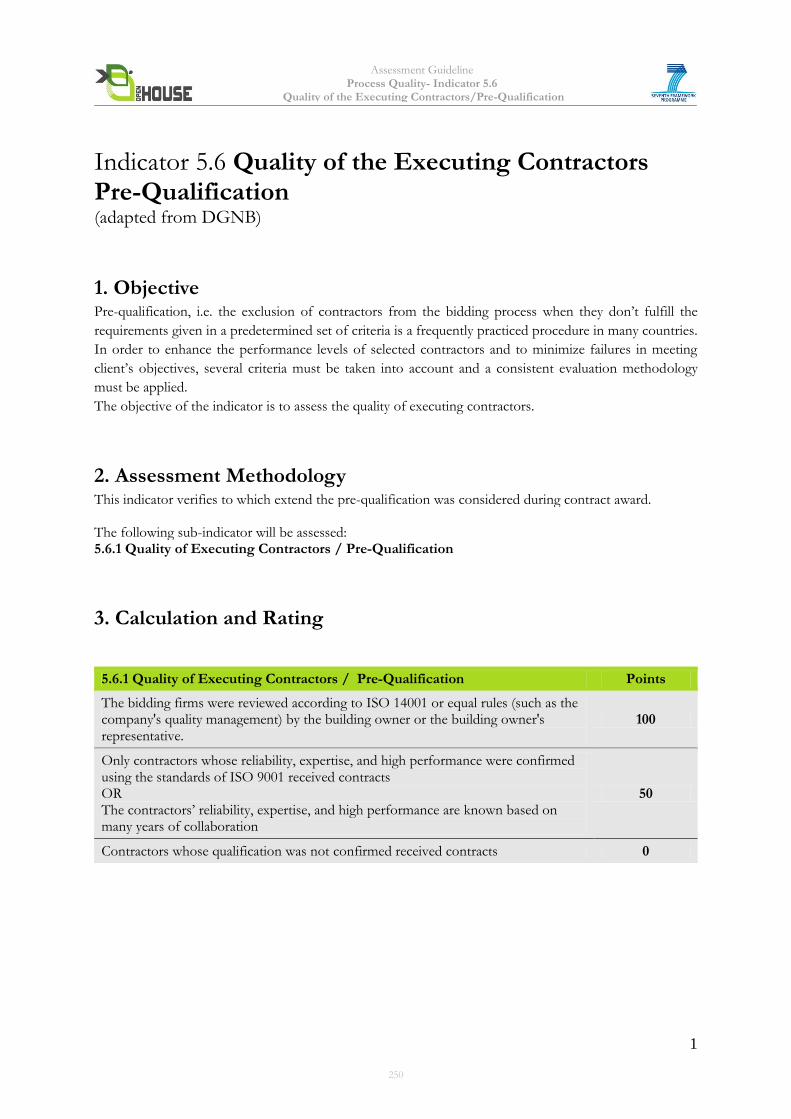
Assessment Guideline Process Quality- Indicator 5.6
Quality of the Executing Contractors/Pre-Qualification
1
Indicator 5.6 Quality of the Executing Contractors Pre-Qualification (adapted from DGNB)
1. Objective Pre-qualification, i.e. the exclusion of contractors from the bidding process when they don’t fulfill the
requirements given in a predetermined set of criteria is a frequently practiced procedure in many countries.
In order to enhance the performance levels of selected contractors and to minimize failures in meeting
client’s objectives, several criteria must be taken into account and a consistent evaluation methodology
must be applied.
The objective of the indicator is to assess the quality of executing contractors.
2. Assessment Methodology This indicator verifies to which extend the pre-qualification was considered during contract award. The following sub-indicator will be assessed: 5.6.1 Quality of Executing Contractors / Pre-Qualification
3. Calculation and Rating
5.6.1 Quality of Executing Contractors / Pre-Qualification Points
The bidding firms were reviewed according to ISO 14001 or equal rules (such as the company's quality management) by the building owner or the building owner's representative.
100
Only contractors whose reliability, expertise, and high performance were confirmed using the standards of ISO 9001 received contracts OR The contractors’ reliability, expertise, and high performance are known based on many years of collaboration
50
Contractors whose qualification was not confirmed received contracts 0
250

Assessment Guideline Process Quality- Indicator 5.6
Quality of the Executing Contractors/Pre-Qualification
2
4. Documentation Guidelines The following documents will be needed to assess the building: Quick & Basic Assessment Letter of commitment or easily and quickly accessible documentation for the required evidence (see Complete Assessment), e.g. reasonable estimations for intended/expected values. Complete Assessment 5.6.1 Quality of Executing Contractors / Pre-Qualification Qualification of contractors Demonstration of contractor eligibility Demonstration of contractors' reliability, expertise, and high performance.
5. Relation to other Indicators None
6. Resources The Government Procurement Agreement (GPA): http://www.wto.org/english/tratop_e/gproc_e/gp_gpa_e.htm Directive 2004/17/EC of the European Parliament and of the Council of 31 March 2004 coordinating the procurement procedures of entities operating in the water, energy, transport and postal services sectors: http://eur-lex.europa.eu/LexUriServ/LexUriServ.do?uri=OJ:L:2004:134:0001:0113:en:PDF Directive 2004/18/EC of the European Parliament and of the Council of 31 March 2004 on the coordination of procedures for the award of public works contracts, public supply contracts and public service contracts: http://eur-lex.europa.eu/LexUriServ/LexUriServ.do?uri=OJ:L:2004:134:0114:0240:en:PDF ISO 9001:2008 “Quality management systems - Requirements”: http://www.iso.org/iso/catalogue_detail?csnumber=46486 ISO 14001:2004 “Environmental management systems - Requirements with guidance for use”: http://www.iso.org/iso/catalogue_detail?csnumber=31807 http://www.praxiom.com/iso-14001-2004.htm GUIDE TO THE COMMUNITY RULES ON PUBLIC WORKS CONTRACTS: http://ec.europa.eu/internal_market/publicprocurement/docs/guidelines/works_en.pdf
7. Attachments
None
251
Assessment Guideline Process Quality - Indicator 5.7 – Quality Assurance of Construction Execution
Indicator 5.7 Quality Assurance of Construction Execution (adapted from DGNB/BNB)
1. Objective The quality reached in the process of the construction execution shall be described, verified, and certified on the one hand to eliminate risks and deficiencies, and on the other hand to demonstrate the achieved quality to third parties. The following aspects are dealt with: 1. The goal of documenting the used and built-in materials, additives, and the systematic collection of the safety data sheets is to create documentation on important building data for a building user guide. A detailed documentation contributes toward facilitating rising upcoming processes during the building’s life cycle. 2. Measurements and analyses (including measurements for determination of the air-tightness of the building’s shell and of the quality of the noise protection) shall verify and document the reaching of the aimed-for qualities and target values.
2. Assessment Methodology The evaluation takes into account the following sub-indicators: 5.7.1 Documentation of the materials, auxiliary materials, and safety data sheets 5.7.2 Measurements for quality control
252
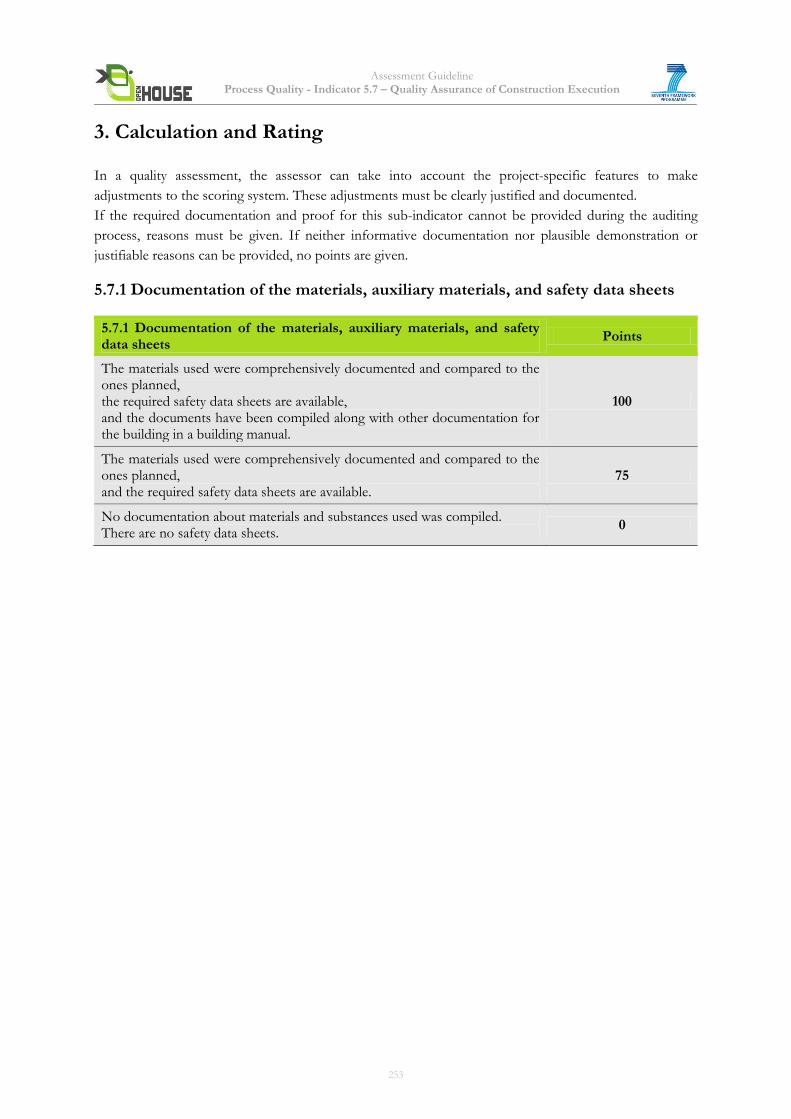
Assessment Guideline Process Quality - Indicator 5.7 – Quality Assurance of Construction Execution
3. Calculation and Rating
In a quality assessment, the assessor can take into account the project-specific features to make
adjustments to the scoring system. These adjustments must be clearly justified and documented.
If the required documentation and proof for this sub-indicator cannot be provided during the auditing
process, reasons must be given. If neither informative documentation nor plausible demonstration or
justifiable reasons can be provided, no points are given.
5.7.1 Documentation of the materials, auxiliary materials, and safety data sheets
5.7.1 Documentation of the materials, auxiliary materials, and safety data sheets
Points
The materials used were comprehensively documented and compared to the ones planned, the required safety data sheets are available, and the documents have been compiled along with other documentation for the building in a building manual.
100
The materials used were comprehensively documented and compared to the ones planned, and the required safety data sheets are available.
75
No documentation about materials and substances used was compiled. There are no safety data sheets.
0
253
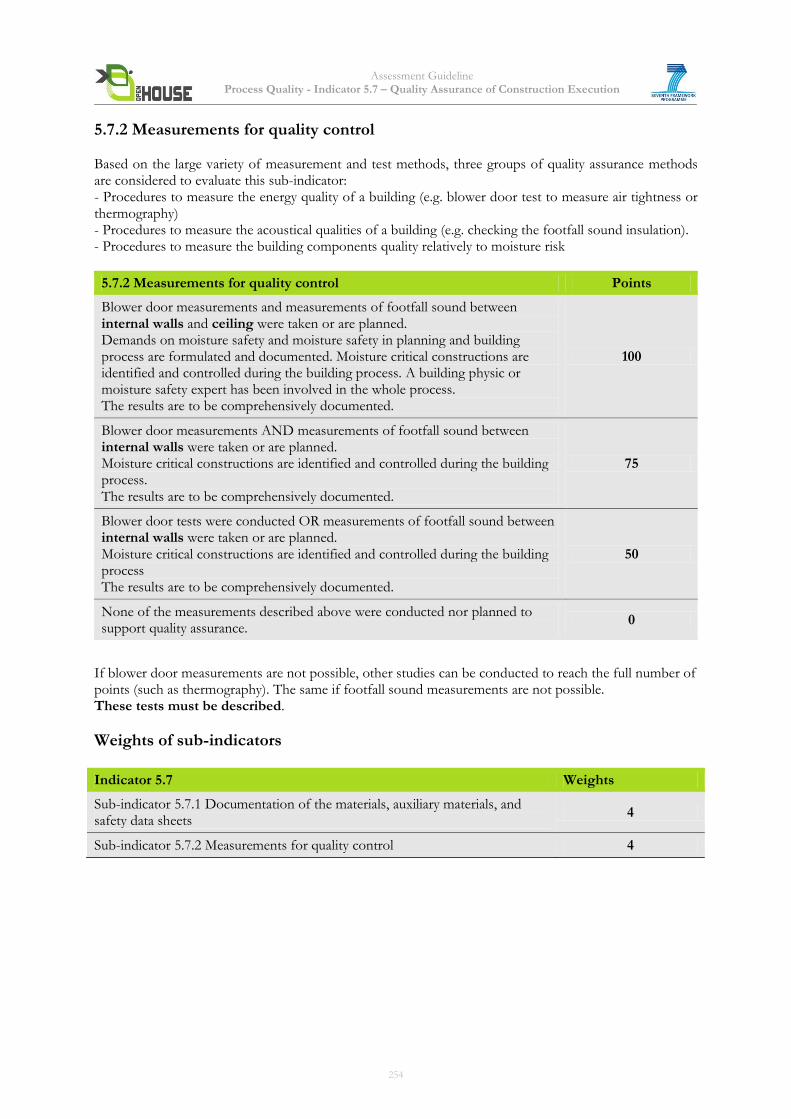
Assessment Guideline Process Quality - Indicator 5.7 – Quality Assurance of Construction Execution
5.7.2 Measurements for quality control Based on the large variety of measurement and test methods, three groups of quality assurance methods are considered to evaluate this sub-indicator: - Procedures to measure the energy quality of a building (e.g. blower door test to measure air tightness or thermography) - Procedures to measure the acoustical qualities of a building (e.g. checking the footfall sound insulation). - Procedures to measure the building components quality relatively to moisture risk
5.7.2 Measurements for quality control Points
Blower door measurements and measurements of footfall sound between internal walls and ceiling were taken or are planned. Demands on moisture safety and moisture safety in planning and building process are formulated and documented. Moisture critical constructions are identified and controlled during the building process. A building physic or moisture safety expert has been involved in the whole process. The results are to be comprehensively documented.
100
Blower door measurements AND measurements of footfall sound between internal walls were taken or are planned. Moisture critical constructions are identified and controlled during the building process. The results are to be comprehensively documented.
75
Blower door tests were conducted OR measurements of footfall sound between internal walls were taken or are planned. Moisture critical constructions are identified and controlled during the building process The results are to be comprehensively documented.
50
None of the measurements described above were conducted nor planned to support quality assurance.
0
If blower door measurements are not possible, other studies can be conducted to reach the full number of points (such as thermography). The same if footfall sound measurements are not possible. These tests must be described.
Weights of sub-indicators
Indicator 5.7 Weights
Sub-indicator 5.7.1 Documentation of the materials, auxiliary materials, and safety data sheets
4
Sub-indicator 5.7.2 Measurements for quality control 4
254
Assessment Guideline Process Quality - Indicator 5.7 – Quality Assurance of Construction Execution
4. Documentation Guidelines The following documents will be needed to assess the building: Quick & Basic Assessment Letter of commitment or easily and quickly accessible documentation for the required evidence (see Complete Assessment), e.g. reasonable estimations for intended/expected values. Complete Assessment 5.7.1 Documentation of the materials, auxiliary materials, and safety data sheets
- Compilation of all product data sheets and safety data sheets in accordance with 91/155/EEC for all layers of the main building components (as for example DIN 276-1 “Building costs – Part 1: Building construction” in Germany) with an easy-to-follow data structure. - Integration of the information on products used (product name, manufacturer, etc.) and building materials (key technical figures) in the building manual. 5.7.2 Measurements for quality control - Checks on a building´s energy quality by means of methods such as the blower door test or thermography - Checks on a building's noise protection/acoustic quality by means of methods such as the footfall sound tests. - Building physic expert report and photographic documentation Note: A blower door test is required for an assessment of the building envelope's heat and moisture protection quality in Indicator 4.6 Building Shell. The documents listed for this sub-indicator only have to be presented if required by the scoring process
5. Relation to other Indicators 1.6 Risks from Materials 4.5 Noise Protection 4.6 Building Shell
6. Resources Directive 91/155/EEC of 5 March 1991 defining and laying down the detailed arrangements for the system of specific information relating to dangerous preparations in implementation of Article 10 of Directive 88/379/EEC: http://www.dehp-facts.com/upload/documents/webpage/document34.pdf DIN 276-1 Building costs – Part 1: Building construction
http://www.beuth.de/cn/J01586CD9D7B736D60E87E40C4ECDA708.4/bGV2ZWw9dHBsLUxhbmdhbnplaWdlJnNtb2lkPTExMTA1MjY3NiZsYW5ndWFnZWlkPWVu.html DGNB - 50 Quality assurance for construction BNB 2011 - 522 Quality Assurance of the Building Construction
7. Attachments
None
255
Assessment Guideline Process Quality - Indicator 5.8 - Commissioning
Indicator 5.8 Commissioning (adapted from DGNB/BNB, BREEAM, LEED)
Core indicator
1. Objective To assess to what extent the advanced commissioning process has been planned, organized, implemented and documented in the building life cycle and whether the commissioning outcomes have been used for systems improvements. Commissioning is a process of preparing systems and setting them to work, verifying their performance and documenting results. The commissioning process will start at the planning phase and will end after one year of operation. Basic commissioning process is based on a commissioning plan developed during the planning phase with functional tests for all selected systems by independent third parties during the delivering period before buildings starts for operation phase. If operation is subsequently optimized by adjusting the facility after 10-14 months of operation, the score is higher because changes in the facility can then take into account the initial operational phase. In a quality assessment, the assessor can take account of project specific features to make adjustments to the scoring system. These adjustments must be clearly justified and documented. If the required documentation and proof for this criterion cannot be provided during the auditing process, reasons must be given. Advanced commissioning is an organized and planned process which should be an integral part of the overall project quality assurance process. Advanced commissioning provides documented confirmation that building systems are planned, designed, installed, tested, and are capable of being operated, and maintained in compliance with the performance requirements, e.g. investor’s project requirements, operational needs (definitive end-users) and other requirements related to building sustainability. The activities of the advanced commissioning should take place in all project stages in the whole building life cycle. The scope of the building systems being commissioned depends on the building type, its complexity, technical and functional performance. Different voluntary or obligatory assessment schemes advocate or require that systems be commissioned. The scope of systems which are to be commissioned has to be defined in the commissioning planning process. The OPEN HOUSE encourages the advanced commissioning of all systems and engineering services which are assessed or closely related to OPEN HOUSE indicators. The main building systems which can be commissioned are: HVAC & DHW, Building Assembly, Electrical, Plumbing, Building Automation and Communication, Protective, and Alarms Systems. Other systems can be commissioned if appropriate in regard to OPEN HOUSE methodology and assessment indicators. The results (performance tests results, commissioning checklists, measurements gathered etc.) might be used in other OH criteria as an input data if appropriate.
256
Assessment Guideline Process Quality - Indicator 5.8 - Commissioning
2. Assessment Methodology The commissioning process and its performance will be assessed by reviewing different paper based or electronic documentation elaborated, accepted and used within the commissioning process. The main parties in the process which will have to provide evidence documentation are:
- Investor or his representative (consulting engineer etc.) - Commissioning Authority (e.g. Commissioning Manager who leads, plans, schedules, and
oversees the whole process, coordinates the commissioning team, and manages the interfaces with third parties if appropriate)
- Members of the commissioning team (representatives of other parties which will take part in commissioning activities, e.g. design professionals, contractor, subcontractors, manufacturers, suppliers, installers, supervisors, O&M 1team)
- Commissioning sub-contractors (specialists specialized for particular systems, tests or services (balancing, measurements...))
Documents, created by other parties (inspectors, administrative authorities, insurance organisations...) will also be taken into consideration. The following sub-indicator will be assessed: 5.8.1 Commissioning process management and documentation .
1 O&M: Operation and Maintenance
257
Assessment Guideline Process Quality - Indicator 5.8 - Commissioning
3. Calculation and Rating
5.8.1 Commissioning process management and documentation Goal is to assess :
- to what extent the commissioning plan has been efficiently supported by commissioning process documents
- if the commissioning process has been implemented and its results documented - that energy and resource optimization processes have been conducted in the first 14
months of use. The basic purpose of building commissioning is to provide a quality-based process with documented confirmation that building systems are planned, designed, installed, tested, operated, and maintained in compliance with the building performance requirements. The commissioning process and its outcomes have to be documented and implemented according to these documents. Commissioning related documents differ from country to country according to country specific practices and/or construction regulation. In the OH assessment process different documents (contracts, procedures, plans, handbook, reports...) or their parts will be assessed when these documents have similar content or meaning as the following group of documents:
- Commissioning plan - Commissioning process management - Commissioning specifications - Commissioning methods and procedures - Commissioning outcome documents (reports, records, check lists..) - Commissioning contractually agreements of the first 14 months
The Commissioning Plan and other documents describing the organization and the commissioning process are well defined by codes of practice for particular countries (for example CIBSE/BSRIA Commissioning Codes in UK) and should be tied to them if appropriate or required. Commissioning plan (or other documents with similar content and meaning) should define the project (investor’s) policy and requirements for commissioning, the systems to be commissioned (commissioning scope), an overall schedule of commissioning process activities, the roles and responsibilities for the commissioning team (including the commissioning authority), the structure of documents describing the process, the organization, communication and reporting procedures of the commissioning team, and the financial provisions for commissioning. Commissioning process management documents support the management of the commissioning process. The Commissioning process documents can be linked to codes of practice for particular countries and should be tied to them if appropriate or required. These documents should be systematically prepared, and verified by Commissioning authority or the commissioning team, regularly updated and filed. Documents should be available to appropriate members of the commissioning team (for example as electronic versions). It is suggested to use the following major Commissioning documents:
- Commissioning programme – defines a detailed schedule of the commissioning activities and their actual status through all project phases. For each commissioning and related activities different information has to be prepared or entered when commissioning progresses. For example short description and reference document(s) (e.g. commissioning specification, standard, practice, method...) and responsible for their elaboration, status of the activity (due date /in progress/finished), responsible party and other parties involved, preconditions to be met, results of implementation, reference to output document(s) (progress report, minutes of the meeting...). Detail commissioning programme should be integrated with the overall project schedule and
258
Assessment Guideline Process Quality - Indicator 5.8 - Commissioning
updated according to the progress of overall project and commissioning activities, and according the decisions of the commissioning team and/or commissioning authority
- Commissioning log book – enables formal recording of problems or concerns that have appeared or have been notified by commissioning team and/or other parties (for example commission subcontractors)
- Progress reports: report the status of the commissioning process activities at defined milestones or according to investor’s request
- Minutes of commissioning meetings: commissioning team should meet on regular basis to discuss the working arrangements, activities completed and planned, and to support decision making within the commissioning process
Commissioning specifications define detailed technical and organizational requirements for various commissioning activities (works, services, tasks) related to particular system to be commissioned and or for specific commissioning activities if appropriate. Commissioning specification might be a standardised procedure (code of practice) tailored to particular system implemented in a building. Commissioning specification should define:
- Scope of commissioning (detailed description of the system and its interrelation with other systems)
- System’s performance requirements (design data and drawings relevant to commissioning, other requirements related to sustainability of the building)
- Technical specifications: type and description of commissioning works and services in different project/commissioning phases (design brief review, static tests, performance tests, integrated system testing, seasonal commissioning), standards, codes of practice, regulation, methods, techniques and instruments to be used
- Organisational provisions for system’s contractors, commissioning sub-contractors and other parties involved (third parties as statutory, administrative authorities for technical inspection, issuing of the user’s permit, utility companies, insurance companies...)
- Requirements for preparation of the systems in different project/commissioning phases - Requirements in regard the use, operating and maintenance (OH manuals, user guides) - Acceptance criteria for completion of the commissioning process - Requirements for commissioning reporting and commissioning outcome managements (the way
how these outcomes will be used for improvements in the future). Commissioning methods and working procedures: written protocols that define working steps, the methods, techniques and instruments to be used, personal to be informed, trained and controlled if needed, and expected outcomes (testing results, measurements, reports generated etc) for particular commissioning work, service, test conducted on particular building system in defined commissioning phase. The manufacturer’s guidance should be taken into account, too. The commissioning methods and working procedures are tailored to different commission procedures, goals and actual systems being commissioned. Commissioning outcome documents are different documents (paper based or electronic) which are resulting from the implementation of the commissioning activities. These documents are different reports, records, minutes of the meetings, test sheets, test results, checklists, statements etc. The templates for these documents should be prepared and accepted in advance.
259
Assessment Guideline Process Quality - Indicator 5.8 - Commissioning
5.8.1 Commissioning process management and documentation Points
The commissioning outcome documents (progress reports, minutes of the meeting, check lists, statements) clearly demonstrate that the commissioning activities - defined in plan and commissioning programme - have been implemented according to commissioning specifications, methods and procedures (consistency between process and process out coming documents). Commissioning plan, programme and other documents have been regularly and systematically updated and integrated with the overall project schedule.
100
Commissioning with subsequent adjustments and operational optimization was conducted or contractually agreed upon within the first 14 months of use. Complete documentation is available or contractually agreed upon.
75
All system components were subjected to a functional test by the contractors who installed them. The type, scope, and results of these functional tests are documented in the handover logs.
50
Documentation why commissioning for all system components have not been conducted with plausible reasons. Functional tests for individual facility components have been conducted
10
No Commissioning was conducted, nor were functional tests for individual facility components.
0
260
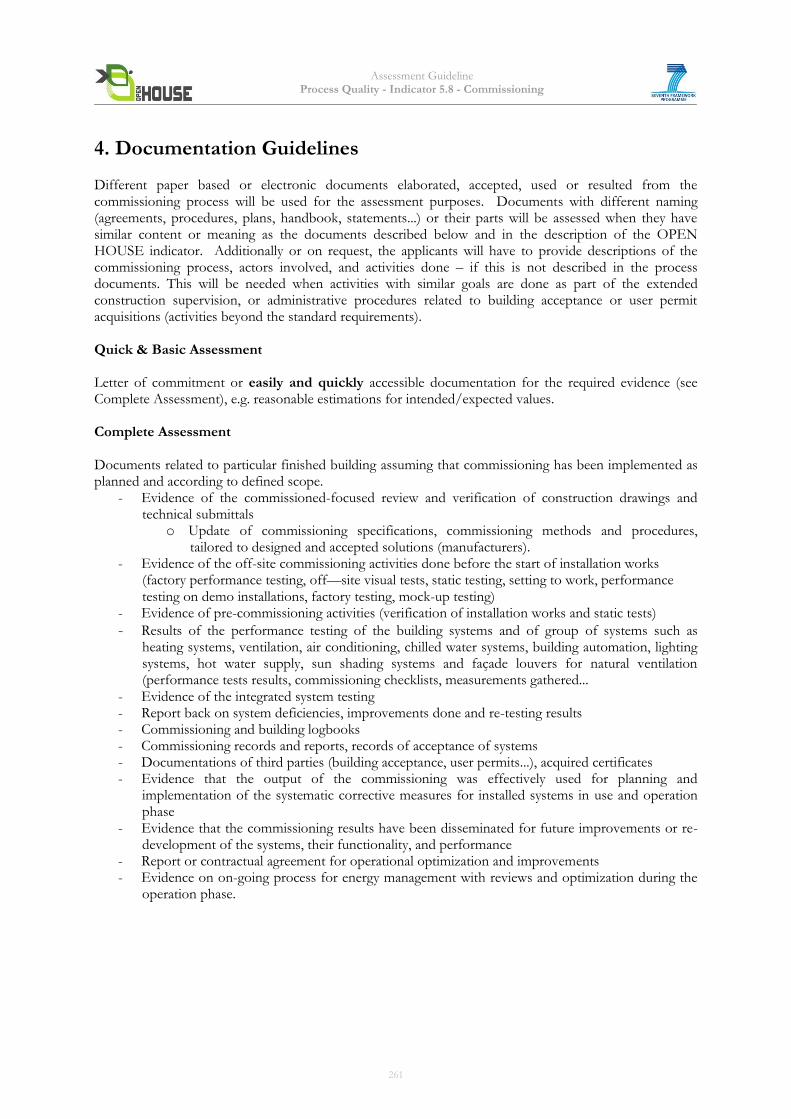
Assessment Guideline Process Quality - Indicator 5.8 - Commissioning
4. Documentation Guidelines Different paper based or electronic documents elaborated, accepted, used or resulted from the commissioning process will be used for the assessment purposes. Documents with different naming (agreements, procedures, plans, handbook, statements...) or their parts will be assessed when they have similar content or meaning as the documents described below and in the description of the OPEN HOUSE indicator. Additionally or on request, the applicants will have to provide descriptions of the commissioning process, actors involved, and activities done – if this is not described in the process documents. This will be needed when activities with similar goals are done as part of the extended construction supervision, or administrative procedures related to building acceptance or user permit acquisitions (activities beyond the standard requirements). Quick & Basic Assessment Letter of commitment or easily and quickly accessible documentation for the required evidence (see Complete Assessment), e.g. reasonable estimations for intended/expected values. Complete Assessment Documents related to particular finished building assuming that commissioning has been implemented as planned and according to defined scope.
- Evidence of the commissioned-focused review and verification of construction drawings and technical submittals
o Update of commissioning specifications, commissioning methods and procedures, tailored to designed and accepted solutions (manufacturers).
- Evidence of the off-site commissioning activities done before the start of installation works (factory performance testing, off—site visual tests, static testing, setting to work, performance testing on demo installations, factory testing, mock-up testing)
- Evidence of pre-commissioning activities (verification of installation works and static tests)
- Results of the performance testing of the building systems and of group of systems such as heating systems, ventilation, air conditioning, chilled water systems, building automation, lighting systems, hot water supply, sun shading systems and façade louvers for natural ventilation (performance tests results, commissioning checklists, measurements gathered...
- Evidence of the integrated system testing - Report back on system deficiencies, improvements done and re-testing results - Commissioning and building logbooks - Commissioning records and reports, records of acceptance of systems - Documentations of third parties (building acceptance, user permits...), acquired certificates - Evidence that the output of the commissioning was effectively used for planning and
implementation of the systematic corrective measures for installed systems in use and operation phase
- Evidence that the commissioning results have been disseminated for future improvements or re-development of the systems, their functionality, and performance
- Report or contractual agreement for operational optimization and improvements - Evidence on on-going process for energy management with reviews and optimization during the
operation phase.
261
Assessment Guideline Process Quality - Indicator 5.8 - Commissioning
5. Relation to other Indicators 5.1 Quality of the Project’s Preparation 5.2 Integrated Planning 5.6 Quality of the Executing Contractors/Pre-Qualification 5.7 Quality Assurance of Construction Execution 5.9 Monitoring, Use and Operation
6. Resources 1. Code of Practice for Project Management for Construction and Development, Chartered Institute of
Building, 2010, Wiley-Blackwell, UK 2. A BSRIA guide: Commissioning Job Book, BSRIA, 2010, by Glen Hawkins 3. White Paper: Commissioning for Great Buildings, February 2005, Building Commissioning
Association, US, 4. Best Practices in Commissioning Existing Buildings, Building Commissioning Association, 5. ACG Commissioning Guideline, www.commissioning.org 6. Whole Building Design Guide, Building commissioning, National Institute of Building sciences, US,
www.wbdg.org/project/buildingcomm.php ) 7. Smernica za naročila javnih gradenj (Guidelines for public tendering), The Slovenian Chamber of
Engineers, 2011 8. DGNB 2009: indicator 51 Commissioning
7. Attachments
None.
262
Assessment Guideline Process Quality - Indicator 5.9 – Handover and Performance Evaluation
Indicator 5.9 Handover and Performance Evaluation (adapted from BREEAM, DGNB/BNB, LEED)
1. Objective This indicator aims to cover many objectives. Firstly, it encourages to handover the building to the users and managers in a way that helps them operate and manage the building efficiently. Moreover, it ensures the necessary information on the building is in order to make users and the building manager aware of the state of construction of the final building with respect to maintenance and operation. It also supports to provide users and building managers with appropriate “building manuals” promoting the efficient operation of the building itself. One main objective is to optimize the actual performance of a building, independent of the inherent environmental quality of the building itself, based on the management policies, procedures and practices related to the operation of the building. Overall this indicator should aid in ensuring the performance of a building during its operation, thus reducing running costs and improving its environmental performance.
2. Assessment Methodology According to the “Specifications Guide for Performance Monitoring Systems (jointly funded CEC PIER-DOE project 2007)”, there are four key aspects of performance monitoring that have to be addressed: • performance metrics • measurement system requirements • data acquisition and archiving • data visualization and reporting The monitoring will focus on the following categories: Energy, Water, Materials & Waste and also Occupant satisfaction. The handover and documentation should be focused on ensuring that operators and users understand the environmental features of the building. Moreover, there is also a need to create conditions to optimize the use and the management of the building, with the verification of the adequacy and accuracy of data as well as clear instructions for users or facility managers. The following sub-indicator will be assessed: 5.9.1 Handover & Documentation 5.9.2 Building Performance Improvement
263
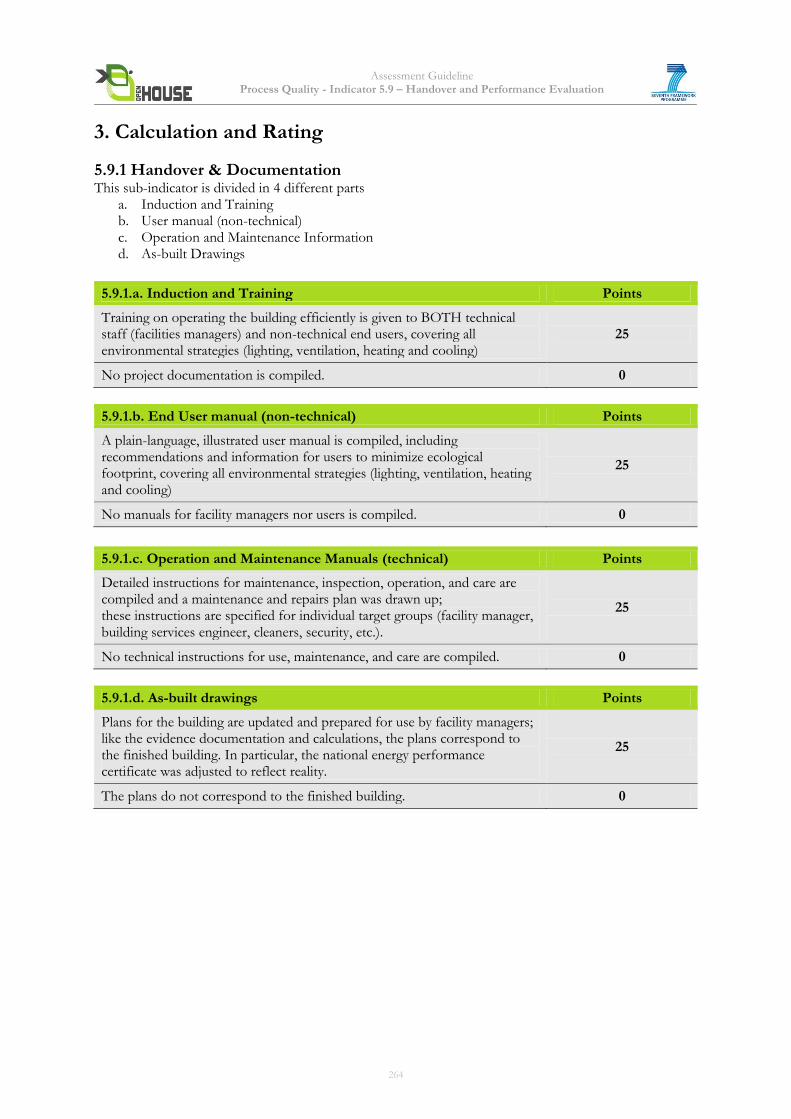
Assessment Guideline Process Quality - Indicator 5.9 – Handover and Performance Evaluation
3. Calculation and Rating
5.9.1 Handover & Documentation This sub-indicator is divided in 4 different parts
a. Induction and Training b. User manual (non-technical) c. Operation and Maintenance Information d. As-built Drawings
5.9.1.a. Induction and Training Points
Training on operating the building efficiently is given to BOTH technical staff (facilities managers) and non-technical end users, covering all environmental strategies (lighting, ventilation, heating and cooling)
25
No project documentation is compiled. 0
5.9.1.b. End User manual (non-technical) Points
A plain-language, illustrated user manual is compiled, including recommendations and information for users to minimize ecological footprint, covering all environmental strategies (lighting, ventilation, heating and cooling)
25
No manuals for facility managers nor users is compiled. 0
5.9.1.c. Operation and Maintenance Manuals (technical) Points
Detailed instructions for maintenance, inspection, operation, and care are compiled and a maintenance and repairs plan was drawn up; these instructions are specified for individual target groups (facility manager, building services engineer, cleaners, security, etc.).
25
No technical instructions for use, maintenance, and care are compiled. 0
5.9.1.d. As-built drawings Points
Plans for the building are updated and prepared for use by facility managers; like the evidence documentation and calculations, the plans correspond to the finished building. In particular, the national energy performance certificate was adjusted to reflect reality.
25
The plans do not correspond to the finished building. 0
264
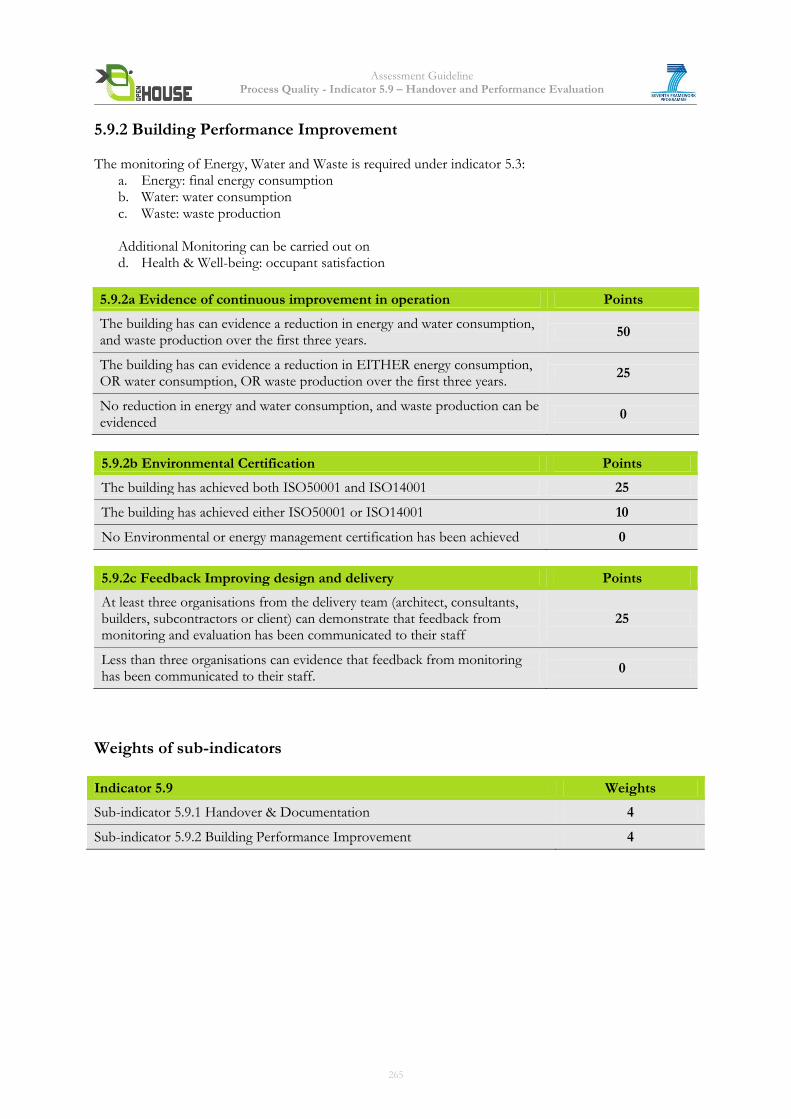
Assessment Guideline Process Quality - Indicator 5.9 – Handover and Performance Evaluation
5.9.2 Building Performance Improvement The monitoring of Energy, Water and Waste is required under indicator 5.3:
a. Energy: final energy consumption b. Water: water consumption c. Waste: waste production Additional Monitoring can be carried out on d. Health & Well-being: occupant satisfaction
5.9.2a Evidence of continuous improvement in operation Points
The building has can evidence a reduction in energy and water consumption, and waste production over the first three years.
50
The building has can evidence a reduction in EITHER energy consumption, OR water consumption, OR waste production over the first three years.
25
No reduction in energy and water consumption, and waste production can be evidenced
0
5.9.2b Environmental Certification Points
The building has achieved both ISO50001 and ISO14001 25
The building has achieved either ISO50001 or ISO14001 10
No Environmental or energy management certification has been achieved 0
5.9.2c Feedback Improving design and delivery Points
At least three organisations from the delivery team (architect, consultants, builders, subcontractors or client) can demonstrate that feedback from monitoring and evaluation has been communicated to their staff
25
Less than three organisations can evidence that feedback from monitoring has been communicated to their staff.
0
Weights of sub-indicators
Indicator 5.9 Weights
Sub-indicator 5.9.1 Handover & Documentation 4
Sub-indicator 5.9.2 Building Performance Improvement 4
265
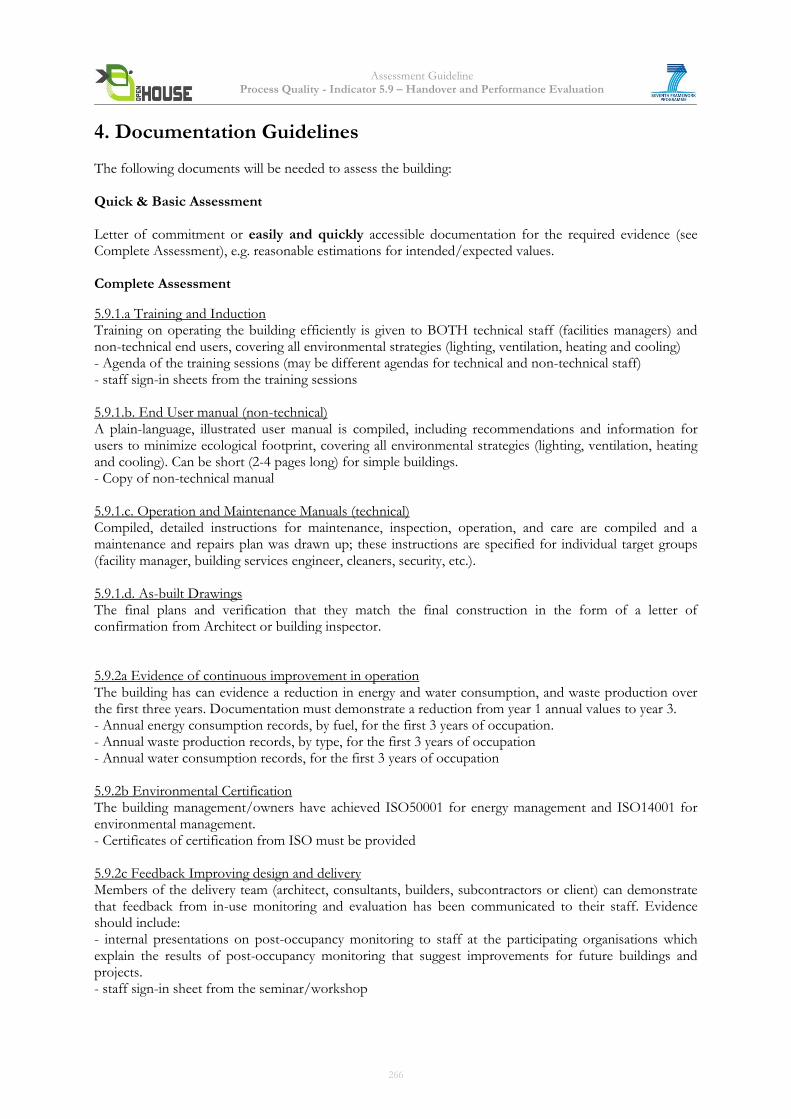
Assessment Guideline Process Quality - Indicator 5.9 – Handover and Performance Evaluation
4. Documentation Guidelines The following documents will be needed to assess the building: Quick & Basic Assessment Letter of commitment or easily and quickly accessible documentation for the required evidence (see Complete Assessment), e.g. reasonable estimations for intended/expected values. Complete Assessment
5.9.1.a Training and Induction Training on operating the building efficiently is given to BOTH technical staff (facilities managers) and non-technical end users, covering all environmental strategies (lighting, ventilation, heating and cooling) - Agenda of the training sessions (may be different agendas for technical and non-technical staff) - staff sign-in sheets from the training sessions 5.9.1.b. End User manual (non-technical) A plain-language, illustrated user manual is compiled, including recommendations and information for users to minimize ecological footprint, covering all environmental strategies (lighting, ventilation, heating and cooling). Can be short (2-4 pages long) for simple buildings. - Copy of non-technical manual 5.9.1.c. Operation and Maintenance Manuals (technical) Compiled, detailed instructions for maintenance, inspection, operation, and care are compiled and a maintenance and repairs plan was drawn up; these instructions are specified for individual target groups (facility manager, building services engineer, cleaners, security, etc.). 5.9.1.d. As-built Drawings The final plans and verification that they match the final construction in the form of a letter of confirmation from Architect or building inspector. 5.9.2a Evidence of continuous improvement in operation The building has can evidence a reduction in energy and water consumption, and waste production over the first three years. Documentation must demonstrate a reduction from year 1 annual values to year 3. - Annual energy consumption records, by fuel, for the first 3 years of occupation. - Annual waste production records, by type, for the first 3 years of occupation - Annual water consumption records, for the first 3 years of occupation 5.9.2b Environmental Certification The building management/owners have achieved ISO50001 for energy management and ISO14001 for environmental management. - Certificates of certification from ISO must be provided 5.9.2c Feedback Improving design and delivery Members of the delivery team (architect, consultants, builders, subcontractors or client) can demonstrate that feedback from in-use monitoring and evaluation has been communicated to their staff. Evidence should include: - internal presentations on post-occupancy monitoring to staff at the participating organisations which explain the results of post-occupancy monitoring that suggest improvements for future buildings and projects. - staff sign-in sheet from the seminar/workshop
266
Assessment Guideline Process Quality - Indicator 5.9 – Handover and Performance Evaluation
5. Relation to other Indicators Indicator 5.8: Commissioning
6. Resources 1. CIBSE TM31 Logbook 2. ISO 14001:2004 3. ISO 50001:2011 4. BSRIA Soft Landings 5. Institute for Sustainability, Guide to BPE http://bob.instituteforsustainability.org.uk/knowledgebank/public/bpereport/Pages/default.aspx 6. BREEAM IN USE, 2009 7. LEED FOR EXISTING BUILDINGS, OPERATION & MAINTENANCE, 2008 8. LEED FOR NEW CONSTRUCTION AND MAJOR RENOVATIONS, 2009 9. DGNB, Criterion 47: Creation of conditions for an Optimal Use and Management 10. NBB, 2011, Criterion 5.1.5: Conditions for optimal management 11. A Specifications Guide for Performance Monitoring Systems http://cbs.lbl.gov/performance-monitoring/specifications/pdf/PM%20Spec%20Guide%20Version%201_2007-03-23.pdf
7. Attachments None
267
Assessment Guideline Version 1.2 New Office Buildings – July 2013
OPEN HOUSE
ASSESSMENT GUIDELINE
The Location
6.1 Risks at the Site 6.2 Circumstances at the Site 6.3 Options for Transportation 6.5 Access to amenities
Note: Core indicators are in bold
268
Assessment Guideline The Location - Indicator 6.1 – Risks at the site
Indicator 6.1 Risks at the site (adapted from DGNB/BNB, BREEAM, ESPON, HQE, LEED)
Core Indicator
1. Objective The objective is to avoid the development of buildings, roads or parking areas in high-risky areas, in inappropriate areas and to reduce the risk resulting from ground, water and man-made-hazards.
2. Assessment Methodology
Several types of risks can be identified on a site: - Those related to the ground, the geology, seismology, volcanism - Those related to the weather, the climate - Those related to human action, voluntary or not (man-made-hazards)
Those various hazard potentials at the site can be evaluated by using existing hazards and risk maps, results of the European Spatial Planning Observation Network (ESPON 2006), project 1.3.1. “The spatial effects and management of natural and technological hazards in general and in relation to climate change” The following sub-indicators will be assessed: Ground, geology, seismology, volcanism 6.1.1. Earthquakes 6.1.2. Landslides 6.1.3. Volcanic eruptions 6.1.4. Tsunamis Weather / climate 6.1.5. Extreme temperatures 6.1.6. Forest fires 6.1.7. Drought 6.1.8. Floods 6.1.9. Storms 6.1.10. Avalanches Man-made-hazards 6.1.11. Technological hazard/Chemical plants accidents 6.1.12. Technological hazard/Contaminant release and explosions 6.1.13. Technological hazard/Radioactive contamination from nuclear power plants accidents For each sub-indicator, the hazard can be evaluated with a hazard map from ESPON. It can be very low, low, moderate, high or very high. The calculation and rating will be based on the level of importance. However, it is recommended to use a local hazard map when it is available and use a similar scale for the scoring.
269
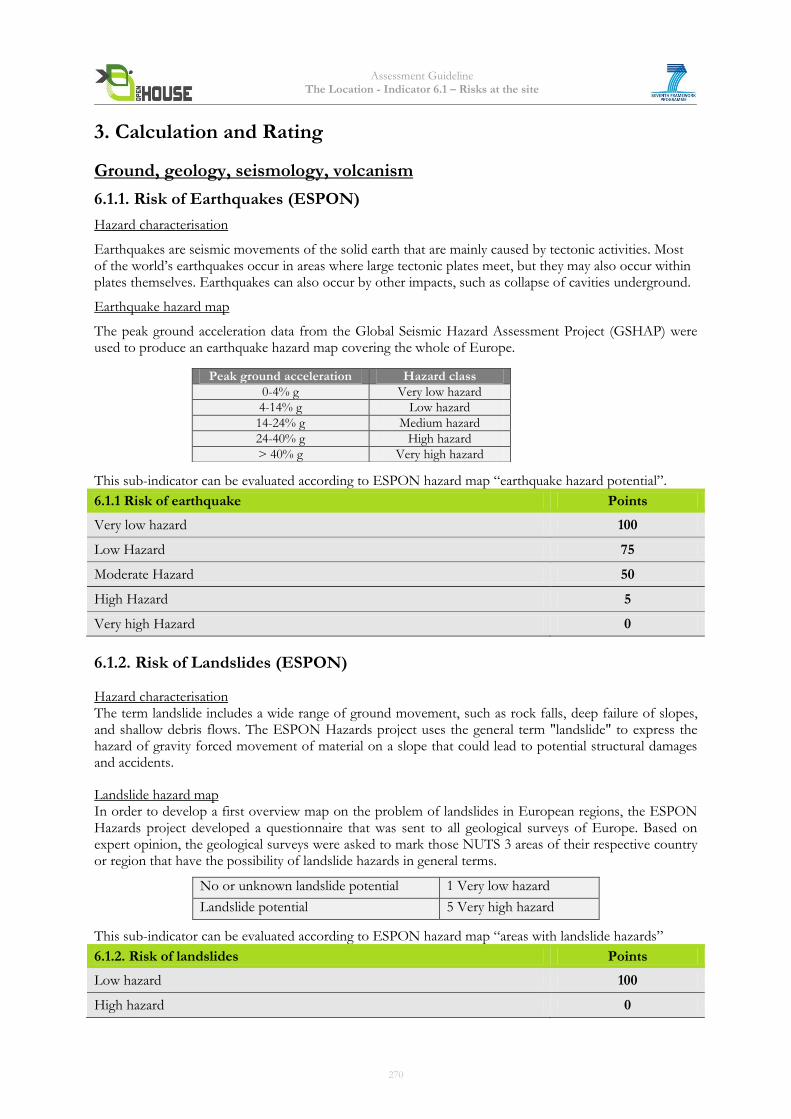
Assessment Guideline The Location - Indicator 6.1 – Risks at the site
3. Calculation and Rating
Ground, geology, seismology, volcanism
6.1.1. Risk of Earthquakes (ESPON)
Hazard characterisation
Earthquakes are seismic movements of the solid earth that are mainly caused by tectonic activities. Most of the world’s earthquakes occur in areas where large tectonic plates meet, but they may also occur within plates themselves. Earthquakes can also occur by other impacts, such as collapse of cavities underground.
Earthquake hazard map
The peak ground acceleration data from the Global Seismic Hazard Assessment Project (GSHAP) were used to produce an earthquake hazard map covering the whole of Europe.
This sub-indicator can be evaluated according to ESPON hazard map “earthquake hazard potential”.
6.1.1 Risk of earthquake Points
Very low hazard 100
Low Hazard 75
Moderate Hazard 50
High Hazard 5
Very high Hazard 0
6.1.2. Risk of Landslides (ESPON)
Hazard characterisation The term landslide includes a wide range of ground movement, such as rock falls, deep failure of slopes, and shallow debris flows. The ESPON Hazards project uses the general term "landslide" to express the hazard of gravity forced movement of material on a slope that could lead to potential structural damages and accidents.
Landslide hazard map In order to develop a first overview map on the problem of landslides in European regions, the ESPON Hazards project developed a questionnaire that was sent to all geological surveys of Europe. Based on expert opinion, the geological surveys were asked to mark those NUTS 3 areas of their respective country or region that have the possibility of landslide hazards in general terms.
No or unknown landslide potential 1 Very low hazard
Landslide potential 5 Very high hazard
This sub-indicator can be evaluated according to ESPON hazard map “areas with landslide hazards”
6.1.2. Risk of landslides Points
Low hazard 100
High hazard 0
Peak ground acceleration Hazard class
0-4% g Very low hazard
4-14% g Low hazard
14-24% g Medium hazard
24-40% g High hazard
> 40% g Very high hazard
270
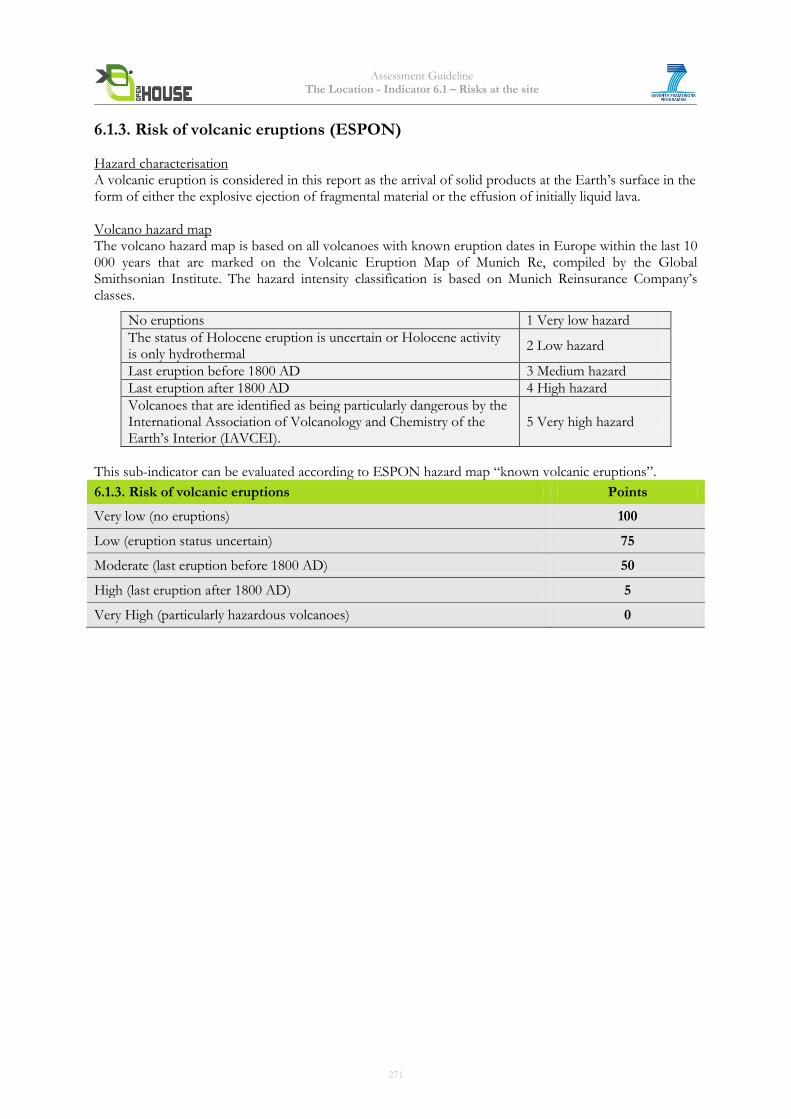
Assessment Guideline The Location - Indicator 6.1 – Risks at the site
6.1.3. Risk of volcanic eruptions (ESPON)
Hazard characterisation A volcanic eruption is considered in this report as the arrival of solid products at the Earth’s surface in the form of either the explosive ejection of fragmental material or the effusion of initially liquid lava. Volcano hazard map The volcano hazard map is based on all volcanoes with known eruption dates in Europe within the last 10 000 years that are marked on the Volcanic Eruption Map of Munich Re, compiled by the Global Smithsonian Institute. The hazard intensity classification is based on Munich Reinsurance Company’s classes.
No eruptions 1 Very low hazard
The status of Holocene eruption is uncertain or Holocene activity is only hydrothermal
2 Low hazard
Last eruption before 1800 AD 3 Medium hazard
Last eruption after 1800 AD 4 High hazard
Volcanoes that are identified as being particularly dangerous by the International Association of Volcanology and Chemistry of the Earth’s Interior (IAVCEI).
5 Very high hazard
This sub-indicator can be evaluated according to ESPON hazard map “known volcanic eruptions”.
6.1.3. Risk of volcanic eruptions Points
Very low (no eruptions) 100
Low (eruption status uncertain) 75
Moderate (last eruption before 1800 AD) 50
High (last eruption after 1800 AD) 5
Very High (particularly hazardous volcanoes) 0
271
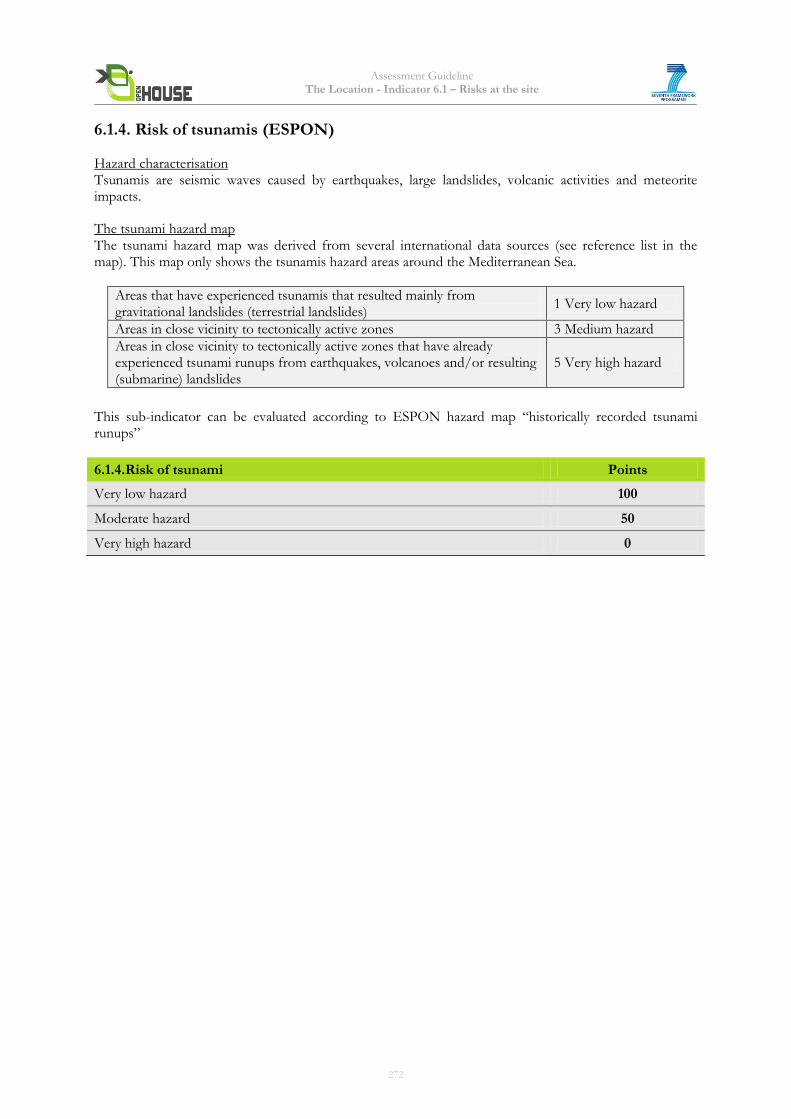
Assessment Guideline The Location - Indicator 6.1 – Risks at the site
6.1.4. Risk of tsunamis (ESPON)
Hazard characterisation Tsunamis are seismic waves caused by earthquakes, large landslides, volcanic activities and meteorite impacts.
The tsunami hazard map The tsunami hazard map was derived from several international data sources (see reference list in the map). This map only shows the tsunamis hazard areas around the Mediterranean Sea.
Areas that have experienced tsunamis that resulted mainly from gravitational landslides (terrestrial landslides)
1 Very low hazard
Areas in close vicinity to tectonically active zones 3 Medium hazard
Areas in close vicinity to tectonically active zones that have already experienced tsunami runups from earthquakes, volcanoes and/or resulting (submarine) landslides
5 Very high hazard
This sub-indicator can be evaluated according to ESPON hazard map “historically recorded tsunami runups”
6.1.4.Risk of tsunami Points
Very low hazard 100
Moderate hazard 50
Very high hazard 0
272
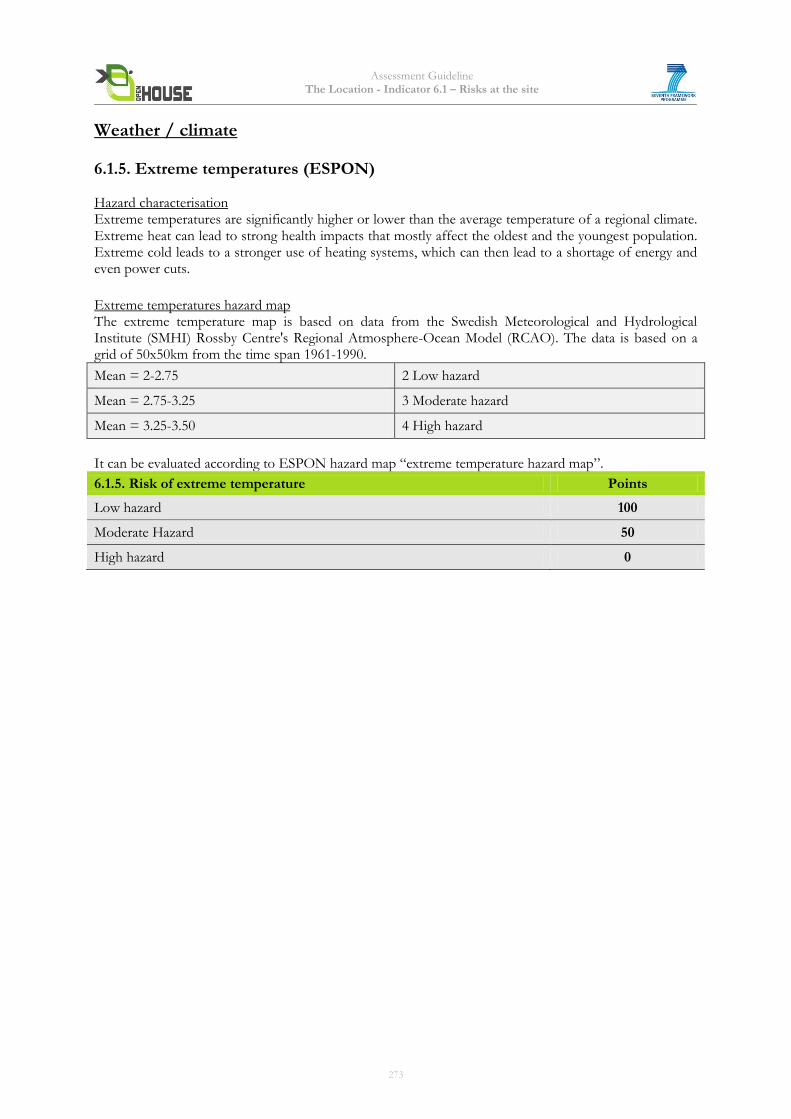
Assessment Guideline The Location - Indicator 6.1 – Risks at the site
Weather / climate
6.1.5. Extreme temperatures (ESPON)
Hazard characterisation Extreme temperatures are significantly higher or lower than the average temperature of a regional climate. Extreme heat can lead to strong health impacts that mostly affect the oldest and the youngest population. Extreme cold leads to a stronger use of heating systems, which can then lead to a shortage of energy and even power cuts.
Extreme temperatures hazard map The extreme temperature map is based on data from the Swedish Meteorological and Hydrological Institute (SMHI) Rossby Centre's Regional Atmosphere-Ocean Model (RCAO). The data is based on a grid of 50x50km from the time span 1961-1990.
Mean = 2-2.75 2 Low hazard
Mean = 2.75-3.25 3 Moderate hazard
Mean = 3.25-3.50 4 High hazard
It can be evaluated according to ESPON hazard map “extreme temperature hazard map”.
6.1.5. Risk of extreme temperature Points
Low hazard 100
Moderate Hazard 50
High hazard 0
273
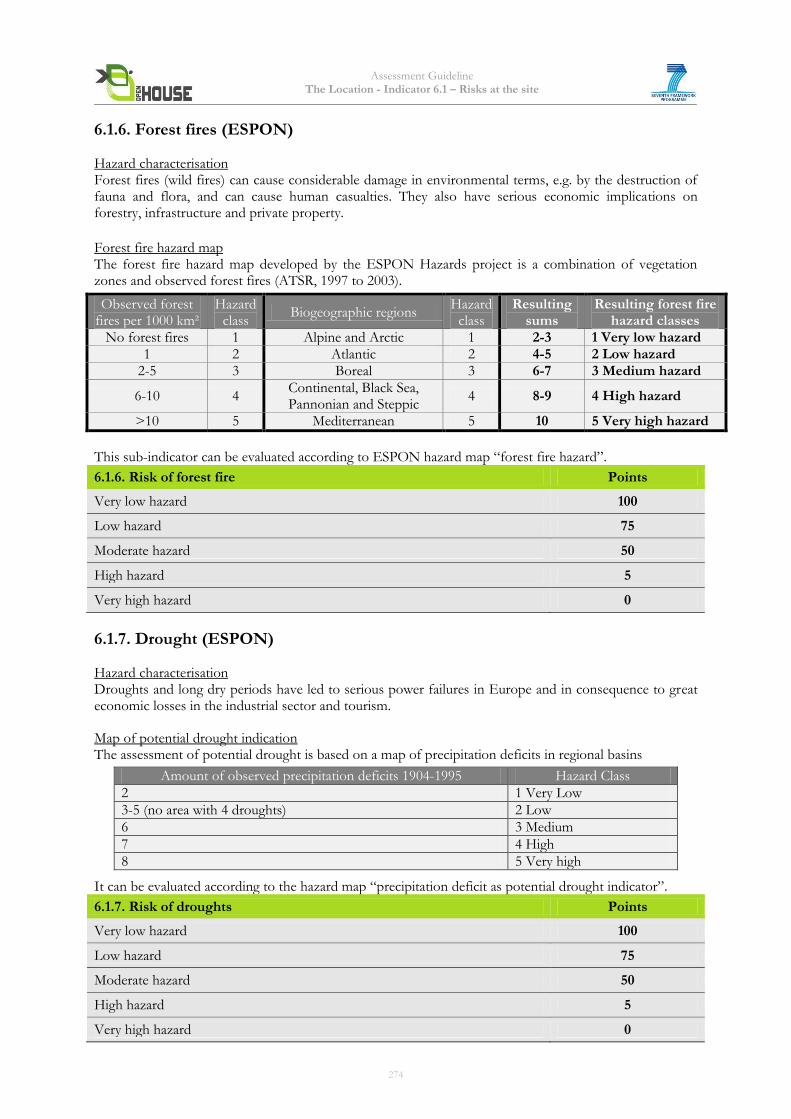
Assessment Guideline The Location - Indicator 6.1 – Risks at the site
6.1.6. Forest fires (ESPON)
Hazard characterisation Forest fires (wild fires) can cause considerable damage in environmental terms, e.g. by the destruction of fauna and flora, and can cause human casualties. They also have serious economic implications on forestry, infrastructure and private property.
Forest fire hazard map The forest fire hazard map developed by the ESPON Hazards project is a combination of vegetation zones and observed forest fires (ATSR, 1997 to 2003).
Observed forest fires per 1000 km²
Hazard class
Biogeographic regions Hazard
class Resulting
sums Resulting forest fire
hazard classes No forest fires 1 Alpine and Arctic 1 2-3 1 Very low hazard
1 2 Atlantic 2 4-5 2 Low hazard 2-5 3 Boreal 3 6-7 3 Medium hazard
6-10 4 Continental, Black Sea, Pannonian and Steppic
4 8-9 4 High hazard
>10 5 Mediterranean 5 10 5 Very high hazard
This sub-indicator can be evaluated according to ESPON hazard map “forest fire hazard”.
6.1.6. Risk of forest fire Points
Very low hazard 100
Low hazard 75
Moderate hazard 50
High hazard 5
Very high hazard 0
6.1.7. Drought (ESPON)
Hazard characterisation Droughts and long dry periods have led to serious power failures in Europe and in consequence to great economic losses in the industrial sector and tourism.
Map of potential drought indication The assessment of potential drought is based on a map of precipitation deficits in regional basins
Amount of observed precipitation deficits 1904-1995 Hazard Class
2 1 Very Low
3-5 (no area with 4 droughts) 2 Low
6 3 Medium
7 4 High
8 5 Very high
It can be evaluated according to the hazard map “precipitation deficit as potential drought indicator”.
6.1.7. Risk of droughts Points
Very low hazard 100
Low hazard 75
Moderate hazard 50
High hazard 5
Very high hazard 0
274
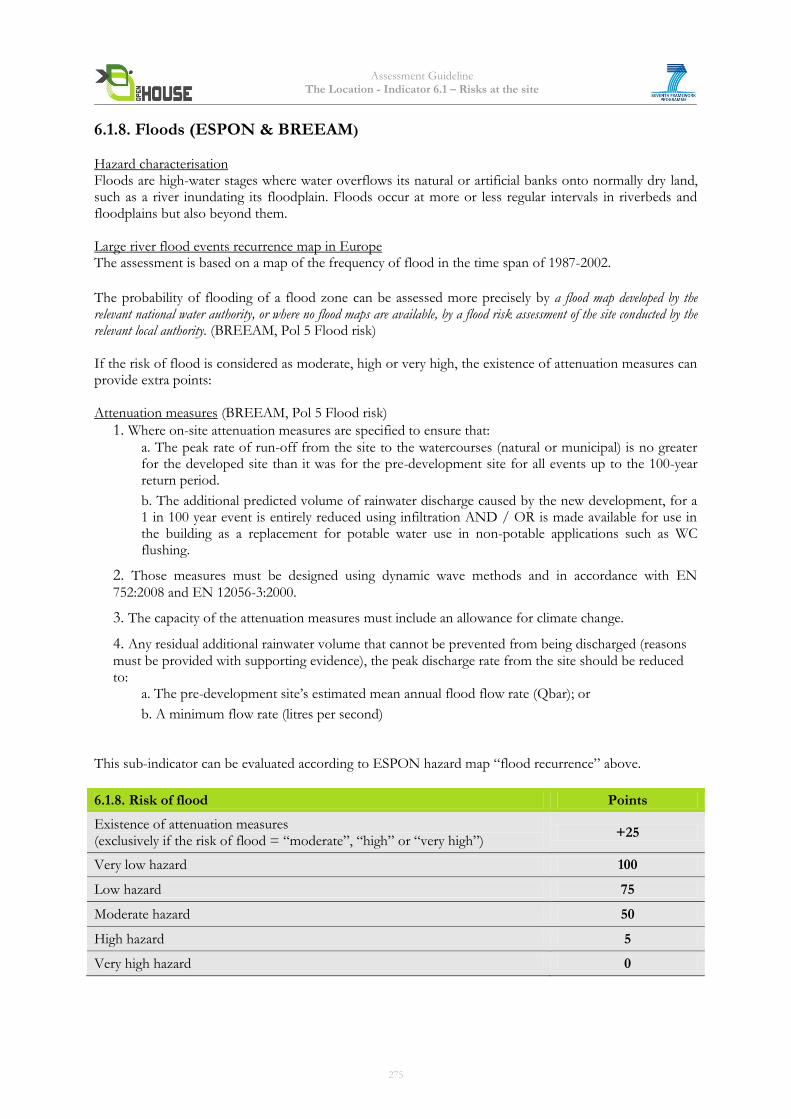
Assessment Guideline The Location - Indicator 6.1 – Risks at the site
6.1.8. Floods (ESPON & BREEAM)
Hazard characterisation Floods are high-water stages where water overflows its natural or artificial banks onto normally dry land, such as a river inundating its floodplain. Floods occur at more or less regular intervals in riverbeds and floodplains but also beyond them. Large river flood events recurrence map in Europe The assessment is based on a map of the frequency of flood in the time span of 1987-2002.
The probability of flooding of a flood zone can be assessed more precisely by a flood map developed by the relevant national water authority, or where no flood maps are available, by a flood risk assessment of the site conducted by the relevant local authority. (BREEAM, Pol 5 Flood risk)
If the risk of flood is considered as moderate, high or very high, the existence of attenuation measures can provide extra points: Attenuation measures (BREEAM, Pol 5 Flood risk)
1. Where on-site attenuation measures are specified to ensure that:
a. The peak rate of run-off from the site to the watercourses (natural or municipal) is no greater for the developed site than it was for the pre-development site for all events up to the 100-year return period.
b. The additional predicted volume of rainwater discharge caused by the new development, for a 1 in 100 year event is entirely reduced using infiltration AND / OR is made available for use in the building as a replacement for potable water use in non-potable applications such as WC flushing.
2. Those measures must be designed using dynamic wave methods and in accordance with EN
752:2008 and EN 12056-3:2000.
3. The capacity of the attenuation measures must include an allowance for climate change.
4. Any residual additional rainwater volume that cannot be prevented from being discharged (reasons must be provided with supporting evidence), the peak discharge rate from the site should be reduced to:
a. The pre-development site’s estimated mean annual flood flow rate (Qbar); or
b. A minimum flow rate (litres per second)
This sub-indicator can be evaluated according to ESPON hazard map “flood recurrence” above.
6.1.8. Risk of flood Points
Existence of attenuation measures (exclusively if the risk of flood = “moderate”, “high” or “very high”)
+25
Very low hazard 100
Low hazard 75
Moderate hazard 50
High hazard 5
Very high hazard 0
275
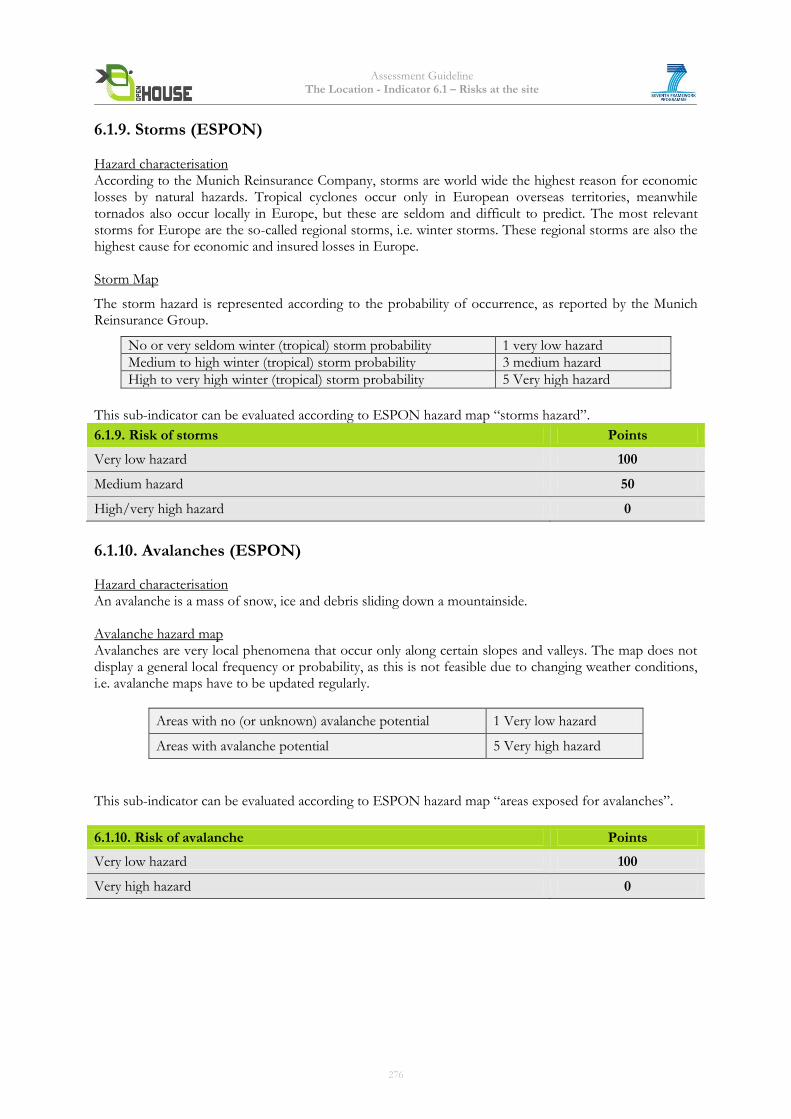
Assessment Guideline The Location - Indicator 6.1 – Risks at the site
6.1.9. Storms (ESPON)
Hazard characterisation According to the Munich Reinsurance Company, storms are world wide the highest reason for economic losses by natural hazards. Tropical cyclones occur only in European overseas territories, meanwhile tornados also occur locally in Europe, but these are seldom and difficult to predict. The most relevant storms for Europe are the so-called regional storms, i.e. winter storms. These regional storms are also the highest cause for economic and insured losses in Europe. Storm Map
The storm hazard is represented according to the probability of occurrence, as reported by the Munich Reinsurance Group.
No or very seldom winter (tropical) storm probability 1 very low hazard
Medium to high winter (tropical) storm probability 3 medium hazard
High to very high winter (tropical) storm probability 5 Very high hazard
This sub-indicator can be evaluated according to ESPON hazard map “storms hazard”.
6.1.9. Risk of storms Points
Very low hazard 100
Medium hazard 50
High/very high hazard 0
6.1.10. Avalanches (ESPON)
Hazard characterisation An avalanche is a mass of snow, ice and debris sliding down a mountainside. Avalanche hazard map Avalanches are very local phenomena that occur only along certain slopes and valleys. The map does not display a general local frequency or probability, as this is not feasible due to changing weather conditions, i.e. avalanche maps have to be updated regularly.
Areas with no (or unknown) avalanche potential 1 Very low hazard
Areas with avalanche potential 5 Very high hazard
This sub-indicator can be evaluated according to ESPON hazard map “areas exposed for avalanches”.
6.1.10. Risk of avalanche Points
Very low hazard 100
Very high hazard 0
276
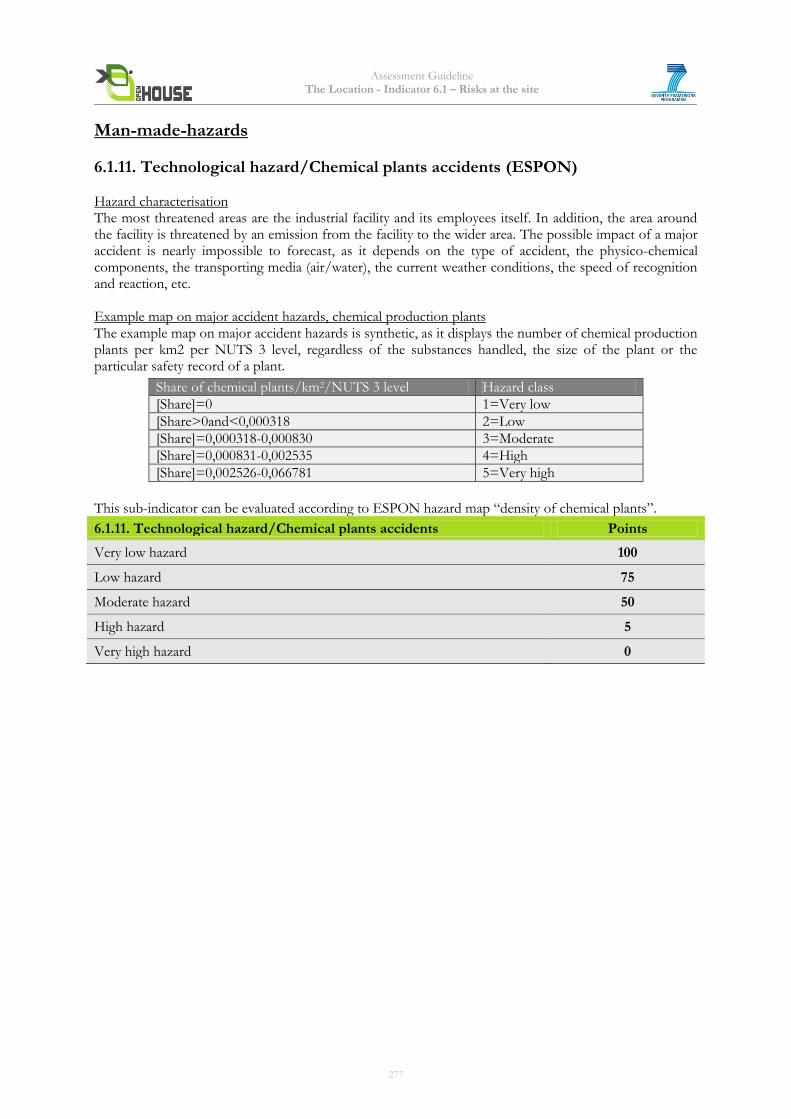
Assessment Guideline The Location - Indicator 6.1 – Risks at the site
Man-made-hazards
6.1.11. Technological hazard/Chemical plants accidents (ESPON)
Hazard characterisation
The most threatened areas are the industrial facility and its employees itself. In addition, the area around the facility is threatened by an emission from the facility to the wider area. The possible impact of a major accident is nearly impossible to forecast, as it depends on the type of accident, the physico-chemical components, the transporting media (air/water), the current weather conditions, the speed of recognition and reaction, etc.
Example map on major accident hazards, chemical production plants The example map on major accident hazards is synthetic, as it displays the number of chemical production plants per km2 per NUTS 3 level, regardless of the substances handled, the size of the plant or the particular safety record of a plant.
Share of chemical plants/km2/NUTS 3 level Hazard class
[Share]=0 1=Very low
[Share>0and<0,000318 2=Low
[Share]=0,000318-0,000830 3=Moderate
[Share]=0,000831-0,002535 4=High
[Share]=0,002526-0,066781 5=Very high
This sub-indicator can be evaluated according to ESPON hazard map “density of chemical plants”.
6.1.11. Technological hazard/Chemical plants accidents Points
Very low hazard 100
Low hazard 75
Moderate hazard 50
High hazard 5
Very high hazard 0
277
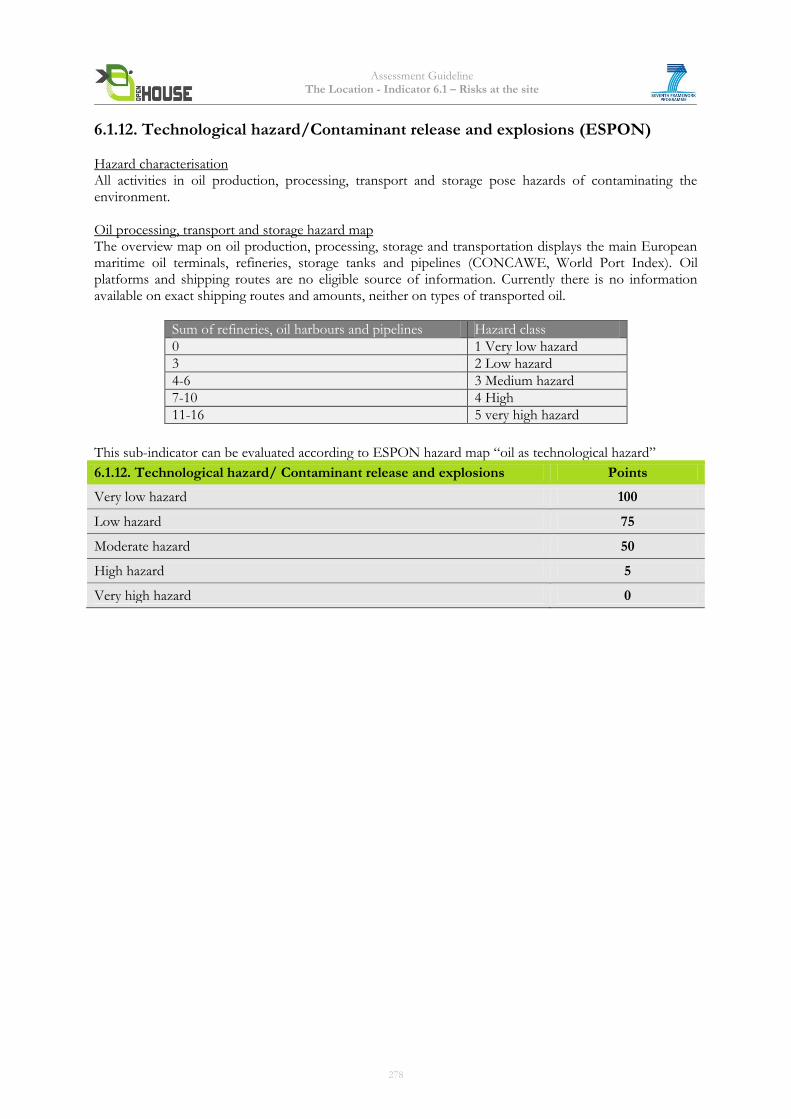
Assessment Guideline The Location - Indicator 6.1 – Risks at the site
6.1.12. Technological hazard/Contaminant release and explosions (ESPON)
Hazard characterisation
All activities in oil production, processing, transport and storage pose hazards of contaminating the environment.
Oil processing, transport and storage hazard map The overview map on oil production, processing, storage and transportation displays the main European maritime oil terminals, refineries, storage tanks and pipelines (CONCAWE, World Port Index). Oil platforms and shipping routes are no eligible source of information. Currently there is no information available on exact shipping routes and amounts, neither on types of transported oil.
Sum of refineries, oil harbours and pipelines Hazard class
0 1 Very low hazard
3 2 Low hazard
4-6 3 Medium hazard
7-10 4 High
11-16 5 very high hazard
This sub-indicator can be evaluated according to ESPON hazard map “oil as technological hazard”
6.1.12. Technological hazard/ Contaminant release and explosions Points
Very low hazard 100
Low hazard 75
Moderate hazard 50
High hazard 5
Very high hazard 0
278
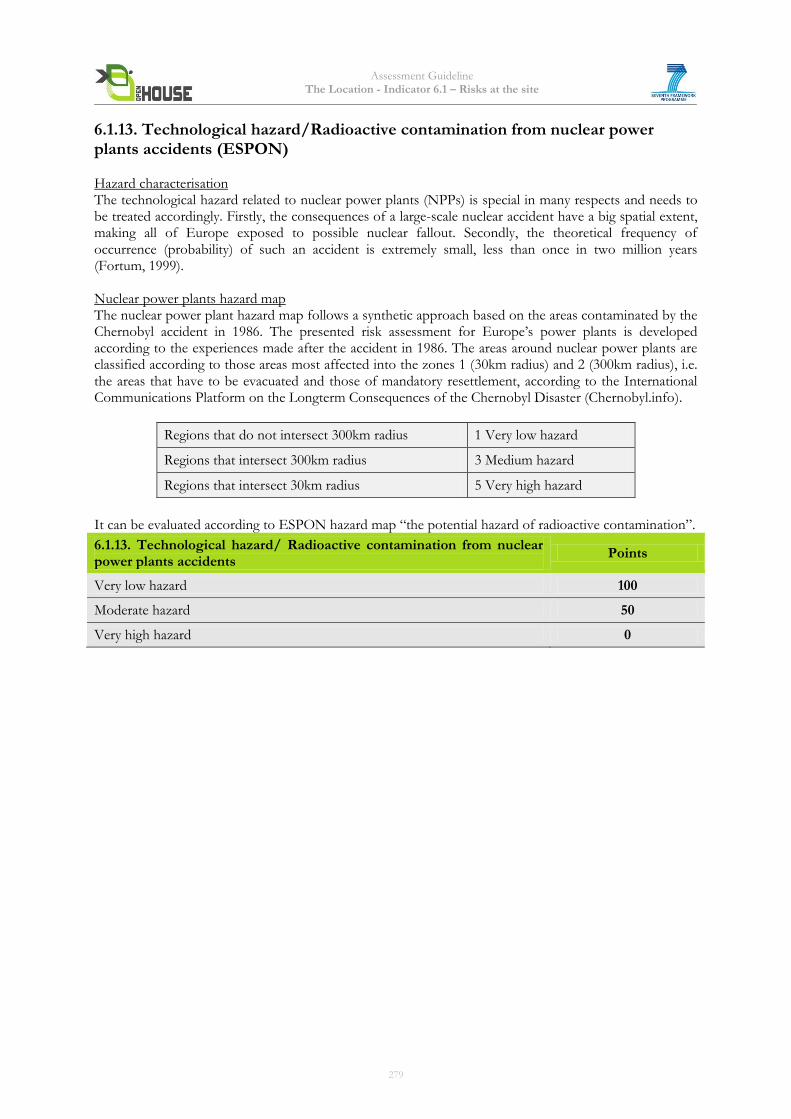
Assessment Guideline The Location - Indicator 6.1 – Risks at the site
6.1.13. Technological hazard/Radioactive contamination from nuclear power plants accidents (ESPON)
Hazard characterisation
The technological hazard related to nuclear power plants (NPPs) is special in many respects and needs to be treated accordingly. Firstly, the consequences of a large-scale nuclear accident have a big spatial extent, making all of Europe exposed to possible nuclear fallout. Secondly, the theoretical frequency of occurrence (probability) of such an accident is extremely small, less than once in two million years (Fortum, 1999).
Nuclear power plants hazard map The nuclear power plant hazard map follows a synthetic approach based on the areas contaminated by the Chernobyl accident in 1986. The presented risk assessment for Europe’s power plants is developed according to the experiences made after the accident in 1986. The areas around nuclear power plants are classified according to those areas most affected into the zones 1 (30km radius) and 2 (300km radius), i.e. the areas that have to be evacuated and those of mandatory resettlement, according to the International Communications Platform on the Longterm Consequences of the Chernobyl Disaster (Chernobyl.info).
Regions that do not intersect 300km radius 1 Very low hazard
Regions that intersect 300km radius 3 Medium hazard
Regions that intersect 30km radius 5 Very high hazard
It can be evaluated according to ESPON hazard map “the potential hazard of radioactive contamination”.
6.1.13. Technological hazard/ Radioactive contamination from nuclear power plants accidents
Points
Very low hazard 100
Moderate hazard 50
Very high hazard 0
279
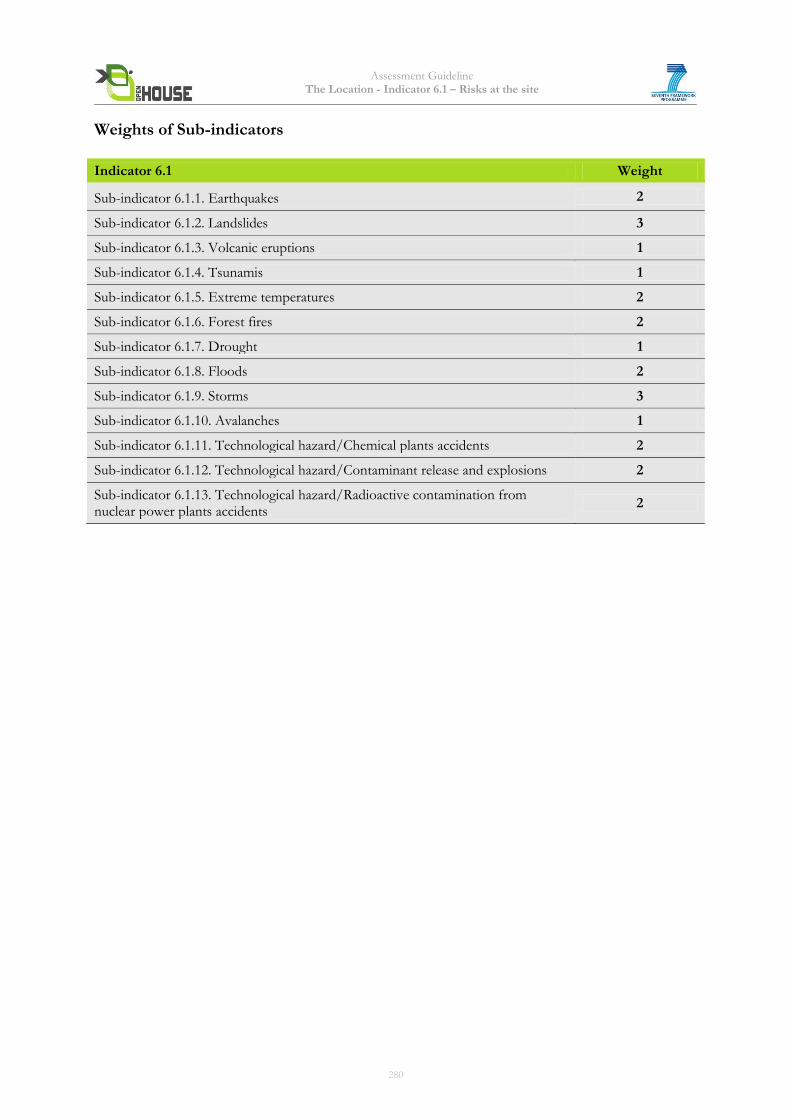
Assessment Guideline The Location - Indicator 6.1 – Risks at the site
Weights of Sub-indicators
Indicator 6.1 Weight
Sub-indicator 6.1.1. Earthquakes 2
Sub-indicator 6.1.2. Landslides 3
Sub-indicator 6.1.3. Volcanic eruptions 1
Sub-indicator 6.1.4. Tsunamis 1
Sub-indicator 6.1.5. Extreme temperatures 2
Sub-indicator 6.1.6. Forest fires 2
Sub-indicator 6.1.7. Drought 1
Sub-indicator 6.1.8. Floods 2
Sub-indicator 6.1.9. Storms 3
Sub-indicator 6.1.10. Avalanches 1
Sub-indicator 6.1.11. Technological hazard/Chemical plants accidents 2
Sub-indicator 6.1.12. Technological hazard/Contaminant release and explosions 2
Sub-indicator 6.1.13. Technological hazard/Radioactive contamination from nuclear power plants accidents
2
280
Assessment Guideline The Location - Indicator 6.1 – Risks at the site
4. Documentation Guidelines The following documents will be needed to assess the building: Quick & Basic Assessment Letter of commitment or easily and quickly accessible documentation for the required evidence (see Complete Assessment), e.g. reasonable estimations for intended/expected values. Complete Assessment 1. Hazard and risk maps on the ESPON Website www.espon.eu with specific information on the sub-
indicators.
2. Other analytical sources, such as GIS data, meteorological maps, data from research institutes, etc., to better describe hazards and risks at a specific location.
5. Relation to other Indicators 4.4 Resistance against hail, storm high water and earthquake.
6. Resources Website of ESPON (European Spatial Planning Observation Network) where all hazards and risk maps presented in this document are kept up to date, i.e. www.espon.eu Website of RMS, which is the world's leading provider of products, services, and expertise for the quantification and management of catastrophe risk, i.e. www.rms.com www.preventionweb.net BREEAM Europe Commercial 2009 Assessor Manual (Issue Pollution 5: Flood risk) LEED Reference Guide for Green Building Design and Construction 2009 Edition HQE Guide Pratique du référentiel pour la qualité environnementale des bâtiments
7. Attachments
ESPON Maps
281
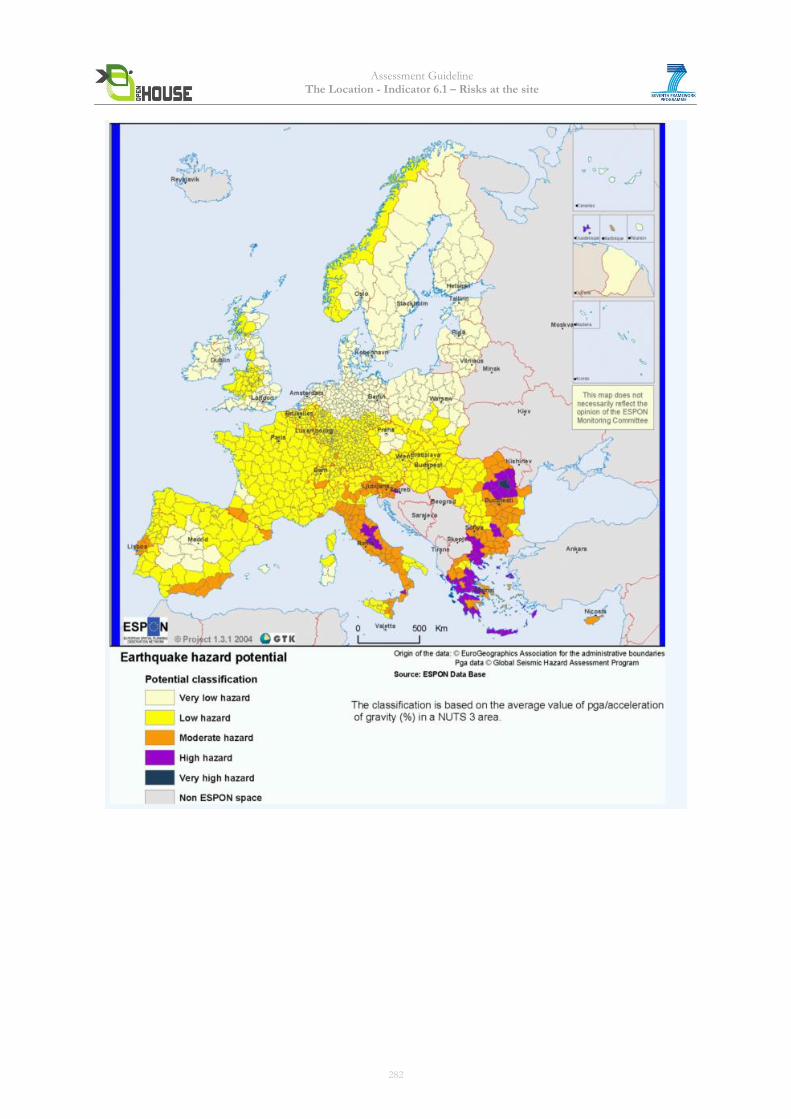
Assessment Guideline The Location - Indicator 6.1 – Risks at the site
282
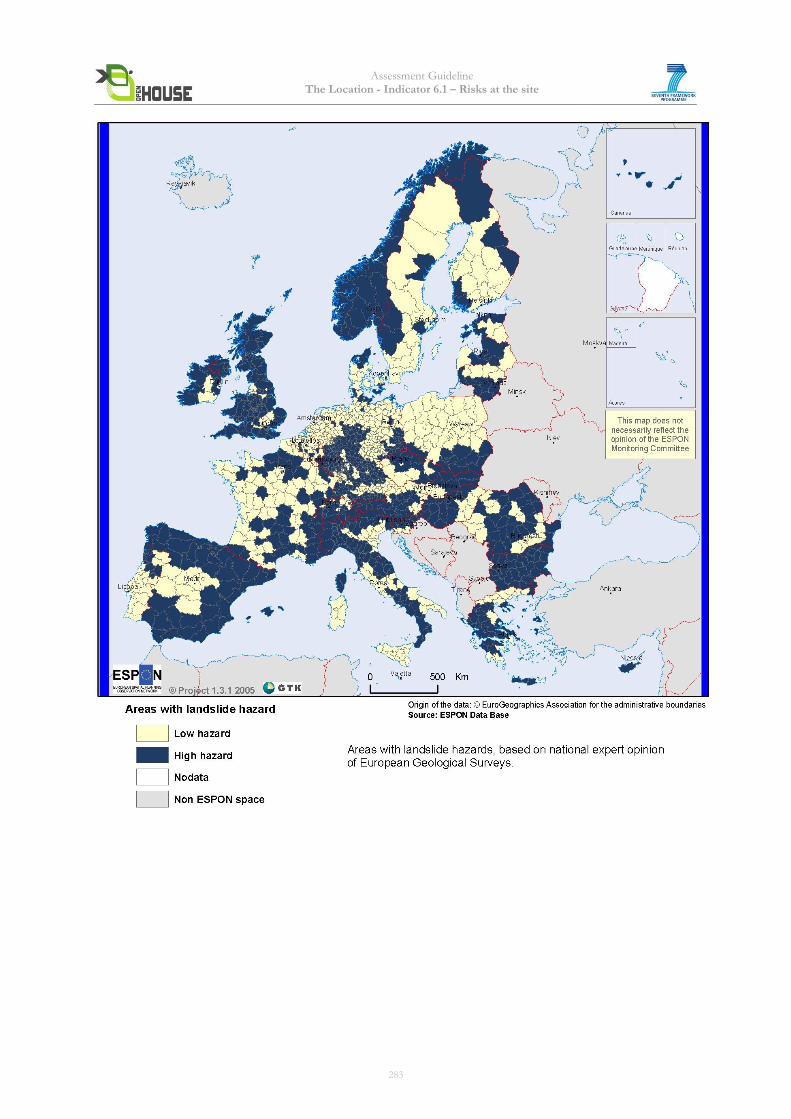
Assessment Guideline The Location - Indicator 6.1 – Risks at the site
283
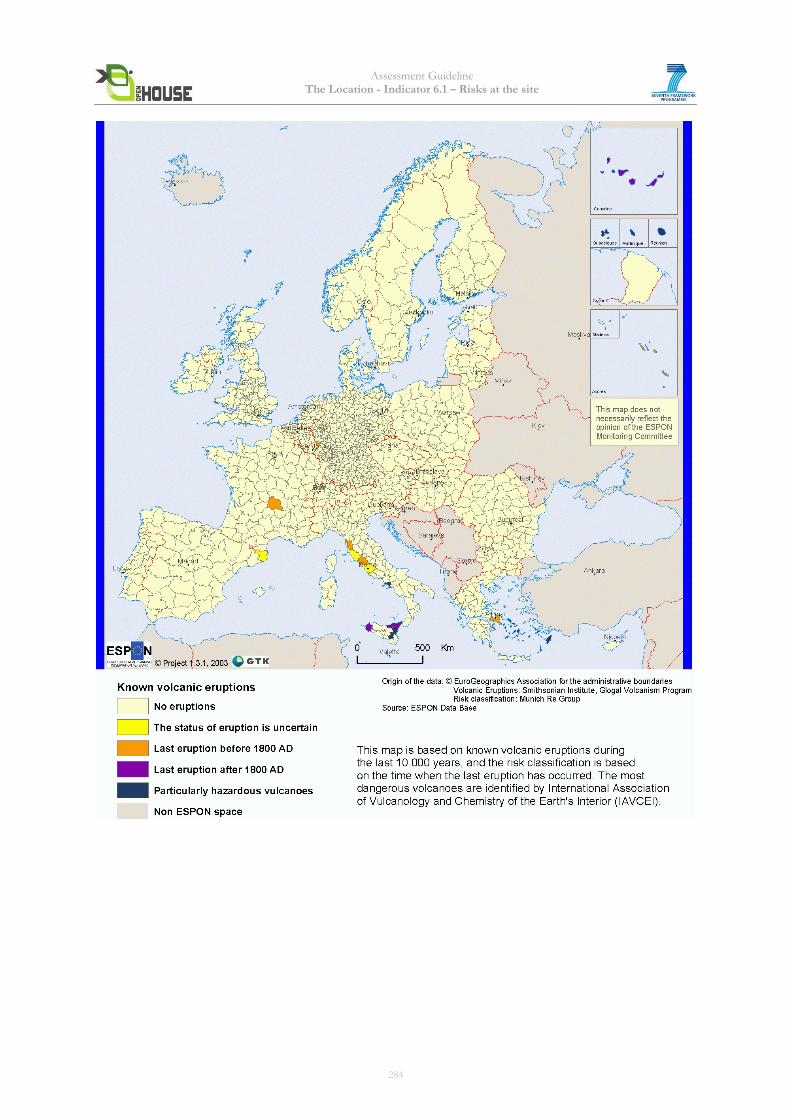
Assessment Guideline The Location - Indicator 6.1 – Risks at the site
284
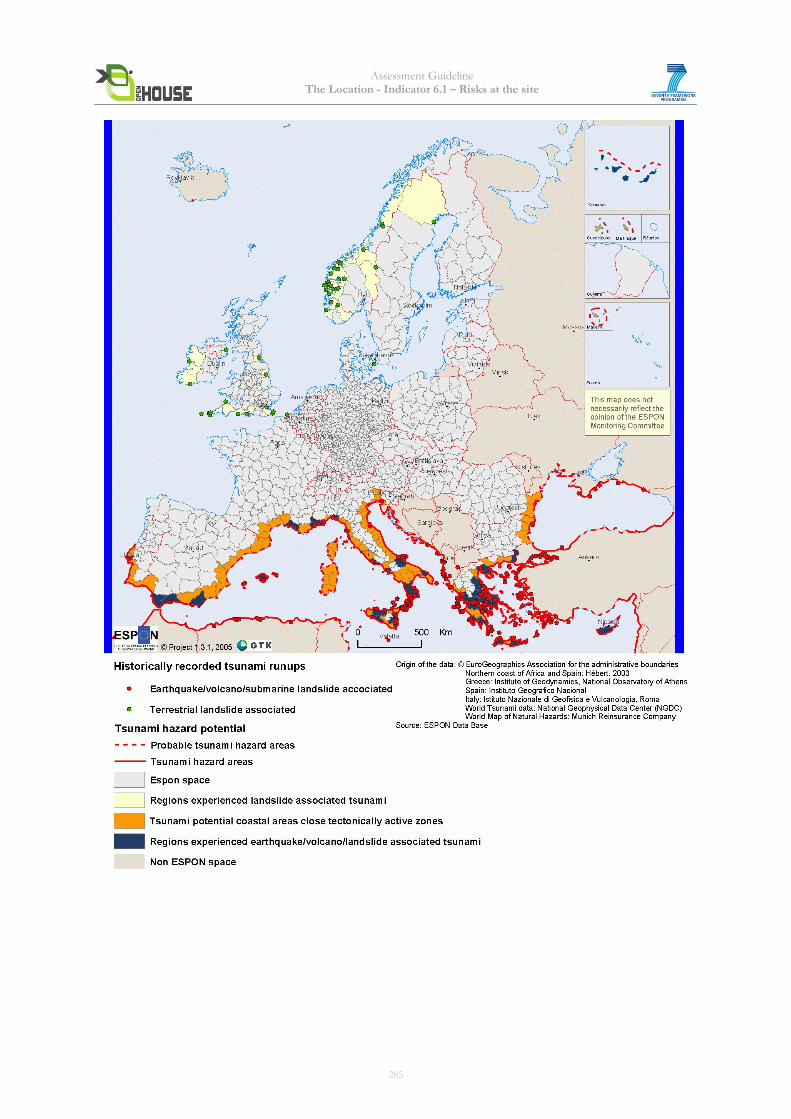
Assessment Guideline The Location - Indicator 6.1 – Risks at the site
285
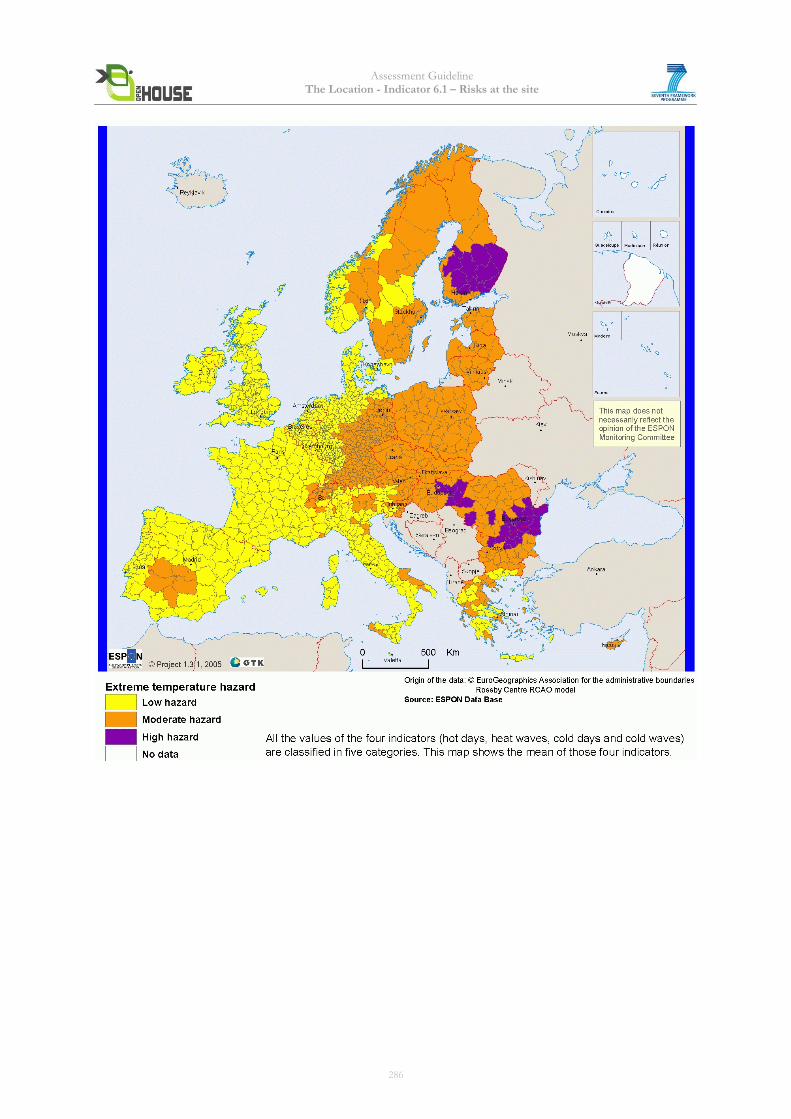
Assessment Guideline The Location - Indicator 6.1 – Risks at the site
286
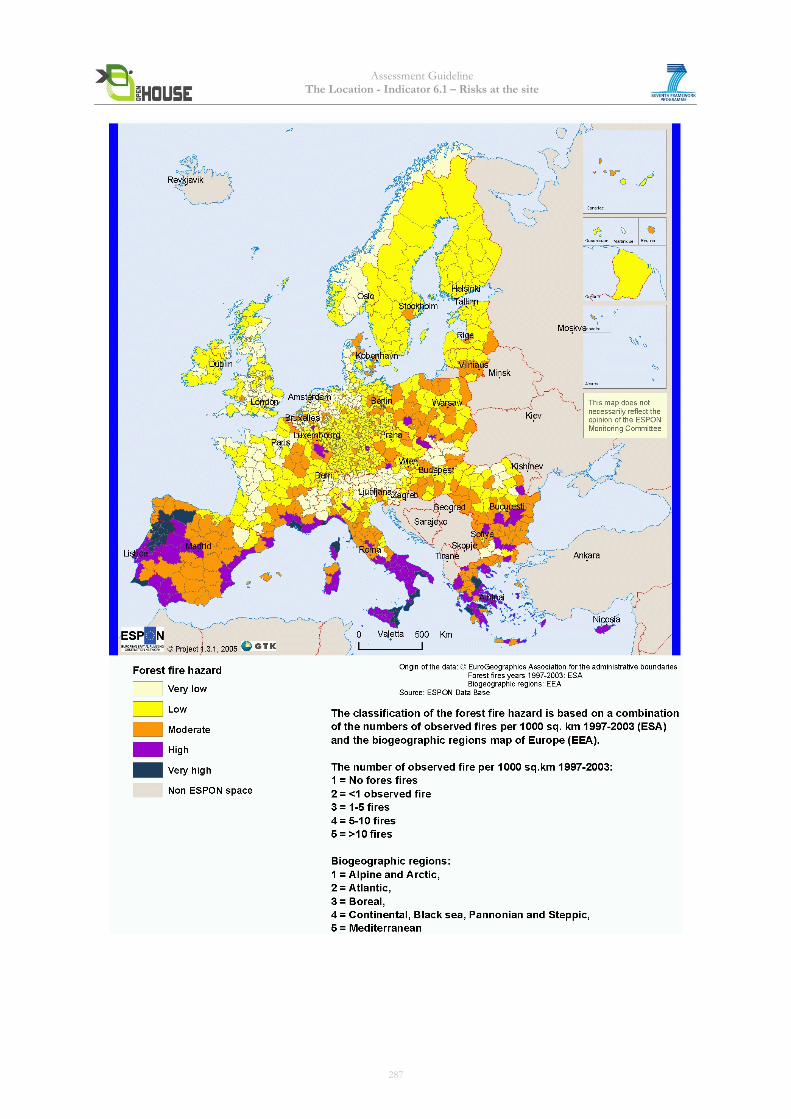
Assessment Guideline The Location - Indicator 6.1 – Risks at the site
287
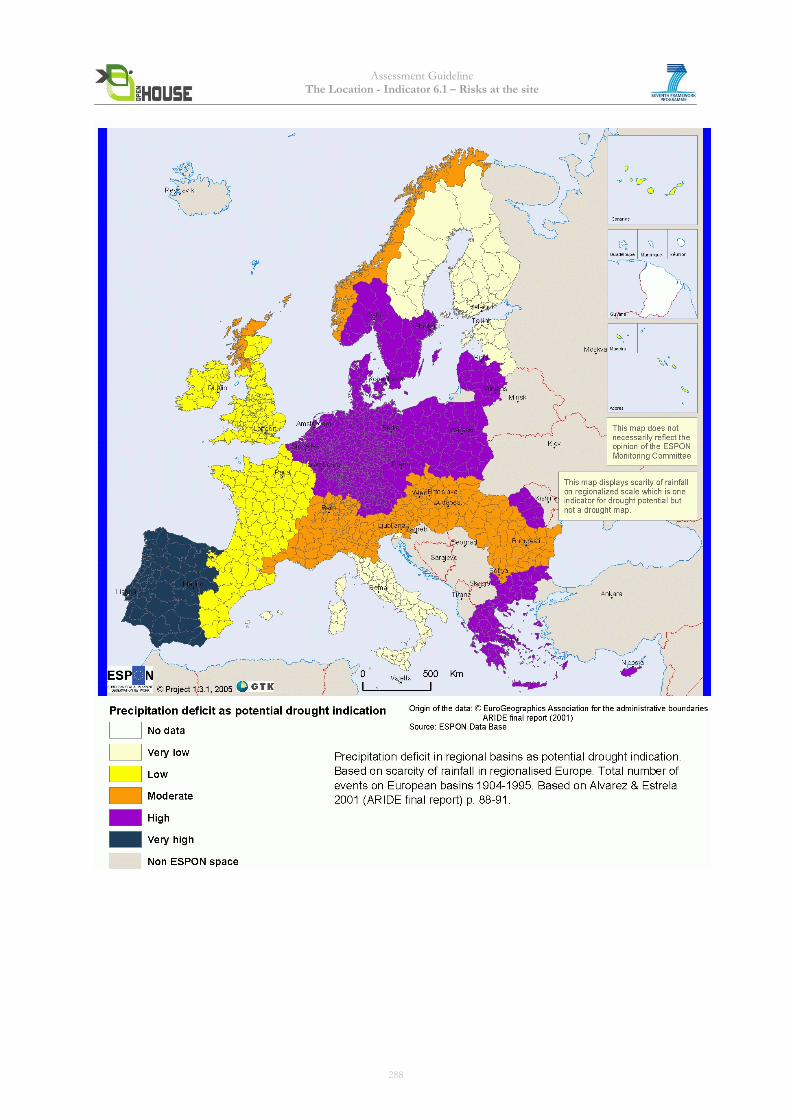
Assessment Guideline The Location - Indicator 6.1 – Risks at the site
288
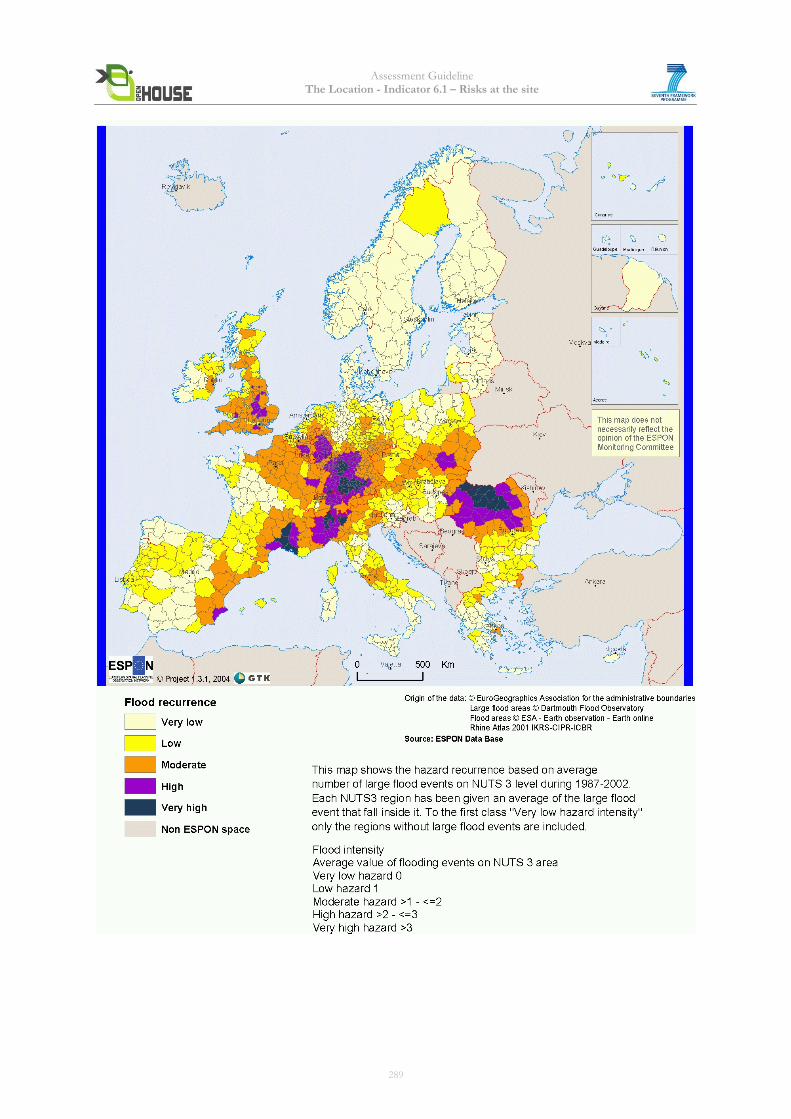
Assessment Guideline The Location - Indicator 6.1 – Risks at the site
289
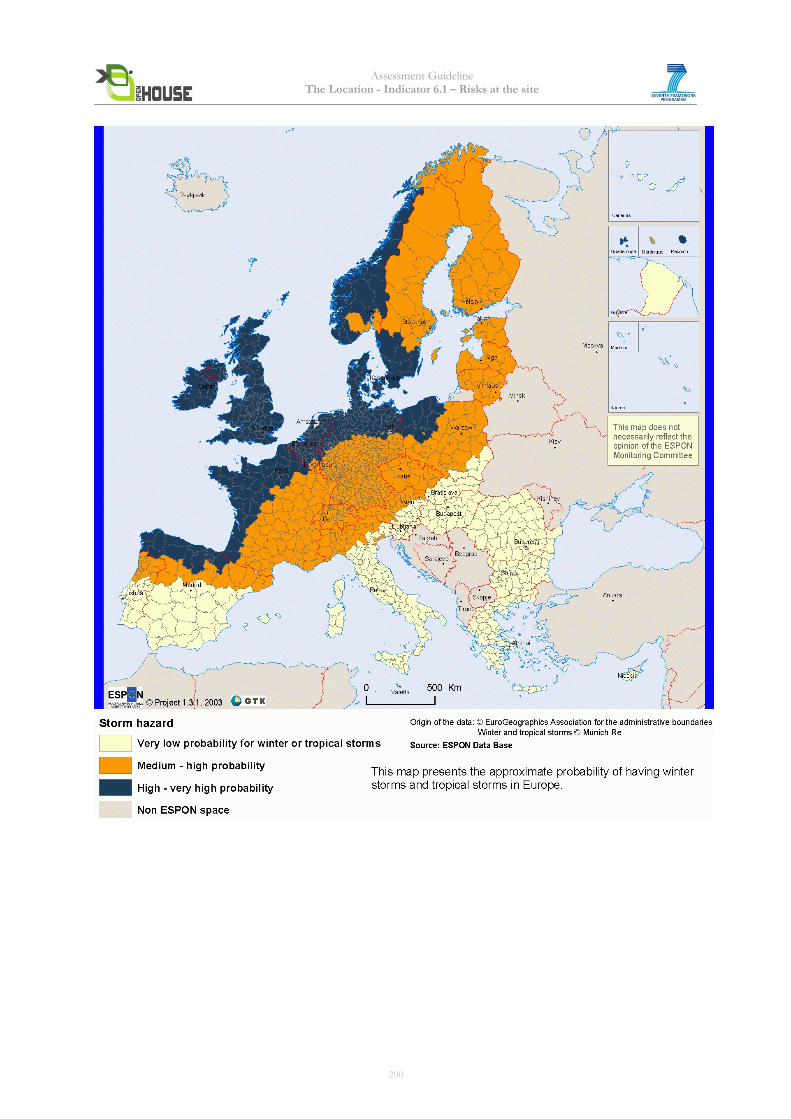
Assessment Guideline The Location - Indicator 6.1 – Risks at the site
290
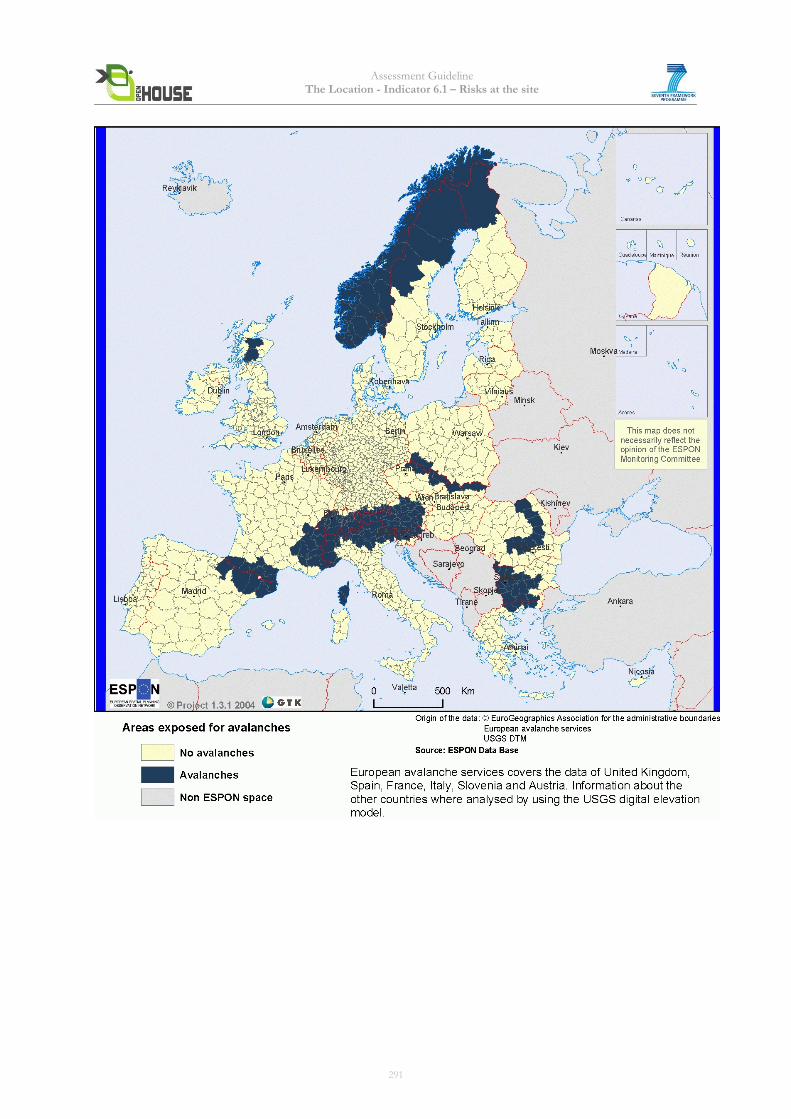
Assessment Guideline The Location - Indicator 6.1 – Risks at the site
291
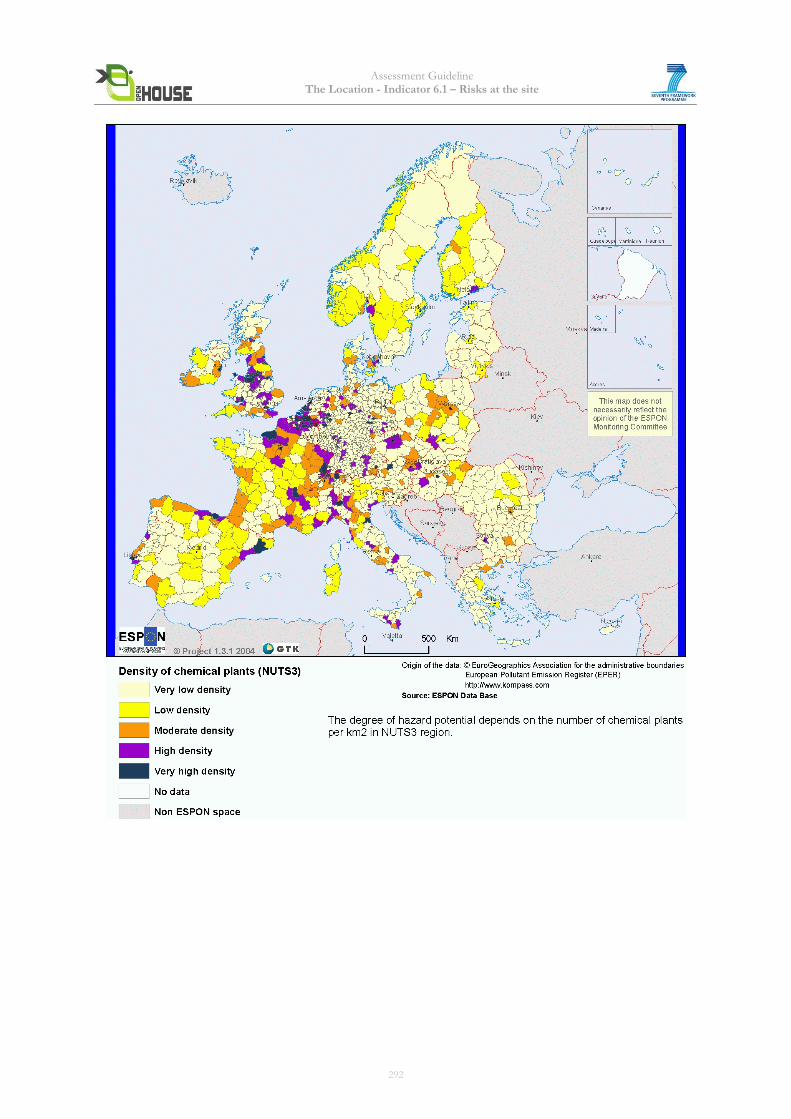
Assessment Guideline The Location - Indicator 6.1 – Risks at the site
292
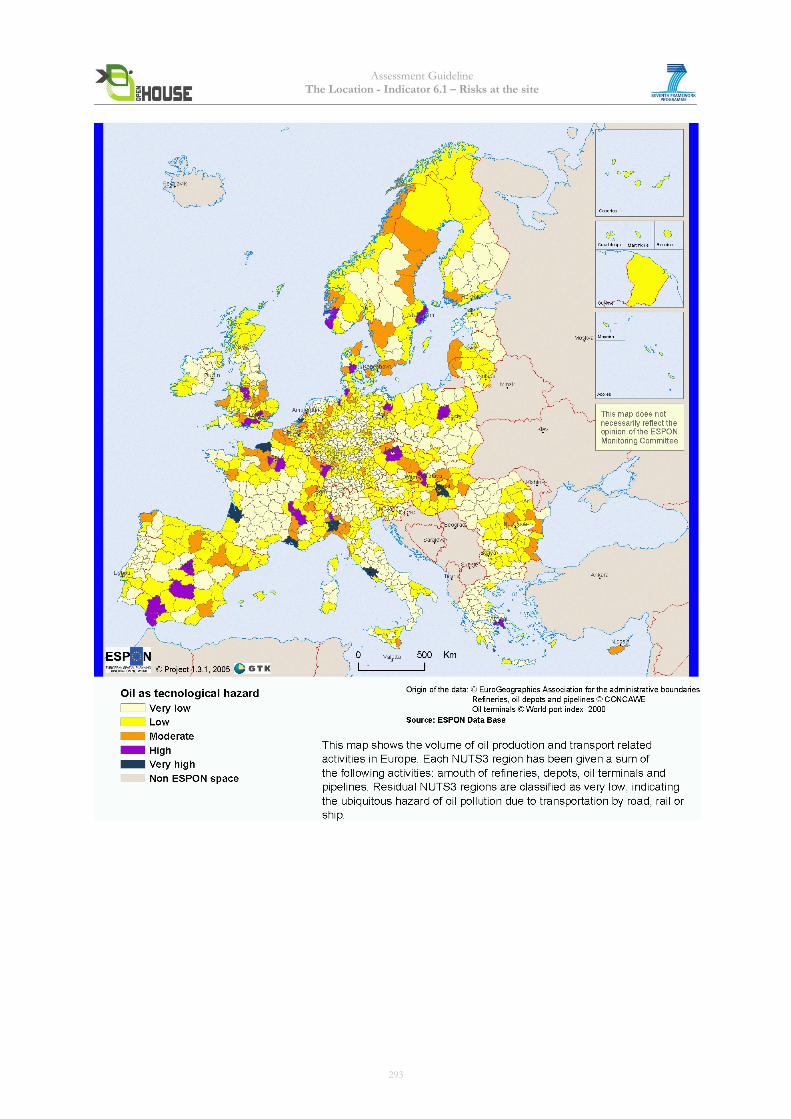
Assessment Guideline The Location - Indicator 6.1 – Risks at the site
293
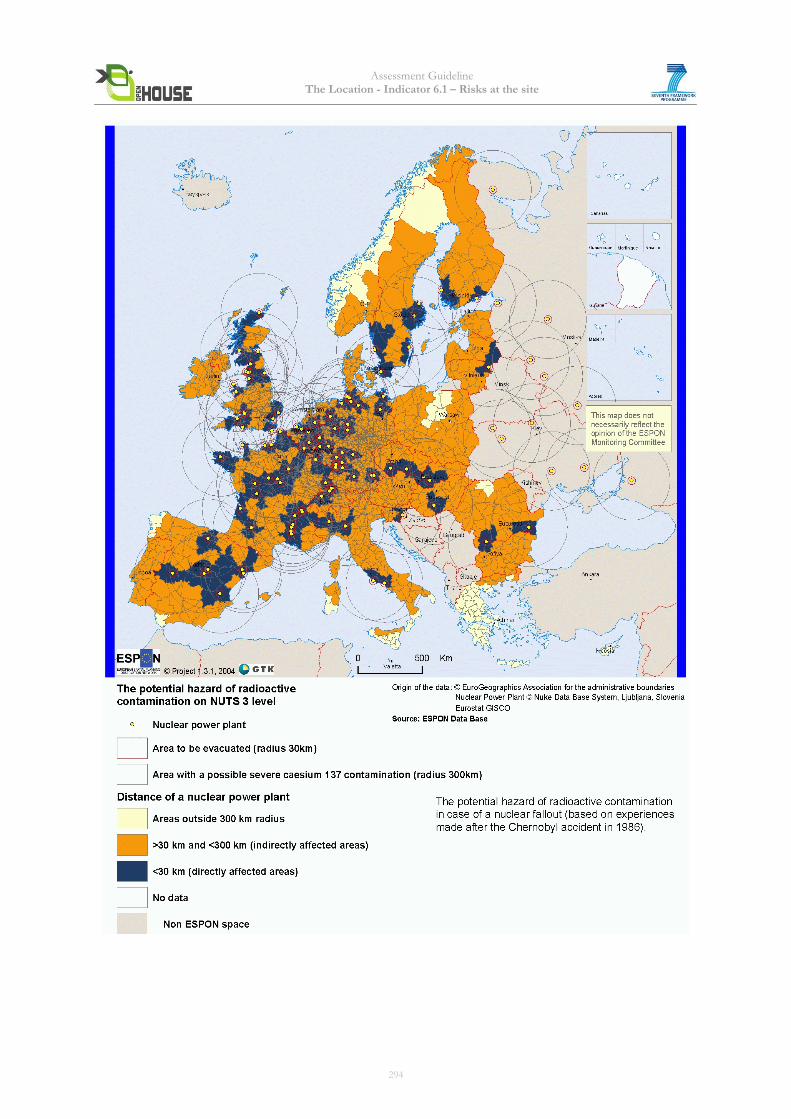
Assessment Guideline The Location - Indicator 6.1 – Risks at the site
294
Assessment Guideline The Location - Indicator 6.2 – Circumstances at the site
Indicator 6.2 Circumstances at the site (adapted from BREEAM, DGNB/BNB, LEED, EN 13779)
1. Objective The objective is to assess the conditions at the site which can have a determining effect on the health and well-being of people (stress, reduced productivity, long term health problems). This supports the European Commission objectives to avoid, prevent or reduce harmful effects of poor ambient air quality1 and environmental noise2 on human health and the environment as a whole.
2. Assessment Methodology The outdoor air quality has a direct impact on the social sustainability of a site. It is an important aspect of the external environment affecting the health and comfort of building occupants and influencing decision making for the adoption of ventilation strategies. The following sources of external pollution are identified: · Highways and the main access roads on the assessed site. · Car parks and delivery/vehicle waiting bays · Other building exhausts, including exhausts from building services plant industrial/agricultural processes The concentration of key pollutants will therefore be assessed. Noise is one of the most pressing environmental problems in urban areas. About 8% of the urban population are exposed to outdoor noise at a level greater than 70 dB(A), while 11% are exposed at levels greater than 65 dB(A). The main source is road traffic followed by neighbourhood and aircraft noise. Sources of ambient noise are emissions from road, rail and traffic, construction sites, industrial sites and recreational areas. Excessive noise seriously harms human health and interferes with people’s daily activities at school, at work, at home and during leisure time. It can disturb sleep, cause cardiovascular and psycho-physiological effects, reduce performance and provoke annoyance responses and changes in social behaviour. Traffic noise alone is harming the health of almost every third person in the WHO European Region. One in five Europeans is regularly exposed to sound levels at night that could significantly damage health. (World Health Organization- Regional office for Europe) Urban Heat Island Effect is defined as thermal gradient differences between developed and undeveloped areas. It leads to increased cooling requirements for buildings in urban areas and also to poor comfort conditions in outdoor spaces. The additional required energy to support the higher cooling loads results in more air pollution, greater resource extraction impacts and higher costs. Reducing or mitigating urban heat islands can counter these negative effects and result in more sustainable buildings apart from a more pleasant urban lifestyle. Urban Heat Island Effect is caused by the removal of vegetation and its replacement with asphalt and concrete roads, buildings and other structures. This phenomenon is linked with the morphology of cities and with the prevailing construction materials. Strong electromagnetic fields (EMFs) of about 50 to 60 cycles per second (hertz, or Hz) and the related electromagnetic radiation (EMR) are harmful to us. Long-term exposure may aggravate any existing health
1 DIRECTIVE 2008/50/EC 2 DIRECTIVE 2002/49/EC
295
Assessment Guideline The Location - Indicator 6.2 – Circumstances at the site
problems or diseases and may cause or intensify especially lack of energy or fatigue, irritability, aggression, hyperactivity, sleep disorders and emotional instability. Increasing numbers of individuals are becoming hypersensitive to EMR; many can feel the electricity going through the body and may experience disabling symptoms such as convulsions, memory problems and depression. Chronic exposure to high levels of EMR, especially while asleep, is a constant drain on our vitality. It creates chronic stress, which interferes with the regeneration and healing that normally takes place during a good night’s sleep. Aim of this sub-indicator is to take in account the impacts of the electromagnetic pollution at the location. This supports the European Commission objective to introduce measures protecting workers from the risks associated with electromagnetic fields, owing to their effects on the health and safety of workers3. The following sub-indicators will be assessed: 6.2.1 Outdoor Air Quality 6.2.2 Ambient Noise Level 6.2.3 Soil and building plot contamination 6.2.4 Urban Heat Island Effect 6.2.5 Electromagnetic Pollution
3 DIRECTIVE 2004/40/EG
296
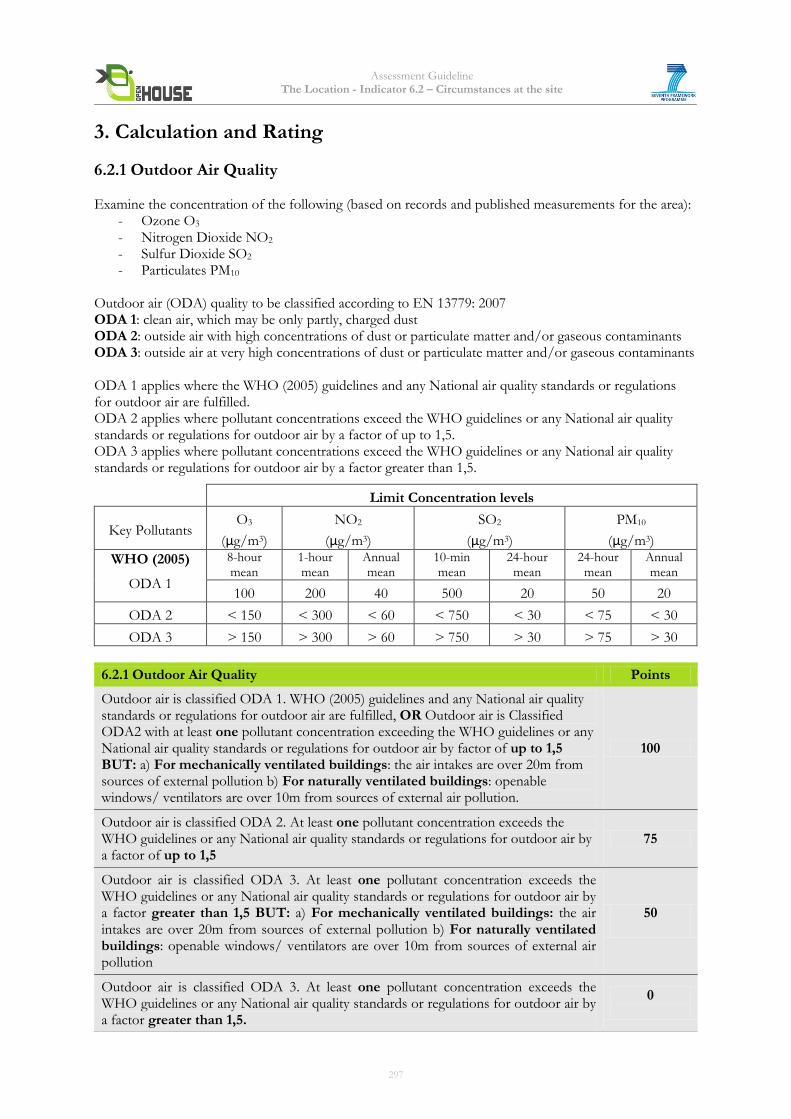
Assessment Guideline The Location - Indicator 6.2 – Circumstances at the site
3. Calculation and Rating
6.2.1 Outdoor Air Quality Examine the concentration of the following (based on records and published measurements for the area):
- Ozone O3 - Nitrogen Dioxide NO2 - Sulfur Dioxide SO2 - Particulates PM10
Outdoor air (ODA) quality to be classified according to EN 13779: 2007 ODA 1: clean air, which may be only partly, charged dust ODA 2: outside air with high concentrations of dust or particulate matter and/or gaseous contaminants ODA 3: outside air at very high concentrations of dust or particulate matter and/or gaseous contaminants ODA 1 applies where the WHO (2005) guidelines and any National air quality standards or regulations for outdoor air are fulfilled. ODA 2 applies where pollutant concentrations exceed the WHO guidelines or any National air quality standards or regulations for outdoor air by a factor of up to 1,5. ODA 3 applies where pollutant concentrations exceed the WHO guidelines or any National air quality standards or regulations for outdoor air by a factor greater than 1,5.
Limit Concentration levels
Key Pollutants O3
(μg/m3)
NO2
(μg/m3)
SO2
(μg/m3)
PM10
(μg/m3)
WHO (2005)
ODA 1
8-hour mean
1-hour mean
Annual mean
10-min mean
24-hour mean
24-hour mean
Annual mean
100 200 40 500 20 50 20
ODA 2 < 150 < 300 < 60 < 750 < 30 < 75 < 30
ODA 3 > 150 > 300 > 60 > 750 > 30 > 75 > 30
6.2.1 Outdoor Air Quality Points
Outdoor air is classified ODA 1. WHO (2005) guidelines and any National air quality standards or regulations for outdoor air are fulfilled, OR Outdoor air is Classified ODA2 with at least one pollutant concentration exceeding the WHO guidelines or any National air quality standards or regulations for outdoor air by factor of up to 1,5 BUT: a) For mechanically ventilated buildings: the air intakes are over 20m from sources of external pollution b) For naturally ventilated buildings: openable windows/ ventilators are over 10m from sources of external air pollution.
100
Outdoor air is classified ODA 2. At least one pollutant concentration exceeds the WHO guidelines or any National air quality standards or regulations for outdoor air by a factor of up to 1,5
75
Outdoor air is classified ODA 3. At least one pollutant concentration exceeds the WHO guidelines or any National air quality standards or regulations for outdoor air by a factor greater than 1,5 BUT: a) For mechanically ventilated buildings: the air intakes are over 20m from sources of external pollution b) For naturally ventilated buildings: openable windows/ ventilators are over 10m from sources of external air pollution
50
Outdoor air is classified ODA 3. At least one pollutant concentration exceeds the WHO guidelines or any National air quality standards or regulations for outdoor air by a factor greater than 1,5.
0
297
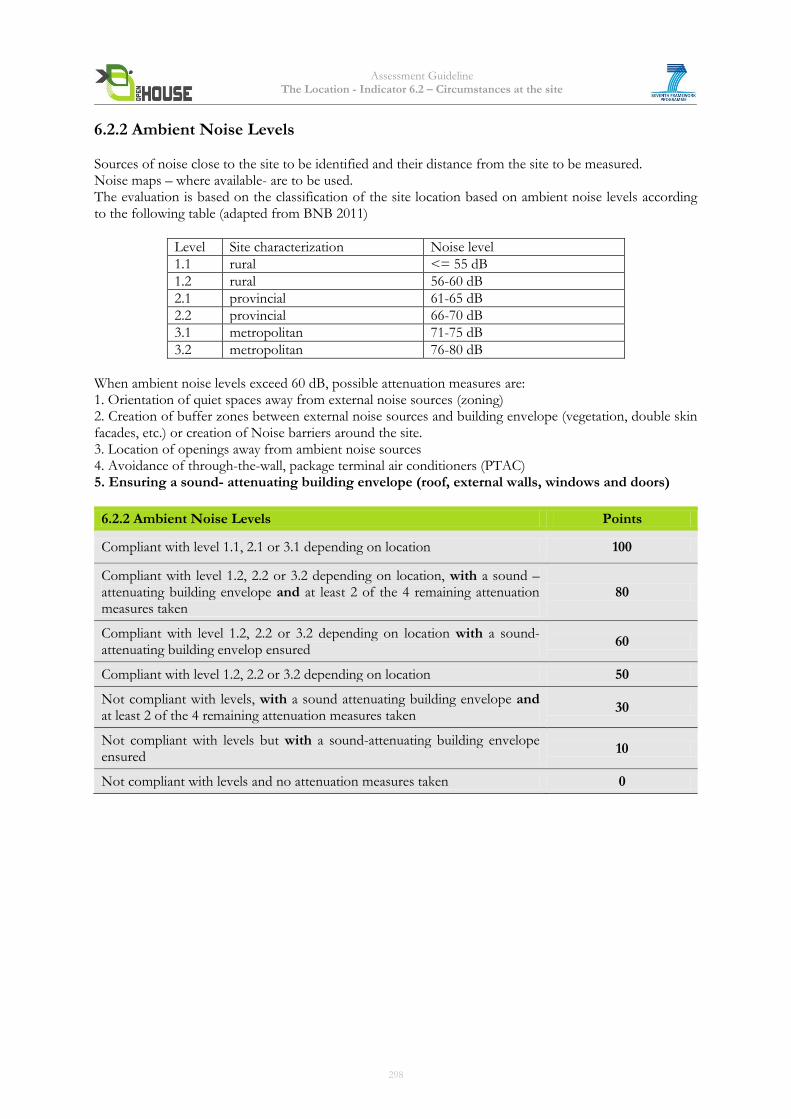
Assessment Guideline The Location - Indicator 6.2 – Circumstances at the site
6.2.2 Ambient Noise Levels Sources of noise close to the site to be identified and their distance from the site to be measured. Noise maps – where available- are to be used. The evaluation is based on the classification of the site location based on ambient noise levels according to the following table (adapted from BNB 2011)
Level Site characterization Noise level
1.1 rural <= 55 dB
1.2 rural 56-60 dB
2.1 provincial 61-65 dB
2.2 provincial 66-70 dB
3.1 metropolitan 71-75 dB
3.2 metropolitan 76-80 dB
When ambient noise levels exceed 60 dB, possible attenuation measures are: 1. Orientation of quiet spaces away from external noise sources (zoning) 2. Creation of buffer zones between external noise sources and building envelope (vegetation, double skin facades, etc.) or creation of Noise barriers around the site. 3. Location of openings away from ambient noise sources 4. Avoidance of through-the-wall, package terminal air conditioners (PTAC) 5. Ensuring a sound- attenuating building envelope (roof, external walls, windows and doors)
6.2.2 Ambient Noise Levels Points
Compliant with level 1.1, 2.1 or 3.1 depending on location 100
Compliant with level 1.2, 2.2 or 3.2 depending on location, with a sound –attenuating building envelope and at least 2 of the 4 remaining attenuation measures taken
80
Compliant with level 1.2, 2.2 or 3.2 depending on location with a sound-attenuating building envelop ensured
60
Compliant with level 1.2, 2.2 or 3.2 depending on location 50
Not compliant with levels, with a sound attenuating building envelope and at least 2 of the 4 remaining attenuation measures taken
30
Not compliant with levels but with a sound-attenuating building envelope ensured
10
Not compliant with levels and no attenuation measures taken 0
298
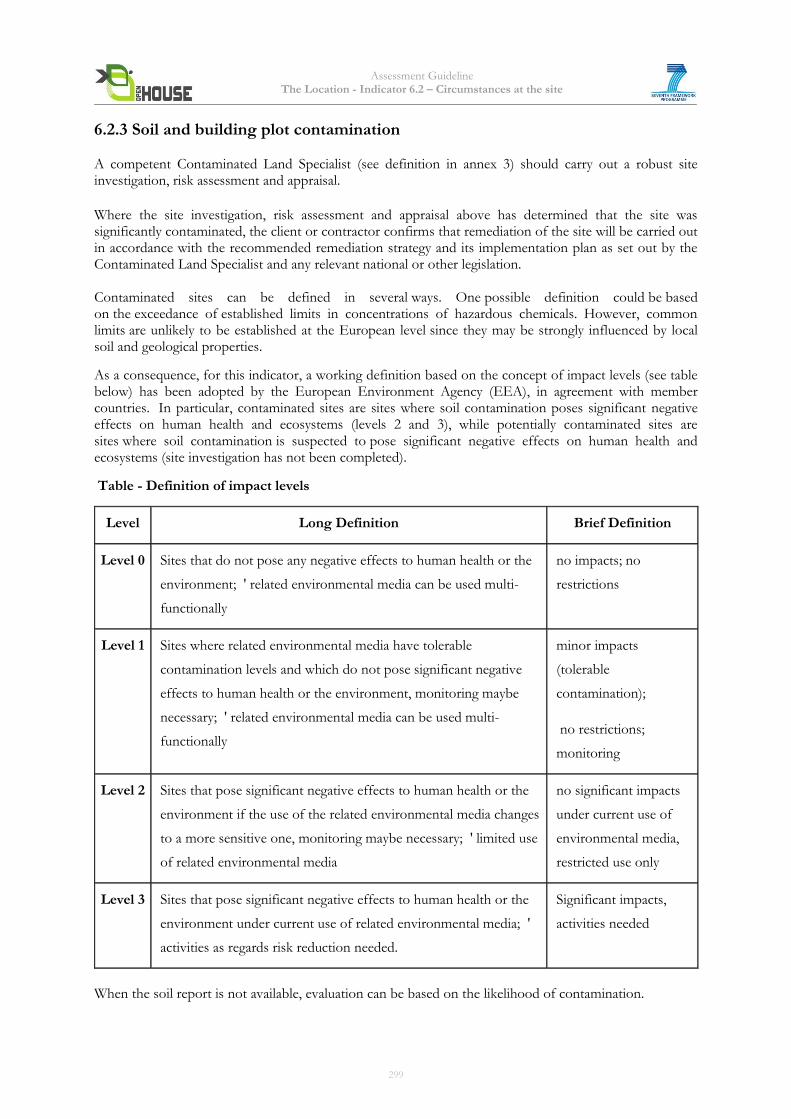
Assessment Guideline The Location - Indicator 6.2 – Circumstances at the site
6.2.3 Soil and building plot contamination
A competent Contaminated Land Specialist (see definition in annex 3) should carry out a robust site investigation, risk assessment and appraisal.
Where the site investigation, risk assessment and appraisal above has determined that the site was significantly contaminated, the client or contractor confirms that remediation of the site will be carried out in accordance with the recommended remediation strategy and its implementation plan as set out by the Contaminated Land Specialist and any relevant national or other legislation. Contaminated sites can be defined in several ways. One possible definition could be based on the exceedance of established limits in concentrations of hazardous chemicals. However, common limits are unlikely to be established at the European level since they may be strongly influenced by local soil and geological properties.
As a consequence, for this indicator, a working definition based on the concept of impact levels (see table below) has been adopted by the European Environment Agency (EEA), in agreement with member countries. In particular, contaminated sites are sites where soil contamination poses significant negative effects on human health and ecosystems (levels 2 and 3), while potentially contaminated sites are sites where soil contamination is suspected to pose significant negative effects on human health and ecosystems (site investigation has not been completed).
Table - Definition of impact levels
Level Long Definition Brief Definition
Level 0 Sites that do not pose any negative effects to human health or the
environment; ' related environmental media can be used multi-
functionally
no impacts; no
restrictions
Level 1 Sites where related environmental media have tolerable
contamination levels and which do not pose significant negative
effects to human health or the environment, monitoring maybe
necessary; ' related environmental media can be used multi-
functionally
minor impacts
(tolerable
contamination);
no restrictions;
monitoring
Level 2 Sites that pose significant negative effects to human health or the
environment if the use of the related environmental media changes
to a more sensitive one, monitoring maybe necessary; ' limited use
of related environmental media
no significant impacts
under current use of
environmental media,
restricted use only
Level 3 Sites that pose significant negative effects to human health or the
environment under current use of related environmental media; '
activities as regards risk reduction needed.
Significant impacts,
activities needed
When the soil report is not available, evaluation can be based on the likelihood of contamination.
299
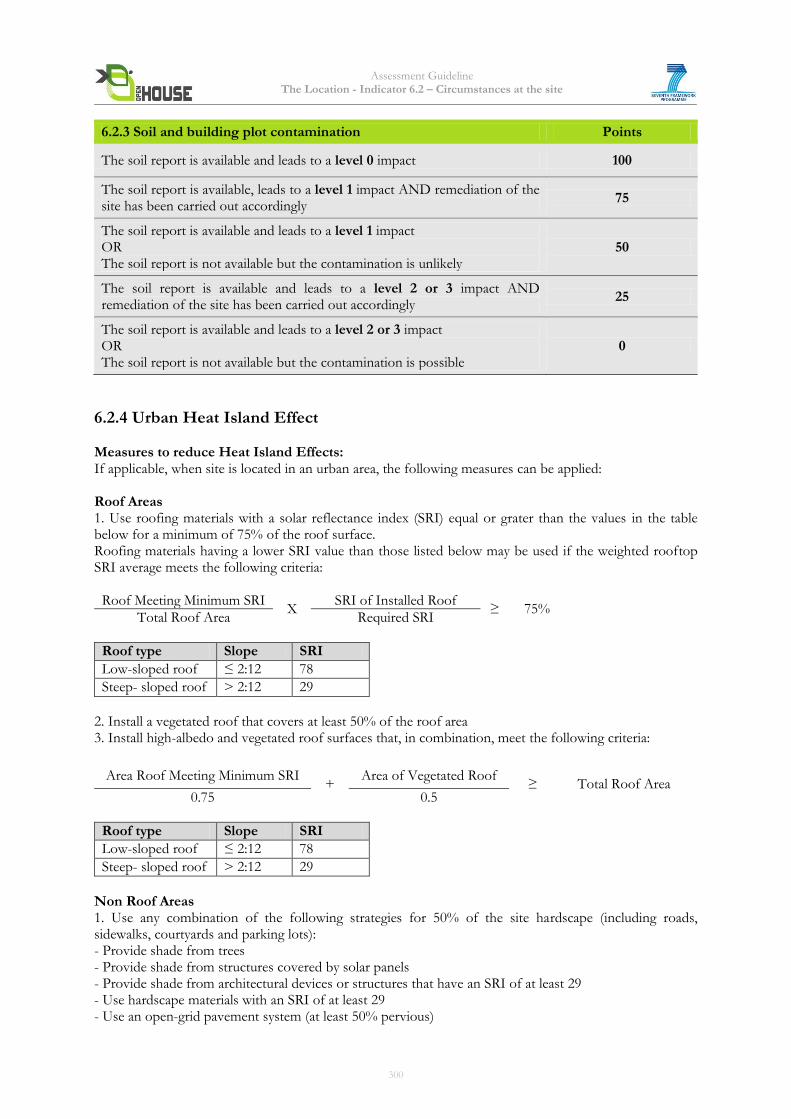
Assessment Guideline The Location - Indicator 6.2 – Circumstances at the site
6.2.3 Soil and building plot contamination Points
The soil report is available and leads to a level 0 impact 100
The soil report is available, leads to a level 1 impact AND remediation of the site has been carried out accordingly
75
The soil report is available and leads to a level 1 impact OR The soil report is not available but the contamination is unlikely
50
The soil report is available and leads to a level 2 or 3 impact AND remediation of the site has been carried out accordingly
25
The soil report is available and leads to a level 2 or 3 impact OR The soil report is not available but the contamination is possible
0
6.2.4 Urban Heat Island Effect Measures to reduce Heat Island Effects: If applicable, when site is located in an urban area, the following measures can be applied: Roof Areas 1. Use roofing materials with a solar reflectance index (SRI) equal or grater than the values in the table below for a minimum of 75% of the roof surface. Roofing materials having a lower SRI value than those listed below may be used if the weighted rooftop SRI average meets the following criteria:
Roof Meeting Minimum SRI X
SRI of Installed Roof ≥ 75%
Total Roof Area Required SRI
Roof type Slope SRI
Low-sloped roof ≤ 2:12 78
Steep- sloped roof > 2:12 29
2. Install a vegetated roof that covers at least 50% of the roof area 3. Install high-albedo and vegetated roof surfaces that, in combination, meet the following criteria:
Area Roof Meeting Minimum SRI +
Area of Vegetated Roof ≥ Total Roof Area
0.75 0.5
Roof type Slope SRI
Low-sloped roof ≤ 2:12 78
Steep- sloped roof > 2:12 29
Non Roof Areas 1. Use any combination of the following strategies for 50% of the site hardscape (including roads, sidewalks, courtyards and parking lots): - Provide shade from trees - Provide shade from structures covered by solar panels - Provide shade from architectural devices or structures that have an SRI of at least 29 - Use hardscape materials with an SRI of at least 29 - Use an open-grid pavement system (at least 50% pervious)
300
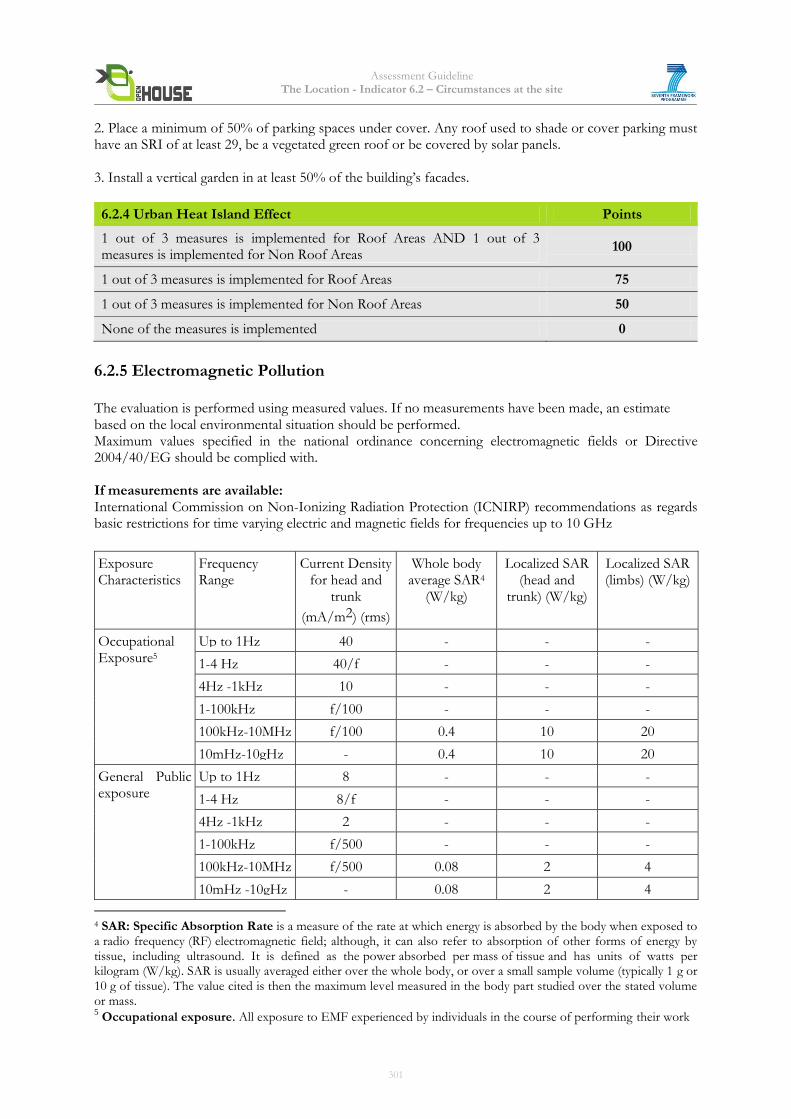
Assessment Guideline The Location - Indicator 6.2 – Circumstances at the site
2. Place a minimum of 50% of parking spaces under cover. Any roof used to shade or cover parking must have an SRI of at least 29, be a vegetated green roof or be covered by solar panels. 3. Install a vertical garden in at least 50% of the building’s facades.
6.2.4 Urban Heat Island Effect Points
1 out of 3 measures is implemented for Roof Areas AND 1 out of 3 measures is implemented for Non Roof Areas
100
1 out of 3 measures is implemented for Roof Areas 75
1 out of 3 measures is implemented for Non Roof Areas 50
None of the measures is implemented 0
6.2.5 Electromagnetic Pollution The evaluation is performed using measured values. If no measurements have been made, an estimate based on the local environmental situation should be performed. Maximum values specified in the national ordinance concerning electromagnetic fields or Directive 2004/40/EG should be complied with. If measurements are available: International Commission on Non-Ionizing Radiation Protection (ICNIRP) recommendations as regards basic restrictions for time varying electric and magnetic fields for frequencies up to 10 GHz
Exposure Characteristics
Frequency Range
Current Density for head and
trunk
(mΑ/m2) (rms)
Whole body average SAR4
(W/kg)
Localized SAR (head and
trunk) (W/kg)
Localized SAR (limbs) (W/kg)
Occupational Exposure5
Up to 1Hz 40 - - -
1-4 Hz 40/f - - -
4Hz -1kHz 10 - - -
1-100kHz f/100 - - -
100kHz-10MHz f/100 0.4 10 20
10mHz-10gHz - 0.4 10 20
General Public exposure
Up to 1Hz 8 - - -
1-4 Hz 8/f - - -
4Hz -1kHz 2 - - -
1-100kHz f/500 - - -
100kHz-10MHz f/500 0.08 2 4
10mHz -10gHz - 0.08 2 4
4 SAR: Specific Absorption Rate is a measure of the rate at which energy is absorbed by the body when exposed to a radio frequency (RF) electromagnetic field; although, it can also refer to absorption of other forms of energy by tissue, including ultrasound. It is defined as the power absorbed per mass of tissue and has units of watts per kilogram (W/kg). SAR is usually averaged either over the whole body, or over a small sample volume (typically 1 g or 10 g of tissue). The value cited is then the maximum level measured in the body part studied over the stated volume or mass. 5 Occupational exposure. All exposure to EMF experienced by individuals in the course of performing their work
301
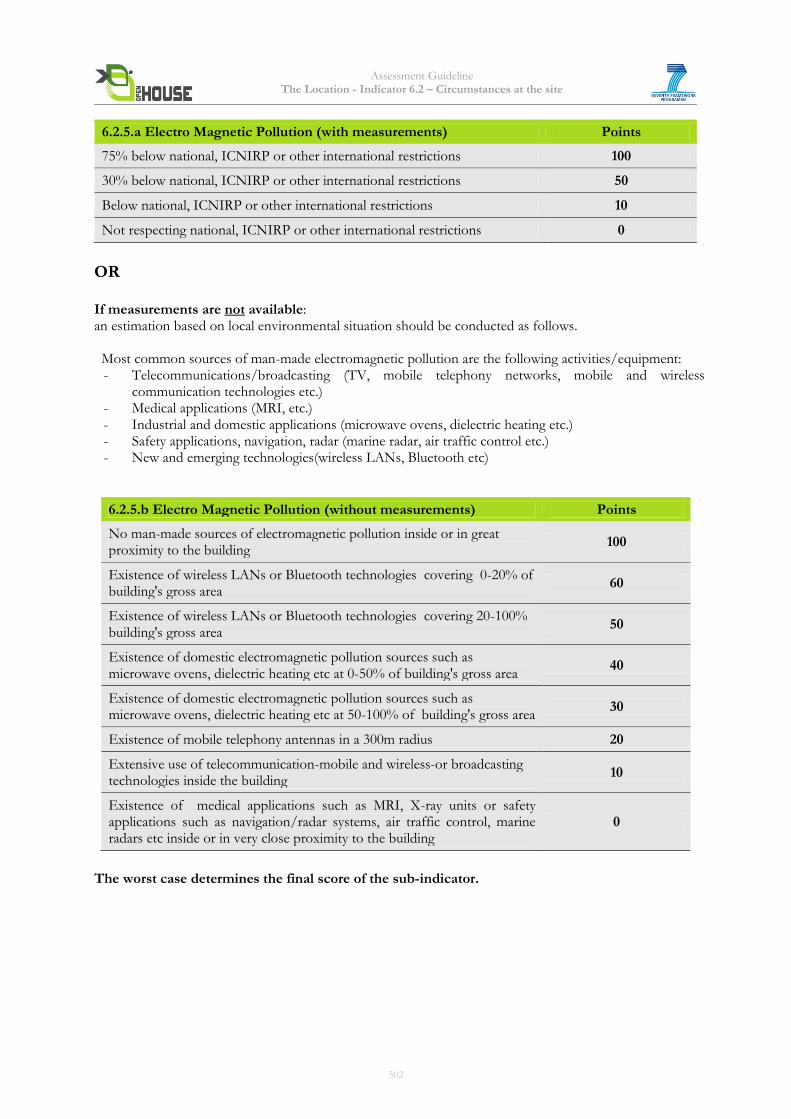
Assessment Guideline The Location - Indicator 6.2 – Circumstances at the site
6.2.5.a Electro Magnetic Pollution (with measurements) Points
75% below national, ICNIRP or other international restrictions 100
30% below national, ICNIRP or other international restrictions 50
Below national, ICNIRP or other international restrictions 10
Not respecting national, ICNIRP or other international restrictions 0
OR If measurements are not available: an estimation based on local environmental situation should be conducted as follows. Most common sources of man-made electromagnetic pollution are the following activities/equipment: - Telecommunications/broadcasting (TV, mobile telephony networks, mobile and wireless
communication technologies etc.) - Medical applications (MRI, etc.) - Industrial and domestic applications (microwave ovens, dielectric heating etc.) - Safety applications, navigation, radar (marine radar, air traffic control etc.) - New and emerging technologies(wireless LANs, Bluetooth etc)
6.2.5.b Electro Magnetic Pollution (without measurements) Points
No man-made sources of electromagnetic pollution inside or in great proximity to the building
100
Existence of wireless LANs or Bluetooth technologies covering 0-20% of building's gross area
60
Existence of wireless LANs or Bluetooth technologies covering 20-100% building's gross area
50
Existence of domestic electromagnetic pollution sources such as microwave ovens, dielectric heating etc at 0-50% of building's gross area
40
Existence of domestic electromagnetic pollution sources such as microwave ovens, dielectric heating etc at 50-100% of building's gross area
30
Existence of mobile telephony antennas in a 300m radius 20
Extensive use of telecommunication-mobile and wireless-or broadcasting technologies inside the building
10
Existence of medical applications such as MRI, X-ray units or safety applications such as navigation/radar systems, air traffic control, marine radars etc inside or in very close proximity to the building
0
The worst case determines the final score of the sub-indicator.
302
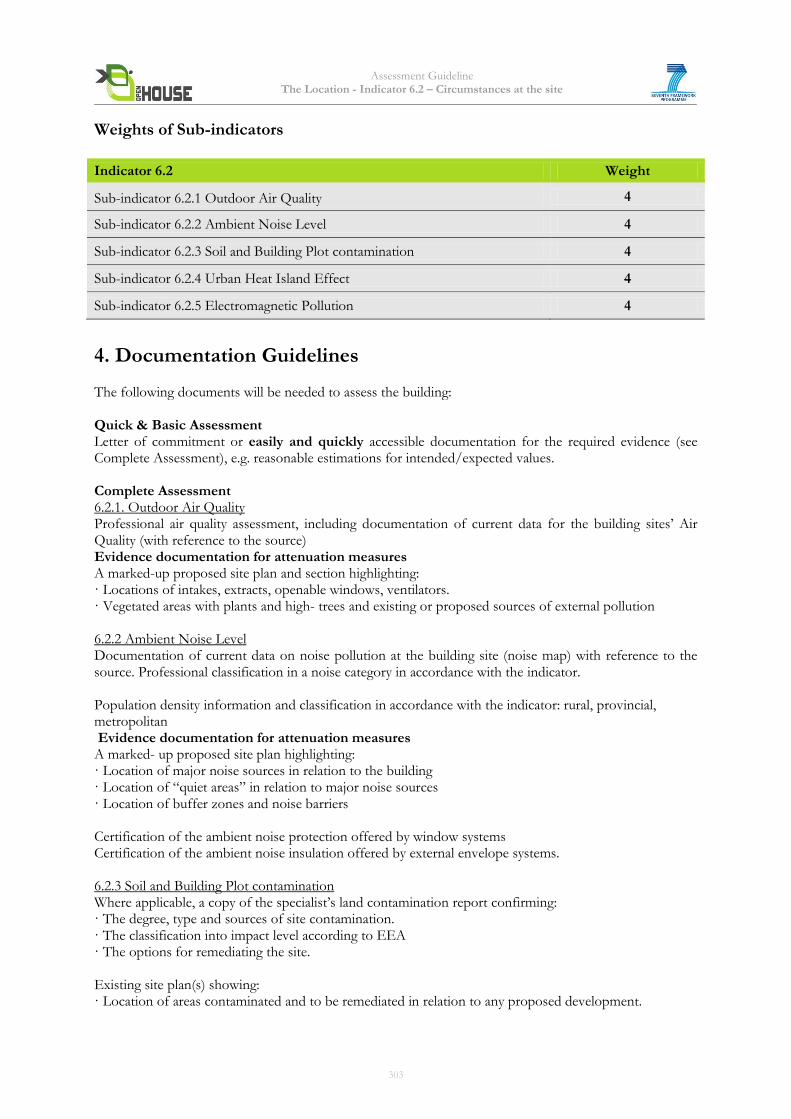
Assessment Guideline The Location - Indicator 6.2 – Circumstances at the site
Weights of Sub-indicators
Indicator 6.2 Weight
Sub-indicator 6.2.1 Outdoor Air Quality 4
Sub-indicator 6.2.2 Ambient Noise Level 4
Sub-indicator 6.2.3 Soil and Building Plot contamination 4
Sub-indicator 6.2.4 Urban Heat Island Effect 4
Sub-indicator 6.2.5 Electromagnetic Pollution 4
4. Documentation Guidelines The following documents will be needed to assess the building: Quick & Basic Assessment Letter of commitment or easily and quickly accessible documentation for the required evidence (see Complete Assessment), e.g. reasonable estimations for intended/expected values. Complete Assessment 6.2.1. Outdoor Air Quality Professional air quality assessment, including documentation of current data for the building sites’ Air Quality (with reference to the source) Evidence documentation for attenuation measures A marked-up proposed site plan and section highlighting: · Locations of intakes, extracts, openable windows, ventilators. · Vegetated areas with plants and high- trees and existing or proposed sources of external pollution 6.2.2 Ambient Noise Level Documentation of current data on noise pollution at the building site (noise map) with reference to the source. Professional classification in a noise category in accordance with the indicator. Population density information and classification in accordance with the indicator: rural, provincial, metropolitan Evidence documentation for attenuation measures A marked- up proposed site plan highlighting: · Location of major noise sources in relation to the building · Location of “quiet areas” in relation to major noise sources · Location of buffer zones and noise barriers Certification of the ambient noise protection offered by window systems Certification of the ambient noise insulation offered by external envelope systems. 6.2.3 Soil and Building Plot contamination Where applicable, a copy of the specialist’s land contamination report confirming: · The degree, type and sources of site contamination. · The classification into impact level according to EEA · The options for remediating the site. Existing site plan(s) showing: · Location of areas contaminated and to be remediated in relation to any proposed development.
303
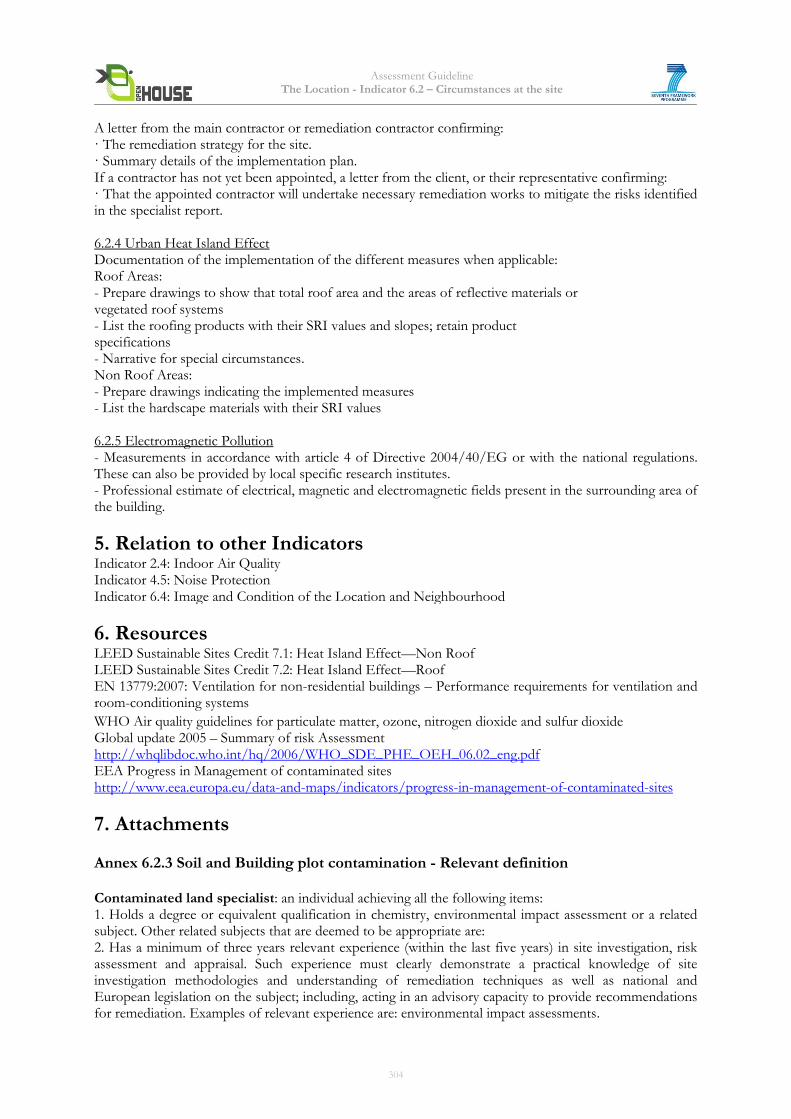
Assessment Guideline The Location - Indicator 6.2 – Circumstances at the site
A letter from the main contractor or remediation contractor confirming: · The remediation strategy for the site. · Summary details of the implementation plan. If a contractor has not yet been appointed, a letter from the client, or their representative confirming: · That the appointed contractor will undertake necessary remediation works to mitigate the risks identified in the specialist report. 6.2.4 Urban Heat Island Effect Documentation of the implementation of the different measures when applicable: Roof Areas: - Prepare drawings to show that total roof area and the areas of reflective materials or vegetated roof systems - List the roofing products with their SRI values and slopes; retain product specifications - Narrative for special circumstances. Non Roof Areas: - Prepare drawings indicating the implemented measures - List the hardscape materials with their SRI values 6.2.5 Electromagnetic Pollution - Measurements in accordance with article 4 of Directive 2004/40/EG or with the national regulations. These can also be provided by local specific research institutes. - Professional estimate of electrical, magnetic and electromagnetic fields present in the surrounding area of the building.
5. Relation to other Indicators Indicator 2.4: Indoor Air Quality Indicator 4.5: Noise Protection Indicator 6.4: Image and Condition of the Location and Neighbourhood
6. Resources LEED Sustainable Sites Credit 7.1: Heat Island Effect—Non Roof LEED Sustainable Sites Credit 7.2: Heat Island Effect—Roof EN 13779:2007: Ventilation for non-residential buildings – Performance requirements for ventilation and room-conditioning systems
WHO Air quality guidelines for particulate matter, ozone, nitrogen dioxide and sulfur dioxide Global update 2005 – Summary of risk Assessment http://whqlibdoc.who.int/hq/2006/WHO_SDE_PHE_OEH_06.02_eng.pdf EEA Progress in Management of contaminated sites http://www.eea.europa.eu/data-and-maps/indicators/progress-in-management-of-contaminated-sites
7. Attachments
Annex 6.2.3 Soil and Building plot contamination - Relevant definition Contaminated land specialist: an individual achieving all the following items: 1. Holds a degree or equivalent qualification in chemistry, environmental impact assessment or a related subject. Other related subjects that are deemed to be appropriate are: 2. Has a minimum of three years relevant experience (within the last five years) in site investigation, risk assessment and appraisal. Such experience must clearly demonstrate a practical knowledge of site investigation methodologies and understanding of remediation techniques as well as national and European legislation on the subject; including, acting in an advisory capacity to provide recommendations for remediation. Examples of relevant experience are: environmental impact assessments.
304
Assessment Guideline The Location - Indicator 6.3 – Options for Transportation
Indicator 6.3 Options for Transportation (adapted from BREEAM, DGNB/BNB, LEED)
Core Indicator 1. Objective As good accessibility to transportation systems (especially low carbon schemes) has positive influence on the environmental performance of the building. The aim of this indicator is to define the effective and shortest distance in metres from a main building entrance to local public means of transportation. This supports the European Commission objective of increasing the quality, accessibility and reliability of transport services, inter alia due to the ageing of the population and the need to promote public transport1. By 2050, key goals include:
- No more conventionally-fuelled cars in cities. - A 50% shift of medium distance intercity passenger and freight journeys from road to rail and
waterborne transport. - All of which will contribute to a 60% cut in transport emissions by the middle of the century.
2. Assessment Methodology The time necessary to reach the nearest option for transportation, such as bus or rapid city train stop, by
considering the shortest distance is evaluated in metres. Particularly valuable are low emission
transportation options, replacing existing less pro-environmental means of transport (e.g. electric buses
replacing fossil-fuelled buses or city bicycle scheme encouraging to stop using other transportation modes
in favour of bicycle). Therefore, a separate sub-indicator is assigned to them.
The following sub-indicators will be assessed: 6.3.1 Accessibility of the nearest railroad station from a main building entrance 6.3.2 Accessibility of the nearest public local transportation stop (bus, rapid city train, tram, metro) 6.3.3 Availability of modern low emission transport options: city bicycle scheme, car club scheme, charging infrastructure for electric/hybrid vehicles, electric/hybrid bus lines 6.3.4 Availability of walking and bicycle paths
1 White Paper: Roadmap to a Single European Transport Area – Towards a competitive and resource efficient
transport system
305
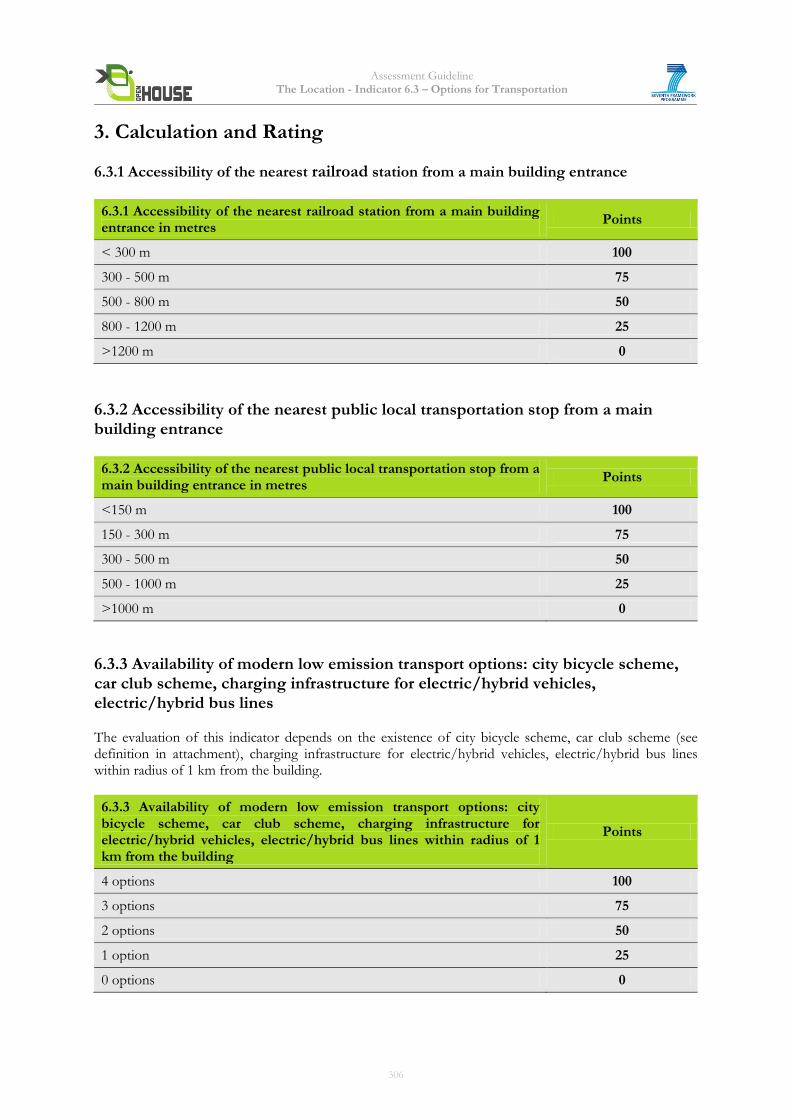
Assessment Guideline The Location - Indicator 6.3 – Options for Transportation
3. Calculation and Rating
6.3.1 Accessibility of the nearest railroad station from a main building entrance
6.3.1 Accessibility of the nearest railroad station from a main building entrance in metres
Points
< 300 m 100
300 - 500 m 75
500 - 800 m 50
800 - 1200 m 25
>1200 m 0
6.3.2 Accessibility of the nearest public local transportation stop from a main building entrance
6.3.2 Accessibility of the nearest public local transportation stop from a main building entrance in metres
Points
<150 m 100
150 - 300 m 75
300 - 500 m 50
500 - 1000 m 25
>1000 m 0
6.3.3 Availability of modern low emission transport options: city bicycle scheme, car club scheme, charging infrastructure for electric/hybrid vehicles, electric/hybrid bus lines The evaluation of this indicator depends on the existence of city bicycle scheme, car club scheme (see definition in attachment), charging infrastructure for electric/hybrid vehicles, electric/hybrid bus lines within radius of 1 km from the building.
6.3.3 Availability of modern low emission transport options: city bicycle scheme, car club scheme, charging infrastructure for electric/hybrid vehicles, electric/hybrid bus lines within radius of 1 km from the building
Points
4 options 100
3 options 75
2 options 50
1 option 25
0 options 0
306
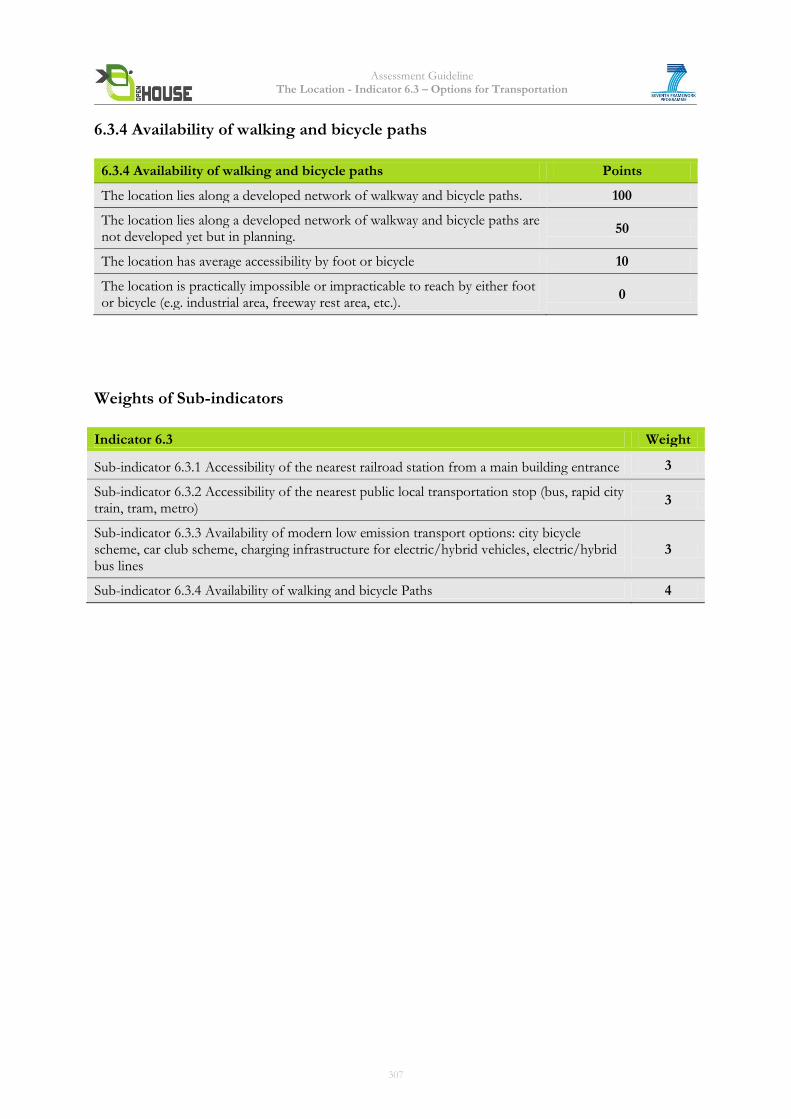
Assessment Guideline The Location - Indicator 6.3 – Options for Transportation
6.3.4 Availability of walking and bicycle paths
6.3.4 Availability of walking and bicycle paths Points
The location lies along a developed network of walkway and bicycle paths. 100
The location lies along a developed network of walkway and bicycle paths are not developed yet but in planning.
50
The location has average accessibility by foot or bicycle 10
The location is practically impossible or impracticable to reach by either foot or bicycle (e.g. industrial area, freeway rest area, etc.).
0
Weights of Sub-indicators
Indicator 6.3 Weight
Sub-indicator 6.3.1 Accessibility of the nearest railroad station from a main building entrance 3
Sub-indicator 6.3.2 Accessibility of the nearest public local transportation stop (bus, rapid city train, tram, metro)
3
Sub-indicator 6.3.3 Availability of modern low emission transport options: city bicycle scheme, car club scheme, charging infrastructure for electric/hybrid vehicles, electric/hybrid bus lines
3
Sub-indicator 6.3.4 Availability of walking and bicycle Paths 4
307
Assessment Guideline The Location - Indicator 6.3 – Options for Transportation
4. Documentation Guidelines The following documents will be needed to assess the building: Quick & Basic Assessment Letter of commitment or easily and quickly accessible documentation for the required evidence (see Complete Assessment), e.g. reasonable estimations for intended/expected values. Complete Assessment
6.3.1 Accessibility of the nearest railroad station from a main building entrance and 6.3.2 Accessibility of the nearest public local transportation stop (bus, rapid city train, tram, metro)
Maps with description of travel distances to transportation systems. 6.3.3 Availability of modern low emission transport options: city bicycle scheme, car club scheme, charging infrastructure for electric/hybrid vehicles, electric/hybrid bus lines Evidence of existence and accessibility of low emission transport options where the building is located; if not yet existing, level of development or planning status of such options.
6.3.4 Availability of walking and bicycle paths Evidence of accessibility, the level of development or planning status of foot and bicycle paths to the location.
5. Relation to other Indicators Indicator 2.16 Provision for bicycle amenities
6. Resources 1. DGNB International Criterion 59: Connection to Transportation 2. BNB Criterion 614 Public Transport Connections 3. BREEAM Criterion Tra 3 - Alternative modes of transport 4. LEED Criterion Credit 4.1: Alternative Transportation – Public Transportation Access
7. Attachments Relevant definition: a car club is an organization which makes available cars to hire from dedicated parking places to those members of the public who are club members. Vehicle bookings are made on-line or by telephone and access to the vehicle is made via card. Car club members generally pay an annual subscription fee and a hourly hire charge which is higher than longer term car hire but lower than a taxi.
308
Assessment Guideline The Location - Indicator 6.5 - Access to Amenities
Indicator 6.5 Access to Amenities (adapted from BREEAM, DGNB/BNB, LEED)
1. Objective The aim of this indicator is to measure the number and the vicinity of key amenities to the assessed building. Although this indicator relates to the site, it addresses social issues. The overall purpose is to reward community connectivity thereby helping reduce transport-related emissions and traffic congestion and promoting communal life.
2. Assessment Methodology A list of amenities is identified and categorized (see below the 9 sub-indicators). The distance and the number of the available facilities of each category are assessed. Points are given for the type and number of facilities of each amenity weighted by the distance to the building. The following sub-indicators will be assessed: 6.5.1 Access to Gastronomy facilities 6.5.2 Access to Local Supply facilities 6.5.3 Access to Parks and Open Spaces 6.5.4 Access to Education facilities 6.5.5 Access to Public Administration facilities 6.5.6 Access to Medical Care facilities 6.5.7 Access to Sport facilities 6.5.8 Access to Leisure facilities 6.5.9 Access to Services
309
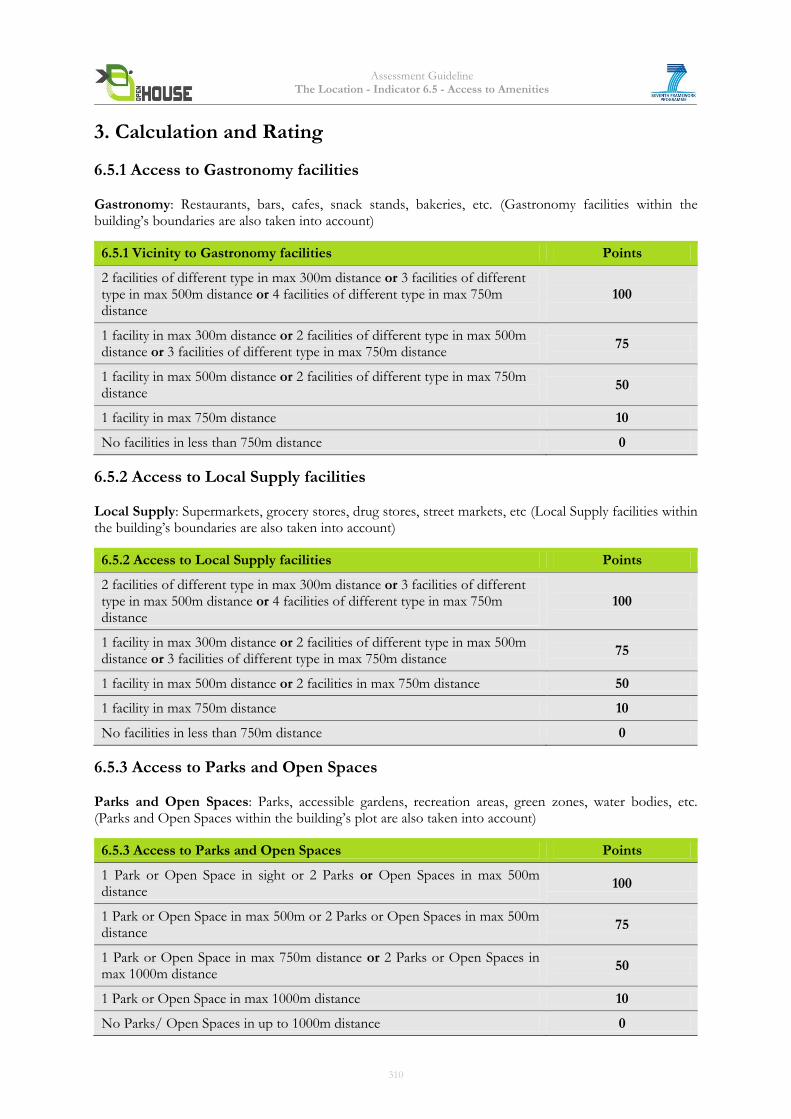
Assessment Guideline The Location - Indicator 6.5 - Access to Amenities
3. Calculation and Rating
6.5.1 Access to Gastronomy facilities Gastronomy: Restaurants, bars, cafes, snack stands, bakeries, etc. (Gastronomy facilities within the building’s boundaries are also taken into account)
6.5.1 Vicinity to Gastronomy facilities Points
2 facilities of different type in max 300m distance or 3 facilities of different type in max 500m distance or 4 facilities of different type in max 750m distance
100
1 facility in max 300m distance or 2 facilities of different type in max 500m distance or 3 facilities of different type in max 750m distance
75
1 facility in max 500m distance or 2 facilities of different type in max 750m distance
50
1 facility in max 750m distance 10
No facilities in less than 750m distance 0
6.5.2 Access to Local Supply facilities Local Supply: Supermarkets, grocery stores, drug stores, street markets, etc (Local Supply facilities within the building’s boundaries are also taken into account)
6.5.2 Access to Local Supply facilities Points
2 facilities of different type in max 300m distance or 3 facilities of different type in max 500m distance or 4 facilities of different type in max 750m distance
100
1 facility in max 300m distance or 2 facilities of different type in max 500m distance or 3 facilities of different type in max 750m distance
75
1 facility in max 500m distance or 2 facilities in max 750m distance 50
1 facility in max 750m distance 10
No facilities in less than 750m distance 0
6.5.3 Access to Parks and Open Spaces Parks and Open Spaces: Parks, accessible gardens, recreation areas, green zones, water bodies, etc. (Parks and Open Spaces within the building’s plot are also taken into account)
6.5.3 Access to Parks and Open Spaces Points
1 Park or Open Space in sight or 2 Parks or Open Spaces in max 500m distance
100
1 Park or Open Space in max 500m or 2 Parks or Open Spaces in max 500m distance
75
1 Park or Open Space in max 750m distance or 2 Parks or Open Spaces in max 1000m distance
50
1 Park or Open Space in max 1000m distance 10
No Parks/ Open Spaces in up to 1000m distance 0
310
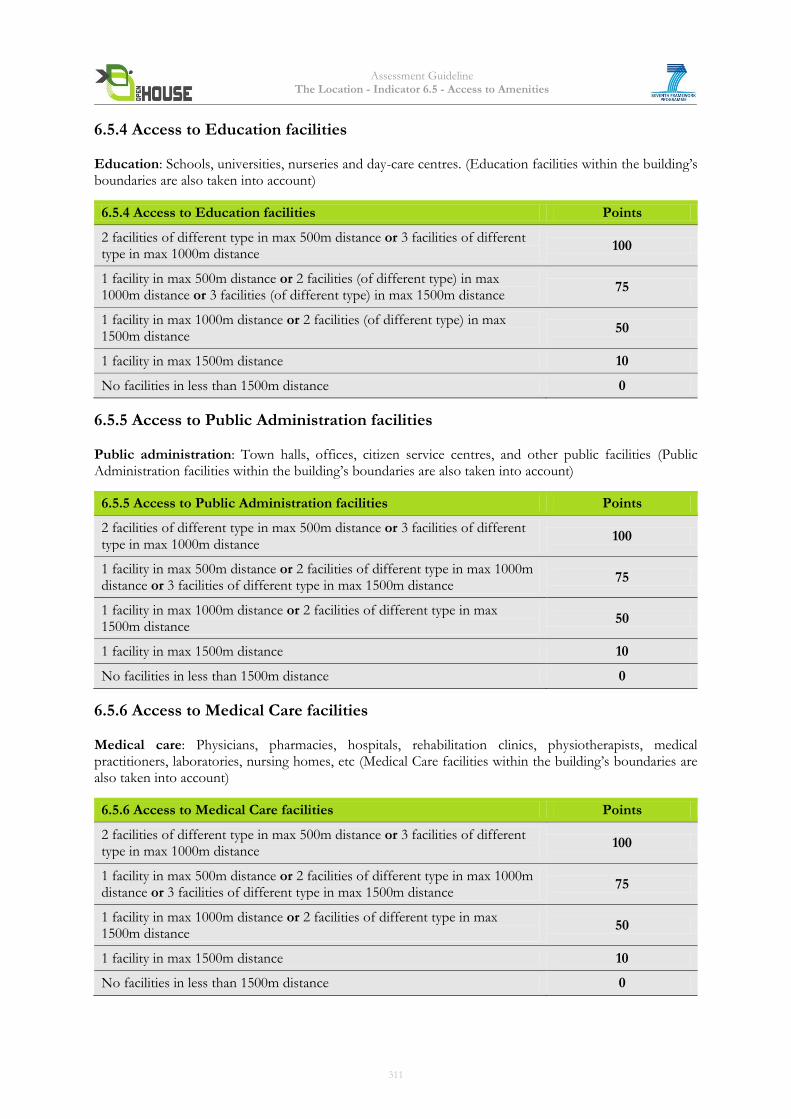
Assessment Guideline The Location - Indicator 6.5 - Access to Amenities
6.5.4 Access to Education facilities Education: Schools, universities, nurseries and day-care centres. (Education facilities within the building’s boundaries are also taken into account)
6.5.4 Access to Education facilities Points
2 facilities of different type in max 500m distance or 3 facilities of different type in max 1000m distance
100
1 facility in max 500m distance or 2 facilities (of different type) in max 1000m distance or 3 facilities (of different type) in max 1500m distance
75
1 facility in max 1000m distance or 2 facilities (of different type) in max 1500m distance
50
1 facility in max 1500m distance 10
No facilities in less than 1500m distance 0
6.5.5 Access to Public Administration facilities Public administration: Town halls, offices, citizen service centres, and other public facilities (Public Administration facilities within the building’s boundaries are also taken into account)
6.5.5 Access to Public Administration facilities Points
2 facilities of different type in max 500m distance or 3 facilities of different type in max 1000m distance
100
1 facility in max 500m distance or 2 facilities of different type in max 1000m distance or 3 facilities of different type in max 1500m distance
75
1 facility in max 1000m distance or 2 facilities of different type in max 1500m distance
50
1 facility in max 1500m distance 10
No facilities in less than 1500m distance 0
6.5.6 Access to Medical Care facilities Medical care: Physicians, pharmacies, hospitals, rehabilitation clinics, physiotherapists, medical practitioners, laboratories, nursing homes, etc (Medical Care facilities within the building’s boundaries are also taken into account)
6.5.6 Access to Medical Care facilities Points
2 facilities of different type in max 500m distance or 3 facilities of different type in max 1000m distance
100
1 facility in max 500m distance or 2 facilities of different type in max 1000m distance or 3 facilities of different type in max 1500m distance
75
1 facility in max 1000m distance or 2 facilities of different type in max 1500m distance
50
1 facility in max 1500m distance 10
No facilities in less than 1500m distance 0
311
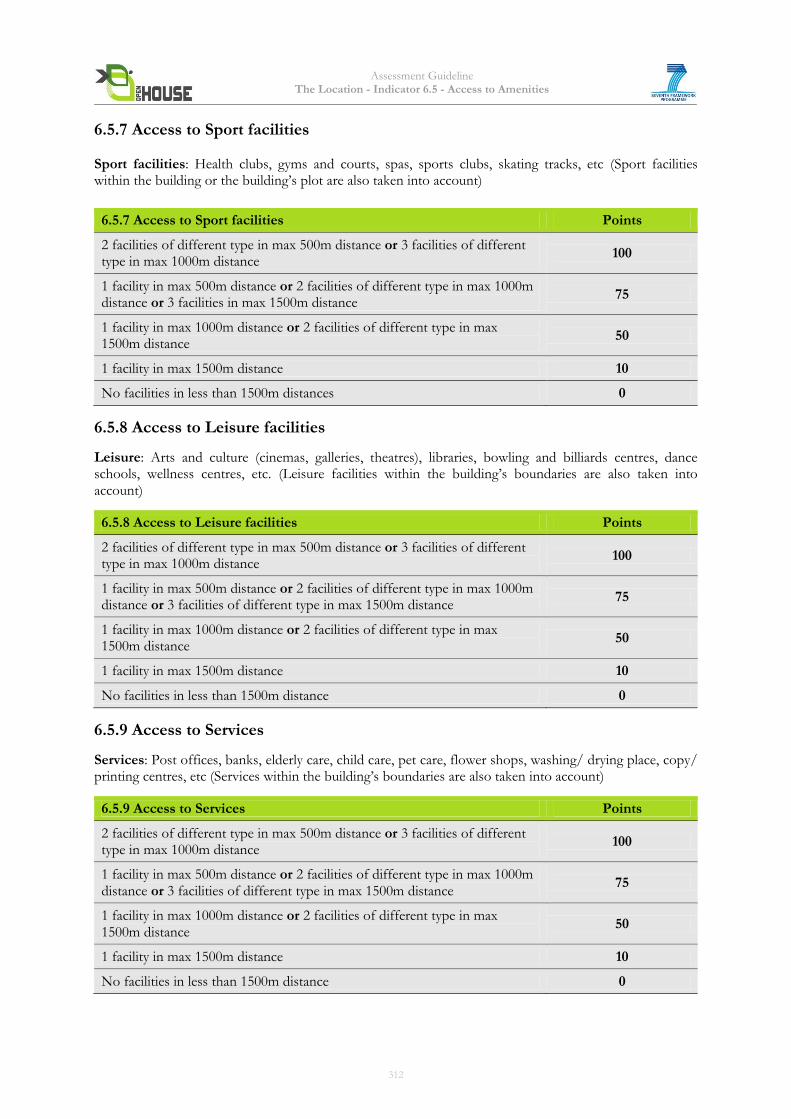
Assessment Guideline The Location - Indicator 6.5 - Access to Amenities
6.5.7 Access to Sport facilities Sport facilities: Health clubs, gyms and courts, spas, sports clubs, skating tracks, etc (Sport facilities within the building or the building’s plot are also taken into account)
6.5.7 Access to Sport facilities Points
2 facilities of different type in max 500m distance or 3 facilities of different type in max 1000m distance
100
1 facility in max 500m distance or 2 facilities of different type in max 1000m distance or 3 facilities in max 1500m distance
75
1 facility in max 1000m distance or 2 facilities of different type in max 1500m distance
50
1 facility in max 1500m distance 10
No facilities in less than 1500m distances 0
6.5.8 Access to Leisure facilities
Leisure: Arts and culture (cinemas, galleries, theatres), libraries, bowling and billiards centres, dance schools, wellness centres, etc. (Leisure facilities within the building’s boundaries are also taken into account)
6.5.8 Access to Leisure facilities Points
2 facilities of different type in max 500m distance or 3 facilities of different type in max 1000m distance
100
1 facility in max 500m distance or 2 facilities of different type in max 1000m distance or 3 facilities of different type in max 1500m distance
75
1 facility in max 1000m distance or 2 facilities of different type in max 1500m distance
50
1 facility in max 1500m distance 10
No facilities in less than 1500m distance 0
6.5.9 Access to Services
Services: Post offices, banks, elderly care, child care, pet care, flower shops, washing/ drying place, copy/ printing centres, etc (Services within the building’s boundaries are also taken into account)
6.5.9 Access to Services Points
2 facilities of different type in max 500m distance or 3 facilities of different type in max 1000m distance
100
1 facility in max 500m distance or 2 facilities of different type in max 1000m distance or 3 facilities of different type in max 1500m distance
75
1 facility in max 1000m distance or 2 facilities of different type in max 1500m distance
50
1 facility in max 1500m distance 10
No facilities in less than 1500m distance 0
312
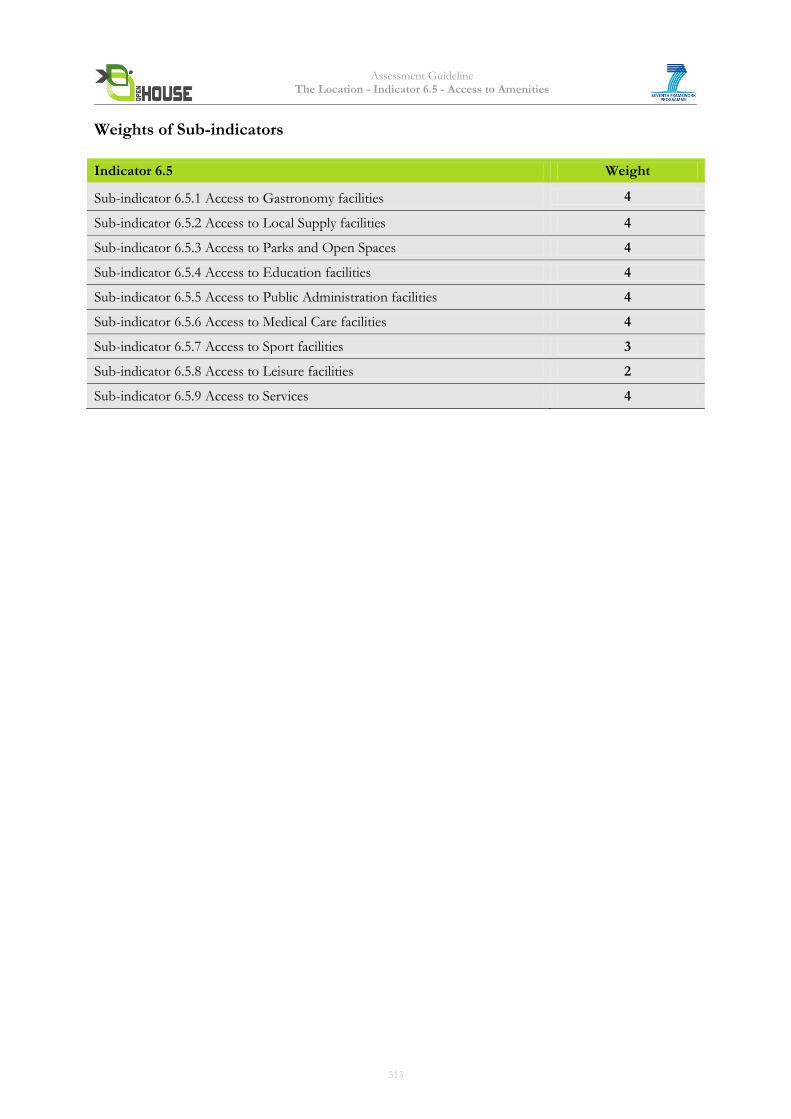
Assessment Guideline The Location - Indicator 6.5 - Access to Amenities
Weights of Sub-indicators
Indicator 6.5 Weight
Sub-indicator 6.5.1 Access to Gastronomy facilities 4
Sub-indicator 6.5.2 Access to Local Supply facilities 4
Sub-indicator 6.5.3 Access to Parks and Open Spaces 4
Sub-indicator 6.5.4 Access to Education facilities 4
Sub-indicator 6.5.5 Access to Public Administration facilities 4
Sub-indicator 6.5.6 Access to Medical Care facilities 4
Sub-indicator 6.5.7 Access to Sport facilities 3
Sub-indicator 6.5.8 Access to Leisure facilities 2
Sub-indicator 6.5.9 Access to Services 4
313
Assessment Guideline The Location - Indicator 6.5 - Access to Amenities
4. Documentation Guidelines The following documents will be needed to assess the building: Quick & Basic Assessment Signed letter stating the availability of amenities or easily and quickly accessible documentation for the required evidence (see Complete Assessment), e.g. reasonable estimations for intended/expected values. Complete Assessment Marked-up site plan or map highlighting: · Location of assessed building · Location, type and number of amenities · The distance to the amenities · Plan/map scale Where the amenities do not currently exist, but are due to be developed, a letter from the client/developer confirming: · The location and type of amenities to be provided · The timescale for development of the amenities
5. Relation to other Indicators 6.4: Image and Condition of the Location and Neighbourhood
6. Resources DGNB - 60 Proximity to use-specific facilities BNB - 615 Vicinity to Use-Specific Services www.nachhaltigesbauen.de/fileadmin/pdf/BNB_Steckbriefe_Buero_Neubau/aktuell/BNB_BN_615.pdf BREEAM EU 2009: - Tra 2 - Proximity to amenities LEED NC 2009: - Development Density and Community Connectivity
7. Attachments
None
314