indian labour year book 2017 - labour bureau
TRANSCRIPT
INDIAN LABOUR YEAR BOOK 2017
GOVERNMENT OF INDIA MINISTRY OF LABOUR AND EMPLOYMENT
LABOUR BUREAU SHIMLA
2
PREFACE
This 63rd
issue of Indian Labour Year Book (ILYB) – 2017 contains information on
developments in the labour-related areas viz., Employment and Skill Development, Wages
and Earnings, Family Income & Expenditure Surveys and Consumer Price Index Numbers,
Industrial Relations, Labour Welfare, Industrial Housing, Health and Safety, Labour
Administration, Labour Legislation, Agricultural/Rural Labour, India and the International
Labour Organisation, and Labour Bureau Publications. Besides, it also contains
information on Labour Acts (Central and State), Conventions & Recommendations
adopted by the International Labour Conference as well as those ratified by India, list of
various journals on labour related issues published in India, a bibliography of the
publications of various Organisations, Departments, Ministries and Autonomous Bodies in
the field of labour.
This Issue also dwells on the various welfare programmes and policies launched
and implemented by the Government for the welfare of labour class in terms of health,
education, employment, housing, social security and other incidental benefits.
I express my sincere thanks to the Central and State Government agencies for their
support and contribution in bringing out this report by responding quickly and positively to
our request for sending the requisite information. I also place on record my appreciation to
the team of officers/officials of the Labour Bureau for their pro-active and untiring follow-
up and compilation of the useful labour-related data in one place. I wish them success in
their continuous endeavor to compress the time within which the publication is released so
as to evince greater interest of the policy-makers and researchers. Every effort has been
made to include in this publication latest data available on this subject till end 2017.
I urge the readers to send their comments and suggestions to enable us to make this
publication more useful to users.
(AMAR SINGH)
DIRECTOR GENERAL
Labour Bureau, Shimla
Dated: 10.07.2019
3
CONTENTS
CHAPTER 1 Pages
EMPLOYMENT AND SKILL DEVELOPMENT
6-33
1. Sector-wise Employment 12 2. Employment Services 20 3. Training & Skill Development 22 4. Absenteeism 24 5. Labour Turnover 27 6. Women and Child Labour 31 CHAPTER 2
WAGES AND EARNINGS
34-61
1. Manufacturing Industries 35 2. Mines 44 3. Plantations 46 4. Transport and Communications 47 5. Central Government Employees 47 6. Employees Covered under the Minimum Wages Act, 1948 47 7. Wages of Agricultural Labour 48 8. Occupational Wage Survey 51 9. Index Numbers of Wage Rates 53
10. Productivity 57 11. Labour Cost 58
CHAPTER 3
FAMILY INCOME AND EXPENDITURE SURVEYS AND CONSUMER PRICE INDEX NUMBERS
62-77
1. Family Income and Expenditure Surveys 62 2. Consumer Price Index Numbers 65
CHAPTER 4
INDUSTRIAL RELATIONS
78-101
1. Trade Unions 78 2. Industrial Disputes 90 3. Machinery for the Prevention and Settlement of Industrial Disputes 98 4. Consultative Machinery 100 5. Workers‟ Education 100 CHAPTER 5
LABOUR WELFARE
102-112
1. Activities of the Government of India 102 2. Activities of the State/Union Territories Governments 102 3. Welfare Work by the Employers 106 4. Welfare Work Under Statutory Welfare Funds
111
4
CHAPTER 6
INDUSTRIAL HOUSING
113-117
1. Urban Housing Development 113 2. Housing Schemes of the State Governments 114 3. Housing for Workers in Major Industries 115 4. Rural Housing Schemes 117 CHAPTER 7
HEALTH AND SAFETY 118-130
1. Health and Safety of Industrial Workers 119 2. Industrial Injuries 126 3. Industrial Safety Measures 127 CHAPTER 8
LABOUR ADMINISTRATION 131-141
1. Central Machinery 131 2. State Machinery 141 CHAPTER 9
LABOUR LEGISLATION 142-175
1. Factories:
The Factories Act, 1948 142
2. Mines:
The Mines Act, 1952 146
3. Plantations:
The Plantations Labour Act, 1951 146
4. Transport:
(a)The Railways Act, 1989 148
(b)The Dock Workers‟ (Regulation of Employment) Act, 1948 148
(c)The Merchant Shipping Act, 1958 148
(d)The Motor Transport workers‟ Act, 1961 149
5. Shops and Commercial Establishments:
The Shops and Commercial Establishments Act (Central and State Acts) 151
6. Industrial Housing 153
7. Safety and Welfare 153
8. Wages and Bonus:
(a)The Payment of Wages Act, 1936 154
(b)The Minimum Wages Act, 1948 154
(c)The Payment of Bonus Act, 1965 156
9. Social Security: (a)The Employee‟s Compensation Act, 1923 157 (b)The Employees‟ State Insurance Act, 1948 158 (c)The Employees‟ Provident Funds and Miscellaneous Provisions Act, 1952 159 (d)The Maternity Benefit Act, 1961 162
5
(e)The Payment of Gratuity Act, 1972 164 (f)The Unorganised Workers‟ Social Security Act, 2008 165
10. Industrial Relations: (a) The Trade Unions Act, 1926 166 (b)The Industrial Employment (Standing Orders) Act, 1946 167 (c)The Industrial Disputes Act, 1947 170
11. Miscellaneous: (a)The Child Labour (Prohibition and Regulation) Act, 1986 170 (b)The Collection of Statistics Act, 2008 171 (c)The Employment Exchanges (Compulsory Notification of Vacancies) Act,
1959 171
(d)The Apprentices Act, 1961 172 (e)The Beedi and Cigar Workers (Conditions of Employment) Act, 1966 172 (f)The Contract Labour (Regulation and Abolition) Act, 1970 172 (g)The Equal Remuneration Act, 1976 173 (h)The Bonded Labour System (Abolition) Act, 1976 173 (i)The Sales Promotion Employees‟(Conditions of Services) Act, 1976 174 (j)The Inter-State Migrant Workmen (Regulation of Employment and
Conditions of Service) Act, 1979 174
(k)The Emigration Act, 1983 175 (l)The Building and Other Construction Workers (Regulation of Employment
and Conditions of Service) Act, 1996 and the Building and Other Construction Workers Welfare Cess Act, 1996
175
CHAPTER 10
AGRICULTURAL/RURAL LABOUR 176-184
1. Agricultural/Rural Labour 176
2. Rural Labour Enquiries 178
3. Socio-economic Welfare of Rural Labour 184
CHAPTER 11
INDIA AND THE INTERNATIONAL LABOUR ORGANISATION 185-197
CHAPTER 12
LABOUR BUREAU PUBLICATIONS 198-202
APPENDICES
1. List of Important Labour Acts 203-206
2. List of Conventions and Recommendations adopted by the International Labour Conference, 1919-2014
207-214
3. Select Bibliography 215-220
6
CHAPTER 1
EMPLOYMENT AND SKILL DEVELOPMENT
In India, like other developing countries, the growth of labour force is accelerating and will remain high for sometime. Hence, employment led rapid economic growth which not only improves income but also working conditions of the workers is an important concern. State intervention in labour markets has served to promote employment and its quality as well. While direct employment programmes were taken up to promote jobs in rural areas, employment oriented policies were adopted for this purpose in the public sector. We need to create jobs, and that too quality jobs, to tackle the problems of poverty and unemployment. Much of this will depend on upgrading the quality of labour force by pursuing suitable education and skill development policies. An increase in overall productivity and skill upgradation will lead to progressive absorption of large number of workers from informal or unorganized sector to the formal or organized sector and ensure rapid economic growth. In the context of economic growth, one must bear in mind that labour plays a dual role. First, it is an important and major contributor to the process of growth along with capital, entrepreneurship and land. Secondly, with improved living standards labour acts as a major source of demand for goods and services produced in the growth process.
Employment Generation is the first priority for Government of India. Government has been working on a comprehensive strategy to bring employment to the core of our development strategy, promoting industrial activity through Make in India, enhancing employability through Skill India and encouraging innovation and entrepreneurship through Start up India, are a few examples of transformative initiative that the Government has taken in recent years. The Ministry of Labour and Employment is committed towards job security, wage security and social security for each and every worker. The Ministry is working on reforms for bringing transparency and accountability in enforcement of labour laws. On the other hand, the Ministry has taken important initiatives to realize and establish the dignity and respect for each and every worker in the country through provision of social security benefits and enhancing the avenues and quality of employment.
Employment Scenario:
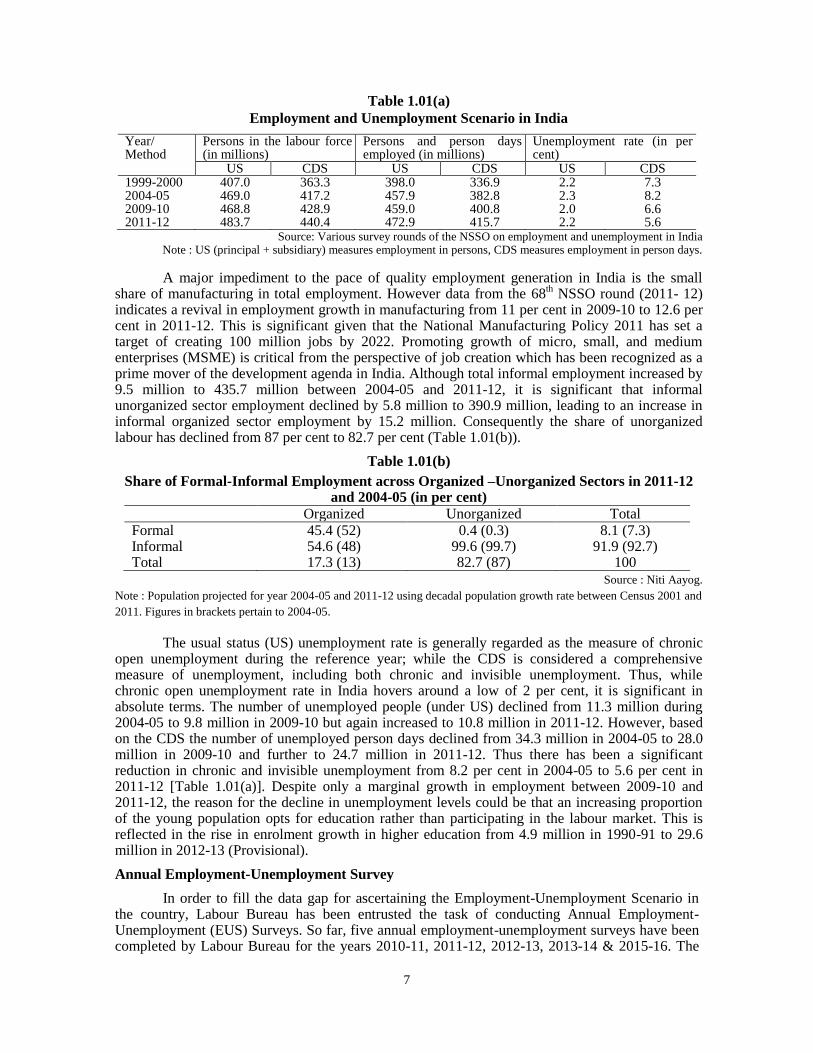
A cause for concern is the deceleration in the Compound Annual Growth Rate (CAGR) of employment during 2004-05 to 2011-12 to 0.5 per cent from 2.8 per cent during 1999-2000 to 2004-05. As per the National Sample Survey Office (NSSO) data during 1999-2000 to 2004-05, employment on usual status (US) basis increased by 59.9 million persons from 398.0 million to 457.9 million as against the increase in labour force by 62.0 million persons from 407.0 million to 469.0 million. After a period of slow progress during 2004-05 to 2009-10, employment generation picked up during 2009-10 to 2011- 12, adding 13.9 million persons to the workforce, but not keeping pace with the increase in labour force (14.9 million persons) (Table 1.01(a)). Based on current daily status (CDS), CAGR in employment was 1.2 per cent and 2.6 per cent against 2.8 per cent and 0.8 per cent in the labour force respectively for the same periods. There have also been structural changes for the first time, the share of the primary sector in total employment has dipped below the halfway mark (declined from 58.5 per cent in 2004-05 to 48.9 per cent in 2011-12), while employment in the secondary and tertiary sectors increased to 24.3 per cent and 26.8 per cent respectively in 2011-12 from 18.1 per cent and 23.4 per cent respectively in 2004-05. Self-employment continues to dominate, with a 52.2 per cent share in total employment. What is critical is the significant share of workers engaged in low-income generating activities. There are other issues of concern like poor employment growth in rural areas, particularly among females. Though employment of rural males is slightly better than that of females, long-term trends indicate a low and stagnant growth. Such trends call for diversification of livelihood in rural areas from agriculture to non-agriculture activities.
7
Table 1.01(a)
Employment and Unemployment Scenario in India
Year/ Method
Persons in the labour force (in millions)
Persons and person days employed (in millions)
Unemployment rate (in per cent)
US CDS US CDS US CDS 1999-2000 407.0 363.3 398.0 336.9 2.2 7.3 2004-05 469.0 417.2 457.9 382.8 2.3 8.2 2009-10 468.8 428.9 459.0 400.8 2.0 6.6 2011-12 483.7 440.4 472.9 415.7 2.2 5.6
Source: Various survey rounds of the NSSO on employment and unemployment in India Note : US (principal + subsidiary) measures employment in persons, CDS measures employment in person days.
A major impediment to the pace of quality employment generation in India is the small share of manufacturing in total employment. However data from the 68
th NSSO round (2011- 12)
indicates a revival in employment growth in manufacturing from 11 per cent in 2009-10 to 12.6 per cent in 2011-12. This is significant given that the National Manufacturing Policy 2011 has set a target of creating 100 million jobs by 2022. Promoting growth of micro, small, and medium enterprises (MSME) is critical from the perspective of job creation which has been recognized as a prime mover of the development agenda in India. Although total informal employment increased by 9.5 million to 435.7 million between 2004-05 and 2011-12, it is significant that informal unorganized sector employment declined by 5.8 million to 390.9 million, leading to an increase in informal organized sector employment by 15.2 million. Consequently the share of unorganized labour has declined from 87 per cent to 82.7 per cent (Table 1.01(b)).
Table 1.01(b)
Share of Formal-Informal Employment across Organized –Unorganized Sectors in 2011-12 and 2004-05 (in per cent)
Organized Unorganized Total Formal 45.4 (52) 0.4 (0.3) 8.1 (7.3) Informal 54.6 (48) 99.6 (99.7) 91.9 (92.7) Total 17.3 (13) 82.7 (87) 100
Source : Niti Aayog.
Note : Population projected for year 2004-05 and 2011-12 using decadal population growth rate between Census 2001 and
2011. Figures in brackets pertain to 2004-05.
The usual status (US) unemployment rate is generally regarded as the measure of chronic open unemployment during the reference year; while the CDS is considered a comprehensive measure of unemployment, including both chronic and invisible unemployment. Thus, while chronic open unemployment rate in India hovers around a low of 2 per cent, it is significant in absolute terms. The number of unemployed people (under US) declined from 11.3 million during 2004-05 to 9.8 million in 2009-10 but again increased to 10.8 million in 2011-12. However, based on the CDS the number of unemployed person days declined from 34.3 million in 2004-05 to 28.0 million in 2009-10 and further to 24.7 million in 2011-12. Thus there has been a significant reduction in chronic and invisible unemployment from 8.2 per cent in 2004-05 to 5.6 per cent in 2011-12 [Table 1.01(a)]. Despite only a marginal growth in employment between 2009-10 and 2011-12, the reason for the decline in unemployment levels could be that an increasing proportion of the young population opts for education rather than participating in the labour market. This is reflected in the rise in enrolment growth in higher education from 4.9 million in 1990-91 to 29.6 million in 2012-13 (Provisional).
Annual Employment-Unemployment Survey
In order to fill the data gap for ascertaining the Employment-Unemployment Scenario in the country, Labour Bureau has been entrusted the task of conducting Annual Employment-Unemployment (EUS) Surveys. So far, five annual employment-unemployment surveys have been completed by Labour Bureau for the years 2010-11, 2011-12, 2012-13, 2013-14 & 2015-16. The
8
field work and data processing of Sixth Annual Employment-Unemployment Survey has also been completed.
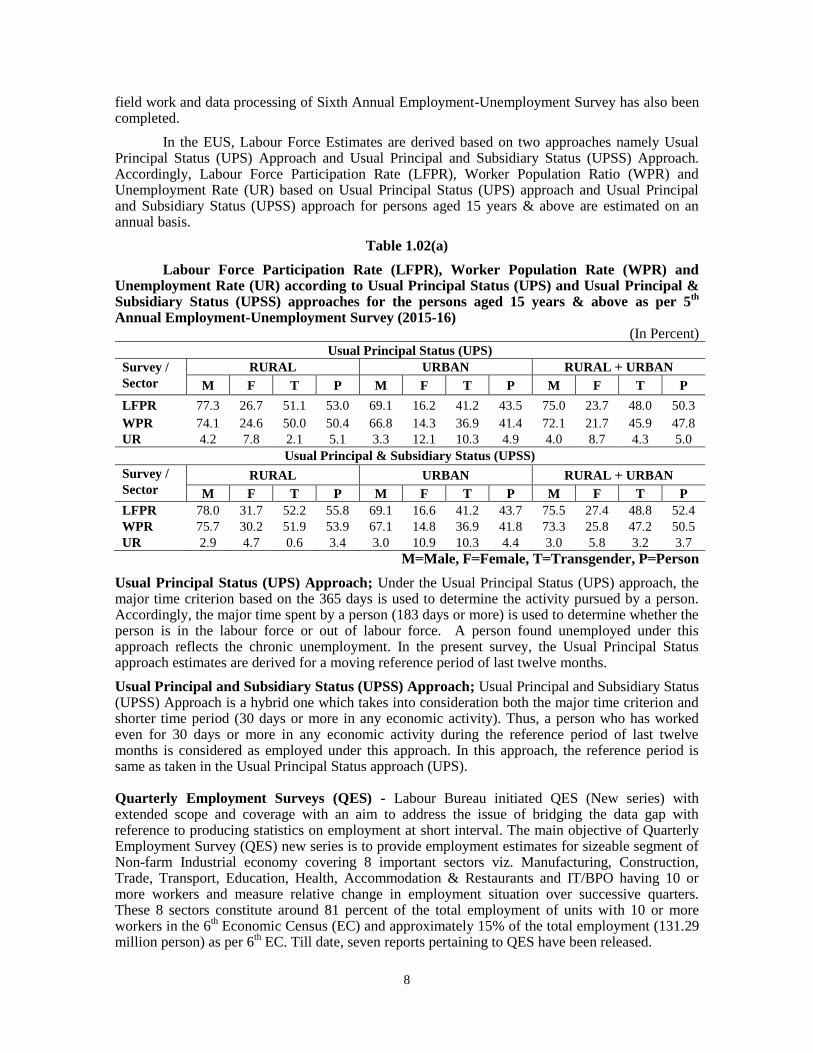
In the EUS, Labour Force Estimates are derived based on two approaches namely Usual Principal Status (UPS) Approach and Usual Principal and Subsidiary Status (UPSS) Approach. Accordingly, Labour Force Participation Rate (LFPR), Worker Population Ratio (WPR) and Unemployment Rate (UR) based on Usual Principal Status (UPS) approach and Usual Principal and Subsidiary Status (UPSS) approach for persons aged 15 years & above are estimated on an annual basis.
Table 1.02(a)
Labour Force Participation Rate (LFPR), Worker Population Rate (WPR) and Unemployment Rate (UR) according to Usual Principal Status (UPS) and Usual Principal & Subsidiary Status (UPSS) approaches for the persons aged 15 years & above as per 5
th
Annual Employment-Unemployment Survey (2015-16) (In Percent)
Usual Principal Status (UPS)
Survey /
Sector
RURAL URBAN RURAL + URBAN
M F T P M F T P M F T P
LFPR 77.3 26.7 51.1 53.0 69.1 16.2 41.2 43.5 75.0 23.7 48.0 50.3
WPR 74.1 24.6 50.0 50.4 66.8 14.3 36.9 41.4 72.1 21.7 45.9 47.8
UR 4.2 7.8 2.1 5.1 3.3 12.1 10.3 4.9 4.0 8.7 4.3 5.0
Usual Principal & Subsidiary Status (UPSS)
Survey /
Sector RURAL URBAN RURAL + URBAN
M F T P M F T P M F T P
LFPR 78.0 31.7 52.2 55.8 69.1 16.6 41.2 43.7 75.5 27.4 48.8 52.4
WPR 75.7 30.2 51.9 53.9 67.1 14.8 36.9 41.8 73.3 25.8 47.2 50.5
UR 2.9 4.7 0.6 3.4 3.0 10.9 10.3 4.4 3.0 5.8 3.2 3.7
M=Male, F=Female, T=Transgender, P=Person
Usual Principal Status (UPS) Approach; Under the Usual Principal Status (UPS) approach, the major time criterion based on the 365 days is used to determine the activity pursued by a person. Accordingly, the major time spent by a person (183 days or more) is used to determine whether the person is in the labour force or out of labour force. A person found unemployed under this approach reflects the chronic unemployment. In the present survey, the Usual Principal Status approach estimates are derived for a moving reference period of last twelve months.
Usual Principal and Subsidiary Status (UPSS) Approach; Usual Principal and Subsidiary Status (UPSS) Approach is a hybrid one which takes into consideration both the major time criterion and shorter time period (30 days or more in any economic activity). Thus, a person who has worked even for 30 days or more in any economic activity during the reference period of last twelve months is considered as employed under this approach. In this approach, the reference period is same as taken in the Usual Principal Status approach (UPS).
Quarterly Employment Surveys (QES) - Labour Bureau initiated QES (New series) with extended scope and coverage with an aim to address the issue of bridging the data gap with reference to producing statistics on employment at short interval. The main objective of Quarterly Employment Survey (QES) new series is to provide employment estimates for sizeable segment of Non-farm Industrial economy covering 8 important sectors viz. Manufacturing, Construction, Trade, Transport, Education, Health, Accommodation & Restaurants and IT/BPO having 10 or more workers and measure relative change in employment situation over successive quarters. These 8 sectors constitute around 81 percent of the total employment of units with 10 or more workers in the 6
th Economic Census (EC) and approximately 15% of the total employment (131.29
million person) as per 6th EC. Till date, seven reports pertaining to QES have been released.
9
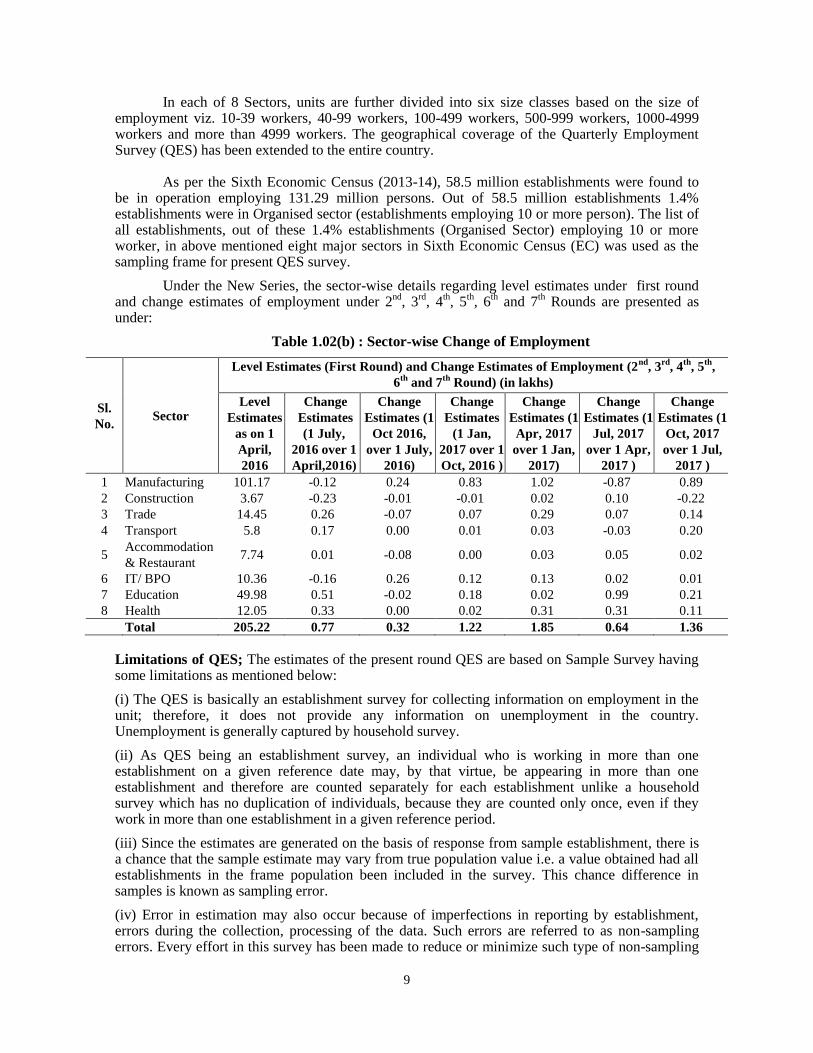
In each of 8 Sectors, units are further divided into six size classes based on the size of employment viz. 10-39 workers, 40-99 workers, 100-499 workers, 500-999 workers, 1000-4999 workers and more than 4999 workers. The geographical coverage of the Quarterly Employment Survey (QES) has been extended to the entire country.
As per the Sixth Economic Census (2013-14), 58.5 million establishments were found to be in operation employing 131.29 million persons. Out of 58.5 million establishments 1.4% establishments were in Organised sector (establishments employing 10 or more person). The list of all establishments, out of these 1.4% establishments (Organised Sector) employing 10 or more worker, in above mentioned eight major sectors in Sixth Economic Census (EC) was used as the sampling frame for present QES survey.
Under the New Series, the sector-wise details regarding level estimates under first round and change estimates of employment under 2
nd, 3
rd, 4
th, 5
th, 6
th and 7
th Rounds are presented as
under:
Table 1.02(b) : Sector-wise Change of Employment
Sl.
No. Sector
Level Estimates (First Round) and Change Estimates of Employment (2nd
, 3rd
, 4th
, 5th
,
6th
and 7th
Round) (in lakhs)
Level
Estimates
as on 1
April,
2016
Change
Estimates
(1 July,
2016 over 1
April,2016)
Change
Estimates (1
Oct 2016,
over 1 July,
2016)
Change
Estimates
(1 Jan,
2017 over 1
Oct, 2016 )
Change
Estimates (1
Apr, 2017
over 1 Jan,
2017)
Change
Estimates (1
Jul, 2017
over 1 Apr,
2017 )
Change
Estimates (1
Oct, 2017
over 1 Jul,
2017 )
1 Manufacturing 101.17 -0.12 0.24 0.83 1.02 -0.87 0.89
2 Construction 3.67 -0.23 -0.01 -0.01 0.02 0.10 -0.22
3 Trade 14.45 0.26 -0.07 0.07 0.29 0.07 0.14
4 Transport 5.8 0.17 0.00 0.01 0.03 -0.03 0.20
5 Accommodation
& Restaurant 7.74 0.01 -0.08 0.00 0.03 0.05 0.02
6 IT/ BPO 10.36 -0.16 0.26 0.12 0.13 0.02 0.01
7 Education 49.98 0.51 -0.02 0.18 0.02 0.99 0.21
8 Health 12.05 0.33 0.00 0.02 0.31 0.31 0.11
Total 205.22 0.77 0.32 1.22 1.85 0.64 1.36
Limitations of QES; The estimates of the present round QES are based on Sample Survey having some limitations as mentioned below:
(i) The QES is basically an establishment survey for collecting information on employment in the unit; therefore, it does not provide any information on unemployment in the country. Unemployment is generally captured by household survey.
(ii) As QES being an establishment survey, an individual who is working in more than one establishment on a given reference date may, by that virtue, be appearing in more than one establishment and therefore are counted separately for each establishment unlike a household survey which has no duplication of individuals, because they are counted only once, even if they work in more than one establishment in a given reference period.
(iii) Since the estimates are generated on the basis of response from sample establishment, there is a chance that the sample estimate may vary from true population value i.e. a value obtained had all establishments in the frame population been included in the survey. This chance difference in samples is known as sampling error.
(iv) Error in estimation may also occur because of imperfections in reporting by establishment, errors during the collection, processing of the data. Such errors are referred to as non-sampling errors. Every effort in this survey has been made to reduce or minimize such type of non-sampling
10
errors by way of carefully designing the questionnaire, undertaking pilot studies, training the field & supervisory staff, data validations and efficient operating procedures. There may be variations between consecutive quarters as a result of seasonal and economic factors.
(v) The Scope of QES new series is limited to all establishments having 10 or more workers. The scope & coverage is further limited to employment in Non-farm Industrial economy covering 8 selected sectors. The 8 sectors constitute around 81 percent of the total employment of units with 10 or more workers in the 6
th Economic Census.
(vi) The fieldwork for 6th Economic Census was conducted during January, 2013 to April, 2014 in
collaboration with State/UT Governments. Therefore, use of 6th Economic Census data as a frame
has some limitations in measurement of current employment scenario in the country.
(vii) Further, the QES (New Series) does not capture the employment data from new units which emerged after the 6
th Economic Census i.e. 2013-14.
(viii) The survey is based on either record or response of the unit. However, verification of record has not been resorted to for collection of data.
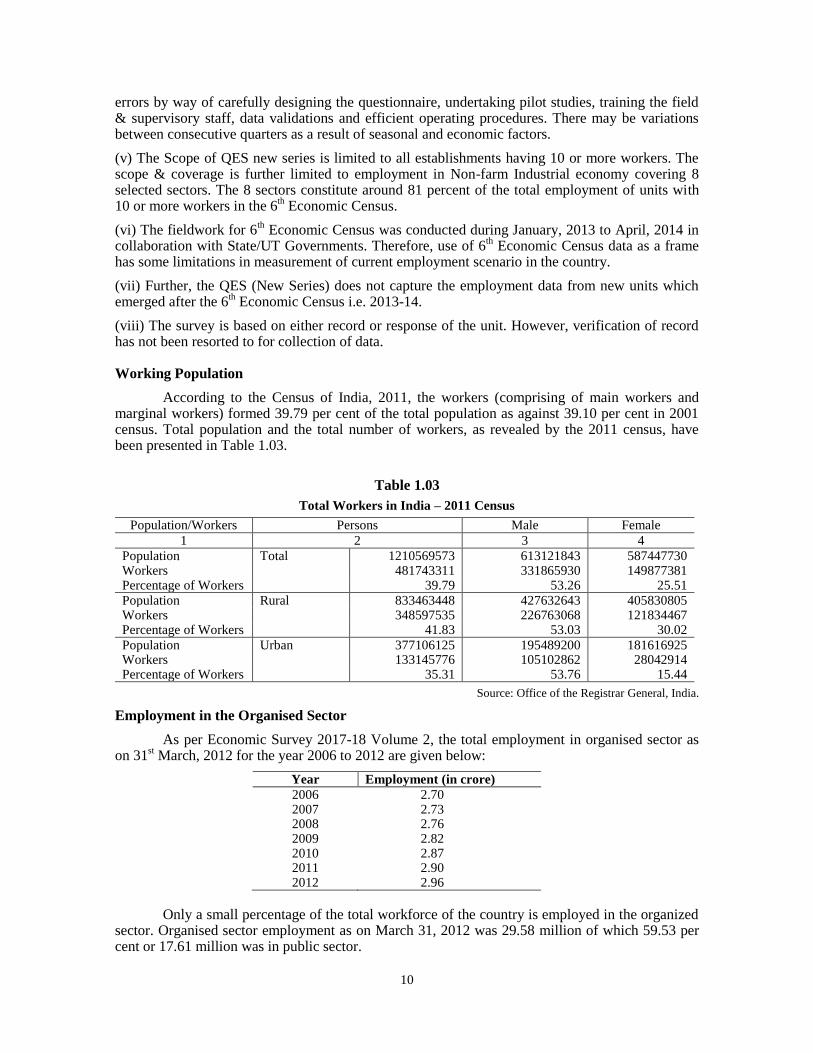
Working Population
According to the Census of India, 2011, the workers (comprising of main workers and marginal workers) formed 39.79 per cent of the total population as against 39.10 per cent in 2001 census. Total population and the total number of workers, as revealed by the 2011 census, have been presented in Table 1.03.
Table 1.03
Total Workers in India – 2011 Census
Population/Workers Persons Male Female
1 2 3 4
Population Total 1210569573 613121843 587447730 Workers 481743311 331865930 149877381 Percentage of Workers 39.79 53.26 25.51
Population Rural 833463448 427632643 405830805 Workers 348597535 226763068 121834467 Percentage of Workers 41.83 53.03 30.02
Population Urban 377106125 195489200 181616925 Workers 133145776 105102862 28042914 Percentage of Workers 35.31 53.76 15.44
Source: Office of the Registrar General, India.
Employment in the Organised Sector
As per Economic Survey 2017-18 Volume 2, the total employment in organised sector as on 31
st March, 2012 for the year 2006 to 2012 are given below:
Year Employment (in crore)
2006 2.70 2007 2.73 2008 2.76 2009 2.82 2010 2.87 2011 2.90 2012 2.96
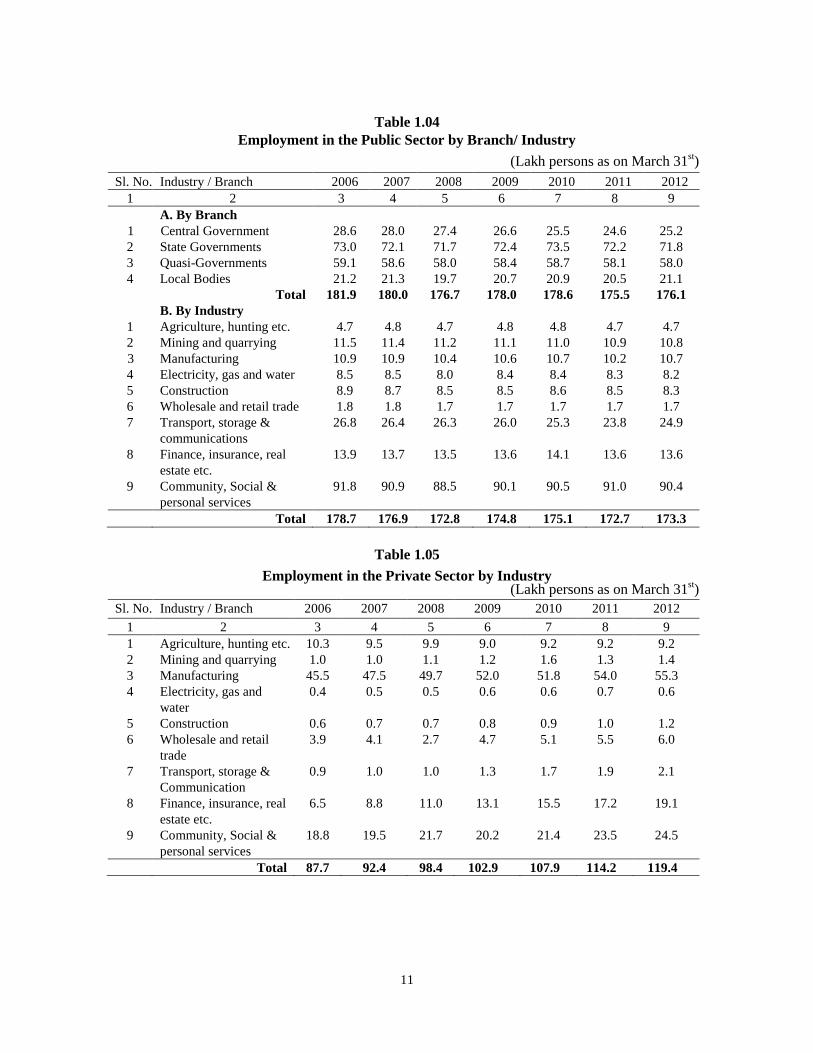
Only a small percentage of the total workforce of the country is employed in the organized sector. Organised sector employment as on March 31, 2012 was 29.58 million of which 59.53 per cent or 17.61 million was in public sector.
11
Table 1.04
Employment in the Public Sector by Branch/ Industry
(Lakh persons as on March 31st)
Sl. No. Industry / Branch 2006 2007 2008 2009 2010 2011 2012
1 2 3 4 5 6 7 8 9
A. By Branch
1 Central Government 28.6 28.0 27.4 26.6 25.5 24.6 25.2
2 State Governments 73.0 72.1 71.7 72.4 73.5 72.2 71.8
3 Quasi-Governments 59.1 58.6 58.0 58.4 58.7 58.1 58.0
4 Local Bodies 21.2 21.3 19.7 20.7 20.9 20.5 21.1
Total 181.9 180.0 176.7 178.0 178.6 175.5 176.1
B. By Industry
1 Agriculture, hunting etc. 4.7 4.8 4.7 4.8 4.8 4.7 4.7
2 Mining and quarrying 11.5 11.4 11.2 11.1 11.0 10.9 10.8
3 Manufacturing 10.9 10.9 10.4 10.6 10.7 10.2 10.7
4 Electricity, gas and water 8.5 8.5 8.0 8.4 8.4 8.3 8.2
5 Construction 8.9 8.7 8.5 8.5 8.6 8.5 8.3
6 Wholesale and retail trade 1.8 1.8 1.7 1.7 1.7 1.7 1.7
7 Transport, storage &
communications
26.8 26.4 26.3 26.0 25.3 23.8 24.9
8 Finance, insurance, real
estate etc.
13.9 13.7 13.5 13.6 14.1 13.6 13.6
9 Community, Social &
personal services
91.8 90.9 88.5 90.1 90.5 91.0 90.4
Total 178.7 176.9 172.8 174.8 175.1 172.7 173.3
Table 1.05
Employment in the Private Sector by Industry (Lakh persons as on March 31
st)
Sl. No. Industry / Branch 2006 2007 2008 2009 2010 2011 2012
1 2 3 4 5 6 7 8 9
1 Agriculture, hunting etc. 10.3 9.5 9.9 9.0 9.2 9.2 9.2
2 Mining and quarrying 1.0 1.0 1.1 1.2 1.6 1.3 1.4
3 Manufacturing 45.5 47.5 49.7 52.0 51.8 54.0 55.3
4 Electricity, gas and
water
0.4 0.5 0.5 0.6 0.6 0.7 0.6
5 Construction 0.6 0.7 0.7 0.8 0.9 1.0 1.2
6 Wholesale and retail
trade
3.9 4.1 2.7 4.7 5.1 5.5 6.0
7 Transport, storage &
Communication
0.9 1.0 1.0 1.3 1.7 1.9 2.1
8 Finance, insurance, real
estate etc.
6.5 8.8 11.0 13.1 15.5 17.2 19.1
9 Community, Social &
personal services
18.8 19.5 21.7 20.2 21.4 23.5 24.5
Total 87.7 92.4 98.4 102.9 107.9 114.2 119.4
12
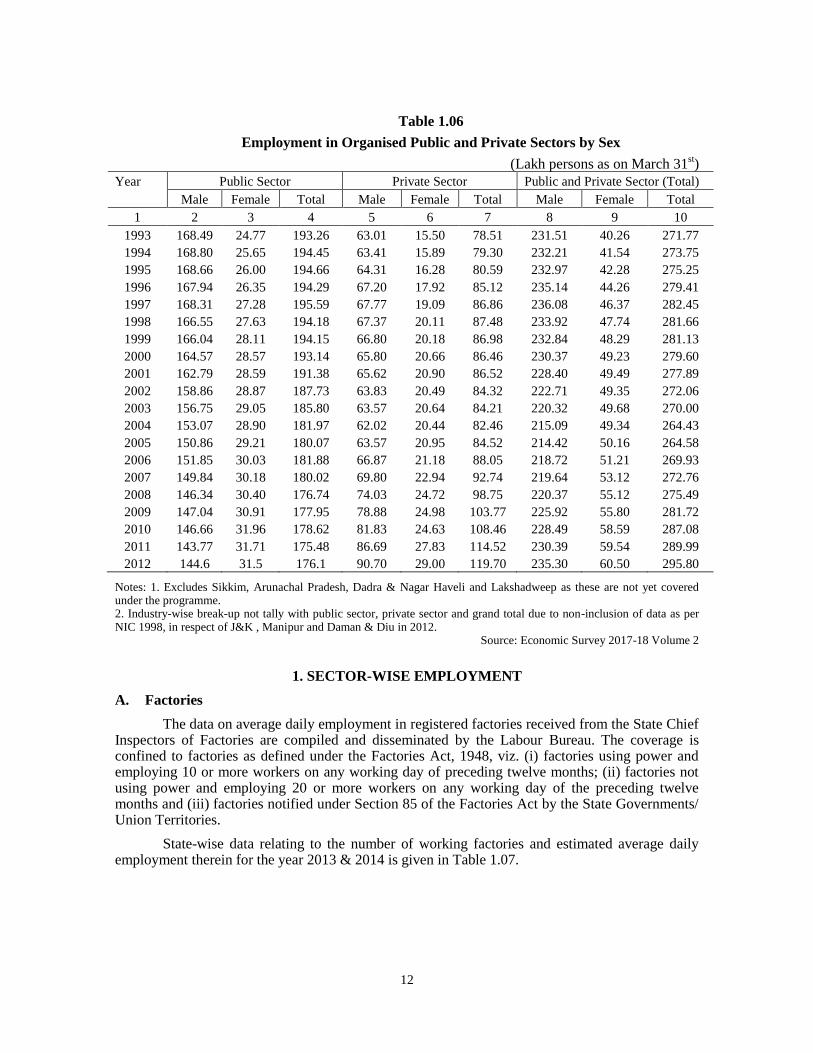
Table 1.06
Employment in Organised Public and Private Sectors by Sex
(Lakh persons as on March 31st)
Year Public Sector Private Sector Public and Private Sector (Total)
Male Female Total Male Female Total Male Female Total
1 2 3 4 5 6 7 8 9 10
1993 168.49 24.77 193.26 63.01 15.50 78.51 231.51 40.26 271.77
1994 168.80 25.65 194.45 63.41 15.89 79.30 232.21 41.54 273.75
1995 168.66 26.00 194.66 64.31 16.28 80.59 232.97 42.28 275.25
1996 167.94 26.35 194.29 67.20 17.92 85.12 235.14 44.26 279.41
1997 168.31 27.28 195.59 67.77 19.09 86.86 236.08 46.37 282.45
1998 166.55 27.63 194.18 67.37 20.11 87.48 233.92 47.74 281.66
1999 166.04 28.11 194.15 66.80 20.18 86.98 232.84 48.29 281.13
2000 164.57 28.57 193.14 65.80 20.66 86.46 230.37 49.23 279.60
2001 162.79 28.59 191.38 65.62 20.90 86.52 228.40 49.49 277.89
2002 158.86 28.87 187.73 63.83 20.49 84.32 222.71 49.35 272.06
2003 156.75 29.05 185.80 63.57 20.64 84.21 220.32 49.68 270.00
2004 153.07 28.90 181.97 62.02 20.44 82.46 215.09 49.34 264.43
2005 150.86 29.21 180.07 63.57 20.95 84.52 214.42 50.16 264.58
2006 151.85 30.03 181.88 66.87 21.18 88.05 218.72 51.21 269.93
2007 149.84 30.18 180.02 69.80 22.94 92.74 219.64 53.12 272.76
2008 146.34 30.40 176.74 74.03 24.72 98.75 220.37 55.12 275.49
2009 147.04 30.91 177.95 78.88 24.98 103.77 225.92 55.80 281.72
2010 146.66 31.96 178.62 81.83 24.63 108.46 228.49 58.59 287.08
2011 143.77 31.71 175.48 86.69 27.83 114.52 230.39 59.54 289.99
2012 144.6 31.5 176.1 90.70 29.00 119.70 235.30 60.50 295.80
Notes: 1. Excludes Sikkim, Arunachal Pradesh, Dadra & Nagar Haveli and Lakshadweep as these are not yet covered under the programme. 2. Industry-wise break-up not tally with public sector, private sector and grand total due to non-inclusion of data as per NIC 1998, in respect of J&K , Manipur and Daman & Diu in 2012.
Source: Economic Survey 2017-18 Volume 2
1. SECTOR-WISE EMPLOYMENT
A. Factories
The data on average daily employment in registered factories received from the State Chief Inspectors of Factories are compiled and disseminated by the Labour Bureau. The coverage is confined to factories as defined under the Factories Act, 1948, viz. (i) factories using power and employing 10 or more workers on any working day of preceding twelve months; (ii) factories not using power and employing 20 or more workers on any working day of the preceding twelve months and (iii) factories notified under Section 85 of the Factories Act by the State Governments/ Union Territories.
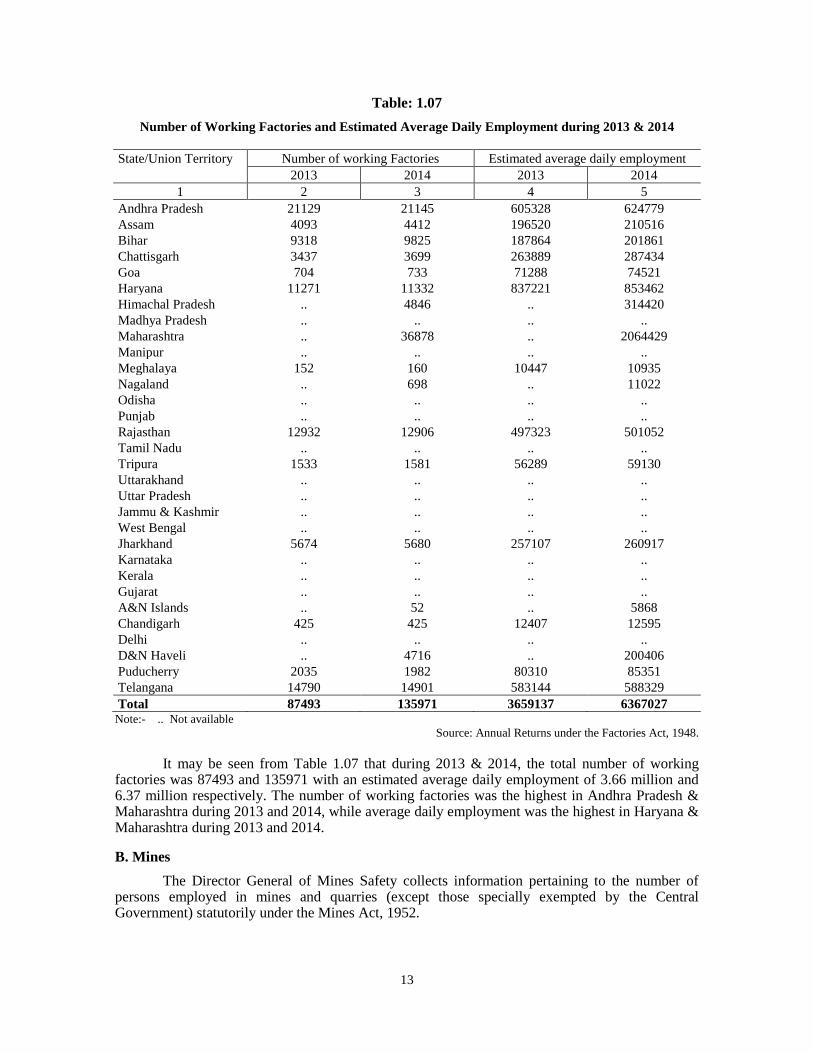
State-wise data relating to the number of working factories and estimated average daily employment therein for the year 2013 & 2014 is given in Table 1.07.
13
Table: 1.07
Number of Working Factories and Estimated Average Daily Employment during 2013 & 2014
State/Union Territory Number of working Factories Estimated average daily employment
2013 2014 2013 2014
1 2 3 4 5
Andhra Pradesh 21129 21145 605328 624779
Assam 4093 4412 196520 210516
Bihar 9318 9825 187864 201861
Chattisgarh 3437 3699 263889 287434
Goa 704 733 71288 74521
Haryana 11271 11332 837221 853462
Himachal Pradesh .. 4846 .. 314420
Madhya Pradesh .. .. .. ..
Maharashtra .. 36878 .. 2064429
Manipur .. .. .. ..
Meghalaya 152 160 10447 10935
Nagaland .. 698 .. 11022
Odisha .. .. .. ..
Punjab .. .. .. ..
Rajasthan 12932 12906 497323 501052
Tamil Nadu .. .. .. ..
Tripura 1533 1581 56289 59130
Uttarakhand .. .. .. ..
Uttar Pradesh .. .. .. ..
Jammu & Kashmir .. .. .. ..
West Bengal .. .. .. ..
Jharkhand 5674 5680 257107 260917
Karnataka .. .. .. ..
Kerala .. .. .. ..
Gujarat .. .. .. ..
A&N Islands .. 52 .. 5868
Chandigarh 425 425 12407 12595
Delhi .. .. .. ..
D&N Haveli .. 4716 .. 200406
Puducherry 2035 1982 80310 85351
Telangana 14790 14901 583144 588329
Total 87493 135971 3659137 6367027 Note:- .. Not available
Source: Annual Returns under the Factories Act, 1948.
It may be seen from Table 1.07 that during 2013 & 2014, the total number of working factories was 87493 and 135971 with an estimated average daily employment of 3.66 million and 6.37 million respectively. The number of working factories was the highest in Andhra Pradesh & Maharashtra during 2013 and 2014, while average daily employment was the highest in Haryana & Maharashtra during 2013 and 2014.
B. Mines
The Director General of Mines Safety collects information pertaining to the number of persons employed in mines and quarries (except those specially exempted by the Central Government) statutorily under the Mines Act, 1952.
14
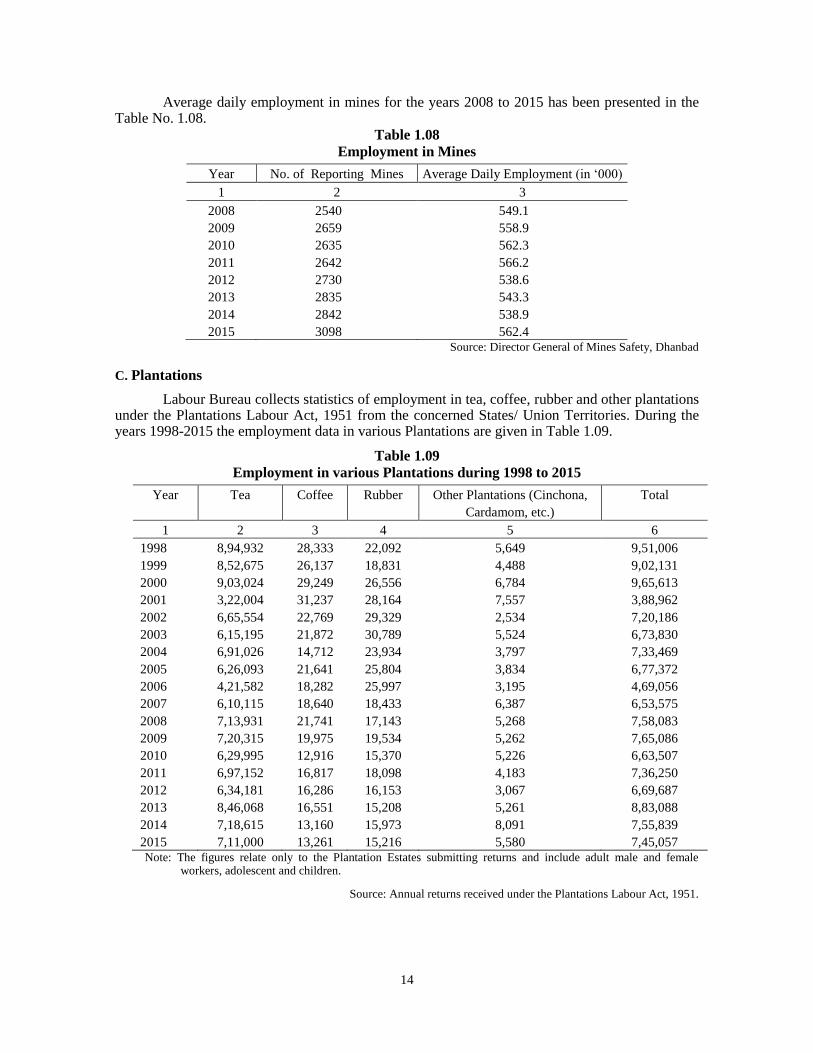
Average daily employment in mines for the years 2008 to 2015 has been presented in the Table No. 1.08.
Table 1.08
Employment in Mines
Year No. of Reporting Mines Average Daily Employment (in „000)
1 2 3
2008 2540 549.1
2009 2659 558.9
2010 2635 562.3
2011 2642 566.2
2012 2730 538.6
2013 2835 543.3
2014 2842 538.9
2015 3098 562.4 Source: Director General of Mines Safety, Dhanbad
C. Plantations
Labour Bureau collects statistics of employment in tea, coffee, rubber and other plantations under the Plantations Labour Act, 1951 from the concerned States/ Union Territories. During the years 1998-2015 the employment data in various Plantations are given in Table 1.09.
Table 1.09
Employment in various Plantations during 1998 to 2015
Year Tea Coffee Rubber Other Plantations (Cinchona,
Cardamom, etc.)
Total
1 2 3 4 5 6
1998 8,94,932 28,333 22,092 5,649 9,51,006
1999 8,52,675 26,137 18,831 4,488 9,02,131
2000 9,03,024 29,249 26,556 6,784 9,65,613
2001 3,22,004 31,237 28,164 7,557 3,88,962
2002 6,65,554 22,769 29,329 2,534 7,20,186
2003 6,15,195 21,872 30,789 5,524 6,73,830
2004 6,91,026 14,712 23,934 3,797 7,33,469
2005 6,26,093 21,641 25,804 3,834 6,77,372
2006 4,21,582 18,282 25,997 3,195 4,69,056
2007 6,10,115 18,640 18,433 6,387 6,53,575
2008 7,13,931 21,741 17,143 5,268 7,58,083
2009 7,20,315 19,975 19,534 5,262 7,65,086
2010 6,29,995 12,916 15,370 5,226 6,63,507
2011 6,97,152 16,817 18,098 4,183 7,36,250
2012 6,34,181 16,286 16,153 3,067 6,69,687
2013 8,46,068 16,551 15,208 5,261 8,83,088
2014 7,18,615 13,160 15,973 8,091 7,55,839
2015 7,11,000 13,261 15,216 5,580 7,45,057 Note: The figures relate only to the Plantation Estates submitting returns and include adult male and female
workers, adolescent and children.
Source: Annual returns received under the Plantations Labour Act, 1951.
15
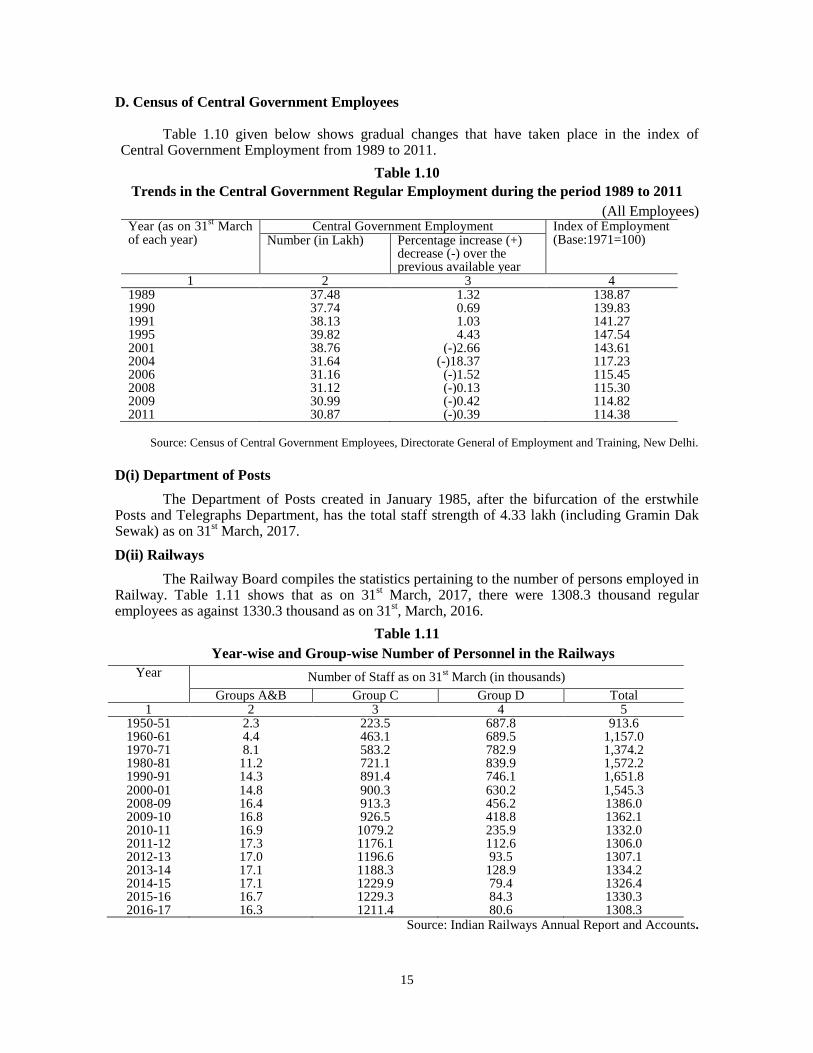
D. Census of Central Government Employees
Table 1.10 given below shows gradual changes that have taken place in the index of Central Government Employment from 1989 to 2011.
Table 1.10
Trends in the Central Government Regular Employment during the period 1989 to 2011
(All Employees) Year (as on 31
st March
of each year) Central Government Employment Index of Employment
(Base:1971=100) Number (in Lakh) Percentage increase (+) decrease (-) over the previous available year
1 2 3 4 1989 37.48 1.32 138.87 1990 37.74 0.69 139.83 1991 38.13 1.03 141.27 1995 39.82 4.43 147.54 2001 38.76 (-)2.66 143.61 2004 31.64 (-)18.37 117.23 2006 31.16 (-)1.52 115.45 2008 31.12 (-)0.13 115.30 2009 30.99 (-)0.42 114.82 2011 30.87 (-)0.39 114.38
Source: Census of Central Government Employees, Directorate General of Employment and Training, New Delhi.
D(i) Department of Posts
The Department of Posts created in January 1985, after the bifurcation of the erstwhile Posts and Telegraphs Department, has the total staff strength of 4.33 lakh (including Gramin Dak Sewak) as on 31
st March, 2017.
D(ii) Railways
The Railway Board compiles the statistics pertaining to the number of persons employed in Railway. Table 1.11 shows that as on 31
st March, 2017, there were 1308.3 thousand regular
employees as against 1330.3 thousand as on 31st, March, 2016.
Table 1.11
Year-wise and Group-wise Number of Personnel in the Railways
Year Number of Staff as on 31st March (in thousands)
Groups A&B Group C Group D Total 1 2 3 4 5
1950-51 2.3 223.5 687.8 913.6 1960-61 4.4 463.1 689.5 1,157.0 1970-71 8.1 583.2 782.9 1,374.2 1980-81 11.2 721.1 839.9 1,572.2 1990-91 14.3 891.4 746.1 1,651.8 2000-01 14.8 900.3 630.2 1,545.3 2008-09 16.4 913.3 456.2 1386.0 2009-10 16.8 926.5 418.8 1362.1 2010-11 16.9 1079.2 235.9 1332.0 2011-12 17.3 1176.1 112.6 1306.0 2012-13 17.0 1196.6 93.5 1307.1 2013-14 17.1 1188.3 128.9 1334.2 2014-15 17.1 1229.9 79.4 1326.4 2015-16 16.7 1229.3 84.3 1330.3 2016-17 16.3 1211.4 80.6 1308.3
Source: Indian Railways Annual Report and Accounts.
16
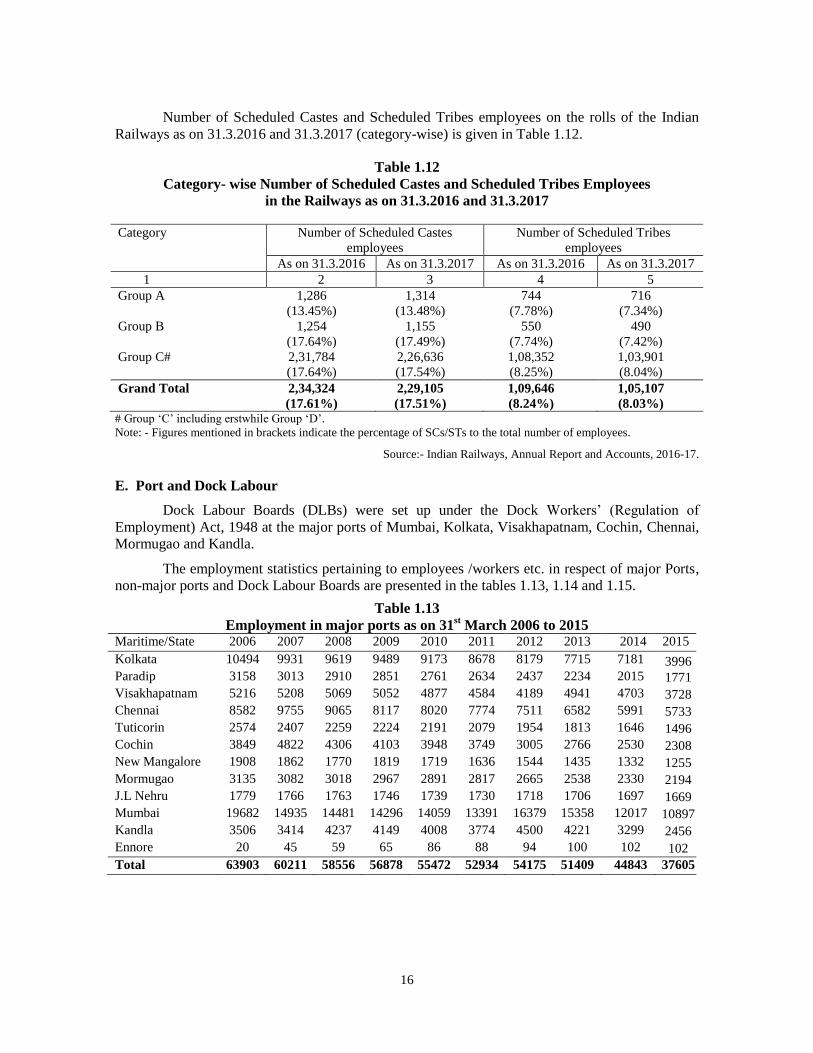
Number of Scheduled Castes and Scheduled Tribes employees on the rolls of the Indian
Railways as on 31.3.2016 and 31.3.2017 (category-wise) is given in Table 1.12.
Table 1.12
Category- wise Number of Scheduled Castes and Scheduled Tribes Employees
in the Railways as on 31.3.2016 and 31.3.2017
Category Number of Scheduled Castes
employees
Number of Scheduled Tribes
employees
As on 31.3.2016 As on 31.3.2017 As on 31.3.2016 As on 31.3.2017
1 2 3 4 5
Group A 1,286 1,314 744 716
(13.45%) (13.48%) (7.78%) (7.34%)
Group B 1,254 1,155 550 490
(17.64%) (17.49%) (7.74%) (7.42%)
Group C# 2,31,784 2,26,636 1,08,352 1,03,901
(17.64%) (17.54%) (8.25%) (8.04%)
Grand Total 2,34,324 2,29,105 1,09,646 1,05,107
(17.61%) (17.51%) (8.24%) (8.03%) # Group „C‟ including erstwhile Group „D‟.
Note: - Figures mentioned in brackets indicate the percentage of SCs/STs to the total number of employees.
Source:- Indian Railways, Annual Report and Accounts, 2016-17.
E. Port and Dock Labour
Dock Labour Boards (DLBs) were set up under the Dock Workers‟ (Regulation of
Employment) Act, 1948 at the major ports of Mumbai, Kolkata, Visakhapatnam, Cochin, Chennai,
Mormugao and Kandla.
The employment statistics pertaining to employees /workers etc. in respect of major Ports,
non-major ports and Dock Labour Boards are presented in the tables 1.13, 1.14 and 1.15.
Table 1.13
Employment in major ports as on 31st March 2006 to 2015
Maritime/State 2006 2007 2008 2009 2010 2011 2012 2013 2014 2015
Kolkata 10494 9931 9619 9489 9173 8678 8179 7715 7181 3996 Paradip 3158 3013 2910 2851 2761 2634 2437 2234 2015 1771
Visakhapatnam 5216 5208 5069 5052 4877 4584 4189 4941 4703 3728
Chennai 8582 9755 9065 8117 8020 7774 7511 6582 5991 5733
Tuticorin 2574 2407 2259 2224 2191 2079 1954 1813 1646 1496
Cochin 3849 4822 4306 4103 3948 3749 3005 2766 2530 2308
New Mangalore 1908 1862 1770 1819 1719 1636 1544 1435 1332 1255
Mormugao 3135 3082 3018 2967 2891 2817 2665 2538 2330 2194
J.L Nehru 1779 1766 1763 1746 1739 1730 1718 1706 1697 1669
Mumbai 19682 14935 14481 14296 14059 13391 16379 15358 12017 10897
Kandla 3506 3414 4237 4149 4008 3774 4500 4221 3299 2456
Ennore 20 45 59 65 86 88 94 100 102 102
Total 63903 60211 58556 56878 55472 52934 54175 51409 44843 37605
17
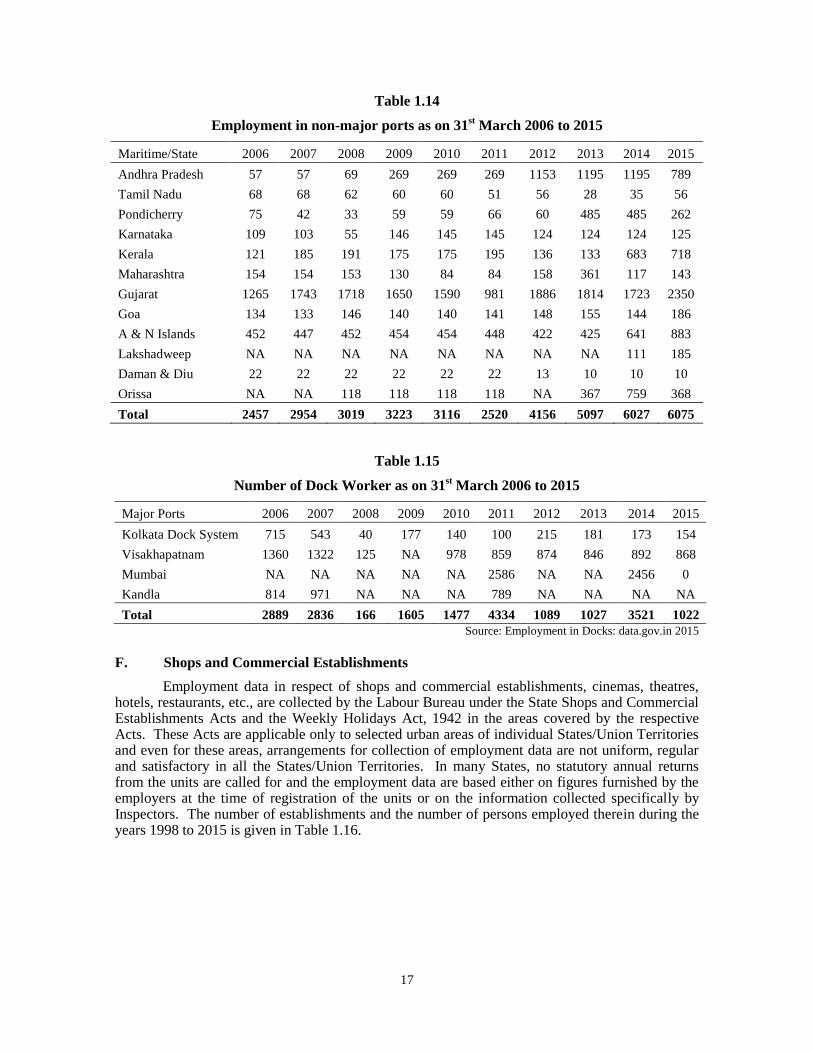
Table 1.14
Employment in non-major ports as on 31st March 2006 to 2015
Maritime/State 2006 2007 2008 2009 2010 2011 2012 2013 2014 2015
Andhra Pradesh 57 57 69 269 269 269 1153 1195 1195 789
Tamil Nadu 68 68 62 60 60 51 56 28 35 56
Pondicherry 75 42 33 59 59 66 60 485 485 262
Karnataka 109 103 55 146 145 145 124 124 124 125
Kerala 121 185 191 175 175 195 136 133 683 718
Maharashtra 154 154 153 130 84 84 158 361 117 143
Gujarat 1265 1743 1718 1650 1590 981 1886 1814 1723 2350
Goa 134 133 146 140 140 141 148 155 144 186
A & N Islands 452 447 452 454 454 448 422 425 641 883
Lakshadweep NA NA NA NA NA NA NA NA 111 185
Daman & Diu 22 22 22 22 22 22 13 10 10 10
Orissa NA NA 118 118 118 118 NA 367 759 368
Total 2457 2954 3019 3223 3116 2520 4156 5097 6027 6075
Table 1.15
Number of Dock Worker as on 31st March 2006 to 2015
Major Ports 2006 2007 2008 2009 2010 2011 2012 2013 2014 2015
Kolkata Dock System 715 543 40 177 140 100 215 181 173 154
Visakhapatnam 1360 1322 125 NA 978 859 874 846 892 868
Mumbai NA NA NA NA NA 2586 NA NA 2456 0
Kandla 814 971 NA NA NA 789 NA NA NA NA
Total 2889 2836 166 1605 1477 4334 1089 1027 3521 1022
Source: Employment in Docks: data.gov.in 2015
F. Shops and Commercial Establishments
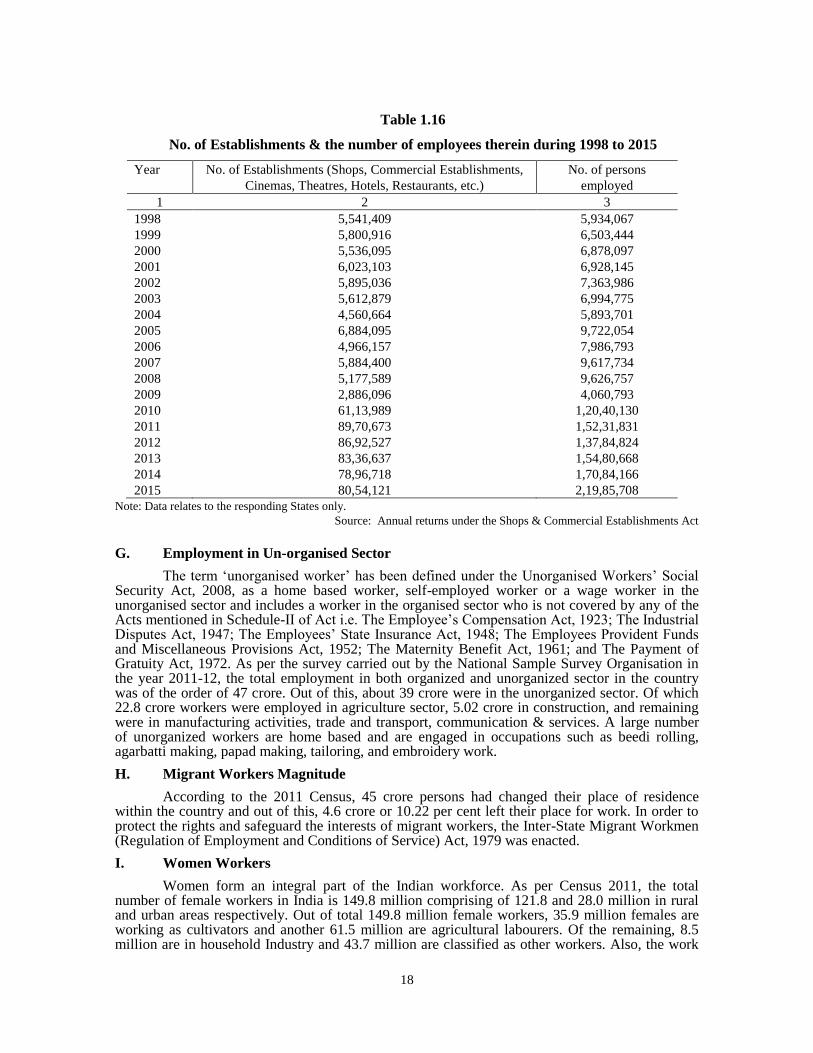
Employment data in respect of shops and commercial establishments, cinemas, theatres, hotels, restaurants, etc., are collected by the Labour Bureau under the State Shops and Commercial Establishments Acts and the Weekly Holidays Act, 1942 in the areas covered by the respective Acts. These Acts are applicable only to selected urban areas of individual States/Union Territories and even for these areas, arrangements for collection of employment data are not uniform, regular and satisfactory in all the States/Union Territories. In many States, no statutory annual returns from the units are called for and the employment data are based either on figures furnished by the employers at the time of registration of the units or on the information collected specifically by Inspectors. The number of establishments and the number of persons employed therein during the years 1998 to 2015 is given in Table 1.16.
18
Table 1.16
No. of Establishments & the number of employees therein during 1998 to 2015
Year No. of Establishments (Shops, Commercial Establishments,
Cinemas, Theatres, Hotels, Restaurants, etc.)
No. of persons
employed
1 2 3
1998 5,541,409 5,934,067
1999 5,800,916 6,503,444
2000 5,536,095 6,878,097
2001 6,023,103 6,928,145
2002 5,895,036 7,363,986
2003 5,612,879 6,994,775
2004 4,560,664 5,893,701
2005 6,884,095 9,722,054
2006 4,966,157 7,986,793
2007 5,884,400 9,617,734
2008 5,177,589 9,626,757
2009 2,886,096 4,060,793
2010 61,13,989 1,20,40,130
2011 89,70,673 1,52,31,831
2012 86,92,527 1,37,84,824
2013 83,36,637 1,54,80,668
2014 78,96,718 1,70,84,166
2015 80,54,121 2,19,85,708
Note: Data relates to the responding States only.
Source: Annual returns under the Shops & Commercial Establishments Act
G. Employment in Un-organised Sector
The term „unorganised worker‟ has been defined under the Unorganised Workers‟ Social Security Act, 2008, as a home based worker, self-employed worker or a wage worker in the unorganised sector and includes a worker in the organised sector who is not covered by any of the Acts mentioned in Schedule-II of Act i.e. The Employee‟s Compensation Act, 1923; The Industrial Disputes Act, 1947; The Employees‟ State Insurance Act, 1948; The Employees Provident Funds and Miscellaneous Provisions Act, 1952; The Maternity Benefit Act, 1961; and The Payment of Gratuity Act, 1972. As per the survey carried out by the National Sample Survey Organisation in the year 2011-12, the total employment in both organized and unorganized sector in the country was of the order of 47 crore. Out of this, about 39 crore were in the unorganized sector. Of which 22.8 crore workers were employed in agriculture sector, 5.02 crore in construction, and remaining were in manufacturing activities, trade and transport, communication & services. A large number of unorganized workers are home based and are engaged in occupations such as beedi rolling, agarbatti making, papad making, tailoring, and embroidery work.
H. Migrant Workers Magnitude
According to the 2011 Census, 45 crore persons had changed their place of residence within the country and out of this, 4.6 crore or 10.22 per cent left their place for work. In order to protect the rights and safeguard the interests of migrant workers, the Inter-State Migrant Workmen (Regulation of Employment and Conditions of Service) Act, 1979 was enacted.
I. Women Workers
Women form an integral part of the Indian workforce. As per Census 2011, the total number of female workers in India is 149.8 million comprising of 121.8 and 28.0 million in rural and urban areas respectively. Out of total 149.8 million female workers, 35.9 million females are working as cultivators and another 61.5 million are agricultural labourers. Of the remaining, 8.5 million are in household Industry and 43.7 million are classified as other workers. Also, the work
19
participation rate for women is 25.51 per cent in 2011 as compared to 25.63 per cent in 2001. The work participation rate for women in rural areas is 30.02 per cent as compared to 15.44 per cent in the urban areas. The conventional employment and unemployment surveys have not been able to capture the various types of unpaid work that women engage in both within and outside households in rural and urban areas in India. Globally, men‟s share in paid work is around 1.8 times that of women, while women have a share three times that of men in unpaid work. Therefore, paid work which is visible and accounted for by the System of National Accounts (SNA) is dominated by men, while unpaid work which is not accounted for is dominated by women and remains unrecognized and unaccounted for.
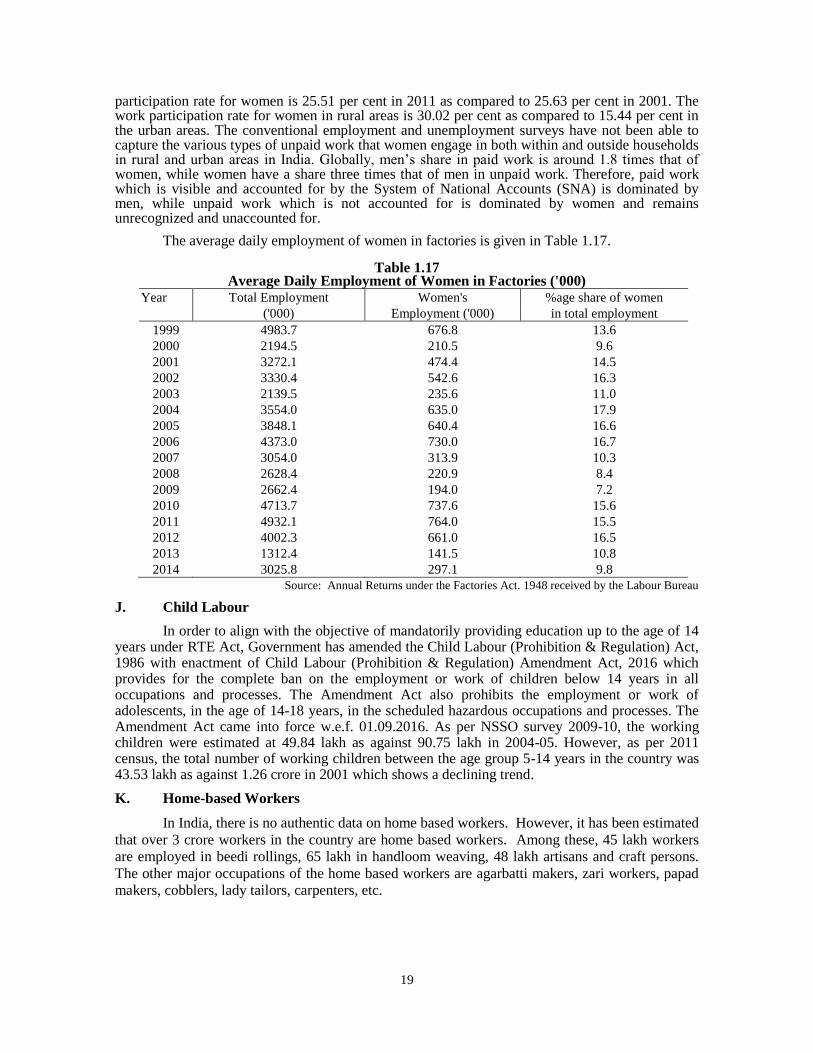
The average daily employment of women in factories is given in Table 1.17.
Table 1.17 Average Daily Employment of Women in Factories ('000)
Year Total Employment Women's %age share of women
('000) Employment ('000) in total employment
1999 4983.7 676.8 13.6
2000 2194.5 210.5 9.6
2001 3272.1 474.4 14.5
2002 3330.4 542.6 16.3
2003 2139.5 235.6 11.0
2004 3554.0 635.0 17.9
2005 3848.1 640.4 16.6
2006 4373.0 730.0 16.7
2007 3054.0 313.9 10.3
2008 2628.4 220.9 8.4
2009 2662.4 194.0 7.2
2010 4713.7 737.6 15.6
2011 4932.1 764.0 15.5
2012 4002.3 661.0 16.5
2013 1312.4 141.5 10.8
2014 3025.8 297.1 9.8
Source: Annual Returns under the Factories Act. 1948 received by the Labour Bureau
J. Child Labour
In order to align with the objective of mandatorily providing education up to the age of 14 years under RTE Act, Government has amended the Child Labour (Prohibition & Regulation) Act, 1986 with enactment of Child Labour (Prohibition & Regulation) Amendment Act, 2016 which provides for the complete ban on the employment or work of children below 14 years in all occupations and processes. The Amendment Act also prohibits the employment or work of adolescents, in the age of 14-18 years, in the scheduled hazardous occupations and processes. The Amendment Act came into force w.e.f. 01.09.2016. As per NSSO survey 2009-10, the working children were estimated at 49.84 lakh as against 90.75 lakh in 2004-05. However, as per 2011 census, the total number of working children between the age group 5-14 years in the country was 43.53 lakh as against 1.26 crore in 2001 which shows a declining trend.
K. Home-based Workers
In India, there is no authentic data on home based workers. However, it has been estimated
that over 3 crore workers in the country are home based workers. Among these, 45 lakh workers
are employed in beedi rollings, 65 lakh in handloom weaving, 48 lakh artisans and craft persons.
The other major occupations of the home based workers are agarbatti makers, zari workers, papad
makers, cobblers, lady tailors, carpenters, etc.
20
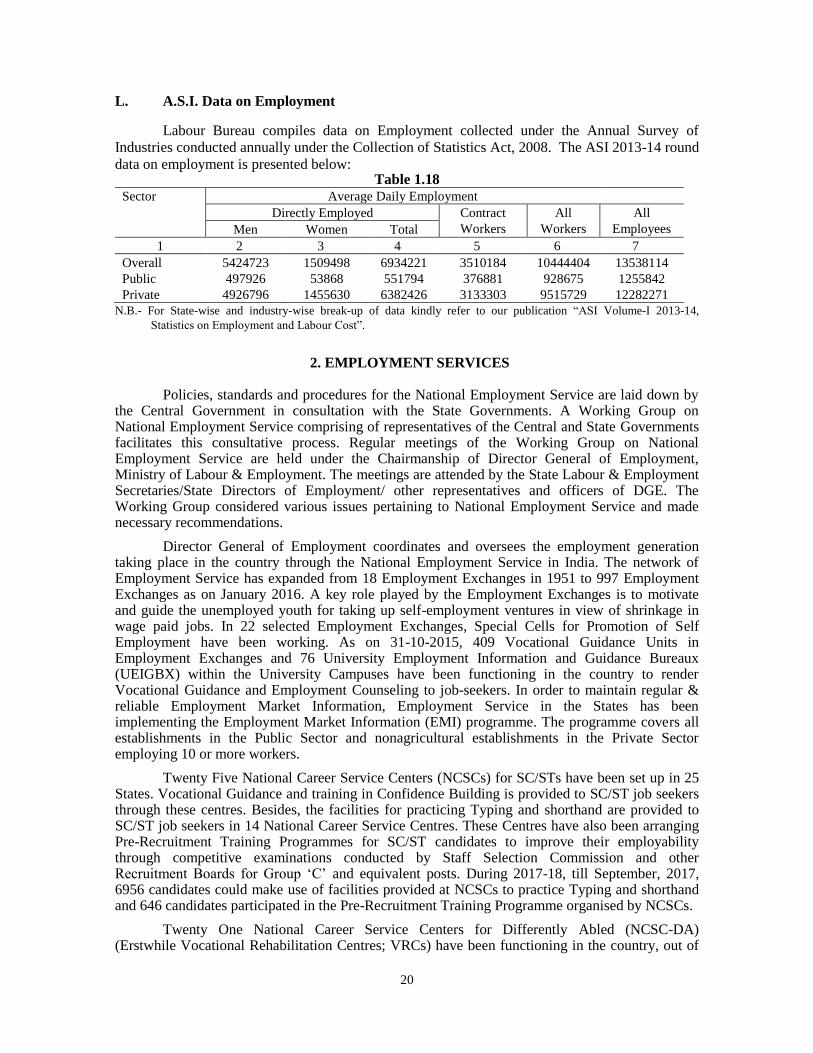
L. A.S.I. Data on Employment
Labour Bureau compiles data on Employment collected under the Annual Survey of
Industries conducted annually under the Collection of Statistics Act, 2008. The ASI 2013-14 round
data on employment is presented below: Table 1.18
Sector Average Daily Employment
Directly Employed Contract
Workers
All
Workers
All
Employees Men Women Total
1 2 3 4 5 6 7
Overall 5424723 1509498 6934221 3510184 10444404 13538114
Public 497926 53868 551794 376881 928675 1255842
Private 4926796 1455630 6382426 3133303 9515729 12282271
N.B.- For State-wise and industry-wise break-up of data kindly refer to our publication “ASI Volume-I 2013-14,
Statistics on Employment and Labour Cost”.
2. EMPLOYMENT SERVICES
Policies, standards and procedures for the National Employment Service are laid down by the Central Government in consultation with the State Governments. A Working Group on National Employment Service comprising of representatives of the Central and State Governments facilitates this consultative process. Regular meetings of the Working Group on National Employment Service are held under the Chairmanship of Director General of Employment, Ministry of Labour & Employment. The meetings are attended by the State Labour & Employment Secretaries/State Directors of Employment/ other representatives and officers of DGE. The Working Group considered various issues pertaining to National Employment Service and made necessary recommendations.
Director General of Employment coordinates and oversees the employment generation taking place in the country through the National Employment Service in India. The network of Employment Service has expanded from 18 Employment Exchanges in 1951 to 997 Employment Exchanges as on January 2016. A key role played by the Employment Exchanges is to motivate and guide the unemployed youth for taking up self-employment ventures in view of shrinkage in wage paid jobs. In 22 selected Employment Exchanges, Special Cells for Promotion of Self Employment have been working. As on 31-10-2015, 409 Vocational Guidance Units in Employment Exchanges and 76 University Employment Information and Guidance Bureaux (UEIGBX) within the University Campuses have been functioning in the country to render Vocational Guidance and Employment Counseling to job-seekers. In order to maintain regular & reliable Employment Market Information, Employment Service in the States has been implementing the Employment Market Information (EMI) programme. The programme covers all establishments in the Public Sector and nonagricultural establishments in the Private Sector employing 10 or more workers.
Twenty Five National Career Service Centers (NCSCs) for SC/STs have been set up in 25 States. Vocational Guidance and training in Confidence Building is provided to SC/ST job seekers through these centres. Besides, the facilities for practicing Typing and shorthand are provided to SC/ST job seekers in 14 National Career Service Centres. These Centres have also been arranging Pre-Recruitment Training Programmes for SC/ST candidates to improve their employability through competitive examinations conducted by Staff Selection Commission and other Recruitment Boards for Group „C‟ and equivalent posts. During 2017-18, till September, 2017, 6956 candidates could make use of facilities provided at NCSCs to practice Typing and shorthand and 646 candidates participated in the Pre-Recruitment Training Programme organised by NCSCs.
Twenty One National Career Service Centers for Differently Abled (NCSC-DA) (Erstwhile Vocational Rehabilitation Centres; VRCs) have been functioning in the country, out of
21
which, one Centre at Vadodara has been set up exclusively for women with disabilities. These Centres evaluates residual capacities of persons with disabilities and provide them adjustment training and skill training with a view to integrate them in the economic mainstream and make them productive citizens of the country. These Centres play pro-active role in creating public awareness and community participation in the rehabilitation of people with disabilities. During 2017-18 (upto 31.10.2017) these centres have registered 17739, evaluated 17676 and rehabilitated 6440 persons with disabilities. To synergize the link between demand and supply of skilled workforce, the Government has established 5 Model Career Centres for PWDs. The Centres will focus on career counselling as key activities for youth with disabilities to pursue skill enhancement courses that the market drive. The officers of the NCSC-DA are being trained on professional counselling techniques. Outreach counseling sessions and job-fairs will be a key activity in these career Centres.
Placement service to the disabled Ex-servicemen/Border Security Force personnel and their dependents is provided through an Ex-servicemen Cell set up in DGE (Hqrs.). During the year 2017 (Jan to Oct) 22 disabled Ex-Serviceman and dependents were registered for Employment Assistance through the Ex-Serviceman Cell. National Institute of Career Service (erstwhile CIRTES) is responsible for imparting training to officers of the Employment Service and conducting research in matter relating to various activities of NES (NCS) and develops tools and techniques for better implementation of NES programmes. It also prepares career literature for vocational guidance and career counseling.
National Employment Policy
Ministry of Labour & Employment had forwarded a Cabinet Note seeking for implementation of National Employment Policy in February, 2013. However, it was advised to upscale and update the document. The Ministry had subsequently entrusted the work of drafting the National Employment Policy to V.V.Giri National Labour Institute (VVGNLI) and while preparing the same, it emerged that the policy had wide ramifications and required inputs from various stake holders, Ministries, trade unions, research institutions, State Governments etc. Accordingly, an Inter Ministerial Committee was constituted on 4
th April, 2014 and a concept note circulated to
stake holders to seek views and suggestions. The draft policy has also been discussed with the State Ministers on 29.08.2014. Another brain storming session was held on 04.06.2015 with key stake holders to discuss the contours of the Proposed National Employment Policy. A meeting was held on 1.07.2016 to discuss the approach papers on NEP. Based on the discussion, follow up action is being taken. Subsequently, a meeting was also held with ILO delegations and on 03.11.2017 employment expert from ILO has given his observations/comments on draft approach paper of NEP. Drafting of the National Employment Policy is under process.
National Career Service
The Ministry is implementing the National Career Service (NCS) Project as a Mission Mode Project for transformation of the National Employment Service to provide a variety of employment related services like career counseling, vocational guidance, information on skill development courses, apprenticeship, internships etc. The progress of this project is summarized below.
The Mission Mode Project on NCS was appraised and approved in November-December, 2013 with an outlay of Rs.148.70 crore in the 12
th FYP. To give shape to the Government‟s
intention of establishing Career Centres, the Project outlay was upwardly appraised, in November, 2014 for an outlay of Rs.292.20 cr. The scope of project was further increased to include the inter-linking of employment exchanges and organizing of job fairs on regular basis with and enhanced outlay of Rs.348 crores during the 12
th Five Year Plan. The approved outlay for the project for the
Financial Year 2016-17 was Rs.100 crores and for the FY 2017-18 it has been increased to Rs.125.00 crores. In order to continue the scheme during 14
th Finance Commission Cycle (2017-
2020) an outlay of Rs.478 crores has been approved by SFC. The services under NCS are available online and can be accessed directly, through Career Centres, Common Service Centres, mobile
22
devices, cyber cafes etc. The various stakeholders on the NCS platform include job seekers, industries, employers, employment exchanges (career centres), training providers, educational institutions and placement organizations.
The NCS Portal (NCSP) has been made functional at the URL (www.ncs.gov.in). The portal was dedicated to the Nation by Hon‟ble Prime Minister of India on 20.7.2015 in Vigyan Bhawan, New Delhi. The NCSP is supported by a dedicated helpdesk (multi-lingual) for assisting users. It has a rich repository of career content of over 3600 occupations under 52 sectors. The portal also facilitates organization of job fairs where both employers and job seekers can interact. With the increased focus of Government on Career Counseling, the Ministry of Labour and Employment proposes to create a network of Career Counselors where the Career Centres will become the hub of Career Counseling in their area. Under the process, 2899 Career counsellors from various States/UTs have got registered at NCS Portal.
The NCS Portal also provides an open architecture for partnering of institutions and organisations for delivery of career and employment related services. The NCS Portal may develop specific pages to help categorise and improve delivery of services in the focus areas or otherwise. The partnering institutions will be provided appropriate space and links on the NCS Portal to improve delivery of services on a non-exclusivity basis and be amenable to the monitoring systems. Ministry of Labour and Employment has engaged with several institutions and organisations to bring more and more job opportunities to our workforce with some of the leading organisations such as Indian Staffing Federation (ISF), Quicker Jobs, Monster.com, Tech Mahindra (Saral Rojgar), Uber, Get Ahead fast, Hindustan Times, Indeed, Freshers World, First Job, Mera job, Urban Clap, Wheebox, Delivery Track, Association Skill Training Providers, Portea, Amity University, Babajob .com, Return of the Million Smile (India Old age/Gold-Fish), Department of post, AITMC and Domestic Worker Sector Skill Council etc.
A series of consultations with State Governments were held on various occasions for the NCS project. Key Ministries, Academia and Industry have been involved in designing the framework of the National Career Service and Career Centres. Under the NCS, it is proposed to create Knowledge Repository of Career Counselling content, by digitizing the existing Counselling literature and making it amenable for periodic updation by stakeholders and made accessible to various users. Multi-stakeholder Expert Groups have been constituted for various aspects under NCS like, network of career counselors, assessment tools, rural outreach strategies etc. Committees have also been constituted for steering the project.
The NCS Project also envisages setting up of Model Career Centres (MCCs) to be established by States to deliver employment services using technology. The Government has approved establishment of 107 Model Career Centres (including 7 non-funded MCCs) to deliver employment services using technology. The NCS Project has also been enhanced to interlink 997 Employment Exchanges with NCS Portal and part funding for up-gradation of Employment Exchange and for organising job fairs.
3. TRAINING & SKILL DEVELOPMENT
The huge mismatch between education, employability and employment has been staring in the face of the country since the last 40 years now. The country had more than 70 odd programs on skill development being run across 29 states through 21 different ministries. Each one had their own norms and outcomes and tracking mechanism. The multiplicity of these initiatives had diffused the impact that Skill Development could have had for the youth of India. There was no rationalisation of the process and system and the training were never outcome focused. There was limited emphasis on mapping of the skilled workforce that was required across sectors. There have been no focused efforts towards streamlining entities working in the skill ecosystem. The country stood on the global map with the maximum number of people in the employable age-group (population between 15-60 years); waiting for some synergies to happen. To shaping the skills landscape, a separate Ministry of Skill Development & Entrepreneurship has been created which in
23
its short life span has invested heavily on restructuring and re-energising the skill ecosystem in the country. It has made some significant efforts in ensuring coordination and convergence across all initiatives and schemes that were active in the skill ecosystem.
The year 2014 saw the launch of Skill India, lead by the newly created Ministry of Skill Development and Entrepreneurship (MSDE), to leverage the potential of India‟s aspiring youth by equipping them with the skills required to acquire sustainable livelihoods. MSDE has made great strides in streamlining and reinvigorating India‟s skilling ecosystem. MSDE‟s journey and its key achievements are detailed below.
The birth of India’s first Ministry of Skill Development and Entrepreneurship; 54% of India‟s population is below 25 years of age and over 62% of the population is the working-age group. Over 109 million incremental human resources will be required in India alone, across 24 key sectors by the year 2022. Yet, only 4.69% of the Indian population has undergone formal skills training. The lack of coordinated action dedicated to addressing the above challenges, has left India far behind, with India‟s demographic dividend on the verge of transforming into a demographic nightmare. The Government of India created India‟s first Department of Skill Development and Entrepreneurship in July 2014 under the Ministry of Youth Affairs and Sports, to rapidly address the above challenges. This Department became the Ministry of Skill Development and Entrepreneurship (MSDE) in November 2014. MSDE was given the mandate of leading India‟s skill development and entrepreneurship agenda, at speed and scale, while ensuring quality outcomes. In November 2014, India‟s skilling ecosystem was highly fragmented. 21 Central government Ministries and departments were implementing over 50 skill training programmes, operating in silos. Conflicting norms between schemes, poor monitoring mechanisms, varying assessment and certification systems and the absence of a coherent vision of success, limited the effectiveness of these initiatives. MSDE, as the lead Ministry for skill training and entrepreneurship, was tasked with coordinating, steering and ensuring coherence within this fractured ecosystem. MSDE‟s first step was to connect the different elements of the ecosystem together. Two verticals from DGT (Training and Apprenticeship), were transferred to MSDE in April 2015. Further, two major Entrepreneurship Development Institutes, were also shifted under MSDE, from the Ministry of Small and Medium Enterprises.
Policy Interventions:
India‟s First National Policy for Skill Development and Entrepreneurship 2015 created to rejuvenate India‟s skill ecosystem: The Policy articulates an overarching framework for skilling at scale and speed while ensuring high quality outcomes.
India‟s first National Skill Development Mission launched in July 2015 to coordinate and Scale up Skilling Efforts. The Mission seeks to converge, coordinate, implement and monitor skilling activities on a pan-India basis.
Common Norms for skill development schemes across India notified to ensure standardisation: In November 2014, there were 52 programs running across different Ministries, each of which had their own training norms and standards. To ensure standardisation and consistency in the structure of skill training initiatives across India, Common Norms for all skill development programmes across Central Ministries/Departments were notified on 15 July 2015, after extensive Inter-Ministerial Consultations.
Operationalisation of National Skill Qualification Framework (NSQF) in progress: The NSQF was created to ensure consistency in measuring the outcomes of skill training.
Programme Interventions: MSDE‟s programme interventions are guided by the principles of Speed, Scale and Quality - which have been addressed simultaneously in each of the initiatives mentioned below.
MSDE‟s Flagship Scheme Pradhan Mantri Kaushal VikasYojana (PMKVY) launched. Industrial Training Institutes (ITI) Ecosystem Revitalised.
24
Private Skill Training Ecosystem Catalysed through National Skill Development Corporation.
Entrepreneurship Initiatives Scaled up through National Institute for Entrepreneurship and Small Business Development (NIESBUD).
Making Skills Aspirational through Participation in World Skills Competitions. Apprenticeship Training scaled up through the modification of the Apprenticeship Act in
December 2014. Comprehensive amendments to Apprentices Act 1961 made with effect from 22
nd December 2014. Act has been made more responsive to industry and youth.
Employers can now engage up to 10% of its total workforce as apprentices. Model Skill Centres to be established in every district of India, to provide access to high
quality, aspirational skill training opportunities for short-term courses across the country. Two new World Bank Projects have been approved to scale up skill development in the
country. This includes the Skills Strengthening For Industrial Value Enhancement (STRIVE) project to revitalize the ITI ecosystem and Skill Training for Employability leveraging Public Private Partnership (STEPPP), which will be implemented in mission mode through World Bank support to achieve the objectives laid down in the National Skill Development Mission (NSDM).
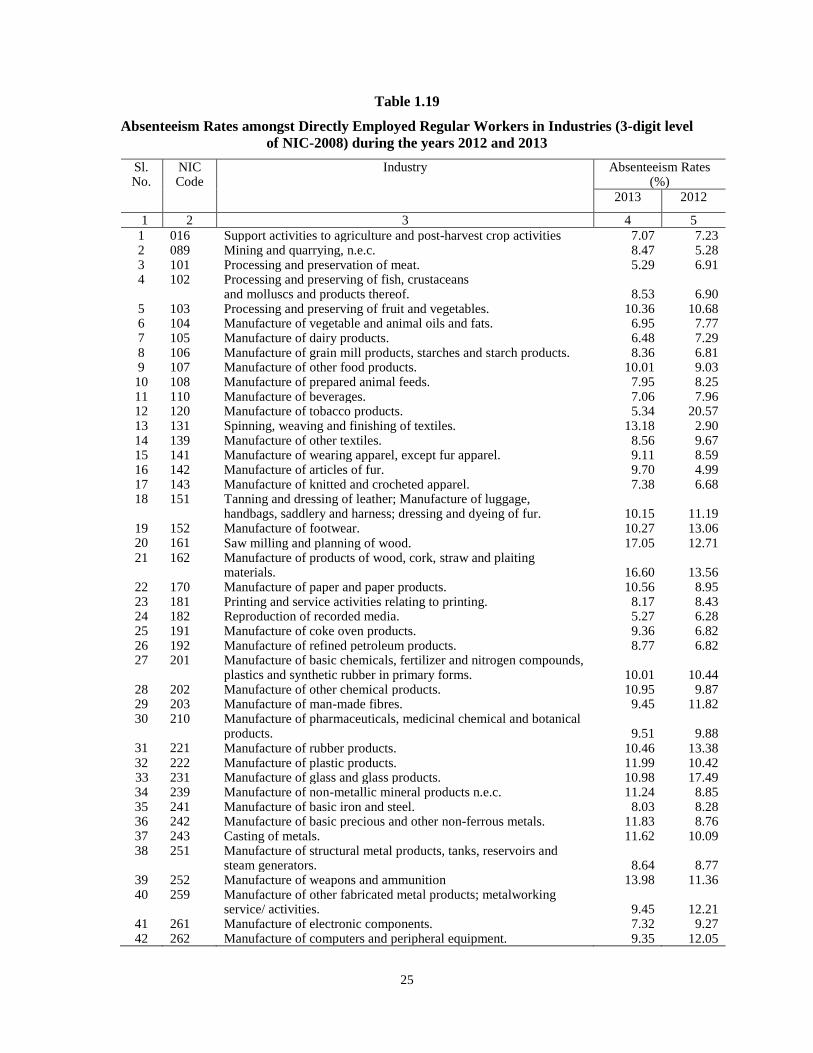
4. ABSENTEEISM
Statistics on Absenteeism collected under the Annual Survey of Industries
Absence means failure of a worker to report for work when he is scheduled to work, i.e., when the employer has work available for him and the worker is aware of it. Authorised absence is also treated as absence, while presence for even a part of a day or a shift is not considered as absence. Absence on account of strike, lock-out or lay-off is not taken into account.
Serial statistics on Absenteeism are obtained on a uniform basis for various Industries in the country through the Annual Survey of Industries (ASI) under the Collection of Statistics Act, 2008, for the whole of the country. The scope of the Survey extends to (i) all establishments registered under Section 2m(i) and 2m(ii) of the Factories Act, 1948 (excluding factories under the control of the Ministry of Defence, Jails, Technical Training Institutes and Oil Storage Depots) and (ii) The Bidi and Cigar Workers (Conditions of Employment) Act, 1966. For the purpose of the Survey, the universe of the establishments has been divided into (a) Census Sector, and (b) Sample Sector. The coverage of units under the two sectors has been decided as under:
(a) Census Sector:
The Coverage under the Census Sector has been undergoing certain minor changes from year to year. For the year 2013-14, the Census Sector comprised of the following:
i. All the units employing 100 or more worker. ii. All the units located in States/Union Territories of Tripura, Meghalaya, Manipur, Nagaland
and Andaman & Nicobar Islands. iii. All factories declared as submitting „Joint Return‟, as identified by NSSO (FOD).
(b) Sample Sector:
The Sample Sector comprised all other industrial establishments not covered in Census Sector. The fieldwork for the Survey is entrusted to the N.S.S.O., while data dissemination is the responsibility of the Labour Bureau.
Absenteeism statistics presented in this section relate to establishments covered both in Census and Sample Sectors for the years 2012 and 2013. These statistics are based on data for the months of January to December for establishments belonging to perennial industries and for the working seasons in respect of seasonal industries.
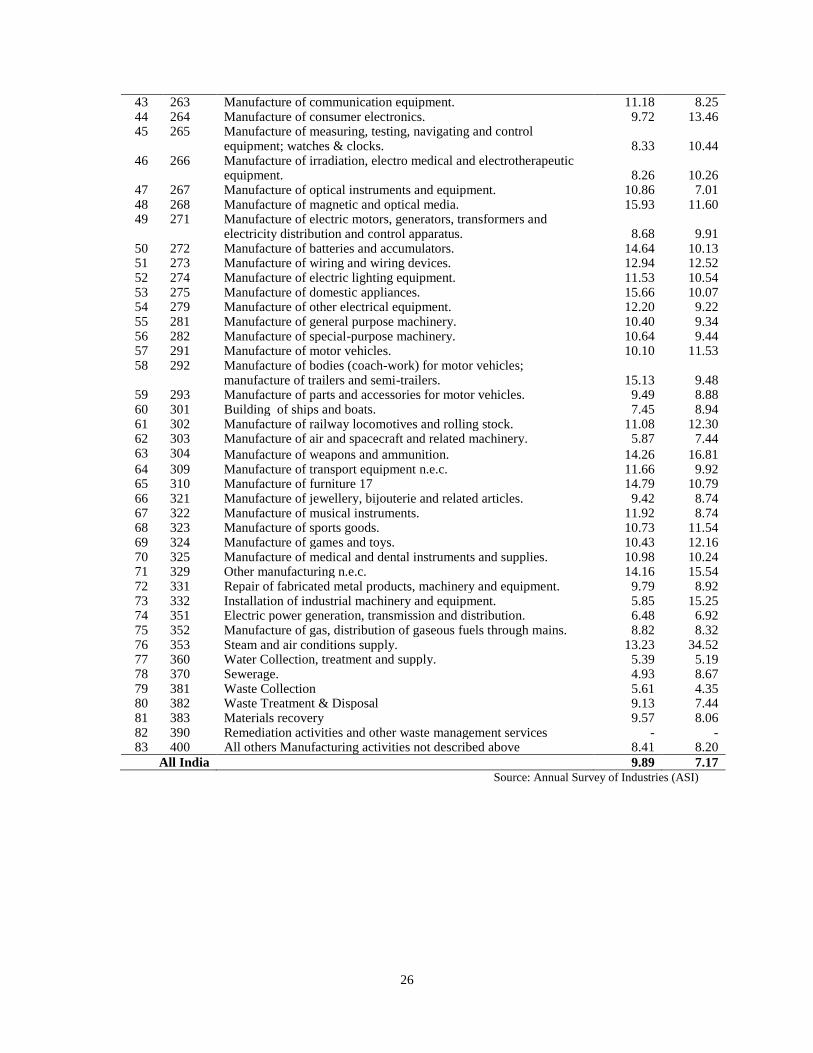
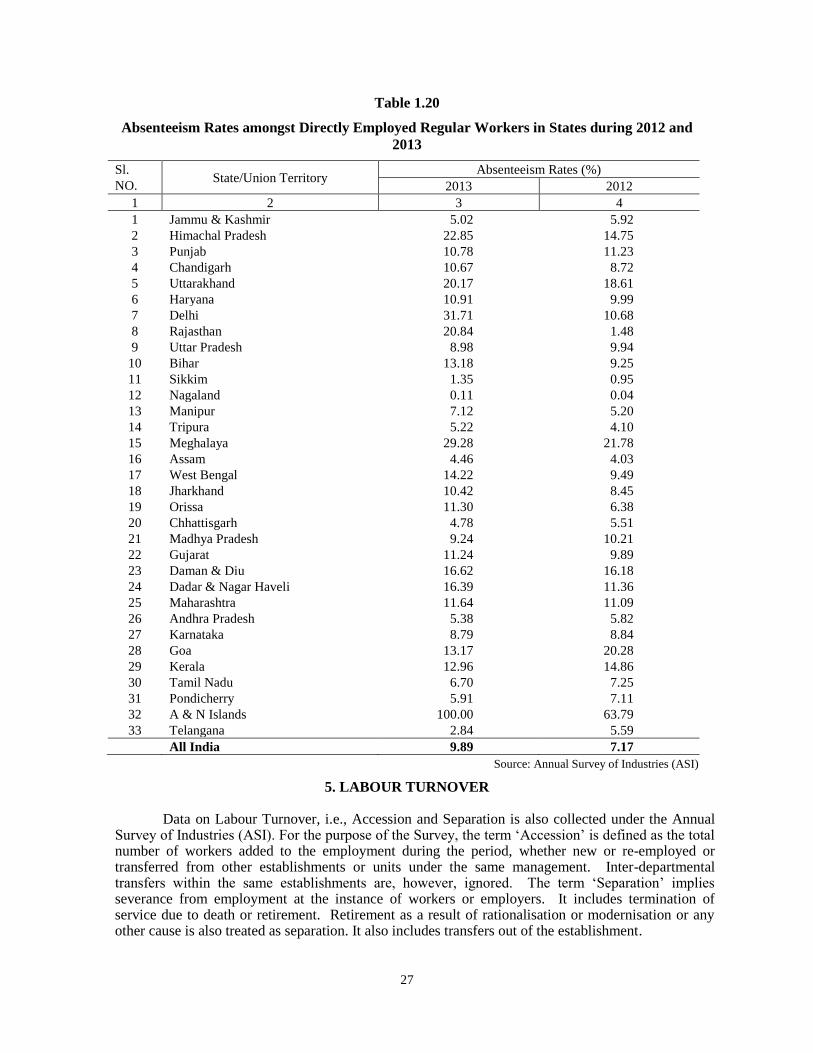
Industry-wise and State-wise Absenteeism rate i.e. percentage of mandays lost due to absence to the number of mandays scheduled to work, are presented in Tables 1.19 and 1.20, respectively.
25
Table 1.19
Absenteeism Rates amongst Directly Employed Regular Workers in Industries (3-digit level
of NIC-2008) during the years 2012 and 2013
Sl. No.
NIC Code
Industry Absenteeism Rates (%)
2013 2012
1 2 3 4 5
1 016 Support activities to agriculture and post-harvest crop activities 7.07 7.23 2 089 Mining and quarrying, n.e.c. 8.47 5.28 3 101 Processing and preservation of meat. 5.29 6.91 4 102 Processing and preserving of fish, crustaceans
and molluscs and products thereof. 8.53 6.90 5 103 Processing and preserving of fruit and vegetables. 10.36 10.68 6 104 Manufacture of vegetable and animal oils and fats. 6.95 7.77 7 105 Manufacture of dairy products. 6.48 7.29 8 106 Manufacture of grain mill products, starches and starch products. 8.36 6.81 9 107 Manufacture of other food products. 10.01 9.03 10 108 Manufacture of prepared animal feeds. 7.95 8.25 11 110 Manufacture of beverages. 7.06 7.96 12 120 Manufacture of tobacco products. 5.34 20.57 13 131 Spinning, weaving and finishing of textiles. 13.18 2.90 14 139 Manufacture of other textiles. 8.56 9.67 15 141 Manufacture of wearing apparel, except fur apparel. 9.11 8.59 16 142 Manufacture of articles of fur. 9.70 4.99 17 143 Manufacture of knitted and crocheted apparel. 7.38 6.68 18 151 Tanning and dressing of leather; Manufacture of luggage,
handbags, saddlery and harness; dressing and dyeing of fur. 10.15 11.19 19 152 Manufacture of footwear. 10.27 13.06 20 161 Saw milling and planning of wood. 17.05 12.71 21 162 Manufacture of products of wood, cork, straw and plaiting
materials. 16.60 13.56 22 170 Manufacture of paper and paper products. 10.56 8.95 23 181 Printing and service activities relating to printing. 8.17 8.43 24 182 Reproduction of recorded media. 5.27 6.28 25 191 Manufacture of coke oven products. 9.36 6.82 26 192 Manufacture of refined petroleum products. 8.77 6.82 27 201 Manufacture of basic chemicals, fertilizer and nitrogen compounds,
plastics and synthetic rubber in primary forms. 10.01 10.44 28 202 Manufacture of other chemical products. 10.95 9.87 29 203 Manufacture of man-made fibres. 9.45 11.82 30 210 Manufacture of pharmaceuticals, medicinal chemical and botanical
products. 9.51 9.88 31 221 Manufacture of rubber products. 10.46 13.38 32 222 Manufacture of plastic products. 11.99 10.42 33 231 Manufacture of glass and glass products. 10.98 17.49 34 239 Manufacture of non-metallic mineral products n.e.c. 11.24 8.85 35 241 Manufacture of basic iron and steel. 8.03 8.28 36 242 Manufacture of basic precious and other non-ferrous metals. 11.83 8.76 37 243 Casting of metals. 11.62 10.09 38 251 Manufacture of structural metal products, tanks, reservoirs and
steam generators. 8.64 8.77 39 252 Manufacture of weapons and ammunition 13.98 11.36 40 259 Manufacture of other fabricated metal products; metalworking
service/ activities. 9.45 12.21 41 261 Manufacture of electronic components. 7.32 9.27 42 262 Manufacture of computers and peripheral equipment. 9.35 12.05
26
43 263 Manufacture of communication equipment. 11.18 8.25 44 264 Manufacture of consumer electronics. 9.72 13.46 45 265 Manufacture of measuring, testing, navigating and control
equipment; watches & clocks. 8.33 10.44 46 266 Manufacture of irradiation, electro medical and electrotherapeutic
equipment. 8.26 10.26 47 267 Manufacture of optical instruments and equipment. 10.86 7.01 48 268 Manufacture of magnetic and optical media. 15.93 11.60 49 271 Manufacture of electric motors, generators, transformers and
electricity distribution and control apparatus. 8.68 9.91 50 272 Manufacture of batteries and accumulators. 14.64 10.13 51 273 Manufacture of wiring and wiring devices. 12.94 12.52 52 274 Manufacture of electric lighting equipment. 11.53 10.54 53 275 Manufacture of domestic appliances. 15.66 10.07 54 279 Manufacture of other electrical equipment. 12.20 9.22 55 281 Manufacture of general purpose machinery. 10.40 9.34 56 282 Manufacture of special-purpose machinery. 10.64 9.44 57 291 Manufacture of motor vehicles. 10.10 11.53 58 292 Manufacture of bodies (coach-work) for motor vehicles;
manufacture of trailers and semi-trailers. 15.13 9.48 59 293 Manufacture of parts and accessories for motor vehicles. 9.49 8.88 60 301 Building of ships and boats. 7.45 8.94 61 302 Manufacture of railway locomotives and rolling stock. 11.08 12.30 62 303 Manufacture of air and spacecraft and related machinery. 5.87 7.44 63 304 Manufacture of weapons and ammunition. 14.26 16.81 64 309 Manufacture of transport equipment n.e.c. 11.66 9.92 65 310 Manufacture of furniture 17 14.79 10.79 66 321 Manufacture of jewellery, bijouterie and related articles. 9.42 8.74 67 322 Manufacture of musical instruments. 11.92 8.74 68 323 Manufacture of sports goods. 10.73 11.54 69 324 Manufacture of games and toys. 10.43 12.16 70 325 Manufacture of medical and dental instruments and supplies. 10.98 10.24 71 329 Other manufacturing n.e.c. 14.16 15.54 72 331 Repair of fabricated metal products, machinery and equipment. 9.79 8.92 73 332 Installation of industrial machinery and equipment. 5.85 15.25 74 351 Electric power generation, transmission and distribution. 6.48 6.92 75 352 Manufacture of gas, distribution of gaseous fuels through mains. 8.82 8.32 76 353 Steam and air conditions supply. 13.23 34.52 77 360 Water Collection, treatment and supply. 5.39 5.19 78 370 Sewerage. 4.93 8.67 79 381 Waste Collection 5.61 4.35 80 382 Waste Treatment & Disposal 9.13 7.44 81 383 Materials recovery 9.57 8.06 82 390 Remediation activities and other waste management services - - 83 400 All others Manufacturing activities not described above 8.41 8.20
All India 9.89 7.17 Source: Annual Survey of Industries (ASI)
27
Table 1.20
Absenteeism Rates amongst Directly Employed Regular Workers in States during 2012 and
2013
Sl.
NO. State/Union Territory
Absenteeism Rates (%)
2013 2012
1 2 3 4
1 Jammu & Kashmir 5.02 5.92
2 Himachal Pradesh 22.85 14.75
3 Punjab 10.78 11.23
4 Chandigarh 10.67 8.72
5 Uttarakhand 20.17 18.61
6 Haryana 10.91 9.99
7 Delhi 31.71 10.68
8 Rajasthan 20.84 1.48
9 Uttar Pradesh 8.98 9.94
10 Bihar 13.18 9.25
11 Sikkim 1.35 0.95
12 Nagaland 0.11 0.04
13 Manipur 7.12 5.20
14 Tripura 5.22 4.10
15 Meghalaya 29.28 21.78
16 Assam 4.46 4.03
17 West Bengal 14.22 9.49
18 Jharkhand 10.42 8.45
19 Orissa 11.30 6.38
20 Chhattisgarh 4.78 5.51
21 Madhya Pradesh 9.24 10.21
22 Gujarat 11.24 9.89
23 Daman & Diu 16.62 16.18
24 Dadar & Nagar Haveli 16.39 11.36
25 Maharashtra 11.64 11.09
26 Andhra Pradesh 5.38 5.82
27 Karnataka 8.79 8.84
28 Goa 13.17 20.28
29 Kerala 12.96 14.86
30 Tamil Nadu 6.70 7.25
31 Pondicherry 5.91 7.11
32 A & N Islands 100.00 63.79
33 Telangana 2.84 5.59
All India 9.89 7.17
Source: Annual Survey of Industries (ASI)
5. LABOUR TURNOVER
Data on Labour Turnover, i.e., Accession and Separation is also collected under the Annual Survey of Industries (ASI). For the purpose of the Survey, the term „Accession‟ is defined as the total number of workers added to the employment during the period, whether new or re-employed or transferred from other establishments or units under the same management. Inter-departmental transfers within the same establishments are, however, ignored. The term „Separation‟ implies severance from employment at the instance of workers or employers. It includes termination of service due to death or retirement. Retirement as a result of rationalisation or modernisation or any other cause is also treated as separation. It also includes transfers out of the establishment.
28
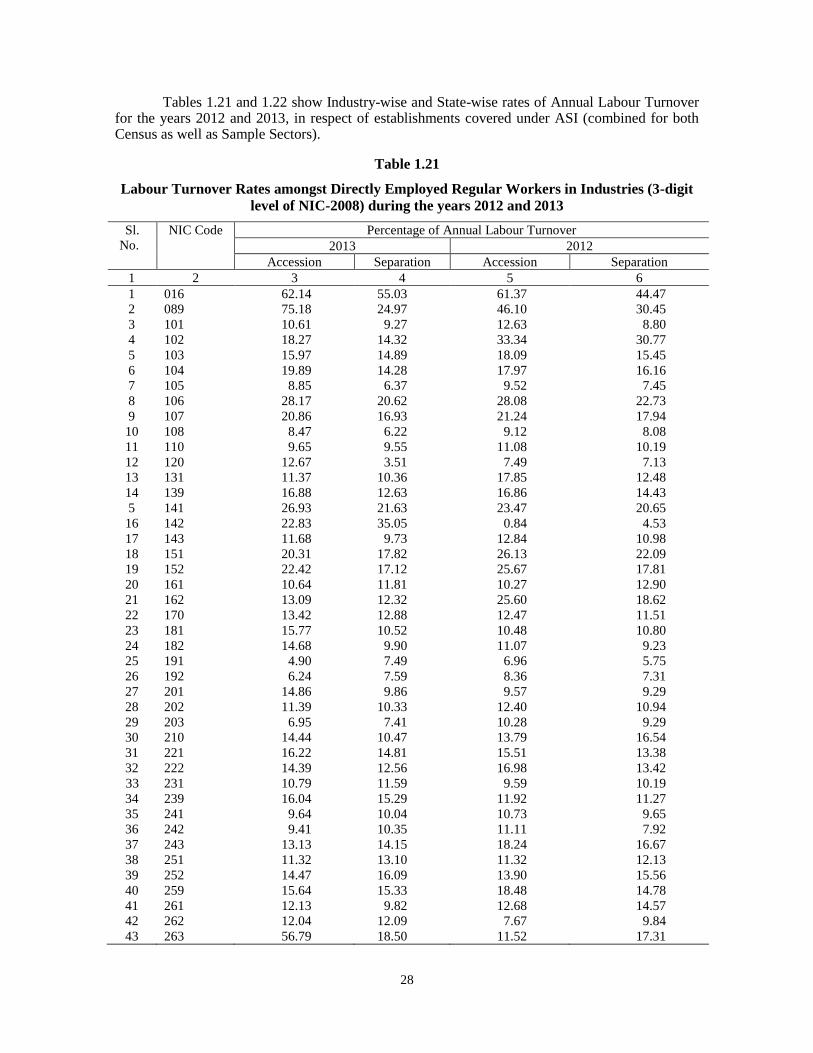
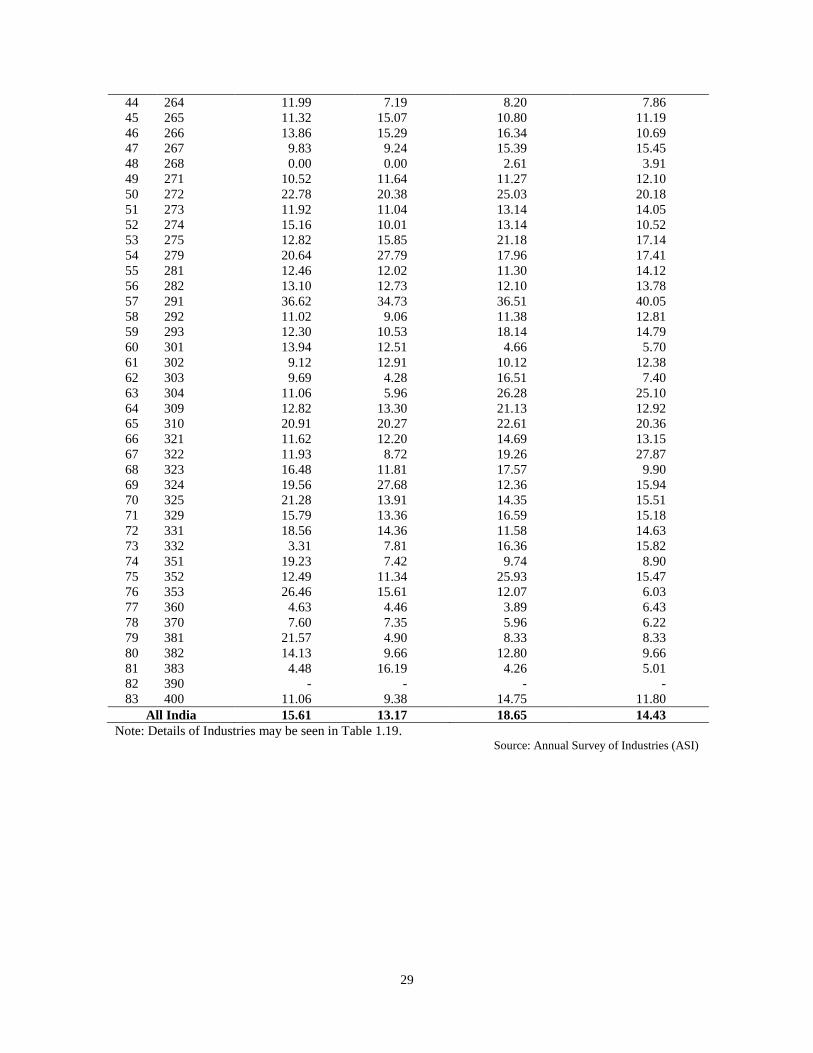
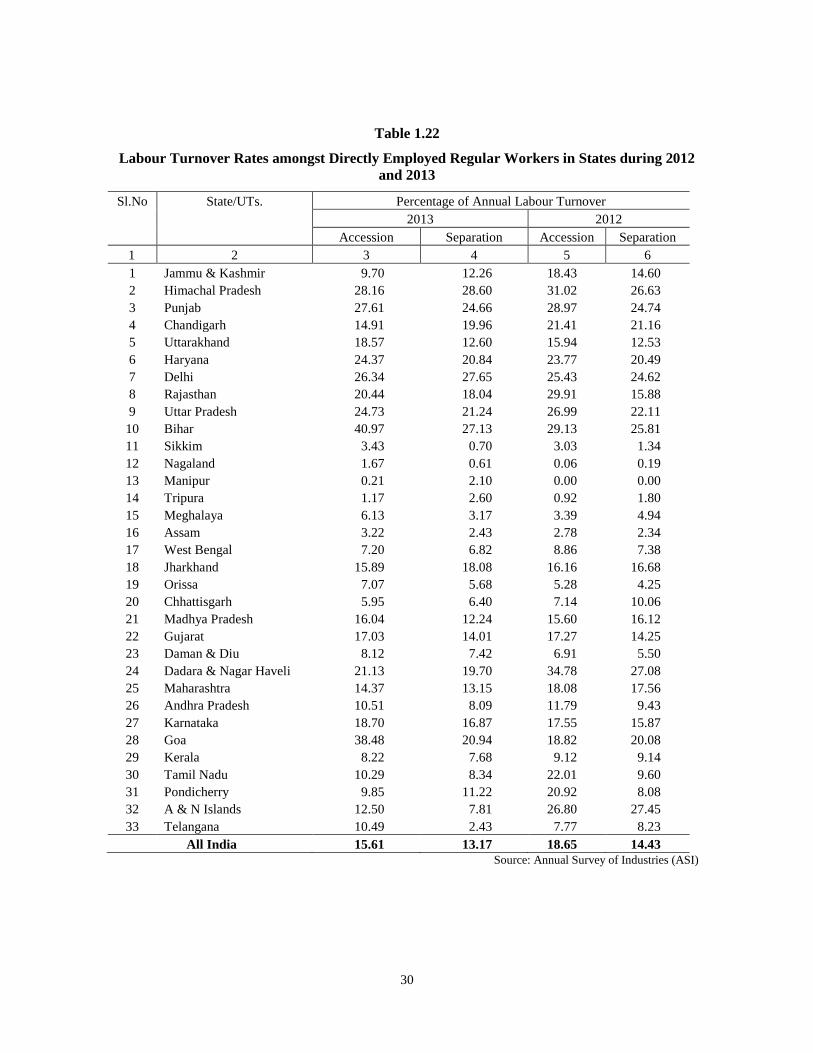
Tables 1.21 and 1.22 show Industry-wise and State-wise rates of Annual Labour Turnover for the years 2012 and 2013, in respect of establishments covered under ASI (combined for both Census as well as Sample Sectors).
Table 1.21
Labour Turnover Rates amongst Directly Employed Regular Workers in Industries (3-digit
level of NIC-2008) during the years 2012 and 2013
Sl.
No.
NIC Code Percentage of Annual Labour Turnover
2013 2012
Accession Separation Accession Separation
1 2 3 4 5 6
1 016 62.14 55.03 61.37 44.47
2 089 75.18 24.97 46.10 30.45
3 101 10.61 9.27 12.63 8.80
4 102 18.27 14.32 33.34 30.77
5 103 15.97 14.89 18.09 15.45
6 104 19.89 14.28 17.97 16.16
7 105 8.85 6.37 9.52 7.45
8 106 28.17 20.62 28.08 22.73
9 107 20.86 16.93 21.24 17.94
10 108 8.47 6.22 9.12 8.08
11 110 9.65 9.55 11.08 10.19
12 120 12.67 3.51 7.49 7.13
13 131 11.37 10.36 17.85 12.48
14 139 16.88 12.63 16.86 14.43
5 141 26.93 21.63 23.47 20.65
16 142 22.83 35.05 0.84 4.53
17 143 11.68 9.73 12.84 10.98
18 151 20.31 17.82 26.13 22.09
19 152 22.42 17.12 25.67 17.81
20 161 10.64 11.81 10.27 12.90
21 162 13.09 12.32 25.60 18.62
22 170 13.42 12.88 12.47 11.51
23 181 15.77 10.52 10.48 10.80
24 182 14.68 9.90 11.07 9.23
25 191 4.90 7.49 6.96 5.75
26 192 6.24 7.59 8.36 7.31
27 201 14.86 9.86 9.57 9.29
28 202 11.39 10.33 12.40 10.94
29 203 6.95 7.41 10.28 9.29
30 210 14.44 10.47 13.79 16.54
31 221 16.22 14.81 15.51 13.38
32 222 14.39 12.56 16.98 13.42
33 231 10.79 11.59 9.59 10.19
34 239 16.04 15.29 11.92 11.27
35 241 9.64 10.04 10.73 9.65
36 242 9.41 10.35 11.11 7.92
37 243 13.13 14.15 18.24 16.67
38 251 11.32 13.10 11.32 12.13
39 252 14.47 16.09 13.90 15.56
40 259 15.64 15.33 18.48 14.78
41 261 12.13 9.82 12.68 14.57
42 262 12.04 12.09 7.67 9.84
43 263 56.79 18.50 11.52 17.31
29
44 264 11.99 7.19 8.20 7.86
45 265 11.32 15.07 10.80 11.19
46 266 13.86 15.29 16.34 10.69
47 267 9.83 9.24 15.39 15.45
48 268 0.00 0.00 2.61 3.91
49 271 10.52 11.64 11.27 12.10
50 272 22.78 20.38 25.03 20.18
51 273 11.92 11.04 13.14 14.05
52 274 15.16 10.01 13.14 10.52
53 275 12.82 15.85 21.18 17.14
54 279 20.64 27.79 17.96 17.41
55 281 12.46 12.02 11.30 14.12
56 282 13.10 12.73 12.10 13.78
57 291 36.62 34.73 36.51 40.05
58 292 11.02 9.06 11.38 12.81
59 293 12.30 10.53 18.14 14.79
60 301 13.94 12.51 4.66 5.70
61 302 9.12 12.91 10.12 12.38
62 303 9.69 4.28 16.51 7.40
63 304 11.06 5.96 26.28 25.10
64 309 12.82 13.30 21.13 12.92
65 310 20.91 20.27 22.61 20.36
66 321 11.62 12.20 14.69 13.15
67 322 11.93 8.72 19.26 27.87
68 323 16.48 11.81 17.57 9.90
69 324 19.56 27.68 12.36 15.94
70 325 21.28 13.91 14.35 15.51
71 329 15.79 13.36 16.59 15.18
72 331 18.56 14.36 11.58 14.63
73 332 3.31 7.81 16.36 15.82
74 351 19.23 7.42 9.74 8.90
75 352 12.49 11.34 25.93 15.47
76 353 26.46 15.61 12.07 6.03
77 360 4.63 4.46 3.89 6.43
78 370 7.60 7.35 5.96 6.22
79 381 21.57 4.90 8.33 8.33
80 382 14.13 9.66 12.80 9.66
81 383 4.48 16.19 4.26 5.01
82 390 - - - -
83 400 11.06 9.38 14.75 11.80
All India 15.61 13.17 18.65 14.43
Note: Details of Industries may be seen in Table 1.19. Source: Annual Survey of Industries (ASI)
30
Table 1.22
Labour Turnover Rates amongst Directly Employed Regular Workers in States during 2012
and 2013
Sl.No State/UTs. Percentage of Annual Labour Turnover
2013 2012
Accession Separation Accession Separation
1 2 3 4 5 6
1 Jammu & Kashmir 9.70 12.26 18.43 14.60
2 Himachal Pradesh 28.16 28.60 31.02 26.63
3 Punjab 27.61 24.66 28.97 24.74
4 Chandigarh 14.91 19.96 21.41 21.16
5 Uttarakhand 18.57 12.60 15.94 12.53
6 Haryana 24.37 20.84 23.77 20.49
7 Delhi 26.34 27.65 25.43 24.62
8 Rajasthan 20.44 18.04 29.91 15.88
9 Uttar Pradesh 24.73 21.24 26.99 22.11
10 Bihar 40.97 27.13 29.13 25.81
11 Sikkim 3.43 0.70 3.03 1.34
12 Nagaland 1.67 0.61 0.06 0.19
13 Manipur 0.21 2.10 0.00 0.00
14 Tripura 1.17 2.60 0.92 1.80
15 Meghalaya 6.13 3.17 3.39 4.94
16 Assam 3.22 2.43 2.78 2.34
17 West Bengal 7.20 6.82 8.86 7.38
18 Jharkhand 15.89 18.08 16.16 16.68
19 Orissa 7.07 5.68 5.28 4.25
20 Chhattisgarh 5.95 6.40 7.14 10.06
21 Madhya Pradesh 16.04 12.24 15.60 16.12
22 Gujarat 17.03 14.01 17.27 14.25
23 Daman & Diu 8.12 7.42 6.91 5.50
24 Dadara & Nagar Haveli 21.13 19.70 34.78 27.08
25 Maharashtra 14.37 13.15 18.08 17.56
26 Andhra Pradesh 10.51 8.09 11.79 9.43
27 Karnataka 18.70 16.87 17.55 15.87
28 Goa 38.48 20.94 18.82 20.08
29 Kerala 8.22 7.68 9.12 9.14
30 Tamil Nadu 10.29 8.34 22.01 9.60
31 Pondicherry 9.85 11.22 20.92 8.08
32 A & N Islands 12.50 7.81 26.80 27.45
33 Telangana 10.49 2.43 7.77 8.23
All India 15.61 13.17 18.65 14.43
Source: Annual Survey of Industries (ASI)
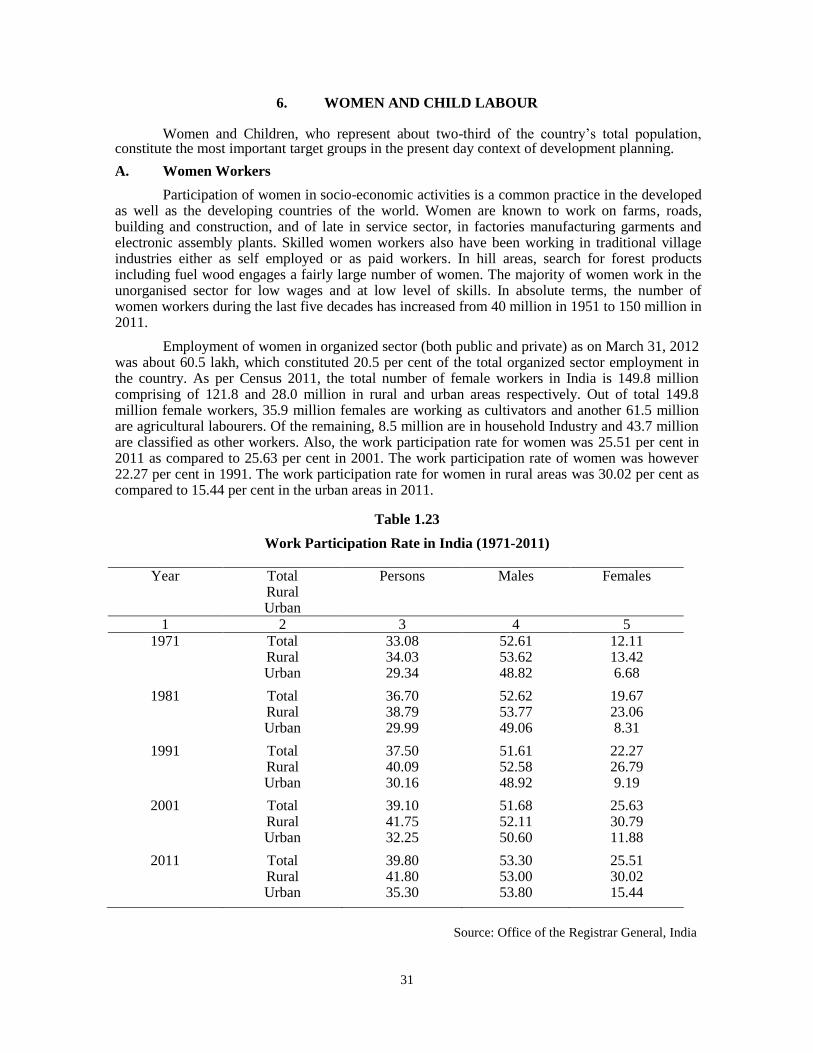
31
6. WOMEN AND CHILD LABOUR
Women and Children, who represent about two-third of the country‟s total population, constitute the most important target groups in the present day context of development planning.
A. Women Workers
Participation of women in socio-economic activities is a common practice in the developed as well as the developing countries of the world. Women are known to work on farms, roads, building and construction, and of late in service sector, in factories manufacturing garments and electronic assembly plants. Skilled women workers also have been working in traditional village industries either as self employed or as paid workers. In hill areas, search for forest products including fuel wood engages a fairly large number of women. The majority of women work in the unorganised sector for low wages and at low level of skills. In absolute terms, the number of women workers during the last five decades has increased from 40 million in 1951 to 150 million in 2011.
Employment of women in organized sector (both public and private) as on March 31, 2012 was about 60.5 lakh, which constituted 20.5 per cent of the total organized sector employment in the country. As per Census 2011, the total number of female workers in India is 149.8 million comprising of 121.8 and 28.0 million in rural and urban areas respectively. Out of total 149.8 million female workers, 35.9 million females are working as cultivators and another 61.5 million are agricultural labourers. Of the remaining, 8.5 million are in household Industry and 43.7 million are classified as other workers. Also, the work participation rate for women was 25.51 per cent in 2011 as compared to 25.63 per cent in 2001. The work participation rate of women was however 22.27 per cent in 1991. The work participation rate for women in rural areas was 30.02 per cent as compared to 15.44 per cent in the urban areas in 2011.
Table 1.23
Work Participation Rate in India (1971-2011)
Year Total Rural Urban
Persons Males Females
1 2 3 4 5 1971 Total
Rural Urban
33.08 34.03 29.34
52.61 53.62 48.82
12.11 13.42 6.68
1981 Total Rural Urban
36.70 38.79 29.99
52.62 53.77 49.06
19.67 23.06 8.31
1991 Total Rural Urban
37.50 40.09 30.16
51.61 52.58 48.92
22.27 26.79 9.19
2001 Total Rural Urban
39.10 41.75 32.25
51.68 52.11 50.60
25.63 30.79 11.88
2011 Total Rural Urban
39.80 41.80 35.30
53.30 53.00 53.80
25.51 30.02 15.44
Source: Office of the Registrar General, India
32
The Equal Remuneration Act, 1976 provides for payment of equal remuneration to men and women workers for same work or work of similar nature without any discrimination and also prevent discrimination against women employees while making recruitment for the same work or work of similar nature, or in any condition of service subsequent to recruitment such as promotions, training or transfer. The provisions of the Act have been extended to all categories of employment. The Act is implemented at two levels viz. Central level and State level.
In this period of economic liberalization and globalization, the quality of women‟s employment will depend upon several factors. The foremost among these are access to education and opportunities for skill development. The solution lies in creating awareness among women about their legal rights and duties and by providing them adequate opportunities to upgrade their skill level. The emphasis should be on effective enforcement of the Minimum Wages Act, 1948 and the Equal Remuneration Act, 1976. Proper enforcement of these Acts will create on enabling environment for women workers. Besides these proactive measures, policies which encourage education, skill development, and training among women also need to be given priority.
Statutory provisions have also been made in certain Labour laws for organizing child care centers for the benefit of women workers. These include Factories Act, 1948, the Beedi & Cigar Workers (Conditions of Employment) Act, 1966, the Mines Act, 1952, the Plantation Act, 1951 and the Building and other Construction Workers (Regulation of Employment and Conditions of Service) Act, 1996.
Labour Bureau conducts surveys aimed at assessing the socio-economic conditions of Women Workers and the extent of the welfare amenities available to them vis-a-vis various Labour Laws. In the first instance these studies were conducted in the organised sector of the economy, comprising mines, plantations and factories covered under the relevant Acts. Keeping in view the utility of the data generated by these surveys, the scheme has since been extended to the unorganised sector as well.
B. Child Labour
Child labour though undesirable persists in various employments on account of socio-economic compulsions. According to 2001 census figures, there were 1.26 crore working children in the age group of 5-14 as compared to 1.13 crore in 1991. State-wise distribution of child labour population in this age group shows that Uttar Pradesh (19 lakh) has the highest child labour population in the country, followed by Andhra Pradesh (14 lakh), Rajasthan (13 lakh) and Bihar (10 lakh). More than 90 per cent of the child labour was engaged in rural areas in agriculture and allied employments like cultivation, agricultural labour, livestock, forestry and fishery. As per NSSO survey 2009-10, the working children were estimated at 49.84 lakh as against 90.75 lakh in 2004-05. However, as per 2011 census, the total number of working children between the age group 5-14 years in the country was 43.53 lakh as against 1.26 crore in 2001.
Our Constitution provides for protection of children from involvement in economic activities and avocations unsuited to their age. Directive Principles of State Policy in the Constitution strongly reiterates this commitment and this is also provided for in the Fundamental Rights. Government of India stands committed to the elimination of child labour in the country. Realizing the multifaceted nature of this problem, Government had embarked on a holistic and multi-pronged approach to eliminate child labour from the country in a phased manner, beginning with children working in hazardous occupations and processes and progressively covering those working in other occupations also. On the one hand, it provides for legal action for enforcement purposes and on the other, it also focuses on general development programmes for the economic empowerment of the families of children as well as project based action in areas of high concentration of child labour.
The Government of India has amended the Child Labour (Prohibition & Regulation) Act, 1986 and enacted Child Labour (Prohibition & Regulation) Amendment Act, 2016 which interalia
33
covers complete prohibition on employment or work of children below 14 years of age in all occupations and processes; linking the age of the prohibition of employment with the age for free and compulsory education under Right to Education Act, 2009; prohibition on employment of adolescents (14 to 18 years of age) in hazardous occupations or processes and making stricter punishment for the employers contravening the provisions of the Act. Subsequent to the amendment in Child Labour Act, Government has framed Child Labour (Prohibition & Regulation) Amendment Rules, 2017 after due consultations with stakeholders and the same has been notified in the Gazette of India on 02.06.2017. The Rules inter alia cover provision for prevention, rescue and rehabilitation and convergence, definition of "help" in the family enterprises owned by the family of the child and regulation of child artists to ensure their safety and security. The Rules also provides for District Nodal Officer (DNO) and Task Force under the chairmanship of District Magistrate to ensure that the provisions of the Act are properly enforced.
Constitutional and legislative provisions providing protection to children against employment has been elaborated in the National Child Labour Policy announced in 1987. The policy addresses the complex issue of Child Labour in a comprehensive, holistic and integrated manner. For rehabilitation of child labour, Government had initiated the National Child Labour Project (NCLP) Scheme in 1988 to rehabilitate working children in 12 child labour endemic districts of the country. As on date the scheme is sanctioned in 280 districts. Under the NCLP Scheme, children are withdrawn from work and put into Special Training Centres, where they are provided with bridge education, vocational training, mid-day meal, stipend, health-care facilities etc. and finally mainstreamed to the formal education system. At present, there are around 3000 NCLP training centres being run in the country with an enrolment of approximately 1.20 lakh children. As on December, 2017 about 13.00 lakh working children have already been mainstreamed to regular education system under the NCLP Scheme.
Considering that the poverty and illiteracy are the root causes for child labour, Government is following a multi-pronged strategy to tackle this problem. Educational rehabilitation of these children has to be supplemented with economic rehabilitation of their families so that they are not compelled to send their children to work. The Government is taking various proactive measures towards convergence between the schemes of different Ministries like Ministries of Human Resource Development, Women & Child Development, Housing & Urban Affairs, Rural Development, etc. so that child labour and their families get covered under the benefits of the schemes of these ministries also.
34
CHAPTER 2
WAGES AND EARNINGS
Wages refer to the remuneration which is paid by the employer to the employee in lieu of
the services provided by the latter engaged in a production or related process. The Payment of Wages Act, 1936 defines wages as all remuneration (whether by way of salary, allowances or other-wise) expressed in terms of money or capable of being so expressed which would, if the terms of employment, expressed or implied, were fulfilled, be payable to a person employed in respect of his employment or of work done in such employment. There exists a mechanism for determination of wages in the organized and unorganized sector though not uniform for all sectors of economy. Wages in the organized sector are determined through negotiations and settlements between employer and employees. In the unorganized sector, where the labour is vulnerable to exploitation due to illiteracy and ineffective bargaining power, minimum rates of wages are fixed by the Govt. in the scheduled employments under the provisions of the Minimum Wages Act, 1948. The Act binds them to pay the wages so fixed from time to time.
Labour Bureau collects and compiles data of average daily employment, gross wage bill etc., from the Annual Statutory returns submitted by the State Governments/Union Territories under the Payment of Wages Act, 1936. A brief description is given in the following paragraphs.
The Payment of Wages Act, 1936
The Payment of Wages Act, 1936 was enacted to regulate payment of wages to workers employed in industries and to ensure a speedy and effective remedy to them against illegal deductions and/or unjustified delay caused in paying wages to them. The wage ceiling under Payment of Wages Act, 1936 was fixed at Rs.1600/- p.m. in 1982. With a view to enhance the wage ceiling to Rs.6500/- p.m. for applicability of the Act, to empower the Central Government to further increase the ceiling in future by way of notification and to enhance the penal provisions etc. the Payment of Wages (Amendment) Act, 2005, which was passed by both Houses of Parliament has been notified on 6.9.2005 as an Act 41 of 2005 by the Ministry of Law and Justice. Subsequently the Ministry of Labour and Employment has issued the Notification S.O.1577(E) to make the Payment of Wages (Amendment) Act, 2005 effective from the 9
th November 2005. In
exercise of the powers conferred by sub-section (6) of Section 1 of the Act, the Central Government, on the basis of figures of the Consumer Expenditure Survey published by National Sample Survey Organisation has enhanced the wage ceiling, further, to Rs. 10,000/- per month vide gazette notification No. S.O. 1380(E) dated 8
th August, 2007. The wage ceiling has further been
enhanced to Rs. 18000.00 vide notification No. SO 2260(E) dated 11th September, 2012. The wage
ceiling has again been enhanced from Rs.18000 to Rs.24000 vide notification No. SO 2806(E) dated 28
th August, 2017.
On the basis of the returns received from the various State/Union Territory Governments, Labour Bureau compiles data annually on per capita annual/daily earnings of workers etc. and publishes for the use of researchers, policy makers and other stake holders.
The Minimum Wages Act, 1948
The Minimum Wages Act, 1948 provides for fixation/ periodic revision of minimum wages in employments where labour is vulnerable to exploitation. The minimum wages system serves a useful purpose in preventing workers exploitation in terms of payment of unduly low wage and helps in reducing inequalities in the standard of living of different social groups of workers by statutorily prescribing minimum wage rates. This helps in reducing poverty and improving the position of low paid wage earners in the sweated industries.
Labour Bureau brings out an Annual Report on the Working of Minimum Wages Act, 1948 on the basis of returns / reports received from various State/ U.T. Governments containing information on employments added, employments in which the minimum wages were fixed for the first time, the minimum wages in different scheduled employments prevalent during the year, the
35
range of minimum wages, comparative minimum wage rates prevailing in scheduled employments and number of inspections etc.
1. MANUFACTURING INDUSTRIES
(A) Data of Per Capita Annual Earnings collected under the Payment of Wages Act, 1936.
Various States and Union Territories are collecting statistics of earnings of factory workers on an annual basis under the Payment of Wages Act, 1936. Over the years various amendments have been carried out in the Act thus widening its scope and coverage. The ceiling has been enhanced in phases from Rs.200/- per month in 1958 to Rs.1600/- per month in 1982 and Rs. 6500/- per month in 2005 as per new NIC 2004. To further enhance the scope and coverage the ceiling was raised to Rs. 10,000/- per month vide the Government of India Notification published on 08.08.2007. The wage ceiling has further been enhanced to Rs. 18000.00 vide notification No. SO 2260(E) dated 11
th September, 2012. The wage ceiling has again been enhanced to Rs. 24000/-
vide Govt. of India Gazette notification No. S.O.2806(E) dated 28th August, 2017.
The coverage of the Act has been extended to factories defined not only under Section 2(m) of the Factories Act, 1948 but also to the factories covered under Section 85 of the same Act.
The consolidated returns received from the States / Union Territories contain data in respect of only those factories which submit returns. The returns contain industry-wise information on the following items:-
(a) Number of factories covered under the Act and submitting returns; (b) Average daily employment during the year; (c) Total man-days worked during the year; and (d) Total gross wage bill, before deductions, broken up into components like basic wages,
cash allowances, bonus, arrears and money value of concessions, etc.
Average daily employment in an industry is derived by dividing total attendances during the year by the number of working days observed by that industry. Total gross wage bill for an industry when divided by the corresponding average daily employment yields the per capita annual earnings. Thus, the per capita annual earnings derived in this manner are subject to variation on account of variation in the number of working days. It is for this reason that the per capita annual earnings have been given only for perennial industries, where the variation in the number of working days during the year is not likely to be appreciable.
The per capita daily earnings are derived by dividing the total gross wage bill for a year by the corresponding figures of total mandays worked in that year. The per capita daily earnings are compiled for all industries i.e. seasonal as well as perennial.
Per Capita Annual/Daily Earnings of workers in different States / Union Territories
State-wise per capita annual and daily earnings during 2015 have been presented in Table Nos. 2.01 (a) and 2.01 (b) respectively.
The per capita annual earnings at All India level in Manufacturing Industries were Rs. 108111/- in the year 2015. The inter State comparison reveals that the States / U.Ts. with highest and lowest per capita earnings vary from year to year. During 2015, the per capita Annual Earnings have been observed to be highest (Rs.181814/-) in Assam and lowest (Rs.47942/-) in Uttarakhand. The per capita daily earning during the year 2015 in all Manufacturing Industries is to (Rs.204.00). The per capita daily earning during the year 2015 were highest to (Rs.607.00) in Assam and lowest (Rs. 169.00) in Telangana.
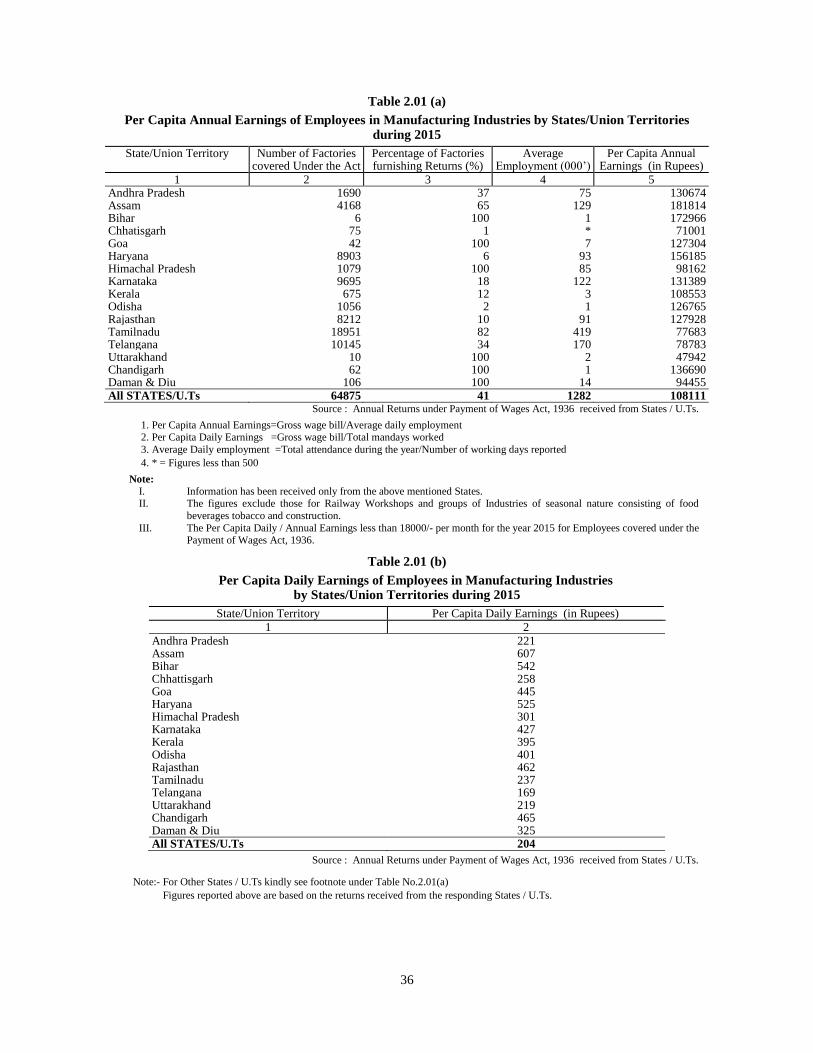
36
Table 2.01 (a)
Per Capita Annual Earnings of Employees in Manufacturing Industries by States/Union Territories during 2015
State/Union Territory Number of Factories covered Under the Act
Percentage of Factories furnishing Returns (%)
Average Employment (000‟)
Per Capita Annual Earnings (in Rupees)
1 2 3 4 5 Andhra Pradesh 1690 37 75 130674 Assam 4168 65 129 181814 Bihar 6 100 1 172966 Chhatisgarh 75 1 * 71001 Goa 42 100 7 127304 Haryana 8903 6 93 156185 Himachal Pradesh 1079 100 85 98162 Karnataka 9695 18 122 131389 Kerala 675 12 3 108553 Odisha 1056 2 1 126765 Rajasthan 8212 10 91 127928 Tamilnadu 18951 82 419 77683 Telangana 10145 34 170 78783 Uttarakhand 10 100 2 47942 Chandigarh 62 100 1 136690 Daman & Diu 106 100 14 94455 All STATES/U.Ts 64875 41 1282 108111
Source : Annual Returns under Payment of Wages Act, 1936 received from States / U.Ts.
1. Per Capita Annual Earnings=Gross wage bill/Average daily employment 2. Per Capita Daily Earnings =Gross wage bill/Total mandays worked
3. Average Daily employment =Total attendance during the year/Number of working days reported
4. * = Figures less than 500
Note:
I. Information has been received only from the above mentioned States. II. The figures exclude those for Railway Workshops and groups of Industries of seasonal nature consisting of food
beverages tobacco and construction.
III. The Per Capita Daily / Annual Earnings less than 18000/- per month for the year 2015 for Employees covered under the Payment of Wages Act, 1936.
Table 2.01 (b)
Per Capita Daily Earnings of Employees in Manufacturing Industries by States/Union Territories during 2015
State/Union Territory Per Capita Daily Earnings (in Rupees)
1 2
Andhra Pradesh 221 Assam 607 Bihar 542 Chhattisgarh 258 Goa 445 Haryana 525 Himachal Pradesh 301 Karnataka 427 Kerala 395 Odisha 401 Rajasthan 462 Tamilnadu 237 Telangana 169 Uttarakhand 219 Chandigarh 465 Daman & Diu 325 All STATES/U.Ts 204
Source : Annual Returns under Payment of Wages Act, 1936 received from States / U.Ts.
Note:- For Other States / U.Ts kindly see footnote under Table No.2.01(a)
Figures reported above are based on the returns received from the responding States / U.Ts.
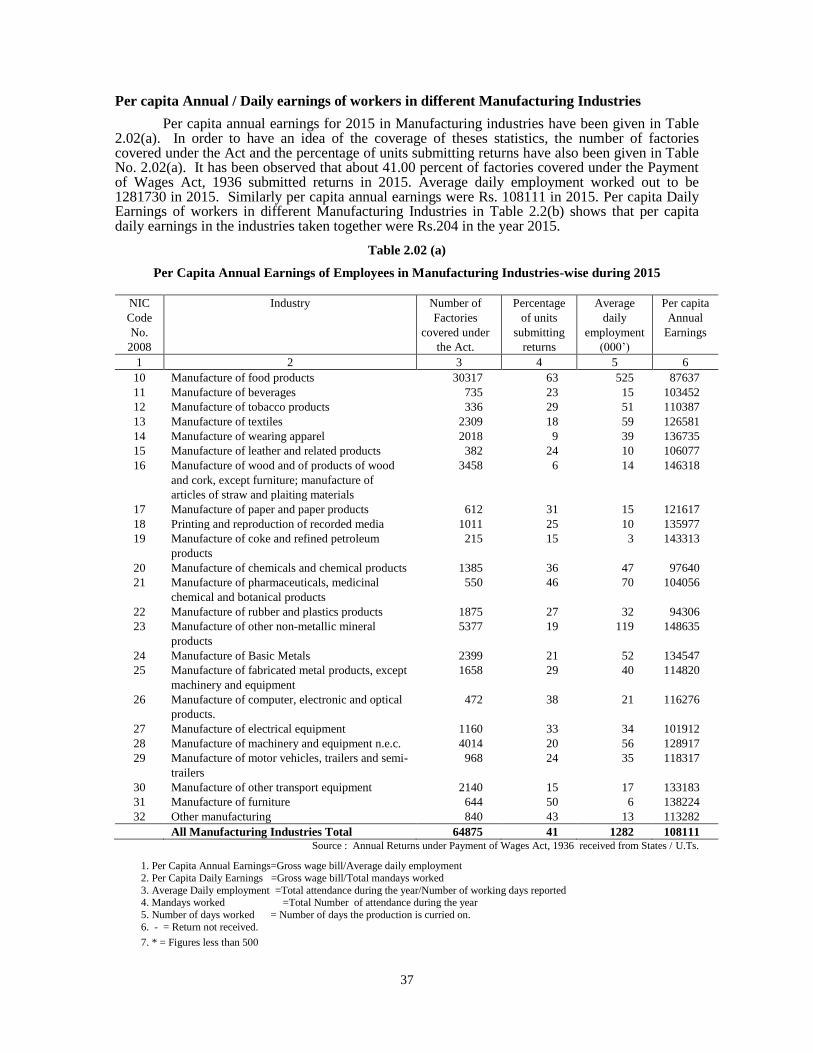
37
Per capita Annual / Daily earnings of workers in different Manufacturing Industries
Per capita annual earnings for 2015 in Manufacturing industries have been given in Table 2.02(a). In order to have an idea of the coverage of theses statistics, the number of factories covered under the Act and the percentage of units submitting returns have also been given in Table No. 2.02(a). It has been observed that about 41.00 percent of factories covered under the Payment of Wages Act, 1936 submitted returns in 2015. Average daily employment worked out to be 1281730 in 2015. Similarly per capita annual earnings were Rs. 108111 in 2015. Per capita Daily Earnings of workers in different Manufacturing Industries in Table 2.2(b) shows that per capita daily earnings in the industries taken together were Rs.204 in the year 2015.
Table 2.02 (a)
Per Capita Annual Earnings of Employees in Manufacturing Industries-wise during 2015
NIC
Code
No.
2008
Industry Number of
Factories
covered under
the Act.
Percentage
of units
submitting
returns
Average
daily
employment
(000‟)
Per capita
Annual
Earnings
1 2 3 4 5 6
10 Manufacture of food products 30317 63 525 87637
11 Manufacture of beverages 735 23 15 103452
12 Manufacture of tobacco products 336 29 51 110387
13 Manufacture of textiles 2309 18 59 126581
14 Manufacture of wearing apparel 2018 9 39 136735
15 Manufacture of leather and related products 382 24 10 106077
16 Manufacture of wood and of products of wood
and cork, except furniture; manufacture of
articles of straw and plaiting materials
3458 6 14 146318
17 Manufacture of paper and paper products 612 31 15 121617
18 Printing and reproduction of recorded media 1011 25 10 135977
19 Manufacture of coke and refined petroleum
products
215 15 3 143313
20 Manufacture of chemicals and chemical products 1385 36 47 97640
21 Manufacture of pharmaceuticals, medicinal
chemical and botanical products
550 46 70 104056
22 Manufacture of rubber and plastics products 1875 27 32 94306
23 Manufacture of other non-metallic mineral
products
5377 19 119 148635
24 Manufacture of Basic Metals 2399 21 52 134547
25 Manufacture of fabricated metal products, except
machinery and equipment
1658 29 40 114820
26 Manufacture of computer, electronic and optical
products.
472 38 21 116276
27 Manufacture of electrical equipment 1160 33 34 101912
28 Manufacture of machinery and equipment n.e.c. 4014 20 56 128917
29 Manufacture of motor vehicles, trailers and semi-
trailers
968 24 35 118317
30 Manufacture of other transport equipment 2140 15 17 133183
31 Manufacture of furniture 644 50 6 138224
32 Other manufacturing 840 43 13 113282
All Manufacturing Industries Total 64875 41 1282 108111 Source : Annual Returns under Payment of Wages Act, 1936 received from States / U.Ts.
1. Per Capita Annual Earnings=Gross wage bill/Average daily employment
2. Per Capita Daily Earnings =Gross wage bill/Total mandays worked
3. Average Daily employment =Total attendance during the year/Number of working days reported 4. Mandays worked =Total Number of attendance during the year
5. Number of days worked = Number of days the production is curried on.
6. - = Return not received.
7. * = Figures less than 500
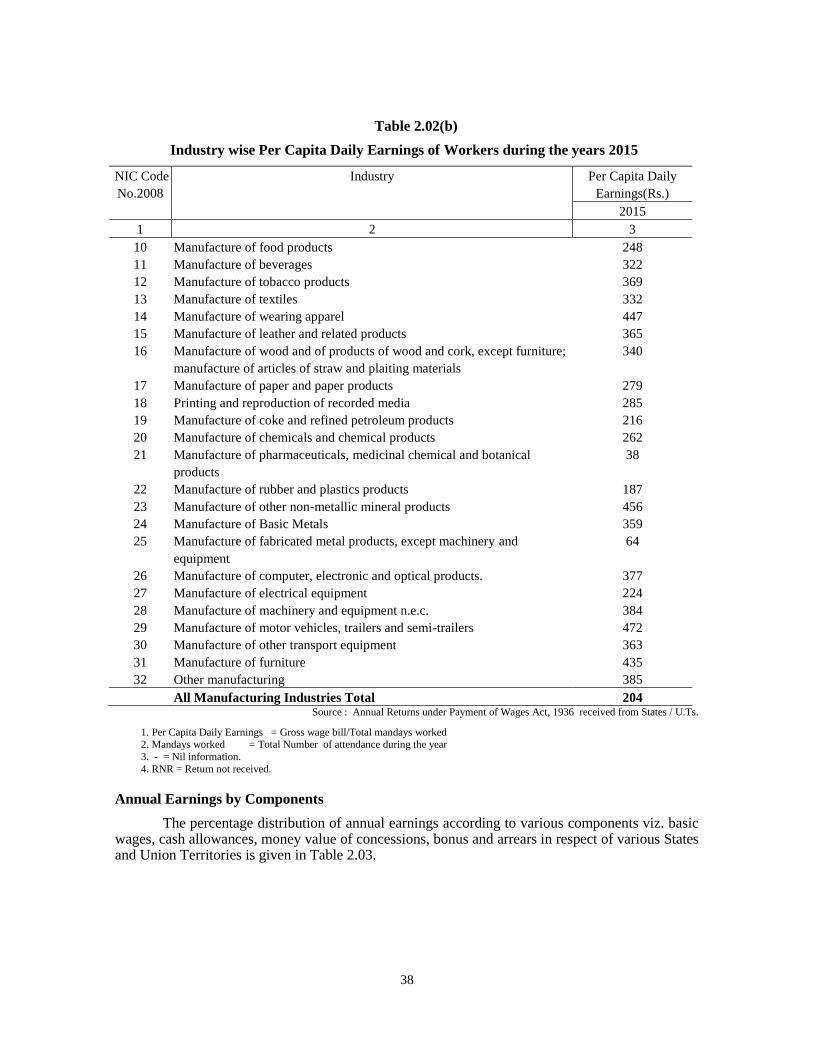
38
Table 2.02(b)
Industry wise Per Capita Daily Earnings of Workers during the years 2015
NIC Code
No.2008
Industry Per Capita Daily
Earnings(Rs.)
2015
1 2 3
10 Manufacture of food products 248
11 Manufacture of beverages 322
12 Manufacture of tobacco products 369
13 Manufacture of textiles 332
14 Manufacture of wearing apparel 447
15 Manufacture of leather and related products 365
16 Manufacture of wood and of products of wood and cork, except furniture;
manufacture of articles of straw and plaiting materials
340
17 Manufacture of paper and paper products 279
18 Printing and reproduction of recorded media 285
19 Manufacture of coke and refined petroleum products 216
20 Manufacture of chemicals and chemical products 262
21 Manufacture of pharmaceuticals, medicinal chemical and botanical
products
38
22 Manufacture of rubber and plastics products 187
23 Manufacture of other non-metallic mineral products 456
24 Manufacture of Basic Metals 359
25 Manufacture of fabricated metal products, except machinery and
equipment
64
26 Manufacture of computer, electronic and optical products. 377
27 Manufacture of electrical equipment 224
28 Manufacture of machinery and equipment n.e.c. 384
29 Manufacture of motor vehicles, trailers and semi-trailers 472
30 Manufacture of other transport equipment 363
31 Manufacture of furniture 435
32 Other manufacturing 385
All Manufacturing Industries Total 204 Source : Annual Returns under Payment of Wages Act, 1936 received from States / U.Ts.
1. Per Capita Daily Earnings = Gross wage bill/Total mandays worked 2. Mandays worked = Total Number of attendance during the year
3. - = Nil information.
4. RNR = Return not received.
Annual Earnings by Components
The percentage distribution of annual earnings according to various components viz. basic wages, cash allowances, money value of concessions, bonus and arrears in respect of various States and Union Territories is given in Table 2.03.
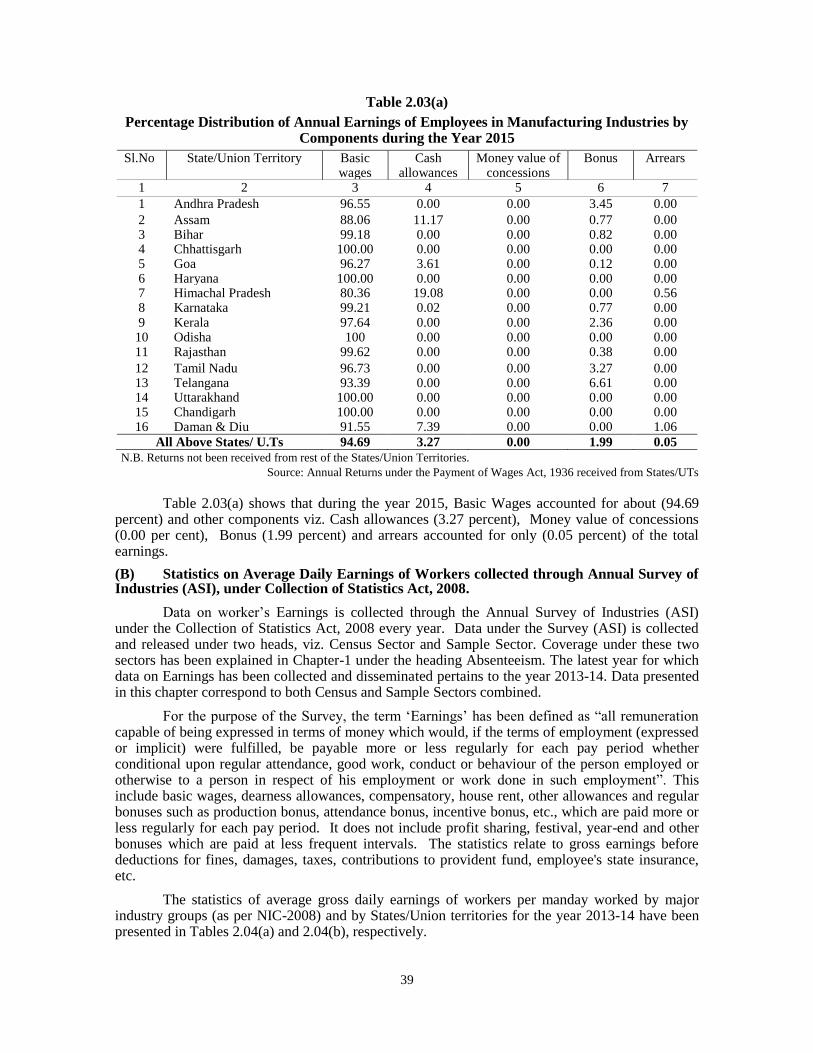
39
Table 2.03(a)
Percentage Distribution of Annual Earnings of Employees in Manufacturing Industries by Components during the Year 2015
Sl.No State/Union Territory Basic wages
Cash allowances
Money value of concessions
Bonus Arrears
1 2 3 4 5 6 7
1 Andhra Pradesh 96.55 0.00 0.00 3.45 0.00
2 Assam 88.06 11.17 0.00 0.77 0.00 3 Bihar 99.18 0.00 0.00 0.82 0.00 4 Chhattisgarh 100.00 0.00 0.00 0.00 0.00 5 Goa 96.27 3.61 0.00 0.12 0.00 6 Haryana 100.00 0.00 0.00 0.00 0.00 7 Himachal Pradesh 80.36 19.08 0.00 0.00 0.56 8 Karnataka 99.21 0.02 0.00 0.77 0.00 9 Kerala 97.64 0.00 0.00 2.36 0.00
10 Odisha 100 0.00 0.00 0.00 0.00 11 Rajasthan 99.62 0.00 0.00 0.38 0.00
12 Tamil Nadu 96.73 0.00 0.00 3.27 0.00 13 Telangana 93.39 0.00 0.00 6.61 0.00 14 Uttarakhand 100.00 0.00 0.00 0.00 0.00 15 Chandigarh 100.00 0.00 0.00 0.00 0.00 16 Daman & Diu 91.55 7.39 0.00 0.00 1.06
All Above States/ U.Ts 94.69 3.27 0.00 1.99 0.05
N.B. Returns not been received from rest of the States/Union Territories.
Source: Annual Returns under the Payment of Wages Act, 1936 received from States/UTs
Table 2.03(a) shows that during the year 2015, Basic Wages accounted for about (94.69 percent) and other components viz. Cash allowances (3.27 percent), Money value of concessions (0.00 per cent), Bonus (1.99 percent) and arrears accounted for only (0.05 percent) of the total earnings.
(B) Statistics on Average Daily Earnings of Workers collected through Annual Survey of Industries (ASI), under Collection of Statistics Act, 2008.
Data on worker‟s Earnings is collected through the Annual Survey of Industries (ASI) under the Collection of Statistics Act, 2008 every year. Data under the Survey (ASI) is collected and released under two heads, viz. Census Sector and Sample Sector. Coverage under these two sectors has been explained in Chapter-1 under the heading Absenteeism. The latest year for which data on Earnings has been collected and disseminated pertains to the year 2013-14. Data presented in this chapter correspond to both Census and Sample Sectors combined.
For the purpose of the Survey, the term „Earnings‟ has been defined as “all remuneration capable of being expressed in terms of money which would, if the terms of employment (expressed or implicit) were fulfilled, be payable more or less regularly for each pay period whether conditional upon regular attendance, good work, conduct or behaviour of the person employed or otherwise to a person in respect of his employment or work done in such employment”. This include basic wages, dearness allowances, compensatory, house rent, other allowances and regular bonuses such as production bonus, attendance bonus, incentive bonus, etc., which are paid more or less regularly for each pay period. It does not include profit sharing, festival, year-end and other bonuses which are paid at less frequent intervals. The statistics relate to gross earnings before deductions for fines, damages, taxes, contributions to provident fund, employee's state insurance, etc.
The statistics of average gross daily earnings of workers per manday worked by major industry groups (as per NIC-2008) and by States/Union territories for the year 2013-14 have been presented in Tables 2.04(a) and 2.04(b), respectively.
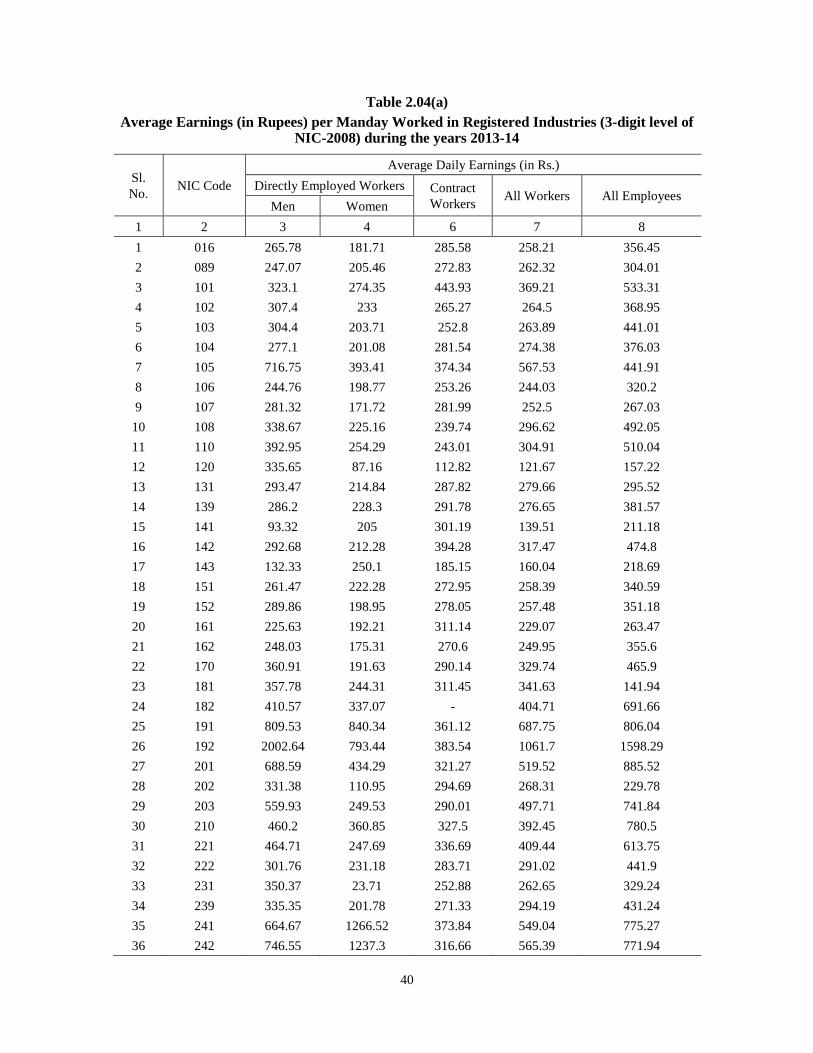
40
Table 2.04(a)
Average Earnings (in Rupees) per Manday Worked in Registered Industries (3-digit level of NIC-2008) during the years 2013-14
Sl.
No. NIC Code
Average Daily Earnings (in Rs.)
Directly Employed Workers Contract
Workers All Workers All Employees
Men Women
1 2 3 4 6 7 8
1 016 265.78 181.71 285.58 258.21 356.45
2 089 247.07 205.46 272.83 262.32 304.01
3 101 323.1 274.35 443.93 369.21 533.31
4 102 307.4 233 265.27 264.5 368.95
5 103 304.4 203.71 252.8 263.89 441.01
6 104 277.1 201.08 281.54 274.38 376.03
7 105 716.75 393.41 374.34 567.53 441.91
8 106 244.76 198.77 253.26 244.03 320.2
9 107 281.32 171.72 281.99 252.5 267.03
10 108 338.67 225.16 239.74 296.62 492.05
11 110 392.95 254.29 243.01 304.91 510.04
12 120 335.65 87.16 112.82 121.67 157.22
13 131 293.47 214.84 287.82 279.66 295.52
14 139 286.2 228.3 291.78 276.65 381.57
15 141 93.32 205 301.19 139.51 211.18
16 142 292.68 212.28 394.28 317.47 474.8
17 143 132.33 250.1 185.15 160.04 218.69
18 151 261.47 222.28 272.95 258.39 340.59
19 152 289.86 198.95 278.05 257.48 351.18
20 161 225.63 192.21 311.14 229.07 263.47
21 162 248.03 175.31 270.6 249.95 355.6
22 170 360.91 191.63 290.14 329.74 465.9
23 181 357.78 244.31 311.45 341.63 141.94
24 182 410.57 337.07 - 404.71 691.66
25 191 809.53 840.34 361.12 687.75 806.04
26 192 2002.64 793.44 383.54 1061.7 1598.29
27 201 688.59 434.29 321.27 519.52 885.52
28 202 331.38 110.95 294.69 268.31 229.78
29 203 559.93 249.53 290.01 497.71 741.84
30 210 460.2 360.85 327.5 392.45 780.5
31 221 464.71 247.69 336.69 409.44 613.75
32 222 301.76 231.18 283.71 291.02 441.9
33 231 350.37 23.71 252.88 262.65 329.24
34 239 335.35 201.78 271.33 294.19 431.24
35 241 664.67 1266.52 373.84 549.04 775.27
36 242 746.55 1237.3 316.66 565.39 771.94
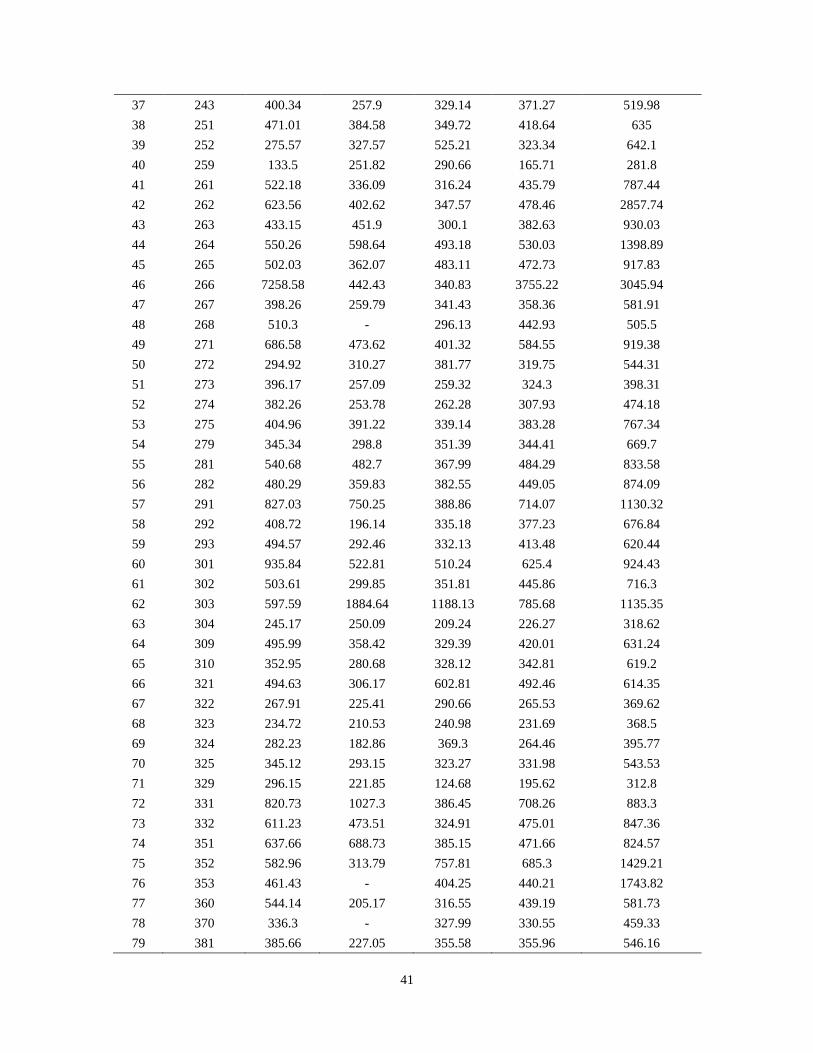
41
37 243 400.34 257.9 329.14 371.27 519.98
38 251 471.01 384.58 349.72 418.64 635
39 252 275.57 327.57 525.21 323.34 642.1
40 259 133.5 251.82 290.66 165.71 281.8
41 261 522.18 336.09 316.24 435.79 787.44
42 262 623.56 402.62 347.57 478.46 2857.74
43 263 433.15 451.9 300.1 382.63 930.03
44 264 550.26 598.64 493.18 530.03 1398.89
45 265 502.03 362.07 483.11 472.73 917.83
46 266 7258.58 442.43 340.83 3755.22 3045.94
47 267 398.26 259.79 341.43 358.36 581.91
48 268 510.3 - 296.13 442.93 505.5
49 271 686.58 473.62 401.32 584.55 919.38
50 272 294.92 310.27 381.77 319.75 544.31
51 273 396.17 257.09 259.32 324.3 398.31
52 274 382.26 253.78 262.28 307.93 474.18
53 275 404.96 391.22 339.14 383.28 767.34
54 279 345.34 298.8 351.39 344.41 669.7
55 281 540.68 482.7 367.99 484.29 833.58
56 282 480.29 359.83 382.55 449.05 874.09
57 291 827.03 750.25 388.86 714.07 1130.32
58 292 408.72 196.14 335.18 377.23 676.84
59 293 494.57 292.46 332.13 413.48 620.44
60 301 935.84 522.81 510.24 625.4 924.43
61 302 503.61 299.85 351.81 445.86 716.3
62 303 597.59 1884.64 1188.13 785.68 1135.35
63 304 245.17 250.09 209.24 226.27 318.62
64 309 495.99 358.42 329.39 420.01 631.24
65 310 352.95 280.68 328.12 342.81 619.2
66 321 494.63 306.17 602.81 492.46 614.35
67 322 267.91 225.41 290.66 265.53 369.62
68 323 234.72 210.53 240.98 231.69 368.5
69 324 282.23 182.86 369.3 264.46 395.77
70 325 345.12 293.15 323.27 331.98 543.53
71 329 296.15 221.85 124.68 195.62 312.8
72 331 820.73 1027.3 386.45 708.26 883.3
73 332 611.23 473.51 324.91 475.01 847.36
74 351 637.66 688.73 385.15 471.66 824.57
75 352 582.96 313.79 757.81 685.3 1429.21
76 353 461.43 - 404.25 440.21 1743.82
77 360 544.14 205.17 316.55 439.19 581.73
78 370 336.3 - 327.99 330.55 459.33
79 381 385.66 227.05 355.58 355.96 546.16
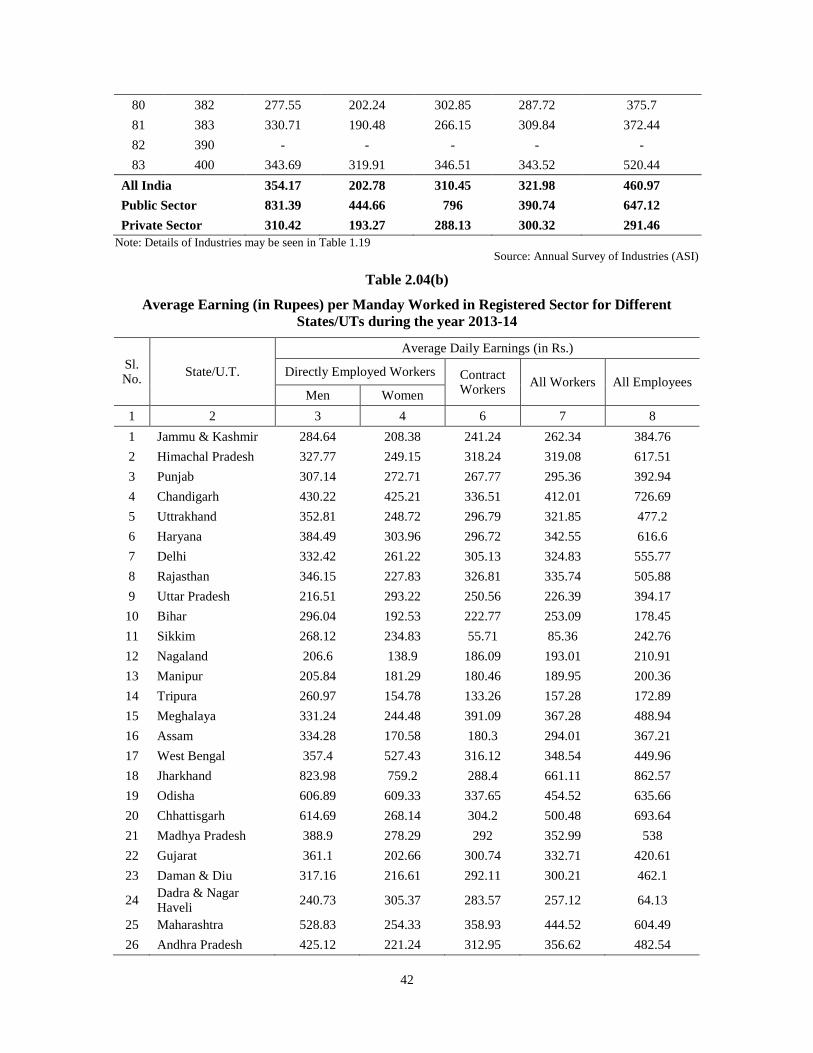
42
80 382 277.55 202.24 302.85 287.72 375.7
81 383 330.71 190.48 266.15 309.84 372.44
82 390 - - - - -
83 400 343.69 319.91 346.51 343.52 520.44
All India 354.17 202.78 310.45 321.98 460.97
Public Sector 831.39 444.66 796 390.74 647.12
Private Sector 310.42 193.27 288.13 300.32 291.46
Note: Details of Industries may be seen in Table 1.19
Source: Annual Survey of Industries (ASI)
Table 2.04(b)
Average Earning (in Rupees) per Manday Worked in Registered Sector for Different
States/UTs during the year 2013-14
Sl. No.
State/U.T.
Average Daily Earnings (in Rs.)
Directly Employed Workers Contract Workers
All Workers All Employees Men Women
1 2 3 4 6 7 8
1 Jammu & Kashmir 284.64 208.38 241.24 262.34 384.76
2 Himachal Pradesh 327.77 249.15 318.24 319.08 617.51
3 Punjab 307.14 272.71 267.77 295.36 392.94
4 Chandigarh 430.22 425.21 336.51 412.01 726.69
5 Uttrakhand 352.81 248.72 296.79 321.85 477.2
6 Haryana 384.49 303.96 296.72 342.55 616.6
7 Delhi 332.42 261.22 305.13 324.83 555.77
8 Rajasthan 346.15 227.83 326.81 335.74 505.88
9 Uttar Pradesh 216.51 293.22 250.56 226.39 394.17
10 Bihar 296.04 192.53 222.77 253.09 178.45
11 Sikkim 268.12 234.83 55.71 85.36 242.76
12 Nagaland 206.6 138.9 186.09 193.01 210.91
13 Manipur 205.84 181.29 180.46 189.95 200.36
14 Tripura 260.97 154.78 133.26 157.28 172.89
15 Meghalaya 331.24 244.48 391.09 367.28 488.94
16 Assam 334.28 170.58 180.3 294.01 367.21
17 West Bengal 357.4 527.43 316.12 348.54 449.96
18 Jharkhand 823.98 759.2 288.4 661.11 862.57
19 Odisha 606.89 609.33 337.65 454.52 635.66
20 Chhattisgarh 614.69 268.14 304.2 500.48 693.64
21 Madhya Pradesh 388.9 278.29 292 352.99 538
22 Gujarat 361.1 202.66 300.74 332.71 420.61
23 Daman & Diu 317.16 216.61 292.11 300.21 462.1
24 Dadra & Nagar Haveli
240.73 305.37 283.57 257.12 64.13
25 Maharashtra 528.83 254.33 358.93 444.52 604.49
26 Andhra Pradesh 425.12 221.24 312.95 356.62 482.54
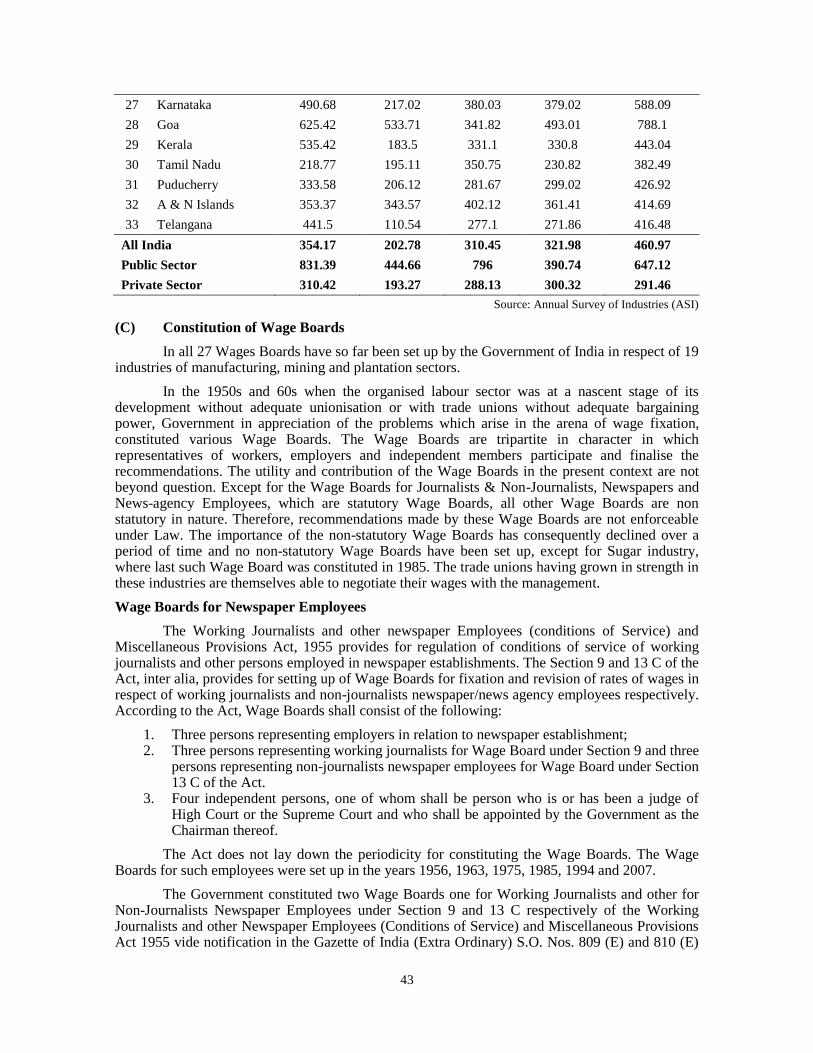
43
27 Karnataka 490.68 217.02 380.03 379.02 588.09
28 Goa 625.42 533.71 341.82 493.01 788.1
29 Kerala 535.42 183.5 331.1 330.8 443.04
30 Tamil Nadu 218.77 195.11 350.75 230.82 382.49
31 Puducherry 333.58 206.12 281.67 299.02 426.92
32 A & N Islands 353.37 343.57 402.12 361.41 414.69
33 Telangana 441.5 110.54 277.1 271.86 416.48
All India 354.17 202.78 310.45 321.98 460.97
Public Sector 831.39 444.66 796 390.74 647.12
Private Sector 310.42 193.27 288.13 300.32 291.46
Source: Annual Survey of Industries (ASI)
(C) Constitution of Wage Boards
In all 27 Wages Boards have so far been set up by the Government of India in respect of 19 industries of manufacturing, mining and plantation sectors.
In the 1950s and 60s when the organised labour sector was at a nascent stage of its development without adequate unionisation or with trade unions without adequate bargaining power, Government in appreciation of the problems which arise in the arena of wage fixation, constituted various Wage Boards. The Wage Boards are tripartite in character in which representatives of workers, employers and independent members participate and finalise the recommendations. The utility and contribution of the Wage Boards in the present context are not beyond question. Except for the Wage Boards for Journalists & Non-Journalists, Newspapers and News-agency Employees, which are statutory Wage Boards, all other Wage Boards are non statutory in nature. Therefore, recommendations made by these Wage Boards are not enforceable under Law. The importance of the non-statutory Wage Boards has consequently declined over a period of time and no non-statutory Wage Boards have been set up, except for Sugar industry, where last such Wage Board was constituted in 1985. The trade unions having grown in strength in these industries are themselves able to negotiate their wages with the management.
Wage Boards for Newspaper Employees
The Working Journalists and other newspaper Employees (conditions of Service) and Miscellaneous Provisions Act, 1955 provides for regulation of conditions of service of working journalists and other persons employed in newspaper establishments. The Section 9 and 13 C of the Act, inter alia, provides for setting up of Wage Boards for fixation and revision of rates of wages in respect of working journalists and non-journalists newspaper/news agency employees respectively. According to the Act, Wage Boards shall consist of the following:
1. Three persons representing employers in relation to newspaper establishment; 2. Three persons representing working journalists for Wage Board under Section 9 and three
persons representing non-journalists newspaper employees for Wage Board under Section 13 C of the Act.
3. Four independent persons, one of whom shall be person who is or has been a judge of High Court or the Supreme Court and who shall be appointed by the Government as the Chairman thereof.
The Act does not lay down the periodicity for constituting the Wage Boards. The Wage Boards for such employees were set up in the years 1956, 1963, 1975, 1985, 1994 and 2007.
The Government constituted two Wage Boards one for Working Journalists and other for Non-Journalists Newspaper Employees under Section 9 and 13 C respectively of the Working Journalists and other Newspaper Employees (Conditions of Service) and Miscellaneous Provisions Act 1955 vide notification in the Gazette of India (Extra Ordinary) S.O. Nos. 809 (E) and 810 (E)
44
dated 24.05.2007. The Wage Boards were given three years time to submit their reports to the Union Government. The Wage Boards functioned from their Headquarters at New Delhi.
The Government appointed Justice G.R Majithia, retired Judge of High Court of Bombay as common Chairman of the two Wage Boards in place of Justice K. Narayana Kurup who resigned w.e.f. 31.08.2008. Justive G.R. Majithia assumed charge on 04.03.2009.
The Central Government, in exercise of powers conferred by Section 9 & 13 C of the Working Journalists and other Newspaper Employees (Conditions of Service) and Miscellaneous Provisions Act, 1955 (45 of 1955), extended the tenure of the Wage Board for Working Journalists and Non-Journalists Newspaper Employees under the Chairmanship of Justice Gurbax Rai Majithia upto 31.12.2010. The Boards submitted their final Report to the Government on 31.12.2010.
The recommendations of the Majithia Wage Boards has been accepted by the Government and notified in the Official Gazette vide S.O. No.2532(E) dated 11.11.2011. As the implementation part vests with the State government/ UTs., copies of notification have been forwarded to all the State Government/ UTs with the request for its implementation.
Meanwhile, a Writ Petition No.246 of 2011 in the matter of ABP Private Limited Vs. UOI & Others alongwith 11 other Writ Petitions by other Newspaper employers were filed before the Hon‟ble Supreme Court of India challenging the constitution and recommendations of the Mahjithia Wage Boards. The Hon‟ble Supreme Court vide its Judgement dated 07.02.2014 in the said Writ Petition No.246 of 2011 has directed that all the Writ Petitions have been dismissed and the wages as revised / determined shall be payable from 11.11.2011 when the Government of India notified the recommendations of the Majithia Wage Boards. All the arrears upto March, 2014 shall be paid to all the eligible persons in four equal installments within a period of one year from 07.02.2014 and continue to pay the revised wages from April, 2014 onwards.
In order to monitor the implementation of the notification, a Central Level Monitoring Committee has been set up under the Chairmanship of Principal Labour & Employment Advisor. The first meeting of the Committee was held at Hyderabad on 24.09.2012 covering the 7 Southern States/U.Ts. So far 8 meetings of the Central Level Monitoring Committee have been held in different regions of India. The eighth such meeting of the Committee was held at New Delhi 16.06.2017 covering all States/UTs to review the implementation of the Wage Board Awards in the country. Hon'ble Minister for Labour & Employment also took a meeting with the representatives of State Governments in July, 2017 to review the progress made in the recommendations of Wage Board Awards.
2. Mines
(A) Coal Mines; Wages in Coal Sector
The wage rates for the workers employed in Coal Mining industry have been prescribed by the Central Wages Board for Coal Mining Industry.
The wage structure and other conditions of service (including fringe benefits, welfare measures, etc.) of the unionised employees (other than executives) in the coal industry are settled by negotiations in the „Joint Bipartite Committee for the Coal Industry‟ (JBCCI). The agreement signed by the JBCCI is applicable to the unionized employees of entire Coal Sector, viz, Coal India Ltd. and its subsidiaries, Singareni Collieries Company Ltd. (SCCL) and the Captive Coal mines of TISCO and IISCO.
The Joint Bipartite Committee for Coal Industry (JBCCI) consists of Central Trade Unions and the Management of Coal Companies. So far ten wage negotiations have been concluded. The 10
th Wage Agreement finalized by the JBCCI-X on 10
th October 2017, which has come into force
w.e.f. 1st July, 2016 and will be effective from 01.07.2016 to 30.06.2021. This Agreement covers
all categories of employees in Coal India Ltd. (CIL) & its Subsidiaries and SCCL.
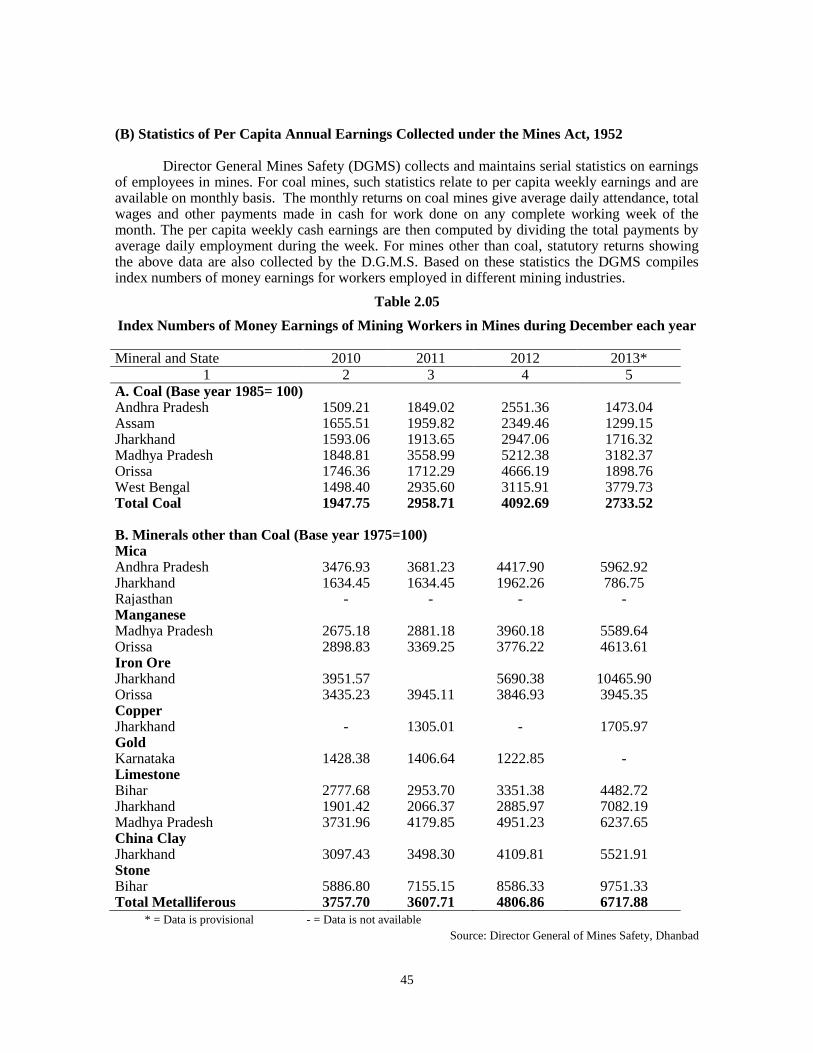
45
(B) Statistics of Per Capita Annual Earnings Collected under the Mines Act, 1952
Director General Mines Safety (DGMS) collects and maintains serial statistics on earnings of employees in mines. For coal mines, such statistics relate to per capita weekly earnings and are available on monthly basis. The monthly returns on coal mines give average daily attendance, total wages and other payments made in cash for work done on any complete working week of the month. The per capita weekly cash earnings are then computed by dividing the total payments by average daily employment during the week. For mines other than coal, statutory returns showing the above data are also collected by the D.G.M.S. Based on these statistics the DGMS compiles index numbers of money earnings for workers employed in different mining industries.
Table 2.05
Index Numbers of Money Earnings of Mining Workers in Mines during December each year
Mineral and State 2010 2011 2012 2013* 1 2 3 4 5
A. Coal (Base year 1985= 100) Andhra Pradesh 1509.21 1849.02 2551.36 1473.04 Assam 1655.51 1959.82 2349.46 1299.15 Jharkhand 1593.06 1913.65 2947.06 1716.32 Madhya Pradesh 1848.81 3558.99 5212.38 3182.37 Orissa 1746.36 1712.29 4666.19 1898.76 West Bengal 1498.40 2935.60 3115.91 3779.73 Total Coal 1947.75 2958.71 4092.69 2733.52 B. Minerals other than Coal (Base year 1975=100) Mica Andhra Pradesh 3476.93 3681.23 4417.90 5962.92 Jharkhand 1634.45 1634.45 1962.26 786.75 Rajasthan - - - - Manganese Madhya Pradesh 2675.18 2881.18 3960.18 5589.64 Orissa 2898.83 3369.25 3776.22 4613.61 Iron Ore Jharkhand 3951.57 5690.38 10465.90 Orissa 3435.23 3945.11 3846.93 3945.35 Copper Jharkhand - 1305.01 - 1705.97 Gold Karnataka 1428.38 1406.64 1222.85 - Limestone Bihar 2777.68 2953.70 3351.38 4482.72 Jharkhand 1901.42 2066.37 2885.97 7082.19 Madhya Pradesh 3731.96 4179.85 4951.23 6237.65 China Clay Jharkhand 3097.43 3498.30 4109.81 5521.91 Stone Bihar 5886.80 7155.15 8586.33 9751.33 Total Metalliferous 3757.70 3607.71 4806.86 6717.88
* = Data is provisional - = Data is not available
Source: Director General of Mines Safety, Dhanbad
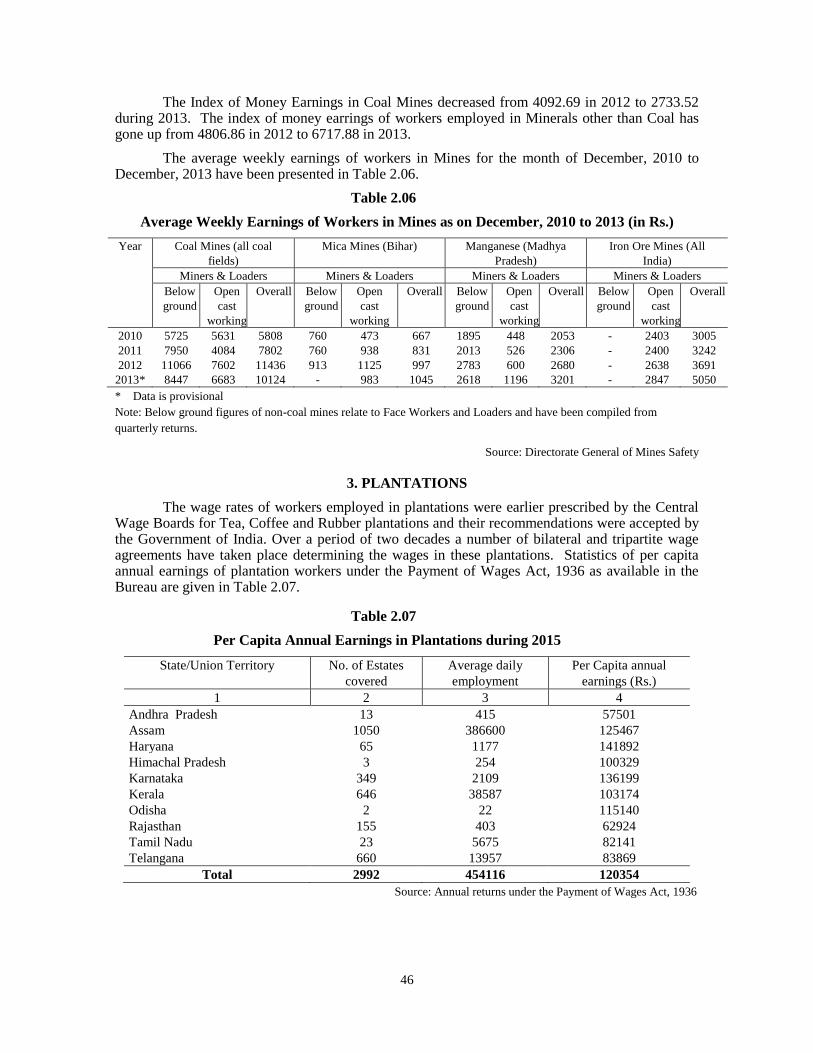
46
The Index of Money Earnings in Coal Mines decreased from 4092.69 in 2012 to 2733.52 during 2013. The index of money earrings of workers employed in Minerals other than Coal has gone up from 4806.86 in 2012 to 6717.88 in 2013.
The average weekly earnings of workers in Mines for the month of December, 2010 to December, 2013 have been presented in Table 2.06.
Table 2.06
Average Weekly Earnings of Workers in Mines as on December, 2010 to 2013 (in Rs.)
Year Coal Mines (all coal
fields)
Mica Mines (Bihar) Manganese (Madhya
Pradesh)
Iron Ore Mines (All
India)
Miners & Loaders Miners & Loaders Miners & Loaders Miners & Loaders
Below
ground
Open
cast
working
Overall Below
ground
Open
cast
working
Overall Below
ground
Open
cast
working
Overall Below
ground
Open
cast
working
Overall
2010 5725 5631 5808 760 473 667 1895 448 2053 - 2403 3005
2011 7950 4084 7802 760 938 831 2013 526 2306 - 2400 3242
2012 11066 7602 11436 913 1125 997 2783 600 2680 - 2638 3691
2013* 8447 6683 10124 - 983 1045 2618 1196 3201 - 2847 5050
* Data is provisional
Note: Below ground figures of non-coal mines relate to Face Workers and Loaders and have been compiled from
quarterly returns.
Source: Directorate General of Mines Safety
3. PLANTATIONS
The wage rates of workers employed in plantations were earlier prescribed by the Central Wage Boards for Tea, Coffee and Rubber plantations and their recommendations were accepted by the Government of India. Over a period of two decades a number of bilateral and tripartite wage agreements have taken place determining the wages in these plantations. Statistics of per capita annual earnings of plantation workers under the Payment of Wages Act, 1936 as available in the Bureau are given in Table 2.07.
Table 2.07
Per Capita Annual Earnings in Plantations during 2015
State/Union Territory No. of Estates
covered
Average daily
employment
Per Capita annual
earnings (Rs.)
1 2 3 4
Andhra Pradesh 13 415 57501
Assam 1050 386600 125467
Haryana 65 1177 141892
Himachal Pradesh 3 254 100329
Karnataka 349 2109 136199
Kerala 646 38587 103174
Odisha 2 22 115140
Rajasthan 155 403 62924
Tamil Nadu 23 5675 82141
Telangana 660 13957 83869
Total 2992 454116 120354
Source: Annual returns under the Payment of Wages Act, 1936
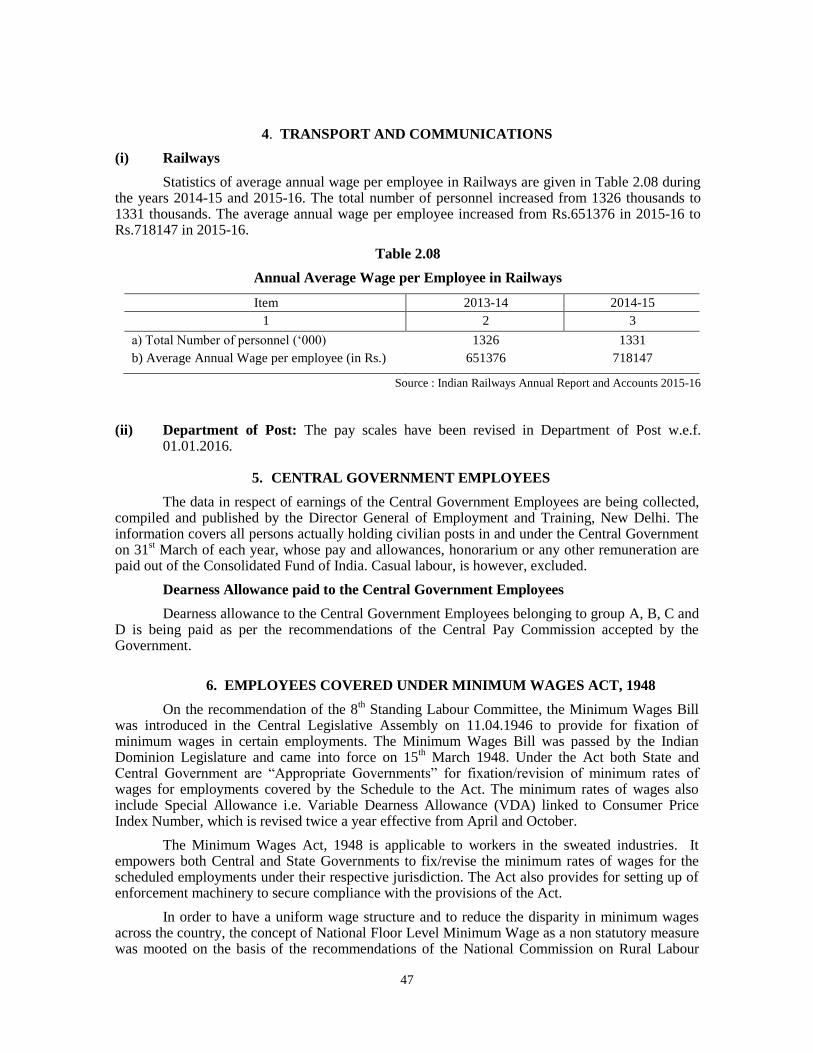
47
4. TRANSPORT AND COMMUNICATIONS
(i) Railways
Statistics of average annual wage per employee in Railways are given in Table 2.08 during the years 2014-15 and 2015-16. The total number of personnel increased from 1326 thousands to 1331 thousands. The average annual wage per employee increased from Rs.651376 in 2015-16 to Rs.718147 in 2015-16.
Table 2.08
Annual Average Wage per Employee in Railways
Item 2013-14 2014-15
1 2 3
a) Total Number of personnel („000) 1326 1331
b) Average Annual Wage per employee (in Rs.) 651376 718147
Source : Indian Railways Annual Report and Accounts 2015-16
(ii) Department of Post: The pay scales have been revised in Department of Post w.e.f. 01.01.2016.
5. CENTRAL GOVERNMENT EMPLOYEES
The data in respect of earnings of the Central Government Employees are being collected, compiled and published by the Director General of Employment and Training, New Delhi. The information covers all persons actually holding civilian posts in and under the Central Government on 31
st March of each year, whose pay and allowances, honorarium or any other remuneration are
paid out of the Consolidated Fund of India. Casual labour, is however, excluded.
Dearness Allowance paid to the Central Government Employees
Dearness allowance to the Central Government Employees belonging to group A, B, C and D is being paid as per the recommendations of the Central Pay Commission accepted by the Government.
6. EMPLOYEES COVERED UNDER MINIMUM WAGES ACT, 1948
On the recommendation of the 8th Standing Labour Committee, the Minimum Wages Bill
was introduced in the Central Legislative Assembly on 11.04.1946 to provide for fixation of minimum wages in certain employments. The Minimum Wages Bill was passed by the Indian Dominion Legislature and came into force on 15
th March 1948. Under the Act both State and
Central Government are “Appropriate Governments” for fixation/revision of minimum rates of wages for employments covered by the Schedule to the Act. The minimum rates of wages also include Special Allowance i.e. Variable Dearness Allowance (VDA) linked to Consumer Price Index Number, which is revised twice a year effective from April and October.
The Minimum Wages Act, 1948 is applicable to workers in the sweated industries. It empowers both Central and State Governments to fix/revise the minimum rates of wages for the scheduled employments under their respective jurisdiction. The Act also provides for setting up of enforcement machinery to secure compliance with the provisions of the Act.
In order to have a uniform wage structure and to reduce the disparity in minimum wages across the country, the concept of National Floor Level Minimum Wage as a non statutory measure was mooted on the basis of the recommendations of the National Commission on Rural Labour
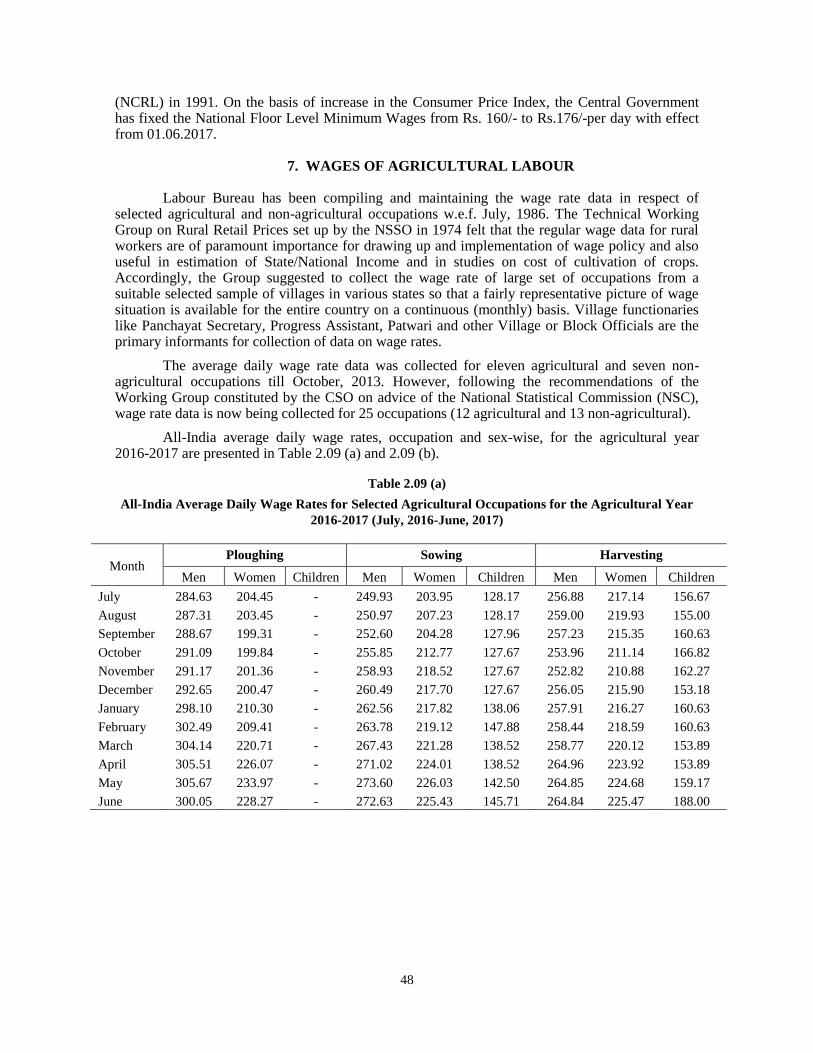
48
(NCRL) in 1991. On the basis of increase in the Consumer Price Index, the Central Government has fixed the National Floor Level Minimum Wages from Rs. 160/- to Rs.176/-per day with effect from 01.06.2017.
7. WAGES OF AGRICULTURAL LABOUR
Labour Bureau has been compiling and maintaining the wage rate data in respect of selected agricultural and non-agricultural occupations w.e.f. July, 1986. The Technical Working Group on Rural Retail Prices set up by the NSSO in 1974 felt that the regular wage data for rural workers are of paramount importance for drawing up and implementation of wage policy and also useful in estimation of State/National Income and in studies on cost of cultivation of crops. Accordingly, the Group suggested to collect the wage rate of large set of occupations from a suitable selected sample of villages in various states so that a fairly representative picture of wage situation is available for the entire country on a continuous (monthly) basis. Village functionaries like Panchayat Secretary, Progress Assistant, Patwari and other Village or Block Officials are the primary informants for collection of data on wage rates.
The average daily wage rate data was collected for eleven agricultural and seven non-agricultural occupations till October, 2013. However, following the recommendations of the Working Group constituted by the CSO on advice of the National Statistical Commission (NSC), wage rate data is now being collected for 25 occupations (12 agricultural and 13 non-agricultural).
All-India average daily wage rates, occupation and sex-wise, for the agricultural year 2016-2017 are presented in Table 2.09 (a) and 2.09 (b).
Table 2.09 (a)
All-India Average Daily Wage Rates for Selected Agricultural Occupations for the Agricultural Year
2016-2017 (July, 2016-June, 2017)
Month Ploughing Sowing Harvesting
Men Women Children Men Women Children Men Women Children
July 284.63 204.45 - 249.93 203.95 128.17 256.88 217.14 156.67
August 287.31 203.45 - 250.97 207.23 128.17 259.00 219.93 155.00
September 288.67 199.31 - 252.60 204.28 127.96 257.23 215.35 160.63
October 291.09 199.84 - 255.85 212.77 127.67 253.96 211.14 166.82
November 291.17 201.36 - 258.93 218.52 127.67 252.82 210.88 162.27
December 292.65 200.47 - 260.49 217.70 127.67 256.05 215.90 153.18
January 298.10 210.30 - 262.56 217.82 138.06 257.91 216.27 160.63
February 302.49 209.41 - 263.78 219.12 147.88 258.44 218.59 160.63
March 304.14 220.71 - 267.43 221.28 138.52 258.77 220.12 153.89
April 305.51 226.07 - 271.02 224.01 138.52 264.96 223.92 153.89
May 305.67 233.97 - 273.60 226.03 142.50 264.85 224.68 159.17
June 300.05 228.27 - 272.63 225.43 145.71 264.84 225.47 188.00
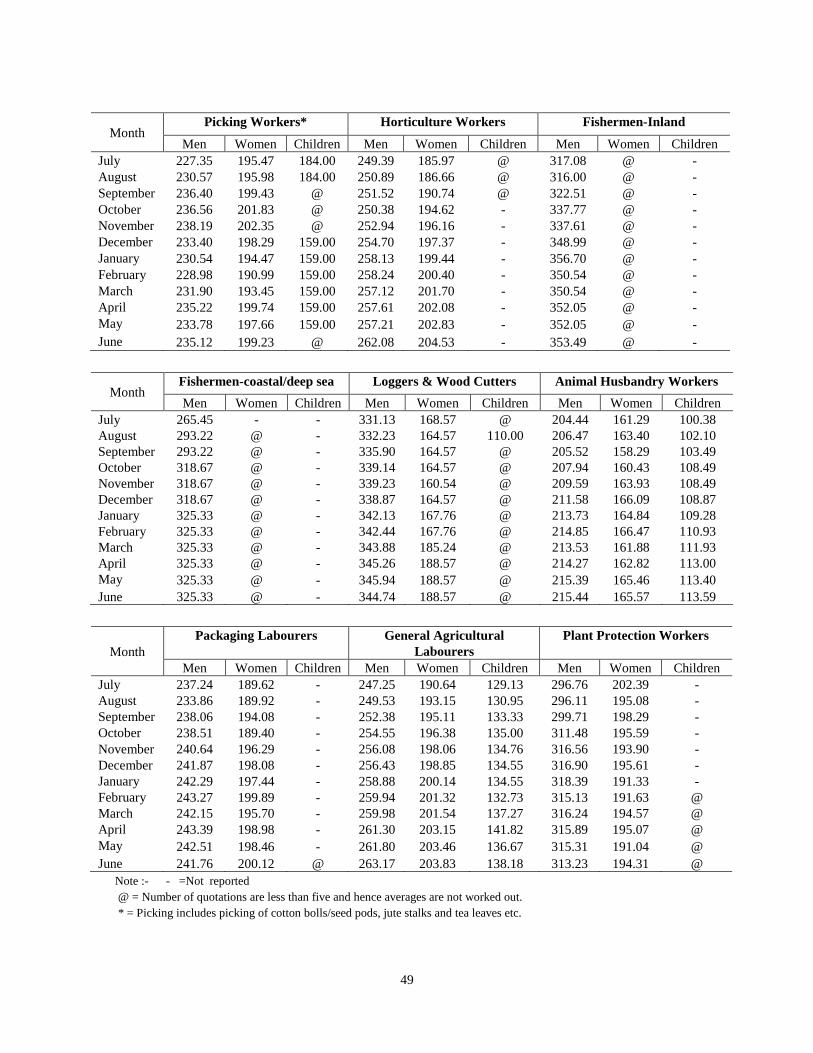
49
Month Picking Workers* Horticulture Workers Fishermen-Inland
Men Women Children Men Women Children Men Women Children
July 227.35 195.47 184.00 249.39 185.97 @ 317.08 @ -
August 230.57 195.98 184.00 250.89 186.66 @ 316.00 @ -
September 236.40 199.43 @ 251.52 190.74 @ 322.51 @ -
October 236.56 201.83 @ 250.38 194.62 - 337.77 @ -
November 238.19 202.35 @ 252.94 196.16 - 337.61 @ -
December 233.40 198.29 159.00 254.70 197.37 - 348.99 @ -
January 230.54 194.47 159.00 258.13 199.44 - 356.70 @ -
February 228.98 190.99 159.00 258.24 200.40 - 350.54 @ -
March 231.90 193.45 159.00 257.12 201.70 - 350.54 @ -
April 235.22 199.74 159.00 257.61 202.08 - 352.05 @ -
May 233.78 197.66 159.00 257.21 202.83 - 352.05 @ -
June 235.12 199.23 @ 262.08 204.53 - 353.49 @ -
Month Fishermen-coastal/deep sea Loggers & Wood Cutters Animal Husbandry Workers
Men Women Children Men Women Children Men Women Children
July 265.45 - - 331.13 168.57 @ 204.44 161.29 100.38
August 293.22 @ - 332.23 164.57 110.00 206.47 163.40 102.10
September 293.22 @ - 335.90 164.57 @ 205.52 158.29 103.49
October 318.67 @ - 339.14 164.57 @ 207.94 160.43 108.49
November 318.67 @ - 339.23 160.54 @ 209.59 163.93 108.49
December 318.67 @ - 338.87 164.57 @ 211.58 166.09 108.87
January 325.33 @ - 342.13 167.76 @ 213.73 164.84 109.28
February 325.33 @ - 342.44 167.76 @ 214.85 166.47 110.93
March 325.33 @ - 343.88 185.24 @ 213.53 161.88 111.93
April 325.33 @ - 345.26 188.57 @ 214.27 162.82 113.00
May 325.33 @ - 345.94 188.57 @ 215.39 165.46 113.40
June 325.33 @ - 344.74 188.57 @ 215.44 165.57 113.59
Month
Packaging Labourers General Agricultural
Labourers
Plant Protection Workers
Men Women Children Men Women Children Men Women Children
July 237.24 189.62 - 247.25 190.64 129.13 296.76 202.39 -
August 233.86 189.92 - 249.53 193.15 130.95 296.11 195.08 -
September 238.06 194.08 - 252.38 195.11 133.33 299.71 198.29 -
October 238.51 189.40 - 254.55 196.38 135.00 311.48 195.59 -
November 240.64 196.29 - 256.08 198.06 134.76 316.56 193.90 -
December 241.87 198.08 - 256.43 198.85 134.55 316.90 195.61 -
January 242.29 197.44 - 258.88 200.14 134.55 318.39 191.33 -
February 243.27 199.89 - 259.94 201.32 132.73 315.13 191.63 @
March 242.15 195.70 - 259.98 201.54 137.27 316.24 194.57 @
April 243.39 198.98 - 261.30 203.15 141.82 315.89 195.07 @
May 242.51 198.46 - 261.80 203.46 136.67 315.31 191.04 @
June 241.76 200.12 @ 263.17 203.83 138.18 313.23 194.31 @
Note :- - =Not reported
@ = Number of quotations are less than five and hence averages are not worked out.
* = Picking includes picking of cotton bolls/seed pods, jute stalks and tea leaves etc.
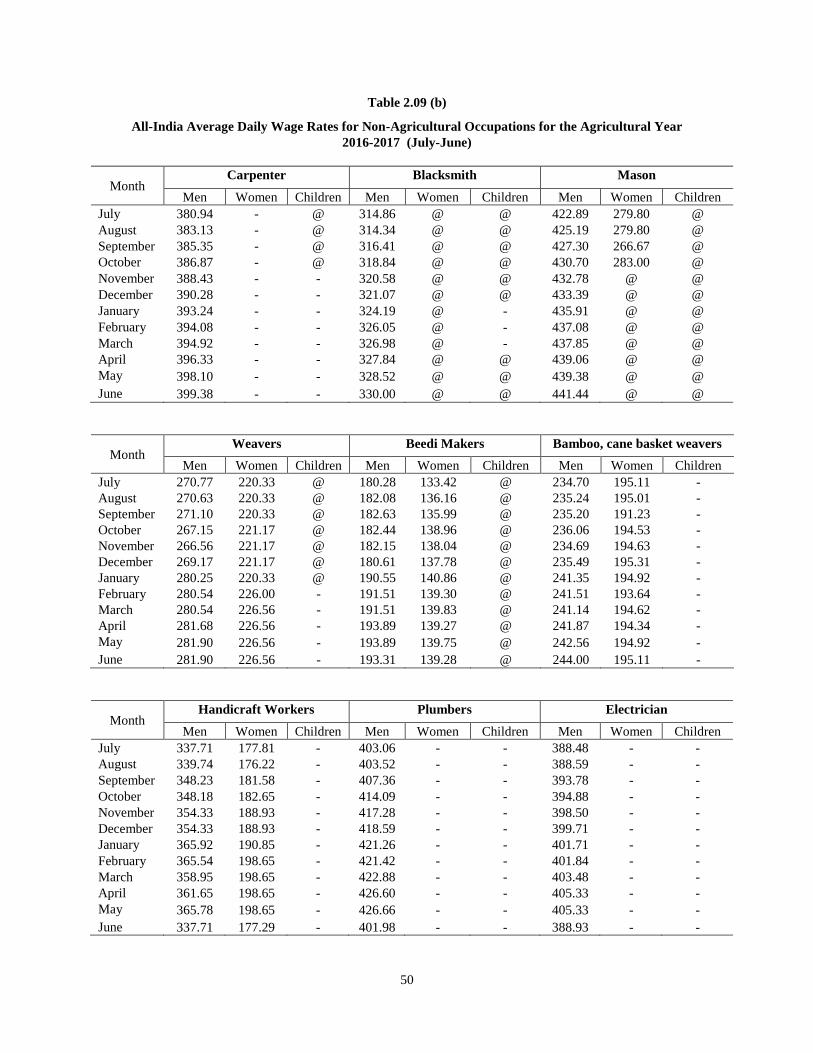
50
Table 2.09 (b)
All-India Average Daily Wage Rates for Non-Agricultural Occupations for the Agricultural Year
2016-2017 (July-June)
Month Carpenter Blacksmith Mason
Men Women Children Men Women Children Men Women Children
July 380.94 - @ 314.86 @ @ 422.89 279.80 @
August 383.13 - @ 314.34 @ @ 425.19 279.80 @
September 385.35 - @ 316.41 @ @ 427.30 266.67 @
October 386.87 - @ 318.84 @ @ 430.70 283.00 @
November 388.43 - - 320.58 @ @ 432.78 @ @
December 390.28 - - 321.07 @ @ 433.39 @ @
January 393.24 - - 324.19 @ - 435.91 @ @
February 394.08 - - 326.05 @ - 437.08 @ @
March 394.92 - - 326.98 @ - 437.85 @ @
April 396.33 - - 327.84 @ @ 439.06 @ @
May 398.10 - - 328.52 @ @ 439.38 @ @
June 399.38 - - 330.00 @ @ 441.44 @ @
Month Weavers Beedi Makers Bamboo, cane basket weavers
Men Women Children Men Women Children Men Women Children
July 270.77 220.33 @ 180.28 133.42 @ 234.70 195.11 -
August 270.63 220.33 @ 182.08 136.16 @ 235.24 195.01 -
September 271.10 220.33 @ 182.63 135.99 @ 235.20 191.23 -
October 267.15 221.17 @ 182.44 138.96 @ 236.06 194.53 -
November 266.56 221.17 @ 182.15 138.04 @ 234.69 194.63 -
December 269.17 221.17 @ 180.61 137.78 @ 235.49 195.31 -
January 280.25 220.33 @ 190.55 140.86 @ 241.35 194.92 -
February 280.54 226.00 - 191.51 139.30 @ 241.51 193.64 -
March 280.54 226.56 - 191.51 139.83 @ 241.14 194.62 -
April 281.68 226.56 - 193.89 139.27 @ 241.87 194.34 -
May 281.90 226.56 - 193.89 139.75 @ 242.56 194.92 -
June 281.90 226.56 - 193.31 139.28 @ 244.00 195.11 -
Month Handicraft Workers Plumbers Electrician
Men Women Children Men Women Children Men Women Children
July 337.71 177.81 - 403.06 - - 388.48 - -
August 339.74 176.22 - 403.52 - - 388.59 - -
September 348.23 181.58 - 407.36 - - 393.78 - -
October 348.18 182.65 - 414.09 - - 394.88 - -
November 354.33 188.93 - 417.28 - - 398.50 - -
December 354.33 188.93 - 418.59 - - 399.71 - -
January 365.92 190.85 - 421.26 - - 401.71 - -
February 365.54 198.65 - 421.42 - - 401.84 - -
March 358.95 198.65 - 422.88 - - 403.48 - -
April 361.65 198.65 - 426.60 - - 405.33 - -
May 365.78 198.65 - 426.66 - - 405.33 - -
June 337.71 177.29 - 401.98 - - 388.93 - -
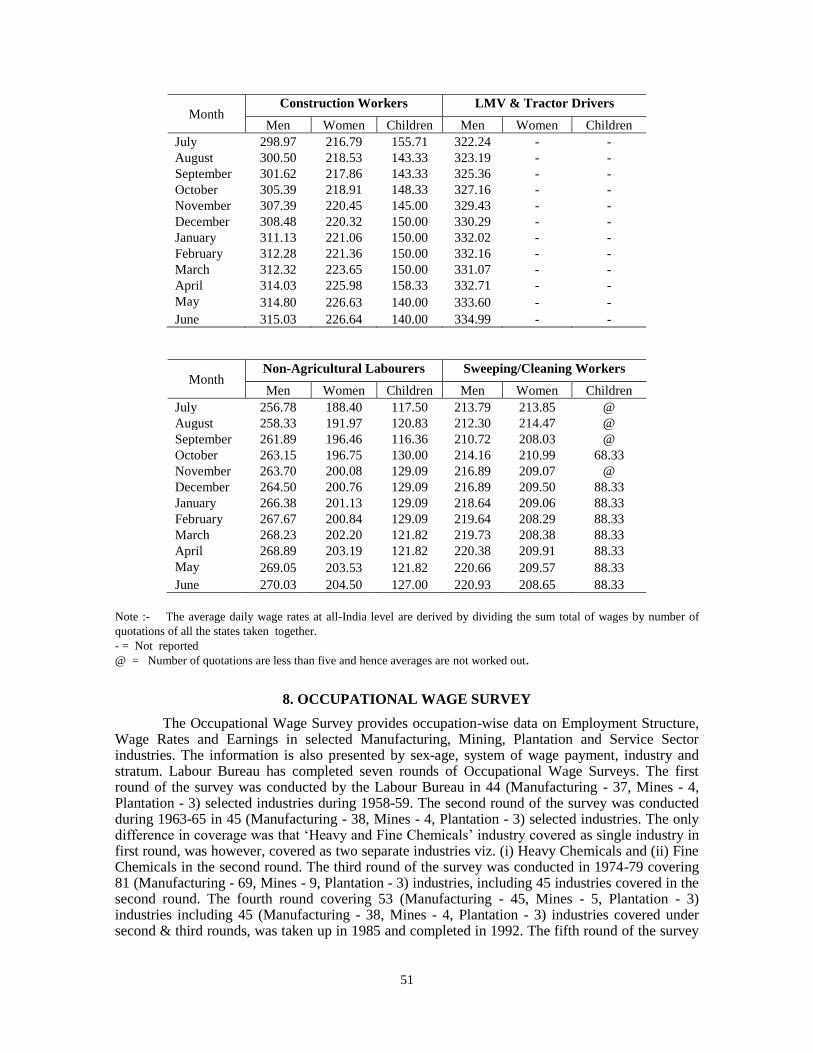
51
Month Construction Workers LMV & Tractor Drivers
Men Women Children Men Women Children
July 298.97 216.79 155.71 322.24 - -
August 300.50 218.53 143.33 323.19 - -
September 301.62 217.86 143.33 325.36 - -
October 305.39 218.91 148.33 327.16 - -
November 307.39 220.45 145.00 329.43 - -
December 308.48 220.32 150.00 330.29 - -
January 311.13 221.06 150.00 332.02 - -
February 312.28 221.36 150.00 332.16 - -
March 312.32 223.65 150.00 331.07 - -
April 314.03 225.98 158.33 332.71 - -
May 314.80 226.63 140.00 333.60 - -
June 315.03 226.64 140.00 334.99 - -
Month Non-Agricultural Labourers Sweeping/Cleaning Workers
Men Women Children Men Women Children
July 256.78 188.40 117.50 213.79 213.85 @
August 258.33 191.97 120.83 212.30 214.47 @
September 261.89 196.46 116.36 210.72 208.03 @
October 263.15 196.75 130.00 214.16 210.99 68.33
November 263.70 200.08 129.09 216.89 209.07 @
December 264.50 200.76 129.09 216.89 209.50 88.33
January 266.38 201.13 129.09 218.64 209.06 88.33
February 267.67 200.84 129.09 219.64 208.29 88.33
March 268.23 202.20 121.82 219.73 208.38 88.33
April 268.89 203.19 121.82 220.38 209.91 88.33
May 269.05 203.53 121.82 220.66 209.57 88.33
June 270.03 204.50 127.00 220.93 208.65 88.33
Note :- The average daily wage rates at all-India level are derived by dividing the sum total of wages by number of
quotations of all the states taken together.
- = Not reported
@ = Number of quotations are less than five and hence averages are not worked out.
8. OCCUPATIONAL WAGE SURVEY
The Occupational Wage Survey provides occupation-wise data on Employment Structure, Wage Rates and Earnings in selected Manufacturing, Mining, Plantation and Service Sector industries. The information is also presented by sex-age, system of wage payment, industry and stratum. Labour Bureau has completed seven rounds of Occupational Wage Surveys. The first round of the survey was conducted by the Labour Bureau in 44 (Manufacturing - 37, Mines - 4, Plantation - 3) selected industries during 1958-59. The second round of the survey was conducted during 1963-65 in 45 (Manufacturing - 38, Mines - 4, Plantation - 3) selected industries. The only difference in coverage was that „Heavy and Fine Chemicals‟ industry covered as single industry in first round, was however, covered as two separate industries viz. (i) Heavy Chemicals and (ii) Fine Chemicals in the second round. The third round of the survey was conducted in 1974-79 covering 81 (Manufacturing - 69, Mines - 9, Plantation - 3) industries, including 45 industries covered in the second round. The fourth round covering 53 (Manufacturing - 45, Mines - 5, Plantation - 3) industries including 45 (Manufacturing - 38, Mines - 4, Plantation - 3) industries covered under second & third rounds, was taken up in 1985 and completed in 1992. The fifth round of the survey
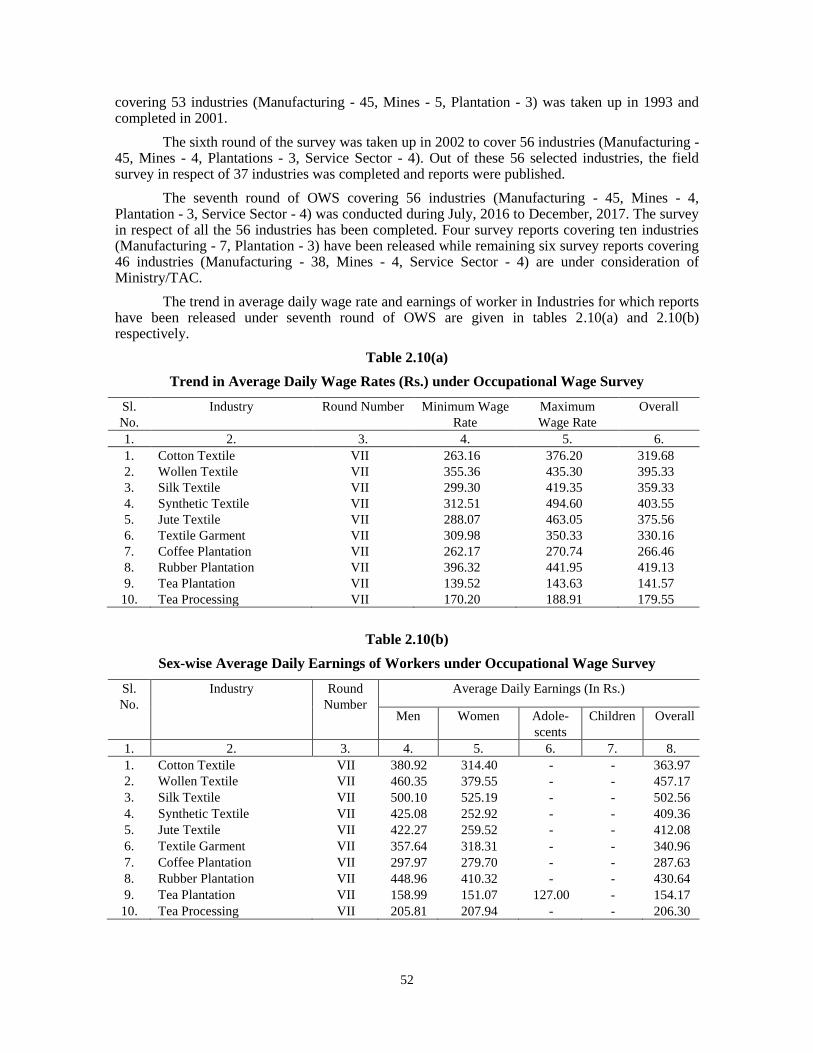
52
covering 53 industries (Manufacturing - 45, Mines - 5, Plantation - 3) was taken up in 1993 and completed in 2001.
The sixth round of the survey was taken up in 2002 to cover 56 industries (Manufacturing - 45, Mines - 4, Plantations - 3, Service Sector - 4). Out of these 56 selected industries, the field survey in respect of 37 industries was completed and reports were published.
The seventh round of OWS covering 56 industries (Manufacturing - 45, Mines - 4, Plantation - 3, Service Sector - 4) was conducted during July, 2016 to December, 2017. The survey in respect of all the 56 industries has been completed. Four survey reports covering ten industries (Manufacturing - 7, Plantation - 3) have been released while remaining six survey reports covering 46 industries (Manufacturing - 38, Mines - 4, Service Sector - 4) are under consideration of Ministry/TAC.
The trend in average daily wage rate and earnings of worker in Industries for which reports have been released under seventh round of OWS are given in tables 2.10(a) and 2.10(b) respectively.
Table 2.10(a)
Trend in Average Daily Wage Rates (Rs.) under Occupational Wage Survey
Sl.
No.
Industry Round Number Minimum Wage
Rate
Maximum
Wage Rate
Overall
1. 2. 3. 4. 5. 6.
1. Cotton Textile VII 263.16 376.20 319.68
2. Wollen Textile VII 355.36 435.30 395.33
3. Silk Textile VII 299.30 419.35 359.33
4. Synthetic Textile VII 312.51 494.60 403.55
5. Jute Textile VII 288.07 463.05 375.56
6. Textile Garment VII 309.98 350.33 330.16
7. Coffee Plantation VII 262.17 270.74 266.46
8. Rubber Plantation VII 396.32 441.95 419.13
9. Tea Plantation VII 139.52 143.63 141.57
10. Tea Processing VII 170.20 188.91 179.55
Table 2.10(b)
Sex-wise Average Daily Earnings of Workers under Occupational Wage Survey
Sl.
No.
Industry Round
Number
Average Daily Earnings (In Rs.)
Men Women Adole-
scents
Children Overall
1. 2. 3. 4. 5. 6. 7. 8.
1. Cotton Textile VII 380.92 314.40 - - 363.97
2. Wollen Textile VII 460.35 379.55 - - 457.17
3. Silk Textile VII 500.10 525.19 - - 502.56
4. Synthetic Textile VII 425.08 252.92 - - 409.36
5. Jute Textile VII 422.27 259.52 - - 412.08
6. Textile Garment VII 357.64 318.31 - - 340.96
7. Coffee Plantation VII 297.97 279.70 - - 287.63
8. Rubber Plantation VII 448.96 410.32 - - 430.64
9. Tea Plantation VII 158.99 151.07 127.00 - 154.17
10. Tea Processing VII 205.81 207.94 - - 206.30
53
9. INDEX NUMBERS OF WAGE RATES (WRI)
Wage Rate Index Numbers depict movement of relative change experienced in the wage rates over a period of time. These indices are being compiled by the Labour Bureau for selected industries since 1969. Initially, Wage Rate Index Numbers were compiled for twelve selected manufacturing industries. However, during 1976, nine more industries, comprising three plantations, four mining and two manufacturing, were added to the list of industries for the compilation of index numbers.
The present Wage Rate Indices are being compiled on the base year 1963-1965 = 100. The base year data on wage rates and employment were obtained from the Second Occupational Wage Survey, which was conducted by the Labour Bureau in 1963-65. The main criteria for selecting an industry for compilation of W.R.I. were its importance in the national economy and employment in the base year. Fourteen selected manufacturing industries accounted for nearly 67 percent of the total employment in the Manufacturing Sector during the base year. Similarly, four mining industries together accounted for nearly 95 percent of the total employment in the Mining Sector whereas the three selected plantations industries accounted for almost the entire employment in the Plantation Sector during base year. Further, in each of these selected industries, the selected occupations together accounted for 75 percent or more of the total employment in the industry.
For the purpose of construction of wage rate index numbers, wage rate has been taken as the sum of basic wage and dearness allowance in respect of workers who receive both these components, while for other workers, the actual consolidated amount of earnings represent this wage rate.
The wage rate data are collected from the sample units in each of the selected industries through mailed questionnaire and relates to the month of January of each year. The data is collected only for adult workers. Personal visits are also made to the non-responding sample establishments, in case the data is not received in time.
The Bureau constructs the wage rate index numbers on the basis of the mean of the minimum and maximum wage rates in each occupation for each of the selected industries. For time rated workers with definite scale of pay, minimum wage rate means the sum of minimum point of the scale and the dearness allowance payable on that point, while maximum wage rate means the sum of maximum point of the scale and dearness allowance payable on that point. For all other workers, minimum and maximum wage rate represents the actual minimum and maximum consolidated amounts/earnings in an occupation. To derive per day wage rates, the monthly, fortnightly and weekly wage rates are divided by 26, 12 and 6, respectively.
The weights adopted for the construction of wage rate index numbers are the employment in the respective occupations in each of the selected industries in the base year. The employment and wage rates for the base period have been derived from the results of the Second Occupational Wage Survey (1963-65).
The indices are generated using the Laspeyre‟s formula, which is the ratio of the weighted average of wages of the current year to wages of the base year. Necessary action has already been initiated to commence the compilation of the WRI on the base 2008=100.
Industry / Stratum-wise Wage Rate Index Number, Absolute Wage Rates and Real Wage Rates for the selected 21 industries for the year 1969, 1976 & 2011 to 2014 are given in Tables-2.11(a), 2.11(b) and 2.11(c).
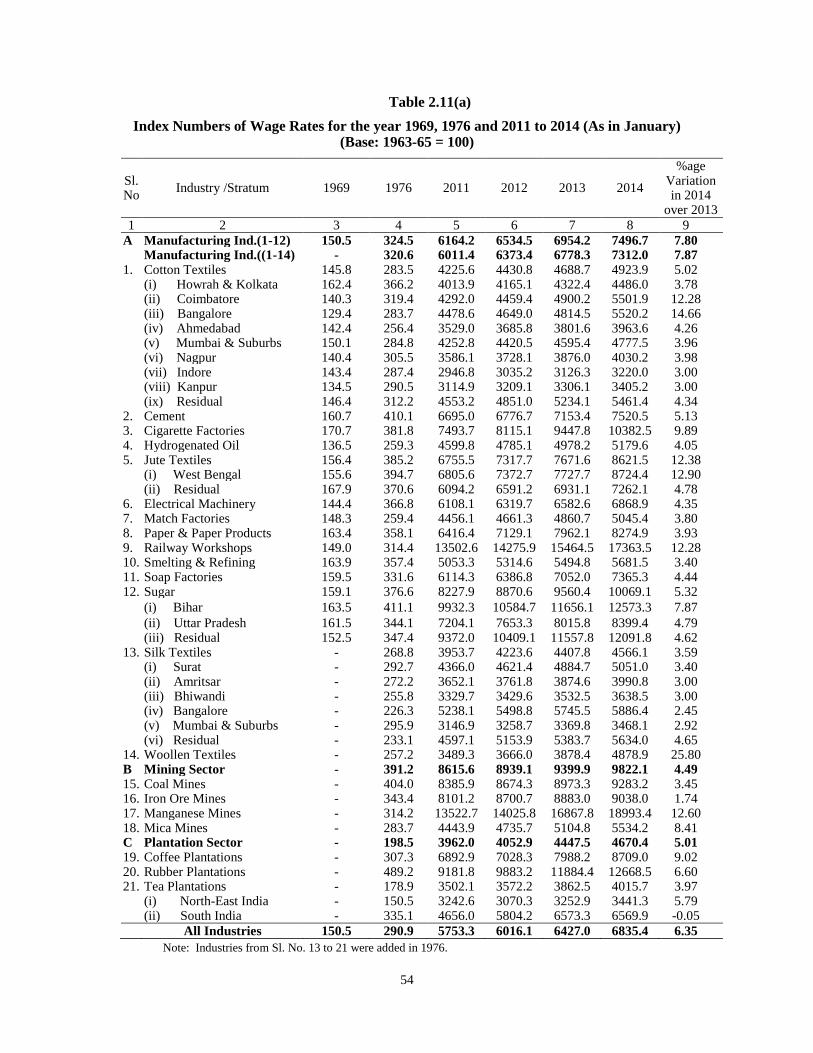
54
Table 2.11(a)
Index Numbers of Wage Rates for the year 1969, 1976 and 2011 to 2014 (As in January) (Base: 1963-65 = 100)
Sl. No
Industry /Stratum 1969 1976 2011 2012 2013 2014
%age Variation in 2014
over 2013
1 2 3 4 5 6 7 8 9
A Manufacturing Ind.(1-12) 150.5 324.5 6164.2 6534.5 6954.2 7496.7 7.80 Manufacturing Ind.((1-14) - 320.6 6011.4 6373.4 6778.3 7312.0 7.87 1. Cotton Textiles 145.8 283.5 4225.6 4430.8 4688.7 4923.9 5.02 (i) Howrah & Kolkata 162.4 366.2 4013.9 4165.1 4322.4 4486.0 3.78 (ii) Coimbatore 140.3 319.4 4292.0 4459.4 4900.2 5501.9 12.28 (iii) Bangalore 129.4 283.7 4478.6 4649.0 4814.5 5520.2 14.66 (iv) Ahmedabad 142.4 256.4 3529.0 3685.8 3801.6 3963.6 4.26 (v) Mumbai & Suburbs 150.1 284.8 4252.8 4420.5 4595.4 4777.5 3.96 (vi) Nagpur 140.4 305.5 3586.1 3728.1 3876.0 4030.2 3.98 (vii) Indore 143.4 287.4 2946.8 3035.2 3126.3 3220.0 3.00 (viii) Kanpur 134.5 290.5 3114.9 3209.1 3306.1 3405.2 3.00 (ix) Residual 146.4 312.2 4553.2 4851.0 5234.1 5461.4 4.34 2. Cement 160.7 410.1 6695.0 6776.7 7153.4 7520.5 5.13 3. Cigarette Factories 170.7 381.8 7493.7 8115.1 9447.8 10382.5 9.89 4. Hydrogenated Oil 136.5 259.3 4599.8 4785.1 4978.2 5179.6 4.05 5. Jute Textiles 156.4 385.2 6755.5 7317.7 7671.6 8621.5 12.38 (i) West Bengal 155.6 394.7 6805.6 7372.7 7727.7 8724.4 12.90 (ii) Residual 167.9 370.6 6094.2 6591.2 6931.1 7262.1 4.78 6. Electrical Machinery 144.4 366.8 6108.1 6319.7 6582.6 6868.9 4.35 7. Match Factories 148.3 259.4 4456.1 4661.3 4860.7 5045.4 3.80 8. Paper & Paper Products 163.4 358.1 6416.4 7129.1 7962.1 8274.9 3.93 9. Railway Workshops 149.0 314.4 13502.6 14275.9 15464.5 17363.5 12.28 10. Smelting & Refining 163.9 357.4 5053.3 5314.6 5494.8 5681.5 3.40 11. Soap Factories 159.5 331.6 6114.3 6386.8 7052.0 7365.3 4.44 12. Sugar 159.1 376.6 8227.9 8870.6 9560.4 10069.1 5.32
(i) Bihar 163.5 411.1 9932.3 10584.7 11656.1 12573.3 7.87
(ii) Uttar Pradesh 161.5 344.1 7204.1 7653.3 8015.8 8399.4 4.79 (iii) Residual 152.5 347.4 9372.0 10409.1 11557.8 12091.8 4.62 13. Silk Textiles - 268.8 3953.7 4223.6 4407.8 4566.1 3.59 (i) Surat - 292.7 4366.0 4621.4 4884.7 5051.0 3.40 (ii) Amritsar - 272.2 3652.1 3761.8 3874.6 3990.8 3.00 (iii) Bhiwandi - 255.8 3329.7 3429.6 3532.5 3638.5 3.00 (iv) Bangalore - 226.3 5238.1 5498.8 5745.5 5886.4 2.45 (v) Mumbai & Suburbs - 295.9 3146.9 3258.7 3369.8 3468.1 2.92 (vi) Residual - 233.1 4597.1 5153.9 5383.7 5634.0 4.65 14. Woollen Textiles - 257.2 3489.3 3666.0 3878.4 4878.9 25.80 B Mining Sector - 391.2 8615.6 8939.1 9399.9 9822.1 4.49 15. Coal Mines - 404.0 8385.9 8674.3 8973.3 9283.2 3.45 16. Iron Ore Mines - 343.4 8101.2 8700.7 8883.0 9038.0 1.74 17. Manganese Mines - 314.2 13522.7 14025.8 16867.8 18993.4 12.60 18. Mica Mines - 283.7 4443.9 4735.7 5104.8 5534.2 8.41 C Plantation Sector - 198.5 3962.0 4052.9 4447.5 4670.4 5.01 19. Coffee Plantations - 307.3 6892.9 7028.3 7988.2 8709.0 9.02 20. Rubber Plantations - 489.2 9181.8 9883.2 11884.4 12668.5 6.60 21. Tea Plantations - 178.9 3502.1 3572.2 3862.5 4015.7 3.97 (i) North-East India - 150.5 3242.6 3070.3 3252.9 3441.3 5.79 (ii) South India - 335.1 4656.0 5804.2 6573.3 6569.9 -0.05
All Industries 150.5 290.9 5753.3 6016.1 6427.0 6835.4 6.35
Note: Industries from Sl. No. 13 to 21 were added in 1976.

55
Table 2.11(b)
Average Daily Wage Rates (Absolute) By Industry & Stratum during 1963-65, 1969, 1976 and 2011 to 2014 (Rs.)
Sl.No Industry/Stratum 1963-65 1969 1976 2011 2012 2013 2014
1 2 3 4 5 6 7 8 9
A Manufacturing Ind.(1-12) 4.86 7.28 15.58 294.10 310.96 330.70 356.26
Manufacturing Ind.((1-14) 4.86 - 15.39 286.56 303.03 322.07 347.30 1. Cotton Textiles 5.46 7.96 15.43 228.65 239.44 252.78 265.41 (i) Howrah & Kolkata 3.76 6.11 13.65 150.95 156.63 162.55 168.70 (ii) Coimbatore 5.66 7.94 18.10 243.25 252.74 277.72 311.62 (iii) Bangalore 4.63 5.99 13.47 207.30 215.18 222.84 255.51 (iv) Ahmedabad 6.81 9.70 17.41 239.40 250.03 257.89 268.78 (v) Mumbai & Suburbs 6.27 9.41 17.85 266.78 277.30 288.26 299.69 (vi) Nagpur 5.30 7.44 16.18 189.94 197.45 205.29 213.46
(vii) Indore 5.12 7.43 14.72 150.84 155.37 160.03 164.83
(viii) Kanpur 5.12 6.89 14.73 158.31 163.09 168.02 173.06 (ix) Residual 4.51 6.60 14.05 204.86 218.26 235.50 245.73
2. Cement 4.50 7.23 18.47 301.52 305.20 322.16 338.69
3. Cigarette Factories 4.90 8.36 18.72 367.51 397.92 463.35 509.19 4. Hydrogenated Oil 5.11 6.98 13.25 235.04 244.51 254.38 264.67 5. Jute Textiles 3.68 5.76 14.18 248.77 269.47 282.50 317.59 (i) West Bengal 3.71 5.77 14.61 251.95 272.94 286.08 322.98
(ii) Residual 3.39 5.69 12.58 206.77 223.63 235.17 246.40
6. Mfg. of Electrical Machinery 5.07 7.32 18.60 309.82 320.57 333.90 348.43
7. Match Factories 3.43 5.09 8.72 152.70 159.73 166.57 172.89 8. Paper & Paper Products 3.72 6.08 13.30 238.59 265.09 296.06 307.70
9. Railway Workshops 5.50 8.20 18.55 742.31 784.83 850.17 954.57
10. Smelting & Refining 5.17 8.47 18.47 261.11 274.61 283.92 293.57 11. Soap Factories 5.13 8.18 17.01 313.60 327.58 361.69 377.76
12. Sugar 3.33 5.30 12.56 276.79 299.14 322.58 339.64 (i) Bihar 3.23 5.28 13.27 320.91 341.94 376.60 406.24 (ii) Uttar Pradesh 3.19 5.15 10.98 230.24 245.02 256.19 268.45 (iii) Residual 3.71 5.29 12.88 347.84 386.57 428.97 448.79 13. Silk Textiles 4.61 - 12.49 179.60 191.20 199.41 206.45 (i) Surat 4.46 - 13.08 194.93 206.34 218.09 225.52 (ii) Amritsar 4.44 - 12.10 162.34 167.21 172.22 177.39 (iii) Bhiwandi 4.92 - 12.56 163.76 168.67 173.73 178.94 (iv) Bangalore 2.65 - 6.00 143.14 150.26 157.01 160.86 (v) Mumbai & Suburbs 5.59 - 16.56 175.84 182.09 188.30 193.79 (vi) Residual 3.99 - 9.47 183.38 205.60 214.77 224.75
14. Woollen Textiles 5.06 - 13.00 175.11 184.08 194.86 246.69
B. Mining Sector 4.18 - 16.57 354.87 367.86 383.59 398.82 15. Coal Mines 4.49 - 18.13 376.46 389.40 402.82 416.74 16. Iron Ore Mines 3.06 - 10.49 247.89 266.33 271.91 276.65
17. Manganese Mines 2.04 - 6.42 276.77 287.07 345.24 389.87
18. Mica Mines 2.23 - 6.30 98.97 105.46 113.68 123.25 C. Plantation Sector 2.32 - 4.47 87.98 89.20 97.32 102.13 19. Coffee Plantations 1.57 - 4.82 108.14 110.26 125.32 136.63 20. Rubber Plantations 1.81 - 8.86 166.30 179.00 215.25 229.45
21. Tea Plantations 2.42 - 4.32 83.71 84.54 91.16 95.00
(i) North-East India 2.50 - 3.76 81.01 76.71 81.27 85.98
(ii) South India 2.06 - 6.89 95.73 119.34 135.16 135.09
All Industries 3.87 7.28 11.85 230.25 240.91 255.65 272.19
Note : Industries from Sl. No. 13 to 21 were added in 1976.
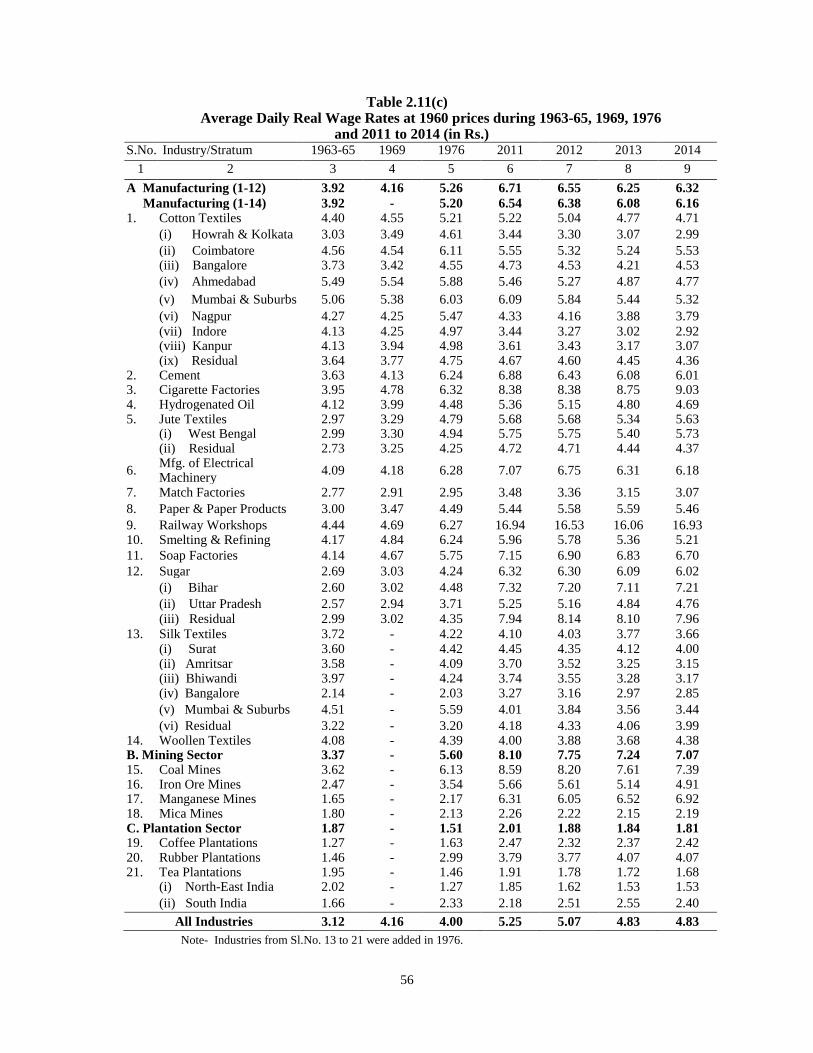
56
Table 2.11(c) Average Daily Real Wage Rates at 1960 prices during 1963-65, 1969, 1976
and 2011 to 2014 (in Rs.) S.No. Industry/Stratum 1963-65 1969 1976 2011 2012 2013 2014
1 2 3 4 5 6 7 8 9
A Manufacturing (1-12) 3.92 4.16 5.26 6.71 6.55 6.25 6.32
Manufacturing (1-14) 3.92 - 5.20 6.54 6.38 6.08 6.16 1. Cotton Textiles 4.40 4.55 5.21 5.22 5.04 4.77 4.71
(i) Howrah & Kolkata 3.03 3.49 4.61 3.44 3.30 3.07 2.99
(ii) Coimbatore 4.56 4.54 6.11 5.55 5.32 5.24 5.53 (iii) Bangalore 3.73 3.42 4.55 4.73 4.53 4.21 4.53
(iv) Ahmedabad 5.49 5.54 5.88 5.46 5.27 4.87 4.77
(v) Mumbai & Suburbs 5.06 5.38 6.03 6.09 5.84 5.44 5.32
(vi) Nagpur 4.27 4.25 5.47 4.33 4.16 3.88 3.79
(vii) Indore 4.13 4.25 4.97 3.44 3.27 3.02 2.92 (viii) Kanpur 4.13 3.94 4.98 3.61 3.43 3.17 3.07 (ix) Residual 3.64 3.77 4.75 4.67 4.60 4.45 4.36 2. Cement 3.63 4.13 6.24 6.88 6.43 6.08 6.01 3. Cigarette Factories 3.95 4.78 6.32 8.38 8.38 8.75 9.03 4. Hydrogenated Oil 4.12 3.99 4.48 5.36 5.15 4.80 4.69 5. Jute Textiles 2.97 3.29 4.79 5.68 5.68 5.34 5.63 (i) West Bengal 2.99 3.30 4.94 5.75 5.75 5.40 5.73 (ii) Residual 2.73 3.25 4.25 4.72 4.71 4.44 4.37
6. Mfg. of Electrical Machinery
4.09 4.18 6.28 7.07 6.75 6.31 6.18
7. Match Factories 2.77 2.91 2.95 3.48 3.36 3.15 3.07
8. Paper & Paper Products 3.00 3.47 4.49 5.44 5.58 5.59 5.46
9. Railway Workshops 4.44 4.69 6.27 16.94 16.53 16.06 16.93 10. Smelting & Refining 4.17 4.84 6.24 5.96 5.78 5.36 5.21
11. Soap Factories 4.14 4.67 5.75 7.15 6.90 6.83 6.70
12. Sugar 2.69 3.03 4.24 6.32 6.30 6.09 6.02
(i) Bihar 2.60 3.02 4.48 7.32 7.20 7.11 7.21
(ii) Uttar Pradesh 2.57 2.94 3.71 5.25 5.16 4.84 4.76 (iii) Residual 2.99 3.02 4.35 7.94 8.14 8.10 7.96
13. Silk Textiles 3.72 - 4.22 4.10 4.03 3.77 3.66 (i) Surat 3.60 - 4.42 4.45 4.35 4.12 4.00 (ii) Amritsar 3.58 - 4.09 3.70 3.52 3.25 3.15 (iii) Bhiwandi 3.97 - 4.24 3.74 3.55 3.28 3.17 (iv) Bangalore 2.14 - 2.03 3.27 3.16 2.97 2.85
(v) Mumbai & Suburbs 4.51 - 5.59 4.01 3.84 3.56 3.44
(vi) Residual 3.22 - 3.20 4.18 4.33 4.06 3.99 14. Woollen Textiles 4.08 - 4.39 4.00 3.88 3.68 4.38 B. Mining Sector 3.37 - 5.60 8.10 7.75 7.24 7.07 15. Coal Mines 3.62 - 6.13 8.59 8.20 7.61 7.39 16. Iron Ore Mines 2.47 - 3.54 5.66 5.61 5.14 4.91 17. Manganese Mines 1.65 - 2.17 6.31 6.05 6.52 6.92 18. Mica Mines 1.80 - 2.13 2.26 2.22 2.15 2.19 C. Plantation Sector 1.87 - 1.51 2.01 1.88 1.84 1.81 19. Coffee Plantations 1.27 - 1.63 2.47 2.32 2.37 2.42 20. Rubber Plantations 1.46 - 2.99 3.79 3.77 4.07 4.07 21. Tea Plantations 1.95 - 1.46 1.91 1.78 1.72 1.68 (i) North-East India 2.02 - 1.27 1.85 1.62 1.53 1.53
(ii) South India 1.66 - 2.33 2.18 2.51 2.55 2.40
All Industries 3.12 4.16 4.00 5.25 5.07 4.83 4.83
Note- Industries from Sl.No. 13 to 21 were added in 1976.
57
10. PRODUCTIVITY
Productivity is a measure of efficiency with which resources, both human and material, are converted into goods and services. Faster rate of economic growth can be ensured through accelerated production and higher productivity in all branches of economic activity. The productivity of human resources (labour), being an important input beside land and capital, play a significant role in determining the overall economic growth of a nation. Apart from the level of human skills, the quantity of raw material and the technology employed are also responsible for the productivity of human resources. The labour productivity growth in India measured in terms of growth in real GDP per person employed for the two time periods show that it was 3.5% during 2000-2005, while, it increased at an annual rate of 6.9% during 2005-2012 period. It may be noted that India‟s labour productivity growth during 2005-2012 was also the second highest among the 20 Asian Productivity Organisation (APO) Member‟s Countries. The Labour Productivity growth during 2000-2012 in India has all along been better than the comparative position in respect of benchmark countries such as United States (except China ). This accounts for the progress achieved by the Indian Economy through higher labour productivity during the decade of globalization.
The National Productivity Council (NPC)
The National Productivity Council (NPC) is an autonomous body under Ministry of Commerce & Industry and is partly funded by the Government of India. NPC aims at Dissemination of knowledge and experience in productivity, promotion of consciousness and improvement in productivity, strengthening of the performance and competitiveness of the economy and improving the conditions and quality of working life. Ministries of the Government of India and representatives of employers‟ and worker‟s organizations are members of the Council. NPC undertakes training programmers in the area of management services, energy efficiency, industrial engineering, economic services and human resource development, industrial pollution control, and also provides consultancy services in both formal and informal sectors of the economy. NPC has instituted National Productivity Awards for selected sectors of the economy such as agriculture and food processing industries with the objective to recognize the enterprise, which excel in productivity performance and to motivate other enterprises to enhance their productivity.
Skill Development Program
Skills and knowledge are the driving forces of economic growth and social development for any country. Countries with higher and better levels of skills adjust more effectively to the challenges and opportunities of world of work. India has set a target of Skilling 500 million people by 2022. Skill Development programmes have been implemented through a number of schemes such as Craftsmen Training Scheme (CTS), Apprenticeship Training Scheme (ATS), Modular Employable Skills (MES), Crafts Instructor Training Scheme (CITS), Advanced Vocational Training Scheme and Hi-tech Training Scheme, Supervisory Training, Women Training Institutes, Central Staff Training and Research Institute, Model Training Institutes and Model Industrial Training Institutes.
Prime Minister’s Shram Award Scheme
To give recognition to outstanding contributions towards production and productivity, technological innovations, cost saving, import substitution, saving of foreign exchange and for showing exemplary zeal and enthusiasm in the discharge of duties, the Ministry of Labour & Employment administers a scheme entitled „Prime Minister‟s Shram Awards‟ to workmen (as defined in the Industrial Dispute Act, 1947) employed in Departmental/Public Sector Undertakings of the Central and State Governments and the manufacturing units employing 500 or more workers in the private sector in recognition of their performance, devotion to duty etc. Only those workmen are eligible for the awards, who are engaged in manufacturing and productive processes and whose performance is assessable. These awards are announced every year generally on the eve of either Republic Day or Independence Day. The awards in the order of precedence are Shram Ratna, Shram Bhushan, Shrama Vir/Shram Veerangana and Shram Shree/Devi. Shram Awards were set up by the Government of India in 1985 to recognize the outstanding contributions of workers in different fields.
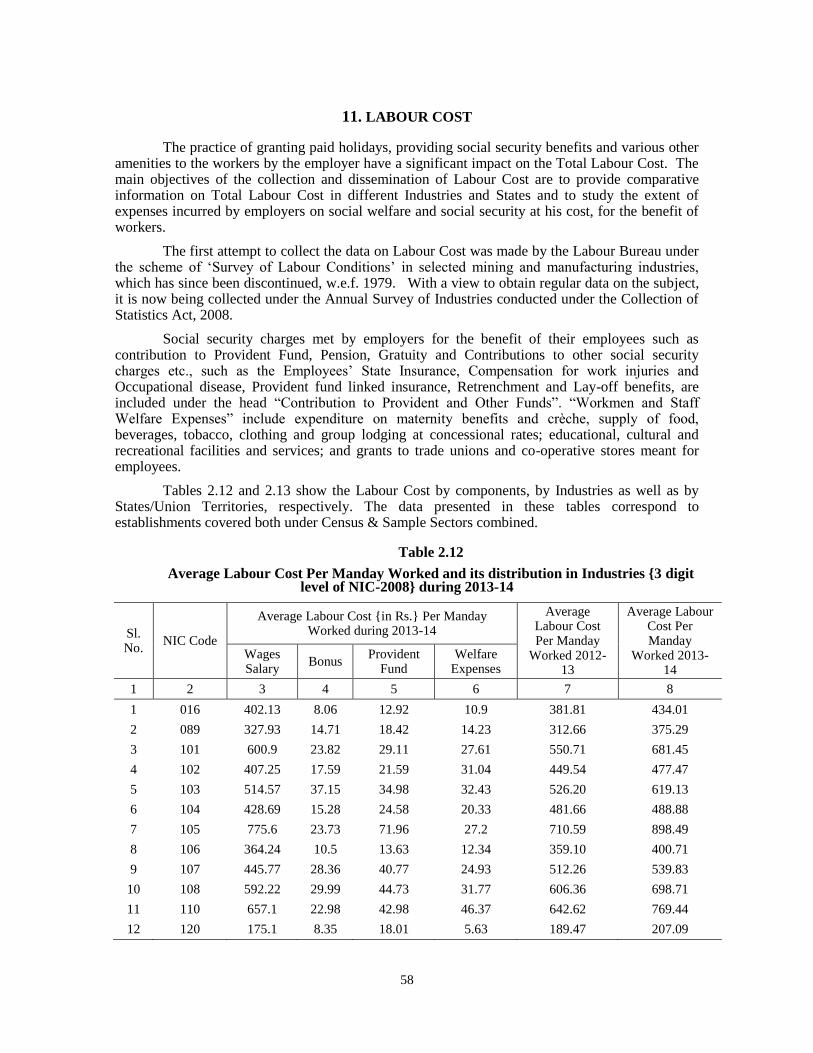
58
11. LABOUR COST
The practice of granting paid holidays, providing social security benefits and various other
amenities to the workers by the employer have a significant impact on the Total Labour Cost. The main objectives of the collection and dissemination of Labour Cost are to provide comparative information on Total Labour Cost in different Industries and States and to study the extent of expenses incurred by employers on social welfare and social security at his cost, for the benefit of workers.
The first attempt to collect the data on Labour Cost was made by the Labour Bureau under the scheme of „Survey of Labour Conditions‟ in selected mining and manufacturing industries, which has since been discontinued, w.e.f. 1979. With a view to obtain regular data on the subject, it is now being collected under the Annual Survey of Industries conducted under the Collection of Statistics Act, 2008.
Social security charges met by employers for the benefit of their employees such as contribution to Provident Fund, Pension, Gratuity and Contributions to other social security charges etc., such as the Employees‟ State Insurance, Compensation for work injuries and Occupational disease, Provident fund linked insurance, Retrenchment and Lay-off benefits, are included under the head “Contribution to Provident and Other Funds”. “Workmen and Staff Welfare Expenses” include expenditure on maternity benefits and crèche, supply of food, beverages, tobacco, clothing and group lodging at concessional rates; educational, cultural and recreational facilities and services; and grants to trade unions and co-operative stores meant for employees.
Tables 2.12 and 2.13 show the Labour Cost by components, by Industries as well as by States/Union Territories, respectively. The data presented in these tables correspond to establishments covered both under Census & Sample Sectors combined.
Table 2.12
Average Labour Cost Per Manday Worked and its distribution in Industries {3 digit level of NIC-2008} during 2013-14
Sl. No.
NIC Code
Average Labour Cost {in Rs.} Per Manday Worked during 2013-14
Average Labour Cost Per Manday
Worked 2012-13
Average Labour Cost Per Manday
Worked 2013-14
Wages Salary
Bonus Provident
Fund Welfare
Expenses
1 2 3 4 5 6 7 8
1 016 402.13 8.06 12.92 10.9 381.81 434.01
2 089 327.93 14.71 18.42 14.23 312.66 375.29
3 101 600.9 23.82 29.11 27.61 550.71 681.45
4 102 407.25 17.59 21.59 31.04 449.54 477.47
5 103 514.57 37.15 34.98 32.43 526.20 619.13
6 104 428.69 15.28 24.58 20.33 481.66 488.88
7 105 775.6 23.73 71.96 27.2 710.59 898.49
8 106 364.24 10.5 13.63 12.34 359.10 400.71
9 107 445.77 28.36 40.77 24.93 512.26 539.83
10 108 592.22 29.99 44.73 31.77 606.36 698.71
11 110 657.1 22.98 42.98 46.37 642.62 769.44
12 120 175.1 8.35 18.01 5.63 189.47 207.09
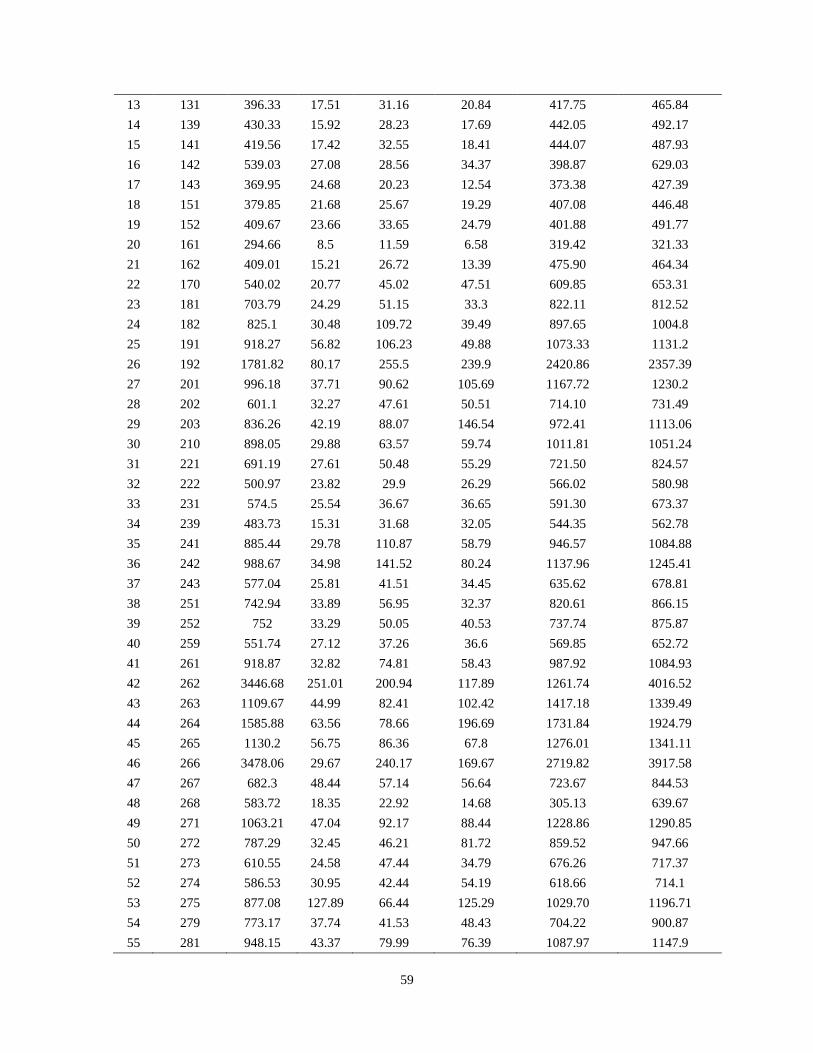
59
13 131 396.33 17.51 31.16 20.84 417.75 465.84
14 139 430.33 15.92 28.23 17.69 442.05 492.17
15 141 419.56 17.42 32.55 18.41 444.07 487.93
16 142 539.03 27.08 28.56 34.37 398.87 629.03
17 143 369.95 24.68 20.23 12.54 373.38 427.39
18 151 379.85 21.68 25.67 19.29 407.08 446.48
19 152 409.67 23.66 33.65 24.79 401.88 491.77
20 161 294.66 8.5 11.59 6.58 319.42 321.33
21 162 409.01 15.21 26.72 13.39 475.90 464.34
22 170 540.02 20.77 45.02 47.51 609.85 653.31
23 181 703.79 24.29 51.15 33.3 822.11 812.52
24 182 825.1 30.48 109.72 39.49 897.65 1004.8
25 191 918.27 56.82 106.23 49.88 1073.33 1131.2
26 192 1781.82 80.17 255.5 239.9 2420.86 2357.39
27 201 996.18 37.71 90.62 105.69 1167.72 1230.2
28 202 601.1 32.27 47.61 50.51 714.10 731.49
29 203 836.26 42.19 88.07 146.54 972.41 1113.06
30 210 898.05 29.88 63.57 59.74 1011.81 1051.24
31 221 691.19 27.61 50.48 55.29 721.50 824.57
32 222 500.97 23.82 29.9 26.29 566.02 580.98
33 231 574.5 25.54 36.67 36.65 591.30 673.37
34 239 483.73 15.31 31.68 32.05 544.35 562.78
35 241 885.44 29.78 110.87 58.79 946.57 1084.88
36 242 988.67 34.98 141.52 80.24 1137.96 1245.41
37 243 577.04 25.81 41.51 34.45 635.62 678.81
38 251 742.94 33.89 56.95 32.37 820.61 866.15
39 252 752 33.29 50.05 40.53 737.74 875.87
40 259 551.74 27.12 37.26 36.6 569.85 652.72
41 261 918.87 32.82 74.81 58.43 987.92 1084.93
42 262 3446.68 251.01 200.94 117.89 1261.74 4016.52
43 263 1109.67 44.99 82.41 102.42 1417.18 1339.49
44 264 1585.88 63.56 78.66 196.69 1731.84 1924.79
45 265 1130.2 56.75 86.36 67.8 1276.01 1341.11
46 266 3478.06 29.67 240.17 169.67 2719.82 3917.58
47 267 682.3 48.44 57.14 56.64 723.67 844.53
48 268 583.72 18.35 22.92 14.68 305.13 639.67
49 271 1063.21 47.04 92.17 88.44 1228.86 1290.85
50 272 787.29 32.45 46.21 81.72 859.52 947.66
51 273 610.55 24.58 47.44 34.79 676.26 717.37
52 274 586.53 30.95 42.44 54.19 618.66 714.1
53 275 877.08 127.89 66.44 125.29 1029.70 1196.71
54 279 773.17 37.74 41.53 48.43 704.22 900.87
55 281 948.15 43.37 79.99 76.39 1087.97 1147.9
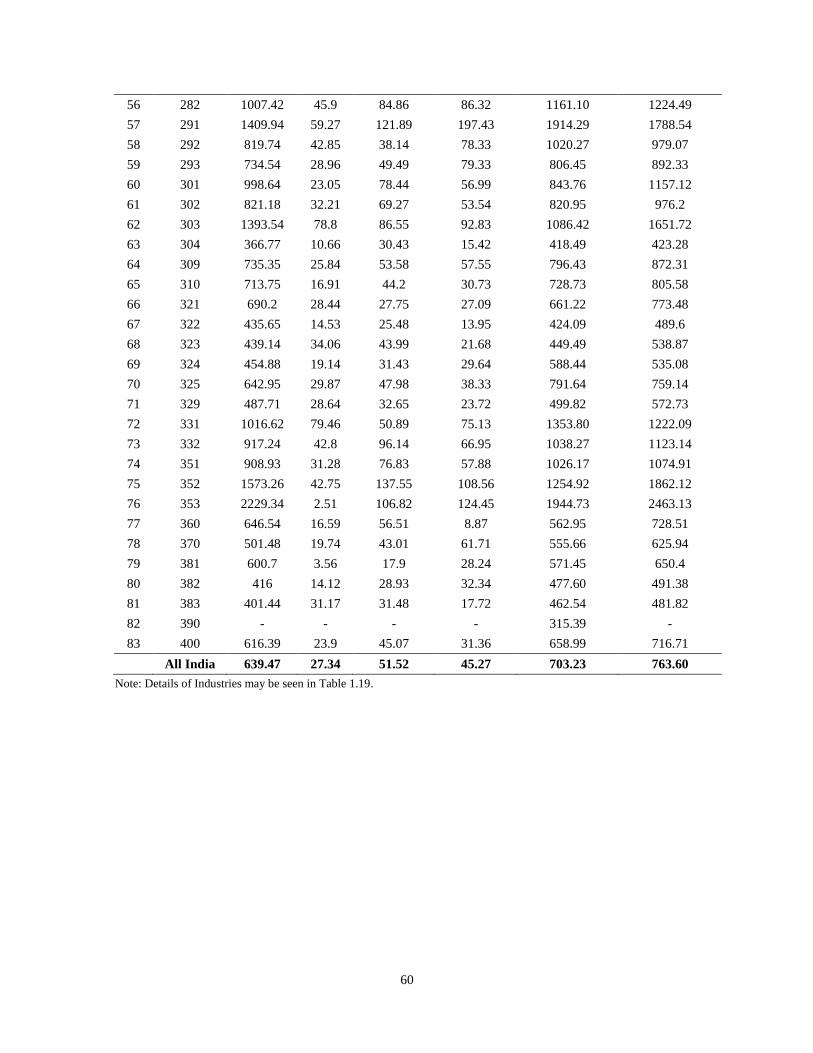
60
56 282 1007.42 45.9 84.86 86.32 1161.10 1224.49
57 291 1409.94 59.27 121.89 197.43 1914.29 1788.54
58 292 819.74 42.85 38.14 78.33 1020.27 979.07
59 293 734.54 28.96 49.49 79.33 806.45 892.33
60 301 998.64 23.05 78.44 56.99 843.76 1157.12
61 302 821.18 32.21 69.27 53.54 820.95 976.2
62 303 1393.54 78.8 86.55 92.83 1086.42 1651.72
63 304 366.77 10.66 30.43 15.42 418.49 423.28
64 309 735.35 25.84 53.58 57.55 796.43 872.31
65 310 713.75 16.91 44.2 30.73 728.73 805.58
66 321 690.2 28.44 27.75 27.09 661.22 773.48
67 322 435.65 14.53 25.48 13.95 424.09 489.6
68 323 439.14 34.06 43.99 21.68 449.49 538.87
69 324 454.88 19.14 31.43 29.64 588.44 535.08
70 325 642.95 29.87 47.98 38.33 791.64 759.14
71 329 487.71 28.64 32.65 23.72 499.82 572.73
72 331 1016.62 79.46 50.89 75.13 1353.80 1222.09
73 332 917.24 42.8 96.14 66.95 1038.27 1123.14
74 351 908.93 31.28 76.83 57.88 1026.17 1074.91
75 352 1573.26 42.75 137.55 108.56 1254.92 1862.12
76 353 2229.34 2.51 106.82 124.45 1944.73 2463.13
77 360 646.54 16.59 56.51 8.87 562.95 728.51
78 370 501.48 19.74 43.01 61.71 555.66 625.94
79 381 600.7 3.56 17.9 28.24 571.45 650.4
80 382 416 14.12 28.93 32.34 477.60 491.38
81 383 401.44 31.17 31.48 17.72 462.54 481.82
82 390 - - - - 315.39 -
83 400 616.39 23.9 45.07 31.36 658.99 716.71
All India 639.47 27.34 51.52 45.27 703.23 763.60
Note: Details of Industries may be seen in Table 1.19.
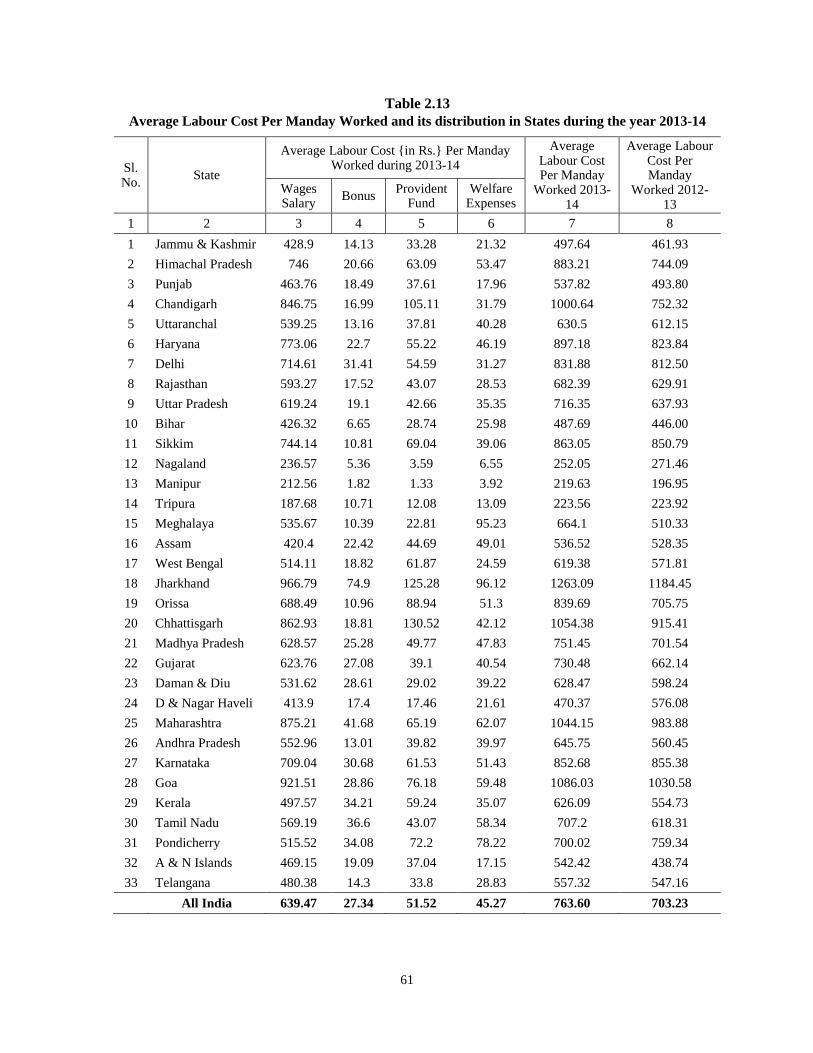
61
Table 2.13
Average Labour Cost Per Manday Worked and its distribution in States during the year 2013-14
Sl. No.
State
Average Labour Cost {in Rs.} Per Manday Worked during 2013-14
Average Labour Cost Per Manday
Worked 2013-14
Average Labour Cost Per Manday
Worked 2012-13
Wages Salary
Bonus Provident
Fund Welfare
Expenses
1 2 3 4 5 6 7 8
1 Jammu & Kashmir 428.9 14.13 33.28 21.32 497.64 461.93
2 Himachal Pradesh 746 20.66 63.09 53.47 883.21 744.09
3 Punjab 463.76 18.49 37.61 17.96 537.82 493.80
4 Chandigarh 846.75 16.99 105.11 31.79 1000.64 752.32
5 Uttaranchal 539.25 13.16 37.81 40.28 630.5 612.15
6 Haryana 773.06 22.7 55.22 46.19 897.18 823.84
7 Delhi 714.61 31.41 54.59 31.27 831.88 812.50
8 Rajasthan 593.27 17.52 43.07 28.53 682.39 629.91
9 Uttar Pradesh 619.24 19.1 42.66 35.35 716.35 637.93
10 Bihar 426.32 6.65 28.74 25.98 487.69 446.00
11 Sikkim 744.14 10.81 69.04 39.06 863.05 850.79
12 Nagaland 236.57 5.36 3.59 6.55 252.05 271.46
13 Manipur 212.56 1.82 1.33 3.92 219.63 196.95
14 Tripura 187.68 10.71 12.08 13.09 223.56 223.92
15 Meghalaya 535.67 10.39 22.81 95.23 664.1 510.33
16 Assam 420.4 22.42 44.69 49.01 536.52 528.35
17 West Bengal 514.11 18.82 61.87 24.59 619.38 571.81
18 Jharkhand 966.79 74.9 125.28 96.12 1263.09 1184.45
19 Orissa 688.49 10.96 88.94 51.3 839.69 705.75
20 Chhattisgarh 862.93 18.81 130.52 42.12 1054.38 915.41
21 Madhya Pradesh 628.57 25.28 49.77 47.83 751.45 701.54
22 Gujarat 623.76 27.08 39.1 40.54 730.48 662.14
23 Daman & Diu 531.62 28.61 29.02 39.22 628.47 598.24
24 D & Nagar Haveli 413.9 17.4 17.46 21.61 470.37 576.08
25 Maharashtra 875.21 41.68 65.19 62.07 1044.15 983.88
26 Andhra Pradesh 552.96 13.01 39.82 39.97 645.75 560.45
27 Karnataka 709.04 30.68 61.53 51.43 852.68 855.38
28 Goa 921.51 28.86 76.18 59.48 1086.03 1030.58
29 Kerala 497.57 34.21 59.24 35.07 626.09 554.73
30 Tamil Nadu 569.19 36.6 43.07 58.34 707.2 618.31
31 Pondicherry 515.52 34.08 72.2 78.22 700.02 759.34
32 A & N Islands 469.15 19.09 37.04 17.15 542.42 438.74
33 Telangana 480.38 14.3 33.8 28.83 557.32 547.16
All India 639.47 27.34 51.52 45.27 763.60 703.23
62
CHAPTER 3
FAMILY INCOME AND EXPENDITURE SURVEYS AND CONSUMER PRICE INDEX
NUMBERS
1. FAMILY INCOME AND EXPENDITURE SURVEYS
A (i) Industrial Workers
1. The Family Budget Surveys in India owe their origin to the deteriorating economic conditions of the workers due to abnormal spurt in prices during the first and the Second World War. In pursuance of the recommendations of the Rau Court of Enquiry, set up by the Government of India in 1940 to investigate the question of dearness allowance, the Family Budget Surveys were conducted for the first time, during 1943 to 1946, on uniform lines, in 28 important industrial centres. With the enactment of the Minimum Wages Act, 1948, it became obligatory for the Central and State Governments to maintain Cost of Living Indices. The Seventh International Conference of Labour Statisticians held in 1949 adopted a resolution defining the objectives of family living studies and setting new international standards. The Committee of Experts on International Definition and Measurement of Standards and Levels of Living jointly convened by the United Nations, the International Labour Organisation and the UNESCO with the co-operation of the FAO and the WHO made further improvements in the field and laid great stress on the desirability of planning and conducting family living studies for comprehensive measurement of actual family living conditions.
2. Accordingly, several State Governments as well as Government of India conducted Family Budget Surveys in various centres with a view of compiling Consumer Price Index Numbers. In order to introduce a uniform and scientific procedure for conduct of such surveys throughout the country, the Labour Bureau, Government of India conducted Family Living Surveys at 50 Centres spread over length and breadth of the country during 1958-59. The weighting diagrams derived from the results of these surveys were adopted for the compilation of Consumer Price Index Numbers for Industrial Workers on base 1960=100 for each of the 50 centres. An All-India Index was also compiled as a weighted average of these centre‟s indices.
3. During the course of the survey, in addition to the data on income, expenditure and consumption, data was also collected from the sampled families on other components of the levels of living, e.g., educational interests, housing conditions, employment, working and service conditions, savings, assets and indebtedness, etc. On the basis of the information, centre-wise analytical reports in respect of all the 50 individual centres were published. Besides, a General Report, discussing mainly the technical details of the survey and inter-centre comparison of the important aspects of the survey, was also published. Similar surveys were also conducted in Tripura (1960-61), Himachal Pradesh (1964-65), Bhilwara (1965), Bhilai (1965), Chhindwara (1965), Kothagudem (1965), Rourkela (1965) and Goa (1966-67). These centres, however, did not form part of the All-India Index.
4. During 1981-82, the Labour Bureau conducted Working Class Family Income and Expenditure Survey at 70 important industrial centres in order to derive a new set of weighting diagrams for compilation of Consumer Price Index Numbers for individual centres as well as an average All-India Index based on latest consumption pattern of the Working Class. In addition to the three sectors of employment (viz., Factories, Mines and Plantations) covered in 1958-59 survey, four more sectors viz., (i) Railways (ii) Motor Transport Undertakings (iii) Electricity generating and distributing establishments and (iv) Ports & Docks were also covered during 1981-82 surveys. The technical details of the survey were finalised by the Labour Bureau under the guidance of the Technical Advisory Committee on Statistics of Prices and Cost of Living (TAC on SPCL) constituted by the Government of India to render guidance on all such matters. In addition to 70 Centres, the survey was also conducted in 6 additional centres with a view to update the old series of Consumer Price Index Numbers of these centres to base 1982=100. Extensive consultations were held with the Index Users, viz., Employers, Employees and State Governments on various aspects of the survey, both before the start of the survey and release of Consumer Price Index Numbers on base 1982=100. Linking factors between old and new series were worked out
63
on the basis of the decision taken at the National Level Tripartite Meeting of the Index Users held on 6
th October, 1988 under the Chairmanship of the then Union Labour Minister. This series of
Consumer Price Index Numbers on base: 1982=100 was released in December, 1988 with the Index for the month of October, 1988.
5. As per the recommendations of the International Labour Organisation, Family Living Surveys should be conducted at frequent intervals generally not exceeding 10 years, so as to revise the base of the Consumer Price Index Numbers. However, due to some administrative reasons, the scheme for updation of the base of the series on base 1982=100, which was slated to start in 1991-92, could commence only in 1997. The field work in respect of 78 centres was undertaken by NSSO during Sept., 1999 to Aug., 2000. The Labour Bureau under the guidance of TAC on SPCL undertook the whole exercise of updation of the series. The results were tabulated by the Regional Computer Centre now known NIELIT, Chandigarh on the basis of Tabulation Plan & Estimation Procedures provided by the Bureau. On the basis of the results thrown up by the Survey, the weighting diagrams (average consumption pattern) have been derived in respect of all the 78 centres. Using the prices pertaining to calendar year 2001 as the base prices, the indices had been compiled using the software developed by the Regional Computer Centre, Chandigarh. The technical details as well as indices had been examined thoroughly by a sub-group of the TAC on SPCL headed by DG & CEO, NSSO, New Delhi.
6. A two day Tripartite National Level Index Users‟ Meeting was organised on 19th - 20
th
May, 2005 at Shimla in connection with the release of new series of CPI(IW). The representatives of Central/State Ministries/Departments, Employers‟ Associations and Central Trade Unions participated in the deliberations on the release of the new series of CPI-(IW). All the technical issues relating to compilation of CPI(IW) on base: 2001=100 series as well as process for regular consultation with the users, especially the Central Trade Unions and Employers‟ Organisations, were discussed. There was a broad consensus so far as the technical aspects of the exercise were concerned. Nonetheless, it was decided in the meeting to address the issues of participation of the Central Trade Unions as well as Employers‟ Organisations in the deliberation of the Technical Advisory Committee on Statistics of Prices and Cost of Living (TAC on SPCL) besides evolving a suitable mechanism for their periodic involvement as users of Index Numbers during the conduct of entire exercise, prospectively for future revision of base in a meeting to be chaired by the Hon‟ble Labour & Employment Minister with the representation of Central Trade Union.
7. As a follow-up, a National Level Index Users‟ Meeting with the representatives of Central Trade Union was held on 9
th September, 2005 in the Ministry of Labour & Employment under the
Chairmanship of Secretary, Labour & Employment. The issues discussed were mainly on the participation of Central Trade Union and Employers‟ Organisations in the TAC on SPCL. It was resolved in this meeting that the meeting of the reconstituted TAC on SPCL having the members from the Central Trade Unions & Employers‟ Organisation be held prior to the release of new series of CPI (IW) on base 2001=100.
8. The 45th meeting of the TAC on SPCL was accordingly convened on 17
th February, 2006,
in which 3 representatives each of the Central Trade Unions & Employers‟ Organisation participated in the deliberation on the release of new series of CPI (IW) on base: 2001=100. After discussions, the TAC on SPCL decided that in view of the improvement made in the new series as also the urgent need for updation of base, the CPI (IW) (New Series) should be released. Accordingly, with the approval of Govt. of India, the Labour Bureau released the new series of CPI (IW) on base: 2001=100 with effect from Jan., 2006 index on 9
th March, 2006. The centre-wise
and All India Index Numbers alongwith linking factors with the previous series of CPI (IW) on base: 1982=100 were also released and published in the Indian Labour Journal.
9. The new series on base: 2001=100 had replaced the old series on base: 1982=100 w.e.f. the index of Jan., 2006. The sample size for the conduct of Working Class Family Income & Expenditure Survey, on the basis of which weighting diagrams have been derived, increased to 41040 families from 32616 families in the 1982 series. The number of items directly retained in the index basket has been increased to 392 items as against 280 items in the 1982 series. Similarly the number of markets and centres which were 226 and 70 in the old series has been increased to 289 and 78, respectively under the new series on base: 2001=100. The Repeat House Rent Surveys are also conducted in six-monthly rounds at all the 78 centres to collect house rent data and related changes and compile house rent indices. The methodology for updation of base and also the
64
compilation of indices were approved by the Technical Advisory Committee on Statistics of Prices and Cost of Living.
10. An Index Review Committee under the Chairmanship of Prof. G.K. Chadha, former Vice-Chancellor of Jawaharlal Nehru University and Member, Prime Minister‟s Economic Advisory Council, with representatives from Trade Unions & Employers‟ Organisations was set up to examine various aspects of new series of CPI(IW) on base: 2001=100. Index Review Committee conducted seven meetings at various places in the country i.e., Shimla, New Delhi (2), Chennai, Mumbai, Dhanbad and Mysore. The Committee has submitted its report on 20
th March, 2009.
A (ii) Urban/Rural Population
1. The National Statistical Commission (NSC) in its Report in 2001 observed that CPI numbers catering to specific segments of the population can be considered as partial indices which are not oriented to reflect a true picture of the price behavior and effect of price fluctuations of various goods and services consumed by the general population in the country over a period of time. Therefore, the commission recommended for compilation of CPI for rural and urban areas in the country. This recommendation was further endorsed by the Standing Committee on Finance (2009-10) (15
th Lok Sabha, 6
th Report on Inflation and Price Rise), which asked the Government to
act upon this recommendation without any further delay and accordingly expedite the compilation of the nation–wide Consumer Price Index for urban and rural areas as a prelude to formulating a national CPI. In pursuance of the above recommendations, the Central Statistics Office (CSO) started compiling a new series of CPI for the entire urban population, viz. CPI (Urban), CPI for the entire rural population, viz. CPI (Rural) and CPI for the entire population (Urban+Rural) viz. CPI (Combined), which would reflect the changes in the price levels of various goods and services consumed by the urban, rural and entire population respectively. The first such indices on base 2010 were compiled and released w.e.f. from January, 2011.
2. The weighting diagrams (consumption pattern) of the CPI-U and CPI-R (2010=100) were derived on the basis of average monthly consumer expenditure of urban and rural households obtained from Consumer Expenditure Survey data (2004-05) of 61
st Round of National Sample
Survey (NSS). All cities/towns having population (2001 Census) more than 9 lakh and all State/UT capitals not covered therein were selected purposively for price collection of CPI-U. In all, 310 towns were selected covering all the States and UTs from which 1114 price quotations are canvassed every month. In the selected towns, market survey was undertaken by NSSO (FOD) for (i) identification of popular markets (ii) selection of shops/outlets for different commodities in the selected markets and (iii) determination of specifications of commodities to be priced. Specification is Structured Product Description (SPD), which uniquely identifies a product/item. It contains price determining characteristic of an item e.g. brand, variety, unit, quantity etc. Markets allocated to a particular town were distributed by ensuring both the geographical coverage of the selected town and the different segments of population living in the town (poor, middle and affluent). Further, markets allotted for the town were distributed over four weeks of a month to take into account week to week variation in prices. There prices are collected on regular basis by the NSSO (FOD) and specified Directorates of Economics and Statistics (DES). For working out Housing index for CPI-U, rented dwellings from which house rent data are collected were also identified in all the selected towns. A total of 13,368 dwelling units of different types are in the sample for collection of rent data.
3. The base year of this series has been revised to 2012=100 and the revised series was released starting from the index of January 2015. In the revised series, many methodological changes have been incorporated. The weighting diagram was updated using the Mixed Modified Reference Period (MMRP) data of Consumer Expenditure Survey of 68
th Round (2011-12) of NSS.
The elementary/item level indices are being computed now as Geometric Mean (GM) of the Price Relatives of current prices to base prices in place of Arithmetic Mean as applied in old series. Sample size of dwelling units for compilation of House Rent Index was also doubled. The classification of items was made adopting the international standard classification COICOP (Classification of Individual Consumption according to Purpose). This ensures better comparability with CPIs of other countries and those compiled within home country at various levels of Groups, Categories, Sub-groups and Sections.
65
B. Agricultural Labourers
The Agricultural/Rural Labour Enquiries, being conducted since 1950-51 at frequent intervals throw up a valuable data on the pattern of consumption expenditure of labourers in the rural areas. The first Agricultural Labour Enquiry (ALE) was conducted during 1950-51. The 2
nd
Agricultural Labour Enquiry was conducted during 1956-57. The scope of the enquiry was widened to cover all the rural labour (agricultural as well as non-agricultural) after the 2
nd A.L.E. Hence now
it is called as the Rural Labour Enquiry to signify the wider coverage. The First Rural Labour Enquiry was conducted during 1963-65 (February, 1963 – January, 1964 & October, 1964 – September, 1965). The data were collected and analysed separately for agricultural as well as non-agricultural labourers, not only to enable comparison with the previous enquiries, but also to throw up information on both classes of labourers in rural areas. The fourth enquiry in the series, i.e. 2
nd
Rural Labour Enquiry was conducted during 1974-75.
A number of Committees and Commissions such as the National Commission on Labour (1969) have acknowledged the usefulness of the data thrown up by the Rural Labour Enquiries. The National Commission on Rural Labour, which submitted its report in 1991, also had acknowledged the utility of data being collected and published through these enquiries and had in fact suggested to strengthen the system of collection of data. In view of the usefulness of the data thrown up by it, the Rural Labour Enquiries are now being conducted at regular intervals on quinquennial basis alongwith general Employment and Unemployment surveys of the National Sample Survey Office. Thus, the subsequent enquiries in the series were conducted during 1977-78, 1983, 1987-88, 1993-94, 1999-2000, 2004-05 and 2009-10. Under the integrated arrangement, besides collection of data from the field, the processing thereof is also being done by the National Sample Survey Office for Labour Bureau. On the basis of these Enquiries the Labour Bureau brings out reports on “Consumption Expenditure”, “Indebtedness”, “Wages & Earnings”, “Employment & Unemployment” and “General Characteristics of Rural Labour Households”.
2. CONSUMER PRICE INDEX NUMBERS
A. Industrial Workers
1. The Consumer Price Index Numbers for Industrial Workers (CPI-IW) which measure the rate of change in prices of fixed basket of goods and services consumed by the defined population are being compiled and maintained by the Labour Bureau since its inception in October, 1946. The Consumer Price Index Numbers are one of the most widely used statistical products which is being put to numerous uses, such as (i) revision of wages and determination of Variable Dearness Allowance to lakhs of workers/employees in the Government and Corporate Sectors (ii) revision of minimum wages of workers in Unorganised Sector (iii) measuring inflationary trend in the country (iv) for policy formulation by the Government and (v) for analytical purposes by the researchers. These index numbers are being compiled on scientific lines by following the standard methodology approved by the Technical Advisory Committee on Statistics of Prices and Cost of Living (TAC on SPCL).
2. The three essential ingredients of Consumer Price Index Numbers are (i) the percentage share of expenditure on each item in relation to the total consumption expenditure known as the “Weighting Diagram” (ii) base year prices which are average prices of 12 months of the year and (iii) current prices. The average consumption expenditure per family as revealed by the Working Class Family Income and Expenditure Survey (1999-2000) forms the basis for deriving the weighting diagram of the existing series i.e., 2001=100. The non-consumption expenditure such as taxes, interest, remittances and litigation expenses were excluded. A uniform base year was adopted for all the selected centres so that All-India index could be obtained directly from the constituent centre‟s indices without resorting to any arithmetical shifting of base in any series. The retail prices firstly for the base period and subsequently for the current period are collected on continuous basis in respect of all the items on a fixed day every week/month from two selected shops of the selected markets of a centre. These prices are inclusive of taxes and levies payable by the consumer. As the Consumer Price Index Numbers are designed to measure the changes of prices alone, all other elements such as specifications, units, shops, markets and price collection day/time are kept fixed during the lifetime of the series so as to exclude spurious changes in prices.
66
All these elements are settled in advance before the main survey when the organisation of price collection machinery and other details are worked out. The guiding factor for deciding these elements is their popularity with the working class families in the base year. The number of markets in a given centre depends on the size of the centre, the concentration of working class population, the variability in prices, etc.
3. Prices are collected for different items and services included in the index basket by personal interview method from the shopkeepers/vendors of the selected shops by the State Government employees. Prices are collected on weekly basis for price sensitive items. For a few standard items such as tea, cigarette, cinema ticket, barber charges, utensils, toilet soap, clothing and footwear etc., prices are collected on monthly basis as they are not expected to fluctuate at short intervals. In case of items distributed through the Public Distribution System, the average price is calculated as the weighted average of the fair price and the open market price, the weights being the proportion of the quantity available through Public Distribution System and the quantity procured from the open market in relation to the base year requirement of an average working class family. The prices of some items such as house rent, school/ college fee and books are collected once in six months and one year respectively.
4. Data on house rent are collected for rented, rent free and owner occupied dwellings. For this purpose, a six monthly House Rent Survey is conducted at all the centres in order to reflect the changes in rental level that the index population has experienced in such industrial centres. The rent index is compiled by using the chain base method in which rent movements are first compared with those of the last six months and then chained (linked) with the base period. Uniform method is followed in compilation of house rent index for all the centres irrespective of the sectors to which they represent. In pursuance of the recommendations of the Committee on Consumer Price Index Numbers (Seal Committee) the weighted house rent index is compiled, weights being the proportion of the families residing in rent free, rented and self-owned dwellings in a centre as selected in the base year survey. The rent index of free dwellings is kept fixed at 100. The rent index of owner-occupied dwelling is based on rent paid for similar or comparable rented dwellings in the same building or nearby locality even if it is occupied by a non-working class family. If it is not possible to collect data from comparable rented dwellings, the self-owned dwellings are substituted by the rented dwellings.
5. Indices are compiled centre-wise at subgroup/group/centre level by using Laspeyre‟s Index formula. The all-India index is computed as a weighted average of the index numbers of the constituent 78 centres, weights being the ratio of total consumption expenditure of estimated number of families allocated to a centre in the state to the sum total of all such expenditures over all centres in the country.
6. The all-India index can be linked to the earlier series on base 1982=100 by using conversion factors of 4.63 and 4.58 for General and Food Indices respectively.
7. A detailed note on the scope and method of compilation of All-India Consumer Price Index Numbers for Industrial Workers (Base: 2001=100) was published in April, 2006 issue of the Bureau‟s monthly publication captioned “Indian Labour Journal.”
8. Annual average of Consumer Price Index Numbers for Industrial workers on base: 1982=100 for all the 70 centres for the year 1998 to 2005 and new series on base: 2001=100 for 78 centres for the year 2006 to 2017 is presented in Table 3.01(a) and Table 3.01(b) respectively.
9. All-India Consumer Price Index Numbers for General and Food Group on base: 1982=100 for the year 1997 to 2005 and on base: 2001=100 for the year 2006 to 2017 along-with month-wise figures for the period January, 2016 to December, 2017 is given in Table 3.02. A comparative chart on General and Food Groups‟ indices for the period 2006 to 2017 is also presented in Figure 1.
10. Y-o-Y inflation based on CPI-IW for the period January, 2016 to December, 2017 is shown in Table 3.03 and Figure 2.
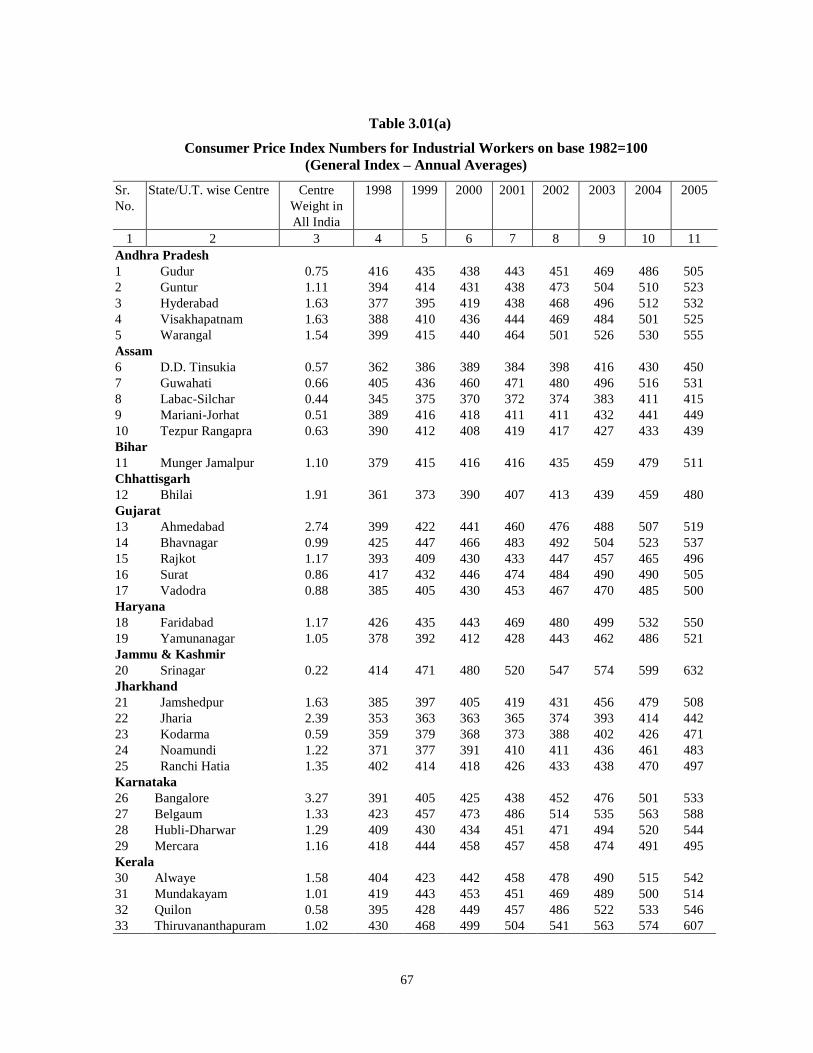
67
Table 3.01(a)
Consumer Price Index Numbers for Industrial Workers on base 1982=100
(General Index – Annual Averages)
Sr.
No.
State/U.T. wise Centre Centre
Weight in
All India
1998 1999 2000 2001 2002 2003 2004 2005
1 2 3 4 5 6 7 8 9 10 11
Andhra Pradesh
1 Gudur 0.75 416 435 438 443 451 469 486 505
2 Guntur 1.11 394 414 431 438 473 504 510 523
3 Hyderabad 1.63 377 395 419 438 468 496 512 532
4 Visakhapatnam 1.63 388 410 436 444 469 484 501 525
5 Warangal 1.54 399 415 440 464 501 526 530 555
Assam
6 D.D. Tinsukia 0.57 362 386 389 384 398 416 430 450
7 Guwahati 0.66 405 436 460 471 480 496 516 531
8 Labac-Silchar 0.44 345 375 370 372 374 383 411 415
9 Mariani-Jorhat 0.51 389 416 418 411 411 432 441 449
10 Tezpur Rangapra 0.63 390 412 408 419 417 427 433 439
Bihar
11 Munger Jamalpur 1.10 379 415 416 416 435 459 479 511
Chhattisgarh
12 Bhilai 1.91 361 373 390 407 413 439 459 480
Gujarat
13 Ahmedabad 2.74 399 422 441 460 476 488 507 519
14 Bhavnagar 0.99 425 447 466 483 492 504 523 537
15 Rajkot 1.17 393 409 430 433 447 457 465 496
16 Surat 0.86 417 432 446 474 484 490 490 505
17 Vadodra 0.88 385 405 430 453 467 470 485 500
Haryana
18 Faridabad 1.17 426 435 443 469 480 499 532 550
19 Yamunanagar 1.05 378 392 412 428 443 462 486 521
Jammu & Kashmir
20 Srinagar 0.22 414 471 480 520 547 574 599 632
Jharkhand
21 Jamshedpur 1.63 385 397 405 419 431 456 479 508
22 Jharia 2.39 353 363 363 365 374 393 414 442
23 Kodarma 0.59 359 379 368 373 388 402 426 471
24 Noamundi 1.22 371 377 391 410 411 436 461 483
25 Ranchi Hatia 1.35 402 414 418 426 433 438 470 497
Karnataka
26 Bangalore 3.27 391 405 425 438 452 476 501 533
27 Belgaum 1.33 423 457 473 486 514 535 563 588
28 Hubli-Dharwar 1.29 409 430 434 451 471 494 520 544
29 Mercara 1.16 418 444 458 457 458 474 491 495
Kerala
30 Alwaye 1.58 404 423 442 458 478 490 515 542
31 Mundakayam 1.01 419 443 453 451 469 489 500 514
32 Quilon 0.58 395 428 449 457 486 522 533 546
33 Thiruvananthapuram 1.02 430 468 499 504 541 563 574 607
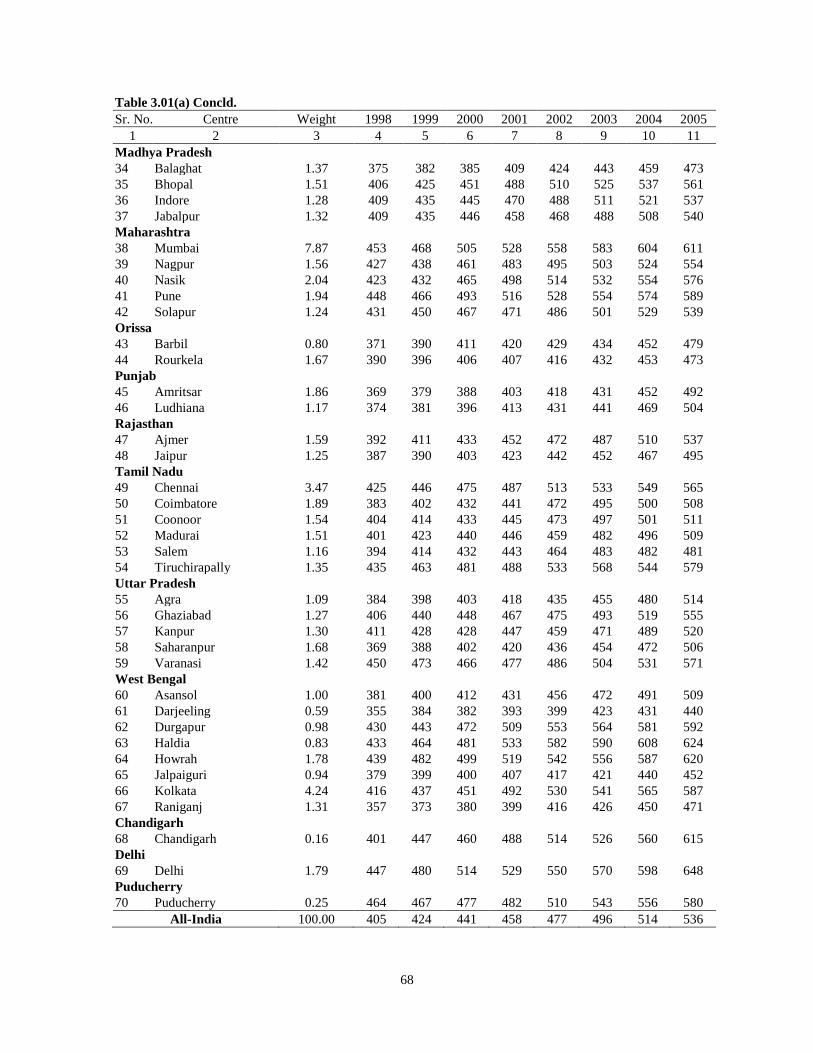
68
Table 3.01(a) Concld.
Sr. No. Centre Weight 1998 1999 2000 2001 2002 2003 2004 2005
1 2 3 4 5 6 7 8 9 10 11
Madhya Pradesh
34 Balaghat 1.37 375 382 385 409 424 443 459 473
35 Bhopal 1.51 406 425 451 488 510 525 537 561
36 Indore 1.28 409 435 445 470 488 511 521 537
37 Jabalpur 1.32 409 435 446 458 468 488 508 540
Maharashtra
38 Mumbai 7.87 453 468 505 528 558 583 604 611
39 Nagpur 1.56 427 438 461 483 495 503 524 554
40 Nasik 2.04 423 432 465 498 514 532 554 576
41 Pune 1.94 448 466 493 516 528 554 574 589
42 Solapur 1.24 431 450 467 471 486 501 529 539
Orissa
43 Barbil 0.80 371 390 411 420 429 434 452 479
44 Rourkela 1.67 390 396 406 407 416 432 453 473
Punjab
45 Amritsar 1.86 369 379 388 403 418 431 452 492
46 Ludhiana 1.17 374 381 396 413 431 441 469 504
Rajasthan
47 Ajmer 1.59 392 411 433 452 472 487 510 537
48 Jaipur 1.25 387 390 403 423 442 452 467 495
Tamil Nadu
49 Chennai 3.47 425 446 475 487 513 533 549 565
50 Coimbatore 1.89 383 402 432 441 472 495 500 508
51 Coonoor 1.54 404 414 433 445 473 497 501 511
52 Madurai 1.51 401 423 440 446 459 482 496 509
53 Salem 1.16 394 414 432 443 464 483 482 481
54 Tiruchirapally 1.35 435 463 481 488 533 568 544 579
Uttar Pradesh
55 Agra 1.09 384 398 403 418 435 455 480 514
56 Ghaziabad 1.27 406 440 448 467 475 493 519 555
57 Kanpur 1.30 411 428 428 447 459 471 489 520
58 Saharanpur 1.68 369 388 402 420 436 454 472 506
59 Varanasi 1.42 450 473 466 477 486 504 531 571
West Bengal
60 Asansol 1.00 381 400 412 431 456 472 491 509
61 Darjeeling 0.59 355 384 382 393 399 423 431 440
62 Durgapur 0.98 430 443 472 509 553 564 581 592
63 Haldia 0.83 433 464 481 533 582 590 608 624
64 Howrah 1.78 439 482 499 519 542 556 587 620
65 Jalpaiguri 0.94 379 399 400 407 417 421 440 452
66 Kolkata 4.24 416 437 451 492 530 541 565 587
67 Raniganj 1.31 357 373 380 399 416 426 450 471
Chandigarh
68 Chandigarh 0.16 401 447 460 488 514 526 560 615
Delhi
69 Delhi 1.79 447 480 514 529 550 570 598 648
Puducherry
70 Puducherry 0.25 464 467 477 482 510 543 556 580
All-India 100.00 405 424 441 458 477 496 514 536
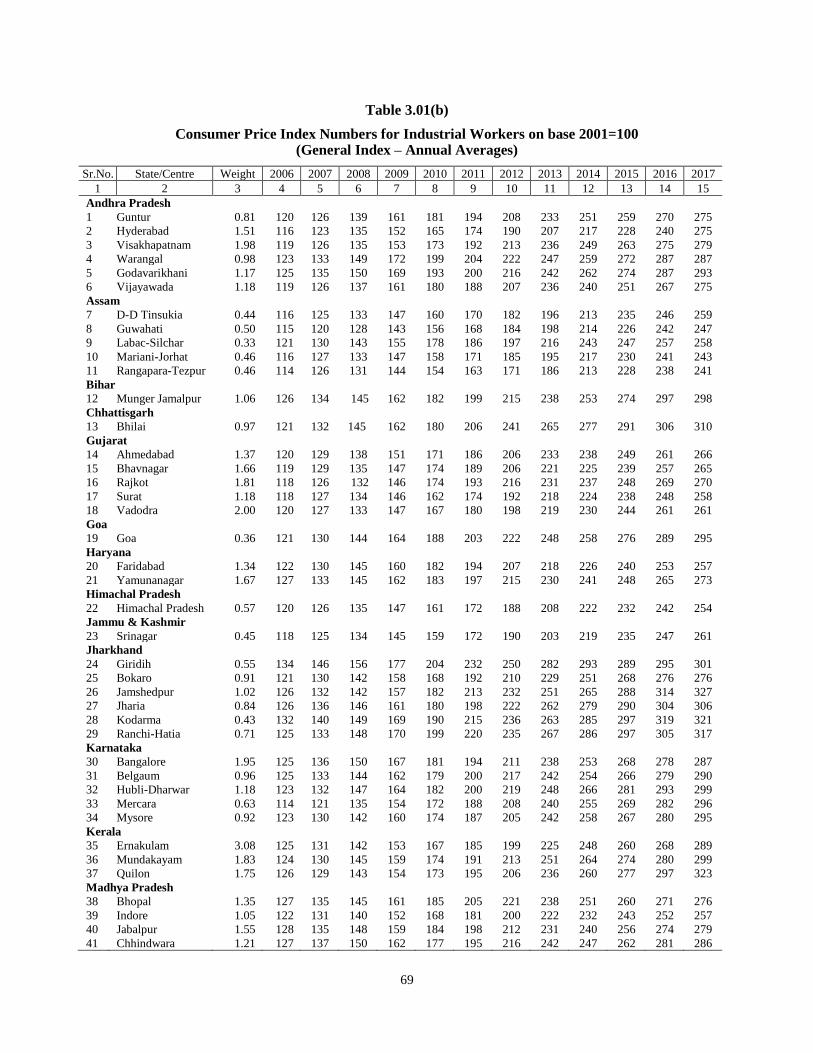
69
Table 3.01(b)
Consumer Price Index Numbers for Industrial Workers on base 2001=100 (General Index – Annual Averages)
Sr.No. State/Centre Weight 2006 2007 2008 2009 2010 2011 2012 2013 2014 2015 2016 2017
1 2 3 4 5 6 7 8 9 10 11 12 13 14 15
Andhra Pradesh
1 Guntur 0.81 120 126 139 161 181 194 208 233 251 259 270 275
2 Hyderabad 1.51 116 123 135 152 165 174 190 207 217 228 240 275
3 Visakhapatnam 1.98 119 126 135 153 173 192 213 236 249 263 275 279
4 Warangal 0.98 123 133 149 172 199 204 222 247 259 272 287 287
5 Godavarikhani 1.17 125 135 150 169 193 200 216 242 262 274 287 293
6 Vijayawada 1.18 119 126 137 161 180 188 207 236 240 251 267 275
Assam
7 D-D Tinsukia 0.44 116 125 133 147 160 170 182 196 213 235 246 259
8 Guwahati 0.50 115 120 128 143 156 168 184 198 214 226 242 247
9 Labac-Silchar 0.33 121 130 143 155 178 186 197 216 243 247 257 258
10 Mariani-Jorhat 0.46 116 127 133 147 158 171 185 195 217 230 241 243
11 Rangapara-Tezpur 0.46 114 126 131 144 154 163 171 186 213 228 238 241
Bihar
12 Munger Jamalpur 1.06 126 134 145 162 182 199 215 238 253 274 297 298
Chhattisgarh
13 Bhilai 0.97 121 132 145 162 180 206 241 265 277 291 306 310
Gujarat
14 Ahmedabad 1.37 120 129 138 151 171 186 206 233 238 249 261 266
15 Bhavnagar 1.66 119 129 135 147 174 189 206 221 225 239 257 265
16 Rajkot 1.81 118 126 132 146 174 193 216 231 237 248 269 270
17 Surat 1.18 118 127 134 146 162 174 192 218 224 238 248 258
18 Vadodra 2.00 120 127 133 147 167 180 198 219 230 244 261 261
Goa
19 Goa 0.36 121 130 144 164 188 203 222 248 258 276 289 295
Haryana
20 Faridabad 1.34 122 130 145 160 182 194 207 218 226 240 253 257
21 Yamunanagar 1.67 127 133 145 162 183 197 215 230 241 248 265 273
Himachal Pradesh
22 Himachal Pradesh 0.57 120 126 135 147 161 172 188 208 222 232 242 254
Jammu & Kashmir
23 Srinagar 0.45 118 125 134 145 159 172 190 203 219 235 247 261
Jharkhand
24 Giridih 0.55 134 146 156 177 204 232 250 282 293 289 295 301
25 Bokaro 0.91 121 130 142 158 168 192 210 229 251 268 276 276
26 Jamshedpur 1.02 126 132 142 157 182 213 232 251 265 288 314 327
27 Jharia 0.84 126 136 146 161 180 198 222 262 279 290 304 306
28 Kodarma 0.43 132 140 149 169 190 215 236 263 285 297 319 321
29 Ranchi-Hatia 0.71 125 133 148 170 199 220 235 267 286 297 305 317
Karnataka
30 Bangalore 1.95 125 136 150 167 181 194 211 238 253 268 278 287
31 Belgaum 0.96 125 133 144 162 179 200 217 242 254 266 279 290
32 Hubli-Dharwar 1.18 123 132 147 164 182 200 219 248 266 281 293 299
33 Mercara 0.63 114 121 135 154 172 188 208 240 255 269 282 296
34 Mysore 0.92 123 130 142 160 174 187 205 242 258 267 280 295
Kerala
35 Ernakulam 3.08 125 131 142 153 167 185 199 225 248 260 268 289
36 Mundakayam 1.83 124 130 145 159 174 191 213 251 264 274 280 299
37 Quilon 1.75 126 129 143 154 173 195 206 236 260 277 297 323
Madhya Pradesh
38 Bhopal 1.35 127 135 145 161 185 205 221 238 251 260 271 276
39 Indore 1.05 122 131 140 152 168 181 200 222 232 243 252 257
40 Jabalpur 1.55 128 135 148 159 184 198 212 231 240 256 274 279
41 Chhindwara 1.21 127 137 150 162 177 195 216 242 247 262 281 286
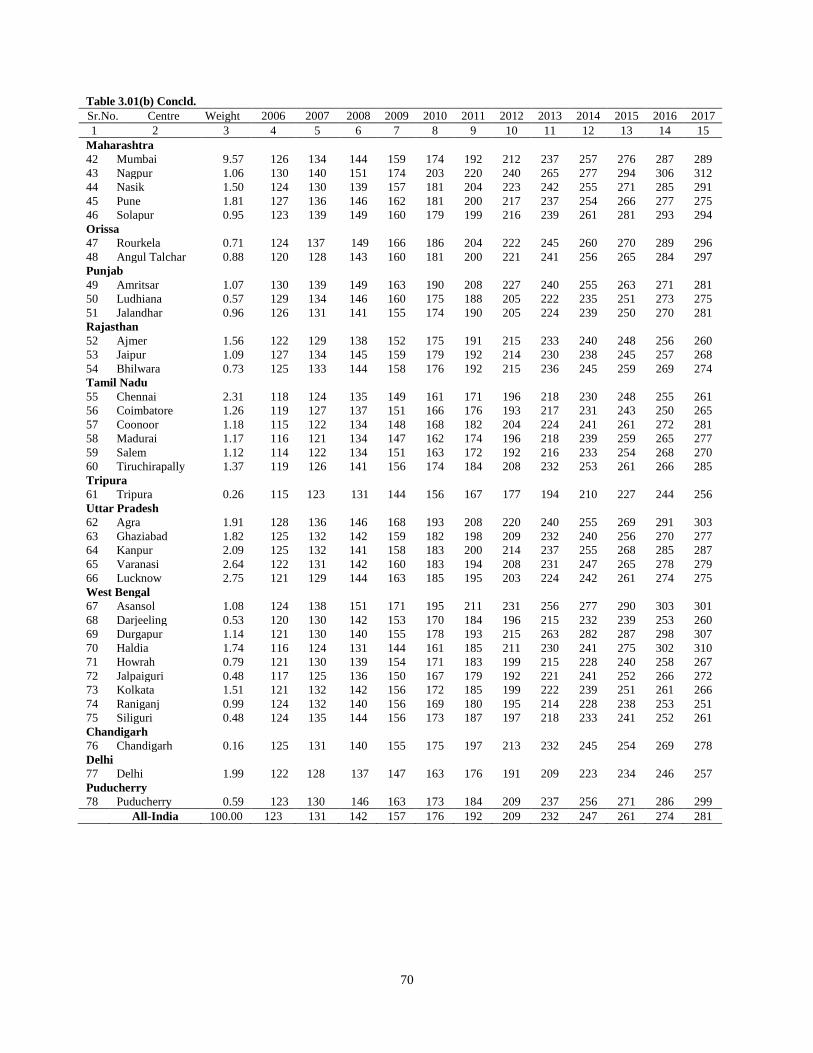
70
Table 3.01(b) Concld.
Sr.No. Centre Weight 2006 2007 2008 2009 2010 2011 2012 2013 2014 2015 2016 2017
1 2 3 4 5 6 7 8 9 10 11 12 13 14 15
Maharashtra
42 Mumbai 9.57 126 134 144 159 174 192 212 237 257 276 287 289
43 Nagpur 1.06 130 140 151 174 203 220 240 265 277 294 306 312
44 Nasik 1.50 124 130 139 157 181 204 223 242 255 271 285 291
45 Pune 1.81 127 136 146 162 181 200 217 237 254 266 277 275
46 Solapur 0.95 123 139 149 160 179 199 216 239 261 281 293 294
Orissa
47 Rourkela 0.71 124 137 149 166 186 204 222 245 260 270 289 296
48 Angul Talchar 0.88 120 128 143 160 181 200 221 241 256 265 284 297
Punjab
49 Amritsar 1.07 130 139 149 163 190 208 227 240 255 263 271 281
50 Ludhiana 0.57 129 134 146 160 175 188 205 222 235 251 273 275
51 Jalandhar 0.96 126 131 141 155 174 190 205 224 239 250 270 281
Rajasthan
52 Ajmer 1.56 122 129 138 152 175 191 215 233 240 248 256 260
53 Jaipur 1.09 127 134 145 159 179 192 214 230 238 245 257 268
54 Bhilwara 0.73 125 133 144 158 176 192 215 236 245 259 269 274
Tamil Nadu
55 Chennai 2.31 118 124 135 149 161 171 196 218 230 248 255 261
56 Coimbatore 1.26 119 127 137 151 166 176 193 217 231 243 250 265
57 Coonoor 1.18 115 122 134 148 168 182 204 224 241 261 272 281
58 Madurai 1.17 116 121 134 147 162 174 196 218 239 259 265 277
59 Salem 1.12 114 122 134 151 163 172 192 216 233 254 268 270
60 Tiruchirapally 1.37 119 126 141 156 174 184 208 232 253 261 266 285
Tripura
61 Tripura 0.26 115 123 131 144 156 167 177 194 210 227 244 256
Uttar Pradesh
62 Agra 1.91 128 136 146 168 193 208 220 240 255 269 291 303
63 Ghaziabad 1.82 125 132 142 159 182 198 209 232 240 256 270 277
64 Kanpur 2.09 125 132 141 158 183 200 214 237 255 268 285 287
65 Varanasi 2.64 122 131 142 160 183 194 208 231 247 265 278 279
66 Lucknow 2.75 121 129 144 163 185 195 203 224 242 261 274 275
West Bengal
67 Asansol 1.08 124 138 151 171 195 211 231 256 277 290 303 301
68 Darjeeling 0.53 120 130 142 153 170 184 196 215 232 239 253 260
69 Durgapur 1.14 121 130 140 155 178 193 215 263 282 287 298 307
70 Haldia 1.74 116 124 131 144 161 185 211 230 241 275 302 310
71 Howrah 0.79 121 130 139 154 171 183 199 215 228 240 258 267
72 Jalpaiguri 0.48 117 125 136 150 167 179 192 221 241 252 266 272
73 Kolkata 1.51 121 132 142 156 172 185 199 222 239 251 261 266
74 Raniganj 0.99 124 132 140 156 169 180 195 214 228 238 253 251
75 Siliguri 0.48 124 135 144 156 173 187 197 218 233 241 252 261
Chandigarh
76 Chandigarh 0.16 125 131 140 155 175 197 213 232 245 254 269 278
Delhi
77 Delhi 1.99 122 128 137 147 163 176 191 209 223 234 246 257
Puducherry
78 Puducherry 0.59 123 130 146 163 173 184 209 237 256 271 286 299
All-India 100.00 123 131 142 157 176 192 209 232 247 261 274 281
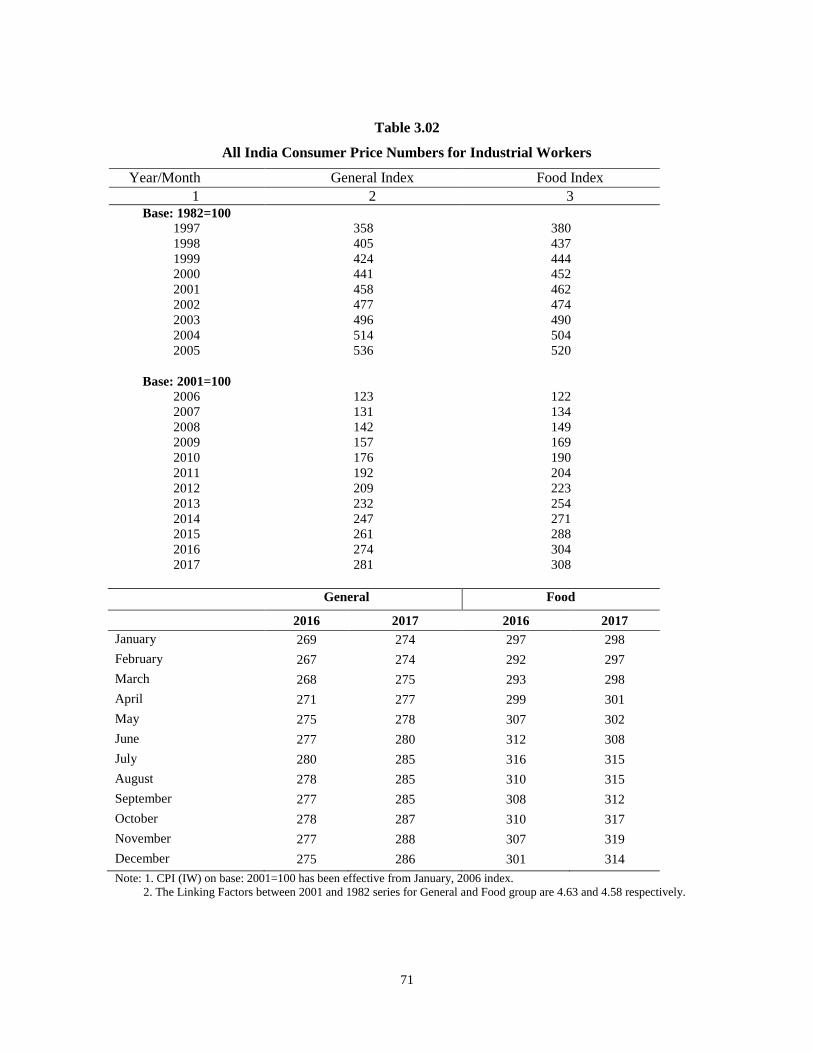
71
Table 3.02
All India Consumer Price Numbers for Industrial Workers
Year/Month General Index Food Index
1 2 3 Base: 1982=100
1997 358 380
1998 405 437
1999 424 444
2000 441 452
2001 458 462
2002 477 474
2003 496 490
2004 514 504
2005 536 520
Base: 2001=100
2006 123 122
2007 131 134
2008 142 149
2009 157 169
2010 176 190
2011 192 204
2012 209 223
2013 232 254
2014 247 271
2015 261 288
2016 274 304
2017 281 308
General Food
2016 2017 2016 2017
January 269 274 297 298
February 267 274 292 297
March 268 275 293 298
April 271 277 299 301
May 275 278 307 302
June 277 280 312 308
July 280 285 316 315
August 278 285 310 315
September 277 285 308 312
October 278 287 310 317
November 277 288 307 319
December 275 286 301 314
Note: 1. CPI (IW) on base: 2001=100 has been effective from January, 2006 index.
2. The Linking Factors between 2001 and 1982 series for General and Food group are 4.63 and 4.58 respectively.
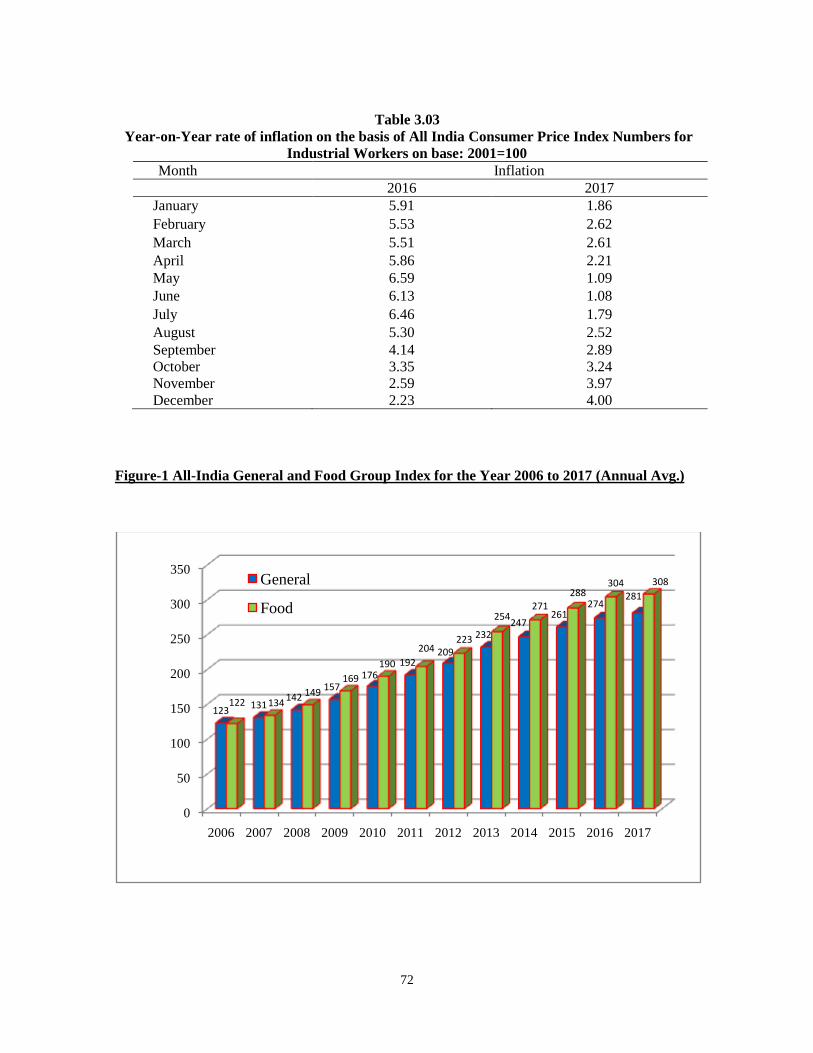
72
Table 3.03
Year-on-Year rate of inflation on the basis of All India Consumer Price Index Numbers for
Industrial Workers on base: 2001=100
Month Inflation
2016 2017
January 5.91 1.86
February 5.53 2.62
March 5.51 2.61
April 5.86 2.21
May 6.59 1.09
June 6.13 1.08
July 6.46 1.79
August 5.30 2.52
September 4.14 2.89
October 3.35 3.24
November 2.59 3.97
December 2.23 4.00
Figure-1 All-India General and Food Group Index for the Year 2006 to 2017 (Annual Avg.)
0
50
100
150
200
250
300
350
2006 2007 2008 2009 2010 2011 2012 2013 2014 2015 2016 2017
123131
142157
176192
209
232247
261274
281
122 134149
169
190
204223
254271
288304 308General
Food
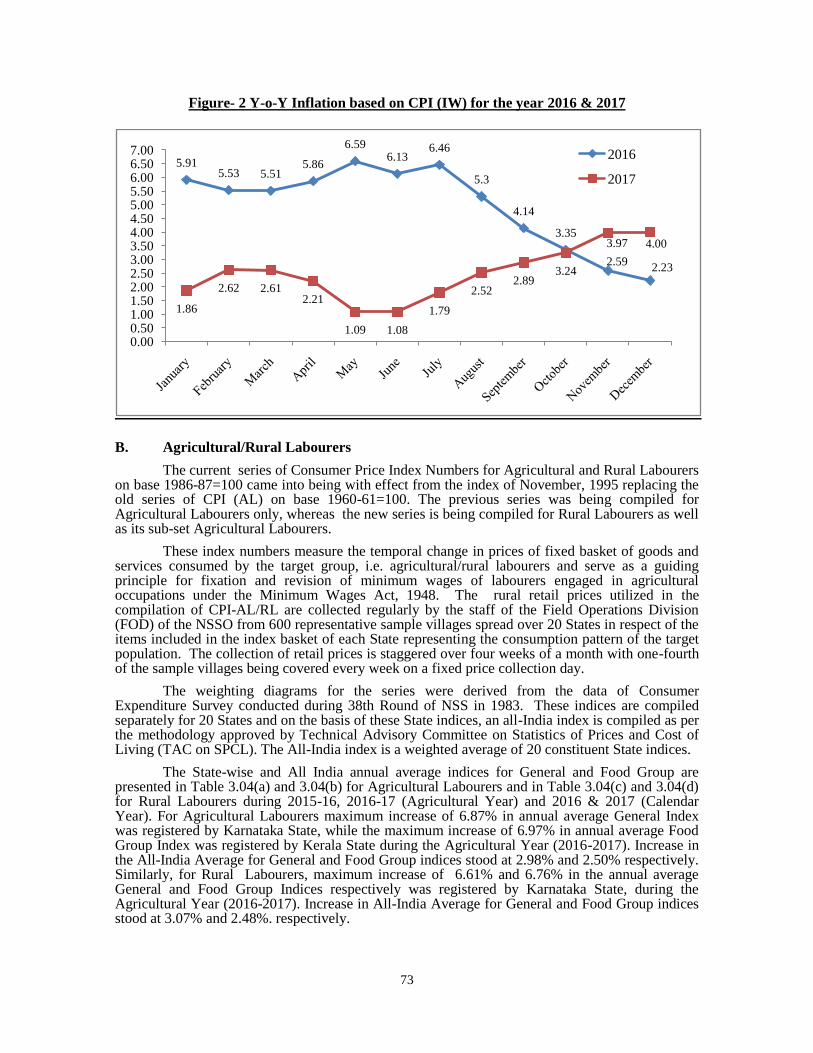
73
Figure- 2 Y-o-Y Inflation based on CPI (IW) for the year 2016 & 2017
B. Agricultural/Rural Labourers
The current series of Consumer Price Index Numbers for Agricultural and Rural Labourers on base 1986-87=100 came into being with effect from the index of November, 1995 replacing the old series of CPI (AL) on base 1960-61=100. The previous series was being compiled for Agricultural Labourers only, whereas the new series is being compiled for Rural Labourers as well as its sub-set Agricultural Labourers.
These index numbers measure the temporal change in prices of fixed basket of goods and services consumed by the target group, i.e. agricultural/rural labourers and serve as a guiding principle for fixation and revision of minimum wages of labourers engaged in agricultural occupations under the Minimum Wages Act, 1948. The rural retail prices utilized in the compilation of CPI-AL/RL are collected regularly by the staff of the Field Operations Division (FOD) of the NSSO from 600 representative sample villages spread over 20 States in respect of the items included in the index basket of each State representing the consumption pattern of the target population. The collection of retail prices is staggered over four weeks of a month with one-fourth of the sample villages being covered every week on a fixed price collection day.
The weighting diagrams for the series were derived from the data of Consumer Expenditure Survey conducted during 38th Round of NSS in 1983. These indices are compiled separately for 20 States and on the basis of these State indices, an all-India index is compiled as per the methodology approved by Technical Advisory Committee on Statistics of Prices and Cost of Living (TAC on SPCL). The All-India index is a weighted average of 20 constituent State indices.
The State-wise and All India annual average indices for General and Food Group are presented in Table 3.04(a) and 3.04(b) for Agricultural Labourers and in Table 3.04(c) and 3.04(d) for Rural Labourers during 2015-16, 2016-17 (Agricultural Year) and 2016 & 2017 (Calendar Year). For Agricultural Labourers maximum increase of 6.87% in annual average General Index was registered by Karnataka State, while the maximum increase of 6.97% in annual average Food Group Index was registered by Kerala State during the Agricultural Year (2016-2017). Increase in the All-India Average for General and Food Group indices stood at 2.98% and 2.50% respectively. Similarly, for Rural Labourers, maximum increase of 6.61% and 6.76% in the annual average General and Food Group Indices respectively was registered by Karnataka State, during the Agricultural Year (2016-2017). Increase in All-India Average for General and Food Group indices stood at 3.07% and 2.48%. respectively.
5.915.53 5.51
5.86
6.596.13
6.46
5.3
4.14
3.35
2.592.23
1.86
2.62 2.612.21
1.09 1.08
1.79
2.522.89
3.24
3.97 4.00
0.000.501.001.502.002.503.003.504.004.505.005.506.006.507.00 2016
2017
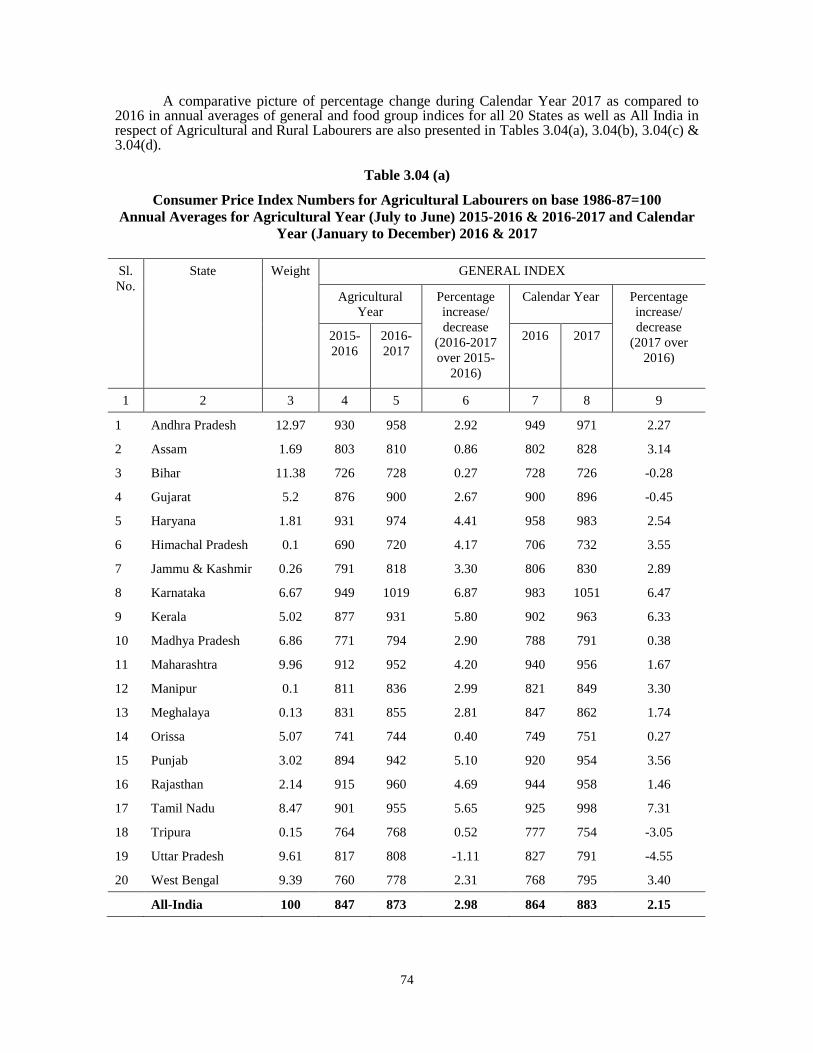
74
A comparative picture of percentage change during Calendar Year 2017 as compared to 2016 in annual averages of general and food group indices for all 20 States as well as All India in respect of Agricultural and Rural Labourers are also presented in Tables 3.04(a), 3.04(b), 3.04(c) & 3.04(d).
Table 3.04 (a)
Consumer Price Index Numbers for Agricultural Labourers on base 1986-87=100
Annual Averages for Agricultural Year (July to June) 2015-2016 & 2016-2017 and Calendar
Year (January to December) 2016 & 2017
Sl.
No.
State Weight GENERAL INDEX
Agricultural
Year
Percentage
increase/
decrease
(2016-2017
over 2015-
2016)
Calendar Year Percentage
increase/
decrease
(2017 over
2016)
2015-
2016
2016-
2017
2016 2017
1 2 3 4 5 6 7 8 9
1 Andhra Pradesh 12.97 930 958 2.92 949 971 2.27
2 Assam 1.69 803 810 0.86 802 828 3.14
3 Bihar 11.38 726 728 0.27 728 726 -0.28
4 Gujarat 5.2 876 900 2.67 900 896 -0.45
5 Haryana 1.81 931 974 4.41 958 983 2.54
6 Himachal Pradesh 0.1 690 720 4.17 706 732 3.55
7 Jammu & Kashmir 0.26 791 818 3.30 806 830 2.89
8 Karnataka 6.67 949 1019 6.87 983 1051 6.47
9 Kerala 5.02 877 931 5.80 902 963 6.33
10 Madhya Pradesh 6.86 771 794 2.90 788 791 0.38
11 Maharashtra 9.96 912 952 4.20 940 956 1.67
12 Manipur 0.1 811 836 2.99 821 849 3.30
13 Meghalaya 0.13 831 855 2.81 847 862 1.74
14 Orissa 5.07 741 744 0.40 749 751 0.27
15 Punjab 3.02 894 942 5.10 920 954 3.56
16 Rajasthan 2.14 915 960 4.69 944 958 1.46
17 Tamil Nadu 8.47 901 955 5.65 925 998 7.31
18 Tripura 0.15 764 768 0.52 777 754 -3.05
19 Uttar Pradesh 9.61 817 808 -1.11 827 791 -4.55
20 West Bengal 9.39 760 778 2.31 768 795 3.40
All-India 100 847 873 2.98 864 883 2.15
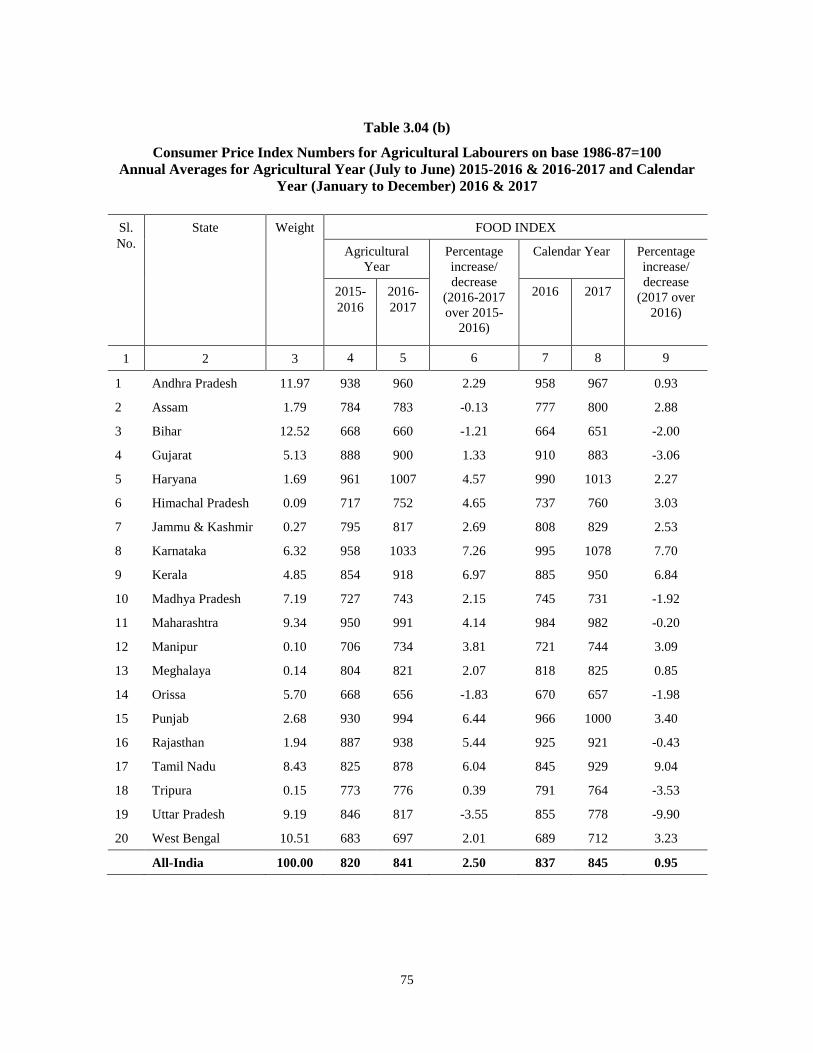
75
Table 3.04 (b)
Consumer Price Index Numbers for Agricultural Labourers on base 1986-87=100
Annual Averages for Agricultural Year (July to June) 2015-2016 & 2016-2017 and Calendar
Year (January to December) 2016 & 2017
Sl.
No.
State Weight FOOD INDEX
Agricultural
Year
Percentage
increase/
decrease
(2016-2017
over 2015-
2016)
Calendar Year Percentage
increase/
decrease
(2017 over
2016)
2015-
2016
2016-
2017
2016 2017
1 2 3 4 5 6 7 8 9
1 Andhra Pradesh 11.97 938 960 2.29 958 967 0.93
2 Assam 1.79 784 783 -0.13 777 800 2.88
3 Bihar 12.52 668 660 -1.21 664 651 -2.00
4 Gujarat 5.13 888 900 1.33 910 883 -3.06
5 Haryana 1.69 961 1007 4.57 990 1013 2.27
6 Himachal Pradesh 0.09 717 752 4.65 737 760 3.03
7 Jammu & Kashmir 0.27 795 817 2.69 808 829 2.53
8 Karnataka 6.32 958 1033 7.26 995 1078 7.70
9 Kerala 4.85 854 918 6.97 885 950 6.84
10 Madhya Pradesh 7.19 727 743 2.15 745 731 -1.92
11 Maharashtra 9.34 950 991 4.14 984 982 -0.20
12 Manipur 0.10 706 734 3.81 721 744 3.09
13 Meghalaya 0.14 804 821 2.07 818 825 0.85
14 Orissa 5.70 668 656 -1.83 670 657 -1.98
15 Punjab 2.68 930 994 6.44 966 1000 3.40
16 Rajasthan 1.94 887 938 5.44 925 921 -0.43
17 Tamil Nadu 8.43 825 878 6.04 845 929 9.04
18 Tripura 0.15 773 776 0.39 791 764 -3.53
19 Uttar Pradesh 9.19 846 817 -3.55 855 778 -9.90
20 West Bengal 10.51 683 697 2.01 689 712 3.23
All-India 100.00 820 841 2.50 837 845 0.95
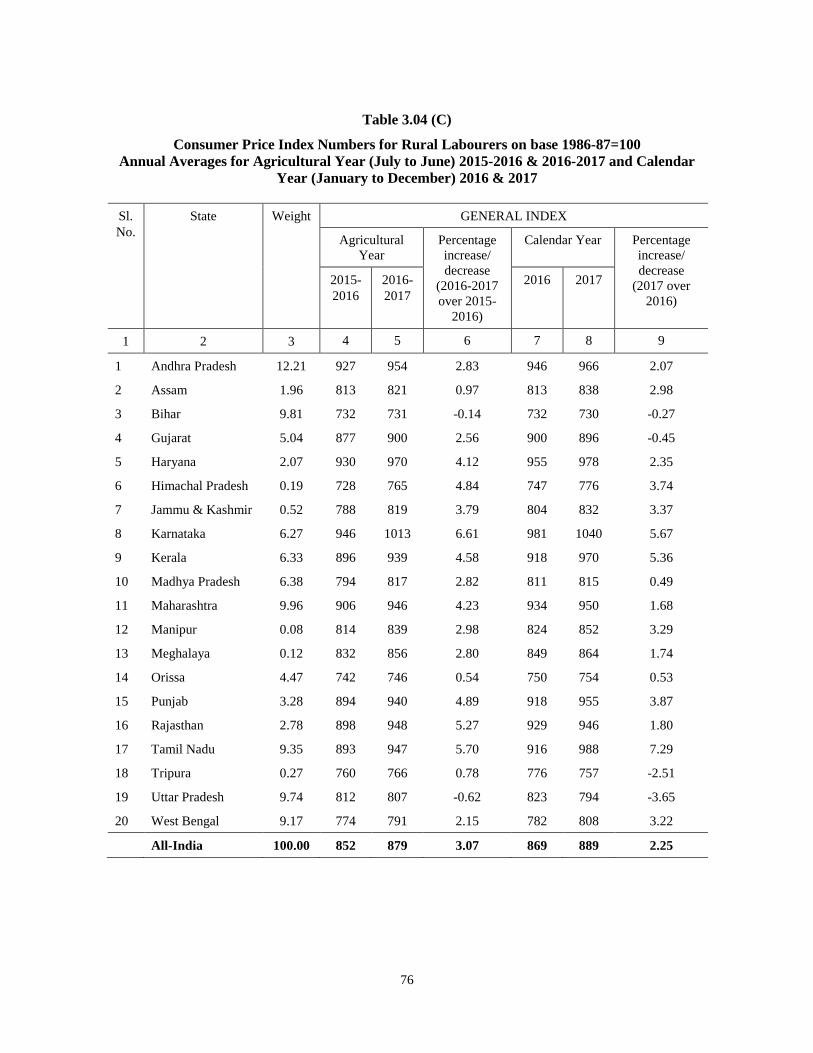
76
Table 3.04 (C)
Consumer Price Index Numbers for Rural Labourers on base 1986-87=100
Annual Averages for Agricultural Year (July to June) 2015-2016 & 2016-2017 and Calendar
Year (January to December) 2016 & 2017
Sl.
No.
State Weight GENERAL INDEX
Agricultural
Year
Percentage
increase/
decrease
(2016-2017
over 2015-
2016)
Calendar Year Percentage
increase/
decrease
(2017 over
2016)
2015-
2016
2016-
2017
2016 2017
1 2 3 4 5 6 7 8 9
1 Andhra Pradesh 12.21 927 954 2.83 946 966 2.07
2 Assam 1.96 813 821 0.97 813 838 2.98
3 Bihar 9.81 732 731 -0.14 732 730 -0.27
4 Gujarat 5.04 877 900 2.56 900 896 -0.45
5 Haryana 2.07 930 970 4.12 955 978 2.35
6 Himachal Pradesh 0.19 728 765 4.84 747 776 3.74
7 Jammu & Kashmir 0.52 788 819 3.79 804 832 3.37
8 Karnataka 6.27 946 1013 6.61 981 1040 5.67
9 Kerala 6.33 896 939 4.58 918 970 5.36
10 Madhya Pradesh 6.38 794 817 2.82 811 815 0.49
11 Maharashtra 9.96 906 946 4.23 934 950 1.68
12 Manipur 0.08 814 839 2.98 824 852 3.29
13 Meghalaya 0.12 832 856 2.80 849 864 1.74
14 Orissa 4.47 742 746 0.54 750 754 0.53
15 Punjab 3.28 894 940 4.89 918 955 3.87
16 Rajasthan 2.78 898 948 5.27 929 946 1.80
17 Tamil Nadu 9.35 893 947 5.70 916 988 7.29
18 Tripura 0.27 760 766 0.78 776 757 -2.51
19 Uttar Pradesh 9.74 812 807 -0.62 823 794 -3.65
20 West Bengal 9.17 774 791 2.15 782 808 3.22
All-India 100.00 852 879 3.07 869 889 2.25
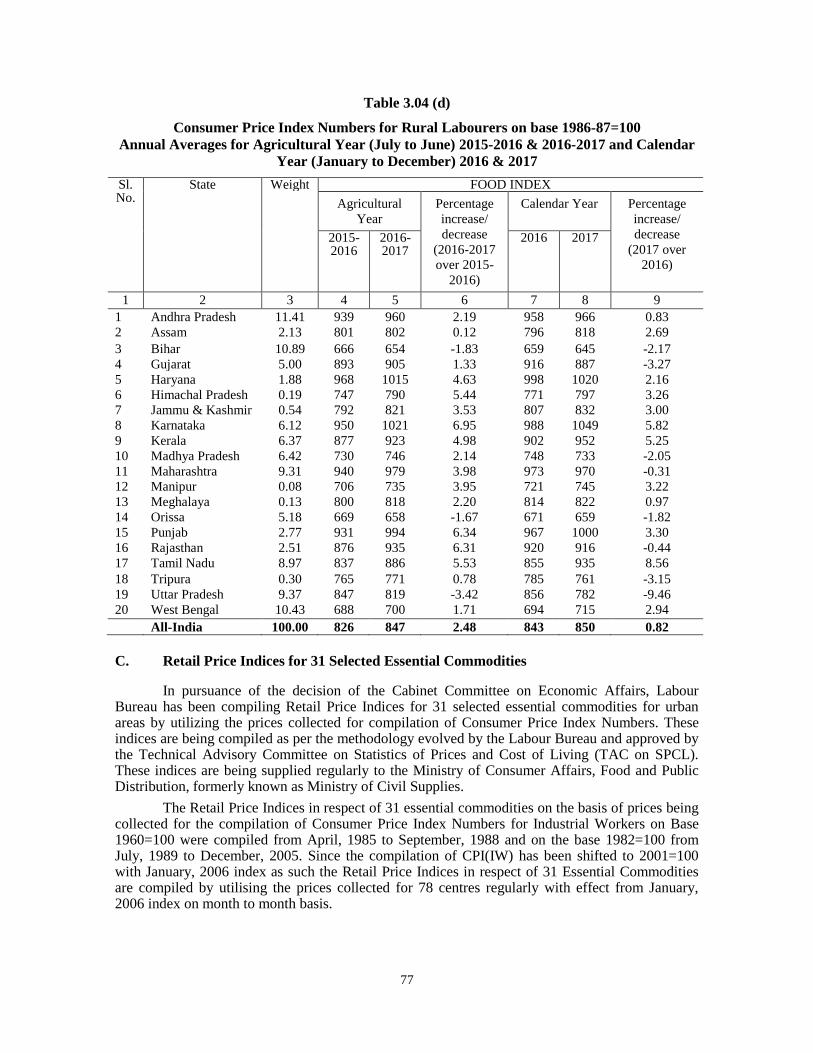
77
Table 3.04 (d)
Consumer Price Index Numbers for Rural Labourers on base 1986-87=100
Annual Averages for Agricultural Year (July to June) 2015-2016 & 2016-2017 and Calendar
Year (January to December) 2016 & 2017
Sl. No.
State Weight FOOD INDEX Agricultural
Year
Percentage
increase/
decrease
(2016-2017
over 2015-
2016)
Calendar Year Percentage
increase/
decrease
(2017 over
2016)
2015-2016
2016-2017
2016 2017
1 2 3 4 5 6 7 8 9
1 Andhra Pradesh 11.41 939 960 2.19 958 966 0.83
2 Assam 2.13 801 802 0.12 796 818 2.69
3 Bihar 10.89 666 654 -1.83 659 645 -2.17
4 Gujarat 5.00 893 905 1.33 916 887 -3.27
5 Haryana 1.88 968 1015 4.63 998 1020 2.16
6 Himachal Pradesh 0.19 747 790 5.44 771 797 3.26
7 Jammu & Kashmir 0.54 792 821 3.53 807 832 3.00
8 Karnataka 6.12 950 1021 6.95 988 1049 5.82
9 Kerala 6.37 877 923 4.98 902 952 5.25
10 Madhya Pradesh 6.42 730 746 2.14 748 733 -2.05
11 Maharashtra 9.31 940 979 3.98 973 970 -0.31
12 Manipur 0.08 706 735 3.95 721 745 3.22
13 Meghalaya 0.13 800 818 2.20 814 822 0.97
14 Orissa 5.18 669 658 -1.67 671 659 -1.82
15 Punjab 2.77 931 994 6.34 967 1000 3.30
16 Rajasthan 2.51 876 935 6.31 920 916 -0.44
17 Tamil Nadu 8.97 837 886 5.53 855 935 8.56
18 Tripura 0.30 765 771 0.78 785 761 -3.15
19 Uttar Pradesh 9.37 847 819 -3.42 856 782 -9.46
20 West Bengal 10.43 688 700 1.71 694 715 2.94
All-India 100.00 826 847 2.48 843 850 0.82
C. Retail Price Indices for 31 Selected Essential Commodities
In pursuance of the decision of the Cabinet Committee on Economic Affairs, Labour Bureau has been compiling Retail Price Indices for 31 selected essential commodities for urban areas by utilizing the prices collected for compilation of Consumer Price Index Numbers. These indices are being compiled as per the methodology evolved by the Labour Bureau and approved by the Technical Advisory Committee on Statistics of Prices and Cost of Living (TAC on SPCL). These indices are being supplied regularly to the Ministry of Consumer Affairs, Food and Public Distribution, formerly known as Ministry of Civil Supplies.
The Retail Price Indices in respect of 31 essential commodities on the basis of prices being collected for the compilation of Consumer Price Index Numbers for Industrial Workers on Base 1960=100 were compiled from April, 1985 to September, 1988 and on the base 1982=100 from July, 1989 to December, 2005. Since the compilation of CPI(IW) has been shifted to 2001=100 with January, 2006 index as such the Retail Price Indices in respect of 31 Essential Commodities are compiled by utilising the prices collected for 78 centres regularly with effect from January, 2006 index on month to month basis.
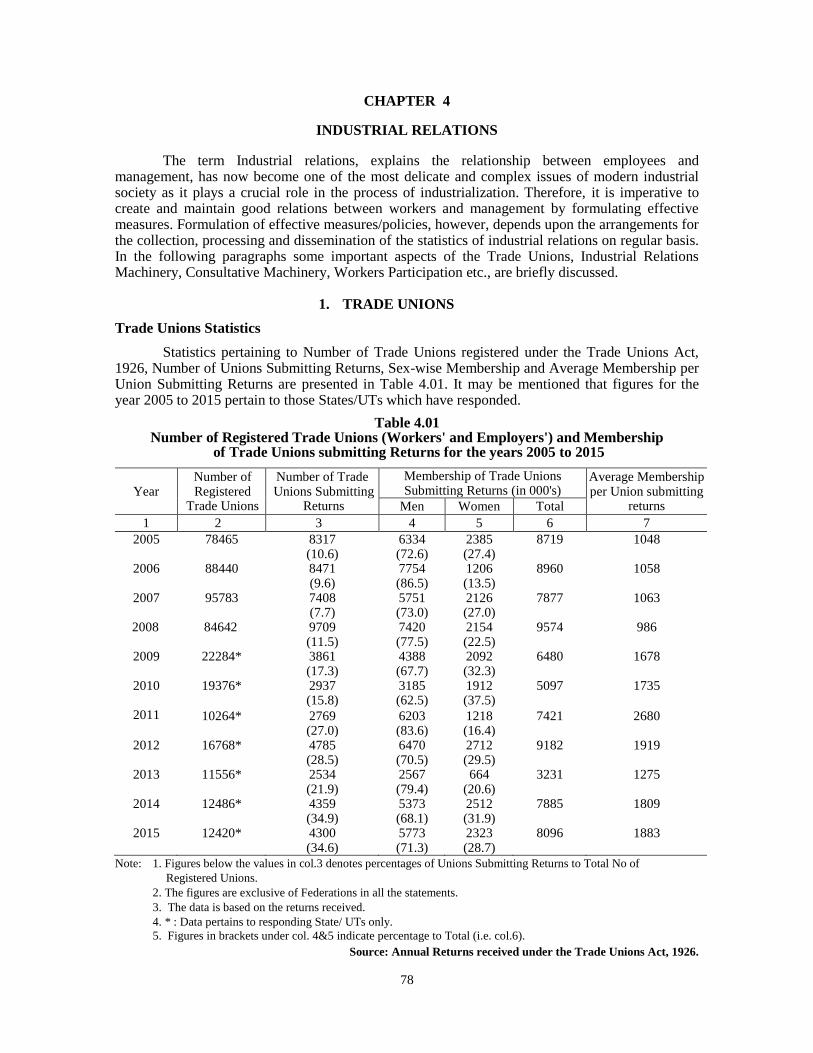
78
CHAPTER 4
INDUSTRIAL RELATIONS
The term Industrial relations, explains the relationship between employees and management, has now become one of the most delicate and complex issues of modern industrial society as it plays a crucial role in the process of industrialization. Therefore, it is imperative to create and maintain good relations between workers and management by formulating effective measures. Formulation of effective measures/policies, however, depends upon the arrangements for the collection, processing and dissemination of the statistics of industrial relations on regular basis. In the following paragraphs some important aspects of the Trade Unions, Industrial Relations Machinery, Consultative Machinery, Workers Participation etc., are briefly discussed.
1. TRADE UNIONS
Trade Unions Statistics
Statistics pertaining to Number of Trade Unions registered under the Trade Unions Act, 1926, Number of Unions Submitting Returns, Sex-wise Membership and Average Membership per Union Submitting Returns are presented in Table 4.01. It may be mentioned that figures for the year 2005 to 2015 pertain to those States/UTs which have responded.
Table 4.01 Number of Registered Trade Unions (Workers' and Employers') and Membership
of Trade Unions submitting Returns for the years 2005 to 2015
Year Number of Registered
Trade Unions
Number of Trade Unions Submitting
Returns
Membership of Trade Unions Submitting Returns (in 000's)
Average Membership per Union submitting
returns Men Women Total
1 2 3 4 5 6 7
2005 78465 8317 6334 2385 8719 1048 (10.6) (72.6) (27.4)
2006 88440 8471 7754 1206 8960 1058 (9.6) (86.5) (13.5)
2007 95783 7408 5751 2126 7877 1063 (7.7) (73.0) (27.0)
2008 84642 9709 7420 2154 9574 986 (11.5) (77.5) (22.5)
2009 22284* 3861 4388 2092 6480 1678 (17.3) (67.7) (32.3)
2010 19376* 2937 3185 1912 5097 1735 (15.8) (62.5) (37.5)
2011 10264* 2769 6203 1218 7421 2680 (27.0) (83.6) (16.4)
2012 16768* 4785 6470 2712 9182 1919 (28.5) (70.5) (29.5)
2013 11556* 2534 2567 664 3231 1275 (21.9) (79.4) (20.6)
2014 12486* 4359 5373 2512 7885 1809 (34.9) (68.1) (31.9)
2015 12420* 4300 5773 2323 8096 1883 (34.6) (71.3) (28.7)
Note: 1. Figures below the values in col.3 denotes percentages of Unions Submitting Returns to Total No of
Registered Unions.
2. The figures are exclusive of Federations in all the statements.
3. The data is based on the returns received.
4. * : Data pertains to responding State/ UTs only.
5. Figures in brackets under col. 4&5 indicate percentage to Total (i.e. col.6).
Source: Annual Returns received under the Trade Unions Act, 1926.
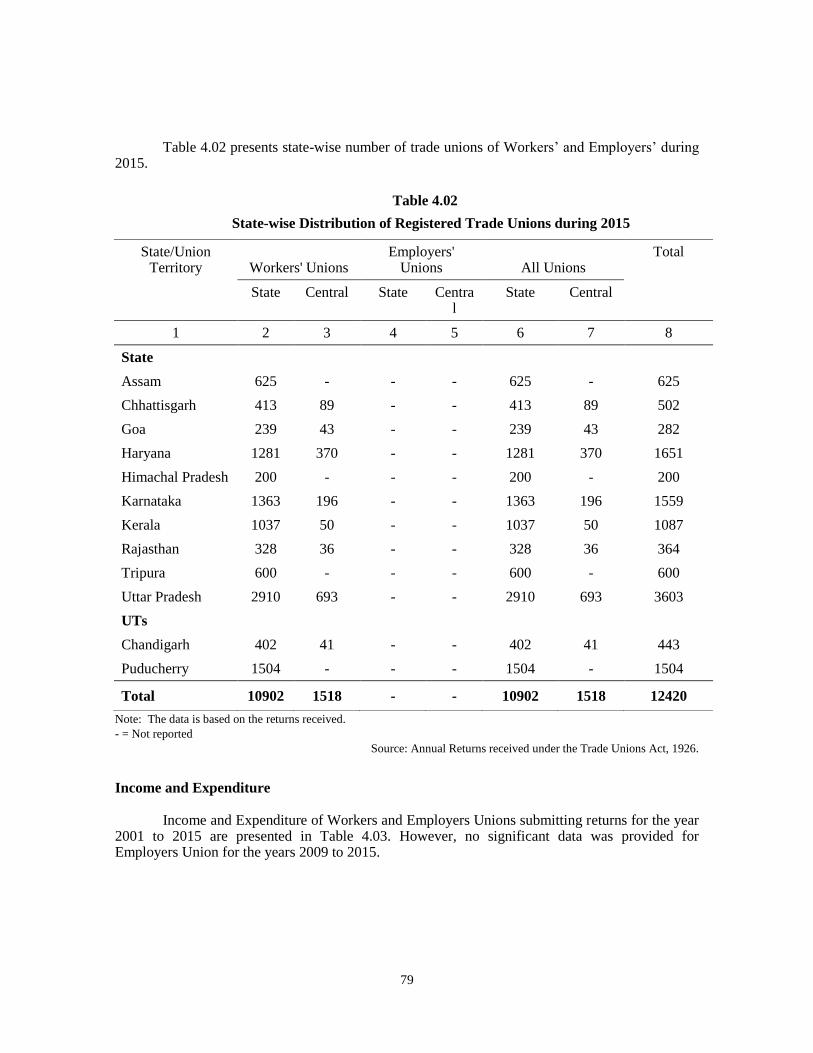
79
Table 4.02 presents state-wise number of trade unions of Workers‟ and Employers‟ during
2015.
Table 4.02
State-wise Distribution of Registered Trade Unions during 2015
Note: The data is based on the returns received.
- = Not reported
Source: Annual Returns received under the Trade Unions Act, 1926. Income and Expenditure
Income and Expenditure of Workers and Employers Unions submitting returns for the year 2001 to 2015 are presented in Table 4.03. However, no significant data was provided for Employers Union for the years 2009 to 2015.
State/Union Territory Workers' Unions
Employers' Unions All Unions
Total
State Central State Central
State Central
1 2 3 4 5 6 7 8
State
Assam 625 - - - 625 - 625
Chhattisgarh 413 89 - - 413 89 502
Goa 239 43 - - 239 43 282
Haryana 1281 370 - - 1281 370 1651
Himachal Pradesh 200 - - - 200 - 200
Karnataka 1363 196 - - 1363 196 1559
Kerala 1037 50 - - 1037 50 1087
Rajasthan 328 36 - - 328 36 364
Tripura 600 - - - 600 - 600
Uttar Pradesh 2910 693 - - 2910 693 3603
UTs
Chandigarh 402 41 - - 402 41 443
Puducherry 1504 - - - 1504 - 1504
Total 10902 1518 - - 10902 1518 12420
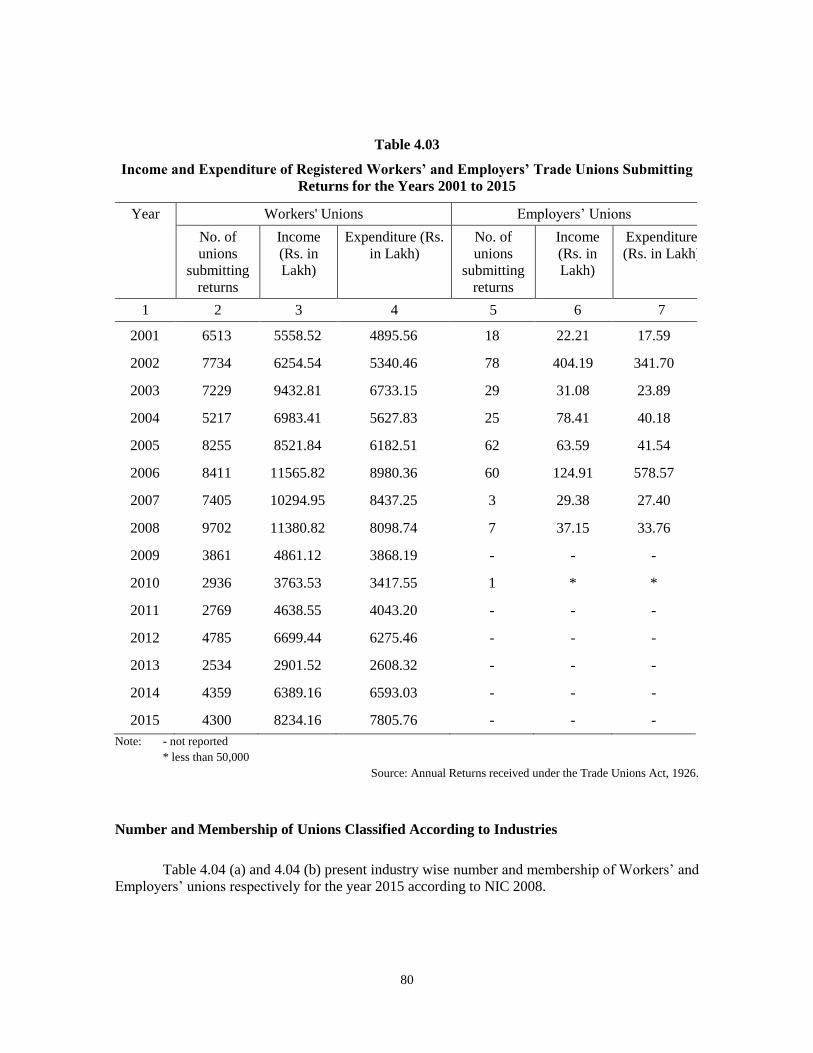
80
Table 4.03
Income and Expenditure of Registered Workers’ and Employers’ Trade Unions Submitting
Returns for the Years 2001 to 2015
Year Workers' Unions Employers‟ Unions
No. of
unions
submitting
returns
Income
(Rs. in
Lakh)
Expenditure (Rs.
in Lakh)
No. of
unions
submitting
returns
Income
(Rs. in
Lakh)
Expenditure
(Rs. in Lakh)
1 2 3 4 5 6 7
2001 6513 5558.52 4895.56 18 22.21 17.59
2002 7734 6254.54 5340.46 78 404.19 341.70
2003 7229 9432.81 6733.15 29 31.08 23.89
2004 5217 6983.41 5627.83 25 78.41 40.18
2005 8255 8521.84 6182.51 62 63.59 41.54
2006 8411 11565.82 8980.36 60 124.91 578.57
2007 7405 10294.95 8437.25 3 29.38 27.40
2008 9702 11380.82 8098.74 7 37.15 33.76
2009 3861 4861.12 3868.19 - - -
2010 2936 3763.53 3417.55 1 * *
2011 2769 4638.55 4043.20 - - -
2012 4785 6699.44 6275.46 - - -
2013 2534 2901.52 2608.32 - - -
2014 4359 6389.16 6593.03 - - -
2015 4300 8234.16 7805.76 - - -
Note: - not reported
* less than 50,000
Source: Annual Returns received under the Trade Unions Act, 1926.
Number and Membership of Unions Classified According to Industries
Table 4.04 (a) and 4.04 (b) present industry wise number and membership of Workers‟ and
Employers‟ unions respectively for the year 2015 according to NIC 2008.
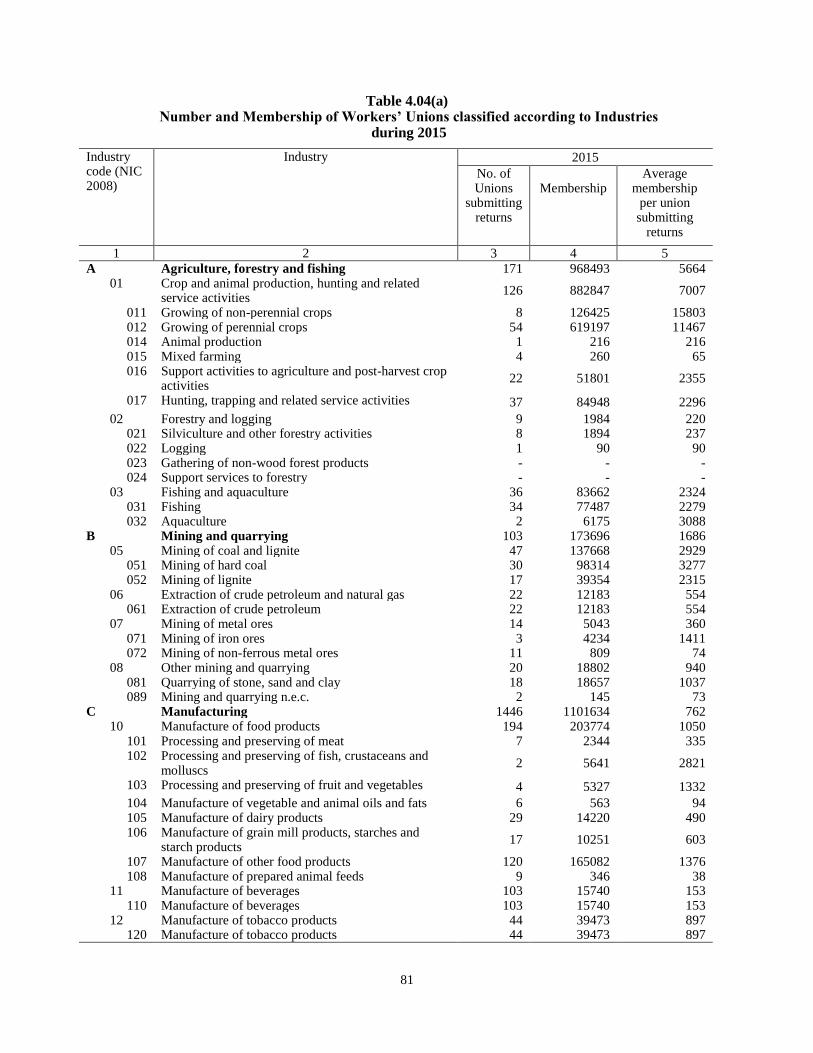
81
Table 4.04(a) Number and Membership of Workers’ Unions classified according to Industries
during 2015
Industry code (NIC 2008)
Industry 2015
No. of Unions
submitting returns
Membership
Average membership
per union submitting
returns
1 2 3 4 5
A Agriculture, forestry and fishing 171 968493 5664 01 Crop and animal production, hunting and related
service activities 126 882847 7007
011 Growing of non-perennial crops 8 126425 15803 012 Growing of perennial crops 54 619197 11467 014 Animal production 1 216 216 015 Mixed farming 4 260 65 016 Support activities to agriculture and post-harvest crop
activities 22 51801 2355
017 Hunting, trapping and related service activities 37 84948 2296
02 Forestry and logging 9 1984 220 021 Silviculture and other forestry activities 8 1894 237 022 Logging 1 90 90 023 Gathering of non-wood forest products - - - 024 Support services to forestry - - -
03 Fishing and aquaculture 36 83662 2324 031 Fishing 34 77487 2279 032 Aquaculture 2 6175 3088
B Mining and quarrying 103 173696 1686 05 Mining of coal and lignite 47 137668 2929
051 Mining of hard coal 30 98314 3277 052 Mining of lignite 17 39354 2315
06 Extraction of crude petroleum and natural gas 22 12183 554 061 Extraction of crude petroleum 22 12183 554
07 Mining of metal ores 14 5043 360 071 Mining of iron ores 3 4234 1411 072 Mining of non-ferrous metal ores 11 809 74
08 Other mining and quarrying 20 18802 940 081 Quarrying of stone, sand and clay 18 18657 1037 089 Mining and quarrying n.e.c. 2 145 73
C Manufacturing 1446 1101634 762 10 Manufacture of food products 194 203774 1050
101 Processing and preserving of meat 7 2344 335 102 Processing and preserving of fish, crustaceans and
molluscs 2 5641 2821
103 Processing and preserving of fruit and vegetables 4 5327 1332
104 Manufacture of vegetable and animal oils and fats 6 563 94 105 Manufacture of dairy products 29 14220 490 106 Manufacture of grain mill products, starches and
starch products 17 10251 603
107 Manufacture of other food products 120 165082 1376 108 Manufacture of prepared animal feeds 9 346 38
11 Manufacture of beverages 103 15740 153 110 Manufacture of beverages 103 15740 153
12 Manufacture of tobacco products 44 39473 897 120 Manufacture of tobacco products 44 39473 897
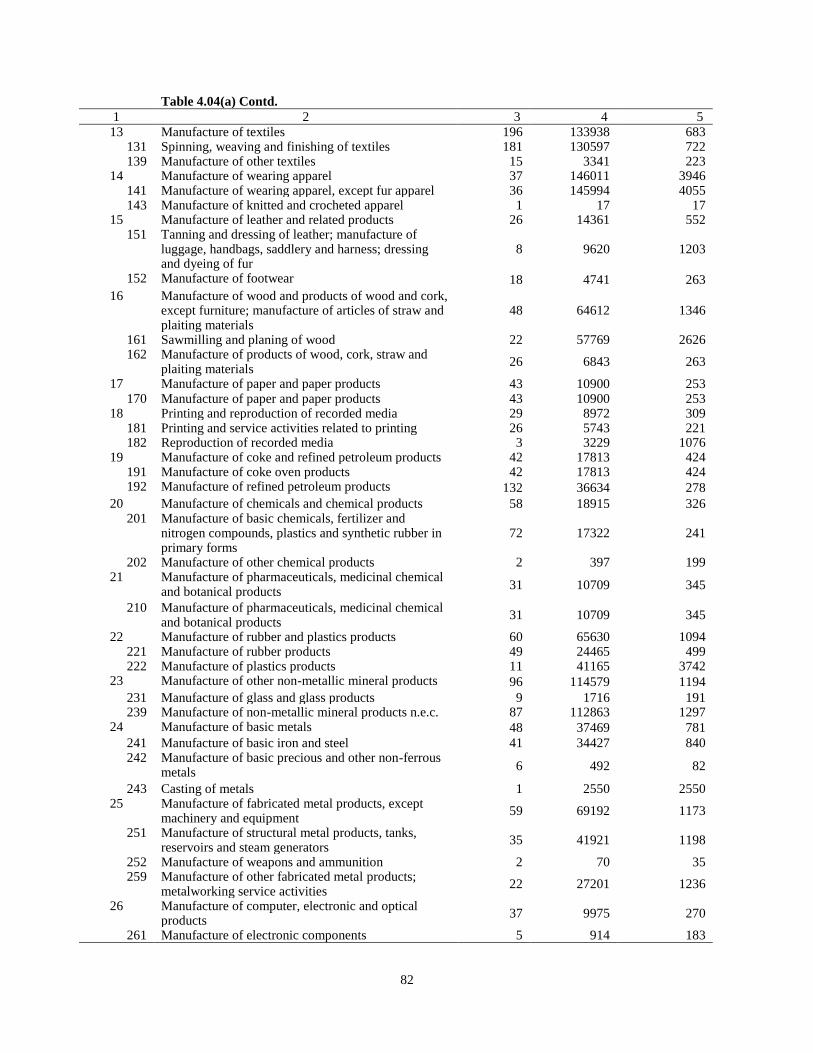
82
Table 4.04(a) Contd.
1 2 3 4 5
13 Manufacture of textiles 196 133938 683 131 Spinning, weaving and finishing of textiles 181 130597 722 139 Manufacture of other textiles 15 3341 223
14 Manufacture of wearing apparel 37 146011 3946 141 Manufacture of wearing apparel, except fur apparel 36 145994 4055 143 Manufacture of knitted and crocheted apparel 1 17 17
15 Manufacture of leather and related products 26 14361 552 151 Tanning and dressing of leather; manufacture of
luggage, handbags, saddlery and harness; dressing and dyeing of fur
8 9620 1203
152 Manufacture of footwear 18 4741 263
16 Manufacture of wood and products of wood and cork, except furniture; manufacture of articles of straw and plaiting materials
48 64612 1346
161 Sawmilling and planing of wood 22 57769 2626 162 Manufacture of products of wood, cork, straw and
plaiting materials 26 6843 263
17 Manufacture of paper and paper products 43 10900 253 170 Manufacture of paper and paper products 43 10900 253
18 Printing and reproduction of recorded media 29 8972 309 181 Printing and service activities related to printing 26 5743 221 182 Reproduction of recorded media 3 3229 1076
19 Manufacture of coke and refined petroleum products 42 17813 424 191 Manufacture of coke oven products 42 17813 424 192 Manufacture of refined petroleum products 132 36634 278
20 Manufacture of chemicals and chemical products 58 18915 326 201 Manufacture of basic chemicals, fertilizer and
nitrogen compounds, plastics and synthetic rubber in primary forms
72 17322 241
202 Manufacture of other chemical products 2 397 199 21 Manufacture of pharmaceuticals, medicinal chemical
and botanical products 31 10709 345
210 Manufacture of pharmaceuticals, medicinal chemical and botanical products
31 10709 345
22 Manufacture of rubber and plastics products 60 65630 1094 221 Manufacture of rubber products 49 24465 499 222 Manufacture of plastics products 11 41165 3742
23 Manufacture of other non-metallic mineral products 96 114579 1194
231 Manufacture of glass and glass products 9 1716 191 239 Manufacture of non-metallic mineral products n.e.c. 87 112863 1297
24 Manufacture of basic metals 48 37469 781
241 Manufacture of basic iron and steel 41 34427 840 242 Manufacture of basic precious and other non-ferrous
metals 6 492 82
243 Casting of metals 1 2550 2550 25 Manufacture of fabricated metal products, except
machinery and equipment 59 69192 1173
251 Manufacture of structural metal products, tanks, reservoirs and steam generators
35 41921 1198
252 Manufacture of weapons and ammunition 2 70 35 259 Manufacture of other fabricated metal products;
metalworking service activities 22 27201 1236
26 Manufacture of computer, electronic and optical products
37 9975 270
261 Manufacture of electronic components 5 914 183
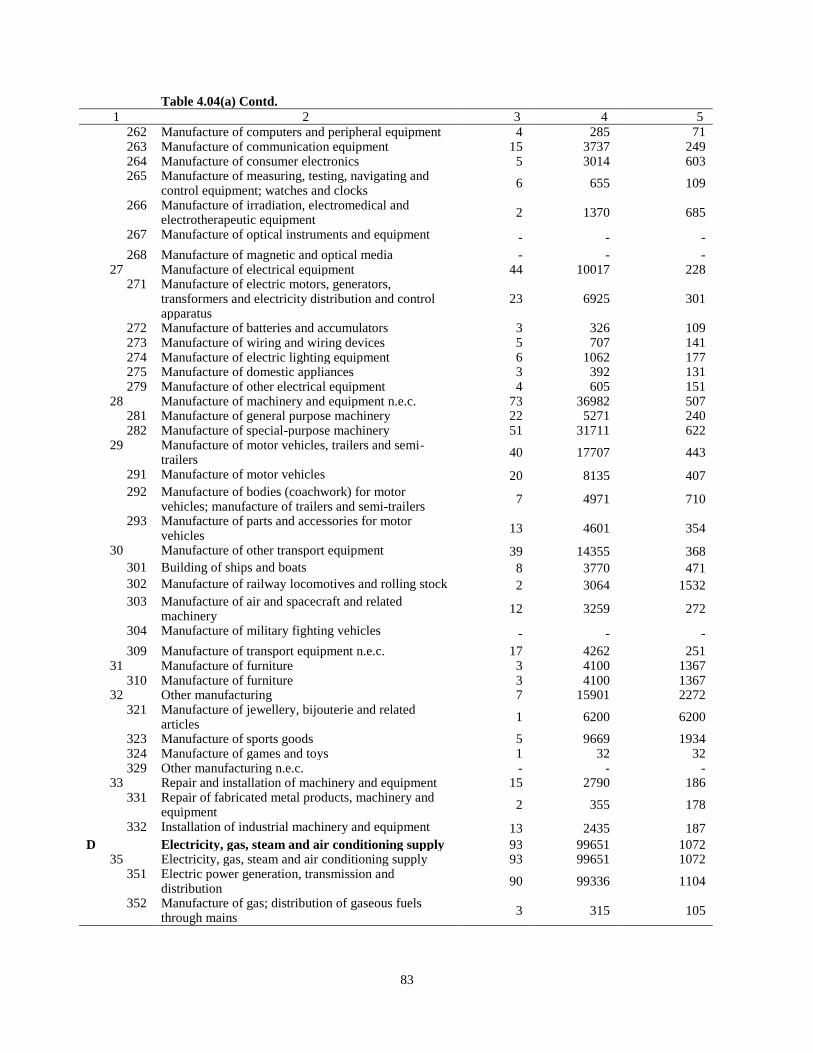
83
Table 4.04(a) Contd.
1 2 3 4 5
262 Manufacture of computers and peripheral equipment 4 285 71 263 Manufacture of communication equipment 15 3737 249 264 Manufacture of consumer electronics 5 3014 603 265 Manufacture of measuring, testing, navigating and
control equipment; watches and clocks 6 655 109
266 Manufacture of irradiation, electromedical and electrotherapeutic equipment
2 1370 685
267 Manufacture of optical instruments and equipment - - -
268 Manufacture of magnetic and optical media - - - 27 Manufacture of electrical equipment 44 10017 228
271 Manufacture of electric motors, generators, transformers and electricity distribution and control apparatus
23 6925 301
272 Manufacture of batteries and accumulators 3 326 109 273 Manufacture of wiring and wiring devices 5 707 141 274 Manufacture of electric lighting equipment 6 1062 177 275 Manufacture of domestic appliances 3 392 131 279 Manufacture of other electrical equipment 4 605 151
28 Manufacture of machinery and equipment n.e.c. 73 36982 507 281 Manufacture of general purpose machinery 22 5271 240 282 Manufacture of special-purpose machinery 51 31711 622
29 Manufacture of motor vehicles, trailers and semi-trailers
40 17707 443
291 Manufacture of motor vehicles 20 8135 407
292 Manufacture of bodies (coachwork) for motor vehicles; manufacture of trailers and semi-trailers
7 4971 710
293 Manufacture of parts and accessories for motor vehicles
13 4601 354
30 Manufacture of other transport equipment 39 14355 368
301 Building of ships and boats 8 3770 471
302 Manufacture of railway locomotives and rolling stock 2 3064 1532
303 Manufacture of air and spacecraft and related machinery
12 3259 272
304 Manufacture of military fighting vehicles - - -
309 Manufacture of transport equipment n.e.c. 17 4262 251 31 Manufacture of furniture 3 4100 1367
310 Manufacture of furniture 3 4100 1367 32 Other manufacturing 7 15901 2272
321 Manufacture of jewellery, bijouterie and related articles
1 6200 6200
323 Manufacture of sports goods 5 9669 1934 324 Manufacture of games and toys 1 32 32 329 Other manufacturing n.e.c. - - -
33 Repair and installation of machinery and equipment 15 2790 186 331 Repair of fabricated metal products, machinery and
equipment 2 355 178
332 Installation of industrial machinery and equipment 13 2435 187
D Electricity, gas, steam and air conditioning supply 93 99651 1072 35 Electricity, gas, steam and air conditioning supply 93 99651 1072
351 Electric power generation, transmission and distribution
90 99336 1104
352 Manufacture of gas; distribution of gaseous fuels through mains
3 315 105
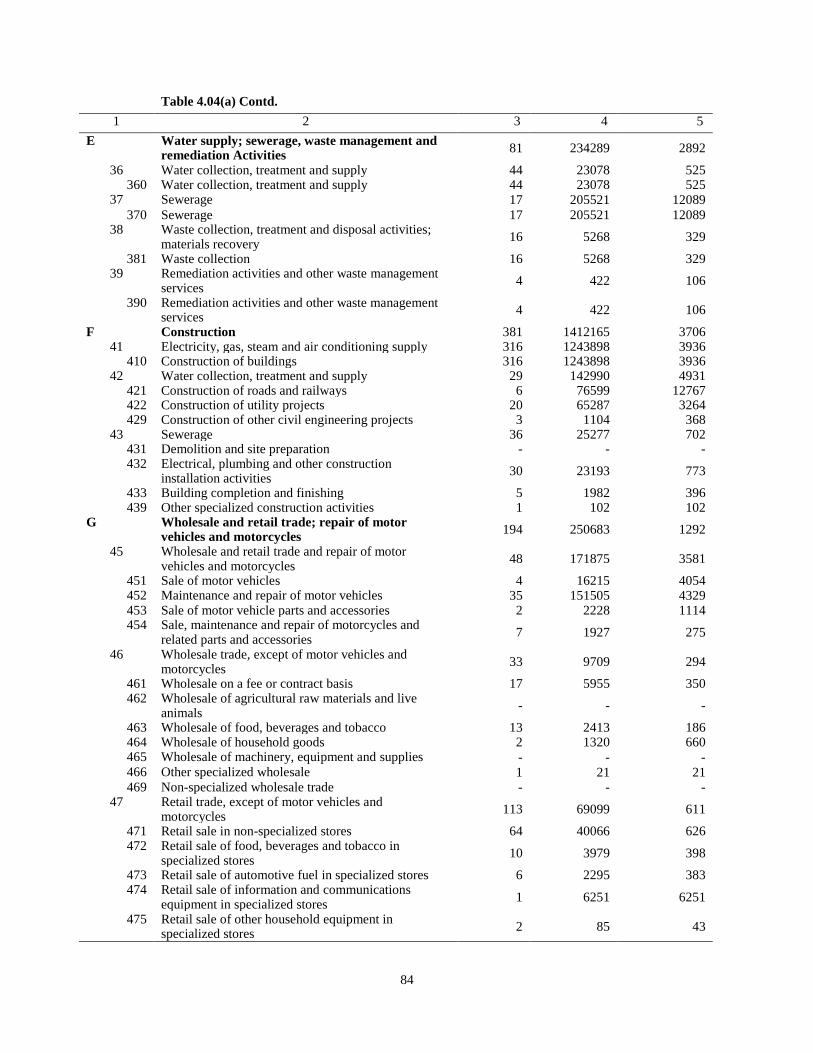
84
Table 4.04(a) Contd.
1 2 3 4 5
E Water supply; sewerage, waste management and remediation Activities
81 234289 2892
36 Water collection, treatment and supply 44 23078 525 360 Water collection, treatment and supply 44 23078 525
37 Sewerage 17 205521 12089
370 Sewerage 17 205521 12089 38 Waste collection, treatment and disposal activities;
materials recovery 16 5268 329
381 Waste collection 16 5268 329 39 Remediation activities and other waste management
services 4 422 106
390 Remediation activities and other waste management services
4 422 106
F Construction 381 1412165 3706 41 Electricity, gas, steam and air conditioning supply 316 1243898 3936
410 Construction of buildings 316 1243898 3936 42 Water collection, treatment and supply 29 142990 4931
421 Construction of roads and railways 6 76599 12767 422 Construction of utility projects 20 65287 3264 429 Construction of other civil engineering projects 3 1104 368
43 Sewerage 36 25277 702 431 Demolition and site preparation - - - 432 Electrical, plumbing and other construction
installation activities 30 23193 773
433 Building completion and finishing 5 1982 396 439 Other specialized construction activities 1 102 102
G Wholesale and retail trade; repair of motor vehicles and motorcycles
194 250683 1292
45 Wholesale and retail trade and repair of motor vehicles and motorcycles
48 171875 3581
451 Sale of motor vehicles 4 16215 4054 452 Maintenance and repair of motor vehicles 35 151505 4329 453 Sale of motor vehicle parts and accessories 2 2228 1114 454 Sale, maintenance and repair of motorcycles and
related parts and accessories 7 1927 275
46 Wholesale trade, except of motor vehicles and motorcycles
33 9709 294
461 Wholesale on a fee or contract basis 17 5955 350 462 Wholesale of agricultural raw materials and live
animals - - -
463 Wholesale of food, beverages and tobacco 13 2413 186 464 Wholesale of household goods 2 1320 660 465 Wholesale of machinery, equipment and supplies - - - 466 Other specialized wholesale 1 21 21 469 Non-specialized wholesale trade - - -
47 Retail trade, except of motor vehicles and motorcycles
113 69099 611
471 Retail sale in non-specialized stores 64 40066 626 472 Retail sale of food, beverages and tobacco in
specialized stores 10 3979 398
473 Retail sale of automotive fuel in specialized stores 6 2295 383 474 Retail sale of information and communications
equipment in specialized stores 1 6251 6251
475 Retail sale of other household equipment in specialized stores
2 85 43
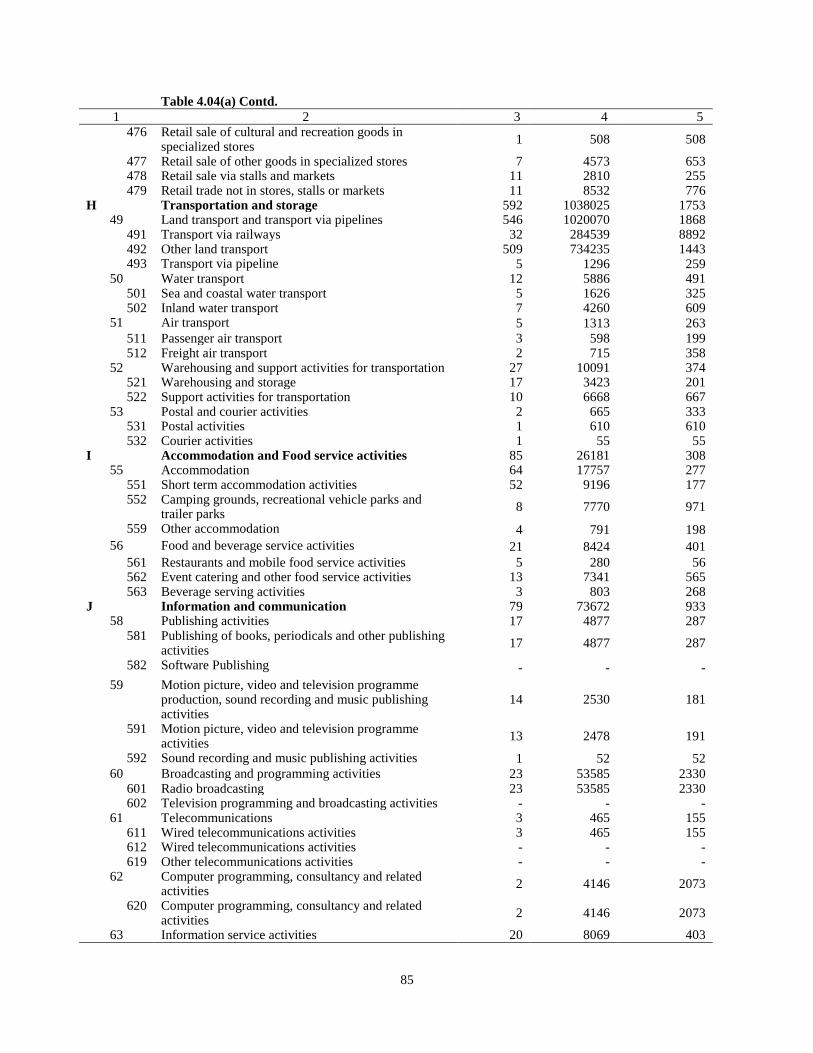
85
Table 4.04(a) Contd.
1 2 3 4 5
476 Retail sale of cultural and recreation goods in specialized stores
1 508 508
477 Retail sale of other goods in specialized stores 7 4573 653 478 Retail sale via stalls and markets 11 2810 255 479 Retail trade not in stores, stalls or markets 11 8532 776
H Transportation and storage 592 1038025 1753 49 Land transport and transport via pipelines 546 1020070 1868
491 Transport via railways 32 284539 8892 492 Other land transport 509 734235 1443 493 Transport via pipeline 5 1296 259
50 Water transport 12 5886 491 501 Sea and coastal water transport 5 1626 325 502 Inland water transport 7 4260 609
51 Air transport 5 1313 263
511 Passenger air transport 3 598 199 512 Freight air transport 2 715 358
52 Warehousing and support activities for transportation 27 10091 374 521 Warehousing and storage 17 3423 201 522 Support activities for transportation 10 6668 667
53 Postal and courier activities 2 665 333 531 Postal activities 1 610 610 532 Courier activities 1 55 55
I Accommodation and Food service activities 85 26181 308 55 Accommodation 64 17757 277
551 Short term accommodation activities 52 9196 177 552 Camping grounds, recreational vehicle parks and
trailer parks 8 7770 971
559 Other accommodation 4 791 198
56 Food and beverage service activities 21 8424 401
561 Restaurants and mobile food service activities 5 280 56 562 Event catering and other food service activities 13 7341 565 563 Beverage serving activities 3 803 268
J Information and communication 79 73672 933 58 Publishing activities 17 4877 287
581 Publishing of books, periodicals and other publishing activities
17 4877 287
582 Software Publishing - - -
59 Motion picture, video and television programme production, sound recording and music publishing activities
14 2530 181
591 Motion picture, video and television programme activities
13 2478 191
592 Sound recording and music publishing activities 1 52 52
60 Broadcasting and programming activities 23 53585 2330 601 Radio broadcasting 23 53585 2330 602 Television programming and broadcasting activities - - -
61 Telecommunications 3 465 155 611 Wired telecommunications activities 3 465 155 612 Wired telecommunications activities - - - 619 Other telecommunications activities - - -
62 Computer programming, consultancy and related activities
2 4146 2073
620 Computer programming, consultancy and related activities
2 4146 2073
63 Information service activities 20 8069 403
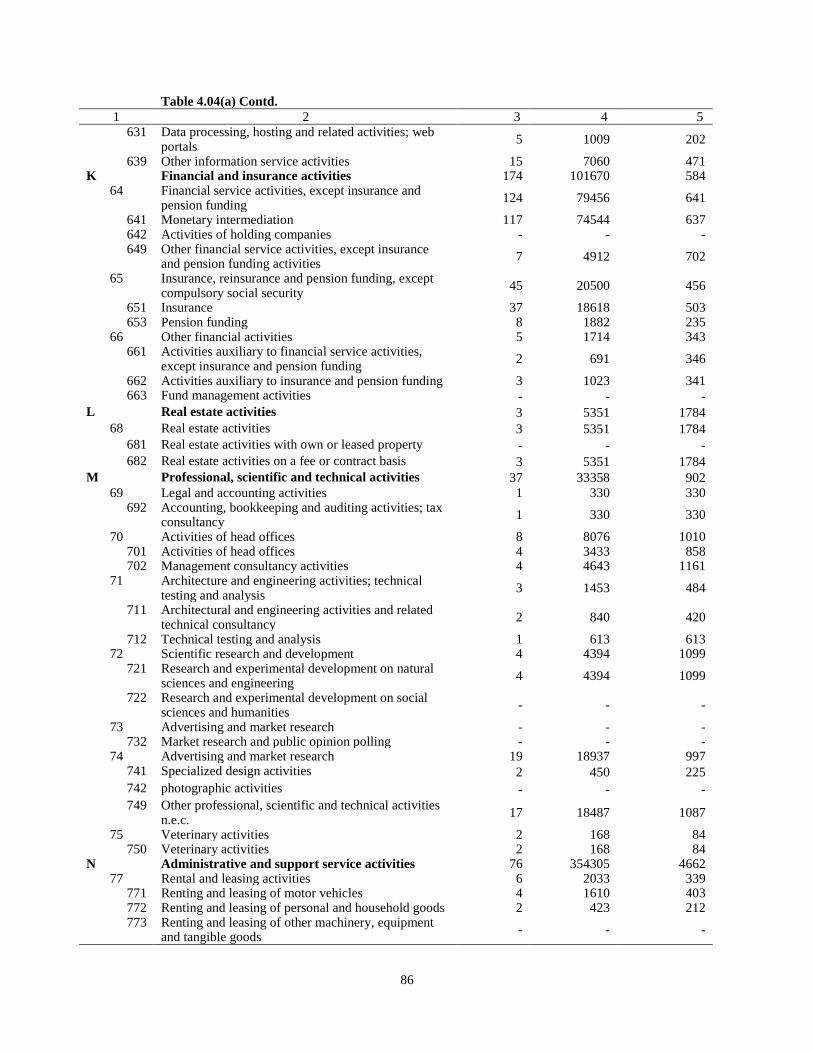
86
Table 4.04(a) Contd.
1 2 3 4 5
631 Data processing, hosting and related activities; web portals
5 1009 202
639 Other information service activities 15 7060 471 K Financial and insurance activities 174 101670 584
64 Financial service activities, except insurance and pension funding
124 79456 641
641 Monetary intermediation 117 74544 637 642 Activities of holding companies - - - 649 Other financial service activities, except insurance
and pension funding activities 7 4912 702
65 Insurance, reinsurance and pension funding, except compulsory social security
45 20500 456
651 Insurance 37 18618 503 653 Pension funding 8 1882 235
66 Other financial activities 5 1714 343 661 Activities auxiliary to financial service activities,
except insurance and pension funding 2 691 346
662 Activities auxiliary to insurance and pension funding 3 1023 341 663 Fund management activities - - -
L Real estate activities 3 5351 1784
68 Real estate activities 3 5351 1784
681 Real estate activities with own or leased property - - -
682 Real estate activities on a fee or contract basis 3 5351 1784
M Professional, scientific and technical activities 37 33358 902
69 Legal and accounting activities 1 330 330 692 Accounting, bookkeeping and auditing activities; tax
consultancy 1 330 330
70 Activities of head offices 8 8076 1010 701 Activities of head offices 4 3433 858 702 Management consultancy activities 4 4643 1161
71 Architecture and engineering activities; technical testing and analysis
3 1453 484
711 Architectural and engineering activities and related technical consultancy
2 840 420
712 Technical testing and analysis 1 613 613 72 Scientific research and development 4 4394 1099
721 Research and experimental development on natural sciences and engineering
4 4394 1099
722 Research and experimental development on social sciences and humanities
- - -
73 Advertising and market research - - - 732 Market research and public opinion polling - - -
74 Advertising and market research 19 18937 997 741 Specialized design activities 2 450 225
742 photographic activities - - -
749 Other professional, scientific and technical activities n.e.c.
17 18487 1087
75 Veterinary activities 2 168 84 750 Veterinary activities 2 168 84
N Administrative and support service activities 76 354305 4662 77 Rental and leasing activities 6 2033 339
771 Renting and leasing of motor vehicles 4 1610 403 772 Renting and leasing of personal and household goods 2 423 212 773 Renting and leasing of other machinery, equipment
and tangible goods - - -
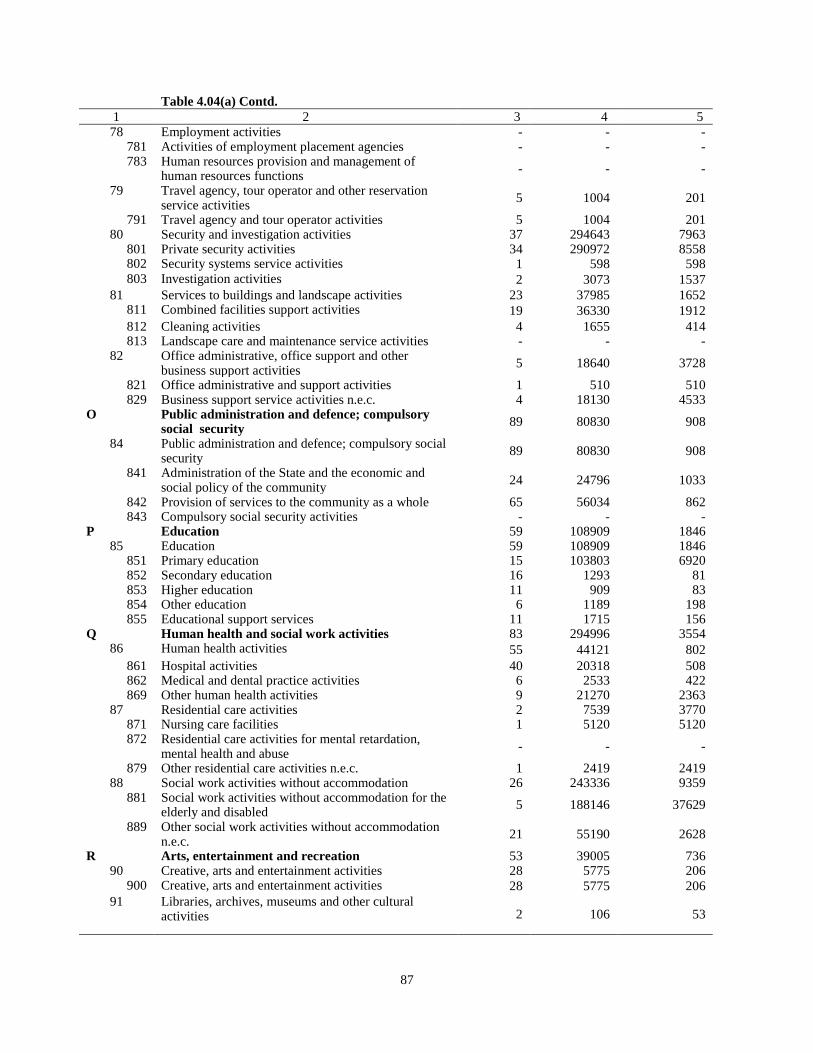
87
Table 4.04(a) Contd.
1 2 3 4 5
78 Employment activities - - - 781 Activities of employment placement agencies - - - 783 Human resources provision and management of
human resources functions - - -
79 Travel agency, tour operator and other reservation service activities
5 1004 201
791 Travel agency and tour operator activities 5 1004 201 80 Security and investigation activities 37 294643 7963
801 Private security activities 34 290972 8558 802 Security systems service activities 1 598 598 803 Investigation activities 2 3073 1537
81 Services to buildings and landscape activities 23 37985 1652 811 Combined facilities support activities 19 36330 1912
812 Cleaning activities 4 1655 414 813 Landscape care and maintenance service activities - - -
82 Office administrative, office support and other business support activities
5 18640 3728
821 Office administrative and support activities 1 510 510 829 Business support service activities n.e.c. 4 18130 4533
O Public administration and defence; compulsory social security
89 80830 908
84 Public administration and defence; compulsory social security
89 80830 908
841 Administration of the State and the economic and social policy of the community
24 24796 1033
842 Provision of services to the community as a whole 65 56034 862 843 Compulsory social security activities - - -
P Education 59 108909 1846 85 Education 59 108909 1846
851 Primary education 15 103803 6920 852 Secondary education 16 1293 81 853 Higher education 11 909 83 854 Other education 6 1189 198 855 Educational support services 11 1715 156
Q Human health and social work activities 83 294996 3554 86 Human health activities 55 44121 802
861 Hospital activities 40 20318 508 862 Medical and dental practice activities 6 2533 422 869 Other human health activities 9 21270 2363
87 Residential care activities 2 7539 3770 871 Nursing care facilities 1 5120 5120 872 Residential care activities for mental retardation,
mental health and abuse - - -
879 Other residential care activities n.e.c. 1 2419 2419 88 Social work activities without accommodation 26 243336 9359
881 Social work activities without accommodation for the elderly and disabled
5 188146 37629
889 Other social work activities without accommodation n.e.c.
21 55190 2628
R Arts, entertainment and recreation 53 39005 736 90 Creative, arts and entertainment activities 28 5775 206
900 Creative, arts and entertainment activities 28 5775 206
91 Libraries, archives, museums and other cultural activities 2 106 53
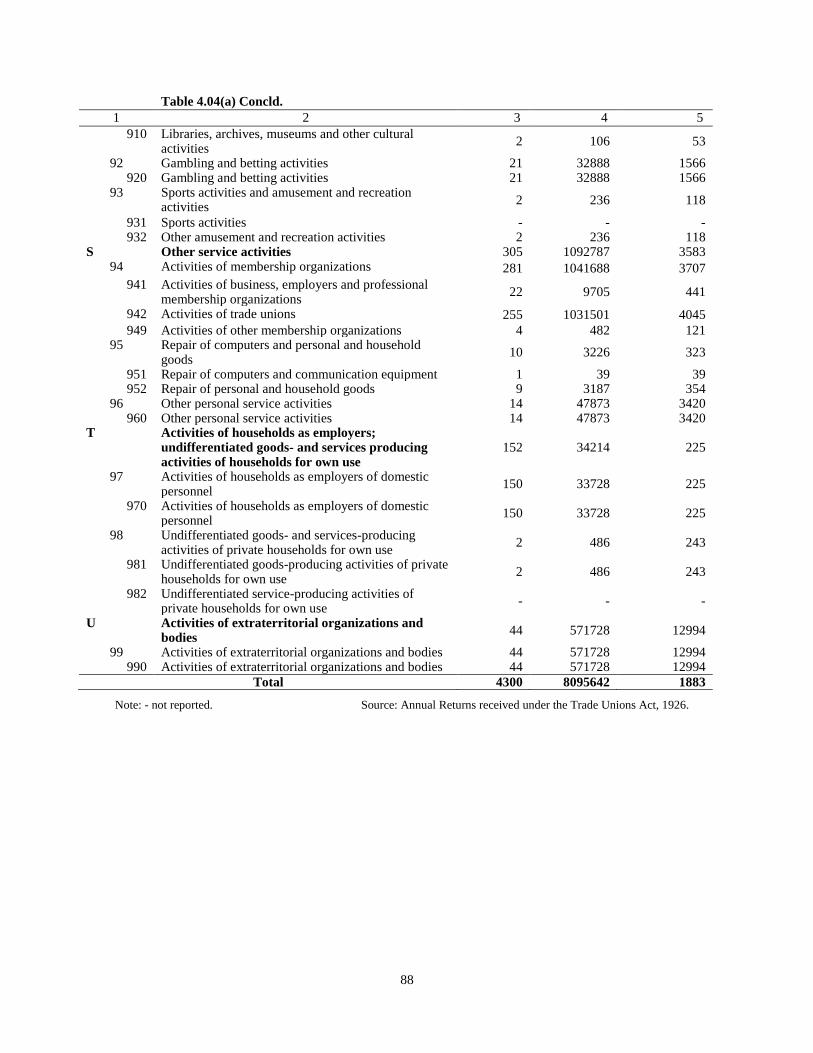
88
Table 4.04(a) Concld.
1 2 3 4 5
910 Libraries, archives, museums and other cultural activities
2 106 53
92 Gambling and betting activities 21 32888 1566 920 Gambling and betting activities 21 32888 1566
93 Sports activities and amusement and recreation activities
2 236 118
931 Sports activities - - - 932 Other amusement and recreation activities 2 236 118
S Other service activities 305 1092787 3583 94 Activities of membership organizations 281 1041688 3707
941 Activities of business, employers and professional membership organizations
22 9705 441
942 Activities of trade unions 255 1031501 4045
949 Activities of other membership organizations 4 482 121 95 Repair of computers and personal and household
goods 10 3226 323
951 Repair of computers and communication equipment 1 39 39 952 Repair of personal and household goods 9 3187 354
96 Other personal service activities 14 47873 3420 960 Other personal service activities 14 47873 3420
T Activities of households as employers; undifferentiated goods- and services producing activities of households for own use
152 34214 225
97 Activities of households as employers of domestic personnel
150 33728 225
970 Activities of households as employers of domestic personnel
150 33728 225
98 Undifferentiated goods- and services-producing activities of private households for own use
2 486 243
981 Undifferentiated goods-producing activities of private households for own use
2 486 243
982 Undifferentiated service-producing activities of private households for own use
- - -
U Activities of extraterritorial organizations and bodies
44 571728 12994
99 Activities of extraterritorial organizations and bodies 44 571728 12994 990 Activities of extraterritorial organizations and bodies 44 571728 12994
Total 4300 8095642 1883
Note: - not reported. Source: Annual Returns received under the Trade Unions Act, 1926.
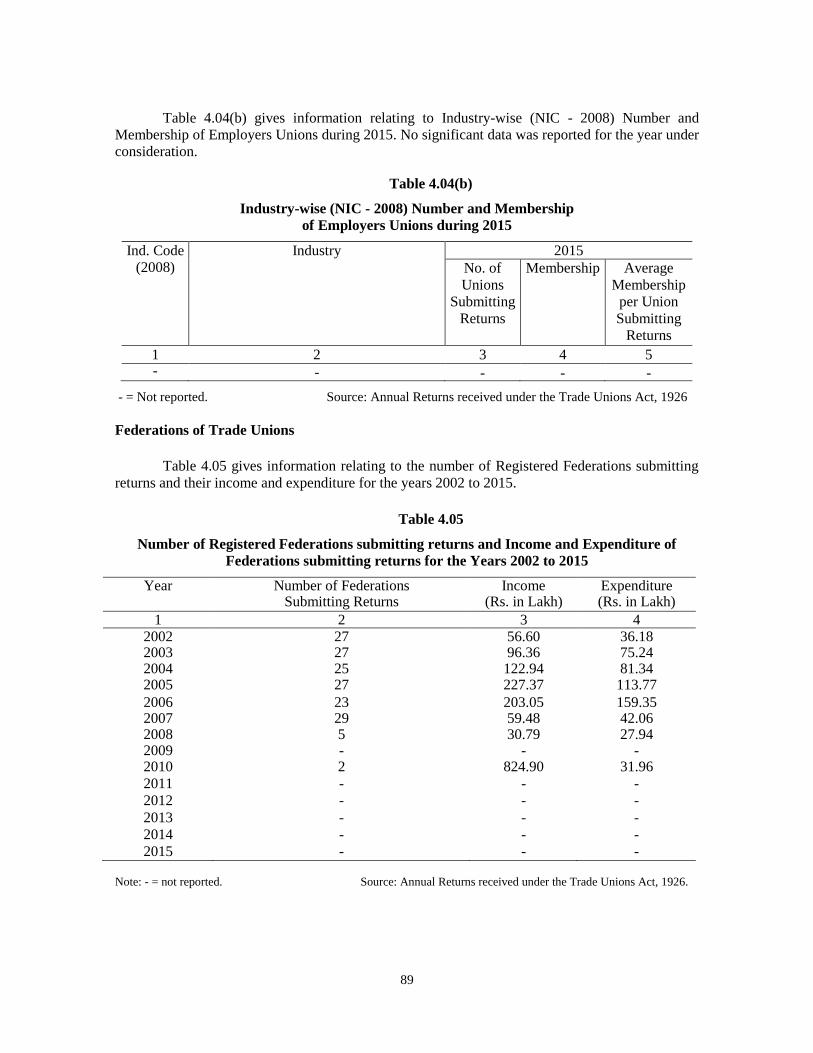
89
Table 4.04(b) gives information relating to Industry-wise (NIC - 2008) Number and
Membership of Employers Unions during 2015. No significant data was reported for the year under
consideration.
Table 4.04(b)
Industry-wise (NIC - 2008) Number and Membership
of Employers Unions during 2015
Ind. Code
(2008)
Industry 2015
No. of
Unions
Submitting
Returns
Membership Average
Membership
per Union
Submitting
Returns
1 2 3 4 5 - - - - -
- = Not reported. Source: Annual Returns received under the Trade Unions Act, 1926
Federations of Trade Unions
Table 4.05 gives information relating to the number of Registered Federations submitting
returns and their income and expenditure for the years 2002 to 2015.
Table 4.05
Number of Registered Federations submitting returns and Income and Expenditure of
Federations submitting returns for the Years 2002 to 2015
Year Number of Federations Submitting Returns
Income (Rs. in Lakh)
Expenditure (Rs. in Lakh)
1 2 3 4
2002 27 56.60 36.18 2003 27 96.36 75.24 2004 25 122.94 81.34 2005 27 227.37 113.77
2006 23 203.05 159.35 2007 29 59.48 42.06 2008 5 30.79 27.94 2009 - - - 2010 2 824.90 31.96
2011 - - -
2012 - - -
2013 - - -
2014 - - -
2015 - - -
Note: - = not reported. Source: Annual Returns received under the Trade Unions Act, 1926.
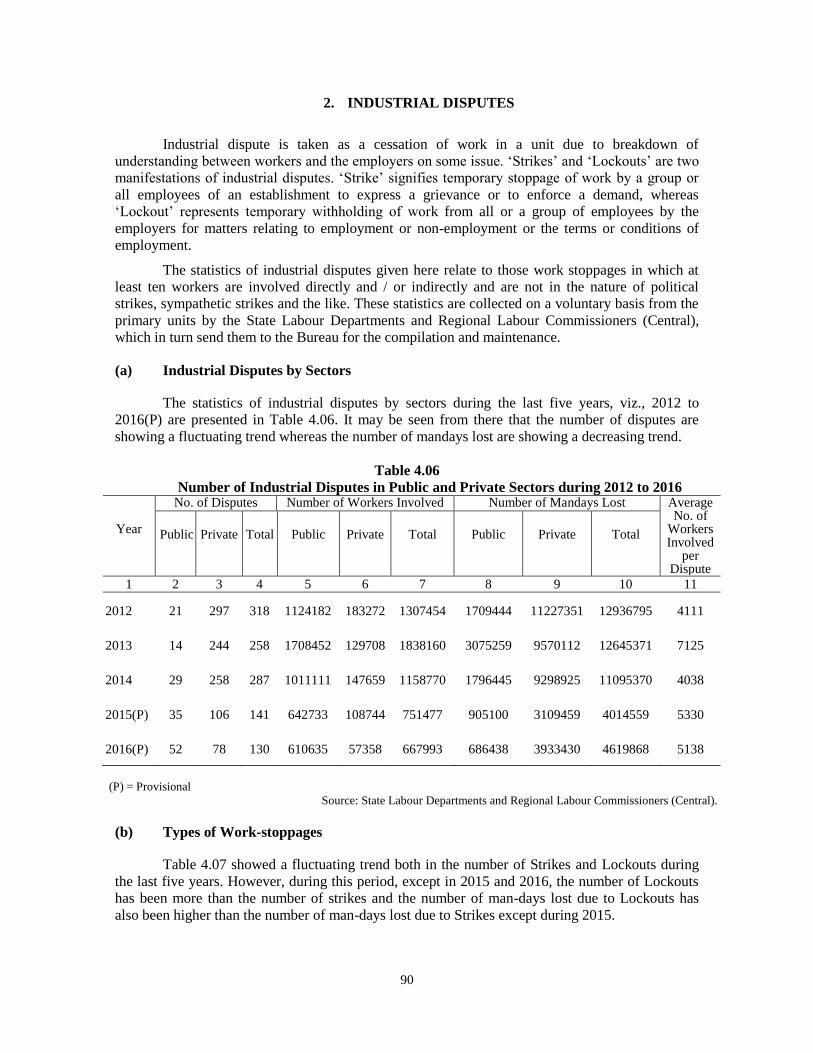
90
2. INDUSTRIAL DISPUTES
Industrial dispute is taken as a cessation of work in a unit due to breakdown of
understanding between workers and the employers on some issue. „Strikes‟ and „Lockouts‟ are two
manifestations of industrial disputes. „Strike‟ signifies temporary stoppage of work by a group or
all employees of an establishment to express a grievance or to enforce a demand, whereas
„Lockout‟ represents temporary withholding of work from all or a group of employees by the
employers for matters relating to employment or non-employment or the terms or conditions of
employment.
The statistics of industrial disputes given here relate to those work stoppages in which at
least ten workers are involved directly and / or indirectly and are not in the nature of political
strikes, sympathetic strikes and the like. These statistics are collected on a voluntary basis from the
primary units by the State Labour Departments and Regional Labour Commissioners (Central),
which in turn send them to the Bureau for the compilation and maintenance.
(a) Industrial Disputes by Sectors
The statistics of industrial disputes by sectors during the last five years, viz., 2012 to
2016(P) are presented in Table 4.06. It may be seen from there that the number of disputes are
showing a fluctuating trend whereas the number of mandays lost are showing a decreasing trend.
Table 4.06
Number of Industrial Disputes in Public and Private Sectors during 2012 to 2016
Year
No. of Disputes Number of Workers Involved Number of Mandays Lost Average No. of
Workers Involved
per Dispute
Public
Private
Total
Public
Private
Total
Public
Private
Total
1 2 3 4 5 6 7 8 9 10 11
2012 21 297 318 1124182 183272 1307454 1709444 11227351 12936795 4111
2013 14 244 258 1708452 129708 1838160 3075259 9570112 12645371 7125
2014 29 258 287 1011111 147659 1158770 1796445 9298925 11095370 4038
2015(P) 35 106 141 642733 108744 751477 905100 3109459 4014559 5330
2016(P) 52 78 130 610635 57358 667993 686438 3933430 4619868 5138
(P) = Provisional
Source: State Labour Departments and Regional Labour Commissioners (Central).
(b) Types of Work-stoppages
Table 4.07 showed a fluctuating trend both in the number of Strikes and Lockouts during
the last five years. However, during this period, except in 2015 and 2016, the number of Lockouts
has been more than the number of strikes and the number of man-days lost due to Lockouts has
also been higher than the number of man-days lost due to Strikes except during 2015.
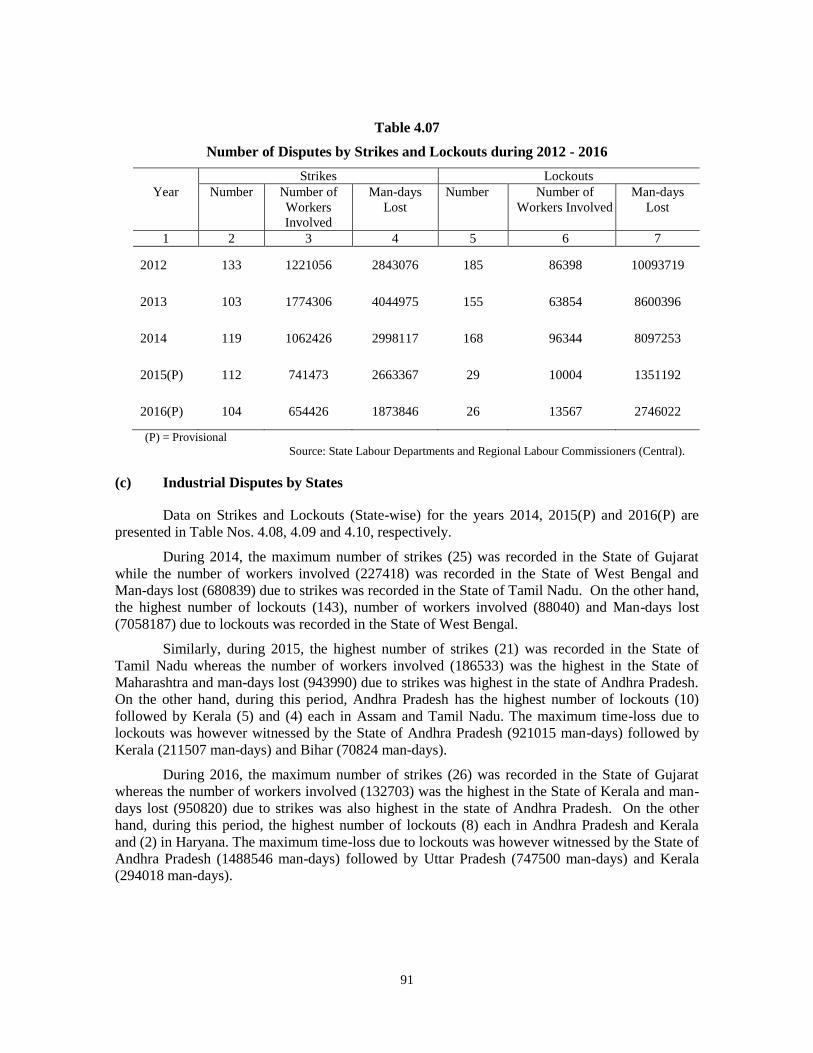
91
Table 4.07
Number of Disputes by Strikes and Lockouts during 2012 - 2016
Strikes Lockouts
Year Number Number of
Workers
Involved
Man-days
Lost
Number Number of
Workers Involved
Man-days
Lost
1 2 3 4 5 6 7
2012 133 1221056 2843076 185 86398 10093719
2013 103 1774306 4044975 155 63854 8600396
2014 119 1062426 2998117 168 96344 8097253
2015(P) 112 741473 2663367 29 10004 1351192
2016(P) 104 654426 1873846 26 13567 2746022
(P) = Provisional
Source: State Labour Departments and Regional Labour Commissioners (Central).
(c) Industrial Disputes by States
Data on Strikes and Lockouts (State-wise) for the years 2014, 2015(P) and 2016(P) are
presented in Table Nos. 4.08, 4.09 and 4.10, respectively.
During 2014, the maximum number of strikes (25) was recorded in the State of Gujarat
while the number of workers involved (227418) was recorded in the State of West Bengal and
Man-days lost (680839) due to strikes was recorded in the State of Tamil Nadu. On the other hand,
the highest number of lockouts (143), number of workers involved (88040) and Man-days lost
(7058187) due to lockouts was recorded in the State of West Bengal.
Similarly, during 2015, the highest number of strikes (21) was recorded in the State of
Tamil Nadu whereas the number of workers involved (186533) was the highest in the State of
Maharashtra and man-days lost (943990) due to strikes was highest in the state of Andhra Pradesh.
On the other hand, during this period, Andhra Pradesh has the highest number of lockouts (10)
followed by Kerala (5) and (4) each in Assam and Tamil Nadu. The maximum time-loss due to
lockouts was however witnessed by the State of Andhra Pradesh (921015 man-days) followed by
Kerala (211507 man-days) and Bihar (70824 man-days).
During 2016, the maximum number of strikes (26) was recorded in the State of Gujarat
whereas the number of workers involved (132703) was the highest in the State of Kerala and man-
days lost (950820) due to strikes was also highest in the state of Andhra Pradesh. On the other
hand, during this period, the highest number of lockouts (8) each in Andhra Pradesh and Kerala
and (2) in Haryana. The maximum time-loss due to lockouts was however witnessed by the State of
Andhra Pradesh (1488546 man-days) followed by Uttar Pradesh (747500 man-days) and Kerala
(294018 man-days).
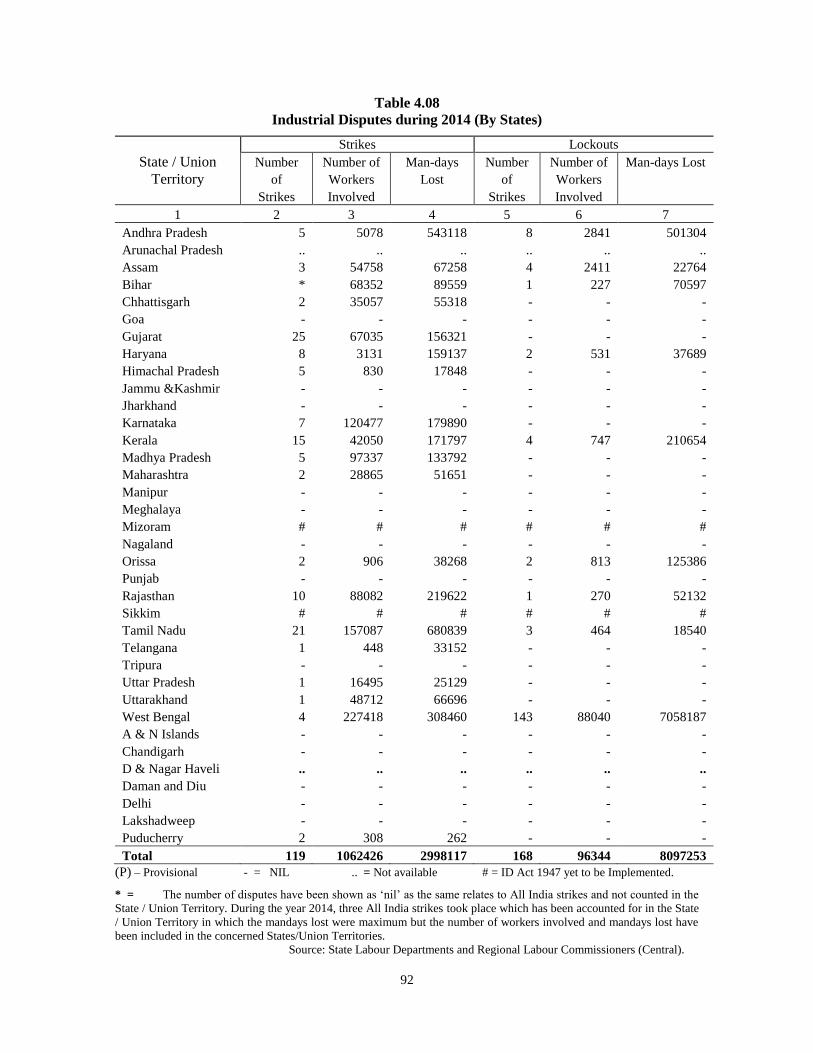
92
Table 4.08
Industrial Disputes during 2014 (By States)
Strikes Lockouts
State / Union
Territory
Number
of
Strikes
Number of
Workers
Involved
Man-days
Lost
Number
of
Strikes
Number of
Workers
Involved
Man-days Lost
1 2 3 4 5 6 7
Andhra Pradesh 5 5078 543118 8 2841 501304
Arunachal Pradesh .. .. .. .. .. ..
Assam 3 54758 67258 4 2411 22764
Bihar * 68352 89559 1 227 70597
Chhattisgarh 2 35057 55318 - - -
Goa - - - - - -
Gujarat 25 67035 156321 - - -
Haryana 8 3131 159137 2 531 37689
Himachal Pradesh 5 830 17848 - - -
Jammu &Kashmir - - - - - -
Jharkhand - - - - - -
Karnataka 7 120477 179890 - - -
Kerala 15 42050 171797 4 747 210654
Madhya Pradesh 5 97337 133792 - - -
Maharashtra 2 28865 51651 - - -
Manipur - - - - - -
Meghalaya - - - - - -
Mizoram # # # # # #
Nagaland - - - - - -
Orissa 2 906 38268 2 813 125386
Punjab - - - - - -
Rajasthan 10 88082 219622 1 270 52132
Sikkim # # # # # #
Tamil Nadu 21 157087 680839 3 464 18540
Telangana 1 448 33152 - - -
Tripura - - - - - -
Uttar Pradesh 1 16495 25129 - - -
Uttarakhand 1 48712 66696 - - -
West Bengal 4 227418 308460 143 88040 7058187
A & N Islands - - - - - -
Chandigarh - - - - - -
D & Nagar Haveli .. .. .. .. .. ..
Daman and Diu - - - - - -
Delhi - - - - - -
Lakshadweep - - - - - -
Puducherry 2 308 262 - - -
Total 119 1062426 2998117 168 96344 8097253
(P) – Provisional - = NIL .. = Not available # = ID Act 1947 yet to be Implemented.
* = The number of disputes have been shown as „nil‟ as the same relates to All India strikes and not counted in the
State / Union Territory. During the year 2014, three All India strikes took place which has been accounted for in the State
/ Union Territory in which the mandays lost were maximum but the number of workers involved and mandays lost have
been included in the concerned States/Union Territories.
Source: State Labour Departments and Regional Labour Commissioners (Central).
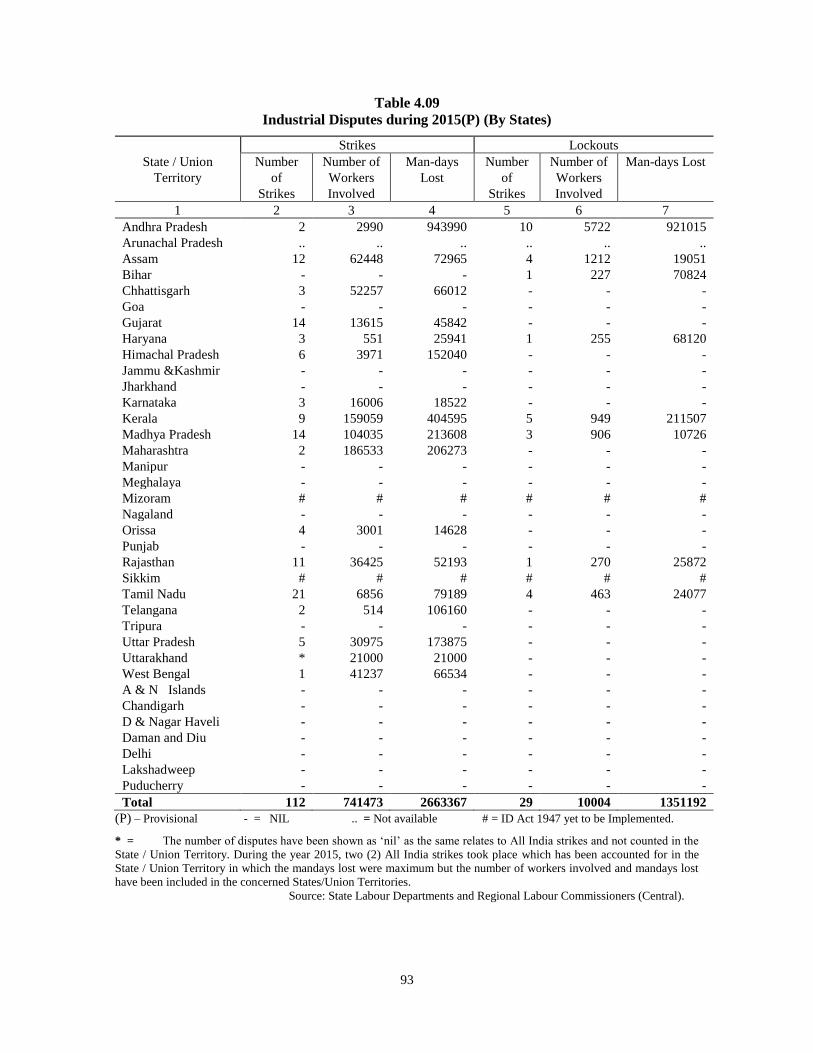
93
Table 4.09
Industrial Disputes during 2015(P) (By States)
Strikes Lockouts
State / Union
Territory
Number
of
Strikes
Number of
Workers
Involved
Man-days
Lost
Number
of
Strikes
Number of
Workers
Involved
Man-days Lost
1 2 3 4 5 6 7
Andhra Pradesh 2 2990 943990 10 5722 921015
Arunachal Pradesh .. .. .. .. .. ..
Assam 12 62448 72965 4 1212 19051
Bihar - - - 1 227 70824
Chhattisgarh 3 52257 66012 - - -
Goa - - - - - -
Gujarat 14 13615 45842 - - -
Haryana 3 551 25941 1 255 68120
Himachal Pradesh 6 3971 152040 - - -
Jammu &Kashmir - - - - - -
Jharkhand - - - - - -
Karnataka 3 16006 18522 - - -
Kerala 9 159059 404595 5 949 211507
Madhya Pradesh 14 104035 213608 3 906 10726
Maharashtra 2 186533 206273 - - -
Manipur - - - - - -
Meghalaya - - - - - -
Mizoram # # # # # #
Nagaland - - - - - -
Orissa 4 3001 14628 - - -
Punjab - - - - - -
Rajasthan 11 36425 52193 1 270 25872
Sikkim # # # # # #
Tamil Nadu 21 6856 79189 4 463 24077
Telangana 2 514 106160 - - -
Tripura - - - - - -
Uttar Pradesh 5 30975 173875 - - -
Uttarakhand * 21000 21000 - - -
West Bengal 1 41237 66534 - - -
A & N Islands - - - - - -
Chandigarh - - - - - -
D & Nagar Haveli - - - - - -
Daman and Diu - - - - - -
Delhi - - - - - -
Lakshadweep - - - - - -
Puducherry - - - - - -
Total 112 741473 2663367 29 10004 1351192
(P) – Provisional - = NIL .. = Not available # = ID Act 1947 yet to be Implemented.
* = The number of disputes have been shown as „nil‟ as the same relates to All India strikes and not counted in the
State / Union Territory. During the year 2015, two (2) All India strikes took place which has been accounted for in the
State / Union Territory in which the mandays lost were maximum but the number of workers involved and mandays lost
have been included in the concerned States/Union Territories.
Source: State Labour Departments and Regional Labour Commissioners (Central).
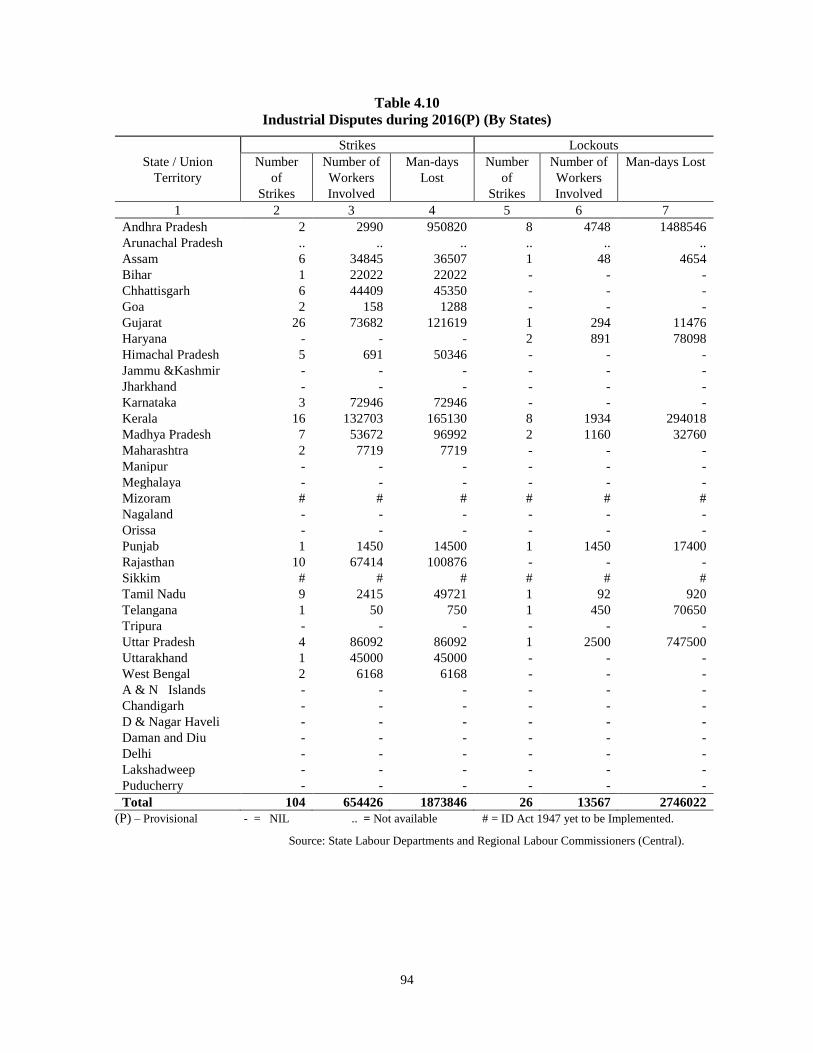
94
Table 4.10
Industrial Disputes during 2016(P) (By States)
Strikes Lockouts
State / Union
Territory
Number
of
Strikes
Number of
Workers
Involved
Man-days
Lost
Number
of
Strikes
Number of
Workers
Involved
Man-days Lost
1 2 3 4 5 6 7
Andhra Pradesh 2 2990 950820 8 4748 1488546
Arunachal Pradesh .. .. .. .. .. ..
Assam 6 34845 36507 1 48 4654
Bihar 1 22022 22022 - - -
Chhattisgarh 6 44409 45350 - - -
Goa 2 158 1288 - - -
Gujarat 26 73682 121619 1 294 11476
Haryana - - - 2 891 78098
Himachal Pradesh 5 691 50346 - - -
Jammu &Kashmir - - - - - -
Jharkhand - - - - - -
Karnataka 3 72946 72946 - - -
Kerala 16 132703 165130 8 1934 294018
Madhya Pradesh 7 53672 96992 2 1160 32760
Maharashtra 2 7719 7719 - - -
Manipur - - - - - -
Meghalaya - - - - - -
Mizoram # # # # # #
Nagaland - - - - - -
Orissa - - - - - -
Punjab 1 1450 14500 1 1450 17400
Rajasthan 10 67414 100876 - - -
Sikkim # # # # # #
Tamil Nadu 9 2415 49721 1 92 920
Telangana 1 50 750 1 450 70650
Tripura - - - - - -
Uttar Pradesh 4 86092 86092 1 2500 747500
Uttarakhand 1 45000 45000 - - -
West Bengal 2 6168 6168 - - -
A & N Islands - - - - - -
Chandigarh - - - - - -
D & Nagar Haveli - - - - - -
Daman and Diu - - - - - -
Delhi - - - - - -
Lakshadweep - - - - - -
Puducherry - - - - - -
Total 104 654426 1873846 26 13567 2746022
(P) – Provisional - = NIL .. = Not available # = ID Act 1947 yet to be Implemented.
Source: State Labour Departments and Regional Labour Commissioners (Central).
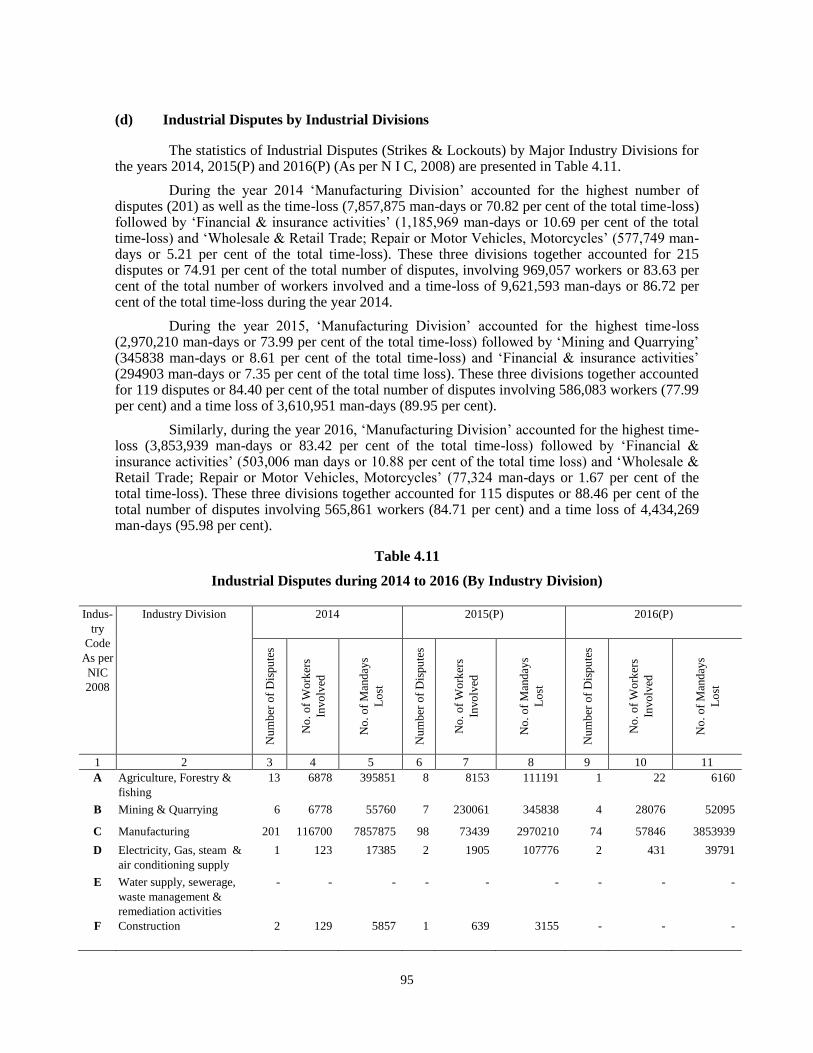
95
(d) Industrial Disputes by Industrial Divisions
The statistics of Industrial Disputes (Strikes & Lockouts) by Major Industry Divisions for the years 2014, 2015(P) and 2016(P) (As per N I C, 2008) are presented in Table 4.11.
During the year 2014 „Manufacturing Division‟ accounted for the highest number of disputes (201) as well as the time-loss (7,857,875 man-days or 70.82 per cent of the total time-loss) followed by „Financial & insurance activities‟ (1,185,969 man-days or 10.69 per cent of the total time-loss) and „Wholesale & Retail Trade; Repair or Motor Vehicles, Motorcycles‟ (577,749 man-days or 5.21 per cent of the total time-loss). These three divisions together accounted for 215 disputes or 74.91 per cent of the total number of disputes, involving 969,057 workers or 83.63 per cent of the total number of workers involved and a time-loss of 9,621,593 man-days or 86.72 per cent of the total time-loss during the year 2014.
During the year 2015, „Manufacturing Division‟ accounted for the highest time-loss (2,970,210 man-days or 73.99 per cent of the total time-loss) followed by „Mining and Quarrying‟ (345838 man-days or 8.61 per cent of the total time-loss) and „Financial & insurance activities‟ (294903 man-days or 7.35 per cent of the total time loss). These three divisions together accounted for 119 disputes or 84.40 per cent of the total number of disputes involving 586,083 workers (77.99 per cent) and a time loss of 3,610,951 man-days (89.95 per cent).
Similarly, during the year 2016, „Manufacturing Division‟ accounted for the highest time-loss (3,853,939 man-days or 83.42 per cent of the total time-loss) followed by „Financial & insurance activities‟ (503,006 man days or 10.88 per cent of the total time loss) and „Wholesale & Retail Trade; Repair or Motor Vehicles, Motorcycles‟ (77,324 man-days or 1.67 per cent of the total time-loss). These three divisions together accounted for 115 disputes or 88.46 per cent of the total number of disputes involving 565,861 workers (84.71 per cent) and a time loss of 4,434,269 man-days (95.98 per cent).
Table 4.11
Industrial Disputes during 2014 to 2016 (By Industry Division)
Indus-
try
Code
As per
NIC
2008
Industry Division 2014 2015(P) 2016(P)
Nu
mb
er o
f D
isp
ute
s
No
. o
f W
ork
ers
Invo
lved
No
. o
f M
and
ays
Lo
st
Nu
mb
er o
f D
isp
ute
s
No
. o
f W
ork
ers
Invo
lved
No
. o
f M
and
ays
Lo
st
Nu
mb
er o
f D
isp
ute
s
No
. o
f W
ork
ers
Invo
lved
No
. o
f M
and
ays
Lo
st
1 2 3 4 5 6 7 8 9 10 11
A Agriculture, Forestry &
fishing
13 6878 395851 8 8153 111191 1 22 6160
B Mining & Quarrying 6 6778 55760 7 230061 345838 4 28076 52095
C Manufacturing 201 116700 7857875 98 73439 2970210 74 57846 3853939
D Electricity, Gas, steam &
air conditioning supply
1 123 17385 2 1905 107776 2 431 39791
E Water supply, sewerage,
waste management &
remediation activities
- - - - - - - - -
F Construction 2 129 5857 1 639 3155 - - -
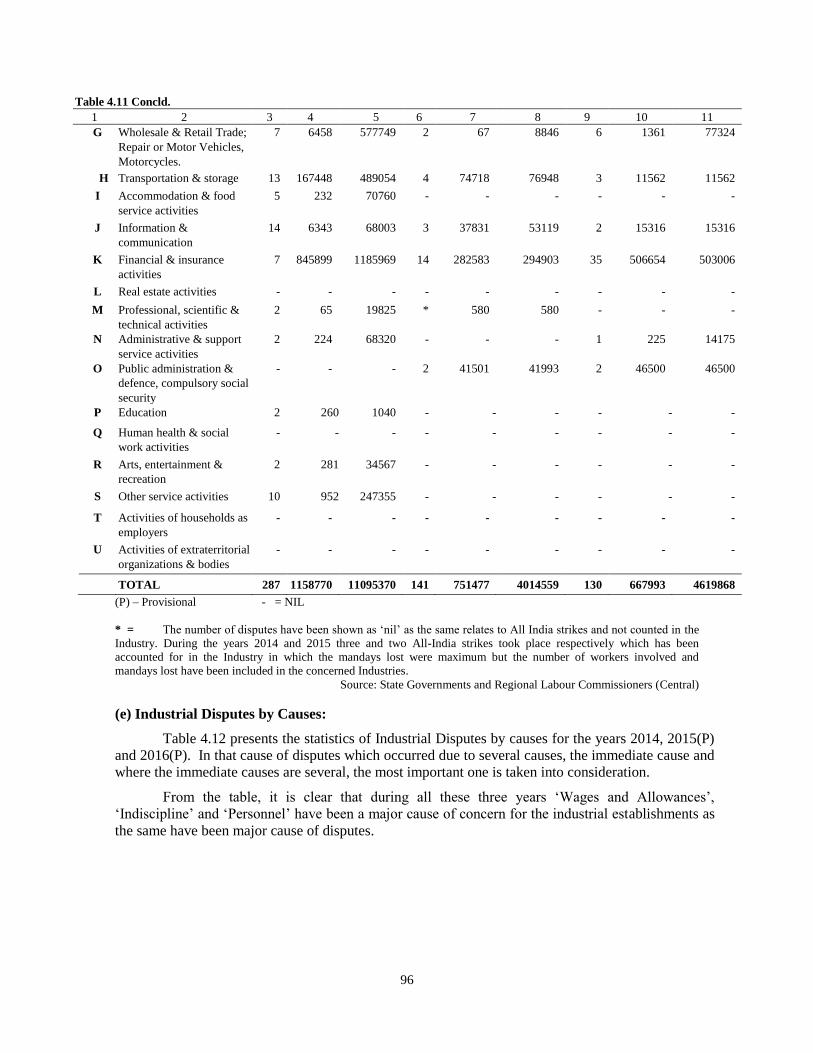
96
Table 4.11 Concld.
1 2 3 4 5 6 7 8 9 10 11
G Wholesale & Retail Trade;
Repair or Motor Vehicles,
Motorcycles.
7 6458 577749 2 67 8846 6 1361 77324
H Transportation & storage 13 167448 489054 4 74718 76948 3 11562 11562
I Accommodation & food
service activities
5 232 70760 - - - - - -
J Information &
communication
14 6343 68003 3 37831 53119 2 15316 15316
K Financial & insurance
activities
7 845899 1185969 14 282583 294903 35 506654 503006
L Real estate activities - - - - - - - - -
M Professional, scientific &
technical activities
2 65 19825 * 580 580 - - -
N Administrative & support
service activities
2 224 68320 - - - 1 225 14175
O Public administration &
defence, compulsory social
security
- - - 2 41501 41993 2 46500 46500
P Education 2 260 1040 - - - - - -
Q Human health & social
work activities
- - - - - - - - -
R Arts, entertainment &
recreation
2 281 34567 - - - - - -
S Other service activities 10 952 247355 - - - - - -
T Activities of households as
employers
- - - - - - - - -
U Activities of extraterritorial
organizations & bodies
- - - - - - - - -
TOTAL 287 1158770 11095370 141 751477 4014559 130 667993 4619868
(P) – Provisional - = NIL
* = The number of disputes have been shown as „nil‟ as the same relates to All India strikes and not counted in the
Industry. During the years 2014 and 2015 three and two All-India strikes took place respectively which has been
accounted for in the Industry in which the mandays lost were maximum but the number of workers involved and
mandays lost have been included in the concerned Industries.
Source: State Governments and Regional Labour Commissioners (Central)
(e) Industrial Disputes by Causes:
Table 4.12 presents the statistics of Industrial Disputes by causes for the years 2014, 2015(P)
and 2016(P). In that cause of disputes which occurred due to several causes, the immediate cause and
where the immediate causes are several, the most important one is taken into consideration.
From the table, it is clear that during all these three years „Wages and Allowances‟,
„Indiscipline‟ and „Personnel‟ have been a major cause of concern for the industrial establishments as
the same have been major cause of disputes.
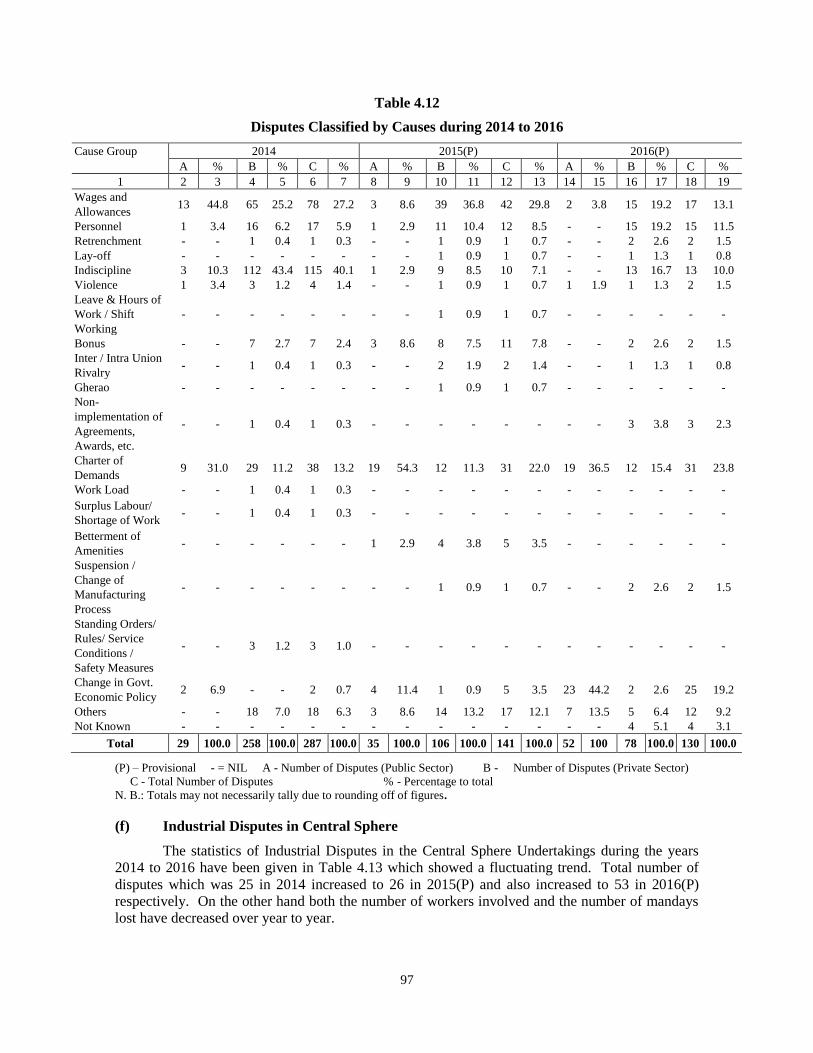
97
Table 4.12
Disputes Classified by Causes during 2014 to 2016
Cause Group 2014 2015(P) 2016(P)
A % B % C % A % B % C % A % B % C %
1 2 3 4 5 6 7 8 9 10 11 12 13 14 15 16 17 18 19
Wages and
Allowances 13 44.8 65 25.2 78 27.2 3 8.6 39 36.8 42 29.8 2 3.8 15 19.2 17 13.1
Personnel 1 3.4 16 6.2 17 5.9 1 2.9 11 10.4 12 8.5 - - 15 19.2 15 11.5
Retrenchment - - 1 0.4 1 0.3 - - 1 0.9 1 0.7 - - 2 2.6 2 1.5
Lay-off - - - - - - - - 1 0.9 1 0.7 - - 1 1.3 1 0.8
Indiscipline 3 10.3 112 43.4 115 40.1 1 2.9 9 8.5 10 7.1 - - 13 16.7 13 10.0
Violence 1 3.4 3 1.2 4 1.4 - - 1 0.9 1 0.7 1 1.9 1 1.3 2 1.5
Leave & Hours of
Work / Shift
Working
- - - - - - - - 1 0.9 1 0.7 - - - - - -
Bonus - - 7 2.7 7 2.4 3 8.6 8 7.5 11 7.8 - - 2 2.6 2 1.5
Inter / Intra Union
Rivalry - - 1 0.4 1 0.3 - - 2 1.9 2 1.4 - - 1 1.3 1 0.8
Gherao - - - - - - - - 1 0.9 1 0.7 - - - - - -
Non-
implementation of
Agreements,
Awards, etc.
- - 1 0.4 1 0.3 - - - - - - - - 3 3.8 3 2.3
Charter of
Demands 9 31.0 29 11.2 38 13.2 19 54.3 12 11.3 31 22.0 19 36.5 12 15.4 31 23.8
Work Load - - 1 0.4 1 0.3 - - - - - - - - - - - -
Surplus Labour/
Shortage of Work - - 1 0.4 1 0.3 - - - - - - - - - - - -
Betterment of
Amenities - - - - - - 1 2.9 4 3.8 5 3.5 - - - - - -
Suspension /
Change of
Manufacturing
Process
- - - - - - - - 1 0.9 1 0.7 - - 2 2.6 2 1.5
Standing Orders/
Rules/ Service
Conditions /
Safety Measures
- - 3 1.2 3 1.0 - - - - - - - - - - - -
Change in Govt.
Economic Policy 2 6.9 - - 2 0.7 4 11.4 1 0.9 5 3.5 23 44.2 2 2.6 25 19.2
Others - - 18 7.0 18 6.3 3 8.6 14 13.2 17 12.1 7 13.5 5 6.4 12 9.2
Not Known - - - - - - - - - - - - - - 4 5.1 4 3.1
Total 29 100.0 258 100.0 287 100.0 35 100.0 106 100.0 141 100.0 52 100 78 100.0 130 100.0
(P) – Provisional - = NIL A - Number of Disputes (Public Sector) B - Number of Disputes (Private Sector)
C - Total Number of Disputes % - Percentage to total
N. B.: Totals may not necessarily tally due to rounding off of figures.
(f) Industrial Disputes in Central Sphere
The statistics of Industrial Disputes in the Central Sphere Undertakings during the years
2014 to 2016 have been given in Table 4.13 which showed a fluctuating trend. Total number of
disputes which was 25 in 2014 increased to 26 in 2015(P) and also increased to 53 in 2016(P)
respectively. On the other hand both the number of workers involved and the number of mandays
lost have decreased over year to year.
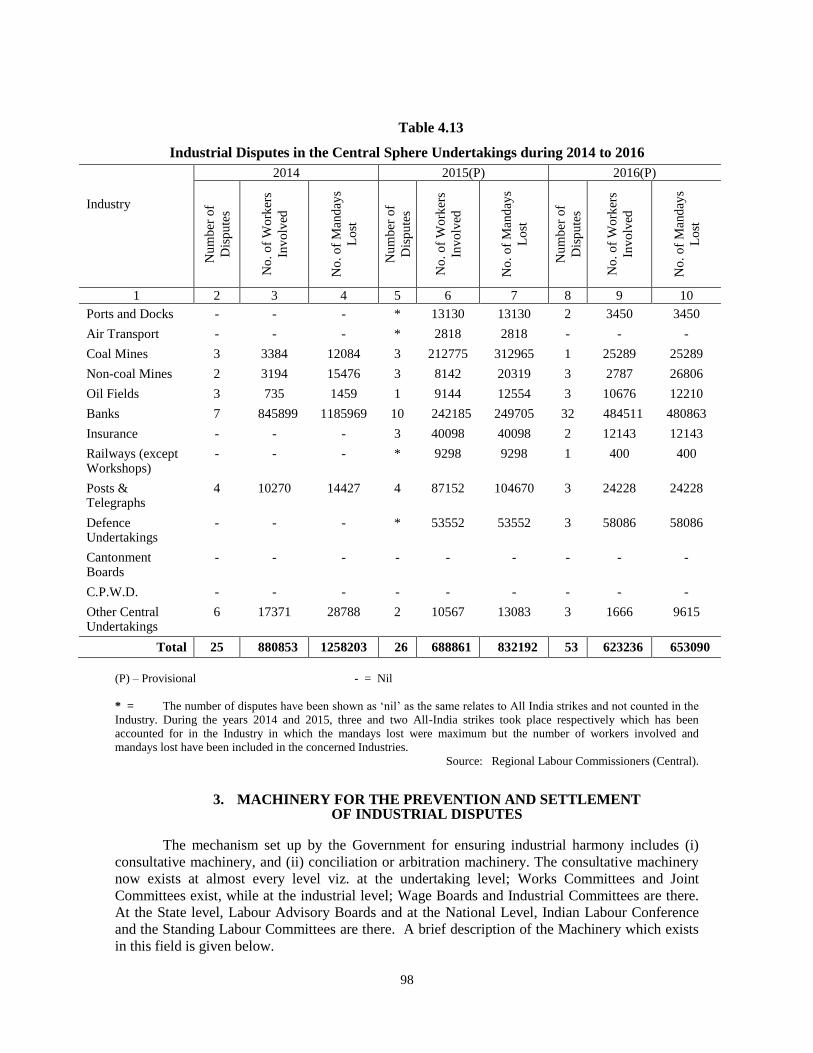
98
Table 4.13
Industrial Disputes in the Central Sphere Undertakings during 2014 to 2016
2014 2015(P) 2016(P)
Industry N
um
ber
of
Dis
pu
tes
No
. o
f W
ork
ers
Inv
olv
ed
No
. o
f M
and
ays
Lo
st
Nu
mb
er o
f
Dis
pu
tes
No
. o
f W
ork
ers
Inv
olv
ed
No
. o
f M
and
ays
Lo
st
Nu
mb
er o
f
Dis
pu
tes
No
. o
f W
ork
ers
Inv
olv
ed
No
. o
f M
and
ays
Lo
st
1 2 3 4 5 6 7 8 9 10
Ports and Docks - - - * 13130 13130 2 3450 3450
Air Transport - - - * 2818 2818 - - -
Coal Mines 3 3384 12084 3 212775 312965 1 25289 25289
Non-coal Mines 2 3194 15476 3 8142 20319 3 2787 26806
Oil Fields 3 735 1459 1 9144 12554 3 10676 12210
Banks 7 845899 1185969 10 242185 249705 32 484511 480863
Insurance - - - 3 40098 40098 2 12143 12143
Railways (except Workshops)
- - - * 9298 9298 1 400 400
Posts & Telegraphs
4 10270 14427 4 87152 104670 3 24228 24228
Defence Undertakings
- - - * 53552 53552 3 58086 58086
Cantonment Boards
- - - - - - - - -
C.P.W.D. - - - - - - - - -
Other Central Undertakings
6 17371 28788 2 10567 13083 3 1666 9615
Total 25 880853 1258203 26 688861 832192 53 623236 653090
(P) – Provisional - = Nil
* = The number of disputes have been shown as „nil‟ as the same relates to All India strikes and not counted in the
Industry. During the years 2014 and 2015, three and two All-India strikes took place respectively which has been
accounted for in the Industry in which the mandays lost were maximum but the number of workers involved and
mandays lost have been included in the concerned Industries.
Source: Regional Labour Commissioners (Central).
3. MACHINERY FOR THE PREVENTION AND SETTLEMENT OF INDUSTRIAL DISPUTES
The mechanism set up by the Government for ensuring industrial harmony includes (i)
consultative machinery, and (ii) conciliation or arbitration machinery. The consultative machinery
now exists at almost every level viz. at the undertaking level; Works Committees and Joint
Committees exist, while at the industrial level; Wage Boards and Industrial Committees are there.
At the State level, Labour Advisory Boards and at the National Level, Indian Labour Conference
and the Standing Labour Committees are there. A brief description of the Machinery which exists
in this field is given below.
99
Union Government
The Ministry of Labour and Employment, Government of India provides all possible help to
the State Governments in taking steps towards preventing work stoppages as expeditiously as
possible. The Central Industrial Relations Machinery (CIRM) also known as the Chief Labour
Commissioner (Central) Organisation is entrusted with the task of maintaining good relations in the
Central Sphere through monitoring, intervention, mediation and conciliation in industrial disputes
and implementation of settlements and awards.
Tripartite Machinery- Indian Labour Conference is the Apex Tripartite Body. The other
Tripartite Bodies have been visualized in the form of Industrial Tripartite Committees (ITCs).
These tripartite bodies provide a forum where the social partners can appreciate each others
industry specific problems through dialogue and help in evolving consensual policy options. These
Committees are non-statutory Committees and their meetings are convened as and when required.
Government‟s proactive role in these Committees has successfully harmonized the interest of the
employers and workers resulting in a change of attitude from confrontation to that of co-operation.
Board of Arbitration Joint Consultative Machinery (JCM) for Central Government
Employees
The Government of India introduced in 1966 a scheme for Joint Consultative and
Compulsory Arbitration for resolving differences between the Government as an employer and the
general body of its employees. The Scheme provides for compulsory arbitration on Pay and
Allowances, weekly hours of work and leave in respect of a class or grade of employees. Under the
Scheme, the Board of Arbitration (JCM) was set up in July, 1968, to function within the
administrative Control of Ministry of Labour and Employment. The Board consists of a Chairman
and two other members from the staff side as well as from the official side.
Recognition of Trade Unions
The verification of membership of unions operating in establishment in Central Sphere is
conducted by Chief Labour Commissioner (Central)‟s office under Code of Discipline for the
purpose of granting recognition as and when directed by the Ministry of Labour and Employment.
Retrenchment, Lay-off and Closure
The Government of India grants prior permission of lay-off and retrenchment of workers as
well as closure of industrial undertakings in respect of all industries for which it is the appropriate
Government under Chapter V-B of the Industrial Disputes Act.
Tribunals and Labour Courts
Twenty two Central Government Industrial Tribunal-cum-Labour Courts have been set up
under the provisions of the Industrial Disputes Act, 1947 for adjudication of industrial disputes in
organizations for which the Central Government is the appropriate Government. Through Finance
Act, 2017, the powers to settle the Appeals arising out of EPF & MP Act, 1952 have also been
entrusted upon to these Tribunals. These Tribunals are located at Dhanbad (Jharkhand), Mumbai,
New Delhi and Chandigarh (two courts each) and one each at Kolkata, Jabalpur, Kanpur, Nagpur,
Lucknow, Ba ngalore, Jaipur, Chen nai, Hyderabad, Bhubaneswar, Ahmedabad, Ernakulam,
Asansol and Guwahati. Further, the two Industrial Tribunals at Mumbai (No.1) and Kolkata also
function as National Tribunals. In order to take care of the huge pendency of unresolved industrial
disputes, Lok Adalats have been introduced as an alternative grievance redressal mechanism,
within the adjudication system of the CGITs from the 10th Five Year Plan. The objective is to settle
industrial disputes through this parallel forum. Cases, which are relatively uncomplicated, are taken
up for adjudication through this system. However, its success depends on the readiness of the
100
litigating parties for getting their cases settled through this method. The Presiding Officers of the
CGITs play the role of facilitators.
4. CONSULTATIVE MACHINERY
Indian Labour Conference is at the apex of the Tripartite Consultative Machinery, which
comprises the Indian Labour Conference, the Standing Labour Committee and the Industrial
Committees, to advise Government with regard to policies in the labour field. All the Central Trade
Union Organisations, Central Organisations of employers, all State Governments and Union
Territories and Central Ministries/Departments concerned with the agenda items, are the members
of the ILC. The first meeting of the Indian Labour Conference (then called Tripartite National
Labour Conference) was held in 1942 and so far a total of 46 Sessions have been held. The 46th
Session of Indian Labour Conference was held on 20-21 July, 2015 at Vigyan Bhavan, New Delhi.
The 48th Session of the Standing Labour Committee (SLC) was held on 11
th May, 2017 in New
Delhi under the chairmanship of Shri Bandaru Dattatreya, the then Minister of State for Labour and
Employment (independent Charge). The meeting was attended by senior representatives of the
Central Trade Union Organizations, Central Employers Organizations, Labour Ministers and
Senior Officers from State Governments/UT Administrations and Senior Officers from Central
Ministries/Departments. The 48th Session of Standing Labour Committee discussed the Action
Taken Report of 46th Indian Labour Conference and decided on agenda items for discussion in the
ensuring 47th Indian Labour Conference.
5. WORKERS’ EDUCATION
The Dattopant Thengadi National Board for Workers Education and Development
erstwhile Central Board for Workers Education (CBWE) was established in 1958 to implement
Workers Education Schemes at National, Regional, Unit and Village Levels. The Board is tripartite
in character and consists of representatives from Central Organisations of Workers / Employers,
Central / State Governments and Educational Institutions. Board organizes different types of
training programmes for the workers in organised, unorganised, rural and informal sectors. Central
Board for Workers Education is headed by a Chairman. Its headquarters is at Nagpur. The Chief
executive of the Board is the Director who is assisted by an Additional Director, Deputy Directors,
Financial Advisor etc. The Board operates through 50 Regional Directorates and 7 Sub-Regional
Directorates. The six Zonal Directorates, at Delhi, Guwahati, Kolkata, Mumbai, Chennai and
Bhopal monitor the activities of the Regional Directorates in their respective zones. Tripartite
Regional Advisory Committees constituted for each Regional Directorate to review the progress of
the scheme and recommend measures for effective implementation of Workers Education
Programmes.
The Indian Institute of Workers Education (IIWE), Mumbai, an apex level training
Institute of the Board, was established in 1970. Training programmes of the Board for workers in
organised sector are conducted at three levels-
At the first level training is imparted to the candidates selected as Education Officers
trainee. After successful completion of the training, these called as Education Officers and
posted at Regional Directorate in the Board. The Education Officer conducts various
programmes at the Regional Directorates.
At the second level, workers from different establishments, sponsored by trade unions are
trained at Regional level.
At the third level, the Trainers conduct classes for the rank and file of workers in their
respective establishments.
101
National Level Programmes for representatives from Central Trade Union Organisations/
Federations and Voluntary Organisations on different subjects are conducted by the IIWE in
addition to giving pre-employment training to Education Officers and reorientation to Regional
Directors and Education Officers of the Board as well. In view of the specialized training needs to
tackle some of the specific issues by Trade Unions, three cells namely; (i) Industrial Health, Safety
and Environment (ii) Education for Rural and Unorganised Sector Workers; and (iii) Women and
Child Labour have been established in the Institute.
Initially the Board concentrated its activities in the organized sector. The Board shifted its
emphasis to rural sector in 1977- 1978 on the recommendations of Workers Education Review
Committee. Initially started with seven pilot projects, the rural workers education programmes
have now become a regular and continuing programme. The objectives of the programme are:
To promote critical awareness of problems, privileges and obligations as workers and
citizens;
To enhance self confidence and build up scientific attitude;
To educate them to develop their organizations through which they can fulfill socio–
economic functions and responsibilities in rural economy and strengthen democratic,
secular and socialist fibre of rural society;
To educate them in protecting and Promoting their individual and social interest;
To motivate for family welfare planning and to combat social evils.
Rural Volunteers are given one week orientation /Refresher Courses at Regional
Directorates to assist Education Officers in conducting Rural Awareness Camps. These camps are
attended by landless labour, tribal labour, artisans, forest workers and educated unemployed in
rural areas etc. Tailor made programmes of one to four days durations, based on the functional and
educational needs of workers, for Handloom, Powerloom, Khadi & Village Industries, Industrial
Estates, Small Scale Units, Handicrafts, Sericulture, Coir Industry, Beedi Industry and Workers of
Weaker Sections such as women workers, handicapped workers, rickshaw drivers, construction
workers, civic and sanitation workers are also organized by the Board.
102
CHAPTER 5
LABOUR WELFARE
The term Labour Welfare is defined differently by various agencies. The International
Labour Organization (ILO) has defined the term „Labour Welfare‟ as “such services, facilities and amenities as may be established in or in the vicinity of undertakings to enable the persons employed in them to perform their work in healthy, congenial surroundings and provided with amenities conducive to good health and high morale”*. This was further elucidated in the I.L.O. Recommendation (No. 102) (1952) concerning welfare facilities for workers. The term „Welfare‟ in that Recommendation includes inter-alia “(i) feeding facilities, (ii) rest and recreation facilities, and (iii) transportation to and from work place where ordinary public transport is inadequate or impracticable”.
The definitions given by different agencies indicate that the term labour welfare is a very comprehensive and dynamic concept in nature as it differs widely with time, region, country, value system, social institution and general level of social and economic development. The term however broadly includes those measures which affect the working and living conditions of the workers including social security measures, educational and cultural facilities and industrial housing etc.
Labour welfare measure plays a crucial role in the economic and social development of any country as it is an important facet of industrial relations. The need of such measure is all the more important for our country because ours is a developing economy aiming at rapid economic and social development. In India, various welfare facilities have been extended by different agencies either through legislation or directly. Some of the important activities are briefly described in the succeeding paragraphs.
1. ACTIVITIES OF THE GOVERNMENT OF INDIA The Factories Act, 1948, the Plantations Labour Act 1951 and the Mines Act, 1952, are basic enactments which contain elaborate provisions for safeguarding the health and safety of workers inside the work place and for providing their welfare. They lay down, minimum standards for ensuring welfare of workers. The Ministry of Labour and Employment, Government of India has also set up Labour Welfare funds to provide welfare amenities for the workers employed in Mica, Iron Ore, Manganese Ore and Chrome Ore, Limestone and Dolomite Mines and in the Beedi and Cinema industries. Separate welfare funds have also been formed for specified services like Posts and Telegraphs, Ports, Dockyards, Railways etc. The Welfare measures financed out of these funds relate to provision of medical, housing, drinking water, educational, recreational and family welfare facilities, etc. Although most of the activities are administered directly by the Welfare Organizations under the Ministry of Labour and Employment, however, there are some loans and subsidies provided to the State Governments, Local Authorities and to the employers for implementation of approved proto-type schemes. The provision of social security in the form of Employees State Insurance Scheme, Provident Fund, Gratuity and Pension under various laws and industrial housing schemes are some of the other prominent measures undertaken by the Central Government to promote welfare of the working class.
2. ACTIVITIES OF THE STATE/ UNION TERRITORIES GOVERNMENTS
This section deals with various activities/initiatives taken by the State / UT Governments in labour welfare.
* International Labour Organization, 2nd
Asian Regional Conference Nuwara Eliya (Ceylon), January, 1950 -
Report-II; Provisions of Facilities for the Promotion of Workers‟ Welfare.
103
Andaman and Nicobar Administration
Under, Statutory Welfare Facilities; the welfare facilities as enshrined under the provisions of the Factories Act are being extended to all workmen. The Forest Department as well as Marine Department appointed Labour Welfare Officers in their organizations as required under the Factories Act 1948 to look after the welfare of the workmen.
In A & N Islands, the total no. of Building Construction Beneficiaries registered under the Building and Other Construction Worker Welfare (BOCW) Board are 14,747. The BOCW Welfare Board extend the facilities of children educational assistance, marriage assistance, maternity benefit, death benefit, funeral benefit, medical assistance, pension benefits etc. to all registered beneficiary workmen. The total beneficiaries registered between January, 2017 to December 2017 were 734.The total amount disbursed to the registered beneficiaries is Rs. 8,80,36,790/- and the amount disbursed between January, 2017 to December, 2017 was Rs. 4,03,84,150/-.
Similarly, under Non-Statutory Welfare Facilities; the Labour Welfare Centres are functioning in different part of Andaman & Nicobar Islands for the benefit of Industrial and Non-Industrial Workers. The Labour Welfare Centres are fully equipped with sport facilities, drinking water and urinal facilities. Small functions and get together are also permitted in labour Welfare Centres.
Assam
The statutory facilities to tea industry workers are housing accommodation, canteens, crèches, recreational centres, educational facilities for worker‟s children, water facilities, electricity, latrines. Statutory facilities provided to certain other Industrial & Non Industrial workers under some Acts are rest room, urinals, drinking water, first aid facilities etc.
Under the Building and Other Construction Workers‟ (Regulation of Employment and Conditions of Service) Act, 1996, the Assam Building and Other Construction Workers Welfare Board provided benefits like death benefit, funeral assistance, medical assistance/ accident benefit, one time education assistance to the children of registered beneficiaries, Janashree Bima Yojana, general pension, RSBY, family pension etc. Bihar
Under statutory welfare facilities in factories, provision for washing facilities, first-aid ambulance room, canteen, shelters, rest rooms and lunch rooms, crèches etc are available for workers.
Chandigarh
The Chandigarh Labour Welfare Board is running a labour Welfare Centre in which following facilities are being provided to the workers and their family members:
a) Indoor Games, outdoor games. b) Reading Room and Library c) Children Park d) Sports Facilities to the children of Industrial Workers.
Chhattisgarh
Chhattisgarh Labour Welfare Board provides various welfare facilities to industrial workers and their dependents. The Board runs community and society education centres, reading rooms and libraries, community necessities, games and sports and other entertainments, Educational Scholarship Scheme, Uttam Shramik Purskar Yojna, Shramik Sahitya Purskar Yojna, Balika Vivaha Sahayata Yojna, Knitting and Embroidery Training Scheme etc.
104
Dadra and Nagar Haveli
Dadra & Nagar Haveli is implementing various Centrally Sponsored Schemes as per criteria/guidelines envisaged in the schemes through Rural Development Agency. NCT of Delhi
The Delhi Welfare Board runs four Holiday Homes at Mussoorie, Haridwar, Allahabad and Shimla for workers, supervisory/managerial and government servants. Board conducts Long Term and Short Term Training Programmes in various vocation/trade at nominal fee. The Board imparts training in Cutting & Tailoring free of cost at various Labour Welfare Centers. Nursery classes are also being conducted by the Board at Wazirpur Labour Welfare Center. Goa
The Goa Labour welfare Board has 17 different schemes for the benefit of Industrial Workers in the State of Goa. The Board is successfully catering to the needs of the Industrial Workers through these welfare schemes. Gujarat
The State Government of Gujarat provides various welfare measures for workers through Gujarat Rural Workers Welfare Board and Rural Labour Commissioner. The welfare schemes are rural welfare centres for Rural Workers, Welfare Centres for Salt Workers, Shramik Suraksha Yojna – an accident death insurance scheme for unorganised rural & urban workers, Cycle scheme for salt workers, financial assistance to unorganized rural workers for treatment of Chronic and Serious diseases and funeral assistance to the rural workers, etc.
Some of the provisions relating to the Labour Welfare as mentioned in the Factories Act, 1948 and Gujarat Factories Rules 1963 are: washing facilities, facilities for storing and drying clothing, facilities for sitting, first aid appliances, canteens, shelters, rest rooms and lunch rooms, crèches and welfare officers. Officers of the Directorate of Industrial Safety & Health, Gujarat have inspected these facilities under the Factories Act, 1948 during the inspection of factories. Total 6429 inspections have been carried out under the Factories Act.
Government of Gujarat has constituted a non statutory board namely „Gujarat Unorganised Labour (Except Agriculture Labour) Welfare Board‟, for the urban unorganized sector workers. The Board formulates and implements various schemes to provide social security and safety net to the workers of urban area engaged in unorganized sector. The Board coverage is in Ahmedabad (MC), Surat (MC) and Jamnagar (MC) urban areas. The Board provides Skill Development Training, Tool Kit Assistance, Health Check-up Camps, Awareness Workshop and Medical Aid (for minimum 24 hours hospitalization). Jammu & Kashmir
The Labour Department in a bid to provide welfare facilities to the Industrial Workers has established Labour Welfare Centers. These centers provide library facilities and other recreational facilities to Industrial Workers. Moreover Labour Sarais have also been constructed at Jammu and Kashmir which provides shelter to labourers. Kerala
Statutory Facilities; Welfare facilities such as drinking water, housing, medical, crèches, recreational facilities and issue of whether protectives are provided to the workers as per the provisions of the Plantation Labour Act and Rules.
Non Statutory; Financial assistance is being given for the education of children‟s of workers of the closed plantation by way of refunding of entire tuition and hostel fee paid by the
105
parents of the students studying professional courses. Death relief, marriage assistance, free medical camp and medical aid to workers of closed plantations are also provided.
There are 15 Statutory Welfare Fund Act and 6 Non Statutory Welfare schemes are in force under the Labour Department. In addition to this, 4 Welfare schemes are being implemented under the direct control of the Labour Commissioner; (i) Kerala Agricultural Workers Pension Scheme 1980 (ii) Kerala Tree Climbers Welfare Scheme 1980 (iii) Estate Workers (Distress Relief) Welfare Fund Scheme 2007 (iv) Daily Waged Employees Distress Relief Fund Scheme 2007. Schemes namely Distress Relief to the Workers of Closed Cashew Factories, Kerala Unorganised Retired Workers Pension Fund Scheme 2008, Rashtriya Swasthya Bhima Yojana, Comprehensive Health Insurance Scheme, Aam Admi Bhima Yojana, Kerala Migrant Workers Welfare Scheme 2010, Maternity Allowance to Unorganized Sector, Tree Climbers Disability Pension Scheme, Income Support Scheme to Traditional Sectors are also operational in the State of Kerala. Lakshadweep
The Union Territory is declared as non industrial zone. Hence no major factories/ industries/ commercial establishments or construction companies etc. are located in this Union Territory. Mizoram
Labour welfare facilities as provided by the provisions of the “Building & Other Construction Workers (RECS) Act, 2016 is being complied with & more than 5,000 workers were registered under the Welfare Board constituted under the said Act during 2017. Meghalaya
There are 5 Labour Welfare Centers in the State which provides 6 months basic training course in sewing, knitting, embroidery, etc. for the benefit of workers and their family members. Besides, a stipend of Rs.200/- p.m. is granted to all the trainees. On completion of the course an examination is also conducted and all successful candidates are given certificates. Punjab
Labour Department is running 12 welfare centers wherein training in sewing, knitting and embroidery is imparted to the women folk of industrial workers. Telangana
Telangana Labour Welfare Board implements various welfare schemes to workers like marriage gift, maternity benefit, natural death relief, funeral expenses, family planning incentive, scholarships to physically challenged, medical aid, scholarships, treatment for Aids, emergent economic ameliorative relief, relief for loss of limbs etc. Telangana Building & Other Construction Workers Welfare Board also implements welfare schemes like accidental death relief, natural death relief, marriage gift, maternity benefit, partial/permanent disability benefit, temporary disability (hospitalization) benefit, funeral expenses etc. Tripura
Statutory Welfare Schemes; Tripura Building and Other Construction Workers Welfare Board is constituted for providing social security and welfare measures to the workers engaged in building and construction work. On registration, the beneficiary is entitled to get benefits under 8 schemes of the Board viz., (i) assistance to a beneficiary in cases of accident (ii) death benefit (iii) pension (iv) medical expenses for treatment (v) maternity benefit to a female beneficiary (vi) scheme for financial assistance for the education of the children of registered beneficiary (vii)

106
assistance to a beneficiary or his/her children for marriage and (viii) funeral assistance in case of death of registered construction workers.
Non-Statutory Welfare Schemes; (i) Asangathita Sramik Sahayika Prakalpa (ASSP) and (ii) Medical Grant Scheme for Rickshaw Pullers.
3. WELFARE WORK BY THE VARIOUS STAKEHOLDERS OF EMPLOYERS
Steel Authority of India Limited, Visvesvaraya Iron & Steel Plant (SAIL-VISL)
Apart from statuary benefits, SAIL-VISL continued to provide welfare facilities to its employees like festival advance scheme for non-executives, leave travel concession/leave travel assistance, mobile advance, group personal accident insurance coverage, company quarters, reimbursement of local traveling expenses, uniforms, raincoats, health facilities to employees and their dependents, scholarship to employees children, sports facilities, social and cultural recreation etc. The United Planters’ Association of Southern India
Under the provisions of the Plantations Labour Act 1951, the plantations statutorily provide the labour with, free living quarters in the estate with water and electricity supply, medical facilities for workers and their families at estate group hospitals/garden hospitals/ dispensaries, sanitation and conservancy, protective clothing, crèche/child care, recreational facilities, educational facilities to the children of workers at school run by the estate managements.
Besides the daily wages, the workers are entitled to incentives for output above the base or standard fixed. In addition, there are statutory benefits related to wages such as provident fund, gratuity, bonus, leave with wages, paid holidays, sick leave with wages and maternity benefits etc. Apart from the Plantations Labour Act, the industry is covered by the entire range of labour legislation passed by the Centre and State Governments. There are in all 24 labour enactments applying to plantations. Indian Railways
IR‟s welfare schemes cover a wide spectrum of activities in the areas of education, medical care, housing, sports, recreation and catering. Staff Benefit Fund is an important channel for providing additional facilities to Railway employees and their families in the sphere of education, recreation, medicare, sports, scouting and cultural activities. Dispensaries under the indigenous systems of medicine, viz. Ayurvedic and Homeopathic, are run with the help of this Fund. Approximately 44.7% of staff has been provided with railway quarters as on 31.03.2017. In total, 1,237 staff quarters were electrified during 2016-17. Co-operative societies of various types are functioning on Indian Railways. These Cooperative Societies are registered under the Multi-State Cooperative Societies Act, 2002 and are under overall Supervision of the Central Registrar of Cooperative Societies, Department of Agriculture & Coop., Krishi Bhawan, New Delhi. There are 42 Thrift and Credit Societies, 146 Railway men‟s Consumer Cooperative Societies, 26 Labour Cooperative Societies and 5 Railway men‟s Housing Societies functioning on Indian Railways during 2016-17. IR attach due importance to recreation for its employees and provide excellent facilities through Institutes/Clubs for sports, libraries, etc. as also Holiday Homes to enable the employees and their families to enjoy vacations at nominal expenses. Chennai Port Trust
Chennai Port Trust extends a number of welfare measures to the officers/employees and their family members. The major and important welfare measures that the Chennai Port Trust has implemented are stated below:
Education: The Trust is granting children‟s education allowance of Rs.15,000/- per annum per child up to a maximum of two children of each employee in the category of class III & IV studying
107
from L.K.G. to Hr. Secondary Courses and polytechnic courses. With a view to provide better educational facilities, the Trust is providing education to the children of the employees of the Trust and nearby residents from L.K.G. to XII Std. through the Chennai Port and Dock Educational Trust‟s Higher Secondary School at the Chennai Port Trust Tondiarpet Housing Colony. The Trust is provided education to the wards of the employees of the Trust at free of cost from LKG to X std. Besides, the Trust is following a scheme called Workers Education Scheme in association with Govt. of India, Ministry of Labour and Employment for the employees of Class III and IV to make them aware of the social, economical and political events of the country and the world.
Welfare Committee: A Welfare Committee consists of 15 members was formed to take care of efficient and orderly maintenance of the Tondiarpet Housing Colony and to promote co-operation, cleanliness, peace, amity and cordiality among the residents of the Colony since 1991.
Sports: A Staff Institute has been functioning at Anchor Gate Building in which Carrom, Chess, Gym, Yoga, Billiards and other Sports Games are practised by the staff of the Chennai Port Trust for entertainment and maintenance of physical and mental health. Besides, a Stadium named as Babu Jegjeevan Ram Sports Complex had been constructed at Tondiarpet Housing Colony with a long pavilion and a capacity of thousand viewers. The facility of gym for men & women residing at Tondiarpet Housing Colony & at Napier bridge officers‟ quarters to practise exercises and Yogasanas and help them maintain their physical and mental health has also been provided.
Canteen: There are 2 major Canteens functioning in the Chennai Port Trust. Out of the 2 Canteens, one Canteen named as (i) Chennai Port Trust Industrial Employees‟ Co-operative Canteen Ltd. (CHPTIECC Ltd) which is functioning at inner harbour (2) Chennai Port Trust Administrative Offices Canteen is being outsourced by the Trust which is functioning at Administrative offices.
Women Welfare Association: For the welfare of the women employees working in the Trust, awareness programmes on Medical treatment, Stress Management, Skin Care and Production of Handicrafts etc. have been conducted by Women Employees‟ Welfare Association. Besides, competition for women employees was conducted and prizes were distributed to the winners on International Women‟s Day.
Other Welfare Activities: Welfare facilities like quarters, family planning scheme, community hall, family disputes counseling, officers‟ club, cultural programmes, Contribution on Chennai Port Trust employees house building advance special family benefit fund, etc are also provided by the Chennai Port Trust. Cochin Port Trust
The Cochin Port Trust provides various welfare facilities and amenities to the employees in different sections of the Port. A brief note of the same is given below:-
Canteens: There are 04 canteens functioning in Cochin Port Trust. The canteens are run by Canteen Management Committee in the respective Departments. One Cafeteria at the Administrative office is also functioning in the Port. Ernakulam and Mattancherry Wharf Canteens are statutory canteens under the Dock Workers (Safety, Health and Welfare) Regulations 1990.
Sports & Games: A Sports Control Board is functioning in the Port for the promotion of Sports and Games activities. An amount of Rs.1,00,000/- is kept in the Welfare Fund and Rs. 9,00,000/- in the Port Fund for the Sports activities. The efforts taken by the Port towards promotion of sports and games include; (i) Sponsoring teams for All India Major Ports Tournaments in Football, Volleyball, Beach Volleyball, Athletics and Shuttle Badminton. (ii) Sponsoring employees/teams for participation in sports and games competitions conducted at the District, State and National levels. (iii) Refreshments to the selected players during practice period. (iv) Special casual leave/duty off to sports personnel when they meet with accidents during the play. Special casual leave/duty off is also granted for the days they spent to participate in outside sporting events. (v) Children‟s Day Celebrations and sports meets for the children of Port employees are conducted every year in a befitting manner under the auspices of Sports Control Board and the selected teams
108
take part in the all India Major Ports Children‟s Sports. (vi) Various other encouragements like financial benefit to outstanding sports personnel, coaching programs to children of employees etc. are also extended. (vii) Cultural teams are also sent for various competitions.
Educational Facilities: Educational Allowance and Reimbursement of Tuition Fees are granted to children of Port employees up to Higher Secondary classes. Nursery School is available inside the Port area and the same are run by Women‟s Club/Ladies Club with the help of Port Administration. The Kerala State Government is running Primary and Secondary Schools at the Port area for which the land, buildings and other facilities have been provided free of cost by the Port Administration. A Kendriya Vidyalaya is functioning at the South End of Willingdon Island, for which buildings, furniture etc. have been provided by the Port Administration. 50% of the seats in each class are allotted to the children of Port employees. Various merit Scholarships are also awarded every year to the children of Port employees and an amount of Rs.1,67,000/- is kept in the Welfare Fund for grant of Scholarships.
Other Welfare Activities: Welfare facilities like rest rooms, first aid facilities, medical facilities, family planning programme, recreational & cultural facilities, library facilities, clubs, training, transport facilities, leave travel concession, house building advance, family benefit fund, personal computer advance, uniforms & washing allowance, exgratia payments, funeral expenses, compassionate appointment, family security fund, group insurance scheme, group gratuity scheme, housing facilities, shopping facilities, financial help for marriage of children of employees, financial aid for purchase of text books, note books etc. are also provided by the Cochin Port Trust. Kandla Port Trust
The Port provides the following welfare measures for the employees and their families. Multi-purpose Auditorium with facilities for indoor games and cultural programmes. Two canteens (Labour amenity Centre) inside the Port and one in Administrative Office
and one in Port Hospital, Gopalpuri. Sports complex at Gopalpuri Recreation Clubs for Officers and Staff in all the colonies. Canteen subsidy for all Class III & IV employees. Buses for transportation of KPT Employees/CISF personnel and their school going
children. Introduced Merit Scholarship and Special Cash Award Schemes for the children of Port
employees from Std. Xth onwards from the Academic Year 2016-17. Children Education Allowance to all Class – III &IV employees up to Std. 12
th.
Medical treatment to pensioners at par with regular employees. Rest Rooms for Women employees. Facilities of Gym have also been provided by the KPT for its all employees and their
family members. Adopted the scheme for grant of financial assistance from KPE Welfare Fund towards
funeral expenses amounting to Rs. 15000/- to the legal heir of deceased employees, died while in service.
Ex-gratia payment of Rs. 5000/- to KPT employee., suffering from diseases like TB, Cancer, Brain Tumour etc who have exhausted his leave.
A noble scheme for grant of special advance (recoverable) to the tune of Rs.2,00,000/- (Two Lakhs only) for marriage of children of port employees restricted up to two child.
Yoga Classes are organised free of cost everyday in the premises of Officers Club, Gopalpuri.
Memento worth Rs.4000/- to the retired employees, to commemorate their long services to the Port.
Summer Vacation Coaching Camps were organised by KPT for the children of Port Employees.
109
Prizes to the employees and their family members for achievements in sports/cultural activities who achieved 1
st, 2
nd and 3
rd position at District / State / National /Major Ports
Level.
Kolkata Port Trust
Kolkata Port Trust (KoPT), consisting of Kolkata Dock System (KDS) and Haldia Dock Complex (HDC) provides following welfare facilities to their employees;
a) Canteen facilities – KoPT operates a number of canteens which provide wholesome food at highly subsidized rate to its employees.
b) Medical facilities, ambulances and first aid boxes – KoPT maintains two well-equipped hospitals, one at Kolkata and another at Haldia Township. Apart from hospitals, a number of dispensaries have also been set up by KoPT for providing free medical services for its employees and dependent family members. There are ambulances under both Dock Systems. In addition, first aid boxes are also maintained in all the offices and operational working sites.
c) Latrines, urinals, washrooms and rest shelters near workplace. d) Drinking water facilities near workplace. e) Quarter accommodation. f) Interest subsidy on house building loan. g) Advance for purchase of motor car/two-wheeler. h) Welfare Fund for meeting certain specified expenses viz., payment of one time grant to the
distressed family members of a deceased employees etc. i) Welfare facilities for SC/ST/OBC communities – Accommodation has been allotted by Port
to the SC/ST and the Backward Classes Welfare Association for the Welfare of such communities. Similar facilities have been provided to Pensioners‟ Association and the Unions also.
j) Recreational facilities through Employees Clubs and Institutes. k) Awarding of medals and grant of scholarship to meritorious wards of KoPT employees. l) Subsidized transportation facilities for to and from journey from residence to work place to
employees of HDC. m) Subsidized education for the wards of employees of HDC. n) With the patronage of KoPT, Officers Wives Association undertakes various welfare
measures for the society as a whole. Apart from running two Schools at Kolkata Dock System they run an Old Age Home and conduct various cultural and social activities.
Mormugao Port Trust
Under the Statutory Welfare Schemes, workers are provided welfare facilities like drinking water, latrines and urinals, lighting, ventilation, washing places, first-aid appliances and ambulance room, changing rooms, rest rooms and canteens. Besides, Mormugao Port Trust has its own 100 bedded hospital equipped with indoor and outdoor departments. Under the Non-Statutory Welfare Schemes, workers are provided welfare facilities like housing facilities, training, workers education, scholarships for the children of port employees, vocational centre, welfare fund, library, educational facilities, officers club, port employees consumer co-op society etc.
Mumbai Port Trust (MbPT)
MbPT provides various welfare facilities and amenities to the employees and their dependents like health, training, financial assistance under different schemes, provident fund, pension, gratuity, leave, canteen facilities at subsidized rates, housing, leave travel concession, encashment of leave, house building advance, advance for purchase of computer, advance for purchase of two wheelers, festival advance etc. As required by the Dock Workers (Safety, Health and Welfare) Regulations 1990, following welfare amenities are also provided to Dock workers: (i)
110
washing facilities; (ii) first-aid boxes; (iii) ambulance room; (iv) ambulance carriage; (v) stretchers; (vi) shelters, rest sheds and lunch rooms; (vii) canteens; (viii) drinking water; and (ix) latrines and urinals. Under the said Regulations medical examination of dock workers is carried out periodically. Financial assistance and scholarships to encourage education of children of Port employees are also provided by the Trust.
New Mangalore Port Trust
The New Mangalore Port Trust provides following Welfare facilities to its employees:
Free education in English Medium up to Xth Std. 50 bedded hospital. Free Consultancy from Specialist Doctors. Referral Hospital facilities. Free Medical Treatment in Alopathy/Ayurveda and Homeopathy. Multi purpose Auditorium. Residential quarters. Nursery School. Subsidised Canteen facilities. Gymkhana for indoor games. Tennis Court. Stadium for out-door games, sports activity. Recreation Club. Children Park. Market Complex. Cable TV facility to Port colony residents at subsidized rates. 100 units free electricity every month to class III & IV employees residing in Port Colony. Rest rooms for certain categories of employees. A closed Auditorium of 750 capacity for conducting various functions at subsidised rates
to Port employees/Dock Workers and their families. Free Medicine and consultation at NMPT clinic and dispencery to all contractual
employees, their dependents and general public in and around the Port area. V.O. Chidambaranar Port Trust
The V.O. Chidambaranar Port Trust, Tuticorin provides following Welfare facilities to the employees:
Education: In order to meet the educational needs of the children of the employees of the Port, the following schools are run by the V.O. Chidambaranar Port Educational Agency established by the Port Trust under the Tamil Nadu Recognized Private Schools (Regulation) Rules, 1974; (i) J.I. Coilpillai Memorial Harbour Primary School (ii) J.I. Coilpillai Memorial Harbour Hr. Sec. School (iii) Dr. B.R. Ambedkar Memorial Harbour Matriculation School. An amount of Rs. 293 lakhs has been sanctioned as financial assistance to the Educational Agency by the V.O. Chidambaranar Port Trust during the year 2017-18 for meeting the expenditure in running the schools over and above the aid grant by the Government of Tamil Nadu. A scheme for award of Merit Scholarship for education and lumpsum payment towards cost of books to the meritorious children of the officers and employees has also been introduced from the year 1986-87. The amount of Merit Scholarship has been revised for the year 2014-15 onwards.
Sports: V.O.Chidambaranar Port Sports Council was formed with the objective of promoting sports and games among the staff of the Port. The Port‟s teams participated in the Inter-Port and other Tournaments with creditable success. The Port is rendering financial assistance of Rs.70.94 lakhs to the Port Sports Council to meet various expenditures.
111
Canteen: To cater the needs of office based staff, employees working at wharves and residents of the colony area canteens are run by the Committee constituted by the Chairman. An amount of Rs.89.94 lakhs has been sanctioned for the year 2017-18 to the Canteen.
Other Welfare Activities: Welfare facilities like medical services, concessions to physically challenged employees, family security fund, employees (hba) special family benefit fund, welfare club, marriage advance, medical benefit for retired employees, assistance to family of employees who die in harness, implementation of Swachh Bharat campaign, housing facility etc. are also provided by the Port Trust. Visakhapatnam Port Trust
The Visakhapatnam Port Trust provided following welfare facilities to the workers: financial assistance was granted to employees and their children for prosecuting higher studies in Graduation and Post Graduation, Polytechnic, Engineering, Medicine and Professional Courses etc., Merit scholarships for the children of port employees, financial assistance in case of diseases, financial assistance for the employees for organizing picnics, financial assistance for canteens, lunch-cum-guest rooms at various work spots, marriage hall, homeo clinic, financial assistance for purchasing medical life saving equipments, financial assistance for funeral expenses to the family of deceased employees, financial assistance towards conducting sports and games among the port employees, organization of cultural programmes, Women‟s Day celebration, medical facilities etc.
4. WELFARE WORK UNDER STATUTORY WELFARE FUNDS To supplement the efforts of the employers and the State Governments in providing welfare amenities to the workers, the Ministry of Labour & Employment administers five Welfare Funds for beedi, cine and certain categories of non-coal mine workers. The Funds have been set up under the following Acts of Parliament:
The Mica Mines Labour Welfare Fund Act, 1946;
The Limestone and Dolomite Mines Labour Welfare Fund Act, 1972;
The Iron Ore, Manganese Ore and Chrome Ore Mines Labour Welfare Fund Act, 1976;
The Beedi Workers‟ Welfare Fund Act, 1976; and
The Cine Workers‟ Welfare Fund Act, 1981
The Acts enable the Central Government to meet the expenditure incurred in connection with measures and facilities which are necessary or expedient to promote the welfare of such workers. In order to give effect to the objectives laid down in the above Acts, various welfare schemes have been formulated and are under operation in the fields of Education, Health and Housing.
The scheme of Welfare Funds is outside the framework of specific employer and employee relationship in as much as the resources are raised by the Government on a non-contributory basis and delivery of welfare services affected without linkage to individual worker‟s contribution. Welfare funds, which follow a sectoral approach, are in addition to a large number of various other poverty alleviation and employment generation programmes, which follow a regional approach and for which most of these workers are eligible.
The Labour Welfare Organization which administers these Funds is headed by a Director General (Labour Welfare). He is assisted by seventeen (17) Regional Welfare Commissioners for the purpose of administration of these Funds in the States.
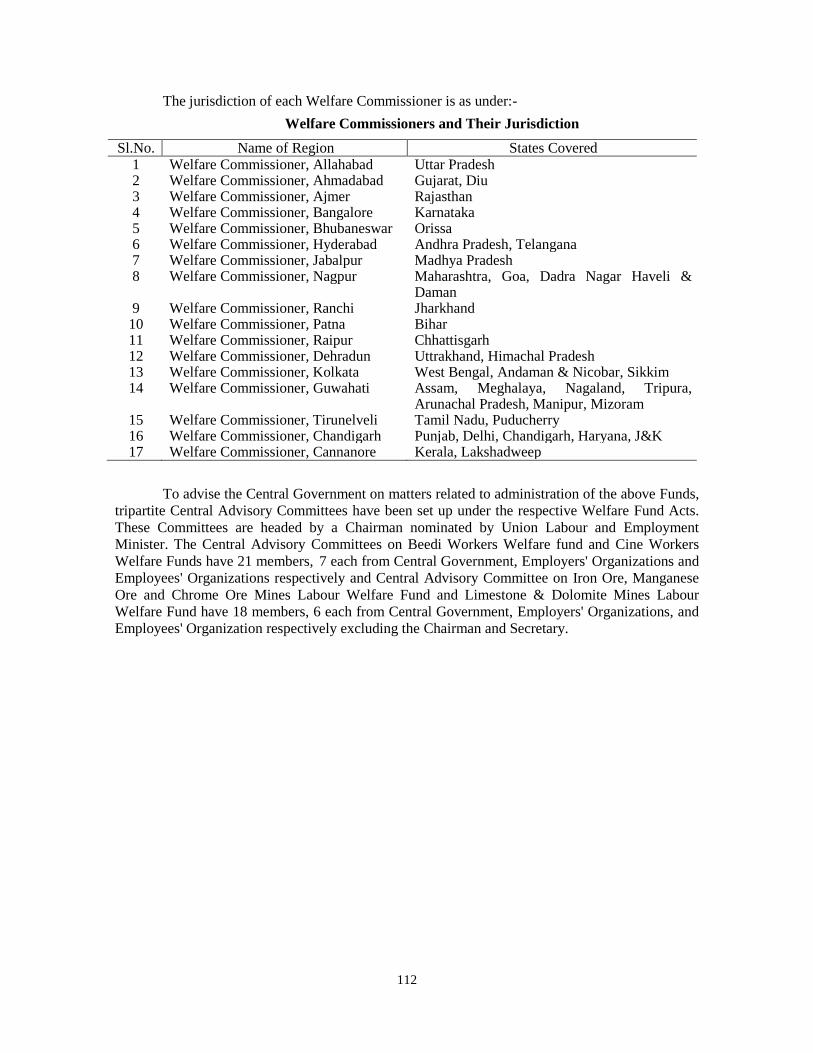
112
The jurisdiction of each Welfare Commissioner is as under:-
Welfare Commissioners and Their Jurisdiction
Sl.No. Name of Region States Covered 1 Welfare Commissioner, Allahabad Uttar Pradesh 2 Welfare Commissioner, Ahmadabad Gujarat, Diu 3 Welfare Commissioner, Ajmer Rajasthan 4 Welfare Commissioner, Bangalore Karnataka 5 Welfare Commissioner, Bhubaneswar Orissa 6 Welfare Commissioner, Hyderabad Andhra Pradesh, Telangana 7 Welfare Commissioner, Jabalpur Madhya Pradesh 8 Welfare Commissioner, Nagpur Maharashtra, Goa, Dadra Nagar Haveli &
Daman 9 Welfare Commissioner, Ranchi Jharkhand 10 Welfare Commissioner, Patna Bihar 11 Welfare Commissioner, Raipur Chhattisgarh 12 Welfare Commissioner, Dehradun Uttrakhand, Himachal Pradesh 13 Welfare Commissioner, Kolkata West Bengal, Andaman & Nicobar, Sikkim 14 Welfare Commissioner, Guwahati Assam, Meghalaya, Nagaland, Tripura,
Arunachal Pradesh, Manipur, Mizoram 15 Welfare Commissioner, Tirunelveli Tamil Nadu, Puducherry 16 Welfare Commissioner, Chandigarh Punjab, Delhi, Chandigarh, Haryana, J&K 17 Welfare Commissioner, Cannanore Kerala, Lakshadweep
To advise the Central Government on matters related to administration of the above Funds,
tripartite Central Advisory Committees have been set up under the respective Welfare Fund Acts.
These Committees are headed by a Chairman nominated by Union Labour and Employment
Minister. The Central Advisory Committees on Beedi Workers Welfare fund and Cine Workers
Welfare Funds have 21 members, 7 each from Central Government, Employers' Organizations and
Employees' Organizations respectively and Central Advisory Committee on Iron Ore, Manganese
Ore and Chrome Ore Mines Labour Welfare Fund and Limestone & Dolomite Mines Labour
Welfare Fund have 18 members, 6 each from Central Government, Employers' Organizations, and
Employees' Organization respectively excluding the Chairman and Secretary.
113
CHAPTER 6
INDUSTRIAL HOUSING
“House for all” is one of the priority area in national agenda for governance which stress on the needs of vulnerable and distress group. Housing is always a basic need and is considered to be vital for human survival and, therefore, essential for socio-economic development. Decent, affordable housing is fundamental to the health and well being of people and to the smooth functioning of the economy. The housing problem has become acute in most industrial regions mainly on account of accelerating urbanisation. As part of the construction industry, housing has emerged as a major sector of economy having backward and forward linkages with almost all other sectors.
1. URBAN HOUSING DEVELOPMENT
Ministry of Housing & Urban Affairs is the apex authority of Government of India at the national level for formulation of housing policy and programme, review of the implementation of the plan schemes, collection and dissemination of data on housing, building materials/techniques and for adopting general measures for reduction of building costs. In addition, it is entrusted with implementation of the specific programmes of urban employment and urban poverty alleviation, including provision of basic amenities to the urban poor and support for establishment of micro-enterprises by skill development of the poor. In the federal structure of the Indian polity, the matters pertaining to the housing and urban development have been assigned by the Constitution of India to the State Governments. The Constitutional 74
th Amendment Act has further delegated
many of these functions to the urban local bodies. Although these are essentially State subjects yet the Government of India plays a coordinating and monitoring role and also supports these programmes through centrally sponsored schemes.
The Ministry of Housing & Urban Affairs plays a nodal role in addressing various issues of urban employment and poverty alleviation and housing sector by formulating policies, providing legislative guidance and through sectoral programmes. The National Policy issues are decided by this Ministry which allocates resources to the State Governments through various centrally sponsored schemes. In addition, this Ministry is also supporting various external assistance programmes for housing, urban employment and poverty alleviation in the country.
The urban sector has witnessed major changes on account of our country‟s transition towards market-based economy and the spirit of decentralization which is embodied in the Constitution (74
th Amendment) Act, 1992. In addition, the role of urban sector in economic growth
and poverty reduction has undergone major change. The need for public private partnership is now widely appreciated. In order to cope with massive problems that have emerged as a result of rapid urban growth, it became imperative to draw up a strategy to implement projects in select cities on mission mode.
Government has expressed its commitment that by the time the nation completes 75 years of its independence, every family will have a pucca house with access to water connection, toilet facilities and 24x7 electricity supply. Accordingly, Pradhan Mantri Awas Yojana (Urban) for ensuring housing for all in urban areas was launched on 25
th June 2015 which is to be implemented
during 2015-2022. The Mission provides central assistance to all eligible families/beneficiaries across all statutory towns for houses included under the mission. States/UTs will have flexibility to include in the Mission, the Planning area as notified with respect to Statutory Town and which surrounds the concerned municipal area. Estimated housing shortage is in the order of 2 crores. Exact number would however be assessed after demand assessment by cities and States under the Mission. To address Housing for All in urban area, the Mission has four verticals: a) “In-situ” Slum Redevelopment with participation of private developers using land as resource for providing housing to eligible slum dwellers; b) Credit Linked Subsidy Scheme for providing interest rate
114
rebate to EWS/LIG beneficiaries; c) Affordable Housing in Partnership with Public and Private Sectors; and d) Beneficiary-led individual house construction/enhancements. Size of house for EWS is 30 sq. mt. in carpet area but states have flexibility to enhance the size of houses in consultation with the Ministry. EWS family has been defined as family with annual income upto Rs. 3 lakh and LIG as family with annual income between Rs. 3-6 Lakh.
Components of PMAY:
“In-situ” Slum Redevelopment: Slum redevelopment grant of Rs.1 lakh per house is admissible for all houses built for eligible slum dwellers under the component of In-situ Slum Redevelopment (ISSR) using land as Resource with participation of private developers. This slum rehabilitation grants can be utilised by States/UTs for any of the slum redevelopment projects. After redevelopment, de-notification of slums by State/UT Government is recommended under the guidelines.
Credit Linked Subsidy Scheme: Beneficiaries of Economically Weaker Section (EWS) and Low Income Group (LIG) seeking housing loans from Banks, Housing Finance Companies and other such institutions are eligible for an interest subsidy of 6.5 % on loan amount upto Rs.6 lakh for loan tenures maximum up to 20 years. The Net Present Value (NPV) of the interest subsidy is to be calculated at a discount rate of 9%. The scope of CLSS for EWS/LIG has been extended to Middle Income Group (MIG) w.e.f. 01.01.2017.
Affordable Housing in Partnership with public or private sector: Central Assistance of Rs.1.5 Lakh per EWS house is provided by GoI in projects where atleast 35% of the houses in the projects are for EWS category and a single project has atleast 250 houses.
Beneficiary-led individual house construction/enhancements: Under this component, central assistance of Rs.1.5 lakh is available to individual eligible families belonging to EWS categories.
Institutional Financing of Housing
The substantial thrust on housing laid by the Government through the facilitating measures including Reserve Bank of India‟s (RBI) regulations relating to priority sector lending, fiscal concessions and budgetary incentives have started to bear fruit. Institutional credit disbursals are being made through Housing Finance Institutions (HFIs) under the ambit of the National Housing Bank (NHB). NHB registers, regulates and supervises Housing Finance Companies (HFCs), keeps surveillance through On-site & Off-site Mechanisms and co-ordinates with other Regulators.
Housing and Urban Development Corporation (HUDCO), since its inception in 1970, has made steady and significant strides in the field of housing and urban infrastructure financing catering to the needs of every section of the population. Unlike the policy adopted by the contemporary housing finance companies, HUDCO‟s assistance covers the housing needs of every class of the society, with special emphasis on the weaker sections and the deprived. With a significant social orientation in its operation, 95.30 % of the housing units sanctioned so far have been for the economically weaker sections (EWS) and low income group (LIG) categories.
The housing schemes for handloom weavers and beedi workers are being implemented through Central Government subsidy as well as the loans provided by the HUDCO. The HUDCO is also providing loan for construction of hostels for working women. A certain proportion of the houses financed by the HUDCO are reserved by state agencies for the SC/ST population.
2. HOUSING SCHEMES OF THE STATE GOVERNMENTS
Keeping in view, the importance of housing, some of the State Governments/UTs have also framed suitable Schemes and Acts for this purpose. Information available on the number of houses constructed/allotted/provided to the workers during the years 2017 are given below:
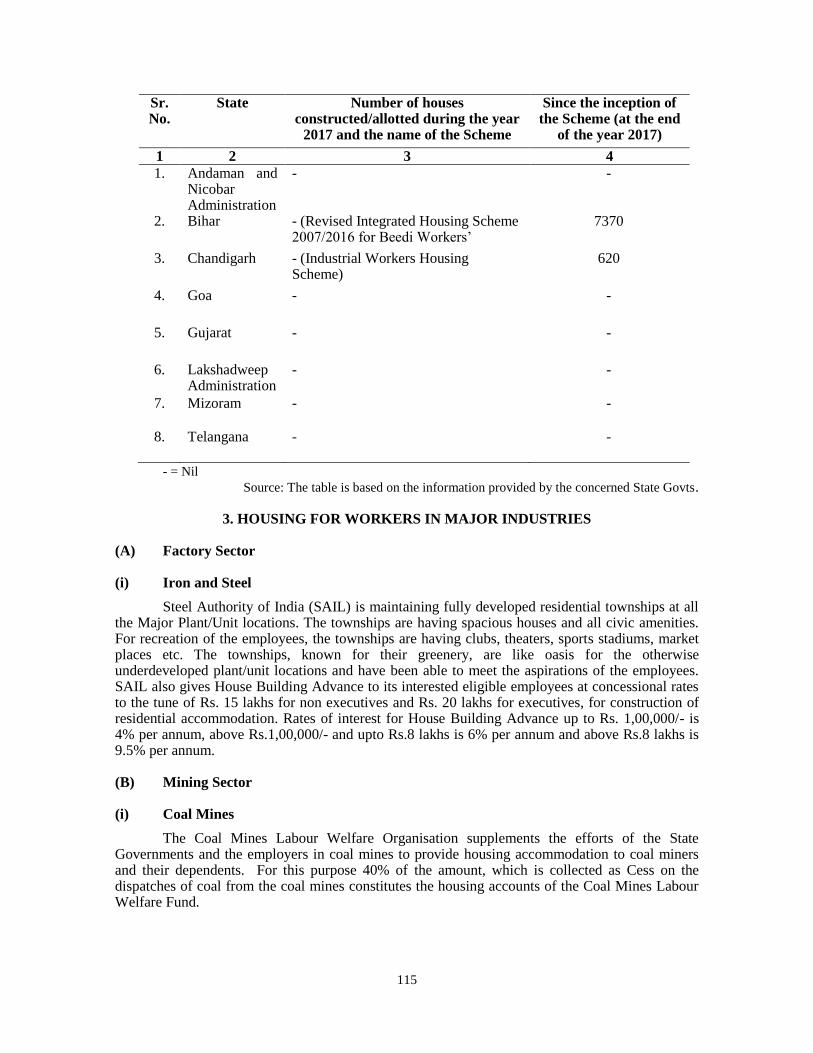
115
Sr.No.
State Number of houses constructed/allotted during the year
2017 and the name of the Scheme
Since the inception of the Scheme (at the end
of the year 2017)
1 2 3 4
1. Andaman and Nicobar Administration
- -
2. Bihar - (Revised Integrated Housing Scheme 2007/2016 for Beedi Workers‟
7370
3. Chandigarh - (Industrial Workers Housing Scheme)
620
4. Goa - -
5. Gujarat - -
6. Lakshadweep Administration
- -
7. Mizoram - -
8. Telangana - -
- = Nil
Source: The table is based on the information provided by the concerned State Govts.
3. HOUSING FOR WORKERS IN MAJOR INDUSTRIES
(A) Factory Sector
(i) Iron and Steel
Steel Authority of India (SAIL) is maintaining fully developed residential townships at all the Major Plant/Unit locations. The townships are having spacious houses and all civic amenities. For recreation of the employees, the townships are having clubs, theaters, sports stadiums, market places etc. The townships, known for their greenery, are like oasis for the otherwise underdeveloped plant/unit locations and have been able to meet the aspirations of the employees. SAIL also gives House Building Advance to its interested eligible employees at concessional rates to the tune of Rs. 15 lakhs for non executives and Rs. 20 lakhs for executives, for construction of residential accommodation. Rates of interest for House Building Advance up to Rs. 1,00,000/- is 4% per annum, above Rs.1,00,000/- and upto Rs.8 lakhs is 6% per annum and above Rs.8 lakhs is 9.5% per annum.
(B) Mining Sector
(i) Coal Mines
The Coal Mines Labour Welfare Organisation supplements the efforts of the State Governments and the employers in coal mines to provide housing accommodation to coal miners and their dependents. For this purpose 40% of the amount, which is collected as Cess on the dispatches of coal from the coal mines constitutes the housing accounts of the Coal Mines Labour Welfare Fund.
116
(ii) Coal India Ltd.
At the time of nationalisation, in Coal India Ltd. and its subsidiaries there were only 1,18,366 houses including sub-standard houses. The availability of these houses has increased to 4,01,795. The housing satisfaction has now reached 70.42%. The coal companies are making all out efforts to further improve these facilities. Employees will be encouraged to form cooperative societies for building their own homes at a place where they would like to finally settle down.
(iii) Mica Mines
The Mica Mines Labour Welfare Organisation, Kalichedu (A.P.) had allotted 533 houses to its workers under various Housing Schemes from 2008.
(C) Plantations
The Plantations Labour Act makes it obligatory for the employers to provide and maintain necessary housing accommodation for every worker and his family residing in the plantation. The Act also requires every employer to provide and maintain necessary housing accommodation for those desiring workers, who have put in six months of continuous service, but are residing outside the plantation. The State Governments are, however, empowered to frame rules to decide the standard and specification of the accommodation.
(D) Railways
The Indian Railways, being the single largest employer in the country have provided the maximum housing facilities to the employees. Approximately 44.7% staff has been provided with railway quarters, as on 31.03.2017. 1237 staff quarters were electrified during 2016-17. 5 Railwaymen's Housing Societies were functional in IR during 2016-17.
(E) Dock and Ports
(i) Chennai Port Trust - The Trust has provided to the serving officers / employees with quarters at Tondiarpet, Cassimode, Clive Battery, Spring Haven Road and Napier Bridge near Heavy Workshop. There are 1399 quarters of various types (Types I to V). Also, Each of the employees who have availed House Building Advances from the Trust contributes Rs.70/- on Chennai Port Trust Employees House Building Advance Special Family Benefit Fund (Chennai Port Trust EHBASFB). The fund is used to compensate the liquidity of the employee towards HBA including interest thereon in the case of an employee dies in harness.
(ii) Cochin Port Trust – 804 Residential quarters have been provided by the Port Trust for their employees. Men‟s Hostel and Women‟s Hostel are also functioning inside the Port area. The House Building Advance Scheme for Central Government officers is being followed by the Port Trusts.
(iii) Kolkata Port Trust – For Class III and IV employees there are 779 quarters at Kolkata Dock System and more than 1700 quarters at Haldia Dock Complex.
(iv) Mormugao Port Trust - Mormugao Port Trust has constructed residential quarters in the localities at Headland, Bogda, Jetty, Desterro and Baina etc. There are 1883 numbers of quarters at the end of 2017 are available. Apart from providing official accommodation, House Building Advance are also given to the eligible employees who desire to construct their new houses or acquire ready build flats/houses.
(iv) Mumbai Port Trust - Residential accommodation is provided by the Port through 7719 residential units subject to recovery of nominal license fees. In addition, employees residing in these quarters are reimbursed 80% of the electricity charges for consumption upto 300 units. Employees who have completed five years of service are eligible for housing loan, at low rates of interest, for acquisition of land and construction or purchase of house or flat. The maximum loan
117
admissible to an individual employee is at 50 times of the Basic Pay of the employee or the actual cost or Rs.7.5 lakh, whichever is less. The repayment is spread-over 20 years or balance service. Under „assistance to defray outstanding housing loan on death of the employees‟ scheme, financial assistance upto Rs.30,000/- or balance amount of housing loan (including interest), whichever is less, is extended to the families of employees who have obtained loan under Mb.P.T. Housing Loan Regulations and expired while in service.
(v) New Mangalore Port Trust - New Mangalore Port Trust has 762 residential houses in the colony which are occupied by the employees working on regular, contract, outsourced, apprenticeship trainees, CISF employees, employees of NMPT and KV school etc.
(vi) V.O. Chidambaranar Port Trust - V.O. Chidambaranar Port Trust provided totally 741 residential accommodation to its employees and officers at Bharathi Nagar and Concession in electricity charges is also granted to the employees residing in Port Quarters upto 100 units/month.
(F) Postal Department
The Department of Post has providing housing facilities to a large number of employees. Rented accommodation is being provided to certain essential staff. In addition, house-building advances are granted to the employees enabling them to purchase land and build their own houses.
4. RURAL HOUSING SCHEMES
In India, nearly 70 per cent of the population lives in rural areas where the housing needs are just unmet. The earliest housing programme taken up by the Government of India was for rehabilitation of refugees immediately after the partition of the country. A formal village housing scheme was later launched in 1957 as part of the Community Development movement. Much later, the programme was enlarged and construction of houses was taken up as a major activity under the National Rural Employment Guarantee Programme (NREGP), which began in 1980 and later under the Rural Landless Employment Guarantee Programme (RLEGP) taken up in 1983. In 1985-86, Indira Awaas Yojana (IAY) was launched as a sub-scheme of RLEGP and from April 1989, it became a sub-scheme of the Jawahar Rozgar Yojana (JRY). On January 1
st, 1996, IAY was finally
delinked from JRY and made an independent scheme.
The IAY aimed at providing dwelling units to houseless below poverty line (BPL) households identified by the gram sabhas and those living in dilapidated and kutcha houses, with a component for providing house sites to the landless poor as well. After more than 30 years of its implementation, although IAY addressed the rural housing shortage, in view of the limited scope of coverage under the programme there were still considerable gaps in rural housing. Government is committed to provide “Housing for All” by 2022. To fulfill the Government‟s commitment and address the gaps in rural housing, IAY has been re-structured as Pradhan Mantri Awaas Yojana – Gramin (PMAY-G) w.e.f. 1
st April, 2016 by the Government.
PMAY-G aims to provide a pucca house with basic amenities to all houseless households and households living in kutcha and dilapidated house by 2022. The target number of houses to be constructed by the year 2021-22, to achieve the objective of “Housing for All”, is 2.95 crore.
118
CHAPTER 7
HEALTH AND SAFETY
Health and safety concern of the employees is a important factor in an organization for their smooth and successful functioning. It increases the production as well as the quality of products and services rendered by improving employee morale, reducing absenteeism and enhancing productivity. Hence it becomes imperative for all the organizations to attach importance towards achieving high Occupational Health and Safety performance as they do to the other key objectives of their business activities. Occupational health & safety standards for industrial workers are implemented through the adoption of common codes of practice, safety legislation and training in related matters. Occupational hazards are one of the major problems created by the machine-made environment. Constitution of India has also specified provisions for ensuring occupational safety and health of the workers in the form of three articles 24, 39 (e & f) and 42. The regulation of labour and safety in mines and oil fields is under the Union List and the welfare of the labour including conditions of work etc. is in the Concurrent List. The Ministry of Labour & Employment, Government of India and Labour Departments of the State and Union Territories are responsible for matters related to safety and health of workers. The Directorate General of Mines Safety (DGMS, Dhanbad) and Directorate General Factory Advice Service & Labour Institutes (DGFASLI, Mumbai) are the two organisations of the Ministry of Labour & Employment which efforts to achieve the principles enshrined in the Constitution in the field of occupational health and safety in mines, factories and ports.
Legislations
The statutes relating to Occupational Health and Safety (OH&S) are broadly divided into three:-
Statutes for safety at workplaces Statutes for safety of substances Statutes for safety of activities
At present, safety and health statutes for regulating OH&S of persons at work exist in four sectors:-
Mining Factories Ports Construction
The major legislations are:-
The Factories Act, 1948
It regulates health, safety, welfare and other working conditions of workers in factories. It is enforced by the State Governments through their factory inspectorates. The Directorate
General Factory Advice Service & Labour Institutes (DGFASLI) co-ordinates matters concerning safety, health and welfare of workers in the factories with the State Governments.
DGFASLI conducts training, studies and surveys on various aspects relating to safety and health of workers through the Central Labour Institute in Mumbai and four other Regional Labour Institutes located at Kolkata, Chennai, Kanpur and Faridabad.
Mines Act, 1952
It contains provisions for measures relating to the health, safety and welfare of workers in the coal, metalliferous and oil mines.
119
The Mines Act, 1952, prescribed duties of the owner (defined as the proprietor, lessee or an agent) to manage mines and mining operation and the health and safety in mines. It also prescribes the number of working hours in mines, the minimum wage rates, and other related matters.
Directorate General of Mines Safety conducts inspections and inquiries, issues competency tests for the purpose of appointment to various posts in the mines, organises seminars/conferences on various aspects of safety of workers.
Courts of Inquiry are set up by the Central Government to investigate into the accidents, which result in the death of 10 or above miners. Both penal and pecuniary punishments are prescribed for contravention of obligation and duties under the Act.
Dock Workers (Safety, Health & Welfare) Act, 1986
It contains provisions for the health, safety and welfare of workers working in ports/docks. It is administered by Directorate General Factory Advice Service and Labour Institutes. The
Inspectorates of Dock Safety are established at 11 major ports of India viz. Kolkata, Mumbai, Chennai, Vishakhapatnam, Paradip, Kandla, Mormugao, Tuticorin, Cochin, New Mangalore and Jawaharlal Nehru Port.
Overall emphasis in the activities of the inspectorates is to contain the accident rates and the number of accidents at the ports.
Other legislations and the rules framed thereunder:-
Plantation Labour Act, 1951 Explosives Act, 1884 Petroleum Act, 1934 Insecticide Act, 1968 Electricity Act, 2003 Indian Boilers Act, 1923 Indian Atomic Energy Act, 1962 Building and Other Construction Workers (Regulation of Employment and Conditions of
Service) Act, 1996 Beedi and Cigar Workers' (Conditions of Employment) Act, 1966.
1. HEALTH AND SAFETY OF INDUSTRIAL WORKERS Following are some of the measures taken to ensure the health & safety conditions of industrial workers. (a) The Employees State Insurance Scheme (ESIS)
The ESI Scheme is an integrated scheme of social benefits which provides medical and cash benefits in the contingencies of sickness, maternity, employment injury and death due to employment injury. The Employees‟ State Insurance Act, 1948 applies to factories employing 10 or more persons. The provisions of the Act are being brought into force area-wise in stages. The Act contains an enabling provision under which the “appropriate government” is empowered to extend the provisions of the Act to other classes of establishments; industrial, commercial, agricultural or otherwise. Under these provisions, the State Governments have extended the provisions of the Act to shops, hotels, restaurants, cinemas including preview theatres, road motor transport undertakings, newspaper establishments, educational and medical institutions employing 10 or more employees. Employees of factories and establishments covered under the Act drawing monthly wages upto Rs.21,000/- per month and Rs.25,000/- per month for persons with disabilities are covered under the Scheme. The ESI Scheme is now operated in 33 States/ Union Territories. As on 31.03.2017, 3.19 crore insured persons and about 12.40 crore beneficiaries are covered under the Scheme. The number of factories and establishments covered by the end of the year had gone up to about 8.98 lakh. The ESI Scheme is mainly financed by contributions from the employers and employees. The
120
rates of the employers‟ and the employees‟ share of contribution are 4.75% and 1.75%, respectively. All contributions received under the ESI Act and all other money belonging to the fund which is not immediately required for defraying day to day expenses are invested in the manner prescribed under ESI (Central) Rules. As on 31.12.2017, the total investment of fund was Rs.67069.16 crore. Besides from medical care, the beneficiaries under ESI Scheme are also provided an array of cash benefits. It is payable in times of physical distress due to sickness, temporary or permanent disablement resulting in loss of earning capacity, confinement in respect of insured women etc. Dependants of insured persons who die of employment injury caused by accident or occupational disease are entitled to monthly payments called the dependant benefits. (b) Medical Facilities under Statutory Welfare Funds
The Labour Welfare Organisation is directly running hospitals and dispensaries at different places in the country to provide basic health care and family welfare services to beedi, mine and cine workers. Health Care is provided to:
a) Beedi workers and their dependents through 8 hospitals and 236 dispensaries all over the country.
b) For cine workers, there are two dispensaries for medical treatment. c) For Iron Ore, Manganese Ore & Chrome Ore Mines workers and their families, there are 3
hospitals and 20 dispensaries. d) For mica workers there are 1 hospital and 292 dispensaries, all over the country.
Diversified Medical Assistance for Workers;
Purpose Nature of Assistance
Ophthalmic Problems Financial assistance of Rs.300/- for purchase of spectacles
Tuberculosis Reservation of beds in T. B. Hospitals and domiciliary treatment for workers. Subsistence allowance Rs.750/- p.m. to Rs.1000/- is paid to workers.
Heart Diseases Reimbursement of expenditure up to Rs.1,30,000/- to workers.
Kidney Transplantation Reimbursement of expenditure up to Rs.2,00,000/- to workers
Cancer Reimbursement of actual expenditure on treatment, medicines, and diet charges incurred by workers, or their dependants.
Minor surgery like Hernia, Appendectomy ulcer,
Reimbursement of expenditure upto Rs.30,000/- to workers and their dependants.
Mental Diseases Financial assistance for treatment of mental diseases, diet, railway fare and subsistence allowance to workers.
In addition to above following welfare schemes are specially formulated for the mine workers:-
a) Scheme for artificial limb for mine workers working in mines; b) Scheme for fatal and serious accidental benefit, for mine workers; c) Scheme for payment for grant-in-aid to the mine managements who are maintaining hospital
for the mine workers and their families; d) Scheme for organizing health camps; e) Grant-in-Aid for the purchase of ambulance, 75% of the cost or Rs.3.00 lakh whichever is
less.
(c) Health & Safety facilities provided by various States/Union Territories:- Assam
The total sanctioned strength of the Medical Inspector of Plantations working under the Labour Commissionerate is 8 of which 2 are working and others are vacant. The Medical Inspector
121
of Plantations are exclusively meant for looking after the statutory provisions relating to providing medical facilities under the Plantation Labour Act, 1951 to be provided to plantation workers. Regular inspection is conducted by the field officers in the establishments to monitor health & hygiene of the workers. Bihar
RLI Kanpur team visited different Silica prone factories in the State and surveyed silicosis prone factories. No case related to this occupational disease was detected in these factories. Gujarat
Factory wing is headed by Director, Industrial Safety and Health, who is responsible for regulating health, safety and welfare of the workers. For efficient administration and effective control, state is divided in to four regions namely Ahmedabad, Vadodara, Surat and Rajkot. These regions are under control of Joint Director, Industrial Safety & Health.
The Directorate, Industrial Safety and Health looks after the implementation of following statue;
The Factories Act 1948 and Gujarat Factories Rules, 1963 The Environment Protection Act, 1986 The Manufacture, Storage and Import of Hazardous Chemical Rules, 1989 Chemical Accidents (Emergency Planning, Preparedness and Response ) Rules, 1996 The Payment of Wages Act, 1936 and Rules there under The Maternity Benefit Act, 1961 and Rules there under The Gujarat Physically Handicapped Persons (Employment in Factories) Act, 1982 The Gujarat Payment of Unemployment Allowance to Workmen (in factories) Act, 1981 The Building and other Construction Workers (Regulation of Employment and Conditions of
Service) Act, 1996 and Rules there under
The history of Factories Act is more than 100 years old. First time the Indian Factories Act was enacted in 1881. After independence, 'The Factories Act, 1948' was made applicable in the country mainly to regulate health, safety, welfare and working conditions of Industrial workers. It has been amended from time to time, but the major amendments were enacted in 1976 and in 1987, wherein emphasis has been laid on safety in general and chemical safety in particular. To strengthen safety in chemical factories, Government of Gujarat amended the 'Gujarat Factories Rules, 1963' in February 1995.
To look after welfare of female workers, Lady Inspector of Factories has also been appointed under the Factories Act, 1948. All Inspectors have been declared as Assistant Public Prosecutors for purpose of Factories Act.
The Director, Industrial Safety and Health, Gujarat State has also been declared authority under certain section of Environment Protection Act, 1986 and Manufacture, Storage, Import of Hazardous Chemicals, Rules, 1989, as amended in 1994.
Under Environment Protection Act, 1986, the Government of India has framed Chemical Accidents (Emergency Planning, Preparedness and Response) Rules, 1996, where the Asstt./Deputy Director of Ind. Safety and Health performs the duties as Member Secretary of various crisis groups constituted under these rules throughout the state.
The Inspectors appointed under the Factories Act have also been appointed as inspectors under the Payment of Wages Act, 1936, so far as the factories registered under the Factories Act, 1948 are concerned. The officers of this wing have also been notified as Inspectors under Maternity Benefit Act, 1961 & The building and other construction workers (Regulation of Employment and conditions of service) Act, 1996.
The inspectors appointed under the Factories Act have also been appointed as inspector under the Building and Other Construction Workers (RECS) Act, 1996, Director Ind. Safety and
122
Health has been appointed as Chief Inspector of Inspections of Building and Construction under the same Act.
Moreover one Dy. Director (chemical) has been appointed for assisting and advising Dir. Industrial Safety & Health about hazards and safety in chemical factories.
To measure and monitor the ill effects of chemicals, cotton dust, Asbestos dust and Silica dust etc., Industrial Hygiene Laboratory has been established under the Director Industrial Safety & Health. It is headed by Dy. Director (Medical) consists of Medical Inspectors of Factories, Certifying Surgeons and other technical staff. Kerala
The Department of Factories and Boilers, under the Ministry of Labour is looking after safety, health and welfare of workers employed in factories. Secretary to Labour is having the administrative control over the Department. The Director of Factories & Boilers is the Head of the Department. The main function of the Factories & Boilers Department is to administer / implement various provisions in the Factories Act 1948, the Indian Boilers Act 1923 and other enactments for ensuring Safety, Health and Welfare of the factory workers and safety of the neighboring public. The departmental functions are regulatory as well as service oriented. The department is adopting a two-tier system viz. Regulatory and advisory to make it an inspection service department. The Director of Factories & Boilers is assisted by enforcement wing consisting of a Joint Director of Factories and Boilers (HQ) and 3 Regional Joint Directors of Factories and Boilers. There are 20 factory divisions each headed by the Inspector of Factories and Boilers in respect of Factories under Section 2(m), hazardous factories coming under section 85 of the Factories Act, 1948 and 23 Additional Inspectors of Factories in charge of non hazardous Factories notified under section 85 of Factories Act 1948.
State Government has formulated the Comprehensive Health Insurance Scheme (CHIS) on the same line of Rashtriya Swasthya Bima Yojana (RSBY) to benefits lakhs of poor families and also those in the APL. RSBY and CHIS is being implemented in all the 14 districts of the State. This Scheme was started on 2.10.2008.
CHISPLUS scheme is the part of CHIS formulated by the State Government for providing treatment for cancer, heart diseases and kidney diseases. Under CHISPLUS free treatment is extending upto Rs.70,000/- for treatment of Diseases. This is in addition to the free treatment available under RSBY / CHIS and is available to all smart card holders except APL. The scheme is implemented through all the Government Medical Colleges, Pariyaram Medical College and all District Head Quarters Hospitals. Steps are taken to bring Regional Cancer centre, Sri Chitra and Malabar cancer centre under the scheme. The scheme was started in January, 2010.
A separate Agency namely, Comprehensive Health Insurance Agency, Kerala (CHIAK) was formulated for implementation of RSBY & CHIS. During 2016-17 Rs.12329 lakhs for RSBY, Rs.15652 lakhs for CHIS and CHISPLUS was allotted to CHIAK. (d) Railways Indian Railway Medical Service was primarily constituted to look after the health of Railway employees. It provides medical facilities to the family members of the employees, retired employees & their family members as per pass rules. Besides curative services, Indian Railway Medical Service provides preventive, promotive, occupational & industrial health, public health services also. It also plays a significant role in monitoring the quality of water & food within Railway premises. With a sanctioned strength of 2,597 Medical Officers it is the largest industrial health services in the world. It is running 24x7 round the year, 127 hospital & 586 health units spread throughout the length & breadth of the country. Indian Railway Medical Service also employs 41,000 paramedical staff for 13,702 indoor beds. It attends to roughly 67 lakh beneficiaries.
123
(e) Factories DGFASLI; The Directorate General Factory Advice Service & Labour Institutes (DGFASLI) Mumbai under the Ministry of Labour & Employment, Government of India functions as a technical arm of the Ministry in regards to matters concerned with safety, health and welfare of workers in factories and ports/docks. It assists the Central Government in formulation and review of policy and legislation on occupational safety and health in factories and ports, maintains a liaison with Factories Inspectorates of States and Union Territories in regard to the implementation and enforcement of provisions of the Factories Act, 1948; renders advice on technical matters; enforces the Dock Workers (Safety, Health and Welfare) Act, 1986; undertakes research in industrial safety, occupational health, industrial hygiene and industrial psychology etc; and provides training in the field of industrial safety and health. In areas of industrial safety related research and allied problems, DGFASLI is providing its services through it‟s headquarter at Mumbai, Central Labour Institute at Mumbai and four Regional Labour Institutes at Kolkata, Chennai, Kanpur and Faridabad. It‟s headquarter has (i) Factory Advice Service Division and (ii) Dock Safety Division. The Central Labour Institute and the four Regional Labour Institutes have the following divisions viz. Industry Safety, Industry Hygiene, Industrial Medicine, Industrial Physiology, Industrial Psychology, Industrial Ergonomics, Industrial Environmental Engineering, Staff Training, Small Scale Industries Cell, Productivity, Major Hazards Chemical Safety, Management Information Services and Safety and Health Communication Division. The different divisions at the Institute undertake activities such as carrying out studies and surveys, organizing training programmes, seminars and workshops, rendering services such as technical advice, safety audits, testing and issuance of performance reports for personal protective equipment, delivering talks, etc. (f) Iron and Steel SAIL (Steel Authority of India Ltd.): SAIL provides full medical care to its employees and their dependants. They are operating their own hospitals at townships with state of the art facilities where free outdoor and indoor medical treatment is provided to all regular employees right from the date of joining the company and their dependant family members. Employees are also referred to specialist hospitals at the cost of the company if need arises. In cities, SAIL is having tie ups with major medical centers for treatment of its employees posted there. For the period of absence due to sickness, full wages against commuted leave is provided to the employees. Also, in case of temporary disablement due to accident arising out of and in course of employment, SAIL provides full wages to its employees for such period of absence. SAIL Group Mediclaim Policy: The employees and their spouses, in case of separation on superannuation/VR/discharge on medical unfitness, and spouse of a deceased employee can enroll under the SAIL Group Mediclaim Policy. SAIL has been operating this scheme for its retired employees and their spouse since 1991. Visvesvaraya Iron & Steel Plant: Heath care of the employees and their dependents is taken care in the 115 bed hospital and occupational health center with medical facilities and a team of experienced doctors and para-medical staff. In addition, the referral facility to specialized hospital based on need is being extended.
VISL is conducting Eye Camps, Family Planning activities, periodical health check up programmes. In addition, VISL also associate with local bodies in arranging social and cultural programmes not only for their employees and their wards but also for the society. VISL Management has taken up schemes of peripheral development under corporate social Responsibility activities with a view to improve the general health, education, providing hygiene drinking water in the peripheral areas. In addition to the facilities extended to the regular employees, the retired
124
employees are also extended the benefits of medical through Company Hospital, Mediclaim facilities as per SAIL guidelines. Rashtriya Ispat Nigam Limited: The statutory Occupational Health needs of the employees are taken care of through a well-equipped Occupational Health Center since Nov.1992. It is the first OHS unit in steel industry to receive ISO-9001, ISO-14001 and OHSAS 18001-2007 certifications. Periodical Medical Examination (PME) of employees at OHS&RC is carried out through a process. Health of employees is monitored at set frequency depending on the nature of work under the Man Management Programme (MMP) and the employee records are managed online through Occupational Health Management System. Various initiatives like health education and heath check-up programmes are also brought out. (g) Docks/Ports No. of Beds, Hospitals & Dispensaries in the Docks / Ports are given below:
Name of the Port No. of beds No. of Hospitals
No. of Dispensaries
1 2 3 4
Chennai Port Trust 185 1 - Cochin Port Trust 150 1 2
Kolkata Port Trust - 2 -
Mormugao Port Trust 100 1 -
Mumbai Port Trust 241 1 4
New Mangalore Port Trust 50 1 -
V.O. Chidambaranar Port Trust 62 1 1 Vishakhapatnam Port trust 80 1 2
Medical Facilities at various Ports
Chennai Port Trust
The facilities in the Chennai Port Trust hospital keep pace with the advances in the field of medical science and high standard of medicare to its employees, their families and also to pensioners are provided. To maintain such high standards in Medicare, constant evaluation and updating of equipment is done. The main Hospital in Spring Haven Road has in-patient facilities for 185 beds. There are two peripheral Out-patient blocks at the Diabetic Specialty Centre located in the former EDLB Building and Tondiarpet Housing Colony which takes care of outpatient cases. A new fully equipped ICU and a modern fully equipped laboratory is available for benefit of the patients. Referral services are also available to patients. Cochin Port Trust
First Aid Facilities; First Aiders equipped with First Aid Boxes have been posted at the following places – Mattancherry Wharf, BTP Jetty, Marine Complex, CFS and Ernakulam Wharf. The services of Ambulance Vans are available round the clock for emergency help. Medical Facilities;
a. A general hospital with 150 beds is available inside the Port area. The hospital is equipped with facilities like air-conditioned Analytical Laboratory, Ultrasound Scan, X-Ray, Ultraviolet Rays, Infra-red Rays, E.C.G., Air-conditioned Operation Theatre complex, Labour Room and Pulmonary Resuscitator. The services at the hospital are available round the clock. Specialists
125
in Surgery, E.N.T., Ophthalmology, Pediatrics and Dentistry etc., visit the hospital on weekly basis for specialized treatments.
b. In-patient and out-patient treatment facilities are provided to all employees and members of their families. Medical facilities at the Port hospital are available for the pensioners & their spouses.
c. The employees and their dependents admitted in the Port Hospital are eligible for diet free of cost.
d. For treatment of chronic illness, employees and family members are referred to specialized hospitals and the cost of such treatments is borne by the Port. Employees and their families can avail treatment facility from outside private hospital when accident and cardiac problem occur.
e. Ambulance Van is provided free of charge to transport sick and injured Port employees from Offices/Work-sites of the Port Trust/Residence. This facility is also extended for taking patients i e., Port employees and their dependants from Port hospital to any private hospital within the limits of Kerala State for better treatment in acute emergency cases.
Kolkata Port Trust
KoPT maintains two well-equipped hospitals, one at Kolkata and another at Haldia Township. There are ambulances under both Dock Systems. In addition, first aid boxes are also maintained in all the offices and operational working sites. Mormugao Port Trust
Adequate First-aid boxes as well as First-aid treatments are readily available during the working hours to the workers at the working places. Ambulance is also provided with the full medical equipments and qualified nursing staff. Mormugao Port Trust has its own 100 bedded hospital, having fully equipped indoor and outdoor departments at Headland and first Aid Centres at Mormugao Harbour, MPT Workshop and at MOHP area. The hospital has also extended medical facilities of Ayurvedic and Homeopathic treatment to the employees and their families. Whenever necessary, arrangements for external specialist consultations/referral are made in the interest of the patient. Apart from medical officers, the hospital is enriched with qualified and experienced nursing personnel and other paramedical staff. Mumbai Port Trust
Free medical aid is provided to the Port employees and their dependent family members through a well-equipped 241 bedded hospital and four dispensaries located near the work spots and residential colonies of MbPT. In addition, if necessary, the patients are referred to other recognized hospitals for specialized treatment. For safety awareness to the Labourers, classes are being conducted at Port Management Training Center and Safety Cell regularly. New Mangalore Port Trust
The New Mangalore Port Trust provides facilities of a 50 bedded hospital, free consultancy from specialist doctors, referral hospital facilities, free medical treatment in Alopathy/Ayurveda and Homeopathy, free medicine and consultation at NMPT clinic and dispencery to all its employees and their dependents. V.O. Chidambaranar Port Trust
V.O. Chidambaranar Port has a full-fledged 62 bedded hospital in the Harbour Estate and a self contained Dispensary at Tuticorin town to meet the need of employees and their families. Four First aid centres are also functioning in the Dock area. It has a network of five Ambulances providing round the clock service at multiple locations. Both the Hospital and Dispensary are manned by medical professionals of various specialties. CISF personnel and their family members are also availing the medical facilities at free of cost. The services of the hospital are also extended
126
to retired employees and their spouses. To avail the services for critical illnesses, Port has also several approved higher referral Hospitals for super specialty services. Employees of other Government Organisations like CECRI, Poompuhar Shipping Corporation, Mercantile Marine Department etc., also avail medical services from Port Trust Hospital on payment basis. A full-fledged casualty unit with seven beds, Operation theatre and Intensive Care Section provides emergency Medical service not only to port employees but also to general public in the Harbour area. Some Major and minor operations in general Surgery, Gynecology and Ophthalmology are carried out in Port Hospital. During the year 2017-18, nearly 0.84 lakhs patients have been treated in the Port Hospital and Town Dispensary. Periodical medical examination of Cargo Handling workers have also been conducted by the Medical Officers of Port Hospital. The Medical Department have also empanelled “Consultant Specialist” like Cardiologist, Neurologist, Orthopedic, Physiotherapist etc and provides specialised care to the employees. In addition, Meenakshi Mission Hospital & Research Centre at Madurai, M/s. Aravind Eye Hospital, Vasan Eye Care and Dr. Agarwall Eye Hospital at Tuticorin have also been empanelled for the benefit of Port employees and retirees. The Medical store in the Port Hospital is handling medicines worth over Rs. 355 lakhs during the year 2017-18. It disburses high quality medicines to the patients. As per MOU between Ministry of Shipping and Department of Aids Control, action plan on HIV/AIDS/STI preventive care, support and treatment activity inside and outside the premises of VOC Port Trust carried out. The Medical Department of VOC Port Trust has been brought under the purview of ISO-QMS in the year 2004 and EMS from the year, 2005. Vishakhapatnam Port trust
An 80 bedded hospital is equipped with a complete range of medical instruments and equipments of diagnosis and treatment. Specialist Clinics for Medical, Surgical, Gynaec, Ortho, ENT, Ophthalmic, Paediatrics and Skin are function for the benefit of Port employees. The hospital provides diagnostic services like clinics and biochemical laboratory, radiology with 500 mA X Ray plant, Ultra Sound Scanner, dental and ECG. Doctors in various discipliners including Super specialities are available. In addition a “Well Baby Clinic” for immunization of children against Polio, DPT, Measles function on every Wednesday and Saturday. AIDS cell and Twin Air Conditioned operation Theatres with special equipment are available to conduct major and minor surgical operations in the hospital. Medical facilities are also extended to retired employees, CISF personnel and dependents and staff working in port schools and colleges. Super speciality treatment is provided to the employees and retired employees at specialized corporation hospital. Branch dispensaries exist at Chinamushidiwada residential colony and near dock area to cater to the requirement of employees and workers and their children/dependents. VPT is running exclusive Homeo Clinic and Ayurvedic Clinic at GJH for the benefit of employees, retirees and their family members.
2. INDUSTRIAL INJURIES
Statistics on injuries in Factories, Mines, Railways, Docks and Ports as collected under the
Factories Act, 1948, the Mines Act, 1952, the Indian Railways Act, 1989 and the Dock Workers‟ (Safety, Health and Welfare) Act, 1986, respectively are presented in this Section. The statistical unit is the number of workers involved, i.e. persons receiving injuries and not the number of accidents.
The Injuries have been defined as under;-
(i) Fatal injury means injuries resulting from industrial accident, which causes death or injured persons are prevented from attending work permanently.
(ii) Non-Fatal injury means injuries resulting from the industrial accidents, which prevent injured workers from attending to work for a period of 48 hours or more immediately following the injuries.
127
(A) Industrial injuries in Factories
The Statistics collected under the Factories Act, 1948 relate to injuries resulting from industrial accidents, which caused death or prevented the injured workers from attending to work for a period of forty eight hours or more, immediately following the injury. As per the data received by Labour Bureau on injuries under the Factories Act, 1948 from various States/ U.T.s. during 2013 & 2014, there were 494 & 515 fatal and 1951 & 3984 non-fatal injuries compared to 682 & 5087 respectively in the year 2012. (B) Industrial injuries in Mines
Statistics relating to injuries to persons employed in Mines are published in the annual report of the Directorate General of Mines Safety.
During the year 2016, there were 72, 33 and 9 fatal accidents involving 76, 42 and 9 fatalities in coal, metal and oil mines, respectively. The numbers of fatal accidents during the previous year 2015 were 53, 42 and 4 for coal, metal and oil mines respectively. (C) Railways
There were 103 (excluding Konkan Railway) consequential train accidents in 2016-17 as compared to 106 accidents in the year 2015-16. Train Accidents per Million Train Kilometers, an important index of safety, has come down to 0.09 during the year 2016-17 as compared to 0.10 in 2015-16. During 2016-17, there were 195 passengers killed and 346 injured in train accidents as against 40 passengers killed and 126 injured in 2015-16. Also, 3 railway employees killed and 4 injured during 2016-17 in train accidents as against 2 and 23 railway employees killed and injured respectively in 2015-16. (D) Ports and Docks
According to Regulation 91 of the Dock Workers (Safety, Health and Welfare) Regulations, 1990, a reportable accident is one which either causes loss of life to a worker or disables him from work for more than 48 hours. However, a notice is required to be sent in all cases when a worker is disabled from work for the rest of the day or shift. According to the above Regulation, certain types of occurrences called dangerous occurrences are reportable within four hours of the occurrence irrespective of the fact whether any injury is caused or not. In cases of reportable accidents and dangerous occurrences the notice shall be confirmed within 72 hours of the occurrence by submitting written report to the Inspector in Form XII of the Dock Workers (Safety, Health and Welfare) Regulation 1990. During the year 2017, there were 49 reportable accidents in Ports, out of which 23 were fatal.
3. INDUSTRIAL SAFETY MEASURES
Rapid increase in the use of sophisticated machinery and process plants in industry has made it possible to eliminate certain physically extracting jobs but at the same time it has made work in industry more risky. Workers‟ safety thus requires more attention. Proper precautionary measures along with the inculcation of safety consciousness among workers can go a long way in preventing industrial injuries. (A) Factory Advice Service
The Directorate General Factory Advice Service & Labour Institutes (DGFASLI) is an attached office of the Ministry of Labour & Employment, Government of India and serves as a technical arm to assist the Ministry in formulation of national policies on OSH in factories and ports. It is responsible for coordination and implementation of the measures under the Factories Act, 1948 by the State Governments and formulation of Model Rules there under. It is also concerned with the administration of the Dock Workers (Safety, Health and Welfare) Act, 1986 in
128
respect of 11 major ports in the country. It undertakes research and consultancy studies in Industrial Safety, Occupational Health, Industrial Hygiene, Industry Psychology and Industrial Physiology, in addition to safety audits. It provides training to the Inspectors of Factories (Enforcement Authorities) and various target groups from the factories including statutory long duration courses for safety officers, factory medical officers and supervisors engaged in hazardous process industries. These activities are carried out at the headquarters located at Mumbai and five Labour Institutes at Mumbai, Chennai, Kolkata, Kanpur & Faridabad. Its headquarters has (i) Factory Advice Service Division and (ii) Dock Safety Division.
The Central Labour Institute at Mumbai and Regional Labour Institutes at Chennai, Kanpur, Faridabad and Kolkata are having professionals from various disciplines such as Engineering, Management, Hygiene, Occupational Health, Industrial Physiology, Ergonomics, Industrial Psychology, etc. These institutes have facilities for conducting research and consultancy studies in various areas of safety and health in an integrated manner and arrive at practical solutions to the problems. The Director General, DGFASLI is also Chief Inspector of Dock Safety under the Dock Workers (Safety, Health and Welfare) Act, 1986 in respect of major ports. Dock Safety Inspectorates are established in all major ports. The Dock Safety Division at the headquarters coordinates with the Dock Safety Inspectorates regarding enforcement activities and also for bringing about amendments in statutes concerning dock work. DGFASLI assists the Ministry of Labour & Employment, Government of India in the operation of National Safety Awards, Vishwakarma Rashtriya Puraskar and Prime Ministers‟ Shram Awards. Safety in Factories
The Factories Act, 1948 is the principal legislation for regulating various aspects relating to safety, health and welfare of workers employed in factories. This Act is a Central Enactment, which aims at protecting workers employed in factories from industrial and occupational hazards. The State Governments and Union Territory Administration frame their Rules under the Act and enforce provisions of the Act and Rules through their Factory Inspectorates/ Directorates. The Ministry of Labour & Employment is accountable to the Parliament for proper enforcement of the Act. Uniformity in the application of the provisions of the Act in various States and Union Territories is achieved by circulating the Model Rules prepared by DGFASLI, which are incorporated by them in their State Factories Rules with necessary modifications to suit local needs. In the task of framing the Model Rules, the DGFASLI, on behalf of the Ministry of Labour & Employment, enlists the cooperation and involvement of the State Governments by convening annually a Conference of Chief Inspectors of Factories (CIF). The Conference discusses all matters relating to the administration of the Act as well as proposed amendments. Besides, the Conference also serves as a forum for discussion of the progress made in the techniques and methods of prevention of accidents and ill health in factories. The Model Rules are being upgraded in consultation with the CIFs. Dock Safety
The Dock Workers (Safety, Health and Welfare) Act, 1986 was enacted on 14.04.1987. The Dock Workers (Safety, Health and Welfare) Rules, 1989 and Regulations, 1990 were framed under this Act. The act and regulations cover the safety, health & welfare aspects of dock worker engaged in loading and unloading of cargo, including the work incidental to dock work. In addition, the Manufacture, Storage and Import of Hazardous Chemicals Rules, 1989 framed under the Environment (Protection) Act, 1986 are also enforced by DGFASLI in the major ports of India through the Inspectorates of Dock Safety. Studies and Surveys
National Studies and Surveys are undertaken by DGFASLI for helping the Central Government to ascertain the status of working conditions, safety and health in factories and port sector, and to formulate the appropriate standards for inclusion in statutes. Under Section-91A of the Factories Act, 1948 in respect of accident prone factories, a Safety and Health Survey at
129
national level is being carried out. State level Studies and Surveys are undertaken in the State in certain priority areas to ascertain status of Safety Health and Environment at work place in the factories. Unit level consultancy studies are carried out at the request of the management and reports are submitted for implementation of the recommendations for further improvements in factories concerned. Safety Awards
The DGFASLI on behalf of the Ministry of Labour and Employment has been implementing the Vishwakarma Rashtriya Puraskar (VRP) (earlier known as Shram Vir National Awards) and National Safety Awards Scheme since 1965. These schemes were modified in 1971, 1978 and again in 2007. The schemes presently in operation are as follows:
(i) Vishwakarma Rashtriya Puruskar: It is aimed at giving recognition at the national level to outstanding suggestions resulting in (i) higher productivity (ii) improvement in safety and working conditions (iii) savings in foreign exchange (import substitution as well as quality and safety of products) and (iv) improvement in overall efficiency of the establishments. It covers workers employed in factories, docks, construction sites and nuclear installations.
(ii) National Safety Awards: National Safety awards are given in recognition of good safety performance on the part of the industrial establishments registered under the Factories Act, 1948, the employers covered under the Dock Worker (Safety, Health and Welfare) Act, 1986, the Building and Other Construction Workers (Regulation of Employment and Conditions of Service) Act, 1996 and installations under Atomic Energy Regulatory Board (AERB). The awards are given under twelve schemes, out of which ten are meant for Factories/Construction sites /Installations under AERB and two are for Ports. Under each award, a Shield and a Certificate of Merit is given to each of the Award Winners and Runners-up. The establishments are classified in different schemes on the basis of working of highest man-hours. (B) Safety in Mines
Since mining has many inherent hazards, detailed provisions have been laid down in the Mines Act, 1952 and Rules and Regulations framed there under to guard against dangers in mines. These provisions are enforced by the Directorate General of Mines Safety, Ministry of Labour & Employment. The DGMS located at Dhanbad also has the responsibility to see that the safety statute is kept updated to absorb technical advancements as well as to make the same comprehensive, practical and legally sound. Functions of the DGMS are inspection of mines, investigation of all fatal/serious accidents, operations, approval of mines safety equipments, appliances & material and conduct of examination for grant of statutory competency certificates, safety promotional incentives including organization of National Safety Awards (Mines), National Safety Conference and Safety Weeks and Campaigns. Under the Mines Act, 1952, the DGMS has been vested with the power to issue improvement notices and prohibitory orders to restrict of prohibit employment of persons in Mines or parts of Mines. (C) Safety in Railways
Under safety measures various steps has been taken by Indian Railways to prevent accidents. Safety Action Plans were continually executed to reduce accidents caused by human errors. A multi-pronged approach with focus on introduction of newer technologies, mechanization of maintenance, early detection of flaws, etc. to reduce human dependence in the first place, alongwith upgrading the skills of the human resources were the prime drivers for accident prevention. Periodical safety audits of different Divisions by multidisciplinary teams of Zonal Railways as well as inter-railway safety audits were conducted on regular basis. During 2016-17, 84 internal safety audits and 31 inter-railway safety audits were carried out. Training facilities for drivers, guards and staff connected with train operation have been upgraded. Disaster Management
130
Modules have also been upgraded. During 2016-17, 1,05,164 safety category employees attended refresher training. (D) National Safety Council
The National Safety Council (NSC), set up by the Ministry of Labour and Employment on 04.03.1966 is an independent, non-profit making and autonomous society. Its mission is building a national movement on safety, health and environment to prevent and mitigate loss of life, human suffering and economic losses, and providing support services. The management and control of the affairs of the Council are vested in the tripartite Board of Governors. The Board consists of 51 members besides the Chairman who is nominated by the Govt. of India. Headquartered in Navi Mumbai, it is an institution of international repute with an all India network of around 8600 members comprising (i) Corporate Members (Industrial establishments, employers‟ organizations, professional bodies and institutions (ii) Trade Union organizations, (iii) Individual Members, (iv) Life Members, and (v) International Members with 17 Chapters across the country.
131
CHAPTER 8
LABOUR ADMINISTRATION
Labour administration is defined by ILO Convention No.150 as “Public administration
activities in the field of national labour policy”. In other words, Labour administration as a unit of
public administration bears major responsibility in respect of policies concerning labour. Although
popularly known as a unit of the national system for worker‟s welfare, labour administration is
meant for promoting economic growth with social justice. It contains features that promote
consensus in formulating, implementing and reviewing national policies and practices and which
ultimately helps in achieving inclusive growth. It is an essential tool at the disposal of government
in fulfilling their responsibilities towards social issues. Labour administration‟s effectiveness
depends on a coherent national labour policy, coordinated system of competent bodies, adequate
human, financial and other resources, integrated active participation of workers, employers and
their respective organizations. It must embody the principles of good governance like credibility of
the policies, transparency and accountability. The system of Labour administration covers all
public bodies, responsible for and/or engaged in labour administration – whether ministerial
departments or public agencies including parastatal and regional or local agencies or any other
form of decentralized administration and any institutional framework for the coordination of the
activities of such bodies and for consultation with and participation by employees and workers and
their organizations.
Labour is a concurrent subject under the Constitution of India and both the Central and
State Governments are competent to enact legislations subject to certain matters being reserved for
the Centre. The Ministry of Labour and Employment at the Centre is responsible for laying down
the norms and standards on matters like industrial relations, employment, cooperation between
labour and management, regulation of wages, conditions of work and safety, labour welfare, social
security of workers, etc., which appear in the Union and Concurrent Lists of the 7th Schedule of the
Constitution of India. The implementation of labour policy is the responsibility of the State
Governments except in the case of labour employed in Railways, Mines, Oil Fields, Banking and
Insurance Companies having branches in more than one State, Major Ports and Central
Government Undertakings where the Central Government retains the responsibility in respect of
labour relations. The Central Government, however, coordinates the activities of the State
Governments in labour matters and tenders advice, as and when necessary. To implement the
legislative measures, administrative machinery exists both at Central and State levels. The
functions of each machinery are separately discussed below.
1. CENTRAL MACHINERY
Ministry of Labour and Employment, Government of India, New Delhi
The Ministry is responsible for
Labour policy (including wage policy) and legislation;
Safety, health and welfare of labour;
Social security of labour;
Policy relating to special target groups such as women and child labour;
Industrial relations and enforcement of labour laws in the Central Sphere;
Adjudication of industrial disputes through Central Government Industrial Tribunals-cum-
Labour Courts
Workers‟ Education;
132
Labour and Employment Statistics;
Employment Services and Vocational Training;
Administration of Central Labour & Employment Services; and
International Cooperation in Labour & Employment matters.
The Ministry has the following attached and subordinate offices, autonomous
organizations, adjudicating bodies and arbitration body.
I ATTACHED OFFICES
Directorate General of Employment, New Delhi
Office of the Chief Labour Commissioner (Central ), New Delhi
Directorate General of Factory Advice Service and Labour Institutes, Mumbai
Labour Bureau, Shimla/ Chandigarh
II SUBORDINATE OFFICES
Directorate General of Mines Safety, Dhanbad
Offices of the Welfare Commissioners
III AUTONOMOUS ORGANISATIONS
Employees‟ State Insurance Corporation, New Delhi
Employees‟ Provident Fund Organisation, New Delhi
V.V.Giri National Labour Institute, Noida (U.P.)
Dattopant Thengadi National Board for Workers Education and Development (erstwhile
CBWE), Nagpur
IV ADJUDICATING BODIES
Twenty two Central Industrial Tribunals-cum-Labour Courts have been set up under the
provision of Industrial Disputes Act, 1947 for adjudication of the industrial disputes in
organisations for which the Central Government is the appropriate Government.
V ARBITRATION BODY
Board of Arbitration (Joint Consultative Machinery), New Delhi.
A brief description of the activities of the Ministry of Labour and Employment and its
offices is given below:
Ministry of Labour and Employment Main Secretariat
The Secretariat of the Ministry is the centre for consideration of all issues/matters
concerning labour as far as the Government of India is concerned. It is the Central Administrative
Machinery for the formulation of labour policy, enforcement of labour laws and for the promotion
of labour welfare. The subjects allotted to the Ministry under the Government of India (Allocation
of Business) Rules are briefly described below: -
133
Part I. Union Subjects
1. In respect of Union Railways - Payment of wages, trade disputes, hours of work from employees
not covered by the Factories Act, and regulation of employment of children.
2. In respect of Docks - Regulation of safety, health and welfare measures concerning dock labour.
3. Regulation of labour and safety in mines and oilfields.
Part II. Concurrent Subjects
4. Factories.
5. Welfare of Labour - Industrial, commercial and agricultural conditions of labour; provident
funds, family pensions, gratuity, employers' liability and workmen's compensation; health and
sickness insurance, including invalidity pensions, old age pensions, improvement of working
conditions in factories; canteens in industrial undertakings.
6. Unemployment Insurance.
7. Trade Union; industrial and labour disputes.
8. Labour statistics.
9. Employment and unemployment except rural employment and unemployment.
10. Omitted.
Part III. Additional Business for States of Himachal Pradesh, Manipur, Tripura and Union
Territory of Delhi.
11. Items mentioned in Part II above.
Part IV. Incidental Business with Respect to any of the Matters Mentioned in Parts I, II And
III Above.
12. The implementing of treaties and agreements with other countries.
13. Jurisdiction and powers of all Central Government Industrial Tribunals/Labour Courts.
Part V. Miscellaneous Business
14. Employment Exchanges.
15. Omitted.
16. International Labour Organisation (ILO).
17. Tripartite Labour Conferences.
18. The War Injuries (Compensation Insurance) Act, 1943 (23 of 1943) and Scheme.
19. Administration of laws connected with safety and welfare in mines other than coal mines;
organisations of the Chief Inspector of Mines and Mica Mines Welfare.
20. Administration of the Indian Dock Labourers Act, 1934 and the Regulations made thereunder
and the Dock Workers (Safety, Health and Welfare) Scheme, 1961 framed under the Dock
Workers (Regulation of Employment) Act, 1948 (9 of 1948).
21. Administration of the Tea Districts Emigrant Labour (Repeal) Act, 1970 (50 of 1970) and the
Organisation of the Controller of Emigrant Labour.
22. Omitted
23. Administration of the Minimum Wages Act, 1948 (11 of 1948).
24. Administration of the Employees' State Insurance Act, 1948 (34 of 1948), the Employees
Provident Funds and Miscellaneous Provisions Act, 1952 (19 of 1952) and the Payment of
Gratuity Act, 1972 (39 of 1972).
25. Administration of Labour Laws in central sphere undertakings.
26. Labour Statistics; Organisation of Director Labour Bureau.
27. Organisation of Chief Labour Commissioner and Constitution and administration of Central
Government Industrial Tribunal, Central Government Labour Courts, National Industrial
Tribunal.
134
28. Organisation of Chief Advisor Factories, Staff Training Division, including Central Labour
Institute, Productivity and Training Within Industry Centres and Regional Museums of Safety,
Health and Welfare.
29. Plantation Labour and administration of the Plantations Labour Act, 1951 (69 of 1951).
30. Recruitment, posting, transfer and training of Central Government Labour Officers.
31. Administration of the Working Journalists and other Newspaper Employees (Conditions of
Service) and Miscellaneous Provisions Act, 1955 (45 of 1955).
32. Schemes regarding workers' education.
33. Schemes regarding workers' participation in management.
34. Discipline in industry.
35. Constitution of Wage Boards for individual industries.
36. Regulation of working condition of motor transport workers.
37. Evaluation of the implementation of Labour Laws in the country.
38. Administration of laws relating to the working conditions and welfare of cinema workers and
cinema theatre workers.
39. Prime Minister Shram Awards, National Safety Awards (for Mines and Factories), Rashtriya
Viswakarma Puraskar.
40. The Building and other Construction Workers (Regulation of Employment and Conditions of
Service) Act, 1996 (27 of 1996) and the Building and other Construction Workers Welfare Cess
Act, 1996 (28 of 1996).
41. Sales Promotion Employees (conditions of Service) Act, 1976 (11 of 1976).
42. Administration of the Provident Funds Act, 1925 (19 of 1925).
Directorate General of Employment (DGE)
The Directorate General of Employment (DGE) in Ministry of Labour & Employment is
responsible for laying policies, standards, norms and guidelines throughout the country for
coordinating employment related services. The responsibilities of DGE include;
(i) Plans and formulates programmes for expansion and development of National
Employment Service in consultation with State Governments.
(ii) Coordinates the work of Employment Service in States/UTs.
(iii) Conducts training programmes and develops staff training material for the Employment
Service personnel.
(iv) Carries out periodic programme of evaluation of policies, procedures and working
practices of Employment Exchanges in the States with a view to assessing and advising
the State Governments on the progressive development of the service and to ensure that
National Policies, Standards and Procedures are effectively implemented.
(v) Provides a central agency for adjusting surpluses and shortages in certain specified areas
where recruitment requires wider circulation.
(vi) Collects and disseminates Employment Market Information and prescribes uniform
reporting procedures for the organized sector and Employment Exchanges.
(vii) Co-ordinates Vocational Guidance and Career Counselling Services rendered through
Employment Exchanges and University Employment Information and Guidance Bureaux
(UEIGBx) to the unemployed youth for choosing and planning their career suited to their
abilities and skills.
(viii) Evaluates residual capabilities of physically challenged persons and to provide them
adjustment training in order to facilitate their economic rehabilitation.
(ix) Establishes coordination and consultation with the Ministries of the Government of India
whose activities affect the employment situation in the country.
(x) Provides Vocational Guidance and Training in confidence building to SC/ST job seekers.
135
(xi) Formulation of National Employment Policy.
Chief Labour Commissioner (Central)
The office of the Chief Labour Commissioner (Central) also known as Central Industrial
relations Machinery (CIRM) is headed by the Chief Labour Commissioner (Central). It has been
entrusted with the task of maintaining harmonious Industrial Relations, enforcement of Labour
Laws and verification of Trade Union membership in Central sphere. The offices of CIRM are
spread over different parts of the country with zonal, regional and area level formations.
The functions of CIRM are; Prevention and settlement of Industrial Disputes, in the
Central Sphere; Enforcement of Labour Laws and Rules made there under in the Central Sphere;
Implementation of awards; Quasi-Judicial functions; Verification of the membership of the Trade
Unions; Welfare and other Miscellaneous functions.
The CIRM ensures harmonious industrial relations in the Central Sphere establishments
through:
Monitoring of industrial relations in the Central Sphere.
Intervention, mediation and conciliation in industrial disputes in order to bring about
settlement of disputes.
Intervention in situations of threatened strikes and lockouts with a view to avert the strikes
and lockouts.
Implementation of settlements and awards.
Enforcement of other provisions in the Industrial Disputes Act, 1947 relating to: (1) Works
Committee, (2) Recovery of Dues, (3) Lay off, (4) Retrenchment, (5) Unfair Labour
Practices, etc.
An important function of CIRM is the enforcement of Labour Laws in the establishments
for which the Central Government is the Appropriate Government. The machinery enforces
following Labour Laws and Rules framed there under:
(i) The Payment of Wages Act, 1936 & Central Rules made there under for Mines, Railways,
Air Transport Services.
(ii) The Minimum Wages Act, 1948 and Central Rules.
(iii) The Contract Labour (Regulation & Abolition) Act, 1970 and Central Rules.
(iv) The Equal Remuneration Act, 1976 & Central Rules.
(v) The Inter-State Migrant Workmen (RE&CS) Act, 1979 and Central Rules.
(vi) The Child Labour (Prohibition & Regulation) Act, 1986 and Central Rules.
(vii) The Payment of Gratuity Act, 1972 and Central Rules.
(viii) The Labour Laws (Exemption from Furnishing returns and Maintaining Registers by
certain Establishments) Act, 1988.
(ix) The Building and Other Construction Workers (Regulation of Employment & Conditions of
Service) Act, 1996 and Central Rules.
(x) Chapter VI-A of Indian Railway Act; Hours of Employment Regulations for Railways
Employees.
(xi) The Industrial Employment (Standing Orders) Act, 1946 & Central Rules.
(xii) The Maternity Benefit Act, 1961 & Mines and Circus Rules, 1963 & Central Rules.
(xiii) The Payment of Bonus Act, 1965 and Central Rules.
Directorate General Factory Advice Service and Labour Institutes
The Directorate General Factory Advice Service & Labour Institutes (DGFASLI), Mumbai
functions as a technical arm of the Ministry in regard to matters concerned with safety, health and
136
welfare of workers in factories and ports. It assists the Central Government in formulation/review
of policies and legislations on occupational safety and health in factories and ports, maintains a
liaison with Factory Inspectorates of States and Union Territories in regard to the implementation
and enforcement of provisions of the Factories Act, 1948; renders advice on technical matters,
enforces the Dock Workers (Safety Health & Welfare) Act, 1986; undertakes research in industrial
safety, occupational health, industrial hygiene, industrial psychology etc.; and provides training,
mainly, in the field of industrial safety and health. The DGFASLI organisation comprises of the
headquarters; five Labour Institutes and 11 Inspectorates of Dock Safety in Major Ports. The
Headquarters in Mumbai has three divisions/ cells, namely, Factory Advice Service Division, Dock
Safety Division and Awards Cell.
Labour Bureau
Until the Second World War, labour statistics were being collected on an ad-hoc basis,
mostly as by-products of administration. It was the inflationary pressure during the early period of
the Second World War, which gave rise to demands of workers for compensation in their wages.
The Government of India, therefore, decided to set up the Rau Court of Enquiry in 1940 under the
Trade Disputes Act (1929) to recommend statistical machinery for measuring movement in prices.
The Rau Court of Enquiry recommended compilation and maintenance of cost of living index
numbers for measuring the rate of compensation to the workers for the rise in cost of living. This
recommendation led to the setting up of the Directorate of Cost of Living at Shimla in 1941. The
need for more comprehensive labour statistics in the context of formulation of labour policy was
also felt thereafter and it was in this perspective that the Labour Bureau was set up in October 1946
by rechristening the Directorate of Cost of Living with added functions.
Organisational Setup
The two main wings of the Labour Bureau are at Chandigarh and at Shimla. It has five
Regional Offices, one each at Ahmedabad, Kanpur, Kolkata, Chennai and Guwahati with a Sub-
Regional Office in Mumbai. The organisation is headed by Director General, a Higher
Administrative Grade Officer from the Indian Economic Service (IES) and assisted by a team of
dedicated professionals from the Indian Economic Service and the Indian Statistical Service. The
work relating to different aspects of Labour Statistics is attended to by its offices in Chandigarh
and Shimla. The Regional Offices mainly attend to the work of price audit so as to ensure
collection of reliable price data used for constructing the Consumer Price Index Numbers for
Industrial Workers. Training programs aimed at improving the quality of data sent by Govt.
agencies under the various Labour enactments are also organised by the Regional Offices.
Functions
The main functions of the Bureau are broadly categorised under the following six groups:
1. Construction and maintenance of Index Numbers;
2. Conducts surveys and studies on various categories and on various facets of labour;
3. Collection of data through a number of statutory and voluntary returns;
4. Bringing out publications;
5. Imparting training, and
6. Other activities.
1. Construction and maintenance of Index Numbers: - Labour Bureau compiles following index
numbers:-
(a) CPI (IW) 2001=100 for factories, mines, plantations, railways, motor transport, electricity
and ports and dock workers at 78 centres spread throughout the length and breadth of the
137
country. Index is being updated to a new base. Base year prices and weighting diagram are
being finalized.
(b) CPI (AL/RL) 1986-87=100 is being compiled for 20 States. Process for updating the base
has already been initiated. Results of 75th round of NSS data would be utilized for deriving
weighting diagram.
(c) Retail Price Indices of 31 essential commodities for both rural and urban centres separately.
(d) Wage Rate Index (1963-65=100) for 21 industries.
2. Surveys and Studies
Surveys and studies conducted by the Bureau provide a reliable data base on working and
living conditions of industrial and agricultural workers. The on-going projects of the Labour
Bureau are:
1. Working Class Family Income and Expenditure Survey (WCFIES);
2. Rural Labour Enquiry;
3. Occupational Wage Survey;
4. Annual Survey of Industries;
5. Socio-economic Survey of workers in (a) un-organised sector of industries (b) SC/ST
workers (c) women workers and (d) evaluation of minimum wages under the Minimum
Wages Act, 1948;
6. Employment-Unemployment Survey;
7. Quick Employment Survey;
8. Area Frame Survey;
9. Survey on Pradhan Mantri Mudra Yojna.
3. Collection of Data
Labour Bureau also collects data on various facets of labour through statutory and voluntary
returns.
4. Publications
Labour Bureau brings out the following publications regularly:-
1. Indian Labour Journal-Monthly
2. Indian Labour Year Book-Annual
3. Indian Labour Statistics-Annual
4. Pocket Book of Labour Statistics (Bi-lingual)-Annual
5. Statistics of Factories-Annual
6. Report on the Working of Minimum Wages Act, 1948-Annual
7. Trade Unions in India-Biennial
8. Review of Industrial Disputes in India-Annual
9. Labour Statistics under the A.S.I.-Annual
10. Statistics on Closure, Retrenchment and Lay-Offs-Annual
11. Annual Report on Consumer Price Index Nos. for Industrial Workers
12. Annual Report on Consumer Price Index Nos. for Agriculture and Rural Labourers
13. Wage Rates in Rural India
14. Report/Review on working of various Labour Acts.
In addition to these regular publications, Labour Bureau also brings out a number of other
reports on the basis of the data thrown up by the various surveys and studies conducted by it and
other agencies.
138
5. Training
Apart from the regular training programmes being organised for (i) Price Collectors and
Price Supervisors from various States and Union Territories; (ii) Senior Officers dealing with
labour statistics collected under various labour laws, and (iii) the primary units furnishing the
returns, Labour Bureau also imparts training to (a) IES/ISS probationers deputed by their
respective cadre controlling authorities; (b) foreign participants of I.S.E.C, Kolkata, sponsored by
the C.S.O, and (c) other various participants.
6. Other Activities
1. Labour Bureau provides guidance with respect to conduct and compilation of Index
Numbers to the various State Governments/ UT Administrations.
2. It has in-house printing facilities, both at Shimla and Chandigarh.
3. Its Research Unit brings out two important publications viz. (i) Statistical Profile of
Women Labour, and (ii) Digest of Indian Labour Research.
Labour Bureau is the competent authority (Notification No. LWI-24 (3) dated 24th October,
1949) under the Minimum Wages Act, 1948 to ascertain, from time to time, the Consumer Price
Index Numbers applicable to employees employed in the Scheduled employments in respect of all
undertakings in the Central Sphere and the Union Territories. With a view to improving the quality
and uniformity of the labour statistics collected by various States and Central authorities, the
Bureau maintains liaison with the concerned agencies.
Directorate General of Mines Safety (DGMS)
The Directorate General of Mines Safety with its Headquarters at Dhanbad (Jharkhand) is
headed by the Director-General of Mines Safety. At Head Quarters, Director General is assisted by
specialist staff–officers of Mining, Electrical and Mechanical Engineering, Occupational Health,
Statistics, Law, Survey, Administration and Accounts disciplines. The Mines Act, 1952 and the
Rules and Regulations framed there under are administered by the Directorate-General of Mines
Safety (DGMS). Apart from administering the Mines Act and Subordinate Legislations there
under, DGMS also administers other allied legislations. These are as follows:
Mines Act, 1952
Coal Mines Regulations, 1957
Metalliferous Mines Regulations, 1961
Oil Mines Regulations, 1984
Mines Rules, 1955
Mines Vocational Training Rules, 1966
Mines Rescue Rules, 1985
Mines Crèche Rules, 1966
Coal Mines Pit Head Bath Rules, 1959
Electricity Act, 2003
Central Electricity Authority Regulation, 2010
Allied Legislation
Factories Act, 1948: Chapters III & IV
Manufacture, Storage & Import of Hazardous Chemicals Rules, 1989 - under
Environmental Protection Act, 1986
The Coal Mines (Conservation & Development) Act, 1974
139
Offices of Welfare Commissioners
The concept of Labour Welfare Fund was evolved in order to extend a measure of social
assistance to workers in the unorganized sector. The Ministry of Labour & Employment is
administering five Welfare Funds to provide housing, medical care, educational and recreational
facilities to workers employed in beedi industry, certain non-coal mines, and cine workers. These
Funds have been set up under the following Acts of Parliament for the welfare of these workers:
The Mica Mines Labour Welfare Fund Act, 1946;
The Limestone and Dolomite Mines Labour Welfare Fund Act, 1972;
The Iron Ore, Manganese Ore and Chrome Ore Mines Labour Welfare Fund Act, 1976;
The Beedi Workers‟ Welfare Fund Act, 1976; and
The Cine Workers‟ Welfare Fund Act, 1981.
The Labour Welfare Organization which administers these Funds is headed by a Director
General (Labour Welfare). He is assisted by seventeen (17) Regional Welfare Commissioners for
the purpose of administration of these Funds in the States.
Central Government Industrial Tribunal-cum-Labour Courts (CGITs)
Twenty two Industrial Tribunal-cum-Labour Courts have been set up under the provisions of
the Industrial Disputes Act, 1947 for adjudication of industrial disputes in organizations for which
the Central Government is the appropriate Government. Through Finance Act, 2017, the powers to
settle the Appeals arising out of Employees‟ Provident Funds and Miscellaneous Provisions (EPF
& MP) Act, 1952 have also been entrusted upon to these Tribunals. These Tribunals are located at
Dhanbad (Jharkhand), Mumbai, New Delhi and Chandigarh (two courts each) and one each at
Kolkata, Jabalpur, Kanpur, Nagpur, Lucknow, Bangalore, Jaipur, Chennai, Hyderabad,
Bhubaneshwar, Ahmedabad, Ernakulam, Asansol and Guwahati.
Board of Arbitration Joint Consultative Machinery (JCM)
The Government of India had introduced in 1966 a scheme for Joint Consultative Machinery
(JCM) and Compulsory Arbitration for Central Government Employees for resolving differences
between the Government, as an employer, and the general body of its employeesin in certain
matters of common concern. The Scheme provides for compulsory arbitration on Pay &
Allowances, weekly hours of work and leave of a class or grade of employees. Under the Scheme,
the Board of Arbitration was set up in July, 1968. The Board consists of a Chairman and two other
members. The Board of Arbitration (BOA), provides for a mechanism for amicable, peaceful and
just settlement of disputes between the Government and its employees, when there is a final
disagreement in the JCM forum between the Official Side and the Staff Side on any arbitrable
matter/issue concerning any class or grade of employees in common.
Dattopant Thengadi National Board for Workers Education and Development (erstwhile
CBWE)
The Dattopant Thengadi National Board for Workers Education and Development (erstwhile
CBWE), with its headquarters at Nagpur operates through 50 Regional Directorates and 7 Sub-
Regional Directorates. The six Zonal Directorates situated at Delhi, Guwahati, Kolkata, Mumbai,
Chennai and Bhopal monitor the activities of the Regional Directorates in their respective zones.
Tripartite Regional Advisory Committees constituted for each Regional Directorate review the
progress of the scheme and recommend measures for effective implementation of Workers
Education Programmes. The Board has an apex level training institute - Indian Institute of Workers
Education, Mumbai established in 1970 to conduct national level training programmes for the
activists of Central Trade Union Organisations/Federations, Voluntary Organisations besides
140
training programmes for Board's Officials. The Board organizes different types of training
programmes for the workers in organised, unorganised, rural and informal sectors. Besides, the
Board has been generating awareness among the informal sector workers about various welfare
schemes through its Labour Welfare and Development Programmes.
V. V. Giri National Labour Institute
The V.V. Giri National Labour Institute (NLI) aims at undertaking, promoting and
coordinating research on labour issues. The General Council, the apex governing body of the
Institute, with Union Labour and Employment Minister as its President, lays down the broad policy
parameters for the functioning of the Institute. The Executive Council with Secretary (Labour and
Employment) as Chairman monitors and guides the activities of the Institute. Both the General
Council and Executive Council are tripartite in nature and consists of members representing the
government, trade union federations, employers‟ associations and also eminent scholars and
practitioners in the field of labour. Director General of the Institute is the Principal Executive and is
responsible for management and administration.
The Institute's vision, mission and mandate place research at the forefront of core activities,
and it occupies a primary place in the activities of the Institute. The subject of research comprises a
broad spectrum of labour related issues and problems in both the organized and the un-organized
sectors. While deciding the topics of research, care is taken to identify subjects and issues of
topical concern and relevance to policy formulation. The Institute continues to place great
emphasis on the problems and issues of labour in unorganized and organised sectors in general and
the more disadvantaged among these such as child labour, women labour and rural labour in
particular. Research activities also explore the basic needs of different groups of trainees such as
trade union leaders and organizers in both organized and unorganized sectors, managers of public
and private sectors, labour administrators and volunteers of non-governmental organizations.
Employees’ Provident Fund Organization
The Employees‟ Provident Funds and Miscellaneous Provisions Act, 1952 provides for
contributory provident fund, family pension and deposit linked insurance schemes. All the three
schemes, namely the Employees‟ Provident Funds Scheme, 1952; the Employees‟ Deposit Linked
Insurance Scheme, 1976 and the Employees‟ Pension Scheme, 1995 are administered by the
Central Board of Trustees which is a Tripartite body. The Central Provident Fund Commissioner is
the Chief Executive Officer of the Organisation and is ex-officio member of the Board.
Employees’ State Insurance Corporation
The ESI Corporation is responsible for implementation of the Employees State Insurance
Act 1948, which provides for medical care and treatment to insured persons and their families.
Assistance is given in terms of benefits during sickness and maternity, compensation for
employment related injury, pensions for dependents on the death of workers due to employment
related injury, etc. The Corporation is a statutory body, which has members representing
Employers, Employees, Central and State Governments, Medical Profession and the Parliament.
The Union Minister for Labour & Employment is the Chairman. A Standing Committee,
constituted from among the members of the Corporation, acts as the executive body for
administration of the Scheme and is chaired by the Secretary, Ministry of Labour & Employment.
The Director General is the Chief Executive Officer of the Corporation and is also an ex-officio
member of the Corporation as well as its Standing Committee.
141
2. STATE MACHINERY
All the States and Union Territories have set up organisations for the administration and
enforcement of the various labour laws which are in force within their territories and for the
collection, compilation and dissemination of statistical and other information relating to labour.
All of them have appointed labour commissioners for the purposes of administration of labour laws
and welfare activities in their respective areas. All States have appointed Chief Inspectors of
Factories and Chief Inspectors of Boilers to administer the Factories Act, 1948 and the Indian
Boilers Act, 1923 respectively. Commissioners for workmen‟s compensation under the
Workmen‟s Compensation Act, 1923 and Registrars of Trade Unions under the Trade Unions Act,
1926 have also been appointed in all the States. The Labour Commissioner often combines the
functions of various officers enumerated above. In certain States, special machinery has been set
up for the collection of labour statistics while in others the above authorities are performing these
duties as well. Competent authorities have been appointed by various State Governments under the
Minimum Wages Act, 1948 to ascertain from time to time fixation and revision of minimum wages
for persons covered by the scheduled employments. Labour Bureau is the competent authority in
respect of the Union Territories and Central Sphere undertakings.
Apart from the statistics and information collected on statutory basis, ad-hoc enquiries are
conducted by some of the State Governments for collection of special data relating to particular
problems of current interest. The results are published in the form of annual reviews or in the
journals published by the State Governments.
142
CHAPTER 9
LABOUR LEGISLATION
The term Labour Legislation refers to the laws which have been enacted to deal with
labour in respect of employment and non-employment, wages, working conditions, industrial
relations, social security and welfare of persons employed in industries. In a planned economy,
organized industry calls for the spirit of cooperation and mutual dependence for attaining the
common purpose of greater, better and cheaper production. Since this has not been happening
willingly, therefore, the need for State intervention becomes essential to protect workers against
oppression, enforce social insurance and labour welfare schemes as individual worker is
economically weak and has little bargaining power. With a view to proper enforcement of labour
laws, the framers of the Indian Constitution, in their wisdom had, therefore, rightly placed the
subject of labour in the Concurrent List so that the Union of India as well as the State Governments
could administer all the matters relating to the subject of labour. The Legislatures, both at the
Central and States level, are responsible for carrying out the welfare of the labour. The objectives
of Labour Legislation are two-fold viz.,
(1) to improve the service conditions of industrial labour so as to provide for them the
ordinary amenities of life and by that process
(2) bring about industrial peace which could in its turn accelerate productive activity of
the country resulting in its prosperity.
This chapter deals with brief description of salient features of some important labour laws
and amendments carried thereto.
1. FACTORIES
The Factories Act, 1948
The main objective of the Factories Act, 1948 is to ensure adequate health, safety and
welfare measures of the workers employed in factories. The Act extends to whole of India and
applies to all establishments employing 10 or more workers where power is used and to
establishments employing 20 or more workers where power is not used. The State Governments
are, however, empowered to apply the provisions of the Act to any premises, irrespective of the
employment therein, where manufacturing process is carried on with or without the aid of power
except where the work is done by the worker solely with the help of the members of his family.
For the purpose of enforcement of various provisions of the Act, the State Governments
appoint persons with the prescribed qualifications as Inspector/Certifying Surgeons in respect of
the local limits assigned to each of them. In addition every District Magistrate is the Inspector for
his district. The Inspector possesses wide powers such as those relating to entry into the factory,
inspection of premises, plant and machinery, making on the spot enquiries requiring production of
documents, etc., for effective enforcement of the Act. The duties of the Certifying Surgeons are to
examine young persons, etc., engaged in hazardous occupations or processes and to conduct
periodical examination of all persons engaged in hazardous occupations in factories and to exercise
general medical supervision. Uniformity in the administration of the Act in various states is sought
to be achieved through the Model Rules framed under the relevant provisions of the Act by the
Directorate General of Factory Advice Service and Labour Institutes (DGFASLI), which is an
attached office of the Ministry of Labour and Employment, Government of India. In the task of
framing the Model rules and achieving uniformity in the standards of enforcement, the DGFASLI,
on behalf of the Ministry of Labour and Employment, enlists the co-operation and involvement of
143
the State Governments by convening annually a Conference of the Chief Enforcement Authorities
of the State Governments under the Factories Act to discuss all matters relating to the
administration of the Act as well as amendments to the provisions, if any, under the Act and the
Rules. Significant amendments were carried out to the provisions of the Act during 1954 and
1976.
During the year 1987 the Act was further amended under the title “Factories (Amendment)
Act, 1987”. Besides amendments in various Sections of the Principal Act, the amending Act
omitted Section 100 of the Principal Act, inserted Sections 7A, 7B, 87A, 96A, 104A, 106A,
111A and 118A, substituted Sections 36 and 38 by new sections, inserted a new Chapter IV-A as
well as two new schedules. Section 70 has been amended so that no female adolescent or a male
adolescent who has not attained the age of 17 years but has been granted a certificate of fitness to
work as an adult, shall be required or allowed to work in any factory except between 6 A.M. and 7
P.M. The State Government may vary the limits but not so as to allow to work between 10 P.M.
and 5 A.M. for any female adolescent. These provisions are not applicable in cases of serious
emergency where national interest is involved. No female child shall be allowed to work in any
factory except between 8 A. M. and 7 P. M.
The Factories (Amendment) Bill, 2003 was introduced in the Lok Sabha on 29th July, 2003.
It proposed to amend section 66 of the Factories Act, 1948 so as to provide flexibility in the matter
of employment of women during night with adequate safeguards for their safety, dignity, honour
and transportation from the factory premises to the nearest point of their residence. The Bill was
referred to the Parliamentary Standing Committee on Labour & Welfare for examination. The
committee in its report had approved the amendment in the Factories Act, 1948 provided the
government took some extra safeguards, in addition to the safeguards already available under the
provision to Section 66. However, due to dissolution of 13th Lok Sabha the Bill lapsed.
Subsequently, the Factories (Amendment) Bill, 2005 has been introduced in the Lok Sabha on 16th
August, 2005. Some official amendments have been introduced to the Factories (Amendment) Bill,
2005 in order to providing for adequate safeguards, such as provision of shelters, rest-rooms,
lunch-rooms, night crèches, ladies toilets, adequate protection of women worker‟s dignity, honour,
safety, protection from sexual harassment and transportation from the factory premises to the
nearest point of their residence. Provision for consultation with and obtaining the consent of the
women worker, their representative Organisation, the employer, their representatives and
representative organizations of workers of the concerned factory has also been made.
Inspections
Table 9.01 (A) and 9.01 (B) shows the number of factories on register, number of factories
inspected and percentage of factories inspected to the number of factories registered in various
States/Union Territories during the year 2013 & 2014 respectively.
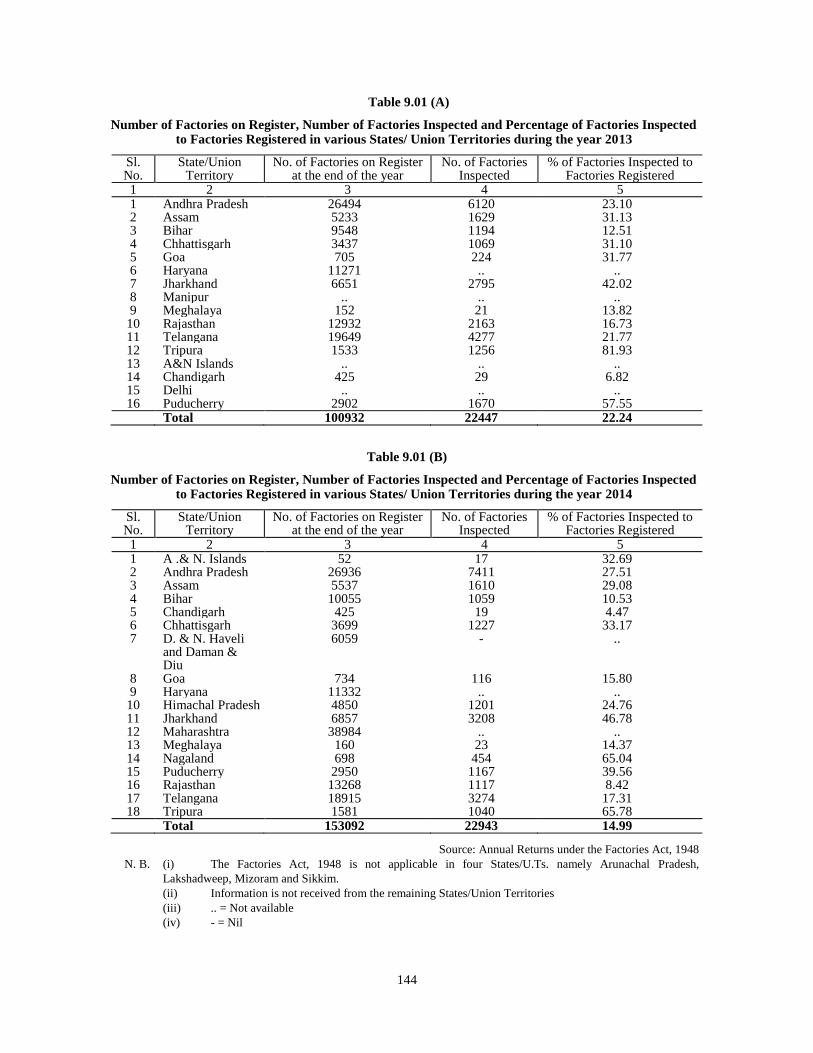
144
Table 9.01 (A)
Number of Factories on Register, Number of Factories Inspected and Percentage of Factories Inspected to Factories Registered in various States/ Union Territories during the year 2013
Sl. No.
State/Union Territory
No. of Factories on Register at the end of the year
No. of Factories Inspected
% of Factories Inspected to Factories Registered
1 2 3 4 5 1 Andhra Pradesh 26494 6120 23.10 2 Assam 5233 1629 31.13 3 Bihar 9548 1194 12.51 4 Chhattisgarh 3437 1069 31.10 5 Goa 705 224 31.77 6 Haryana 11271 .. .. 7 Jharkhand 6651 2795 42.02 8 Manipur .. .. .. 9 Meghalaya 152 21 13.82
10 Rajasthan 12932 2163 16.73 11 Telangana 19649 4277 21.77 12 Tripura 1533 1256 81.93 13 A&N Islands .. .. .. 14 Chandigarh 425 29 6.82 15 Delhi .. .. .. 16 Puducherry 2902 1670 57.55
Total 100932 22447 22.24
Table 9.01 (B)
Number of Factories on Register, Number of Factories Inspected and Percentage of Factories Inspected to Factories Registered in various States/ Union Territories during the year 2014
Sl. No.
State/Union Territory
No. of Factories on Register at the end of the year
No. of Factories Inspected
% of Factories Inspected to Factories Registered
1 2 3 4 5 1 A .& N. Islands 52 17 32.69 2 Andhra Pradesh 26936 7411 27.51 3 Assam 5537 1610 29.08 4 Bihar 10055 1059 10.53 5 Chandigarh 425 19 4.47 6 Chhattisgarh 3699 1227 33.17 7 D. & N. Haveli
and Daman & Diu
6059 - ..
8 Goa 734 116 15.80 9 Haryana 11332 .. ..
10 Himachal Pradesh 4850 1201 24.76 11 Jharkhand 6857 3208 46.78 12 Maharashtra 38984 .. .. 13 Meghalaya 160 23 14.37 14 Nagaland 698 454 65.04 15 Puducherry 2950 1167 39.56 16 Rajasthan 13268 1117 8.42 17 Telangana 18915 3274 17.31 18 Tripura 1581 1040 65.78
Total 153092 22943 14.99
Source: Annual Returns under the Factories Act, 1948
N. B. (i) The Factories Act, 1948 is not applicable in four States/U.Ts. namely Arunachal Pradesh,
Lakshadweep, Mizoram and Sikkim.
(ii) Information is not received from the remaining States/Union Territories
(iii) .. = Not available
(iv) - = Nil
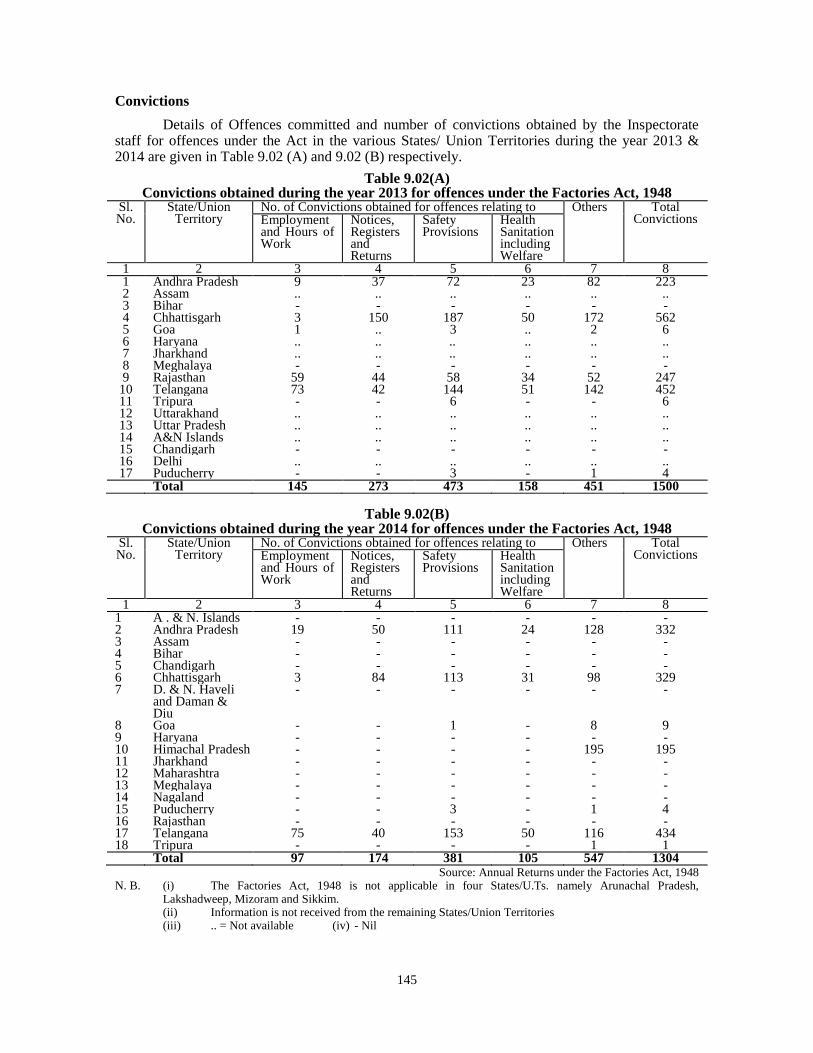
145
Convictions
Details of Offences committed and number of convictions obtained by the Inspectorate staff for offences under the Act in the various States/ Union Territories during the year 2013 & 2014 are given in Table 9.02 (A) and 9.02 (B) respectively.
Table 9.02(A) Convictions obtained during the year 2013 for offences under the Factories Act, 1948
Sl. No.
State/Union Territory
No. of Convictions obtained for offences relating to Others Total Convictions Employment
and Hours of Work
Notices, Registers and Returns
Safety Provisions
Health Sanitation including Welfare
1 2 3 4 5 6 7 8 1 Andhra Pradesh 9 37 72 23 82 223 2 Assam .. .. .. .. .. .. 3 Bihar - - - - - - 4 Chhattisgarh 3 150 187 50 172 562 5 Goa 1 .. 3 .. 2 6 6 Haryana .. .. .. .. .. .. 7 Jharkhand .. .. .. .. .. .. 8 Meghalaya - - - - - - 9 Rajasthan 59 44 58 34 52 247
10 Telangana 73 42 144 51 142 452 11 Tripura - - 6 - - 6 12 Uttarakhand .. .. .. .. .. .. 13 Uttar Pradesh .. .. .. .. .. .. 14 A&N Islands .. .. .. .. .. .. 15 Chandigarh - - - - - - 16 Delhi .. .. .. .. .. .. 17 Puducherry - - 3 - 1 4
Total 145 273 473 158 451 1500
Table 9.02(B) Convictions obtained during the year 2014 for offences under the Factories Act, 1948
Sl. No.
State/Union Territory
No. of Convictions obtained for offences relating to Others Total Convictions Employment
and Hours of Work
Notices, Registers and Returns
Safety Provisions
Health Sanitation including Welfare
1 2 3 4 5 6 7 8 1 A . & N. Islands - - - - - - 2 Andhra Pradesh 19 50 111 24 128 332 3 Assam - - - - - - 4 Bihar - - - - - - 5 Chandigarh - - - - - - 6 Chhattisgarh 3 84 113 31 98 329 7 D. & N. Haveli
and Daman & Diu
- - - - - -
8 Goa - - 1 - 8 9 9 Haryana - - - - - - 10 Himachal Pradesh - - - - 195 195 11 Jharkhand - - - - - - 12 Maharashtra - - - - - - 13 Meghalaya - - - - - - 14 Nagaland - - - - - - 15 Puducherry - - 3 - 1 4 16 Rajasthan - - - - - - 17 Telangana 75 40 153 50 116 434 18 Tripura - - - - 1 1 Total 97 174 381 105 547 1304
Source: Annual Returns under the Factories Act, 1948 N. B. (i) The Factories Act, 1948 is not applicable in four States/U.Ts. namely Arunachal Pradesh,
Lakshadweep, Mizoram and Sikkim. (ii) Information is not received from the remaining States/Union Territories (iii) .. = Not available (iv) - Nil
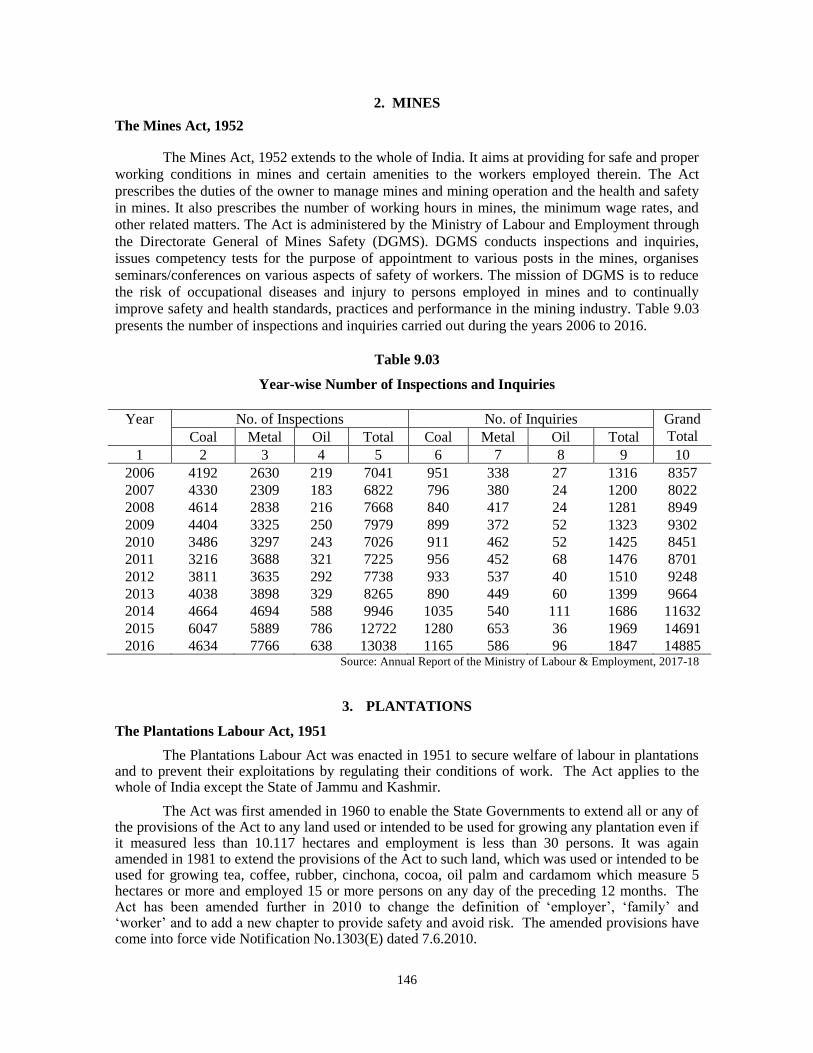
146
2. MINES
The Mines Act, 1952
The Mines Act, 1952 extends to the whole of India. It aims at providing for safe and proper
working conditions in mines and certain amenities to the workers employed therein. The Act
prescribes the duties of the owner to manage mines and mining operation and the health and safety
in mines. It also prescribes the number of working hours in mines, the minimum wage rates, and
other related matters. The Act is administered by the Ministry of Labour and Employment through
the Directorate General of Mines Safety (DGMS). DGMS conducts inspections and inquiries,
issues competency tests for the purpose of appointment to various posts in the mines, organises
seminars/conferences on various aspects of safety of workers. The mission of DGMS is to reduce
the risk of occupational diseases and injury to persons employed in mines and to continually
improve safety and health standards, practices and performance in the mining industry. Table 9.03
presents the number of inspections and inquiries carried out during the years 2006 to 2016.
Table 9.03
Year-wise Number of Inspections and Inquiries
Year No. of Inspections No. of Inquiries Grand
Total Coal Metal Oil Total Coal Metal Oil Total
1 2 3 4 5 6 7 8 9 10
2006 4192 2630 219 7041 951 338 27 1316 8357
2007 4330 2309 183 6822 796 380 24 1200 8022
2008 4614 2838 216 7668 840 417 24 1281 8949
2009 4404 3325 250 7979 899 372 52 1323 9302
2010 3486 3297 243 7026 911 462 52 1425 8451
2011 3216 3688 321 7225 956 452 68 1476 8701
2012 3811 3635 292 7738 933 537 40 1510 9248
2013 4038 3898 329 8265 890 449 60 1399 9664
2014 4664 4694 588 9946 1035 540 111 1686 11632
2015 6047 5889 786 12722 1280 653 36 1969 14691
2016 4634 7766 638 13038 1165 586 96 1847 14885 Source: Annual Report of the Ministry of Labour & Employment, 2017-18
3. PLANTATIONS
The Plantations Labour Act, 1951
The Plantations Labour Act was enacted in 1951 to secure welfare of labour in plantations and to prevent their exploitations by regulating their conditions of work. The Act applies to the whole of India except the State of Jammu and Kashmir.
The Act was first amended in 1960 to enable the State Governments to extend all or any of the provisions of the Act to any land used or intended to be used for growing any plantation even if it measured less than 10.117 hectares and employment is less than 30 persons. It was again amended in 1981 to extend the provisions of the Act to such land, which was used or intended to be used for growing tea, coffee, rubber, cinchona, cocoa, oil palm and cardamom which measure 5 hectares or more and employed 15 or more persons on any day of the preceding 12 months. The Act has been amended further in 2010 to change the definition of „employer‟, „family‟ and „worker‟ and to add a new chapter to provide safety and avoid risk. The amended provisions have come into force vide Notification No.1303(E) dated 7.6.2010.
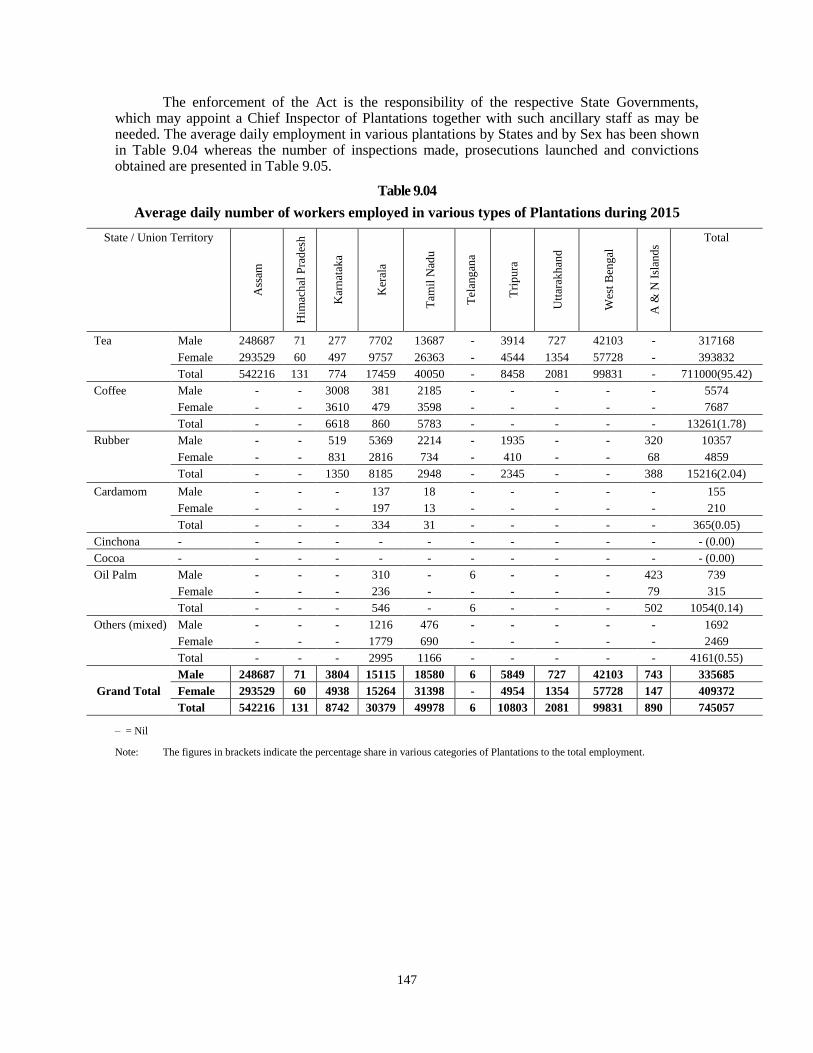
147
The enforcement of the Act is the responsibility of the respective State Governments, which may appoint a Chief Inspector of Plantations together with such ancillary staff as may be needed. The average daily employment in various plantations by States and by Sex has been shown in Table 9.04 whereas the number of inspections made, prosecutions launched and convictions obtained are presented in Table 9.05.
Table 9.04
Average daily number of workers employed in various types of Plantations during 2015
State / Union Territory
Ass
am
Him
ach
al P
rad
esh
Kar
nat
aka
Ker
ala
Tam
il N
adu
Tel
ang
ana
Tri
pu
ra
Utt
arak
han
d
Wes
t B
eng
al
A &
N I
slan
ds
Total
Tea Male 248687 71 277 7702 13687 - 3914 727 42103 - 317168
Female 293529 60 497 9757 26363 - 4544 1354 57728 - 393832
Total 542216 131 774 17459 40050 - 8458 2081 99831 - 711000(95.42)
Coffee Male - - 3008 381 2185 - - - - - 5574
Female - - 3610 479 3598 - - - - - 7687
Total - - 6618 860 5783 - - - - - 13261(1.78)
Rubber
Male - - 519 5369 2214 - 1935 - - 320 10357
Female - - 831 2816 734 - 410 - - 68 4859
Total - - 1350 8185 2948 - 2345 - - 388 15216(2.04)
Cardamom Male - - - 137 18 - - - - - 155
Female - - - 197 13 - - - - - 210
Total - - - 334 31 - - - - - 365(0.05)
Cinchona - - - - - - - - - - - - (0.00)
Cocoa - - - - - - - - - - - - (0.00)
Oil Palm Male - - - 310 - 6 - - - 423 739
Female - - - 236 - - - - - 79 315
Total - - - 546 - 6 - - - 502 1054(0.14)
Others (mixed) Male - - - 1216 476 - - - - - 1692
Female - - - 1779 690 - - - - - 2469
Total - - - 2995 1166 - - - - - 4161(0.55)
Grand Total
Male 248687 71 3804 15115 18580 6 5849 727 42103 743 335685
Female 293529 60 4938 15264 31398 - 4954 1354 57728 147 409372
Total 542216 131 8742 30379 49978 6 10803 2081 99831 890 745057
– = Nil
Note: The figures in brackets indicate the percentage share in various categories of Plantations to the total employment.
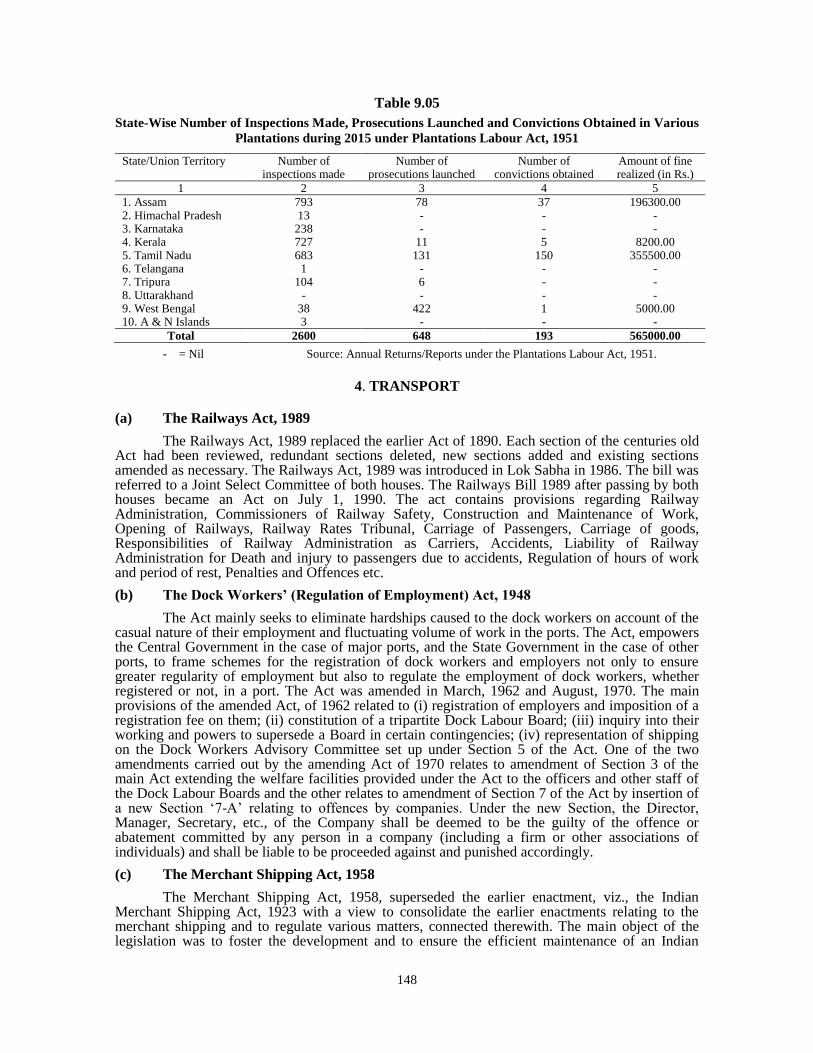
148
Table 9.05
State-Wise Number of Inspections Made, Prosecutions Launched and Convictions Obtained in Various
Plantations during 2015 under Plantations Labour Act, 1951
State/Union Territory Number of inspections made
Number of prosecutions launched
Number of convictions obtained
Amount of fine realized (in Rs.)
1 2 3 4 5
1. Assam 793 78 37 196300.00 2. Himachal Pradesh 13 - - - 3. Karnataka 238 - - - 4. Kerala 727 11 5 8200.00 5. Tamil Nadu 683 131 150 355500.00 6. Telangana 1 - - - 7. Tripura 104 6 - - 8. Uttarakhand - - - - 9. West Bengal 38 422 1 5000.00 10. A & N Islands 3 - - -
Total 2600 648 193 565000.00
- = Nil Source: Annual Returns/Reports under the Plantations Labour Act, 1951.
4. TRANSPORT
(a) The Railways Act, 1989
The Railways Act, 1989 replaced the earlier Act of 1890. Each section of the centuries old Act had been reviewed, redundant sections deleted, new sections added and existing sections amended as necessary. The Railways Act, 1989 was introduced in Lok Sabha in 1986. The bill was referred to a Joint Select Committee of both houses. The Railways Bill 1989 after passing by both houses became an Act on July 1, 1990. The act contains provisions regarding Railway Administration, Commissioners of Railway Safety, Construction and Maintenance of Work, Opening of Railways, Railway Rates Tribunal, Carriage of Passengers, Carriage of goods, Responsibilities of Railway Administration as Carriers, Accidents, Liability of Railway Administration for Death and injury to passengers due to accidents, Regulation of hours of work and period of rest, Penalties and Offences etc.
(b) The Dock Workers’ (Regulation of Employment) Act, 1948
The Act mainly seeks to eliminate hardships caused to the dock workers on account of the casual nature of their employment and fluctuating volume of work in the ports. The Act, empowers the Central Government in the case of major ports, and the State Government in the case of other ports, to frame schemes for the registration of dock workers and employers not only to ensure greater regularity of employment but also to regulate the employment of dock workers, whether registered or not, in a port. The Act was amended in March, 1962 and August, 1970. The main provisions of the amended Act, of 1962 related to (i) registration of employers and imposition of a registration fee on them; (ii) constitution of a tripartite Dock Labour Board; (iii) inquiry into their working and powers to supersede a Board in certain contingencies; (iv) representation of shipping on the Dock Workers Advisory Committee set up under Section 5 of the Act. One of the two amendments carried out by the amending Act of 1970 relates to amendment of Section 3 of the main Act extending the welfare facilities provided under the Act to the officers and other staff of the Dock Labour Boards and the other relates to amendment of Section 7 of the Act by insertion of a new Section „7-A‟ relating to offences by companies. Under the new Section, the Director, Manager, Secretary, etc., of the Company shall be deemed to be the guilty of the offence or abatement committed by any person in a company (including a firm or other associations of individuals) and shall be liable to be proceeded against and punished accordingly.
(c) The Merchant Shipping Act, 1958
The Merchant Shipping Act, 1958, superseded the earlier enactment, viz., the Indian Merchant Shipping Act, 1923 with a view to consolidate the earlier enactments relating to the merchant shipping and to regulate various matters, connected therewith. The main object of the legislation was to foster the development and to ensure the efficient maintenance of an Indian
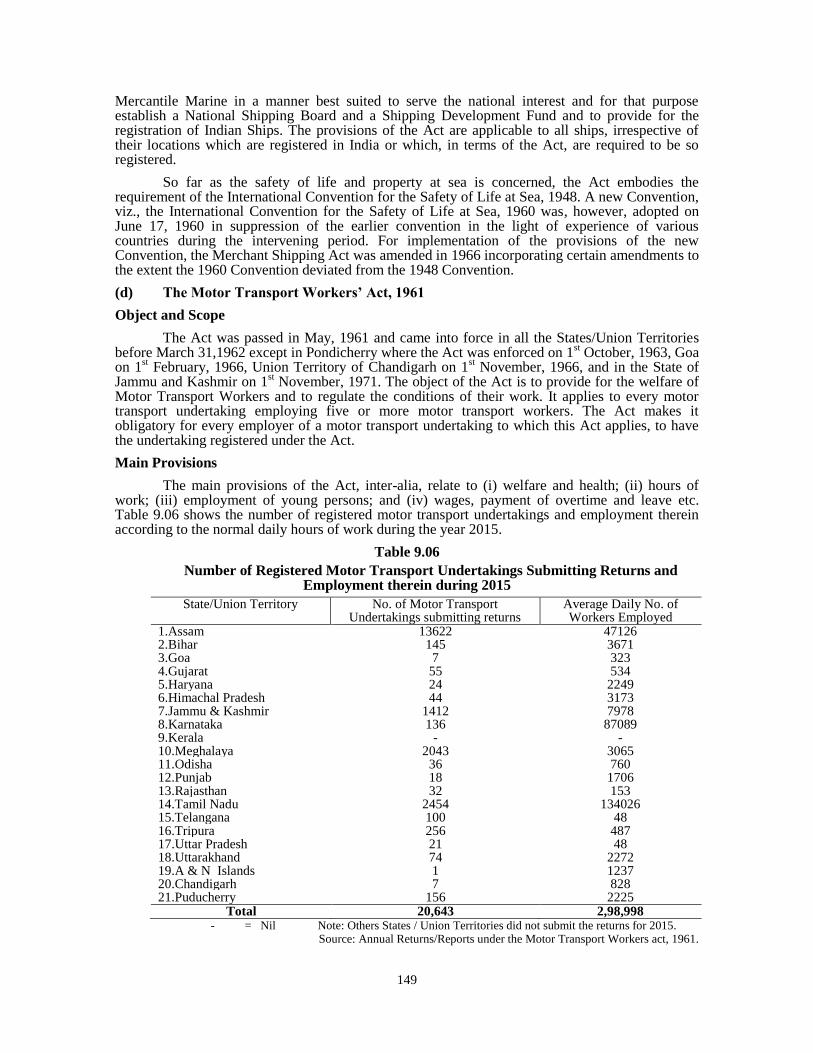
149
Mercantile Marine in a manner best suited to serve the national interest and for that purpose establish a National Shipping Board and a Shipping Development Fund and to provide for the registration of Indian Ships. The provisions of the Act are applicable to all ships, irrespective of their locations which are registered in India or which, in terms of the Act, are required to be so registered.
So far as the safety of life and property at sea is concerned, the Act embodies the requirement of the International Convention for the Safety of Life at Sea, 1948. A new Convention, viz., the International Convention for the Safety of Life at Sea, 1960 was, however, adopted on June 17, 1960 in suppression of the earlier convention in the light of experience of various countries during the intervening period. For implementation of the provisions of the new Convention, the Merchant Shipping Act was amended in 1966 incorporating certain amendments to the extent the 1960 Convention deviated from the 1948 Convention.
(d) The Motor Transport Workers’ Act, 1961
Object and Scope
The Act was passed in May, 1961 and came into force in all the States/Union Territories before March 31,1962 except in Pondicherry where the Act was enforced on 1
st October, 1963, Goa
on 1st February, 1966, Union Territory of Chandigarh on 1
st November, 1966, and in the State of
Jammu and Kashmir on 1st November, 1971. The object of the Act is to provide for the welfare of
Motor Transport Workers and to regulate the conditions of their work. It applies to every motor transport undertaking employing five or more motor transport workers. The Act makes it obligatory for every employer of a motor transport undertaking to which this Act applies, to have the undertaking registered under the Act.
Main Provisions
The main provisions of the Act, inter-alia, relate to (i) welfare and health; (ii) hours of work; (iii) employment of young persons; and (iv) wages, payment of overtime and leave etc. Table 9.06 shows the number of registered motor transport undertakings and employment therein according to the normal daily hours of work during the year 2015.
Table 9.06
Number of Registered Motor Transport Undertakings Submitting Returns and Employment therein during 2015
State/Union Territory No. of Motor Transport Undertakings submitting returns
Average Daily No. of Workers Employed
1.Assam 13622 47126 2.Bihar 145 3671 3.Goa 7 323 4.Gujarat 55 534 5.Haryana 24 2249 6.Himachal Pradesh 44 3173 7.Jammu & Kashmir 1412 7978 8.Karnataka 136 87089 9.Kerala - - 10.Meghalaya 2043 3065 11.Odisha 36 760 12.Punjab 18 1706 13.Rajasthan 32 153 14.Tamil Nadu 2454 134026 15.Telangana 100 48 16.Tripura 256 487 17.Uttar Pradesh 21 48 18.Uttarakhand 74 2272 19.A & N Islands 1 1237 20.Chandigarh 7 828 21.Puducherry 156 2225
Total 20,643 2,98,998 - = Nil Note: Others States / Union Territories did not submit the returns for 2015.
Source: Annual Returns/Reports under the Motor Transport Workers act, 1961.
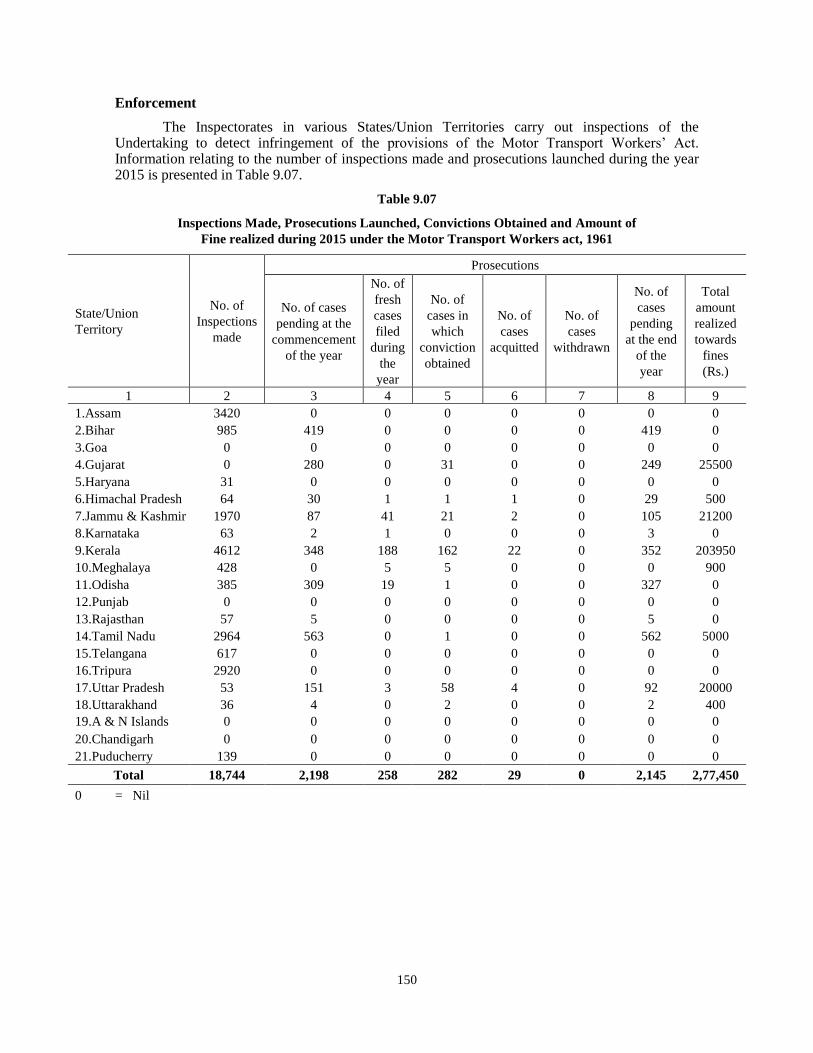
150
Enforcement
The Inspectorates in various States/Union Territories carry out inspections of the Undertaking to detect infringement of the provisions of the Motor Transport Workers‟ Act. Information relating to the number of inspections made and prosecutions launched during the year 2015 is presented in Table 9.07.
Table 9.07
Inspections Made, Prosecutions Launched, Convictions Obtained and Amount of
Fine realized during 2015 under the Motor Transport Workers act, 1961
State/Union
Territory
No. of
Inspections
made
Prosecutions
No. of cases
pending at the
commencement
of the year
No. of
fresh
cases
filed
during
the
year
No. of
cases in
which
conviction
obtained
No. of
cases
acquitted
No. of
cases
withdrawn
No. of
cases
pending
at the end
of the
year
Total
amount
realized
towards
fines
(Rs.)
1 2 3 4 5 6 7 8 9
1.Assam 3420 0 0 0 0 0 0 0
2.Bihar 985 419 0 0 0 0 419 0
3.Goa 0 0 0 0 0 0 0 0
4.Gujarat 0 280 0 31 0 0 249 25500
5.Haryana 31 0 0 0 0 0 0 0
6.Himachal Pradesh 64 30 1 1 1 0 29 500
7.Jammu & Kashmir 1970 87 41 21 2 0 105 21200
8.Karnataka 63 2 1 0 0 0 3 0
9.Kerala 4612 348 188 162 22 0 352 203950
10.Meghalaya 428 0 5 5 0 0 0 900
11.Odisha 385 309 19 1 0 0 327 0
12.Punjab 0 0 0 0 0 0 0 0
13.Rajasthan 57 5 0 0 0 0 5 0
14.Tamil Nadu 2964 563 0 1 0 0 562 5000
15.Telangana 617 0 0 0 0 0 0 0
16.Tripura 2920 0 0 0 0 0 0 0
17.Uttar Pradesh 53 151 3 58 4 0 92 20000
18.Uttarakhand 36 4 0 2 0 0 2 400
19.A & N Islands 0 0 0 0 0 0 0 0
20.Chandigarh 0 0 0 0 0 0 0 0
21.Puducherry 139 0 0 0 0 0 0 0
Total 18,744 2,198 258 282 29 0 2,145 2,77,450
0 = Nil
151
5. SHOPS AND COMMERCIAL ESTABLISHMENTS
The Shops and Commercial Establishments Acts (Central and State Acts)
Object and Scope
The conditions of employment of the persons working in Shops and Commercial
Establishments in the country are being largely governed by the Acts passed by the respective State
Governments and the rules framed there under. In addition, there is also a Central Act, viz., the
Weekly Holidays Act, 1942 which facilitates grant of weekly holidays for the employees covered
under the respective State Acts. The Acts passed by various State Governments and Union
Territory Administrations and Rules framed there under regulate, inter-alia, the daily and weekly
hours of work of the establishments, payments of wages, overtime, holidays with pay, annual leave,
etc. These Acts apply in the first instance to Shops and Commercial Establishments, Restaurants,
Hotels and Places of Amusement in certain notified urban areas and prohibit the employment of
children below 14 years of age and working of women at night. The State Governments are,
however, empowered to extend the application of the Acts to such other areas or to such categories
of undertakings, as they may consider necessary. However, certain type of employees, such as
those employed in a confidential capacity or where the work is of intermittent nature, are excluded
from the provisions of the Acts. The Central Act known as the Weekly Holidays Act, 1942,
provides for the grant of weekly holidays to persons employed in Shops and Commercial
Establishments, etc., is operative only in those States which notify its application to specified areas
within their jurisdiction.
Administration
There is no uniform pattern of departments/organizations in different States in
administrating these Acts. In the States of Andhra Pradesh, West Bengal and Chandigarh (UT),
these Acts are administered by the Chief Inspectors of Shops and Commercial Establishments
whereas in other States they are administered by the Labour Commissioners or Factory Inspectors
or by the Officials of the Health or Revenue Department.
Enforcement
Table 9.08 presents the number of inspections made, prosecutions launched, cases disposed
off by the courts and the amount of fines realised during the year 2015 in the States/Union
Territories for which information is available.
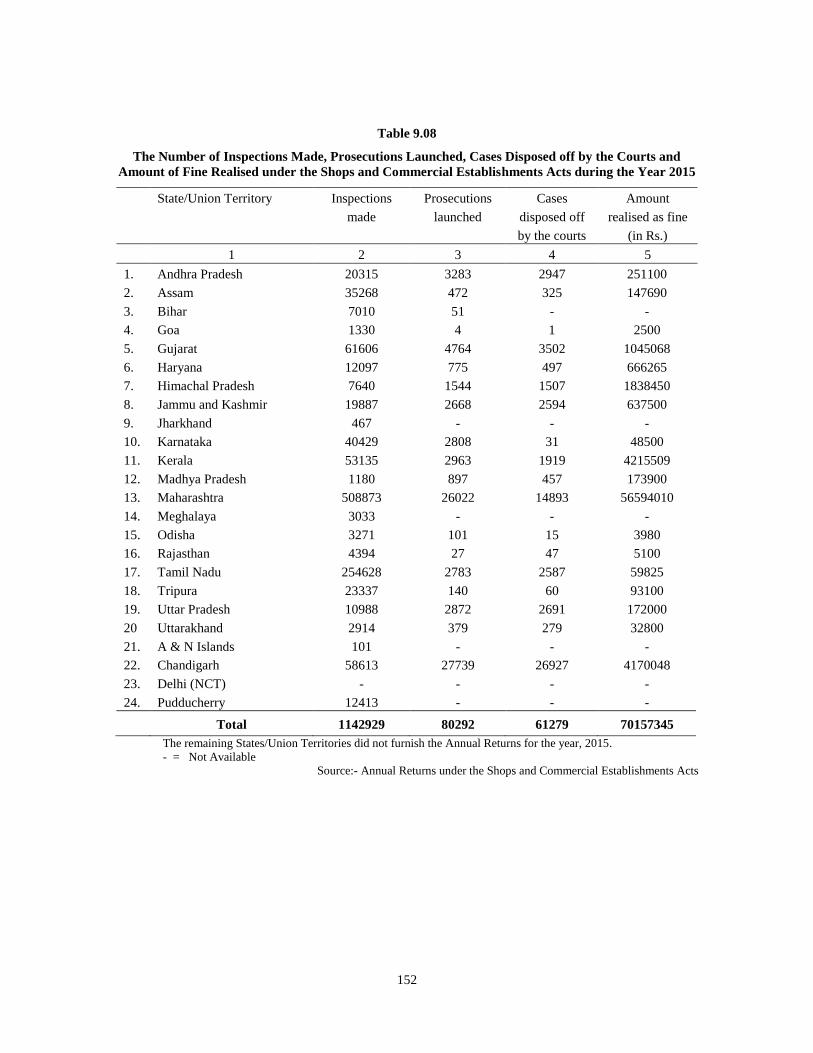
152
Table 9.08
The Number of Inspections Made, Prosecutions Launched, Cases Disposed off by the Courts and
Amount of Fine Realised under the Shops and Commercial Establishments Acts during the Year 2015
State/Union Territory Inspections
made
Prosecutions
launched
Cases
disposed off
by the courts
Amount
realised as fine
(in Rs.)
1 2 3 4 5
1. Andhra Pradesh 20315 3283 2947 251100
2. Assam 35268 472 325 147690
3. Bihar 7010 51 - -
4. Goa 1330 4 1 2500
5. Gujarat 61606 4764 3502 1045068
6. Haryana 12097 775 497 666265
7. Himachal Pradesh 7640 1544 1507 1838450
8. Jammu and Kashmir 19887 2668 2594 637500
9. Jharkhand 467 - - -
10. Karnataka 40429 2808 31 48500
11. Kerala 53135 2963 1919 4215509
12. Madhya Pradesh 1180 897 457 173900
13. Maharashtra 508873 26022 14893 56594010
14. Meghalaya 3033 - - -
15. Odisha 3271 101 15 3980
16. Rajasthan 4394 27 47 5100
17. Tamil Nadu 254628 2783 2587 59825
18. Tripura 23337 140 60 93100
19. Uttar Pradesh 10988 2872 2691 172000
20 Uttarakhand 2914 379 279 32800
21. A & N Islands 101 - - -
22. Chandigarh 58613 27739 26927 4170048
23. Delhi (NCT) - - - -
24. Pudducherry 12413 - - -
Total 1142929 80292 61279 70157345
The remaining States/Union Territories did not furnish the Annual Returns for the year, 2015.
- = Not Available
Source:- Annual Returns under the Shops and Commercial Establishments Acts
153
6. INDUSTRIAL HOUSING £
In the domain of industrial housing, the only Act which operated prior to Independence
was the Land Acquisition (Amendment) Act, 1933, which enabled the employers to secure land for
the construction of houses for the employees. In the year 1946, a real beginning was made in this
direction when the Mica Mines Labour Welfare Fund Act, 1946 was passed by the Central
Government. This was followed by the Coal Mines Labour Welfare Fund Act, 1947; the Limestone
and Dolomite Mines Labour Welfare Fund Act, 1972; the Iron Ore, Manganese Ore and Chrome
Ore Mines Labour Welfare Fund Act, 1976; and the Beedi Workers Welfare Fund Act, 1976.
These Acts, inter-alia, make provision for the construction of houses for workers in mines and
beedi industry. The State Governments of Andhra Pradesh, erstwhile Bombay, erstwhile
Saurashtra, Mysore (now Karnataka), Madhya Pradesh, erstwhile Hyderabad, Uttar Pradesh and
Punjab had enacted legislations to provide suitable housing accommodation for working class. In
addition to this, the housing for the economically weaker sections of the society and Minimum
Needs Programme for providing house site and construction assistance to rural landless labourers
were later initiated by the Central Government. The following schemes which provide for housing
facilities to iron ore, manganese ore, chrome ore, limestone, dolomites, mica mine and beedi
workers are also being implemented:
Type I Housing Scheme;
Type II Housing Scheme;
Build Your Own House Scheme;
Group Housing Scheme for Beedi & Mine Workers; and
Scheme for grant of Subsidy/Financial Assistance to Co-operative Societies for Beedi
Workers
7. SAFETY AND WELFARE *
The Welfare Fund Organisations undertake activities for welfare of the workers employed
in Mica, Iron Ore, Manganese Ore, Limestone and Dolomite Mines and Beedi Industry. The
Welfare Scheme are implemented and monitored through the Regional Offices of the Labour
Welfare Organisation, each under the charge of a Welfare Commissioner. In the field of Safety and
Welfare, the important Acts which are in operation, are:
The Mica Mines Labour Welfare Fund Act,1946;
The Limestone and Dolomite Mines Labour Welfare Fund Act,1972;
The Iron Ore Mines, Manganese Ore Mines and Chrome Ore Mines Labour Welfare Fund
Act,1976;
The Iron Ore Mines, Manganese Ore Mines and Chrome Ore Mines Labour Welfare Cess Act,
1976;
The Beedi Workers Welfare Fund Act,1976;
The Beedi Workers Welfare Cess Act, 1976;
The Labour Welfare Fund Laws (Amendment) Act,1987 ;
The Dock Workers (Safety, Health and Welfare) Act, 1986; and
The Cine Workers Welfare Fund Act, 1981
£ For details on the subject, kindly refer to Chapter 6 of the Year Book. * Chapter 5 and 7 also give detailed information on Welfare and Safety respectively.
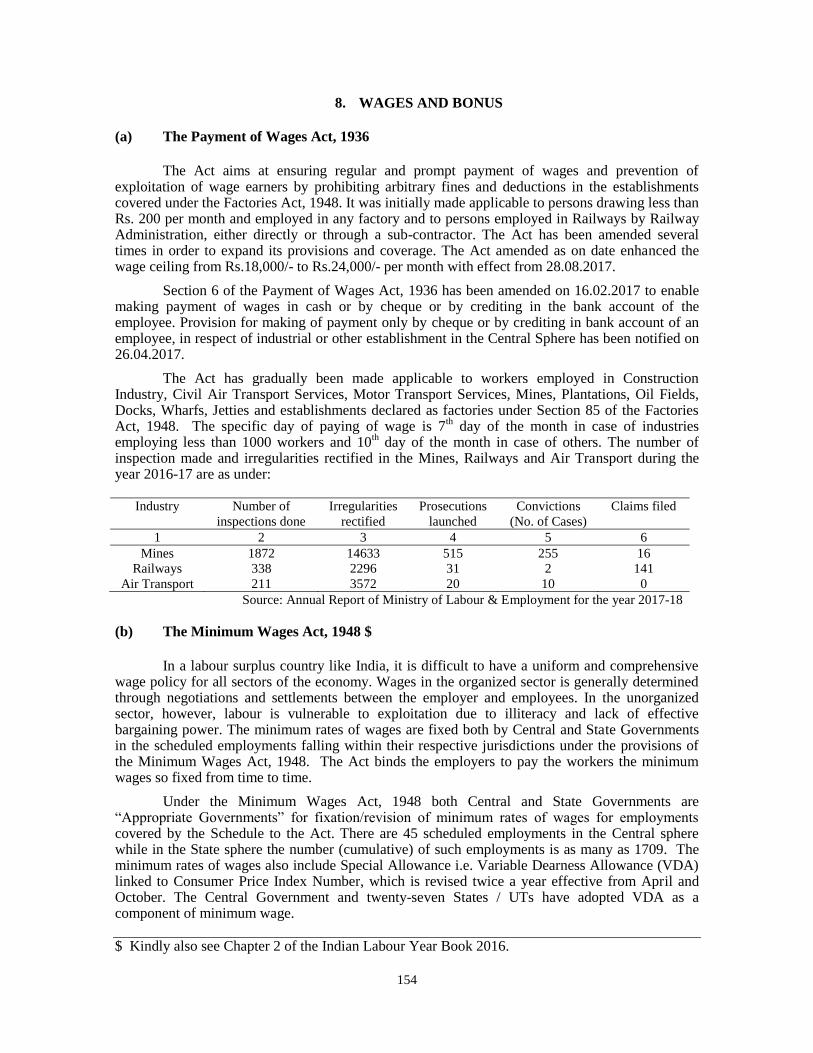
154
8. WAGES AND BONUS
(a) The Payment of Wages Act, 1936
The Act aims at ensuring regular and prompt payment of wages and prevention of exploitation of wage earners by prohibiting arbitrary fines and deductions in the establishments covered under the Factories Act, 1948. It was initially made applicable to persons drawing less than Rs. 200 per month and employed in any factory and to persons employed in Railways by Railway Administration, either directly or through a sub-contractor. The Act has been amended several times in order to expand its provisions and coverage. The Act amended as on date enhanced the wage ceiling from Rs.18,000/- to Rs.24,000/- per month with effect from 28.08.2017.
Section 6 of the Payment of Wages Act, 1936 has been amended on 16.02.2017 to enable making payment of wages in cash or by cheque or by crediting in the bank account of the employee. Provision for making of payment only by cheque or by crediting in bank account of an employee, in respect of industrial or other establishment in the Central Sphere has been notified on 26.04.2017.
The Act has gradually been made applicable to workers employed in Construction Industry, Civil Air Transport Services, Motor Transport Services, Mines, Plantations, Oil Fields, Docks, Wharfs, Jetties and establishments declared as factories under Section 85 of the Factories Act, 1948. The specific day of paying of wage is 7
th day of the month in case of industries
employing less than 1000 workers and 10th day of the month in case of others. The number of
inspection made and irregularities rectified in the Mines, Railways and Air Transport during the year 2016-17 are as under:
Source: Annual Report of Ministry of Labour & Employment for the year 2017-18
(b) The Minimum Wages Act, 1948 $
In a labour surplus country like India, it is difficult to have a uniform and comprehensive wage policy for all sectors of the economy. Wages in the organized sector is generally determined through negotiations and settlements between the employer and employees. In the unorganized sector, however, labour is vulnerable to exploitation due to illiteracy and lack of effective bargaining power. The minimum rates of wages are fixed both by Central and State Governments in the scheduled employments falling within their respective jurisdictions under the provisions of the Minimum Wages Act, 1948. The Act binds the employers to pay the workers the minimum wages so fixed from time to time.
Under the Minimum Wages Act, 1948 both Central and State Governments are “Appropriate Governments” for fixation/revision of minimum rates of wages for employments covered by the Schedule to the Act. There are 45 scheduled employments in the Central sphere while in the State sphere the number (cumulative) of such employments is as many as 1709. The minimum rates of wages also include Special Allowance i.e. Variable Dearness Allowance (VDA) linked to Consumer Price Index Number, which is revised twice a year effective from April and October. The Central Government and twenty-seven States / UTs have adopted VDA as a component of minimum wage.
$ Kindly also see Chapter 2 of the Indian Labour Year Book 2016.
Industry Number of
inspections done
Irregularities
rectified
Prosecutions
launched
Convictions
(No. of Cases)
Claims filed
1 2 3 4 5 6
Mines 1872 14633 515 255 16
Railways 338 2296 31 2 141
Air Transport 211 3572 20 10 0
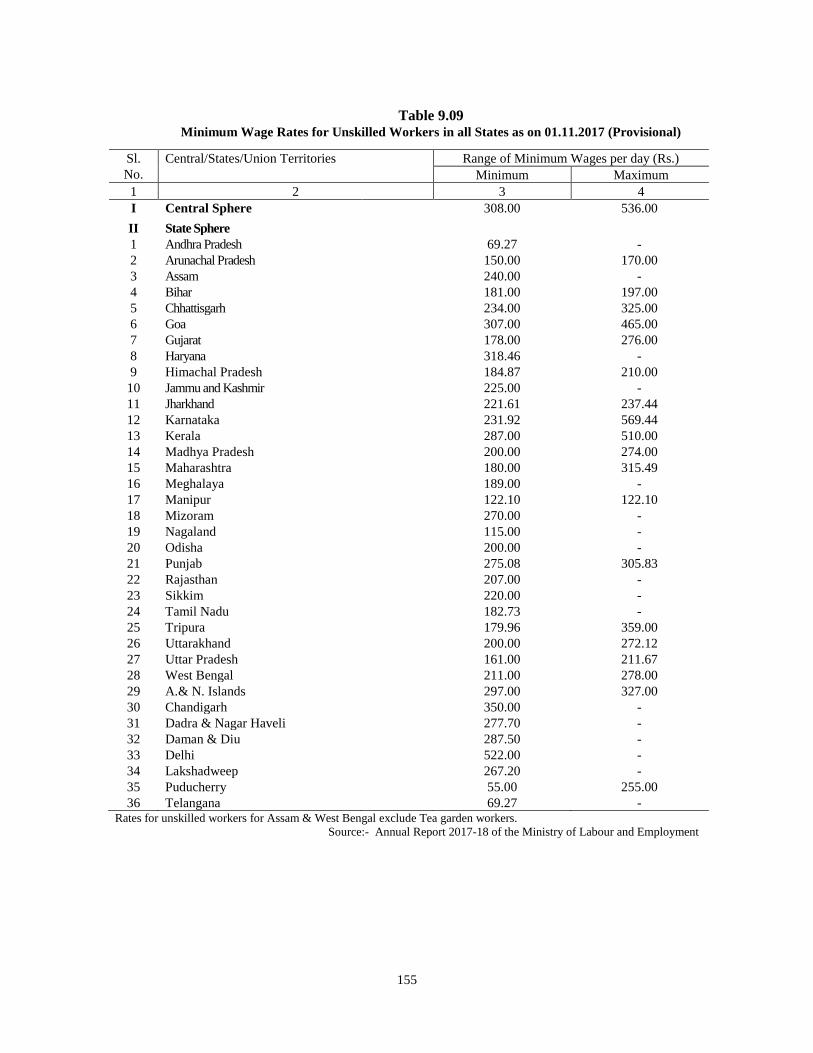
155
Table 9.09
Minimum Wage Rates for Unskilled Workers in all States as on 01.11.2017 (Provisional)
Rates for unskilled workers for Assam & West Bengal exclude Tea garden workers.
Source:- Annual Report 2017-18 of the Ministry of Labour and Employment
Sl.
No.
Central/States/Union Territories Range of Minimum Wages per day (Rs.)
Minimum Maximum
1 2 3 4
I Central Sphere 308.00 536.00
II State Sphere
1 Andhra Pradesh 69.27 -
2 Arunachal Pradesh 150.00 170.00
3 Assam 240.00 -
4 Bihar 181.00 197.00
5 Chhattisgarh 234.00 325.00
6 Goa 307.00 465.00
7 Gujarat 178.00 276.00
8 Haryana 318.46 -
9 Himachal Pradesh 184.87 210.00
10 Jammu and Kashmir 225.00 -
11 Jharkhand 221.61 237.44
12 Karnataka 231.92 569.44
13 Kerala 287.00 510.00
14 Madhya Pradesh 200.00 274.00
15 Maharashtra 180.00 315.49
16 Meghalaya 189.00 -
17 Manipur 122.10 122.10
18 Mizoram 270.00 -
19 Nagaland 115.00 -
20 Odisha 200.00 -
21 Punjab 275.08 305.83
22 Rajasthan 207.00 -
23 Sikkim 220.00 -
24 Tamil Nadu 182.73 -
25 Tripura 179.96 359.00
26 Uttarakhand 200.00 272.12
27 Uttar Pradesh 161.00 211.67
28 West Bengal 211.00 278.00
29 A.& N. Islands 297.00 327.00
30 Chandigarh 350.00 -
31 Dadra & Nagar Haveli 277.70 -
32 Daman & Diu 287.50 -
33 Delhi 522.00 -
34 Lakshadweep 267.20 -
35 Puducherry 55.00 255.00
36 Telangana 69.27 -
156
National Floor Level Minimum Wage
In order to have a uniform wage structure and to reduce the disparity in minimum wages across the country, the concept of National Floor Level Minimum Wage as a non statutory measure was mooted on the basis of the recommendations of the National Commission on Rural Labour (NCRL) in 1991. On the basis of increase in the Consumer Price Index, the Central Government has fixed the National Floor Level Minimum Wages from Rs.160/- to Rs.176/- per day w.e.f. 01.06.2017.
(c) The Payment of Bonus Act, 1965
The Payment of Bonus Act, 1965 provides for payment of bonus to employees of factories and other establishments employing 20 or more persons, on the basis of profits or on the basis of production or productivity and for matters connected therewith.
The minimum bonus of 8.33 per cent is payable by every industry and establishment under section 10 of the Act. The maximum bonus including productivity link bonus that can be paid in any accounting year shall not exceed 20 per cent of the salary/wage of an employee under section 31 A of the Act.
Two ceilings are available under the Payment of Bonus Act, 1965. Section 2(13) which defines an employee is generally known as the eligibility limit and Section 12 is known as the calculation ceiling. The two ceilings are revised from time to time to keep pace with the price rise and increase in the salary structure. The calculating ceilings and eligibility limits were revised to Rs.750/- and Rs.1600/- per month in 1965, Rs.1600/- and Rs.2500/- in 1985, Rs.2500/- and Rs.3500/- in 1995, Rs.3500/- and Rs.10000/- in 2007 and Rs.7000/- and Rs.21000/- by Gazette notification dated 01.01.2016.
The Payment of Bonus Act, 1965 has been amended to revise the statutory eligibility limit from Rs.10,000/- per month to Rs.21,000/- per month and the calculation ceiling from Rs.3500/- to Rs.7,000/- or the minimum wage for the scheduled employment, as fixed by the appropriate Government, whichever is higher. The changes in the Payment of Bonus Act, 1965 are effective retrospectively from 01.04.2014.
9. SOCIAL SECURITY
The Directive Principles of the State Policy as contained in the Constitution of India enjoins upon the State to enact social security legislations for the welfare of the working class. In the era of industrialisation, the workers are exposed to economic insecurity, thereby losing their livelihood and physical insecurity arising out of sickness, accident, old age and so on. The State has come forward to fulfill its responsibility to provide social security to its workers by enacting various social security legislations. The social security benefits flow either at the cost of the employer or on the part of joint contributions of the employer and the employees. However, the social security schemes cover only organized workforce and the government has moved forward through legislation to extend the benefits of social security schemes to cover workforce in the unorganized sector also. The compliance of these benefits is the responsibility of the employers.
The principal social security laws enacted in India are the following:
1. The Workmen‟s Compensation Act, 1923 2. The Employees‟ State Insurance Act, 1948 3. The Employees‟ Provident Funds & Miscellaneous Provisions Act, 1952 (Separate provident fund legislations exist for workers employed in coal mines, tea plantations in the State of Assam and for seamen). 4. The Maternity Benefit Act, 1961 5. The Payment of Gratuity Act, 1972 6. The Unorganised Workers‟ Social Security Act, 2008
157
(a) The Employee’s Compensation Act, 1923
It is obligatory for the employers to pay compensation to their workers for injury caused to
a workman by accident, arising out of and in the course of employment, resulting in death or in
total/partial disablement under the Workmen‟s Compensation Act. Compensation is also payable
for some occupational diseases contracted by workmen during the course of their employment.
The Act extends to the whole of India and applies to certain categories of railway servants
and workers employed in any capacity specified in Schedule II of the Act which includes Factories,
Mines, Plantations, Mechanically Propelled Vehicle, Construction Work and certain other
hazardous occupations. There is no wage limit for coverage of workers under the Act. The Act
does not, however, apply to (i) persons whose employment is of a casual nature and who are
employed for purposes other than the employers‟ trade or business; (ii) persons serving in Armed
Forces and (iii) workers covered by the Employees‟ State Insurance Act.
Under Section 3(3) of the Act, the State Governments are empowered to extend the scope
of the Act to any class of persons whose occupations are considered hazardous after giving three
months notice in the Official Gazette.
The Act is administered by the State Governments who are required to appoint
commissioners for Workmen‟s Compensation. The functions of the Commissioners include (i)
settlement of disputed claims (ii) disposal of cases of injuries involving death, and (iii) revision of
periodical payments. The Commissioners for Workmen‟ Compensation have also been empowered
to impose penalty on employers who fail to pay compensation due under the Act to the injured
worker within one month from the date it fell due.
The Act has been amended to make it gender neutral and will now be called “the
Employees‟ Compensation Act, 1923”. Besides, the minimum compensation under the Act has
been enhanced from Rs.80,000/- to Rs.1,20,000/- in case of death, from Rs.90,000/- to
Rs.1,40,000/- in case of disablement and from Rs.2,500/- to 5,000/- towards funeral expenses. The
maximum amount for death and permanent total disablement can go up to Rs.9.14 lakh and
Rs.10.97 lakh respectively depending on age and wages of the employees. The employees shall be
reimbursed the actual medical expenditure incurred by him for treatment of injuries caused during
the course of employment without any ceiling. A new Section 25A has been added for the
Commissioner to dispose the matter relating to compensation under this Act within a period of
three months from the date of reference. The wage ceiling limit for working out compensation has
been increased from Rs.4,000/- to Rs.8,000/- per month. The amendment was notified on
23.12.2009 and made effective from 18.01.2010.
As per the Employee‟s Compensation (Amendment) Act, 2017, Section 17A has been
added. Now, Every employer shall immediately at the time of employment of an employee, inform
the employee of his rights to compensation under this Act, in writing as well as through electronic
means, in English or Hindi or in the official language of the area of employment, as may be
understood by the employee. Further, under Section 18A, penalty for contravention of Act has been
increased from present Rs.5000/- to Rs.50000/- which may extend to one lakh rupees.
Employers are required to notify the appropriate authorities the number of accidents,
amount of compensation paid, etc. The State Governments compile these statistics and forward
them to the Labour Bureau.
The average daily number of workers covered, number of accidents resulting in death,
permanent disablement, etc. and the amount of compensation paid during the years 2010-2015 are
given in Table 9.10.
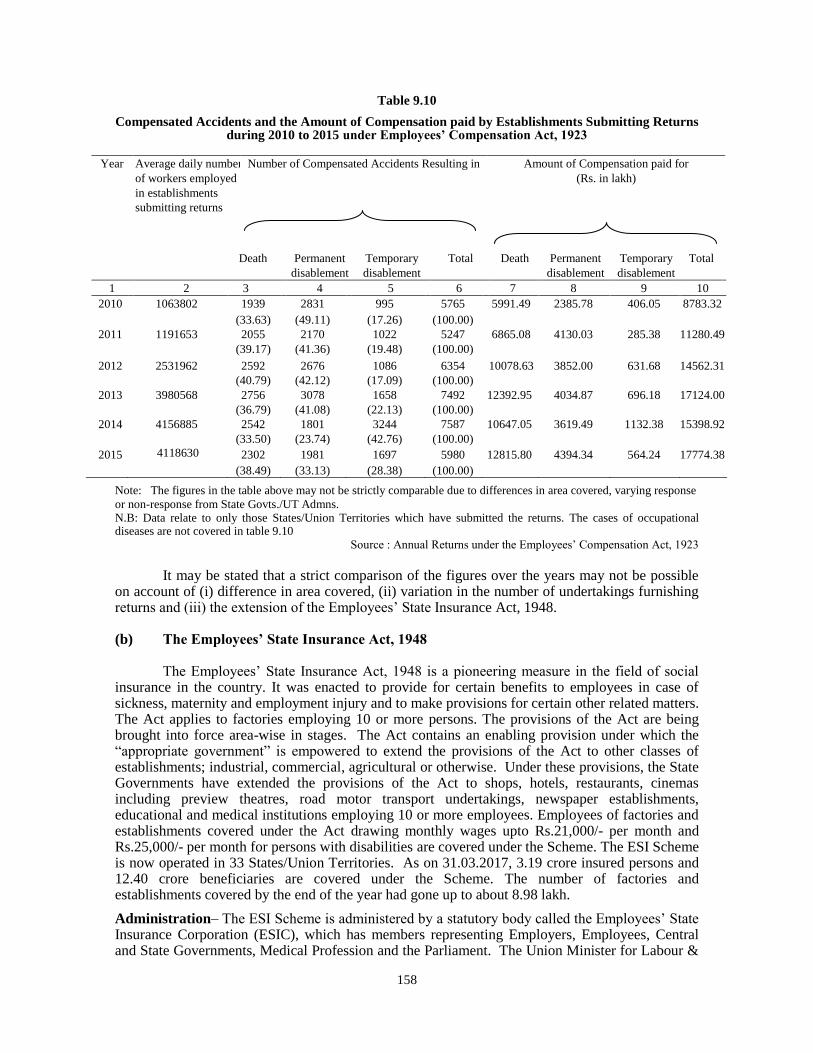
158
Table 9.10
Compensated Accidents and the Amount of Compensation paid by Establishments Submitting Returns during 2010 to 2015 under Employees’ Compensation Act, 1923
Year Average daily number
of workers employed
in establishments
submitting returns
Number of Compensated Accidents Resulting in
Amount of Compensation paid for
(Rs. in lakh)
Death Permanent
disablement
Temporary
disablement
Total Death Permanent
disablement
Temporary
disablement
Total
1 2 3 4 5 6 7 8 9 10
2010 1063802 1939 2831 995 5765 5991.49 2385.78 406.05 8783.32
(33.63) (49.11) (17.26) (100.00)
2011 1191653 2055 2170 1022 5247 6865.08 4130.03 285.38 11280.49
(39.17) (41.36) (19.48) (100.00)
2012 2531962 2592 2676 1086 6354 10078.63 3852.00 631.68 14562.31
(40.79) (42.12) (17.09) (100.00)
2013 3980568 2756 3078 1658 7492 12392.95 4034.87 696.18 17124.00
(36.79) (41.08) (22.13) (100.00)
2014 4156885 2542 1801 3244 7587 10647.05 3619.49 1132.38 15398.92
(33.50) (23.74) (42.76) (100.00)
2015 4118630 2302 1981 1697 5980 12815.80 4394.34 564.24 17774.38
(38.49) (33.13) (28.38) (100.00)
Note: The figures in the table above may not be strictly comparable due to differences in area covered, varying response
or non-response from State Govts./UT Admns. N.B: Data relate to only those States/Union Territories which have submitted the returns. The cases of occupational diseases are not covered in table 9.10
Source : Annual Returns under the Employees‟ Compensation Act, 1923
It may be stated that a strict comparison of the figures over the years may not be possible on account of (i) difference in area covered, (ii) variation in the number of undertakings furnishing returns and (iii) the extension of the Employees‟ State Insurance Act, 1948. (b) The Employees’ State Insurance Act, 1948 The Employees‟ State Insurance Act, 1948 is a pioneering measure in the field of social insurance in the country. It was enacted to provide for certain benefits to employees in case of sickness, maternity and employment injury and to make provisions for certain other related matters. The Act applies to factories employing 10 or more persons. The provisions of the Act are being brought into force area-wise in stages. The Act contains an enabling provision under which the “appropriate government” is empowered to extend the provisions of the Act to other classes of establishments; industrial, commercial, agricultural or otherwise. Under these provisions, the State Governments have extended the provisions of the Act to shops, hotels, restaurants, cinemas including preview theatres, road motor transport undertakings, newspaper establishments, educational and medical institutions employing 10 or more employees. Employees of factories and establishments covered under the Act drawing monthly wages upto Rs.21,000/- per month and Rs.25,000/- per month for persons with disabilities are covered under the Scheme. The ESI Scheme is now operated in 33 States/Union Territories. As on 31.03.2017, 3.19 crore insured persons and 12.40 crore beneficiaries are covered under the Scheme. The number of factories and establishments covered by the end of the year had gone up to about 8.98 lakh.
Administration– The ESI Scheme is administered by a statutory body called the Employees‟ State Insurance Corporation (ESIC), which has members representing Employers, Employees, Central and State Governments, Medical Profession and the Parliament. The Union Minister for Labour &
159
Employment is the Chairman. A Standing Committee, constituted from among the members of the Corporation, acts as the executive body for administration of the Scheme and is chaired by the Secretary, Ministry of Labour & Employment. There are 26 Regional Boards and 244 Local Committees. The Director General is the Chief Executive Officer of the Corporation and is also an ex-officio member of the Corporation as well as its Standing Committee. The Hqrs. of the ESI Corporation is located at Delhi. The Corporation has 66 field offices- 24 Regional Offices, 40 Sub-Regional Offices, 2 Camp Offices throughout the country. Besides, there are 630 Branch Offices and 185 Pay Offices for administration of cash benefits to Insured Persons.
Contribution- The ESI Scheme is mainly financed by contributions from the employers and employees. The rates of the employer's and the employee's share of contribution are 4.75% and 1.75% respectively. For the newly implemented areas w.e.f. 6.10.2016, the rate of contribution is 4% (1% being employee's share & 3% employer's share) for the first 24 months. The Corporation has prescribed per capita per annum ceiling on reimbursement of Medical care Expenditure of State Govt. At present the prescribed ceiling is Rs.3000/- per Insured Person Family Unit per annum. The expenditure on medical benefit is shared between ESI Corporation and State Government in the ratio of 7:1 with the ceiling. All capital expenditure on construction of ESI Hospitals and other buildings including their maintenance is borne exclusively by the Corporation.
Investment– All contributions received under the ESI Act and all other money belonging to the fund which are not immediately required for defraying day to day expenses are invested in the manner prescribed under ESI (Central) Rules. As on 31.10.2017, the total investment of fund was Rs.67069.16 crore. Out of this, an amount of Rs.13445.89 crore was invested in the Special Deposit Account with Central Government and the balance amount of Rs.53623.27 crore was invested in fixed deposits with nationalized banks.
Exemption from the Operation of the Act- Exemptions under Section 87 of the E.S.I. Act can be granted to any factory or establishment or class of factories or establishments who provide social security benefits to their employees, superior or similar to those available under the ESI Scheme.
Benefits- Two types of social security cover is provided under the scheme namely – (i) Medical Care and (ii) Cash Benefits.
(i) Medical Care- The Scheme provides reasonable medical facilities from primary health care to super specialty treatment in respect of the insured persons and their family members. The medical care under the scheme is administered by the State Governments, except in Delhi and Noida (UP). The Corporation also directly runs 42 Hospitals as on 31.03.2017.
(ii) Cash benefits are constituted of the followed benefits:
i. Sickness benefit (SB) ii. Disablement benefit iii. Dependents benefit iv. Maternity benefit (MB) v. Medical benefit vi. Unemployment allowances (RGSKY) vii. Other benefits
(c) The Employees’ Provident Funds and Miscellaneous Provisions Act, 1952
The Employees‟ Provident Funds and Miscellaneous Provisions Act, 1952 provides for institution of compulsory provident funds for employees in factories and other establishments. The purpose is to make some provisions for the future of the industrial workers after he retires or for his dependents in case of his early death. Initially, the Act covered only 6 major industries viz., (i) Cement, (ii) Cigarette, (iii) Iron and Steel, (iv) Electrical, Mechanical or General Engineering Products, (v) Paper and (vi) Textile (cotton, wool, silk and jute), which had completed 3 years of existence and employed 50 or more workers. However, with the extension of the Act more and
160
more industries were covered from time to time. The Act is now applicable to factories/establishments engaged in 197 industries/classes of establishments employing 20 or more workers. As on 31.03.2017, there were 10,24,188 establishments and factories covered under the Act with a membership of 1933.91 lakh under EPF Scheme, both in the Exempted and Un-exempted sectors.
The Act extends to whole of India except the State of Jammu & Kashmir. The State Government of Jammu and Kashmir instituted a separate Provident Fund Scheme, w.e.f., 1
st June,
1961. The Act applies to all factories and other establishments of any notified industry if they employ 20 or more persons. However, any newly started undertaking remains exempted for a period of five years if it employs less than 50 persons and for three years if it employs 50 or more persons. It has now been substituted by a uniform provision of three years infancy period with effect from 1.8.1988 by the Employees‟ Provident Fund (Amendment) Act, 1988. The Act does not apply to (i) establishments registered under the Co-operative Societies Act, 1912 (or under any other law relating to co-operative societies) if the establishments employ less than 50 persons and work without the aid of power; (ii) tea plantations and tea factories in the State of Assam, where the State Government have a separate scheme for these establishments. The wage ceiling for coverage under the EPF Scheme was enhanced from Rs. 5,000 to Rs. 6,500 per month with effect from 1.6.2001. With effect from 01.09.2014, an employee, on joining the employment in a covered establishment and getting wages upto Rs.15,000/- is required to become a member of the fund.
Rate of Contribution- The normal rate of contributions payable by the employers and employees prescribed under the Act is 10 per cent of the wages of the employees‟ w.e.f. 01.05.1997. The Act, also empowers the Central Government to enhance, if deemed fit, the rate of contribution to 12 per cent of wages in respect of any industry or class of establishments. The Central Government has enhanced the rate of contribution to 12 per cent in most of the establishments. Out of 12 per cent of employers‟ share, 3.67 per cent goes to Provident Fund and 8.33 per cent contributed to the Pension Fund. The minimum rate of Provident Fund Contribution of 10 per cent is applicable to the five industries only, i.e. brick, beedi, jute, coir and guargum.
Rate of Interest - The Government of India on the recommendation of the Central Board of Trustees of the Employees Provident Fund Organisation declares the rate of interest to be credited to the accounts of Provident Fund members annually. The three schemes under the EPF & M.P. Act, 1952 are; (i) Employees Provident Fund Scheme, 1952; (ii) Employees Pension Scheme, 1995; and (iii) Employees Deposit Linked Insurance Scheme, 1976. (i) The Employees’ Provident Fund Scheme, 1952
The Employees‟ Provident Funds and Miscellaneous Provisions Act, 1952 initially
provided for framing of the Scheme – Employees‟ Provident Fund Scheme, 1952 which came into force with effect from 1.11.1952. It aims at making provision for the future of the covered employees after they retire and also for their dependants in case unfortunate death. An employee with a pay upto Rs.15000/- per month is eligible for membership of the Fund from the very date of joining an establishment. The rate of Provident Fund contribution is 12 per cent (in case of general establishments) and 10 per cent (in case of notified establishments) of the monthly wages of the subscribers.
In order to provide prompt, time bound and trouble free service to the subscribers, para 72 of the EPF Scheme has been amended so as to fix 30 days statutory time limit for settlement of claims. Now the PF claims complete in all respects are required to be settled within 30 days. In respect of incomplete claims, the reasons for non-settlement are to be communicated to the applicant within 30 days. In case the Commissioner fails to settle a claim complete in all respects within 30 days he shall be held personally liable for the delay beyond the said period and penal
161
interest @ 12 per cent p.a. on the benefit amount may be charged and recovered from the salary of the Commissioner. (ii) The Employees Pension Scheme, 1995
The Employees‟ Pension Scheme is compulsory for all the persons who were members of the Family Pensions Scheme, 1971. It is also compulsory for the persons who became members of the Provident Fund from 16.11.1995 i.e. the date of introduction of the Scheme. The PF subscribers, who were not members of the Family Pension Scheme, have an option to join this pension scheme. Upon introduction of the new Pension Scheme, 1995, the erstwhile Family Pension Scheme, 1971 ceased to operate and all the assets and liabilities of the erstwhile Family Pension Fund were taken over and merged with the new Pension Fund. The benefits and entitlements to the member under the old Scheme shall remain protected and continued under the new Pension Scheme, 1995. A minimum 10 years contributory service is required for entitlement to Pension. Normal superannuation pension is payable on attaining the age of 58 years. Pension on a discounted rate is also payable on attaining the age of 50 years. Where pensionable service is less than 10 years, the member has an option to remain covered for pensionary benefits till 58 years of age or claim return of contribution/withdrawal benefits. The Government has notified a minimum pension of Rs.1000/- p.m. to pensioners under EPS, 1995 w.e.f. 01.09.2014.
Under the scheme, neither the employer nor the employee is required to make additional contribution. From 16.11.95, the employer‟s share of P.F. contribution representing 8.33 per cent of the wage is being diverted to the said fund. The Central Government is also contributing to the Pension Fund at the rate of 1.16 per cent of the wage of the employees. The Pension Fund is required to be evaluated through qualified Actuary on annual basis. Based on the valuation results, the benefit quantum is revised.
Benefits
The Scheme provides the following benefits to the members and their families:
(a) Monthly member pension (b) Disablement pension (c) Widow/ widower pension (d) Children pension (e) Disabled Children/Orphan pension (f) Nominee pension (g) Pension to dependent parents (h) Withdrawal benefit
The amount of monthly pension varies from member to member depending upon his
pensionable salary and pensionable service. (iii) The Employees’ Deposit-Linked Insurance Scheme, 1976
Employees Deposit-Linked Insurance Scheme, 1976 (EDLI) is applicable to all factories/ establishments with effect from 1
st August, 1976. All the employees, who are members of the
Employees‟ Provident Fund Scheme, are required to become members of this Scheme. Employers are required to pay contributions to the Insurance Fund at the rate of 0.5 per cent of pay i.e., basic wages, dearness allowance including cash value of food concession and retaining allowance, if any. The benefit under para 22 of this Scheme on the death of an employee has been further increased by 20% in addition to the benefits already provided therein. During the year 2016-17, 32,688 EDLI claims were settled. At the end of 2016-17, the EPFO had cumulative investments of Rs.20,282.05 crore under this Scheme.
162
(d) The Maternity Benefit Act, 1961
The Act regulates the employment of women in factories, mines, the circus industry,
plantation units and shops or establishments employing 10 or more persons except the employees
covered under the Employees State Insurance (ESI) Act, 1948 for certain periods before and after
birth and provides for maternity and other benefits. It extends to whole of India, except the State of
Sikkim.
The Act was amended by the Maternity Benefit (Amendment) Act, 1988 which came into
force from 10th January, 1989. The Amended Act provides, inter-alia, for extension of its
provisions to Shops and Establishments employing 10 or more persons, reducing the qualifying
period for grant of maternity benefit from 160 days of actual work to 80 days of actual work,
enhancing the rate of medical bonus payable under the Act from Rs. 25 to Rs.250 (if no pre-natal
confinement and post natal confinement and post natal care are provided by the employer free of
charge) and fixing the rate of maternity benefit at average daily wages for three calendar months or
minimum wages fixed/revised under the Minimum Wages Act,1948 or Rs. 10 per day, whichever
is higher for a period of actual absence from duty up to 12 weeks, of which not more than 6 weeks
may be availed before delivery and remaining period after delivery. With a view to encouraging
planned parenthood, the Maternity Benefit Act, 1961 has been amended to provide six weeks leave
with wages in cases of medical termination of pregnancy (MTP), grant of leave with wages for a
maximum period of one month in cases of illness arising out of MTP or tubectomy and two weeks
leave with wages to women workers who undergo tubectomy operation. These amendments have
been enforced with effect from 1.2.1996. The Act was last amended by the Maternity Benefit
(Amendment) Act, 2017 which came into force from 1st April, 2017. The amended Act provides
Maternity leave entitlement to an entitled women employee has been increased from 12 weeks to
26 weeks. Further, the Act previously allowed pregnant women to avail benefit for only 6 weeks
prior to the date of expected delivery, which now has been increased to 8 weeks.
The Central Government is responsible for administration of the provisions of the Act in
Mines and in the Circus Industry, while the State Governments are responsible for administration
of the Act in factories, plantations and other establishments. The Central Government has entrusted
the Administration of the Act to the Chief Labour Commissioner in respect of the circus industry
and to the Director General of Mines Safety in respect of mines.
The Act has been amended to enhance the medical bonus from Rs.250/- to Rs.1,000/- and
also empowering the Central Government to increase it from time to time before every three years,
by way of notification in the Official Gazette, subject to maximum of Rs.20,000/-. The amendment
was notified on 15.04.2008 making it effective from the same date. The Medical Bonus has further
been increased from Rs.1,000/- to Rs.2,500/- w.e.f. 11.08.2008 and Rs.2,500/- to Rs.3,500/- w.e.f.
19.12.2011.
The Labour Bureau compiles data pertaining to the number of women workers covered,
number of claims made and amount paid, etc. contained in the reports of the State Governments.
Table 9.11 gives details regarding the benefits obtained by the women workers during 2015 under
the Maternity Benefit Act. Maternity benefits paid in different States under the Employees‟ State
Insurance Act, 1948 during the year 2015-16 are given in Table 9.12.
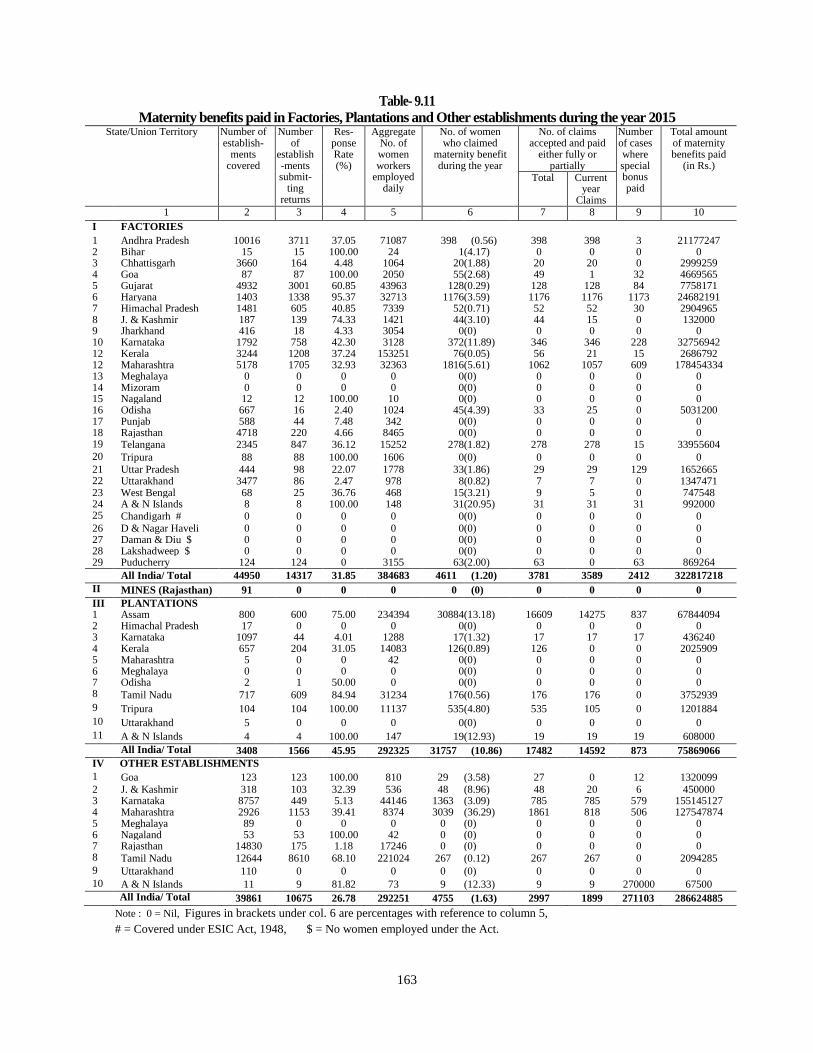
163
Table- 9.11
Maternity benefits paid in Factories, Plantations and Other establishments during the year 2015 State/Union Territory Number of
establish-ments
covered
Number of
establish-ments submit-
ting returns
Res-ponseRate (%)
AggregateNo. of women workers
employed daily
No. of women who claimed
maternity benefit during the year
No. of claims accepted and paid
either fully or partially
Number of cases where special bonus paid
Total amount of maternity benefits paid
(in Rs.) Total Current
year Claims
1 2 3 4 5 6 7 8 9 10
I FACTORIES
1 Andhra Pradesh 10016 3711 37.05 71087 398 (0.56) 398 398 3 21177247 2 Bihar 15 15 100.00 24 1 (4.17) 0 0 0 0 3 Chhattisgarh 3660 164 4.48 1064 20 (1.88) 20 20 0 2999259 4 Goa 87 87 100.00 2050 55 (2.68) 49 1 32 4669565 5 Gujarat 4932 3001 60.85 43963 128 (0.29) 128 128 84 7758171 6 Haryana 1403 1338 95.37 32713 1176 (3.59) 1176 1176 1173 24682191 7 Himachal Pradesh 1481 605 40.85 7339 52 (0.71) 52 52 30 2904965 8 J. & Kashmir 187 139 74.33 1421 44 (3.10) 44 15 0 132000 9 Jharkhand 416 18 4.33 3054 0 (0) 0 0 0 0 10 Karnataka 1792 758 42.30 3128 372 (11.89) 346 346 228 32756942 12 Kerala 3244 1208 37.24 153251 76 (0.05) 56 21 15 2686792 12 Maharashtra 5178 1705 32.93 32363 1816 (5.61) 1062 1057 609 178454334 13 Meghalaya 0 0 0 0 0 (0) 0 0 0 0 14 Mizoram 0 0 0 0 0 (0) 0 0 0 0 15 Nagaland 12 12 100.00 10 0 (0) 0 0 0 0 16 Odisha 667 16 2.40 1024 45 (4.39) 33 25 0 5031200 17 Punjab 588 44 7.48 342 0 (0) 0 0 0 0 18 Rajasthan 4718 220 4.66 8465 0 (0) 0 0 0 0 19 Telangana 2345 847 36.12 15252 278 (1.82) 278 278 15 33955604 20 Tripura 88 88 100.00 1606 0 (0) 0 0 0 0 21 Uttar Pradesh 444 98 22.07 1778 33 (1.86) 29 29 129 1652665 22 Uttarakhand 3477 86 2.47 978 8 (0.82) 7 7 0 1347471 23 West Bengal 68 25 36.76 468 15 (3.21) 9 5 0 747548 24 A & N Islands 8 8 100.00 148 31 (20.95) 31 31 31 992000 25 Chandigarh # 0 0 0 0 0 (0) 0 0 0 0 26 D & Nagar Haveli 0 0 0 0 0 (0) 0 0 0 0 27 Daman & Diu $ 0 0 0 0 0 (0) 0 0 0 0 28 Lakshadweep $ 0 0 0 0 0 (0) 0 0 0 0 29 Puducherry 124 124 0 3155 63 (2.00) 63 0 63 869264
All India/ Total 44950 14317 31.85 384683 4611 (1.20) 3781 3589 2412 322817218
II MINES (Rajasthan) 91 0 0 0 0 (0) 0 0 0 0
III PLANTATIONS 1 Assam 800 600 75.00 234394 30884 (13.18) 16609 14275 837 67844094 2 Himachal Pradesh 17 0 0 0 0 (0) 0 0 0 0 3 Karnataka 1097 44 4.01 1288 17 (1.32) 17 17 17 436240 4 Kerala 657 204 31.05 14083 126 (0.89) 126 0 0 2025909 5 Maharashtra 5 0 0 42 0 (0) 0 0 0 0 6 Meghalaya 0 0 0 0 0 (0) 0 0 0 0 7 Odisha 2 1 50.00 0 0 (0) 0 0 0 0 8 Tamil Nadu 717 609 84.94 31234 176 (0.56) 176 176 0 3752939
9 Tripura 104 104 100.00 11137 535 (4.80) 535 105 0 1201884
10 Uttarakhand 5 0 0 0 0 (0) 0 0 0 0
11 A & N Islands 4 4 100.00 147 19 (12.93) 19 19 19 608000
All India/ Total 3408 1566 45.95 292325 31757 (10.86) 17482 14592 873 75869066
IV OTHER ESTABLISHMENTS
1 Goa 123 123 100.00 810 29 (3.58) 27 0 12 1320099 2 J. & Kashmir 318 103 32.39 536 48 (8.96) 48 20 6 450000 3 Karnataka 8757 449 5.13 44146 1363 (3.09) 785 785 579 155145127 4 Maharashtra 2926 1153 39.41 8374 3039 (36.29) 1861 818 506 127547874 5 Meghalaya 89 0 0 0 0 (0) 0 0 0 0 6 Nagaland 53 53 100.00 42 0 (0) 0 0 0 0 7 Rajasthan 14830 175 1.18 17246 0 (0) 0 0 0 0 8 Tamil Nadu 12644 8610 68.10 221024 267 (0.12) 267 267 0 2094285 9 Uttarakhand 110 0 0 0 0 (0) 0 0 0 0
10 A & N Islands 11 9 81.82 73 9 (12.33) 9 9 270000 67500
All India/ Total 39861 10675 26.78 292251 4755 (1.63) 2997 1899 271103 286624885
Note : 0 = Nil, Figures in brackets under col. 6 are percentages with reference to column 5,
# = Covered under ESIC Act, 1948, $ = No women employed under the Act.
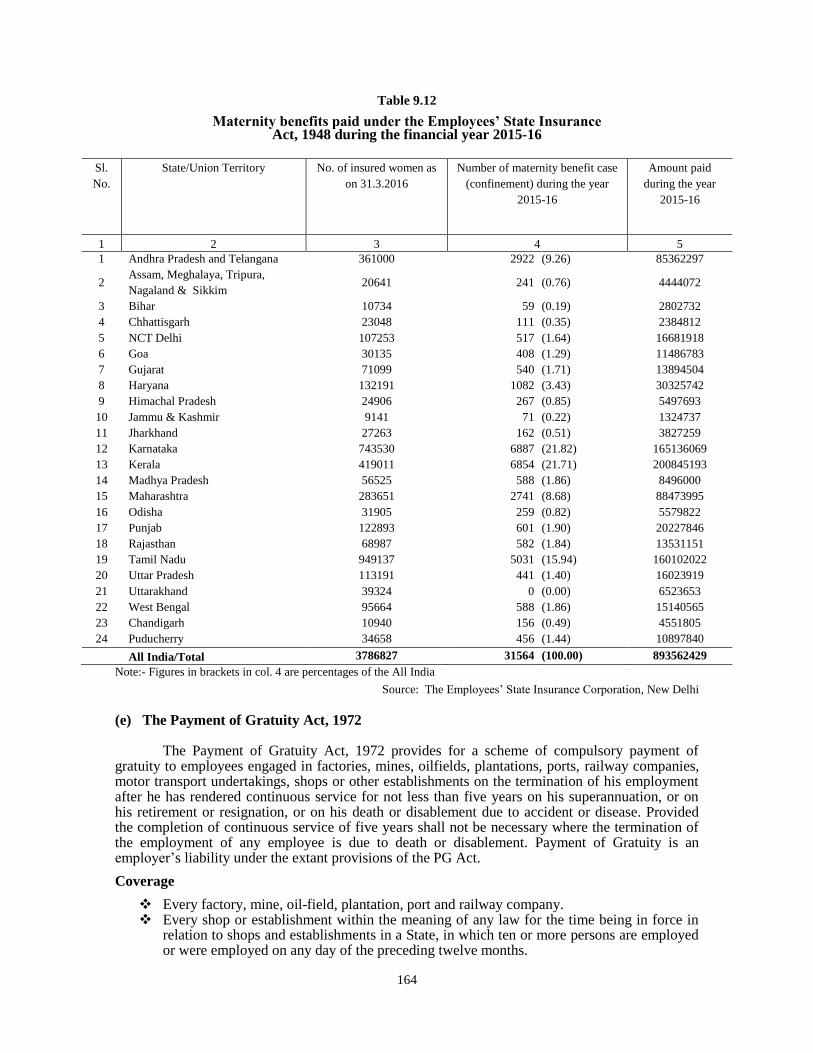
164
Table 9.12
Maternity benefits paid under the Employees’ State Insurance Act, 1948 during the financial year 2015-16
Note:- Figures in brackets in col. 4 are percentages of the All India
Source: The Employees‟ State Insurance Corporation, New Delhi
(e) The Payment of Gratuity Act, 1972
The Payment of Gratuity Act, 1972 provides for a scheme of compulsory payment of gratuity to employees engaged in factories, mines, oilfields, plantations, ports, railway companies, motor transport undertakings, shops or other establishments on the termination of his employment after he has rendered continuous service for not less than five years on his superannuation, or on his retirement or resignation, or on his death or disablement due to accident or disease. Provided the completion of continuous service of five years shall not be necessary where the termination of the employment of any employee is due to death or disablement. Payment of Gratuity is an employer‟s liability under the extant provisions of the PG Act.
Coverage
Every factory, mine, oil-field, plantation, port and railway company. Every shop or establishment within the meaning of any law for the time being in force in
relation to shops and establishments in a State, in which ten or more persons are employed or were employed on any day of the preceding twelve months.
Sl.
No.
State/Union Territory No. of insured women as
on 31.3.2016
Number of maternity benefit case
(confinement) during the year
2015-16
Amount paid
during the year
2015-16
1 2 3 4 5
1 Andhra Pradesh and Telangana 361000 2922 (9.26) 85362297
2 Assam, Meghalaya, Tripura,
Nagaland & Sikkim 20641 241 (0.76) 4444072
3 Bihar 10734 59 (0.19) 2802732
4 Chhattisgarh 23048 111 (0.35) 2384812
5 NCT Delhi 107253 517 (1.64) 16681918
6 Goa 30135 408 (1.29) 11486783
7 Gujarat 71099 540 (1.71) 13894504
8 Haryana 132191 1082 (3.43) 30325742
9 Himachal Pradesh 24906 267 (0.85) 5497693
10 Jammu & Kashmir 9141 71 (0.22) 1324737
11 Jharkhand 27263 162 (0.51) 3827259
12 Karnataka 743530 6887 (21.82) 165136069
13 Kerala 419011 6854 (21.71) 200845193
14 Madhya Pradesh 56525 588 (1.86) 8496000
15 Maharashtra 283651 2741 (8.68) 88473995
16 Odisha 31905 259 (0.82) 5579822
17 Punjab 122893 601 (1.90) 20227846
18 Rajasthan 68987 582 (1.84) 13531151
19 Tamil Nadu 949137 5031 (15.94) 160102022
20 Uttar Pradesh 113191 441 (1.40) 16023919
21 Uttarakhand 39324 0 (0.00) 6523653
22 West Bengal 95664 588 (1.86) 15140565
23 Chandigarh 10940 156 (0.49) 4551805
24 Puducherry 34658 456 (1.44) 10897840
All India/Total 3786827 31564 (100.00) 893562429
165
Every motor transport undertaking in which ten or more persons were employed on any day of the preceding twelve months.
Such other establishments or class of establishments in which ten or more employees are employed or were employed on any day of the preceding twelve months as the Central government may, by notification, specify in this behalf.
A shop or establishment once covered shall continue to be covered notwithstanding that the number of persons employed therein at any time falls below ten.
Entitlement
Every employee, other than apprentice irrespective of his wages is entitled to receive gratuity after he has rendered continuous service for five years or more. Gratuity is payable at the time of termination of his service either (i) on superannuation or (ii) on retirement or resignation or (iii) on death or disablement due to accident or disease. Termination of services includes retrenchment. However, the condition of five years‟ continuous service is not necessary if services are terminated due to death or disablement. In case of death of the employee, the gratuity payable to him is to be paid to his nominee, and if no nomination has been made, then to his heirs.
Calculation of Benefits
For every completed year of service or part thereof in excess of six months, the employer pays gratuity to an employee at the rate of fifteen days‟ wages based on the rate of wages last drawn. As per section 4(3) of the Act, the amount of the gratuity payable to an employee shall not exceed Rs.10,00,000/-.
Administration
The Act is enforced both by the Central and State Governments. Section 3 authorizes the appropriate government to appoint any officer as a controlling authority for the administration of the Act. Mines, major ports, oilfields, railway companies and establishment owned or controlled by the Central Government and establishment having branches in more than one State are controlled by the Central Government. The remaining factories and/ establishments are looked after by the State Governments. The Central/State Governments appoint the Controlling Authorities and Inspectors for different areas, to ensure that the provisions of the Act are complied with. The Central/State Governments also frame rules for administration of the Act.
(f) The Unorganised Workers’ Social Security Act, 2008
In order to ensure welfare of workers in the unorganized sector, the Ministry of Labour & Employment has enacted the Unorganised Workers‟ Social Security Act, 2008. The Act has come into force with effect from 16.05.2009. The Central Rules under the Act have been framed.
The Salient features of the Act are as under:
Section (2) provides for the definitions, including those relating to unorganised worker, self-employed and wage worker.
Section 3 (1) provides for formulation of schemes by the Central Government for different sections of unorganised workers on matters relating to (a) life and disability cover; (b) health and maternity benefits; (c) old age protection (d) any other benefit as may be determined by the Central Government.
Section 3 (4) provides for formulation of schemes relating to provident fund, employment injury benefits, housing, educational schemes for children, skill upgradation, funeral assistance and old age homes by the State Governments.
Section 4 relates to funding of the schemes formulated by Central Government. Section 5 envisages constitution of National Social Security Board under the chairmanship
of Union Minister for Labour & Employment with Director General (Labour Welfare) as Member Secretary and 34 nominated members representing Members of Parliament, unorganised workers, employers of unorganised workers, civil society, Central Ministries and State Governments.
166
Provision for adequate representation to persons belonging to the Scheduled Castes, the Scheduled Tribes, the Minorities and Women in the Board has been made.
The National Board would recommend the Central Government suitable schemes for different sections of unorganised workers; monitor implementation of schemes and advise the Central Government on matters arising out of the administration of the Act.
Section 6 has provision for constitution of similar Boards at the State level. Section 7 relates to funding pattern of the schemes formulated by the State Governments. Section 8 prescribes record keeping functions by the District Administration. For this
purpose, the State Government may direct (a) the District Panchayat in rural areas; and (b) the Urban Local Bodies in urban areas to perform such functions.
Section 9 provides for setting up of Workers‟ Facilitation Centre to (a) disseminate information on social security schemes available to them (b) facilitate registration of workers by the district administration and enrollment of unorganised workers.
Section 10 provides for eligibility criteria for registration as also the procedure for registration under the Act.
Sections 11-17 contain miscellaneous provisions for implementing the Act.
The Unorganised Workers‟ Social Security Rules, 2009 under the Act have been framed and the National Social Security Board was constituted on 18.08.2009. The National Board shall recommend social security schemes viz. life and disability cover, health and maternity benefits, old age protection and any other benefit as may be determined by the Government for unorganized workers.
In India approximately 93% of workers are in the unorganized sector. The various social security schemes are currently being run by different Ministries/Departments and agencies at the State Level under Schedule II of the “The Unorganized Workers Social Security Act, 2008” for welfare of the unorganized workers, with different eligibility criteria, enrolment processes and benefit thereunder.
10. INDUSTRIAL RELATIONS
(a) The Trade Unions Act, 1926 Object and Scope- The Act mainly seeks to confer a legal and corporate status on registered trade unions. The Act provides immunity from civil and criminal liability to trade union executives and members for bonafide trade union activities. The Act applies to the entire Indian Union.
Main Provisions- The main provisions of the Trade Unions Act, 1926 relate to (i) registration of unions; (ii) rights and privileges; and (iii) obligations and liabilities of registered trade unions. For registration, the Act provides that any seven or more members of a trade union can apply to the Registrar, appointed under the Act, for registration of the union. At least half the total number of office bearers of a registered union must be persons actually engaged in the industry to which the union belongs. Persons convicted of offences involving moral turpitude are debarred from becoming office bearers or members of the executive of a registered trade union. Under certain circumstances, the Registrar of Trade Unions is authorized to withdraw or cancel the registration. The Act stipulates that when once an application for registration has been entertained, it cannot be deemed to have become invalid, if at the time of registration some of the applicants not exceeding half of them cease to be members of the trade union or disassociate themselves from the application.
The Act protects the office bearers and members of registered trade unions against criminal proceedings in respect of any agreement for the purpose of furtherance of any legal object of the union. They are also protected from civil suits in respect of any act done in contemplation or furtherance of trade dispute.
The Act lays down the purpose for which the general funds of a registered trade union can be utilized. It is open to the unions to constitute a separate political fund for the promotion of civil
167
and political interest of its members. The registered unions are also required to submit annual returns in the prescribed form to the Registrar alongwith an audited statement of income and expenditure. The Unions are required to submit annual returns on a calendar year basis. The account books of the unions and the list of members thereof are required to be kept open for inspection by an office bearer or member of the union. Under the Act, the Registrar or any other duly authorized officer is empowered to inspect or require production of the certificate of registration, account books, registers and other documents relating to trade unions for examining the returns submitted by them under Section 28 of the Act. Any changes in the name, constitution and rules of the union as well as the office bearers have to be notified to the Registrar. The Trade Unions Act, 1926 was last amended and enforced with effect from 9.1.2002 to ensure orderly growth of trade unions and reduce multiplicity of trade unions and promote internal democracy. Administration and Enforcement- The Act is administered by the State Governments which are required to appoint Registrars of Trade Unions to look after the proper compliance of the provisions of the Act. (b) The Industrial Employment (Standing Orders) Act, 1946 Scope and Objective The Industrial Employment (Standing Orders) Act, 1946 came into force on April 23, 1946. The Standing Orders define with sufficient precision the conditions of employment for information of workmen. The Act applies to the whole of India. It was initially made applicable to only those industrial units/undertakings/establishments wherein 100 or more workers were employed on any day of the preceding 12 months. Subsequently the Act was amended in 1961, 1963 and 1982. The Act empowers the appropriate Governments to extend the provisions to establishments employing less than 100 workers after giving not less than two months notice, of its intention to do so in the official gazette. The Act applies to all the Industrial Establishments as defined in clause (II) of Section 2 of the Payment of Wages Act, 1936 and factories as defined in clause (II) of Section 2 of the Factories Act, 1948; the Railways as defined in the Indian Railways Act, 1890 and establishment of a contractor who employs workmen for the purpose of fulfilling the contract with the owner of any Industrial Establishment. The Act does not, however, apply to workmen who are governed by the Fundamental and Supplementary Rules, Civil Service Temporary Service Regulations, Civilians in Defence Services (Classification, Control and Appeal) Rules or the Indian Railways Establishments Code or any other rules or regulations that may be notified in this behalf by the appropriate Government. The provisions of the Act also apply to newspaper establishments wherein 20 or more employees are employed by virtue of the enforcement of the Working Journalists (Conditions of Service and Miscellaneous Provisions) Act, 1955. The main objectives of the Act, besides maintaining harmonious relationship between the employers and the employees, are to regulate the conditions of recruitment, discharge, disciplinary action, leave, holidays, etc. of the workers employed in industrial establishments. The Act amended in 1982 also provides for a payment of subsistence allowance to the workmen who are kept under suspension pending domestic enquiry. The rules regarding payment of subsistence allowance to the suspended workmen were further amended by a notification in 1984 facilitating payment during the suspension period, the subsistence allowance at the rate of 50 per cent of the wages, which he was entitled to immediately preceding the date of suspension, for the first 90 days, and 75 per cent of such wages subsequently for the remaining period of suspension, if the delay in completion of the disciplinary proceedings is not directly attributable to his conduct. The employer shall normally complete the enquiry within 10 days and the payment of subsistence allowance shall also be subject to the workman not taking any employment elsewhere during the period of suspension.
Certifying Officer- As per Section 2(c) of the Act, all the Regional Labour Commissioners are Certifying Officers in relation to industrial establishments throughout the country under the control of the Central Government. However, for administrative convenience, they exercise the powers of
168
Certifying Officers within their respective territorial jurisdictions. The Regional Labour Commissioners in the Chief Labour Commissioner‟s Office function as Certifying Officers in relation to industrial establishments falling in the Central Sphere and having branches in more than one State. Besides, Deputy Chief Labour Commissioner, New Delhi has also been appointed Certifying Officer in relation to industrial establishment falling in the Central Sphere.
Procedure for Certification –Section 3 of the Act provides that within 6 months from the date on which the Act becomes applicable to an industrial establishment the employer shall submit to the Certifying Officer copies of the draft Standing Orders proposed by him for adoption in his industrial establishment. The Certifying Officer shall ensure that provision is made in the Standing Orders for every matter set out in the Schedule applicable to the industrial establishment and the Standing Orders are in conformity with the provisions of the Act. Certifying Officers and appellate authorities have been vested with powers of Civil Courts for the purposes of receiving evidence, administering oath, enforcing the attendance of witnesses. The progress of Certification of Standing Orders during the Calendar Year 2015 is given in Table 9.13. Modification of Standing Orders – Section 10 of the Act makes provision for modification of the Certified Standing Orders. If the management and the workmen agree, the standing orders can be modified even before the expiry of the prescribed time limit.
Enforcement –The following offences are punishable under Section 18 of the Act and the Central Industrial Relations Machinery is to take action wherever infringements of the same come to their notice:
Failure on the part of an employer to submit draft Standing Orders as required under Section 3.
Modification by employer of the Certified Standing Orders otherwise than in accordance with the prescribed procedure.
Any action of the employer in contravention of the provisions of the Certified Standing Orders.
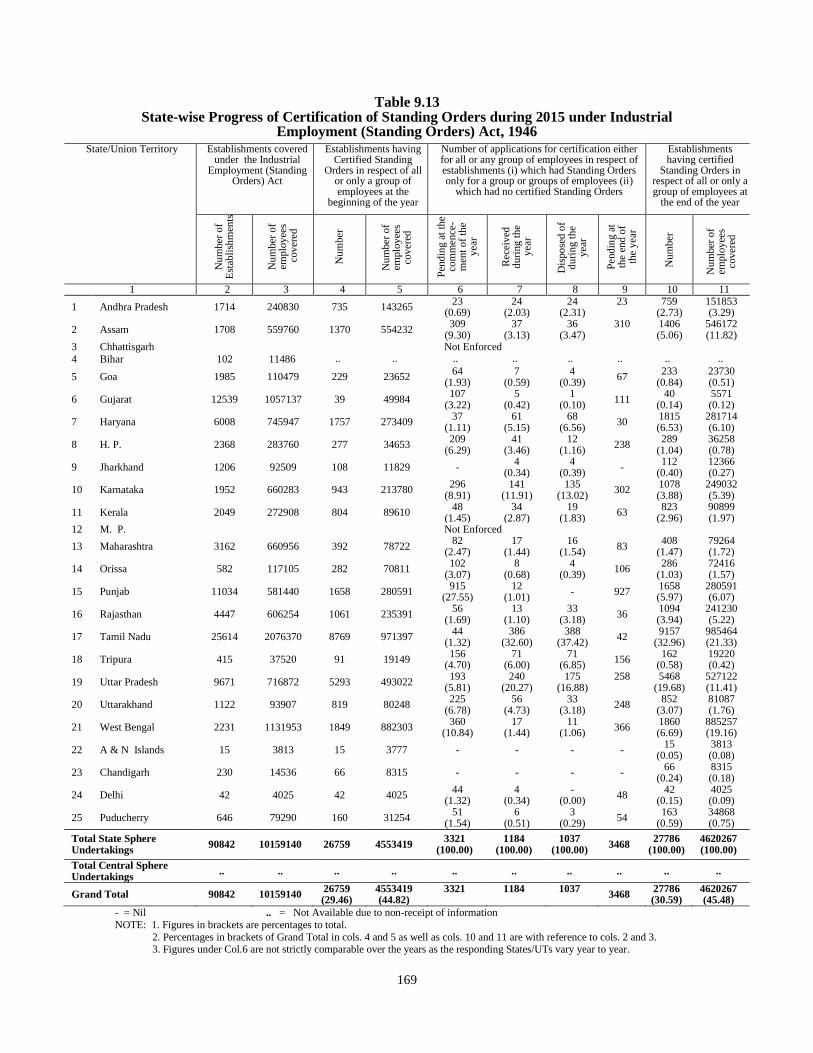
169
Table 9.13 State-wise Progress of Certification of Standing Orders during 2015 under Industrial
Employment (Standing Orders) Act, 1946 State/Union Territory Establishments covered
under the Industrial Employment (Standing
Orders) Act
Establishments having Certified Standing
Orders in respect of all or only a group of employees at the
beginning of the year
Number of applications for certification either for all or any group of employees in respect of establishments (i) which had Standing Orders only for a group or groups of employees (ii)
which had no certified Standing Orders
Establishments having certified
Standing Orders in respect of all or only a group of employees at
the end of the year
Nu
mber
of
Est
abli
shm
ents
Nu
mber
of
emplo
yee
s c
ov
ered
Nu
mber
Nu
mber
of
emplo
yee
s
cov
ered
Pen
din
g a
t th
e co
mm
ence
- m
ent
of
the
y
ear
Rec
eiv
ed
du
ring
the
y
ear
Dis
po
sed
of
d
uri
ng
the
y
ear
Pen
din
g a
t
the
end
of
th
e y
ear
Nu
mber
Nu
mber
of
emplo
yee
s
cov
ered
1 2 3 4 5 6 7 8 9 10 11
1 Andhra Pradesh 1714 240830 735 143265 23
(0.69) 24
(2.03) 24
(2.31) 23
759
(2.73) 151853 (3.29)
2 Assam 1708 559760 1370 554232 309
(9.30) 37
(3.13) 36
(3.47) 310
1406 (5.06)
546172 (11.82)
3 Chhattisgarh Not Enforced
4 Bihar 102 11486 .. .. .. .. .. .. .. ..
5 Goa 1985 110479 229 23652 64
(1.93) 7
(0.59) 4
(0.39) 67
233 (0.84)
23730 (0.51)
6 Gujarat 12539 1057137 39 49984 107
(3.22) 5
(0.42) 1
(0.10) 111
40 (0.14)
5571 (0.12)
7 Haryana 6008 745947 1757 273409 37
(1.11) 61
(5.15) 68
(6.56) 30
1815 (6.53)
281714 (6.10)
8 H. P. 2368 283760 277 34653 209
(6.29) 41
(3.46) 12
(1.16) 238
289 (1.04)
36258 (0.78)
9 Jharkhand 1206 92509 108 11829 - 4
(0.34) 4
(0.39) -
112 (0.40)
12366 (0.27)
10 Karnataka 1952 660283 943 213780 296
(8.91) 141
(11.91) 135
(13.02) 302
1078 (3.88)
249032 (5.39)
11 Kerala 2049 272908 804 89610 48
(1.45) 34
(2.87) 19
(1.83) 63
823 (2.96)
90899 (1.97)
12 M. P. Not Enforced
13 Maharashtra 3162 660956 392 78722 82
(2.47) 17
(1.44) 16
(1.54) 83
408 (1.47)
79264 (1.72)
14 Orissa 582 117105 282 70811 102
(3.07) 8
(0.68) 4
(0.39) 106
286 (1.03)
72416 (1.57)
15 Punjab 11034 581440 1658 280591 915
(27.55) 12
(1.01) - 927
1658 (5.97)
280591 (6.07)
16 Rajasthan 4447 606254 1061 235391 56
(1.69) 13
(1.10) 33
(3.18) 36
1094 (3.94)
241230 (5.22)
17 Tamil Nadu 25614 2076370 8769 971397 44
(1.32) 386
(32.60) 388
(37.42) 42
9157 (32.96)
985464 (21.33)
18 Tripura 415 37520 91 19149 156
(4.70) 71
(6.00) 71
(6.85) 156
162 (0.58)
19220 (0.42)
19 Uttar Pradesh 9671 716872 5293 493022 193
(5.81) 240
(20.27) 175
(16.88) 258
5468
(19.68) 527122 (11.41)
20 Uttarakhand 1122 93907 819 80248 225
(6.78) 56
(4.73) 33
(3.18) 248
852 (3.07)
81087 (1.76)
21 West Bengal 2231 1131953 1849 882303 360
(10.84) 17
(1.44) 11
(1.06) 366
1860 (6.69)
885257 (19.16)
22 A & N Islands 15 3813 15 3777 - - - - 15
(0.05) 3813 (0.08)
23 Chandigarh 230 14536 66 8315 - - - - 66
(0.24) 8315 (0.18)
24 Delhi 42 4025 42 4025 44
(1.32) 4
(0.34) -
(0.00) 48
42 (0.15)
4025 (0.09)
25 Puducherry 646 79290 160 31254 51
(1.54) 6
(0.51) 3
(0.29) 54
163 (0.59)
34868 (0.75)
Total State Sphere Undertakings
90842 10159140 26759 4553419 3321
(100.00) 1184
(100.00) 1037
(100.00) 3468
27786 (100.00)
4620267 (100.00)
Total Central Sphere Undertakings
.. .. .. .. .. .. .. .. .. ..
Grand Total 90842 10159140 26759 (29.46)
4553419 (44.82)
3321
1184
1037
3468 27786 (30.59)
4620267 (45.48)
- = Nil .. = Not Available due to non-receipt of information
NOTE: 1. Figures in brackets are percentages to total.
2. Percentages in brackets of Grand Total in cols. 4 and 5 as well as cols. 10 and 11 are with reference to cols. 2 and 3. 3. Figures under Col.6 are not strictly comparable over the years as the responding States/UTs vary year to year.
170
(c) The Industrial Disputes Act, 1947£ Object and Scope-The Industrial Disputes Act was passed in March, 1947 repealing the Trade Disputes Act, 1929. The Act extends to the whole of India. The Act of 1947 was a comprehensive measure adopted by the Central Government with a view to improving industrial relations. The Act introduced the principle of compulsory arbitration and prohibited strikes without notice in public utility services. It also provided, for the first time two new institutions, viz. (i) Works Committees consisting of representatives of employers and employees in undertakings employing 100 or more workers, and (ii) Industrial Tribunal for the adjudication of industrial disputes. The main provisions of the Act relate to (i) works committees, (ii) conciliation and adjudication machinery, (iii) strikes and lockouts and (iv) lay-off, retrenchment and closure. The Act has been amended to amplify the term „appropriate government‟ defined under Section 2(a) of the Act, enhance the wage ceiling from Rs.1,600/- to Rs.10,000/- per month to cover workmen working in supervising capacity, provide direct access for the workman to the Labour Court or Tribunal in case of disputes arising out of Section 2A of the Act, expand the scope of qualifications of Presiding Officers of Labour Courts or Tribunals, establish Grievance Redressal Machinery and empowering the Labour Court or Tribunal to execute the awards etc. The amendment has been notified on 19.08.2010 and made effective from 15.09.2010.
11. MISCELLANEOUS
(a) The Child Labour (Prohibition and Regulation) Act, 1986
Child Labour (Prohibition & Regulation) Act, 1986, was enacted to prohibit employment of children below the age of 14 years in notified hazardous occupations and processes like carpet weaving; building and construction work; brick kilns; production of hosiery goods etc. and to regulate the working conditions of children in other occupations / processes. A corollary to this would be that if a child is in the work place, he would miss school. In order to align with the objective of mandatorily providing education up to the age of 14 years under RTE Act, Government has amended the Child Labour (Prohibition & Regulation) Act, 1986 with enactment of Child Labour (Prohibition & Regulation) Amendment Act, 2016 which provides for the complete ban on the employment or work of children below 14 years in all occupations and processes. The Amendment Act also prohibits the employment or work of adolescents, in the age of 14-18 years, in the scheduled hazardous occupations and processes. The Amendment Act came into force w.e.f. 01.09.2016.
The Act provides for constitution of a Technical Advisory Committee (TAC), which is a body of experts, to advise the Central Government to add or omit the occupations and processes in the Schedule of the Act. The Committee consists of a Chairman and such other members, not exceeding 10, as may be appointed by the Central Government. The Government has constituted TAC on 01.09.2016 for review of the present Schedule of the Act. Section 2 (i) of the Child and Adolescent Labour (Prohibition and Regulation) Act, 1986, defines the jurisdiction of both Central and State Governments in implementing the Act. The Central Government is the “appropriate Government” in relation to establishments under the control of the Central Government or a railway administration or a major port or a mine or oilfield. In all other cases, the State Government is the “appropriate Government”.
£ For data on Strikes and Lockouts kindly see Chapter 4 (2).
171
(b) The Collection of Statistics Act, 2008
The Collection of Statistics Act, 2008 was enacted by the Parliament on 7th January 2009.
It was brought into force on 11th June 2010. The Act repealed the Collection of Statistics Act, 1953.
Rules under the Act, namely, the Collection of Statistics Rules, 2011 were notified on 16th May
2011.
Some of the salient features of the Collection of Statistics Act, 2008 and the Rules made thereunder are as follows: -
The Act provides for collecting statistics on economic, demographic, social, scientific and environmental aspects not only from industrial and commercial concerns but also from individuals and households.
The Central/State Governments, UT Administrations and the local governments such as Panchayats and Municipalities have been empowered to collect any statistics. Any of them may appoint a statistics officer for each subject of data collection and/ or for each geographical unit.
Duplication of surveys has been a matter of concern, as it not only leads to wastage of resources on survey work, but also may give rise to conflicting statistics. The Act empowers the Central Government to make rules for avoiding duplication. The Rules made under the Act provide for designating a nodal officer at the Centre and in each State/ UT who would advice the concerned line Ministries on steps to be taken to avoid unnecessary duplication.
The Act provides for all methods of data collection including oral interviews and filing of returns electronically.
The information collected from any informant under the Act cannot be made use of for any purpose other than for prosecution under the Act or for statistical purposes. In other words, the information collected cannot be used as evidence for prosecution under any other law.
The Act provides penalties for neglect or refusal to furnish information. The penalty is up to Rs.1,000/- for individuals (Rs.5,000/- in case of a company).
More importantly, the obligation to furnish information under the Act will not cease after conviction for an offence. If the concerned person continues to neglect or refuse to furnish information after the expiry of fourteen days from the date of conviction, then he may be punished with a further fine up to Rs.1,000/- (Rs.5,000/- in case of a company) for each day after the first during which the failure continues.
The Act provides for stringent penalties for furnishing false information and for other serious offences in the form of simple imprisonment up to six months or with a fine or with both.
The Act and the Rules made thereunder provide for adequate confidentiality for the data collected and for appropriate safeguards when data collection is outsourced. Disclosure of information collected from any person without suppressing the identification particulars of that person is not permitted under the Act.
Prosecution for offences committed under the Act would be by way of a summary trial. (c) The Employment Exchanges (Compulsory Notification of Vacancies) Act, 1959
The Act came into force with effect from the 1st May, 1960 and has been implemented in
all the States in the country. It covers all establishments in Public Sector and non-agricultural establishments employing 25 or more workers in the Private Sector. It is not applicable in relation to vacancies (a) in any agriculture (including horticulture) establishments in private sector other than employment as agricultural or farm machinery operatives, (b) in any employment in domestic service, (c) in any employment, the total duration of which is less than 3 months, (d) in any employment to do unskilled office work e.g., daftary, jamadar, orderly, peon, dusting man, record lifter, process server, watchman, sweeper and any other employee doing any routine or unskilled
172
work which the Central Government by notification, may declare to be unskilled office work, and (e) any employment connected with the staff of the Parliament. Unless the Central Government otherwise directs by notification in the Official Gazette in this behalf, the Act is not applicable in relation to (a) vacancies which are proposed to be filled through promotion or by absorption of surplus staff of any branch or department of the same establishment or on the result of any examination or interview held by, or on the recommendations of any independent agency, such as, the Union or State Public Service Commission and the like and (b) vacancies in any employment which carry a remuneration of less than Rs. 60 in a month.
The Act requires that in any State or area thereof the employer in every establishment in public or private sector shall, before filling up any vacancy, notify them to employment exchanges. It also enjoins upon the Employers to furnish information about the number and type of vacancies occurred and filled during each quarter and the occupational and educational pattern of employees with them every alternate year. State Employment Market Information Units have been set up at each State Headquarter and Employment Market Information units have been set up at more than 500 districts in the country to maintain close liaison with employers. The Employment Officers of these units are provided extensive training by the State as well as Central Government in the field. Special stress is laid on using persuasive rather than coercive methods in collection of information under the Act. In case of Government Establishments liaison is maintained even at the level of the Head Quarter of the organization so that the field units do not lag behind in providing information. In case of Private Sector employers‟ personal contact through telephone, internet, fax and finally personal visits is the key to collection of information. The utility of the information in National Planning is stressed and employers are assured that the information provided by them would not put them in any disadvantageous position. The legal provisions in the Act, of prosecution of the employers, for non-rendering of information are used only in rare cases where all persuasion fails. (d) The Apprentices Act, 1961 The Apprentices Act, 1961 came into force on March 1, 1962. The main object of the Act is to provide for the regulation and control of training of apprentices in trades and for matters connected therewith. The Act extends to the whole of India. The Act makes it obligatory on the part of employers both in Public and Private Sector establishments having requisite training infrastructure as laid down in the Act, to engage apprentices in industries and establishments covered under the Act. (e) The Beedi and Cigar Workers (Conditions of Employment) Act, 1966 The object of the Act is to regulate the conditions of work in beedi and cigar manufacturing establishments and to provide for the welfare of workers employed therein. It extends to the whole of India except the State of Jammu and Kashmir but all or any of its provisions becomes operative in any State or part of it only from such date as notified by the State Government. Under the Act, an industrial premises is defined as a place or premises including precincts thereof in which or in any part of which an industry or manufacturing process connected with the making of beedi or cigar or both is carried on with or without the aid of power.
The Main provisions of the Act relate to (i) health and welfare, (ii) hours of work and wages for overtime, (iii) employment of young persons and women, and (iv) leave and holidays. The administration of the Act rests with the State Governments. (f) The Contract Labour (Regulation and Abolition) Act, 1970 The Contract Labour (Regulation & Abolition) Act aims at regulating employment of contract labour so as to place it at par with labour employed directly, with regard to the working conditions and certain other benefits. Contract labour refers to the workers engaged by a contractor for the user enterprises. These workers are generally engaged in agricultural operations, plantation,
173
construction industry, ports & docks, oil fields, factories, railways, shipping, airlines, road transport, etc. The Act applies to every establishment/ contractor in which twenty or more workmen are employed or were employed on any day of the preceding twelve months as contract labour. Every establishment and contractor, to whom the Act applies, has to register themselves or obtain a license for execution of the contract work.
The interests of contract workers are protected in terms of wages, hours of work, welfare, health and social security. The amenities to be provided to contract labour include canteen, rest rooms, first aid facilities and other basic necessities at the work place like drinking water etc. The liability to ensure payment of wages and other benefits is primarily that of the contractor, and in case of default, that of the principal employer. The Act is implemented both by the Centre and the State Governments. The Central Government has jurisdiction over establishments like railways, banks, mines etc. and the State Governments have jurisdiction over units located in that state. In the Central sphere, the Central Industrial Relations Machinery (CIRM) headed by Chief Labour Commissioner (Central) and his officers have been entrusted with the responsibility of enforcing the provisions of the Act and the rules made thereunder. Apart from the regulatory measures provided under the Act for the benefit of the contract labour, the 'appropriate government' under the Act is authorised, as the case may be, to prohibit, by notification in the official gazette, employment of contract labour in any establishment in any process, operation or other work.
(g) The Equal Remuneration Act, 1976 Consequent upon the ratification of ILO Convention No.100, the Equal Remuneration Act, 1976 was passed by the Parliament. The main object of this Act is to provide for the payment of equal remuneration to men and women workers and for the prevention of discrimination on the ground of sex, against women in the matter of employment and for matters connected therewith or incidental thereto. The Act extends to the whole of India. Under this Act, no employer shall pay to any worker, employed by him in an establishment or employment, remuneration, whether payable in cash or in kind at rates less favorable than those at which remuneration is paid by him to the workers of the opposite sex in such establishment or employment for performing the same work or work of similar nature. “Same work or work of a similar nature” has been defined as work in respect of which the skill, effort and responsibility required are the same, when performed under similar working conditions, by a man or a woman and the differences, if any, between the skill, effort and responsibility required of a man and those required of a woman are not of practical importance in relation to the terms and conditions of employment. In case, before the commencement of this Act, the remuneration for men and women were being paid differently, then the higher (in cases where there were two rates) or the highest (in cases where there were more than two rates) of such rates would be the rate at which remuneration would be payable, on and from such commencement, to such men and women workers as may be prescribed. No discrimination is to be made while recruiting men and women workers for the same or a similar nature of work except where the employment of women in such work is prohibited or restricted by or under any law for the time being. (h) The Bonded Labour System (Abolition) Act, 1976 The practice of bonded labour system stands abolished throughout the country with the enactment of Bonded Labour System (Abolition) Act, 1976 and made the practice of bondage cognizable offence punishable by law. Though the responsibility of implementing the Act lies with the State Government, with a view to supplementing the efforts of the State Governments a Centrally Sponsored Plan Scheme for rehabilitation of bonded labour was launched by the Ministry of Labour and Employment in May, 1978. The Scheme was drastically modified in May 2000. Under the modified scheme since May, 2000, rehabilitation assistance @ 20,000 per bonded labour was provided which was equally borne by the Central and State Governments. In the case of the
174
North Eastern States, 100% central assistance was provided, if they expressed their inability to provide their share.
The Government has revamped the Centrally Sponsored Plan Scheme for Rehabilitation of Bonded Labourers with effect from 17
th May, 2016. The revamped scheme is known as the
„Central Sector Scheme for Rehabilitation of Bonded Labourers, 2016‟. The revised scheme is a Central Sector Scheme. The State Government is not required to pay any matching contribution for the purpose of cash rehabilitation assistance. Financial assistance has been increased from Rs. 20,000/- to one lakh per adult male beneficiary, Rs. 2 lakh for special category beneficiaries such as children including orphans or those rescued from organized & forced begging rings or other forms of forced child labour, and women and Rs. 3 lakh in cases of bonded or forced labour involving extreme cases of deprivation or marginalization such as trans-genders, or woman or children rescued from ostensible sexual exploitation such as brothels, massage parlours, placement agencies etc., or trafficking, or in cases of differently abled persons, or in situations where the District Magistrate deems fit. A sum of Rs.9102.12 Lakhs has been released under the scheme to the State Governments for rehabilitation of 2,89,222 bonded labourers. (i) The Sales Promotion Employees’ (Conditions of Services) Act, 1976 The main object of this Act is to regulate certain conditions of service of sales promotion employees in certain establishments. The Central Government is responsible for the framing of the rules concerning this Act.
The Act in the first instance applies to every establishment engaged in pharmaceutical industry. However, the Central Government, by notification, can apply the provisions of the Act to any other establishment engaged in the notified industry. The provisions of the Workmen‟s Compensation Act, 1923, the Industrial Disputes Act, 1947, the Minimum Wages Act, 1948, the Maternity Benefit Act, 1961, the Payment of Bonus Act 1965 and the Payment of Gratuity Act, 1972 have been made applicable to sales promotion employees.
In addition to casual leave or other kinds of leave, as may be prescribed, every sales promotion employee will be entitled to earned leave on full wages for not less than one-eleventh of the period spent on duty and leave on medical certificate on one half of the wages for not less than one eighteenth of the period of service.
(j) The Inter-State Migrant Workmen (Regulation of Employment and Conditions of Service) Act, 1979
The Inter-State Migrant Workmen (Regulation of Employment and Conditions of Service) Act, 1979 and the Inter-State Migrant Workmen (Regulation of Employment and Conditions of Service) Central Rules, 1980 came into force with effect from the 2
nd October, 1980. The Act is
intended to safeguard the interests of the workmen who are recruited by contractors from one State for service in an establishment situated in another State and to guard against the exploitation of such workmen by the contractors.
The Act regulates the employment of inter-state migrant workmen and also provides for their conditions of service and for matters connected therewith. It extends to the whole of India and applies to every establishment in which five or more inter-State migrant workmen (whether or not in addition to other workmen) are employed or who were employed on any day of the preceding twelve months. It also applies to every contractor who employs or who employed five or more inter-State migrant workmen on any day of the preceding twelve months.
The Act provides for registration of certain establishments, prohibition against employment of inter-State migrant workmen, registration, licensing of contractors, duties and obligations of contractors, wages and other conditions of service of such workmen, appointment of Inspection staff, etc.
175
(k) The Emigration Act, 1983 The Emigration Act, 1983, which came into effect from 30
th December, 1983 embodies the
guidelines enunciated by the Supreme Court of India in its judgement and order dated 20-03-1979 (Kanga Vs. Union of India and Others) and provides a regulatory framework in respect of emigration of Indian workers for overseas employment and seeks to safeguard their interests, and ensure their protection and welfare. Procedural safeguards have been provided under the law for protection of emigrants. The Act regulates recruitment for overseas employment and departure of the intending emigrants from India. It provides for penalties against offences.
Operational matters relating to emigration, the provision of emigration services to emigrants and the enforcement of the Emigration Act, 1983 are under the Protector General of Emigrants (PGE). The PGE is the statutory authority under the Emigration Act and responsible for the welfare and protection of emigrant workers.
(l) The Building and Other Construction Workers (Regulation of Employment and Conditions of Service) Act, 1996 and the Building and Other Construction Workers Welfare Cess Act, 1996
Two Acts viz., the Building and Other Construction Workers (Regulation of Employment
and Conditions of Service) Act, 1996 and the Building and Other Construction Workers Welfare Cess Act, 1996 have been brought on the Statute Book w.e.f. 20.8.1996. These legislations provide for regulating the employment and conditions of service, safety and health and welfare measures for the construction workers through State Welfare Boards constituted at the State level. Welfare measures are financed by levy of cess on all construction works at rates between 1 to 2% of the construction cost incurred by an employer (the Government has notified the cess @ 1%). The funds so collected are to be used for providing financial assistance to the families of registered workers in case of accident, old age pension, housing loans, payment of insurance premia, children's education, medical and maternity benefits, etc.
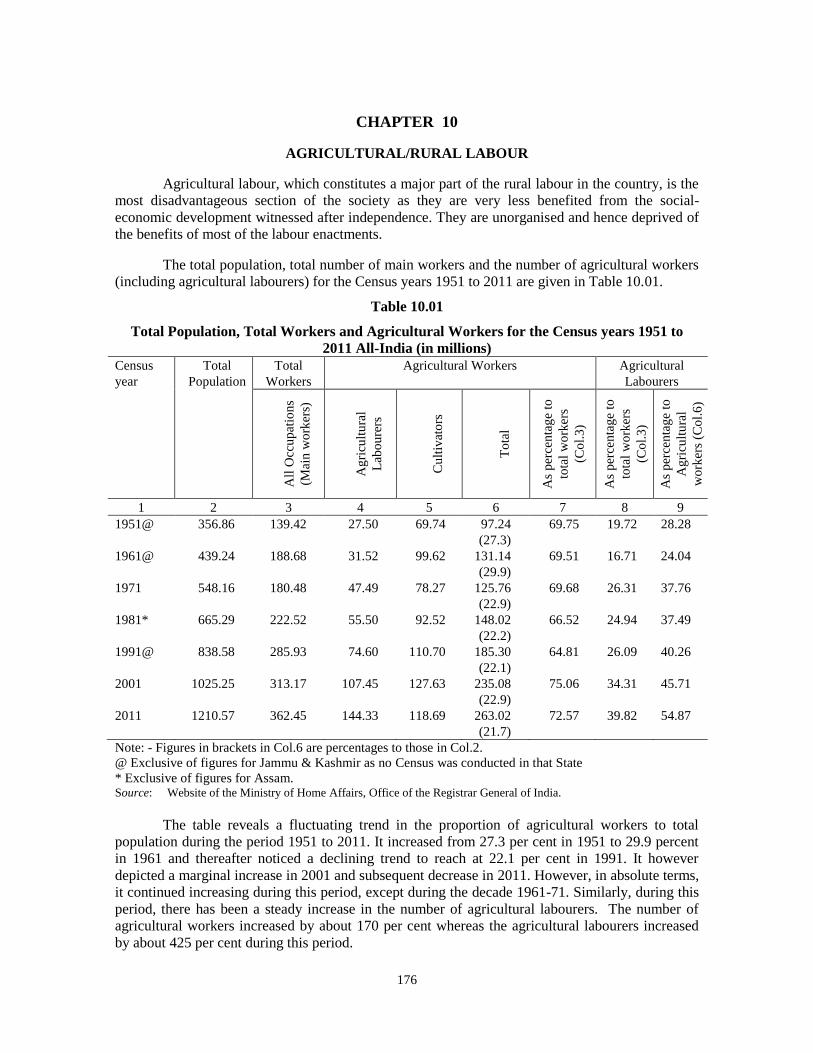
176
CHAPTER 10
AGRICULTURAL/RURAL LABOUR
Agricultural labour, which constitutes a major part of the rural labour in the country, is the
most disadvantageous section of the society as they are very less benefited from the social-
economic development witnessed after independence. They are unorganised and hence deprived of
the benefits of most of the labour enactments.
The total population, total number of main workers and the number of agricultural workers
(including agricultural labourers) for the Census years 1951 to 2011 are given in Table 10.01.
Table 10.01
Total Population, Total Workers and Agricultural Workers for the Census years 1951 to
2011 All-India (in millions)
Census
year
Total
Population
Total
Workers
Agricultural Workers Agricultural
Labourers
All
Occ
up
atio
ns
(Mai
n w
ork
ers)
Ag
ricu
ltu
ral
Lab
ou
rers
Cu
ltiv
ato
rs
To
tal
As
per
cen
tag
e to
tota
l w
ork
ers
(Co
l.3
)
As
per
cen
tag
e to
tota
l w
ork
ers
(Co
l.3
)
As
per
cen
tag
e to
Ag
ricu
ltu
ral
wo
rker
s (C
ol.
6)
1 2 3 4 5 6 7 8 9
1951@ 356.86 139.42 27.50 69.74 97.24
(27.3)
69.75 19.72 28.28
1961@ 439.24 188.68 31.52 99.62 131.14
(29.9)
69.51 16.71 24.04
1971 548.16 180.48 47.49 78.27 125.76
(22.9)
69.68 26.31 37.76
1981* 665.29 222.52 55.50 92.52 148.02
(22.2)
66.52 24.94 37.49
1991@ 838.58 285.93 74.60 110.70 185.30
(22.1)
64.81 26.09 40.26
2001 1025.25 313.17 107.45 127.63 235.08
(22.9)
75.06 34.31 45.71
2011 1210.57 362.45 144.33 118.69 263.02
(21.7)
72.57 39.82 54.87
Note: - Figures in brackets in Col.6 are percentages to those in Col.2.
@ Exclusive of figures for Jammu & Kashmir as no Census was conducted in that State
* Exclusive of figures for Assam. Source: Website of the Ministry of Home Affairs, Office of the Registrar General of India.
The table reveals a fluctuating trend in the proportion of agricultural workers to total
population during the period 1951 to 2011. It increased from 27.3 per cent in 1951 to 29.9 percent
in 1961 and thereafter noticed a declining trend to reach at 22.1 per cent in 1991. It however
depicted a marginal increase in 2001 and subsequent decrease in 2011. However, in absolute terms,
it continued increasing during this period, except during the decade 1961-71. Similarly, during this
period, there has been a steady increase in the number of agricultural labourers. The number of
agricultural workers increased by about 170 per cent whereas the agricultural labourers increased
by about 425 per cent during this period.
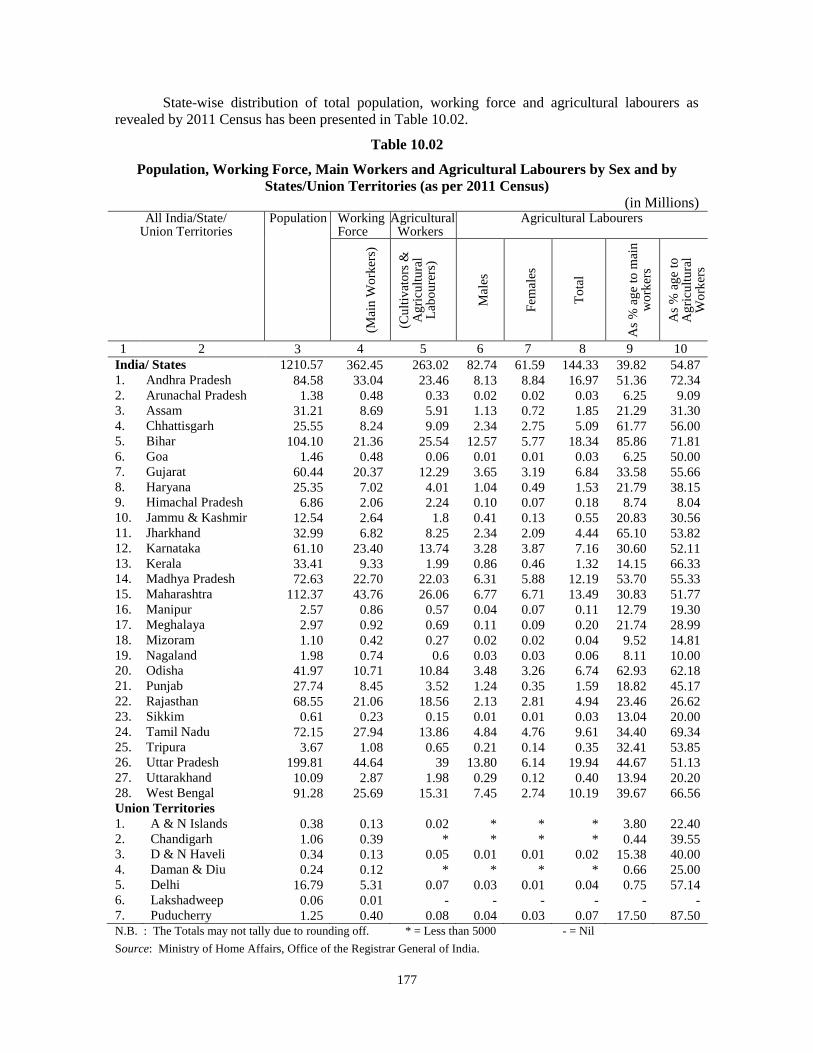
177
State-wise distribution of total population, working force and agricultural labourers as
revealed by 2011 Census has been presented in Table 10.02.
Table 10.02
Population, Working Force, Main Workers and Agricultural Labourers by Sex and by
States/Union Territories (as per 2011 Census)
(in Millions) All India/State/
Union Territories Population Working
Force Agricultural
Workers Agricultural Labourers
(M
ain
Wo
rker
s)
(Cu
ltiv
ato
rs &
A
gri
cult
ura
l L
abo
ure
rs)
M
ales
F
emal
es
T
ota
l
A
s %
ag
e to
mai
n
wo
rker
s
As
% a
ge
to
Ag
ricu
ltu
ral
Wo
rker
s
1 2 3 4 5 6 7 8 9 10
India/ States 1210.57 362.45 263.02 82.74 61.59 144.33 39.82 54.87 1. Andhra Pradesh 84.58 33.04 23.46 8.13 8.84 16.97 51.36 72.34 2. Arunachal Pradesh 1.38 0.48 0.33 0.02 0.02 0.03 6.25 9.09 3. Assam 31.21 8.69 5.91 1.13 0.72 1.85 21.29 31.30 4. Chhattisgarh 25.55 8.24 9.09 2.34 2.75 5.09 61.77 56.00 5. Bihar 104.10 21.36 25.54 12.57 5.77 18.34 85.86 71.81 6. Goa 1.46 0.48 0.06 0.01 0.01 0.03 6.25 50.00 7. Gujarat 60.44 20.37 12.29 3.65 3.19 6.84 33.58 55.66 8. Haryana 25.35 7.02 4.01 1.04 0.49 1.53 21.79 38.15 9. Himachal Pradesh 6.86 2.06 2.24 0.10 0.07 0.18 8.74 8.04 10. Jammu & Kashmir 12.54 2.64 1.8 0.41 0.13 0.55 20.83 30.56 11. Jharkhand 32.99 6.82 8.25 2.34 2.09 4.44 65.10 53.82 12. Karnataka 61.10 23.40 13.74 3.28 3.87 7.16 30.60 52.11 13. Kerala 33.41 9.33 1.99 0.86 0.46 1.32 14.15 66.33 14. Madhya Pradesh 72.63 22.70 22.03 6.31 5.88 12.19 53.70 55.33 15. Maharashtra 112.37 43.76 26.06 6.77 6.71 13.49 30.83 51.77 16. Manipur 2.57 0.86 0.57 0.04 0.07 0.11 12.79 19.30 17. Meghalaya 2.97 0.92 0.69 0.11 0.09 0.20 21.74 28.99 18. Mizoram 1.10 0.42 0.27 0.02 0.02 0.04 9.52 14.81 19. Nagaland 1.98 0.74 0.6 0.03 0.03 0.06 8.11 10.00 20. Odisha 41.97 10.71 10.84 3.48 3.26 6.74 62.93 62.18 21. Punjab 27.74 8.45 3.52 1.24 0.35 1.59 18.82 45.17 22. Rajasthan 68.55 21.06 18.56 2.13 2.81 4.94 23.46 26.62 23. Sikkim 0.61 0.23 0.15 0.01 0.01 0.03 13.04 20.00 24. Tamil Nadu 72.15 27.94 13.86 4.84 4.76 9.61 34.40 69.34 25. Tripura 3.67 1.08 0.65 0.21 0.14 0.35 32.41 53.85 26. Uttar Pradesh 199.81 44.64 39 13.80 6.14 19.94 44.67 51.13 27. Uttarakhand 10.09 2.87 1.98 0.29 0.12 0.40 13.94 20.20 28. West Bengal 91.28 25.69 15.31 7.45 2.74 10.19 39.67 66.56 Union Territories 1. A & N Islands 0.38 0.13 0.02 * * * 3.80 22.40 2. Chandigarh 1.06 0.39 * * * * 0.44 39.55 3. D & N Haveli 0.34 0.13 0.05 0.01 0.01 0.02 15.38 40.00 4. Daman & Diu 0.24 0.12 * * * * 0.66 25.00 5. Delhi 16.79 5.31 0.07 0.03 0.01 0.04 0.75 57.14 6. Lakshadweep 0.06 0.01 - - - - - - 7. Puducherry 1.25 0.40 0.08 0.04 0.03 0.07 17.50 87.50 N.B. : The Totals may not tally due to rounding off. * = Less than 5000 - = Nil
Source: Ministry of Home Affairs, Office of the Registrar General of India.
178
2. RURAL LABOUR ENQUIRIES (RLE)
Introduction: It has always been main objective of the Government of India to ensure maximum
opportunities for work and better living to the rural labourers as they constitute the major part of
the labour force in the country. With this objective in view, Labour Bureau was entrusted with the
work of conducting Rural Labour Enquiries (RLE). Under RLE, data on various socio-economic
aspects of rural and agricultural labour are collected and analysed on quinquennial basis. The First
Rural Labour Enquiry, preceded by two Agricultural Labour Enquiries, was conducted in the year
1963-65. The RLE was integrated with the General Employment & Unemployment Survey of the
NSSO in the year 1977-78 so as to narrow down the gap between the successive rounds of the
Enquiries. The latest RLE (2009-10) has already been completed and the results have also been
generated.
The data pertaining to Agricultural and Rural Labour Households collected under each of
the quinquennial surveys conducted by the NSSO are processed by the Labour Bureau and reports
on different aspects of Agricultural/Rural Labour Households viz; Indebtedness, Consumption
Expenditure, Wages & Earnings, Employment & Unemployment and General Characteristics of
Rural Labour Households are brought out for each round of the NSSO. RLE Reports based on 66th
NSS (2009-10) Round have been compiled and released by the Bureau.
The concepts and definitions over successive enquiries have been refined to generate better
estimates. These changes affected the comparability of data to some extent for different enquiries.
During the First Agricultural Labour Enquiry, the Agricultural Labour Household was defined on
the basis of employment criteria, whereas with effect from the second Agricultural Labour Enquiry,
the basis was changed to income. While only households engaged in crop production were covered
for the first enquiry, all households engaged in activities like dairy farming, horticulture, raising of
livestock etc. were also included in second Agricultural Labour Enquiry. The concepts and
definitions adopted for first and second Rural Labour Enquiries were identical but some additional
information regarding educational standards, trade unionism and awareness of the Minimum
Wages Act was also collected during second Rural Labour Enquiry. Data on employment and
unemployment were collected adopting the usual activity status, current weekly status and current
day activity status as recommended by the Committee of Experts on Unemployment Estimates
(1970). During the 32nd
, 38th, 43
rd, 50
th, 55
th, 61
st and
66
th rounds of N.S.S., some additional
information on subsidiary occupations etc. of the members of the households was also collected.
Wages & Earnings of Rural Labour Households: Many socio-economic factors affect the wage
structure in rural India. Despite the beneficial provision of the Minimum Wages Act, 1948 for
agricultural labourers, the wages are not consistent. Seasonal phenomenon in agriculture also plays
a pivotal role in the wage structure. During the peak agricultural season, the increased demand for
labour pushes up the wages whereas during the agricultural lean season there is hardly any work
for a large number of workers and the application of even the statutory minimum wages becomes
difficult. The details on earnings for the reference week were collected during the Rural Labour
Enquiry for each of the activities engaging the household members on wage paid labour. The
number of days to which the earnings related were recorded in terms of defined intensities. The
time-intensity of an activity was measured in half-day unit. The details of the average daily
earnings in respect of agricultural and non-agricultural operations are presented in table 10.03.
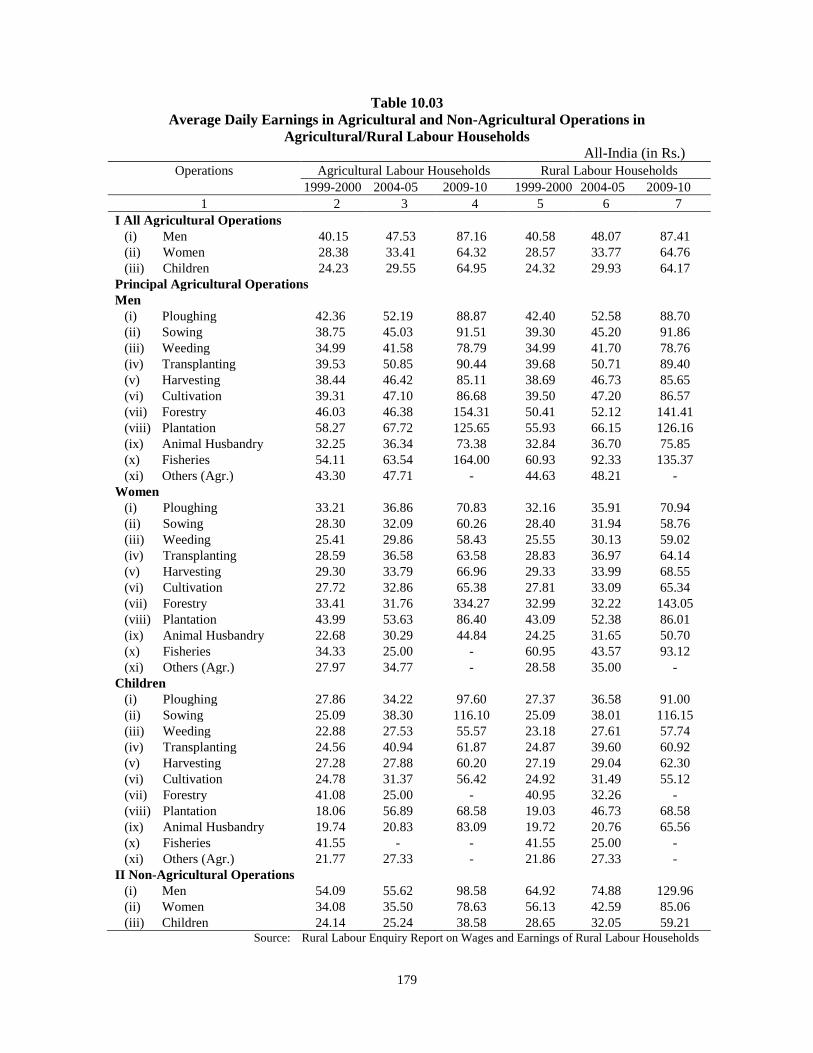
179
Table 10.03
Average Daily Earnings in Agricultural and Non-Agricultural Operations in
Agricultural/Rural Labour Households
All-India (in Rs.)
Operations Agricultural Labour Households Rural Labour Households
1999-2000 2004-05 2009-10 1999-2000 2004-05 2009-10
1 2 3 4 5 6 7
I All Agricultural Operations
(i) Men 40.15 47.53 87.16 40.58 48.07 87.41
(ii) Women 28.38 33.41 64.32 28.57 33.77 64.76
(iii) Children 24.23 29.55 64.95 24.32 29.93 64.17
Principal Agricultural Operations
Men
(i) Ploughing 42.36 52.19 88.87 42.40 52.58 88.70
(ii) Sowing 38.75 45.03 91.51 39.30 45.20 91.86
(iii) Weeding 34.99 41.58 78.79 34.99 41.70 78.76
(iv) Transplanting 39.53 50.85 90.44 39.68 50.71 89.40
(v) Harvesting 38.44 46.42 85.11 38.69 46.73 85.65
(vi) Cultivation 39.31 47.10 86.68 39.50 47.20 86.57
(vii) Forestry 46.03 46.38 154.31 50.41 52.12 141.41
(viii) Plantation 58.27 67.72 125.65 55.93 66.15 126.16
(ix) Animal Husbandry 32.25 36.34 73.38 32.84 36.70 75.85
(x) Fisheries 54.11 63.54 164.00 60.93 92.33 135.37
(xi) Others (Agr.) 43.30 47.71 - 44.63 48.21 -
Women
(i) Ploughing 33.21 36.86 70.83 32.16 35.91 70.94
(ii) Sowing 28.30 32.09 60.26 28.40 31.94 58.76
(iii) Weeding 25.41 29.86 58.43 25.55 30.13 59.02
(iv) Transplanting 28.59 36.58 63.58 28.83 36.97 64.14
(v) Harvesting 29.30 33.79 66.96 29.33 33.99 68.55
(vi) Cultivation 27.72 32.86 65.38 27.81 33.09 65.34
(vii) Forestry 33.41 31.76 334.27 32.99 32.22 143.05
(viii) Plantation 43.99 53.63 86.40 43.09 52.38 86.01
(ix) Animal Husbandry 22.68 30.29 44.84 24.25 31.65 50.70
(x) Fisheries 34.33 25.00 - 60.95 43.57 93.12
(xi) Others (Agr.) 27.97 34.77 - 28.58 35.00 -
Children
(i) Ploughing 27.86 34.22 97.60 27.37 36.58 91.00
(ii) Sowing 25.09 38.30 116.10 25.09 38.01 116.15
(iii) Weeding 22.88 27.53 55.57 23.18 27.61 57.74
(iv) Transplanting 24.56 40.94 61.87 24.87 39.60 60.92
(v) Harvesting 27.28 27.88 60.20 27.19 29.04 62.30
(vi) Cultivation 24.78 31.37 56.42 24.92 31.49 55.12
(vii) Forestry 41.08 25.00 - 40.95 32.26 -
(viii) Plantation 18.06 56.89 68.58 19.03 46.73 68.58
(ix) Animal Husbandry 19.74 20.83 83.09 19.72 20.76 65.56
(x) Fisheries 41.55 - - 41.55 25.00 -
(xi) Others (Agr.) 21.77 27.33 - 21.86 27.33 -
II Non-Agricultural Operations
(i) Men 54.09 55.62 98.58 64.92 74.88 129.96
(ii) Women 34.08 35.50 78.63 56.13 42.59 85.06
(iii) Children 24.14 25.24 38.58 28.65 32.05 59.21 Source: Rural Labour Enquiry Report on Wages and Earnings of Rural Labour Households
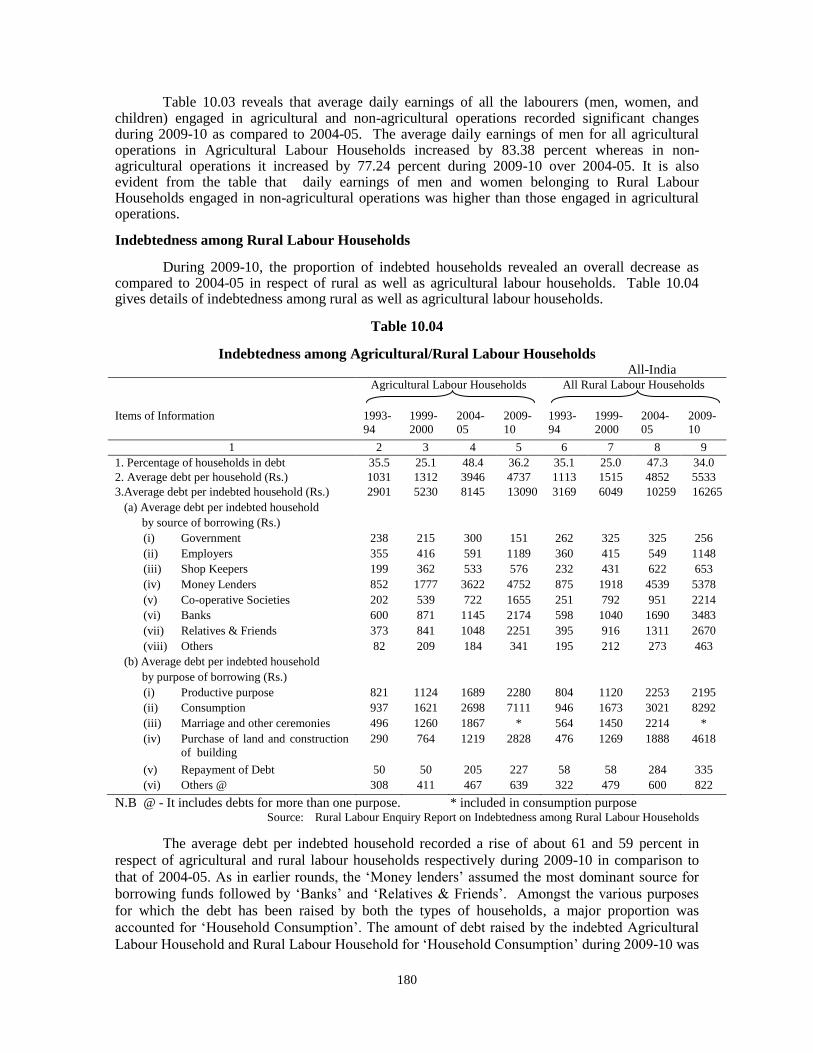
180
Table 10.03 reveals that average daily earnings of all the labourers (men, women, and children) engaged in agricultural and non-agricultural operations recorded significant changes during 2009-10 as compared to 2004-05. The average daily earnings of men for all agricultural operations in Agricultural Labour Households increased by 83.38 percent whereas in non-agricultural operations it increased by 77.24 percent during 2009-10 over 2004-05. It is also evident from the table that daily earnings of men and women belonging to Rural Labour Households engaged in non-agricultural operations was higher than those engaged in agricultural operations.
Indebtedness among Rural Labour Households
During 2009-10, the proportion of indebted households revealed an overall decrease as compared to 2004-05 in respect of rural as well as agricultural labour households. Table 10.04 gives details of indebtedness among rural as well as agricultural labour households.
Table 10.04
Indebtedness among Agricultural/Rural Labour Households All-India
Agricultural Labour Households
All Rural Labour Households
Items of Information 1993-
94
1999-
2000
2004-
05
2009-
10
1993-
94
1999-
2000
2004-
05
2009-
10
1 2 3 4 5 6 7 8 9
1. Percentage of households in debt 35.5 25.1 48.4 36.2 35.1 25.0 47.3 34.0
2. Average debt per household (Rs.) 1031 1312 3946 4737 1113 1515 4852 5533
3.Average debt per indebted household (Rs.) 2901 5230 8145 13090 3169 6049 10259 16265
(a) Average debt per indebted household
by source of borrowing (Rs.)
(i) Government 238 215 300 151 262 325 325 256
(ii) Employers 355 416 591 1189 360 415 549 1148
(iii) Shop Keepers 199 362 533 576 232 431 622 653
(iv) Money Lenders 852 1777 3622 4752 875 1918 4539 5378
(v) Co-operative Societies 202 539 722 1655 251 792 951 2214
(vi) Banks 600 871 1145 2174 598 1040 1690 3483
(vii) Relatives & Friends 373 841 1048 2251 395 916 1311 2670
(viii) Others 82 209 184 341 195 212 273 463
(b) Average debt per indebted household
by purpose of borrowing (Rs.)
(i) Productive purpose 821 1124 1689 2280 804 1120 2253 2195
(ii) Consumption 937 1621 2698 7111 946 1673 3021 8292
(iii) Marriage and other ceremonies 496 1260 1867 * 564 1450 2214 *
(iv) Purchase of land and construction
of building
290 764 1219 2828 476 1269 1888 4618
(v) Repayment of Debt 50 50 205 227 58 58 284 335
(vi) Others @ 308 411 467 639 322 479 600 822
N.B @ - It includes debts for more than one purpose. * included in consumption purpose Source: Rural Labour Enquiry Report on Indebtedness among Rural Labour Households
The average debt per indebted household recorded a rise of about 61 and 59 percent in
respect of agricultural and rural labour households respectively during 2009-10 in comparison to
that of 2004-05. As in earlier rounds, the „Money lenders‟ assumed the most dominant source for
borrowing funds followed by „Banks‟ and „Relatives & Friends‟. Amongst the various purposes
for which the debt has been raised by both the types of households, a major proportion was
accounted for „Household Consumption‟. The amount of debt raised by the indebted Agricultural
Labour Household and Rural Labour Household for „Household Consumption‟ during 2009-10 was
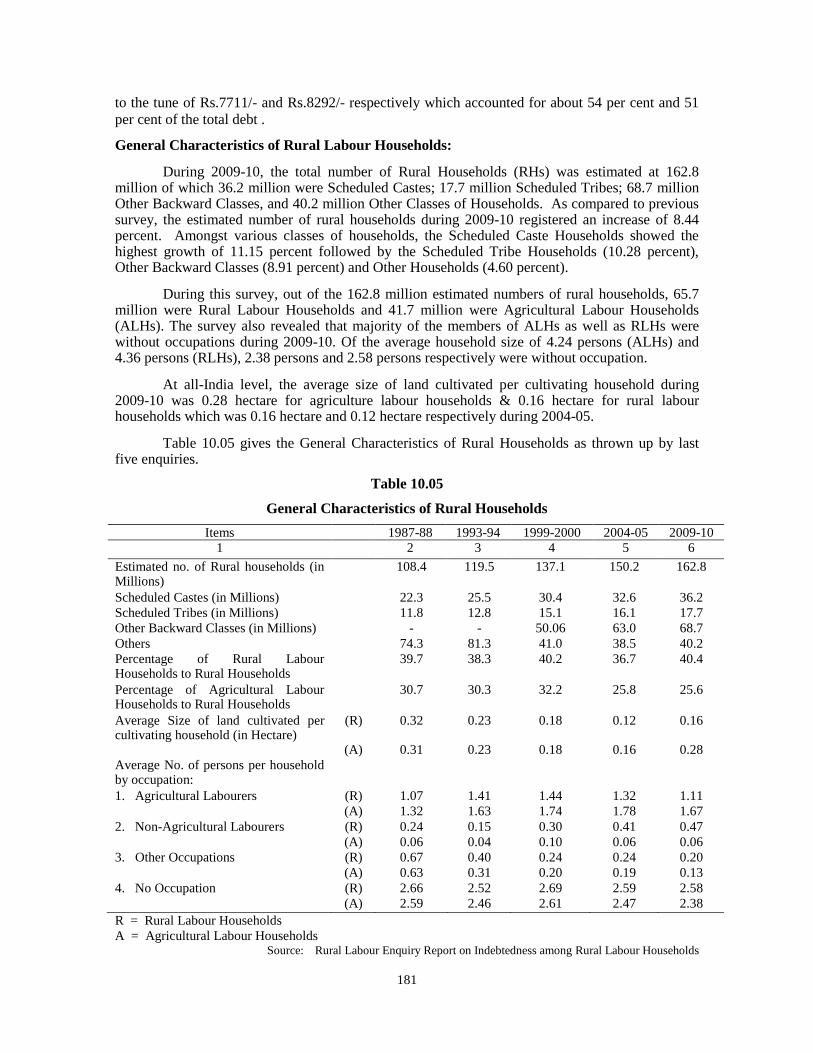
181
to the tune of Rs.7711/- and Rs.8292/- respectively which accounted for about 54 per cent and 51
per cent of the total debt .
General Characteristics of Rural Labour Households:
During 2009-10, the total number of Rural Households (RHs) was estimated at 162.8 million of which 36.2 million were Scheduled Castes; 17.7 million Scheduled Tribes; 68.7 million Other Backward Classes, and 40.2 million Other Classes of Households. As compared to previous survey, the estimated number of rural households during 2009-10 registered an increase of 8.44 percent. Amongst various classes of households, the Scheduled Caste Households showed the highest growth of 11.15 percent followed by the Scheduled Tribe Households (10.28 percent), Other Backward Classes (8.91 percent) and Other Households (4.60 percent).
During this survey, out of the 162.8 million estimated numbers of rural households, 65.7 million were Rural Labour Households and 41.7 million were Agricultural Labour Households (ALHs). The survey also revealed that majority of the members of ALHs as well as RLHs were without occupations during 2009-10. Of the average household size of 4.24 persons (ALHs) and 4.36 persons (RLHs), 2.38 persons and 2.58 persons respectively were without occupation.
At all-India level, the average size of land cultivated per cultivating household during 2009-10 was 0.28 hectare for agriculture labour households & 0.16 hectare for rural labour households which was 0.16 hectare and 0.12 hectare respectively during 2004-05.
Table 10.05 gives the General Characteristics of Rural Households as thrown up by last five enquiries.
Table 10.05
General Characteristics of Rural Households
Items 1987-88 1993-94 1999-2000 2004-05 2009-10
1 2 3 4 5 6
Estimated no. of Rural households (in Millions)
108.4 119.5 137.1 150.2 162.8
Scheduled Castes (in Millions) 22.3 25.5 30.4 32.6 36.2
Scheduled Tribes (in Millions) 11.8 12.8 15.1 16.1 17.7
Other Backward Classes (in Millions) - - 50.06 63.0 68.7
Others 74.3 81.3 41.0 38.5 40.2
Percentage of Rural Labour Households to Rural Households
39.7 38.3 40.2 36.7 40.4
Percentage of Agricultural Labour Households to Rural Households
30.7 30.3 32.2 25.8 25.6
Average Size of land cultivated per cultivating household (in Hectare)
(R) 0.32 0.23 0.18 0.12 0.16
(A) 0.31 0.23 0.18 0.16 0.28
Average No. of persons per household by occupation:
1. Agricultural Labourers (R) 1.07 1.41 1.44 1.32 1.11
(A) 1.32 1.63 1.74 1.78 1.67
2. Non-Agricultural Labourers (R) 0.24 0.15 0.30 0.41 0.47
(A) 0.06 0.04 0.10 0.06 0.06
3. Other Occupations (R) 0.67 0.40 0.24 0.24 0.20
(A) 0.63 0.31 0.20 0.19 0.13
4. No Occupation (R) 2.66 2.52 2.69 2.59 2.58
(A) 2.59 2.46 2.61 2.47 2.38
R = Rural Labour Households
A = Agricultural Labour Households Source: Rural Labour Enquiry Report on Indebtedness among Rural Labour Households
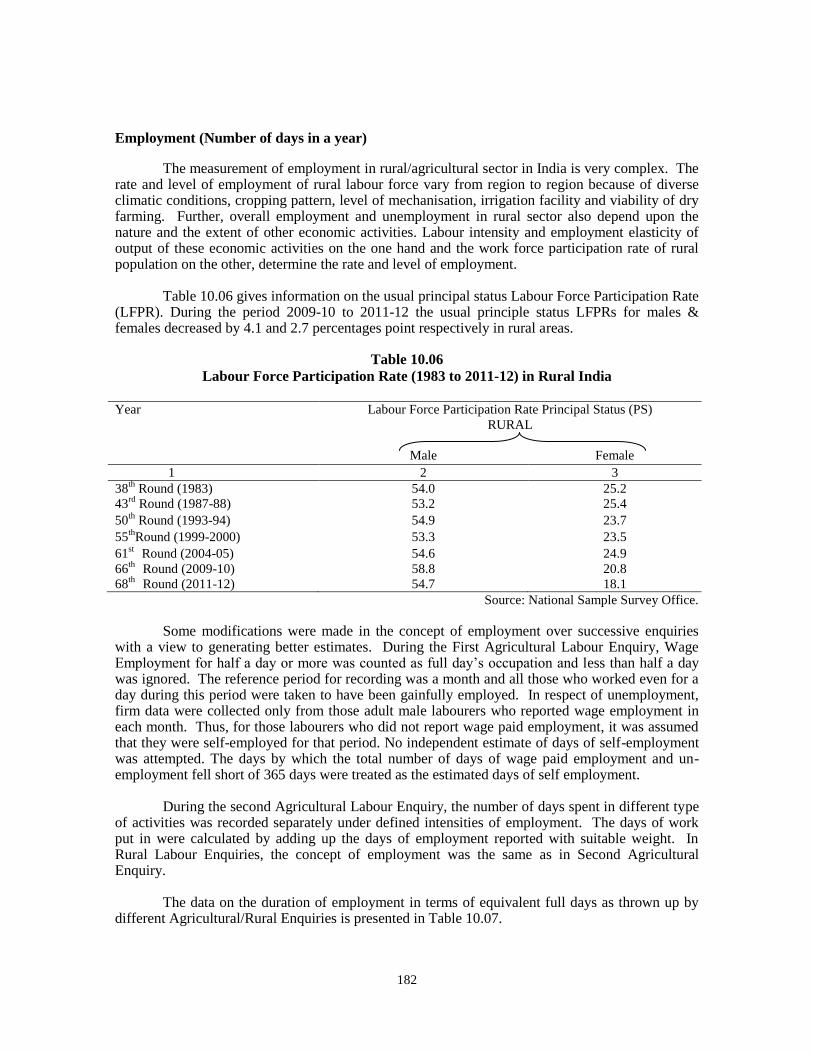
182
Employment (Number of days in a year) The measurement of employment in rural/agricultural sector in India is very complex. The rate and level of employment of rural labour force vary from region to region because of diverse climatic conditions, cropping pattern, level of mechanisation, irrigation facility and viability of dry farming. Further, overall employment and unemployment in rural sector also depend upon the nature and the extent of other economic activities. Labour intensity and employment elasticity of output of these economic activities on the one hand and the work force participation rate of rural population on the other, determine the rate and level of employment. Table 10.06 gives information on the usual principal status Labour Force Participation Rate (LFPR). During the period 2009-10 to 2011-12 the usual principle status LFPRs for males & females decreased by 4.1 and 2.7 percentages point respectively in rural areas.
Table 10.06
Labour Force Participation Rate (1983 to 2011-12) in Rural India
Year Labour Force Participation Rate Principal Status (PS)
RURAL
Male Female
1 2 3
38th
Round (1983) 54.0 25.2
43rd
Round (1987-88) 53.2 25.4
50th
Round (1993-94) 54.9 23.7
55th
Round (1999-2000) 53.3 23.5
61st
Round (2004-05)
66th
Round (2009-10)
68th
Round (2011-12)
54.6
58.8
54.7
24.9
20.8
18.1
Source: National Sample Survey Office.
Some modifications were made in the concept of employment over successive enquiries with a view to generating better estimates. During the First Agricultural Labour Enquiry, Wage Employment for half a day or more was counted as full day‟s occupation and less than half a day was ignored. The reference period for recording was a month and all those who worked even for a day during this period were taken to have been gainfully employed. In respect of unemployment, firm data were collected only from those adult male labourers who reported wage employment in each month. Thus, for those labourers who did not report wage paid employment, it was assumed that they were self-employed for that period. No independent estimate of days of self-employment was attempted. The days by which the total number of days of wage paid employment and un-employment fell short of 365 days were treated as the estimated days of self employment.
During the second Agricultural Labour Enquiry, the number of days spent in different type of activities was recorded separately under defined intensities of employment. The days of work put in were calculated by adding up the days of employment reported with suitable weight. In Rural Labour Enquiries, the concept of employment was the same as in Second Agricultural Enquiry.
The data on the duration of employment in terms of equivalent full days as thrown up by different Agricultural/Rural Enquiries is presented in Table 10.07.
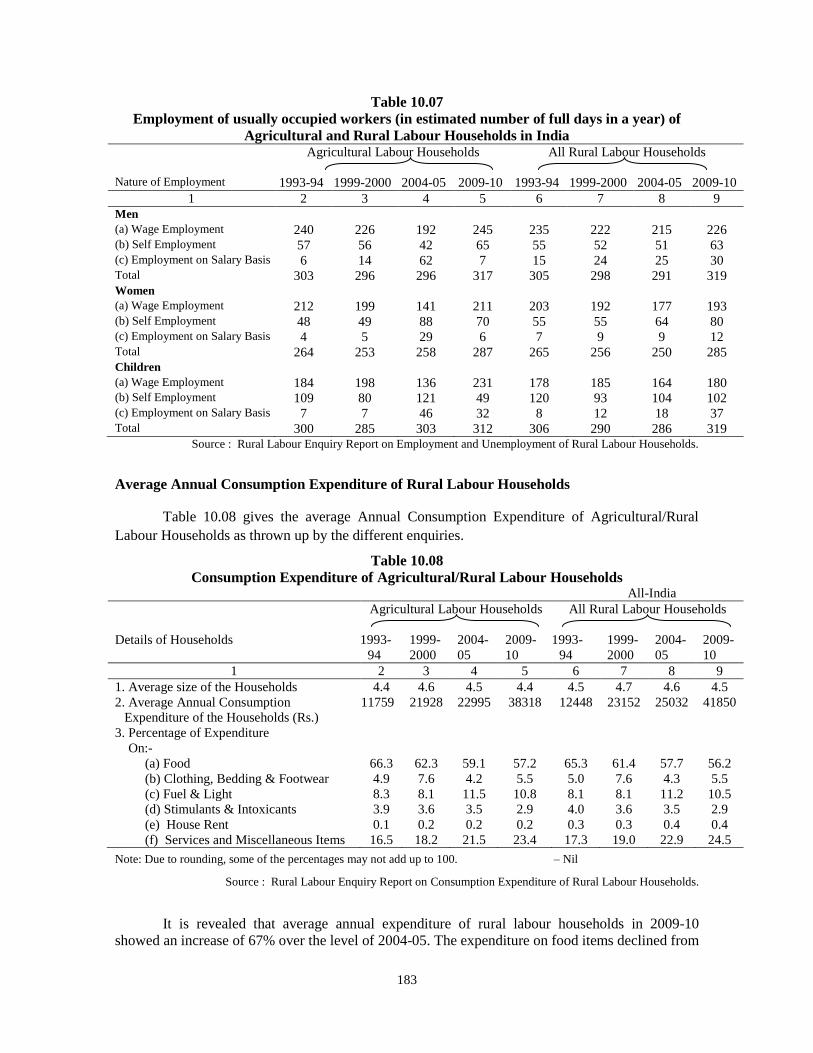
183
Table 10.07
Employment of usually occupied workers (in estimated number of full days in a year) of
Agricultural and Rural Labour Households in India Agricultural Labour Households
All Rural Labour Households
Nature of Employment 1993-94 1999-2000 2004-05 2009-10 1993-94 1999-2000 2004-05 2009-10
1 2 3 4 5 6 7 8 9
Men (a) Wage Employment 240 226 192 245 235 222 215 226 (b) Self Employment 57 56 42 65 55 52 51 63 (c) Employment on Salary Basis 6 14 62 7 15 24 25 30 Total 303 296 296 317 305 298 291 319 Women (a) Wage Employment 212 199 141 211 203 192 177 193 (b) Self Employment 48 49 88 70 55 55 64 80 (c) Employment on Salary Basis 4 5 29 6 7 9 9 12 Total 264 253 258 287 265 256 250 285 Children (a) Wage Employment 184 198 136 231 178 185 164 180 (b) Self Employment 109 80 121 49 120 93 104 102 (c) Employment on Salary Basis 7 7 46 32 8 12 18 37 Total 300 285 303 312 306 290 286 319
Source : Rural Labour Enquiry Report on Employment and Unemployment of Rural Labour Households.
Average Annual Consumption Expenditure of Rural Labour Households Table 10.08 gives the average Annual Consumption Expenditure of Agricultural/Rural
Labour Households as thrown up by the different enquiries.
Table 10.08
Consumption Expenditure of Agricultural/Rural Labour Households All-India
Agricultural Labour Households
All Rural Labour Households
Details of Households 1993-
94
1999-
2000
2004-
05
2009-
10
1993-
94
1999-
2000
2004-
05
2009-
10
1 2 3 4 5 6 7 8 9
1. Average size of the Households 4.4 4.6 4.5 4.4 4.5 4.7 4.6 4.5
2. Average Annual Consumption
Expenditure of the Households (Rs.)
11759 21928 22995 38318 12448 23152 25032 41850
3. Percentage of Expenditure
On:-
(a) Food 66.3 62.3 59.1 57.2 65.3 61.4 57.7 56.2
(b) Clothing, Bedding & Footwear 4.9 7.6 4.2 5.5 5.0 7.6 4.3 5.5
(c) Fuel & Light 8.3 8.1 11.5 10.8 8.1 8.1 11.2 10.5
(d) Stimulants & Intoxicants 3.9 3.6 3.5 2.9 4.0 3.6 3.5 2.9
(e) House Rent 0.1 0.2 0.2 0.2 0.3 0.3 0.4 0.4
(f) Services and Miscellaneous Items 16.5 18.2 21.5 23.4 17.3 19.0 22.9 24.5
Note: Due to rounding, some of the percentages may not add up to 100. – Nil
Source : Rural Labour Enquiry Report on Consumption Expenditure of Rural Labour Households.
It is revealed that average annual expenditure of rural labour households in 2009-10
showed an increase of 67% over the level of 2004-05. The expenditure on food items declined from
184
57.7% of the total expenditure of rural labour households in 2004-05 to 56.2% in 2009-10. An
upward trend was observed in Clothing, Bedding & Footwear and Services & Miscellaneous group
items.
3. SOCIO-ECONOMIC WELFARE OF RURAL LABOUR
India has been a welfare state ever since it‟s Independence and the primary objective of all governmental endeavors has been the welfare of its millions. As about two third of the population of the country lives in villages, main objective of the governmental endeavors has been alleviating rural poverty and ensuring improved quality of life for the rural population especially those below the poverty line. The Ministry of Rural Development has been acting as a catalyst effecting the change in rural areas through the implementation of wide spectrum of poverty alleviation, employment generation, infrastructure development and social security programmes. With the experience gained, over the years, in the implementation of the programmes and in response to the felt needs of the poor, several programmes have been modified and new programmes have been introduced. The following major programmes are being operated by the Ministry of Rural Development in rural areas, (i) Mahatma Gandhi National Rural Employment Guarantee Act (MGNREGA) (ii) Deendayal Antyodaya Yojana - National Rural Livelihoods Mission (NRLM) (iii) Deen Dayal Upadhyaya Grameen Koushalya Yojana (DDU-GKY) (iv) Pradhan Mantri Gram Sadak Yojana (PMGSY) (v) National Social Assistance Programme (NSAP) (vi) Pradhan Matri Awas Yojana – Gramin (PMAY-G) (vii) Saansad Adarsh Gram Yojana (SAGY) and (viii) Shyama Prasad Mukherji Rurban Mission (SPMRM) etc. The programmes/schemes aim at:
● Providing livelihood opportunities to those in need including women and other vulnerable sections with focus on Below Poverty Line (BPL) households.
● Providing for the enhancement of livelihood security of households in rural areas by providing at least 100 days of guaranteed wage employment in every financial year to every household demanding it.
● Provision of all weather rural connectivity to unconnected rural habitations and upgradation of existing roads to provide market access.
● Providing basic housing and homestead to all household in rural areas. ● Providing social assistance to the elderly, widow and disabled persons. ● Providing urban amenities in rural areas for improvement of quality of rural life. ● Capacity development and training of rural development functionaries. ● Promoting involvement of voluntary agencies and individuals for Rural Development.
Article 41 of the Constitution of India directs the State to provide public assistance to its
citizens in case of unemployment, old age, sickness and disablement and in other cases of undeserved want within the limit of its economic capacity and development. It is in accordance with these noble principles that the Government of India included the National Social Assistance Programme in the Central Budget for 1995-96. This programme was meant for providing social assistance benefit to the aged, the BPL households in the case of death of the primary breadwinner and for maternity. These programmes were aimed at ensuring minimum national standards in addition to the benefits that the States were then providing or would provide in future. The NSAP now comprise Indira Gandhi National Old Age Pension Scheme (IGNOAPS), Indira Gandhi National Widow Pension Scheme (IGNWPS), Indira Gandhi National Disability Pension Scheme (IGNDPS), National Family Benefit Scheme (NFBS) and Annapurna.
185
CHAPTER 11
INDIA AND THE INTERNATIONAL LABOUR ORGANISATION
INTRODUCTION: The International Labour Organisation (ILO) was created in 1919, as part of the Treaty of Versailles that ended World War I, to reflect the belief that universal and lasting peace can be accomplished only if it is based on social justice.
The Constitution was drafted during January and April, 1919, by the Labour Commission set up by the Peace Conference, which first met in Paris and then in Versailles. It resulted in a Tripartite Organization, the only one of its kind bringing together representatives of Governments, employers and workers in its executive bodies.
The driving forces for ILO‟s creation arose from security, humanitarian, political and economic considerations. Summarizing them, the ILO Constitution‟s Preamble says the High Contracting Parties were „moved by sentiments of justice and humanity as well as by the desire to secure the permanent peace of the world.‟
There was keen appreciation of the importance of social justice in securing peace, against a background of exploitation of workers in the industrializing nations of that time. There was also increasing understanding of the world‟s economic interdependence and the need for co-operation to obtain similarity of working conditions in countries competing for markets. Reflecting these ideas, the Preamble States:
Whereas universal and lasting peace can be established only if it is based upon social justice;
And whereas conditions of labour exist involving such injustice, hardship and privation to large numbers of people as to produce unrest so great that the peace and harmony of the world are imperiled; and an improvement of those conditions is urgently required;
Whereas also the failure of any nation to adopt humane conditions of labour is an obstacle in the way of other nations which desire to improve the conditions in their own countries:
The areas of improvement listed in the Preamble remain relevant today, for example:
Regulation of the hours of work including the establishment of a maximum working day and week;
Regulation of labour supply, prevention of unemployment and provision of an adequate living wage;
Protection of the worker against sickness, disease and injury arising out of his employment;
Protection of children, young persons and women; Provision for old age and injury, protection of the interests of workers when employed
in countries other than their own; Recognition of the principle of equal remuneration for work of equal value; Recognition of the principle of freedom of association; Organization of vocational and technical education, and other measures.
Membership, Conventions & Recommendations At present, ILO has 187 member states. The ILO has so far, adopted a total of 189 Conventions, 6 Protocols and 205 Recommendations (Appendix-2) out of which India has ratified 47 conventions and one protocol of the ILO.
186
Working of ILO The ILO accomplishes its work through three main bodies, all of which comprise government, employer and worker representatives. International Labour Conference (ILC) The member States of the ILO meet at the International Labour Conference in June of each year, in Geneva. Two government delegates, an employer delegate and a worker delegate represent each Member State. Technical advisors assist the delegations, which are usually headed by Cabinet Ministers who take the floor on behalf of their governments.
Employer and worker delegates can freely express themselves and vote according to instructions received from their organizations. They sometimes vote against each other or even against their government representatives.
The Conference establishes and adopts International Labour Standards and is a forum for discussion of key social and labour questions. It also adopts the Organization‟s budget and elects the Governing Body. The Governing Body The Governing Body is the executive council of the ILO and meets three times a year, in March, June and November in Geneva. It takes decisions on ILO policy and establishes the programme and the budget, which it then submits to the Conference for adoption. It also elects the Director-General.
The ILO Governing Body is composed of 56 titular members (28 Government Members, 14 Employer Members and 14 Worker Members) and 66 Deputy Members (28 Government, 19 Employers and 19 Workers). Ten of the titular government seats are permanently held by States of Chief Industrial Importance. The other government members are elected by the Conference every three years taking into account geographical distribution. The employers and workers elect their own representatives respectively.
The International Labour Office The International Labour Office is the permanent secretariat of the International Labour Organization. It is the focal point for ILO‟s overall activities, which it prepares under the scrutiny of the Governing Body and under the leadership of a Director-General, who is elected for a five-year renewable term.
The office employs some 1,900 officials of over 110 nationalities at the Geneva headquarters and in 40 field offices around the world. In addition, some 600 experts undertake missions in all regions of the world under the programme of technical cooperation. The office also contains a research and documentation centre and a printing facility, which issue many specialized studies, reports and periodicals. INDIA AND INTERNATIONAL LABOUR ORGANISATION (ILO) India is one of the founding members of International Labour Organisation (ILO) that came into existence in 1919 and has been a permanent member of the ILO Governing Body since 1922. At present the ILO has 187 member states.
India and ILO have an enduring and vibrant relationship which is marked by close and dynamic cooperation over the years. This relationship has been a matter of mutual benefaction too. Even as India has significantly contributed to the achievement of ILO‟s objectives, its thought processes, deliberations and style of functioning, ILO too has made impression on the India‟s
187
legislative framework related to World of Work. Human dignity, social justice, equality of opportunity, avoidance of discriminations, freedom of association, etc., are but a few of the common sinews inherent in the Constitution of the Republic of India and of the ILO. Creation of a just and equitable World Order; securing distributive justice concurrently with economic growth and creation of employment opportunities for the purpose; increasing productivity to increase shareable gains; workers‟ participation; human resource development; human and environmental dimensions of technology; poverty alleviation; and economic reform with a human face are amongst the major thrust areas presented to ILO by India. INTERNATIONAL LABOUR CONFERENCE India has been playing a pro-active role in the proceedings of the ILO since its inception. The Indian delegation, which is tripartite in composition, has been participating in the International Labour Conference (ILC) on a regular basis. The ILC is the main policy making body of the ILO. While the International Labour Standards adopted by the ILC have been enriched by the vast experience of its delegates and advisers, the experience gained in this International forum by the members of the Indian delegations over a period of time has helped in giving the much needed international perspective to our national laws and practices. We have so far ratified 47 Conventions and one Protocol of the ILO. Latest Ratification by India
In a historic step towards eradication of Child Labour from the country, India ratified International Labour Organization‟s Convention No. 138 (minimum age for employment) and Convention No. 182 (worst forms of child labour) to symbolise its commitment and initiatives for eradication of child labour and attainment of Sustainable Development Goal 8.7 related with curbing of child labour. The ratification of both conventions coincided with the International Day against Child Labour expressing country‟s commitment along with global partners to fight the menace of child labour and providing the childhood back to them. Former Hon‟ble Minister of Labour and Employment Shri Bandaru Dattatreya handed the Instruments of Ratification to Mr. Guy Ryder, DG, ILO at the sideline event held in Geneva at the International Labour Conference, 2017 on 13
th June 2017.
With ratification of these two core ILO conventions, India has now ratified 47 Conventions which includes six core or fundamental human rights Conventions like Forced Labour Convention (C-29), Equal Remuneration Convention (C-100), Abolition of Forced Labour Convention (C-105), Discrimination (Employment & Occupation) Convention (C-111), Minimum Wage Convention, 1973 (C-138) and Worst Forms of Child Labour Convention, 1999 (C-182) and three priority/governance conventions such as Labour Inspection Convention (No. 81), Employment and Social Policy Convention (No. 122) and Tripartite Consultations (International Labour Standards). 106
th Session of the International Labour Conference & 330
th Session of the Governing Body,
ILO
The 106th Session of the International Labour Conference (ILC) of ILO and 330
th Session
of Governing Body was held from 4th June to 17
th June, 2017 in Geneva. A high level Indian
Tripartite Delegation led by Shri Bandaru Dattatreya, the then Hon'ble Minister of State for Labour & Employment (Independent Charge) attended the ILC. Besides officials from Ministry of Labour & Employment, the delegation included 11 representatives each from Workers (Central Trade Union Organizations) and Central Organization of Employers' side in the ILC. The Conference was followed by 330
th Session of the Governing Body meeting of ILO.
On the sidelines of 106th ILC, a special event highlighting various measures taken by India
to eradicate child labour was hosted on 13th June, 2017. Hon‟ble Minister of State for Labour &
188
Employment handed over the Instruments of Ratification of the ILO‟s core Child Labour - related Conventions (No. 138 & 182) signed by the Hon‟ble President of India to Director General, ILO.
Heads of States and Governments of ILO Member States with participants from representing governments, employers and workers groups attended the conference. Given the federal structure of Government and the fact that labour is a concurrent subject, the Indian delegation also included Labour Ministers from Rajasthan, Assam and Andhra Pradesh.
Synopsis of the Composition of the 106th
Session of the International Labour Conference of ILO
335 Government delegates, 162 Employers' delegates and 163 Workers' delegates - a total of 6,092 representatives accredited to take part in the Conference in conformity with the provisions of the Constitution of the Organization (as compared to 5,982 in 2016, 5,912 in 2015, 5,245 in 2014, 5,593 in 2013 and 5,327 in 2012). This year the tripartite delegation representing governments, employers and workers from 169 of the ILO Member States attended the conference.
Agenda of the Conference and Items placed on the agenda by the Conference
Standing Items
I) Reports of the Chairperson of the Governing Body and of the Director General. II) Programme and budget proposals for 2018-19 and other questions. III) Information and reports on the application of Conventions and Recommendations.
Items placed on the agenda by the Conference or the Governing Body
IV) Labour Migration (general discussion) V) Employment and decent work for peace and resilience: Revision of the Employment
(Transition from War to Peace) Recommendation, 1944 (No. 71) (Standard setting second discussion)
VI) A recurrent discussion on the strategic objective of fundamental principles and rights at work, under the follow-up to the ILO Declaration on Social Justice for a Fair Globalization, 2008.
VII) Abrogation of Conventions No. 4, 15, 28, 41, 60 and 67.
Plenary Session
Speaking at the Plenary Session of the International Labour Conference on 14th June 2017,
Hon'ble Labour and Employment Minister, Mr. Bandaru Dattatreya expressed his happiness over the growing coherence between the Sustainable Development Goals and the agenda of ILO and other UN forums. He said that no development was complete unless it benefitted each and every person in the society. He further added that poverty eradication, employment generation and reducing inequality formed the core of the development strategy of India. On ratification by India of two core ILO conventions on Child Labour, he reiterated India's commitment for a safe, healthy and happy future for children. He further added that the government is committed to provide social security for 450 million workforce in the informal sector. He informed about the amended Maternity Benefit Amendment Act, 2017 that provides for paid maternity leave of 26 weeks which would encourage women into employment.
Smt. M. Sathiyavathy, Secretary, Labour and Employment, addressed the Plenary Session of the 106
th ILC and placed on record India's appreciation for a comprehensive and topical report of
Director General, ILO, Mr. Guy Ryder on 'Work in a changing climate: The Green Initiative'. She indicated that the Paris Agreement of 2015 had defined the global climate initiative in the changing context of globalization which recognized national contexts, yet respected the principles of shared responsibility and collective commitments. The fact that 195 countries have signed and 147 have recognized it, is a testimony of its importance. She reiterated India's commitment to cleaner climate and energy transition. She mentioned about setting up of the international and inter-governmental organization - „International Solar Alliance‟ headquartered at National Institute of Solar Energy
189
(NISE) in India that is dedicated to promotion and for making solar energy a valuable source of affordable, reliable, green and clean energy in 121 member countries.
Committee Wise Discussion
A. Committee on Application of Standards
The Committee on the Application of Conventions and Recommendation deals with information and reports on the application of Conventions and Recommendations. The Committee considered 24 individual cases of serious failure by member states relating to application of various conventions. From India, Smt. M. Sathiyavathy, Secretary (L&E), MoLE, Shri Rajiv Chander, Ambassador, PMI Geneva and Shri Manish Kumar Gupta, Joint Secretary, MoLE represented the country in this Committee.
India presented its case on Convention 81 concerning Labour Inspection Convention which relates to a complaint made by a Indian Central Trade Union in 2014 alleging the dilution of Labour Inspection system in particular the free initiative of labour inspectors to undertake labour inspections in wake of the labour law reforms initiated by the Government of India as well as implementation of a web based platform Shram Suvidha Portal for enabling IT enabled compliance and enforcement of labour laws. The case has been examined by CAS in 104
th Session of ILC in
2015 where Government of India had submitted an elaborate reply, substantiated by detailed statistics, to each of the observations of the Committee. Committee, at the end of the examination of the case, sought for more information on various aspects of Labour Inspection system in India which has been since then duly supplied by Government both in August 2015 and then in September 2016 as a part of periodical submission of information to ILO under the Article 22 of ILO constitution in respect of ratified Convention.
B. Committee on Labour Migration
The committee made its deliberation for discussion on five questions relating to opportunities and challenges presented by labour migration governance; enhancing cooperation and coordination between ministries of labour and other relevant government entities dealing with migration; strengthening of social dialogue on labour migration; relevance of ILO‟s existing normative and policy frameworks; and actions to be taken by ILO‟s constituents and office on issues such as labour migration data. India reiterated the need of increased focus on promotion of productive skills & protection from exploitation at the core of labour migration governance. Unilateral measures, bilateral and multilateral agreements are a key set of instruments to address migration risks and provide social protection. Coordination and cooperation between ministries of labour and other relevant government entities is crucial to make labour migration an engine of growth. The need for establishment of specific regional and national level mechanisms in the form of joint working groups with a mandate to resolve inter-ministerial issues through dialogue was also highlighted.
At the national and global level there is a need for regional policy approach and coordination for harmonization of labour policies through the inclusion of mechanisms for social dialogue in these aspects at the sub-regional and regional levels which could go a long way towards harmonization of these policies in consultation with ILO. India in its Intervention stated that ILO has made substantial progress in making the existing normative and policy frameworks concerning bilateral agreement and fair recruitment more effective. The existing framework is quite efficient given that national priorities may be different and this cannot be ignored. The following areas were highlighted where scope for improvement exists - collection of high quality reliable data for informed policy making and to enhance safe orderly & regular migration, efforts to develop comparable international indicators and the need of enhanced support for effective and targeted capacity building in developing countries to achieve the goal of quality & reliable data.
C. Committee on Employment and decent work for peace and resilience: Revision of the Employment (Transition from War to Peace) Recommendation, 1944 (No. 71)
190
India in its intervention, expressed satisfaction that the definition of the term „disaster‟ has been expanded to include “human, material, economic or environmental losses and impacts”. India reiterated that its reservations on the term 'full, productive, freely chosen' in the text of the Recommendation and that migrants and refugees have different obligations on the part of the receiving countries depending upon the standards governing them. Refugees pose several challenges to host governments, communities, and nationals and to refugees themselves and highlights the need for a more balanced, multifaceted, flexible and coordinated response. India reiterated that the responsibilities must be shared.
D. Committee on Fundamental Principles and Rights at Work
The Committee discussed the strategic objective of fundamental principles and rights at work, under the follow-up to the ILO Declaration on Social Justice for a Fair Globalization, 2008. Shri Rajeev Arora, Joint Secretary, MOLE, represented India in this committee. He, in his intervention, emphasized on a participative and consultative mechanism with the member constituents and social partners in strategic matters concerning development cooperation. Regional and County office of ILO may play the lead role by involving the national partners in identifying the key priorities of the constituents including region specific problems, opportunities and challenges. He stressed that the focus should be on long-term commitments to support development, prevent crises and built resilience.
Decent Work Country Program is an effective tool of ILO to extend technical expertise to tripartite partners on core labour issues. Synergy of DWCP with the activities of national government can make DWCP extremely relevant to the member county and can create a sense of ownership in the constituents. With regard to resource mobilization for ILO development cooperation strategy, he insisted that traditional north south cooperation must be pursued independently. He informed that India has enacted the Child Labour (Prohibition & Regulation) Amendment Act 2016 that provides for complete prohibition on work or employment of children below 14 years in all occupations and processes. Further, the employment of adolescents (14-18) has been prohibited in the hazardous occupations and processes. Government of India constituted the Technical Advisory Committee to advise the Government for review of existing Schedule on hazardous occupations and processes of the Act. The TAC has submitted its report and accordingly a revised Schedule of hazardous occupations and processes has been framed, after wide consultation with the tripartite members, and has been notified to include a comprehensive list of about 118 occupations and processes.
E. Committee on Abrogation of Conventions
The Committee discussed the abrogation of Conventions No. 4, 15, 28, 41, 60 and 67. While, supporting the abrogation of four and withdrawal of two international labour conventions, India in its intervention stated that robust and up-to-date ILO instruments are needed to respond to the changes taking place in the world of work and to ensure decent work for the workers. It was stated how the world of work has changed due to changing policies and strategies of countries; privatization and globalization of economies with consequent impact on labour markets. Updation of ILO instruments would become imperative with the technological revolutions and emergence of new forms of employment. Side-line Meetings during 106
th Session of ILC
NAM Ministerial Meeting
At the NAM Ministerial Meeting held on 13th June 2017, Hon‟ble Minister of Labour and
Employment, Shri Bandaru Dattatreya said “In India, we have leveraged the technological advancement. Technology forms the basis of many of our programmes, like Digital India, National Career Service (NCS) portal, extending social security benefits (DBT). NCS portal is our strengthened public employment services platform effectively using the information technology. The Portal already hosts more than 38 million job seekers and around 1.5 million job providers. We
191
are not against technological innovation, rather we embrace it. Besides, we have also embarked on massive skilling programmes by creating a separate Ministry for the purpose”.
ASPAG Ministerial Meeting
At the ASPAG Ministerial Meeting held on 13th June 2017, Hon‟ble Minister of Labour
and Employment, Shri Bandaru Dattatreya said “India firmly believes that employment generation with assured social protection and greater gender parity are fundamental to create an inclusive society”. He further added that “poverty alleviation strategy must be linked to robust employment generation policies and equally robust wage policies and social protection. Our challenge is to implementing these policies to the informal sector. In a recent massive drive we were successful in opening bank accounts for close to 5 million wage workers across the country in last 6 months. We amended the legislative provisions to enable the payment of wages through banking transactions thereby adding to the transition to formality”.
G20 Meeting
At the G20 Labour and Employment Ministerial Meeting held on 14th June 2017, Hon'ble Minister of Labour and Employment, Shri Bandaru Dattatreya, expressed his happiness that issues like technology transfers by businesses in the global supply chain and promotion of decent work through capacity building formed the part of the G20 Labour and Employment Ministerial Declaration adopted by G20 Labour and Employment Ministers in Bad Neuenahr, Germany in May 2017. He further urged the G20 countries to explore the possibility of signing bilateral agreements for providing social security cover to our workers and for promoting their skill development.
Bilateral Meeting
Indian delegation led by Minister also participated in bilateral meeting held with Iran and spoke about issues concerning MSMEs, rural employment and vocational training.
Meeting of Secretary (L&E)
In addition to the above meeting, Secretary, L&E had meeting with Iraq Delegation Ambassador Ms. Sandus Omar Ali Albayraqdar and Kurdistan Regional Government Minister Dr. Muhammad Q Hawdyani and discussed the issue of labour migration and possibility of MoU between India and Iraq. 330
th Session of the Governing body, ILO
330
th Session of the Governing Body of the International Labour Organisation was held on
17th June 2017 in Geneva. The Indian delegation participated in the Governing Body.
331
st Session of the Governing Body
331
st Session of the Governing Body (GB) of the International Labour Organisation was
held from 26 October - 9 November, 2017 in Geneva. The Indian delegation, led by Shri Arun Goel, Additional Secretary & Financial Adviser, participated in the Governing Body meeting along with officers from Permanent Mission of India in Geneva. Shri Rajit Punhani, Joint Secretary & Director General, Labour Welfare and Ms. Kamini Tandekar, Assistant Director, Ministry of Labour and Employment were the other members of the delegation. G20 Labour and Employment Ministers Meeting 2017 under German Presidency, 18-19 May 2017 in Neuenahr, Germany
Shri Bandaru Dattatreya, Hon‟ble Minister of State (IC), Labour and Employment, Smt. M. Sathiyavathy, Secretary (Labour and Employment), Shri Rajit Punhani, JS & DGLW and Dr. Sasi Kumar, Senior Fellow, VVGNLI and Shri C. Sudharshan Reddy, PS to MOS (IC), participated in
192
the G20 Labour and Employment Ministerial Meeting, held at Bad Neuenahr, Germany during 18-19
th May, 2017. India made interventions on the following agenda items:
Shaping the Future of Work
Three factors that will determine the future of work: technology, new forms of employment and labour migration. Technological progress gives us an opportunity to ensure that unproductive, unskilled work gives way to better productivity and better jobs for which skilling, reskilling and upskilling would play an important role. Today labour markets are witnessing a rise in the non-standard forms of employment like contract employment, part-time, temporary agency work. Blurring of employer and employee relationship poses challenges to the responsibility and accountability framework for ensuring decent work. It requires a renewed commitment from employers. It requires a different organizational focus for trade unions.
Reducing Gender Gaps in Labour Force Participation and Pay by Improving Women’s Job Quality
Women in the labour markets are mostly engaged in low paid work in the informal sector. Further, women are also engaged in occupations that are not accounted such as domestic work. Attracting more women into the labour force at first instance would require access to education followed by skilling and training initiatives. Law and policies have to be in place to ensure necessary positive discrimination for promoting active participation of women in the labour force and ensuring non-discrimination in pay. India has taken active measures for promoting female labour force participation such as enactment of acts such as Shops and Establishment Act, Maternity Benefit Amendment Act 2017, Sexual Harassment of Women at Workplace Act and implementation of schemes such as Ajeevika, Seekho aur Kamao etc.
Promoting Fair and Effective Labour Market Integration of Regular Migrants and Recognised Refugees
India reiterated that „refugees‟ and „migrants‟ are two different issues and these should not be mixed and must be governed by intergovernmental negotiated and agreed principles. Refugees pose several challenges to host governments, communities, and nationals and to refugees themselves and highlights the need for a more balanced, multifaceted, flexible and coordinated response. Refugees enjoy specific status and protections under international refugee law including the 1951 UN Convention on the Status of Refugees and its 1967 Protocol, which is distinct from those governing economic migrants. Labour and employment policies relating to refugees should continue to be guided under the framework of well-established refugee law. Attempts to apply other instruments should be approached with caution. In case of refugees, any measures to promote labour market access in host countries should be seen as temporary response and the focus instead should be on finding durable solutions while respecting the principle of non-refoulement.
Boosting Youth Employment
The fact that a large number of countries are actually facing the challenge on the opposite side of age line makes this discussion even more complex. We believe that encouraging labour mobility following fair migration principals can be a win-win solution for addressing this demand supply imbalance. To harness the advantage of youth, it is important to create an ecosystem of appropriate policies and programmes for promoting their health, education, employment and ensuring their skilling and training. Various measures have been taken to promote employment opportunities among the youth such as implementation of schemes like Make in India, Prime Minister's Employment Promotion Scheme, National Apprenticeship Promotion Scheme, Pradhan Mantri Kaushal Vikas Yojana; setting up of National Career Service Platform etc. Innovation and entrepreneurship is also being encouraged among the youth through provision of enabling ecosystem for startups.
193
Fostering decent work for sustainable global supply chains
India has always taken a very strong and calibrated stand on this matter following a detailed inter-ministerial consultation. Global Supply Chains affect countries differently depending upon how and where they are placed. At the G20 forum, the emphasis should be on promoting Decent Work by strengthening domestic legislature / policy framework through appropriate hand holding without any prescriptive approach. Any global intervention in this regard should therefore be exercised with extreme caution. Labour and trade issues should not be mixed. G20 should encourage handholding including technology transfer by the lead firms to the supplier firms down the value chain. The responsibility for ensuring decent work in the GSCs should be shared by both the buying and the selling firms. Therefore, voluntary participation by the employers / enterprises should be encouraged. India recognises that GSC is a global issue that needs international governance; however, international governance should not necessarily translate into universal rules for everyone. It strongly advocates adherence to CBDR (Common But Differentiated Responsibilities) principles to be followed in the governance of GSCs. India believes that for ensuring sustainable GSCs, the G20 should not merely mimic standards setting role of ILO, rather it should address issues of skill development, technology transfers, and environmental challenges in GSCs and encourage hand holding on these issues.
The meeting ended with the adoption of Ministerial Declaration by G20 Labour and Employment Ministers. MULTILATERAL COOPERATION
MoU between V. V. Giri, National Labour Institute and ILO for mutual cooperation on research training, extended through addendum to MoU for a period of one year up to 30.10.2018. High-level International Meetings Some of the prominent International meetings where India participated actively include:
Dr. Avneesh Singh, Director General, DGFASLI and Shri Ajay Kumar Singh, Under Secretary attended USTDA Reverse Trade Mission on Construction Workplace Safety during 2-8
April, 2017 in Washington DC, Chicago Illinois and Seattle, Washington, USA.
Visit of Shri Pravin Srivastava, DDG (E) had attended OECD Joint Conference on Pathways to Youth Employment Apprenticeships and Work based Training from 06.04.2017 to 07.04.2017 at South Africa.
Shri Manish Kumar Gupta, JS, MOL&E, Smt. Anuja Bapat, Director, MOL&E and Ms. Ruma Ghosh, Fellow, VV Giri NLI attended „First BRICS Employment Working Group (EWG)‟ on 19-20 April, 2017 in Yuxi, China.
Shri Suresh Singh, Director, MoLE had attended ILO‟s Tripartite Meeting on Improving Employment and Working Condition in Health Services at Geneva, Switzerland on 24-28, April, 2017.
A high level Indian delegation led by Shri Bandaru Dattatreya, the then Minister of State for Labour and Employment (Independent Charge) along with Smt. M. Sathiyavathy, Secretary (L& E), Shri Rajit Punhani, Joint Secretary, MOLE, Shri C. Sudharsan Reddy, Private Secretary to the then Minister of State for Labour and Employment (Independent Charge) and Shri S. K. Sasikumar, Sr. Fellow, VVG NLI attended the Fourth meeting of G20 Employment Working Group meeting and G 20 Labour & Employments Ministers‟ Meeting during 16-19 May, 2017 in Bad Neuenahr, Germany.
Shri Deepak Dan Barnwal, Under Secretary, MoLE had attended ITC-ILO Training on “Identifying and Investigating cases of forced labour and human trafficking” on 22-26, May, 2017 in Turin, Italy.
194
A high level delegation led by Shri Bandaru Dattatreya, the then Hon'ble Minister of State for Labour and Employment (Independent Charge) attended the 106
th Session of
International Labour Conference of ILO and 330th Session of Governing Body of ILO held at
Geneva, Switzerland from 4th June to 17
th June, 2017.
A high level delegation led by Shri Bandaru Dattatreya, the then Hon'ble Minister of State for Labour & Employment (Independent Charge) along with Smt. M. Sathiyavathy, Secretary (L&E), Shri Manish Kumar Gupta, Joint Secretary, MoLE, Smt. Anuja Bapat, Director, MoLE, Shri Rahul Kashyap, OSD to the then Minister of State for Labour and Employment (Independent Charge) and Shri S.K. Sasi kumar, Sr. Fellow, VVGNLI attended Second BRICS Employment Working Group (EWG) Meeting and BRICS Labour & Employment Ministers‟ Meeting from 25-27, July, 2017 in Chongquing, China.
Sh. R.K. Elangovan, Dy. Director General, DG FASLI along with Sh. M. Arun Rasith, Dy. Director, MOLE attended the G20 EWG and OSH Network Consultative meeting on 6
th
September, 2017 in Singapore.
Shri Satpal Sharma, Under Secretary, DGLW had attended ILO Programme on Global knowledge sharing forum on transition to formal economy from 11-15, September, 2017 in Turin, Italy.
Shri Deepak Kumar, Deputy Director, DG Labour Bureau had attended Regional Capacity Building workshop of Asia Pacific Countries on Work Statistics in Rural Areas for Promotion of Decent Work from 11.09.2017 to 15.09.2017 at Thailand.
Shri V. Srikanth, Dy. Director, MOLE had attended ILO's Tripartite Meeting on Issues relating to Migrant Fishers on 18
th September to 22
nd September, 2017 in Geneva,
Switzerland.
Shri Mitter Sain, DDGE had attended WAPES Experts Meeting on Labour Market Information from 19.09.2017 to 21.09.2017 in Japan.
Shri Onkar Sharma, RLC (C) and Shri Sushil Kumar Tripathi, Under Secretary, attended the ILO‟s third meeting of the Working Group on Standard Review Mechanism from 25.09.2017 to 29.09.2017 at Geneva, Switzerland.
Shri Anoop Kumar Satpathy, Fellow, VVG NLI had attended the twelfth meeting of the United Nations Delhi Group on Informal Economy Statistics from 02.10.2017 to 03.10.2017 at Geneva, Switzerland.
Shri Sasi kumar, Sr. Fellow had attended ILO International Consultation on Labour Migration from Asia and Africa to Middle East from 04.10.2017 to 05.10.2017 in Lebanon.
Shri Suresh Singh, Director had attended ILO Programme on „National Programme and Systems of Occupation Safety and Health‟ from 2
nd to 13
th October, 2017 at Turin, Italy.
Shri V. Srikanth, Dy. Director, MOLE had attended ILO Sweden Multi Stakeholder Regional Meeting on „Promoting Decent Work in Garment Sector Supply Chains in Asia‟ on 10
th – 11
th October, 2017 in Bangkok, Thailand.
Shri Ram Kumar Gupta, Joint Secretary and Shri H.L. Meena, Director attended the Panel discussion on Tackling Childcare on 12.10.2017 at Washington DC, USA.
Smt. Bhavaraju Neeraja, Under Secretary, MOLE and Shri Ravindra Tulshidas Mandekar, Director, Mines Safety attended ILO‟s meeting of Experts on Safety and Health in Opencast mines on 16
th – 20
th October, 2017 in Geneva, Switzerland.
Shri Sukhdeep Singh, Deputy Director and Ms. Renjini Das, Welfare Administrator, MoLE attended UN ESCAP Statistical institute for Asia and the Pacific‟s course on informality from 16
th to 20
th October 2017 in Chiba, Japan.
Dr. H. Srinivas, DG, V. V. Giri, NLI, Ms. Vayaila Rungsung, Deputy Secretary, MoLE and Ms. Ellina Samantroy Jena, Fellow, V. V. Giri, NLI attended 80
th Session of the Board
meeting of International Training Centre of ILO on 26th – 27
th October, 2017 in Turin, Italy.
195
Shri Arun Goel, AS & FA (L&E), Shri Rajit Punhani, Jt. Secretary, DGLW and Ms. Kamini Tandeker, Asstt. Director attended 331
st Session of Governing Body of ILO on 30
th October,
2017- 9th November, 2017 in Geneva, Switzerland.
Shri Himmant Singh Raghav, Director had attended the ITC ILO training programme on Academy on Labour Market Statistics and Analysis from 30.10.2017 to 10.11.2017 at Italy.
Ms. Priyanka Sethi, Assistant Director, MoLE had attended Asia Pacific Regional Preparatory Meeting for the Global Compact on Safe, Orderly and Regular Migration at Bangkok, Thailand on 6
th -8
th, November, 2017.
Shri Santosh Kumar Gangwar, Hon‟ble Minister of State for Labour & Employment (Independent Charge), Shri Manu Tentiwal, Private Secretary to MoS(IC) for L&E and Smt. Anita Tripathi attended IV Global Conference on the Sustained Eradication of Child Labour on 14
th -16
th November, 2017 in Buenos Aires, Argentina.
Shri Susheel Kumar Kalra, Deputy Secretary had attended ILO training programme on „Macroeconomic Policies, Jobs and Inclusive Growth‟ from 20.11.2017 to 24.11.2017 at Turin, Italy.
Smt. Rekha Raikar Kumar, CCA, MoLE had attended Professional Certificate Course in Strategic Public Administrative by International Center for Parliamentary Studies London from 20.11.200.017 to 24.11.2017 at UK.
Shri Santosh Kumar Singh, Under Secretary and Shri D. K. Himanshu, Under Secretary attended ILO training Programme on „Improving Occupation Safety and Health in Small and Micro Enterprises‟ from 04.12.2017 to 15.12.2017 at Turin, Italy.
Some of the prominent International Delegations visited India to meet officials of Ministry
of Labour and Employment are:
Ms. Deborah Greenfield, Dy. Director General (Policy), ILO, Geneva had a courtesy visit with Hon'ble Minister of State (Independent Charge) for Labour & Employment on 24.07.2017 during her tour to India from 24-26 July 2017. She complimented India on ratification of Convention (No. 138 &182) of ILO on Child Labour, and exchanged her views on future of work.
Mr. Stanly Henderson, DDG, EPWP, Ministry of Public Works, South Africa along with a study team had a meeting with officials of the Ministry headed by Mr. Heeralal Samaria, Additional Secretary (L&E) on 22.09.2017 on social security benefits to workers of public welfare programmes.
TECHNICAL COOPERATION PROGRAMMES
India and ILO share a very significant and fruitful cooperation in various technical programmes in the areas of employment, occupational safety & health, improvement of working conditions, up gradation of technical facilities and skills development, management consultation development, social security, skill development and other labour related issues.
Under the Active Partnership Policy of the ILO, collaboration between India and ILO is supported by technical inputs from the multidisciplinary teams at ILO, New Delhi as well as by the technical departments at the ILO Headquarters. The technical specialists provide advisory services in international labour standards, statistics and also discuss areas of possible collaboration in future. The tripartite machinery of the Government, Workers‟ and Employers‟ Organizations, worked closely with the ILO in identifying the major Decent Work Country Programmes objectives for the ensuing years.
A number of officers from Ministry of Labour & Employment were deputed for training, workshops, seminars and meeting under fellowships provided by ILO.
196
ILO also utilizes the training facilities available in a number of institutions under the Ministry of Labour & Employment in India including V. V. Giri National Labour Institute, Central Labour Institute (Mumbai), Regional Labour Institutes (Kolkata, Kanpur & Chennai), Vocational Training Institutes under the Directorate General of Employment, Pandit Deen Dayal Upadhyaya National Academy of Social Security and various other premier institutes of the country. FINANCE AND INDIA’S ASSISTANCE TO ILO
ILO is financed mainly by contribution received from the member states. The ILO Budget follows the calendar year and annual contributions are paid by the Governments of the member states according to a scale, which the International Labour Conference on year-to year basis fixes, in line with the U.N. scale of assessment. For the year 2017, India‟s share of contribution is SF 2,786,397.00 which is SF 378,351,039.00 of the total ILO Budget and worked out to Rs.19,19,27,025.00 in Indian Currency (approx). CONCLUSION
India has always a positive approach towards International Labour Standards. The basis principles set out in the International Labour Standards are by and large reflected in our national laws and regulations especially for free exercise of and for protection of rights of our workforce. We have so far ratified forty-seven Conventions and one Protocol of the ILO as given in Box 11.1.
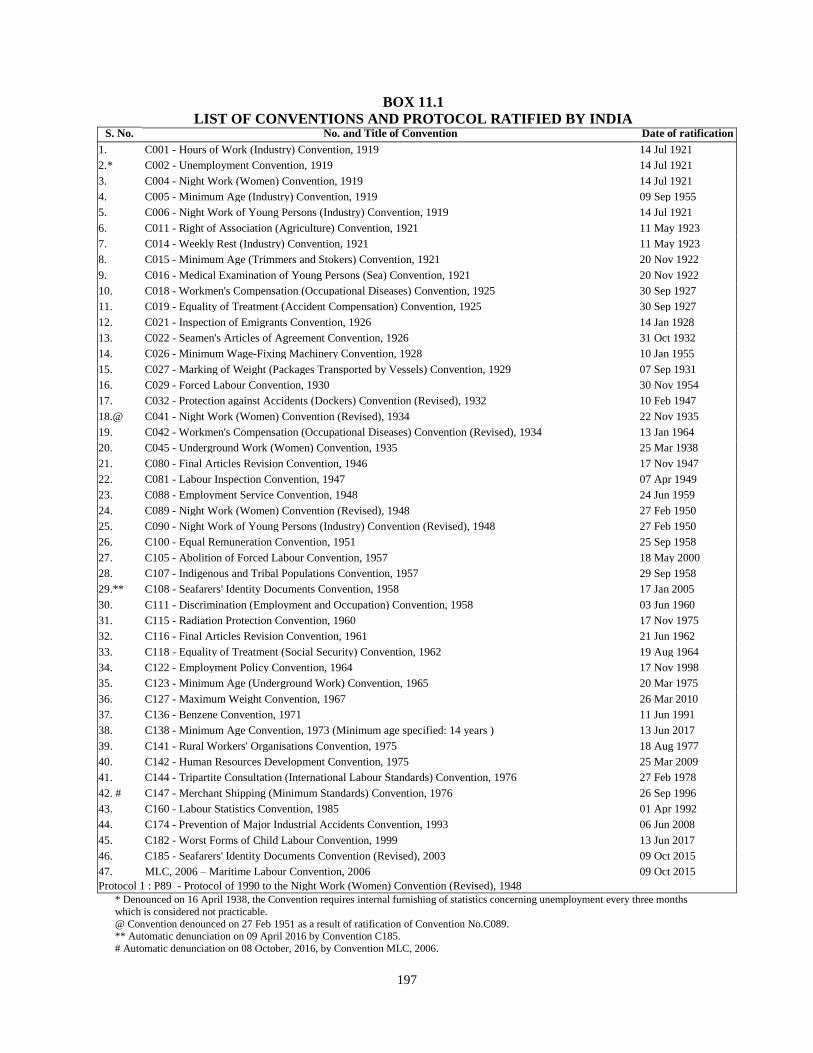
197
BOX 11.1
LIST OF CONVENTIONS AND PROTOCOL RATIFIED BY INDIA S. No. No. and Title of Convention Date of ratification
1. C001 - Hours of Work (Industry) Convention, 1919 14 Jul 1921
2.* C002 - Unemployment Convention, 1919 14 Jul 1921
3. C004 - Night Work (Women) Convention, 1919 14 Jul 1921
4. C005 - Minimum Age (Industry) Convention, 1919 09 Sep 1955
5. C006 - Night Work of Young Persons (Industry) Convention, 1919 14 Jul 1921
6. C011 - Right of Association (Agriculture) Convention, 1921 11 May 1923
7. C014 - Weekly Rest (Industry) Convention, 1921 11 May 1923
8. C015 - Minimum Age (Trimmers and Stokers) Convention, 1921 20 Nov 1922
9. C016 - Medical Examination of Young Persons (Sea) Convention, 1921 20 Nov 1922
10. C018 - Workmen's Compensation (Occupational Diseases) Convention, 1925 30 Sep 1927
11. C019 - Equality of Treatment (Accident Compensation) Convention, 1925 30 Sep 1927
12. C021 - Inspection of Emigrants Convention, 1926 14 Jan 1928
13. C022 - Seamen's Articles of Agreement Convention, 1926 31 Oct 1932
14. C026 - Minimum Wage-Fixing Machinery Convention, 1928 10 Jan 1955
15. C027 - Marking of Weight (Packages Transported by Vessels) Convention, 1929 07 Sep 1931
16. C029 - Forced Labour Convention, 1930 30 Nov 1954
17. C032 - Protection against Accidents (Dockers) Convention (Revised), 1932 10 Feb 1947
18.@ C041 - Night Work (Women) Convention (Revised), 1934 22 Nov 1935
19. C042 - Workmen's Compensation (Occupational Diseases) Convention (Revised), 1934 13 Jan 1964
20. C045 - Underground Work (Women) Convention, 1935 25 Mar 1938
21. C080 - Final Articles Revision Convention, 1946 17 Nov 1947
22. C081 - Labour Inspection Convention, 1947 07 Apr 1949
23. C088 - Employment Service Convention, 1948 24 Jun 1959
24. C089 - Night Work (Women) Convention (Revised), 1948 27 Feb 1950
25. C090 - Night Work of Young Persons (Industry) Convention (Revised), 1948 27 Feb 1950
26. C100 - Equal Remuneration Convention, 1951 25 Sep 1958
27. C105 - Abolition of Forced Labour Convention, 1957 18 May 2000
28. C107 - Indigenous and Tribal Populations Convention, 1957 29 Sep 1958
29.** C108 - Seafarers' Identity Documents Convention, 1958 17 Jan 2005
30. C111 - Discrimination (Employment and Occupation) Convention, 1958 03 Jun 1960
31. C115 - Radiation Protection Convention, 1960 17 Nov 1975
32. C116 - Final Articles Revision Convention, 1961 21 Jun 1962
33. C118 - Equality of Treatment (Social Security) Convention, 1962 19 Aug 1964
34. C122 - Employment Policy Convention, 1964 17 Nov 1998
35. C123 - Minimum Age (Underground Work) Convention, 1965 20 Mar 1975
36. C127 - Maximum Weight Convention, 1967 26 Mar 2010
37. C136 - Benzene Convention, 1971 11 Jun 1991
38. C138 - Minimum Age Convention, 1973 (Minimum age specified: 14 years ) 13 Jun 2017
39. C141 - Rural Workers' Organisations Convention, 1975 18 Aug 1977
40. C142 - Human Resources Development Convention, 1975 25 Mar 2009
41. C144 - Tripartite Consultation (International Labour Standards) Convention, 1976 27 Feb 1978
42. # C147 - Merchant Shipping (Minimum Standards) Convention, 1976 26 Sep 1996
43. C160 - Labour Statistics Convention, 1985 01 Apr 1992
44. C174 - Prevention of Major Industrial Accidents Convention, 1993 06 Jun 2008
45. C182 - Worst Forms of Child Labour Convention, 1999 13 Jun 2017
46. C185 - Seafarers' Identity Documents Convention (Revised), 2003 09 Oct 2015
47. MLC, 2006 – Maritime Labour Convention, 2006 09 Oct 2015
Protocol 1 : P89 - Protocol of 1990 to the Night Work (Women) Convention (Revised), 1948
* Denounced on 16 April 1938, the Convention requires internal furnishing of statistics concerning unemployment every three months
which is considered not practicable.
@ Convention denounced on 27 Feb 1951 as a result of ratification of Convention No.C089. ** Automatic denunciation on 09 April 2016 by Convention C185.
# Automatic denunciation on 08 October, 2016, by Convention MLC, 2006.
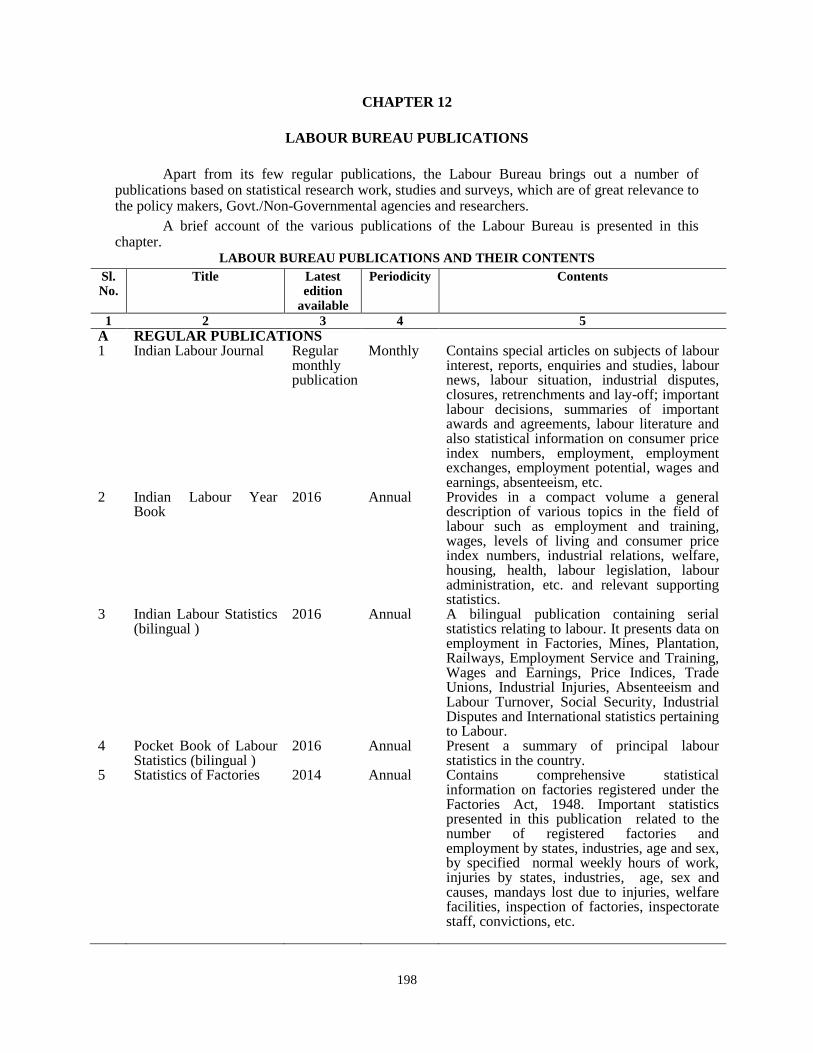
198
CHAPTER 12
LABOUR BUREAU PUBLICATIONS
Apart from its few regular publications, the Labour Bureau brings out a number of publications based on statistical research work, studies and surveys, which are of great relevance to the policy makers, Govt./Non-Governmental agencies and researchers.
A brief account of the various publications of the Labour Bureau is presented in this chapter.
LABOUR BUREAU PUBLICATIONS AND THEIR CONTENTS
Sl.No.
Title Latest edition
available
Periodicity Contents
1 2 3 4 5
A REGULAR PUBLICATIONS 1 Indian Labour Journal Regular
monthly publication
Monthly Contains special articles on subjects of labour interest, reports, enquiries and studies, labour news, labour situation, industrial disputes, closures, retrenchments and lay-off; important labour decisions, summaries of important awards and agreements, labour literature and also statistical information on consumer price index numbers, employment, employment exchanges, employment potential, wages and earnings, absenteeism, etc.
2 Indian Labour Year Book
2016 Annual Provides in a compact volume a general description of various topics in the field of labour such as employment and training, wages, levels of living and consumer price index numbers, industrial relations, welfare, housing, health, labour legislation, labour administration, etc. and relevant supporting statistics.
3 Indian Labour Statistics (bilingual )
2016 Annual A bilingual publication containing serial statistics relating to labour. It presents data on employment in Factories, Mines, Plantation, Railways, Employment Service and Training, Wages and Earnings, Price Indices, Trade Unions, Industrial Injuries, Absenteeism and Labour Turnover, Social Security, Industrial Disputes and International statistics pertaining to Labour.
4 Pocket Book of Labour Statistics (bilingual )
2016 Annual Present a summary of principal labour statistics in the country.
5 Statistics of Factories 2014 Annual Contains comprehensive statistical information on factories registered under the Factories Act, 1948. Important statistics presented in this publication related to the number of registered factories and employment by states, industries, age and sex, by specified normal weekly hours of work, injuries by states, industries, age, sex and causes, mandays lost due to injuries, welfare facilities, inspection of factories, inspectorate staff, convictions, etc.
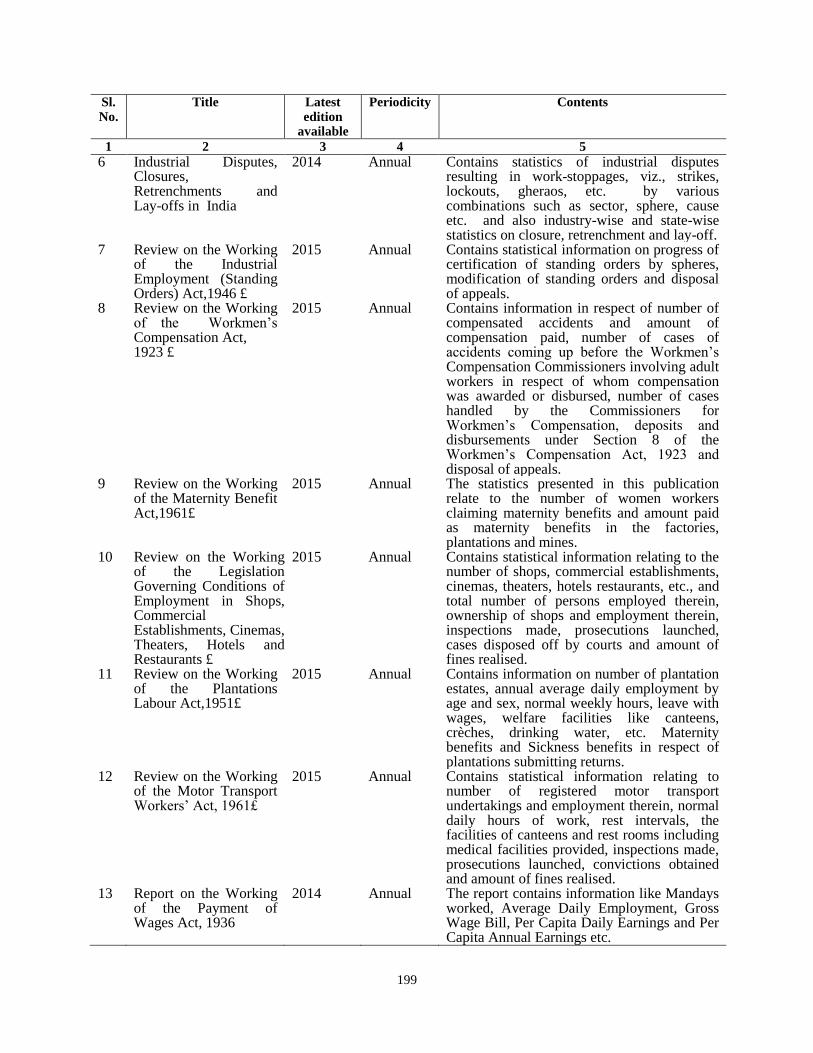
199
Sl.No.
Title Latest edition
available
Periodicity Contents
1 2 3 4 5
6 Industrial Disputes, Closures, Retrenchments and Lay-offs in India
2014 Annual Contains statistics of industrial disputes resulting in work-stoppages, viz., strikes, lockouts, gheraos, etc. by various combinations such as sector, sphere, cause etc. and also industry-wise and state-wise statistics on closure, retrenchment and lay-off.
7 Review on the Working of the Industrial Employment (Standing Orders) Act,1946 £
2015 Annual Contains statistical information on progress of certification of standing orders by spheres, modification of standing orders and disposal of appeals.
8 Review on the Working of the Workmen‟s Compensation Act, 1923 £
2015 Annual Contains information in respect of number of compensated accidents and amount of compensation paid, number of cases of accidents coming up before the Workmen‟s Compensation Commissioners involving adult workers in respect of whom compensation was awarded or disbursed, number of cases handled by the Commissioners for Workmen‟s Compensation, deposits and disbursements under Section 8 of the Workmen‟s Compensation Act, 1923 and disposal of appeals.
9 Review on the Working of the Maternity Benefit Act,1961£
2015 Annual The statistics presented in this publication relate to the number of women workers claiming maternity benefits and amount paid as maternity benefits in the factories, plantations and mines.
10 Review on the Working of the Legislation Governing Conditions of Employment in Shops, Commercial Establishments, Cinemas, Theaters, Hotels and Restaurants £
2015 Annual Contains statistical information relating to the number of shops, commercial establishments, cinemas, theaters, hotels restaurants, etc., and total number of persons employed therein, ownership of shops and employment therein, inspections made, prosecutions launched, cases disposed off by courts and amount of fines realised.
11 Review on the Working of the Plantations Labour Act,1951£
2015 Annual Contains information on number of plantation estates, annual average daily employment by age and sex, normal weekly hours, leave with wages, welfare facilities like canteens, crèches, drinking water, etc. Maternity benefits and Sickness benefits in respect of plantations submitting returns.
12 Review on the Working of the Motor Transport Workers‟ Act, 1961£
2015 Annual Contains statistical information relating to number of registered motor transport undertakings and employment therein, normal daily hours of work, rest intervals, the facilities of canteens and rest rooms including medical facilities provided, inspections made, prosecutions launched, convictions obtained and amount of fines realised.
13 Report on the Working of the Payment of Wages Act, 1936
2014 Annual The report contains information like Mandays worked, Average Daily Employment, Gross Wage Bill, Per Capita Daily Earnings and Per Capita Annual Earnings etc.
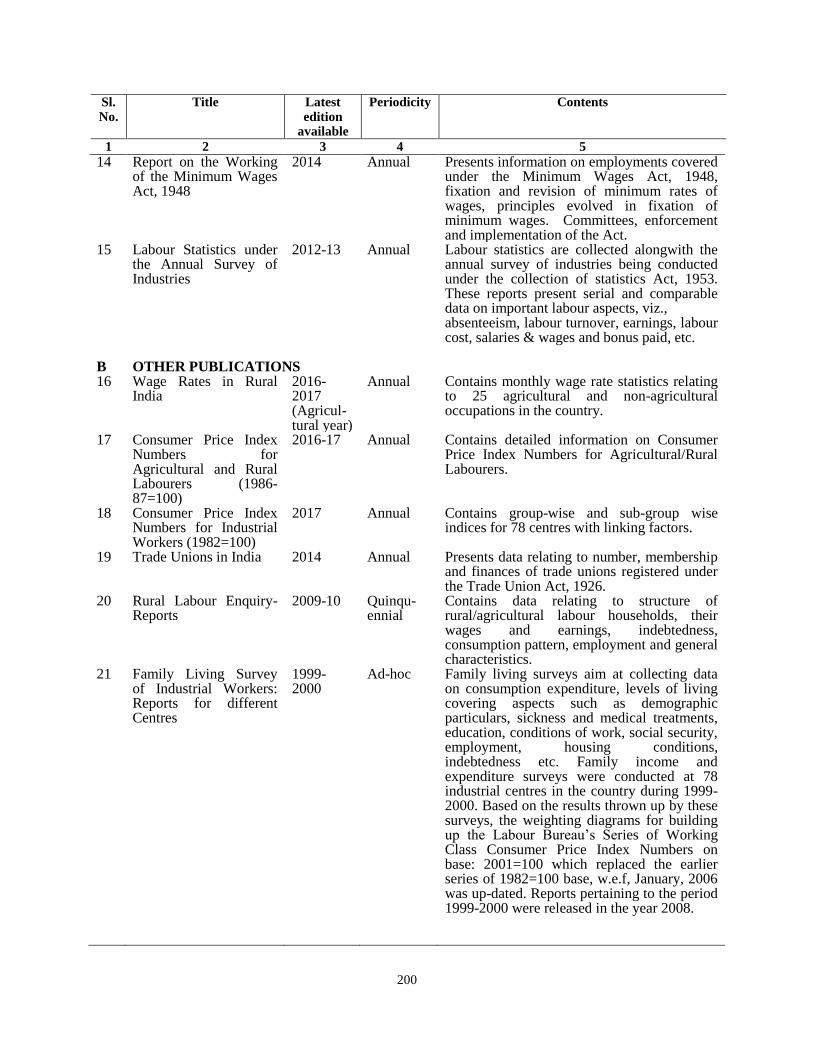
200
Sl.No.
Title Latest edition
available
Periodicity Contents
1 2 3 4 5
14 Report on the Working of the Minimum Wages Act, 1948
2014 Annual Presents information on employments covered under the Minimum Wages Act, 1948, fixation and revision of minimum rates of wages, principles evolved in fixation of minimum wages. Committees, enforcement and implementation of the Act.
15 Labour Statistics under the Annual Survey of Industries
2012-13 Annual Labour statistics are collected alongwith the annual survey of industries being conducted under the collection of statistics Act, 1953. These reports present serial and comparable data on important labour aspects, viz., absenteeism, labour turnover, earnings, labour cost, salaries & wages and bonus paid, etc.
B OTHER PUBLICATIONS 16 Wage Rates in Rural
India
2016-2017 (Agricul-tural year)
Annual Contains monthly wage rate statistics relating to 25 agricultural and non-agricultural occupations in the country.
17 Consumer Price Index Numbers for Agricultural and Rural Labourers (1986-87=100)
2016-17 Annual Contains detailed information on Consumer Price Index Numbers for Agricultural/Rural Labourers.
18 Consumer Price Index Numbers for Industrial Workers (1982=100)
2017 Annual Contains group-wise and sub-group wise indices for 78 centres with linking factors.
19 Trade Unions in India 2014 Annual Presents data relating to number, membership and finances of trade unions registered under the Trade Union Act, 1926.
20 Rural Labour Enquiry- Reports
2009-10 Quinqu-ennial
Contains data relating to structure of rural/agricultural labour households, their wages and earnings, indebtedness, consumption pattern, employment and general characteristics.
21 Family Living Survey of Industrial Workers: Reports for different Centres
1999-2000
Ad-hoc Family living surveys aim at collecting data on consumption expenditure, levels of living covering aspects such as demographic particulars, sickness and medical treatments, education, conditions of work, social security, employment, housing conditions, indebtedness etc. Family income and expenditure surveys were conducted at 78 industrial centres in the country during 1999-2000. Based on the results thrown up by these surveys, the weighting diagrams for building up the Labour Bureau‟s Series of Working Class Consumer Price Index Numbers on base: 2001=100 which replaced the earlier series of 1982=100 base, w.e.f, January, 2006 was up-dated. Reports pertaining to the period 1999-2000 were released in the year 2008.
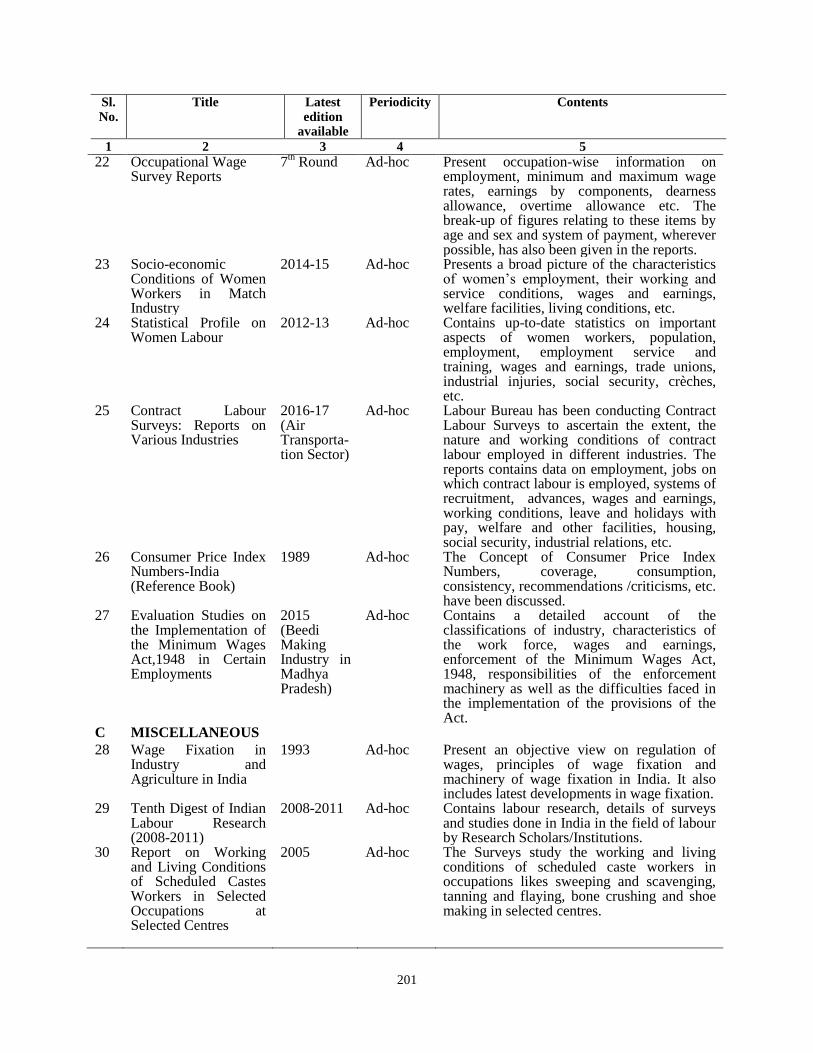
201
Sl.No.
Title Latest edition
available
Periodicity Contents
1 2 3 4 5
22 Occupational Wage Survey Reports
7th Round Ad-hoc Present occupation-wise information on
employment, minimum and maximum wage rates, earnings by components, dearness allowance, overtime allowance etc. The break-up of figures relating to these items by age and sex and system of payment, wherever possible, has also been given in the reports.
23 Socio-economic Conditions of Women Workers in Match Industry
2014-15 Ad-hoc Presents a broad picture of the characteristics of women‟s employment, their working and service conditions, wages and earnings, welfare facilities, living conditions, etc.
24 Statistical Profile on Women Labour
2012-13 Ad-hoc Contains up-to-date statistics on important aspects of women workers, population, employment, employment service and training, wages and earnings, trade unions, industrial injuries, social security, crèches, etc.
25 Contract Labour Surveys: Reports on Various Industries
2016-17 (Air Transporta-tion Sector)
Ad-hoc Labour Bureau has been conducting Contract Labour Surveys to ascertain the extent, the nature and working conditions of contract labour employed in different industries. The reports contains data on employment, jobs on which contract labour is employed, systems of recruitment, advances, wages and earnings, working conditions, leave and holidays with pay, welfare and other facilities, housing, social security, industrial relations, etc.
26 Consumer Price Index Numbers-India (Reference Book)
1989 Ad-hoc The Concept of Consumer Price Index Numbers, coverage, consumption, consistency, recommendations /criticisms, etc. have been discussed.
27 Evaluation Studies on the Implementation of the Minimum Wages Act,1948 in Certain Employments
2015 (Beedi Making Industry in Madhya Pradesh)
Ad-hoc Contains a detailed account of the classifications of industry, characteristics of the work force, wages and earnings, enforcement of the Minimum Wages Act, 1948, responsibilities of the enforcement machinery as well as the difficulties faced in the implementation of the provisions of the Act.
C MISCELLANEOUS
28 Wage Fixation in Industry and Agriculture in India
1993 Ad-hoc Present an objective view on regulation of wages, principles of wage fixation and machinery of wage fixation in India. It also includes latest developments in wage fixation.
29 Tenth Digest of Indian Labour Research (2008-2011)
2008-2011 Ad-hoc Contains labour research, details of surveys and studies done in India in the field of labour by Research Scholars/Institutions.
30 Report on Working and Living Conditions of Scheduled Castes Workers in Selected Occupations at Selected Centres
2005
Ad-hoc
The Surveys study the working and living conditions of scheduled caste workers in occupations likes sweeping and scavenging, tanning and flaying, bone crushing and shoe making in selected centres.
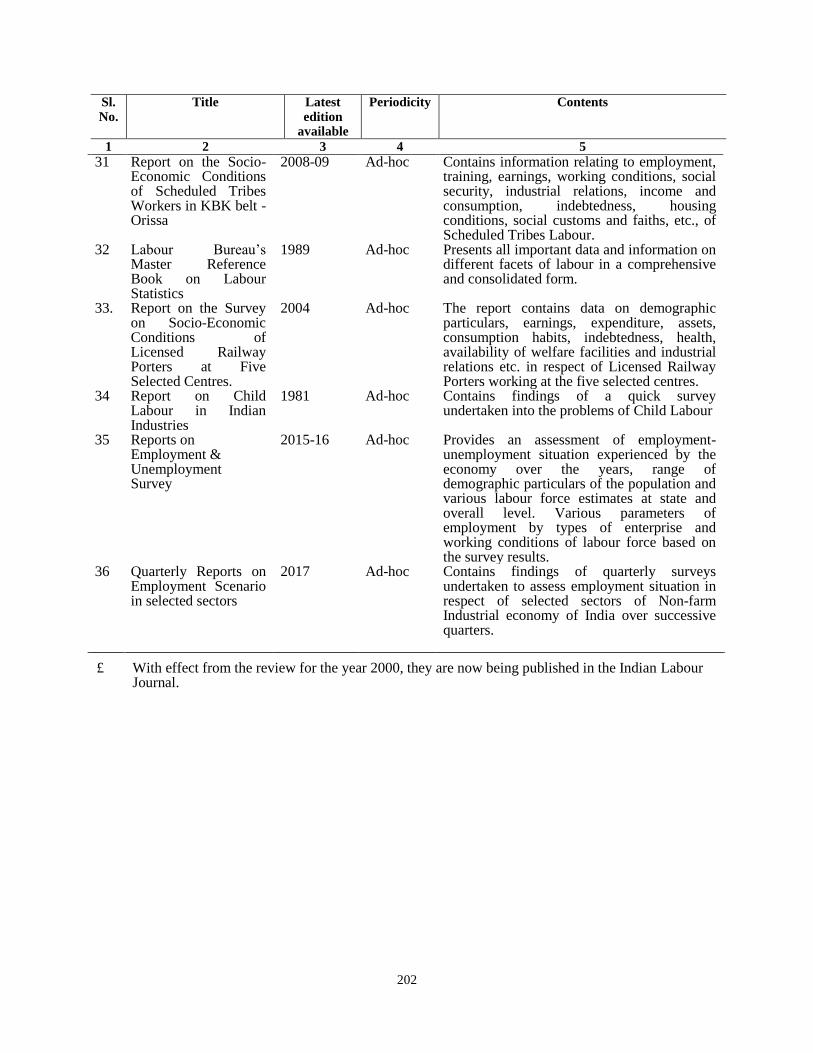
202
Sl.No.
Title Latest edition
available
Periodicity Contents
1 2 3 4 5
31 Report on the Socio-Economic Conditions of Scheduled Tribes Workers in KBK belt - Orissa
2008-09 Ad-hoc Contains information relating to employment, training, earnings, working conditions, social security, industrial relations, income and consumption, indebtedness, housing conditions, social customs and faiths, etc., of Scheduled Tribes Labour.
32 Labour Bureau‟s Master Reference Book on Labour Statistics
1989 Ad-hoc Presents all important data and information on different facets of labour in a comprehensive and consolidated form.
33. Report on the Survey on Socio-Economic Conditions of Licensed Railway Porters at Five Selected Centres.
2004 Ad-hoc The report contains data on demographic particulars, earnings, expenditure, assets, consumption habits, indebtedness, health, availability of welfare facilities and industrial relations etc. in respect of Licensed Railway Porters working at the five selected centres.
34 Report on Child Labour in Indian Industries
1981 Ad-hoc Contains findings of a quick survey undertaken into the problems of Child Labour
35 Reports on Employment & Unemployment Survey
2015-16 Ad-hoc Provides an assessment of employment-unemployment situation experienced by the economy over the years, range of demographic particulars of the population and various labour force estimates at state and overall level. Various parameters of employment by types of enterprise and working conditions of labour force based on the survey results.
36 Quarterly Reports on Employment Scenario in selected sectors
2017 Ad-hoc Contains findings of quarterly surveys undertaken to assess employment situation in respect of selected sectors of Non-farm Industrial economy of India over successive quarters.
£ With effect from the review for the year 2000, they are now being published in the Indian Labour Journal.
203
APPENDICES
APPENDIX 1
LIST OF IMPORTANT LABOUR ACTS
Under the Constitution of India, Labour is a subject in the concurrent list where both the Central and State Governments are competent to enact legislations. The Labour related legislations can be categorized as follows:
1) Labour laws enacted by the Central Government, where the Central Government has the sole responsibility for enforcement.
2) Labour laws enacted by Central Government and enforced both by Central and State Governments.
3) Labour laws enacted by Central Government and enforced by the State Governments.
4) Labour laws enacted and enforced by the various State Governments which apply to respective States.
(a) Labour laws enacted by the Central Government, where the Central Government has the sole responsibility for enforcement
1. The Employees‟ State Insurance Act, 1948
2. The Employees‟ Provident Fund and Miscellaneous Provisions Act, 1952
3. The Dock Workers (Safety, Health and Welfare) Act, 1986
4. The Mines Act, 1952
5. The Iron Ore Mines, Manganese Ore Mines and Chrome Ore Mines Labour Welfare (Cess) Act, 1976
6. The Iron Ore Mines, Manganese Ore Mines and Chrome Ore Mines Labor Welfare Fund Act, 1976
7. The Mica Mines Labour Welfare Fund Act, 1946
8. The Beedi Workers Welfare Cess Act, 1976
9. The Limestone and Dolomite Mines Labour Welfare Fund Act, 1972
10. The Cine Workers Welfare (Cess) Act, 1981
11. The Beedi Workers Welfare Fund Act, 1976
12. The Cine Workers Welfare Fund Act, 1981
(b) Labour laws enacted by Central Government and enforced both by Central and State Governments
13. The Child Labour (Prohibition and Regulation) Act, 1986
14. The Building and Other Constructions Workers‟ (Regulation of Employment and Conditions of Service) Act, 1996
15. The Contract Labour (Regulation and Abolition) Act, 1970
16. The Equal Remuneration Act, 1976
17. The Industrial Disputes Act, 1947
18. The Industrial Employment (Standing Orders) Act, 1946
19. The Inter-State Migrant Workmen (Regulation of Employment and Conditions of Service) Act, 1979
20. The Labour Laws (Exemption from Furnishing Returns and Maintaining Registers by Certain Establishments) Act, 1988
204
21. The Maternity Benefit Act, 1961
22. The Minimum Wages Act, 1948
23. The Payment of Bonus Act, 1965
24. The Payment of Gratuity Act, 1972
25. The Payment of Wages Act, 1936
26. The Cine Workers and Cinema Theatre Workers (Regulation of Employment) Act, 1981
27. The Building and Other Construction Workers Cess Act, 1996
28. Unorganized Workers Social Security Act, 2008
29. Working Journalists (Fixation of Rates of Wages) Act, 1958
(c) Labour laws enacted by Central Government and enforced by the State Governments
30. The Employers‟ Liability Act, 1938 (Repealed)
31. The Factories Act, 1948
32. The Motor Transport Workers Act, 1961
33. The Personal Injuries (Compensation Insurance) Act, 1963 (Repealed)
34. The Personal Injuries (Emergency Provisions) Act, 1962 (Repealed)
35. The Plantation Labour Act, 1951
36. The Sales Promotion Employees (Conditions of Service) Act, 1976
37. The Trade Unions Act, 1926
38. The Weekly Holidays Act, 1942 (Under Repeal)
39. The Working Journalists and Other Newspapers Employees (Conditions of Service) and Miscellaneous Provisions Act, 1955
40. The Workmen‟s Compensation Act, 1923 (now renamed as the Employee‟s Compensation Act, 1923)
41. The Employment Exchange (Compulsory Notification of Vacancies) Act, 1959
42. The Children (Pledging of Labour) Act 1938 (Repealed)
43. The Bonded Labour System (Abolition) Act, 1976
44. The Beedi and Cigar Workers (Conditions of Employment) Act, 1966
205
Also, we may classify labour laws under the following heads:
I. Laws related to Industrial Relations such as:
1. Trade Unions Act, 1926
2. Industrial Employment Standing Order Act, 1946
3. Industrial Disputes Act, 1947
II. Laws related to Wages such as:
4. Payment of Wages Act, 1936
5. Minimum Wages Act, 1948
6. Payment of Bonus Act, 1965
7. Working Journalists (Fixation of Rates of Wages) Act, 1958
III. Laws related to Working Hours, Conditions of Service and Employment such as:
8. Factories Act, 1948
9. Plantation Labour Act, 1951
10. Mines Act, 1952
11. Working Journalists and other Newspaper Employees‟ (Conditions of Service and Misc. Provisions) Act, 1955
12. Motor Transport Workers Act, 1961
13. Beedi & Cigar Workers (Conditions of Employment) Act, 1966
14. Contract Labour (Regulation & Abolition) Act, 1970
15. Inter-State Migrant Workmen (Regulation of Employment and Conditions of Service) Act, 1979
16. Dock Workers (Safety, Health & Welfare) Act, 1986
17. Building & Other Construction Workers (Regulation of Employment & Conditions of Service) Act, 1996
18. Building and Other Construction Workers Welfare Cess Act, 1996
19. Cine-Workers and Cinema Theatre Workers (Regulation of Employment) Act, 1981
20. The Weekly Holidays Act, 1942 (Under Repeal)
21. The Labour Laws (Exemption from Furnishing Returns and Maintaining Registers by Certain
Establishments) Act, 1988
22. The Sales Promotion Employees (Conditions of Service) Act, 1976
23. The Employment Exchange (Compulsory Notification of Vacancies) Act, 1959
IV. Laws related to Equality and Empowerment of Women such as:
24. Maternity Benefit Act, 1961
25. Equal Remuneration Act, 1976
V. Laws related to Deprived and Disadvantaged Sections of the Society such as:
26. Bonded Labour System (Abolition) Act, 1976
27. Child Labour (Prohibition & Regulation) Act, 1986
28. Children (Pledging of Labour) Act, 1933 (Repealed)
206
VI. Laws related to Social Security such as:
29. Workmen‟s Compensation Act, 1923 (now renamed as the Employee‟s Compensation Act, 1923)
30. Employees‟ State Insurance Act, 1948
31. Employees‟ Provident Fund & Miscellaneous Provisions Act, 1952
32. Payment of Gratuity Act, 1972
33. Employers‟ Liability Act, 1938 (Repealed)
34. Beedi Workers Welfare Cess Act, 1976
35. Beedi Workers Welfare Fund Act, 1976
36. Cine workers Welfare Cess Act, 1981
37. Cine Workers Welfare Fund Act, 1981
38. Iron Ore Mines, Manganese Ore Mines and Chrome Ore Mines Labour Welfare Cess Act, 1976
39. Iron Ore Mines, Manganese Ore Mines and Chrome Ore Mines Labour Welfare Fund Act, 1976
40. Limestone and Dolomite Mines Labour Welfare Fund Act, 1972
41. Mica Mines Labour Welfare Fund Act, 1946
42. Personal Injuries (Compensation Insurance) Act, 1963 (Repealed)
43. Personal Injuries (Emergency Provisions) Act, 1962 (Repealed)
44. Unorganised Workers‟ Social Security Act, 2008
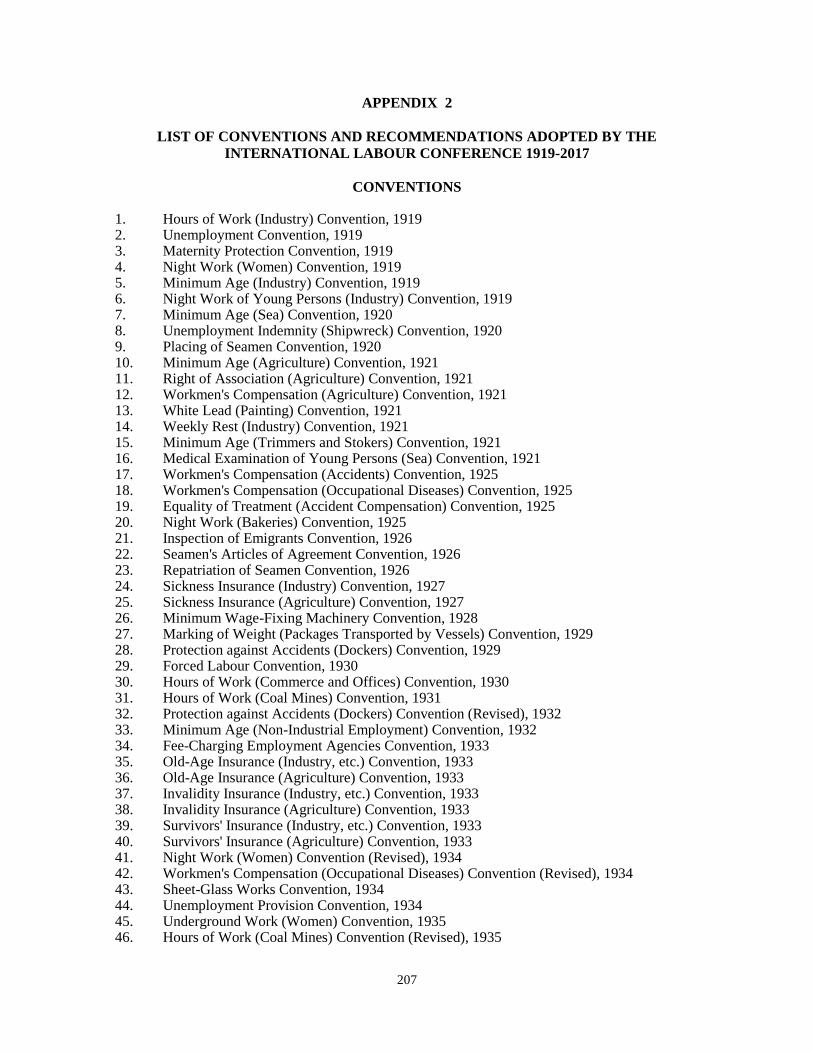
207
APPENDIX 2
LIST OF CONVENTIONS AND RECOMMENDATIONS ADOPTED BY THE
INTERNATIONAL LABOUR CONFERENCE 1919-2017
CONVENTIONS 1. Hours of Work (Industry) Convention, 1919 2. Unemployment Convention, 1919 3. Maternity Protection Convention, 1919 4. Night Work (Women) Convention, 1919 5. Minimum Age (Industry) Convention, 1919 6. Night Work of Young Persons (Industry) Convention, 1919 7. Minimum Age (Sea) Convention, 1920 8. Unemployment Indemnity (Shipwreck) Convention, 1920 9. Placing of Seamen Convention, 1920 10. Minimum Age (Agriculture) Convention, 1921 11. Right of Association (Agriculture) Convention, 1921 12. Workmen's Compensation (Agriculture) Convention, 1921 13. White Lead (Painting) Convention, 1921 14. Weekly Rest (Industry) Convention, 1921 15. Minimum Age (Trimmers and Stokers) Convention, 1921 16. Medical Examination of Young Persons (Sea) Convention, 1921 17. Workmen's Compensation (Accidents) Convention, 1925 18. Workmen's Compensation (Occupational Diseases) Convention, 1925 19. Equality of Treatment (Accident Compensation) Convention, 1925 20. Night Work (Bakeries) Convention, 1925 21. Inspection of Emigrants Convention, 1926 22. Seamen's Articles of Agreement Convention, 1926 23. Repatriation of Seamen Convention, 1926 24. Sickness Insurance (Industry) Convention, 1927 25. Sickness Insurance (Agriculture) Convention, 1927 26. Minimum Wage-Fixing Machinery Convention, 1928 27. Marking of Weight (Packages Transported by Vessels) Convention, 1929 28. Protection against Accidents (Dockers) Convention, 1929 29. Forced Labour Convention, 1930 30. Hours of Work (Commerce and Offices) Convention, 1930 31. Hours of Work (Coal Mines) Convention, 1931 32. Protection against Accidents (Dockers) Convention (Revised), 1932 33. Minimum Age (Non-Industrial Employment) Convention, 1932 34. Fee-Charging Employment Agencies Convention, 1933 35. Old-Age Insurance (Industry, etc.) Convention, 1933 36. Old-Age Insurance (Agriculture) Convention, 1933 37. Invalidity Insurance (Industry, etc.) Convention, 1933 38. Invalidity Insurance (Agriculture) Convention, 1933 39. Survivors' Insurance (Industry, etc.) Convention, 1933 40. Survivors' Insurance (Agriculture) Convention, 1933 41. Night Work (Women) Convention (Revised), 1934 42. Workmen's Compensation (Occupational Diseases) Convention (Revised), 1934 43. Sheet-Glass Works Convention, 1934 44. Unemployment Provision Convention, 1934 45. Underground Work (Women) Convention, 1935 46. Hours of Work (Coal Mines) Convention (Revised), 1935
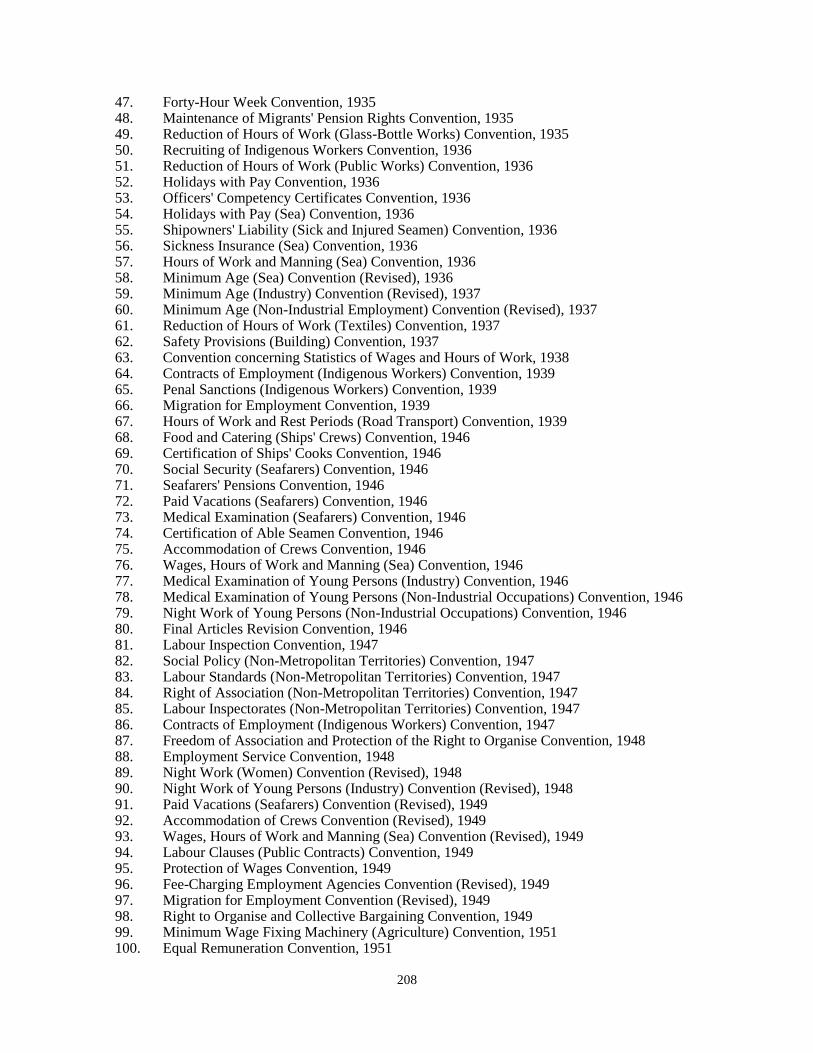
208
47. Forty-Hour Week Convention, 1935 48. Maintenance of Migrants' Pension Rights Convention, 1935 49. Reduction of Hours of Work (Glass-Bottle Works) Convention, 1935 50. Recruiting of Indigenous Workers Convention, 1936 51. Reduction of Hours of Work (Public Works) Convention, 1936 52. Holidays with Pay Convention, 1936 53. Officers' Competency Certificates Convention, 1936 54. Holidays with Pay (Sea) Convention, 1936 55. Shipowners' Liability (Sick and Injured Seamen) Convention, 1936 56. Sickness Insurance (Sea) Convention, 1936 57. Hours of Work and Manning (Sea) Convention, 1936 58. Minimum Age (Sea) Convention (Revised), 1936 59. Minimum Age (Industry) Convention (Revised), 1937 60. Minimum Age (Non-Industrial Employment) Convention (Revised), 1937 61. Reduction of Hours of Work (Textiles) Convention, 1937 62. Safety Provisions (Building) Convention, 1937 63. Convention concerning Statistics of Wages and Hours of Work, 1938 64. Contracts of Employment (Indigenous Workers) Convention, 1939 65. Penal Sanctions (Indigenous Workers) Convention, 1939 66. Migration for Employment Convention, 1939 67. Hours of Work and Rest Periods (Road Transport) Convention, 1939 68. Food and Catering (Ships' Crews) Convention, 1946 69. Certification of Ships' Cooks Convention, 1946 70. Social Security (Seafarers) Convention, 1946 71. Seafarers' Pensions Convention, 1946 72. Paid Vacations (Seafarers) Convention, 1946 73. Medical Examination (Seafarers) Convention, 1946 74. Certification of Able Seamen Convention, 1946 75. Accommodation of Crews Convention, 1946 76. Wages, Hours of Work and Manning (Sea) Convention, 1946 77. Medical Examination of Young Persons (Industry) Convention, 1946 78. Medical Examination of Young Persons (Non-Industrial Occupations) Convention, 1946 79. Night Work of Young Persons (Non-Industrial Occupations) Convention, 1946 80. Final Articles Revision Convention, 1946 81. Labour Inspection Convention, 1947 82. Social Policy (Non-Metropolitan Territories) Convention, 1947 83. Labour Standards (Non-Metropolitan Territories) Convention, 1947 84. Right of Association (Non-Metropolitan Territories) Convention, 1947 85. Labour Inspectorates (Non-Metropolitan Territories) Convention, 1947 86. Contracts of Employment (Indigenous Workers) Convention, 1947 87. Freedom of Association and Protection of the Right to Organise Convention, 1948 88. Employment Service Convention, 1948 89. Night Work (Women) Convention (Revised), 1948 90. Night Work of Young Persons (Industry) Convention (Revised), 1948 91. Paid Vacations (Seafarers) Convention (Revised), 1949 92. Accommodation of Crews Convention (Revised), 1949 93. Wages, Hours of Work and Manning (Sea) Convention (Revised), 1949 94. Labour Clauses (Public Contracts) Convention, 1949 95. Protection of Wages Convention, 1949 96. Fee-Charging Employment Agencies Convention (Revised), 1949 97. Migration for Employment Convention (Revised), 1949 98. Right to Organise and Collective Bargaining Convention, 1949 99. Minimum Wage Fixing Machinery (Agriculture) Convention, 1951 100. Equal Remuneration Convention, 1951
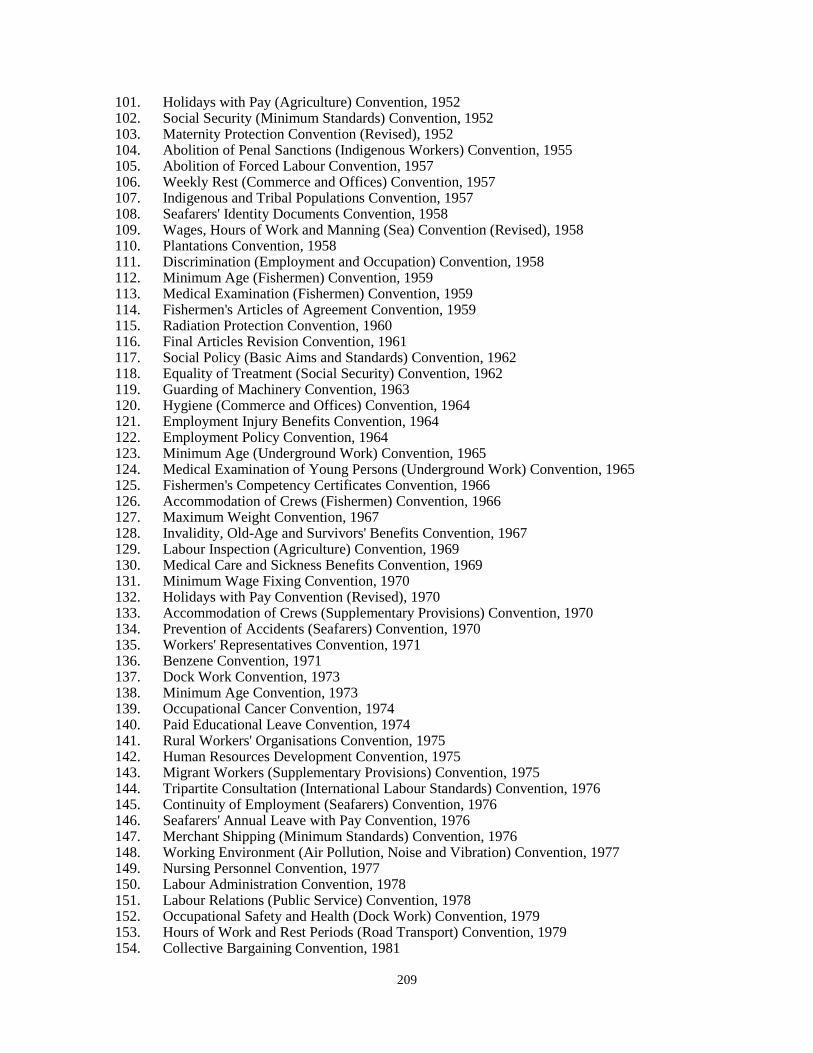
209
101. Holidays with Pay (Agriculture) Convention, 1952 102. Social Security (Minimum Standards) Convention, 1952 103. Maternity Protection Convention (Revised), 1952 104. Abolition of Penal Sanctions (Indigenous Workers) Convention, 1955 105. Abolition of Forced Labour Convention, 1957 106. Weekly Rest (Commerce and Offices) Convention, 1957 107. Indigenous and Tribal Populations Convention, 1957 108. Seafarers' Identity Documents Convention, 1958 109. Wages, Hours of Work and Manning (Sea) Convention (Revised), 1958 110. Plantations Convention, 1958 111. Discrimination (Employment and Occupation) Convention, 1958 112. Minimum Age (Fishermen) Convention, 1959 113. Medical Examination (Fishermen) Convention, 1959 114. Fishermen's Articles of Agreement Convention, 1959 115. Radiation Protection Convention, 1960 116. Final Articles Revision Convention, 1961 117. Social Policy (Basic Aims and Standards) Convention, 1962 118. Equality of Treatment (Social Security) Convention, 1962 119. Guarding of Machinery Convention, 1963 120. Hygiene (Commerce and Offices) Convention, 1964 121. Employment Injury Benefits Convention, 1964 122. Employment Policy Convention, 1964 123. Minimum Age (Underground Work) Convention, 1965 124. Medical Examination of Young Persons (Underground Work) Convention, 1965 125. Fishermen's Competency Certificates Convention, 1966 126. Accommodation of Crews (Fishermen) Convention, 1966 127. Maximum Weight Convention, 1967 128. Invalidity, Old-Age and Survivors' Benefits Convention, 1967 129. Labour Inspection (Agriculture) Convention, 1969 130. Medical Care and Sickness Benefits Convention, 1969 131. Minimum Wage Fixing Convention, 1970 132. Holidays with Pay Convention (Revised), 1970 133. Accommodation of Crews (Supplementary Provisions) Convention, 1970 134. Prevention of Accidents (Seafarers) Convention, 1970 135. Workers' Representatives Convention, 1971 136. Benzene Convention, 1971 137. Dock Work Convention, 1973 138. Minimum Age Convention, 1973 139. Occupational Cancer Convention, 1974 140. Paid Educational Leave Convention, 1974 141. Rural Workers' Organisations Convention, 1975 142. Human Resources Development Convention, 1975 143. Migrant Workers (Supplementary Provisions) Convention, 1975 144. Tripartite Consultation (International Labour Standards) Convention, 1976 145. Continuity of Employment (Seafarers) Convention, 1976 146. Seafarers' Annual Leave with Pay Convention, 1976 147. Merchant Shipping (Minimum Standards) Convention, 1976 148. Working Environment (Air Pollution, Noise and Vibration) Convention, 1977 149. Nursing Personnel Convention, 1977 150. Labour Administration Convention, 1978 151. Labour Relations (Public Service) Convention, 1978 152. Occupational Safety and Health (Dock Work) Convention, 1979 153. Hours of Work and Rest Periods (Road Transport) Convention, 1979 154. Collective Bargaining Convention, 1981
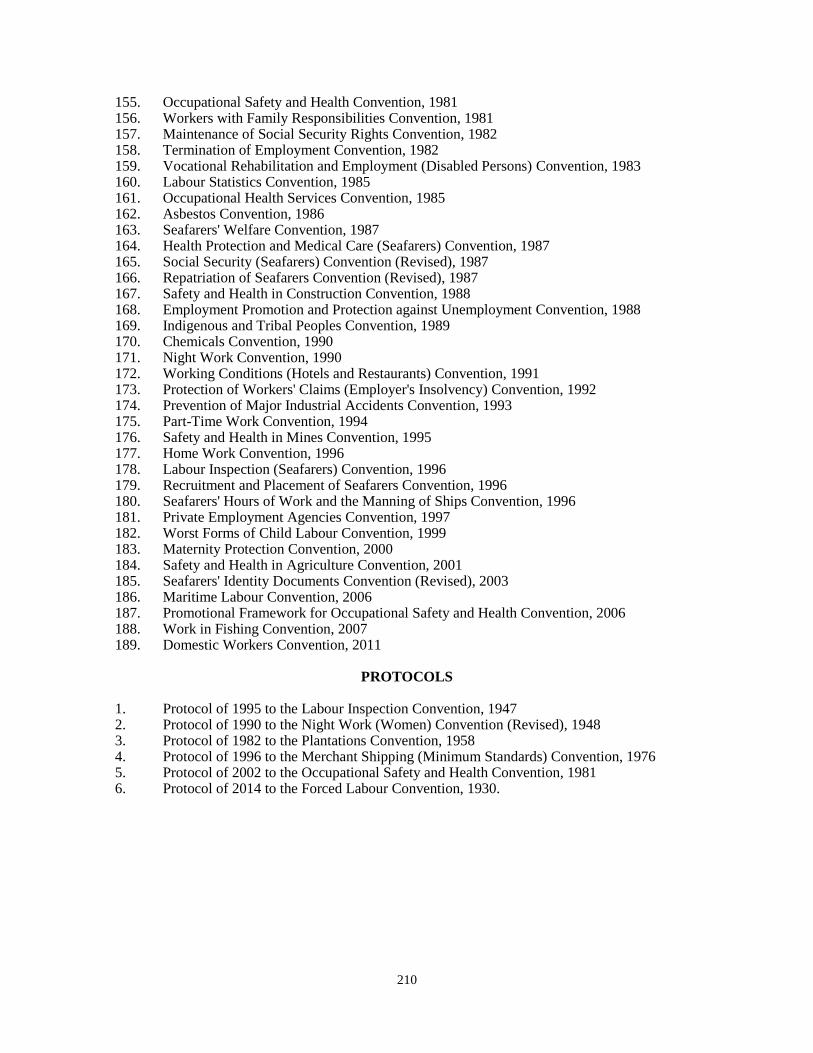
210
155. Occupational Safety and Health Convention, 1981 156. Workers with Family Responsibilities Convention, 1981 157. Maintenance of Social Security Rights Convention, 1982 158. Termination of Employment Convention, 1982 159. Vocational Rehabilitation and Employment (Disabled Persons) Convention, 1983 160. Labour Statistics Convention, 1985 161. Occupational Health Services Convention, 1985 162. Asbestos Convention, 1986 163. Seafarers' Welfare Convention, 1987 164. Health Protection and Medical Care (Seafarers) Convention, 1987 165. Social Security (Seafarers) Convention (Revised), 1987 166. Repatriation of Seafarers Convention (Revised), 1987 167. Safety and Health in Construction Convention, 1988 168. Employment Promotion and Protection against Unemployment Convention, 1988 169. Indigenous and Tribal Peoples Convention, 1989 170. Chemicals Convention, 1990 171. Night Work Convention, 1990 172. Working Conditions (Hotels and Restaurants) Convention, 1991 173. Protection of Workers' Claims (Employer's Insolvency) Convention, 1992 174. Prevention of Major Industrial Accidents Convention, 1993 175. Part-Time Work Convention, 1994 176. Safety and Health in Mines Convention, 1995 177. Home Work Convention, 1996 178. Labour Inspection (Seafarers) Convention, 1996 179. Recruitment and Placement of Seafarers Convention, 1996 180. Seafarers' Hours of Work and the Manning of Ships Convention, 1996 181. Private Employment Agencies Convention, 1997 182. Worst Forms of Child Labour Convention, 1999 183. Maternity Protection Convention, 2000 184. Safety and Health in Agriculture Convention, 2001 185. Seafarers' Identity Documents Convention (Revised), 2003 186. Maritime Labour Convention, 2006 187. Promotional Framework for Occupational Safety and Health Convention, 2006 188. Work in Fishing Convention, 2007 189. Domestic Workers Convention, 2011
PROTOCOLS
1. Protocol of 1995 to the Labour Inspection Convention, 1947 2. Protocol of 1990 to the Night Work (Women) Convention (Revised), 1948 3. Protocol of 1982 to the Plantations Convention, 1958 4. Protocol of 1996 to the Merchant Shipping (Minimum Standards) Convention, 1976 5. Protocol of 2002 to the Occupational Safety and Health Convention, 1981 6. Protocol of 2014 to the Forced Labour Convention, 1930.
211
RECOMMENDATIONS 1. Unemployment Recommendation, 1919 2. Reciprocity of Treatment Recommendation, 1919 3. Anthrax Prevention Recommendation, 1919 4. Lead Poisoning (Women and Children) Recommendation, 1919 5. Labour Inspection (Health Services) Recommendation, 1919 6. White Phosphorus Recommendation, 1919 7. Hours of Work (Fishing) Recommendation, 1920 8. Hours of Work (Inland Navigation) Recommendation, 1920 9. National Seamen's Codes Recommendation, 1920 10. Unemployment Insurance (Seamen) Recommendation, 1920 11. Unemployment (Agriculture) Recommendation, 1921 12. Maternity Protection (Agriculture) Recommendation, 1921 13. Night Work of Women (Agriculture) Recommendation, 1921 14. Night Work of Children and Young Persons (Agriculture) Recommendation, 1921 15. Vocational Education (Agriculture) Recommendation, 1921 16. Living-in Conditions (Agriculture) Recommendation, 1921 17. Social Insurance (Agriculture) Recommendation, 1921 18. Weekly Rest (Commerce) Recommendation, 1921 19. Migration Statistics Recommendation, 1922 20. Labour Inspection Recommendation, 1923 21. Utilisation of Spare Time Recommendation, 1924 22. Workmen's Compensation (Minimum Scale) Recommendation, 1925 23. Workmen's Compensation (Jurisdiction) Recommendation, 1925 24. Workmen's Compensation (Occupational Diseases) Recommendation, 1925 25. Equality of Treatment (Accident Compensation) Recommendation, 1925 26. Migration (Protection of Females at Sea) Recommendation, 1926 27. Repatriation (Ship Masters and Apprentices) Recommendation, 1926 28. Labour Inspection (Seamen) Recommendation, 1926 29. Sickness Insurance Recommendation, 1927 30. Minimum Wage-Fixing Machinery Recommendation, 1928 31. Prevention of Industrial Accidents Recommendation, 1929 32. Power-driven Machinery Recommendation, 1929 33. Protection against Accidents (Dockers) Reciprocity Recommendation, 1929 34. Protection against Accidents (Dockers) Consultation of Organisations Recommendation,
1929 35. Forced Labour (Indirect Compulsion) Recommendation, 1930 36. Forced Labour (Regulation) Recommendation, 1930 37. Hours of Work (Hotels, etc.) Recommendation, 1930 38. Hours of Work (Theatres, etc.) Recommendation, 1930 39. Hours of Work (Hospitals, etc.) Recommendation, 1930 40. Protection against Accidents (Dockers) Reciprocity Recommendation, 1932 41. Minimum Age (Non-Industrial Employment) Recommendation, 1932 42. Employment Agencies Recommendation, 1933 43. Invalidity, Old-Age and Survivors' Insurance Recommendation, 1933 44. Unemployment Provision Recommendation, 1934 45. Unemployment (Young Persons) Recommendation, 1935 46. Elimination of Recruiting Recommendation, 1936 47. Holidays with Pay Recommendation, 1936 48. Seamen's Welfare in Ports Recommendation, 1936 49. Hours of Work and Manning (Sea) Recommendation, 1936 50. Public Works (International Co-operation) Recommendation, 1937 51. Public Works (National Planning) Recommendation, 1937
212
52. Minimum Age (Family Undertakings) Recommendation, 1937 53. Safety Provisions (Building) Recommendation, 1937 54. Inspection (Building) Recommendation, 1937 55. Co-operation in Accident Prevention (Building) Recommendation, 1937 56. Vocational Education (Building) Recommendation, 1937 57. Vocational Training Recommendation, 1939 58. Contracts of Employment (Indigenous Workers) Recommendation, 1939 59. Labour Inspectorates (Indigenous Workers) Recommendation, 1939 60. Apprenticeship Recommendation, 1939 61. Migration for Employment Recommendation, 1939 62. Migration for Employment (Co-operation between States) Recommendation, 1939 63. Control Books (Road Transport) Recommendation, 1939 64. Night Work (Road Transport) Recommendation, 1939 65. Methods of Regulating Hours (Road Transport) Recommendation, 1939 66. Rest Periods (Private Chauffeurs) Recommendation, 1939 67. Income Security Recommendation, 1944 68. Social Security (Armed Forces) Recommendation, 1944 69. Medical Care Recommendation, 1944 70. Social Policy in Dependent Territories Recommendation, 1944 71. Employment (Transition from War to Peace) Recommendation, 1944 72. Employment Service Recommendation, 1944 73. Public Works (National Planning) Recommendation, 1944 74. Social Policy in Dependent Territories (Supplementary Provisions) Recommendation, 1945 75. Seafarers' Social Security (Agreements) Recommendation, 1946 76. Seafarers (Medical Care for Dependants) Recommendation, 1946 77. Vocational Training (Seafarers) Recommendation, 1946 78. Bedding, Mess Utensils and Miscellaneous Provisions (Ships' Crews) Recommendation,
1946 79. Medical Examination of Young Persons Recommendation, 1946 80. Night Work of Young Persons (Non-Industrial Occupations) Recommendation, 1946 81. Labour Inspection Recommendation, 1947 82. Labour Inspection (Mining and Transport) Recommendation, 1947 83. Employment Service Recommendation, 1948 84. Labour Clauses (Public Contracts) Recommendation, 1949 85. Protection of Wages Recommendation, 1949 86. Migration for Employment Recommendation (Revised), 1949 87. Vocational Guidance Recommendation, 1949 88. Vocational Training (Adults) Recommendation, 1950 89. Minimum Wage-Fixing Machinery (Agriculture) Recommendation, 1951 90. Equal Remuneration Recommendation, 1951 91. Collective Agreements Recommendation, 1951 92. Voluntary Conciliation and Arbitration Recommendation, 1951 93. Holidays with Pay (Agriculture) Recommendation, 1952 94. Co-operation at the Level of the Undertaking Recommendation, 1952 95. Maternity Protection Recommendation, 1952 96. Minimum Age (Coal Mines) Recommendation, 1953 97. Protection of Workers' Health Recommendation, 1953 98. Holidays with Pay Recommendation, 1954 99. Vocational Rehabilitation (Disabled) Recommendation, 1955 100. Protection of Migrant Workers (Underdeveloped Countries) Recommendation, 1955 101. Vocational Training (Agriculture) Recommendation, 1956 102. Welfare Facilities Recommendation, 1956 103. Weekly Rest (Commerce and Offices) Recommendation, 1957 104. Indigenous and Tribal Populations Recommendation, 1957
213
105. Ships' Medicine Chests Recommendation, 1958 106. Medical Advice at Sea Recommendation, 1958 107. Seafarers' Engagement (Foreign Vessels) Recommendation, 1958 108. Social Conditions and Safety (Seafarers) Recommendation, 1958 109. Wages, Hours of Work and Manning (Sea) Recommendation, 1958 110. Plantations Recommendation, 1958 111. Discrimination (Employment and Occupation) Recommendation, 1958 112. Occupational Health Services Recommendation, 1959 113. Consultation (Industrial and National Levels) Recommendation, 1960 114. Radiation Protection Recommendation, 1960 115. Workers' Housing Recommendation, 1961 116. Reduction of Hours of Work Recommendation, 1962 117. Vocational Training Recommendation, 1962 118. Guarding of Machinery Recommendation, 1963 119. Termination of Employment Recommendation, 1963 120. Hygiene (Commerce and Offices) Recommendation, 1964 121. Employment Injury Benefits Recommendation, 1964 122. Employment Policy Recommendation, 1964 123. Employment (Women with Family Responsibilities) Recommendation, 1965 124. Minimum Age (Underground Work) Recommendation, 1965 125. Conditions of Employment of Young Persons (Underground Work) Recommendation,
1965 126. Vocational Training (Fishermen) Recommendation, 1966 127. Co-operatives (Developing Countries) Recommendation, 1966 128. Maximum Weight Recommendation, 1967 129. Communications within the Undertaking Recommendation, 1967 130. Examination of Grievances Recommendation, 1967 131. Invalidity, Old-Age and Survivors' Benefits Recommendation, 1967 132. Tenants and Share-croppers Recommendation, 1968 133. Labour Inspection (Agriculture) Recommendation, 1969 134. Medical Care and Sickness Benefits Recommendation, 1969 135. Minimum Wage Fixing Recommendation, 1970 136. Special Youth Schemes Recommendation, 1970 137. Vocational Training (Seafarers) Recommendation, 1970 138. Seafarers' Welfare Recommendation, 1970 139. Employment of Seafarers (Technical Developments) Recommendation, 1970 140. Crew Accommodation (Air Conditioning) Recommendation, 1970 141. Crew Accommodation (Noise Control) Recommendation, 1970 142. Prevention of Accidents (Seafarers) Recommendation, 1970 143. Workers' Representatives Recommendation, 1971 144. Benzene Recommendation, 1971 145. Dock Work Recommendation, 1973 146. Minimum Age Recommendation, 1973 147. Occupational Cancer Recommendation, 1974 148. Paid Educational Leave Recommendation, 1974 149. Rural Workers' Organisations Recommendation, 1975 150. Human Resources Development Recommendation, 1975 151. Migrant Workers Recommendation, 1975 152. Tripartite Consultation (Activities of the International Labour Organisation)
Recommendation, 1976 153. Protection of Young Seafarers Recommendation, 1976 154. Continuity of Employment (Seafarers) Recommendation, 1976 155. Merchant Shipping (Improvement of Standards) Recommendation, 1976 156. Working Environment (Air Pollution, Noise and Vibration) Recommendation, 1977
214
157. Nursing Personnel Recommendation, 1977 158. Labour Administration Recommendation, 1978 159. Labour Relations (Public Service) Recommendation, 1978 160. Occupational Safety and Health (Dock Work) Recommendation, 1979 161. Hours of Work and Rest Periods (Road Transport) Recommendation, 1979 162. Older Workers Recommendation, 1980 163. Collective Bargaining Recommendation, 1981 164. Occupational Safety and Health Recommendation, 1981 165. Workers with Family Responsibilities Recommendation, 1981 166. Termination of Employment Recommendation, 1982 167. Maintenance of Social Security Rights Recommendation, 1983 168. Vocational Rehabilitation and Employment (Disabled Persons) Recommendation, 1983 169. Employment Policy (Supplementary Provisions) Recommendation, 1984 170. Labour Statistics Recommendation, 1985 171. Occupational Health Services Recommendation, 1985 172. Asbestos Recommendation, 1986 173. Seafarers' Welfare Recommendation, 1987 174. Repatriation of Seafarers Recommendation, 1987 175. Safety and Health in Construction Recommendation, 1988 176. Employment Promotion and Protection against Unemployment Recommendation, 1988 177. Chemicals Recommendation, 1990 178. Night Work Recommendation, 1990 179. Working Conditions (Hotels and Restaurants) Recommendation, 1991 180. Protection of Workers' Claims (Employer's Insolvency) Recommendation, 1992 181. Prevention of Major Industrial Accidents Recommendation, 1993 182. Part-Time Work Recommendation, 1994 183. Safety and Health in Mines Recommendation, 1995 184. Home Work Recommendation, 1996 185. Labour Inspection (Seafarers) Recommendation, 1996 186. Recruitment and Placement of Seafarers Recommendation, 1996 187. Seafarers' Wages, Hours of Work and the Manning of Ships Recommendation, 1996 188. Private Employment Agencies Recommendation, 1997 189. Job Creation in Small and Medium-Sized Enterprises Recommendation, 1998 190. Worst Forms of Child Labour Recommendation, 1999 191. Maternity Protection Recommendation, 2000 192. Safety and Health in Agriculture Recommendation, 2001 193. Promotion of Cooperatives Recommendation, 2002 194. List of Occupational Diseases Recommendation, 2002 195. Human Resources Development Recommendation, 2004 196. Work in Fishing Recommendation, 2005 197. Promotional Framework for Occupational Safety and Health Recommendation, 2006 198. Employment Relationship Recommendation, 2006 199. Work in Fishing Recommendation, 2007 200. HIV and AIDS Recommendation, 2010 201. Domestic Workers Recommendation, 2011 202. Social Protection Floors Recommendation, 2012 203. Forced Labour (Supplementary Measures) Recommendation, 2014 204. Transition from the Informal to the Formal Economy Recommendation, 2015 205. Employment and Decent Work for Peace and Resilience Recommendation, 2017
215
APPENDIX 3
SELECT BIBLIOGRAPHY
In order to keep the readers well informed of the latest available literature on labour matters, the first „Select Bibliography‟ was included in the 1948-49 edition of the Year Book. Since then it is being updated and published in the successive editions. In this issue of the Year Book an effort has been made to include as much bibliographical information pertaining to the Year 2017 as possible. For a list of previous publications, earlier editions of the Year Book may be consulted.
1. PUBLICATIONS, REPORTS, ETC, OF THE CENTRAL GOVERNMENT AND ILO
Ministry of Labour and Employment Annual Report of the Ministry of Labour 2017-18. 2
nd Labour Commission Report.
Directorate General of Mines Safety, Dhanbad Quarterly Bulletin for metalliferous Mines. Annual Report of Directorate General of Mines Safety. Directorate General of Employment, New Delhi Monthly Highlights of Employment and Unemployment. Annual Report to the People on Employment. Employment Exchange Statistic. Census of Central Government Employees Ministry of Railways Annual Report and Accounts of Indian Railways, 2016-17. Employees Provident Fund Organisation Annual Report 2016-17 Labour Bureau, Shimla/Chandigarh Indian Labour Journal (Monthly). Indian Labour Year Book 2016 Statistics on Industrial Disputes, Closure, Retrenchment and Lay-off in Industries in India
during the year 2014 Consumer Price Index Numbers for Industrial Workers – Annual Report 2017 Consumer Price Index Numbers for Agricultural and Rural Labourers (Base:1986-87=100) –
Annual Report 2016-17 (Agricultural Year) Wage Rates in Rural India 2016-17 (Agricultural Year) Annual Survey of Industries 2012-2013 (Vol.I.) Statistics on Employment and Labour Cost Annual Survey of Industries 2012-2013 (Vol.II.) Report on Absenteeism, Labour Turnover,
Employment and Labour cost Pocket Book of Labour Statistics 2016 (Bilingual) Annual Reviews for the year 2015 on the Working of the Industrial Employment (Standing
Orders) Act 1946; the Workmen‟s Compensation Act 1923; the Maternity Benefit Act, 1961, and the Shops and Commercial Establishments Acts.
Tenth Digest of Indian Labour Research 2010 Report on the Working of the Minimum Wages Act, 1948 for the year 2014 V.V. Giri National Labour Institute, Noida A Study of Welfare Measures for Beedi Workers in Bangalore and Hyderabad Regions Bharat main Private Suraksha Agencies Dwara Niyojit Suraksha Garud Conditions of Employment, Work and Service of Faculty in Private Engineering Colleges in
India Employment and Social Protection of Cashew Workers in India With Special Reference to
Kerala Labour & Development (a bi-annual journal) Awards Digest (a bi-monthly journal) Shram Vidhan (a bi-monthly Hindi journal)
216
VVGNLI Indradhanush (a bi-monthly newsletter) Child Hope (a quarterly newsletter) Marine Fishery Industry and Marine Fish Workers in India: A Study with Special Reference to
Exploring Employment Potentials in the Sector Child Labour and Legislative Framework Changing Land Utilisation Patterns in Tea Plantation Sector in West Bengal: Some Policy
Imperatives Social Security for International Labour Migrants: Issues and Policy Options Child Labour and Health Hazards Worker‟s Rights and Practices in the Contemporary Scenario: An Overview Work Participation and Time-Use Pattern of Women in Rural Arunachal Pradesh Fundamental Principles and Rights at Work and Informal Economy in India: Trends, Initiatives
and Challenges The Anti-Khoti Movement in the Konkan, C. 1920-1949 Migrant and Trafficked Children in Hazardous Employment: The Case of Nagaland Expansion of Natural Rubber Cultivation in Tripura: Impact on Landholding, Employment and
Income ILO Convention 181: Issues and Challenges in the Context of Private Placement Agencies in
India Comprehending Child Labour Convergence of Social Security Schemes for Elimination of Child Labour Ministry of Shipping Annual Report, 2016-17. Ministry of Communications and Information Technology Annual Report, 2016-17. Ministry of Women and Child Development Annual Report 2016-17. Ministry of Road Transport & Highways Annual Report 2016-17. Ministry of Finance Economic Survey 2017-18. Ministry of Human Resource Development Annual Report 2015-16. Ministry of Rural Development Annual Report, 2016-17. Ministry of Urban Development Annual Report, 2016-17. Central Board for Workers Education CBWE News (Monthly). Workers‟ Education Journal (Quarterly). National Sample Survey Office Level and Pattern of Consumer Expenditure 68
th Round 2011-12
Employment and Unemployment Situation in India 68th Round 2011-12
Key Indicators of Employment And Unemployment in India, 2011-12 Key Indicators of Household Consumer Expenditure in India, 2011-12 Key Results of Survey on Unincorporated Non-agricultural Enterprises in India, 2010-11 Central Statistical Office Situation Analysis of the Elderly in India 2011 India in figures a Ready Reference Women and Men in India (annual) Millennium Development goals-India Country Report (Biennial) Statistical Year Book India Informal Sector & Conditions of Employment in India 2009-10 (Vol. I & II) Selected Socio Economic Statistics
217
International Labour Organisation World Employment and Social Outlook Global Wage Report World Social Protection Report World of Work Report Wages in Asia and the Pacific: Dynamic but uneven progress Development and employment in Latin America and the Caribbean: A look ahead An Accuracy Assessment of the Global Employment Trends‟ Unemployment Rate Forecasts Kenya: Making quality employment the driver of development Tackling the jobs crisis in Portugal Bangladesh: Seeking better employment conditions for better socioeconomic outcomes The Social Dimensions of Free Trade Agreements 2. PUBLICATIONS, REPORTS, ETC OF THE STATE GOVERNMENTS
Directorate of Economics and Statistics, Andhra Pradesh Price Wage and Index Numbers Directorate of Economics and Statistics, Bihar Bihar at a Glance Bihar Statistical Hand Book Directorate of Economics and Statistics, Gujarat Socio Economic Review Statistical Outline Gujarat Directorate of Economics and Statistics, Goa Index of Industrial Production in Goa Directorate of Economics and Statistics, Himachal Pradesh Economic Review of Himachal Pradesh Directorate of Economics and Statistics, Jammu & Kashmir Economic Review of J&K
Compendium of Evaluation Studies J&K in Indian Economy
Directorate of Economics and Statistics, Maharashtra Hand Book of Basic Statistics of Maharashtra State Economic Survey Economy in Figures Directorate of Economics and Statistics, Manipur Economic Survey Price Statistics of Manipur Directorate of Economics and Statistics, Rajasthan Economic Review Directorate of Economics and Statistics, Tamil Nadu
Statistical Hand Book of Tamil Nadu Directorate of Economics and Statistics, Delhi Labour Statistics Government of Tripura Labour in Tripura Government of Orissa Labour Statistics Directorate of Economics and Statistics, Uttar Pradesh Statistical Abstract, Uttar Pradesh District Statistical Handbook
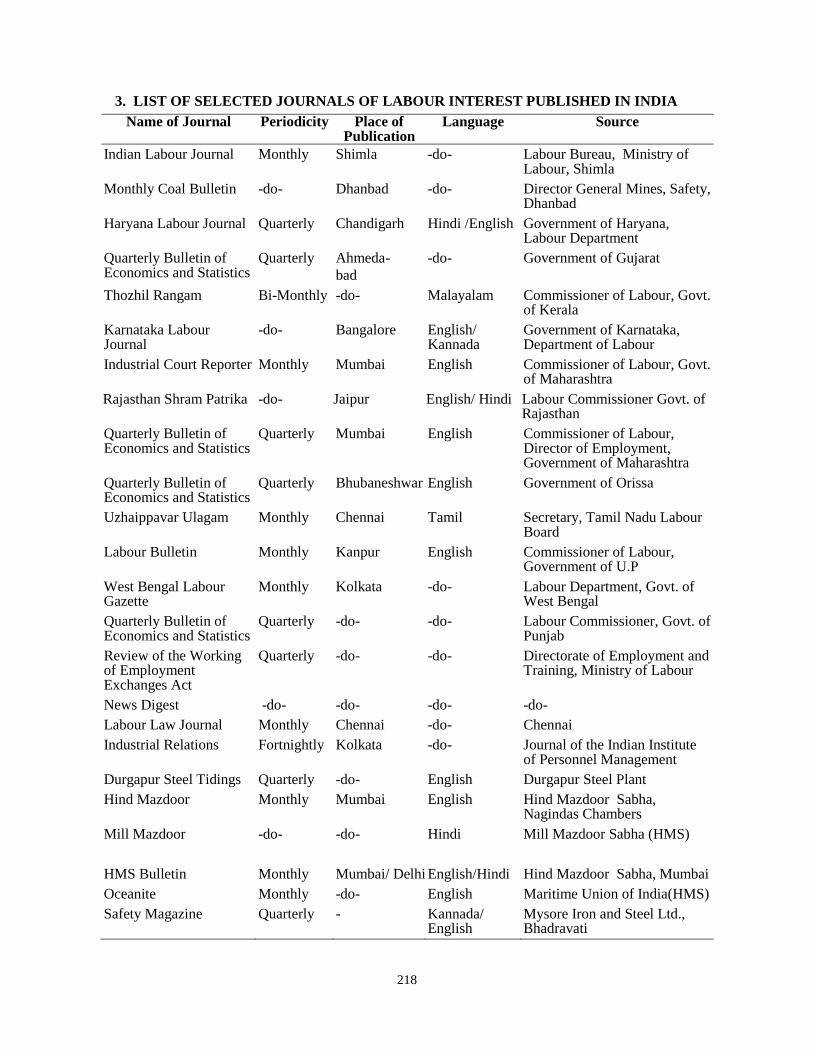
218
3. LIST OF SELECTED JOURNALS OF LABOUR INTEREST PUBLISHED IN INDIA
Name of Journal Periodicity Place of Publication
Language Source
Indian Labour Journal Monthly Shimla -do- Labour Bureau, Ministry of Labour, Shimla
Monthly Coal Bulletin -do- Dhanbad -do- Director General Mines, Safety, Dhanbad
Haryana Labour Journal Quarterly Chandigarh Hindi /English Government of Haryana, Labour Department
Quarterly Bulletin of Economics and Statistics
Quarterly Ahmeda-
bad
-do- Government of Gujarat
Thozhil Rangam Bi-Monthly -do- Malayalam Commissioner of Labour, Govt. of Kerala
Karnataka Labour Journal
-do- Bangalore English/ Kannada
Government of Karnataka, Department of Labour
Industrial Court Reporter Monthly Mumbai English Commissioner of Labour, Govt. of Maharashtra
Rajasthan Shram Patrika -do- Jaipur English/ Hindi Labour Commissioner Govt. of Rajasthan
Quarterly Bulletin of Economics and Statistics
Quarterly Mumbai English Commissioner of Labour, Director of Employment, Government of Maharashtra
Quarterly Bulletin of Economics and Statistics
Quarterly Bhubaneshwar English Government of Orissa
Uzhaippavar Ulagam Monthly Chennai Tamil Secretary, Tamil Nadu Labour Board
Labour Bulletin Monthly Kanpur English Commissioner of Labour, Government of U.P
West Bengal Labour Gazette
Monthly Kolkata -do- Labour Department, Govt. of West Bengal
Quarterly Bulletin of Economics and Statistics
Quarterly -do- -do- Labour Commissioner, Govt. of Punjab
Review of the Working of Employment Exchanges Act
Quarterly -do- -do- Directorate of Employment and Training, Ministry of Labour
News Digest -do- -do- -do- -do-
Labour Law Journal Monthly Chennai -do- Chennai
Industrial Relations Fortnightly Kolkata -do- Journal of the Indian Institute of Personnel Management
Durgapur Steel Tidings Quarterly -do- English Durgapur Steel Plant
Hind Mazdoor Monthly Mumbai English Hind Mazdoor Sabha, Nagindas Chambers
Mill Mazdoor -do- -do- Hindi Mill Mazdoor Sabha (HMS)
HMS Bulletin Monthly Mumbai/ Delhi English/Hindi Hind Mazdoor Sabha, Mumbai
Oceanite Monthly -do- English Maritime Union of India(HMS)
Safety Magazine Quarterly - Kannada/ English
Mysore Iron and Steel Ltd., Bhadravati
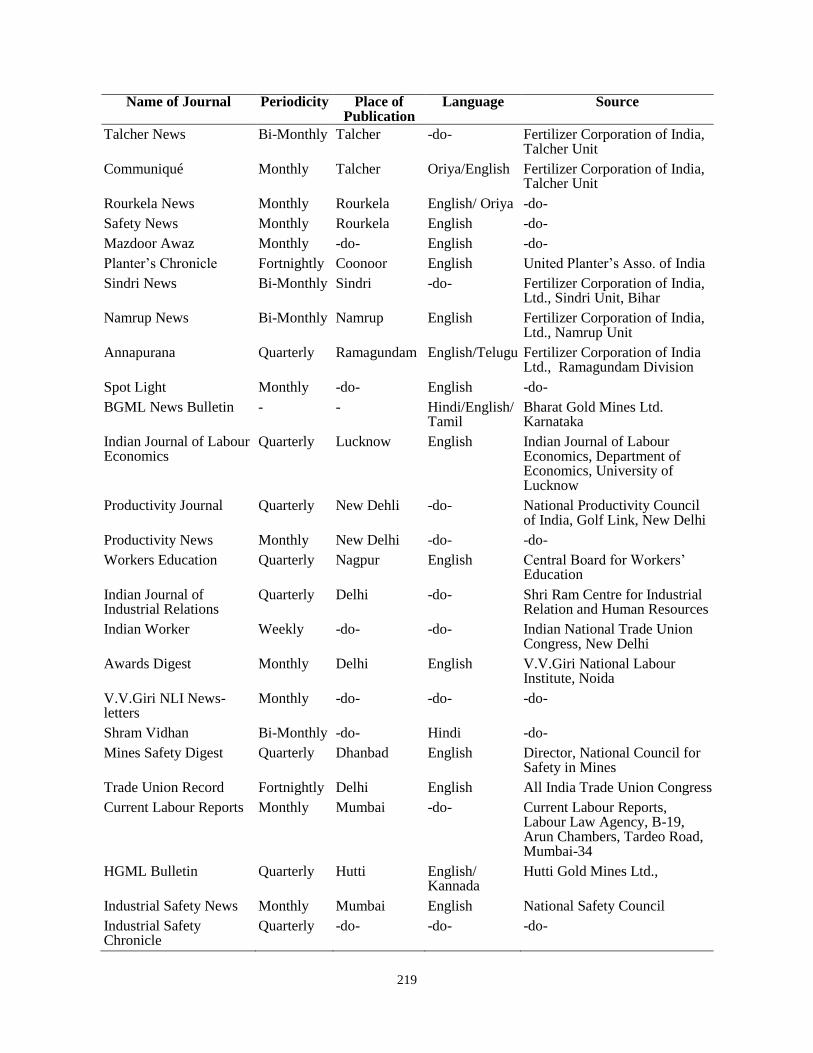
219
Name of Journal Periodicity Place of Publication
Language Source
Talcher News Bi-Monthly Talcher -do- Fertilizer Corporation of India, Talcher Unit
Communiqué Monthly Talcher Oriya/English Fertilizer Corporation of India, Talcher Unit
Rourkela News Monthly Rourkela English/ Oriya -do-
Safety News Monthly Rourkela English -do-
Mazdoor Awaz Monthly -do- English -do-
Planter‟s Chronicle Fortnightly Coonoor English United Planter‟s Asso. of India
Sindri News Bi-Monthly Sindri -do- Fertilizer Corporation of India, Ltd., Sindri Unit, Bihar
Namrup News Bi-Monthly Namrup English Fertilizer Corporation of India, Ltd., Namrup Unit
Annapurana Quarterly Ramagundam English/Telugu Fertilizer Corporation of India Ltd., Ramagundam Division
Spot Light Monthly -do- English -do-
BGML News Bulletin - - Hindi/English/ Tamil
Bharat Gold Mines Ltd. Karnataka
Indian Journal of Labour Economics
Quarterly Lucknow English Indian Journal of Labour Economics, Department of Economics, University of Lucknow
Productivity Journal Quarterly New Dehli -do- National Productivity Council of India, Golf Link, New Delhi
Productivity News Monthly New Delhi -do- -do-
Workers Education Quarterly Nagpur English Central Board for Workers‟ Education
Indian Journal of Industrial Relations
Quarterly Delhi -do- Shri Ram Centre for Industrial Relation and Human Resources
Indian Worker Weekly -do- -do- Indian National Trade Union Congress, New Delhi
Awards Digest Monthly Delhi English V.V.Giri National Labour Institute, Noida
V.V.Giri NLI News-letters
Monthly -do- -do- -do-
Shram Vidhan Bi-Monthly -do- Hindi -do-
Mines Safety Digest Quarterly Dhanbad English Director, National Council for Safety in Mines
Trade Union Record Fortnightly Delhi English All India Trade Union Congress
Current Labour Reports Monthly Mumbai -do- Current Labour Reports, Labour Law Agency, B-19, Arun Chambers, Tardeo Road, Mumbai-34
HGML Bulletin Quarterly Hutti English/ Kannada
Hutti Gold Mines Ltd.,
Industrial Safety News Monthly Mumbai English National Safety Council
Industrial Safety Chronicle
Quarterly -do- -do- -do-
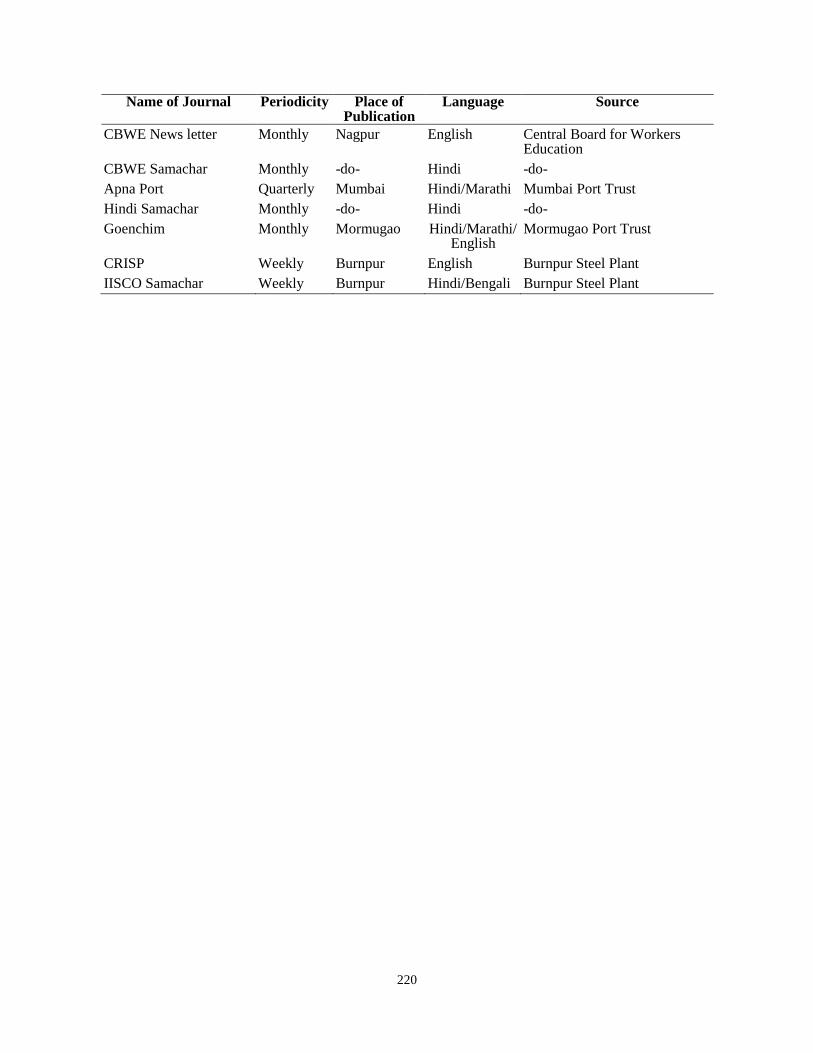
220
Name of Journal Periodicity Place of Publication
Language Source
CBWE News letter Monthly Nagpur English Central Board for Workers Education
CBWE Samachar Monthly -do- Hindi -do-
Apna Port Quarterly Mumbai Hindi/Marathi Mumbai Port Trust
Hindi Samachar Monthly -do- Hindi -do-
Goenchim Monthly Mormugao Hindi/Marathi/ English
Mormugao Port Trust
CRISP Weekly Burnpur English Burnpur Steel Plant
IISCO Samachar Weekly Burnpur Hindi/Bengali Burnpur Steel Plant
221
© भारत सरकार नियंत्रक प्रकाशि
PDLB-19-2017
175-2019(DSK-III)
Price: Rs. 230.00
Printed by the Printing Unit, Labour Bureau, Shimla
for the Controller of Publications,
Civil Lines, Delhi - 110054