indian education sector outlook (insights on schooling segment
TRANSCRIPT
Indian Education Sector Outlook
(Insights on Schooling Segment)
www.technopak.comEducation
a quar terly repor t by technopak | Outlook July, 2012

Author:
Aurobindo Saxena Principal Consultant | [email protected] | +91-9891321279
Design & Development:
Bharat KaushikSr. Manager-Design I [email protected] I +91-9811661493
Arvind Sundriyal, Assistant Manager-Design I [email protected] I +91-9910493934
OVERVIEW OF INDIAN EDUCATION SECTOR
Educational Infrastructure | Key Segments | Schooling Segment | Challenges in the Schooling Segment
01
ABOUT TECHNOPAK11
06EMERGING BUSINESS OPPORTUNITIES
Opportunity Assessment | Entry Strategy | K-12 Schools – Indicative Economics
Outlook July, 2012 | Indian Education Sector Outlook (Insights on Schooling Segment)
1 2
Market OverviewIndia has the world’s largest population in the age bracket 5 to 24 years of about 450 million. It also has around 500 million in the 25 to 59 age bracket which constitutes the working population and is expected to continuously increase even as the world’s working population ages and diminishes. This phenomenon will make India a supplier of workforce to the entire world. In the wake of this reality, the Indian education system should therefore be able to produce a workforce which is globally competitive and thus reap its demographic dividend.
Literacy in India is one of the key deterrents to socio-economic progress of the country. The Indian literacy rate currently stands at 74% compared to 12% at the end of British rule in 1947. Although there has been a six fold growth, the level is well below the world average literacy rate of 84%, and India currently has the largest illiterate population compared to any other nation in the world. A quick look at Exhibit 1 below provides an insight into the current literacy levels of Indians.
Therefore, as India moves ahead on the path of globalization, it needs to overhaul its education system to meet the future demands.
Educational Infrastructure The size of our educational infrastructure can be assessed by the private and public spends on education. The Indian private spend on education in 2011 was estimated to be over USD 60 bilion across all segments (Schooling, Higher Education, Vocational and Ancillary) or approximately equal to 3% of our GDP. The 11th five year plan (2007-12) was termed as “India’s educational plan” and placed the highest priority on education as a central instrument for achieving rapid and inclusive growth. At USD 54 billion, it constituted 20% of the plan.
During the financial year 2011-12, the Central Government allocated USD 8 billion to the Department of School Education and Literacy itself, which is the main department dealing with primary education in India. Yet, there exists a huge demand and supply gap, which requires a sizable and sustainable public and private investment. Exhibit 2 below provides an overview of the current Indian educational infrastructure and the need gap.
Another indicator of this widening gap is the number of students going abroad for higher education, which is estimated at over 0.2 million students and an annual spending of over USD 13 billion.
Key SegmentsThe Indian Education sector can be segmented under four broad heads, namely, Schooling, Higher Education, Vocational Education & Skill Development and Ancillary. The Exhibit 3 below provides an overview of the various education segments and their respective sub-segments.
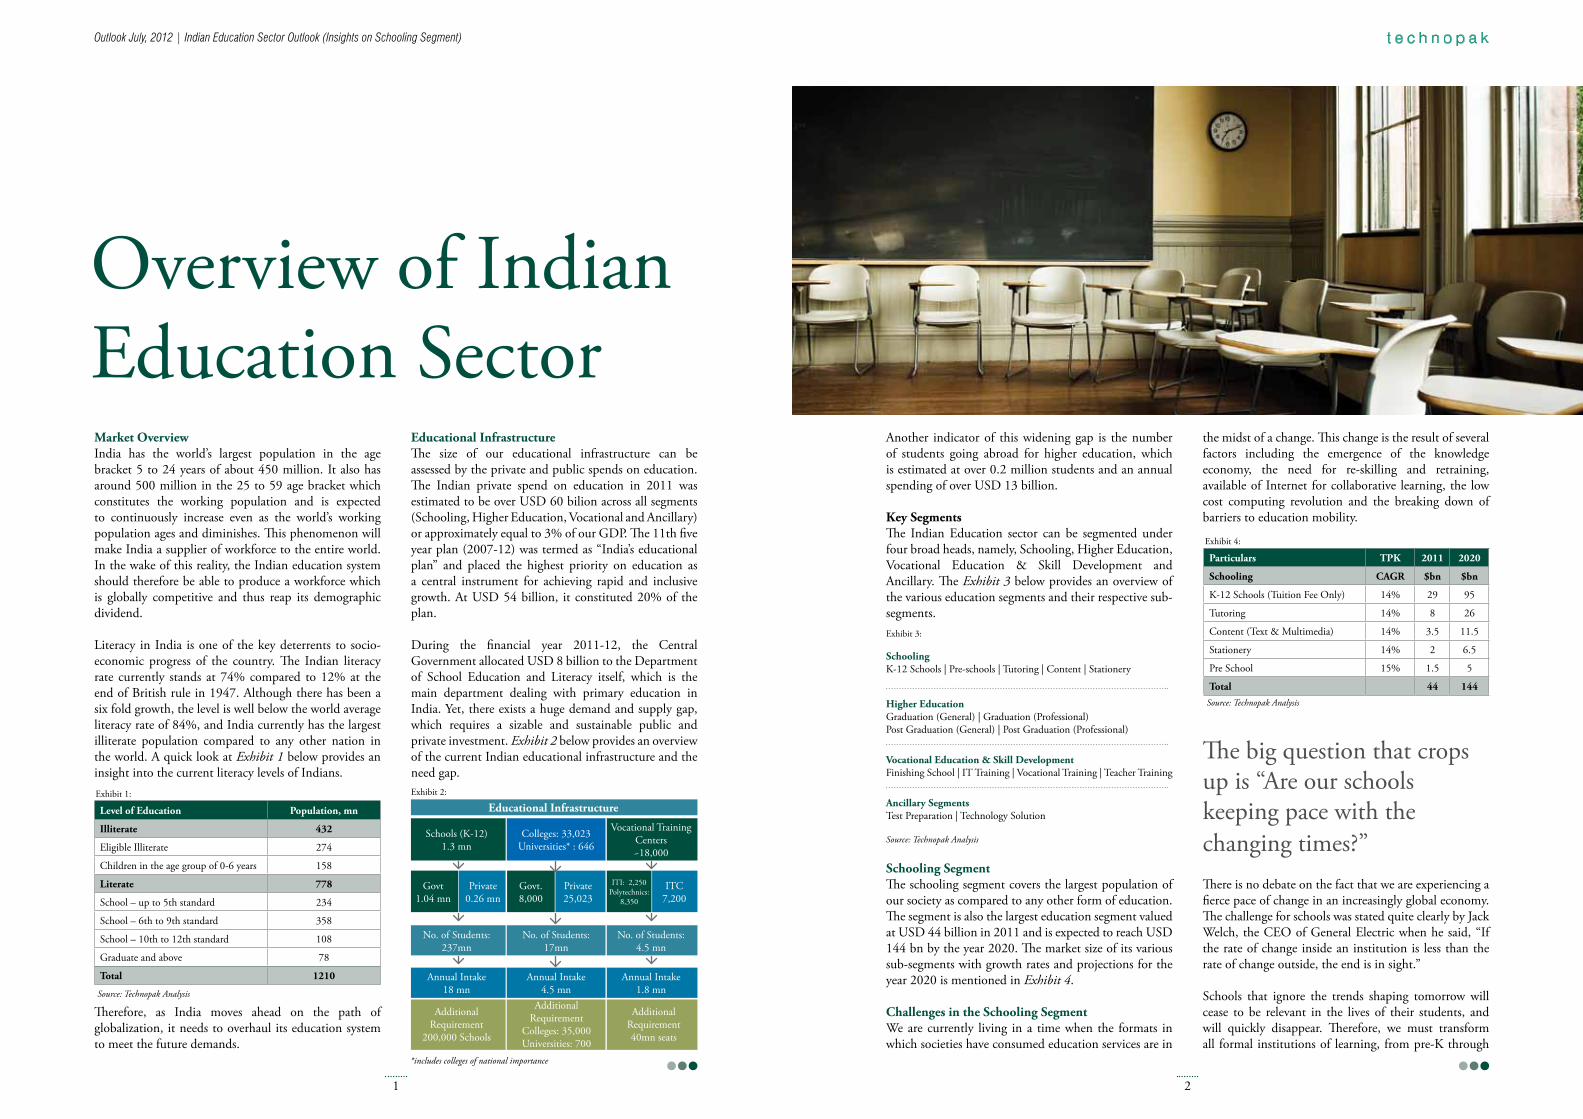
Schooling SegmentThe schooling segment covers the largest population of our society as compared to any other form of education. The segment is also the largest education segment valued at USD 44 billion in 2011 and is expected to reach USD 144 bn by the year 2020. The market size of its various sub-segments with growth rates and projections for the year 2020 is mentioned in Exhibit 4.
Challenges in the Schooling SegmentWe are currently living in a time when the formats in which societies have consumed education services are in
Overview of Indian Education Sector
the midst of a change. This change is the result of several factors including the emergence of the knowledge economy, the need for re-skilling and retraining, available of Internet for collaborative learning, the low cost computing revolution and the breaking down of barriers to education mobility.
There is no debate on the fact that we are experiencing a fierce pace of change in an increasingly global economy. The challenge for schools was stated quite clearly by Jack Welch, the CEO of General Electric when he said, “If the rate of change inside an institution is less than the rate of change outside, the end is in sight.”
Schools that ignore the trends shaping tomorrow will cease to be relevant in the lives of their students, and will quickly disappear. Therefore, we must transform all formal institutions of learning, from pre-K through
Level of Education Population, mn
Illiterate 432
Eligible Illiterate 274
Children in the age group of 0-6 years 158
Literate 778
School – up to 5th standard 234
School – 6th to 9th standard 358
School – 10th to 12th standard 108
Graduate and above 78
Total 1210
Exhibit 1:
Source: Technopak Analysis
Particulars TPK 2011 2020
Schooling CAGR $bn $bn
K-12 Schools (Tuition Fee Only) 14% 29 95
Tutoring 14% 8 26
Content (Text & Multimedia) 14% 3.5 11.5
Stationery 14% 2 6.5
Pre School 15% 1.5 5
Total 44 144
Exhibit 4:
Source: Technopak Analysis
Exhibit 3:
Source: Technopak Analysis
SchoolingK-12 Schools | Pre-schools | Tutoring | Content | Stationery
Higher EducationGraduation (General) | Graduation (Professional)Post Graduation (General) | Post Graduation (Professional)
Vocational Education & Skill DevelopmentFinishing School | IT Training | Vocational Training | Teacher Training
Ancillary SegmentsTest Preparation | Technology Solution
Exhibit 2:
*includes colleges of national importance
Educational Infrastructure
Schools (K-12)1.3 mn
No. of Students: 237mn
Annual Intake18 mn
Additional Requirement
200,000 Schools
Additional Requirement
Colleges: 35,000 Universities: 700
Additional Requirement40mn seats
Govt1.04 mn
Private0.26 mn
Govt.8,000
Private25,023
ITI: 2,250 Polytechnics:
8,350
ITC7,200
Colleges: 33,023Universities* : 646
No. of Students: 17mn
Annual Intake4.5 mn
Vocational Training Centers~18,000
No. of Students: 4.5 mn
Annual Intake1.8 mn
The big question that crops up is “Are our schools keeping pace with the changing times?”
Outlook July, 2012 | Indian Education Sector Outlook (Insights on Schooling Segment)
3 4
college, in order to ensure that we are preparing students for their future, not for their past.
The challenge of transforming education in India cannot be met by quick-fix solutions or isolated reforms. It can only be accomplished with a clear, coherent and coordinated vision of reform. The important thing to note here is that anything we do today to fix our schools will take fifteen to twenty years to show significant results. Therefore, leaders of today will need to have clear understanding of how the world may be different 15 to 20 years from now.
It is evident that we are facing the challenge of an underperforming education system. Interestingly, the problem is not due to scarcity of funds. In the year 2011, world’s government spent over USD 2 trillion on education. Despite increased spending, the quality of education has barely improved.
In the following sections we assess the key challenges being faced by Indian schooling system.
Enrolment LevelsDespite having the largest Kindergarten to Grade 12 (K-12) population globally, India has a low enrolment rate in schools, especially at the senior secondary level. The enrolment percentage has fallen from 113% at primary to 81% at middle school and then to 31% at secondary & higher secondary levels. Low enrolment and high drop-out rates are caused by low availability of schools in rural areas, low awareness, and prevalence of child labour amongst lower income strata.
The enrolment percentage is calculated as the ratio of total numbers of students enrolled in specified grades to total number of children in that age group.
At the primary level this is upwards of 100%, as even children greater than 11 years of age are enrolled in Grades 1-5. This is largely a rural phenomenon prevalent in Govt. schools across the country.
Public School InfrastructurePoor infrastructure in Govt. schools and lack of good teachers have forced the Indian middle class to withdraw their children from Govt. schools and enrol them in private schools. While private schools account for 20% (.26 million) of the total number of schools (1.3 million), they provide education to more than 30% of students. The increasing demand for quality education is also backed by the willingness to pay for it.
The rise of IB schools in India over the last few years is one of the key evidences of this trend. The first IB school was authorized in 1976 (The Kodaikanal International School, Tamil Nadu). By 2001, there were 8 IB schools in India and in 2011 there were 84 authorized schools. This trend for better quality education, improved & world class facilities and activities is going to see an accelerated growth in the future. We estimate that by 2020, India will have close to 900 IB schools, as mentioned in Exhibit 6.
Capacity ConstraintsMetros like Delhi and Mumbai have very high land prices and almost no vacant education land parcels, thereby limiting capacity expansion. The limited capacity in established quality schools has resulted in higher fees being charged by schools.
A state wise analysis on the need gap indicates a shortage of schools in Chandigarh, Kerala and Delhi/NCR. In places like Delhi, this situation is expected to remain unchanged due to high land costs and unavailability of new school land parcels. Probably running schools in shifts could address some of these issues.
346 mn children should be in School
237 mn children are in school
School Level Eligible (Mn)
Enrolled (Mn)
Gap (Mn)
Enrolled percentage (%)
Grades 1-5 (ages 6-11) 118 133 -15 113%
Grades 6-8(ages 11-14) 68 55 13 81%
Grades 9-12(ages 14-18) 160 49 111 31%
Total 346 237 109 68%
Exhibit 5:
Source: UNESCO Institute for Statistics, DISE, MHRD, Technopak Analysis
• The enrolment ratio drops to 81% after primary schooling and to 31% in grades 9 to 12
• The ‘gap” is because of a combination of children in school, high drop-out ratios at different levels, and the demand supply gap. These estimates include the formal and non-formal education segments
Shortage of Trained TeachersThe education system in India suffers from a shortage of trained teachers and this has become a big concern for the education sector. The low pay scales and availability of jobs in sectors like BPO have contributed to this shortfall.
The quality of education is dependent on the teachers and the quality of teaching. Thus in order to improve the quality of education it is imperative to address the shortage of teachers as well as the quality of teachers and teacher training courses.
As a result of this, leading chains of schools are setting up in-house teacher training facilities.
As per our analysis, states like Bihar, Uttar Pradesh and Jharkhand have an acute shortage of teachers. Smaller states like Andaman & Nicobar Islands, Arunachal Pradesh, Jammu & Kashmir, Himachal Pradesh, Lakshadweep and Sikkim have a much better student teacher ratio.
Quality of EducationAs if the shortage of teachers was not sufficient to degrade the quality of Indian education, most schools still follow the rote learning practices, which hamper the quality of education severely. This is further supplemented by ineffective assessment of students. The overwhelming acceptance of international boards like the IB and the Cambridge, indicate that people are looking at alternative curriculums and pedagogies that lean towards practical and applied learning rather than rote learning.
We estimate that India will require 6.0mn more teachers by 2020 to attain the world average in terms of student teacher ratio. This would mean a requirement to train 0.75mn teachers p.a., as against this the total capacity of all B.Ed. Colleges currently is only 0.25mn p.a.
0
20
40
60
80
100
0
200
400
600
800
1000
Num
ber o
f IB
Scho
ols
Number of IB Schools
Gro
wth
Rat
e* (%
)
Growth Rate(%)
1976
15
2 8
84
900
3027
15
1991 2001 2011 2020
Exhibit 6
Source: Technopak Analysis

Outlook July, 2012 | Indian Education Sector Outlook (Insights on Schooling Segment)
5 6
PISA 2009+The OECD Programme for International Student Assessment (PISA) is an international comparative survey of the knowledge and skills possessed by 15 year-olds in reading, mathematics and science. PISA seeks to measure how young adults have acquired the knowledge and skills required to function as successful members of society. PISA is a regular, ongoing series of assessments that are administered in participating countries every three years. PISA provides a set of indicators that can be tracked across time to assist in monitoring trends in these educational outcomes.
India’s debut at the prestigious PISA saw the participartion of some sixteen thousand 15-year-olds from schools in Himachal Pradesh and Tamil Nadu. They ranked near the bottom in all categories, outscoring only Kyrgyzstan. Ironically, after such a disappointing performance, the Indian administration decided not to take part in the next cycle of PISA rankings.
Current Regulations The school segment is also moderately regulated. Some of the key regulations include:
• The school must be formed as a Trust or Society, even if it is a privately funded school.
• The surplus must be ploughed back for the improvement of the school.
• The school must be established as a non-proprietary entity without any direct control held by a family or individual.
• A school is not allowed to pay out dividends.
• Admissions cannot be granted on the basis of any form of donations.
• The Right to Education Act requires even private schools to ensure 25% reservation for children from disadvantaged and weaker sections.
Annual Status of Education Report (ASER) 2011 ASER is the largest annual survey of children in rural India. Facilitated by Pratham, ASER is undertaken by local organizations and concerned citizens. ASER 2011 reached 558 districts, 16,017 villages, 327,372 households and 633,465 children. According to the ASER Report 2011 the current education infrastructure is in a very bad shape. Some key highlights of the report are as under:
• Decline in Reading Levels: Nationally, reading levels are estimated to have declined in many states across North India. The All India figure for the proportion of children in Std V able to read a Std 2 level text has dropped from 53.7% in 2010 to 48.2% in 2011. Such declines are not visible in the southern states.
• Decline in Arithmetic Levels: Basic arithmetic levels estimated in ASER 2011 also show a decline. For example, nationally, the proportion of Std III children able to solve a 2 digit subtraction problem with borrowing has dropped from 36.3% in 2010 to 29.9% in 2011. Among Std V children, the ability to do similar subtraction problems has dropped from 70.9% in 2010 to 61.0% in 2011.
• Decline in Attendance: At the All India level, children’s attendance shows a decline from 73.4% in 2007 to 70.9% in 2011 in rural primary schools.
• Multi-Grade classrooms: Nationally, for rural government primary schools, data suggests that over half of all classes visited are multi-grade. For example, all India Std 2 was sitting with one or more other classes in 58.3% of Std 2 classes in primary schools were sitting with another class. This figure is 53% for Std 4.
Emerging Business OpportunitiesEducation, across the spectrum, can be a profitable business, if operations are managed efficiently. Indian Education companies have been reporting substantial growth in the last 5 years with several new ventures mushrooming thick and fast. Growth in the private education market has largely been a function of India’s GDP and population growth coupled with increasing household income and increasing demand for quality education.
In the following section, we have discussed the various feasible entry strategies into the education market for a new player.
Opportunity Assessment We have tried to create a set of filters which can be used by a new entrant to decide on which segment to enter in the schooling space. Each parameter has been given a weightage, based on our understanding. Based on these parameters and their respective weightages, each sub-segment is ranked on a scale of 0 to 4, where 0 is represented by a blank circle and 4 by a fully shaded circle. The score and weights can be multiplied for each category and added to arrive at a total score for a sub-segment.
From the above quantitative analysis, K-12 schools emerge as the preferred choice for entering the space, followed by Tutoring and Content, Preschools and Stationery. Interestingly, all the sub-segments of the schooling space other than the K-12 segment have an asset light model and are also less regulated. However, K-12 segment has tremendous potential for a long term investor.
S. No. Weight Parameter K-12 Schools Tutoring Content Pre Schools Stationery
1 10 Market Opportunity
2 15 Regulation
3 20 Financial Metrics
4 15 International tie-up
5 15 Scalability
6 15 Operational Feasibility
7 10 Social Impact
Exhibit 7:
Source: Technopak Analysis

Outlook July, 2012 | Indian Education Sector Outlook (Insights on Schooling Segment)
7 8
A quick look at the following Exhibit will provide an insight into the advantages and disadvantages of the various entry strategies.
Technically, one can also acquire an existing school and thereby enter the market. However, from our experience this is a tough nut to crack for many reasons. Primarily, the question is around the mode of payment, followed by valuations and then finally turning around the school in terms of top line and brand image. The Brownfield approach is also not very scalable as the amount of initial investment is huge.
Currently, the private schools are being set up using a two-tier structure for investment with a management company providing various services to the trust and a separate infrastructure company providing the land & building to the trust on lease.
Setting up schools is highly capital intensive. In order to improve economics, players are setting up schools in JVs with real estate developers. Undertaking management contracts for existing or new schools is another model being used by private players to capitalize on K-12 market potential. Some professionally managed school chains are using a mix of franchisee and owned schools in order to scale up. Though franchisee model is less capital intensive and helps in faster ramp up, yet it requires significant effort in managing operations.
Besides a quantitative assessment we have also analysed various schooling sub-segments for their respective positives and concerns:
From our analysis K-12 segment emerges as the most promising segment for a new entrant to venture. However, specific assessments can be undertaken based on entrants’ needs and preferences.
Entry StrategyBroadly, one can enter the K-12 segment either through a Greenfield (set up a new school) or a Brownfield (acquire an existing school) approach. In the Greenfield approach, there are choices available in terms of setting up an own brand school or setting up a franchisee school or having a hybrid model where hypothetically there can be three different partners – one who owns the land, a second constructs the infrastructure and a third manages the school.
Particulars Positives Concerns
Schools Segment
K-12 Schools (Tuition Fee Only)
• Recession proof• Zero working capital• Assured returns after
the initial 3-5 years.• Core segment of
education• Target Audience has
high propensity to spend
• High Investment• Payback period of
8-10 years.• 2-3 years to break
even• Regulatory hurdles
impact the progress.
Tutoring
• Low capital requirement
• High margins • High usage amongst
target audience
• Unorganized and localized market
• More people driven than process driven
Content (Text & Multimedia)
• Grows in sync with the schools and enrolment
• Low capital requirement
• High Margins • Low on regulations • Highly scalable
• Growth hindered by reuse of books and piracy
• Availability of online and free content
• Subject to changes in syllabus and regulations on price.
Stationery
• More focus on spending on expensive items.
• Low regulations
• Inventory management
• Low entry barrier
Pre School
• Target Audience has high propensity to spend
• Low on Regulations • Anti-Recession • Zero Working Capital• Easy exit option
• Likely to remain restricted to urban areas.
• Low entry barrier• Highly sensitive and
operational intensive as target audience consists of children in the age group of 2-5 years.
Exhibit 8:
Source: Technopak Analysis
Exhibit 9:
Source: Technopak Analysis
Advantages• Less lead time• Assured cashflows
Disadvantages• Pre established brand image • Difficult to change the existing infrastructure and manpower• Huge upfront payouts & mode of payment
Advantages• Faster rampup • Well laid out systems and processes
Disadvantages• Less Returns to individual partners
Advantages• Faster ramp up • Well laid out systems and processe
Disadvantages• Substantial Roayalty payouts • Strict operational norms
Advantages• Own Brand • No Royalty payments
Disadvantages• Moderate ramp up • Brand building takes time
Brownfield
Greenfield - JV
Greenfield - Franchisee
Greenfield - Own Brand
Pref
eren
ce C
onti
nuum
Hig
hLo
w
Outlook July, 2012 | Indian Education Sector Outlook (Insights on Schooling Segment)
9 10
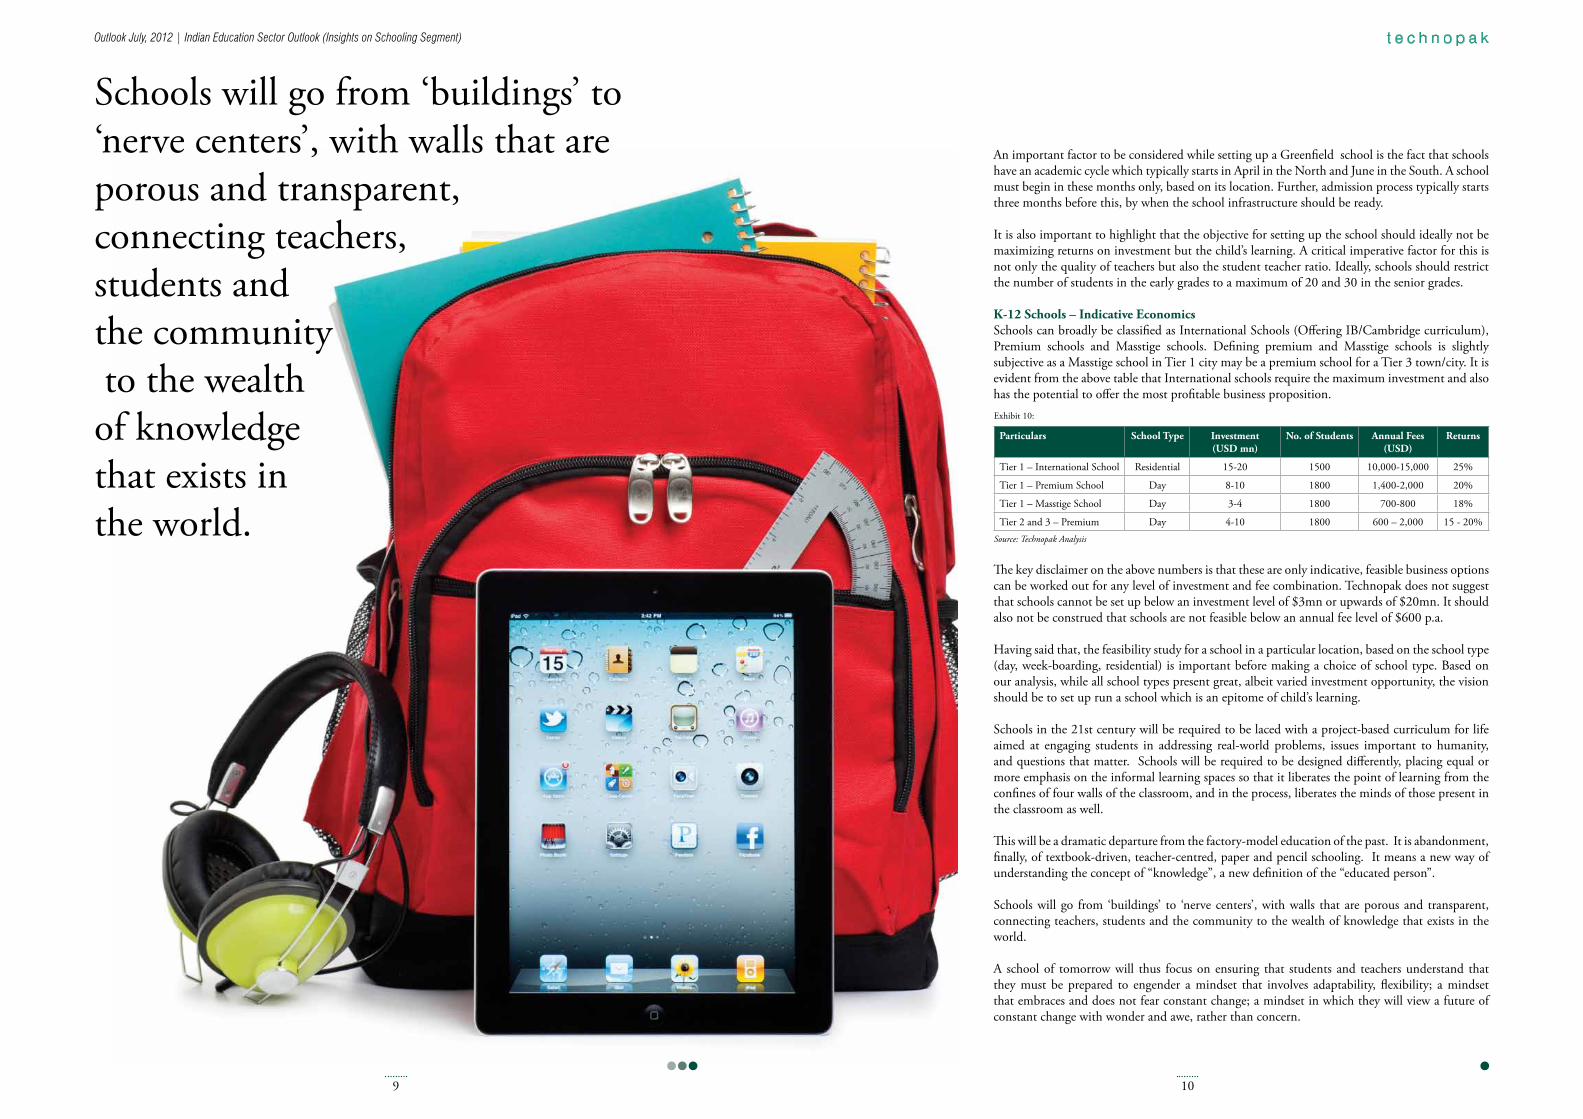
An important factor to be considered while setting up a Greenfield school is the fact that schools have an academic cycle which typically starts in April in the North and June in the South. A school must begin in these months only, based on its location. Further, admission process typically starts three months before this, by when the school infrastructure should be ready.
It is also important to highlight that the objective for setting up the school should ideally not be maximizing returns on investment but the child’s learning. A critical imperative factor for this is not only the quality of teachers but also the student teacher ratio. Ideally, schools should restrict the number of students in the early grades to a maximum of 20 and 30 in the senior grades.
K-12 Schools – Indicative EconomicsSchools can broadly be classified as International Schools (Offering IB/Cambridge curriculum), Premium schools and Masstige schools. Defining premium and Masstige schools is slightly subjective as a Masstige school in Tier 1 city may be a premium school for a Tier 3 town/city. It is evident from the above table that International schools require the maximum investment and also has the potential to offer the most profitable business proposition.
The key disclaimer on the above numbers is that these are only indicative, feasible business options can be worked out for any level of investment and fee combination. Technopak does not suggest that schools cannot be set up below an investment level of $3mn or upwards of $20mn. It should also not be construed that schools are not feasible below an annual fee level of $600 p.a.
Having said that, the feasibility study for a school in a particular location, based on the school type (day, week-boarding, residential) is important before making a choice of school type. Based on our analysis, while all school types present great, albeit varied investment opportunity, the vision should be to set up run a school which is an epitome of child’s learning.
Schools in the 21st century will be required to be laced with a project-based curriculum for life aimed at engaging students in addressing real-world problems, issues important to humanity, and questions that matter. Schools will be required to be designed differently, placing equal or more emphasis on the informal learning spaces so that it liberates the point of learning from the confines of four walls of the classroom, and in the process, liberates the minds of those present in the classroom as well.
This will be a dramatic departure from the factory-model education of the past. It is abandonment, finally, of textbook-driven, teacher-centred, paper and pencil schooling. It means a new way of understanding the concept of “knowledge”, a new definition of the “educated person”.
Schools will go from ‘buildings’ to ‘nerve centers’, with walls that are porous and transparent, connecting teachers, students and the community to the wealth of knowledge that exists in the world.
A school of tomorrow will thus focus on ensuring that students and teachers understand that they must be prepared to engender a mindset that involves adaptability, flexibility; a mindset that embraces and does not fear constant change; a mindset in which they will view a future of constant change with wonder and awe, rather than concern.
Particulars School Type Investment (USD mn)
No. of Students Annual Fees (USD)
Returns
Tier 1 – International School Residential 15-20 1500 10,000-15,000 25%
Tier 1 – Premium School Day 8-10 1800 1,400-2,000 20%
Tier 1 – Masstige School Day 3-4 1800 700-800 18%
Tier 2 and 3 – Premium Day 4-10 1800 600 – 2,000 15 - 20%
Exhibit 10:
Source: Technopak Analysis
Schools will go from ‘buildings’ to ‘nerve centers’, with walls that are porous and transparent, connecting teachers, students and the community to the wealth of knowledge that exists in the world.
11
About TechnopakIndia’s leading management consulting firm with more than 20 years of experience in working with organizations across consumer goods and services.
Founded on the principle of “concept to commissioning”, we partner our clients to identify their maximum-value opportunities, provide solutions to their key challenges and help them create a robust and high growth business models.
We have the ability to be the strategic advisors with customized solution during the ideation phase, implementation guide through start-up and a trusted advisor overall.
Drawing from the extensive experience of more than 175 professionals, Technopak focuses on six major divisions, which are Fashion & Textile, Retail & Consumer Goods, Healthcare, Education, Food & Agriculture and Leisure & Tourism.
Our key services are:Business Strategy. Assistance in developing value creating strategies based on consumer insights, competition mapping, international benchmarking and client capabilities.
Start-Up Assistance. : Leveraging operations and industry expertise to ‘commission the concept’ on turnkey basis.
Performance Enhancement. Operations, industry & management of change expertise to enhance the performance and value of client operations and businesses.
Capital Advisory. Supporting business strategy and execution with comprehensive capital advisory in our industries of focus.
Consumer Insights. Holistic consumer & shopper understanding applied to offer implementable business solutions.
4th Floor, Tower A, Building 8, DLF Cyber City, Phase II, Gurgaon 122 002 (National Capital Region of Delhi)
T: +91-124-454 1111, F: +91-124-454 1198
Technopak Advisors Pvt. Ltd.
www.technopak.com
Enayet KabirAssociate Director
[email protected]: +91-9999034360
Aurobindo SaxenaPrincipal Consultant
[email protected]: +91-9891321279
For further dialogue, please contact: