incident management, final report - rosa p
TRANSCRIPT
Prepared for
Trucking Research InstituteATA Foundation, Inc.
October 1990
Final Report
Incident Management
Prepared by
Cambridge Systematics, Inc.
in association with
JHK & AssociatesTransmode Consultants, Inc.Sydec, Inc.
Incident Management
Prepared by
Cambridge Systematics, Inc.in association withJHK & AssociatesTransmode Consultants, Inc.Sydec, Inc.
© 1990 Trucking Research InstitutePrice: $25.00
Contents
Summary. . . . . . . . . . . . . . . . . . . . . . . . . . . . . . . . . . . . . . . . . . . . . .
Chapter 1: Introduction . . . . . . . . . . . . . . . . . . . . . . . . . . . . . . . . . . . . . . . . . . . . . . . . . . . . . . . . . . . . . . . . . . . . . . . . . . . . . . .
Chapter 2: Incident Management: An Overview. . . . . . . . . . . . . . . . . . . . . . . . . . . . . . . . . . .
Chapter 3: Case Studies
Introduction . . . . . . . . . . . . . . . . . . . . . . . . . . . . . . . . . . . . . . . . . . . . . . . . . . . . . . . . . . . . . . . . . . . . . . . . . . . . . . . .. . . . . . . . . . . .
Chicago . . . . . . . . . . . . . . . . . . . . . . . . . . . . . . . . . . . . . . . . . . . . . . . . . . . . . . . . . . . . . . . . . . . . . . . . . . . . . . . . . . . . . . . . . . . . . . . . . . . .
Los Angeles. . . . . . . . . . . . . . . . . . . . . . . . . . . . . . . . . . . . . . . . . .. . . . . . . . . . . 28
Fort Worth. . . . . . . . . . . . . . . . . . . . . . . . . . . . . . . . . . . . . . . . . . . . . . . . . . . . . . . . . . . . . . . . . . . . . . . . . . . . . . . . . . . . . . . . . . . . . . .
Minneapolis .............................................................................................
New York/New Jersey (TRANSCOM) ..............................................
Chapter 4: Findings and Conclusions. . . . . . . . . . . . . . . . . . . . . . . . . . . . . . . . . . . . . . . . . . . . . . . . . . . . . . . 59
Chapter 5: Recommendations . . . . . . . . . . . . . . . . . . . . . . . . . . . . . . . . . . . . . . . . . . . . . . . . . . . . . . . . . . . . . . . . . . . . . 65
References . . . . . . . . . . . . . . . . . . . . . . . . . . . . . . . . . . . . . . . . . . . . . . . . . . . . . . . . . . . . . . . . . . . . . . . . . . . . . . . . . . . . . . . . . . . . . . . . . . . . . . . . . 71
Appendix AChicago Benefit-Cost Analysis
Appendix BMaryland Quick Clearance Policy
Page
ix
1
7
19
21
39
44
52
Cambridge Systematics, Inc.
List of Exhibits
Exhibit 1: Vehicle-Miles of Travel, Total Capital andMaintenance Spending for Highways, Streets,Roads and Bridges . . . . . . . . . . . . . . . . . . . . . . . . . . . . . . . . . . . . . . . . . . . . . . . . . . . . . . . . . . . . . .
Exhibit 2: Composite Profile of Reported Incidents by Type
Exhibit 3: Schematic of Traffic Flow During an Incident
Exhibit 4: Incident Management Programs. . . . ................................
Page
3
8
10
12
Cambridge Systematics, Inc.
Acknowledgments
This study was performed for the Trucking Research Institute by CambridgeSystematics, Inc. in association with JHK & Associates, TransmodeConsultants, Inc., and Sydec, Inc. Lance R. Grenzeback, Senior Associate withCambridge Systematics, was the project director and major author of thereport. The contributing authors were Robyn S. Champion, Associate withCambridge Systematics, and James M. Schoen, Senior TransportationEngineer with JHK & Associates. Robyn Champion conducted and wrotemajor portions of the case studies, contributing expertise and knowledge ofpublic sector organization and management. James Schoen analyzed anddescribed the congestion impacts of incidents in Chicago and Los Angeles.
The authors drew heavily on the expertise, good advice, and patience of ourcolleagues: Dr. Joseph R. Stowers, President of Sydec, Inc.; Dr. Paul 0.Roberts, President of Transmode Consultants, Inc.; and John S. Reed, AnthonyJ. DiSarcina, Catherine DeMaggio, Lynne Thompson, and Sue Caruso ofCambridge Systematics. We thank them for their help.
We interviewed almost one hundred people in the course of our research andcase studies; we thank each of them. We would like to give specialrecognition to Charles McLean, Ted Smith, Joseph McDermott, and GeraldRawling in Chicago; Robert Zimowski, David Roper, Richard Noonan, andDuane Clement in Los Angeles; Howard Hill and Wallace Ewe11 in FortWorth; Gene Ofstead, Richard Stehr, and Glen Carlson in Minneapolis; andMatthew Edelman and David Judd in New York. Their hospitality andinterest were very much appreciated.
We are grateful to the study’s Task Force for their advice and assistancethroughout the study. Larry Darnes and Jim Robinson of FHWA, PeterKoltnow of ATA, Barry King of the Maryland SHA, and Carlton Robinson ofthe Highway Users Federation were very generous with their time andexperience.
Finally, we owe special thanks to Clyde Woodle, Executive Director of theTrucking Research Institute. His interest, good humor, and professionaldirection brought us through the study without incident.
Cambridge Systematics, Inc. vii
Summary
Highway congestion is a daily phenomenon in all large metropolitan areasand a source of frustration and anxiety for millions of commuters andbusiness travelers. Incidents - vehicle accidents and breakdowns that tie uphighway traffic - are a major cause of urban highway congestion. It isestimated that incidents account for 60 percent of the vehicle-hours lost tocongestion. Incidents cause billions of hours of lost time every year andimpose huge economic costs on state and national economies.
Incidents are a special concern for motor carriers. Incident congestion has adirect impact on the productivity and profitability of the motor carrierindustry, and truck-involved incidents exacerbate the public’s negative imageof trucking and truck safety.
Incident management programs are in place in many cities, but the scope ofmost incident management programs is limited. With few exceptions,incident management programs are not visible to the public, and the generalpublic perception is that they are not doing the job.
This study looks at what is being done to deal with incident congestion andrecommends actions to reduce the time lost to highway incidents. Theprimary focus of the study is on incident management, not incidentprevention.
The study concludes that the major impediments to development ofcomprehensive metropolitan incident management programs areorganizational and institutional. Incident management programs lack a clearmandate. Once a local problem, incident management has become ametropolitan-scale problem that falls awkwardly between the traditionalresponsibilities of state government and local government. Responsibility isdivided among many agencies, each of which has a legitimate role in incidentmanagement, but all too often duties overlap, authority is fragmented, andactions are inconsistent.
The problem is compounded because the costs of incident congestion, andtherefore the benefits to be gained by reducing incident delay, are not wellunderstood. Most metropolitan areas lack reliable counts of incidents;adequate measures of traffic impacts; and consistent estimates of overallhighway congestion.
The study finds that incident management programs can address theproblem. The techniques, equipment, and expertise to operate effective
Cambridge Systematics, Inc. ix
programs are available and proven. There are successful models fordeveloping and operating comprehensive metropolitan incident managementprograms. Moreover, incident management can be cost-effective. TheChicago incident management program returns about $17 in benefits for each$1 invested in the program.
The key organizational approaches used by successful incident managementprograms include: traffic management teams; traffic operations centers;dedicated service patrols; incident command systems; contingency planning;quick-clearance policies; partnerships with commercial radio and televisionstations; and a strong service orientation.
The study recommends that states mandate the development ofcomprehensive metropolitan incident management programs; assignresponsibility for implementation of these programs; and establish clear linesof authority for the management of incidents. In addition, the studyrecommends that states adopt quick-clearance policies and require uniformannual reporting of incidents.
The study recommends that the ATA strongly support federal and stateincident management programs and quick-clearance policies. It alsorecommends that ATA develop an education program on incidentmanagement for state trucking associations and private fleet associations sothat they can effectively explain and support industry policy on incidentmanagement before their state legislatures.
The study recommends that the next federal highway act make capital andoperating funds available to states to set up or expand comprehensiveincident management programs. Funding in the initial two years should be ata ratio of 95 percent federal funds to 5 percent state matching funds, steppingdown to a 50:50 ratio in succeeding years. It recommends further that federaltransportation policy explicitly recognize the role and importance of incidentmanagement, and traffic management generally, in reducing congestion. Andfinally, the study recommends that the Federal Highway Administrationdevelop and demonstrate methodologies for the uniform measurement andreporting of recurring congestion, incidents, and the congestion impacts ofincidents.
Cambridge Systematics, Inc. X
1. Introduction
Highway congestion is a daily phenomenon in all large metropolitan areasand a source of frustration and anxiety for millions of commuters andbusiness travelers. Incidents - vehicle accidents and breakdowns that tie uphighway traffic - are a major cause of urban highway congestion. This studylooks at what is being done to deal with incident congestion and recommendsactions to reduce the time lost to highway incidents. The primary focus of thestudy is on incident management, not incident prevention.
Congestion
Once a downtown issue, congestion is now a metropolitan concern.Congestion is a symptom of the travel boom that has occurred in our citiesand metropolitan areas, and reflects underlying structural changes inpopulation, employment, and automobile use, especially in the suburbs:l
l Metropolitan areas have grown rapidly. Over three-fourths of the U.S.population now lives in urban areas. Since 1970, most of the nation’sgrowth in population and jobs has been in metropolitan areas; three-fourths of this growth has occurred in the suburbs.
l More people are working. Almost two-thirds of the adult population isworking, and women now make up almost half of the nation’s workforce. In the 1970s employment grew about twice as fast as population,’the highest rate of expansion in any decade since the 1900s.
l More people have cars. The majority of households now have two ormore cars. As a nation, we have more vehicles than licensed drivers.
l More people are commuting by car. Automobile trips now account forover four-fifths of all work trips. In some metropolitan areas, over halfof all work trips are made from suburb-to-suburb.
The concentration of people and jobs, along with the increased use ofautomobiles for shopping and recreation, has fueled a steady growth invehicle-miles of travel. Since 1970, travel in urban areas (predominantlypassenger vehicle travel but including truck travel) has doubled and travel onurban interstates has tripled.2
The growth in travel has outpaced our investment in highways. Over the lasttwenty years, capital spending on roads and bridges has dropped
Cambridge Systemtics, Inc. 1
precipitously, and maintenance expenditures have lagged subs tantially.3 SeeExhibit 1. State and local government investment has increased in recentyears, but overall we are living with an aging road system not much largerthan it was in 1970.
With limited growth in roadway capacity there has been an increase incongestion. In 1981, 16 percent of urban interstate miles were severelycongested (that is, operating at levels of service D and E with volume-to-capacity ratios in excess of 0.95 during peak periods). In 1988 over 30 percentof urban interstate miles were severely congested.4
Demographic projections suggest that congestion will not ease appreciably inthe foreseeable future:5
l Population growth is slowing but is still expected to grow by 30 millionpeople over the next twenty years. This is equivalent to 70 percent of thepopulation growth experienced over the last twenty years.
l Over 80 percent of the nation’s growth is expected to be in metropolitanareas and most of it will occur in the suburbs.
l For the next twenty years the baby-boom generation will be middle-aged, providing a source of economic growth and travel demand.
Congestion is a national issue today because it is affecting trucking and themanufacturing and retailing sectors that trucking serves. Congestion is nolonger limited to highways near downtowns; it has spread over the beltwaysthat were once the bypass routes for congested cities. And it is no longer apeak-hour problem; it has become a peak-period problem, spreading overfour, six, and even eight hours a day in the larger metropolitan areas.Metropolitan congestion is creating sticky nodes on the national highwaysystem, and it is impeding the flow of regional and interstate freight as well aslocal freight.
Metropolitan congestion has a significant impact on trucking. One-third of alltruck-miles of travel occur in large urban areas, and it is estimated that two-thirds of that mileage is on freeways.6 Driving on congested freewaysincreases driving time, fuel consumption, and wear-and-tear on trucks. Theseadditional costs are ultimately passed on to shippers and receivers, increasingthe cost of transporting goods. The impact is sizeable because the economy isvery dependent upon trucking. In 1988 trucks carried 40 percent of alldomestic tonnage and accounted for 78 percent of domestic freight revenues,about $240 billion dollars.7
Cambridge Systenmtics, inc. 2
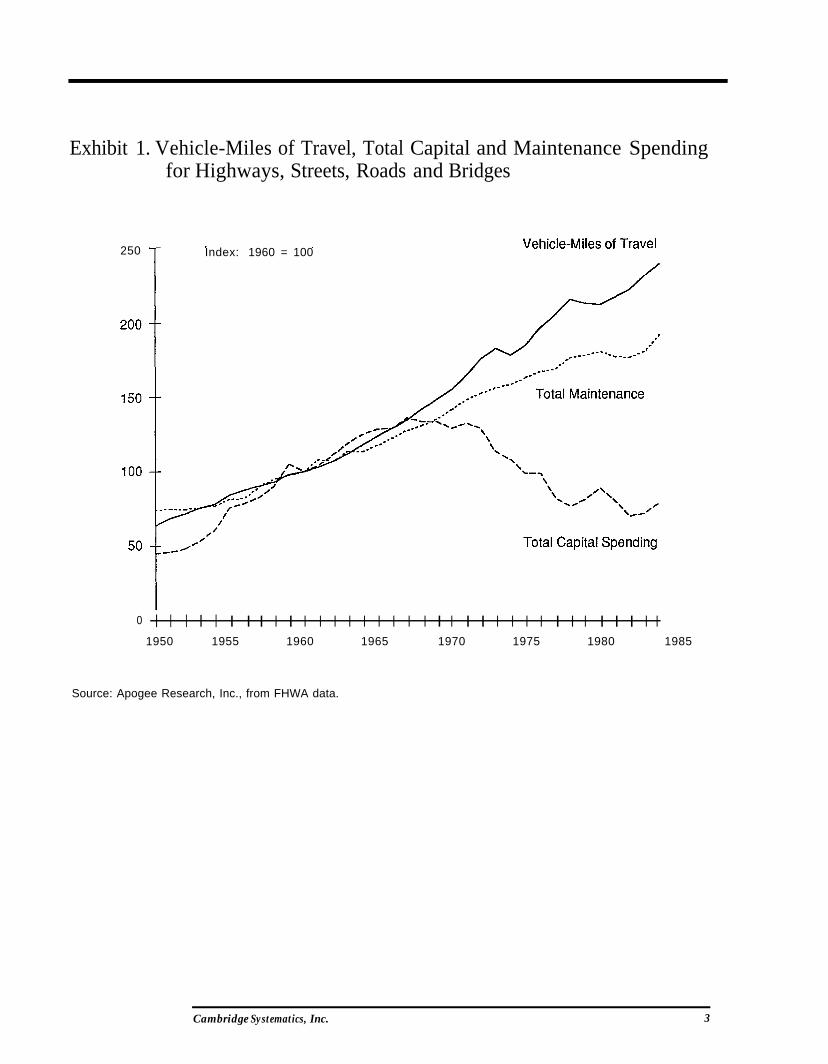
Exhibit 1. Vehicle-Miles of Travel, Total Capital and Maintenance Spendingfor Highways, Streets, Roads and Bridges
250 Index: 1960 = 100
0 | | | I | | | | | | | | | | | | | | | | | | | | | | | | | | | | | | |
1950 1955 1960 1965 1970 1975 1980 1985
Source: Apogee Research, Inc., from FHWA data.
Cambridge Systematics, Inc. 3
The effect of congestion on freight movement is more noticeable as globalcompetition forces U.S. companies to change the way they do business. Manyof the changes - such as the use of overseas parts suppliers, introduction ofjust-in-time manufacturing and distribution, and increased emphasis onquality and customer service - are having a direct impact on motor carriers.Carriers are being asked to provide faster, more reliable, and more cost-effective services; but increasing congestion on the national highway networkis making it costly to meet these service and productivity requirements.
Forecasts of economic activity suggest that we will be even more dependenton fast, reliable, and cost-effective freight services in the future than we aretoday:’
l Most of the nation’s growth will be in services, high-technologyindustries, and foreign trade. Firms in these growth sectors will besmaller, employ fewer people, and be less materials intensive. There willbe less bulk freight, more small shipments, and more demand forindividualized freight services.
l The value of shipments will increase. The need for rapid, on-timedelivery of these products will increase the demand for air and trucktransportation.
l Production will be geographically dispersed. There will be fewer largefacilities and more small facilities. The need for low-cost land and accessto labor will continue to make suburbs attractive to growing industries.
Congestion is recognized as a problem. The U.S. Department ofTransportation, in its recently issued “Statement of National TransportationPolicy,” emphasizes the need to “maintain and expand the nation’stransportation system” with particular commitment “to reducing congestionin the aviation and highway systems.“’ The Transportation 2020 Programidentified congestion and the inability to deal with it effectively as the majorconcern of urban transportation users.10 And Mobility 2000 has identifiedincreasing congestion as the primary reason that the nation should investheavily in intelligent vehicle/highway systems.11
But there is limited information on the scope and cost of congestion. The onlycomprehensive national estimate of the cost of urban freeway congestion wasmade in a staff study by the Federal Highway Administration.12 UsingFHWA’s Highway Performance Monitoring System database, it wasestimated that freeway congestion in the nation’s thirty-seven largest citiescost the nation 1.25 billion vehicle-hours of lost time in 1984. The lost timeand wasted fuel were valued at $9 billion. In a 1987 update, the cost ofcongestion was estimated at 2 billion hours and $16 billion. Using the 1987
Cambridge Systematics, Inc. 4
statistics and current trends, it was projected that urban congestion costscould rise as high as 8 billion vehicle-hours and $88 billion by 2005.
Most of the cost of congestion is borne by large cities. A dozen large urbanareas account for over 80 percent of freeway congestion cost. New York, LosAngeles, San Francisco, and Houston have the highest congestion costs, about$2 billion per year each in current dollars; Detroit, Chicago, Boston, Dallas,and Seattle, about $1 billion each; and Atlanta, Washington DC, andMinneapolis, about $0.5 billion each.
The patterns of past growth and the trends for the immediate future all pointtoward the conclusion that congestion will continue to be a significantmetropolitan and national issue. Without attention, congestion will sap theproductivity and competitiveness of our economy, contribute to air pollution,and degrade the quality of life in our metropolitan areas.
Incidents
Incidents are a major cause of congestion. Congestion has two components:recurring congestion - the predictable delay caused by the high volume ofvehicles using the highways; and non-recurring or incident congestion - theunpredictable delay caused by incidents. Incidents include accidents and avast array of small events - stalls, flats, spills, debris on the road, evenhighway maintenance work - that divert drivers’ attention and disrupt thenormal flow of traffic.
It is estimated that incidents account for 60 percent of the vehicle-hours lostto congestion. According to the FHWA estimates for 1987, incidentcongestion cost the nation 1.3 billion vehicle-hours of delay at a loss of nearly$10 billion. For a large metropolitan area like New York, incident congestiontoday costs over $1.2 billion per year or about $100 per person per year.
Incidents are a special concern for motor carriers. Incident congestion has adirect impact on the productivity and profitability of the motor carrierindustry, and truck-involved incidents exacerbate the public’s negative imageof trucking and truck safety. Media coverage of truck fires in WashingtonDC, San Francisco, and Los Angeles has reinforced the public’s perceptionthat truck incidents are more frequent today; are more severe; and areresponsible for a growing amount of the frustrating congestion on urbanfreeways. The public response has been to call for truck bans and broadrestrictions on the transportation of hazardous materials, actions that couldsubstantially increase the cost of goods and services to consumers.
Cambridge Systematics, Inc. 5
Incident management programs are in place in many cities. Exemplaryprograms were established in Chicago in the 1960s and in Los Angeles in the1970s. The techniques of incident management are well developed and welldocumented: Engineers for Detroit’s Lodge Freeway published detailedstudies of incident rates in the early 1960s. Caltrans reported extensively inthe mid-1970s on the techniques developed during the Los Angeles AreaFreeway Surveillance and Control Project. FHWA published twovoluminous reports on freeway and incident management - “AlternativeSurveillance Concepts and Methods for Freeway Incident Management” in1978 and “A Freeway Management Handbook” in 1983. And in 1988 theTransportation Research Board sponsored a synthesis report on “FreewayIncident Management.”
But the scope of most incident management programs is limited. Themajority are focused on specific facilities - tunnels and bridges. Of the twelvemajor cities Listed above, only four or five can be said to have comprehensivemetropolitan incident management programs, and the resources allocated tothe programs have not kept pace with congestion. With few exceptions,incident management programs are not visible to the public, and the generalpublic perception is that they are not doing the job.
The questions addressed in this study are: What are the barriers to betterincident management? What can and should be done to improve incidentmanagement?
Cambridge Systematics, Inc. 6
2. Incident Management
Types of Incidents and Their Impact
It is estimated that 70 percent of all highway incidents are recorded by policeand highway agencies, usually as brief annotations in communications logs.The other 30 percent go unreported and, as such, are assumed to be minorincidents having little impact on traffic.1 Exhibit 2 is a composite profile ofrecorded incidents drawn from the limited research available on freewayincidents.
Of the incidents that are recorded by police and highway departments, thevast majority, some 80 percent, are vehicle disablements - cars and trucks thathave run out of gas, had a flat tire, or been abandoned by their drivers.* Ofthese, 80 percent wind up on the shoulder of the highway for an average of 15to 30 minutes. During off-peak periods when traffic volumes are low thesedisabled vehicles have little or no impact on traffic flow. But when trafficvolumes are high the presence of a stalled car or a driver changing a flat tirein the breakdown lane can slow traffic in the adjacent travel lane, causing100-200 vehicle-hours of delay to other motorists.3
Twenty percent of disabled vehicles fail in the travel lanes, blocking one ormore lanes of traffic. Most disabled vehicles are moved to the shoulder within5-10 minutes, but larger vehicles, such as stalled trucks, are often difficult tomove and block travel lanes for a longer period of time. On average, vehiclesthat break down in the travel lanes are there for 15-30 minutes, and duringpeak periods they cause 500-2,000 vehicle-hours of delay for the traffic thatmust squeeze around them.
Accidents account for only 10 percent of reported incidents. Most are theresult of minor collisions, such as sideswipes and slow-speed rear-endcollisions. In 60 percent of accidents, drivers are able to move their vehicles tothe shoulder. Each such incident lasts an average of 45-60 minutes. Incongested traffic, they can trigger 500-1,000 vehicle-hours of delay perincident. The congestion impact of those minor accidents is substantialbecause the presence of a police car, tow truck, ambulance, or fire truck willcause passing motorists to slow down and gawk, even if the vehicles involvedin the accident are well off the highway.
Forty percent of accidents block one or, occasionally, two lanes of traffic.These often involve injuries or spills. Each such incident typically last 45-90minutes causing 1,200-2,500 vehicle-hours of delay.
Cambridge Systematics, Inc. 7
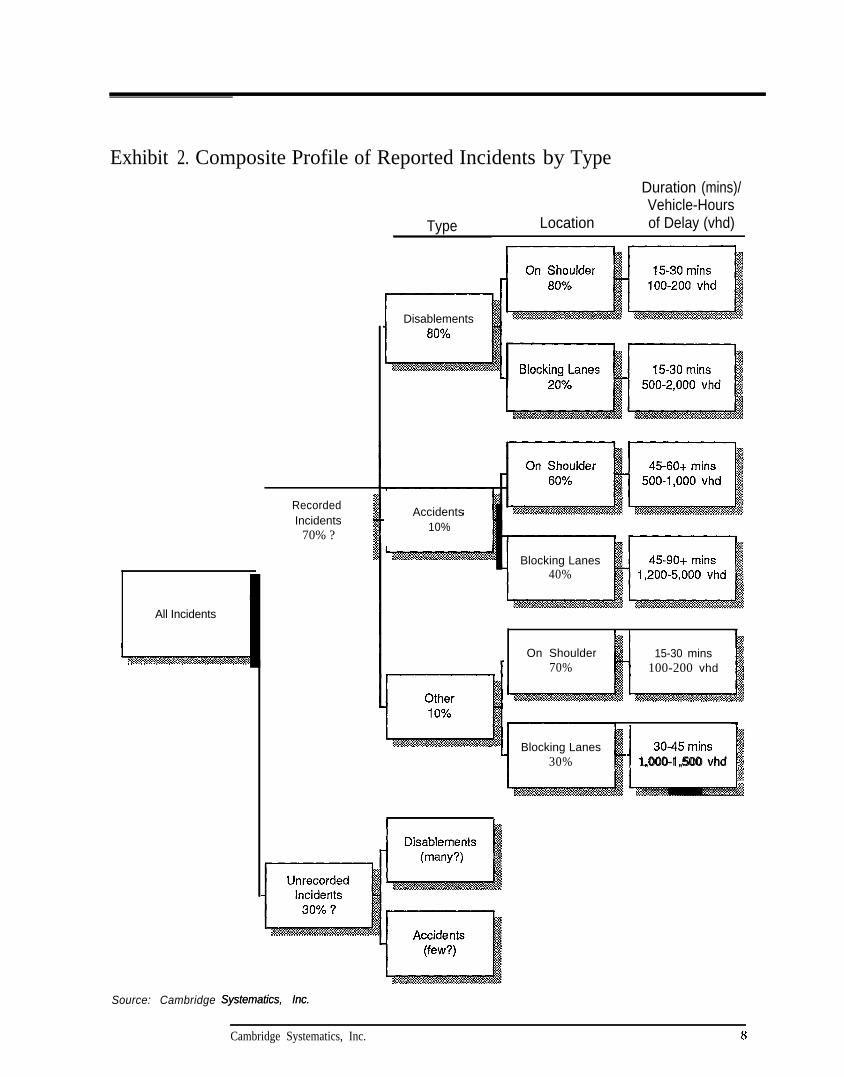
Exhibit 2. Composite Profile of Reported Incidents by Type
Type Location
Duration (mins)/Vehicle-Hoursof Delay (vhd)
All Incidents
RecordedIncidents
70% ?
Source: Cambridge Systematics, Inc.Systematics, Inc.
Disablements
Accidents10%
Blocking Lanes40%
On Shoulder70%
15-30 mins100-200 vhd
Blocking Lanes30%
30-45 mins1,000-l ,500 vhd
.
Cambridge Systematics, Inc.
It is estimated that major accidents make up 5-15 percent of all accidents andcause 2,500-5,000 vehicle-hours of delay per incident.4 A very few of thesemajor incidents, typically those involving hazardous materials, last ten totwelve hours and cause 30,000-40,000 vehicle hours of delay. These incidentsare rare, but their impacts can be catastrophic and trigger gridlock.
Emergency maintenance work, debris on the road, brush fires, wanderingpedestrians, stray animals, and other events account for the remaining 10percent of incidents that appear in police and highway agency records. Theirimpacts are similar to those caused by vehicle disablements. Seventy percentare confined to the shoulder where they have minimal impact on traffic; and30 percent block one or more lanes of traffic for 30-45 minutes causing 1,000 1,500 vehicle hours of delay per incident under congested conditions.Highway construction is classified as a type of incident in traffic engineeringand incident management literature, but construction “incidents” are notusually reported by police and highway agencies.
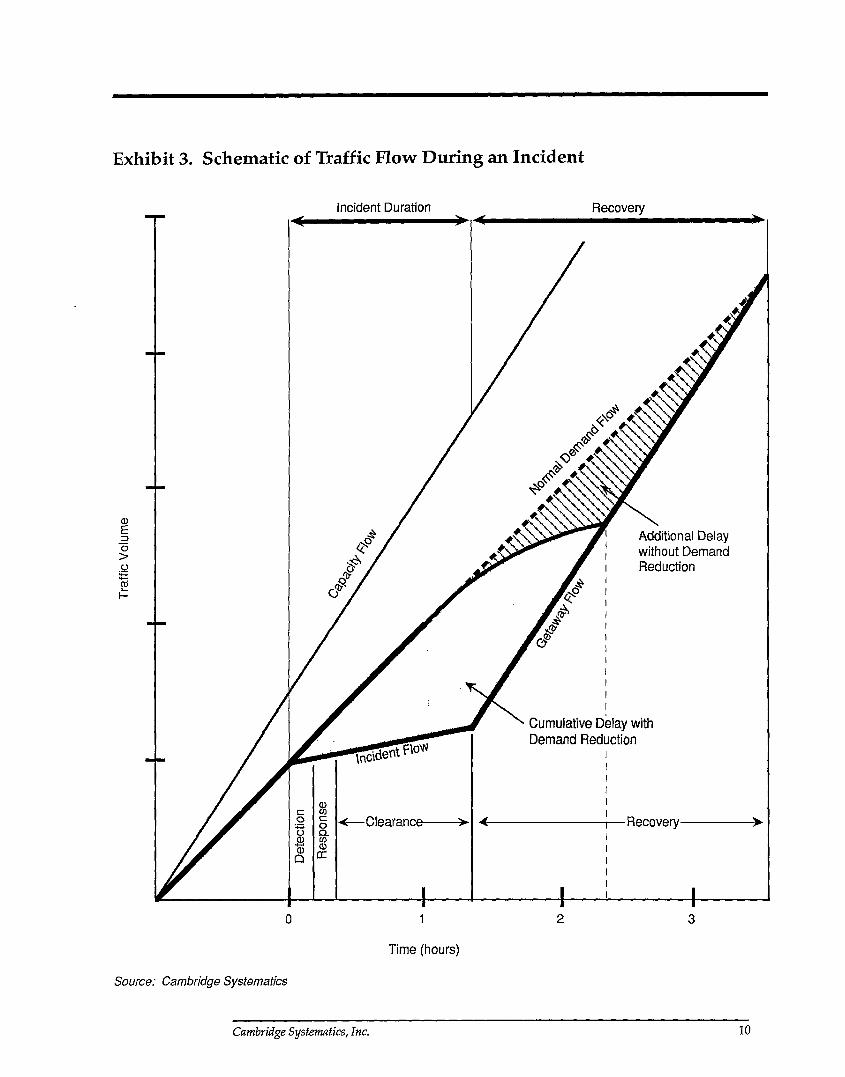
Traffic Flow During Incidents
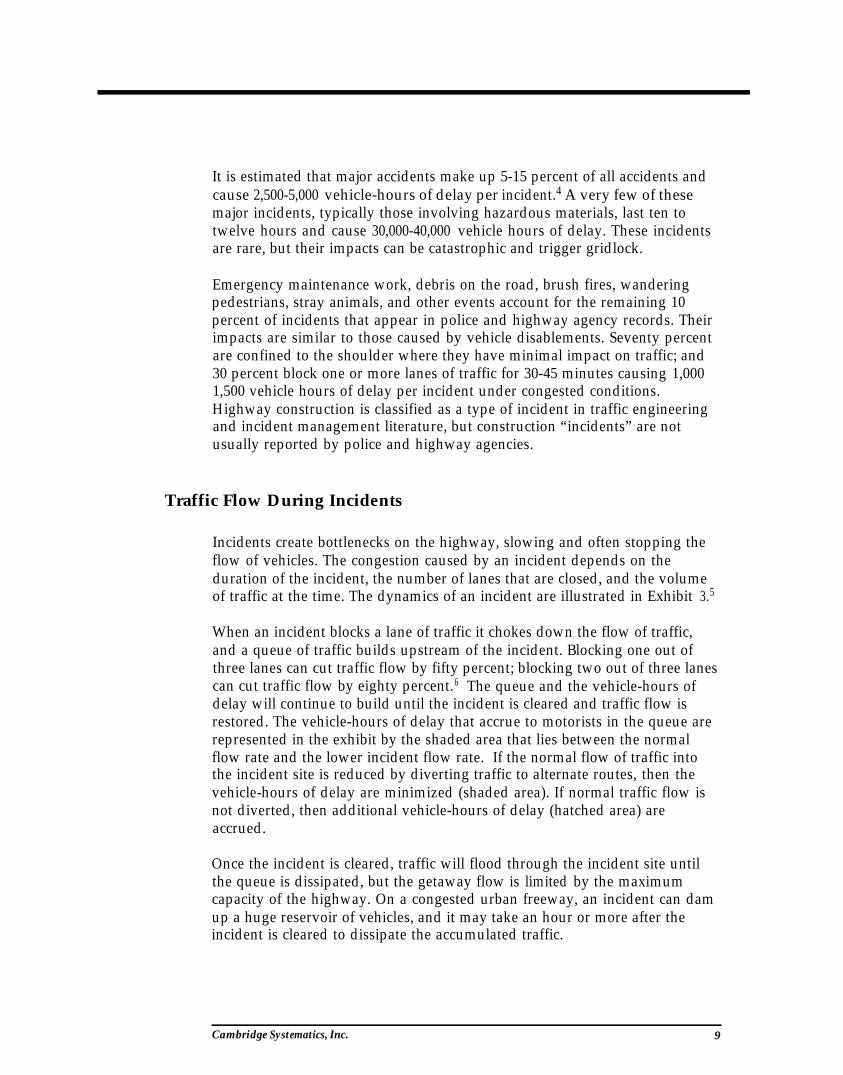
Incidents create bottlenecks on the highway, slowing and often stopping theflow of vehicles. The congestion caused by an incident depends on theduration of the incident, the number of lanes that are closed, and the volumeof traffic at the time. The dynamics of an incident are illustrated in Exhibit 3.5
When an incident blocks a lane of traffic it chokes down the flow of traffic,and a queue of traffic builds upstream of the incident. Blocking one out ofthree lanes can cut traffic flow by fifty percent; blocking two out of three lanescan cut traffic flow by eighty percent.6 The queue and the vehicle-hours ofdelay will continue to build until the incident is cleared and traffic flow isrestored. The vehicle-hours of delay that accrue to motorists in the queue arerepresented in the exhibit by the shaded area that lies between the normalflow rate and the lower incident flow rate. If the normal flow of traffic intothe incident site is reduced by diverting traffic to alternate routes, then thevehicle-hours of delay are minimized (shaded area). If normal traffic flow isnot diverted, then additional vehicle-hours of delay (hatched area) areaccrued.
Once the incident is cleared, traffic will flood through the incident site untilthe queue is dissipated, but the getaway flow is limited by the maximumcapacity of the highway. On a congested urban freeway, an incident can damup a huge reservoir of vehicles, and it may take an hour or more after theincident is cleared to dissipate the accumulated traffic.
Cambridge Systematics, Inc. 9
Incident Management
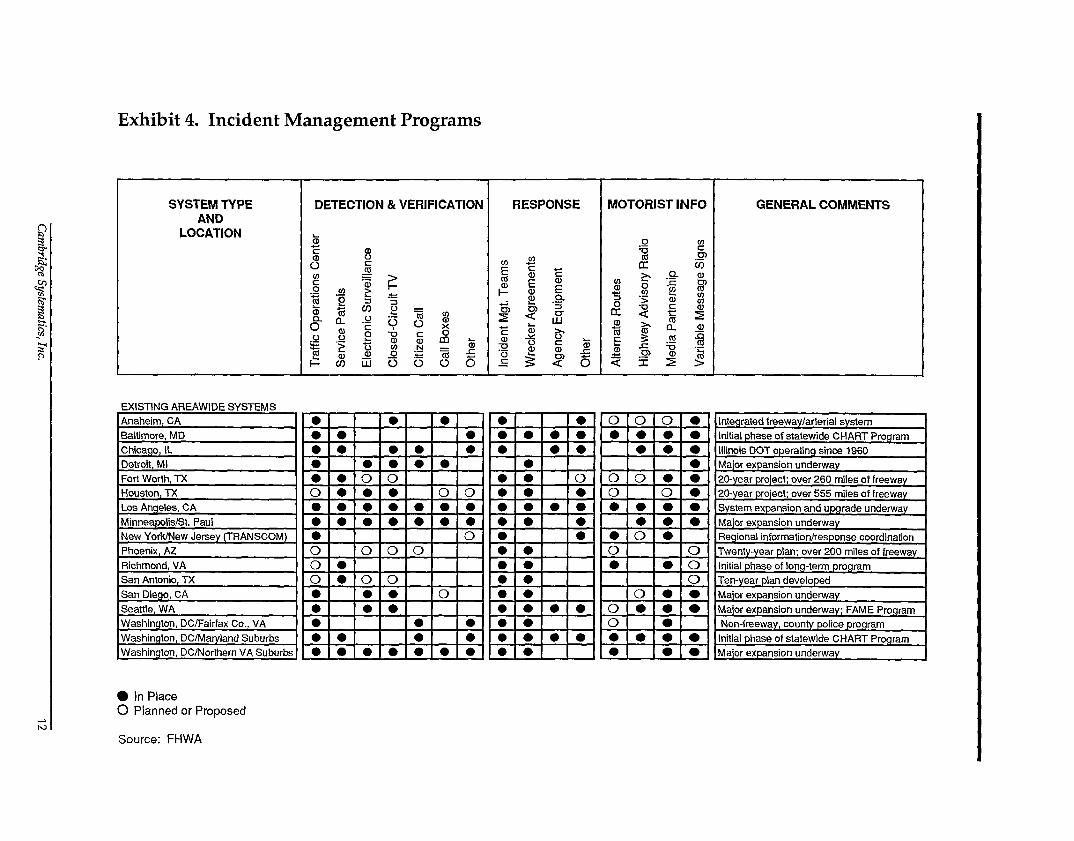
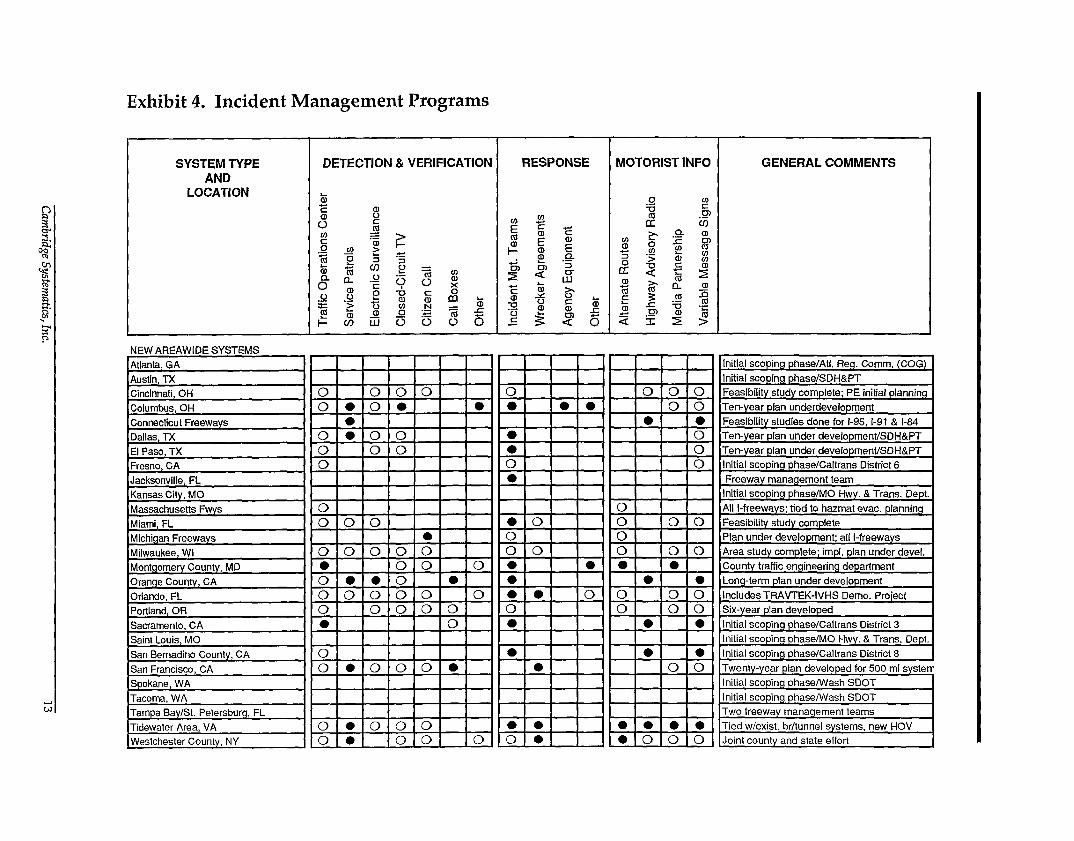
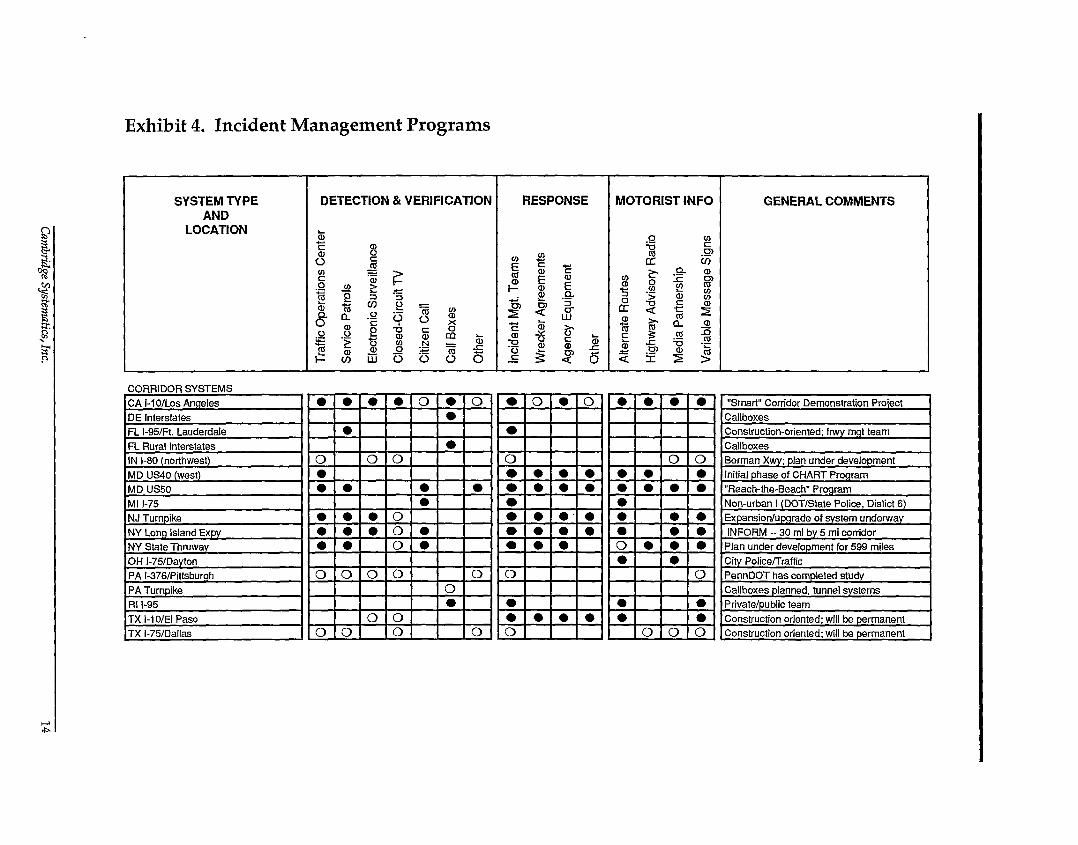
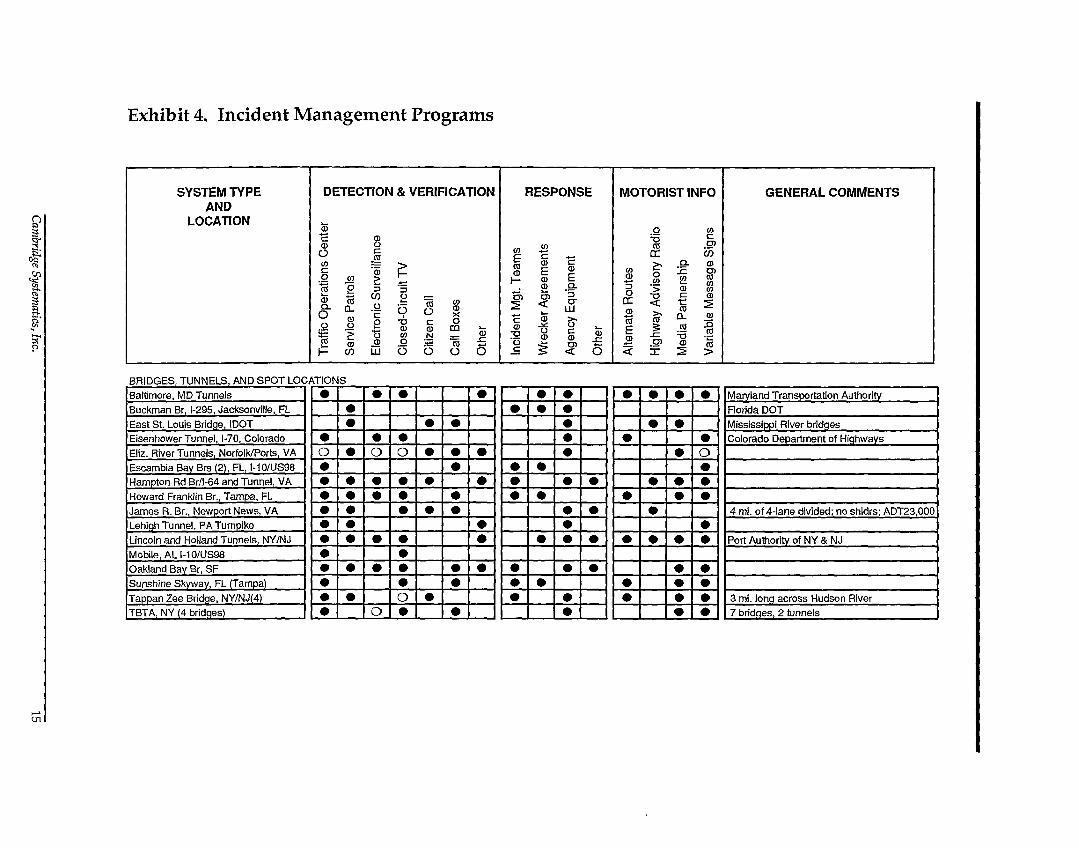
Incident congestion can be minimized by clearing incidents as quickly aspossible and diverting traffic before vehicles are caught in the incident queue.About thirty cities have programs to manage freeway incidents and reduceincident congestion. Exhibit 4 lists the major freeway management programsin the US. and the techniques they employ for incident management.7 Thescope and effectiveness of these programs varies widely.
The time saved by an incident management program depends on how wellthe four stages of an incident - detection, response, clearance, and recovery -are managed.’ The general state-of-practice is as follows:
l Detection. Most major incidents are detected within 5-15 minutes;however, minor incidents may go unreported for 30 minutes or more. Itis estimated that one-third to one-half of reported incidents are detectedby routine police patrols or, in the few cities that have them, by servicepatrols. The other half are reported to police from roadside callboxes,over citizen-band radio, and increasingly by mobile phones. Asignificant accident may trigger up to a dozen calls to the police.Automatic vehicle detectors, usually wire-loop detectors installed in thepavement, are used in about a half-dozen cities to monitor traffic flow.With proper computer software, these can be used to detect the trafficimpacts of major incidents and some minor incidents. Bridges, tunnels,and a few highly congested highway corridors are monitored usingclosed-circuit television cameras. These are particularly useful forverifying incidents.
l Response. The police handle most incidents. It is their responsibility toconfirm the incident; assess what needs to be done; and summon help asneeded. Communications about an incident are commonly handleddirectly by police dispatchers, but an increasing number of cities andstates are building special-purpose traffic management centers tocoordinate traffic and incident communications. State police or statehighway patrols have jurisdiction over most freeways including urbanfreeways, but in some states, such as Texas, freeways within city limitsare under the jurisdiction of city police. Almost all urban areas haveemergency response plans for catastrophic incidents, especially thoseinvolving hazardous materials; some have traffic diversion plans formajor incidents; and a few have procedures for routine incidents. Trafficmanagement teams representing state and local police and highway
Cambridge Systemafics, Inc. 11
engineers are gaining in popularity as a way to develop response plans andtraffic diversion routes.
l Clearance. Private tow-truck operators clear the great majority offreeway incidents. Most police departments maintain formal or informalrotation lists that distribute work among competing tow operators, andsome let work on the basis of competitively bid franchises. Very fewpolice or highway agencies have performance standards for private towoperators, and incompetent operators are seldom dismissed except forgross negligence. The exceptions to this pattern are bridge and tunneloperating authorities, which are likely to own and operate their own towtrucks and wreckers.
An effective clearance operation requires that the police officer on thescene diagnose the problem correctly; summon the right tow equipment;and make sure the operation is carried out with dispatch. This is seldoma problem in minor incidents, such as stalls and fender-benders, but isfrequently a problem in major incidents, especially those involving largetrucks. Minor incidents are frequent, and police officers quickly developthe experience to deal with them. Large-truck incidents are much lessfrequent, and few police officers develop adequate experience unlessthey are assigned to special commercial-vehicle safety enforcement unitsor receive training in truck-clearance techniques. These techniques varywith the type of load, configuration of the truck, and potentialenvironmental impacts. Most police departments do not providespecialized training in incident management; tow-truck rotation listsoften turn out the wrong type of equipment; and most private towoperators lack the expertise and experience to handle large truckaccidents. These problems, often compounding, can double or triple thetime required to clear an incident.
l Recovery. Recovery consists of three steps: restoring traffic flow at thesite of the incident; preventing more traffic from flowing into the areaand getting trapped in the upstream queue; and preventing congestionfrom spilling across the metropolitan traffic network. Incidentcongestion can be minimized by these actions, but traffic management isthe least developed element of most incident management programs.Police at the scene of an incident have little time to manage traffic flowaround an incident; indeed, many police and fire departments encouragetheir officers to block traffic as a safety measure to prevent their beingrun down by drunken or unobservant drivers. Corridor- and system-level traffic management is a goal of many incident managementprograms but is not often realized in practice.
Cambridge Sysfemafics, Inc. 16
In summary, the vast majority of incidents are vehicle disablements andminor accidents. During off-peak periods when traffic volumes are low, theseincidents have little or no impact on freeway traffic. But when traffic volumesare high, their cumulative effect is substantial. Police and private towoperators can clear these incidents rapidly and efficiently, but most agenciesdo not give this work high priority. Incident congestion could be reducedconsiderably by assigning higher priority to the detection and clearance ofminor incidents.
Major incidents are relatively few. They are given immediate attention, whichis appropriate, but police officers and tow operators usually lack the trainingand experience necessary to handle these incidents efficiently. In majorincidents, congestion could be reduced considerably by improving clearanceand recovery capabilities.
Cambridge Systematics, Inc. 17
3. Case Studies
Introduction
Five comprehensive metropolitan incident management programs wereexamined in detail. This chapter reports the findings of those case studies.The programs are representative of incident management in the United States,but they are not typical. These are exemplary programs that have beenrecognized for their effective and innovative efforts. The purpose of the casestudies was to identify the technical, organizational, and institutionalapproaches that made these incident management programs successful. Thecase studies include established programs, emerging programs, and newapproaches to metropolitan incident management:
Established Programs: Chicago and Los Angeles
The incident management programs in Chicago and Los Angeles areestablished programs. The Chicago program started in the early 1960s andthe Los Angeles program took shape during the early 1970s. The keyquestions for these case studies were: What was achieved? Are the programscost effective? How well have the organizations been able to adapt over timeto the changing traffic and political environments?
Emerging Programs: Fort Worth and Minneapolis
Fort Worth and Minneapolis are relatively new programs. The two programswere selected because they are representative of a class of new and innovativetraffic and incident management programs being developed in several states,including Maryland, Virginia, Arizona, Washington State, and Florida. Thekey questions for these case studies were: How do these programs differ fromChicago and Los Angeles? How are they deploying new traffic and incidentmanagement technology? How are they organizing their programs?
New Approaches: New York/New Jersey
TRANSCOM (the Transportation Operations Coordinating Committee) wasselected because it is a departure from traditional incident managementprograms. It has forged a regional traffic and incident management capabilityin the New York/New Jersey metropolitan area by providing information
Cambridge Systemntics, Inc. 19
about incidents and road construction to police and highway agencies acrossthe region. The key questions for this case study were: How doesTRANSCOM maintain a constituency for its services? How effective isinformation management as a traffic and incident management tool?
The case studies were done between January and April of 1990. Interviewswere conducted in each city. Those interviewed included:
l State Policel State Departments of Transportationl City Policel City Departments of Transportationl Incident Management Program Managersl Bridge and Tunnel Program Managersl State Trucking Associations. Motor Carriersl Traffic Reportersl American Automobile Association Clubsl Private Sector Interest Groupsl Regional Planning Agenciesl Transportation Researchersl FHWA Officials
Cambridge Systematics, Inc.
20
Chicago
Evolution of the Program
Chicago’s incident management program started in 1960 with a crisis on thenewly opened Kennedy Expressway. Designed to handle 1,500 vehicles perhour per lane, the new highway was quickly swamped as peak-hour trafficvolumes exceeded 2,000 vehicles per hour per lane. Stalled cars and fenderbenders aggravated congestion and often created massive traffic jams in thosesections of the expressway that had no breakdown lanes. To manage thecrisis, the Illinois Department of Transportation (then the Department ofPublic Works and Buildings) assigned twenty people in pick-up trucks to thejob of patrolling the expressway during the morning and afternoon peakcommuter periods. The emergency patrol, eventually named the “MinutemanPatrol,” was charged with keeping the Kennedy Expressway open by clearingtravel lanes of disabled vehicles.
Today, the program employs sixty people and has an annual operatingbudget of $3.5 million funded from state motor fuel taxes. The Minutemenoperate in three shifts, twenty-four hours a day, on patrols that cover 80 milesof the 150-mile Chicago expressway system. The pick-up trucks have beenreplaced by a fleet of thirty-five heavy-duty tow trucks. Several largerecovery trucks, cranes, and other specialized equipment have been added tothe fleet. However, the basic function of the patrols has not changed: it is toensure that the expressway system is working smoothly by clearing incidentsfrom travel lanes as quickly as possible.
Building and Maintaining a Constituency
The Minuteman Patrol program has survived and grown because it has built apublic constituency for itself by providing assistance to motorists. When a carbreaks down on the Chicago expressways, the patrol will move it to a safeplace (a “safe drop”); provide the driver with gas and water; help make minorrepairs; and if necessary arrange for a commercial tow. A motorist in troublecan usually get assistance in less than half an hour. The patrol is funded outof state motor fuel tax revenues, and services to motorists are free. If thepatrol provides gas, motorists are given an invoice for five dollars. Paymentis voluntary and is made by mail to the state treasury, not to the Minutemen.The highly visible presence of the service patrol (the trucks are painted brightyellow) and their focus on personal service has built strong support and apositive reputation for the Minutemen. Public support for the program is
Cambridge Systematics, Inc. 21
now so strong that a commonly heard comment in Chicago is: “TheMinutemen make Illinois DOT look good.” To protect this reputation, theprogram manages its operations very tightly: vehicles are clearly markedwith signs stating that the services provided to motorists are free; andpersonnel assignments are rotated to avoid charges of favoritism.
But maintaining the program has been a struggle. Illinois DOT has never hada formal mandate for the Chicago program. The program was initiated withinthe traffic group in the Chicago district and has always been closely identifiedwith Chicago; there is no counterpart for the incident management group atIllinois DOT’s Springfield headquarters. The only comparable program inIllinois is a much smaller program that manages the bridge crossing theMississippi River from East Saint Louis.
The program grew steadily throughout the 1960s as new expressways wereadded to the Chicago system. By the end of the decade, the Minuteman Patrolemployed over 120 people and operated a fleet of over fifty tow trucks. Thestaff level was cut in half in the early 1970s during a change in the state’sadministration and has continued to fluctuate with the vicissitudes of statepolitics: expanding under state DOT administrators from the Chicago areaand contracting under administrators from downstate Illinois.
Illinois DOT has used reconstruction programs to maintain and revitalize theemergency patrol program. Federal and state construction guidelines permitIllinois DOT to charge the cost of traffic and incident management aroundworksites to construction budgets. When the Dan Ryan Expressway was to berebuilt in 1988, Illinois DOT formed a committee to develop plans to handletraffic and incidents during the reconstruction. As a major participant in theproject, the Minuteman Patrol was able to add sixteen more people and investin used military trucks and cranes to increase their recovery equipment. Afterthe Ryan rebuild was complete, the program was able to obtain additionalstate funding and retain thirteen of the sixteen temporary people aspermanent patrolmen. Illinois DOT hopes to use the next project -reconstruction of the Kennedy Expressway where the program started thirtyyears ago - as another opportunity to demonstrate the value of expanding theprogram.
Experience More Valuable Than Equipment
Although Illinois DOT takes great pride in the tow trucks and otherequipment that it has assembled for its incident management program, itbelieves that the critical factor in its success is the level of experience amongthe Minuteman personnel. Program managers spend considerable time
Cambridge Systematics, Inc. 22
screening and training applicants for the patrol jobs; much of the effort isdirected toward finding people who can work effectively in teams. Once inthe program, Minutemen tend to stay; over fifty percent of the current staffhas been with the program for more than ten years. With this continuity, thepatrol has been able to develop considerable expertise and sophistication inrighting and towing heavy trucks as well as in dealing with people.
The cost of obtaining the experience to operate an effective freeway programcan be quite high, as the Illinois State Police found out when they took overenforcement responsibilities from the Chicago City Police. During the 1960sand 1970s the Chicago Police Department’s metropolitan traffic unit enforcedtraffic laws on the expressway system. Like the Minuteman Patrol, they hadbuilt up a cadre of experienced officers over a period of twenty years. But bythe early 198Os, Chicago was short of money and could no longer afford theexpressway traffic group. In 1984, citing budget cuts, pressures to focus onneighborhood crime, and concerns about managing private tow operators, theChicago Police withdrew from the expressways and the Illinois State Policeassumed the responsibility for enforcement.
The state police began their operations with volunteers, many from ruraldownstate Illinois. Most had neither training nor experience in dealing withurban drivers on congested expressways. The state police lost a number ofcruisers in accidents during the first year and took considerable criticism forclosing down the expressways to investigate accidents. Their early efforts tobuild an experienced cadre of troopers were undercut by rotation policies andhigh turnover rates among rookies disillusioned with urban service. Sincethen, the state police have expanded their training programs to coverexpressway traffic management techniques and have drawn upon theMinutemen for training in incident management and clearance. Although stillunderstaffed, the state police have succeeded in developing a stable andsophisticated expressway enforcement operation.
The shift of enforcement responsibility from the Chicago police to the statepolice also meant that the Minutemen had to rebuild their institutionalrelationships. Although there were no formal interagency agreementsestablished to ensure cooperation between the agencies, the Minutemen andthe Chicago police had developed an effective working relationship, largelybecause the Minutemen were perceived by the Chicago police as supportingthe traditional role and responsibilities of the police. When the enforcementjurisdiction changed, the Minuteman operation had to rebuild thatrelationship with the state police.
The process has been slow because each agency sets different priorities. TheMinutemen judge their performance on how smoothly they keep theexpressway working; the state police, on the other hand, are trained to protect
Cambridge Systematics, inc. 23
individual and property rights and usually do not give traffic management ahigh priority. The police and the patrol are gradually building a new systemof working priorities that satisfy the requirements of both agencies. The statepolice are acknowledging that to get their job done they need the MinutemanPatrol on the expressway system; and Illinois DOT has drawn the police intotraffic management through a “hire back” program that permits Illinois DOTto pay off-duty troopers to manage the traffic details protecting Illinois DOT’sconstruction work sites.
Organization
The state police are still grappling with the issue of how to best organize theirexpressway operations. The troopers patrolling the Chicago region currentlyoperate out of four districts, each of which has its own command andcommunications center: District 3 in Chicago, District 4 in Crestwood, andDistrict 2 in Elgin cover the Illinois DOT metropolitan Chicago expresswaysystem. District 15 in Oakbrook polices the TriState Tollway (the region’snorth-south suburban circumferential highway) under contract to the IllinoisState Toll Highway Authority. The state police have considered, but not yetacted on, proposals to reorganize three, and perhaps all four, of the districtsinto a single Chicago metropolitan district.
In this respect, the state police are not that far behind the DOT. Illinois DOThas a single district that covers the Chicago metropolitan area, but theincident management program is a composite of three different divisionswithin the district. The Incident Management Office and the MinutemanPatrol fall under the jurisdiction of the Illinois DOT Bureau of Traffic; thecommunication center under the Bureau of Electrical Operations; and theTransportation Systems Center under its own Bureau of TransportationSystems.
Chicago has no formal mechanism to bring together the managers of thedifferent agencies involved in incident management. An agency-levelcommittee -to which shippers, receivers, and motor carriers were invited asobservers -was formed to oversee and coordinate traffic management duringthe reconstruction of the Dan Ryan; however, this committee folded uponcompletion of the reconstruction project. Chicago Area Transportation Study,the region’s transportation planning agency, sponsors a traffic operationscommittee. Its primary focus is on planning issues, not operating problems,so it tends to draw managers as opposed to operating personnel. As a result,interagency relationships depend on personal relationships built over theyears and reinforced during reconstruction projects, such as the Dan Ryanproject.
Cambridge Systematics, Inc. 24
Clearance Program: Costs and Benefits
The continuity of the Illinois DOT program and the experience of theMinutemen have produced an effective incident management program.Program managers estimate that most incidents, even small breakdowns, aredetected within twenty minutes, and clearance times for major incidents havebeen reduced from four or more hours to about two hours.
In 1988, the Minutemen responded to about 100,000 incidents. Of these,60,000 involved disabled vehicles; 30,000 were for abandoned vehicles, debrison the road, and fires; and the remaining 10,000 were accidents. The statepolice, who patrol a larger area of the expressways than the Minutemen andoften call private tow trucks rather than the Minutemen for minor accidents,reported 21,000 accidents that year. Of these, about 80 percent wereautomobile-only accidents and 20 percent were truck-involved accidents.Combination trucks, typically tractor-semitrailers, accounted for 9 percent ofall accidents or about half of the truck-involved accidents. The police respondto a large number of incidents; these are recorded on daily communicationlogs, but are not tabulated.
We estimate that the Minuteman program returns about $17 in benefits foreach $1 invested in the program. The total program costs $5.5 million peryear. We estimate that the program saves motorists 9.5 million vehicle-hoursof delay at a value of $95 million per year. (The costs and benefits of theprogram are described in detail in Appendix A.)
Improving Detection and Response Times
Most incidents on the expressways are detected by the state police and theMinutemen. Illinois DOT managers estimate that half of the calls for theMinutemen are initiated by the state police and the other half by theMinutemen themselves. However, an increasing number of incidents arebeing reported to the state police and the Minutemen over mobile phone 911emergency lines. To tap this resource and shift non-emergency calls awayfrom the 911 lines, Illinois DOT has set up a *999 expressway-emergencynumber for mobile phone users. Motorists calling this number reach adispatcher who will take their call and switch it to the Minutemen, statepolice, city police, or fire department as needed. The program has been set upas a two-year experimental service. The *999 line is currently logging over7,000 calls per month.
Cambridge Systematics, Inc. 25
Illinois DOT has experimented with closed-circuit television for incidentdetection. They concluded that while closed-circuit television is an effectivetool for confirming incidents, the requirements for staffing and monitoring anextensive closed-circuit television system make it a costly tool for routineincident detection.
Fast Removal Policy
Illinois DOT removes automobiles and trucks from the expressway as fast aspossible. As soon as it is safe to do so, they will tow, drag, or push disabledvehicles to the nearest exit or other safe drop point. They will do so even ifthere is a risk that they will further damage the vehicle or its cargo.Moreover, Illinois DOT generally does not allow motor carriers the right offirst refusal to hire their own towing contractors or to hand pick a load beforeremoving a trailer from the expressway, especially during peak periods.During off-peak periods, the state police and Illinois DOT program managerswill allow motor carriers to clear their own trucks if it is done within areasonable time. Initial concerns about incurring substantial liabilities underthe fast removal policy have not materialized. Automobile owners and motorcarriers may claim damages from the state, but very few do so.*
Illinois DOT’s dominant role in incident and accident clearance hasoccasionally become a contentious issue with local private tow operators. TheMinutemen contend that private contractors do not have the equipment,experience, or incentive to deal quickly with large truck accidents. This wasthe case when the emergency patrol operation was first developed; however,private tow operators contend that they now have the equipment andexperience to provide both light- and heavy-tow services. The state policewill authorize private tow companies to remove vehicles from theexpressways in non-emergency situations; and all vehicles towed by theMinutemen are turned over to private contractors at safe drop sites near theexpressways.
Critical Role of Traffic Information Program
Illinois DOT’s traffic information services may have as much impact onreducing incident congestion as the patrol and clearance programs. TheDOT’s Traffic Systems Center (TSC) routinely provides Chicago’s commercial
* Maryland is the only state that has a written policy on quick clearance. A copy ofthe Maryland policy is in Appendix B.
Cambridge Systematics, Inc. 26
radio and television stations with traffic and incident information. Duringpeak periods,TSC provides information every five minutes on congestedexpressway sections and average travel times from point to point .
TSC provides traffic and incident information to the media by teletype,computer modem, or direct video feed of color-coded expressway congestionmaps. The availability of timely and accurate information has made thepackaging and presentation of traffic news a commercially viable service.Traffic news is now considered very much a part of the competitive mediaenvironment in Chicago. Currently, two all-news-and-traffic stations, ninecommercial radio and television stations, and four commercial trafficreporting services are linked to TSC. They, in turn, feed more than fifty otherradio and television stations providing regular traffic information reports.Illinois DOT traffic engineers believe that this traffic status informationsignificantly reduces queuing and delays at incident sites because motoriststake alternative routes or shift their travel times.
The information system that provides the data to the commercial media is fedby an extensive loop-detector system installed in the expressways. Theprimary function of the loops is to provide traffic flow data for ramp meters,but the loops can also be used to detect congestion created by accidents andincidents. The first twenty-five detectors were installed on a five-mile sectionof the Eisenhower Expressway in 1960. The system now has 1,800 detectors(installed at half-mile intervals on the mainline and at each ramp) coveringmore than 100 miles of expressway.
Building a Regional Incident Management Program
Chicago has established an effective incident management program, but itdoes not have a coordinated regional program. The Chicago Police and theChicago Public Works Department manage traffic and incidents on the city’sarterials streets; Illinois DOT manages traffic and incidents on themetropolitan expressway; and the Illinois State Toll Highway Authoritymanages traffic and incidents on the region’s extensive tollway system. Thelinks among these agencies for coordinating traffic and incident managementare relatively weak. Observers in Chicago believe that the next majorchallenge for Chicago is to develop an integrated regional incidentmanagement program.
Cambridge Systematics, Inc. 27
Los Angeles
In the 196Os, Los Angeles developed the nation’s premiere freeway system,and in the 1970s the California Highway Patrol (CHP) and the CaliforniaDepartment of Transportation (Caltrans) set up an exemplary incidentmanagement program in Los Angeles. Under this program, CHP hasstatutory responsibility for overall management at the site of all freewayincidents, and Caltrans is responsible for system traffic control during majorincidents and for maintenance support. Clearance for major and minorincidents is done by private tow-truck operators under the direction of CHP.Today, this incident management system is struggling because the resourcesallocated to incident management have not grown apace with traffic andcongestion on the freeways. Los Angeles is now searching for new solutions.
Evolution of the Program
Los Angeles’ current incident program has it roots in the Los Angeles AreaFreeway Surveillance and Control Project (LAAFSACP). In the early 1970s,many believed that congestion and incidents had reached crisis proportions.In response to these concerns, Caltrans was given a legislative mandate tolook at new approaches to managing congestion. A task force was formed,and a number of promising approaches were identified. These became thebasis of the federally funded demonstration project.
The initial focus of LAAFSACP was demonstrating traffic monitoring andmanagement techniques, with much of the early effort going to demonstratethat ramp metering could both smooth traffic flow and reduce accidents. TheLAAFSACP demonstrations were set up on the forty-two mile triangular loopof freeways formed by the Santa Monica (I-lo), the San Diego (I-405), and theHarbor (I-1 10) Freeways. Loop detectors, ramp meters, changeable messagesigns, highway advisory radios and, later, closed-circuit television cameraswere installed and demonstrated.
During the course of the demonstrations, Caltrans engineers found that theywere able to detect incidents, but that while CHP officers and Caltransmaintenance staff were dealing with an incident, no one was managing thetraffic around the incident site. Of particular concern to CHP were thesecondary accidents that were occurring at the end of the traffic queues.Often these were more severe than the primary incident and greatlycompounded traffic congestion. The LAAFSACP program began to focusattention on the management of incidents and the dynamics of traffic flowaround the incident site. Site clearance operations were observed, and the
Cambridge Systematics, Inc. 28
traffic queues and vehicle hours of delay triggered by incidents weremeasured. Caltrans began developing and demonstrating techniques to dealdirectly with the traffic impacts of incidents. Service patrols in lightweighttow trucks were fielded to speed the clearance of minor incidents, and trafficmanagement teams were trained to set up diversion routes and providewarning to drivers approaching the end of traffic queues.
These early demonstrations evolved into today’s major incident responseteams, which Caltrans dispatches when CHP expects that an incident willclose down two or more lanes of a freeway for two or more hours. The teamconsists of a supervisor with a radio car and one or more heavy-duty pick-uptrucks equipped with traffic cones and changeable message signs to redirecttraffic flows. The team can also deploy a truck equipped with a mobilehighway advisory radio unit and call upon Caltrans maintenance staff forsand trucks (to absorb oil spills), front loaders, and other heavy equipment asneeded. The response teams provide technical expertise in system trafficcontrol and carry with them detailed traffic diversion plans prepared byCaltrans and CHP.
Another product of the LAAFSACP demonstrations was the traffic operationscenter. The center is jointly staffed by CHP and Caltrans and serves as theinformation center for the region’s freeway system. The center collatesinformation from the loop detectors, traffic meters, and closed-circuittelevision cameras. It also has access to CHP’s computer-aided dispatchsystem, and can monitor CHP, Caltrans, and commercial radiocommunications. The center serves as a central point of contact during majorincidents; however, CHP’s Los Angeles communications center is responsiblefor mobilizing resources and coordinating with other agencies.
The task force that set up the LAAFSACP program became the nucleus ofCaltrans’ permanent traffic operations group. The district-level group,originally a spin-off of the traffic engineering department, is made up today ofthe traffic operations and systems unit, which deals with incident congestion;traffic engineering, which deals with the problems of recurrent congestion;and traffic design, which develops and oversees implementation of trafficengineering and operations projects.
Severe Congestion Creating New Problems
The incident management system that grew out of the LAAFSACP programhas served the Los Angeles region well, but today that sys tern is strugglingbecause congestion and incidents have outpaced the resources allocated fortraffic and incident management. The Los Angeles incident management
Cambridge Systemtics, Inc. 29
system is breaking down, in part, because the nature of the problem haschanged. As the freeway system has become saturated with traffic, smallincidents have become a substantial problem; delays in clearing accidents arefelt over a wider area; more actors are drawn into incident managementincreasing the potential for jurisdictional squabbles; and the boom and bustcycles created by incidents can no longer be mitigated by traditional trafficengineering techniques.
Dealing With Small Incidents
Small incidents are now as much a part of the problem as major incidents.Small incidents - stoppages caused by cars and trucks that run out of gas,overheat, lose a fan belt, or drop debris on the roadway - may make up asmuch as 80 to 90 percent of all freeway incidents. These events are randomand unpredictable, but their cumulative effect is significant. As the freewaysystem has become saturated, the impact of small incidents has beenmagnified. A single car stalled in a lane, even a motorist changing a tire onthe shoulder of the road, can slow traffic, create queues, and trigger secondaryaccidents.
The problem with small incidents is that they are difficult to find and resolvequickly. Caltrans’ major incident response teams are organized to handlemajor incidents, not minor incidents. CHP locates many small incidents andcan push a stalled car from the travel lanes to the safety of the shoulder, butthe police cruisers are not equipped to replenish gas or make repairs. Forthese services, CHP must radio back to their dispatcher and arrange for aprivate tow truck. Managing even a relatively small number of such incidentstakes up a considerable amount of time, and the sheer volume of smallerincidents taxes CHP’s capacity even though the department has added 150officers a year statewide since the 1987-88 fiscal year.
Adding Service Patrols
CHP and Caltrans believe that part of the answer to small incidents may beservice patrols. Service patrols on routine beats can locate and respondquickly to incidents, and tow-truck patrols can clear stalled cars and resolveminor accidents as soon as they locate them.
Both Caltrans and CHP would like to operate service patrols: Caltransarguing that they are critical to their system management functions; and CHParguing that service patrols are a direct extension of their statutoryresponsibility to provide assistance to motorists on the freeways. Both
Cambridge Systematics, Inc. 30

agencies are also keenly aware of the public relations value of service patrols:Caltrans looks to service patrols to offset the public’s frustration withconstruction and reconstruction projects that seem to add inexorably longdelays on top of the existing congestion; and CHP looks to patrols as a way tohelp balance out the resentment generated by routine law enforcementactions, such as handing out 55-mile per hour speeding tickets.
But while service patrols are effective, they are also labor intensive and,therefore, expensive. So the question becomes “Who can pay for them?”Within Caltrans, funds for traffic operations, including service patrols, comeout of the regular operations budget. Funding is generally stable, but as inmany government agencies, maintenance and operations are often sacrificedwhen budgets are tight. Traffic operations and incident management haveoften had to do with less rather than more. Caltrans has fielded interimservice patrols for reconstruction projects using federal project funds, butthese funds are always tied to construction budgets and lapse when theproject is complete. They do not provide a stable funding mechanism forpermanent operations.
CHP, which does not have access to construction funds, has cobbled togethera number of service patrol programs using grants and regular operatingfunds. CHP has also made direct budget requests to the state for servicepatrol funding, but it has been a difficult sell in the era of tight state budgets.Nor has it been easy for CHP to maintain their service patrols once they havethem underway. In several programs, they found that their service patroloperators were routinely being hired away by private tow-truck operators,motor carriers, and local government. By training their service operators toC H P standards, CHP had inadvertently created a work force that was veryattractive to private industry.
C H P h a s side stepped these problems for the moment by refocusing the job ofits patrol officers during the peak periods. Until recently, CHP stressed theimportance of “in view” patrols that use marked CHP units whenapprehending speeders and issuing tickets, but on congested urban freewaysthe mere presence of a patrol car with flashing lights causes people to slowdown and gawk, creating additional congestion. CHP is now stressing theimportance of keeping traffic moving and has shifted its emphasis during thepeak hours from law enforcement toward traffic management.
Under its CLEAR (Clear Lanes Efficiently And Rapidly) program, CHPcreates flexible, short-duration teams that can quickly get at and resolve trafficproblems on chronically congested freeways. When an incident occurs, thebeat officer can call for assistance from a “clear unit,” usually a motorcycleofficer and a patrol car officer drawn from adjacent beats. The objective forthe team and the program is to keep traffic moving by handling incidents as
Cambridge Systematics Inc. 31
quickly and safely as possible. CHP believes that the program is having apositive effect. They cite as one measure the fact that with better deploymentand faster response times they are reaching and resolving more minorincidents than they were before implementation of the CLEAR program.
The debate over who should fund and control service patrols is going to go onfor sometime; however, more of the burden of paying for incidentmanagement may eventually be borne directly by those involved in incidents.For some years Caltrans has been billing motor carriers and their insurerswhen accidents have caused physical damage to state property. NowCaltrans is billing motor carriers for the costs of incident management. Todate, the collection attempts have been selective, focusing on major incidentswhere there has been considerable damage and congestion. In the future,collection attempts are likely to increase and, perhaps, include smallerincidents.
Clearing Incidents Faster
When freeways are saturated with traffic, as they are during the morning andevening commute periods in Los Angeles, delays in clearing incidents are feltover a wide area. Queues build up quickly and spread rapidly to connectingfreeways and adjacent arterials. Incidents that yesterday blocked a singlefacility today create a real risk of gridlock for large portions of the freewaysystem. This has put a higher value on being able to clear incidents in theshortest possible time.
Getting the right tow truck to the right place at the right time is part of theanswer, but many in CHP and Caltrans regard the acquisition of tow servicesas the weakest link in their incident management process. CHP does notcontract for tow services; all services are provided by private tow operators.When a tow is needed, CHP must call one from a rotation list. Two lists aremaintained: one for heavy-duty equipment operators; the other for light-dutyequipment operators. Within the City of Los Angeles, CHP draws down fromthe rotation lists of the official police garages. Outside the city, CHP areacommands define their own tow districts and maintain their own tow-servicerotation lists.
The system works, but the present procedures do not always guarantee eitherthe right equipment or the nearest available equipment. The next tow serviceon the rotation list may be some distance from the incident site and may notarrive with the right equipment, especially when heavy equipment is need toclear truck accidents.
Cambridge Systematics, Inc. 32
These problems have prompted CHP to examine their tow districts andprocedures to minimize travel time and cases of mismatched equipment.CHP is giving more attention to pre-qualifying tow-truck services; refiningthe rotation list by capability (light, heavy, super-heavy, etc.); and givingofficers greater latitude and discretion in determining the type of tow servicethat should be called. CHP can drop poor performers from the rotation list tomake this threat more effective, and CHP is tightening up its performancestandards. It is also increasing the frequency and detail of its tow inspectionsand considering the introduction of minimum training standards for tow-truck operators.
Improving Communications
Another way to speed up clearance operations is to make better use ofcommunications technology to detect and respond to incidents. CHP andCaltrans units are equipped with two-way radios. In addition, the LosAngeles incident management system utilizes passive motion-detection loops,closed-circuit television, roadside callboxes, and mobile phone 911 lines.Loops (installed to drive the ramp meters) can detect major incidents wheretraffic is brought to a halt, but are less reliable for small incidents, which mustbe verified by the CHP. Caltrans has installed closed-circuit televisioncameras in high incident areas to cut down the time required to verify andidentify problems, but the camera systems are expensive and difficult foroperators to monitor over long periods of time.
The majority of freeway incidents are reported through roadside callboxes.The first callboxes were installed in the Los Angeles area in 1965. Under thestate authorizing legislation for the callbox program, the counties design andlocate the callboxes; Caltrans reviews the plans; and CHP operates the system.CHP’s Los Angeles communication center currently handles over 65,000 callsper month from the freeway callboxes. Center managers estimate that 80percent of the calls are for assistance with gas, flat tires, and minor repairs;and 20 percent of the calls are emergency calls.
CHP and Caltrans are watching with interest the increasing use of the mobilephone 911 lines. All mobile phone 911 calls go to CHIP’s communicationscenter (all other 911 calls go to the nearest local police station). The LosAngeles communications center is currently receiving 20,000 calls per monthover the 911 lines. Center managers estimate that 85 percent are calls for CHPconcerning incidents; 10 percent are for fires or crimes out of CHP’sjurisdiction; and 5 percent are non-emergency calls.
Cambridge Systematics, Inc. 33
For each major incident, the communications center may receive six to tencalls, usually from private citizens or drivers of local delivery and courierservices. Many calls are received before CHP or Caltrans units in the fielddiscover the problem. To make better use of mobile 911 calls, CHP andCaltrans are considering posting more frequent mile markers to make it easierfor motorists to pinpoint the location of incidents.
Improving communications among the operating agencies may also reducethe time required to clear incidents. CHP and Caltrans are exploring twoimprovements. The first would establish a state highway operations center tohouse the traffic operations center and the communication groups from CHPand Caltrans Maintenance. The traffic operations center and CaltransMaintenance communications group have adjoining facilities in Caltrans’downtown office, but CHP’s communications center is located in a separatebuilding some miles away. The new facility would bring all three groups intothe same building. The major organizational objective of the move would beto bring the parties together in a jointly staffed facility and improve face-to-face communications as well as electronic communications.
The second communications improvement would be to equip CHP andCaltrans field units with mobile telephones. At present, CHP units at anincident site cannot talk directly to Caltrans units in the area except byrelaying messages through their respective dispatchers. Mobile phoneswould provide a common communications link as well as direct access toother parties, such as motor carrier dispatchers and hazardous materialsexperts.
Dealing With Jurisdictional Squabbles
CHP and Caltrans use a team approach to incident management. CHP hasstatutory responsibility for overall management at the site of all freewayincidents, and Caltrans is responsible for system traffic control during majorincidents and for maintenance support. The agencies have been careful tonurture this working relationship, which has been basic to the success of theirincident management program. Both agencies have used Los Angeles as atraining ground for C H P and Caltrans staff from other areas.
This team approach works well if team members are in frequent contact witheach other and come to know and rely on the others’ capabilities. But ascongestion has increased, more actors have been drawn into incidentmanagement, and each of these parties brings new priorities to incidentmanagement, increasing the potential for jurisdictional squabbles. All toofrequently, interagency squabbles have led to delays in clearing incidents and
Cambridge Systematics, Inc. 34
increased costs for agencies and motorists alike. In Los Angeles, as elsewherein the country, the major new element in incident management has been theinterjection of environmental and public health agencies, whose mandates toprotect public safety are defined by environmental and health issues, not bytransportation system efficiency and motorist services. While incidentsinvolving hazardous materials are relatively infrequent, time-consumingsquabbles among agencies over priorities and procedures are not.
Defining Lines of Authority
CHP’s response to this problem has been to seek better definition of the linesof authority for incident management. They have found that clearly definedlines of authority provide a base upon which to build team operations. CHPis promoting the concept of an incident command system. The system definesthe lead agency for incident management, but stresses the need for acoordinated team approach that brings all skills to bear on the problem. Theincident command system gives the team leader both the option andresponsibility of inviting others to join a unified command, and it emphasizesthe responsibilities of team members to contribute productively to the team.CHP hopes to have the system implemented into CHP’s operations by theend of 1990.
A device that reinforces the team approach is contingency planning. Caltranshas found that having a traffic diversion plan available at the site commandpost helps pull the team together. It provides a means of focusing attentionon the substantive issues rather than personalities and bureaucratic turf. Butmaking plans available has become a problem in its own right. Caltransestimates that it has over 3,000 traffic diversion plans on file for the LosAngeles area alone, far more than CHP and Caltrans staff can carry in theirvehicles. Caltrans would like to transfer the plans to a computer database,use GIS (geographic information systems) software to retrieve plans, and thenuse mobile telephone and fax technology to send specific diversion plans fromthe traffic operations center to field units.
Dealing With Boon and Bust Cycles
Caltrans has found that the boom and bust cycles created by incidents can nolonger be mitigated entirely by traditional freeway engineering approaches.These traditional approaches focus on managing the supply (capacity) offreeways: eliminating bottlenecks and adding lanes to increase capacity;installing ramp meters and positive traffic controls to stabilize traffic flowsand maximize throughput; and providing adequate storage space on ramps to
Cambridge Systanatics, Inc. 35
handle queues when traffic slows down. These techniques are usuallyeffective at containing the situation under moderate, steady-state trafficconditions. But when the freeway system is saturated, as during evening rushhours, traffic backups overflow onto local streets and can ripple through thesystem triggering backups on other freeways. This situation has forcedCaltrans to look to other solutions.
Using Information to Influence Travel Demand
Caltrans is exploring greater use of information to influence travel demand:providing more accurate and more timely information on incidents andcongestion to get motorists to take alternative routes or reschedule trips. Thisapproach is at the core of the Smart Corridor demonstration project beingdeveloped by Caltrans, CHP, the City of Los Angeles, and the Los AngelesCounty Transportation Commission. The demonstration will instrument theSanta Monica Freeway (I-10) and the parallel arterial streets betweendowntown Los Angeles and the San Diego Freeway (I-405). The key objectiveof the demonstration will be to determine if information on traffic flows canbe collected and disseminated quickly enough to influence traffic flows. Thelessons learned from the demonstration will be applied regionwide.
Caltrans is using local highway advisory radios (HAR), mounted on pick-uptrucks, to communicate information to motorists directly affected by majorincidents. HARs are effective in these situations because they can transmitmore selective information than can commercial radio stations, which havelimited time for traffic reports and must broadcast to the entire region. ButHARs are much less effective at influencing traffic at the corridor and regionallevel. Motorists usually tune to the HAR frequencies only after they are stuckin a traffic jam and then discount the information because many HARs usecanned message loops. The future of HARs in Los Angeles is uncertain. TheFCC is considering proposals to shift the HAR frequencies from 530 and 1610AM to 450 and 1700 AM as part of an effort to allocate more of the frequencyspectrum to commercial radio broadcasters. This would put the HARfrequencies out of range for many motorists until new radios are introducedto the automobile fleet.
CHP and Caltrans believe that a more promising approach is to build closerworking relationships with Los Angeles’ commercial radio and TV stations.CHP and Caltrans provide information on congestion and incidents throughtheir commercial radio advisory service. This has been a permanent programfor some years, but CHP and Caltrans have moved recently to strengthen it.CHP is now chairing monthly meetings attended by CHP, Caltrans, and theregion’s radio and TV traffic reporters. Examples of topics discussed at recent
Cambridge Systematics, Inc. 36
meetings were the need for uniform designation of freeways; the need formore timely information about planned construction work; the lack ofaccuracy about the duration of delays; and concerns about overwhelmingdrivers with information, much of which may be irrelevant for an individualdriver’s commute.
In an effort to target traffic information to motorists, Caltrans will soon begina demonstration using teletext technology. The objective is to make trafficinformation and incident advisories available to motorists before they leavetheir offices and homes. Initially, monitors will be installed in buildinglobbies, but the eventual goal is to make the information directly available inhomes and offices, including motor carrier dispatch offices.
Setting Statewide Policy Direction
Public concern about congestion and incidents in Los Angeles is high.Congestion is consistently ranked among the top two or three issues in publicpolls, and there have been a number of recent proposals and studies dealingwith various aspects of congestion. During the 1987 mayoral electioncampaign, Los Angeles’ Mayor Bradley proposed banning large trucks fromthe freeway during peak commute periods as a measure to relieve congestionand air pollution problems. More recently, the mayor and the city councilhave instructed the city’s department of transportation to investigate thefeasibility of a truck permit program that would restrict the number of largetrucks that motor carriers could operate on city streets during the peakperiods. The South Coast Air Quality District, under strong pressure to cleanup the air in the Los Angeles basin, has taken broader aim at transportationcongestion. It is calling for mandatory ridesharing and consideringmandatory night shipping and receiving regulations for business andindustry.
These proposals have triggered a broad-ranging debate at the state level oncongestion and incident management. In 1988 Caltrans undertook a study ofthe impacts of large trucks on peak-period congestion.** The study identifiedthe costs and benefits of strategies to deal with urban freeway congestion.The strategies included better traffic management; expanded incidentmanagement; mandatory night shipping and receiving; and peak-periodfreeway truck bans. The study recommended that the state considerexpanding and intensifying its incident management programs, arguing thatthese programs would have an immediate and cost-effective impact onreducing delays from incidents.
* * “Urban Freeway Gridlock Study." Cambridge Systematics, Inc., December 1988.
Cambridge Systenratics, Inc. 37
Acting on the study’s recommendation, the state legislature requested thatCHP and Caltrans review the state’s incident management efforts andrecommend improvements. To support the review, the legislature appointedan advisory committee with representation from state agencies, city andcounty governments, highway users, business and industry, and the motorcarriers. This committee is taking a broad look at congestion and incidentmanagement. It is expected that the committee and agency recommendationswill set new directions for incident management programs in Los Angeles andother California cities.
Cambridge Systematics, Inc.
Fort Worth
Incident Clearance Program
Fort Worth’s major incident clearance program is considered by many to bethe most aggressive and successful program in Texas. The program wasstarted in the 1970s after a series of major incidents blocked highways aroundthe city for several days at a time.
Responsibility for major incident clearance rests with the Texas StateDepartment of Highways’ (SDH’s) district safety coordinator and his deputy.Most observers in Fort Worth credit the success of the program to theexperience and longevity of the district safety coordinator. This two-manteam, on call twenty-four hours a day, responds to all major incidents andaccidents on the highway system. The coordinator’s office monitors the policeradio and is often called directly by the police. The coordinator also has apolice radio in his car and gets information on the incident and clearancerequirements directly from the patrol on the scene.
When a major incident occurs, the fire department is usually the first agencyon the scene and is responsible for providing first aid. When the police arrive,they conduct an investigation and, in the case of minor incidents andaccidents, will order a commercial tow service to clear the site. If it is a majorincident, the district safety coordinator will locate the appropriate clearanceequipment, handle traffic around the incident site, and notify radio andtelevision stations of the incident from a cellular telephone in his car. (If theincident occurs during the business day, the public relations staff at thedistrict offices handles calls for the coordinator.) The safety coordinator hasdeveloped diversion routes for the Fort Worth highway system and will setup the appropriate traffic diversions during the course of an accidentclearance effort.
The Fort Worth district puts a high priority on clearing the highway ofincidents as quickly as possible. To do this, they will call to the incident siteany equipment that is necessary for clearance, whether it is SHD equipment,commercial tow equipment, or equipment belonging to private contractorswho may be working on nearby highway projects. The primary criteria forselecting equipment are travel time to the incident site and capacity to handlethe operation.
As in Chicago, if the initial tow is done by SDH or contractor’s equipment, itis to a “safe drop” location only. Once the vehicle is moved to a safe locationoff the highway, the automobile owner or motor carrier must arrange with a
Cambridge Systemtics, Inc. 39
commercial tow operator to have the vehicle towed for repair. These tows areusually arranged by the city police,who have enforcement jurisdiction over allhighways within the city limits. According to SDH managers, when the policecall a commercial tow service, they do not use tow rotation lists; they selecttow services by proximity to the incident site and reputation of the towcompany.
To date, Fort Worth’s quick clearance policy has not generated a significantnumber of liability claims. District officials believe that their mandate toprovide for public safety and traffic management gives them adequateauthority to clear the highways quickly. The Fort Worth district bills motorcarriers for the cost of clearing a major incident. District officials estimate thatthey recover 90 percent of their clearance costs. Trucking companies arecredited with being fairly responsible for bearing the damage and clearancecosts.
The district safety coordinator also directs a courtesy patrol that provides freeservice to motorists. Two pick-up trucks equipped with directional arrows,traffic cones, and basic repair equipment operate twenty-four hours a day onthe Fort Worth area highways. The patrol clears minor incidents and assistswith traffic management during major incidents. The district believes that byquickly clearing stalled vehicles from travel and breakdown lanes the patrolprevents about half of the secondary accidents that might otherwise occur.
Traffic Management Team
Fort Worth’s incident clearance program was the springboard for theestablishment of a traffic management team for the district. This in turn hasled to the development of a comprehensive traffic management program. Theclearance program set the stage by building working relationships betweenthe SDH and the city police agencies in Fort Worth and Arlington, thedistrict’s major cities.
The first meeting of the Fort Worth area traffic management team was held inSeptember, 1979. The objective was to “work toward the optimum movementof people and goods within freeway corridors so as to obtain the high degreeof mobility needed to improve the well being of people and to maintain andincrease the economy of the cities.” There are now fifteen members on theFort Worth area team representing District 2 of the SDH, Tarrant County, andthe cities of Fort Worth and Arlington. Although there are no formalagreements among the member agencies, the traffic management teamcoordinates interagency activity and helps set program and policy directionsfor the four SDH district offices represented on the team.
Cambridge Systematics, Inc.
The original objective of the traffic management team was to deal withcongestion problems related to incidents in specific corridors, but the teamhas also become the forum for developing highway system operating goalsand improvement plans. This planning process has served to cement thefoundation for long-term interagency cooperation.
Traffic Management Program
The traffic management team has developed a comprehensive, high-technology traffic management plan for the Fort Worth metropolitan area.The plan is being designed and implemented as part of a massive highwayreconstruction effort. Many of the highways in the metropolitan areas werebuilt in the 1950s and now need complete reconstruction because of age andrapid regional economic growth. The traffic management plan was submittedand approved in 1985. The first reconstruction project incorporating the newtraffic management equipment was completed in 1989.
The traffic management system envisioned by the Fort Worth team consists offour elements: a remote sensing and surveillance system that will constantlymonitor the operating conditions on the highways; an interactive controlnetwork that will allow for the implementation of corrective actions ashighway conditions deteriorate due to recurring congestion or an incident; ajoint city-state command center (the traffic management center) that willcoordinate activities on both the highways and city streets; and an area-widecommunications network that will link all systems to the traffic managementcenter and provide a central contact point for other agencies.
The primary enforcement agency, the Fort Worth city police, will share directoperational control of the traffic management center (TMC) with the SDHdistrict. The district traffic management team has located the TMC in thebasement of the Fort Worth Police and Courts Building. Smaller monitoringfacilities will be located in the district’s headquarters and in the city ofArlington. The TMC will be staffed twenty-four hours a day by police anddistrict personnel. The TMC staff will monitor both city streets and areahighways.
The TMC will monitor the freeways through loop detectors, which will beinstalled at one-half mile intervals in all lanes, and closed-circuit television. Ifintervention is required, it will be done by activating variable ramp meters,changeable message signs, highway advisory radios, lane use signals, andthrough adjustment of the system’s signal-timing system. The courtesy patrolwill be run directly from the TMC when the facility becomes operational.
Cambridge Systematics, Inc. 41
Traffic information is now disseminated to local radio and television stationsthrough Metro Traffic, a commercial traffic reporting service. The district andcity police telephone travel time and congestion information to Metro Traffic,which then relays the information to its member stations for broadcast duringtraffic-bulletin time slots. Stations that do not subscribe to Metro Traffic aretelephoned separately, either by the district or the police. Once the TMC isoperational, the district plans to provide real-time traffic-advisoryinformation directly to Metro Traffic, local commercial media, othergovernment agencies, and major employment centers over TMC’scommunications network.
Anticipated Benefits
The district believes that the benefits of their extensive traffic managementprogram will be well worth the construction and implementation costs. Theyestimate that the traffic management projects will cost a total of $53 million.The projects include equipping 161 miles of freeway with loop detectors;installing meters at 207 ramps; providing controllable signals on frontageroads and changeable message signs at key decision points along thefreeways; mounting 80 closed-circuit television cameras; wiring lane controlsignals; purchasing and installing a highway advisory radio system; settingup a data collection facility; and expanding the courtesy patrol.
The cost of the traffic management program is estimated to be less than threepercent of the total highway reconstruction costs for the region, which areestimated to be about $2 billion. The district anticipates that the annualmaintenance and operation of the traffic management system will amount toabout eight percent of the installation cost. The initial costs will be lower, butwill increase over the next twenty years as highways are reconstructed andthe elements of the traffic management system are installed.
The district is looking at long-term options for funding the trafficmanagement system. Federal funds are available for planning, design, andinstallation of the system, but do not cover long-term operations andmaintenance. The state must identify a stable source of operating funds afterthe reconstruction effort is completed. This is expected to be a long anddifficult process.
The district estimates that when the reconstruction is completed the trafficmanagement program will save 156,000 vehicle hours of delay per day andreduce accidents by thirty percent. They also hope to increase the volume of
Cambridge Systematics, Inc. 42
vehicles that can be handled per hour by twelve to twenty percent and makepossible a ten-mile-per-hour increase in average travel speeds.
State Policy
The Fort Worth incident and traffic management programs are among thestrongest programs in Texas. In large part, this reflects the high priority givento these programs by the district. Within the Texas State Department ofHighways and Public Transportation, each district operates with a great dealof autonomy and programmatic independence. In 1984 and 1985, the SDHdirected each of the state’s twenty-four districts to establish annual goals forimproving traffic management, but left program design and implementationto the discretion of the district engineers. Some districts have implementedcomprehensive programs while others are still in the developmental stage.
The effects of this policy are evident when one compares the incident andtraffic management programs in Fort Worth and Dallas, whose highways aremanaged by different SDH districts. Both Fort Worth and Dallas areanticipating major reconstruction periods, and both districts are using federalmoney to develop traffic management programs in conjunction with theirreconstruction projects. However, the programs have developed at verydifferent rates, reflecting different local priorities. In Dallas, the trafficmanagement team, which consists of eleven members, has been meeting forjust over one year. At this point, the traffic management team is servingprimarily as an information clearinghouse for member agencies. The Dallasdistrict office is optimistic that the North Central Expressway reconstructionproject, due to begin in 1990, will serve as a catalyst for more team planningand the development of a full-blown incident management program. Thedistrict is working with the Texas Transportation Institute on elements of thatprogram.
Cambridge Systematics, Inc. 43
Minneapolis
Strategic Approach: Investing Now to Stay Ahead of Congestion
For years the Minnesota Department of Transportation has watched othercities struggle to cope with overwhelming congestion problems resulting fromtraffic growth and incidents on urban freeways. In an effort to stave off theimpacts of similar congestion on the Minneapolis/St. Paul freeways, theMinnesota Department of Transportation (MnDOT) is investing heavily in aproactive strategy that it hopes will keep it ahead of the growing congestionin its area. The department is developing a premier, state-of-the art trafficmanagement system that will regulate the flow of traffic on the freewaysystem for the entire Twin Cities metropolitan area. Using the latesttechnology in closed-circuit television, loop detection systems, and satellitecommunications, the department hopes to build a traffic management systemthat will be among the best in the country. MnDOT has prioritized its trafficmanagement projects based on studies of annual freeway volumes, traveltimes, and accident rates. System development is taking place on a largescale, through a series of multi-corridor contracts.
The initiative that culminated in this energetic approach to congestionmanagement began with a strategic planning process within MnDOT. Thestrategic plan originated when the State Legislature turned down thedepartment’s funding requests for new freeway construction and expansionin the Twin Cities area. In lieu of a multi-million dollar capital investment,the department revised its approach and decided that its only recourse was tomanage the available roadway system.
The strategic plan defined three primary objectives for the department: securestable departmental funding sources; enhance freeway safety for drivers andhighway workers; and reduce congestion in the Minneapolis/St. Paul area.With the support of the governor, the department’s new administrationappointed a task force to develop an action plan to deal with congestion andincidents. Because of prior work done by MnDOT operations personnel, thetask force was able to quickly develop an outline of the operational specificsof their plan.
The strategic plan and the task force’s recommendations led to thereorganization of the department. In the past, MnDOT had divided theMinneapolis/St. Paul area into two transportation districts; one for each city.As the department began planning and development of the trafficmanagement program, it found that this organization was not workingeffectively. With strong internal support, the department was able to combine
Cambridge Systematics, Inc. 44
the two districts into one new Metro Diskict. This enabled it to pursue acomprehensive and coordinated approach to its congestion managementprogram.
MnDOT’s strategic approach echoes what is occurring in several other areasof the country. There is a national shift away from construction andmaintenance as the sole means to solve congestion problems towardsmaximizing operational capability. Transportation agencies are redefiningtheir role to be traffic service management encompassing civil engineering,traffic engineering, traffic management, and safety. The roadway user isconsidered a “client” of the kansportation agency. This transition to a serviceagency orientation is due in large part to the skyrocketing capital costs ofconstructing new highway systems, as well as increasingly stronger andwidespread environmental concerns about the effects of traffic congestion onair quality. One aspect of this shift toward operations is the emerging interestin intelligent vehicle highway systems (IVHS) - the development of “smartcars” and “smart highways” as a way to eke more capacity and productivityout of existing roadway systems.
Incident Management As Part Of A Multifaceted Program
The deparhnent views incident management as part of a multifaceted trafficservices strategy. Because the costs of freeway construction are so high,MnDOT directed its traffic operations and engineering personnel to explorethe viability of any service initiative that might reduce the impacts ofincidents on the system and cost less than $5 million to implement. TheHighway Helper program is one of these smaller, entrepreneurial initiatives.Its six vehicles - light pick-up trucks with gas, water and light repairequipment - patrol sixty-one miles of freeway during the morning andevening peak periods. They rescue stranded motorists and remove stalledcars during the heavy commuter periods around the Twin Cities. Thisprogram is credited with making over 7,000 assists since it was instituted in1989.
MnDOT is betting that by investing heavily in traffic management systems itwill be able to significantly reduce the frequency of incidents. Thedepartment started operation of its traffic management system in 1974. It isnow expanding its system and aggressively pursuing the installation of state-of-the-art traffic monitoring technologies. A system of loop detectors andramp meters has been installed to control the flow of traffic. Over 130 rampsare currently metered, and more than 200 ramps wiIl be metered by 1991. Theentire 200 miles of freeways and another 40 miles of arterials will beconnected by a fiber-optic communication network and will be under camera
Cambridge Systematics, Inc. 45
surveillance by 1995. MnDOT has developed a network of changeablemessage signs and closed-circuit television cameras (CCTV) strategicallylocated throughout the freeway system. The loop detectors, signs, andCCTVs will be run from the traffic management center (TMC). Currentlybeing enlarged, the TMC will have forty CCTV monitors, a switcher to controlthe cameras, computer graphics, and computers to control the ramp metersand signs. The department is also working closely with the Center forTransportation Studies at the University of Minnesota in the development andtesting of a video image-detection technology called Autoscope, whichautomatically counts vehicles. This technology may ultimately replace theloop detector system used to monitor traffic flow and detect incidents.MnDOT is planning to add this capability to the TMC in 1991. In addition,GUIDESTAR, an intelligent vehicle highway system program, is beingimplemented in concert with the traffic management program.
It is still too early to know whether any individual component or combinationof technologies will have the effect that the department is seeking becausemost of the traffic management program components are currently beinginstalled and evaluated. But in the department’s view, the certainty of rapidlyincreasing traffic volumes in the Twin Cities area leave it no alternative but totry a broad management attack on congestion problems. In this respect,Minnesota is one of number of states attempting a broad systems approach tosolve congestion problems. Washington State, Maryland, and Virginia arealso developing their traffic management programs with a similarmultifaceted approach.
Building New Interagency Relationships
MnDOT’s experience with several of its initiatives has brought home to thedepartment the fact that it needs to develop new interagency relationships.This is particularly evident where its growing role in developing andimplementing traffic system programs conflicts with the traditional roles ofother agencies and jurisdictions. Three of the department’s recent projects -installing roadside callboxes, locating new accident investigations sites, anddeveloping joint ventures with Minneapolis area radio and televisionstations - illustrate the problems and opportunities in building newinteragency relationships.
Callboxes: Building New Relationships with the State Police
One of MnDOT’s early initiatives was to demonstrate a system of push-buttoncallboxes that were placed at regular intervals along a 22-mile section of the
Cambridge Systematics, Inc. 46
freeway system. The callboxes were developed and installed by thedepartment. However, the callboxes are answered by the Minnesota StatePatrol dispatch center; and the State Patrol is responsible for responding tocallbox calls. After the callbox system was operational, the State Patrol’sambivalence about the system surfaced because they felt that it did notadequately address all their needs. Push-button technology did not allow thedispatch center to gather enough information about the nature of the incidentor accident being called in; often people left the callbox site after the call wasmade so that State Patrol time was wasted; and many of the calls coming intothe State Patrol dispatch were inappropriate for State Patrol action. A total of573 calls were recorded through December of 1989, an average of 4.3 calls perday. Of these calls, 348 were for motorist-aid service; 158 were for the StatePatrol; 8 were medical; and 59 were for a combination of services.
It is clear to MnDOT now that had the Patrol been brought into thedevelopment of the callbox project earlier, perhaps during the feasibility anddesign stages, many of the difficulties being experienced by the Patrol mightwell have been addressed before installation of the system. The State Patrolhas since suggested that the department reconsider the value of the callboxsystem and perhaps investigate the development of a cellular telephoneprogram, as well as expanded use of mobile phone 911 lines. MnDOT isplanning to do this in its evaluation of the callbox demonstration, and will usethis experience as a starting point to build a new planning process with theState Patrol.
Accident Investigation Sites: Building New Relationships withMotorists
The department is also demonstrating a system of twenty accidentinvestigation sites. An accident investigation site is an area off the freewaywhere the police and motorists can conduct an accident investigation withoutdanger of being hit by vehicles on the freeway. Accident investigation sitesalso help to diminish “gaper’s block” by removing vehicles from the side ofthe freeway to an area out of the sight lines of the travelling public. Ideally,accident investigation sites are not far off the freeway, easily located, well lit,safe, and have a telephone.
In an effort to cooperate with local jurisdictions, the department selected sitesthat were good solutions from a land use and neighborhood perspective, butnot necessarily ideal sites for highway motorists. When developing locationsfor the accident investigation sites, the department was aware that spottingsites in heavily developed freeway corridors would be difficult. Thedepartment worked closely with local officials to select sites that would be
Cambridge Systematics, Inc. 47
acceptable to local neighborhoods. The goal of site location was to producesites that highway motorists will use, but because of local land useconsiderations, some of the sites are a considerable distance from the freeway.Some MnDOT officials are concerned that people not familiar with the areawill hesitate to use the more distant sites.
MnDOT now faces a long program of public education about the accidentinvestigation sites. Many motorists believe that they should not remove theircar from the scene of an incident, particularly to a site off the freeway, until apolice officer completes his investigation. As a result, there has been verylittle use of accident investigation sites by the travelling public on a voluntarybasis, although the State Patrol is beginning to use some of the better-locatedsites.
As in any state, working with local jurisdictions to implement a projectrequires considerable effort. Each jurisdiction has its own concerns andissues, and what is considered important by a state agency may not be apriority to a local town, city agency, or neighborhood group. This has beenbrought home to the department through the accident investigation siteplanning process. It became clear that a firm understanding of what appealsto the highway user is critical, as well as an understanding of the needs ofboth highway engineers and local neighborhoods. MnDOT believes thatproviding a forum to adjust or augment preliminary decisions will ensurelong-term program viability.
Commercial Radio and TV Joint Ventures: Building NewRelationships with the Private Sector
Traffic reporting in the Minneapolis/St. Paul area has not developed ascompetitive an edge as it has in Chicago and Los Angeles because trafficcongestion is less severe in Minneapolis/St. Paul. Traffic information is onlybroadcast every twenty minutes, and traffic reports are discounted becausethey are often inaccurate. In part this is because the duration of incidents isshort, and by the time the traffic information is broadcast, the situation isoften cleared. In addition, in an area where the average commute time in themorning and evening is about 20 minutes, many commuters are alreadycommitted to their routes before traffic radio spots can warn them ofincidents. A contributing problem is that until the department developed itstraffic management system, there was no way that commercial stations couldget real-time data to feed into their traffic reports.
The situation in Minneapolis/St. Paul is rapidly changing as the departmentadvances its strategic program. As the traffic management system is
Cambridge Systematics, Inc. 48
activated, the department is finding itself with real-time information thatneeds to find an effective distribution channel to highway users. MnDOT hasbeen using a high school FM radio station to broadcast “live” traffic reports.This radio provides metropolitan coverage, but reaches only a limitedaudience. The department found that it was effective for providing coverageduring a major incident, which they define as lasting more than an hour, butineffectual when it came to recurring congestion and covering incidents thatlast less than an hour. In an effort to expand the broadcast’s effectiveness,MnDOT has installed a system of roadside signs equipped with radio-activated flashing lights that advise drivers to tune into the FM station duringa major incident.
At the present time MnDOT provides traffic information to local stations andtraffic services, which re-broadcast the information, as in Chicago. Thedepartment has proposed contracting with a commercial radio and televisionstation to broadcast traffic information directly from the traffic managementcenter. The broadcaster would be a MnDOT employee with a broadcastingbackground. In exchange for direct access to the traffic information providedby the center, MnDOT wants to negotiate access to traffic observers in thestation’s helicopters. Eventually, the department would like to work out apooling arrangement with the station and other media so that the entiremetropolitan area is not left without aerial coverage when the commercialmedia rush to cover a major incident during peak commuting periods.
MnDOT’s bidding process and the proposed contract were immediatelychallenged by a local competing traffic reporting service, Although it is notcertain what form the final arrangements will take, it is clear that, because ofits new data collection capability, the department will play an increasinglycentral role in traffic information dissemination, either through its own(contracted) media facility or through a new agreement with the existingtraffic reporting services. The issue for the department is to determine thebest form of public-private partnership to deliver what it considers to be acritical level of traffic information to the travelling public.
Redefining the Role of the State Highway Patrol
MnDOT’s sister agency, the Minnesota State Patrol, has been forced toredefine its enforcement role because the department is quickly developing abroad operational role for itself in traffic management. The State Patrol waschartered in the 1920s as a highway patrol operation to assist motorists andenforce motor vehicle traffic laws. Originally part of the State HighwayDepartment, the State Patrol was transferred to a newly created Departmentof Public Safety in the 1970s. As the State Patrol’s policing powers increased,
Cambridge Systematics, Inc. 49
so too did the organizational emphasis on protecting individual citizens andproperty. Now, with the task of managing congested highways becomingmore important, the State Patrol is reconsidering the effect of its lawenforcement procedures on highway operations. In particular, the StatePatrol is reviewing changes to three of its traditional procedures:
l Conducting detailed accident investigations on the site. Accidentinvestigations by the side of the roadway, in full view of the travel lanes,can often tie up large sections of freeway as motorists slow down to gawk.This has resulted in secondary accidents at the end of the gawker’s queue.When there are no injuries or fatalities and the vehicles can be moved, theState Patrol is urging its officers to utilize MnDOT's new accidentinvestigation sites.
. Stopping motorists for traffic violations regardless of the time of day orroadway conditions. The State Patrol now finds that traffic volumes aresuch that stopping motorists on congested roads during peak commuterperiods slows down traffic and exposes both the motorist and the officer toincreased risk of being hit by an unobservant driver. The State Patrol isnow evaluating the effect of this policy.
l Protecting the property rights of motorists by allowing car drivers todetermine themselves who will tow their vehicle once they have had anaccident or incident, and truck drivers to determine how their spilled loadswill be removed. The State Patrol will now push a car off to the side of theroad, and they are exploring with the department and private industry theuse of contract towing services that will guarantee that trucks and loadswill be removed expeditiously, even at the risk of damage or load losses.The State Patrol is also considering shortening the length of time it willallow a stalled vehicle to remain on the freeway shoulder.
With no clear state or public mandate on its specific role, the State Patrol ismoving cautiously to revise operational procedures that will define a newbalance between its responsibilities as a law enforcement agency and itsresponsibilities as a highway agency.
Future Issues
MnDOT’s long-term challenge is to build an external constituency for itsprograms, using its positive relationships with other agencies to helpconstruct a public mandate for a coordinated, interagency traffic managementprogram. The department enjoys a relatively positive reputation and has anactive public outreach program. As part of its traffic management strategy, it
Cambridge Systematics, Inc. 50
initiated a series of outreach activities in 1989 that included an incidentmanagement workshop. The purpose of the workshop was to identify newefforts and solutions to congestion resulting from truck accidents andincidents. Participants included the State Patrol, the Minnesota State TruckingAssociation, twelve metropolitan area cities, several trucking firms,commercial media stations, private businesses, and a citizen association.
As traffic conditions worsen over the next decade and the freeway systemapproaches saturation levels, the ability to quickly detect, respond, and clearminor incidents will become increasingly important to the operation of thefreeway system and to the public’s perception of the department. The publicoutreach program on which the department has embarked can serve as aforum for discussion to develop solutions to these problems.
Cambridge Systematics, Inc. 51
New York/New Jersey (TRANSCOM)
TRANSCOM, the Transportation Operations Coordinating Committee, is aformal public entity funded and staffed by its fourteen member agencies,which include the Port Authority of New York and New Jersey, the New YorkState Department of Transportation, the New Jersey Department ofTransportation, and the New York City Department of Transportation.TRANSCOM has fashioned a regional incident management capability for theNew York/New Jersey metropolitan area. It has done this by acting as avalue-added provider of information. TRANSCOM gathers and disseminatesinformation about incidents and traffic conditions. Its clients are ninety-sixtransportation and traffic enforcement agencies in the metropolitan area.TRANSCOM’s services have resulted in improved traffic coordination acrossthe region and a forum for corridor and regional incident planning.
Incident Notification Service
When an incident occurs, TRANSCOM’s traffic information center collatesinformation about the incident, assesses its potential traffic impact, andnotifies agencies that might be affected. For example, an accident on theThrogs Neck or Whitestone Bridges, which control the northern approaches toLong Island, will be handled by the Triborough Bridge and Tunnel Authority(TBTA), but a call from the TBTA to TRANSCOM will ensure that otheragencies up and down the corridor are notified. Depending on the time ofday, TRANSCOM’s alerts will reach thirty-five or more groups. Theinformation is sent directly to agencies and traffic reporting services usingalphanumeric pagers, telephone, and facsimile machines. The pagers can becarried by incident management staff in the field or hooked into a printer inan operations office.
For the participating agencies, TRANSCOM’s service saves tirne. Operationsmanagers make only one call, rather than ten or twenty, to ensure thatnotification procedures are set in motion. Notification is immediate; there is arecord of the transaction; and the potential for embarrassing oversights isminimized. Moreover, the early identification of emerging problems givesmanagers time to react. An incident at the Throgs Neck or WhitestoneBridges will shift traffic westward to the Triborough Bridge, but earlynotification will give the Triborough’s managers time to hold toll collectorsover at the end of shift and add police details to handle the additional traffic.For suburban police departments, who may need to set up diversion routesaround an incident, TRANSCOM’s early notification provides time to call upofficers to direct traffic.
Cambridge Systematics, Inc. 52
Timely information about incidents and traffic conditions is also valuablebecause the regional highway network is saturated, and even moderatelysevere incidents can trigger substantial congestion. The problem is acute inthe New York metropolitan area because of the region’s geography; it is lacedtogether by bridges and tunnels crossing the area’s rivers and bays. Thesefacilities are bottlenecks during normal traffic conditions and quickly becomechokepoints under abnormal traffic loads.
A major incident on a critical link, such as the George Washington Bridge,which carries I-95 across the Hudson River, can tie up thousands ofcommuters. One-hundred million vehicles use the fourteen-lane bridge eachyear, and on an average day 130,000 vehicles cross the bridge in eachdirection. Incidents that affect the bridge have a direct impact on the region’seconomy. Among the 130,000 vehicles on the bridge are 15,000 trucks,including trucks carrying most of the fresh vegetables, frozen meats, andother foods destined for points in New York City and Long Island.
Multiple Jurisdictions
Timely information is also valuable because the region must mobilize manyagencies to respond to an incident. The New York/New Jersey region isblanketed with jurisdictions. Within the 500 square miles of the metropolitanarea served by TRANSCOM, there are 3 states, 23 counties, over 300municipalities, and nearly 20 independent authorities. Many of thesejurisdictions have several agencies involved in transportation and incidentmanagement.
Mobilizing and coordinating agencies across jurisdictional lines has long beena problem. Agencies in the region are vociferous about protecting their turf,believing that diversity and independence ensure local control andaccountability. Solutions used in other metropolitan areas to deal withregional problems, such as creating new regional authorities or combining theoperations of existing jurisdictions, are difficult to implement and seldomattempted. In the past, the price of the diversity of the region was that the lefthand often didn’t know what the right hand was doing. Transportationagencies in one jurisdiction were, all too frequently, unaware of trafficproblems in a neighboring jurisdiction.
Cambridge Systematics, Inc. 53
Evolution of the Program
The resurgence of the metropolitan economy in the early 1980s provided theimpetus to address regional traffic management needs. The economic boomtriggered an increase in commuter trips and truck movements across theHudson: jobs and retail sales were increasing in Manhattan and Long Islandwhile construction of residential housing and warehouses was increasing inthe New Jersey suburbs. The Port Authority of New York and New Jersey,which is responsible for the interstate tunnels and bridges crossing theHudson, recognized the need to expand the capacity of the Hudson crossings.It also realized that the expansion and reconstruction projects would takeseveral years.
The prospect of gridlock, caused by construction projects intended to solvecongestion problems, led to the formation of TRANSCOM, the TransportationOperations Coordinating Committee, in 1985. TRANSCOM’s initial mandatewas to maintain regional traffic capacity. It was to do this by improvingcommunications among its member agencies about planned improvementprojects and coordinating the timing of these projects to assure that parallelroutes were not under construction at the same time. The Port Authorityfunded half of the committee’s budget; the New York State Department ofTransportation, the New Jersey Department of Transportation, the New YorkCity Department of Transportation, and other members funded the other halfof the budget.
The Lincoln and Holland Tunnels case illustrates the type of problem thatTRANSCOM was formed to address. In 1987, New Jersey DOT wasrehabilitating New Jersey Route 495 at the west end of the Lincoln Tunnel.The project had a high priority because it was a critical link between the NewJersey suburbs and the Manhattan central business district. The constructionplans called for closing several of the westbound lanes on Route 495 leadingout of the tunnel. The closing would have significantly restricted traffic flowoutbound from Manhattan and the tunnel.
At the same time, the Port Authority was continuing reconstruction work onthe parallel Holland Tunnel. The Port Authority construction plans called forclosing the westbound tube of the Holland Tunnel on weeknights anddiverting traffic outbound from Manhattan to the Lincoln Tunnel. Althoughthe construction divisions of the two agencies were generally aware of theparallel construction schedules, no one had evaluated the overall trafficimpacts. These would have resulted in night-time traffic jams in midtownManhattan and costly delays for motor carriers and businesses that depend onoff-peak deliveries. TRANSCOM identified the potential problems andarranged meetings between the agencies. Construction schedules weresubsequently adjusted, and a traffic management plan, which involved local
Cambridge Systematics , Inc. 54
police from the four towns affected by the construction, was developed andimplemented.
Today, TRANSCOM maintains a comprehensive data base on its memberagencies’ construction projects. TRANSCOM plots the projects on corridorand regional maps, analyzes their potential impacts, and if they aresignificant, makes sure they are brought to the attention of the affectedagencies. TRANSCOM disseminates a weekly traffic advisory report onregional projects that may have interagency impacts. The advisory reportgoes out by fax every Thursday night so that it is available to the agencies onFriday morning as they prepare for the next week’s construction activities.TRANSCOM has recently added information about the completion of projectsso that agencies know when traffic restrictions are lifted.
Growth of the Program
TRANSCOM has been careful to focus its activities on information aboutincidents and construction projects, rather than operations or enforcement. Ithas done this explicitly to minimize jurisdictional conflicts with operating andenforcement agencies. Judged by the volume of business, the TRANSCOMapproach has been successful: its client base has grown to 96 agencies; thevolume of transactions (measured by the number of incidents put on thepaging system) has grown from 130 in 1985 to 3,000 in 1989 and continues toincrease. TRANSCOM’s traffic information center now operates twenty-fourhours a day. TRANSCOM’s budget has grown to $1.7 million per year and isnow supported by a dozen agencies. The Port Authority, which provided 50percent of the TRANSCOM budget in 1985, now provides about 20 percent ofthe total budget, as do NYSDOT and NJDOT.
Contingency Planning
The growth of the program has made it possible for TRANSCOM to expandits role as a broker for corridor and regional contingency planning. TheTRANSCOM meetings are the sole forum where New York and New Jerseyofficials involved in traffic and incident management can meet theircounterparts in other agencies and conduct business. TRANSCOM and theagencies have used this as an opportunity to create corridor-level trafficmanagement teams and define formal contingency plans. These plans spellout the actions to be taken by agencies to handle traffic when a major incidentcloses all or part of a highway. The plans detail notification procedures,establish pre-approved detour routes, and assign responsibilities.TRANSCOM coordinates the implementation of the communications and
Cambridge Systematics, Inc. 55
diversion elements of the plans. The agency on whose facility the incidentoccurs implements the diversion elements of these plans.
TRANSCOM is using federal, state, and local funds to develop trafficmanagement teams and contingency plans in six critical corridors: theVerrazano/Staten Island/New Jersey corridor; the Raritan River Bridgescorridor, including a key section of the Garden State Parkway which providesaccess to the New Jersey shore area; the I-280 corridor through Hudson, Essex,and Morris Counties in New Jersey; the New Jersey Route 495 corridor, whichforms the western approach to the Lincoln Tunnel; the I-287 corridor inWestchester and Rockland Counties in New York, which forms the region’snorthern bypass; and the Long Island Sound Bridges (the Triborough, ThrogsNeck, and Whitestone) which control the northern approaches to Long Island.And recently, the Urban Mass Transportation Administration has providedTRANSCOM with funds to develop a transit-corridor incident managementplan.
Building a Long-Term Constituency
TRANSCOM’s next organizational challenge is to build a stable, long-termconstituency to support its services. TRANSCOM is not an independentagency with its own powerbase and is, therefore, dependent on continuingcooperation and funding from its member agencies. Despite budget problemsand changing political administrations among its member agencies,TRANSCOM has succeeded in obtaining increased agency support for thenext three years. While there is strong support today, funding cuts, politicalsquabbles, or further changes in political administrations could lead to a lossof agency support and funding for TRANSCOM. Public support for regionaltraffic management is tenuous because TRANSCOM’s services are not visibleto the average motorist. The motorist who reads a sign on the GeorgeWashington Bridge alerting him to a problem on the New England Thruwayis unaware that it is TRANSCOM that is responsible for this timely message.
TRANSCOM is looking to new services to broaden its constituency andfunding base. It is currently working with its agencies to coordinate the use ofchangeable message signs across the region. The objective is to provideinformation about alternative routes to motorists before they are trapped incongestion. Each time a participating agency adds a changeable message signor highway advisory radio system, TRANSCOM works to make sure that thisresource is available for major regional incidents.
Cambridge Systematics, Inc. 56
Targeting Information to Specific Markets
TRANSCOM is also trying to target information to specific markets. Underan ATA Foundation demonstration grant, TRANSCOM is providing incidentand construction advisories directly to twelve motor carriers that operate inthe New York/New Jersey region. The carriers’ dispatch offices are linked toTRANSCOM by pagers and fax machines. Preliminary reviews of theprogram suggest that the information has been useful to carriers who havetime-sensitive operations and two-way communications with their fleets.These carriers have used the information to reroute trucks, keep shippers andreceivers informed about pickup and delivery times, and improve theefficiency of terminal operations. TRANSCOM would like to expand this typeof information service to large employers, providing them with traffic andtransit information for their employees.
Applying New Information and Communication Technologies
Finally, TRANSCOM has been working to give the New York-New Jerseyregion a greater role in FHWA’s national research agenda on congestionmanagement. Prior to the establishment of TRANSCOM, attempts to capturefederal congestion management grants often failed because the responsibilityfor administering, managing, and accounting for grants had to be split amongmany agencies. By designating TRANSCOM as the region’s grantee forfederal congestion research funds, the region has provided FHWA with asingle point of contact and greatly streamlined procedures. TRANSCOM,acting on behalf of New York City DOT, New York State DOT, New JerseyDOT, and the Port Authority, was awarded one of the five congested corridorstudies funded by FHWA. The study will focus on the George WashingtonBridge-Cross Bronx Expressway corridor, analyzing traffic patterns andrecommending congestion management technologies for the corridor.
TRANSCOM was recently awarded a $3 million appropriation from FHWA’sresearch budget for demonstration and evaluation of new technologies thatcould speed up the collection and dissemination of traffic information. Thegrant provides for demonstrations of highway advisory radios, video imagedetection systems, electronic bulletin boards, and automatic vehicleidentification technology for faster toll collection.
TRANSCOM has a project underway to develop a geographic informationsystem (GIS). The system would allow TRANSCOM to superimposeinformation about incidents, construction work, and diversion plans on avideo map of the region’s roadways. The objective is to make it easier tocorrelate and interpret complex information. Eventually, TRANSCOM hopes
Cambridge Systematics, Inc. 57
to be able to download incident information in the form of advisory maps.These would be transmitted by video feed or fax from TRANSCOM’scomputers directly to its clients, including commercial traffic reportingservices.
Cambridge Systematics, Inc. 58
4. Findings and Conclusions
This chapter presents the key findings and conclusions of the incidentmanagement study. The findings and conclusions are divided into twogroups: findings about the nature of the problem (why better incidentmanagement programs have not developed); and findings about solutions(what is being done to improve incident management).
Findings About The Problem
The major impediment to the development of incident management programs is thelack of a clear mandate. Although frustration and anxiety about urban highwaycongestion are high and there is strong public opinion that ‘something needsto be done,’ the responsibility for incident management - and trafficmanagement generally - is unfocused. The federal government regardsincident management as an operational issue and therefore the prerogativeand responsibility of state government. The states, in turn, have usuallydelegated the responsibility for traffic and incident management to localpolice and fire departments on the scene. This delegation of responsibilitieshas worked well as long as incident congestion could be handled within citylimits; but congestion is now a metropolitan problem and must be managed atthat scale.
Many urban areas are looking to their state transportation departments totake responsibility for metropolitan traffic and incident management, but statetransportation departments have been reluctant to do so. Most arepreoccupied with their search for funds to repair deteriorating roads andbridges, and metropolitan traffic management is not the traditional businessof state transportation agencies. State highway departments have a long-established mandate to build highways, and in the early 1900s state highwaypatrols were given the task of policing them; but the state agencies generallyhave not been responsible for traffic management. This is reflected in thestaffing of state highway agencies, where the majority of senior managers stillare civil engineers, not traffic engineers.
When state transportation agencies have been drawn into metropolitan trafficand incident management, they have had uncertain support. Localjurisdictions have resisted any changes in their traditional roles andresponsibilities; motorists have been reluctant to tax themselves for newservices; and the trucking industry - fragmented, preoccupied withderegulation, and reactive -has been slow to sort out its interests and find a
Cambridge Systematics, Inc. 59
voice on the issue. Where programs have emerged, they have usually beenad hoc responses to major crises.
In the absence of a clear mandate, marry efforts to develop comprehensive incidentmanagement program have been hamstrung by an inability to reconcile conflictingdepartmental goals and practices. Responsibility for incident management isdivided among state police and highway agencies; local police and firedepartments; tow-truck operators; hazardous-materials specialists; vehicleand cargo insurers; and public health officials. Each has long-establishedorganizational goals and practices that define how incidents are to behandled. For highway engineers, incident management means protecting thecapacity and efficiency of the highway network. For police and fire officials,incident management means protecting individual safety and property rights.For public health and environmental protection agencies, incidentmanagement means protecting public and environmental health. And fortow-truck operators and insurers, incident management means a business anda livelihood. Each has a legitimate role in incident management and manyagencies are effective and innovative, but all too often duties overlap,authority is fragmented, and actions are inconsistent.
Most metropolitan areas tolerate this patchwork approach and muddlethrough incident management. But as congestion increases, so does thepressure to change, and this leads to conflicts among agencies reluctant togive up traditional responsibilities and established practices. At best theseconflicts only slow the rate of change, but at worst they cause confusion andsquabbling at the site of incidents, greatly increasing their duration andimpact.
The costs of incident congestion, and therefore the benefits to be gained by reducingincident delay, are not well understood. This undermines efforts to document theneed for incident management and build support for incident managementprograms.
Most metropolitan areas do not have reliable counts of incidents. The incidentrates used by FHWA to estimate the national cost of urban incidentcongestion were, for lack of better data, based largely on research done in theearly 1960s. There is no reliable information on current highway incidentrates and no current national research on the topic although it is clear thatautomobile technology and driving habits have changed significantly over thelast thirty years.
The traffic impacts of incidents -measured in hours of delay to vehicles onthe highway - are seldom documented. Most estimates, if they are made atall, are calculated after the fact using police report data on duration, numberof lanes closed, and typical traffic volumes. The direct costs of congestion
Cambridge Systanatics, Inc. 60
(lost time and increased vehicle operating costs) can be estimated reasonablywell, but the indirect costs to business, industry, and the economy resultingfrom lost time and increased vehicle costs are seldom estimated because thereis limited data on truck movements within urban areas and very littleinformation on how shippers and receivers are affected by delays.
Finally, metropolitan areas do not know the full contribution of incidents tothe congestion problem because they do not have consistent and reliableestimates of the extent and economic cost of overall highway congestion.Metropolitan areas recognize congestion as a problem, but do not have a goodunderstanding of its dimensions.
Findings About Solutions
A key objective of the case studies was to assess the state-of-the-art andidentify effective approaches to organizing comprehensive incidentmanagement. The major findings from the case studies are:
Incident management can be cost-effective. The Chicago Minuteman programreturns about $17 in benefits for each $1 invested in the program. It isestimated that the program saves commuters and motor carriers $95 millionper year at a cost of $5.5 million per year. In a time of tight budgets, incidentmanagement programs that maintain highway capacity are a good investmentand may be a better investment in some situations than new highwayconstruction.
There are successful models for developing and operating comprehensive metropolitanincident management programs. The institutional arrangements differ, but eachof the programs examined in the case studies has dealt successfully with theneed to provide metropolitan-scale traffic and incident management servicesby reallocating traditional roles and responsibilities.
l Chicago has created an incident management capability within IllinoisDOT by coordinating the activities of traditionally separate operatingbureaus.
l In Los Angeles, the California Highway Patrol and the CaliforniaDepartment of Transportation, two strong and independent agencies,have built a statewide traffic and incident management capability bynegotiating a set of formal and informal agreements that have created astrong interdependent team.
Cambridge Systematics, Inc. 61
l Fort Worth has created a formal multi-agency traffic management teamthat is functioning as a metropolitan traffic and incident managementorganization.
l In Minneapolis, the Minnesota Department of Transportation has takenlead responsibility for metropolitan traffic and incident management byredefining the department’s strategic role and reorganizing internally todevelop new organizational and technical skills.
l TRANSCOM has forged a regional traffic and incident managementcapability for the New York-New Jersey metropolitan region byproviding information services that coordinate incident management butdo not challenge the traditional roles and responsibilities of the hundredsof operating agencies in the region.
The key organizational approaches used by successful incident management programsinclude:
l Traffic management team to organize multiple jurisdictions and multipleagencies. Traffic management teams provide a forum for programdevelopment without directly challenging traditional agency roles andresponsibilities. They are especially effective in the early stages ofprogram development because they are informal, problem-oriented, anddo not require participating agencies to commit to a formalreorganization.
l Traffic operations centers to coordinate incident management activities at ametropolitan scale. Traffic operations centers are information serviceorganizations that collect, collate, and communicate information onincidents and traffic conditions. They facilitate the work involved inincident clearance and recovery for line managers in police, fire, andhighway departments. With good information, managers are able toanticipate problems, marshall resources, and avoid costly duplication ofeffort. This saves time and makes the managers more willing toparticipate in incident management programs.
l Dedicated service patrols to speed detection and response to incidents,especially small incidents. Service patrols make it possible to respond toincidents quickly; provide a training ground for incident managers; andheighten the public visibility needed to maintain a constituency forincident management programs.
l Incident command systems, contingency planning, and quick-clearance policiesto minimize interagency conflicts over roles and responsibilities at thesite of an incident. Incident command systems, such as California’s,
Cambridge Systematics, Inc. 62
define the lines of authority at an incident and make both individualsand agencies accountable for their actions. Under California statutes, thestate highway patrol is responsible for overall command at highwayincidents. The incident command system gives the officer-in-charge boththe option and the responsibility of inviting others to join a unifiedcommand, and it emphasizes the responsibility of team members tocontribute productively to the team. The California system codifiesmanagement practices that have evolved over twenty years and aresimilar to the lines of authority established by other successful incidentmanagement programs.
The major programs make extensive use of written contingency plans.By having traffic diversion plans available at the site command post,attention stays focused on substantive issues rather than personalitiesand bureaucratic turf.
The most effective programs also have quick-clearance policies. Thesepolicies, usually undocumented (Maryland is the first state to haveissued a formal written policy), require that roadways be reopened asquickly and safely as possible. The policies provide a common objectivefor the many different participants - police, fire, tow-truck operators,highway maintenance teams, and hazardous materials experts - drawnto an incident.
l Partnerships with comnercial radio and television stations to marketinformation to motorists. The objective of these public-privatepartnerships is to get information about incidents to motorists beforethey are caught up in an incident queue, while they still have time todelay their trip or take an alternate route. The partnerships blend theincident management program’s ability to collect and organize incidentand traffic information with the media’s ability to package and market itto a metropolitan audience.
l Strong service orientation to build a constituency and maintain acommitment to the incident management program. The successfulprograms have established a corporate culture that emphasizes their roleas a service organization. This is advertised to the public and inculcatedin the employees to define the social value of the program and instillpride in the organization.
Effective incident management program can be built using existing technology.New technology is not required. Technology can improve the effectiveness ofservice patrols and incident management teams, but it cannot substitute forthem. New technologies, especially communications technology, are beingadapted and applied to improve incident management. Agencies are
Cambridge Systematics, Inc. 63
,
investing in electronic traffic sensors and computerized traffic controls so thatthey can monitor and manage traffic flows. They are also slowly butsystematically developing the capability to disseminate information onincidents and traffic conditions. By providing drivers the option to rescheduletrips or take alternative routes, these driver information systems offer greatpotential for reducing the congestion impacts of freeway incidents. Thesystems being assembled by today’s incident management programs willform the core of tomorrow’s IVHS programs (intelligent vehicle and highwaysystems).
Cambridge Systematics, Inc.
5. Recommendations
Incident congestion is a major problem, especially in large metropolitan areas.Incidents cause billions of hours of lost time every year; they impose hugeeconomic costs on state and national economies; and their cost is likely toincrease in the foreseeable future. Incident management programs canaddress the problem. The techniques, equipment, and expertise to operateeffective incident management programs are available and proven.
The major impediments to the development of comprehensive metropolitanincident management programs are not technical, but organizational andinstitutional. Once a local problem, incident management has become ametropolitan-scale problem that falls awkwardly between the traditionalresponsibilities of state government and local government; as a consequence,incident management duties overlap, authority is fragmented, and actions areinconsistent.
A commitment is needed to address the problem and take advantage of theknowledge, skills, and technology that already exist. The states, the motorcarrier industry, and the federal government must make this commitment.The investment required is modest; the benefits substantial.
l States and their metropolitan areas must take the initiative to developcomprehensive metropolitan incident management programs. Thestates alone have the police powers and organizational capacity todevelop programs that will be effective across a metropolitan freewaynetwork.
l The ATA and the motor carrier industry must provide strong supportfor these initiatives. Carriers have an immediate economic interest inminimizing congestion. Moreover, they risk being blamed, fairly orunfairly, by a frustrated public if they fail to exercise leadership on thisissue.
l The Federal government must create an environment that encouragesinitiative and innovation in incident management. The Federalgovernment’s National Transportation Policy has made a strongcommitment to encourage better management of the nation’stransportation facilities and more cost-effective use of the nation’stransportation dollars. Incident management provides an opportunityto realize those policies in a way that will contribute directly to theproductivity and competitiveness of the nation’s economy.
Cambridge Systematics, Inc. 65
The following actions are recommended to expand and improve incidentmanagement.
State Initiatives
1. States should mandate the development of comprehensive metropolitanincident management programs. The objective of the mandate should beto establish incident management as a state priority. In most states,existing transportation statutes provide a solid legal foundation forincident management programs. These statutes typically require statedepartments of transportation and highway patrols to safeguard livesand property and maintain the safe and orderly flow of traffic on publicstreets and highways. Incident management programs address thesegoals directly. Nevertheless, states may wish to consider additionallegislation that specifically mandates and authorizes the development ofcomprehensive incident management programs. The state’s mandateshould:
l Recognize congestion as a major problem affecting the social,economic, and environmental well-being of major metropolitan areas.
l Recognize the role and importance of incident management, andtraffic management generally, in reducing congestion.
l Require the development of comprehensive metropolitan incidentmanagement programs that provide for systematic treatment ofincident detection, response, clearance, and recovery.
2. States should assign responsibility for the organization andimplementation of incident management programs. The objectiveshould be to fill the vacuum that exists today between state and localgovernment responsibilities. The appropriate lead agency will vary fromarea to area, but typically has been a state department of transportation,state highway patrol, or metropolitan police department.
3. States should establish clear lines of authority for the management ofincidents, especially incidents involving hazardous materials. Theobjective should be to establish accountability and minimize the risk ofinteragency squabbles at incidents.
4. States should adopt and implement a quick-clearance policy forincidents. The objective should be to minimize the congestion cost ofincidents by requiring that roadways be reopened as quickly as possible
Cambridge Systanatics, inc. 66
to reduce delay. The policy must recognize that public safety is thehighest priority and must be secured, especially if injuries or hazardousmaterials are involved. The policy should give incident managers widediscretion to set performance standards for commercial tow-truckoperators; call out equipment; and remove disabled vehicles, spilledloads, and abandoned vehicles quickly.
5. The states should require uniform annual reporting of recurringcongestion, incidents, and the congestion impacts of incidents. Theobjective should be to provide the states with a report card by whichthey can measure the extent and severity of congestion and assess theeffectiveness of their incident management programs.
ATA/Motor Carrier Industry Initiatives
1. The ATA should strongly support federal and state incidentmanagement legislation and programs. The objective of this effortshould be to focus attention on the importance of incident managementto the economy. The ATA should take the initiative to develop a broadcoalition within the trucking industry to support federal and stateincident management legislation and programs.
2. The ATA should develop an education program on incidentmanagement for state trucking associations and private fleetassociations. The objective of the education program should be toprovide the associations with information so that they can effectivelyexplain and support industry policy on incident management beforetheir state legislatures.
3. The ATA should support quick-clearance policies. The objective of thispolicy should be to minimize the cost of incident congestion to the motorcarrier industry and other highway users.
4. The ATA should expand its technical research and training programs.The objective of these programs should be to provide state departmentsof transportation, police agencies, and motor carriers with safe andefficient incident clearance techniques, especially for heavy trucks andhazardous materials.
5. The ATA should expand its driver and truck safety programs, such asthe America’s Road Team program. The objective should be to promotesafe truck-driving procedures for congested urban freeways. Theprograms should encourage motor carriers to implement driving policies
Cambridge Systematics, Inc. 67
that reduce the risk of accidents by minimizing lane changes;establishing safe following distances; and setting appropriate speeds.ATA may wish to consider developing standards and prototype policiesthat motor carriers and state agencies could utilize.
6. ATA should research the issue of motor carrier liability and costresponsibility for incidents. Motor carriers believe that they are beingbilled for all incident clean-up costs whether or not they are at fault.Conversely, state agencies cite concerns about liability for damage tovehicles and cargo as a reason why they should not implement a quick-clearance policy. Actual experience suggests that these concerns areseldom an issue, but there is little definitive information on the topic.The research should determine when, where, why and to what extentmotor carriers are held responsible for incident costs. The informationwill help motor carriers, shippers, and insurers better define the risks ofoperating on urban freeways, thereby encouraging safer routing anddriving practices.
Federal Initiatives
1. The next federal highway act should make funds available to the states toset up or expand comprehensive incident management programs. Fundsshould cover operating costs as well as capital and equipment costs andshould be provided for the duration of the legislation. The objective ofthe funding should be to encourage effective management of existingfreeway systems and provide incentives to state and local governmentsto look at cost-effective alternatives to construction.
Funding in the initial two years should be at a ratio of 95 percent federalfunds to 5 percent state matching funds. In the succeeding years, thefunding ratio for operating expenses should be stepped down to 50percent federal funds and 50 percent state funds. The objectives of thisfunding strategy should be 1) to ensure that incident managementprograms can compete effectively with construction and maintenanceprograms for state matching funds; 2) to provide states with adequatetime to build a constituency for incident management; and 3) to allowstates to develop revenues to support the long-term operation of theprograms.
To assure the broadest possible support for incident managementprograms, funding should be made available to all states andmetropolitan areas. However, priority should be given to fundingincident management programs in the dozen large urban areas that have
Cambridge Systematics, Inc. 68
the highest freeway congestion costs today (i.e., New York, Los Angeles,San Francisco, Houston, Detroit, Chicago, Boston, Dallas, Seattle,Atlanta, Washington DC, and Minneapolis). Within ten years, fifteen totwenty urban areas from the next tier of cities should also have majorincident management programs in place.
2. Federal government transportation policy should explicitly recognize therole and importance of incident management, and traffic managementgenerally, in reducing congestion. Federal highway policy should:
* Recognize that incident management contributes directly to thenation’s ability to meet the goals outlined in the NationalTransportation Policy.
l Promote comprehensive treatment of incident management andencourage innovative and systematic approaches to incident detection,response, clearance, and recovery.
l Encourage the development of uniform incident managementpractices across states and cities.
3. The Federal Highway Administration should develop and demonstratemethodologies for the uniform measurement and reporting of recurringcongestion, incidents, and the congestion impacts of incidents. Theobjective of this work should be to better quantify the impacts ofcongestion and incidents.
As part of this effort, the Federal Highway Administration shouldrequire the recipients of federal incident management program funds tomeasure and report on recurring congestion, incidents, and thecongestion impacts of incidents as part of the planning and operation oftheir incident management programs. The objective of the reportingrequirement should be to establish contemporary incident rates.
4. The Federal Highway Administration should focus research,demonstration, and training efforts on incident management. Theobjective of these efforts should be to develop a broad base ofknowledge, skills, and experience in incident management techniques.
The Federal Highway Administration may wish to consider thefollowing research topics for priority attention:
l Quick-clearance policies and performance guidelines for incidentmanagement, especially with regard to hazardous materials.
Cambridge Systematics, Inc. 69
l Communications and information management technologies for thecollection and dissemination of incident and traffic information toincident management teams and motorists.
l Market research and marketing techniques for the dissemination ofincident and traffic information.
l Diversion and contingency plans, and techniques for their distributionto field units to improve teamwork and reduce clearance time.
l Service patrols as an incident management tool and as a means ofbuilding a public constituency to support incident management.
Cambridge Systematics, Inc.
70
References
Chapter 1
1 Summary statistics are drawn from “A Toolbox for Alleviating TrafficCongestion.” Michael D. Meyer and others, Institute of TransportationEngineers, Washington DC, 1989; and from the “National TransportationStrategic Planning Study.” U.S. Department of Transportation,Washington DC, March 1990.
2 “Highway Statistics: Summary to 1985.” and “Highway Statistics: 1988.”Federal Highway Administration, Washington, DC.
3 “Evaluating the Performance of Eight Categories of Public Works:Highways, Streets, Roads, and Bridges.” Analysis by Apogee Research,Inc., reported in Appendix I in “Fragile Foundations: A Report onAmerica’s Public Works, Final Report to the President and Congress,”National Council on Public Works Improvement, Washington DC,February 1988.
4 “Organizing and Funding Transportation for 2020.” Joseph R. Stowers in“A Look Ahead: Year 2020,” Transportation Research Board, WashingtonDC, 1988; and “Highway Statistics: 1988.” Federal HighwayAdministration, Washington, DC.
5 “Demographic Trends.” in “National Transportation Strategic PlanningStudy,” U.S. Department of Transportation, Washington DC, March 1990.
6 “Distribution of Total Miles of Travel by Truck Type and Area Type.”Kenneth L. Campbell, in “National Truck Trip Information Survey,”University of Michigan Transportation Research Institute, 1988.
7 “Transportation in America.” Frank A. Smith, The Eno Foundation forTransportation, Westport CT, 1989.
8 “Future Prospects for Freight Transportation Markets.” in “NationalTransportation Strategic Planning Study,” U.S. Department ofTransportation, Washington DC, March 1990.
9 “Moving America: New Directions, New Opportunities. A Statement ofNational Transportation Policy; Strategies for Action.” U.S. Department ofTransportation, Washing ton DC, February 1990.
Cambridge Systematics, Inc. 71
10 “Beyond Gridlock: The Future of Mobility as the Public Sees It.” AdvisoryCommittee on Highway Policy, 2020 Transportation Program,Washington DC, June 1988.
11 “Intelligent Vehicles and Highway Systems: 1990 Summary.”Mobility 2000, July 1990.
12 “Quantification of Urban Freeway Congestion and Analysis of RemedialMeasures.” Jeffrey A. Lindley, Federal Highway Administration StaffReport RD-87/052, October 1986. See also by the same author “UrbanFreeway Congestion: Quantification of the Problem and Effectiveness ofPotential Solutions.” ITE Journal, January 1987; and “Urban FreewayCongestion Problems and Solutions: An Update.” ITE Journal,December 1989. Lindley’s estimates are based on HPMS data for freewaysin urban areas with populations greater than 50,000. Delay is calculatedby comparing the time for travel under congested travel to the time fortravel under uncongested conditions. The analysis uses an average travelspeed of 55 miles per hour on freeways to represent travel underuncongested conditions. The 1984 cost estimates assume an averagevehicle occupancy of 1.25 persons; an average value of travel time of $6.25per vehicle hour; and a $1.00 per gallon cost of fuel. The 1987 estimatesuse an average value of travel time of $6.85 per vehicle hour and a $1 .lOper gallon cost of fuel.
Chapter 2
1 Cambridge Systematics, Inc. estimate based on case study interviews withincident management program officials.
2 Cambridge Systematics, Inc. estimate based on case study interviews,incident management program records, and available studies. Fewrigorous studies are available; among the best is “Incident Characteristics,Frequency, and Duration on a High Volume Urban Freeway [I-10, LosAngeles].” Genevieve Giuliano, Institute of Transportation Studies,University of California at Irvine, June 1988. (Reprinted May 1989.)
3 JHK & Associates estimate based on delay evaluation procedures in“Alternative Surveillance Concepts and Methods for Freeway IncidentManagement: Volume Z-Planning and Trade-Off Analyses for Low-CostAlternatives.” Federal Highway Administration, Washington DC,March 1978; “A Freeway Management Handbook: Volume Z-Planningand Design.” Federal Highway Administration, Washington DC,May 1983; and modifications recommended by California Department ofTransportation engineers interviewed for the case studies.
Cambridge Systematics, Inc. 72
For a review of the impacts of major accidents, see “An Analysis of theCharacteristics and Congestion Impacts of Truck-Involved FreewayAccidents.” Final Report prepared for the California Department ofTransportation by Wilfred W. Recker and others, Institute ofTransportation Studies, University of California at Irvine, December 1988.
Cambridge Systematics, Inc. based on similar diagrams appearing in“Freeway Incident Management: NCHRP Synthesis of Highway Practice.”prepared by David H. Roper for the Transportation Research Board,Washington DC, December 1988; and “A Freeway ManagementHandbook: Volume -Planning and Design.” Federal HighwayAdministration, Washington DC, May 1983.
“Influence of Incidents on Freeway Quality of Service.” Merrell E. Goolsby,Highway Research Record 349, Highway Research Board, WashingtonDC, 1971.
“Incident Management Programs in the United States.” James R. Robinsonand Jonathan D. McDade, Office of Traffic Operations, Federal HighwayAdministration, Washington DC, October 1990.
“Freeway Incident Management.” Dennis C. Judycki and James R.Robinson, Office of Traffic Operations, Federal Highway Administration,Washington DC, March 1988.
Cambridge Systematics, Inc. 73

Appendix A
Chicago Benefit-Cost Analysis
Summary
A benefit-cost analysis of the Chicago incident management program foundthat the Minuteman program returns $17 in benefits for each $1 invested inthe program. The total cost of the program is estimated at $5.5 million peryear. The program saves Chicago motorists 9.5 million vehicle-hours of delayvalued at $95 million dollars per year. This memorandum describes themethodology and findings of the analysis.
Methodology
Costs for the Chicago program are defined as
Capital (vehicles and garage)Operations and maintenance (vehicles and garage)Labor (salaries and fringes)
plus Overhead (Illinois DOT)Total program costs
Benefits of the Chicago program are defined as
Cost of time delay without the programless Cost of time delay with a program
Net value of time savings (or loss) to motorists
All benefits and costs are stated in current (1989) dollars. To account for thecost impacts of capital equipment replacement, costs and benefits of theChicago program are projected forward 15 years and then discounted at rateof 8 percent to calculate net present cost and net present benefit.
The benefit to cost ratio is calculated as
Net present benefitNet present cost
Cambridge Systematics, Inc. A-l
Costs
1989 Budget for Chicago Incident Management Program
Exhibit A-l shows the 1989 line item budget for the Chicago incidentmanagement program. The budget totals $3,500,000. Labor costs are thesingle largest item in the budget, accounting for $2,400,000 or 70 percent of thebudget. In 1989 (and early 1990 when the case study was conducted) theChicago program employed 54 drivers, 9 supervisors, and 12 support staff.
The program operates 35 large tow trucks - emergency patrol vehicles (EPVs).Patrols are fielded 24-hours a day, seven days a week. The EPVs are inoperation between 8 and 16 hours a day. They last about four years in regularservice. Eight EPV chassis (frame, motor, transmission, axles, and wheels) arereplaced each year at a cost of about $30,000 per chassis. (The cabs, towequipment, and tool boxes are salvaged from the old trucks, refurbished, andremounted on the new chassis.) Fuel and oil cost $4,900 per vehicle per year;and maintenance totals about $6,000 per vehicle per year.
In addition to its EPVs, the Chicago program operates four heavy wreckers.These have an estimated service life of 15 years. Replacement costs areestimated at $220,000 per vehicle. The wreckers see intermittent but intenseuse; because of this total fuel costs are low, about $4,000 per year.Maintenance costs about $13,000 annually.
The Chicago program is housed in an old industrial garage on propertyowned by the Illinois Department of Transportation (IDOT). The programpays no rent for the building or land. Total building costs (primarilymaintenance) are estimated at $50,000 per year.
The Chicago incident management program must purchase sand (forabsorbing oil spills), deicing salt, and other expendable items that are used inincident clearance operations. The 1989 budget allocated $350,000 for thesecosts.
The line item budget does not include any allowance for general overhead,such as IDOT management, insurance, pension management, or legal services.
Estimated Cost of Chicago Incident Management Program
Exhibit A-2 shows the estimated total cost of the Chicago incidentmanagement program. This cost - $5,550,000 per year - was used in thebenefit-cost analysis and includes the following adjustments and additions tothe 1989 line item budget.
Cambridge Systematics, Inc. A-2
Personnel and EPV costs were increased to reflect the cost of a 36-vehicle fleet.The Chicago program is authorized at 36 vehicles; however, during 1989 theprogram operated with 35 vehicles.
Building costs totaling $803,300 were added to the budget to reflect theestimated cost of space for the program. The Chicago program is constructinga new $5,000,000 garage with space for maintenance and staff offices. Thiscost was used as the basis for estimating building costs. Maintenance, heat,light, and cleaning costs for the new building were estimated using currentcosts for comparable industrial space in Chicago.
General overhead costs totaling $1,186,000 were added to reflect the cost ofthe management, financial, legal, and pension services, etc., provided byTDOT. These costs were estimated to be equivalent to 48 percent of laborcosts.1
For comparative purposes, an estimate was made of the cost of operating theChicago incident management program if vehicles, fuel, and other expendableitems were purchased on the commercial market rather than through IDOT.As a public agency that buys in bulk, IDOT obtains discounts of 25 to50 percent on vehicles, fuel and other supplies. It is estimated that this savesthe program about $1.2 million per year. Exhibit A-3 shows the estimated costof the program assuming that these supplies were purchased without thepublic sector discounts.
Benefits
Benefits were estimated by determining 1) the number and type of incidentshandled annually by the Chicago Minuteman program; 2) the duration ofthese incidents with and without the program; 3) the likely congestionimpacts of the incidents; and 4) the value of the time lost (or saved) in incidentcongestion. The following sections describe how each of these estimates weredetermined.
1 / Cambridge Systematics based on conversations with Illinois DOT administrativeofficers.
Cambridge Systematics, Inc. A-3
Number and Type of Incidents
In 1988 the Chicago Minuteman program responded to 98,300 incidents.’Exhibit A-4 shows the distribution of these incidents by type. Vehicledisablements - mechanical and electrical breakdown, flat tires, and vehiclesout of fuel - account for the majority of all recorded assists. Accidentsaccount for only 10 percent of all recorded assists.
It is estimated that 15 percent of the incidents resulted in a vehicle blockingone or more lanes of the expressway. Of these it is estimated that 94 percentblock a single lane, and the remaining 6 percent block two or more lanes.These distributions are based on estimates made by Chicago programmanagers and incident data reported by FHWA3 and Recker.4
All incidents that do not involve a collision, roll-over, jackknife, spill, or lostload were considered shoulder incidents. Eighty-five percent of incidentsresult in a vehicle on the shoulder of the expressway.
Duration of Incidents
Exhibit A-5 presents the estimated durations of lane-blocking and shoulderincidents. Estimates are made for duration with and without incidentmanagement. Typical incident durations are estimated for three scenarios:1) Full incident management program, defined as service patrols (i.e., ChicagoMinutemen) and major incident clearance teams (i.e., Chicago heavywreckers; Los Angeles major incident response team); 2) Partial incidentmanagement program, defined as major clearance teams only (i.e., Chicagoheavy wreckers; Los Angeles major incident response team); and 3) Noincident management program.
2// “1988 Chicago Area Expressway Accidents - Annual Summary.” IllinoisDepartment of Transportation, Division of Traffic Safety, 1989. The 1988 statisticsshow 102,931 assists, but 4,636 of these involve the dispatch of a secondemergency patrol vehicle to assist units already at the scene of an incident. Thesesecond calls were removed to avoid double counting of incidents.
3// “A Freeway Management Handbook: Volume 2 - Planning and Design.” FederalHighway Administration, Washington DC, May 1983.
4// For an analysis of the frequency, duration, and delay impacts of major truck-involved accidents, see “An Analysis of the Characteristics and CongestionImpacts of Truck-Involved Freeway Accidents.” Wilfred W. Recker and others,Institute of Transportation Studies, University of California at Irvine, (Draft FinalReport) December 1988.
Cambridge Systematics, Inc. A-4
The estimated incident durations are based on discussions with Chicago andLos Angeles program managers; review of major incidents in Chicago and LosAngeles (Exhibits A-10 through A-20); review of the preliminary results of theLos Angeles Freeway Service Patrol Project; and incident durations reportedin the literature by Giuliano,5 and Recker. The Los Angeles Freeway ServicePatrol Project, a test project conducted by the California Highway Patrol in1988, indicates that shoulder incidents were removed from the freeway tenminutes faster with a service patrol than without a service patrol.
Congestion Impact of Incidents
The congestion delay impacts of freeway incidents were estimated usingcalculation routines developed by the Federal Highway Administration.These were modified to account for demand reduction. The modificationswere based on an analysis of major incidents in Chicago and Los Angeles(Exhibits A-10 through A-20).
Incident Delay Curves
The congestion delay impacts of freeway incidents were estimated usingcalculation routines developed by the Federal Highway Administration andreported in “Alternative Surveillance Concepts and Methods for FreewayIncident Management: Volume 2 - Planning and Trade-Off Analyses forLow-Cost Alternatives.” Federal Highway Administration, Washington DC,March 1978 and “A Freeway Management Handbook: Volume 2 - Planningand Design.” Federal Highway Administration, Washington DC, May 1983.The delay estimates were developed as a set of incident delay curves wherethe delay - measured in vehicle-hours of delay to motorists in the incidentqueue - is a function of the duration of the incident, the number of freewaylanes, freeway capacity (vphpl), typical peak and off-peak flow rates, andtypical incident flow rates. The incident delay curves are shown inExhibits A-6, A-7 and A-8.
Demand Reduction Modifications
The incident flow rates shown in Exhibits A-6, A-7 and A-8 account fordemand reduction. Both Chicago and Los Angeles have well-developedtraffic advisory services. When an incident occurs, especially a major
5// “Incident Characteristics, Frequency, and Duration on a High Volume UrbanFreeway [I-10 Los Angeles].” Genevieve Giuliano, Institute of TransportationStudies, University of California at Irvine, June 1988. (Reprinted May 1989.)
Cambridge Systematics, Inc. A-5
incident, it is widely, and usually accurately, reported. This informationmakes it possible for drivers to delay their trips or divert to alternate routes.
It is estimated that demand reduction begins within 15 to 30 minutes of theonset of a major incident. Depending upon the severity and duration of theincident, up to 60 percent of normal traffic demand may be diverted. It isfurther estimated that half of this shift is accounted for by drivers that leavethe freeway and seek an alternate route; the other half by drivers that delaytheir trip or seek an alternative route without ever entering the freeway. Toaccount for this phenomenon, traffic flow rates during an incident werereduced after the first 15 minutes of an incident. For every additional15-minutes that the incident lasted, demand was reduced by an additional5 percent. A maximum demand reduction of 40 percent is reflected in thedelay curves shown in Exhibits A-6, A-7 and A - 8 . 6
Analysis of Major Incidents in Chicago and Los Angeles
As a part of the case studies in Chicago and Los Angeles, a dozen majorincidents were analyzed in detail. The objectives the analysis were to:1) provide a framework for detailed discussion of the management andoperations of the programs; 2) examine the impact of the incidentmanagement program on incident duration; and 3) develop empirical data ondemand reduction and its impact on total delay.
Incident records from the last six months of 1989 were obtained from IDOTand Caltrans. The records were screened to identify incidents that occurredon weekdays between 5 AM and 7 PM; during or shortly before the peakcommute periods; on freeway segments equipped with automatic trafficcounters; and on freeways that were not under construction. Twenty-fivecandidate incidents were selected for further review. As a general rule, onlycommon freeway incidents - collisions, jackknifes, lost loads or spills -wereconsidered; unique events were not selected for analysis.
Historical traffic flow data were then obtained from IDOT and Caltrans.These data included mainline traffic flow rates on the day of the incident andone week before and after the incident; and average mainline speeds before,during, and after the incident. If sufficient reliable data were not available,another incident was selected.
Eleven incidents were eventually selected for detailed study. These includedfive incidents in Chicago and six incidents in Los Angeles. Using the traffic
6// JHK & Associates based on trends observed by Caltrans engineers performingincident analysis in Los Angeles.
Cambridge Systematics, Inc. A-6
flow and incident response records, traffic flow plots were prepared for eachincident.7 Exhibit A-9 is a summary table describing the duration and impactof each of the incidents. The plots are shown in Exhibits A-10 through A-20.The vehicle-hours of delay that accrue to motorists in the incident queue arerepresented in the exhibits by the shaded area that lies between the normalflow rate and the lower incident flow rates.8
Value of Time
The value of time lost (or saved) by drivers affected by freeway incidents inChicago was estimated at $10 per hour. This value is a weighted average ofthe values of time assigned to automobile drivers and truck drivers.According to the Bureau of Labor Statistics, the 1989 average wage rate for theChicago area was $9.63/hour (without overhead)? The value of time forautomobile drivers was estimated to be 80 percent of the average wage rate or$7.70 per hour. The average wage rate for truck drivers in Chicago wasestimated to be $20.62 (with benefits).10o To obtain a weighted average, it wasassumed that 80 percent of vehicle-hours of travel on Chicago expressways
7// Traffic flow plots and delay calculations are based on models provided in “AFreeway Management Handbook: Volume 2 - Planning and Design.” FederalHighway Administration, Washington DC, May 1983.
8// The level of detail of each plot depends upon the traffic and incident responsedata available. Less detail was available on the Chicago incidents since the trafficvolume data consisted of hourly counts. However, more data on incidentresponse activities was available from Chicago. The Los Angeles incidents arebased, in part, on the result of previous incident analyses performed by CaltransDistrict 7 engineers.
9// Bureau of Labor Statistics, Employment and Earnings, 1989. The average fullyloaded wage rate for all workers in Chicago in 1989 was $12.52, which included a30 percent allowance for fringe benefits. The reported average wage rate of $9.63is an adjusted rate reflecting part-time and partial employment during the year.
10// Bureau of Labor Statistics1988 Area Wage Survey. The mean earning for alltruck drivers in Chicago in 1988 was $14.66 per hour (flat rate). Adjusting this to1989 results in a rate of $14.73 per hour. A fully loaded truck driver wage rate of$20.62 includes a 40 percent fringe. The 40 percent fringe rate reflects an aboveaverage benefit rate, similar to that for strong union industries (like steel).Health benefits account for approximately 10 percent of the fringe rate; vacationbenefits for 15 percent; unemployment, workers compensation, and otherbenefits for 5 to 15 percent. The 30 percent fringe for “all workers” reflects both alower fringe rate and part-time coverage. National average wages for truckdrivers are 87 percent of those in Chicago.
Cambridge Systemtics, Inc. A-7
was accounted for by automobile drivers (i.e., commuters) and 20 percent bytruck drivers and other commercial drivers. The calculated average of $10.68was rounded downward to a more conservative $10.00 per hour.
Calculation of Benefits
Data Inputs
Exhibit A-21 summarizes the data and assumptions used to estimate the hoursand cost of delay for incidents on the Chicago expressways. Three scenarioswere estimated: 1) Full incident management program, defined as servicepatrols (i.e., Chicago Minutemen) and major incident clearance teams (i.e.,Chicago heavy wreckers); 2) Partial incident management program, definedas major clearance teams only (i.e., Chicago heavy wreckers); and 3) Noincident management program.
The number of incidents (line 1) are those responded to by the Minutemen in1988. The program saw a modest increase in the number of assists in 1989,however, the tabulations for 1989 were not available in time for the case studyanalysis. The analysis does not include incidents responded to by the IllinoisState Police only, and therefore understates the total number of incidents onthe expressway system. (The State Police log accidents and other incidents,but tabulate and report only accidents.)
The percentages of lane-blocking and shoulder incidents (lines 2 and 3) arebased on the distribution of 1988 incidents. A brief review of incident assisttabulations from prior years suggests that these proportions remain relativelystable from year to year, but no detailed analysis was done to determine thelikely variation. The distributions are similar to those reported by incidentprogram managers in other cities.
The distribution of incidents by time of day (line 4) was assumed to beproportional to traffic volumes by time of day: 40 percent during the morningand evening peak periods; another 40 percent during the midday off-peak;and the remaining 20 percent during the late night or early morning hours.11
Only incidents occurring during the peak and midday periods - and thereforecreating significant congestion -were considered for this analysis.
The number of expressway lanes (line 5) was developed from IDOT statisticsfor the Chicago district.
11 /- This distribution is in accord with incident data reported in the literature byZiesler, Vallette, Najjar, and NASS.
Cambridge Systematics, Inc. A-8
Typical incident durations (line 6) for each scenario are the same as thoseshown in Exhibit A-5. The vehicle-hours of delay by type of incident (line 7)were derived from the incident delay curves (Exhibits A-6, A-7 and A-8) andaccount for demand reduction.
Delay cost was approximated by using a weighted value of time of $10 perhour.
Delay Estimates
Exhibit A-22 summarizes the vehicle-hours of delay and delay costs for eachof the scenarios. The analysis shows that:
l Scenario 1: Full Program (service patrols and major incident responseteams) results in 11.6 million vehicle hours of delay at a cost of $116.6million to Chicago area automobile and truck drivers. This represents asavings of 9.5 million vehicle hours of delay and $95 million whencompared to the worst case, Scenario 3-No Program.
l Scenario 2: Partial Program (major incident response teams only) resultsin 15.5 million vehicle hours of delay at a cost of $154.7 million tomotorists. This represents a savings of 5.6 million vehicle hours and $56million over Scenario 3.
l Scenario 3: No Program results in 21 million vehicle hours of delay at acost of $211 million.
The analysis understates the impact of incident delays by disregarding thevalue of time for automobile passengers. An average auto occupancy of factorof 1.2 would increase person-hours of delay by 20 percent, although the valueof this additional time is often heavily discounted. The analysis also does notaccount for fuel wasted (or saved). The fuel costs of incident congestion havebeen variously estimated to be about one gallon per vehicle-hour of delay. Ata cost of one dollar per gallon, inclusion of this cost would add about a dollarper vehicle hour of delay. A third factor not estimated for this analysis is theopportunity cost of time delays to shippers and receivers whose goods aredelayed in transit. Finally, no estimate was made of the delay costs (orsavings) accruing to motorists who, upon hearing about an incident, delayedtheir trips or took alternative routes. Caltrans has done some empiricalresearch on travel times for incident diversion routes, and researchers haveused network models to explore the impact of information on travel time, butno attempt was made to quantify this effect in this case study.
Cambridge Systemtics, Inc. A-9
The incidence of the costs and benefits are very different. The costs of theChicago incident management program, which are very tangible costs, areborne by Illinois DOT. The benefits, which are much less tangible, accrue tomotorists using the Chicago expressway. The large majority of these, andtherefore the major beneficiaries, are Chicago area commuters. Their delaysavings directly benefit the Chicago metropolitan economy. Truck drivers,and therefore their employers, are also significant beneficiaries of the delaysavings provided by the incident management program. Some of theirsavings accrue to Chicago area business and industry, but some of the savingsbenefit business and industry outside the Chicago area. The Chicago incidentmanagement program is funded from state motor fuel taxes. In general,urban automobile owners pay a disproportionately large share of motor fueltaxes. To the extent that this is true in Chicago, the benefits of the programmay be accruing to those largely responsible for funding it. The analysis didnot attempt to prove or disprove this linkage.
Net Present Costs and Benefits
Exhibit A-23 presents the net present costs and benefits and the benefit-costratios for each of the scenarios. For comparative purposes, the net presentcosts and benefits were calculated at discount rates of 8 percent and 5 percent.The analysis of the Chicago incident management program finds that theMinuteman program returns $17 in benefits for each $1 invested in theprogram.
Cambridge Systematics, Inc. A-10
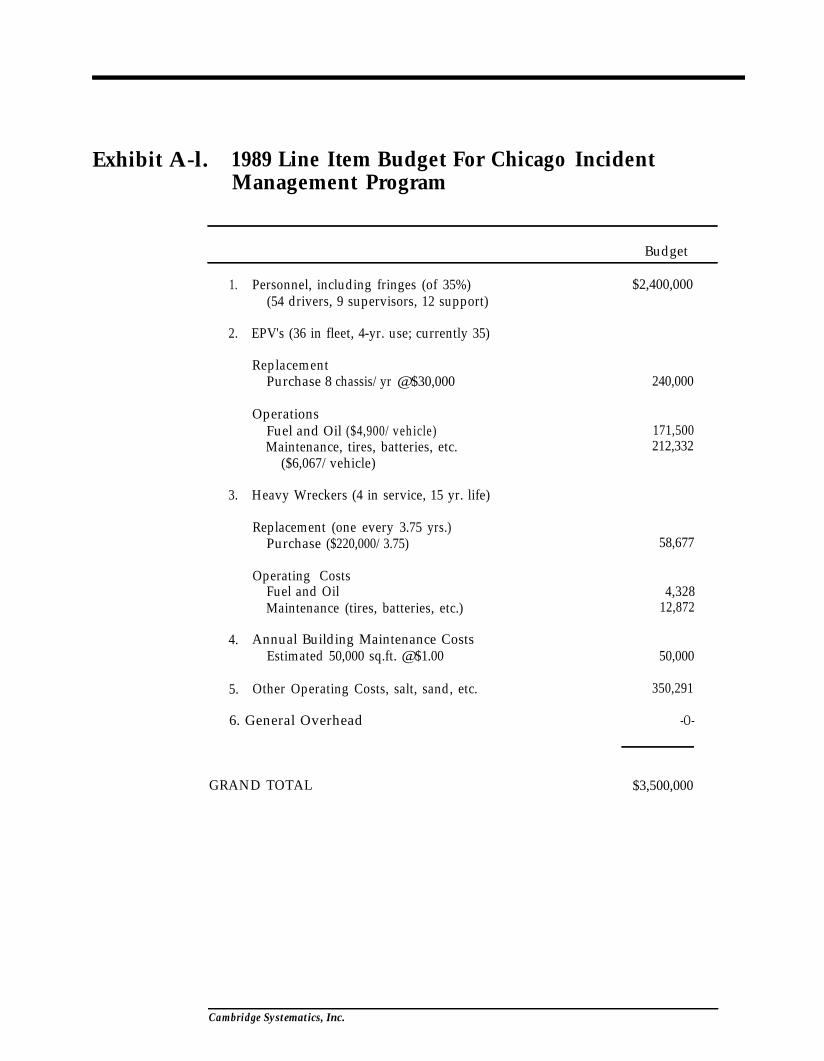
Exhibit A-l. 1989 Line Item Budget For Chicago IncidentManagement Program
Budget
1. Personnel, including fringes (of 35%) $2,400,000(54 drivers, 9 supervisors, 12 support)
2. EPV's (36 in fleet, 4-yr. use; currently 35)
ReplacementPurchase 8 chassis/yr @ $30,000
OperationsFuel and Oil ($4,900/vehicle)Maintenance, tires, batteries, etc.
($6,067/vehicle)
3. Heavy Wreckers (4 in service, 15 yr. life)
Replacement (one every 3.75 yrs.)Purchase ($220,000/3.75)
Operating CostsFuel and OilMaintenance (tires, batteries, etc.)
4. Annual Building Maintenance CostsEstimated 50,000 sq.ft. @ $1.00
5. Other Operating Costs, salt, sand, etc.
6. General Overhead
240,000
171,500212,332
58,677
4,32812,872
50,000
350,291
-O-
GRAND TOTAL $3,500,000
Cambridge Systematics, Inc.
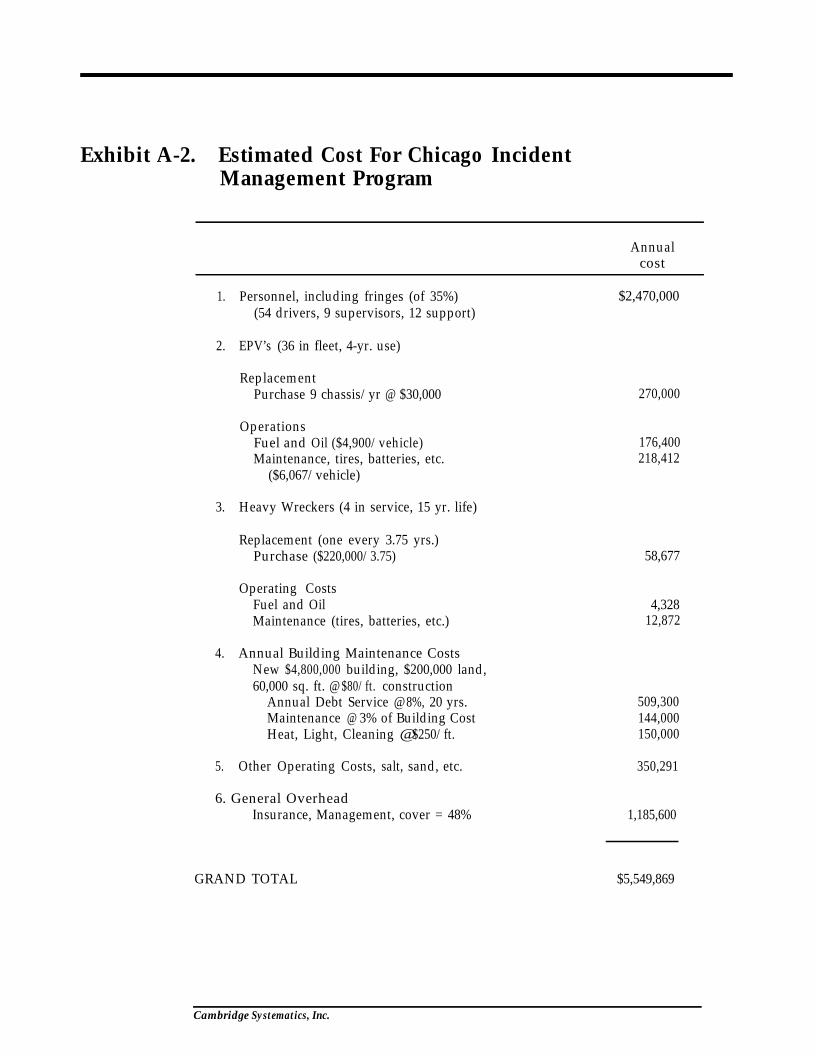
Exhibit A-2. Estimated Cost For Chicago IncidentManagement Program
Annualcost
1. Personnel, including fringes (of 35%) $2,470,000(54 drivers, 9 supervisors, 12 support)
2. EPV’s (36 in fleet, 4-yr. use)
ReplacementPurchase 9 chassis/yr @ $30,000
OperationsFuel and Oil ($4,900/vehicle)Maintenance, tires, batteries, etc.
($6,067/vehicle)
3. Heavy Wreckers (4 in service, 15 yr. life)
Replacement (one every 3.75 yrs.)Purchase ($220,000/3.75)
Operating CostsFuel and OilMaintenance (tires, batteries, etc.)
4. Annual Building Maintenance CostsNew $4,800,000 building, $200,000 land,60,000 sq. ft. @ $80/ft. construction
Annual Debt Service @ 8%, 20 yrs.Maintenance @ 3% of Building CostHeat, Light, Cleaning @ $250/ft.
5. Other Operating Costs, salt, sand, etc. 350,291
6. General OverheadInsurance, Management, cover = 48%
270,000
176,400218,412
58,677
4,32812,872
509,300144,000150,000
1,185,600
GRAND TOTAL $5,549,869
Cambridge Systematics, Inc.
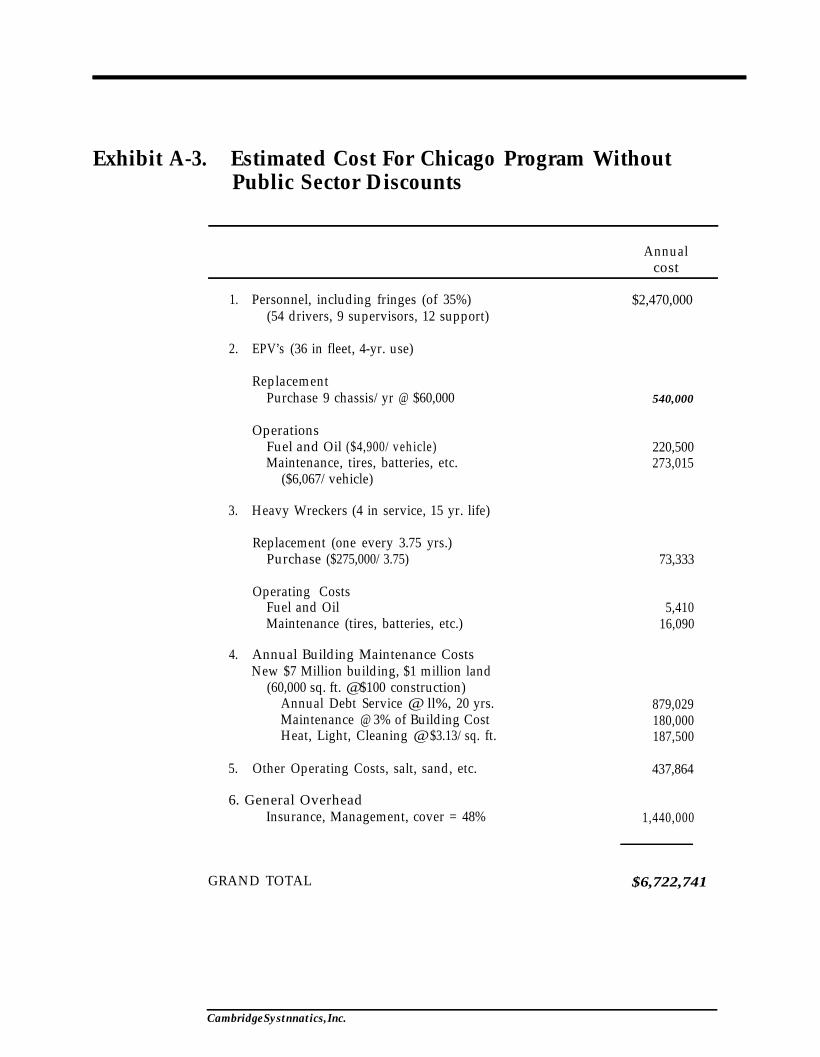
Exhibit A-3. Estimated Cost For Chicago Program WithoutPublic Sector Discounts
Annualcost
1. Personnel, including fringes (of 35%) $2,470,000(54 drivers, 9 supervisors, 12 support)
2. EPV’s (36 in fleet, 4-yr. use)
ReplacementPurchase 9 chassis/yr @ $60,000
OperationsFuel and Oil ($4,900/vehicle)Maintenance, tires, batteries, etc.
($6,067/vehicle)
3. Heavy Wreckers (4 in service, 15 yr. life)
Replacement (one every 3.75 yrs.)Purchase ($275,000/3.75)
Operating CostsFuel and OilMaintenance (tires, batteries, etc.)
4. Annual Building Maintenance CostsNew $7 Million building, $1 million land
(60,000 sq. ft. @ $100 construction)Annual Debt Service @ ll%, 20 yrs.Maintenance @ 3% of Building CostHeat, Light, Cleaning @ $3.13/sq. ft.
5. Other Operating Costs, salt, sand, etc. 437,864
6. General OverheadInsurance, Management, cover = 48%
GRAND TOTAL $6,722,741
540,000
220,500273,015
73,333
5,41016,090
879,029180,000187,500
1,440,000
Cambridge Systnnatics, Inc.
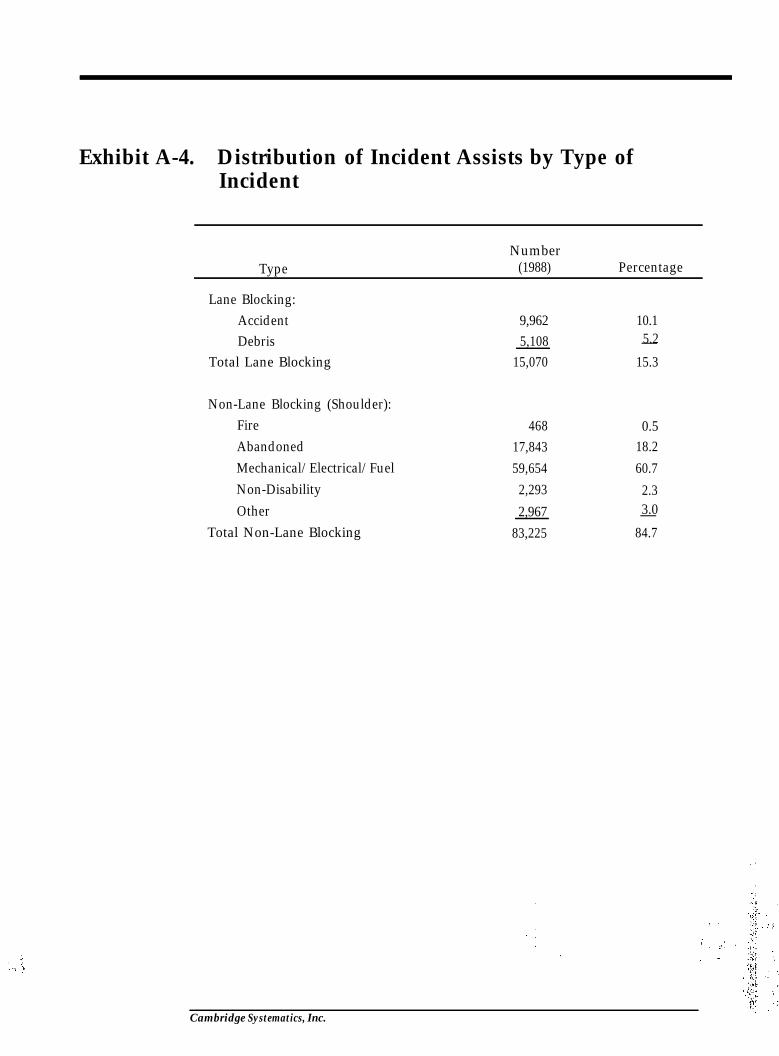
Exhibit A-4. Distribution of Incident Assists by Type ofIncident
TypeNumber
(1988) Percentage
Lane Blocking:AccidentDebris
Total Lane Blocking
Non-Lane Blocking (Shoulder):FireAbandonedMechanical/Electrical/FuelNon-DisabilityOther
Total Non-Lane Blocking
9,962 10.15,108 5.2-
15,070 15.3
46817,84359,654
2,2932,967
83,225
0.518.260.7
2.33.0-
84.7
Cambridge Systematics, Inc.
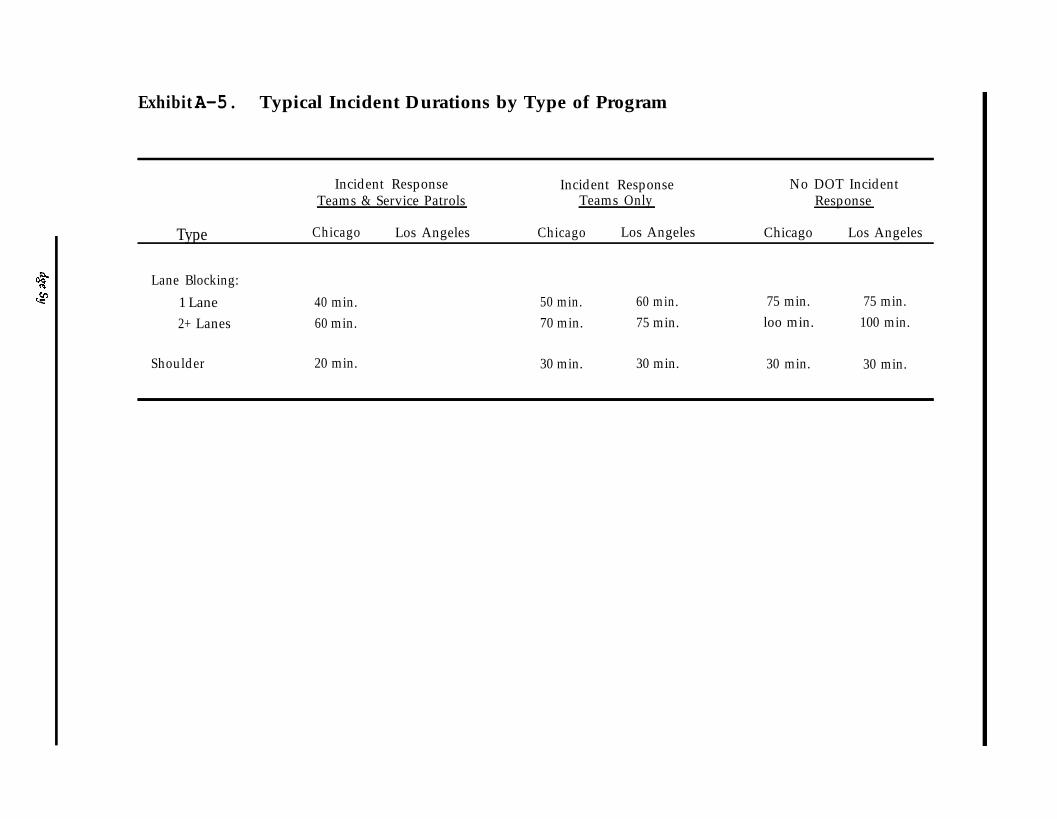
Exhibit A-5. Typical Incident Durations by Type of Program
Incident Response Incident ResponseTeams & Service Patrols Teams Only
No DOT IncidentResponse
Type Chicago Los Angeles Chicago Los Angeles Chicago Los Angeles
Lane Blocking:1 Lane2+ Lanes
40 min. 50 min. 60 min. 75 min. 75 min.60 min. 70 min. 75 min. loo min. 100 min.
Shoulder 20 min. 30 min. 30 min. 30 min. 30 min.
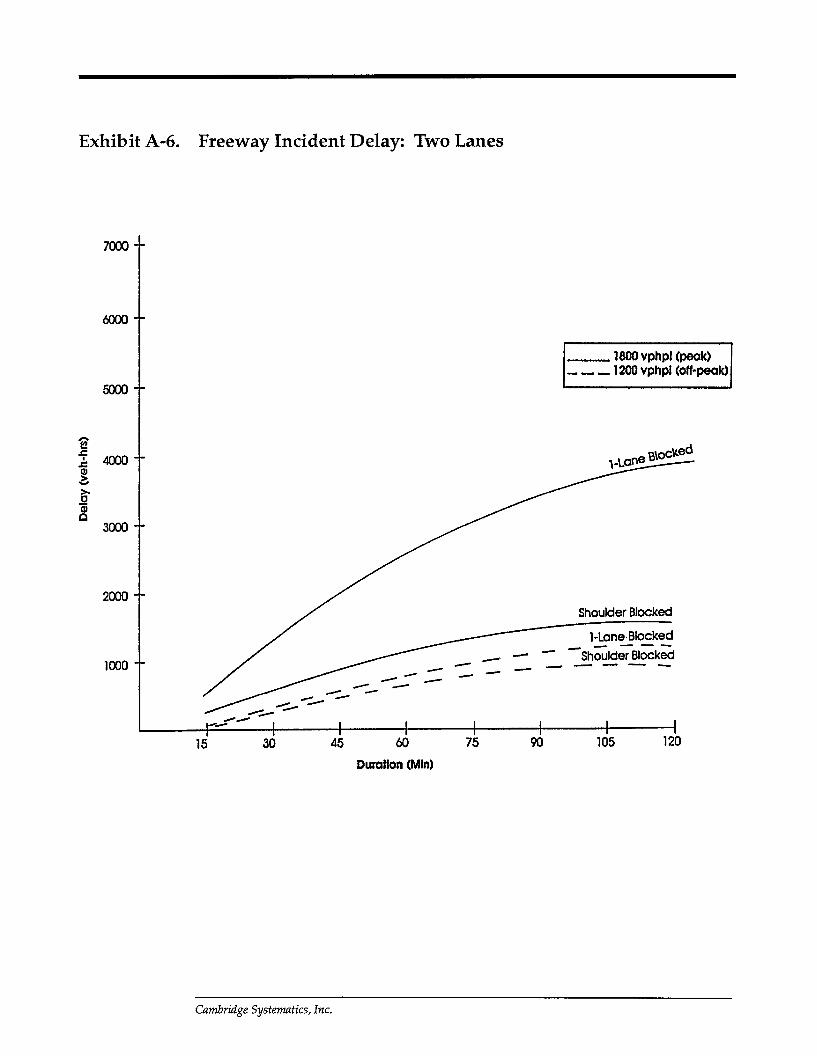
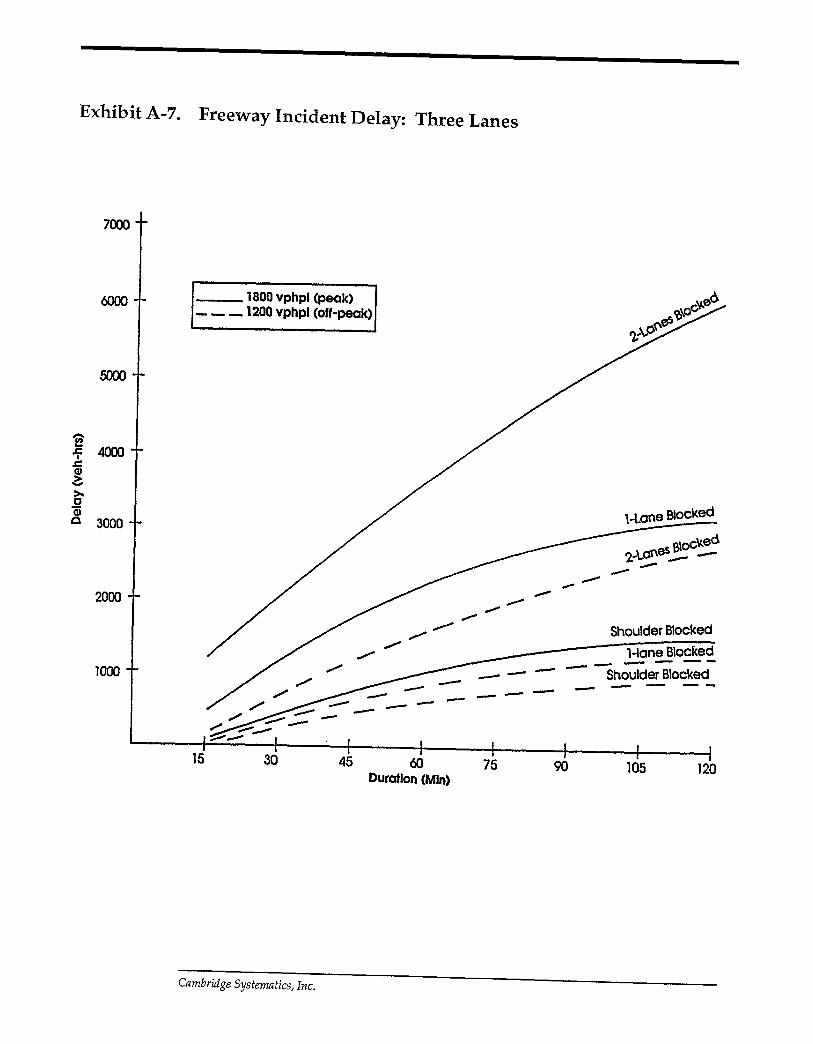
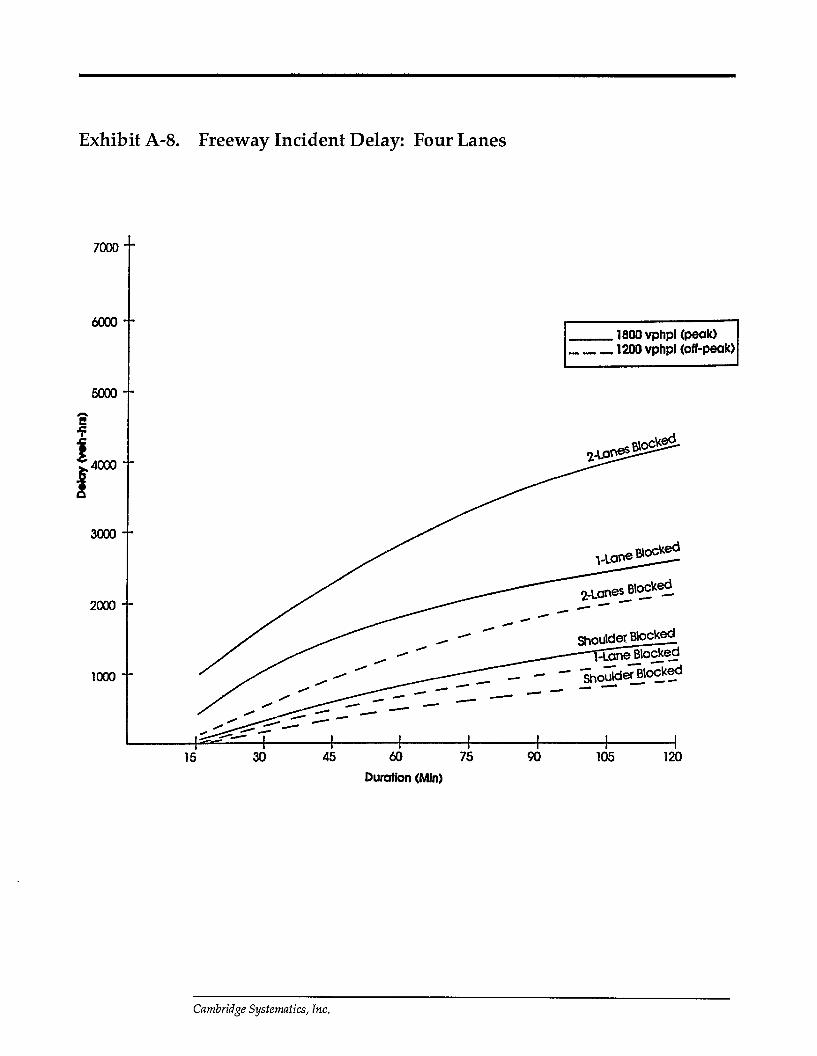
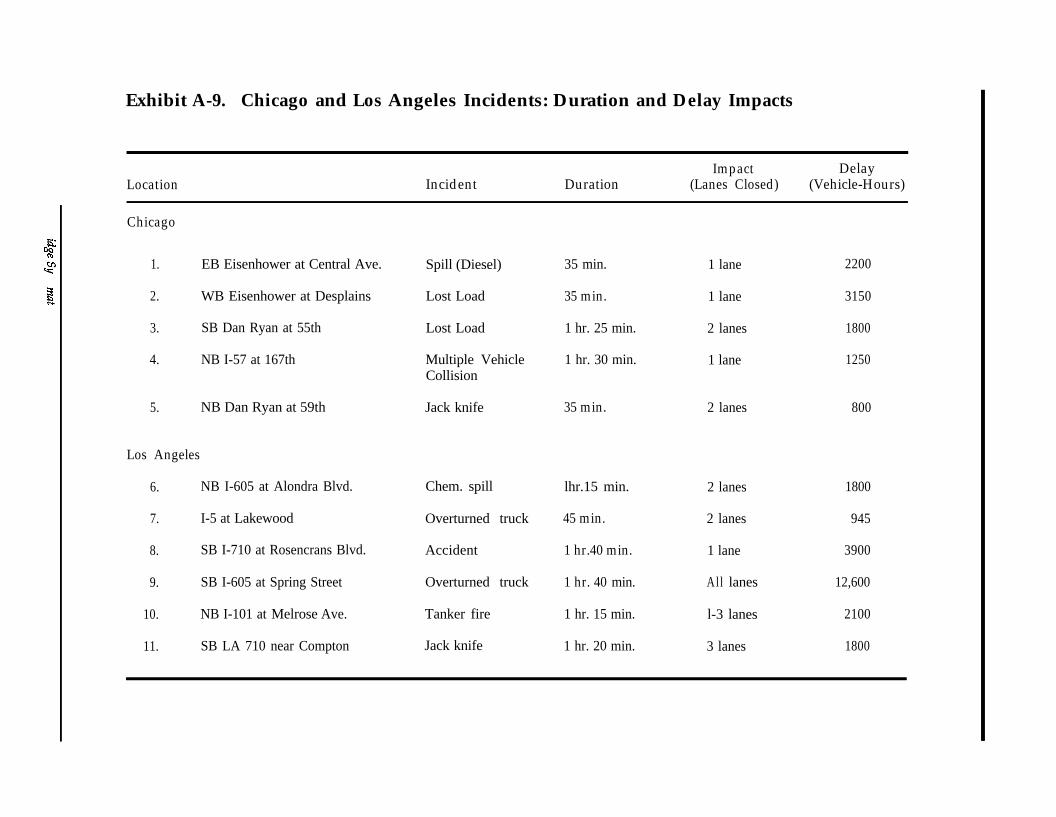
Exhibit A-9. Chicago and Los Angeles Incidents: Duration and Delay Impacts
Location Incident DurationImpact
(Lanes Closed)Delay
(Vehicle-Hours)
Chicago
1. EB Eisenhower at Central Ave.
2. WB Eisenhower at Desplains
3. SB Dan Ryan at 55th
4. NB I-57 at 167th
5. NB Dan Ryan at 59th
Los Angeles
6. NB I-605 at Alondra Blvd.
7. I-5 at Lakewood
8. SB I-710 at Rosencrans Blvd.
9. SB I-605 at Spring Street
10. NB I-101 at Melrose Ave.
11. SB LA 710 near Compton
Spill (Diesel)
Lost Load
Lost Load
Multiple VehicleCollision
Jack knife
Chem. spill
Overturned truck
Accident
Overturned truck
Tanker fire
Jack knife
35 min.
35 min.
1 hr. 25 min.
1 hr. 30 min.
35 min.
lhr.15 min.
45 min.
1 hr.40 min.
1 hr. 40 min.
1 hr. 15 min.
1 hr. 20 min.
1 lane 2200
1 lane 3150
2 lanes 1800
1 lane 1250
2 lanes
2 lanes 1800
2 lanes 945
1 lane 3900
All lanes 12,600
l-3 lanes 2100
3 lanes 1800
800
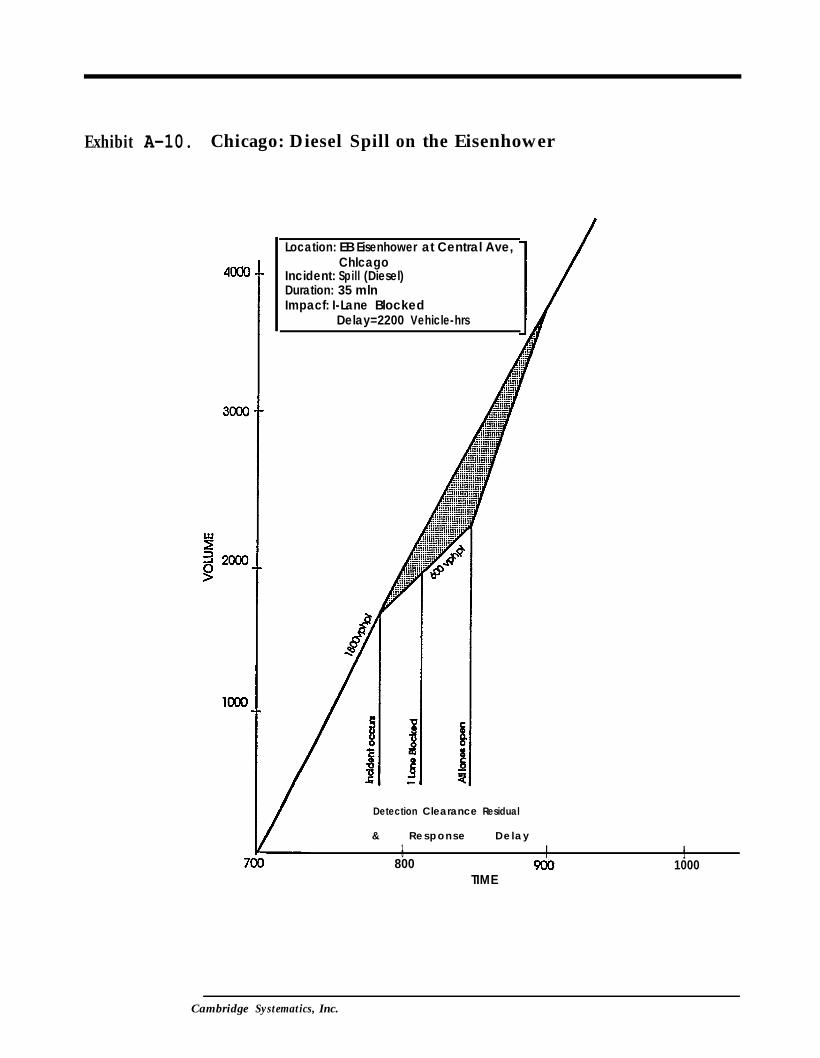
Exhibit A-10. Chicago: Diesel Spill on the Eisenhower
Location: EB Eisenhower at Central Ave,Chlcago
Incident: Spill (Diesel)Duration: 35 mlnImpacf: I-Lane Blocked
Delay=2200 Vehicle-hrs
Detection Clearance Residual
& Response Delay1 I6 I
800I 1
1000TIME
Cambridge Systematics, Inc.
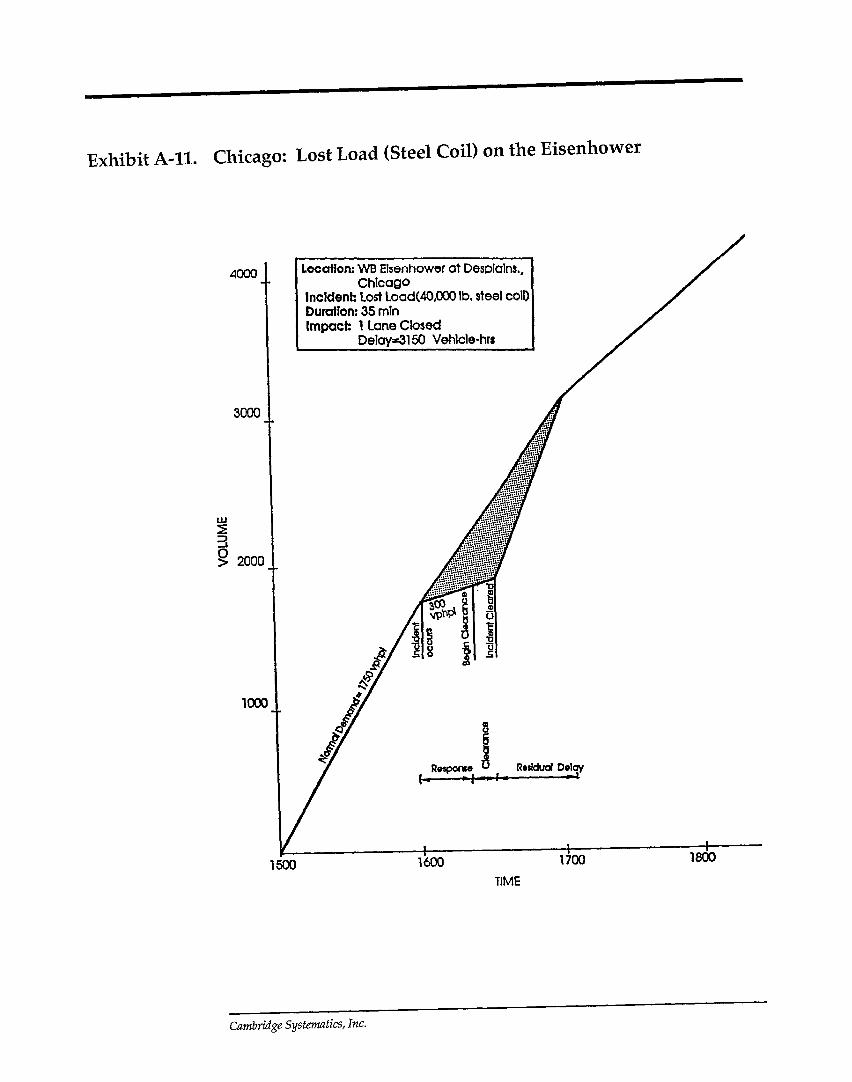
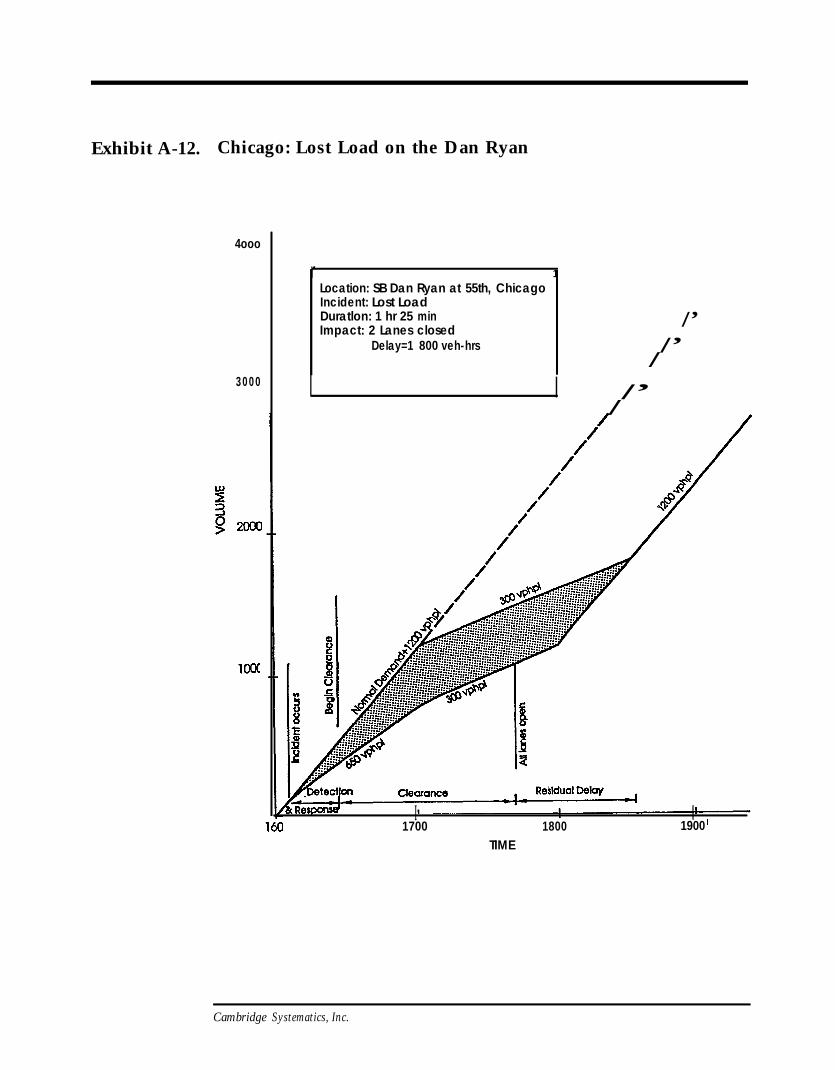
Exhibit A-12. Chicago: Lost Load on the Dan Ryan
4ooo
3 0 0 0
r 1Location: SB Dan Ryan at 55th, ChicagoIncident: Lost LoadDuratlon: 1 hr 25 minImpact: 2 Lanes closed
Delay=1 800 veh-hrs
/’/’/
I I /’/
I 8 1700 1800 1900TIME
Cambridge Systematics, Inc.
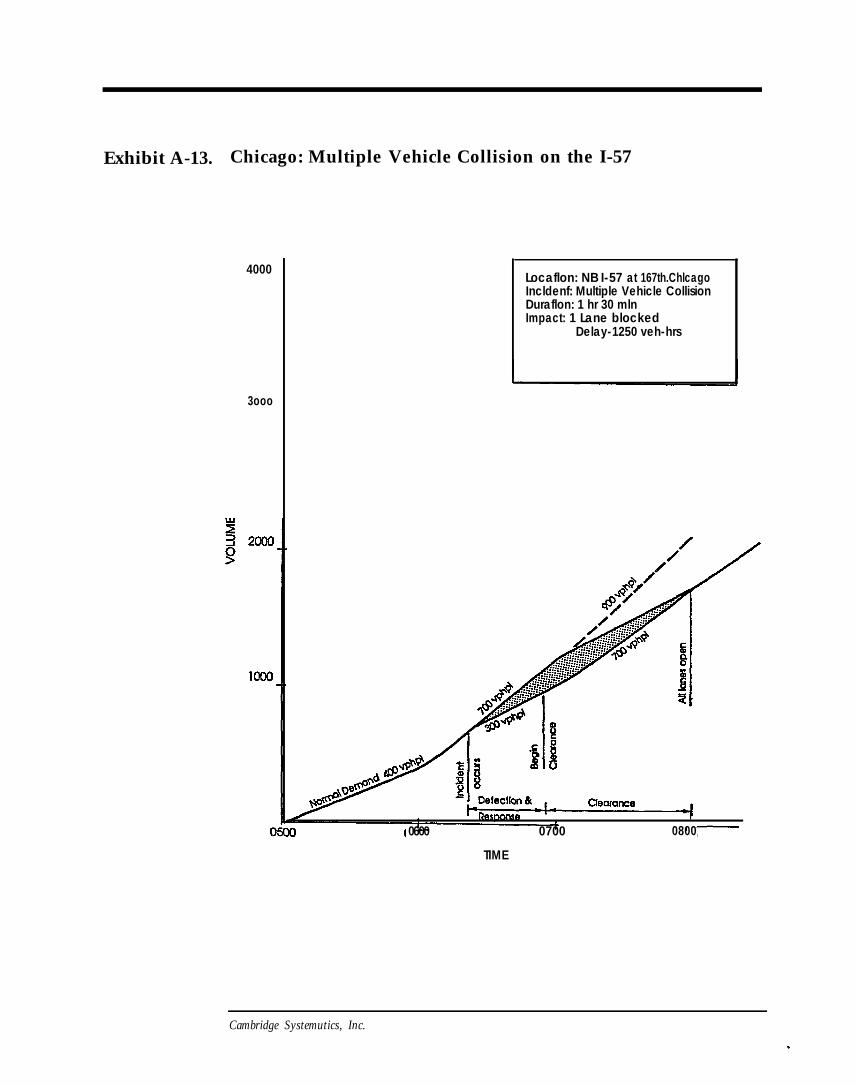
Exhibit A-13. Chicago: Multiple Vehicle Collision on the I-57
Locaflon: NB I-57 at 167th.ChlcagoIncldenf: Multiple Vehicle CollisionDuraflon: 1 hr 30 mlnImpact: 1 Lane blocked
Delay-1250 veh-hrs
4000
3ooo
I0600 0700 0800
TIME
Cambridge Systemutics, Inc.
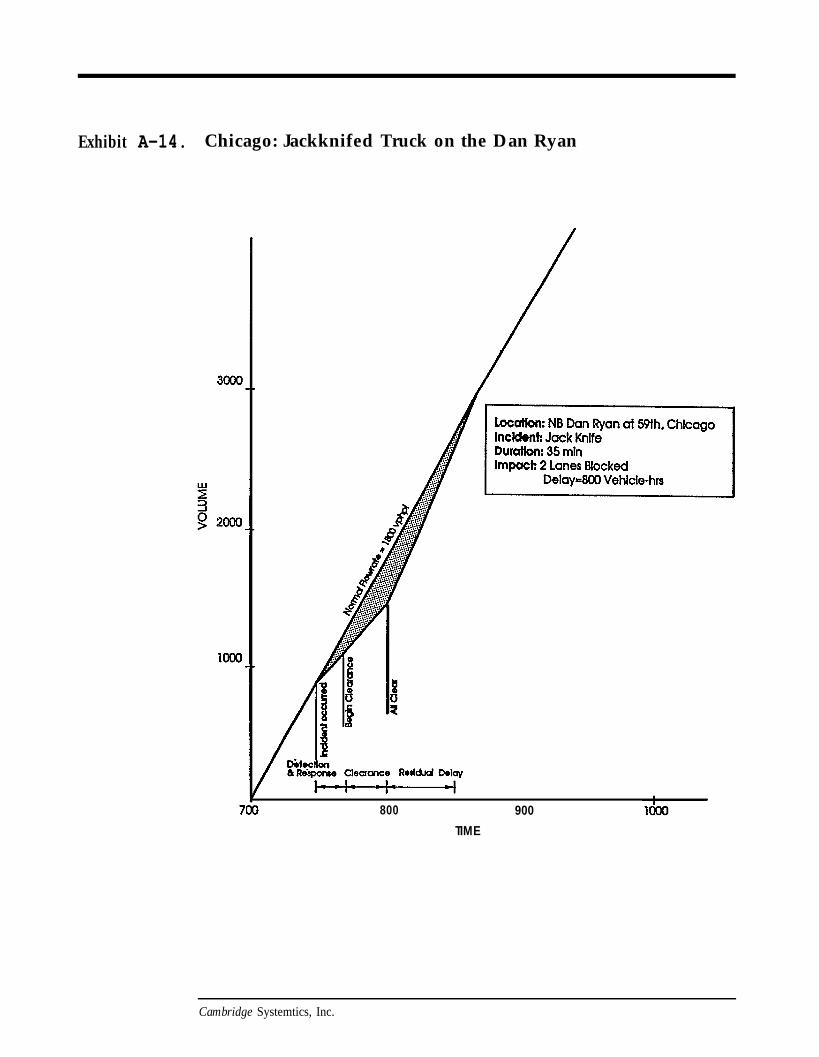
Exhibit A-14. Chicago: Jackknifed Truck on the Dan Ryan
800 900TIME
Cambridge Systemtics, Inc.
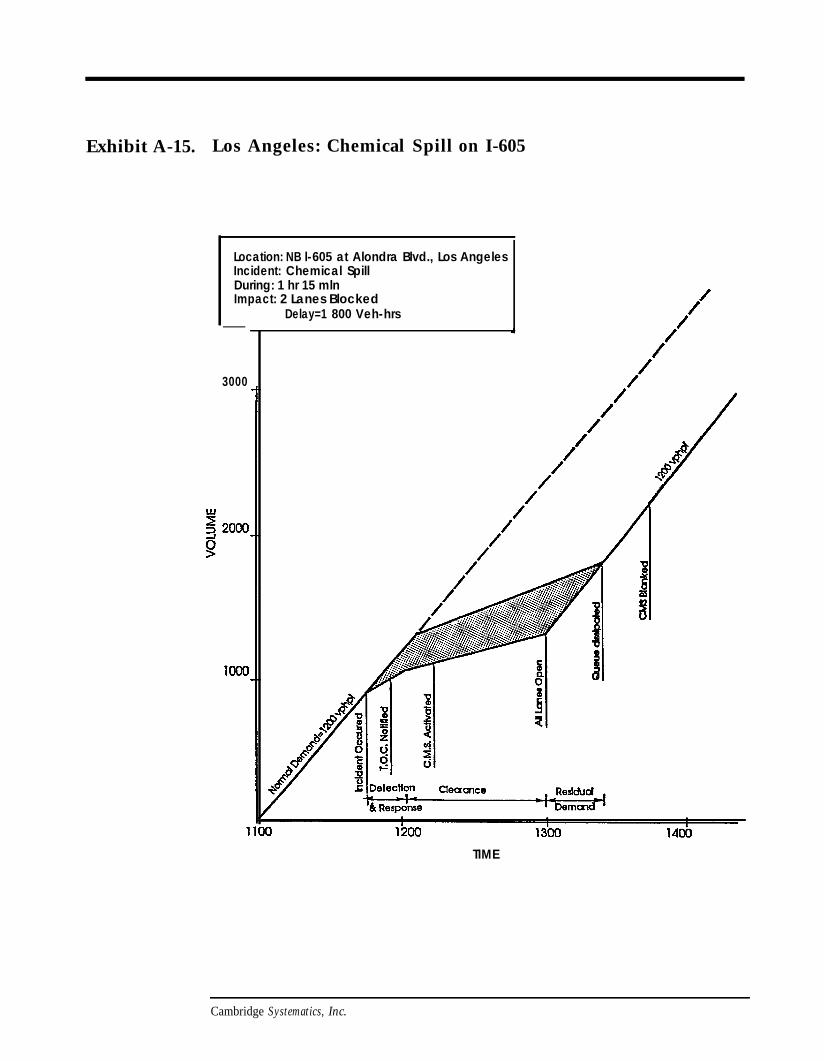
Exhibit A-15. Los Angeles: Chemical Spill on I-605
Location: NB l-605 at Alondra Blvd., Los AngelesIncident: Chemical SpillDuring: 1 hr 15 mlnImpact: 2 Lanes Blocked
-
3000
Delay=1 800 Veh-hrs
TIME
Cambridge Systematics, Inc.
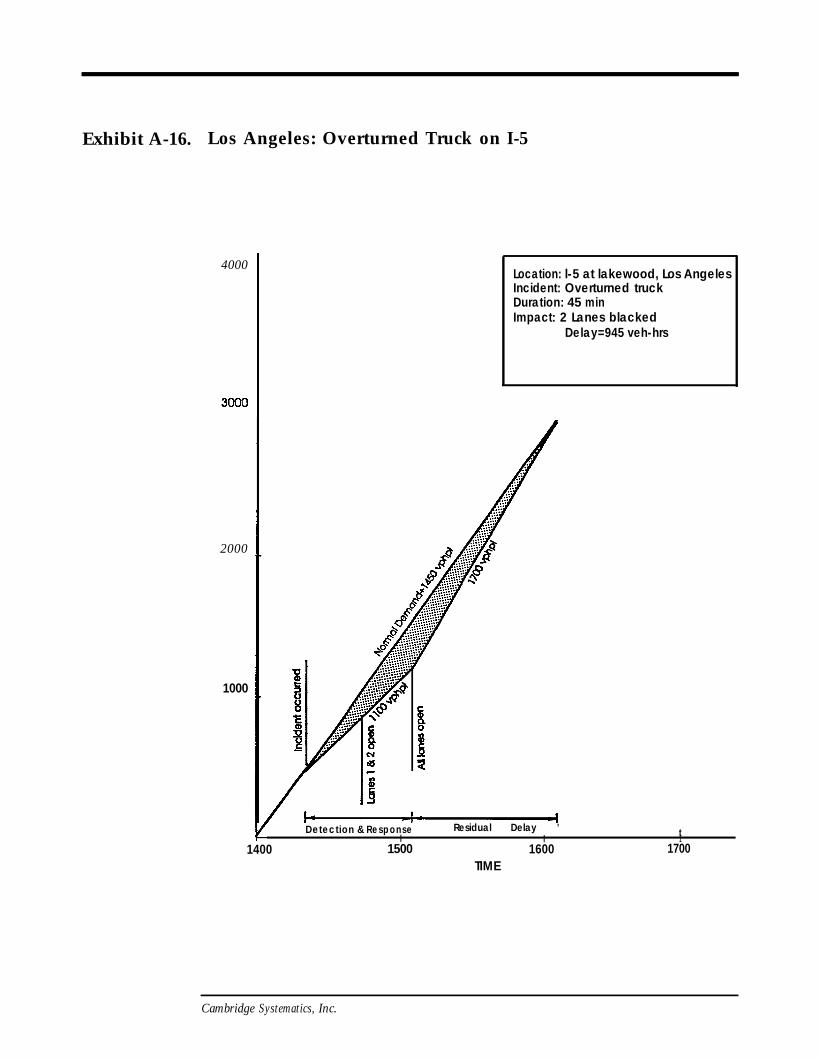
Exhibit A-16. Los Angeles: Overturned Truck on I-5
4000
2000
1000
Location: l-5 at lakewood, Los AngelesIncident: Overturned truckDuration: 45 minImpact: 2 Lanes blacked
Delay=945 veh-hrs
Detection & Response Residual Delay ’ tI I1400 1500
11600 1700
TIME
Cambridge Systematics, Inc.
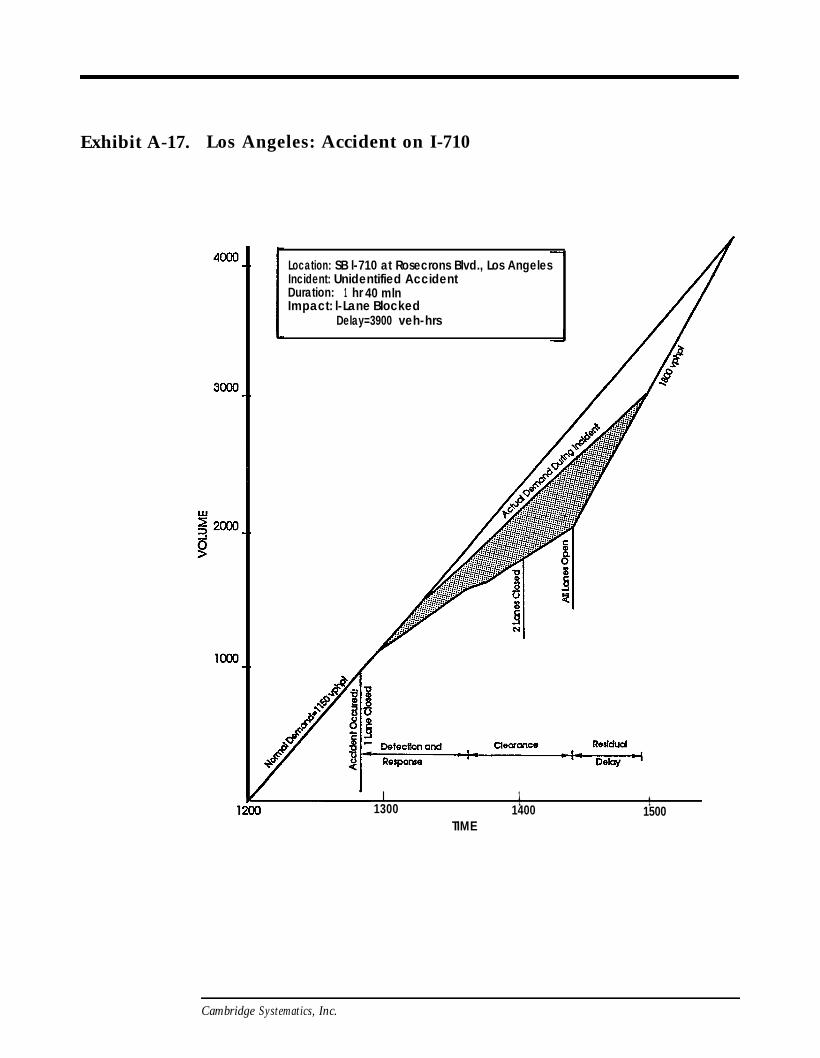
Exhibit A-17. Los Angeles: Accident on I-710
Location: SB l-710 at Rosecrons Blvd., Los AngelesIncident: Unidentified AccidentDuration: 1 hr 40 mlnImpact: l-Lane Blocked
Delay=3900 veh-hrs
I 1 ,1300 1 11400 1500
TIME
Cambridge Systematics, Inc.
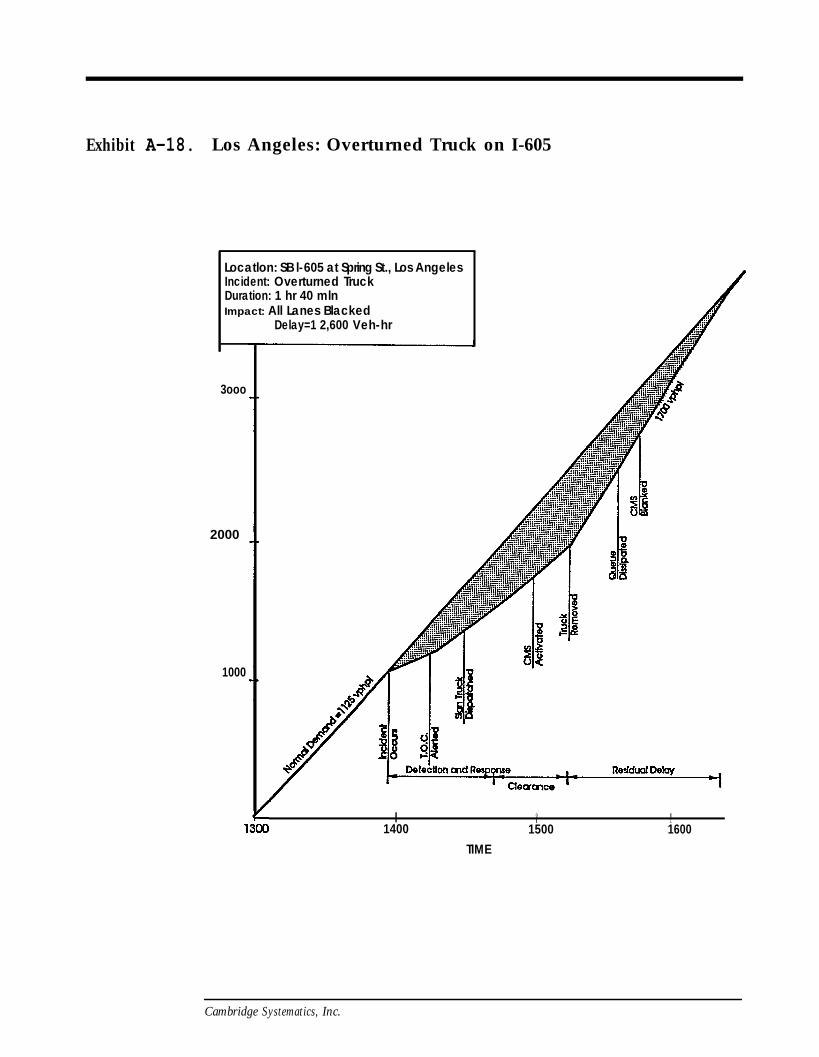
Exhibit A-18. Los Angeles: Overturned Truck on I-605
3ooo
2000
1000
Locatlon: SB l-605 at Spring St., Los AngelesIncident: Overturned TruckDuration: 1 hr 40 mlnImpact: All Lanes Blacked
Delay=1 2,600 Veh-hr
| 9 II 1
1400 1500 1600TIME
Cambridge Systematics, Inc.
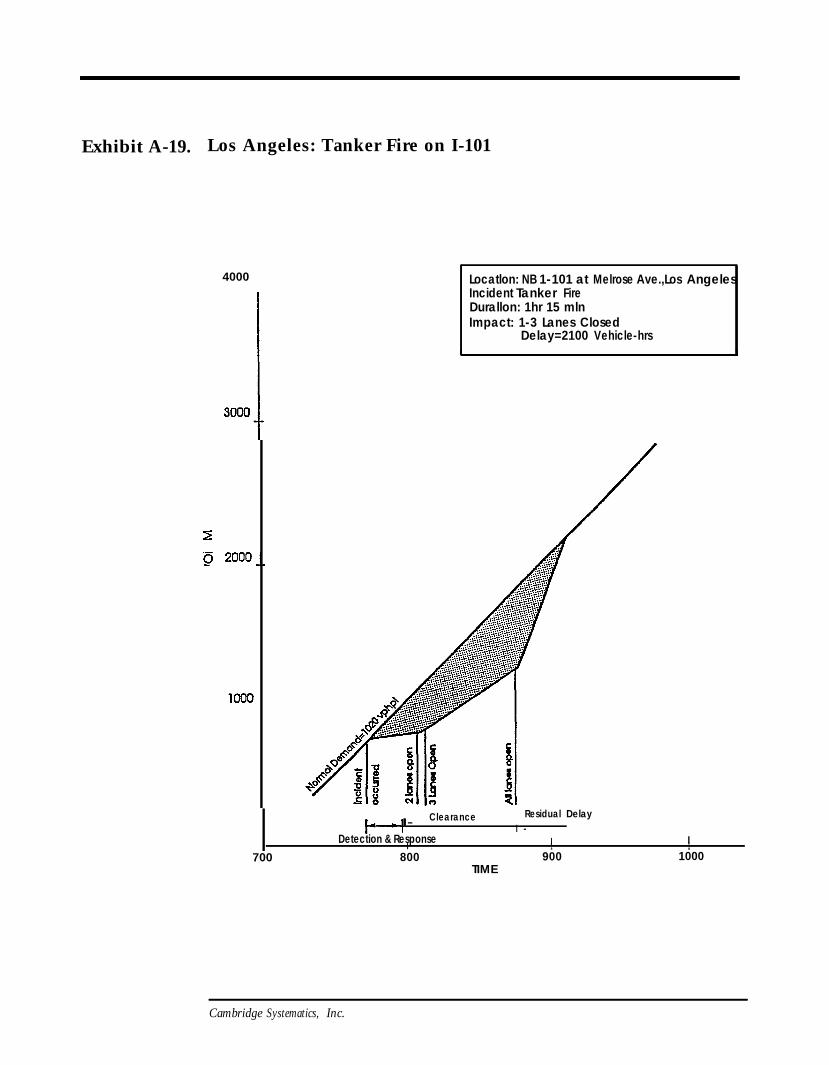
Exhibit A-19. Los Angeles: Tanker Fire on I-101
4000 Locatlon: NB 1-101 at Melrose Ave.,Los AngelesIncident Tanker FireDurallon: 1hr 15 mlnImpact: 1-3 Lanes Closed
Delay=2100 Vehicle-hrs
700
I- Clearance Residual DelayI -
Detection & Response I II 1 1800 900 1000
TIME
Cambridge Systematics, Inc.
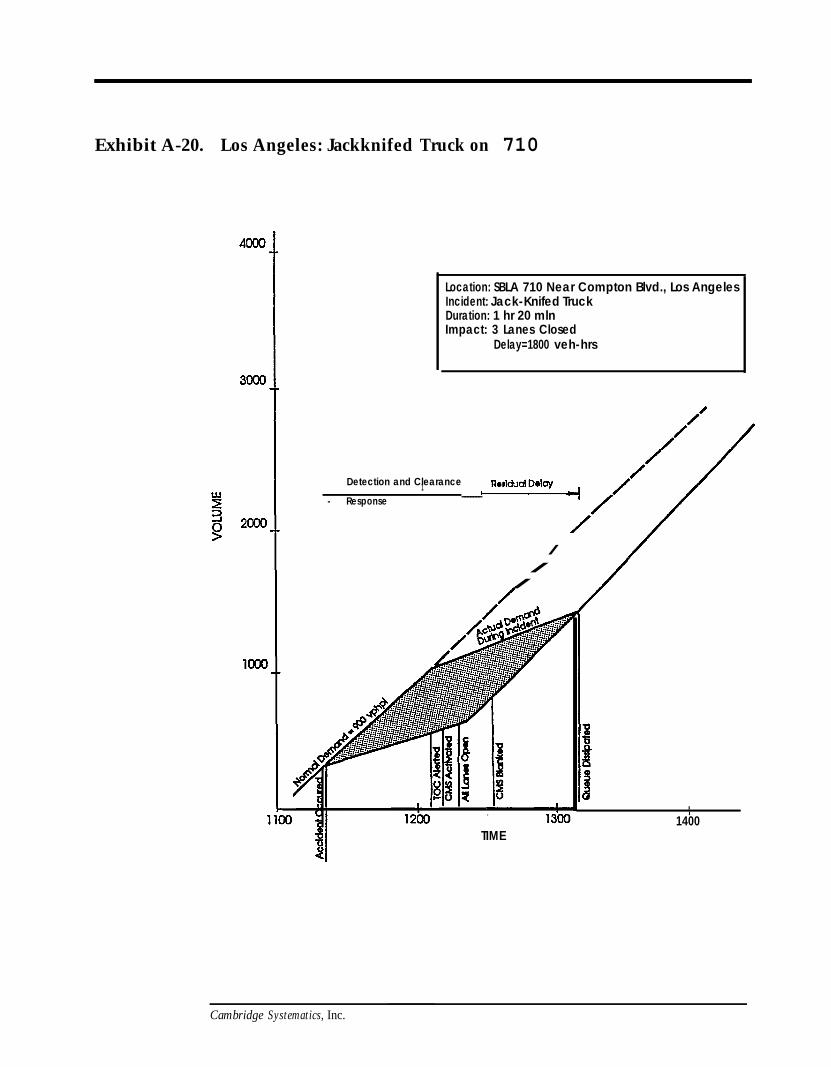
Exhibit A-20. Los Angeles: Jackknifed Truck on 710
Location: SBLA 710 Near Compton Blvd., Los AngelesIncident: Jack-Knifed TruckDuration: 1 hr 20 mlnImpact: 3 Lanes Closed
Delay=1 800 veh-hrs
Detection and Clearance1- Response -------
///
II
1400TIME
Cambridge Systematics, Inc.
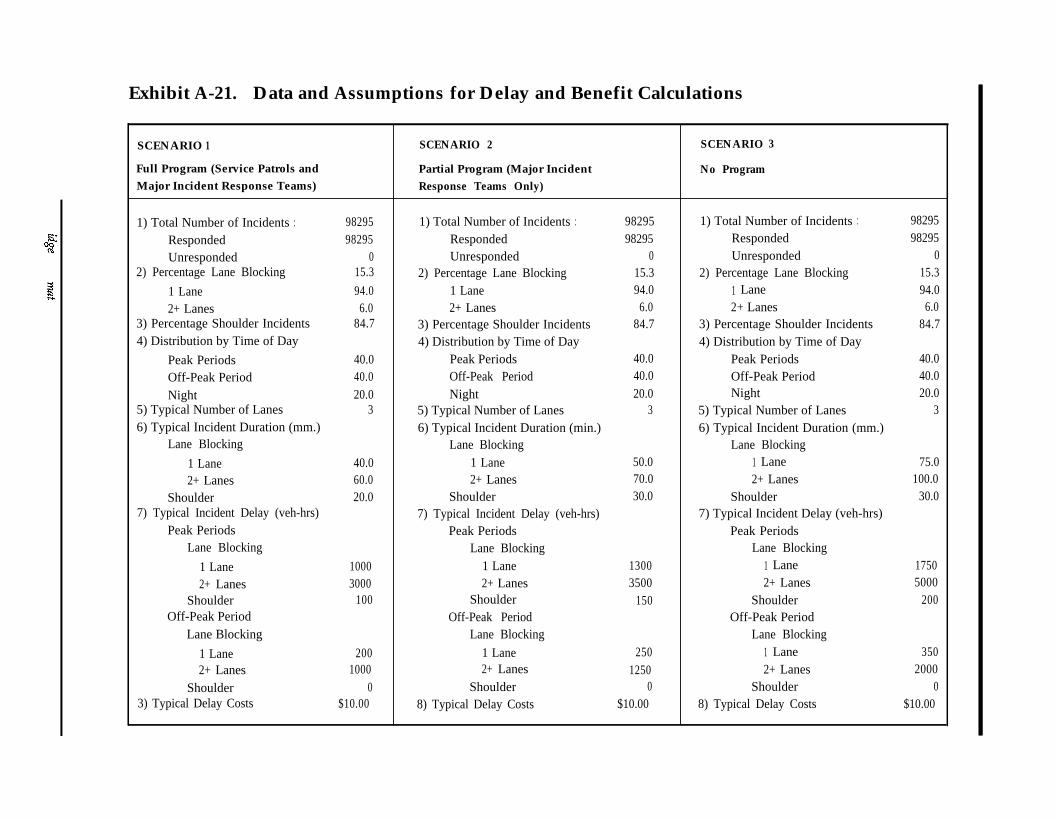
Exhibit A-21. Data and Assumptions for Delay and Benefit Calculations
SCENARIO 1 SCENARIO 2
Full Program (Service Patrols and Partial Program (Major IncidentMajor Incident Response Teams) Response Teams Only)
SCENARIO 3
No Program
1) Total Number of Incidents : 98295 1) Total Number of Incidents : 98295 1) Total Number of Incidents : 98295Responded 98295 Responded 98295 Responded 98295Unresponded 0 Unresponded 0 Unresponded 0
2) Percentage Lane Blocking 15.3 2) Percentage Lane Blocking 15.3 2) Percentage Lane Blocking 15.31 Lane 94.0 1 Lane 94.0 1 Lane 94.02+ Lanes 6.0 2+ Lanes 6.0 2++ Lanes 6.0
3) Percentage Shoulder Incidents 84.7 3) Percentage Shoulder Incidents 84.7 3) Percentage Shoulder Incidents 84.74) Distribution by Time of Day 4) Distribution by Time of Day 4) Distribution by Time of Day
Peak Periods 40.0 Peak Periods 40.0 Peak Periods 40.0Off-Peak Period 40.0 Off-Peak Period 40.0 Off-Peak Period 40.0Night 20.0 Night 20.0 Night 20.0
5) Typical Number of Lanes 3 5) Typical Number of Lanes 3 5) Typical Number of Lanes 36) Typical Incident Duration (mm.) 6) Typical Incident Duration (min.) 6) Typical Incident Duration (mm.)
Lane Blocking Lane Blocking Lane Blocking1 Lane 40.0 1 Lane 50.0 1 Lane 75.02+ Lanes 60.0 2+ Lanes 70.0 2+ Lanes 100.0
Shoulder 20.0 Shoulder 30.0 Shoulder 30.07) Typical Incident Delay (veh-hrs) 7) Typical Incident Delay (veh-hrs) 7) Typical Incident Delay (veh-hrs)
Peak Periods Peak Periods Peak PeriodsLane Blocking Lane Blocking Lane Blocking
1 Lane 1000 1 Lane 1300 1 Lane 17502+ Lanes 3000 2+ Lanes 3500 2+ Lanes 5000
Shoulder 100 Shoulder 150 Shoulder 200Off-Peak Period Off-Peak Period Off-Peak Period
Lane Blocking Lane Blocking Lane Blocking1 Lane 200 1 Lane 250 1 Lane 3502+ Lanes 1000 2+ Lanes 1250 2+ Lanes 2000
Shoulder 0 Shoulder 0 Shoulder 03) Typical Delay Costs $10.00 8) Typical Delay Costs $10.00 8) Typical Delay Costs $10.00
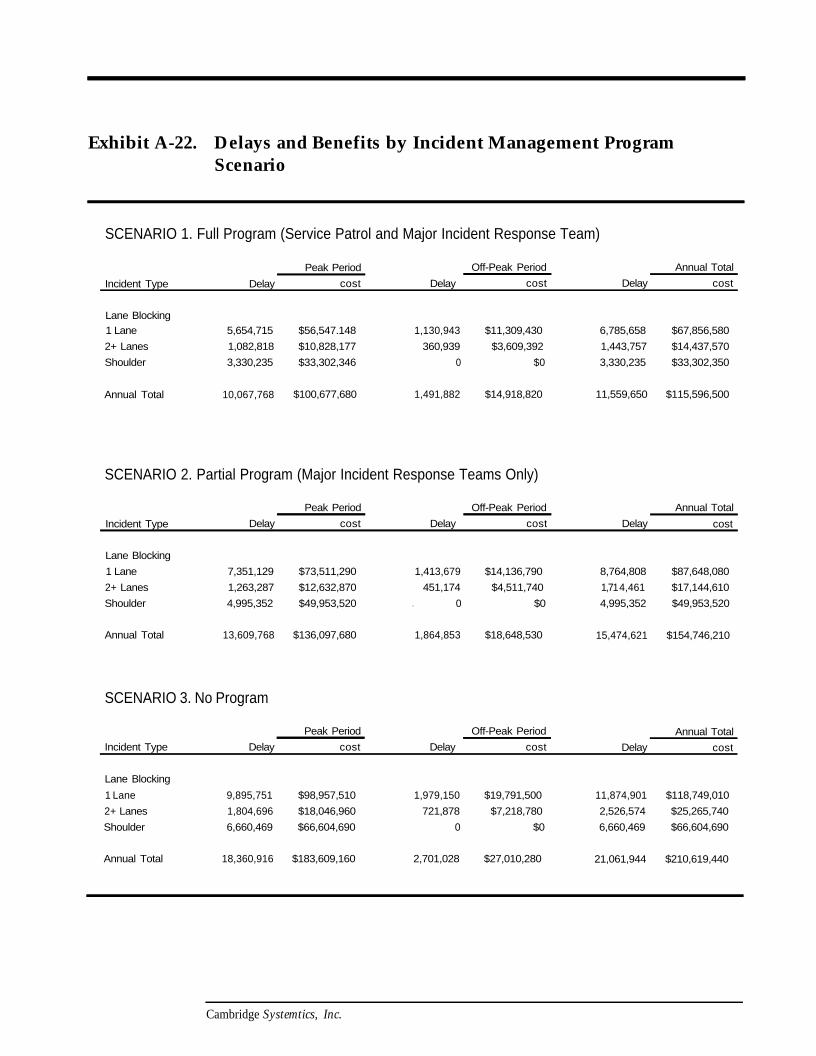
Exhibit A-22. Delays and Benefits by Incident Management ProgramScenario
SCENARIO 1. Full Program (Service Patrol and Major Incident Response Team)
Incident Type DelayPeak Period
costOff-Peak Period Annual Total
Delay cost Delay cost
Lane Blocking1 Lane2+ LanesShoulder
5,654,715 $56,547.148 1,130,943 $11,309,430 6,785,658 $67,856,5801,082,818 $10,828,177 360,939 $3,609,392 1,443,757 $14,437,5703,330,235 $33,302,346 0 $0 3,330,235 $33,302,350
Annual Total 10,067,768 $100,677,680 1,491,882 $14,918,820 11,559,650 $115,596,500
SCENARIO 2. Partial Program (Major Incident Response Teams Only)
Incident Type DelayPeak Period
costOff-Peak Period Annual Total
Delay cost Delay cost
Lane Blocking1 Lane2+ LanesShoulder
7,351,129 $73,511,290 1,413,679 $14,136,790 8,764,808 $87,648,0801,263,287 $12,632,870 451,174 $4,511,740 1,71 4,461 $17,144,6104,995,352 $49,953,520 0. $0 4,995,352 $49,953,520
Annual Total 13,609,768 $136,097,680 1,864,853 $18,648,530 15,474,621 $154,746,210
SCENARIO 3. No Program
Incident Type DelayPeak Period
costOff-Peak Period Annual Total
Delay cost Delay cost
Lane Blocking1 Lane2+ LanesShoulder
9,895,751 $98,957,510 1,979,150 $19,791,500 11,874,901 $118,749,0101,804,696 $18,046,960 721,878 $7,218,780 2,526,574 $25,265,7406,660,469 $66,604,690 0 $0 6,660,469 $66,604,690
Annual Total 18,360,916 $183,609,160 2,701,028 $27,010,280 21,061,944 $210,619,440
Cambridge Systemtics, Inc.
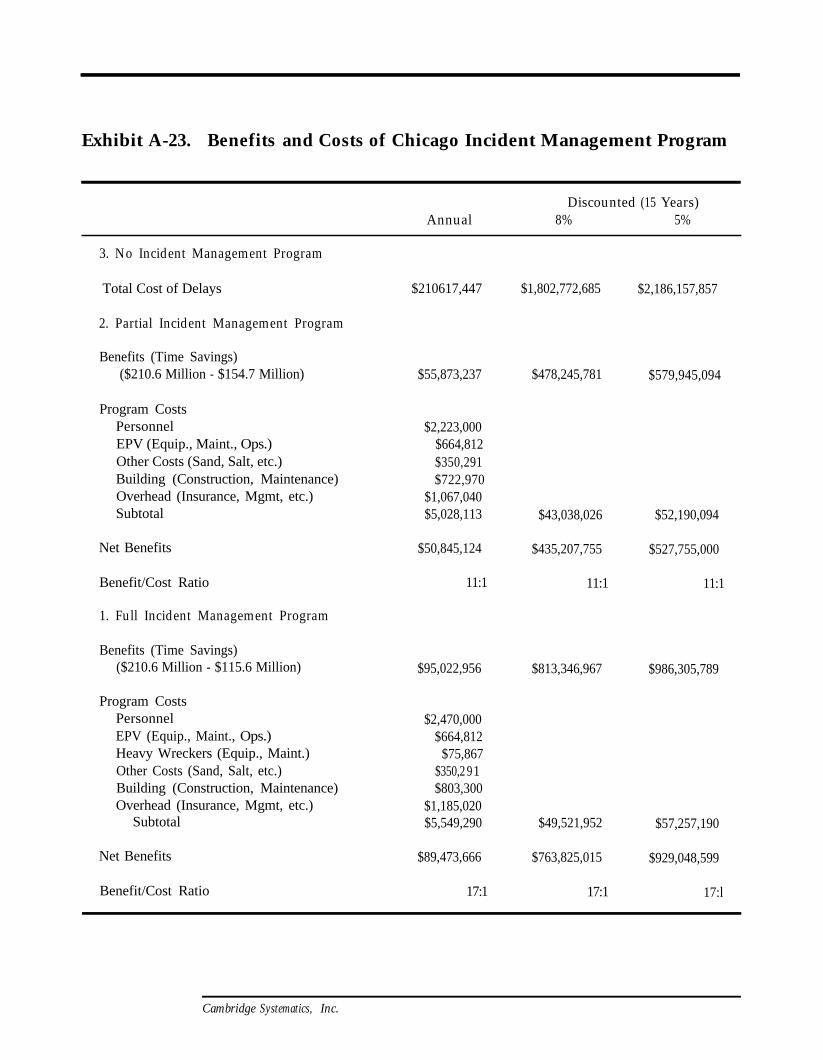
Exhibit A-23. Benefits and Costs of Chicago Incident Management Program
AnnualDiscounted (15 Years)
8% 5%
3. No Incident Management Program
Total Cost of Delays $210617,447 $1,802,772,685 $2,186,157,857
2. Partial Incident Management Program
Benefits (Time Savings)($210.6 Million - $154.7 Million) $55,873,237 $478,245,781 $579,945,094
Program CostsPersonnelEPV (Equip., Maint., Ops.)Other Costs (Sand, Salt, etc.)Building (Construction, Maintenance)Overhead (Insurance, Mgmt, etc.)Subtotal
$2,223,000$664,812$350,291$722,970
$1,067,040$5,028,113 $43,038,026
$435,207,755
11:1
$52,190,094
$527,755,000
11:1
Net Benefits $50,845,124
Benefit/Cost Ratio 11:1
1. Full Incident Management Program
Benefits (Time Savings)($210.6 Million - $115.6 Million) $95,022,956 $813,346,967 $986,305,789
Program CostsPersonnelEPV (Equip., Maint., Ops.)Heavy Wreckers (Equip., Maint.)Other Costs (Sand, Salt, etc.)Building (Construction, Maintenance)Overhead (Insurance, Mgmt, etc.)
Subtotal
$2,470,000$664,812
$75,867$350,2 91$803,300
$1,185,020$5,549,290 $49,521,952
$763,825,015
17:1
$57,257,190
$929,048,599
17:l
Net Benefits $89,473,666
Benefit/Cost Ratio 17:1
Cambridge Systematics, Inc.

Appendix B
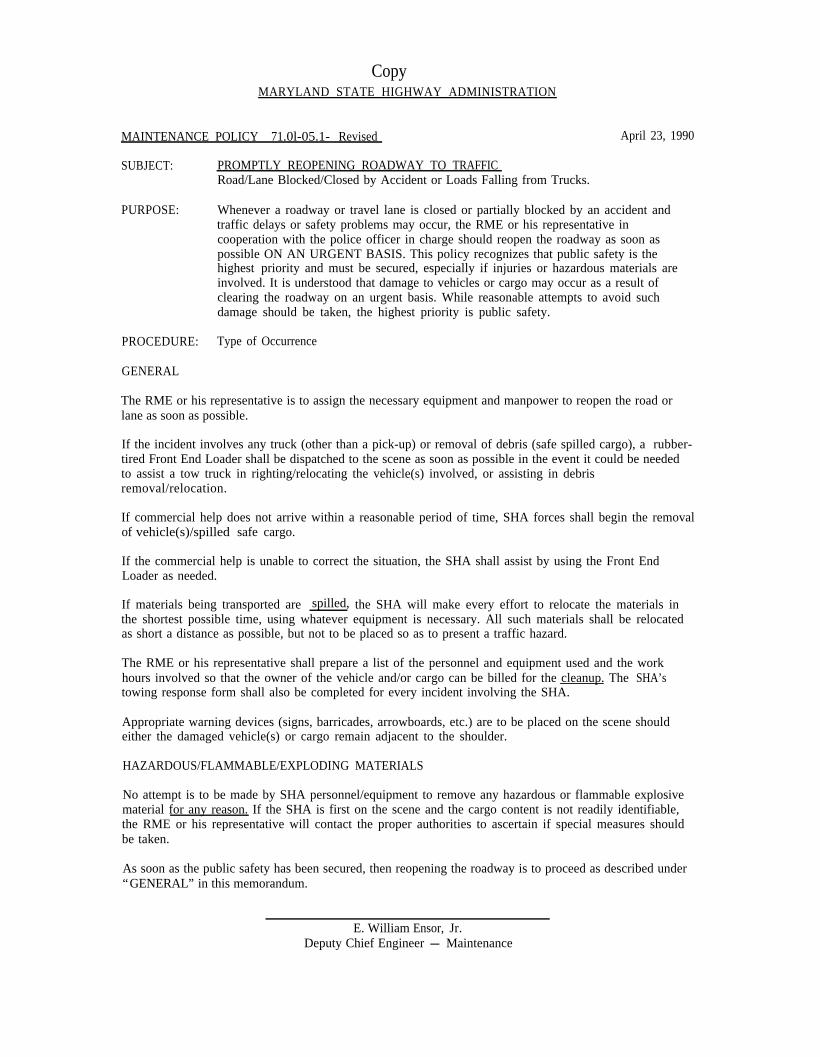
CopyMARYLAND STATE HIGHWAY ADMINISTRATION
MAINTENANCE POLICY 71 .0l-05.1- Revised
SUBJECT: PROMPTLY REOPENING ROADWAY TO TRAFFICRoad/Lane Blocked/Closed by Accident or Loads Falling from Trucks.
April 23, 1990
PURPOSE: Whenever a roadway or travel lane is closed or partially blocked by an accident andtraffic delays or safety problems may occur, the RME or his representative incooperation with the police officer in charge should reopen the roadway as soon aspossible ON AN URGENT BASIS. This policy recognizes that public safety is thehighest priority and must be secured, especially if injuries or hazardous materials areinvolved. It is understood that damage to vehicles or cargo may occur as a result ofclearing the roadway on an urgent basis. While reasonable attempts to avoid suchdamage should be taken, the highest priority is public safety.
PROCEDURE: Type of Occurrence
GENERAL
The RME or his representative is to assign the necessary equipment and manpower to reopen the road orlane as soon as possible.
If the incident involves any truck (other than a pick-up) or removal of debris (safe spilled cargo), a rubber-tired Front End Loader shall be dispatched to the scene as soon as possible in the event it could be neededto assist a tow truck in righting/relocating the vehicle(s) involved, or assisting in debrisremoval/relocation.
If commercial help does not arrive within a reasonable period of time, SHA forces shall begin the removalof vehicle(s)/spilled safe cargo.
If the commercial help is unable to correct the situation, the SHA shall assist by using the Front EndLoader as needed.
If materials being transported are spilled, the SHA will make every effort to relocate the materials inthe shortest possible time, using whatever equipment is necessary. All such materials shall be relocatedas short a distance as possible, but not to be placed so as to present a traffic hazard.
The RME or his representative shall prepare a list of the personnel and equipment used and the workhours involved so that the owner of the vehicle and/or cargo can be billed for the cleanup. The SHA’stowing response form shall also be completed for every incident involving the SHA.
Appropriate warning devices (signs, barricades, arrowboards, etc.) are to be placed on the scene shouldeither the damaged vehicle(s) or cargo remain adjacent to the shoulder.
HAZARDOUS/FLAMMABLE/EXPLODING MATERIALS
No attempt is to be made by SHA personnel/equipment to remove any hazardous or flammable explosivematerial for any reason. If the SHA is first on the scene and the cargo content is not readily identifiable,the RME or his representative will contact the proper authorities to ascertain if special measures shouldbe taken.
As soon as the public safety has been secured, then reopening the roadway is to proceed as described under“GENERAL” in this memorandum.
E. William Ensor, Jr.Deputy Chief Engineer - Maintenance