improving environmental interventions by understanding
TRANSCRIPT

Improving environmental
interventions by understanding
social networks
Emiel de Lange
Thesis submitted for the degree of
Doctor of Philosophy
The University of Edinburgh
School of Geoscience
2021

1
Abstract Interventions to conserve biodiversity often aim to change human behaviour. Social
relations and interactions, or social networks, have a strong influence on the information
people receive and on their behaviour. Thus, the interactions between social networks and
behaviour have been the subject of intense research effort in countless domains, and
practitioners in fields such as public health have developed a range of strategies which
account for relational processes in their interventions. This thesis seeks to integrate these
insights into conservation and explore their practical implications. I begin by synthesising
the literature and discussing the relevance of social network interventions for conservation.
The remainder of the thesis examines the role of social networks in a case study
intervention aiming to reduce wildlife poisoning in Northern Cambodia. I first use a mixed-
method approach to better understand wildlife poisoning. I find that it is widespread,
occurring in eight of the ten villages studied, but generally low prevalence, and often carried
out by young men or children. However, most residents hold negative attitudes towards
poisoning. With the Wildlife Conservation Society (WCS) Cambodia, I develop and pilot a
social marketing intervention to promote the use of a hotline for reporting incidences of
poisoning. I then use longitudinal data on behaviour and dynamic social network models to
unpick the role of information flow and social influence in this intervention. I find that
information from the intervention flowed widely through the village social networks,
particularly within households, reaching an audience three-times larger than originally
targeted. Having a knowledgeable household member doubled the probability that an
individual would become knowledgeable. I also find that intention to report poisoning
increases throughout the village in the short-term but returns to baseline levels in the long
term. These changes are not driven by knowledge of the intervention. Instead, individuals
are influenced by the intentions of network peers. One way to more effectively produce
behavioural change that exploits these social influences is to target interventions at
influential individuals identified using sociometric data. Using diffusion simulations, I explore
the cost-effectiveness of these approaches within the study village. I find that network-
informed targeting could result in uptake of the hotline more than double other targeting
strategies, but that the relatively high cost of collecting network data makes it cost-
ineffective. A more feasible strategy for large-scale interventions might be to conduct
network research to identify general rules-of-thumb that can be used to select influential

2
individuals. However, I find that rules-of-thumb identified in other contexts do not apply in
Cambodia. Overall, my findings highlight the critical importance of social relations in shaping
the outcomes of conservation interventions and illustrate some possible strategies for
exploiting them in intervention.
Lay Summary Consider some of the major factors causing deforestation or the extinction of wildlife;
clearing of forests for agriculture, over-hunting of wildlife, or logging for wood. All these
factors result from people’s actions. So, to conserve habitats and wildlife, we need to
understand why people behave as they do. One of the most important influences on
people’s behaviour is the behaviour of the people they communicate and interact with on a
regular basis – their social networks. Understanding social networks - how and from whom
people get information on different topics - can therefore help us to more effectively
influence their behaviour, such as by working with influential ‘opinion leaders’ who are
connected to many people. In this thesis, I explore how this might work in a conservation
context.
I started by reviewing the published literature from other disciplines, such as public health
and sociology, and considered the relevance of the approaches they use to conservation.
Then, in the rest of the thesis I looked at the role of social networks in an intervention
aiming to reduce wildlife poisoning in Cambodia. First, I used a variety of research methods
to better understand wildlife poisoning. I found that some residents are poisoning wildlife
for food, particularly young men, and some children. But most residents in the area are
strongly against wildlife poisoning. To help local efforts against poisoning, I therefore
worked with a local NGO, WCS Cambodia, to develop and test a strategy for promoting the
use of a hotline for reporting poisoning in one village.
To look at how the village social network might affect the success of these efforts, I used a
survey to gather information from everyone in the village about their social relations,
enabling me to map the social network in the village. I then used surveys to measure
residents’ behaviour and knowledge at three time points, before and after the intervention.
I used dynamic network models to determine how these changes relate to the social
network. WCS invited a group of 41 people to the promotion event, but I found that

3
information from the event spread through the village, so at least 144 people had received
some information after six months. Most of this spread occurred within households. After
two weeks, people throughout the village reported being more likely to report poisoning.
But this was not a result of them learning about the hotline. Instead, it seems they were
influenced by their peers who attended the event. After six months, this peer influence also
played a role in people reverting to their previous level of behaviour.
With information about the social network, WCS may be able to better spread information
about the hotline, or target people who can persuade others to use it. I use computer
simulations to see how information about the hotline, or intention to use the hotline, might
spread through the network depending on who WCS targets to receive information. I find
that targeting individuals that are highly connected in the network is much more effective
than targeting people based on other characteristics, such as wealthy people or those in
leadership positions. However, this increase in effectiveness is not large enough to justify
the costs of collecting and analysing network data. It would be more cost-effective to target
a greater number of randomly chosen people. If WCS are promoting the hotline in many
villages, they might be able to analyse the social network of one village to identify some
rules-of-thumb about what sorts of people are well connected, which they can then apply
elsewhere. For example, perhaps wealthy households tend to be better connected. But I
find that rules-of-thumb identified in other studies do not apply here and are probably quite
context-specific.
Overall, this thesis highlights how important it is to take social networks into account when
designing a behaviour-change strategy. We find that social relationships can help to spread
information but can also reinforce existing behaviours and prevent behaviour change.
Understanding the structure of a social network can suggest targeting strategies that could
overcome this barrier, and interventions should try to use social influences wherever
possible. For example, once some residents adopt a new behaviour, they can be a valuable
resource for influencing others.

4
Acknowledgements Foremost thanks are due to my supervisors, Dr Aidan Keane and Professor EJ Milner-
Gulland. They have been fantastic, supportive mentors and I hope we will continue working
together in the future. This thesis is impossible to imagine without them. Different parts of
this thesis would also have been impossible without the patient guidance and generous
knowledge of my collaborators. To Dr Andy Dobson for his assistance developing the
simulation models in Chapter 6, and to Dr Cohen Simpson for always being a reassuring
voice on the phone when I struggled with RSiena. Thanks to Dr Diogo Verissimo for his
guidance in social marketing. I would also like to thank my advisor Janet Fisher, and other
staff within the School of Geosciences who have enriched my academic life in numerous
ways, including Sam Staddon, Clare Barnes, Isla Myers-Smith, and Casey Ryan. And thanks to
ICCS, for being such a positive group of peers.
I am proud that this thesis comes from the real world and was born from a collaboration
with the Wildlife Conservation Society Cambodia programme. I am grateful that they gave
me room to grow and that they have the open-mindedness to allow a young researcher to
interfere in their interventions. Thanks to Simon and Sarah, who took me in to their home in
Phnom Penh. To Alistair for guiding me through the halls of power in Preah Vihear. To
Sithan, Sitha, Sakuna, Kim Lang, Solita, Khean, Sophan, Vann (may he rest in peace), Sokha,
Sokny, Chris Hamley, and all the other staff in Preah Vihear for assisting me in innumerable
ways and letting me score in football. My thanks must also go to the Ministry of
Environment of the Royal Government of Cambodia, the provincial Department of
Environment in Preah Vihear, and the provincial Governors office of Preah Vihear, for
providing me permissions. Most of all, this research owes its existence to my fieldworkers
who put up with sometimes challenging conditions and always worked with good humour.
Vichet and Theavy, we had a baptism by fire (or was it by rain?)! Vimean, Rithy, Sothea,
Samreaksa, and Siekleang, thank you all for your company and efforts. Perhaps even more
importantly, this research would not have been possible without the generous time and
hospitality given by the residents of twelve villages in Preah Vihear province.
សូមអរគុណជាពិសសសចំស ោះសោ សរឿន និង សស សុខន។

5
On a more personal note: I would not have completed this thesis without the support,
distraction, and care of my friends, and family. To the Barradise family: Zac, Emma, Ioanna,
Josep, Eoin, and Jack. I could not have dreamt of a more pleasant office environment; I hope
we can gather at Kebab Mahal again one day. To my other PhD family: Jiayen, Keiko, Ivonne,
Josep, Gergo, and others; we will celebrate our graduations together when this pandemic is
over. To Harriet, my Cambodia buddy. To Phun and the gang from Kampong Thom, for
letting me be one of them. And last but not least, thank you to my parents, for their
unflagging support, and for caring for me as I finished my thesis at home while the
pandemic raged. I would not be who I am now without you.
This work was funded by a studentship from NERC UK, and an early career grant from the
National Geographic Society.
កំហុសរមមងមានដល់អនកស្វើ អនកសៅឥតអំសពើរ បានអវីនឹងខុស ។
Blame for error always lies with those who act;
those who do nothing, what do they have to be wrong about?
ឃ្វវ លក្កបជីិោះក្កបី ឃ្វវ លសោជិោះសោ ។ Tending the buffalo, ride the buffalo; tending the cow, ride the cow.
ចង់សចោះស្វើលងង់ ។
If you want knowledge, act ignorant.

6
Declaration of Originality
I, Emiel de Lange, declare that this thesis has been composed by me, that it is my own work,
that it has not been submitted for any other degree or professional qualification, and that
the publications included in this thesis (listed below) are my own work except where
indicated.
Signature: Emiel de Lange
Date: 12/03/2021

7
Table of Contents Abstract ...................................................................................................................................... 1
Lay Summary .............................................................................................................................. 2
Acknowledgements .................................................................................................................... 4
Declaration of Originality ........................................................................................................... 6
Table of Contents ....................................................................................................................... 7
List of Tables & Figures .............................................................................................................. 9
1. Introduction ......................................................................................................................... 11
1.1 Problem statement ........................................................................................................ 11
1.2 Aims and objectives ....................................................................................................... 14
1.3 Thesis outline ................................................................................................................. 14
1.4 Methodological approach .............................................................................................. 17
1.5 Positionality & Ethics ..................................................................................................... 21
2. Background .......................................................................................................................... 30
2.1 Cambodia ....................................................................................................................... 30
2.2 Cambodia’s Northern Plains .......................................................................................... 32
2.3 Study villages.................................................................................................................. 36
2.4 Social life in the village ................................................................................................... 37
2.5 Wildlife poisoning and interventions ............................................................................. 40
3. Improving environmental interventions by understanding information flows ................... 45
3.1 Abstract .......................................................................................................................... 45
3.2 Glossary .......................................................................................................................... 45
3.3 Behaviour change and communication ......................................................................... 47
3.4 The Anatomy of Information Flows & Behaviour Change ............................................. 48
3.5 Studying Information Flows ........................................................................................... 55
3.6 Network Strategies for Behaviour Change .................................................................... 60
3.7 Concluding Remarks....................................................................................................... 65
4. Using mixed methods to understand sensitive wildlife poisoning behaviours in northern
Cambodia ................................................................................................................................. 67
4.1 Abstract .......................................................................................................................... 67
4.2 Introduction ................................................................................................................... 68
4.3 Study area ...................................................................................................................... 72
4.4 Methods ......................................................................................................................... 74
4.5 Results ............................................................................................................................ 76

8
4.6 Discussion ....................................................................................................................... 88
5. Social networks can both amplify and undermine conservation behaviour change
interventions ............................................................................................................................ 94
5.1 Abstract .......................................................................................................................... 94
5.2 Introduction ................................................................................................................... 94
5.3 Methods ......................................................................................................................... 96
5.4 Results .......................................................................................................................... 104
5.5 Discussion ..................................................................................................................... 111
6. Combining simulation and empirical data to explore the scope for social network
interventions in conservation ................................................................................................ 115
6.1 Abstract ........................................................................................................................ 115
6.2 Introduction ................................................................................................................. 115
6.3 Methods ....................................................................................................................... 118
6.4 Results .......................................................................................................................... 129
6.5 Discussion ..................................................................................................................... 134
7. Discussion ........................................................................................................................... 138
7.1 Summary of thesis contributions ................................................................................. 138
7.2 Cross-cutting themes ................................................................................................... 141
7.3 Future research directions ........................................................................................... 151
7.4 Recommendations for WCS ......................................................................................... 158
7.5 Conclusion .................................................................................................................... 161
Bibliography ........................................................................................................................... 163
Appendix 1: Supplementary material for Chapter 4 ............................................................. 186
Appendix 2: Supplementary material for Chapter 5 ............................................................. 193
Appendix 3: Supplementary material for Chapter 6 ............................................................. 237

9
List of Tables & Figures
Figure 1.1 Project management cycle 19
Figure 1.2 Research team interviewing a respondent 24
Figure 2.1 Cambodia’s dry forests in the Northern Plains 33
Figure 2.2 Map of Cambodia’s Northern Plains landscape 34
Figure 2.3 Two village houses 39
Figure 2.4 A theory of change for the pilot intervention 42
Figure 2.5 WCS Staff presenting during the intervention event 44
Figure 2.6 Materials disseminated during the intervention 44
Table 3.1 Examples of information transfer strategies in conservation 48
Table 3.2 Information flow concepts and examples of interventions 50
Box 3.1 Methods for studying information flow 57
Figure 3.1 Example of a social network diagram 58
Figure 3.2 Illustration of two types of network intervention 64
Box 3.2 Outstanding questions 66
Figure 4.1 Image of a waterhole poisoning 69
Figure 4.2 The Theory of Planned Behaviour as applied to poisoning 71
Figure 4.4 Packaging of the pesticides used in poisoning 77
Figure 4.5 Summary of evidence around wildlife poisoning 82
Figure 4.6 Results from the Theory of Planned Behaviour questionnaires 85
Figure 4.7 Results of Generalised Linear Models for wildlife poisoning 86
Figure 4.8 Reasons given by hunters for not using poison 87
Figure 4.9 Results for linear models of behavioural control 87

10
Figure 5.1 The conceptual model of social influence for the pilot intervention 99
Figure 5.2 Changes in psychological outcomes following intervention 106
Figure 5.3 Results of Generalised Linear Models for reporting poisoning 107
Figure 5.4 Changes in knowledge following the intervention 108
Table 5.1 Results from SAOM models of social influence 110
Table 6.1 Network-informed targeting strategies 122
Table 6.2 Targeting strategies used in simulated interventions 125
Figure 6.1 Performance of simulated targeting strategies 130
Figure 6.2 Results for targeting 20 individuals 132
Table 6.3 Costs of targeting strategies 133

11
1. Introduction
1.1 Problem statement
Conservation problems are largely driven by human behaviours. As such, the behavioural
sciences can play an important role in designing conservation interventions (St. John, Keane
& Milner-Gulland, 2013; Milner-Gulland, 2012; Schultz, 2011; Reddy et al., 2016).
Recognising this, conservation scientists have begun drawing on theory and evidence from
the behavioural sciences and from behaviour-change disciplines such as public health and
social marketing (Bennett et al., 2017). Insight from these fields can provide valuable
frameworks through which to analyse conservation issues, and useful tools for designing
interventions. For example, the Theory of Planned Behaviour (Ajzen, 1991) is now widely
used to assess the determinants of conservation behaviours (Mastrangelo et al., 2014;
Steinmetz et al., 2014; Ward, Holmes & Stringer, 2018), and there is a burgeoning discipline
of ‘conservation marketing’ which aims to apply the methods of social marketing to
conservation problems (Wright et al., 2015; Ryan et al., 2020).
Social scientists have long understood the importance of social relations in shaping
individual behaviours. At the micro-scale, research has highlighted the ways in which
individuals influence one another, and shape one another’s perceptions of social norms
(Cialdini & Goldstein, 2004; Shepherd, 2017). At larger scales, the social relations between
individuals aggregate to form social structures (Borgatti et al., 2009) which shape the
distribution and patterns of change in behaviour within a population (Centola, 2018; Rogers,
2003). Even in environments with high penetration of mass media and digital
communications, social relations have been found to play an important role in people's
interpretation of and response to information (Bennett & Manheim, 2006; Hilbert et al.,
2017). Understanding how social relations are structured and how they interact with
behaviour therefore has the potential to suggest more effective forms of social intervention
(Valente, 2012), and such strategies have been widely used in other disciplines, such as
public health (Kim et al., 2015; Perkins, Subramanian & Christakis, 2015), counterterrorism
(e.g. Everton, 2012), agricultural extension (Beaman et al., 2014), and social work (Sales,
Estabrooks & Valente, 2010).
A powerful way by which researchers and practitioners can conceptualise social relations
and make them amenable to analysis is as a social network. In a social network, individuals

12
are represented as nodes that are connected to one another through ties, corresponding to
different forms of relation or interaction, such as communication, affiliation, or resource
exchange. A social network therefore consists of a population of nodes and the ties between
them, of multiple types, which can differ in their importance (Borgatti et al., 2009; Knoke &
Yang, 2011). Measurement of a social network can be done in a variety of ways, but the
most common approach for offline interactions is a survey instrument called the ‘name
generator’, which asks respondents to nominate individuals with whom they interact in
specific ways (Shakya, Christakis & Fowler, 2017). This sociometric data can then be
analysed using mathematical and statistical methods derived from graph theory
(Wasserman & Faust, 1994).
Interventions making use of sociometric data or other information about social relations fall
broadly into four categories (Valente, 2012): First, interveners can identify individuals
occupying important positions in a network, such as those with high numbers of
connections, and target them for an intervention to leverage their positions (Valente &
Pumpuang, 2007). Second, interventions can be designed so that they induce further
interaction in the network, such as in viral marketing (Kaplan & Haenlein, 2011). Third,
individuals in a network can be segmented and targeted separately based on their position
in the social structure, such as identifying those at the periphery or core of a social group
(Borgatti & Everett, 2000). Finally, practitioners can intervene in the social structure of a
group, encouraging the removal or creation of new ties between individuals. For example,
they could bring together individuals from disconnected groups to facilitate collective action
or learning (Pretty & Ward, 2001). These approaches are discussed more fully in Chapter
three.
Behavioural research in conservation science has largely focused on the attitudes,
behaviours, and knowledge of individual decision makers (St. John, Keane & Milner-Gulland,
2013; Bennett et al., 2017). This has provided insights into how conservation messages can
be framed (Kidd et al., 2019; Kusmanoff et al., 2020), how audiences can be segmented
according to relevant characteristics (Jones et al., 2019; St. John et al., 2018), or how
individuals are likely to respond to financial incentives (Selinske et al., 2017; Sommerville,
Rahajaharison & Jones, 2010). Although frameworks such as the Theory of Planned
Behaviour do account for social effects (i.e. the individual’s perception of social norms), and

13
the literature on message framing emphasises the importance of normative frames, these
perspectives emphasise individual cognition rather than the dynamic social processes
through which conservation behaviours spread and norms are produced (Bodin & Prell,
2011; Prentice & Paluck, 2020).
Research on these social processes is still rare in conservation in the context of behaviour-
change interventions, but several important studies have been published in recent years,
which examine various aspects of social networks in conservation behaviour. For example,
Barnes et al., (2016) examined the relation between network structure and shark bycatch in
a Hawaiian fishery and demonstrated that social networks do shape conservation outcomes.
Turning to the possibilities for intervention, Mbaru & Barnes (2017) used network data to
identify influential fishermen on the Kenyan coast. They showed that those in formal
leadership positions tend to occupy important positions in the social networks of fishermen.
In the related field of agricultural extension, a large randomised controlled trial has
demonstrated the effectiveness of using network theory to target farmers for the
promotion of new sustainable practices (Beaman et al., 2014). More recently, Rhodes et al.
(2020) used simulations to assess the value of social network data for intervening depending
on the social structure of human populations and the spatial distribution of wildlife
populations.
There is still huge scope for conservation science to better understand how social networks
shape conservation outcomes, and to integrate insights from other disciplines to improve
the effectiveness of conservation interventions. In this thesis, I hope to contribute to these
aims using a case study from Cambodia focussed on wildlife poisoning. Using data from a
real intervention, I seek to understand the role of social processes such as information flow
and social influence in producing a behaviour change. I then use simulations to explore how
data on social relations can be used in designing conservation interventions that more
effectively influence behaviour.

14
1.2 Aims and objectives
The overall aim of this thesis is to contribute to more effective design of conservation
interventions, by furthering understanding of the role of social networks in conservation
behaviours.
The objectives of the study are as follows:
1. To synthesise knowledge about social networks and explore their relevance for
conservation.
2. To investigate wildlife poisoning behaviours in Cambodia’s Northern Plains and
inform the design of effective interventions
3. To examine the role of social network processes in the success of a conservation
intervention intended to reduce wildlife poisoning.
4. To understand how information about a social network could be cost-effectively
integrated into intervention design.
1.3 Thesis outline
1.3.1 Chapter 1
In the first chapter, I give an overview of the problems this thesis aims to address and set
out the objectives. I then describe some of the key methodological approaches used in the
thesis and discuss the positionality and ethics of the research.
1.3.2 Chapter 2
Here I give the background and context of my study site, Cambodia’s Northern Plains, and
describe the villages where fieldwork was conducted. I give an overview of existing
conservation interventions and previous research conducted in the area. Finally, I review
knowledge about social relations in the case-study village.
1.3.3 Chapter 3
This chapter synthesises the literature on information flows and social networks in the
context of behaviour change interventions – the central concern of my thesis; and presents
theory that will underlie the remaining chapters. Information flow in social networks is a
well-established field of practice and research in areas such as public health, but it has been
little developed in conservation. I therefore relate these insights as much as possible to
conservation contexts.

15
This chapter is published as: de Lange E, Milner-Gulland EJ, & Keane A. Improving
Environmental Interventions by Understanding Information Flows. Trends Ecol. Evol., 34
(2019), pp. 1034-1047, 10.1016/j.tree.2019.06.007
I wrote this chapter, with input from all authors.
1.3.4 Chapter 4
Conservation interventions are more likely to succeed if they are grounded in a robust
understanding of the problem they are intended to address. In this chapter, I report on a
study of wildlife poisoning in Cambodia's Northern Plains, which forms the basis for the
intervention studied in later chapters. I used a mixed-methods approach, combing
structured surveys with focus group discussions and key informant interviews in 12 villages.
I aim to understand the key groups engaging in or enabling wildlife poisoning, their
motivations, and the social context in which it occurs.
This chapter is published as: de Lange E, Milner-Gulland EJ, Yim V, Leng C, Phann S, & Keane
AM. Using mixed methods to understand sensitive wildlife poisoning behaviours in northern
Cambodia. Oryx. doi:10.1017/S0030605319001492
I wrote this chapter. The study was designed by me, AK, and EJMG, with input from all
authors. EdL, YV, and LC collected the data. All authors reviewed the manuscript.
1.3.5 Chapter 5
This chapter examines the role of social networks in mediating the success of the
intervention aiming to promote a hotline for reporting poisoning. I use complete social
network data in the village, together with three waves of data on knowledge and behaviour,
to model the relation between networks and behaviour using stochastic actor-oriented
models. I focus on the processes of information flow and social influence.
This chapter has been submitted for review at Conservation Biology. I wrote this chapter.
The study was designed by me, AK, and EJMG. All authors reviewed the manuscript.
1.3.6 Chapter 6
This chapter asks: How can information about a social network best be used to inform the
design of interventions that aim to spread information or change behaviour, in a cost-
effective manner? I use complete social network and other forms of data collected in our

16
study village to generate possible intervention targeting strategies. I then use simulations of
behaviour change and information diffusion in the network to assess which strategies are
most effective, and which are cost-effective.
This chapter has been submitted for review at Biological Conservation. I wrote this chapter.
The study was designed with input from all authors. Andy M Dobson and I designed the
simulations models. All authors reviewed the manuscript.
1.3.7 Chapter 7
This chapter synthesises the main findings of this thesis and presents recommendations for
practitioners and for future study.
1.3.8 Other published research
Throughout my PhD I have had the good fortune to be involved with several other projects
and publications, some of which are related to my PhD, but many of which are not. To date,
this has resulted in the following publications:
1. Dobson A.D.M., de Lange E., Keane A., Ibbett H., and Milner-Gulland E. J. 2019.
Integrating models of human behaviour between the individual and population levels to
inform conservation interventions. Philosophical Transactions of the Royal Society B, 374:
20180053
2. Brittain, S., Ibbett, H., de Lange, E., Dorward, L., Hoyte, S., Marino, A., Milner‐Gulland, E.J.,
Newth, J., Rakotonarivo, S., Veríssimo, D. and Lewis, J. (2020), Ethical considerations when
conservation research involves people. Conservation Biology, 34: 925-933.
3. Veríssimo, D., et al. “Ethical Publishing in Biodiversity Conservation Science.”
Conservation & Society, vol. 18, no. 3, 2020, pp. 220–225.
4. Pienkowski, T., et al. “Personal traits predict conservationists’ optimism about outcomes
for nature”. In review at Conservation Letters.
5. Pienkowski, T., et al. “Balancing making a difference with making a living in the
conservation sector”. In review at Conservation Biology.

17
1.4 Methodological approach
This thesis is a work of applied science. I have not attempted to answer any fundamental
questions about social organisation or behaviour. Instead, in this thesis I attempt to
generate knowledge that will help a particular set of social actors to achieve their
objectives; conservationists (Sandbrook et al., 2013), whose goal is to preserve the diversity
of living things that inhabit this planet. Achieving this goal requires tackling complex
problems that do not sit neatly within the boundaries of any scholarly discipline (Kareiva &
Marvier, 2012). The thesis is therefore an interdisciplinary work, drawing on knowledge
from diverse fields. Applied and interdisciplinary conservation research inevitably carries
with it significant epistemological, methodological, political, and ethical implications
(Nicolescu, 2014; Pooley, Mendelsohn & Milner-Gulland, 2013).
There are distinct epistemologies operating within the natural and social sciences.
Conservation science is historically rooted in conservation biology (Soulé, 1985; Kareiva &
Marvier, 2012) and positivism, which posits that there is an objective natural world which
can be understood through the scientific method. But as conservation science becomes
increasingly interdisciplinary and focused on social processes, social scientists have critiqued
the discipline by showing that ‘nature’ is understood and constructed through social,
cultural, and political processes, a perspective known as constructivism (Adams, 2007;
Neumann, 2005). A possible synthesis of these perspectives is critical realism, which posits
that the world (and nature) does exist independently of human knowledge of it, but that
scientific knowledge can only produce a representation of this reality (Neumann, 2005). I
adopt this perspective, since the representation of reality produced through scientific
measurement and observation can be useful for acting upon that reality without making any
claims about the true nature of reality.
Applied science aims to generate knowledge which can be used by social actors. This
knowledge is most likely to be useful when it is co-produced with local practitioners (Beier
et al., 2017; Smith et al., 2009). I therefore undertook efforts to develop this thesis in
collaboration with the Wildlife Conservation Society (WCS) and Cambodia’s Ministry of
Environment. Together, we defined the scope of the research and identified the research
problems through a series of meetings and workshops held in March 2017. This

18
collaboration forms part of a longer and broader collaboration between WCS and my
supervisors, particularly Professor Milner-Gulland.
Conservation interventions, such as those implemented by WCS and the Ministry of
Environment, often follow a project cycle comprising five steps: 1) conceptualising the
problem; 2) planning actions to address the problem; 3) implementing these actions; 4)
analysing and evaluating data from these actions; and 5) learning from these evaluations
(Figure 1.1, Grantham et al., 2010). The thesis follows a similar structure, mirroring the
collaborative process undertaken. Following identification of wildlife poisoning as the focal
issue, my collaborators and I co-designed research to better understand the problem
(presented in Chapter 4). In July 2018, I facilitated a three-day workshop with collaborators
and representatives from local communities, to discuss these results and plan an
intervention. This intervention was implemented by WCS with support from the various
local government departments in February 2019 (see Chapter 2 for more details). I also
planned a monitoring and evaluation approach, for which I conducted three seasons of
fieldwork in 2019. The results of these evaluations are reported in Chapter five and form the
basis of separate communications with collaborators which are intended to facilitate
learning. Chapter six also aims to formalise some of the learning from this process.
This thesis, then, focuses largely on a case-study intervention, taking place in one
community. Case study research is often mistakenly viewed as of limited interest because of
supposed difficulties in generalising from the case (Flyvbjerg, 2006). However, this thesis
makes several contributions which are of general interest (Yin, 2014). First, through detailed
analysis of fine-scale data I unpick the mechanisms and processes operating within our case.
Consequently, I can point to important phenomena which have previously not been
considered in the literature. For example, Chapter five details the importance of social
influence mechanisms in shaping conservation outcomes. Second, I demonstrate the
application and value of novel study designs and analyses which may serve as a model for
future research. For example, Chapters five and six respectively demonstrate new ways of
modelling and simulating how behaviour change occurs in a social network. These methods
could be applied more broadly in conservation research to plan and evaluate interventions.
Taken together, these two points suggest that our case study might therefore be seen as a
paradigmatic case study for future work (Flyvbjerg, 2006).

19
Figure 1.1: The Open Standards Project Management Cycle, produced by the Conservation
Measures Partnership. This represents the five key steps of project management: 1)
conceptualising the problem; 2) planning actions; 3) implementing actions; 4) analysing and
adapting; and 5) capturing learning. For more details, see:
http://www.conservationmeasures.org/CMP/
Third, I replicate and deploy methodologies used or proposed by other scholars. Our
findings complicate or contradict the findings of this previous research, allowing us to
nuance disciplinary understanding and pose further questions. For example, Chapter six
finds that methods of identifying key players used in other conservation contexts are
difficult to apply in Cambodia. In this sense, our case acts as a critical case (Flyvbjerg, 2006).
Fourth, through careful analysis of the context of our case and comparison with other cases,
I suggest some general implications from our findings. For example, Chapter six analyses the
cost-effectiveness of network-informed targeting strategies using our case study
intervention, but I provide some general recommendations by considering how other

20
intervention types might vary from this case study. Finally, effective scientific disciplines
require the production of empirical exemplary cases (Kuhn, 1987). As financial pressures
and career incentives are reducing the proportion of conservation science publications that
are based on fieldwork and data collection from new cases (Ríos-Saldaña, Delibes-Mateos &
Ferreira, 2018), rigorous empirical exploration of case studies is more important than ever.
Throughout this thesis I use the Theory of Planned Behaviour (Ajzen, 1991) to conceptualise
and measure conservation behaviours and socio-psychological predictors of behaviour. In
Chapter 4, I aim to measure the predictors of wildlife poisoning, while in Chapters 5 and 6, I
am measuring respondent’s intention to report wildlife poisoning. Using the Theory of
Planned Behaviour has several advantages. First, it is the most widely studied cognitive
theory and there is strong empirical support for its predictive utility across a wide range of
behaviours (Hagger, Chatzisarantis & Biddle, 2002; Armitage & Conner, 2001), including
dishonest behaviours (Beck & Ajzen, 1991). It has also been used to successfully understand
and predict conservation behaviours, such as participation in protected area governance in
Madagascar (Ward, Holmes & Stringer, 2018) and forest conservation by landholders in the
Gran Chaco (Mastrangelo et al., 2014). Second, there are clear processes and guidelines for
operationalising the theory, resulting in quantitative measures that can be used to compare
individuals and populations (Fishbein & Ajzen, 2010). Third, the theory provides a clear
framework for informing the design of behaviour-change interventions, a consideration at
the core of this thesis (Michie et al., 2008; Hardeman et al., 2002). Finally, the focus on
individual decision-making is compatible with my research questions, which aim to unpack
the role of social relations between individuals that make up a community (Gurney et al.,
2016; Agrawal & Gibson, 1999).
As implied by its name, the Theory of Planned Behaviour, is most relevant to behaviours
that are intentional and planned (Ajzen, 1991). This distinguishes it from other frameworks,
such as social practice theory, which focuses on regular or habitual practices and places the
focus of attention on the practice rather than individual (Kurz et al., 2015). Based on
preparatory qualitative work, I learned that both the act of wildlife poisoning and the act of
reporting poisoning events are likely to be planned actions, and compatible with the Theory
of Planned Behaviour. However, the theory may fail to account for affective (van der Pligt et
al., 1997) or other forms of context-specific motivations. Indeed, one potential difficulty

21
with the Theory of Planned Behaviour is that it measures intentions within very specific
contexts which must be carefully defined in terms of timing, targets, actors, and actions
(Presseau et al., 2019), which is challenging for the behaviours I study.
A final methodological consideration worth discussing is the relation between qualitative
and quantitative data. Both forms of data are important for understanding complex social
problems, and both are employed throughout the thesis in various combinations, enhancing
the quality and explanatory power of my results (Hollstein, 2016). In Chapters four, five, and
six, a sequential exploratory design is used, whereby qualitative data is collected to inform
the subsequent design and deployment of quantitative measures. This ensures the
measures are internally valid and well designed. In Chapter four, qualitative and
quantitative methods are used in parallel, and the results are jointly interpreted, enabling
both breadth and depth in understanding. Chapters five and six also involve some
conversion of qualitative data into quantitative data. For example, I ask people about the
intervention, and convert their open-ended responses into a quantitative knowledge score.
1.5 Positionality & Ethics
1.5.1 My intellectual position
When I began this research, I hoped it would give me the opportunity to become a fully-
fledged social scientist. I had graduated with a bachelor’s degree in biology with a focus on
ecology, through which I had learned to look at the world from the positivist perspective of
a natural scientist. I had also been exposed to little bits of social science, in courses such as
resource management, which piqued my interest in the social complexities underlying
conservation although they framed these as technical problems that could largely be solved
through technical solutions or through market mechanisms.
At the end of my degree, I completed a thesis with Professor E.J. Milner-Gulland (then at
Imperial College London). For the first time, I was exposed to literature on social justice,
equity, and human wellbeing. I had to come to grips with the distinction between
quantitative and qualitative data, the different methods of collecting social data, and many
possible study designs for social research. Not yet fully turned away from ecology, I
subsequently enrolled in a master’s course in ‘tropical forest ecology’, but I soon realised my

22
interests were firmly with the ‘human dimensions’. Thankfully, I had a great deal of
flexibility in selecting a 9-month research project, and Professor Milner-Gulland put me in
touch with WCS Cambodia. In designing my thesis project, I was simply glad to have the
chance of conducting research in collaboration with real conservationists and went along
with whatever WCS said would be useful for them.
I spent five months in Cambodia, at the Seima protection forest, and some time conducting
fieldwork in a Bunong community. This period felt like a baptism of fire. With very little
training or guidance (my supervisors were an ecologist and a practitioner, no social scientist
among them), I was conducting interviews in a context completely different from any I had
previously been in, culturally and politically. Although from an academic standpoint the
project was not a great success, I learned a great deal: about the challenges of social
research; about working cross-culturally; about the complex reality and politics of
conservation; and about the workings of conservation organisations. My ethical and moral
convictions were also being unsettled.
When the opportunity arose to do further research with WCS in Cambodia and with two
excellent supervisors I jumped at it. I began with a strong awareness of my patchy education
as a social scientist, and therefore a determination to learn from a wide variety of social
science perspectives. I also wanted to explore the space between the practitioner and the
scholar more fully. I have learned a great deal throughout the PhD, and my perspectives
have changed substantially. Experience in the field and exposure to anthropological and
geographical thought has disabused me of the notion that society can be explained and
acted on with the mathematical surety of a physical system and impressed on me the
importance of cultural meaning and power. I have thus felt a tension between conflicting
perspectives: between the practitioner’s demands for actionable knowledge, and the
scholarly desire to step back and reflect dispassionately; between the scientists need for
systematic data collection, and human curiosity and empathy in the lives of others; and
between the position of critique and the position of co-production. At times, these tensions
have been challenging and uncomfortable, but I hope they have also been productive.

23
1.5.2 Conservation research in Cambodia
Conducting applied conservation research in Cambodia necessarily enmeshes the researcher
in a complicated web of relations, which must be acknowledged and negotiated (Brittain et
al., 2020).
The collaboration and guidance of the Wildlife Conservation Society Cambodia programme
was essential in producing this thesis. WCS have been active in the landscape for over 20
years and have deep, if complicated, links with local government and local communities (see
Chapter 2, Riggs, Langston & Phann, 2020). For example, several staff were until recently on
secondment from WCS to the local Department of Environment or split their time between
both organisations. WCS support was essential for receiving research permissions, and they
often acted as a broker for me by arranging meetings with government officials.
Throughout the process, I felt that WCS respected my independence as a scholar and gave
me considerable freedoms to pursue the research as I saw fit. Nevertheless, co-producing
this research with WCS meant the questions I tried to answer were strongly shaped by WCS
priorities through negotiation and discussion. It also meant that throughout the research, I
felt some responsibilities towards WCS, such as to provide useful feedback, or to advise on
various questions. As a result of the long periods I spent in the villages, some staff at higher
levels of the organisation began to see me as an informant. I recognised the limitations of
my perspective, but also felt an obligation, and perhaps a pride, in being useful. I felt that
WCS listened with an open mind, even when I brought critique and it is to their credit that
they dedicated staff and resources to the workshops and interventions I facilitated, which
were new and challenging. Nevertheless, there were clear institutional boundaries to what
WCS could participate in. To a large extent, these are shaped by their relation to the State.
Another important relation for producing this research was my relationship with my
research assistants. Over the course of the PhD, I worked with seven individuals. Yim Vichet,
Leang Chantheavy, Bun Sothea, Chor Siekleang, Seang Samreaksa, and Roeurn Rithy, were
all undergraduate students (or recent graduates), recruited from the Royal University of
Agriculture or the Royal University of Phnom Penh. Vichet and Chantheavy were part of the
team at the start of the project, and they contributed significantly to research design and
survey piloting. Their contributions are recognised with co-authorship of Chapter four. The
other researchers joined the project for several months at a time, such as during their

24
summer break, and were responsible for implementing survey protocols that had already
been established previously. Nevertheless, I tried to get their input wherever possible, and
to give them ownership of their own working methods and patterns as much as possible. At
a later stage I also recruited Hout Vimean, a more experienced freelance researcher, who
lives in Preah Vihear province. This allowed me to leave the research team to work
independently while I travelled to meetings elsewhere.
The research assistants were the main point of interaction for most respondents (Figure
1.2). Aside from the practical considerations of their involvement (translating conversations,
making up for deficiencies in my language skills, and dividing the workload to conduct
surveys more quickly), their presence also served to legitimise our status as ‘students’ and
facilitated relations with the host families. Although the research assistants tended to be
from more affluent parts of the country and were often surprised at the basic conditions in
the villages, they inevitably were a more familiar presence for villagers and may have
reduced suspicions. I observed that they often got along well with our host families, they
helped to cook and played with the children, and there was genuine mutual exchange of
stories and experiences.
Figure 1.2. Vichet and I interviewing a respondent

25
Conducting academic research in Cambodia’s frontier regions, one is continuously aware
and made fearful of state power (Schoenberger & Beban, 2018). In order to be able to carry
out academic work, researchers are forced to adopt various strategies (Schoenberger &
Beban, 2017). Without concealing my relationship with WCS, I attempted to construct an
identity as a ‘neutral’ academic (or even as the less threatening ‘student’), carrying letters
from the university and many copies of official permission letters. In conversation, I
emphasised the aspects of the research that are ‘apolitical’ and emphasised my status as
naïve outsider.
Nevertheless, in Cambodia the presence of outsiders in remote forest areas brings the
potential for witnessing violence or corruption. Surveillance is therefore constant, and at
some moments is brought vividly to the fore. For example, after reaching one remote village
and spending a night at the chief’s house, we were awoken by a group of men loudly
discussing our presence. The village chief spent some time on the phone, speaking to his
superiors, before apologetically demanding that we leave his village. Our research
permissions only applied to villages within the protected area, while this village straddled
the protected area border and half of the households were outside. The only way for the
chief to resolve this ambiguity was to play it safe and refuse us. In another case, I had
walked to a village shop to buy a snack and hang out when several trucks carrying illegally
logged wood passed by. A policeman was keeping watch and I could see that he was holding
up his phone and filming me, ensuring I did not interfere with the operation. Inevitably he
approached me. After a brief chat where I explained who I was, he promised to visit us later.
In the evening, he did visit us and carefully documented all our research permits and
identity documents.
The result of this surveillance, and of wider restrictions on the activities of civil society
(extending to the murder of forest activists and the closing of NGOs who are too critical of
the government) are self-censorship and a narrowing of the space available for discussion
(Morgenbesser, 2019; Beban et al., 2019). As conservation researchers working with an
NGO, it means we are limited in the research topics we can address and the conservation
actions we can recommend. The processes leading to large-scale deforestation, such as
industrial logging and land-grabs (Billon, 2000; Beauchamp, Clements & Milner-Gulland,
2019; Milne, 2015), are largely off-limits, although there is behind-the-scenes lobbying from

26
civil society to prevent land-grabbing, and widespread resistance from communities
(Verkoren & Ngin, 2017; Baird, 2017; Sokphea, 2016; Young, 2019, 2019). Much of the
action undertaken by formalised NGOs such as WCS instead focuses pragmatically on
working with local communities, aiming to improve livelihoods and conserve forests in ways
that do not overtly challenge state power, but which do further local control over forests
while formalising and influencing access to forest land.
Another factor contributing to this fraught atmosphere is the recent memory of civil war
and of the Khmer Rouge genocide. The spectre of violence and chaos is frequently used by
the state to legitimise its own rule, and to control local populations (Schoenberger & Beban,
2018; Gidley, 2017). Villagers’ own memories of the Khmer Rouge period also produce
trauma and a tendency to avoid potentially sensitive issues or conflicts. In many villages,
there are deep social fissures originating from past conflicts, and there is a general lack of
trust between villagers who are not directly related (Marston, 2011). These factors pose
sensitive challenges to researchers for which there are no straightforward answers.
On top of this, the politics of conservation are complex at the village level. Within each
village, there are social classes which intersect in different ways with village conservation
institutions, and this influences the positionality of the researcher in relation to each
household (Biddulph, 2015). The sensitive and controversial nature of our research topic
(wildlife poisoning) added a further dimension to this. Some villagers evaded us and our
questions, while others were glad to speak with us. Our best efforts to appear neutral and
unaffiliated could never correct for the unusual presence of a European researcher in the
village (particularly when previous foreign researchers had come to speak about
conservation issues), nor could it paper over the potentially alarming questions we were
posing. Chapter four discusses this issue in more detail for the surveys I conducted in all ten
villages and describes the methodological choices I made to overcome it.
The bulk of our work (Chapters 5 & 6) was focussed in one village, offering the opportunity
to develop relationships with villagers and gain a richer understanding of our evolving
positionalities. Over time, through exposure, and perhaps because my Khmer language skills
improved, my relationships with certain people in the village changed. I developed a
positive and familiar relationship with the village chief and his family, at whose home we
stayed for many months over the course of the project. By the end of my fieldwork, they

27
asked me to stay a while longer so I could join them at a village party happening a few days
later, we made plans for them to visit me in Phnom Penh, and I occasionally speak to them
on the phone from Europe. The chief seemed invested in my research project and regularly
expressed his belief that we were catalysing positive developments in the community. He
was exceedingly helpful in organising village events, such as the feedback presentation I
held during my last visit, where his wife and her sister prepared meals for the attendees.
Over time, as research participants came to understand my presence and my research more
clearly, their attitudes towards me changed. Initially, there was a uniform sense of dutiful
and curious participation. But as the nature and purpose of the research became clearer,
participants could decide whether they believed it was beneficial to participate, whether the
research might threaten their livelihoods, or simply whether refusing to participate would
bring consequences from higher authorities. As a result, some became friendlier and more
supportive, taking time to chat, ask questions, or comment positively on the research.
Others became more evasive, rude, or simply refused to participate. Their responses were
probably linked to their attitudes towards the research topic, their participation in
conservation or illegal activities, or their relationships with supportive figures like the village
chief. However, I do not believe the village chief’s power is such that anyone felt coerced to
participate because of my relationship with him.
At the end of my project, I returned to the village and organised an event at the village hall.
With the chief’s help I sent word around the village that we would share some of the
findings of the project and share a meal of noodles. More than 75 people attended, in a
village of 155 households. I felt that this was a high rate of participation, potentially
reflecting a high level of interest. The village chief and commune chief opened with rousing
words of support and I presented my results in Khmer (a proud moment for me). We left a
poster hanging and distributed plain-language summary leaflets. Throughout the
presentation, the audience indicated that they had understood what we were saying. I was
particularly impressed by the silence that fell when we began to talk about the data from
the village, as talk about poisoning in general was accompanied by loud chatter. When time
for questions came, one man stumbled forward and asked a question about whether it was
truly bad to eat poisoned meat. The others shouted, “he’s drunk” and apologetically pushed
him away. There were no further questions.

28
1.5.3 Research Ethics
This research was approved by the University of Edinburgh School of Geosciences ethics
committee (No. 132, 2017, & No. 191, 2018). Research permissions were received from the
Ministry of Environment of the Royal Government of Cambodia, and the governor’s office of
Preah Vihear province. Before commencing research in any village, we gained the free,
prior, and informed consent of the village chief. All respondents and participants in the
research also gave their free prior and informed consent verbally before participation. This
followed us explaining our identities, the purpose of the research, and providing guarantees
of confidentiality. Verbal consent was considered appropriate due to high levels of illiteracy.
Following collection, the data was anonymised and is kept on an encrypted, password-
protected device.
Collection of network data may raise special ethical concerns (Kadushin, 2005; Klovdahl,
2005). Firstly, data collection is not anonymous. This makes a thorough explanation of the
research process, data handling, and confidentiality arrangements prior to receiving consent
particularly important. In the context of rural Cambodia, this was challenging, given limited
understanding of research processes and terms like ‘data’. We explained that we would
record their responses but not share them with anyone or any other organisation. I
anonymised the data following production of the networks.
Second, respondents can nominate others who have not given consent to participate in the
research. As a result, non-consenting individuals may still be included in the dataset and in
subsequent analyses. However, this is not unusual in social research, as many other domains
of research or methods of data-collection will collect information from respondents about
their relations with or ideas about other people. Nevertheless, because very few
respondents refused to participate in data-collection, we were able to remove the names of
non-consenting individuals from our data (i.e. individuals who refused consent, or who we
were not able to ask for consent) (Borgatti & Molina, 2005).
Third, there is a risk that individuals with knowledge of the study population will be able to
infer the identities of respondents from presented network data. For example, they may see
a network diagram and be able to infer the identity of highly connected individuals. In our
case, I believe the network is sufficiently large to eliminate this risk (Borgatti & Molina,

29
2005). Furthermore, in all publications (and in this thesis), the location and name of the
village is withheld.
A final ethical question concerns the distribution of benefits from this research (Kadushin,
2005). The prime beneficiary is me: from this data I will attain a degree, build a reputation
from publications and presentations, and raise funds or secure future employment. WCS
and the provincial Department of Environment are also clear beneficiaries. The results of
this thesis provide them with valuable information which they can use to advance their
activities and interests. My research assistants attained short term, but well-paid contracts
of employment. They received training in a variety of research methods and developed a
network of conservation and development practitioners in Preah Vihear. Almost all have
received references from me and found permanent employment. Chantheavy and Siekleang
now work with WCS in Preah Vihear, while Sothea works for WWF, another conservation
NGO.
Despite my best intentions, benefits to the research participants are variable and indirect.
Working collaboratively with WCS, my intention was to design and inform actions that
would be supported by and beneficial to local communities. The interventions we piloted
aimed to reduce pesticide misuse, and thereby reduce conflict over poisoning, risks to
human and livestock health, and improve environmental quality. However, these benefits
will be felt unevenly within the village, and some, perhaps those engaging in wildlife
poisoning, may perceive negative consequences from this research if they lose access to a
source of food or income. Although, I did not find that poisoning was directly related to food
insecurity, this may still pose a burden to poorer households. To avoid undue burdens, our
interventions were not coercive, and instead aimed to be persuasive. We invited community
representatives to participate in intervention planning, although in future I would work to
make the process more accessible to a wider range of community members and engage
them at an earlier stage in the research process.
Finally, I hope this research benefits the wildlife of Cambodia and helps species such as the
Giant Ibis, White-shouldered Ibis, White-rumped Vulture, Slender-billed Vulture, Red-
headed Vulture, Banteng, Sarus Crane, Lesser & Greater Adjutant, White-winged Duck, and
many others, to avoid extinction.

30
2. Background
2.1 Cambodia
Cambodia is a relatively small country in peninsular South-East Asia, with a population of
approximately 16 million people. Over 95% of the population is Khmer speaking, but there
are significant populations of Cham, Vietnamese, Chinese, and several highland groups such
as the Bunong. Historically, the Khmer population has been concentrated in the low-lying
valleys of central Cambodia, around the Mekong river and in the floodplains of the vast
Tonle Sap lake. Away from these areas, the country is densely forested and rises into hills
and mountains, which are sparsely populated. From around the 9th Century AD, rice
production in the valley areas supported the Angkor civilisation, which built huge cities and
monuments, and developed a rich culture until it’s decline in the 14th and 15th Centuries
(Chandler, 2018).
The events and structures of the ensuing period are less well documented, but it is generally
understood to be a period of frequent conflict where neighbouring states (Siam and Viet
Nam) exercised control over different parts of the Cambodian territory and population.
Khmer elites sought protection from these powerful neighbours and were often set against
one another. A low-point was reached in the 19th Century, and in 1863 Cambodia became a
protectorate of France, which administered Cambodia as a colony until 1949, and Cambodia
achieved full independence in 1953 (Chandler, 2018).
Following independence, Cambodia entered a further period of intense turmoil. King
Sihanouk’s repressive government bred discontent among leftist intellectuals and among
part of the rural population. Some revolutionary groups took arms against the state and
already controlled large parts of Cambodia’s territory by 1952. A small group of intellectuals,
including Pol Pot, returned from studies in Paris and established insurgent bases in the
remote province of Ratanakiri – becoming the Red Khmer, or the Khmer Rouge. During the
American war in Viet Nam (1955-1973), Sihanouk allowed the Viet Cong to transport
materials and manpower through Cambodian territory. In response, America heavily
bombed Cambodia, causing mass dislocation and suffering for rural populations, many of
whom sought refuge in cities or joined the Khmer Rouge insurgency. In 1970, riots broke out
in anger at Sihanouk’s tacit support of North Viet Nam, and Prime Minister Lon Nol seized
power in a coup backed by the US military.

31
On 17 April 1975, the Khmer Rouge defeated Lon Nol’s forces and took control of Phnom
Penh, beginning a nightmare that lasted for three years and eight months. The new regime,
called Democratic Kampuchea, immediately evacuated urban populations to the
countryside and established a system of communes for production of rice, food, and other
raw materials. Families were separated, and others were forced to marry. Communes were
forced to work to meet impossible production quotas, and the result was mass famine. The
regime distrusted and murdered intellectuals, and other so-called ‘new people’ with
backgrounds not suitable for an agrarian society, such as those who spoke foreign languages
or wore glasses. Surveillance and violence became organising principles of the country. In
three years and eight months’ time about 2.5 million people died; around a quarter of the
population.
In 1978, neighbouring Viet Nam invaded Democratic Kampuchea and established a pro-
soviet one-party state, the People’s Republic of Kampuchea. However, fighting continued,
and a coalition of factions led by the Khmer Rouge held on to the country’s seat at the
United Nations. The state government under Prime Minister Hun Sen (himself a defector
from the Khmer Rouge) from 1985 attempted to rebuild the state while fighting the Khmer
Rouge who held out in the north of the country. A 1991 peace accord negotiated in Paris
provided for a cease-fire and elections to be held in 1993, and a United Nations Transitional
Authority (UNTAC) was established to supervise and administer these arrangements. At the
1993 elections, Hun Sen’s Cambodian People’s Party (CPP) narrowly lost to the royalist
FUNCINPEC party, but a coalition government was formed. However, in 1997 violent clashes
occurred between the two parties, and Hun Sen once again took power in a coup. He
remains prime minister to this day.
Today, political scientists characterise Cambodia as a hegemonic authoritarian state as Hun
Sen has used a combination of violence, patronage, propaganda, and legal manoeuvres to
diminish the opposition and win election after election (Morgenbesser, 2019). The CPP has
established a ‘shadow state’, raising funds greater than those in official state budgets from
connected businessmen and exploitation of natural resources, and dispensing these funds
to the population to buy support (Strangio, 2014; Craig & Kimchoeun, 2011) while state
budgets are largely dependent on foreign aid (Ear, 2007). Today, Cambodia’s economy is

32
growing rapidly, but unequally, and the majority of the population is still employed in
agriculture (Hughes & Un, 2011).
2.2 Cambodia’s Northern Plains In recent decades, Cambodia’s forests have been the site of intense and often violent social
and ecological change. In just twenty years from 2000 to 2020, over a quarter of Cambodia’s
forest cover has been lost (World Resources Institute, 2014), indicating large-scale
degradation and loss of habitat for numerous endangered species, and the transformation
of rural livelihoods (Chann, 2020; Diepart & Dupuis, 2014). In post-conflict Cambodia, both
land and forests emerged as vital resources for smallholders as well as for the consolidation
of state power (Loughlin & Milne, 2020; Billon, 2000; Cock, 2016). Powerful actors have
used the state apparatus to claim and exploit large areas of forested land, excluding and
marginalising local smallholders (Billon, 2000; Loughlin & Milne, 2020; Davis et al., 2015; Le
Billon, 2002). At the same time, despite rapid economic growth (Hughes & Un, 2011), the
forest frontier remains increasingly important for rural families dependent on natural
resources (Beauchamp, Clements & Milner-Gulland, 2019; Beauchamp et al., 2018; Ken et
al., 2020). Smallholder farmers are also increasingly being driven to the forest frontiers
through dispossession of land in the central provinces, increasing debt burdens (Green,
2020), or the closure of urban labour markets (Kong et al., 2019; Chann, 2021).
Some of the largest forests remain in Cambodia’s north, where years of armed conflict in
the last holdout of the Khmer Rouge prevented economic activity and kept infrastructure
development at bay (Chandler, 2018). The forests in this landscape, referred to as the
Northern Plains landscape (largely located in Preah Vihear province), comprise the largest
remaining fragments of lowland forest in mainland Southeast Asia, and were once home to
dense populations of big mammals, such as wild cattle (Gaur, Bos gaurus, and Banteng, Bos
javanicus). The mosaic of evergreen forest, dry deciduous forest, and grasslands (Figure 2.1),
is the result of a long history of migrating grazers and people using fire and irrigation to
shape the landscape for rice cultivation (Wharton, 1966). Today, at least 28 Critically
endangered or Endangered species persist here, including Cambodia’s national bird, the
critically endangered Giant Ibis (Thaumatibis gigantea, Clements et al., 2010). Other
important species are the White-shouldered Ibis (Pseudibis davisoni), Sarus crane (Grus

33
antigone), Greater adjutant (Leptopilus dubius), Masked finfoot (Heliopais personatus), Red-
headed vulture (Sarcogyps calvus), White-rumped vulture (Gyps bengalensis), Slender-billed
vulture (Gyps tenuirostris), White-winged duck (Asarcornis scutulata), and Pileated gibbon
(Hylobates pileatus). There may also be small populations of the Asian elephant (Elephas
maximus) and the Dhole (Cuon alpinus). The Northern Plains is thus a site of considerable
conservation interest, centred on three protected areas: Chheb, Kulen Promtep, and Prey
Preah Rokha wildlife sanctuaries (Fig 2.2). All three are managed by the Ministry of
Environment of the Royal Government of Cambodia, with technical support from WCS
Cambodia.
Figure 2.2. The dry forest in Cambodia's Northern Plains
Villages are scattered throughout the protected areas, many of which originated from small
groups of Khmer Rouge soldiers or other groups evading state control in the remote forests
(Scott, 2009). Some also include households belonging to indigenous groups such as the Kuy
(Swift, 2013). Subsistence rice farming and collection of forest products such as wild meat,
vegetables, and resin-tapping, remain important livelihood activities. Historically rice
growing occurred in a swidden pattern, but today it is usually fixed (Swift & Cock, 2015).

34
Land tenure can be held jointly by a husband and wife, comprising a single household, and
one hectare of land is typically considered the minimum required to support a small family.
But, with increased integration into the market economy and loss of access to natural
resources, livelihoods are changing rapidly. Besides production of rice, farmers increasingly
clear land to produce cash crops for export, such as cassava or cashew (Beauchamp,
Clements & Milner-Gulland, 2019; Beauchamp et al., 2018), or speculate on land prices.
Figure 2.2: A map of Cambodia's Northern Plains landscape, Preah Vihear province, showing
the three protected areas: Kulen Promtep; Prey Preah Roka; and Chhep Wildlife Sanctuaries.
Balancing conservation goals with local communities' aspirations for development is a
central challenge for governance in this landscape (Riggs et al., 2020). With the support of
WCS, the government has implemented a complex set of management interventions to
achieve these aims. Underpinning these interventions is the zonation of protected areas
into core protection, sustainable use, and community zones, each with distinct rules
regarding land use and other activities. The Ministry of Environment conducts patrols to
enforce these rules (Paley, 2015). Participatory Land Use Plans were developed by WCS with

35
some local communities to strengthen village institutions for managing community land and
forests. To monitor and enforce compliance with these rules, many communities elect a
community protected area committee (Beauchamp, Clements & Milner-Gulland, 2018a).
Other communities may have a community forest, with a similarly elected management
committee (Poffenberger, 2013). However, the community forest model is a remnant of
past times when protected areas fell under the jurisdiction of the Forestry Administration.
The Ministry of Environment replaced community forests with the community protected
area model before the period of research.
To incentivise conservation and compliance with community rules, three payment schemes
were instituted by WCS in villages in and around the Northern Plains' Protected Areas
(Clements et al., 2010). The first comprises direct payments to individuals for locating nests
belonging to priority bird species, and for protecting the nests from disturbance (Clements
et al., 2013). Second, in three communities with suitable locations, community-based
ecotourism projects have been developed. These communities have received finance and
support to establish wildlife-based tourism sites and receive income from tourists. Part of
this is paid directly as wages to community members, but the largest part is paid into a
village development fund which is managed and disbursed by an elected committee. Third,
the Ibis Rice project buys rice from conservation-compliant farmers at 40% above market
prices. Participating farmers agree to follow conservation rules, use organic agriculture, and
have their land mapped. They may not clear forest for new land unless approved by the
local government (Clements et al., 2020).
Long term impact evaluation of these programmes started in 2008 and has continued until
the present day (Beauchamp, Clements & Milner-Gulland, 2018a; Clements et al., 2013;
Clements & Milner-Gulland, 2015; Clements et al., 2014, 2020). These evaluations show that
households within the protected areas are increasing their incomes and their socio-
economic status, but at a lower rate than households outside the protected areas.
Conversely, within the protected areas, households have more secure tenure over natural
resources such as resin trees. Participants in the Ibis Rice project improved their status more
rapidly than others and had improved rice yields and food security. In addition, a
randomised controlled trial conducted since 2018 shows that participating households were
four times less likely to engage in deforestation. However, there are still significant barriers

36
to participation in Ibis Rice for poorer households or those without adequate land (Clements
et al., 2020).
2.3 Study villages
This thesis includes data from ten villages spread across two protected areas (Chhep and
Kulen Promtep) in the Northern Plains. A further two villages outside the protected areas
were used to pilot the methods employed in Chapter four. These villages were all included
in previous research, meaning that there is substantial knowledge and data available about
livelihoods and wellbeing in each village (Beauchamp, Clements & Milner-Gulland, 2018a;
Beauchamp et al., 2018). The villages are varied. Some are predominately Khmer, while
others are largely Kuy. Some have over 300 households while others have less than 100.
Some are located very remotely, inaccessible by road during the rains, while others are
located near covered roads and market towns. Furthermore, some have high rates of
participation in multiple conservation programmes, while others do not.
Chapters five and six focus on just one village. This village consists of around 155 households
located in Chhep wildlife sanctuary, close to important wildlife habitat. The village has been
a focus of conservation attention for over a decade. It was among the first to participate in
the Ibis Rice programme and has an unusually high rate of participation in this programme.
For example, in 2016-2017, 111 households signed sale agreements to participate in Ibis
Rice (this does not mean all were compliant). The village has a community forest instead of
a community protected area. The village was chosen as the site of the pilot intervention and
as the focus for this research because of its size, ease of access, and because the village
chief had previously acted against wildlife poisoning.
According to the village chief, the village was first settled shortly after King Sihanouk began
his reign in 1941, at a location a few hundred meters from the current place. It was moved
to its present location due to flooding, and to be nearer to a small cart track which passed
through the forest. This had become possible because the Royal government at the time
had cracked down on bandits, who were previously raiding settlements and travellers along
the track. Older villagers recall a close-knit community of around 25, mostly related,
households that was largely self-reliant and interdependent. Wildlife was abundant and was

37
the primary source of meat besides fish, and villagers would harvest and process forest
products to trade at the Laos border on the Mekong river, approximately 30km away.
The chief told me that at the time of the Khmer Rouge regime (1975-1979), the villagers
were forced to re-organise their production on collective lines but were permitted to remain
in the village. Since conflict ceased and the Royal Government of Cambodia regained control
of the province in the 1990s, rapid transformations have occurred. In 2004, a primary school
was built, and in 2014 the first high quality (dirt) road was constructed nearby, reliably
linking the village to a market town, the border markets, and to a nearby village with a high
school where many village children travel every day. These changes have also attracted
migrants in search of land or commercial opportunities. For example, at least two
households have arrived in the past five years to open small shops.
Since construction of the road, many households have physically relocated, as the road
provides better access to transport and to the rice fields. The village therefore now consists
of two sections. First, the ‘old’ village core of about forty households laid in a dense grid and
another 34 households arranged on a slightly newer road grid. In this section, one also finds
the primary school, the village hall, and two shop-houses. The second section, separated
from the first by several hundred metres of fields, comprises households laid out along the
new road. The farthest households on either end of this section are about 8km apart, and
the junction into the old village is located roughly halfway between them. Close to the
junction there is also a small police post which is manned two days a week, a small garage
(motorcycle repair shop) and two well-supplied general stores. Many households maintain
small wooden huts at their fields for the intensive work seasons.
2.4 Social life in the village
As much of this thesis is about the role of social networks in producing conservation
behaviour change, it is worth discussing what this means within the context of the village
being studied. A social network is a way of conceptualising the relations and interactions
between individuals. For the purposes of my analysis, I measure very specific forms of
interaction between individuals, which are described in further detail in the relevant
Chapters (5 & 6). The most important of these ties are the ties between members of a
household, and those who visit one another at home. To understand the importance of

38
these ties, and how they fit into a wider village life, it is helpful to discuss the nature of
social life in rural Cambodia.
While it may be a slight exaggeration to say that “every household is an island” (Ovesen,
Trankell & Ojendal, 1996, Figure 2.3), it is true that social relations in rural Cambodia rarely
extend beyond the kinship group. Each household organises its own agricultural or
commercial production and therefore acts relatively autonomously (Ovesen, Trankell &
Ojendal, 1996), and a household can consist of multiple generations. Often, there is a
preference for adult daughters to remain near the parental home and have their husbands
join them, and it is not uncommon for a separate house to be built within the parental
compound. On the other hand, sons may travel some distance when they marry to be near
the wife’s family. Although these arrangements are flexible, and may depend on the
availability of land or other factors, social life in the village tends to be geographically
arranged around the parental home and held together by female relations in this way
(Ledgerwood, 1995; Crochet, 2011). The construction of the road passing the village
disrupted this spatial organisation for those families who decided to move, but the
traditional patterns of household co-location have resumed since, forming a “rosary bead”
of compounds spaced along the road – a pattern familiar across Cambodia, and motorbikes
now enable families divided geographically to visit one another with relative ease.
Crochet (2011) describes how in another village, people “did not even know the names of
the […] people, even though they were 200 metres away”. To some extent, this holds true
for our village as well, particularly for households along the new road, but within the old
core most people are acquainted and may even be distant relatives. This may be a feature
of the relative stability experienced by households here during the civil war. Nevertheless,
even if they do not know one another’s names, there are still social interactions occurring
between unrelated households (Ebihara, 1968). Primary among these is the reciprocal
exchange of labour on the rice fields during labour-intensive periods such as harvest, but
other important interactions include money lending, the sharing of food or tools, and
tending of animals. These interactions are reciprocal because they are often limited to a
moment of exchange which both parties feel is beneficial, but being able to partake in such
exchanges is seen as an important moral and social marker (Sedara, 2011). Of course,
weaker interactions occur daily, such as chitchat when passing on the road or at the shop.

39
Figure 2.3. Two contrasting village houses. Left, a small house in a recently cut area of forest.
Right, a larger house with a painted roof in the core of a village. In front are palm mats
which will serve as roofing for a new structure.
There is a strong temporal dimension to social interaction. This is tied to the annual rice-
growing cycle as most residents are subsistence rice farmers. For large parts of the year,
households relocate to small huts at the fields, to work the crops more efficiently or watch
over them. Social interaction is thus confined to small household groups, or to other
households, usually kin, who may be farming nearby (personal observation). When
harvesting or transplanting is complete, the village regains its population (Ebihara, 1968).
These times are marked by the important religious and social festivals, such as pchum ben (a
15-day ancestor festival) and the Khmer new year, at which social relations are re-affirmed
and enacted through acts of patronage (Ledgerwood, 2012b).
It is a matter of debate whether rural Cambodian communities have always lacked durable
village-level institutions beyond kinship, or whether this is the result of decades of violent
conflict and, more recently, neoliberal reforms (Marston, 2011; Ebihara, 1968; Springer,
2009). Nevertheless, our village is not unique in this lack of social institutions. Furthermore,
a Buddhist wat (temple), which is known to play an important role in building social
solidarity in other villages (Ledgerwood, 2012a), is not present here - the nearest wat is in
the next village. There is, however, a village chief appointed by the state who is responsible

40
for various bureaucratic tasks, and who enjoys some respect (Ledgerwood & Vijghen, 2002).
Unusually, the village sub-chief is a woman. Furthermore, as described previously,
conservationists and local government have made some efforts to develop village
institutions for governing land use, including a community forestry committee and a ‘village
market network’ to manage participation in Ibis Rice, but the role of these institutions in
social life appears to remain limited.
2.5 Wildlife poisoning and interventions
In 2015 the first reported cases of wildlife poisoning were documented in Preah Vihear
province, and poisoning was identified as a little-understood conservation threat (Loveridge
et al., 2019). Chapter four reports an in-depth study of wildlife poisoning. However, I give a
brief overview of this phenomenon and the interventions piloted to reduce wildlife
poisoning here, as this informs the approach taken in Chapters five and six.
We determined that poisoning was primarily carried out by young men aged 20-30, and
young children aged 10-15, as a method for harvesting wild meat. There was no clear
relation with food insecurity; instead, it appears that (mis-)perceptions about the health
risks of poisoning play a stronger role in decisions to use poison. Furthermore, most villagers
had strongly negative attitudes towards poisoning and perceived negative social norms
around poisoning, largely due to potential negative impacts including loss of domestic
animals, fisheries, access to clean water, and risks to human health. In several villages, local
authorities have acted against poisoning, such as by disciplining poison hunters, or
discussing the problem at village meetings (Chapter 4).
In 2018, I facilitated a three-day workshop with WCS staff, provincial department of
environment staff, and members of local communities. We developed a conceptual model
(Figure 2.4, Margoluis et al., 2009) of wildlife poisoning and used a social marketing
framework (Smith, Verissimo & Macmillan, 2010) to generate possible intervention
strategies. For the purposes of this research, we used a number of these strategies to design
a pilot intervention, which was carried out in one village in February 2019.
The intervention was intended to: a) promote the use of a reporting hotline to improve
detection and response to poisoning events, and b) reduce community support for

41
poisoning by increasing the perception of risk to human health and from law enforcement.
In addition, we believed that these two goals would reinforce one another, as concern
about poisoning would increase usage of the hotline, while increased reporting would
further increase the salience of poisoning and the risks of detection for poisoners (Saypanya
et al., 2013). The idea of a reporting hotline came from literature on similar interventions in
Laos and was enthusiastically endorsed by workshop participants (Saypanya et al., 2013).
Four barriers to reporting poisoning were identified:
• Unclear procedures & lack of knowledge
• Low concern about personal risks of poisoning
• Fear of provoking conflict with poisoners
• Perceptions that others would disapprove.
The intervention was therefore designed to alter these perceptions (Figure 2.4). The
intervention consisted of an event with four components. First, trusted messengers,
including officials from the health, environment, and agriculture departments as well as a
veterinary expert, gave presentations describing the risks of poisoning to human health,
livestock, the environment, and legal risks. Past victims of poisoning from a nearby village
also provided testimony with graphic images. Second, practical information about the
reporting hotline was provided by WCS staff, explaining the expected response from
authorities and anonymity guarantees. The hotline was endorsed by the village and
commune chiefs.

42
Figure 2.4: a simplified representation of the theory of change for our pilot intervention developed during a three-day workshop

43
Third, a short film was shown, which dramatised the moral dilemmas and conflicts that
might be faced in deciding whether to report poisoning (Bicchieri, 2017b). The main
character resolves these dilemmas with advice from his parents and the village chief, and
eventually is reconciled with the poisoner after he reports the poisoning. The film also
depicts two children who become sick and miss school after bathing in poisoned water.
Finally, members of the audience were invited to make a public pledge (Niemiec et al.,
2019) of vigilance against poisoning and safe pesticide use. This was framed as a ‘good
citizenship’ pledge, and pledgees received a certificate from the commune chief.
Forty-one people attended the event on invitation (Figure 2.5). These were the parents of
children aged between 10 and 15 years, who we selected because we believed parents
would be especially concerned about poisoning and would be able to influence their
children who may be poisoning. In addition, it was necessary to select a small group for the
purposes of our research. We produced and disseminated several types of material (Figure
2.6) to ensure the intervention messages would remain salient, and to facilitate
communication of the messages to other residents in the village. Materials with information
about the hotline included colourful stickers and small calendar leaflets, which people might
display, keep at home, or share with others. We printed colouring books for children with
the story from the short film, and distributed DVDs. Finally, as well as receiving certificates,
pledgees also received large and attractive posters describing their commitments which
they could display on their houses. This intervention forms a core component of Chapter six,
and especially Chapter five, which analyses the impacts of the intervention on knowledge
and psychological outcomes in the village.

44
Figure 2.5: a WCS staff member speaking at the pilot event.
Figure 2.6: Material disseminated in the intervention. Clockwise from top: 1) a villager receiving a good citizenship certificate from the commune chief, 2) a poster given to good citizen households, 3) a still from the short film (Chan), 4) the Chan story book distributed to parents, 5) a sticker with the hotline number.

45
3. Improving environmental interventions by understanding
information flows
This chapter is published as: de Lange E, Milner-Gulland EJ, & Keane A. Improving
Environmental Interventions by Understanding Information Flows. Trends Ecol. Evol., 34
(2019), pp. 1034-1047, 10.1016/j.tree.2019.06.007
3.1 Abstract
Conservationists are increasingly interested in changing human behaviour. One key aspect
of such interventions that has seen little attention is information flow. Different patterns of
interpersonal communication and social structures within communities influence the
adoption of behavioural changes through processes of social influence and social
reinforcement. Understanding the structure of information flow in a group, using tools such
as social network analysis, can therefore offer important insights for interventions. For
example, communications may be targeted to highly connected opinion leaders to leverage
their influence, or facilitation of communication between distinct subgroups may enable
collective action. Incorporating these approaches into conservation interventions can
promote more effective behaviour change. This review introduces conservation researchers
and practitioners to key concepts underpinning information flows for interventions
targeting networks of individuals.
3.2 Glossary
Bridge; an individual or individuals that connect two subgroups in a community, or connect
neighbourhoods in a network.
Centrality; various measures indicating an individual’s influence in a network (i.e., degree
centrality is the number of connections an individual has to others in the network).
Channels; the technology or media used for communication, such as television, radio, social
media or interpersonal communication.
Complex contagion; contagions, such as behaviours, that require social reinforcement
before they can be adopted by individuals.

46
Contagion; the cultural items, such as behaviours or information, that spread within a
group.
Diffusion; the spread of cultural items such as behaviours, ideas, or knowledge.
Homophilous groups; are groups that consist of similar individuals that are highly
connected. The same community may be characterised as homophilous or heterophilous
depending on the behaviours and interactions in question. For example, a small, rural
community of rice farmers is homophilous in the context of agricultural activity, but may be
heterophilous in terms of the forest products they gather.
Incubator neighbourhoods; a small group of individuals that are socially connected and that
are collectively targeted for adoption of a new behaviour.
Induction; attempts to stimulate information flows and encourage further communication
of a message, by incentives or incorporating encouraging features into the message.
Inductive messaging; messaging strategies that are designed to encourage further
dissemination or spread of the message, such as by incentivising communication, facilitating
signalling, or incorporating encouraging features into the message.
Information flow; the overall pattern of communication within a group or the route taken
by a specific message within the group.
Information transfer; the directed communication of a message by the conservation to its
intended recipient, whether directly or indirectly
Opinion leaders or hubs; highly connected individuals who can exert influence on their
groups, often key to disseminating new information or behaviours.
Social norms; expectations or rules around appropriate behaviour within a social context.
Social reinforcement; positive signals or information received from others about a
behaviour.
Target; the individuals who are intended to receive a communication, or the individuals who
are intended to change their behaviour.

47
Threshold; the number of an individual’s social relations, or the proportion of their ties, that
must adopt a behaviour before an individual also adopts.
Ties; are the links between individuals. In the context of information flows these will usually
be the interactions through which individuals communicate, but many other types exist.
3.3 Behaviour change and communication
Conservation interventions frequently seek to change people’s behaviour to stem human-
driven loss of biodiversity (St. John, Keane & Milner-Gulland, 2013). As people respond to
information received about the world (Schlüter et al., 2017), transfer of information is a key
component of all interventions (Table 3.1). Many types of information can be used to
motivate behaviour change, such as information about the risks and benefits of an activity
(Thøgersen, 2005); social norms (Schultz et al., 2016); or evoking emotional responses
(Schneider et al., 2017). Some behavioural changes are simple and adoption is a direct result
of receiving information, but for complex behavioural changes (see Glossary), adoption is
mediated through social influences and social reinforcement, which occurs through further
interpersonal communication and information flow between peers (Centola & Macy, 2007;
Green et al., 2019).
Much research is devoted to improving the effectiveness of conservation interventions (e.g.
Nilsson et al., 2016), and researchers increasingly look to the behavioural and social sciences
for insight (Reddy et al., 2016), such as in the field of conservation marketing (Wright et al.,
2015). However, the role of information flows in promoting conservation behaviour change
is poorly understood. Understanding this can help to improve the effectiveness of
interventions (Barnes et al., 2016b), and applications have been developed in other
behaviour-change settings, most notably public health and social marketing (e.g. McKenzie-
Mohr & Schultz, 2014). Drawing on insights from such fields, we clarify key concepts in the
study of information flows. We examine how messages reach their targets and how
interpersonal communication and social structures determine patterns of behavioural
adoption (Rogers, 2003). We discuss the tools used to study these structures, most notably
social network analysis (SNA), and the insights these methods have generated. Finally, we

48
draw on other behaviour-change disciplines to suggest strategies for designing more
effective interventions.
Table 3.1: Examples of information transfer and targeting strategies in common
conservation behaviour change interventions.
Behaviour-
change
Strategy
Information
Transferred
Example Targeting strategy Reference
Rule
enforcement
Risks & costs of
punishment
Offenders learn this information
when caught and pass it on to their
network
(Keane et
al., 2008)
Environmental
education
The importance
and cultural value
of nature
Education sessions are held at local
schools and children pass
information to their parents
(Monroe,
2003)
Payments for
ecosystem
services
Payment structure
& conditions
Communities are invited to a
meeting where this is explained
directly [62]
(Clements
et al.,
2010)
Alternative
Livelihoods
New livelihood
options
Training workshops are held to
teach local farmers alternative
livelihoods
(Wright et
al., 2016)
3.4 The Anatomy of Information Flows & Behaviour Change
3.4.1 Information Transfer, Flow, and Communication
The fundamental process of information transfer is that a message is communicated from
conservationists to behaviour-change targets. Communicating information is not a “magic
bullet” with predictable effects on the receiver, but a complex social process where
messages may reach their intended target by different, indirect, routes and their meanings
are continuously revised within the context of social relationships (Littlejohn & Foss, 2011).
Understanding these processes is important to enhance the probability of desired targets
receiving and acting on a message in the desired way.

49
Communication occurs through channels which differ in what they can convey, who they
can reach, and how they are likely to affect behaviour (Bryants & Heath, 2000). Mass
communications through channels such as TV and radio can potentially reach large
audiences with a uniform message. Such messages can be agenda-setting but are transient
and, alone, may not be effective at changing complex behaviours (Wakefield, Loken &
Hornik, 2010). The internet and social media also enable large audiences to be reached, but
with personalised messages (Bennett & Manheim, 2006). Where access to technology is
low, speaking with people directly may be the only possibility.
Interpersonal communication between peers is likely to comprise a significant volume of
information flow in all interventions. Messages disseminated through mass media typically
reach much of their audience indirectly, following interpretation and propagation of the
message by influential individuals. Most information therefore flows to receivers through
multiple steps (Bennett & Manheim, 2006). As a result, messages will usually have reach and
influence beyond just those people directly targeted, and these multi-step flows are
intentionally embedded into the design of some conservation interventions (see Table 3.2).
When information flows through multiple steps, the identities and relationships of
communicators will influence how they understand and respond to a message. This ’social
influence’ is composed of multiple factors, such as the perceived credibility of the
information source (Pornpitakpan, 2004); the relationship between source and receiver
(Faraji-Rad, Samuelsen & Warlop, 2015); their positions in larger power structures (Smith &
Magee, 2015); and perceptions of relevant social norms (McDonald & Crandall, 2015). Social
influence can make the difference between a message that is rejected and ignored, and a
message that changes behaviour, so interventions that stimulate more interpersonal
communication are more likely to change behaviour (Green et al., 2019).

50
Table 3.2. Selected information flow concepts and examples of interventions using these concepts from various disciplines
Concept Public health or development example Marketing or Management example Conservation example
Targeting
communications
at opinion
leaders
In a randomised trial across 32 villages, a sample of
villagers were educated and given multivitamins, as
well as vouchers to pass on to others. In villages
where targets were identified using peer-
nomination surveys a 12.2% increase in adoption
was seen compared with villages where targets
were randomly selected (Kim et al., 2015)
Microsoft identified opinion leaders
and distributed pre-release copies of
Windows 95 to 450,000 of them. The
commercial product was quickly
adopted and within four days of
release a million copies were sold
(Galeotti, 2009).
Rare ‘Pride’ campaigns seek to
identify ‘trusted messengers’:
influential community members
that can drive widespread
behavioural change, once a
number of peers have already
adopted the new behaviour and
some momentum has been
generated (Butler, Green & Galvin,
2013)
Targeting an
incubator
neighbourhood
In a randomised controlled trial, agricultural
extension workers in Malawi trained individuals in
200 villages on pit-planting (an agricultural
technique) and trained them to disseminate this in
their village. In some villages, these individuals
were chosen to span the entire network, but in
other villages they were chosen as ‘clusters’ of
None found None found

51
connected individuals. In clustered villages, there
was a 56% greater likelihood that diffusion would
occur, and after three years a 3% greater adoption
(Beaman et al., 2014)
Recruiting
opinion leaders
as change
agents
An anti-conflict intervention was experimentally
introduced to 54 schools with 24,191 students,
after measuring their social networks. Selected
students were trained and then took the lead in
designing anti-conflict strategies for their school.
Schools where highly connected students were
recruited had a 30% greater reduction in conflict
than where students were randomly selected
(Paluck, Shepherd & Aronow, 2016)
Marketers working for Hokey Pokey,
a premium ice-cream store in India,
researched the local social media
market. They identified influential
social media users that were
observed to have many connections
and gained many responses to their
activity, in addition to other
characteristics. Influencers with
relevant interests were invited to
create a personal ice-cream creation
and incentivised to tweet and
Facebook about their creation.
Customers could also see these
creations on a wall at the store and
purchase them. Flavours used in
Ewaso Lions’ ‘Warrior Watch’
programme recruits Samburu
Warriors to act as ambassadors for
wildlife in their community, raising
awareness and mitigating conflicts
with predators. These warrior
ambassadors are selected in
cooperation with community
leaders and are provided a small
stipend and given education in
return. Attitudes toward wildlife
were found to have improved for
90% of community members, with
most attributing this to
information received from the
warriors (H. Gurd, MSc thesis,

52
these creations increased in
popularity, and brand awareness
and sales revenue increased
dramatically (Kumar & Mirchandani,
2012).
Imperial College London, 2012).
Connecting
subgroups
In 1995 the US Public Health Service launched the
National Information Infrastructure. One of the key
objectives of this project was to improve
communication between healthcare providers
across the US, as well as other actors essential to
delivering public health such as the media,
government and citizens. For example, medical
practices across a city now began to share
information with a central database, which
enabled monitoring of wider trends and early
warnings for epidemics (Lasker, Humphreys &
Braithwaite, 1995).
A global consultancy firm believed
one of their highly skilled strategic
teams was underperforming. A SNA
was performed to understand the
information flows, revealing two
disconnected sub-groups within the
team. Each group had a different
expertise and skillset, with little
knowledge of the other. A facilitated
discussion was held with the entire
team, resulting in practice changes
designed to encourage closer
connection: projects were jointly led
by one member of each group, and
new communication channels were
Three settlements in Nepal made
use of the same forest, but had
organised themselves into two
separate forest associations, as
two of the settlements were more
closely connected. This led to
conflicts over boundaries and
memberships. Meetings were
organised between the leaders of
the three settlements where
residents agreed to merge the two
forest associations. The new,
single, forest association functions
well and has overseen
improvements in the condition of

53
opened. This led to improvement in
outcomes, and a follow-up SNA
revealed a much more connected
group (Cross, Borgatti & Parker,
2002).
the forest (Varughese & Ostrom,
2001).
Connecting
peers for
learning and
reinforcement
Alcoholics Anonymous is one of the few models to
show positive abstinence outcomes. Participants
join support groups where they are connected with
peers undergoing the same behavioural change
and discuss their experiences. Studies have shown
that support-group peers often replace non-
supportive friends in participants social-networks,
and that this method is most effective for
individuals with harmful social networks (Groh,
Jason & Keys, 2008)
As part of a strategy to increase the
effectiveness of institutions in
developing countries, the OECD
organises peer-learning sessions. For
example, individuals working at anti-
corruption organisations in Eastern
Europe and Central Asia were
invited to a workshop to meet with
experts and discuss their
experiences and knowledge. Though
little evaluation has been done, it is
thought that this enables greater
learning and that the connections
generated between peers will
sustain long-term knowledge sharing
Following requests from local
women, Ewaso Lions’ ‘Mama
Simba’ project provides general
and environmental education to
women in Samburu communities.
Participants learn and share their
knowledge together, including of
environmentally sustainable
practices, and disseminate this
knowledge to their peers (Ewaso
Lions, 2018), see
http://ewasolions.org/conservatio
n/mamasimba/

54
(Andrews & Manning, 2016)
Inducing multi-
step
communication
flows to
indirectly reach
the target
audience
Injecting drug users (seeds) were given coupons to
distribute to their peers, which contained
information about a safety education class. When a
peer redeemed a coupon at the education centre,
they were given additional coupons to distribute,
and the seed was awarded $10, incentivising
distribution. An additional $10 was awarded if the
peer had been given some education by the seed
before arriving. Compared to worker-based
outreach, this method recruited 36% more
participants over a 2-year period, and a much
wider range of individuals. Peer-outreach was also
found to be more effective at reducing risk-related
behaviours, and many times more cost-effective
(Broadhead et al., 1998).
In 2008, Burger King began their
‘Whopper Sacrifice’ campaign. Using
a specially designed application on
Facebook, individuals would receive
a coupon for a free whopper in
return for removing 10 connections
from their Facebook account. These
connections would receive a
message explaining why they had
been removed and encouraging
them to download the app
themselves. The campaign only ran
for 10 days but over 20,000 coupons
were generated and 233,096 people
were reached (Kaplan & Haenlein,
2011).
Environmental education is often
targeted to children. One reason
for this is the assumption that
children will pass information to
their adult relatives and influence
them. Lessons are often design to
induce such further
communication, for example by
asking students to complete
worksheets together with their
parents (Duvall & Zint, 2007;
Damerell, 2010)

55
3.4.2 Social structures
Social influence is important because often only a few ‘low-threshold’ individuals adopt an
attitude or behaviour directly after receiving a message, while most targets require social
reinforcement and influence from others before they adopt. These ‘complex contagions’
occur for several reasons, depending on the social context and nature of the behavioural
change (Centola, 2018): Firstly, as the outcomes of behavioural change are uncertain,
individuals may wait to see how it benefits others (i.e. credibility) before adopting (Rogers,
2003). Secondly, social norms play an important role in human decision-making (McDonald
& Crandall, 2015), and people may wait for others to adopt (i.e. legitimacy) before following
(Cialdini & Goldstein, 2004). Finally, in other cases new behaviours are only beneficial if they
are also adopted by others (i.e., complementarity). For example, many conservation issues
relate to the management of common-pool resources where collective behavioural changes
are required (Ostrom, 1990). Such decisions may be made collectively or by authorities
recognised as legitimate by the group.
For complex behaviours, information about the behaviours and views of an individual’s
social peers are key to driving diffusion, rather than the messages that were used to initiate
behaviour change. As a result, these behaviours diffuse through a group along social ties as
information about the behaviour flows through repeated interactions (Rogers, 2003). The
structure of a social group will therefore influence the rate and patterns of diffusion. For
example, groups of strongly connected individuals tend to behave more similarly
(Mcpherson, Smith-lovin & Cook, 2001), and shape each other’s perceptions of social norms
(Shepherd, 2017). If a group member receives information about a new behaviour from
outside the group, they may not adopt unless other members also adopt (Centola, 2018).
To predict how behavioural changes spread, we need to understand these social structures
and how information about new behaviours flows through them.
3.5 Studying Information Flows
Understanding how information flows through a group and drives adoption of a behaviour
can be a demanding exercise, but there are several key pieces of knowledge that can inform
meaningful improvements to intervention design (Valente, 2012):

56
1) Identifying and defining relevant social interactions
2) Measuring or observing these social interactions
3) Identifying key structural features and key individuals
3.5.1 Identifying relevant interactions
How do targets communicate, seek advice, or learn about the behaviour in question? As a
rule of thumb, in traditional societies multiple types of information tend to be sought from
the same relations, such as kin. Conversely, in modern societies individuals seek different
types of information from different specialised networks (Weimann, 1994). Even in contexts
where information appears to flow through formalised channels (e.g. in organisations),
informal interactions such as friendships are still likely to play a significant role (Soda &
Zaheer, 2012; Weenig, 1999). We can determine the types of ties that are relevant in a
given instance by using qualitative methods, such as group discussions or interviews with
group members. Methods such as ECCO (Episodic Communications Channels in
Organisation) analysis may also be used to empirically investigate the ties through which
specific messages flow (Box 3.1). Understanding the ways in which targets receive
information from external sources is also important, particularly if mass-media is used
(Veríssimo et al., 2018).
3.5.2 Social structure
Once ties have been identified and defined, we can investigate how they are structured
within the group. Social network analysis (SNA) is a powerful tool widely used in the social
sciences to study social structures (Borgatti et al., 2009) and can provide a global description
of the system and identify many important features (Figure 3.1, Box 3.1). Qualitative
methods such as group discussions or interviews can also provide more detailed information
about certain features.

57
Box 3.1: Methods for studying information flows
ECCO Analysis
Episodic Communication Channels in Organisations analysis is used to understand how
messages flow through informal channels. Conservation researchers could use this method
to test assumptions about information flow when piloting interventions; to investigate the
types of ties through which a message flows, to map a social network, or validate whether a
mapped network predicts the route taken by a message. Firstly, a relevant message is
identified and disseminated in a controlled manner. A series of follow-up questionnaire
surveys is then administered, assessing which individuals have received the message and
asking them from whom they received the message (Zwijze-Koning, 2005).
Social Network Analysis
Social Network Analysis (SNA) is a powerful tool that is widely used in the social sciences to
study the structures of social groups. A vast multi-disciplinary literature has contributed to
the development, application and interpretation of SNA data (Knoke & Yang, 2011). Here,
we give an overview of the basic principles of SNA.
SNA generates a ‘sociogram’ (Figure 3.1), depicting individuals as nodes and their
interactions as ties. The interactions represented are usually of a single type, can be
directional or non-directional, and usually have some measurement of tie-strength
associated. For example, an intervention aiming to promote new agricultural techniques
may ask farmers to nominate individuals they go to for advice (Isaac et al., 2007). Advice-
seeking is a directional interaction, and tie-strength could be measured in the frequency of
interaction, or perceived value of the advice received.
SNA data can be collected using several methods. Most common is the name-generator
questionnaire, which is suitable when the relationships can be reported on by the actors
involved in them, such as most communicative interactions. Respondents list the names of
people with whom they interact and provide other information such as interaction
frequency. This method is simple and reliable, but effort intensive as a large proportion of
the community must be questioned to obtain an accurate representation of the network.
Furthermore, responses may be subject to recall or social desirability bias (Knoke & Yang,
2011).

58
Figure 3.1: The ties between individuals in a group can be visualised as a network, revealing
the structure of information flows. Some groups of individuals are more densely connected
than others, suggesting the existence of sub-groups (A & B). Each subgroup has a core
(green) and a periphery of less connected individuals. The most highly connected individuals
(red) tend to be more influential and are also known as Opinion Leaders, while those
connecting different sub-groups are known as bridges (blue).
3.5.2.1 Structural features
In homophilous groups, where individuals are similar and densely connected, information
flows rapidly but complex behaviours face resistance as individuals resist deviating from
existing social norms (Valente, 2012). Conversely, heterophilous groups with more different
individuals and sparser ties tend to be more open to innovations (Rogers, 2003). However,
density is rarely uniform across a network, and many groups have a homophilous core, or
multiple homophilous subgroups (Figure 3.1), and a periphery of more loosely connected
individuals (Borgatti & Everett, 2000). Information may flow between these subgroups via
mutual acquaintances, but the social norms in each may vary (Mcpherson, Smith-lovin &
Cook, 2001; Crona & Bodin, 2011). For example, subgroups in an information-sharing
network of Hawaiian fishers were found to differ in their fishing behaviour, with significant
implications for shark bycatch (Barnes et al., 2016b). Several quantitative methods have
been developed to detect such groupings in social network data (Borgatti & Everett, 2000).

59
Using qualitative methods to determine groupings requires careful elicitation from
respondents with knowledge of the group.
3.5.2.2 Individual positions – hubs or opinion leaders
The positions that individuals occupy in their networks will, to a large extent, predict the
role that they play in the flow of information and the social influence that they wield (Pei,
Morone & Makse, 2018). Most importantly, individuals vary in the number of ties they have
and their position within the global network. The most connected individuals (i.e. ‘opinion
leaders’ or ‘hubs’) play an important role in successful dissemination of messages and can
catalyse widespread adoption of new behaviours due to their social influence (Valente &
Davis, 1999; Valente & Pumpuang, 2007). However, they tend to be less susceptible to
influence and are rarely among the first to adopt complex behaviours, while less connected
peripheral individuals tend to be less constrained (Aral & Walker, 2012).
SNA data can be used to calculate the centrality of individuals (Figure 3.1), as well as
indicating different roles (see Mbaru & Barnes, 2017). Opinion leaders can also be identified
through expert elicitation or peer-nomination surveys (Valente & Pumpuang, 2007). Most
commonly, opinion leaders are identified using assumed correspondences with personal
characteristics such as wealth, or formal leadership positions. However, comparison with
SNA data has shown that these correspondences are context specific. For example, in a
Kenyan fishery formal leaders, but not the wealthy, were among the most connected
(Mbaru & Barnes, 2017).
3.5.2.3 Bridges
Where different subgroups exist, some individuals may be connected to others outside the
group, acting as bridges. In some cases, groups may be linked by just a single individual,
forming a very ‘narrow’ bridge (Figure 3.1). Such bridging individuals are unique as they
have access to information from multiple groups and control the flow of information
between them (Bodin, Crona & Ernstson, 2006). In homogenous societies this gives them a
high level of social capital, but where they bridge conflicting or competing groups they may
be mistrusted. For example, in a Hawaiian fishery, individuals who bridged ethnic groupings
were denied access to information, resulting in lower fishing productivity (Barnes et al.,
2016a).

60
Bridges can be identified from SNA data using several metrics (Valente & Fujimoto, 2010).
However, few other methods of identification have been used. Potential alternatives include
eliciting knowledge from local informants, or identifying context-specific individual
characteristics (e.g. wealth) that indicate bridging roles (Mbaru & Barnes, 2017). For
example, in remote rural areas, individuals with commercial livelihoods may be more likely
to travel, visit markets and interact with outsiders.
SNA or other data on key individuals or structural features are essentially predictions about
how information will flow through the group and result in behavioural changes. In some
cases, it may be valuable to validate these predictions, such as when piloting an
intervention. For example, have the relevant ties been identified correctly? Do identified
opinion leaders exert influence on the target behaviours? ECCO analysis, which empirically
observes the flow of a message (Zwijze-Koning, 2005), can be used to answer these
questions. Weenig (1999) used ECCO analysis with SNA to investigate the adoption of a new
programme in a large company. Results showed that information about the programme was
usually received through formal channels, but that intention to adopt was more strongly
influenced by informal ties, such as friendship. Stochastic Actor-Oriented Models can also be
used to statistically investigate whether a measured network is influencing the observed
spread of knowledge or behaviour (Snijders, 2017).
3.6 Network Strategies for Behaviour Change
We can use this knowledge to design more effective interventions. Most simply, we can
target communications more effectively, but more complex interventions may attempt to
alter group structures. Many of these approaches have been applied successfully in public
health and marketing (Table 3.2). The best strategy will depend on the capacity of the
intervener, the type of behaviour change required, as well as current social structures,
norms and values.
3.6.1 Communication targeting
For widespread dissemination of a message, hubs are essential communication targets
(Kaplan & Haenlein, 2011, Figure 3.2). Different SNA metrics can be used to identify
individuals for different purposes, such as: ‘closeness’ (distance to all other individuals) for

61
rapid diffusion of information, or ‘eigenvector centrality’ (connectedness to other well-
connected individuals) for long-term widespread diffusion of complex behaviours (see
Mbaru & Barnes, 2017). In certain cases, it may be effective to recruit opinion leaders as
‘change agents’, providing training and incentives to help encourage adoption of new
behaviours within their network, but this requires buy-in and commitment from these
individuals (Nisbet & Kotcher, 2009). Where multiple subgroups exist, hubs can be selected
and matched to specific target groups (Valente, 2012). Empirical evidence suggests targeting
opinion leaders (e.g. Kim et al., 2015) or recruiting change agents (e.g. Starkey et al., 2009;
Paluck et al., 2016) can be more effective than conventional messaging approaches. In
conservation, Rare’s Pride campaigns target “trusted messengers” in the community who
provide an example for others to follow (Butler et al., 2013, Table 3.2).
For complex behavioural changes, hub individuals may be too constrained by existing group
norms to act as initial adopters (Valente & Pumpuang, 2007). In such cases, targeting
clusters of connected and similar individuals as “incubator neighbourhoods” can allow a
new behaviour to become established within a socially-reinforcing group (Beaman et al.,
2014). These adopters can then influence mutual contacts and collectively promote the
behaviour more effectively than an individual could (Centola, 2011, Figure 3.2). Complex
behaviours are also less likely to spread between sparsely connected subgroups (i.e., via
narrow bridges), so clusters within each subgroup could be targeted.
Where equitable development outcomes are required, targeting individuals on the
periphery of a community with empowering information may be an end itself, as these are
often less likely to have access to social services or to participate in governance (Valente,
2012). Similarly, if the poorest and marginalised are less likely to participate in institutions
that are targeted for promoting collective conservation action (Agrawal & Gibson, 1999),
and therefore do not change their behaviour, it may be important to communicate with
them directly.
3.6.2 Message induction
A full discussion of message design is beyond the scope of this review (see e.g. Cialdini,
2015), but induction approaches to message design are relevant. These approaches attempt
to increase information flow by incorporating positive, attractive or encouraging features
into the message, such as in viral marketing (Kaplan & Haenlein, 2011, Table 3.2). As

62
evidence suggests widespread behaviour change is more likely when communication
between adopters is greater (Green et al., 2019), induction can be an important tool.
Induction strategies can also encourage adopters to signal their behaviour to others. For
example, by incentivising participants in a livelihoods improvement scheme to recruit new
members, or ensuring that adoption of a new behaviour is visible to others through public
commitment-making or promotional signalling (e.g. free clothing) (Niemiec et al., 2019).
Messages can also be designed to reach otherwise hidden or hard-to-reach parts of the
population (Johnston & Sabin, 2010). For example, the relatives of an arrested poacher are
likely to know more poachers and could be given communication materials to disseminate.
3.6.3 Channel choice
Communication channels differ in what they can communicate, who they can reach, and
how they affect recipients. Complex behavioural changes may require direct experience of
the new behaviour which is reinforced by peer learning, while passive use of mass media
might be sufficient for preventing future adoption of negative behaviours (Wakefield, Loken
& Hornik, 2010). For example, televised health warnings may effectively prevent people
from trying new pesticides, whereas in communities where use is already widespread, more
work might be needed to encourage alternative practices. Secondly, individuals differ in the
types of media they consume, so the appropriate channel will depend on who is targeted. In
many cases, mass media can be effective at reaching large audiences, but the media habits
of the audience must be understood in detail if this is to occur (Veríssimo et al., 2018).
Interventions targeting a small select group, such as recruitment of change agents or
incubator neighbourhoods, may require more personalised approaches involving direct
contact by the intervention team. Ideally, interventions aiming to effect widespread
behaviour change will make use of a mix of channels, combining the strategies described.
For example, workshops targeted to incubator neighbourhoods could initiate adoption
while simultaneously mass media could increase the likelihood of diffusion to the wider
population.
3.6.4 Altering Networks
If current network structures are not conducive for widespread behavioural change,
interventions can attempt to alter them. New channels of communication can be developed
by facilitating meetings or providing communication technology, e.g., to coordinate

63
community-led anti-poaching patrols, facilitate peer-learning, or promote collective action.
One notable success in agricultural extension has been ‘farmer field schools’ that enable
farmers to collectively learn and adopt more sustainable techniques (Pretty & Ward, 2001).
Such peer-learning can be more effective than conventional approaches because the group
can co-produce the new practice in a socially meaningful way. Connecting adopting
individuals alters their normative environment by increasing the proportion of ties engaged
in the behaviour and reducing pressure to conform to previous group norms (Kincaid, 2004).
For example, smokers who have contact with abstinent ex-smokers are more likely to quit
successfully (Myneni et al., 2015, Table 3.2). The existence of disconnected sub-groups
could lead to the divergence of norms (Friedkin & Johnsen, 2011), and so encouraging
communication between groups could help maintain desirable norms, and improve the
spread of complex behaviours. These bridges will need to be wide (i.e. multiple strong
connections between members of each group) to enable the spread of complex behaviours,
and require significant time and investment to form (Centola, 2010).
In cases where collective action is required, such as for governing common pool resources, it
may be necessary to create forums where participants can communicate and ensure
compliant behavioral norms are maintained and enforced (Ostrom, 1990; Clements et al.,
2010). Interventions aiming to create such bodies often co-opt existing structures, such as
traditional councils, but this risks neglecting peripheral groups or those underrepresented in
these structures. For example, in one community-based ecotourism project designed to
incentivise protection of wildlife, geographically distant groups had little awareness of the
project and may therefore have no incentive to change their behaviour (see
http://tinyurl.com/y32jydya). In such cases, identifying disconnected subgroups can enable
facilitators to connect them. At the same time, to avoid resentment, exclusion, and conflict,
it is important to understand and respect current social structures and norms (Brown &
Lassoie, 2010; Leach, Mearns & Scoones, 1999). For example, existing hierarchies within
each subgroup and cultural concepts of legitimacy could be considered in selecting
representatives. Finally, providing individuals with access to information can also alter their
position in the network with potentially unexpected consequences. Opinion leaders may
lose respect if they champion an unpopular cause. Conversely, beneficial information can
improve an individual’s prestige (Matous & Wang, 2019).

64
Figure 3.2: Two stylised intervention scenarios showing the flow of a message (red arrows) and the adoption of a new behaviour (red figures) through a social network in time: (left) recruitment of opinion leaders as change agents and (right) targeting an incubator neighbourhood. Recruiting highly connected individuals to spread a behaviour can be highly effective. Due to the influence these individuals wield, others in their network are likely to follow them in adopting new behaviours. However, they may be resistant to adopting risky or complex behaviours. Using incubator neighbourhoods, the new behaviour is socially reinforced, and adopters can work together to spread the behaviour. In this example, two adopters are needed to recruit another. In the subgroup on the central hub has catalysed a widespread shift in behaviour, but the behaviour is not able to spread to the other group via a single bridging individual.

65
3.7 Concluding Remarks
Disciplines such as public health have intervention strategies which exploit social networks,
such as targeting communications to influential individuals, or facilitating social
reinforcement between adopters (Valente, 2012). Evidence suggests that such network-
based interventions can be more effective than conventional approaches (e.g. Kim et al.,
2015; Paluck et al., 2016), and incorporating these practices can make conservation more
effective. The optimal strategy will be context-specific, dependent on the nature of the
behavioural change and the social context. Many interventions may require multiple
strategies to be implemented at different stages. It is therefore essential to gain an in-depth
understanding of the context prior to the intervention, including baseline research and
active piloting of messages and delivery mechanisms, as well as evaluation of interventions
to enable learning (Ferraro & Pattanayak, 2006). Currently it is unknown what strategies are
used to target conservation interventions, and what sort of information about group
structures is used when designing interventions. More research is required to understand
the types of information flow that commonly occur in conservation contexts and whether
generalities exist that can be used as rules of thumb to guide intervention planning (see Box
3.2). Furthermore, SNA is a costly method, so more feasible accurate methods for
identifying important individuals or structural features must be developed if practitioners
are to adopt these approaches. As conservation interventions increasingly focus on
changing human behaviour, incorporating insights from the social sciences, such as by
understanding information flows, will be critical for achieving conservation goals.

66
Box 3.2: Outstanding Questions
• How do conservationists currently target their communications in behaviour change
interventions?
• What sort of information about group structures is currently used when designing
interventions?
• How well do qualitative methods for identifying key positions or structural features
correspond to SNA results? What low-cost methods are most reliable?
• How do conservation interventions alter the structure of local social networks, and
how does this influence conservation and wellbeing outcomes?
• What sorts of social ties are most important for influencing conservation behaviours,
and how are these networks structured in conservation areas?
• What are the costs and benefits of adopting network-informed intervention
strategies? Do the increases in effectiveness justify the costs of conducting formative
research?

67
4. Using mixed methods to understand sensitive wildlife poisoning
behaviours in northern Cambodia
This chapter is published as: de Lange E, Milner-Gulland EJ, Yim V, Leng C, Phann S, & Keane
AM. Using mixed methods to understand sensitive wildlife poisoning behaviours in northern
Cambodia. Oryx. 2020; doi:10.1017/S0030605319001492
4.1 Abstract
In northern Cambodia, threatened wildlife, livestock, and people are being poisoned by
pesticides deposited in seasonal waterholes. Addressing this critical conservation threat
requires understanding the drivers of poisoning behaviours and the social contexts in which
they occur. This study across 10 communities in two protected areas aimed to provide a first
assessment of this phenomenon. We used the theory of planned behaviour to measure
socio-psychological determinants of behaviour and deepened this understanding using
informant interviews and focus group discussions. Informants reported that so-called
termite poisons, including powerful carbamates, are deliberately deposited at waterholes to
catch wildlife for consumption. This method is perceived to be low effort and high efficacy,
and perceptions of the health risks vary. Predominant users are young men and children, but
it is not clear whether the practice is related to food insecurity. Threatened wildlife species
reported as affected include the giant ibis Pseudibis gigantea and vulture species. Overall,
social norms are strongly negative towards poisoning; 75% of survey respondents perceived
negative norms because of impacts on human and livestock health, environmental quality,
and risks of legal sanctions. This has led to interventions by local authorities in half of the
studied villages. We suggest that future interventions should raise the salience of negative
norms by providing a non-conflictual mechanism for community members to participate in
monitoring and sanctioning, such as a reporting hotline. Regulatory interventions are also
required to control the supply of restricted pesticides.

68
4.2 Introduction
Toxic agrochemicals used in agriculture are a major threat to wildlife, leading to widespread
declines in insect and bird populations (Carson, 1962) and deaths of larger animals(Berny,
2007). Deliberate poisoning of large animals is also widespread (Richards, 2011); e.g. in
Africa, some farmers use Carbofuran pesticides to kill predators (Ogada, 2014) driving a
crash in vulture populations (Buechley & Şekercioğlu, 2016; Ogada, Botha & Shaw, 2016).
However, the use of agrochemicals for harvesting wild meat has rarely been documented
(e.g. (Odino, 2011).
In 2015, five seasonal waterholes (trapeangs) in Cambodia’s Preah Vihear province were
found to contain the pesticide Carbofuran. Threatened wildlife species found dead included
critically endangered vultures, and people fell ill after drinking contaminated water (Figure
4.1, (LACANET, 2016; Loveridge et al., 2019). Although reports of suspected wildlife
poisonings in Cambodia are common, including 51 suspected vulture poisonings during
2004–2015 (Loveridge et al., 2019), these were the first records of poisoned waterholes with
toxicological confirmation. Because of the potentially critical threat to human health and
populations of threatened wildlife, conservation groups took immediate action based on
assumptions about poisoning, including awareness-raising meetings in local communities,
and producing educational media (Loveridge et al., 2019). To inform intervention design, this
study aims to provide a broad assessment of waterhole poisoning in Preah Vihear province:
identifying the actors involved, understanding their motivations and describing the social
context in which poisoning occurs.
Cambodia has been described as a dumping ground for unwanted pesticides because of
weak regulation of imports (imports increased 17-fold during 2002–2012; (Matsukawa et al.,
2016) and sale (Environmental Justice Foundation, 2002). For example, although Cambodia
is signatory to international conventions restricting Carbofuran use, it remains widely used
(Rotterdam Convention, 2013; Matsukawa et al., 2016). Inadequate education and labelling
mean that pesticide misuse is widespread, and poisoning of farmers, both acute and chronic,
is common (Environmental Justice Foundation, 2002). Researchers have suggested that
misuse, accidental run-off and intentional poisoning are affecting fish and wildlife
populations at a national scale (Saroeun, 1999).

69
Figure 4.1: A waterhole poisoning showing dead wildlife (a plaintive cuckoo, Cacomantis
merulinus) close to the water. A purple granular pesticide is visible on the fallen tree. Photo
credit: WCS Cambodia
Effectively addressing wildlife poisoning requires understanding the specific practices and
actors involved, their motivations and attitudes (St. John, Keane & Milner-Gulland, 2013),
and the social context (St. John, Edwards-Jones & Jones, 2010). Local NGO workers have
suggested that waterhole poisoning could be an unintended consequence of agriculture, a
result of conflicts such as land disputes or intentional wildlife killing. Each practice may have
multiple interacting drivers. For example, intentionally poisoning wildlife could be driven by
socio-cultural demand for wild meat (Delisle et al., 2018) or by economic incentives to
supply wildlife products to market (Milner-Gulland et al., 2003). It may also be employed as
an act of resistance against conservation authorities (Norgrove & Hulme, 2006; Peterson,
Essen & Hansen, 2017).

70
Theory from social psychology can guide research on human behaviour. The theory of
planned behaviour (Figure 4.2) has been widely used to understand the socio-psychological
determinants of conservation behaviours (St. John, Edwards-Jones & Jones, 2010; Ward,
Holmes & Stringer, 2018). This theory posits that an individual’s intention to carry out a
behaviour in a particular context is predicted by that individual’s attitudes (i.e., is it a good
thing to do?), perceptions of social norms (i.e. do others do it?), and perceived control over
the behaviour (i.e. am I able to use this method?). It assumes that these are semi-stable
constructs that can be reliably determined by measuring relevant salient beliefs (Ajzen,
1991). The theory of planned behaviour can inform the design of behaviour change
interventions (Hardeman et al., 2002; Michie et al., 2008). For example, there may be
multiple actors with different psychological determinants, requiring multi-faceted
interventions that segment audiences (Mckenzie-Mohr, 2000; Jones et al., 2019; Travers et
al., 2019). Where individual behaviours are constrained or enabled by external factors,
conservationists may additionally intervene at higher levels, such as by influencing economic
drivers (McKenzie-Mohr & Schultz, 2014).
To inform intervention design, our study set out to understand waterhole poisoning across
two protected areas in Preah Vihear, using a mixed-methods approach. We aimed to
quantify the prevalence of relevant practices and measure variables from the theory of
planned behaviour to unpack socio-psychological drivers. We collected qualitative data on
poisoning practices to contextualise our quantitative data, and to determine the motivations
of poisoners and the social contexts in which poisoning occurs.

71
Figure 4.2 A summary of the theory of planned behaviour (Ajzen, 1991) as applied to wildlife
poisoning in this study. Within the theory an individual’s behaviour is predicted by their
intention to behave, which in turn is influence by their attitudes towards the behaviour, their
perceived control over the behaviour, and their perception of social norms related to the
behaviour. The subjective norm is in turn influenced by descriptive norms (how others
behave) and injunctive norms (how others think one ought to behave). We found that
attitudes, and perceptions of social norms towards poisoning are on average negative,
whereas perceived behavioural control are mixed. Because of the sensitivity of the
behaviour, behavioural intention or prevalence could not be measured.

72
4.3 Study area
Preah Vihear province in northern Cambodia lies in a global biodiversity hotspot (Chapter 2;
Myers et al., 2000), contains the largest remaining mosaics of forests and grassland in
mainland South-east Asia and is home to 28 Critically Endangered or Endangered species
(Clements et al., 2010), including the giant ibis Pseudibis gigantea, white-shouldered ibis
Pseudibis davisoni, and three vulture species. Many rely on waterholes for food and water
throughout the dry season (Pin et al., 2018). At the time of this study, two protected areas
were managed by the Ministry of Environment (a third was gazetted in late 2017, Figure 2.2),
with support from the Wildlife Conservation Society: Chheb and Kulen Promtep Wildlife
Sanctuaries.
We conducted our study across the two protected areas in 10 villages that reflect a cross-
section of levels of wealth, access to markets, and involvement in conservation programmes.
All were involved in previous research (Beauchamp, Clements & Milner-Gulland, 2018a;
Beauchamp et al., 2018; Beauchamp, Clements & Milner-Gulland, 2019). Many originated
from small groups of indigenous communities, Khmer Rouge soldiers, or other fugitives,
living in the remote forest. After the Royal Government recaptured this area from the Khmer
Rouge in the late 1990s the state consolidated control over the region through mass
patronage and infrastructure development. Cambodia’s political system is described as
hegemonic authoritarianism and the government closely monitors rural life and political
activity (Chapter 2; Craig & Kimchoeun, 2011; Beban et al., 2019; Morgenbesser, 2019).
Cambodia has liberalized its economy, with GDP growth averaging 8.7% per year (Hughes &
Un, 2011). Although this has led to increased employment opportunities and improved
access to markets, for many residents it has led to dispossession of agricultural land and
nearby forests by corporate interests with state backing, and migration of landless people
from other provinces (Davis et al., 2015; Milne, 2015; Beauchamp, Clements & Milner-
Gulland, 2018a). Given these pressures and opportunities, many residents who previously
farmed subsistence rice now clear forest and accumulate land, to grow and sell cash-crops
such as cassava or cashew or to take advantage of rising land prices (Beauchamp, Clements
& Milner-Gulland, 2018a). Clearing land within the protected areas is illegal, but is facilitated
or promoted by personal relationships with local officials (Milne, 2015). Cambodian society

73
is marked by neopatrimonialism: power is exercised through personalized patron-client
relations, with an emphasis on kinship. A village is a geographical collection of relatively
autonomous households and much interaction is governed by norms of reciprocity (Ovesen,
Trankell & Ojendal, 1996; Ledgerwood & Vijghen, 2002; Sedara, 2011). Each village has a
chief who is either appointed by the state or nominated by village elites. Chiefs vary in
influence; they tend to be loyal party members who participate in surveillance and
disciplining of the community (including researchers). Their bureaucratic position gives them
power to mediate access to the state (i.e. registration of land titles), but some may enjoy
respect for facilitating the community’s interests (Ledgerwood & Vijghen, 2002; Biddulph,
2015). Other disputes may be settled through informal processes by village elders (Luco,
2002; Travers et al., 2011).
The Ministry of Environment and the Wildlife Conservation Society support village
institutions and conservation programmes in most communities within the protected areas
(Chapter 2). Participatory land-use plans have been developed with residential,
conservation, agricultural and other zones. Community protected area or community forest
committees are elected in nine out of the 10 villages, to monitor and enforce compliance
with these rules. To incentivize compliance, the Ibis Rice company buys rice at a premium
from farmers who follow conservation rules (including no hunting and no use of pesticides;
Clements et al., 2010). Village market network committees are elected to monitor farmers’
compliance and determine eligibility in five of the villages. There are also community-
managed ecotourism projects in three villages that generate village development funds and
direct payments to individuals to protect the nests of priority birds (Clements et al., 2010;
Clements & Milner-Gulland, 2015). Medium-term evaluations show that these programmes
have contributed to improved tenure security and have provided additional livelihood
options (Beauchamp, Clements & Milner-Gulland, 2018a). Law enforcement patrols are also
conducted by the state.
Fish and wild meat remain important dietary components, and collection of non-timber
forest products, such as liquid resin and mushrooms, provides additional income (Travers et
al., 2011; Beauchamp et al., 2018a). Most households are engaged in incidental wildlife
hunting for home consumption, such as setting traps around agricultural land, taking dogs
into the forest when collecting mushrooms or a slingshot while fishing. This affects common

74
species such as water monitors (Varanus salvator), muntjac (Muntiacus muntjak), or wild
pigs (Sus scrofa), and is tolerated by authorities. The meat is considered preferable to
domestic or market meat because it is seen as chemical-free. Only a small proportion of
households do targeted hunting in the forest using homemade guns or snares, as this
requires skilled labour. They target high-value species for sale at local markets (Coad, Lim &
Nuon, 2019; Ibbett et al., 2020).
4.4 Methods
The research team comprised students from the UK and Cambodia and operated
independently of the Wildlife Conservation Society. We used unmarked vehicles and
discussed our position with chiefs and other participants. Participants (all aged over 18) gave
verbal consent following explanation of the research.
Exploratory pilot studies were conducted in two villages, outside the protected areas, which
had been matched to our study villages (Clements & Milner-Gulland, 2015). We used key
informant interviews and focus group discussions to investigate pesticide usage. We
identified salient beliefs to measure for the theory of planned behaviour and to develop the
questionnaire, which was piloted with c. 30 respondents in each of the two villages.
Question wording was refined after each village. To measure the prevalence of sensitive
poisoning practices we initially used the single sample count method (Petroczi et al., 2011)
but switched to the unmatched count technique for the second village because of its lower
cognitive demand. The surveys were initially translated into Khmer and back into English to
ensure accuracy and again whenever modifications were.
In the full study, we administered the final survey to a sample of households, organized
focus group discussions, and conducted key informant interviews in each of the 10 villages.
We visited each village for approximately 5 days during July–September 2017, staying at the
home of the village chief or a nominated subordinate. It was necessary to stay at a home for
security reasons, and association with the chief was considered the best option as it is a
common practice for visitors without personal contacts in the community. This also
legitimized our activities, and reassured villagers that talking to us was condoned, but may

75
have raised concerns that responses would be shared with authorities, despite our
assurances.
We administered the questionnaire to 30–60 households in each village. Sampling was
opportunistic because of the unpredictable availability of household members, but we
attempted to sample proportionally from all geographical sections of a village. We sought to
interview male household heads (as in the pilot these were found to be most knowledgeable
on the topic), but also surveyed 24 woman-headed households. We visited respondents at
their homes and survey data was collected using Open Data Kit (Brunette et al., 2013). We
collected demographic and livelihood information and used an adaptation of a basic
necessities survey previously developed for the same area, to give an index of household
wealth (Beauchamp et al., 2018a).
We used the unmatched count technique to estimate prevalence of sensitive wildlife
poisoning practices (Hinsley et al., 2019). In each round, respondents selected one of two
face-down cards. One card displayed images of four related non-sensitive behaviours. The
second card was identical but included the sensitive behaviour. Without identifying which,
respondents were asked to state the number of displayed behaviours they had practised in
the past year. A non-sensitive practice round was used to confirm that the procedure was
understood before continuing (Hinsley et al., 2019). We then asked about pest control issues
and uses of pesticides identified during the pilot study. We used images of pesticide
packaging collected during a market shelf survey to help respondents identify specific
products. We used five-point Likert scales to measure constructs from the theory of planned
behaviour related to wildlife poisoning: two items for each of attitudes, perceived
behavioural control, and perceptions of descriptive and injunctive norms. Finally, we directly
questioned the respondent about their hunting practices, including use of poison for
hunting.
Focus group discussions were organised separately for men and women in each village. We
invited eight participants, selected in consultation with the village chief, but the number of
attendees was 4–10. We began by asking about non-sensitive topics such as pest issues, pest
control, and use of pesticides, and finally other forms of poisoning. We adapted key
informant interviews depending on the specific knowledge of the informant. In each village
we made efforts to interview the village chief, local doctors, shopkeepers, and leaders of

76
conservation committees, and opportunistically interviewed other individuals. When
informants indicated direct knowledge or experience of wildlife poisoning, we asked about
the practice, the motivations for it, and how they learned this method.
Statistical analysis was performed in R 3.5.2 (R Core Team, 2017). We used the list package
to analyse unmatched count technique data (Blair & Imai, 2010). We calculated estimated
prevalence of each behaviour and counted the number of maximal responses (i.e.,
respondents stating that they perform all behaviours on the card). Using the method
described by Blair & Imai (2012) we also tested for design effects: lower than expected
responses from respondents who see the sensitive item, indicating dishonest responses.
When theory of planned behaviour construct measures was internally consistent (i.e.
Cronbach’s alpha >0.5), we summed them into single continuous measures. We fitted linear
mixed models with a Gaussian or binomial response to test for associations between
individual variables and beliefs, practices, perceptions, and theory of planned behaviour
variables. For individual ordinal Likert measurements, we used cumulative link (logit) mixed
models. Village was included as a random effect in all models. Qualitative data was
translated, and transcribed into NVivo (QSR International, 2015). Text was then coded into
pre-defined themes related to the research questions. New themes were also allowed to
emerge from the data, following which the data were recoded. Our results subheadings
reflect these themes.
In total, we interviewed 462 respondents (20–50% of households in each village) and carried
out 20 focus group discussions and 53 key informant interviews. We preserve the anonymity
of the villages.
4.5 Results
4.5.1 Waterhole poisoning practices
During the dry season termite poison mixed with rice, water, fruit or fish, is placed in the
water of a waterhole or in a container nearby, to hunt wildlife (Figure 4.1). One respondent
summarized this as follows, and similar descriptions were provided by a total of 28
informants from eight villages, including during two focus group discussions.

77
In the dry season, when the waterholes are dry, I put the poison in a coconut shell. It is a
powder which I dissolve in the water and put in the shell […]. Using this poison, I used to
catch a lot of birds, maybe five or six each time, and I would try three times in one season.
Termite poisons are considered the strongest chemicals available. This term referred to
multiple products, identified by packaging, including carbosulphan, carbofuran, fipronil,
diazinon and cypermethrin. Respondents often described the poisons by their blue, red or
purple colour. Small unlabelled bags of termite poison are also available in local shops for
KHR 1,000 (c. USD 0.25, Figure 4.3). We also recorded other misuses of pesticides (Appendix
1).
Figure 4.3: Packaging of one of the most commonly available ‘termite poisons’ as (a) sold in
a provincial market, and (b) resold in a village shop. This is a Carbamate which is banned in
many countries in the world and is restricted in Cambodia (Royal Government of Cambodia,
2012).

78
4.5.2 Prevalence
When directly questioned, 174 respondents (38%) stated they hunted wild meat, but only six
respondents (1.3%) admitted to poisoning waterholes (Appendix 2). In the unmatched count
technique, the practice round showed no design effect (p=0.67). The estimated prevalence
of waterhole poisoning was −40% of the population (SE=0.12, p<0.01). This is an impossible
result, and the significant design effect (p<0.01), suggests it is produced because
respondents actively reduced their answer in response to the treatment question.
Nonetheless, six respondents (2.4%) gave a maximal response to the treatment card,
effectively indicating engagement in waterhole poisoning.
Informants in eight villages reported occurrences of waterhole poisoning. In one village the
chief estimated c. 30% of households engaged in the practice, and two other informants
gave estimates of 25–30%. In other villages, estimates varied more widely. For example, one
chief denied any poisoning, but his deputy gave an estimate of 30%. In another village, some
estimates varied from c. 4 to 10%, and another two informants estimated 50%. In the other
four villages, just a few households were indicated to engage in the practice (Figure 4.4).
Three informants reported practising waterhole poisoning for many years. One man
admitted that he stopped poisoning 7 years ago after suffering from symptoms of poisoning
and accidentally killing one of his dogs. Another told us he had learnt the method from his
father who had been practising it for many years.
4.5.3 Impacts of poisoning
Informants and focus group discussion participants described impacts of poisoning on the
environment, wildlife, domestic animals and human health. Concerns raised included
reduced availability of clean water, and lost fishing grounds. Poisoning at waterholes was
seen as indiscriminate and many informants reported seeing a wide variety of species killed,
including species of conservation concern (Table A1.2). Many were unable to identify the
species they had observed but reported seeing large numbers of dead animals.
Informants in three villages complained their dogs had been poisoned. Similarly, two village
chiefs reported cattle being killed after drinking poisoned water. There were widespread
concerns about consuming poisoned meat; many respondents across all types of
questioning gave direct or indirect accounts of symptoms, including diarrhoea, stomach

79
aches, chest pain, intestine pain, joint pain, fever, tiredness, hot eyes, thirst and dizziness.
One traditional doctor in a village where the pilot study was conducted reported the death
of a young boy who consumed poisoned meat whilst suffering malaria, although this could
not be corroborated. Some respondents who admitted having used poison had stopped
after suffering stomach aches, but others had not suffered any symptoms. Other informants
attributed symptoms to other factors such as the being meat unwashed or did not consider
the symptoms significant. There was a widespread belief that removing the internal organs
and head of the animal renders the meat safe to eat. One male focus group discussion
participant, during the pilot study, summarized these beliefs:
A few men have had stomach aches after eating poisoned birds, but they continue to eat. It
is of low concern, and they avoid eating the internal organs for this reason […]. Some who
have experienced this have switched to using nets, but not all […]. The stomach pain is mild
and happens after a lot of meat is eaten, there is no diarrhoea […]. They don’t worry enough
to go to the doctor, and not even all men experience this.
4.5.4 Motivations and key actors
Most reports were of villagers using poison to catch food for household consumption,
including six individuals, the participants of one focus group discussion who had engaged in
poisoning themselves, and almost all of the 34 informants who had indirect knowledge of
poisoning. Informants in three villages explicitly denied the existence of trade in poisoned
meat when asked, but one informant reported that trade with the nearest market was
occurring, and another described trade occurring within another village. Sharing surplus
poisoned meat with relatives and neighbours was more common. Further reports from two
villages indicated that workers from nearby agro-industry concessions used poison to defend
crops from cattle encroachment. Similarly, in one focus group discussion participants
implicated soldiers stationed nearby. One chief suggested that poisoning may be done as
retaliation, or out of jealousy, by conservation rule-breakers who had been excluded from
the benefits of conservation programmes.
Most informants stated that poisoning is practised predominantly by young men of up to c.
30 years of age, to provide meat for their families. Some informants suggested that poorer

80
households are more likely to use this method. For example, one male informant explained
the motivations of a friend: ‘He had no work and is poor and wanted to eat meat.’
Other informants suggested that wealthier households were also likely to use the method,
one explaining that poison was too expensive for him. From four villages we obtained
reports that children older than c. 12 years were using poison. We spoke to a mother who
admitted that her children used this method and were taught by a shopkeeper. Although she
did not condone the practice, the family shared the meat together. Shopkeepers may be a
source of knowledge about these methods. Informants reported that adults may also learn
the method from sellers at local markets, through personal experimentation, or from other
villagers. For example, one informant learnt the method from his father, who in turn was
taught by a neighbour.
4.5.5 Village perceptions
During one pilot focus group discussion, poisoning was discussed openly, and multiple male
participants admitted to practising it. In this village, informants and discussants claimed that
wildlife poisoning was not illegal and spoke in detail about the practice. Participants claimed
they discussed this practice with each other and learnt from each other, such as when eating
wild meat at a relatives’ home and enquiring about its origin or asking acquaintances about
their dinner plans. Others knew not to catch fish at poisoned waterholes. Half of participants
had practised poisoning, and other informants gave prevalence estimates as high as 70%,
but many had decided to switch to nets because of health concerns.
Poisoning was only acknowledged in three of the 20 focus group discussions within the
protected areas, as something done by other villagers or by outsiders. In remaining focus
group discussions, participants claimed to know nothing about poisoning and discussions
were generally characterised by low levels of disagreement, perhaps reflecting pressures to
produce socially acceptable responses. This occurred in villages where other informants
reported poisoning to be common. In one case such an informant was participating in the
focus group discussion but remained silent on this point. We elicited views about waterhole
poisoning on a hypothetical basis. For example, in one discussion participants claimed not to
know about poisoning but suggested that if it were happening, it would be done in secret to
avoid legal repercussions. When asked who else might disapprove of the practice, a male

81
participant stated: ‘If people in the village knew this was happening, they would be unhappy
as it could kill their cattle’.
In the same village, multiple informants indicated that poisoning was occurring, and the
chief reported having raised the issue at a meeting. The chief estimated that c. 30% of
households used poison, but that they ‘are not among [his] friends’. One young man
informed us that a lot of people in the village are unhappy about the practice. A woman in
this village told us: ‘Everyone in the village knows this happens and many people don't even
like using pesticides on their crops but will poison animals’.
In another village, one male informant reported that poisoning was widespread in the past,
but that now only c. 50% of the village continued to use this method. He suggested that
those who had stopped became concerned about the health effects and were unhappy
about the risk posed to livestock. Another man gave a similar estimate for prevalence and
believed that although most others might refuse to buy poisoned meat because of health
concerns, they don’t mind that it occurs and prefer to avoid arguments. Nevertheless, some
are unhappy about lost access to waterhole fisheries. The chief downplayed the prevalence
of poisoning as just ‘four or five households’ and stated that it never led to arguments.
4.5.6 Attitudes, perceptions and beliefs
4.5.6.1 Attitudes
The survey data showed that hunting with poisons was regarded as unsafe by 87% and not
viewed as a good method by 89% of respondents (Figure 4.5). Nonetheless, 32 respondents
from across all villages stated that it is a good method. The two Likert items measuring
attitudes were internally consistent (α=0.51) and were combined into a single measure.
Wealthier respondents tended to have more negative attitudes, but no other variables had
significant effects (Figure 4.6, Table A1.3). Of 168 self-reported hunters asked to explain why
they did not use poison, concerns for safety and health were the most frequent response
(63%, Figure 4.7), with lack of knowledge about the practice second (20%).

82
Figure 4.4: The strength of evidence to support each statement or research question across
all 10 villages. Villages 1–6 are in Kulen Promtep Wildlife Sanctuary, and villages 7–10 in
Chhep Wildlife Sanctuary. Triangles pointing downward indicate that the evidence
contradicts, circles indicate that the evidence is neutral, and triangles pointing upward
indicate that the evidence is in support of the statement on the left. Larger shapes indicate
that the evidence is stronger for this conclusion. Blank squares indicate that the conclusion is
not applicable (i.e., because poisoning is not thought to occur in a particular village) or that
there is no evidence related to the statement. The top five rows are based on quantitative
measurements using Likert scales. Evidence is considered weak if the SD overlaps with the
centre of the next category (e.g., mean attitude is negative, but SD overlaps with centre of
the neutral category). The remaining rows are based on qualitative evidence, and subjective
judgement of the evidence. Evidence is considered strong if more than three independent
sources confirmed it.

83
4.5.6.2 Perceived behavioural control
Likert measures for perceived behavioural control were not consistent (Cronbach’s α=0.09),
so these were analysed separately: 65% of respondents did not think poisoning was an easy
(sruol) method, and 13% did not know if it was easy. Wealth, agricultural pesticide use, and
membership of the village market network correlated positively with perceived ease of use,
whereas age and length of local residence correlated negatively (Figure 4.8, Table A1.4).
Agricultural pesticide use (effect=0.82, SE=0.25) had the largest effect. Conversely, 68% of
respondents stated that poisoning is an effective method for catching wildlife, especially
younger people and those using agricultural pesticides (effect=0.61, SE=0.28). Respondents
living in Kulen Promtep Wildlife Sanctuary were more likely to perceive it as effective
(effect=1.63, SE=0.50, Figure 4.4, Table A1.5). Informants from four villages (three in Kulen
Promtep Wildlife Sanctuary, one in Chheb Wildlife Sanctuary) referred to the efficacy of
poisoning as an advantage and a potential reason for others to practise it. This included the
ease with which the method can be learnt and applied, the effectiveness and speed with
which animals are killed, and the quantity of wildlife that can be harvested. Two informants
also made favourable comparisons to guns and slingshots. Small amounts of termite poison
are cheaply available locally, and several respondents suggested this made it accessible to
even the poorest.
4.5.6.3 Perceived social norms
Over 75% of respondents indicated anti- or non-poisoning norms for each of the four Likert
items, and average responses did not vary by village (Figure 4.4). Nevertheless, 28
respondents (6%), 17 of whom resided in two villages in Chheb Wildlife Sanctuary, perceived
wildlife poisoning to be a common practice in their community. The four Likert items were
internally consistent (Cronbach’s α=0.61) and were analysed together. Older respondents
and those living in Kulen Promtep Wildlife Sanctuary (effect=−1.89, SE=0.24) were more
likely to perceive norms as being anti-poisoning (Figure 4.6, Table A1.3). Furthermore, when
descriptive and injunctive norms were analysed separately, differences emerged: wealth had
a small positive effect (effect=0.15, SE=0.06) on descriptive norms (i.e. wealthier people
were more likely to think poisoning is common in the village), but in villages where local
authorities had taken action against poisoning (effect=0.48, SE=0.15) wealth had a negative

84
correlation with perceptions of injunctive norms (i.e. more likely to say that other villagers
did not approve).
4.5.7 Perceived and actual repercussions
According to informants and focus group discussions, hunters carry out poisoning in secret,
which they suggested may be a reason why conflict or sanctioning has rarely occurred. For
example, in one focus group discussion participants believed that if a cow was poisoned it
would not lead to an argument because they would be unable to identify the poisoner. An
informant who had a dog killed gave a similar explanation. The possibility of facing legal
consequences was cited by four respondents across four villages, and by participants in two
focus group discussions, as reason to conduct poisoning in secrecy. For example, one chief
expected that most adults would phone the police if they saw children using poison.
Another informant suggested that no one would talk to us about poisoning because of fear
we would report them to the government. Nevertheless, among those who admitted
hunting, legality was only offered as a reason not to use poison by three individuals (2%,
Figure 4.7). Among former poisoners, only one cited law enforcement as a reason for having
stopped the practice.

85
Figure 4.5 Each construct from the theory of planned behaviour (attitudes, perceived behavioural control, injunctive norms, and descriptive
norms) was measured using two questions on a five-point Likert scales. The respondent was presented with a statement and asked to what
extent they agreed or disagreed. The percentage of respondents (total = 462) providing each answer for each statement is shown.

86
In five villages, local authorities reported action to deter or punish poisoning, after receiving
reports from members of the community or directly observing poisoning. Usually, members
of community protected area committees observed these incidents when patrolling. The
first response is a verbal warning, but they may also be referred to the village chief. One
chief asked offenders to sign a contract, a common practice in Cambodia, promising to
refrain from poisoning. Informants perceived that these individually targeted interventions
were successful in deterring individual hunters from using poison again. For example, one
community protected area chief claimed:
In 2013 we caught someone and brought him to the village chief. He had put a plastic bag in
a hole in the waterhole and put a termite poison in […] If cattle had been poisoned, he would
have to pay a big fine, but the [village] chief made him sign a contract [not to continue] and
he has now stopped…
Figure 4.6 We fitted generalised linear models to understand which variables predict
constructs from the theory of planned behaviour. This figure shows the effect sizes of several
variables on attitudes, descriptive norms and injunctive norms. The bars represent 95%
confidence intervals. Intercept values are 4.08 for attitudes, 3.86 for descriptive norms, and
4.61 for injunctive norms. Normalised variables have been divided by their standard
deviation.

87
Figure 4.7 Reasons given for not using poison, by 168 survey respondents who stated they
hunt wildlife.
Figure 4.8 We fit cumulative linked mixed models (logistic regressions), to understand which
variables predict perceived behavioural control. The two Likert responses (poisoning is easy,
and poisoning is effective) used to measure this construct were analysed separately. This
figure shows the effect size for each variable, and the bars show the 95% confidence
intervals.

88
In three villages, preventive action had been taken at the community level. Two chiefs used
village meetings to ask villagers not to use poison, and in one case also forbade shopkeepers
from stocking the poison (although several informants indicated local stocks existed and a
shopkeeper reacted angrily when we inquired). Another chief had referred the issue to the
commune chief, following which environment authorities came to hold a similar meeting.
This chief also expressed the expectation that a fine should be levied if a hunter was known
to have poisoned cattle. However, wildlife poisoning continues, and this was acknowledged
by the chiefs, for example:
The villagers are all unhappy [about poisoning] […]. Last year I told everyone at a meeting to
not do it and forbade the shopkeepers to sell the poison, […] but people continue to do it in
secret.
4.6 Discussion
In northern Cambodia, wildlife is being poisoned by pesticides deposited near to seasonal
waterholes. We found that several practices and actors may be contributing to wildlife
poisoning, but most significant is an intentional form of hunting carried out by local
residents, particularly young men and children older than 12 years. Our study presents a first
characterization of this practice using a mixed methods approach and quantifies its socio-
psychological determinants using the theory of planned behaviour (Ajzen, 1991). Although
we were unable to quantify the prevalence of poisoning, reports suggest that it was being
practiced in eight of the ten villages surveyed, and that it is affecting the environment, public
health, livestock and wildlife. The pesticides used include carbamates, which are extremely
toxic to birds (Richards, 2011), and placement at critical dry season water sources means
that even low frequencies of poisoning may be having significant impacts on threatened bird
species (Pin et al., 2018; Loveridge et al., 2019). For example, individuals of Critically
Endangered species of vulture and ibis were reported to be affected. Further anecdotal
evidence suggests these practices are occurring beyond our study area (e.g. (Sokpheng,
2015) and they should be taken seriously by local and national authorities.

89
Some poisoning in Cambodia may be occurring as a symbolic and visible form of resistance
to conservation rules (Norgrove & Hulme, 2006; Essen & Allen, 2017). This was suggested by
one village chief in a community with a long-standing ecotourism project, where a waterhole
had been poisoned close to the guest lodge. However, most poisoning occurs where visibility
is low, and the low salience of conservation law enforcement among hunters and
interviewees suggests this form of symbolic poisoning is a limited occurrence (Peterson et
al., 2017). Most reports indicated that poisoning is predominately a method of harvesting
wild meat for household consumption. It is seen as an effective method that requires few
skills and little effort, and is practised during the dry season, when other sources of meat are
less available (Coad et al., 2019). Our data do not suggest a clear link with poverty or food
insecurity as wealthier households were also implicated, and many poorer households
expressed disapproval. Similarly, hunters using poison whom we spoke to directly did not
raise food insecurity as a consideration in deciding whether or not to continue using poison.
Nevertheless, it may play a role for some hunters.
Varying perceptions of the health risks associated with consuming poisoned meat seem to
play a larger role. Among other hunters and former poisoners, health concerns were a
prominent reason given for not using poison. But others downplayed these risks or believed
that removing the internal organs rendered the meat safe. For them, the ability to catch
meat with ease in the dry season outweighed the perceived health risks. This form of
poisoning is unusual as most documented cases of wildlife poisoning are symbolic acts
related to conflicts (Berny, 2007; Richards, 2011), but there are similarities with practices
documented in Bunyala, Kenya, where carbofuran pesticides and baits are used to harvest
wild birds at seasonal wetlands. Consumers there also believed that poisoned meat can be
rendered safe, although in Cambodia, hunters consume the meat themselves, whereas in
Kenya they supply markets (Odino, 2011).
Waterhole poisoning affects other members of the community (i.e., harming cattle and
dogs) and represents a risk to public health through distribution of contaminated meat and
contamination of water sources (used for drinking and washing) and fisheries. Concerns
about these impacts have led some local authorities to sanction individual hunters or
organize meetings to discourage further poisoning. These have taken place in villages where
injunctive norms are more negative, either because the authorities’ actions produced these

90
negative norms or because authorities feel enabled to act where negative injunctive norms
already exist. Whether these sanctions have had deterrent effects is unknown, but poisoning
continues to occur. This suggests there are groups of villagers who consider poisoning
acceptable and who are not influenced by the chief, and potentially that other influential
villagers condone poisoning (perhaps implicitly) among their clients (Ledgerwood & Vijghen,
2002). In other words, there are variable perceptions of social norms within different parts
of the village social network (Shepherd, 2017), or as one chief articulated: ‘they are not
among my friends’. For example, younger respondents tended to have less negative norm
perceptions, suggesting they may feel less constrained by village norms. This may also
explain why informants gave diverging estimates of prevalence: either because they had
access to different social information (i.e., they believe it was common because their
relatives all did it), or because they felt different social pressures to exaggerate or downplay
poisoning in their responses to us. Our association with the chiefs may have played a role in
this.
We did not record any reports of conflicts caused by poisoning. Some informants suggested
that they simply don’t know who is poisoning and so can’t do anything about it. Perhaps
some are not aware that it occurs, particularly in villages where it has not yet had large
negative impacts. Others were aware but chose to keep silent, as revealed by the actions of
one informant who spoke freely in private, but not in a group setting. Many of the questions
related to poisoning posed during group discussions were met with long silences. This
culture of silence may have been towards us as outsiders, who potentially cannot be trusted
and who might bring law enforcement or other consequences to the village, or to maintain
the village’s reputation (Nyumba et al., 2018). Law enforcement was cited by some as reason
for secrecy, but only rarely cited as reason not to poison.
Alternatively, silence is maintained to preserve harmony within the community, or to avoid
retribution. Khmer culture is conflict averse, but resentment can simmer before erupting
violently (Luco, 2002). Data from one pilot village outside the protected areas provides a
stark comparison, as poisoning was discussed openly, was widespread, and was perceived as
legal. Perhaps the absence of conservation activity there meant villagers did not understand
the illegality of their actions and were not concerned about legal sanction. But we also
recorded no negative impacts on other villagers here, perhaps because there were social

91
norms regulating where and how waterholes could be poisoned, which served to prevent
conflict. For example, discussants knew to avoid fishing in poisoned waterholes. Similar
dynamics may exist among some groups in the other villages, but perhaps involvement in
conservation has precluded the possibility of these norms emerging at village level, as at
least some elites will be interested in maintaining conservation programmes. Our study does
not indicate how different networks and individuals, with different poisoning norms and
behaviours interact within a village, and how conservation may be producing anti-poisoning
norms or resistance to these norms at different levels.
Our study highlights some methodological challenges in the study of sensitive behaviour. We
applied the unmatched count technique to measure the prevalence of poisoning, but
observed a design effect, suggesting respondents actively manipulated their responses to
avoid implication of engagement in poisoning. Other unmatched count technique studies in
Cambodia or on wildlife poisoning have encountered similar problems (Nuno & St. John,
2015; Fairbrass et al., 2016; Ibbett et al., 2017). If the unmatched count technique is to
become a widely applicable tool, more research will be needed into how respondents
perceive the method, and how this varies across contexts (Hinsley et al., 2019). Other
measured variables such as beliefs and attitudes may be equally susceptible to social
desirability biases but lack specialized methods for measurement in sensitive cases. For
example, individuals who have positive attitudes towards poisoning might disclose a
negative attitude. Researchers should develop methods to measure complex sensitive
variables that go beyond prevalence (but see (Kramon & Weghorst, 2019). An alternative is
to use more in-depth ethnographic approaches to study the social dynamics in one place,
but there is a trade-off between depth and generalizability. We chose in this study to gain a
more superficial understanding of broad patterns over a landscape, as a prelude to gaining
deeper understanding in fewer locations. Despite these limitations, our study nonetheless
generated reliable insights into wildlife poisoning by using multiple complementary methods
and triangulating qualitatively across a large number of data sources. The many informants
across multiple communities giving similar descriptions of poisoning practices, motivations,
actors and community perceptions gives confidence in these results. The neutral
presentation of the research team was key to collecting this data (Drury, Homewood &

92
Randall, 2011). We have carried out a more in-depth study in one village that further
supports our findings (Chapter 5).
Our results could be used to guide the design of more effective interventions (Michie et al.,
2008). Perceptions of health risks were a salient factor in decisions about poisoning. The
approach employed in Bunyala, Kenya, focused on raising awareness about the risks of
consuming poisoned-meat, but this was unsuccessful as consumers had extensive personal
experiences that supported their belief that risks were low (Wu & Shaffer, 1987; Odino,
2011). We found similar beliefs in our study, but these could potentially be influenced by
selecting appropriate messengers, such as local doctors (Pornpitakpan, 2004). Social norms
can be a powerful motivator for behaviour change (Cialdini, 2015), so the anti-poisoning
norms present in some places may be effective levers (McDonald et al., 2013). Interventions
could increase the prominence of these norms and provide new avenues for villagers to
apply social pressure on others in ways that avoid direct conflict. Conflict could have
unintended negative consequences in this context, such as reinforcing poisoning as a norm
within certain subgroups, or provoking poisoning as a form of resistance (Luco, 2002;
Peterson et al., 2017). For this reason, commonly used normative interventions such as
community discussions may be culturally inappropriate as they require open confrontation.
Media dramatization could alternatively be used to provoke changes in normative
perceptions (Bicchieri, 2017b), and encouraging and rewarding public pledges (i.e. to use
pesticides correctly, or to report poisoning) could facilitate strong normative signals and
positive social incentives to engage (McKenzie-Mohr & Schultz, 2014). One approach
successfully trialled in Laos was implementing a hotline to facilitate anonymous reporting of
hunting, and then providing public feedback on these reports (Saypanya et al., 2013). As a
result, influential individuals might perceive that authorities are aware of the problem and
that to continue condoning poisoning within their networks could jeopardise their position.
As children appear to be using poisons to hunt, interventions could encourage parents to be
more vigilant by focusing on health risks, working with trusted messengers such as local
schools. Because there is heterogeneity in use of poison between villages (Figure 4.4),
interventions could prioritize those where poisoning is more prevalent, tailored to the
situation in each community. Where local chiefs have already acted against poisoning and
strong anti-poisoning norms exist, interventions could be co-designed with these

93
authorities. In other places where poisoning is less salient (i.e., villagers are less conscious of
it), and norms are weaker, awareness-raising activities could be more impactful. Finally,
enforcing existing pesticide regulations, and limiting the availability of restricted chemicals,
such as carbofurans, should be a national priority.
Effectively addressing new conservation threats such as wildlife poisoning requires
knowledge of behavioural drivers and social contexts (St. John et al., 2013). For such
sensitive behaviours, data collecting can be challenging. Nevertheless, as our study shows,
using multiple complementary methods and triangulating data allowed us to draw more
reliable inferences. These findings can be used to select interventions that are likely to be
more effective than those based on intuition or expert opinion (Cook, Hockings & Carter,
2010). Robust testing and evaluation of the ensuing interventions will also be essential
(Baylis et al., 2016) but, whether or not evaluation occurs, formative mixed-methods
research such as those used in this study can play a valuable role in conservation
interventions. As poisoning is potentially widespread and may have catastrophic impacts on
wildlife, people, animals and the environment, this issue should be prioritized by local and
national authorities.

94
5. Social networks can both amplify and undermine conservation
behaviour change interventions
5.1 Abstract
Social networks are critical to the success of behavioural interventions in conservation as
network processes such as information flows and social influence can enable behaviour
change to spread beyond a targeted group. We investigated these mechanisms using
dynamic network models and longitudinal behavioural data from a conservation
intervention in Cambodia. The intervention initially targeted ~11% of a village population,
but knowledge of the intervention reached ~40% of the population within six months. The
likelihood of having this knowledge doubled with each additional knowledgeable household
member. In the short term, there was also a small, but widespread increase in pro-
conservation behavioural intention (+5%), but this did not persist into the long term.
Estimates from network models suggest that the influences of social peers, rather than
knowledge, were important in changes in intention and contributed to the failure in
behaviour-change in the long term. Our results point to the importance of accounting for
the interaction between networks and behaviour when designing conservation
interventions.
5.2 Introduction
Biodiversity conservation practitioners and researchers are increasingly interested in
designing interventions that influence human behaviour (St. John, Keane & Milner-Gulland,
2013). Social networks – i.e. the connections between individuals within a population – play
a strong role in shaping behaviour as individuals communicate with and learn from one
another (Borgatti et al., 2009; Prentice & Paluck, 2020). The structure of social networks
therefore have important implications for environmental and conservation outcomes
(Bodin, Crona & Ernstson, 2006; Barnes et al., 2016b), and understanding how social
networks influence behaviour can enable practitioners to design more effective
interventions (Chapter 3, Valente, 2012).
Most network studies aiming to inform conservation practice use observations of social
relations taken at a single point in time, usually before the intervention takes place (Groce

95
et al., 2018) to predict the social dynamics that are likely to occur following an intervention.
For example, researchers may use network data to identify individuals likely to influence
others (Mbaru & Barnes, 2017) or to uncover relevant structural features such as the
existence of disconnected sub-groups (Crona & Bodin, 2006). Other studies measure both
behaviours and networks to identify the social processes that shape conservation outcomes
(Barnes et al., 2016b). However, to untangle the mechanisms shaping behaviour there is a
need to move beyond cross-sectional approaches and adopt a longitudinal perspective
(Robins, 2015; Shalizi & Thomas, 2011; Steglich, Snijders & Pearson, 2010). Such studies
have not been conducted in conservation.
Two network processes are thought to play an important role in any social intervention:
information flow and social influence (Banerjee et al., 2013; Contractor & DeChurch, 2014).
First, as people make decisions based on information they receive about the world, the
transfer of new information is a core part of any intervention and it is likely that many will
receive such information indirectly, through their social networks (Hilbert et al., 2017; Cai,
De Janvry & Sadoulet, 2015). The social contexts within which information is shared
significantly influence how information is interpreted and acted upon. This can involve
effects related to the identity of the messenger, the relationships between communicators,
and their positions in larger power structures (Pornpitakpan, 2004; Wakefield, Loken &
Hornik, 2010; Faraji-Rad, Samuelsen & Warlop, 2015).
Second, individuals tend to behave similarly to others in their social networks, and decisions
to change or adopt new behaviour can be strongly determined by social influences (Centola,
2018). For example, individuals may seek to comply and conform with the behaviours of
others in their social network (Cialdini & Goldstein, 2004), or adjust their perceptions of
social norms based on the behaviours or attitudes of their peers (McDonald & Crandall,
2015; Bicchieri, 2017; Shepherd, 2017). Many interventions aim to leverage such forms of
social influence, such as intentionally targeting influential individuals and expecting
behavioural spill-over to occur (Nakano et al., 2018; Kim et al., 2015).
To understand how information flow and social influence mediates the success or failure of
a conservation intervention, we present a longitudinal study of an intervention in a part of
Cambodia where pesticide misuse has been linked to the killing of threatened wildlife
species and harm to humans. The intervention aimed to promote the use of a hotline for

96
reporting pesticide contamination in one village (Chapters 2 & 4). We use a combination of
linear models and Stochastic Actor-Oriented Models (SAOMs) to understand how
knowledge and psychological outcomes changed throughout the village, and to explore the
role of village social networks in these changes.
5.3 Methods
5.3.1 Study context
Cambodia’s Preah Vihear province lies in a global biodiversity hotspot (Myers et al., 2000),
and contains the largest remaining mosaics of forests and grassland in mainland South-east
Asia, and 28 Critically Endangered or Endangered species (Clements et al., 2010). Waterhole
poisoning was first documented here in 2015 and is an increasing threat to wildlife. It is
practiced by some local farmers to harvest wild meat for home consumption, but most
residents do not approve of this practice and are concerned by possible risks to health and
the environment. In some villages, local authorities have taken action to prevent further
poisoning (de Lange et al., 2020). To support these efforts the Wildlife Conservation Society
(WCS), in partnership with the provincial Department of Environment, is piloting the
introduction of a reporting hotline (Chapter 4). Residents can call this number anonymously
to report pesticide contamination. After receiving a report, local officials will respond by
removing the poison and beginning an investigation. By communicating the results of these
investigations clearly within the community, conservationists hope to reduce the perception
that poisoning is tolerated by the community and by authorities (Saypanya et al., 2013).
5.3.2 Study design
In February 2019, the Wildlife Conservation Society (WCS) delivered an information session
to a group of 41 adults in the target audience of parents with children aged 10 to 15, an age-
group known to participate in poisoning and whose parents may be particularly concerned
about the consequences of poisoning for their children’s health (Chapter 4). Attendees
received information about the threat of poisoning and about the hotline (Figure 2.5). To
persuade them to use the hotline, testimony was provided by past victims of poisoning, and
a short film was shown dramatizing a poisoning incident affecting children. Finally,
attendees were invited to make a public pledge of safe pesticide use and to participate in
poisoning prevention, for which they received a certificate. Materials with practical and

97
persuasive information were distributed, which attendees were encouraged to display or
share with others, such as posters and stickers (Figure 2.6).
The intervention served as an experiment, allowing us to observe how changes in
knowledge and psychological outcomes throughout the village changed with respect to
village social networks. The intervention aimed to increase attendees' intention to report
pesticide contamination, by providing information that was expected to alter their beliefs
and perceptions. Other residents who did not attend the event were also expected to
increase their intention to report poisoning through network effects. This could occur
through (a) information flow, if they receive information about the intervention causing
them to re-evaluate their beliefs and perceptions, or (b) social influence if they observe
social networks peers (e.g., event participants) changing their intention or attitudes causing
them to re-evaluate their own (Figure 5.1).
In advance of the intervention (in September 2017) we measured the village social network
through a survey of nearly adults in the village. We then measured behaviour, knowledge,
and perceptions related to the intervention through three survey waves before and after
the intervention. The first wave took place two weeks before the intervention, the second
wave took place two weeks after the intervention, and the third wave was six months later,
in August 2019. The study was approved by the University of Edinburgh School of
Geosciences ethical review board, and all participants gave their informed consent. All
survey instruments were initially piloted and refined using a small sample of respondents in
another village or using a small sample of respondents from the study village which was not
included in the analysis.
In communities such as the one being studied; the presence of outside researchers may
potentially have a strong influence on the behaviour of respondents. For example, a foreign
researcher asking questions about poisoning and reporting, may increase the salience of this
topic, causing respondents to re-evaluate their beliefs, communicate with others, or seek
further information. Although network analysis requires complete data, we considered it
necessary to be able to control for this effect. In wave 1, we therefore excluded a randomly
selected half of the village. In all other waves, we aimed to interview all adults in the village
and all event attendees.

98
5.3.2.1 Network data
We measured a general social network which aims to capture habitual social contact (i.e.,
time spent together) between adult villagers (>18 years). To construct this network, we
measured and combined ties of three kinds: 1) co-residence ties between adults in the same
household, 2) household visits, and 3) household visitors. For co-residence ties, we assumed
that ties existed between adults living in the same household (i.e., that individuals within a
household mix and communicate homogenously). We measured the other ties using a
name-generator survey: respondents were asked to nominate others whom they visit at
home, or who come to visit them at home (Knoke & Yang, 2011). Extensive prior qualitative
research suggested that these ties are likely to comprise the bulk of every-day social
interaction in the village, therefore making them a key conduit for both information and
influence (see Appendix 2). We excluded individuals who did not participate in the survey
from the social network.
Networks and behaviour co-evolve (Snijders, 2017). However, the study village is remote
and has a low rate of population change. We therefore assumed that change in the social
network would be minimal within the period of the research. Furthermore, conducting
research in this context poses resource and logistical constraints. For these reasons, we did
not re-measure the social network at each survey wave, except in the final wave (wave 3).
We also measured other network ties such as friendship, and communication about NGO
activities, but did not use these in the analysis because of low response rates.

99
Figure 5.3: The hypothesised and observed relations between knowledge and variables from the theory of planned behaviour (TPB) throughout
the village. The data were analysed using a combination of linear mixed effect models and stochastic actor-oriented models (SAOM). (a)
Overview of the observed mechanisms of behaviour change in the village. The intervention influenced people’s intentions and increased
knowledge about reporting of poisoning. This information flowed through the village. Moreover, changes in intention propagated through the
social network through social influences. (b) Further detail on the hypothesised and observed cognitive mechanisms of behaviour change.
Dotted arrows indicated hypothesised relationships between variables that were not supported by the data, while the thicker solid arrows
represent correlations observed in the data. For the TPB variables, small circles indicate whether the variable changed in the short term (left)
and long term (right). Black indicates change, and white indicates no change, relative to the baseline. In turn, attitudes, perceived behavioural
control, and perceived injunctive norms also correlated with intention. SAOMs showed a strong effect of peer intention but did not support
other social influence mechanisms.

100
5.3.2.2 Psychological data
Poisoning events are rare, therefore measuring reporting events as an indicator of
behavioural change would provide highly biased data. Instead, we used the Theory of
Planned Behaviour (TPB) to conceptualise and measure changes in psychological constructs
produced by the intervention (Ajzen, 1991). This theory predicts that use of the hotline will
be strongly determined by an individual’s intention to report poisoning. In turn, intention
will be influenced by an individual’s attitudes towards reporting (e.g., do they think
reporting is good?), their perceptions of behavioural control (e.g., do they feel they can
report?), and their perceptions of social norms. We further divide the social norm
perception into descriptive norms (e.g., do they perceive that others would report?) and
injunctive norms (e.g., do they perceive that others support reporting?). We used multiple
five-point Likert scales and summed these for each variable to produce continuous
measures of each variable from the TPB at each survey wave. We assessed the internal
consistency of the measures for each construct using Cronbach’s alpha.
Following the intervention, we measured respondents' knowledge of key intervention
messages using twelve questions related to three components of the intervention: details of
the hotline, details of the short film, and details of the pledge. We asked questions in an
open-ended manner and recorded the response verbatim before coding correct and wrong
answers. We then summed the correct responses to arrive at a knowledge score. Questions
were worded so as not to give away any of the information for future surveys. We also
asked respondents to describe the source of their information and coded responses into the
following categories: relatives, other people, and intervention materials.
5.3.3 Analytical approach
All analyses were conducted in R 4.02 (R Core Team, 2017). We used linear models to
explore variation in TPB variables and knowledge over time and across the population. We
used SAOMs to determine whether network or other factors were influencing these
changes. To describe the network, we calculated simple statistics using the igraph package
(Csardi & Nepusz, 2006): Density is the number of ties measured as a proportion of all
possible ties. Transitivity is the proportion of connected triples that form a closed triangle (a
measure of clustering). Assortativity measures the extent to which individuals tend to
connect with other similar individuals using Pearson’s r coefficient of correlation.

101
5.3.3.1 Missing data imputation
Due to missingness in our psychological data (see Appendix 2), we use a combination of
complete-case analysis and multiple imputation (Pepinsky, 2018). We generated 20
imputations using predictive mean matching in the ‘mice’ package (van Buuren & Groothuis-
Oudshoorn, 2011). Twenty imputations was considered to be a good compromise between
robustness and computation time (Krause, Huisman & Snijders, 2018). Furthermore, we
observed that the model estimates did not vary greatly between 5 and 20 imputations,
suggesting that they are robust to the number of imputations. The imputation model
included all knowledge and psychological constructs for all waves, and all demographic and
other variables used in the analysis models. We compared the imputed and observed
datasets graphically to check for implausible imputations, such as those that have
distributions very different to the observed data (Nguyen, Carlin & Lee, 2017). To estimate
SAOMs we carried out 20 joint multiple imputations of the network and behaviour following
the procedure in Krause et al. (2018). This takes the imputations produced using mice as a
starting point, and then accounts for the SAOM specification to generate the imputations
(Krause, Huisman & Snijders, 2018). For full details of the imputation procedure and model
specification, see Appendix 2.
5.3.3.2 Changes in knowledge and behavioural intention
To explore variation in the data, we fitted linear mixed effect models (LMMs). First, we
examined how knowledge and TPB variables changed over time within the attendee and
non-attendee groups, by modelling these dependent variables with the interaction between
attendance at the event and time-period as predictors. We used linear hypothesis testing in
the ‘car’ package to compare the effects of time on different groups, and calculated
standard errors using the delta method (Fox & Weisberg, 2019). Second, we examined the
relation between knowledge and TPB variables. We modelled TPB variables with the total
knowledge score, and separately with knowledge of the three intervention components as
separate predictors (hotline, story, pledge). Each model also included the following control
variables; gender, age (normalised by dividing by the standard deviation), pesticide use,
household wealth, inclusion in the baseline survey and participation in the conservation
agriculture programme Ibis Rice. Individual identity was included as the random effect. We
modelled the complete-case data, and pooled estimates modelled with the twenty imputed

102
datasets (van Buuren, 2018). Finally, to assess the psychological determinants of intention
to report poisoning, we fit a generalised linear model (GLM) for the TPB at each survey
wave.
5.3.3.3 Stochastic actor-oriented models
To understand whether changes in knowledge and behaviour are being influenced by
network or other processes, we fitted SAOMs implemented in the R package “RSiena”
(Ripley et al., 2020). SAOMs are dynamic models of network-behaviour co-evolution which
enable us to model how changes in behaviour are influenced by the structure of the social
network (Snijders et al., 2010; Greenan, 2015). These changes are driven by the simulated
decisions of individual actors in continuous time, where the SAOM simulations are
calibrated to empirical observations of the network/behaviour at fixed time points (Snijders,
2017). We fitted the SAOMs with three waves of data and used forward estimation to build
the model; including theoretically important effects, and then including effects related to
our research questions (Ripley et al., 2020). We continued until the models included as
many effects of interest as possible, had an overall convergence ratio under 0.2, and
adequately fitted the data as observed using the visual method described by Wang et al.
(2020).
Because our research questions are about the effects of the network on behaviour change
(not evolution of the social network) and we did not expect significant changes to the
structure of the network to occur over the time period in question, we fitted each model
with the network kept constant throughout all periods, akin to a stationary SAOM whilst
allowing the behaviour to change (Block, Stadtfeld & Snijders, 2016; Snijders & Steglich,
2015). The partial re-measurement of network data in wave 3 was incomplete and not
sufficient for dynamic network models. However, assuming both network measurements
represent observations of the same underlying social network, we perform a robustness
check by repeating our models using the updated network. In this network, individuals not
surveyed in wave 3 retain their network ties from wave 1.
5.3.3.4 Modelling information flow
To determine whether network ties predicted information flow we modelled knowledge
using the ‘Diffusion of Innovations’ extension to the SAOM (Greenan, 2015). In this model,
knowledge is binary (i.e., does the individual have any knowledge?) and non-decreasing. In

103
the first wave, we assume that only those who participated in the intervention had
knowledge. First, we modelled information diffusion in relation to the habitual social
contact network. Second, we modelled information diffusion with the three types of social
tie (i.e., co-residence, visits, and visitors) included as separate social networks, to compare
their effects. In each model, the effect of interest was the total exposure of each individual
to the information (i.e., the total number of network connections with knowledge). No
further effects were included as this decreased model fit or reduced convergence.
5.3.3.5 Modelling social influence
Next, we used SAOMs to examine network influences on behaviour. We separately
modelled three social influence pathways, using the combined network: First, do individuals
tend to change their behavioural intention to match their peers? Second: Do perceptions of
descriptive norms vary with the intentions of an individual’s peers?; and Third: Do
perceptions of injunctive norms vary with the attitudes of an individual’s peers? For the first
model, we modelled social influence using the ‘average similarity’ effect. This effect is
defined as the average of the similarity scores between an individual’s behaviour and that of
the others to whom they are tied. In this case, a positive effect reflects the tendency for
individuals to become more similar to the average of their peers over time.
The second and third models examined the effect of peer intentions or attitudes on an
individual’s perceived norms. We therefore used the ‘alter’s covariate average’ effect. This is
defined as the product of the individual’s perceived norm (i.e., descriptive or injunctive
norm) and the average covariate values (i.e. intention or attitudes) of those with whom they
are connected. A positive effect indicates the tendency that individuals whose peers have
higher intentions or attitudes tend to also increase their perceived norms over time.
To compare the effects of knowledge and social influences on behaviour, these models
included the effect of knowledge about the intervention. We also included a time dummy
variable to account for heterogeneity in effects between time periods (Lospinoso et al.,
2011). This dummy variable would indicate whether psychological outcomes tended to
increase or decrease in the second period. We interacted this variable with the social
influence effects to determine if social influence is stronger in either period. We also
interacted knowledge with social influence, to determine if having more knowledge of the
intervention reduced the influence of peers or vice versa. The first two models included

104
effects controlling for gender, age, wealth, participation in Ibis Rice, pesticide use, in-degree
and out-degree. The latter effects express the tendency for individuals with higher numbers
of incoming or outgoing connections, respectively, to increase their behavioural outcome
over time. Due to difficulties with SAOM convergence (see Ripley et al., 2020), only in-
degree and out-degree were included as control effects in the third model.
5.4 Results
Overall, 400 adult residents from 156 households were represented in our data, of which
365 were included in the measured social network and network models. The three waves
had 181, 283, and 192 respondents, respectively. As a percentage of the 365 individuals
included in the social network, the missingness for each wave of behavioural data is 50%,
22%, and 47% for waves 1, 2, and 3, respectively.
5.4.1 Changes in psychological outcomes
Before the intervention attitudes and intention to report poisoning were positive on
average but varied widely (Figure 5.2). Perceptions of control and perceptions of both
descriptive and injunctive norms were lower on average. In all three waves, intention was
correlated with attitudes, perceptions of control, and perceptions of injunctive norms, but
not with perceptions of descriptive norms (Figure 5.3). Attitudes remained the most
important predictor (GLM, βatt=0.25, SE=0.05, p<0.01, in wave 3), while the correlation with
injunctive norms was higher in wave 2 (βinj=0.28, SE=0.03, p <0.01), than in wave 3
(βinj=0.12, SE=0.04, p=0.02). Analysis of the imputed data showed similar patterns (see
Appendix 2, Table A2.11).
5.4.1.1 Changes among participants
Initially, there were no differences between those who would later attend the intervention
and others (Tables A2.5:A2.9). LMMs and linear hypothesis testing showed that the
intervention successfully changed behavioural intention among intervention participants in
the short term (βpar+w2=1.19, SE=0.39, p<0.01). Perceptions of injunctive norms (β
par+w2=1.76, SE=0.55, p<0.01) and perceptions of control (βpar+w2=1.41, SE=0.44, p<0.01) also
increased significantly, but attitudes and perceptions of descriptive norms did not. Analysis
of the multiply imputed data only showed clear evidence for an increase in perceptions of

105
injunctive norms in the short term (β par+w2=1.76, SE=0.50, p<0.01, Table A2.9). However,
after six months, no measured variables were significantly different from baseline.
5.4.1.2 Changes among non-participants
Behavioural changes also occurred amongst residents who did not attend the intervention
(Tables A2.5:A2.9). After two weeks, intention to report poisoning (β=0.55, SE=0.18,
p<0.01), and perceptions of control (βw2=0.79, SE=0.21, p<0.01) increased by a similar
magnitude as for attendees. In the long term, intention to report poisoning declined back to
baseline levels, but perceptions of control remained higher than baseline (βw3=0.67,
SE=0.22, p<0.01). Attitudes (βw3=0.58, SE=0.25, p=0.02) and perceptions of descriptive
norms (β w3=0.41, SE=0.14, p<0.01) also increased in the long-term. Analyses of the imputed
datasets suggested similar patterns of change for each variable, except that perceived
control was not significantly higher than baseline in the long-term (Table A2.7).
5.4.1.3 Changes in knowledge of the intervention
Intervention participants could recall on average, 58% (SD = 25%) of messages from the
intervention after two weeks, and 48% (SD = 27%) after six months, across all imputations.
Residents who did not attend also learned about the intervention. After two weeks, at least
55 (15% of the sample) individuals had some knowledge about the intervention. Across all
imputations, an average of 79 individuals (SD=5.1) were knowledgeable, recalling on
average 18% (SD = 13%) of messages presented. After six months at least 141 adult
residents (39%, including attendees) could recall information from the event (Figure 5.4).
Across all imputations an average of 148 respondents (SD=8.6) were knowledgeable,
recalling on average 32% (SD = 22%) of messages shared. Information about the three key
components of the intervention spread differently: on average after six months, 50
(SD=5.6), 52 (SD=7.4), and 72 (SD=9.2) non-participants were knowledgeable about the
hotline, pledge, and film, respectively across all imputations.
Of the non-attendees who were knowledgeable, 27% stated that they had learnt about the
intervention from relatives. Others reported learning about the intervention through
disseminated materials (e.g., stickers with the hotline number printed, ~10%), or through
communication with others in the village (~8%). However, 52% could not recall where they
had received the information.

106
Figure 5.2 (previous page): Changes in the measured values for each construct from the Theory of Planned Behaviour. From left to right: intention
to report poisoning, attitudes towards reporting, perceived control, perceived descriptive norms, and perceived injunctive norms. Each construct is
constructed from a set of questions answered on a five-point Likert scale. The range of values for each construct differs, so they are scaled from 0-
1 to enable visual comparison. Measurements in waves 1 (pre-intervention), 2 (two weeks post-intervention), and 3 (six months post-
intervention), are coloured red, green, and blue respectively. The mean value is shown by a black stripe, the box indicates the standard deviation,
and the whiskers represent the 95% confidence intervals. Outliers are shown by dots. Significance levels are shown for the differences between
waves, estimated using linear mixed effect models (* p<0.5, ** p<0.1, *** p<0.001, ns: not significant).

107
5.4.1.4 The relationship between knowledge and psychological outcomes
In LMMs, knowledge was associated with higher behavioural intention (βkno=0.14, SE=0.06,
p=0.02), attitudes (βkno=0.31, SE=0.08, p<0.01), perceptions of control (βkno=0.23, SE=0.07,
p<0.01), perceptions of descriptive norms (βkno=0.09, SE=0.04, p=0.04), and perceptions of
injunctive norms (βkno=0.32, SE=0.09, p<0.01). In the imputed data, the effect of knowledge
on intention and perceptions of descriptive norms were not significant. Modelling
knowledge of each intervention component separately, the only significant correlation was
between knowledge about the hotline and perceived injunctive norms (βhot=0.38, SE=0.14,
p<0.01).
Figure 5.3: Relationship between attitude, descriptive and injunctive norms, and behavioural
control and intention to report poisoning. The coefficients were estimated from Generalised
Linear Models, using complete case data at each survey wave. Intention is positively
correlated with attitudes, perceived injunctive norms, and with perceived behavioural control
at all time points, but not with perceived descriptive norms. The relative importance of the
perceived injunctive norm increases relative to perceived behavioural control in wave 2. 95%
confidence intervals are shown.

108
Figure 5.4: How does knowledge about the intervention change over time? The mean
number of individuals with each level of knowledge (measured out of 12), across twenty
imputation. Before the intervention, in wave 1, nobody has knowledge because the
messages were designed to be unknowable to those not attending the event. Those who
participated in the event are shown in grey, while those who did not are in black. Wave 2
(left) was measured two weeks following the intervention, while wave 3 (right) was
measured after six months. The standard error bars show the variation between
imputations. Individuals without any knowledge are not shown: 248 non-participants (SD=5.00) and
1 participant (SD=0.00) in wave 2, and 213 non-participants (SD=8) and 4 participants (SD=1) in wave
3.

109
5.4.2 The village social network
In total, the village social network comprised 1637 asymmetric ties, of which 650 (40%)
were co-residence ties. For the overall habitual social contact network, residents had an
average of 4.49 outgoing relationships, 57% of which were reciprocated, and graph
transitivity was 0.27. One percent of all possible ties between residents were observed
(network density). Using the assortativity coefficient (i.e., Pearson’s r) we found that
respondents tended to nominate others of the same gender for visiting ties (Pearson’s r
=+0.46), but age (+0.16), household wealth (+0.06) or participation in Ibis Rice (+0.07), were
more variable.
5.4.3 Information flow
SAOMs showed that having an additional social tie with an individual knowledgeable of the
intervention increased the probability that a respondent would become knowledgeable of
the intervention by a factor of 1.39, SE=0.12 (i.e., the exponent of the effect size = 𝑒0.332,
Table A2.12). Models with separated ties showed that exposure within the household was
significant, but exposure through other ties was not. Having an additional household
member with knowledge of the intervention increased the probability that an individual
would become knowledgeable by a factor of 1.87 (𝑒0.627, SE=0.26).
Table 5.1 (next page): Summary results from three Stochastic Actor Oriented Models
modelling the effect of the social network on 1) intention to report poisoning, 2) perceived
descriptive norms, and 3) perceived injunctive norms. For each effect the parameter
estimates are presented as log-odds ratios, and the standard errors are shown. When an
effect was not included in that model, this is indicated by a dash. The average covariate alter
effect (row 2) was specified differently for model 2 and model 3. For model 2, this is the
effect of peer intention. For model 3, this is the effect of peer attitudes. Significant effects
are shown in bold. Model parameters are combined from estimates across twenty
imputations.

110
Dependent variable: 1. Change in
Intention
2. Perceived
descriptive norm
3. Perceived
Injunctive norm
Effect Estimate S.E. Estimate S.E. Estimate S.E.
1. Average similarity +1.713 0.542 - - - -
2. Average covariate alter
(intention or attitudes)
- - -0.004 0.036 -0.012 0.013
3. Intervention knowledge +0.036 0.022 +0.064 0.029 +0.047 0.015
4. Period 2 -0.222 0.048 +0.099 0.068 -0.049 0.028
Interactions
5. Social influence x
Knowledge
+0.381 0.487 -0.011 0.029 +0.006 0.013
6. Social influence x
Period 2
+0.448 0.699 +0.003 0.074 -0.036 0.027
Control effects
7. Linear shape +0.035 0.065 +0.039 0.091 -0.021 0.040
8. Quadratic shape -0.034 0.011 -0.180 0.015 -0.048 0.003
9. In-degree -0.001 0.009 +0.015 0.013 +0.014 0.005
10. Out-degree +0.010 0.014 -0.010 0.019 -0.006 0.008
11. Age +0.002 0.002 +0.002 0.002 - -
12. Wealth -0.021 0.023 -0.019 0.030 - -
13. Gender +0.0001 0.040 -0.013 0.062 - -
14. Conservation
agriculture
+0.040 0.040 +0.140 0.068 +0.029 0.031
15. Pesticide use -0.007 0.047 +0.009 0.069 - -

111
5.4.4 Network influences on psychology
SAOM estimates for social influence models are presented as log-odds ratios in Table 5.1.
Changes in intention to report poisoning were predicted by the intentions of social peers,
but not by knowledge of the intervention (Model 1, effects 1 & 3). Residents were 1.24
times more likely to adjust their intention towards the average intention of their peers than
not to change (i.e., exponent of the effect size divided by the number of levels of the
behaviour = 𝑒1.713
8 ). This effect did not vary over time or with knowledge of the intervention
(effects 5 & 6). There was also a tendency to reduce intention in the second period (i.e.,
between waves 2 and 3, effect 4), which was not accounted for by other effects, indicating a
potential weakening of the intervention’s effects over time.
Peer intentions and attitudes did not predict changes in perceived norms (Models 2 & 3,
effect 2), but knowledge of the intervention did (effect 3). There was also a tendency for
perceived injunctive norms to reduce in the second period (i.e., between waves 2 and 3).
Participants in Ibis Rice were also more likely to increase their perceptions of descriptive
norms (Table 5.1).
5.5 Discussion
Using state-of-the-art models of network-behaviour dynamics, longitudinal behavioural data
collected across an entire village, and an innovative study design, we show how social
networks shape the outcomes of an important conservation intervention. Specifically, we
show that a social marketing event aiming to reduce wildlife poisoning by encouraging use
of a reporting hotline had spill-over effects beyond the individuals targeted (i.e., the
intervention participants) that were mediated by a village social network capturing habitual
social contact. We observed a significant increase in intention to report poisoning
throughout the entire village after two weeks, and information from the intervention spread
widely through the village. However, despite lasting changes in some psychological
outcomes, such as perceived behavioural control and attitudes, the intervention failed to
change behavioural intentions in the long term. Evidence from SAOMs suggests that both
the increase and subsequent decrease in intention were driven by the social influences of
network peers, rather than by individuals learning about the intervention (Table 5.1). The

112
social network may therefore have initially promoted and subsequently undermined the
intervention as residents sought to match their intentions with their social peers.
The intervention included dissemination of information and materials to facilitate learning
about poisoning and the hotline, as this was considered an essential precondition for
behaviour change. This information flowed relatively well for a small intervention; after six
months, the number of residents knowledgeable about the intervention more than tripled
(Figure 5.4). Much of this flow could be predicted by household co-residence ties, not social
visiting ties, suggesting that reaching at least one member of as many households as
possible could be an effective information dissemination strategy in this context. Our
measured social network did not adequately capture the interactions through which
information might have spread between households. This highlights the difficulty in
capturing and measuring the weak interactions through which information spreads in
physical communities (Granovetter, 1973), which may include brief encounters with
strangers, or even overhearing others’ conversations.
Knowledge of the intervention was correlated with higher intentions, attitudes, perceived
control, and perceptions of social norms in linear models. However, dynamic network
models showed that learning about the intervention did not lead to changes in behavioural
intention overall (Table 5.1). Instead, Individuals with more positive attitudes towards or
perceptions of reporting may have actively sought out information or were better able to
recall it (Valente, Paredes & Poppe, 1998). In support of this interpretation, we observed no
increase in attitudes in the short term despite widespread dissemination of information.
Instead, these models showed that the influences of network peers predicted changes in
intention, as individuals increased or decreased their intention to be more similar to their
peers. After learning about the hotline, residents may have sought out social cues to
determine whether reporting was a socially appropriate behaviour (Prentice & Paluck,
2020). Rather than driving behavioural change, communication about the new behaviour
may ultimately have reinforced the status quo, pushing residents to conform with existing
levels of behaviour. This contradicts evidence from elsewhere that increased
communication about a new conservation behaviour tends to increase behavioural change
(Green et al., 2019).

113
Although our models indicated that social influences were occurring, we could not establish
the cognitive mechanisms underlying this effect as peer intentions did not appear to drive
changes in perceptions of descriptive norms, nor did peer attitudes influence perceptions of
injunctive norms (Cialdini, Kallgren & Reno, 1991). Perhaps individuals are mis-perceiving
the attitudes or intentions of their peers because reporting poisoning is both a rare and
potentially sensitive behaviour, which makes observation of others' behaviour or
communication about the behaviour uncommon (Prentice & Miller, 1996). In the absence of
clear social cues from their network peers, residents may have used other sources of
information to evaluate social norms. This might explain why knowledge about the
intervention tended to drive more positive norm perceptions, indicating that the
intervention messages were appropriately framed (Kusmanoff et al., 2020). For example,
the short film and pledging ceremony were both designed to alter norm perceptions
(Bicchieri, 2017a). But, our measures of the perceived descriptive norm had a low internal
consistency, suggesting that we did not adequately measure the underlying construct.
The peer-influence effects we observed for behavioural intention may have occurred
through other processes. For example, individuals may resolve ambiguity around reporting
poisoning by deferring to the opinions of their peers, without updating their perceived
norms (i.e. informational influence, Wooten & Reed II, 1998). Alternatively, there may be
important but unobserved variables, such as personality traits, which tend to be similar for
socially close individuals and which are challenging to discount in observational studies
(Shalizi & Thomas, 2011). Alternatively, individuals’ norm perceptions may be informed by
individuals with whom they don’t have direct ties represented in our social network
(Shepherd, 2017). For example, they may be looking to local leaders, or others to whom
they are weakly tied rather than their direct peers (Lee & Kronrod, 2020). Further research
to understand which referent groups are salient in perceptions of norms is therefore critical
(Prentice & Paluck, 2020).
Despite successfully diffusing information necessary for behaviour changes to occur (such as
information about the hotline), and using appropriate message framings to influence norm
perceptions, attitudes, and perceptions of control, our intervention did not succeed in
changing intentions in the long-term. The countervailing effect of social influence indicates
that use of the reporting hotline is a complex contagion, which, unlike information, requires

114
social reinforcement for adoption (Centola & Macy, 2007). This is also likely to be the case
for many conservation behaviours, which are often related to provision of public or
common goods (Turaga, Howarth & Borsuk, 2010). The observed changes in knowledge and
psychology provide the conditions necessary for future behaviour change to occur, perhaps
because of further intervention or other exogenous events. However, to sustain these
impacts and create behaviour change in the long-term, continued engagement with a
community, consisting of repeated interventions, and other efforts at gradually influencing
relevant social structures (Brooks, Waylen & Mulder, 2013) or exploiting social influences
are needed (Centola, 2018; Valente, 2012). This could involve working with highly
connected opinion leaders (Valente & Pumpuang, 2007), small groups of socially close
individuals (Centola, 2018), or even forming new ties between receptive individuals
(Contractor & DeChurch, 2014). In Cambodia, anti-poisoning interventions could be
integrated with broader social interventions, such as the Ibis Rice conservation agriculture
programme, that aim to influence agricultural and conservation decision-making (Clements
et al., 2020). Furthermore, such strategies may alter the structures of social networks in the
long-term, potentially producing more enabling social contexts (Chapter 2).
Although conservation scientists are increasingly interested in relational processes, little
research has looked at how these processes operate in real-world conservation contexts
(Groce et al., 2018; de Lange et al., 2019). Using an innovative network modelling approach
(Greenan, 2015; Steglich, Snijders & Pearson, 2010), we interrogated the social influence
processes that followed a conservation intervention. Our results highlight the critical
importance of social relations in shaping conservation behaviours. In this case, network
peers influenced one another’s behaviour, but we could not identify the specific cognitive
mechanisms through which this occurred. In keeping with the theory of complex contagions,
we found that information flow occurs more easily than behaviour change, and does not
lead straightforwardly to change in intention (Centola, 2018; Schultz, 2002). Furthermore, as
conservation practitioners begin to incorporate relational insights into their intervention,
such as the targeting of network-central individuals (Mbaru & Barnes, 2017), longitudinal
studies such as this one will be needed to evaluate these approaches. This will support
better understanding of the dynamic processes of social change, and the design of more
effective intentions (Ferraro & Pattanayak, 2006; Chapter 3).

115
6. Combining simulation and empirical data to explore the scope for
social network interventions in conservation
6.1 Abstract
Conservationists can use social network analysis to improve targeting for behaviour-change
interventions, selecting individuals to target who will go on to inform or influence others.
However, collecting sociometric data is expensive. Using empirical data from a case study in
Cambodia and simulations we examine the conditions under which collecting this data is
cost-effective. Our results show that targeting interventions using sociometric data can lead
to greater dissemination of information and adoption of new behaviours. However, these
approaches are not cost-effective for small interventions implemented in only a few
communities, and it is an order of magnitude cheaper to achieve the same results by simply
targeting more individuals in each community at random. For interventions across multiple
communities, network data from one community could inform rules of thumb that can be
applied to boost the effectiveness of interventions. In rural Cambodia, this approach is only
worthwhile if it can inform interventions covering at least 31 villages. Our findings provide a
framework for understanding how insights from network sciences, such as targeting clusters
of individuals for interventions that aim to change behaviour, can make a practical
contribution to conservation.
6.2 Introduction
Conservation interventions aiming to influence human behaviour are commonly targeted
directly at the people they aim to influence (Jones et al., 2019). An alternative perspective
recognises that new behaviours tend to spread through social ties (Centola, 2018; Rogers,
2003), and suggests interventions should target influential individuals who may
subsequently propagate the behaviour throughout the group (Chapters 3 & 5; Valente,
2012). This approach is little used in conservation, perhaps because it can be costly to
collect the sociometric data necessary to identify such individuals (Eckles et al., 2019). A
potentially cheaper approach is to use ‘rules-of-thumb’, or other indicators of influence
(Valente & Pumpuang, 2007; Mbaru & Barnes, 2017), but little research has been done to
identify such indicators in conservation contexts. We use data from a case study in

116
Cambodia to a) determine the cost-effectiveness of targeting informed by sociometric data,
and b) explore the potential for identifying effective rules-of-thumb.
Little information is available about how conservation behaviour change interventions are
targeted in practice, but much research has been devoted to identifying individuals or
groups whose behaviour needs to be changed, or who are most susceptible to change
(Jones et al., 2019). For example, research may identify frequent consumers of wildlife
products, or those most willing to adopt alternative products (Doughty et al., 2019; Davis et
al., 2016). Targeting is therefore based directly on observations of the behaviour that the
intervention aims to change. However, many behaviours spread through less easily
identifiable social processes such as information flow and social influence, which may be
unrelated to the behaviour of concern (Borgatti et al., 2009; Centola, 2018; Rogers, 2003).
For example, bushmeat hunting in the Amazon may be driven by affective relations between
friends and kin (Carignano Torres et al., 2021). Understanding the social relationships within
a group can therefore suggest ways to more effectively target an intervention (Chapter 3;
Valente, 2012).
Sociometric data (i.e. data about social ties within a population) can enable researchers to
identify an optimal set of target individuals to maximise the spread of new behaviours or
information (Banerjee, Jenamani & Pratihar, 2020). In public health, a common approach is
to target so-called ‘key-players’ using measures of importance in a social network (Valente
& Pumpuang, 2007; Borgatti, 2006). For example, in information-sharing networks,
individuals that are a source of information for many others (referred to as high in-degree
centrality), tend to also be trusted and influential (Freeman, 1978). Randomised controlled
trials in various contexts have shown that targeting interventions at such key-players can
lead to greater adoption of new behaviours compared to other approaches (Kim et al.,
2015; Paluck, Shepherd & Aronow, 2016; Valente, 2012).
However, to robustly identify key-players spanning a network, it is desirable to have
sociometric data covering as much of the target population as possible (Knoke & Yang,
2011; Borgatti, 2006; Costenbader & Valente, 2003). In conservation contexts, which are
often rural, remote, and low-technology environments, collecting such data can require
costly surveys (Eckles et al., 2019). A potentially cheaper way to identify key-players is to
use proxy attributes thought to correlate with influence, such as wealth, experience, or

117
formal leadership positions (Valente & Pumpuang, 2007). For example, Mbaru & Barnes
(2017) used sociometric data from several villages on the Kenyan coast to determine that
formal leaders, but not experienced fisherman, tended to be key players. Therefore,
targeting formal leaders could be a rule-of-thumb for better targeting within similar
contexts. However, such rules of thumb are not universal (Valente & Pumpuang, 2007) and
in some contexts suitable rules-of-thumb may simply not be identifiable (de Roo et al.,
2021).
Despite the evidence demonstrating the effectiveness of key-player targeting, approaches
based on individual network positions may be insufficient when the adoption of behaviours
depends on social reinforcement (Centola & Macy, 2007; Aral & Walker, 2012). The spread
of these behaviours is referred to as “complex contagion” and exhibits different patterns to
the spread of “simple contagions”, such as information, which can spread easily through
single exposures (Centola & Macy, 2007). For individuals to adopt “complex” behaviours,
multiple social peers need to adopt first, meaning a single key player may not succeed in
promoting adoption (Centola, 2018). This suggests that interventions can better target
clusters of mutually connected individuals. For example, rather than targeting two key
players in different parts of a network, targeting a key player and one of their peers will
enable them to collectively influence their mutual acquaintances (Centola, 2018; Beaman et
al., 2014). This approach could enable researchers to exploit network effects without
needing to collect sociometric data.
For conservation practitioners to be able to target their interventions most effectively, we
need to understand the cost-effectiveness of using sociometric data, and the possibility of
identifying rules-of-thumb, across different intervention contexts. Here, we combine
empirical and simulation approaches within a case study from Cambodia to make two
contributions: First, to evaluate the cost-effectiveness of strategies informed by sociometric
data and theory at spreading information or complex behaviours under different conditions,
compared with more conventional targeting strategies. Second, to identify rules-of-thumb
that might be used to identify key-players and target interventions more effectively in this
context. We use data from the case study and a variety of possible strategies to generate
sets of individuals to target for intervention and compare the composition of these sets to

118
identify possible rules-of-thumb. We then use diffusion simulations to predict the
effectiveness of these different targeting strategies and compare their cost-effectiveness.
6.3 Methods
6.3.1 Case study
Our case study uses data from a village located in a protected area in northern Cambodia.
Most village households are engaged in rice-growing as a primary livelihood, but some also
grow cash-crops such as cassava or cashew, participate in logging activities, or run small
shops. The village has a village chief and sub-chief appointed by the state. The village is near
critical wildlife habitat, and is involved in several long-term conservation initiatives,
including a bird-nest protection scheme, a conservation agriculture programme, and
community forestry (Chapter 2; Poffenberger, 2013; Clements et al., 2010). The community
forests and conservation agriculture programmes are overseen by separate elected village
committees. Furthermore, environmental education and conservation awareness-raising
events are regularly implemented.
Currently, conservationists are concerned about several cases of wildlife poisoning that have
been documented in the surrounding area. There is also widespread concern about this
practice among residents, therefore one intervention approach being trialled by the Wildlife
Conservation Society and local authorities is the introduction of a hotline for reporting
poisoning events (Chapters 4 & 5). To promote the hotline, it is necessary to both
disseminate information about the hotline (e.g., the phone number, the purpose of
reporting) as widely as possible, and to overcome concerns residents may have about social
conflict or disapproval from others (i.e. social barriers). An intervention might thus target
individuals well positioned to disseminate information, or target communication in a way
that maximises the social reinforcement needed for widespread adoption of the hotline to
occur. To compare the cost-effectiveness of different targeting strategies and identify rules-
of-thumb, we use sociometric, demographic, and behavioural data from this village to select
individuals to target following a variety of selection strategies. We compare the composition
of the sets of selected individuals to identify potential rules-of-thumb, then compare the
cost-effectiveness of sociometric and rule-of-thumb strategies by simulating how

119
information and behaviours diffuse through the village social network. All analysis was
conducted in R 4.0.0 (R Core Team, 2017).
6.3.2 Data collection
We collected data using questionnaire surveys at two time points. All questionnaires were
previously piloted and refined with individuals in another nearby village. The questionnaires
were translated from English to Khmer and back to check accuracy, and conducted in Khmer
by research assistants using tablets and Open Data Kit software (Brunette et al., 2013). In
September 2017, we conducted sociometric and demographic data, aiming to interview all
consenting adults in the village. We recorded respondent’s age, occupation, positions in the
village, and an index of household wealth. To measure wealth, we used a Basic Necessities
Survey previously developed for this region (Beauchamp et al., 2018).
In January 2019, after the intervention objectives were established, we interviewed a
sample of households to measure attitudes related to reporting of poisoning. We
interviewed all adult residents of 93 randomly selected households (~60% of households,
155 individuals in total). We measured attitudes using four five-point scales, which were
then summed to produce an attitude score out of 20 (see Appendix 3), as an indicator of the
likelihood that an individual would adopt use of the hotline.
6.3.3 Social networks
We aimed to measure a social network that would capture the relations through which
residents are likely to communicate about the hotline – a habitual social contact network.
To better understand social interactions and identify the relevant ties, we first conducted
qualitative research and reviewed the literature (see Appendix 3). In rural Cambodia, the
household forms the core of social organisation (Chapter 2; Ovesen, Trankell & Ojendal,
1996). Individuals within a household are likely to spend significant time together and share
information about many topics (Chapter 5). We therefore recorded the names of
individuals in each household and included bi-directional ties between all co-residents,
assuming homogenous mixing within the household. We also identified household visits as
an important form of interaction and communication with peers outside of the household,
and asked respondents to nominate others that they have regularly visited at home in the
past year. We allowed respondents to freely recall as many names as they wished and
prompted them until they declined to nominate further. We then included directional

120
household visit ties (i.e., if person A nominates person B as a social contact, then
information can only flow from B to A) in our network (see Appendix 3).
6.3.4 Intervention targeting
To identify plausible intervention targeting approaches, we reviewed the literature and
drew on our own experiences, and then selected sets of individuals to target for
interventions following each identified strategy. We did this for various levels intervention
effort (number of individuals =n), selecting sets of 2, 10, 20, and 30 individuals to target.
This reflects the range of intervention intensities we have observed carried out by WCS
Cambodia in this context, where directly reaching more than 30 individuals at one time is
challenging.
6.3.4.1 Sociometric targeting
For targeting strategies based on network theory, we used the sociometric data to identify
key-players in the network, following the centrality measures used by Mbaru & Barnes
(2017). These measures are in-degree centrality, betweenness centrality, closeness
centrality, and eigenvector centrality (Table 1). We used the Keyplayer algorithm, which
selects a set of n individuals that optimally span the network based on each centrality
measure (Borgatti, 2006). Since our network has disconnected sections, we used the
harmonic measure of closeness centrality.
As clusters of connected individuals are predicted to better enable the spread of complex
contagions, we also implemented clustered targeting strategies, by pairing key-players of
each kind with social peers whom they visit outside the household. For example, to
generate a set of size n=30, we selected 15 key-players and then included 15 of their social
peers.
6.3.4.2 Non-sociometric targeting
To identify possible non-sociometric targeting strategies currently used by conservationists
we conducted a literature search. We searched the Web of Science database using the
keywords: “intervention AND behavi*”, filtered by the “biodiversity conservation” category.
We scanned over 200 resulting abstracts and selected papers describing real behaviour-
change interventions. We searched these for information about targeting strategies and
identified 15 papers with clear descriptions. We also drew on the papers cited in the

121
following reviews: (Nilsson et al., 2016a; Olmedo, Sharif & Milner-Gulland, 2017; Ryan et al.,
2020), and on our experiences collaborating with conservation practitioners. We identified
nine commonly deployed and clearly definable targeting strategies (Table 6.2). For example,
conservationists may target individuals in formal leadership positions with the expectation
that they may be influential (Mbaru & Barnes, 2017), or target those with more positive
attitudes towards the new behaviour (Metcalf et al., 2018). We selected sets of target
individuals in our village following each strategy, using the demographic and attitudinal
data. The leadership and conservationist sets were not employed for effort level n=30, as
there were not enough individuals meeting the criteria.
As a null comparator we generated 30 sets of randomly selected individuals at each level of
intervention effort (i.e., size of target set). Furthermore, we created random sets of clusters,
selecting random individuals, and a social peer for each. For example, to generate a set of
size n=30, we selected 15 random individuals and selected 15 social peers.
6.3.5 Identifying rules-of-thumb
We used two approaches to identifying potential rules-of-thumb. First, we look for non-
sociometric strategies that result in sets of targets that are very similar to strategies
informed by network theory. To assess similarity between each pair of sets, we use the
Jaccard similarity index (Jaccard, 1912). This is the proportion of individuals that occur in
both of a pair of sets. Second, we look for other observable traits that can predict inclusion
in a key-player set (at n=30), using binary logistic regression. We assessed correlation with
wealth, leadership position, age, and gender.

122
Table 6.1: Targeting strategies informed by the network interventions literature. The first four are "key-players" approaches selecting individuals
that span the networks, while the last two are clustering strategies selecting groups of connected individuals. Diagrams for key-players
approaches (1 to 4) are adapted from Mbaru & Barnes (2017)).
Targeting
strategy
Case study rationale Modelling strategy Example Diagram
In-degree
centrality
Identifies popular individuals
who have many connections
with others and are
influential.
We select the individuals
with the highest in-degree
centrality, using the Key-
players Algorithm
(Mbaru &
Barnes, 2017)
Betweenness
centrality
Identifies individuals who
can broker information
between disconnected
groups
We select the individuals
with the highest
betweenness centrality,
using the Key-players
Algorithm
(Mbaru &
Barnes, 2017)

123
Closeness
centrality
Identifies individuals who
can rapidly spread
information
We select the individuals
with the highest closeness
centrality, using the Key-
players Algorithm
(Mbaru &
Barnes, 2017)
Eigenvector
centrality
Identifies individuals with
influential friends, who can
facilitate the spread of the
hotline
We select the individuals
with the highest
eigenvector centrality,
using the Key-players
Algorithm
(Mbaru &
Barnes, 2017)
Clusters Use of the hotline is socially
sensitive so targeting groups
of friends is more likely to
result in adoption.
We select random
individuals and then
include all their
nominated peers.
(Beaman et al.,
2014)

124
Combined
approach
Groups of friends that are
well-connected are more
likely to adopt, and more
likely to spread the hotline
to others.
We select individuals with
high centrality and include
their connected peers.
-

125
Table 6.2: Targeting strategies used in our simulated intervention, informed by a review of the conservation science literature.
Targeting strategy Case study rationale Modelling strategy Example
Negative attitudes
to the behaviour
Changing the behaviour of those individuals
least likely to support reporting of poisoning
will be most effective
We select the individuals least likely to
want to report poisoning from our
sample
(Saypanya et al., 2013; Jones et
al., 2019; Kamins et al., 2015)
Positive attitudes to
the behaviour
Targeting individuals already predisposed to
using the hotline will be most effective.
We select the individuals most in favour
of reporting poisoning from our sample
(Jones et al., 2019; Metcalf et
al., 2018)
Wealth Wealthy individuals are thought to be
influential, and they will help to promote
use of the hotline.
We select the heads of the wealthiest
households
(Olmedo, Sharif & Milner-
Gulland, 2017; Mbaru & Barnes,
2017)
Leadership Local leaders are trusted, have good local
knowledge, and will provide legitimacy to
the hotline.
We select individuals occupying formal
leadership positions in the community,
such as the village chief and sub-chief,
leaders & secretaries in the community
forest committee.
(Saypanya et al., 2013; Gibson &
Marks, 1995; Mbaru & Barnes,
2017; Day et al., 2014;
Steinmetz et al., 2014)
Gatekeeper We have an existing relationship with the
village chief. We can rely on his local
knowledge and assume he has influential
We select individuals within our network
connected to the village chief through
(Gibson & Marks, 1995)

126
friends. any kind of tie.
Convenience Hosting an event at the village hall is likely
to attract an interested crowd and is
convenient.
We select a random set of individuals,
with a bias towards women and those
living near the village hall, as we know
these are more likely to attend.
(Cartwright, Wall & Placide
Kaya, 2012; Saypanya et al.,
2013)
Conservationists We have existing relationships with some
individuals and know they are committed to
conservation. We can rely on their local
knowledge.
We select individuals known to be
engaged in conservation activities in
general, such as members of the
community forest and Ibis Rice
committees.
(Day et al., 2014)
School students School children are more easily influenced
and may influence their parents.
Not considered in this study (Damerell, Howe & Milner-
Gulland, 2013; Freund et al.,
2020; Steinmetz et al., 2014;
Padua, 1994)
Random Without specific information upon which to
base our targeting we choose random
residents in the village.
We select a random set of individuals. (Jones et al., 2019; Day et al.,
2014; Baruch-Mordo et al.,
2011; Saypanya et al., 2013)

127
6.3.6 Comparing effectiveness using simulation
We compared the performance of each strategy using a simulation model. In each
simulation, we initiate diffusion through a set of target individuals, and observe how
information about the hotline, a simple contagion, and intention to use the hotline, a
complex contagion, diffuse through the village social network. The model, described below,
is adapted from that specified in (Dobson et al., 2019).
The diffusion model simulates the spread of information or behaviour through a network
based on simple assumptions and rules. At any time, any individual (i) in the network has
one of two possible states (β): indicating that they have received information or adopted a
behaviour (βi = 1), or that they have not (βi = 0). Initially, at t=0, we assume that βi = 0 for all
individuals, except for those in the targeted intervention set, for whom βi = 1. At subsequent
time points (t=1, 2, …20) individuals are exposed (α) to the information or behaviour
through their network connections to others who have already adopted it, either in their
own household (X) or among those they visit (Y). Exposure through visits ties is weighted
double, Yi = 2Xi, as we assume that social peers explicitly nominated are likely to be more
influential on an individual’s behaviour than household co-residents, who are only linked
because of the homogenous mixing assumption. Furthermore, stochasticity was introduced
into the model through a ‘communication probability’, L: the probability that
communication of the information or change in behaviour will occur following interaction
between any pair of individuals at t, where L = 0.2 or 0.8. Therefore:
𝐸𝑞𝑢𝑎𝑡𝑖𝑜𝑛 6.1: 𝛼 = 𝐿(∑ 𝛽𝑥 + 2 ∑ 𝛽𝑦).
To compare the effectiveness of different strategies at different levels of intervention effort,
we used each of the identified sets of targets to initiate diffusion. Further individuals will
adopt the information/behaviour (βi = 0 → 1) if α ≥ λ, where λ is the exposure threshold. To
compare the spread of information with the spread of behaviour, we repeated the
simulations with λ = 1, 3. At λ=1 information can be passed from any single connection,
while at λ =3, at least two connections outside the household are required for adoption of
the behaviour, or three within the household, or some combination of these. Each
simulation continued until t=20 and was repeated 20 times. Each time step represents an
arbitrary period, during which individuals may communicate with their peers.

128
As a measure of intervention effectiveness in each simulation, we use the area under the
diffusion curve (AUC, see Appendix 3) as a percentage of the maximum possible AUC (size of
network x number of periods). Therefore, the AUC percentage reflects both the number of
individuals knowing about the hotline or intending to use it, and the speed with which this
change occurs. We calculated bootstrapped 95% confidence intervals across the 20
repeated simulations. For the clustered and random strategies, we combined results across
all 30 sets giving 20x30=600 model simulations for each. We bootstrapped 95% confidence
intervals for AUC across all 600 results.
6.3.7 Cost-benefit analysis
Finally, to compare the cost-effectiveness of each strategy at achieving diffusion, we
estimated the financial costs of collecting the data required to identify targets for each
strategy and to implement the hotline intervention, based on our experiences conducting
simple information-provisioning or social marketing interventions (i.e. single events where
persuasive information is presented to participants, see Appendix 3). The intervention takes
a similar format regardless of the targeting strategy used, and cost is dependent only on the
level of effort (i.e., the number of targets). This included travel, staff, and materials costs.
For example, an intervention with two targets consists of two NGO staff meeting targets at
their home and providing information materials. For interventions with twenty or thirty
targets, multiple staff would take multiple days to prepare a venue, invite participants, and
source additional materials, such as posters to display.
We summed the data-collection and intervention costs for each simulation and then linearly
interpolated the cost required to arrive at a target AUC (using the ‘approx’ function in R).
Assuming we can use our data to identify general rules of thumb applicable in other villages,
we calculated the number of villages (N) an intervention must include in order for
sociometric data collection to be cost-effective at achieving the target AUC. To do so, we
used the formula 𝑁 =𝐷
𝐶𝑛𝑜𝑛− 𝐶𝑛𝑒𝑡, where D is the cost of collecting sociometric data ($5160),
Cnon is the cost of the best performing non-sociometric strategy, and Cnet is the cost of the
best performing sociometric strategy. This assumes that the increase in efficacy and effort
required remains proportional across villages.

129
6.4 Results
6.4.1 Description of the sample & network
The network included 365 adults from 155 households. We recorded 774 nominations for
household visits, and after cleaning the data retained 701 ties. The final habitual social
contact network included 1350 ties (see Table A3.1 for descriptive statistics).
6.4.2 Set comparisons & rules-of-thumb
Overall, the sets of individuals selected for targeting under different strategies were distinct
and had a low degree of overlap (see Tables & Figures A3.2, A3.3 & A3.4). Of the key-player
sets, only closeness and betweenness centrality had any overlap with non-sociometric sets
(albeit low; Jaccard = 0.05), namely with the wealth and gatekeeper sets respectively. At the
highest effort level, the greatest overlap between a key-player set and a conventional set
was J = 0.09 for the gatekeeper and in-degree centrality sets.
Only one variable was significantly associated with inclusion in the key-player sets based on
each centrality measure. In-degree centrality key-players tended to be older (effect size =
0.52 ± 1.74, p < 0.01), while closeness centrality key-players tended to be younger (effect =-
0.80 ± 0.29, p < 0.01). For eigenvector centrality, women were more likely to be included
than men (effect size = 1.05 ± 0.45, p = 0.02). Betweenness centrality, was not significantly
associated with any variable.
6.4.3 Simulations
6.4.3.1 Diffusing information
For diffusing information, all strategies performed well, and there was diminishing return on
effort (Figure 6.1). At higher effort and higher communication probability there was low
variation in performance. For example, at effort n=30, even the worst-performing strategies
achieved >80% AUC. Only sociometric strategies performed better than the 95% confidence
interval for random targeting. In-degree centrality and betweenness centrality key-players
performed best at all levels of effort, and clusters based on these two centrality measures
also performed well. The best-performing conventional strategies were targeting through
the gatekeeper and targeting those with less positive attitudes. These performed at the
upper end of the random range. Other strategies performed similarly or worse than the
median random strategy.

130

131
Figure 6.4 (previous page): Performance of different targeting strategies at diffusing an
innovation, based on simulations using the measured social network. Each strategy is
simulated at four levels of effort (2, 10, 20, & 30 targeted individuals) except for
‘conservation’ and ‘leaders’ which are not simulated at n=30, because not enough of these
people existed within the network. Performance is measured as the area under the diffusion
curve (AUC) as percentage of the maximum possible diffusion at time t=20. This captures
both the speed and the scale of diffusion in one metric. Bootstrapped 95% confidence
intervals are shown. The shaded area is the 95% confidence interval range for simulations on
30 randomly generated sets of targets, acting as a null comparator. If the line falls within the
shaded area, its performance is within the bounds of random targeting. Colours indicate the
threshold of diffusion: blue for complex contagions such as conservation behaviours, and red
for simple contagions such as information. On the left are results when the communication
probability (i.e., the probability of communication between two connected individuals) is low
(0.2), and on the right it is high (0.8). See Table 6.2 for explanations of the strategies.
6.4.3.2 Diffusing complex behaviours
For the diffusion of behavioural changes (complex contagions), performance was much
lower across all strategies and tended to increase linearly with effort (Figure 6.1). At low
effort, only clustered strategies achieved any diffusion. Variation in performance increased
with effort and communication probability. For example, at the highest effort level and
communication probability, the median random set achieved 18% AUC while targeting
clusters based on the in-degree centrality key-players achieved 62% AUC. This was the best
performing strategy, and the only strategy to perform better than random at all levels of
effort. At effort greater than 20 targets, targeting in-degree, betweenness or eigenvector
centrality key-players also performed well (Figures 6.1 & 6.2). Targeting clusters based on
these key-players tended to perform at the upper random range or slightly better. Of the
conventional strategies, only targeting through the gatekeeper performed better than
random, at higher levels of effort. Targeting wealthy households performed at the upper
limits of the random sets at high efforts (n>20, Figure 6.2). At low communication
probability, targeting random clusters performed better on average than targeting random
individuals.
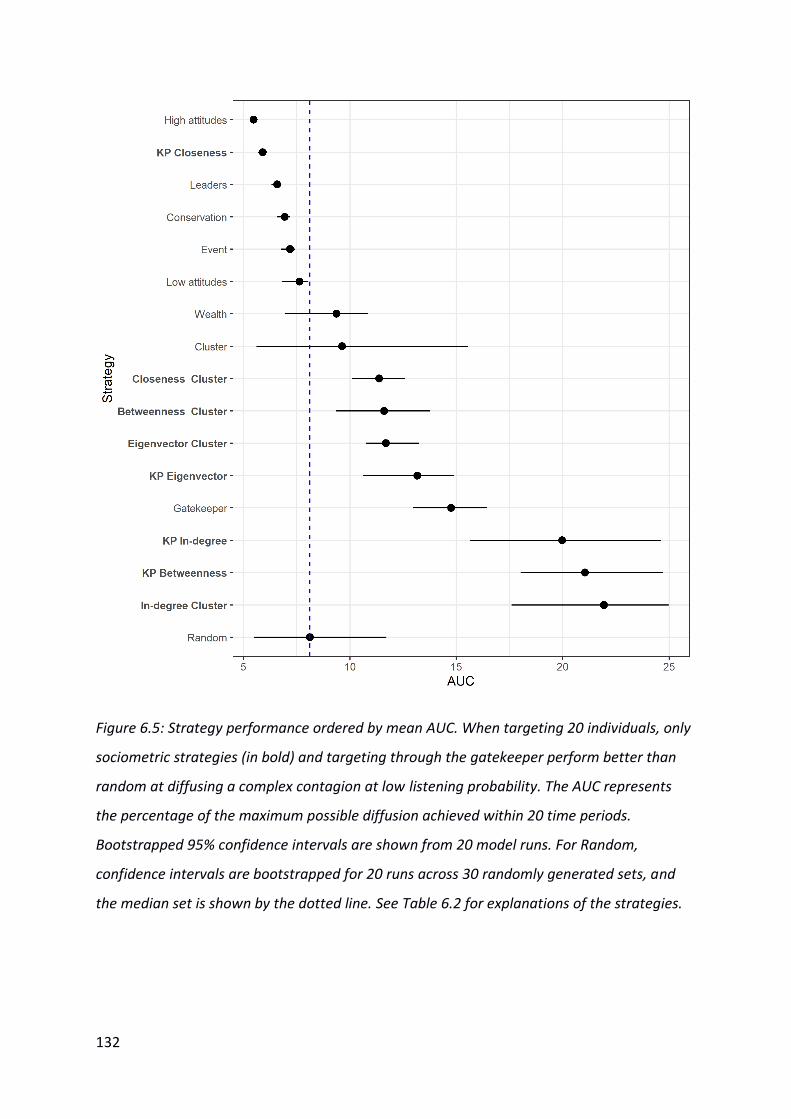
132
Figure 6.5: Strategy performance ordered by mean AUC. When targeting 20 individuals, only
sociometric strategies (in bold) and targeting through the gatekeeper perform better than
random at diffusing a complex contagion at low listening probability. The AUC represents
the percentage of the maximum possible diffusion achieved within 20 time periods.
Bootstrapped 95% confidence intervals are shown from 20 model runs. For Random,
confidence intervals are bootstrapped for 20 runs across 30 randomly generated sets, and
the median set is shown by the dotted line. See Table 6.2 for explanations of the strategies.

133
6.4.4 Cost-benefit analyses
Intervention costs increased as effort increased, from $52 for targeting two individuals to
$502 for targeting 30 individuals (Table A3.5), though the cost per person targeted
decreased as effort increased. The cost of collecting data for targeting was an order of
magnitude greater: $5160 for sociometric data, and $2200 for other data (Table A3.6).
It was always more cost-effective to increase intervention effort and apply a conventional
strategy than to collect data in order to use sociometric strategies, or other strategies for
which data collection is needed (i.e., people with less positive attitudes, wealthy people).
For example, to achieve AUC=15% for a complex contagion at low communication
probability, it would cost approximately $318 using the gatekeeper strategy, $487 through
random targeting, or $5276 for the best-performing sociometric strategy (in-degree
clusters) (Table 6.3).
Table 6.3: Costs required to achieve a target AUC for four example strategies (one from each
type), at a low communication probability. The costs are calculated based on interpolated
effort levels. Missing costs indicate that it was not possible to achieve this target AUC using
this particular strategy in our simulations. The costs are estimated based on the authors’
experience in the study context. For explanations of the strategies, see Table 6.2.
Strategy Target AUC for complex contagion Target AUC for simple contagion
10% 15% 20% 60% 70% 80%
KP In-degree $5349 $5475 $5488 - $5269 $5330
Gatekeeper $301 $353 - $91 $153 $513
Wealth $2555 $2682 - $2340 $2402 $2712
Random $379 - - $131 $178 $510
Targeting clusters based on in-degree centrality key-players was the best performing
strategy for diffusing behavioural change at low listening probability, but was not cost-
effective compared to other approaches, such as targeting through the gatekeeper. The cost
of sociometric data collection would be justified if used to inform thirty-one interventions.

134
To cost the same as a randomly targeted intervention only 21 interventions are needed. For
the diffusion of information, betweenness centrality key-players were most effective. To
achieve 80% AUC at a comparable price to random targeting, the intervention must include
15 interventions, but to achieve 70% AUC at comparable price to random targeting, 75
interventions are required.
6.5 Discussion
Using simulations, our results confirm predictions from network theory (Mbaru & Barnes,
2017; Valente, 2012) and evidence from other disciplines (Paluck, Shepherd & Aronow,
2016; Kim et al., 2015), in showing that sociometric targeting is more effective at diffusing
new behaviours than non-sociometric strategies. In particular, we demonstrate that
targeting connected clusters of individuals is a highly effective strategy for diffusing
behavioural change (Centola, 2018; Beaman et al., 2014). However, our results also show
that, in our case study, the high costs associated with collecting sociometric data compared
to the cost of the intervention itself mean it is rarely cost-effective, and that resources are
usually better spent on targeting more individuals.
The value of sociometric data increases as diffusion becomes more challenging (Akbarpour,
Malladi & Saberi, 2020). For example, it was relatively straightforward to effectively diffuse
information (a simple contagion). By targeting 30 random individuals it was possible to
reach over 80% of the 365 villagers in our case study. However, when adoption of a
behaviour requires social reinforcement, targeting choices become more important and the
best performing approaches were those informed by sociometric data. Within the range of
interventions simulated, only sociometric targeting achieved diffusion greater than 20% of
the theoretical maximum. Similarly, sociometric strategies performed relatively better when
the probability of communication between individuals was lower. In some cases, the
probability of individuals communicating about the conservation behaviour may be lower
than we have modelled, such as when the behaviour is sensitive, meaning we may be
underestimating the importance of targeting.
Despite the higher performance of sociometric strategies for diffusing complex behaviours,
they were never a cost-effective option. For example, to achieve 15% of maximum diffusion,

135
it was an order of magnitude cheaper to use the best performing conventional strategy
whilst targeting more people, than to collect sociometric data and precisely target a smaller
number of key-players. This result is in agreement with predictions from other simulation
studies (Akbarpour, Malladi & Saberi, 2020).
However, it may be worth collecting sociometric data if this one-time investment could be
leveraged to generate rules of thumb that can be applied to improve intervention outcomes
beyond the study site. For example, if a more easily observed variable such as wealth is
strongly correlated with network centrality. According to our analysis, an investment in
sociometric data collection would become cost-effective if such an approach could be
applied across 21 villages (compared to random targeting and assuming the rule of thumb
performs just as well as the sociometric strategy). This is a large number, but it is feasible
within our case study area, where there are 28 further villages with community protected
areas. Social networks are dynamic (Bignami-Van Assche, 2005), but within a particular
timeframe these data could also be used to guide multiple interventions within the same
villages assuming the measured networks are relevant. For more expensive forms of
intervention, requiring prolonged engagement with targets (e.g., a farmer field school), or
financial incentives, it is likely to be more cost-effective to collect sociometric data and work
in fewer villages (Akbarpour, Malladi & Saberi, 2020). A formal analysis of the value of
information could be used to guide decision-making around data collection (Canessa et al.,
2015).
Our analyses did not suggest any particularly promising rules of thumb, with effect sizes
much smaller than those found by Mbaru & Barnes (2017) but do suggest that older
individuals tend to be better connected (in-degree centrality), while closeness-centrality
key-players tended to be younger. As found in other studies in rural developing country
contexts, the results suggests that central individuals in our network are not necessarily
those with the highest wealth or social status (de Roo et al., 2021). At higher effort levels
there was some overlap between the gatekeeper and in-degree centrality key-player sets,
and the gatekeeper strategy also performed relatively well in our simulations, indicating
that targeting through the gatekeeper may be an effective rule of thumb. Nevertheless, this
strategy was much less effective than the best sociometric strategy, more villages would
need to be included in the intervention to justify investment in sociometric data collection.

136
Our results probably underestimate the power of village chiefs (the gatekeepers in our case
study) for diffusing behaviours as they can access further resources, networks, and use their
social capital to reach others (Ledgerwood & Vijghen, 2002; Marston, 2011). For example,
we know that some village chiefs have organised meetings on their own initiative to discuss
the issue of wildlife poisoning (Chapter 4). Replicating our study in other villages could
provide confidence that this strategy is effective across rural Cambodia, and qualitative local
knowledge may help determine the appropriateness of this strategy in each village. An
assessment of the best approach also needs to take other social and ethical considerations
into account. For example, interventions working through a gatekeeper may lead to elite
capture of the benefits of the intervention, further marginalising other groups (Lucas &
Lucas, 2016).
If sociometric data have already been collected, diffusion simulations can be applied to
select optimal sets of intervention targets (Beaman et al., 2014; Banerjee et al., 2013). Our
model provides a framework for achieving this but could be refined to better capture real
world dynamics. Firstly, individuals vary in their contribution to conservation behaviours.
For example, we could weight our valuation of the behavioural change (adoption of the
hotline) if undertaken by individuals thought more likely to have knowledge of wildlife
poisoning, as this would be a greater gain for conservation than its use by others. This is the
logic behind strategies such as targeting individuals with more or less positive attitudes
towards the behaviour of concern. Secondly, one could use behavioural data to parametrise
a distribution of adoption thresholds (Valente, 1996), reflecting the varying propensities of
individuals to adopt new behaviours. Thirdly, one could include more types of tie in a
multiplex network to better capture the dynamics of social influence and information
sharing. Finally, our model output, the area under the diffusion curve, captures both the
speed and the extent of diffusion. If intervention objectives require behaviours to diffuse
within a particular timeframe, simulations can examine the performance of these
parameters separately (Akbarpour, Malladi & Saberi, 2020).
Network theory more generally suggests some universal improvements to intervention
design which are supported by our results. In particular we show that selecting targets in
clusters is more likely to result in diffusion of complex behaviours than targeting individuals
from across a network (Centola, 2018; Beaman et al., 2014). Conservationists could easily

137
apply this insight. For example, if only a small number of individuals can be targeted in each
village, one could select them using a rule of thumb (such as selecting the village chief) and
ask them to invite their close connections to participate in the intervention. In Cambodia,
anecdotal evidence suggests that after switching from village-wide meetings to small
meetings with groups of related farmers, a 50% increase in recruitment to a conservation
agriculture scheme was achieved in one village (Chapter 3).
Our study shows that network analysis has the potential to improve conservation
interventions on three levels. First, the collection of sociometric data can identify optimal
sets of targets for diffusing complex behaviours that greatly outperform other strategies.
However, this is unlikely to be cost-effective for small or cheap interventions. Instead,
resources are better spent targeting more individuals, selected via cheaper means. Second,
sociometric data can be used in combination with other knowledge to produce generalised
rules of thumb for targeting interventions. Our results suggest these are likely to be context
specific. This approach may be valuable for refining large-scale interventions; in our case,
collecting sociometric data is only cost-effective if a very large number of villages are
included in the intervention (although the absolute cost of data collection is still low).
Simple calculations of the value of information combined with simulations can help to guide
these intervention-design decisions (Rhodes et al., 2020; Akbarpour, Malladi & Saberi, 2020;
Canessa et al., 2015). Third, the large literature on network interventions (Valente, 2012)
can suggest improvements to intervention design that apply across contexts, such as the use
of clustered targeting strategies (Centola, 2018). Given the relative cost of collecting
sociometric data, this is likely to be the most generally useful contribution of network data
to conservation practice. Conservationists should continue to incorporate these insights into
their interventions (Groce et al., 2018), while further research on social networks within
different conservation contexts is needed to identify further applicable insights.

138
7. Discussion
7.1 Summary of thesis contributions
7.1.1 Context
Conservation scientists are increasingly interested in adopting methods and tools from the
behavioural sciences to design more effective interventions that influence human behaviour
and protect biodiversity (St. John, Keane & Milner-Gulland, 2012; Schultz, 2011). To this end,
substantial amounts of conservation research have been published examining tools such as
social marketing (Wright et al., 2015) or generating insights into the behaviours and
attitudes of individuals in a population (Jones et al., 2019; St. John et al., 2012). An aspect of
behaviour change that has not yet been widely studied by conservation scientists is the
social relational processes that shape individual behaviour, such as communication through
social networks and the production of social norms (Ernstson, 2011). Scholars in the social
and behavioural sciences have developed a rich body of theory and practice incorporating
these social processes into the design of interventions. Integrating these insights into
conservation practice could help to achieve conservation goals (Borgatti et al., 2009;
Valente, 2012; Centola, 2018; Prentice & Paluck, 2020).
In this thesis, I aimed to contribute to more effective design of conservation interventions
by furthering understanding of the role of social networks in conservation behaviours,
focussing on a case study intervention of wildlife poisoning. To do so I first synthesised the
literature on network interventions from other disciplines. I then carried out a series of
studies following the project management cycle of an intervention, starting with formative
research to inform intervention design, and ending with an evaluation of the intervention’s
effectiveness. I used the Theory of Planned Behaviour to conceptualise and measure
behaviour throughout. First, I used a mixed method approach to better understand the
phenomenon of wildlife poisoning. I then facilitated the design of a social marketing
intervention together with WCS Cambodia and the Department of Environment in Preah
Vihear province. I collected longitudinal data on behaviour and knowledge and modelled
these in conjunction with a measured social network, to understand how social relations
shaped responses to the intervention. Finally, I used simulations of diffusion in the social
network to explore the cost-effectiveness of targeting strategies informed by network
theory.

139
7.1.2 Key contributions
Overall, this thesis has furthered the integration of methods and insights from the
behavioural sciences into conservation. Firstly, by synthesising the literature on ‘network
interventions’, and secondly by applying these insights to a real conservation problem. Here,
I discuss the key contributions made towards each objective.
7.1.2.1 Objective 1: Synthesising knowledge on social networks.
Chapter three synthesised the literature from disciplines such as sociology, social
psychology, and public health, on the role of social relations/networks in shaping human
behaviour and discussed approaches to ‘network intervention’ in the context of
conservation. I discussed evidence and theory about the importance of information of
various types in human decision-making and highlight the particular importance of social
information. I described a methodological framework through which researchers can collect
data about the social networks that are relevant to an intervention and identify important
structural features. I introduced the concept of simple and complex contagions to
conservation. Finally, I provided an overview of the various intervention options available
that exploit or leverage knowledge about social network, such as more effective targeting of
intervention, or altering network structures, relating examples from fields such as public
health and marketing to conservation.
7.1.2.2 Objective 2: Understanding wildlife poisoning.
Chapter four presented a study into wildlife poisoning practices in Northern Cambodia.
Wildlife poisonings were first documented in this area in 2015 and were recognised as a
potentially critical threat to conservation (Loveridge et al., 2019). To inform intervention
design, we carried out a mixed method study across ten villages in the landscape, aiming to
understand the prevalence of this practice, identify the groups involved and their
motivations, and understand the attitudes and perceptions of others in the villages. We
found that wildlife poisoning is a deliberate practice used by hunters to catch wildlife during
the dry season and that there are widespread misperceptions about the health risks of this
behaviour. Nevertheless, over 75% of respondents reported perceived negative social
norms, and 87% perceived it as an unsafe method. Concerns for safety were given as the
predominant reason by hunters (63%) for not using poison. We documented actions taken
against poisoning by authorities in five villages, particularly in those villages where norms

140
were perceived most negatively. These actions included disciplining of individual hunters,
and village meetings to discuss poisoning.
7.1.2.3 Objective 3: Understanding how social networks influence behaviour change
interventions
Chapter five presented a study of the mechanisms through which social relations influenced
the outcomes of an intervention. The intervention aimed to promote the use of a hotline for
reporting poisoning and consisted of an event attended by 41 individuals. We measured
network ties among 365 adults in the village, and measured their knowledge of the
intervention, and their psychological outcomes in three survey waves before and after the
intervention. We then used linear models and stochastic actor-oriented models, a kind of
dynamic network-behaviour model, to determine the relation between social networks and
intervention outcomes. We found that information flowed following our intervention largely
within households, and that 144 individuals (~40%) were knowledgeable about the
intervention after six months. However, as predicted by the theory of complex contagions,
dynamic network models showed that changes in behaviour throughout the village were
largely driven by social influences, and not by information flow.
7.1.2.4 Objective 4: Exploring the potential use of network data for targeting an intervention
Chapter six presented a study exploring the scope and cost-effectiveness of network-
informed interventions using sociometric (data about the social ties or relationships
between individuals), demographic, and behavioural data for all residents of one village in
northern Cambodia. Using different intervention strategies, including those from the
literature, strategies informed by network theory, and random selection, we generated sets
of individuals to target for an intervention. We compared the composition of these sets and
compared their effectiveness by simulating the diffusion of behaviour and information
through the social network. We then determined the cost-effectiveness of each approach
based on our own experiences of intervening in this context. We found that targeting
strategies informed by network theory and data were approximately twice as effective as
the best-performing of the other strategies, based on individual characteristics such as
wealth or attitudes. Furthermore, most of the conventional strategies did not perform
better than random. This difference was greater for diffusion of behaviour compared with
the diffusion of information, as expected under the theory of complex contagions. However,

141
this improved efficacy did not justify the costs required to collect network data, which were
an order of magnitude greater than targeting costs in this context. In all cases we examined,
it was more cost-effective to target a greater number of people randomly, than to target
specific network-informed individuals.
7.2 Cross-cutting themes
This thesis followed the project cycle of an intervention; from formative research, through
intervention design, and finally to evaluation and learning from intervention outcomes. To
meet the research objectives described, I paid close attention to the role of social relations
and social networks throughout this process. Therefore, reviewing this thesis in its entirety,
several key insights and themes emerge. First, I briefly discuss the ways in which residents
communicate and learn about new behaviours, and what this means for information
transfer. Then, I highlight the ways in which individuals in our case study influenced one
another regarding wildlife poisoning, as well as in the context of our hotline intervention.
Recognising the important role of social influence in conservation behaviour opens new
ways of thinking about intervention design, which I describe with reference to literature
from other disciplines. Finally, I discuss the key implications of this research for efforts to
reduce wildlife poisoning in Cambodia, connecting our results with broader literatures on
the political economy of pesticide use.
7.2.1 Learning and information flows
Information about the world is a central input to human cognition and plays a key role in
human decision-making (Schlüter et al., 2017). Chapters three and five show that the
transfer of information is a necessary, but not sufficient, component of any intervention
which aims to change behaviour.
In the Northern Plains we found a striking lack of communication within the communities
about problems such as pesticide use (Chapter 4). Most farmers reported a preference for
learning from market sellers. Typically, farmers would go to market to seek advice on
specific problems they faced, or if they observed other farmers using a new tool, they would
go to the market to seek further information. Shopkeepers within the village were also an
important conduit as they have links with market traders, and we know of at least two who

142
were distributing and promoting poisons in their villages. These patterns, together with a
reliance on personal experimentation and observation, meant that farmers tended to have
poor access to information about pesticides as packaging and labelling is often absent or
unclear, while market sellers are not likely to provide objective information. This has
resulted in misinformation and misperceptions about the risks of pesticide use, which may
have contributed to wildlife poisoning behaviours.
It is against this background that our intervention was planned. As is typical, we were only
able to directly target a relatively small proportion of the intended audience for the
conservation messages (~10%). We therefore relied on information flow to amplify the
effect of the intervention. Sociometric data showed that, in general, the village was sparsely
connected (Chapter 5). Most villagers only had two or three people outside of their own
household with whom they regularly and intentionally spent time, and these tended to be
relatives. Consistent with anthropological observations elsewhere in Cambodia, we found
that communication and interaction among unrelated households tends to be quite
minimal, even amongst those living in close proximity (Marston, 2011). Accordingly, we
found that information about the intervention flowed relatively easily but tended to flow
most within households (Chapter 5). This suggests that strategies which aim to reach at
least one individual from each household (i.e., by inviting a representative to attend
information sessions) are likely to be most successful for disseminating information. This
was in contrast to the findings from simulations of information flow, which suggested that
information dissemination is relatively straightforward, and that high levels of diffusion can
be achieved simply by targeting a small number of random individuals (Chapter 6).
7.2.2 The role of social relations in conservation behaviour
Although information about new behaviour is essential for human decision making, and
information flows relatively easily, providing information is not sufficient to change
behaviour, because the causal links between knowledge about an issue and behaviour
changes are complex and mediated by social and material processes (Valente, Paredes &
Poppe, 1998). Nevertheless, many conservation interventions still rely on the assumption
that providing information will lead to behaviour change, the so-called ‘information deficit
model’ (Monroe, 2003). This model does not account for motivations, barriers, and the

143
other material and psychological factors that can encourage or discourage behavioural
changes (Schultz, 2002; Monroe, 2003; McKenzie-Mohr & Schultz, 2014).
In the last decade, conservation scientists have adopted theory and tools from the
behavioural sciences to better understand conservation behaviours and design effective
interventions (St. John, Edwards-Jones & Jones, 2010; St. John, Keane & Milner-Gulland,
2013; Schultz, 2011). For example, behaviour change frameworks such as social marketing
(Green et al., 2019) recognise the limitations of the information deficit model and are
increasingly adopted in conservation (Wright et al., 2015; Smith, Verissimo & Macmillan,
2010). But often these efforts are still focussed on the behaviours, or even attitudes, of
individuals, and neglect the dynamic social cues that are essential for behaviour change to
occur throughout a population (Prentice & Paluck, 2020; Ernstson, 2011). Another body of
literature examining the collective, group-level, or relational, processes through which
societies change (Prentice & Paluck, 2020) has been largely absent from conservation
science (Carignano Torres et al., 2021; Naito, Zhao & Chan, 2021). This perspective
emphasises the ways in which individuals interact and communicate with one another to
arrive at shared understandings, or social norms, which shape their behaviour (Schultz et al.,
2016; Prentice & Paluck, 2020; Miller & Prentice, 2016). Recognising this, researchers must
attend to social structures, using tools such as social network analysis, and consider social
relations instead of just individual beliefs when designing interventions (Valente, 2012).
In this thesis, I attempted to model this perspective. I studied both individual and social
influences on the phenomenon of wildlife poisoning. I used the Theory of Planned
Behaviour to conceptualise and measure behaviour. Although this theory focuses on the
micro-scale individual cognitive determinants of behaviour, it measures beliefs about
external factors, such as perceptions of control and perceived norms. I expanded on this by
interpreting behavioural data in conjunction with qualitative data (Chapter 4), and social
network data (Chapter 5). In particular, I model changes in individual measures of behaviour
and link them to others by taking account of social structure (Chapter 5). The behaviours I
studied were not directly observable, making it challenging to validate whether the theory is
accurately identifying predictors of behaviour. For example, it is possible that measured
intentions to report poisoning do not accurately predict reporting if the context of reporting
differs from that described during questioning. Nevertheless, the Theory of Planned

144
Behaviour provided a practical and convenient framework through which to assess and
compare theoretically-important determinants of behaviour across the population, and
from which to plan the interventions carried out (Chapter 2). Qualitative data corroborated
the importance of norms, attitudes, and perceptions of control as important factors in the
behaviours studied.
I found that individual beliefs about the efficacy of hunting with poisons, or of the possible
health impacts of consuming poisoned meat certainly played a role in decisions to use
poison. However, I also found a variety of social factors which enable or constrain poisoning
behaviours (Chapter 4). The myriad negative impacts that poisoning can have on other
members of the community have generated widely shared negative attitudes, and
perceptions that anti-poisoning norms are widespread. These norms were likely an enabling
factor for village authorities to act against poisoning in some villages, and pre-existing
norms against poisoning are likely to be an important factor in the success of future
interventions as well (Bicchieri, 2017a). On the other hand, the ease with which poisoning
can be carried out in secret, and wider cultural norms favouring conflict avoidance, enable
hunters to use poison without credible fear of social repercussions (Saypanya et al., 2013).
Social structures may also insulate hunters from wider village norms. For example, one
village chief pointed out that there were many people using poison in the village but that
they were not in his friendship circles. There were also differences in perceptions of norms
between different age groups. Understanding these social structures might therefore also
suggest more effective ways to intervene.
The intervention we piloted was designed with these insights in mind. We promoted the use
of a reporting hotline because this might tap into existing anti-poisoning norms to generate
action by residents, and potentially raise the salience of these norms for hunters who are
otherwise socially insulated from them (Saypanya et al., 2013). We targeted the parents of
youth in a vulnerable age group because of the potential influence they could exert on their
children. However, we knew that fears of social conflict or upset neighbours might be
significant barriers to reporting. We therefore used normative messaging and encouraged
individuals to make a public pledge to use pesticides responsibly and to be vigilant against
poisonings (Bicchieri, 2017a). The materials we disseminated were designed to enable these
individuals to communicate this stance with others in the community, which we hoped

145
would catalyse a shift in the beliefs about social responses to poisoning (Prentice & Paluck,
2020). Chapter five evaluated this intervention in detail. We found that our key messages
did spread through the community, likely through weak social ties. But social influences
were an important predictor of changes in intention, and probably contributed to a failure
to increase intention in the long term as individuals sought to conform with norms in their
immediate social circles.
While transfer of information may have laid the groundwork for future behaviour change, a
sustainable shift in behaviour across the population requires more attention be paid to
these social relations. The socially sensitive nature of reporting poisoning meant that
expectation about the beliefs and responses of others in an individuals’ social network (i.e.
“social proof”) are critical in deciding whether or not to report (Prentice & Paluck, 2020).
Unless these expectations are changed the best-crafted intervention messages are unlikely
to succeed at influencing behaviour (Bicchieri, 2017a), and these changes will likely only
occur through communication between the individuals concerned, or through observations
of behaviour of referent groups (Prentice & Paluck, 2020; Bicchieri & Xiao, 2009). It is
therefore essential to understand the social structure of the group, and to identify who it is
that individuals are referring to for these social cues. This knowledge can then be used to
work with these individuals and leverage their influence (Valente & Pumpuang, 2007;
Paluck, Shepherd & Aronow, 2016).
I explored one possible way of doing this; namely by targeting communications at key-
players in the social network (Valente & Davis, 1999; Mbaru & Barnes, 2017). I showed that
social visiting and household co-residence ties were important for influencing decisions to
report poisoning (Chapter 5), and that adoption of the hotline by individuals at the centre of
these social networks could lead to much more widespread diffusion of the behaviour than
initial adoption by others. But, despite the considerably higher expense of collecting the
data for identifying these key-players, overall adoption rates were still low (Chapter 6). The
key-player approach can therefore be an important tool for intervention, but it is not a silver
bullet or a shortcut to influence. Furthermore, in reality, key-players can often be reluctant
to adopt new behaviours that might risk their social status, making them challenging targets
for intervention (Aral & Walker, 2012).

146
The relational perspective shows us that the challenge of behaviour change is formidable.
There is a natural ‘inertia’ and resistance to change within social groups because deviating
from existing group norms is risky, costly, and potentially undesirable (Centola, 2018).
Furthermore, in many cases the key-players whose influence we would like to tap into to
create change are also those most resistant to changing the status-quo (Aral & Walker,
2012). However, once disabused of the illusion that the social network provides shortcuts to
influencing behaviour, we can start to understand the possibilities in a more realistic sense. I
propose three key insights for designing effective interventions.
Firstly, we must recognise that there are no silver bullets. Societies are complex, individuals
and groups vary in intersectional ways, relate to one another in diverse ways, and therefore
respond to information, incentives, and other stimuli differently. For this reason, social
marketing interventions typically segment audiences based on key characteristics (Kotler &
Lee, 2008). Conservationists have also begun to do this, such as identifying groups of
hunters with the highest impact on important species (Jones et al., 2019). For interventions
to be effective across a population, they will need to be multi-faceted, tailoring different
approaches to each segment. Knowledge or data (such as sociometric data) about social
relations can be a useful, and complementary, way to segment audiences based on their
social positions and social influence (Valente, 2012).
Second, behaviour change has a socio-temporal quality (rather than spatio-temporal), as
new behaviours spread through social networks over time (Rogers, 2003). One-shot
interventions are unlikely to succeed, as our experience in Chapter five demonstrates. The
population segments that initially adopt the behaviour will perceive different barriers to
behaviour change and respond to different interventions than those who might adopt later.
Therefore, conservationists should recognise that repeated interventions will be needed,
and that strategies and targeting must adapt as beliefs and behaviours change throughout a
social network. In the classic theory of ‘Diffusion of Innovations’, Rogers (2003) segments
the population based on the speed with which they adopt and proposes unique forms of
intervention at each stage. Conservationists therefore need strategic patience, recognising
that their first efforts might be more impactful if they aim to gradually change beliefs and
perceptions within certain parts of a population, rather than aiming to change behaviour all

147
at once. In this way, they can build the critical mass required to drive change in social norms
in the long term (Centola, 2018; Valente, 1996).
Third, social influences are more important for later adopters than for early adopters. This
temporal perspective opens up opportunities for later interventions to build on and
leverage early gains, as early adopters become valuable social resources that can drive
further adoption through their social networks (Valente, 2012). For example, early adopters
may be peripheral in a social network, and therefore feel less social constraint, but they can
build the momentum needed for central key-players to adopt. Once key-players adopt,
behaviour change is likely to accelerate (Valente & Davis, 1999; Valente et al., 2007).
Interventions should explicitly account for social influence within the theory of change by
identifying referent groups and other individuals likely to influence each of their audience
segments (Prentice & Paluck, 2020). As behaviour change progresses through the
population and intervention effort turns to different social groups, their respective referent
and influential groups will also come into play as resources for intervention. Viewed from
the other end, as different segments of the population undergo behavioural change, they
also become potential influencers for the next segment. To capitalise on this,
conservationists could identify those who are already behaving in the desired way and work
with them as change agents, equipping and motivating them to reach out to others in their
social networks (Crona & Bodin, 2010; Valente, 2012). This can involve recruitment into
organizations and co-design of interventions (Paluck, Shepherd & Aronow, 2016), providing
incentives to recruit others, or simply creating opportunities for social signalling, such as
providing materials that enable them to display their behaviour to others (Niemiec et al.,
2019, 2021).
At present, there are still many existing ideas and strategies that have not been used by
conservationists, and there is no need for us to reinvent the wheel of behavioural
intervention. Indeed, the ideas discussed here are widely accepted in various behavioural
science disciplines, and applied by communities of practice such as in public health (Prentice
& Paluck, 2020; Valente, 2012). Although it is still rare to see conservationists considering
social influence processes, one programme which exemplifies the practical application of
these insights is the Lands for Life project implemented by Rare in Colombia, which aims to
promote climate-smart agriculture amongst smallholder farmers (Bujold & Karak, 2021).

148
According to Rare, social proof (i.e. observing adoption of the behaviour by other farmers)
and social pressures are key for farmer’s decision making (Rodriguez et al., 2009), and
“previous efforts to change behaviour failed because they didn’t incorporate either of these
social variables […]” (Bujold & Karak, 2021). The programme they developed in response
aimed to use these social processes. First, they segmented farmers by how resistant they
might be to adoption and recruited low-resistance farmers into their programme. These
farmers became social proof and helped to influence more resistant farmers. Rare,
facilitated this process through peer-to-peer workshops and radio interviews. Finally, once
substantial numbers of farmers were participating, they pressured the most resistant
farmers, which Rare facilitated using social marketing and community events. There is no
formal evaluation of this programme in the peer-reviewed literature, but there is sufficient
evidence from other disciplines, and in this thesis, to suggest that conservationists can
leverage the processes of social influence in similar ways to achieve conservation outcomes.
Perhaps Rare, as early adopters, will help to catalyse a broader shift in how conservation is
done. It is my hope that this thesis can play a similar role.
7.2.3 The political economy of wildlife poisoning
Chapter four looks in detail at the behavioural drivers of deliberate poisoning for harvesting
wild meat, with an eye to local intervention. But wildlife poisoning can have numerous
causes, ranging from unintentional spill over from agricultural practices to deliberate
targeting of wildlife using poisoned baits (Carson, 1962; Odino, 2011; Ogada, Keesing &
Virani, 2012; Ogada, 2014; Ogada, Botha & Shaw, 2016; Lalah et al., 2011). In the Northern
Plains of Cambodia, we also found a diversity of poisoning practices carried out by different
actors. Conservation problems are driven by overlapping political, economic, cultural, and
social systems (IPBES, 2019). Behaviour change interventions are a valuable tool for driving
transformative social change, but it is vital that they are used strategically together with
broader efforts to drive change at all levels (Naito, Zhao & Chan, 2021). In the case of
wildlife poisoning, this means recognising the underlying political economies that are driving
pesticides to become ubiquitous in Cambodia.
Globally, use of pesticides is increasing, but particularly in countries such as Cambodia
where agriculture is fast intensifying (Schreinemachers & Tipraqsa, 2012; Environmental
Justice Foundation, 2002). This has both demand and supply side drivers (Shattuck, 2021).

149
On the demand side, wildlife poisoning is a product of the changing forms of agricultural
production in rural Cambodia. As smallholders are increasingly integrated into markets
there is pressure to generate surplus production (Scheidel, Giampietro & Ramos-Martin,
2013). This requires intensification and/or extensification of production, and farmers often
turn to pesticides to achieve this. Studies in various locations have also found pesticide use
linked with access to credit, labour-shortages due to rural-urban migration and increased
wages, and cash crop booms (Shattuck, 2021) – all processes occurring in Northern
Cambodia (Beauchamp, Clements & Milner-Gulland, 2018b, 2019; Riggs et al., 2020; Kong et
al., 2019). We documented several forms of pesticide misuse for protecting crops by
smallholder farmers which exemplify these changes (Chapter 4). For example, many farmers
lack the labour necessary to transplant rice (i.e., grow the stalk in a nursery and then plant it
in the field) at the scale required to produce profitable surpluses. As a result, many have
switched to broadcasting (i.e., scattering seeds across the field) which promotes growth of
weeds and the spread of pests. To compensate, they scatter granular pesticides on the rice
fields. Farmers were also more likely to use pesticides on cash crops than on rice grown for
their own consumption (unpublished data).
The ownership of land has also changed drastically in the Northern Plains, as large areas of
rural land have been transferred to industrial plantations (Beauchamp, Clements & Milner-
Gulland, 2019; Davis et al., 2015). This has spill-over effects on the technologies and
chemicals available to nearby smallholders as well as on the way they manage their land
(Anti, 2021). For example, market sellers set up to serve the plantations were a key
promotor of pesticide use for smallholders. Moreover, these land transfers generate severe
conflicts (Baird, 2017). In recent years, WCS has documented several cases of poisoning
where large amounts of pesticide were placed on land belonging to or adjacent to large
concessions (e.g., Heng Yue, Rui Feng sugarcane) and it is likely that these poisonings were
carried out by labourers, perhaps on the order of their employers, to deter encroachment of
cattle onto company land.
On the supply side, as patents have expired, pesticides are increasingly manufactured in
Asia and at lower costs (Shattuck, 2021). They are thus more available and more accessible
than ever before in Cambodia. In 2002, the Environmental Justice Foundation described
Cambodia as a ‘dumping ground’ for unwanted chemicals (Environmental Justice

150
Foundation, 2002), because unscrupulous chemical manufacturers in neighbouring
countries can offload their unwanted product onto the weakly regulated marketplace in
Cambodia. Besides the ubiquity of these products, they are also often poorly labelled and
packaged. In Chapter four, we found that market sellers stocked a wide variety of different
chemicals, which vary in their toxicity. Often, they are labelled in foreign languages, or
repackaged so that safety information is missing. The market traders themselves also have
little knowledge of what they are selling and are prone to misleading their customers. Most
concerning was the availability and use of carbamates, including carbofuran (Richards,
2011), which are banned by the international Rotterdam convention (Rotterdam
Convention, 2013). Our attempts to trace the supply chains of these pesticides did not go
beyond local shops, but it was clear that these dangerous chemicals were sold and used
interchangeably with other, much less harmful, chemicals such as fipronil and abamectin.
We documented an interesting example of a local effort at resistance when one village chief
tried to pronounce a ban on the sale of certain chemicals by shops within his community
(Chapter 4). Although, we do not know what effect this ban had, and the pesticides have
again become available since, such efforts should be supported. Much of the data presented
in this thesis focuses on the beliefs and behaviours of local community members, but one
motivation for establishing a reporting hotline was to enable residents to participate in
efforts to protect their environment and their own health. Generating collective actions like
this may be key, as communities are both more likely to detect poisoning events (compared
to government patrols), and may have stronger motivations to prevent poisoning (Cooney et
al., 2017). Furthermore, generating political support for an alternative development model
that does not rely on pesticide use, will require organizing local communities so that they
can advocate for their own interests, and demonstrating that such a model can be viable
and profitable. The Ibis Rice conservation agriculture project may be a key lever in this
process (see Chapter 2).
Besides interventions aiming to influence the practices of local farmers and hunters,
reducing the burden of poisoning on wildlife and local communities will require efforts to
counteract the interests of ‘petro-chemical capital’ at global and national scales, including
stronger regulation of trade, combating misinformation, and resisting agro-industrial land
grabs (Faber, 2020). A 2002 report by the Environmental Justice Foundation (EJF, 2002)

151
provided many recommendations for Cambodia to grapple with pesticides, of which I
highlight a few:
• Cambodia should accede to the Rotterdam Convention procedures, placing the onus
on exporter countries to control trade in restricted chemicals.
• The government should inspect markets for restricted pesticides and residues on
food products.
• They should ban advertising of pesticides and develop communication and
education campaigns to deter pesticide use and promote alternatives such as
integrated pest management.
• The donor community can encourage and facilitate these actions by funding the
activities described above and supporting capacity building within the relevant
ministries.
• Donors should also recognise pesticide-problems as a public health crisis
comparable to HIV and malaria.
• The agro-chemical industry and their financiers must recognise the reputational and
regulatory risks in continuing to produce and market unsafe chemicals and should
ensure that products sold in Cambodia are labelled with safety information in
Khmer.
• Finally, the European Union and United States should end exports of chemicals that
are not permitted for use within their own borders.
In 2012, the Cambodian government passed a law on pesticides which established a list of
restricted chemicals, standards of use and disposal and mandated the Ministry of
Agriculture, Forestry and Fisheries to regulate these and carry out education campaigns
(Royal Government of Cambodia, 2012). This is an important step, but in regions such as the
Northern Plains, these regulations are rarely enforced, and further efforts are required.
7.3 Future research directions
7.3.1 Cheap methods of learning about social structure
A key theme in this thesis is the importance of accounting for social relations when
designing behaviour change intervention. Chapter three describes a variety of intervention
approaches used in other disciplines that do so, including targeting of individuals occupying

152
important positions in the network. Chapter six explores this strategy further using
simulations and finds that these approaches are promising but that the cost of collecting
network data can be prohibitive. There is thus a clear need for methods for gathering robust
information about a social network, such as identifying important individuals or delineating
social groups, which do not necessitate expensive name generator surveys across an entire
population.
Valente & Pumpuang (2007) reviewed the literature and found a variety of techniques used
in interventions to identify ‘opinion leaders’; individuals thought to be influential within a
group. Many of these approaches aim to determine which individuals are highly connected
in a group using methods of varying robustness, such as by collecting sociometric data
through name-generator surveys. One way to reduce the cost of such surveys is to simply
sample a proportion of the population. The cost of data collection will decrease in
proportion to the sampling factor, but the costs of analysing the data are likely to remain
constant. Furthermore, as the sample coverage of the population decreases, robustness will
also decrease (Eckles et al., 2019). The nature of this trade-off varies depending on the
structure of the network and the type of centrality measures being used. For example,
simulation studies have shown that in-degree centrality is relatively robust to missing data,
whereas betweenness centrality is not. Identifying influencers using in-degree centrality
may even be robust with up to half of the network missing at random, representing real
potential for cost saving (Costenbader & Valente, 2003). Nevertheless, the cost-benefit
analyses we conducted in Chapter six suggest even a 50% reduction in cost is unlikely to be
enough to justify data collection for sociometric analysis.
Other sociometric methods are peer-nomination surveys, where a sample in the population
is asked to nominate individuals they perceive as influential, or qualitative techniques such
as expert identification or ratings by key informants (Valente & Pumpuang, 2007). These
methods could potentially be applied to much smaller samples of the population and are
low-cost and simple to implement. Given that there are few published examples of
conservationists targeting opinion leaders, these methods could be valuable simple
additions to the conservation toolbox, even if they do not identify optimal targets in the
network. Future research could assess the reliability of these approaches by comparing the
elicited nominations with key players identified using complete sociometric data.

153
Furthermore, little research has been done to identify other network features without
complete sociometric data, such as the delineation of social groups, which can be important
in different intervention scenarios (Valente, 2012). Future research could examine the
robustness of group-delineation algorithms to sampling sizes. As in Costenbader & Valente’s
(2003) study of centrality measure stability, researchers could sample network data at
varying levels of completeness and compare the results produced using different group-
detection algorithms. Further research could assess the reliability of cheaper group-
identification methods, such as expert elicitation or informant interviews, by comparing the
results with sociometric data in varying contexts.
Other methods identified by Valente & Pumpuang (2007) aim to identify influential
individuals based on other criteria thought to indicate influence. This includes selection of
individuals occupying specific organisational or institutional positions, allowing opinion
leaders to self-identify, and targeting celebrities. The ‘rule of thumb’ represents a promising
approach because it is low-cost and allows network data collected in one place to inform
robust strategies that apply more broadly. In the context of a Kenyan fishery, Mbaru &
Barnes (2017) used network data to identify possible rules of thumb that could be used to
reliably identify individuals occupying important positions in six village social networks. They
found that formal leaders, those elected to manage coastal resources, tended to also be
important according to three of the four network measures they assessed. In Chapter six, I
replicated their analyses in a very different conservation context, and did not find that
formal leadership, or any other of the variables assessed by Mbaru & Barnes, predicted
importance in the network. Further research to identify rules of thumb that work (or do not)
in different contexts would be extremely valuable. For example, a database of network
studies identifying rules of thumb in a variety of different contexts could allow researchers
to tease out the factors that predict which sorts of individuals are likely to be socially
important. Conservationists working in diverse settings could potentially draw on these
syntheses in combination with their local knowledge to reliably select well-informed and
appropriate intervention approaches.
7.3.2 Disentangling the mechanisms of social influence
Chapter five demonstrates the importance of social influence for psychological outcomes.
Social influence can occur through a wide variety of mechanisms. For example, individuals

154
can directly influence one another through pressure and persuasion (Wood, 2000), or seek
to comply and conform with social norms by taking cues from referent individuals (Cialdini &
Goldstein, 2004; Prentice & Paluck, 2020). In our case study, the intentions of an individual’s
social peers were a strong predictor of changes in the individual’s behavioural intention.
However, these influences did not operate through altering perceived social norms.
Furthermore, perceptions of descriptive norms did not seem to play an important role in
determining intention. Instead, it is likely that individuals were seeking social cues from
their direct contacts and responding to them through interpersonal mechanisms like
contagion or conformity, rather than looking for information about what the prevailing
social norms were within the community. To get a firmer understanding of what was
happening, future research could complement quantitative data on behaviour and
perceptions of social norms with qualitative approaches. For example, group discussions
could be used to understand how some behaviours are governed by broader norms (see
Chapter 2).
Differences in the mechanisms of social influence are likely to have important implications
for intervention design. For example, where behaviours are shaped by perceptions of
societal norms which are informed by cues from weak social ties (Lee & Kronrod, 2020),
interventions might use media to communicate messages crafted to shift these perceptions
(Bicchieri, 2017a). Conversely, where behaviours are shaped more strongly by interaction
between socially close individuals, such as in our case study, interventions may require more
intensive collaboration with influential individuals in the social network (Paluck, Shepherd &
Aronow, 2016; Beaman et al., 2014). Furthermore, different segments within a population
are likely to respond to different forms of influence.
Further research to understand the different social mechanisms operating on different
conservation behaviours in different contexts could be useful for informing intervention
design. A variety of research methods can be used to elucidate social influence mechanisms,
such as qualitative or ethnographic approaches, or questionnaire surveys designed to assess
discrepancies between perceived norms and group behaviour (Borsari & Carey, 2003). Such
studies can evaluate the impacts of conservation interventions or analyse existing
conservation behaviours, as we have done in Chapter four. However, the most robust
methodologies will take a longitudinal perspective, and will combine observations of both

155
behaviour and social interaction. Modelling these two types of data in conjunction, as we
have done in Chapter five, could enable researchers to investigate a variety of social
influence mechanisms, and discount confounding processes such as changing social ties
(Steglich, Snijders & Pearson, 2010). For example, the Stochastic Actor-Oriented models
which we used, support the modelling of contagion processes (Greenan, 2015), the
influence of group-level behaviours, and a wide variety of interpersonal mechanisms (Ripley
et al., 2020).
The data collection required for these types of studies is resource intensive but analysing
several case studies in different contexts could provide robust evidence, and enable
commonalities and differences to be teased out, which could be used to inform intervention
design more generally. For example, a large body of such evidence now exists for adolescent
school networks and harmful behaviours such as smoking and alcohol abuse. A systematic
review of forty studies found that both alcohol and tobacco shape social networks, as
adolescents prefer to socialise with peers with similar consumption habits. Adolescents also
tended to become more similar to their peers in terms of alcohol consumption, but this
effect was weaker for tobacco consumption (Henneberger, Mushonga & Preston, 2021).
This suggests that interventions which aim to disrupt friend formation between smokers
and influence network structures (e.g., by reducing the social appeal of smoking) would
probably be more successful than interventions using traditional social influence approaches
(e.g., equipping adolescents to resist peer influence) or those which aim to change
perceptions of descriptive norms. This is an important finding given that most interventions
do focus on social influence rather than peer selection (Henneberger, Gest & Zadzora,
2019).
7.3.3 Network alteration
Social networks are constantly evolving as people develop new relationships and allow
existing ties to fade (Palla, Barabási & Vicsek, 2007). Social networks not only shape
behaviour, but their evolution is also influenced by the changing behaviours of individuals
(Steglich, Snijders & Pearson, 2010). For example, individuals often seek to form
relationships with others who are similar to them (a process known as homophily)
(Mcpherson, Smith-lovin & Cook, 2001). As conservation interventions influence individual
behaviour, they can inadvertently alter the structures of social networks. For example,

156
Indonesian farmers who were taken for training and networking outside of their villages
became more influential in their village social networks (Matous & Wang, 2019).
Other interventions deliberately aim to influence or alter network structures, as described in
Chapter three. These interventions may try to disrupt ties that facilitate negative
behaviours, such as those between actors involved in illegal wildlife trade (Sánchez-
Mercado et al., 2020). Or they may attempt to form network structures that reinforce and
facilitate positive conservation action, such as bringing farmers together to facilitate social
learning (Matous & Todo, 2018), or bringing resource users together to facilitate collective
action for managing natural resources (Ernstson, 2011). For example, in Ethiopia, providing
farmers with mobile phones allowed them to communicate and seek information more
frequently from acquaintances living further away than they did previously (Matous, Todo &
Ishikawa, 2014).
This thesis focussed on interventions exploiting existing networks to diffuse new
information or behaviours, but there is great scope to a): study the ways in which
conservation interventions lead to changes in social networks; and b) explore the feedbacks
between evolving networks and behaviours. For example, farmers participating in a
conservation agriculture scheme may find more opportunities to interact and communicate
with one another, leading to the formation of new social ties. This could then reinforce their
participation in the scheme, but it could also reduce their connection with other farmers
and reinforce non-participation in other groups. Collection of network and behavioural data
at multiple time points before and after intervention, and dynamic network modelling, can
tell us about the degree to which change occurs and about the mechanisms shaping this
coevolution (Steglich, Snijders & Pearson, 2010).
When interventions explicitly aim to alter network structures, network modelling can form
an important part of intervention evaluation strategies. Such research carried out in
different contexts could help conservationists to predict when network alteration might be
beneficial and provide evidence on the best approaches to take given the objectives and
intervention context. More generally, network modelling could offer important insights into
the ways in which existing conservation interventions are impacting communities. For
example, do institution-building efforts, such as the establishment of community forestry
management, rewire social ties in a way that further promotes collective action? Do they

157
improve the social capital and influence of some actors over that of others? These
approaches are also likely to have important impacts on the wellbeing of different groups,
potentially affecting feelings of agency or belonging, which should be carefully considered
and evaluated from an ethics perspective (Matous, Wang & Lau, 2021). Conversely, a
network approach could help to shed light on why some groups, such as women, might be
marginalised and suggest strategies of empowerment (Adams, Madhavan & Simon, 2002).
7.3.4 New communication technologies
Conservation efforts are taking place against a backdrop of rapid societal and technological
change. New communication technologies are rapidly reshaping the ways in which
individuals communicate, receive information, and influence one another (Aral & Nicolaides,
2017; Centola, 2011). In the Northern Plains of Cambodia, communities that were long cut
off from markets, roads, and the wider world, are now starting to receive mobile internet
coverage and electricity to power satellite televisions. This is likely to have profound
implications for the information they receive and therefore on conservation behaviours
(Matous, Todo & Ishikawa, 2014). For example, in the context of wildlife poisoning, farmers
could be further exposed to predatory marketing practices from pesticide traders, leading to
further uptake and misuse of pesticides. Conversely, farmers could use the internet to gain
more trustworthy information about pesticides, bypassing market traders. Further research
will be required to understand the ways in which these developments impact village
networks and conservation behaviours.
These technologies also provide opportunities for more effective conservation intervention.
In villages with good mobile internet coverage, social media channels could be used to
communicate directly with residents, bypassing the cumbersome village meetings and
ensuring messages penetrate widely within the community (Bennett & Manheim, 2006).
These channels also enable messages to be generated and delivered that are more closely
targeted to specific ‘micro’ audiences (Metcalf et al., 2018). Communication technologies
also provide opportunities for rewiring networks in ways that support conservation. For
example, by enabling community patrol teams to share information with each other and
with authorities and to coordinate their actions, or to allow farmers participating in
conservation agriculture schemes to seek advice from one another (Matous, Todo &
Ishikawa, 2014). More broadly, conservation agriculture programmes might produce new

158
social networks allowing farmers to communicate and share information across a landscape
using mobile phones, rather than relying on extension agents. For example, WeFarm is a
global peer-to-peer knowledge sharing platform for smallholder farmers in the global south
with over 2 million members (Wefarm, 2021).
Future research examining the ways in which communication technologies are altering
farmer’s social networks and access to information would be useful for anticipating these
opportunities, or potential threats, and intervention strategies that use online or offline
social networks to communicate conservation messages could be compared. Researchers
could test this experimentally, as Matous, Todo & Ishikawa did in Ethiopia (2014), by
mapping farmers’ social networks and then providing mobile phones and observing how the
networks changed over time. These changes could then be modelled in conjunction with
measurements of conservation-related beliefs or behaviour to understand the implications
for conservation outcomes (Steglich, Snijders & Pearson, 2010). Communication using
internet technologies can also be manipulated to serve experimental purposes. For
example, Centola (2010) created an online social network where participants were placed
into specific network structures, and observed that the spread of health-related behaviours
was dependent on this structure. Similar platforms geared towards populations of
conservation interest, such as WeFarm, could provide large amounts of data about both
communication and behaviour and provide opportunities for experimental research.
7.4 Recommendations for WCS
This thesis was carried out in collaboration with WCS Cambodia, with the aspiration of
supporting their interventions in the study area. Therefore, I offer some recommendations
aimed at WCS to help them to reduce wildlife poisoning in the Northern Plains and improve
the effectiveness of their future interventions. These are:
• We found that poisoning has multi-faceted impacts on human health, animal health,
the environment, and wildlife (Chapter 4). Addressing poisoning will require an
equally multi-faceted response combining messaging from trusted messengers
around health risks (e.g., doctors or health officials), normative messaging within the
community, promotion of safer agricultural practises, and efforts at regulating the

159
availability of restricted pesticides. Therefore, collaboration between different
ministries and organisations will be key. To facilitate this, WCS could convene a
provincial working group on pesticide poisoning, including the departments of
agriculture, health, and environment. This working group can be used to coordinate
action against pesticide misuse. Furthermore, raising awareness of pesticide
poisoning as a public health and conservation issue among officials, could help to
generate support for action at higher political levels. Similarly, WCS could collaborate
with other civil society organisations and donors, from across multiple sectors, to
campaign for greater awareness of pesticide poisoning and push for government
action at a national level.
• Pesticide use is likely to increase if current development trajectories continue in
Preah Vihear province, as these promote intensification of agriculture, large-scale
industrial agriculture, and integration of smallholders into the market economy. An
alternative trajectory is possible drawing on Preah Vihear’s abundant natural
resources and traditional agro-ecological practices. WCS should continue to develop
and promote alternative models of sustainable development using the Ibis Rice
programme, which requires participants to stop chemical use. This programme is a
key lever for farmers and communities to build political capital for greener
development pathways, and provides important wellbeing value sfor farmers and
citizens. Furthermore, WCS could use behavioural insights and leverage social
influences to drive further recruitment of farmers (see final point).
• We found that there is widespread disapproval of wildlife poisoning in the Northern
Plains, and that village authorities in some areas are motivated to implement
interventions to reduce poisoning. Furthermore, poisoning is difficult to detect and
more widespread than previously understood (Chapter 4). For these reasons, we
trialled the introduction of a reporting hotline, intended to be a key tool for
gathering data about poisoning, responding quickly to poisoning events, and
providing normative messaging for future social marketing campaigns. We found
that there is great potential for adoption of the hotline by local communities given
further intervention (Chapter 5). WCS should work to implement the reporting
hotline across the northern plains landscape, and to formalise this in partnership

160
with the department of environment. They should ensure robust response protocols
are in place when reports are made, in coordination with community protected area
committees. WCS can promote the hotline in local communities and continue to
develop social marketing campaigns to enable uptake (see next point).
• In Chapter five, I evaluated a pilot intervention, which used a combination of
normative messaging and messaging about the health risks of pesticide misuse, to
promote adoption of the reporting hotline. We found that this pilot was successful at
disseminating information and influenced residents’ beliefs about behavioural
control and social norms. However, social influences and a lack of long-term
engagement may have contributed to the failure of widespread behaviour change in
the long term. The intervention might therefore serve as the basis for further
intervention but should be repeated and further tailored to reach different segments
in the villages. For example, WCS could collaborate with local schools to deliver
health-focused pesticide-information geared towards children and parents, including
the short-film, through the school curriculum. Furthermore, in the absence of clear
rules-of-thumb that can be used to identify key influencers in the Northern Plains
and given the expense of collecting further sociometric data (Chapter 6), further
intervention could capitalise on the early successes of the pilot by leveraging the
social influence of early adopters. For example, WCS could collaborate with local
early adopters, such as those residents who took the safe pesticide use pledge, and
other motivated local influencers, such as Ibis Rice farmers or Community Protected
Area committee members. WCS could work with these groups to design further
interventions and equip them to conduct further promotion efforts in their villages.
For example, Ibis Rice farmers may be concerned about possible pesticide
contamination on their organic crops and could help to exert social pressure on
neighbouring farmers to reduce their pesticide use. WCS should also recognise the
potential marginalising impacts this could have on certain social groups. This could
be ameliorated by ensuring interventions are not coercive, and that poorer
households can access benefits from participating in conservation.
• I have examined in detail the complex personal, social, and behavioural factors
underlying an important conservation behaviour and influencing intervention

161
outcomes (Chapters 3, 4 & 5). I highlight the important role of social influences, and
in this chapter (see section 7.2) I discuss the implications of this insight for
conservation interventions. Furthermore, this thesis demonstrates the value of both
formative and evaluative research for designing and refining interventions (Chapters
4, 5 & 6). To improve the effectiveness of their interventions, and ensure continued
learning, WCS should mainstream the social and behavioural sciences in their
programmes, by further collaborating with social scientists. They should abandon
initiatives not founded on a clear theory of change, such as the awareness-raising
and education sessions, and replace them with targeted social marketing
interventions built on sound behavioural science. This means working with local
stakeholders to define clear behaviour change objectives, identifying specific
audiences for intervention, considering how social networks might influence
intervention outcomes, and building on their understanding of the audience to craft
clear and motivating messages. Furthermore, they should plan for long-term
engagement, iteratively adapting and refining their interventions based on learning
from formal evaluation and experimentation. The process documented and
described in this thesis could serve as a model for future work.
7.5 Conclusion
As conservationists continue to adopt insights from the behavioural sciences when
designing behaviour-change intervention, they need to think beyond the beliefs, attitudes,
and behaviours of individuals. People are social animals, and much of what we do is shaped
by the relationships we have with others. Within this thesis, I explored some of the ways in
which this is important for conservation practice. I demonstrated the importance of social
ties using both a synthesis of evidence and theory from other disciplines, and an empirical
study of an intervention taking place in Cambodia. The research methods used in this thesis,
including the use of dynamic network models, can be built upon to further understand how
interventions are influencing people’s behaviour. Furthermore, I describe a wide variety of
intervention approaches that conservationists can use to improve their interventions,
through a review of literature from other disciplines, and by exploring their feasibility in a
conservation context. The thesis will therefore be of interest to researchers, as well as

162
conservation practitioners interested in using insights about human behaviour to improve
their practice.

163
Bibliography Adams, A.M., Madhavan, S. & Simon, D. (2002) Women’s social networks and child survival in Mali. Social Science & Medicine. 54 (2), 165–178. doi: https://doi.org/10.1016/S0277-9536(01)00017-X.
Adams, W. (2007) Thinking like a human: science and the two cultures problem. Oryx. 41 (3), 275–276. doi: https://doi.org/10.1017/S0030605307004131.
Agrawal, A. & Gibson, C.C. (1999) Enchantment and disenchantment: The role of community in natural resource conservation. World Development. 27 (4), 629–649. doi: 10.1016/S0305-750X(98)00161-2.
Ajzen, I. (1991) The theory of planned behavior. Organizational Behavior and Human Decision Processes. 50, 179–211. doi: 10.1016/0749-5978(91)90020-T.
Andrews, M. & Manning, N. (2016) A Guide to Peer-to-Peer Learning. Available from: https://www.effectiveinstitutions.org/media/The_EIP_P_to_P_Learning_Guide.pdf.
Anti, S. (2021) Land grabs and labor in Cambodia. Journal of Development Economics. 149, 102616. doi: https://doi.org/10.1016/j.jdeveco.2020.102616.
Aral, S. & Nicolaides, C. (2017) Exercise contagion in a global social network. Nature Communications. 8, 1–8. doi:10.1038/ncomms14753.
Aral, S. & Walker, D. (2012) Identifying influential and susceptible members of social networks. Science. 337 (July), 337–341. doi:10.1126/science.1215842.
Armitage CJ, Conner M. Efficacy of the Theory of Planned Behaviour: a meta-analytic review. Br J Soc Psychol. 2001 Dec;40(Pt 4):471-99. doi: 10.1348/014466601164939
Baird, I. (2017) Resistance and Contingent Contestations to Large-Scale Land Concessions in Southern Laos and Northeastern Cambodia. Land. 6 (1), 16. doi:10.3390/land6010016.
Banerjee, A., Chandrasekhar, A.G., Duflo, E. & Jackson, M.O. (2013) The diffusion of microfinance. Science. 341 (6144). doi:10.1126/science.1236498.
Banerjee, S., Jenamani, M. & Pratihar, D.K. (2020) A survey on influence maximization in a social network. Knowledge and Information Systems. 62 (9), 3417–3455. doi:10.1007/s10115-020-01461-4.
Barnes, M.L., Kalberg, K., Pan, M. & Leung, P.S. (2016a) When is brokerage negatively associated with economic benefits? Ethnic diversity, competition, and common-pool resources. Social Networks. 45, 55–65. doi: 10.1016/j.socnet.2015.11.004.
Barnes, M.L., Lynham, J., Kalberg, K. & Leung, P. (2016b) Social networks and environmental outcomes. Proceedings of the National Academy of Sciences. 201523245. doi:10.1073/pnas.1523245113.
Baruch-Mordo, S., Breck, S.W., Wilson, K.R. & Broderick, J. (2011) The Carrot or the Stick? Evaluation of Education and Enforcement as Management Tools for Human-Wildlife Conflicts. PLOS ONE. 6 (1), e15681. Available from: https://doi.org/10.1371/journal.pone.0015681.

164
Baylis, K., Honey-Rosés, J., Börner, J., Corbera, E., et al. (2016) Mainstreaming Impact Evaluation in Nature Conservation. Conservation Letters. 9 (1), 58–64. doi: 10.1111/conl.12180.
Beaman, L., Benyishay, A., William, C. & Mobarak, A.M. (2014) Can Network Theory based Targeting Increase Technology Adoption? NBER Working paper. Available from: https://www.nber.org/papers/w24912.
Beauchamp, E., Clements, T. & Milner-Gulland, E.J. (2018a) Assessing Medium-term Impacts of Conservation Interventions on Local Livelihoods in Northern Cambodia. World Development. 101, 202–218. doi: 10.1016/j.worlddev.2017.08.008.
Beauchamp, E., Clements, T. & Milner-Gulland, E.J. (2018b) Exploring trade-offs between development and conservation outcomes in Northern Cambodia. Land Use Policy. 71 (December 2017), 431–444. doi: 10.1016/j.landusepol.2017.11.021.
Beauchamp, E., Clements, T. & Milner-Gulland, E.J. (2019) Investigating Perceptions of Land Issues in a Threatened Landscape in Northern Cambodia. Sustainability. 11 (21), 5881. doi:10.3390/su11215881 [Accessed: 7 November 2019].
Beauchamp, E., Woodhouse, E., Clements, T. & Milner-Gulland, E.J. (2018) “Living a good life”: conceptualizations of well-being in a conservation context in Cambodia. Ecology & Society. 23 (2). doi:10.5751/ES-10049-230228.
Beban, A., Schoenberger, L., Lamb, V., Beban, A., et al. (2019) Pockets of liberal media in authoritarian regimes: what the crackdown on emancipatory spaces means for rural social movements in Cambodia movements in Cambodia *. Journal of Peasant Studies. doi: 10.1080/03066150.2019.1672664.
Beck, L., & Ajzen, I. (1991). Predicting dishonest actions using the theory of planned behavior. Journal of Research in Personality, 25, 285-301.
Beier, P., Hansen, L.J., Helbrecht, L. & Behar, D. (2017) A How-to Guide for Coproduction of Actionable Science. Conservation Letters. 10 (3), 288–296. doi: https://doi.org/10.1111/conl.12300.
Bennett, N.J., Roth, R., Klain, S.C., Chan, K., et al. (2017) Conservation social science: Understanding and integrating human dimensions to improve conservation. Biological Conservation. 205, 93–108. doi: 10.1016/j.biocon.2016.10.006.
Bennett, W.L. & Manheim, J.B. (2006) The one-step flow of communication. Annals of the American Academy of Political and Social Science. 608 (November), 213–232. doi: 10.1177/0002716206292266.
Berny, P. (2007) Pesticides and the intoxication of wild animals. Journal of Veterinary Pharmacology and Therapeutics. 30 (2), 93–100. doi: 10.1111/j.1365-2885.2007.00836. x.
Bicchieri, C. (2017a) Norms in the Wild: How to Diagnose, Measure, and Change Social Norms. Oxford, Uk, Oxford University Press.
Bicchieri, C. (2017b) Tools for Change. In: Norms in the Wild: How to diagnose, measure, and change social norms. New York, Oxford University Press. pp. 45–66. doi: 10.1093/acprof:oso/9780190622046.001.0001.

165
Bicchieri, C. & Xiao, E. (2009) Do the right thing: but only if others do so. Journal of Behavioral Decision Making. 22 (2), 191–208. doi:10.1002/bdm.621.
Biddulph, R. (2015) In whose name and in whose interests? An actor-oriented analysis of community forestry in Bey, a Khmer village in Northeast Cambodia. In: S Milne & S Mahanty (eds.). Conservation and Development in Cambodia. Abingdon, UK, Routledge. pp. 160–176.
Le Billon, P. (2002) Logging in muddy waters: The politics of forest exploitation in Cambodia. Critical Asian Studies. 34 (4), 563–586. doi: 10.1080/1467271022000035938.
Le Billon, P. (2000) The Political Ecology of Transition in Cambodia 1989 ± 1999: War, Peace and Forest Exploitation. 31 (1998), 785–805.
Blair, G. & Imai, K. (2010) list: Statistical Methods for the Item Count Technique and List Experiment.
Blair, G. & Imai, K. (2012) Statistical analysis of list experiments. Political Analysis. 20 (1), 47–77. doi: 10.1093/pan/mpr048.
Block, P., Stadtfeld, C. & Snijders, T.A.B. (2016) Forms of Dependence: Comparing SAOMs and ERGMs From Basic Principles. Sociological Methods & Research. 48 (1), 202–239. doi: 10.1177/0049124116672680.
Bodin, Ö., Crona, B.I. & Ernstson, H. (2006) Social networks in natural resource management: what is there to learn from a structural perspective? Ecology and Society. 11 (2), r2. Available from: http://www.ecologyandsociety.org/vol11/iss2/resp2/%5Cnhttp://www.ecologyandsociety.org/vol11/iss2/resp2/ES-2006-1808.pdf.
Bodin Ö & Prell C (eds.) (2011) Social Networks and Natural Resource Management. Cambridge, UK, Cambridge University Press.
Borgatti, S.P. (2006) Identifying sets of key players in a social network. Computational and Mathematical Organization Theory. 12 (1), 21–34. doi: 10.1007/s10588-006-7084-x.
Borgatti, S.P. & Everett, M.G. (2000) Models of core /periphery structures. Social networks. 375–395. doi: 10.1016/S0378-8733(99)00019-2.
Borgatti, S.P., Mehra, A., Brass, D.J. & Labianca, G. (2009) Network Analysis in the Social Sciences. Science. 323 (5916), 892–895.
Borgatti, S.P. & Molina, J.-L. (2005) Toward Ethical Guidelines for Network Research in Organizations. Social Networks. 27 (2), 107–117.
Borsari, B. & Carey, K.B. (2003) Descriptive and injunctive norms in college drinking: a meta-analytic integration. Journal of studies on alcohol. 64 (3), 331–341. doi: 10.1016/j.biotechadv.2011.08.021.Secreted.
Brittain, S., Ibbett, H., de Lange, E., Dorward, L., et al. (2020) Ethical considerations when conservation research involves people. Conservation Biology. 34 (4), 925–933. doi: https://doi.org/10.1111/cobi.13464.

166
Broadhead, R.S., Heckathorn, D.D., Weakliem, D.L., Anthony, D.L., et al. (1998) Harnessing peer networks as an instrument for AIDS prevention: Results from a peer- driven intervention. Public Health Reports. 113 (Supplement 1), 42–57.
Brooks, J., Waylen, K.A. & Mulder, M.B. (2013) Assessing community-based conservation projects: A systematic review and multilevel analysis of attitudinal, behavioral, ecological, and economic outcomes. Environmental Evidence. 2 (1), 2. doi: 10.1186/2047-2382-2-2.
Brown, H.C.P. & Lassoie, J.P. (2010) Institutional choice and local legitimacy in community-based forest management: Lessons from Cameroon. Environmental Conservation. 37 (3), 261–269. doi: 10.1017/S0376892910000603.
Brunette, W., Sundt, M., Dell, N., Chaudhri, R., et al. (2013) Open Data Kit 2.0: Expanding and Refining Information Services for Developing Regions. Available from: http://dl.acm.org/citation.cfm?id=2444790.
Bryants, J. & Heath, R.L. (2000) Human Communication Theory and Research. Mahwah, New Jersey, Lawrence Erlbaum associates.
Buechley, E.R. & Şekercioğlu, Ç.H. (2016) The avian scavenger crisis: Looming extinctions, trophic cascades, and loss of critical ecosystem functions. Biological Conservation. 198, 220–228. doi: 10.1016/j.biocon.2016.04.001.
Bujold, P. & Karak, M. (2021) To scale behavior change: target early adopters, then leverage social proof and social pressure. Behavioral Scientist. Available from: https://behavioralscientist.org/to-scale-behavior-change-target-early-adopters-then-leverage-social-proof-and-social-pressure/.
Butler, P., Green, K. & Galvin, D. (2013) The Principles of Pride: The science behind the mascots. Available from: https://www.rare.org/sites/default/files/Principles%2520of%2520Pride%25202013%2520lo%2520res.pdf.
van Buuren, S. (2018) Flexible Imputation of Missing Data. 2nd edition. CRC Press. Available from: https://stefvanbuuren.name/fimd/.
van Buuren, S. & Groothuis-Oudshoorn, K. (2011) mice: Multivariate Imputation by Chained Equations in R. Journal of Statistical Software. 45 (3), 1–67. Available from: https://www.jstatsoft.org/v45/i03/.
Cai, J., De Janvry, A. & Sadoulet, E. (2015) Social Networks and the Decision to Insure. American Economic Journal: Applied Economics. 7 (2), 81–108. doi: http://dx.doi.org/10.1257/app.20130442.
Carignano Torres, P., Morsello, C., Parry, L. & Pardini, R. (2021) Forest cover and social relations are more important than economic factors in driving hunting and bushmeat consumption in post-frontier Amazonia. Biological Conservation. 253, 108823. doi: https://doi.org/10.1016/j.biocon.2020.108823.
Carson, R. (1962) Silent Spring. New York, Houghton Mifflin.
Cartwright, B.J., Wall, J.E. & Placide Kaya, J.A. (2012) Conservation Education and Environmental Communication in Great Ape Re-Introduction Projects: Two Cases from the
167
Republic of Congo. The Journal of Environmental Education. 43 (4), 241–258. doi: 10.1080/00958964.2011.652694.
Centola, D. (2011) An Experimental Study of Homophily in the Adoption of Health Behavior. Science. 334 (6060), 1269 LP – 1272. doi: 10.1126/science.1207055.
Centola, D. (2018) How Behaviour Spreads: The Science of Complex Contagions. Princeton, NJ, Princeton University Press.
Centola, D. (2010) The Spread of Behavior in an Online Social Network Experiment. Science. 329 (5996), 1194–1197. doi: 10.1126/science.1185231.
Centola, D. & Macy, M. (2007) Complex Contagions and the Weakness of Long Ties. American Journal of Sociology. 113 (3), 702–734.
Chandler, D. (2018) A History of Cambodia. 4th edition. Routledge.
Chann, S. (2021) Climate change migration in the post-conflict state: understanding Cambodian migration narratives through geopolitical history and land struggles. Area. doi: 10.1111/area.12697.
Chann, S. (2020) Making place and creating frontiers: Examining land and resource struggles in Cambodian post-conflict resource landscapes. The Geographical Journal. 186 (3), 262–275. doi: https://doi.org/10.1111/geoj.12340.
Cialdini, R.B. (2015) Crafting Normative Messages to Protect the Environment. Current Directions in Psychological Science. 12 (4), 105–109.
Cialdini, R.B. & Goldstein, N.J. (2004) Social Influence: Compliance and Conformity. Annual Review of Psychology. (1974), 591–621. doi: 10.1146/annurev.psych.55.090902.142015.
Cialdini, R.B., Kallgren, C.A. & Reno, R.R. (1991) A Focus Theory of Normative Conduct: A Theoretical Refinement and Reevaluation of the Role of Norms in Human Behavior. In: Mark P B T - Advances in Experimental Social Psychology Zanna (ed.). Academic Press. pp. 201–234. doi: https://doi.org/10.1016/S0065-2601(08)60330-5.
Clements, T., John, A., Nielsen, K., An, D., et al. (2010) Payments for biodiversity conservation in the context of weak institutions: Comparison of three programs from Cambodia. Ecological Economics. 69 (6), 1283–1291. doi: 10.1016/j.ecolecon.2009.11.010.
Clements, T. & Milner-Gulland, E.J. (2015) Impact of payments for environmental services and protected areas on local livelihoods and forest conservation in northern Cambodia. Conservation Biology. 29 (1), 78–87. doi: 10.1111/cobi.12423.
Clements, T., Neang, M., Milner-Gulland, E.J. & Travers, H. (2020) Measuring impacts of conservation interventions on human wellbeing and the environment in Northern Cambodia. Available from: https://www.3ieimpact.org/sites/default/files/2020-03/IE106-DPW1.1045-Cambodia-PES.pdf.
Clements, T., Rainey, H., An, D., Rours, V., et al. (2013) An evaluation of the effectiveness of a direct payment for biodiversity conservation: The Bird Nest Protection Program in the Northern Plains of Cambodia. Biological Conservation. 157, 50–59. doi: 10.1016/j.biocon.2012.07.020.

168
Clements, T., Suon, S., Wilkie, D.S. & Milner-Gulland, E.J. (2014) Impacts of Protected Areas on Local Livelihoods in Cambodia. World Development. 64, S125–S134. doi: https://doi.org/10.1016/j.worlddev.2014.03.008.
Coad, L., Lim, S. & Nuon, L. (2019) Wildlife and Livelihoods in the Cardamom Mountains, Cambodia. Frontiers in Ecology and Evolution. 7 (296). doi: 10.3389/fevo.2019.00296.
Cock, A. (2016) Governing Cambodia’s Forests: The International Politics of Policy Reform. NIAS Press.
Contractor, N.S. & DeChurch, L.A. (2014) Integrating social networks and human social motives to achieve social influence at scale. Proceedings of the National Academy of Sciences. 111 (Supplement 4), 13650 LP – 13657. doi: 10.1073/pnas.1401211111.
Cook, C.N., Hockings, M. & Carter, R.W. (Bill) (2010) Conservation in the dark? The information used to support management decisions. Frontiers in Ecology and the Environment. 8 (4), 181–186. doi:10.1890/090020.
Cooney, R., Roe, D., Dublin, H., Phelps, J., et al. (2017) From Poachers to Protectors: Engaging Local Communities in Solutions to Illegal Wildlife Trade. Conservation Letters. 10 (3), 367–374. doi: https://doi.org/10.1111/conl.12294.
Costenbader, E. & Valente, T.W. (2003) The stability of centrality measures when networks are sampled. Social Networks. 25 (4), 283–307. doi: https://doi.org/10.1016/S0378-8733(03)00012-1.
Craig, D. & Kimchoeun, P. (2011) Party Financing of Local Investment Projects. In: Caroline Hughes & Kheang Un (eds.). Cambodia’s Economic Transformation. Copenhagen, Nordic Institute of Asian Studies. pp. 219–244.
Crochet, S. (2011) Catching facts or sketching the elephant? Village monographs in Cambodia, yesterday, today, tomorrow. In: John Marston (ed.). Anthropology and community in Camodia2. Caulfield, Monash University Press. pp. 131–152.
Crona, B. & Bodin, Ö. (2010) Power Asymmetries in Small-Scale Fisheries: A Barrier to Governance Transformability? Ecology and Society. 15 (4).
Crona, B. & Bodin, Ö. (2006) What You Know is Who You Know? Communication Patterns Among Resource Users as a Prerequisite for Co-management. Ecology and Society. 11 (2), 7. doi: 10.1038/nature09798.
Crona, B.I. & Bodin, Ö. (2011) Friends or neighbors? Subgroup heterogeneity and the importance of bonding and bridging ties in natural resource governance. Social Networks and Natural Resource Management: uncovering the social fabric of environmental governance. 206–233. doi: 10.1017/CBO9780511894985.010.
Cross, R., Borgatti, S.P. & Parker, A. (2002) Making Invisible Work Visible: Using Social Network Analysis to Support Strategic Collaboration. California Management Review. 44 (2), 25–46.
Csardi, G. & Nepusz, T. (2006) The igraph software package for complex network research. InterJournal. Complex Sy, 1695. Available from: https://igraph.org/.

169
Damerell, P., Howe, C. & Milner-Gulland, E.J. (2013) Child-orientated environmental education influences adult knowledge and household behaviour. Environmental Research Letters. 8, 015016. doi: 10.1088/1748-9326/8/1/015016.
Damerell, P.J. (2010) From knowledge to behaviour: can environmental education realise its potential? Available from: http://www.iccs.org.uk/wp-content/thesis/consci/2009/Damerell.pdf.
Davis, E.O., O’Connor, D., Crudge, B., Carignan, A., et al. (2016) Understanding public perceptions and motivations around bear part use: A study in northern Laos of attitudes of Chinese tourists and Lao PDR nationals. Biological Conservation. 203, 282–289. doi: 10.1016/j.biocon.2016.09.009.
Davis, K.F., Yu, K., Rulli, M.C., Pichdara, L., et al. (2015) Accelerated deforestation driven by large-scale land acquisitions in Cambodia. Nature Geoscience. 8 (10), 772–775. doi: 10.1038/ngeo2540.
Day, B.A., DeWan, A., Cadiz, F.C., Jakosalem-Balane, J., et al. (2014) Rare Social Marketing for Sustainable Fishing in Cortes, Surigao del Sur, Philippines. Applied Environmental Education & Communication. 13 (1), 56–65. doi: 10.1080/1533015X.2014.916585.
Delisle, A., Kiatkoski Kim, M., Stoeckl, N., Watkin Lui, F., et al. (2018) The socio-cultural benefits and costs of the traditional hunting of dugongs Dugong dugon and green turtles Chelonia mydas in Torres Strait, Australia. Oryx. 52 (2), 250–261. doi: 10.1017/S0030605317001466.
Diepart, J.C. & Dupuis, D. (2014) The peasants in turmoil: Khmer Rouge, state formation and the control of land in northwest Cambodia. Journal of Peasant Studies. 41 (4), 445–468. doi: 10.1080/03066150.2014.919265.
Doughty, H., Veríssimo, D., Tan, R.C.Q., Lee, J.S.H., et al. (2019) Saiga horn user characteristics, motivations, and purchasing behaviour in Singapore. PLOS ONE. 14 (9), e0222038. Available from: https://doi.org/10.1371/journal.pone.0222038.
Drury, R., Homewood, K. & Randall, S. (2011) Less is more: The potential of qualitative approaches in conservation research. Animal Conservation. 14 (1), 18–24. doi: 10.1111/j.1469-1795.2010.00375.x.
Duvall, J. & Zint, M. (2007) A Review of Research on the Effectiveness of Environmental Education in Promoting Intergenerational Learning. The Journal of Environmental Education. 38 (4), 37–41. doi: 10.3200/JOEE.38.4.14-24.
Ear, S. (2007) The Political Economy of Aid and Governance in Cambodia. Asian Journal of Political Science. 15 (1), 68–96. doi: 10.1080/02185370701315624.
Ebihara, M.M. (1968) Svay: A Khmer Village in Cambodia. Ithaca, NY, Cornell University Press.
Eckles, D., Esfandiari, H., Mossel, E. & Rahimian, M.A. (2019) Seeding with Costly Network Information. Available from: http://arxiv.org/abs/1905.04325 [Accessed: 6 November 2020].

170
Environmental Justice Foundation (2002) Death in Small Doses: Cambodia’s Pest Problems and Solutions.
Ernstson, H. (2011) Transformative collective action: a network approach to transformative change in ecosystem-based management. doi: 10.1017/CBO9780511894985.012.
Essen, E. & Allen, M. (2017) Interspecies Violence and Crimes of Dissent: Communication Ethics and Legitimacy in Message. Critical Criminology. 25 (2), 261–274. doi: 10.1007/s10612-017-9358-7.
Everton, S.F. (2012) Disrupting Dark Networks. 1st edition. New York, USA, Cambridge University Press.
Ewaso Lions (2018) Mama Simba. 2018. Available from: http://ewasolions.org/conservation/mamasimba/ [Accessed: 29 January 2018].
Faber, D. (2020) Poisoning the World for Profit: Petro-Chemical Capital and the Global Pesticide Crisis. Capitalism Nature Socialism. 31 (4), 1–17. doi: 10.1080/10455752.2020.1829794.
Fairbrass, A., Nuno, A., Bunnefeld, N. & Milner-Gulland, E.J. (2016) Investigating determinants of compliance with wildlife protection laws: bird persecution in Portugal. European Journal of Wildlife Research. 62 (1), 93–101. doi: 10.1007/s10344-015-0977-6.
Faraji-Rad, A., Samuelsen, B.M. & Warlop, L. (2015) On the Persuasiveness of Similar Others: The Role of Mentalizing and the Feeling of Certainty. Journal of Consumer Research. 42 (3), 458–471. doi: 10.1093/jcr/ucv032.
Ferraro, P.J. & Pattanayak, S.K. (2006) Money for Nothing? A Call for Empirical Evaluation of Biodiversity Conservation Investments. PLOS Biology. 4 (4), e105. Available from: https://doi.org/10.1371/journal.pbio.0040105.
Fishbein, M. & Ajzen, I. (2010) Predicting and Changing Behavior: The Reasoned Action Approach. Routledge, UK. ISBN: 9781138995215
Flyvbjerg, B. (2006) Five Misunderstandings About Case-Study Research. 219–245.
Fox, J. & Weisberg, S. (2019) An R Companion to Applied Regression. 3rd edition. Thousand Oaks, CA, Sage. Available from: https://socialsciences.mcmaster.ca/jfox/Books/Companion/.
Freeman, L.C. (1978) Centrality in social networks conceptual clarification. Social Networks. 1 (3), 215–239. doi: https://doi.org/10.1016/0378-8733(78)90021-7.
Freund, C.A., Achmad, M., Kanisius, P., Naruri, R., et al. (2020) Conserving orangutans one classroom at a time: evaluating the effectiveness of a wildlife education program for school-aged children in Indonesia. Animal Conservation. 23 (1), 18–27. doi:10.1111/acv.12513.
Friedkin, N.E. & Johnsen, E.C. (2011) Models of Group Decision-Making. In: Social Influence Network Theory. New York, Cambridge University Press. pp. 235–258.
Galeotti, A. (2009) Influencing the influencers: a theory of strategic diffusion. The RAND Journal of Economics. 40 (3), 509–532.

171
Gibson, C.C. & Marks, S.A. (1995) Transforming rural hunters into conservationists: An assessment of community-based wildlife management programs in Africa. World Development. 23 (6), 941–957. doi: https://doi.org/10.1016/0305-750X(95)00025-8.
Gidley, R. (2017) The Political Construction of Narrative and Collective Memory in Cambodia. Situations. 10 (1), 99–118.
Granovetter, M. (1973) The Strength of Weak Ties. American Journal of Sociology. 78 (6) pp.1360–1380. doi: 10.1086/225469.
Grantham, H.S., Bode, M., McDonald-Madden, E., Game, E.T., et al. (2010) Effective conservation planning requires learning and adaptation. Frontiers in Ecology and the Environment. 8 (8), 431–437. doi: https://doi.org/10.1890/080151.
Green, K.M., Crawford, B.A., Williamson, K.A. & Dewan, A.A. (2019) A Meta-Analysis of Social Marketing Campaigns to Improve Global Conservation Outcomes. Social Marketing Quarterly. 25 (1), 69–87. doi: 10.1177/1524500418824258.
Green, W.N. (2020) Regulating Over-indebtedness: Local State Power in Cambodia’s Microfinance Market. Development and Change. 51 (6), 1429–1453. doi: 10.1111/dech.12620.
Greenan, C.C. (2015) Diffusion of innovations in dynamic networks. Journal of the Royal Statistical Society: Series A (Statistics in Society). 178 (1), 147–166. doi: https://doi.org/10.1111/rssa.12054.
Groce, J.E., Farrelly, M.A., Jorgensen, B.S. & Cook, C.N. (2018) Using social-network research to improve outcomes in natural resource management. Conservation Biology. 1–52. doi: 10.1111/cobi.13127.
Groh, D.R., Jason, L.A. & Keys, C.B. (2008) Social network variables in alcoholics anonymous: A literature review. Clinical Psychology Review. 28 (3), 430–450. doi: 10.1016/j.cpr.2007.07.014.
Gurney, G.G., Cinner, J.E., Sartin, J., Pressey, R.L., Ban, N.C., Marshall, N., & Prabuning, D. (2016) Participation in devolved commons management: Multiscale socioeconomic factors related to individuals’ participation in community-based management of marine protected areas in Indonesia. Environmental Science & Policy. 61, 212-220. doi: 10.1016/j.envsci.2016.04.015
Hagger, M. S., Chatzisarantis, N. L., & Biddle, S. J. (2002). A Meta-Analytic Review of the Theories of Reasoned Action and Planned Behavior in Physical Activity: Predictive Validity and the Contribution of Additional Variables, Journal of Sport and Exercise Psychology, 24(1), 3-32. doi: 10.1123/jsep.24.1.3
Hardeman, W., Johnston, M., Johnston, D., Bonetti, D., et al. (2002) Application of the Theory of Planned Behaviour in Behaviour Change Interventions: A Systematic Review. Psychology & Health. 17 (2), 123–158. doi: 10.1080/08870440290013644a.
Henneberger, A.K., Gest, S.D., Zadzora, K.M. (2019) Preventing adolescent substance use: a content analysis of peer processes targeted within universal school-based programs The Journal of Primary Prevention. 40 (2), 213-230. doi: 10.1007/s10935-019-00544-5

172
Henneberger, A.K., Mushonga, D.R., Preston, A.R. (2021) Peer influence and adolescent substance use: a systematic review of dynamic social network research. Adolescent Research Review. 6 (1), 57-73, doi: 10.1007/s40894-019-00130-0
Hilbert, M., Vásquez, J., Halpern, D., Valenzuela, S., et al. (2017) One Step, Two Step, Network Step? Complementary Perspectives on Communication Flows in Twittered Citizen Protests. Social Science Computer Review. 35 (4), 444–461. doi: 10.1177/0894439316639561.
Hinsley, A., Keane, A.M., St. John, F.A.V., Ibbett, H., et al. (2019) Asking sensitive questions using the Unmatched Count Technique: Applications and guidelines for conservation. Methods in Ecology and Evolution. 10 (3), 308–319. doi: 10.1111/2041-210X.13137.
Hollstein, B. (2016) Mixed Methods Social Networks Research: An Introduction. Cambridge University Press, Cambridge UK. ISBN: 9781139227193
Hughes, C. & Un, K. (2011) Cambodia’s Economic Transformation: Historical and Theoretical Frameworks. In: Caroline Hughes & Kheang Un (eds.). Cambodia’s Economic Transformation. Copenhagen, Nordic Institute of Asian Studies. pp. 1–26.
Huisman, M. & Steglich, C. (2008) Treatment of non-response in longitudinal network studies. Social Networks. 30 (4), 297–308. doi: https://doi.org/10.1016/j.socnet.2008.04.004.
Ibbett, H., Keane, A., Dobson, A.D.M., Griffin, O., et al. (2020) Estimating hunting prevalence and reliance on wild meat in Cambodia’s Eastern Plains. Oryx. 1–11. doi: DOI: 10.1017/S0030605319001455.
Ibbett, H., Lay, C., Phlai, P., Song, D., et al. (2017) Conserving a globally threatened species in a semi-natural, agrarian landscape. Oryx. 1–11. doi: 10.1017/S0030605316001708.
IPBES (2019) Global assessment report on biodiversity and ecosystem services of the Intergovernmental Science-Policy Platform on Biodiversity and Ecosystem Services. Available from: https://ipbes.net/global-assessment.
Isaac, M.E., Erickson, B.H., Quashie-Sam, S.J. & Timmer, V.R. (2007) Transfer of knowledge on agroforestry management practices: The structure of farmer advice networks. Ecology and Society. 12 (2). doi: 32.
St. John, F.A.V., Edwards-Jones, G. & Jones, J.P.G. (2010) Conservation and human behaviour: lessons from social psychology. Wildlife Research. 37 (Persky 1995), 658–667. doi: 10.1071/WR10032.
St. John, F.A.V., Keane, A.M., Edwards-Jones, G., Jones, L., et al. (2012) Identifying indicators of illegal behaviour: carnivore killing in human-managed landscapes. Proceedings of the Royal Society B: Biological Sciences. 279 (1729), 804–812. doi: 10.1098/rspb.2011.1228.
St. John, F.A.V., Keane, A.M. & Milner-Gulland, E.J. (2013) Effective conservation depends upon understanding human behaviour. In: David W Macdonald & Katherine J Willis (eds.). Key Topics in Conservation Biology 2. John Wiley & Sons. p.

173
St. John, F.A.V., Linkie, M., Martyr, D.J., Milliyanawati, B., et al. (2018) Intention to kill: Tolerance and illegal persecution of Sumatrantigers and sympatric species. Conservation Letters. doi: 10.1111/conl.12451.
Johnston, L.G. & Sabin, K. (2010) Sampling Hard-to-Reach Populations with Respondent Driven Sampling. Methodological Innovations Online. 5 (2), 38.1-48. doi: 10.4256/mio.2010.0017.
Jones, S., Keane, A., St. John, F.A.V., Vickery, J., et al. (2019) Audience segmentation to improve targeting of conservation interventions for hunters. Conservation Biology. doi:10.1111/cobi.13275.
Kadushin, C. (2005) Who benefits from network analysis: Ethics of social network research. Social Networks. 27 (2), 139–153. doi: 10.1016/j.socnet.2005.01.005.
Kamins, A.O., Rowcliffe, J.M., Ntiamoa-Baidu, Y., Cunningham, A.A., et al. (2015) Characteristics and Risk Perceptions of Ghanaians Potentially Exposed to Bat-Borne Zoonoses through Bushmeat. EcoHealth. 12 (1), 104–120. doi: 10.1007/s10393-014-0977-0.
Kaplan, A.M. & Haenlein, M. (2011) Two hearts in three-quarter time: How to waltz the social media / viral marketing dance. Business Horizons. 54 (3), 253–263. doi: 10.1016/j.bushor.2011.01.006.
Kareiva, P. & Marvier, M. (2012) What Is Conservation Science? BioScience. 62 (11), 962–969. Available from: http://dx.doi.org/10.1525/bio.2012.62.11.5.
Keane, A.M., Jones, J.P.G., Edwards-Jones, G. & Milner-Gulland, E.J. (2008) The sleeping policeman: understanding issues of enforcement and compliance in conservation. Animal Conservation. 11 (2), 75–82. doi: 10.1111/j.1469-1795.2008.00170.x [Accessed: 14 September 2016].
Ken, S., Entani, T., Tsusaka, T.W. & Sasaki, N. (2020) Effect of REDD+ projects on local livelihood assets in Keo Seima and Oddar Meanchey, Cambodia. Heliyon. 6 (4), e03802. doi: https://doi.org/10.1016/j.heliyon.2020.e03802.
Kidd, L.R., Garrard, G.E., Bekessy, S.A., Mills, M., et al. (2019) Messaging matters: A systematic review of the conservation messaging literature. Biological Conservation. 236, 92–99. doi: 10.1016/J.BIOCON.2019.05.020 [Accessed: 27 May 2019].
Kim, D.A., Hwong, A.R., Stafford, D., Hughes, D.A., et al. (2015) Social network targeting to maximise population behaviour change: A cluster randomised controlled trial. The Lancet. 386 (9989), 145–153. doi: 10.1016/S0140-6736(15)60095-2.
Kincaid, L.D. (2004) From Innovation to Social Norm: Bounded Normative Influence. Journal of Health Communication. 9 (March), 37–57. doi: 10.1080/10810730490271511.
Klovdahl, A.S. (2005) Social network research and human subjects protection: Towards more effective infectious disease control. Social Networks. 27 (2), 119–137. doi: 10.1016/j.socnet.2005.01.006.
Knoke, D. & Yang, S. (2011) Social Network Analysis. SAGE Publications. doi: http://dx.doi.org/10.4135/9781412985864.

174
Kong, R., Diepart, J.-C., Castella, J.-C., Lestrelin, G., et al. (2019) Understanding the drivers of deforestation and agricultural transformations in the Northwestern uplands of Cambodia. Applied Geography. 102, 84–98. doi: https://doi.org/10.1016/j.apgeog.2018.12.006.
Kotler, P. & Lee, N.R. (2008) Segmenting, evaluating and selecting target audiences. In: Social Marketing: Changing Behaviors for Good. SAGE Publications. pp. 122–152.
Kramon, E. & Weghorst, K. (2019) (Mis)Measuring Sensitive Attitudes with the List Experiment: Solutions to List Experiment Breakdown in Kenya. Public Opinion Quarterly. 83 (S1), 236–263. doi: 10.1093/poq/nfz009.
Krause, R.W., Huisman, M. & Snijders, T.A.B. (2018) Multiple imputation for longitudinal network data. Statistica Applicata - Italian Journal of Applied Statistics. 30 (1), 33–57. doi: doi.org/10.26398/IJAS.0030-002.
Kuhn, T.S. (1987) What are scientific revolutions? In: L Kruger, L. J. Daston, & M. Heidelberger (eds.). The probabilistic revolution, Vol. 1: Ideas in history. Cambridge, MA, MIT Press. pp. 7–22.
Kumar, V. & Mirchandani, R. (2012) Increasing the ROI of Social Media Marketing. MIT Sloan Management Review. 54 (1), 54–61.
Kusmanoff, A.M., Fidler, F., Gordon, A., Garrard, G.E., et al. (2020) Five lessons to guide more effective biodiversity conservation message framing. Conservation Biology. 34 (5), 1131–1141. doi: https://doi.org/10.1111/cobi.13482.
Kurz, T., Gardner, B., Verplanken, B. and Abraham, C. (2015), Habitual behaviors or patterns of practice? Explaining and changing repetitive climate‐relevant actions. WIREs Clim Change, 6: 113-128. https://doi.org/10.1002/wcc.327
LACANET (2016) Carbofuran poisoning at the interface between wildlife, livestock, and humans.
Lalah, J.O., Otieno, P.O., Richards, N., Odino, M., et al. (2011) A Chronicling of Long-Standing Carbofuran Use and its Menace to Wildlife in Kenya. Carbofuran and Wildlife Poisoning: Global Perspectives and Forensic Approaches. 39–98. doi: 10.1002/9781119998532.ch3.
Lasker, R.D., Humphreys, B.L. & Braithwaite, W.R. (1995) Making a Powerful Connection: The Health of the Public and the National Information Infrastructure. Available from: https://www.nlm.nih.gov/pubs/staffpubs/lo/makingpd.html.
Leach, M., Mearns, R. & Scoones, I.A.N. (1999) Environmental Entitlements: Dynamics and Institutions in Community-Based Natural Resource Management. World Development. 27 (2), 225–247.
Ledgerwood, J. (2012a) A tale of two temples: communities and their wats. In: John Marston (ed.). Anthropology and community in Camodia. Monash University Press. pp. 105–130.
Ledgerwood, J. (2012b) Buddhist ritual and the reordering of social relations in Cambodia. South East Asia Research. 20 (2), 191–205. doi: 10.5367/sear.2012.0100.
Ledgerwood, J. & Vijghen, J. (2002) Decision making in rural Khmer villages.

175
Ledgerwood, J.L. (1995) Khmer Kinship: The Matriliny/Matriarchy Myth. Journal of Anthropological Research. 51 (3), 247–261. Available from: http://www.jstor.org/stable/3630360.
Lee, J.K. & Kronrod, A. (2020) The Strength of Weak-Tie Consensus Language. Journal of Marketing Research. 57 (2), 353–374. doi: 10.1177/0022243720904957.
Littlejohn, S.W. & Foss, K.A. (2011) Theories of Human Communication. 10th edition. Long Grove, IL, Waveland Press.
Lospinoso, J.A., Schweinberger, M., Snijders, T.A.B. & Ripley, R.M. (2011) Assessing and accounting for time heterogeneity in stochastic actor-oriented models. Advances in Data Analysis and Classification. 5 (2), 147–176. doi: 10.1007/s11634-010-0076-1.
Loughlin, N. & Milne, S. (2020) After the Grab? Land Control and Regime Survival in Cambodia since 2012. Journal of Contemporary Asia. 00 (00), 1–23. doi: 10.1080/00472336.2020.1740295.
Loveridge, R., Ryan, G.E., Sum, P., Grey-Read, O., et al. (2019a) Poisoning causing the decline in South-East Asia’s largest vulture population. Bird Conservation International. 29 (1), 41–54. doi: 10.1017/s0959270918000126.
Luco, F. (2002) Between a tiger and a crocodile. Management of local conflicts in Cambodia: an anthropological approach to traditional and new practices. Available from: http://unesdoc.unesco.org/images/0015/001595/159544e.pdf.
Margoluis, R., Stem, C., Salafsky, N. & Brown, M. (2009) Using conceptual models as a planning and evaluation tool in conservation. Evaluation and Program Planning. 32 (2), 138–147. doi: https://doi.org/10.1016/j.evalprogplan.2008.09.007.
Marston, J.A. (ed) (2011) Anthropology and Community in Cambodia: reflections on the work of May Ebihara. John A Marston (ed.). Monash University Press.
Mastrangelo, M.E., Gavin, M.C., Laterra, P., Linklater, W.L., et al. (2014) Psycho-Social Factors Influencing Forest Conservation Intentions on the Agricultural Frontier. Conservation Letters. 7 (2), 103–110. doi: 10.1111/conl.12033.
Matous, P. & Todo, Y. (2018) An experiment in strengthening the networks of remote communities in the face of environmental change: leveraging spatially distributed environmental memory. Regional Environmental Change. (Letina 2016), 1–12. doi: 10.1007/s10113-018-1307-9.
Matous, P., Todo, Y. & Ishikawa, T. (2014) Emergence of multiplex mobile phone communication networks across rural areas: An Ethiopian experiment. Network Science. 2 (02), 162–188. doi: 10.1017/nws.2014.12.
Matous, P. & Wang, P. (2019) External exposure, boundary-spanning, and opinion leadership in remote communities: A network experiment. Social Networks. 56, 10–22. doi: 10.1016/j.socnet.2018.08.002.
Matous, P., Wang, P. & Lau, L. (2021) Who benefits from network intervention programs? TERGM analysis across ten Philippine low-income communities. Social Networks. 65, 110–123. doi: https://doi.org/10.1016/j.socnet.2020.12.008.

176
Matsukawa, M., Ito, K., Kawakita, K. & Tanaka, T. (2016) Current status of pesticide use among rice farmers in Cambodia. Applied Entomology and Zoology. 51 (4), 571–579. doi: 10.1007/s13355-016-0432-5.
Mbaru, E.K. & Barnes, M.L. (2017) Key players in conservation diffusion: Using social network analysis to identify critical injection points. Biological Conservation. 210 (March), 222–232. doi: 10.1016/j.biocon.2017.03.031.
McDonald, R.I. & Crandall, C.S. (2015) Social norms and social influence. Current Opinion in Behavioral Sciences. 3, 147–151. doi: 10.1016/j.cobeha.2015.04.006.
Mckenzie-Mohr, D. (2000) Promoting Sustainable Behavior: An Introduction to Community-Based Social Marketing. Journal of Social Issues. 56 (3), 543–554. doi: 10.1111/0022-4537.00183.
McKenzie-Mohr, D. & Schultz, P.W. (2014) Choosing effective behavior change tools. Social Marketing Quarterly. 20 (1), 35–46. doi: 10.1177/1524500413519257.
Mcpherson, M., Smith-lovin, L. & Cook, J.M. (2001) Birds of a Feather: Homophily in Social Networks. Annual Review of Sociology. 27, 415–444. doi: 10.1146/annurev.soc.27.1.415.
Metcalf, A.L., Angle, J.W., Phelan, C.N., Muth, B.A., et al. (2018) More “Bank” for the Buck: Microtargeting and Normative Appeals to Increase Social Marketing Efficiency. Social Marketing Quarterly. 25 (1), 26–39. doi: 10.1177/1524500418818063.
Michie, S., Johnston, M., Francis, J., Hardeman, W., et al. (2008) From Theory to Intervention: Mapping Theoretically Derived Behavioural Determinants to Behaviour Change Techniques. Applied Psychology. 57 (4), 660–680. doi: 10.1111/j.1464-0597.2008.00341.x.
Miller, D.T. & Prentice, D. a. (2016) Changing norms to change behavior. Annual Review of Psychology. 67, 339–361. doi: 10.1146/annurev-psych-010814-015013.
Milne, S. (2015) Cambodia’s Unofficial Regime of Extraction: Illicit Logging in the Shadow of Transnational Governance and Investment. Critical Asian Studies. 47 (2), 200–228. doi: 10.1080/14672715.2015.1041275.
Milner-Gulland, E.J. (2012) Interactions between human behaviour and ecological systems. Philosophical Transactions of the Royal Society B: Biological Sciences. 367 (1586), 270–278. doi: 10.1098/rstb.2011.0175.
Milner-Gulland, E.J., Bennett, E.L., Abernethy, K., Bakarr, M., et al. (2003) Wild meat: The bigger picture. Trends in Ecology and Evolution. 18 (7), 351–357. doi: 10.1016/S0169-5347(03)00123-X.
Monroe, M. (2003) Two Avenues for Encouraging Conservations Behaviors. Human Ecology Review. 10 (2), 113–125. doi: 10.1177/1086026601141001.
Morgenbesser, L. (2019) Cambodia’s Transition to Hegemonic Authoritarianism. Journal of Democracy. 30 (1), 158–171.
Myers, N., Mittermeier, R.A., Mittermeier, C.G., Fonseca, G.A.B. d., et al. (2000) Biodiversity hotspots for conservation priorities. Nature. 403 (February), 853–858.

177
Myneni, S., Fujimoto, K., Cobb, N. & Cohen, T. (2015) Content-Driven Analysis of an Online Community for Smoking Cessation: Integration of Qualitative Techniques, Automated Text Analysis, and Affiliation Networks. American Journal of Public Health. 105 (6), 1206–1212. doi: 10.2105/AJPH.2014.302464.
Naito, R., Zhao, J. & Chan, K.M.A. (2021) An integrative framework for transformative social change: A case in global wildlife trade. SocArxiv. doi: 10.31235/osf.io/5zmxd.
Nakano, Y., Tsusaka, T.W., Aida, T. & Pede, V.O. (2018) Is farmer-to-farmer extension effective? The impact of training on technology adoption and rice farming productivity in Tanzania. World Development. 105, 336–351. doi: 10.1016/j.worlddev.2017.12.013.
Neumann, R.P. (2005) Making Political Ecology. Hodder Education.
Nguyen, C.D., Carlin, J.B. & Lee, K.J. (2017) Model checking in multiple imputation: An overview and case study. Emerging Themes in Epidemiology. 14 (1), 1–12. doi: 10.1186/s12982-017-0062-6.
Nicolescu, B. (2014) Methodology of Transdisciplinarity. World Futures. 70 (3–4), 186–199. doi: 10.1080/02604027.2014.934631.
Niemiec, R., Jones, M.S., Lischka, S. & Champine, V. (2021) Efficacy-based and normative interventions for facilitating the diffusion of conservation behavior through social networks. Conservation Biology. n/a (n/a). doi: https://doi.org/10.1111/cobi.13717.
Niemiec, R.M., Willer, R., Ardoin, N.M. & Brewer, F.K. (2019) Motivating landowners to recruit neighbors for private land conservation. Conservation Biology. 33 (4), 930–941. doi: https://doi.org/10.1111/cobi.13294.
Nilsson, D., Baxter, G., Butler, J.R.A. & Mcalpine, C.A. (2016a) How do community-based conservation programs in developing countries change human behaviour? A realist synthesis. BIOC. 200, 93–103. doi: 10.1016/j.biocon.2016.05.020.
Nilsson, D., Gramotnev, G., Baxter, G., Butler, J.R.A., et al. (2016b) Community motivations to engage in conservation behavior to conserve the Sumatran orangutan. Conservation Biology. 30 (4), 816–826. doi: 10.1111/cobi.12650.
Nisbet, M.C. & Kotcher, J.E. (2009) A Two-Step Flow of Influence?: Opinion-Leader Campaigns on Climate Change. Science Communication. 30 (3), 328–354. doi: 10.1177/1075547008328797.
Norgrove, L. & Hulme, D. (2006) Confronting Conservation at Mount Elgon, Uganda. Development and Change. 37 (5), 1093–1116.
Nuno, A. & St. John, F.A.V. (2015) How to ask sensitive questions in conservation: A review of specialized questioning techniques. Biological Conservation. 189, 5–15. doi: 10.1016/j.biocon.2014.09.047.
Nyumba, T.O., Wilson, K., Derrick, C.J. & Mukherjee, N. (2018) The use of focus group discussion methodology: Insights from two decades of application in conservation. Methods in Ecology and Evolution. 9 (1), 20–32. doi: 10.1111/2041-210X.12860.

178
Odino, M. (2011) Measuring the conservation threat that deliberate poisoning poses to birds in Kenya: The case of pesticide hunting with Furadan in the Bunyala Rice Irrigation Scheme. In: Ngaio Richards (ed.). Carbofuran and Wildlife Poisoning: Global Perspectives and Forensic Approaches. Wiley-Blackwell. pp. 53–69.
Ogada, D., Botha, A. & Shaw, P. (2016) Ivory poachers and poison: Drivers of Africa’s declining vulture populations. Oryx. 50 (4), 593–596. doi: 10.1017/S0030605315001209.
Ogada, D.L. (2014) The power of poison: Pesticide poisoning of Africa’s wildlife. Annals of the New York Academy of Sciences. 1322 (1), 1–20. doi: 10.1111/nyas.12405.
Ogada, D.L., Keesing, F. & Virani, M.Z. (2012) Dropping dead: causes and consequences of vulture population declines worldwide. Annals of the New York Academy of Sciences. 1249, 57–71. doi: 10.1111/j.1749-6632.2011.06293.x [Accessed: 22 August 2016].
Olmedo, A., Sharif, V. & Milner-Gulland, E.J. (2017) Evaluating the Design of Behaviour Change Interventions: A Case Study of Rhino Horn in Vietnam. Conservation Letters. doi: 10.1111/conl.12365.
Ostrom, E. (1990) Governing the Commons: The Evolution of Institutions for Collective Action. Cambridge University Press.
Ovesen, J., Trankell, I.-B. & Ojendal, J. (1996) When every household is an island: social organization and power structures in rural Cambodia. Uppsala, Sweden, Department of Cultural Anthropology, Uppsala University.
Padua, S.M. (1994) Conservation Awareness through an Environmental Education Programme in the Atlantic Forest of Brazil. Environmental Conservation. 21 (2), 145–151. doi: DOI: 10.1017/S0376892900024577.
Paley, R. (2015) Managing protected areas in Cambodia. In: Sarah Milne & Sango Mahanty (eds.). Conservation and Development in Cambodia2. Routledge. pp. 141–159.
Palla, G., Barabási, A.-L. & Vicsek, T. (2007) Quantifying social group evolution. Nature. 446 (7136), 664–667. doi: 10.1038/nature05670.
Paluck, E.L., Shepherd, H.R. & Aronow, P.M. (2016) Changing climates of conflict: a social network experiment in 56 schools. Proceedings of the National Academy of Sciences of the United States of America. 113 (3), 566–571. doi: 10.1073/pnas.1514483113.
Pei, S., Morone, F. & Makse, H.A. (2018) Theories for Influencer Identification in Complex Networks. In: S Lehmann & Y.Y. Ahn (eds.). Complex Spreading Phenomena in Social Systems: Influence and Contagion in Real-World Social Networks. Cham: Springer International Publishing. pp. 125–148.
Pepinsky, T.B. (2018) A Note on Listwise Deletion versus Multiple Imputation. Political Analysis. 26 (4), 480–488. doi: DOI: 10.1017/pan.2018.18.
Perkins, J.M., Subramanian, S. V. & Christakis, N.A. (2015) Social networks and health: A systematic review of sociocentric network studies in low- and middle-income countries. Social Science and Medicine. 125, 60–78. doi: 10.1016/j.socscimed.2014.08.019.

179
Peterson, M.N., Essen, E. Von & Hansen, H.P. (2017) Illegal fishing and hunting as resistance to neoliberal colonialism. Crime, Law, and Social Change. 67, 401–413. doi: 10.1007/s10611-016-9664-0.
Petroczi, A., Nespusz, T., Cross, P., Taft, H., et al. (2011) New non-randomised model to assess the prevalence of discimination behavious: A pilot study on mephedrone. Substance abuse treatment, prevention, and policy. 6 (20), 1–18. doi: 10.1186/1747-597X-6-20.
Pin, C., Ngoprasert, D., Gray, T.N.E., Savini, T., et al. (2018) Utilization of waterholes by globally threatened species in deciduous dipterocarp forest of the Eastern Plains Landscape of Cambodia. Oryx. 1–11. doi: 10.1017/S0030605318000455.
Poffenberger, M. (2013) Cambodia’s contested forest domain: the role of community forestry in the new millenium. Mark Poffenberger (ed.). Manila, Ateneo de Manila University Press.
Pooley, S.P., Mendelsohn, J.A. & Milner-Gulland, E.J. (2013) Hunting Down the Chimera of Multiple Disciplinarity in Conservation Science. Conservation Biology. 28 (1), 22–32. doi: 10.1111/cobi.12183.
Pornpitakpan, C. (2004) The Persuasiveness of Source Credibility: A Critical Review of Five Decades Evidence. Journal of Applied Social Psychology. 34 (2), 243–281. doi: 10.1111/j.1559-1816.2004.tb02547.x.
Prentice, D. & Paluck, E.L. (2020) Engineering social change using social norms: lessons from the study of collective action. Current Opinion in Psychology. 35, 138–142. doi: https://doi.org/10.1016/j.copsyc.2020.06.012.
Prentice, D.A. & Miller, D.T. (1996) Pluralistic Ignorance and the Perpetuation of Social Norms by Unwitting Actors. Advances in Experimental Social Psychology. 28 (C), 161–209. doi: 10.1016/S0065-2601(08)60238-5.
Presseau, J., McCleary, N., Lorencatto, F. et al. Action, actor, context, target, time (AACTT): a framework for specifying behaviour. Implementation Sci 14, 102 (2019). https://doi.org/10.1186/s13012-019-0951-x
Pretty, J. & Ward, H. (2001) Social Capital and the Environment. World Development. 29 (2), 209–227.
QSR International (2015) NVivo.
R Core Team (2017) R: A Language and Environment for Statistical Computing. Available from: https://www.r-project.org.
Reddy, S.M.W., Montambault, J., Masuda, Y.J., Gneezy, A., et al. (2016) Advancing Conservation by Understanding and Influencing Human Behavior. Conservation Letters. 00 (May), 1–9. doi: 10.1111/conl.12252.
Royal Government of Cambodia (2012) Law on the Management of Pesticides and Fertilizers. Available from: http://extwprlegs1.fao.org/docs/pdf/cam151539.pdf.

180
Rhodes, J.R., Guerrero, A., Bodin, Ö. & Chadès, I. (2020) Fundamental insights on when social-network data are most critical for conservation planning. Conservation Biology. doi: 10.1111/cobi.13500.
Richards, N. (2011) Carbofuran and Wildlife Poisoning: Global Perspectives and Forensic Approaches. 1st edition. Ngaio Richards (ed.). Chichester, Wiley-Blackwell. doi: 10.1002/9781119998532.
Riggs, R.A., Langston, J.D., Beauchamp, E., Travers, H., et al. (2020) Examining Trajectories of Change for Prosperous Forest Landscapes in Cambodia. Environmental Management. 66 (1), 72–90. doi: 10.1007/s00267-020-01290-9.
Riggs, R.A., Langston, J.D. & Phann, S. (2020) Actor network analysis to leverage improvements in conservation and development outcomes in Cambodia. Ecology and Society. 25 (4). doi: 10.5751/ES-11854-250428.
Ríos-Saldaña, C.A., Delibes-Mateos, M. & Ferreira, C.C. (2018) Are fieldwork studies being relegated to second place in conservation science? Global Ecology and Conservation. 14, e00389. doi: https://doi.org/10.1016/j.gecco.2018.e00389.
Ripley, R.M., Snijders, T.A.B., Boda, Z., Voros, A., et al. (2020) Manual for SIENA version 4.0. Available from: http://www.stats.ox.ac.uk/~snijders/siena/RSiena_Manual.pdf.
Robins, G. (2015) Doing Social Network Research: Network-Based Research Design for Social Scientists. SAGE Publications.
Rodriguez, J.M., Molnar, J.J., Fazio, R.A., Sydnor, E., et al. (2009) Barriers to adoption of sustainable agriculture practices: Change agent perspectives. Renewable Agriculture and Food Systems. 24 (1), 60–71. Available from: http://www.jstor.org/stable/44490690.
Rogers, E.M. (2003) Diffusion of Innovations. 5th edition. New York, Free Press.
de Roo, N., Amede, T.T., Elias, E., Almekinders, C., et al. (2021) Opinion leadership under imperfect market conditions: the case of malt barley technology in South Ethiopia. International Journal of Agricultural Education and Extension.
Rotterdam Convention (2013) Cambodia. 2013.
Ryan, J., Mellish, S., Dorrian, J., Winefield, T., et al. (2020) Effectiveness of biodiversity-conservation marketing. Conservation Biology. 34 (2), 354–367. doi: 10.1111/cobi.13386.
Sales, A.E., Estabrooks, C.A. & Valente, T.W. (2010) The impact of social networks on knowledge transfer in long-term care facilities: Protocol for a study. Implementation Science. 5 (1), 49. doi: Artn 49\rDoi 10.1186/1748-5908-5-49.
Sánchez-Mercado, A., Cardozo-Urdaneta, A., Moran, L., Ovalle, L., et al. (2020) Social network analysis reveals specialized trade in an Endangered songbird. Animal Conservation. 23 (2), 132–144. doi: https://doi.org/10.1111/acv.12514.
Sandbrook, C., Adams, W.M., Buscher, B. & Vira, B. (2013) Social Research and Biodiversity Conservation. Conservation Biology. 27 (6), 1487–1490. doi: https://doi.org/10.1111/cobi.12141.
Saroeun, B. (1999) Pesticides killing Great Lake. The Phnom Penh Post. May.

181
Saypanya, S., Hansel, T., Johnson, A., Bianchessi, A., et al. (2013) Effectiveness of a social marketing strategy, coupled with law enforcement, to conserve tigers and their prey in Nam Et Phou Louey National Protected Area, Lao People’s Democratic Republic. Conservation Evidence. 10 (2013), 57–66.
Scheidel, A., Giampietro, M. & Ramos-Martin, J. (2013) Self-sufficiency or surplus: Conflicting local and national rural development goals in Cambodia. Land Use Policy. 34, 342–352. doi: 10.1016/j.landusepol.2013.04.009.
Schlüter, M., Baeza, A., Dressler, G., Frank, K., et al. (2017) A framework for mapping and comparing behavioural theories in models of social-ecological systems. Ecological Economics. 131, 21–35. doi: 10.1016/j.ecolecon.2016.08.008.
Schneider, C.R., Zaval, L., Weber, E.U. & Markowitz, E.M. (2017) The influence of anticipated pride and guilt on pro-environmental decision making. PLoS ONE. 12 (11), 1–14. doi: 10.1371/journal.pone.0188781.
Schoenberger, L. & Beban, A. (2018) “They Turn Us into Criminals”: Embodiments of Fear in Cambodian Land Grabbing. Annals of the American Association of Geographers. 108 (5), 1338–1353. doi: 10.1080/24694452.2017.1420462.
Schoenberger, L. & Beban, A. (2017) What is academic research on the Cambodian frontier? Critical Asian Studies. 49 (3), 437–440. doi: 10.1080/14672715.2017.1339446.
Schreinemachers, P. & Tipraqsa, P. (2012) Agricultural pesticides and land use intensification in high, middle and low income countries. Food Policy. 37 (6), 616–626. doi: https://doi.org/10.1016/j.foodpol.2012.06.003.
Schultz, P.W. (2011) Conservation Means Behavior. Conservation Biology. 25 (6), 1080–1083. doi: 10.1111/j.1523-1739.2011.01766.x.
Schultz, P.W., Nolan, J.M., Cialdini, R.B., Goldstein, N.J., et al. (2016) The Constructive, Destructive, and Reconstructive Power of Social Norms. 18 (5), 429–434.
Schultz, P.W.W. (2002) Knowledge, information, and household recycling: Examining the knowledge-deficit model of behavior change. In: Paul Stern & Thomas Dietz (eds.). New Tools for Environmental Protection: Education, Information, and Voluntary Measures. National Academy Press. pp. 67–82.
Scott, J.C. (2009) The Art of Not Being Governed. Yale University Press.
Sedara, K. (2011) Reciprocity: informal patterns of social interaction in a Cambodian village. In: John A. Marston (ed.). Anthropology and community in Camodia. Victoria, Australia, Monash University Press. pp. 153–170.
Selinske, M.J., Cooke, B., Torabi, N., Hardy, M.J., et al. (2017) Locating financial incentives among diverse motivations for long-term private land conservation. Ecology and Society. 22 (2), art7. doi: 10.5751/ES-09148-220207.
Shakya, H.B., Christakis, N.A. & Fowler, J.H. (2017) An exploratory comparison of name generator content: Data from rural India. Social Networks. 48, 157–168. doi: 10.1016/j.socnet.2016.08.008.

182
Shalizi, C.R. & Thomas, A.C. (2011) Homophily and Contagion Are Generically Confounded in Observational Social Network Studies. Sociological Methods & Research. 40 (2), 211–239. doi: 10.1177/0049124111404820.
Shattuck, A. (2021) Generic, growing, green?: The changing political economy of the global pesticide complex. The Journal of Peasant Studies. 1–23. doi: 10.1080/03066150.2020.1839053.
Shepherd, H.R. (2017) The Structure of Perception: How Networks Shape Ideas of Norms. Sociological Forum. 32 (1), 72–93. doi: 10.1111/socf.12317.
Smith, P.K. & Magee, J.C. (2015) The interpersonal nature of power and status. Current Opinion in Behavioral Sciences. 3, 152–156. doi: 10.1016/j.cobeha.2015.04.007.
Smith, R.J., Veríssimo, D., Leader-Williams, N., Cowling, R.M., et al. (2009) Let the locals lead. Nature. 462 (7271), 280–281. doi: 10.1038/462280a.
Smith, R.J., Verissimo, D. & Macmillan, D.C. (2010) Marketing and Conservation: How to Lose Friends and Influence People. Trade-Offs in Conservation: Deciding What to Save. 215–232. doi: 10.1002/9781444324907.ch12.
Snijders, T.A.B. (2017) Stochastic Actor-Oriented Models for Network Dynamics. Annual Review of Statistics and Its Application. 4 (1), 343–363. doi: 10.1146/annurev-statistics-060116-054035.
Snijders, T.A.B., van de Bunt, G.G. & Steglich, C.E.G. (2010) Introduction to stochastic actor-based models for network dynamics. Social Networks. 32 (1), 44–60. doi: https://doi.org/10.1016/j.socnet.2009.02.004.
Snijders, T.A.B. & Steglich, C.E.G. (2015) Representing Micro–Macro Linkages by Actor-based Dynamic Network Models. Sociological Methods & Research. 44 (2), 222–271. doi: 10.1177/0049124113494573.
Soda, G. & Zaheer, A. (2012) A network perspective on organizational architecture: performance effects of the interplay of formal and informal organization. Strategic Management Journal. 33, 751–771. doi: 10.1002/smj.1966.
Sokphea, Y. (2016) Movement of indigenous communities targeting an agro-industrial investment in north-eastern Cambodia. Asian Journal of Social Science. 44 (1–2), 187–213. doi: 10.1163/15685314-04401008.
Sokpheng, H. (2015) A man suicides by drinking poison, as his wife refuses to sleep with him. Koh Santepheap Daily. 21 June. Available from: https://kohsantepheapdaily.com.kh/article/122566.html.
Sommerville, M., Rahajaharison, M. & Jones, J.P.G. (2010) Impact of a Community-Based Payment for Environmental Services Intervention on Forest Use in Menabe, Madagascar. 24 (6), 1488–1498. doi: 10.1111/j.1523-1739.2010.01526.x.
Soulé, M.E. (1985) What is Conservation Biology? A new synthetic discipline addresses the dynamics and problems of perturbed species, communities, and ecosystems. BioScience. 35 (11), 727–734. Available from: http://dx.doi.org/10.2307/1310054.

183
Springer, S. (2009) Violence, Democracy, and the Neoliberal “Order”: The Contestation of Public Space in Posttransitional Cambodia. Annals of the Association of American Geographers. 99 (1), 138–162. doi: 10.1080/00045600802223333.
Starkey, F., Audrey, S., Holliday, J., Moore, L., et al. (2009) Identifying influential young people to undertake effective peer-led health promotion: The example of A Stop Smoking in Schools Trial (ASSIST). Health Education Research. 24 (6), 977–988. doi: 10.1093/her/cyp045.
Steglich, C., Snijders, T.A.B. & Pearson, M. (2010) Dynamic Networks and Behavior: Separating Selection from Influence. Sociological Methodology. 40 (1), 329–393. doi: 10.1111/j.1467-9531.2010.01225.x.
Steinmetz, R., Srirattanaporn, S., Mor-Tip, J. & Seuaturien, N. (2014) Can community outreach alleviate poaching pressure and recover wildlife in South-East Asian protected areas? Journal of Applied Ecology. 51 (6), 1469–1478. doi: 10.1111/1365-2664.12239.
Strangio, S. (2014) Hun Sen’s Cambodia. New Haven, Yale University Press.
Swift, P. (2013) Changing ethnic identities among the Kuy in Cambodia: Assimilation, reassertion and the making of Indigenous identity. Asia Pacific Viewpoint. 54 (3), 296–308. doi: 10.1111/apv.12025.
Swift, P. & Cock, A. (2015) Traditional Khmer Systems of Forest Management. Journal of the Royal Asiatic Society. 25 (1), 153–173. doi: 10.1017/S13561863140003.
Thøgersen, J. (2005) How may consumer policy empower consumers for sustainable lifestyles? Journal of Consumer Policy. 28 (2), 143–177. doi: 10.1007/s10603-005-2982-8.
Travers, H., Archer, L.J., Mwedde, G., Roe, D., et al. (2019) Understanding complex drivers of wildlife crime to design effective conservation interventions. Conservation Biology. doi: 10.1111/cobi.13330.
Travers, H., Clements, T., Keane, A.M. & Milner-Gulland, E.J. (2011) Incentives for cooperation: The effects of institutional controls on common pool resource extraction in Cambodia. Ecological Economics. 71 (1), 151–161. doi: 10.1016/j.ecolecon.2011.08.020.
Turaga, R.M.R., Howarth, R.B. & Borsuk, M.E. (2010) Pro-environmental behavior. Annals of the New York Academy of Sciences. 1185 (1), 211–224. doi: https://doi.org/10.1111/j.1749-6632.2009.05163.x.
Valente, T.W. (2012) Network Interventions. Science. 337 (6090), 49–53. doi: 10.1126/science.1217330.
Valente, T.W. (1996) Social network thresholds in the diffusion of innovations. Social Networks. 18 (1), 69–89. doi: 10.1016/0378-8733(95)00256-1.
Valente, T.W. & Davis, R.L. (1999) Accelerating the Diffusion of Innovations Using Opinion Leaders. Annals of the American Academy of Political and Social Science. 566 (1), 55–67.
Valente, T.W. & Fujimoto, K. (2010) Bridging: Locating critical connectors in a network. Social Networks. 32 (3), 212–220. doi: 10.1016/j.socnet.2010.03.003.

184
Valente, T.W., Paredes, P. & Poppe, P.R. (1998) Matching the Message to the Process: the relative ordering of knowledge, attitudes, and practices in behavior change research. Human Communication Research. 24 (3), 366–385. doi: 10.1177/0093650211427140.
Valente, T.W. & Pumpuang, P. (2007) Identifying Opinion Leaders to Promote Behavior Change. Health Education & Behavior. 34 (6), 881–896. doi: 10.1177/1090198106297855.
Valente, T.W., Ritt-Olson, A., Stacy, A., Unger, J.B., et al. (2007) Peer acceleration: Effects of a social network tailored substance abuse prevention program among high-risk adolescents. Addiction. 102 (11), 1804–1815. doi: 10.1111/j.1360-0443.2007.01992.x.
van der Pligt, J., Zeelenberg, M., van Dijk, W.W., de Vries, N.K., & Richard, R. (1997) Affect, Attitudes and Decisions: Let's Be More Specific, European Review of Social Psychology, 8:1, 33-66, DOI: 10.1080/14792779643000074
Varughese, G. & Ostrom, E. (2001) The contested role of hetrogenity in collective action: Some evidence from community forestry in Nepal. Word Development. 29 (5), 747–765.
Veríssimo, D., Schmid, C., Kimario, F.F. & Eves, H.E. (2018) Measuring the impact of an entertainment-education intervention to reduce demand for bushmeat. Animal Conservation. 1–8. doi: 10.1111/acv.12396.
Verkoren, W. & Ngin, C. (2017) Organizing against Land Grabbing in Cambodia: Exploring Missing Links. Development and Change. 48 (6), 1336–1361. doi: 10.1111/dech.12346.
Wakefield, M.A., Loken, B. & Hornik, R.C. (2010) Use of mass media campaigns to change health behaviour. The Lancet. 376 (9748), 1261–1271. doi: 10.1016/S0140-6736(10)60809-4.
Wang, C., Butts, C.T., Hipp, J. & Lakon, C.M. (2020) Model Adequacy Checking/Goodness-of-fit Testing for Behavior in Joint Dynamic Network/Behavior Models, with an Extension to Two-mode Networks. Sociological Methods & Research. 0049124120914933. doi: 10.1177/0049124120914933.
Ward, C., Holmes, G. & Stringer, L. (2018) Perceived barriers to and drivers of community participation in protected-area governance. Conservation Biology. 32 (2), 437–446. doi: 10.1111/cobi.13000.
Wasserman, S. & Faust, K. (1994) Social network analysis: Methods and applications. Cambridge, Cambridge University Press. doi: 10.1017/CBO9780511815478.
Weenig, M.W.H. (1999) Communication Networks in the Diffusion of an Innovation in an Organization. Journal of Applied Social Psychology. 29 (5), 1072–1092. doi: 10.1111/j.1559-1816.1999.tb00141.x.
Wefarm (2021) wefarm. 2021. Available from: https://wefarm.co/ [Accessed: 4 March 2021].
Weimann, G. (1994) Typologies of Opinion Leadership. In: The Influentials: People who influence people. Albany, State University of New York Press. pp. 53–70.

185
Wharton, C.H. (1966) Man, fire and wild cattle in northern Cambodia. Proc. Annu. Tall Timbers Fire Ecol. Conf. 5 (1940), 23–65.
Wood, W. (2000) Attitude Change: Persuasion and Social Influence. Annual Review of Psychology. 51 (1), 539–570. doi: 10.1146/annurev.psych.51.1.539.
Wooten, D.B. & Reed II, A. (1998) Informational Influence and the Ambiguity of Product Experience: Order Effects on the Weighting of Evidence. Journal of Consumer Psychology. 7 (1), 79–99. doi: https://doi.org/10.1207/s15327663jcp0701_04.
World Resources Institute (2014) Global Forest Watch. 2014. Available from: http://www.globalforestwatch.org/ [Accessed: 22 December 2020].
Wright, A.J., Verissimo, D., Pilfold, K., Parsons, E.C.M., et al. (2015) Competitive outreach in the 21st century: Why we need conservation marketing. Ocean and Coastal Management. 115, 41–48. doi: 10.1016/j.ocecoaman.2015.06.029.
Wright, J.H., Hill, N.A.O., Roe, D., Rowcliffe, M., et al. (2016) Reframing the concept of alternative livelihoods. Conservation Biology. 30 (1), 7–13. doi: 10.1111/cobi.12607.
Wu, C. & Shaffer, D.R. (1987) Susceptibility to Persuasive Appeals as a Function of Source Credibility and Prior Experience with the Attitude Object. Journal of Personality and Social Psychology. 52 (4), 677–688. doi: 10.1037/0022-3514.52.4.677.
Yin, R.K. (2014) Case study research: design and methods. SAGE Publications.
Young, S. (2019) Social movements in Cambodia: why they succeed or fail. Journal of International Relations and Development. (0123456789). doi: 10.1057/s41268-019-00175-7.
Zwijze-Koning, K.H. (2005) Auditing Information Structures in Organizations: A Review of Data Collection Techniques for Network Analysis. Organizational Research Methods. 8 (4), 429–453. doi: 10.1177/1094428105280120.

186
Appendix 1: Supplementary material for Chapter 4
A1.1 Hunting 168 respondents (36%) stated that they hunted wildlife in the past year. The most common method of hunting was using traps (56% of 168 hunters), followed by slingshots (12%). Twenty-four (1%) hunters used nets and 23 (1%) used dogs. Finally, four hunters stated that they used cross bows, and three hunters stated that they used guns to hunt, but this may refer to the homemade air guns commonly found. Most hunters used a single method, but 44 (26%) reported using a combination of methods. Younger respondents were more likely to hunt (effect = -0.04, z = -4.19, p < 0.01, Supplementary Table 3), but no effect was found for wealth or other variables.
A1.2 Agricultural Pesticide usage Pesticides were reported as used in all villages except one. Overall, 15% of households surveyed stated in response to a direct question that they had used pesticides in the past year, but this varied by village between 0 and 47% (median 8%). Interviews with village chiefs and FGD data suggest that usage varies from year to year and usually occurs in response to observations of pests on crops intended for commercial sale, but not on rice
grown for home consumption. According to informants, irregularly occurring ‘worm’ (ដងកូវ) outbreaks are a major driver of usage, but this did not occur in the year of our study. These ‘worms’ are in fact a kind of caterpillar which occurs seasonally. Pesticides are also mixed with water in the wet rice paddy to kill crabs which may then be consumed.
Twenty-one different pesticide products were identified by respondents as used for these purposes. Farmers typically report learning how to use pesticides from sellers at local markets when seeking advice on pest management, or from agricultural middlemen. We found no relation between respondent age and pesticide use, but wealthier households were more likely to use pesticides (effect size = 0.25, z = 2.06, p = 0.04, Supplementary Table 3). ‘Termite poisons’ are also used to prevent termite damage by soaking the roots of cassava or cashew crops before planting.
A1.3 Rice field poisoning In addition to waterhole poisoning, several other practices make use of poisons or pesticides to kill wildlife. Firstly, following a traditional method, poison produced from tree bark is placed in a water source to stun fish. This is a common method but is not believed to be harmful to wildlife due to the weak effect of the poison. Secondly, poisons are sprayed on fruit trees to kill birds, but this was only reported in one village. Third, granular-form pesticides are mixed or boiled with rice and scattered in the rice field to kill birds that eat the rice crop. Poisoning at rice fields was thought by respondents across all types of questioning to affect only doves, parakeets, and sparrows. This was reported in six villages, and we included this practice in our UCT questionnaire. The proportion of respondents allocated the treatment and control cards in this round did not differ significantly from 1:1 (χ2 = 2.1, df = 1, p = 0.15). The UCT results indicated that the proportion of households engaging in rice-field poisoning across 10 villages was not significantly different from zero with no design effect (p = 0.42, Supplementary Table 1). However, 4 respondents (1.7%) gave a maximal response for rice-field poisoning and when questioned directly, 10 respondents (2.2%) admitted to poisoning rice fields in the past year.

187
Table A1.1: Summary of prevalence estimates for different behaviours using the Unmatched Count Technique, a method used to estimate prevalence of sensitive behaviours. This includes the results for the practice round which focused on fruit eating, and direct questioning estimates for poisoning practices. A significant design effect indicates sensitivity of the practice.
Behaviour Practice: fruit eating Poisoning in rice field Poisoning at waterholes
Size of treatment group (total = 462)
221 241 254
Estimate % ± SE (p) 32% ± 14 (0.02) -10% ± 12 (0.40) -40% ± 12 (<0.001)
Design effect (p value) 0.67 0.42 <0.01
No. of maximal responses in treatment group (%)
22 (10.0 %) 4 (1.7 %) 6 (2.4 %)
Positive responses to direct question
NA 10 (2.2%) 6 (1.3%)

188
Table A1.2: Poisoned wildlife observed by informants, showing the number of informants who have observed the species poisoned.
Wildlife Species IUCN Redlist status No. Reports
“Egrets” 13
“Doves” 11
“Parakeet” 9
“Civets” 5
“Doves” 3
Red junglefowl Gallus gallus Least concern 3
Black-winged kite Elanus caeruleus 3
Green imperial pigeon Ducula aenea Least concern 3
Sarus crane Antigone antigone Vulnerable 2
“Sparrows” 2
Chinese francolin Francolinus pintadeanus Least concern 3
Giant ibis Thaumatibis gigantea Critically endangered
2
Wild boar Sus scrofa Least concern 1
“Monkeys” 1
“Cobras” 1
Lesser Mouse deer Tragulus kanchil Least concern 1
“Storks” 1
Green peafowl Pavo muticus Endangered 1
Lesser adjutant Leptoptilos javanicus Vulnerable 1
“Eagles” 1
“Snakes” 1
“Drongo” 1

189
Table A1.3: Fixed effect coefficients from linear mixed models. Effect size estimates are given relative to the intercept. Bolded variables have effect sizes larger than two times the standard error, or for generalised models have a p-value less than 0.05.
Model Descriptive norms
Linear mixed model
Injunctive norms
Linear mixed model
Combined norms
Linear mixed model
Variable/Coefficient Estimate Std. Error
T-value 95% C.I. lower bound
95% C.I. upper bound
Estimate Std. Error
T-value 95% C.I. lower bound
95% C.I. upper bound
Estimate Std. Error
T-value 95% C.I. lower bound
95% C.I. upper bound
Intercept 3.878 0.335 11.57 3.223 4.508 4.612 0.320 14.41 3.995 5.229 8.478 0.514 16.49 7.477 9.479
Age (Years / SD) -0.052 0.081 -0.649 -0.210 0.103 -0.231 0.077 -2.978 -0.380 -0.079 -0.283 0.125 -2.261 -0.527 -0.039
Agricultural Pesticide use 0.093 0.202 0.461
-0.300 0.481 -0.258 0.194 -1.330
-0.641 0.109 -0.175 0.313 -0.560
-0.784 0.433
Residence time (years / SD) -0.042 0.082 -0.509
-0.199 0.118 -0.010 0.079 -0.123
-0.165 0.139 -0.053 0.127 -0.420
-0.300 0.193
Native Intervention village 0.136 0.162 0.836
-0.153 0.424 -0.484 0.151 -3.199
-0.766 -0.205 -0.346 0.231 -1.500
-0.796 0.103
VMN member -0.164 0.176 -0.933 -0.496 0.184 -0.016 0.168 -0.092 -0.339 0.314 -0.169 0.272 -0.620 -0.698 0.361
Wealth score 0.150 0.060 2.526
0.039 0.270 -0.035 0.057 -0.621 -0.145 0.076 0.121 0.092 1.310 -0.059 0.300
Protected area (Kulen Promtep) -1.129 0.167 -6.752
-1.433 -0.828 -0.756 0.157 -4.822
-1.051 -0.470 -1.891 0.242 -7.819
-2.362 -1.420

190
Model Attitudes
Linear mixed model
Pesticide usage
Generalised linear mixed model
Hunting
Generalised linear mixed model
Variable/Coefficient Estimate Std. Error
T-value 95% C.I. lower bound
95% C.I. upper bound
Estimate Std. Error z-value P-value
Estimate Std. Error z-value P-value
Intercept 4.083 0.381 10.71 3.401 4.837 -2.673 0.865 -3.091 0.002 0.758 0.484 1.566 0.117
Age (Years / SD) -0.121 0.088 -1.379 -0.317 0.036 0.322 0.168 1.924 0.054 -0.522 0.128 -4.068 <0.001
Agricultural Pesticide use 0.394 0.222 1.773
-0.048 0.782 N/A N/A N/A N/A N/A N/A N/A N/A
Residence time (years / SD) 0.052 0.090 0.581
-0.084 0.251 -0.218 0.177 -1.234 0.217 0.176 0.126 1.397 0.1624
Native Intervention village -0.294 0.229 -1.284
-0.619 -0.009 N/A N/A N/A N/A N/A N/A N/A N/A
VMN member -0.010 0.191 -0.052 -0.397 0.322 -1.132 0.477 -2.372 0.018 -0.367 0.264 -1.392 0.164
Wealth score -0.216 0.065 -3.335
-0.337 -0.093
0.250 0.138 1.816 0.069
0.057 0.088 0.654 0.513
Protected area (Kulen Promtep) -0.114 0.227 -0.502
-0.433 0.206
-1.400 0.658 -2.127 0.033
-0.322 0.218 -1.478 0.139

191
Table A1.4: Fixed effect coefficients from Cumulative Linked logistic mixed models for perceived behavioural control. Bold indicates an effect size greater than the two times standard error, or a p-value below 0.05.
MODEL: PERCEIVED BEHAVIOURAL CONTROL 1: EFFECTIVE
CUMULATIVE LINKED (LOGIT) MIXED MODEL
PERCEIVED BEHAVIOURAL CONTROL 2: EASY
CUMULATIVE LINKED (LOGIT) MIXED MODEL
VARIABLES/COEFFICIENTS ESTIMATE STD. ERROR Z VALUE P VALUE ESTIMATE STD. ERROR Z VALUE P VALUE
Age (Years / SD) -0.166 0.109 -1.524 0.128 -0.289 0.108 -2.674 0.008
Agricultural Pesticide use 0.609 0.281 2.170 0.030 0.817 0.253 3.233 0.001
Residence time (Years / SD) 0.013 0.112 0.116 0.908 -0.141 0.111 -1.262 0.207
VMN member 0.091 0.247 0.366 0.714 0.519 0.231 2.244 0.025
Wealth score -0.025 0.081 -0.306 0.760 0.113 0.080 1.402 0.161
Protected Area (Kulen Promtep) 1.634 0.501 3.258 0.001 -0.130 0.211 -0.617 0.537
Class membership: 1|2 -1.299 0.569 -2.284 0.022 -0.510 0.438 -1.164 0.244
Class membership: 2|3 -0.722 0.564 -1.279 0.201 0.136 0.437 0.312 0.755
Class membership: 3|4 -0.224 0.563 -0.397 0.691 0.801 0.439 1.824 0.068
Class membership: 4|5 1.158 0.567 2.041 0.041 1.537 0.448 3.433 0.001

192
Table A1.5: Random effect coefficients for models of attitudes, perceived norms, and perceived behavioural control. Bold indicates a value greater than two times the standard error or deviation. S.D. = standard deviation, S.E. = standard error.
MODEL: COMBINED
NORMS
LINEAR MIXED
EFFECT MODEL
DESCRIPTIVE
NORMS
LINEAR MIXED
EFFECT MODEL
INJUNCTIVE
NORMS
LINEAR MIXED
EFFECT MODEL
ATTITUDES
LINEAR MIXED
EFFECT MODEL
PERCEIVED BEHAVIOURAL
CONTROL 1: EFFECTIVE
CUMULATIVE LINKED (LOGIT)
MIXED MODEL
PERCEIVED BEHAVIOURAL
CONTROL 2: EASY
CUMULATIVE LINKED (LOGIT)
MIXED MODEL
VARIABLES/COEFFICIENTS VALUE S.D. VALUE S.D. VALUE S.D. VALUE S.D. VALUE S.E. VALUE S.E.
Village 1 0.000 0.000 -
0.001 0.084 -0.014 0.068 0.114 0.152 -0.575 0.061
-0.055 0.009
Village 2 0.000 0.000 0.014 0.087 0.020 0.069 0.283 0.169 0.092 0.092 0.025 0.009
Village 3 0.000 0.000 -
0.008 0.087 0.009 0.069 0.040 0.169 -0.087 0.081
0.0002 0.010
Village 4 0.000 0.000 0.054 0.084 0.0003 0.068 0.017 0.153 1.191 0.076 0.041 0.010
Village 5 0.000 0.000 -
0.037 0.087 0.038 0.069 -0.164 0.171
-0.062 0.068 0.021 0.009
Village 6 0.000 0.000 -
0.046 0.086 -0.009 0.068 -0.058 0.160 -1.252 0.070
-0.062 0.010
Village 7 0.000 0.000 0.038 0.084 0.011 0.068 0.097 0.152 -0.400 0.051 -0.034 0.009
Village 8 0.000 0.000 -
0.033 0.089 0.0002 0.070 -0.128 0.181 0.572 0.054
0.031 0.010
Village 9 0.000 0.000 0.017 0.087 -0.035 0.069 -0.192 0.167 0.593 0.060 0.037 0.010
Village 10 0.000 0.000 0.003 0.087 -0.020 0.069 -0.010 0.166 -0.112 0.075 -0.002 0.010

193
Appendix 2: Supplementary material for Chapter 5
Contents 1. Context & Study site ...................................................................................................... 194
Study site ........................................................................................................................ 194
Wildlife Poisoning .......................................................................................................... 194
Case study intervention ................................................................................................. 194
Study village ................................................................................................................... 195
2. Data collection ............................................................................................................... 195
Data types ...................................................................................................................... 196
3. Missingness & imputation strategies ............................................................................. 199
Missingness .................................................................................................................... 199
Complete case analyses ................................................................................................. 200
Knowledge ..................................................................................................................... 201
Behavioural variables ..................................................................................................... 201
Network imputation ...................................................................................................... 203
5. Stochastic Actor Oriented Models ................................................................................. 207
6. Model results ................................................................................................................. 209
Linear mixed effect models for intention to report....................................................... 209
Linear mixed effect models for attitudes ...................................................................... 210
Linear mixed effect models for perceived behavioural control .................................... 212
Linear mixed effect models for perceived descriptive norms ....................................... 214
Linear mixed effect models for perceived injunctive norms ......................................... 216
Linear mixed effect models for knowledge ................................................................... 218
Generalised linear models for the theory of planned behaviour .................................. 219
Stochastic actor-oriented models .................................................................................. 220
7. Model diagnostics .......................................................................................................... 224
8. Data and code ................................................................................................................ 230
9. References ..................................................................................................................... 230

194
A2.1. Context & Study site
A2.1.1 Study site Preah Vihear province in northern Cambodia contains some of the largest remaining stretches of the lowland forests which used to cover much of mainland Southeast Asia. The forests consist of a complex mosaic of evergreen rainforest, deciduous dry forests, and grasslands. They are home to at least 28 species listed as Endangered or Critically Endangered (Clements et al., 2010). Many of these species rely on seasonal waterholes for food and water throughout the dry season (Pin et al., 2018).
Conservation efforts in this region have focused on three protected areas: Chheb, Prey Preah Rokha, and Kulen Promtep Wildlife Sanctuaries, managed by the Ministry of Environment. Several villages are located within the protected areas, comprised largely of rice farmers. A challenge is therefore to balance conservation with the development and livelihood aspirations of local communities. Several interventions have been implemented to meet these goals (Riggs et al., 2020). Most notably, a conservation agriculture programme, which enables participating farmers to achieve higher prices for their produce if they comply with conservation rules (Beauchamp, Clements & Milner-Gulland, 2018a).
A2.1.2 Wildlife Poisoning Wildlife poisoning was first reported here in 2015. This method of hunting seems to be increasingly common and has severe implications for threatened wildlife and human health. Hunters place carbamate pesticides near waterholes in the dry season to catch wildlife, largely for home consumption. It is not clear whether this practice is related to food insecurity, but there is a clearer link with attitudes and (mis)-perceptions of the health risks involved in consuming poisoned meat. Poisoning has negative impacts on other residents, their livestock, and access to fisheries and clean water sources. Most residents have strongly negative attitudes towards poisoning, and in several villages local authorities have attempted to act against poisoning, such as by holding village meetings, disciplining poison hunters, or even informally banning sale of carbamates (Chapter 4).
A2.1.3 Case study intervention To support these local efforts, the Wildlife Conservation Society is trialling the introduction of a reporting hotline to enable residents to anonymously report poisoning. Such a report would enable authorities to respond to poisoning more quickly, by removing the contamination, and would enable communities to display clear anti-poisoning norms and reduce the likelihood of poisoning. To promote this hotline, we co-designed a social marketing intervention and piloted this in one community. The intervention consisted of a half-day event. For the pilot, and for the purposes of this study, forty-one adults, chosen because they have children aged 10 to 15, were invited to the village hall.
At the event, officials from provincial government departments (agriculture, health, and environment) and local NGOs talked about different aspects and consequences of wildlife poisoning. Residents of a neighbouring village who had lost cattle to poisoning also gave testimony, with graphic evidence, and the audience was given the opportunity to ask questions. NGO staff then introduced and explained the hotline, and a short film was shown. This film dramatizes a poisoning event in a local village which ends happily after the hotline is used by the protagonist and his family (Figure 2.6). Finally, participants were invited to make a public pledge of ‘good citizenship’, pledging to use pesticides responsibly and be vigilant to report misuse. Pledgees were given a certificate by the commune chief. All

195
participants received various materials aimed at reinforcing the event’s key messages and enabling them to share the messages in their social networks (Figure 2.6). Our study focused on three key messages from the event relating to the 1) details about the hotline, 2) the short film plot, and 3) participants and details in the pledge.
A2.1.4 Study village Our study takes place in the village targeted for this pilot intervention. The village was selected because it is situated close to important wildlife habitat, poisoning has occurred there in the past, and the village chief has previously attempted to act against poisoning. Furthermore, the village was a feasible choice for this study because of its moderate size and easy access by road. Like other villages in the landscape, the village consists largely of rice farmers, but increasingly residents also grow cash crops, such as cassava or cashew. Gathering of forest products, such as mushrooms and resin, are also important livelihood activities, as are fishing and, to a lesser extent, hunting. A small group are engaged in illegal logging of luxury hardwoods. A further small number of households spread throughout the village run business like small shops, or a garage.
The village was settled in the first half of the twentieth century, within memory of some older residents. It is in a large expanse of forest and was relatively isolated for decades. Since the end of fighting with the Khmer Rouge in 1999, the Cambodian state has steadily consolidated its control over the area through infrastructure development and patronage schemes. In 2014 a good quality dirt road was built, passing by the village, and the roads within the village were formalised into a grid. This has enabled increasing migration of people from other provinces into the village and prompted many villagers to relocate their homes to better access the road. The village is thus comprised of two sections with roughly equal population: an older core, laid out in a grid and inhabited mainly by long-term residents, and a short distance away, households arranged along the road.
The village has a chief appointed by the state with the consent of village elites. He is responsible for bureaucratic functions such as signing marriage certificates and approving land transfers. He also has a deputy. Furthermore, there is a community forest, managed and patrolled by a small committee of elected residents, and a village market network which regulates enrolment in the conservation agriculture project and is also managed by an elected committee.
A2.2. Data collection All data was collected using questionnaire surveys administered verbally by a research assistant in Khmer. The questionnaires were translated from English, and then translated back to English, to ensure accuracy. Research assistants were trained in questionnaire protocols, and each questionnaire used was piloted in another village, or among a small sample of households in the study village, which were then excluded from the data if any subsequent changes were made. The questions were asked verbally, and verbal responses were recorded on tablets using the Open Data Kit software (Brunette et al., 2013). Each survey was delivered by two research assistants under the supervision of the lead author. Prior to each survey, consent was received from the village chief, and each respondent provided their informed consent prior to the interview. These protocols were approved by the University of Edinburgh, School of Geosciences, Ethics committee (No. 132, 2017, & No. 191, 2018).

196
A2.2.1 Data types
A2.2.1.1 Network data In 2017, we conducted a qualitative exploratory study to understand which social interactions may be important for communicating about topics such as agriculture, conservation, poisoning, or other village events. We organised focus group discussions in 12 villages with men and women separately, interviewed key informants, and observed social interaction over a month spent in the villages. We determined that information related to the intervention was not likely to flow through interactions specific to this topic, but instead would flow through general every-day interactions. We determined that most time is spent interacting with members of one’s household, but that villagers also visit one another at home.
We then collected data on these social ties using a name generator questionnaire in free-recall format. We asked respondents to nominate those individuals whom they a) visited at home during their spare time, or b) received as visitors at their home. Respondents would typically provide one or two names, and the research assistant would then prompt them for more names until they declined to provide more names. We collected data on household co-residence through an initial household survey. One adult in each household was asked to describe and name all individuals living in the household. We then returned to the household for the individual interviews and verified their identities.
We employed several strategies to ensure the social tie data collected was reliable and could be used to produce a social network. Firstly, the research team manually corroborated and corrected respondent names against a village census provided by the village chief. Secondly, we used fuzzy matching in R to identify all names in the data that differed from other names by less than three characters. Third, we generated a list of names that occurred only once in our dataset. Having compiled a set of potentially problematic cases using these two methods, we manually checked each name to see if there were obvious identity confusions, or if nicknames were used. We used kinship data we had collected to create a genealogy, which served as a reference to check and correct possible misspellings. For example, if Rob Franks had nominated Tim Franks and Mary Franks as siblings, but Mary had nominated Rob and Tom as siblings, we presumed Tim and Tom were alternate spellings of the same person. We selected one option and corrected any occurrences of this name in the dataset. This is a conservative strategy given that illiteracy is prevalent, and many possible spellings exist for any name in Khmer.
A2.2.1.2 Demographic & household data During the household survey we collected data about the livelihood strategies employed by the household, pesticide usage, participation in the conservation agriculture programme, and household wealth. We corroborated data on participation in the conservation agriculture programme with data provided by Sansum Mlup Prey, the administering organisation. Household wealth was measured in a 6-point scale adapted from the Basic Necessities Survey previously developed in this area (Beauchamp et al., 2018).
A2.2.1.3 Psychological outcomes We measured five variables from the Theory of Planned Behaviour (Ajzen, 1991): intention to report poisoning, attitudes towards reporting poisoning, perception of behavioural control, perceptions of descriptive norms, and perceptions of injunctive norms. We used multiple questions for each variable, measured using 5-point Likert scales, and summed

197
these to provide a value for that variable. Each five-point scale consisted of Strongly Agree, Agree, Neutral, Disagree, Strongly Disagree. ‘Don’t know’ was also an option, and these responses were excluded from the data. Questions were worded both negatively and positively and were ordered randomly. The questions are grouped by variable below.
INTENTION Next time I see a trapeang with poison I will keep it to myself and not report it.
សតើអនកយល់ក្សបមដរឬសេថា,សលើកសក្ោយអនកស ើញក្ត ំងមានោរបំពុល អនកនឹងមិនរាយោរណ៍សៅោជាា ្រសេ ?
I will report poisoning if I see it.
សតើអនកយល់ក្សបមដរឬសេថា,អនកនងឹរាយោរណ៍ពីោរបពំុល ក្បសិនសបើអនកបានស ើញ ?
ATTITUDES
If you see poisoning, it is good to keep it to yourself and not report it.
សតើអនកយល់ក្សបមដរឬសេថា,ក្បសនិសបើអនកស ើញមានោរបពំលុ វាជាសរឿងលអមដលអនកគួរលាក់េកុសហើយមនិស្វើោររាយោរណ៍សៅោជាា ្រ ?
If I see poisoning and report it, the village will be safer.
សតើអនកយល់ក្សបមដរឬសេថា,ក្បសនិសបើអនកស ើញមានោរបពំលុសហើយរាយោរណ៍ សតើអនកភូមនិឹងមានសុវតថិភាពជាងមនុមដរឫសេ?
Reporting poisoning is a good way to keep livestock safe.
សតើអនកយល់ក្សបមដរឬសេថា,ោររាយោរណ៍ពីោរបពំុលជាវិ្ីសាក្សតដល៏អមយួសដើមបីបាននូវសុវតថភិាពជីវិតសតវ?
If I see poisoning and report it, no one will come to clean the environment.
សតើអនកយល់ក្សបមដរឬសេថា,ក្បសនិសបើអនកស ើញោរបពំុលសហើយរាយោរណ៍ ោា ននរណាមាន ក់នងឹមកសមាអ តបរិសាថ នរបស់អនកសេ ?
PERCEIVED BEHAVIORAL CONTROL
If I see a poisoned trapeang, I know how I can report it.
សតើអនកយល់ក្សបមដរឬសេថាក្បសិនសបើអនកបានស ើញមានោរបំពុល អនកដឹងពីវិ្ ីមដលអនកោចស្វើោររាយោរណ៍ពោីរបពំុល?
Reporting poisoning takes a lot of effort and time.
សតើអនកយល់ក្សបមដរឬសេថាោររាយោរណ៍ពីោរបំពុលគចឺណំាយោរខំក្បងឹនងិសពលសវលាសក្ចើន ?

198
It’s easy to report trapeang poisoning.
សតើអនកយល់ក្សបមដរឬសេថាវាមានលកខណៈងាយក្សលួកនងុោររាយោរណ៍ពីោរបំពុល?
PERCEIVED INJUNCTIVE NORMS
It’s better not to report poisoning, because it will cause conflict in the village.
សតើអនកយល់ក្សបមដរឬសេថាវាជាសរឿងលអមដលមនិរាយោរណ៍ពីោរបពំុល ពីសក្ ោះវាោចបណាា លសោយអនកមានជំសលាោះសៅកនុងភូមិ ?
If I see poisoning and report it, other people in the village will argue with with me.
សតើអនកយល់ក្សបមដរឬសេថា,ក្បសនិសបើអនកស ើញោរបំពុលសហើយរាយោរណ៍ សតើក្បជាជនសសេងសេៀតសៅកនុងភូមមិានោរអនច់ិតតជាមយួអនកមដរឫសេ?
If I see poisoning and report it, most villagers will be happy with me.
សតើអនកយល់ក្សបមដរឬសេថាក្បសិនសបើអនកស ើញមានោរបំពលុសហើយរាយោរណ៍ក្បជាជនភាគសក្ចើននឹងសបាយចិតតជាមយួអនក ?
The village authorities expect me to report poisoning if I see it.
សតើអនកយល់ក្សបមដរឬសេថា,ោជាា ្ររំពឹងេុកថាអនកនឹងរាយោរណ៍ពីោរបំពុលក្បសិនសបើអនកបានស ើញពីោរបំពុល?
PERCEIVED DESCRIPTIVE NORMS
Normal people will report poisoning if they see it
សតើអនកយល់ក្សបមដរឬសេថា, ក្បជាជន្មាតានងឹស្វើោររាយោរណ៍ពីោរបពំុលក្បសនិសបើពួកោត់បានស ើញ មានោរបពំុល ?
Most people in the village will not report poisoning if they see it
សតើអនកយល់ក្សបមដរឬសេថា,ក្បជាជនភាគសក្ចើនសៅកនងុភមូនិឹងមិនរាយោរណ៍ពីោរបំពលុក្បសនិសបើពួកសគស ើញមានោរបំពុល?

199
A2.2.1.4 Internal consistency checks The questions for each variable were all internally consistent (Cronbach’s alpha > 0.5), except for perceived behavioural control (Table A2.1).
Table A2.1: internal consistency checks for TPB constructs, measured using Cronbach’s alpha.
Variable Wave 1 Wave 2 Wave 3 Overall
Intention 0.57 0.80 0.40 0.64
Control 0.42 0.48 0.47 0.45
Attitudes 0.64 0.52 0.62 0.58
Injunctive norms 0.48 0.66 0.43 0.53
Descriptive norms
0.15 0.39 0.33 0.32
A2.2.1.5 Knowledge & information In survey waves following the intervention we used 12 questions about aspects of the intervention to assess respondent’s knowledge of key messages. These questions were designed so that they did not give away the relevant information for future interviews. We asked about knowledge which no respondent could have had access to prior to the intervention. Furthermore, knowledge was grouped around three themes of the intervention: 1) details of the reporting hotline; 2) the plot of the short story; and 3) information about the pledge taken by some event attendees. Questions were posed in an open-ended way, but each question had a single correct answer, so we coded responses into binary variables for correct/false.
A2.3. Missingness & imputation strategies
A2.3.1 Missingness There is considerable missingness in our data (Table A2.2). In Wave two, missingness is largely because we excluded a randomly select half of households from the survey, in order to be able to control for the effect of the survey on later changes in behaviour and knowledge.

200
Table A2.2: Summary of data-collection waves
Survey
wave
Description Data
Collected
Completeness (%
individuals of 365)
Completeness (%
households of
154)
Preliminary Preliminary
surveys of
individuals and
households
Network 100 100
One Baseline
measurements
Behaviour 50 60
Two Post-intervention
measurements
Behaviour 77 93
Three Final medium-
term follow-up
Network* &
Behaviour
53 72
In wave 3 (Table A2.2), we recorded the reasons for non-responses (Table A2.3). We are
confident that at least 10 respondents were missing at random, for reasons unrelated to our
research, such as the travel for health reasons or work. We received these explanations
from other household members encountered. A further 25 respondents were encountered
but refused consent to participate in the study. These non-responses are likely not random
with respect to the data, as respondents will have been aware of the research topic from
previous waves. The largest number of non-responses, 62, were for unknown reasons.
Often, this is because the entire household was absent from the village. We can assume that
a large portion of these non-responses will have been at random, perhaps because of travel
to other places, or temporary relocation to the rice fields for work. However, it is a
possibility that some households decided to leave the village when they became aware that
the research team was present. These households will therefore not be missing at random.
Table A2.3: Reasons recorded for non-response of respondents in wave 3.
Reason for non-response No. of respondents
Travel to other places 10
Refused consent 25
Unknown 62
A2.3.2 Complete case analyses
Only 24% of individual respondents were present in all four waves, while 62% were present
in at least three waves (including the network data in wave one). Complete-case analysis

201
across all four waves would therefore reduce the amount of data available to an
unreasonable level. For generalised linear models, we therefore undertook analysis on a
period-by-period basis, to maximise retention of data. We also conducted network analyses
on complete cases using the handling of missingness built-in to the SIENA algorithm (see
section 5).
A2.3.3 Knowledge
We manually imputed missing data on knowledge about information from the intervention.
As the modal state for any question about knowledge at each time point was zero (i.e., no
knowledge), we set any missing values to zero. However, if the respondent had answered
the question correctly at the previous wave, we carried this correct answer forward,
assuming that they would still be able to recall the information. This is a conservative
assumption as of the 266 ‘bits’ of knowledge recorded in wave two, only 34 (13%) were not
recalled again in wave three.
A2.3.4 Behavioural variables
To impute the five variables from the Theory of Planned Behaviour, we used the multiple
imputation using chained equations algorithm (van Buuren & Groothuis-Oudshoorn, 2011)
in R (R Core Team, 2017). We generated twenty imputations used the predictive mean
matching method and included the following variables in the imputation algorithm (Table
3). These imputed variables were used in generalised linear models.
Table A2.4: List of variables used in imputation using mice.
Variable Type
Attendance at the event Binary
Household number (ID) integer
Household pesticide use binary
Household participation in conservation agriculture programme
binary
Gender binary
Age (normalised) integer
Household wealth score integer (1-5)
Inclusion in the baseline survey binary
Network in-degree integer
Average intention of network alters in wave 1 integer
Average intention of network alters in wave 2 integer
Average intention of network alters in wave 3 integer
Average attitudes of network alters in wave 1 integer

202
Average attitudes of network alters in wave 2 integer
Average attitudes of network alters in wave 3 integer
Baseline knowledge (0) integer
Wave 2 knowledge of hotline integer
Wave 3 knowledge of hotline integer
Wave 2 knowledge of story integer
Wave 3 knowledge of story integer
Wave 2 knowledge of pledge integer
Wave 3 knowledge of pledge integer
Baseline intention integer
Baseline attitudes integer
Baseline perceived control integer
Baseline perceived descriptive norms integer
Baseline perceived injunctive norms integer
Wave 2 intention integer
Wave 2 attitudes integer
Wave 2 perceived control integer
Wave 2 perceived descriptive norms integer
Wave 2 perceived injunctive norms integer
Wave 3 intention integer
Wave 3 attitudes integer
Wave 3 perceived control integer
Wave 3 perceived descriptive norms integer
Wave 3 perceived injunctive norms integer
We observe the following output plots. Figure A2.1 shows the values for each of the missing
variables across the twenty imputations. There are no clear patterns, trends, or outliers in
the imputed variables, indicating a reasonable imputation. Figure A2.2 shows the imputed
distributions for each variable in red, and the observed distribution in blue. There are no
obviously concerning discrepancies between the observed and imputed distributions.
However, there is high variation between the imputed values.

203
A2.3.5 Network imputation
Network data was complete for 365 individuals in the preliminary wave, was not collected in
wave one or two, and was 52% complete in wave three. We modelled the data with
network measured in the preliminary wave held constant across all waves and modelled
changes in behaviour with reference to this network. We used a joint network-behaviour
multiple imputation to impute the missing behavioural data. This approach assumes that
social interactions are unlikely to change significantly within the two-year period of the
research study. For household co-residence ties this is a very plausible assumption. The
partial re-measurement of network data in wave 3 was incomplete and not sufficient for
dynamic network modelling. However, assuming that both network measurements
represent observations of the same underlying social network, we perform a robustness
check by repeating our models using the updated network. In this network, individuals not
surveyed in wave 3 retain their network ties from wave 1. The updated network had 1604
ties, of which 954 were visit ties between members of different households. Among ties
outside of the household, there was assortment by wealth (+0.48) and participation in
conservation agriculture (+0.43), but not by age (+0.08) or gender (+0.09). Mean out-degree
= 4.40, Reciprocity = 0.54, Transitivity = 0.23, Density = 0.01.
RSiena In-built handling of missingness
RSiena treats missing data as ‘non-informative’ and attempts to reduce the influence of
missing data on results (Ripley et al., 2020). The method is thought to be robust to
missingness of around 20% depending on the informativeness of the missing data (Huisman
& Steglich, 2008), far lower than the missingness in our dataset. To do this, the model
carries out simulations over all variables by imputing missing values. Missing data on
network ties is set to ‘0’, i.e., assuming no ties are present, but in following waves, data is
carried forward. In other words, if an individual has reported tie data in wave one but is
missing from wave two, their ties will be assumed to remain constant from wave one to
wave two. Behavioural data is also imputed. If the data point was measured in the previous
wave, it is simply assumed to be unchanged. If it is not present in the previous wave, but is
present in the following wave, it is also imputed and assumed unchanged. If this is also
absent, then the observed mode of that variable is imputed. Individual covariates are
imputed with the mean of that variable. Imputed data is treated as non-informative, so its
effects on parameter estimates is minimised. For any period where an actor has missing
data that is required for calculating a statistic, this actor in that period does not contribute
to that statistic.
Joint multiple imputation of network and behaviour
Because of the higher missingness in our data, we used the joint network-behaviour
multiple imputation strategy described by (Krause, Huisman & Snijders, 2018). A
walkthrough script is available online at the link below, which we adapted to our purposes.
We implemented this procedure separately for each model specification (see section A2.5).
http://www.stats.ox.ac.uk/~snijders/siena/MultipleImputationNetworkAndBehavior.html#i
mputing-the-behavior-with-mice.

204
Following multiple imputation with mice, we estimate a stationary stochastic actor-oriented
model (SAOM). This is an analysis of cross-sectional network data using the SAOM model,
which is usually applied to dynamic networks (Snijders & Steglich, 2015). In the cross-
sectional SAOM, we fixed the network rate function at a low value (0.01), in effect assuming
that the network is in a “stochastically stable state” (Krause, Huisman & Snijders, 2018). We
also fixed the behavioural rate function at a low value (4). This allows the model simulations
to produce some variation from the behavioral values imputed by mice in wave 1. We
included all network and behavioural effects that were included in the final estimation
model and estimated the model over the constant network from wave one, with all twenty
behavioral imputations. The observed behaviour at wave 2 was also included as a covariate.
Once the model was estimated we imputed 20 sets of behaviour values for wave one using
a maximum likelihood simulation. (note: this required creating one random change in the
network).
We used each of the 20 imputed values in wave one to impute behaviour and/or network
data for waves 2 and 3 sequentially. Again, all the effects to be included in the final
estimation were included here. The variable ‘knowledge’ was not included in the initial
stationary SAOM because at wave one knowledge values for all individuals are zero. As the
network was kept constant, each wave was treated as a stationary SAOM with respect to
the network, meaning that the network rate function was fixed at 0.01, and network effects
were not included. Finally, the 20 sets of imputed values for all waves were used in the final
SAOM estimation, including the same effects. The results were then combined using Rubin’s
Rules (Krause, Huisman & Snijders, 2018).

205
Figure A2.6: Mean imputed values and standard deviations for 20 imputations of each of 36 variables with missing data

206
Figure A2.7: Density plot showing the distributions of imputed values (red) and the observed values (blue) for each variable with missing data

207
A2.4. Stochastic Actor Oriented Models The stochastic actor-oriented model (SAOM) is an agent-based model of network and
behaviour co-evolution (Snijders, van de Bunt & Steglich, 2010; Steglich, Snijders & Pearson,
2010). The rate function determines how many opportunities each actor has to alter their
behaviour or ties. At each opportunity, individuals in the network can increase, decrease, or
maintain their behaviour, and they can maintain, remove, or form new social ties. These
decisions are simulated, and at the end of each period, are compared with the observed
data provided. The decisions are also influenced by specified effects which can be the
effects of individual or dyadic covariates, the effects of network on behaviour, behaviour on
network choices, or more complex interactions. Please see the manual for more details
(Ripley et al., 2020).
Our primary research interest was to do with the effects of network ties on behaviour and
information diffusion, not the evolution of the social network. Because we only have partial
network data available for the latter waves, we therefore estimated SAOMs with the
network kept constant throughout all periods. This enabled us to model how the behaviours
changed in relation to the network. We did this by setting the rate parameter for the
network to a low value (=0.01, personal communication from Professor Tom Snijders). As a
robustness check to account for noise in the network measurements, we also fitted models
with the updated network ties in wave 3.
A forward model selection approach is advised with SAOMs because of difficulties in
achieving model convergence. This means that models are built step by step, adding
additional effects one by one so long as the model achieves a good convergence ratio (<0.2
in our case). We applied this approach to building our models. For the models with network
held constant, we began with the effect of interest (i.e., social influence), and then added
control effects. For the dynamic network models, we started with fundamental network
mechanisms, such as reciprocity. The final models presented here may therefore not include
all the effects that would ideally be included, but they are the best fitting models that
converge.
Here follows a description of the different effects.
The rate parameters represent the number of stochastically determined opportunities for
actors to change their network ties or their behaviour. For the network ties, these are fixed
by us at 0.01, limiting the opportunities for changes in the network at close to zero
(however, a zero value is not tolerated by the algorithm).
Outdegree (density) must always be included but is not of interest given the fixed rate
parameter for the network ties. The negative value simply indicates that individuals in the
network do not tend to create new outgoing network ties.
Linear shape expresses the basic tendency for the behaviour to increase over time.
However, this effect cannot be easily interpreted in relation to the other effects in the
model and is residual on the other effects.

208
Quadratic shape is the effect of the behaviour on itself. A positive effect expresses the
tendency for those at high levels of the behaviour to further increase their behaviour. A
negative effect indicates a negative feedback. This is also a difficult effect to interpret with
similarity effects included in the model.
In-degree and out-degree effects express the tendency for individuals with higher numbers
of incoming and outgoing network ties respectively to increase their behaviour.
Effects from covariates, including age, gender, wealth, pesticide use, and participation in
conservation agriculture, indicate the tendency for individuals with higher variates of these
covariates to increase their behaviour. For changing covariates, such as the time dummy or
knowledge, this expresses the tendency for individuals with higher values of the covariate in
a given period to subsequently increase their behaviour.
Average similarity effects express the tendency for individuals to increase or decrease their
behaviour in the direction of the average (mean) of their peer’s behaviour.
Average alter covariate effects express the tendency for individuals whose peers have a
higher average value for a covariate, x, to increase their level of the behaviour. For example,
we model the tendency for those whose alters have higher intention to report poisoning to
subsequently increase their perceived descriptive norms.
Additionally, to model the flow of information or knowledge about the intervention, we use
the diffusion of innovations extension (Greenan, 2015). This models the spread of
knowledge as a binary variable (i.e., knowledgeable or not), and non-decreasing (i.e.
individuals cannot forget). As knowledge is a simple contagion (Granovetter, 1973), it can be
transmitted through any single contact. The effect used to model this spread is the total
exposure effect, which expresses the likelihood of an individual ‘adopting’ knowledge as a
function of the total number of their network peers who have previously become
knowledgeable. A higher value thus indicates that individuals are more likely to become
knowledgeable with each additional knowledgeable peer.

209
A2.5. Model results
Table A2.5: Linear mixed effect models for intention to report.
Event participation Intervention knowledge (combined) Intervention knowledge (split)
1. Complete cases
2. 20 imputations
3. Complete cases
4. 20 imputations 5. Complete cases
Variable Estimate SE Estimate SE Estimate SE Estimate SE Estimate
Intercept 7.750 0.439 7.605 0.382 7.715 0.427 7.584 0.376 7.714
Wave 2 (βw2) 0.559 0.184 0.546 0.194 0.560 0.176 0.557 0.189 0.501
Wave 3 (βw3) -0.077 0.195 -0.130 0.172 -0.216 0.190 -0.224 0.178 -0.182
Participation in the event (βpar)
0.065 0.374 0.052 0.330 - - - - -
Combined knowledge of the intervention normalised (βknow)
- - - - 0.144 0.062 0.105 0.066 -
- Knowledge of the pledge (βpledge)
- - - - - - - - 0.2335
- Knowledge of the hotline (βhotline)
- - - - - - - - -0.053
- Knowledge of the story (βstory)
- - - - - - - - 0.173
Gender (βgen) 0.202 0.167 0.178 0.154 0.185 0.164 0.168 0.153 0.162
Age (normalised) (βage) 0.069 0.089 0.114 0.186 0.085 0.084 0.098 0.078 0.089
Participation in conservation agriculture (βSMP)
0.191 0.180 0.090 0.080 0.177 0.177 0.108 0.185 0.178
Household wealth (βwea) -0.098 0.088 -0.053 0.088 -0.098 0.087 -0.051 0.088 -0.096
Participation in baseline survey (βbase)
-0.045 0.178 -0.047 0.165 -0.023 0.174 -0.035 0.163 -0.031
Household pesticide use (βpest)
-0.135 0.200 -0.115 0.222 -0.148 0.198 -0.120 0.222 -0.154
Participation in the event * wave 2 (βpar*w2)
0.628 0.422 0.615 0.390 - - - - -
Participation in the event * wave 3 (βpar*w3)
-0.159 0.460 -0.114 0.400 - - - - -

210
Table A2. 6: Linear mixed effect models for attitudes
Event participation Intervention knowledge (combined) Intervention knowledge (split)
1. Complete
cases
2. 20
imputations
3. Complete
cases
4. 20 imputations 5. Complete
cases
6. 20
imputations
Variable Estimate SE Estimate SE Estimate SE Estimate SE Estimate SE Estimate SE
Intercept 15.643 0.525 15.655 0.449 15.712 0.501 15.667 0.437 15.719 0.501 15.670 0.436
Wave 2 (βw2) 0.157 0.236 0.217 0.238 -0.025 0.224 0.087 0.234 -0.046 0.227 0.070 0.231
Wave 3 (βw3) 0.579 0.250 0.523 0.227 0.278 0.241 0.273 0.226 0.298 0.242 0.281 0.231
Participation in the event
(βpar)
0.431 0.462 0.267 0.426 - - - - - - - -
Combined knowledge of
the intervention
normalised (βknow)
- - - - 0.306 0.075 0.330 0.095 - - - -
- Knowledge of the pledge(βpledge)
- - - - - - - - 0.272 0.157 0.215 0.151
- Knowledge of the hotline (βhotline)
- - - - - - - - 0.097 0.074 0.155 0.153
- Knowledge of the story (βstory)
- - - - - - - - 0.128 0.140 0.111 0.082
Gender (βgen) 0.509 0.196 0.412 0.199 0.483 0.189 0.394 0.197 0.481 0.190 0.390 0.200
Age (normalised) (βage) -0.074 0.105 0.282 0.202 -0.066 0.097 0.260 0.199 -0.070 0.092 0.262 0.198
Participation in
conservation agriculture
0.322 0.211 -0.028 0.098 0.282 0.205 -0.023 0.093 0.281 0.205 -0.023 0.094

211
(βSMP)
Household wealth (βwea) -0.156 0.104 -0.192 0.103 -0.156 0.101 -0.188 0.100 -0.154 0.101 -0.187 0.100
Participation in baseline
survey (βbase)
-0.182 0.212 -0.181 0.188 -0176 0.204 -0.171 0.180 -0.177 0.204 -0.173 0.179
Household pesticide use
(βpest)
0.094 0.237 0.106 0.234 0.075 0.229 0.100 0.232 0.078 0.229 0.100 0.230
Participation in the event
* wave 2 (βpar*w2)
0.228 0.542 0.413 0.521 - - - - - - - -
Participation in the event
* wave 3 (βpar*w3)
-0.214 0.589 0.076 0.571 - - - - - - - -

212
Table A2.7: Linear mixed effect models for perceived behavioural control
Event participation Intervention knowledge (combined) Intervention knowledge (split)
1. Complete
cases
2. 20
imputations
3. Complete
cases
4. 20 imputations 5. Complete
cases
6. 20
imputations
Variable Estimate SE Estimate SE Estimate SE Estimate SE Estimate SE Estimate SE
Intercept 10.246 0.522 10.169 0.492 10.215 0.507 10.138 0.481 10.217 0.506 10.138 0.480
Wave 2 (βw2) 0.786 0.208 0.666 0.261 0.726 0.198 0.621 0.237 0.680 0.201 0.577 0.235
Wave 3 (βw3) 0.666 0.222 0.525 0.261 0.461 0.214 0.351 0.247 0.489 0.216 0.365 0.248
Participation in the event
(βpar)
0.220 0.437 0.340 0.415 - - - - - - - -
Combined knowledge of
the intervention
normalised (βknow)
- - - - 0.233 0.072 0.205 0.078 - - - -
- Knowledge of the pledge(βpledge)
- - - - - - - - 0.253 0.146 0.180 0.149
- Knowledge of the hotline (βhotline)
- - - - - - - - 0.019 0.069 0.207 0.132
- Knowledge of the story (βstory)
- - - - - - - - 0.176 0.130 0.003 0.069
Gender (βgen) 0.395 0.200 0.328 0.207 0.372 0.196 0.307 0.206 0.356 0.196 0.287 0.207
Age (normalised) (βage) -0.093 0.106 0.091 0.241 -0.071 0.100 0.079 0.240 -0.069 0.101 0.081 0.239

213
Participation in
conservation agriculture
(βSMP)
0.126 0.215 -0.072 0.101 0.101 0.213 -0.051 0.097 0.101 0.212 -0.044 0.098
Household wealth (βwea) -0.070 0.106 -0.006 0.096 -0.067 0.104 0.000 0.095 -0.066 0.104 -0.001 0.095
Participation in baseline
survey (βbase)
0.195 0.211 0.120 0.206 0.221 0.207 0.151 0.203 0.216 0.206 0.143 0.201
Household pesticide use
(βpest)
-0.023 0.241 -0.039 0.245 -0.040 0.237 -0.052 0.242 -0.043 0.237 -0.060 0.239
Participation in the event
* wave 2 (βpar*w2)
0.628 0.479 0.595 0.486 - - - - - - - -
Participation in the event
* wave 3 (βpar*w3)
-0.077 0.523 -0.138 0.506 - - - - - - - -

214
Table A2.8: Linear mixed effect models for perceived descriptive norms
Event participation Intervention knowledge (combined) Intervention knowledge (split)
1. Complete
cases
2. 20 imputations 3. Complete
cases
4. 20
imputations
5. Complete
cases
6. 20 imputations
Variable Estimate SE Estimate SE Estimat
e
SE Estimate SE Estimat
e
SE Estimat
e
SE
Intercept 6.255 0.306 6.196 0.299 6.259 0.298 6.206 0.297 6.251 0.298 6.203 0.296
Wave 2 (βw2) 0.106 0.136 0.076 0.142 0.091 0.128 0.049 0.136 0.071 0.130 0.041 0.133
Wave 3 (βw3) 0.419 0.144 0.382 0.172 0.364 0.138 0.314 0.166 0.367 0.139 0.313 0.167
Participation in the event
(βpar)
-0.182 0.268 -0.132 0.276 - - - - - - - -
Combined knowledge of
the intervention
normalised (βknow)
- - - - 0.093 0.044 0.112 0.059 - - - -
- Knowledge of the pledge(βpledge)
- - - - - - - - 0.011 0.091 0.005 0.088
- Knowledge of the hotline (βhotline)
- - - - - - - - 0.005 0.043 0.128 0.078
- Knowledge of the story (βstory)
- - - - - - - - 0.158 0.082 0.030 0.053
Gender (βgen) -0.104 0.114 -0.118 0.119 -0.102 0.114 -0.119 0.118 -0.120 0.114 -0.129 0.119
Age (normalised) (βage) 0.020 0.061 0.147 0.120 0.009 0.058 0.138 0.119 0.019 0.059 0.139 0.118

215
Participation in
conservation agriculture
(βSMP)
0.194 0.123 0.012 0.074 0.182 0.123 0.005 0.069 0.185 0.123 0.010 0.069
Household wealth (βwea) -0.028 0.061 0.013 0.055 -0.028 0.060 0.013 0.055 -0.028 0.060 0.012 0.055
Participation in baseline
survey (βbase)
0.170 0.123 0.114 0.117 0.166 0.121 0.105 0.116 0.160 0.122 0.102 0.114
Household pesticide use
(βpest)
0.084 0.138 0.059 0.144 0.083 0.137 0.062 0.144 0.074 0.137 0.057 0.145
Participation in the event
* wave 2 (βpar*w2)
0.317 0.313 0.297 0.304 - - - - - - - -
Participation in the event
* wave 3 (βpar*w3)
0.152 0.340 0.185 0.361 - - - - - - - -

216
Table A2.9: Linear mixed effect models for perceived injunctive norms
Event participation Intervention knowledge (combined) Intervention knowledge (split)
1. Complete
cases
2. 20
imputations
3. Complete
cases
4. 20
imputations
5. Complete
cases
6. 20
imputations
Variable Estimate SE Estimate SE Estimate SE Estimate SE Estimate SE Estimate SE
Intercept 13.359 0.647 13.024 0.575 13.196 0.630 12.968 0.560 13.177 0.627 12.960 0.558
Wave 2 (βw2) 0.283 0.261 0.264 0.273 0.310 0.247 0.246 0.264 0.238 0.250 0.199 0.267
Wave 3 (βw3) 0.074 0.277 0.091 0.247 -0.082 0.268 -0.124 0.244 -0.066 0.269 -0.116 0.246
Participation in the event
(βpar)
-0.206 0.543 -0.086 0.476 - - - - - - - -
Combined knowledge of
the intervention
normalised (βknow)
- - - - 0.322 0.090 0.337 0.103 - - - -
- Knowledge of the pledge(βpledge)
- - - - - - - - 0.114 0.181 0.125 0.173
- Knowledge of the hotline (βhotline)
- - - - - - - - 0.017 0.085 0.380 0.144
- Knowledge of the story (βstory)
- - - - - - - - 0.480 0.162 0.052 0.074
Gender (βgen) 0.231 0.247 0.319 0.239 0.211 0.243 0.295 0.242 0.157 0.243 0.264 0.240
Age (normalised) (βage) 0.175 0.131 -0.031 0.259 0.205 0.125 -0.053 0.257 0.232 0.125 -0.050 0.255

217
Participation in
conservation agriculture
(βSMP)
0.202 0.266 0.194 0.112 0.170 0.264 0.209 0.106 0.179 0.263 0.224 0.107
Household wealth (βwea) -0.098 0.131 0.006 0.119 -0.092 0.129 0.012 0.118 -0.093 0.129 0.009 0.118
Participation in baseline
survey (βbase)
0.113 0.262 0.089 0.232 0.169 0.257 0.112 0.225 0.150 0.256 0.101 0.225
Household pesticide use
(βpest)
0.344 0.298 0.118 0.314 0.326 0.295 0.107 0.310 0.301 0.293 0.092 0.308
Participation in the event
* wave 2 (βpar*w2)
1.476 0.599 1.493 0.537 - - - - - - - -
Participation in the event
* wave 3 (βpar*w3)
0.629 0.655 0.446 0.567 - - - - - - - -

218
Table A2.10: Linear mixed effect models for knowledge
Event participation
1. Complete
cases
2. 20
imputations
Variable Estimate SE Estimate SE
Intercept 0.357 0.290 0.306 0.323
Wave 2 (βw2) 0.517 0.121 0.520 0.127
Wave 3 (βw3) 1.229 0.138 1.324 0.203
Participation in the
event (βpar)
0.152 0.271 0.151 0.295
Gender (βgen) 0.077 0.122 0.163 0.165
Age (normalised) (βage) -0.117 0.063 0.146 0.163
Participation in
conservation
agriculture (βSMP)
0.123 0.132 -0.101 0.072
Household wealth
(βwea)
-0.035 0.064 -0.039 0.070
Participation in
baseline survey (βbase)
-0.157 0.121 -0.154 0.145
Household pesticide
use (βpest)
0.110 0.147 0.078 0.183
Participation in the
event * wave 2
(βpar*w2)
6.483 0.344 6.480 0.365
Participation in the
event * wave 3
(βpar*w3)
4.362 0.382 4.491 0.471

219
Table A2.11: Generalised linear models for the theory of planned behaviour
Wave 1 Wave 2 Wave 3
1. Complete
cases
2. 20
imputations
3. Complete
cases
4. 20
imputations
5. Complete
cases
6. 20
imputations
Variable Estimate SE Estimate SE Estimate SE Estimate SE Estimate SE Estimate SE
Intercept -1.860 0.680 -1.162 0.842 -1.860 0.680 -0.878 0.754 -0.535 0.797 -0.043 0.744
Perceived
behavioural
control (βcon) 0.201 0.045 0.215 0.048 0.201 0.045 0.135 0.039 0.183 0.065 0.143 0.079
Attitudes (βatt) 0.314 0.043 0.291 0.054 0.314 0.043 0.260 0.050 0.251 0.054 0.232 0.060
Perceived
descriptive norms
(βdes) 0.086 0.076 0.009 0.093 0.086 0.076 -0.080 0.064 0.081 0.077 0.123 0.084
Perceived
injunctive norms
(βinj) 0.162 0.041 0.161 0.052 0.162 0.041 0.299 0.035 0.119 0.048 0.115 0.052

220
Stochastic actor-oriented models
Table A2.12: Information flow
Network 1 Updated network
1. Combined
network
2. Split network 3. Combined
network
4. Split network
Effect Estimate SE Estimate SE Estimate SE Estimate SE
Network dynamics
Rate constant
(period 1)
0.010
(Fixed)
NA 0.010
(Fixed)
NA 0.010
(Fixed)
NA 0.010
(Fixed)
NA
Rate constant
(period 2)
0.010
(Fixed)
NA 0.010
(Fixed)
NA 0.010
(Fixed)
NA 0.010
(Fixed)
NA
Density (Habitual social contact network) -2.542 0.425 - - -2.541 0.424 - -
- Density (Household co-residence) - - -2.763 0.424 - - -2.764 0.423
- Density (Household visits) - - -2.740 0.434 - - -2.755 0.435
- Density (Household visitors) - - -2.810 0.466 - - -2.839 0.473
Behaviour dynamics
Rate (period 1) 0.141 0.028 0.141 0.029 0.136 0.030 0.143 0.029
Rate (period 2) 0.090 0.024 0.091 0.023 0.087 0.024 0.094 0.025
Total exposure effect (Habitual social contact 0.332 0.088 - - 0.373 0.090 - -

221
network)
- Total exposure effect (Household co-residence) - - 0.627 0.140 - - 0.618 0.138
- Total exposure effect (Household visits) - - 0.115 0.185 - - 0.084 0.208
- Total exposure effect (Household visitors) - - 0.114 0.209 - - 0.117 0.239
Linear shape 2.231 1.090 2.340 1.044 2.202 1.125 2.368 1.136

222
Table A2.13: Psychological outcomes
Dependent variable: 1. Change in Intention 2. Perceived descriptive norm 3. Perceived Injunctive norm
Network 1 Updated
network
Network 1 Updated
network
Network 1 Updated
network
Effect Estimate S.E. Estimate S.E. Estimate S.E. Estimate S.E. Estimate S.E. Estimate S.E.
1. Average similarity +1.713 0.542 +2.074 0.593 - - - - - - - -
2. Average covariate
alter (intention or
attitudes)
- - - - -0.004 0.036 +0.033 0.038 -0.012 0.013 +0.001 0.014
3. Intervention
knowledge
+0.036 0.022 +0.035 0.023 +0.064 0.029 0.056 0.032 +0.047 0.015 +0.043 0.015
4. Period 2 -0.222 0.048 -0.207 0.053 +0.099 0.068 +0.078 0.066 -0.049 0.028 -0.046 0.029
Interactions
5. Social influence x
Knowledge
+0.381 0.487 +0.270 0.505 -0.011 0.029 -0.006 0.034 +0.006 0.013 +0.007 0.013
6. Social influence x
Period 2
+0.448 0.699 +0.349 0.969 +0.003 0.074 +0.003 0.100 -0.036 0.027 -0.056 0.027
Control effects
7. Linear shape +0.035 0.065 +0.001 0.060 +0.039 0.091 -0.082 0.094 -0.021 0.040 -0.085 0.039
8. Quadratic shape -0.034 0.011 -0.029 0.012 -0.180 0.015 -0.185 0.020 -0.048 0.003 -0.047 0.004

223
9. In-degree -0.001 0.009 +0.013 0.009 +0.015 0.013 +0.002 0.012 +0.014 0.005 +0.012 0.006
10. Out-degree +0.010 0.014 +0.003 0.013 -0.010 0.019 +0.027 0.019 -0.006 0.008 +0.012 0.009
11. Age +0.002 0.002 +0.001 0.001 +0.002 0.002 +0.002 0.002 - - - -
12. Wealth -0.021 0.023 -0.023 0.021 -0.019 0.030 -0.025 0.026 - - - -
13. Gender +0.0001 0.04 +0.045 0.042 -0.013 0.062 -0.046 0.057 - - - -
14. Conservation
agriculture
+0.04 0.04 +0.020 0.047 +0.140 0.068 +0.127 0.067 +0.029 0.031 +0.004 0.032
15. Pesticide use -0.01 0.05 -0.016 0.048 +0.009 0.069 -0.007 0.067 - - - -
Network dynamics
16. Rate (period 1) 0.010
(Fixed)
NA 0.010
(Fixed)
NA 0.010
(Fixed)
NA 0.010
(Fixed)
NA 0.010
(Fixed)
NA 0.010
(Fixed)
NA
17. Rate (period 2) 0.010
(Fixed)
NA 0.010
(Fixed)
NA 0.010
(Fixed)
NA 0.010
(Fixed)
NA 0.010
(Fixed)
NA 0.010
(Fixed)
NA
18. Outdegree
(density)
-2.539 0.435 -2.556 0.479 -2.541 0.422 -2.559 0.422 -2.539 0.431 -2.558 0.434

224
A2.6. Model diagnostics All reported models had convergence ratios below 0.2. We checked the goodness of fit
using the method described by (Wang et al., 2020) for behavioural dependent variables.
This was done for all 20 models, but only a single example is given below for each model.
The figures show eight methods for checking model adequacy. In each panel, the observed
outcome is shown by a red line, while the distribution of model predictions is given by the
violin/box plots in blue. Figures on the panel indicate the observed values, and p-values for
comparison of observed and predicted values are given underneath. From left to right, top
to bottom, the panels are as follows: 1) the predicted frequency distribution of behavioural
levels; 2) the distribution of transitions between each pair of behavioural values in the final
period; 3) the magnitudes of the behavioural transitions; 4) the out-degree for individuals at
each level of the behaviour; 5) the in-degree for individuals at each level of the behaviour.
Indices 6-8 are combined onto the final panel. 6) the edgewise homophily (a measure of
behavioural similarity among connected individuals); 7) Moran’s I (a measure of network
autocorrelation of the behaviour, i.e., do connected individuals tend to be more similar?);
and 8) Geary’s C (another measure of network autocorrelation, inverse to Moran’s I).
Intention
The models for intention to report had a good fit on all aspects assessed.
Descriptive norms
The models for perceived descriptive norms had a good fit on all aspects assessed. The
model appears to overestimate the in- and out-degree of individuals with very low levels of
the behaviour (i.e., 2 & 3), but this is because there were no individuals at this level in the
observed data.
Injunctive norms
The models for perceived injunctive norms had a good fit for most aspects. The same
apparent issue for in-degree and out-degree is observed as for perceived descriptive norms
(see above). The models underestimated edgewise homophily, but had a very good fit for
the other measures of network autocorrelation. Although the model predicted levels of
behaviour and changes in the magnitude of behaviour well, it did not adequately predict the
specific transitions between behavioural levels.
Information diffusion
The models for information diffusion have adequate fit for all aspects.

225
Figure A2.4: Intention

226
Figure A2.5: Descriptive norms

227
Figure A2.6: Injunctive norms

228
Figure A2.7: Information diffusion combined network

229
Figure A2.8: Information diffusion on multiple networks. Network-behaviour measures are shown for the three separate networks. From top to
bottom: 1) household visits; 2) household visitors; and 3) household co-residence.

230
A2.7. Data and code Data and code to replicate all the analyses described here are available on GitHub:
https://github.com/emieldelange/Social-Influence-Information-flow
A2.8. Questionnaire Note: This is a copy of the questionnaire used in wave 3. In waves 1 and 2 the same
questions were used.
Consent statement: សេចក្តីថ្លែងការ: ខ្ញុំជានិស្សិតនៅសាកលវទិ្យាល័យភូមិនទកសិ្កមមដែលកុំពញងន្វើការជាមួយសាកលវទិ្យាល័យ Edinburgh នៅចក្កភពអង់នលេស្ ន ើយនយើងក្តូវការស្ម្ភា ស្ន៍អនកនែើមបីដស្វងរកនូវបញ្ហា មួយចុំនួនដែលពាក់ពាក់ព័នធនៅនឹងកសិ្កមម និងការអភិរកស។ ការសិ្កាស្រសាវក្ជាវននេះម្ភនការអនញញ្ហា តតពីរដ្ឋា ភិបាល ន ើយនិងក្បធានភូមិផងដែរ នបើន េះបីជានយើងមិនបានន្វើនែើមបីពួកនល ឬ អងគការនក្ៅរដ្ឋាភិបាលណាមួយក៏នដ្ឋយ។ ក្បសិ្ននបើអនកយល់ក្ពមនោយពួកនយើងស្ម្ភា ស្ន៍ នយើងនឹងកត់ក្ាទ្យញកនូវន ម្ េះ និងចនមេើយរបស់្អនក ប ញដនតអនកកញុំដចករ ុំដលកការស្ម្ភា ស្ន៍ននេះជាមួយអនកនផសងនទ្យៀត។ អនកោចបញ្ឈប់ការស្ម្ភា ស្ន៍នពលណាក៏បាន យល់ក្ពមឬនៅ?
Date: _________
Name:________
Household no. ______
Age: _________
Gender: M/F
Are you married? ________________
What does it mean to be a good citizen? _________________________________________
សតើស្វើដចូសមាចសដើមបោីា យជាពលរដឋលអ?
Follow-up survey: Do you know about the good citizenship pledge?
__________________________
សតើអនកដងឹឫសេពកីិចចសនាសដើមបីោា យជាពលរដឋលអ?
=> Have you taken the pledge? Y / N
សតើអនកធ្លា បប់ានចុោះកិចចសនាសនោះមដរឫសេ?
=> Do you have a certificate? Y / N

231
តរើអ្នកធ្លា បប់ានទទួលសញ្ញា បត្រពីកិច្ចសនាដែរឫតទ? => How did you hear about this? From who? _________________________________
សតើអនកបានដឹងពពីត៌មានសនោះសោយរសបៀបណា? ពនីរណា?
=> When did you first talk about this? ___________________________________________
សតើអនកធ្លា បប់ាននិយាយពីកចិចសនាសលើកដំបងូសៅសពលណា?
=> About how many times [since the intervention] have you discussed this with someone?
សតើប ុន្មា នដង(ចាប់តំាងពីមានោរសេពវសាយកចិចសនាជាពលរដឋលអ)សតើអនកធ្លា ប់បានពិភាកាជាមួយនរណាមាន ក់មដរឫសេ?
=> Was it you who brought the subject up or them?
សតើអនកជាអនកសលើកយកមកនិយាយមនុសគ ឫសគជាអនកចាប់សសាើមនិយាយមនុ?
=> Do you know other people who have taken this pledge? Who? Why/why not?
សតើអនកដងឹថាមានអនកសសេងសេៀត បានចុោះកចិចសនាសនោះមដរឫសេ? អនកណា?
=> Why have other people decided to sign the contract? Or why not?
សហតុអវបីានជាអនកសសេងសេៀតបានសសក្មចចតិតចោុះកចិចសនា? សហតុអវីបានជាពួកោតម់ិនសសក្មចតិតចោុះកចិចសនា?
=> Why did you decide to take this pledge? ___________________________________
សហតុអវបីានជាអនកសសក្មចចតិតចុោះកចិចសនាសនោះ?
What would you do if you saw a trapeang with poison?
____________________________________
សតើអនកនងឹស្វើអវី ក្បសិនសបើអនកបានស ើញក្ត ំងមានោរបំពលុ?
Is there a way to report poisoning? Y/N ___________
សតើមានមស្ាបាយកនងុោររាយោរណ៍មដរឫសេ?
=> Follow up survey: Do you know about the WCS hotline? Y/N
សតើបានដឹងអំពោីរទាកេ់ងបន្មា ន់សៅោន់ wcsមដរឫសេ?
=> What is the phone number for the hotline? _______________________
សតើសលខេូរស័ពាទាកេ់ងបន្មា ន់មានសលខអវីខាោះ?
=> What will happen if you call the hotline? _________________________
សតើនឹងមានអវីសកើតស ើង ក្បសនិសបើអនកនងឹស្វើោរខលបន្មា ន់?
=> Can you tell me more about the hotline? _________________________
សតើអនកោចក្បាបខ់ាុំបមនថមបានសេពីោរខលបន្មា ន់?

232
Do you agree with the following?
សតើអនកយល់ក្សបជាមួយនឹងអវីមដលមានសៅខាងសក្ោមមដរឫសេ?
I dont know how I can report poisoning if I see it 5-1 DK
សតើអនកយល់ក្សបមដរឬសេថាអនកមិនដឹងពីវិ្ីមដលអនកោចស្វើោររាយោរណព៍ីោរបំពុលក្បសនិសបើអនកបានស ើញមានោរបំពុល?
Next time I see a trapeang with poison I will keep it to myself and not report it 5-1 DK
សតើអនកយល់ក្សបមដរឬសេថា,សលើកសក្ោយអនកស ើញក្ត ំងមានោរបំពុល អនកនឹងមិនរាយោរណ៍សៅោជាា ្រសេ ?
It is easier not to report poisoning than to report it 5-1 DK
សតើអនកយល់ក្សបមដរឬសេថា,ោរមនិរាយោរណ៍ពីោរបពំុលគឺវាងាយក្សួលជាងោររាយោរណ៍ពីោរបំពលុ ?
If you see poisoning, it is good to keep it to yourself and not report it 5-1 DK
សតើអនកយល់ក្សបមដរឬសេថា,ក្បសនិសបើអនកស ើញមានោរបពំលុ វាជាសរឿងលអមដលអនកគួរលាក់េកុសហើយមនិស្វើោររាយោរណ៍សៅោជាា ្រ ?
If I report poisoning someone will come to solve the problem 5-1 DK
សតើអនកយល់ក្សបមដរឬសេថា,ក្បសនិសបើអនករាយោរណ៍ពីោរបំពុល នរណាមាន កន់ឹងមកសោោះក្សាយពបីញ្ហា សនោះ?
If I see poisoning and report it, the village will be safer 5-1 DK
សតើអនកយល់ក្សបមដរឬសេថា,ក្បសនិសបើអនកស ើញមានោរបពំលុសហើយរាយោរណ៍ សតើអនកភូមនិឹងមានសុវតថិភាពជាងមនុមដរឫសេ?
If I see poisoning and report it, other people in the village will be upset with me 5-1 DK
សតើអនកយល់ក្សបមដរឬសេថា,ក្បសនិសបើអនកស ើញោរបំពុលសហើយរាយោរណ៍ សតើក្បជាជនសសេងសេៀតសៅកនុងភូមមិានោរអនច់ិតតជាមយួអនកមដរឫសេ?
If I see poisoning and report it, it will not help to improve our environment 5-1 DK
សតើអនកយល់ក្សបមដរឬសេថា,ក្បសនិសបើអនកស ើញោរបំពុលសហើយរាយោរណ៍ វានឹងមិនស្វើឱ្យបរិសាថ នរបស់សយើងមានភាពក្បសសើរស ើងសេ?
Most people in the village would report poisoning if they see it 5-1 DK
សតើអនកយល់ក្សបមដរឬសេថា,ក្បជាជនភាគសក្ចើនសៅកនុងភូមនិងឹរាយោរណ៍ពោីរបពំុលក្បសិនសបើពកួសគស ើញមានោរបំពលុ?
I will report poisoning if I see it 5-1 DK
សតើអនកយល់ក្សបមដរឬសេថា,អនកនងឹរាយោរណ៍ពីោរបពំុល ក្បសិនសបើអនកបានស ើញ ?
Reporting poisoning is a good way to keep livestock safe 5-1 DK
សតើអនកយល់ក្សបមដរឬសេថា,ោររាយោរណ៍ពីោរបពំុលជាវិ្ីសាក្សតដល៏អមយួសដើមបីបាននូវសុវតថភិាពជីវិតសតវ?
Other people never report poisoning if they see it 5-1 DK
សតើអនកយល់ក្សបមដរឬសេថា,ក្បសនិសបើក្បជាជនសសេងសេៀតស ើញមានោរបំពុល ពកួោត់មនិមដលបានរាយោរណ៍សេ?
The authorities expect me to report poisoning if I see it 5-1 DK
សតើអនកយល់ក្សបមដរឬសេថា,ោជាា ្ររំពងឹេកុថាអនកនឹងរាយោរណ៍ពីោរបពំុលក្បសនិសបើអនកបានស ើញពីោរបំពលុ?
I will phone WCS if I see a poisoned trapeang 5-1 DK

233
សតើអនកយល់ក្សបមដរឬសេថា,អនកនងឹខលសៅអងគោរwcsក្បសិនសបើអនកបានស ើញោរបំពលុេកឹក្ត ងំ?
=> How did you learn about the hotline? ________________________________
សតើអនកបានសរៀនអំពោីរខលបន្មា ន់តាមរយៈអវី?
=> Who has talked to you about this (names)? __________________________________
សតើអនកណាធ្លា ប់បាននិយាយជាមួយអនកអពំីសរឿងសនោះ (ស ា្ ោះ)?
=> when did you first hear about this? _____________________________________
សតើអនកធ្លា បប់ានលឺអពំីសរឿងសនោះជាសលើកដំបងូសៅសពលណា?
=> About how many times [since the intervention] have you discussed this with someone?
សតើក្បមហលប ុន្មា នដង(ចាបត់ាំងពីមានោរសេពវសាយពីសលខេំន្មកេ់នំងបន្មា ន់) មដលអនកបានពិភាកាជាមួយអនកសសេង?
=> Was it you who brought the subject up or them?
សតើអនកជាអនកសលើកស ើងពីក្បធ្លនបេ ឫក៏ពកួសគជាអនកសលើកស ើង?
Follow up: Do you know the story about [Chan]? Y / N
សតើអនកបានដឹងអពំីសាច់សរឿងរបស់ចាន់មដរឫសេ?
=> What did Chan see when he was playing with his friends?
____________________________
សតើចានប់ានស ើញអវីសៅសពលមដលោតក់ំពងុសលងជាមួយមិតតភកាិរបស់ោត់?
If they don’t know: He saw a trapeang with dead animals around it.
ក្បសិនសបើោតម់និដងឹ(ចសមាើយ៖ោត់បានស ើញក្ត ំងមួយជាមួយនឹងសាកសពសតវសៅវិញក្ត ំង)
=> How did XXX know there was poison in the trapeang?
______________________________
សតើចានប់ានដឹងសោយរសបៀបណា ថាេកឹក្ត ំងមានជាតពិលុ?
If they don’t know: Because some of his friends became ill after drinking.
ក្បសិនសបើោតម់និដងឹ(ចសមាើយ៖សោយសារមិតតភកាិរបស់ោតម់ួយចនំនួបានឈឺបន្មា បព់ីសកឹេកឹក្ត ំងរួច)
=> What do Chan, his parents, and his community decide to do?
____________________________
សតើចាន់ ឪពកុមាា យរបស់ចាន់ នងិសហគមន៍របស់ចានប់ានសសក្មចចិតតស្វើសមាច សដើមបីសោោះក្សាយបញ្ហា មដលជួបក្បេោះ?
If they don’t know: They inform the chief and report it on the hotline.
ក្បសិនសបើោតម់និដងឹ(ចសមាើយ៖ពកូសគបានរាយោរណ៍សៅោន់សលខខលបន្មា ន់)

234
=> What happens after this?
____________________________________________________
សតើនឹងមានអវីសកើតស ើងបន្មា ប់ពមីានោររាយោរណ៍រចួ?
How did you hear about this story? From whom?
_______________________________________
សតើអនកបានដឹងពីសរឿងសនោះតាមរយៈអវី? ពីនរណា?
When did you hear about this first?
____________________________________________________
សតើអនកបានលឺអពំីសាច់សរឿងសនោះជាសលើកដបំងូសៅសពលណា?
Have you talked with anyone about this story?
(Name)_____________________________________
សតើអនកធ្លា បប់ាននិយាយជាមយួអនកណាខាោះអំពីសាច់សរឿងសនោះ? (ស ា្ ោះ)
About how many times [since the intervention] have you discussed this with someone?
សតើក្បមហលប ុន្មា នដង(តាំងពីមានោរសេពវសាយសាច់សរឿង) មដលអនកធ្លា បប់ានពិភាកាជាមយួអនកសសេង?
Was it you who brought the subject up or them?
សតើអនកជាអនកសលើកយកសាច់សរឿងសនោះមកនិយាយមនុ ឫពកួសគជាអនកនិយាយមុន?
Now we would like to ask a few more questions about different topics.
If this is the first person surveyed in this household, ask them the following:
Do the following people still live in this household? If not, where do they live?
[Record any changes after comparing to the household list]
Is there anyone not listed who lives in this household?

235
4. Wealth Indicators ោរវាស់មវងក្េពយសមបតត ិ
4.1 Do you eat three meals a day? សតើអនកហូបោហារបីសពលរាល់សងងឬសេ? YES / NO
4.2 What is the material of your roof? សតើ
ដំបូលសាោះរបស់អនកសាងសង់អពំីអវី? ->
4.3 Do you own a Kor-Yun សតើអនកមានសោយនត
ឬសេ?
YES / NO
4.4 Do you own a motorbike? សតើអនកមានម ូតឬូសេ? YES
/ NO
4.5 Are you able to pay for healthcare without selling property? សតើអនកោចមានលេធភាពចំណាយសលើោរមង
រកាសខុភាពសោយោា នោរលក់ក្េពយសមបតតឬិសេ? YES / NO
4.6 Do you have a toilet? សតើអនកមានបងគន់សៅសាោះឬសេ? YES / NO
5.1 Does your household own a TV? សតើសាោះរបស់អនកមានេូរេសេនឬ៍សេ? YES / NO
5.2 Does your household own a radio? សតើសាោះរបស់អនកមានវិេយុឬសេ? YES
/ NO
Thatch សបវូ
Palm leaf សាឹកសតាន ត
Wood ត ើ
Metal/Zinc មដក/ ស័ង្កសី
Tile ត្បឿង្

236
7. Name generators Now we want to ask you some questions about who you talk with.
Don’t worry, your answers will be kept secret.
➔ 7.A1 When you have some free time, who do you go to visit at their house?
សៅសពលអនកេំសនរ, សតើអនកសៅសលងនរណា?
Number Name How many times a week?
1
2
3
4
5
7.A2 How often do you visit this person? សតើប ុន្មា នដងកនងុមយួសបាត ហ៍?
7.B1 Who visits your house when they have free time?
សតើនរណាមកសលងសាោះរបស់អនកសៅសពលមដលពួកសគេំសនរ?
Number Name How many times a week?
1
2
3
4
5
7.B2 How often does this person visit? សតើប នុ្មា នដងកនងុមួយសបាត ហ៍?

237
Appendix 3: Supplementary material for Chapter 6 A3.1. Qualitative identification of relevant ties.
We conducted qualitative research to understand social interactions within our study area
and to identify relevant ties to measure. We visited twelve villages (including the focal
village) from June to September 2017 (Chapter 4), conducted two focus group discussions in
each village (one or each gender), and interviewed informants such as those in official
positions, shopkeepers, and others (see de Lange et. al 2020 in Oryx for further information
about this study). In these discussions we asked participants where they received
information about related topics such as agriculture, conservation, health, and hunting. We
asked them to reflect on what makes certain information sources trustworthy and about
influential relationships, such as individuals trusted to resolve conflicts, agricultural, or
health issues. Additionally, we observed behaviour during our time in these villages, drew
on our own experience working in rural Cambodia, consulted with local experts, and with
the literature.
We then coded the data to identify discrete forms of interactions which could feasibly be
measured and selected a set of ties to measure in consultation with local experts and NGO
staff.
A3.2. Description of ties included in the network.
Household visits
Throughout the year, adult residents in Preah Vihear province spend much of the day
working at their farms or gathering food in the forest. These activities are usually done in
small groups from the same household, and because the farms are located far from the
village, there is little opportunity for social contact with others, unless two farms happen to
be located close to one another, which is rarely the case. At some parts of the year, farmers
will stay in small huts at their farms for extended periods, further limiting opportunities for
social contact. At other parts of the year, such as when the rains first start or when harvests
are complete, all farmers will stay in the village to participate in social and religious festivals.
However, for most of the year, adults will return home to the village each evening and
return to the farm in the early morning. The evening is therefore an opportunity to relax,
eat, and socialise. Residents will visit others at their homes to check in, catch up on gossip,
and hang out. This applies to both men and women, although women are more likely to
stay home during the day if they have young children and may visit with relatives and
neighbours throughout the day. We asked respondents to name those who they visited at
their homes during their free time. This is a directional tie, meaning the respondent visiting
a nominated other does not necessarily mean the other also visits the respondent.
Household co-residence
The household is the core unit of social organisation in Khmer society. Multiple generations
of adults may live in the same household as it is customary for the youngest daughter to
remain at home and to care for the parents. When the youngest daughter marries, her
husband will also join the household, and together they will eventually take over the
running of the household and inherit the house. As members of the same household eat
together every day, and work together on the farm, much communication occurs between

238
them. We generated a census of each household in the village and generated co-residence
ties between all members of the same household.
A3.3. Details of cleaning and verification procedures for network data
Firstly, the research team manually corroborated and corrected respondent names against a
village census provided by the village chief. Secondly, we used fuzzy matching in R to
identify all names in the data that differed from other names by less than three characters.
Third, we generated a list of names that occurred only once in our dataset. Having compiled
a set of potentially problematic cases using these two methods, we manually checked each
name to see if there were obvious identity confusions, or if nicknames were used. We used
kinship data we had collected to create a genealogy, which served as a reference to check
and correct possible misspellings. For example, if Rob Franks had nominated Tim Franks and
Mary Franks as siblings, but Mary had nominated Rob and Tom as siblings, we presumed
Tim and Tom were alternate spellings of the same person. We selected on option and
corrected any occurrences of this name in the dataset. This is a conservative strategy given
that illiteracy is prevalent, and many possible spellings exist for any name in Khmer.
A3.4. Likert items for measuring attitudes towards reporting poisoning
If I see poisoning and report it, the village will be safer.
សតើអនកយល់ក្សបមដរឬសេថា,ក្បសិនសបើអនកស ើញមានោរបំពុលសហើយរាយោរណ៍ សតើអនកភូមិនឹងមានសុវតថិភាព
ជាងមុនមដរឫសេ?
Strongly disagree 1 – 2 – 3 – 4 – 5 Strongly Agree – Don’t know
If you see poisoning, it is good to keep it to yourself and not report it.
សតើអនកយល់ក្សបមដរឬសេថា,ក្បសិនសបើអនកស ើញមានោរបំពុល វាជាសរឿងលអមដលអនកគួរលាក់េុកសហើយមិនស្វើ
ោររាយោរណ៍សៅោជាា ្រ ? Strongly disagree 1 – 2 – 3 – 4 – 5 Strongly Agree – Don’t know
Reporting poisoning is a good way to keep livestock safe.
សតើអនកយល់ក្សបមដរឬសេថា,ោររាយោរណ៍ពីោរបំពុលជាវិ្ីសាក្សតដ៏លអមួយសដើមបីបាននូវសុវតថិភាពជីវិត
សតវ?

239
Strongly disagree 1 – 2 – 3 – 4 – 5 Strongly Agree – Don’t know
If I see poisoning and report it, no one will come to clean the environment.
សតើអនកយល់ក្សបមដរឬសេថា,ក្បសិនសបើអនកស ើញោរបំពុលសហើយរាយោរណ៍ ោា ននរណាមាន ក់នឹងមកសមាអ តប
រិសាថ នរបស់អនកសេ ? Strongly disagree 1 – 2 – 3 – 4 – 5 Strongly Agree – Don’t know
A3.5. Centrality measures used.
In-degree centrality
In-degree centrality is the number of incoming connections each individual has. For
example, in the household visits network, this is the number of times an individual is
nominated by others. Individuals with high in-degree centrality are therefore directly
connected to many other individuals. They are able to rapidly diffuse contagions.
Betweenness centrality
Betweenness centrality is the number of times an individual falls on the shortest possible
path between each other pair of individuals. It is a measure of the power an individual has
to broker the exchange of information between others.
Closeness centrality
Closeness centrality is sum of the shortest distance from an individual to every other
individual in the network. In other words, an individual with high closeness centrality has
relatively few degrees of separation to all other individuals in the network and can therefore
reach any other person relatively easily. They are able to spread information, or simple
contagions, rapidly.
Eigenvector centrality
Eigenvector centrality is the extent to which an individual is connected to other individuals
with high eigenvector centrality. It is a recursive measure, which indicates an individual’s
ability to influence or inform other influential individuals.

240
5. Area under the diffusion curve (AUC)
At each time period more individuals in the network adopt the contagion. This can be
visualised as a cumulative diffusion curve (adapted from Dobson et. al., 2019):
The area under this curve therefore gives an indication of both the scale and the rate of
adoption.
Table A3.1: Descriptive statistics from the sample
Variable Definition Value
Gender Male 159 (44%)
Female 206 (56%)
Age Mean age in years 34 (SD = ± 14)
Married Yes 326 (89%)
No 38 (11%)
Household size Mean number of adults surveyed per household
2.4 (SD = ± 1.0)
Network statistics Percentage of respondents nominating others in the household visit network
92%
Mean out-degree (i.e., number of nominations) in the household visit network
1.92 (SD = ± 1.14)
Mean in-degree (i.e., number of times nominated by others) in the household visit network
3.84 (SD = ± 2.54)
Mean in-degree in the 7.40 (SD = ± 3.16)

241
combined household visit and co-residence network
Density (i.e., the proportion of all possible ties that are observed) of the combined network.
0.01
Number of components (i.e., disconnected parts) in the combined network
4
Diameter (i.e., largest number of steps between any two individuals) of the largest component in the combined network
18 ties
Transitivity (i.e., density of closed triangles) of the combined network
0.31
Attitude Mean attitude towards reporting poisoning, where 20 is the most positive, and 4 is the most negative.
15.1 (SD = ± 2.22)

242
Table A3.2: Jaccard similarity index calculated for all sets of targets (n = 10)
KP In-degree
KP Betweenness
KP Closeness
KP Eigenvector
Low attitudes
High attitudes Wealth Leaders
Gatekeeper Event
Conservation
KP In-degree 1.000 0.250 0.111 0.176 0.000 0.000 0.000 0.000 0.000 0.000 0.000
KP Betweenness 0.250 1.000 0.333 0.111 0.000 0.000 0.000 0.000 0.053 0.000 0.000
KP Closeness 0.111 0.333 1.000 0.053 0.000 0.000 0.053 0.000 0.000 0.000 0.000
KP Eigenvector 0.176 0.111 0.053 1.000 0.000 0.000 0.000 0.000 0.000 0.000 0.000
Low attitudes 0.000 0.000 0.000 0.000 1.000 0.000 0.053 0.000 0.000 0.000 0.000
High attitudes 0.000 0.000 0.000 0.000 0.000 1.000 0.053 0.111 0.053 0.053 0.111
Wealth 0.000 0.000 0.053 0.000 0.053 0.053 1.000 0.000 0.000 0.000 0.000
Leaders 0.000 0.000 0.000 0.000 0.000 0.111 0.000 1.000 0.250 0.000 0.429
Gatekeeper 0.000 0.053 0.000 0.000 0.000 0.053 0.000 0.250 1.000 0.000 0.053
Event 0.000 0.000 0.000 0.000 0.000 0.053 0.000 0.000 0.000 1.000 0.000
Conservation 0.000 0.000 0.000 0.000 0.000 0.111 0.000 0.429 0.053 0.000 1.000

243
Figure A3.1: A heatmap showing the
Jaccard similarity between each pair
of target sets at size n=10. A lighter
colour indicates greater similarity.

244
Table A3.3: Jaccard similarity index calculated for all sets of targets (n = 20)
KP In-degree
KP Betweenness
KP Closeness
KP Eigenvector
Low attitudes
High attitudes
Wealth Leaders Gatekeeper
Event Conservation
KP In-degree 1.000 0.143 0.000 0.143 0.053 0.026 0.053 0.053 0.111 0.000 0.000
KP Betweenness 0.143 1.000 0.053 0.081 0.000 0.000 0.053 0.053 0.053 0.026 0.000
KP Closeness 0.000 0.053 1.000 0.026 0.026 0.026 0.026 0.053 0.026 0.081 0.026
KP Eigenvector 0.143 0.081 0.026 1.000 0.053 0.026 0.026 0.143 0.111 0.081 0.026
Low attitudes 0.053 0.000 0.026 0.053 1.000 0.000 0.026 0.000 0.000 0.026 0.000
High attitudes 0.026 0.000 0.026 0.026 0.000 1.000 0.026 0.111 0.053 0.026 0.083
Wealth 0.053 0.053 0.026 0.026 0.026 0.026 1.000 0.053 0.026 0.000 0.000
Leaders 0.053 0.053 0.053 0.143 0.000 0.111 0.053 1.000 0.111 0.000 0.219
Gatekeeper 0.111 0.053 0.026 0.111 0.000 0.053 0.026 0.111 1.000 0.000 0.026
Event 0.000 0.026 0.081 0.081 0.026 0.026 0.000 0.000 0.000 1.000 0.000
Conservation 0.000 0.000 0.026 0.026 0.000 0.083 0.000 0.219 0.026 0.000 1.000

245
Figure A3.2: A heatmap showing the
Jaccard similarity between each pair of
target sets at size n=20. A lighter colour
indicates greater similarity.

246
Table A3.4: Jaccard similarity index calculated for all sets of targets (n = 30)
KP In-degree
KP Betweenness
KP Closeness
KP Eigenvector
Low attitudes
High attitudes
Wealth Gatekeeper Convenience
KP In-degree 1.000 0.176 0.000 0.200 0.017 0.053 0.034 0.000 0.094
KP Betweenness 0.176 1.000 0.132 0.111 0.034 0.053 0.034 0.000 0.055
KP Closeness 0.000 0.132 1.000 0.000 0.034 0.034 0.034 0.000 0.018
KP Eigenvector 0.200 0.111 0.000 1.000 0.017 0.017 0.034 0.000 0.074
Low attitudes 0.017 0.034 0.034 0.017 1.000 0.000 0.034 0.000 0.000
High attitudes 0.053 0.053 0.034 0.017 0.000 1.000 0.053 0.000 0.074
Wealth 0.034 0.034 0.034 0.034 0.034 0.053 1.000 0.000 0.074
Gatekeeper 0.000 0.000 0.000 0.000 0.000 0.000 0.000 1.000 0.000
Convenience 0.094 0.055 0.018 0.074 0.000 0.074 0.074 0.000 1.000

247
Figure A3.3: A heatmap showing the
Jaccard similarity between each pair of
target sets at size n=30. A lighter colour
indicates greater similarity.

248
Table A3.5: Results of logistic regressions 1
2
Dependent variable:
Predictor variable:
In-degree centrality key-player Betweenness centrality key-player
Closeness centrality key-player Eigenvector centrality key-player
Estimate S.E. P-value Estimate S.E. P-value Estimate S.E. P-value Estimate S.E. P-value
Intercept -4.352 0.949 <0.001 -3.068 0.949 0.001 -1.418 0.965 0.142 -3.052 0.895 0.001
Age 0.516 0.174 0.003 -0.097 0.201 0.629 -0.803 0.287 0.005 0.208 0.183 0.254
Gender (male) -0.652 0.421 0.121 0.487 0.385 0.206 0.494 0.393 0.209 -1.045 0.453 0.021
Wealth 0.234 0.198 0.237 0.185 0.204 0.364 0.127 0.204 0.533 0.127 0.194 0.513
Leadership positions
-15.189 983.031 0.988 -15.426 1014.778
0.988 -0.268 1.079 0.804 0.041 1.086 0.970
3

249
Figure A3.4: Results from logistic binary regressions testing (see supplementary table 5) for associations between some key individual attributes (wealth, formal leadership positions, gender, and normalised age) with inclusion in each of four key-players sets, size 30, calculated using the centrality measures: In-degree, Betweenness, Closeness, and Eigenvector. The effect sizes are shown bounded by the 95% confidence intervals. The intercept is shown as a dotted line. Formal leadership positions is omitted from the plot for In-degree and Betweenness centrality, as the confidence intervals exceeded the range of the graph.

250
Figure A3.5: The result (as a percentage of the maximum AUC) of diffusion simulations for a complex contagion using 30 randomly generated sets of clusters (size = 10), communication probability = 0.2. Bootstrapped 95% confidence intervals are shown.

251
Table A3.5: A rough budget for each level of intervention effort. An intervention targeting two people could consist of a meeting with two NGO staff at the target's homes with provision of personal materials. An intervention with thirty targets requires coordination with the village chief to invite participants, provision of food and refreshments, and production of public materials to be displayed. At least five NGO staff will be required.
Item Two targets Ten targets Twenty targets Thirty targets
Staff costs 22 36 48 72
Material costs 20 90 200 280
Event costs 10 20 100 150
Total (USD) $52 $146 $348 $502
Table A3.6: a rough budget for a research team of two junior Cambodian researchers to undertake six weeks of work collecting network data, or four weeks of work for other data, in our focal village. This includes time for preparation, training, and some preparatory qualitative work. For network data, this also include a consultancy fee for a network analyst to clean the data and identify the target sets. Conventional strategies requiring other data are ‘wealth’, ‘relatively negative attitudes’, and ‘relatively positive attitudes’. Other conventional strategies did not require additional data collection and can be implemented using local knowledge
Item Network data (USD) Other data (USD)
Research staff costs 1200 800
Food & accommodation 1260 840
Equipment 200 200
Transport & fuel 200 160
Respondent gifts 200 200
Network analyst consultant 2000 -
Total $5160 $2200