improving economic dispatch through transmission switching
TRANSCRIPT

PSERC
Improving Economic Dispatch throughTransmission Switching:
New Opportunities for a Smart Grid
PSERC SeminarJune 9, 2009
Kory Hedman and Shmuel OrenUniversity of California, Berkeley
(based on joint work with Emily Fisher, Richard O'Neill, and Michael Ferris)

PSERC
2
Motivation Transmission planning addresses long term problem
and a broad range of contingencies so the grid is built with redundancies that may not be needed in every state of the system
Network redundancies motivated by reliability requirements may constrain generation dispatch create congestion and reduce economic efficiency
Transmission assets are currently seen as static in the short term and control of transmission assets for economic reasons is underutilized
Security constrained economic dispatch can be improved and congestion reduced through co-optimization of generation dispatch and the network active topology while ensuring reliability

PSERC
3
Motivation (cont’d) Optimal transmission switching does not necessarily
indicate inefficient transmission planning but such an option may affect planning
With appropriate Smart Grid switching technology, some backup transmission can be kept offline (just in time N-1)
Currently operators change transmission assets’ states on ad-hoc basis (per private communication with Andy Ott, VP, PJM)
Economically motivated transmission switching is consistent with FERC order 890 (supports transmission for economics)

PSERC
4
Transmission Switching Example
Original Optimal Cost: $20,000 (A=180MW,B=30MW, C=40MW)
Open Line A-B, Optimal Cost: $15,000 (A=200MW, B=50MW)
120MW
80MW
Original Feasible Set
150MW 180MW 200MW
Gen B
Gen A
30MW
Feasible set with Line A-B switched off
50MW

PSERC
5
Objectives and Scope Co-optimize transmission topology and generation
dispatch Efficiency improvements with no reliability degradation Smart grid application by exploiting short term
reconfiguration flexibility Asses cost of achieving reliability through network
redundancy (e.g. N-1 criterion) Explore options and lay foundation for new reliability
concepts (just in time N-1) Explore market implications of dynamic transmission
switching and impact on transmission rights Proof of concept: IEEE 118, IEEE 73 (RTS 96), ISO-NE
5000 bus model

PSERC
6
Technical ApproachTraditional DCOPF Minimize: Total generation cost
Subject to: – Bus angle constraints– Generator min & max operating constraints– Node balance constraints– Line flow constraints– Line min & max operating (thermal) constraint
Initially we do not consider generation unit commitment (do not consider startup, no load cost or minimum load)
We do not use PTDFs but rather: 0)( =−− nmkmnk PB θθ

PSERC
7Optimal Transmission Switching with DCOPF
Zk: Binary variable – State of transmission line (0 open, 1 closed)
Update line min/max thermal constraints:– Original:– New:
Update line flow constraints:– Original:
– New:
maxmink
nmkk PPP ≤≤
kknm
kkk zPPzP maxmin ≤≤
0)( =−− nmkmnk PB θθ
0)1()( ≥−+−− kknm
kmnk MzPB θθ0)1()( ≤−−−− kk
nmkmnk MzPB θθ

PSERC
Optimal Transmission Switching DCOPF

PSERC
9Optimal Transmission Switching with N-1 DCOPF
Add contingency constraints to DCOPF transmission switching problem
Any new topology solution must satisfy all contingencies Determine modified N-1 contingency list for test cases IEEE 118 bus test case is not N-1 compliant with original
topology– Modified N-1 contingency list includes all contingencies that can be
met for the IEEE 118 test case with its original network topology RTS 96 test case is N-1 compliant with original topology
– All N-1 contingencies are included Load shedding not allowed

PSERC
Optimal Transmission Switching with Gen. Unit Commitment N-1 DCOPF
Generation Unit Commitment Multi-Period Model– Startup costs– Shutdown costs– Minimum up and down time constraints
• Facet defining valid inequalities– Ramp rate constraints
Transmission SwitchingN-1 Contingency Constraints

PSERC
11
Results IEEE 118 Bus Model:
– DCOPF transmission switching solution with no contingencies saves 25% of total generation cost (10 lines switched off)
– Up to 16% savings with N-1 DCOPF transmission switching (for feasible solutions)
IEEE 73 (RTS 96) Bus Model – Up to 8% savings with N-1 DCOPF transmission
switching (for feasible solutions) ISONE 5000 bus model (includes NEPOOL, NYISO, NB,
NS – costs for NEPOOL only)– 5% to 13% savings of $600k total cost for NEPOOL for
1hr (for feasible solutions) - DCOPF

PSERC
12
Results – DCOPF – IEEE 118 Transmission switching solution saves 25% of total
generation cost
J

PSERC
13
Results – DCOPF – IEEE 118 IEEE 118
openedlines for J=10
Note: this diagram has additional gens than our model

PSERC
14
Results – DCOPF – IEEE 118

PSERC
15
Results – DCOPF – IEEE 118 Results are % of static network’s DCOPF solution
40%
60%
80%
100%
120%
140%
160%
180%
200%
J=0 J=1 J=2 J=3 J=4 J=5 J=6 J=7 J=8 J=9 J=10 Case1
Case2
Best
Generation CostGeneration RevenueGeneration RentCongestion RentLoad Payment

PSERC
16Results – N-1 DCOPF IEEE 118

PSERC
17Results – N-1 DCOPF IEEE 118
Results are % of static network’s N-1 DCOPF solution
20%
40%
60%
80%
100%
120%
140%
J=0
J=1
J=2
J=3
J=4
J=5
J=6
J=7
J=8
J=9
J=10
IL1 (J
=10)
IL2 (J
=12)
J: No. of Open Tx Elements
$/h
% o
f J =
0 V
alue
Generation Cost Generation RevenueGeneration Rent Congestion RentLoad Payment

PSERC
18Results – N-1 DCOPF – IEEE 73 (RTS 96)
Results are % of static network’s N-1 DCOPF solution
30%
40%
50%
60%
70%
80%
90%
100%
J=0 J=1 J=2 J=3 J=4 J=5J: No. of Open Tx Elements
$/h
% o
f J =
0 V
alue
Generation Cost Generation RevenueGeneration Rent Congestion RentLoad Payment

PSERC
19
Results – DCOPF – ISONE ISONE – Summer Peak Model (5000 bus network)

PSERC
20
Results – DCOPF – ISONE Results are % of static network’s DCOPF solution ISONE – Summer Peak Model
20%
40%
60%
80%
100%
120%
J=0
J=2
J=4
J=6
J=8
J=10
J=12
J=14
J=16
J=18
J=20
Generation Cost Generation RevenueGeneration Rent Congestion RentLoad Payment

PSERC
21
Results – DCOPF – ISONE (cont’d) Results are % of static network’s DCOPF solution ISONE – Connecticut Import Study Model
0%
20%
40%
60%
80%
100%
J=0 J=1 J=2 J=3 J=4 J=5 J=6 J=7 J=8 J=9 J=10 IL1
Generation Cost Generation RevenueGeneration Rent Congestion RentLoad Payment

PSERC
22Results – 24HR Gen UC & Optimal Transmission Switching N-1 DCOPF
Model: IEEE RTS-96 system Results show:
– Optimal network topology varies from hour to hour– Changing the network topology can change the optimal
generation unit commitment solution – Total startup costs may be reduced– Peaker units initially required with original topology were not
required once transmission switching was incorporated into the problem
3.7% overall savings or over $120,000 (24hr) for this medium sized IEEE test case – can translate into millions for large scale networks for entire year
PSERC
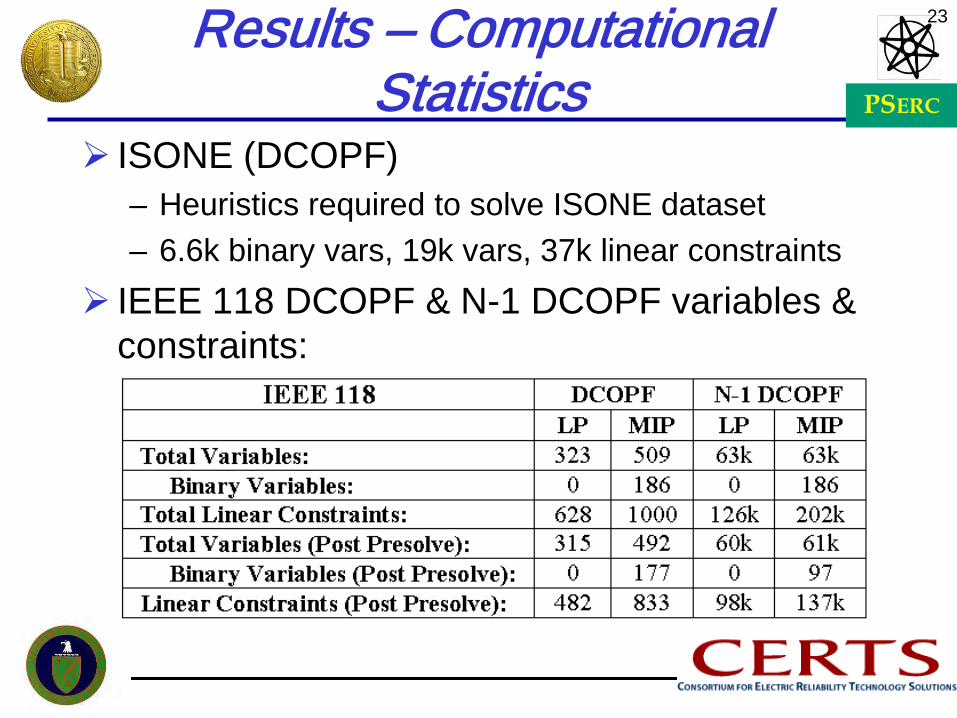
23Results – Computational Statistics
ISONE (DCOPF)– Heuristics required to solve ISONE dataset– 6.6k binary vars, 19k vars, 37k linear constraints
IEEE 118 DCOPF & N-1 DCOPF variables & constraints:

PSERC
24
Revenue Adequacy in Financial Transmission Rights Market
FTRs: Hedging mechanism
Market operator compensates FTR owners with congestion rent (surplus)
Revenue adequacy not guaranteed if topology changes
Following example illustrates potential congestion revenue shortfall due to transmission switching
PSERC
25
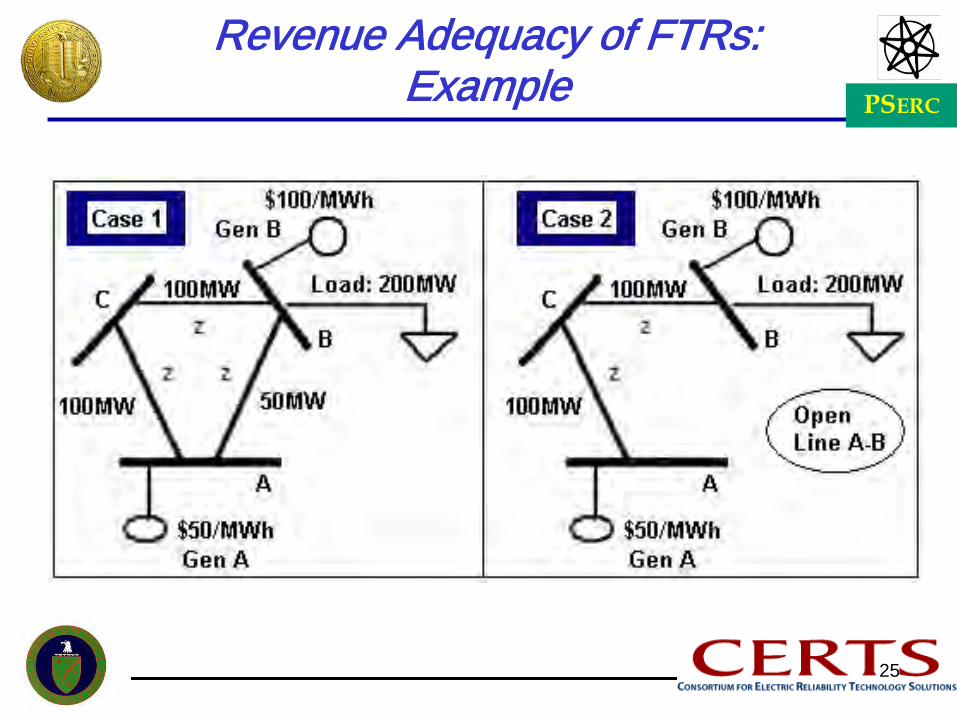
Revenue Adequacy of FTRs: Example

PSERC
Revenue Adequacy of FTRs Cont’d
BUS: Gen Pg: LMP: Gen Cost: BRANCH: Line Flow: Congestion Rent:
A 75MW $50/MWh $3,750 From A to B 50MW $2,500
B 125MW $100/MWh $12,500 From A to C 25MW $625
C 0MW $75/MWh $0 From B to C -25MW $625
Total Gen Cost: $16,250 Total Congestion Rent: $3750
Without Switching Line A-B In (Case 1):
With Switching Line A-B Out (Case 2):BUS Gen Pg: LMP: Gen Cost: BRANCH: Line Flow: Congestion Rent:
A 100MW $50/MWh $5,000 From A to B 0MW $0B 100MW $100/MWh $10,000 From A to C 100MW $5,000C 0MW $100/MWh $0 From B to C -100MW $0
Total Gen Cost: $15,000 Total Congestion Rent: $5,000
PSERC
27
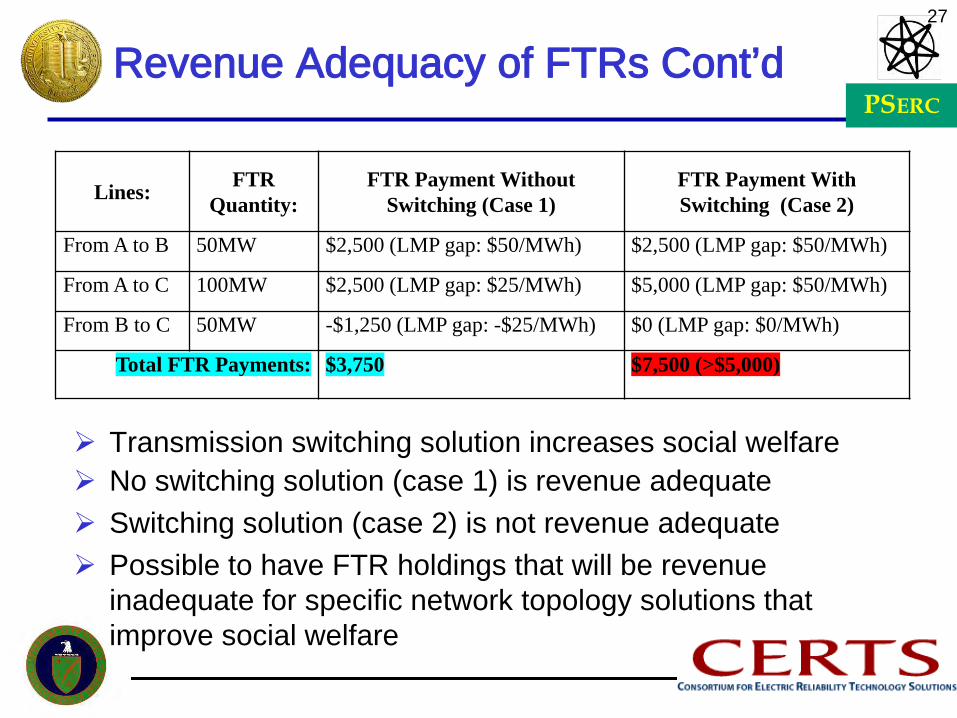
Lines: FTR Quantity:
FTR Payment Without Switching (Case 1)
FTR Payment With Switching (Case 2)
From A to B 50MW $2,500 (LMP gap: $50/MWh) $2,500 (LMP gap: $50/MWh)
From A to C 100MW $2,500 (LMP gap: $25/MWh) $5,000 (LMP gap: $50/MWh)
From B to C 50MW -$1,250 (LMP gap: -$25/MWh) $0 (LMP gap: $0/MWh)
Total FTR Payments: $3,750 $7,500 (>$5,000)
Revenue Adequacy of FTRs Cont’d
Transmission switching solution increases social welfare No switching solution (case 1) is revenue adequate Switching solution (case 2) is not revenue adequate Possible to have FTR holdings that will be revenue
inadequate for specific network topology solutions that improve social welfare

PSERC
28
Further Research Revenue adequacy and FTR settlement
– Incorporate revenue adequacy feasibility test within transmission switching formulation
– Do we need a compensation scheme to offset the impact on FTR settlements?
Benders’ decomposition– Analyze various sub-problem formats– Research techniques to improve solution time
• Combinatorial cuts• Local branching
Use AC OPF for short term (e.g. hourly) switching problem– MINLP very difficult– Research heuristic techniques

PSERC
29
Documentation and Publications[1] K. W. Hedman, R. P. O’Neill, E. B. Fisher, S. S. Oren, “Optimal transmission
switching – sensitivity analysis and extensions,” IEEE Trans. Power Syst., vol. 23, no. 3, pp. 1469-1479, Aug. 2008.
[2] K. W. Hedman, R. P. O’Neill, E. B. Fisher, S. S. Oren, “Optimal transmission switching with contingency analysis,” IEEE Trans. Power Syst., vol. 24, no. 3, Aug. 2009.
[3] K. W. Hedman, R. P. O’Neill, S. S. Oren, “Analyzing valid inequalities of the generation unit commitment problem,” in Proc. Power Syst. Conf. and Expo. (PSCE), March 2009.
[4] E. B. Fisher, K. W. Hedman, R. P. O’Neill, M. C. Ferris, S. S. Oren, “Optimal transmission switching in electric networks for improved economic operations,” in INFRADAY Conference 2008.
[5] K. W. Hedman, M. C. Ferris, R. P. O’Neill, E. B. Fisher, S. S. Oren, “Co-optimization of generation unit commitment and transmission switching with N-1 reliability,” IEEE Trans. Power Syst., submitted for publication.
[6] K. W. Hedman, R. P. O’Neill, E. B. Fisher, S. S. Oren, “Smart flexible just-in-time transmission and flowgate bidding,” IEEE Trans. Power Syst., submitted for publication.
[7] K. W. Hedman, R. P. O’Neill, S. S. Oren, “Ensuring revenue adequacy of FTRs with transmission switching,” working paper.

PSERCQUESTIONS?Thank you!
http://www.ieor.berkeley.edu/~oren/index.htm