implementation-of-total-concept-in-northern-european
TRANSCRIPT

Mads Mysen and Aileen Yang
SINTEF
March 2017
Implementation of the Total Concept
method in twelve buildings in Northern
European countries
Summary report of
technical results
2 (54)
This report has been developed as part of the project “The Total Concept method for major reduction of energy use in non-residential buildings”, supported by Intelligent Energy Europe Programme. Contract number: IEE/13/613/SI2.675832 Project webpage: www.totalconcept.info Editors for this report have been Mads Mysen and Aileen Yang SINTEF Contact: [email protected]
Responsible partners for the pilot buildings in the different countries are:
Sweden: CIT Energy Management, Mari-Liis Maripuu
Norway: SINTEF Building & Infrastructure, Anders-Johan Almås
Denmark: Rambøll DK, Pawel Krawczyk
Finland: Bionova Oy, Tytti Bruce
Estonia: Eesti Kütte- ja Ventilatsiooniinseneride Ühendus (EKVÜ), Kalle Kuusk
Project webpage: www.totalconcept.info Project coordinator: Åsa Wahlström, CIT Energy Management AB, [email protected] March 2017
Disclaimer The sole responsibility for the content of this publication lies with the authors. It does not necessarily reflect the opinion of the European Union. Neither the EACI nor the European Commission are responsible for any use that may be made of the information contained therein.

3 (54)
Table of content
1. Introduction...............................................................................................................................4
2. Overview of the pilots ................................................................................................................5
3. Road Office in Steinkjer, Norway – Step 3 ....................................................................................9
4. Högsbo office building, Sweden – Step 3.................................................................................... 13
5. Norrtälje prison, Sweden – Step 3 ............................................................................................. 18
6. Segevångs school, Sweden – Step 1 ........................................................................................... 23
7. Town hall of Ballerup, Denmark – Step 1 ................................................................................... 25
8. Lyngby Port, Denmark – Step 3 ................................................................................................. 27
9. Pärnu high school, Estonia – Step 3 ........................................................................................... 33
10. Kiriku 2/4, Estonia – Step 3 ..................................................................................................... 37
11. Gonsiori 29, Estonia - Step 3.................................................................................................... 40
12. Tampere Hall Congress & Concert Centre, Finland – Step 3 ....................................................... 43
13. Oulu health care station, Finland – Step 1 ................................................................................ 53
14. Kaarstad building, Norway – Step 1 ......................................................................................... 54
4 (54)
1. Introduction This report covers the implementation of the Total Concept method in 12 pilot buildings. The
objectives were to carry out pilot studies in each of the five participating countries of the IEE Total
Concept project, including identification of energy saving measures with cost estimates and energy
saving calculations together with a thorough follow-up of energy use the first year.
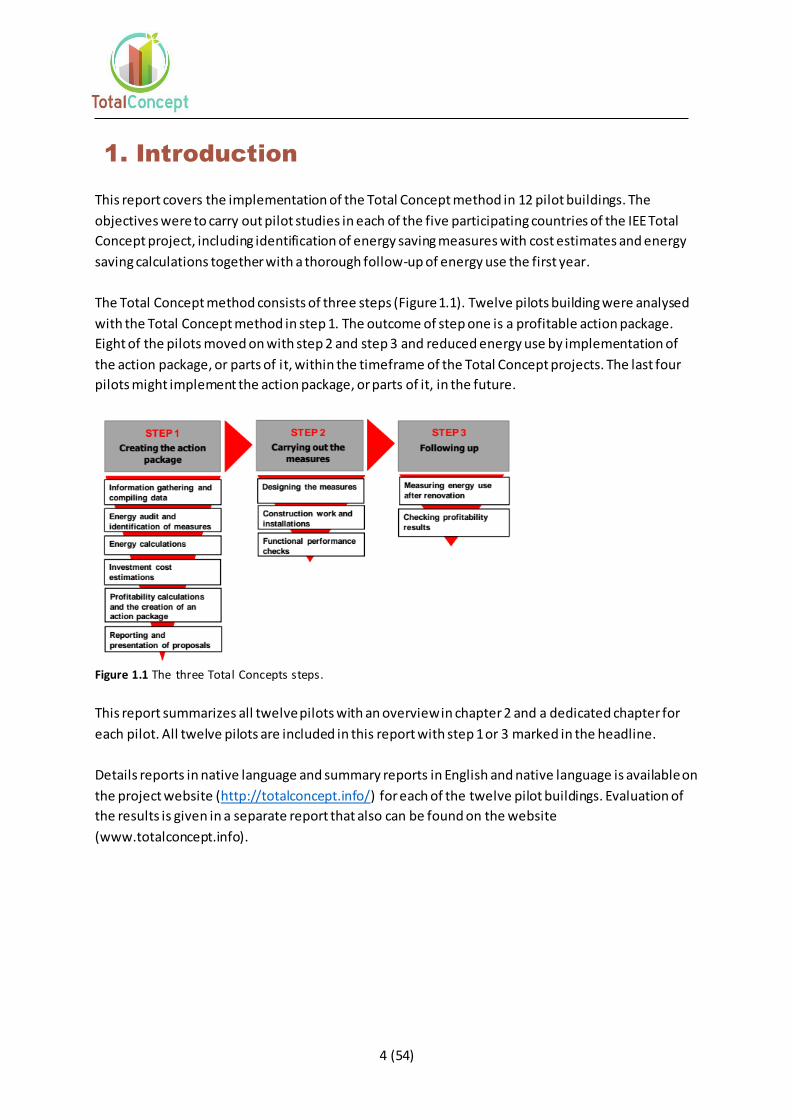
The Total Concept method consists of three steps (Figure 1.1). Twelve pilots building were analysed
with the Total Concept method in step 1. The outcome of step one is a profitable action package.
Eight of the pilots moved on with step 2 and step 3 and reduced energy use by implementation of
the action package, or parts of it, within the timeframe of the Total Concept projects. The last four
pilots might implement the action package, or parts of it, in the future.
Figure 1.1 The three Total Concepts steps.
This report summarizes all twelve pilots with an overview in chapter 2 and a dedicated chapter for
each pilot. All twelve pilots are included in this report with step 1 or 3 marked in the headline.
Details reports in native language and summary reports in English and native language is available on
the project website (http://totalconcept.info/) for each of the twelve pilot buildings. Evaluation of
the results is given in a separate report that also can be found on the website
(www.totalconcept.info).
5 (54)
2. Overview of the pilots
2.1 Pilot building and measures
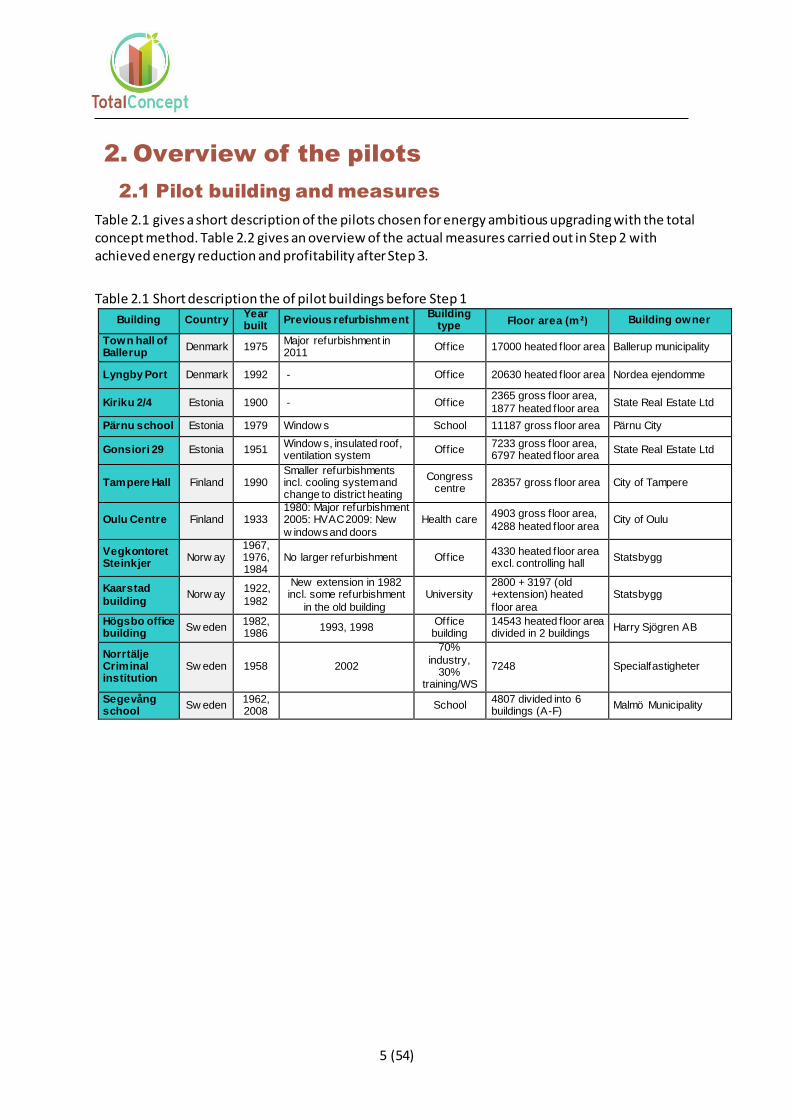
Table 2.1 gives a short description of the pilots chosen for energy ambitious upgrading with the total concept method. Table 2.2 gives an overview of the actual measures carried out in Step 2 with achieved energy reduction and profitability after Step 3.
Table 2.1 Short description the of pilot buildings before Step 1
Building Country Year built
Previous refurbishment Building
type Floor area (m ²) Building owner
Town hall of Ballerup
Denmark 1975 Major refurbishment in 2011
Office 17000 heated f loor area Ballerup municipality
Lyngby Port Denmark 1992 - Off ice 20630 heated f loor area Nordea ejendomme
Kiriku 2/4 Estonia 1900 - Off ice 2365 gross f loor area,
1877 heated f loor area State Real Estate Ltd
Pärnu school Estonia 1979 Window s School 11187 gross f loor area Pärnu City
Gonsiori 29 Estonia 1951 Window s, insulated roof, ventilation system
Office 7233 gross f loor area, 6797 heated f loor area
State Real Estate Ltd
Tampere Hall Finland 1990 Smaller refurbishments incl. cooling system and change to district heating
Congress centre
28357 gross f loor area City of Tampere
Oulu Centre Finland 1933 1980: Major refurbishment 2005: HVAC 2009: New
w indows and doors
Health care 4903 gross f loor area,
4288 heated f loor area City of Oulu
Vegkontoret Steinkjer
Norw ay 1967, 1976, 1984
No larger refurbishment Office 4330 heated f loor area excl. controlling hall
Statsbygg
Kaarstad
building Norw ay
1922,
1982
New extension in 1982 incl. some refurbishment
in the old building
University 2800 + 3197 (old +extension) heated
f loor area
Statsbygg
Högsbo office building
Sw eden 1982, 1986
1993, 1998 Office building
14543 heated f loor area divided in 2 buildings
Harry Sjögren AB
Norrtälje Criminal institution
Sw eden 1958 2002
70%
industry, 30%
training/WS
7248 Specialfastigheter
Segevång school
Sw eden 1962, 2008
School 4807 divided into 6 buildings (A-F)
Malmö Municipality
6 (54)
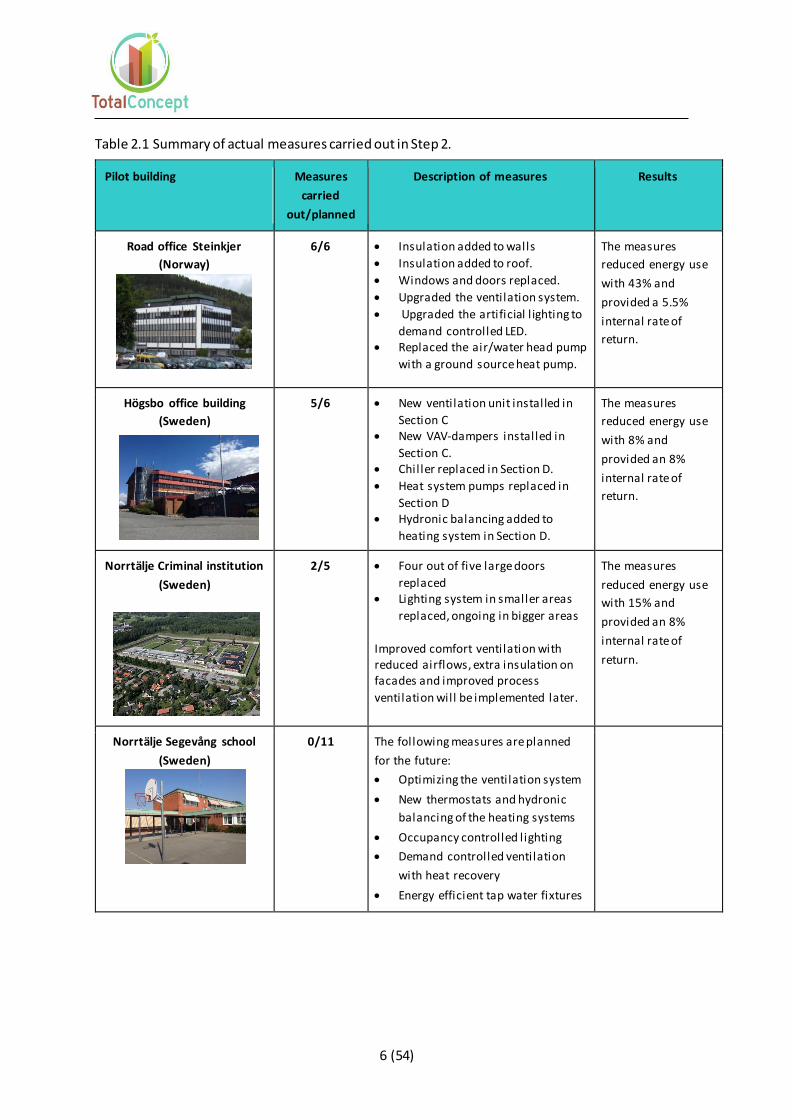
Table 2.1 Summary of actual measures carried out in Step 2.
Pilot building Measures
carried
out/planned
Description of measures Results
Road office Steinkjer
(Norway)
6/6 Insulation added to walls
Insulation added to roof.
Windows and doors replaced.
Upgraded the ventilation system.
Upgraded the artificial l ighting to
demand controlled LED. Replaced the air/water head pump
with a ground source heat pump.
The measures
reduced energy use
with 43% and
provided a 5.5%
internal rate of
return.
Högsbo office building
(Sweden)
5/6 New ventilation unit installed in
Section C New VAV-dampers installed in
Section C. Chiller replaced in Section D.
Heat system pumps replaced in
Section D Hydronic balancing added to
heating system in Section D.
The measures
reduced energy use
with 8% and
provided an 8%
internal rate of
return.
Norrtälje Criminal institution
(Sweden)
2/5 Four out of five large doors
replaced Lighting system in smaller areas
replaced, ongoing in bigger areas
Improved comfort ventilation with reduced airflows, extra insulation on facades and improved process
ventilation will be implemented later.
The measures
reduced energy use
with 15% and
provided an 8%
internal rate of
return.
Norrtälje Segevång school
(Sweden)
0/11 The following measures are planned
for the future:
Optimizing the ventilation system
New thermostats and hydronic
balancing of the heating systems
Occupancy controlled lighting
Demand controlled ventilation
with heat recovery
Energy efficient tap water fixtures
7 (54)
Pilot building Measures
carried
out/planned
Description of measures Results
Town hall of Ballerup
(Denmark)
0/3 The following measures are planned
for the future:
Exchanging windows
Optimization of BMS system,
including heating, l ighting,
ventilation and solar shading
Photovoltaic
Lyngby Port
(Denmark)
4/7 Ventilators replaced
Extra insulation in the shaft ducts
New BMS system
New cooling system.
Converting to district heating and solar
panels are planned in spring 2017. The
last measure - PIR sensors in the toilets
might be implemented.
The measures
reduced energy use
with 20% and
provided a 4%
internal rate of
return.
Pärnu school
(Estonia)
6/6 New ventilation system
District heating as a heat source
for ventilation New heating systems
Lower SFP
Insulation of whole building
envelope
Energy efficient l ighting system
The measures
reduced energy use
with 46% and
provided a 6.6%
internal rate of
return.
Kiriku 2/4
(Estonia)
7/7 Adjustment of heating curve
Insulation of the attic floor
New circulation pumps
Ventilation system with heat
recovery New windows
Insulation of ground slab
New T5 lighting
The measures
reduced energy use
with 28% and
provided a negative
internal rate of
return.
Gonsiori 29
(Estonia)
2/8 New windows
new lighting system
Because building is planned to be sold in 2018, the owner was interested only in doing measures which could help to increase indoor climate and decrease
complaints.
The measures
reduced energy use
with 3.5% and
provided a negative
internal rate of
return.
8 (54)
Pilot building Measures
carried
out/planned
Description of measures Results
Tampere Hall
(Finland)
5/7 Replaced southern glass wall in
the hallway Replaced northern glass wall
New lighting system
Installed efficient heating system
in the Moomin museum
Installation of heat recovery in the
kitchen AC The package will be executed in three parts.
After renovation is
completed, the
measures are
expected to reduce
energy use by 23%,
and to provide an
8.5% internal rate of
return.
Oulu Centre
(Finland)
0/5-8 The following measures are identified
in a profitable action package:
ventilation with heat recovery
temperature controllers
efficient fans
LED lighting
New faucets
Kaarstad building
(Norway)
0/5 The following measures are identified
in a profitable action package:
Replace radiators and new
thermostatic valves
Façade insulation
Roof insulation
Demand controlled ventilation
Occupancy controlled l ighting
9 (54)
3. Road Office in Steinkjer, Norway – Step 3
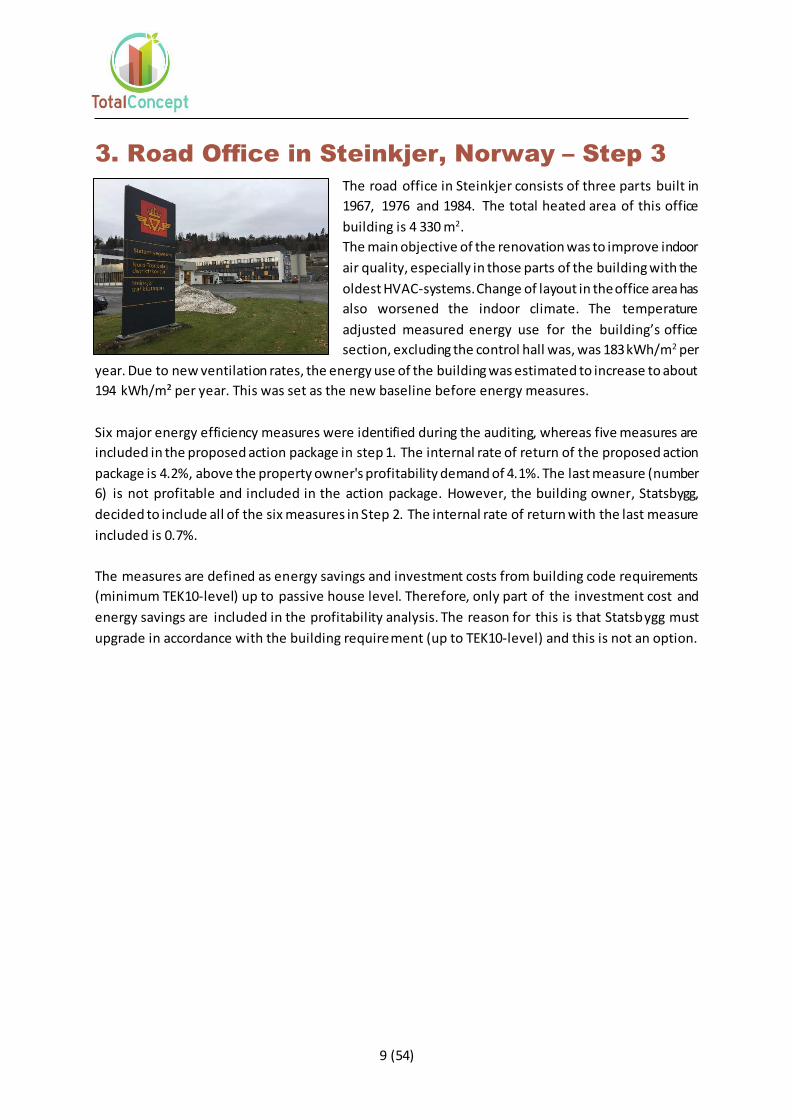
The road office in Steinkjer consists of three parts built in
1967, 1976 and 1984. The total heated area of this office
building is 4 330 m2.
The main objective of the renovation was to improve indoor
air quality, especially in those parts of the building with the
oldest HVAC-systems. Change of layout in the office area has
also worsened the indoor climate. The temperature
adjusted measured energy use for the building’s office
section, excluding the control hall was, was 183 kWh/m2 per
year. Due to new ventilation rates, the energy use of the building was estimated to increase to about
194 kWh/m² per year. This was set as the new baseline before energy measures.
Six major energy efficiency measures were identified during the auditing, whereas five measures are
included in the proposed action package in step 1. The internal rate of return of the proposed action
package is 4.2%, above the property owner's profitability demand of 4.1%. The last measure (number
6) is not profitable and included in the action package. However, the building owner, Statsbygg,
decided to include all of the six measures in Step 2. The internal rate of return with the last measure
included is 0.7%.
The measures are defined as energy savings and investment costs from building code requirements
(minimum TEK10-level) up to passive house level. Therefore, only part of the investment cost and
energy savings are included in the profitability analysis. The reason for this is that Statsbygg must
upgrade in accordance with the building requirement (up to TEK10-level) and this is not an option.
10 (54)
3.1 Summary tables
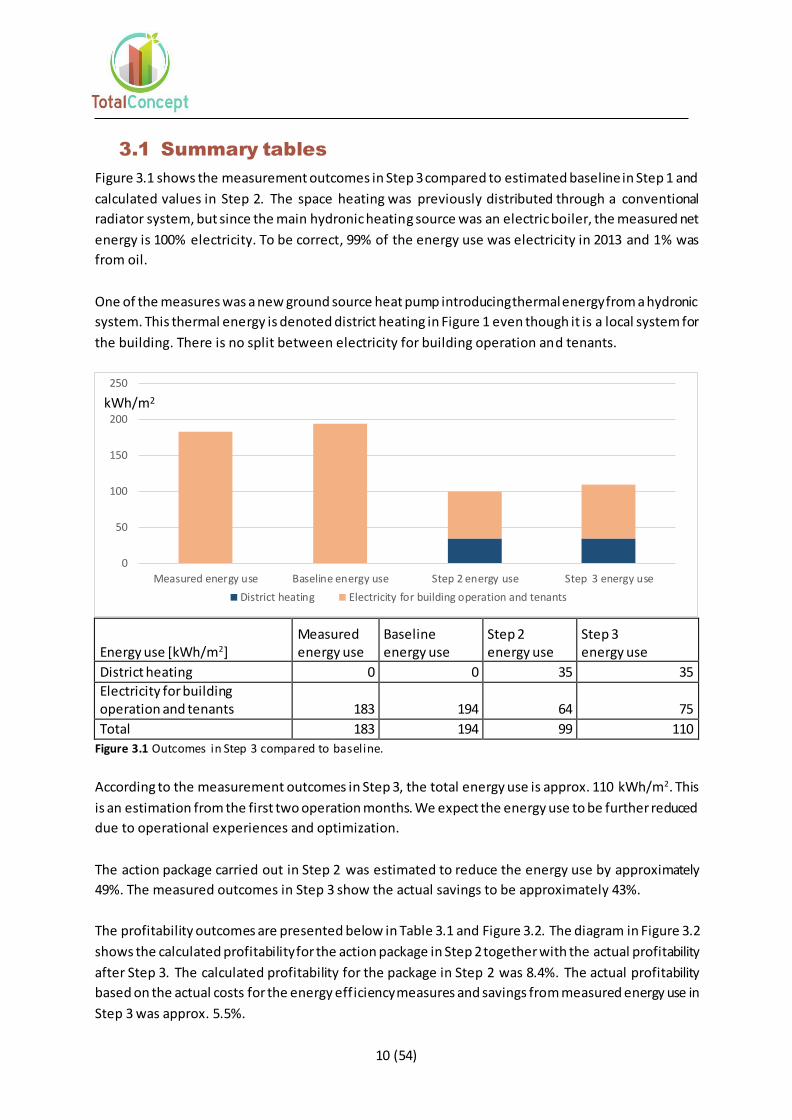
Figure 3.1 shows the measurement outcomes in Step 3 compared to estimated baseline in Step 1 and
calculated values in Step 2. The space heating was previously distributed through a conventional
radiator system, but since the main hydronic heating source was an electric boiler, the measured net
energy is 100% electricity. To be correct, 99% of the energy use was electricity in 2013 and 1% was
from oil.
One of the measures was a new ground source heat pump introducing thermal energy from a hydronic
system. This thermal energy is denoted district heating in Figure 1 even though it is a local system for
the building. There is no split between electricity for building operation and tenants.
Energy use [kWh/m2] Measured energy use
Baseline energy use
Step 2 energy use
Step 3 energy use
District heating 0 0 35 35
Electricity for building operation and tenants 183 194 64 75
Total 183 194 99 110
Figure 3.1 Outcomes in Step 3 compared to baseline.
According to the measurement outcomes in Step 3, the total energy use is approx. 110 kWh/m2. This
is an estimation from the first two operation months. We expect the energy use to be further reduced
due to operational experiences and optimization.
The action package carried out in Step 2 was estimated to reduce the energy use by approximately
49%. The measured outcomes in Step 3 show the actual savings to be approximately 43%.
The profitability outcomes are presented below in Table 3.1 and Figure 3.2. The diagram in Figure 3.2
shows the calculated profitability for the action package in Step 2 together with the actual profitability
after Step 3. The calculated profitability for the package in Step 2 was 8.4%. The actual profitability
based on the actual costs for the energy efficiency measures and savings from measured energy use in
Step 3 was approx. 5.5%.
0
50
100
150
200
250
Measured energy use Baseline energy use Step 2 energy use Step 3 energy use
District heating Electricity for building operation and tenants
kWh/m2
11 (54)
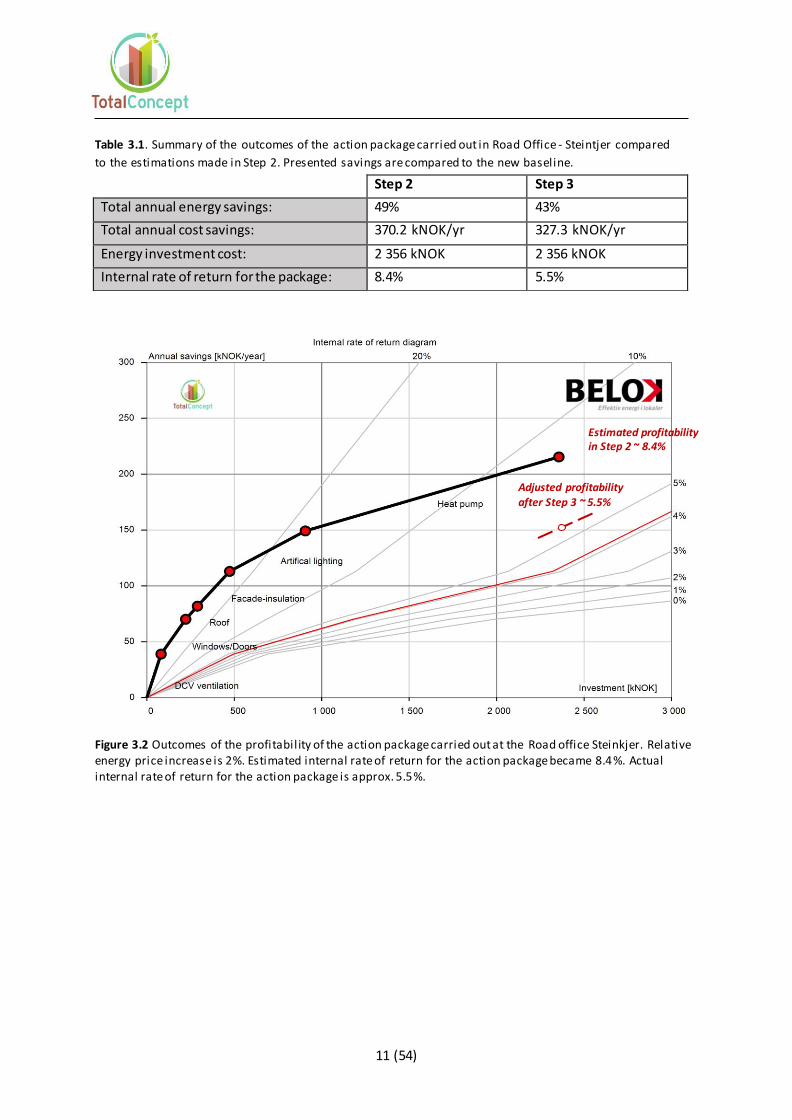
Table 3.1. Summary of the outcomes of the action package carried out in Road Office - Steintjer compared
to the estimations made in Step 2. Presented savings are compared to the new baseline.
Figure 3.2 Outcomes of the profitability of the action package carried out at the Road office Steinkjer. Relative energy price increase is 2%. Estimated internal rate of return for the action package became 8.4%. Actual internal rate of return for the action package is approx. 5.5%.
Step 2 Step 3
Total annual energy savings: 49% 43%
Total annual cost savings: 370.2 kNOK/yr 327.3 kNOK/yr
Energy investment cost: 2 356 kNOK 2 356 kNOK
Internal rate of return for the package: 8.4% 5.5%
Estimated profitability in Step 2 ~ 8.4%
Adjusted profitability after Step 3 ~ 5.5%
12 (54)
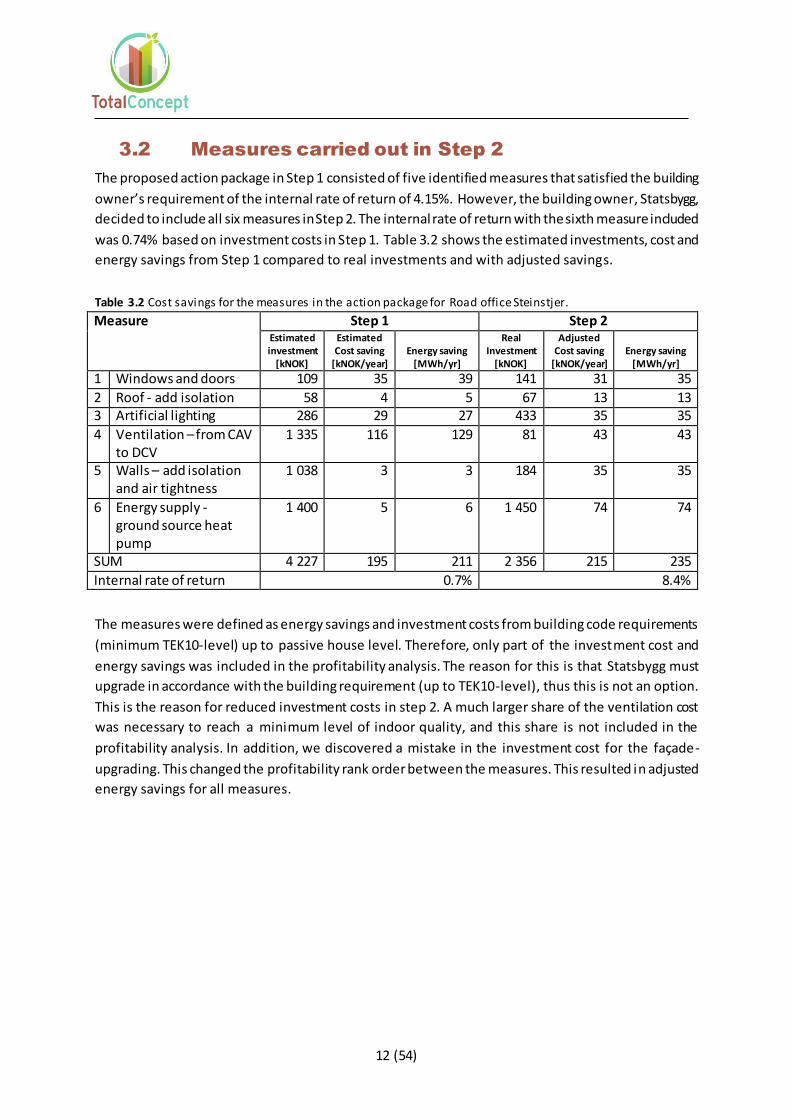
3.2 Measures carried out in Step 2
The proposed action package in Step 1 consisted of five identified measures that satisfied the building
owner’s requirement of the internal rate of return of 4.15%. However, the building owner, Statsbygg,
decided to include all six measures in Step 2. The internal rate of return with the sixth measure included
was 0.74% based on investment costs in Step 1. Table 3.2 shows the estimated investments, cost and
energy savings from Step 1 compared to real investments and with adjusted savings.
Table 3.2 Cost savings for the measures in the action package for Road office Steinstjer.
Measure Step 1 Step 2 Estimated investment
[kNOK]
Estimated Cost saving
[kNOK/year] Energy saving
[MWh/yr]
Real Investment
[kNOK]
Adjusted Cost saving
[kNOK/year] Energy saving
[MWh/yr]
1 Windows and doors 109 35 39 141 31 35
2 Roof - add isolation 58 4 5 67 13 13 3 Artificial lighting 286 29 27 433 35 35
4 Ventilation – from CAV to DCV
1 335 116 129 81 43 43
5 Walls – add isolation and air tightness
1 038 3 3 184 35 35
6 Energy supply - ground source heat pump
1 400 5 6 1 450 74 74
SUM 4 227 195 211 2 356 215 235
Internal rate of return 0.7% 8.4%
The measures were defined as energy savings and investment costs from building code requirements
(minimum TEK10-level) up to passive house level. Therefore, only part of the investment cost and
energy savings was included in the profitability analysis. The reason for this is that Statsbygg must
upgrade in accordance with the building requirement (up to TEK10-level), thus this is not an option.
This is the reason for reduced investment costs in step 2. A much larger share of the ventilation cost
was necessary to reach a minimum level of indoor quality, and this share is not included in the
profitability analysis. In addition, we discovered a mistake in the investment cost for the façade-
upgrading. This changed the profitability rank order between the measures. This resulted in adjusted
energy savings for all measures.
13 (54)
measured
2013-
2014
Baseline
2015
Step 2
(calculate
d)
Step 3
(measure
d)
Electricity for tenants 31 36 36 35
Electricity for building operation 33 34 31 29
District heating 57 58 52 53
0
20
40
60
80
100
120
140
Spe
cifi
c e
ne
rgy
use
[k
Wh
/m2
yr]
-7%
-11%
0% -2%
-15%
-8%
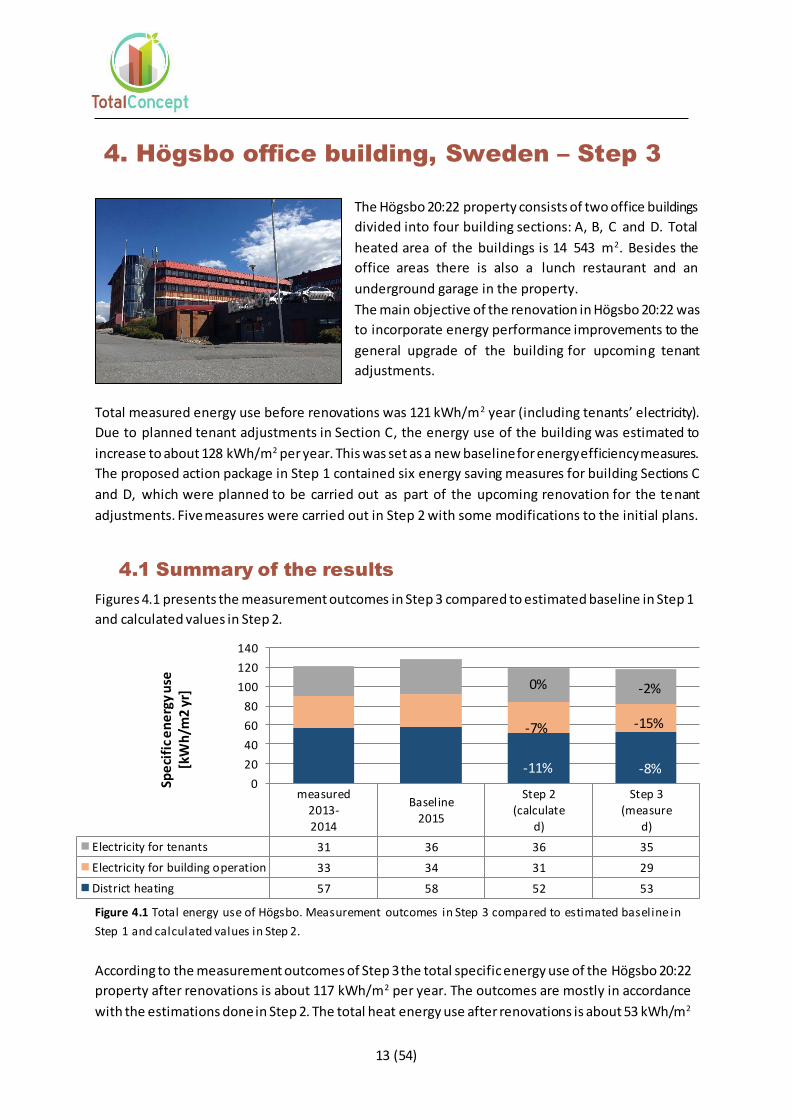
4. Högsbo office building, Sweden – Step 3
The Högsbo 20:22 property consists of two office buildings
divided into four building sections: A, B, C and D. Total
heated area of the buildings is 14 543 m2. Besides the
office areas there is also a lunch restaurant and an
underground garage in the property.
The main objective of the renovation in Högsbo 20:22 was
to incorporate energy performance improvements to the
general upgrade of the building for upcoming tenant
adjustments.
Total measured energy use before renovations was 121 kWh/m2 year (including tenants’ electricity).
Due to planned tenant adjustments in Section C, the energy use of the building was estimated to
increase to about 128 kWh/m2 per year. This was set as a new baseline for energy efficiency measures.
The proposed action package in Step 1 contained six energy saving measures for building Sections C
and D, which were planned to be carried out as part of the upcoming renovation for the tenant
adjustments. Five measures were carried out in Step 2 with some modifications to the initial plans.
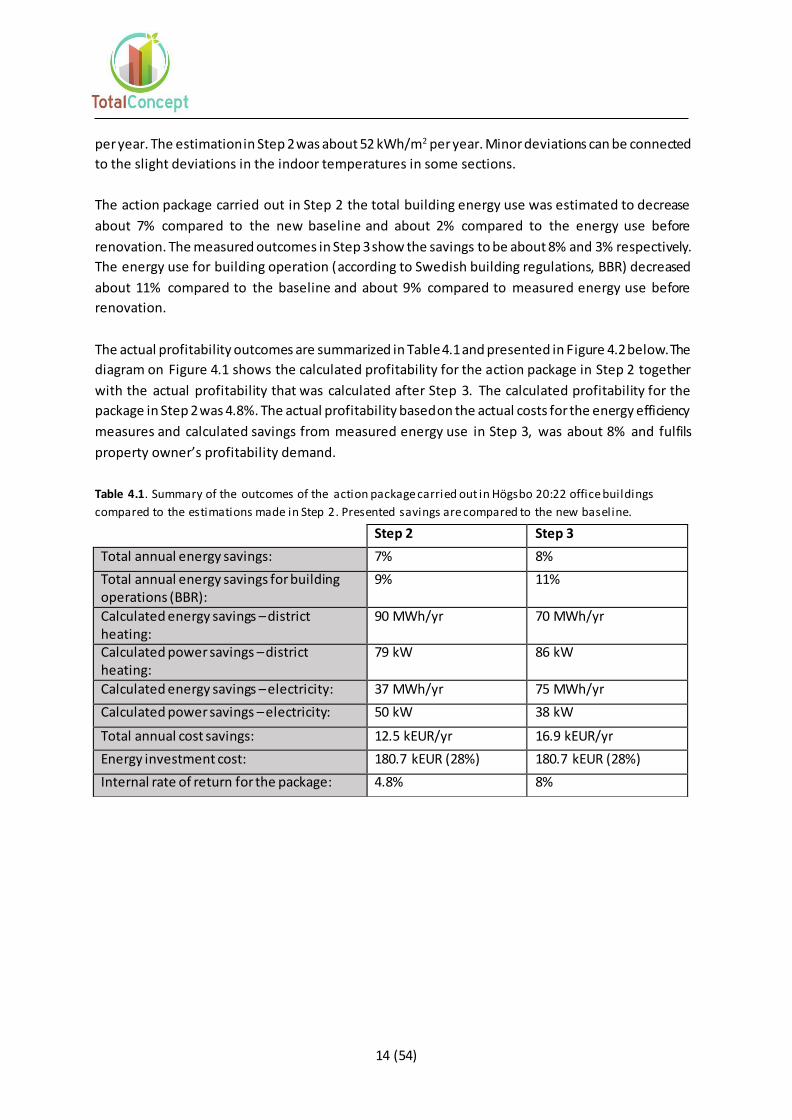
4.1 Summary of the results
Figures 4.1 presents the measurement outcomes in Step 3 compared to estimated baseline in Step 1
and calculated values in Step 2.
Figure 4.1 Total energy use of Högsbo. Measurement outcomes in Step 3 compared to estimated baseline in
Step 1 and calculated values in Step 2.
According to the measurement outcomes of Step 3 the total specific energy use of the Högsbo 20:22
property after renovations is about 117 kWh/m2 per year. The outcomes are mostly in accordance
with the estimations done in Step 2. The total heat energy use after renovations is about 53 kWh/m2
14 (54)
per year. The estimation in Step 2 was about 52 kWh/m2 per year. Minor deviations can be connected
to the slight deviations in the indoor temperatures in some sections.
The action package carried out in Step 2 the total building energy use was estimated to decrease
about 7% compared to the new baseline and about 2% compared to the energy use before
renovation. The measured outcomes in Step 3 show the savings to be about 8% and 3% respectively.
The energy use for building operation (according to Swedish building regulations, BBR) decreased
about 11% compared to the baseline and about 9% compared to measured energy use before
renovation.
The actual profitability outcomes are summarized in Table 4.1 and presented in Figure 4.2 below. The
diagram on Figure 4.1 shows the calculated profitability for the action package in Step 2 together
with the actual profitability that was calculated after Step 3. The calculated profitability for the
package in Step 2 was 4.8%. The actual profitability based on the actual costs for the energy efficiency
measures and calculated savings from measured energy use in Step 3, was about 8% and fulfils
property owner’s profitability demand.
Table 4.1. Summary of the outcomes of the action package carried out in Högsbo 20:22 office buildings
compared to the estimations made in Step 2. Presented savings are compared to the new baseline.
Step 2 Step 3
Total annual energy savings: 7% 8%
Total annual energy savings for building operations (BBR):
9% 11%
Calculated energy savings – district heating:
90 MWh/yr 70 MWh/yr
Calculated power savings – district heating:
79 kW 86 kW
Calculated energy savings – electricity: 37 MWh/yr 75 MWh/yr
Calculated power savings – electricity: 50 kW 38 kW
Total annual cost savings: 12.5 kEUR/yr 16.9 kEUR/yr
Energy investment cost: 180.7 kEUR (28%) 180.7 kEUR (28%)
Internal rate of return for the package: 4.8% 8%
15 (54)
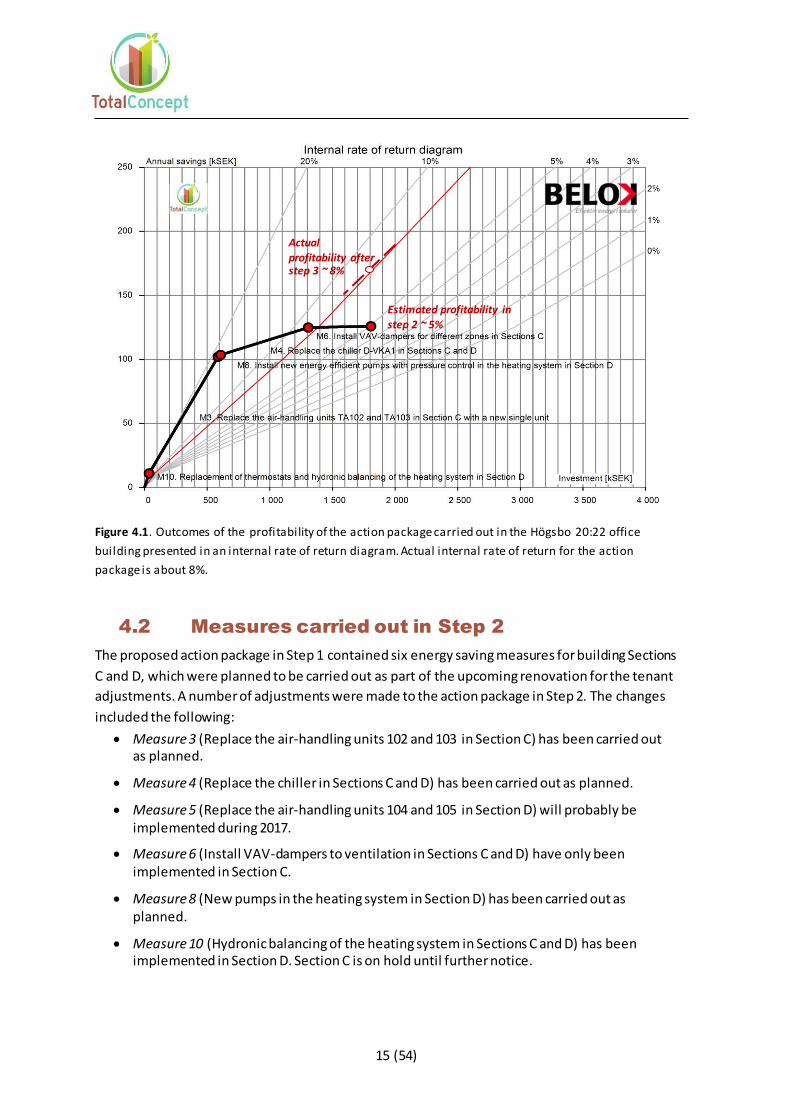
Figure 4.1. Outcomes of the profitability of the action package carried out in the Högsbo 20:22 office
building presented in an internal rate of return diagram. Actual internal rate of return for the action
package is about 8%.
4.2 Measures carried out in Step 2
The proposed action package in Step 1 contained six energy saving measures for building Sections
C and D, which were planned to be carried out as part of the upcoming renovation for the tenant
adjustments. A number of adjustments were made to the action package in Step 2. The changes
included the following:
Measure 3 (Replace the air-handling units 102 and 103 in Section C) has been carried out as planned.
Measure 4 (Replace the chiller in Sections C and D) has been carried out as planned.
Measure 5 (Replace the air-handling units 104 and 105 in Section D) will probably be implemented during 2017.
Measure 6 (Install VAV-dampers to ventilation in Sections C and D) have only been implemented in Section C.
Measure 8 (New pumps in the heating system in Section D) has been carried out as planned.
Measure 10 (Hydronic balancing of the heating system in Sections C and D) has been implemented in Section D. Section C is on hold until further notice.
Actual profitability after step 3 ~ 8%
Estimated profitability in
step 2 ~ 5%
16 (54)
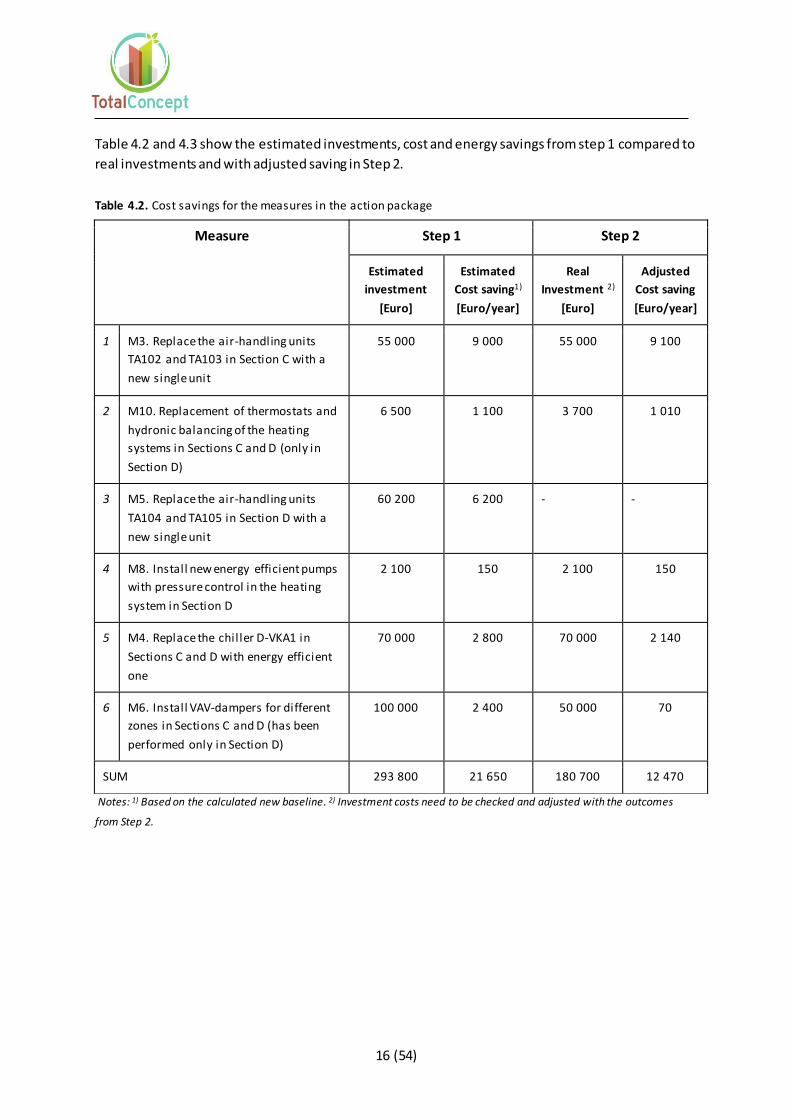
Table 4.2 and 4.3 show the estimated investments, cost and energy savings from step 1 compared to
real investments and with adjusted saving in Step 2.
Table 4.2. Cost savings for the measures in the action package
Notes: 1) Based on the calculated new baseline. 2) Investment costs need to be checked and adjusted with the outcomes
from Step 2.
Measure Step 1 Step 2
Estimated
investment
[Euro]
Estimated
Cost saving1)
[Euro/year]
Real
Investment 2)
[Euro]
Adjusted
Cost saving
[Euro/year]
1 M3. Replace the air-handling units
TA102 and TA103 in Section C with a
new single unit
55 000 9 000 55 000 9 100
2 M10. Replacement of thermostats and
hydronic balancing of the heating
systems in Sections C and D (only in
Section D)
6 500 1 100 3 700 1 010
3 M5. Replace the air-handling units
TA104 and TA105 in Section D with a
new single unit
60 200 6 200 - -
4 M8. Install new energy efficient pumps
with pressure control in the heating
system in Section D
2 100 150 2 100 150
5 M4. Replace the chiller D-VKA1 in
Sections C and D with energy efficient
one
70 000 2 800 70 000 2 140
6 M6. Install VAV-dampers for different
zones in Sections C and D (has been
performed only in Section D)
100 000 2 400 50 000 70
SUM 293 800 21 650 180 700 12 470
17 (54)
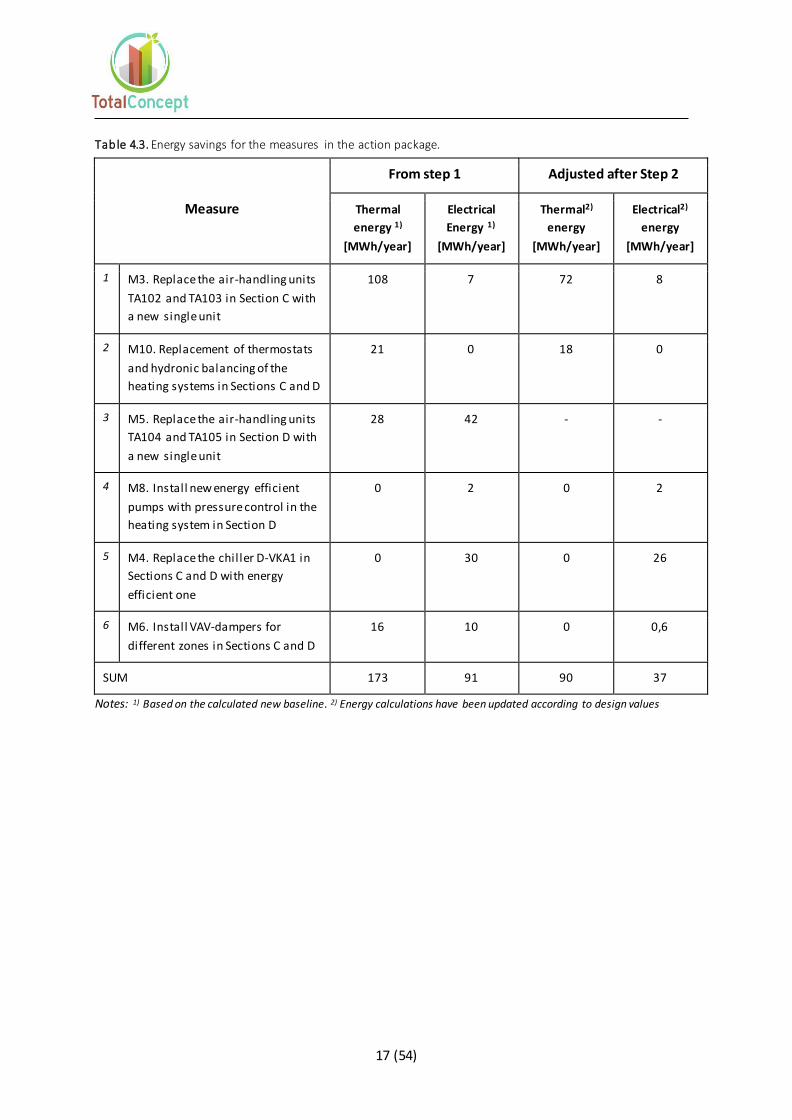
Table 4.3. Energy savings for the measures in the action package.
Measure
From step 1 Adjusted after Step 2
Thermal
energy 1)
[MWh/year]
Electrical
Energy 1)
[MWh/year]
Thermal2)
energy
[MWh/year]
Electrical2)
energy
[MWh/year]
1 M3. Replace the air-handling units
TA102 and TA103 in Section C with
a new single unit
108 7 72 8
2 M10. Replacement of thermostats
and hydronic balancing of the
heating systems in Sections C and D
21 0 18 0
3 M5. Replace the air-handling units
TA104 and TA105 in Section D with
a new single unit
28 42 - -
4 M8. Install new energy efficient
pumps with pressure control in the
heating system in Section D
0 2 0 2
5 M4. Replace the chiller D-VKA1 in
Sections C and D with energy
efficient one
0 30 0 26
6 M6. Install VAV-dampers for
different zones in Sections C and D
16 10 0 0,6
SUM 173 91 90 37
Notes: 1) Based on the calculated new baseline. 2) Energy calculations have been updated according to design values
18 (54)
5. Norrtälje prison, Sweden – Step 3
The Norrtälje prison is a high security institution for male
prisoners. The building of interest – Building 9 – has 8 030 m2
heated floor area and holds several activities. The greater part
of the building is for stock-keeping, carpentry and mechanical
work were wood furniture and all sorts of sheet-metal work is
carried out. The rest of the building is for office and
educational use. Since there is only one energy meter for
district heating for the entire site then the energy use before
measures have been calculated. Based on the calculations, the specific annual energy use for the
building is today about 121 kWh/m2, including electricity for tenants.
According to the energy audit in Step 1, it was difficult to meet the indoor climate requirements set
for the premises. For improving thermal comfort the room temperature set points needed to be
increased in some areas of the building. The new baseline for the total specific annual energy use for
Building 9 will be 128 kWh/m2 yr. The proposed action package in Step 1 contained five energy
efficiency improvement measures. In December 2016 some of the measures have been partly carried
out and some of the measures are ongoing. Therefore, only partial results of the outcomes will be
presented here.
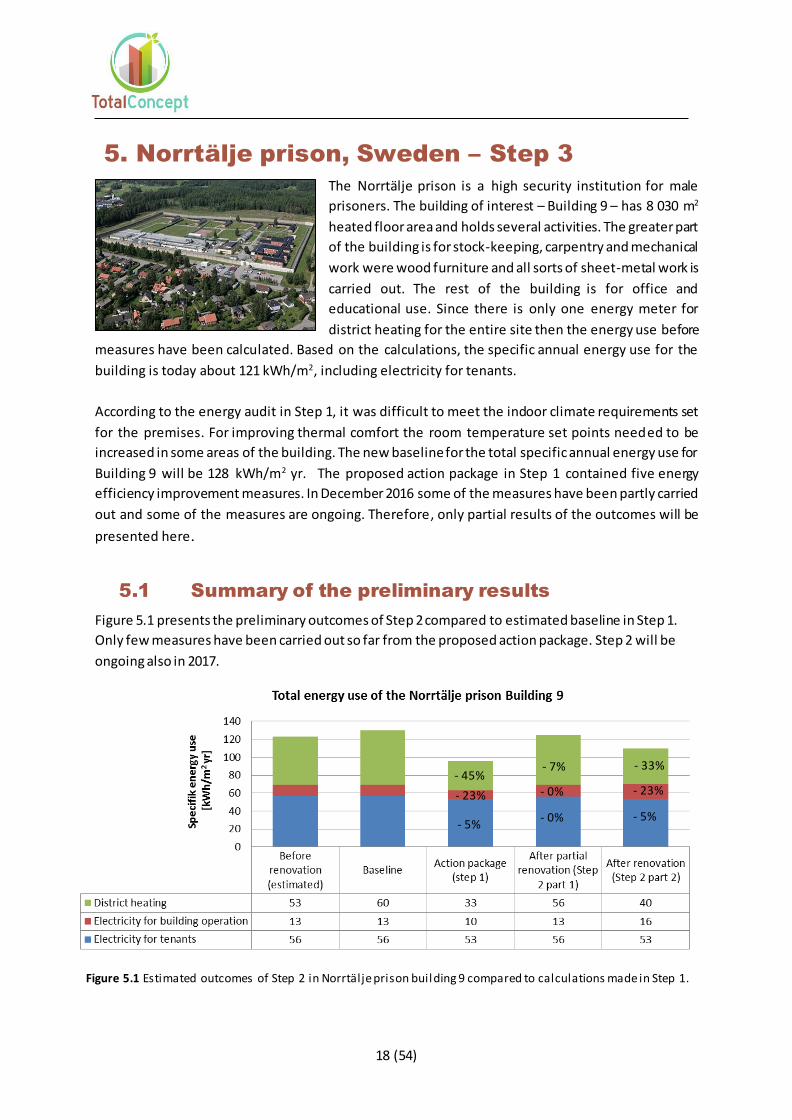
5.1 Summary of the preliminary results
Figure 5.1 presents the preliminary outcomes of Step 2 compared to estimated baseline in Step 1.
Only few measures have been carried out so far from the proposed action package. Step 2 will be
ongoing also in 2017.
Figure 5.1 Estimated outcomes of Step 2 in Norrtälje prison building 9 compared to calculations made in Step 1.
- 45%
- 23%
- 5% - 0%
- 0%
- 7%
- 5%
- 23%
- 33%
19 (54)
According to the estimations, the action package with planned measures in Step 2 will lead to a total
specific energy use of the building of about 110 kWh/m2 per year. The total heat energy use after
renovations will be about 40 kWh/m2 per year and total electricity use about 69 kWh/m2 per year,
where majority is used by the tenants.
With the action package carried in Step 2 the total building energy use is estimated to decrease about
15% compared to the new baseline and about 10% compared to the energy use before renovation.
The energy use for building operation (BBR) will decrease about 23% compared to the baseline and
about 15% compared to measured energy use before renovation.
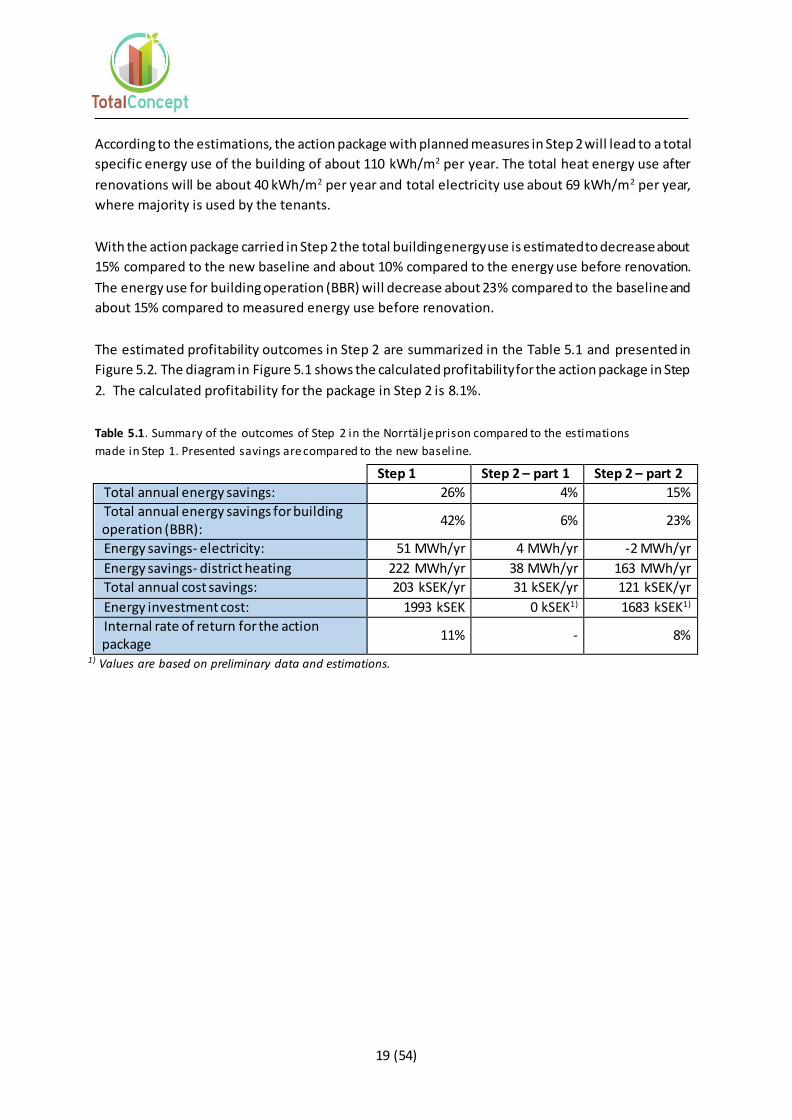
The estimated profitability outcomes in Step 2 are summarized in the Table 5.1 and presented in
Figure 5.2. The diagram in Figure 5.1 shows the calculated profitability for the action package in Step
2. The calculated profitability for the package in Step 2 is 8.1%.
Table 5.1. Summary of the outcomes of Step 2 in the Norrtälje prison compared to the estimations
made in Step 1. Presented savings are compared to the new baseline.
1) Values are based on preliminary data and estimations.
Step 1 Step 2 – part 1 Step 2 – part 2
Total annual energy savings: 26% 4% 15%
Total annual energy savings for building operation (BBR):
42% 6% 23%
Energy savings- electricity: 51 MWh/yr 4 MWh/yr -2 MWh/yr
Energy savings- district heating 222 MWh/yr 38 MWh/yr 163 MWh/yr
Total annual cost savings: 203 kSEK/yr 31 kSEK/yr 121 kSEK/yr
Energy investment cost: 1993 kSEK 0 kSEK1) 1683 kSEK1)
Internal rate of return for the action package
11% - 8%
20 (54)
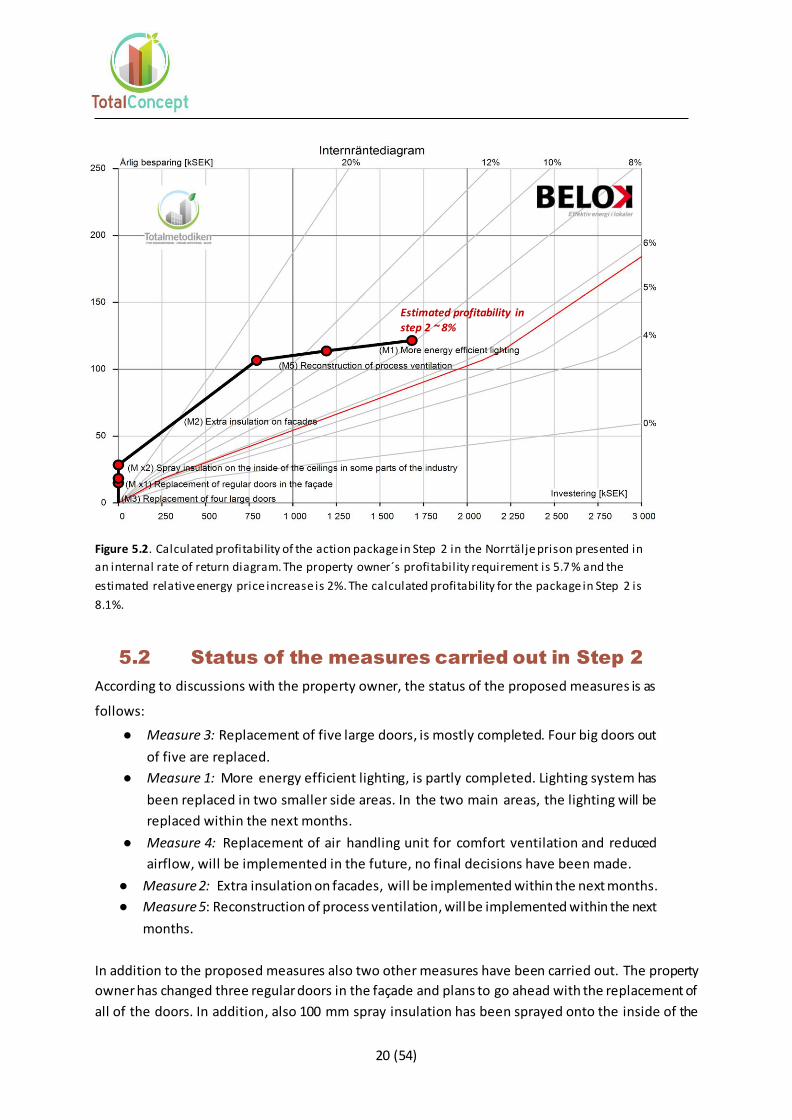
Figure 5.2. Calculated profitability of the action package in Step 2 in the Norrtälje prison presented in
an internal rate of return diagram. The property owner´s profitability requirement is 5.7 % and the
estimated relative energy price increase is 2%. The calculated profitability for the package in Step 2 is
8.1%.
5.2 Status of the measures carried out in Step 2
According to discussions with the property owner, the status of the proposed measures is as
follows:
● Measure 3: Replacement of five large doors, is mostly completed. Four big doors out
of five are replaced.
● Measure 1: More energy efficient lighting, is partly completed. Lighting system has
been replaced in two smaller side areas. In the two main areas, the lighting will be
replaced within the next months.
● Measure 4: Replacement of air handling unit for comfort ventilation and reduced
airflow, will be implemented in the future, no final decisions have been made.
● Measure 2: Extra insulation on facades, will be implemented within the next months.
● Measure 5: Reconstruction of process ventilation, will be implemented within the next
months.
In addition to the proposed measures also two other measures have been carried out. The property
owner has changed three regular doors in the façade and plans to go ahead with the replacement of
all of the doors. In addition, also 100 mm spray insulation has been sprayed onto the inside of the
Estimated profitability in
step 2 ~ 8%
21 (54)
industry area roof (360 m2) and to another part close by (54 m2) to create better insulation and to
improve the acoustics. Furthermore, a small parts of the exterior facade has been insulated with the
spray insulation.
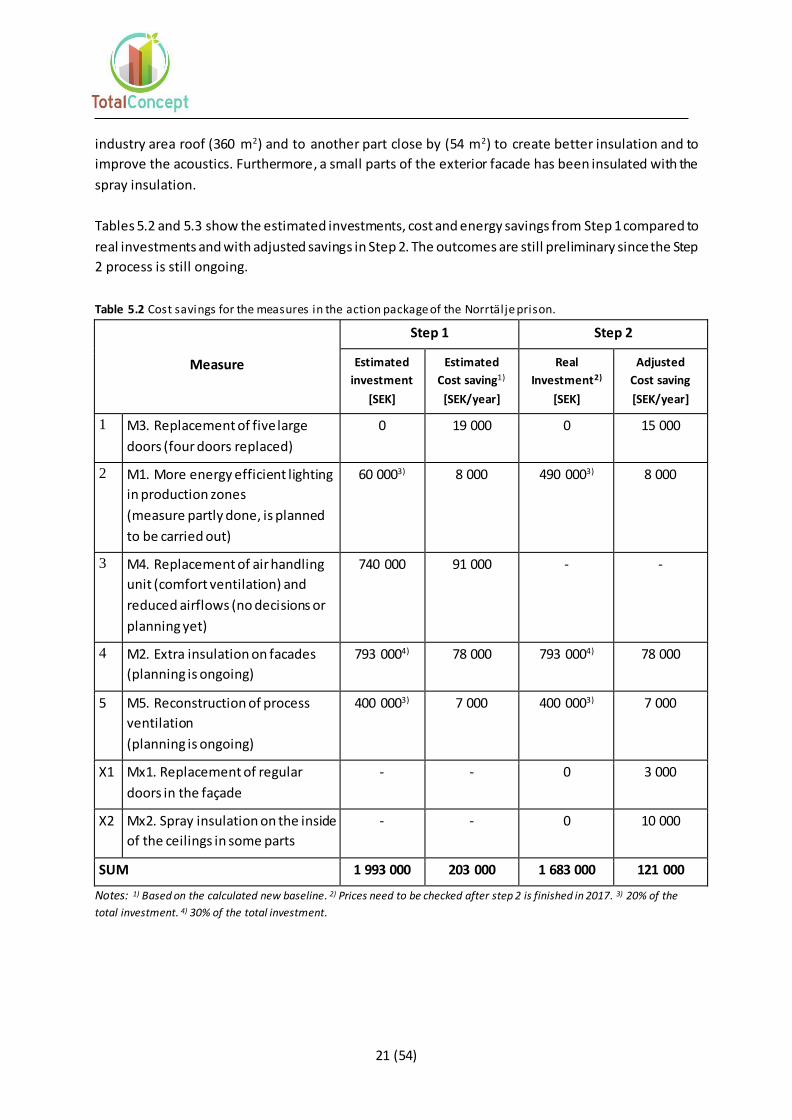
Tables 5.2 and 5.3 show the estimated investments, cost and energy savings from Step 1 compared to
real investments and with adjusted savings in Step 2. The outcomes are still preliminary since the Step
2 process is still ongoing.
Table 5.2 Cost savings for the measures in the action package of the Norrtälje prison.
Measure
Step 1 Step 2
Estimated
investment
[SEK]
Estimated
Cost saving1)
[SEK/year]
Real
Investment2)
[SEK]
Adjusted
Cost saving
[SEK/year]
1 M3. Replacement of five large
doors (four doors replaced)
0 19 000 0 15 000
2 M1. More energy efficient lighting
in production zones
(measure partly done, is planned
to be carried out)
60 0003) 8 000 490 0003) 8 000
3 M4. Replacement of air handling
unit (comfort ventilation) and
reduced airflows (no decisions or
planning yet)
740 000 91 000 - -
4 M2. Extra insulation on facades
(planning is ongoing)
793 0004) 78 000 793 0004) 78 000
5 M5. Reconstruction of process
ventilation
(planning is ongoing)
400 0003) 7 000 400 0003) 7 000
X1 Mx1. Replacement of regular
doors in the façade
- - 0 3 000
X2 Mx2. Spray insulation on the inside
of the ceilings in some parts
- - 0 10 000
SUM 1 993 000 203 000 1 683 000 121 000
Notes: 1) Based on the calculated new baseline. 2) Prices need to be checked after step 2 is finished in 2017. 3) 20% of the
total investment. 4) 30% of the total investment.
22 (54)
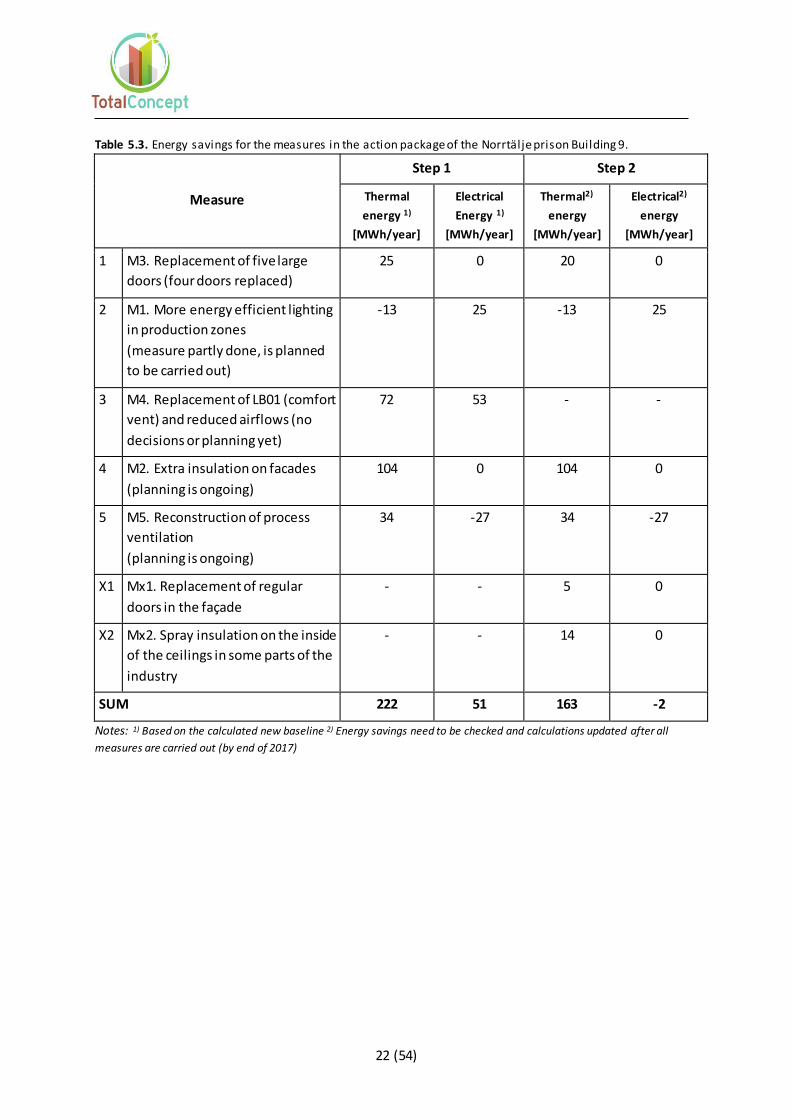
Table 5.3. Energy savings for the measures in the action package of the Norrtälje prison Building 9.
Measure
Step 1 Step 2
Thermal
energy 1)
[MWh/year]
Electrical
Energy 1)
[MWh/year]
Thermal2)
energy
[MWh/year]
Electrical2)
energy
[MWh/year]
1 M3. Replacement of five large
doors (four doors replaced)
25 0 20 0
2 M1. More energy efficient lighting
in production zones
(measure partly done, is planned
to be carried out)
-13 25 -13 25
3 M4. Replacement of LB01 (comfort
vent) and reduced airflows (no
decisions or planning yet)
72 53 - -
4 M2. Extra insulation on facades
(planning is ongoing)
104 0 104 0
5 M5. Reconstruction of process
ventilation
(planning is ongoing)
34 -27 34 -27
X1 Mx1. Replacement of regular
doors in the façade
- - 5 0
X2 Mx2. Spray insulation on the inside
of the ceilings in some parts of the
industry
- - 14 0
SUM 222 51 163 -2
Notes: 1) Based on the calculated new baseline 2) Energy savings need to be checked and calculations updated after all
measures are carried out (by end of 2017)
23 (54)
6. Segevångs school, Sweden – Step 1
The Segevångs school is an elementary school located in
Malmö. The property consists of six buildings: Building A, B, C,
D, E and F. Most of the buildings were built in the 1960s. Two of
the buildings were built or fully renovated in 2006 (Buildings E
and F). The buildings incorporate classrooms, gymnastic hall and
a canteen for about 260 students in total.
Measured total energy use of the building in 2011-2014 was in
an average about 186 kWh/m2 per year inclusive tenants’
electricity (corrected to normal year). According to the energy audit, it can be diff icult to meet the
indoor climate requirements set for the school premises with the current system solutions in Buildings
B, C and D. Therefore, upgrading of ventilation systems is recommended. The new baseline will be
about 167 kWh/m² per year inclusive tenants’ electricity.
The proposed action package in Step 1 included the following measures:
• Optimizing the ventilation system in Building B
• New thermostats and hydronic balancing of the heating systems in Building A, B, C and D
• Occupancy control of the lighting system in the corridors and additional areas in Building B
• Installation of supply and exhaust air system with heat recovery and demand controlled
ventilation in Building B, C and D
• New energy efficient tap water fixtures in the toilets
• Occupancy control of the lighting system in the corridors and additional areas
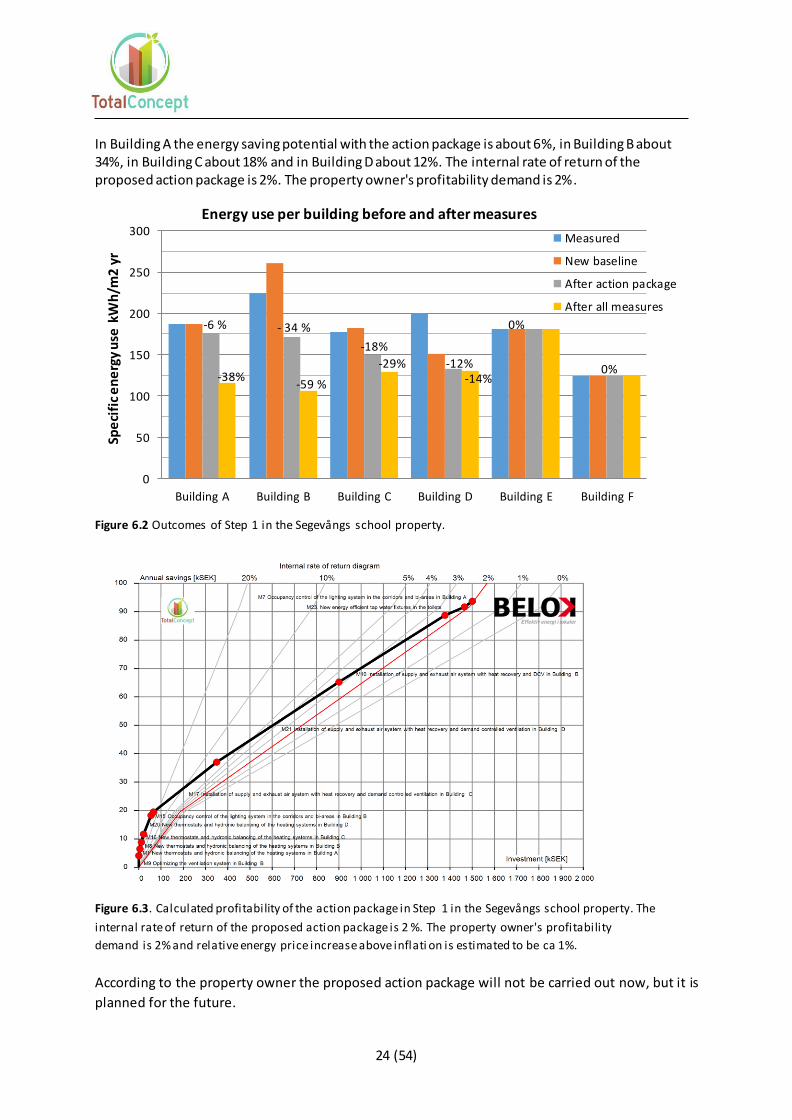
The total energy saving potential with the proposed action package is approximately 12% compared
to the new baseline. Annual district heating use can be reduced by 12% and electricity use by 13%.
Figure 6.1 Outcomes of Step 1 in the Segevångs school property.
0
20
40
60
80
100
120
140
160
180
200
Measured New baseline After action
package
Spe
cifi
c e
ne
rgy
use
[kW
h/m
2 y
r]
Total energy use of the Segevångs school property
Electricity (total)
District heating
-13 %
-12 %
24 (54)
In Building A the energy saving potential with the action package is about 6%, in Building B about 34%, in Building C about 18% and in Building D about 12%. The internal rate of return of the proposed action package is 2%. The property owner's profitability demand is 2%.
Figure 6.2 Outcomes of Step 1 in the Segevångs school property.
Figure 6.3. Calculated profitability of the action package in Step 1 in the Segevångs school property. The
internal rate of return of the proposed action package is 2 %. The property owner's profitability
demand is 2% and relative energy price increase above inflati on is estimated to be ca 1%.
According to the property owner the proposed action package will not be carried out now, but it is
planned for the future.
0
50
100
150
200
250
300
Building A Building B Building C Building D Building E Building F
Spe
cifi
c e
ne
rgy
use
kW
h/m
2 yr
Energy use per building before and after measures
Measured
New baseline
After action package
After all measures
-6 %
-38%
- 34 %
-59 %
-18%
-29% -12%-14%
0%
0%
25 (54)
7. Town hall of Ballerup, Denmark – Step 1
The office and administration building is owned by and situated
in Ballerup municipality in Denmark. It is built 1975. The building
occupies 600 persons on a heated floor area of 17000 m². There
was one major extension and refurbishment of the building and
the building service systems in 2011.
Baseline energy use was 155 kWh/m2. The following action
package was identified:
Exchanging windows
Optimization of BMS system, including heating, lighting, ventilation and solar shading
Photovoltaic
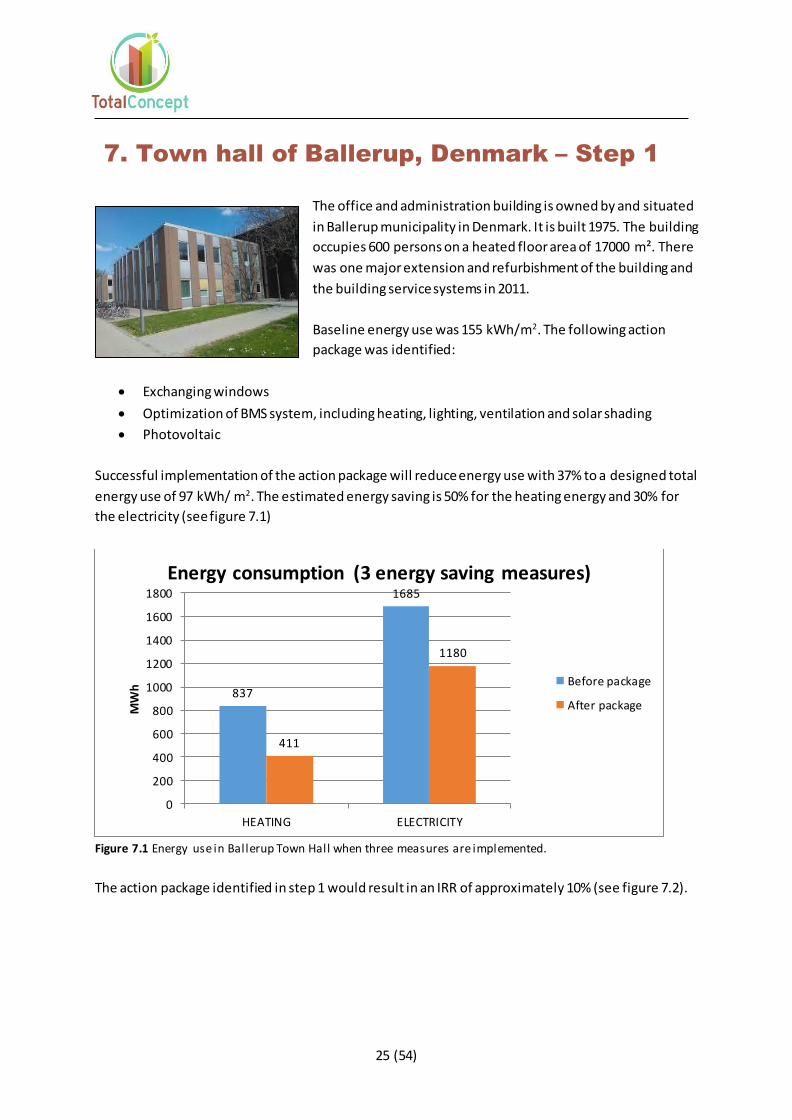
Successful implementation of the action package will reduce energy use with 37% to a designed total
energy use of 97 kWh/ m2. The estimated energy saving is 50% for the heating energy and 30% for
the electricity (see figure 7.1)
Figure 7.1 Energy use in Ballerup Town Hall when three measures are implemented.
The action package identified in step 1 would result in an IRR of approximately 10% (see figure 7.2).
837
1685
411
1180
0
200
400
600
800
1000
1200
1400
1600
1800
HEATING ELECTRICITY
MW
h
Energy consumption (3 energy saving measures)
Before package
After package
26 (54)
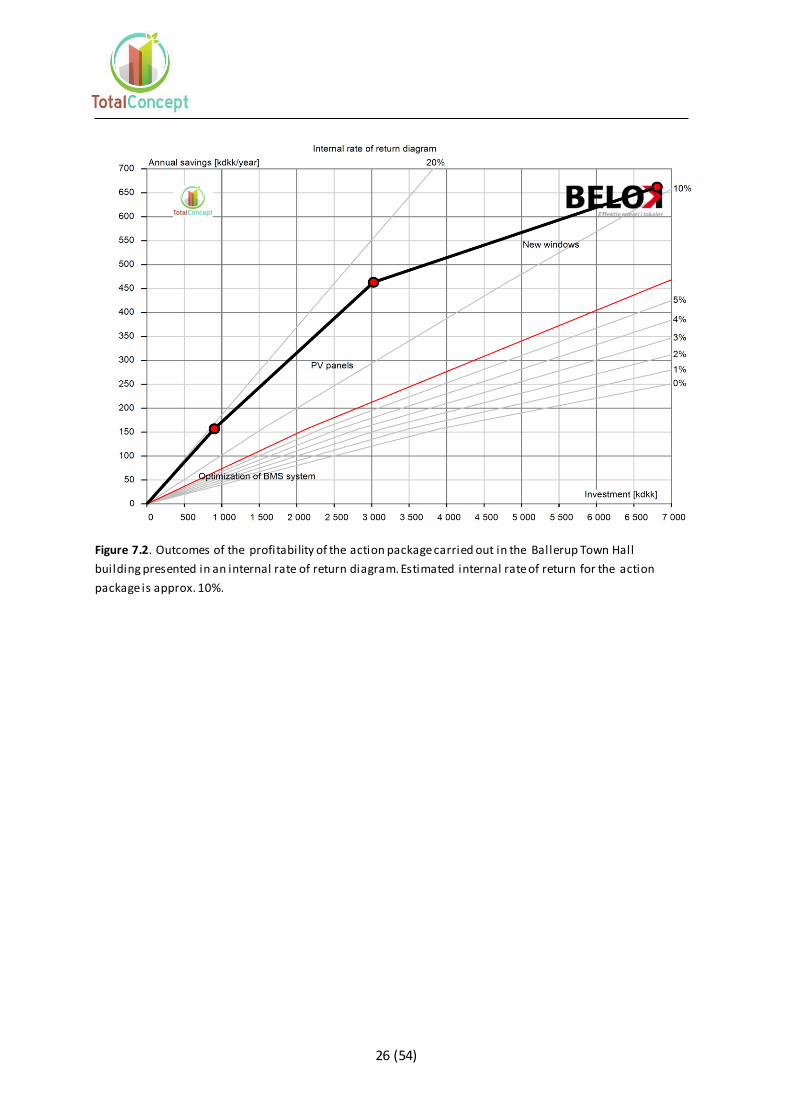
Figure 7.2. Outcomes of the profitability of the action package carried out in the Ballerup Town Hall
building presented in an internal rate of return diagram. Estimated internal rate of return for the action
package is approx. 10%.
27 (54)
8. Lyngby Port, Denmark – Step 3
Lyngby Port is an office building in portfolio of a Danish
property company Nordea Ejendomme. The building is built
in 1992 and divided into 3 building segments; A, B and C at
Lyngby Hovedgade 94, 96 and 98 - each of them have main
energy meters installed. In Lyngby Port segment A has seven
floors, B has six floors and C has five floors.
Before renovation the building consisted of cell offices
grouped in modules and had several tenants. The intensity of
occupancy was around 25m2 per person. The office building Lyngby Port was prepared for a new tenant
in larger parts of the building with more open office areas and higher number of employees.
Total measured energy use before renovations was 2549 MWh (124 kWh/m2) per year (including
tenants’ electricity). Due to planned tenant adjustments of indoor climate and number of occupants
that requires a higher ventilation rate, the energy use of the building was estimated to increase to
about 2703 MWh (131 kWh/m2) per year. This was set as a new baseline for energy efficiency
measures. The proposed action package in Step 1 contained seven energy saving measures, which were
planned to be carried out as part of the upcoming renovation for the tenant adjustments. Four of the
six suggested measures were carried out in Step 2 with some modifications to the initial plans.
The renovation finished entirely in 2016 only for section A and B of the building. Furthermore , section
A remained empty in 2016. The renovation in section C finished in October 2016. The presented results
are therefore only valid for section B (and partly section C) and they were scaled for section A and C.
The scaling of the results from section B is based on assumption that the energy decrease w ould be
similar in section A and C when fully occupied.
8.1 Summary of the results
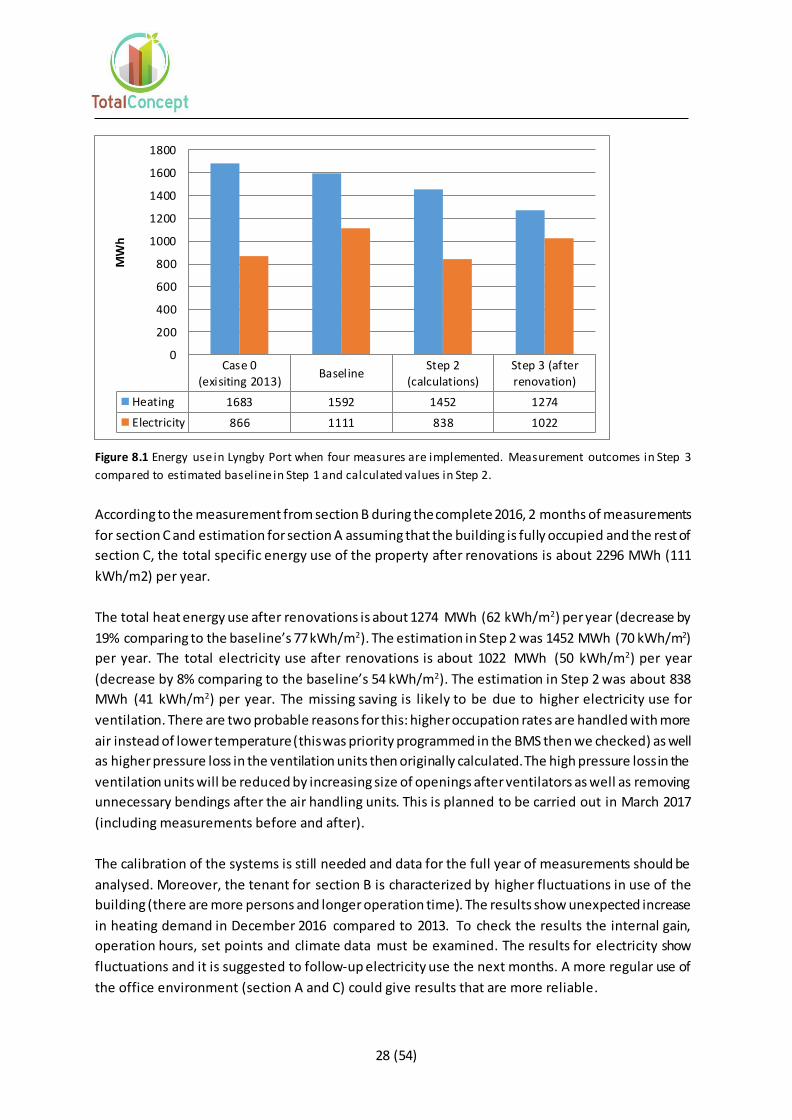
Figure 8.1 presents the measurement outcomes in Step 3 compared to estimated baseline in Step 1
and calculated values in Step 2.
28 (54)
Figure 8.1 Energy use in Lyngby Port when four measures are implemented. Measurement outcomes in Step 3
compared to estimated baseline in Step 1 and calculated values in Step 2.
According to the measurement from section B during the complete 2016, 2 months of measurements
for section C and estimation for section A assuming that the building is fully occupied and the rest of
section C, the total specific energy use of the property after renovations is about 2296 MWh (111
kWh/m2) per year.
The total heat energy use after renovations is about 1274 MWh (62 kWh/m2) per year (decrease by
19% comparing to the baseline’s 77 kWh/m2). The estimation in Step 2 was 1452 MWh (70 kWh/m2)
per year. The total electricity use after renovations is about 1022 MWh (50 kWh/m2) per year
(decrease by 8% comparing to the baseline’s 54 kWh/m2). The estimation in Step 2 was about 838
MWh (41 kWh/m2) per year. The missing saving is likely to be due to higher electricity use for
ventilation. There are two probable reasons for this: higher occupation rates are handled with more
air instead of lower temperature (this was priority programmed in the BMS then we checked) as well
as higher pressure loss in the ventilation units then originally calculated. The high pressure loss in the
ventilation units will be reduced by increasing size of openings after ventilators as well as removing
unnecessary bendings after the air handling units. This is planned to be carried out in March 2017
(including measurements before and after).
The calibration of the systems is still needed and data for the full year of measurements should be
analysed. Moreover, the tenant for section B is characterized by higher fluctuations in use of the
building (there are more persons and longer operation time). The results show unexpected increase
in heating demand in December 2016 compared to 2013. To check the results the internal gain,
operation hours, set points and climate data must be examined. The results for electricity show
fluctuations and it is suggested to follow-up electricity use the next months. A more regular use of
the office environment (section A and C) could give results that are more reliable.
Case 0
(exisiting 2013)Baseline
Step 2
(calculations)
Step 3 (after
renovation)
Heating 1683 1592 1452 1274
Electricity 866 1111 838 1022
0
200
400
600
800
1000
1200
1400
1600
1800
MW
h

29 (54)
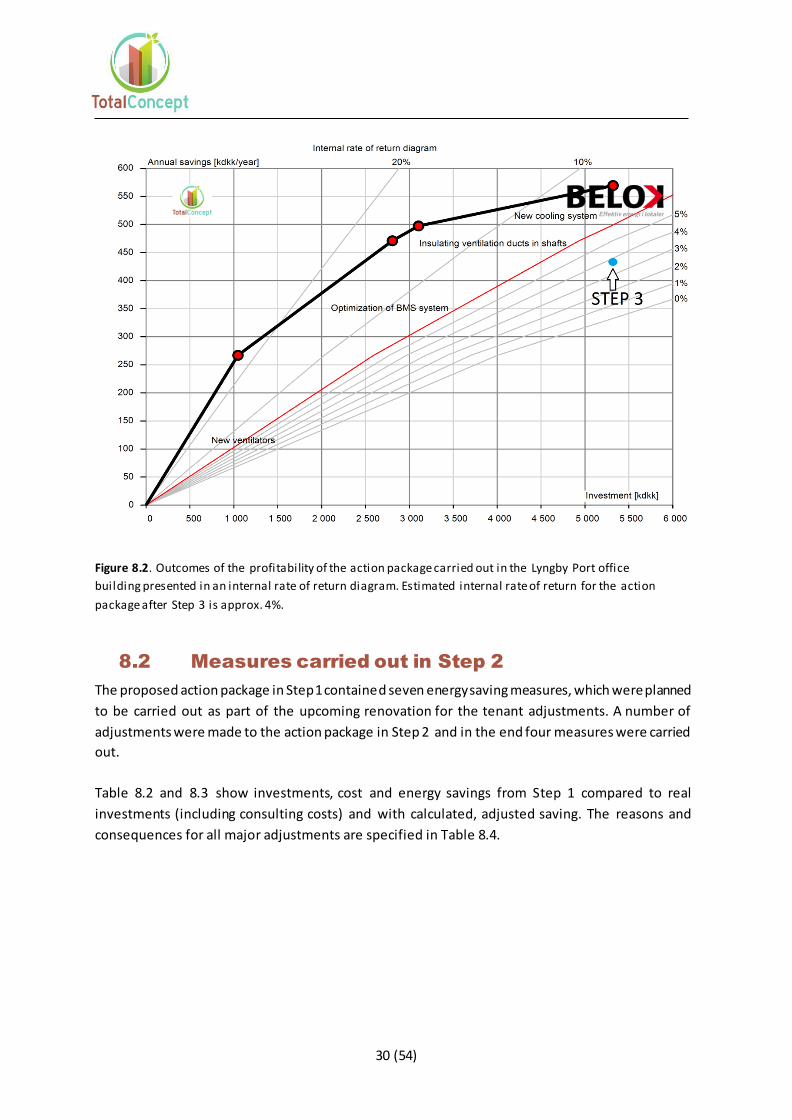
For the action package carried out in Step 2, the total building energy use was estimated to be with
the internal rate of return about 8%. The measured/scaled outcomes in Step 3 show that the savings
for now will give an internal rate of return of 4%. The result is only informative as there are still some
unclarified issues. After solving the problem with high pressure loss in the ventilation system, the
internal rate of return will be higher.
The actual profitability outcomes are presented in Table 8.1 below. The diagram in Figure 8.2 shows
the calculated profitability for the action package in Step 2 together with the true profitability that
was calculated after Step 3.
Table 8.1. Summary of the outcomes of the action package carried out in Lyngby Port compared to the
estimations made in Step 2. Presented savings are compared to the baseline.
Step 2 Step 3
Total annual energy savings: 15% 15%
Calculated energy savings – district heating:
140 MWh/yr 318 MWh/yr
Calculated energy savings – electricity: 273 MWh/yr 89 MWh/yr
Total annual cost savings: 72 kEUR/yr 29 kEUR/yr (+ maintenance costs)
Internal rate of return for the package: 8% 4%
30 (54)
Figure 8.2. Outcomes of the profitability of the action package carried out in the Lyngby Port office
building presented in an internal rate of return diagram. Estimated internal rate of return for the action
package after Step 3 is approx. 4%.
8.2 Measures carried out in Step 2
The proposed action package in Step 1 contained seven energy saving measures, which were planned
to be carried out as part of the upcoming renovation for the tenant adjustments. A number of
adjustments were made to the action package in Step 2 and in the end four measures were carried
out.
Table 8.2 and 8.3 show investments, cost and energy savings from Step 1 compared to real
investments (including consulting costs) and with calculated, adjusted saving. The reasons and
consequences for all major adjustments are specified in Table 8.4.
31 (54)
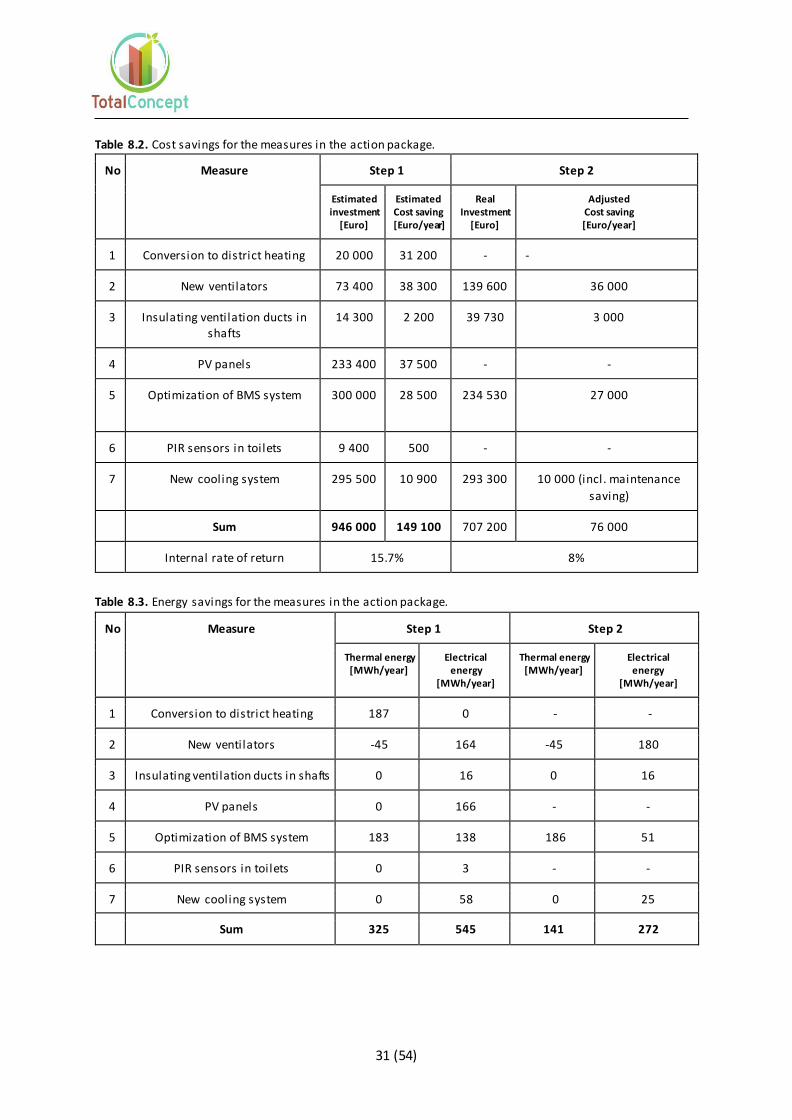
Table 8.2. Cost savings for the measures in the action package.
No Measure Step 1 Step 2
Estimated investment
[Euro]
Estimated Cost saving [Euro/year]
Real Investment
[Euro]
Adjusted Cost saving [Euro/year]
1 Conversion to district heating 20 000 31 200 - -
2 New ventilators 73 400 38 300 139 600 36 000
3 Insulating ventilation ducts in shafts
14 300 2 200 39 730 3 000
4 PV panels 233 400 37 500 - -
5 Optimization of BMS system 300 000 28 500 234 530 27 000
6 PIR sensors in toilets 9 400 500 - -
7 New cooling system 295 500 10 900 293 300 10 000 (incl. maintenance
saving)
Sum 946 000 149 100 707 200 76 000
Internal rate of return 15.7% 8%
Table 8.3. Energy savings for the measures in the action package.
No Measure Step 1 Step 2
Thermal energy [MWh/year]
Electrical energy
[MWh/year]
Thermal energy [MWh/year]
Electrical energy
[MWh/year]
1 Conversion to district heating 187 0 - -
2 New ventilators -45 164 -45 180
3 Insulating ventilation ducts in shafts 0 16 0 16
4 PV panels 0 166 - -
5 Optimization of BMS system 183 138 186 51
6 PIR sensors in toilets 0 3 - -
7 New cooling system 0 58 0 25
Sum 325 545 141 272
32 (54)
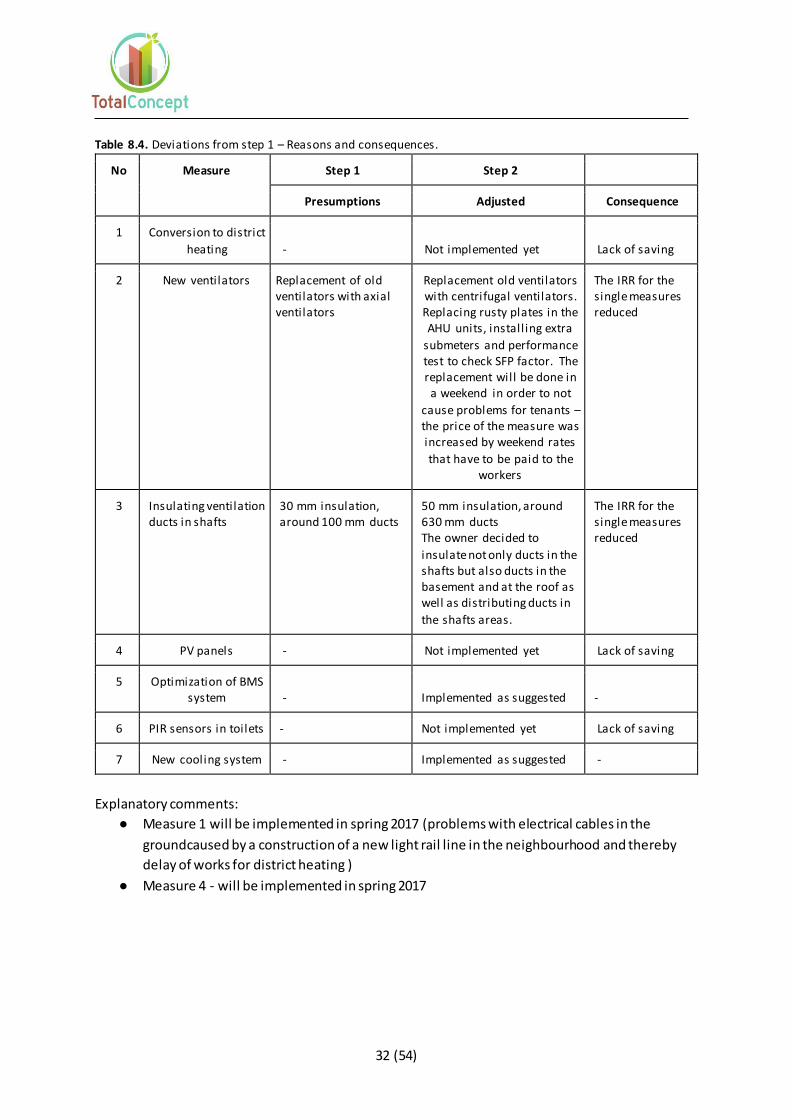
Table 8.4. Deviations from step 1 – Reasons and consequences.
No Measure Step 1 Step 2
Presumptions Adjusted Consequence
1 Conversion to district
heating - Not implemented yet Lack of saving
2 New ventilators Replacement of old ventilators with axial ventilators
Replacement old ventilators with centrifugal ventilators. Replacing rusty plates in the AHU units, install ing extra
submeters and performance test to check SFP factor. The replacement will be done in
a weekend in order to not
cause problems for tenants – the price of the measure was increased by weekend rates
that have to be paid to the workers
The IRR for the single measures reduced
3 Insulating ventilation ducts in shafts
30 mm insulation, around 100 mm ducts
50 mm insulation, around 630 mm ducts The owner decided to
insulate not only ducts in the shafts but also ducts in the basement and at the roof as well as distributing ducts in
the shafts areas.
The IRR for the single measures reduced
4 PV panels - Not implemented yet Lack of saving
5 Optimization of BMS system - Implemented as suggested -
6 PIR sensors in toilets - Not implemented yet Lack of saving
7 New cooling system - Implemented as suggested -
Explanatory comments:
● Measure 1 will be implemented in spring 2017 (problems with electrical cables in the
groundcaused by a construction of a new light rail line in the neighbourhood and thereby
delay of works for district heating )
● Measure 4 - will be implemented in spring 2017
33 (54)
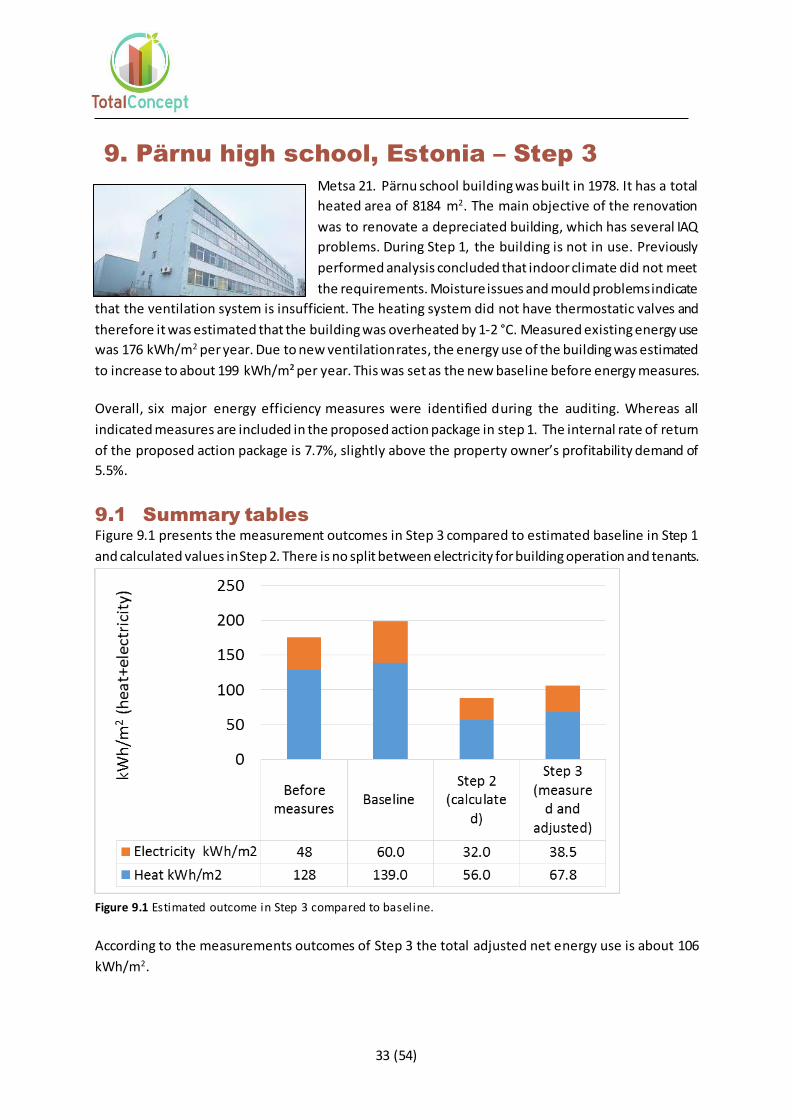
9. Pärnu high school, Estonia – Step 3
Metsa 21. Pärnu school building was built in 1978. It has a total
heated area of 8184 m2. The main objective of the renovation
was to renovate a depreciated building, which has several IAQ
problems. During Step 1, the building is not in use. Previously
performed analysis concluded that indoor climate did not meet
the requirements. Moisture issues and mould problems indicate
that the ventilation system is insufficient. The heating system did not have thermostatic valves and
therefore it was estimated that the building was overheated by 1-2 °C. Measured existing energy use
was 176 kWh/m2 per year. Due to new ventilation rates, the energy use of the building was estimated
to increase to about 199 kWh/m² per year. This was set as the new baseline before energy measures.
Overall, six major energy efficiency measures were identified during the auditing. Whereas all
indicated measures are included in the proposed action package in step 1. The internal rate of return
of the proposed action package is 7.7%, slightly above the property owner’s profitability demand of
5.5%.
9.1 Summary tables
Figure 9.1 presents the measurement outcomes in Step 3 compared to estimated baseline in Step 1
and calculated values in Step 2. There is no split between electricity for building operation and tenants.
Figure 9.1 Estimated outcome in Step 3 compared to baseline.
According to the measurements outcomes of Step 3 the total adjusted net energy use is about 106
kWh/m2.
34 (54)
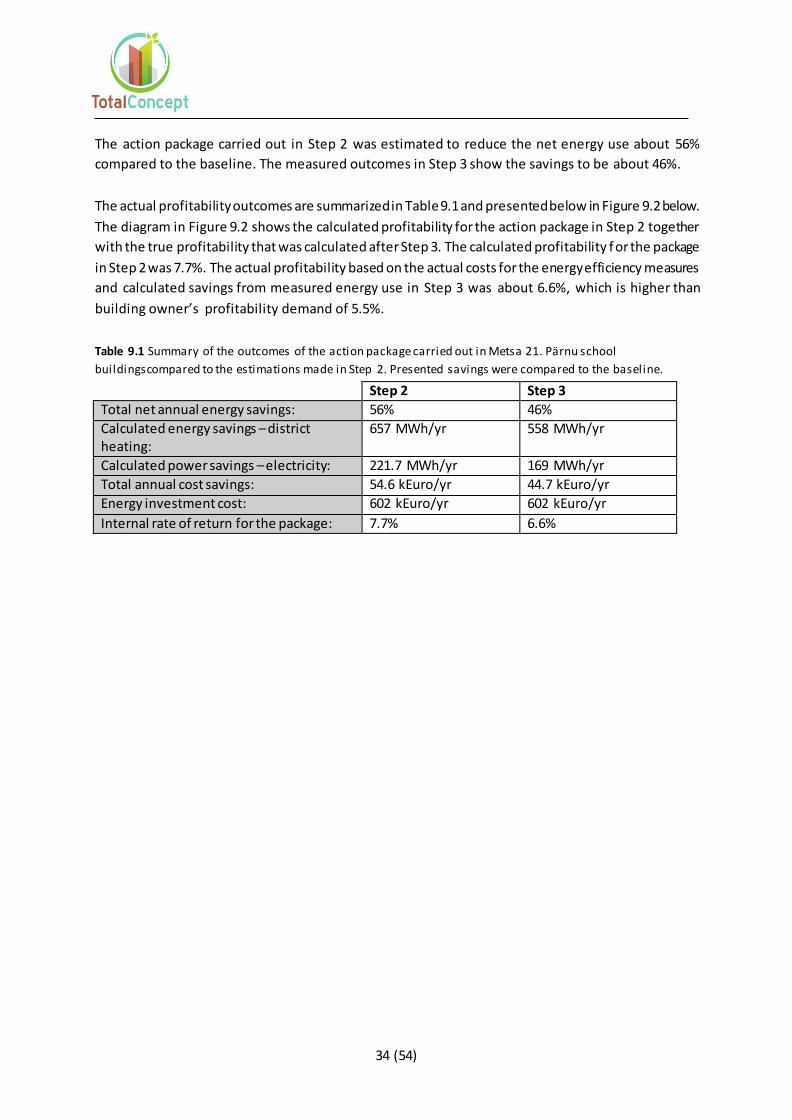
The action package carried out in Step 2 was estimated to reduce the net energy use about 56%
compared to the baseline. The measured outcomes in Step 3 show the savings to be about 46%.
The actual profitability outcomes are summarized in Table 9.1 and presented below in Figure 9.2 below.
The diagram in Figure 9.2 shows the calculated profitability for the action package in Step 2 together
with the true profitability that was calculated after Step 3. The calculated profitability f or the package
in Step 2 was 7.7%. The actual profitability based on the actual costs for the energy efficiency measures
and calculated savings from measured energy use in Step 3 was about 6.6%, which is higher than
building owner’s profitability demand of 5.5%.
Table 9.1 Summary of the outcomes of the action package carried out in Metsa 21. Pärnu school
buildingscompared to the estimations made in Step 2. Presented savings were compared to the baseline.
Step 2 Step 3
Total net annual energy savings: 56% 46%
Calculated energy savings – district heating:
657 MWh/yr 558 MWh/yr
Calculated power savings – electricity: 221.7 MWh/yr 169 MWh/yr
Total annual cost savings: 54.6 kEuro/yr 44.7 kEuro/yr
Energy investment cost: 602 kEuro/yr 602 kEuro/yr
Internal rate of return for the package: 7.7% 6.6%
35 (54)
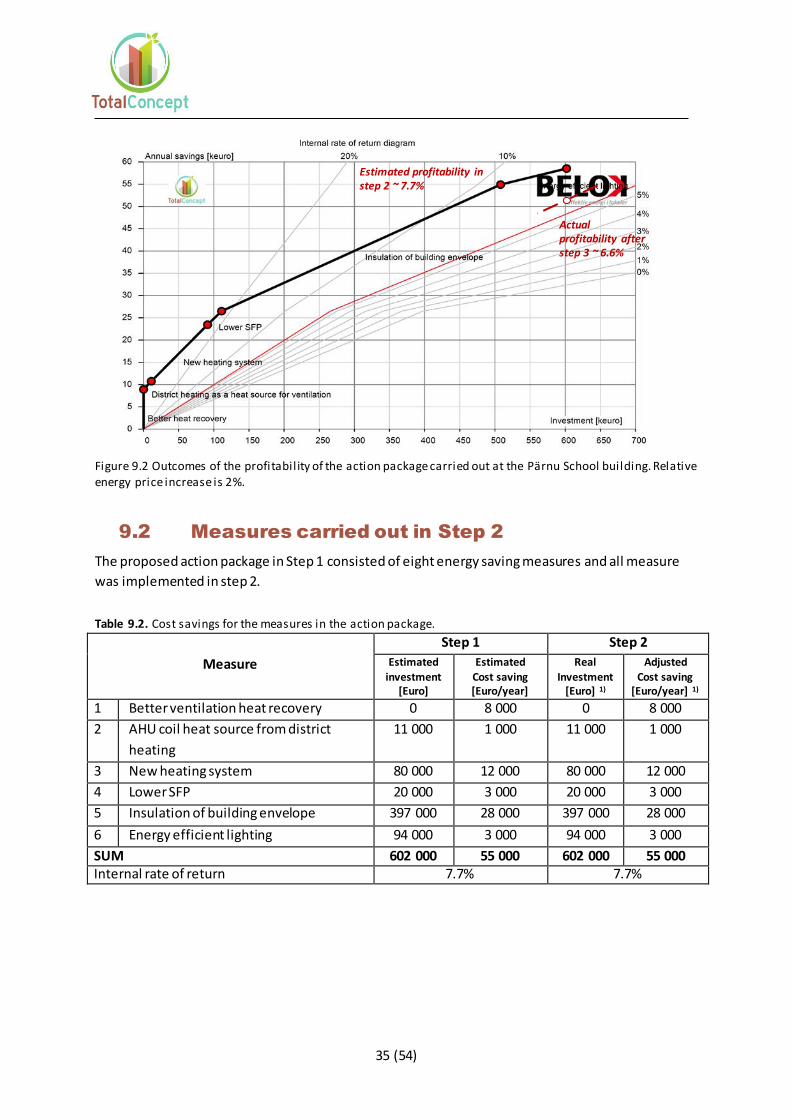
Figure 9.2 Outcomes of the profitability of the action package carried out at the Pärnu School building. Relative energy price increase is 2%.
9.2 Measures carried out in Step 2
The proposed action package in Step 1 consisted of eight energy saving measures and all measure
was implemented in step 2.
Table 9.2. Cost savings for the measures in the action package.
Measure
Step 1 Step 2
Estimated investment
[Euro]
Estimated Cost saving [Euro/year]
Real Investment
[Euro] 1)
Adjusted Cost saving
[Euro/year] 1)
1 Better ventilation heat recovery 0 8 000 0 8 000
2 AHU coil heat source from district
heating
11 000 1 000 11 000 1 000
3 New heating system 80 000 12 000 80 000 12 000
4 Lower SFP 20 000 3 000 20 000 3 000
5 Insulation of building envelope 397 000 28 000 397 000 28 000
6 Energy efficient lighting 94 000 3 000 94 000 3 000
SUM 602 000 55 000 602 000 55 000 Internal rate of return 7.7% 7.7%
Actual profitability after step 3 ~ 6.6%
Estimated profitability in step 2 ~ 7.7%
36 (54)
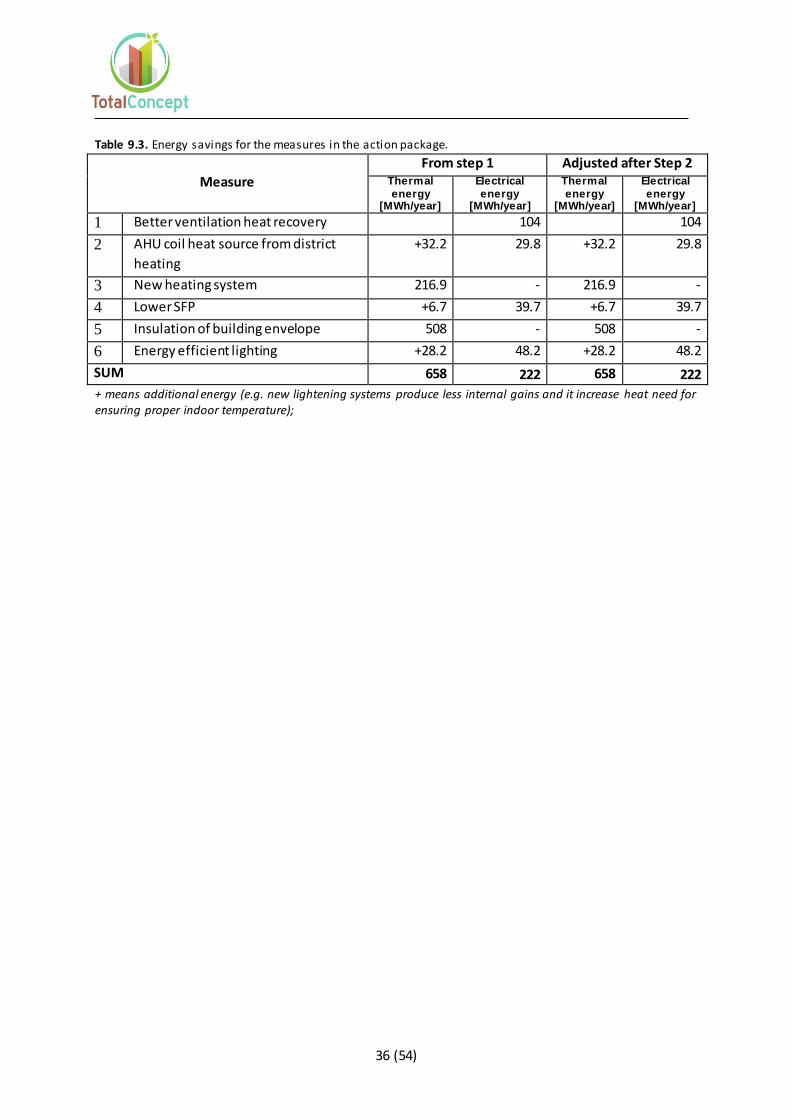
Table 9.3. Energy savings for the measures in the action package.
Measure
From step 1 Adjusted after Step 2 Thermal
energy [MWh/year]
Electrical energy
[MWh/year]
Thermal
energy [MWh/year]
Electrical energy
[MWh/year] 1 Better ventilation heat recovery 104 104
2 AHU coil heat source from district
heating
+32.2 29.8 +32.2 29.8
3 New heating system 216.9 - 216.9 -
4 Lower SFP +6.7 39.7 +6.7 39.7
5 Insulation of building envelope 508 - 508 -
6 Energy efficient lighting +28.2 48.2 +28.2 48.2
SUM 658 222 658 222
+ means additional energy (e.g. new lightening systems produce less internal gains and it increase heat need for ensuring proper indoor temperature);

37 (54)
10. Kiriku 2/4, Estonia – Step 3
Kiriku 2-4. Tallinn office building was built in 18th century. It
has a total heated area of 1877 m2.
The main objective of the renovation was to renovate an
empty depreciated building with a perfect location in
medieval city centre. Measured existing energy use was 282
kWh/m2 per year. Due to new ventilation rates, the energy
use of the building was estimated to increase to about 376
kWh/m² per year. This was set as the new baseline before
energy measures.
Overall, seven major energy efficiency measures were identified during the auditing. Whereas all
indicated measures are included in the proposed action package in Step 1. The internal rate of return
of the proposed action package is negative, below the property owner’s profitability demand of 5.5%
but the main objective of the owner is to renovate the building.
10.1 Summary tables
Figure 10.1 presents the measurement outcomes in Step 3 compared to estimated baseline in Step 1
and calculated values in Step 2. There is no split between electricity for building operation and tenants.
Figure 10.1. Estimated outcome in Step 3 compared to baseline.
According to the measurements outcomes of Step 3 the total net energy use is about 268 kWh/m2.
The action package carried out in Step 2 was estimated to reduce the net energy use about 41%
compared to baseline. The measured outcomes in Step 3 show the savings to be about 28%.
The actual profitability outcomes are summarized in Table 10.1 and presented in Figure 10.2 below.
The diagram in Figure 10.2 shows the calculated profitability for the action package in Step 2 together
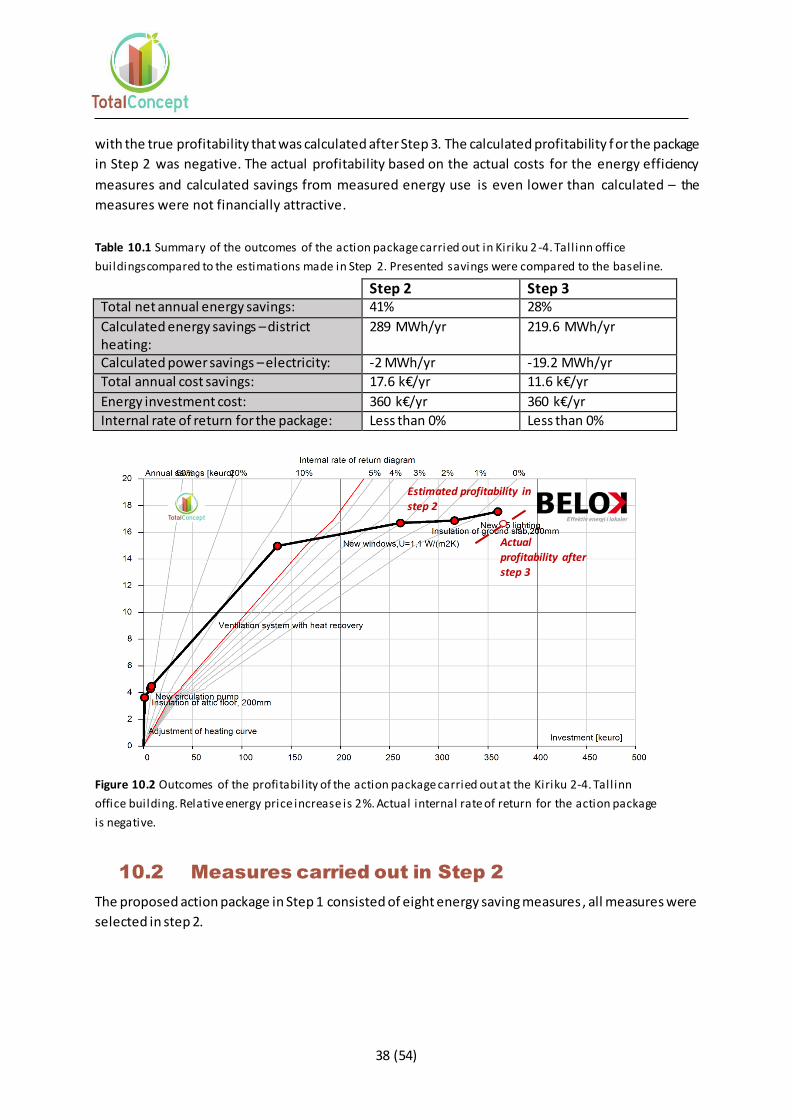
38 (54)
with the true profitability that was calculated after Step 3. The calculated profitability f or the package
in Step 2 was negative. The actual profitability based on the actual costs for the energy efficiency
measures and calculated savings from measured energy use is even lower than calculated – the
measures were not financially attractive.
Table 10.1 Summary of the outcomes of the action package carried out in Kiriku 2 -4. Tall inn office
buildingscompared to the estimations made in Step 2. Presented savings were compared to the baseline.
Figure 10.2 Outcomes of the profitability of the action package carried out at the Kiriku 2-4. Tall inn
office building. Relative energy price increase is 2%. Actual internal rate of return for the action package
is negative.
10.2 Measures carried out in Step 2
The proposed action package in Step 1 consisted of eight energy saving measures, all measures were
selected in step 2.
Step 2 Step 3 Total net annual energy savings: 41% 28%
Calculated energy savings – district heating:
289 MWh/yr 219.6 MWh/yr
Calculated power savings – electricity: -2 MWh/yr -19.2 MWh/yr
Total annual cost savings: 17.6 k€/yr 11.6 k€/yr
Energy investment cost: 360 k€/yr 360 k€/yr
Internal rate of return for the package: Less than 0% Less than 0%
Actual profitability after step 3
Estimated profitability in
step 2
39 (54)
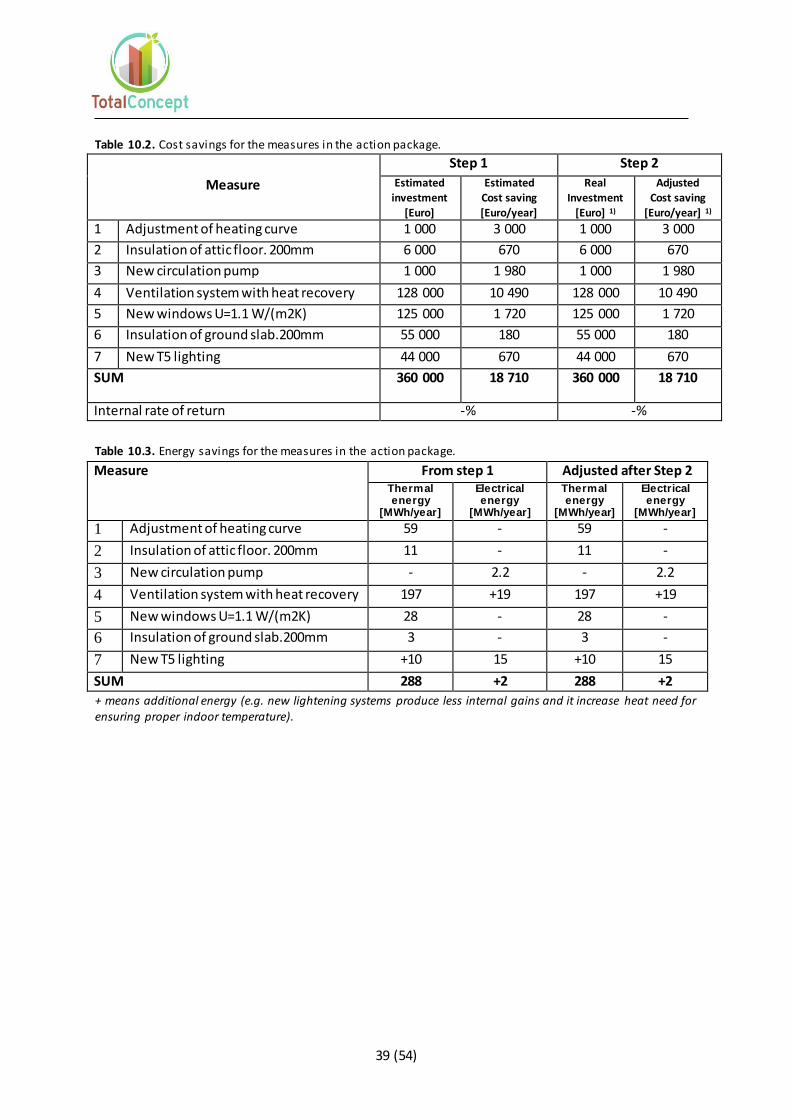
Table 10.2. Cost savings for the measures in the action package.
Measure
Step 1 Step 2
Estimated investment
[Euro]
Estimated Cost saving
[Euro/year]
Real Investment
[Euro] 1)
Adjusted Cost saving
[Euro/year] 1)
1 Adjustment of heating curve 1 000 3 000 1 000 3 000
2 Insulation of attic floor. 200mm 6 000 670 6 000 670
3 New circulation pump 1 000 1 980 1 000 1 980
4 Ventilation system with heat recovery 128 000 10 490 128 000 10 490
5 New windows U=1.1 W/(m2K) 125 000 1 720 125 000 1 720
6 Insulation of ground slab.200mm 55 000 180 55 000 180
7 New T5 lighting 44 000 670 44 000 670
SUM 360 000 18 710 360 000 18 710
Internal rate of return -% -%
Table 10.3. Energy savings for the measures in the action package.
Measure From step 1 Adjusted after Step 2 Thermal energy
[MWh/year]
Electrical energy
[MWh/year]
Thermal energy
[MWh/year]
Electrical energy
[MWh/year] 1 Adjustment of heating curve 59 - 59 -
2 Insulation of attic floor. 200mm 11 - 11 -
3 New circulation pump - 2.2 - 2.2
4 Ventilation system with heat recovery 197 +19 197 +19
5 New windows U=1.1 W/(m2K) 28 - 28 -
6 Insulation of ground slab.200mm 3 - 3 -
7 New T5 lighting +10 15 +10 15
SUM 288 +2 288 +2
+ means additional energy (e.g. new lightening systems produce less internal gains and it increase heat need for ensuring proper indoor temperature).
40 (54)
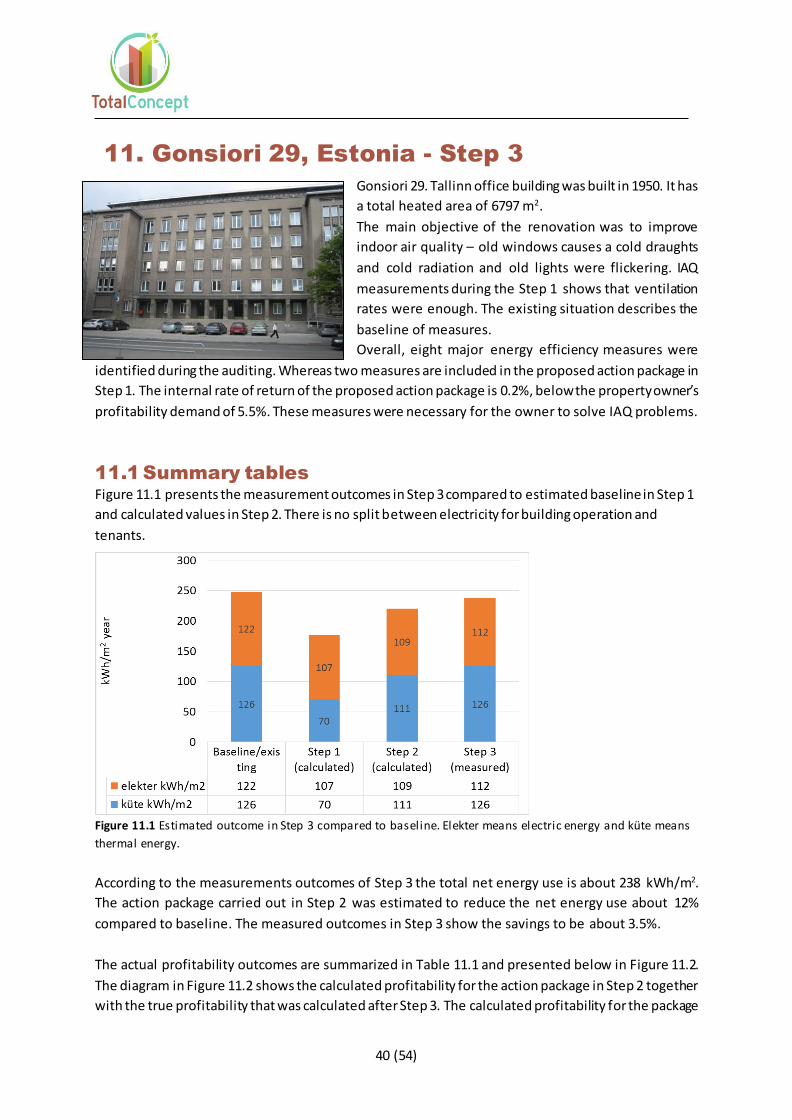
11. Gonsiori 29, Estonia - Step 3
Gonsiori 29. Tallinn office building was built in 1950. It has
a total heated area of 6797 m2.
The main objective of the renovation was to improve
indoor air quality – old windows causes a cold draughts
and cold radiation and old lights were flickering. IAQ
measurements during the Step 1 shows that ventilation
rates were enough. The existing situation describes the
baseline of measures.
Overall, eight major energy efficiency measures were
identified during the auditing. Whereas two measures are included in the proposed action package in
Step 1. The internal rate of return of the proposed action package is 0.2%, below the property owner’s
profitability demand of 5.5%. These measures were necessary for the owner to solve IAQ problems.
11.1 Summary tables
Figure 11.1 presents the measurement outcomes in Step 3 compared to estimated baseline in Step 1
and calculated values in Step 2. There is no split between electricity for building operation and
tenants.
Figure 11.1 Estimated outcome in Step 3 compared to baseline. Elekter means electric energy and küte means
thermal energy.
According to the measurements outcomes of Step 3 the total net energy use is about 238 kWh/m2.
The action package carried out in Step 2 was estimated to reduce the net energy use about 12%
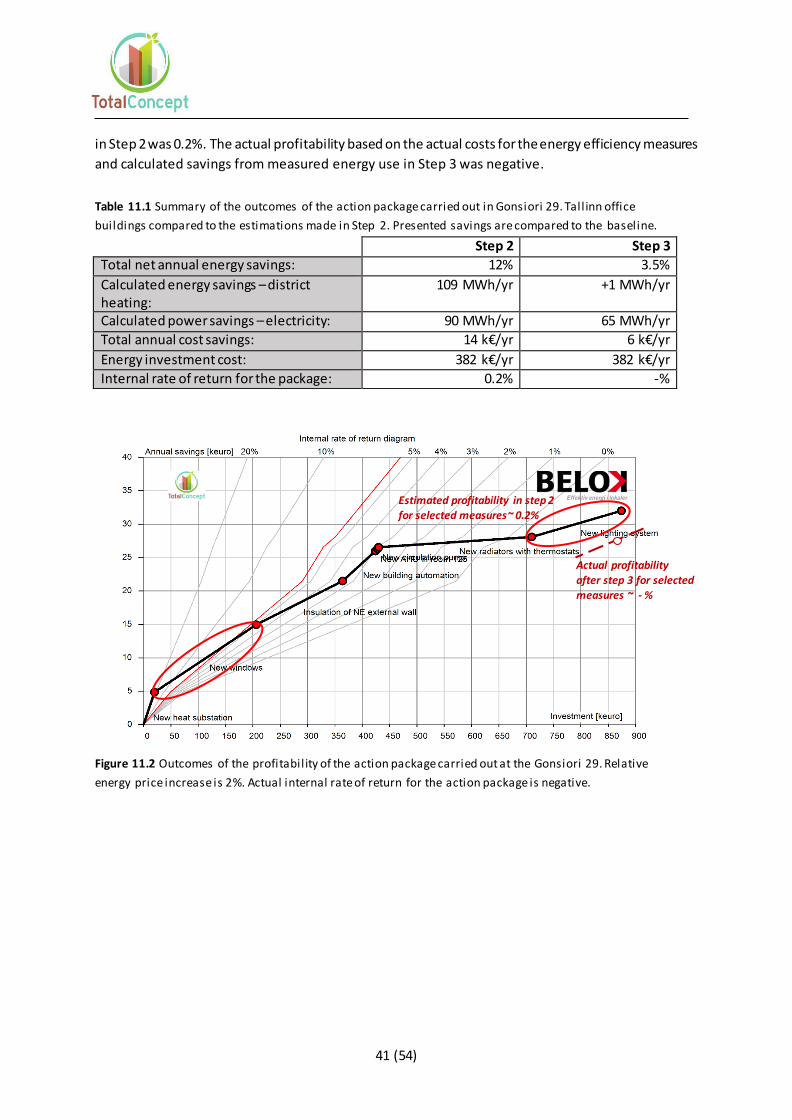
compared to baseline. The measured outcomes in Step 3 show the savings to be about 3.5%.
The actual profitability outcomes are summarized in Table 11.1 and presented below in Figure 11.2.
The diagram in Figure 11.2 shows the calculated profitability for the action package in Step 2 together
with the true profitability that was calculated after Step 3. The calculated profitability for the package
41 (54)
in Step 2 was 0.2%. The actual profitability based on the actual costs for the energy efficiency measures
and calculated savings from measured energy use in Step 3 was negative.
Table 11.1 Summary of the outcomes of the action package carried out in Gonsiori 29. Tall inn office
buildings compared to the estimations made in Step 2. Presented savings are compared to the baseline.
Figure 11.2 Outcomes of the profitability of the action package carried out at the Gonsiori 29. Relative
energy price increase is 2%. Actual internal rate of return for the action package is negative.
Step 2 Step 3
Total net annual energy savings: 12% 3.5%
Calculated energy savings – district heating:
109 MWh/yr +1 MWh/yr
Calculated power savings – electricity: 90 MWh/yr 65 MWh/yr
Total annual cost savings: 14 k€/yr 6 k€/yr
Energy investment cost: 382 k€/yr 382 k€/yr
Internal rate of return for the package: 0.2% -%
Estimated profitability in step 2
for selected measures~ 0.2%
Actual profitability
after step 3 for selected measures ~ - %
42 (54)
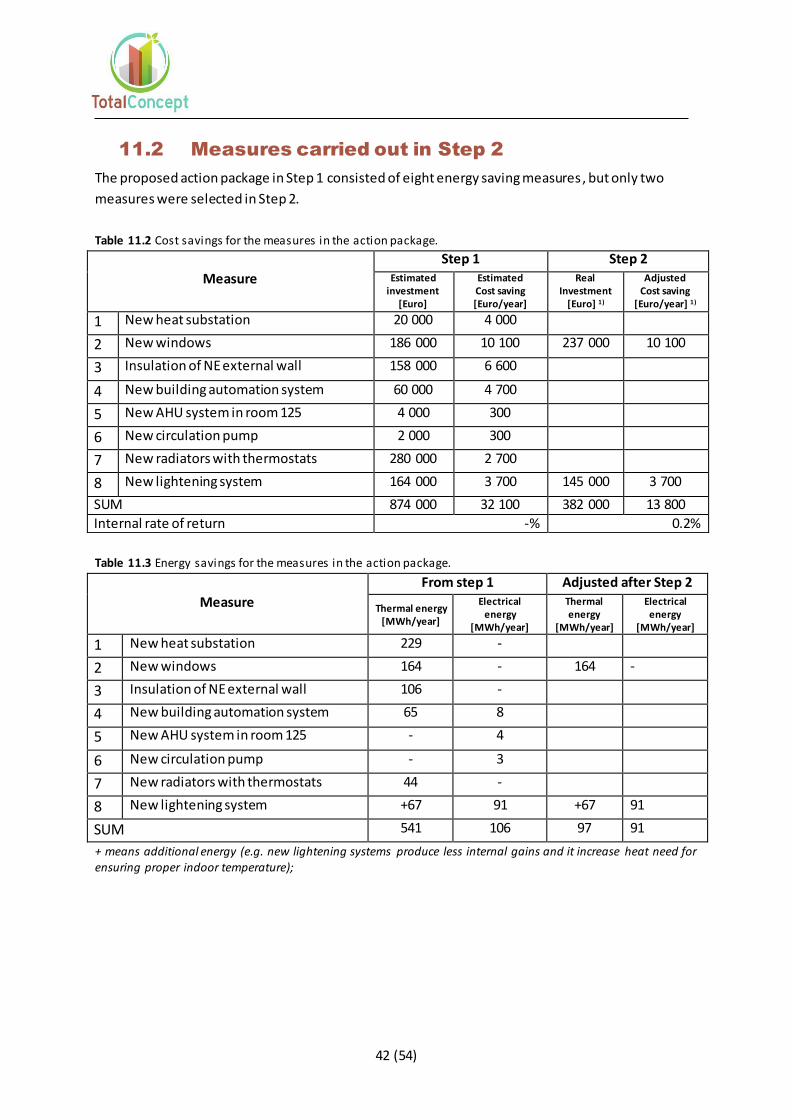
11.2 Measures carried out in Step 2
The proposed action package in Step 1 consisted of eight energy saving measures, but only two
measures were selected in Step 2.
Table 11.2 Cost savings for the measures in the action package.
Measure
Step 1 Step 2 Estimated
investment [Euro]
Estimated Cost saving [Euro/year]
Real Investment
[Euro] 1)
Adjusted Cost saving
[Euro/year] 1)
1 New heat substation 20 000 4 000
2 New windows 186 000 10 100 237 000 10 100
3 Insulation of NE external wall 158 000 6 600
4 New building automation system 60 000 4 700
5 New AHU system in room 125 4 000 300
6 New circulation pump 2 000 300
7 New radiators with thermostats 280 000 2 700
8 New lightening system 164 000 3 700 145 000 3 700
SUM 874 000 32 100 382 000 13 800
Internal rate of return -% 0.2%
Table 11.3 Energy savings for the measures in the action package.
Measure
From step 1 Adjusted after Step 2
Thermal energy [MWh/year]
Electrical energy
[MWh/year]
Thermal energy
[MWh/year]
Electrical energy
[MWh/year]
1 New heat substation 229 -
2 New windows 164 - 164 -
3 Insulation of NE external wall 106 -
4 New building automation system 65 8
5 New AHU system in room 125 - 4
6 New circulation pump - 3
7 New radiators with thermostats 44 -
8 New lightening system +67 91 +67 91
SUM 541 106 97 91
+ means additional energy (e.g. new lightening systems produce less internal gains and it increase heat need for ensuring proper indoor temperature);

43 (54)
12. Tampere Hall Congress & Concert
Centre, Finland – Step 3
Tampere Hall Congress & Concert Centre was built in 1990 and
has a total area of 28 357 m2. Shortly after completion, an
adjacent hall, the Sorsapuisto hall was built. In 2005, the
Sorsapuisto hall was connected to the main building with a
glass tunnel . An extension between Sorsapuisto hall and the
main building will be built between 2015 and 2016 and this
extension is denoted part 9 in figure 12.3. During the ongoing
phase of the renovation, a museum (Muumilaakso) will move to the building. Additional office spaces
are also to be constructed. There is also a restaurant and a café open to the publ ic during the working
hours of the centre. In the future, a permanent museum and a new restaurant will open in the ground
floor. Total measured district heating consumption in 2013 was 3050 MWh (heating 2930 MWh and
warm water 130 MWh).
Due to building owner’s and users’ business targets and financial reality it was not possible to close
the whole building at once for a renovation. Therefore, the proposed action package was divided into
several parts that would influence only certain parts of the building per time period. The whole action
package, the different stages of the renovation and its related areas of the building are shown in Figure
12.1 and 12.2.
44 (54)
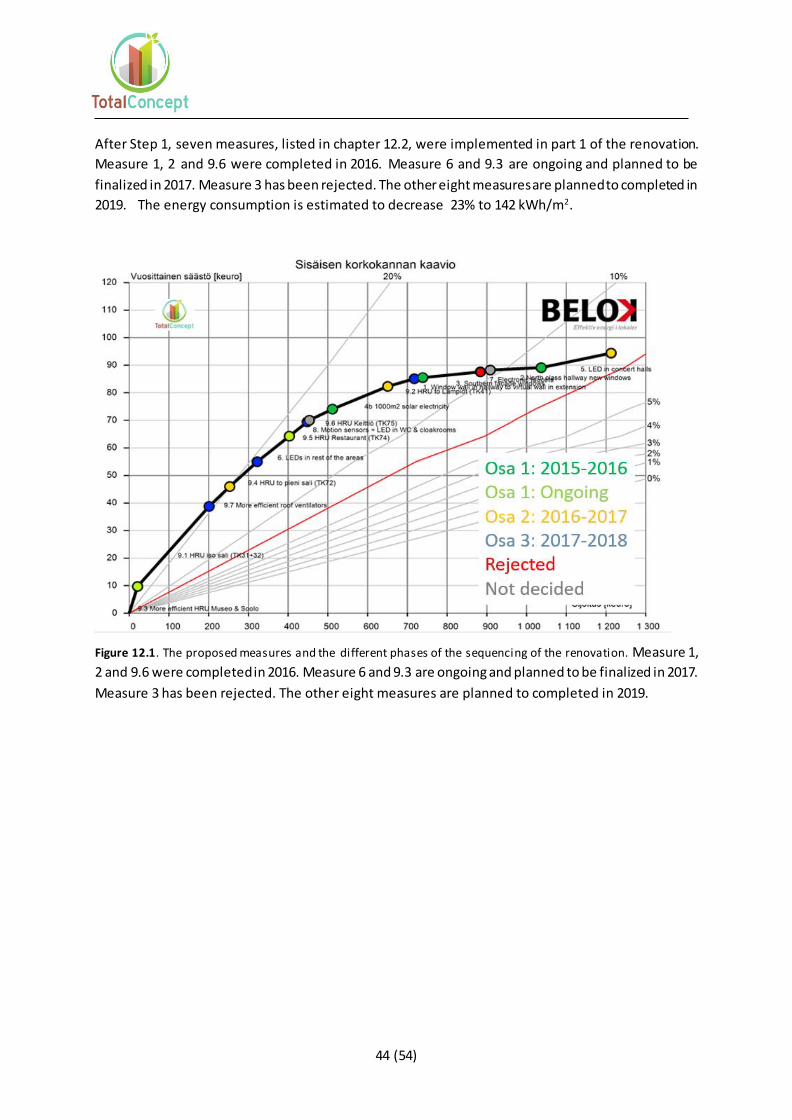
After Step 1, seven measures, listed in chapter 12.2, were implemented in part 1 of the renovation.
Measure 1, 2 and 9.6 were completed in 2016. Measure 6 and 9.3 are ongoing and planned to be
finalized in 2017. Measure 3 has been rejected. The other eight measures are planned to completed in
2019. The energy consumption is estimated to decrease 23% to 142 kWh/m2.
Figure 12.1. The proposed measures and the different phases of the sequencing of the renovation. Measure 1,
2 and 9.6 were completed in 2016. Measure 6 and 9.3 are ongoing and planned to be finalized in 2017.
Measure 3 has been rejected. The other eight measures are planned to completed in 2019.
45 (54)
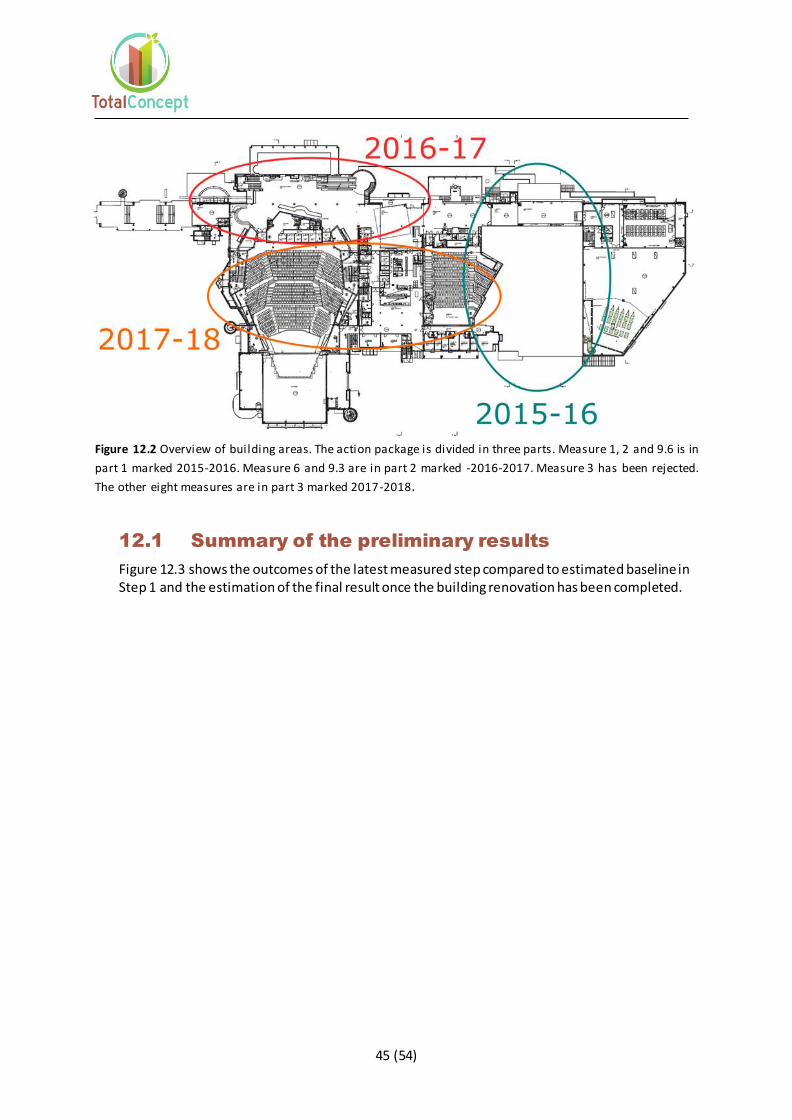
Figure 12.2 Overview of building areas. The action package is divided in three parts. Measure 1, 2 and 9.6 is in
part 1 marked 2015-2016. Measure 6 and 9.3 are in part 2 marked -2016-2017. Measure 3 has been rejected.
The other eight measures are in part 3 marked 2017-2018.
12.1 Summary of the preliminary results
Figure 12.3 shows the outcomes of the latest measured step compared to estimated baseline in Step 1 and the estimation of the final result once the building renovation has been completed.
46 (54)
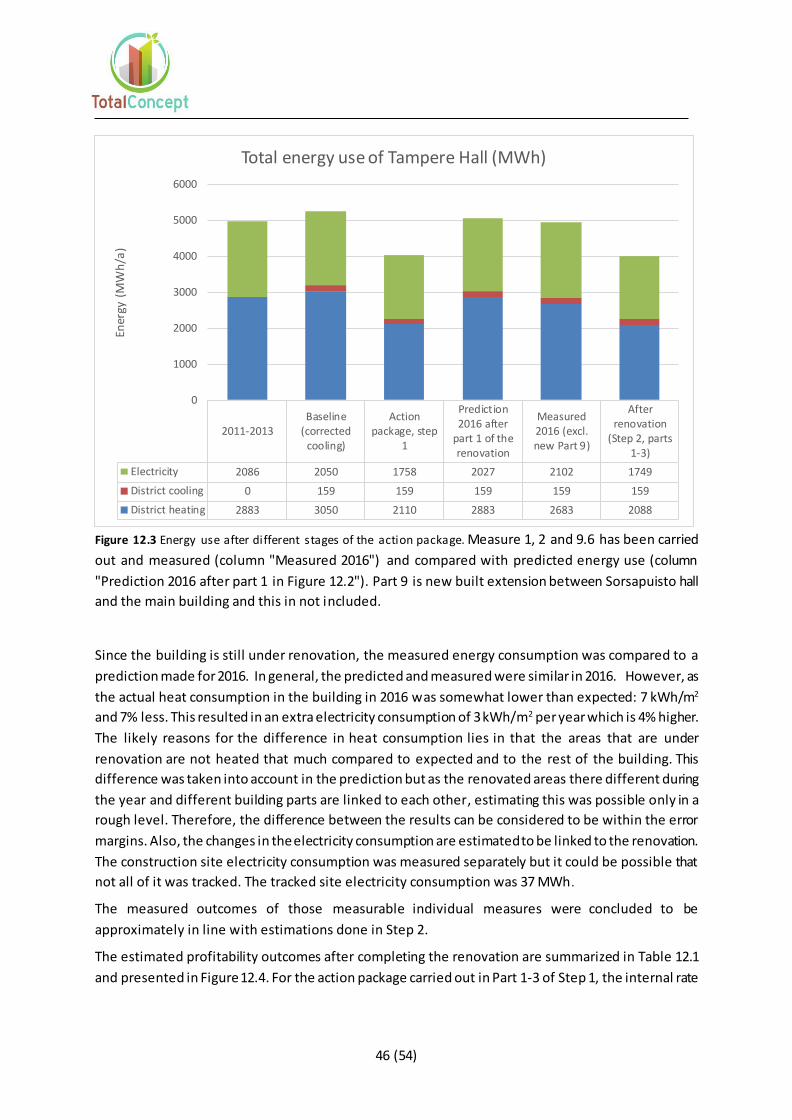
Figure 12.3 Energy use after different stages of the action package. Measure 1, 2 and 9.6 has been carried
out and measured (column "Measured 2016") and compared with predicted energy use (column
"Prediction 2016 after part 1 in Figure 12.2"). Part 9 is new built extension between Sorsapuisto hall
and the main building and this in not included.
Since the building is still under renovation, the measured energy consumption was compared to a
prediction made for 2016. In general, the predicted and measured were similar in 2016. However, as
the actual heat consumption in the building in 2016 was somewhat lower than expected: 7 kWh/m2
and 7% less. This resulted in an extra electricity consumption of 3 kWh/m2 per year which is 4% higher.
The likely reasons for the difference in heat consumption lies in that the areas that are under
renovation are not heated that much compared to expected and to the rest of the building. This
difference was taken into account in the prediction but as the renovated areas there different during
the year and different building parts are linked to each other, estimating this was possible only in a
rough level. Therefore, the difference between the results can be considered to be within the error
margins. Also, the changes in the electricity consumption are estimated to be linked to the renovation.
The construction site electricity consumption was measured separately but it could be possible that
not all of it was tracked. The tracked site electricity consumption was 37 MWh .
The measured outcomes of those measurable individual measures were concluded to be
approximately in line with estimations done in Step 2.
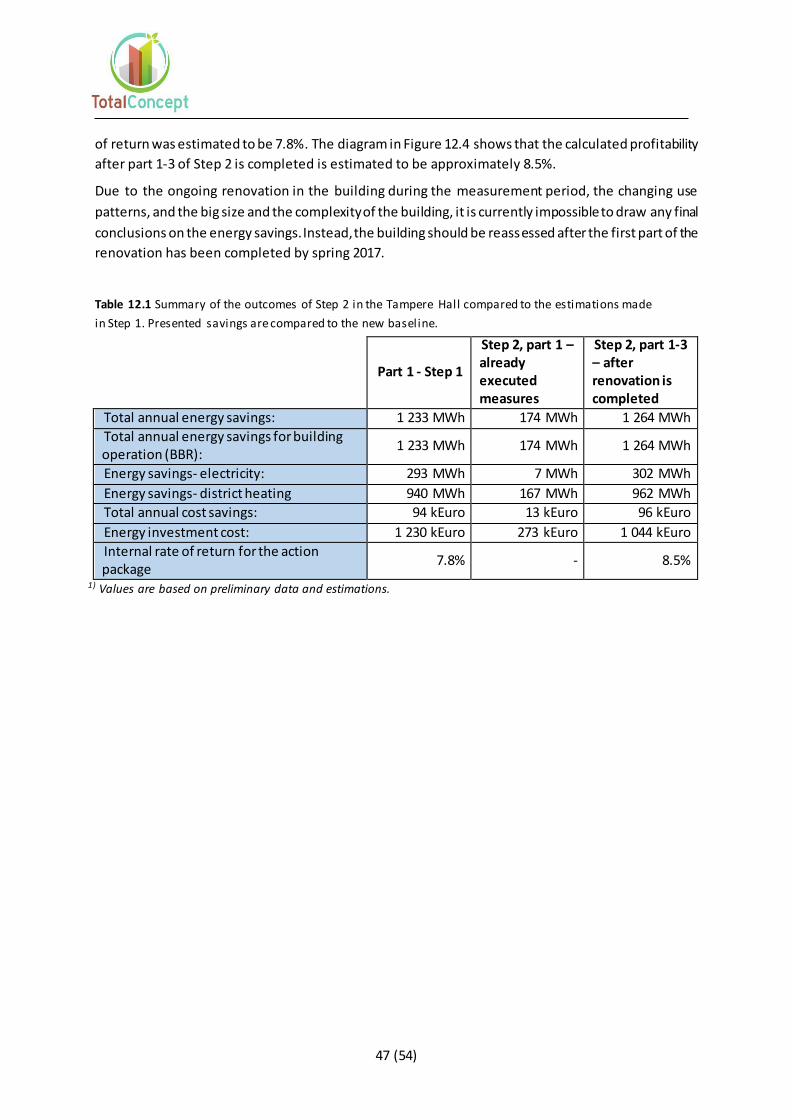
The estimated profitability outcomes after completing the renovation are summarized in Table 12.1
and presented in Figure 12.4. For the action package carried out in Part 1-3 of Step 1, the internal rate
2011-2013Baseline
(correctedcooling)
Actionpackage, step
1
Prediction2016 after
part 1 of therenovation
Measured2016 (excl.new Part 9)
Afterrenovation
(Step 2, parts1-3)
Electricity 2086 2050 1758 2027 2102 1749
District cooling 0 159 159 159 159 159
District heating 2883 3050 2110 2883 2683 2088
0
1000
2000
3000
4000
5000
6000
Ener
gy (
MW
h/a
)
Total energy use of Tampere Hall (MWh)
47 (54)
of return was estimated to be 7.8%. The diagram in Figure 12.4 shows that the calculated profitability
after part 1-3 of Step 2 is completed is estimated to be approximately 8.5%.
Due to the ongoing renovation in the building during the measurement period, the changing use
patterns, and the big size and the complexity of the building, it is currently impossible to draw any final
conclusions on the energy savings. Instead, the building should be reassessed after the first part of the
renovation has been completed by spring 2017.
Table 12.1 Summary of the outcomes of Step 2 in the Tampere Hall compared to the estimations made
in Step 1. Presented savings are compared to the new baseline.
1) Values are based on preliminary data and estimations.
Part 1 - Step 1
Step 2, part 1 – already executed measures
Step 2, part 1-3 – after renovation is completed
Total annual energy savings: 1 233 MWh 174 MWh 1 264 MWh
Total annual energy savings for building operation (BBR):
1 233 MWh 174 MWh 1 264 MWh
Energy savings- electricity: 293 MWh 7 MWh 302 MWh
Energy savings- district heating 940 MWh 167 MWh 962 MWh
Total annual cost savings: 94 kEuro 13 kEuro 96 kEuro
Energy investment cost: 1 230 kEuro 273 kEuro 1 044 kEuro
Internal rate of return for the action package
7.8% - 8.5%
48 (54)
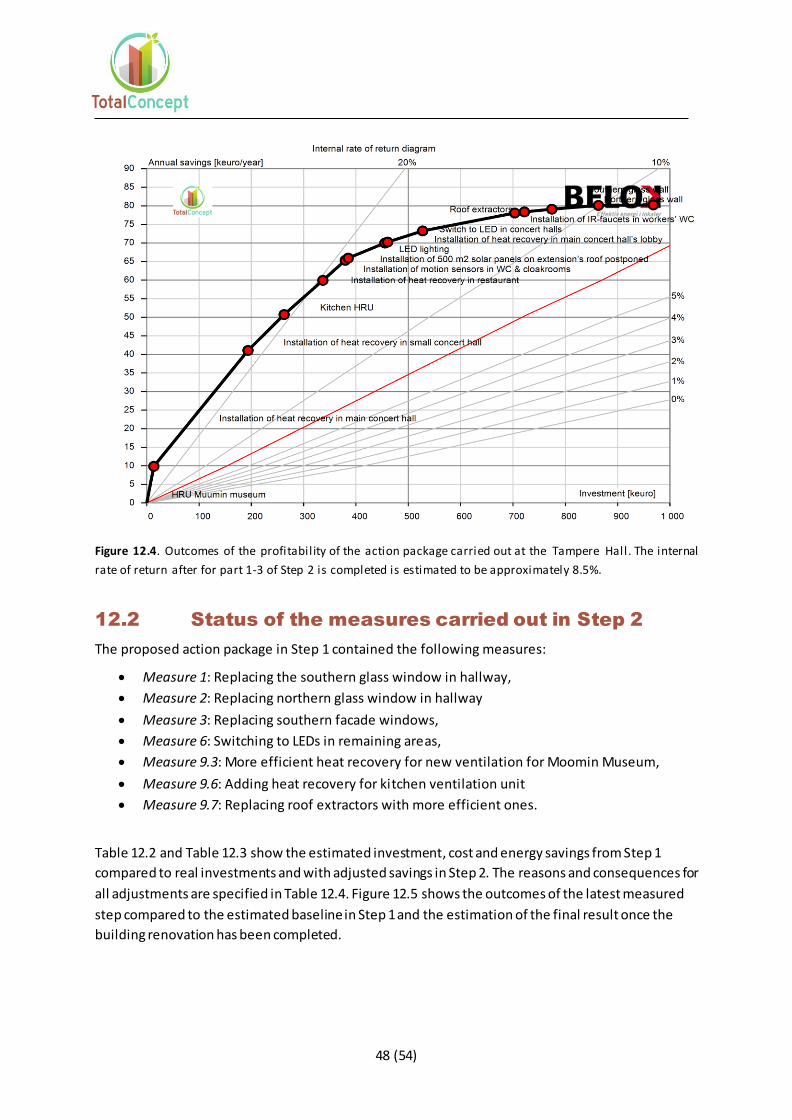
Figure 12.4. Outcomes of the profitability of the action package carried out at the Tampere Hall . The internal
rate of return after for part 1-3 of Step 2 is completed is estimated to be approximately 8.5%.
12.2 Status of the measures carried out in Step 2
The proposed action package in Step 1 contained the following measures:
Measure 1: Replacing the southern glass window in hallway,
Measure 2: Replacing northern glass window in hallway
Measure 3: Replacing southern facade windows,
Measure 6: Switching to LEDs in remaining areas,
Measure 9.3: More efficient heat recovery for new ventilation for Moomin Museum,
Measure 9.6: Adding heat recovery for kitchen ventilation unit
Measure 9.7: Replacing roof extractors with more efficient ones.
Table 12.2 and Table 12.3 show the estimated investment, cost and energy savings from Step 1
compared to real investments and with adjusted savings in Step 2. The reasons and consequences for
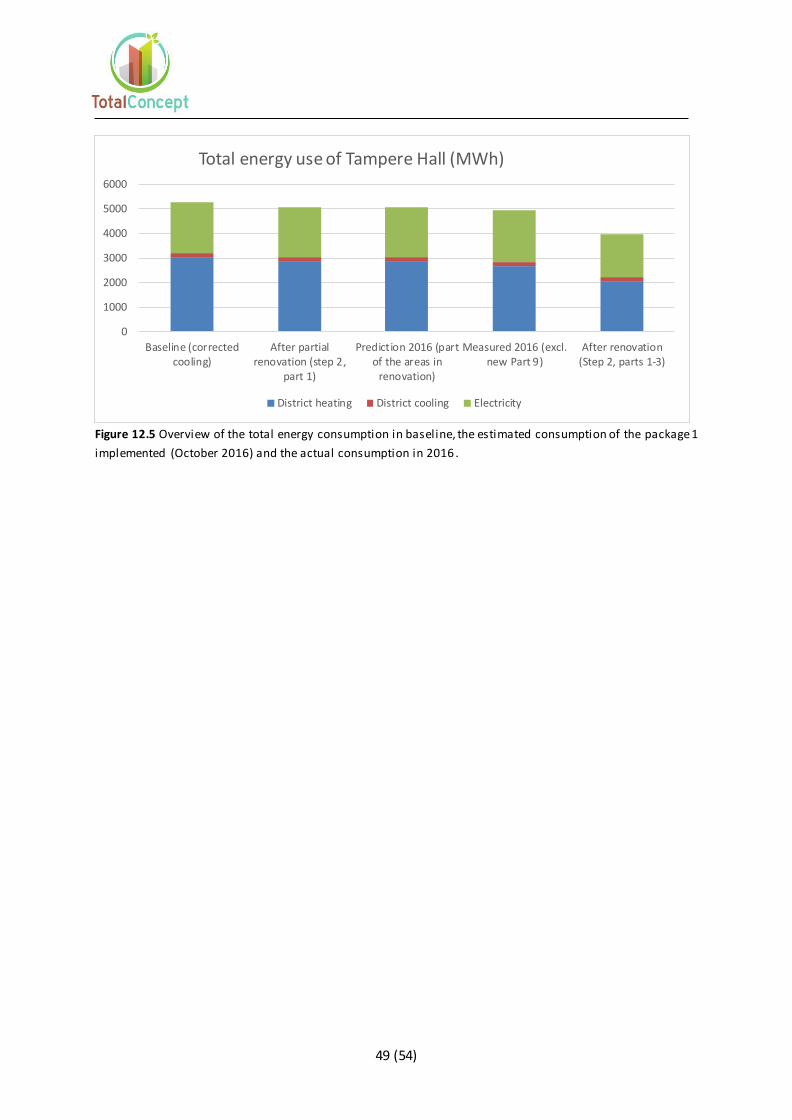
all adjustments are specified in Table 12.4. Figure 12.5 shows the outcomes of the latest measured
step compared to the estimated baseline in Step 1 and the estimation of the final result once the
building renovation has been completed.
49 (54)
Figure 12.5 Overview of the total energy consumption in baseline, the estimated consumption of the package 1
implemented (October 2016) and the actual consumption in 2016 .
0
1000
2000
3000
4000
5000
6000
Baseline (correctedcooling)
After partialrenovation (step 2,
part 1)
Prediction 2016 (partof the areas in
renovation)
Measured 2016 (excl.new Part 9)
After renovation(Step 2, parts 1-3)
Total energy use of Tampere Hall (MWh)
District heating District cooling Electricity
50 (54)
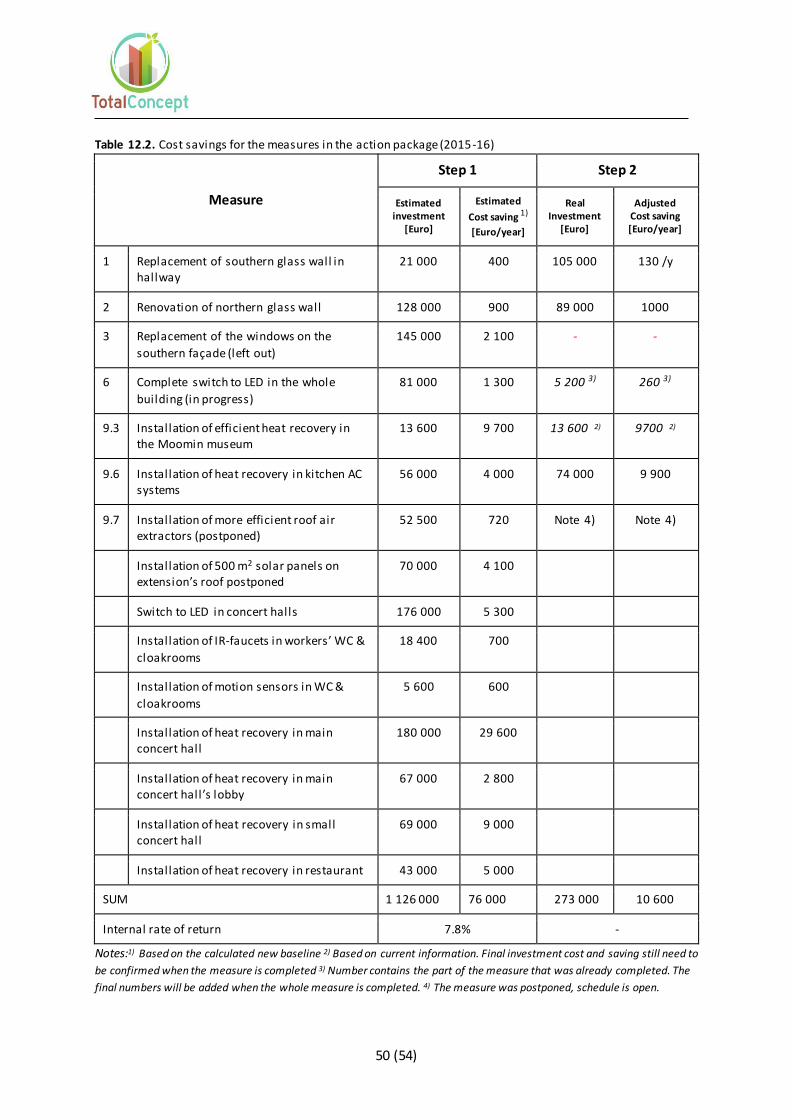
Table 12.2. Cost savings for the measures in the action package (2015-16)
Measure
Step 1 Step 2
Estimated investment
[Euro]
Estimated Cost saving 1) [Euro/year]
Real Investment
[Euro]
Adjusted Cost saving [Euro/year]
1 Replacement of southern glass wall in hallway
21 000 400 105 000 130 /y
2 Renovation of northern glass wall 128 000 900 89 000 1000
3 Replacement of the windows on the
southern façade (left out)
145 000 2 100 - -
6 Complete switch to LED in the whole
building (in progress)
81 000 1 300 5 200 3) 260 3)
9.3 Installation of efficient heat recovery in the Moomin museum
13 600 9 700 13 600 2) 9700 2)
9.6 Installation of heat recovery in kitchen AC systems
56 000 4 000 74 000 9 900
9.7 Installation of more efficient roof air extractors (postponed)
52 500 720 Note 4) Note 4)
Installation of 500 m2 solar panels on extension’s roof postponed
70 000 4 100
Switch to LED in concert halls 176 000 5 300
Installation of IR-faucets in workers’ WC &
cloakrooms
18 400 700
Installation of motion sensors in WC &
cloakrooms
5 600 600
Installation of heat recovery in main concert hall
180 000 29 600
Installation of heat recovery in main concert hall’s lobby
67 000 2 800
Installation of heat recovery in small concert hall
69 000 9 000
Installation of heat recovery in restaurant 43 000 5 000
SUM 1 126 000 76 000 273 000 10 600
Internal rate of return 7.8% -
Notes:1) Based on the calculated new baseline 2) Based on current information. Final investment cost and saving still need to
be confirmed when the measure is completed 3) Number contains the part of the measure that was already completed. The
final numbers will be added when the whole measure is completed. 4) The measure was postponed, schedule is open.
51 (54)
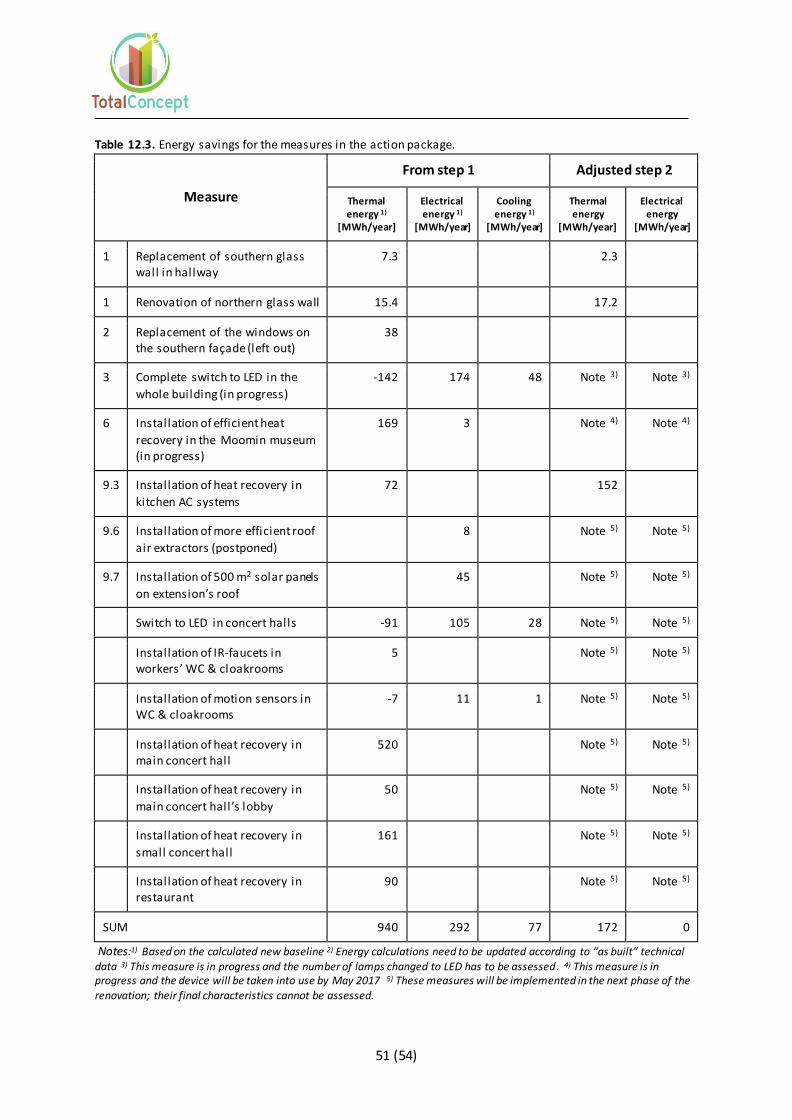
Table 12.3. Energy savings for the measures in the action package.
Measure
From step 1 Adjusted step 2
Thermal energy 1)
[MWh/year]
Electrical energy 1)
[MWh/year]
Cooling energy 1)
[MWh/year]
Thermal energy
[MWh/year]
Electrical energy
[MWh/year]
1 Replacement of southern glass wall in hallway
7.3 2.3
1 Renovation of northern glass wall 15.4 17.2
2 Replacement of the windows on the southern façade (left out)
38
3 Complete switch to LED in the
whole building (in progress)
-142 174 48 Note 3) Note 3)
6 Installation of efficient heat
recovery in the Moomin museum (in progress)
169 3 Note 4) Note 4)
9.3 Installation of heat recovery in
kitchen AC systems
72 152
9.6 Installation of more efficient roof
air extractors (postponed)
8 Note 5) Note 5)
9.7 Installation of 500 m2 solar panels
on extension’s roof
45 Note 5) Note 5)
Switch to LED in concert halls -91 105 28 Note 5) Note 5)
Installation of IR-faucets in workers’ WC & cloakrooms
5 Note 5) Note 5)
Installation of motion sensors in WC & cloakrooms
-7 11 1 Note 5) Note 5)
Installation of heat recovery in main concert hall
520 Note 5) Note 5)
Installation of heat recovery in
main concert hall’s lobby
50 Note 5) Note 5)
Installation of heat recovery in
small concert hall
161 Note 5) Note 5)
Installation of heat recovery in restaurant
90 Note 5) Note 5)
SUM 940 292 77 172 0
Notes:1) Based on the calculated new baseline 2) Energy calculations need to be updated according to “as built” technical
data 3) This measure is in progress and the number of lamps changed to LED has to be assessed. 4) This measure is in progress and the device will be taken into use by May 2017 5) These measures will be implemented in the next phase of the
renovation; their final characteristics cannot be assessed.
52 (54)
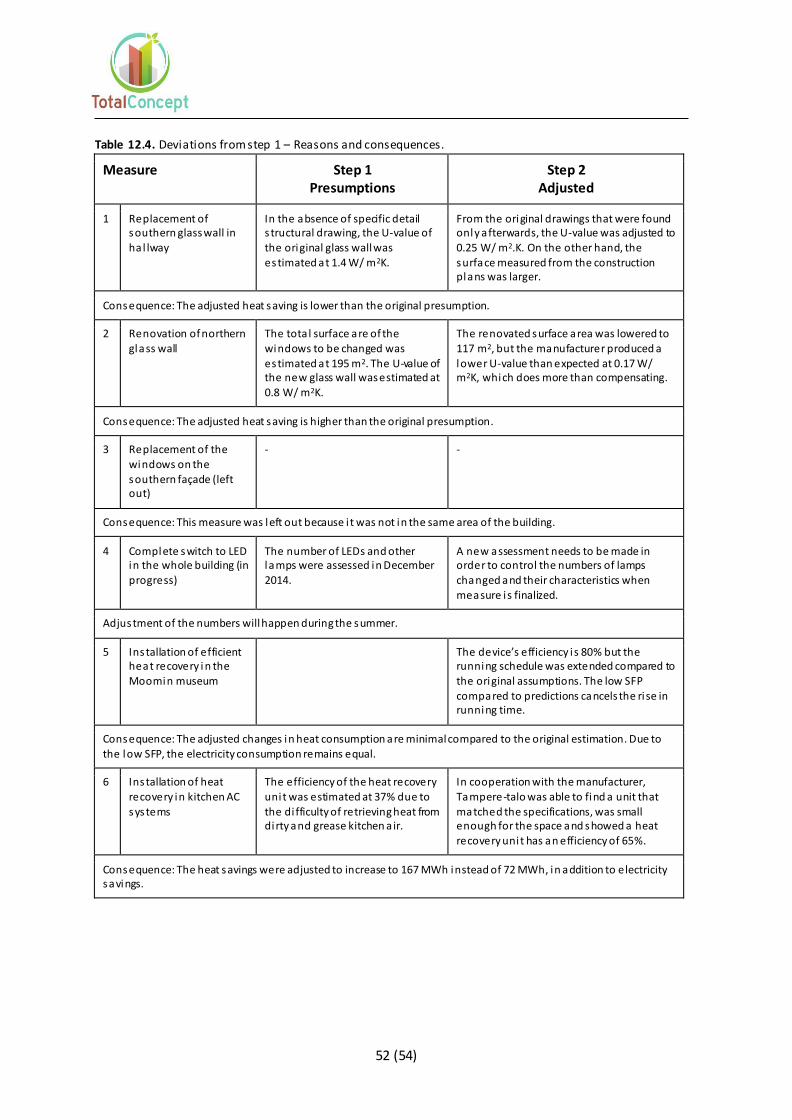
Table 12.4. Deviations from step 1 – Reasons and consequences.
Measure Step 1 Presumptions
Step 2 Adjusted
1 Replacement of southern glass wall in
ha l lway
In the absence of specific detail s tructural drawing, the U-value of
the original glass wall was estimated at 1.4 W/ m2K.
From the original drawings that were found only afterwards, the U-value was adjusted to
0.25 W/ m2.K. On the other hand, the surface measured from the construction plans was larger.
Consequence: The adjusted heat saving is lower than the original presumption.
2 Renovation of northern glass wall
The tota l surface are of the windows to be changed was
estimated at 195 m2. The U-value of the new glass wall was estimated at
0.8 W/ m2K.
The renovated surface area was lowered to 117 m2, but the manufacturer produced a
lower U-value than expected at 0.17 W/ m2K, which does more than compensating.
Consequence: The adjusted heat saving is higher than the original presumption.
3 Replacement of the windows on the
southern façade (left out)
- -
Consequence: This measure was left out because i t was not in the same area of the building.
4 Complete switch to LED in the whole building (in
progress)
The number of LEDs and other lamps were assessed in December
2014.
A new assessment needs to be made in order to control the numbers of lamps
changed and their characteristics when measure i s finalized.
Adjustment of the numbers will happen during the summer.
5 Installation of efficient heat recovery i n the Moomin museum
The device’s efficiency i s 80% but the running schedule was extended compared to the original assumptions. The low SFP
compared to predictions cancels the ri se in running time.
Consequence: The adjusted changes in heat consumption are minimal compared to the original estimation. Due to the low SFP, the electricity consumption remains equal.
6 Installation of heat recovery in kitchen AC
systems
The efficiency of the heat recovery unit was estimated at 37% due to
the di fficulty of retrieving heat from dirty and grease kitchen a ir.
In cooperation with the manufacturer, Tampere-talo was able to find a unit that
matched the specifications, was small enough for the space and showed a heat recovery unit has an efficiency of 65%.
Consequence: The heat savings were adjusted to increase to 167 MWh instead of 72 MWh, in addition to electricity savings.

53 (54)
13. Oulu health care station, Finland – Step 1
'The health care station in Oulu is from 1933. It has a
heated floor area of 4288 m2. The objective of the
refurbishment was to improve the indoor air quality with
an air cooling system. The building has undergone a major
refurbishment in 1980. The HVAC system was refurbished
in 2005 and the windows were replaced in 2009.
The proposed action package in Step 1 consisted of 6 measures mainly related to the building
technology. The largest savings potential was the ventilation system as the equipment did not
include heat recovery or it could be replaced with more efficient equipment. In addition, the energy
consumption of the equipment could be reduced with changes in control methods and by replacing
old, energy intensive fans with new, more efficient ones. In addition to the ventilation devices,
profitable energy saving measures were also identified in replacing the existing lighting with more
energy efficient LED lighting and changing faucets into electronic ones.
Baseline energy use was 257 kWh/ m2. The identified action package had an IRR of approximately
7%. Successful implementation of the action package will reduce energy use with 39% to a designed
energy use of 156 kWh/ m2.
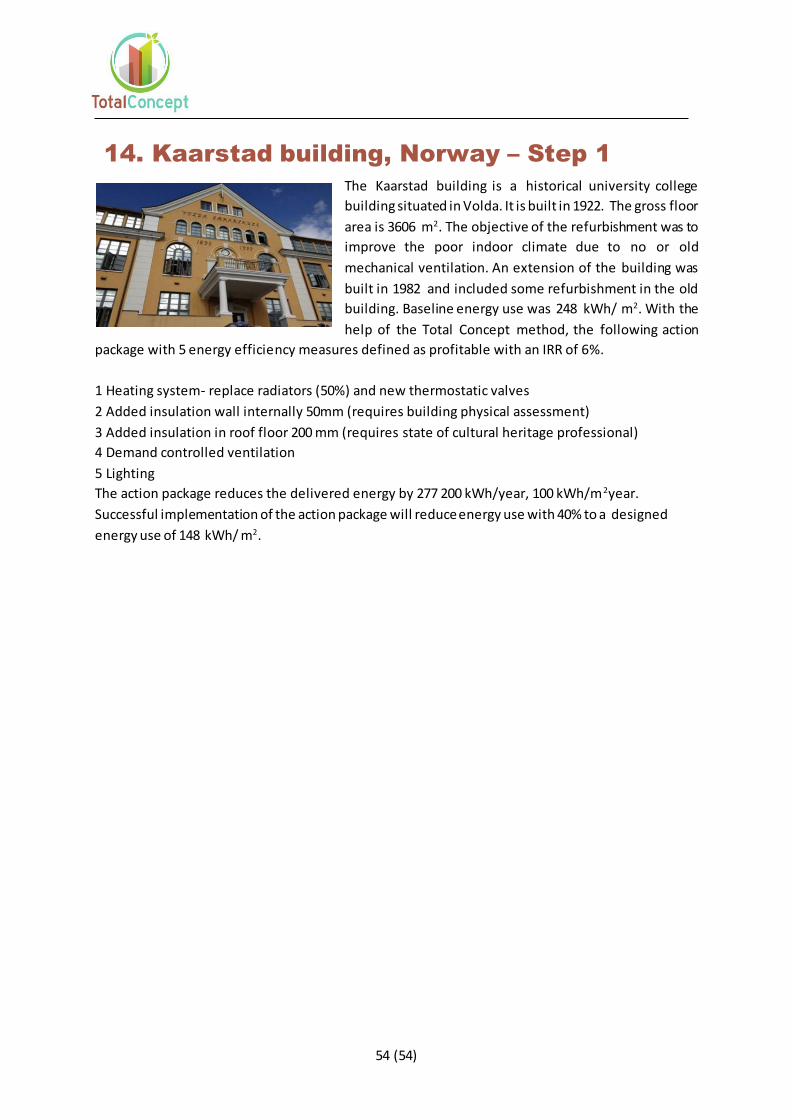
54 (54)
14. Kaarstad building, Norway – Step 1
The Kaarstad building is a historical university college
building situated in Volda. It is built in 1922. The gross floor
area is 3606 m2. The objective of the refurbishment was to
improve the poor indoor climate due to no or old
mechanical ventilation. An extension of the building was
built in 1982 and included some refurbishment in the old
building. Baseline energy use was 248 kWh/ m2. With the
help of the Total Concept method, the following action
package with 5 energy efficiency measures defined as profitable with an IRR of 6%.
1 Heating system- replace radiators (50%) and new thermostatic valves
2 Added insulation wall internally 50mm (requires building physical assessment)
3 Added insulation in roof floor 200 mm (requires state of cultural heritage professional)
4 Demand controlled ventilation
5 Lighting
The action package reduces the delivered energy by 277 200 kWh/year, 100 kWh/m2year.
Successful implementation of the action package will reduce energy use with 40% to a designed
energy use of 148 kWh/ m2.