impact parameters in rolling contact lubrication
TRANSCRIPT
ISSN 1220-8434 Volume 17, 2009


ACTA TRIBOLOGICA
Volume 17, 2009

Acta tribologicaA Journal on the Science of Contact Mechanics, Friction, Lubrication,
Wear, Micro/Nano Tribology, and Biotribology
Volume 17, 2009
EDITOR E. Diaconescu, University of Suceava, ROMANIA
EDITORIAL BOARD N.N. Antonescu, Petroleum-Gas University of Ploiesti, ROMANIAJ.R. Barber, University of Michigan, U.S.AY. Berthier, INSA de Lyon, FRANCEM. Ciavarella, Politecnico di Bari, ITALYT. Cicone, University Politehnica of Bucharest, ROMANIAS. Cretu, Technical University of Iasi, ROMANIAL. Deleanu, University of Galati, ROMANIAD. Dini, Imperial College London, UNITED KINGDOMV. Dulgheru, Technical University of Moldova, MOLDOVAI. Etsion, Technion, Haifa, ISRAELM. Glovnea, University of Suceava, ROMANIAR. Glovnea, University of Sussex, UNITED KINGDOMI. Green, Georgia Institute of Technology, U.S.AM. Khonsari, Louisiana State University, U.S.AY. Kligerman, Technion, Haifa, ISRAELD. Nelias, INSA de Lyon, FRANCED. Olaru, Technical University of Iasi, ROMANIAM. Pascovici, University Politehnica of Bucharest, ROMANIAM. Ripa, University of Galati, ROMANIAA. Tudor, University Politehnica of Bucharest, ROMANIA
ASSISTANT EDITOR S. Spinu, University of Suceava, ROMANIA

Published by the Applied Mechanics Section of the University of Suceava
University “Stefan cel Mare” of Suceava Publishing House
13th University Street, Suceava, 720229, Suceava, ROMANIAPhone: (40) – 0230 – 216 – 147 int. 273, E-mail: [email protected]

ACTA TRIBOLOGICA VOLUME 17, 2009
CONTENTS
1 E. DIACONESCU, V.F. ZEGREAN, M. GLOVNEAShear Properties of Molecular Liquid near a Metallic Wall
6 L. PETRARU, F. NOVOTNY-FARKAS, K. BAUMANNNew Approach in Oxidation Stability Testing of the Gas Turbine Oils
13 L. BOGATU, I. PETRE, A. MARIN, C. TĂNĂSESCU, D. PETRE, N. N. ANTONESCU, L. MIRCIHydraulic Oils from Regenerable Feed Stocks with a Low EnvironmentalImpact
17 C. BUJOREANU, V. PALEUImpact Parameters in Rolling Contact Lubrication
21 G. IANUŞ, D. OLARU, P. LORENZ Adhesion in Ball on Flat Microsystems
25 G.V. PUIU, D. OLARU, V. PUIUFriction Torque and Efficiency in Ball - Screw Systems
30 V. VASAUSKAS, J. PADGURSKAS, R. RUKUIZASurface Modification of Carbon Steel by Deposition of Fluor-Oligomeric Films
34 A. SZUDER, I.D. MARINESCU, T.G. MATHIA, G. MEILLEAbrasion in Finishing Processes
42 S. GHEORGHE, C. TEISANU, A. MERSTALLINGER, I. CIUPITUThe Influence of the Sintering Atmospheres on the Wear Behaviour of CopperBased Alloys
46 G. MEILLE, T.G. MATHIAStrategy for Identification of Wear Mode of Engineering Surfaces
52 I. SOVILJ-NIKIC, B. SOVILJ, M. BREZOCNIK, S. SOVILJ-NIKIC,V. PEJICAnalysis of Influence of Gear Hob Geometric Parameters on the Tool LifeUsing a Genetic Algorithm

58 A. TACHE, C. TACHEThermal Aspects Regarding the Drilling Process
63 L. PASTRAV, S. JAECQUES, M. MULIER, G. VAN DER PERREThe Detection of Insertion Endpoint and Stability Assessment of CementlessHip Stems by Vibration Analysis: A Per-Operative Pilot Study
ISSN 1220 - 8434 ACTA TRIBOLOGICA Volume 17, (2009), 1-5
Emanuel DIACONESCU
Vlad – Flaviu ZEGREAN email: [email protected]
Marilena GLOVNEA
Department of Applied Mechanics,
University “Stefan cel Mare” of Suceava,
ROMANIA
SHEAR PROPERTIES OF MOLECULAR LIQUID NEAR A METALLIC WALL
Although the thickness of EHD oil films should vanish at very low rolling speeds, experimental investigations indicate that often this thickness does not fall below a remnant value of 10-30 nm. Initially, this phenomenon was attributed to a much higher viscosity near the wall than in the bulk, according to an empirical formula. Recently, theoretical physical background of the phenomenon was advanced by means of molecule-wall interaction potential. It was shown that, besides viscosity, shear modulus and limiting shear stress are enhanced in the neighborhood of the wall. These theoretical findings predict correctly experimentally found thin film thickness. New experimental evidence is needed to support theoretical results. This paper provides experimental results concerning the evaluation of structural flow units, minimum intermolecular potential and limiting shear stress in thin layers. Keywords: liquid-wall interaction, viscosity, shear modulus, limiting shear stress, molecular layer
1. INTRODUCTION
EHL theory predicts that if the relative rolling speed of two surfaces tends towards zero, the film thickness formed between them must vanish. Experimental results obtained by Johnson, Waite and Spikes [1], Cann and Spikes [2], Luo and Wen [3], and others show that a lubricant film of about 10…30 nm or thicker is preserved between the surfaces at very low speeds. Zhang, Luo and Wen [4,5] attributed this phenomenon to the existence of an ordered lubricant film, caused by the interaction between liquid molecules and the metallic surface, which is placed between central EHD film and the adsorbed layer. To predict theoretically the thickness of this layer, they used an empirical equation for the viscosity and a numerical program written for one-dimensional flow. They carried out experimental investigations of thin film thickness using a ball on disk apparatus and they found a good agreement with the numerical results.
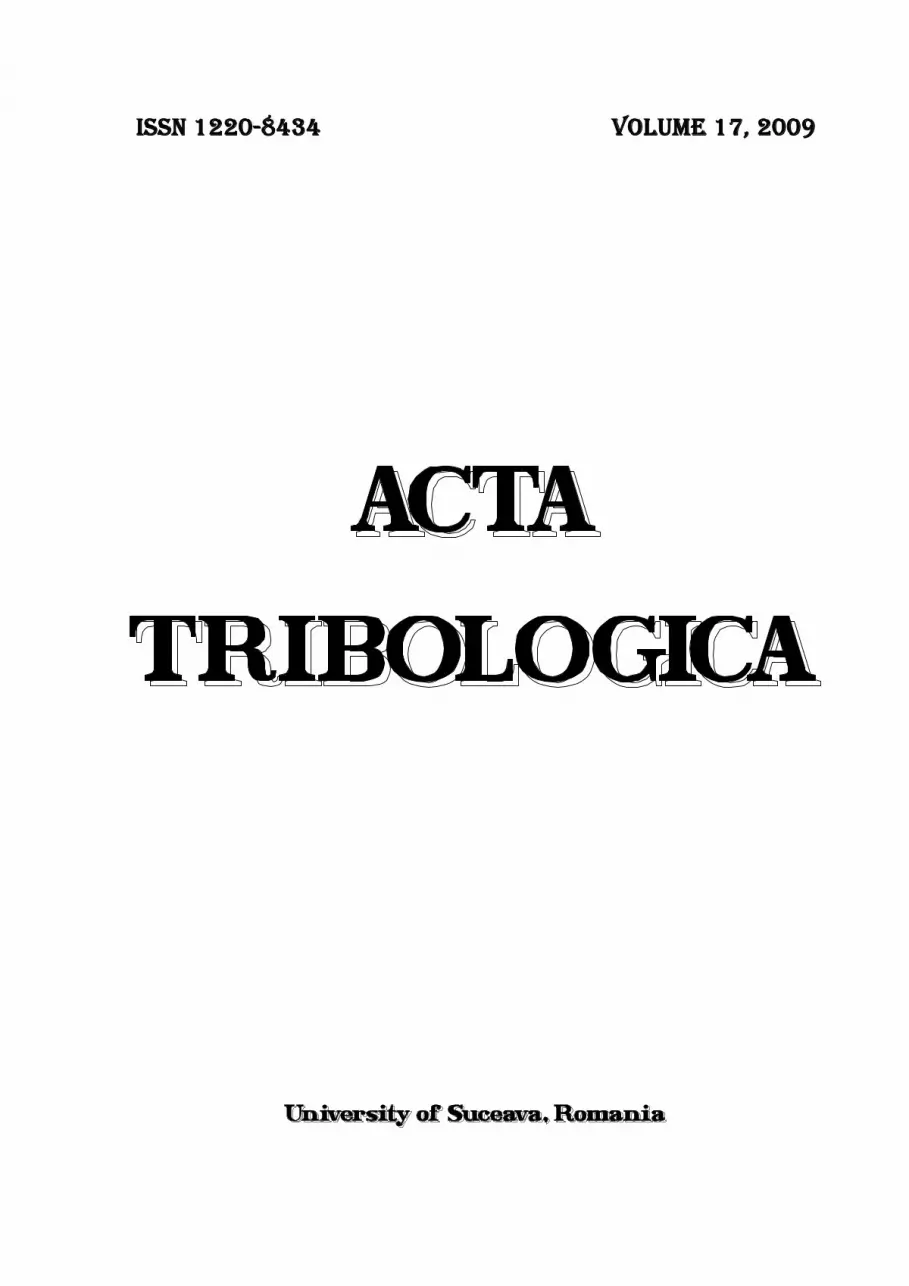
By noting the insufficiency of an empirical formula for the viscosity in the neighborhood of the wall, Diaconescu [6,7] approached the subject by using the molecule-wall interaction potential and a general theoretical viscosity equation. The viscosity is found to decrease exponentially with the distance from the wall as shown in Figure 1. This distance is expressed by the number of molecular layers from the wall and the dimensionless viscosity is referenced by the bulk viscosity.
0 101
10
100
1 103
20
j
j Figure 1. The dependence of viscosity on the
number of molecular layer from the metallic surface
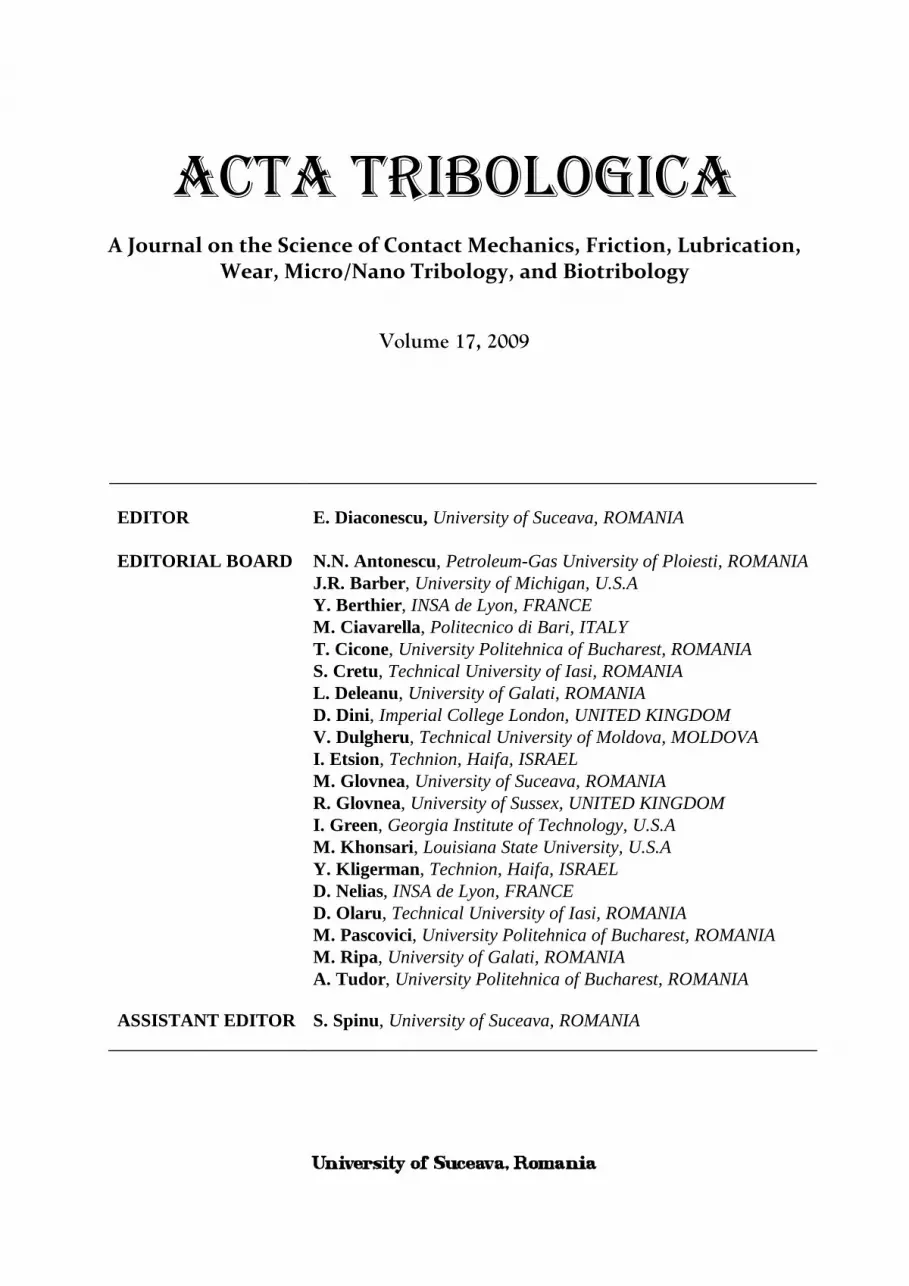
Using a molecular theory previously advanced for the solid like properties of molecular substances, [8], and the molecule-wall interaction potential, [6], Diaconescu, [7] found that both shear modulus and limiting shear stress increase in the wall vicinity with respect to their bulk values in the same fashion, as shown in Figure 2.
Again, the distance from the wall is indicated by the number of the molecular layers, whereas dimensionless shear modulus g, is referenced to its bulk value.
The advanced theory shows that the wall viscosity is hundred times higher that in the bulk, whereas the wall shear modulus as well as the wall limiting shear stress exceed by a few times their corresponding values in the bulk.
0 100
2
4
6
8
10
20
gj
j Figure 2. Dimensionless variation of shear modulus
and limiting shear stress with the number of molecular layer from the metallic surface
These values show that, compared to the bulk, the liquid flow is impeded in the neighborhood of the wall, as well as its elastic or plastic shear. This suggests that the supplementary attraction in the wall neighborhood generates a thin attached layer on each wall, measuring 6 to 14 molecular layers. These attached layers are responsible for remnant oil film. At very low rolling speeds, the thickness of this film is the sum of the thicknesses of the layers attached to the wall. If the speed is high enough, an EHD film is formed between attached layers. Consequently, total film thickness is the sum of remnant and EHD film thicknesses. The effects of pressure and temperature upon nanometric film thickness enter by their influence upon bulk shear properties of the liquid. This conclusion and the predicted dependence of thin EHD oil films on rolling speed agree very well with the experimental results of Zhang, Luo, and Wen [4,5]. This agreement suggests that the advanced theory is qualitatively correct. Nevertheless, supplementary experimental confirmation is needed, especially concerning the shear properties of molecular liquids in the neighborhood of a metallic wall. This paper aims to provide new experimental evidence into the subject, as well as corresponding experimental procedures.
2. EXPERIMENTAL RESULTS
2.1 Evaluation of structural flow units A unanimous point of view upon the
structural flow units in EHD oil films was not achieved yet. These may be single molecules, molecular clusters or molecular segments. According to Hirst and Moore, [9], molecular clustering occurs at low temperatures, which dissociate into molecules as the temperature rises. When the liquid possesses branched molecules, at certain moments, some of these branches can flow individually. To clarify the subject, new evidence is needed.
Experimental investigations on an atomic force microscope (AFM) were performed to identify
the flow units in liquid paraffin, as well as their average dimension.
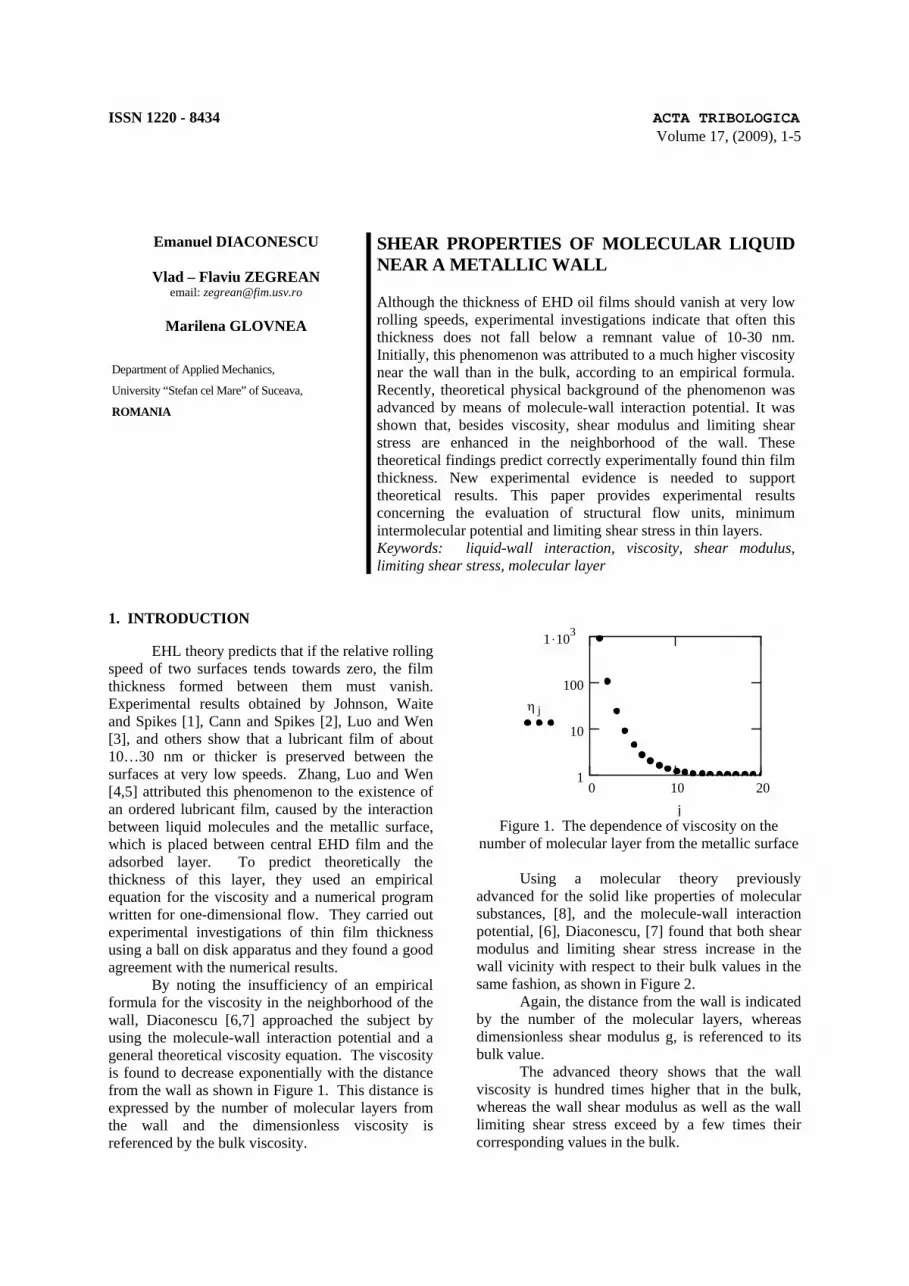
Figure 3. Typical scanned image of
solid paraffin film
To this end, a tiny amount of melted paraffin was let to drop on a cooled mica surface, thus freezing rapidly while preserving the flow structural units. In its turn, the mica layer was fixed on a cool metallic surface. Then, the surface of solid paraffin film was scanned by aid of a non-contact AFM. A typical example for obtained images is depicted in Figure 3.
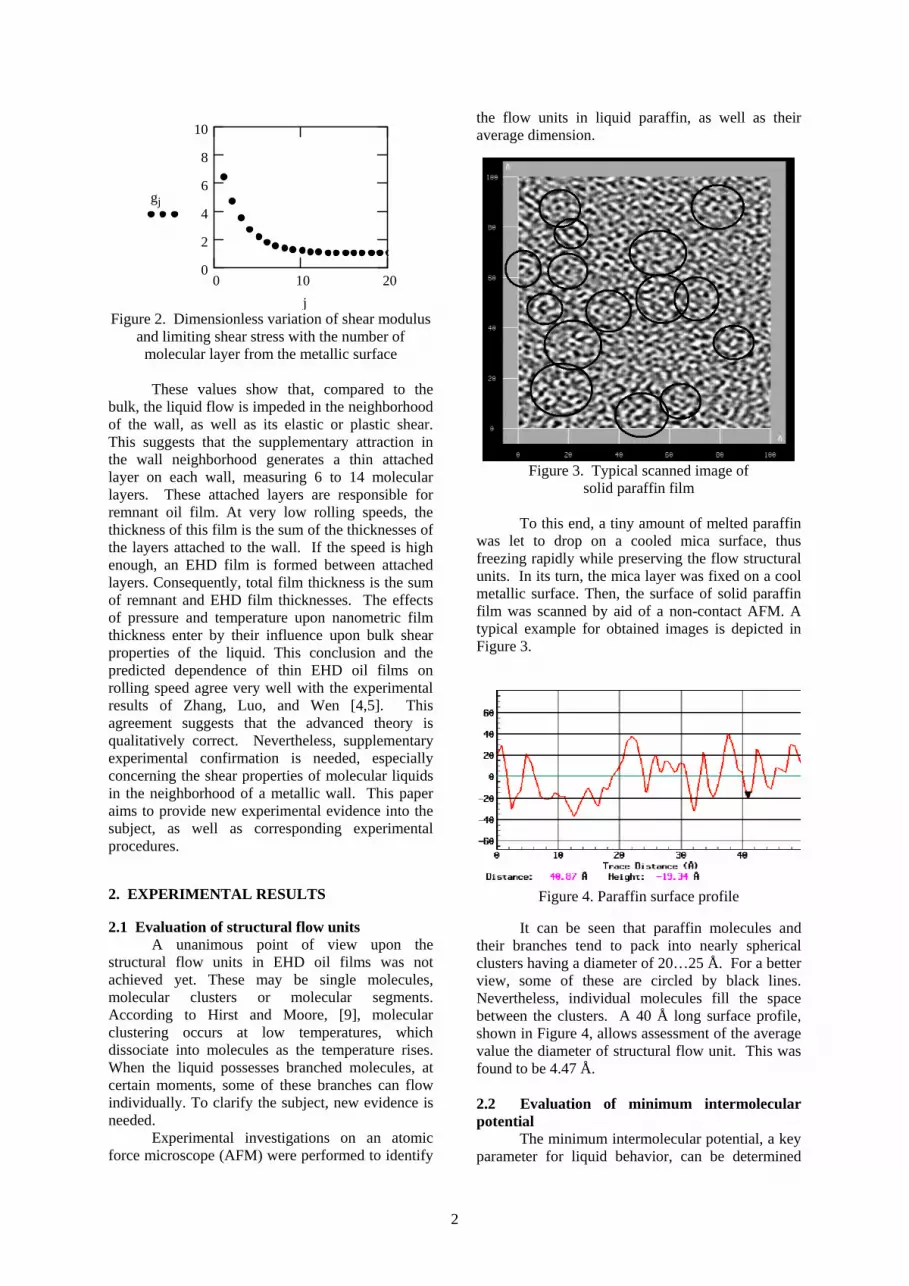
Figure 4. Paraffin surface profile
It can be seen that paraffin molecules and their branches tend to pack into nearly spherical clusters having a diameter of 20…25 Å. For a better view, some of these are circled by black lines. Nevertheless, individual molecules fill the space between the clusters. A 40 Å long surface profile, shown in Figure 4, allows assessment of the average value the diameter of structural flow unit. This was found to be 4.47 Å.
2.2 Evaluation of minimum intermolecular potential
The minimum intermolecular potential, a key parameter for liquid behavior, can be determined
2
either by measuring the maximum intermolecular force or by determining the oil surface tension.
The maximum intermolecular forces depend on the parameters of intermolecular potential. It occurs when the intermolecular distance reaches the following value:
6m pT
13r r
7 , (1)
where is the equilibrium intermolecular distance
at pressure p and temperature T. Maximum value of intermolecular force is:
pTr
max e pTm
f 2.6899k kr
, (2)
in which ε is the minimum value of intermolecular potential and , are coefficients defined in
[8]. It is obvious that the knowledge of maximum intermolecular force f
ek pTk
max yields the minimum intermolecular potential ε if is known. mr
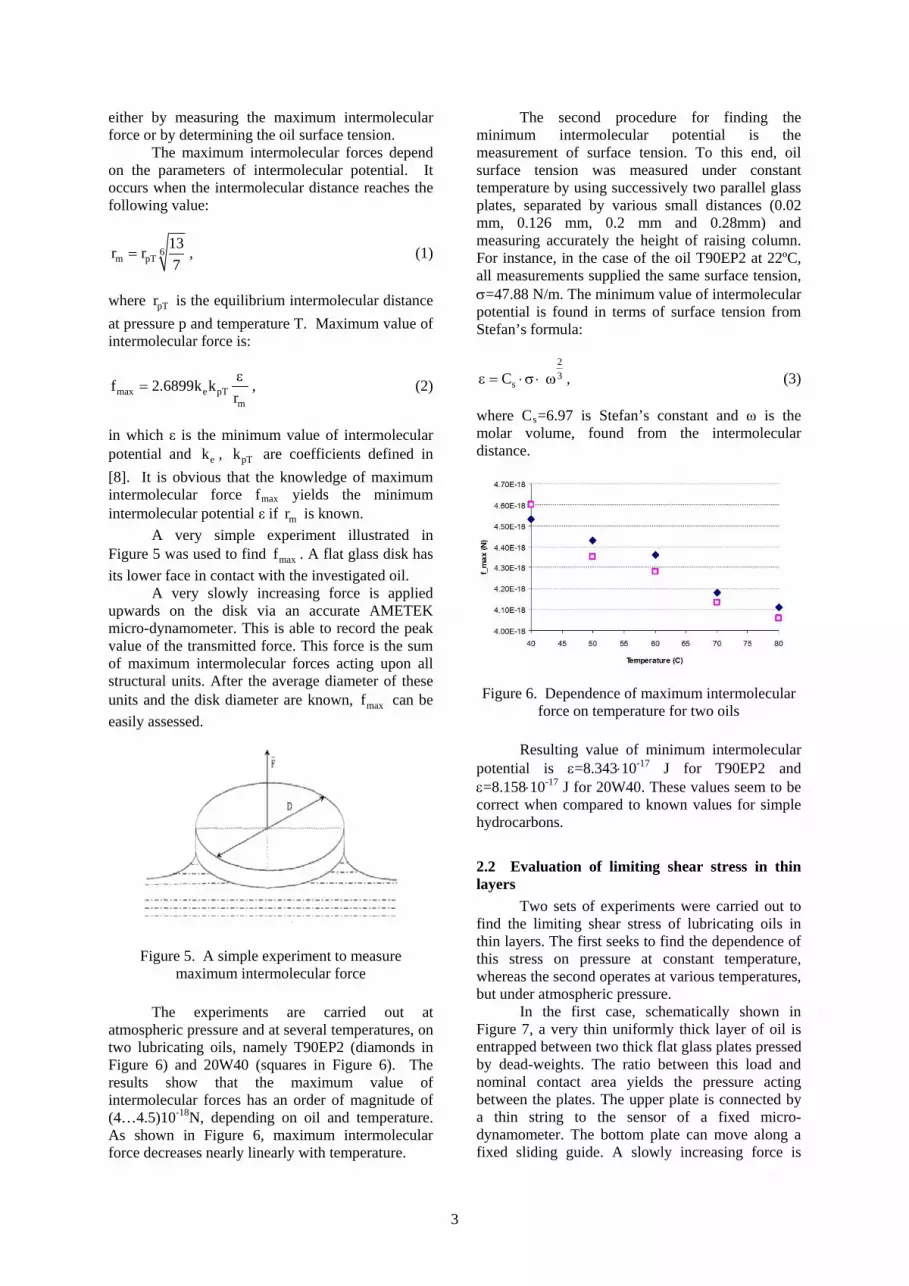
A very simple experiment illustrated in Figure 5 was used to find . A flat glass disk has
its lower face in contact with the investigated oil. maxf
A very slowly increasing force is applied upwards on the disk via an accurate AMETEK micro-dynamometer. This is able to record the peak value of the transmitted force. This force is the sum of maximum intermolecular forces acting upon all structural units. After the average diameter of these units and the disk diameter are known, can be
easily assessed. maxf
Figure 5. A simple experiment to measure maximum intermolecular force
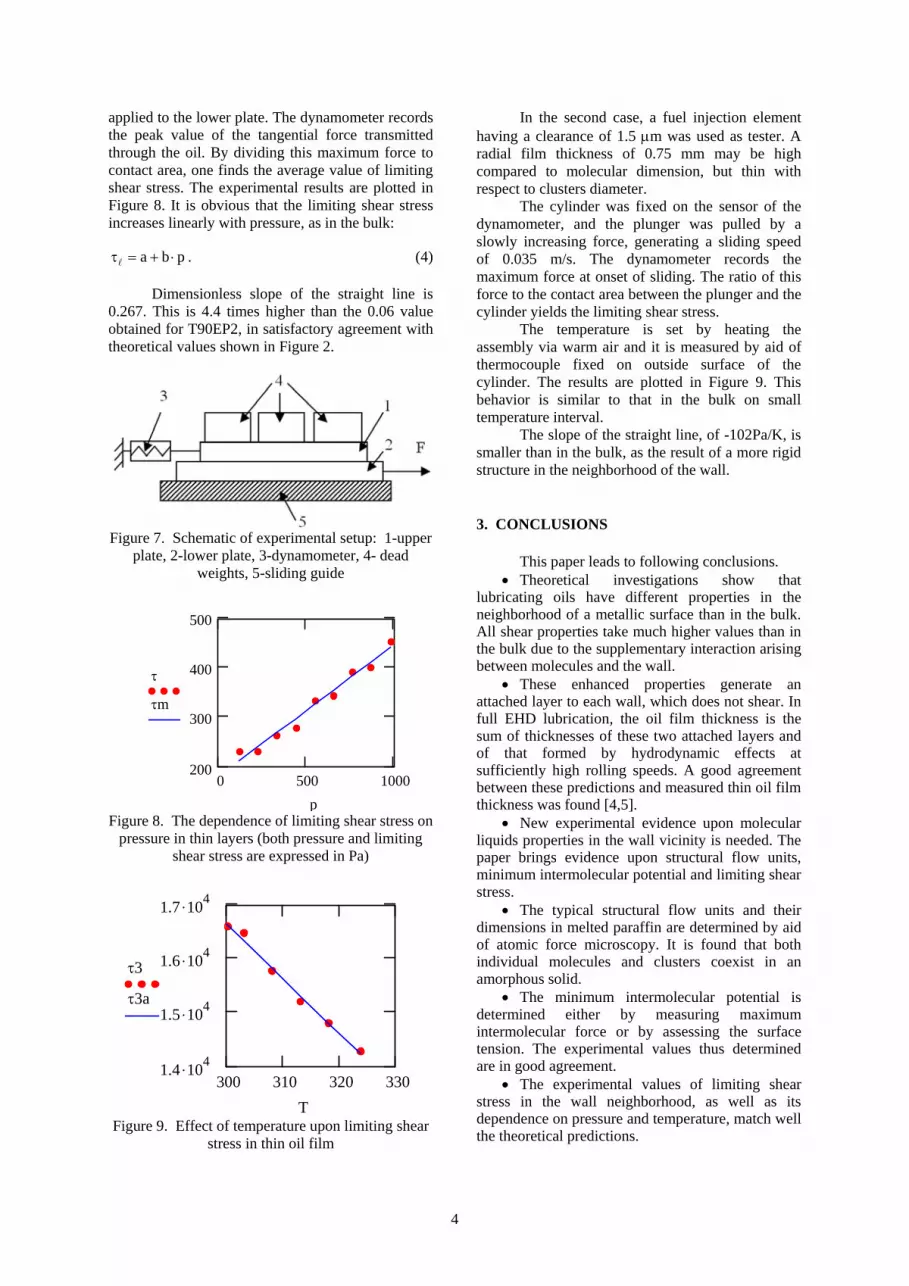
The experiments are carried out at
atmospheric pressure and at several temperatures, on two lubricating oils, namely T90EP2 (diamonds in Figure 6) and 20W40 (squares in Figure 6). The results show that the maximum value of intermolecular forces has an order of magnitude of (4…4.5)10-18N, depending on oil and temperature. As shown in Figure 6, maximum intermolecular force decreases nearly linearly with temperature.
The second procedure for finding the minimum intermolecular potential is the measurement of surface tension. To this end, oil surface tension was measured under constant temperature by using successively two parallel glass plates, separated by various small distances (0.02 mm, 0.126 mm, 0.2 mm and 0.28mm) and measuring accurately the height of raising column. For instance, in the case of the oil T90EP2 at 22ºC, all measurements supplied the same surface tension, =47.88 N/m. The minimum value of intermolecular potential is found in terms of surface tension from Stefan’s formula:
2
3sC , (3)
where Cs=6.97 is Stefan’s constant and ω is the molar volume, found from the intermolecular distance.
Figure 6. Dependence of maximum intermolecular force on temperature for two oils
Resulting value of minimum intermolecular
potential is =8.34310-17 J for T90EP2 and =8.15810-17 J for 20W40. These values seem to be correct when compared to known values for simple hydrocarbons.
2.2 Evaluation of limiting shear stress in thin layers
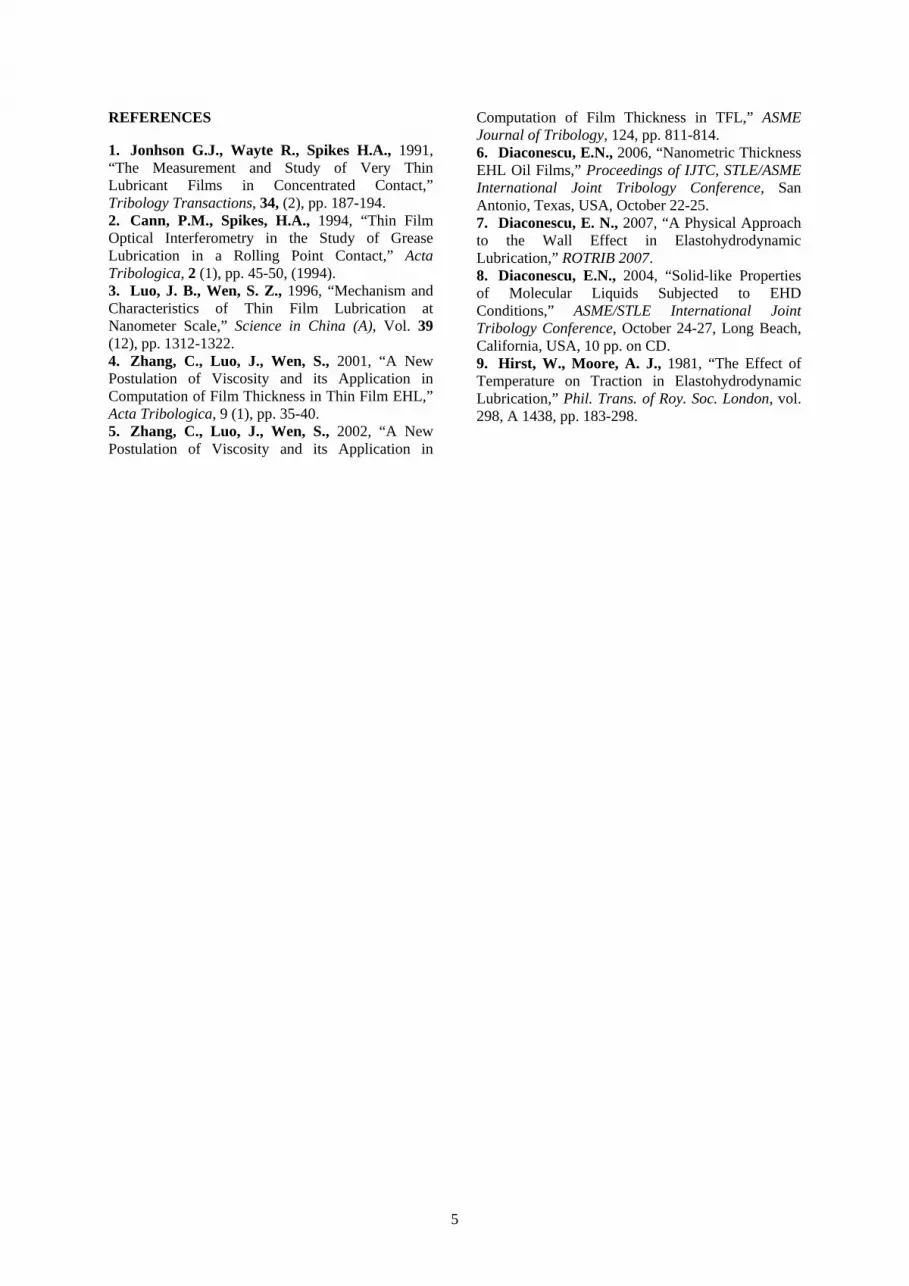
Two sets of experiments were carried out to find the limiting shear stress of lubricating oils in thin layers. The first seeks to find the dependence of this stress on pressure at constant temperature, whereas the second operates at various temperatures, but under atmospheric pressure.
In the first case, schematically shown in Figure 7, a very thin uniformly thick layer of oil is entrapped between two thick flat glass plates pressed by dead-weights. The ratio between this load and nominal contact area yields the pressure acting between the plates. The upper plate is connected by a thin string to the sensor of a fixed micro-dynamometer. The bottom plate can move along a fixed sliding guide. A slowly increasing force is
3
applied to the lower plate. The dynamometer records the peak value of the tangential force transmitted through the oil. By dividing this maximum force to contact area, one finds the average value of limiting shear stress. The experimental results are plotted in Figure 8. It is obvious that the limiting shear stress increases linearly with pressure, as in the bulk:
a b p . (4)
Dimensionless slope of the straight line is 0.267. This is 4.4 times higher than the 0.06 value obtained for T90EP2, in satisfactory agreement with theoretical values shown in Figure 2.
Figure 7. Schematic of experimental setup: 1-upper plate, 2-lower plate, 3-dynamometer, 4- dead
weights, 5-sliding guide
0 500 1000200
300
400
500
m
p Figure 8. The dependence of limiting shear stress on
pressure in thin layers (both pressure and limiting shear stress are expressed in Pa)
300 310 320 3301.4 10
4
1.5 104
1.6 104
1.7 104
3
3a
T Figure 9. Effect of temperature upon limiting shear
stress in thin oil film
In the second case, a fuel injection element having a clearance of 1.5 m was used as tester. A radial film thickness of 0.75 mm may be high compared to molecular dimension, but thin with respect to clusters diameter.
The cylinder was fixed on the sensor of the dynamometer, and the plunger was pulled by a slowly increasing force, generating a sliding speed of 0.035 m/s. The dynamometer records the maximum force at onset of sliding. The ratio of this force to the contact area between the plunger and the cylinder yields the limiting shear stress.
The temperature is set by heating the assembly via warm air and it is measured by aid of thermocouple fixed on outside surface of the cylinder. The results are plotted in Figure 9. This behavior is similar to that in the bulk on small temperature interval.
The slope of the straight line, of -102Pa/K, is smaller than in the bulk, as the result of a more rigid structure in the neighborhood of the wall.
3. CONCLUSIONS
This paper leads to following conclusions. Theoretical investigations show that
lubricating oils have different properties in the neighborhood of a metallic surface than in the bulk. All shear properties take much higher values than in the bulk due to the supplementary interaction arising between molecules and the wall.
These enhanced properties generate an attached layer to each wall, which does not shear. In full EHD lubrication, the oil film thickness is the sum of thicknesses of these two attached layers and of that formed by hydrodynamic effects at sufficiently high rolling speeds. A good agreement between these predictions and measured thin oil film thickness was found [4,5].
New experimental evidence upon molecular liquids properties in the wall vicinity is needed. The paper brings evidence upon structural flow units, minimum intermolecular potential and limiting shear stress.
The typical structural flow units and their dimensions in melted paraffin are determined by aid of atomic force microscopy. It is found that both individual molecules and clusters coexist in an amorphous solid.
The minimum intermolecular potential is determined either by measuring maximum intermolecular force or by assessing the surface tension. The experimental values thus determined are in good agreement.
The experimental values of limiting shear stress in the wall neighborhood, as well as its dependence on pressure and temperature, match well the theoretical predictions.
4
5
REFERENCES
1. Jonhson G.J., Wayte R., Spikes H.A., 1991, “The Measurement and Study of Very Thin Lubricant Films in Concentrated Contact,” Tribology Transactions, 34, (2), pp. 187-194. 2. Cann, P.M., Spikes, H.A., 1994, “Thin Film Optical Interferometry in the Study of Grease Lubrication in a Rolling Point Contact,” Acta Tribologica, 2 (1), pp. 45-50, (1994). 3. Luo, J. B., Wen, S. Z., 1996, “Mechanism and Characteristics of Thin Film Lubrication at Nanometer Scale,” Science in China (A), Vol. 39 (12), pp. 1312-1322. 4. Zhang, C., Luo, J., Wen, S., 2001, “A New Postulation of Viscosity and its Application in Computation of Film Thickness in Thin Film EHL,” Acta Tribologica, 9 (1), pp. 35-40. 5. Zhang, C., Luo, J., Wen, S., 2002, “A New Postulation of Viscosity and its Application in
Computation of Film Thickness in TFL,” ASME Journal of Tribology, 124, pp. 811-814. 6. Diaconescu, E.N., 2006, “Nanometric Thickness EHL Oil Films,” Proceedings of IJTC, STLE/ASME International Joint Tribology Conference, San Antonio, Texas, USA, October 22-25. 7. Diaconescu, E. N., 2007, “A Physical Approach to the Wall Effect in Elastohydrodynamic Lubrication,” ROTRIB 2007. 8. Diaconescu, E.N., 2004, “Solid-like Properties of Molecular Liquids Subjected to EHD Conditions,” ASME/STLE International Joint Tribology Conference, October 24-27, Long Beach, California, USA, 10 pp. on CD. 9. Hirst, W., Moore, A. J., 1981, “The Effect of Temperature on Traction in Elastohydrodynamic Lubrication,” Phil. Trans. of Roy. Soc. London, vol. 298, A 1438, pp. 183-298.

ISSN 1220 - 8434 ACTA TRIBOLOGICA Volume 17, (2009), 6-12
Laura PETRARUe-mail: [email protected]
Franz NOVOTNY-FARKAS
Karin BAUMANN
OMV Refining & Marketing, Competence Center
Lubes, 2320 Schwechat,
AUSTRIA
NEW APPROACH IN OXIDATION STABILITYTESTING OF THE GAS TURBINE OILS
The chemosorbic compounds with metal are composing aftercoating the surface with fluor-oligomeric material (FOM).Hardness, indentation and friction behavior of FOM coat wereinvestigated. Scratch adhesion and friction tests show that thefluor-oligomeric film decreases the solid body micro-hardness andmodifies contact rheology by reducing the shearing force at thelocal contact. FOM coat shows good elasticity in rough contacts,but with a higher hardness it may be more suitable for abrasiveapplications, i.e. reduced plasticity in a given tribo-contact.Keywords: gas turbine oils, antioxidants, thermo-oxidative stability
1. INTRODUCTION
Modern gas turbine oils are designed to meetan exceptional high thermo-oxidative stability due tothe development of more efficient power plants.Even in so called “high performance” gas turbineoils, oxidation causes sludge, deposits and varnishformation. These thermo-oxidation stability relatedproblems lead to early breakdowns, wear, filterplugging and other operation failures [1].
For a better understanding of the phenomena,extensive studies of the given thermo-oxidationstability problems are required.
2. TURBO-MACHINES AND THEIRLUBRICATION
The worldwide energy demand is growingcontinuously and the electrical power consumptionis hardly covered by newly established productionplants and capacities.
In the power generation, there are three mainprincipal types of turbo-machinery that gained theirmajor role and importance, widespread acceptanceand common popularity: water, steam and gasturbines.
Due to their high efficiency and flexibility inheavy-duty operation regimes, a greater than evermarket share has been achieved, especially by gasand combined cycle turbines.
A representative layout and typical scheme ofthe combined cycle turbine operation is shown inFigure 1.
These different turbo-machines arecharacterized by a wide variety of speeds,mechanical loads and thermal stresses.
The turbo-machinery design andconstruction, the operating conditions, such as loads,operating temperatures, oil makeup andcontaminants, belong to the main factors thatdetermine turbine oil performance requirements andits service life [4-6,8].
Figure 1. Steam, gas and combined cycle turbines

7
3. DEMANDS ON TURBINE OILS
The demands on turbine oils are defined bythe turbines themselves and their specific operatingconditions. The oil in the lubricating and controlcircuits of steam and gas turbines has to fulfillseveral objectives [7]:
hydrodynamic lubrication of all bearings andthe lubrication of gearboxes,
heat dissipation, functional fluid for control and safety circuits, avoidance of friction and wear on gear tooth
flanks in turbine gearboxes and when the turbine isspooled-up.
Apart from these mechanical-dynamicrequirements, the following physical-chemicalspecifications also have to be fulfilled by turbine oils[7]:
aging stability for long operating periods,
hydrolytic stability, corrosion protection, even if water, steam
and/or condensation is present, reliable separation of water (vapor and
separation of condensed water), rapid air release and low foaming, good filterability and purity.
The general overview of turbine oil operationconditions is shown in Table 1 [2].
Gas turbine applications have the most severeoperation conditions for turbine oil (see Table 1).
Elevated sump temperature and high hot spotpeaks represent the uniqueness of overall gas turbineoil challenges.
This unfavorable impact of much higheroperation temperatures call for distinguishing oilswith much higher thermal and oxidation resistanceand robustness.
Table 1. Overview of turbine oil operation conditionsWater Steam Gas
Critical turbine components bearingsguide vanes
control system
bearings
control system
bearingsgear
control systemSpeed, rpm 50…600 >3000 3000…7000Oil sump temp., ºC 40…60 45…65 50…95Hot spot peaks, ºC 75…90 80…150 150…180Unfavourable impact (water)
air(steam)
airair
high temp.Oil service life, thousand hours 100…250 50…150 20…30
Furthermore, there are strong efforts toensure a longer, more extended, but trouble-freeoperation of gas turbines. An adequate lubricatingoil quality should be responsible to ensure andperform that desired longer service life and thereliability of the gas turbines operation.
These more challenging operation conditionsdictate the use of gas turbine oils with specialperformance level regarding their thermo-oxidationstability.
4. TURBINE LUBRICANTS –SPECIFICATIONS
For matching these severe operationrequirements, in recent time, new or revisedindustrial standards and turbine oil specificationshave been introduced.
DIN 51515 lubricants and Governor Fluidsfor Turbines were revised in 2001 (Part 1-L-TDformal service, specifications) and new, so-called“high temperature turbine oils” were defined in DIN51515 part 2 (Part 2-L-TG, Lubricants and governorFluids for turbines for higher temperature servicespecifications).
Table 2 presents the specificationshighlighted in the German standard DIN 51515-1/2[3].
Table 2. German Specification: DIN 51515-1/2.
5. OEM SPECIFICATIONS
The development and the progress ofstandardization activities have not been stopped withthe creation of international and nationalspecifications.
In the meantime there have been alsointroduced or revised several new OriginalEquipment Manufacturers (OEM) specifications andguidelines for turbine oils. Especially the gasturbine oils have been recently specified indistinctive product standard with individualperformance requirements for thermo -oxidationstability. An overview of the main OEMspecifications is listed in Table 3.
8
Table 3. OEM specifications
5.1 Gas turbine oil formulation trends and benchtesting
In order for a turbine oil to fulfill itsfundamental functions, it must possess differentchemical and physical features. These features andthe performance level of turbine oils is a function ofthe type, character and quality of base stocks used intheir formulations.
The chemical structure and composition ofbase stocks can determine the finished oil properties,as the thermo - oxidation stability, agingcharacteristics, solubility of aging products,efficiency of antioxidants and other functionaladditives.
Turbine oil formulators and manufacturersresponded by using non-conventional base stockswith extremely increased antioxidant additive treat-rates [9].
Correspondingly, enhanced types of turbineoils appeared and were commercialized to satisfythese lately specified demands on better thermo –oxidation stability.
As main test criteria for thermo-oxidationstability were employed, same bench test methods asmeasured by ASTM D 2272 Rotating PressureVessel Oxidation Test (RPVOT) and ASTM D 943Turbine Oil Stability Test (TOST) as in evaluationof the traditional R&O and conventional formulatedturbine oils.
Industrial representatives still believe thatthermo-oxidation stability, evaluated even byRPVOT/TOST values, is a priority and extremelyimportant. So, they have prescribed and listed firstlythose two old bench tests in their new more severespecifications for gas turbine oils (Tables 4 and 5).
Table 4. Comparison of main physical and chemical characteristics in specifications of gas turbine oils (I)

9
Table 5. Comparison of thermo -oxidation test requirements in specification of gas turbine oils (II)
In fact, recent gas turbine oil developments ofoil companies concentrated on the satisfaction andfulfillment of the required extremely highRPVOT/TOST values only, but not under real-lifeoperating conditions. The methodology validationsand the evaluation of fleet discrepancies have notbeen taken into account.
6. OIL FORMULATION CONSIDERATIONS
6.1 How to balance the oil formulation?Oil’s molecular composition influences its
physical and chemical properties, particularly thethermo–oxidation resistance and agingcharacteristics. Nitrogen heterocycles and aromaticcompounds have a negative influence on base oilstability. Some sulphur containing compounds areviewed as desirable since they inhibit hydrocarbonautocatalytic oxidation through free-radical chaintermination pathways. Therefore, the solvent refinedbase stocks Group I can hardly fulfill modern heavy-duty gas turbine performance requirements.
Without an effective antioxidant, which isnon-volatile and thermally stable, even the non-conventional base stocks will be oxidized quiterapidly.
Part of antioxidants can be lost byvaporization or become ineffective as a result ofhigh temperatures. The proper treat rate andchemical selection of antioxidants are key issues forthe design of the thermal stability and agingresistance [10].
6.2 Dilemma of using non-conventional basestocks
The non-conventional base stocks areadvantageous because of much higher oxidation andthermo–oxidation stability, by comparison toconventional base stocks Group I.
They have a quite homogenous hydrocarbonstructure (Figure 2), with nearly full absence ofaromatic, and/or heteroaromatic constituents.
Figure 2. Basestock categories according toATIEL/API
Non-conventional base stocks have anexcellent additive response for a comparableperformance level, and a lower additive treat rate isrequired.
Nevertheless, all these non-conventional basestocks have lower solvency, resulting in earliersludge formation and additive dropout if commonlyhigh treat rates and antioxidant types are used.
6.3 Selection and proper balance of antioxidantsThere are a huge number of different
chemical sorts of antioxidants that can be selectedand employed for gas turbine oils.
A proper formulation balance requires aselection of two or more chemical type ofantioxidants with synergetic potential andmultifunctional character, finding out the ways toreduce overall additive treat rates.
Lower treat rates of antioxidants can decreasethe additive solubility weakness in highly non-polarbase stocks, and also minimize the probability foradditive dropout, sludge and deposit formation.
10
The individual components of employedantioxidant additives and their chemistry must becarefully selected and have low volatility, goodthermal stability and adequate solubility in the basestocks used in the desired gas turbine oilformulations.
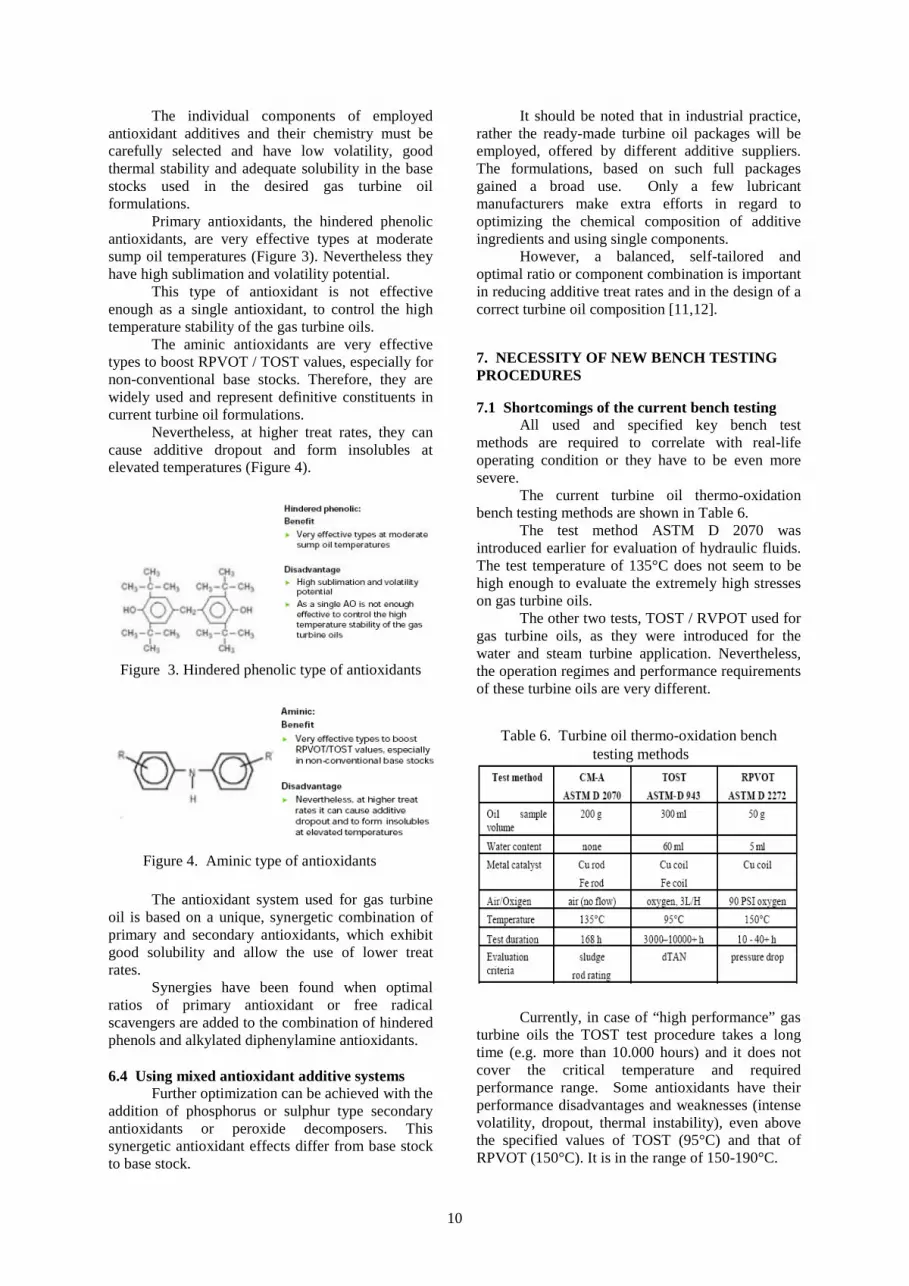
Primary antioxidants, the hindered phenolicantioxidants, are very effective types at moderatesump oil temperatures (Figure 3). Nevertheless theyhave high sublimation and volatility potential.
This type of antioxidant is not effectiveenough as a single antioxidant, to control the hightemperature stability of the gas turbine oils.
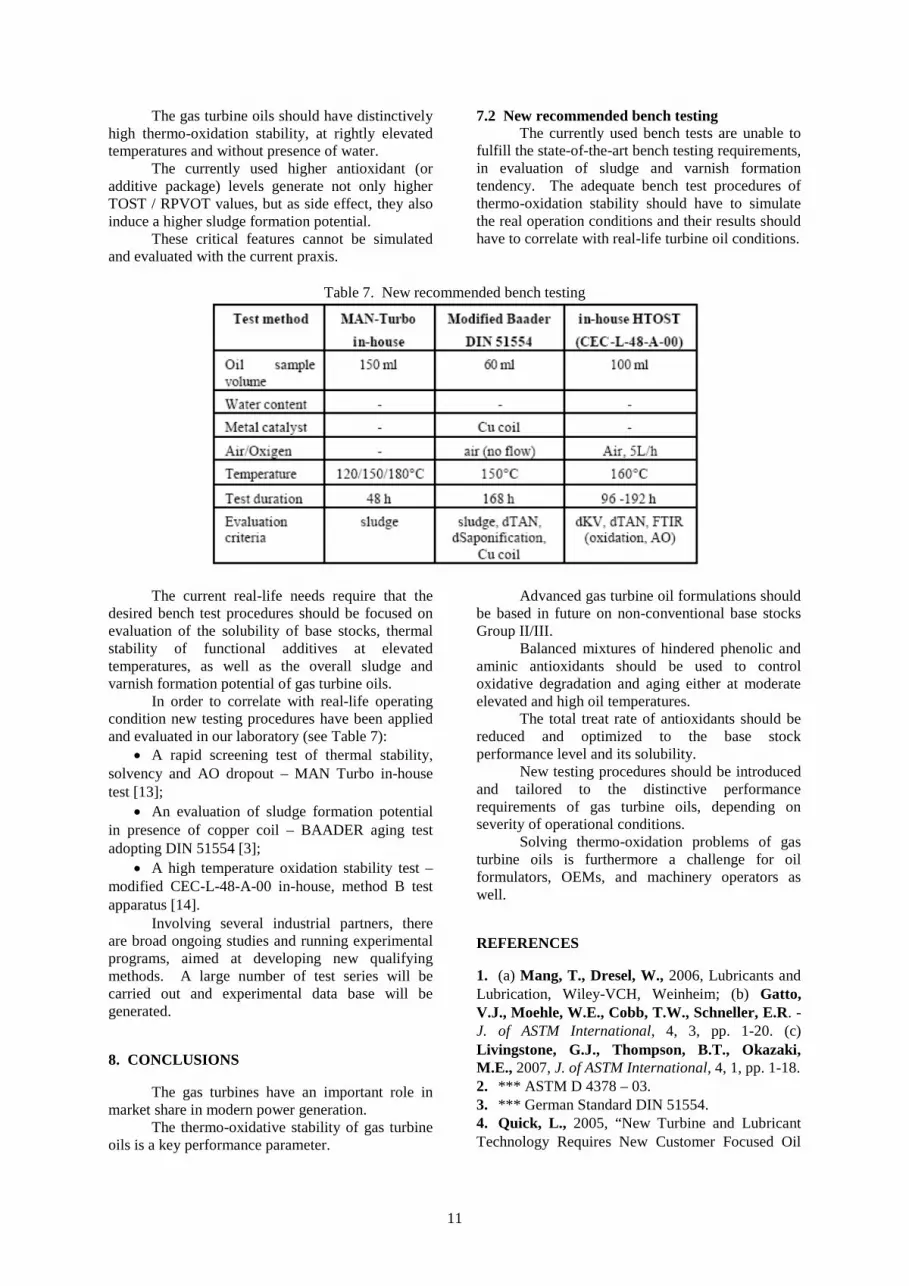
The aminic antioxidants are very effectivetypes to boost RPVOT / TOST values, especially fornon-conventional base stocks. Therefore, they arewidely used and represent definitive constituents incurrent turbine oil formulations.
Nevertheless, at higher treat rates, they cancause additive dropout and form insolubles atelevated temperatures (Figure 4).
Figure 3. Hindered phenolic type of antioxidants
Figure 4. Aminic type of antioxidants
The antioxidant system used for gas turbineoil is based on a unique, synergetic combination ofprimary and secondary antioxidants, which exhibitgood solubility and allow the use of lower treatrates.
Synergies have been found when optimalratios of primary antioxidant or free radicalscavengers are added to the combination of hinderedphenols and alkylated diphenylamine antioxidants.
6.4 Using mixed antioxidant additive systemsFurther optimization can be achieved with the
addition of phosphorus or sulphur type secondaryantioxidants or peroxide decomposers. Thissynergetic antioxidant effects differ from base stockto base stock.
It should be noted that in industrial practice,rather the ready-made turbine oil packages will beemployed, offered by different additive suppliers.The formulations, based on such full packagesgained a broad use. Only a few lubricantmanufacturers make extra efforts in regard tooptimizing the chemical composition of additiveingredients and using single components.
However, a balanced, self-tailored andoptimal ratio or component combination is importantin reducing additive treat rates and in the design of acorrect turbine oil composition [11,12].
7. NECESSITY OF NEW BENCH TESTINGPROCEDURES
7.1 Shortcomings of the current bench testingAll used and specified key bench test
methods are required to correlate with real-lifeoperating condition or they have to be even moresevere.
The current turbine oil thermo-oxidationbench testing methods are shown in Table 6.
The test method ASTM D 2070 wasintroduced earlier for evaluation of hydraulic fluids.The test temperature of 135°C does not seem to behigh enough to evaluate the extremely high stresseson gas turbine oils.
The other two tests, TOST / RVPOT used forgas turbine oils, as they were introduced for thewater and steam turbine application. Nevertheless,the operation regimes and performance requirementsof these turbine oils are very different.
Table 6. Turbine oil thermo-oxidation bench testing methods
Currently, in case of “high performance” gasturbine oils the TOST test procedure takes a longtime (e.g. more than 10.000 hours) and it does notcover the critical temperature and requiredperformance range. Some antioxidants have theirperformance disadvantages and weaknesses (intensevolatility, dropout, thermal instability), even abovethe specified values of TOST (95°C) and that ofRPVOT (150°C). It is in the range of 150-190°C.
11
The gas turbine oils should have distinctivelyhigh thermo-oxidation stability, at rightly elevatedtemperatures and without presence of water.
The currently used higher antioxidant (oradditive package) levels generate not only higherTOST / RPVOT values, but as side effect, they alsoinduce a higher sludge formation potential.
These critical features cannot be simulatedand evaluated with the current praxis.
7.2 New recommended bench testingThe currently used bench tests are unable to
fulfill the state-of-the-art bench testing requirements,in evaluation of sludge and varnish formationtendency. The adequate bench test procedures ofthermo-oxidation stability should have to simulatethe real operation conditions and their results shouldhave to correlate with real-life turbine oil conditions.
Table 7. New recommended bench testing
The current real-life needs require that thedesired bench test procedures should be focused onevaluation of the solubility of base stocks, thermalstability of functional additives at elevatedtemperatures, as well as the overall sludge andvarnish formation potential of gas turbine oils.
In order to correlate with real-life operatingcondition new testing procedures have been appliedand evaluated in our laboratory (see Table 7):
A rapid screening test of thermal stability,solvency and AO dropout – MAN Turbo in-housetest [13];
An evaluation of sludge formation potentialin presence of copper coil – BAADER aging testadopting DIN 51554 [3];
A high temperature oxidation stability test –modified CEC-L-48-A-00 in-house, method B testapparatus [14].
Involving several industrial partners, thereare broad ongoing studies and running experimentalprograms, aimed at developing new qualifyingmethods. A large number of test series will becarried out and experimental data base will begenerated.
8. CONCLUSIONS
The gas turbines have an important role inmarket share in modern power generation.
The thermo-oxidative stability of gas turbineoils is a key performance parameter.
Advanced gas turbine oil formulations shouldbe based in future on non-conventional base stocksGroup II/III.
Balanced mixtures of hindered phenolic andaminic antioxidants should be used to controloxidative degradation and aging either at moderateelevated and high oil temperatures.
The total treat rate of antioxidants should bereduced and optimized to the base stockperformance level and its solubility.
New testing procedures should be introducedand tailored to the distinctive performancerequirements of gas turbine oils, depending onseverity of operational conditions.
Solving thermo-oxidation problems of gasturbine oils is furthermore a challenge for oilformulators, OEMs, and machinery operators aswell.
REFERENCES
1. (a) Mang, T., Dresel, W., 2006, Lubricants andLubrication, Wiley-VCH, Weinheim; (b) Gatto,V.J., Moehle, W.E., Cobb, T.W., Schneller, E.R. -J. of ASTM International, 4, 3, pp. 1-20. (c)Livingstone, G.J., Thompson, B.T., Okazaki,M.E., 2007, J. of ASTM International, 4, 1, pp. 1-18.2. *** ASTM D 4378 – 03.3. *** German Standard DIN 51554.4. Quick, L., 2005, “New Turbine and LubricantTechnology Requires New Customer Focused Oil

12
Monitoring Methods,” ASTM Symposium, December5th, Norfolk, VA.5. Habereder T., 2006, “Ashless AdditiveTechnology for Modern Turbine Oils,” LubricantsRussia, WTC, Moscow.6. Bloch, H.P., 2000, Practical Lubrication forIndustrial Facilities, Marcel Dekker.7. Mang, T., Dresel W., 2001, Lubricants andLubrications, Wiley-VCH.8. Sweeney P.J., 2001, Lubrication of Steam, Gasand Water Turbines in Power Generation – AChevron Texaco Experience, Sydney NSW.9. Lopopolo V., 2005, “Development and Testingof an Antiwear Gas Turbine Lubricant in
Challenging Offshore Environment,” IAGTSymposium, Banff, October.10. Rudnick L.R.., 2003, Lubricant Additives –Chemistry and Applications, Marcel Dekker.11. Denis, J. et al., 2000, Lubricant PropertyAnalysis & Testing, Editions Technip Paris.12. Gatto, V., et al., 2005, “Oxidation Fundamentals& its Application to Turbine Oil Testing,” ASTMSymposium, Dec. 5th (2005), Norfolk, VA.13. *** MAN Turbomaschinen AG AA-10-217/A-C.14. *** International Standard CEC-L-48-A-00.
ISSN 1220 - 8434 ACTA TRIBOLOGICA Volume 17, (2009), 13-16
Liana BOGATU1
email: [email protected]
Ion PETRE1
Anca MARIN1
Constantin TĂNĂSESCU2
Diana PETRE2
Niculae Napoleon ANTONESCU3
Liviu MIRCI3
1 SC ICERP SA Ploieşti, ROMANIA2 Petroleum and Gas University of Ploieşti,
ROMANIA3 Politehnica University of Timisoara,, ROMANIA
HYDRAULIC OILS FROM REGENERABLE FEEDSTOCKS WITH A LOW ENVIRONMENTALIMPACT
The aim of this research study is to obtain biodegradable hydraulicoils characterized in accordance with European standard regardingthe quality and environmental impact. The formulation of this typeof lubricant is based on vegetable oils or mixtures of vegetable oilswith more stable base oils and appropriate additives. The studyevaluates the laboratory testing results regarding vegetable oil-based lubricating characteristics and hydraulic oils obtained frombase oil mixture and suitable additives.Keywords: hydraulic oils, vegetable oil-based lubricants,biodegradable lubricating oils, vegetable oils oxidation stability
1. INTRODUCTION
The monitoring and observing studiesconducted in Europe and in the USA on thelubricating oils’ life cycle have proved that over 50%of used oils get in the ecosystem. Due to the factthat 95% of lubricating oils are obtained frompetroleum resources that have a low grade ofbiodegradability, these uncontrolled losses of usedoils have, from the environmental point of view, analarming impact.
In the international context there is animportant experience in problems regardinglubricating oils environmental impact. In the lastyears, remarkable interests were identified in theNordic countries and, also, in other Europeancountries. Thus, the following organizations werecreated: Nordic Swan (Nordic Countries), SwedishStandard (Sweden), Blue Angel (Germany), NF-Environment Mark (France), Austrian Ecol-Label(Austria), VAMIL regulation (The Netherlands), ISO15380 (International Standard) [1].
Significant results have been obtained on theinternational level, especially in the Nordic countriesthat advanced concerns in the environmental aspectsof legislations field, results in elaborating aregulation for renewable feed stocks requirements.Therefore, the Swedish Standard for greasesfabrication (SS 15570 Greases) includesrequirements for renewable feed stocks. Also, theNordic Swan includes requirements for lubricatingoils.
Among the viable solutions for ecologicallubricating oils fabrication, significant results havebeen obtained in vegetable lube base oils using field,because these are characterized by a highbiodegradable grade, a lower toxicity level and are
obtained from renewable feed stocks. Thus, it can beachieved simultaneously both the objective regardingthe biodegradability of the obtained lubricating oilsand the natural resources savings objective,respectively oilfields protection (very difficult torenew) that are continuously decreasing both asnumber and as exploitation potential.
Vegetable oil-based lubricants are emergingas an environmentally preferable alternative toexisting petroleum oil products. Users are findingthat vegetable oils can offer even better performancethan petroleum oils in some applications, with theadded benefits of being less toxic, renewable andbiodegradable.
The lubricants include a large and varioustypes of oils, such as: engine oils, hydraulic oils,compressor oils, turbine oils, slide way oils,transmission oils, greases, metal working fluids,preservative fluids and so on. After engine oils, thehydraulic oils are the most used type of lubricant.Different types of vegetable oil-based biodegradablehydraulic fluids for use in heavy equipment aremoving toward commercialization [2].
In the last years, the authors have maderesearch studies regarding the use of vegetable baseoils to lubricant formulations [3-8].
2. HYDRAULIC OILS CHARACTERISTICS
The most important characteristics requiredby the hydraulic oils are the adequate fluid viscosityand antiwear properties.
Other significant characteristics include: oxidation resistance – important with a
growing tendency for bulk oil temperatures toincrease in many hydraulic systems;

14
thermal stability – to resist degradation andattack of metals at high temperatures;
corrosion resistance to avoid harmful attackon the variety of metals used in hydraulicsystems;
extreme pressure properties; water separation – to avoid problems of
emulsification with small quantities of waterentering the system through condensation;
air-release and antifoam properties – to avoidcavitation effects and increasedcompressibility.The specific values of these characteristics
are regulated by standards as DIN 51524, NFE48603, DENISON HF-O, CINCINNATIMILACRON etc.
3. COMPARISON BETWEEN VEGETABLEOILS AND OTHER BASE OILS
Nowadays, the lubricants market is dividedlike this:
Mineral oils (92…94%); Synthetic oils (5…6% ); Vegetable oils (1.5…2%).
The data about such type of oils, concerningthe lubricating properties, environmental impact andextent, emphasize the following aspects (Table 1).
Evaluating these results it can be noticed theindication “very good” for mineral type as regardsthe extent, for vegetable type concerningbiodegradability and renewability and for syntheticreferring to quality.
Vegetable oils have a promising potential tobe used for lubricants fabrication, according with theactual regulations regarding biodegradability, therenewability and toxicity. But, the environmentalimpact and human safety represent only a part of theimposed requirements of lubricant oils. For specific
applications of the lubricants we have to consider alot of aspects referring to the working conditions.
To satisfy these requirements, the feed stockfor lubricating oils fabrication, respectively lube baseoils and additives, have to accomplish someimportant characteristics as:
viscosity corresponding to the designedworking parameters;
high viscosity index; low pour point; high flash point; high oxidation resistance; high biodegradability grade; others (corrosion resistance, wear protection,
extreme pressure resistance, foamingtendency, desemulsification etc).Referring to these properties, Table 2 shows
the characteristic average values for threerepresentative base oil types: vegetable oil, mineraloil and synthetic oil.
As it can be noticed, vegetable oils haveremarkable viscosity index, flash point andbiodegradability, but poor acidity, pour point andcompletely unsatisfactory oxidation resistance.
Mineral oils have a good viscosity index,flash point, pour point, acidity and oxidationresistance, but a low biodegradability capacity.
The synthetic oils as polyalphaolefins have avery good viscosity index and pour point, good flashpoint, acidity and oxidation resistance and anacceptable biodegradability capacity, the onlyproblem being their higher price.
Referring to vegetable oils, the application ofthis type of base oils at lubricant fabrication isconditioned by improving oxidation resistance.
Considering these facts, the idea of theresearch study was to mix the vegetable oils withappropriate base oils and additives that have theneeded performance.
Table 1. Lubricants comparisonOil type Lubricating
propertiesBiodegradability Renewability Extent Price
Mineral good low low very good goodVegetable acceptable very good very good low acceptableSynthetic very good partial - low high
Table 2. Tested characteristics
CharacteristicsVegetable oil
SunflowerMineral oilISO-VG 32
Synthetic oilPAO 6 Test method
KinematicsViscosity
at 100oC, cStat 40oC, cSt
31.857.62
29.504.93
31.165.78
ISO 3104
Viscosity Index 222 92 129 ASTM 2270Pour Point oC -9 -12 -40 ISO 3016Flash Point, oC 260 210 210 ISO 2592Oxidation stability RBOT, minutes 10 60 100 ASTM 2272Acidity, mg KOH/g 6 0.005 0.03 ASTM 974Biodegradability, % >90 <50 >70 CEC L-33-A-934
15
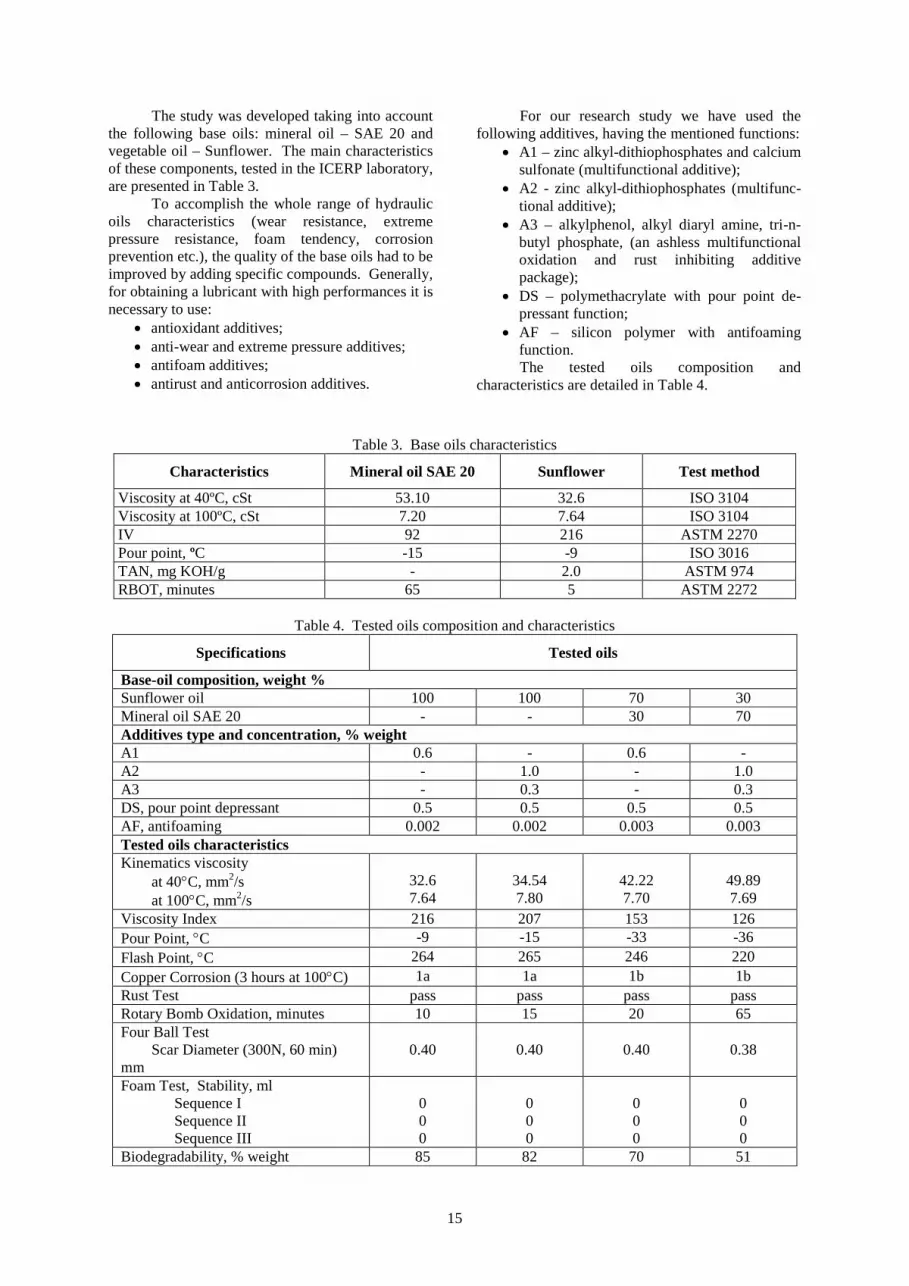
The study was developed taking into accountthe following base oils: mineral oil – SAE 20 andvegetable oil – Sunflower. The main characteristicsof these components, tested in the ICERP laboratory,are presented in Table 3.
To accomplish the whole range of hydraulicoils characteristics (wear resistance, extremepressure resistance, foam tendency, corrosionprevention etc.), the quality of the base oils had to beimproved by adding specific compounds. Generally,for obtaining a lubricant with high performances it isnecessary to use:
antioxidant additives; anti-wear and extreme pressure additives; antifoam additives; antirust and anticorrosion additives.
For our research study we have used thefollowing additives, having the mentioned functions:
A1 – zinc alkyl-dithiophosphates and calciumsulfonate (multifunctional additive);
A2 - zinc alkyl-dithiophosphates (multifunc-tional additive);
A3 – alkylphenol, alkyl diaryl amine, tri-n-butyl phosphate, (an ashless multifunctionaloxidation and rust inhibiting additivepackage);
DS – polymethacrylate with pour point de-pressant function;
AF – silicon polymer with antifoamingfunction.The tested oils composition and
characteristics are detailed in Table 4.
Table 3. Base oils characteristics
Characteristics Mineral oil SAE 20 Sunflower Test method
Viscosity at 40ºC, cSt 53.10 32.6 ISO 3104Viscosity at 100ºC, cSt 7.20 7.64 ISO 3104IV 92 216 ASTM 2270Pour point, ºC -15 -9 ISO 3016TAN, mg KOH/g - 2.0 ASTM 974RBOT, minutes 65 5 ASTM 2272
Table 4. Tested oils composition and characteristics
Specifications Tested oils
Base-oil composition, weight %Sunflower oil 100 100 70 30Mineral oil SAE 20 - - 30 70Additives type and concentration, % weightA1 0.6 - 0.6 -A2 - 1.0 - 1.0A3 - 0.3 - 0.3DS, pour point depressant 0.5 0.5 0.5 0.5AF, antifoaming 0.002 0.002 0.003 0.003Tested oils characteristicsKinematics viscosity at 40C, mm2/s at 100C, mm2/s
32.67.64
34.547.80
42.227.70
49.897.69
Viscosity Index 216 207 153 126Pour Point, C -9 -15 -33 -36Flash Point, C 264 265 246 220Copper Corrosion (3 hours at 100C) 1a 1a 1b 1bRust Test pass pass pass passRotary Bomb Oxidation, minutes 10 15 20 65Four Ball Test Scar Diameter (300N, 60 min)mm
0.40 0.40 0.40 0.38
Foam Test, Stability, ml Sequence I Sequence II Sequence III
000
000
000
000
Biodegradability, % weight 85 82 70 51
16
4. CONCLUSIONS
Using only vegetable oils for biodegradablehydraulic oils formulation, a high biodegradabilitygrade is obtained, but it doesn’t accomplish all thequality conditions required for such a lubricant type.
The additives used frequently in mineral andsynthetic oils based lubricants fabrication (anti-oxidant, antiwear, anticorrosion, depressant, anti-foaming additives) are not as efficient for vegetableoils.
Good results were obtained using mixturesbetween vegetable oils, mineral oils and specificadditives. Thus, the required performance level forall the characteristics is obtained.
The vegetable oils could be an approachablesolution for hydraulic lubricants fabrication and analternative for the mineral base oil.
The mixtures between vegetable oils, mineraloils and suitable additives provide adequatecharacteristics for the formulated lubricants.
Most convenient mixtures (with smallerdosage of mineral oils) could be obtained using newand more efficient additives.
REFERENCES
1. Norrby, T., Kopp, M., 2000, “EnvironmentallyAdapted Lubri-cants in Swedish Forest Industry. ACritical Review and Case Study,” Tribology 2000-Plus, 12th International Colloquium Esslingen,January 11-13, pp. 161-168.
2. McGraw, L., 2000, Biodegradable HydraulicFluid Nears Market, USA Agricultural ResearchService, April 19.3. Bogatu, L., Tănăsescu, C., 2005, „Uleiurilubrifiante biodegra-dabile”, Buletinul UniversităţiiPetrol-Gaze din Ploieşti, Seria Tehnică, 57, 2, pp.53-56.4. Bogatu, L., Tănăsescu, C., 2005,“Biodegradable lubricating oils,” 2nd Intern. Conf.on Manufacturing Engineering ICMEN, Proc., ed.Bouzakis, K.D., 5-7 October, Chalkidiki, Greece,pp. 591-595.5. Tănăsescu, C., Petre, D., Jugănaru, T.,Ciuparu, D., Bogatu, L., 2007, “Increasing theOxidation Stabi-lity of Vegetable Oil by CatalyticHydrogenation for Application in Lubrication,” 10th
Intern. Conf. on Tribology, SERBIATRIB-07,Kragujevac, Serbia, 19-21 June.6. Bogatu, L., Petre, I., Marin, A., Amira, C.,2007, „Biodegradable hydraulic lubricants based onmodified vegetable oils,” 10th Intern. Conf. onTribology, SERBIATRIB-07, Kragujevac, Serbia,19-21 June.7. Mirci, L.E., Boran, S., Herdan, J.M., 2000,“New Synthetic Ester Type Base Oils (withBiodegra-dability Potential),” Tribology 2000-Plus,12th Intern. Colloquium Esslingen, January 11-13,pp. 135-141.8. Mirci, L.E., Boran, S., Pode, V., Resiga, D.,2007, “Synthetic lubricants based on sebaciccomplex esters,” J. of Synthetic Lubrication, 24, 1,pp. 51-63.
ISSN 1220 - 8434 ACTA TRIBOLOGICA Volume 17, (2009), 17-20
Carmen BUJOREANUemail: [email protected]
Viorel PALEU
Dept. of Machine Elements & Mechatronics,
“Gh. Asachi” Technical University of Iasi,
ROMANIA
IMPACT PARAMETERS IN ROLLING CONTACTLUBRICATION
The EHD mechanism is the “miracle mechanism” for life anddurability. The key to unlock the mysteries behind oil physicalproperties and chemical attributes is the identification of thefunctional regions of a lubricated contact. Some experimentsrelated to a severe wear leading to contact catastrophic damage arepresented and emphasize the mean parameters controllinglubrication and failure mechanisms. The test method invokestribological interactions measured in terms of friction, gentlepolishing wear of surface features, adhesive wear events andscuffing. With respect to lubrication and failure mechanisms for agiven tribo-contact system, we propose that the key performanceparameters are the entraining velocity, the sliding velocity, andtemperature.Keywords: lubrication, rolling contact, scuffing, sliding,temperature
1. INTRODUCTION
The EHD contact can be divided into threeregions. The inlet region is the convergent sectionupstream of the high pressure Hertzian contactregion. The inlet region is the functional region forEHD pressure generation, which has rigorousmathematical foundations for predicting filmthickness within the Hertzian region. The dynamicmotions within the inlet region pump the film up.The Hertzian region rides the film, and the exitregion discharges the film. The decoupling of thesefunctional regions is the secret behind testingmachines and testing methods.
Oil and its viscosity, as well as pressure-viscosity properties within the convergent inletregion control EHD film thickness in a reliable andpredictable fashion. The shear and traction of thepressurized film within the Hertzian contact regiongives rise to heat generation, which is dissipatedwithin the contacting bodies. For surface life anddurability, the preservation of the EHD or micro-EHD mechanism is essential [1].
The primary purpose of oil chemicalattributes is to preserve the EHD mechanisms asmuch as possible. Loss of "surface integrity" is thefirst step toward wear and scuffing failuremechanisms. While EHD mechanisms are essentialfor life and durability, chemical attributes forboundary lubrication mechanisms are equallyessential. Chemical attributes play a critical role inpreserving surface integrity. The processes ofphysical adsorption and chemical reaction heal and
protect against local adhesion and disruption of thesurface topography.
Tribo-contact systems, which have oilproperties for EHD film-forming capability andchemical attributes for film-forming ability workingtogether, can achieve remarkable levels durability.
2. IMPACT FACTORS
The decoupling of the inlet region EHDlubrication functions from the Hertzian regionboundary and micro-EHD mechanisms providesmeans to identify the impact parameters associatedwith lubrication and failure.
Failure mechanisms of wear, scuffing andsurface initiated fatigue are the result of micro-scaleevents associated with roughness features [2]. Ifroughness features do not "run-in" or have exhibitedplastic flow, high normal stresses with repeatedcontact cycles can result in surface initiated fatigueor "frosting". Since EHD film thickness is afunction of viscous properties in the inlet region andthe entraining velocity, the entraining velocitybecomes an impact performance factor.
The sliding velocity within the Hertzianregion determines the shear strain at asperity sites.The shear stress at these sites is directly connected tothe frictional conditions created at asperity sites.
Since sliding velocity controls the strain atasperity sites, as well as frictional heating, slidingvelocity becomes an impact factor.
18
We recognized that contact load or stress isan important engineering parameter. It certainly iswith respect to subsurface initiated fatigue, wherematerial fatigue is directly related to shear stressesbelow the surface. From a tribological perspectiveof processes at the surface interface under high-speed lubricated conditions, load is translated intocontact size, heat generation, and to some degree,asperity stress and strain. While engineers like towork in terms of load and stress, the criticalphenomena within the contact is really seen to agreater degree as temperature or tangential stress andstrain. Temperature can be viewed as the sum ofbulk temperature from the contacting bodies andcontact temperature within the contact itself. Thebulk temperature controls the viscous properties inthe inlet region for EHD film thickness. The contacttemperature controls the bulk fluid tractioncoefficient in the Hertzian region. It is also a majorcontributor to oil and material chemical reactivitywithin the Hertzian region. So, the temperature isan impact factor associated with lubrication andfailure mechanisms.
With respect to lubrication and failuremechanisms for a given tribo-contact system, wepropose that the key performance parameters are theentraining velocity, the sliding velocity andtemperature.
3. FAILURE EVALUTION
Tangential stress and strain under high-speedconditions, and without sufficient chemical responseat the interface, can lead to scuffing failure. In somecontact situations, wear, scuffing and fatigue mayoccur simultaneously. The dominant failure modewill depend upon the impact parameters abovementioned.
One can categorize surface deterioration intothree basic modes: wear, scuffing and fatigue.
The term “adhesive wear” is commonly usedwhen failed surfaces appear to have undergoneplastic flow due to local “adhesion” at the interface.When attempting surface fatigue simulation testswith advanced bearing materials having corrosionresistant properties, local adhesive events have beenfound to prevent operation when the EHD filmthickness is small relative to surface roughnessheight. If the chemistry of the material does notallow the formation of surface films from reactionswith the oil, adhesive wear can supersede surfacedeterioration due to surface initiated fatigue. Inaddition, material properties that affect plastic flow,like hardness, seem to influence the onset ofadhesive wear [3].
The mechanisms that control the ability of asurface to handle high normal and shear stress and torecover subsequent to local damaging events are amystery. Testing for these mechanisms andassociated surface durability attributes is essential
for material development and assurance ofperformance in service.
It was found that surface failure by adhesivewear is initiated at microscopic sites of insufficientsurface film lubrication or at sites of debrisencounters. With limited chemical reactivitybetween lubricating oil and some corrosion resistantmaterials, local adhesion events, which are not ableto recover, propagate into broad patches of adhesivewear damage. With sufficient sliding velocity andcontact stress, adhesive wear can transition into amajor scuffing event. A scuffing event ischaracterized by a rapid rise in friction andtemperature.
Some scuffing tests have been carried out onthe high-speed twin-disk machine (see Figure 1)available at LMC-INSA Lyon facilities, using thedisc specimens (see Figure 2).
The test protocol described below is anattempt to simulate the adhesive wear mechanismsthat believed to occur in rolling element bearings.
In the experimental procedure the scuffinglimit is reached by increasing progressively thesliding speed, other operating conditions such nor-mal load and the rolling speed being kept constant.
The evidence of disk scuffing is a suddenincrease of friction force, which stops automaticallythe machine at an earlier stage of damage process.
The contacting disks, presented in Figure 1,were arched performed in order to reproduce theball-inner ring contact from 7206 ball bearing (theellipticity factor k=8.964). A total of 16 tests havebeen carried out.
The lubricant used in these tests is a mineraloil, ELF 154 NS. Its rheological behaviour isestimated from experimental traction curvesobtained on the twin-disk machine.
Scuffing limits for mean rolling speed of 40m/s, three maximum Hertzian pressures (0.8, 1.0 and1.2 GPa) and three oil feed temperatures (40, 70,100 0C) have been studied on the twin-disk machine.
Figure 1. High-speed twin-disk machine
19
Figure 2. Disk specimens
For this simulative tribotesting, thesimulation criteria reefer to material, geometricalcharacteristics and the lubrication regime of thepractical system, that is 7206 angular ball-bearing.
4. RESULTS
The scuffing approaches analysis and ouroriginal experiments on rolling contacts have beendetached the idea that, any scuffing mechanismconsidered, there is an energetically unbalance in therolling contact. This unbalance generatesdisruptions in lubrication conditions and the scuffingrisk appears. So, we consider the most adequatemodel to estimate the scuffing limits an energeticallyone. A dependence between contact pressure,sliding speed and critical level of energy dissipatedcan be settle for any operating conditions in a ballbearing which contact geometry and lubricantproperties are known.
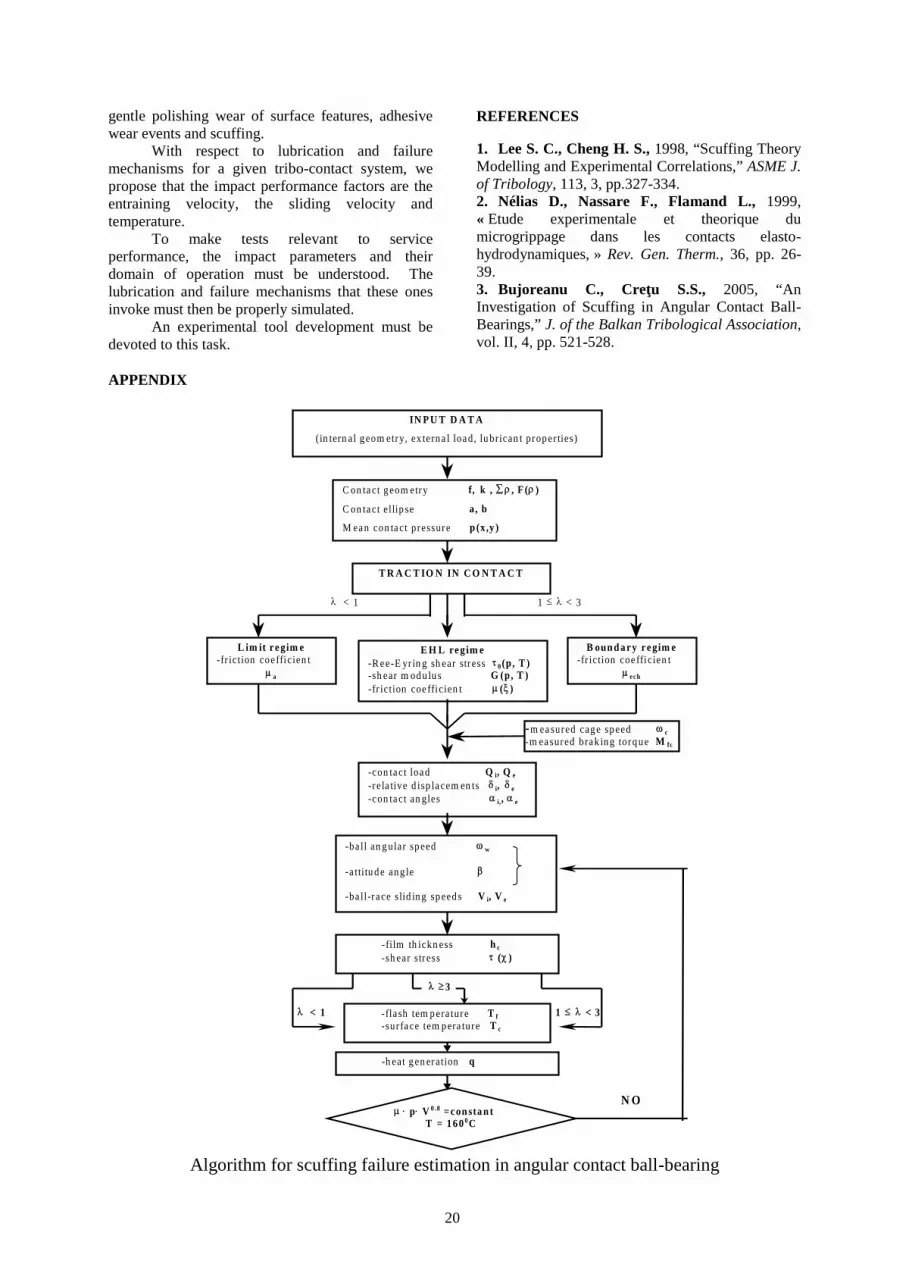
To estimate the scuffing failure for an angularcontact ball bearing an algorithm have beenproposed, as is presented in Appendix.
According to lubrication regime, the amountof heat is related to the oil film parameter . Alsowe consider the calculated and also measuredcontact temperature T as a supplementary criterionthat reinforces the scuffing limits evaluation.
It was calculated the energy dissipated incontact and the onset of scuffing was estimatedaround 21014 Wm-3.
Scuffing areas are corresponding to scuffingcriterion:
p V0.8= constant (1)
Corroboration between all these experimentalresults allows a scuffing criterion to estimate thistype of damage in angular contact ball bearing(7206C).
Figure 3 presents some scuffing experimentalresults obtained on specimens, using the test
protocol above described and scuffing appearanceon specimen surface.
Sliding speed and contact pressure withscuffing risk were found in antagonist coexistence,as follows:
scuffing sliding speed has critical value up to9 m/s (for specified testing conditions and acomplete EHL regime);
increasing the contact pressure and also theoil temperature impose the decreasing ofcritical sliding speed leading to scuffing.
0
2
4
6
8
10
12
14
16
0 5 10 15 20 25 30 35
slide-to-roll %
fric
tio
n c
oef
fici
ent
%
1 GPa
0.8 GPa
T = 40°Cur = 40m/s
T = 100°Cur= 40m/s
0
2
4
6
8
10
12
14
16
0 5 10 15 20 25 30 35
slide-to-roll %
fric
tio
n c
oe
ffic
ien
t %
1 GPa
0.8 GPa
Figure 3. Scuffing onset
5. CONCLUSIONS
The test method invokes tribological inter-actions, which are measured in terms of friction,
Sliding direction
20
gentle polishing wear of surface features, adhesivewear events and scuffing.
With respect to lubrication and failuremechanisms for a given tribo-contact system, wepropose that the impact performance factors are theentraining velocity, the sliding velocity andtemperature.
To make tests relevant to serviceperformance, the impact parameters and theirdomain of operation must be understood. Thelubrication and failure mechanisms that these onesinvoke must then be properly simulated.
An experimental tool development must bedevoted to this task.
REFERENCES
1. Lee S. C., Cheng H. S., 1998, “Scuffing TheoryModelling and Experimental Correlations,” ASME J.of Tribology, 113, 3, pp.327-334.2. Nélias D., Nassare F., Flamand L., 1999,« Etude experimentale et theorique dumicrogrippage dans les contacts elasto-hydrodynamiques, » Rev. Gen. Therm., 36, pp. 26-39.3. Bujoreanu C., Creţu S.S., 2005, “AnInvestigation of Scuffing in Angular Contact Ball-Bearings,” J. of the Balkan Tribological Association,vol. II, 4, pp. 521-528.
APPENDIX
1 1 3
3
1 1 3
N O
IN P U T D A T A
(in tern al g eom etry, ex tern a l loa d, lu brican t prop er ties)
C on ta ct g eom etry f, k , , F ( )
C on ta ct ellip se a, b
M ea n con ta ct pressure p (x,y )
T R A C T IO N IN C O N T A C T
E H L re g im e-R e e-E yr in g sh ear str ess 0(p, T )-sh ear m od u lu s G (p, T )-fr iction coe fficien t ( )
L im it r e gim e-fr iction coe fficien t
a
B oun d a r y r e gim e-fr iction coe fficien t
ech
-con ta ct loa d Q i, Q e
-r ela tive d isp la cem en ts i, e
-con ta ct an gles i,, e
-m ea sured cag e sp eed c
-m ea sured bra k in g torq u e M fc
-ba ll an g ular sp eed w
-a ttitu d e an g le
-ba ll-r a ce slid in g sp eed s V i, V e
-film th ickn ess h c
-sh ear str ess ( )
-fla sh tem p era ture T f
-sur fa ce tem p era ture T c
-h eat g en eration q
p V 0 .8 =c on sta n tT = 1 6 0 0C
F ig ura 6.1 . A lg or itm d e eva lu are a l lim itelor d e gr ipare in con ta ctul bila -ca le d e ru lareAlgorithm for scuffing failure estimation in angular contact ball-bearing
ISSN 1220 - 8434 ACTA TRIBOLOGICA Volume 17, (2009), 21-24
Gelu IANUŞ1
Dumitru OLARU1
e-mail: [email protected]
Peter LORENZ2
1 Technical University “Gh. Asachi” Iasi, Dept. of
Machine Design & Mechatronics, ROMANIA2 Hochschule fur Technik und Wirtshaft des
Saarlandes HTW, GERMANY
ADHESION IN BALL ON FLAT MICROSYSTEMS
In the field of microsystems, adhesion force between the twocontact surfaces has an important contribution to the friction losses.Two adhesion models have been presented and compared with theclassical Hertzian model: the Johnson–Kendall–Roberts (JKR)model and the Derjaguin-Muller-Toporov (DMT) model. Using theabove adhesion mentioned models, friction coefficient in a microballs linear system has been analytical investigated.Keywords: adhesion, adhesive contacts, contact mechanics,sphere–plane contact
1. INTRODUCTION
The influence of adhesion between solidsurfaces on their mechanical performance becomesincreasingly important with smoother surfaces,smaller length scales, and lighter loads.Nanotribological studies aim at explaining thefrictional behavior of solid contacts by analyzing themechanical properties of nanometer-sized asperities.Moreover, the advent of scanning probe techniques,particularly the scanning force microscope, has leadto a growing interest in theories describing theelastic deformation of small contacts under lightload considering attractive forces [1].
If applied to arbitrary contact geometries,such theories easily become very complex. One ofthe mathematically simplest descriptions is obtainedby assuming a sphere with radius R that is in contactwith a flat surface. This geometry represents theperhaps most universal approximation of actualarbitrary single asperity contacts by any modelgeometry. However, easily applicable analytictheories that would describe its full mechanicalcontact behavior have not yet been reported even forthis idealized model geometry [2-4].
Several continuum mechanics models havebeen developed which are able to predict the contactarea between two elastic bodies. The first one ofthese models is due to Hertz and concerns twoelastic spheres in the absence of adhesion. However,at small scales, such as the case of the tip–sampleinteraction in atomic force microscopy (AFM), thesurface-to-bulk ratio becomes significant. Othermodels including the adhesion in the description ofthe contact area developed: the Johnson–Kendall–Roberts (JKR) model, the Derjaguin–Muller–Toporov (DMT) model, the Maugis–Dugdale (MD)and the Generalized Analytical Model [1].
Three of the above mentioned models wasanalyzed by the authors to obtain the best model foradhesion in a micro rolling linear system.
2. ANALYTICAL MODELS FOR ADHESIVECONTACT
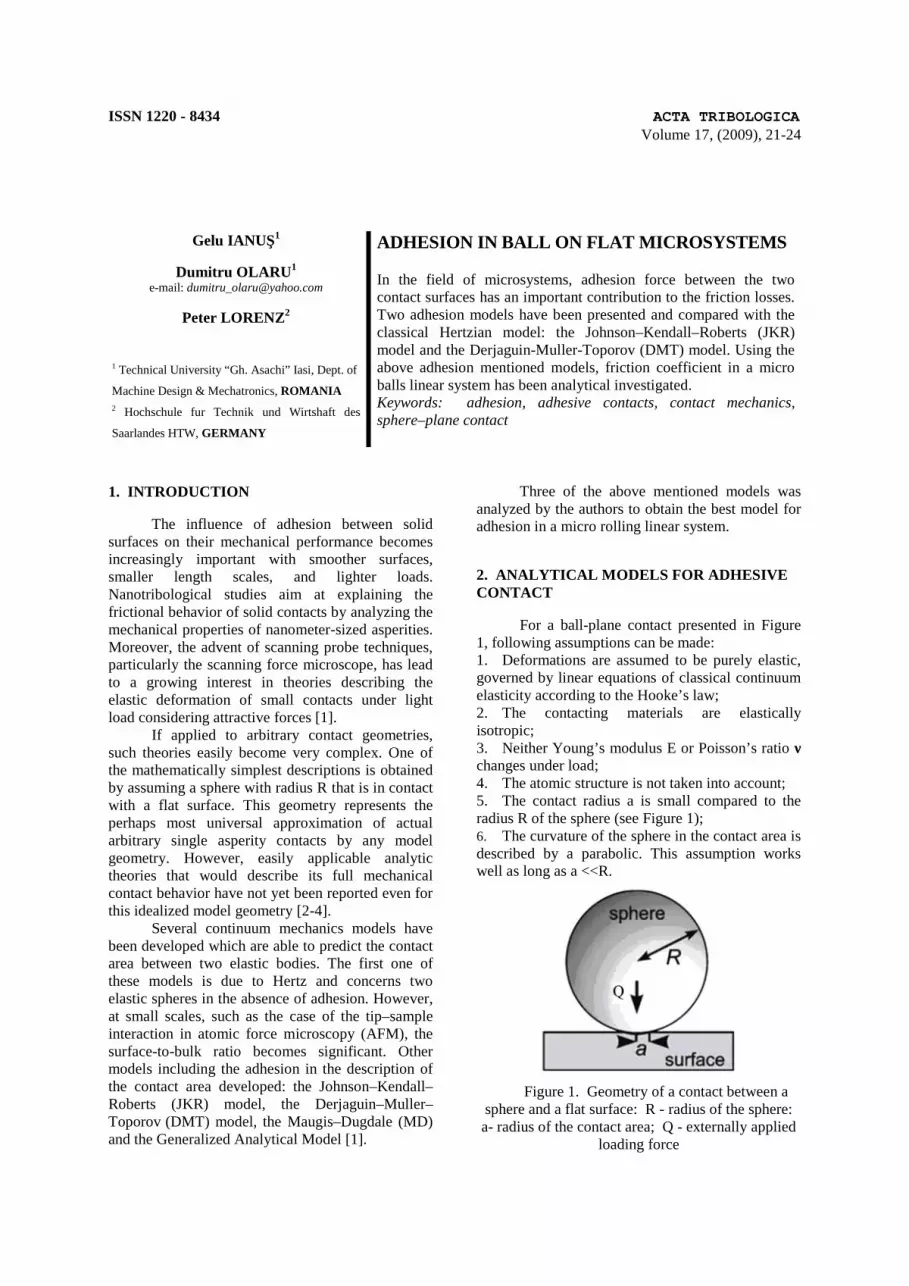
For a ball-plane contact presented in Figure1, following assumptions can be made:1. Deformations are assumed to be purely elastic,governed by linear equations of classical continuumelasticity according to the Hooke’s law;2. The contacting materials are elasticallyisotropic;3. Neither Young’s modulus E or Poisson’s ratio νchanges under load;4. The atomic structure is not taken into account;5. The contact radius a is small compared to theradius R of the sphere (see Figure 1);6. The curvature of the sphere in the contact area isdescribed by a parabolic. This assumption workswell as long as a <<R.
Figure 1. Geometry of a contact between asphere and a flat surface: R - radius of the sphere:a- radius of the contact area; Q - externally applied
loading force

22
Table 1 summarizes the relations for theradius of the contact area and the adhesion force fora spherical tip on a plane surface according to thethree most used adhesion theories.
In the Table 1 following notations was made: Fad – adhesive force between a sphere and a
flat surface in N; R – radius of the sphere in m; Q – externally applied force in N; W- work of adhesion in N/m, Etot – reduced Young’s modulus determined
by the relation:
12 21 2
tot1 2
1 14E
3 E E
, (1)
where E1 and E2 are Young’s modulus of sphere andsurface in N/m2, 1 and 2 are Poisson coefficients ofsphere and surface; a - radius of contact zonebetween sphere and surface, in m.
In Hertz model the adhesion of the sample isneglected, whereas the two other theories takeaccount of it outside (DMT) or inside (JKR) thecontact area. Hence, Hertz theory can only beapplied when the adhesion force is much smallerthan the maximum load. In the two other theories,the work of adhesion W can be calculated from thejump-off-contact, if the sphere radius R is known.Then it is possible to calculate a as a function of thereduced Young’s modulus Etot. The JKR theory canbe applied in the case of soft samples with a largeadhesion, the DMT theory in the case of stiffsamples with a small adhesion [2].
Table 1. Relations for the contact radius a and the adhesion force Fad for a sphere on a flat surface [1]Fad a
Hertz 03
tot
RQ
E
DMT 2 RW 3
tot
RQ 2 RW
E
JKR (3 RW)
2
23
tot
R(Q 3 RW 6 RWQ 3 RW )
E
3. EVALUATION OF FRICTION LOSSES INA MICRO LINEAR BALL BEARING
The adhesion models presented in Table 1was applied to a micro linear ball rolling systemexperimentally studied in [5]. Also, for this linearsystem, Olaru et al. developed an analytical model toevaluate the friction forces, model presented indetail in [6]. In Figure 2 is presented the geometryof a micro linear ball bearing.
The slider is in relative linear motion fromthe stator with the linear speed v and the ball has aangular velocity ωb .
The geometrical characteristics of the microlinear systems are [8]:
4 stainless steel balls without contact betweenballs with diameter d=285 μm;
silicon slider and stator with two V – grovesrealized at an angle θ =54.7o;
mass of the slider G =0.9 grams.For these dimensions the adhesion between
balls and silicon contact surfaces must beconsidered. Under the external load G all the fourcontacts of the ball with slider and stator are loadedwith a normal force Q0 given by relation:
0G
Q2 z cos
, (2)
Figure 2. The geometry of the micro-linearball-bearing [8]
According to the adhesion models presentedin Table 1 the normal force for every ball – racecontact Q will be determined by equations:
Hertz model:
0Q Q ; (3)
DMT model:
0Q Q 2 RW ; (4)
JKR model:
23
20 0Q Q 3 WR 6 WRQ 3 WR
. (5)
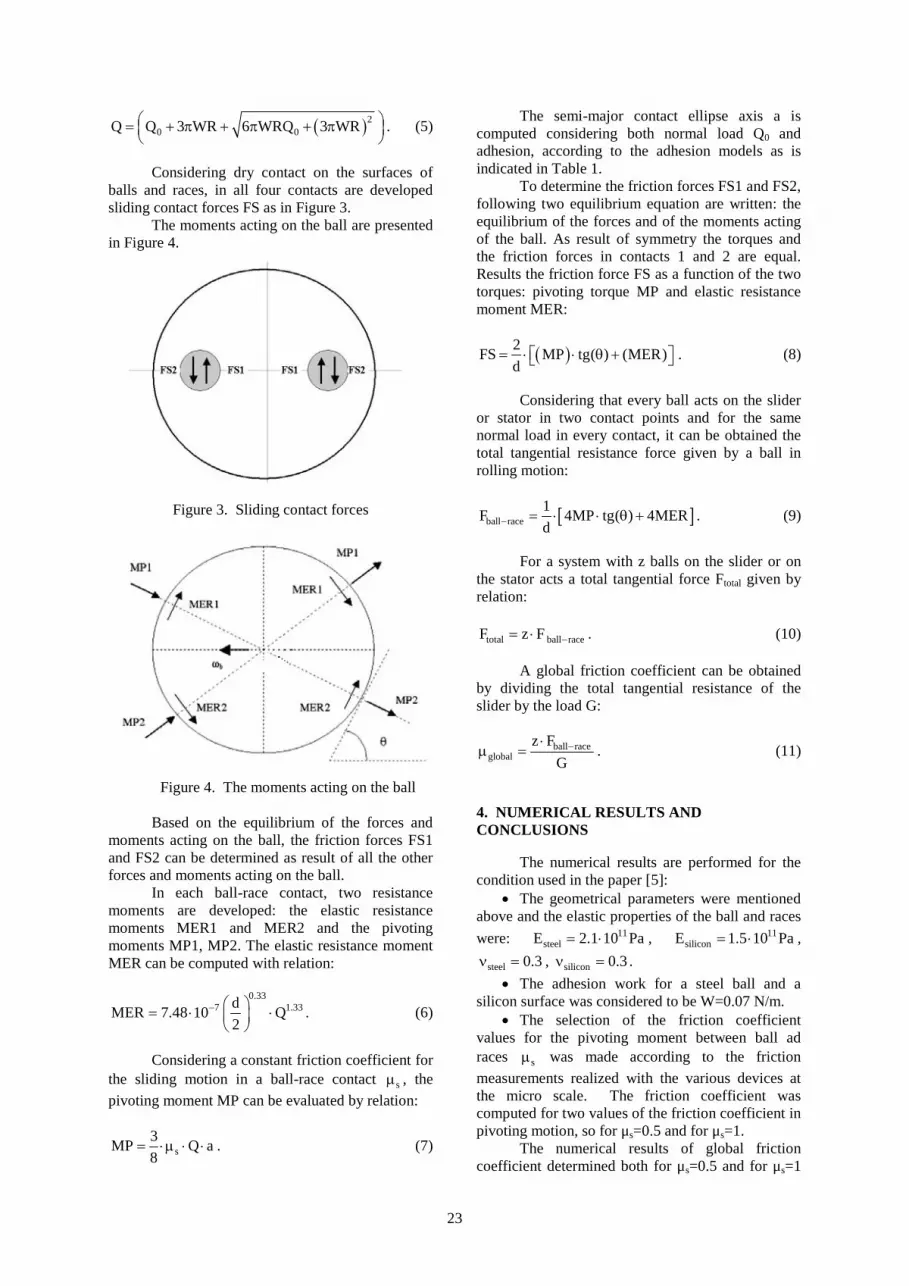
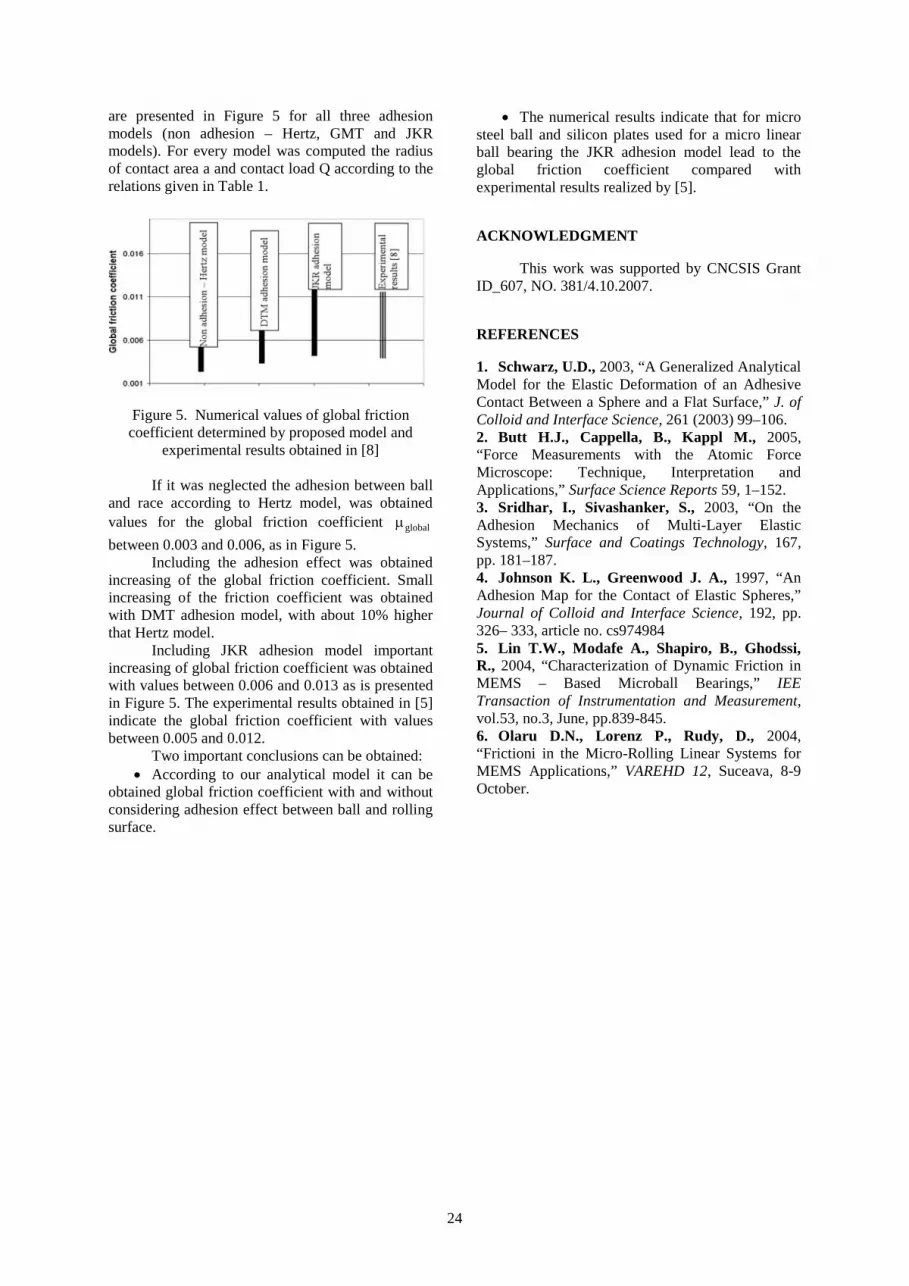
Considering dry contact on the surfaces ofballs and races, in all four contacts are developedsliding contact forces FS as in Figure 3.
The moments acting on the ball are presentedin Figure 4.
Figure 3. Sliding contact forces
Figure 4. The moments acting on the ball
Based on the equilibrium of the forces andmoments acting on the ball, the friction forces FS1and FS2 can be determined as result of all the otherforces and moments acting on the ball.
In each ball-race contact, two resistancemoments are developed: the elastic resistancemoments MER1 and MER2 and the pivotingmoments MP1, MP2. The elastic resistance momentMER can be computed with relation:
0.337 1.33d
MER 7.48 10 Q2
. (6)
Considering a constant friction coefficient forthe sliding motion in a ball-race contact s , the
pivoting moment MP can be evaluated by relation:
s3
MP Q a8
. (7)
The semi-major contact ellipse axis a iscomputed considering both normal load Q0 andadhesion, according to the adhesion models as isindicated in Table 1.
To determine the friction forces FS1 and FS2,following two equilibrium equation are written: theequilibrium of the forces and of the moments actingof the ball. As result of symmetry the torques andthe friction forces in contacts 1 and 2 are equal.Results the friction force FS as a function of the twotorques: pivoting torque MP and elastic resistancemoment MER:
2FS MP tg( ) (MER)
d . (8)
Considering that every ball acts on the slideror stator in two contact points and for the samenormal load in every contact, it can be obtained thetotal tangential resistance force given by a ball inrolling motion:
ball race1
F 4MP tg( ) 4MERd . (9)
For a system with z balls on the slider or onthe stator acts a total tangential force Ftotal given byrelation:
total ball raceF z F . (10)
A global friction coefficient can be obtainedby dividing the total tangential resistance of theslider by the load G:
ball raceglobal
z F
G
. (11)
4. NUMERICAL RESULTS ANDCONCLUSIONS
The numerical results are performed for thecondition used in the paper [5]:
The geometrical parameters were mentionedabove and the elastic properties of the ball and races
were: 11steelE 2.1 10 Pa , 11
siliconE 1.5 10 Pa ,
steel 0.3 , silicon 0.3 .
The adhesion work for a steel ball and asilicon surface was considered to be W=0.07 N/m.
The selection of the friction coefficientvalues for the pivoting moment between ball adraces s was made according to the friction
measurements realized with the various devices atthe micro scale. The friction coefficient wascomputed for two values of the friction coefficient inpivoting motion, so for μs=0.5 and for μs=1.
The numerical results of global frictioncoefficient determined both for μs=0.5 and for μs=1
24
are presented in Figure 5 for all three adhesionmodels (non adhesion – Hertz, GMT and JKRmodels). For every model was computed the radiusof contact area a and contact load Q according to therelations given in Table 1.
Figure 5. Numerical values of global frictioncoefficient determined by proposed model and
experimental results obtained in [8]
If it was neglected the adhesion between balland race according to Hertz model, was obtainedvalues for the global friction coefficient globalbetween 0.003 and 0.006, as in Figure 5.
Including the adhesion effect was obtainedincreasing of the global friction coefficient. Smallincreasing of the friction coefficient was obtainedwith DMT adhesion model, with about 10% higherthat Hertz model.
Including JKR adhesion model importantincreasing of global friction coefficient was obtainedwith values between 0.006 and 0.013 as is presentedin Figure 5. The experimental results obtained in [5]indicate the global friction coefficient with valuesbetween 0.005 and 0.012.
Two important conclusions can be obtained: According to our analytical model it can be
obtained global friction coefficient with and withoutconsidering adhesion effect between ball and rollingsurface.
The numerical results indicate that for microsteel ball and silicon plates used for a micro linearball bearing the JKR adhesion model lead to theglobal friction coefficient compared withexperimental results realized by [5].
ACKNOWLEDGMENT
This work was supported by CNCSIS GrantID_607, NO. 381/4.10.2007.
REFERENCES
1. Schwarz, U.D., 2003, “A Generalized AnalyticalModel for the Elastic Deformation of an AdhesiveContact Between a Sphere and a Flat Surface,” J. ofColloid and Interface Science, 261 (2003) 99–106.2. Butt H.J., Cappella, B., Kappl M., 2005,“Force Measurements with the Atomic ForceMicroscope: Technique, Interpretation andApplications,” Surface Science Reports 59, 1–152.3. Sridhar, I., Sivashanker, S., 2003, “On theAdhesion Mechanics of Multi-Layer ElasticSystems,” Surface and Coatings Technology, 167,pp. 181–187.4. Johnson K. L., Greenwood J. A., 1997, “AnAdhesion Map for the Contact of Elastic Spheres,”Journal of Colloid and Interface Science, 192, pp.326– 333, article no. cs9749845. Lin T.W., Modafe A., Shapiro, B., Ghodssi,R., 2004, “Characterization of Dynamic Friction inMEMS – Based Microball Bearings,” IEETransaction of Instrumentation and Measurement,vol.53, no.3, June, pp.839-845.6. Olaru D.N., Lorenz P., Rudy, D., 2004,“Frictioni in the Micro-Rolling Linear Systems forMEMS Applications,” VAREHD 12, Suceava, 8-9October.
ISSN 1220 - 8434 ACTA TRIBOLOGICA Volume 17, (2009), 25-29
George V. PUIU1
Dumitru OLARU2
e-mail: [email protected]
Vasile PUIU2
1 University of Bacau, Dept. of Machine Design,
ROMANIA2 Technical University “Gh. Asachi” Iasi, Dept. of
Machine Design and Mechatronics,
ROMANIA
FRICTION TORQUE AND EFFICIENCY INBALL - SCREW SYSTEMS
Complex relations for the friction torque and efficiency in a ball-screw system has been developed. The relations were adapted for aball-screw system and influence of the speed and load on totalfriction torque were investigated. The efficiency of the system wascomputed and good agreement with the literature results wasobtained. Also, a relation for the global friction coefficient in a ballscrew system has been proposed.Keywords: ball screw system, rolling friction, efficiency
1. INTRODUCTION
In a ball screw system the total frictionconsist of rolling and sliding friction in rollingcontacts, friction in the return zones andrecirculation channels, friction generated bylubricant and friction generated by sealing systems.The total friction torque generated in a ball screwsystem can be approximate by some empiricalformulas depending of load and preload, rotationalspeed, lubricant, lubrication regimes, temperatures,sealing systems etc. In many applications it isnecessary to accuracy estimate the friction torqueacting on the nut or on the screw, for variousoperating conditions.
Based on the friction models for rollingbearings and for linear rolling guidance systems, theauthors developed a new analytical model toevaluate the friction torque and efficiency in a ballscrew system considering only the friction lossesbetween the balls and races and between the balls.The numerical results were compared withexperimental results obtained in literature [4,6] andgood agreement was obtained.
2. FRICTION FORCES AND MOMENTS IN ABALL SCREW SYSTEM
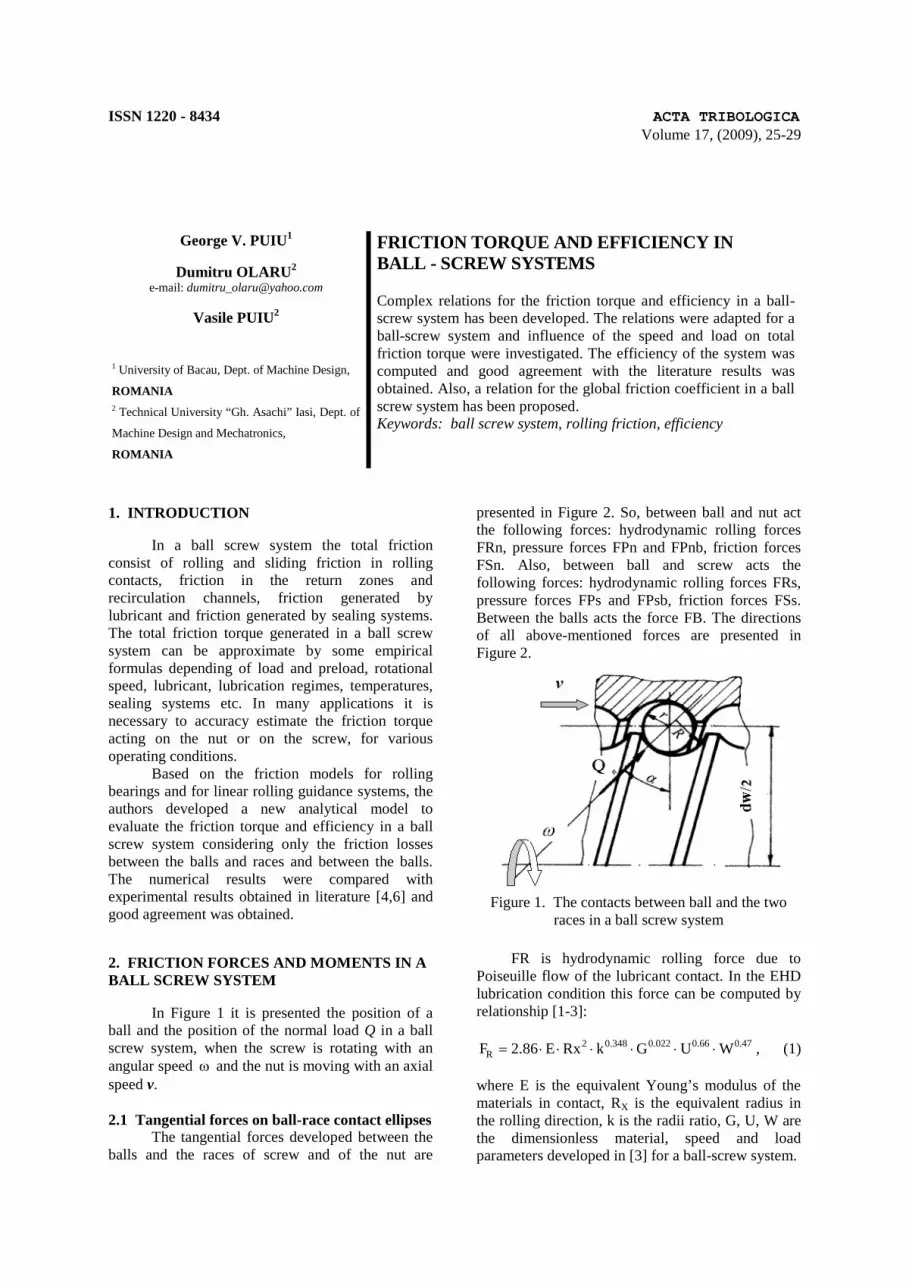
In Figure 1 it is presented the position of aball and the position of the normal load Q in a ballscrew system, when the screw is rotating with anangular speed and the nut is moving with an axialspeed v.
2.1 Tangential forces on ball-race contact ellipsesThe tangential forces developed between the
balls and the races of screw and of the nut are
presented in Figure 2. So, between ball and nut actthe following forces: hydrodynamic rolling forcesFRn, pressure forces FPn and FPnb, friction forcesFSn. Also, between ball and screw acts thefollowing forces: hydrodynamic rolling forces FRs,pressure forces FPs and FPsb, friction forces FSs.Between the balls acts the force FB. The directionsof all above-mentioned forces are presented inFigure 2.
Figure 1. The contacts between ball and the tworaces in a ball screw system
FR is hydrodynamic rolling force due toPoiseuille flow of the lubricant contact. In the EHDlubrication condition this force can be computed byrelationship [1-3]:
2 0.348 0.022 0.66 0.47RF 2.86 E Rx k G U W , (1)
where E is the equivalent Young’s modulus of thematerials in contact, RX is the equivalent radius inthe rolling direction, k is the radii ratio, G, U, W arethe dimensionless material, speed and loadparameters developed in [3] for a ball-screw system.
d m/ 2

26
a)
FRs
FSsFPsb
FPs
FB
FRnFSnFPn
FPnbFSn
FSs
b)
MCs
MERs
MB
MERn
MCn
ωb
Figure 2. The forces (a) and the moments (b) actingon the ball and on the two races in a ball-screw
system
FP is pressure forces due to the horizontalcomponent of the lubricant pressure in the rollingdirection. For a ball–ring contact, the pressure forceacting on the center of the ball can be expressed as afunction of hydrodynamic rolling force FR [1-3]:
for ball-nut contact:
w
m
d cosFPnb 2 FRn 1
d
; (2)
for ball-screw contact:
w
m
d cosFPsb 2 FRs 1
d
. (3)
FB is the contact force between two balls. Inthis analysis FB is imposed.
The friction forces FSn and FSs on the twocontacts are the sliding traction forces due to localmicro-slip occurring in the contact, and can becalculated by the equilibrium of forces and momentsacting on the ball.
2.2 The moments developed in the ball-racecontact ellipses.
In the contact ellipses following twomoments are developed: the moments due to elasticresistance generated in ball–races contacts MER andthe moments generated by the curvature frictionMC. Also, on the ball acting the resistance momentdue to frictions between balls MB. In Figure 2 thereare presented the moments which acts on the balland are gene-rated on the contact ellipses: MCs,
MERs are developed in the ball–screw race contactellipse and MCn, MERn are developed in the ball–nut race contact ellipse.
MC is the curvature friction moment due tothe local shear stresses developed in the slip region.Using a constant coefficient of friction μm dependingof lubrication regime and a Hertzian distribution ofthe contact pressure, analytical relation for MCresults [1,2,4]:
23 5
mw
Q aMC 0.2 (1 5 Y 3 Y )
d
, (4)
where Y is dimensionless distance between the pointof pure rolling and the center of contact ellipse andcan be considered 0.34, and a is semi major axis ofcontact ellipse.
MER is the elastic resistance of pure rollingand can be determined with relation of Snare [1-3]:
0.337 1.33w
0.8063
dMER 7.4 10 Q
2
1 3.519 10 k 1 .
(5)
MB is a braking moment applied about thecenter of the rolling element:
wb
dMB FB
2 , (6)
where b is the friction coefficient between the
contacted balls and FB is the contact force betweenthe balls.
3. FRICTION TORQUE AND EFFICIENCY INA BALL-SCREW SYSTEM
It is possible to express sliding forces FSsand FSn analytically to satisfy the equilibrium offorces and moments around the center of the ball.According to the forces and moments acting on theball and presented in Figure 2 the followingexpressions for the forces FSs and FSn wasdeveloped:
w
w
m
MCn MCs MERn MERs MBFSs
d
(FRs FRn) d cos FB FRn ;
d 2
(7)
w
w
m
MCn MCs MERn MERs MBFSn
d
(FRs FRn) d cos FB FRs .
d 2
(8)

27
According to Figure 2 the total tangentialforce between a ball and the screw Fs is thealgebraic sum of the tangential contact forces in therolling direction as Fs FRs FSs and results:
w
w
m
MCn MCs MERn MERs MBFs
d
(FRs FRn) d cos FBFRn FRs .
d 2
(9)
The friction torque generated by a ball-screwcontact is:
wm d cosdMs Fs
2 2
(10)
The total tangential force between a ball andthe nut Fn is the algebraic sum of the tangentialcontact forces in the rolling direction asFn=FRn+FSn and results:
w
w
m
MCn MCs MERn MERs MBFn
d
(FRs FRn) d cos FB FRn FRs .
d 2
(11)
The friction torque generated by a ball-nutcontact is:
wm d cosdMn Fn
2 2
. (12)
For a number of z loaded balls, the totalfriction torque acting on the screw and on the nut isobtained by summing of the all friction torques inthe ball-screw contacts, respectively:
z
i1
MS Ms ;z
i1
MN Mn . (13)
In a ball-screw system, neglecting thefriction, to transmit an axial load F must acts on thespindle with an active torque MSa given by relation:
m
pMSa F Rs
d
, (14)
where p is the axial pitch of the screw.Considering only the friction losses in ball-
races contacts, the efficiency of the ball-screwsystem can be expressed by relation:
MSa
MSa MS
. (15)
A relation for the global friction coefficienthas been proposed. So, it can be determined a
global friction coefficient in a ball screw - system,similarly with a rolling bearing, using the followingrelation:
globalMS
Rs F
. (16)
4. NUMERICAL RESULTS
A numerical program was developed in orderto analyze the variation of the efficiency accordingto rotational speed of the screw and axial load.
Following geometrical parameters wasconsidered: the average diameter of the screw dm=40mm; the ball screw dw=3.175 mm; the pitch of thescrew p = 5 mm; the number of active balls z=56;contact angle =/4; ball roughness is
b 0.08 m ; screw and nut races roughness
s n =0.3 m friction coefficient betweens balls
b =0.1. The viscosity of the lubricant is considered
as η0 = 0.05 Pa.s. The contact load between balls isassumed to be FB=1/z Newtons. The dimensionlessparameter Y is assumed to be 0.34, both for ball –screw and ball- nut contacts. The conformity of thescrew and nut races was considered to have valuesof 0.515. The rotational speed n was consideredbetween zero and 1000 rpm and axial load F wasbetween 100 to 4000 Newtons.
The variations of the friction torque MS withrotational speed of the screw and contact load arepresented in Figure 3. Increasing of the normal loadleads to the increasing of the total friction torque.For small normal loads (Q=20 N) it can observe acontinuum increase of the friction torque with speed.For high normal load (Q=100 N) it can be observeda Striebeck curve in variation of the friction torquewith rotational speed. So, for low speed limits tomixed lubrication conditions in ball-races contactscan be developed with high value for the frictioncoefficient μm.
Increasing of the speed implies increasing ofthe lubricant film thickness and transfer to the mixedor EHD lubrication conditions.
The proposed analytical model gives for ball-screw efficiency values between 0.90 to 0.96,according to relation (15), depending on thegeometrical and functional conditions.
In Figure 4 there is presented the variation ofthe ball-screw efficiency with rotational speed of thescrew for different normal loads.
When the ball-screw system is low loaded(Q=20 N) important decreasing of the efficiency canbe observed, for increasing of the rotational speed.By increasing of the axial load it can be obtainedgood values for the efficiency η=(0.93…0.95).Also, as result of a Striebeck behavior, a maximumefficiency can be obtained for (50 – 100) rot/min.
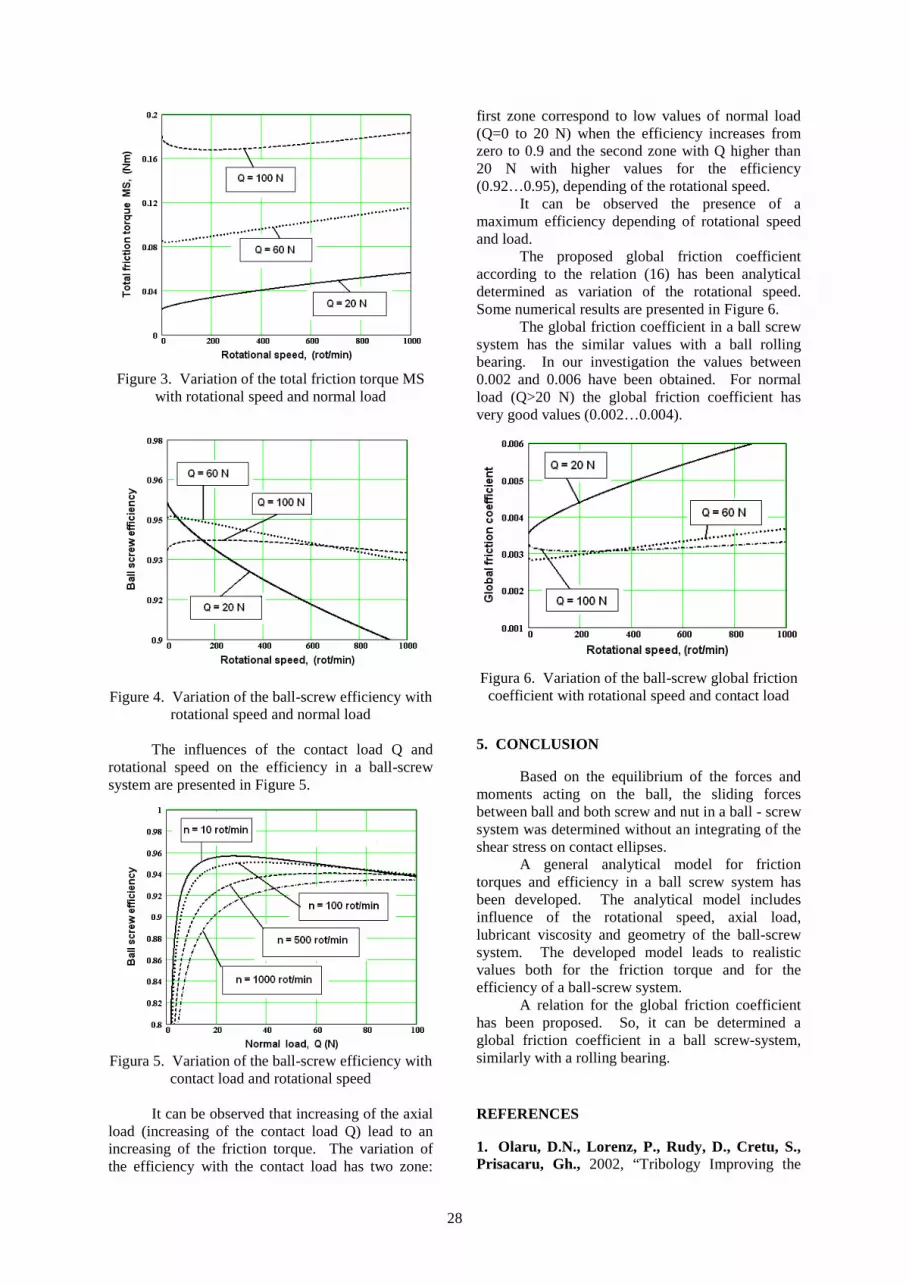
28
Figure 3. Variation of the total friction torque MSwith rotational speed and normal load
Figure 4. Variation of the ball-screw efficiency withrotational speed and normal load
The influences of the contact load Q androtational speed on the efficiency in a ball-screwsystem are presented in Figure 5.
Figura 5. Variation of the ball-screw efficiency withcontact load and rotational speed
It can be observed that increasing of the axialload (increasing of the contact load Q) lead to anincreasing of the friction torque. The variation ofthe efficiency with the contact load has two zone:
first zone correspond to low values of normal load(Q=0 to 20 N) when the efficiency increases fromzero to 0.9 and the second zone with Q higher than20 N with higher values for the efficiency(0.92…0.95), depending of the rotational speed.
It can be observed the presence of amaximum efficiency depending of rotational speedand load.
The proposed global friction coefficientaccording to the relation (16) has been analyticaldetermined as variation of the rotational speed.Some numerical results are presented in Figure 6.
The global friction coefficient in a ball screwsystem has the similar values with a ball rollingbearing. In our investigation the values between0.002 and 0.006 have been obtained. For normalload (Q>20 N) the global friction coefficient hasvery good values (0.002…0.004).
Figura 6. Variation of the ball-screw global frictioncoefficient with rotational speed and contact load
5. CONCLUSION
Based on the equilibrium of the forces andmoments acting on the ball, the sliding forcesbetween ball and both screw and nut in a ball - screwsystem was determined without an integrating of theshear stress on contact ellipses.
A general analytical model for frictiontorques and efficiency in a ball screw system hasbeen developed. The analytical model includesinfluence of the rotational speed, axial load,lubricant viscosity and geometry of the ball-screwsystem. The developed model leads to realisticvalues both for the friction torque and for theefficiency of a ball-screw system.
A relation for the global friction coefficienthas been proposed. So, it can be determined aglobal friction coefficient in a ball screw-system,similarly with a rolling bearing.
REFERENCES
1. Olaru, D.N., Lorenz, P., Rudy, D., Cretu, S.,Prisacaru, Gh., 2002, “Tribology Improving the

29
Quality in the Linear Rolling Guidance Systems.Part1 Friction in Two Contact Points Systems,” Proc. ofthe 13th International Colloquium on Tribology,Esslingen (Germany), 15-17 January, (2002).2. Olaru, D.N., Lorenz, P., Rudy, D., 2004,“Friction in the Circular–Arc Grooves LinearRolling Guidance System,” Tribologie undSchmierungstechnik, 2, pp. 9 –14.3. Olaru, D.N., Puiu, G., Puiu V., 2004, “Frictionin Ball-Screw System,” Proc. of InternationalConference VAREHD 12, Suceava.
4. Puiu, V., 1999, “Ball Helical Transmission,”Buletinul Institutului Politehnic Iaşi, vol.XLV(XLIX), fasc. 1-2, secţia V (Construcţii de maşini),pp.35-40.5. Puiu, V., Olaru, D.N., 1999, “Film Thickness inBall Screw”, Buletinul Institutului Politehnic Iaşi,vol.XLV (XLIX), fasc. 3-4, secţia V (Construcţii demaşini), pp.17-20.6. Purice, V., 1984, “Influenţa tipului de lubrifiantşi a parame-trilor funcţionali asupra momentului defrecare din şuruburile cu bile,” TRIBOTEHNICA’84,vol. II, Iaşi, pp.105-110.
ISSN 1220 - 8434 ACTA TRIBOLOGICA Volume 17, (2009), 30-33
Vytautas VASAUSKAS
Juozas PADGURSKAS
Raimundas RUKUIZA
1 Department of Mechanical Engineering,
Lithuanian University of Agriculture ,
LITHUANIA
SURFACE MODIFICATION OF CARBON STEELBY DEPOSITION OF FLUOR-OLIGOMERICFILMS
The chemosorbic compounds with metal are composing aftercoating the surface with fluor-oligomeric material (FOM).Hardness, indentation and friction behaviour of FOM coat wereinvestigated. Scratch adhesion and friction tests show that thefluor-oligomeric film decreases the micro-hardness of solid bodyand modifies the contact rheology by reducing the shearing force atthe local contact. FOM coat shows good elasticity in roughcontacts, but with a higher hardness it may be more suitable forabrasive applications, i.e. reduced plasticity in a given tribo-contact.Keywords: fluor-oligomeric films, indentation, micro-hardness,chemosorbic compounds
1. INTRODUCTION
Growing attention to fluor-polymer andoligomeric films having the thickness from 0.1 up to10 μm is recently given. The reason is their specificproperties, such as good thermal stability, lowcoefficient of friction and simple coating of thefriction surface [1,2]. Fluor-oligomeric materials(FOM), known under trade names as “FOLEOX”and “EPILOM”, are liquid steamy oligomericcompounds of fluorine with oxygen and carbon andthere are a kind of perfect self-lubricating materialdue to its low friction coefficient, good high-temperature stability and chemical stability [3]. Thisnew family of composite materials frequentlyexhibits remarkable improvements of materialproperties when comparing to conventional micro-and macro-composite materials. The chemosorbiccompounds with metal are composing after coatingthe surface with FOM. Surface modification shouldconstitute a few mono-layers of the FOM polymersurface and the deeper layers (bulk material) shouldnot be altered. This transfer into the top mono-layers (what is known as Rebinder effect) hasdifferent (generally desired) properties than the bulkmaterial, which retains the original properties.Generally, chemical reactions that involve theincorporation of particular elements (fluorine atomsetc.) in tribo-film formation are invoked formodification processes [4]. The mechanicalbehavior, the elastic modulus and the hardness ofthin coats is usually characterized throughindentation hardness tests, particularly using depth-sensing indentation equipment. The maximalindentation depth, which eliminates the influence ofthe substrate to hardness measurement, can be quite
small for very thin films. The aim of thisinvestigation is to characterize the fluor-oligomericcoats as concerning their ductility, coat thicknessand tribological properties.
2. EXPERIMENTAL PROCEDURE
The solutions of FOM (0.5…10%concentration) type FOLEOX were used for creatingpolymer coat on the metal surface. The specimenmaterials are carbon steel used for machinestructures (carbon content 0.45%). Cylindricalsamples of 30x30 mm in size of medium carbonsteel grade AISI 1045 (DIN 1.1186) composition inwt % being (Fe, (0.37…0.44) C, (0.6…0.9) Mn,(0.19…0.23) Si), were cut, quenched and temperedfor various hardness levels (40<HRC<63). Thesamples were grounded and mechanically polishedto a surface roughness Ra of 0.2 μm. They werecleaned with acetone before testing. The mass of theFOM films in this study, depending of the thickness,was in the μg range. After the surface is coated withfluor-oligomeric coat, the chemosorbic bindings arecreated between metal surface and the film. Thethickness of FOM layers was about 0.1…0.16 μm.Although the films allow water vapour diffusion, thefilms are both hydrophobic and not “wetted” whenliquid waters contact these layers. The main goal ofdepth-sensing indentation is to obtain the elasticmodulus and the hardness of the FOM filmspecimen by processing the experimental readings ofindenter load and penetration depth. When the loadis removed from the indenter there is some degree ofrecovery due to the relaxation of elastic strainswithin the material. The analysis of the initial
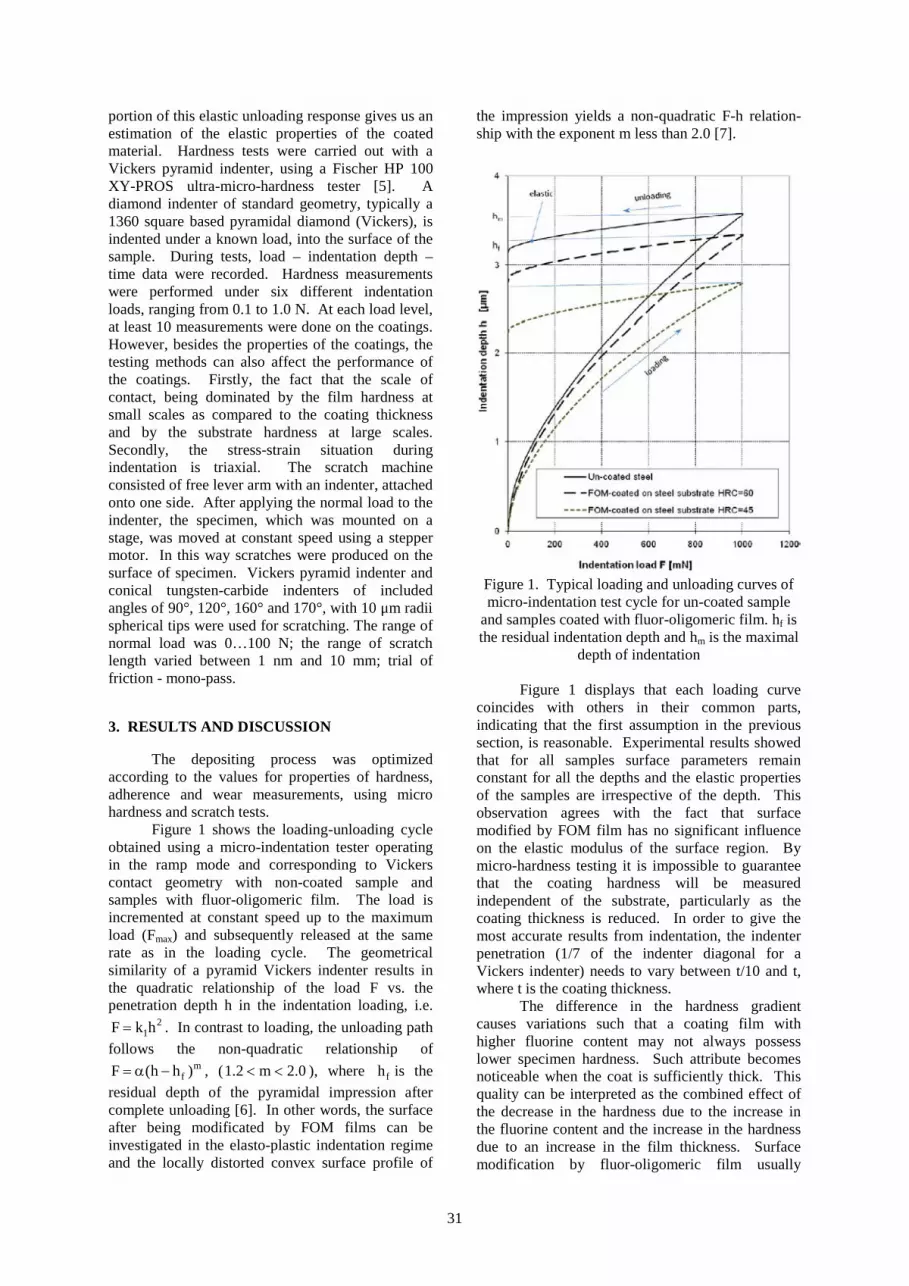
31
portion of this elastic unloading response gives us anestimation of the elastic properties of the coatedmaterial. Hardness tests were carried out with aVickers pyramid indenter, using a Fischer HP 100XY-PROS ultra-micro-hardness tester [5]. Adiamond indenter of standard geometry, typically a1360 square based pyramidal diamond (Vickers), isindented under a known load, into the surface of thesample. During tests, load – indentation depth –time data were recorded. Hardness measurementswere performed under six different indentationloads, ranging from 0.1 to 1.0 N. At each load level,at least 10 measurements were done on the coatings.However, besides the properties of the coatings, thetesting methods can also affect the performance ofthe coatings. Firstly, the fact that the scale ofcontact, being dominated by the film hardness atsmall scales as compared to the coating thicknessand by the substrate hardness at large scales.Secondly, the stress-strain situation duringindentation is triaxial. The scratch machineconsisted of free lever arm with an indenter, attachedonto one side. After applying the normal load to theindenter, the specimen, which was mounted on astage, was moved at constant speed using a steppermotor. In this way scratches were produced on thesurface of specimen. Vickers pyramid indenter andconical tungsten-carbide indenters of includedangles of 90°, 120°, 160° and 170°, with 10 μm radiispherical tips were used for scratching. The range ofnormal load was 0…100 N; the range of scratchlength varied between 1 nm and 10 mm; trial offriction - mono-pass.
3. RESULTS AND DISCUSSION
The depositing process was optimizedaccording to the values for properties of hardness,adherence and wear measurements, using microhardness and scratch tests.
Figure 1 shows the loading-unloading cycleobtained using a micro-indentation tester operatingin the ramp mode and corresponding to Vickerscontact geometry with non-coated sample andsamples with fluor-oligomeric film. The load isincremented at constant speed up to the maximumload (Fmax) and subsequently released at the samerate as in the loading cycle. The geometricalsimilarity of a pyramid Vickers indenter results inthe quadratic relationship of the load F vs. thepenetration depth h in the indentation loading, i.e.
21F k h . In contrast to loading, the unloading path
follows the non-quadratic relationship ofm
fF (h h ) , (1.2 m 2.0 ), where fh is the
residual depth of the pyramidal impression aftercomplete unloading [6]. In other words, the surfaceafter being modificated by FOM films can beinvestigated in the elasto-plastic indentation regimeand the locally distorted convex surface profile of
the impression yields a non-quadratic F-h relation-ship with the exponent m less than 2.0 [7].
Figure 1. Typical loading and unloading curves ofmicro-indentation test cycle for un-coated sample
and samples coated with fluor-oligomeric film. hf isthe residual indentation depth and hm is the maximal
depth of indentation
Figure 1 displays that each loading curvecoincides with others in their common parts,indicating that the first assumption in the previoussection, is reasonable. Experimental results showedthat for all samples surface parameters remainconstant for all the depths and the elastic propertiesof the samples are irrespective of the depth. Thisobservation agrees with the fact that surfacemodified by FOM film has no significant influenceon the elastic modulus of the surface region. Bymicro-hardness testing it is impossible to guaranteethat the coating hardness will be measuredindependent of the substrate, particularly as thecoating thickness is reduced. In order to give themost accurate results from indentation, the indenterpenetration (1/7 of the indenter diagonal for aVickers indenter) needs to vary between t/10 and t,where t is the coating thickness.
The difference in the hardness gradientcauses variations such that a coating film withhigher fluorine content may not always possesslower specimen hardness. Such attribute becomesnoticeable when the coat is sufficiently thick. Thisquality can be interpreted as the combined effect ofthe decrease in the hardness due to the increase inthe fluorine content and the increase in the hardnessdue to an increase in the film thickness. Surfacemodification by fluor-oligomeric film usually
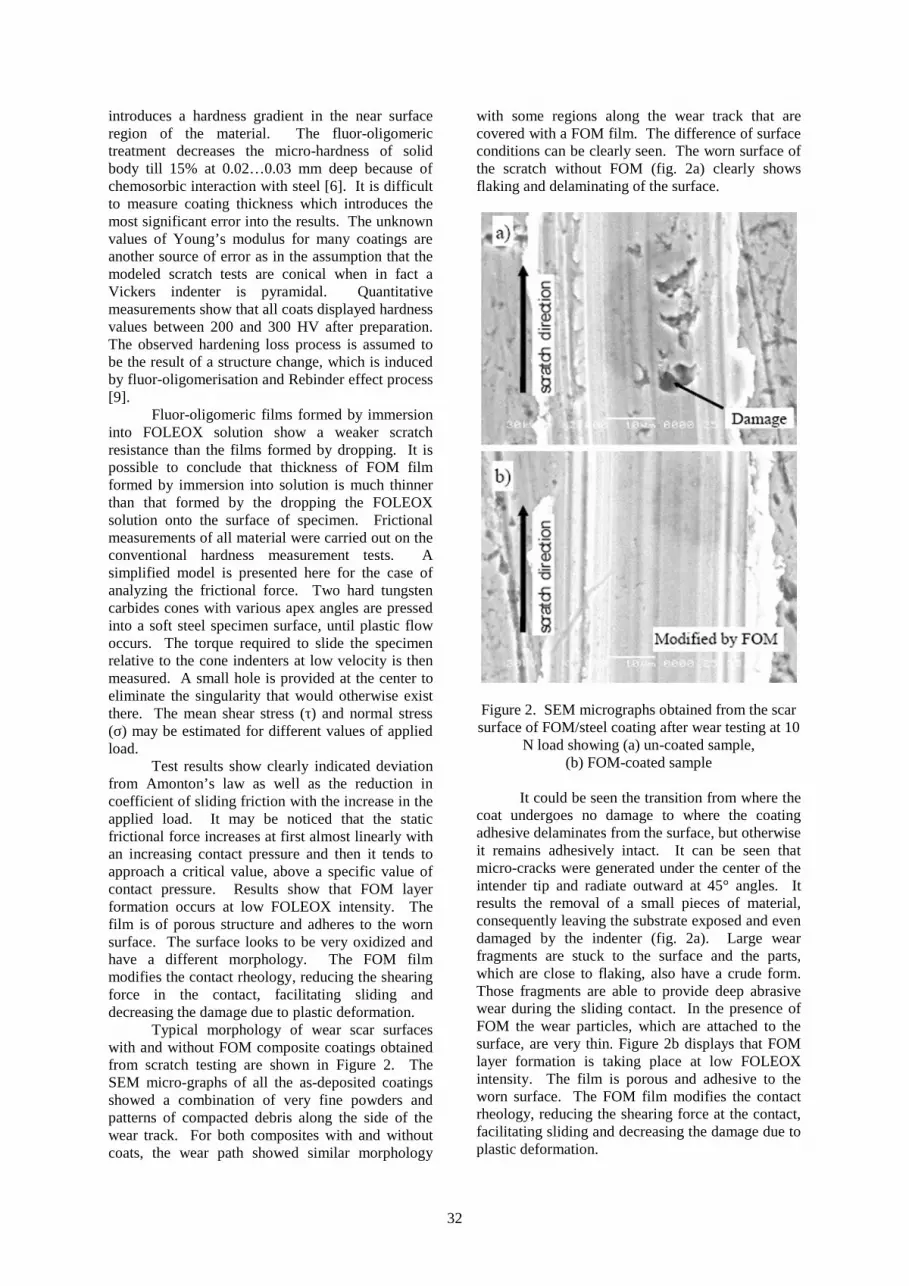
32
introduces a hardness gradient in the near surfaceregion of the material. The fluor-oligomerictreatment decreases the micro-hardness of solidbody till 15% at 0.02…0.03 mm deep because ofchemosorbic interaction with steel [6]. It is difficultto measure coating thickness which introduces themost significant error into the results. The unknownvalues of Young’s modulus for many coatings areanother source of error as in the assumption that themodeled scratch tests are conical when in fact aVickers indenter is pyramidal. Quantitativemeasurements show that all coats displayed hardnessvalues between 200 and 300 HV after preparation.The observed hardening loss process is assumed tobe the result of a structure change, which is inducedby fluor-oligomerisation and Rebinder effect process[9].
Fluor-oligomeric films formed by immersioninto FOLEOX solution show a weaker scratchresistance than the films formed by dropping. It ispossible to conclude that thickness of FOM filmformed by immersion into solution is much thinnerthan that formed by the dropping the FOLEOXsolution onto the surface of specimen. Frictionalmeasurements of all material were carried out on theconventional hardness measurement tests. Asimplified model is presented here for the case ofanalyzing the frictional force. Two hard tungstencarbides cones with various apex angles are pressedinto a soft steel specimen surface, until plastic flowoccurs. The torque required to slide the specimenrelative to the cone indenters at low velocity is thenmeasured. A small hole is provided at the center toeliminate the singularity that would otherwise existthere. The mean shear stress (τ) and normal stress(σ) may be estimated for different values of appliedload.
Test results show clearly indicated deviationfrom Amonton’s law as well as the reduction incoefficient of sliding friction with the increase in theapplied load. It may be noticed that the staticfrictional force increases at first almost linearly withan increasing contact pressure and then it tends toapproach a critical value, above a specific value ofcontact pressure. Results show that FOM layerformation occurs at low FOLEOX intensity. Thefilm is of porous structure and adheres to the wornsurface. The surface looks to be very oxidized andhave a different morphology. The FOM filmmodifies the contact rheology, reducing the shearingforce in the contact, facilitating sliding anddecreasing the damage due to plastic deformation.
Typical morphology of wear scar surfaceswith and without FOM composite coatings obtainedfrom scratch testing are shown in Figure 2. TheSEM micro-graphs of all the as-deposited coatingsshowed a combination of very fine powders andpatterns of compacted debris along the side of thewear track. For both composites with and withoutcoats, the wear path showed similar morphology
with some regions along the wear track that arecovered with a FOM film. The difference of surfaceconditions can be clearly seen. The worn surface ofthe scratch without FOM (fig. 2a) clearly showsflaking and delaminating of the surface.
Figure 2. SEM micrographs obtained from the scarsurface of FOM/steel coating after wear testing at 10
N load showing (a) un-coated sample,(b) FOM-coated sample
It could be seen the transition from where thecoat undergoes no damage to where the coatingadhesive delaminates from the surface, but otherwiseit remains adhesively intact. It can be seen thatmicro-cracks were generated under the center of theintender tip and radiate outward at 45° angles. Itresults the removal of a small pieces of material,consequently leaving the substrate exposed and evendamaged by the indenter (fig. 2a). Large wearfragments are stuck to the surface and the parts,which are close to flaking, also have a crude form.Those fragments are able to provide deep abrasivewear during the sliding contact. In the presence ofFOM the wear particles, which are attached to thesurface, are very thin. Figure 2b displays that FOMlayer formation is taking place at low FOLEOXintensity. The film is porous and adhesive to theworn surface. The FOM film modifies the contactrheology, reducing the shearing force at the contact,facilitating sliding and decreasing the damage due toplastic deformation.
33
The surface modification by FOM coatingshows good elasticity in rough contacts but with ahigher hardness it may be more suitable for abrasiveapplications, i.e. reduced plasticity in a given tribo-contact.
4. CONCLUSIONS
With regard to the enhancement of themechanical contact responses of substrate by thinfluor-oligomeric coatings we can do the followingconclusions.
The coating process should be optimizedaccording to the values for properties of hardness,adherence and friction, measured using micro-hardness and scratch tests.
For a displacement having the order of thecoating thickness, the maximal residualdisplacement of indenter is reduced by ~30%.
The fluor-oligomeric coat has a pronouncedeffect on hardness and dominates response atdisplacements ≤ t/10.
Surface modification by fluor-oligomericfilm usually introduces a hardness gradient in thenear surface region of the material. The fluor-oligomeric treatment decreases the micro-hardnessof solid body till 15% at 0.02…0.03 mm deepbecause of chemosorbic interaction with steel.
Fluor-oligomeric films formed by immersioninto FOLEOX solution show a weaker scratch resis-tance than the films formed by dropping. It ispossible to conclude that thickness of FOM filmformed by immersion into solution is much thinnerthan that formed by the dropping the FOLEOXsolution onto the surface of specimen.
Coated system, which has induced possiblefracture, follows the substrate crack path inconditions of plastic yielding.
FOM coating shows good elasticity in roughcontacts but with a higher hardness it may be moresuitable for abrasive applications, i.e. reducedplasticity in a given tribo-contact.
ACKNOWLEDGMENTS
The study was performed under INTASfinancial support (Grant Ref. Nr 05-104-7540).
REFERENCES
1. Bhushan, B., Gupta, B.K., 1991, Handbook ofTribology: Materials, Coatings and SurfaceTreatments, McGraw-Hill, New York, USA.2. Myshkin, N.K., Petrokovets, M.I., Kovalev,A.V., 2004, “Tribology of Polymers: Adhesion,Friction, Wear and Mass-Transfer,” TribologyInternational, 38, pp. 910-921.3. Isakovich, V.S., Struk, V.A., Gubanov, V.A.,1992, Troi-chanskaya, P.A. “The Influence ofHydrophobic Chemosorbic Films on theTribotechnical Characteristics of Pair Metal-Metaland Polymer-Metal,” Friction and Wear, 13, 2, pp.306-310 (in Russian).4. Rukuiza, R., Padgurskas, J., Vötter, M.,Wollesen, V., 1999, “New Tribotechnical Materialsfor the Friction Pair Radial Lip Seal / Shaft,”Industrial Lubrication and Tribology, 51, 5, pp. 233-238.5. *** Evaluation Manual of Indentation Procedure,Helmut Fischer GmbH + Co, Sindelfingen,Germany, (2000).6. Gore, G.J., Gates, F.D., 1997, “Effect ofHardness on Three Very Different Forms of Wear,”Wear, 203/204, pp. 544-563.7. Briscoe, B.J., 1996, “Scratching Maps forPolymers,” Wear, 200, pp. 137-147.8. Rukuiza, R., Padgurskas, J., 2007, “Influenceof Fluor-Oligomeric Film on Tribological Propertiesin Local Contact Conditions,” Tribologie undSchmierungstechnik (in press).9. Rebinder, P.A., Likhtman, V., 1957, Proc. of2nd int. conf. Surface Activity, III ed. J.H. Schulman,Academic Press, New York, USA, pp. 563.
ISSN 1220 - 8434 ACTA TRIBOLOGICA Volume 17, (2009), 34-41
Andrei SZUDER1
e-mail: [email protected]
Ioan D. MARINESCU2
T. G. MATHIA3
G. MEILLE3
1 University Politehnica Bucharest, Center for
Advanced Technologies, Bucharest,
ROMANIA2 University of Toledo, Toledo, Ohio,
USA3 Laboratoire de Tribologie et Dynamique des
Systèmes- C.N.R.S.; École Nationale d’Ingénieurs
de St. Etienne, École Centrale de Lyon, Ecully,
FRANCE
ABRASION IN FINISHING PROCESSES
The paper is an overview of the present state of the art and of theresearch and development results concerning the finishing abrasiveprocesses.Finishing processes are final machining processes which use finegrit abrasive as the cutting medium. The processes are widely usedin industry in order to improve the surface topography to increasethe bearing area and load-carrying capacity.The main characteristic of finishing abrasive machining processes isthat these processes are more random than many other machiningprocesses. Tribology offers a good approach for describing themain characteristic of abrasive finishing processes and offers theability to predict some of the outputs of the processes like abrasionrate or the surface quality.The basic concepts and recent developments in lapping, polishingand fretting as well as the significance of surface metrology(especially the 3D methods) in finishing processes are presented.Keywords: finishing, abrasion, lapping, polishing, fretting
1. INTRODUCTION
Abrasive manufacturing processes areprobably less understood, published and educatedfor various scientific and economic reasons. Onother side, economically the abrasive manufacturingprocess mostly is a final operation, therefore ifcorrectly achieved is giving very high additionalvalue. From energy point of view, the abrasivemanufacturing procedure is one of more consuming.If one takes into consideration the ratio of the weightand the volume per amount of consumed energy isone of the highest.
The great difficulty facing the abrasionstudies with abrasives lies in the great number ofprocess interdependent variables and particularly inthe abrasive variables of shape size and sizedistribution [1].
In most cases, the abrasive mode of surfacefinishing is a final one. In addition, the abrasivemanufacturing process is also highly timeconsuming. Therefore, the abrasive process isprobably the most expensive mode of industrializedmachining and finishing of surfaces, frequently keptsecret.
Abrasive machining processes aremanufacturing techniques which employ very hardgranular particles in machining, abrading, orpolishing to modify the shape and surface texture ofmanufactured parts.
Abrasive finishing processes are accepted ina wide range of material applications and industries;
typical examples are finishing of variouscomponents used in aerospace, automotive,mechanical seals, fluid handling, and many otherprecision engineering industries.
A wide range of such processes is mostlyused to produce high quality parts to high accuracyand to close tolerances. Examples range from verylarge parts such as machine slideways to small partssuch as contact lenses, needles, electroniccomponents, silicon wafers, and ball bearings.
While accuracy and surface texturerequirements are common reasons for selectingabrasive processes, there is another common reason.Abrasive processes are the natural choice formachining and finishing hard materials andhardened surfaces.
The manifestations of abrasive wear are thechange of the surface roughness resulting frommaterial removal and the change of the physical andchemical properties of the surface and subsurfacewith respect to those of the bulk. In addition to themechanical and geometrical description, thesedeformations are accompanied by:
the production of highly localized heat; the creation of excitations and defects in the
material; the production of dangling bonds and trapped
electrons; the emission of excited and reactive species
into the gas phase (exo-emission).All these phenomena result in a highly
reactive surface accompanied by the formation of a

35
surface composition different from that of the bulk.Separation of charges also leads to the creation ofintense electric fields at the surface of manyinsulating materials.
The abrasive processes may be categorizedinto one of following groups:
grinding; lapping; polishing; honing.
This is not a completely inclusive list butusually the lapping, polishing and honing areconsiderate finishing processes and will be treated inthis state of the art analysis
Honing is a process that employs bonded orfixed abrasives within the abrasive tool, whereaslapping employs free abrasive particles, oftensuspended in a liquid or a wax medium [2].
2. ABRASIVE MECHANISMS
The abrasive mechanisms occurring in a dryor humid environment result from the simultaneousactions of normal and tangential forces and arematerialized by the development of ploughinggrooves or scratches which are in some instancesaccompanied by Hertzian fractures.
The main characteristic of abrasivemachining processes is that these processes are morerandom than many manufacturing processes
One classification scheme divides abrasivewear into two basic modes known as two-bodyabrasion and three-body abrasion. Another usedapproach involves division into three categories:gouging abrasion, high-stress abrasion and lowstress abrasion. Whereas the two body/three bodyabrasion classification appears to be dominant inEurope, the gouging/high stress/low-stress abrasionapproach appears to be favored in the US andAustralia.
For the classification of the abrasive wearmodes, we will use the most widely acceptedterminology known as two-body abrasion and three-body abrasion.
The primary meaning of the two-body/three-body concept is to describe whether the abrasiveparticles are bound (two-body) or free to roll or slide(three-body).
3. TWO BODY ABRASION
The two-body abrasive wear is caused byabrasive particles or asperities which are rigidlyattached (embedded) in the second body (Figure 1).
The relative motion between the abrasive andthe workpiece is usually considered pure sliding
The abrasive particles in a two-bodymechanism are able to cut deeply into the workpiecematerial, whereas in the case of three-body abrasion,
the abrasive grains may spend only part of their timecutting into the material. Therefore, two-bodyabrasion is considered to produce wear rates threetimes bigger than in the case of three-body abrasionunder the same loading condition [2].
Figure 1. Two body abrasion
3.1 Three body abrasionThe three-body abrasion refers to wear
caused by free and loose abrasive particles existingas interfacial elements between a solid body and acounterbody.
The free particles in a three-body wear modemay be intentionally added abrasives or be detacheddebris from the worn surface (Figure 3).
The three-body abrasion can be divided into"closed" and "open" groups. The closed groupcovers the cases of abrasives between closely matingsurfaces and the open group covers the cases wherethere is a thick bed of abrasives.
The distinction between low-stress and highstress abrasion centers whether or not the abrasiveparticles are fractured during abrasion. This may besignificant since fracturing generates fresh, sharpcutting edges and usually gives higher wear rates.
Figure 2. Three body abrasion
3.2 LappingIn lapping, a free abrasive is introduced
between a lap, which may be a cast iron plate, andthe workpiece surface. The free abrasive is usuallysuspended in a liquid medium, such as oil, providinglubrication and helping to transport the abrasive.The lap and the abrasive are both subject to wear.
Each abrasive grain used for lapping hassharp irregular shapes and, when a relative motion isinduced and pressure applied, the sharp edges of thegrains are forced into the workpiece material.
The loose abrasive particles wear the surfacesby making indentations or causing the material tocut away very small particles. Even though the

36
abrasive grains are irregular in size and shape, theyare used in large quantities and thus a cutting actiontakes place continuously over the entire contactsurface.
To maintain the required geometry of the lapand of the workpiece surface, it is necessary to paycareful attention to the nature of the motionsinvolved to average out the wear across the surfaceof the lap. Several laps may be employed andperiodically interchanged to assist this process.
The size and size distribution of the abrasiveare important factors in the surface obtained bylapping. The size of the abrasive is directlyproportional to the material removal rate and surfaceroughness.
Larger grain sizes have a higher stockremoval rate than smaller abrasive grains but thesmaller abrasives produce a lower surface roughnessthan larger abrasive sizes.
Another important factor is the concentrationof abrasive (the amount of abrasive per volume ofcarrier) which represents the number of grains incontact with the surface of the workpiece material.When the concentration varies, the load distributionchanges. This means that with an increase in thenumber of grains, the effective load per grain
decreases because of the larger number of contactpoints. If the size of the abrasive grains decreasesbelow sub-micron sizes, the number of grainsincreases accordingly.
In lapping, the material removal mechanismincludes rolling abrasives, sliding abrasives, andmicro-cutting abrasives. It is a very complexmechanism that involves abrasive phenomena,brittle fracture, and plastic deformation. Thepredominant mode is dependent mainly on the sizeof the abrasive and the normal load.
Szuder [1] found that the in the three bodyabrasion (lapping) simulation the wear it is not dueonly to a micro cutting process, but mainly to arepeated plastic deformation process betweencontiguous built-up edges produces by repeatedplastic deformations.
In the real lapping process the samephenomena may occur in the majority of the cases.The wear is induced by millions of plasticallydeformations produced by the tips of the rollinggrits. Those plastically deformations producesbulges which are highly deformed and submittedcontinuously to new dynamical solicitations untilthey fail and wear debris are produced on the lappedsurface.
Figure 3. The lapping mechanism for ceramics [8]
Where a greater pressures are at play, a largershare of the normal load (W) is borne elastically(We) but still there is left a larger number of grainswhich deform plastically (Wp) (Figure 3).
With an increase of grain diameter there willbe fewer grains in contact and these grains willevidence diameters of spaced out statisticaldistribution. According to the general rule, thenumber of plastically deforming grains increaseswith an increase in grain diameter up to a certaindiameter or a certain range of diameters when their
small number does not allow them to plastically bearthe pressure.
In this case the hypothesis of rigid grains is nolonger valid. Grains will crack until a newequilibrium sets in the more compact layer ofabrasive grains whose diameters are closer. This isan explanation of "Critical Diameter" by elastic-plastic phenomena at the interface.
A possible explanation of constant increasingstock removal rates for the lapping oil as carrier maybe the higher viscosity of the lapping oil retaining
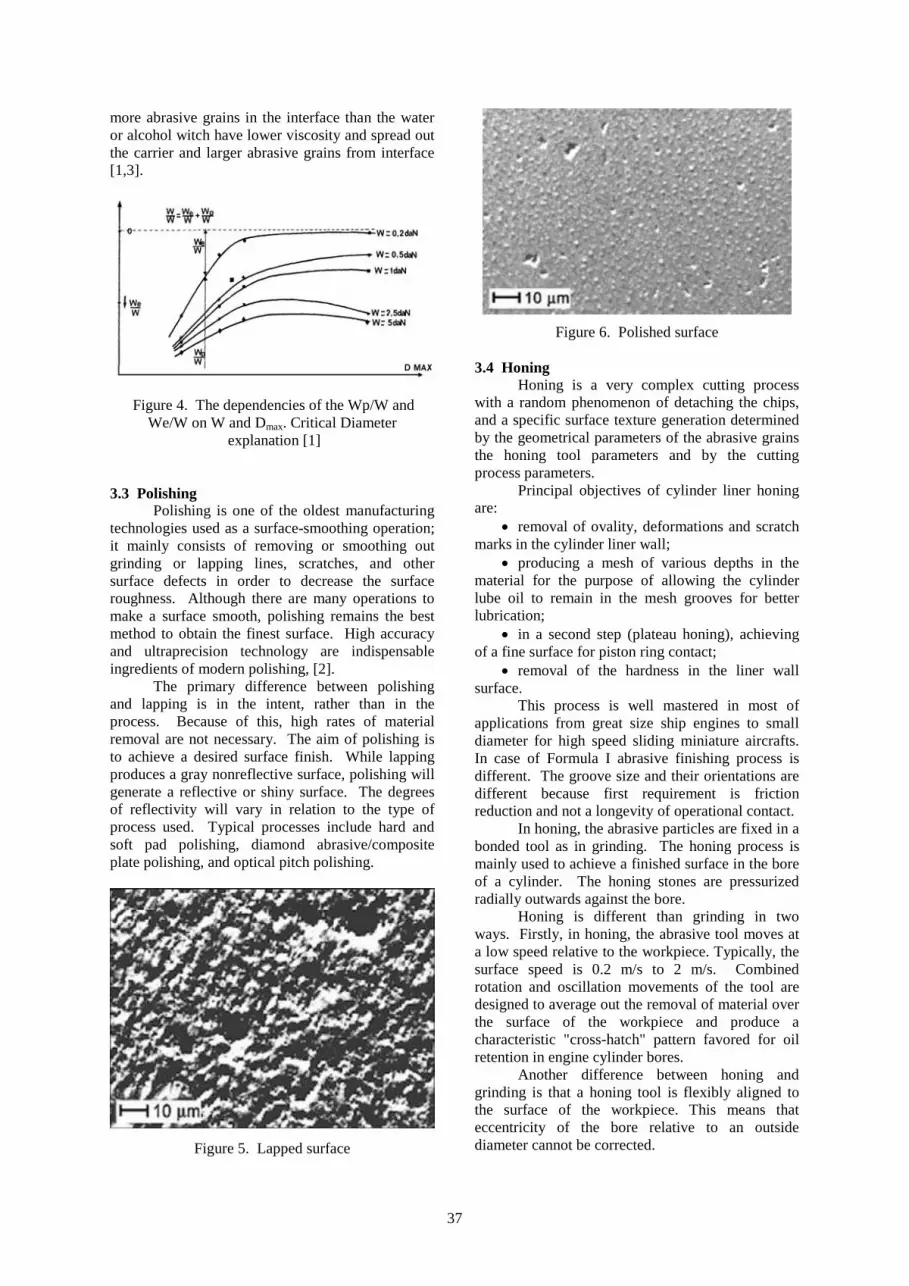
37
more abrasive grains in the interface than the wateror alcohol witch have lower viscosity and spread outthe carrier and larger abrasive grains from interface[1,3].
Figure 4. The dependencies of the Wp/W andWe/W on W and Dmax. Critical Diameter
explanation [1]
3.3 PolishingPolishing is one of the oldest manufacturing
technologies used as a surface-smoothing operation;it mainly consists of removing or smoothing outgrinding or lapping lines, scratches, and othersurface defects in order to decrease the surfaceroughness. Although there are many operations tomake a surface smooth, polishing remains the bestmethod to obtain the finest surface. High accuracyand ultraprecision technology are indispensableingredients of modern polishing, [2].
The primary difference between polishingand lapping is in the intent, rather than in theprocess. Because of this, high rates of materialremoval are not necessary. The aim of polishing isto achieve a desired surface finish. While lappingproduces a gray nonreflective surface, polishing willgenerate a reflective or shiny surface. The degreesof reflectivity will vary in relation to the type ofprocess used. Typical processes include hard andsoft pad polishing, diamond abrasive/compositeplate polishing, and optical pitch polishing.
Figure 5. Lapped surface
Figure 6. Polished surface
3.4 HoningHoning is a very complex cutting process
with a random phenomenon of detaching the chips,and a specific surface texture generation determinedby the geometrical parameters of the abrasive grainsthe honing tool parameters and by the cuttingprocess parameters.
Principal objectives of cylinder liner honingare:
removal of ovality, deformations and scratchmarks in the cylinder liner wall;
producing a mesh of various depths in thematerial for the purpose of allowing the cylinderlube oil to remain in the mesh grooves for betterlubrication;
in a second step (plateau honing), achievingof a fine surface for piston ring contact;
removal of the hardness in the liner wallsurface.
This process is well mastered in most ofapplications from great size ship engines to smalldiameter for high speed sliding miniature aircrafts.In case of Formula I abrasive finishing process isdifferent. The groove size and their orientations aredifferent because first requirement is frictionreduction and not a longevity of operational contact.
In honing, the abrasive particles are fixed in abonded tool as in grinding. The honing process ismainly used to achieve a finished surface in the boreof a cylinder. The honing stones are pressurizedradially outwards against the bore.
Honing is different than grinding in twoways. Firstly, in honing, the abrasive tool moves ata low speed relative to the workpiece. Typically, thesurface speed is 0.2 m/s to 2 m/s. Combinedrotation and oscillation movements of the tool aredesigned to average out the removal of material overthe surface of the workpiece and produce acharacteristic "cross-hatch" pattern favored for oilretention in engine cylinder bores.
Another difference between honing andgrinding is that a honing tool is flexibly aligned tothe surface of the workpiece. This means thateccentricity of the bore relative to an outsidediameter cannot be corrected.

38
Figure 7. Typical 3D topography image showing dominating honing process [4]
Figure 8. The anisotropy analysis tool helping in control quality of honing processshowing almost perfect finishing [4]
One of the main purposes of the honingprocess is the specific honed surface texture,specially designed to retain during the operationallife an important volume of lubricant. The lubricantvolume is mainly determinate by the surface textureand the surface texture by the abrasive grain sizeutilized.
This problem has certain difficulties, attachedto the complex phenomena appearing in honingprocesses.
Considering the above factors, researchstudies on surface generation by honing and adetailed analysis of the honing surfaces texture areimportant in modeling the process.
The following factors have been taking intoconsideration in computer simulation of honingprocess and experimental researches [6]:
bore geometry: diameter, length; cutting tool parameters: Macro
parameters width of lamella length of lamellanumber of lamellas for the honing head Microparameters material of lamella material of lintminimum number of grain edges maximumnumber of grain edges dispersion of the numbergrain edges maximum radius lamella min. radiusof lamella disperse of radius maximum intergranular disperse minimum inter granular disperse
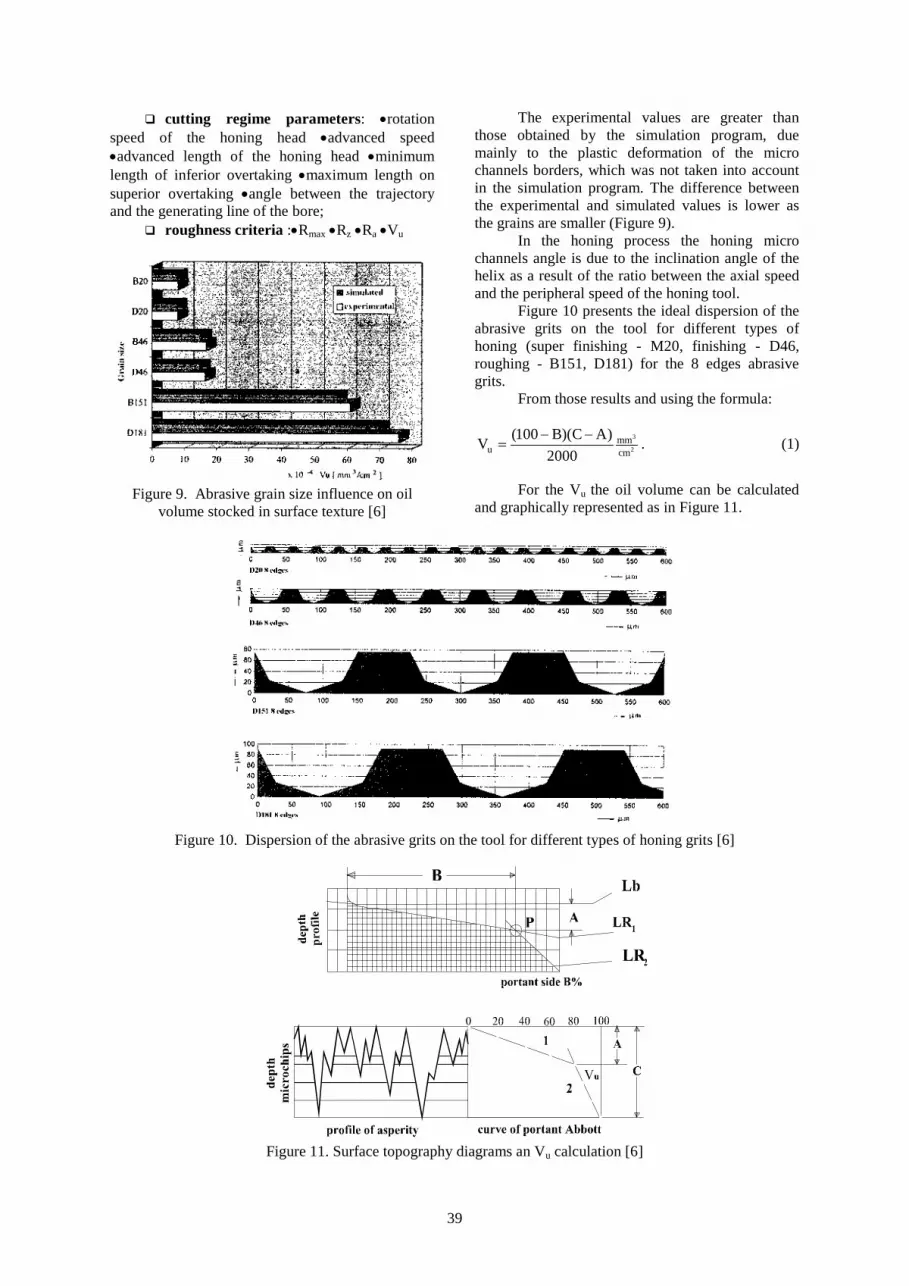
39
cutting regime parameters: rotationspeed of the honing head advanced speedadvanced length of the honing head minimumlength of inferior overtaking maximum length onsuperior overtaking angle between the trajectoryand the generating line of the bore;
roughness criteria :Rmax Rz Ra Vu
Figure 9. Abrasive grain size influence on oilvolume stocked in surface texture [6]
The experimental values are greater thanthose obtained by the simulation program, duemainly to the plastic deformation of the microchannels borders, which was not taken into accountin the simulation program. The difference betweenthe experimental and simulated values is lower asthe grains are smaller (Figure 9).
In the honing process the honing microchannels angle is due to the inclination angle of thehelix as a result of the ratio between the axial speedand the peripheral speed of the honing tool.
Figure 10 presents the ideal dispersion of theabrasive grits on the tool for different types ofhoning (super finishing - M20, finishing - D46,roughing - B151, D181) for the 8 edges abrasivegrits.
From those results and using the formula:
3
2mm
u cm
(100 B)(C A)V
2000
. (1)
For the Vu the oil volume can be calculatedand graphically represented as in Figure 11.
Figure 10. Dispersion of the abrasive grits on the tool for different types of honing grits [6]
Figure 11. Surface topography diagrams an Vu calculation [6]

40
Figure 12. The simulated roughness of the surface, the Abbott curve and the Vu. [6]
Figure 12 presents in the same graph thesimulated roughness of the surface, the Abbott curveand the Vu. for the D46 abrasive grits with differentinclination angles. It can be noticed that the oilvolume varies from 11.6 to 15.3 mm3/cm2.
3.5 Significance of surface metrology in finishingprocesses
The most important quantitative parameter ina surface finishing system is the roughness of thesurface. Although it is somewhat obvious that thekey to a flat surface is minimizing its surfaceroughness, a quantitative understanding of howroughness is changed by the finishing process is notperfectly understood.
Although much discussion has focused on therate at which material can be removed from asurface in finishing processes, an importantindustrial consideration in the manufacturingprocess, comparatively little attention thus far hasbeen devoted to determining surface roughness as afunction of other finishing parameters.
Many functional aspects of engineeringsurfaces are determined by their morphology: theirroughness, shape, organization of surface motifs etc.[1,2]. The measurement and characterization ofthese geometrical aspects is one field ofmorphological metrology.
The extraordinary development of varioustechniques (Atomic Force Microscopy, PhaseShifting Interferometry, Confocal Microscopy,Tactile Topometry) and metrology software, havetheir respective advantages and disadvantagesspecific applications, frequently without professionalprecautions. They make it possible to characterizein 3D surfaces whose amplitudes extend from 0.05nm to 5 mm and scanning areas in the range of 1 µmto a few mm or event cm. We present someexamples of problems solved thanks to the
metrology of 3D topography of surfaces of differentmaterials intended for various functions.
In metrology of surface morphology twomain families of techniques can be considered, thefirst one requires a contact between a stylus tip andthe surface, whereas the second one is a non-tactiletechnique, in which morphological information isobtained optically, without any contact between thesensor and the surface. The mechanical principle ofthe tactile technique is very simple: the verticalmovements of a tip, which follows the roughnessprofile of a surface, are amplified and digitized toextract the usual roughness parameters for a profile.3D morphology is obtained by collecting parallelscanning profiles with defined steps [1]. Severaloptical non contact systems are proposed, involvingdifferent physical phenomena: interferential hetero-dyne microscopy [3], defocalisation and confocalmicroscopy [4], roughness diffusion by reflection ofmonochromatic coherent beams [5,6], with varioustypes of processes like phase shearing microscopy[7] and projected fringes. Typical ranges andresolution limits of the various techniques, in bothvertical and horizontal directions, are different asschematically illustrated in Figure 13 for mentionedtechniques.
An appropriate selection of expensivemetrological equipment is a difficult task.Moreover, it is only possible to test the comparativecapabilities of the metrological topologicaltechniques by a complete analysis of different typesof materials: homogeneous or heterogeneous, porousor continuous, structurally or/and topographicallyanisotropic, (with respect to the quality and thefeasibility of determination of the significantmorphological parameters). Here, comparative testswith the most commonly used 3D techniques aremade on industrial finely polished flat but porousceramic heterogeneous surfaces [5].

41
Figure 13. Ranges and resolution limits of differenttechniques: AFM- Atomic Force Microscopy,SCM-Scanning Confocal Microscopy, SSM-Scanning Stylus Microscopy, SEM-Scanning
Electron Microscopy, STM- Scanning TunnelingMicroscopy, OIM- Optical Interference
Microscopy [4]
Measurements with AFM (Atomic ForceMicroscopy), SCM (Scanning ConfocalMicroscopy), SSM (Scanning Stylus Microscopy)and OIM (Optical Interferometric Microscopy)techniques which have recently become widespreadhave also been carried out, in order to take intoglobal consideration the problem of micro-, macro-and meso-morphology's metrology of engineeringsurfaces [5,8].
Different tactile and optical 3D topometerswere used, analyses were conducted on themeasured textures using commercial surface Frenchanalysis soft-ware’s Surfascan® V.2.6 fromSomicronic and MountainsMap® 4.0 from DigitalSurf includes a large number of 3D surface stateparameters most of them being standardized. Theseparameters including the “14 Birminghamparameters” were proposed by the assemblycomposed of two educational institutions; Universityof Birmingham and Ecole Centrale de Lyon in
collaboration with five industrial partners; Perthen,Exxon, Somicronic, Lucas Ltd and WBC [1]. Theseparameters are classified by family: amplitudeparameters, hybrid parameters, spatial parameters,functional parameters, functional indices andvolume parameters. Kurtosis of the heightdistribution – Sku, and Skewness of the heightdistribution – Ssk, and anisotropy characterizationswere revealed most pertinent.
REFERENCES
1. Szuder, A., 2002, Ingineria suprafetelor, Ed.Tehnica, Bucuresti.2. Marinescu, D.I., Rowe, W.B, Dimitrov, B,Inasaki, I, 2004, Tribology of Abrasive MachiningProcesses, William Andrew, New York.3. Szuder, A, Marinescu, A, Popescu, M., 1986,“Study of the Influences of Flat Lapping,” Intern.Grinfing Conf., June 10-12, Philadelphia,Pennsylvania. Society of Manufacturing Engineers.USA, MR 86-633.1-8.4. Mathia T., 2007, “3D Surface MorphologyMeasurements in Abrasive Machining,” Bases &Techniques of Abrasive Machining Rzeszow, Poland,12-14, Novembre, Ed. E.Oczos & J.Burek.5. Mathia, T. G., Ducret, S., Lanteri, P., Midol,A., Meille, G., 2007, “Improvement of Ski s SolePerformance via Specific Abrasive Finishing andWaxing Process Using Simultaneously: GPS² andSkiing Forces Metrologies,” Advances in ProductionEngineering, pp. 360-369, 14-16 juin, Warsaw,Poland.6. Szuder, A, Bardac, D, Palalau D, Bardac, D.,1998, “Considerations Concerning the LiquidVolume into the Honned Textures withSuperabrasives,” I.C.M.E. CIRP InternationalSeminar on Intelligent Computation inManufacturing Engineering, July 1-3, Capri , Italy,pp. 665-669.7. Mathia T., Domeck, N., Leprat, E., 2006,“Why the 3D Metrology of Surfaces Morphology isRequired?,” Scientific Bulletin of University ofBielsko-Biala, vol. 22, pp.185-198.8. Informationszentrum Technical Ceramics,Verband der Keramischen Industrie e.V, BrevierTechnical Ceramics, Fahner Verlag 2007.
ISSN 1220 - 8434 ACTA TRIBOLOGICAVolume 17, (2009), 42-45
Stefan GHEORGHE1
Cristina TEISANU1
email: [email protected]
Andreas MERSTALLINGER2
Ion CIUPITU1
1 University of Craiova, Faculty of Mechanics,
Dept. of Technologies & Materials,
ROMANIA2 Austrian Research Centre Seibersdorf,
AUSTRIA
THE INFLUENCE OF THE SINTERINGATMOSPHERES ON THE WEAR BEHAVIOUROF COPPER BASED ALLOYS
The Powder Metallurgy (PM) technique allows the manufacturingof sintered self-lubricating materials having a high wear resistance.It is well known that the small and medium size bearings areprocessed by PM with better characteristics than those obtained bycasting. The tested materials are Cu-based, having Sn, Zn, and Pbas alloying elements to improve the tribological properties. Thesealloys are designed to be used for manufacturing self-lubricatingbearings. The alloy compositions were obtained by cold diecompacting, using different pressures. The sintering was performedin vacuum. The wear test was performed for four ring samples on aball on pin tester, the test atmosphere being vacuum and normal air.Keywords: sintered bearings, sintering atmosphere, wearbehaviour, linear wear
1. INTRODUCTION
Powder Metallurgy (PM) technology allowsthe control of the alloying elements content andobtaining of certain porosity which allows theabsorption of the oil through the material pores; so,the parts can work without supplementary oil addition[1-3].
The tested material is the alloy gradeCuSn5Zn5Pb4 without graphite, considered as a goodantifriction sintered alloy.
The wear test was performed for ring sampleswith a ball pin and the atmospheres used werevacuum and air. The materials were tested at theAustrian Research Center Seibersdorf.
This is a large class of materials for thesebearings processing and their selection depends on theworking environment, relative speed shaft-bearing,specific pressure etc. The elaboration of the bearingsby PM technique is a complex process, whichdepends on many factors such as: the type andmorphology of powder particles, the chemicalcomposition of the material, the alloying method, thecompacting pressure, the sintering atmosphere, thesintering temperature, the cooling rate etc.
Bearings made of sintered bronze are still themost used parts in technical applications because ofthe availability of the copper powder and their verygood tribological and self-lubricated properties.However, a substitution tendency of the tin powderwith other chemical elements was noticed, due to veryexpensive and reduced amount of tin powder. Someof those materials are CuSnZn alloys with 1%graphite.
By Powder Metallurgy technology it ispossible to obtain sintered materials for self-lubricating bearings having a high wear resistance anda porosity ranging between (15…30)%. This can bepossible by different ways of driving the processcycle. The pore volume is impregnated with oil andduring the bearing operation the oil is eliminated frompores, forming a thin film between the bush and theshaft walls. As the structure is porous these materialscan be used in those conditions where the oil is notpresent. Because of these advantages powder-metallurgy bearings are superior to thoseconventionally made, for many applications [3-5].
Therefore these materials can be used in ancompletely dry atmosphere. But the oil from theirpores improves the antifriction behaviour.
2. EXPERIMENTAL PROCEDURE
The tested materials are sintered copper basedalloys having Sn, Zn and Pb as alloying elements towhich 1% graphite was added in order to improve thetribological properties. These alloys are meant to beused for manufacturing self-lubricating bearings. Thefollowing sintered alloys:
CuSn5Zn5Pb4 + 1% graphite (PBM 1), CuSn5Zn5Pb5 + 1% graphite (PBM 2), CuSn5Zn5Pb6 + 1% graphite (PBM 3), CuSn5Zn5Pb7 + 1% graphite (PBM 4), CuSn5Zn5Pb8 + 1% graphite (PBM 5),
were structural, mechanical and technological studied.Also, tribological tests were performed in order to

43
determine the amount of wear and the value offriction coefficient [1-3].
These materials were cold die compacted attwo pressures, 165 MPa and 210 MPa, respectively(green state density = 6.9 g/cm3), values which takeinto account the chemical composition of the alloysand the required mechanical and technologicalproperties.
The sintering atmosphere was a high vacuum(10-4 atm) and hydrogen. The wear test wasperformed for ring samples with a ball pin and theatmosphere used was vacuum and air.
The material tested is the CuSn5Zn5Pb4 alloygrade without graphite, considered as a goodantifriction sintered alloy.
To perform the wear test ring samples wereobtain by PM technology with the following initialdata:
- material–powder mixture of CuSn5Zn5Pb4;- homogenization of the mixture with Turbula
device;- cold compaction with a pressure of 225 MPa
(proportionally F = 38,000 daN);- sintering at two temperatures, 805°C and
815°C in vacuum and hydrogen atmosphere;The sintering cycle is presented in Figure 1.Due to heavy wear loadings of the bearings it
is necessary to accomplish the wear test of theirmaterials.
The wearing can be expressed as a length, anarea, a volume or a weight deterioration of the
materials through friction process. Thus, the wearingand the friction phenomenon can not be separated andone of the results is the loss of mass.
There are known a lot of wear test methodslike the macro and micro geometric dimensionsmeasurement, the weighting method, the physical orchemical analysis of the lubricant and so on.
A technological test particular to self-lubricating materials is the wear test developed on thesintered bearing or on specific samples of therequested material. Because the quality of the oil canimprove the wear resistance, the materials areindicated to be tested without oil in pores. In this casethe p v value is smaller than 1.8 MPa m/s, where p is
the pressure and v is the relative sliding speed.The wear test was performed for the ring
samples with a ball pin and the atmosphere used wasvacuum and air. The friction coefficient values arebetter for vacuum test than those performed in air forboth samples sintered at 805°C and 815°C [4]. Thebest value is 0.11 for the sample sintered at 815°C andtested in vacuum.
The dependence of the sliding distance as afunction of the friction coefficient shows a constantvalue after the beginning period.
The experimental conditions are:- material of ball - 100Cr6;- sliding speed of ball – 0.6m/s;- load - 1N;- sliding distance - 2000 m.
The sintering cycle for vacuum and hydrogen atmospheresT=815°C; heating rate = 5°C/min
720
815815
2020
720
620
620
550
550
450
450
350350
300
300
250
250
200
200
100
1000
100
200
300
400
500
600
700
800
900
Time [min]
Tem
pera
ture
[°C]
Figure 1. Sintering cycle for vacuum and hydrogen atmosphere, T = 815°C, heating velocity = 5°C/min
3. RESULTS AND DISCUSSION
During the wear test there are covered allthree distinguished stages specific to wear evolutionin time: running in wear, normal or steady wear andaccelerated or damage wear.
As it may be seen in diagrams depicted inFigures 2 through 7, the wear increases rapidly inthe first stage (running-in period) and then it remains
almost constant in the steady period of functioning.After finishing the wear test it was noticed
that the wear value remains constant on the slidingdistance of 2000 m, excepting a little increased pickcharacterising the starting point. This is also themoment when the friction is very intensive.
At the end of the wear test the materials didnot failed, being capable to continue the running.

44
0.000
0.200
0.400
0.600
0.800
1.000
1.200
1.400
0 50 100 150 200 250 300 350 400 450 500Distance [m]
Line
ar w
ear [
mm
]
Calibrated-Mean
Figure 2. Linear wear for the ring sample sintered at815°C and tested in vacuum
1.00E-02
1.00E-01
1.00E+00
1.00E+01
1.00E+02
1.00E+03
1.00E+04
0 50 100 150 200 250 300 350 400 450 500Distance [m]
Wea
r
Calibrated-Mean Wae rate [mm³/nm]
Calibrated-Mean volume mm³
Figure 3. Calibrated mean wear rate and calibratemean volume for the ring sample sintered at 815°C
and tested in vacuum
0.000
0.500
1.000
1.500
2.000
2.500
0 50 100 150 200 250 300 350 400 450 500Distance [m]
Line
ar w
ear [
mm
]
Calibrated-Mean
Figure 4. Linear wear for the ring sample sintered at815°C and tested in air
1.00E-02
1.00E-01
1.00E+00
1.00E+01
1.00E+02
1.00E+03
0 50 100 150 200 250 300 350 400 450 500Distance [m]
Wea
r
Calibrated-Mean Wae rate[mm³/nm]Calibrated-Mean volume mm³
Figure 5. Calibrated mean wear rate and calibratemean volume for the ring sample sintered at 815°C
and tested in air
0.000
0.200
0.400
0.600
0.800
1.000
1.200
0 50 100 150 200 250 300 350 400Distance [m]
Linea
r wea
r [m
m] Calibrated-Mean
Figure 6. Linear wear for the ring sample sintered at805°C and tested in air
1.00E-02
1.00E-01
1.00E+00
1.00E+01
1.00E+02
1.00E+03
1.00E+04
0 50 100 150 200 250 300 350 400Distance [m]
Wea
r
Calibrated-Mean Wae rate[mm³/nm]Calibrated-Mean volume mm³
Figure 7. Calibrated mean wear rate and calibratemean volume for the ring sample sintered at 805°C
and tested in air
45
4. CONCLUSIONS
The samples sintered in hydrogen atmospherepresent a very good tribologic behaviour comparableto those of the speciality literature.
The running in period of the sintered samplesis very short being in normal functioning quite fast.
The lowest values of the wear rate areobserved at the samples sintered at 805°C and weartested in air.
REFERENCES
1. Gheorghe, St., Teisanu, C., and Ciupitu, I.,2005, “Some Aspects Regarding Wear Test of SomePM Antifriction Copper Based Alloys,” Proc. of the4th Int. Conf. on Sci., Tech. and Applications ofSintering, 1, pp. 421-423.
2. Gheorghe, St., Teisanu, C., and Ciupitu, I.,2005, “Some Aspects Regarding Wear Test of SomePM Antifriction Copper Based Alloys,” Third Int.Conf. on PM, RoPM, 871.3. Teişanu C., Gheorghe St., and Ciupitu I.,2005, “Hardness Optimization of the Iron Base Self-Lubricating Bearings,” Euro PM2005 - EuropeanCongress and Exhibition on Powder Metallurgy,Praga, Cehia, 2-5 october, vol.2, pg. 185-190.4. Gheorghe, St., Ciupitu, I., Merstallinger, A.,and Kladler, G., 2004, “Friction And WearBehavior Of Iron-Copper Sintered Alloys,”European Powder Metallurgy Association (EPMA),International Powder Metallurgy Congress &Exhibition, Euro PM2007, vol. 4, pp. 769-774.5. Gheorghe, S., Ciupitu, I., Mangra, M., andTeisanu, C., 2001, “Wear Resistant Alloys withLow Tin Content,” European Congress andExhibition on Powder Metalurgy, Nice, France, 22-24 October.
ISSN 1220 - 8434 ACTA TRIBOLOGICAVolume 17, (2009), 46-51
G. MEILLE
T. G. MATHIAe-mail: [email protected]
Laboratoire de Tribologie et Dynamique des
Systèmes- C.N.R.S., École Centrale de Lyon,
Ecully, FRANCE
STRATEGY FOR IDENTIFICATION OF WEARMODE OF ENGINEERING SURFACES
Identification of engineering surfaces damage modes requires theselections of appropriate analytical techniques for characterisationof morphology, rheology as well as of physical & chemicalproperties. Different techniques of visual observations, based onoptical and electronic microscopy, coupled with specific imageanalysis software are presented and discussed. The authors sheartheir experience in specific case studies.Different strategies are discussed and numerous examplescommented and illustrated for solving, choosing, and diagnosingvarious tribology problems by using contact mechanics, solidmechanics, system dynamics, physical chemistry, engineeringmaterials science, lubricant chemistry, and metallurgy knowledge.Below, a functional simplified diagram is presented, based on 30years of experience and 1000 expertises. Some case studies areanalysed in-depth.Keywords: wear, expertise, diagnostic, analytical techniques,engineering surfaces
1. INTRODUCTION
1.1 Principal modes of wearIn materials science, wear represents all sorts
of initial performances reduction of any system interms of its functionality. From material engineeringpoint of view it concerns any deformation,geometrical evolution or transfer or removal ofmaterial from a solid surface by the action of anothersolid, gas or liquid. The study of the processes ofwear is part of the discipline of tribology. There arefour principal widely recognized wear processes [1-3]:
1. adhesive wear;2. abrasive wear;3. corrosive wear;4. surface and volume fatigue.Voluntary we are not going to treat in detail
mechanical and thermal failures like buckling, creep,fracture, fretting, yielding as melting and thermalshock. The definition of wear does not include lossof dimension from irreversible deformation, althoughwear has occurred despite no material removal occurs.Also this definition fails to include impact wearwhere there is no sliding motion or cavitations (alsocorrosion) where counter-body is a fluid or somegazes. Wear can possibly be better defined as aprocess in which interaction of surface(s) or boundingface(s) of a solid with the working environmentresults in the dimensional loss of the solid, with or
without loss of material. Wear environment includesloads (mono or multi directional, reciprocating,rolling, impact), kinematics, speed, temperatures,counter - bodies (solid, liquid, gas), types of contact(single phase or multiphase in which phases involvedcan be liquid plus solid particles plus gas bubbles).
1.2 Adhesive wearAdhesive wear is also known as scoring,
galling, or seizing. It occurs when two solid surfacesslide over one another under pressure. Surfaceprotuberances, or asperities, are plastically deformedand eventually welded together by high local pressure.As sliding continues, these bonds are broken,producing cavities on the surface, material transfer onthe second surface, and frequently tiny, abrasiveparticles, all of which contributes to future wear ofsurfaces.
1.3 Abrasive wearWhen material is removed by contact with
hard particles, abrasive wear occurs. The particleseither may be present at the surface of a secondmaterial or may exist as loose particles between twosurfaces. For example abrasive wear can bemeasured as loss of mass by the Tabor Abrasion Testaccording to ISO 9352 or ASTM D 1044.
1.4 Corrosive wearOften referred to simply as “corrosion”,
corrosive wear is the deterioration of useful properties
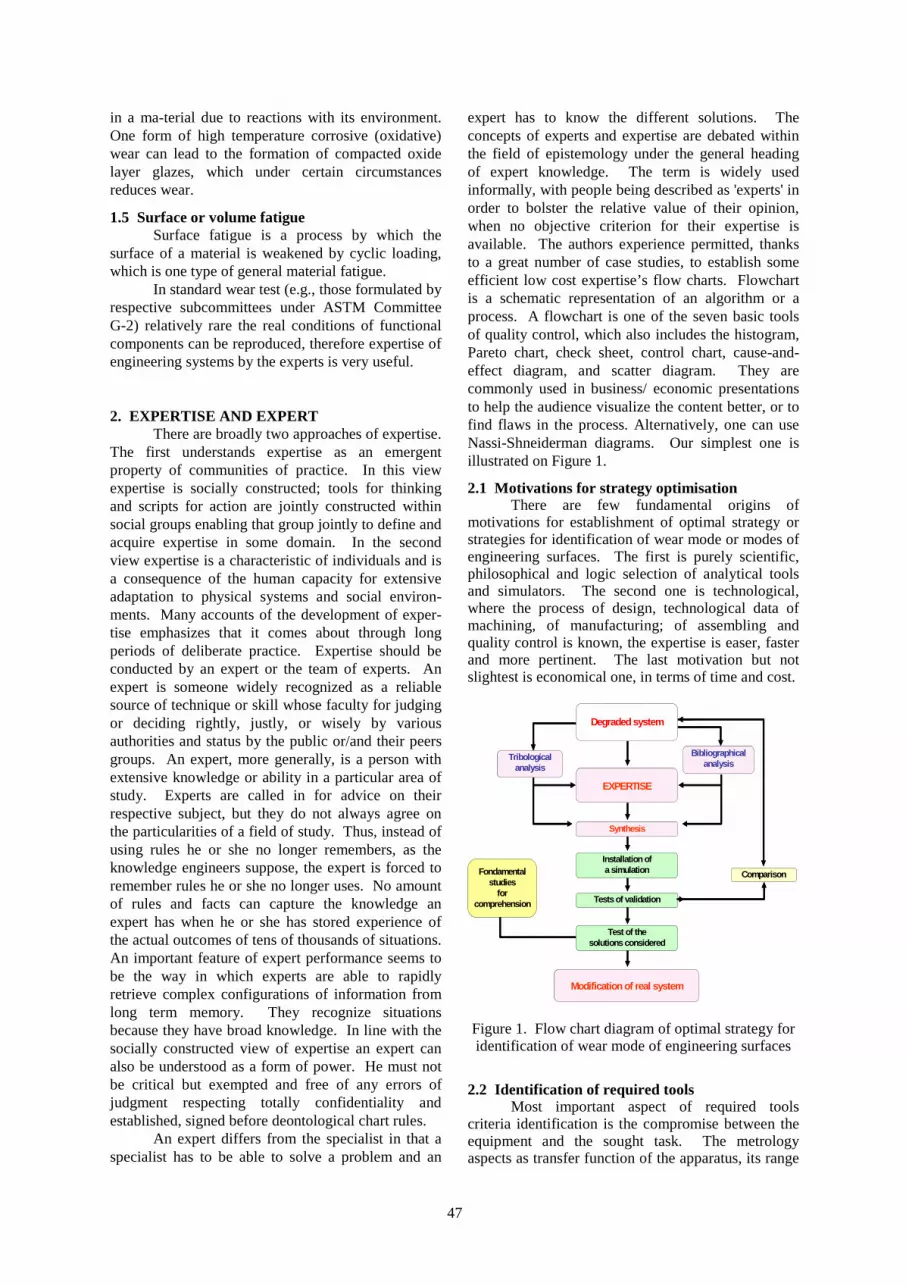
47
in a ma-terial due to reactions with its environment.One form of high temperature corrosive (oxidative)wear can lead to the formation of compacted oxidelayer glazes, which under certain circumstancesreduces wear.
1.5 Surface or volume fatigueSurface fatigue is a process by which the
surface of a material is weakened by cyclic loading,which is one type of general material fatigue.
In standard wear test (e.g., those formulated byrespective subcommittees under ASTM CommitteeG-2) relatively rare the real conditions of functionalcomponents can be reproduced, therefore expertise ofengineering systems by the experts is very useful.
2. EXPERTISE AND EXPERTThere are broadly two approaches of expertise.
The first understands expertise as an emergentproperty of communities of practice. In this viewexpertise is socially constructed; tools for thinkingand scripts for action are jointly constructed withinsocial groups enabling that group jointly to define andacquire expertise in some domain. In the secondview expertise is a characteristic of individuals and isa consequence of the human capacity for extensiveadaptation to physical systems and social environ-ments. Many accounts of the development of exper-tise emphasizes that it comes about through longperiods of deliberate practice. Expertise should beconducted by an expert or the team of experts. Anexpert is someone widely recognized as a reliablesource of technique or skill whose faculty for judgingor deciding rightly, justly, or wisely by variousauthorities and status by the public or/and their peersgroups. An expert, more generally, is a person withextensive knowledge or ability in a particular area ofstudy. Experts are called in for advice on theirrespective subject, but they do not always agree onthe particularities of a field of study. Thus, instead ofusing rules he or she no longer remembers, as theknowledge engineers suppose, the expert is forced toremember rules he or she no longer uses. No amountof rules and facts can capture the knowledge anexpert has when he or she has stored experience ofthe actual outcomes of tens of thousands of situations.An important feature of expert performance seems tobe the way in which experts are able to rapidlyretrieve complex configurations of information fromlong term memory. They recognize situationsbecause they have broad knowledge. In line with thesocially constructed view of expertise an expert canalso be understood as a form of power. He must notbe critical but exempted and free of any errors ofjudgment respecting totally confidentiality andestablished, signed before deontological chart rules.
An expert differs from the specialist in that aspecialist has to be able to solve a problem and an
expert has to know the different solutions. Theconcepts of experts and expertise are debated withinthe field of epistemology under the general headingof expert knowledge. The term is widely usedinformally, with people being described as 'experts' inorder to bolster the relative value of their opinion,when no objective criterion for their expertise isavailable. The authors experience permitted, thanksto a great number of case studies, to establish someefficient low cost expertise’s flow charts. Flowchartis a schematic representation of an algorithm or aprocess. A flowchart is one of the seven basic toolsof quality control, which also includes the histogram,Pareto chart, check sheet, control chart, cause-and-effect diagram, and scatter diagram. They arecommonly used in business/ economic presentationsto help the audience visualize the content better, or tofind flaws in the process. Alternatively, one can useNassi-Shneiderman diagrams. Our simplest one isillustrated on Figure 1.
2.1 Motivations for strategy optimisationThere are few fundamental origins of
motivations for establishment of optimal strategy orstrategies for identification of wear mode or modes ofengineering surfaces. The first is purely scientific,philosophical and logic selection of analytical toolsand simulators. The second one is technological,where the process of design, technological data ofmachining, of manufacturing; of assembling andquality control is known, the expertise is easer, fasterand more pertinent. The last motivation but notslightest is economical one, in terms of time and cost.
Bibliographicalanalysis
Degradedsystem
Tribologicalanalysis
Synthesis
Installationofa simulation
Tests of validation
Test of thesolutionsconsidered
Modification of real system
EXPERTISE
ComparisonFondamentalstudies
forcomprehension
Bibliographicalanalysis
Degradedsystem
Tribologicalanalysis
Synthesis
Installationofa simulation
Tests of validation
Test of thesolutionsconsidered
Modification of real system
EXPERTISE
ComparisonFondamentalstudies
forcomprehension
Figure 1. Flow chart diagram of optimal strategy foridentification of wear mode of engineering surfaces
2.2 Identification of required toolsMost important aspect of required tools
criteria identification is the compromise between theequipment and the sought task. The metrologyaspects as transfer function of the apparatus, its range
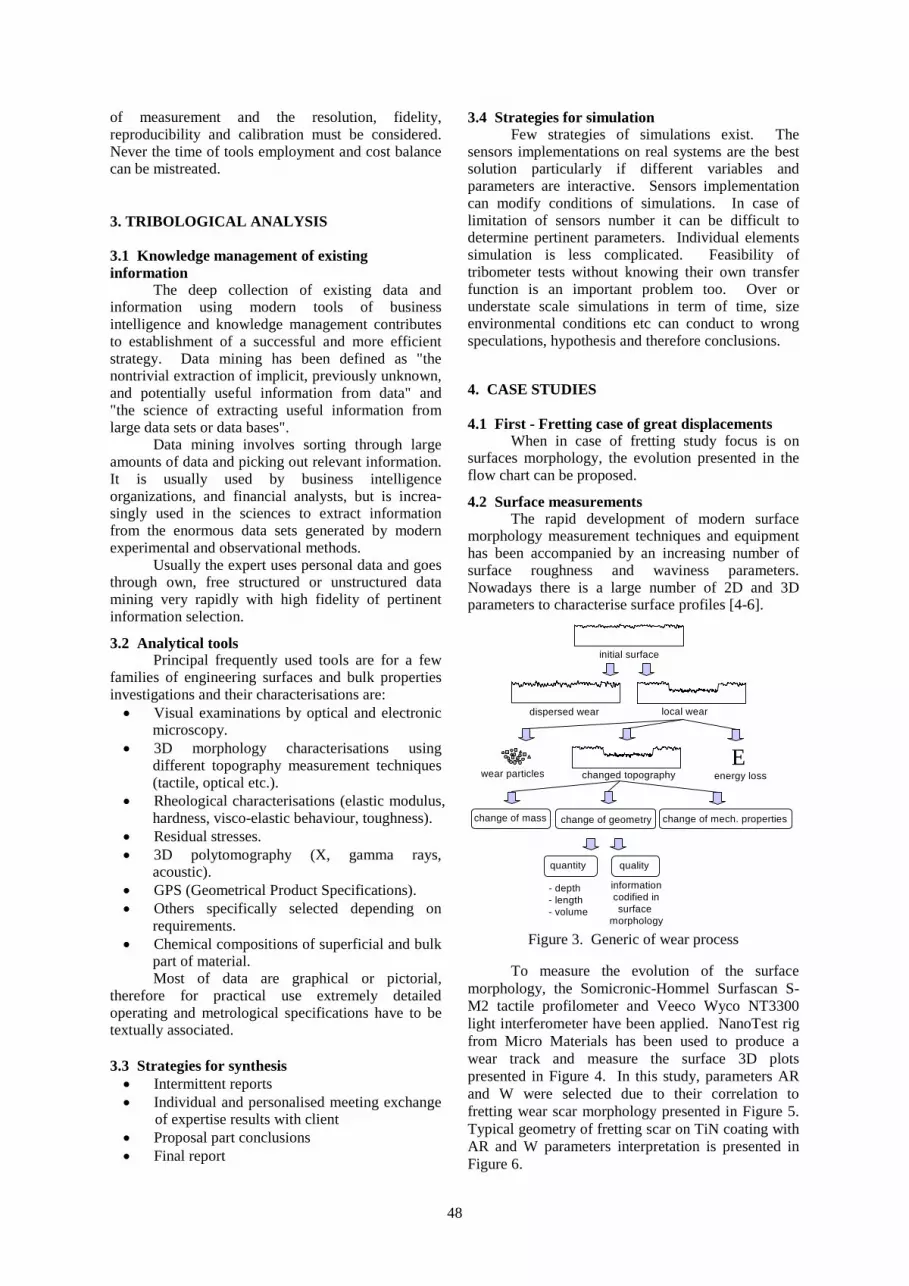
48
of measurement and the resolution, fidelity,reproducibility and calibration must be considered.Never the time of tools employment and cost balancecan be mistreated.
3. TRIBOLOGICAL ANALYSIS
3.1 Knowledge management of existinginformation
The deep collection of existing data andinformation using modern tools of businessintelligence and knowledge management contributesto establishment of a successful and more efficientstrategy. Data mining has been defined as "thenontrivial extraction of implicit, previously unknown,and potentially useful information from data" and"the science of extracting useful information fromlarge data sets or data bases".
Data mining involves sorting through largeamounts of data and picking out relevant information.It is usually used by business intelligenceorganizations, and financial analysts, but is increa-singly used in the sciences to extract informationfrom the enormous data sets generated by modernexperimental and observational methods.
Usually the expert uses personal data and goesthrough own, free structured or unstructured datamining very rapidly with high fidelity of pertinentinformation selection.
3.2 Analytical toolsPrincipal frequently used tools are for a few
families of engineering surfaces and bulk propertiesinvestigations and their characterisations are: Visual examinations by optical and electronic
microscopy. 3D morphology characterisations using
different topography measurement techniques(tactile, optical etc.).
Rheological characterisations (elastic modulus,hardness, visco-elastic behaviour, toughness).
Residual stresses. 3D polytomography (X, gamma rays,
acoustic). GPS (Geometrical Product Specifications). Others specifically selected depending on
requirements. Chemical compositions of superficial and bulk
part of material.Most of data are graphical or pictorial,
therefore for practical use extremely detailedoperating and metrological specifications have to betextually associated.
3.3 Strategies for synthesis Intermittent reports Individual and personalised meeting exchange
of expertise results with client Proposal part conclusions Final report
3.4 Strategies for simulationFew strategies of simulations exist. The
sensors implementations on real systems are the bestsolution particularly if different variables andparameters are interactive. Sensors implementationcan modify conditions of simulations. In case oflimitation of sensors number it can be difficult todetermine pertinent parameters. Individual elementssimulation is less complicated. Feasibility oftribometer tests without knowing their own transferfunction is an important problem too. Over orunderstate scale simulations in term of time, sizeenvironmental conditions etc can conduct to wrongspeculations, hypothesis and therefore conclusions.
4. CASE STUDIES
4.1 First - Fretting case of great displacementsWhen in case of fretting study focus is on
surfaces morphology, the evolution presented in theflow chart can be proposed.
4.2 Surface measurementsThe rapid development of modern surface
morphology measurement techniques and equipmenthas been accompanied by an increasing number ofsurface roughness and waviness parameters.Nowadays there is a large number of 2D and 3Dparameters to characterise surface profiles [4-6].
initial surface
dispersed wear local wear
Ewear particles changed topography energy loss
change of mass change of geometry change of mech. properties
quantity quality
- depth- length- volume
informationcodified insurface
morphology
Figure 3. Generic of wear process
To measure the evolution of the surfacemorphology, the Somicronic-Hommel Surfascan S-M2 tactile profilometer and Veeco Wyco NT3300light interferometer have been applied. NanoTest rigfrom Micro Materials has been used to produce awear track and measure the surface 3D plotspresented in Figure 4. In this study, parameters ARand W were selected due to their correlation tofretting wear scar morphology presented in Figure 5.Typical geometry of fretting scar on TiN coating withAR and W parameters interpretation is presented inFigure 6.

49
(a) (b)
(c) (d)
1400 m1400 m
1200 m1200 m
700m
700 m80
0m
800 m
5m
5m
45m
35m
Figure 4. 3D topographical measurementsof simulating fretting tests
4.3 Criteria for tests validations and test ofretained solutions
In case of fretting tests, French motifs standardhas been very efficiently used, thanks to the use of theparameter W, effectively easy to measure and welladapted to identification of transitional stages and therecognition of local destruction of protective coatingshown on Figure 6.
4.4 Tests of validationIndustrial standardised test and scientific are
not every time perfectly correlated. It is very useful tocompare carefully the results from standardisedmethods advanced many years before and today’sscientific well metrologically established scientificmeasurements. Frequently surprising of conclusiondifferences push to deep elucidations.
AR1 AR2
W1 W2
2WW
W
2ARAR
AR
21
21
Figure 5. Extracted axial profile of the fretting wearscar on TiN coating with AR and W morphological
parameters
4.5 Comparisons with initial results of the analysis.This stage of expertise depends very much on
available budget of time and finances. It is detailedbelow in second case of study.
4.6 Second - Wear of male splined shaft and sleevebushing
This stage of expertise depends very much onexpert knowledge. It is detailed below in next case ofstudy.
stageI
stageII
stageIII
deep substrate
coating
early substrate
0
0.5
1.0
1.5
2.0
2.5
3.0
0 1 2 3 4 5 6surface morphology parameter : W (μm)
wea
r vol
ume
: WV
(106
μm3 )
Figure 6. Fretting wear scar volume as a function ofW surface parameter
4.7 Third – thermal degradationMelting bubbles easily recognized on SEM
images occur. Extractional sudation of Pb frommatrix Cu-Pb under friction and thermal constrainsare seen in Figures 10 and 11. The wear is dueessentially to inefficient lubrication and misalignmentof bearing parts.
Permanent couplingwithout translation
Coupling with translation
Start Positionvibrations without loading
Movement engagement,sleeve bushingoverload on lineparticles generationInterfacial slidingabrasion
Sleeve bushingisinmovement, whencoupling starts when contacting surfaces aresmallimportant over loading
Coupling is achievedthe interface is undersemi-static high pressure and vibrationsfretting
When the Interface isdelinkingdue to inversemovement ofsleeve bushing approaching to initialpositionmore important over loadingand localdeformationwith present wear particlesabrasion
Back to initial position without loadingsleevebushingisblockedvibrations without load
Kinematics analysis
Translation + Coupling
Translation
Without translation & coupling
Without translation & coupling
Figure 7.a. Complete kinematics analysis is evidentlydemonstrated via microscopic visual observations
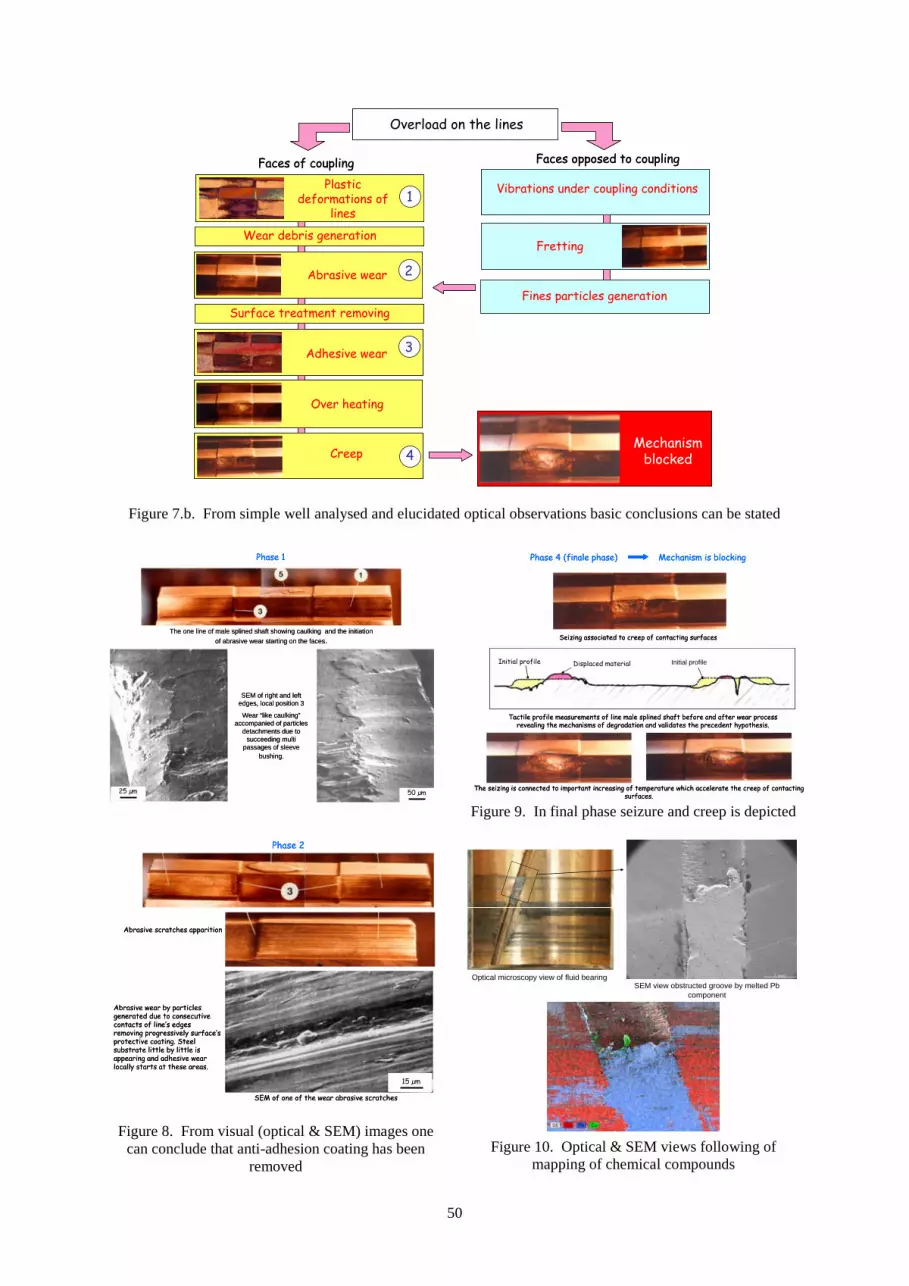
50
Adhesive wear
Over heating
Creep
Overload on the lines
Wear debris generation
Plasticdeformations of
lines
Vibrations under coupling conditions
Fines particles generation
Fretting
1
4
3
Abrasive wear 2
Mechanismblocked
Surface treatment removing
Faces of coupling Faces opposed to coupling
Adhesive wear
Over heating
Creep
Overload on the lines
Wear debris generation
Plasticdeformations of
lines
Vibrations under coupling conditions
Fines particles generation
Fretting
1
4
3
Abrasive wear 2
Mechanismblocked
Surface treatment removing
Faces of coupling Faces opposed to coupling
Figure 7.b. From simple well analysed and elucidated optical observations basic conclusions can be stated
The one line of maleThe one line of male splined shaft showing caulking and the initiationof abrasive wear starting on the faces.
SEM of right and leftedges, local position 3
Wear “like caulking”accompanied of particles
detachments due tosucceeding multi
passages of sleevebushing.
25 µm 50 µm
Phase 1
The one line of maleThe one line of male splined shaft showing caulking and the initiationof abrasive wear starting on the faces.
SEM of right and leftedges, local position 3
Wear “like caulking”accompanied of particles
detachments due tosucceeding multi
passages of sleevebushing.
25 µm25 µm25 µm 50 µm50 µm50 µm
Phase 1
Phase 2
Abrasive scratches apparition
15 µm
Abrasive wear by particlesgenerated due to consecutivecontacts of line’s edgesremoving progressively surface’sprotective coating. Steelsubstrate little by little isappearing and adhesive wearlocally starts at these areas.
SEM of one of the wear abrasive scratches
Phase 2
Abrasive scratches apparition
15 µm15 µm15 µm
Abrasive wear by particlesgenerated due to consecutivecontacts of line’s edgesremoving progressively surface’sprotective coating. Steelsubstrate little by little isappearing and adhesive wearlocally starts at these areas.
SEM of one of the wear abrasive scratches
Figure 8. From visual (optical & SEM) images onecan conclude that anti-adhesion coating has been
removed
Phase 4 (finale phase) Mechanism is blocking
Initial profileDisplaced materialInitial profile
Tactile profile measurements of line male splined shaft before and after wear processrevealing the mechanisms of degradation and validates the precedent hypothesis.
Seizing associated to creep of contacting surfaces
The seizing is connected to important increasing of temperature which accelerate the creep of contactingsurfaces.
Figure 9. In final phase seizure and creep is depictedThermal degradation of Pb-Cu fluid bearing
Optical microscopy view of fluid bearingSEM view obstructed groove by melted Pb
component
Figure 10. Optical & SEM views following ofmapping of chemical compounds

51
Spectrum 2
Spectrum 1
Spectrum 2
Spectrum 1
Principal element : Pb
Traces of CuPrincipal element : Cu
Traces of Si, Pb, Sn
Figure 11. SEM (Scanning Electron Microscopy)view of thermal degradation due to extremeconditions of friction in case of pseudo-alloy
(Cu-Pb-Sn) bearing associated with EDS (EnergyDispersive Spectrometry)
5. CONCLUDING REMARKS ANDSUGGESTIONS
Only very professional and well orientedinvestigations following deep elucidation based on"retour d’expérience" can help in efficientinvestigations in strategy of wear mode ofengineering surfaces. There is not time and space forfree improvisations. The term cindynics (from theGreek kindunos, "danger") is currently used in frameof science (science of risks study and its reduction).It is generally used in case of risks preventions, whichis the case of strategy the authors have developedassociated with preclusions in great number of risk’sdomains like feasibility, industrial manufacturing,commerce, economy up to environmental policy.
ACKNOWLEDGEMENTS TO INDUSTRIALPARTNERS
The authors wish to express theirs appreciationto the Centre National de la Recherche Scientifiqueand to the clients from French, Italian, Japanese, U.K.Swedish, American, German industries helping inimprovement of our strategy of tribological expertisekeeping our confidence since so many years.References of the companies for confidential reasonsare not plainly mentioned.
REFERENCES
1. Chattopadhyay R., 2001, “Surface Wear-Analysis, Treatment and Prevention,” ASM-International, OH, USA.2. Germain, M. L., 2006, Development andpreliminary validation of a psychometric measure ofexpertise: The Generalized Expertise Measure (GEM),Unpublished Doctoral Dissertation. Barry University,Florida.3. Swanson, R. A., and Holton, E. F., 2001,Foundations of Human Resource Development, SanFrancisco: Berrett-Koehler Publishers, Inc.4. Liskiewicz, T., Mathia T., Fouvry, S., andNeville A., 2007, “Systematic MorphologicalApproach for Analysing Fretting Worn Surfaces,”33rd Leeds – Lyon Symposium on Tribology, Leeds,Royaume-Uni, 12-15 September, TriboTest Journal,John Wiley & Sons, Ltd, nr. 13, pp. 139-150.5. Chattopadhyay, R., 2004, Advanced ThermallyAssisted Surface Engineering Processes, KluwerAcademic Publishers, MA, USA (now Springer, NY).6. Blunt, W., Dong, P., Luo, N., Mathia, T., Stout,K J., Sullivan, P. J., and Zahouani, H., 2004,Surface Topography, Stylus Publishing Press.

ISSN 1220 - 8434 ACTA TRIBOLOGICA Volume 17, (2009), 52-57
Ivan SOVILJ-NIKIC1
Bogdan SOVILJ1
Miran BREZOCNIK2
Sandra SOVILJ-NIKIC1
e-mail: [email protected]
Vlastimir PEJIC3
1 Faculty of Technical Sciences, Novi Sad,
SERBIA2 Faculty of Mechanical Engineering, Maribor,
SLOVENIA3 Technical Faculty, Doboj,
BOSNIA AND HERZEGOVINA
ANALYSIS OF INFLUENCE OF GEAR HOBGEOMETRIC PARAMETERS ON THE TOOLLIFE USING A GENETIC ALGORITHM
Hob milling is one of the most complex machining processes. It isused at the mostly in operation of serration of spur wheels thanks tothe high productivity of the process. Complicated cinematic andgeometric relations between gear hob and work-piece raise someproblems which disable optimal use of the tool and the machine.Optimization of working processes is based on reliablemathematical formulas which define the process in dependence onits parameters. In this paper, reliable tool life function of gear hobin the dependence on geometric parameters using a geneticalgorithm was determined.Keywords: wear, gear hob, genetic algorithm, tool life,optimization
1. INTRODUCTION
One of the basic trends in the development ofmodern mechanical engineering is to improveefficiency of metal machining. Successful solvingof these aims is connected with investigation ofworking conditions of cutting tool as one of the mostimportant links in the chain of machining process.Also, it is needed to investigate the physicalphenomenon connected with machining process.The use of optimal geometric parameters of cuttingpiece of cutting tool and optimal working conditionsprovides minimal cost of the products and maximalwork productivity. Gear hobs are used tomanufacture gear serration with straight, slant andhelical teeth, as well as to manufacture worm wheelsfor external conjugation with involute profile.
Taking significance of geometric parametersof gear hob into consideration for economy andproductivity during processing of gear serration,within this paper the investigation is directed to theapplication of artificial intelligence in order todetermine optimal geometric parameters of gear hob.High quality cutting tools are necessary foreconomical production. Production of these toolsrequires comprehensive study, computation andconstruction of each specific case.
There are a lot of factors influencing hobmilling process. The great number of factors andtheir interactions make investigation of wear processdifficult. They are hi - width of concentrated wearon the transition between outlet flank and tip oftooth, ht - width of wear zone along the blade, hu -width of concentrated wear on the transition betweeninlet flank and tip of tooth (Figure 2).
Figure 1. Products with serration and tools forserration processing
Figure 2. Distribution of wear
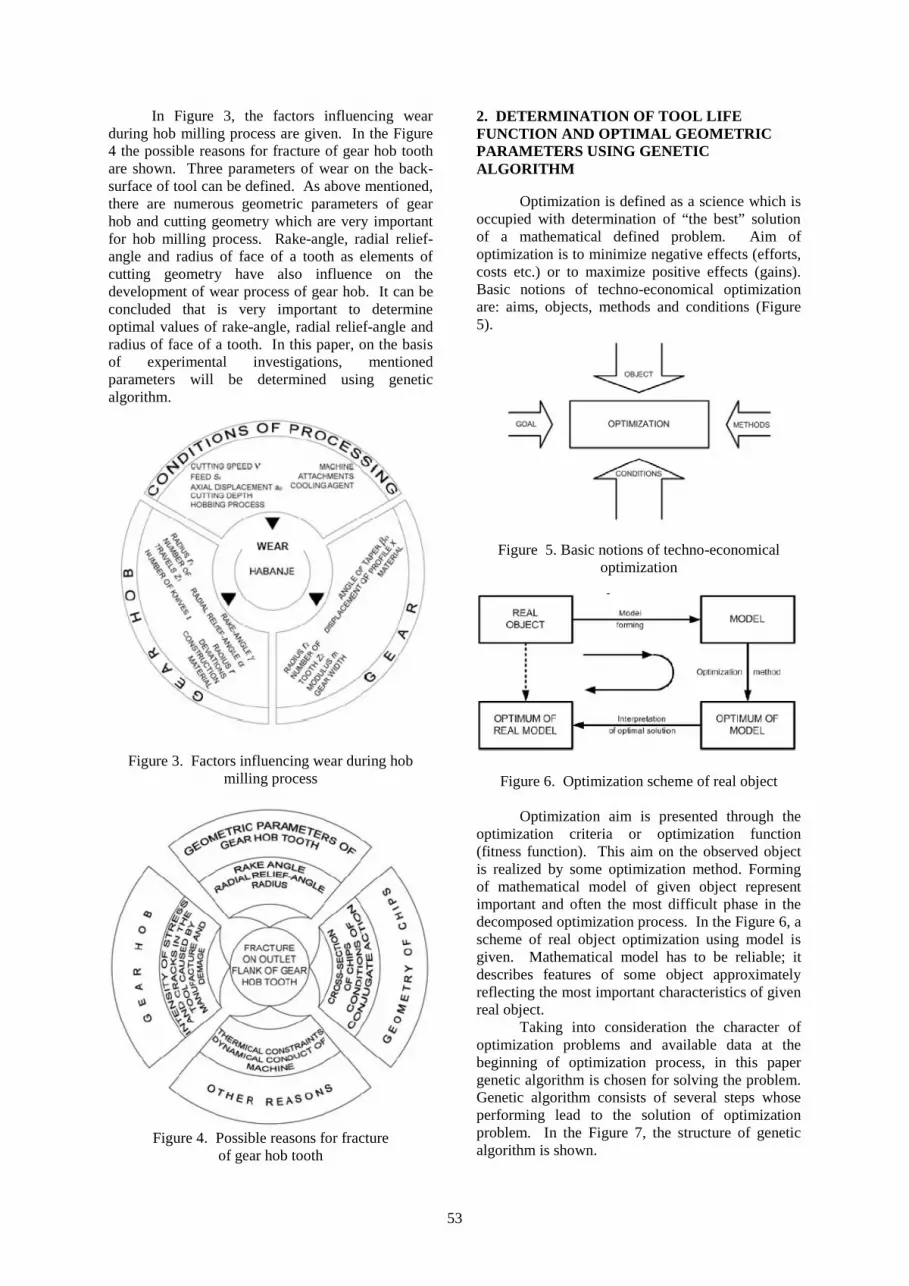
53
In Figure 3, the factors influencing wearduring hob milling process are given. In the Figure4 the possible reasons for fracture of gear hob toothare shown. Three parameters of wear on the back-surface of tool can be defined. As above mentioned,there are numerous geometric parameters of gearhob and cutting geometry which are very importantfor hob milling process. Rake-angle, radial relief-angle and radius of face of a tooth as elements ofcutting geometry have also influence on thedevelopment of wear process of gear hob. It can beconcluded that is very important to determineoptimal values of rake-angle, radial relief-angle andradius of face of a tooth. In this paper, on the basisof experimental investigations, mentionedparameters will be determined using geneticalgorithm.
Figure 3. Factors influencing wear during hobmilling process
Figure 4. Possible reasons for fractureof gear hob tooth
2. DETERMINATION OF TOOL LIFEFUNCTION AND OPTIMAL GEOMETRICPARAMETERS USING GENETICALGORITHM
Optimization is defined as a science which isoccupied with determination of “the best” solutionof a mathematical defined problem. Aim ofoptimization is to minimize negative effects (efforts,costs etc.) or to maximize positive effects (gains).Basic notions of techno-economical optimizationare: aims, objects, methods and conditions (Figure5).
Figure 5. Basic notions of techno-economicaloptimization
Figure 6. Optimization scheme of real object
Optimization aim is presented through theoptimization criteria or optimization function(fitness function). This aim on the observed objectis realized by some optimization method. Formingof mathematical model of given object representimportant and often the most difficult phase in thedecomposed optimization process. In the Figure 6, ascheme of real object optimization using model isgiven. Mathematical model has to be reliable; itdescribes features of some object approximatelyreflecting the most important characteristics of givenreal object.
Taking into consideration the character ofoptimization problems and available data at thebeginning of optimization process, in this papergenetic algorithm is chosen for solving the problem.Genetic algorithm consists of several steps whoseperforming lead to the solution of optimizationproblem. In the Figure 7, the structure of geneticalgorithm is shown.
54
Figure 7. Structure of genetic algorithm
In this paper, in order to model the tool lifefunction L of a single tooth gear hob, the model ofsecond order was used:
o 1 2 3 4 5 6
2 2 37 8 9 10
L k k k k r k k r k r
k r k k k r .
(1)
Optimization aim using genetic algorithm isto obtain values of coefficients ko, k1, k2, k3, k4, k5,k6, k7, k8, k9, k10, such that the difference betweenexperimental and predicted values should beminimal.
First step in the determination of anappropriate model using genetic algorithm is togenerate initial population P(t) randomly.Population P(t) consists of organisms. Everyorganism represents one of the possible problemsolutions and it contains genes that are realconstants: ko, k1, k2, k3, k4, k5, k6, k7, k8, k9, k10.
The absolute deviation D(i,t) of individualmodel i (organism) in generation time t wasintroduced as the fitness measure. It is defined as:
n
j 1
D i, t E j P i, j
, (2)
where E(j) is the experimental value formeasurement j, P(i,j) is the predicted value returnedby the individual model i for measurement j, and n isthe maximum number of measurements. Equation(2) is standard raw fitness measure for solving
regression problems proposed by Koza [13]. Theaim of the optimization task is to find such modelthat equation 2 would give an as low absolutedeviation as possible. However, because it is notnecessary that the smallest values of the aboveequation also means the smallest percentagedeviation of this model, the average absolutepercentage deviation of all measurements forindividual model i is defined as:
D i, ji 100%
E j n
. (3)
After generating the initial population,iterative procedure of genetic operations(reproduction, crossover and mutation) applies toindividuals until convergence criteria would not besatisfied. Two parents are selected randomly andthey create their two offspring in the crossoveroperation. Crossover enables to exchangeinformation between different potential solutions. Inthis paper decade encoding and real arithmeticcrossover is applied. Crossover is performedbetween two parental genes with identical indexes.These parental genes are selected randomly, too.Offspring genes are formed as:
1 2PARENT1 PARENT2OFFSPTRING1
2
;
2 1PARENT1 PARENT2OFFSPTRING2
2
(4)
Coefficients λ1 and λ2 are selected randomlyin the range [0.1].
After crossover, the next operation ismutation. One individual is selected randomly andone of its genes, which will be altered, is alsoselected. Mutation introduces new genetic materialinto population. Initial population which consists of100 organisms was generated randomly. In theinitial generation values of coefficients [k0, k10] wereselected in the range [-10, 10] randomly.
In order to mitigate negative features ofelitism and to accelerate performing of geneticalgorithm in the great extent, probability ofreproduction is 0.1. In this paper tournamentselection is applied to select potential parents.Probability of recombination is 0.3. Withintournament selection participants of the tournamentcan also be participants of some other tournament.In other words, an individual which was not the bestindividual in the tournament can be as an selectedindividual for recombination in some othertournament until 30% of population which give theiroffspring would not be selected. Recombination ofonly one gene realizes between 10% pairs of
55
individuals and in 90% recombination carries out onseveral genes.
Probability of mutation is 60%. Mutation ofonly one gene realizes at 50% individuals andremaining individuals have mutation on more thanone gene. Procedure of civilization generating wasdeveloped to 5,000-th generation and then it wasstopped temporary. If the average deviation Δ(i) ofassumed model (organism) in the population is lessthan 4% evolution of population would be continuedto 20000-th generation. On the contrary, processwould be stopped. After each phase of training theaccuracy of the best models is tested with the help ofinitial data. Five independent civilizations wereused during modeling.
3. EXPERIMENTAL RESULTS
Investigations were carried out on the gearhob machine MODUL-ZFWZ-250X5AVE producedby STARKSTROM - Anlagenbau, KarlMarx,Germany. In the investigations, special designedand constructed single tooth tool manufactured atFaculty of Technical Sciences in Novi Sad was used(Figure 8).
Figure 8. Single tooth gear hob
Optimization of geometric parameters ofcutting tool precedes internal optimization, i.e.optimization of cutting regimes. In order todetermine the optimal cutting geometry, it isnecessary to provide rational working conditions. Inother words, it is needed to determine cutting speed,feed and axial displacement in order to carry outexperimental investigations of cutting tool geometry.
Obtained experimental results are shown inthe Table 1. For each experimental point, values ofcharacteristic wear (hu, ht, hi) are obtained bymeasurements. On the basis of analysis, wearcriterion of single tooth tool was adopted. It is widthof wear zone on the outlet flank hi=0.6 mm. Foreach experimental point, the curves of wear processdevelopment are drawn. In Figure 9, the curve forthe fourth experimental point is given.
4. ANALYSIS OF OBTAINED RESULTS
Using genetic algorithm some possible modelssatisfying the chosen criterion, were obtained.Therefore, they represent a potential solution of theproblem.
Table 1. Experimental conditions andobtained results
REGIME OF PROCESSINGv = 98.125(m/min),sa = 2.0(mm/ob),ap = 0.63(mm),b = 54mm
MO Č4721hi=0.6(mm)
Cutting geometricparameters
Experimental
results ofO
rder
of
expe
rim
ent
real
izat
ion
Num
ber
of e
xper
imen
tal
poin
ts
g[o] a[o]r
(mm)L(m)
1 7 0 20 0.75 732 4 0 8 0.55 293 1 12 8 0.55 394 6 12 20 0.75 995 15 6 14 0.65 646 2 12 20 0.55 687 3 0 20 0.55 608 18 3 15 0.63 799 5 12 8 0.75 41
10 16 6 17 0.66 9111 17 4 16 0.65 9112 8 0 8 0.75 3913 14 6 14 0.818 6014 20 7 18 0.67 9315 10 16.092 14 0.65 5316 13 6 14 0.482 4817 19 8 18 0.7 9318 12 6 24.092 0.65 8119 11 6 3.908 0.65 3420 9 -4.092 14 0.65 41
The characteristics of one of these models oftool life function are:
opt
2
2 2
L 3.47514 4.84292 0.00449625
23.1512r 0.195747 5.9446 r
0.36683 r 0.323794 r 0.0495238
0.0859158 18.7778r
(5)
56
Figure 9. Development of wear process on single tooth gear hob
Table 2. Experimental values of tool life andpredicted values of tool life
Ord
er n
umbe
rof
mea
sure
men
t
Exp
erim
enta
lre
sults
Res
ults
pred
icte
d by
mod
el
D (i) Δ (i)
1 73.000 71.360 1.640 2.2472 29.000 29.037 -0.037 0.1283 39.000 39.091 -0.091 0.2344 99.000 80.146 18.854 19.04
55 52.000 52.025 -0.025 0.0486 68.000 67.891 0.109 0.1617 60.000 60.380 -0.380 0.6338 41.000 41.140 -0.140 0.3429 39.000 39.137 -0.137 0.350
10 60.000 59.985 0.015 0.02511 53.000 52.942 0.058 0.10912 48.000 45.124 2.876 5.99113 81.000 88.396 -7.396 9.13114 34.000 33.154 0.846 2.48715 41.000 41.019 -0.019 0.047
Total absolute difference of the bestindividual is 40.977. The deviation of the bestindividual in percentages: 2.7318. The generationwith the best individual: 18885.
In Table 2, the experimental obtained valuesof tool life and the model predicted values of toollife are given. Also, absolute values and percentage
values of the difference between experimental andpredicted results are shown. Predicted results referto the best individual in the generation. On the basisof shown results one can see that the deviationbetween experimental and predicted results is lessthan 10% in all measurements, except in the fourthmeasurement. In some measurements this deviationis less than 1%.
Because of this significant difference ofsuccessfulness Δ(i) between fourth measurement andthe others, it can be concluded there is somepossibility for existence of errors during themeasurement, manifesting in tool and working piecematerials, human factor, vibrations of machine toolsand some other stochastic disturbances. Also, on thebasis of this difference of Δ(i) it can be concludedthat a quality of solution obtained using geneticalgorithm depends on the reliability of the datawhich are used in the optimization.
In Figure 10, the diagram showing thetendency of organism improvement through thegenerations is given. On the diagram one can seethat the successfulness of the best organismincreases rapidly at the beginning, in other words thevalues of successfulness measure decrease rapidly.After 1500 generations this trend starts to decreasemore and more, and it exceeds into stagnation.Finally, it achieves the largest successfulness in the18,885-th generation in which the organism withaverage deviation Δ(i,t)=2.7318% was obtained.
After achievement of the largestsuccessfulness, it decreases. Identical value of thelargest successfulness will appear in latergenerations again, but the number of its appearanceis almost insignificant with constant tendency tosuccessfulness reduction, i.e. increasing of Δ(i).
57
Figure 10. Average percentage deviationof the best models
Variety of individuals in the population wasvery large with permanent oscillating in allgenerations (Figure 11). On the basis of the bestmodel, the determination of maximum tool life andoptimal geometric parameters was performed.
Figure 11. Variety curve of the population
Figure 12. Dependence of tool life on geometricalparameters of gear hob
Using mathematical methods maximal toollife L=105.836 mm was determined. Geometricparameters that provide global maximum for thegiven model are r = 0.818 mm, = 24.092º, = 16.092º.
5. CONCLUSION
There are numerous controlled anduncontrolled factors influencing hob milling process.Because of these factors this kind of processing isvery complex.
The great number influencing factors and theinteraction among these make difficult to investigateand define mathematically the process of hobmilling.
Optimization of fitness function using geneticalgorithm needs much less information about fitnessfunction and it does not need satisfying of someconditions like classical methods, for instancefunction differentiability and continuity. In thispaper the optimal geometry of blade was researched.Obtained results enable the construction,manufacture and application of gear hobs which givebetter techno-economical effects.
REFERENCES
1. Brezočnik, M., 2000, Uporaba genetskegaprogramiranja v inteligentnih proizvodnih sistemih,Fakulteta za strojništvo, Maribor.2. Koza, J.R., 1992, Genetic programming, TheMIT Press: Massachusetts.3. Sovilj-Nikić, I., 2007, Primena genetskogalgoritma u optimizaciji geometrijskih parametaraodvalnog glodala, Diplomski-master rad, Fakultettehničkih nauka, Novi Sad.
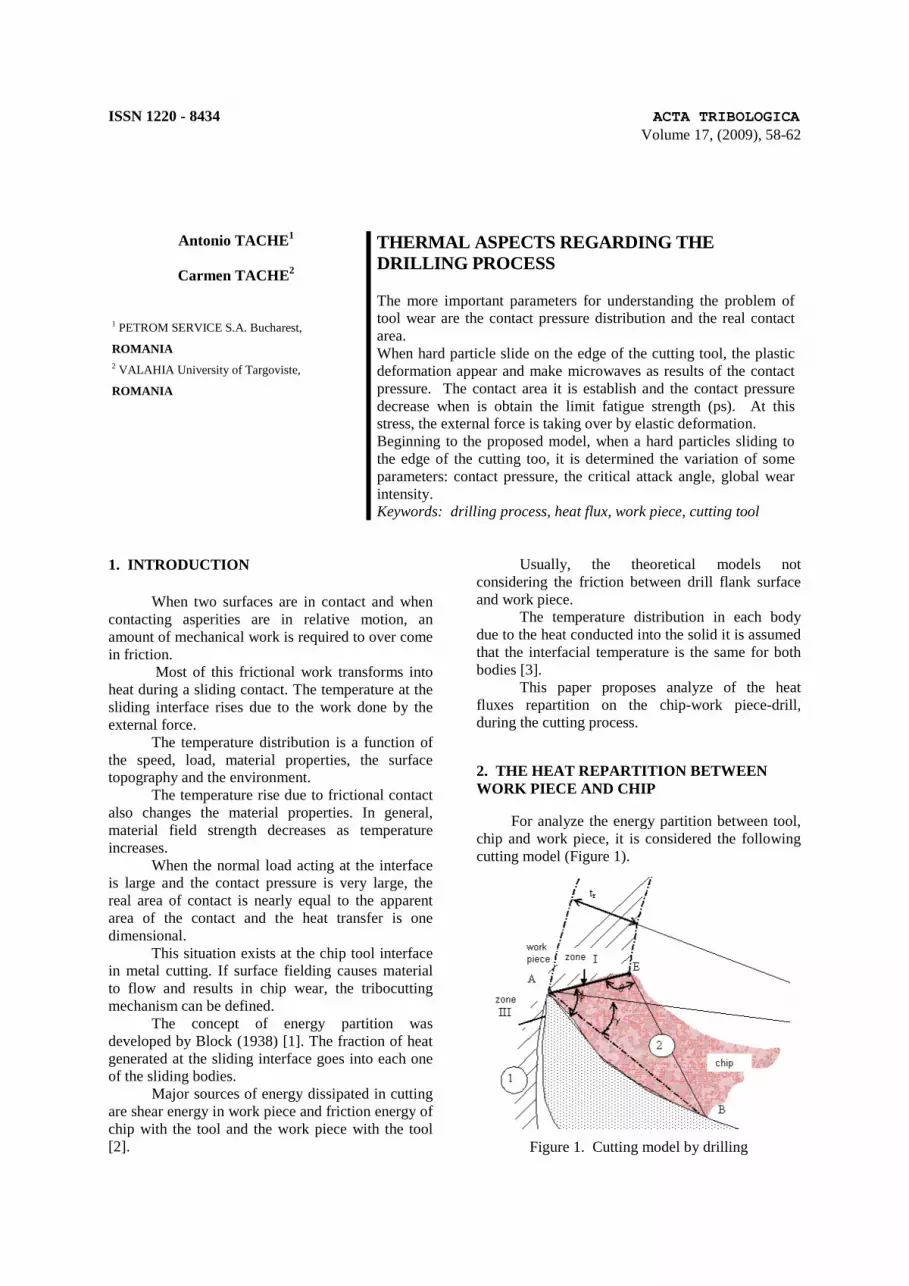
ISSN 1220 - 8434 ACTA TRIBOLOGICA Volume 17, (2009), 58-62
Antonio TACHE1
Carmen TACHE2
1 PETROM SERVICE S.A. Bucharest,
ROMANIA2 VALAHIA University of Targoviste,
ROMANIA
THERMAL ASPECTS REGARDING THEDRILLING PROCESS
The more important parameters for understanding the problem oftool wear are the contact pressure distribution and the real contactarea.When hard particle slide on the edge of the cutting tool, the plasticdeformation appear and make microwaves as results of the contactpressure. The contact area it is establish and the contact pressuredecrease when is obtain the limit fatigue strength (ps). At thisstress, the external force is taking over by elastic deformation.Beginning to the proposed model, when a hard particles sliding tothe edge of the cutting too, it is determined the variation of someparameters: contact pressure, the critical attack angle, global wearintensity.Keywords: drilling process, heat flux, work piece, cutting tool
1. INTRODUCTION
When two surfaces are in contact and whencontacting asperities are in relative motion, anamount of mechanical work is required to over comein friction.
Most of this frictional work transforms intoheat during a sliding contact. The temperature at thesliding interface rises due to the work done by theexternal force.
The temperature distribution is a function ofthe speed, load, material properties, the surfacetopography and the environment.
The temperature rise due to frictional contactalso changes the material properties. In general,material field strength decreases as temperatureincreases.
When the normal load acting at the interfaceis large and the contact pressure is very large, thereal area of contact is nearly equal to the apparentarea of the contact and the heat transfer is onedimensional.
This situation exists at the chip tool interfacein metal cutting. If surface fielding causes materialto flow and results in chip wear, the tribocuttingmechanism can be defined.
The concept of energy partition wasdeveloped by Block (1938) [1]. The fraction of heatgenerated at the sliding interface goes into each oneof the sliding bodies.
Major sources of energy dissipated in cuttingare shear energy in work piece and friction energy ofchip with the tool and the work piece with the tool[2].
Usually, the theoretical models notconsidering the friction between drill flank surfaceand work piece.
The temperature distribution in each bodydue to the heat conducted into the solid it is assumedthat the interfacial temperature is the same for bothbodies [3].
This paper proposes analyze of the heatfluxes repartition on the chip-work piece-drill,during the cutting process.
2. THE HEAT REPARTITION BETWEENWORK PIECE AND CHIP
For analyze the energy partition between tool,chip and work piece, it is considered the followingcutting model (Figure 1).
Figure 1. Cutting model by drilling
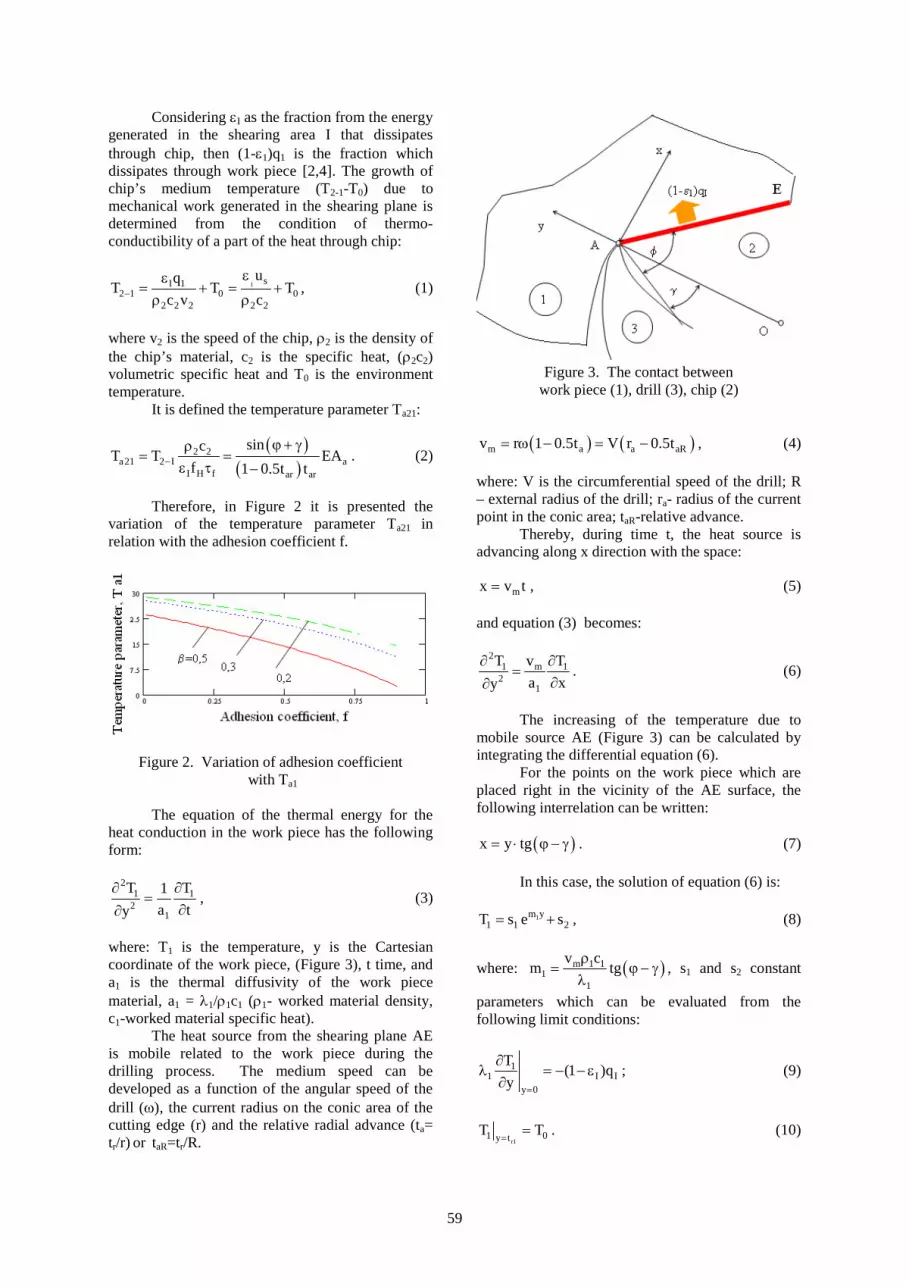
59
Considering I as the fraction from the energygenerated in the shearing area I that dissipatesthrough chip, then (1-1)q1 is the fraction whichdissipates through work piece [2,4]. The growth ofchip’s medium temperature (T2-1-T0) due tomechanical work generated in the shearing plane isdetermined from the condition of thermo-conductibility of a part of the heat through chip:
1 sI 12 1 0 0
2 2 2 2 2
uqT T T
c v c
, (1)
where v2 is the speed of the chip, 2 is the density ofthe chip’s material, c2 is the specific heat, (2c2)volumetric specific heat and T0 is the environmenttemperature.
It is defined the temperature parameter Ta21:
2 2a21 2 I a
I H f ar ar
sincT T EA
f 1 0.5t t
. (2)
Therefore, in Figure 2 it is presented thevariation of the temperature parameter Ta21 inrelation with the adhesion coefficient f.
Figure 2. Variation of adhesion coefficient with Ta1
The equation of the thermal energy for theheat conduction in the work piece has the followingform:
21 1
21
T T1
a ty
, (3)
where: T1 is the temperature, y is the Cartesiancoordinate of the work piece, (Figure 3), t time, anda1 is the thermal diffusivity of the work piecematerial, a1 = 1/1c1 (1- worked material density,c1-worked material specific heat).
The heat source from the shearing plane AEis mobile related to the work piece during thedrilling process. The medium speed can bedeveloped as a function of the angular speed of thedrill (), the current radius on the conic area of thecutting edge (r) and the relative radial advance (ta=tr/r) or taR=tr/R.
Figure 3. The contact betweenwork piece (1), drill (3), chip (2)
m a a aRv r 1 0.5t V r 0.5t , (4)
where: V is the circumferential speed of the drill; R– external radius of the drill; ra- radius of the currentpoint in the conic area; taR-relative advance.
Thereby, during time t, the heat source isadvancing along x direction with the space:
mx v t , (5)
and equation (3) becomes:
21 m 1
21
T v T
a xy
. (6)
The increasing of the temperature due tomobile source AE (Figure 3) can be calculated byintegrating the differential equation (6).
For the points on the work piece which areplaced right in the vicinity of the AE surface, thefollowing interrelation can be written:
x y tg . (7)
In this case, the solution of equation (6) is:
1m y1 1 2T s e s , (8)
where: m 1 11
1
v cm tg
, s1 and s2 constant
parameters which can be evaluated from thefollowing limit conditions:
11 I I
y 0
T(1 )q
y
; (9)
r11 0y t
T T
. (10)
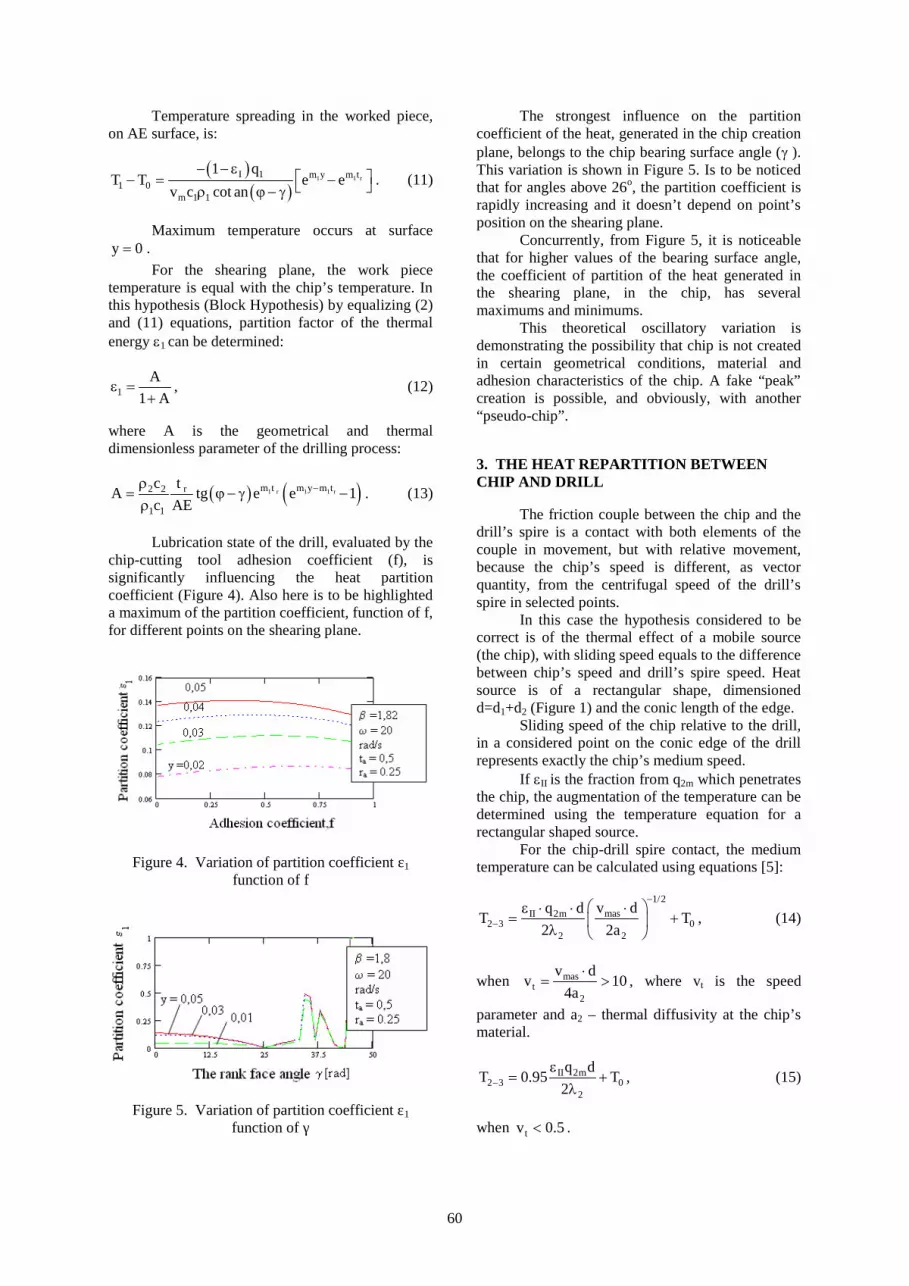
60
Temperature spreading in the worked piece,on AE surface, is:
1 1 rI 1 m y m t1 0
m 1 1
1 qT T e e
v c cot an
. (11)
Maximum temperature occurs at surfacey 0 .
For the shearing plane, the work piecetemperature is equal with the chip’s temperature. Inthis hypothesis (Block Hypothesis) by equalizing (2)and (11) equations, partition factor of the thermalenergy 1 can be determined:
1A
1 A
, (12)
where A is the geometrical and thermaldimensionless parameter of the drilling process:
1 r 1 1 rm t m y m t2 2 r
1 1
c tA tg e e 1
c AE
. (13)
Lubrication state of the drill, evaluated by thechip-cutting tool adhesion coefficient (f), issignificantly influencing the heat partitioncoefficient (Figure 4). Also here is to be highlighteda maximum of the partition coefficient, function of f,for different points on the shearing plane.
Figure 4. Variation of partition coefficient ε1
function of f
Figure 5. Variation of partition coefficient ε1
function of γ
The strongest influence on the partitioncoefficient of the heat, generated in the chip creationplane, belongs to the chip bearing surface angle ( ).This variation is shown in Figure 5. Is to be noticedthat for angles above 26o, the partition coefficient israpidly increasing and it doesn’t depend on point’sposition on the shearing plane.
Concurrently, from Figure 5, it is noticeablethat for higher values of the bearing surface angle,the coefficient of partition of the heat generated inthe shearing plane, in the chip, has severalmaximums and minimums.
This theoretical oscillatory variation isdemonstrating the possibility that chip is not createdin certain geometrical conditions, material andadhesion characteristics of the chip. A fake “peak”creation is possible, and obviously, with another“pseudo-chip”.
3. THE HEAT REPARTITION BETWEENCHIP AND DRILL
The friction couple between the chip and thedrill’s spire is a contact with both elements of thecouple in movement, but with relative movement,because the chip’s speed is different, as vectorquantity, from the centrifugal speed of the drill’sspire in selected points.
In this case the hypothesis considered to becorrect is of the thermal effect of a mobile source(the chip), with sliding speed equals to the differencebetween chip’s speed and drill’s spire speed. Heatsource is of a rectangular shape, dimensionedd=d1+d2 (Figure 1) and the conic length of the edge.
Sliding speed of the chip relative to the drill,in a considered point on the conic edge of the drillrepresents exactly the chip’s medium speed.
If II is the fraction from q2m which penetratesthe chip, the augmentation of the temperature can bedetermined using the temperature equation for arectangular shaped source.
For the chip-drill spire contact, the mediumtemperature can be calculated using equations [5]:
1/2
masII 2m2 3 0
2 2
v dq dT T
2 2a
, (14)
when mast
2
v dv 10
4a
, where vt is the speed
parameter and a2 – thermal diffusivity at the chip’smaterial.
II 2m2 3 0
2
q dT 0.95 T
2
, (15)
when tv 0.5 .
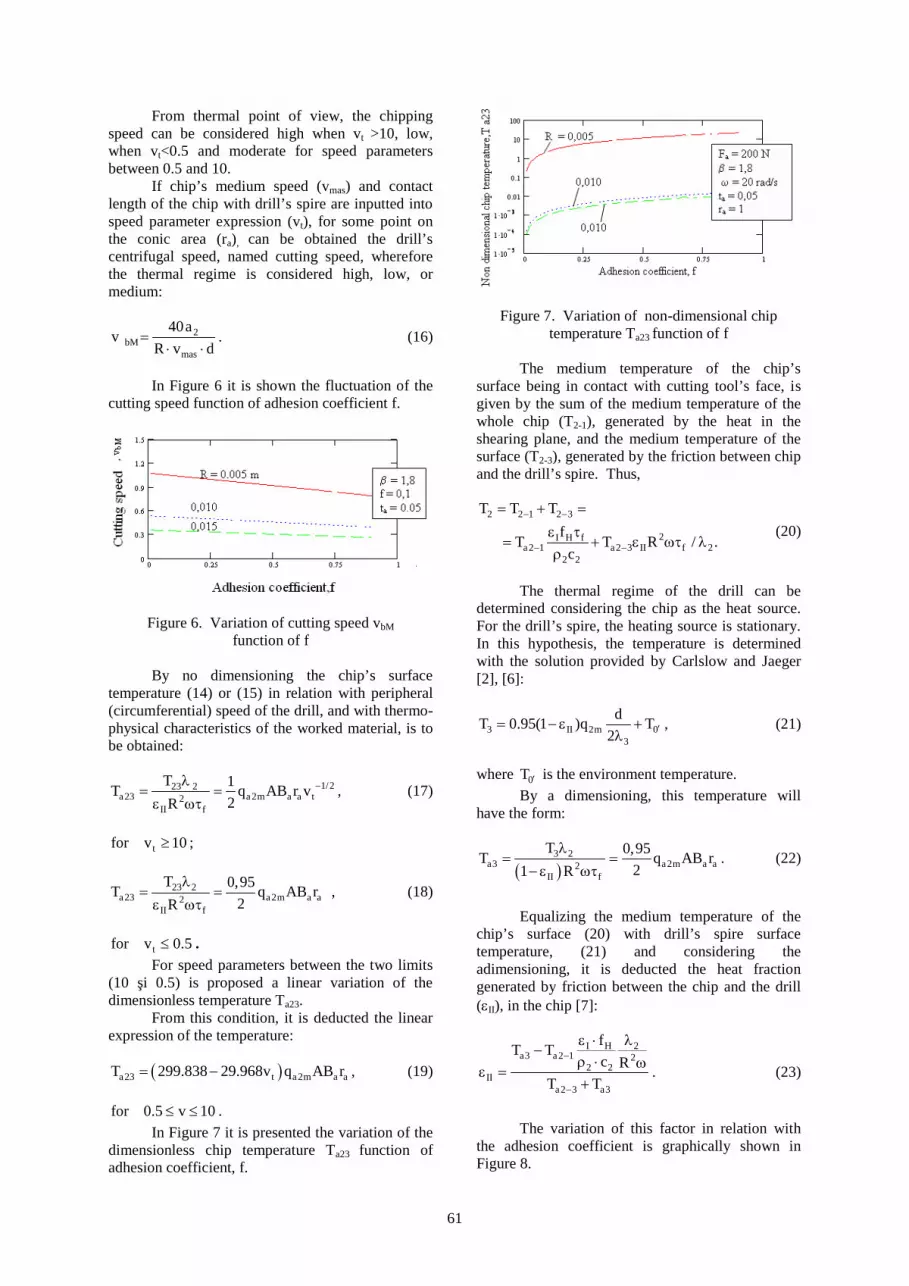
61
From thermal point of view, the chippingspeed can be considered high when vt >10, low,when vt<0.5 and moderate for speed parametersbetween 0.5 and 10.
If chip’s medium speed (vmas) and contactlength of the chip with drill’s spire are inputted intospeed parameter expression (vt), for some point onthe conic area (ra), can be obtained the drill’scentrifugal speed, named cutting speed, whereforethe thermal regime is considered high, low, ormedium:
2bM
mas
40av
R v d
. (16)
In Figure 6 it is shown the fluctuation of thecutting speed function of adhesion coefficient f.
Figure 6. Variation of cutting speed vbM
function of f
By no dimensioning the chip’s surfacetemperature (14) or (15) in relation with peripheral(circumferential) speed of the drill, and with thermo-physical characteristics of the worked material, is tobe obtained:
1/223 2a23 a2m a a t2
II f
T 1T q AB r v
2R
, (17)
tfor v 10 ;
23 2a23 a2m a a2
II f
T 0,95T q AB r
2R
, (18)
tfor v 0.5 .For speed parameters between the two limits
(10 şi 0.5) is proposed a linear variation of thedimensionless temperature Ta23.
From this condition, it is deducted the linearexpression of the temperature:
a23 t a2m a aT 299.838 29.968v q AB r , (19)
for 0.5 v 10 .
In Figure 7 it is presented the variation of thedimensionless chip temperature Ta23 function ofadhesion coefficient, f.
Figure 7. Variation of non-dimensional chiptemperature Ta23 function of f
The medium temperature of the chip’ssurface being in contact with cutting tool’s face, isgiven by the sum of the medium temperature of thewhole chip (T2-1), generated by the heat in theshearing plane, and the medium temperature of thesurface (T2-3), generated by the friction between chipand the drill’s spire. Thus,
2 2 1 2 3
2I H fa2 1 a2 3 II f 2
2 2
T T T
f T T R / .
c
(20)
The thermal regime of the drill can bedetermined considering the chip as the heat source.For the drill’s spire, the heating source is stationary.In this hypothesis, the temperature is determinedwith the solution provided by Carlslow and Jaeger[2], [6]:
3 II 2m 03
dT 0.95(1 )q T
2
, (21)
where 0T is the environment temperature.
By a dimensioning, this temperature willhave the form:
3 2
a3 a2m a a2II f
T 0,95T q AB r
21 R
. (22)
Equalizing the medium temperature of thechip’s surface (20) with drill’s spire surfacetemperature, (21) and considering theadimensioning, it is deducted the heat fractiongenerated by friction between the chip and the drill(II), in the chip [7]:
I H 2a3 a2 1 2
2 2II
a2 3 a3
fT T
c RT T
. (23)
The variation of this factor in relation withthe adhesion coefficient is graphically shown inFigure 8.
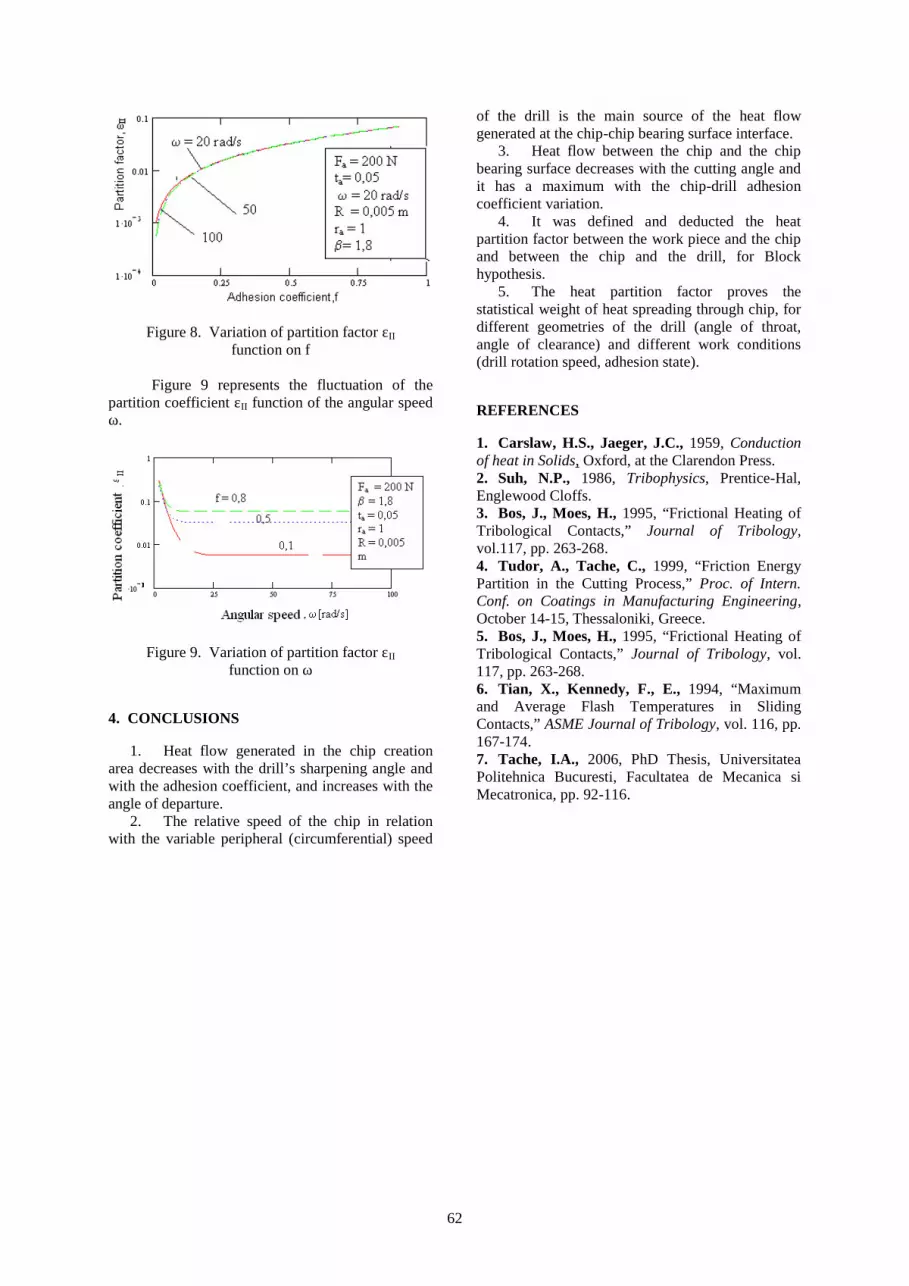
62
Figure 8. Variation of partition factor εII
function on f
Figure 9 represents the fluctuation of thepartition coefficient εII function of the angular speedω.
Figure 9. Variation of partition factor εII
function on ω
4. CONCLUSIONS
1. Heat flow generated in the chip creationarea decreases with the drill’s sharpening angle andwith the adhesion coefficient, and increases with theangle of departure.
2. The relative speed of the chip in relationwith the variable peripheral (circumferential) speed
of the drill is the main source of the heat flowgenerated at the chip-chip bearing surface interface.
3. Heat flow between the chip and the chipbearing surface decreases with the cutting angle andit has a maximum with the chip-drill adhesioncoefficient variation.
4. It was defined and deducted the heatpartition factor between the work piece and the chipand between the chip and the drill, for Blockhypothesis.
5. The heat partition factor proves thestatistical weight of heat spreading through chip, fordifferent geometries of the drill (angle of throat,angle of clearance) and different work conditions(drill rotation speed, adhesion state).
REFERENCES
1. Carslaw, H.S., Jaeger, J.C., 1959, Conductionof heat in Solids, Oxford, at the Clarendon Press.2. Suh, N.P., 1986, Tribophysics, Prentice-Hal,Englewood Cloffs.3. Bos, J., Moes, H., 1995, “Frictional Heating ofTribological Contacts,” Journal of Tribology,vol.117, pp. 263-268.4. Tudor, A., Tache, C., 1999, “Friction EnergyPartition in the Cutting Process,” Proc. of Intern.Conf. on Coatings in Manufacturing Engineering,October 14-15, Thessaloniki, Greece.5. Bos, J., Moes, H., 1995, “Frictional Heating ofTribological Contacts,” Journal of Tribology, vol.117, pp. 263-268.6. Tian, X., Kennedy, F., E., 1994, “Maximumand Average Flash Temperatures in SlidingContacts,” ASME Journal of Tribology, vol. 116, pp.167-174.7. Tache, I.A., 2006, PhD Thesis, UniversitateaPolitehnica Bucuresti, Facultatea de Mecanica siMecatronica, pp. 92-116.
ISSN 1220 - 8434 ACTA TRIBOLOGICAVolume 17, (2009), 63-68
Leonard PASTRAVe-mail: [email protected]
Siegfried JAECQUESe-mail: [email protected]
Michiel MULIERe-mail: [email protected]
Georges VAN DER PERREe-mail: [email protected]
Catholic University of Leuven,
BELGIUM
THE DETECTION OF INSERTION ENDPOINTAND STABILITY ASSESSMENT OF CEMENTLESSHIP STEMS BY VIBRATION ANALYSIS: A PER-OPERATIVE PILOT STUDY
The stability of an implant in bone is directly related to the qualityof the contact at the bone-implant interface. The assessment of theprimary stability of cementless implants still remains a subjectivefactor in total hip replacement (THR) and, as a consequence, theexcessive press-fitting of a THR component can be the cause ofintra-operative fractures. Objective information about the stabilityof implant-bone structures can be obtained using methods based onvibration analysis. After extensive in vitro studies a per-operativeprotocol was designed to detect the insertion endpoint and/or toassess the stability of custom made hip prostheses. The frequencyresponse function evolution during the hip stem insertion in thefemur was studied. The experiments were performed in per-operative conditions.Keywords: cementless hip implant, implant-bone contact, implantstability, vibration analysis, frequency response function
1. INTRODUCTION
Initial stability seems to be very important forany prosthetic implant but the objective assessmentof this parameter for cementless hip stems remains achallenge. Surgeons rely mainly on experience toevaluate the extent of stem stability and the insertionend point. Excessive press-fitting of a total hipreplacement (THR) component, Figure 1, can causeintra-operative fractures with an incidence of up to30% in revision cases [1].
Different methods based on vibration analysishave been successfully used to determine bonemechanical properties in vitro as well as in vivo [2-6], to monitor the fracture healing [7-9], to quantifyfixation of dental implants [10,11], and to assessmechanical properties of the hip stem/femurstructure, both in vitro and in vivo [12-16].
In a previous study [17], it was confirmedthat the imperfections in the contact between a THRprosthetic stem and a femur can most sensitively bedetected by observing shifts in the resonancefrequency of the higher vibration modes of thefemur/prosthesis system. This observation is inagreement with the work of Qi et al who state thatthe most sensitive frequency band for observingdefects in the femur/prosthesis contact is placedabove 2500 Hz [18].
Figure 1. Total Hip Replacement (THR)
An experimental study [19] performed onartificial human femora (Sawbone® nr. 3306, LeftLarge Composite Femur, www.sawbones.com) hasshown that the evolution of the frequency responsefunction (FRF) can be used to detect the insertionend point as well.
This paper presents the per-operative protocolderived from the previous in vitro studies and partialresults obtained in a pilot experimental studyperformed in per-operative conditions.
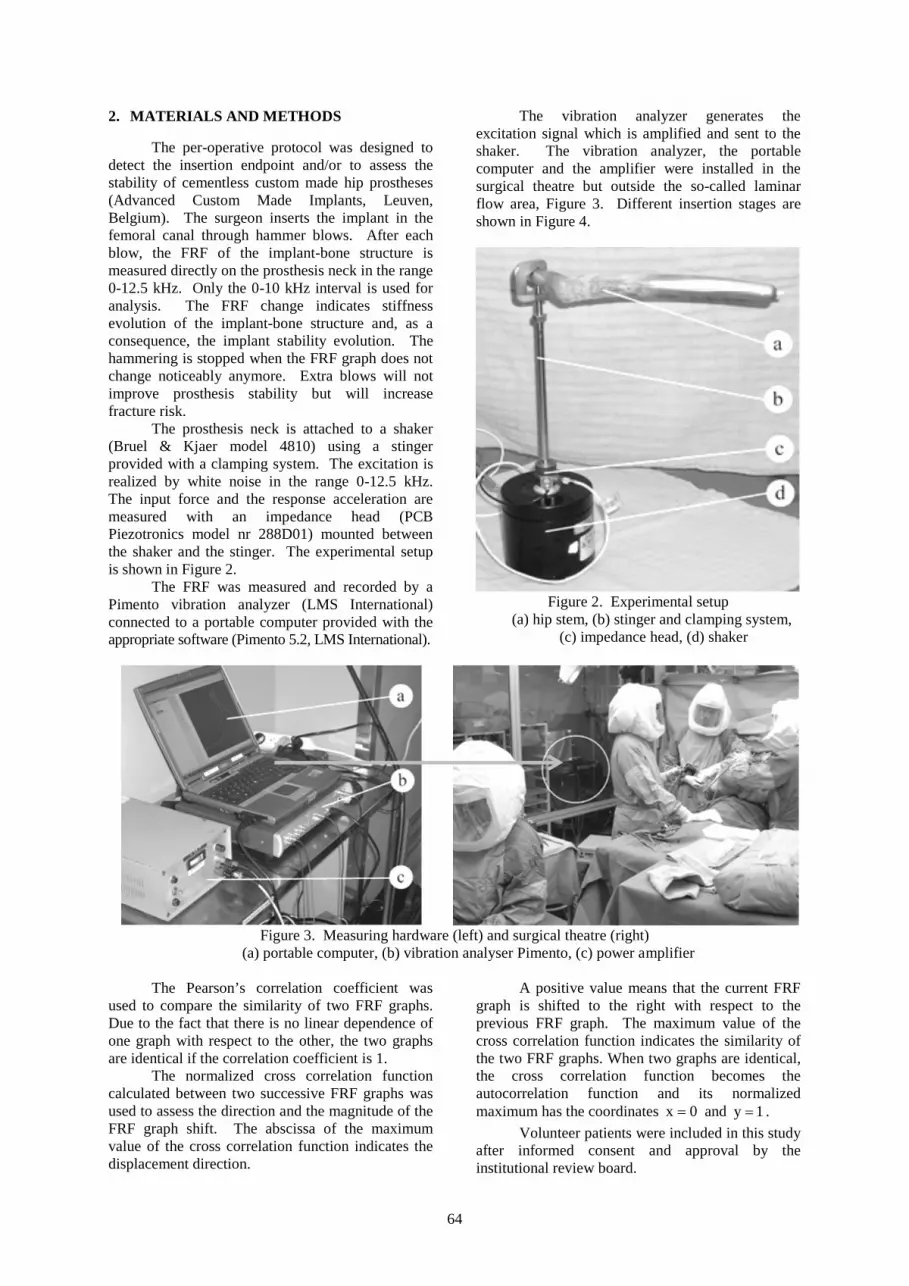
64
2. MATERIALS AND METHODS
The per-operative protocol was designed todetect the insertion endpoint and/or to assess thestability of cementless custom made hip prostheses(Advanced Custom Made Implants, Leuven,Belgium). The surgeon inserts the implant in thefemoral canal through hammer blows. After eachblow, the FRF of the implant-bone structure ismeasured directly on the prosthesis neck in the range0-12.5 kHz. Only the 0-10 kHz interval is used foranalysis. The FRF change indicates stiffnessevolution of the implant-bone structure and, as aconsequence, the implant stability evolution. Thehammering is stopped when the FRF graph does notchange noticeably anymore. Extra blows will notimprove prosthesis stability but will increasefracture risk.
The prosthesis neck is attached to a shaker(Bruel & Kjaer model 4810) using a stingerprovided with a clamping system. The excitation isrealized by white noise in the range 0-12.5 kHz.The input force and the response acceleration aremeasured with an impedance head (PCBPiezotronics model nr 288D01) mounted betweenthe shaker and the stinger. The experimental setupis shown in Figure 2.
The FRF was measured and recorded by aPimento vibration analyzer (LMS International)connected to a portable computer provided with theappropriate software (Pimento 5.2, LMS International).
The vibration analyzer generates theexcitation signal which is amplified and sent to theshaker. The vibration analyzer, the portablecomputer and the amplifier were installed in thesurgical theatre but outside the so-called laminarflow area, Figure 3. Different insertion stages areshown in Figure 4.
Figure 2. Experimental setup(a) hip stem, (b) stinger and clamping system,
(c) impedance head, (d) shaker
Figure 3. Measuring hardware (left) and surgical theatre (right)(a) portable computer, (b) vibration analyser Pimento, (c) power amplifier
The Pearson’s correlation coefficient wasused to compare the similarity of two FRF graphs.Due to the fact that there is no linear dependence ofone graph with respect to the other, the two graphsare identical if the correlation coefficient is 1.
The normalized cross correlation functioncalculated between two successive FRF graphs wasused to assess the direction and the magnitude of theFRF graph shift. The abscissa of the maximumvalue of the cross correlation function indicates thedisplacement direction.
A positive value means that the current FRFgraph is shifted to the right with respect to theprevious FRF graph. The maximum value of thecross correlation function indicates the similarity ofthe two FRF graphs. When two graphs are identical,the cross correlation function becomes theautocorrelation function and its normalizedmaximum has the coordinates x 0 and y 1 .
Volunteer patients were included in this studyafter informed consent and approval by theinstitutional review board.

65
Figure 4. Hip stem insertion(a) the beginning, (b) hammering, (c) an intermediate stage, (d) the final stage
3. RESULTS
Eleven cases of cementless stems werestudied and a typical example is presented in Figure5. Figures 5.a to 5.d show the FRFs calculated fortwo successive insertion stages. Stage 0 correspondsto the FRF calculated after the stem was introducedin femur by hand. Stage 1 corresponds to the FRFcalculated after the first hammer blow series, stage 2after the second hammer blow series and so on. Thesurgeon needed 5 stages (0…4) to completely insertthe stem in this case.
The evolution of Pearson’s correlationcoefficient (R) calculated for two successive FRFs isrepresented in Figure 5.e. The normalized cross
correlation function was also calculated for the lastthree successive FRF pairs and presented in Figure5.f. The evolution of the maximum values of thecross correlation function can be observed in Figure5.g. Figure 6 shows a similar case with fourinsertion stages (0…3).
The final Pearson’s correlation coefficientscalculated for all the eleven cementless cases areshown in Table 1.
During the insertion procedure, changes ofboundary conditions and implant stability betweendifferent stages are reflected by the FRF evolutionand the most sensitive frequency band is above 4kHz.
Table 1. Pearson’s correlation coefficients calculated between FRFs corresponding to the final two insertionsteps
Casenumber 1 2 3 4 5 6 7 8 9 10 11 Average
R 0.997 0.999 0.992 0.999 0.999 0.998 0.955 0.998 0.964 0.994 0.999 0.990
* In cases 7 and 9, the insertion was stopped early because of suspected bone fragility.
b

66
Figure 5. Cementless stem (example case 1)(a-d) FRF graphs for successive insertion steps; (e) Pearson’s correlation coefficients for the FRF pairs of
Figures 5.a-5.d; (f) Normalized cross correlation functions calculated for the FRF pairs represented in Figures5.b-5.d; (g) Maximum values of the cross correlation functions represented in Figure 5.f
4. DISCUSSION AND CONCLUSIONS
The structures analyzed in this study arecomposed of stinger, hip stem and femur. Sinceduring the insertion process the single variableelement is the contact between the stem and thefemur, a logical conclusion would be that theresonance frequencies of the studied structures areinfluenced only by this variable.
A FRF shift to the right indicates an increasingstiffness [20] of the stem-bone connection, thus an
increasing stability of the implant. If the FRF doesnot change between two successive insertion stages,then the mechanical properties of the structure did notchange by the additional hammer blows, thus thestem-bone connection is stable and the insertion endpoint is reached.
During the operation, the surgeoncorroborates the information obtained by directvisual and tactile observation, with the informationfurnished by vibration analysis, in order to takeoptimal decisions.
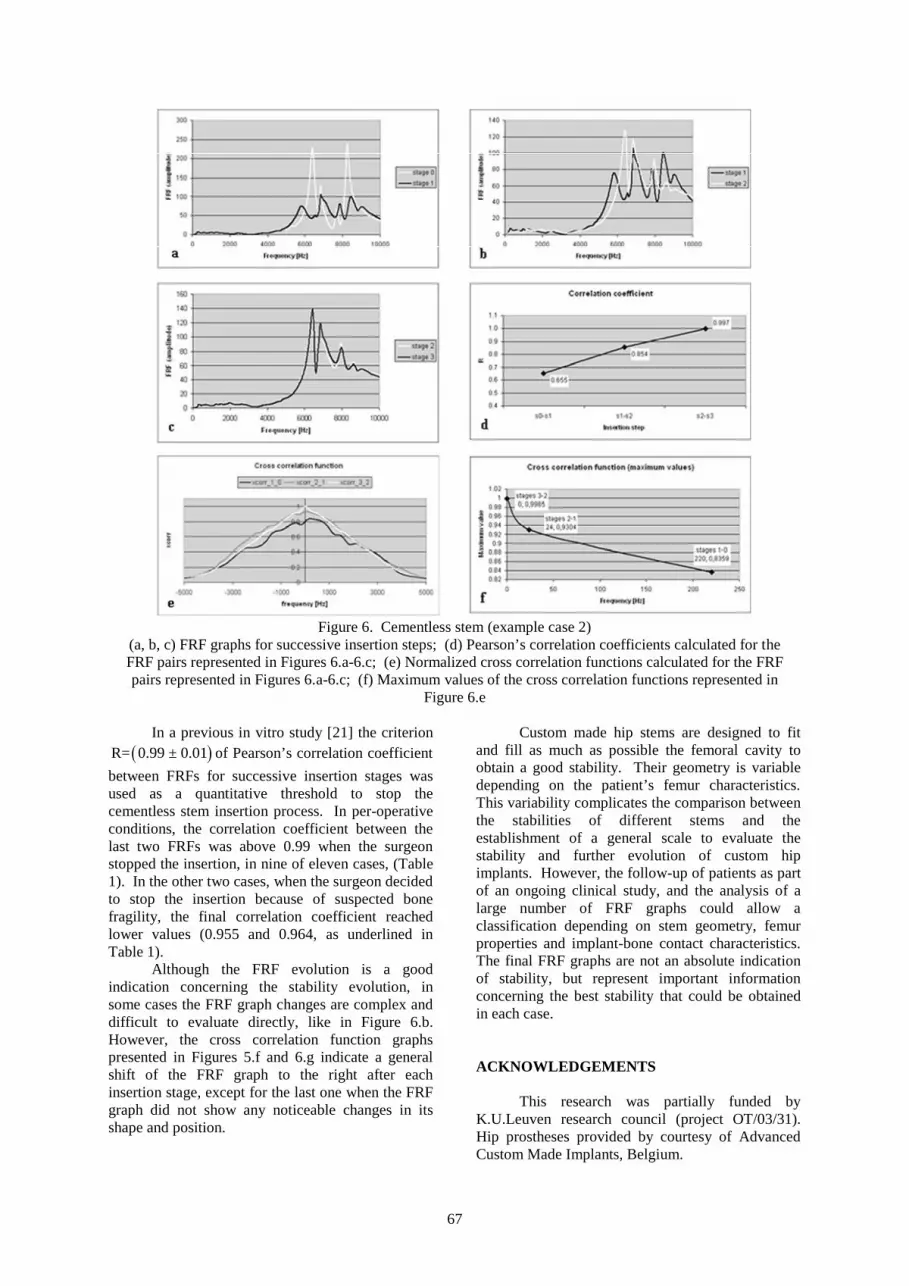
67
Figure 6. Cementless stem (example case 2)(a, b, c) FRF graphs for successive insertion steps; (d) Pearson’s correlation coefficients calculated for theFRF pairs represented in Figures 6.a-6.c; (e) Normalized cross correlation functions calculated for the FRFpairs represented in Figures 6.a-6.c; (f) Maximum values of the cross correlation functions represented in
Figure 6.e
In a previous in vitro study [21] the criterion
R= 0.99 ± 0.01 of Pearson’s correlation coefficientbetween FRFs for successive insertion stages wasused as a quantitative threshold to stop thecementless stem insertion process. In per-operativeconditions, the correlation coefficient between thelast two FRFs was above 0.99 when the surgeonstopped the insertion, in nine of eleven cases, (Table1). In the other two cases, when the surgeon decidedto stop the insertion because of suspected bonefragility, the final correlation coefficient reachedlower values (0.955 and 0.964, as underlined inTable 1).
Although the FRF evolution is a goodindication concerning the stability evolution, insome cases the FRF graph changes are complex anddifficult to evaluate directly, like in Figure 6.b.However, the cross correlation function graphspresented in Figures 5.f and 6.g indicate a generalshift of the FRF graph to the right after eachinsertion stage, except for the last one when the FRFgraph did not show any noticeable changes in itsshape and position.
Custom made hip stems are designed to fitand fill as much as possible the femoral cavity toobtain a good stability. Their geometry is variabledepending on the patient’s femur characteristics.This variability complicates the comparison betweenthe stabilities of different stems and theestablishment of a general scale to evaluate thestability and further evolution of custom hipimplants. However, the follow-up of patients as partof an ongoing clinical study, and the analysis of alarge number of FRF graphs could allow aclassification depending on stem geometry, femurproperties and implant-bone contact characteristics.The final FRF graphs are not an absolute indicationof stability, but represent important informationconcerning the best stability that could be obtainedin each case.
ACKNOWLEDGEMENTS
This research was partially funded byK.U.Leuven research council (project OT/03/31).Hip prostheses provided by courtesy of AdvancedCustom Made Implants, Belgium.
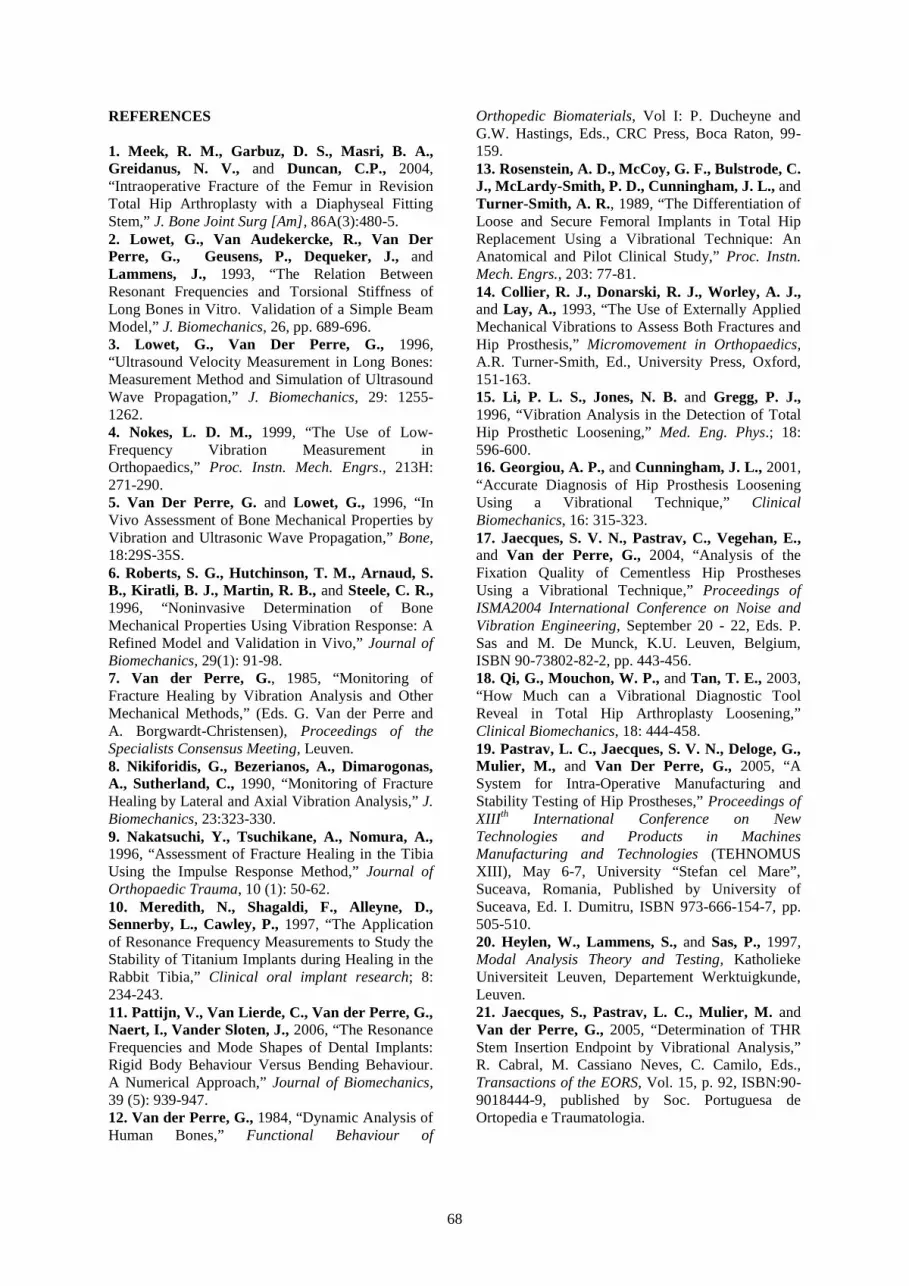
68
REFERENCES
1. Meek, R. M., Garbuz, D. S., Masri, B. A.,Greidanus, N. V., and Duncan, C.P., 2004,“Intraoperative Fracture of the Femur in RevisionTotal Hip Arthroplasty with a Diaphyseal FittingStem,” J. Bone Joint Surg [Am], 86A(3):480-5.2. Lowet, G., Van Audekercke, R., Van DerPerre, G., Geusens, P., Dequeker, J., andLammens, J., 1993, “The Relation BetweenResonant Frequencies and Torsional Stiffness ofLong Bones in Vitro. Validation of a Simple BeamModel,” J. Biomechanics, 26, pp. 689-696.3. Lowet, G., Van Der Perre, G., 1996,“Ultrasound Velocity Measurement in Long Bones:Measurement Method and Simulation of UltrasoundWave Propagation,” J. Biomechanics, 29: 1255-1262.4. Nokes, L. D. M., 1999, “The Use of Low-Frequency Vibration Measurement inOrthopaedics,” Proc. Instn. Mech. Engrs., 213H:271-290.5. Van Der Perre, G. and Lowet, G., 1996, “InVivo Assessment of Bone Mechanical Properties byVibration and Ultrasonic Wave Propagation,” Bone,18:29S-35S.6. Roberts, S. G., Hutchinson, T. M., Arnaud, S.B., Kiratli, B. J., Martin, R. B., and Steele, C. R.,1996, “Noninvasive Determination of BoneMechanical Properties Using Vibration Response: ARefined Model and Validation in Vivo,” Journal ofBiomechanics, 29(1): 91-98.7. Van der Perre, G., 1985, “Monitoring ofFracture Healing by Vibration Analysis and OtherMechanical Methods,” (Eds. G. Van der Perre andA. Borgwardt-Christensen), Proceedings of theSpecialists Consensus Meeting, Leuven.8. Nikiforidis, G., Bezerianos, A., Dimarogonas,A., Sutherland, C., 1990, “Monitoring of FractureHealing by Lateral and Axial Vibration Analysis,” J.Biomechanics, 23:323-330.9. Nakatsuchi, Y., Tsuchikane, A., Nomura, A.,1996, “Assessment of Fracture Healing in the TibiaUsing the Impulse Response Method,” Journal ofOrthopaedic Trauma, 10 (1): 50-62.10. Meredith, N., Shagaldi, F., Alleyne, D.,Sennerby, L., Cawley, P., 1997, “The Applicationof Resonance Frequency Measurements to Study theStability of Titanium Implants during Healing in theRabbit Tibia,” Clinical oral implant research; 8:234-243.11. Pattijn, V., Van Lierde, C., Van der Perre, G.,Naert, I., Vander Sloten, J., 2006, “The ResonanceFrequencies and Mode Shapes of Dental Implants:Rigid Body Behaviour Versus Bending Behaviour.A Numerical Approach,” Journal of Biomechanics,39 (5): 939-947.12. Van der Perre, G., 1984, “Dynamic Analysis ofHuman Bones,” Functional Behaviour of
Orthopedic Biomaterials, Vol I: P. Ducheyne andG.W. Hastings, Eds., CRC Press, Boca Raton, 99-159.13. Rosenstein, A. D., McCoy, G. F., Bulstrode, C.J., McLardy-Smith, P. D., Cunningham, J. L., andTurner-Smith, A. R., 1989, “The Differentiation ofLoose and Secure Femoral Implants in Total HipReplacement Using a Vibrational Technique: AnAnatomical and Pilot Clinical Study,” Proc. Instn.Mech. Engrs., 203: 77-81.14. Collier, R. J., Donarski, R. J., Worley, A. J.,and Lay, A., 1993, “The Use of Externally AppliedMechanical Vibrations to Assess Both Fractures andHip Prosthesis,” Micromovement in Orthopaedics,A.R. Turner-Smith, Ed., University Press, Oxford,151-163.15. Li, P. L. S., Jones, N. B. and Gregg, P. J.,1996, “Vibration Analysis in the Detection of TotalHip Prosthetic Loosening,” Med. Eng. Phys.; 18:596-600.16. Georgiou, A. P., and Cunningham, J. L., 2001,“Accurate Diagnosis of Hip Prosthesis LooseningUsing a Vibrational Technique,” ClinicalBiomechanics, 16: 315-323.17. Jaecques, S. V. N., Pastrav, C., Vegehan, E.,and Van der Perre, G., 2004, “Analysis of theFixation Quality of Cementless Hip ProsthesesUsing a Vibrational Technique,” Proceedings ofISMA2004 International Conference on Noise andVibration Engineering, September 20 - 22, Eds. P.Sas and M. De Munck, K.U. Leuven, Belgium,ISBN 90-73802-82-2, pp. 443-456.18. Qi, G., Mouchon, W. P., and Tan, T. E., 2003,“How Much can a Vibrational Diagnostic ToolReveal in Total Hip Arthroplasty Loosening,”Clinical Biomechanics, 18: 444-458.19. Pastrav, L. C., Jaecques, S. V. N., Deloge, G.,Mulier, M., and Van Der Perre, G., 2005, “ASystem for Intra-Operative Manufacturing andStability Testing of Hip Prostheses,” Proceedings ofXIIIth International Conference on NewTechnologies and Products in MachinesManufacturing and Technologies (TEHNOMUSXIII), May 6-7, University “Stefan cel Mare”,Suceava, Romania, Published by University ofSuceava, Ed. I. Dumitru, ISBN 973-666-154-7, pp.505-510.20. Heylen, W., Lammens, S., and Sas, P., 1997,Modal Analysis Theory and Testing, KatholiekeUniversiteit Leuven, Departement Werktuigkunde,Leuven.21. Jaecques, S., Pastrav, L. C., Mulier, M. andVan der Perre, G., 2005, “Determination of THRStem Insertion Endpoint by Vibrational Analysis,”R. Cabral, M. Cassiano Neves, C. Camilo, Eds.,Transactions of the EORS, Vol. 15, p. 92, ISBN:90-9018444-9, published by Soc. Portuguesa deOrtopedia e Traumatologia.

ACTA TRIBOLOGICA VOLUME 17, 2009
CONTENTS
1 E. DIACONESCU, V.F. ZEGREAN, M. GLOVNEAShear Properties of Molecular Liquid near a Metallic Wall
6 L. PETRARU, F. NOVOTNY-FARKAS, K. BAUMANNNew Approach in Oxidation Stability Testing of the Gas Turbine Oils
13 L. BOGATU, I. PETRE, A. MARIN, C. TĂNĂSESCU, D. PETRE, N. N. ANTONESCU, L. MIRCIHydraulic Oils from Regenerable Feed Stocks with a Low Environmental Impact
17 C. BUJOREANU, V. PALEUImpact Parameters in Rolling Contact Lubrication
21 G. IANUŞ, D. OLARU, P. LORENZ Adhesion in Ball on Flat Microsystems
25 G.V. PUIU, D. OLARU, V. PUIUFriction Torque and Efficiency in Ball - Screw Systems
30 V. VASAUSKAS, J. PADGURSKAS, R. RUKUIZASurface Modification of Carbon Steel by Deposition of Fluor-Oligomeric Films
34 A. SZUDER, I.D. MARINESCU, T.G. MATHIA, G. MEILLEAbrasion in Finishing Processes
42 S. GHEORGHE, C. TEISANU, A. MERSTALLINGER, I. CIUPITUThe Influence of the Sintering Atmospheres on the Wear Behaviour of Copper BasedAlloys
46 G. MEILLE, T.G. MATHIAStrategy for Identification of Wear Mode of Engineering Surfaces
52 I. SOVILJ-NIKIC, B. SOVILJ, M. BREZOCNIK, S. SOVILJ-NIKIC,V. PEJICAnalysis of Influence of Gear Hob Geometric Parameters on the Tool Life Using aGenetic Algorithm
58 A. TACHE, C. TACHEThermal Aspects Regarding the Drilling Process
63 L. PASTRAV, S. JAECQUES, M. MULIER, G. VAN DER PERREThe Detection of Insertion Endpoint and Stability Assessment of Cementless HipStems by Vibration Analysis: A Per-Operative Pilot Study