immunomodulatory effects of interferon-alpha on t cell
TRANSCRIPT
1
Immunomodulatory effects of interferon-alpha on T cell subsets in Behcet’s disease ex vivo, and the in vitro effects of treatment on healthy
donor cells
David Shih-Fan Yang
Institute of Ophthalmology, University College London and
Moorfields Eye Hospital NHS Foundation Trust
Supervisors: Professor Susan Lightman and Doctor Virginia Calder
Thesis submitted for the degree of Doctor of Philosophy
University College London
May 2011

2
Declaration
I hereby declare that this thesis is my own work and that, to the best of my
knowledge and belief, all material which is not my own has been properly
acknowledged.
3
Abstract
Many patients with Behcet’s disease (BD) have disease that is severe and do not
respond to the conventional treatment of systemic corticosteroids and
immunosuppressive agents. Recently, IFN-α therapy has shown promise as an
effective treatment that may also improve long-term outcome. This study aims to
provide an insight into the mechanisms of action and disease-modifying ability of
IFN-α by focussing on the impact on T cell subsets.
In this study, I describe my investigation into the effects of an additional 6-month course
of IFN-α therapy in modulating T cell subsets and their cytokine expression in BD
patients ex vivo over the first 12 months. Investigation of T cell responses confirms
previous findings on Th1 and Th2 cells and their associated cytokines following IFN-
α treatment. Analysis of Th17 cells shows these cells are downregulated by IFN-α
therapy in peripheral blood. On the other hand, Foxp3+ T cells are upregulated by
IFN-α therapy which is a novel mechanism that may contribute substantially towards
the disease-modifying ability of IFN-α treatment. Notably, most effects of IFN-α on T
cells, including Th17 and Treg cells, persist even after cessation of treatment.
Also, I report in details the responses of CD4+, CD8+ and γδ T cell subsets in vitro
following treatment of healthy donor PBMCs with IFN-α. The findings are largely in
agreement with the ex vivo study. Fopx3-expressing and IFN-γ-, IL-10-, and TGF-β-
producing CD4+ and CD8+ T cells are all increased by IFN-α treatment. Whereas,
IL-17-producing CD4+, CD8+ and γδ T cell are decreased following treatment with
IFN-α.
Our data may provide new inroads into elucidating the immunomodulatory
mechanisms involved in the disease-modifying ability of IFN-α therapy. Which of the
above mechanisms plays the most important role in the observed beneficial effects
of IFN-α in the treatment of BD remains to be elucidated.
4
Table of Contents
Chapter 1: Introduction ......................................................................................... 18
1.1 Overview of the immune system .................................................................... 18
1.2 B and T Lymphocytes .................................................................................... 20
1.3 T cell development ......................................................................................... 21
1.4 CD4+ and CD8+ T cells ................................................................................... 26
1.5 Cytokines and chemokines ............................................................................ 28
1.6 Helper T cells ................................................................................................. 31
1.7 T helper 17 and IL-17 producing T cells ......................................................... 36
1.8 Regulatory T cells .......................................................................................... 42
1.9 Collaboration between transcription factors in fine-tuning T helper
differentiation ....................................................................................................... 53
1.10 Plasticity of T helper subsets ....................................................................... 55
1.11 Subsets of CD8+ effector T cells .................................................................. 56
1.12 γδ T cells ...................................................................................................... 57
1.13 NKT cells ...................................................................................................... 60
1.14 Central and peripheral tolerance .................................................................. 61
1.15 Autoimmunity ............................................................................................... 63
1.16 Autoimmune diseases and the roles of Th1/Th2 subsets ............................. 63
1.17 IL-23/IL-17 axis in autoimmune and inflammatory diseases ........................ 68
1.18 Regulatory T cells and autoimmune disease ............................................... 70
1.19 Behcet’s disease .......................................................................................... 74
1.20 Aetiopathogenesis of Behcet’s disease ........................................................ 82
1.21 Treatment in Behcet’s disease ..................................................................... 90
1.22 Interferon-alpha as a treatment option for Behcet’s disease ........................ 95
1.23 Clinical trials on interferon-α in Behcet’s disease ......................................... 98
1.24 Pegylated interferon-alpha ......................................................................... 103
1.25 Biological effects of interferon-alpha and possible mechanisms of action .. 106
1.26 Aims of the project ..................................................................................... 111
Chapter 2: Materials and Methods ..................................................................... 113
2.1 Materials ...................................................................................................... 113
5
2.2 Antibodies .................................................................................................... 114
2.3 Preparation and storing of stock solutions and reagents .............................. 115
2.4 Subjects and blood samples for ex vivo studies ........................................... 121
2.5 Sample preparation ...................................................................................... 123
2.6 Experimental assays .................................................................................... 127
2.7 Flow cytometry and analysis ........................................................................ 133
2.8 Statistical analysis ........................................................................................ 134
Chapter 3: Immunomodulatory effects of subcutaneous interferon-alpha 2b on
conventional T helper subsets and their cytokines in patients with Behcet’s
disease ex vivo .................................................................................................... 136
3.1 Introduction .................................................................................................. 136
3.2 Aims ............................................................................................................. 138
3.3 Results ......................................................................................................... 139
3.3.1 IFN-α therapy does not induce any changes in the surface CD4, CD8, and
TCRαβ expression in T lymphocytes in BD patients ....................................... 139
3.3.2 IFN-α2b therapy upregulates IFN-γ expression by T cells in BD patients......
....................................................................................................................... 141
3.3.3 IFN-α2b therapy enhances TNF-α expression by T cells in BD patients 144
3.3.4 IFN-α2b therapy increases IL-2 expression by T cells in BD patients .... 146
3.3.5 IFN-α2b therapy upregulates IL-4 expression by T cells in BD patients 148
3.4 Discussion .................................................................................................... 150
3.5 Summary of findings .................................................................................... 163
Chapter 4: The effects of subcutaneous interferon-alpha 2b on Th17 and
regulatory T cells and their cytokines in patients with Behcet’s disease ex vivo
.............................................................................................................................. 164
4.1 Introduction .................................................................................................. 164
4.2 Aims ............................................................................................................. 165
4.3 Results ......................................................................................................... 166
4.3.1 IFN-α2b therapy suppresses IL-17 expression by CD4+ T cells in BD
patients ........................................................................................................... 166
6
4.3.2 IFN-α2b therapy potently enhances Foxp3 expression by CD4+ T cells in
BD patients ..................................................................................................... 169
4.3.3 IFN-α2b therapy shows a tendency to increase IL-10 expression by T cells
in BD patients ................................................................................................. 179
4.3.4 IFN-α2b therapy shows the tendency to increase TGF-β expression by T
cells in BD patients ......................................................................................... 183
4.3.5 IFN-α2b therapy does not increase CD56+ expression by T cells in BD
patients ........................................................................................................... 185
4.4 Discussion .................................................................................................... 187
4.5 Summary of findings .................................................................................... 204
Chapter 5: The in vitro effects of interferon-alpha 2a & 2b on IFN-γ and IL-17
expression by CD4+ and CD8+ T cells in healthy donors ................................ 205
5.1 Introduction .................................................................................................. 205
5.2 Aims ............................................................................................................. 207
5.3 Results ......................................................................................................... 208
5.3.1 Preliminary experiments to establish Th1/Th17 test models with antigens
and polyclonal stimulation ............................................................................... 208
5.3.2 Preliminary experiments to establish the needs to rest cells in the medium
after thawing and the effects of adding suboptimal IL-2.................................. 211
5.3.3 Preliminary experiments to establish the choice of culture medium ...... 213
5.3.4 Preliminary experiments to establish incubation time with polyclonal stimuli..
....................................................................................................................... 215
5.3.5 IFN-α has the tendency to promote CD4+ but inhibit CD8+ T cells ......... 217
5.3.6 IFN-α induces IFN-γ production by both CD4+ and CD8+ T cells ........... 220
5.3.7 The kinetics of the upregulatory effect of IFN-α on IFN-γ production by T
cells ................................................................................................................ 224
5.3.8 IFN-α inhibits IL-17 production by both CD4+ and CD8+ T cells ............. 227
5.3.9 The kinetics of the inhibitory effect of IFN-α on IL-17 production by T
cells… ............................................................................................................. 231
5.4 Discussion .................................................................................................... 234
5.5 Summary of findings .................................................................................... 242
7
Chapter 6: The in vitro effects of interferon-alpha 2a & 2b on CD4+ and CD8+
regulatory T cells and associated regulatory cytokines in healthy donors .. 243
6.1 Introduction .................................................................................................. 243
6.2 Aims ............................................................................................................. 245
6.3 Results ......................................................................................................... 245
6.3.1 Preliminary experiments on Treg cells with antigens and polyclonal
stimuli… .......................................................................................................... 245
6.3.2 IFN-α induces Foxp3 expression by CD4+ T cells ................................. 249
6.3.3 IFN-α induces Foxp3 expression by CD8+ T cells ................................. 253
6.3.4 The kinetics of the upregulatory effect of IFN-α on Foxp3 expression by T
cells ................................................................................................................ 257
6.3.5 IFN-α upregulates IL-10 production by both CD4+ and CD8+ T cells ..... 261
6.3.6 The kinetics of the upregulatory effect of IFN-α on IL-10 production by T
cells ................................................................................................................ 266
6.3.7 IFN-α upregulates TGF-β production by both CD4+ and CD8+ T cells ... 269
6.3.8 The kinetics of the upregulatory effect of IFN-α on TGF-β production by T
cells ................................................................................................................ 272
6.4 Discussion .................................................................................................... 274
6.5 Summary of findings .................................................................................... 282
Chapter 7: The immunomodulatory effects of interferon-alpha on γδ T cells 283
7.1 Introduction .................................................................................................. 283
7.2 Aims ............................................................................................................. 284
7.3 Results ......................................................................................................... 285
7.3.1 IFN-α therapy helps maintain a stable population of γδ T cells in BD
patients ........................................................................................................... 285
7.3.2 Preliminary experiments to establish in vitro γδ T test models with antigens
and polyclonal stimulation ............................................................................... 287
7.3.3 Preliminary experiments to establish the needs to rest cells in the medium
after thawing and the effects of adding suboptimal IL-2.................................. 289
7.3.4 Preliminary experiments to establish the choice of culture medium ...... 291
8
7.3.5 Preliminary experiments to establish incubation time with polyclonal stimuli..
....................................................................................................................... 293
7.3.6 IFN-α induces a downregulation of γδ T cells ........................................ 295
7.3.7 IFN-α promotes IFN-γ production by γδ T cells ..................................... 297
7.3.8 IFN-α suppresses IL-17 production by γδ T cells ................................... 299
7.3.9 The kinetics of immunomodulatory effects of IFN-α on γδ T cells
expressing IFN-γ and IL-17 ............................................................................ 301
7.4 Discussion .................................................................................................... 304
7.5 Summary of findings .................................................................................... 309
Chapter 8: General discussion and future work ............................................... 311
8.1 General discussion ....................................................................................... 311
8.1.1 Approaches used in this study ................................................................. 311
8.1.2 Findings from ex vivo experiments ........................................................... 312
8.1.3 Findings from in vitro experiments ........................................................... 313
8.1.4 The implications of the findings in this study .......................................... 314
8.2 Limitations of this study ................................................................................ 320
8.3 Future work .................................................................................................. 322
References ........................................................................................................... 325
Appendix 1: Overview of the IFN-α Trial ........................................................... 374
Appendix 2: Fluorescent antibodies .................................................................. 375
Appendix 3: Representative ex vivo FACS plots on Behcet’s disease patients
............................................................................................................................... 376
Appendix 4: Representative in vitro FACS plots ............................................... 380
9
List of figures
Fig 1.1: Human αβ and γδ thymocyte development ............................................. 25
Fig 1.2: An overview of the main populations of CD4+ effector T cells ................. 34
Fig 1.3: An overview of the pro- and anti-inflammatory properties of IFN-γ ......... 67
Fig 1.4: Causes of impaired Treg cell-mediated suppression in autoimmunity .... 71
Fig 1.5: Plot of the time trend of activity for different PEG-IFN-α2b dose and
conventional PEG-IFN-α2b groups .................................................................... 105
Fig 1.6: Interferon pathway ................................................................................ 110
Fig 2.1: Schematic figure of a density gradient centrifugation ............................ 125
Fig 3.1: IFN-α therapy does not change the percentage of CD4+ or CD8+
Lymphocytes ...................................................................................................... 140
Fig 3.2: IFN-α therapy does not change the percentage of TCRαβ expression in
either CD4+ or CD8+ lymphocytes ...................................................................... 140
Fig 3.3: Upregulation of IFN-γ expression with IFN-α therapy in CD3+ T cells ... 142
Fig 3.4: Tendency of IFN-γ expression to upregulate with IFN-α therapy in CD4+ T
cells .................................................................................................................... 143
Fig 3.5: Enhancement of TNF-α expression with IFN-α therapy in CD3+ T cells 145
Fig 3.6: Upregulation of IL-2 expression with IFN-α therapy in CD3+ T cells ..... 147
Fig 3.7: Augmentation of IL-4 expression with IFN-α therapy in CD3+ T cells .... 149
Fig 4.1: Downregulation of IL-17 expression with IFN-α therapy in CD4+ T cells 168
Fig 4.2: Flow cytometry: CD25 gating for identifying Treg subsets .................... 172
Fig 4.3: CD4+ T cells expressing Foxp3 in a BD patient on IFN-α2b therapy ..... 173
Fig 4.4: The influence of IFN-α2b therapy on the expression of CD25 and Foxp3
............................................................................................................................ 174
Fig 4.5: Upregulation of Foxp3 expression with IFN-α therapy in CD4+ T cells .. 175
Fig 4.6: Upregulation of Foxp3 expression with IFN-α therapy in CD4+CD25+ T
cells .................................................................................................................... 176
Fig 4.7: Upregulation of Foxp3 expression with IFN-α therapy in CD4+CD25high T
cells .................................................................................................................... 177
Fig 4.8: Phenotyping experiments showing augmentation of Foxp3 expression with
IFN-α therapy in CD4+ T cells ............................................................................ 178
Fig 4.9: Upregulation of IL-10 expression with IFN-α therapy in CD3+ T cells ... 181

10
Fig 4.10: Upregulation of IL-10+ and IL-10+Foxp3- expression with IFN-α therapy in
CD4+ T cells ....................................................................................................... 182
Fig 4.11: The effects of IFN-α therapy on TGF-β expression by CD3+ T cells ... 184
Fig 4.12: Phenotyping experiments showing CD56 expression by CD3+ T cells in
BD patients ........................................................................................................ 186
Fig 5.1: The effect of a selection of stimuli on the levels of Th1 and Th17 cells in
healthy donors ................................................................................................... 210
Fig 5.2: The effect of resting PBMCs and suboptimal concentration of IL-2 on the
proportion of Th1 and Th17 cells ....................................................................... 212
Fig 5.3: The effect of different culture media on the levels of Th1 and Th17 cell
populations ......................................................................................................... 214
Fig 5.4: The influence of length of culture time on the levels of Th1 and Th17 cell
populations ......................................................................................................... 216
Fig 5.5: The upregulatory effect of recombinant IFN-α on CD4 expression by T
cells .................................................................................................................... 218
Fig 5.6: The downregulatory effect of recombinant IFN-α on CD8 expression by T
cells .................................................................................................................... 219
Fig 5.7: The upregulatory effect of recombinant IFN-α on Th1 response ........... 222
Fig 5.8: The enhancing effect of recombinant IFN-α on CD8+ T cells expressing
IFN-γ .................................................................................................................. 223
Fig 5.9: The kinetics of upregulatory effect of IFN-α on T cells expressing IFN-γ…...
........................................................................................................................... 226
Fig 5.10: The inhibitory effect of recombinant IFN-α on Th17 cell response ...... 229
Fig 5.11: The inhibitory effect of recombinant IFN-α on CD8+ T cells expressing IL-
17 ....................................................................................................................... 230
Fig 5.12: The kinetics of inhibitory effect of IFN-α on T cells expressing IL-17 .. 233
Fig 6.1: The effect of a selection of stimuli on Foxp3+ expression levels in healthy
donor PBMCs ..................................................................................................... 247
Fig 6.2: The effect of a selection of stimuli on IL-10+ expression by CD4+ T
cells…… ............................................................................................................. 248
Fig 6.3: IFN-α induces Foxp3 expression by CD4+ T cells ................................. 250
Fig 6.4: IFN-α induces an upregulation of Foxp3 expression by CD4+CD25+ T cells..
........................................................................................................................... 251
11
Fig 6.5: IFN-α induces an upregulation of Foxp3 expression by CD4+CD25high T
cells .................................................................................................................... 252
Fig 6.6: IFN-α induces Foxp3 expression by CD8+ T cells ................................. 254
Fig 6.7: IFN-α induces an upregulation of Foxp3 expression by CD8+CD25+ T cells..
........................................................................................................................... 255
Fig 6.8: IFN-α induces an upregulation of Foxp3 expression by CD8+CD25high T
cells .................................................................................................................... 256
Fig 6.9: The kinetics of upregulatory effect of IFN-α on CD4+ T cells expressing
Foxp3 ................................................................................................................. 259
Fig 6.10: The kinetics of upregulatory effect of IFN-α on CD8+ T cells expressing
Foxp3 ................................................................................................................. 260
Fig 6.11: IFN-α upregulates IL-10 expression by CD4+ T cells .......................... 263
Fig 6.12: Upregulation of IL-10 expression by IFN-α is mainly in the Foxp3- subset
in CD4+ T cells ................................................................................................... 264
Fig 6.13: IFN-α upregulates IL-10 expression by CD8+ T cells .......................... 265
Fig 6.14: The kinetics of upregulatory effect of IFN-α on IL-10 expression by T cells.
........................................................................................................................... 268
Fig 6.15: IFN-α upregulates TGF-β expression by CD4+ T cells ........................ 270
Fig 6.16: IFN-α upregulates TGF-β expression by CD8+ T cells ........................ 271
Fig 6.17: The kinetics of upregulatory effect of IFN-α on TGF-β expression by T
cells .................................................................................................................... 273
Fig 7.1: IFN-α therapy promotes a stable population of γδ T cells ..................... 286
Fig 7.2: The effect of a selection of stimuli on the levels of γδ cells producing IFN-γ
and IL-17 in healthy donors ................................................................................ 288
Fig 7.3: The effect of resting PBMCs and suboptimal concentration of IL-2 on the
proportion of IFN-γ and IL-17 producing γδ T cells ............................................ 290
Fig 7.4: The effect of different culture media on the levels of IFN-γ and IL-17
producing γδ T cell populations .......................................................................... 292
Fig 7.5: The influence of length of culture time on the levels of IFN-γ and IL-17
producing γδ T cell populations .......................................................................... 294
Fig 7.6: The inhibitory effect of recombinant IFN-α on TCRγδ expression by CD3+
T cells ................................................................................................................. 296
Fig 7.7: The augmenting effect of recombinant IFN-α on γδ T cells producing IFN-
γ. ........................................................................................................................ 298

12
Fig 7.8: The inhibitory effect of recombinant IFN-α on IL-17 producing γδ T
cells…… ............................................................................................................. 300
Fig 7.9: The kinetics of immunomodulatory effects of IFN-α on γδ T cells producing
IFN-γ and IL-17 .................................................................................................. 303
13
List of Tables
Table 1.1: Target cells and genes of IL-17 ........................................................... 38
Table 1.2: International Study Group Criteria ....................................................... 75
Table 1.3: Revised diagnostic criteria proposed by the Behcet’s Disease Research
Committee of Japan in 2003 ................................................................................ 76
Table 1.4: EULAR recommendations for treatment of BD 2008 ........................... 94
Table 1.5: Significant clinical studies reporting the use of interferon-alpha in
Behcet’s disease ................................................................................................ 102
Table 1.6: Classification of human IFNs ............................................................. 106
Table 2.1: Primary antibodies used for flow cytometry ....................................... 114
Table 2.2 IFN-α2b treatment dose for trial patients with Behcet’s disease ........ 121
Table 2.3 Prednisolone dosage for the two groups of trial patients at baseline . 122
Table 2.4 Immunosuppressive treatment for the two groups of trial patients at
baseline .............................................................................................................. 122
14
Abbreviation List
aa amino acids
Ab antibody
Ag antigen
AHR aryl hydrocarbon receptor
AICD activation-induced cell death
ANA anti-nuclear antibody
AP-1 activator protein-1
APC antigen presenting cell
APC allophycocyanin
ASCA anti-Saccharomyces cerevisiae antibodies
aTreg activated regulatory T cells
BAFF B cell-activating factor
BATF basic leucine zipper transcription factor, ATF-like
Bcl B-cell lymphoma
Brn-3b brain-specific homeobox/POU domain protein 3b
CIA collagen-induced arthritis
c-Maf cellular musculoaponeurotic fibrosarcoma
CNS central nervous system
CRKL CT10 regulator of kinase like proteins
CRP C-reactive protein
CTLA-4 cytotoxic T lymphocyte antigen 4
DMSO dimethyl sulfoxide
EAE experimental autoimmune encephalomyelitis
EAU experimental autoimmune uveitis
EIF4EBP1 eukaryotic translation-initiation factor 4E-binding protein 1
ELISA enzyme linked immunosorbent assay
FACS fluorescence activated cell sorting
FasL Fas ligand
FCS foetal calf serum
FITC fluorescein isothiocyanate
Foxp3 forkhead box protein 3
g gravity (relative centrifugal force)
15
α-GalCer glycolipid α-galactosylceramide
GAS IFN-γ activated site
GATA-3 GATA-binding protein 3
GITR glucocorticoid-induced tumor necrosis factor receptor
GM-CSF Granulocyte-macrophage colony-stimulating factor
HLA human leukocyte antigen
HSP heat shock proteins
IBD inflammatory bowel disease
ICAM intercellular adhesion molecule
ICOS inducible T cell co-stimulator
IFN interferon
Ig immunoglobulin
IgG immunglobulin G
IL interleukin
ILT immunoglobulin-like transcript
IQR interquartile range
IRBP interphotoreceptor binding protein
IRF interferon regulatory factor
ISG IFN stimulated genes
ISGF3 IFN-stimulated gene factor 3
ISRE IFN-stimulated response elements
iTreg inducible regulatory T cells
Jak janus kinase
kD kiloDalton
LPS lipopolysaccharide
M molar
mAb monoclonal antibody
MAD mothers against decapentaplegic
ME mercaptoethanol
μg microgram
MAPK mitogen-activated protein kinase
MHC major histocompatability complex
MICA MHC class I chain-related gene A
ml millilitre

16
MMP matrix metalloproteinases
mRNA messenger ribose nucleic acid
MS multiple sclerosis
NF-κB nuclear factor-κB
NFAT nuclear factor of activated T cell
NK natural killer cells
NKT natural killer T cells
nTreg naturally occurring regulatory T cells
PBMC peripheral blood mononuclear cells
PBS phosphate buffered saline
PD1 programmed cell death 1
PE phycoerythrin
PEG polyethylene glycols
PerCP peridinin chlorophyll protein
PHA phytohemagglutinin
PI propidium iodide
PI3K phosphatidylinositol 3-kinase
PMA phorbol myristate acetate
R receptor
RA rheumatoid arthritis
Rap1 Ras-related protein 1
RNA ribose nucleic Acid
ROR retinoic acid-related orphan receptor
RPE retinal pigment epithelium
rpm revolutions per minute
RPMI 1640 Roswell Park Memorial Institute 1640 culture medium
rTreg resting regulatory T cells
Runx Runt-related transcription factor
S-Ag retinal soluble antigen
SD standard deviation
SEM standard error of the mean
sFasL soluble Fas ligand
SLE systemic lupus erythematosus
Smad SMA and MAD related protein
17
SSH suppression subtractive hybridisation
Stat signal transducer and activator of transcription
T-bet T-box-expressed-in-T-cells
Tc cytotoxic T cell
TCR T cell receptor
TGF-β transforming growth factor-beta
Th helper T cell
TLR toll-like receptor
TNF-α tumor necrosis factor-alpha
TNF-R tumour necrosis factor receptor
Tr1 type 1 T regulatory cells
Treg regulatory T cells
Tresp responder T cells
VKH Vogt-Koyanagi-Harada syndrome
vol/vol volume to volume ratio
18
Chapter 1
Introduction
1.1 Overview of the immune system
The immune system is an elaborate and dynamic network of cells, tissues, and
organs that work together to defend the body against a myriad of ever-evolving
pathogens, including bacteria, viruses, and parasites, as well as disease. One
critical feature of the immune system is its ability to distinguish self from non-self. It
detects a wide variety of harmful stimuli and through a series of steps called immune
response, the immune system seeks out and destroys disease-causing organisms or
substance. In most cases, it does a great job of launching attacks that eliminate
invading microbes, infected cells, and tumours while ignoring healthy tissues
(Janeway et al. 2005). Importantly, the immune system normally does not mount a
strong immune response against self antigens, a phenomenon called self-tolerance.
When the immune system recognises a self antigen and mounts a strong response
against it, autoimmune disease develops and may result in a serious threat to health.
Therefore, it is imperative proper balance has to be maintained between preserving
immune competence and preventing self-harm and autoimmunity (Jager & Kuchroo
2010).
The immune system is composed of two major subdivisions, the innate and the
adaptive immune systems, and protects individuals with layered defences of
increasing specificity. Both innate and adaptive immunity depend on the ability of
the immune system to distinguish between self and non-self molecules, and
achieving appropriate immune response against harmful stimuli requires
coordination between the two types of immunity (Janeway et al. 2005). Although
autoimmune diseases are mediated by the actions of adaptive immune cells
targeting self-antigen in tissues, the innate immune system plays a key role in the
initiation and propagation of tissue inflammation (Codarri, Fontana, & Becher 2010).
The innate immunity system is what we are born with and it is non-specific; all
antigens are attacked pretty much equally. It is genetically based and we pass it on
19
to our offspring. This system does not confer long-standing immunity against a
pathogen. It consists of external physical barriers such as the skin and mucous
membranes and also cells like phagocytes (macrophages, neutrophils, and dendritic
cells), mast cells, eosinophils, basophils and natural killer cells. The complement
system participates in innate immunity as well. Once activated complement can lead
to increased vascular permeability, recruitment of phagocytic cells, and lysis and
opsonisation of pathogens. Innate immune responses are controlled by the
recognition of conserved features of pathogens using invariant pattern recognition
receptors such as toll-like receptors (TLRs) expressed mainly on antigen-presenting
cells (APCs). However, this early phase of defence can be overcome by many
pathogens (Janeway et al. 2005).
When an innate response fails to eliminate a pathogen, the more versatile adaptive
immunity is initiated by the activation of T and B lymphocytes in secondary lymphoid
tissues, where dendritic cells carry antigens collected in the periphery. Innate
immunity is an essential prerequisite for the adaptive immune response, because the
antigen-specific lymphocytes of the adaptive immune response are activated by co-
stimulatory molecules that are induced on cells of the innate immune system during
their interaction with foreign organisms or substance. The cytokines produced
during these early phases also play a key role in stimulating the subsequent adaptive
immune response and shaping its development (Janeway et al. 2005).
The adaptive immune system is mediated by two main cell types, T and B
lymphocytes, and the response is closely regulated. B cells are produced in the
stem cells of the bone marrow; they produce highly specific soluble receptors termed
antibodies (Ab) and oversee humoral immunity. T cells are nonantibody-producing
lymphocytes which are also produced in the bone marrow but sensitised in the
thymus and constitute the basis of cell-mediated immunity. Many T cell effector
functions are achieved through the production of pro-inflammatory, anti-inflammatory
or regulatory cytokines, which help to amplify or modulate the immune response
(Janeway et al. 2005).

20
1.2 B and T Lymphocytes
Lymphocytes comprise approximately 20-30% of leucocytes in the circulation.
However, the relative proportion of cells populations in whole blood can vary greatly
between individuals and with states of health and disease, and in response to stimuli.
Within the lymphocyte subset, the relative proportion of T lymphocytes and B
lymphocytes in healthy adults has been reported to range from 61-85% and 7-23%
respectively (Junqueira, Carneiro, & Kelley 1992;Palmer et al. 2006). Each
lymphocyte expresses cell surface receptors of a single specificity, generated by the
random recombination of variable receptor gene segments and the pairing of distinct
variable chains. The process enables lymphocytes to deal with virtually any antigens
(Janeway et al.2005).
There are three sets of molecules responsible for the specificity of acquired immune
response based on their capacity to bind foreign antigen. Lymphocyte antigen
receptors, in the form of immunoglobulins (Ig) on B cells and T cell receptors (TCR)
on T cells, are the means by which lymphocytes recognise antigens. Ig exist in both
membrane-bound forms (B-cell receptors) and secreted forms (antibodies). On the
other hand, TCR are membrane-bound proteins that are able to recognise short
protein sequences (peptides) that are presented by APC. Major histocompatibility
complex (MHC) molecules constitute a third class of antigen-binding molecules and
consist of two types: class I and class II (Janeway et al. 2005).
In the early stages of Ig and TCR production, a mechanism of genetic recombination,
known as VDJ recombination or somatic recombination, takes place. Antigen
receptor gene rearrangement of variable (V), diversity (D) and joining (J) gene
segments generates enormous repertoire of antigen receptors with different antibody
specificities, providing the versatility that is essential to normal immune functioning.
Also, antigen-dependent immunoglobulin gene diversification, via somatic
hypermutation (SHM), and class-switch recombination (CSR) occur in mature B cells
during the humoral immune response. SHM generates point mutations in the
variable domains of the immunoglobulin heavy and light chains and CSR generates
different antibody isotypes by recombination (Janeway et al. 2005).
21
In contrast to those of Ig and TCR, the binding groove of MHC is not a product of
gene rearrangement. The function of MHC molecules is to present products of self
or foreign proteins to T cells. The peptides that bind to class I molecules commonly
derive from proteins synthesised intracellularly, whereas class II molecules usually
bind peptides derived from proteins synthesised extracellularly. The two classes of
MHC molecule are different in their structure and expression pattern on tissues of
the body. Besides engagement by TCR, the two types of MHC molecules are
recognised by different co-receptor molecules, CD8 and CD4, during antigen
recognition and the binding is necessary for the T cell to make an effective response
(Janeway et al. 2005).
For both B and T cells, signalling through antigen receptors of lymphocytes induces
clonal expansion and differentiation of antigen-specific lymphocytes, provided that
they receive a co-stimulatory signal. Antigens that stimulate B cells can be either in
solution or fixed to a solid matrix and bind to membrane Ig. Whereas, T cells are
generally stimulated by small peptides and TCR do not bind antigen in solution.
After priming and clonal selection of T lymphocytes bearing antigen-specific
receptors, activated T cells leave the lymphoid tissues and travel to the inflammation
site, where they exert specific effector functions. To provide enhanced protection
against reinfection, a subset of these proliferating lymphocytes differentiates into
memory cells (Janeway et al. 2005). Priming, expansion and memory formation are
controlled by APCs and evidence reveals that chemokine ligands and receptors
control or modulate various phases of the adaptive immune response (Viola,
Contento, & Molon 2006).
1.3 T cell development
1.3.1 Thymocytes and stages of their development
The earliest progenitors of T cells are produced in the bone marrow. T, in T cell,
stands for thymus, since this is the principal organ responsible for the T cell’s
maturation. The thymus can be divided into an outer cortex and inner medulla.
Within the thymus, T cell precursors develop into thymocytes and progress through a
22
series of phenotypically distinct stages. Immature thymocytes are present in the
outer cortex of the thymus, and mature thymocytes are present in the inner medulla
of the thymus. Distinct maturational phases are marked by changes in the status of
T cell receptor genes and in the expression of the T cell receptor, and by changes in
expression of cell surface proteins such as the CD3 complex and the co-receptor
proteins CD4 and CD8. Particular combinations of cell surface proteins can thus be
used as markers for T cells at different stages of differentiation. Thymocytes are
subdivided roughly as being double negative (DN), double positive (DP), or single
positive (SP), based on the expression of the CD4 and CD8 coreceptors (Janeway et
al. 2005).
When precursor cells first enter the thymus from the bone marrow, they do not
express TCR and lack most of the surface molecules characteristic of mature T cells
such as CD4 and CD8. Such cells are called DN thymocytes. The DN stage is
heterogeneous and can be subdivided into four distinct subsets in mice (DN I-IV)
based on the expression of CD44 and CD25. On the other hand, immature
thymocytes do not express the same surface markers in humans. The
corresponding human DN subpopulations are characterised by the differential
expression of CD34, CD38, and CD1a. Three distinct DN stages can be recognised:
a CD34+CD38-CD1a- stage that represents the most immature thymic subset,
followed by the CD34+CD38+CD1a-, and CD34+CD38+CD1a+ stages (Dik et al. 2005).
Following the acquisition of CD1a expression, human thymocytes mature via a CD4
immature single positive (ISP) intermediate in between the DN and DP stages. With
regards to DP thymocytes, there are two discrete stages of development before
surface expression of CD3. Firstly, the early DP (EDP) stage is characterised by the
expression of CD8α, resulting in cells that are CD3-CD4+CD8α+β-. Secondly, the DP
blast stage results from the upregulation of CD8β, producing CD3-CD4+CD8α+β+
cells. The next stage in maturation is the single positive stage, where cells lose
expression of either CD4 or CD8, leaving them either CD4+CD8- or CD4-CD8+.
Single positive thymocytes migrate to the medulla of the thymus and remain there for
1-2 weeks. They are tested for interactions with self-MHC molecules and undergo
final maturational changes before release to peripheral tissues (Joachims et al.
2006).
23
1.3.2 αβ and γδ lineage commitment
The thymus is able to generate distinct types of mature T cells that are differentiated
for specific TCR recognition and effector functions. Multipotent precursor
thymocytes rearrange and express the genes encoding TCR during development
and mature as either αβ or γδ lineage T cells. αβ T cells represent the majority of
thymocytes in the thymus and T cells in the periphery. On the other hand, γδ T cells
have been reported to be prominent during embryonic thymic development, and
represent a small minority population of T cells in the peripheral blood but a major
subset in other anatomical locations. The development of γδ T cells may involve
also extrathymic sites (Kreslavsky et al. 2010). Since αβ and γδ cells derive from a
common precursor, the issue of when the two lineages diverge during development
is of considerable interest.
Previous reports have indicated that human thymocytes first rearrange their TCRδ
locus, followed closely by TCRγ locus. Progenitors that productively rearrange
TCRγ and TCRδ loci express functional TCRγδ at the cell surface (Dik et al. 2005).
Most that are successful early in development never attempt TCRβ gene
rearrangements, and the majority of them become functionally mature without
progression through the DP stage and egress to the periphery with a CD4-CD8- (or,
more rarely, with CD4-CD8+ or CD4+CD8-) phenotype (Janeway et al. 2005).
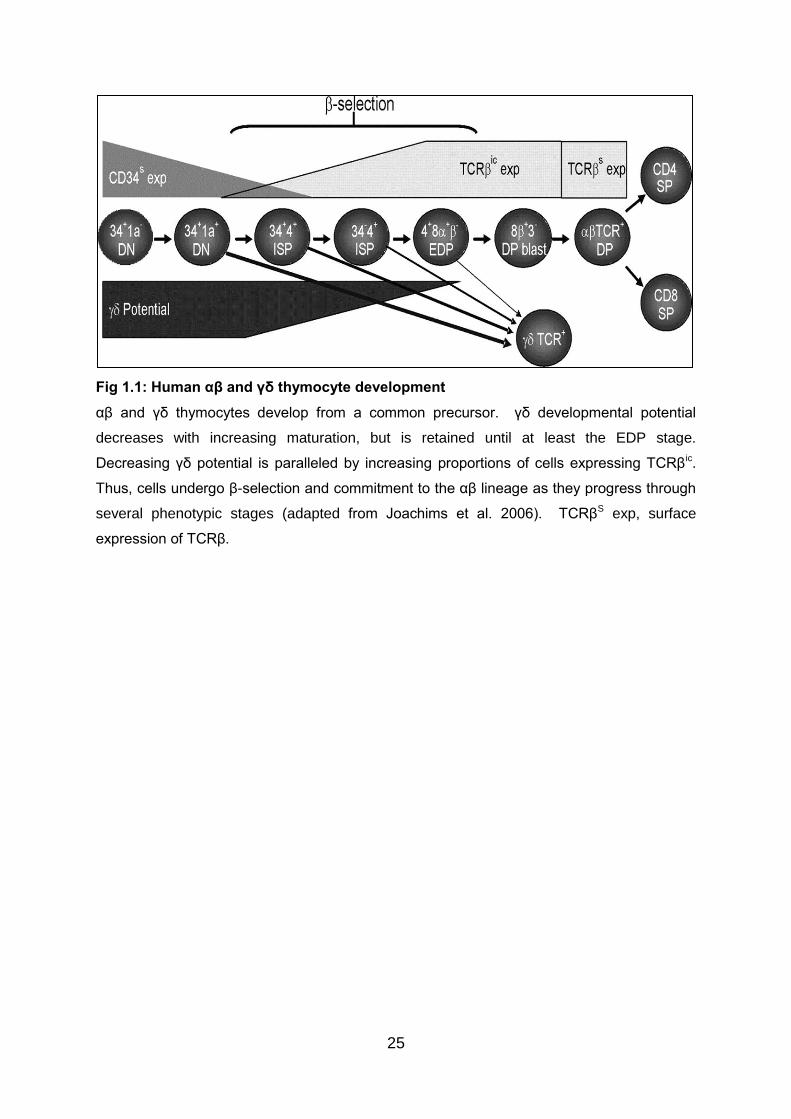
However, γδ developmental potential persists into the later phases of human
thymocyte development until at least the CD3-CD4+CD8α+β- (EDP) stage. Even
though the majority of EDP cells express intracellular TCRβ (TCRβic), a small
percentage of these cells still have the capacity to yield γδ cells. Nevertheless, the
γδ potential in the next developmental stage (DP blasts) is drastically diminished.
Thus, it is likely that γδ potential correlates inversely with the expression of TCRβ ic in
thymocyte populations (Joachims et al. 2006) (Fig 1.1).
The percentage of TCRβic+ cells continue to increase as the cells mature and reach
a plateau at the EDP and DP blast stages (Joachims et al. 2006) (Fig 1.1). The
process in which the TCRβ chain pairs with the pre-TCRα protein to produce a pre-
TCR complex that signals survival, expansion, and allelic exclusion is referred to as
β-selection. Expression of pre-TCR complex leads to a burst of proliferation,
24
upregulation of both CD4 and CD8 coreceptors, silencing of TCRγ expression, and
initiation of TCRα rearrangement (which leads to the deletion of TCRδ found within
TCRα locus) (Joachims et al. 2006). Hence, β-selection results in the expression of
a complete TCRαβ. However, the point of β-selection in human thymocyte
development is still controversial. Though one study indicated that β-selection
occurs at the EDP to DP blast transition (Carrasco et al. 1999), other studies
suggested it begins as early as the CD34+CD38+CD1a+ (Dik et al. 2005) or CD4 ISP
stages (Blom et al. 1999).
Over time it has become clear that correspondence between the type of TCR
expressed and the developmental history of a cell is not always perfect. Therefore, it
is of major interest to study whether the types of TCR play a role in αβ versus γδ
lineage determination or only in the progression of already committed precursors. It
has been reported that the majority of γδ thymocytes have variable gene segments
of TCRβ in germline configuration, and a small percentage of γδ thymocytes have
complete rearrangements in the TCRβ locus. However, the few complete TCRβ
rearrangements are predominately out-of-frame. As a result, whether the few γδ
cells with complete in-frame TCRβ rearrangements die by apoptosis or are diverted
to the αβ lineage remains to be clarified (Joachims et al. 2006).
In addition, the majority of αβ thymocytes have been reported to have both their γ
alleles rearranged, and one-third of the TCRγ rearrangements in αβ thymocytes are
in-frame. The potential for a significant proportion of αβ cells to express a functional
TCRγδ, therefore, could not be ruled out. However, data have demonstrated that αβ
thymocytes are depleted of in-frame δ rearrangements, and productive TCRγ and
TCRδ rearrangements are rare in αβ cells. Consequently, it has been suggested
that vast majority of cells that develop into αβ thymocytes are those that could not
express a functional TCRγδ (Joachims et al. 2006).
25
Fig 1.1: Human αβ and γδ thymocyte development
αβ and γδ thymocytes develop from a common precursor. γδ developmental potential
decreases with increasing maturation, but is retained until at least the EDP stage.
Decreasing γδ potential is paralleled by increasing proportions of cells expressing TCRβic.
Thus, cells undergo β-selection and commitment to the αβ lineage as they progress through
several phenotypic stages (adapted from Joachims et al. 2006). TCRβS exp, surface
expression of TCRβ.
26
Although human αβ vs γδ development is primarily influenced by the timing of TCR
gene rearrangements and expression of functional TCR, other cellular factors and
signalling pathways that regulate the accessibility of TCR loci and gene
recombination can play a key role in lineage decisions. This is supported by reports
that sustained Notch signalling efficiently skew the development of earliest thymic
progenitors toward a γδ cell fate (De Smedt et al. 2002;Garcia-Peydro, de Yebenes,
& Toribio 2003).
Intriguingly, in various murine transgenic and knockout systems, the TCR per se
does not play a deterministic role in the lineage decision, leading to the development
of γδ lineage cells driven by TCRαβ and vice versa. These puzzling observations
were recently explained by the demonstration that TCR signal strength, rather than
TCR type per se, instructs lineage fate, with stronger TCR signal favoring γδ and
weaker signal favoring αβ lineage fates (Kreslavsky, Gleimer, & von Boehmer 2010).
The potential relevance of the signal strength model of αβ/γδ lineage choice in
humans is currently unknown and will require clarification by further investigation.
Collectively, development of thymocytes is a flexible and dynamic process during
which CD4 and CD8 are successively upregulated. Also, αβ and γδ T cells share a
large portion of their developmental paths and there is a prolonged window of
development through which β-selection and γδ lineage commitment can occur
simultaneously. As the development progresses through stages, the frequency of β-
selected cells increases and γδ potential diminishes. Cells that survive the rigorous
selective processes that operate in the central lymphoid organs are exported to the
peripheral lymphoid organs before emerging as immunocompetent cells in the
peripheral circulation. Upon entry to the peripheral bloodstream, the cells are
considered mature T cells. With regards to effector functions, there are no major
differences between γδ T cells and αβ T cells (Kreslavsky et al. 2010).
1.4 CD4+ and CD8+ T cells
Two different functional classes of αβ T cells are distinguished by the type of
glycoprotein co-receptor (CD4 or CD8) expressed on the cell surface. CD4+ and
27
CD8+ T cells have distinct effector functions and recognise different class of MHC
molecules. After engaging MHC class II molecules, CD4+ T cells function to activate
other effector cells of the immune system. MHC class II molecules are normally
found on specialised APCs such as B lymphocytes, dendritic cells, and
macrophages (Janeway et al.2005). When CD4+ T cells recognise peptides bound
to MHC class II molecules on B cells, they stimulate B cells to produce antibodies.
In the absence of CD4+ T cell help, although B cell responses can be initiated, the
somatic hypermutation, isotype switching, and clonal selection necessary for
production of high-affinity immunoglobulins are restricted (Castellino & Germain
2006). Moreover, CD4+ T cells recognising peptides bound to MHC class II
molecules on macrophages activate these cells to destroy foreign organisms or
substances in their vesicles (Janeway et al. 2005).
By contrast, CD8+ T cells predominantly recognise peptides presented by MHC class
I molecules, which are expressed by almost all nucleated cells. CD8+ T cells
contribute to host defense during acute and chronic infection with viruses,
intracellular bacteria, or single-cell as well as multi-cellular parasites, and they also
participate in the elimination of transformed cells (Janeway et al. 2005). The
differentiation of CD8+ T cells is characterised by the acquisition of effector functions
as well as modifications in adhesion molecule and chemokine receptor expression
on the surface of the CD8+ T cells. In comparison with CD4+ T cells, the time
required of antigen exposure to initiate proliferation is less for naive CD8+ T cells,
and they also divide sooner and more frequently (Seder & Ahmed 2003). Help by
CD4+ T cells is crucial in inducing CD8+ memory, and a lack of CD4+ T cell help will
allow an acute but not a sustained CD8+ T cell response (Castellino & Germain
2006).
In the course of immune responses, both MHC class I and MHC class II molecule
expression is regulated by cytokines, in particular interferons. In the case of IFN-γ, it
upregulates the expression of MHC class I and MHC class II molecules, and can
promote the expression of MHC class II molecules on certain types of cells that do
not normally express them. Interferons also augment the antigen presenting function
of MHC class I molecules by facilitating the expression of intracellular components
that allow peptides to be loaded onto MHC molecules (Janeway et al. 2005).
28
Ligation of the TCR and co-receptor is not enough to stimulate naive T cells to
acquire effector capacity and proliferate. Co-stimulatory signal, delivered by the
same APC is required as well. CD8+ T cells have been suggested to need a
stronger co-stimulatory signal than CD4+ T cells. The two B7 glycoproteins,
B7.1(CD80) and B7.2(CD86), are the best studied co-stimulatory molecules. CD28,
a member of the immunoglobulin family, is the receptor for B7 molecules on the T
cell. Ligation of CD28 by B7 molecules or by anti-CD28 antibodies is an absolute
requirement for clonal expansion of naive T cells. After activation, naive T cells
express an array of proteins that sustain or modify the co-stimulatory signal. One
example is CD40 ligand (CD154), which transmits activating signals to the T cell and
activates APCs to express B7 molecules after binding to CD40 on APCs. This
enables further T cell proliferation as a result (Janeway et al. 2005).
1.5 Cytokines and chemokines
1.5.1 Cytokines
Cytokines are a family of pleiotropic host derived signalling proteins and peptides
that provide a fundamental mechanism for cell-cell communication. They mediate
and regulate immunity, inflammation, and haematopoiesis and link cells of the
immune system to those in surrounding tissues. Actions of cytokines can contribute
to clinical manifestations of diseases and complex interactions exist between
cytokines, inflammation and the adaptive responses in maintaining homeostasis,
health, and well-being (Elenkov et al. 2005). The names of the various cytokines
reflect the context of their discovery, rather than a systematic naming strategy. For
example, the term ‘interleukins’ was initially used as a naming system for proteins
with the ability to act as communication signals between different populations of
leucocytes, however, it then became recognised that the spectrum of action of
interleukins was not confined to leucocytes (Janeway et al. 2005).
It is well appreciated that cytokines are produced by immunologically competent cells
during host response to infection, invasion and inflammation. During development,
29
after injury or in tumour growth, cytokines can convey destructive or reparative
signals to other cells (Stow et al. 2009). Notably, cytokines influence the quantitative,
as well as the qualitative outcome of the immune response, i.e. they regulate the
intensity of the inflammatory and specific immune reaction; and they determine
whether the exposure to a given antigen will result in a state of specific tolerance. In
addition, certain cytokines upregulate the effector function of self-aggressive cells,
others participate in the suppression of such cells. Hence, cytokines are relevant to
the regulation of self-tolerance (Janeway et al. 2005).
It is common for different cell types to secrete the same cytokine or for a single
cytokine to produce multiple biologic effects on a variety of cells and tissues
(pleiotropy). Cytokines are redundant in their activity, meaning similar functions can
be stimulated by different cytokines. Cytokines can promote either induction or
inhibition of the synthesis of other cytokines by their synergistic or antagonistic
effects. They operate in both an autocrine and paracrine fashion to control the
proliferation, differentiation, and activity of immune cells. Of note, significant quantity
can be detected within the systemic circulation. This makes initiation of functional
changes at tissue locations distant from the original site of synthesis possible, and
thus, potentially all tissues are likely to be influenced by cytokines (Stow et al. 2009).
Cytokines typically act in cascades or networks and stimulate metabolic and
biochemical changes in responding cells when present at low concentrations. They
usually have a short duration of action and act over short distances, although some,
such as colony stimulating factors, act at distant sites. Communication between
cells can be mediated by cytokines through binding to specific cell surface receptors
directly and activating intracellular second-messenger systems. Subsequent
activation of protein kinases or phosphatases, in turn, regulates the activity of
transcription factors that recognise specific sequences in the promoters of a variety
of genes, including genes encoding message for cytokines. (Stow et al. 2009).
Depending on the cytokine, its extracellular abundance, the presence and availability
of the matching receptor on the cell surface, and downstream signals activated by
receptor binding, the effect of a particular cytokine on a given cell can vary.
Responses to cytokines include increasing or decreasing expression of membrane
30
proteins (including cytokine receptors), proliferation, and secretion of effector
molecules. Cytokine activity can be blocked by antagonists, molecules which bind
cytokines or their receptors. Interestingly, a number of membrane-bound cytokine
receptors also exist in a soluble form. Soluble cytokine receptors usually function as
natural antagonists for the biological actions of the respective cytokines (Zidek,
Anzenbacher, & Kmonickova 2009).
1.5.2 Chemokines
A special class of more than 50 cytokines has the generic term chemokines (derived
from chemotactic cytokines) because they have a broad range of actions on the
recruitment and function of specific populations of leukocytes at the sites of infection
and inflammation. These proteins target many cell types and exert their biological
effects by interacting with G protein-linked transmembrane receptors called
chemokine receptors. Some chemokines are considered pro-inflammatory and can
be induced during an immune response to recruit cells of the immune system to a
site of infection, while others are considered homeostatic and are involved in
controlling the migration of cells during normal processes of tissue maintenance or
development (Janeway et al. 2005).
Chemokines are classified into four groups, depending on the relative position of the
first N-terminal cystein residues. In the CC family (β-chemokines), the first two
cysteins are adjacent; in the CXC family (α-chemokines), they are intervened by one
amino acid. In the CX3C family (δ-chemokines), the first two cysteins are separated
by three amino acids. The C family (γ-chemokines) contains only two of the four
conserved cysteins. Chemokines are released by many different cell types and
serve to guide cells of both innate immune system and adaptive immune system
(Zidek, Anzenbacher, & Kmonickova 2009).
31
1.6 Helper T cells
The importance of distinct subsets of CD4+ T lymphocytes in the aetiology of a
variety of immune-mediated diseases has become clear in the last 20 years. They
play a central role in immune protection and orchestrate diverse immune responses
through production of cytokines and chemokines. CD4+ helper T cells are important
regulators of both humoral and cellular immunity, and can be differentiated from
naive CD4+ T cells upon antigen stimulation by professional APCs and the
contextual micro-environment provided by the innate immune system (Murphy &
Reiner 2002). Each subset of CD4+ T lymphocytes expresses unique transcription
factors which confer subset-specific expression profiles of cytokine production and
effector function. CD4+ T cells are capable of augmenting responses of CD8+ T cells,
helping B cells make antibodies, enhancing microbicidal activity in macrophages and
recruiting neutrophils, eosinophils and basophils to sites of inflammation. Also, CD4+
T cells are important mediators of immunologic memory (Zhu & Paul 2008).
1.6.1 Th1 and Th2 cells
In 1986, Mosmann and Coffman showed that the functional heterogeneity of murine
CD4+ T cells was due to their different profile of cytokine production and identified 2
main subsets of activated CD4+ T cells, Th1 cells and Th2 cells (Mosmann et al.
1986). Th1 cells secrete interleukin IL-2, IFN-γ, and TNF-β, whereas Th2 cells
secrete IL-4, IL-5, IL-6, and IL-10. Human CD4+ T cell clones have similar, but not
identical, restricted cytokine profiles. Human Th1 and Th2 subsets are usually
defined according to IFN-γ/IL-4 production because the synthesis of IL-2, IL-6, and
IL-10 is not stringently restricted to a single subset (Vukmanovic-Stejic et al. 2000).
Th1 cells are responsible for both phagocyte activation and the production of
opsonising and complement-fixing antibodies, thus playing an important role in
mediating immune responses against intracellular pathogens (Annunziato &
Romagnani 2009). The principal cytokine products of Th1 cells include IFN-γ,
lymphotoxin-α (TNF-β), and IL-2 (Wan 2010), and Th1 cells predominantly express
chemokine receptors CXCR3 and CCR5 (Yamamoto et al. 2000). IL-12 has been
32
shown to play a central role in the differentiation of Th1 cells, and it is appreciated
that IFN-γ also contribute to the induction of Th1 cells (Zhu, Yamane, & Paul 2010).
Furthermore, stimulation of differentiated Th1 cells with IL-18 plus IL-12 induces
TCR-independent IFN-γ production (Annunziato & Romagnani 2009).
IL-12, which is produced by activated APCs, activates the transcription factor, Stat4.
In conjunction with TCR-dependent signals, Stat4-dependent signalling induces the
expression of the transcription factor T-bet, also known as Tbx21 (Szabo et al. 2003).
In addition, activation of Stat1 by IFN-γ has been shown to be important for the
induction of T-bet during Th1 differentiation in vitro (Afkarian et al. 2002;Lighvani et
al. 2001). Collectively, the outcomes of IFN-γ and IL-12 signalling are to solidify their
Th1 function through promoting the expression of T-bet. T-bet belongs to the T-box
family of transcription factors and is the only known T-box gene specifically
expressed in the lymphoid system. It is rapidly and specifically induced in
developing Th1 cells and is critical for initiating Th1 development. Thus, T-bet is
recognised as a master regulator of Th1 differentiation (Szabo et al. 2000). T-bet
also synergises with Stat4 to induce many Th1-specific genes, including IFN-γ, IL-
12Rβ2, and IL-18R1 (Zhu, Yamane, & Paul 2010).
Conversely, Th2 cells mediate host defence against extracellular parasites including
helminths and play an important role in the induction and persistence of allergic
inflammatory diseases. The cytokines produced by Th2 cells include IL-4, IL-5, IL-9,
IL-13, and IL-25 (Zhu & Paul 2008), and Th2 cells express chemokine receptors
CCR3, CCR4, and CCR8 (Yamamoto et al. 2000). IL-4, produced by activated T
cells and some innate immune cells, provides positive feedback for Th2 cell
differentiation and activates Stat6, which upregulates the expression of the
transcription factors GATA-3 and c-maf (Murphy & Reiner 2002). GATA-3 alone,
however, is not sufficient to induce IL-4 production.
IL-2 is also important for initial IL-4 production, and Stat5 activation by IL-2 is critical
for Th2 development (Annunziato & Romagnani 2009). Activated human basophils,
eosinophils and mast cells express IL-25, which can upregulate GATA-3 expression
in human memory Th2 cells (Wang et al. 2007). In addition, thymic stromal

33
lymphopoietin (TSLP) could induce naive CD4+ T cells to differentiate into Th2 cells
in the presence of allogeneic myeloid DCs (Lu et al. 2009).
Of note, T cells expressing both Th1 and Th2 cytokine patterns are designated Th0
and may be Th1/Th2 precursors (Miner & Croft 1998). There is a mutual regulation
of Th1 and Th2 polarisation induced not only by IL-4 and IFN-γ, respectively, but
also by the Th1-specific and Th2-specific transcription factors. GATA-3 has been
revealed to downregulate Stat4 (Usui et al. 2003), and strong Stat5 activation
suppresses T-bet expression (Zhu et al. 2003). In addition, T-bet can inhibit GATA-3
expression (Usui et al. 2006).
1.6.2 New fates of Helper T cells
In recent years, new fates of CD4+ T cells have emerged. Each subset specialises
in regulating different aspects of immunity and each has their own distinct cytokine
products and biological functions. Some of these, such as naturally occurring
regulatory T cells (nTreg) and natural killer T cells (NKT), are already distinct
lineages when they leave the thymus. However, other than Th1 and Th2, naive
CD4+ T cells could differentiate into other distinct subsets including Th17, follicular
helper T cells (Tfh), and ones that produce IL-9 (Th9) and IL-22 (Th22) only
(Veldhoen 2009;Zhu & Paul 2008) (Fig 1.2).

34
Figure 1.2: An overview of the main populations of CD4+ effector T cells
When the naive CD4+ T helper cell recognises a given antigen on the surface of the antigen
presenting cell, the cytokines present in the microenvironment created by the response of
the innate immunity play a critical role in dictating the type of effector cell that is
subsequently induced (adapted from Annunziato & Romagnani 2009). DTH, delayed type
hypersensitivity. EAE, experimental autoimmune encephalomyelitis. EAU, experimental
autoimmune uveitis. PIA, peptoglycan-induced arthritis. CIA, collagen-induced arthritis.
c

35
Described since 2005, Th17 cells are characterised by IL-17 production and may
have evolved for protection against microbes that Th1 or Th2 cells are not suited for
(Harrington et al. 2005;Park et al. 2005). Although Th17 cells have been recognised
as a unique subset only recently, IL-17 has been discovered for much longer. On
the other hand, CD4+ Tregs were originally identified by their constitutive expression
of CD25 (IL-2 receptor-α) and have been referred to as CD4+CD25+ Tregs for many
years (Sakaguchi et al. 1995). In 2003, forkhead box protein 3 (Foxp3) was reported
to be the master transcriptional regulator for nTregs (Fontenot, Gavin, & Rudensky
2003;Hori, Nomura, & Sakaguchi 2003). As there have been substantial amount of
discoveries on both Th17 and Treg due to intense interests recently, their
development, function and molecular characterisation are described in more details
in the following sections.
Th9 cells were proposed in 2008. TGF-β was shown to reprogram Th2 cells to lose
their characteristic profile and switch to IL-9 secretion. Differentiation of these cells
was able to be promoted in the presence of TGF-β and IL-4. They have not been
shown to express any transcription factors related to other CD4+ T cell subsets like
T-bet, GATA3, RORγt and Foxp3, emphasising that Th9 cells are distinct from Th1,
Th2, Th17 and Foxp3+ iTreg populations (Veldhoen et al. 2008b).
Th22 cells became the latest addition to the CD4+ T helper cell subsets in 2009 and
they were hypothesised to be important in skin homeostasis and pathology. This
distinct subset of human memory T cells was identified to express chemokine
receptor CCR6, skin-homing receptors CCR4, and CCR10 and high levels of IL-22.
Little IL-17 and IFN-γ were produced by these cells. Th22 cells could be induced by
stimulation of naive T cells in the presence of IL-6 and TNF or by the presence of
plasmacytoid dendritic cells. Compared with Th17 cells, they were less dependent
on transcription factor, retinoic acid-related orphan receptor-γt (RORγt) for IL-22
production. Additionally, aryl hydrocarbon receptor (AHR) agonists were shown to
promote Th22 cell differentiation and Th22 cells could be generated in vitro in the
presence of IL-6 and TNF from naive CD4+ T cells (Duhen et al. 2009;Trifari et al.
2009).
36
The term Tfh has been suggested for a subpopulation of B helper T cells that
specifically localise to B cell areas of lymph nodes and spleen, and express CXCR5.
The absence of a transcriptional master switch has long prevented the recognition of
Tfh as a separate subset (Breitfeld et al. 2000;Schaerli et al. 2000). Tfh cells play a
crucial role in orchestrating T cell-dependent B cell responses and can be regarded
as a subset linking innate immunity and subsequent B cell responses (Reinhardt,
Liang, & Locksley 2009). In peripheral blood, they were demonstrated to coexpress
CD45RO and CCR7. However, CCR7 expression is lost in secondary lymphoid
organs, which allows these cells to home to B-cell follicles and germinal centers
where they express high levels of CD40 ligand and inducible T cell co-stimulator
(ICOS). Tfh cells are also defined by enhanced expression of programmed cell
death 1 (PD1), the transcriptional repressor B cell lymphoma 6 (Bcl-6) and cytokines
IL-21 and IL-4, which stimulate B cell differentiation and antibody production (King
2009). Although the cytokine profile of these cells have been found to be
heterogeneous, two cytokines are important in the development of Tfh: IL-6 and IL-
21 (Vogelzang et al. 2008).
1.7 T helper 17 and IL-17-producing T cells
1.7.1 T helper 17 cells and associated cytokines
CD4+ T cells are the best-characterised source of IL-17 during adaptive immune
responses and perhaps during chronic inflammatory responses, but other cells such
as neutrophils, CD8+ T cells, invariant NKT cells and γδ T cells all were reported to
express IL-17 (Ferretti et al. 2003;Lockhart, Green, & Flynn 2006;Michel et al.
2007;Shin et al. 1999). Human Th17 cells mediate immune responses against
extracellular bacteria and fungi (Weaver et al. 2006) and produce IL-17A, IL-17F, IL-
6, IL-21, IL-22, IL-26 and TNF-α, but not IFN-γ or IL-4 (Crome, Wang, & Levings
2010). IL-17A is now recognised as the founding member of a family of pro-
inflammatory cytokines: IL-17A, IL-17B, IL-17C, IL-17D, IL-17E (also known as IL-25)
and IL-17F (Kolls & Linden 2004). IL-17 has been known to play a role in inducing
the activation of macrophages, fibroblasts, epithelial and endothelial cells and
promoting the production of various inflammatory cytokines such as TNF-α, IL-1β,
37
and IL-6 as well as enhancing proliferation, maturation and recruitment of neutrophils
(Kolls & Linden 2004;Witowski, Ksiazek, & Jorres 2004).
The inflammatory responses by IL-17 involve NF-κB and mitogen-activated protein
kinase (MAPK) pathways (Schwandner, Yamaguchi, & Cao 2000;Shalom-Barak,
Quach, & Lotz 1998), and most cells can potentially respond to this cytokine as the
IL-17 receptor is expressed ubiquitously. Table 1.1 shows representative target cell
types and the influence of cytokine IL-17. The target cell types best analysed are of
non-immune origin, particularly epithelial and mesenchymal cells within diseased or
inflamed tissues. IL-17-dependent activities have been revealed in immune cells as
well, particularly B lymphocytes and APCs (Onishi & Gaffen 2010).
The receptor for IL-17 is a heterodimer made up of IL-17RA and IL-17RC. In contrast
to IL-17RC, IL-17RA is expressed at particularly high levels in haematopoietic tissues.
Both IL-17A and IL-17F use the IL-17RA chain for their signalling, but IL-17A binds
to IL-17RA with much higher affinity. IL-17A and IL-17F are within close proximity on
the chromosome and have a co-ordinated expression pattern, implying they have
very similar functions and are likely to be regulated by similar mechanisms (Crome,
Wang, & Levings 2010;Hymowitz et al. 2001). IL-21 promotes Th17 differentiation in
an autocrine fashion (Nurieva et al. 2007) and serves as a positive feedback
amplifier. IL-22, a member of the IL-10 family, is a multifunctional cytokine that has
both pro-inflammatory and anti-inflammatory roles and can induce the expression of
anti-microbial peptides (Hirota, Martin, & Veldhoen 2010). The expression of IL-22 is
inhibited by TGF-β (McGeachy et al. 2007).

38
Table 1.1: Target cells and genes of IL-17.
IL-17 acts on a variety of cells due to its ubiquitous receptor. Shown are
representative target cell types, the role of IL-17 (adverse or beneficial) and key
target genes (Onishi & Gaffen 2010).
39
1.7.2 Chemokine and other surface receptors for T helper 17 cells
Several studies have examined the pattern of chemokine and cytokine receptor
expression on Th17 cells. CCR6 identifies almost all IL-17-producing T cells in
human peripheral blood and CD45RO+CCR6+ peripheral blood T cells secrete 100-
fold more IL-17 protein than do CCR6- T cells (Singh et al. 2008). However, CCR6+
IL-17-secreting population is not homogeneous (Acosta-Rodriguez et al. 2007).
Expression of CCR6 and CCR4 together identifies a homogeneous population of IL-
17-secreting peripheral blood memory T cells. Whereas, CCR6 and CXCR3
together detects Th1 cells secreting IFN-γ only and CD4+ T cells secreting both IFN-
γ and IL-17. It is now generally accepted that Th17 cells express IL-23R in humans.
Most recently, CD161, a C-type lectin, has been demonstrated to be a novel surface
marker for human Th17 cells as well. It was observed that not only do human Th17
cells express CD161 during their life, but they also exclusively originate from a
CD161+ naive CD4+ T cell precursor (Cosmi et al. 2008). AHR, a receptor which
interacts with environmental toxins such as dioxin, is abundantly expressed in Th17
cells and is important in IL-22 expression (Veldhoen et al. 2008a). It remains to be
determined whether human AHR polymorphisms exist that would link environmental
pollutants with a genetic predisposition to the development of autoimmunity.
1.7.3 Transcription factors related to T helper 17 cells and associated
cytokines
Stat3, the major signal transducer for IL-6, IL-21 and IL-23, is indispensable for IL-17
production and deletion of Stat3 results in the loss of IL-17 producing cells (Harris et
al. 2007;Laurence et al. 2007;Mathur et al. 2007). Stat3 is also responsible for the
induction of IL-23R and Foxp3 is upregulated in its absence. Like other T cell
subsets, Th17 also have a lineage-specific transcription factor, namely retinoic acid-
related orphan receptor gamma-t (RORγt) in mice or retinoic acid-related orphan
receptor C isoform 2 (RORc2) in human (Ivanov et al. 2006). Cells deficient in these
factors produce very little IL-17. Furthermore, over-expression of RORc2 induces
many aspects of the Th17 cell phenotype, including expression of CCR6, CCR4, CD161
and induction of a Th17-associated cytokine profile (Crome et al. 2009). Another closely
40
related transcription factor, RORα, can also play a role in controlling IL-17A and IL-
17F production (Yang et al. 2008c). Runx1 also interacts with RORγt and induces
optimal RORγt expression and IL-17 production in Th17 cells (Zhang, Meng, &
Strober 2008).
1.7.4 Positive and negative regulations of T helper 17 cells
The combination of cytokines that induce the differentiation of human Th17 cells is a
subject of much debate. It is not easy to compare the results of experiments designed to
investigate how human Th17 cells develop in vitro, because several different
activation conditions, types of culture media and experimental readouts have been
reported. Culturing human naive CD4+ T cells from cord blood in serum-free medium
revealed a need of TGF-β for Th17 differentiation (Manel, Unutmaz, & Littman 2008),
but TGF-β appears to have dual effects on human Th17 differentiation in a dose-
dependent manner.
While TGF-β is required for the expression of RORγt, it can inhibit the function of
RORγt at high doses and favour inducible regulatory T cell differentiation (Manel,
Unutmaz, & Littman 2008). However, inflammatory cytokines (IL-1β, IL-6, and IL-21
or IL-23) relieve the latter effect of TGF-β (Manel, Unutmaz, & Littman 2008).
Therefore, inducible regulatory T cells and Th17 cells are reciprocally regulated
during differentiation. A recent study has further explored the role of TGF-β in the
development of human Th17 cells in vitro, and found the requirement of TGF-β is indirect,
and related to suppression of Th1 development (Santarlasci et al. 2009). By using
serum-free medium, it has been clarified that the optimum conditions for human
Th17 differentiation are TGF-β, IL-1β, and IL-2 in combination with IL-6, and IL-21 or
IL-23 (Amadi-Obi et al. 2007;Annunziato et al. 2007;Volpe et al. 2008;Yang et al.
2008a). Of the latter cytokines, IL-23 have been suggested to be the most effective
(Chen et al. 2007b;Janeway et al. 2005;Manel, Unutmaz, & Littman 2008;Volpe et al.
2008;Wilson et al. 2007).
A key aspect of the control of Th17 proliferation is the regulation of IL-23R (Chen et
al. 2007b). Although naive CD4+ T cells express low levels of this receptor, the

41
combination of TGF-β, IL-1β, and IL-23 can induce IL-23R effectively (Chen et al.
2007b;Manel, Unutmaz, & Littman 2008). Thus, IL-23 promotes expression of its
own receptor, enabling it to become an effective inducer of IL-17. In addition to
cytokine-driven Th17 lineage commitment, it has been shown that exposure of memory
CD4+ T cells to prostaglandin E2 (PGE2), a mediator of tissue inflammation, results in
populations that are enriched for IL-17-producing cells. PGE2, acting via the
prostaglandin receptor EP2-mediated and EP4-mediated signalling and cAMP
pathways, also induces upregulation of IL-23 and IL-1 receptor expression in human
T cells (Boniface et al. 2009). Conversely, reduced IFN-γ production by freshly
isolated memory T cells in the presence of PGE2 was observed. Therefore, PGE2
may affect the balance between the highly inflammatory cytokine IL-17 and the
negative feedback loop exerted by IFN-γ considerably in chronically inflamed tissues
(Napolitani et al. 2009).
Because of their potential for inducing immune-mediated damage to the host, it is
perhaps not surprising that multiple mechanisms exist to inhibit Th17 production as
demonstrated in murine studies. Both Th1-related IFN-γ and Th2-related IL-4 have
been shown to downregulate Th17 differentiation (Harrington et al. 2005;Park et al.
2005). Recent studies have shown that IL-27, an IL-12 related cytokine, is able to
inhibit Th17 development as well as induce IL-10 production from T cells (Yoshida,
Nakaya, & Miyazaki 2009).
1.7.5 Co-expression of IL-17 and IFN-γ
Cells that co-express IFN-γ and IL-17 have been described in various papers and
named Th17/Th1 (Acosta-Rodriguez et al. 2007; Annunziato et al. 2007). It is
intriguing to note that both Th17 cells and these double-producer cells have been
reported to co-express the lineage-specific transcription factors T-bet and RORC and
express not only IL-23R but also IL-12Rβ2 chain. Stimulation of human Th17 clones
in the presence of IL-12 can downregulate RORC and upregulate T-bet and enable
these cells to produce IFN-γ in addition to IL-17A (Annunziato, Cosmi, & Romagnani
2010). Also, it has recently been demonstrated that human Th1 clones that express
the Th17-associated molecule CD161, can express the transcription factor RORC

42
(Cosmi et al. 2010). Similar to cells that expressed IL-17 alone, these Th17/Th1
cells have been observed to be resistant to suppression of proliferation by regulatory
T cells (Annunziato et al. 2007). These CD4+ T cells that co-express IL-17 and IFN-γ
may support the synergism between IL-17 and IFN-γ in producing tissue damage.
Whether the cells producing both IL-17 and IFN-γ represent a stable population or a
transitional phenotype is currently still unclear.
1.8 Regulatory T cells
Tregs play a key role in maintaining self-tolerance and in preventing immune
pathologies by suppressing the strength and/or nature of the immune response to
non-self antigens (Sakaguchi 2004;Shevach 2000). Treg cells were reported to
represent ~5-10% of the peripheral CD4+ T cells in humans (Dieckmann et al. 2001).
In humans, several different types of Tregs have been described and these include
specialised subsets of CD4+, CD8+, double-negative CD3+CD4-CD8-, γδ T cells, and
NKT cells (Allan et al. 2008b). It is likely that these Tregs interact with each other in
a synergistic manner to maintain immune homeostasis and therapeutic research is
most advanced for two main types of CD4+ Tregs: Foxp3+ and IL-10 producing type
1 T regulatory (Tr1) cells.
1.8.1 Mechanisms of action
The mechanisms of action of Tregs are complex and not well defined. These have
included cell contact-mediated suppression and secretion of suppressor cytokines
(IL-10, TGF-β, IL-35) (Brusko, Putnam, & Bluestone 2008;Collison et al. 2010). Treg
cell-mediated suppression affects the function of APC as well. The interaction of
CTLA-4 on Treg cells with CD80 and CD86 on DCs is an important pathway and
inhibition of CD80 and CD86 expression by Treg cells limits the capacity of the DCs
to stimulate naive T cells through CD28 resulting in immune suppression (Shevach
2009). Interactions between CTLA-4 and CD80 and CD86 can also lead to the
expression of the regulatory molecule indoleamine 2,3-dioxygenase (IDO) which
induces the catabolism of tryptophan into pro-apoptotic metabolites that result in the
43
suppression of effector T cell activation. IDO induction was found to depend on high
expression of CTLA-4 on the Treg cells (Grohmann et al. 2002).
Another cell surface antigen that may play a role in Treg cell suppression of DC
function is lymphocyte activation gene-3 (LAG-3), a CD4 homolog that binds MHC
class II molecules with very high affinity. Binding of LAG-3 to MHC class II
molecules expressed by immature DCs induces inhibition on DC maturation and
immunostimulatory capacity. Due to capability of activated human T cells to express
MHC class II molecules, Treg cell-mediated ligation of LAG-3 on effector cells might
also result in suppression (Liang et al. 2008). One other anti-inflammatory
mechanism that may be used by Treg cells is the catalytic inactivation of
extracellular ATP by CD39. This allows Treg cells to quench ATP-driven pro-
inflammatory processes on multiple cell types, particularly DCs (Borsellino et al.
2007).
Treg-mediated suppression can involve apoptosis and cytolysis of target cells by a
variety of means. It has been reported that Treg cells can upregulate Fas and FasL
expression following activation and suppress the proliferation of CD8+CD25- cells by
inducing Fas-mediated apoptosis (Strauss, Bergmann, & Whiteside 2009). Also,
Human CD4+CD25+Foxp3+ Treg cells can be activated by a combination of
antibodies to CD3 and CD46 to express granzyme A and kill activated CD4+ and
CD8+ T cells and other cell types in a perforin-dependent, Fas-FasL-independent
manner (Grossman et al. 2004). Additionally, cytokine deprivation by Treg cells may
contribute to their suppressive activity. It has been suggested that nTreg cells
suppress conventional T cell activation through competition for IL-2 consumption,
which may result in effector T cell death due to deprivation of growth factors
(Shevach 2009;Wan & Flavell 2008). All these mechanisms are believed to operate
collectively at the site of antigen presentation and a regulatory milieu that promotes
bystander suppression and infectious tolerance is created.
The phenomenon of bystander suppression results when Tregs are first activated
through their respective TCRs to induce suppressive activity, but once activated, the
cells with one antigen specificity can suppress effector T cells with many other
distinct antigen specificities in a non-specific manner. Infectious tolerance, on the
44
other hand, is a result of one population of Treg cells generating an
immunoregulatory milieu that persists long after the removal of the eliciting cell
population and promotes the outgrowth of a new population of Treg cells with
antigen specificities distinct from those of the original Treg population (Tang &
Bluestone 2008). This could explain how such a small population of cells can
regulate a much larger population of responder cells in vivo, and the two
mechanisms together allow Tregs of single specificity to establish a broad and stable
immunoregulatory effects.
1.8.2 CD4+CD25+/highFoxp3+ Treg cells
Human Treg cells were initially defined according to their high expression of CD25,
based on the finding that murine CD4+CD25+ T cells are highly suppressive. In mice,
CD4+CD25+ regulatory subset is isolated from all CD25+ T cells regardless of their
levels of CD25 expression. However, when similar criteria are followed to isolate
these cells from human blood, the resulting CD25+ cells did not consistently exhibit
an anergic phenotype or significant suppressive function. This is likely due to the
population being a mixture of activated effector T cells and Tregs. Further
investigations led to the identification of CD4+CD25high T cells which exhibited in vitro
characteristics similar to those of the CD4+CD25+ murine regulatory cells (Baecher-
Allan et al. 2001).
The CD4+CD25high cells may exist in a semi-activated state in vivo, expressing a
number of surface Ags that are usually associated with activated T cells, and these
Treg cells may be primed for a fast response, or constantly turned out in order to
engage in low level regulatory activity continuously. The suppressive function of
these cells was reported to be cytokine-independent as the addition of blocking anti-
TGF-β or anti-IL-10 Abs had no effect on the ability of CD4+CD25high cells to
suppress the proliferation of co-cultured CD4+CD25- cells (Baecher-Allan et al. 2001).
More recently, different Treg populations have been described according to their
origin, generation, and mechanism of actions and the Foxp3 transcription factor was
identified as both a marker and a lineage commitment factor for CD4+CD25+ Tregs.
45
Foxp3+ Treg cells exist in at least two forms. nTreg cells develop in the thymus and
regulate self-reactive T cells in the periphery. Little is known about the requirements
for thymic Treg cell development in humans. A second type, termed adaptive or
induced regulatory T cells (iTreg), can differentiate from naive CD4+CD25- T cell
precursors in peripheral lymphoid organs after antigen stimulation (Bluestone &
Abbas 2003).
It has been demonstrated that Foxp3+ Tregs of both direct thymic and peripheral origin can
specifically recognise a wide variety of Ags due to their broad αβ TCR specificity
(Fazilleau et al. 2007a). nTreg and iTreg cells differ in their principal antigen
specificities and strength of TCR stimulation needed for their generation. While
nTregs are primarily generated in response to self-antigens expressed in the thymus,
environmental antigens presented by dendritic cells in peripheral lymphoid organs
are essential for iTreg development (Jordan et al. 2001). Compared with iTregs, the
Foxp3 expression by nTregs are more stable, possibly due to these cells being
continuously stimulated by self-antigens (Horwitz, Zheng, & Gray 2008).
In terms of the CD25 expression level, it is high in nTreg cells, but more variable in
iTreg cells (Bluestone & Abbas 2003). For both types of Foxp3+ Treg cells, IL-2 has
important, non-redundant effects on their maintenance and survival. Evidence
indicated that Stat5 activation, likely driven by IL-2 (and IL-15), is required for Foxp3
differentiation in Tregs (Burchill et al. 2008). As Tregs express little or no IL-7Rα
(CD127), this in combination with high levels of CD25 expression was proposed as a
way to identify Treg cells (Liu et al. 2006). Up to 85-95% of CD4+CD25+CD127lo
cells were reported to show Foxp3+ expression after purification. However, like
CD25, CD127 is not flawless as it is down-regulated early during T cell activation
(Shevach 2006). Although other cell surface markers such as glucocorticoid-induced
tumor necrosis factor receptor (GITR), CTLA-4, Neuropilin-1, and PD1 have all been
described to be present on Treg cells, none of them are unique to Tregs (Brusko,
Putnam, & Bluestone 2008). GITR and CTLA-4 can also be expressed on recently
activated T cells.
Foxp3+ cells in humans were recently reported to be a heterogeneous group in terms
of their function and phenotype. They include not only suppressive T cells but also

46
non-suppressive ones that secrete pro-inflammatory cytokines. The main three
subpopulations identified were CD4+CD45RA-Foxp3high activated Treg (aTreg) cells
and CD4+CD45RA+FoxP3low resting Treg (rTreg) cells, both of which were potently
suppressive in vitro, and non-suppressive CD4+CD45RA-Foxp3low non-Treg cells
(Miyara et al. 2009).
Most of the Foxp3high aTreg cells were shown to originate from rTreg cells and these
appeared to be terminally differentiated Treg cells. aTregs were indicated to be the
main effectors of suppression which died rapidly after exertion of function. aTreg
cells also suppressed the proliferation of rTreg cells in a negative feedback fashion.
On the other hand, rTreg cells were demonstrated to be highly proliferative and
upregulate Foxp3 expression and differentiate to aTreg cells upon stimulation
(Miyara et al. 2009). Interestingly, activated and resting Tregs might operate on
different suppressive mechanism as it was observed that aTreg cells were more
active in IL-10 transcription but less active in TGF-β transcription than rTreg cells
(Miyara et al. 2009).
1.8.3 The role of transcription factor Foxp3 in Treg cells
Foxp3 is still the best characterised Treg-specific marker, and controls some
distinctive features of Tregs such as promoting the expression of CD25 (IL-2
receptor α chain), CTLA-4 and TGF-β receptor (Brusko, Putnam, & Bluestone 2008).
The expression of Foxp3 has been demonstrated to correlate with suppressive ability
(Yagi et al. 2004). Importantly, it is only when human cells express Foxp3 at high
and constitutive levels, however, that they acquire suppressor function (Allan et al.
2008a). Although transient Foxp3 expression is also possible in CD45RA+ cells with
TGF-β stimulation in vitro following activation, its expression may not always
correlate with suppressive capability (Tran, Ramsey, & Shevach 2007). Of note, not
all CD25+ cells are suppressive and not all Foxp3+ cells are CD25+ (Fontenot et al.
2005).
Foxp3 was originally suspected to be important for Treg functions in 2001 because
its mutations were linked to the autoimmune scurfy mice and human
47
immunodysregulation, polyendocrinopathy, enteropathy, X-linked syndrome (IPEX)
(Brunkow et al. 2001;Patel 2001). Mice that lack Foxp3, either through spontaneous
or targeted mutation, fail to develop Treg cells and succumb to fatal autoimmune
lymphoproliferative disease. Mutations in the human Foxp3 gene, located on
chromosome Xp11.23, result in IPEX syndrome, which is characterised by insulin-
dependent diabetes, thyroiditis, massive T cell infiltration into the skin and
gastrointestinal tract, high levels of serum autoantibodies, and chronic wasting. To
date, about 20 different mutations in Foxp3 have been described in patients suffering
from IPEX. Because Foxp3 is on the X chromosome, the affected population is
mainly boys.
Foxp3 has three discernible functional domains, a carboxyl-termination forkhead
domain (FKH; aa 338-421), a single Cys2His2 zinc finger (aa 200-223), and a
leucine zipper-like motif (aa 240-261). There is also a domain at the amino terminal
region that is reasonably proline-rich (aa 1-193). Mutations have been found
throughout Foxp3 in IPEX patients, including in each of the domains described
except for the zinc-finger, demonstrating that these regions of the protein are
important for proper function (Buckner & Ziegler 2008). Moreover, Foxp3 has been
shown to be part of a large macromolecular complex in Tregs. This complex
includes both histone acetyltransferases (TIP-60) and histone deacetylaces (HDAC7
and HDAC). Interestingly, Foxp3 itself is also acetylated (Li et al. 2007).
In contrast to the mouse, there are two isoforms of human Foxp3, differing by the
inclusion or exclusion of exon 2 (aa71-105). Although the expression levels of these
two isoforms appear to be equivalent in human Treg cells, the isoform lacking exon 2,
Foxp3B, is functionally different from the full-length one, Foxp3A, in interaction and
suppression (Allan et al. 2005). The interaction between full-length Foxp3 and
RORα inhibits transcriptional activation mediated by RORα, but not in the case of the
isoform lacking exon 2 as the region of Foxp3 involved in the interaction is encoded
by exon 2 (Du et al. 2008). However, either of the two isoforms can confer
regulatory function when strongly overexpressed (Aarts-Riemens et al. 2008).
Despite the obvious importance of Foxp3 in the development and function of Treg
cells, its mechanism of action needs to be investigated further. It has been shown so

48
far that Foxp3 can directly interact with NFAT, a key regulator of T cell activation and
anergy, and the NF-κB subunit p65. NFAT forms complexes with the AP-1 family of
transcription factors and regulates T cell activation-associated genes (Wu et al.
2006). Notably, many of the genes regulated by Foxp3 are also target genes for
NFAT, including the CD25 and CTLA-4 genes which are promoted by both NFAT
and Foxp3 (Hori, Nomura, & Sakaguchi 2003). Moreover, recent work has identified
a crucial regulatory role for retinoic acid in promoting Foxp3 induction and inhibiting
Th17 cell differentiation (Elias et al. 2008;Mucida et al. 2007).
1.8.4 IL-10 and IL-10-secreting Treg cells
IL-10 was originally identified by Mosmann and colleagues (Fiorentino, Bond, &
Mosmann 1989;Moore et al. 1990). It has been known for many years that IL-10 is
an immunosuppressive cytokine that can inhibit actions of many types of immune
cells, suppress the progression of immune-mediated diseases and play a central role
in maintaining tolerance (Moore et al. 2001). Apart from its immunosuppressive
effects, IL-10 can also act as a growth factor for mast cells, promote B cell growth
and differentiation, and stimulate CD8+ T cell proliferation (Moore et al. 1993). IL-10
production can be promoted by IL-10 itself, IL-27 and TGF-β (Zhu & Paul 2008).
IL-10 is secreted by monocytes, stimulated macrophages, DCs, T cells, B cells,
eosinophils, mast cells, keratinocytes, and epithelial cells and is normally produced
late in the immune response compared with other cytokines to dampen the response
by suppressing inflammatory cytokines (Moore et al. 1993;Mosser & Zhang 2008).
CD8+ T cells and all the CD4+ T cell subsets including Th1, Th2, Th17, as well as
Treg cells are capable of producing IL-10 under certain circumstances. In the case
of IL-10 production by Th1 and Th17 cells, it may serve as a negative regulatory
mechanism for limiting their own effector function to prevent host tissue damage
(Jankovic & Trinchieri 2007). Of note, IL-10 production was reported to be
independent of Foxp3 in Treg cells (Gavin et al. 2007).
The cytokine signals through a two-receptor complex consisting of two copies each
of IL-10R1 and IL-10R2 (Moore et al.2001). IL-10R1 binds IL-10 with a relatively
49
high affinity and the recruitment of IL-10R2 to the receptor complex makes only a
marginal contribution to ligand binding (Mosser & Zhang 2008). The binding of IL-10
to the receptor complex activates the Janus tyrosine kinases, JAK1 and Tyk2,
associated with IL-10R1 and IL-10R2, respectively, to phosphorylate the cytoplasmic
tails of the receptors. This results in the recruitment of Stat3 to the IL-10R1
(Donnelly et al. 2004). After homodimerisation of Stat3, the Stat homodimer is
released from the receptor. This is followed by translocation into the nucleus and the
binding of Stat 3 to Stat-binding elements in the promoters of various genes. IL-10
gene itself is upregulated by Stat3 (Staples et al. 2007). Stat3 also activates the
suppressor of cytokine signaling 3 (SOCS3), which exerts negative regulatory effects
on various cytokine genes (Murray 2007;O'shea & Murray 2008). Moreover, the
phosphoinositide 3-kinase (PI3K) pathway is also activated by IL-10 (Mosser &
Zhang 2008).
Most haematopoietic cells constitutively express low levels of IL-10R1, and receptor
expression can often be considerably upregulated by various stimuli. Non-
haematopoietic cells, such as fibroblasts and epithelial cells, can also upregulate IL-
10R1 in response to stimuli. On the other hand, IL-10R2 is expressed on most cells,
and thus a large number of diverse cells have the capacity to bind to and consume
IL-10 (Mosser & Zhang 2008). Interestingly, activated T cells have been described
to downregulate expression of IL-10R1 to overcome the suppressive effects of IL-10,
whereas activated monocytes upregulate this molecule and become more prone to a
negative feedback pathway (Liu et al. 1994;Moore et al. 2001).
Although many cell types produce IL-10, Tr1 cells characteristically produce high
levels of IL-10 as well as moderate levels of IL-5, IFN-γ and TGF-β, and are one of
the main T cell mediators of cytokine-dependent immune regulation (Roncarolo et al.
2006). Currently, neither a single cell surface marker nor a combination of markers
could be used to track and purify Tr1 cells, thus it is difficult to isolate these cells ex
vivo (Allan et al. 2008b). However, Tr1 cells have been reported to be induced from
naive CD4+ T cells activated by tolerogenic APCs in the periphery in the presence of IL-
10 (Roncarolo et al. 2006). These Tr1 cells mediate suppressive effects by secreting IL-10
and TGF-β, and promote bystander suppression once activated via the TCR (Allan et al.
2008b). Although Tr1 cells from humans usually produce IFN-γ, the production levels
50
of the cytokine are at least 1 log lower than those produced by Th1 cells (Levings et
al. 2001). Whether or not IFN-γ has any functional role remains to be determined.
Apart from being able to regulate the responses of naive and memory T cells in vitro
and in vivo, Tr1 cells also suppress the production of immunoglobulin by B cells
(Kitani et al. 2000).
1.8.5 TGF-β and TGF-β-secreting Treg cells
TGF-β is another regulatory cytokine with a pivotal role in regulating immune
responses and it has pleiotropic effects on proliferation, differentiation, migration and
survival in a broad range of cell lineages. In mammals, three homologous TGF-β
isoforms, TGF-β1, TGF-β2, TGF-β3, have been identified, and the effects of these
three cytokines on immune cells are largely indistinguishable in vitro. TGF-β1 is the
predominant form expressed in the immune system as lymphoid cells produce
mostly TGF-β1 (Li & Flavell 2008). TGF-β is synthesised in an inactive form, pre-
pro-TGF-β precursor, and additional stimuli are required to liberate active TGF-β.
The active form of TGF-β can function in either a cell-surface bound form or a
soluble form (Wan & Flavell 2008). TGF-β is operative as a surface bound protein
on nTRegs, and blockade of cell-surface TGF-β disrupts the suppressive function of
nTRegs (Abdulahad, Boots, & Kallenberg 2010).
By binding to TGF-β type I (TGF-βRI) and type II (TGF-βRII) receptors, both of which
are serine/threonine kinases, TGF-β exerts its functions primarily through the Smad-
dependent pathway. In addition, TGF-β transduces signals through Smad-
independent pathways by activating phosphatidylinositol 3-kinase (PI3K) and various
MAPKs (Li et al. 2006). TGF-β has strong anti-proliferative effects on CD4+ T cells
owing to its ability to inhibit IL-2 production and to upregulate cell cycle inhibitors
(Gorelik & Flavell 2002). TGF-β also impedes Th1 and Th2 cell differentiation by
suppressing the transcription factors required for expression of IFN-γ (T-bet) and IL-
4 (GATA-3) respectively (Gorelik, Constant, & Flavell 2002;Heath et al. 2000). At the
level of APCs, TGF-β can block the activation of macrophages and their ability to
produce pro-inflammatory cytokines. In addition, it thwarts the maturation of DCs
51
and, like IL-10, inhibits upregulation of MHC class II surface expression (Gorelik &
Flavell 2002).
TGF-β is produced by activated macrophages, but also by a wide variety of lymphoid
and non-lymphoid cells (Wahl, McCartney-Francis, & Mergenhagen 1989). Foxp3+
Treg cells also contributes significantly as a source of TGF-β and the production of
this cytokine plays a crucial role in controlling autoimmune diseases (Li, Sanjabi, &
Flavell 2006). Besides its well-known inhibitory activities on effector T cell
differentiation and the acquisition of Th cell functions, TGF-β has an important role in
the generation of Tregs. It has been shown that activation of CD4+ cells in the
presence of TGF-β promotes expression of CD25 and CTLA-4 (Zheng et al. 2002).
Also, TGF-β activates Smad3 while TCR stimulation induces the activation of NFAT.
Smad3 and NFAT collaborate to remodel the Foxp3 enhancer region and induce
Foxp3 expression (Tone et al. 2008). As TGF-β induces the Foxp3 expressing
CD4+CD25+ Tregs, it can therefore indirectly influence T cell activation.
T helper 3 (Th3) regulatory T cells, another subset of adaptive Tregs, express high
levels of TGF-β, and are suggested to be antigen-induced regulatory T cells at the
tissue site of inflammation (Chen et al. 1994). Surface marker CD25 cannot
distinguish Th3 from thymic-derived Tregs as they can display this molecule after
activation (Zheng et al. 2002).
1.8.6 CD8+ regulatory T cells
In recent years, CD4+ Treg function has become the object of intense study.
Nevertheless, regulatory T cells are not strictly confined to the CD4+ T cell
compartment. In 1972, Gershon et al. published their landmark article about
‘suppressor T cells’ paving the way for the concept that T cells are not only able to
augment but also to suppress immune response (Gershon et al. 1972). In those
early years, the focus was in fact mainly on CD8+ T cells. Although CD8+ Tregs also
contribute to immunoregulation, circulating CD8+Foxp3+ T cells constitute a
minuscule fraction of peripheral CD8+ T cells in humans. The relatively low
frequency of CD8+ Treg cells in the peripheral circulation in humans makes in vivo
52
identification and functional characterisation difficult. To date, knowledge on CD8+
Tregs in general, remains scarce compared with CD4+ Tregs. Research on CD8+
Treg cells has also received considerably less attention (Gavin et al. 2006).
In parallel with naturally occurring and adaptive CD4+ Treg cells, CD8+ Treg cells
may originate from both the thymus and the periphery, where they develop from
naive or effector CD8+ T cells (Aandahl, Torgersen & Tasken 2008). CD8+ Treg cells
generally express low levels of CD25 and Foxp3 and, as for CD4+ Treg cells, no
distinguishing marker has been identified that discriminates between naturally
occurring and adaptive CD8+ Treg cells (Aandahl, Torgersen & Tasken 2008).
Within CD8+ T cell subset, CD8+CD25+ cells have been described to share similar
phenotypic characteristics with CD4+CD25+ thymocytes, since they may be found in
the same areas of human thymus and constitutively express Foxp3 and GITRmRNA.
Following stimulation, CD8+CD25+ thymocytes express CTLA-4 and TGF-β1 on their
surface but do not produce any cytokines or express much CD127 (Cosmi et al.
2003). Also, CD8+ Treg cells have been reported to express TNFR2, and the
combined expression of TNFR2 and CD25 can identify a potent subpopulation of
CD8+ Treg cells (Ablamunits, Bisikirska, & Herold 2010). Contact inhibition via
CTLA-4 and TGF-β1 has been demonstrated to be the mechanism responsible for
the suppressive capacity of CD8+CD25+ Treg cells. It has been suggested that
CD8+CD25+ Treg cells may be responsible for the regulation of T cell responses
directed against viruses and transformed cells, which are usually exploited by
cytotoxic CD8+ T lymphocytes (Cosmi et al. 2003).
Furthermore, two subsets of adaptive CD8+CD28- Treg cells have been described to
exist in humans. Antigen-specific CD8+CD28- Treg are regulatory cells that differ
from the non-antigen-specific CD8+CD28- Treg subset by several aspects. In terms
of phenotype, antigen-specific CD8+CD28- Treg cells express both CTLA-4 and
Foxp3 (Scotto et al. 2004). They act through cell-to-cell direct contact, promoting the
upregulation of inhibitory ILT3 and ILT4 receptor molecules on APCs, which is
essential to the tolerogenic phenotype acquired by APCs. Tolerogenic APCs show
decreased expression of costimulatory molecules and induce antigen-specific
unresponsiveness in CD4+ T helper cells (Chang et al. 2002).
53
On the other hand, non-antigen-specific CD8+CD28- Treg cells do not express Foxp3
and downregulate CD127 during their differentiation from circulating non-regulatory
CD8+CD28- T lymphocytes to Tregs. The generation process requires monocytes
that secrete IL-10 after GM-CSF stimulation. GITR is involved in generation
processes as well but not in suppressor function of these cells (Fenoglio et al. 2008).
Their suppressive function, including one on the antigen-specific cytotoxic activity of
cytotoxic T lymphocytes, is mediated by IL-10 (Filaci et al. 2004). Other types of
CD8+ regulatory T cells are less well characterised.
Like in CD4 T regulatory cells, CD8 Treg cells employ their suppressive function by
releasing cytokines or by directly altering the functional status of T cells or APC.
Secreted products and cell surface receptors facilitating suppression are only
partially understood. Also, CD8 Treg cells are a heterogeneous group of subsets.
Whether all these subsets derive from a common precursor or whether different
types of CD8 T cells can differentiate into suppressor cells is not known.
1.9 Collaboration between transcription factors in fine-tuning T helper
differentiation
The master transcription factors and the Stat proteins are indispensable for Th cell
fate determination and cytokine production. Unlike the activities of master
transcription factors which are mainly influenced by their expression levels, those of
the Stats are controlled by cytokine-mediated post-translational modification,
involving tyrosine and/or serine/threonine phosphorylation. Not only do the activated
Stat proteins, in collaboration with master transcription factors, dictate the production
of the key cytokines by Th cells, they also play crucial roles in the induction of the
master transcription regulators (Zhu, Yamane, & Paul 2010). Other transcription
factors, either constitutively expressed or induced by TCR and/or cytokine-mediated
signalling, are also involved in attaining or modifying Th cell functions.
Runx proteins have been indicated to have important roles at multiple stages of T
cell development and in the homeostasis of mature T cells. It was shown that Runx1
54
activates IL-2 and IFN-γ gene expression in conventional CD4+ T cells by binding to
their respective promoter. Furthermore, Runx1 interacts physically with Foxp3
protein, and it was demonstrated that this interaction might be responsible for the
suppression of IL-2 and IFN-γ production and upregulation of Treg cell-associated
molecules (Ono et al. 2007). Besides being important for Th2 cell differentiation,
IRF4 is also indispensable for Th17 differentiation (Brustle et al. 2007). BATF, an
AP-1 family transcription factor, plays a critical role in Th17 cell differentiation as it is
required for RORγt induction (Schraml et al. 2009). Despite not being involved in
determining T helper lineage fates, several transcription factors play a major role in
cytokine production upon TCR and /or cytokine stimulation and these include
members of the NFAT and Notch families.
T cells express NFAT1, NFAT2, and NFAT4. NFAT forms a complex with AP-1 and
NFκB and regulates the expression of IL-2, IL-4, and IFN-γ in conventional T cells
(Hu et al. 2007). NFAT proteins play key roles in modulating Th cell differentiation
and are indispensable for the production of effector cytokine upon TCR activation in
differentiated Th cells. TCR ligation increases intracellular Ca2+ concentration. Ca2+
binds to calmodulin, which in turn triggers the activation of calcineurin. Activated
calcineurin dephosphorylates NFAT proteins, which results in the translocation of
NFAT to the nucleus and subsequent induction of NFAT-dependent gene
transcription (Macian 2005).
On the other hand, Notch signaling has an important co-stimulatory role in controlling
optimal T cell activation as inhibition of Notch activation decreases the division of
both CD4+ and CD8+ T cells considerably in response to TCR stimulation (Zhu,
Yamane, & Paul 2010). Notch is also important in regulating differentiation of naive
CD4+ T cells into distinct Th lineages such as iTreg and Th17 cells. Collectively, all
these molecules form a sophisticated transcription factor network, which is critical for
Th cell fate determination, expansion, and function.
55
1.10 Plasticity of T helper subsets
CD4+ T cell lineage commitment was considered as a unidirectional process in early
studies. However, the discovery of new CD4+ T cell fates and observation of cells
with mixed phenotypes have raised the questions about the stability of CD4+ T cell
subsets and relationship among lineages. Recent findings suggest that CD4+ T cells
frequently have the capacity to redirect their programs as to achieve balance
between regulatory and effector functions. This requires plasticity in the regulation of
transcriptional targets and the process allows the host to shift resources as
appropriate to eliminate offending pathogens and limit potential collateral tissue
damage (Veldhoen 2009).
Th1 and Th2 cells antagonise each other’s development and have not been
observed to be converted into Th17 cells (Veldhoen 2009). However, Th17 clones
were described to express T-bet, the Th1 transcription factor, and they could be
shifted to Th1 by the addtion of IL-12, an effect that was partially antagonised by IL-
23. This suggested a flexibility of human Th17 cells and their possible common
developmental origin with Th1 cells (Annunziato et al. 2007). Also, in vitro generated
mouse Th17 cells were able to be converted into Th2 cells in response to IL-4
(Lexberg et al. 2008). However, this has not been verified in humans.
In addition, Foxp3+ Treg cells capable of IL-17 production have been identified and
these cells co-express transcription factors RORc2 and Foxp3 (Koenen et al.
2008;Voo et al. 2009). Inflammatory cytokines including IL-21, IL-23 and especially
IL-1β promote IL-17 production by Tregs (Koenen et al. 2008;Voo et al. 2009).
Conversion of Tregs into IL-17-producing cells can be facilitated by the stimulation of
APCs, especially monocytes, and IL-2 as well (Deknuydt et al. 2009;Koenen,
Smeets, Vink, van Rijssen, Boots, & Joosten 2008). However, the addition of TGF-β
and IL-6 has no effect (Koenen et al. 2008). The IL-17-producing Foxp3+ Treg cells
preferentially express CCR6 and these cells inhibit the proliferation of CD4+
responder T cells in vitro, albeit to a lesser extent than freshly isolated Tregs
(Koenen et al. 2008; Voo et al. 2009). Notably, unlike conventional Th17 cells, these
IL-17+FoxP3+ T cells have not been detected to express CD161, IL-22 or TNF-α
(Ayyoub et al. 2009).
56
After incubation with low numbers of CD40-activated allogeneic B cells, naive human
CD4+ T cells have been shown to preferentially differentiate into alloantigen-specific
CD4highCD25high Treg cells. These differentiated cells potently suppress effector T
cell responses and express T-bet, IFN-γ, and CXCR3, the features of Th1 effector
cells. As CXCR3 confers the preferential trafficking of T cells to tissue sites of IFN-γ,
these Th1-like Treg cells have been suggested to be useful for regulating
pathological Th1 effector responses (Zheng et al. 2010).
As yet, the functional significance of this plasticity between Th17, Th1 and Foxp3+
Treg cells in humans is poorly understood. It has been suggested by promoting
Th17 cells during the initial response, Treg-mediated suppression could be
undermined via production of inflammatory cytokines. On the other hand, persisting
inflammation might drive cells into Th1-like phenotype and increase their
susceptibility to suppression by Treg cells (O'Connor, Taams, & Anderton 2009).
Reprogramming of T helper cell effector functions may be critical for host defense to
specific microbial challenge.
1.11 Subsets of CD8+ effector T cells
Historically, CD8+ T cells have been regarded as a homogeneous population of
cytotoxic cells producing a limited number of cytokines. Indeed, some of the CD8+ T
cells can become directly cytotoxic via perforin and granzyme B secretion (Kaech &
Wherry 2007). More recently, it has become clear that CD8+ T cells have the
potential to produce a much wider array of cytokines, and the existence of distinct
subsets of CD8+ T cells that are similar to their CD4+ counterparts has been
established (Vukmanovic-Stejic et al.2000). CD8+ effector T cells designated Tc1 or
Tc2, based on their production of IFN-γ or IL-4, can be generated in vitro with the
addition of IL-12 and IL-4 respectively (Seder & Ahmed 2003). Tc1 clones have
been shown to favour the development of CD4+ effectors that are Th1-biased.
Whereas Tc2 clones not only can promote Th2 effectors but also can efficiently
suppress the development of Th1 cells (Vukmanovic-Stejic et al. 2000). With
regards to in vitro cytolytic activity and the level of FasL expression, however, no
57
difference has been reported between Tc1 and Tc2 cells (Vukmanovic-Stejic et al.
2000).
Two of the best-described regulators of effector CD8+ T cell differentiation are a pair
of highly homologous T-box transcription factors, Eomesodermin and T-bet. Studies
have indicated that Eomesodermin is responsible for regulating expression of
granzyme B, perforin, and cytotoxicity (Pearce et al. 2003). T-bet, the main
transcription factor controlling Th1 differentiation, have been reported to be rapidly
induced in activated CD8+ T cells downstream of TCR, IFN-γ and IL-12 signalling
(Rutishauser & Kaech 2010). The introduction of T-bet into polarised Tc2 cells can
result in the conversion of these cells into Tc1 cells with production of IFN-γ and
repression of IL-4 production (Szabo et al. 2002). Also, GATA-3 has been
demonstrated to be negatively correlated with the proportion of Tc1 cells and
positively correlated with the percentage of Tc2 cells in peripheral blood
mononuclear cells (Tan et al. 2007).
Recently, IL-17 producing CD8+ T cells (Tc17) have been identified in CD27+/-
CD28+CD45RA- memory subsets and reported to differentiate from the same
precursors as IFN-γ-producing CD8+ T cells. These cells could produce IL-17 alone
or in combination with IFN-γ (Kondo et al. 2009). Tc17 cells are capable of secreting
high levels of IL-22 and they express cytokine receptor IL-23R (Billerbeck et al.
2010). CD161 are a relevant marker for these human IL-17 producing cells as well.
In terms of chemokine receptors, they have been shown to express CCR6 and a
high level of CCR5 (Kondo et al. 2009). Also, these cells are associated with
transcription factors consistent with type 17 differentiation, including RORγt (RORc)
and RORα (Billerbeck et al. 2010). By culturing naive CD8+ T cells stimulated with
anti-CD3 and anti-CD28 mAbs in the medium with IL-1β, IL-6, IL-23, and TGF-β,
Tc17 cells can be induced (Kondon et al. 2009).
1.12 γδ T cells
Patients with bacterial, parasitic and viral infections often have increased numbers of
γδ T cells in the peripheral blood and in autoimmune disease patients, γδ T cells are
58
often noted for being overrepresented among the lymphocytes that infiltrate target
tissues (Chien, Jores, & Crowley 1996;Konigshofer & Chien 2006). γδ T cells not
only support regeneration of epithelium but also attract neutrophils just after tissue
injury so as to remove necrotic epithelial cells (Kuhl et al. 2009). Like αβ T cells,
they develop in the thymus before entering the periphery. They make up a minor
part of human thymocytes and T cells in the spleen, lymph nodes, and peripheral
blood after birth, but are greatly enriched in epithelial tissues, such as the epidermis
and mucosa of the digestive and reproductive tracts (Bonneville, O'Brien, & Born
2010). They play a major role in mucosal immunity and are induced in the early
response just after innate but well ahead of the conventional adaptive immune
response (Deknuydt, Scotet, & Bonneville 2009). Several γδ T cell subsets have a
memory and pre-activated phenotype in naive individuals that can respond to a given
challenge and enable responses to occur rapidly, without the need for prior selection
and expansion. In fact, antigen-naive γδ T cells are known to produce large amount
of effector cytokines within hours upon infection (Roark et al. 2008).
In support of their roles in early responses to microbial infections, studies have
revealed that some human γδ T cells express functional TLRs such as TLR2 (Deetz
et al. 2006;Martin et al. 2009). Unlike αβ T cells, the detection of stress-induced
molecules by γδ T cells is achieved by both TCR and non-TCR molecules, such as
TLRs and NK receptors that act separately, synergistically or additively to activate
particular γδ T cell effector functions (Bonneville, O'Brien, & Born 2010). Of note, γδ
T cells frequently express invariant or closely related γδ TCRs in a given tissue site,
which differ from one tissue to another, reflecting homogeneous, but distinct, antigen
recognition repertoires. γδ T cells express mostly Vγ9Vδ2 (Vγ2Vδ2 in the American
nomenclature) TCR in peripheral blood but mostly Vδ1 and Vδ3 TCR in spleen and
gut respectively (Deknuydt, Scotet, & Bonneville 2009). The repertoire of γδ TCRs is
very limited but they directly recognise poorly defined polymorphic structures without
the requirement for antigen-processing and presentation by specialised APCs.
Unlike αβ T cells, human Vδ2+ T cells do not recognise peptides presented by
classical or non-classical MHC molecules. Instead Vδ2+ T cells recognise a group of
non-peptidic prenyl pyrophosphate antigens known as phosphoantigens (Sireci et al.
2001).

59
It has been demonstrated that γδ T cells are able to produce a range of cytokines
similar to those of αβ T cells (Konigshofer & Chien 2006). Apart from the production
of soluble mediators, γδ T cells usually display potent cytotoxic effector activity. Also,
these cells can kill susceptible target cells by the secretory pathway through the
production of perforin and granzymes, but can also make use of the receptor-ligand
such as Fas/FasL pathway (Dalton et al. 2004;Narazaki et al. 2003). Vδ2 T cells
generally have high cytotoxic activity and display a predominant Th1-like pattern of
cytokine production as they release massive amounts of TNF-α and IFN-γ. However,
certain subsets of γδ T cells, like Vδ1+ T cells, have lower cytotoxic potential and
produce either Th1, Th2 cytokines or IL-17 (Bonneville, O'Brien, & Born
2010;Deknuydt, Scotet, & Bonneville 2009). In contrast to the slow adaptive Th17
response, γδ T cells along with NKT cells are potent innate IL-17 producers which
contribute to the initial defence against pathogens (Michel et al. 2007;Roark et al.
2008).
Several transcription factors have been described in relation to γδ T cell effector
function. IFN-γ production is regulated by the transcription factors T-bet and
eomesodermin (Chen et al. 2007a), IL-4 production correlates with GATA3
expression (Qi et al. 2009), and IL-17 production is controlled by RORγt (Fenoglio et
al. 2009;O'Brien et al. 2010). Besides, potent regulatory properties have been
reported in γδ T cells as deficiency in these cells exacerbated colitis in animal
models. In one recent study, human γδ T cells with negative Foxp3 expression were
shown to suppress T helper cell growth at least to the same degree as CD4+CD25+ T
cells in an IL-2 independent manner and they responded poorly to CD3/CD28
stimulation. The mechanism of suppression was suggested to be related to strong
TGF-β secretion, especially by the Vδ1 subset as they were found to be the main
TGF-β producer compared to Vδ2 T cells (Kuhl et al. 2009). In a separate study,
Vδ2 Treg cells which expressed Foxp3, was induced in vitro with the combination of
TGF-β1, IL-15 and TCR stimulation. These Foxp3+ Vδ2 T cells displayed higher
levels of activated phenotype (CD69+, CD25+, and HLA-DR+) and an upregulated
expression of CTLA-4 molecules compared with the Foxp3- Vδ2 T cells. Similar to
nTreg cells, cell contact appeared to be central to the inhibitory activity in these cells
(Casetti et al. 2009).
60
1.13 NKT cells
NKT cells are a unique and relatively small subset of T cells that were originally
defined to share properties of both conventional T and NK cells. They are involved
in immediate immune responses, tumor rejection, immune surveillance and control of
autoimmune diseases. They make up <0.1% of peripheral blood and are
distinguished from NK cells by the expression of the CD3/TCR complex as well as
NK cell markers, such as CD161c and CD56 (Hammond & Godfrey 2002). They are
a heterogeneous population of lymphocytes and are currently divided into three
categories according to their TCR α-chain diversity, CD1d dependency, and
reactivity to the glycolipid α-galactosylceramide (α-GalCer). Type I classical
“invariant” NKT (iNKT) cells possess invariant TCR α-chains and react to α-GalCer in
a CD1d-dependent manner. Type II cells show diverse TCR α-chains but are also
CD1d dependent. Type III cells are CD1d independent and possess diverse TCR α-
chains. Both types II and III NKT cells do not react to α-GalCer (Rachitskaya et al.
2008).
Human iNKT cells express a Vα24-Jα18 TCR α-chain coupled with a Vβ11 β-chain
and can be further allocated as CD4+ iNKT, CD8+ iNKT or double-negative iNKT
cells (Gabriel, Morley, & Rogers 2009). Due to the constitutive expression of IFN-γ
and IL-4mRNA, iNKT cells were demonstrated to produce great amounts of both
Th1- or Th2-type cytokines within hours of TCR stimulation (Godfrey & Kronenberg
2004). Interestingly, innate production of IL-17 by this group of cells was discovered
recently in human as well. IL-17 production was detected after purified NKT cells
from healthy donors were stimulated with anti-CD3 Ab and IL-23 for 24 hours,
independent of exogenous IL-6 (Rachitskaya et al. 2008). Although NKT cells
potentially can act as effector cells, it is likely that regulatory function reflects their
true physiologic role which is more consistent with their small numbers. Similar to
CD4+CD25+ Tregs, iNKT cells have been identified to express CD25 and regulate a
range of immune responses. Therefore, it was suggested that some activity
attributed to CD4+CD25+ Tregs could actually be related to CD4+CD25+ NKT cells
(Godfrey & Kronenberg 2004). Aberrant number and/or function of iNKT cells has
been reported for various organ-specific and systemic autoimmune conditions such
as RA, MS and SLE (Hammond & Godfrey 2002).
61
1.14 Central and peripheral tolerance
The goal of the immune system is to protect individuals from foreign agents while
avoiding pathology or undesirable outcomes to self during such useful responses or
owing to undesirable reactivity to self. The immune system relies on continuous
generation of lymphocytes in primary lymphoid organs and hence, tolerance
induction to self must be a continuous process throughout life. Because the
receptors of immune cells are generated in a random process, ones with self-
reactive receptors need to be eliminated (Daniel, Nolting, & von Boehmer 2009).
Self-tolerance is achieved via multiple checkpoints operating on both precursor
lymphocytes during their development in primary lymphoid tissues (central tolerance)
and on mature cells in secondary lymphoid tissues as well as parenchymal sites
(peripheral tolerance). Self-reactive immune cells that manage to escape these
checkpoints can pose a serious threat to health, as they can lead to the development
of autoimmunity (Castellino & Germain 2006).
To ensure the usefulness and safety of mature T cells, developing T cells within the
thymus undergo rigorous selection. During development, most of the thymocytes
undergo ‘death by neglect’ as most TCRs cannot recognise any self-peptide/MHC
molecules. If their TCRs have low affinity for self-peptide/MHC molecules, the
thymocytes stay alive and expand. This positive selection ensures that mature T
cells have the potential to recognise foreign peptide in association with self-MHC. At
the late stage of positive selection, CD4/CD8 lineage commitment occurs and
thymocytes differentiate into either single CD4+ or single CD8+ T cells (Daniel,
Nolting, & von Boehmer 2009).
Positively selected CD4+ and CD8+ thymocytes test their TCRs against a broad array
of self-MHC and self-peptide combinations for self-reactivity. If TCRs have a high
affinity for self-peptide/MHC molecules, negative selection (deletion) occurs as the
cells are induced to upregulate Bim, a protein which drives cell death by apoptosis.
Negative selection removes potentially dangerous T cells that recognise self-
peptides, and dendritic cells are important for the negative selection of T cells in the
thymus. However, such negative selection is not a foolproof mechanism, and some
62
T cells capable of damaging autoimmune reactivity escape to the periphery (Daniel,
Nolting, & von Boehmer 2009). Despite the processes of positive and negative
selection in the thymus, all individuals still harbor a subset of cells that have TCRs
directed toward self-antigens in peripheral tissues and organs. Yet, most individuals
never develop autoimmune disease.
To further limit effector responses to both self as well as harmless environmental
antigens, multiple mechanisms in the immune system function to control unwanted
immunity. To activate mature T lymphocytes, the dose and affinity of the antigen
required is higher than for immature thymocytes, which leads to activation-related
ignorance of many self-peptides presented in the periphery. Also, T cell responses
are regulated by requirements for simultaneous or coordinated signalling. Antigen
presenting cells, in particular DCs, require stimulation through innate receptors, such
as TLRs, to be highly effective in triggering naive T cells and to induce production of
mediators that facilitate T cell clonal expansion, viability, and development of effector
function. A requirement for multiple antigen-specific lymphocytes to interact, either
directly with each other or through the intermediation of DCs, further decreases the
risk of inappropriate responses to harmless antigens and limit the capacity of
potentially autoaggressive cells (Castellino & Germain 2006). Another pathway
involved is activation-induced cell death (Bach 2002).
In addition, some thymocytes are selected to become regulatory T cells, which are
usually cells which have an intermediate affinity for self-peptide (Hogquist, Baldwin,
& Jameson 2005). Peripheral tolerance mechanisms involving regulatory T cells are
essential in dealing with low-affinity, self-reactive cells and keep them in check
(Daniel, Nolting, & von Boehmer 2009). It is now well established that, in addition to
central tolerance established as a result of induced apoptosis of strongly self-
reactive cells in the thymus, peripheral tolerance exists with significant contribution
coming from Treg cell populations (Littman & Rudensky 2010).
63
1.15 Autoimmunity
Many autoimmune diseases are driven by self-reactive T helper cells. Until recently,
organ-specific autoimmune diseases were primarily associated with Th1 cells but not
Th2 cells. However, the discovery of a number of new effector T cell subsets, like
Th17 and Th9 cells, and regulatory T cells, like Tregs and Tr1 cells, has changed the
way we view and understand autoimmunity at cellular and molecular levels. In recent
years, IL-17-producing Th17 cells have emerged as major players in autoimmunity.
The complicated relationship between Th1 and Th17 cells, as well as the intricate
balance between Tregs and Th17 cells, provides a basis for understanding the
immunological mechanisms that induce and regulate autoimmunity. Here, we give an
overview of the interplay between different effector T cell subsets and regulatory T
cell subsets, and how they contribute to the development of autoimmunity and tissue
inflammation (Jager & Kuchroo 2010).
1.16 Autoimmune diseases and the roles of Th1/Th2 subsets
The term ‘autoimmunity’ denotes an adaptive immune response directed against
self-antigen. Autoimmune diseases form a spectrum ranging from organ-specific
conditions to systemic disorders in which the pathology is distributed throughout the
body. It is estimated that 5-10% of the world population is affected by autoimmune
diseases (Shoenfeld et al. 2008). The ability to discriminate between self and non-
self antigens is vital to the functioning of the immune system and failure in self-
tolerance can result in pathological autoimmune states. An effector phase typified by
chronic inflammation and tissue damage subsequent to autoimmunity against self-
antigens inevitably leads to significant morbidity and mortality. Many autoimmune
diseases including RA, MS and IBD are characterised by the presence of
macrophages with an “M1” classically activated phenotype at sites of inflammation.
These macrophages are believed to be key mediators in immunopathology through
the production of cytokines such as TNF, IL-1, and IL-6 (Mosser & Edwards 2008).
In the development of autoimmune diseases, a strong maybe deregulated Th1
response has been implicated. This is owing to the observations that the adoptive
64
transfer of Th1 clones and treatment with IL-12 induced or aggravated experimental
autoimmune encephalomyelitis (EAE) and collagen-induced arthritis (CIA)
respectively (Dardalhon et al. 2008). Also, at the peak of EAE, Th1 cytokines such
as IFN-γ were readily detectable in central nervous system (CNS) inflammatory
lesions but decrease during remission (Renno et al. 1995). However, it is now clear
that Th1 cells are not solely responsible for driving autoimmune tissue damage in
EAE and CIA. This is because exacerbated disease in the absence of IFN-γ
signalling was associated with massive neutrophil and macrophage infiltrates in the
CNS in EAE (Ferber et al. 1996) and a reduced IFN-γ signalling resulted in more
severe disease in CIA (Matthys et al. 1998). These observations question the
classic pro-inflammatory role of IFN-γ but also the Th1/Th2 paradigm as a basis for
explaining the regulation of autoimmune diseases. Current evidence suggests that
IFN-γ may act as a double-edged sword in immune responses and inflammatory
processes as it can either promote or contain autoimmunity depending on the
specific disease and the timing, location, and intensity of IFN-γ action (Kelchtermans,
Billiau, & Matthys 2008).
Classically, IFN-γ has been treated as a pro-inflammatory cytokine as they play a
key role in macrophage activation, inflammation and immunity. Recently, it is
recognised as a pleiotropic cytokine (Figure 1.3) which has physiological importance
in controlling immune and inflammatory responses. IFN-γ induces the production of
cytokines, upregulates the expression of class I and II MHC antigens, Fc receptor
and leukocyte adhesion molecules on a variety of cells. On the one hand, it
promotes a Th1 response, not only in the effector phase but also as one of the
autocrine factors favouring Th1-directed differentiation. The functional activity of
macrophages is enhanced by the presence of IFN-γ and IFN-γ is known to influence
isotype switching and potentiate the secretion of immunoglobulins by B cells.
Moreover, it augments Th cell expansion and promotes T cell migration to the site of
inflammation (Kelchtermans, Billiau, & Matthys 2008).
On the other hand, the intensity of Th1-induced inflammation potentially triggers self-
regulating mechanisms in response to overt inflammation. IFN-γ has been shown to
reduce tissue destruction by attenuating tissue infiltration by neutrophils and
monocytes and suppressing genes responsible for tissue-destructive enzymes such
65
as matrix metalloproteinases (MMPs), serine proteases and enzymes related to
prostaglandin metabolism (Hu & Ivashkiv 2009). Another important way is attributed
to the ability of IFN-γ to downregulate IL-17 secretion (Meyers et al. 2006).
Moreover, IFN-γ treatment was shown to promote negative feedback with
differentiation of CD4+ Treg cells as characterised by increased expression of Foxp3,
from CD4+CD25- T cells in a recent murine study. These converted cells acquired
marked regulatory properties after in vitro treatment and showed a significant
increase in the ability to inhibit autologous T cell proliferation induced by anti-CD3
and anti-CD28 antibodies (Wang et al. 2006).
Th2 cells provide optimal help for humoral immunity, especially in B cell activation
and immunoglobulin isotype switching and mucosal immunity, through induction of
mast cell and eosinophil differentiation and expansion. They evoke especially strong
antibody responses but relatively weak cellular activity (Janeway et al. 2005). Th2-
derived cytokines suppress several macrophage functions. Studies have shown that
IL-4 impedes macrophage secretion of IL-1β, TNF-α, and IL-6 (Schulze-Koops &
Kalden 2001). IL-10, although not an unique cytokine to Th2 cells, can also inhibit
monocyte/macrophage function by potently suppressing the production of pro-
inflammatory cytokines, including IL-12 and TNF-α, and downregulating the surface
expression of MHC class II, which profoundly affects the ability of APCs to activate T
cells (Akdis & Blaser 2001;Mosser & Zhang 2008). It has thus been suggested that
skewing immune responses towards a Th2 phenotype could protect from or reduce
severity of an autoimmune disease.
Nevertheless, IL-4 has no known immunosuppressive effect on either naive or
resting memory Th cells. In fact, Th2-cytokines may participate in autoimmune
diseases with a predominant humoral component. Th2 cytokines are implicated in
the development of SLE, a human autoimmune disease characterised by T cell
abnormalities and polyclonal B cell activation, as an upregulation of Th2 cytokine
gene expression in this disease was described (Richaud-Patin, Alcocer-Varela, &
Llorente 1995). In accordance with this finding, another study has reported that IL-4+
and IL-10+ cells are present more frequently in SLE patients than in normal subjects.
Whereas, the proportions of IFN-γ+ and IL-2+ cells are lower in both CD4+ and CD4-
cells in these patients. Thus, it has been suggested that deviation of immune

66
responses towards a Th2 phenotype may have an important role in the induction of
the polyclonal B cell activation in SLE patients (Funauchi et al. 1998).
Although other cell types could trigger auto-aggressive responses independently of
CD4+ T cells, a lack of cooperation from these cells would limit the damage to the
host due to the reduced duration of such responses as a result. Indeed, a sustained
memory CD8+ T cell response and high-affinity immunoglobulin production by B cells
are restricted without CD4+ T cell help (Castellino & Germain 2006).
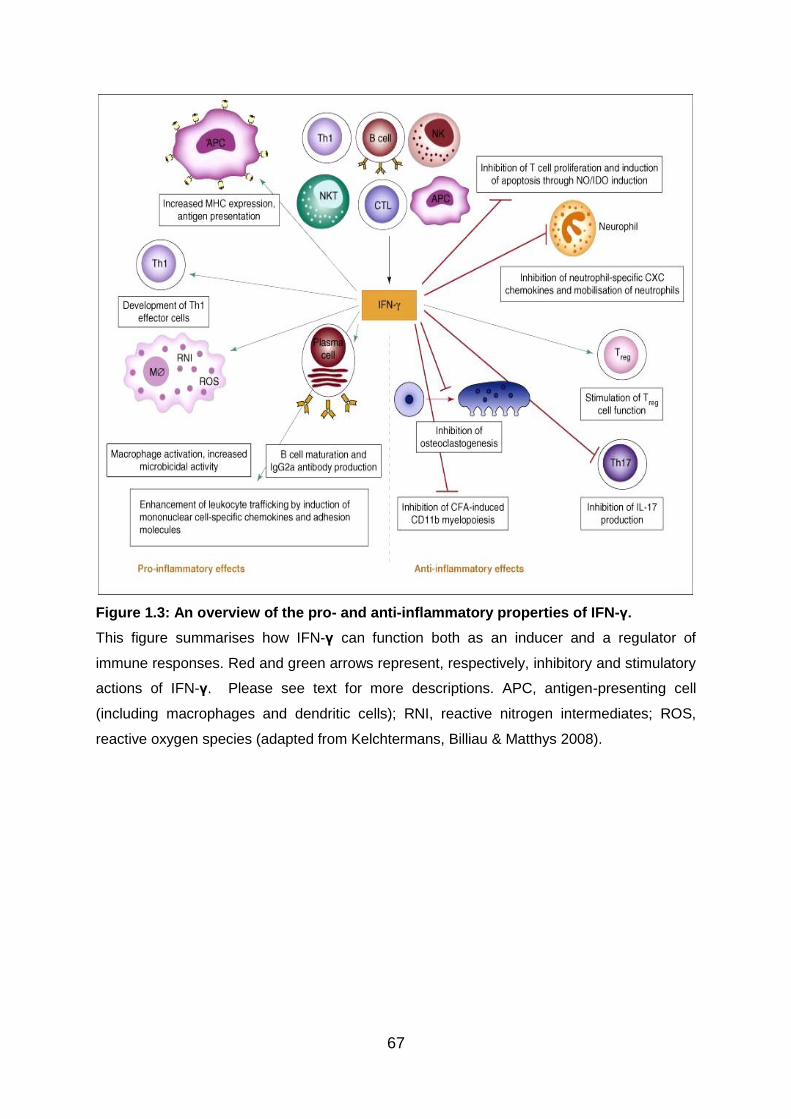
67
Figure 1.3: An overview of the pro- and anti-inflammatory properties of IFN-γ.
This figure summarises how IFN-γ can function both as an inducer and a regulator of
immune responses. Red and green arrows represent, respectively, inhibitory and stimulatory
actions of IFN-γ. Please see text for more descriptions. APC, antigen-presenting cell
(including macrophages and dendritic cells); RNI, reactive nitrogen intermediates; ROS,
reactive oxygen species (adapted from Kelchtermans, Billiau & Matthys 2008).
68
1.17 IL-23/IL-17 axis in autoimmune and inflammatory diseases
Before the discovery of Th17 subset as a distinct CD4+ effector population, it was
considered that Th1, Th2 and B cells were the main mediators of pathology in
autoimmunity. Recent discoveries have forced immunologists to revisit and
reinterpreting existing models of autoimmunity. A more balanced role for Th1 cells
and IFN-γ in autoimmune diseases is also emerging as autoimmune pathology has
been demonstrated to develop in the context of either a Th17 or a Th1 effector
response (Luger et al. 2008). Factors that may drive the dominant effector
phenotype could include quality/quantity of TLR and other innate signals, as well as
the identity and diversity of cells functioning as APCs at the site of initial Ag exposure.
Studies on IL-23p19-deficient mice and the anti-IL-23p19 antibody have revealed IL-
23, a new IL-12 family member, as the culprit in autoimmunity (Cua et al. 2003;Hue
et al. 2006;Yen et al. 2006).
IL-23 shares with IL-12 the p40 subunit - the heterodimer of IL-12 being made up of
p40 and p35, and that of IL-23 being made up of p40 and p19 (Oppmann et al. 2000).
Interestingly, the IL-23 receptor (IL-23R) shares with IL-12 a chain of its receptor as
well - the IL-12 receptor being consisted of IL-12Rβ1 and IL-12Rβ2 chains, and that
of IL-23 being consisted of IL-12Rβ1 and IL-23R chains (Parham et al. 2002). IL-23
has been shown to induce the proliferation of antigen-experienced T cells, and the
resulting IL-23R-expressing Th17 cells are highly pathogenic in causing
autoimmunity (Langrish et al. 2005). A not very well studied function of IL-23 is its
role in promoting IFN-γ-producing Th1 cells. Current published data suggest that IL-
23 affects the Th1 response, as its genetic lack or neutralisation by antibodies
reduces not only the IL-17, but also the IFN-γ response to Ag (Luger et al. 2008).
Therefore, IL-23 could be required to promote Th1 as well as Th17 effector
responses. Furthermore, IL-10 production is counter-acted by IL-23, which helps
explain the essential role of IL-23 in mediating autoimmunity despite the fact that it is
dispensable for Th17 differentiation (McGeachy et al. 2007). Therefore, IL-23 is
implicated as a crucial factor to inflammation and autoimmune diseases.
As IL-17 has profound pro-inflammatory effects and induces tissue damage during
the course of various immune-mediated diseases, Th17 cells are increasingly being
69
recognised to occupy a central position in autoimmune and inflammatory diseases.
After stimulation by IL-23, Th17 cells produce a variety of inflammatory mediators
such as TNF-α, IL-6, granulocyte-macrophage colony-stimulating factor (GM-CSF),
CXCL1 and CCL20 (Kunz & Ibrahim 2009). Th17 cells have been shown to be
involved in autoimmune pathology in studies using murine models of EAE and CIA,
two experimental autoimmune diseases that had been previously attributed to
unchecked Th1 responses, as IL-17A-deficient mice have reduced incidence and
severity of CIA and EAE (Koenders & van den Berg 2010). There have been reports
of a relationship between Th17 cells and autoimmune uveitis as well (Amadi-Obi et
al. 2007;Chi et al. 2007). Moreover, aberrant IL-17 expression has been described
to be associated with human diseases including RA, IBD, SLE and psoriasis
(Annunziato et al. 2007).
Compared to Th1 disease with predominant macrophage infiltrates, Th17 cell-
mediated disease was characterised by heavy infiltrates of neutrophils (Hu &
Ivashkiv 2009). It is now widely believed that the interactions between
environmental exposures and genetic predisposition contribute to the onset of
autoimmune disease. In genetically susceptible individuals, disease may develop
after contact with environmental factors. Recently, with the discovery of the AHR
expression in Th17 cells, a link between Th17 cells and the environmental theory of
autoimmunity has been suggested. AHR is a transcription factor involved in direct
recognition of aromatic hydrocarbons found in cigarette smokes, grilled food and
industrial pollutants. Interestingly, AHR was also found in Treg, albeit at a much
lower level than Th17 cells (Veldhoen et al. 2008a).
Autoreactive B and T cells are eliminated by apoptosis. As a result of defects in
apoptotic signalling, autoimmune diseases can develop from persistence of self-
reactive lymphocytes. IL-17, alone and especially in synergy with the B cell-
activating factor (BAFF), was shown to protect B cells from apoptosis and in so doing,
the proliferation, survival, and differentiation of B cells into plasma cells were
promoted (Doreau et al. 2009). Like Th1 and Th2 cells, Th17 cells were found to
modulate B cell function and promote production of IgM, IgG and IgA, but not IgE
(Annunziato et al. 2007). Whether the ability of Th17 cells to modify B cell function
directly contributes to autoimmune pathologies is to be further clarified. While most
70
studies on IL-17 production focused on CD4+ αβ T cells, γδ T cells have also been
shown to be a potent source of IL-17. Studies have reported that many γδ T cells
already exist as effector memory cells, ready to mount strong IL-17 responses
quickly.(Peng et al. 2008;Roark et al. 2008). In CIA, a mouse model that shares
many hallmarks with human rheumatoid arthritis, the Vγ4Vδ4+ subset of γδ T cells
was shown to expand and produce IL-17. Depletion of these γδ T cells resulted in
less severe disease (Roark et al. 2008). All these findings make a strong case for a
role of IL-23/IL-17 axis in human autoimmune diseases.
1.18 Regulatory T cells and autoimmune disease
Treg cells serve to restrain overactivation of effector T cells, control the reactivity of
self-aggressive T cells not eliminated in the thymus and maintain the immune system
in homeostatic balance. Immune responses against pathogens must be regulated to
prevent bystander immune pathology, and these mechanisms of regulation may also
promote remission from autoimmune inflammatory response and prevent excessive
tissue damage (Allan et al. 2008b).
The importance of T cell regulation is highlighted by autoimmunity and massive
immunopathology that occur in disease states in human and mouse. In scurfy
mutant mice, a frameshift mutation in Foxp3 transmitted by X-lined inheritance
results in production of non-functional product and give rise to a fatal syndrome of
extensive immune activation, oversecretion of cytokines and multi-organ
inflammatory infiltration (Brunkow et al. 2001). In humans, IPEX is resulted from
mutations in Foxp3 gene located on chromosome Xp11.23 and the rare disease is
usually fatal due to poor efficacy of immunosuppressive treatment. Its reported
manifestations include refractory and life-threatening diarrhoea, type1 diabetes,
hypothyroidism, haemolytic anaemia, thrombocytopaenia and eczema (Bacchetta et
al. 2006).
To address the question of whether immune suppression by Treg cells is impaired in
the setting of human autoimmune disease, it is crucial to understand the potential
means by which a defect may arise. As shown in Fig 1.4, defects in the number and
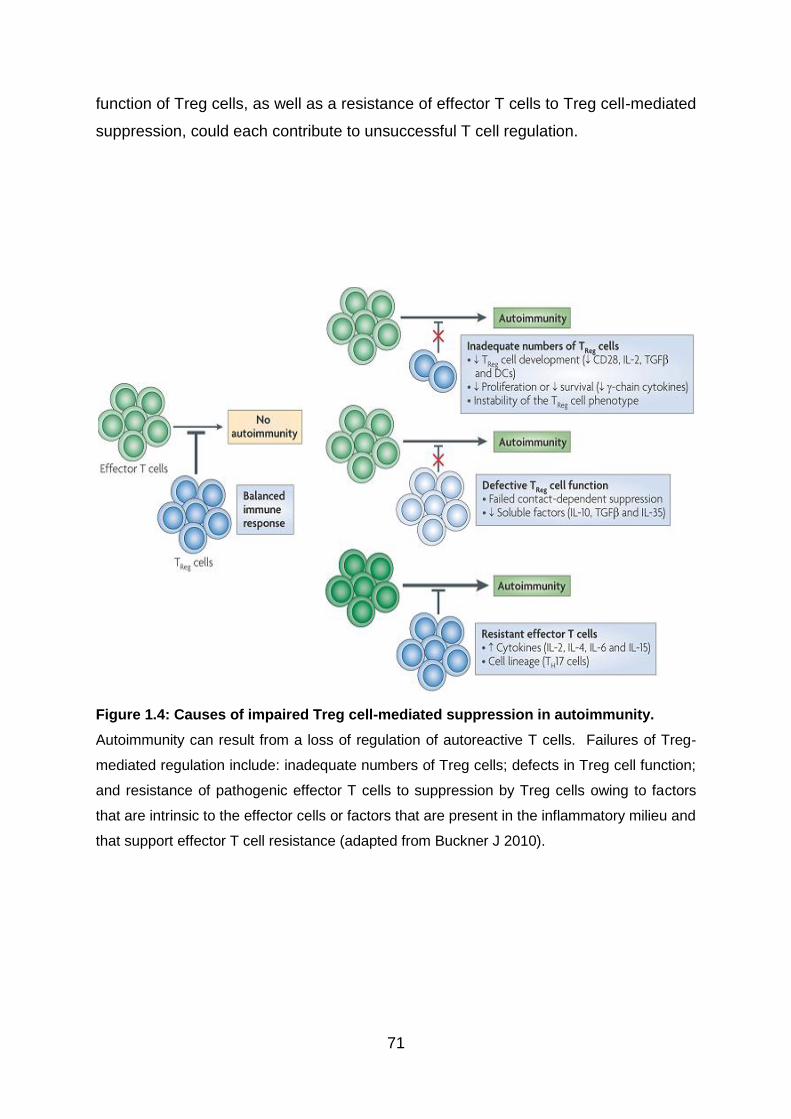
71
function of Treg cells, as well as a resistance of effector T cells to Treg cell-mediated
suppression, could each contribute to unsuccessful T cell regulation.
Figure 1.4: Causes of impaired Treg cell-mediated suppression in autoimmunity.
Autoimmunity can result from a loss of regulation of autoreactive T cells. Failures of Treg-
mediated regulation include: inadequate numbers of Treg cells; defects in Treg cell function;
and resistance of pathogenic effector T cells to suppression by Treg cells owing to factors
that are intrinsic to the effector cells or factors that are present in the inflammatory milieu and
that support effector T cell resistance (adapted from Buckner J 2010).
72
The number of Treg cells found in individuals with autoimmune disease is dictated by
Treg cell development, proliferation, and survival in the periphery and homing to the
site of inflammation. Genetic factors are likely to have the strongest impact on
thymic output of Treg cells. On the other hand, maintenance of Treg cells in the
periphery is a dynamic process, influenced in part by conditions that promote Treg
cell induction in the periphery and assist their proliferation and survival. Factors that
favour the thymic development, peripheral growth and persistence of Treg cells,
including CD28, TGF-β, dendritic cells and the common cytokine receptor γ-chain
cytokines (IL-2, IL-4, IL-7 and IL-15), have also been shown to have an effect on
Foxp3 expression (Buckner 2010).
Treg cell dysfunction in autoimmune disease may result from a defect in one of the
many mechanisms through which Treg cells function. This could happen through
diminished expression of cell surface molecules that are known to be involved in
contact‑dependent suppression, such as CTLA-4, CD39, lymphocyte activation gene
3 (LAG3), granzyme A and FAS or as a result of a failure to produce soluble factors,
including TGF-β, IL‑10 and IL‑35, that are involved in aspects of suppression.
Underlying genetic factors may have an impact on these mechanisms. In addition,
the composition of the local milieu, such as the types of APCs and cytokines
(including TNF, IL‑4, IL‑6, IL‑12, IL‑7, IL‑15 and IL‑21), can call influence Treg cell
function (Buckner 2010).
Either reduced frequency or impaired function of CD4+CD25high Treg cells has been
reported in patients with a number of autoimmune diseases. In SLE patients, a
significant drop in Treg cell numbers in untreated patients and a reduction in Foxp3
expression in patients with or without treatment were reported. Impaired Treg
function in SLE patients was also revealed compared to healthy donors (Lyssuk et al.
2007). Similarly, Treg cells from peripheral blood of patients with MS showed
defects in Treg function and clonal expansion. A decrease in Foxp3 levels in the
Tregs were detected in MS patients as well and this correlated with deterioration of
Treg function (Huan et al. 2005).
73
CD4+CD25high Treg cells derived from active RA patients, although still anergic,
displayed compromised function as they were not able to inhibit pro-inflammatory
cytokine secretion from effector T cells and monocytes, or convey a suppressive
phenotype to effector CD4+CD25- T cells (Ehrenstein et al. 2004). Interestingly,
higher frequencies of Treg cells were found in synovial fluid than blood in patients
and these synovial cells displayed an enhanced suppressive capacity compared with
cells from blood (Lawson et al. 2006;van Amelsfort et al. 2004). Diminished
suppressor activity in both blood and target tissue Treg cells was demonstrated in
psoriasis (Sugiyama et al. 2005). Moreover, decreased frequency and diminished
function of peripheral blood CD4+CD25high Treg cells were reported to be associated
with active uveitis seen in Vogt-Koyanagi-Harada (VKH) syndrome (Chen et al.
2008).
Multiple mechanisms by which effector T cells resist Treg cells have been proposed.
Cell‑intrinsic resistance to suppression has been reported to occur in Th17 cells
(Annunziato et al. 2007; Crome et al. 2009). The cytokines IL-2, IL-4, IL-7 and IL-15
support the proliferation of effector T cells in the presence of Treg cells, indicating
that despite the favourable roles of these cytokines in Treg cell homeostasis, the
presence of these cytokines in the short term allows effector T cells to bypass
suppression by Treg cells (Yates et al. 2007). In addition, it has been suggested that
Treg cells may not be able to suppress strongly activated responder T cells (Tresp)
in highly inflammatory environments (Costantino, Baecher-Allan, & Hafler 2008).
This has important implications in patients with autoimmune disease as autoreactive
T cells are readily activated in these patients compared to healthy individuals
(Baecher-Allan & Hafler 2006;Scholz et al. 1998). The report of the loss of IL-6
during autoimmune responses and the resultant significant increase in numbers of
Foxp3 expressing regulatory T cells has given further supports to the theory (Korn et
al. 2007).
Although adoptive transfer of Tregs has been shown to be effective in preventing or
even reversing disease in animal models, there have been no clinical studies of
adoptive immunotherapy with Tregs in human autoimmune diseases (Brusko,
Putnam, & Bluestone 2008). An alternative to adoptive transfer of Tregs is the
74
promotion of de novo Treg development in vivo. Glatiramer acetate (GA), a drug
commonly used in MS patients, has been shown to induce generation of Foxp3+
Treg cells. These Foxp3+ Tregs induced by GA either in vitro or in vivo show
suppressive function, and GA treatment is correlated with disease improvement in
patients with MS (Hong et al. 2005). Another common treatment used in MS
patients is IFN-β therapy, which, in relapsing-remitting MS patients can also lead to
an increase in the percentage of functional Foxp3+ Tregs in the peripheral blood (de
Andres et al. 2007). Type 1 diabetes is a hallmark manifestation of IPEX syndrome.
The use of rapamycin can promote expansion of functional CD4+CD25+Foxp3+ Tregs
in type 1 diabetic patients, in whom an intrinsic defect in CD4+CD25+ Tregs has been
reported (Monti et al. 2008).
1.19 Behcet’s disease
1.19.1 Overview
The first description of Behcet’s disease was attributed to the Turkish dermatologist
Hulusi Behçet in 1937 who described the classical signs of the disease: oral ulcers,
genital ulcers and uveitis (Bonfioli & Orefice 2005). However, it was originally
described by Hippocrates 2500 years ago. BD is a chronic, multisystem immune-
mediated disorder that is heterogeneous in onset and has variable organ
involvement. The underlying pathological process of BD is a systemic, immune-
mediated occlusive vasculitis involving small and large arteries and veins (George et
al. 1997;Kalayciyan & Zouboulis 2007). It is primarily characterised by recurrent oral
aphthous ulcers, genital ulcers, skin lesions, and uveitis (Sakane et al. 1999). In
addition, BD patients may suffer from non-deforming arthritis, gastrointestinal tract
lesions, and vascular and central nervous system problems in severe cases. Eye
involvement occurs in more than 50% of the patients with BD and is the presenting
symptoms in 20% of cases (Evereklioglu 2005).
The clinical course of BD is characterised by exacerbation and remission of
unpredictable duration and frequency (Evereklioglu 2005). The disease can result in
considerable morbidity and increased mortality. The prognosis of ocular involvement
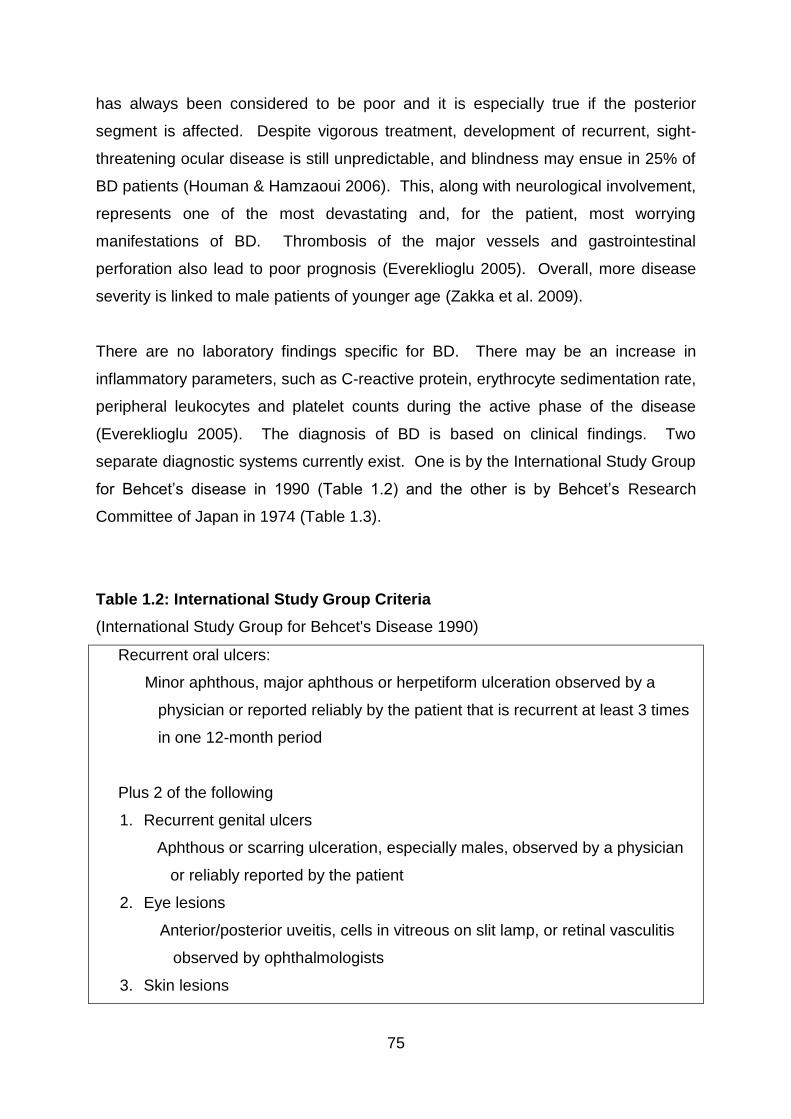
75
has always been considered to be poor and it is especially true if the posterior
segment is affected. Despite vigorous treatment, development of recurrent, sight-
threatening ocular disease is still unpredictable, and blindness may ensue in 25% of
BD patients (Houman & Hamzaoui 2006). This, along with neurological involvement,
represents one of the most devastating and, for the patient, most worrying
manifestations of BD. Thrombosis of the major vessels and gastrointestinal
perforation also lead to poor prognosis (Evereklioglu 2005). Overall, more disease
severity is linked to male patients of younger age (Zakka et al. 2009).
There are no laboratory findings specific for BD. There may be an increase in
inflammatory parameters, such as C-reactive protein, erythrocyte sedimentation rate,
peripheral leukocytes and platelet counts during the active phase of the disease
(Evereklioglu 2005). The diagnosis of BD is based on clinical findings. Two
separate diagnostic systems currently exist. One is by the International Study Group
for Behcet’s disease in 1990 (Table 1.2) and the other is by Behcet’s Research
Committee of Japan in 1974 (Table 1.3).
Table 1.2: International Study Group Criteria
(International Study Group for Behcet's Disease 1990)
Recurrent oral ulcers:
Minor aphthous, major aphthous or herpetiform ulceration observed by a
physician or reported reliably by the patient that is recurrent at least 3 times
in one 12-month period
Plus 2 of the following
1. Recurrent genital ulcers
Aphthous or scarring ulceration, especially males, observed by a physician
or reliably reported by the patient
2. Eye lesions
Anterior/posterior uveitis, cells in vitreous on slit lamp, or retinal vasculitis
observed by ophthalmologists
3. Skin lesions
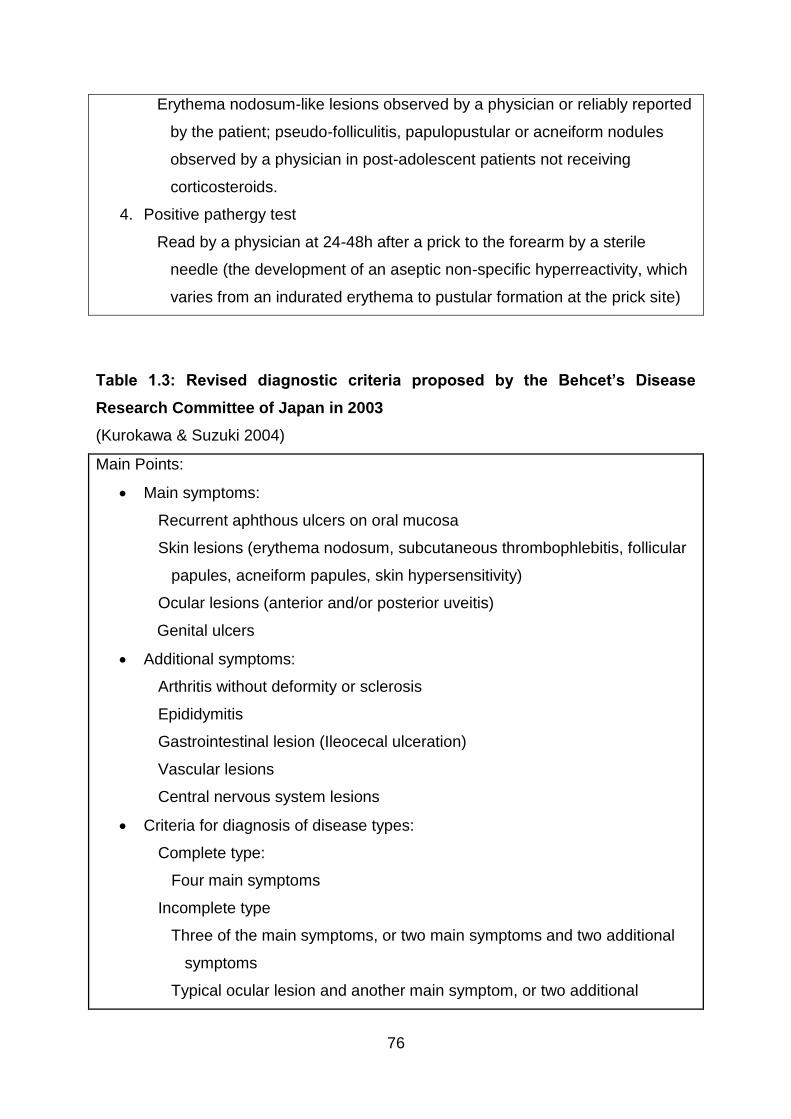
76
Erythema nodosum-like lesions observed by a physician or reliably reported
by the patient; pseudo-folliculitis, papulopustular or acneiform nodules
observed by a physician in post-adolescent patients not receiving
corticosteroids.
4. Positive pathergy test
Read by a physician at 24-48h after a prick to the forearm by a sterile
needle (the development of an aseptic non-specific hyperreactivity, which
varies from an indurated erythema to pustular formation at the prick site)
Table 1.3: Revised diagnostic criteria proposed by the Behcet’s Disease
Research Committee of Japan in 2003
(Kurokawa & Suzuki 2004)
Main Points:
Main symptoms:
Recurrent aphthous ulcers on oral mucosa
Skin lesions (erythema nodosum, subcutaneous thrombophlebitis, follicular
papules, acneiform papules, skin hypersensitivity)
Ocular lesions (anterior and/or posterior uveitis)
Genital ulcers
Additional symptoms:
Arthritis without deformity or sclerosis
Epididymitis
Gastrointestinal lesion (Ileocecal ulceration)
Vascular lesions
Central nervous system lesions
Criteria for diagnosis of disease types:
Complete type:
Four main symptoms
Incomplete type
Three of the main symptoms, or two main symptoms and two additional
symptoms
Typical ocular lesion and another main symptom, or two additional
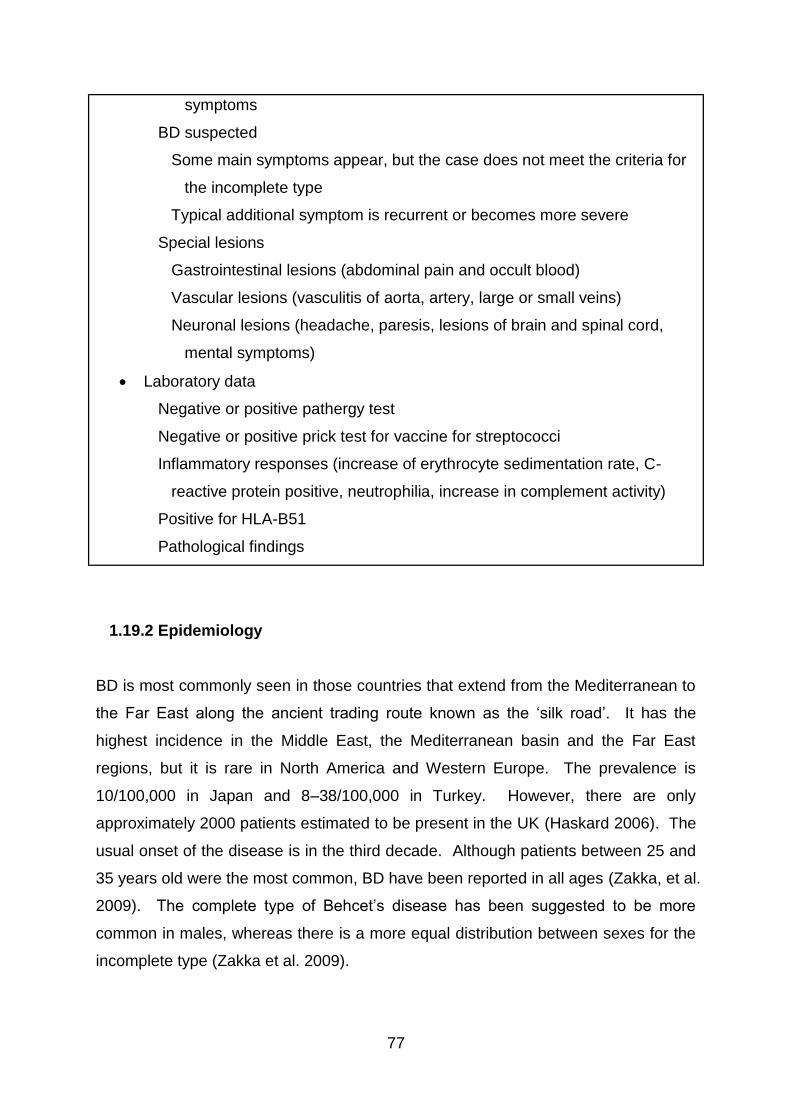
77
symptoms
BD suspected
Some main symptoms appear, but the case does not meet the criteria for
the incomplete type
Typical additional symptom is recurrent or becomes more severe
Special lesions
Gastrointestinal lesions (abdominal pain and occult blood)
Vascular lesions (vasculitis of aorta, artery, large or small veins)
Neuronal lesions (headache, paresis, lesions of brain and spinal cord,
mental symptoms)
Laboratory data
Negative or positive pathergy test
Negative or positive prick test for vaccine for streptococci
Inflammatory responses (increase of erythrocyte sedimentation rate, C-
reactive protein positive, neutrophilia, increase in complement activity)
Positive for HLA-B51
Pathological findings
1.19.2 Epidemiology
BD is most commonly seen in those countries that extend from the Mediterranean to
the Far East along the ancient trading route known as the ‘silk road’. It has the
highest incidence in the Middle East, the Mediterranean basin and the Far East
regions, but it is rare in North America and Western Europe. The prevalence is
10/100,000 in Japan and 8–38/100,000 in Turkey. However, there are only
approximately 2000 patients estimated to be present in the UK (Haskard 2006). The
usual onset of the disease is in the third decade. Although patients between 25 and
35 years old were the most common, BD have been reported in all ages (Zakka, et al.
2009). The complete type of Behcet’s disease has been suggested to be more
common in males, whereas there is a more equal distribution between sexes for the
incomplete type (Zakka et al. 2009).
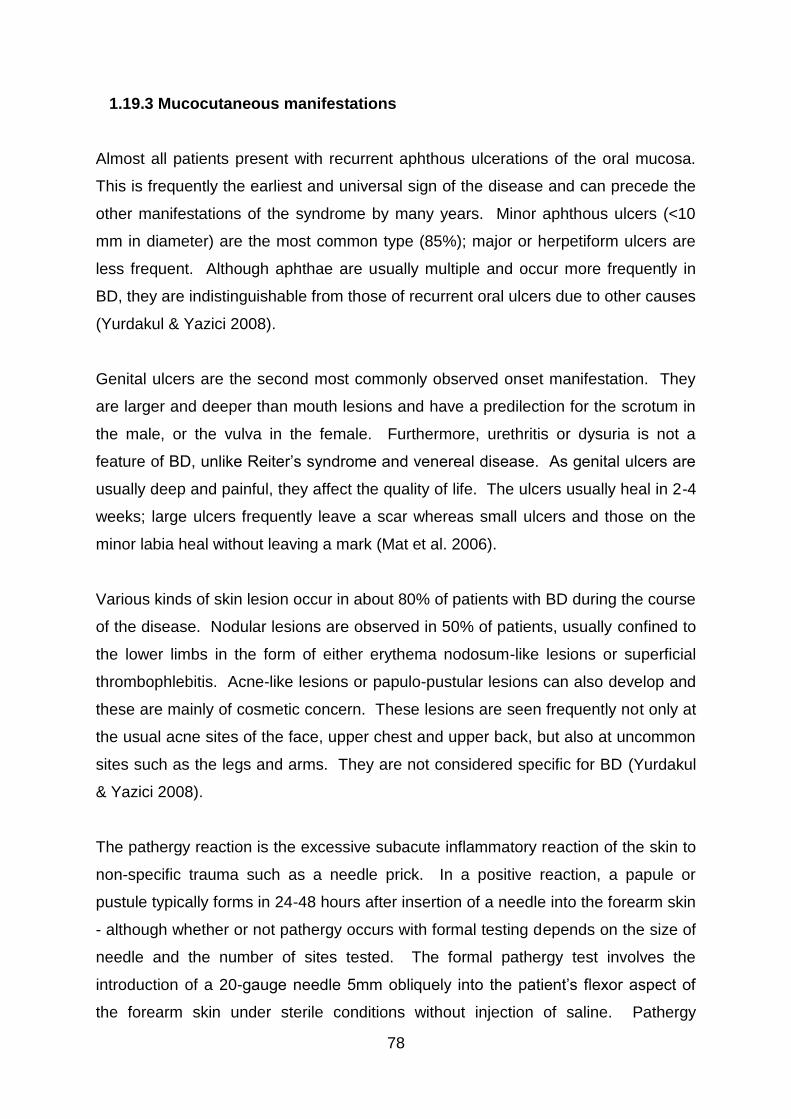
78
1.19.3 Mucocutaneous manifestations
Almost all patients present with recurrent aphthous ulcerations of the oral mucosa.
This is frequently the earliest and universal sign of the disease and can precede the
other manifestations of the syndrome by many years. Minor aphthous ulcers (<10
mm in diameter) are the most common type (85%); major or herpetiform ulcers are
less frequent. Although aphthae are usually multiple and occur more frequently in
BD, they are indistinguishable from those of recurrent oral ulcers due to other causes
(Yurdakul & Yazici 2008).
Genital ulcers are the second most commonly observed onset manifestation. They
are larger and deeper than mouth lesions and have a predilection for the scrotum in
the male, or the vulva in the female. Furthermore, urethritis or dysuria is not a
feature of BD, unlike Reiter’s syndrome and venereal disease. As genital ulcers are
usually deep and painful, they affect the quality of life. The ulcers usually heal in 2-4
weeks; large ulcers frequently leave a scar whereas small ulcers and those on the
minor labia heal without leaving a mark (Mat et al. 2006).
Various kinds of skin lesion occur in about 80% of patients with BD during the course
of the disease. Nodular lesions are observed in 50% of patients, usually confined to
the lower limbs in the form of either erythema nodosum-like lesions or superficial
thrombophlebitis. Acne-like lesions or papulo-pustular lesions can also develop and
these are mainly of cosmetic concern. These lesions are seen frequently not only at
the usual acne sites of the face, upper chest and upper back, but also at uncommon
sites such as the legs and arms. They are not considered specific for BD (Yurdakul
& Yazici 2008).
The pathergy reaction is the excessive subacute inflammatory reaction of the skin to
non-specific trauma such as a needle prick. In a positive reaction, a papule or
pustule typically forms in 24-48 hours after insertion of a needle into the forearm skin
- although whether or not pathergy occurs with formal testing depends on the size of
needle and the number of sites tested. The formal pathergy test involves the
introduction of a 20-gauge needle 5mm obliquely into the patient’s flexor aspect of
the forearm skin under sterile conditions without injection of saline. Pathergy
79
positivity is fairly specific to BD patients; however, its sensitivity varies in different
countries. Whereas 60-70% of patients in Turkey and Japan have a positive
pathergy test, it is infrequently observed in patients with BD from Northern Europe
and North America (Yurdakul & Yazici 2008). In the UK, it has been seen in less
than 10% of the ‘definite’ and ‘probable’ patient groups (Pickering & Haskard 2000).
An alternative to pathergy test is to inject monosodium urate crystals into the forearm
skin and observe the inflammatory response, which tends to be significantly
prolonged in patients with BD (Pickering & Haskard 2000).
1.19.4 Ocular manifestations
Eye disease is seen in half of all patients but is more frequent and more severe
among the male. It typically occurs within 3 years of disease onset. In general,
initial exacerbations tend to be more anterior and unilateral, whereas subsequent
attacks tend to involve the vitreous and posterior segment of the eye, becoming
bilateral (Evereklioglu 2005). Anterior uveitis with hypopyon, in which the
inflammatory exudates forms a visible layer of cells in the anterior chamber, is a
characteristic sign of ocular BD but is only observed in one-third of patients.
Common complications of the recurrent anterior segment involvement include
anterior and posterior synechiae, which may lead to secondary glaucoma and
cataract formation. Conjunctivitis, sicca syndrome, episcleritis, scleritis, keratitis with
or without corneal ulcerations and lid lesions present rarely in BD patients (Deuter et
al. 2008).
The most common and universal posterior segment findings are persistent vitritis
and retinal perivasculitis that usually involve the veins (periphlebitis) and less
frequently the arteries (periarteritis). Retinitis is another common finding. During the
active phase of the disease, vascular leakage with diffuse retinal or optic disc
oedema, venous engorgement, and intraretinal haemorrhages may be present
(Evereklioglu 2005). Recurrent inflammation in the posterior eye segment may result
in retinal oedema, especially macular oedema, and retinal atrophy with vascular
occlusion, the main cause of loss of useful vision (Deuter et al. 2008). In advanced
cases, periphlebitis may also lead to gliotic inflammatory vessel sheathing, macular
80
degeneration with pigment epithelial changes, scarring and epiretinal membrane
formation, optic disc swelling, neovascularisation of the iris, retina and/or optic disc
and tractional retinal detachment (Evereklioglu 2005). Importantly, severity and
number of repeated inflammatory exacerbations of the posterior segment determine
the extent of permanent ocular structural changes and, therefore, the resultant rate
of irreversible visual loss.
1.19.5 Musculoskeletal manifestations
Joint disease is observed in around 50% of patients in the form of synovitis, arthritis,
and/or arthralgia. It is mostly oligoarticular and asymmetrical. Joint disease resolves
in a few weeks and it seldom results in deformity and radiological erosions. Chronic
arthritis and osteonecrosis are seen occasionally. Arthritis in BD affects most
commonly the medium and large joints. Knees are most frequently involved,
followed in frequency by ankles, wrists, and elbows. Involvement of the spine and
sacro-iliac joints is uncommon, and back pain is quite rare. Also, myositis can be
seen in local or generalised forms (Yurdakul & Yazici 2008).
1.19.6 Cardiovascular manifestations
Vascular involvement can involve both the venous and arterial sides and is more
common in men than in women. One-third of patients have thrombophlebitis of
either the deep or the superficial veins, usually of the lower extremities. It is
generally migratory in nature, appearing simultaneously at several locations (Yates &
Michelson 2006). Importantly, BD can lead to thrombotic occlusion of the venous
system of the upper limbs, the inferior and superior vena cava, the dural sinuses and
the hepatic (Budd-Chiari syndrome) and renal veins (Pickering & Haskard 2000).
Despite the high frequency of thrombophlebitis, thromboembolism is rare, most
probably due to adherence of thrombi to the diseased veins.
Arterial disease is less frequent but is a serious cause of morbidity and mortality,
especially when it involves the pulmonary arteries. Arterial involvement predisposes
81
to aneurysm formation or less commonly arterial thrombosis and it can involve the
entire arterial tree. The most frequently affected vessels, in decreasing order, are
the pulmonary, femoral, popliteal, subclavian and carotid arteries (Al Otaibi, Porter, &
Poate 2005). Thrombosis has been suggested to relate to vascular inflammation
and the resulting endothelial dysfunction (Deuter et al. 2008).
Overall, cardiac involvement is rare. However, sporadic cases have been reported
with pericarditis, valvular lesions, myocarditis, intracardiac thrombosis,
endomyocardial fibrosis, coronary artery involvement and ventricular aneurysms
(Marshall 2004). Available data currently show that atherosclerosis is probably not
increased in BD (Yurdakul & Yazici 2008).
1.19.7 Central nervous system manifestations
The neurological complications of BD predominantly involve the CNS, although,
rarely, there may be involvement of muscle and peripheral nerves (Al Otaibi, Porter,
& Poate 2005). Headaches are common and often migrainous in nature (Pickering &
Haskard 2000). CNS involvement occurs in 5-10% of patients and is one of the most
serious manifestations of BD, causing both increased morbidity and mortality
(Sakane et al. 1999). The natural history is extremely variable and characterised by
fluctuations that may mimic multiple sclerosis. The outcome varies from full recovery
to a slowly progressive, intermittent course resulting in paralysis and death.
Pathologic examination can show softening of both white and gray matter with foci of
demyelination in the brain and nerves (Yates & Michelson 2006).
CNS disease of BD can be divided into two categories, namely, parenchymal and
non-parenchymal (vascular). Most patients (80%) have parenchymal brain
involvement, which mainly affects the brainstem, manifested by pyramidal, followed
by cerebellar and sensory symptoms and signs, sphincter disturbances and
behavioural changes. Non-parenchymal disease (20%) takes the form of intracranial
hypertension due to dural sinus thrombosis manifested by headaches and
papilloedema. Simultaneous involvement of the dural sinuses and brain parenchyma
82
is unusual. Dural sinus thrombosis has a relatively benign prognosis in comparison
to parenchymal involvement (Yurdakul & Yazici 2008).
Psychological disturbances can be present at some point in at least half of BD
patients. Changes include memory impairment, dementia, irritability, hallucination,
delusions, anxiety, depression, and insomnia. These disturbances sometimes lead
to suicide attempts (Yates & Michelson 2006).
1.19.8 Gastrointestinal manifestations
The involvement of the gastrointestinal tract is very variable in different populations
and can be present in up to 30% of BD patients. BD shares many of the features of
the inflammatory bowel disease and differentiation is difficult (Deuter et al. 2008).
The symptoms include anorexia, vomiting, dyspepsia, diarrhoea and abdominal pain.
Mucosal ulcerations can occur at any point along the gastrointestinal tract and they
are most commonly seen in the ileum, followed by the caecum and other parts of the
colon. The ileocaecal ulcers have a distinct tendency to perforate (Yurdakul & Yazici
2008).
1.19.9 Renal manifestations
Several renal disorders have been associated with BD and can be divided into five
groups, namely, (1) glomerulonephritis, (2) amyloidosis, (3) renal vascular
involvement, (4) interstitial nephritis, and (5) other problems such as complications of
drug therapy or genitor-urinary system abnormalities (Akpolat et al. 2002).
1.20 Aetiopathogenesis of Behcet’s disease
Despite research in the last decades, the aetiology and pathogenesis of BD remains
unclear. A complex genetic background leading to a pro-inflammatory, innate
immune system-derived activation, perpetuated by the adaptive immune response of
83
T cells against infectious- and/or auto-antigens has been suggested in BD
pathogenesis (Direskeneli 2006).
1.20.1 Autoimmune features of Behcet’s disease
BD does not present like a classical autoimmune disease with anti-nuclear antibody
(ANA) positivity, female dominance or association with other autoimmune diseases
(Yazici 1997). In contrast to most classical autoimmune disorders which have an
MHC class II association, a class I antigen, HLA-B51, is associated with BD
(Direskeneli 2001). However, there are features that suggest BD as being
‘autoimmune’. A general B cell activation and autoantibodies against cell surface
antigens such as anti-endothelial cell (AECA) and anti-lymphocyte antibodies have
been demonstrated (Direskeneli et al. 1995;Eksioglu-Demiralp et al. 1999b).
Interestingly, PBMC from BD patients with active disease were shown to be highly
sensitive to spontaneous and Fas-mediated AICD after PHA activation, which
indicate chronic in vivo activation (Frassanito et al. 1999).
1.20.2 Genetic background
Among various genetic markers, the association of BD with HLA-B5 and its subclass
B51 allele on chromosome 6p21, provides the strongest evidence supporting the
involvement of genetic factors in BD pathogenesis in high prevalence countries. The
HLA-B51 association is most pronounced in patients from the Middle and the Far
East (Verity et al. 1999). Of these, HLA-B5101 and HLA-B5108 are particularly
associated with increased risk of developing BD (Deuter et al. 2008). Recently, the
first genome-wide association study of BD results clearly showed a dual,
independent contribution of two HLA alleles to BD's pathogenesis: HLA-B5101 and
HLA-A26 (Meguro et al. 2010). Additionally, HLA-B5701 has been identified to be
associated with disease susceptibility in Caucasian patients in the United Kingdom,
carrying a relative risk of disease equivalent to that of HLA-B51 (Ahmad et al. 2003).
However, the direct role of HLA-B5 in BD development remains unclear.

84
Another important finding of the recent genome-wide association studies was
discovery of the IL-10 gene association with BD. One study found two single
nucleotide polymorphisms (rs1800871 and rs1800872) in the promoter region of the
IL-10 gene giving the strongest association result in Japanese patients (Mizuki et al.
2010). Another study identified an intronic polymorphism in a high linkage
disequilibrium block of the IL-10 gene region (rs1518111). This variation was
associated with lower mRNA epression as well as decreased production of IL-10
from mononuclear cells/monocytes following stimulation with LPS or muramyl
dipeptide+PAM3Cys, respectively (Remmers et al. 2010). The association between
IL-10 polymorphism and BD helps at least partially explaining the
dysregulated/exaggerated inflammatory response observed in BD patients as IL-10
is an essential cytokine in the regulation of both innate and adaptive immune
responses.
Another shared genetic association in Turkish and Japanese BD patients was
located within an intergenic region between the IL-23R and IL-12RB2 genes, which
was demonstrated to be in linkage disequilibrium block of the IL-23R gene (Mizuki et
al. 2010; Remmers et al. 2010). IL-23 has been shown to stimulate Th17 cell
proliferation and increase the production of inflammatory cytokines including IL-1, IL-
6, IL-17 and TNF-α (Langrish et al. 2005). On the other hand, IL-12 plays a key role
in Th1 responses, T-cell and NK-cell cytotoxicity, and IFN-γ production by T cells
and NK cells (Annunziato & Romagnani 2009).
Gene in linkage disequilibrium with HLA-B51, such as MHC class I chain-related
gene A (MICA), has been indicated to contribute to pathogenesis of BD (Mizuki et al.
2000). The link between BD and TNF-α gene, which is closely linked to the HLA-
B51 gene, has also been investigated recently and TNF-α-1031C allele was reported
to be associated with susceptibility to BD (Akman et al. 2008). Moreover, IL-1, IL-12,
IFN-γ and TGF-β1 gene polymorphisms were all found to be increased in BD
patients and these could contribute to host susceptibility to BD (Alayli et al.
2007;Coskun et al. 2005;Dilek et al. 2009).
Similar to other complex disorders, BD is unlikely to be a single-gene disease.
Genome-wide association studies and other approaches would help to elucidate the
85
inflammatory pathways further as well as yet unknown networks between the
associated genes and/or pathways. The demonstration of new loci of susceptibility
to BD is of great significance in the pathogenesis of the disease, detecting patients
negative to HLA-B5. Each disease associated functional polymorphism may have a
distinct role within the context of other associated genes, all interacting in a network
(Gul 2011). Their interaction with yet uncertain environmental factors may contribute
to the complex nature of the disease.
1.20.3 Infectious agents
Various microorganisms such as streptococci and herpes simplex virus have been
implicated in the aetiopathogenesis of BD (Evereklioglu 2005). No reliable animal
model, however, has been described for BD and the model with the highest clinical
resemblance to the human disease is that induced by inoculation with herpes
simplex virus in which animals show several symptoms similar to BD (Deuter et al.
2008).
Due to an immune hyper-reactivity in patients, a role of streptococci in BD has been
suggested. KTH-1, an extract of S. sanguis SSH-83 and encoded by BES-1 gene,
was shown to promote IL-6 and IFN-γ secretion by peripheral blood T cells in BD
patients (Hirohata, Oka, & Mizushima 1992) and the immunogenic antigen was
observed to upregulate γδ T cells from patients with BD, which secrete the pro-
inflammatory mediators IL-6, IL-8 and TNF-α (Mochizuki et al. 1994). The similarities
of the KTH-1 protein amino acid sequence encoded by BES-1 gene with human
intraocular peptide Brn-3b have also made this protein a candidate for auto-reactive
response in BD (Yoshikawa et al. 1998). In addition to streptococcal antigens,
Escherichia coli and Staphylococcus aureus have been reported to activate
lymphocytes from BD patients to release increased amount of IL-6 and IFN-γ
(Hirohata & Hashimoto 1998). Therefore, these bacteria seem to participate and, at
least, act as triggers during the course of BD.
86
Furthermore, serum titres of antibodies against Saccharomyces cerevisiae (ASCA)
has been found to be increased in BD patients with gastrointestinal involvement
(Fresko et al. 2005), although the clinical relevance of this finding is uncertain.
1.20.4 Heat shock proteins
HSPs are highly conserved molecules induced by variable stress factors. The
presence of molecular mimicry and possible cross-reactivity between microbial and
human HSPs have been implicated as the pathogenetic mechanism in BD
(Direskeneli 2001). Lymphoproliferative responses to the 65 kDa mycobacterial and
60 kDa human HSP derived peptides were shown to be significantly higher in
patients with BD compared to healthy controls. Also, stimulation of peripheral blood
lymphocytes in patients with BD by specific epitopes of human HSP60, especially
peptide 336-351, was found to result in excess amounts of Th1 cytokine production
(Direskeneli et al. 2000;Kaneko et al. 1997).
Moreover, it was observed that the expression of HSP60 in mucocutaneous lesions
was increased in patients with BD (Ergun et al. 2001). For intestinal BD, HSP60 was
expressed in peripheral blood lymphocytes and intestinal tissues of BD in the active
state of the disease (Imamura et al. 2005). Also, dominant infiltration of TLR-2 and
TLR-4 expressing cells was recently revealed in the intestinal lesions of BD. The
TLR-2 expressing cells produced IL-12 and could contribute to the induction of Th1-
dominant immune responses in intestinal BD. As it has been shown that HSP60/65
is a ligand for TLR-2 and TLR-4, TLR/HSP60 interaction may be important for the
pathogenesis and progression of intestinal inflammation of BD (Nara et al. 2008).
1.20.5 BD-related autoantigens
A well-recognised immunological abnormality in BD is the hyperresponsiveness of T
cells to a variety of antigens. Attempts to identify the putative antigens have
produced candidates such as retinal soluble antigen (S-Ag), a potent uveitic
87
autoantigen which is localised in the photoreceptor area of the retina. S-Ag specific
T cells, despite being at a low frequency, were found in patients with active disease.
In response to S-Ag challenge, PBMCs from BD patients with active uveitis produced
IFN-γ and TNF-α but not IL-2, IL-4, or IL-17 (Zhao et al. 2008). In other studies,
cellular proliferative response to S-Ag peptides in BD patients were described (de
Smet et al. 2001;Yamamoto et al. 1993). This finding is similar to the sensitisation
against HSPs.
Besides S-Ag, immune responses to interphotoreceptor retinoid binding protein
(IRBP), another retina-specific autoantigen, has been suggested to be involved in
the pathogenesis of human uveitis, including BD (Takeuchi et al. 2010). It was
reported that IRBP-stimulated IFN-γ and IL-17 production by PBMCs was
significantly higher in BD patients than in healthy controls, indicating Th1 and Th17
polarisation. In particular, IFN-γ produced by IRBP-specific T cells was significantly
increased in BD patients during the active phase of uveitis.
A significant increase in lymphoproliferative response to α-tropomyosin as well as
autoantibodies to tropomyosin have been observed in BD patients with posterior
uveitis (Mahesh et al. 2005). Also, α-enolase protein has been found to be the target
protein of serum anti-endothelial cell antibodies (AECA) in BD patients (Lee et al.
2003). Approximately 20% of the BD patients with uveitis has been identified to be
positive for anti-selenium-binding protein antibody and these patients have more
frequent ocular inflammation (Okunuki et al. 2007). Moreover, detection of serum
kinectin autoantibody has been demonstrated in Chinese patients with BD (Lu et al.
2005).
1.20.6 Immunological abnormalities
In an early study, it was shown that ocular exacerbations were associated with a
corresponding reduction in serum IgA immune complexes and an elevation in
concentration of IgM and IgG immune complexes (Levinsky, Paganelli, & Lehner
1979). Although the number of total B lymphocytes was found to be normal, they
were functionally activated during the course of BD and expressed CD13, CD33 and
88
CD80 with an increased immunoglobulin secretion. An expansion of memory B cell
subsets was also observed (Eksioglu-Demiralp et al. 1999).
Additionally, T lymphocyte has been implicated to be the predominant cell type in the
immunopathogenesis of BD (Zakka et al. 2009). In patients with active disease, a
significant increase of peripheral Th1 cells was detected compared with those in
remission and healthy controls (Frassanito et al. 1999). The finding of upregulated
T-bet expression in active BD patients further substantiated the preferential skewing
of the immune response toward the Th1 pathway (Li et al. 2003). Surprisingly, the
serum levels of IFN-γ in patients with BD were demonstrated to be significantly
higher than in normal controls but the titre of IFN-γ correlated inversely with disease
activity in an early study (Ohno et al. 1982).
Various pro-inflammatory cytokines, including IL-1, IL-6, IL-8, IL-18, TNF-α, and
soluble IL-2 receptor (sIL-2R), have been reported to be elevated in the sera of BD
patients (Evereklioglu et al. 2002;Oztas et al. 2005;Yosipovitch et al. 1995).
Although many immunologically active cells and neutrophils may produce these
cytokines following stimulation, one of the major sources is monocytes and may play
a part in the pathogenesis of chronic inflammation in this disorder. Although NK cell
activity in the peripheral blood of patients in the clinically active stage of Behcet's
disease is significantly lower than that of patients in the inactive stage and normal
controls, the actual number of NK cells is markedly increased in the peripheral blood
of patients with active disease (Kaneko et al. 1985). In accordance with this early
study, an abnormal killer inhibitory receptor (KIR) expression on NK cells of BD
patients has recently been reported (Takeno et al. 2004). On the other hand,
neutrophils are hyperactive in BD, with increased chemotaxis, phagocytosis,
superoxide production and myeloperoxidase expression and produce several
cytokines such as IL-12 (Verity et al. 2003;Zierhut et al. 2003).
1.20.7 γδ T cells
Besides, various studies have reported the presence of elevated γδ T cells in BD
patients. An increased number of Vγ9Vδ2 subsets of T cells was demonstrated in
89
the intraocular fluid of BD patients with uveitis (Verjans et al. 2002). Recently, the
diversity of γδ T cells of BD patients in the peripheral blood and in oral mucosa was
investigated and polyclonal activation was revealed (Freysdottir et al. 2006). Studies
also demonstrated a specific increase in CD8 expression by γδ T cells, and in
absolute numbers of CD8+ γδ T cells. Most of these CD8+ γδ T cells were revealed
to be high IFN-γ, but poor IL-2, IL-4, IL-10, and TGF-β producing cells (Clemente et
al. 2010;Freysdottir, Lau, & Fortune 1999).
Notably, γδ T cells from inflammatory sites were reported to exhibit a higher cytotoxic
activity (Hamzaoui et al. 1994). In the presence of bacterial supernatants, Vδ2+ cells
from BD patients were demonstrated to expand considerably more than normal after
a short time in culture (Bank, Duvdevani, & Livneh 2003). Thus, it was suggested
that γδ T cells in BD patients had previously been primed to respond to bacterial
antigens, and a second encounter with bacterial products or cross-reactive
autoantigens could lead to inappropriate activation of these cells and result in an
autoaggressive attack against host cells.
1.20.8 Immunohistopathology of Behcet’s disease lesions
The pathology of BD varies according to the site of lesions. The hallmark of BD
features perivascular lymphocytic and monocytic cellular infiltrates, with or without
fibrin deposition in the vessel wall, especially venules, swelling and surrounding
tissue necrosis. Also, it was reported that neutrophils and CD4+ T lymphocytes
accumulated around the vasa vasorum and perivascular area, which expressed IL-
1α, TNF-β, IFN-γ, and IL-2 receptors (Evereklioglu 2005).
A recent histopathological and immunofluorescence study of papulopustular lesions
detected an immune complex-mediated leukocytoclastic vasculitis as compared with
non-lesional skin in patients with BD. The vessels of the lesional skin demonstrated
a higher IgM deposition than non-lesional skin (Alpsoy et al. 2003). In line with this
finding, immunoglobulin and complement depositions were identified in the biopsies
from mucocutaneous ulcers and papulopustular skin lesions in earlier studies (Onder
& Gurer 1999;Onder & Gurer 2001). Also, erythema nodosum-like lesions were
90
reported to be characterised by phleblitis and arteriolitis, demonstrating variable
numbers of neutrophils, lymphocytes, and histiocytes with expressions of adhesion
molecules such as E- and L-selectins (Kim & LeBoit 2000;Senturk et al. 2003).
In biopsies of oral ulcers, it was found the majority of lymphocytes present in the oral
ulcers were T cells, with no observed difference in the proportion of CD4+ or CD8+
cells in patients with BD. The Th1-related cytokines IL-12, IFN-γ, and TNF-α and the
Th1-associated chemokine receptors CCR5 and CXCR3 were increased as
compared to normal controls. However, low levels of the Th2 cytokine IL-4 was
detected in oral ulcers of BD patients. It was thus suggested that the complex
mixture of responses in the BD patients may be due to a mixture of antigenic stimuli
(Dalghous, Freysdottir, & Fortune 2006). Likewise, intestinal lesions of BD
expressed IFN-γ, TNF-α and IL-12 mRNA, and mRNA of Txk, a Tec family tyrosine
kinase specific to Th1 cells, was also expressed in the lesions. These indicated Th1-
dominant responses in vivo (Imamura et al. 2005).
Throughout the courses of neuro-Behcet’s disease, lesions are typified by
perivascular cuffing of T lymphocytes and monocytes (Hirohata 2008). In the brain,
demyelination is another common finding (Zakka, Chang, Giuliari, & Foster 2009).
Ocularly, diffuse infiltration of predominantly neutrophils in the active stage, followed
by lymphocytes and plasma cells during remission have been found in the anterior
chamber, iris, ciliary body and choroids. When the disease becomes chronic and
recurrent, collagen fibres proliferate which can lead to iris atrophy, cyclitic membrane
formation, choroidal thickening and eventually hypotonia and phthisis bulbi (Hegab &
Al Mutawa 2000). Retinal vasculitis, which involves veins more than arteries, is
characterised by infiltration of leukocytes and plasma cells. The photoreceptor
layers in the retina are often damaged and optic neuritis, ischemia, and even atrophy
may result in more advanced cases. Recently, mural IgG, IgA, and C3 in both
episcleral and choroidal vessels, along with increased serum concentrations, have
also been observed in patients with BD (Bardak & Aridogan 2004). Moreover,
intraocular infiltration of CD8brightCD56+ T cells in BD patients has been reported and
these cells are characterised as cytotoxic effector cells with functional NK receptors
91
that kill through both Fas ligand-dependent and perforin-dependent pathways (Ahn
et al. 2005).
1.21 Treatment in Behcet’s disease
Treatment of various manifestations in BD is empirical due to the paucity of
adequately powered, randomised controlled trials and the poor understanding of the
aetiopathogenesis. The conventional regimen was based on inducing severe
immunosuppression in patients by targeting broad pathways of inflammation of the
disease in a non-specific manner, and the regimen comprises systemic
corticosteroids, colchicine, and immunosuppressive agents such as azathioprine,
cyclosporine, mycophenolate mofetil and methotrexate in cases proven to be highly
steroid dependent. These have been tried with some success, and anti-
inflammatory drugs including NSAIDs may also prove useful.
Corticosteroids produce a broad and non-selective inhibition of the immune system
by suppressing cyclo-oxygenase and lipo-oxygenase pathways. Therefore, the
formation of prostaglandins, leukotrienes, and thromboxane is reduced. Also, it
decreases lymphocyte migration and chemotaxis, circulating monocytes,
macrophage activity, as well as the levels of complement and interleukins. Although
topical and systemic corticosteroids are commonly used for the treatment of vast
majority of BD manifestations, controlled studies are lacking and their long-term use
is to be avoided if possible because of significant adverse effects. Systemic
corticosteroid treatment is started with a high dose with subsequent tapering over
several weeks as quickly as clinical manifestations allow. Despite successfully
suppressing acute inflammation, corticosteroids alone often fail to prevent relapses,
so they are frequently used in combination with other medications (Evereklioglu
2005).
Cyclosporine is a calcineurin inhibitor with more specific effects on the immune
system than corticosteroid and cytotoxic drugs. It is a cytostatic agent and its
primary effect is to inhibit T cell activation and recruitment (Evereklioglu 2005).
Because of its rapid action, cyclosporine is usually the treatment of choice for sight-
92
threatening and progressive uveitis, especially with retinal vasculitis (Yurdakul &
Yazici 2008). However, the long-term use of cyclosporine is limited by the
development of neurological side effects, hirtutism, hyperglycaemia, hepatotoxicity,
nephrotoxicity and hypertension (Evereklioglu 2005).
Azathioprine and methotrexate are anti-metabolite agents. The action of
azathioprine depends on the depletion of cellular purine stores, thus suppressing
both DNA and RNA synthesis (Al Mutawa & Hegab 2004). Patients on azathioprine
should be followed for gastrointestinal disturbances and be monitored by a complete
blood count every month for bone marrow suppression and liver function test every
three months for hepatotoxicity (Evereklioglu 2005).
Methotrexate is a cyclo-oxygenase inhibitor and suppresses the production of
thymidylate and de novo purine synthesis. It has multiple in vivo and in vitro effects,
including inhibitory effects on B and T cell lymphocyte proliferation, endothelial cell
growth, chemotaxis, neovascularisation, and generation of inflammatory mediators,
such as lipo-oxygenase products. Methotrexate also inhibits dihydrofolate reductase,
which is an enzyme responsible for the reduction of folic acid. Therefore, use of folic
acid or folinic acid therapy can reduce toxicity without affecting the efficacy of
methotrexate (Al Mutawa & Hegab 2004). Patients on methotrexate should be
monitored for gastrointestinal side effects, hepatotoxicity, renal toxicity, and bone
marrow suppression (Evereklioglu 2005).
Mycophenolate mofetil (MMF) is a relatively new immunosuppressive drug and is a
specific inhibitor of B and T lymphocytes. Since its efficacy has been well
established in the management of various autoimmune diseases as well as in
different forms of non-infectious uveitis, it may have a role to play in the treatment of
BD (Marshall 2004). Also, colchicine is an anti-inflammatory plant alkaloid and
inhibits neutrophil chemotaxis by accumulating in these cells and suppressing the
microtubule function (Evereklioglu 2005).
Combined treatment is also often used in order to diminish corticosteroid dose. Drug
combinations are often preferred and many patients progress through various drug
combinations with time, usually due to adverse effects. Medications must be given
93
under expert specialist supervision and need regular monitoring to detect potential
side effects and determine response. Relief of symptoms, control of active
inflammation, and prevention of recurrences and hence of irreversible end-organ
damage and functional disability are the main goals (Evereklioglu 2005).
Although the prognosis has improved with early and aggressive immunosuppressive
treatment, many patients have refractory disease. Over the past decade, biological
agents that target one cytokine or inflammatory mediator have emerged as powerful
therapies for a number of inflammatory disorders. They are also proving to be most
useful in BD and can result in dramatic reduction of disease burden and
improvement of long-term outcome. Small case series have demonstrated the value
of biological therapies such as IFN-α and TNF-α antagonists, particularly infliximab,
even in patients resistant to conventional treatment. Both IFN-α and infliximab have
proved capable of rapidly inducing remission in active disease. If an adequate initial
dose is used, IFN-α is capable of triggering a dramatic improvement within a few
days (Deuter et al. 2008). For infliximab, the benefit is usually temporary and
infusions are required every 4-8 weeks to sustain remission (Imrie & Dick 2007); very
few cases have been described in which treatment could be stopped without
relapses within a few months. In contrast, 50-60% of patients treated with IFN-α do
not relapse one year after cessation of therapy (Deuter et al. 2008).
In order to develop evidence-based recommendations for the management of BD,
the European League Against Rheumatism (EULAR) combined current evidence
from clinical trials with expert opinion (Hatemi et al. 2008). Recommendations
related to the eye, mucocutaneous disease and arthritis are mainly evidence based,
but recommendations on vascular disease, neurological and gastrointestinal
involvement are based largely on expert opinion and uncontrolled evidence from
open trials and observational studies (Table 1.4).
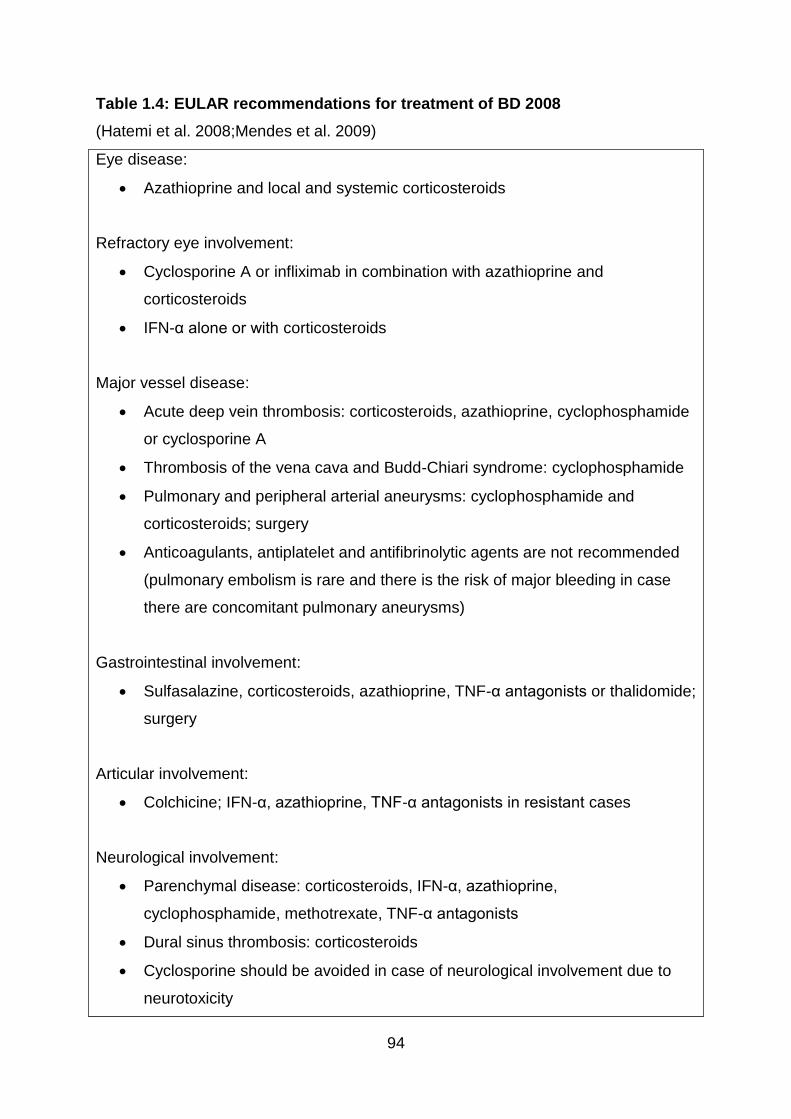
94
Table 1.4: EULAR recommendations for treatment of BD 2008
(Hatemi et al. 2008;Mendes et al. 2009)
Eye disease:
Azathioprine and local and systemic corticosteroids
Refractory eye involvement:
Cyclosporine A or infliximab in combination with azathioprine and
corticosteroids
IFN-α alone or with corticosteroids
Major vessel disease:
Acute deep vein thrombosis: corticosteroids, azathioprine, cyclophosphamide
or cyclosporine A
Thrombosis of the vena cava and Budd-Chiari syndrome: cyclophosphamide
Pulmonary and peripheral arterial aneurysms: cyclophosphamide and
corticosteroids; surgery
Anticoagulants, antiplatelet and antifibrinolytic agents are not recommended
(pulmonary embolism is rare and there is the risk of major bleeding in case
there are concomitant pulmonary aneurysms)
Gastrointestinal involvement:
Sulfasalazine, corticosteroids, azathioprine, TNF-α antagonists or thalidomide;
surgery
Articular involvement:
Colchicine; IFN-α, azathioprine, TNF-α antagonists in resistant cases
Neurological involvement:
Parenchymal disease: corticosteroids, IFN-α, azathioprine,
cyclophosphamide, methotrexate, TNF-α antagonists
Dural sinus thrombosis: corticosteroids
Cyclosporine should be avoided in case of neurological involvement due to
neurotoxicity
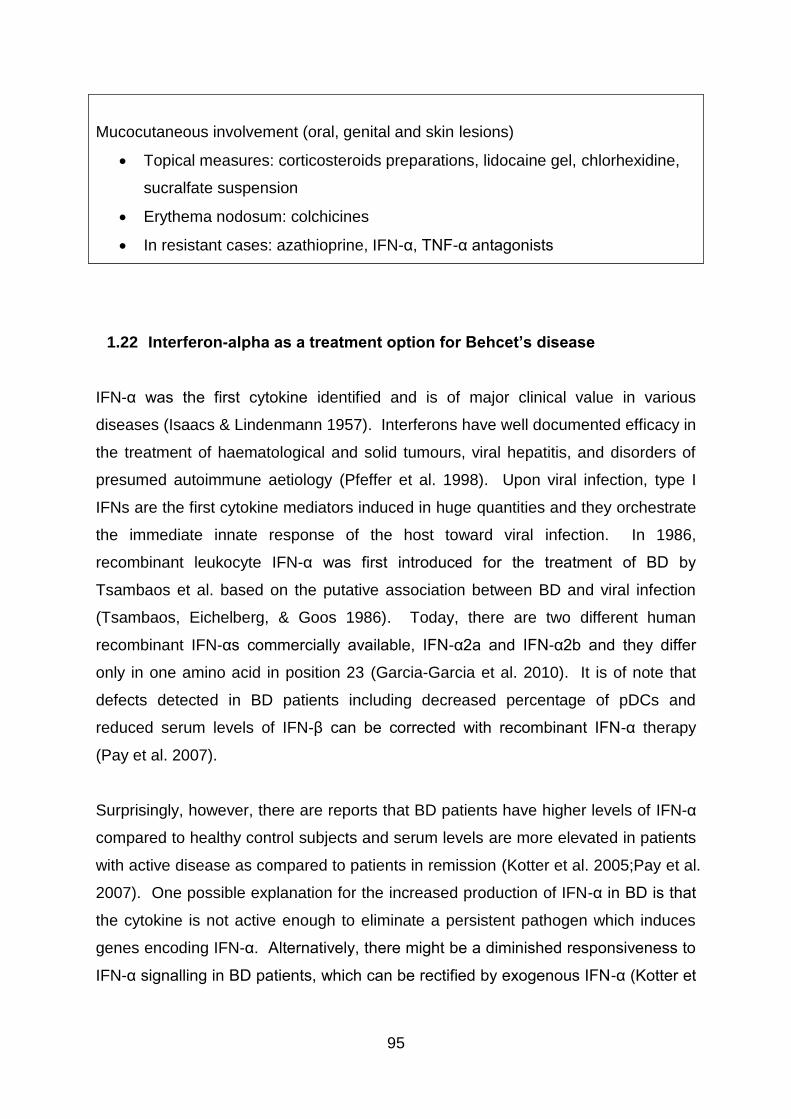
95
Mucocutaneous involvement (oral, genital and skin lesions)
Topical measures: corticosteroids preparations, lidocaine gel, chlorhexidine,
sucralfate suspension
Erythema nodosum: colchicines
In resistant cases: azathioprine, IFN-α, TNF-α antagonists
1.22 Interferon-alpha as a treatment option for Behcet’s disease
IFN-α was the first cytokine identified and is of major clinical value in various
diseases (Isaacs & Lindenmann 1957). Interferons have well documented efficacy in
the treatment of haematological and solid tumours, viral hepatitis, and disorders of
presumed autoimmune aetiology (Pfeffer et al. 1998). Upon viral infection, type I
IFNs are the first cytokine mediators induced in huge quantities and they orchestrate
the immediate innate response of the host toward viral infection. In 1986,
recombinant leukocyte IFN-α was first introduced for the treatment of BD by
Tsambaos et al. based on the putative association between BD and viral infection
(Tsambaos, Eichelberg, & Goos 1986). Today, there are two different human
recombinant IFN-αs commercially available, IFN-α2a and IFN-α2b and they differ
only in one amino acid in position 23 (Garcia-Garcia et al. 2010). It is of note that
defects detected in BD patients including decreased percentage of pDCs and
reduced serum levels of IFN-β can be corrected with recombinant IFN-α therapy
(Pay et al. 2007).
Surprisingly, however, there are reports that BD patients have higher levels of IFN-α
compared to healthy control subjects and serum levels are more elevated in patients
with active disease as compared to patients in remission (Kotter et al. 2005;Pay et al.
2007). One possible explanation for the increased production of IFN-α in BD is that
the cytokine is not active enough to eliminate a persistent pathogen which induces
genes encoding IFN-α. Alternatively, there might be a diminished responsiveness to
IFN-α signalling in BD patients, which can be rectified by exogenous IFN-α (Kotter et
96
al. 2005). The latter explanation is supported by polymorphisms recently
demonstrated in the receptor for the type 1 IFNs in patients with BD (Pay et al. 2009).
Recent studies have focused on IFN-α2a, either used alone or in association with
steroids and/or immunosuppressive agents. Due to the immunomodulatory rather
than immunosuppressive nature, it is reasoned that the use of interferons needs an
unsuppressed immune system (Onal et al. 2009). Therefore, the use of IFN-α
combined with immunosuppressants remains a matter of debate and it has been
suggested by some that concurrent use of immunosuppressives is to be avoided and
corticosteroids should be used in low doses (Mackensen, Max, & Becker 2006).
Treatment modalities of IFN-α vary greatly, with doses ranging from an injection of 3
to 9 million units 3-7 times a week and treatment duration between 11 days to 64
months. Optimal treatment duration is not clear but intermediate to high IFN-α
dosages were shown to be more effective than low-dose regimens. Also, long-term
remissions were associated with higher dosages, but no benefit was noticed with
longer therapy in terms of efficacy or duration of induced remission (Kotter et al.
2004a;Zouboulis & Orfanos 1998).
Indeed, the risk of developing binding and neutralising antibodies increases with
longer treatment, possibly decreasing its beneficial effects (Antonelli et al.
1991;Zouboulis & Orfanos 1998). Recombinant IFN-α2a induces neutralising
antibodies in about 20% of patients, in contrast to only about 6% of those treated
with recombinant IFN-α2b (Antonelli et al. 1991). Autoantibodies can be detectable
three to twelve months after initiation of IFN-α therapy and their production or
increase in titre has been observed in up to 50% of patients treated. Thyroid
autoantibodies have been reported to be the most frequent. However,
manifestations of overt autoimmune disease have been observed in only 1-2% of
patients.(Hauschild et al. 2008;Pellicano et al. 2005) Overall, a meta-analysis of 144
BD patients from 22 reports showed that despite different therapeutic regimens
employed in individual studies, overall efficacy of IFN-α therapy was 74% for
mucocutaneous manifestations, 93% for arthritis and 95% for uveitis (Zouboulis &
Orfanos 1998). Regarding time to response to IFN-α therapy, remission in ocular
manifestations usually occurred in 2 to 4 weeks and nonocular manifestations
remitted in 4-6 weeks (Kotter et al. 2004a).
97
The side effect profile of IFN-α is generally less severe than other systemic
immunosuppressants. Common side effects of IFN-α include injection site reactions,
flu-like symptoms (fever, headache, myalgia, arthralgia, sweating and fatigue), mild
leukopaenia and alopecia. The flu-like symptoms could be alleviated by concomitant
administration of paracetamol and represent a good prognostic marker for a
response to IFN-α treatment as this may indicate the absence of pre-existing anti-
IFN-α autoantibodies (Deuter et al. 2008;Mackensen, Max, & Becker 2006). Even
without pre-existing psychiatric disease, depression and suicidal ideations can occur
during therapy. An asymptomatic increase in liver enzymes has been reported,
especially ones who receive high-dose IFN-α. In case of an greater than five times
elevation of liver enzymes, a therapy pause followed by a dose reduction has been
suggested (Hauschild et al. 2008). IFN-associated retinopathy with features such as
cotton wool spots, arteriolar occlusions, retinal oedema and haemorrhages has been
described in hepatitis C and melanoma patients treated with IFN-α but so far this has
not been confirmed in BD patients. Risk factors reported include arterial
hypertension, diabetes mellitus and age above 45 years (Deuter et al. 2008).
Gastrointestinal side effects such as dyspepsia, diarrhoea, loss of appetite and
weight loss can occur, as can other less common side effects which include
thrombocytopaenia, hypertriglyceridaemia, reduced libido, hypotension and cardiac
disturbances (Hauschild et al. 2008).
The two IFN-α isotypes have a comparable adverse effect profile, although flu-like
symptoms and mild leukopaenia are more commonly reported with IFN-α2a
regimens and mild alopecia more commonly with IFN-α2b treatment (Zouboulis &
Orfanos 1998). Fortunately, nearly all of the side effects are temporary, dose-
dependent and reversible, and discontinuation of IFN-α therapy due to adverse
effects has been reported to be rare as a result (Deuter et al. 2008). Of note, type 1
diabetes occasionally develops during IFN-α treatment (Devendra & Eisenbarth
2004). Interestingly, disorders such as systemic lupus erythematosus, sarcoidosis,
rheumatoid arthritis, autoimmune hepatitis, epilepsy and psoriasis may present for
the first time during IFN-α therapy. These conditions are contraindications for IFN-α
treatment and treatment should be individually evaluated with the risk-benefit profile
taken into careful consideration (Deuter et al. 2008;Hauschild et al. 2008;Selmi et al.
98
2006). Unlike anti-TNF therapy, INF-α treatment is not associated with an increased
risk of infection (Imrie & Dick 2007).
1.23 Clinical trials on interferon-α in Behcet’s disease
Despite a lack of data from randomised controlled trials, the results of studies
performed so far with IFN-α therapy have been promising especially for those
patients with disease resistant to conventional immunosuppressive treatments. In
particular, the clinical efficacy of IFN-α in the treatment of BD associated uveoretinitis
appears fairly convincing.
1.23.1 The beneficial effects of IFN-α on ocular manifestations
In one open-label, prospective series involving 50 BD patients with sight-threatening
refractory uveitis, a 92% response rate was demonstrated with recombinant human
IFN-α2a at initial doses of six million units subcutaneously daily. Retinal infiltrates
resolved after 2-3 weeks in all patients, macular oedema resolved, and visual acuity
improved or remained stable in 97% of affected eyes (Kotter et al. 2004b). The IFN-
α dose was subsequently adjusted according to the clinical response, and was
discontinued whenever possible. Importantly, 40% of patients remained in remission
for a mean of 29.5 months after cessation of treatment. IFN-α treatment was also
beneficial for extraocular problems including arthritis, genital ulcers, and cutaneous
and gastrointestinal manifestations as well, but less so for oral ulcerations.
In a retrospective analysis carried out on 44 BD patients with uveitis unresponsive to
conventional immunosuppressants, IFN-α2a was given at an initial dose of 3-6
million units daily for a mean duration of 12.4 months and led to a partial or complete
response in 91% of patients (Tugal-Tutkun, Guney-Tefekli, & Urgancioglu 2006).
Visual acuity significantly improved and this benefit was preserved in 95% of patients
throughout follow-up. Interestingly, patients who received IFN-α treatment at the
time of a relapse did not behave differently compared with those whose treatment
was started during remission. Another retrospective study by the same group found
99
that treatment with IFN-α2a resulted in resolution of neovascularisation of the optic
disc, whether inflammation- or ischaemia-induced (Tugal-Tutkun et al. 2006).
An open, prospective study also evaluated the intermediate-term efficacy of IFN-α2a
in patients with active Behcet’s uveitis who failed to respond to conventional
treatments, and 53 patients (106 eyes) were assessed. Complete remission (no
relapse within the first year of follow-up) was obtained in 38 patients (71.6%). This
was achieved even in patients with chronic inflammation associated with retinal and
optic nerve vasculitis, neovascularisation of the optic disc, and cystoid macular
oedema, which were unresponsive to previous conventional treatments. The mean
ocular attack rate of 3.6 per year decreased to 0.56 per year at one year follow-up.
Moreover, fifteen patients (28.3%) were off treatment for all the medications and
disease free for 28 months. However, reinstitution of IFN-α2a treatment was
required at a median follow-up of 65 months (Sobaci et al. 2010).
Recent studies have provided valuable information concerning the beneficial effect of
IFN-α on long-term visual prognosis in BD. A retrospective study of 32 patients with
severe refractory uveitis who were treated with IFN-α2a at a dose of 3-6 million units
three times a week in combination with initial high doses of steroids demonstrated
promising results, with uveitis being controlled in 28 patients (87.5%) and 19 patients
(59.4%) being able to stop IFN-α after a mean treatment period of 32 months. Of the
28 responders, the mean follow-up period was 70.6 months. 13 patients (68%) were
free of recurrences, and visual acuity was stabilised or improved in 87.5% of eyes
(Gueudry et al. 2008). In another study of 45 patients who received IFN-α for ocular
BD, patients were followed up for a mean of 6.67 years. Nine patients (20%) were
able to stop IFN-α after a mean treatment period of 33 months. Those patients
remained relapse free for a mean of 37 months. Importantly, 92% of the affected
eyes showed improvement in or stabilisation of visual acuity during follow-up (Krause
et al. 2008).
These results on favourable long-term visual prognosis are supported by finding of a
retrospective study of 53 BD patients (96 eyes) with sight-threatening uveitis. Higher
initial dosage of 6 million IU every day was used and visual acuity of the affected
eyes in the series improved or remained unchanged in 91 eyes (94.8%). IFN-α was
100
able to be discontinued in 47 patients (88.7%), but twenty of these 47 (42.6%)
needed a second treatment course during a median follow-up of 6.0 years.
Nevertheless, ocular disease remained in remission in 50% of the patients 45.9
months after cessation of the first IFN-α course (Deuter et al. 2010).
1.23.2 The beneficial effects of IFN-α on non-ocular manifestations
The beneficial effects of IFN-α for the non-ocular manifestations of BD have also
been demonstrated. A randomised, placebo-controlled, double-blind trial showed
that both pain and duration of oral ulcers were reduced in 23 patients treated with
IFN-α2a at a dosage of six million units subcutaneously three times a week for 3
months (Alpsoy et al. 2002). IFN-α decreased the frequency of both genital ulcers
and papulopustular lesions. Additionally, in five of six patients, the severity and
frequency of ocular attacks was noted to improve. However, all manifestations had
the tendency to return to pre-treatment levels after cessation of therapy.
In an open, self-controlled trial of 20 patients treated with IFN-α2b for 16 weeks and
followed for 48 weeks, the frequency and duration of arthritic attacks has been
demonstrated to reduce after treatment with IFN-α2b. The mean number of
mucocutaneous lesions also showed a tendency to decrease. However, except for
the duration of arthritis, the mean number and frequency of all symptoms tended to
return to pretreatment levels in the post-treatment phase (Hamuryudan et al. 1994).
Currently, there is little information concerning the efficacy of IFN-α therapy for
involvement of gastrointestinal tract, central nervous system and large vessels,
although one small study demonstrated remission in 9 of 10 patients with vascular
disease and 4 of 4 with neurological disease after a mean duration of 22.2 months of
IFN-α treatment (Calguneri et al. 2003).
101
1.23.3 The combined use of azathioprine and IFN-α
The efficacy of the combined use of azathioprine and IFN-α was examined in a small
open study of ten male BD patients with retinal involvement. For 24 weeks, they
were treated with azathioprine and IFN-α2b five million units three times a week.
The IFN-α was stopped after 24 weeks and the patients continued to take
azathioprine or switched to cyclosporin A as indicated. The mean visual acuity of
either eye improved significantly during treatment and throughout the follow-up.
However, frequent but reversible myelosuppression, mainly leukopaenia, was
observed and short withdrawals of either or both drugs were necessary
(Hamuryudan et al. 2002).
In one long-term retrospective analysis, experience of IFN-α treatment on seven
paediatric BD patients with severe uveitis was described (Guillaume-Czitrom et al.
2007). IFN-α2a was given at a dosage of 1.5 or 3 million units thrice a week in
children weighing 20-30kg or 30-50kg, respectively. The treatment was combined
with azathioprine for two of the children. The results are encouraging due to rapid
steroid-sparing effect in five patients and sustained remission was achieved in four
children. The results, together with the above study, suggest the combination of
IFN-α and azathioprine might be an option in the management of severe refractory
BD uveitis.
The details of these trials are summarised in Table 1.5.
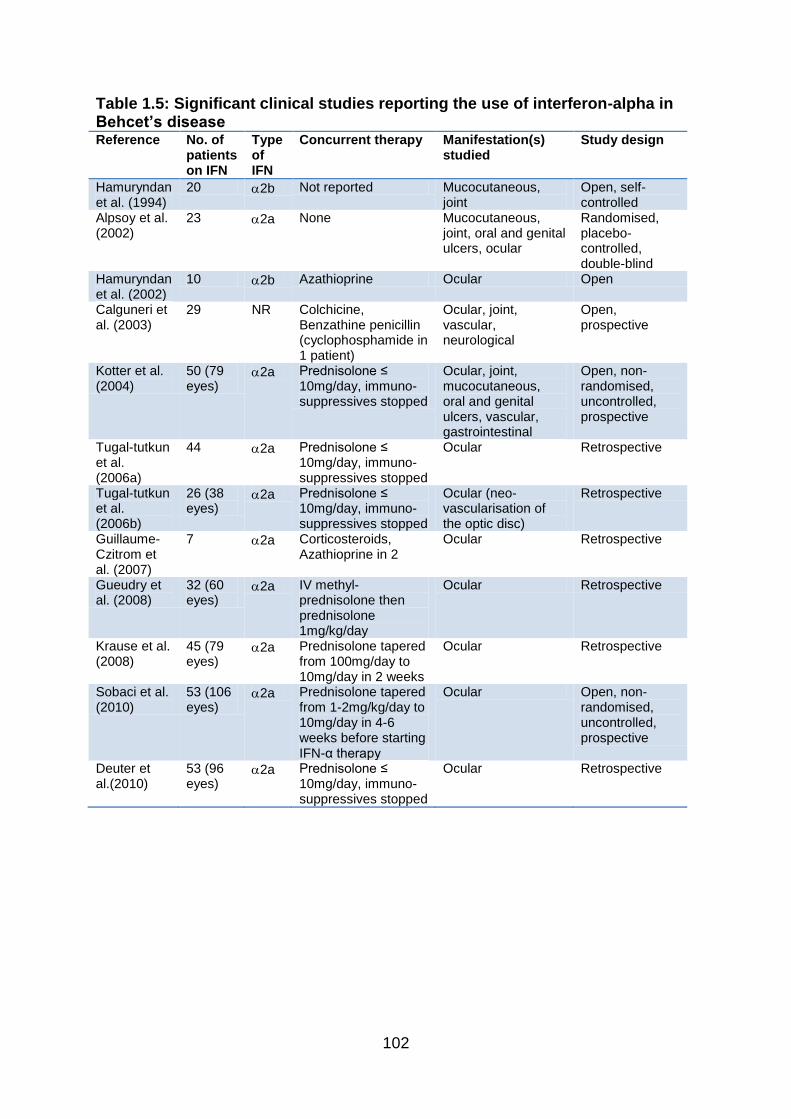
102
Table 1.5: Significant clinical studies reporting the use of interferon-alpha in Behcet’s disease Reference No. of
patients on IFN
Type of IFN
Concurrent therapy Manifestation(s) studied
Study design
Hamuryndan et al. (1994)
20 2b Not reported Mucocutaneous, joint
Open, self-controlled
Alpsoy et al. (2002)
23 2a None Mucocutaneous, joint, oral and genital ulcers, ocular
Randomised, placebo-controlled, double-blind
Hamuryndan et al. (2002)
10 2b Azathioprine Ocular Open
Calguneri et al. (2003)
29 NR Colchicine, Benzathine penicillin (cyclophosphamide in 1 patient)
Ocular, joint, vascular, neurological
Open, prospective
Kotter et al. (2004)
50 (79 eyes)
2a Prednisolone ≤ 10mg/day, immuno-suppressives stopped
Ocular, joint, mucocutaneous, oral and genital ulcers, vascular, gastrointestinal
Open, non-randomised, uncontrolled, prospective
Tugal-tutkun et al. (2006a)
44 2a Prednisolone ≤ 10mg/day, immuno-suppressives stopped
Ocular Retrospective
Tugal-tutkun et al. (2006b)
26 (38 eyes)
2a Prednisolone ≤ 10mg/day, immuno-suppressives stopped
Ocular (neo-vascularisation of the optic disc)
Retrospective
Guillaume-Czitrom et al. (2007)
7 2a Corticosteroids, Azathioprine in 2
Ocular Retrospective
Gueudry et al. (2008)
32 (60 eyes)
2a IV methyl-prednisolone then prednisolone 1mg/kg/day
Ocular Retrospective
Krause et al. (2008)
45 (79 eyes)
2a Prednisolone tapered from 100mg/day to 10mg/day in 2 weeks
Ocular Retrospective
Sobaci et al. (2010)
53 (106 eyes)
2a Prednisolone tapered from 1-2mg/kg/day to 10mg/day in 4-6 weeks before starting IFN-α therapy
Ocular Open, non-randomised, uncontrolled, prospective
Deuter et al.(2010)
53 (96 eyes)
2a Prednisolone ≤ 10mg/day, immuno-suppressives stopped
Ocular Retrospective
103
1.24 Pegylated interferon-alpha
The clinical use of recombinant IFN-α has been restricted due to its short circulating
half-life, which makes frequent dosing over an extended period necessary. The
frequently used three times weekly administration schedule of IFN-α produces peak
drug concentration/trough concentration cycles which compromise the tolerability of
the drug because of the high incidence of peak concentration-related adverse effects
(Perry & Jarvis 2001). This problem has been overcome with the introduction of
pegylated interferons as they have a covalently attached polyethylene glycol chain
which helps to reduce immunogenicity and clearance, and improve compliance and
efficacy (Foster 2004). Polyethylene glycols (PEG) are biologically inert molecules
that can be attached to proteins to reduce their degradation and the molecular
weight and conformation of PEG chains can have an impact on the conjugate’s
properties (Foster 2004).
Two products are now in widespread clinical use. The 40 kDa PEG-IFN-α2a (F.
Hoffmann-La Roche Ltd, Switzerland) is linked to a branch chain, 40 kDa PEG
moiety and the 12 kDa PEG-IFN-α2b (Schering-Plough, USA) consists of IFN-α2b
linked to a linear PEG chain. The two PEG-IFN-α drugs differ in the way that the
PEG chain is cross-linked to the IFN-α. The PEG molecule in PEG-IFN-α2b is
attached via a urethane bond. This urethane linkage is unstable and susceptible to
hydrolysis such that, once injected, native interferon-α2b is released and circulates in
the body. Thus, PEG-IFN-α2b is probably best regarded as a pro-drug. On the
other hand, the PEG polymer in PEG-IFN-α2a is attached to a lysine residue within
the IFN-α2a molecule via a hydrolytically stable amide bond. Consequently, the
entire pegylated molecule circulates intact and interacts with the cell surface receptor
(Foster 2004).
Conventional IFN-α has an absorption half-life of 2.3 hours and 7 to 12 hours after
subcutaneous administration conventional IFN-α reaches peak serum levels. It is
rapidly eliminated with a clearance of 6000ml/h and has an elimination half-life of 4
to 16 hours. Twenty-four hours after administration there is almost no measurable
IFN in the serum (Chatelut et al. 1999;Wills 1990). PEG-IFN-α2b has a relatively
rapid absorption (absorption half life of 4.6h), a wide volume of distribution
104
(approximately 0.99L/kg), and reduced clearance (725ml/h) (Glue et al. 2000).
Maximum concentrations are achieved between 15 and 44 hours post-dosing and
are sustained for 48-72 hours (Foster 2004). Whereas, the 40 kDa PEG-IFN-α2a is
absorbed more slowly (absorption half life of 50h), has a more limited volume of
distribution (8L, suggests distribution predominantly into the intravascular
compartment), and a noticeably diminished rate of clearance (60ml/h) (Bailon et al.
2001). Maximum concentrations occur approximately 80 hours after dose
administration and are sustained up to 168 hours (Foster 2004).
The bioactivity of PEG-IFN-α2b has been shown to be at least comparable to that of
the frequently used thrice weekly administration of non-pegylated IFN-α2b (Jen et al.
2001) (Fig 1.5). The dosage of PEG-IFN-α2b must be adjusted for body weight to
overcome the effect of extensive tissue distribution and metabolism of the drug.
Whereas, PEG-IFN-α2a can be given as a single fixed dose (Reddy 2004). Of note,
increased serum concentrations after several weeks of dosing have been reported
for both pegylated and conventional interferons (Jen et al. 2001).
PEG-IFN-α2a is cleared by both the liver and kidney and the liver plays an important
role in the metabolism of the drug. On the other hand, PEG-IFN-α2b releases free
IFN-α2b soon after administration, and this is renally excreted (Foster 2010). From
the clinical experience, the relatively rapid absorption of PEG-IFN-α2b leads to swift
onset of side effects and a fall in neutrophil and platelet counts could take place. On
the other hand, the side effects of PEG-IFN-α2a gradually increase over the first few
weeks and neutrophil and platelet counts might not plummet until the second month
of therapy (Foster 2004).
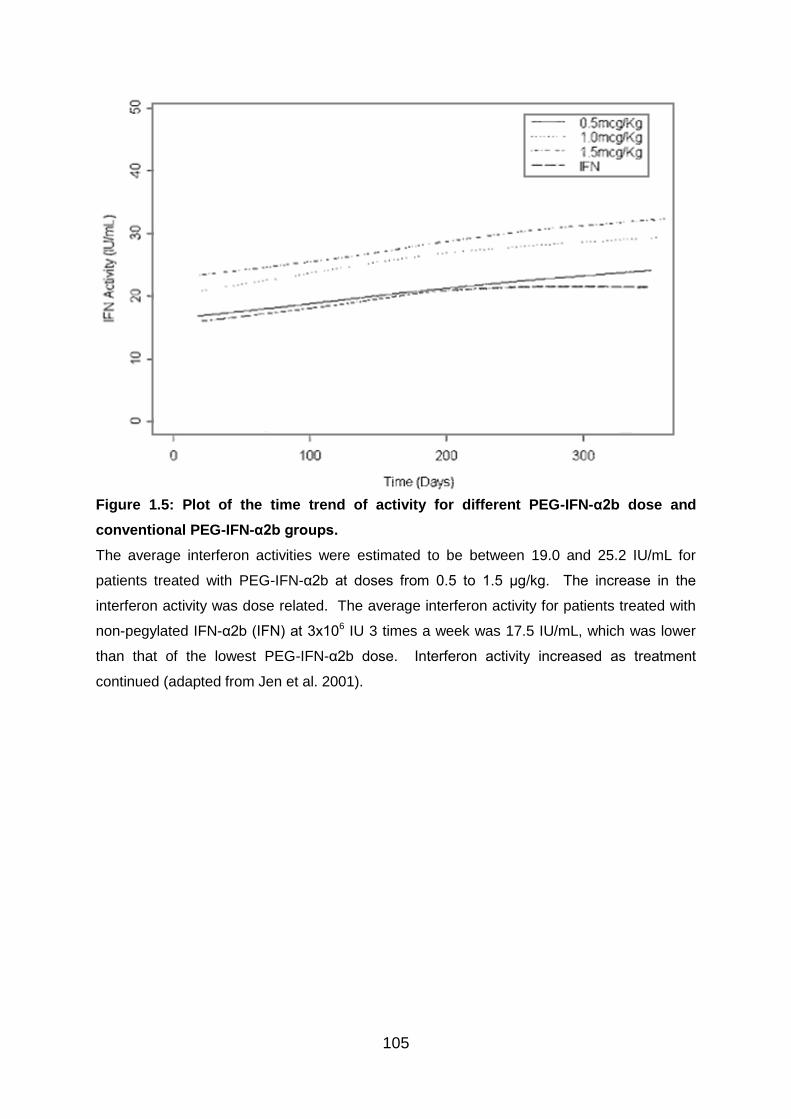
105
Figure 1.5: Plot of the time trend of activity for different PEG-IFN-α2b dose and
conventional PEG-IFN-α2b groups.
The average interferon activities were estimated to be between 19.0 and 25.2 IU/mL for
patients treated with PEG-IFN-α2b at doses from 0.5 to 1.5 μg/kg. The increase in the
interferon activity was dose related. The average interferon activity for patients treated with
non-pegylated IFN-α2b (IFN) at 3x10⁶ IU 3 times a week was 17.5 IU/mL, which was lower
than that of the lowest PEG-IFN-α2b dose. Interferon activity increased as treatment
continued (adapted from Jen et al. 2001).
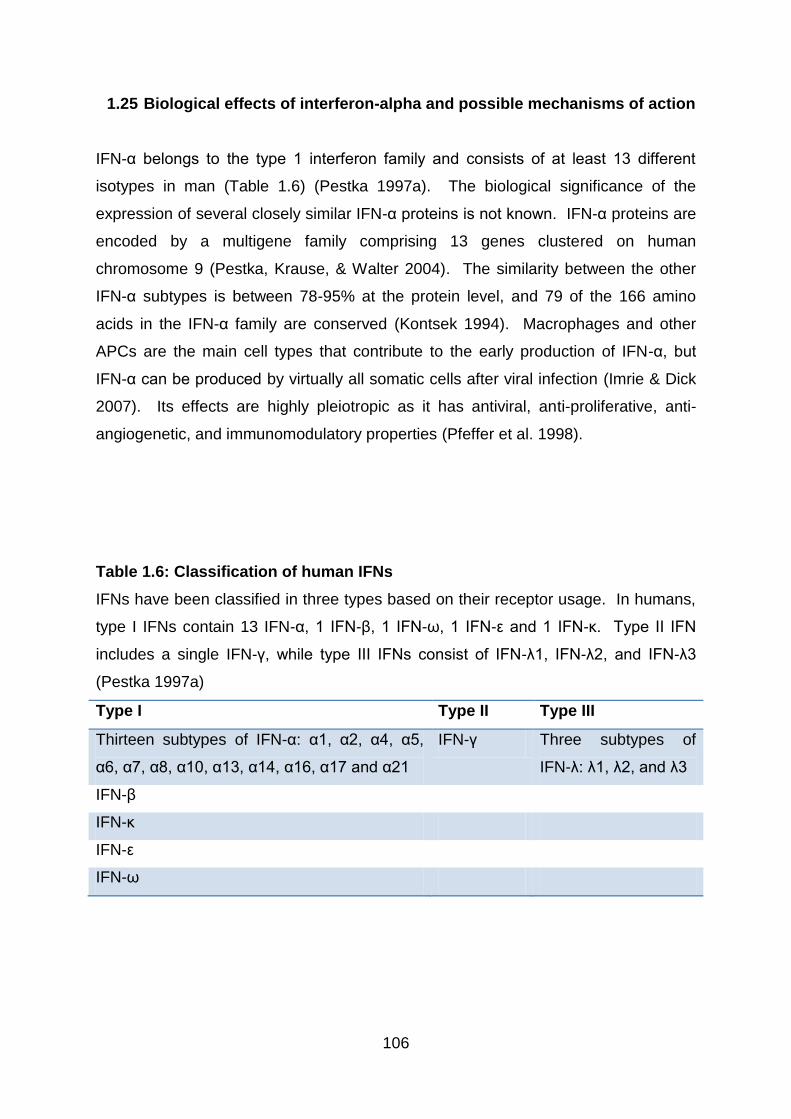
106
1.25 Biological effects of interferon-alpha and possible mechanisms of action
IFN-α belongs to the type 1 interferon family and consists of at least 13 different
isotypes in man (Table 1.6) (Pestka 1997a). The biological significance of the
expression of several closely similar IFN-α proteins is not known. IFN-α proteins are
encoded by a multigene family comprising 13 genes clustered on human
chromosome 9 (Pestka, Krause, & Walter 2004). The similarity between the other
IFN-α subtypes is between 78-95% at the protein level, and 79 of the 166 amino
acids in the IFN-α family are conserved (Kontsek 1994). Macrophages and other
APCs are the main cell types that contribute to the early production of IFN-α, but
IFN-α can be produced by virtually all somatic cells after viral infection (Imrie & Dick
2007). Its effects are highly pleiotropic as it has antiviral, anti-proliferative, anti-
angiogenetic, and immunomodulatory properties (Pfeffer et al. 1998).
Table 1.6: Classification of human IFNs
IFNs have been classified in three types based on their receptor usage. In humans,
type I IFNs contain 13 IFN-α, 1 IFN-β, 1 IFN-ω, 1 IFN-ε and 1 IFN-κ. Type II IFN
includes a single IFN-γ, while type III IFNs consist of IFN-λ1, IFN-λ2, and IFN-λ3
(Pestka 1997a)
Type I Type II Type III
Thirteen subtypes of IFN-α: α1, α2, α4, α5,
α6, α7, α8, α10, α13, α14, α16, α17 and α21
IFN-γ Three subtypes of
IFN-λ: λ1, λ2, and λ3
IFN-β
IFN-κ
IFN-ε
IFN-ω
107
The receptor for the Type 1 IFNs consists of two chains, IFN-αR1 and IFN-αR2c
(Pestka, Krause, & Walter 2004), which are encoded by two different genes located
on chromosome 21q (Lutfalla et al. 1992). The receptor is expressed by nearly all
cell types and tissues, including immune cells (Prinz et al. 2008). By interacting with
their specific receptor, IFN-α activates Stat complexes which are a family of
transcription factors that regulate the expression of certain immune system genes.
Stat activation initiates the most well-defined cell signalling pathway for all IFNs, the
classical Jak-Stat signalling pathway (Pestka 1997b;Stark et al. 1998). In this
pathway (Figure 1.6), Jaks associate with IFN receptors and, following receptor
engagement with IFN, phosphorylate both Stat1 and Stat2. As a result, an IFN-
stimulated gene factor 3 (ISGF3) complex forms - this contains Stat1, Stat2 and a
transcription factor called interferon regulatory factor 9 (IRF9) - and moves into the
cell nucleus. Inside the nucleus, the ISGF3 complex binds to specific nucleotide
sequences called IFN-stimulated response elements (ISRE) in the promoters of
certain genes, known as IFN stimulated genes (ISG). Binding of ISGF3 and other
trasncriptional complexes induces transcription of these genes (Platanias 2005).
In addition, Stat homodimers or heterodimers form from different combinations of
Stat-1, -3, -4, -5, or -6 during IFN signalling; these dimers initiate gene transcription
by binding to IFN-γ activated site (GAS) elements in gene promoters (Platanias
2005). The signalling by IFN-α is predominantly through Stat1 and Stat2, however,
the pathways can involve Stat3, Stat4, Stat5, and IFN regulatory factors in various
cells and under diverse conditions (Su & David 2000;Ziegler-Heitbrock et al. 2003).
Type I IFNs can induce expression of genes with either ISRE or GAS elements, but
gene induction by type II IFN can occur only in the presence of a GAS element
(Platanias 2005).
Besides the JAK-STAT pathway, IFNs can activate several other signalling
cascades. Both type I and type II IFNs activate a member of the CRK family of
adaptor proteins called CT10 regulator of kinase like (CRKL), a nuclear adaptor for
Stat5 that also regulates signalling through the C3G/Rap1 pathway (Platanias 2005).
Type I IFNs further activate p38 MAPK to induce gene transcription. Anti-viral and
anti-proliferative properties of IFN-α are resulted from p38 MAPK signalling
(Platanias 2005). Another pathway, the PI3K signalling pathway, is also regulated
108
by type I IFNs. PI3K activates P70-S6 Kinase 1, an enzyme that increases protein
synthesis and cell proliferation; phosphorylates of ribosomal protein s6, which is
involved in protein synthesis; and phosphorylates a translational repressor protein
called eukaryotic translation-initiation factor 4E-binding protein 1 (EIF4EBP1) in
order to deactivate it (Platanias 2005).
Interferons have diverse effects, influencing both innate and adaptive immune
responses and form a network of complex interactions with other cytokines (Baccala,
Kono, & Theofilopoulos 2005). As well as augmenting the number of B cells and
monocytes (Corssmit et al. 1997;Wejstal et al. 1992), IFN-α has been found to
promote CD4+ T cells (Simon et al. 2003). Furthermore, it was reported to enhance
human leukocyte antigen-1(HLA-1) expression on monocytes in BD patients
(Piazzolla et al. 1996) and improve the activity of natural killer cells and cytotoxic T
cells (Arnaud 2002). Under IFN-α therapy, the number of circulating NK cell, CD8+
γδ T cells, CD3+ γδ T cells and leukocytes, especially neutrophils were all reported to
be substantially lowered (Simon et al. 2003;Treusch et al. 2004)
By interacting with the cytokine cascade, IFN-α has displayed anti-inflammatory
properties including abilities to inhibit IL-8 expression (Aman et al. 1993), increase
IL-10 production (Aman et al. 1996;Kaser, Molnar, & Tilg 1998) and induce IL-1
receptor antagonist (Tilg et al. 1993) and soluble TNFR-55 and TNFR-77 (Corssmit
et al. 1997;Tilg, Vogel, & Dinarello 1995). Also, it has been shown that IFN-α
suppressed IL-1- and PMA-induced IL-1 synthesis by PBMCs (Schindler, Ghezzi, &
Dinarello 1990). However, the production of IL-4 was not always reported to be
augmented by IFN-α (Brinkmann et al. 1993;Kaser, Molnar, & Tilg 1998). On the
other hand, the production of another Th2 cytokine, IL-5, as well as IL-13, were
shown to be downregulated by IFN-α (Kaser, Molnar, & Tilg 1998;Schandene et al.
1996).
Surprisingly, although IFN-α was described to suppress TNF-α gene expression and
protein synthesis in vitro and in vivo (Abu-Khabar, Armstrong, & Ho 1992;Larrea et
al. 1996), it was demonstrated to enhance IFN-γ production by CD4+ T cells
(Brinkmann et al. 1993;Simon et al. 2003). However, IFN-γ has been suggested
more recently to be not only a mediator of disease but also as a protective factor in
109
models of autoimmunity (O'shea, Ma, & Lipsky 2002). Furthermore, it has been
revealed that IFN-α can restore the impaired intracellular IL-2 production up to
normal levels by promoting Th1 differentiation. IL-2, along with B7 co-stimulators,
has been demonstrated to promote the development of Treg cells or apoptosis of
activated T cells. Thus, termination of immune responses and maintenance of self
tolerance can be achieved (Abbas 2003;Amberger et al. 2007). Other actions
demonstrated by IFN-α involve abilities to suppress T cell binding to endothelial cells
and inhibit intercellular adhesion molecule-1 (ICAM-1) expression on endothelial
cells stimulated by IFN-γ (Eguchi et al. 1992). The capacity of IFN-α to inhibit T cell
adhesion to endothelial cells can conceivably impede with the transmigration of
inflammatory cells and reduce tissue injury as a result.
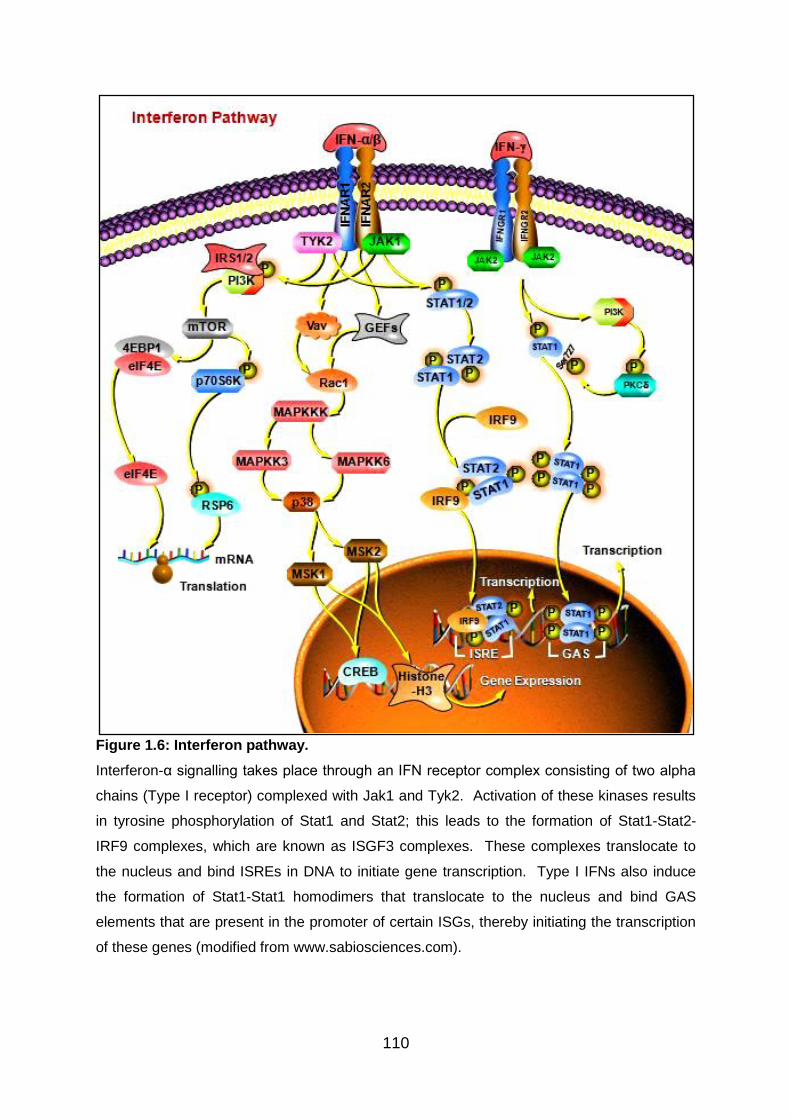
110
Figure 1.6: Interferon pathway.
Interferon-α signalling takes place through an IFN receptor complex consisting of two alpha
chains (Type I receptor) complexed with Jak1 and Tyk2. Activation of these kinases results
in tyrosine phosphorylation of Stat1 and Stat2; this leads to the formation of Stat1-Stat2-
IRF9 complexes, which are known as ISGF3 complexes. These complexes translocate to
the nucleus and bind ISREs in DNA to initiate gene transcription. Type I IFNs also induce
the formation of Stat1-Stat1 homodimers that translocate to the nucleus and bind GAS
elements that are present in the promoter of certain ISGs, thereby initiating the transcription
of these genes (modified from www.sabiosciences.com).
111
1.26 Aims of the project
The overarching aim of this project is to examine further the immunomodulatory
effects of recombinant IFN-α, with special reference to its role as a disease-
modifying therapy in Behcet’s disease, an immune-mediated disorder. In order to
achieve this, aspects of the influence of IFN-α will be assessed in several different
populations of T cells. The first major area to be studied is the conventional T helper
subsets, Th1 and Th2, and expression of their related cytokines in response to a 6-
month course of subcutaneous IFN-α2b therapy in BD patients ex vivo. In the first
results chapter (Chapter 3), the influence of subcutaneous IFN-α2b therapy on the
relative proportions of CD4+, CD8+, and TCRαβ+ T cells and pattern of cytokine
release by CD3+ T cells, including IFN-γ, TNF-α, IL-2, and IL-4, in BD patients are
assessed ex vivo. The longitudinal effect of the IFN-α is of particular interest, and
the data from before, during and after IFN-α therapy are compared.
In the second results chapter (Chapter 4), this analysis is extended to Th17 and Treg
cells, exploring the influence of a 6-month course of subcutaneous IFN-α2b therapy
on these cell populations and the expression of IL-17, IL-10, TGF-β, and Foxp3 by T
cells in BD patients ex vivo. Again, the longitudinal effect of the IFN-α is of particular
interest, as this is crucial, along with longitudinal data from Chapter 3, to help gain
insights into the disease-modifying nature of the IFN-α therapy and its potential to
induce long-term remission. The effect of subcutaneous IFN-α2b therapy on the
relative proportion of CD56+ NKT cells is examined as well.
In Chapters 5-7, preliminary tests are first performed using healthy donor PBMC to
establish in vitro models in order to test the immunomodulatory effects of IFN-α
subsequently. In the third results chapter (Chapter 5), the modulating action of both
forms of recombinant IFN-α (2a and 2b) on CD4+ and CD8+ T cells producing IFN-γ
and IL-17 cytokines are assessed. In the fourth results chapter (Chapter 6), the
objective is to investigate whether recombinant IFN-α2a and IFN-α2b induce
expansion of regulatory T cell subsets and expression of immunoregulatory
cytokines, IL-10 and TGF-β, as well as Foxp3. In the final results chapter (Chapter
7), the influence of a 6-month course of subcutaneous IFN-α2b therapy on the
relative proportions of TCRγδ+ T cells in BD patients was analysed ex vivo. This is

112
of particular interest, as γδ T cells have been implicated to play key roles in the
pathogenesis of BD. The ex vivo experiments are followed by assessment of the
changes in the proportion of γδ T cell within lymphocytes and their production of
cytokines, including IFN-γ and IL-17, under the influence of recombinant IFN-α2a
and IFN-α2b in vitro. Finally, the kinetics of cytokine production by T cells are
explored by the introduction of IFN-α2a at different time-points during in vitro assays
and the resultant changes in cytokine levels expressed by T cells are analysed for
Foxp3 and all the cytokines examined in Chapter 5-7.
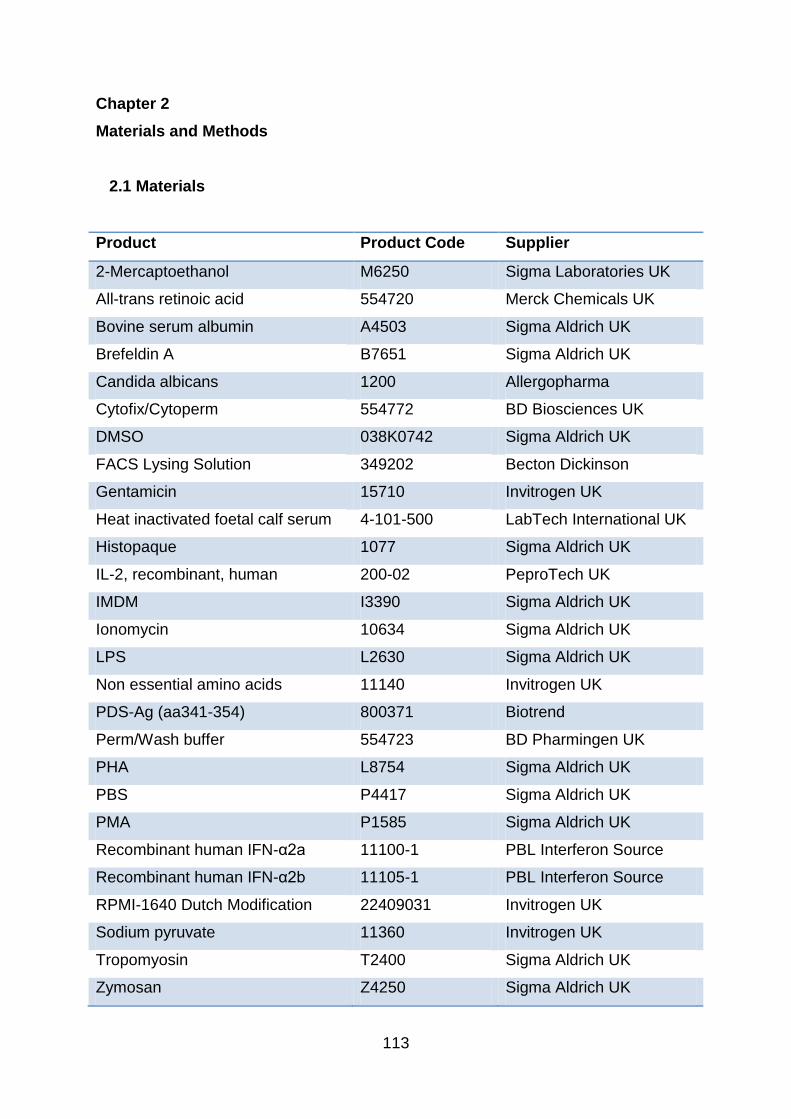
113
Chapter 2
Materials and Methods
2.1 Materials
Product Product Code Supplier
2-Mercaptoethanol M6250 Sigma Laboratories UK
All-trans retinoic acid 554720 Merck Chemicals UK
Bovine serum albumin A4503 Sigma Aldrich UK
Brefeldin A B7651 Sigma Aldrich UK
Candida albicans 1200 Allergopharma
Cytofix/Cytoperm 554772 BD Biosciences UK
DMSO 038K0742 Sigma Aldrich UK
FACS Lysing Solution 349202 Becton Dickinson
Gentamicin 15710 Invitrogen UK
Heat inactivated foetal calf serum 4-101-500 LabTech International UK
Histopaque 1077 Sigma Aldrich UK
IL-2, recombinant, human 200-02 PeproTech UK
IMDM I3390 Sigma Aldrich UK
Ionomycin 10634 Sigma Aldrich UK
LPS L2630 Sigma Aldrich UK
Non essential amino acids 11140 Invitrogen UK
PDS-Ag (aa341-354) 800371 Biotrend
Perm/Wash buffer 554723 BD Pharmingen UK
PHA L8754 Sigma Aldrich UK
PBS P4417 Sigma Aldrich UK
PMA P1585 Sigma Aldrich UK
Recombinant human IFN-α2a 11100-1 PBL Interferon Source
Recombinant human IFN-α2b 11105-1 PBL Interferon Source
RPMI-1640 Dutch Modification 22409031 Invitrogen UK
Sodium pyruvate 11360 Invitrogen UK
Tropomyosin T2400 Sigma Aldrich UK
Zymosan Z4250 Sigma Aldrich UK
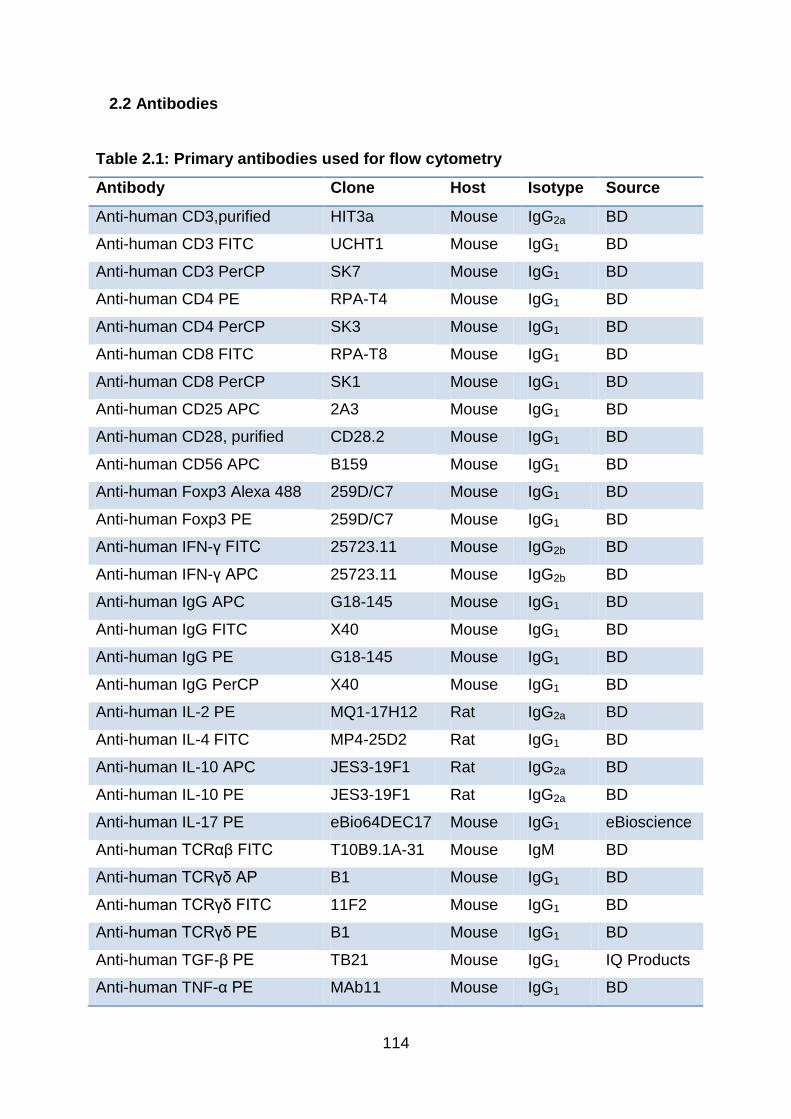
114
2.2 Antibodies
Table 2.1: Primary antibodies used for flow cytometry
Antibody Clone Host Isotype Source
Anti-human CD3,purified HIT3a Mouse IgG2a BD
Anti-human CD3 FITC UCHT1 Mouse IgG1 BD
Anti-human CD3 PerCP SK7 Mouse IgG1 BD
Anti-human CD4 PE RPA-T4 Mouse IgG1 BD
Anti-human CD4 PerCP SK3 Mouse IgG1 BD
Anti-human CD8 FITC RPA-T8 Mouse IgG1 BD
Anti-human CD8 PerCP SK1 Mouse IgG1 BD
Anti-human CD25 APC 2A3 Mouse IgG1 BD
Anti-human CD28, purified CD28.2 Mouse IgG1 BD
Anti-human CD56 APC B159 Mouse IgG1 BD
Anti-human Foxp3 Alexa 488 259D/C7 Mouse IgG1 BD
Anti-human Foxp3 PE 259D/C7 Mouse IgG1 BD
Anti-human IFN-γ FITC 25723.11 Mouse IgG2b BD
Anti-human IFN-γ APC 25723.11 Mouse IgG2b BD
Anti-human IgG APC G18-145 Mouse IgG1 BD
Anti-human IgG FITC X40 Mouse IgG1 BD
Anti-human IgG PE G18-145 Mouse IgG1 BD
Anti-human IgG PerCP X40 Mouse IgG1 BD
Anti-human IL-2 PE MQ1-17H12 Rat IgG2a BD
Anti-human IL-4 FITC MP4-25D2 Rat IgG1 BD
Anti-human IL-10 APC JES3-19F1 Rat IgG2a BD
Anti-human IL-10 PE JES3-19F1 Rat IgG2a BD
Anti-human IL-17 PE eBio64DEC17 Mouse IgG1 eBioscience
Anti-human TCRαβ FITC T10B9.1A-31 Mouse IgM BD
Anti-human TCRγδ AP B1 Mouse IgG1 BD
Anti-human TCRγδ FITC 11F2 Mouse IgG1 BD
Anti-human TCRγδ PE B1 Mouse IgG1 BD
Anti-human TGF-β PE TB21 Mouse IgG1 IQ Products
Anti-human TNF-α PE MAb11 Mouse IgG1 BD
115
2.3 Preparation and storing of stock solutions and reagents
A number of reagents were prepared, aliquoted and stored at optimum temperature
in order to prevent degradation of the reagents as a result of multiple freeze thaw
cycles and to protect stock solutions from contamination.
2.3.1 2-Mercaptoethanol
2-mercaptoethanol (2ME; molecular weight 78.13) was purchased as a 14.3M stock
solution. 14.3M 2-ME was diluted in PBS [1/14.3 vol/vol] in the laminar flow hood.
This was then sterilised by passing through a 0.22M filter and aliquoted in 500l
volumes and stored at -20C until use. When 2-ME was required to be used, it was
thawed and further diluted [1/50000 vol/vol] in culture medium to give a final
concentration of 2x10⁻⁵ M.
2.3.2 All-trans retinoic acid (ATRA)
A stock solution was made up to 25mg/ml by adding DMSO to stock powder. It was
stored at 4°C in the fridge and diluted in culture medium if necessary before use to
achieve intended final concentrations.
2.3.3 Bovine serum albumin (BSA)
In order to make up a stock solution of 10% BSA, 1g BSA lyophilised powder was
added to 9ml of sterile PBS. To make a buffer solution containing 0.1% BSA to
dilute IFN-α2a, 100μl of 10% BSA was added to 9.9ml of sterile PBS.
116
2.3.4 Brefeldin A (BFA)
A stock solution of BFA was made up to 5mg/ml by adding 1ml of DMSO to the
powder in the laminar flow hood. This was aliquoted and stored at -20°C in the
freezer until used. During cell culture, BFA was diluted 1:10 in RPMI before
appropriate amount was added to provide a final concentration of 10μg/ml.
2.3.5 Candida antigens
A stock solution was made up to 2mg/ml by adding sterile PBS to stock powder. It
was stored at 4°C in the fridge and diluted in culture medium if necessary before use
to achieve desired final concentrations.
2.3.6 FACS lysing solution
This reagent was provided as a 10 x concentrate and therefore was diluted 1:10 in
deionised water and stored at room temperature before use. The prepared solution
is stable for up to 1 month when stored at room temperature (20° to 25°C).
2.3.7 Foetal calf serum (FCS)
After complete thawing of heat-inactivated FCS, it was aliquoted in 50ml volumes
under aseptic condition. FCS was then stored at -20C until use and thawed in a
37C water bath when required for tissue culture.
2.3.8 IFN-α2a
To make a stock solution of 106U/ml, each 5μl of IFN-α2a [5.4 x 10⁷ U/ml] was
diluted with 265μl of sterile PBS containing 0.1% BSA under sterile conditions in

117
accordance to the manufacturer’s instructions. This was then aliquoted and stored
at -70°C in the freezer. When IFN-α2a was required to be used, it was thawed at
room temperature and diluted in culture medium if necessary to achieve desired final
concentrations.
2.3.9 IFN-α2b
A stock solution [106U/ml] was aliquoted without dilution and stored at -70°C in the
freezer. When it was required to be used, it was thawed at room temperature and
diluted in culture medium if necessary to achieve desired final concentrations.
2.3.10 Non-essential amino acids (NEAA)
Sterile NEAA solution [100x stock] was stored at 4°C in the fridge.
2.3.11 Ionomycin
A stock solution of 0.5mg/ml was made up by adding ethanol to ionomycin powder in
the laminar flow hood. This was then aliquoted and stored at -20°C in the freezer
until use. When it was required to be used, it was thawed at room temperature and
diluted 1:10 in RPMI 1640 Dutch Modification. Appropriate amount was then added
to provide a final concentration of 1μg/ml.
2.3.12 L-Glutamine
Glutamine stock solution [200mM] was thawed in a 37C water bath and aliquoted in
5ml volumes under aseptic condition. Aliquots were then refrozen and stored at -
20C in the freezer. When it was required to be used, it was thawed in a 37C water
bath in order to be used in tissue culture media at a final concentration of 2mM.
118
2.3.13 Lipopolysaccharides (LPS)
A stock solution of 1mg/ml was made up by adding sterile PBS to stock powder and
aliquoted under aseptic conditions. Aliquots were stored at -20°C in the freezer.
When it was required to be used, it was thawed at room temperature and diluted in
culture medium if necessary to achieve desired final concentrations.
2.3.14 Phosphate buffered saline (PBS)
PBS was prepared following the manufacturer’s instructions. Each PBS tablet was
dissolved in 200ml of deionised water with a magnetic stirrer. Sterile PBS was
prepared in aseptic conditions by placing PBS in a 25ml syringe and filtering through
a 0.22M filter.
2.3.15 PDSAg
A stock solution of 1mg/ml peptide was made up by adding sterile PBS to stock
powder and aliquoted under aseptic conditions. Aliquots were stored at -20°C in the
freezer. When it was required to be used, it was thawed at room temperature and
diluted in culture medium if necessary to achieve desired final concentrations.
2.3.16 Permwash buffer
Concentrated Permwash buffer was diluted 1:10 in deionised water before use.
Once diluted, the solution was stored at 4C and used within 7 days.
119
2.3.17 Phorbol myristate acetate (PMA)
A stock solution of 1mg/ml was made up by dissolving PMA powder in DMSO under
aseptic condition. This was then aliquoted and stored at -20°C in the freezer until
use. When it was required to be used, it was thawed at room temperature and
diluted 1:1000 in RPMI 1640 Dutch Modification. Appropriate amount was then
added to achieve a final concentration of 25ng/ml.
2.3.18 Phytohemagglutinin (PHA)
A stock solution was made up to 1mg/ml by adding sterile PBS to powder under
aseptic condition and aliquoted. Aliquots of PHA were stored at -20°C in the freezer
until use. When it was required to be used, it was thawed at room temperature and
diluted 1:10 in RPMI Dutch Modification. Appropriate amount was then added to
provide a final concentration of 1μg/ml.
2.3.19 Purified mouse anti-human CD3 antibody
Stock solution [0.5mg/ml] was stored at 4°C in the fridge. During cell culture, this
was diluted 1:1000 in RPMI 1640 Dutch Modification and appropriate amount was
added to achieve a final concentration of 5ng/ml.
2.3.20 Purified mouse anti-human CD28 antibody
Stock solution [0.5mg/ml] was stored at 4°C in the fridge. During cell culture, this
was diluted 1:10 in RPMI 1640 Dutch Modification and appropriate amount was
added to achieve a final concentration of 1μg/ml.
120
2.3.21 Sodium pyruvate
Sterile sodium pyruvate solution was stored at 4°C in the fridge.
2.3.22 T cell medium
T cell medium was prepared using RPMI 1640 Dutch Modification or in the case of
Th1/Th17 in vitro experiments, Iscove's modified Dulbecco's medium (IMDM). In
aseptic conditions 67.5ml of medium was removed from a 500ml bottle of medium.
The bottle of medium was then supplemented with FCS [10% v/v], 1% sodium
pyruvate [1mM], 1% non-essential amino acids [1mM], L-glutamine [2mM],
gentamicin [50g/ml] and 2-mercaptoethanol [2x10⁻⁵ M], and stored at 4°C until use.
Once the medium was made, it was used within 14 days.
2.3.23 Tropomyosin
A stock solution of 5mg/ml was made up by adding sterile RPMI to lyophilised
powder under aseptic conditions and stored at 4°C in the fridge until use. When it
was required to be used, it was then diluted in culture medium if necessary and
appropriate amount was added in order to achieve desired final concentrations.
2.3.24 Zymosan
In order to make a stock solution of 1mg/ml, 5ml of ethanol was added to 50mg of
zymosan powder in a 50ml container under aseptic conditions. The mixture was
vortexed to homogenise before the addition of 45mls of sterile endotoxin-free water.
This was then stored at 4°C in the fridge until use. When it was required to be used,
it was then diluted in culture medium if necessary and appropriate amount was
added in order to achieve desired final concentrations.
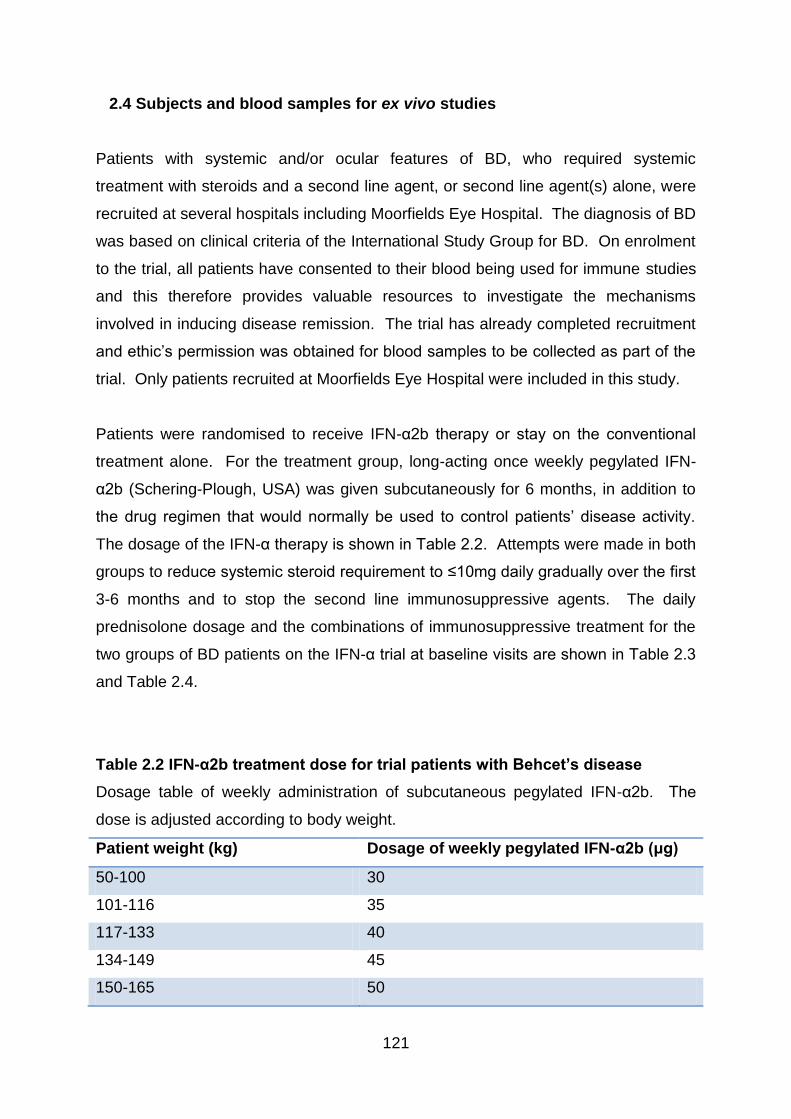
121
2.4 Subjects and blood samples for ex vivo studies
Patients with systemic and/or ocular features of BD, who required systemic
treatment with steroids and a second line agent, or second line agent(s) alone, were
recruited at several hospitals including Moorfields Eye Hospital. The diagnosis of BD
was based on clinical criteria of the International Study Group for BD. On enrolment
to the trial, all patients have consented to their blood being used for immune studies
and this therefore provides valuable resources to investigate the mechanisms
involved in inducing disease remission. The trial has already completed recruitment
and ethic’s permission was obtained for blood samples to be collected as part of the
trial. Only patients recruited at Moorfields Eye Hospital were included in this study.
Patients were randomised to receive IFN-α2b therapy or stay on the conventional
treatment alone. For the treatment group, long-acting once weekly pegylated IFN-
α2b (Schering-Plough, USA) was given subcutaneously for 6 months, in addition to
the drug regimen that would normally be used to control patients’ disease activity.
The dosage of the IFN-α therapy is shown in Table 2.2. Attempts were made in both
groups to reduce systemic steroid requirement to ≤10mg daily gradually over the first
3-6 months and to stop the second line immunosuppressive agents. The daily
prednisolone dosage and the combinations of immunosuppressive treatment for the
two groups of BD patients on the IFN-α trial at baseline visits are shown in Table 2.3
and Table 2.4.
Table 2.2 IFN-α2b treatment dose for trial patients with Behcet’s disease
Dosage table of weekly administration of subcutaneous pegylated IFN-α2b. The
dose is adjusted according to body weight.
Patient weight (kg) Dosage of weekly pegylated IFN-α2b (μg)
50-100 30
101-116 35
117-133 40
134-149 45
150-165 50
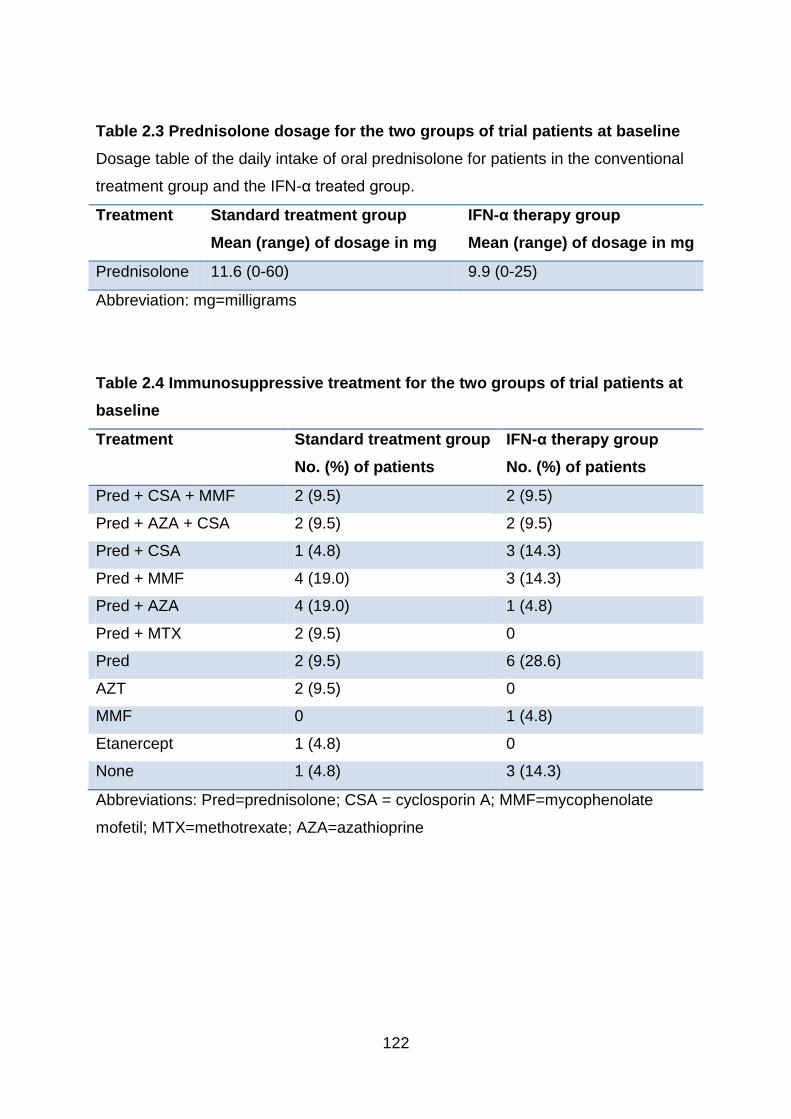
122
Table 2.3 Prednisolone dosage for the two groups of trial patients at baseline
Dosage table of the daily intake of oral prednisolone for patients in the conventional
treatment group and the IFN-α treated group.
Treatment Standard treatment group
Mean (range) of dosage in mg
IFN-α therapy group
Mean (range) of dosage in mg
Prednisolone 11.6 (0-60) 9.9 (0-25)
Abbreviation: mg=milligrams
Table 2.4 Immunosuppressive treatment for the two groups of trial patients at
baseline
Treatment Standard treatment group
No. (%) of patients
IFN-α therapy group
No. (%) of patients
Pred + CSA + MMF 2 (9.5) 2 (9.5)
Pred + AZA + CSA 2 (9.5) 2 (9.5)
Pred + CSA 1 (4.8) 3 (14.3)
Pred + MMF 4 (19.0) 3 (14.3)
Pred + AZA 4 (19.0) 1 (4.8)
Pred + MTX 2 (9.5) 0
Pred 2 (9.5) 6 (28.6)
AZT 2 (9.5) 0
MMF 0 1 (4.8)
Etanercept 1 (4.8) 0
None 1 (4.8) 3 (14.3)
Abbreviations: Pred=prednisolone; CSA = cyclosporin A; MMF=mycophenolate
mofetil; MTX=methotrexate; AZA=azathioprine
123
Whenever ocular or systemic relapse occurred, the patients were assessed by the
trial doctors and medications, other than IFN-α2b, were adjusted accordingly. To
take rapid control over the intraocular or systemic inflammation during a relapse,
topical or systemic corticosteroids were utilised. Following control of intraocular
inflammation, dose of systemic corticosteroids was rapidly tapered to a maximum of
10mg per day prednisone equivalent or discontinued. Occasionally, introduction of
another second line agent was required in order to contain repeated relapses,
especially in patients on conventional treatment alone.
IFN-α2b therapy was discontinued after 6 months and the follow-up period is 3 years
for each trial patient. The first blood samples were obtained at baseline visits and in
the case of IFN-α2b treatment group, before the commencement of IFN-α2b therapy.
After that, serial blood samples were taken from both groups at formal assessment
visits at 3, 6, 12 and 24 month follow-ups. As I am not involved in the long-term
follow-ups of these patients, my data are focused solely on detecting the changes in
the first 12 months.
2.5 Sample preparation
2.5.1 Study on patients with BD
Bloods were taken from patients by venous puncture into both heparinised and non-
heparinised tubes. Apart from using whole blood for various immunoassays, serum,
PBMC, RNA, DNA and cell culture supernatants were collected for future studies.
To collect serum, non-heparinised tubes containing venous blood from patients were
centrifuged at 3000rpm for 10 minutes. Each 500μl of serum was placed in 1.8ml
cryotubes and stored at -70°C in the freezer. With regards to samples in heparinised
tubes, a small aliquot of blood was firstly spotted onto FTA Elute Cards (Whatman
plc, UK) to store DNA for each patient. The amount of whole blood required for
phenotyping, intracellular cytokine staining and PCNA proliferation assays were set
aside, and the remaining BD patient blood was processed to collect PBMC.
124
PBMCs were isolated by differential density centrifugation. 15ml of Histopaque-1077
solution was placed in a 50ml Leucosep tube (Greiner Bio-one, Germany) and
centrifuged for 90 seconds at 1000g to allow the histopaque to go beneath the filters
in the tubes. After that, the blood was diluted 1:1 with RPMI 1640 Dutch Modification
before being added onto the filters within the Leucosep tubes under aseptic
conditions. These tubes were then centrifuged for 12 minutes at 1000g (Fig 2.1).
After centrifugation, mononuclear cells were retrieved from the enriched cell fraction
above the porous barrier by means of a Pasteur pipette. The porous barrier is for
avoiding recontamination with pelleted erythrocytes and granulocytes.
The cells were then washed with 10ml of sterile RPMI and centrifuged twice at 400g.
1 ml of RPMI 1640 Dutch Modification was added to the cell pellet to resuspend the
cells before the number of cells was counted in a haemocytometer. Cell viability was
determined by Trypan Blue exclusion. 1x10⁶ cells were taken from each patient visit
and placed in a 1.5ml microcentrifuge tubes with 300μl of RNAprotect cell reagent
(Qiagen, UK) for immediate RNA stabilisation. These were stored at -70°C for future
RNA studies. Those PBMC which were not used were put in two 1.8ml cryotubes for
each patient and pre-cooled before mixing 1:1 with DMSO buffered with 20% FCS
under aseptic conditions. Cryotubes were immediately wrapped in paper to insulate
and placed in the freezer at -70°C for 1-2 days. Afterwards, PBMC were transferred
to liquid nitrogen tanks for long term storage.
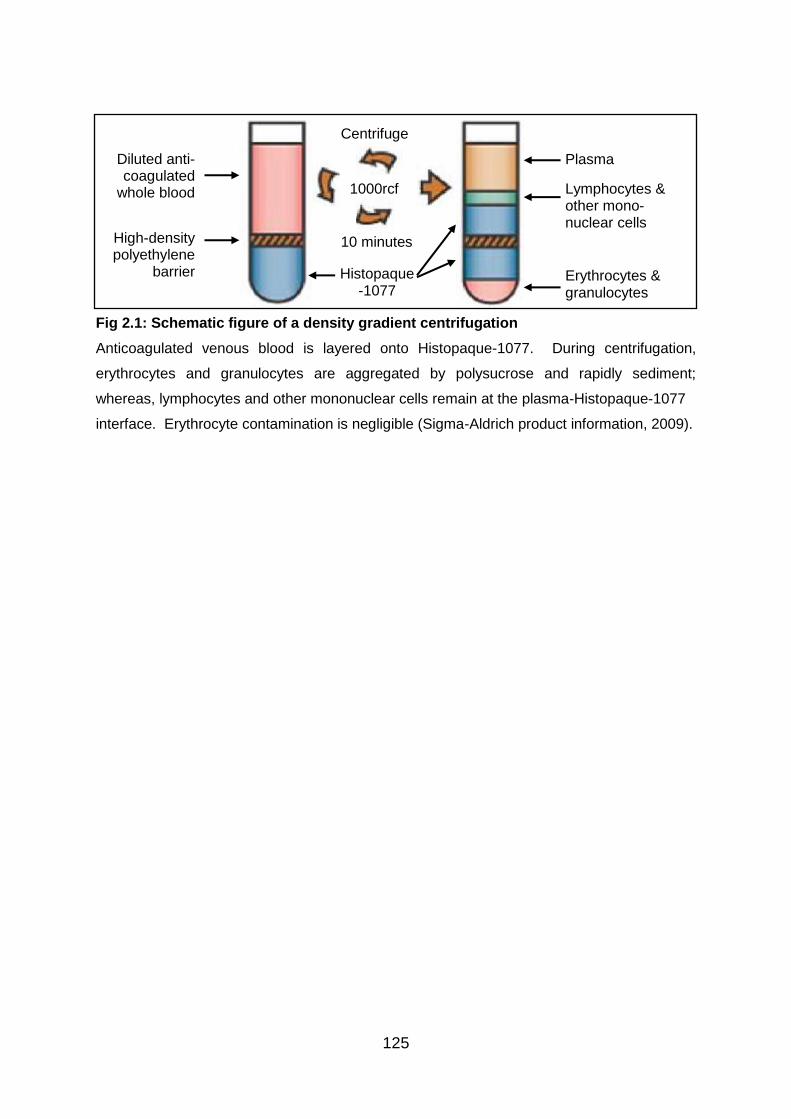
125
Fig 2.1: Schematic figure of a density gradient centrifugation
Anticoagulated venous blood is layered onto Histopaque-1077. During centrifugation,
erythrocytes and granulocytes are aggregated by polysucrose and rapidly sediment;
whereas, lymphocytes and other mononuclear cells remain at the plasma-Histopaque-1077
interface. Erythrocyte contamination is negligible (Sigma-Aldrich product information, 2009).
Centrifuge
1000rcf
10 minutes
Histopaque -1077
High-density polyethylene
barrier
Diluted anti-coagulated
whole blood Lymphocytes & other mono-nuclear cells
Erythrocytes & granulocytes
Plasma
126
2.5.2 PBMC preparation for in vitro studies
PBMCs were isolated by differential density centrifugation. 15ml of Histopaque-1077
solution was placed in 50ml Leucosep tubes and centrifuged for 90 seconds at
1000g. Buffy coats obtained from normal healthy adult donors (North London Blood
Transfusion Service) were diluted 1:5 with RPMI 1640 Dutch Modification under
sterile conditions. After that, diluted buffy coats were added directly onto the filters
within the Leucosep tubes. These tubes were then centrifuged for 12 minutes at
1000g. After centrifugation, mononuclear cells were retrieved from the enriched cell
fraction above the porous barrier by means of a Pasteur pipette.
The cells were then washed with 10ml of sterile RPMI 1640 Dutch Modification and
centrifuged twice at 400g. 10ml of RPMI 1640 Dutch Modification was added to the
cell pellet to resuspend the cells before the number of cells was counted in a
haemocytometer. Cell viability was determined by Trypan Blue exclusion. In each
1.8ml cryotube, 1x10⁷ pre-cooled cells suspended in 500μl of RPMI 1640 Dutch
Modification were mixed 1:1 with DMSO buffered with 20% FCS. Cryotubes were
immediately wrapped in paper to insulate and placed in the freezer at -70°C for 1-2
days. Afterwards, PBMCs were transferred and stored at -196ºC in liquid nitrogen
tanks. Healthy donor PBMCs obtained this way were used in all in vitro experiments,
except in some preliminary experiments testing the polarising effects of tropomyosin
and PDSAg, where PBMCs from BD patients were used instead.
2.5.3 Thawing of PBMCs
20ml of RPMI 1640 Dutch Modification with 10% FCS was prepared for each tube of
cryo-preserved PBMCs and the medium was warmed in a 37°C water bath until use.
Sufficient amount of cryotubes containing cryo-preserved PBMCs required for
experiments were taken out of storage in liquid nitrogen tank and thawed quickly in a
37°C water bath. The tubes were swirled around to facilitate thawing of cells. As
soon as PBMCs were defrosted, they were added drop-wise into the warm medium
under aseptic conditions. These were then centrifuged for 10 minutes at 400g.
Supernatants were decanted and pellets of cells were resuspended. Cells were
127
washed again with warm RPMI 1640 Dutch Modification containing 10% FCS to
remove DMSO. Cells were counted in a haemocytometer and viable cells were
determined by Trypan Blue exclusion. Appropriate amount of T cell medium, either
RPMI 1640 Dutch Modification- or IMDM-based, was then added to achieve 1 x 10⁶
live PBMC in each 750μl of medium. During in vitro experiments, these were further
diluted with the addition of various reagents and T cell medium to reach a final
concentration of 1 x 10⁶ cells/ml.
2.6 Experimental assays
2.6.1 Cell surface phenotyping in patients with BD ex vivo
Whole blood studies were performed so that drugs were still present in the blood.
Changes in cell surface phenotype were evaluated using fluorochrome-conjugated
antibodies and flow cytometry. 100µl aliquots of whole blood were placed in 1.5ml
microcentrifuge tubes and stained with 5µl of anti-surface marker antibodies and the
surface markers examined included CD3, CD4, CD8, CD25, CD56, TCRαβ and
TCRγδ. These were left in the dark at room temperature for 30 minutes before red
cell lysis was carried out with the addition of 1ml 1x FACS lysing solution according
to manufacturer’s instructions and left in the dark for 10 minutes. Afterwards,
samples were centrifuged at 4000rpm for 4 minutes. Supernatants were decanted
and washing was carried out using 1ml of PBS. These samples were stored in 300μl
of PBS at 4ºC until ready for flow cytometry.
In addition, intracellular expression of Foxp3 was examined in these experiments.
After red cell lysis and decanting of supernatants, cells were fixed and permeabilised
with 100μl of Cytofix/Cytoperm in keeping with manufacturer’s instructions for 20
minutes at 4°C. 1ml of Permwash was then added to microcentrifuge tubes to keep
cells permeabilised and to serve as an antibody diluent and cell wash buffer.
Subsequently, samples were incubated with 5μl of anti-Foxp3 antibodies for 30
minutes at 4°C. 1ml of Permwash was applied again before finally keeping the cells
in 200µl of PBS at 4ºC until ready for flow cytometry.
128
2.6.2 Intracellular cytokine staining in patients with BD
Whole blood was diluted 1:1 with RPMI 1640 Dutch Modification medium and
aliquoted, 200µl/well, in 96 well flat bottom cell culture plates. Cell cultures were
unstimulated, stimulated with anti-CD3 [5ng/ml] and anti-CD28 [1μg/ml] monoclonal
Abs, or a combination of PMA [25ng] and ionomycin [1μg/ml] for 24 hours. BFA
[10μg/ml] was added to all cell cultures to prevent protein secretion and allow
accumulation of cytokines within cells. After incubating overnight (approximately 22
hours) at 37°C in a humidified 5% CO2 atmosphere, cells were transferred to 1.5ml
microcentrifuge tubes before staining. Staining of surface markers was performed
with 5μl of fluorochrome-conjugated anti-CD3, CD4 and CD25 Abs or matched
isotype control mAbs for 30 minutes at room temperature in the dark. Red cell lysis
was carried out with 1ml 1x FACS lysing solution as described in Section 2.6.1.
Subsequently, cells were fixed and permeabilised with 100μl of Cytofix/Cytoperm
and incubated at 4°C for 20 minutes.
Cells in each tube were washed with 1ml 1x Permwash before staining with
fluorochrome-conjugated anti-cytokine antibodies including IFN-γFITC (5μl), IL-2PE
(5μl), IL-4FITC (50μl of 1:150 dilution with 1x Permwash) , IL-10PE (50μl of 1:50
dilution with 1x Permwash), IL-10APC (25μl of 1:250 dilution with 1x Permwash), TNF-
α (5μl), IL-17 (5μl), and TGF-β1 (5μl), as well as anti-Foxp3 Ab (5μl) and matched
isotype controls (5μl of 1:50 dilution with 1x Permwash) for 30 minutes. Incubations
were carried out in the dark in order to prevent fluorochrome from photobleaching.
Finally, washing in Permwash was carried out and samples were stored in 200µl of
PBS at 4ºC until acquisition of data with flow cytometry.
2.6.3 PCNA proliferation assay in patients with BD
Whole blood was diluted 1:5 with RPMI 1640 Dutch Modification and aliquoted,
250μl/well, in 24 well flat bottom cell culture plates. Cells were stimulated with anti-
CD3 [5ng/ml] and anti-CD28 [1μg/ml] mAbs, PHA [1μg/ml], and a selection of
antigens, including recall Ag tuberculin purified protein [0.1, 0.5, 1, 5, and 10μg/ml]
(Statens Seruminstitut, Denmark), and putative Behcet’s Ags such as PDSAg [0.5, 1,
129
2.5, and 5μg/ml], α-tropomyosin [0.01, 0.1, 1, 10μg/ml], and heat shock protein 60 [5,
10, 50μg/ml] (HSP60, aa336-351; Biotrend, Germany). In each well, the volume was
made up to 500μl/well with RPMI 1640 Dutch Modification and the plates were then
incubated in an incubator with 5% CO2 at 37°C for 5 days. Aliquots of supernatants
from these cultures were taken at 24hours under aseptic conditions and stored at -
70ºC for future studies as well.
After 5 days, content of the wells was transferred to 5ml polystyrene round bottom
test tubes and red cell lysis was performed with 3.5ml 1x FACS lysing solution. After
10 minutes in the dark at room temperature, cells were washed with 4ml of PBS and
centrifuged at 300rcf for 5 minutes. Supernatants were decanted and 1ml of
methanol was added to each tube. The content of each tube was mixed well by
vortexing gently and cells were then incubated at 4°C for 30 minutes. Afterwards,
each tube of cells were washed with 3ml of PBS before adding 100μl of
Cytofix/Cytoperm. Again, cells were incubated at 4°C for 30 minutes. Subsequently,
cells were washed wtih 1x Permwash followed by adding 2.5μl of PCNAFITC (Abd
Serotec, UK) to each tube. The tubes were incubated overnight at 4°C. On final day,
each tube of cells were washed with 2ml 1x Permwash before adding 200μl to
resuspend the cells. Immediately before aquisition of data with flow cytometry, 2μl
propidium iodide [1mg/ml] (Sigma-Aldrich, UK) was added to each tube.
Although I have performed these proliferation assays and acquired some of the data
in collaboration with my colleagues, this area was not the focus of my research and
therefore I did not carry out analysis of data obtained from these assays.
2.6.4 Preliminary tests in vitro
2.6.4.1 PBMC stimulation with antigens and polyclonal stimuli
In order to establish in vitro models to investigate the effects of IFN-α on T cells,
required amount of frozen PBMCs were thawed as described in Section 2.5.3. 300μl
(4x10⁵ cells) of healthy donor PBMCs were placed in each well of 48 well flat bottom
culture plates and these cells were untreated or stimulated with polyclonal stimuli,
130
including anti-CD3 [5ng/ml] and anti-CD28 [1μg/ml] Abs, and PMA [25ng/ml] and
ionomycin [1μg/ml], or with Ags such as LPS; zymosan, Candida albicans, and
ATRA. In the case of BD-related antigens, such as PDSAg and α-tropomyosin,
PBMCs from BD patients were used as a trial instead of healthy donor cells.
Appropriate amount of T cell medium was then added to make up to 400μl for each
well. Cells were cultured in an incubator with 5% CO2 at 37°C for either 24 or 39
hours. BFA was added straight after the introduction of stimuli in cultures incubated
over 24 hours. In the case of 39 hour cultures, BFA was added after 15 hours of
incubation. At the end of cell culture, intracellular cytokine staining was carried out
as described in Section 2.6.7. Staining and data analysis were performed to
examine IFN-γ and IL-17 producing CD4+ and γδ T cells, as well as CD4+ T cells
expressing IL-10 and Foxp3.
2.6.4.2 Tests of the influence of 1 day resting on PBMC cultures in vitro
It was examined whether resting frozen healthy donor PBMCs for one day in culture
medium in the presence or absence of IL-2 after thawing could alter cytokine
production by these cells. On day 1, required amount of frozen healthy donor
PBMCs were thawed as described in Section 2.5.3, and resuspended in IMDM-
based T cell medium. 600μl (8x10⁵ cells) of PBMCs were placed in wells of 24 well
flat bottom culture plates under aseptic conditions, except the wells designated for
tests without resting the cells. For half of these wells, suboptimal IL-2 [0.5U/ml] was
added before T cell medium was added to make up to 800μl per well. After 24 hours
of incubation with 5% CO2 at 37°C, 600μl (8x10⁵ cells) of freshly thawed frozen
healthy donor PBMC were placed in the wells earmarked for tests without resting.
Straight after, cells defrosted on both day 1 and day 2 were activated with polyclonal
stimuli, including anti-CD3 [5ng/ml] and anti-CD28 [1μg/ml] Abs, and PMA [25ng/ml]
and ionomycin [1μg/ml], or left untreated. PHA [1μg/ml] was used as a trial stimulus
as well. BFA was added 2 hours after the introduction of stimuli to all wells, and cells
were further incubated for 22 hours in an incubator with 5% CO2 at 37°C. At the end
of culture on day 3, intracellular cytokine staining was performed as described in

131
Section 2.6.7. Staining and data analysis were carried out to examine IFN-γ and IL-
17 producing CD4+ and γδ T cell populations only.
2.6.4.3 Tests of the effects of medium choice on PBMC cultures in vitro
On day 1, required amount of frozen healthy donor PBMCs were thawed as
described in Section 2.5.3, and resuspended in either RPMI 1640 Dutch
Modification- or IMDM-based T cell medium. 600μl (8x10⁵ cells) of healthy donor
PBMCs were placed in wells of 24 well flat bottom culture plates under aseptic
conditions. After that, cells were activated with polyclonal stimuli, including anti-CD3
[5ng/ml] and anti-CD28 [1μg/ml] Abs, and PMA [25ng/ml] and ionomycin [1μg/ml], or
left untreated. T cell medium was then added to make up to 800μl per well. BFA
was added 2 hours after the introduction of stimuli to all wells, and cells were further
incubated for 22 hours in an incubator with 5% CO2 at 37°C. At the end of culture on
day 2, intracellular cytokine staining was performed as described in Section 2.6.7.
Staining and data analysis were carried out to examine IFN-γ and IL-17 producing
CD4+ and γδ T cell populations only.
2.6.4.4 Tests of the influence of longer incubation time on PBMC cultures in
vitro
On day 1, required amount of frozen healthy donor PBMCs were thawed as
described in Section 2.5.3, and resuspended in IMDM-based T cell medium. 600μl
(8x10⁵ cells) of healthy donor PBMCs were placed in wells of 24 well flat bottom
culture plates under aseptic conditions. After that, cells were activated with
polyclonal stimuli, including anti-CD3 [5ng/ml] and anti-CD28 [1μg/ml] Abs, and PMA
[25ng/ml] and ionomycin [1μg/ml], or left untreated. T cell medium was then added
to make up to 800μl per well. Cells were incubated for 24 and 39 hours in an
incubator with 5% CO2 at 37°C, and BFA was added in the last 22 hours of
incubation for all wells. At the end of culture, intracellular cytokine staining was
performed as described in Section 2.6.7. Staining and data analysis were carried
out to examine IFN-γ and IL-17 producing CD4+ and γδ T cell populations only.
132
2.6.5 Tests of the effects of recombinant IFN-α on PBMC cultures in vitro
Required amount of frozen healthy donor PBMCs were thawed as described in
Section 2.5.3, and resuspended in T cell medium. 600μl (8x10⁵ cells) of healthy
donor PBMCs were placed in wells of 24 well flat bottom culture plates under aseptic
conditions. After that, cells were treated with IFN-α2a (101-105 U/ml) or IFN-α2b
(101-104 U/ml), or left untreated. This was then followed by activation with polyclonal
stimuli, including anti-CD3 [5ng/ml] and anti-CD28 [1μg/ml] Abs, and PMA [25ng/ml]
and ionomycin [1μg/ml], or left alone without stimulation. T cell medium was then
added to make up to 800μl per well. Cells were incubated for 24 hours, and in some
earlier experiments 39 hours, in an incubator with 5% CO2 at 37°C, and BFA was
added in the last 22 hours of incubation for all wells. At the end of culture,
intracellular cytokine staining was performed as described in Section 2.6.7.
2.6.6 Kinetics of the influence of IFN-α on PBMC cultures in vitro
On day 1, required amount of frozen healthy donor PBMCs were thawed as
described in Section 2.5.3, and resuspended in T cell medium. 600μl (8x10⁵ cells) of
healthy donor PBMCs were placed in wells of 24 well flat bottom culture plates under
aseptic conditions. One-fifth of the wells were treated with 104 U/ml IFN-α2a straight
away before incubation in an incubator with 5% CO2 at 37°C. 24 hours later on day
2, half of the wells were stimulated with PMA [25ng/ml] in combination with
ionomycin [1μg/ml], and the other half was left alone without stimulation. In addition,
104 U/ml IFN-α2a was added to one-fifth of the wells for each of the 3 time-points at
4 hours before, the same time as, or 4 hours after, the introduction of
PMA/ionomycin on day 2. T cell medium was added to make up to 800μl per well,
and BFA was added in the last 22 hours of incubation for all wells. At the end of
culture, intracellular cytokine staining was performed as described in Section 2.6.7.
133
2.6.7 Intracellular cytokine staining for in vitro cell cultures
At the end of cell culture at 37°C in a humidified 5% CO2 atmosphere, cells were
transferred from cell culture plates to 1.5ml microcentrifuge tubes. Samples were
centrifuged at 4000rpm for 4 minutes in order to take off supernatants. Dispersed
cells were then stained for surface markers with 5μl of fluorochrome-conjugated anti-
CD3, CD4, CD8, CD25 and TCRγδ antibodies (BD Biosciences) or matched isotype
control mAb and cells were incubated in the dark for 30 minutes at room temperature.
After that, each tube of cells was washed with 1ml of PBS and then fixed and
permeabilised with 100μl of Cytofix/Cytoperm according to manufacturer’s
instructions. After 20 minutes of incubation at 4°C, each tube of cells was washed
with 1ml 1x Permwash. Subsequently, intracellular staining was carried out with
fluorochrome-conjugated anti-cytokine antibodies including IFN-γFITC (5μl), IFN-γAPC
(5μl), IL-10PE (50μl of 1:50 dilution with 1x Permwash), IL-10APC (25μl of 1:250
dilution with 1x Permwash), IL-17PE (5μl), and TGF-β1PE (5μl), as well as anti-
Foxp3AlexaFluor488 (5μl), anti-Foxp3PE (5μl) and matched isotype controls (5μl of 1:50
dilution with 1x Permwash) for 30 minutes at 4°C. Cells were washed once more
with 1x Permwash before 200μl PBS was added to each tube. Samples were stored
at 4ºC until ready for acquisition with flow cytometry.
2.7 Flow cytometry and analysis
To quantify the populations of T cell subsets, acquisition was carried out using four-
colour FACSCalibur and CellQuest software (BD Biosciences). Data analysis was
performed using Winlist Version 3.0 (Verity Software House, USA). At least 10,000
events were acquired for all experiments in ex vivo studies, and in the case of
samples stained with Foxp3, at least 25,000 events were attained. For in vitro
studies, at least 25,000 events were acquired for all samples except for preliminary
experiments. Viable lymphocytes were gated according to forward and side scatters,
and careful attention was paid to avoid inclusion of debris and dead cells from
analysis. Flow cytometric determination of cytokines in the cytoplasm of peripheral
CD3+, CD4+ and CD8+ T cells was performed. Cytokine-positive T cells were
defined by setting regions with the lower-limits for cytokine positivity determined from
134
unstimulated cultures. Results were expressed as the percentages of cytokine-
producing cells in CD3+, CD4+ or CD8+ T cell populations. For Treg cell analysis,
CD4+CD25high T cells were defined by selecting those CD4+ lymphocytes whose
CD25 expression exceeded the level of CD25 positivity seen on the CD4- population
(usually more than 102 of fluorescence intensity) (Fig 4.2). Also, unreactive isotype-
matched Abs were used as negative controls and to verify the amount of background
staining, and as a guide for setting markers to delineate “positive” and “negative”
populations.
For data analysis in Chapters 3 and 4, data from follow-up assessment visits were
compared to data from initial visits for BD patients. The aims are to identify changes
in immune cell and cytokine profile in IFN-α treated patients throughout the 12 month
observation period and whether these alterations are distinct features when
compared to those receiving conventional immunosuppressive therapy alone.
Patients were analysed only when paired data were available. That is, patients were
not included in the analysis if either baseline or follow-up visits were missing. Due to
this same reason, 12 month visits were examined separately from 3 and 6 month
ones as not all patients who have been through 3 and 6 months visits have data from
12 month assessment visits. This way, maximal numbers of patients could be
included in the analysis of the 3 and 6 month data, and the disease modifying ability
of IFN-α, even when patients were off treatment, could be examined separately.
Also, some samples were omitted from the ex vivo experiments due to insufficient
cell numbers, and these data were not included in the analysis. In addition, less
patient numbers were available for Th17 cell analysis in ex vivo intracellular cytokine
staining experiments as these staining combinations were included after half way
through the trial and baseline data were not available for more than half of BD
patients.
2.8 Statistical analysis
Statistical calculations were performed using Prism 5 (Graphpad Software, Inc, USA)
for ex vivo BD patient data and Excel 2007 (Microsoft Corporation, USA) for in vitro
data. Wilcoxon signed-rank test and Student’s t-test were used for statistical

135
analysis of ex vivo and in vitro data respectively. A p-value of <0.05 was taken to be
significant and marked with ‘*’ on the figures (‘**’ if p-value was <0.01), unless
otherwise stated in the figures. Boxplots show the median and interquartile range
(IQR) and the ends of the whiskers illustrate the minimum and maximum of all the
data for individual variables.
136
Chapter 3
Immunomodulatory effects of subcutaneous interferon-alpha 2b on
conventional T helper subsets and their cytokines in patients with Behcet’s
disease ex vivo
3.1 Introduction
T helper (Th) cells are a heterogeneous population of lymphocytes that are involved
in activating and directing other immune cells. Mature Th cells are described to
always express the surface protein CD4 (Zhu & Paul 2008). Th cells play a central
role in immune protection and orchestrate the magnitude and persistence of diverse
immune responses through production of cytokines and chemokines (Zhu & Paul
2008). They are essential in helping B cells to produce antibodies in the primary
response, in the activation and growth of cytotoxic T cells, and in maximising
bactericidal activity of phagocytes such as macrophages. Th cells are neither
phagocytic nor cytotoxic (Zhu, Yamane, & Paul 2010).
The reason for the heterogeneity of Th cells is mainly related to their protective
function, because it enables the best type of response to combat pathogens and
maintain immune homeostasis. It is the diversity in function and their role in
influencing other cells that gives T helper cells their name (Annunziato & Romagnani
2009). CD4+ T cells are generally treated as having a pre-defined role as helper T
cells within the immune system, although there are known rare exceptions. For
example, there are sub-groups of regulatory T cells, natural killer T cells, and
cytotoxic T cells that are known to express CD4 (although cytotoxic examples have
been observed in extremely low numbers in specific disease states, they are usually
considered non-existent) (Gabriel, Morley, & Rogers 2009;van de Berg et al. 2008).
All of the latter CD4+ T cell groups are not considered T helper cells.
The initial understanding of the existence of distinctive populations of differentiated
CD4+ T cells came from the analysis of mouse CD4+ T cell clones that were shown
to be divisible into two major groups, designated Th1 and Th2 cells by Mosmann &
Coffman (Mosmann & Coffman 1989). Subsequently, distinct subpopulations of Th
137
cells similar to those first identified by Mosmann et al in mice are found also in
humans (Del Prete et al. 1991). Th1 and Th2 clones could be distinguished mainly
by the cytokines produced by the cells, and through the expression of different
patterns of cell surface molecules. Establishment of a Th1/Th2 balance plays an
important regulatory role in the immune system and imbalances of cytokine
production contribute to immunopathologic conditions (Jager & Kuchroo 2010).
With regard to cytokine expression, Th1 cells make IFN-γ as their signature cytokine
and also uniquely produce lymphotoxin (TNF-β). Th1 cells tend to be good IL-2
producers, and many make TNF-α as well. The most important function of Th1 cells
is to promote cell-mediated immunity as they are crucial for activating macrophages
and induce proliferation of cytotoxic CD8+ T cells. Over-exuberant pro-inflammatory
activities of Th1 cells can cause tissue damage and elicit unwanted inflammatory
response. By contrast, Th2 cells fail to produce IFN-γ or lymphotoxin. Their
signature cytokines are IL-4, IL-5, and IL-13. They also make TNF-α, and some
produce IL-9. Although initially thought to be unable to make IL-2, later results
indicated that Th2 cells could often produce relatively modest amounts of IL-2 (Zhu,
Yamane, & Paul 2010). Th2 cells promote allergic reactions, and were viewed as
the primary helpers of B cell responses and, therefore, autoantibody production
(Palmer & Weaver 2010). Both Th1 and Th2 cells also produce IL-10 (O'Garra &
Vieira 2007).
Behcet’s disease is a chronic, relapsing vasculitis of uncertain aetiology and
immunopathogenesis which may produce distressing symptoms with the
combinations of variable systemic involvements (Yates & Michelson 2006). It is
characterised by exacerbations and remissions with varying healing time among
patients (Evereklioglu 2005). There is strong evidence for generalized aberrant T
cell responses in BD. The percentage of CD4+ cells has been reported to be
significantly lower in patients with BD as compared to healthy controls. This is
especially in the CD4+CD45RA+ subset and when patients are in the active phase of
the disease. On the other hand, increase in CD8+ cells have been observed among
BD patients (Kahan, Hamzaoui, & Ayed 1992).
138
The examination of mucocutaneous biopsies of BD patients has revealed enhanced
levels of IL-8, IL-10, monocyte chemoattractant protein 1 (MCP-1), IFN-γ and IL-12
mRNA. The parallel increase in IL-12 and IFN-γ expression within mucocutaneous
lesions, associated with the absence of Th2-related cytokines IL-4 and IL-13, points
to a strong polarised Th1 immune response (Ben Ahmed et al. 2004). Observation
of increased serum IL-18, a factor capable of inducing IFN-γ production (Gracie,
Robertson, & McInnes 2003), and TNF-α levels in BD patients further supports Th1
predominance (Oztas et al. 2005). As IL-8 is a strong activator of neutrophil function,
the upregulation of its level may support the implication of polynuclear cell
hyperfunction in the pathogenesis of BD lesions (Ben Ahmed et al. 2004).
BD patients on immunosuppressive treatment were recruited at various sites but
blood samples were only collected from Moorfields Eye Hospital patients (more
details in Chapter 2). Patients were randomised into two groups with one group
receiving additional 6 months of IFN-α therapy. As Th1 predominance has been
reported in BD patients and IFN-α treatment has been suggested to induce Th1-
related cytokines, especially IFN-γ (Simon et al. 2003;Takaoka et al. 2000). The
influence of subcutaneous IFN-α2b therapy was examined first on conventional αβ T
cell subsets and related cytokines. Given the significant role of γδ T cells in BD, its
response following IFN-α treatment was examined as well and results were shown in
a separate chapter (Chapter 7).
3.2 Aims
IFN-α is known to exert pleiotropic effects and we aim to verify whether previously
reported effects of IFN-α including the induction of Th1-related cytokines can be
demonstrated following IFN-α treatment in BD patients. More specifically, the
influence of a 6-month course of subcutaneous pegylated IFN-α2b therapy on
modulating conventional Th1 and Th2 subsets and the production of IFN-γ, TNF-α,
IL-2 and IL-4 by peripheral blood lymphocytes before, during and after cessation of
therapy are examined.

139
Another aim is to investigate the effect of pegylated IFN-α2b therapy on surface
phenotype of T cells, such as CD4, CD8 and TCRαβ expression, in whole blood
samples of BD patients.
3.3 Results
The experiments presented here were performed in conjunction with Mr A
Nouraeinejad and Ms G Galatowicz. Approximately 70% of the samples used for
data analysis in this section were processed by me, and all data analysis is my own
work.
3.3.1 IFN-α therapy does not induce any changes in the surface CD4, CD8,
and TCRαβ expression in T lymphocytes in BD patients
To examine the influence of IFN-α therapy on CD4 and CD8 expression by
peripheral blood T lymphocytes in BD patients and the proportions of TCRαβ-
expressing subpopulations within the CD4+ and CD8+ subsets, serial whole blood
samples from BD patients receiving conventional immunosuppressive therapy with
or without recombinant IFN-α2b treatment were phenotyped. The CD4/CD8
phenotyping results were obtained after gating on the CD3+ lymphocytes during
analysis. As shown in Figure 3.1, there was no significant alteration of the levels of
either CD4 or CD8 surface expression on peripheral blood T lymphocytes in BD
patients whether they were on IFN-α or not.
As for the assessment of TCRαβ expression, presence of CD8 surface protein was
used to discriminate between CD4+ and CD8+ T cell population after gating on
lymphocytes. Like the individuals on conventional immunosuppressive treatment, no
significant effect on the TCRαβ expression was consistently displayed by the
patients on IFN-α therapy (Figure 3.2).

140
Fig 3.1: IFN-α therapy does not change the percentage of CD4+ or CD8+ lymphocytes Whole blood from BD patients receiving either the conventional treatment alone (n=16) or
with IFN-α2b therapy (n=15) were obtained at 0, 3, 6 and 12 month assessment visits.
These samples were stained with anti-CD3, anti-CD4, and anti-CD8 antibodies. (a), The
graph shows percentages of the CD4+ fraction. (b), The graph displays the proportions of
CD8+ T cells. The results are presented as boxplots.
Fig 3.2: IFN-α therapy does not change the percentage of TCRαβ expression in either
CD4+ or CD8+ lymphocytes
Whole blood from BD patients receiving either the conventional treatment alone (n=13) or
with IFN-α2b therapy (n=12) were obtained at 0, 3, 6 and 12 month assessment visits.
These samples were stained with anti-CD8, and anti-TCRαβ antibodies. (a), The graph
shows percentages of the TCRαβ expression in the CD4 T cells. (b), The graph displays the
proportions of the TCRαβ expression in the CD8 T cells. The results are presented as
boxplots.
(a)
0 3 6 12 0 3 6 120
20
40
60
80
100*
Conventionaltreatment alone
IFN- therapy inthe first 6 months
(n=16) Months (n=15)
% o
f C
D4
+ e
xp
ressio
n
(b)
0 3 6 12 0 3 6 120
20
40
60
80
100 Conventionaltreatment alone
IFN- therapy inthe first 6 months
(n=16) Months (n=15)
% o
f C
D8
+ e
xp
ressio
n
(a)
0 3 6 12 0 3 6 120
20
40
60
80
100
Conventionaltreatment alone
IFN- therapy inthe first 6 months
(n=13) Months (n=12)
% o
f C
D8
-T
CR
+ e
xp
ressio
n
(b)
0 3 6 12 0 3 6 120
20
40
60
80
100 Conventionaltreatment alone
IFN- therapy inthe first 6 months
(n=13) Months (n=12)
% o
f C
D8
+T
CR
+ e
xp
ressio
n
141
3.3.2 IFN-α2b therapy upregulates IFN-γ expression by T cells in BD patients
To investigate the effects of IFN-α on signature Th1 cytokine, IFN-γ, serial whole
blood samples from BD patients on conventional immunosuppressive therapy with or
without additional IFN-α2b treatment were studied using intracellular cytokine
staining method and flow cytometry. Cell cultures were either untreated or treated
with anti-CD3/CD28 Abs or PMA/ionomycin for 24 hours before staining. Cytokine
production was analysed by gating on either CD3+ or CD4+ lymphocyte populations.
In terms of IFN-γ+ production by CD3+ T cells in untreated cultures (Fig 3.3a), a
significant increase was detected in the IFN-α2b-treated group at 3 months after
initiation of therapy (median 0.7% and IQR 0.5-1.3%; p<0.05) as compared to data
from baseline visits (median 0.4% and IQR 0.3-0.7%). This upregulation of IFN-γ
level was maintained at 6 month visits (median 0.7% and IQR 0.4-0.9%; p<0.05) and
even after cessation of therapy at 12 months (median 1.0% and IQR 0.6-1.5%;
p<0.01) in the IFN-α treated patients. In cultures stimulated with PMA/ionomycin
(Fig 3.3b), such enhancement of IFN-γ-expressing cells was only observed at 12
month follow-ups (median 9.0% and IQR 6.5-11.0%; p<0.05) as compared to initial
visits (median 4.6% and IQR 3.3-7.9%). In CD3/CD28 stimulated cultures, no
significant change in levels was detected in either group of BD patients (data not
shown). Similarly, a tendency to increase in IFN-γ expression was evident in CD4+ T
cells (Fig 3.4) from patients with IFN-α treatment, however, none of the results was
statistically significant.
No change in IFN-γ production by either CD3+ or CD4+ T cells was identified in the
individuals on conventional immunosuppressants alone. However, a significantly
decreased expression by CD4+ T cells was found in 12 month visit samples after
activation with PMA/ionomycin (median 6.8% and IQR 3.3-10.4%; p<0.05) as
compared to baseline visit ones (median 4.0% and IQR 1.4-6.7%) (Fig 3.4b).

142
Fig 3.3: Upregulation of IFN-γ expression with IFN-α therapy in CD3+ T cells
Whole blood samples from BD patients were obtained at baseline visits and follow-ups at 3,
6, and 12 months. These were stained with anti-CD3 surface antibodies before
intracellularly with anti-IFN-γ antibodies. The data are shown as percentages of IFN-γ+ cells
among CD3+ lymphocytes. Of the patients presented here, 17 (14) BD patients were on
conventional treatment alone and 15 (14) were on IFN-α2b therapy as well. The number in
brackets denotes the number of patients represented in the 12 month data. In (a), results
were from untreated cell cultures; in (b), results were from cell cultures stimulated with PMA
and ionomycin. All results are presented as boxplots.
(a) Untreated
0 3 6 0 3 60
2
4
6Conventionaltreatment alone
Plus IFN-therapy
*
*
(n=17) Months (n=15)
% o
f IF
N-
+ e
xp
ressio
n
0 12 0 120
2
4
6Conventionaltreatment alone
IFN- therapy inthe first 6 months
(n=14) Months (n=14)
% o
f IF
N-
+ e
xp
ressio
n **
(b) PMA/ionomycin stimulation
0 3 6 0 3 60
10
20
30
40 Conventionaltreatment alone
Plus IFN-therapy
(n=17) Months (n=15)
% o
f IF
N-
+ e
xp
ressio
n
0 12 0 120
10
20
30
40 Conventionaltreatment alone
IFN- therapy inthe first 6 months
(n=14) Months (n=14)
% o
f IF
N-
+ e
xp
ressio
n
*
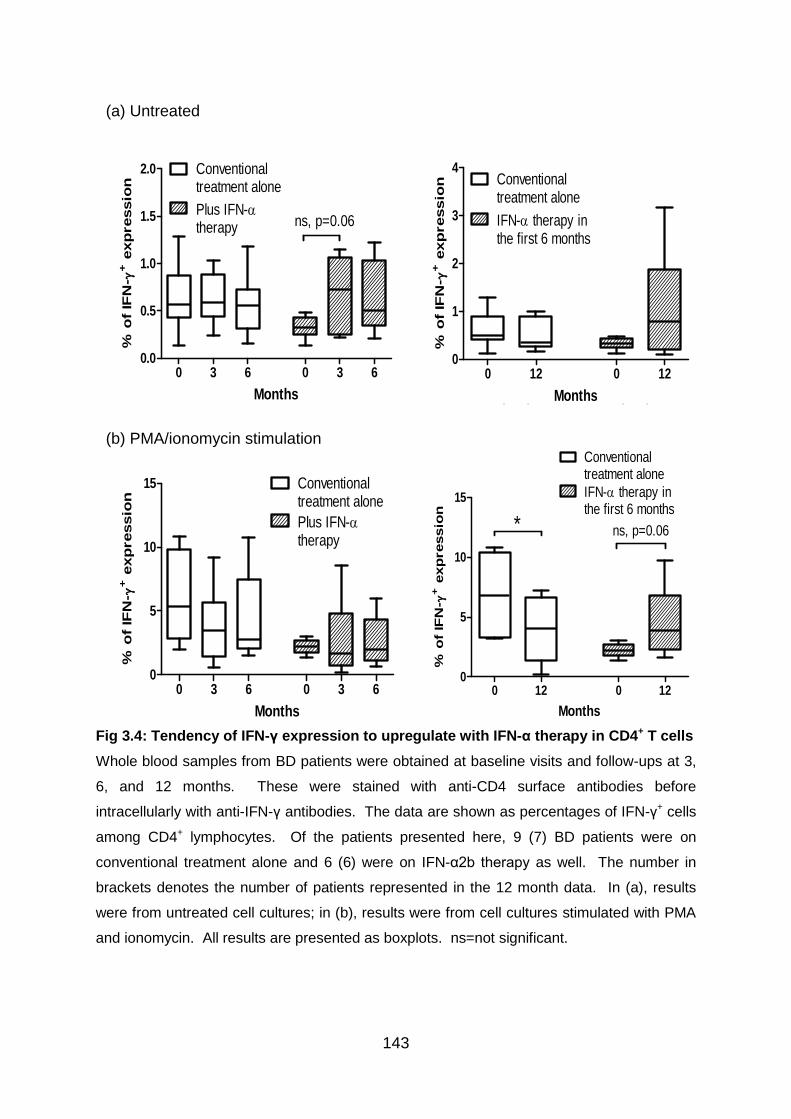
143
Fig 3.4: Tendency of IFN-γ expression to upregulate with IFN-α therapy in CD4+ T cells
Whole blood samples from BD patients were obtained at baseline visits and follow-ups at 3,
6, and 12 months. These were stained with anti-CD4 surface antibodies before
intracellularly with anti-IFN-γ antibodies. The data are shown as percentages of IFN-γ+ cells
among CD4+ lymphocytes. Of the patients presented here, 9 (7) BD patients were on
conventional treatment alone and 6 (6) were on IFN-α2b therapy as well. The number in
brackets denotes the number of patients represented in the 12 month data. In (a), results
were from untreated cell cultures; in (b), results were from cell cultures stimulated with PMA
and ionomycin. All results are presented as boxplots. ns=not significant.
(a) Untreated
0 3 6 0 3 60.0
0.5
1.0
1.5
2.0 Conventionaltreatment alone
Plus IFN-therapy ns, p=0.06
(n=9) Months (n=6)
% o
f IF
N-
+ e
xp
ressio
n
0 12 0 120
1
2
3
4Conventionaltreatment alone
IFN- therapy inthe first 6 months
(n=7) Months (n=6)
% o
f IF
N-
+ e
xp
ressio
n
(b) PMA/ionomycin stimulation
0 3 6 0 3 60
5
10
15 Conventionaltreatment alone
Plus IFN-therapy
(n=9) Months (n=6)
% o
f IF
N-
+ e
xp
ressio
n
0 12 0 120
5
10
15
Conventionaltreatment alone
IFN- therapy inthe first 6 months
* ns, p=0.06
(n=7) Months (n=6)
% o
f IF
N-
+ e
xp
ressio
n
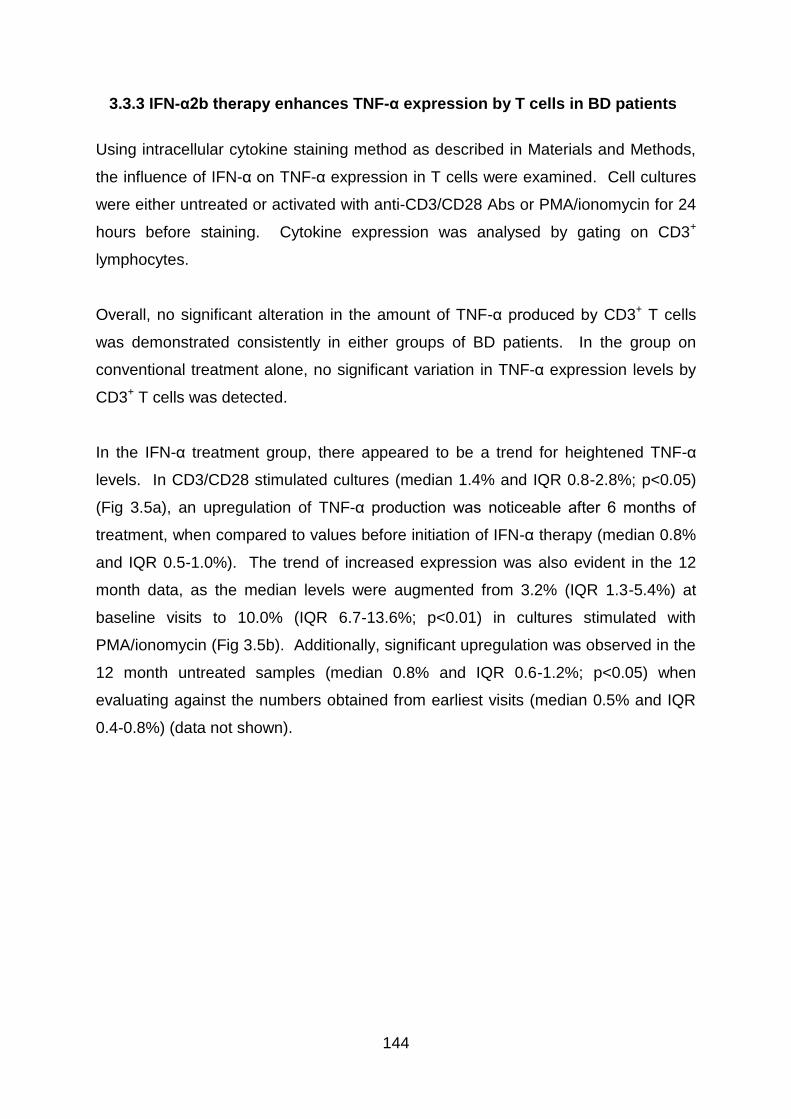
144
3.3.3 IFN-α2b therapy enhances TNF-α expression by T cells in BD patients
Using intracellular cytokine staining method as described in Materials and Methods,
the influence of IFN-α on TNF-α expression in T cells were examined. Cell cultures
were either untreated or activated with anti-CD3/CD28 Abs or PMA/ionomycin for 24
hours before staining. Cytokine expression was analysed by gating on CD3+
lymphocytes.
Overall, no significant alteration in the amount of TNF-α produced by CD3+ T cells
was demonstrated consistently in either groups of BD patients. In the group on
conventional treatment alone, no significant variation in TNF-α expression levels by
CD3+ T cells was detected.
In the IFN-α treatment group, there appeared to be a trend for heightened TNF-α
levels. In CD3/CD28 stimulated cultures (median 1.4% and IQR 0.8-2.8%; p<0.05)
(Fig 3.5a), an upregulation of TNF-α production was noticeable after 6 months of
treatment, when compared to values before initiation of IFN-α therapy (median 0.8%
and IQR 0.5-1.0%). The trend of increased expression was also evident in the 12
month data, as the median levels were augmented from 3.2% (IQR 1.3-5.4%) at
baseline visits to 10.0% (IQR 6.7-13.6%; p<0.01) in cultures stimulated with
PMA/ionomycin (Fig 3.5b). Additionally, significant upregulation was observed in the
12 month untreated samples (median 0.8% and IQR 0.6-1.2%; p<0.05) when
evaluating against the numbers obtained from earliest visits (median 0.5% and IQR
0.4-0.8%) (data not shown).
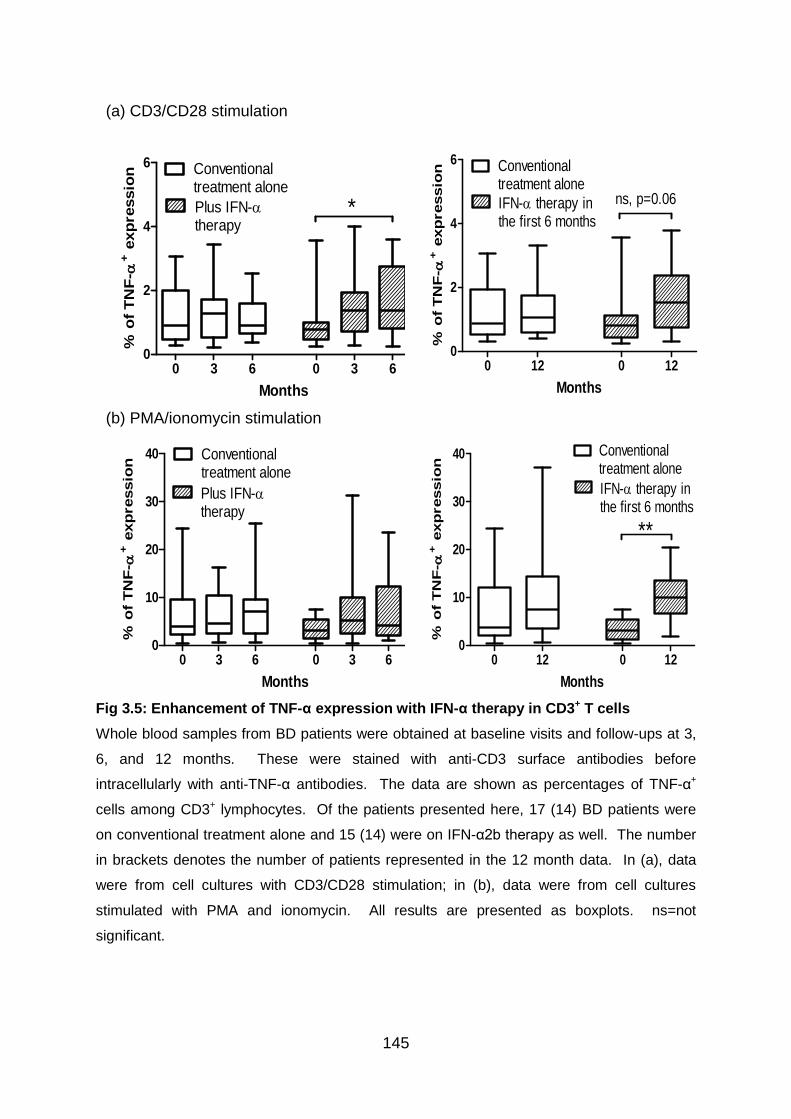
145
Fig 3.5: Enhancement of TNF-α expression with IFN-α therapy in CD3+ T cells
Whole blood samples from BD patients were obtained at baseline visits and follow-ups at 3,
6, and 12 months. These were stained with anti-CD3 surface antibodies before
intracellularly with anti-TNF-α antibodies. The data are shown as percentages of TNF-α+
cells among CD3+ lymphocytes. Of the patients presented here, 17 (14) BD patients were
on conventional treatment alone and 15 (14) were on IFN-α2b therapy as well. The number
in brackets denotes the number of patients represented in the 12 month data. In (a), data
were from cell cultures with CD3/CD28 stimulation; in (b), data were from cell cultures
stimulated with PMA and ionomycin. All results are presented as boxplots. ns=not
significant.
(a) CD3/CD28 stimulation
0 3 6 0 3 60
2
4
6 Conventionaltreatment alone
Plus IFN-therapy
*
(n=17) Months (n=15)
% o
f T
NF
- + e
xp
ressio
n
0 12 0 120
2
4
6 Conventionaltreatment alone
IFN- therapy inthe first 6 months
(n=14) Months (n=14)
% o
f T
NF
- + e
xp
ressio
n
ns, p=0.06
(b) PMA/ionomycin stimulation
0 3 6 0 3 60
10
20
30
40 Conventionaltreatment alone
Plus IFN-therapy
(n=17) Months (n=15)
% o
f T
NF
- + e
xp
ressio
n
0 12 0 120
10
20
30
40 Conventionaltreatment alone
IFN- therapy inthe first 6 months
(n=14) Months (n=14)
% o
f T
NF
- + e
xp
ressio
n
**
146
3.3.4 IFN-α2b therapy increases IL-2 expression by T cells in BD patients
Analysis of the effects of IFN-α on IL-2 production by CD3+ T cells was approached
by using intracellular cytokine staining on whole blood samples as described in
Materials and Methods. Cell cultures were either untreated or activated with anti-
CD3/CD28 Abs or PMA/ionomycin for 24 hours before staining. Cytokine expression
was analysed by gating on CD3+ lymphocytes.
From our data, there was a global enhancement of IL-2 production by CD3+ T cells in
the IFN-α treatment group. In CD3/CD28 stimulated cultures (Fig 3.6a), the levels
were significantly increased at 3 months (median 0.6% and IQR 0.2-1.4%; p<0.05)
and 6 months (median 0.5% and IQR 0.3-1.1%; P<0.05) when compared to the data
from initial visits (median 0.2% and IQR 0.2-0.6%). This upregulation was still
evident when evaluating 12 month data (median 0.7% and IQR 0.5-1.6%; p<0.01)
against baseline ones (median 0.3% and IQR 0.2-0.6%). Similar results were
observed in cultures stimulated with PMA and ionomycin as well (Fig 3.6b). When
compared to data from initial ones (median 1.8% and IQR 0.8-6.7%), the proportion
of CD3+ T cells expressing IL-2 was increased as early as at 3 months (median 7.4%
and IQR 1.3-29.9%; p<0.05) following initiation of IFN-α therapy. Consistently, the
median levels were enhanced from 2.2% (IQR 0.7-7.7%) before initiation of IFN-α
therapy to 9.4% (IQR 5.1-14.3%; p<0.05) at 12 months. Furthermore, similar results
of IL-2 expression upregulation were found with data acquired from untreated
samples (data not shown).
In the group on conventional treatment alone, no significant alteration in the
expression of IL-2 by CD3+ T cells was detected with the exception of a decrease
observed in CD3/28 stimulated samples when comparing 3 month values (median
0.6% and IQR 0.3-1.3%) with the 6 month ones (median 0.4% and IQR 0.2-0.5%;
p<0.05) (Fig 3.6a).
147
Fig 3.6: Upregulation of IL-2 expression with IFN-α therapy in CD3+ T cells
Whole blood samples from BD patients were obtained at baseline visits and follow-ups at 3,
6, and 12 months. These were stained with anti-CD3 surface Ab before intracellularly with
anti-IL-2 Ab. The data are shown as percentages of IL-2+ cells among CD3+ lymphocytes.
Of the patients presented here, 16 (15) BD patients were on conventional treatment alone
and 14 (13) were on IFN-α2b therapy as well. The number in brackets denotes the number
of patients represented in the 12 month data. In (a), data were from cell cultures with
CD3/CD28 stimulation; in (b), data were from cell cultures stimulated with PMA and
ionomycin. All results are presented as boxplots.
(a) CD3/CD28 stimulation
0 3 6 0 3 60
2
4
6Conventionaltreatment alone
Plus IFN- therapy
(n=16) Months (n=14)
% o
f IL
-2+ e
xp
ressio
n
* *
*
0 12 0 120
2
4
6 Conventionaltreatment alone
IFN- therapy inthe first 6 months
(n=15) Months (n=13)
% o
f IL
-2+ e
xp
ressio
n
**
(b) PMA/ionomycin stimulation
0 3 6 0 3 60
10
20
30
40
50 Conventionaltreatment alone
Plus IFN-therapy
(n=16) Months (n=14)
% o
f IL
-2+ e
xp
ressio
n
*
0 12 0 120
10
20
30
40
50Conventionaltreatment alone
IFN- therapy inthe first 6 months
(n=15) Months (n=13)
% o
f IL
-2+ e
xp
ressio
n
*
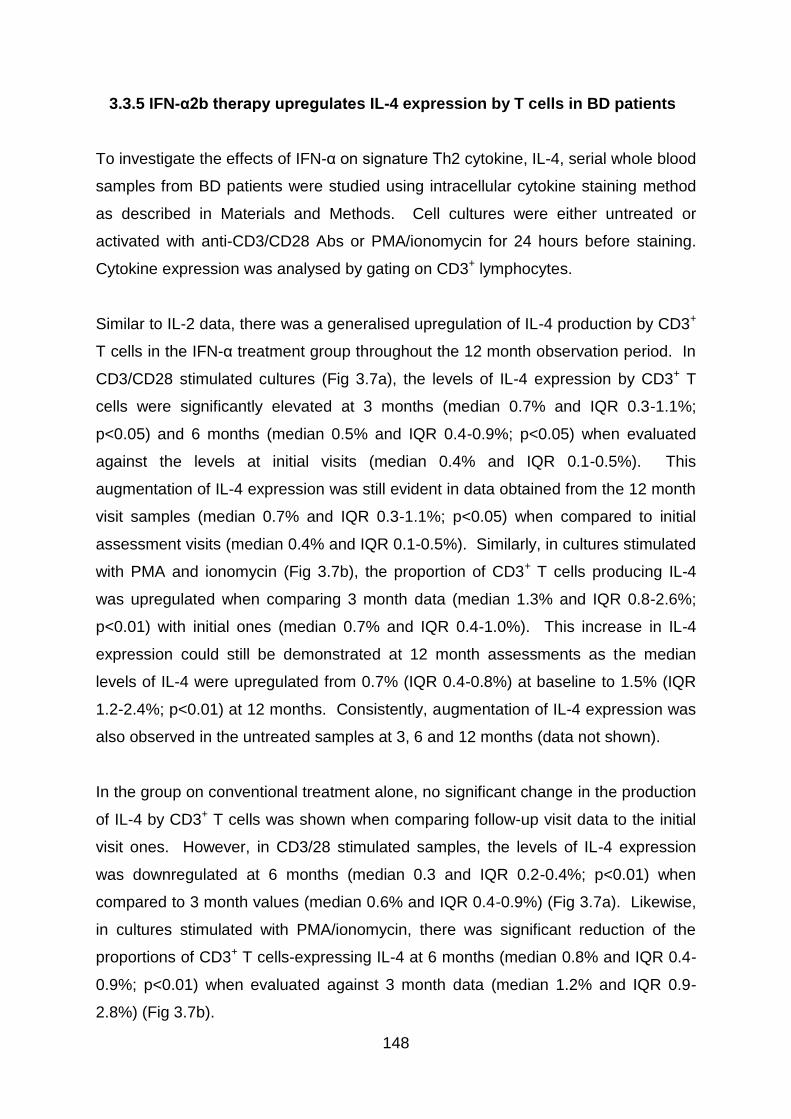
148
3.3.5 IFN-α2b therapy upregulates IL-4 expression by T cells in BD patients
To investigate the effects of IFN-α on signature Th2 cytokine, IL-4, serial whole blood
samples from BD patients were studied using intracellular cytokine staining method
as described in Materials and Methods. Cell cultures were either untreated or
activated with anti-CD3/CD28 Abs or PMA/ionomycin for 24 hours before staining.
Cytokine expression was analysed by gating on CD3+ lymphocytes.
Similar to IL-2 data, there was a generalised upregulation of IL-4 production by CD3+
T cells in the IFN-α treatment group throughout the 12 month observation period. In
CD3/CD28 stimulated cultures (Fig 3.7a), the levels of IL-4 expression by CD3+ T
cells were significantly elevated at 3 months (median 0.7% and IQR 0.3-1.1%;
p<0.05) and 6 months (median 0.5% and IQR 0.4-0.9%; p<0.05) when evaluated
against the levels at initial visits (median 0.4% and IQR 0.1-0.5%). This
augmentation of IL-4 expression was still evident in data obtained from the 12 month
visit samples (median 0.7% and IQR 0.3-1.1%; p<0.05) when compared to initial
assessment visits (median 0.4% and IQR 0.1-0.5%). Similarly, in cultures stimulated
with PMA and ionomycin (Fig 3.7b), the proportion of CD3+ T cells producing IL-4
was upregulated when comparing 3 month data (median 1.3% and IQR 0.8-2.6%;
p<0.01) with initial ones (median 0.7% and IQR 0.4-1.0%). This increase in IL-4
expression could still be demonstrated at 12 month assessments as the median
levels of IL-4 were upregulated from 0.7% (IQR 0.4-0.8%) at baseline to 1.5% (IQR
1.2-2.4%; p<0.01) at 12 months. Consistently, augmentation of IL-4 expression was
also observed in the untreated samples at 3, 6 and 12 months (data not shown).
In the group on conventional treatment alone, no significant change in the production
of IL-4 by CD3+ T cells was shown when comparing follow-up visit data to the initial
visit ones. However, in CD3/28 stimulated samples, the levels of IL-4 expression
was downregulated at 6 months (median 0.3 and IQR 0.2-0.4%; p<0.01) when
compared to 3 month values (median 0.6% and IQR 0.4-0.9%) (Fig 3.7a). Likewise,
in cultures stimulated with PMA/ionomycin, there was significant reduction of the
proportions of CD3+ T cells-expressing IL-4 at 6 months (median 0.8% and IQR 0.4-
0.9%; p<0.01) when evaluated against 3 month data (median 1.2% and IQR 0.9-
2.8%) (Fig 3.7b).
149
Fig 3.7: Augmentation of IL-4 expression with IFN-α therapy in CD3+ T cells
Whole blood samples from BD patients were obtained at baseline visits and follow-ups at 3,
6, and 12 months. These were stained with anti-CD3 surface Ab before intracellularly with
anti-IL-4 Ab. The data are shown as percentages of IL-4+ cells among CD3+ lymphocytes.
Of the patients presented here, 16 (15) BD patients were on conventional treatment alone
and 14 (13) were on IFN-α2b therapy as well. The number in brackets denotes the number
of patients represented in the 12 month data. In (a), data were from cell cultures with
CD3/CD28 stimulation; in (b), data were from cell cultures stimulated with PMA and
ionomycin. All results are presented as boxplots.
(a) CD3/CD28 stimulation
0 3 6 0 3 60
1
2
3
4 Conventionaltreatment alone
Plus IFN-therapy
(n=16) Months (n=14)
% o
f IL
-4+ e
xp
ressio
n
** *
*
0 12 0 120
1
2
3
4 Conventionaltreatment alone
IFN- therapy inthe first 6 months
(n=15) Months (n=13)
% o
f IL
-4+ e
xp
ressio
n *
(b) PMA/ionomycin stimulation
0 3 6 0 3 60
2
4
6
8 Conventionaltreatment alone
Plus IFN-therapy
(n=16) Months (n=14)
% o
f IL
-4+ e
xp
ressio
n
**
**
0 12 0 120
2
4
6 Conventionaltreatment alone
IFN- therapy inthe first 6 months
(n=15) Months (n=13)
% o
f IL
-4
+ e
xp
ressio
n
**

150
3.4 Discussion
IFN-α has wide-ranging immunomodulatory properties and it has differential
influences on cells of the immune system. In an early study on the short-term effects
of IFN-α, a single subcutaneous injection IFN-α2b induced noticeable changes in
peripheral blood leukocyte numbers as well as activation of neutrophils and
monocytes in healthy individuals. IFN-α administration resulted in an increase in
neutrophil counts and provoked sustained decrease in the number of lymphocytes,
basophils and eosinophils (Corssmit et al. 1997).
3.4.1 Influence of IFN-α on peripheral blood lymphocytes
IFN-α treatment was reported to induce expansion of peripheral blood lymphocytes
and monocytes in patients with severe steroid-induced asthma. This is in contrast to
the number of neutrophils which was substantially reduced under the influence of
IFN-α therapy. Although no alteration was detected in the number of CD8+ T cells, a
relative increase in CD4+ T cells was observed (Simon et al. 2003). In our
experiments, there was no significant change in the expression levels of CD4, CD8
or TCRαβ by peripheral blood T lymphocytes in BD patients whether they were on
IFN-α or not at any time points.
3.4.2.1 Biology of IFN-γ
IFN-γ is a 17kD protein produced mainly by NK cells and NKT cells as part of the
innate immune response, and by lymphocytes expressing the surface antigens CD4
and CD8 once antigen-specific immunity develops. Within the CD4+ T cell population,
IFN-γ is produced predominantly by the Th1 subset (Billiau & Matthys 2009). The
IFN-γ receptor consists of two subunits, IFN-γ receptor 1 (IFNGR1) and IFNGR2,
and each molecule interacts with a member of the JAK family, which are non-
receptor protein tyrosine kinases. JAKs phosphorylate receptors and
transcriptional coactivators known as Stats. Thus, the binding of IFN-γ to its
receptor activates the JAK-Stat pathway (Saha et al. 2010).
151
IFN-γ has physiological importance in regulating immune responses and
inflammatory events and its effects include the ability to enhance the functional
activity of macrophages, promotion of T and B cell development, and modulation of
both class I and II MHC antigen expression on a various cell types (Billiau &
Matthys 2009). By induction of the transcription factor T-bet, IFN-γ enables B
cells to undergo class switching more efficiently (Xu & Zhang 2005). IFN-γ
activates NK cells, enhancing their cytotoxicity and cell-mediated immune
responses. IFN-γ also plays an important role in chemokine-controlled processes.
Generally, induction of neutrophil chemotactic chemokines is inhibited, but
induction of mononuclear cell-chemotactic chemokines is stimulated by IFN-γ
(Billiau & Matthys 2009).
IFN-γ plays important roles in modulating T cell activation by two main pathways:
by direct effects of IFN-γ on T cells or via modulation of APC function. During
generation of a primary Th1 response, IFN-γ acts as a positive regulator by
selectively inducing Th1 differentiation. Traditionally, IFN-γ was seen as a pro-
inflammatory cytokine, but it should be recognised that IFN-γ has important anti-
inflammatory potential as well. In recent years, a more balanced role for Th1 cells
and IFN-γ in autoimmune inflammation has become apparent. The intensity of Th1-
induced inflammation can trigger a self-regulating mechanism in response to overt
inflammation. In the early stages of CD4+ T cell activation, IFN-γ regulates T cell
proliferation by inducing caspase and ensuing apoptosis. Once Th1 cells become
committed, they lose their capacity to be directly affected. However, IFN-γ counter-
regulatory circuits can still contribute by promoting Th1 cell death indirectly through
induction of numerous factors, such as nitric oxide, indoleamine 2,3 dioxygenase
(IDO), and TNF-α receptors (Kelchtermans, Billiau, & Matthys 2008).
3.4.2.2 Th1 cells, IFN-γ and Behcet’s disease
An early study has indicated that BD is characterised by an increased percentage of
peripheral IL-2- and IFN-γ-producing T cells in peripheral blood lymphocytes during
active phase of disease, indicating a strong, polarised Th1 immune response in vivo
152
(Frassanito et al. 1999). The disease activity in patients with BD is also correlated
with serum IL-12 levels. IL-12 rescues Th1 lymphocytes from spontaneous and Fas-
mediated apoptosis and initiates production of Th1 cytokine IFN-γ from Th precursor
cells. Moreover, IL-12 promotes differentiation of precursor cells along the Th1
pathway and subsequent proliferation (Frassanito et al. 1999). It is difficult at the
present time to understand the exact biological role of IFN-γ in BD and issues, such
as whether the increased IFN-γ is the cause or the result of developing this disease,
need to be investigated further in order to elucidate the pro- and anti-inflammatory
roles of IFN-γ in BD.
3.4.2.3 The immunomodulatory effect of IFN-α on IFN-γ
From our BD patient data, an upregulation or a tendency to upregulate IFN-γ-
expressing cells was detected in both CD3+ and CD4+ T cell populations during IFN-
α2b therapy and even 6 months after the termination of treatment. This is in contrast
to the patients on conventional treatment alone, where even a significant
downregulation of IFN-γ expression in CD4+ lymphocytes was sporadically observed.
The findings are in accordance with results from another study, which showed that
CD4+ T cells producing IFN-γ were upregulated further in BD patients under IFN-α
treatment (Amberger et al. 2007). Consistently, in a highly efficacious trial of IFN-α
treatment in patients with corticosteroid-unresponsive asthma, the therapy
dramatically increased the capacity of peripheral blood T cells to generate IFN-γ
(Simon et al. 2003).
Interestingly, it has been revealed in an very early study that the serum levels of IFN-
γ in patients with BD were significantly higher than in normal controls but the titre of
IFN-γ correlated inversely with disease activity (Ohno et al. 1982). Although IFN-γ
can mediate disease, its anti-inflammatory properties can serve as a protective factor
in models of autoimmunity (Kelchtermans, Billiau, & Matthys 2008). Hence,
enhancement of CD4+ T cells producing IFN-γ are not necessarily counterintuitive to
the effectiveness of IFN-α as a treatment for BD. It has been suggested that type I
IFNs, IFN-α/β, augment IFN-γ signalling via association of type I and type II IFN
receptor subunits (Takaoka et al. 2000). Also, the type of adaptive immune
153
response is conditioned by the type of preceding innate immunity. IFN-α produced
by dendritic cells and/or IFN-γ released by NK cells upon stimulation by IL-12
activate Stat1 in the naive CD4+ T cells. Activated Stat1 upregulates T-bet
expression in T cells and subsequently promotes early T cell IFN-γ production and
IL-12Rβ2 expression. T cells with IL-12Rβ2 expression can then respond to IL-12
directly and induce high IFN-γ production and sustain the expression of IL-12Rβ2
through activation of Stat4 (Szabo et al. 1997). These interactions could offer one
explanation why Th1 polarisation was observed in our patients after treatment with
exogenous IFN-α. Moreover, it has been reported that IFN-α2a induces phenotypic
maturation of dendritic cells and enhances their capacity to stimulate T cells. In
CD40-stimulated DCs, IFN-α2a augments the production of IL-12, which contributes
to Th1 polarisation and IFN-γ secretion (Tamir et al. 2005).
3.4.3.1 Biology of TNF-α
TNF-α, a 17 kD peptide, is a multi-functional inflammatory cytokine, which plays a
fundamental role in the establishment and maintenance of the inflammatory
response. It is produced predominantly as a secreted protein by several types of
cells including T and B lymphocytes, mast cells, NK cells, neutrophils, endothelial
cells, smooth and cardiac muscle cells, fibroblasts and osteoclasts, but especially by
activated macrophages (Bradley 2008). Cells expressing CD4 secrete TNF-α while
CD8+ cells secrete little or no TNF-α.
The effects of TNF-α are mediated by binding of TNF-α to distinct TNF receptor type
1 (TNFR1) and type 2 (TNFR2). The two TNF-α receptors have similar affinities, and
they are found on many cell types, including activated T and B cells, macrophages,
and neutrophils (Benveniste & Benos 1995). Apart from mediating cell survival and
pro-inflammatory signals through NF-κB and AP-1, TNFR1 can initiate cell death
signalling pathways. Ligation of TNFR1 is both necessary and sufficient to induce
cytotoxic and pro-inflammatory TNF-α responses. However, the signalling pathways
initiated by TNFR2 are less clearly defined, and TNFR2 appears to signal both
shared and opposing effects to TNFR1. TNFR2 may promote cell activation,
migration or proliferation (Bradley 2008).
154
TNF-α is produced early and rapidly during inflammation and its release stimulates
numerous other pro-inflammatory mediators such as IL-1, IL-6, IL-8, and TNF-α itself,
which can further influence the course and outcome of an inflammatory response
and subsequent pathologic consequences (Duzgun et al. 2005). At sites of
inflammation, chronic TNF-α signals can contribute to the survival of effector T cells
(Clark et al. 2005). The cytokine has been described to modulate immunological
responses by enhancing the expression of MHC class I and class II molecules (Ma
2001). Also, TNF-α is a major inducer of endothelial adhesion molecules and
chemokines. Hence, the upregulation of TNF-α may have a major effect on the
recruitment of leukocytes to active inflammatory sites (Duzgun et al. 2005).
TNF-α possesses immunosuppressive effects as well. In an early murine study, it
has been demonstrated that chronic exposure to TNF-α suppresses the response of
both Th1 and Th2 subsets and attenuates T cell receptor signaling in vivo (Cope et al.
1997). Upon macrophage activation, TNF-α signalling can selectively inhibit IL-12
gene expression as part of the scheme of cytokine feedback and self-limiting
modulations (Ma et al. 2000). Moreover, TNF-α can promote lymphoid T cell
apoptosis, inhibit dendritic cell co-stimulation and induce other cytokines that can
inhibit cell-mediated immunity (O'shea, Ma, & Lipsky 2002). Recently, it was reported
that the suppressive function of Treg cells was regulated by TNF-α through its
receptor TNFR2, constitutively expressed on human Tregs and particularly at higher
levels in the CD45RA- subset. TNF-α/TNFR2 signalling was demonstrated to inhibit
the suppressive function of CD4+CD25high Tregs via activation of the NF-κB cascade
(Nagar et al. 2010) and pre-treatment (up to 48 hours) of Treg cells with TNF-α
caused a marked downregulation of Foxp3 mRNA and protein expression (Valencia
et al. 2006).
Interesting findings on Treg cells were demonstrated in RA patients treated with an
anti-TNF-α agent, infliximab, as well. CD4+CD25high T cells isolated from patients
with active RA showed inability to suppress pro-inflammatory cytokines released by
effector T cells and monocytes. After treatment with infliximab, the capacity of Treg
cells to suppress cytokine production was restored to the level found in healthy
individuals, and a regulatory phenotype was able to be conveyed to effector T cells
155
(Ehrenstein et al. 2004). A subsequent study by the same group revealed that the
restoration of function of the CD4+CD25high population after infliximab therapy was
most likely to be due to the suppressive effects of the newly differentiated
Foxp3+CD25highCD62L- Treg cells which suppressed via TGF-β- and IL-10-
dependent mechanisms. Of note, the natural CD62L+ Treg cells remained defective
in infliximab-treated patients (Nadkarni, Mauri, & Ehrenstein 2007).
These findings suggest a mechanism by which TNF-α can modulate Treg cells. It
has been postulated that at the start of an inflammatory process, intense TNF-α
production may debilitate the activity of Treg cells and support induction of immune
reactivity and the effector phase of lymphocyte responses. During recovery, a
reduction in TNF-α level may lead to enhanced Treg function that keeps immune
reactivity in check and avoids triggering immune responses to autologous tissue
antigens revealed during inflammation (Valencia et al. 2006).
3.4.3.2 TNF-α and Behcet’s disease
TNF-α has been considered to be associated with the pathogenesis and activity of
BD as higher levels of TNF-α have been found in the aqueous humour and serum of
BD patients with uveitis (Dilek et al. 2009;Santos et al. 2001). This is in accordance
with another study which showed a significant increase of both serum IL-18 and
TNF-α in BD patients with active disease when compared with healthy volunteers
(Oztas et al. 2005). Increased levels of IL-18 may support Th1 predominance in
Behcet’s disease. In addition, the number of TNF-α producing cells was reported to
be increased in the active phases of the disease (Misumi et al. 2003).
TNF-blocking agents such as infliximab and etanercept have been reported to
induce rapid and effective suppression of almost all manifestations of systemic and
ocular BD, at least in the short term (Sfikakis et al. 2007). The most commonly used
anti-TNF agent has been infliximab, and it has been shown to promote a complete
and rapid remission of sight-threatening ocular inflammation and improvements of
visual acuities (Sfikakis et al. 2004). A single infusion of infliximab (5 mg/kg) can
lead to complete response of vitritis and retinitis in about half of the cases. Cystoid
156
macular oedema, the most-therapy resistant manifestation of ocular BD, resolve in
90% of patients by day 28. The initial response is fast, e.g. within 24 hours, but
relapses can necessitate continuous treatment. The recent recommendations are to
include it as an add-on immunosuppressive therapy for selected patients with BD,
who are refractory or intolerant to traditional immunosuppressives (Sfikakis et al.
2007). Moreover, in the only placebo-controlled study of any anti-TNF agent in BD,
etanercept was demonstrated to significantly reduce the mean numbers of oral
ulcers, nodular and papulopustular lesions (Melikoglu et al. 2005).
3.4.3.3 The immunomodulatory effect of IFN-α on TNF-α
With the exception of data analysed using 6 month CD3/CD28 stimulated samples,
our data did not reveal any meaningful upregulation in the proportion of CD3+TNF-α+
T cells in BD patients in the first 6 months while they were on IFN-α2b therapy.
However, after 6 months of IFN-α2b treatment and especially after cessation of
therapy, significantly elevated TNF-α expression levels were sporadically observed
in the blood samples of these patients. On the other hand, increased TNF-α
production was not detected in the group of patients on conventional treatment alone.
In a previous study, a significant increase in TNF-α level, reflecting activation of
macrophages, in the serum of BD patients during treatment with IFN-α2a was
reported (Kotter et al. 2005). This is in line with an early study which demonstrated
IFN-γ augmentation in IL-2-, mitogen-, or PMA-induced production of both TNF-α
and TNF-β by PBMCs (Nedwin et al. 1985). Therefore, the observed upregulation of
IFN-γ in our experiments could contribute to the sporadic increase in TNF-α
production levels.
The proportions of CD3+ T cells producing TNF-α were low in our experiments on BD
patients as the mean levels were less than 2% with CD3/CD28 stimulation and less
than 10% with PMA/ionomycin stimulation. The data is comparable to an early study
where healthy donor PBMCs were stimulated with PMA/ionomycin for 24 hours. The
proportion of CD3+ cells producing TNF-α was found to be less than 5% (Mascher,
Schlenke, & Seyfarth 1999).
157
3.4.4.1 Biology of IL-2
IL-2, a 15kD cytokine, is historically known as T cell growth factor. It is a cytokine
that is produced primarily by newly activated CD4+ T cells, although CD8+ T cells, B
cells, NK cells, NKT cells, and dendritic cells activated by microbial stimuli have also
been reported to produce IL-2 in low levels (Gaffen 2001;Letourneau et al. 2009).
Three distinct receptor chains have been identified as components of the IL-2
receptor (IL-2R): the common γ chain (γc) or CD132, which is shared by the
common γ chain cytokine family, comprising IL-2, IL-4, IL-7, IL-9, IL-15, and IL-21;
the β chain or CD122, which is shared by both IL-2R and the IL-15 receptor; and the
α chain or CD25 (Kovanen & Leonard 2004;Letourneau et al. 2009).
Two functional IL-2 receptor forms have been described: the dimeric low-affinity
receptor, which is composed solely of CD122 and γc, and the trimeric high-affinity
receptor, which is composed of CD25, CD122, and γc. The low-affinity receptor is
found at low levels on naive CD4+ T cells, at intermediate levels on naive CD8+ T
cells and memory CD4+ T cells, and at high levels on memory CD8+ T cells and NK
cells. In contrast, the high-affinity receptor is essentially expressed on
CD4+CD25+Foxp3+ Treg cells and activated T cells (Letourneau et al. 2009).
Early in an immune response, IL-2 maintains T cell survival and supports the growth
and expansion of T cells. If the response is enduring, as in the case of self-antigens,
the prolonged IL-2 exposure makes T cells sensitive to Fas-mediated apoptosis and
terminates the response (Abbas 2003). IL-2 has initially been reported to inhibit the
differentiation of Th17 cells (Laurence et al. 2007). However, this effect is abolished
in the presence of IL-1β (Kryczek et al. 2007) and under these conditions, IL-2 has
instead a positive effect on IL-17 production by human CD4+ T cells (Manel,
Unutmaz, & Littman 2008).
Recent studies demonstrated that IL-2, along with B7 co-stimulators, promoted the
development of Treg cells. Thus, along with the effect on apoptosis of activated T
cells, termination of immune responses and maintenance of self tolerance can be
achieved (Abbas 2003;Amberger et al. 2007). IL-2 is indispensable for the induction
of Tregs as IL-2 signalling is required for thymic development, peripheral expansion

158
and suppressive activity of Treg cells (Shevach et al. 2006). In line with previous
studies, treatment of cancer patients with exogenous IL-2 has been correlated with an
increase in the frequency of Foxp3+ Tregs. These cells generated by IL-2 therapy
expressed similar levels of Foxp3 and had similar potency for suppression compared
to Treg cells present in healthy controls (Ahmadzadeh & Rosenberg 2006;Zhang et
al. 2005). Although regulatory CD4+CD25high cells express high levels of IL-2
receptors, the suppressive ability of these cells is inhibited with the addition of
exogenous IL-2 to co-cultures of CD4+CD25high cells and CD4+CD25- responder cells
in vitro. It has thus been suggested that suppression by Treg cells at the initiation of
significant inflammatory responses in vivo would be kept in check by the secretion of
IL-2 by Ag-responsive T cells (Baecher-Allan et al. 2001).
3.4.4.2 IL-2 and Behcet’s disease
Early studies revealed that serum level of IL-2 in BD patients is comparable to
healthy controls (Kosar et al. 1999;Sayinalp et al. 1996). However, a more recent
study showed that the fraction of CD3+ and CD4+ T cells producing IL 2 was
substantially lower in untreated BD patients compared to healthy controls. On the
other hand, there was no difference for the CD8+ subsets between patients with BD
and healthy individuals (Amberger et al. 2007).
3.4.4.3 The immunomodulatory effect of IFN-α on IL-2
From our data, there was an upregulated expression of IL-2 by CD3+ T cells noted in
BD patients who received IFN-α2b therapy. This augmentation effect was observed
even after cessation of IFN-α2b therapy. This result is supported by previous
findings that IFN-α2a therapy enhanced CD3+ T cells producing IL-2 in BD patients,
which may be explained by the promotion of Th1 differentiation (Amberger et al.
2007). Increased IL-2 levels in myeloma patients treated with IFN-α2a have been
demonstrated as well (Sonmez et al. 2004). It is possible that the upregulation of IL-
2 may impede autoimmune inflammatory responses through induction of Treg cells.
By this means, patients may regain self-tolerance and clinical remission is seen.

159
3.4.5.1 Biology of IL-4
IL-4, a 20kD glycoprotein, is a pleiotropic common gamma chain cytokine best
known for its ability to direct antigen-activated T cells to differentiate into Th2 and
Tc2 effectors and its action on activated B cells to undergo IgE isotype switch
(Annunziato & Romagnani 2009). Apart from T cells, numerous sources of IL-4 have
been identified, including γδ T cells, eosinophils, basophils, NKT cells and mast cells
(Min 2010). Stat5 activation induced by IL-2 is crucial for Th2 cell differentiation in
vitro (Paul & Zhu 2010). IL-4 exerts its biological effects by binding to the IL-4
receptor α-chain, a component of both the type 1 and type 2 IL-4 receptors (IL-4R).
In the type 2 IL-4R, IL-4Rα is paired with IL-13Rα1 rather than the common γ chain,
which also binds IL-13 (Nelms et al. 1999). These receptors are widely expressed
throughout the body. IL-4 modulates T cell activation, mast cell proliferation, and
haematopoiesis. It is an important growth factor for T and B cells and increases the
survival of cultured human lymphocytes. Overproduction of IL-4 has been
associated with elevated IgE production and allergic diseases in vivo (Schulze-
Koops & Kalden 2001).
Of importance in regulating immune responses is the ability of IL-4 to downregulate
the activation and the inflammatory functions of monocytes and macrophages. IL-4
enhances the expression of MHC class II molecules and of several cytokine
inhibitors such as IL-1 receptor antagonist (IL-1Ra), soluble IL-1 receptor type II and
TNF receptors while inhibiting the secretion of pro-inflammatory cytokines, including
IL-1β, TNF-α, IL-6, IL-8 and IL-12 (Schulze-Koops & Kalden 2001). The ability of
Th2 effectors to control Th1-mediated inflammatory responses has been attributed
largely to these anti-inflammatory effects of IL-4. Consequently, IL-4 has been used
in vivo as a successful treatment for a number of experimental autoimmune diseases
that are caused by activated Th1 cells in animals, such as experimental allergic
encephalomyelitis. Moreover, IL-4 downregulates metalloproteinase production in
vitro and stimulates tissue inhibitor of metalloproteinases 1 (TIMP1) production,
suggesting a protective effect of IL-4 towards extracellular matrix degradation
(Schulze-Koops & Kalden 2001). In mice, IL-4 has also been shown to
downregulate Th17 differentiation (Harrington et al. 2005;Park et al. 2005).
160
More recently, IL-4 was demonstrated to induce the development of CD4+CD25+ T
cells with regulatory capacity from peripheral naive CD4+CD25- precursor cells. The
IL-4-induced generation of peripheral Tregs was independent of the presence of
TGF-β or IL-10, but was dependent on Ag-specific stimulation and B7 costimulation.
Also, endogenous IL-2 was demonstrated to have a role as a growth factor for
CD25+ Treg cells. IL-4-induced CD25+ Tregs phenotypically and functionally
resembled naturally occurring CD25+ Treg cells. IL-13, the other IL-4R α-chain-
binding cytokine, was identified to have similar effects on the induction of CD25+
Treg cells (Skapenko et al. 2005). Interestingly, it has been shown in a recent
murine study that Treg cells with attenuated Foxp3 expression preferentially convert
into IL-4-producing Th2 effector cells even in a Th1-polarising environment (Wan &
Flavell 2007).
3.4.5.2 IL-4 and Behcet’s disease
Like in healthy control subjects, it has been described that the amount of IL-4-
producing cells is low in patients with BD. Previous studies showed that there was
no significant difference in the frequency of IL-4-producing CD3+, CD4+ and CD8+
cells in patients with active BD, BD patients in complete remission, and healthy
control subjects (Frassanito et al. 1999;Sugi-Ikai et al. 1998). These findings
suggested that resolution of active BD did not involve a Th2 immune response.
3.4.5.3 The immunomodulatory effect of IFN-α on IL-4
Analysing our data, IL-4 upregulation was detected in T cells as early as 3 months
after initiation of IFN-α therapy in BD patients and this trend was evident at 6 month
assessments as well. At 12 months, this increase in CD3+ T cells expressing IL-4
was still maintained despite cessation of IFN-α therapy in the treatment group. In
accordance to our observation, it was demonstrated that at the protein level, IFN-α
increased IL-4 synthesis dose-dependently in PBMCs from healthy donors,
especially after stimulation with Concanavalin A or anti-CD28/PMA (Kaser, Molnar, &
Tilg 1998). Also, in the presence of IFN-α, CD4+ T cells stimulated with PMA and
161
anti-CD28 Ab were shown to increase in IL-4 mRNA accumulation after 24 hours of
culture (Schandene et al. 1996).
As IL-2 has been shown to be necessary for T cells to acquire IL-4 producing
capacity (Paul & Zhu 2010), the enhanced amounts of IL-2 expression detected in
our experiments could contribute to IL-4 augmentation. This is further supported by
the finding in a murine study which have shown that CD25 (IL-2Rα) expression is
higher in developing Th2 cells than in developing Th1 cells, possibly due to the
action of transcription factor c-Maf. Hyperresponsiveness of IL-2 may be conferred
as a result of such higher expression of CD25 (Hwang, White, & Ho 2002).
Nevertheless, the production of IL-4 has not always been reported to be augmented
by IFN-α. In a study on freshly isolated, purified human CD4+ and CD8+ T cells
stimulated for 24 hours via TCR/CD3 complex, it was demonstrated that IFN-α did
not increase the frequency of IL-4-producing cells and it antagonised the
suppressive effect of IL-4 on IFN-γ production (Brinkmann et al. 1993). The
molecular basis for these variable effects of IFN-α on IL-4 production remains to be
specified.
In our experiments on BD patients, the mean proportions of CD3+ T cells producing
IL-4 were up to 2% after cells were stimulated with PMA/ionomycin overnight. These
levels are similar to a study on healthy subjects where the mean percentages of
CD3+ T cells and subpopulations of CD4+ T cells producing IL-4 after 6 hours of
stimulation with PMA/ionomycin were shown to be 2.1% and 5.1% respectively
(Baran et al. 2001). In another study, the proportions of IL-4 producing CD4+ T cells
from patients with BD and normal subjects were shown to be around 5% after
PBMCs were cultured with Concanavalin A (ConA) followed by PMA/ionomycin
(Koarada et al. 2004).
3.4.6 The potential influence of systemic steroids and immunosuppressants
The findings from experiments were not always consistent with previous studies, and
this could be explained in part because patient blood samples were collected in

162
different disease phases and in part due to ongoing immunosuppressive therapies.
Unfortunately, the influence of subcutaneous IFN-α therapy could not be tested in
the absence of some degree of immunosuppression in our patients. As a result, the
variability observed in phenotype and cytokine profile could partly be explained by
individual treatment history of each patient.
Glucocorticoids (GCs), such as prednisolone, are among the most potent
immunosuppressive and anti-inflammatory drugs available and widely used as
therapeutics for inflammatory and autoimmune disorders. GCs were shown to
suppress the production by APCs of IL-12, the main inducer of Th1 responses.
Since IL-12 is extremely potent in enhancing IFN-γ and inhibiting IL-4 synthesis by T
cells, the effect on IL-12 was found to be associated with decreased IFN-γ but
increased production of IL-4 by T cells. GCs were also reported to have a direct
effect on Th2 cells by upregulating their IL-4 and IL-13 production (Elenkov 2004). In
a recent study on MS patients, TNF-α production by peripheral blood cells was
observed to be suppressed following a short course of IV methylprednisolone. The
inhibitory effect of dexamethasone on LPS-stimulated TNF-α production by
peripheral blood cells in vitro was demonstrated as well (van Winsen et al. 2010).
With regards to IL-2, GCs were shown to block its signaling via the Jak-Stat pathway
(Bianchi, Meng, & Ivashkiv 2000).
Cyclosporine A was found to significantly block IFN-γ production by polyclonally
stimulated PBMCs as well as CD4+ and CD8+ T cells from both BD patients and
normal controls. The ex vivo production of IFN-γ by PBMCs was also significantly
inhibited in BD patients with active uveitis after 1 and 3 months of cyclosporine A
treatment in ELISA experiments (Chi et al. 2010). With regards to TNF-α,
cyclosporine A was shown to inhibit its production in 24 hour co-cultures of activated
peripheral blood lymphocytes and THP-1 cells from a monocytic leukaemia cell line
(Gonzalez-Alvaro et al. 2009). In terms of IL-2 protein secretion, it was
demonstrated to be significantly inhibited in anti-CD3/CD28 stimulated whole blood
cultures in vitro when cyclosporine A was added (Hartel et al. 2003).
It was shown that methotrexate inhibited anti-CD3/CD28 stimulated IFN-γ, TNF-α
and IL-4 cytokine production by whole blood, PBMCs and T cells from healthy

163
donors in vitro, and oral intake of 10 mg methotrexate by rheumatoid arthritis
patients led to marked inhibition of cytokine production in blood drawn after 2 hours
(Gerards et al. 2003). In the presence of mycophenolic acid throughout the culture
period, the production of IL-2 by polyclonally activated peripheral blood lymphocytes
was elevated after 24 hours and the mechanism was indicated to be a decrease in
IL-2 consumption due to blocking of the T cell proliferation. In the same system,
however, the production of IFN-γ was suppressed (Izeradjene et al. 2001). Also, it
was shown that mycophenolic acid did not have any influence on the production of
TNF-α (Gonzalez-Alvaro et al. 2009).
Due to these findings on the influence of immunosuppressants, it was considered to
divide the patients into smaller subgroups to examine our results further according to
patients’ individual treatment in order to minimise biases. However, this approach
would have required a much larger sample size before meaningful results could be
achieved.
3.5 Summary of findings
We did not detect any dissimilarity in terms of the number of CD4+, CD8+ and αβ T
cells before and after the initiation of IFN-α2b therapy. Six months of subcutaneous
pegylated IFN-α2b therapy showed the tendency to enhance T cell production of
IFN-γ but not TNF-α on a regular basis in BD patients. Under the influence of IFN-
α2b therapy, upregulation of IL-2 and IL-4 expression by CD3+ T cells was also
consistently observed. All the positive effects of IFN-α described here were clearly
enduring as they were evident even after the termination of IFN-α2b treatment. One
must be aware that although Th1 and Th2 cells are the major sources of their
respective cytokines such as IFN-γ and IL-4, many others cells within and outside
the immune system also produce these. However, it wasn’t in the scope of this
study to explore this further.
164
Chapter 4
The effects of subcutaneous interferon-alpha 2b on Th17 and regulatory T
cells and their cytokines in patients with Behcet’s disease ex vivo
4.1 Introduction
Th17 cells are currently defined as CD4+ cells that produce IL-17A and F, but not
IFN-γ or IL-4 (Crome, Wang, & Levings 2010). IL-17 has been known to promote the
production of various pro-inflammatory cytokines such as TNF-α, IL-1β, and IL-6 as
well as enhancing proliferation, maturation and recruitment of neutrophils. Based on
evidence that Th17 cells can mediate inflammation and tissue destruction, there has
been intense interest in defining their origins, functions and developing strategies to
block their pathological effects (Kolls & Linden 2004;Witowski, Ksiazek, & Jorres
2004).
In BD patients, apart from the previously known pathogenic cytokines, increased
serum IL-17 levels have been demonstrated as compared to that of healthy controls
(Hamzaoui et al. 2002). It was also reported that IL-17 serum levels in active BD
patients were enhanced to a higher degree than that of patients in remission, and a
possible role of IL-17 in the pathogenesis of BD was thus suggested. A recent study
investigated the role of IL-23 and IL-17 in BD and identified increased expression of
IL-23 and IL-17 in patients with active uveitis compared to normal controls and
patients in remission (Chi et al. 2008). It was shown that IL-17 was predominantly
produced by CD45RO+ memory T cells and the percentage of CD4+ T cells
producing IL-17 was significantly higher than CD8+ T cells producing IL-17. In
addition, it has been revealed that IL-17A has an important role in acute attacks of
not only eye disease but also oral ulcers, genital ulcers, and articular manifestations
in BD patients (Ekinci et al. 2010). Moreover, it has been reported that IL-17 gene
single nucleotide polymorphisms (SNPs) may influence the susceptibility of BD (Jang
et al. 2008).
Treg subsets and their associated cytokines, including IL-10 and TGF-β, play a
crucial role in maintaining self-tolerance and in preventing immune pathologies by
165
regulating the strength and/or nature of the immune response to non-self antigens
(Sakaguchi 2004;Shevach 2000). It was reported recently that although the
percentages of CD4+CD25high Treg cells among CD4+ T cells in BD patients with
inactive disease were normal, the levels decreased significantly before ocular
attacks (Nanke et al. 2008). This is in contrast to an earlier report that the frequency
of Tregs increased significantly in a transient fashion during inflammatory
manifestations and recovered to normal values during the remission phase
(Hamzaoui, Hamzaoui, & Houman 2006).
In addition, in vitro experiments have demonstrated that the suppressive capacity of
CD4+CD25high Treg cells in BD patients with active disease may be reduced,
comparing with Treg cells from healthy controls. Also, it is possible that the most
potent CD4+CD25high T cells are not found in the peripheral blood but exert their
suppressive activity in the target organs (Shevach 2004). In CSF, CD25high and
Foxp3-expressing CD4 cells have been demonstrated to be significantly increased in
BD patients when compared with non-inflammatory neurological control patients
(Hamzaoui, Houman, & Hamzaoui 2007).
Surprisingly, the serum levels of IL-10 were found to be significantly higher in BD
patients compared to healthy controls and it may elevate even further during active
disease (Hamzaoui et al. 2002). Regarding the serum levels of TGF-β in BD
patients, they were demonstrated to be comparable to those in both rheumatoid
arthritis and osteoarthritis patients (Ertenli et al. 2001). Unfortunately, the serum
TGF-β levels were not compared to the ones in healthy individuals in the study.
4.2 Aims
Having observed the positive influence of IFN-α on Th1 and Th2 cytokines, the aim
of this chapter is to investigate the effect of a 6-month course of subcutaneous IFN-
α2b therapy on modulating the non-conventional T cell subsets associated with
immune-mediated disorders. In particular, changes to the proportions of peripheral
blood Th17 and Foxp3+ Treg subsets and their cytokine profile before, during and
after cessation of therapy are examined.
166
Another aim is to study the effect of pegylated IFN-α2b therapy on the relative
amount of CD3+CD56+ NK T cells in whole blood samples of BD patients by
phenotyping, as these cells have been shown to have the capacity to secrete IL-17
or exhibit regulatory function.
4.3 Results
The experiments presented here were performed in conjunction with Mr A
Nouraeinejad and Ms G Galatowicz. Approximately 70% of the samples used for
data analysis in this section were processed by me, and all data analysis is my own
work.
4.3.1 IFN-α2b therapy suppresses IL-17 expression by CD4+ T cells in BD
patients
To investigate the effects of IFN-α on Th17 cell population, serial whole blood
samples from BD patients on conventional immunosuppressive therapy with or
without IFN-α2b treatment were studied using intracellular cytokine staining method
and flow cytometry. Cell cultures were either untreated or treated with anti-
CD3/CD28 Abs or PMA/ionomycin for 24 hours before staining. Cytokine expression
was analysed by gating on either CD4+ lymphocyte populations.
Although, no significant change was detected in the proportions of Th17 cells in the
untreated cultures and cultures with CD3/CD28 stimulation (data not shown), a
significant downregulation of Th17 cells was found in the IFN-α2b-treated group over
the 12 month observation period in cultures stimulated with PMA/ionomycin (Fig
4.1a). As early as 3 months after initiation of IFN-α therapy, the percentage of IL-17+
expression by CD4+ T cells in our patients was observed to be reduced (median
0.8% and IQR 0.3-1.9%; p<0.05) compared to the initial values from baseline visits
(median 2.0% and IQR 1.7-2.7%). Although no further decrease was seen at follow-
ups afterwards, the levels of Th17 cells remained low at 6 months (median 0.8% and
167
IQR 0.7-1.2%; p<0.05) with IFN-α therapy and even after the end of treamtent period
(median 1.0% and IQR 0.7-1.8%; p<0.05). The suppressive effect of IFN-α
treatment on Th17 was not detected in the individuals on conventional treatment
alone.
As CD4+ T cells producing both IL-17 and IFN-γ has been reported (Annunziato et al.
2007), this cell population was included in our data analysis as well. Unlike patients
treated with IFN-α, there was a significant decrease in the levels of CD4+ T cells
expressing both IL-17 and IFN-γ comparing 12 month values (median 0.1% and IQR
0.0-0.2%; p<0.05) with the ones from initial visits (median 0.4% and IQR 0.4-0.8%) in
individuals on conventional treatment alone (Fig 4.1b). This was only demonstrated
in data with PMA/ionomycin. Thus, this is unlikely to be a consistent trend as it was
not observed in other culture conditions or at other time points.
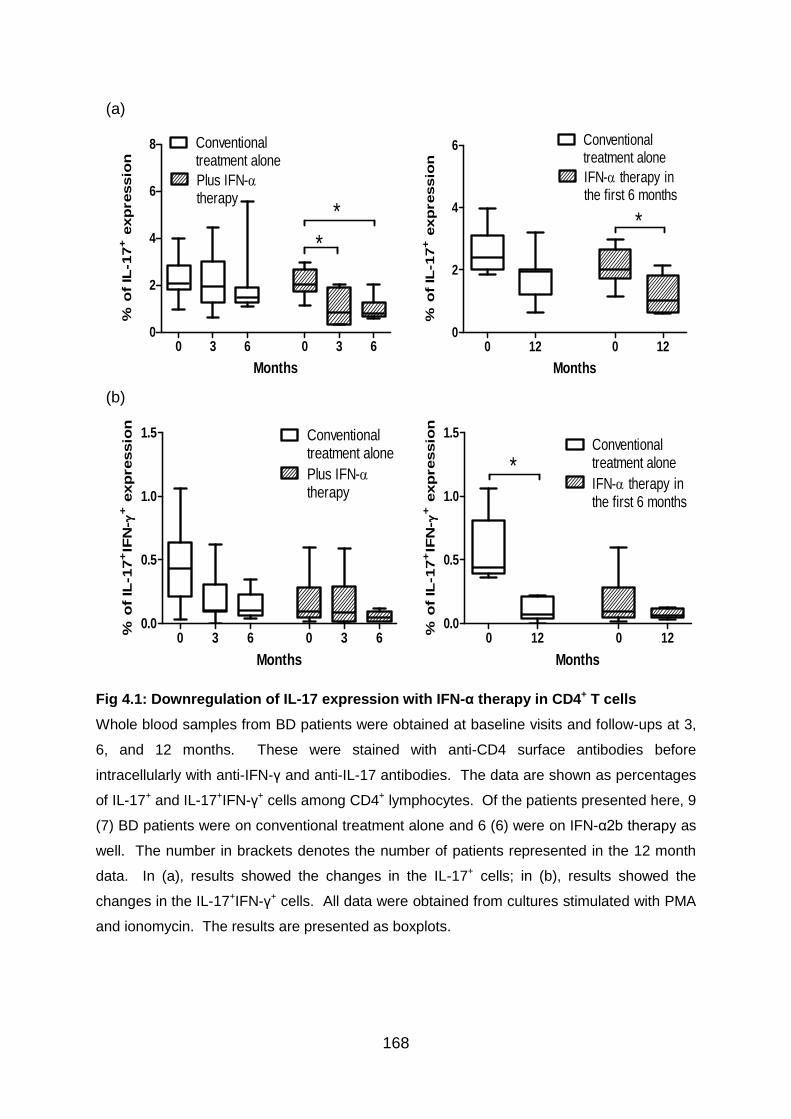
168
Fig 4.1: Downregulation of IL-17 expression with IFN-α therapy in CD4+ T cells
Whole blood samples from BD patients were obtained at baseline visits and follow-ups at 3,
6, and 12 months. These were stained with anti-CD4 surface antibodies before
intracellularly with anti-IFN-γ and anti-IL-17 antibodies. The data are shown as percentages
of IL-17+ and IL-17+IFN-γ+ cells among CD4+ lymphocytes. Of the patients presented here, 9
(7) BD patients were on conventional treatment alone and 6 (6) were on IFN-α2b therapy as
well. The number in brackets denotes the number of patients represented in the 12 month
data. In (a), results showed the changes in the IL-17+ cells; in (b), results showed the
changes in the IL-17+IFN-γ+ cells. All data were obtained from cultures stimulated with PMA
and ionomycin. The results are presented as boxplots.
(a)
0 3 6 0 3 60
2
4
6
8 Conventionaltreatment alone
Plus IFN-therapy
*
*
(n=9) Months (n=6)
% o
f IL
-17
+ e
xp
ressio
n
0 12 0 120
2
4
6 Conventionaltreatment alone
IFN- therapy inthe first 6 months
*
(n=7) Months (n=6)
% o
f IL
-17
+ e
xp
ressio
n
(b)
0 3 6 0 3 60.0
0.5
1.0
1.5 Conventionaltreatment alone
Plus IFN-therapy
(n=9) Months (n=6)
% o
f IL
-17
+IF
N-
+ e
xp
ressio
n
0 12 0 120.0
0.5
1.0
1.5Conventionaltreatment alone
IFN- therapy inthe first 6 months
*
(n=7) Months (n=6)
% o
f IL
-17
+IF
N-
+ e
xp
ressio
n
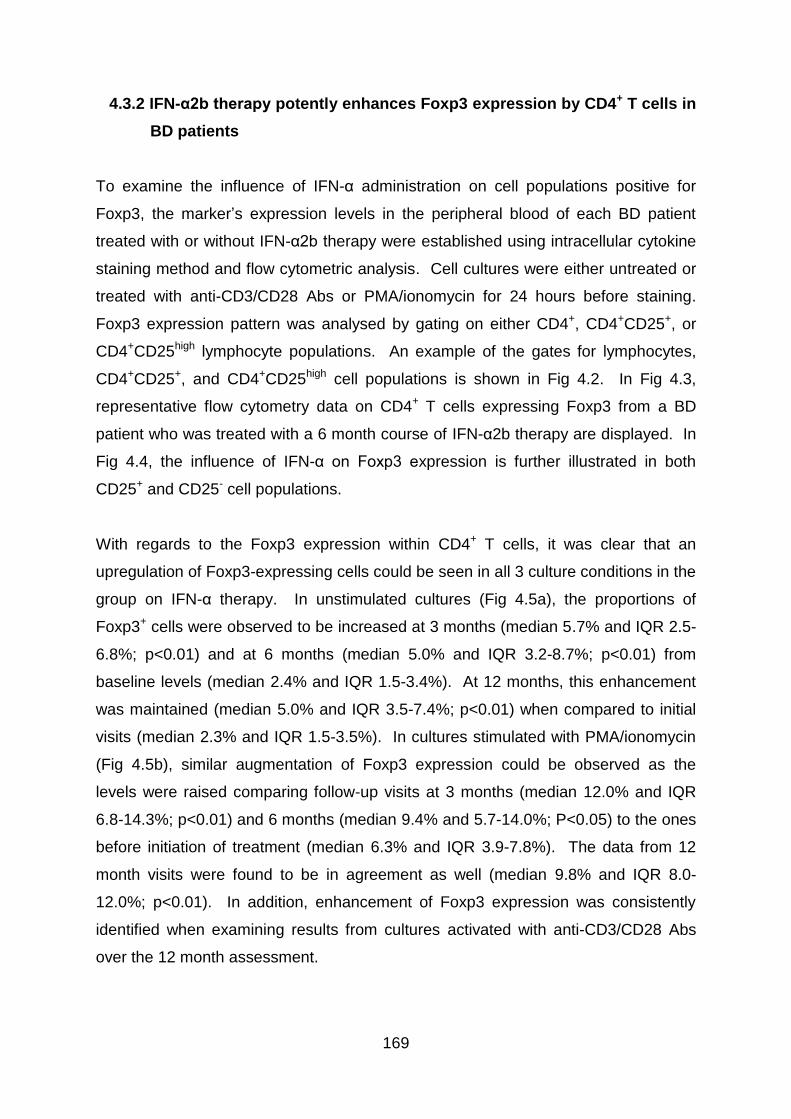
169
4.3.2 IFN-α2b therapy potently enhances Foxp3 expression by CD4+ T cells in
BD patients
To examine the influence of IFN-α administration on cell populations positive for
Foxp3, the marker’s expression levels in the peripheral blood of each BD patient
treated with or without IFN-α2b therapy were established using intracellular cytokine
staining method and flow cytometric analysis. Cell cultures were either untreated or
treated with anti-CD3/CD28 Abs or PMA/ionomycin for 24 hours before staining.
Foxp3 expression pattern was analysed by gating on either CD4+, CD4+CD25+, or
CD4+CD25high lymphocyte populations. An example of the gates for lymphocytes,
CD4+CD25+, and CD4+CD25high cell populations is shown in Fig 4.2. In Fig 4.3,
representative flow cytometry data on CD4+ T cells expressing Foxp3 from a BD
patient who was treated with a 6 month course of IFN-α2b therapy are displayed. In
Fig 4.4, the influence of IFN-α on Foxp3 expression is further illustrated in both
CD25+ and CD25- cell populations.
With regards to the Foxp3 expression within CD4+ T cells, it was clear that an
upregulation of Foxp3-expressing cells could be seen in all 3 culture conditions in the
group on IFN-α therapy. In unstimulated cultures (Fig 4.5a), the proportions of
Foxp3+ cells were observed to be increased at 3 months (median 5.7% and IQR 2.5-
6.8%; p<0.01) and at 6 months (median 5.0% and IQR 3.2-8.7%; p<0.01) from
baseline levels (median 2.4% and IQR 1.5-3.4%). At 12 months, this enhancement
was maintained (median 5.0% and IQR 3.5-7.4%; p<0.01) when compared to initial
visits (median 2.3% and IQR 1.5-3.5%). In cultures stimulated with PMA/ionomycin
(Fig 4.5b), similar augmentation of Foxp3 expression could be observed as the
levels were raised comparing follow-up visits at 3 months (median 12.0% and IQR
6.8-14.3%; p<0.01) and 6 months (median 9.4% and 5.7-14.0%; P<0.05) to the ones
before initiation of treatment (median 6.3% and IQR 3.9-7.8%). The data from 12
month visits were found to be in agreement as well (median 9.8% and IQR 8.0-
12.0%; p<0.01). In addition, enhancement of Foxp3 expression was consistently
identified when examining results from cultures activated with anti-CD3/CD28 Abs
over the 12 month assessment.
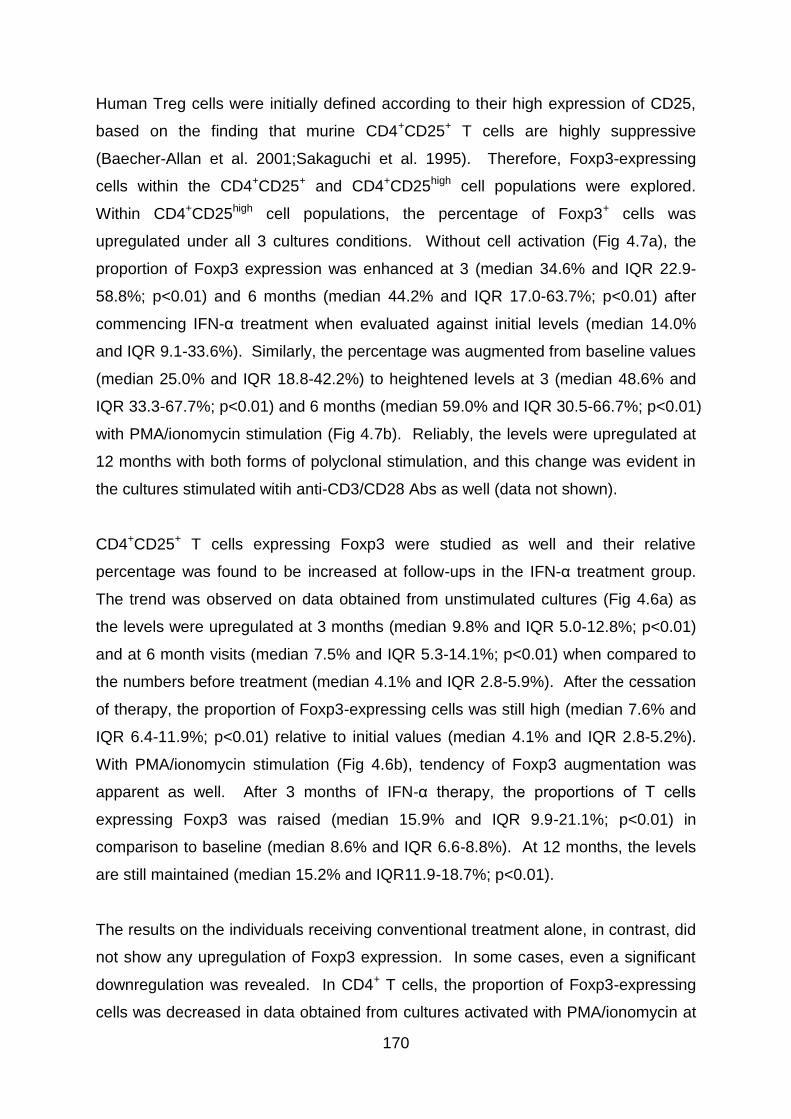
170
Human Treg cells were initially defined according to their high expression of CD25,
based on the finding that murine CD4+CD25+ T cells are highly suppressive
(Baecher-Allan et al. 2001;Sakaguchi et al. 1995). Therefore, Foxp3-expressing
cells within the CD4+CD25+ and CD4+CD25high cell populations were explored.
Within CD4+CD25high cell populations, the percentage of Foxp3+ cells was
upregulated under all 3 cultures conditions. Without cell activation (Fig 4.7a), the
proportion of Foxp3 expression was enhanced at 3 (median 34.6% and IQR 22.9-
58.8%; p<0.01) and 6 months (median 44.2% and IQR 17.0-63.7%; p<0.01) after
commencing IFN-α treatment when evaluated against initial levels (median 14.0%
and IQR 9.1-33.6%). Similarly, the percentage was augmented from baseline values
(median 25.0% and IQR 18.8-42.2%) to heightened levels at 3 (median 48.6% and
IQR 33.3-67.7%; p<0.01) and 6 months (median 59.0% and IQR 30.5-66.7%; p<0.01)
with PMA/ionomycin stimulation (Fig 4.7b). Reliably, the levels were upregulated at
12 months with both forms of polyclonal stimulation, and this change was evident in
the cultures stimulated witih anti-CD3/CD28 Abs as well (data not shown).
CD4+CD25+ T cells expressing Foxp3 were studied as well and their relative
percentage was found to be increased at follow-ups in the IFN-α treatment group.
The trend was observed on data obtained from unstimulated cultures (Fig 4.6a) as
the levels were upregulated at 3 months (median 9.8% and IQR 5.0-12.8%; p<0.01)
and at 6 month visits (median 7.5% and IQR 5.3-14.1%; p<0.01) when compared to
the numbers before treatment (median 4.1% and IQR 2.8-5.9%). After the cessation
of therapy, the proportion of Foxp3-expressing cells was still high (median 7.6% and
IQR 6.4-11.9%; p<0.01) relative to initial values (median 4.1% and IQR 2.8-5.2%).
With PMA/ionomycin stimulation (Fig 4.6b), tendency of Foxp3 augmentation was
apparent as well. After 3 months of IFN-α therapy, the proportions of T cells
expressing Foxp3 was raised (median 15.9% and IQR 9.9-21.1%; p<0.01) in
comparison to baseline (median 8.6% and IQR 6.6-8.8%). At 12 months, the levels
are still maintained (median 15.2% and IQR11.9-18.7%; p<0.01).
The results on the individuals receiving conventional treatment alone, in contrast, did
not show any upregulation of Foxp3 expression. In some cases, even a significant
downregulation was revealed. In CD4+ T cells, the proportion of Foxp3-expressing
cells was decreased in data obtained from cultures activated with PMA/ionomycin at
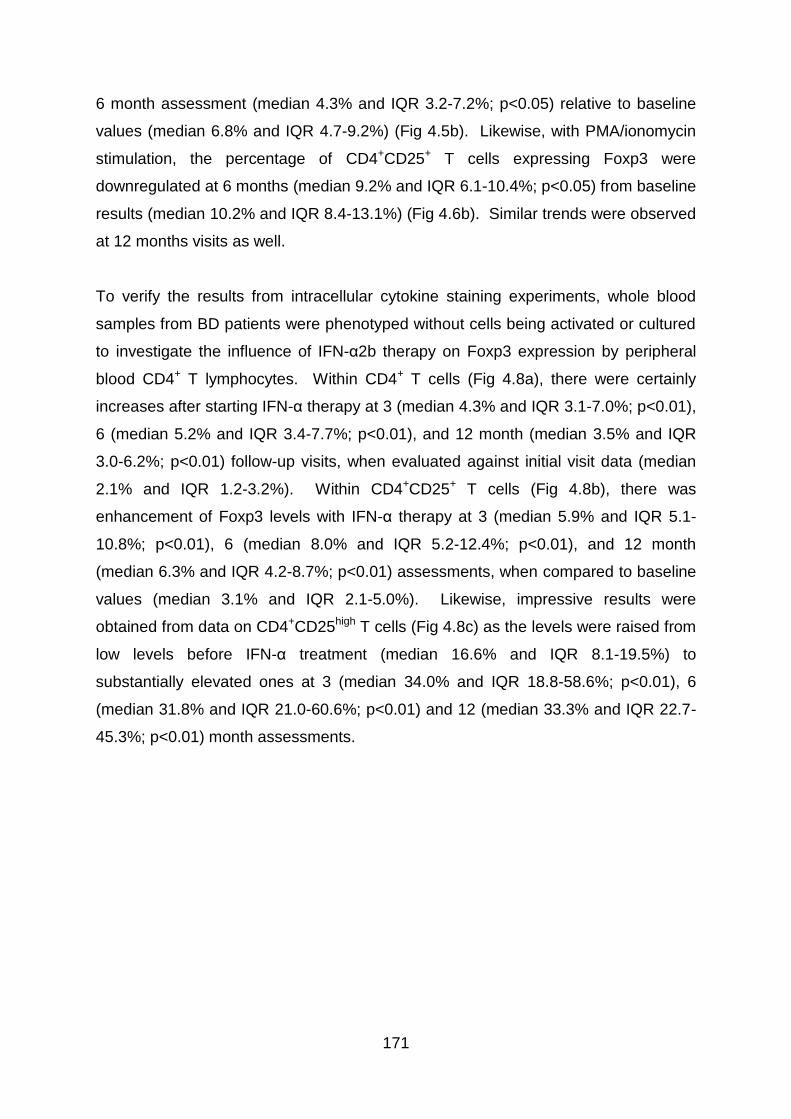
171
6 month assessment (median 4.3% and IQR 3.2-7.2%; p<0.05) relative to baseline
values (median 6.8% and IQR 4.7-9.2%) (Fig 4.5b). Likewise, with PMA/ionomycin
stimulation, the percentage of CD4+CD25+ T cells expressing Foxp3 were
downregulated at 6 months (median 9.2% and IQR 6.1-10.4%; p<0.05) from baseline
results (median 10.2% and IQR 8.4-13.1%) (Fig 4.6b). Similar trends were observed
at 12 months visits as well.
To verify the results from intracellular cytokine staining experiments, whole blood
samples from BD patients were phenotyped without cells being activated or cultured
to investigate the influence of IFN-α2b therapy on Foxp3 expression by peripheral
blood CD4+ T lymphocytes. Within CD4+ T cells (Fig 4.8a), there were certainly
increases after starting IFN-α therapy at 3 (median 4.3% and IQR 3.1-7.0%; p<0.01),
6 (median 5.2% and IQR 3.4-7.7%; p<0.01), and 12 month (median 3.5% and IQR
3.0-6.2%; p<0.01) follow-up visits, when evaluated against initial visit data (median
2.1% and IQR 1.2-3.2%). Within CD4+CD25+ T cells (Fig 4.8b), there was
enhancement of Foxp3 levels with IFN-α therapy at 3 (median 5.9% and IQR 5.1-
10.8%; p<0.01), 6 (median 8.0% and IQR 5.2-12.4%; p<0.01), and 12 month
(median 6.3% and IQR 4.2-8.7%; p<0.01) assessments, when compared to baseline
values (median 3.1% and IQR 2.1-5.0%). Likewise, impressive results were
obtained from data on CD4+CD25high T cells (Fig 4.8c) as the levels were raised from
low levels before IFN-α treatment (median 16.6% and IQR 8.1-19.5%) to
substantially elevated ones at 3 (median 34.0% and IQR 18.8-58.6%; p<0.01), 6
(median 31.8% and IQR 21.0-60.6%; p<0.01) and 12 (median 33.3% and IQR 22.7-
45.3%; p<0.01) month assessments.
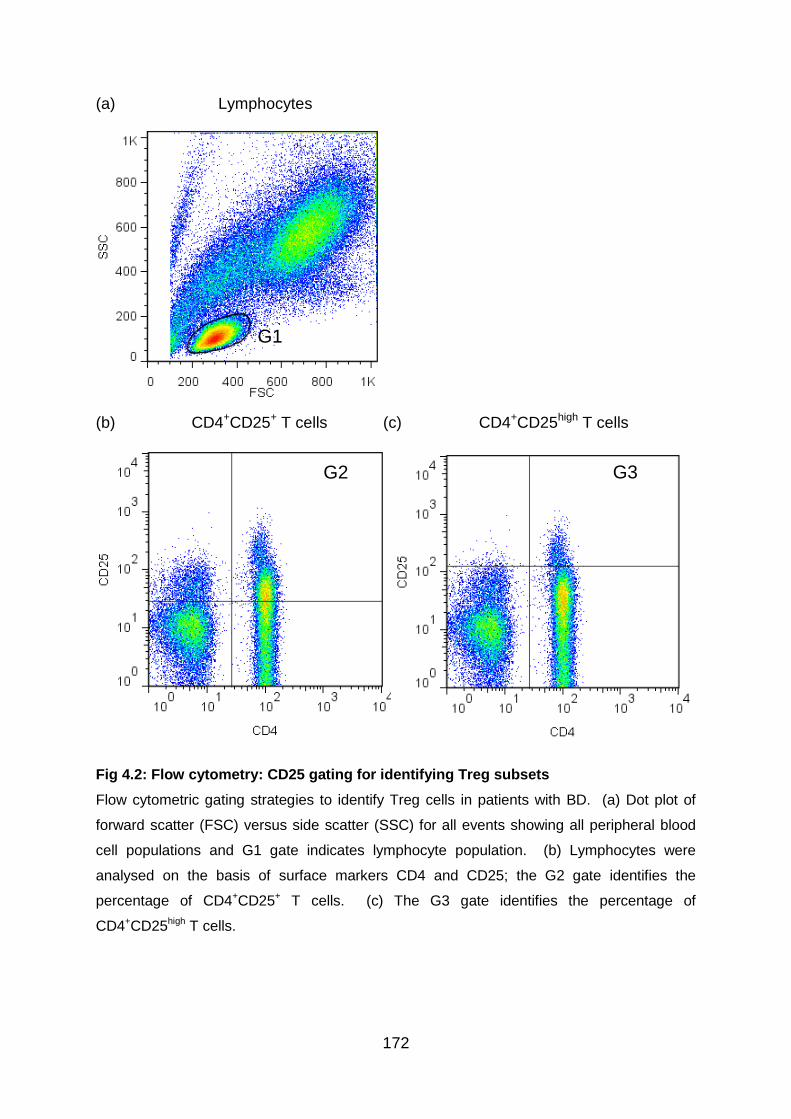
172
(a) Lymphocytes
(b) CD4+CD25+ T cells (c) CD4+CD25high T cells
Fig 4.2: Flow cytometry: CD25 gating for identifying Treg subsets
Flow cytometric gating strategies to identify Treg cells in patients with BD. (a) Dot plot of
forward scatter (FSC) versus side scatter (SSC) for all events showing all peripheral blood
cell populations and G1 gate indicates lymphocyte population. (b) Lymphocytes were
analysed on the basis of surface markers CD4 and CD25; the G2 gate identifies the
percentage of CD4+CD25+ T cells. (c) The G3 gate identifies the percentage of
CD4+CD25high T cells.
G2
G1
G3 G2
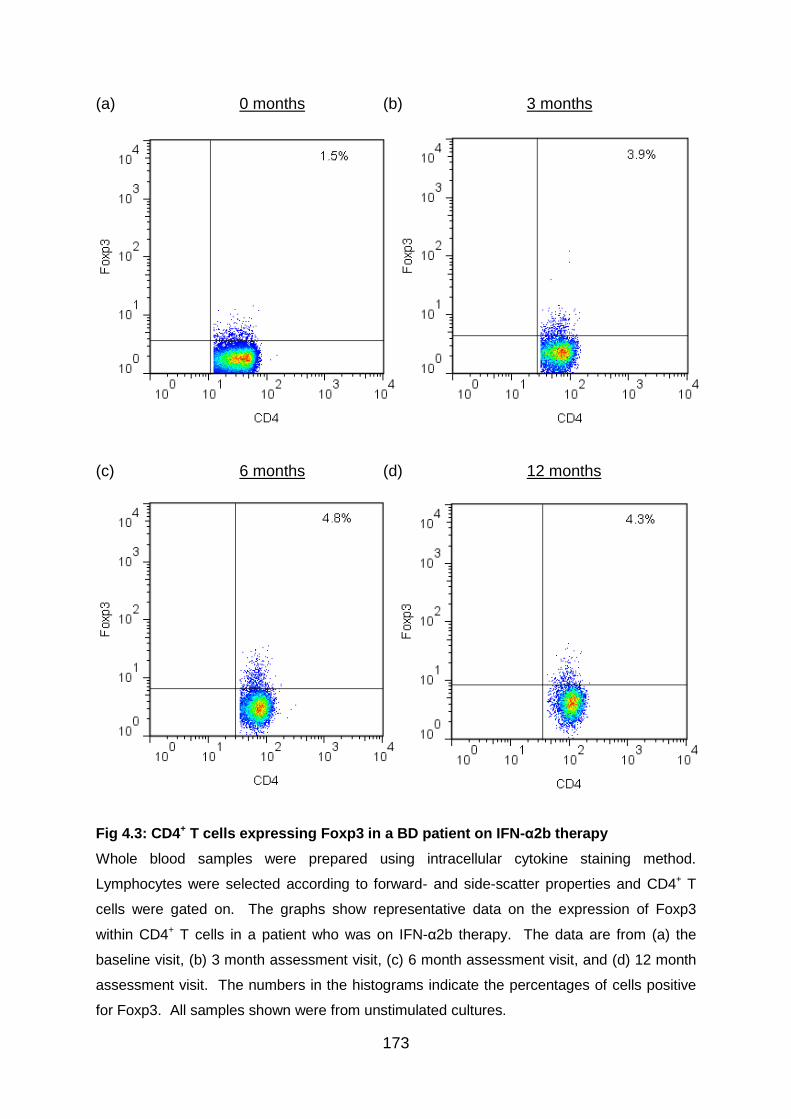
173
(a) 0 months (b) 3 months
(c) 6 months (d) 12 months
Fig 4.3: CD4+ T cells expressing Foxp3 in a BD patient on IFN-α2b therapy
Whole blood samples were prepared using intracellular cytokine staining method.
Lymphocytes were selected according to forward- and side-scatter properties and CD4+ T
cells were gated on. The graphs show representative data on the expression of Foxp3
within CD4+ T cells in a patient who was on IFN-α2b therapy. The data are from (a) the
baseline visit, (b) 3 month assessment visit, (c) 6 month assessment visit, and (d) 12 month
assessment visit. The numbers in the histograms indicate the percentages of cells positive
for Foxp3. All samples shown were from unstimulated cultures.
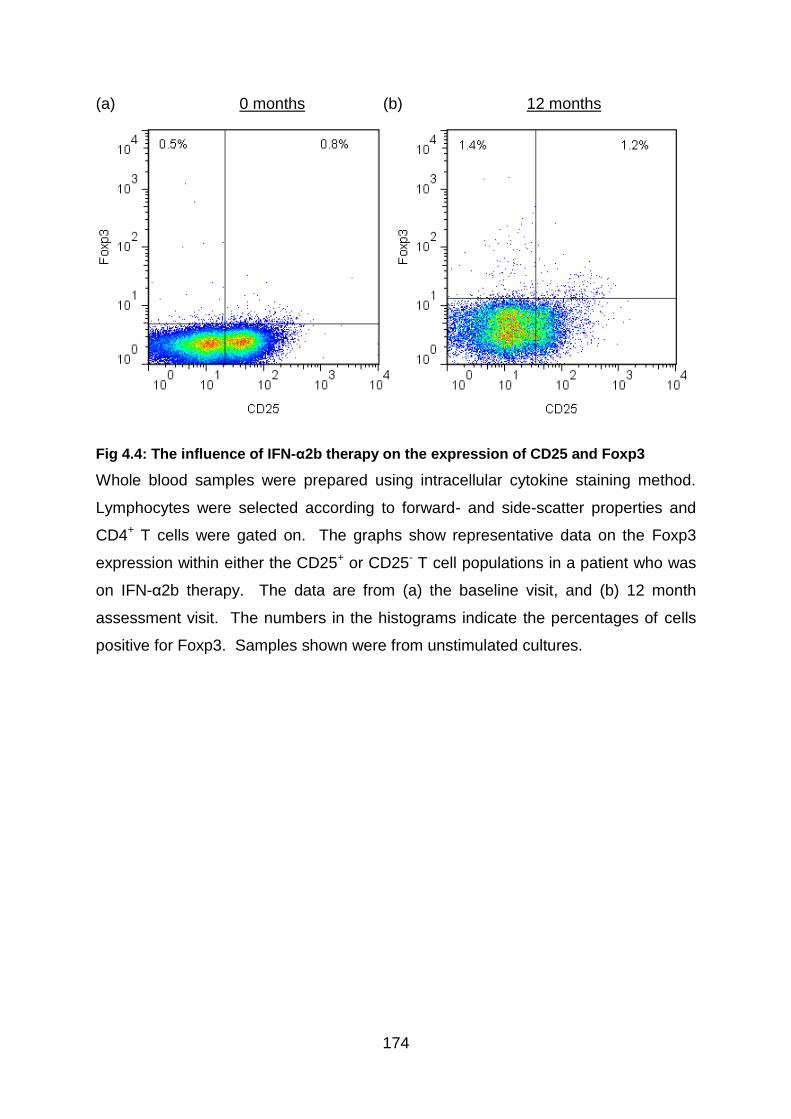
174
(a) 0 months (b) 12 months
Fig 4.4: The influence of IFN-α2b therapy on the expression of CD25 and Foxp3
Whole blood samples were prepared using intracellular cytokine staining method.
Lymphocytes were selected according to forward- and side-scatter properties and
CD4+ T cells were gated on. The graphs show representative data on the Foxp3
expression within either the CD25+ or CD25- T cell populations in a patient who was
on IFN-α2b therapy. The data are from (a) the baseline visit, and (b) 12 month
assessment visit. The numbers in the histograms indicate the percentages of cells
positive for Foxp3. Samples shown were from unstimulated cultures.
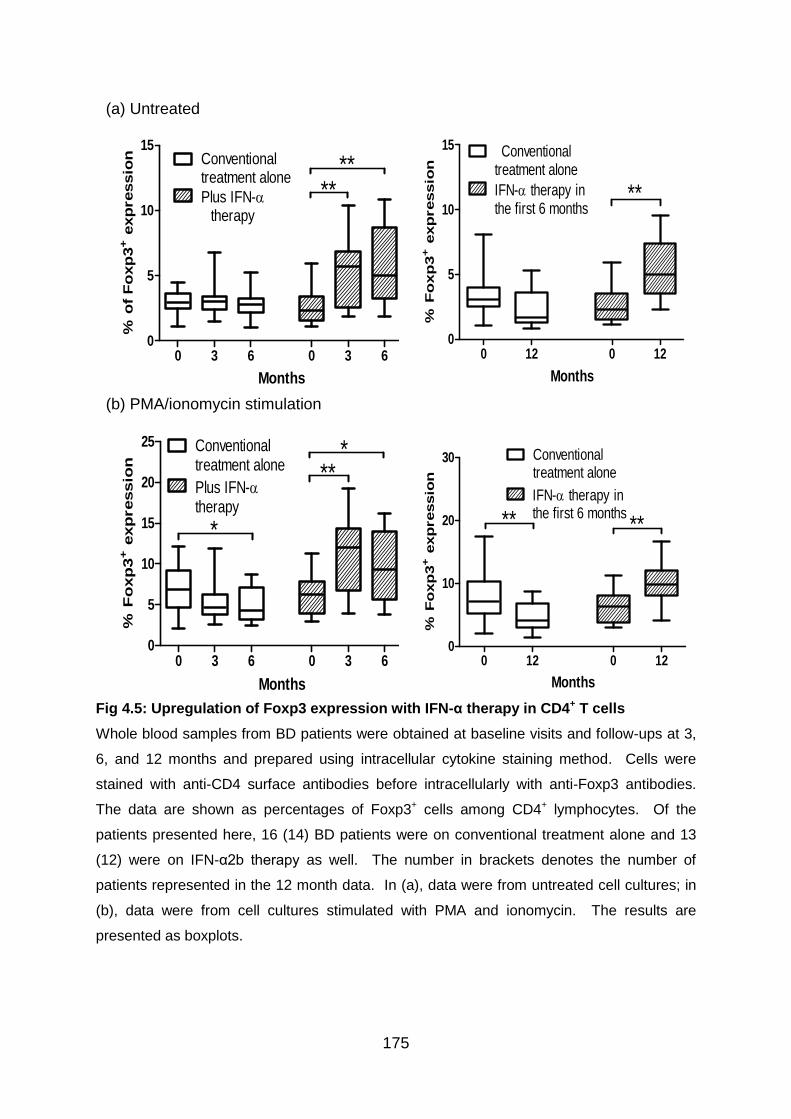
175
Fig 4.5: Upregulation of Foxp3 expression with IFN-α therapy in CD4+ T cells
Whole blood samples from BD patients were obtained at baseline visits and follow-ups at 3,
6, and 12 months and prepared using intracellular cytokine staining method. Cells were
stained with anti-CD4 surface antibodies before intracellularly with anti-Foxp3 antibodies.
The data are shown as percentages of Foxp3+ cells among CD4+ lymphocytes. Of the
patients presented here, 16 (14) BD patients were on conventional treatment alone and 13
(12) were on IFN-α2b therapy as well. The number in brackets denotes the number of
patients represented in the 12 month data. In (a), data were from untreated cell cultures; in
(b), data were from cell cultures stimulated with PMA and ionomycin. The results are
presented as boxplots.
(a) Untreated
0 3 6 0 3 60
5
10
15Conventionaltreatment alone
Plus IFN-therapy
Months
% o
f F
oxp
3+ e
xp
ressio
n
****
0 12 0 120
5
10
15 Conventionaltreatment alone
IFN- therapy inthe first 6 months
**
Months
% F
oxp
3+ e
xp
ressio
n
(b) PMA/ionomycin stimulation
0 3 6 0 3 60
5
10
15
20
25 Conventionaltreatment alone
Plus IFN-therapy
*
***
Months
% F
oxp
3+ e
xp
ressio
n
0 12 0 120
10
20
30 Conventionaltreatment alone
IFN- therapy inthe first 6 months
Months
% F
oxp
3+ e
xp
ressio
n
****
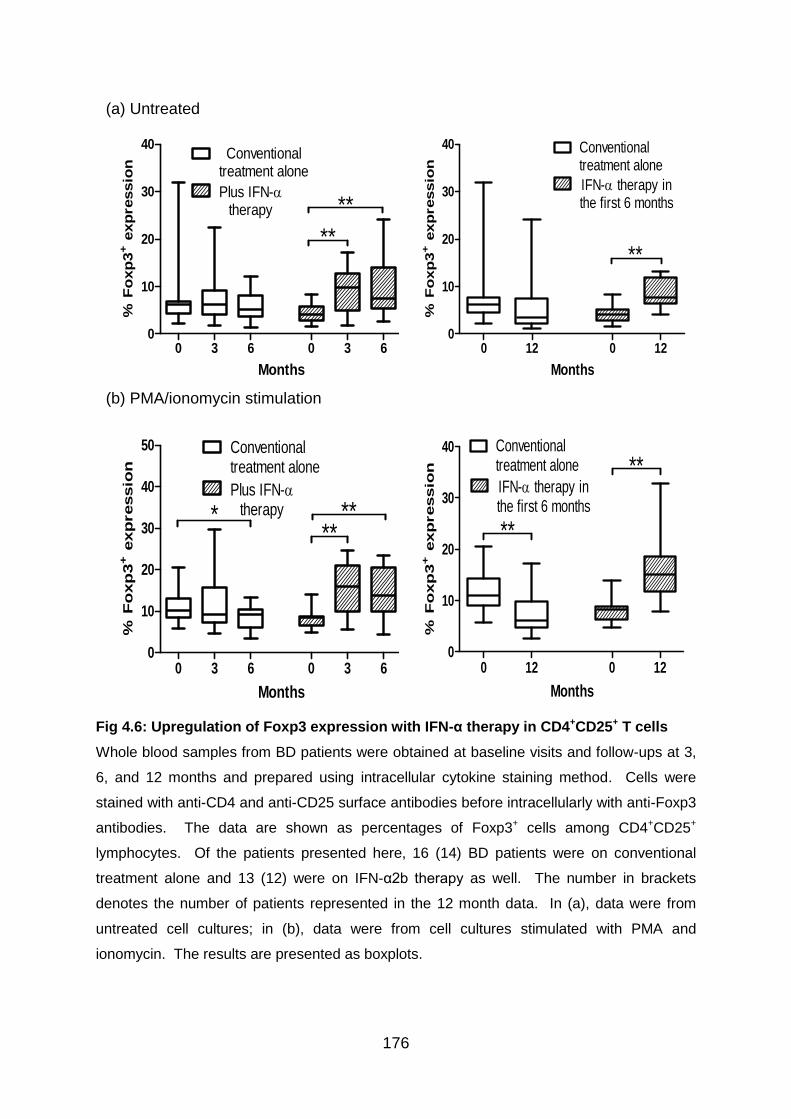
176
Fig 4.6: Upregulation of Foxp3 expression with IFN-α therapy in CD4+CD25+ T cells
Whole blood samples from BD patients were obtained at baseline visits and follow-ups at 3,
6, and 12 months and prepared using intracellular cytokine staining method. Cells were
stained with anti-CD4 and anti-CD25 surface antibodies before intracellularly with anti-Foxp3
antibodies. The data are shown as percentages of Foxp3+ cells among CD4+CD25+
lymphocytes. Of the patients presented here, 16 (14) BD patients were on conventional
treatment alone and 13 (12) were on IFN-α2b therapy as well. The number in brackets
denotes the number of patients represented in the 12 month data. In (a), data were from
untreated cell cultures; in (b), data were from cell cultures stimulated with PMA and
ionomycin. The results are presented as boxplots.
(a) Untreated
0 3 6 0 3 60
10
20
30
40Conventional
treatment alone
Plus IFN-therapy
**
Months
% F
oxp
3+ e
xp
ressio
n
**
0 12 0 120
10
20
30
40
**
Conventionaltreatment alone
IFN- therapy inthe first 6 months
Months
% F
oxp
3+ e
xp
ressio
n
(b) PMA/ionomycin stimulation
0 3 6 0 3 60
10
20
30
40
50 Conventionaltreatment alone
Plus IFN-therapy*
Months
% F
oxp
3+ e
xp
ressio
n
****
0 12 0 120
10
20
30
40 Conventionaltreatment alone
IFN- therapy inthe first 6 months
Months
% F
oxp
3+ e
xp
ressio
n **
**
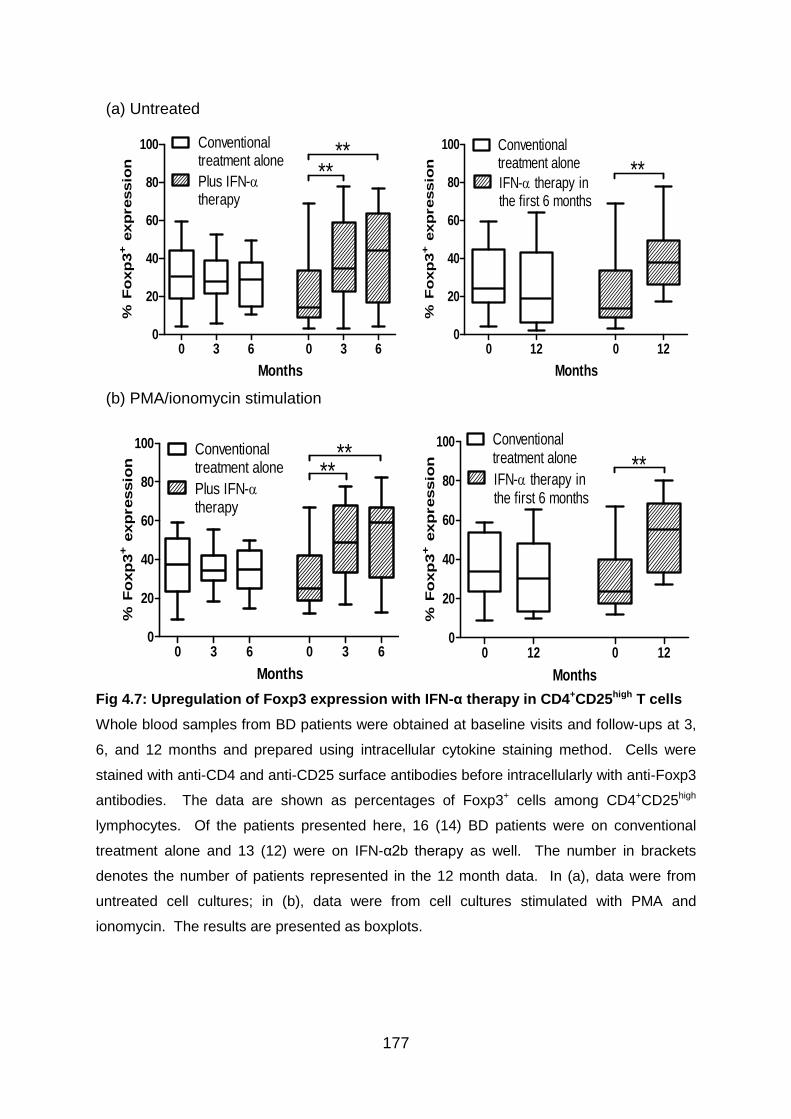
177
Fig 4.7: Upregulation of Foxp3 expression with IFN-α therapy in CD4+CD25high T cells
Whole blood samples from BD patients were obtained at baseline visits and follow-ups at 3,
6, and 12 months and prepared using intracellular cytokine staining method. Cells were
stained with anti-CD4 and anti-CD25 surface antibodies before intracellularly with anti-Foxp3
antibodies. The data are shown as percentages of Foxp3+ cells among CD4+CD25high
lymphocytes. Of the patients presented here, 16 (14) BD patients were on conventional
treatment alone and 13 (12) were on IFN-α2b therapy as well. The number in brackets
denotes the number of patients represented in the 12 month data. In (a), data were from
untreated cell cultures; in (b), data were from cell cultures stimulated with PMA and
ionomycin. The results are presented as boxplots.
(a) Untreated
0 3 6 0 3 60
20
40
60
80
100 Conventionaltreatment alone
Plus IFN-therapy
****
Months
% F
oxp
3+ e
xp
ressio
n
0 12 0 120
20
40
60
80
100 Conventionaltreatment alone
IFN- therapy inthe first 6 months
Months
% F
oxp
3+ e
xp
ressio
n **
(b) PMA/ionomycin stimulation
0 3 6 0 3 60
20
40
60
80
100 Conventionaltreatment alone
Plus IFN-therapy
**
Months
% F
oxp
3+ e
xp
ressio
n
**
0 12 0 120
20
40
60
80
100 Conventionaltreatment alone
IFN- therapy inthe first 6 months
Months
% F
oxp
3+ e
xp
ressio
n **
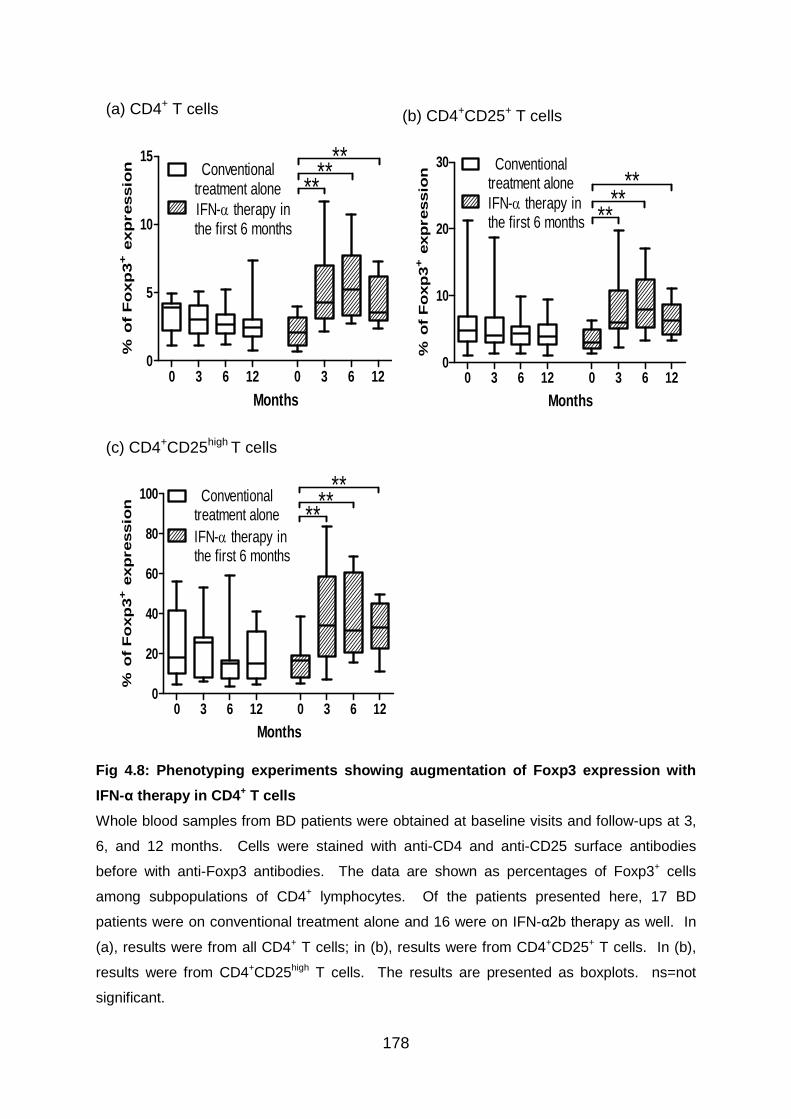
178
Fig 4.8: Phenotyping experiments showing augmentation of Foxp3 expression with
IFN-α therapy in CD4+ T cells
Whole blood samples from BD patients were obtained at baseline visits and follow-ups at 3,
6, and 12 months. Cells were stained with anti-CD4 and anti-CD25 surface antibodies
before with anti-Foxp3 antibodies. The data are shown as percentages of Foxp3+ cells
among subpopulations of CD4+ lymphocytes. Of the patients presented here, 17 BD
patients were on conventional treatment alone and 16 were on IFN-α2b therapy as well. In
(a), results were from all CD4+ T cells; in (b), results were from CD4+CD25+ T cells. In (b),
results were from CD4+CD25high T cells. The results are presented as boxplots. ns=not
significant.
(a) CD4+ T cells
0 3 6 12 0 3 6 120
5
10
15Conventional
treatment alone
IFN- therapy inthe first 6 months
Months
% o
f F
oxp
3+ e
xp
ressio
n
****
**
(b) CD4+CD25+ T cells
0 3 6 12 0 3 6 120
10
20
30 Conventionaltreatment alone
IFN- therapy inthe first 6 months
Months
% o
f F
oxp
3+ e
xp
ressio
n
****
**
(c) CD4+CD25high T cells
0 3 6 12 0 3 6 120
20
40
60
80
100 Conventionaltreatment alone
IFN- therapy inthe first 6 months
Months
% o
f F
oxp
3+ e
xp
ressio
n
****
**
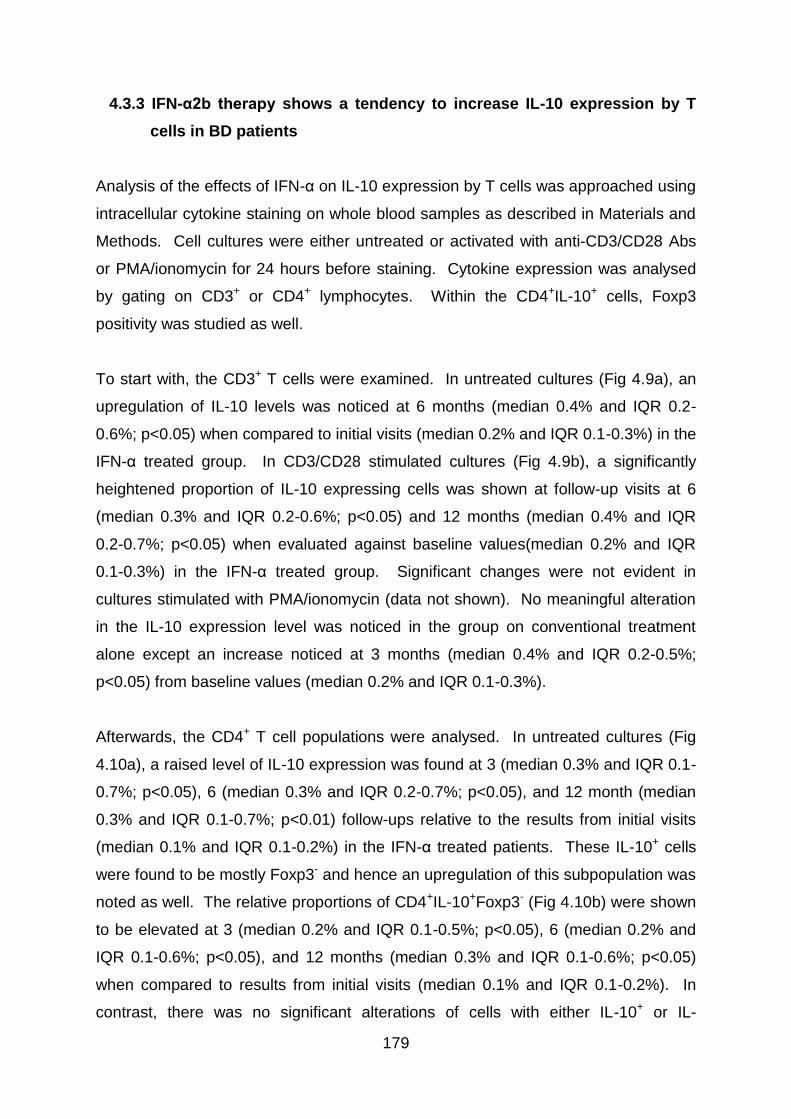
179
4.3.3 IFN-α2b therapy shows a tendency to increase IL-10 expression by T
cells in BD patients
Analysis of the effects of IFN-α on IL-10 expression by T cells was approached using
intracellular cytokine staining on whole blood samples as described in Materials and
Methods. Cell cultures were either untreated or activated with anti-CD3/CD28 Abs
or PMA/ionomycin for 24 hours before staining. Cytokine expression was analysed
by gating on CD3+ or CD4+ lymphocytes. Within the CD4+IL-10+ cells, Foxp3
positivity was studied as well.
To start with, the CD3+ T cells were examined. In untreated cultures (Fig 4.9a), an
upregulation of IL-10 levels was noticed at 6 months (median 0.4% and IQR 0.2-
0.6%; p<0.05) when compared to initial visits (median 0.2% and IQR 0.1-0.3%) in the
IFN-α treated group. In CD3/CD28 stimulated cultures (Fig 4.9b), a significantly
heightened proportion of IL-10 expressing cells was shown at follow-up visits at 6
(median 0.3% and IQR 0.2-0.6%; p<0.05) and 12 months (median 0.4% and IQR
0.2-0.7%; p<0.05) when evaluated against baseline values(median 0.2% and IQR
0.1-0.3%) in the IFN-α treated group. Significant changes were not evident in
cultures stimulated with PMA/ionomycin (data not shown). No meaningful alteration
in the IL-10 expression level was noticed in the group on conventional treatment
alone except an increase noticed at 3 months (median 0.4% and IQR 0.2-0.5%;
p<0.05) from baseline values (median 0.2% and IQR 0.1-0.3%).
Afterwards, the CD4+ T cell populations were analysed. In untreated cultures (Fig
4.10a), a raised level of IL-10 expression was found at 3 (median 0.3% and IQR 0.1-
0.7%; p<0.05), 6 (median 0.3% and IQR 0.2-0.7%; p<0.05), and 12 month (median
0.3% and IQR 0.1-0.7%; p<0.01) follow-ups relative to the results from initial visits
(median 0.1% and IQR 0.1-0.2%) in the IFN-α treated patients. These IL-10+ cells
were found to be mostly Foxp3- and hence an upregulation of this subpopulation was
noted as well. The relative proportions of CD4+IL-10+Foxp3- (Fig 4.10b) were shown
to be elevated at 3 (median 0.2% and IQR 0.1-0.5%; p<0.05), 6 (median 0.2% and
IQR 0.1-0.6%; p<0.05), and 12 months (median 0.3% and IQR 0.1-0.6%; p<0.05)
when compared to results from initial visits (median 0.1% and IQR 0.1-0.2%). In
contrast, there was no significant alterations of cells with either IL-10+ or IL-

180
10+Foxp3- expression in the group on conventional treatment alone. Also, no
change in the CD4+IL-10+Foxp3+ subpopulation was revealed in our patients whether
they received IFN-α treatment or not (data not shown).
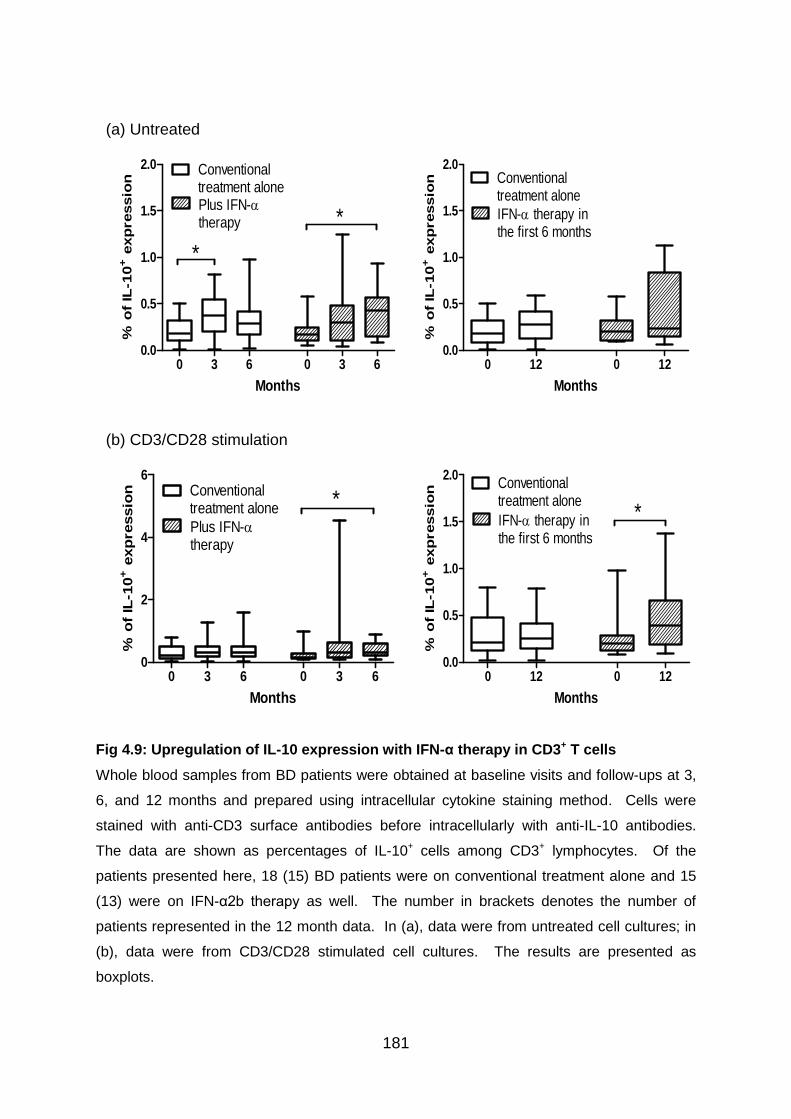
181
Fig 4.9: Upregulation of IL-10 expression with IFN-α therapy in CD3+ T cells
Whole blood samples from BD patients were obtained at baseline visits and follow-ups at 3,
6, and 12 months and prepared using intracellular cytokine staining method. Cells were
stained with anti-CD3 surface antibodies before intracellularly with anti-IL-10 antibodies.
The data are shown as percentages of IL-10+ cells among CD3+ lymphocytes. Of the
patients presented here, 18 (15) BD patients were on conventional treatment alone and 15
(13) were on IFN-α2b therapy as well. The number in brackets denotes the number of
patients represented in the 12 month data. In (a), data were from untreated cell cultures; in
(b), data were from CD3/CD28 stimulated cell cultures. The results are presented as
boxplots.
(a) Untreated
0 3 6 0 3 60.0
0.5
1.0
1.5
2.0 Conventionaltreatment alonePlus IFN-therapy
*
*
(n=18) Months (n=15)
% o
f IL
-10
+ e
xp
ressio
n
0 12 0 120.0
0.5
1.0
1.5
2.0Conventionaltreatment alone
IFN- therapy inthe first 6 months
(n=15) Months (n=13)
% o
f IL
-10
+ e
xp
ressio
n
(b) CD3/CD28 stimulation
0 3 6 0 3 60
2
4
6Conventionaltreatment alone
Plus IFN-therapy
*
(n=18) Months (n=15)
% o
f IL
-10
+ e
xp
ressio
n
0 12 0 120.0
0.5
1.0
1.5
2.0Conventionaltreatment alone
IFN- therapy inthe first 6 months
*
(n=15) Months (n=13)
% o
f IL
-10
+ e
xp
ressio
n
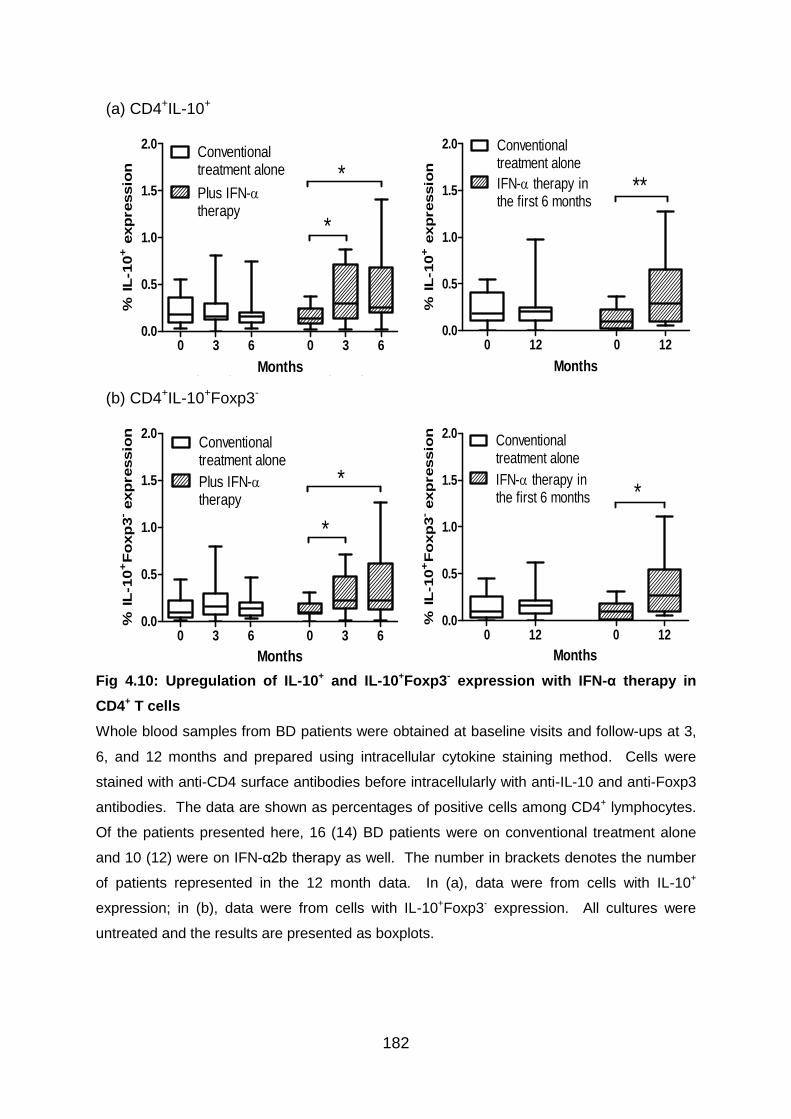
182
Fig 4.10: Upregulation of IL-10+ and IL-10+Foxp3- expression with IFN-α therapy in
CD4+ T cells
Whole blood samples from BD patients were obtained at baseline visits and follow-ups at 3,
6, and 12 months and prepared using intracellular cytokine staining method. Cells were
stained with anti-CD4 surface antibodies before intracellularly with anti-IL-10 and anti-Foxp3
antibodies. The data are shown as percentages of positive cells among CD4+ lymphocytes.
Of the patients presented here, 16 (14) BD patients were on conventional treatment alone
and 10 (12) were on IFN-α2b therapy as well. The number in brackets denotes the number
of patients represented in the 12 month data. In (a), data were from cells with IL-10+
expression; in (b), data were from cells with IL-10+Foxp3- expression. All cultures were
untreated and the results are presented as boxplots.
(a) CD4+IL-10+
0 3 6 0 3 60.0
0.5
1.0
1.5
2.0Conventionaltreatment alone
Plus IFN-therapy
*
*
(n=16) Months (n=10)
% IL
-10
+ e
xp
ressio
n
0 12 0 120.0
0.5
1.0
1.5
2.0
**
Conventionaltreatment alone
IFN- therapy inthe first 6 months
(n=14) Months (n=12)
% IL
-10
+ e
xp
ressio
n
(b) CD4+IL-10+Foxp3-
0 3 6 0 3 60.0
0.5
1.0
1.5
2.0Conventionaltreatment alone
Plus IFN-therapy
*
*
(n=16) Months (n=10)
% IL
-10
+F
oxp
3- exp
ressio
n
0 12 0 120.0
0.5
1.0
1.5
2.0
*
Conventionaltreatment alone
IFN- therapy inthe first 6 months
(n=14) Months (n=12)
% IL
-10
+F
oxp
3- exp
ressio
n
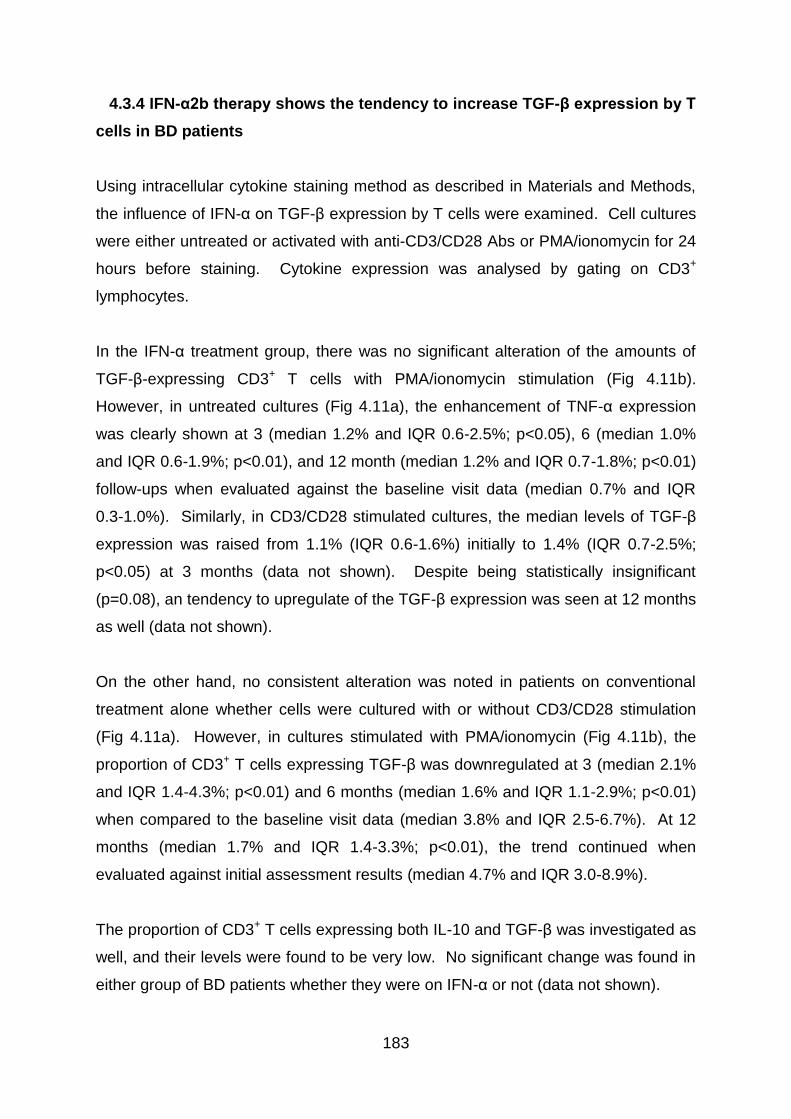
183
4.3.4 IFN-α2b therapy shows the tendency to increase TGF-β expression by T
cells in BD patients
Using intracellular cytokine staining method as described in Materials and Methods,
the influence of IFN-α on TGF-β expression by T cells were examined. Cell cultures
were either untreated or activated with anti-CD3/CD28 Abs or PMA/ionomycin for 24
hours before staining. Cytokine expression was analysed by gating on CD3+
lymphocytes.
In the IFN-α treatment group, there was no significant alteration of the amounts of
TGF-β-expressing CD3+ T cells with PMA/ionomycin stimulation (Fig 4.11b).
However, in untreated cultures (Fig 4.11a), the enhancement of TNF-α expression
was clearly shown at 3 (median 1.2% and IQR 0.6-2.5%; p<0.05), 6 (median 1.0%
and IQR 0.6-1.9%; p<0.01), and 12 month (median 1.2% and IQR 0.7-1.8%; p<0.01)
follow-ups when evaluated against the baseline visit data (median 0.7% and IQR
0.3-1.0%). Similarly, in CD3/CD28 stimulated cultures, the median levels of TGF-β
expression was raised from 1.1% (IQR 0.6-1.6%) initially to 1.4% (IQR 0.7-2.5%;
p<0.05) at 3 months (data not shown). Despite being statistically insignificant
(p=0.08), an tendency to upregulate of the TGF-β expression was seen at 12 months
as well (data not shown).
On the other hand, no consistent alteration was noted in patients on conventional
treatment alone whether cells were cultured with or without CD3/CD28 stimulation
(Fig 4.11a). However, in cultures stimulated with PMA/ionomycin (Fig 4.11b), the
proportion of CD3+ T cells expressing TGF-β was downregulated at 3 (median 2.1%
and IQR 1.4-4.3%; p<0.01) and 6 months (median 1.6% and IQR 1.1-2.9%; p<0.01)
when compared to the baseline visit data (median 3.8% and IQR 2.5-6.7%). At 12
months (median 1.7% and IQR 1.4-3.3%; p<0.01), the trend continued when
evaluated against initial assessment results (median 4.7% and IQR 3.0-8.9%).
The proportion of CD3+ T cells expressing both IL-10 and TGF-β was investigated as
well, and their levels were found to be very low. No significant change was found in
either group of BD patients whether they were on IFN-α or not (data not shown).
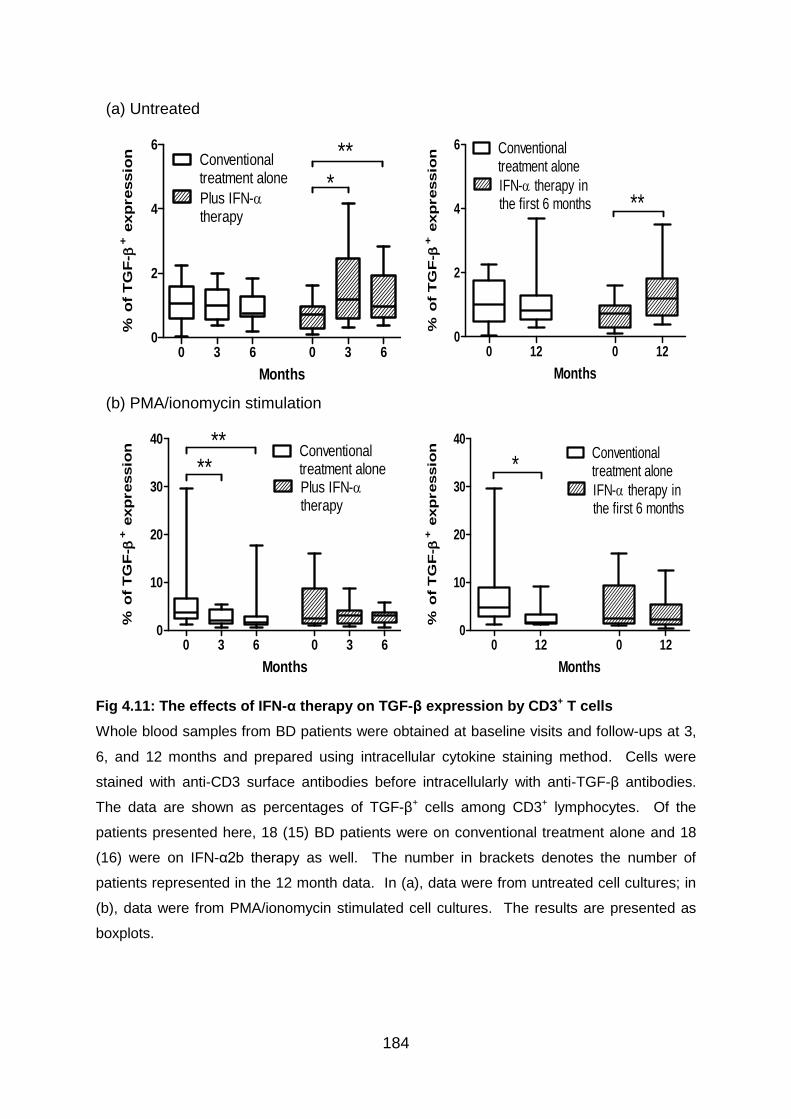
184
Fig 4.11: The effects of IFN-α therapy on TGF-β expression by CD3+ T cells
Whole blood samples from BD patients were obtained at baseline visits and follow-ups at 3,
6, and 12 months and prepared using intracellular cytokine staining method. Cells were
stained with anti-CD3 surface antibodies before intracellularly with anti-TGF-β antibodies.
The data are shown as percentages of TGF-β+ cells among CD3+ lymphocytes. Of the
patients presented here, 18 (15) BD patients were on conventional treatment alone and 18
(16) were on IFN-α2b therapy as well. The number in brackets denotes the number of
patients represented in the 12 month data. In (a), data were from untreated cell cultures; in
(b), data were from PMA/ionomycin stimulated cell cultures. The results are presented as
boxplots.
(a) Untreated
0 3 6 0 3 60
2
4
6Conventionaltreatment alone
Plus IFN-therapy
*
**
(n=18) Months (n=18)
% o
f T
GF
- + e
xp
ressio
n
0 12 0 120
2
4
6 Conventionaltreatment alone
IFN- therapy inthe first 6 months **
(n=15) Months (n=16)
% o
f T
GF
-
+ e
xp
ressio
n
(b) PMA/ionomycin stimulation
0 3 6 0 3 60
10
20
30
40Conventionaltreatment alonePlus IFN-therapy
****
(n=18) Months (n=18)
% o
f T
GF
- + e
xp
ressio
n
0 12 0 120
10
20
30
40Conventionaltreatment alone
IFN- therapy inthe first 6 months
*
(n=15) Months (n=16)
% o
f T
GF
-
+ e
xp
ressio
n
185
4.3.5 IFN-α2b therapy does not increase CD56+ expression by T cells in BD
patients
To examine the influence of IFN-α therapy on NKT cells in BD patients, serial whole
blood samples from BD patients receiving conventional immunosuppressive therapy
with or without recombinant IFN-α2b treatment were phenotyped. The phenotyping
results were obtained by analysing CD56+ cells after gating on the CD3+
lymphocytes.
As shown in Figure 4.12, there was no significant change in the levels of CD56
expression within the CD3+ T lymphocyte populations in BD patients whether they
were on IFN-α or not. The only exception found was an increased percentage of the
CD3+CD56+ T cells in the group on conventional treatment alone when 3 month
levels (median 6.0% and IQR 4.3-10.2%; p<0.01) were compared to the baseline
ones (median 3.3% and IQR 2.4-6.1%).
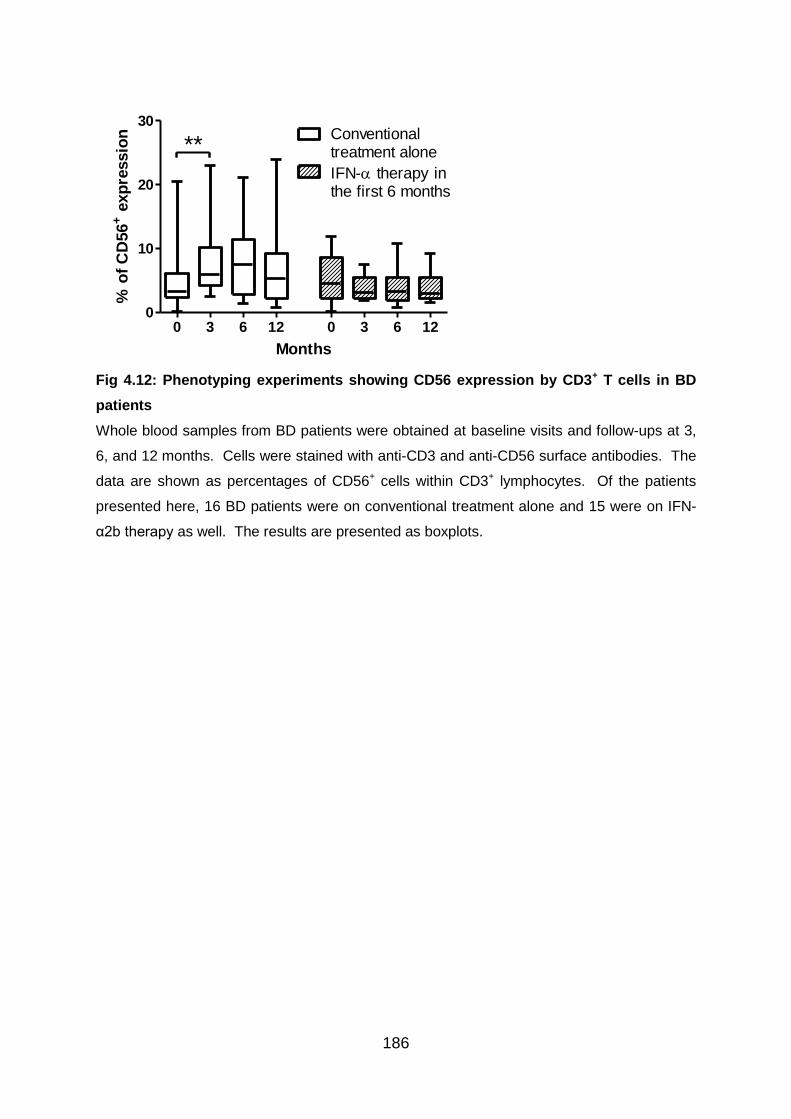
186
0 3 6 12 0 3 6 120
10
20
30
**Conventionaltreatment alone
IFN- therapy inthe first 6 months
(n=16) Months (n=15)
% o
f C
D56
+ e
xp
ressio
n
Fig 4.12: Phenotyping experiments showing CD56 expression by CD3+ T cells in BD
patients
Whole blood samples from BD patients were obtained at baseline visits and follow-ups at 3,
6, and 12 months. Cells were stained with anti-CD3 and anti-CD56 surface antibodies. The
data are shown as percentages of CD56+ cells within CD3+ lymphocytes. Of the patients
presented here, 16 BD patients were on conventional treatment alone and 15 were on IFN-
α2b therapy as well. The results are presented as boxplots.
187
4.4 Discussion
Inflammation is characterised by a complex interaction of pro- and anti-inflammatory
mediators. A favourable balance leads to a recovery of homeostasis while an
unfavourable balance, associated with an exacerbated release of pro-inflammatory
cytokines, leads to damaging effects. Individual background seems to govern this
equilibrium, and it is known that a great heterogeneity exists between individuals.
4.4.1.1 Biology of IL-17
IL-17 has assorted biological functions, but the most notable role of IL-17 is its
involvement in inducing and mediating pro-inflammatory responses. As well as
promoting neutrophil recruitment and macrophage activation and survival, IL-17
stimulates the production of many other pro-inflammatory cytokines, chemokines and
prostaglandins from a variety of immune and non-immune cells (Crome, Wang, &
Levings 2010). Recently it was described that IL-17 itself can also function as a
chemokine, acting directly on the IL-17RA and IL-17RC of monocytes to induce their
migration (Shahrara et al. 2009). Due to these roles, the IL-17 family has been linked to
many immune/autoimmune related diseases.
4.4.1.2 The immunomodulatory effect of IFN-α on IL-17
From our data, a downregulation of IL-17 expression was seen after cells cultures
were activated with PMA/ionomycin in the IFN-α2b-treated group compared to
patients on conventional treatment alone. This was evident at all follow-up visits up
to 12 months compared to the data before initiation of treatment. This is in
accordance to a recent study which found that IFN-α significantly decreased IL-17
production by anti-CD3/CD28 stimulated PBMCs in cell culture supernatants from
BD patients (Liu et al. 2011). These findings are supported by other studies on
inflammatory conditions. In ulcerative colitis patients, treatment with pegylated IFN-
α2b therapy was reported to result in a significant decrease of colonic IL-17A mRNA
expression after 4 weeks and the downregulation of IL-17A expression in colonic
188
tissue was associated with clinical remission (Moschen et al. 2008). Similarly, direct
IFN-β1a treatment of CD4+CD45RA+ naive T cells cultured in Th17-polarising
conditions demonstrated decrease in RORc, IL-17A, IL-23R and CCR6 levels in both
MS patients and healthy controls (Ramgolam et al. 2009).
4.4.1.3 Mechanisms leading to the inhibitory effects of IFN-α on IL-17
Like IFN-γ, IFN-α mediates its signal through phosphorylation of Stat1 resulting in
induction of T-bet, which is critical for Th1 cell development, and subsequent
inhibition of Th17 responses (Harrington et al. 2005). In addition to the direct
inhibitory effect of IFN-α on Th17 development, IFN-α binds to the type 1 IFN
receptor on DCs, macrophages and microglia cells within the CNS. In these cells,
IFN-α-mediated signalling inhibits the activation of an intracellular isoform of
osteopontin, followed by the induction of IL-27 (Guo, Chang, & Cheng 2008).
Although IL-27 induces Th1 differentiation, the same cytokine has
immunosuppressive properties which depend on IL-2 suppression, induction of IL-10
production as well as inhibition of Th17 differentiation (Yoshida, Nakaya, & Miyazaki
2009).
IFN-γ plays an important role in Th17 cell biology. The development of Th17 cells
from naive precursor cells is strongly suppressed by IFN-γ both in vitro and in vivo
(Harrington et al. 2005;Meyers et al. 2006;Park et al. 2005). Anti-IFN-γ added during
in vitro Th17 differentiation leads to upregulated IL-17 expression, and increased
expression of the IL-23R is displayed by the treated cells as well. Therefore, it was
proposed that IFN-γ signaling might exert its inhibitory effect on pathogenic Th17
cells by thwarting IL-23R expression (Harrington et al. 2005). It has been observed
that both IL-4 and IFN-γ suppress RORC2 by upregulating GATA-3 and T-bet,
respectively, thereby inhibiting Th17 differentiation. However, IL-17 does not
significantly alter expression of IL-4 or IFN-γ but does induce IL-2 expression in
CD4+ T cells, suggesting that this cytokine may promote T cell proliferation and survival
(Crome, Wang, & Levings 2010). All these mechanisms, by which autoreactive
Th17 cells can be regulated, may explain the molecular basis of IFN-α therapy for
Behcet’s disease. As described in Chapter 3, we have observed upregulation of
189
both IFN-γ and IL-4 expression by T cells, and this could help explain why a
suppression of Th17 cells was found in patients treated with recombinant IFN-α.
4.4.1.4 T cells co-expressing IL-17 and IFN-γ
Although Th17 lineage development is independent of that of Th1, they can often be
found side-by-side, suggesting that the interplay between Th17 and Th1 is likely to
be important for our understanding of autoimmune disorders (Annunziato et al. 2007).
In our experiments, the so-called Th1/Th17 cells were detected only in very low
amount and IFN-α2b therapy did not seem to have any influence on this cell
population. In the future it will be important to determine if these Th1/Th17 cells are a
distinct and stable lineage of CD4+ T effector cells, or whether they are an intermediate
state destined to become true Th1 or Th17 cells.
4.4.2.1 Biology of regulatory T cells
Treg cells are pivotal for the maintenance of peripheral self-tolerance and
imbalances in this T cell compartment have been shown to contribute to various
autoimmune diseases (Allan et al. 2008b). Foxp3+ Tregs regulate a wide variety of
different immune cells including naive and memory CD4+ and CD8+ T effector cells, B
cells, NK cells, monocytes, and DCs in vitro and in vivo (Grossman et al. 2004;Lim et al.
2005). Currently, it is not clear whether Foxp3+ Tregs of direct thymic origin differ in
phenotype or function from those of peripheral origin. What is clear is that cells of both
types can specifically recognise a wide variety of Ags (Fazilleau et al. 2007b).
In peripheral blood, roughly 50% of lymphocytes are CD4+ and the CD4+CD25high T
cell subset comprises 1-2% of circulating CD4+ T cells in humans. nTreg cells
mainly reside within the CD4+CD25high cell population (Baecher-Allan et al. 2001). In
adult human peripheral blood, CD4+CD25high Treg cell compartment contains not
only antigen-experienced, CD45RA- memory cells, but also a subpopulation of
CD45RA+ naive recent thymic emigrants without previous exposure to extrathymic
self or foreign antigens (Seddiki et al. 2006). Analysis of naive Treg cell prevalence in

190
peripheral blood indicates that their proportion among CD4+ T cells declines with age,
starting from a range of 4-10% in cord blood and decreasing to 1-4% in young adults
and to 0.5-1.5% in healthy elderly donors. However, the prevalence of CD45RA- Treg
cells slightly increases with age starting from a range of 0-0.5% in cord blood and
increasing to 1-2.5% in young adults and to 1-4% in elderly health donors (Miyara et al.
2009; Sakaguchi et al. 2010).
4.4.2.2 CD25 expression and its relationship with Foxp3+ Treg cells
Although there is not one particular cell surface marker that defines Treg cells, the
CD25 surface molecule is at least expressed on the vast majority of cells that
express the Foxp3 transcription factor (Apostolou et al. 2008). Given that the
expression levels of CD25 and Foxp3 are usually proportional in human Foxp3+ T
cells, one shortcoming of examining T cells expressing high levels of CD25 is the
exclusion of CD25intFoxp3low naive Treg cells (Miyara et al. 2009). Therefore, in our
experiments, CD4+CD25+ T cells were examined as well as CD4+CD25high T cells in
order to cover the effects of IFN-α2b on these naive Treg populations. However, one
must be aware that CD4+ T cells with intermediate CD25 expression (CD25int) are
made up mainly of recently activated non-regulatory effector T cells, with only 5 to
15 % Foxp3+ Treg cells (Hoffmann et al. 2006).
In addition, it has been reported that non-regulatory CD45RO+Foxp3low T cells that
produce pro-inflammatory cytokines may constitute 30-50% of the CD4+Foxp3+ T
cells, which contain the CD4+CD25-Foxp3+ cell population (Sakaguchi et al. 2010).
Committed regulatory T cells with the CD25- phenotype are present in the periphery
as a minor fraction of CD4+ T cells but they may become CD25+ upon activation.
Data have shown that CD4+CD25- cells exhibit an approximately 60-fold lower level
of Foxp3 mRNA expression than CD4+CD25+ cells as measured by real-time
quantitative RT-PCR (Yagi et al. 2004).
In accordance to these findings, our data consistently demonstrated that Foxp3+
expression levels were much lower in either CD4+ or CD4+CD25+ cell subpopulations
compared to CD4+CD25high cell population. One important point to bear in mind
191
though is that there is no firm criterion suggested from previous studies as to where
the boundary lies between intermediate and high CD25 expression. This vague
boundary has complicated the reproducibility of clinical data analysing the number
and function of Treg cells, particularly under inflammatory conditions in which
activated T cells express CD25.
In order to reduce populations with transient expression of Foxp3 and determine the
true fraction of stable Foxp3+ Tregs among CD25high cells, it may be an idea to
incorporate steps to rest cells obtained from patients with inflammatory disorders
during experiments. Alternatively, analysis of CD69 expression on Treg subsets has
been suggested in order to determine whether these cells are contaminated with
recently activated CD4+ T cells as these would be mainly CD69+ (Valencia et al.
2006).
4.4.2.3 Foxp3 expression levels in CD4+CD25high T cells
Approximately 60% to 90% of CD25high cells are Foxp3+ (Tang & Bluestone 2006). It
was reported that CD45RA+CD4+CD25high T cells homogeneously maintained their
Treg cell phenotype and function even after long-term culture (up to 3 weeks). In
contrast to CD45RA+CD4+CD25high Treg cells, CD4+ T cells selected solely for
CD25high expression, were highly variable with respect to Foxp3 expression (50.5 to
72.8% Foxp3+ cells) after long-term in vitro expansion (Hoffmann et al. 2006). This
was despite that more than 90% of the sorted cells expressed Foxp3 after isolation.
In our experiments the percentages of Foxp3+ cells in CD25high cells were observed to
be substantially lower. This was evident whether whole blood samples were cultured
over 24 hours or not as shown in the phenotyping and intracellular cytokine staining
experiments. One possible explanation could be the presence of non-regulatory
effector T cells that preferentially expand in culture over time. Another explanation
could be the presence of a substantial number of ‘‘induced’’ Tregs that only
transiently express Foxp3 after recent in vivo stimulation and revert to effector T cells
during culture or before phenotyping could be performed (Tran, Ramsey, & Shevach
2007;Walker et al. 2003). The BD patient blood samples used in our experiments

192
were not usually processed on the day of collection. They were stored at room
temperature and processed in the morning the following day. One other possible
factor to consider could be that our BD patients had lower basal levels of
CD25highFoxp3+ cells to begin with.
Additional contributing factor leading to the observed lower Foxp3+ expression has
been provided by recent findings that Foxp3 mRNA and protein expression in cell
lines derived from CD45RA-CD4+CD25high Treg cells is particularly prone to be lost
after 2 to 3 weeks in culture upon repetitive polyclonal TCR and CD28 co-receptor-
mediated stimulation. After long-term culture, there can be parallel increase in
cytokine-secreting cells within this cell population, even in the absence of a pro-
inflammatory milieu (Hoffmann et al. 2009). Despite gaining the ability to secrete
inflammatory cytokines (IL-2, IFN-γ, or both), these cytokine-secreting cells do not
convert completely to effector T cells, as they also produce substantial amounts of
IL-10. Thus, such cells may still be regulatory but mediate their effects via cytokines
rather than cell-contact-dependent mechanisms. Of note, these data have been
obtained using cell cultures with high-dose exogenous IL-2 present. As IL-2 has
been demonstrated to have important, non-redundant effects on the maintenance
and survival of Foxp3+ Treg cells (Burchill et al. 2008), the loss of Foxp3+ expression
in our experiments could be greater and over shorter period of time as a result of
absence of exogenous IL-2 in cultures.
4.4.2.4 Upregulation of Foxp3 expression in BD patients treated with IFN-α
Our data from phenotyping and intracellular cytokine staining experiments showed a
significant upregulation of Foxp3 expression in CD4+CD25high T cell subsets as early as
after 3 months of subcutaneous IFN-α2b therapy. The enhanced expression of Foxp3 in
BD patients was also observed in the CD4+ and CD4+CD25+ T cell populations.
Importantly, these positive findings were observed consistently in both phenotyping
experiments and unstimulated cultures where no cell activation was involved.
Consequently, expansion of recently activated non-regulatory CD45RO+Foxp3low T
cells was unlikely to be a major contributor to these results. Collectively, these
results are likely to signify that Treg cell populations were promoted in BD patients
193
treated with IFN-α2b. In BD patients receiving conventional treatment alone, however,
no change or even a decrease in the proportion of Foxp3 expressing cells were
detected. This may indicate that the augmentation of Foxp3 expression in IFN-α2b-
treated patients was not associated with the influence of systemic prednisolone or
other immunosuppressants.
It remains to be determined how stable the enhanced expression of Foxp3 is and
whether the status can be sustained even after stopping the IFN-α2b therapy.
Encouragingly, Foxp3 expression levels were significantly elevated in our IFN-α2b-
treated BD patients at 6 month assessments and these changes were still evident at
12 month visits, 6 months after ending the treatment.
Our findings of Foxp3 upregulation in peripheral blood lymphocytes by IFN-α2b
therapy are in contrast to a recent study on melanoma patients receiving 4 weeks of
IFN-α2b treatment where no statistically significant change in Foxp3+ Treg level was
detected (Ascierto et al. 2010). This could be explained in part by different patient
characteristics at recruitment as Behcet’s disease patients may have normal or even
decreased levels of CD4+CD25high Treg cells in peripheral blood to start with (Nanke
et al. 2008) compared to increased levels in melanoma patients (Ascierto et al. 2010).
Also, the treatment duration for our patients on IFN-α2b therapy was for 6 months,
which was substantially longer.
In accordance to our results, an upregulation of Foxp3+ Treg cells, associated with
increase of Stat5 but downregulation of Stat3, was demonstrated in lymph node
biopsies of melanoma patients with nodal metastasis after a course of high-dose
IFN-α2b therapy over 48 weeks (Wang et al. 2008). Similarly, in a study on MS
patients, treatment with IFN-β increased the expression of Foxp3 mRNA in PBMCs
significantly after 6 months but not Foxp3 protein on CD4+CD25+ T cells
(Vandenbark et al. 2009). Although a significant reduction was demonstrated in the
capability of patients’ plasmacytoid dendritic cells (pDCs), known inducers of Tregs,
to produce IFN-α in a group of heterogeneous uveitis patients including BD (Plskova
et al. 2006), it was suggested that the deficiency could be overcome with the
administration of exogenous IFN-α.
194
4.4.2.5 Foxp3 and Treg function
Hypoproliferative (‘anergic’) and immune suppressive activities are two defining
properties for Foxp3 expressing Treg cells. Intriguingly, Foxp3low expressing T cells
were demonstrated to remain anergic upon TCR stimulation in vitro, but their
immunosuppressive activities were greatly impaired (Wan & Flavell 2007). Thus,
anergy and immune suppression are two separable properties of Treg cells that are
affected differentially by the expression levels of Foxp3. While Foxp3 does not seem
to control the entire Treg transcriptome, it is clearly essential for Treg differentiation
and/or function, as its absence leads to a lack of Tregs and fatal autoimmune
disease (Buckner & Ziegler 2008). Notably, previous studies have shown that
transfection of human Foxp3 into naive CD4+ T cells can induce Treg functions
(Oswald-Richter et al. 2004;Yagi et al. 2004).
Foxp3 is expressed by both activated and regulatory T cells in the peripheral blood
as are other known Treg cell biomarkers such as CD25. Virtually all activated CD4+
and CD8+ T cells have been shown to transiently upregulate Foxp3 and acquire
suppressive properties (Pillai et al. 2007). However, it has been indicated that only
those cells with sustained, high level Foxp3 expression go on to differentiate into
Treg cells (Buckner & Ziegler 2008). In one study, it was noted that not all CD25+ T
cells in typical activation cultures had regulatory function and the great majority of
these cells became CD25- after 10 days. Only those T cells that remained CD25+ 10
days after activation were Foxp3+ and showed suppressive function (Walker et al.
2005). Data from another group suggested that the human cells, unlike mouse cells,
need more time to become fully differentiated CD4+CD25+Foxp3+ suppressor cells.
It was observed that upon repeated stimulation, the cells became anergic, some then
expressed membrane TGF-β, and T cell proliferation was strongly suppressed
subsequently (Horwitz et al. 2008).
Activated T cells possibly require additional factors, as well as the functional and
phenotypic changes generated by Foxp3 expression, to acquire full suppressive
activity. It has been reported that the maintenance of intrinsic Treg stability likely
involves the epigenetic modification of the Foxp3 locus, especially the two highly
conserved CpG-rich regions located in the Foxp3 first intron and up-stream Foxp3
195
promoter. The methylation status of these two regions is tightly associated with
stable gene expression of Foxp3 (Miyara et al. 2009). In Foxp3+ Tregs with
suppressive activity, CpGs in these regions are fully demethylated, whereas the
CpG's of Foxp3low non-regulatory T cells are incompletely demethylated. More
recently, the expression of Helios, a member of the Ikaros transcription factor family,
has been shown to be unique in thymus-derived CD4+CD25+Foxp3+ Treg cells and
this enables nTreg to be distinguished from iTreg cells and, most importantly,
recently activated cells (Thornton et al. 2010).
Interaction of Foxp3 with other transcription factors has also been suggested to be
critical to its action. Foxp3 has been demonstrated to directly interact with NFAT, a
key regulator of T cell activation and anergy, and the NF-κB subunit p65. Several
residues in the forkhead domain of Foxp3 interact with NFAT directly, and
mutagenesis of these residues result in a decrease in the ability of Foxp3 to inhibit
IL-2 production (Buckner & Ziegler 2008). Therefore, at least one mechanism of
Foxp3-mediated transcriptional repression involves direct contact with NFAT and
subsequent inhibition.
Requirement of other transcription factors, such as Runx, has been described.
There are three putative Runx binding sites in the proximal Foxp3 promoter. It has
been suggested that these binding sites have partially redundant functions, but
binding to at least two sites seems to be necessary for full promoter activation. In
suppression experiments, reduced suppressive activity has been shown to be
caused by reduced Foxp3 expression in CD4+CD25+Foxp3+ iTreg cells by small
interfering RNA (siRNA) inhibition of Runx1 and Runx3. These results demonstrate
the important role of Runx1 and Runx3 not only for the induction of Foxp3, but also
for the suppressive capacity of Treg cells (Klunker et al. 2009).
It remains to be determined whether the induced Foxp3+ T cells in our experiments
are functionally competent suppressive cells. Maintenance of sustained Foxp3
expression as T cell activation wanes may be key for acquisition of suppressor
function and development of peripherally induced Tregs. Nevertheless, we can
speculate that a small subset of effector T cells with activation induced Foxp3 may
not downregulate Foxp3 and therefore ultimately develop into functional Treg cells.
196
4.4.3.1 Biology of IL-10
IL-10 is a multi-functional regulatory cytokine first described as a molecule secreted
by Th2 cells that could inhibit cytokine synthesis by Th1 cells (Zhu & Paul 2008). All
the CD4+ T cell subsets including Th1, Th2, Th17, as well as Treg cells are capable
of producing IL-10 under certain conditions (Anderson et al. 2007;Jankovic et al.
2007;McGeachy et al. 2007). The principal role of IL-10 seems to be keeping
immune responses in check and preventing the detrimental effects of excessive
inflammatory reactions.
IL-10 is a potent inhibitor of antigen presentation, and its main biological function
appears to be exerted on DCs and macrophages. It inhibits MHC class II expression
as well as the upregulation of costimulatory molecules CD80 (B7-1) and CD86 (B7-
2), which profoundly affects the ability of APCs to activate T cells. IL-10 inhibits the
maturation of DCs and differentiation of DCs from monocyte precursors. Thus, many
of the immuno-inhibitory characteristics of IL-10 can be attributed to their effect on
APCs to downregulate the production of the Th1-associated cytokines IL-2 and IFN-γ,
and also the Th2-associated cytokines IL-4 and IL-5. Thus, the original description
of IL-10 as a crossregulator of Th1/Th2 immunity is probably no longer applicable.
The other profound effect of IL-10 is to suppress the production of pro-inflammatory
cytokines and mediators from macrophages and DCs, including IL-1, IL-6, IL-12,
TNF-α. IL-10 can further inhibit inflammation by increasing the release of IL-1
receptor antagonist by macrophages (Akdis & Blaser 2001;Mosser & Zhang 2008).
IL-10 can target naive CD4+ T cells, possibly via an inhibition of CD28 signalling
pathway. It has little or no direct effects on activated or memory T cells due to the
reduction of IL-10R upon T cell activation (Akdis & Blaser 2001). Inflammatory
chemokines of both the CC and CXC type are suppressed by IL-10, as is the
production of macrophage matrix metalloproteases. Then again, it is important to
note that the biologic functions of IL-10 are not solely restricted to suppression of the
immune system. IL-10 can augment B cell proliferation, prolong B cell survival, and
contribute to class switching in B cells. It can also costimulate NK cell proliferation
and cytokine production. IL-10 can act as a growth factor to stimulate the
proliferation of certain subsets of CD8+ T cells (Mosser & Zhang 2008). Furthermore,

197
T cells are protected from apoptotic death by IL-10 through upregulation of Bcl-2, a
protooncogene (Cohen et al. 1997).
4.4.3.2 The immunomodulatory effect of IFN-α on IL-10
Analysing our data, a tendency to upregulate IL-10 production by CD3+ and CD4+ T
cells was observed. The finding is in line with a recent study which showed that IFN-
α significantly increased IL-10 production by anti-CD3/CD28 stimulated PBMCs in
cell culture supernatants from BD patients (Liu et al. 2011). Our results are also in
agreement with earlier studies. In patients with uveitis, IL-10 production by
CD3+/CD4+ T cells was reduced but was restored to normal after IFN-α therapy (Ito
et al. 2001;Plskova et al. 2006). In patients with corticosteroids-resistant asthma, the
observation of increased IL-10 expression in venous blood T cells and monocytes as
a consequence of IFN-α therapy has been described (Simon et al. 2003). In addition,
IFN-α was found to induce mild upregulation of IL-10 production by CD4+CD3- Th2-
like clones isolated from peripheral blood of patients with hypereosinophilic
syndrome (Schandene et al. 1996). Stimulation of DCs with LPS induced mainly
production of IL-10 that was further amplified by IFN-α (Tamir et al. 2005).
4.4.3.3 Biology of Tr1 cells
For the systemic control of autoreactive T effector cells in a multi-system
inflammatory disease, apart from Foxp3+ Treg subsets that function mainly via
contact-dependent mechanism, distinct induced Tr1 cells that lack Foxp3 expression
also regulate T cell functions. Recent evidence suggests that, like in the case of
human effector T cells, Tr1 cells can express Foxp3 upon activation, albeit
transiently (Roncarolo & Gregori 2008). Human Tr1 cells generated in vitro do not
constitutively express Foxp3, but upon activation can upregulate this transcription
factor to levels similar to those observed in activated effector T cells. Interestingly,
functional suppressor Tr1 cells can be differentiated in vitro from naive T cells of
IPEX patients lacking Foxp3 (Roncarolo & Gregori 2008). It has been indicated that
one of the mechanisms of action of Foxp3+ Treg cells may relate to the induction of Tr1
198
cells in vivo, as there is evidence that Foxp3+ Treg cells induce the development of Tr1
cells in vitro (Dieckmann et al. 2002).
Through the capacity to secrete IL-10 by Tr1 cells, infectious tolerance can be mediated
effectively. Also, Tr1 cells may enhance the function of Foxp3+ Treg cells by inhibiting
production of pro-inflammatory cytokines such as TNF-α, as the presence of these
cytokines may compromise the suppressive capacity of Foxp3+ Tregs (Thunberg et al.
2007). Currently, there are no known specific cell-surface markers for Tr1 cells, and
it is therefore difficult to identify and track these cells. Although many cell types
produce IL-10, Tr1 cells characteristically produce high levels of IL-10 as well as
lower levels of TGF-β (Roncarolo et al. 2006). In addition to their cytokine production
profile, Tr1 cells are functionally characterised by their intrinsic low proliferative
capacity (Levings et al. 2001). Tr1 cells are found in vivo in the chronic presence of
low levels of antigen. Although Tr1 cells must encounter their antigen to exert these
regulatory effects, once activated, they seem to suppress in an antigen non-specific
manner and bystander inhibition by cytokines such as IL-10 (Groux et al.
1997;Roncarolo, Levings, & Traversari 2001). Furthermore, Tr1 cells can be
induced from naive CD4+ T cells activated by tolerogenic APCs in the periphery in the
presence of IL-10 (Roncarolo et al. 2006).
4.4.3.4 The immunomodulatory effect of IFN-α on Tr1 cells
From our experiments, a tendency to enhance IL-10 production by CD3+ and CD4+ T
cells was detected. This is likely to support induction of a larger population of Tr1
cells. Notably, the increase in the CD4+IL-10+ T cell populations was mostly
accounted for by the CD4+IL-10+Foxp3- cells, some of which were likely to be Tr1
cells. Not surprisingly, an upregulation of CD4+IL-10+Foxp3- T cells themselves were
also observed.
199
4.4.4.1 Biology of TGF-β
Previous studies revealed that TGF-β plays a key role in inducing tolerance and
maintaining T cell homeostasis. It can target proliferation and differentiation
programs in T cells independently. TGF-β has been found to inhibit T cell
proliferation via multiple pathways, including blocking IL-2 expression (Wan & Flavell
2008). However, inclusion of IL-2 in T cell cultures relieves TGF-β inhibition of T cell
proliferation. Of note, TGF-β-mediated inhibition of Th cell differentiation can still
take place in the presence of IL-2 despite the fact that T cell proliferation is
encouraged (Sad & Mosmann 1994;Wan & Flavell 2008). This indicates that TGF-β
can inhibit T cell proliferation through yet to be defined IL-2-independent
mechanisms.
TGF-β is a powerful regulator of effector T cell differentiation, and it generally
impedes the acquisition of Th cell functions (Gorelik & Flavell 2002). TGF-β has
been shown to inhibit both Th1 and Th2 differentiation, possibly through
downregulation of Th1 and Th2 master regulators, T-bet, and GATA3 (Gorelik,
Constant, & Flavell 2002;Gorelik, Fields, & Flavell 2000;Park, Letterio, & Gorham
2007). However, the activity of TGF-β is influenced by the environmental milieu.
Also, TGF-β is intimately associated with the survival and function of Treg cells (Li et
al. 2006). Nevertheless, it is now generally accepted that whereas TGF-β alone
induces Foxp3 and inhibits Th17 differentiation, if inflammatory cytokines such as IL-6
are present, TGF-β-induced Foxp3 is suppressed and the expression of Th17-defining
transcription factors is favoured (Yang et al. 2008b).
4.4.4.2 The immunomodulatory effect of IFN-α on TGF-β
Our ex vivo data showed the tendency to upregulate TGF-β by CD3+ T cell
populations as early as 3 months after starting IFN-α therapy and the trend was still
evident at 12 month visits. This is in contrast to patients on conventional treatment
alone as no change or even a downregulation of TGF-β expression by T cells was
observed. The positive effects of IFN-α therapy on TGF-β levels have not been
reported previously.
200
In a study on myeloma patients treated with 2 weeks of low dose IFN-α2a, no
significant change in TGF-β level was detected with IFN-α administration (Sonmez et
al. 2004). Also, there was no significant effect observed on the levels of TGF-β in
patients with melanoma treated with 4 weeks of IFN-α2b either (Ascierto et al. 2010).
The difference could be related to the dosage of IFN-α administered and the shorter
period of IFN-α therapy compared to our study. Importantly, the production and
action of IL-10 and TGF-β are interrelated and likely involve a positive feedback loop
in which IL-10 enhances expression of TGF-β and vice versa. IL-10 not only
enhances production of TGF-β, but it can also modulate the ability of cells to respond
to TGF-β. This involves the IL-10-mediated restoration of TGF-βR2 expression on
recently activated T cells, which typically downregulate this molecule and become
resistant to the inhibitory effects of TGF-β (Cottrez & Groux 2001). Therefore, the
production and function of IL-10 and TGF-β may be interdependent, and the
enhancement of one cytokine may also lead to the augmentation of the other as
observed in our data.
4.4.5 Relationships between Th17 and Treg cells
The developmental relationship between Treg and Th17 subsets is complex and has
not been completely elucidated. Previous studies have suggested the existence of
not only a functional antagonism between the two subsets, but also of a dichotomy,
mutually exclusive, in their generation. During development, both Treg and Th17
cells require TGF-β for differentiation, albeit at different levels (Manel, Unutmaz, &
Littman 2008). Also of note is that aTreg cells specifically expressed high amounts
of AHR repressor transcripts and the ensuing constraint on Th17 cell development
might play an important part in promoting Treg cell differentiation (Miyara et al. 2009).
In the presence of IL-1β, IL-2, IL-21 and IL-23, CD4+CD25hiFoxp3+ Tregs were found
to differentiate into IL-17-producing cells, when stimulated by allogeneic APCs
(Koenen, Smeets, Vink, van Rijssen, Boots, & Joosten 2008). In agreement, another
study reported that Treg cells converted to Th17 cells when cultured in the presence
of monocyte-derived IL-1β and IL-2 and lost their suppressive abilities (Deknuydt et
al. 2009).
201
Interestingly, memory Tregs (CD25+CD127lowCD45RA−Foxp3+) display more a
tendency to be converted to Th17 cells than conventional memory CD4+ T cells. In
addition, memory Tregs demonstrate a more pronounced proficiency to give rise to
Th17 cells than natural naive Tregs (CD25+CD127lowCD45RA+Foxp3+) (Deknuydt et
al. 2009). In the peripheral blood, up to 3% of Foxp3+ Tregs cells in peripheral blood
are capable of producing IL-17 upon activation and these cells co-express
transcription factors RORc2 and Foxp3 (Voo et al. 2009). These cells are suggested
to be generated in the periphery. Intriguingly, these IL-17+Foxp3+ Treg cells are
reported to function as both effector and Tregs cells and are capable of suppressing
the proliferation of CD4+ responder cells in vitro. Compared to Foxp3+IL-17- cells,
the levels of Foxp3 expression in the Foxp3+IL-17+ cells are significantly lower (Voo
et al. 2009). It is likely CD4+ T cells positive for IL-17 in our experiments contain
some cells with Foxp3+IL-17+ phenotype as a large part of our experiments involved
some kinds of polyclonal activation. Further evaluation will need to be carried out in
the future in order to clarify the roles of this subset of cells in relation to our findings.
A disputable question is whether Th17 cells are susceptible to the suppressive effects of
Tregs. As exacerbation of Behcet’s disease may be linked to Th17 cells, it is crucial to
understand whether an upregulation of Treg cells would ameliorate this aspect of
inflammation. Consistent data from human studies show that Th17 cells are resistant to
Treg-mediated suppression at the level of proliferation, as well as cytokine production
(Annunziato et al. 2007;Evans et al. 2007;Lohr et al. 2006). Further examination
revealed that although Treg cells could limit TNF-α and IL-6 produced by RORc2-
transduced T cells, they failed to suppress IL-17 (Crome et al. 2009). IL-17 has been
shown to induce effector T cell proliferation and also impede the ability of Treg cells to
regulate this proliferation. Also, the fact that IL-17 could stimulate IL-2 production by effector
T cells all may help explain the resistance of Th17 cells to suppression by Treg cells
(Crome et al. 2009).
202
4.4.6.1 Biology of NKT cells
NKT cells are a special kind of lymphocyte that bridges the adaptive immune system
with the innate immune system. Once activated, these cells can perform functions
ascribed to both Th and Tc cells, including cytokine production and release of
cytolytic molecules (Godfrey & Kronenberg 2004;Kawano et al. 1999). NKT cells
may promote the functions of CD4+CD25high T cells by secreting cytokines, including
IL-2 and TGF-β, and modulate both Th1 and Th2-associated immunity (Godfrey et al.
2000;La Cava, Van Kaer, & Fu 2006). Similar to CD4+CD25+ Tregs, iNKT cells have
been identified to express CD25 and regulate a range of immune responses
(Godfrey & Kronenberg 2004). Innate production of IL-17 by this group of cells was
discovered recently in human as well (Rachitskaya et al. 2008).
4.4.6.2 NKT cells and Behcet’s disease
In BD, a decreased frequency of NKT cells in the peripheral circulation was observed
in patients with neurological manifestations, contrasting with a high percentage of
these cells within the CSF mononuclear cells. The difference was considered due to
migration of unimpaired NKT cells toward the inflammatory sites to exert their
regulatory function. These NKT cells were found to be biased towards a Th1
phenotype (Hamzaoui et al. 2006). However, in a separate study, CD3+CD56+ cells,
especially the CD8+CD56+ subset, were reported to increase significantly in both the
aqueous humor and peripheral blood of BD patients with uveitis compared with
healthy controls and patients with idiopathic anterior uveitis (Yu et al. 2004). Similar
increase of CD4+CD56+ T cells in the peripheral blood of BD patients were
described as well (Eksioglu-Demiralp et al. 1999a). Therefore, these cells may play
a role in the pathogenesis of BD, but their precise role remains to be clarified.
Analysing our data, no significant influence on NKT cell populations by IFN-α therapy
was detected.
203
4.4.7 The potential influence of systemic steroids and immunosuppressants
As the majority of our BD patients were still taking various combinations of steroids
and other immunosuppressants. Their potential effects on Th17 and Treg cells are
discussed in this section.
4.4.7.1 The immunomodulatory effects on IL-17
In one report, methylprednisolone (MP), a synthetic glucocorticoid, was shown to
partially block PMA/ionomycin-triggered IL-17 production by lymphocytes from
healthy donors in vitro (Ziolkowska et al. 2000). Interestingly, IL-17 production was
reported to be less sensitive than IFN-γ production to the influence of MP
(Momcilovic et al. 2008). Also, it was recently demonstrated that intravenous MP
enhanced Treg cells and their expression of functional molecules including IL-10 in
patients with MS two days after treatment. However, the levels returned to baseline
values by 6 weeks post-treatment (Braitch et al. 2008).
Cyclosporine A was shown to significantly block IL-17 production by polyclonally
stimulated PBMCs as well as CD4+ and CD8+ T cells from both BD patients and
normal controls. The ex vivo production of IL-17 by PBMCs was also significantly
inhibited in BD patients with active uveitis after 1 and 3 months of cyclosporine A
treatment in ELISA experiments (Chi et al. 2010). Compared to corticosteroids,
cyclosporine A was found to have even greater inhibitory action on IL-17.
Furthermore, the presence of cyclosporine A in cell cultures was observed to
significantly downregulate IL-17 production by memory Th17 cells at both protein
and mRNA levels in healthy individuals and RA patients (Zhang et al. 2008).
Mycophenolic acid was shown to inhibit IL-17 production induced by IL-15 in
peripheral blood lymphocytes. Methotrexate, however, did not exhibit any effect on
the production of IL-17 (Gonzalez-Alvaro et al. 2009).

204
4.4.7.2 The immunomodulatory effects on Treg cells
It was reported that steroid treatment resulted in a significant increase in Foxp3 and
IL-10 mRNA expression by freshly isolated and unstimulated CD4+ T cells in patients
with moderate to severe asthma. In vitro, 6 and 24 hours of dexamethasone
treatment of healthy donor CD4+ T cells also led to an upregulation in Foxp3 mRNA
expression (Karagiannidis et al. 2004).
On the other hand, calcineurin inhibitors such as cyclosporine were found to be
damaging to Foxp3+ Tregs as high blood levels of these correlated with lower Foxp3+
Treg frequency in liver transplant patients (San Segundo et al. 2007).
Conversion of immunosuppressive treatment from calcineurin inhibitors to
mycophenolate mofetil in liver transplant recipients, however, resulted in the
enrichment of CD25+Foxp3+ T cells in peripheral blood after 6 months (Demirkiran et
al. 2009).
4.5 Summary of findings
We demonstrated that 6 months of subcutaneous IFN-α2b therapy can result in
lower amount of peripheral blood Th17 cells in BD patients. On the other hand,
CD4+Foxp3+ Treg cell populations, especially CD4+CD25high T cells, were augmented
following IFN-α2b treatment in these patients. Notably, both of these effects were
enduring as they were observed even after cessation of IFN-α therapy. Also, a
tendency to upregulate the production levels of IL-10 and TGF-β by T cells was
detected after treatment with IFN-α. This increase in immunoregulatory cytokine levels
could assist in the regulation of Th cells and promote the number and function of Treg
subsets. Regarding NKT cells, however, no significant result was able to be observed.
205
Chapter 5
The in vitro effects of interferon-alpha 2a & 2b on IFN-γ and IL-17 expression
by CD4+ and CD8+ T cells in healthy donors
5.1 Introduction
Before the discovery of Th17 subset as a distinct CD4+ effector population, Th1 cells
were long considered to be the major effectors in multiple autoimmune and immune-
mediated diseases. Preferential skewing of the immune response toward the Th1
pathway was also demonstrated in BD patients (Li et al. 2003). As IL-17 has
profound pro-inflammatory effects and induces tissue damage during the course of
various immune-mediated diseases, Th17 cells are increasingly being recognised to
have a key role in autoimmune and inflammatory diseases (Kunz & Ibrahim 2009).
IL-17A and IL-17F can form homo- or hetero-dimers. This can give rise to three
forms of IL-17: IL-17A/A, IL-17A/F and IL-17F/F, with potentially different biological
activities. A study on mouse Th17 cells showed that IL-17A/A appears to have the
strongest function in tissue inflammation, followed by IL-17A/F. However, polarised
Th17 cells express IL-17F/A in higher amounts than either homodimer (Liang et al.
2007). IL-17 (A and F) induces production of a broad range of pro-inflammatory
cytokines and chemokines, including IL-6, colony-stimulating factors, CXC
chemokines, human β-defensin-2 and metalloproteinases, by a variety of cells
(Weaver et al. 2007). Dysregulated IL-17 has been implicated to cause severe
pathogenic consequences. Recently, increased expression of IL-17 and IL-23 has
been identified in BD patients with active uveitis compared to normal controls and
patients in remission (Chi et al. 2008).
As a result, when investigating the immunomodulatory effects of IFN-α treatment,
analysing changes in T cell subsets producing IFN-γ and IL-17 became one of our
main focus. In Chapter 3, we have shown that subcutaneous IFN-α2b therapy has
the tendency to augment IFN-γ levels in T cells and suppress Th17 cells in BD
patients in vivo. In this chapter, we concentrate on exploring the in vitro effects of
exogenous IFN-α on IL-17- and IFN-γ-producing T cells. In order to establish
206
adequate amount of Th17 cells to test the effects of exogenous IFN-α, various stimuli,
including LPS, zymosan, Candida albicans, alpha-tropomyosin, PDS-Ag, and all-
trans retinoic acid (ATRA) were used in an attempt to induce healthy donor PBMCs
to produce IL-17 in the preliminary tests. These stimuli were chosen based on
previously reported links with Th17 or Behcet’s disease. The only exception is ATRA,
which is expected to have a suppressive rather than augmentation effect on Th17
cells. Polyclonal stimulation using anti-CD3/CD28 Ab and PMA/ionomycin was
evaluated as well.
LPS is the major component of the outer membrane of Gram-negative bacteria, and
activates TLR4. It promotes the secretion of pro-inflammatory cytokines in many cell
types. Low titre of antibodies against LPS have been found in BD patients' sera
(Cuchacovich et al. 2005), and LPS-stimulated production of TNF-α, IL-1, IL-6 and
IL-8 has been observed to be significantly increased in patients with BD (Mege et al.
1993). LPS-conditioned medium was found to exhibit strong IL-17 inducing activity
in naive human CD4+ T cells after 5 days in culture with CD3/CD28 polyclonal
activation. Conditioned medium was derived from supernatants of PBMCs cultured
for 72 hours with LPS, and IL-17 concentrations were measured by ELISA (Kattah et
al. 2008). Similarly, stimulation of healthy donor PBMCs with 1mg/ml LPS has been
shown to induce increased concentration of IL-17 in supernatants collected after 24
hours of culture as measured by ELISA (Moschen et al. 2008).
Zymosan, a yeast cell-wall component, binds to TLR2 and human dectin-1 (β-glucan
receptor) (Dillon et al. 2006). It was demonstrated that the supernatants of
zymosan-stimulated DCs contained IL-1β and IL-23 and induced production of IL-17
and IL-22 in naive human CD4+ T cells stimulated with anti-CD3 and anti-CD28. In
the experiments, naive cells were initially stimulated with anti-CD3 and anti-CD28 Ab
and were washed and stimulated again with anti-CD3 Ab and 10ng/ml PMA after 5
days. Supernatants were collected another 18 hours later (Gerosa et al. 2008).
C. albicans is a dimorphic organism that can take either a yeast form (spherical
morphology) or hyphal form (rod morphology). In the presence of heat-killed C.
albicans yeast or hyphae, ELISA measurements of IFN-γ and IL-17 concentrations in
5 day culture supernatants of naive CD4+ T cells stimulated with autologous
207
monocytes and anti-CD3 were performed. C. albicans in the yeast form induced the
differentiation of IFN-γ-producing cells, whereas C. albicans in the hyphal form
primed naive T cell differentiation toward Th17 cells. Also, the yeast form of this
fungus induced monocyte-derived DCs to produce IL-12 and at high concentrations,
IL-23, as revealed in 48 hour culture supernatants. On the other hand, C. albicans
hyphae selectively triggered IL-23 production (Acosta-Rodriguez et al. 2007).
Retinal-S antigen (S-Ag) is a candidate autoantigen in BD. The protein is found
mainly in the retina, and an immune mediated response to this antigen can only
occur after eye damage due to uveitis. T cell responses against S-Ag are present in
various types of human uveitis, including BD. Among the immunodominant epitopes
of S-Ag, an epitope named PDS-Ag (aa 342–355) is found to share homology with
HLA-B51 and HLA-B27, which are linked to uveitis in BD (Direskeneli 2001).
Tropomyosins are a family of proteins expressed in muscle as well as in non-muscle
cells including epithelial cells, fibroblasts, and platelets. A significantly increased
lymphoproliferative response to alpha-tropomyosin as well as autoantibodies to
tropomyosin have been reported in BD patients with posterior uveitis (Mahesh et al.
2005). These abnormalities support a possible role for alpha-tropomyosin as a self-
antigen in patients with BD.
A crucial regulatory role for retinoic acid in promoting Foxp3 induction and inhibiting
Th17 cell differentiation has been identified (Elias et al. 2008;Mucida et al. 2007).
This is in accordance to a recent report that IL-17 secretion by naive human CD4+ T
cells was partially inhibited by addition of exogenous retinoic acid after 5 days in
culture with polyclonal activation in the presence of Th17 polarising mileu (TGF-β,
IL-1β, IL-6 and IL-23) (Kattah et al. 2008).
5.2 Aims
Having established the capacity of subcutaneous IFN-α2b to upregulate T cells
producing IFN-γ and suppress Th17 cells in vivo in Chapters 3 and 4, the aim of this
chapter is to investigate the in vitro immunomodulatory effects of IFN-α on CD4+ as
208
well as CD8+ T cells producing IFN-γ and IL-17. As the effect of IFN-α on Th1-type
cytokines is more established, the focus is therefore more on T cells producing IL-17
in this chapter. Assays are set up using healthy donor PBMCs to test the influence
of various concentrations of IFN-α2a and IFN-α2b on T cells and the kinetics of the
interactions.
5.3 Results
5.3.1 Preliminary experiments to establish Th1/Th17 test models with
antigens and polyclonal stimulation
In order to develop in vitro models with adequate amount of Th17 cells to test the
effects of IFN-α on these cells, healthy donor PBMCs were either activated with
various concentrations of antigens or stimulated with polyclonal stimuli for 24 hours
before intracellular cytokine staining and preparation for flow cytometry. Untreated
cultures were included as part of the experiments as well. Cytokine expression was
analysed by gating on CD4+ lymphocyte populations.
It was found that antigens, including LPS, zymosan and candida, promoted very low
levels of IFN-γ (Fig 5.1a) and IL-17 (Fig 5.1b) expression in CD4+ T cells regardless
of the concentrations of antigens used, and as expected the levels were even lower
in the case of ATRA. Subsequently, extra 15 hours of incubation was tested for cell
cultures with LPS and candida yeast extract so there would be more time for
interactions between cells and antigens. However, the increase in production levels
of IFN-γ and IL-17 achieved was far from satisfactory. Concurrent use of LPS and
CD3/CD28 stimulation was evaluated as well, but the effect was no more than using
anti-CD3/CD28 Ab alone.
Thus, it was decided to test BD patient PBMCs with BD-related antigens, such as
alpha-tropomyosin and PDS-Ag as a trial. However, similar results were observed
and IFN-γ and IL-17 production levels achieved were no better than using LPS on
healthy donor PBMCs. Originally, HSP60 was going to be tested as well if the trials
on alpha-tropomyosin and PDS-Ag were successful. Because of the very low
209
production levels achieved, it was decided not to use up any more of the precious
BD patient PBMCs to test the immunomodulatory ability of HSP60 and other BD-
related antigens.
Fortunately, substantially higher production levels of both IFN-γ and IL-17 were able
to be induced in CD4+ T cells consistently with polyclonal stimulation such as anti-
CD3/CD28 Ab and especially PMA/ionomycin (Fig 5.1a and Fig 5.1b). These results
were repeatable as shown by the data in nine separate experiments each for Th1
and Th17 cells despite the fact that the experiments were performed in singles.
As a result, healthy donor PBMCs activated with anti-CD3/CD28 Ab and/or
PMA/ionomycin were chosen as the basis for test models in subsequent in vitro
experiments and further preliminary experiments with antigens were not carried out.
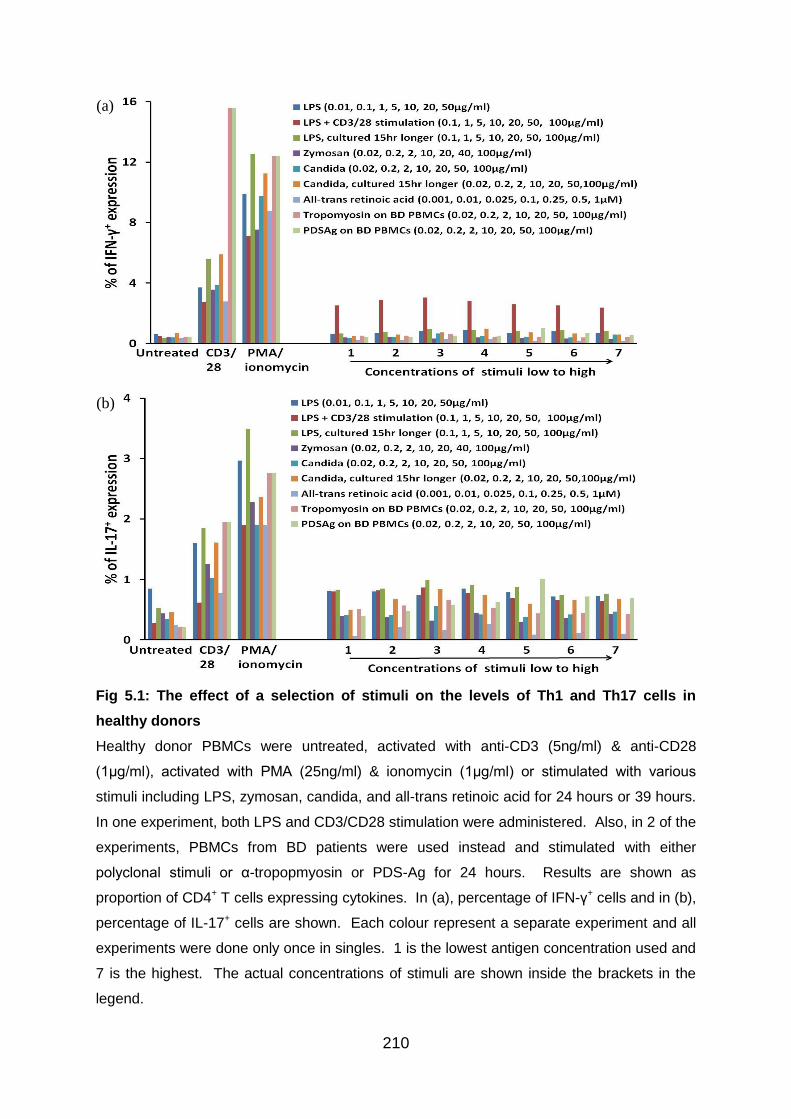
210
Fig 5.1: The effect of a selection of stimuli on the levels of Th1 and Th17 cells in
healthy donors
Healthy donor PBMCs were untreated, activated with anti-CD3 (5ng/ml) & anti-CD28
(1μg/ml), activated with PMA (25ng/ml) & ionomycin (1μg/ml) or stimulated with various
stimuli including LPS, zymosan, candida, and all-trans retinoic acid for 24 hours or 39 hours.
In one experiment, both LPS and CD3/CD28 stimulation were administered. Also, in 2 of the
experiments, PBMCs from BD patients were used instead and stimulated with either
polyclonal stimuli or α-tropopmyosin or PDS-Ag for 24 hours. Results are shown as
proportion of CD4+ T cells expressing cytokines. In (a), percentage of IFN-γ+ cells and in (b),
percentage of IL-17+ cells are shown. Each colour represent a separate experiment and all
experiments were done only once in singles. 1 is the lowest antigen concentration used and
7 is the highest. The actual concentrations of stimuli are shown inside the brackets in the
legend.
(b)
(a)

211
5.3.2 Preliminary experiments to establish the needs to rest cells in the
medium after thawing and the effects of adding suboptimal IL-2
Next, it was examined whether resting healthy donor PBMCs for one day in culture
medium with or without addition of suboptimal amount of IL-2 after thawing could
lead to recovery of functional ability by “stunned” cells and thus enhance the
proportions of T cells producing cytokines.
In terms of IFN-γ production by CD4+ T cells (Fig 5.2a), a small upregulation of
cytokine levels was evident in PHA stimulated cultures with one day resting and
presence of IL-2 (p<0.01). In PMA/ionomycin stimulated cultures, an increase in the
proportion of CD4+ T cells expressing IFN-γ was observed with one day resting
whether IL-2 was added or not. However, these results with PMA/ionomycin
stimulation were not statistically significant. On the other hand, in CD3/CD28
stimulated cultures, IFN-γ production by CD4+ T cells was downregulated with
resting, whether IL-2 was added (p<0.05) or not (p<0.01). These inconsistent results
may be able to be resolved with repeating experiments, but these were not carried
out as the main focus was more on setting up reliable Th17 models using the limited
resources available.
In terms of IL-17 production by CD4+ T cells (Fig 5.2b), one day resting in culture
medium with or without the addition of IL-2 after thawing did not have any significant
impact on the proportion of CD4+ T cells expressing IL-17. Anti-CD3/CD28 Ab and
PHA were comparable in their capacity to stimulate IL-17 expression and IL-17-
enhancing effect achieved was far greater with PMA/ionomycin stimulation. Overall,
the findings suggest there is no advantage in resting PBMCs or adding suboptimal
concentration of IL-2 for experiments involving Th17 cell populations.
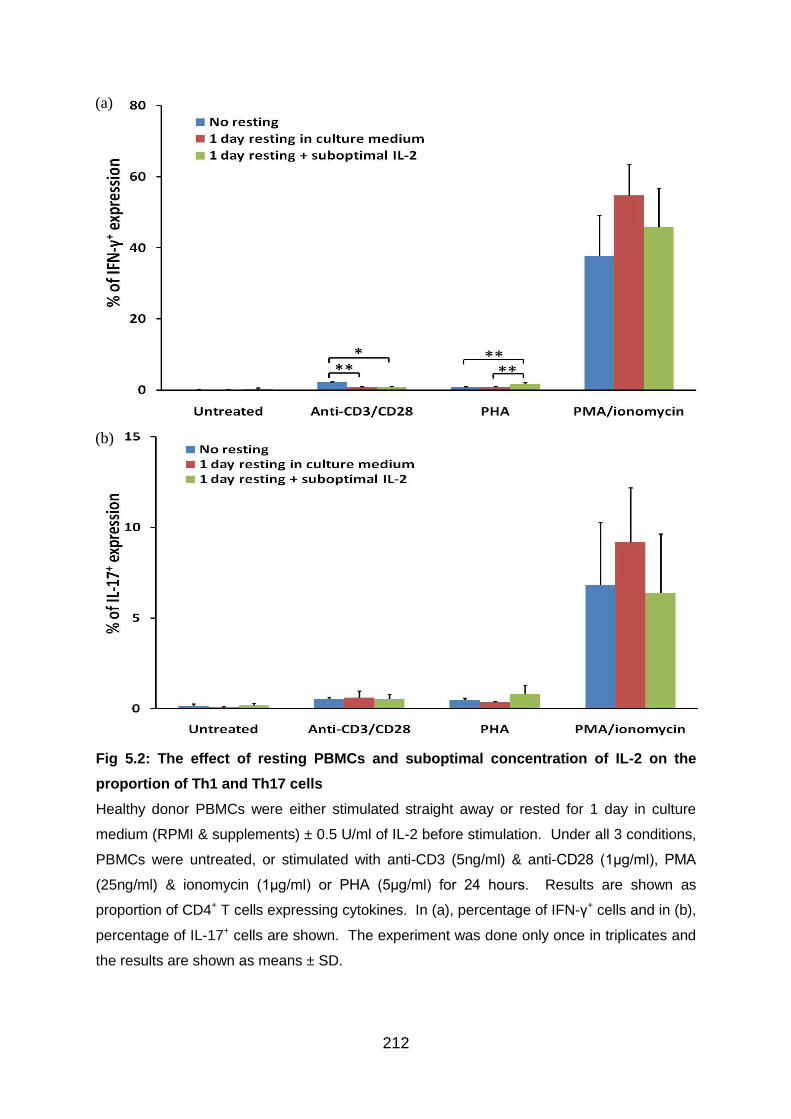
212
Fig 5.2: The effect of resting PBMCs and suboptimal concentration of IL-2 on the
proportion of Th1 and Th17 cells
Healthy donor PBMCs were either stimulated straight away or rested for 1 day in culture
medium (RPMI & supplements) ± 0.5 U/ml of IL-2 before stimulation. Under all 3 conditions,
PBMCs were untreated, or stimulated with anti-CD3 (5ng/ml) & anti-CD28 (1μg/ml), PMA
(25ng/ml) & ionomycin (1μg/ml) or PHA (5μg/ml) for 24 hours. Results are shown as
proportion of CD4+ T cells expressing cytokines. In (a), percentage of IFN-γ+ cells and in (b),
percentage of IL-17+ cells are shown. The experiment was done only once in triplicates and
the results are shown as means ± SD.
(a)
(b)
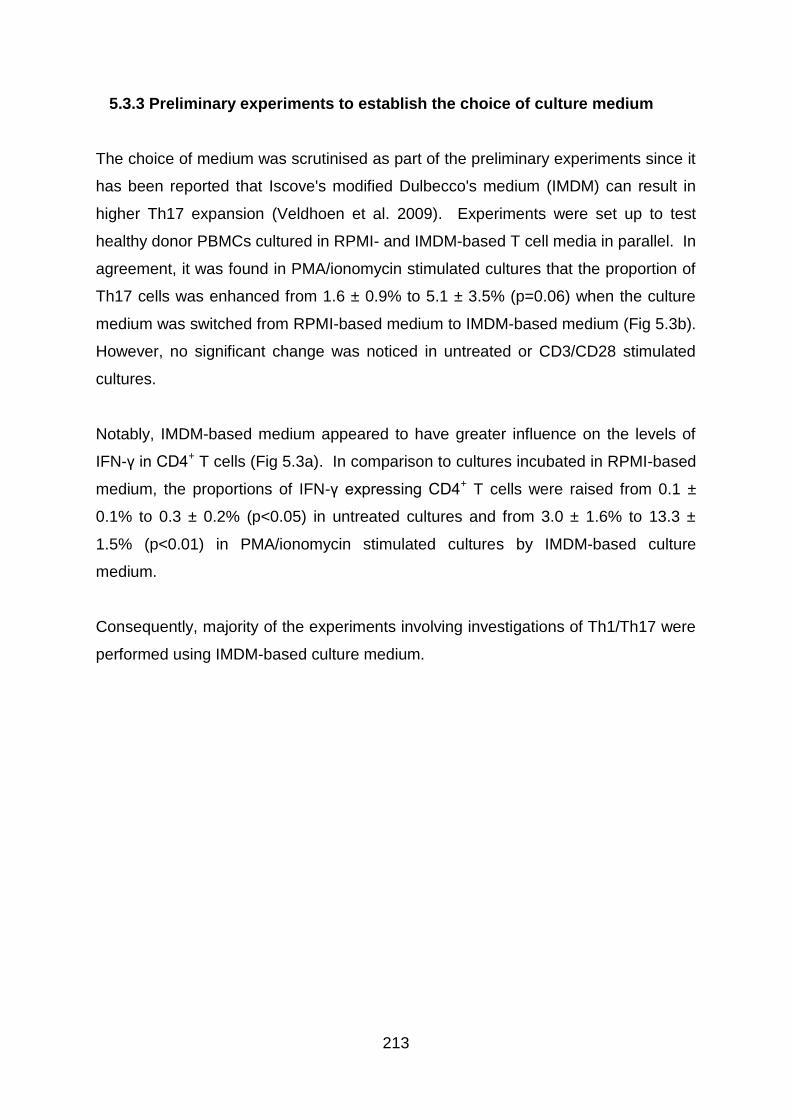
213
5.3.3 Preliminary experiments to establish the choice of culture medium
The choice of medium was scrutinised as part of the preliminary experiments since it
has been reported that Iscove's modified Dulbecco's medium (IMDM) can result in
higher Th17 expansion (Veldhoen et al. 2009). Experiments were set up to test
healthy donor PBMCs cultured in RPMI- and IMDM-based T cell media in parallel. In
agreement, it was found in PMA/ionomycin stimulated cultures that the proportion of
Th17 cells was enhanced from 1.6 ± 0.9% to 5.1 ± 3.5% (p=0.06) when the culture
medium was switched from RPMI-based medium to IMDM-based medium (Fig 5.3b).
However, no significant change was noticed in untreated or CD3/CD28 stimulated
cultures.
Notably, IMDM-based medium appeared to have greater influence on the levels of
IFN-γ in CD4+ T cells (Fig 5.3a). In comparison to cultures incubated in RPMI-based
medium, the proportions of IFN-γ expressing CD4+ T cells were raised from 0.1 ±
0.1% to 0.3 ± 0.2% (p<0.05) in untreated cultures and from 3.0 ± 1.6% to 13.3 ±
1.5% (p<0.01) in PMA/ionomycin stimulated cultures by IMDM-based culture
medium.
Consequently, majority of the experiments involving investigations of Th1/Th17 were
performed using IMDM-based culture medium.
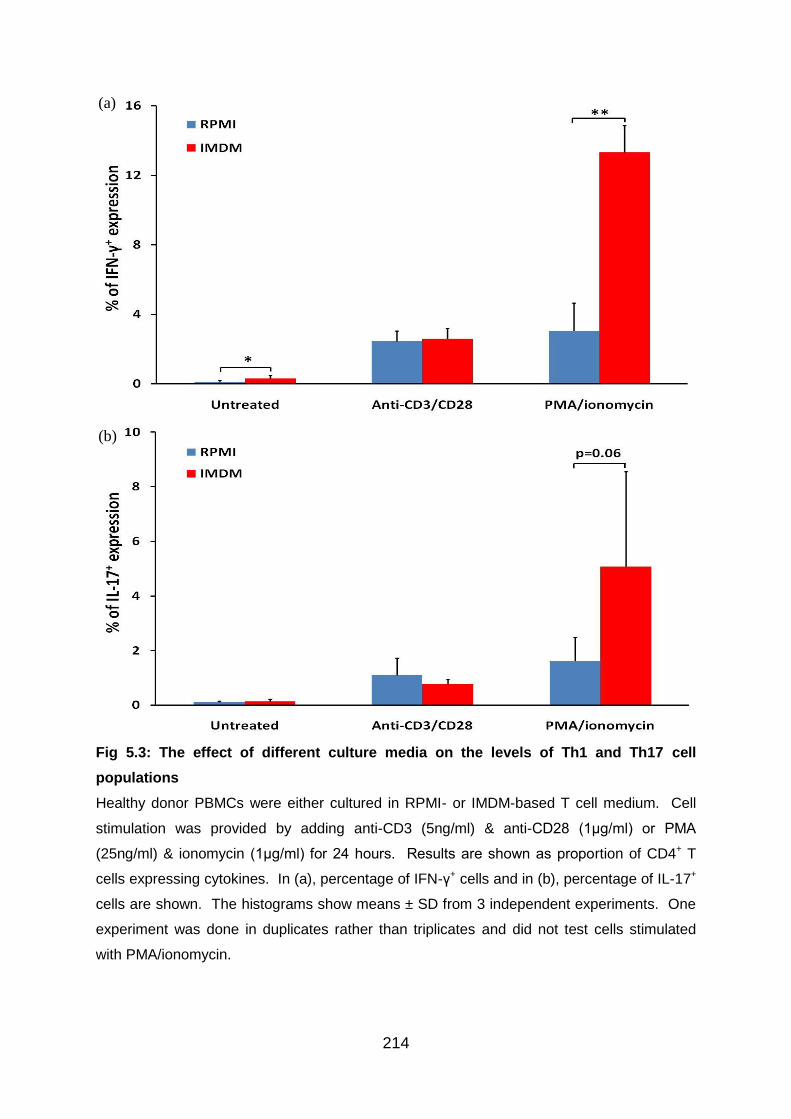
214
Fig 5.3: The effect of different culture media on the levels of Th1 and Th17 cell
populations
Healthy donor PBMCs were either cultured in RPMI- or IMDM-based T cell medium. Cell
stimulation was provided by adding anti-CD3 (5ng/ml) & anti-CD28 (1μg/ml) or PMA
(25ng/ml) & ionomycin (1μg/ml) for 24 hours. Results are shown as proportion of CD4+ T
cells expressing cytokines. In (a), percentage of IFN-γ+ cells and in (b), percentage of IL-17+
cells are shown. The histograms show means ± SD from 3 independent experiments. One
experiment was done in duplicates rather than triplicates and did not test cells stimulated
with PMA/ionomycin.
(a)
(b)
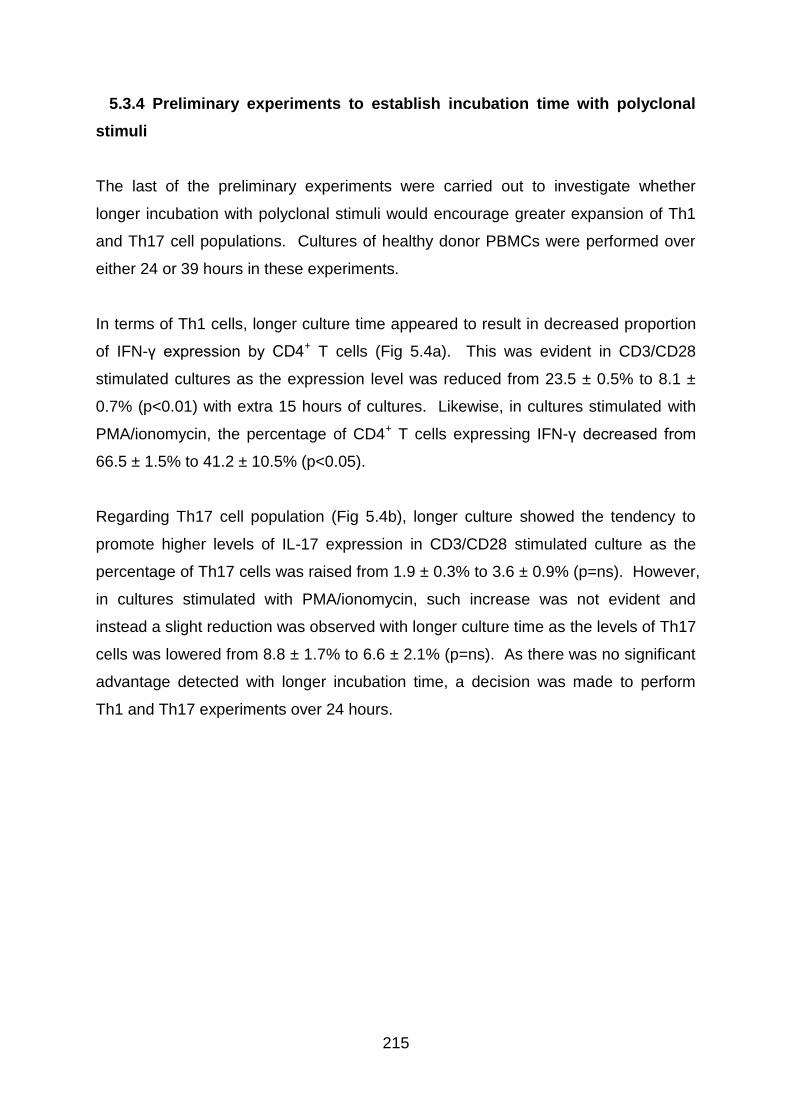
215
5.3.4 Preliminary experiments to establish incubation time with polyclonal
stimuli
The last of the preliminary experiments were carried out to investigate whether
longer incubation with polyclonal stimuli would encourage greater expansion of Th1
and Th17 cell populations. Cultures of healthy donor PBMCs were performed over
either 24 or 39 hours in these experiments.
In terms of Th1 cells, longer culture time appeared to result in decreased proportion
of IFN-γ expression by CD4+ T cells (Fig 5.4a). This was evident in CD3/CD28
stimulated cultures as the expression level was reduced from 23.5 ± 0.5% to 8.1 ±
0.7% (p<0.01) with extra 15 hours of cultures. Likewise, in cultures stimulated with
PMA/ionomycin, the percentage of CD4+ T cells expressing IFN-γ decreased from
66.5 ± 1.5% to 41.2 ± 10.5% (p<0.05).
Regarding Th17 cell population (Fig 5.4b), longer culture showed the tendency to
promote higher levels of IL-17 expression in CD3/CD28 stimulated culture as the
percentage of Th17 cells was raised from 1.9 ± 0.3% to 3.6 ± 0.9% (p=ns). However,
in cultures stimulated with PMA/ionomycin, such increase was not evident and
instead a slight reduction was observed with longer culture time as the levels of Th17
cells was lowered from 8.8 ± 1.7% to 6.6 ± 2.1% (p=ns). As there was no significant
advantage detected with longer incubation time, a decision was made to perform
Th1 and Th17 experiments over 24 hours.
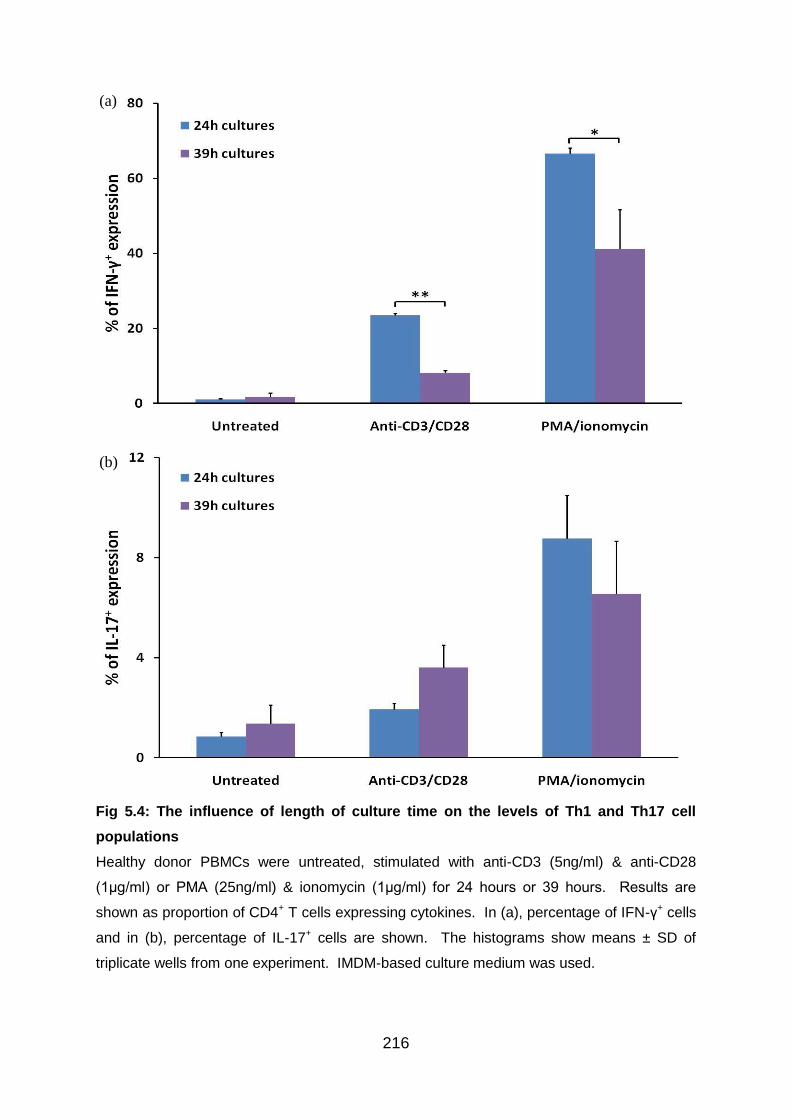
216
Fig 5.4: The influence of length of culture time on the levels of Th1 and Th17 cell
populations
Healthy donor PBMCs were untreated, stimulated with anti-CD3 (5ng/ml) & anti-CD28
(1μg/ml) or PMA (25ng/ml) & ionomycin (1μg/ml) for 24 hours or 39 hours. Results are
shown as proportion of CD4+ T cells expressing cytokines. In (a), percentage of IFN-γ+ cells
and in (b), percentage of IL-17+ cells are shown. The histograms show means ± SD of
triplicate wells from one experiment. IMDM-based culture medium was used.
(a)
(b)
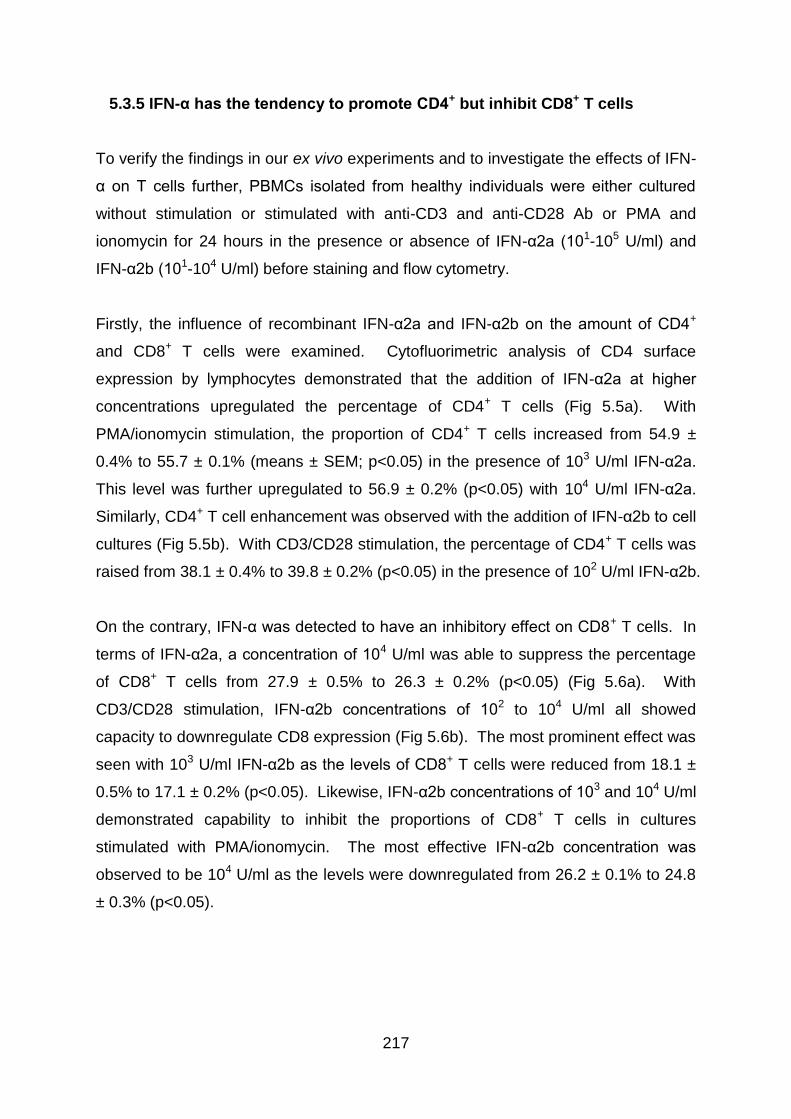
217
5.3.5 IFN-α has the tendency to promote CD4+ but inhibit CD8+ T cells
To verify the findings in our ex vivo experiments and to investigate the effects of IFN-
α on T cells further, PBMCs isolated from healthy individuals were either cultured
without stimulation or stimulated with anti-CD3 and anti-CD28 Ab or PMA and
ionomycin for 24 hours in the presence or absence of IFN-α2a (101-105 U/ml) and
IFN-α2b (101-104 U/ml) before staining and flow cytometry.
Firstly, the influence of recombinant IFN-α2a and IFN-α2b on the amount of CD4+
and CD8+ T cells were examined. Cytofluorimetric analysis of CD4 surface
expression by lymphocytes demonstrated that the addition of IFN-α2a at higher
concentrations upregulated the percentage of CD4+ T cells (Fig 5.5a). With
PMA/ionomycin stimulation, the proportion of CD4+ T cells increased from 54.9 ±
0.4% to 55.7 ± 0.1% (means ± SEM; p<0.05) in the presence of 103 U/ml IFN-α2a.
This level was further upregulated to 56.9 ± 0.2% (p<0.05) with 104 U/ml IFN-α2a.
Similarly, CD4+ T cell enhancement was observed with the addition of IFN-α2b to cell
cultures (Fig 5.5b). With CD3/CD28 stimulation, the percentage of CD4+ T cells was
raised from 38.1 ± 0.4% to 39.8 ± 0.2% (p<0.05) in the presence of 102 U/ml IFN-α2b.
On the contrary, IFN-α was detected to have an inhibitory effect on CD8+ T cells. In
terms of IFN-α2a, a concentration of 104 U/ml was able to suppress the percentage
of CD8+ T cells from 27.9 ± 0.5% to 26.3 ± 0.2% (p<0.05) (Fig 5.6a). With
CD3/CD28 stimulation, IFN-α2b concentrations of 102 to 104 U/ml all showed
capacity to downregulate CD8 expression (Fig 5.6b). The most prominent effect was
seen with 103 U/ml IFN-α2b as the levels of CD8+ T cells were reduced from 18.1 ±
0.5% to 17.1 ± 0.2% (p<0.05). Likewise, IFN-α2b concentrations of 103 and 104 U/ml
demonstrated capability to inhibit the proportions of CD8+ T cells in cultures
stimulated with PMA/ionomycin. The most effective IFN-α2b concentration was
observed to be 104 U/ml as the levels were downregulated from 26.2 ± 0.1% to 24.8
± 0.3% (p<0.05).
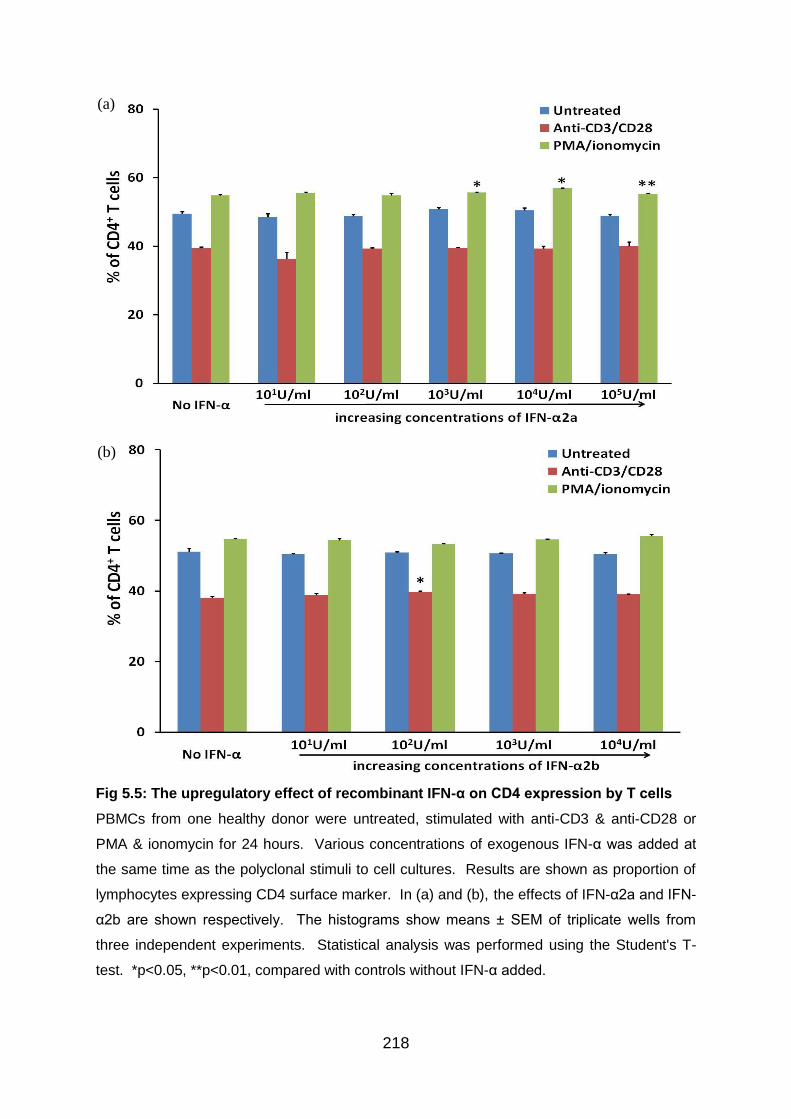
218
Fig 5.5: The upregulatory effect of recombinant IFN-α on CD4 expression by T cells
PBMCs from one healthy donor were untreated, stimulated with anti-CD3 & anti-CD28 or
PMA & ionomycin for 24 hours. Various concentrations of exogenous IFN-α was added at
the same time as the polyclonal stimuli to cell cultures. Results are shown as proportion of
lymphocytes expressing CD4 surface marker. In (a) and (b), the effects of IFN-α2a and IFN-
α2b are shown respectively. The histograms show means ± SEM of triplicate wells from
three independent experiments. Statistical analysis was performed using the Student's T-
test. *p<0.05, **p<0.01, compared with controls without IFN-α added.
(a)
(b)
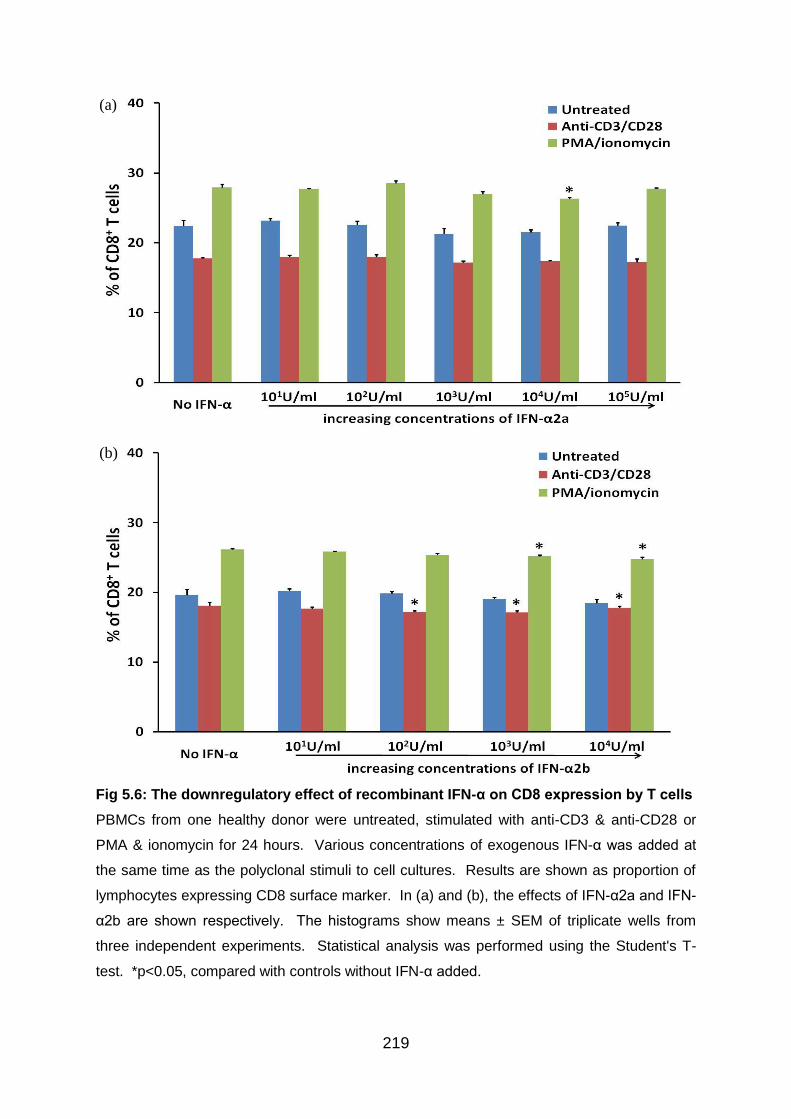
219
Fig 5.6: The downregulatory effect of recombinant IFN-α on CD8 expression by T cells
PBMCs from one healthy donor were untreated, stimulated with anti-CD3 & anti-CD28 or
PMA & ionomycin for 24 hours. Various concentrations of exogenous IFN-α was added at
the same time as the polyclonal stimuli to cell cultures. Results are shown as proportion of
lymphocytes expressing CD8 surface marker. In (a) and (b), the effects of IFN-α2a and IFN-
α2b are shown respectively. The histograms show means ± SEM of triplicate wells from
three independent experiments. Statistical analysis was performed using the Student's T-
test. *p<0.05, compared with controls without IFN-α added.
(a)
(b)
220
5.3.6 IFN-α induces IFN-γ production by both CD4+ and CD8+ T cells
Results from Chapter 3 showed that Th1 response can be promoted by 6 months of
subcutaneous IFN-α2b therapy. In order to verify this finding, PBMCs isolated from
healthy individuals were cultured without stimulation or stimulated with anti-CD3 and
anti-CD28 Ab or PMA and ionomycin in the presence or absence of IFN-α2a (101-
105 U/ml) and IFN-α2b (101-104 U/ml) before intracellular cytokine staining and flow
cytometry. Cytokine expression was analysed by gating on either CD4+/CD3+CD8-
or CD8+ lymphocyte populations to study the ability of IFN-α to induce IFN-γ
expression in CD4+ and CD8+ T cells in vitro.
The data revealed that Th1 response was consistently promoted by the presence of
IFN-α in cultures, especially with higher concentrations. In untreated cultures, the
proportion of CD4+ T cells producing IFN-γ was upregulated with 105 U/ml of IFN-
α2a from 1.4 ± 0.4% to 2.3 ± 0.3% (means ± SD; p<0.05) (Fig 5.7a). Similarly, IFN-
α2a concentrations of 103 and 104 U/ml enhanced Th1 cell percentage from 13.5 ±
0.4% to 17.5 ± 0.9% (p<0.01) and 18.1 ± 0.7 (p<0.01) respectively with CD3/CD28
stimulation. With PMA/ionomycin stimulation, a dose-dependent, upregulating effect
of IFN-α2a on Th1 cells was detected. The peak response was seen with a IFN-α2a
concentration of 105 U/ml, and the proportion of CD4+ T cells producing IFN-γ was
raised from a level of 58.8 ± 0.7% to 63.9 ± 0.8% (p<0.01). In correspondence,
addition of IFN-α2b with concentrations of 103 and 104 U/ml to cultures increased
Th1 cell percentage from 54.5 ± 1.0% to 57.7 ± 0.5% (p<0.01) and 60.3 ± 0.6
(p<0.01) respectively with PMA/ionomycin stimulation (Fig 5.7b).
The data also showed that CD8+ T cells producing IFN-γ were induced by
exogenous IFN-α. In CD3/CD28 stimulated cultures, the proportion of IFN-γ
producing CD8+ T cells were elevated in a dose-dependent manner with IFN-α2a
(Fig 5.8a). In particular, a IFN-α2a concentration of 104 U/ml was demonstrated to
increase IFN-γ producing CD8+ T cells from 12.1 ± 0.8% to 20.1 ± 1.1% (p<0.01).
Similar trend was observed in untreated cultures and cultures activated with
PMA/ionomycin as well, but in both cases, the highest IFN-α2a concentration tested
of 105 U/ml was most the most potent. In agreement, IFN-α2b was found to be
equally effective in inducing CD8+ T cells producing IFN-γ, especially with a IFN-α2b

221
concentration of 104 U/ml (Fig 5.8b). With addition of 104 U/ml IFN-α2b, the
proportion of IFN-γ producing CD8+ T cells was upregulated from 0.9 ± 0.1% to 2.1 ±
0.5% (p<0.05) in untreated cultures, from 13.9 ± 1.0% to 20.8 ± 0.5% (p<0.01) in
CD3/CD28 stimulated cultures, and from 64.7 ± 1.1% to 69.8 ± 1.0% (p<0.01) in
cultures stimulated with PMA/ionomycin.
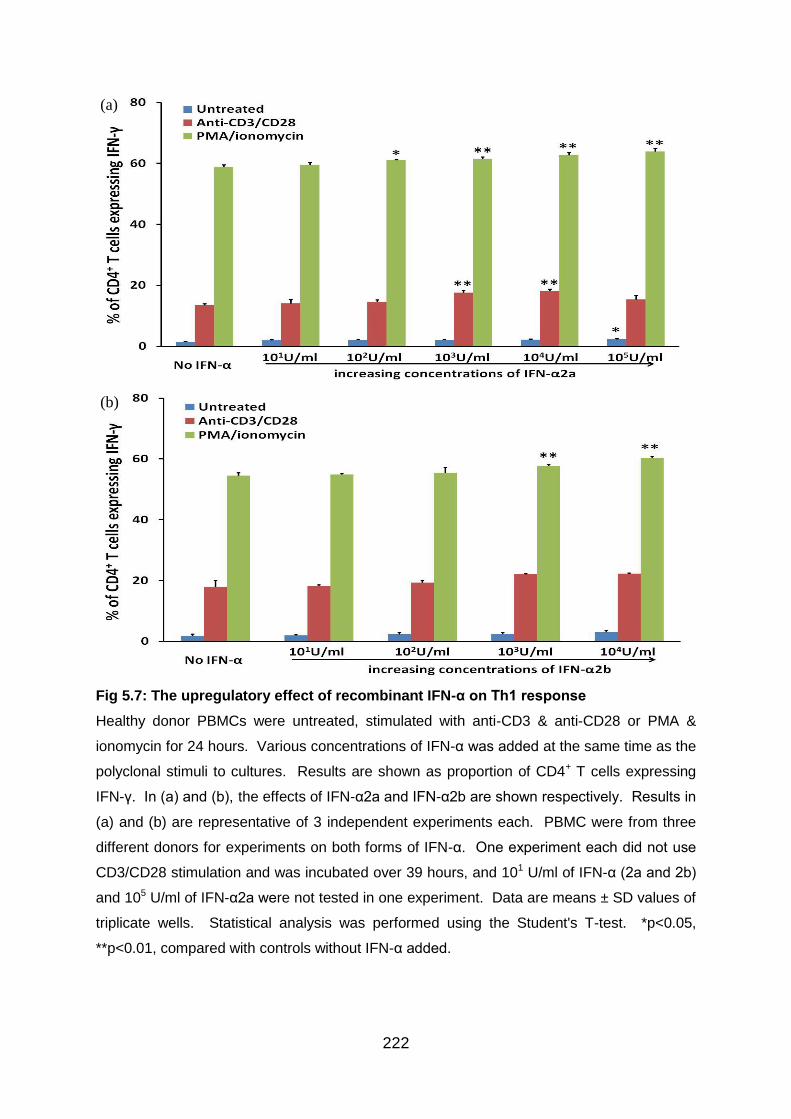
222
Fig 5.7: The upregulatory effect of recombinant IFN-α on Th1 response
Healthy donor PBMCs were untreated, stimulated with anti-CD3 & anti-CD28 or PMA &
ionomycin for 24 hours. Various concentrations of IFN-α was added at the same time as the
polyclonal stimuli to cultures. Results are shown as proportion of CD4+ T cells expressing
IFN-γ. In (a) and (b), the effects of IFN-α2a and IFN-α2b are shown respectively. Results in
(a) and (b) are representative of 3 independent experiments each. PBMC were from three
different donors for experiments on both forms of IFN-α. One experiment each did not use
CD3/CD28 stimulation and was incubated over 39 hours, and 101 U/ml of IFN-α (2a and 2b)
and 105 U/ml of IFN-α2a were not tested in one experiment. Data are means ± SD values of
triplicate wells. Statistical analysis was performed using the Student's T-test. *p<0.05,
**p<0.01, compared with controls without IFN-α added.
(a)
(b)
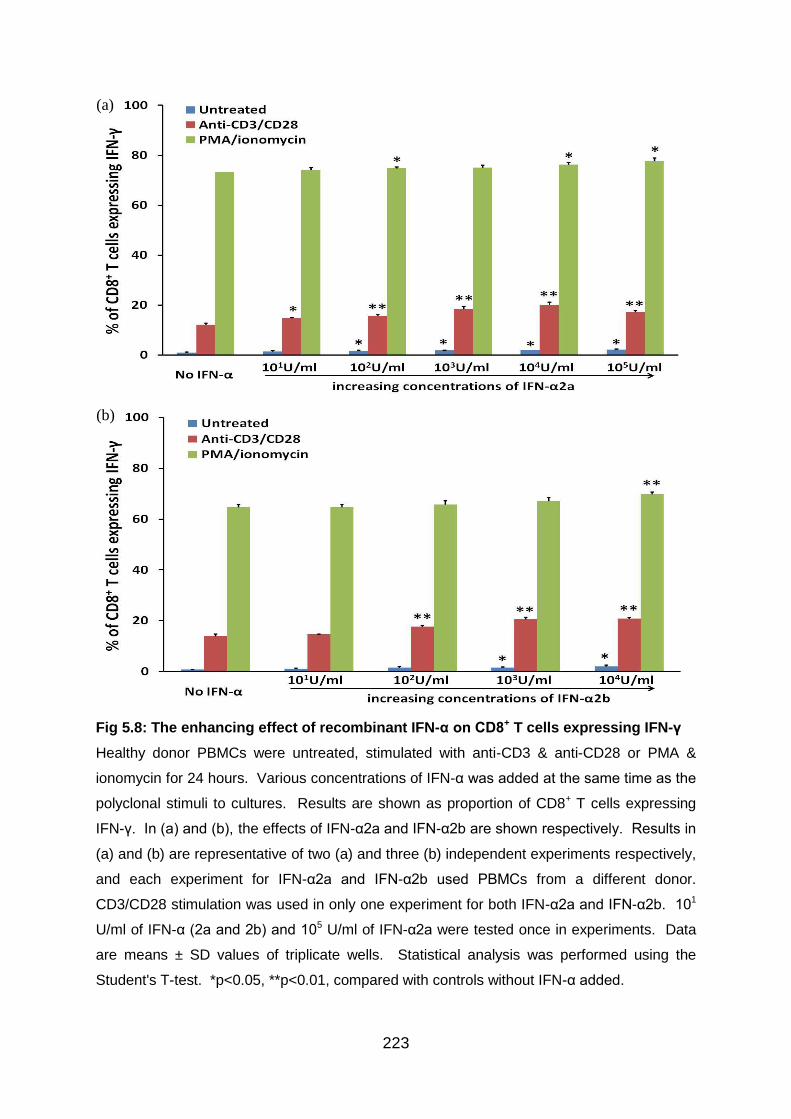
223
Fig 5.8: The enhancing effect of recombinant IFN-α on CD8+ T cells expressing IFN-γ
Healthy donor PBMCs were untreated, stimulated with anti-CD3 & anti-CD28 or PMA &
ionomycin for 24 hours. Various concentrations of IFN-α was added at the same time as the
polyclonal stimuli to cultures. Results are shown as proportion of CD8+ T cells expressing
IFN-γ. In (a) and (b), the effects of IFN-α2a and IFN-α2b are shown respectively. Results in
(a) and (b) are representative of two (a) and three (b) independent experiments respectively,
and each experiment for IFN-α2a and IFN-α2b used PBMCs from a different donor.
CD3/CD28 stimulation was used in only one experiment for both IFN-α2a and IFN-α2b. 101
U/ml of IFN-α (2a and 2b) and 105 U/ml of IFN-α2a were tested once in experiments. Data
are means ± SD values of triplicate wells. Statistical analysis was performed using the
Student's T-test. *p<0.05, **p<0.01, compared with controls without IFN-α added.
(a)
(b)
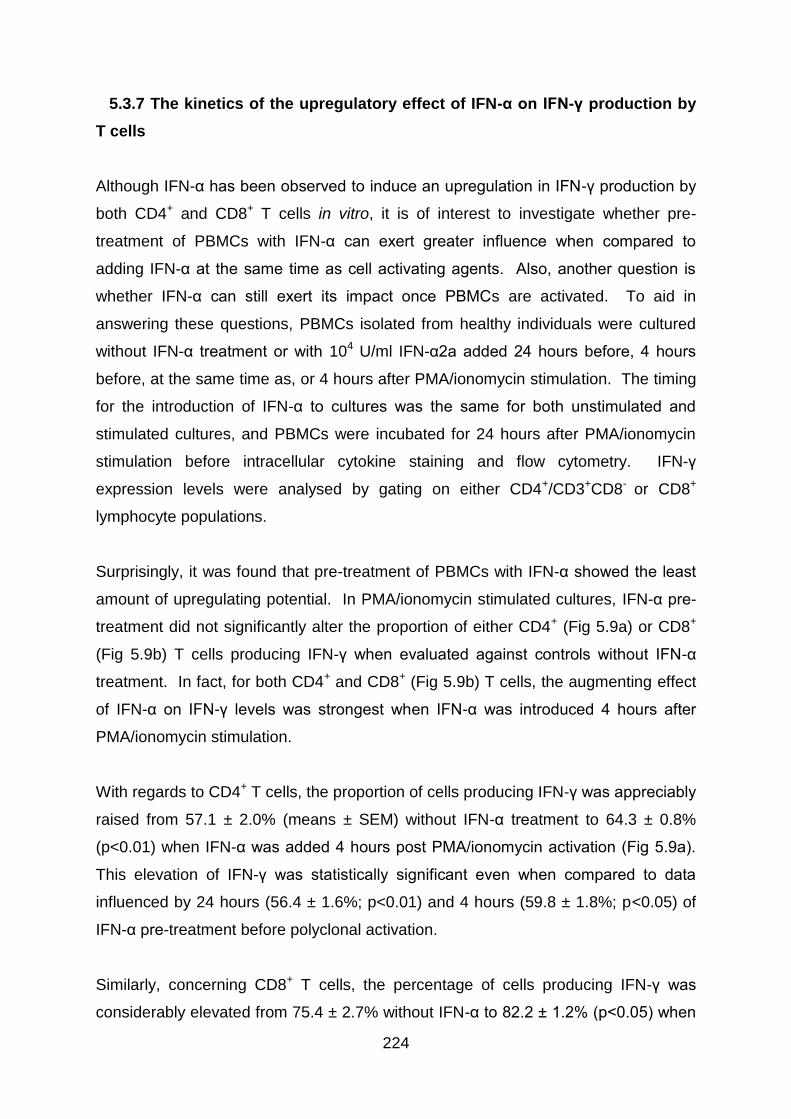
224
5.3.7 The kinetics of the upregulatory effect of IFN-α on IFN-γ production by
T cells
Although IFN-α has been observed to induce an upregulation in IFN-γ production by
both CD4+ and CD8+ T cells in vitro, it is of interest to investigate whether pre-
treatment of PBMCs with IFN-α can exert greater influence when compared to
adding IFN-α at the same time as cell activating agents. Also, another question is
whether IFN-α can still exert its impact once PBMCs are activated. To aid in
answering these questions, PBMCs isolated from healthy individuals were cultured
without IFN-α treatment or with 104 U/ml IFN-α2a added 24 hours before, 4 hours
before, at the same time as, or 4 hours after PMA/ionomycin stimulation. The timing
for the introduction of IFN-α to cultures was the same for both unstimulated and
stimulated cultures, and PBMCs were incubated for 24 hours after PMA/ionomycin
stimulation before intracellular cytokine staining and flow cytometry. IFN-γ
expression levels were analysed by gating on either CD4+/CD3+CD8- or CD8+
lymphocyte populations.
Surprisingly, it was found that pre-treatment of PBMCs with IFN-α showed the least
amount of upregulating potential. In PMA/ionomycin stimulated cultures, IFN-α pre-
treatment did not significantly alter the proportion of either CD4+ (Fig 5.9a) or CD8+
(Fig 5.9b) T cells producing IFN-γ when evaluated against controls without IFN-α
treatment. In fact, for both CD4+ and CD8+ (Fig 5.9b) T cells, the augmenting effect
of IFN-α on IFN-γ levels was strongest when IFN-α was introduced 4 hours after
PMA/ionomycin stimulation.
With regards to CD4+ T cells, the proportion of cells producing IFN-γ was appreciably
raised from 57.1 ± 2.0% (means ± SEM) without IFN-α treatment to 64.3 ± 0.8%
(p<0.01) when IFN-α was added 4 hours post PMA/ionomycin activation (Fig 5.9a).
This elevation of IFN-γ was statistically significant even when compared to data
influenced by 24 hours (56.4 ± 1.6%; p<0.01) and 4 hours (59.8 ± 1.8%; p<0.05) of
IFN-α pre-treatment before polyclonal activation.
Similarly, concerning CD8+ T cells, the percentage of cells producing IFN-γ was
considerably elevated from 75.4 ± 2.7% without IFN-α to 82.2 ± 1.2% (p<0.05) when

225
IFN-α was added 4 hours post PMA/ionomycin activation (Fig 5.9b). This increase in
IFN-γ was still significant when evaluated against data collected from cultures with
24 hours (74.3 ± 2.7%; p<0.05) of IFN-α pre-treatment before polyclonal activation.
These trends were detected in untreated cultures as well, among both CD4+ and
CD8+ T cells.
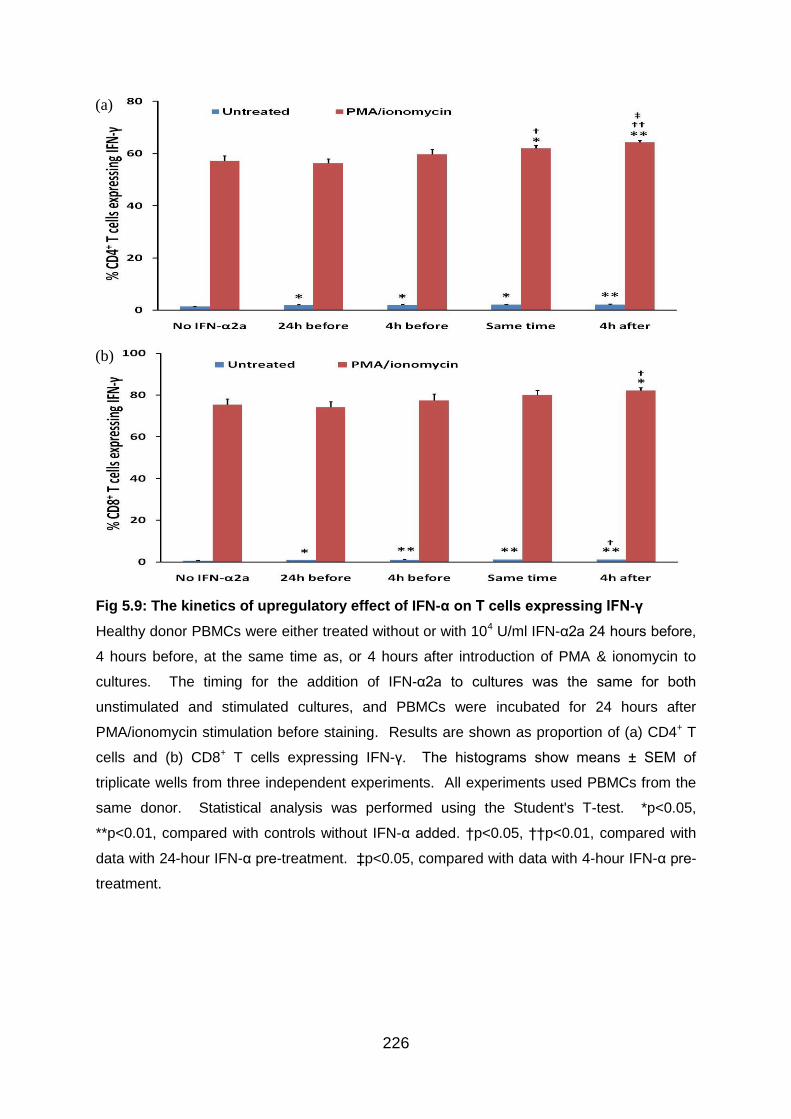
226
Fig 5.9: The kinetics of upregulatory effect of IFN-α on T cells expressing IFN-γ
Healthy donor PBMCs were either treated without or with 104 U/ml IFN-α2a 24 hours before,
4 hours before, at the same time as, or 4 hours after introduction of PMA & ionomycin to
cultures. The timing for the addition of IFN-α2a to cultures was the same for both
unstimulated and stimulated cultures, and PBMCs were incubated for 24 hours after
PMA/ionomycin stimulation before staining. Results are shown as proportion of (a) CD4+ T
cells and (b) CD8+ T cells expressing IFN-γ. The histograms show means ± SEM of
triplicate wells from three independent experiments. All experiments used PBMCs from the
same donor. Statistical analysis was performed using the Student's T-test. *p<0.05,
**p<0.01, compared with controls without IFN-α added. †p<0.05, ††p<0.01, compared with
data with 24-hour IFN-α pre-treatment. ‡p<0.05, compared with data with 4-hour IFN-α pre-
treatment.
(a)
(b)
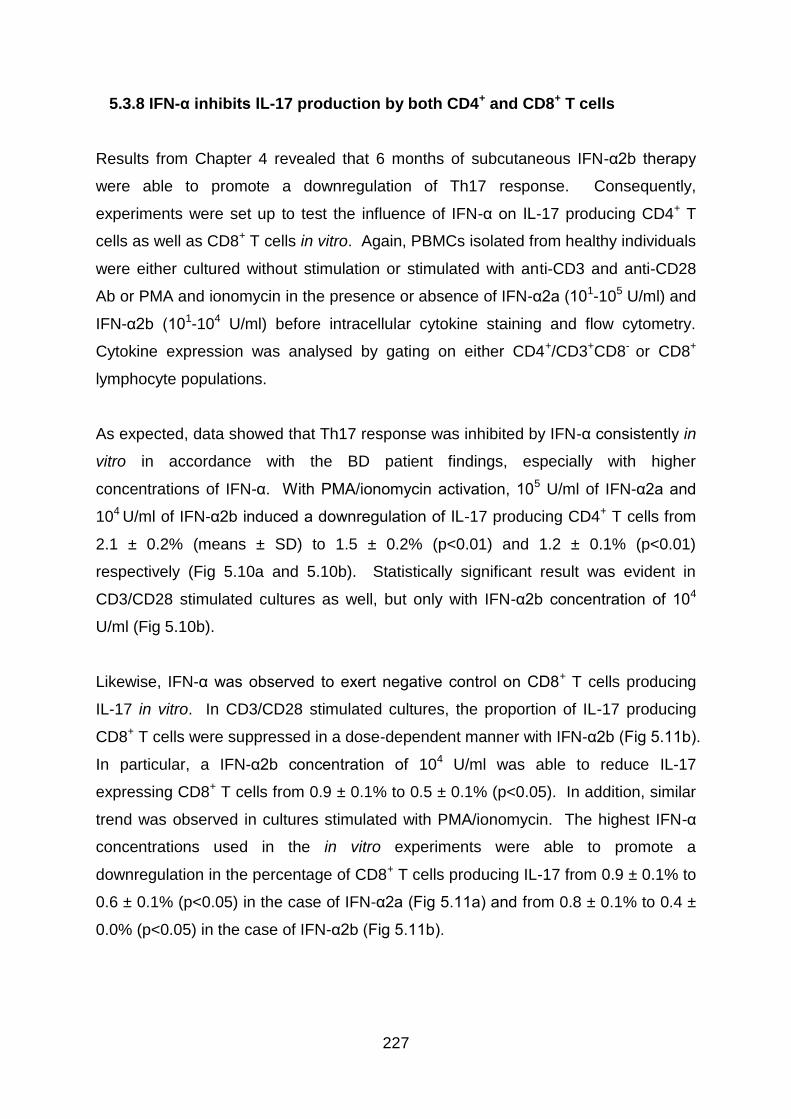
227
5.3.8 IFN-α inhibits IL-17 production by both CD4+ and CD8+ T cells
Results from Chapter 4 revealed that 6 months of subcutaneous IFN-α2b therapy
were able to promote a downregulation of Th17 response. Consequently,
experiments were set up to test the influence of IFN-α on IL-17 producing CD4+ T
cells as well as CD8+ T cells in vitro. Again, PBMCs isolated from healthy individuals
were either cultured without stimulation or stimulated with anti-CD3 and anti-CD28
Ab or PMA and ionomycin in the presence or absence of IFN-α2a (101-105 U/ml) and
IFN-α2b (101-104 U/ml) before intracellular cytokine staining and flow cytometry.
Cytokine expression was analysed by gating on either CD4+/CD3+CD8- or CD8+
lymphocyte populations.
As expected, data showed that Th17 response was inhibited by IFN-α consistently in
vitro in accordance with the BD patient findings, especially with higher
concentrations of IFN-α. With PMA/ionomycin activation, 105 U/ml of IFN-α2a and
104 U/ml of IFN-α2b induced a downregulation of IL-17 producing CD4+ T cells from
2.1 ± 0.2% (means ± SD) to 1.5 ± 0.2% (p<0.01) and 1.2 ± 0.1% (p<0.01)
respectively (Fig 5.10a and 5.10b). Statistically significant result was evident in
CD3/CD28 stimulated cultures as well, but only with IFN-α2b concentration of 104
U/ml (Fig 5.10b).
Likewise, IFN-α was observed to exert negative control on CD8+ T cells producing
IL-17 in vitro. In CD3/CD28 stimulated cultures, the proportion of IL-17 producing
CD8+ T cells were suppressed in a dose-dependent manner with IFN-α2b (Fig 5.11b).
In particular, a IFN-α2b concentration of 104 U/ml was able to reduce IL-17
expressing CD8+ T cells from 0.9 ± 0.1% to 0.5 ± 0.1% (p<0.05). In addition, similar
trend was observed in cultures stimulated with PMA/ionomycin. The highest IFN-α
concentrations used in the in vitro experiments were able to promote a
downregulation in the percentage of CD8+ T cells producing IL-17 from 0.9 ± 0.1% to
0.6 ± 0.1% (p<0.05) in the case of IFN-α2a (Fig 5.11a) and from 0.8 ± 0.1% to 0.4 ±
0.0% (p<0.05) in the case of IFN-α2b (Fig 5.11b).

228
Although CD4+ and CD8+ T cells producing both IFN-γ and IL-17 were detected, they
were present in negligible amount and IFN-α2a and IFN-α2b did not have any
significant effects on these subpopulations (data not shown).
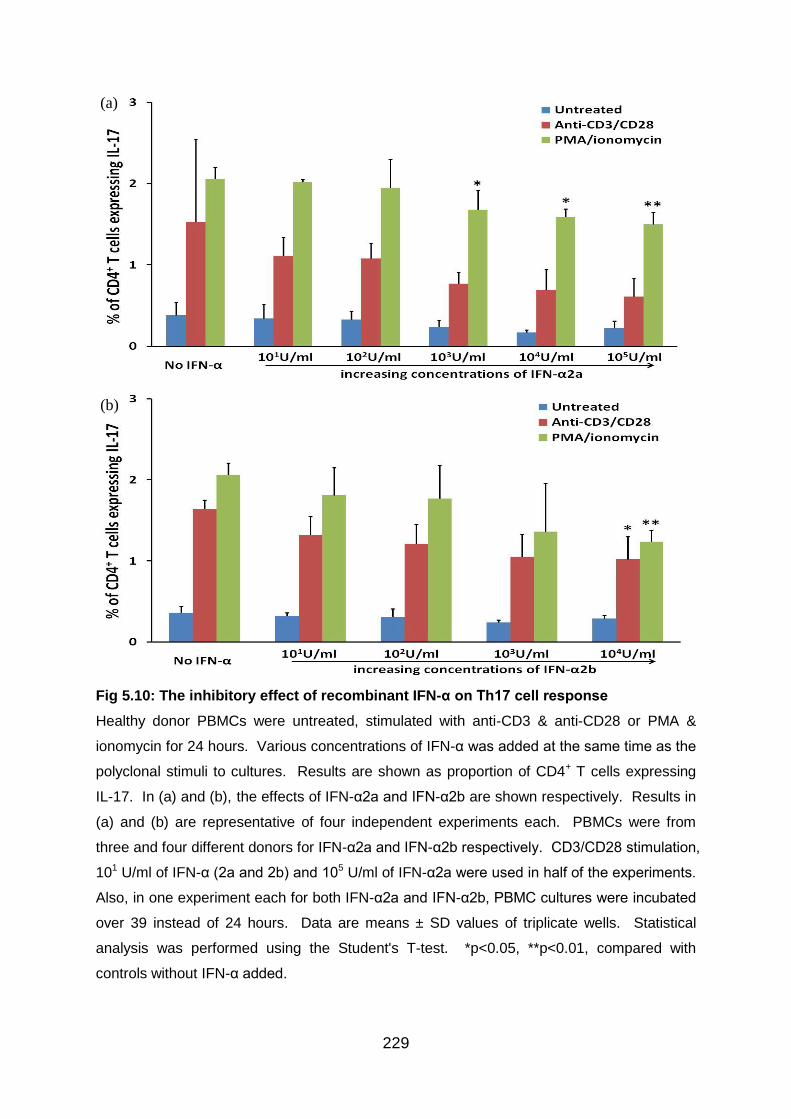
229
Fig 5.10: The inhibitory effect of recombinant IFN-α on Th17 cell response
Healthy donor PBMCs were untreated, stimulated with anti-CD3 & anti-CD28 or PMA &
ionomycin for 24 hours. Various concentrations of IFN-α was added at the same time as the
polyclonal stimuli to cultures. Results are shown as proportion of CD4+ T cells expressing
IL-17. In (a) and (b), the effects of IFN-α2a and IFN-α2b are shown respectively. Results in
(a) and (b) are representative of four independent experiments each. PBMCs were from
three and four different donors for IFN-α2a and IFN-α2b respectively. CD3/CD28 stimulation,
101 U/ml of IFN-α (2a and 2b) and 105 U/ml of IFN-α2a were used in half of the experiments.
Also, in one experiment each for both IFN-α2a and IFN-α2b, PBMC cultures were incubated
over 39 instead of 24 hours. Data are means ± SD values of triplicate wells. Statistical
analysis was performed using the Student's T-test. *p<0.05, **p<0.01, compared with
controls without IFN-α added.
(a)
(b)
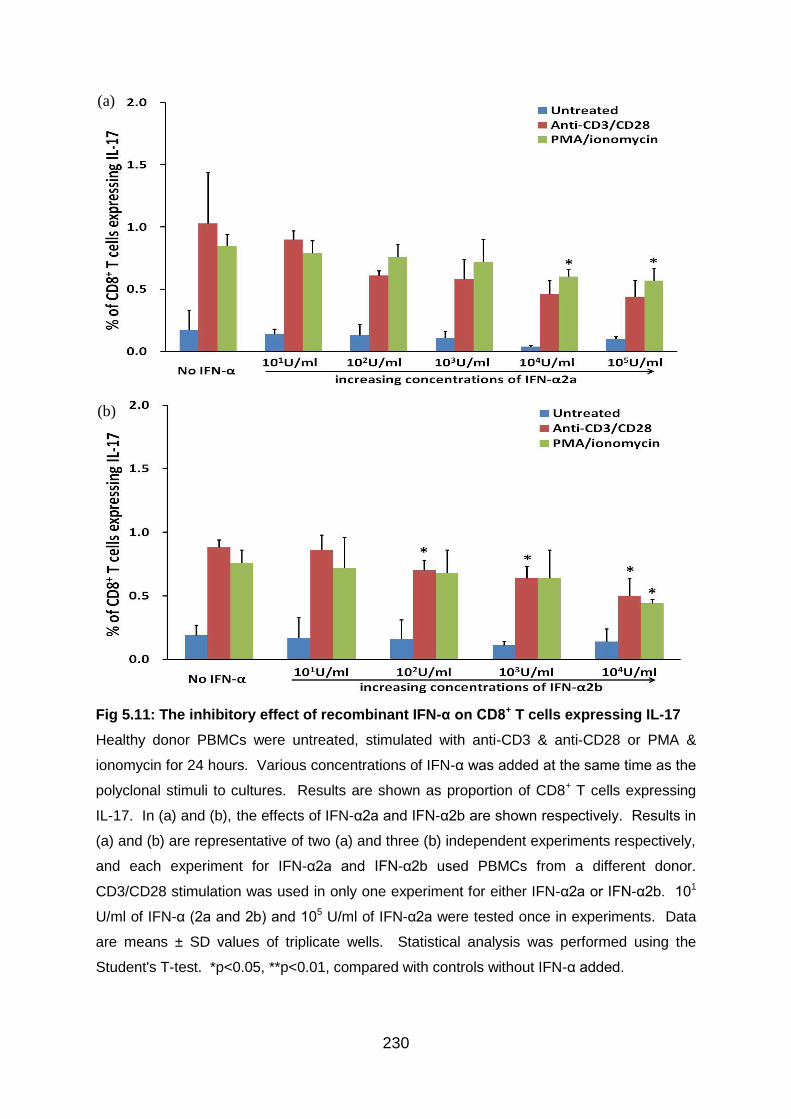
230
Fig 5.11: The inhibitory effect of recombinant IFN-α on CD8+ T cells expressing IL-17
Healthy donor PBMCs were untreated, stimulated with anti-CD3 & anti-CD28 or PMA &
ionomycin for 24 hours. Various concentrations of IFN-α was added at the same time as the
polyclonal stimuli to cultures. Results are shown as proportion of CD8+ T cells expressing
IL-17. In (a) and (b), the effects of IFN-α2a and IFN-α2b are shown respectively. Results in
(a) and (b) are representative of two (a) and three (b) independent experiments respectively,
and each experiment for IFN-α2a and IFN-α2b used PBMCs from a different donor.
CD3/CD28 stimulation was used in only one experiment for either IFN-α2a or IFN-α2b. 101
U/ml of IFN-α (2a and 2b) and 105 U/ml of IFN-α2a were tested once in experiments. Data
are means ± SD values of triplicate wells. Statistical analysis was performed using the
Student's T-test. *p<0.05, **p<0.01, compared with controls without IFN-α added.
(a)
(b)
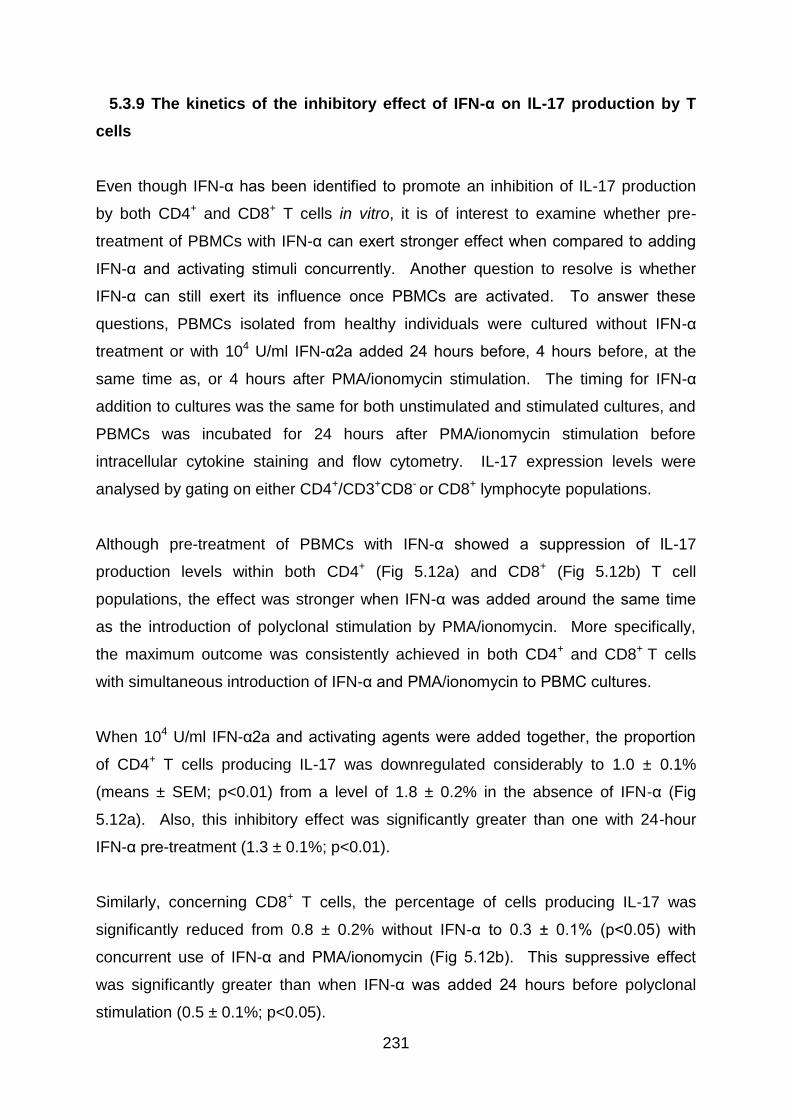
231
5.3.9 The kinetics of the inhibitory effect of IFN-α on IL-17 production by T
cells
Even though IFN-α has been identified to promote an inhibition of IL-17 production
by both CD4+ and CD8+ T cells in vitro, it is of interest to examine whether pre-
treatment of PBMCs with IFN-α can exert stronger effect when compared to adding
IFN-α and activating stimuli concurrently. Another question to resolve is whether
IFN-α can still exert its influence once PBMCs are activated. To answer these
questions, PBMCs isolated from healthy individuals were cultured without IFN-α
treatment or with 104 U/ml IFN-α2a added 24 hours before, 4 hours before, at the
same time as, or 4 hours after PMA/ionomycin stimulation. The timing for IFN-α
addition to cultures was the same for both unstimulated and stimulated cultures, and
PBMCs was incubated for 24 hours after PMA/ionomycin stimulation before
intracellular cytokine staining and flow cytometry. IL-17 expression levels were
analysed by gating on either CD4+/CD3+CD8- or CD8+ lymphocyte populations.
Although pre-treatment of PBMCs with IFN-α showed a suppression of IL-17
production levels within both CD4+ (Fig 5.12a) and CD8+ (Fig 5.12b) T cell
populations, the effect was stronger when IFN-α was added around the same time
as the introduction of polyclonal stimulation by PMA/ionomycin. More specifically,
the maximum outcome was consistently achieved in both CD4+ and CD8+ T cells
with simultaneous introduction of IFN-α and PMA/ionomycin to PBMC cultures.
When 104 U/ml IFN-α2a and activating agents were added together, the proportion
of CD4+ T cells producing IL-17 was downregulated considerably to 1.0 ± 0.1%
(means ± SEM; p<0.01) from a level of 1.8 ± 0.2% in the absence of IFN-α (Fig
5.12a). Also, this inhibitory effect was significantly greater than one with 24-hour
IFN-α pre-treatment (1.3 ± 0.1%; p<0.01).
Similarly, concerning CD8+ T cells, the percentage of cells producing IL-17 was
significantly reduced from 0.8 ± 0.2% without IFN-α to 0.3 ± 0.1% (p<0.05) with
concurrent use of IFN-α and PMA/ionomycin (Fig 5.12b). This suppressive effect
was significantly greater than when IFN-α was added 24 hours before polyclonal
stimulation (0.5 ± 0.1%; p<0.05).

232
Moreover, in untreated cultures, the addition of IFN-α inhibited IL-17 producing CD4+
and CD8+ T cells, but there was no appreciable difference adding IFN-α early or later
during culture.
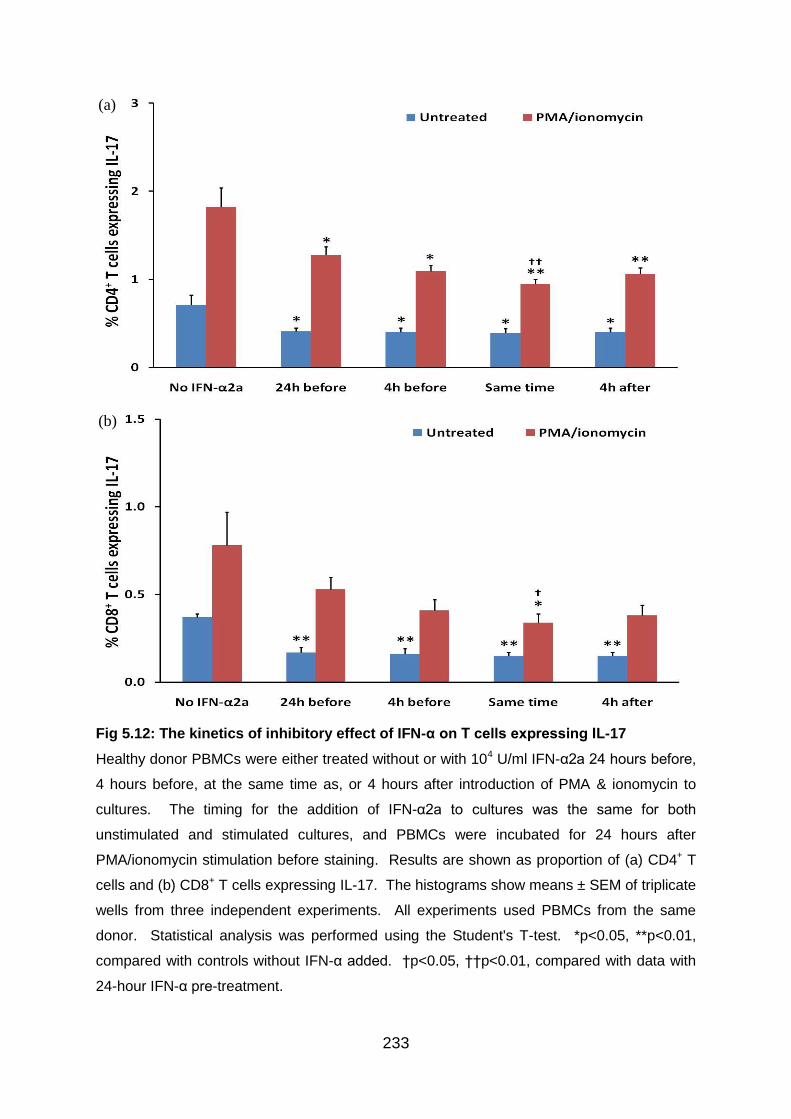
233
Fig 5.12: The kinetics of inhibitory effect of IFN-α on T cells expressing IL-17
Healthy donor PBMCs were either treated without or with 104 U/ml IFN-α2a 24 hours before,
4 hours before, at the same time as, or 4 hours after introduction of PMA & ionomycin to
cultures. The timing for the addition of IFN-α2a to cultures was the same for both
unstimulated and stimulated cultures, and PBMCs were incubated for 24 hours after
PMA/ionomycin stimulation before staining. Results are shown as proportion of (a) CD4+ T
cells and (b) CD8+ T cells expressing IL-17. The histograms show means ± SEM of triplicate
wells from three independent experiments. All experiments used PBMCs from the same
donor. Statistical analysis was performed using the Student's T-test. *p<0.05, **p<0.01,
compared with controls without IFN-α added. †p<0.05, ††p<0.01, compared with data with
24-hour IFN-α pre-treatment.
(a)
(b)
234
5.4 Discussion
5.4.1.1 Setting up Th1/Th17 in vitro test models using antigens and
polyclonal stimuli
It has been shown that cytokines present upon T cell activation can shape the
differentiation of T cells. However, there are other variables that are known to affect
the development of T cell subsets which include the affinity of the TCR for Ag, the
duration of the interaction between TCR and Ag, and differential co-stimulation by
APCs (Zhu, Yamane, & Paul 2010). In our in vitro experiments, selected antigens
and polyclonal stimuli were used to induce expansion of Th1 and in particular, Th17
cells in healthy donor PBMCs in order to set up test models for subsequent
investigation of the immunomodulatory effects of exogenous IFN-α on these two cell
populations. Analysing our data on healthy donor PBMCs, all antigens promoted
very low production levels of IL-17 and IFN-γ in CD4+ T cells, even with extra time in
culture.
Although LPS, zymosan and candida were previously reported to possess IL-17
inducing activity (Acosta-Rodriguez et al. 2007;Gerosa et al. 2008; Kattah et al.
2008), LPS was the only one which demonstrated some potential. However, even
the levels of Th17 cells achieved with LPS were less than one percent of
lymphocytes. Also, the commercial candida antigens used in the experiments were
mainly made up of components from the yeast form rather the hyphal form, so it is
not surprising to induce little Th17 response. ATRA, as expected, resulted in lowest
amount of Th17 and this is in accordance to previous report of its ability to inhibit
Th17 cell differentiation (Elias et al. 2008;Mucida et al. 2007).
Consequently, two of the BD-related antigens, PDS-Ag and alpha-tropomyosin, were
used as a trial but they did not elicit much Th17 response by PBMCs from BD
patients either. Thus it was decided to conserve valuable BD patient samples and
not to test any other BD-related antigens such as HSP60.
On the other hand, polyclonal stimuli consistently showed good potential to promote
Th17 cell populations out of all combinations used, especially in the case of PMA in
235
combination with ionomycin. Polyclonal stimuli are quite efficient in inducing Th1 cell
populations as well. PMA is a mitogen which binds and activates protein kinase C,
causing a wide range of effects in cells and tissues (Castagna et al. 1982), and
ionomycin is a potent and selective calcium ionophore agent. In human T cells,
ionomycin induces hydrolysis of phosphoinositides and synergises with PMA in
enhancing the activation of protein kinase C to mediate T cell activation (Chatila et al.
1989).
However, phorbol esters induce CD4 phosphorylation and a consequence of this is
enhancement of CD4 internalisation and subsequent degradation of membrane CD4
in lysosomes (Petersen et al. 1992). As a result of this CD4 deficiency, substantial
amount of the experiment results which involved PMA/ionomycin stimulation and
analysed by gating on CD4 was found to be inconsistent. Therefore, a solution of
using CD3 and CD8 instead of CD4 to stain for CD4+ T cells was adopted in later
experiments to resolve the problem of PMA-induced CD4 internalisation. CD3+CD8-
T cells were then considered as equivalent to CD4+ T cells.
5.4.1.2 Testing other aspects of the in vitro experimental design
It has been suggested resting PBMCs overnight after thawing before testing effector
functions would remove cells destined for death and allow “stunned” cells to recover
functional ability (Lamoreaux, Roederer, & Koup 2006). Therefore, instead of
stimulating cells straight after thawing, one day resting in culture medium with or
without suboptimal level of IL-2 was performed. It was observed that neither resting
nor addition of IL-2 augmented the number of Th1 or Th17 cells consistently. This is
in agreement with a recent study which showed overnight resting did not improve the
CD4+ or CD8+ T cell IFN-γ responses to antigens (Owen et al. 2007). It was thus
concluded that it was not necessary to allow time for PBMCs to recover before
stimulation.
Concerning the choice of culture medium, it was shown recently that IMDM, a
medium richer in aromatic amino acids, consistently resulted in higher Th17
expansion (Veldhoen et al. 2009). In line with the finding, IMDM did display a
236
tendency to preferentially upregulate Th17 cells as well as enhancing Th1 response
when PMA/ionomycin stimulation was applied to cultures of healthy donor PBMC in
our experiments, although there was no significant difference between RPMI- and
IMDM-based media in untreated and CD3/CD28 stimulated cultures. Consequently,
Th17 cell experiments were carried out using IMDM-based culture medium, except
some earlier experiments which were performed using RPMI-based culture medium.
Variation of duration of cultures was experimented as well and PBMC cultures were
performed over either 24 or 39 hours to examine whether higher proportions of Th1
and Th17 cells could be achieved with longer culture time. In the end, it was decided
to perform experiments over 24 hours as there was no advantage detected with
extra time in culture with regards to enhancing either IFN-γ or IL-17 production levels
by CD4+ T cells.
5.4.2 Choosing the concentrations of IFN-α used for in vitro experiments
In our BD patient trial, pegylated IFN-α2b was given according to a dosage table
(table 2.1). As the majority of our patients weighed between 50-100kg, 30μg of
pegylated IFN-α2b per week was received by most patients. The specific activity of
pegylated IFN-α2b is approximately 7.0 x 10⁷ IU/mg protein, compared with 2.6 x 10⁸
IU/mg protein for standard IFN-α2b. As a result, each patient received an equivalent
of approximately 2.1 million units every week for 6 months (Schering-Plough 2007).
The actual tissue concentrations of IFN-α2b may be difficult to assess following in
vivo administration, and further studies are required to attain the approximation for
pegylated IFN-α2b. However, a dose of 1-10 x 106 IU unconjugated IFN-α in vivo
has been estimated to correlate with a concentration of 100 IU/ml at the tissue level
(Krishnaswamy et al. 1996).
It was reported that IFN-α promoted cell-cycle arrest in CD4+ T cells and the
inhibitory effect of IFN-α on cell proliferation reached a plateau between
concentrations of 103 and 104 U/ml. Of note, inhibition of proliferation could be
associated with a decrease in the production of inflammatory cytokines from cells.
Additionally, cell viability was shown to be maintained in PBMCs and T cell clones at
237
103 U/ml of IFN-α (Krishnaswamy et al. 1996). Nevertheless, it is currently unclear
whether the anti-proliferative effect of IFN-α is more effective on certain subsets such
as Th17 cells than the other ones. Due to these early findings, a concentration of
1000 U/ml of IFN-α was picked as the median concentration for our in vitro studies
using healthy donor PBMCs.
5.4.3.1 Biology of CD8+ T cells
CD8+ T cells represent an important arm of adaptive immunity and they play a role in
the regulation of the activation and differentiation of CD4+ cells (Vukmanovic-Stejic et
al. 2000). Notably, dysregulated CD8+ T cells have been implicated in the
pathogenesis of various autoimmune diseases (Liblau et al. 2002). CD8+ T cells
exert their effector functions through production of inflammatory cytokines such as
IFN-γ, and induction of cytotoxic damage of target cells expressing MHC class I
molecules and the relevant antigenic peptide via perforin/granzyme and death
receptor pathways (Li et al. 2006). As MHC class I molecules are found in every
nucleated cells of the body, it is clear that there is potential for considerable amount
of tissue damage.
Compares with CD4+ T cells, naive CD8+ T cells acquire effector T cell functions
more readily upon antigen stimulation (Seder & Ahmed 2003). Activated CD8+ T
cells can produce very high levels of inflammatory cytokines, including TNF-α and
IFN-γ (Liblau et al. 2002). All these may contribute greatly to target cell destruction
in autoimmune diseases and therefore stringent regulation is essential for CD8+ T
cells.
5.4.3.2 Influence of IFN-α on peripheral blood CD4+ and CD8+ T lymphocytes
From our ex vivo experiments in Chapter 3, there was no significant alteration of the
expression levels of CD4 or CD8 by T cells from BD patients whether they received
IFN-α therapy or not. Unlike our ex vivo results, there was a tendency for CD4+ T
cell upregulation but CD8+ T cell downregulation by addition of either IFN-α2a or
238
IFN-α2b to healthy donor PBMC cultures in a dose-dependent manner, and IFN-α
concentrations of 103 or 104 U/ml were generally found to be most powerful. The
difference could be related to how peripheral blood cells were treated as the in vitro
cultures were activated with polyclonal stimulation and incubated for 24 hours.
Our results are in part supported by a previous study on patients with severe steroid-
resistant asthma. It was described that IFN-α treatment promoted a relative increase
in CD4+ T cells but a downregulation of CD8+ T cells was not reported (Simon et al.
2003). In the study, 3x10⁶ IU/day of recombinant IFN-a2a was administered on each
patient and systemic corticosteroid treatment was maintained until a clinical
improvement was seen and then gradually reduced. An upregulation of CD4+ T cells
was observed from 44.2 ± 2.8% within the lymphocyte populations before
introduction of IFN-α therapy to 50.2 ± 2.6% two to four weeks after initiation of
cytokine therapy.
5.4.4.1 The influence of IFN-α on IFN-γ production by CD4+ T cells
IFN-α was reported to stimulate the production of IFN-γ by resting CD4+ T cells
activated by PMA and anti-CD28 in a dose-dependent manner and IFN-α
concentration of 104 IU/ml was found to be most stimulating (Schandene et al. 1997).
Using freshly isolated human cells, it was revealed that IFN-α increased the
expression of mRNA for IFN-γ and as a result the frequency of IFN-γ-producing
CD4+ T cells within 24 hours of culture (Brinkmann et al. 1993). Also, another study
demonstrated that IFN-α augmented IL-12 priming for subsequent IFN-γ production
and the generation of Th1 responses (Wenner et al. 1996). These results are in line
with our experimental findings that both IFN-α2a and IFN-α2b were proficient in
inducing IFN-γ production by CD4+ T cells, especially at higher concentrations.
5.4.4.2 The influence of IFN-α on IFN-γ production by CD8+ T cells
Analysing our data, it was found that CD8+ T cells producing IFN-γ were upregulated
by the introduction of IFN-α. This is in contrast to an early study which did not detect
239
any positive effects on the frequency of IFN-γ-producing CD8+ T cells by IFN-α. The
responsiveness of both purified CD4+ or CD8+ T cells to IFN-α was not altered by the
addition of monocytes (Brinkmann et al. 1993).
Of note, IFN-γ producing CD8+ T cells may have a significant role in the
pathogenesis of BD. It was revealed that the numbers of IFN-γ producing CD8+ T
cells in patients with BD were increased, which resulted in a significant increase of
the Tc1: Tc2 ratio compared with normal controls (Houman et al. 2004).
5.4.5.1 The influence of IFN-α on IL-17 production by CD4+ T cells
From our in vitro experiments, Th17 response was found to be inhibited by IFN-α
consistently just like in the case of the BD patient findings. IFN-α suppresses the
proportions of Th17 cells in a dose-dependent manner and higher concentrations of
both IFN-α2a and IFN-α2b were particularly effective. Notably, in accordance with
our BD patient data, the inhibitory effect was seen only in activated cultures
stimulated with polyclonal stimuli but not in unstimulated cultures. Our findings are
supported by some recent reports. It was shown that pre-treatment with either
recombinant IFN-α or IFN-β inhibited PBMC secretion of superantigen-induced IL-17
and CD40 ligand-induced IL-23, which has the capacity to promote IL-17 secretion
by memory/effector Th cells. Similar inhibitory effects were observed with pDC TLR9
agonist-induced type I IFN on activation-induced IL-23 and IL-17 expression (Meyers
et al. 2006).
Another study demonstrated that IFN-α potently reduced IL-17A mRNA expression
levels in healthy donor PBMCs 8 hours after CD3/CD28 stimulation. IFN-α
downregulated IL-17 release from PBMCs and Th17 cells in a dose-dependent
manner and the highest IFN-α concentration used, 103 IU/ml, was found to exert
strongest influence. Similar to IL-17A, IL-17F mRNA expression was inhibited by
IFN-α as well (Moschen et al. 2008). Also, IFN-α was found to significantly reduce
IL-17 production by either anti-CD3/CD28 stimulated PBMCs or CD4+ T cells in
culture supernatants from healthy patients (Liu et al. 2011). Moreover, research on
mice reported that both IFN-αA/D and IFN-β can inhibit the differentiation of murine
240
naive Th cells into effector Th17 cells. The αA/D molecule consists of the N-terminal
portion of IFN-α2 and the C terminal portion of IFN-α1. However, like IFN-γ, the
suppressive effects were limited to the inductive phase and polarised Th17 cells
were resistant to IFN-mediated suppression of IL-17 production as a result
(Harrington et al. 2005).
5.4.5.2 The influence of IFN-α on IL-17 production by CD8+ T cells
IL-17 production was initially reported within CD4+ αβ T cells and more recently IL-17
producing cells within CD8+ αβ T cells (Tc17) was described in healthy human donor
blood. Tc17 cells are able to produce IL-17 alone or in combination with IFN-γ.
They share many common differentiation patterns with Th17 cells, including key
transcription factors, chemokine receptors, and cytokine receptors (Kondo et al.
2009). However, little is known about the role of IL-17 producing CD8+ lymphocytes
in a normal immune response or in disease conditions.
From our in vitro experiments, the levels of CD8+ T cells producing IL-17 was
observed to be suppressed by IFN-α consistently as well, and like in CD4+ T cells, in
a dose-dependent manner. Again, higher concentrations of both IFN-α2a and IFN-
α2b had the strongest influence, and the suppressive effect was seen only in
activated cultures stimulated with polyclonal stimuli but not in unstimulated cultures.
5.4.6 Cytokine levels in comparison to other studies
From our data, the proportions of CD4+ T cells producing IL-17 in healthy donor
PBMCs were around 2% even after stimulation with PMA/ionomycin for 24 hours.
The proportions of CD8+ T cells producing IL-17 were even lower. The levels
achieved are similar to a recent study where purified human CD4+ T cells were
stimulated with PMA/ionomycin and stained 6 hours later with anti-IL-17A. The
percentage of CD4+ T cells expressing IL-17A was shown to be around 1% in
healthy donors (Brucklacher-Waldert et al. 2009).
241
In a study where naive CD4+ T cells were stimulated with anti-CD3/CD28 Abs and
cultured with medium, IL-12 or IL-23 for 5 days before restimulation with
PMA/ionomycin. Again, the level of Th17 cells is comparable to our data and small
changes in cell populations were described to be significant. The mean percentage
of IL-17 producing CD4+ cells was increased from 0.9% in cultures without IL-23 to
1.8% in the presence of IL-23. However, the level of Th17 cells was decreased in
the presence of IL-12 to 0.7%. On the other hand, measurement of the number of
IFN-γ producing CD4+ cells showed reciprocal data, and a decrease of Th1 cells in
the presence of IL-23 from 16.3% to 13.6% was detected when compared to cultures
without added IL-23 (Hoeve et al. 2006).
Also, in a recent study where peripheral blood samples from normal and SLE
patients were incubated with PMA and ionomycin for 4 hours before
immunofluorescence staining. The levels of Th17 within CD4+ T cells were ranging
between 1.6 ± 0.7% for normal controls and 2.0±1.2% for SLE patients with inactive
disease. On the other hands, the proportions of Tc17 within CD8+ T cells were
ranging between 0.3 ± 0.1% for normal controls and 0.6 ± 0.4% for SLE patients with
active disease. All the levels reported are comparable to our study and the very
small increase in active SLE patients was reported to be significant compared to
healthy controls (Henriques et al. 2010).
5.4.7 The effect of IFN-α on the kinetics of IFN-γ and IL-17 production by T
cells
The kinetics of PBMC response under the influence of IFN-α was measured with
regards to both IFN-γ and IL-17 producing CD4+ and CD8+ T cells. This was carried
out to obtain some indications in the potential roles of IFN-α not only as a treatment
in chronic inflammatory diseases but possibly as a prophylaxis option in susceptible
patients to chronic inflammatory diseases like BD.
Unexpectedly, IFN-α pre-treatment of healthy donor PBMCs did not demonstrate as
much upregulatory effect on either CD4+ or CD8+ T cells producing IFN-γ as when
IFN-α was added later on in the cultures. The highest level of T cells positive for

242
IFN-γ was achieved with introduction of IFN-α at the last time-point tested.
Observations from PMA/ionomycin stimulated cultures raised the question whether
exogenous IFN-α exerted greater control of IFN-γ production on activated PBMCs
than unstimulated cells. However, this wouldn’t explain the results analysed using
untreated cultures. Another possible explanation is that IFN-γ was produced in
greater quantity earlier during incubation in response to IFN-α treatment and the
results were simply a reflection of the experimental design picking up data at various
stages of cytokine production.
Similar stories were found with regards to IL-17 producing CD4+ and CD8+ T cells.
No significant difference in terms of IL-17 production levels was observed regardless
of when exogenous IFN-α was added to unstimulated cell cultures. With
PMA/ionomycin stimulation, however, IFN-α pre-treatment of healthy donor PBMCs
was not able to produce as much inhibitory effect on either CD4+ or CD8+ T cells
producing IL-17 as when IFN-α was added later on in the cultures. Regarding IL-17
production by T cells, concurrent use of IFN-α and PMA/ionomycin was detected to
result in strongest downregulatory effect. Again, this could be related to PBMC
incubation time chosen before cell preparation and staining for flow cytometry. It is
likely that the cytokine IL-17 was produced later by T cells during cultures in
comparison to IFN-γ.
5.5 Summary of findings
Under the influence of higher doses of either recombinant IFN-α2a or IFN-α2b, there
was a small tendency for CD4+ T cell upregulation but CD8+ T cell downregulation in
healthy donor PBMCs. Regarding impact on inflammatory cytokine production by T
cells in vitro, IFN-α2a and IFN-α2b were demonstrated to be equally effective. Both
forms of IFN-α showed the tendency to upregulate IFN-γ producing CD4+ and CD8+
T cells and suppress CD4+ and CD8+ T cells producing IL-17. IFN-α appeared to
exert the strongest influence on IFN-γ producing and IL-17 producing T cells when it
was added 20 hours before and 24 hours before intracellular cytokine staining and
flow cytometry respectively. Notably, IFN-α was found to be able to exert its effects
on Th17 cells both before and after cell activation.
243
Chapter 6
The in vitro effects of interferon-alpha 2a & 2b on CD4+ and CD8+ regulatory T
cells and associated regulatory cytokines in healthy donors
6.1 Introduction
The existence of self-reactive T cells in healthy individuals suggests that many self-
reactive T cells that escape clonal deletion in the thymus are subsequently released
into the periphery, where they are capable of differentiating into potentially
pathogenic effector cells (Bouneaud, Kourilsky, & Bousso 2000). Thus, peripheral
mechanisms exist in order to control immune responses and to dampen potential
autoimmunity.
It has been recognised Treg cells play prominent roles in the maintenance of
lymphoid homeostasis, and these cells maintain tolerance to self and control
autoimmune deviation by restraining overzealous immune responses (Allan et al.
2008b). Treg cells, therefore, represent an attractive target for therapeutic immune
strategies in various clinical situations, and the interest in this field has exploded the
past 5-10 years. However, the increasing number and the heterogeneity of T cell
subsets with immunosuppressive properties make it difficult to fully characterise and
determine their importance in various clinical conditions. The lack of knowledge of
the mechanism of suppression by many of these Treg cell subsets further
contributes to the complexity and hampers the development of therapeutic strategies
that could have clinical applications.
CD4+ Treg cells can be subdivided into naturally occurring Treg cells that originate
from the thymus and adaptive Treg cells that are induced in the periphery. Whereas
CD4+ nTreg cells functionally require constitutive expression of the transcription
factor Foxp3, adaptive CD4+ Treg cells are frequently Foxp3- (Allan et al. 2008a).
Apart from CD4+CD25highFOXP3+ Treg cells, there are other T cell subsets with
regulatory function. Most of these cells, including IL-10-secreting Tr1 cells and TGF-
β-secreting Th3 cells, acquire regulatory functions following specific antigenic
stimulation in particular cytokine milieus (Sakaguchi et al. 2010).
244
Nevertheless, regulatory T cells are not strictly confined to the CD4+ T cell
compartment. Naturally occurring CD8+ Treg cells originate from the thymus and are
often considered to represent a separate T cell lineage. Postnatal human thymus
contains a defined population of CD8+ Treg cells. They express the phenotype
CD8+CD25+CTLA-4+GITR+Foxp3+ and suppress in a contact-dependent manner
(Cosmi et al. 2003). These cells should have a broad repertoire of antigenic
specificities. Conversely, adaptive CD8+ Treg cells originate from the postthymic T
cell pool and are induced through a variety of in vivo or in vitro stimuli. Adaptive
CD8+ Treg cells can be further subclassified into those that have antigen specificity
and those that display their immunoregulatory function in an antigen-non-specific
fashion (Scotto et al. 2004).
According to a recent study, it is relatively easy to generate non-antigen-specific
adaptive CD8+CD28-Foxp3-CD56- Treg cells (Filaci et al. 2004). Culturing
CD8+CD28- T cells in a cytokine cocktail containing IL-2, IL-10 and GM-CSF is
sufficient to expand CD8+ Treg cells; antigen recognition is not required. Induction of
this cell, however, is monocyte dependent, possibly reflecting the requirement for
GM-CSF. Antigen non-specific CD8 Treg cells are able to survive in culture for more
than 1 month, broadening their potential therapeutic application. Such non-antigen-
specific CD8+ Treg cells suppress APC-mediated antigen presentation, T-cell
proliferation, and CTL-mediated cytotoxicity via IL-10 secretion, a cytokine that has
been linked to anergy induction in activated T cells (Filaci et al. 2004; Xystraks et al.
2004). Likewise, adaptive alloantigen-specific CD8+ Treg cells can also be
generated in vitro from naive CD8+ T cells and are present in human transplant
patients (Manavalan et al. 2004).
The concept that T cells are capable of downregulating immunity is now firmly
established. Both within the CD4 and the CD8 T cell subsets, specialised
populations apply sophisticated mechanisms to inhibit early and late steps of
immune responses.

245
6.2 Aims
In this chapter, we set out to explore the in vitro effects of IFN-α on regulatory T cell
populations, expression of Foxp3, and production of immunoregulatory cytokines,
that serve as critical gatekeepers in immune homeostasis. The ex vivo data from
chapter 4 demonstrated the tendency to upregulate IL-10 and TGF-β in T cells after
6 months of IFN-α2b therapy which was preserved even at 12 month visits. Assays
are set up using healthy donor PBMCs to test the influence of various concentrations
of IFN-α2a and IFN-α2b on CD4+ and CD8+ Treg subsets, production of IL-10 and
TGF-β and the kinetics of the cytokine production.
6.3 Results
6.3.1 Preliminary experiments on Treg cells with antigens and polyclonal
stimuli
Having tested the influence of various antigens and polyclonal stimuli on Th1 and
Th17 cell populations as described in chapter 5, the same panel of stimuli was
applied to healthy donor PBMC cultures for 24 hours before intracellular cytokine
staining to test their effects on Treg cells and IL-10 production as a comparison.
Foxp3 expression was analysed by gating on CD4+ or CD4+CD25high T lymphocyte
populations, whereas IL-10 expression was analysed by gating on CD4+ T
lymphocytes only.
It was found that anti-CD3/CD28 Ab and especially, PMA/ionomycin consistently
promoted higher levels of Foxp3 (Fig 6.1) and IL-10 (Fig 6.2) expression by CD4+ T
cells. Also, as expected, ATRA showed the potential to induce Foxp3 expression in
both CD4+ or CD4+CD25high T lymphocytes, and the optimal concentration of ATRA
appreared to be 0.01μM. However, ATRA had little effect on IL-10 expression. At 5-
20μg/ml, LPS demonstrated the tendency to augment Foxp3 expression by
CD4+CD25high T cells (Fig 6.1b) with longer incubation time. Concurrent use of LPS
and CD3/CD28 stimulation was evaluated as well, but the effect was no more than
using anti-CD3/CD28 Ab alone. Candida antigens were another candidate showing
246
the capacity in inducing Foxp3 expression by both CD4+ (Fig 6.1a) and
CD4+CD25high (Fig 6.1b) T lymphocytes. Unlike most other antigens tested, candida
antigens, especially at lower concentrations, also showed the tendency to induce IL-
10 production by CD4+ T cells (Fig 6.2). Furthermore, LPS, when used at a
concentration of 5μg/ml, displayed some tendency to increase IL-10 producing CD4+
T cells with longer incubation time.
In addition, PBMCs from BD patients were cultured with BD-related antigens, such
as alpha-tropomyosin and PDS-Ag as a trial. However, no significant effect on
Foxp3 and IL-10 expression levels was noticed with either antigen on BD patient
PBMCs, regardless of the concentrations of antigens used. Therefore, it was
decided not to use up any more of the precious BD patient PBMCs to test the
immunomodulatory ability of other BD-related antigens, including HSP60. Notably,
Foxp3 (Fig 6.1b) and IL-10 (Fig 6.2) expression levels in PBMCs from BD patients
were particularly low without stimulation when compared to healthy donor PBMCs,
but the levels did increase considerably with polyclonal stimuli, especially in the case
of PMA/ionomycin stimulation.
Based on the findings in preliminary tests, PBMCs activated with anti-CD3/CD28 Ab
and/or PMA/ionomycin were selected as the basis for our subsequent in vitro
experiments and further preliminary experiments with antigens were not carried out.
The positives results with polyclonal stimulation were repeatable as shown by the
data in nine separate experiments despite the fact that the experiments were
performed in singles.
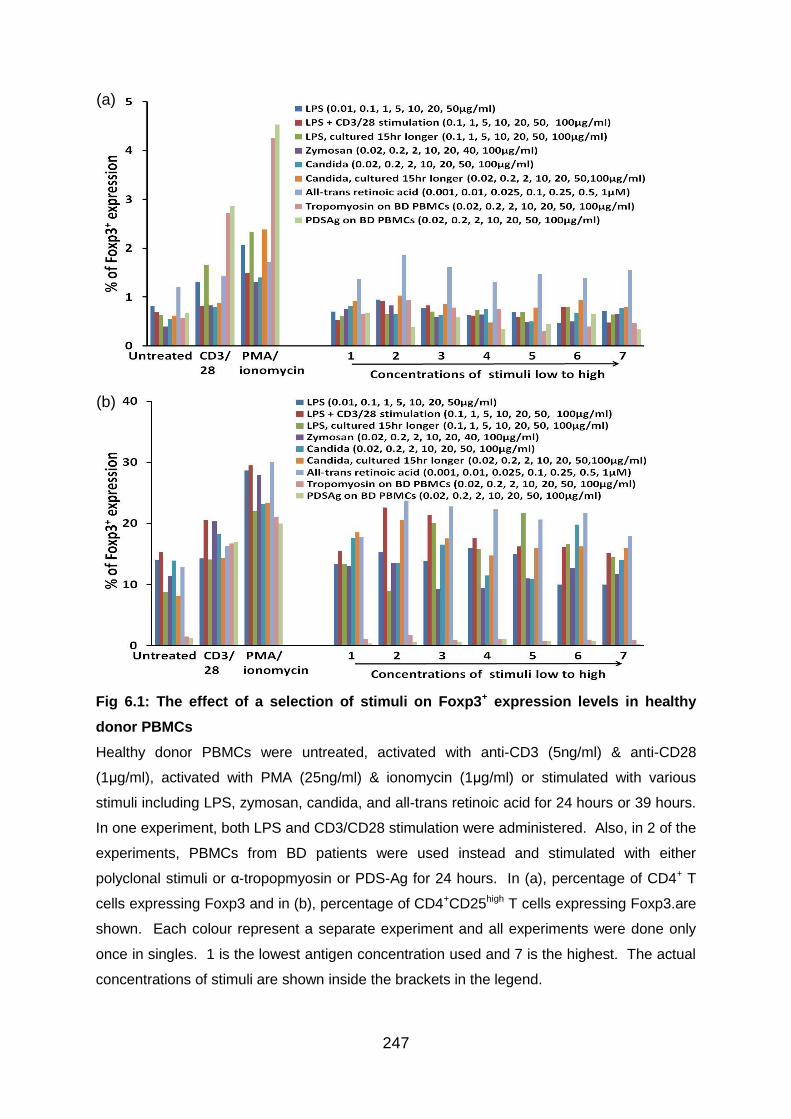
247
Fig 6.1: The effect of a selection of stimuli on Foxp3+ expression levels in healthy
donor PBMCs
Healthy donor PBMCs were untreated, activated with anti-CD3 (5ng/ml) & anti-CD28
(1μg/ml), activated with PMA (25ng/ml) & ionomycin (1μg/ml) or stimulated with various
stimuli including LPS, zymosan, candida, and all-trans retinoic acid for 24 hours or 39 hours.
In one experiment, both LPS and CD3/CD28 stimulation were administered. Also, in 2 of the
experiments, PBMCs from BD patients were used instead and stimulated with either
polyclonal stimuli or α-tropopmyosin or PDS-Ag for 24 hours. In (a), percentage of CD4+ T
cells expressing Foxp3 and in (b), percentage of CD4+CD25high T cells expressing Foxp3.are
shown. Each colour represent a separate experiment and all experiments were done only
once in singles. 1 is the lowest antigen concentration used and 7 is the highest. The actual
concentrations of stimuli are shown inside the brackets in the legend.
(a)
(b)

248
Fig 6.2: The effect of a selection of stimuli on IL-10+ expression by CD4+ T cells
Healthy donor PBMCs were untreated, activated with anti-CD3 (5ng/ml) & anti-CD28
(1μg/ml), activated with PMA (25ng/ml) & ionomycin (1μg/ml) or stimulated with various
stimuli including LPS, zymosan, candida, and all-trans retinoic acid for 24 hours or 39 hours.
In one experiment, both LPS and CD3/CD28 stimulation were administered. Also, in 2 of the
experiments, PBMCs from BD patients were used instead and stimulated with either
polyclonal stimuli or α-tropopmyosin or PDS-Ag for 24 hours. Percentage of CD4+ T cells
producing IL-10 is shown. Each colour represent a separate experiment and all experiments
were done only once in singles. 1 is the lowest antigen concentration used and 7 is the
highest. The actual concentrations of stimuli are shown inside the brackets in the legend.
249
6.3.2 IFN-α induces Foxp3 expression by CD4+ T cells
The results from chapter 4 demonstrated that Foxp3 expression by CD4+ Tcells in
patients with BD was upregulated under IFN-α2b therapy. In order to verify these
findings, experiments were set up with PBMCs isolated from healthy individuals to
study the influence of IFN-α on Foxp3 expression in vitro. PBMCs were cultured
without stimulation or stimulated with anti-CD3 and anti-CD28 Ab or PMA and
ionomycin in the presence or absence of IFN-α2a (101-105 U/ml) and IFN-α2b (101-
104 U/ml) before intracellular cytokine staining and flow cytometry. Foxp3
expression was analysed by gating on CD4+, CD4+CD25+ and CD4+CD25high
lymphocyte populations.
In agreement with data from chapter 4, consistent augmentation of Foxp3 expression
by CD4+ T cells in a dose-dependent manner was detected. With regards to IFN-
α2a, concentrations between 103 to 105 U/ml were demonstrated to enhance Foxp3
expression significantly (Fig 6.3a). In the presence of 103 U/ml IFN-α2a, the
proportion of CD4+ T cells expressing Foxp3 was elevated from 0.8 ± 0.3% to 2.4 ±
0.5% (means ± SD; p<0.05) with PMA/ionomycin stimulation. Similarly, the Foxp3
expression levels by CD4+ T cells were raised from 1.0 ± 0.3% to 2.7 ± 0.3% (p<0.01)
in the presence of 103 U/ml IFN-α2b and PMA/ionomycin stimulation (Fig 6.3b).
Within CD4+CD25+ T cell population, Foxp3 expression was increased by addtion of
IFN-α as well and this was especially evident in cultures activated with
PMA/ionmycin in the presence of 104 U/ml IFN-α. The percentage of CD4+CD25+ T
cells expressing Foxp3 was upregulated from 1.2 ± 0.4% to 3.0 ± 0.5% (p<0.01) with
104 U/ml IFN-α2a (Fig 6.4a) and from 1.5 ± 0.3% to 3.0 ± 0.3% (p<0.01) with 104
U/ml IFN-α2b (Fig 6.4b).
In addition, within CD4+CD25high T cells, a population enriched in Tregs, a dose-
dependent increase in Foxp3 expression was induced by IFN-α consistently.
Results from cultures activated with PMA/ionomycin showed that the proportion of
CD4+CD25high T cells expressing Foxp3 was elevated from 4.7 ± 1.2% up to 8.0 ±
0.7% (p<0.05) with 104 U/ml IFN-α2a (Fig 6.5a) and from 4.4 ± 1.2% up to 9.3 ±
0.5% (p<0.01) with 103 U/ml IFN-α2b (Fig 6.5b). Similar trend could be observed in
unstimulated cultures as well.
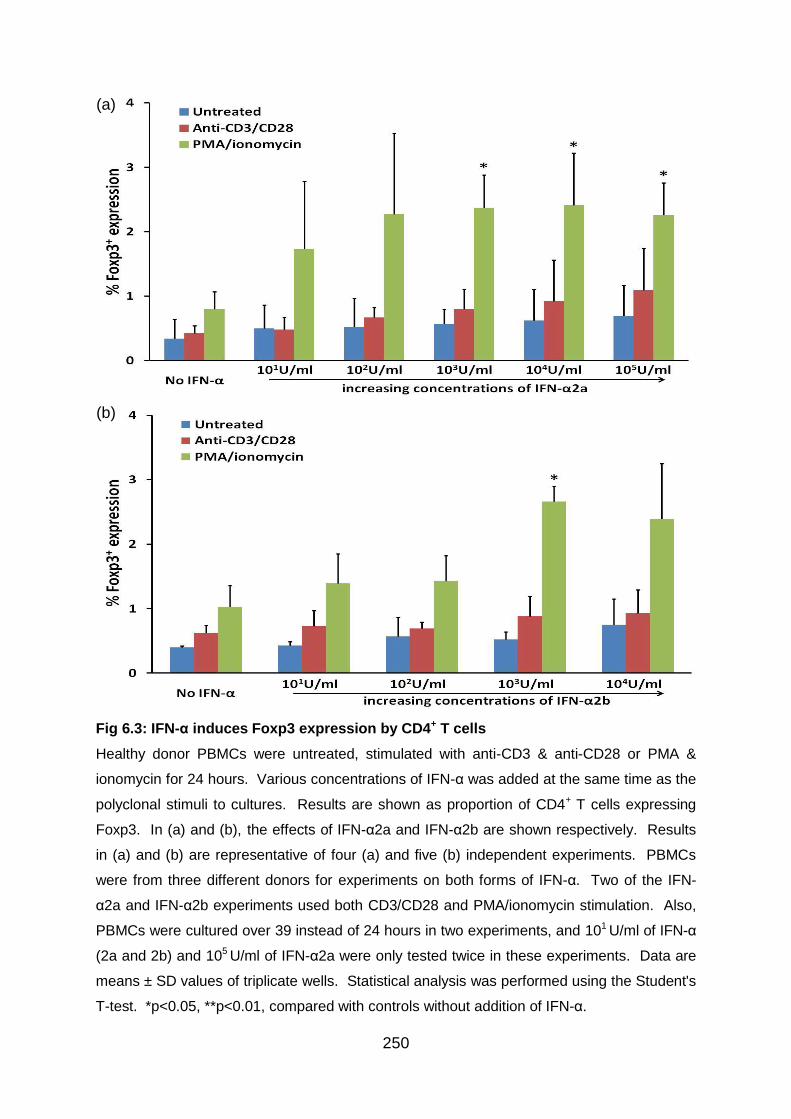
250
Fig 6.3: IFN-α induces Foxp3 expression by CD4+ T cells
Healthy donor PBMCs were untreated, stimulated with anti-CD3 & anti-CD28 or PMA &
ionomycin for 24 hours. Various concentrations of IFN-α was added at the same time as the
polyclonal stimuli to cultures. Results are shown as proportion of CD4+ T cells expressing
Foxp3. In (a) and (b), the effects of IFN-α2a and IFN-α2b are shown respectively. Results
in (a) and (b) are representative of four (a) and five (b) independent experiments. PBMCs
were from three different donors for experiments on both forms of IFN-α. Two of the IFN-
α2a and IFN-α2b experiments used both CD3/CD28 and PMA/ionomycin stimulation. Also,
PBMCs were cultured over 39 instead of 24 hours in two experiments, and 101 U/ml of IFN-α
(2a and 2b) and 105 U/ml of IFN-α2a were only tested twice in these experiments. Data are
means ± SD values of triplicate wells. Statistical analysis was performed using the Student's
T-test. *p<0.05, **p<0.01, compared with controls without addition of IFN-α.
(a)
(b)

251
Fig 6.4: IFN-α induces an upregulation of Foxp3 expression by CD4+CD25+ T cells
Healthy donor PBMCs were untreated, stimulated with anti-CD3 & anti-CD28 or PMA &
ionomycin for 24 hours. Various concentrations of IFN-α was added at the same time as the
polyclonal stimuli to cultures. Results are shown as proportion of CD4+CD25+ T cells
expressing Foxp3. In (a) and (b), the effects of IFN-α2a and IFN-α2b are shown respectively.
Results in (a) and (b) are representative of four (a) and five (b) independent experiments.
PBMCs were from three different donors for experiments on both forms of IFN-α. Two of the
IFN-α2a and IFN-α2b experiments used both CD3/CD28 and PMA/ionomycin stimulation.
Also, PBMCs were cultured over 39 instead of 24 hours in two experiments, and 101 U/ml of
IFN-α (2a and 2b) and 105 U/ml of IFN-α2a were only tested twice in these experiments.
Data are means ± SD values of triplicate wells. Statistical analysis was performed using the
Student's T-test. *p<0.05, **p<0.01, compared with controls without addition of IFN-α.
(a)
(b)
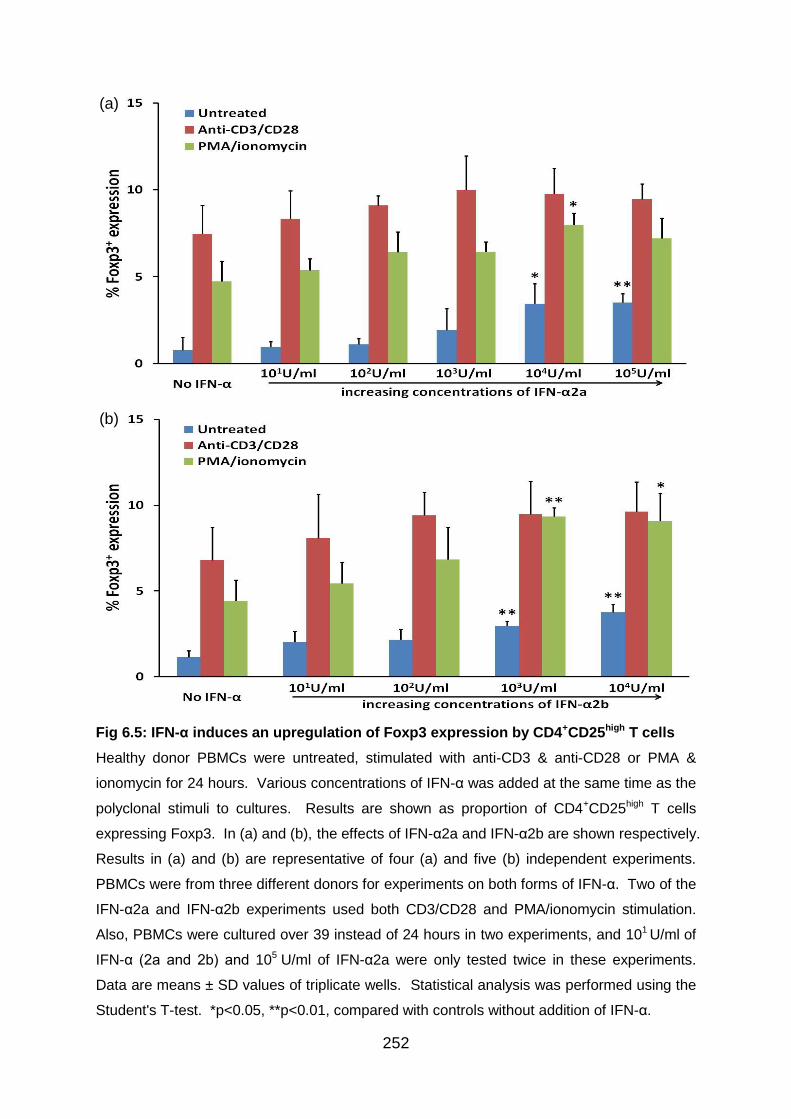
252
Fig 6.5: IFN-α induces an upregulation of Foxp3 expression by CD4+CD25high T cells
Healthy donor PBMCs were untreated, stimulated with anti-CD3 & anti-CD28 or PMA &
ionomycin for 24 hours. Various concentrations of IFN-α was added at the same time as the
polyclonal stimuli to cultures. Results are shown as proportion of CD4+CD25high T cells
expressing Foxp3. In (a) and (b), the effects of IFN-α2a and IFN-α2b are shown respectively.
Results in (a) and (b) are representative of four (a) and five (b) independent experiments.
PBMCs were from three different donors for experiments on both forms of IFN-α. Two of the
IFN-α2a and IFN-α2b experiments used both CD3/CD28 and PMA/ionomycin stimulation.
Also, PBMCs were cultured over 39 instead of 24 hours in two experiments, and 101 U/ml of
IFN-α (2a and 2b) and 105 U/ml of IFN-α2a were only tested twice in these experiments.
Data are means ± SD values of triplicate wells. Statistical analysis was performed using the
Student's T-test. *p<0.05, **p<0.01, compared with controls without addition of IFN-α.
(a)
(b)
253
6.3.3 IFN-α induces Foxp3 expression by CD8+ T cells
Having established the effect of IFN-α on inducing Foxp3 expression within CD4+ T
cells, the next goal was to explore whether similar effect was present with CD8+ T
cells. Again, experiments were set up with PBMCs isolated from healthy individuals,
and cells were cultured without stimulation or stimulated with anti-CD3 and anti-
CD28 Ab or PMA and ionomycin for 24 hours in the presence or absence of IFN-α2a
(101-105 U/ml) and IFN-α2b (101-104 U/ml) before intracellular cytokine staining and
flow cytometry. Foxp3 expression was analysed by gating on CD8+, CD8+CD25+ and
CD8+CD25high lymphocyte population.
From our experiments, it was revealed that although the Foxp3 expression levels by
CD8+ T cells were very low to begin with, an upregulation was still able to be
detected. Following activation with PMA/ionomycin, the proportion of Foxp3
expressing CD8+ T cells was elevated from 0.4 ± 0.1% up to 1.3 ± 0.4% (means ±
SD; p<0.05) in the presence of 104 U/ml IFN-α2a (Fig 6.6a) and from 0.4 ± 0.2% up
to 1.0 ± 0.3% (p<0.05) in the presence of 104 U/ml IFN-α2b (Fig 6.6b). Similarly,
within CD8+CD25+ cell population, Foxp3 expression levels were raised enhanced
from 0.5 ± 0.1% up to 1.1% (p<0.01) in the presence of 105 U/ml IFN-α2a (Fig 6.7a)
and from 0.6 ± 0.1% up to 1.5 ± 0.2% (p<0.05) in the presence of 104 U/ml IFN-α2b
(Fig 6.7b) with PMA/ionomycin stimulation. Similar trend of Foxp3 augmentation
could be detected in cultures stimulated with anti-CD3/CD28 Ab as well. Notably,
within CD8+CD25high lymphocytes, although there appeared to be a tendency for
inreased Foxp3 expression levels induced by IFN-α, none of the changes was
statistically significant (Fig 6.8).
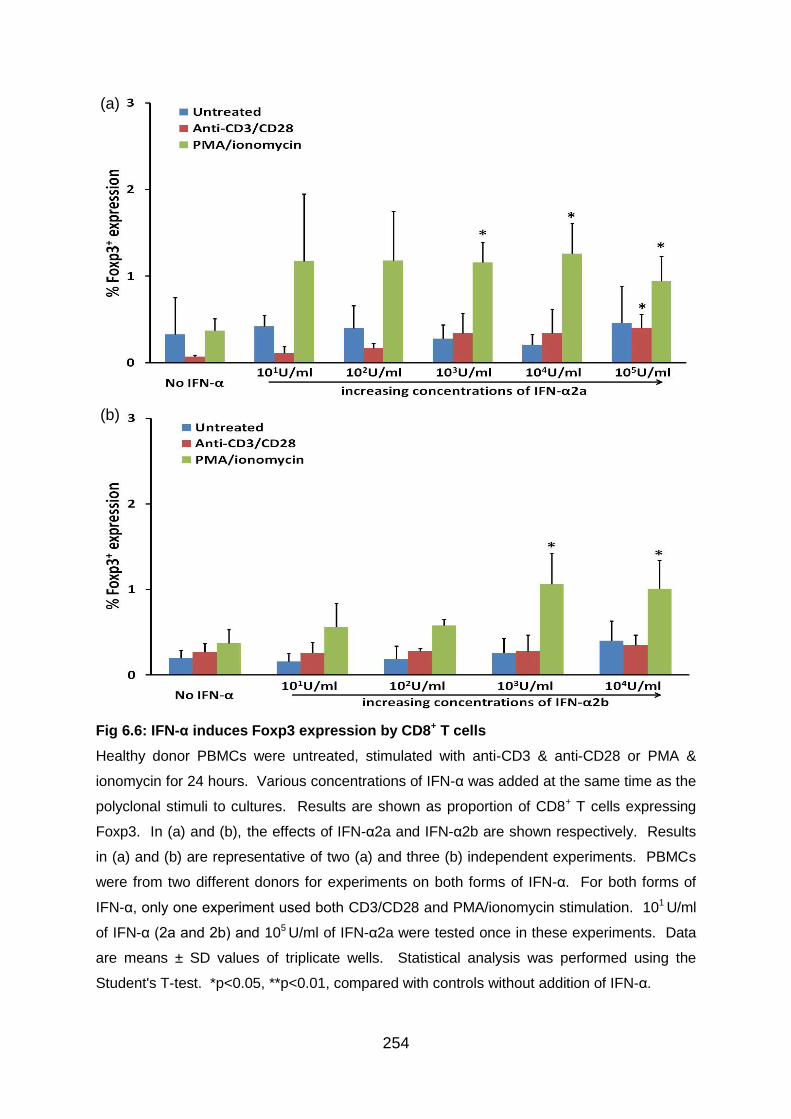
254
Fig 6.6: IFN-α induces Foxp3 expression by CD8+ T cells
Healthy donor PBMCs were untreated, stimulated with anti-CD3 & anti-CD28 or PMA &
ionomycin for 24 hours. Various concentrations of IFN-α was added at the same time as the
polyclonal stimuli to cultures. Results are shown as proportion of CD8+ T cells expressing
Foxp3. In (a) and (b), the effects of IFN-α2a and IFN-α2b are shown respectively. Results
in (a) and (b) are representative of two (a) and three (b) independent experiments. PBMCs
were from two different donors for experiments on both forms of IFN-α. For both forms of
IFN-α, only one experiment used both CD3/CD28 and PMA/ionomycin stimulation. 101 U/ml
of IFN-α (2a and 2b) and 105 U/ml of IFN-α2a were tested once in these experiments. Data
are means ± SD values of triplicate wells. Statistical analysis was performed using the
Student's T-test. *p<0.05, **p<0.01, compared with controls without addition of IFN-α.
(a)
(b)
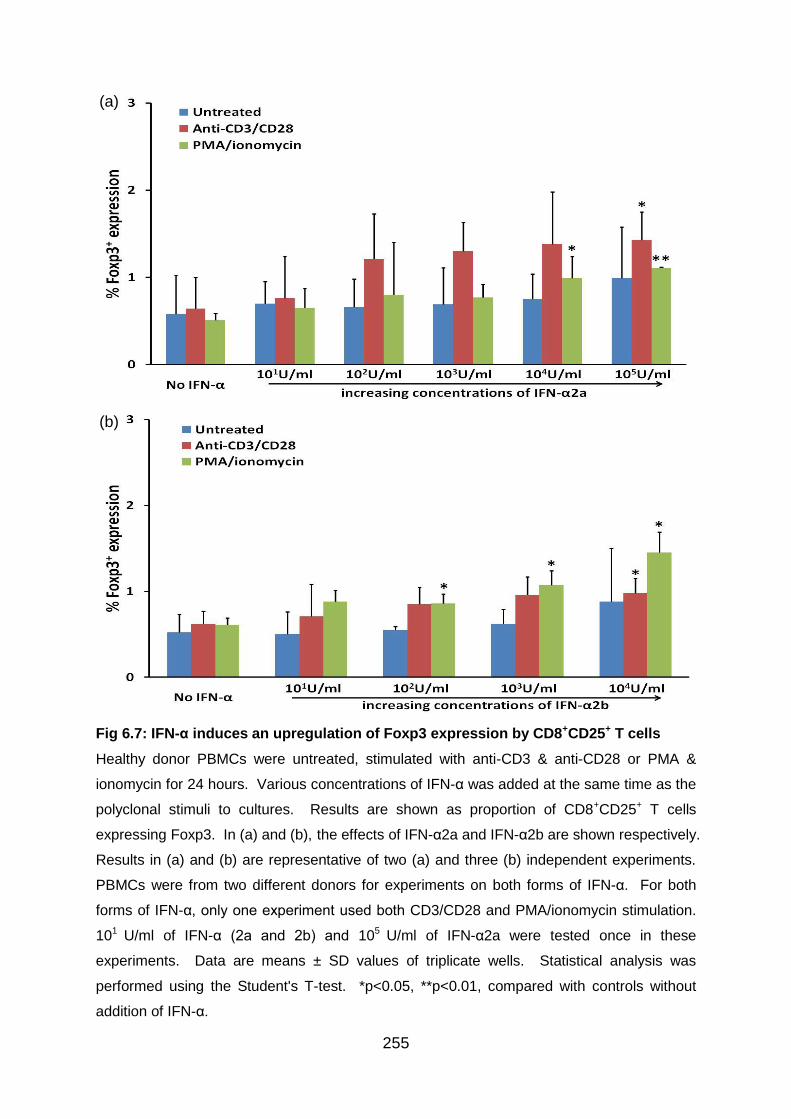
255
Fig 6.7: IFN-α induces an upregulation of Foxp3 expression by CD8+CD25+ T cells
Healthy donor PBMCs were untreated, stimulated with anti-CD3 & anti-CD28 or PMA &
ionomycin for 24 hours. Various concentrations of IFN-α was added at the same time as the
polyclonal stimuli to cultures. Results are shown as proportion of CD8+CD25+ T cells
expressing Foxp3. In (a) and (b), the effects of IFN-α2a and IFN-α2b are shown respectively.
Results in (a) and (b) are representative of two (a) and three (b) independent experiments.
PBMCs were from two different donors for experiments on both forms of IFN-α. For both
forms of IFN-α, only one experiment used both CD3/CD28 and PMA/ionomycin stimulation.
101 U/ml of IFN-α (2a and 2b) and 105 U/ml of IFN-α2a were tested once in these
experiments. Data are means ± SD values of triplicate wells. Statistical analysis was
performed using the Student's T-test. *p<0.05, **p<0.01, compared with controls without
addition of IFN-α.
(a)
(b)
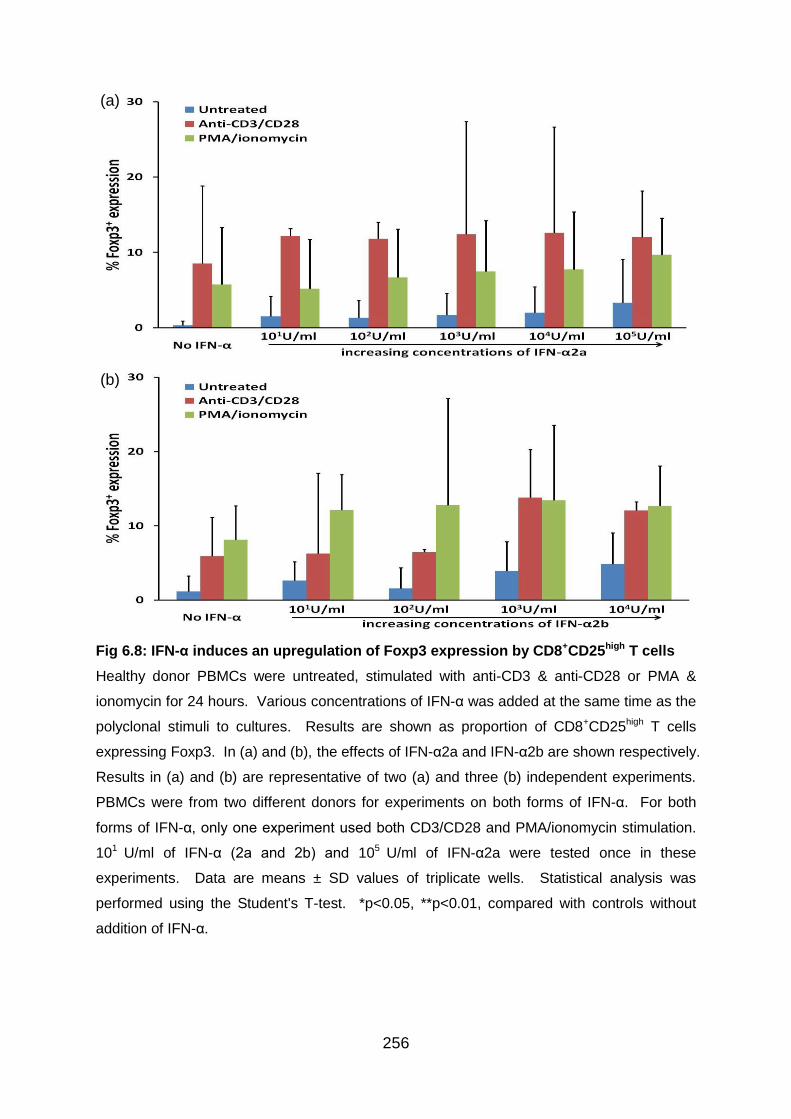
256
Fig 6.8: IFN-α induces an upregulation of Foxp3 expression by CD8+CD25high T cells
Healthy donor PBMCs were untreated, stimulated with anti-CD3 & anti-CD28 or PMA &
ionomycin for 24 hours. Various concentrations of IFN-α was added at the same time as the
polyclonal stimuli to cultures. Results are shown as proportion of CD8+CD25high T cells
expressing Foxp3. In (a) and (b), the effects of IFN-α2a and IFN-α2b are shown respectively.
Results in (a) and (b) are representative of two (a) and three (b) independent experiments.
PBMCs were from two different donors for experiments on both forms of IFN-α. For both
forms of IFN-α, only one experiment used both CD3/CD28 and PMA/ionomycin stimulation.
101 U/ml of IFN-α (2a and 2b) and 105 U/ml of IFN-α2a were tested once in these
experiments. Data are means ± SD values of triplicate wells. Statistical analysis was
performed using the Student's T-test. *p<0.05, **p<0.01, compared with controls without
addition of IFN-α.
(a)
(b)
257
6.3.4 The kinetics of the upregulatory effect of IFN-α on Foxp3 expression by
T cells
Although IFN-α has been observed to induce an upregulation in Foxp3 expression by
both CD4+ and CD8+ T cells in vitro, the kinetics of this particular effect by IFN-α
remained to be explored. PBMCs isolated from healthy individuals were cultured
without IFN-α treatment or with 104 U/ml IFN-α2a added 24 hours before, 4 hours
before, at the same time as, or 4 hours after PMA/ionomycin stimulation. The timing
for the introduction of IFN-α to cultures was the same for both unstimulated and
stimulated cultures, and PBMCs were incubated for 24 hours after addition of
PMA/ionomycin before intracellular cytokine staining and flow cytometry. Foxp3
expression levels were analysed by gating on CD4+, CD4+CD25+, CD4+CD25high,
CD8+, CD8+CD25+ and CD8+CD25high lymphocyte populations in turn.
Clearly, adding IFN-α to PBMC cultures at all time-points tested was effective in
inducing an upregulation of Foxp3 expression by CD4+, CD4+CD25+, and
CD4+CD25high T cells (Fig 6.9). Despite not being statistically significant, pre-
treatment of PBMCs with 104 U/ml IFN-α2a showed more efficacy in Foxp3 induction
within all three cell populations than adding IFN-α2a after polyclonal activation by
PMA/ionomycin or at the last time-point in the case of untreated cultures. Following
activation with PMA/ionomycin, the proportion of CD4+ T cells expressing Foxp3 was
upregulated from 1.0 ± 0.1% up to 2.4 ± 0.2% (means ± SEM; p<0.01) with 24 hours
of IFN-α pre-treatment and only up to 1.8 ± 0.4% (p<0.05) with 4 hours of IFN-α
post-treatment (Fig 6.9a). Similar results were observed within CD4+CD25+ T cells
as well as the Foxp3 expression levels were increased from 1.6 ± 0.1% up to 3.0 ±
0.3% (p<0.01) following 24 hours of IFN-α pre-treatment and PMA/ionomycin
stimulation (Fig 6.9b). In accordance, within CD4+CD25high T cells, the Foxp3
expression levels were elevated from 4.6 ± 0.4% up to 7.6 ± 0.7% (p<0.01) with 24
hours of IFN-α pre-treatment and activation by PMA/ionomycin (Fig 6.9c).
With regards to CD8+ T cells, Foxp3 expression levels were quite low relative to
CD4+ T cells, but they were able to be brought up with the introduction of 104 U/ml
IFN-α2a. Adding IFN-α at any time-points to PBMC cultures was demonstrated to be
equally efficacious as the proportion of CD8+ T cells expressing Foxp3 was raised

258
from 0.5% to 0.8 ± 0.1% (p<0.05) following IFN-α treatment and PMA/ionomycin
stimulation (Fig 6.10a). However, within CD8+CD25+ T cells, pre-treatment with IFN-
α again showed the tendency to be more potent in upregulating Foxp3 expression
than adding IFN-α later during incubation (Fig 6.10b). With PMA/ionomycin
stimulation, the proportion of CD8+CD25+ T cells expressing Foxp3 was enhanced
from 0.8 ± 0.1% to 1.3 ± 0.1% (p<0.05) after 24 hours of IFN-α pre-treatment but
only up to 1.1 ± 0.1% (p=ns) when IFN-α was added 4 hours after polyclonal
stimulation with PMA/ionomycin. In contrast, there was no appreciable
augmentation of Foxp3 expression within CD8+CD25high with the introduction of IFN-
α to cell cultures, although adding IFN-α earlier in cultures showed greater potential
than doing so later on (Fig 6.10c).
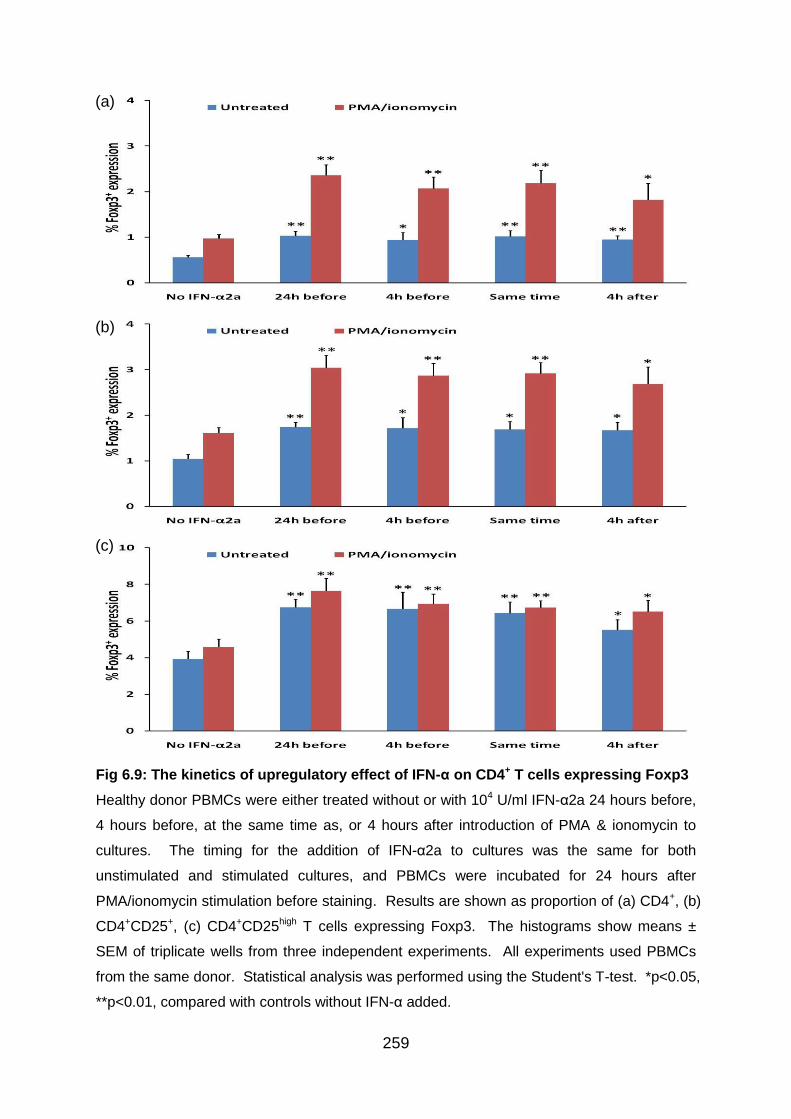
259
Fig 6.9: The kinetics of upregulatory effect of IFN-α on CD4+ T cells expressing Foxp3
Healthy donor PBMCs were either treated without or with 104 U/ml IFN-α2a 24 hours before,
4 hours before, at the same time as, or 4 hours after introduction of PMA & ionomycin to
cultures. The timing for the addition of IFN-α2a to cultures was the same for both
unstimulated and stimulated cultures, and PBMCs were incubated for 24 hours after
PMA/ionomycin stimulation before staining. Results are shown as proportion of (a) CD4+, (b)
CD4+CD25+, (c) CD4+CD25high T cells expressing Foxp3. The histograms show means ±
SEM of triplicate wells from three independent experiments. All experiments used PBMCs
from the same donor. Statistical analysis was performed using the Student's T-test. *p<0.05,
**p<0.01, compared with controls without IFN-α added.
(a)
(b)
(c)
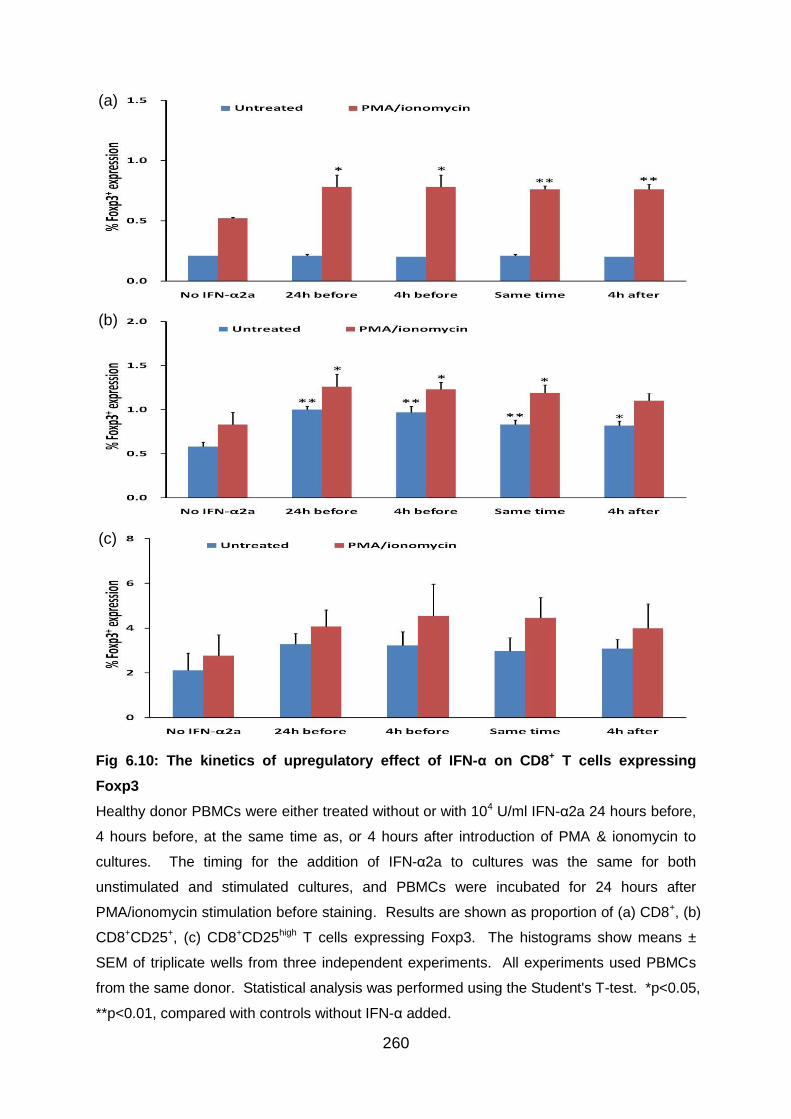
260
Fig 6.10: The kinetics of upregulatory effect of IFN-α on CD8+ T cells expressing
Foxp3
Healthy donor PBMCs were either treated without or with 104 U/ml IFN-α2a 24 hours before,
4 hours before, at the same time as, or 4 hours after introduction of PMA & ionomycin to
cultures. The timing for the addition of IFN-α2a to cultures was the same for both
unstimulated and stimulated cultures, and PBMCs were incubated for 24 hours after
PMA/ionomycin stimulation before staining. Results are shown as proportion of (a) CD8+, (b)
CD8+CD25+, (c) CD8+CD25high T cells expressing Foxp3. The histograms show means ±
SEM of triplicate wells from three independent experiments. All experiments used PBMCs
from the same donor. Statistical analysis was performed using the Student's T-test. *p<0.05,
**p<0.01, compared with controls without IFN-α added.
(a)
(b)
(c)
261
6.3.5 IFN-α upregulates IL-10 production by both CD4+ and CD8+ T cells
Results from chapter 4 demonstrated a tendency to upregulate the levels of IL-10
producing T cells in BD patients who received subcutaneous IFN-α2b therapy. In order
to verify these findings, experiments were set up to test the influence of recombinant
IFN-α on CD4+ T cells as well as CD8+ T cells producing IL-10 in vitro. Healthy
donor PBMCs were cultured without stimulation or stimulated with anti-CD3 and anti-
CD28 Ab or PMA and ionomycin in the presence or absence of IFN-α2a (101-105
U/ml) and IFN-α2b (101-104 U/ml) before intracellular cytokine staining and flow
cytometry. Cytokine expression was analysed by gating on either CD4+/CD3+CD8-
or CD8+ lymphocyte populations.
Within CD4+ T cells, although proportions of IL-10 producing cells were quite low even
after CD3/CD28 or PMA/ionomycin stimulation, the addition of IFN-α was able to induce
an upregulation of IL-10 production in a dose-dependent manner under all three culture
conditions. When 105 U/ml of IFN-α2a was added to untreated PBMC cultures, the
proportion of CD4+ T cells expressing IL-10 was increased from 0.6 ± 0.1% to 0.9 ±
0.1% (means ± SD; p<0.05) (Fig 6.11a). In correspondence, the percentage of IL-10
producing CD4+ T cells was elevated from 0.9 ± 0.1% to 2.1 ± 0.6% (p<0.05) with
CD3/CD28 stimulation and from 0.7 ± 0.1% to 1.3 ± 0.1% (p<0.01) following
PMA/ionomycin stimulation. Similarly, when 104 U/ml of IFN-α2b was added to
untreated PBMC cultures, the IL-10 production levels by CD4+ T cells was raised from
0.6% to 1.1 ± 0.2% (p<0.01) (Fig 6.11b). Correspondingly, the proportion of IL-10
producing CD4+ T cells was upregulated from 1.0 ± 0.2% to 1.7 ± 0.3% (p<0.05) with
CD3/CD28 stimulation and from 0.8 ± 0.1% to 1.5 ± 0.1% (p<0.01) following
PMA/ionomycin stimulation.
Having established enhancement of IL-10 levels by CD4+ T cells, data were further
analysed to investigate Foxp3 expression in these IL-10 producing cells. It was
revealed that the increase in IL-10 production levels was mainly due to Foxp3- cells.
Following CD3/CD28 stimulation, the percentage of CD4+ T cells with IL-10+Foxp3-
expression was augmented from 0.5 ± 0.3% up to 1.7 ± 0.6% (p<0.05) in the presence
of 105 U/ml of IFN-α2a (Fig 6.12a) and from 0.4 ± 0.2% up to 1.3 ± 0.3% (p<0.01) in the
presence of 104 U/ml of IFN-α2b (Fig 6.12b). On the other hand, very low levels of
262
CD4+ T cells displayed IL-10+Foxp3+ expression and IFN-α was not observed to have
any effects on these cells, regardless of the concentrations used (data not shown).
Within CD8+ T cells, an upregulation of IL-10 production by IFN-α in a dose-dependent
manner could be detected consistenly as well under all three culture conditions. In the
presence of 105 U/ml of IFN-α2a, the proportions of CD8+ T cells producing IL-10 were
raised from 1.1 ± 0.2% up to 1.9 ± 0.1% (p<0.01) in untreated cultures, from 1.9 ± 0.3%
up to 4.6 ± 0.4% (p<0.01) in CD3/CD28 stimulated cultures, and from 1.6 ± 0.2% up to
2.1 ± 0.1% (p<0.05) in cultures activated with PMA/ionomycin (Fig 6.13a). Likewise, in
the presence of 104 U/ml of IFN-α2b, the percentages of IL-10 producing CD8+ T cells
were elevated from 1.1 ± 0.2% up to 1.5 ± 0.1% (p<0.05) in untreated cultures, from 1.0
± 0.2% up to 2.9 ± 0.8% (p<0.05) in CD3/CD28 stimulated cultures, and from 1.0 ± 0.1%
up to 1.8 ± 0.3% (p<0.05) with PMA/ionomycin stimulation (Fig 6.13b).
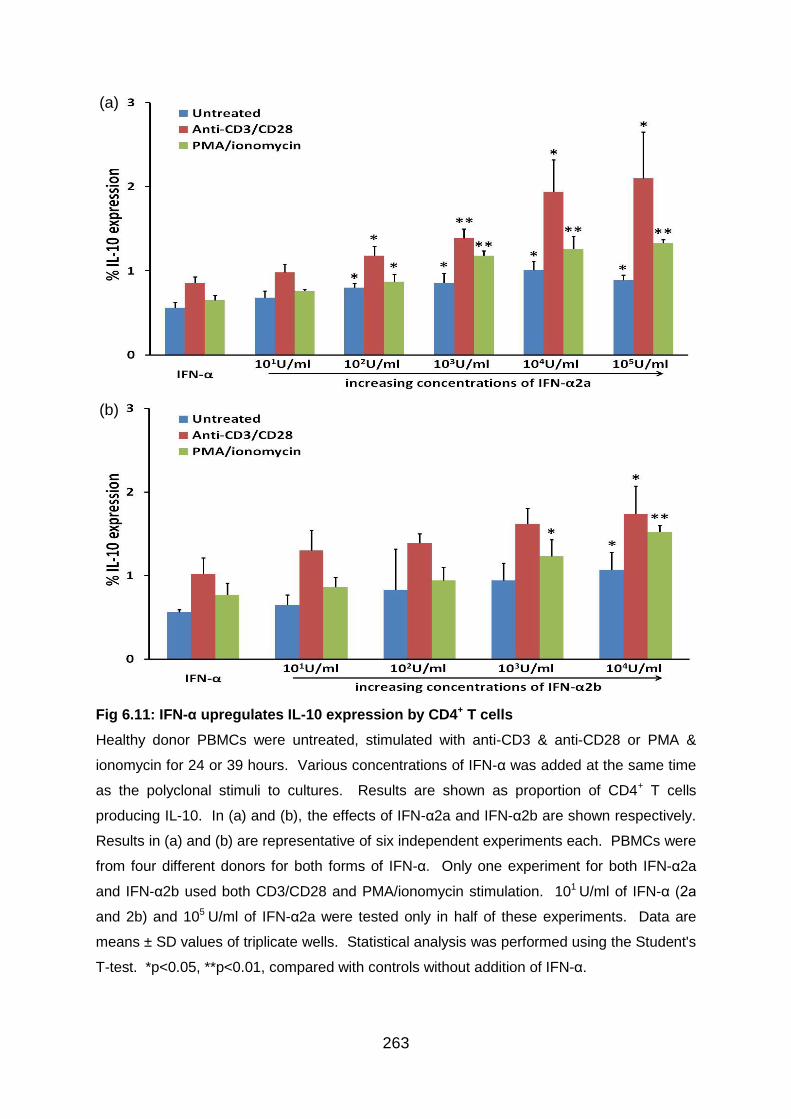
263
Fig 6.11: IFN-α upregulates IL-10 expression by CD4+ T cells
Healthy donor PBMCs were untreated, stimulated with anti-CD3 & anti-CD28 or PMA &
ionomycin for 24 or 39 hours. Various concentrations of IFN-α was added at the same time
as the polyclonal stimuli to cultures. Results are shown as proportion of CD4+ T cells
producing IL-10. In (a) and (b), the effects of IFN-α2a and IFN-α2b are shown respectively.
Results in (a) and (b) are representative of six independent experiments each. PBMCs were
from four different donors for both forms of IFN-α. Only one experiment for both IFN-α2a
and IFN-α2b used both CD3/CD28 and PMA/ionomycin stimulation. 101 U/ml of IFN-α (2a
and 2b) and 105 U/ml of IFN-α2a were tested only in half of these experiments. Data are
means ± SD values of triplicate wells. Statistical analysis was performed using the Student's
T-test. *p<0.05, **p<0.01, compared with controls without addition of IFN-α.
(a)
(b)
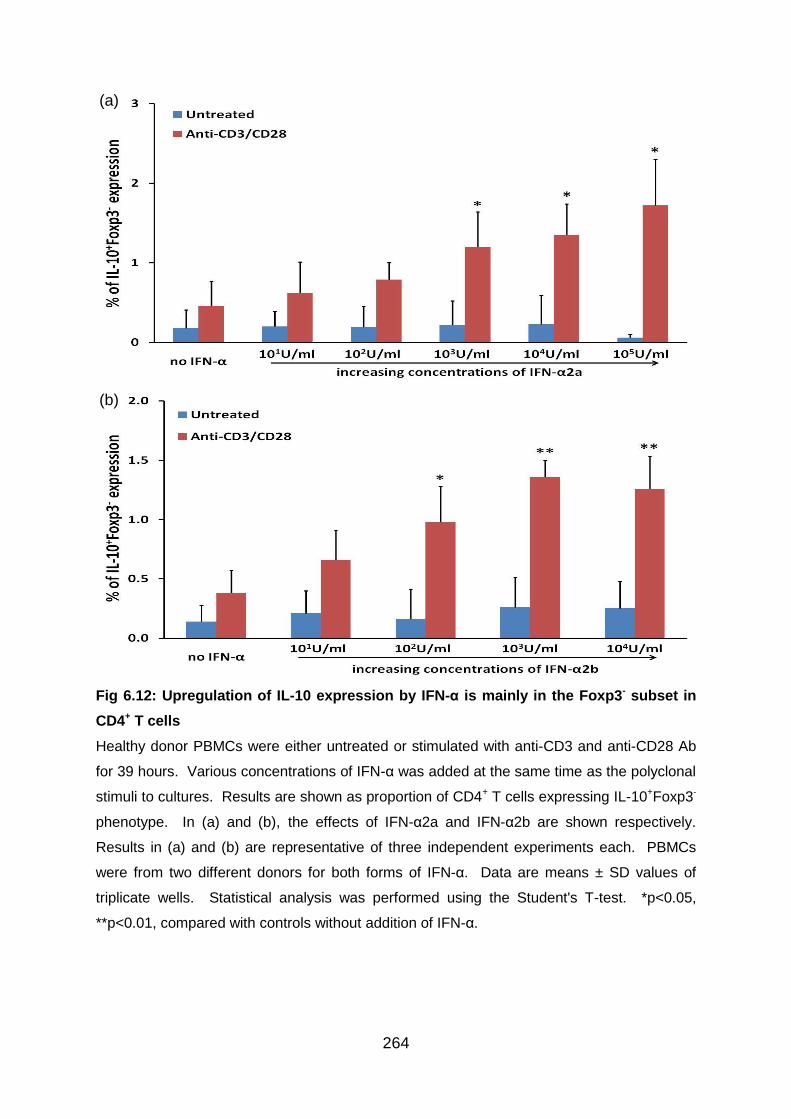
264
Fig 6.12: Upregulation of IL-10 expression by IFN-α is mainly in the Foxp3- subset in
CD4+ T cells
Healthy donor PBMCs were either untreated or stimulated with anti-CD3 and anti-CD28 Ab
for 39 hours. Various concentrations of IFN-α was added at the same time as the polyclonal
stimuli to cultures. Results are shown as proportion of CD4+ T cells expressing IL-10+Foxp3-
phenotype. In (a) and (b), the effects of IFN-α2a and IFN-α2b are shown respectively.
Results in (a) and (b) are representative of three independent experiments each. PBMCs
were from two different donors for both forms of IFN-α. Data are means ± SD values of
triplicate wells. Statistical analysis was performed using the Student's T-test. *p<0.05,
**p<0.01, compared with controls without addition of IFN-α.
(a)
(b)

265
Fig 6.13: IFN-α upregulates IL-10 expression by CD8+ T cells
Healthy donor PBMCs were untreated, stimulated with anti-CD3 & anti-CD28 or PMA &
ionomycin for 24 hours. Various concentrations of IFN-α was added at the same time as the
polyclonal stimuli to cultures. Results are shown as proportion of CD8+ T cells producing IL-
10. In (a) and (b), the effects of IFN-α2a and IFN-α2b are shown respectively. Results in (a)
and (b) are representative of three independent experiments each. PBMCs were from two
different donors for both forms of IFN-α. Only one experiment for both IFN-α2a and IFN-α2b
used both CD3/CD28 and PMA/ionomycin stimulation. 101 U/ml of IFN-α (2a and 2b) and
105 U/ml of IFN-α2a were tested only once in these experiments. Data are means ± SD
values of triplicate wells. Statistical analysis was performed using the Student's T-test.
*p<0.05, **p<0.01, compared with controls without addition of IFN-α.
(a)
(b)
266
6.3.6 The kinetics of the upregulatory effect of IFN-α on IL-10 production by T
cells
Having established the potential of IFN-α to induce IL-10 production by both CD4+
and CD8+ T cells in vitro, the next objective was to investigate the influence of IFN-α
on kinetics of IL-10 production. PBMCs isolated from healthy individuals were
cultured without IFN-α treatment or with 104 U/ml IFN-α2a added 24 hours before, 4
hours before, at the same time as, or 4 hours after PMA/ionomycin stimulation. The
timing for the introduction of IFN-α to cultures was the same for both unstimulated
and stimulated cultures, and PBMCs were incubated for 24 hours after addition of
PMA/ionomycin before intracellular cytokine staining and flow cytometry. IL-10
expression levels were analysed by gating on CD4+/CD3+CD8- or CD8+ lymphocyte
populations.
Evidently, the introduction of 104 U/ml IFN-α2a to PBMC cultures at all time-points
tested showed a positive effect on IL-10 production by CD4+ T cells. Despite not
being statistically significant, pre-treatment of PBMCs with IFN-α demonstrated
better capacity in IL-10 induction within CD4+ T cells than adding IFN-α after
polyclonal activation with PMA/ionomycin or at the last time-point in the case of
untreated cultures. Following activation with PMA/ionomycin, the proportion of CD4+
T cells producing IL-10 was elevated from 1.0 ± 0.1% to 1.7 ± 0.1% (means ± SEM;
p<0.01) with 24 hours of IFN-α pre-treatment (Fig 6.14a), and only up to 1.3 ± 0.1%
(p<0.05) when IFN-α was added after PBMC activation. In accordance, the IL-10
expression levels were upregulated from 0.7 ± 0.1% up to 1.3 ± 0.1% (p<0.01) with
24 hours of IFN-α pre-treatment in untreated cultures and only to 1.1 ± 0.1% when
IFN-α was added at the last time-point.
Similarly, IL-10 expression levels by CD8+ T cells were augmented significantly with
the introduction of 104 U/ml IFN-α2a at any time points following PMA/ionomycin
stimulation. However, 24 hour of IFN-α pre-treatment was the most effective as
proportion of CD8+ T cells producing IL-10 was raised from 1.2 ± 0.1% up to 1.9 ±
0.2% (p<0.01) when compared to just 1.5 ± 0.1% (p<0.05) with IFN-α added at the
last time-point (Fig 6.14b). In untreated cultures, although an upregulation of IL-10
levels within CD8+ T cell population was observed with IFN-α treatment at all time-
267
points, the increase was only statistically significant when comparing 24 hours pre-
treatment data (1.9 ± 0.2%; p<0.05) to ones without IFN-α treatment (0.9 ± 0.2%). In
fact, the levels of IL-10 producing CD8+ T cells were significantly lower when IFN-α
were added at later time-points (1.2 ± 0.2% and 1.1 ± 0.2%; p<0.05) when evaluated
against data with 24 hours of IFN-α pre-treatment (Fig 6.14b).

268
Fig 6.14: The kinetics of upregulatory effect of IFN-α on IL-10 expression by T cells
Healthy donor PBMCs were either treated without or with 104 U/ml IFN-α2a 24 hours before,
4 hours before, at the same time as, or 4 hours after introduction of PMA & ionomycin to
cultures. The timing for the addition of IFN-α2a to cultures was the same for both
unstimulated and stimulated cultures, and PBMCs were incubated for 24 hours after
PMA/ionomycin stimulation before staining. Results are shown as proportion of (a) CD4+
and (b) CD8+ T cells producing IL-10. The histograms show means ± SEM of triplicate wells
from three independent experiments. All experiments used PBMCs from the same donor.
Statistical analysis was performed using the Student's T-test. *p<0.05, **p<0.01, compared
with controls without IFN-α added.
(a)
(b)
269
6.3.7 IFN-α upregulates TGF-β production by both CD4+ and CD8+ T cells
A tendency of T cells to display a heightened TGF-β level in BD patients under
subcutaneous IFN-α2b therapy was detected in chapter 4. In order to verify this effect,
in vitro experiments were performed to examine the influence of recombinant IFN-α
on CD4+ and CD8+ T cells producing TGF-β. Healthy donor PBMCs were cultured
without stimulation or stimulated with anti-CD3 and anti-CD28 Ab or PMA and
ionomycin for 24 hours in the presence or absence of IFN-α2a (101-105 U/ml) and
IFN-α2b (101-104 U/ml) before intracellular cytokine staining and flow cytometry.
Cytokine expression was analysed by gating on either CD4+/CD3+CD8- or CD8+
lymphocyte populations.
Regarding CD4+ T cells, higher concentrations of IFN-α were able to induce an
enhancement of TGF-β levels, especially after polyclonal activation. When 105 U/ml of
IFN-α2a was added to CD3/CD28 stimulated cultures, the proportion of CD4+ T cells
producing TGF-β was upregulated from 1.4 ± 0.4% to 2.6 ± 0.5% (means ± SD; p<0.05)
(Fig 6.15a). In correspondence, the percentage of TGF-β expressing CD4+ T cells was
elevated from 1.7 ± 0.5% to 2.9 ± 0.4% (p<0.05) with PMA/ionomycin stimulation.
Similarly, when IFN-α2b was added to PBMC cultures stimulated with PMA/ionomycin,
a dose-dependent increase in TGF-β expression levels by CD4+ T cells was
consistently observed. The most potent dose of IFN-α2b was at a concentration of 104
U/ml and the TGF-β expression levels by CD4+ T cells was raised from 0.7 ± 0.1%
without the influence of IFN-α to 2.0 ± 0.3% (p<0.01) (Fig 6.15b).
With regards to CD8+ T cells, an upregulation of TGF-β expression by higher
concentrations of IFN-α could be observed consistenly as well. In the presence of 105
U/ml of IFN-α2a, the proportion of CD8+ T cells producing TGF-β was increased from
1.0 ± 0.6% to 2.8 ± 0.4% (p<0.01) in untreated cultures and from 3.2 ± 0.8% to 5.1 ±
0.3% (p<0.05) in cultures activated with anti-CD3/CD28 Ab (Fig 6.16a). Similar trend
was detected in cultures stimulated with PMA/ionomycin as well in the presence of
higher concentrations of IFN-α2a. Likewise, in the presence of 104 U/ml of IFN-α2b, the
proportion of TGF-β expressing CD8+ T cells was upregulated to 3.6 ± 0.6% (p<0.05)
with CD3/CD28 stimulation and 2.3 ± 0.2% (p<0.05) without cell activation from 1.9 ±
0.7% and 1.0 ± 0.5% respectively (Fig 6.16b).
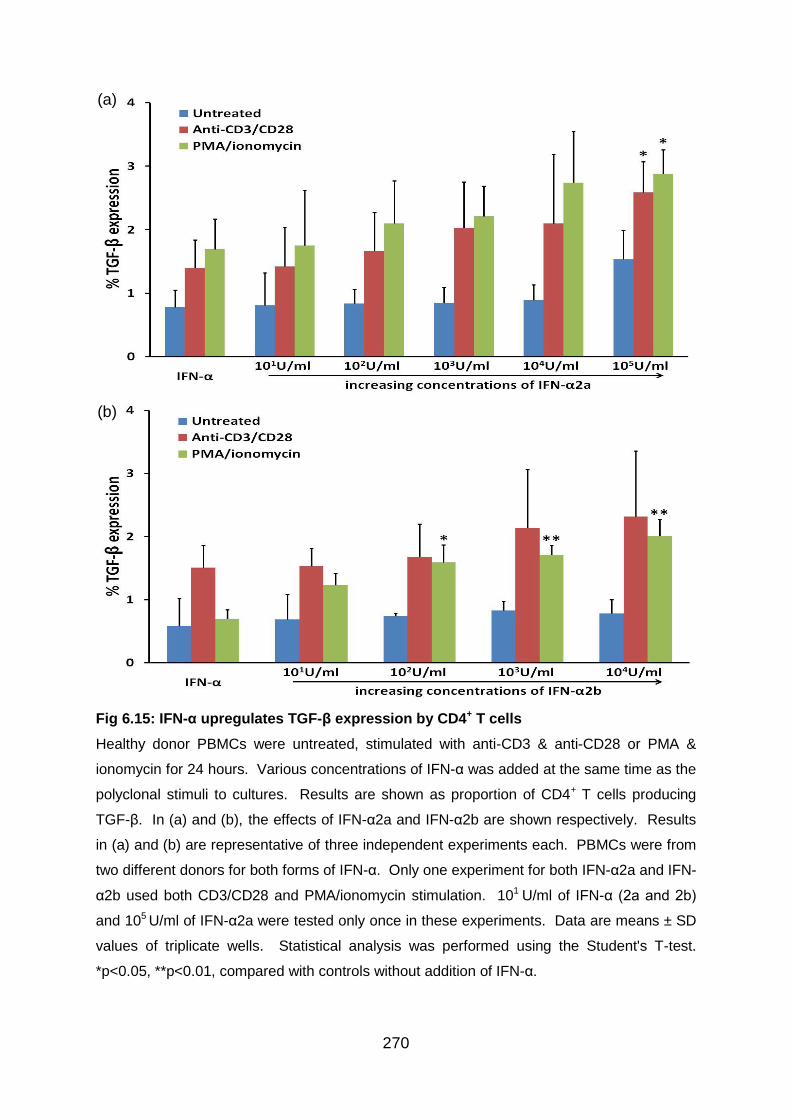
270
Fig 6.15: IFN-α upregulates TGF-β expression by CD4+ T cells
Healthy donor PBMCs were untreated, stimulated with anti-CD3 & anti-CD28 or PMA &
ionomycin for 24 hours. Various concentrations of IFN-α was added at the same time as the
polyclonal stimuli to cultures. Results are shown as proportion of CD4+ T cells producing
TGF-β. In (a) and (b), the effects of IFN-α2a and IFN-α2b are shown respectively. Results
in (a) and (b) are representative of three independent experiments each. PBMCs were from
two different donors for both forms of IFN-α. Only one experiment for both IFN-α2a and IFN-
α2b used both CD3/CD28 and PMA/ionomycin stimulation. 101 U/ml of IFN-α (2a and 2b)
and 105 U/ml of IFN-α2a were tested only once in these experiments. Data are means ± SD
values of triplicate wells. Statistical analysis was performed using the Student's T-test.
*p<0.05, **p<0.01, compared with controls without addition of IFN-α.
(a)
(b)
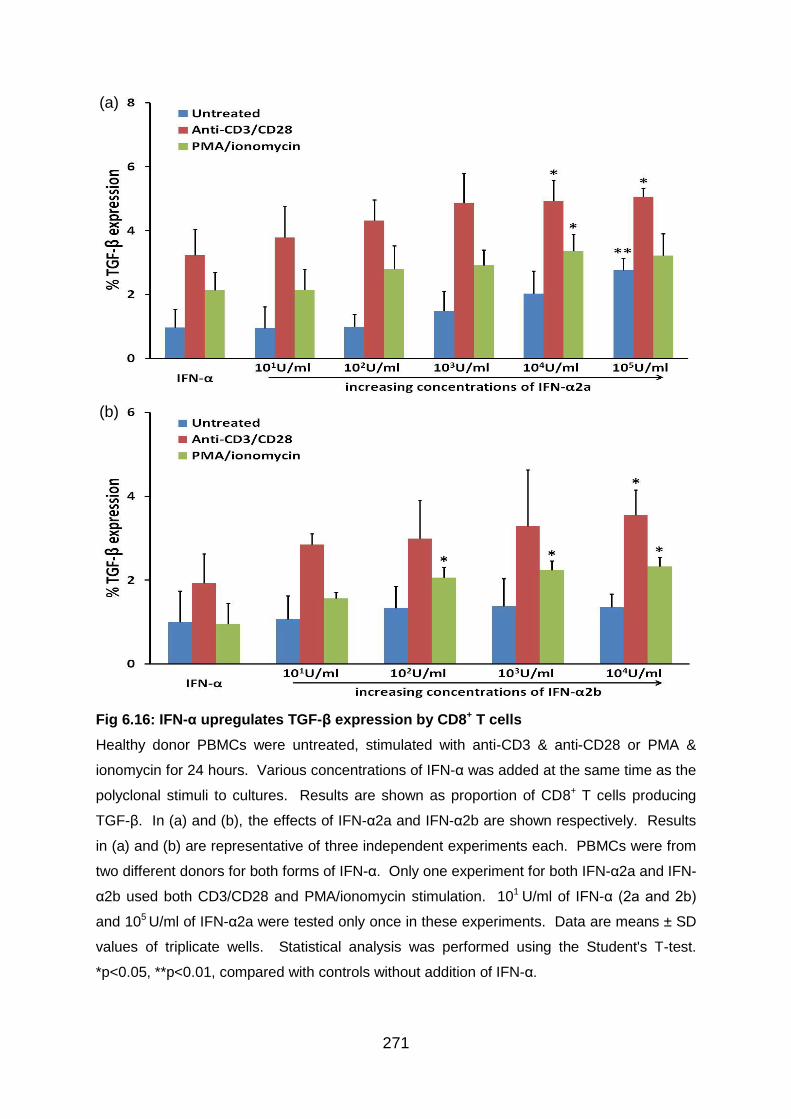
271
Fig 6.16: IFN-α upregulates TGF-β expression by CD8+ T cells
Healthy donor PBMCs were untreated, stimulated with anti-CD3 & anti-CD28 or PMA &
ionomycin for 24 hours. Various concentrations of IFN-α was added at the same time as the
polyclonal stimuli to cultures. Results are shown as proportion of CD8+ T cells producing
TGF-β. In (a) and (b), the effects of IFN-α2a and IFN-α2b are shown respectively. Results
in (a) and (b) are representative of three independent experiments each. PBMCs were from
two different donors for both forms of IFN-α. Only one experiment for both IFN-α2a and IFN-
α2b used both CD3/CD28 and PMA/ionomycin stimulation. 101 U/ml of IFN-α (2a and 2b)
and 105 U/ml of IFN-α2a were tested only once in these experiments. Data are means ± SD
values of triplicate wells. Statistical analysis was performed using the Student's T-test.
*p<0.05, **p<0.01, compared with controls without addition of IFN-α.
(a)
(b)
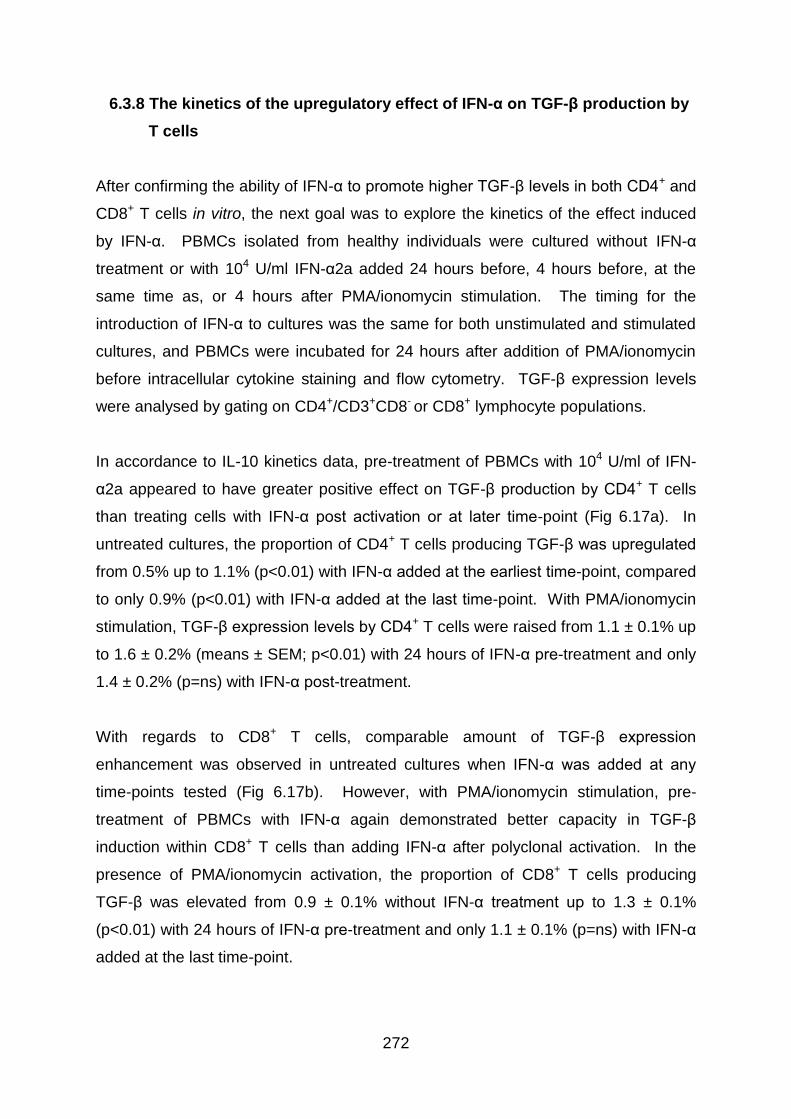
272
6.3.8 The kinetics of the upregulatory effect of IFN-α on TGF-β production by
T cells
After confirming the ability of IFN-α to promote higher TGF-β levels in both CD4+ and
CD8+ T cells in vitro, the next goal was to explore the kinetics of the effect induced
by IFN-α. PBMCs isolated from healthy individuals were cultured without IFN-α
treatment or with 104 U/ml IFN-α2a added 24 hours before, 4 hours before, at the
same time as, or 4 hours after PMA/ionomycin stimulation. The timing for the
introduction of IFN-α to cultures was the same for both unstimulated and stimulated
cultures, and PBMCs were incubated for 24 hours after addition of PMA/ionomycin
before intracellular cytokine staining and flow cytometry. TGF-β expression levels
were analysed by gating on CD4+/CD3+CD8- or CD8+ lymphocyte populations.
In accordance to IL-10 kinetics data, pre-treatment of PBMCs with 104 U/ml of IFN-
α2a appeared to have greater positive effect on TGF-β production by CD4+ T cells
than treating cells with IFN-α post activation or at later time-point (Fig 6.17a). In
untreated cultures, the proportion of CD4+ T cells producing TGF-β was upregulated
from 0.5% up to 1.1% (p<0.01) with IFN-α added at the earliest time-point, compared
to only 0.9% (p<0.01) with IFN-α added at the last time-point. With PMA/ionomycin
stimulation, TGF-β expression levels by CD4+ T cells were raised from 1.1 ± 0.1% up
to 1.6 ± 0.2% (means ± SEM; p<0.01) with 24 hours of IFN-α pre-treatment and only
1.4 ± 0.2% (p=ns) with IFN-α post-treatment.
With regards to CD8+ T cells, comparable amount of TGF-β expression
enhancement was observed in untreated cultures when IFN-α was added at any
time-points tested (Fig 6.17b). However, with PMA/ionomycin stimulation, pre-
treatment of PBMCs with IFN-α again demonstrated better capacity in TGF-β
induction within CD8+ T cells than adding IFN-α after polyclonal activation. In the
presence of PMA/ionomycin activation, the proportion of CD8+ T cells producing
TGF-β was elevated from 0.9 ± 0.1% without IFN-α treatment up to 1.3 ± 0.1%
(p<0.01) with 24 hours of IFN-α pre-treatment and only 1.1 ± 0.1% (p=ns) with IFN-α
added at the last time-point.
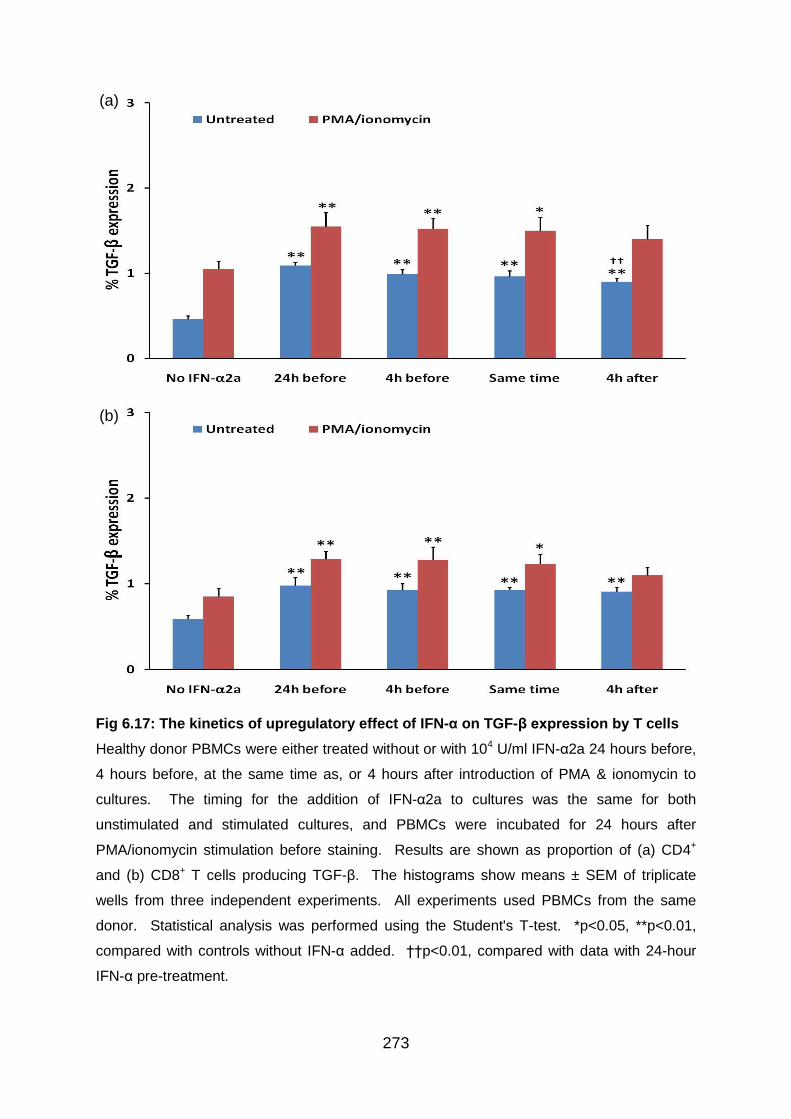
273
Fig 6.17: The kinetics of upregulatory effect of IFN-α on TGF-β expression by T cells
Healthy donor PBMCs were either treated without or with 104 U/ml IFN-α2a 24 hours before,
4 hours before, at the same time as, or 4 hours after introduction of PMA & ionomycin to
cultures. The timing for the addition of IFN-α2a to cultures was the same for both
unstimulated and stimulated cultures, and PBMCs were incubated for 24 hours after
PMA/ionomycin stimulation before staining. Results are shown as proportion of (a) CD4+
and (b) CD8+ T cells producing TGF-β. The histograms show means ± SEM of triplicate
wells from three independent experiments. All experiments used PBMCs from the same
donor. Statistical analysis was performed using the Student's T-test. *p<0.05, **p<0.01,
compared with controls without IFN-α added. ††p<0.01, compared with data with 24-hour
IFN-α pre-treatment.
(a)
(b)
274
6.4 Discussion
A number of regulatory T cell subsets have been identified, and there is growing
evidence that these cells are essential for controlling immune responses. Although
we have much to learn about the biology of Treg cells, it has become clear that via
expression of inhibitory cell-surface molecules and production of cytokines such as
IL-10 and TGF-β, Treg cells maintain peripheral tolerance to self and foreign Ags,
and that in their absence the host may succumb to a variety of autoimmune and
chronic inflammatory diseases (Levings et al. 2002). Remarkably, Treg cells are
able to suppress activated T cells in vitro at a ratio of one Treg to 20 effector cells
(Dieckmann et al. 2001). Therefore, a large clone size for Treg cells is less
important than for conventional T cells, and induction of naive precursor T cells into
Foxp3-expressing cells with regulatory capacity has become an attractive
mechanism to dampen an overactive acute inflammation or to curtail the response to
a chronic unresolved challenge in theory.
6.4.1 Setting up Treg in vitro test models using antigens and polyclonal
stimuli
Although immunosuppressive activity of Treg cells is exerted in a non-specific
manner, the identification of few Ag recognised by Tregs in a murine study suggests
that in vivo expansion of these cells could result from Ag-specific stimuli (Thornton &
Shevach 2000). Also, it has been described that Tregs express a range of TLRs,
stimulation of which can have significant effects on the expansion and suppressive
function of Treg cells (Allan et al. 2008b). Tregs treated with HSP60 were reported to be
more effective than untreated ones in suppressing CD4+CD25- or CD8+ T cells and the
enhancing effects of HSP60 on Treg cells involved TLR2 signalling. Besides, it was
indicated that the HSP60-treated Tregs induced their target CD4+CD25- T cells to secrete
IL-10 (Zanin-Zhorov et al. 2006). Zymosan, a stimulus for TLR2 and dectin-1 (Dillon et al.
2006), was demonstrated to promote IL-10 production by DCs at a concentration of
200μg/ml after 18 hours of culture as tested by ELISA of culture supernatants
(Gerosa et al. 2008).
275
In our preliminary experiments, two TLR ligands were used. Zymosan was not found
to induce an upregulation of either Foxp3 or IL-10 expression, even at 100μg/ml.
LPS, on the other hand, showed the tendency to induce higher expression levels of
Foxp3 by CD4+CD25hi T cells at 5-20μg/ml and IL-10 by CD4+ T cells at 5μg/ml with
longer incubation time. Another antigen made from candida extracts also displayed
some potential in promoting Foxp3+ T cells and IL-10 cytokine. However, of all the
antigens used, there was none better than ATRA, at a range of concentrations, in
enhancing Foxp3 expression. This is consistent with reports of a crucial regulatory
role for retinoic acid in promoting Foxp3 induction (Elias et al. 2008;Mucida et al.
2007). However, the presence of ATRA in PBMC cultures was not observed to
increase IL-10 production.
Due to consistent observation that polyclonal activation by anti-CD3/CD28 Ab and
PMA/ionomycin enhanced greater amount of Foxp3 and IL-10 expression by CD4+ T
cells, healthy donor PBMCs with or without polyclonal activation were chosen for the
subsequent tests on the in vitro immunoregulatory effects of IFN-α.
6.4.2.1 CD8+ Treg cells
Like in CD4+ T cells, polyclonal activation of PBMCs can lead to induction of Foxp3
expression by human CD8+ T cells in vitro (Gavin et al. 2006;Morgan et al. 2005).
Notably, the ability to express Foxp3 has been demonstrated to be inherent to CD8+
T cells, and it is independent of the mode of TCR activation yet critically dependent
on IL-2 or IL-15 signalling (Ahmadzadeh, Antony, & Rosenberg 2007).
Recently, it has been indicated that highly suppressive adaptive CD8+CD25+Foxp3+
T cells can be induced from CD8+CD25- T cells by continuous antigen stimulation in
the presence of monocytes as well. These adaptive CD8+ Treg cells express
markers associated with a regulatory phenotype, and inhibit CD4+ and CD8+ T cell
proliferation and cytokine production. A contact-dependent mechanism appears to
be the key for their suppressive activity, even though these regulatory cells express
prostaglandin E2, IL-10, and TGF-β (Mahic et al. 2008). An alternative way to
induce CD8+ Treg cells is to stimulate PBMCs from primed donors with the
276
mycobacterial vaccine Bacillus Calmette Guerin (BCG) yielding
CD8+CD25+lymphocyte-activation gene 3 (LAG-3)+Foxp3+CCL4+ cells. The
suppressive function of such CD8+ Treg cells was assigned to secretion of the
chemokine CCL4 (Joosten et al. 2007).
6.4.2.2 The influence of IFN-α on Foxp3 expressing CD4+ and CD8+ T cells
A dose-dependent upregulation of Foxp3 expression by either exogenous IFN-α2a or
IFN-α2b was clearly evident in CD4+, CD4+CD25+, and CD4+CD25high T cells in our
experiments. Also, a dose-dependent enhancement of Foxp3 expression by either
exogenous IFN-α2a or IFN-α2b was observed in CD8+, CD8+CD25+ T cells, but not
CD8+CD25high T cells. The difference in results with CD8+CD25high T cell population
could be related to the much smaller number of cells detected with flow cytometry
and hence larger variation in data as a result. Moreover, the upregulation in the
proportion of CD8+ T cells expressing Foxp3 observed in our data was likely
contributed not only by the promotion of CD8+CD25+Foxp3+ T cells but also other
Treg subsets such as the antigen-specific adaptive CD8+CD28- Tregs, which have
been described to express both CTLA-4 and Foxp3 (Scotto et al. 2004).
In support of our results, it was reported that in vitro treatment of PBMCs from MS
patients with IFN-α could induce an increased frequency of CD4+CD25high T cells
and a linear correlation between the CD25 mRNA and Foxp3 mRNA expression was
also observed (Penton-Rol et al. 2008). No study was found to describe the effect of
in vitro IFN-α treatment on Foxp3 expressing CD8+ T cells.
Of note, there are two isoforms of human Foxp3, a full-length form and a smaller
form lacking exon 2, and they were reported to be induced equally in freshly
activated CD4+CD25- T cells (Allan et al. 2005). It is likely that the two isoforms are
expressed in different Treg cell subsets. However, further analysis of our data could
not be performed as reagents that distinguish between the isoforms by flow
cytometry are yet to be developed.

277
6.4.2.3 Foxp3 levels in comparison to other studies
In our experiments on healthy donor PBMCs, polyclonal stimulation with anti-
CD3/CD28 and/or PMA/ionomycin was applied for 24 hours but sometimes 39 hours
to PBMC cultures. Notably, a recent study demonstrated that activation with anti-
CD3/CD28-coated beads led to induction of newly expressing Foxp3+ cells as early
as 24 hours, which peaked at 72 hours and then decreased over a period of 7-10
days (Allan et al. 2007). From our data, the mean proportions of T cells expressing
Foxp3 were generally less than 3% for CD4+ T cells and less than 1.5% for CD8+ T
cells with or without activation. The Foxp3 expression levels achieved are
comparable to a recent study. It was reported that the percentages of CD4+ T cells
expressing Foxp3 were between 3-6% depending on the types of antibodies used
and the proportions of CD8+ T cells expressing Foxp3 were around 0.5% in normal
subjects (Gavin et al. 2006).
6.4.3.1 Biology of IL-10 and Tr1 cells
Suppression of specific immune response and induction of anergy in T cells are
essential processes in regulation of immune defense. T cell anergy can be induced
when CD4+ or CD8+ T cells are activated in the presence of IL-10 or with APCs
which have been pre-treated with IL-10 (Groux et al. 1996;Steinbrink et al. 2002). IL-
10, a suppressor cytokine of T cell proliferative and cytokine responses, thus plays
an important role in peripheral T cell tolerance and contributes to the homeostasis of
the immune system. This effect of IL-10 is not only due to downregulation of co-
stimulatory molecules on APCs, but also dependent on direct effects on the T cells
themselves (Moore et al. 2001).
IL-10-anergised T cells become non-responsive and fail to produce cytokines. In
addition, these cells acquire regulatory activity and attenuate T cell responses. This
function is not dependent on production of immunosuppressive cytokines, but rather
is mediated by cell-cell contact-dependent mechanisms via suppressive molecules
expressed on the cell surface (Groux et al. 1996;Steinbrink et al. 2002) Interestingly,
when IL-10-anergised T cells are put through forced proliferation, and likely following
278
repetitive exposure to antigen, the cells regain some ability to proliferate and IL-10-
producing Tr1 cells are induced as a result (Allan et al. 2008b).
Fully differentiated Tr1 cells may be more potent suppressor cells than anergic T
cells in vivo, since they have been shown to inhibit both APCs and T cells, and may
even induce the development of Tr1 cells from naive CD4+ T cells via their ability to
produce IL-10 (Roncarolo et al. 2001). Cultures containing Tr1 cells have been
demonstrated to display reduced responses to alloantigens via a mechanism that
was partially mediated by IL-10 and TGF-β. Compared to IL-10, which has been
considered essential for both the differentiation and effector function of Tr1 cells,
TGF-β appeared to play little part in the enhancement of Tr1 cell development
(Levings et al. 2001). Of note, CD4+CD25+ Treg cells, which were observed to be
upregulated in our experiments, may actively promote the differentiation of Tr1 cells
as well (Levings et al. 2002).
6.4.3.2 The influence of IFN-α on IL-10 producing CD4+ and CD8+ T cells
From our experimental data, a dose-dependent upregulation of IL-10 level was
consistently detected in both CD4+ and CD8+ T cells with IFN-α treatment in vitro.
These results are in line with an early study evaluating the effects of IFN-α on resting
CD4+ cells purified from normal PBMCs and stimulated with PMA in conjunction with
anti-CD28 Ab, which found IFN-α enhanced IL-10 production in a dose-dependent
manner with a four-fold increase in IL-10 levels in the presence of 104 IU/ml IFN-α
(Schandene et al. 1996). Increased IL-10 mRNA accumulation was found in the
system as well. Also, another early study reported that IFN-α enhanced IL-10
expression by unseparated PBMCs. Upregulation of IL-10 production by either
activated CD4+ T cells or activated monocytes were demonstrated as well, but these
purified cells failed to express IL-10 with IFN-α treatment unless they were activated
with appropriate stimuli. Activation with PHA and PMA was required for purified
CD4+ T cells and LPS was required for purified monocytes (Aman et al. 1996). In
contrast to IFN-α, IL-4 and IFN-γ were not observed to regulate IL-10 synthesis by
CD3/CD28 stimulated CD4+ T cells. Recently, IFN-α was found to significantly
279
increase IL-10 production by either anti-CD3/CD28 stimulated PBMCs or CD4+ T
cells in culture supernatants from healthy patients (Liu et al. 2011).
In accordance to our ex vivo data, the upregulation in IL-10 expression level in CD4+
T cells was mostly attributed to Foxp3- cells. It has been reported that CD4+ T cells
from cord blood or peripheral blood in the presence of IFN-α and IL-10 resulted in a
population of cells that display a Tr1 phenotype of cytokine production: IL-10+IFN-
γ+IL-2-/lowIL-4-. The data demonstrated that the additive effects of IL-10 and IFN-α
acted directly on T cells to induce differentiation of Tr1 cells (Levings et al. 2001). In
keeping with the observation, it was reported that IL-10-producing regulatory T cells
can be induced after priming of mature CD11c+ DCs by IFN-α (Ito et al. 2001).
Therefore, it is likely the enhanced IL-10 production synergised with exogenous IFN-
α to promote a larger and more stable population of Tr1 cells in our experiments.
Furthermore, a population of CD8+CXCR3+ cells have recently been identified and
suggested as the counterpart of murine CD8+CD122+ Tregs. These cells are CD28+
and able to produce IL-10 (Shi et al. 2009). It is quite possible that the increased
number of CD8+IL-10+ T cells observed in our experiments contain some cells from
such population.
6.4.3.3 IL-10 levels in comparison to other studies
The percentages of CD4+ or CD8+ T cells producing IL-10 were low and mostly less
than 3% in our experiments. These levels were comparable to a recent study using
PBMCs stimulated with increasing concentrations of bacterial superantigens of
Streptococcus pyogenes over 5 days. Of note, it was indicated that IL-10 production
appeared to occur later with a much greater proportion of CD4+ T cells producing IL-
10 at day 5 (up to 15%) than at day 1 (<2%) (Taylor & Llewelyn 2010). Thus, it is
likely that longer incubation time may be required to generate higher percentage of
IL-10 producing CD4+ or CD8+ T cells.
In accordance to our results, PMA/ionomycin was not shown to be very effective in
the stimulation of significant levels of intracellular IL-10 production in an earlier study.
280
PBMCs were cultured for 48 hours in the presence of PMA/ionomycin and were
labelled for CD3. The proportions of IL-10 producing CD3+ T cells were upregulated
slightly from 0.4% in culture medium alone to 1.0% in representative results from a
healthy donor (Baran et al. 2001).
In another recent study, PBMCs were cultured with anti-CD3 for 5 days and were
labelled for CD8. The percentages of CD8+ T cells producing IL-10 in healthy
subjects were found to be around 2.5% and the levels increased to around 6.5% with
6 hours of PMA/ionomycin restimulation (Ablamunits, Bisikirska, & Herold 2010).
6.4.4.1 Biology of TGF-β
Studies of animal models and human patients have revealed the importance of TGF-
β in regulating leukocyte functions in autoimmune diseases. Although TGF-β can
modulate the activity of multiple cell types, it exerts the greatest impact on T
lymphocytes. It inhibits the production of most effector cytokines in T cells (IFN-γ, IL-
2, IL-4 and IL-10), and ectopic expression of TGF-β1 in T cells induces enhanced
production of the anti-inflammatory cytokine IL-10. This effect is associated with
TGF-β activation of the IL-10 promoter via Smad4 (Kitani et al. 2003). However,
studies suggest that endogenous TGF-β has little contribution in the induction of
anergy by IL-10 in human cells (Levings et al. 2002).
Like in Th1 cells, the presence of TGF-β greatly attenuates IFN-γ expression in CD8+
T cells. Also, TGF-β regulates cytotoxic T lymphocyte functions of CD8+ T cells by
inhibition of perforin expression in activated CD8+ T cells (Li et al. 2006). Of note,
TGF-β regulation of CD8+ T cell differentiation is context dependent and is
modulated by co-stimulatory receptor and cytokine signaling pathways (Ahmadzadeh
& Rosenberg 2005). Furthermore, TGF-β is a critical regulator of B lymphocyte
activity. TGF-β inhibits B cell proliferation, provokes apoptosis of immature or resting
B cells, and opposes B cell activation and class switching to most isotypes except for
IgA (Li et al. 2006).
281
6.4.4.2 The influence of IFN-α on TGF-β producing CD4+ and CD8+ T cells
In line with findings in our ex vivo experiments, our in vitro data showed that TGF-β
expression was upregulated in both CD4+ and CD8+ T cells in the presence of IFN-α,
especially at higher concentrations.
Increased TGF-β expression by CD4+ T cells could be an indicator of expansion of
Th3-like cells. Th3 are a subset of antigen-induced regulatory T cells reported to be
predominantly found at the tissue site of inflammation. The degree to which Th3 and
Tr1 cells come from similar precursors or are different types of regulatory T cells is
not known (Weiner 2001). TGF-β itself can promote the differentiation of Th3 cells, a
process that can be enhanced by IL-4 and IL-10 (Seder et al. 1998).
6.4.4.3 TGF-β levels in comparison to other studies
The percentages of CD4+ or CD8+ T cells producing TGF-β were low and mostly less
than 5% in our experiments. The levels are in keeping with a recent study where
PBMCs were cultured with anti-CD3 for 5 days and labelled for CD8. The
proportions of CD8+ T cells producing TGF-β were observed to be less than 1% with
or without PMA/ionomycin restimulation (Ablamunits, Bisikirska, & Herold 2010).
6.4.5 The effect of IFN-α on the kinetics of Foxp3, IL-10 and TGF-β expression
by T cells
The kinetics of PBMC response under the influence of IFN-α was measured as well
for Foxp3, IL-10 and TGF-β levels within CD4+ and CD8+ T cell populations. The
idea was to obtain some indications in the potential roles of IFN-α therapy could play
as either prophylaxis or treatment options in chronic inflammatory diseases.
In terms of Foxp3, the potential for greater enhancement of its expression within
CD4+, CD4+CD25+, CD4+CD25high and CD8+CD25+ T cell populations were observed
with longer exposure of PBMCs to IFN-α. With PMA/ionomycin stimulation, IFN-α

282
showed greater activity in upregulating Foxp3 in T cells when it was added before
rather than after cell activation.
Similar trends could also be observed in terms of IL-10 and TGF-β expression by
both CD4+ and CD8+ T cells as higher levels were associated with adding IFN-α at
the earlier time-points or introduction of IFN-α before cell activation by
PMA/ionomycin. This could imply that expression of Foxp3 and regulatory cytokines,
including IL-10 and TGF-β, by T cells were induced to a greater degree in response
to longer IFN-α exposure or cells required more time to respond to IFN-α treatment
and the results were simply a reflection of the experimental design picking up data at
different stages of cytokine production.
6.5 Summary of findings
We were able to verify findings from BD patient data and recombinant IFN-α2a and
IFN-α2b were found to be equally potent in their augmenting effects on
immunoregulatory subsets and cytokines in vitro. Both forms of IFN-α were
efficacious in inducing Foxp3 expression by CD4+, CD4+CD25+, CD4+CD25high, CD8+,
and CD8+CD25+ T cell populations. IFN-α2a and IFN-α2b were also observed to
consistently upregulate IL-10 and TGF-β levels in CD4+ and CD8+ T cells. Moreover,
IFN-α was able to exert its effects both before and after cell activation.

283
Chapter 7
The immunomodulatory effects of interferon-alpha on γδ T cells
7.1 Introduction
Although the vast majority of mature T lymphocytes express αβ TCR, a small subset
(1-5%) of peripheral blood T cells carries the alternative γδ TCR, which is composed
of a γ and δ chain heterodimer (Konigshofer & Chien 2006). However, they
constitute a major population in other anatomical localisations such as the small
intestine and some epithelia (Hayday 2000). The physiological roles fulfilled by γδ T
cells are diverse and include protective immunity against extracellular and
intracellular pathogens, tumour surveillance, modulation of innate and adaptive
immune responses, tissue healing and epithelial cell maintenance, and regulation of
physiological organ function (Bendelac et al. 2001;Hayday 2009). γδ T cells are
capable of responding to various environmental insults despite having only a limited
amount of expressed TCR repertoire, and regulate αβ T cell activation through
cytokine production (Kuhl et al. 2009). The functional specialisation of γδ T cell
subsets bestows them with a unique ability to carry out a restricted set of tasks with
spatial and temporal features that are unmatched by other immune effectors.
In Behcet’s disease, the basic aetiopathogenic mechanism consists of a
hyperactivation of neutrophils but the primary trigger is unknown. At present, the
most accepted hypothesis is that a multifactorial process induces an immune
dysregulation that results in exaggerated neutrophils activation (Mendes et al. 2009).
γδ T lymphocytes have been suggested as one of the causes of cytokine
dysregulation that results in neutrophils hyperactivation in BD patients. This is
because that an enhanced level of γδ T cells, especially CD8+ γδ T cells, in active
lesions and peripheral blood, has consistently been demonstrated in BD patients
(Nishida et al. 1998;Treusch et al. 2004). Compared with healthy donors, there is
not only neutrophil hyperactivity, but also a significant elevation of monocytes and γδ
T cells in patients with active BD before treatment (Treusch et al. 2004). These γδ T
cells have been shown to express activation markers, such as CD25, CD69, and

284
CD29 and produce inflammatory cytokines including IFN-γ and TNF-α (Freysdottir,
Lau, & Fortune 1999).
There are two main γδ T cell subpopulations in humans as Vδ2+ and Vδ1+ account
for more than 90% of the total γδ T cells (Carding & Egan 2002). It was reported
recently that there is a preferential activation of peripheral blood Vδ1 as compared to
Vδ2 γδ T cells in patients with active BD (Yasuoka et al. 2008). In supporting these
findings and a key role of these cells in the pathogenesis of BD, increased frequency
and number of γδ T cells, predominantly Vγ9Vδ2 T cells have been found in
peripheral blood of BD patients (Yamashita et al. 1997) and in the intraocular fluid of
BD patients with uveitis (Verjans et al. 2002). Significantly, antigens that activate γδ
T cells could play an important role in the pathogenesis of the disease. Indeed,
peripheral blood γδ T cells from BD patients can respond specifically to peptides
derived from the mycobacterial HSP65 and the homologous human HSP60 (Hasan
et al. 1996). In addition, peripheral blood Vγ9Vδ2 T cells from patients with active
BD were found to secrete elevated amounts of the serine protease granzyme A
when stimulated with phosphoantigens (Accardo-Palumbo et al. 2004).
7.2 Aims
The aim of this chapter is to assess the immunomodulatory effects of 6 months of
subcutaneous IFN-α therapy on γδ T cells in BD patients ex vivo. In vitro assays are
also performed to test the influence of various concentrations of IFN-α2a and IFN-
α2b on γδ T cells and their IFN-γ and IL-17 cytokine production using healthy donor
PBMCs. The kinetics of interactions between IFN-α and IFN-γ and IL-17 cytokine
production by γδ T cells are to be explored as well.
285
7.3 Results
7.3.1 IFN-α therapy helps maintain a stable population of γδ T cells in BD
patients
To examine the influence of IFN-α therapy on γδ T cells among peripheral blood T
lymphocytes in BD patients, serial whole blood samples from BD patients receiving
conventional immunosuppressive therapy with or without recombinant IFN-α2b
treatment were obtained for immunofluorescence staining and flow cytometry.
PBMCs were not incubated or activated with polyclonal stimuli. Apart from analysing
TCRγδ expression by gating on lymphocytes, results were analysed further using
CD8 surface protein to acquire data on CD4+ and CD8+ T lymphocyte populations.
Conspicuously, there was no significant alteration of the proportions of γδ T cells in
BD patients under IFN-α therapy. This is in contrast to patients on conventional
treatment alone, who demonstrated a tendency to have elevated levels of γδ T cells.
Among lymphocytes, the percentages of γδ T cells were raised at 6 (median 5.5%
and IQR 3.8-8.6%; p<0.05) and 12 months (median 5.0% and IQR 2.9-7.8%; p<0.05)
when compared to values at recruitments (median 4.9 and IQR 3.1-6.5%) (Figure
7.1a).
Within CD4+ T lymphocytes, the levels of TCRγδ+ cells were increased when
comparing values at 6 month visits (median 3.8% and IQR 2.4-7.3%; p<0.05) with
ones at 3 months (median 2.8% and IQR 2.0-4.9%) (Fig 7.1b). Also, within CD8+ T
lymphocytes, the proportions of TCRγδ+ cells were elevated at 12 month
assessment visits (median 1.2% and IQR 0.7-2.5%; p<0.01) when evaluated against
baseline visit values (median 0.7% and IQR 0.3-1.1%) (Fig 7.1c).
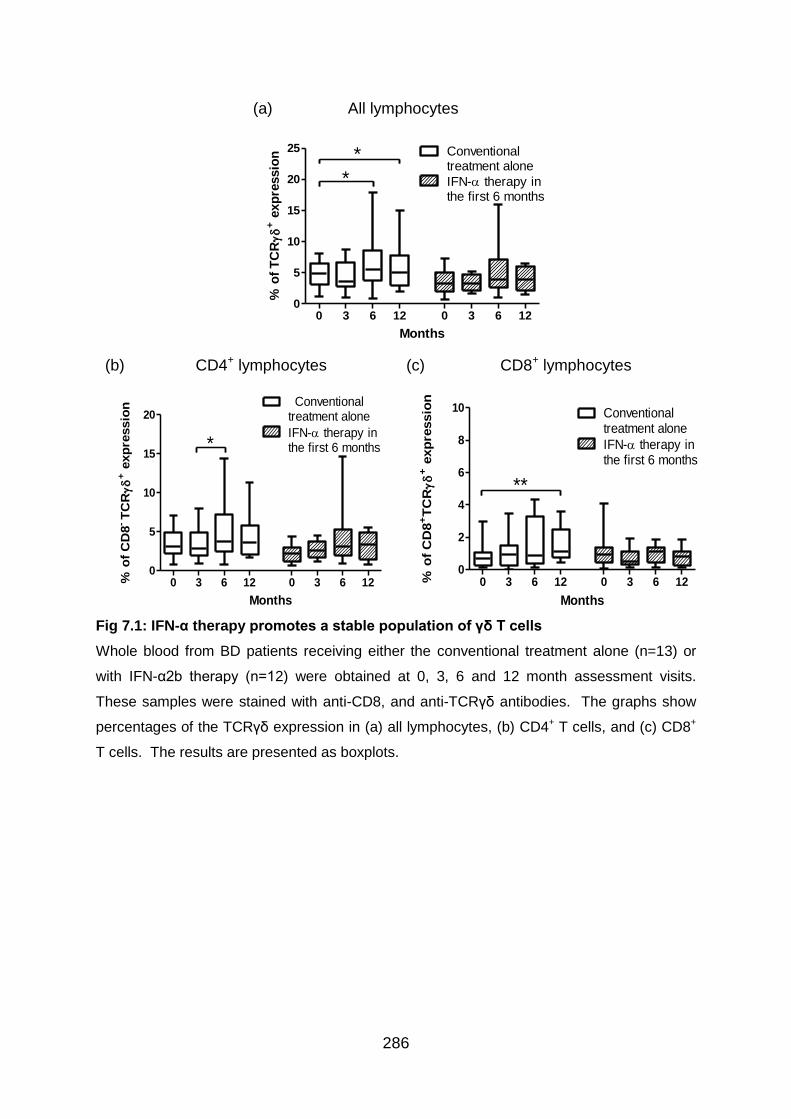
286
Fig 7.1: IFN-α therapy promotes a stable population of γδ T cells
Whole blood from BD patients receiving either the conventional treatment alone (n=13) or
with IFN-α2b therapy (n=12) were obtained at 0, 3, 6 and 12 month assessment visits.
These samples were stained with anti-CD8, and anti-TCRγδ antibodies. The graphs show
percentages of the TCRγδ expression in (a) all lymphocytes, (b) CD4+ T cells, and (c) CD8+
T cells. The results are presented as boxplots.
(a) All lymphocytes
0 3 6 12 0 3 6 120
5
10
15
20
25 Conventionaltreatment alone
IFN- therapy inthe first 6 months
(n=13) Months (n=12)
% o
f T
CR
+ e
xp
ressio
n
*
*
(b) CD4+ lymphocytes
0 3 6 12 0 3 6 120
5
10
15
20Conventional
treatment alone
IFN- therapy inthe first 6 months
(n=13) Months (n=12)
% o
f C
D8
-T
CR
+ e
xp
ressio
n
*
(c) CD8+ lymphocytes
0 3 6 12 0 3 6 120
2
4
6
8
10 Conventionaltreatment alone
IFN- therapy inthe first 6 months
(n=13) Months (n=12)
% o
f C
D8
+T
CR
+ e
xp
ressio
n
**
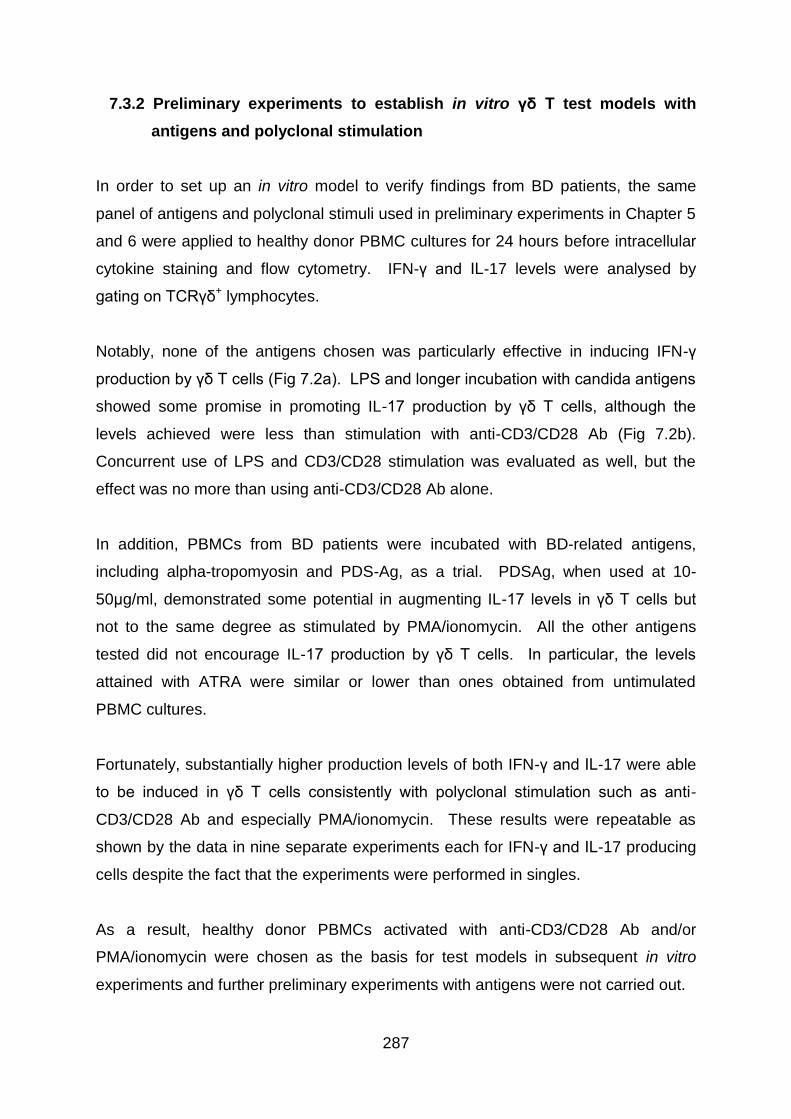
287
7.3.2 Preliminary experiments to establish in vitro γδ T test models with
antigens and polyclonal stimulation
In order to set up an in vitro model to verify findings from BD patients, the same
panel of antigens and polyclonal stimuli used in preliminary experiments in Chapter 5
and 6 were applied to healthy donor PBMC cultures for 24 hours before intracellular
cytokine staining and flow cytometry. IFN-γ and IL-17 levels were analysed by
gating on TCRγδ+ lymphocytes.
Notably, none of the antigens chosen was particularly effective in inducing IFN-γ
production by γδ T cells (Fig 7.2a). LPS and longer incubation with candida antigens
showed some promise in promoting IL-17 production by γδ T cells, although the
levels achieved were less than stimulation with anti-CD3/CD28 Ab (Fig 7.2b).
Concurrent use of LPS and CD3/CD28 stimulation was evaluated as well, but the
effect was no more than using anti-CD3/CD28 Ab alone.
In addition, PBMCs from BD patients were incubated with BD-related antigens,
including alpha-tropomyosin and PDS-Ag, as a trial. PDSAg, when used at 10-
50μg/ml, demonstrated some potential in augmenting IL-17 levels in γδ T cells but
not to the same degree as stimulated by PMA/ionomycin. All the other antigens
tested did not encourage IL-17 production by γδ T cells. In particular, the levels
attained with ATRA were similar or lower than ones obtained from untimulated
PBMC cultures.
Fortunately, substantially higher production levels of both IFN-γ and IL-17 were able
to be induced in γδ T cells consistently with polyclonal stimulation such as anti-
CD3/CD28 Ab and especially PMA/ionomycin. These results were repeatable as
shown by the data in nine separate experiments each for IFN-γ and IL-17 producing
cells despite the fact that the experiments were performed in singles.
As a result, healthy donor PBMCs activated with anti-CD3/CD28 Ab and/or
PMA/ionomycin were chosen as the basis for test models in subsequent in vitro
experiments and further preliminary experiments with antigens were not carried out.
288
Fig 7.2: The effect of a selection of stimuli on the levels of γδ cells producing IFN-γ
and IL-17 in healthy donors
Healthy donor PBMCs were untreated, activated with anti-CD3 (5ng/ml) & anti-CD28
(1μg/ml), activated with PMA (25ng/ml) & ionomycin (1μg/ml) or stimulated with various
stimuli including LPS, zymosan, candida, and all-trans retinoic acid for 24 hours or 39 hours.
In one experiment, both LPS and CD3/CD28 stimulation were administered. Also, in 2 of the
experiments, PBMCs from BD patients were used instead and stimulated with either
polyclonal stimuli or α-tropopmyosin or PDS-Ag for 24 hours. Results are shown as
proportion of γδ T cells expressing cytokines. In (a), percentage of IFN-γ+ cells and in (b),
percentage of IL-17+ cells are shown. Each colour represent a separate experiment and all
experiments were done only once in singles. 1 is the lowest antigen concentration used and
7 is the highest. The actual concentrations of stimuli are shown inside the brackets in the
legend.
(a)
(b)
289
7.3.3 Preliminary experiments to establish the needs to rest cells in the
medium after thawing and the effects of adding suboptimal IL-2
Next, it was examined whether resting healthy donor PBMCs for one day in culture
medium with or without addition of suboptimal amount of IL-2 after thawing could
enhance cytokine production.
With regards to IFN-γ producing γδ T cells (Fig 7.3a), there was a tendency for more
elevated levels with resting PBMCs for one day without additional IL-2 under all 4
culture conditions, but none of these results were statistically significant.
With regards to IL-17 producing γδ T cells (Fig 7.3b), there was no advantage in
resting the cells in three out of four culture conditions and again none of the
variations were statistically significant.
Also, PHA and anti-CD3/CD28 Ab were comparable in their ability to induce either
IFN-γ or IL-17 expression and the effects of both were not as strong as one exerted
by PMA/ionomycin stimulation.
Overall, the findings suggest there is no significant advantage in resting PBMCs or
adding suboptimal concentration of IL-2 for experiments involving IFN-γ and IL-17
producing γδ T cells.
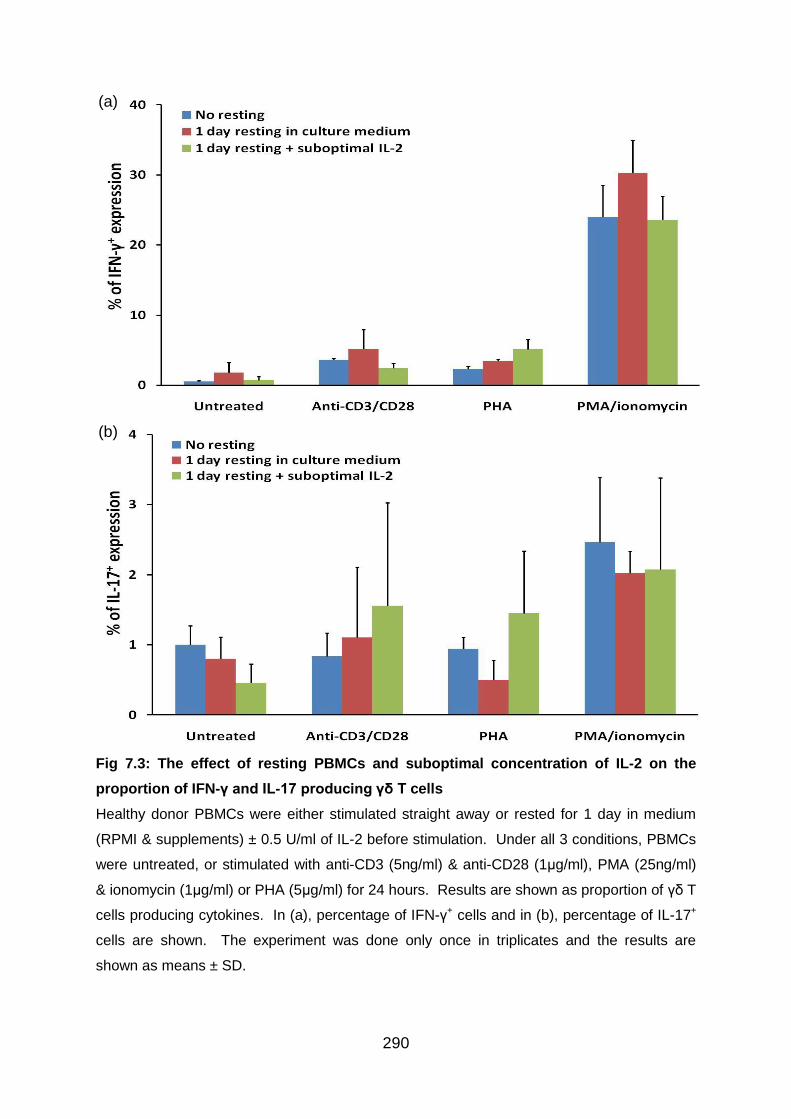
290
Fig 7.3: The effect of resting PBMCs and suboptimal concentration of IL-2 on the
proportion of IFN-γ and IL-17 producing γδ T cells
Healthy donor PBMCs were either stimulated straight away or rested for 1 day in medium
(RPMI & supplements) ± 0.5 U/ml of IL-2 before stimulation. Under all 3 conditions, PBMCs
were untreated, or stimulated with anti-CD3 (5ng/ml) & anti-CD28 (1μg/ml), PMA (25ng/ml)
& ionomycin (1μg/ml) or PHA (5μg/ml) for 24 hours. Results are shown as proportion of γδ T
cells producing cytokines. In (a), percentage of IFN-γ+ cells and in (b), percentage of IL-17+
cells are shown. The experiment was done only once in triplicates and the results are
shown as means ± SD.
(a)
(b)
291
7.3.4 Preliminary experiments to establish the choice of culture medium
The choice of medium was scrutinised as it has been reported that Iscove's modified
Dulbecco's medium (IMDM) can result in higher Th17 expansion (Veldhoen et al.
2009). Experiments were set up to test healthy donor PBMCs cultured in RPMI- and
IMDM-based T cell media in parallel.
Results from these experiments demonstrated that there was no significant
advantage with using either types of culture medium to expand IFN-γ and IL-17
producing γδ T cell populations whether polyclonal activation was applied or not.
Therefore, it was decided to perform γδ T cell experiments using IMDM-based
culture medium in line with Th1 and Th17 experiments in Chapter 5.

292
Fig 7.4: The effect of different culture media on the levels of IFN-γ and IL-17 producing
γδ T cell populations
Healthy donor PBMCs were either cultured in RPMI- or IMDM-based T cell medium. Cell
stimulation was provided by adding anti-CD3 (5ng/ml) & anti-CD28 (1μg/ml) or PMA
(25ng/ml) & ionomycin (1μg/ml) for 24 hours. Results are shown as proportion of γδ T cells
producing cytokines. In (a), percentage of IFN-γ+ cells and in (b), percentage of IL-17+ cells
are shown. The histograms show means ± SD from 3 independent experiments. One
experiment was done in duplicates rather than triplicates and did not test cells stimulated
with PMA/ionomycin.
(a)
(b)
293
7.3.5 Preliminary experiments to establish incubation time with polyclonal
stimuli
PBMC cultures were performed over 24 and 39 hours to investigate whether longer
exposure to polyclonal stimuli would promote greater expansion of γδ T cell
population producing either IFN-γ or IL-17.
With regards to γδ T cells producing IFN-γ, longer incubation time actually resulted in
decreased levels under all three culture conditions (Fig 7.5a). The levels were
lowered from 3.6 ± 0.3% to 2.4 ± 0.6% (p<0.05), 7.2 ± 1.0% to 3.2 ± 0.4% (p<0.05),
and 47.1 ± 1.1% to 25.6 ± 3.4% (p<0.01) in untreated cultures, CD3/CD28 stimulated
cultures, and PMA/ionomycin stimulated cultures respectively.
Similarly, the proportion of γδ T cells producing IL-17 was reduced with extra 15
hours of incubation time as well (Fig 7.5b). The levels were decreased from 2.4 ±
0.4% to 1.4 ± 0.4% (p<0.05) and 4.1 ± 0.5% to 2.0 ± 0.8% (p<0.05) in untreated
cultures and CD3/CD28 stimulated cultures respectively. Such trend, however, was
not evident in PBMC cultures activated by PMA/ionomycin.
Based on the findings, a decision was made to perform γδ T cell experiments with 24
hours of culture time.
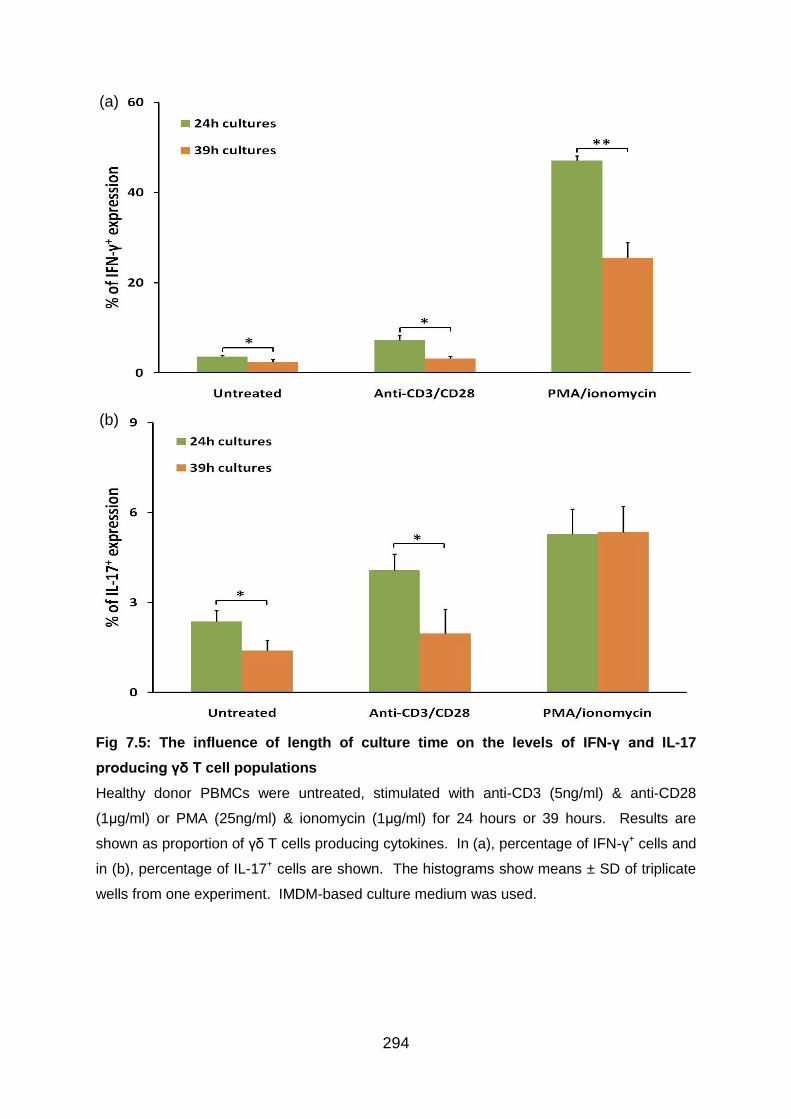
294
Fig 7.5: The influence of length of culture time on the levels of IFN-γ and IL-17
producing γδ T cell populations
Healthy donor PBMCs were untreated, stimulated with anti-CD3 (5ng/ml) & anti-CD28
(1μg/ml) or PMA (25ng/ml) & ionomycin (1μg/ml) for 24 hours or 39 hours. Results are
shown as proportion of γδ T cells producing cytokines. In (a), percentage of IFN-γ+ cells and
in (b), percentage of IL-17+ cells are shown. The histograms show means ± SD of triplicate
wells from one experiment. IMDM-based culture medium was used.
(a)
(b)
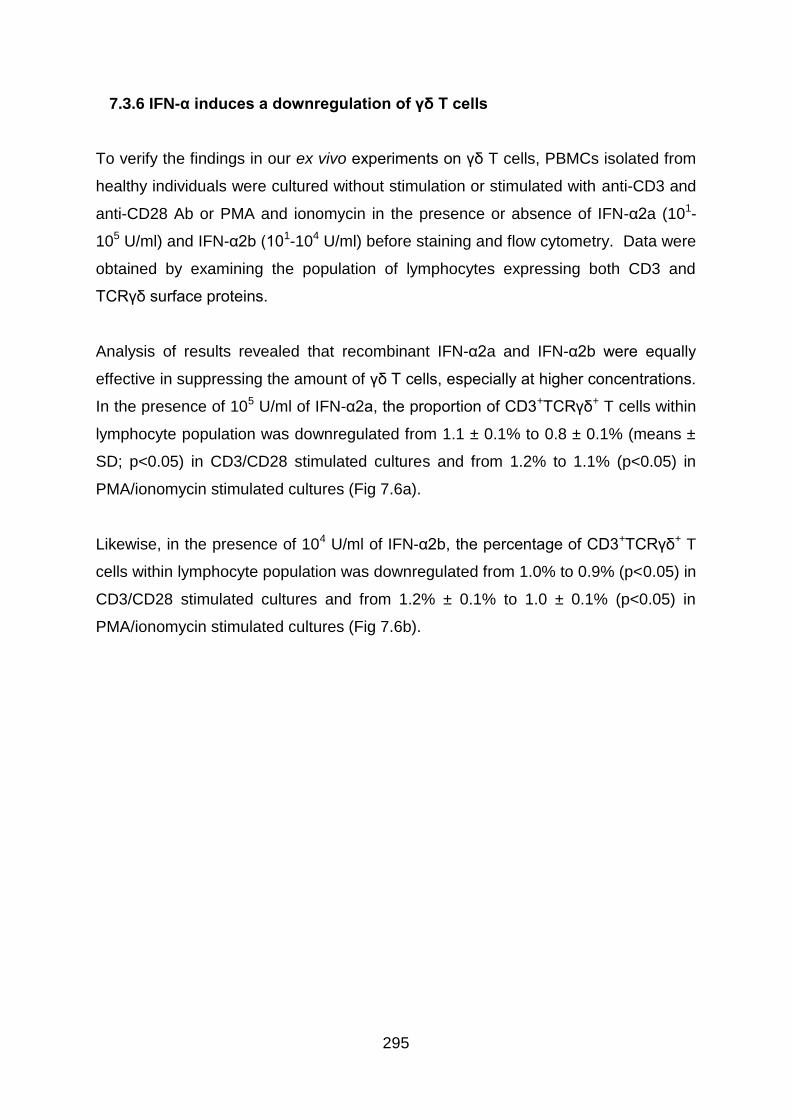
295
7.3.6 IFN-α induces a downregulation of γδ T cells
To verify the findings in our ex vivo experiments on γδ T cells, PBMCs isolated from
healthy individuals were cultured without stimulation or stimulated with anti-CD3 and
anti-CD28 Ab or PMA and ionomycin in the presence or absence of IFN-α2a (101-
105 U/ml) and IFN-α2b (101-104 U/ml) before staining and flow cytometry. Data were
obtained by examining the population of lymphocytes expressing both CD3 and
TCRγδ surface proteins.
Analysis of results revealed that recombinant IFN-α2a and IFN-α2b were equally
effective in suppressing the amount of γδ T cells, especially at higher concentrations.
In the presence of 105 U/ml of IFN-α2a, the proportion of CD3+TCRγδ+ T cells within
lymphocyte population was downregulated from 1.1 ± 0.1% to 0.8 ± 0.1% (means ±
SD; p<0.05) in CD3/CD28 stimulated cultures and from 1.2% to 1.1% (p<0.05) in
PMA/ionomycin stimulated cultures (Fig 7.6a).
Likewise, in the presence of 104 U/ml of IFN-α2b, the percentage of CD3+TCRγδ+ T
cells within lymphocyte population was downregulated from 1.0% to 0.9% (p<0.05) in
CD3/CD28 stimulated cultures and from 1.2% ± 0.1% to 1.0 ± 0.1% (p<0.05) in
PMA/ionomycin stimulated cultures (Fig 7.6b).
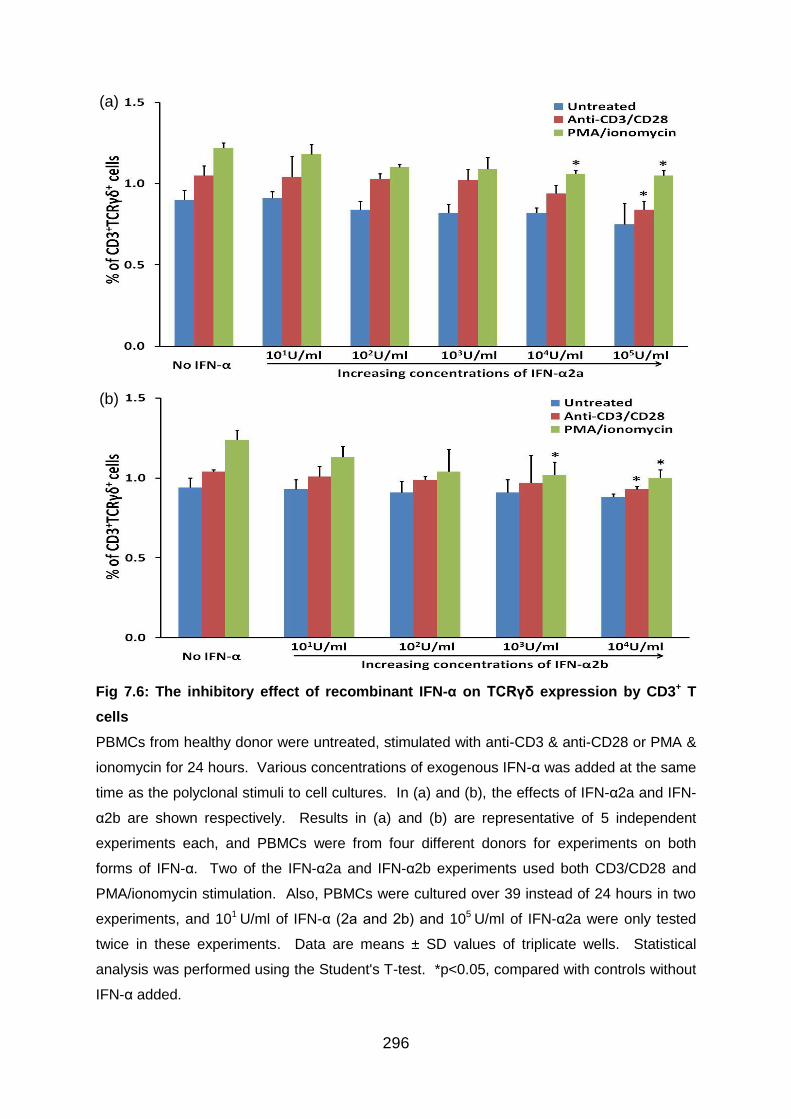
296
Fig 7.6: The inhibitory effect of recombinant IFN-α on TCRγδ expression by CD3+ T
cells
PBMCs from healthy donor were untreated, stimulated with anti-CD3 & anti-CD28 or PMA &
ionomycin for 24 hours. Various concentrations of exogenous IFN-α was added at the same
time as the polyclonal stimuli to cell cultures. In (a) and (b), the effects of IFN-α2a and IFN-
α2b are shown respectively. Results in (a) and (b) are representative of 5 independent
experiments each, and PBMCs were from four different donors for experiments on both
forms of IFN-α. Two of the IFN-α2a and IFN-α2b experiments used both CD3/CD28 and
PMA/ionomycin stimulation. Also, PBMCs were cultured over 39 instead of 24 hours in two
experiments, and 101 U/ml of IFN-α (2a and 2b) and 105 U/ml of IFN-α2a were only tested
twice in these experiments. Data are means ± SD values of triplicate wells. Statistical
analysis was performed using the Student's T-test. *p<0.05, compared with controls without
IFN-α added.
(a)
(b)
297
7.3.7 IFN-α promotes IFN-γ production by γδ T cells
To study the ability of IFN-α to induce IFN-γ expression by γδ T cells in vitro, PBMCs
isolated from healthy individuals were cultured without stimulation or stimulated with
anti-CD3 and anti-CD28 Ab or PMA and ionomycin in the presence or absence of
IFN-α2a (101-105 U/ml) and IFN-α2b (101-104 U/ml) before intracellular cytokine
staining and flow cytometry. IFN-γ expression was analysed by gating on
CD3+TCRγδ+ lymphocyte populations.
Evidently, both IFN-α2a and IFN-α2b showed that they could enhance IFN-γ
production by γδ T cells at higher concentrations. Following PMA/ionomycin
activation, the IFN-γ producing γδ T cells were raised from 69.6 ± 4.9% in the
absence of IFN-α up to 78.1 ± 0.9% (means ± SD; P<0.05) in the presence of 105
U/ml IFN-α2a (Fig 7.7a). Similarly, in the presence of 104 U/ml IFN-α2b, the
proportions of γδ T cells producing IFN-γ were upregulated from 4.1 ± 0.9% up to 6.4
± 0.2% (p<0.05) in untreated cultures and 70.1 ± 4.8% up to 78.0 ± 2.9% (p<0.05) in
cultures stimulated with PMA/ionomycin (Fig 7.7b).
A tendency for both IFN-α2a and IFN-α2b to augment IFN-γ could be detected in
CD3/CD28 stimulated cultures as well, but the results were not statistically significant.
298
Fig 7.7: The augmenting effect of recombinant IFN-α on γδ T cells producing IFN-γ
Healthy donor PBMCs were untreated, stimulated with anti-CD3 & anti-CD28 or PMA &
ionomycin for 24 hours. Various concentrations of IFN-α was added at the same time as the
polyclonal stimuli to cultures. Results are shown as proportions of γδ T cells producing IFN-
γ. In (a) and (b), the effects of IFN-α2a and IFN-α2b are shown respectively. Results in (a)
and (b) are representative of 5 independent experiments each, and PBMCs were from four
different donors for experiments on both forms of IFN-α. Two of the IFN-α2a and IFN-α2b
experiments used both CD3/CD28 and PMA/ionomycin stimulation. Also, PBMCs were
cultured over 39 instead of 24 hours in two experiments, and 101 U/ml of IFN-α (2a and 2b)
and 105 U/ml of IFN-α2a were only tested twice in these experiments. Data are means ± SD
values of triplicate wells. Statistical analysis was performed using the Student's T-test.
*p<0.05, **p<0.01, compared with controls without IFN-α added.
(a)
(b)
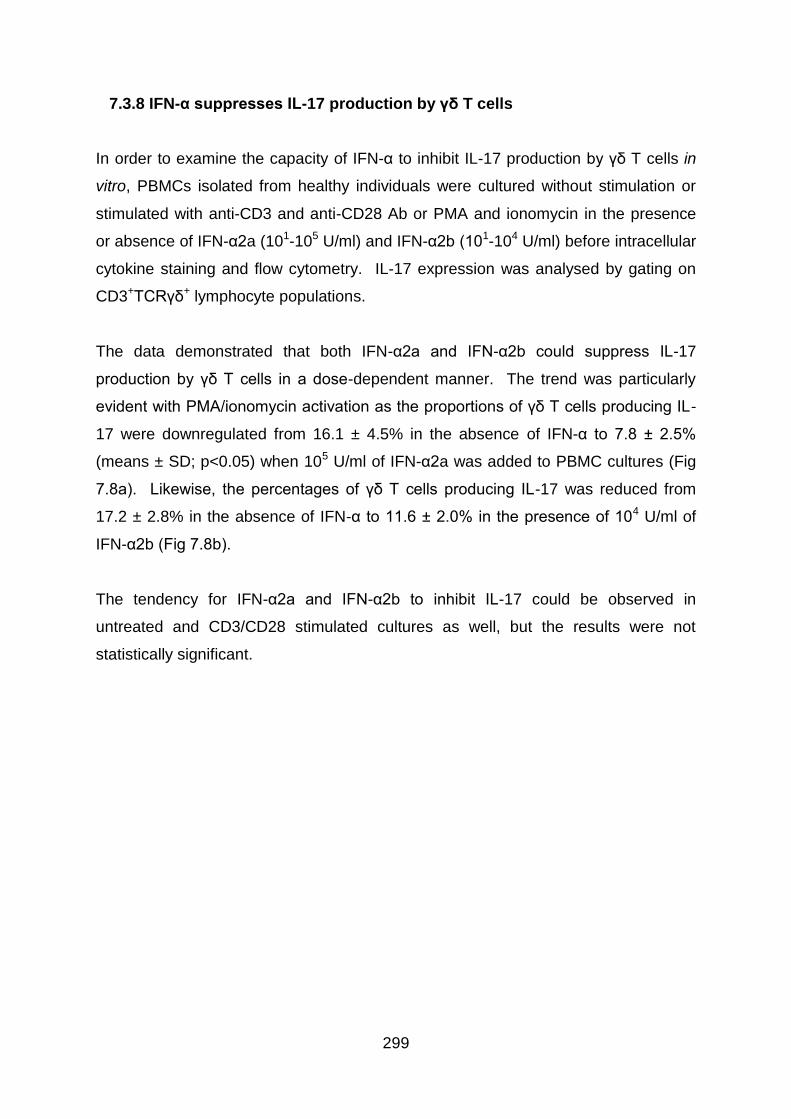
299
7.3.8 IFN-α suppresses IL-17 production by γδ T cells
In order to examine the capacity of IFN-α to inhibit IL-17 production by γδ T cells in
vitro, PBMCs isolated from healthy individuals were cultured without stimulation or
stimulated with anti-CD3 and anti-CD28 Ab or PMA and ionomycin in the presence
or absence of IFN-α2a (101-105 U/ml) and IFN-α2b (101-104 U/ml) before intracellular
cytokine staining and flow cytometry. IL-17 expression was analysed by gating on
CD3+TCRγδ+ lymphocyte populations.
The data demonstrated that both IFN-α2a and IFN-α2b could suppress IL-17
production by γδ T cells in a dose-dependent manner. The trend was particularly
evident with PMA/ionomycin activation as the proportions of γδ T cells producing IL-
17 were downregulated from 16.1 ± 4.5% in the absence of IFN-α to 7.8 ± 2.5%
(means ± SD; p<0.05) when 105 U/ml of IFN-α2a was added to PBMC cultures (Fig
7.8a). Likewise, the percentages of γδ T cells producing IL-17 was reduced from
17.2 ± 2.8% in the absence of IFN-α to 11.6 ± 2.0% in the presence of 104 U/ml of
IFN-α2b (Fig 7.8b).
The tendency for IFN-α2a and IFN-α2b to inhibit IL-17 could be observed in
untreated and CD3/CD28 stimulated cultures as well, but the results were not
statistically significant.
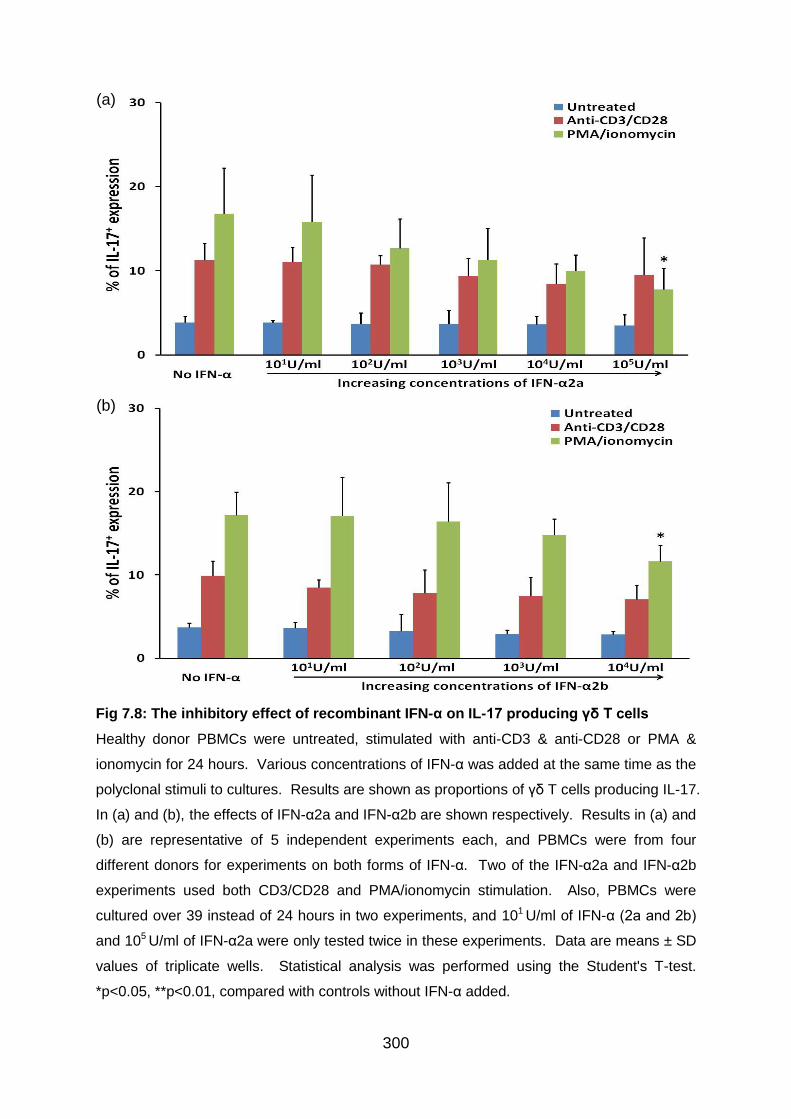
300
Fig 7.8: The inhibitory effect of recombinant IFN-α on IL-17 producing γδ T cells
Healthy donor PBMCs were untreated, stimulated with anti-CD3 & anti-CD28 or PMA &
ionomycin for 24 hours. Various concentrations of IFN-α was added at the same time as the
polyclonal stimuli to cultures. Results are shown as proportions of γδ T cells producing IL-17.
In (a) and (b), the effects of IFN-α2a and IFN-α2b are shown respectively. Results in (a) and
(b) are representative of 5 independent experiments each, and PBMCs were from four
different donors for experiments on both forms of IFN-α. Two of the IFN-α2a and IFN-α2b
experiments used both CD3/CD28 and PMA/ionomycin stimulation. Also, PBMCs were
cultured over 39 instead of 24 hours in two experiments, and 101 U/ml of IFN-α (2a and 2b)
and 105 U/ml of IFN-α2a were only tested twice in these experiments. Data are means ± SD
values of triplicate wells. Statistical analysis was performed using the Student's T-test.
*p<0.05, **p<0.01, compared with controls without IFN-α added.
(a)
(b)
301
7.3.9 The kinetics of immunomodulatory effects of IFN-α on γδ T cells
expressing IFN-γ and IL-17
Although IFN-α has been observed to enhance IFN-γ while inhibiting IL-17
production by γδ T cells in vitro, it was not clear whether pre-treatment of PBMCs
with IFN-α could exert greater influence when compared to adding IFN-α at the same
time as activating agents. Also, it was doubtful whether IFN-α could produce its
effect once PBMCs were activated. To aid in answering these questions, PBMCs
isolated from healthy individuals were cultured without IFN-α treatment or with 104
U/ml IFN-α2a added 24 hours before, 4 hours before, at the same time as, or 4
hours after PMA/ionomycin stimulation. The timing for the introduction of IFN-α to
cultures was the same for both unstimulated and stimulated cultures, and PBMCs
were incubated for 24 hours after PMA/ionomycin stimulation before intracellular
cytokine staining and flow cytometry. IFN-γ and IL-17 expression levels were
analysed by gating on CD3+TCRγδ+ lymphocyte populations.
In terms of IFN-γ producing γδ T cells, although upregulation was evident at all four
time-points relative to the levels achieved without the presence of IFN-α, statistical
significance was reached only when IFN-α was added at the second last time-point.
In the case of untreated cultures, the proportions of IFN-γ producing γδ T cells were
raised from 4.4 ± 0.5% in the absence of IFN-α up to 5.9 ± 0.4% (means ± SEM;
p<0.05) at this time-point (Fig 7.9a). Also, the concurrent introduction of IFN-α and
PMA/ionomycin at this time-point was able to enhance the levels of IFN-γ producing
γδ T cells from 65.4 ± 3.2% to 75.2 ± 2.1% (p<0.05).
With regards to γδ T cells producing IL-17, an inhibitory effect was seen at all time-
points. However, the strongest effect was seen when IFN-α was added at the
second last time-point (Fig 7.9b). In the case of untreated cultures, the proportions
of IL-17 producing γδ T cells were downregulated from 2.8 ± 0.4% without the
presence of IFN-α to 1.3 ± 0.1% (p<0.01) at this time-point. The decrease was even
significant relative to results obtained from the first (2.6 ± 0.5%; P<0.05) and second
(2.1 ± 0.3%; p<0.05) time-points. With PMA/ionomycin stimulation, the concurrent
use of IFN-α reduced the levels of IL-17 producing γδ T cells from 8.3 ± 1.1% in the

302
absence of IFN-α to 5.4 ± 0.7% (p<0.05). This result was significant even when
evaluated against data with 24 hours of IFN-α pre-treatment (8.7 ± 0.8; p<0.01).
303
Fig 7.9: The kinetics of immunomodulatory effects of IFN-α on γδ T cells producing
IFN-γ and IL-17
Healthy donor PBMCs were treated without or with 104 U/ml IFN-α2a 24 hours before, 4
hours before, at the same time as, or 4 hours after introduction of PMA & ionomycin to
cultures. The timing for the addition of IFN-α2a to cultures was the same for both
unstimulated and stimulated cultures, and PBMCs were incubated for 24 hours after
PMA/ionomycin stimulation before staining. Results are shown as proportions of γδ T cells
producing (a) IFN-γ and (b) IL-17. The histograms show means ± SEM of triplicate wells
from three independent experiments. All experiments used PBMCs from the same donor.
Statistical analysis was performed using the Student's T-test. *p<0.05, **p<0.01, compared
with controls without IFN-α added. †p<0.05, ††p<0.01, compared with data with 24-hour
IFN-α pre-treatment. ‡p<0.05, compared with data with 4-hour IFN-α pre-treatment.
(a)
(b)
304
7.4 Discussion
7.4.1.1 γδ T cells and Behcet’s disease
γδ T cells make up 1-10% of the peripheral blood T cells (Kaufmann 1996), and may
help bridge the gap between early innate and later adaptive immune responses.
They represent a unique subset of unconventional lymphocytes, because they
display features of both conventional αβ T cells and NK cells (Hayday 2000). γδ T
cells localise in specialised areas such as the mucosal tissues and can produce
additional cytokines with relevance for the local immune response (Bonneville,
O'Brien, & Born 2010). γδ T cells freshly isolated from human peripheral blood tend
to be primed toward a Th1 phenotype (Wesch, Glatzel, & Kabelitz 2001).
γδ T cells are mainly CD4-CD8- T lymphocytes characterised by their expression of
an antigen receptor encoded by the γ and δ TCR genes. As they do not express
CD4 or CD8 co-receptors in most cases, activation of γδ T cells is possible without
requirement of Ag processing and restriction by MHC molecules. These
characteristics might allow γδ T cells to be highly autoreactive. However, the TCRγδ
restriction to small compounds over-expressed after infection or cell stress, the
restricted tissue distribution of TCR agonists as well as the short half-life of the
effector cells all contribute to the limitation of the inherent self-reactivity of γδ T cells
(Nedellec, Bonneville, & Scotet 2010).
In Behcet’s disease, γδ T cell numbers has been observed to be significantly higher
during active disease than in remission (Bank, Duvdevani, & Livneh 2003),
suggesting that the increase in γδ T cells in BD is a result of disease activity, rather
than an innately augmented level of γδ T cells in these individuals.
7.4.1.2 Influence of IFN-α on peripheral blood γδ T cells
From our data on BD patients, escalations of both CD8- and CD8+ γδ T cell numbers
were detected sporadically in individuals on conventional treatment alone, which
were likely to coincide with their spontaneous relapses. However, this tendency to
305
increase appeared to be thwarted by the addition of IFN-α therapy in the treatment
group.
Consistently, our in vitro results displayed that higher concentrations of both IFN-α2a
and IFN-α2b could significantly downregulate the proportions of CD3+ γδ T cells in
healthy donor PBMCs following polyclonal activation by anti-CD3/CD28 or
PMA/ionomycin.
In agreement with our results, IFN-α2a was reported to decrease the number of
circulating CD3+ and CD8+ γδ T cells considerably after 24 weeks of treatment in BD
patients with active ocular disease (Treusch et al. 2004). Also, the proportions of
CD8+ γδ T cells were observed to be reduced by IFN-α therapy in patients with
hepatitis C in an early study (Wejstal et al. 1992).
7.4.2.1 Setting up IFN-γ and IL-17 producing γδ T cell in vitro test models
using antigens and polyclonal stimuli
IL-17-producing γδ T cells were reported to express TLR1 and TLR2, as well as
dectin-1 in mice (Martin et al. 2009). In agreement, a role for TLR2 in the
enhancement of IL-17 production by γδ T cells was revealed in another recent
murine study. TLR2 activation alone was not sufficient in inducing IL-17 production
from γδ T cells, but in combination with IL-23 induced an upregulated IL-17
responses compared to cells treated with IL-23 alone (Reynolds et al. 2010). As a
result of these reports, zymosan, a stimulus for TLR2 and dectin-1 (Dillon et al.
2006), was considered likely to have positive influence on IL-17 producing γδ T cells.
However, such result was not observed.
Analysing our data, LPS, candida antigens, and PDS-Ag were the ones which
demonstrated some activity in the enhancement of IL-17 producing γδ T cells. The
tendency of LPS to promote IL-17 in CD4+ T cells was noticed in Chapter 5, and LPS
were previously reported to possess IL-17 inducing activity (Kattah et al.
2008;Moschen et al. 2008). Longer cultures with candida antigens also revealed
their potential to augment IL-17 production in γδ T cells, which was unexpected as
306
the commercial candida antigens used in the experiments were mainly made up of
components from the yeast form rather the hyphal form. C. albicans in the yeast
form were reported to induce differentiation of IFN-γ producing cells rather than IL-17
producing cells as in the case of C. albicans in hyphal form (Acosta-Rodriguez et al.
2007). PDS-Ag, a BD-related antigen, was another surprise as it did not elicit much
Th17 response as depicted in Chapter 5. ATRA, as expected, resulted in lowest IL-
17 levels in γδ T cells and this is in accordance to previous report of its ability to
inhibit Th17 cell differentiation (Elias et al. 2008;Mucida et al. 2007).
On the other hand, all antigens used in our preliminary experiments promoted very
low levels of IFN-γ producing γδ T cells, even with extra time in culture. Of all the
combinations used to promote cytokine production by γδ T cells, polyclonal stimuli
consistently showed greater potential than using antigens alone, especially in the
case of PMA in combination with ionomycin.
7.4.2.2 Testing other aspects of the in vitro experimental design
It has been suggested resting PBMCs overnight after thawing before testing effector
functions would remove cells destined for death and allow “stunned” cells to recover
functional ability (Lamoreaux, Roederer, & Koup 2006). Therefore, instead of
stimulating cells straight after thawing, one day resting in culture medium with or
without suboptimal level of IL-2 was performed. It was noted that neither resting nor
addition of IL-2 augmented the levels of IFN-γ producing and IL-17 producing γδ T
cells appreciably.
Unlike the Th1 and Th17 experiments in Chapter 5, a significant difference between
RPMI- and IMDM-based culture media was not found in terms of ability to induce
IFN-γ producing and IL-17 producing γδ T cells, whether PBMC cultures were
activated or not. Consequently, majority of the γδ T cell experiments were carried
out using IMDM-based culture medium in line with Th1 and Th17 experiments
performed previously.
307
The benefit of extra time in culture was tested as well but 24 hours of culture was
shown to be superior to 39 hours of culture with regards to achieving higher levels of
IFN-γ and IL-17 cytokine production by γδ T cells in general. The only exception
was IL-17 production by γδ T cells following PMA/ionomycin stimulation where the
levels achieved were comparable between 24 and 39 hours of culture. Therefore, a
decision was made to perform experiments over 24 hours without resting healthy
donor PBMCs.
7.4.3 The influence of IFN-α on IFN-γ production by γδ T cells
Classically, IFN-γ has been regarded as a pro-inflammatory cytokine. In recent
years, however, IFN-γ has been implicated not only as a mediator of disease but
possibly as a protective factor during autoimmunity depending on factors such as the
timing, location, and intensity of IFN-γ action (Kelchtermans, Billiau, & Matthys
2008;O'shea, Ma, & Lipsky 2002).
In Chapter 5, our data have consistently shown that both IFN-α2a and IFN-α2b could
increase IFN-γ production by CD4+ and CD8+ T cells in vitro, especially at higher
concentrations. Similarly, the levels of γδ T cells producing IFN-γ were found to be
upregulated in our experiments in the presence of increasing dose of IFN-α. The
possible mechanism of action has been suggested to be that type I IFNs, including
IFN-α, promote IFN-γ signalling via association of type I and type II IFN receptor
subunits (Takaoka et al. 2000).
Of note, IFN-γ producing γδ T cells were found to lack expression of TLR2, dectin-1,
CCR6 and AHR in comparison to IL-17+ γδ T cells in a recent murine study (Martin et
al. 2009).
7.4.4.1 Biology of IL-17 producing γδ T cells
It now seems that IL-17 is one of the more important villains in the pathogenesis of
autoimmune diseases. It is a potent inducer of autoimmunity through the promotion
308
of tissue inflammation and the mobilisation of the innate immune system. The
challenge is to keep IL-17 in check, while maintaining host defence at the same time.
Importantly, IL-17 production is not an exclusive characteristic of CD4+ αβ T cells,
and γδ T cells are recognised as a powerful cellular source of IL-17 as well and
contribute to the initial defence against pathogens (Michel et al. 2007;Roark et al.
2008).
Low but significant numbers of adult human blood Vγ2Vδ2 T cells produce IL-17 or
IL-22 ex vivo, although few produce both. Induction of IL-17-producing cells from
neonatal naive Vγ2Vδ2 T cells requires cytokines including IL-1β, IL-6, TGF-β, but
not IL-23. On the other hand, IL-23, not IL-6, is essential for maximal expansion of
IL-17-producing memory Vγ2Vδ2 T cells in adults. For both neonatal and adult
Vγ2Vδ2 T cells, cells producing IL-17 have higher levels of RORγt compared with
non-IL-17 producing cells, demonstrating the importance of RORγt in IL-17
production (Ness-Schwickerath, Jin, & Morita 2010). It has been observed that
many γδ T cells already exist as effector memory cells, ready to mount strong IL-17
responses quickly.
Moreover, it was shown that some phenotypic characteristics are shared between
Th17 and IL-17-producing γδ T cells including CCR6, RORγt, AHR, and IL-23
receptor in a recent murine study (Martin et al. 2009).
7.4.4.2 The influence of IFN-α on IL-17 production by γδ T cells
Our results from Chapter 4 and 5 demonstrated the capacity of recombinant IFN-α in
the suppression of IL-17 production by CD4+ and CD8+ T cells. It was also shown in
a study that pre-treatment with recombinant IFN-α could inhibit human PBMC
secretion of IL-17 and activation-induced IL-23 as measured by ELISA (Meyers et al.
2006). However, the subgroups of cells capable of producing IL-17, including γδ T
cells, were not discriminated.
In accordance with these findings, both IFN-α2a and IFN-α2b were observed in our
experiments using healthy donor PBMCs to inhibit IL-17 production by γδ T cells in a
309
dose-dependent manner. The results are particularly relevant in the understanding
of IFN-α therapy being used as a disease-modifying treatment in immune-mediated
diseases like BD as elevated levels of γδ T cells and IL-17 have been described to
be associated with disease activity and implicated in the pathogenesis of BD (Bank,
Duvdevani, & Livneh 2003;Chi et al. 2008).
7.4.5 The effect of IFN-α on the kinetics of IFN-γ and IL-17 production by γδ T cells
The kinetics of PBMC response under the influence of IFN-α was measured with
regards to IFN-γ and IL-17 production levels within γδ T cell populations. The idea
was to obtain some indications in the ways IFN-α therapy could contribute as either
prophylaxis or treatment options in chronic inflammatory diseases.
Unexpectedly, adding IFN-α and PMA/ionomycin simultaneously induced the largest
increase in IFN-γ levels in γδ T cells. On the other hand, concurrent use of IFN-α
and PMA/ionomycin resulted in the greatest amount of IL-17 inhibition in γδ T cells.
However, these immunomodulatory effects were not significant when IFN-α was
added as a pre-treatment at earlier time-points. Similar trends were also observed in
untreated samples.
A possible explanation is that IFN-γ was produced by γδ T cells in greater quantity
relatively early during incubation in response to IFN-α treatment. On the other hand,
IL-17 production by γδ T cells occurred later during cultures after longer exposure of
PBMCs to IFN-α. The results could be simply a reflection of the experimental design
picking up data at various stages of cytokine production.
7.5 Summary of findings
Our data demonstrated that both IFN-α2a and IFN-α2b have the potential to
suppress the number of γδ T cells and their production of cytokine IL-17. On the
other hand, IFN-γ producing γδ T cells were shown to be induced following treatment

310
with IFN-α. Of note, IFN-α appeared to exert the strongest influence on IFN-γ
producing and IL-17 producing γδ T cells when it was added 24 hours before
intracellular cytokine staining and flow cytometry.
311
Chapter 8
General discussion and future work
8.1 General discussion
IFN-α is a leukocyte-derived cytokine with profound immunomodulatory capabilities.
Despite its discovery more than 50 years ago (Isaacs & Lindenmann 1957), the in vivo
operative mechanisms of actions are still not sufficiently understood. Interferons have
diverse effects, influencing both innate and adaptive immune responses and form a
network of complex interactions with other cytokines (Baccala, Kono, & Theofilopoulos
2005). Current advances in our understanding of the development of autoimmune
responses, including the important roles played by both recently discovered Treg and
Th17 cell lineages, have enabled us to investigate the properties of this effective therapy
further.
8.1.1 Approaches used in this study
The work presented in this thesis has been directed at exploring the immunomodulatory
effects of IFN-α on peripheral blood T cells, with a view to a potential disease-modifying
therapy for the treatment of Behcet’s disease. In order to achieve this goal, a number of
approaches have been utilised. Firstly, serial whole blood samples from BD patients
receiving conventional immunosuppressive therapy with or without recombinant IFN-
α2b treatment were phenotyped without activation or culture. Secondly, serial whole
blood samples from the same group of BD patients were studied using intracellular
cytokine staining, elucidating the influence of IFN-α on both conventional T cells and
more recently discovered T cell subsets. Thirdly, the phenotype of interferon treated
healthy donor PBMCs was analysed in vitro using intracellular cytokine staining and flow
cytometry.
Human PBMCs usually contain only very low percentages of effector cells which
produce relatively high levels of cytokines required for this kind of analysis (Vyas &
Noble 2008). It is therefore necessary to activate the T cells to induce rapid
312
accumulation of cytoplasmic cytokines before analysis. In our study, cell cultures were
either treated with anti-CD3/CD28 Abs or PMA/ionomycin for 24 or 39 hours in order to
study cytokine production. However, this makes it difficult to analyse the antigen
specificity of responding T cells but will indicate the type 1/type 2/type 17 bias of the
population, reflecting previous exposures to antigen.
Intracellular cytokine staining directly analyses T cells producing a given cytokine and is
a sensitive and convenient way of monitoring the effect of a medication longitudinally.
Also, a unique strength of this technique is the ability to assess multiple cytokines
simultaneously. The human whole blood assay employed in our ex vivo experiments for
determining IFN-α effects may resemble the in vivo situation most closely, as other
essential factors for T lymphocyte activation are present at physiologic concentrations.
However, our in vitro experiments gave us an indication of the influence of IFN-α in the
absence of other immunosuppressants.
8.1.2 Findings from ex vivo experiments
Analysing our data, six months of subcutaneous pegylated IFN-α2b therapy was not
observed to have any impact on the proportions of CD4+, CD8+ and αβ T cells in BD
patients. However, the tendency of γδ T cell number to increase in BD patients was
suppressed in those who received IFN-α therapy. In terms of cytokine production,
IFN-α therapy demonstrated the tendency to enhance T cell production of IFN-γ but
not TNF-α. Under the influence of IFN-α2b therapy, upregulation of IL-2 and IL-4
expression by CD3+ T cells was consistently observed. All these findings have been
described in some earlier studies, even though the subjects of most previous studies
were not BD patients. Notably, all the positive effects of IFN-α detected in our work
were enduring as they were evident even after the termination of IFN-α2b treatment.
To our knowledge, this is the first time 12-month longitudinal data concerning BD
patients who received IFN-α treatment was presented.
CD4+ T lymphocytes play an essential role in steering immune responses and can
contribute to autoimmunity. These cells include effector T cells and regulatory T
cells, which protect against effector responses to autoantigens and also against
313
responses to exogenous antigens. Discoveries made over the past two decades
have markedly changed the way we study immunological processes. Not the least
of these was the identification and cloning of several new cytokines, including IL-17.
These discoveries provided compelling reasons to explore outside the Th1/Th2 cell
paradigm in search of answers to explain the effector T cell responses that occur
independently of known Th1 and Th2 cell signalling pathways. Understanding the
roles played by alternative T cell subsets is critical in avoiding excessive chronic
inflammation and tissue damage.
With regards to Th17 cells, it was demonstrated in our experiments that 6 months of
subcutaneous IFN-α2b therapy could downregulate these cells in peripheral blood of
BD patients. This is in accordance to a very recent study which found that IFN-α
significantly suppressed IL-17 production in PBMC culture supernatants from BD
patients in vitro (Liu et al. 2011). Whereas, CD4+Foxp3+ Treg cell populations,
especially CD4+CD25high T cells, were upregulated following IFN-α2b treatment in
BD patients. To our knowledge, this is the first time that IFN-α treatment has been
observed to increase the proportions of CD4+Foxp3+ T cells in PBMCs. Importantly,
the effects on Th17 and Treg cells were enduring as they were observed even after
cessation of IFN-α therapy. These findings could be pivotal in order to understand
IFN-α as a disease-modifying treatment for BD.
Furthermore, a tendency to upregulate the production levels of IL-10 and TGF-β by T
cells was detected after treatment with IFN-α. This increase in immunoregulatory
cytokine levels could assist in the regulation of Th cells and promote the number and
function of Treg subsets.
8.1.3 Findings from in vitro experiments
In our study, in vitro experiments were carried out using healthy donor PBMCs to test
the effects of IFN-α in the absence of the influence by corticosteroids and other
immunosuppressants. The other aim was to examine whether similar effects by IFN-
α on BD patients could be observed in healthy donor cells. Additionally, the
influence of IFN-α on different subsets of CD8+ and γδ T cells was explored further.
314
Both recombinant IFN-α2a and IFN-α2b were used and they were demonstrated to
be equally effective in their control on the relative proportions of T cell subsets and
inflammatory cytokine production by T cells.
Higher doses of IFN-α demonstrated the tendency to upregulate CD4+ but inhibit
CD8+ T cells. IFN-α also showed the potential to increase IFN-γ producing CD4+
and CD8+ T cells and suppress CD4+ and CD8+ T cells producing IL-17. On the
other hand, IFN-α2a and IFN-α2b were efficacious in inducing Foxp3 expression by
CD4+, CD4+CD25+, CD4+CD25high, CD8+, and CD8+CD25+ T cell populations. Both
forms of IFN-α were observed to consistently upregulate IL-10 and TGF-β levels in
CD4+ and CD8+ T cells as well. Notably, IFN-α was found to be able to exert its
effects on Th17 and Treg cells both before and after cell activation. This may imply
that IFN-α therapy may be effective even when the disease is active. Moreover, our
data showed that both IFN-α2a and IFN-α2b have the potential to suppress the
number of γδ T cells and their production of cytokine IL-17. On the other hand, IFN-
γ producing γδ T cells were observed to be induced following treatment with IFN-α.
To our knowledge, it is the first time that induction of CD4+Foxp3+ and CD8+Foxp3+ T
cells by IFN-α has been demonstrated in vitro. The effects of IFN-α on various CD8+
and γδ T cells subsets described here has not been reported in previous studies
either.
8.1.4 The implications of the findings in this study
In chronic inflammatory and autoimmune conditions, the entire cytokine network is in
a long-term persistent state of activation. In such situations, either the stimulatory or
the counter-regulatory circuits might in the end predominate in determining the net
global effect of cytokines (Kelchtermans, Billiau & Matthys 2008). It is possible that
acute flares of autoimmune diseases may be explained by a preferential
differentiation towards pro-inflammatory lineages or enhanced survival of these
phenotypes in the periphery. T cell heterogeneity and plasticity open opportunities
for targeting or redirecting specific subsets in immune-mediated diseases. In our
study, cytokine production by CD4+ T cells, CD8+ T cells and γδ T cells was

315
investigated. It is likely that cooperation between different cytokine-producing T cell
subsets needs to be regulated to achieve desired immune responses and immune
system homeostasis.
It has been suggested that the cytokines secreted by CD4+ T cells play a
complementary function with cytokines produced by CD8+ and γδ T cells as they
release cytokines at different phase during an inflammatory response. Importantly,
even though other cell types could trigger auto-aggressive responses independently
of CD4+ T cells, a lack of cooperation from these cells would limit the damage to the
host due to the reduced duration of such responses as a result. Indeed, a sustained
memory CD8+ T cell response and high-affinity immunoglobulin production by B cells
are restricted without CD4+ T cell help (Castellino & Germain 2006).
In comparison to CD4+ T cells, naive CD8+ T cells acquire effector T cell functions
more readily upon antigen stimulation (Seder & Ahmed 2003). Activated CD8+ T
cells can produce very high levels of inflammatory cytokines, including IFN-γ (Liblau
et al. 2002). These may contribute greatly to target cell destruction in autoimmune
diseases and therefore regulation is essential for CD8+ T cells. Notably, it has been
demonstrated that CD8+ T cells can direct the development of CD4+ T cells into Th1 and
Th2 effectors. Tc1 clones have been shown to favour the development of CD4+
effectors that are Th1-biased. Whereas Tc2 clones not only can promote Th2 effectors
but also can efficiently suppress the development of Th1 cells (Vukmanovic-Stejic et al.
2000).
γδ T cells are able to prime downstream immune events, including the production of
pathogenic TNF-α and T helper type 1 cytokines, it is plausible that the disruption of
γδ T cell-mediated immunostimulation could be an important mechanism of action for
IFN-α. Antigen-naive γδ T cells are known to produce large amount of effector
cytokines within hours upon infection. Also, cytokines produced by γδ T cells can
contribute to the regulation of αβ T cell activation (Kuhl et al. 2009;Roark et al. 2008).
From our data, IFN-α was shown to have the tendency to promote Th1 signature
cytokine IFN-γ. The proportions of IFN-γ secreting T cells, including CD4+, CD8+
and γδ T cells were all upregulated by IFN-α in vitro. This could be due to the
316
augmentation of IFN-γ signalling by IFN-α via association of type I and type II IFN
receptor subunits (Takaoka et al. 2000). It may also be that the effects of IFN-α on
one cell subset to secrete IFN-γ induced stimulation of other immune cells to produce
IFN-γ in a series of positive feedback loops. IFN-γ lowers host damage during active
disease by lowering the recruitment of neutrophils to inflammatory sites and suppressing
the production of highly pro-inflammatory molecules, including IL-17, and the
development of the Th17 lineage (Kelchtermans, Billiau, & Matthys 2008). Therefore, it
was not unexpected that IFN-α was observed to have the capacity to downregulate IL-
17 secreting T cells including CD4+, CD8+ and γδ T cells in our experiments. All IL-17
producing cells may have pivotal roles in licensing T cell effector functions that result in
inflammatory disease. However, the relative contributions of Th17 cells versus other IL-
17 producing T cells to inflammatory responses in Behcet’s disease are not clear.
The ratio of IFN-γ : IL-4 secreting cells has been reported to be higher in BD patient with
active disease (Misumi et al. 2003). Thus, increased disease activity in BD patients
could be associated with higher IFN-γ : IL-4 ratio rather than higher levels of IFN-γ alone.
It was observed in our ex vivo experiments that IL-4 production by T cells was
appreciably augmented by IFN-α therapy, even though IFN-γ production by T cells
showed a tendency to be upregulated by IFN-α as well. Thus, our patients who had
less active disease after IFN-α therapy might even have lower ratio of IFN-γ : IL-4
secreting cells when compared to before initiation of treatment.
As IL-2 has been shown to be necessary for T cells to acquire IL-4 producing capacity
(Paul & Zhu 2010), the enhanced amounts of IL-2 expression detected in our
experiments could contribute to IL-4 augmentation. Early in an immune response, IL-2
maintains T cell survival and supports the growth and expansion of T cells. If the
response is enduring, as in the case of self-antigens, the prolonged IL-2 exposure
makes T cells sensitive to Fas-mediated apoptosis and terminates the response
(Abbas 2003) IL-2 is indispensable for the induction of Tregs as IL-2 signalling is
required for thymic development, peripheral expansion and suppressive activity of
Treg cells (Shevach et al. 2006). The other common γ-chain cytokines including IL-4
were also reported to maintain maximal regulatory function, suggesting a degree of
redundancy of the cytokines required to maintain Treg function. However, the
concentrations required for IL-4 to achieve the same effect were up 50-fold higher
317
than for IL-2 in vitro, thought to reflect the high density of expression of the IL-2 αβγ
receptor by CD4+CD25+ Tregs (Yates et al. 2007).
Our results are, to our knowledge, the first demonstration of an upregulatory effect
on T cell Foxp3 expression in PBMCs by IFN-α treatment. It is possible that
proliferation of Foxp3low naive natural regulatory T cells as well as induced Treg cells
may have contributed to our findings. Increases in Foxp3 expression can also be a
result of activation in effector T cells, and in this case it is likely that the induced
Foxp3 expression may provide a way to fine-tune proliferation and effector function
of these cells. This is based on the fact that Foxp3-transduced human naive
CD4+CD25-CD45RA+ T cells have been demonstrated to be hyporesponsive and
have a significantly reduced capacity to produce cytokines, including IL-2 and IFN-γ,
upon TCR-mediated activation in comparison with controls (Allan et al. 2005).
Moreover, Foxp3 may form transcription factor complexes with T-bet, GATA3, or
RORγt so that the capacity of these factors to induce effector cytokines is inhibited
(Zhu & Paul 2010). Importantly, our findings indicate a previously unrecognised
potential mechanism by which IFN-α therapy may provide benefit to BD patients.
Tregs have the capacity to actively block immune responses, inflammation, and
tissue destruction and have a major role in suppressing proliferation and effector
functions of other immune cells of both the adaptive (CD4+ and CD8+ αβ T cells, and
B cells), and the innate (NK cells, NKT cells, monocytes and dendritic cells) immune
system (Grossman et al. 2004;Tang & Bluestone 2008). Recently, it was also
demonstrated that CD4+CD25highFoxp3+ T cells isolated from human blood could
inhibit both anti-CD3 and antigen-driven activation and IFN-γ production by Vδ2+ T
cells (Mahan et al. 2009). Tregs were shown to suppress γδ T cell proliferation via a
cell-cell contact-independent mechanism (Kunzmann et al. 2009). However, it was
reported that human Th17 cells were less sensitive to Tregs than Th1 cells.
Likewise, CD8+IL-17+ cells showed little susceptibility to Tregs from peripheral blood
(Annunziato et al. 2007;Ortega et al. 2009).
Of note, human Treg cells probably cannot suppress pro-inflammatory cytokine
production and proliferation in conditions in which effector T cells are strongly
activated (Sakaguchi et al. 2010). It is likely that the loss of suppression observed in
318
the presence of strongly activating factors is due to both an increase in effector T
cells resistance and a decrease in Treg cell function (Koenen et al. 2008). In
addition, there is propensity of Tregs to convert to Th17 cells in the context of pro-
inflammatory stimuli, such as IL-1β and IL-6, in humans (Abdulahad, Boots, &
Kallenberg 2010). Increased Foxp3 expression induced by IFN-α in our study,
however, could help stabilise the phenotype and function of Foxp3+ Treg cells and
reduce their conversion to pathogenic IL-17 secreting effector T cells during active
phase of immune-mediated disease like BD.
The diversity of effector mechanisms affords versatility to a Treg-mediated
suppression program capable of restraining diverse types of inflammatory responses
in different tissues (Feuerer et al. 2009). In some systems, direct cell-to-cell contact
seems to be required; in other systems, suppression seems to involve TGF-β and IL-
10 cytokines. Our data have suggested that IFN-α therapy has the tendency to
upregulate IL-10 and TGF-β production by T cells. Therefore, besides promoting
Treg cell subsets, IFN-α may enhance negative feedback mechanisms ascribed to
cytokines such as IL-10 and TGF-β, which limits the inflammatory reactions.
Major T cell sources of IL-10 include subsets of regulatory T cells designated Tr1 as
well as Th2, Th1, and Th17 cells. CD8+ T cells also produce IL-10 (Mosser & Zhang
2008). Our results indicated that it was likely some Tr1 cells were induced by IFN-α
treatment. Notably, IL-10 production can be promoted by IL-10 itself, IL-27 and
TGF-β (Zhu & Paul 2008). As our results showed the tendency for increased TGF-β
secretion by T cells of BD and healthy patients ex vivo and in vitro respectively
following IFN-α treatment, it is possible that besides Tr1 cells, Th3 regulatory cells
might also be induced by IFN-α therapy. Different types of Treg cells have
complementary and overlapping functions in suppression of autoimmunity and
associated inflammation (Littman & Rudensky 2010).
TGF-β suppresses immune responses through at least two ways: inhibiting the
function of inflammatory cells and promoting the function of Treg cells (Wan & Flavell
2008). Although T cell specific target genes of TGF-β are largely unknown, the
expression of genes important for T cell differentiation and function, such as GATA3,
T-bet, STAT4, IFN-γ, and granzyme-B, are suppressed by TGF-β (Wan & Flavell
319
2008). Although nTreg cell commitment is independent of TGF-β signalling, TGF-β
has been suggested to promote nTreg cell survival by antagonising T cell negative
selection and protecting nTreg cells from apoptosis (Ouyang et al. 2010).
Of note, recent findings have revealed that TGF-β can also have a pro-inflammatory role
dependent on the immunological environment. Thus, in the presence of pro-
inflammatory cytokines, TGF-β contributes to the generation of immunopathogenic IL-17
secreting T cells (Yang et al. 2008b). Consequently, the prerequisite for the generation
of Treg cells, rather than IL-17 secreting T cells, by TGF-β is the removal of pro-
inflammatory cytokines, specifically IL-6, but also TNF-α and IL-1. IFN-α can serve this
function well as it has been indicated in an early study to suppress the ability of IL-6, the
critical partner for TGF-β in the production of IL-17 producing T cells, to bind to the IL-6
receptor by downregulating IL-6 receptor expression (Anthes et al. 1995). Also, it has
been shown in some very early studies that IFN-α inhibits IL-1 synthesis by PBMCs
(Schindler, Ghezzi, & Dinarello 1990), and induces IL-1 receptor antagonist (Tilg et al.
1993).
Therapy targeting Treg cell populations and immunoregulatory cytokines could be
a powerful approach for modulating responses in immune-mediated disease like
Behcet’s disease. Activated Treg cells can suppress a wide range of immune
responses through bystander suppression (Tang & Bluestone 2008), and Treg cells
have been known to induce the development of long-lasting immunologic memory via
modulation of APCs and de novo development of Tregs (Jonuleit et al. 2002;Roncarolo et
al. 2006). Thus, even though individual Treg cells have a finite lifespan, their ability to
impart a tolerant phenotype to other cells via infectious tolerance means that their
transient immunosuppressive signal could be maintained for a long time.
In this study, we have explored the potentiation of Tregs with IFN-α treatment as evident
by increases in Foxp3 expression and regulatory cytokine production ex vivo and in vitro.
The resulting Foxp3+ Tregs likely serve to curb escalating effector T cell responses
and control tissue damage. Restoring immune homeostasis with upregulation of
Tregs would, it is hoped, be effective as at least a short-term therapy, because it
would then allow a tolerogenic milieu to develop and ultimately promote the recovery of
natural regulatory responses. It is tempting to speculate that increases in Treg cell
320
subsets after 6 months of IFN-α therapy could be responsible for the long-lived
efficacy in patients with BD.
IFN-α therapy holds the promise to replace and/or supplement indiscriminatory
immunosuppression by drugs with potentially deadly side effects. This is not to say
that immunosuppressants may be completely useless. Their transient application
may help to set the immune system to a stage where Treg cells can be more
effective in dealing specifically with unwanted immunity. The data presented here
could serve as a basis for understanding the mechanism of action of IFN-α and
identifying strategies for effective treatment. Our findings may provide new inroads
into elucidating the mechanisms involved in the disease-modifying ability of IFN-α
therapy. Which of the above mechanisms plays the most important role in the
observed beneficial effects of IFN-α in the treatment of BD remains to be elucidated.
In conclusion, IFN-α has unique immunomodulatory properties and is a treatment
option for BD. This study provides molecular evidences for possible mechanisms of
action of IFN-α in the BD treatment.
8.2 Limitations of this study
The diverse immunosuppressive drugs received by BD patients in our study, especially
those with active disease, may have an influence on peripheral blood T cell subsets and
contribute to interindividual heterogeneity. Attempts were made in both groups of BD
patients to reduce systemic steroid requirement to ≤10mg daily gradually over the
initial 3-6 months and to stop the second line immunosuppressive agents. However,
a possible implication of the concurrent use of corticosteroids and other
immunosuppressants in our BD patients cannot be definitely ruled out. Since similar
effects on cytokine production were not consistently detected in patients on
immunosuppressants alone and response of our IFN-α treated patients was
impressive and enduring, our results suggested the observed effects were
predominantly due to IFN-α therapy in BD patients.
321
Regrettably, larger sample size would have been more ideal as this would enable
subgroup analysis of patients on similar immunosuppressants. However, the
amount of time required to recruit a much larger number of BD patients meeting the
inclusion criteria was not practical. Therefore, the impact of concurrent use of
steroids and second line agents was minimised as much as we could under the
circumstances through randomisation. Undoubtedly, further studies on the
influences of IFN-α monotherapy on the cytokine network in newly diagnosed yet
untreated patients with different manifestations of BD would be useful to overcome
the limitations of the present study. Moreover, no age- and sex-matched healthy
volunteer was enrolled in our study and therefore data on cytokine producing T cells
obtained from our trial patient samples could not be evaluated against healthy
subjects to determine whether the levels were normal to start with.
It is unfortunate that an investigation of the inflammatory parameters in the active
inflammatory sites could not be carried out as specimens other than peripheral bloods
were not available. As BD is a multisystem inflammatory disorder, studying peripheral
blood samples of patients alone may not help us understand fully the extent of damages
caused by the inflammatory response in these patients. Also, due to omission from the
original trial design, the in vivo effects of 6 months of IFN-α therapy on some potentially
interesting T cell subsets such as IL-17 producing γδ and CD8+ T lymphocytes were
not included in the investigation of our BD patients.
Following the discovery that Foxp3 expression has a central role in the differentiation
and maintenance of Treg cells, the use of flow cytometry-based analysis of Foxp3
expression in T cells became the gold standard for defining Treg cells (Buckner
2010). However, it was discovered that Foxp3 can also be expressed by effector T
cells following activation, raising the possibility that any assessment of Treg cell
number or function may include recently activated effector T cells in the Treg cell
populations (Pillai et al. 2007). The lack of a cell marker that is unique to Treg cells
and the multiplicity of Treg cell subsets complicated the task of enumerating Treg
cells. In our study, a phenotypical evaluation of Treg cells was the approach used to
get an indication of their levels, but no functional assays or Treg suppression assays
were performed to assist in the assessment of Treg levels. Of note, as Foxp3 is a
nuclear protein, assessment of its expression in T cells requires fixation and
322
permeabilisation of the cells, resulting in an inability to obtain viable cells for further
functional analysis (Buckner 2010).
8.3 Future work
Due to the fact that human effector T cells could transiently express Foxp3 following
TCR-mediated activation (Pillai et al. 2007), performing functional assays would be
useful to get an indication whether an upregulation of Foxp3+ expression by T cells
following IFN-α treatment would also lead to an increase in Treg function.
Studies of Treg cell function in human autoimmune diseases have examined the
proliferation of responder cells in response to polyclonal activation in co-cultures with
Treg cells isolated from PBMCs. Evaluation is based on the incorporation of either
tritiated thymidine (3H-thymidine) or on the dilution of the fluorescent label 5,6-
carboxyfluorescein diacetate succinimidyl ester (CFSE). Measurements of cytokine
production by the responder cells can also be performed in conjunction with these
assays. The classical suppression assay involves the co-culture of CD25+ Tregs
and CD25- responder T cells over a range of suppressor : responder ratios in order
to measure the functional activity of Tregs (Thornton & Shevach 1998).
CFSE dilution is considered a superior approach for examining Treg cell-mediated
suppression, as it shows the number of cell divisions throughout the culture period.
On the other hand, 3H-thymidine incorporation assays only demonstrate the level of
proliferation that occurs during the period in which the 3H-thymidine is present in the
culture, which typically lasts for 12-16 hours. The use of CFSE also has the
advantage of allowing simultaneous analysis of cell surface markers and cytokines to
better define the character of the proliferating responder cells. However, the quantity
of cells that is needed for CFSE assays is much greater than that required for 3H-
thymidine incorporation assays, making CFSE assays less useful when only small
amounts of blood are available (Buckner 2010).
Of note, the results of these types of studies are influenced by the way by which the
Treg cells are isolated. This can affect the composition of the Treg cell pool and
323
hence the degree of inhibition. The type of selection method (bead based or flow
cytometry based) and the stringency of selection (based on the level of CD25
expression and the use of additional Treg cell markers) can lead to large differences
in the percentage of isolated cells that express Foxp3 and in the level of suppression.
The type and strength of the stimulus used should be taken into account as well
when interpreting any of these studies (Buckner 2010).
The specificity and activation status of regulatory and effector T cell populations as
well as the cytokines present in the microenvironment and the activation status of
antigen-presenting cells (APCs) will influence the capacity of Tregs to suppress in
vivo. These conditions are often not well modelled in vitro and this caveat
represents the greatest limitation of this type of assay. Suppressing the proliferation
or cytokine production of highly activated polarised T cells is much more challenging.
Tregs from the site of inflammation are more suppressive than their peripheral blood
counterparts but, simultaneously, the activated responder T cells from the
inflammatory foci are more resistant to suppression (de Kleer et al. 2004;van
Amelsfort et al. 2004).
To examine whether IFN-α modifies the functional features of peripheral CD4+CD25-
T cells and CD4+CD25high T cells (which should be enriched for nTreg) , their
proliferative capacity, cytokine production profile, and suppressive function can be
tested in vitro. One idea is to perform functional assays on the two T cell subsets
purified from Behcet’s disease patients before and during IFN-α monotherapy.
Another idea is to treat either purified Treg cells or responder cell populations from
healthy donor PBMCs with IFN-α before performing in vitro functional assay using
the two T cell subsets and the results can be compared to data collected from
untreated assays. These functional assays are likely to give some indication of the
potential of IFN-α to enhance Treg cell function and decrease resistance of
responder cells to suppression.
As the BD patients in our study are intended to be followed up for 3 years,
longitudinal data at two and three year assessment visits will be available for
analysis in the near future. This valuable information should help confirm whether
the disease-modifying ability of IFN-α therapy persists after termination of treatment.

324
Moreover, all the clinical details and disease activity of BD patients throughout the
trial will become available once the clinical trial has come to an end, correlation
between clinical findings and experimental data will then be able to be examined. It
would also be of interest to analyse both BD patients with active and inactive disease
and investigate whether there is a difference between the two groups in terms of
peripheral blood T cell populations.
325
References
Aarts-Riemens, T., Emmelot, M. E., Verdonck, L. F., & Mutis, T. 2008, "Forced overexpression of either of the two common human Foxp3 isoforms can induce regulatory T cells from CD4(+)CD25(-) cells", Eur.J.Immunol., vol. 38, no. 5, pp. 1381-1390.
Abbas, A. K. 2003, "The control of T cell activation vs. tolerance", Autoimmun.Rev., vol. 2, no. 3, pp. 115-118.
Abdulahad, W. H., Boots, A. M., & Kallenberg, C. G. 2010, "FoxP3+ CD4+ T cells in systemic autoimmune diseases: the delicate balance between true regulatory T cells and effector Th-17 cells", Rheumatology.(Oxford).
Ablamunits, V., Bisikirska, B., & Herold, K. C. 2010, "Acquisition of regulatory function by human CD8(+) T cells treated with anti-CD3 antibody requires TNF", Eur.J.Immunol., vol. 40, no. 10, pp. 2891-2901.
Abu-Khabar, K. S., Armstrong, J. A., & Ho, M. 1992, "Type I interferons (IFN-alpha and -beta) suppress cytotoxin (tumor necrosis factor-alpha and lymphotoxin) production by mitogen-stimulated human peripheral blood mononuclear cell", J.Leukoc.Biol., vol. 52, no. 2, pp. 165-172.
Accardo-Palumbo, A., Ferrante, A., Cadelo, M., Ciccia, F., Parrinello, G., Lipari, L., Giardina, A. R., Riili, M., Giardina, E., Dieli, F., & Triolo, G. 2004, "The level of soluble Granzyme A is elevated in the plasma and in the Vgamma9/Vdelta2 T cell culture supernatants of patients with active Behcet's disease", Clin.Exp.Rheumatol., vol. 22, no. 4 Suppl 34, p. S45-S49.
Acosta-Rodriguez, E. V., Rivino, L., Geginat, J., Jarrossay, D., Gattorno, M., Lanzavecchia, A., Sallusto, F., & Napolitani, G. 2007, "Surface phenotype and antigenic specificity of human interleukin 17-producing T helper memory cells", Nat.Immunol., vol. 8, no. 6, pp. 639-646.
Afkarian, M., Sedy, J. R., Yang, J., Jacobson, N. G., Cereb, N., Yang, S. Y., Murphy, T. L., & Murphy, K. M. 2002, "T-bet is a STAT1-induced regulator of IL-12R expression in naive CD4+ T cells", Nat.Immunol., vol. 3, no. 6, pp. 549-557.
Ahmad, T., Wallace, G. R., James, T., Neville, M., Bunce, M., Mulcahy-Hawes, K., Armuzzi, A., Crawshaw, J., Fortune, F., Walton, R., Stanford, M. R., Welsh, K. I., Marshall, S. E., & Jewell, D. P. 2003, "Mapping the HLA association in Behcet's disease: a role for tumor necrosis factor polymorphisms?", Arthritis Rheum., vol. 48, no. 3, pp. 807-813.
Ahmadzadeh, M., Antony, P. A., & Rosenberg, S. A. 2007, "IL-2 and IL-15 each mediate de novo induction of FOXP3 expression in human tumor antigen-specific CD8 T cells", J.Immunother., vol. 30, no. 3, pp. 294-302.
Ahmadzadeh, M. & Rosenberg, S. A. 2005, "TGF-beta 1 attenuates the acquisition and expression of effector function by tumor antigen-specific human memory CD8 T cells", J.Immunol., vol. 174, no. 9, pp. 5215-5223.
326
Ahmadzadeh, M. & Rosenberg, S. A. 2006, "IL-2 administration increases CD4+ CD25(hi) Foxp3+ regulatory T cells in cancer patients", Blood, vol. 107, no. 6, pp. 2409-2414.
Ahn, J. K., Chung, H., Lee, D. S., Yu, Y. S., & Yu, H. G. 2005, "CD8brightCD56+ T cells are cytotoxic effectors in patients with active Behcet's uveitis", J.Immunol., vol. 175, no. 9, pp. 6133-6142.
Akdis, C. A. & Blaser, K. 2001, "Mechanisms of interleukin-10-mediated immune suppression", Immunology, vol. 103, no. 2, pp. 131-136.
Akman, A., Sallakci, N., Kacaroglu, H., Tosun, O., Yavuzer, U., Alpsoy, E., & Yegin, O. 2008, "Relationship between periodontal findings and the TNF-alpha Gene 1031T/C polymorphism in Turkish patients with Behcet's disease", J.Eur.Acad.Dermatol.Venereol., vol. 22, no. 8, pp. 950-957.
Akpolat, T., Akkoyunlu, M., Akpolat, I., Dilek, M., Odabas, A. R., & Ozen, S. 2002, "Renal Behcet's disease: a cumulative analysis", Semin.Arthritis Rheum., vol. 31, no. 5, pp. 317-337.
Al Mutawa, S. A. & Hegab, S. M. 2004, "Behcet's disease", Clin.Exp.Med., vol. 4, no. 3, pp. 103-131.
Al Otaibi, L. M., Porter, S. R., & Poate, T. W. 2005, "Behcet's disease: a review", J.Dent.Res., vol. 84, no. 3, pp. 209-222.
Alayli, G., Aydin, F., Coban, A. Y., Sullu, Y., Canturk, F., Bek, Y., Durupinar, B., & Canturk, T. 2007, "T helper 1 type cytokines polymorphisms: association with susceptibility to Behcet's disease", Clin.Rheumatol., vol. 26, no. 8, pp. 1299-1305.
Allan, S. E., Alstad, A. N., Merindol, N., Crellin, N. K., Amendola, M., Bacchetta, R., Naldini, L., Roncarolo, M. G., Soudeyns, H., & Levings, M. K. 2008a, "Generation of potent and stable human CD4+ T regulatory cells by activation-independent expression of FOXP3", Mol.Ther., vol. 16, no. 1, pp. 194-202.
Allan, S. E., Broady, R., Gregori, S., Himmel, M. E., Locke, N., Roncarolo, M. G., Bacchetta, R., & Levings, M. K. 2008b, "CD4+ T-regulatory cells: toward therapy for human diseases", Immunol.Rev., vol. 223, pp. 391-421.
Allan, S. E., Crome, S. Q., Crellin, N. K., Passerini, L., Steiner, T. S., Bacchetta, R., Roncarolo, M. G., & Levings, M. K. 2007, "Activation-induced FOXP3 in human T effector cells does not suppress proliferation or cytokine production", Int.Immunol., vol. 19, no. 4, pp. 345-354.
Allan, S. E., Passerini, L., Bacchetta, R., Crellin, N., Dai, M., Orban, P. C., Ziegler, S. F., Roncarolo, M. G., & Levings, M. K. 2005, "The role of 2 FOXP3 isoforms in the generation of human CD4+ Tregs", J.Clin.Invest, vol. 115, no. 11, pp. 3276-3284.
Alpsoy, E., Durusoy, C., Yilmaz, E., Ozgurel, Y., Ermis, O., Yazar, S., & Basaran, E. 2002, "Interferon alfa-2a in the treatment of Behcet disease: a randomized placebo-controlled and double-blind study", Arch.Dermatol., vol. 138, no. 4, pp. 467-471.
327
Alpsoy, E., Uzun, S., Akman, A., Acar, M. A., Memisoglu, H. R., & Basaran, E. 2003, "Histological and immunofluorescence findings of non-follicular papulopustular lesions in patients with Behcet's disease", J.Eur.Acad.Dermatol.Venereol., vol. 17, no. 5, pp. 521-524.
Amadi-Obi, A., Yu, C. R., Liu, X., Mahdi, R. M., Clarke, G. L., Nussenblatt, R. B., Gery, I., Lee, Y. S., & Egwuagu, C. E. 2007, "TH17 cells contribute to uveitis and scleritis and are expanded by IL-2 and inhibited by IL-27/STAT1", Nat.Med., vol. 13, no. 6, pp. 711-718.
Aman, M. J., Rudolf, G., Goldschmitt, J., Aulitzky, W. E., Lam, C., Huber, C., & Peschel, C. 1993, "Type-I interferons are potent inhibitors of interleukin-8 production in hematopoietic and bone marrow stromal cells", Blood, vol. 82, no. 8, pp. 2371-2378.
Aman, M. J., Tretter, T., Eisenbeis, I., Bug, G., Decker, T., Aulitzky, W. E., Tilg, H., Huber, C., & Peschel, C. 1996, "Interferon-alpha stimulates production of interleukin-10 in activated CD4+ T cells and monocytes", Blood, vol. 87, no. 11, pp. 4731-4736.
Amberger, M., Groll, S., Gunaydin, I., Deuter, C., Vonthein, R., & Kotter, I. 2007, "Intracellular cytokine patterns in Behcet's disease in comparison to ankylosing spondylitis--influence of treatment with interferon-alpha2a", Clin.Exp.Rheumatol., vol. 25, no. 4 Suppl 45, p. S52-S57.
Anderson, C. F., Oukka, M., Kuchroo, V. J., & Sacks, D. 2007, "CD4(+)CD25(-)Foxp3(-) Th1 cells are the source of IL-10-mediated immune suppression in chronic cutaneous leishmaniasis", J.Exp.Med., vol. 204, no. 2, pp. 285-297.
Annunziato, F., Cosmi, L., & Romagnani, S. 2010, "Human and murine Th17", Curr.Opin.HIV.AIDS, vol. 5, no. 2, pp. 114-119.
Annunziato, F., Cosmi, L., Santarlasci, V., Maggi, L., Liotta, F., Mazzinghi, B., Parente, E., Fili, L., Ferri, S., Frosali, F., Giudici, F., Romagnani, P., Parronchi, P., Tonelli, F., Maggi, E., & Romagnani, S. 2007, "Phenotypic and functional features of human Th17 cells", J.Exp.Med., vol. 204, no. 8, pp. 1849-1861.
Annunziato, F. & Romagnani, S. 2009, "Heterogeneity of human effector CD4+ T cells", Arthritis Res.Ther., vol. 11, no. 6, p. 257.
Anthes, J. C., Zhan, Z., Gilchrest, H., Egan, R. W., Siegel, M. I., & Billah, M. M. 1995, "Interferon-alpha down-regulates the interleukin-6 receptor in a human multiple myeloma cell line, U266", Biochem.J., vol. 309 ( Pt 1), pp. 175-180.
Antonelli, G., Currenti, M., Turriziani, O., & Dianzani, F. 1991, "Neutralizing Antibodies to Interferon-Alpha - Relative Frequency in Patients Treated with Different Interferon Preparations", Journal of Infectious Diseases, vol. 163, no. 4, pp. 882-885.
Apostolou, I., Verginis, P., Kretschmer, K., Polansky, J., Huhn, J., & von Boehmer, H. 2008, "Peripherally induced Treg: mode, stability, and role in specific tolerance", J.Clin.Immunol., vol. 28, no. 6, pp. 619-624.
328
Arnaud, P. 2002, "[The interferons: pharmacology, mechanism of action, tolerance and side effects]", Rev.Med.Interne, vol. 23 Suppl 4, pp. 449s-458s.
Ascierto, P. A., Napolitano, M., Celentano, E., Simeone, E., Gentilcore, G., Daponte, A., Capone, M., Caraco, C., Calemma, R., Beneduce, G., Cerrone, M., De, R., V, Palmieri, G., Castello, G., Kirkwood, J. M., Marincola, F. M., & Mozzillo, N. 2010, "Regulatory T cell frequency in patients with melanoma with different disease stage and course, and modulating effects of high-dose interferon-alpha 2b treatment", J.Transl.Med., vol. 8, no. 1, p. 76.
Ayyoub, M., Deknuydt, F., Raimbaud, I., Dousset, C., Leveque, L., Bioley, G., & Valmori, D. 2009, "Human memory FOXP3+ Tregs secrete IL-17 ex vivo and constitutively express the T(H)17 lineage-specific transcription factor RORgamma t", Proc.Natl.Acad.Sci.U.S.A, vol. 106, no. 21, pp. 8635-8640.
Baccala, R., Kono, D. H., & Theofilopoulos, A. N. 2005, "Interferons as pathogenic effectors in autoimmunity", Immunological Reviews, vol. 204, pp. 9-26.
Bacchetta, R., Passerini, L., Gambineri, E., Dai, M., Allan, S. E., Perroni, L., Dagna-Bricarelli, F., Sartirana, C., Matthes-Martin, S., Lawitschka, A., Azzari, C., Ziegler, S. F., Levings, M. K., & Roncarolo, M. G. 2006, "Defective regulatory and effector T cell functions in patients with FOXP3 mutations", J.Clin.Invest, vol. 116, no. 6, pp. 1713-1722.
Bach, J. F. 2002, "[Current concepts of autoimmunity]", Rev.Neurol.(Paris), vol. 158, no. 10 Pt 1, pp. 881-886.
Baecher-Allan, C., Brown, J. A., Freeman, G. J., & Hafler, D. A. 2001, "CD4+CD25high regulatory cells in human peripheral blood", J.Immunol., vol. 167, no. 3, pp. 1245-1253.
Baecher-Allan, C. & Hafler, D. A. 2006, "Human regulatory T cells and their role in autoimmune disease", Immunol.Rev., vol. 212, pp. 203-216.
Bailon, P., Palleroni, A., Schaffer, C. A., Spence, C. L., Fung, W. J., Porter, J. E., Ehrlich, G. K., Pan, W., Xu, Z. X., Modi, M. W., Farid, A., & Berthold, W. 2001, "Rational design of a potent, long-lasting form of interferon: A 40 kDa branched polyethylene glycol-conjugated interferon alpha-2a for the treatment of hepatitis C", Bioconjugate Chemistry, vol. 12, no. 2, pp. 195-202.
Bank, I., Duvdevani, M., & Livneh, A. 2003, "Expansion of gammadelta T-cells in Behcet's disease: role of disease activity and microbial flora in oral ulcers", J.Lab Clin.Med., vol. 141, no. 1, pp. 33-40.
Baran, J., Kowalczyk, D., Ozog, M., & Zembala, M. 2001, "Three-color flow cytometry detection of intracellular cytokines in peripheral blood mononuclear cells: comparative analysis of phorbol myristate acetate-ionomycin and phytohemagglutinin stimulation", Clin.Diagn.Lab Immunol., vol. 8, no. 2, pp. 303-313.
Bardak, Y. & Aridogan, B. C. 2004, "The demonstration of serum interleukin 6-8, tumor necrosis factor-alpha, complement, and immunoglobulin levels in Behcet's disease with ocular involvement", Ocul.Immunol.Inflamm., vol. 12, no. 1, pp. 53-58.
329
Ben Ahmed, M., Houman, H., Miled, M., Dellagi, K., & Louzir, H. 2004, "Involvement of chemokines and Th1 cytokines in the pathogenesis of mucocutaneous lesions of Behcet's disease", Arthritis Rheum., vol. 50, no. 7, pp. 2291-2295.
Bendelac, A., Bonneville, M., & Kearney, J. F. 2001, "Autoreactivity by design: innate B and T lymphocytes", Nat.Rev.Immunol., vol. 1, no. 3, pp. 177-186.
Benveniste, E. N. & Benos, D. J. 1995, "TNF-alpha- and IFN-gamma-mediated signal transduction pathways: effects on glial cell gene expression and function", FASEB J., vol. 9, no. 15, pp. 1577-1584.
Bianchi, M., Meng, C., & Ivashkiv, L. B. 2000, "Inhibition of IL-2-induced Jak-STAT signaling by glucocorticoids", Proc.Natl.Acad.Sci.U.S.A, vol. 97, no. 17, pp. 9573-9578.
Billerbeck, E., Kang, Y. H., Walker, L., Lockstone, H., Grafmueller, S., Fleming, V., Flint, J., Willberg, C. B., Bengsch, B., Seigel, B., Ramamurthy, N., Zitzmann, N., Barnes, E. J., Thevanayagam, J., Bhagwanani, A., Leslie, A., Oo, Y. H., Kollnberger, S., Bowness, P., Drognitz, O., Adams, D. H., Blum, H. E., Thimme, R., & Klenerman, P. 2010, "Analysis of CD161 expression on human CD8+ T cells defines a distinct functional subset with tissue-homing properties", Proc.Natl.Acad.Sci.U.S.A, vol. 107, no. 7, pp. 3006-3011.
Billiau, A. & Matthys, P. 2009, "Interferon-gamma: a historical perspective", Cytokine Growth Factor Rev., vol. 20, no. 2, pp. 97-113.
Blom, B., Verschuren, M. C., Heemskerk, M. H., Bakker, A. Q., Gastel-Mol, E. J., Wolvers-Tettero, I. L., van Dongen, J. J., & Spits, H. 1999, "TCR gene rearrangements and expression of the pre-T cell receptor complex during human T-cell differentiation", Blood, vol. 93, no. 9, pp. 3033-3043.
Bluestone, J. A. & Abbas, A. K. 2003, "Natural versus adaptive regulatory T cells", Nat.Rev.Immunol., vol. 3, no. 3, pp. 253-257.
Bonfioli, A. A. & Orefice, F. 2005, "Behcet's disease", Semin.Ophthalmol., vol. 20, no. 3, pp. 199-206.
Boniface, K., Bak-Jensen, K. S., Li, Y., Blumenschein, W. M., McGeachy, M. J., McClanahan, T. K., McKenzie, B. S., Kastelein, R. A., Cua, D. J., & de Waal, M. R. 2009, "Prostaglandin E2 regulates Th17 cell differentiation and function through cyclic AMP and EP2/EP4 receptor signaling", J.Exp.Med., vol. 206, no. 3, pp. 535-548.
Bonneville, M., O'Brien, R. L., & Born, W. K. 2010, "Gammadelta T cell effector functions: a blend of innate programming and acquired plasticity", Nat.Rev.Immunol., vol. 10, no. 7, pp. 467-478.
Borsellino, G., Kleinewietfeld, M., Di Mitri, D., Sternjak, A., Diamantini, A., Giometto, R., Hopner, S., Centonze, D., Bernardi, G., Dell'Acqua, M. L., Rossini, P. M., Battistini, L., Rotzschke, O., & Falk, K. 2007, "Expression of ectonucleotidase CD39 by Foxp3+ Treg cells: hydrolysis of extracellular ATP and immune suppression", Blood, vol. 110, no. 4, pp. 1225-1232.
330
Bouneaud, C., Kourilsky, P., & Bousso, P. 2000, "Impact of negative selection on the T cell repertoire reactive to a self-peptide: a large fraction of T cell clones escapes clonal deletion", Immunity., vol. 13, no. 6, pp. 829-840.
Bradley, J. R. 2008, "TNF-mediated inflammatory disease", J.Pathol., vol. 214, no. 2, pp. 149-160.
Braitch, M., Harikrishnan, S., Robins, R. A., Nichols, C., Fahey, A. J., Showe, L., & Constantinescu, C. S. 2008, "Glucocorticoids increase CD4(+)CD25(high) cell percentage and Foxp3 expression in patients with multiple sclerosis", Acta Neurol.Scand.
Breitfeld, D., Ohl, L., Kremmer, E., Ellwart, J., Sallusto, F., Lipp, M., & Forster, R. 2000, "Follicular B helper T cells express CXC chemokine receptor 5, localize to B cell follicles, and support immunoglobulin production", J Exp.Med., vol. 192, no. 11, pp. 1545-1552.
Brinkmann, V., Geiger, T., Alkan, S., & Heusser, C. H. 1993, "Interferon alpha increases the frequency of interferon gamma-producing human CD4+ T cells", J.Exp.Med., vol. 178, no. 5, pp. 1655-1663.
Brucklacher-Waldert, V., Steinbach, K., Lioznov, M., Kolster, M., Holscher, C., & Tolosa, E. 2009, "Phenotypical characterization of human Th17 cells unambiguously identified by surface IL-17A expression", J.Immunol., vol. 183, no. 9, pp. 5494-5501.
Brunkow, M. E., Jeffery, E. W., Hjerrild, K. A., Paeper, B., Clark, L. B., Yasayko, S. A., Wilkinson, J. E., Galas, D., Ziegler, S. F., & Ramsdell, F. 2001, "Disruption of a new forkhead/winged-helix protein, scurfin, results in the fatal lymphoproliferative disorder of the scurfy mouse", Nat.Genet., vol. 27, no. 1, pp. 68-73.
Brusko, T. M., Putnam, A. L., & Bluestone, J. A. 2008, "Human regulatory T cells: role in autoimmune disease and therapeutic opportunities", Immunol.Rev., vol. 223, pp. 371-390.
Brustle, A., Heink, S., Huber, M., Rosenplanter, C., Stadelmann, C., Yu, P., Arpaia, E., Mak, T. W., Kamradt, T., & Lohoff, M. 2007, "The development of inflammatory T(H)-17 cells requires interferon-regulatory factor 4", Nat.Immunol., vol. 8, no. 9, pp. 958-966.
Buckner, J. H. 2010, "Mechanisms of impaired regulation by CD4(+)CD25(+)FOXP3(+) regulatory T cells in human autoimmune diseases", Nat.Rev.Immunol., vol. 10, no. 12, pp. 849-859.
Buckner, J. H. & Ziegler, S. F. 2008, "Functional analysis of FOXP3", Ann.N.Y.Acad.Sci., vol. 1143, pp. 151-169.
Burchill, M. A., Yang, J., Vang, K. B., Moon, J. J., Chu, H. H., Lio, C. W., Vegoe, A. L., Hsieh, C. S., Jenkins, M. K., & Farrar, M. A. 2008, "Linked T cell receptor and cytokine signaling govern the development of the regulatory T cell repertoire", Immunity., vol. 28, no. 1, pp. 112-121.
331
Calguneri, M., Ozturk, M. A., Ertenli, I., Kiraz, S., Apras, S., & Ozbalkan, Z. 2003, "Effects of interferon alpha treatment on the clinical course of refractory Behcet's disease: an open study", Ann.Rheum.Dis., vol. 62, no. 5, pp. 492-493.
Carding, S. R. & Egan, P. J. 2002, "Gammadelta T cells: functional plasticity and heterogeneity", Nat.Rev.Immunol., vol. 2, no. 5, pp. 336-345.
Carrasco, Y. R., Trigueros, C., Ramiro, A. R., de Yebenes, V. G., & Toribio, M. L. 1999, "Beta-selection is associated with the onset of CD8beta chain expression on CD4(+)CD8alphaalpha(+) pre-T cells during human intrathymic development", Blood, vol. 94, no. 10, pp. 3491-3498.
Casetti, R., Agrati, C., Wallace, M., Sacchi, A., Martini, F., Martino, A., Rinaldi, A., & Malkovsky, M. 2009, "Cutting edge: TGF-beta1 and IL-15 Induce FOXP3+ gammadelta regulatory T cells in the presence of antigen stimulation", J.Immunol., vol. 183, no. 6, pp. 3574-3577.
Castagna, M., Takai, Y., Kaibuchi, K., Sano, K., Kikkawa, U., & Nishizuka, Y. 1982, "Direct activation of calcium-activated, phospholipid-dependent protein kinase by tumor-promoting phorbol esters", J.Biol.Chem., vol. 257, no. 13, pp. 7847-7851.
Castellino, F. & Germain, R. N. 2006, "Cooperation between CD4+ and CD8+ T cells: when, where, and how", Annu.Rev.Immunol., vol. 24, pp. 519-540.
Chang, C. C., Ciubotariu, R., Manavalan, J. S., Yuan, J., Colovai, A. I., Piazza, F., Lederman, S., Colonna, M., Cortesini, R., Dalla-Favera, R., & Suciu-Foca, N. 2002, "Tolerization of dendritic cells by T(S) cells: the crucial role of inhibitory receptors ILT3 and ILT4", Nat.Immunol., vol. 3, no. 3, pp. 237-243.
Chatelut, E., Rostaing, L., Gregoire, N., Payen, J. L., Pujol, A., Izopet, J., Houin, G., & Canal, P. 1999, "A pharmacokinetic model for alpha interferon administered subcutaneously", British Journal of Clinical Pharmacology, vol. 47, no. 4, pp. 365-371.
Chatila, T., Silverman, L., Miller, R., & Geha, R. 1989, "Mechanisms of T cell activation by the calcium ionophore ionomycin", J.Immunol., vol. 143, no. 4, pp. 1283-1289.
Chen, L., He, W., Kim, S. T., Tao, J., Gao, Y., Chi, H., Intlekofer, A. M., Harvey, B., Reiner, S. L., Yin, Z., Flavell, R. A., & Craft, J. 2007a, "Epigenetic and transcriptional programs lead to default IFN-gamma production by gammadelta T cells", J.Immunol., vol. 178, no. 5, pp. 2730-2736.
Chen, L., Yang, P., Zhou, H., He, H., Ren, X., Chi, W., Wang, L., & Kijlstra, A. 2008, "Diminished frequency and function of CD4+CD25high regulatory T cells associated with active uveitis in Vogt-Koyanagi-Harada syndrome", Invest Ophthalmol.Vis.Sci., vol. 49, no. 8, pp. 3475-3482.
Chen, Y., Kuchroo, V. K., Inobe, J., Hafler, D. A., & Weiner, H. L. 1994, "Regulatory T cell clones induced by oral tolerance: suppression of autoimmune encephalomyelitis", Science, vol. 265, no. 5176, pp. 1237-1240.
332
Chen, Z., Tato, C. M., Muul, L., Laurence, A., & O'shea, J. J. 2007b, "Distinct regulation of interleukin-17 in human T helper lymphocytes", Arthritis Rheum., vol. 56, no. 9, pp. 2936-2946.
Chi, W., Yang, P., Li, B., Wu, C., Jin, H., Zhu, X., Chen, L., Zhou, H., Huang, X., & Kijlstra, A. 2007, "IL-23 promotes CD4+ T cells to produce IL-17 in Vogt-Koyanagi-Harada disease", J.Allergy Clin.Immunol., vol. 119, no. 5, pp. 1218-1224.
Chi, W., Yang, P., Zhu, X., Wang, Y., Chen, L., Huang, X., & Liu, X. 2010, "Production of interleukin-17 in Behcet's disease is inhibited by cyclosporin A", Mol.Vis., vol. 16, pp. 880-886.
Chi, W., Zhu, X., Yang, P., Liu, X., Lin, X., Zhou, H., Huang, X., & Kijlstra, A. 2008, "Upregulated IL-23 and IL-17 in Behcet patients with active uveitis", Invest Ophthalmol.Vis.Sci., vol. 49, no. 7, pp. 3058-3064.
Chien, Y. H., Jores, R., & Crowley, M. P. 1996, "Recognition by gamma/delta T cells", Annu.Rev.Immunol., vol. 14, pp. 511-532.
Clark, J., Vagenas, P., Panesar, M., & Cope, A. P. 2005, "What does tumour necrosis factor excess do to the immune system long term?", Ann.Rheum.Dis., vol. 64 Suppl 4, p. iv70-iv76.
Clemente, A., Cambra, A., Munoz-Saa, I., Crespi, C., Pallares, L., Juan, A., Matamoros, N., & Julia, M. R. 2010, "Phenotype markers and cytokine intracellular production by CD8+ gammadelta T lymphocytes do not support a regulatory T profile in Behcet's disease patients and healthy controls", Immunol.Lett., vol. 129, no. 2, pp. 57-63.
Codarri, L., Fontana, A., & Becher, B. 2010, "Cytokine networks in multiple sclerosis: lost in translation", Curr.Opin.Neurol., vol. 23, no. 3, pp. 205-211.
Cohen, S. B., Crawley, J. B., Kahan, M. C., Feldmann, M., & Foxwell, B. M. 1997, "Interleukin-10 rescues T cells from apoptotic cell death: association with an upregulation of Bcl-2", Immunology, vol. 92, no. 1, pp. 1-5.
Collison, L. W., Chaturvedi, V., Henderson, A. L., Giacomin, P. R., Guy, C., Bankoti, J., Finkelstein, D., Forbes, K., Workman, C. J., Brown, S. A., Rehg, J. E., Jones, M. L., Ni, H. T., Artis, D., Turk, M. J., & Vignali, D. A. 2010, "IL-35-mediated induction of a potent regulatory T cell population", Nat.Immunol., vol. 11, no. 12, pp. 1093-1101.
Cope, A. P., Liblau, R. S., Yang, X. D., Congia, M., Laudanna, C., Schreiber, R. D., Probert, L., Kollias, G., & McDevitt, H. O. 1997, "Chronic tumor necrosis factor alters T cell responses by attenuating T cell receptor signaling", J.Exp.Med., vol. 185, no. 9, pp. 1573-1584.
Corssmit, E. P., Heijligenberg, R., Hack, C. E., Endert, E., Sauerwein, H. P., & Romijn, J. A. 1997, "Effects of interferon-alpha (IFN-alpha) administration on leucocytes in healthy humans", Clin.Exp.Immunol., vol. 107, no. 2, pp. 359-363.

333
Coskun, M., Bacanli, A., Sallakci, N., Alpsoy, E., Yavuzer, U., & Yegin, O. 2005, "Specific interleukin-1 gene polymorphisms in Turkish patients with Behcet's disease", Exp.Dermatol., vol. 14, no. 2, pp. 124-129.
Cosmi, L., De Palma, R., Santarlasci, V., Maggi, L., Capone, M., Frosali, F., Rodolico, G., Querci, V., Abbate, G., Angeli, R., Berrino, L., Fambrini, M., Caproni, M., Tonelli, F., Lazzeri, E., Parronchi, P., Liotta, F., Maggi, E., Romagnani, S., & Annunziato, F. 2008, "Human interleukin 17-producing cells originate from a CD161+CD4+ T cell precursor", J.Exp.Med., vol. 205, no. 8, pp. 1903-1916.
Cosmi, L., Liotta, F., Lazzeri, E., Francalanci, M., Angeli, R., Mazzinghi, B., Santarlasci, V., Manetti, R., Vanini, V., Romagnani, P., Maggi, E., Romagnani, S., & Annunziato, F. 2003, "Human CD8+CD25+ thymocytes share phenotypic and functional features with CD4+CD25+ regulatory thymocytes", Blood, vol. 102, no. 12, pp. 4107-4114.
Cosmi, L., Maggi, L., Santarlasci, V., Capone, M., Cardilicchia, E., Frosali, F., Querci, V., Angeli, R., Matucci, A., Fambrini, M., Liotta, F., Parronchi, P., Maggi, E., Romagnani, S., & Annunziato, F. 2010, "Identification of a novel subset of human circulating memory CD4(+) T cells that produce both IL-17A and IL-4", J.Allergy Clin.Immunol., vol. 125, no. 1, pp. 222-230.
Costantino, C. M., Baecher-Allan, C. M., & Hafler, D. A. 2008, "Human regulatory T cells and autoimmunity", Eur.J.Immunol., vol. 38, no. 4, pp. 921-924.
Cottrez, F. & Groux, H. 2001, "Regulation of TGF-beta response during T cell activation is modulated by IL-10", J.Immunol., vol. 167, no. 2, pp. 773-778.
Crome, S. Q., Wang, A. Y., Kang, C. Y., & Levings, M. K. 2009, "The role of retinoic acid-related orphan receptor variant 2 and IL-17 in the development and function of human CD4+ T cells", Eur.J.Immunol., vol. 39, no. 6, pp. 1480-1493.
Crome, S. Q., Wang, A. Y., & Levings, M. K. 2010, "Translational mini-review series on Th17 cells: function and regulation of human T helper 17 cells in health and disease", Clin.Exp.Immunol., vol. 159, no. 2, pp. 109-119.
Cua, D. J., Sherlock, J., Chen, Y., Murphy, C. A., Joyce, B., Seymour, B., Lucian, L., To, W., Kwan, S., Churakova, T., Zurawski, S., Wiekowski, M., Lira, S. A., Gorman, D., Kastelein, R. A., & Sedgwick, J. D. 2003, "Interleukin-23 rather than interleukin-12 is the critical cytokine for autoimmune inflammation of the brain", Nature, vol. 421, no. 6924, pp. 744-748.
Cuchacovich, M., Merino, G., Yamamoto, J. H., Villarroel, F., Saavedra, T., Jofre, S., Gatica, H., Velasquez, V., Pizzo, S. V., & Gonzalez-Gronow, M. 2005, "Behcet's disease patients present high levels of deglycosylated anti-lipoteichoic acid IgG and high IL-8 production after lipoteichoic acid stimulation", Clin.Exp.Rheumatol., vol. 23, no. 4 Suppl 38, p. S27-S34.
Dalghous, A. M., Freysdottir, J., & Fortune, F. 2006, "Expression of cytokines, chemokines, and chemokine receptors in oral ulcers of patients with Behcet's disease (BD) and recurrent aphthous stomatitis is Th1-associated, although Th2-
334
association is also observed in patients with BD", Scand.J.Rheumatol., vol. 35, no. 6, pp. 472-475.
Dalton, J. E., Howell, G., Pearson, J., Scott, P., & Carding, S. R. 2004, "Fas-Fas ligand interactions are essential for the binding to and killing of activated macrophages by gamma delta T cells", J.Immunol., vol. 173, no. 6, pp. 3660-3667.
Daniel, C., Nolting, J., & von Boehmer, H. 2009, "Mechanisms of self-nonself discrimination and possible clinical relevance", Immunotherapy., vol. 1, no. 4, pp. 631-644.
Dardalhon, V., Korn, T., Kuchroo, V. K., & Anderson, A. C. 2008, "Role of Th1 and Th17 cells in organ-specific autoimmunity", J.Autoimmun.
de Andres, C., Aristimuno, C., de, l. H., V, Martinez-Gines, M. L., Bartolome, M., Arroyo, R., Navarro, J., Gimenez-Roldan, S., Fernandez-Cruz, E., & Sanchez-Ramon, S. 2007, "Interferon beta-1a therapy enhances CD4+ regulatory T-cell function: an ex vivo and in vitro longitudinal study in relapsing-remitting multiple sclerosis", J.Neuroimmunol., vol. 182, no. 1-2, pp. 204-211.
de Kleer, I. M., Wedderburn, L. R., Taams, L. S., Patel, A., Varsani, H., Klein, M., de Jager, W., Pugayung, G., Giannoni, F., Rijkers, G., Albani, S., Kuis, W., & Prakken, B. 2004, "CD4+CD25bright regulatory T cells actively regulate inflammation in the joints of patients with the remitting form of juvenile idiopathic arthritis", J.Immunol., vol. 172, no. 10, pp. 6435-6443.
De Smedt, M., Reynvoet, K., Kerre, T., Taghon, T., Verhasselt, B., Vandekerckhove, B., Leclercq, G., & Plum, J. 2002, "Active form of Notch imposes T cell fate in human progenitor cells", J.Immunol., vol. 169, no. 6, pp. 3021-3029.
de Smet, M. D., Bitar, G., Mainigi, S., & Nussenblatt, R. B. 2001, "Human S-antigen determinant recognition in uveitis", Invest Ophthalmol.Vis.Sci., vol. 42, no. 13, pp. 3233-3238.
Deetz, C. O., Hebbeler, A. M., Propp, N. A., Cairo, C., Tikhonov, I., & Pauza, C. D. 2006, "Gamma interferon secretion by human Vgamma2Vdelta2 T cells after stimulation with antibody against the T-cell receptor plus the Toll-Like receptor 2 agonist Pam3Cys", Infect.Immun., vol. 74, no. 8, pp. 4505-4511.
Deknuydt, F., Bioley, G., Valmori, D., & Ayyoub, M. 2009, "IL-1beta and IL-2 convert human Treg into T(H)17 cells", Clin.Immunol., vol. 131, no. 2, pp. 298-307.
Deknuydt, F., Scotet, E., & Bonneville, M. 2009, "Modulation of inflammation through IL-17 production by gammadelta T cells: mandatory in the mouse, dispensable in humans?", Immunol.Lett., vol. 127, no. 1, pp. 8-12.
Del Prete, G. F., De Carli, M., Mastromauro, C., Biagiotti, R., Macchia, D., Falagiani, P., Ricci, M., & Romagnani, S. 1991, "Purified protein derivative of Mycobacterium tuberculosis and excretory-secretory antigen(s) of Toxocara canis expand in vitro human T cells with stable and opposite (type 1 T helper or type 2 T helper) profile of cytokine production", J.Clin.Invest, vol. 88, no. 1, pp. 346-350.
335
Demirkiran, A., Sewgobind, V. D., van der, W. J., Kok, A., Baan, C. C., Kwekkeboom, J., Tilanus, H. W., Metselaar, H. J., & van der Laan, L. J. 2009, "Conversion from calcineurin inhibitor to mycophenolate mofetil-based immunosuppression changes the frequency and phenotype of CD4+FOXP3+ regulatory T cells", Transplantation, vol. 87, no. 7, pp. 1062-1068.
Deuter, C. M., Kotter, I., Wallace, G. R., Murray, P. I., Stubiger, N., & Zierhut, M. 2008, "Behcet's disease: ocular effects and treatment", Prog.Retin.Eye Res., vol. 27, no. 1, pp. 111-136.
Deuter, C. M., Zierhut, M., Mohle, A., Vonthein, R., Stobiger, N., & Kotter, I. 2010, "Long-term remission after cessation of interferon-alpha treatment in patients with severe uveitis due to Behcet's disease", Arthritis Rheum., vol. 62, no. 9, pp. 2796-2805.
Devendra, D. & Eisenbarth, G. S. 2004, "Interferon alpha - a potential link in the pathogenesis of viral-induced type 1 diabetes and autoimmunity", Clinical Immunology, vol. 111, no. 3, pp. 225-233.
Dieckmann, D., Bruett, C. H., Ploettner, H., Lutz, M. B., & Schuler, G. 2002, "Human CD4(+)CD25(+) regulatory, contact-dependent T cells induce interleukin 10-producing, contact-independent type 1-like regulatory T cells [corrected]", J.Exp.Med., vol. 196, no. 2, pp. 247-253.
Dieckmann, D., Plottner, H., Berchtold, S., Berger, T., & Schuler, G. 2001, "Ex vivo isolation and characterization of CD4(+)CD25(+) T cells with regulatory properties from human blood", J.Exp.Med., vol. 193, no. 11, pp. 1303-1310.
Dik, W. A., Pike-Overzet, K., Weerkamp, F., de Ridder, D., de Haas, E. F., Baert, M. R., van der, S. P., Koster, E. E., Reinders, M. J., van Dongen, J. J., Langerak, A. W., & Staal, F. J. 2005, "New insights on human T cell development by quantitative T cell receptor gene rearrangement studies and gene expression profiling", J.Exp.Med., vol. 201, no. 11, pp. 1715-1723.
Dilek, K., Ozcimen, A. A., Saricaoglu, H., Saba, D., Yucel, A., Yurtkuran, M., Yurtkuran, M., & Oral, H. B. 2009, "Cytokine gene polymorphisms in Behcet's disease and their association with clinical and laboratory findings", Clin.Exp.Rheumatol., vol. 27, no. 2 Suppl 53, p. S73-S78.
Dillon, S., Agrawal, S., Banerjee, K., Letterio, J., Denning, T. L., Oswald-Richter, K., Kasprowicz, D. J., Kellar, K., Pare, J., van Dyke, T., Ziegler, S., Unutmaz, D., & Pulendran, B. 2006, "Yeast zymosan, a stimulus for TLR2 and dectin-1, induces regulatory antigen-presenting cells and immunological tolerance", J.Clin.Invest, vol. 116, no. 4, pp. 916-928.
Direskeneli, H. 2001, "Behcet's disease: infectious aetiology, new autoantigens, and HLA-B51", Ann.Rheum.Dis., vol. 60, no. 11, pp. 996-1002.
Direskeneli, H. 2006, "Autoimmunity vs autoinflammation in Behcet's disease: do we oversimplify a complex disorder?", Rheumatology.(Oxford), vol. 45, no. 12, pp. 1461-1465.
336
Direskeneli, H., Eksioglu-Demiralp, E., Yavuz, S., Ergun, T., Shinnick, T., Lehner, T., & Akoglu, T. 2000, "T cell responses to 60/65 kDa heat shock protein derived peptides in Turkish patients with Behcet's disease", J.Rheumatol., vol. 27, no. 3, pp. 708-713.
Direskeneli, H., Keser, G., D'Cruz, D., Khamashta, M. A., Akoglu, T., Yazici, H., Yurdakul, S., Hamuryudan, V., Ozgun, S., Goral, A. J., & . 1995, "Anti-endothelial cell antibodies, endothelial proliferation and von Willebrand factor antigen in Behcet's disease", Clin.Rheumatol., vol. 14, no. 1, pp. 55-61.
Donnelly, R. P., Sheikh, F., Kotenko, S. V., & Dickensheets, H. 2004, "The expanded family of class II cytokines that share the IL-10 receptor-2 (IL-10R2) chain", J.Leukoc.Biol., vol. 76, no. 2, pp. 314-321.
Doreau, A., Belot, A., Bastid, J., Riche, B., Trescol-Biemont, M. C., Ranchin, B., Fabien, N., Cochat, P., Pouteil-Noble, C., Trolliet, P., Durieu, I., Tebib, J., Kassai, B., Ansieau, S., Puisieux, A., Eliaou, J. F., & Bonnefoy-Berard, N. 2009, "Interleukin 17 acts in synergy with B cell-activating factor to influence B cell biology and the pathophysiology of systemic lupus erythematosus", Nat Immunol., vol. 10, no. 7, pp. 778-785.
Du, J., Huang, C., Zhou, B., & Ziegler, S. F. 2008, "Isoform-specific inhibition of ROR alpha-mediated transcriptional activation by human FOXP3", J.Immunol., vol. 180, no. 7, pp. 4785-4792.
Duhen, T., Geiger, R., Jarrossay, D., Lanzavecchia, A., & Sallusto, F. 2009, "Production of interleukin 22 but not interleukin 17 by a subset of human skin-homing memory T cells", Nat Immunol., vol. 10, no. 8, pp. 857-863.
Duzgun, N., Ayaslioglu, E., Tutkak, H., & Aydintug, O. T. 2005, "Cytokine inhibitors: soluble tumor necrosis factor receptor 1 and interleukin-1 receptor antagonist in Behcet's disease", Rheumatol.Int., vol. 25, no. 1, pp. 1-5.
Eguchi, K., Kawakami, A., Nakashima, M., Ida, H., Sakito, S., Matsuoka, N., Terada, K., Sakai, M., Kawabe, Y., Fukuda, T., & . 1992, "Interferon-alpha and dexamethasone inhibit adhesion of T cells to endothelial cells and synovial cells", Clin.Exp.Immunol., vol. 88, no. 3, pp. 448-454.
Ehrenstein, M. R., Evans, J. G., Singh, A., Moore, S., Warnes, G., Isenberg, D. A., & Mauri, C. 2004, "Compromised function of regulatory T cells in rheumatoid arthritis and reversal by anti-TNFalpha therapy", J.Exp.Med., vol. 200, no. 3, pp. 277-285.
Ekinci, N. S., Alpsoy, E., Karakas, A. A., Yilmaz, S. B., & Yegin, O. 2010, "IL-17A has an important role in the acute attacks of Behcet's disease", J.Invest Dermatol., vol. 130, no. 8, pp. 2136-2138.
Eksioglu-Demiralp, E., Direskeneli, H., Ergun, T., Fresko, I., & Akoglu, T. 1999a, "Increased CD4+CD16+ and CD4+CD56+ T cell subsets in Behcet's disease", Rheumatol.Int., vol. 19, no. 1-2, pp. 23-26.
Eksioglu-Demiralp, E., Kibaroglu, A., Direskeneli, H., Yavuz, S., Karsli, F., Yurdakul, S., Yazici, H., & Akoglu, T. 1999b, "Phenotypic characteristics of B cells in Behcet's
337
disease: increased activity in B cell subsets", J.Rheumatol., vol. 26, no. 4, pp. 826-832.
Elenkov, I. J. 2004, "Glucocorticoids and the Th1/Th2 balance", Ann.N.Y.Acad.Sci., vol. 1024, pp. 138-146.
Elenkov, I. J., Iezzoni, D. G., Daly, A., Harris, A. G., & Chrousos, G. P. 2005, "Cytokine dysregulation, inflammation and well-being", Neuroimmunomodulation., vol. 12, no. 5, pp. 255-269.
Elias, K. M., Laurence, A., Davidson, T. S., Stephens, G., Kanno, Y., Shevach, E. M., & O'shea, J. J. 2008, "Retinoic acid inhibits Th17 polarization and enhances FoxP3 expression through a Stat-3/Stat-5 independent signaling pathway", Blood, vol. 111, no. 3, pp. 1013-1020.
Ergun, T., Ince, U., Eksioglu-Demiralp, E., Direskeneli, H., Gurbuz, O., Gurses, L., Aker, F., & Akoglu, T. 2001, "HSP 60 expression in mucocutaneous lesions of Behcet's disease", J.Am.Acad.Dermatol., vol. 45, no. 6, pp. 904-909.
Ertenli, I., Kiraz, S., Calguneri, M., Celik, I., Erman, M., Haznedaroglu, I. C., & Kirazli, S. 2001, "Synovial fluid cytokine levels in Behcet's disease", Clin.Exp.Rheumatol., vol. 19, no. 5 Suppl 24, p. S37-S41.
Evans, H. G., Suddason, T., Jackson, I., Taams, L. S., & Lord, G. M. 2007, "Optimal induction of T helper 17 cells in humans requires T cell receptor ligation in the context of Toll-like receptor-activated monocytes", Proc.Natl.Acad.Sci.U.S.A, vol. 104, no. 43, pp. 17034-17039.
Evereklioglu, C. 2005, "Current concepts in the etiology and treatment of Behcet disease", Surv.Ophthalmol., vol. 50, no. 4, pp. 297-350.
Evereklioglu, C., Er, H., Turkoz, Y., & Cekmen, M. 2002, "Serum levels of TNF-alpha, sIL-2R, IL-6, and IL-8 are increased and associated with elevated lipid peroxidation in patients with Behcet's disease", Mediators.Inflamm., vol. 11, no. 2, pp. 87-93.
Fazilleau, N., Bachelez, H., Gougeon, M. L., & Viguier, M. 2007a, "Cutting edge: size and diversity of CD4+CD25high Foxp3+ regulatory T cell repertoire in humans: evidence for similarities and partial overlapping with CD4+", J.Immunol., vol. 179, no. 6, pp. 3412-3416.
Fazilleau, N., Bachelez, H., Gougeon, M. L., & Viguier, M. 2007b, "Cutting edge: size and diversity of CD4+CD25high Foxp3+ regulatory T cell repertoire in humans: evidence for similarities and partial overlapping with CD4+CD25- T cells", J.Immunol., vol. 179, no. 6, pp. 3412-3416.
Fenoglio, D., Ferrera, F., Fravega, M., Balestra, P., Battaglia, F., Proietti, M., Andrei, C., Olive, D., Antonio, L. C., Indiveri, F., & Filaci, G. 2008, "Advancements on phenotypic and functional characterization of non-antigen-specific CD8+CD28- regulatory T cells", Hum.Immunol., vol. 69, no. 11, pp. 745-750.
Fenoglio, D., Poggi, A., Catellani, S., Battaglia, F., Ferrera, A., Setti, M., Murdaca, G., & Zocchi, M. R. 2009, "Vdelta1 T lymphocytes producing IFN-gamma and IL-17 are
338
expanded in HIV-1-infected patients and respond to Candida albicans", Blood, vol. 113, no. 26, pp. 6611-6618.
Ferber, I. A., Brocke, S., Taylor-Edwards, C., Ridgway, W., Dinisco, C., Steinman, L., Dalton, D., & Fathman, C. G. 1996, "Mice with a disrupted IFN-gamma gene are susceptible to the induction of experimental autoimmune encephalomyelitis (EAE)", J.Immunol., vol. 156, no. 1, pp. 5-7.
Ferretti, S., Bonneau, O., Dubois, G. R., Jones, C. E., & Trifilieff, A. 2003, "IL-17, produced by lymphocytes and neutrophils, is necessary for lipopolysaccharide-induced airway neutrophilia: IL-15 as a possible trigger", J.Immunol., vol. 170, no. 4, pp. 2106-2112.
Feuerer, M., Hill, J. A., Mathis, D., & Benoist, C. 2009, "Foxp3+ regulatory T cells: differentiation, specification, subphenotypes", Nat.Immunol., vol. 10, no. 7, pp. 689-695.
Filaci, G., Fravega, M., Negrini, S., Procopio, F., Fenoglio, D., Rizzi, M., Brenci, S., Contini, P., Olive, D., Ghio, M., Setti, M., Accolla, R. S., Puppo, F., & Indiveri, F. 2004, "Nonantigen specific CD8+ T suppressor lymphocytes originate from CD8+CD28- T cells and inhibit both T-cell proliferation and CTL function", Hum.Immunol., vol. 65, no. 2, pp. 142-156.
Fiorentino, D. F., Bond, M. W., & Mosmann, T. R. 1989, "Two types of mouse T helper cell. IV. Th2 clones secrete a factor that inhibits cytokine production by Th1 clones", J.Exp.Med., vol. 170, no. 6, pp. 2081-2095.
Fontenot, J. D., Gavin, M. A., & Rudensky, A. Y. 2003, "Foxp3 programs the development and function of CD4+CD25+ regulatory T cells", Nat.Immunol., vol. 4, no. 4, pp. 330-336.
Fontenot, J. D., Rasmussen, J. P., Williams, L. M., Dooley, J. L., Farr, A. G., & Rudensky, A. Y. 2005, "Regulatory T cell lineage specification by the forkhead transcription factor foxp3", Immunity., vol. 22, no. 3, pp. 329-341.
Foster, G. R. 2004, "Pegylated interferons: chemical and clinical differences", Alimentary Pharmacology & Therapeutics, vol. 20, no. 8, pp. 825-830.
Foster, G. R. 2010, "Pegylated interferons for the treatment of chronic hepatitis C: pharmacological and clinical differences between peginterferon-alpha-2a and peginterferon-alpha-2b", Drugs, vol. 70, no. 2, pp. 147-165.
Frassanito, M. A., Dammacco, R., Cafforio, P., & Dammacco, F. 1999, "Th1 polarization of the immune response in Behcet's disease: a putative pathogenetic role of interleukin-12", Arthritis Rheum., vol. 42, no. 9, pp. 1967-1974.
Fresko, I., Ugurlu, S., Ozbakir, F., Celik, A., Yurdakul, S., Hamuryudan, V., & Yazici, H. 2005, "Anti-Saccharomyces cerevisiae antibodies (ASCA) in Behcet's syndrome", Clin.Exp.Rheumatol., vol. 23, no. 4 Suppl 38, p. S67-S70.
339
Freysdottir, J., Hussain, L., Farmer, I., Lau, S. H., & Fortune, F. 2006, "Diversity of gammadelta T cells in patients with Behcet's disease is indicative of polyclonal activation", Oral Dis., vol. 12, no. 3, pp. 271-277.
Freysdottir, J., Lau, S., & Fortune, F. 1999, "Gammadelta T cells in Behcet's disease (BD) and recurrent aphthous stomatitis (RAS)", Clin.Exp.Immunol., vol. 118, no. 3, pp. 451-457.
Funauchi, M., Ikoma, S., Enomoto, H., & Horiuchi, A. 1998, "Decreased Th1-like and increased Th2-like cells in systemic lupus erythematosus", Scand.J.Rheumatol., vol. 27, no. 3, pp. 219-224.
Gabriel, L., Morley, B. J., & Rogers, N. J. 2009, "The role of iNKT cells in the immunopathology of systemic lupus erythematosus", Ann.N.Y.Acad.Sci., vol. 1173, pp. 435-441.
Gaffen, S. L. 2001, "Signaling domains of the interleukin 2 receptor", Cytokine, vol. 14, no. 2, pp. 63-77.
Garcia-Garcia, I., Gonzalez-Delgado, C. A., Valenzuela-Silva, C. M., Diaz-Machado, A., Cruz-Diaz, M., Nodarse-Cuni, H., Perez-Perez, O., Bermudez-Badell, C. H., Ferrero-Bibilonia, J., Paez-Meireles, R., Bello-Rivero, I., Castro-Odio, F. R., Lopez-Saura, P. A., & Farmapeg, S. G. 2010, "Pharmacokinetic and pharmacodynamic comparison of two "pegylated" interferon alpha-2 formulations in healthy male volunteers: A randomized, crossover, double-blind study", BMC.Pharmacol., vol. 10, no. 1, p. 15.
Garcia-Peydro, M., de Yebenes, V. G., & Toribio, M. L. 2003, "Sustained Notch1 signaling instructs the earliest human intrathymic precursors to adopt a gammadelta T-cell fate in fetal thymus organ culture", Blood, vol. 102, no. 7, pp. 2444-2451.
Gavin, M. A., Rasmussen, J. P., Fontenot, J. D., Vasta, V., Manganiello, V. C., Beavo, J. A., & Rudensky, A. Y. 2007, "Foxp3-dependent programme of regulatory T-cell differentiation", Nature, vol. 445, no. 7129, pp. 771-775.
Gavin, M. A., Torgerson, T. R., Houston, E., DeRoos, P., Ho, W. Y., Stray-Pedersen, A., Ocheltree, E. L., Greenberg, P. D., Ochs, H. D., & Rudensky, A. Y. 2006, "Single-cell analysis of normal and FOXP3-mutant human T cells: FOXP3 expression without regulatory T cell development", Proc.Natl.Acad.Sci.U.S.A, vol. 103, no. 17, pp. 6659-6664.
George, R. K., Chan, C. C., Whitcup, S. M., & Nussenblatt, R. B. 1997, "Ocular immunopathology of Behcet's disease", Surv.Ophthalmol., vol. 42, no. 2, pp. 157-162.
Gerards, A. H., de Lathouder, S., de Groot, E. R., Dijkmans, B. A., & Aarden, L. A. 2003, "Inhibition of cytokine production by methotrexate. Studies in healthy volunteers and patients with rheumatoid arthritis", Rheumatology.(Oxford), vol. 42, no. 10, pp. 1189-1196.
Gerosa, F., Baldani-Guerra, B., Lyakh, L. A., Batoni, G., Esin, S., Winkler-Pickett, R. T., Consolaro, M. R., De, M. M., Giachino, D., Robbiano, A., Astegiano, M.,
340
Sambataro, A., Kastelein, R. A., Carra, G., & Trinchieri, G. 2008, "Differential regulation of interleukin 12 and interleukin 23 production in human dendritic cells", J.Exp.Med., vol. 205, no. 6, pp. 1447-1461.
Gershon, R., Cohen, P., Hencin, R., Liebhaber, S. 1972, "Suppressor T cells", J Immunol, vol. 108, no. 3, pp. 586-90.
Glue, P., Fang, J. W. S., Rouzier-Panis, R., Raffanel, C., Sabo, R., Gupta, S. K., Salfi, M., & Jacobs, S. 2000, "Pegylated interferon-alpha 2b: Pharmacokinetics, pharmacodynamics, safety, and preliminary efficacy data", Clinical Pharmacology & Therapeutics, vol. 68, no. 5, pp. 556-567.
Godfrey, D. I., Hammond, K. J., Poulton, L. D., Smyth, M. J., & Baxter, A. G. 2000, "NKT cells: facts, functions and fallacies", Immunol.Today, vol. 21, no. 11, pp. 573-583.
Godfrey, D. I. & Kronenberg, M. 2004, "Going both ways: immune regulation via CD1d-dependent NKT cells", J.Clin.Invest, vol. 114, no. 10, pp. 1379-1388.
Gonzalez-Alvaro, I., Ortiz, A. M., Dominguez-Jimenez, C., Aragon-Bodi, A., Diaz, S. B., & Sanchez-Madrid, F. 2009, "Inhibition of tumour necrosis factor and IL-17 production by leflunomide involves the JAK/STAT pathway", Ann.Rheum.Dis., vol. 68, no. 10, pp. 1644-1650.
Gorelik, L., Constant, S., & Flavell, R. A. 2002, "Mechanism of transforming growth factor beta-induced inhibition of T helper type 1 differentiation", J.Exp.Med., vol. 195, no. 11, pp. 1499-1505.
Gorelik, L., Fields, P. E., & Flavell, R. A. 2000, "Cutting edge: TGF-beta inhibits Th type 2 development through inhibition of GATA-3 expression", J.Immunol., vol. 165, no. 9, pp. 4773-4777.
Gorelik, L. & Flavell, R. A. 2002, "Transforming growth factor-beta in T-cell biology", Nat.Rev.Immunol., vol. 2, no. 1, pp. 46-53.
Gracie, J. A., Robertson, S. E., & McInnes, I. B. 2003, "Interleukin-18", J.Leukoc.Biol., vol. 73, no. 2, pp. 213-224.
Grohmann, U., Orabona, C., Fallarino, F., Vacca, C., Calcinaro, F., Falorni, A., Candeloro, P., Belladonna, M. L., Bianchi, R., Fioretti, M. C., & Puccetti, P. 2002, "CTLA-4-Ig regulates tryptophan catabolism in vivo", Nat.Immunol., vol. 3, no. 11, pp. 1097-1101.
Grossman, W. J., Verbsky, J. W., Barchet, W., Colonna, M., Atkinson, J. P., & Ley, T. J. 2004, "Human T regulatory cells can use the perforin pathway to cause autologous target cell death", Immunity., vol. 21, no. 4, pp. 589-601.
Groux, H., Bigler, M., de Vries, J. E., & Roncarolo, M. G. 1996, "Interleukin-10 induces a long-term antigen-specific anergic state in human CD4+ T cells", J.Exp.Med., vol. 184, no. 1, pp. 19-29.
341
Groux, H., O'Garra, A., Bigler, M., Rouleau, M., Antonenko, S., de Vries, J. E., & Roncarolo, M. G. 1997, "A CD4+ T-cell subset inhibits antigen-specific T-cell responses and prevents colitis", Nature, vol. 389, no. 6652, pp. 737-742.
Gueudry, J., Wechsler, B., Terrada, C., Gendron, G., Cassoux, N., Fardeau, C., Lehoang, P., Piette, J. C., & Bodaghi, B. 2008, "Long-term efficacy and safety of low-dose interferon alpha2a therapy in severe uveitis associated with Behcet disease", Am.J.Ophthalmol., vol. 146, no. 6, pp. 837-844.
Guillaume-Czitrom, S., Berger, C., Pajot, C., Bodaghi, B., Wechsler, B., & Kone-Paut, I. 2007, "Efficacy and safety of interferon-alpha in the treatment of corticodependent uveitis of paediatric Behcet's disease", Rheumatology.(Oxford), vol. 46, no. 10, pp. 1570-1573.
Gul, A. 2011, "Genome-wide association studies in Behcet's disease: expectations and promises", Clin Exp Rheumatol, vol. 29 (suppl. 67), pp. S3-S5.
Guo, B., Chang, E. Y., & Cheng, G. 2008, "The type I IFN induction pathway constrains Th17-mediated autoimmune inflammation in mice", J.Clin.Invest, vol. 118, no. 5, pp. 1680-1690.
Hammond, K. J. & Godfrey, D. I. 2002, "NKT cells: potential targets for autoimmune disease therapy?", Tissue Antigens, vol. 59, no. 5, pp. 353-363.
Hamuryudan, V., Moral, F., Yurdakul, S., Mat, C., Tuzun, Y., Ozyazgan, Y., Direskeneli, H., Akoglu, T., & Yazici, H. 1994, "Systemic interferon alpha 2b treatment in Behcet's syndrome", J.Rheumatol., vol. 21, no. 6, pp. 1098-1100.
Hamuryudan, V., Ozyazgan, Y., Fresko, Y., Mat, C., Yurdakul, S., & Yazici, H. 2002, "Interferon alfa combined with azathioprine for the uveitis of Behcet's disease: an open study", Isr.Med.Assoc.J., vol. 4, no. 11 Suppl, pp. 928-930.
Hamzaoui, K., Hamzaoui, A., Guemira, F., Bessioud, M., Hamza, M., & Ayed, K. 2002, "Cytokine profile in Behcet's disease patients. Relationship with disease activity", Scand.J.Rheumatol., vol. 31, no. 4, pp. 205-210.
Hamzaoui, K., Hamzaoui, A., & Houman, H. 2006, "CD4+CD25+ regulatory T cells in patients with Behcet's disease", Clin.Exp.Rheumatol., vol. 24, no. 5 Suppl 42, p. S71-S78.
Hamzaoui, K., Houman, H., & Hamzaoui, A. 2007, "Regulatory T cells in cerebrospinal fluid from Behcet's disease with neurological manifestations", J.Neuroimmunol., vol. 187, no. 1-2, pp. 201-204.
Hamzaoui, K., Kamoun, M., Houman, H., Hentati, F., Hamza, M., Ayed, K., & Hamzaoui, A. 2006, "Discrepancies of NKT cells expression in peripheral blood and in cerebrospinal fluid from Behcet's disease", J.Neuroimmunol., vol. 175, no. 1-2, pp. 160-168.
Harrington, L. E., Hatton, R. D., Mangan, P. R., Turner, H., Murphy, T. L., Murphy, K. M., & Weaver, C. T. 2005, "Interleukin 17-producing CD4+ effector T cells develop
342
via a lineage distinct from the T helper type 1 and 2 lineages", Nat.Immunol., vol. 6, no. 11, pp. 1123-1132.
Harris, T. J., Grosso, J. F., Yen, H. R., Xin, H., Kortylewski, M., Albesiano, E., Hipkiss, E. L., Getnet, D., Goldberg, M. V., Maris, C. H., Housseau, F., Yu, H., Pardoll, D. M., & Drake, C. G. 2007, "Cutting edge: An in vivo requirement for STAT3 signaling in TH17 development and TH17-dependent autoimmunity", J.Immunol., vol. 179, no. 7, pp. 4313-4317.
Hartel, C., Hammers, H. J., Schlenke, P., Fricke, L., Schumacher, N., Kirchner, H., & Muller-Steinhardt, M. 2003, "Individual variability in cyclosporin A sensitivity: the assessment of functional measures on CD28-mediated costimulation of human whole blood T lymphocytes", J.Interferon Cytokine Res., vol. 23, no. 2, pp. 91-99.
Hasan, A., Fortune, F., Wilson, A., Warr, K., Shinnick, T., Mizushima, Y., Van der, Z. R., Stanford, M. R., Sanderson, J., & Lehner, T. 1996, "Role of gamma delta T cells in pathogenesis and diagnosis of Behcet's disease", Lancet, vol. 347, no. 9004, pp. 789-794.
Haskard, D. O. 2006, "Behcet's disease", Medicine, vol. 34, no. 11, pp. 493-495.
Hatemi, G., Silman, A., Bang, D., Bodaghi, B., Chamberlain, A. M., Gul, A., Houman, M. H., Kotter, I., Olivieri, I., Salvarani, C., Sfikakis, P. P., Siva, A., Stanford, M. R., Stubiger, N., Yurdakul, S., & Yazici, H. 2008, "EULAR recommendations for the management of Behcet disease", Ann.Rheum.Dis., vol. 67, no. 12, pp. 1656-1662.
Hauschild, A., Kahler, K. C., Schafer, M., & Fluck, M. 2008, "Interdisciplinary management recommendations for toxicity associated with interferon-alfa therapy", J.Dtsch.Dermatol.Ges.
Hayday, A. C. 2000, "[gamma][delta] cells: a right time and a right place for a conserved third way of protection", Annu.Rev.Immunol., vol. 18, pp. 975-1026.
Hayday, A. C. 2009, "Gammadelta T cells and the lymphoid stress-surveillance response", Immunity., vol. 31, no. 2, pp. 184-196.
Heath, V. L., Murphy, E. E., Crain, C., Tomlinson, M. G., & O'Garra, A. 2000, "TGF-beta1 down-regulates Th2 development and results in decreased IL-4-induced STAT6 activation and GATA-3 expression", Eur.J.Immunol., vol. 30, no. 9, pp. 2639-2649.
Hegab, S. & Al Mutawa, S. 2000, "Immunopathogenesis of Behcet's disease", Clin.Immunol., vol. 96, no. 3, pp. 174-186.
Henriques, A., Ines, L., Couto, M., Pedreiro, S., Santos, C., Magalhaes, M., Santos, P., Velada, I., Almeida, A., Carvalheiro, T., Laranjeira, P., Morgado, J. M., Pais, M. L., da Silva, J. A., & Paiva, A. 2010, "Frequency and functional activity of Th17, Tc17 and other T-cell subsets in Systemic Lupus Erythematosus", Cell Immunol., vol. 264, no. 1, pp. 97-103.
Hirohata, S. 2008, "Histopathology of central nervous system lesions in Behcet's disease", J.Neurol.Sci., vol. 267, no. 1-2, pp. 41-47.
343
Hirohata, S. & Hashimoto, T. 1998, "Abnormal T cell responses to bacterial superantigens in Behcet's disease (BD)", Clin.Exp.Immunol., vol. 112, no. 2, pp. 317-324.
Hirohata, S., Oka, H., & Mizushima, Y. 1992, "Streptococcal-related antigens stimulate production of IL6 and interferon-gamma by T cells from patients with Behcet's disease", Cell Immunol., vol. 140, no. 2, pp. 410-419.
Hirota, K., Martin, B., & Veldhoen, M. 2010, "Development, regulation and functional capacities of Th17 cells", Semin.Immunopathol., vol. 32, no. 1, pp. 3-16.
Hoeve, M. A., Savage, N. D., de Boer, T., Langenberg, D. M., de Waal, M. R., Ottenhoff, T. H., & Verreck, F. A. 2006, "Divergent effects of IL-12 and IL-23 on the production of IL-17 by human T cells", Eur.J.Immunol., vol. 36, no. 3, pp. 661-670.
Hoffmann, P., Boeld, T. J., Eder, R., Huehn, J., Floess, S., Wieczorek, G., Olek, S., Dietmaier, W., Andreesen, R., & Edinger, M. 2009, "Loss of FOXP3 expression in natural human CD4+CD25+ regulatory T cells upon repetitive in vitro stimulation", Eur.J.Immunol., vol. 39, no. 4, pp. 1088-1097.
Hogquist, K. A., Baldwin, T. A., & Jameson, S. C. 2005, "Central tolerance: learning self-control in the thymus", Nat.Rev.Immunol., vol. 5, no. 10, pp. 772-782.
Hong, J., Li, N., Zhang, X., Zheng, B., & Zhang, J. Z. 2005, "Induction of CD4+CD25+ regulatory T cells by copolymer-I through activation of transcription factor Foxp3", Proc.Natl.Acad.Sci.U.S.A, vol. 102, no. 18, pp. 6449-6454.
Hori, S., Nomura, T., & Sakaguchi, S. 2003, "Control of regulatory T cell development by the transcription factor Foxp3", Science, vol. 299, no. 5609, pp. 1057-1061.
Horwitz, D. A., Zheng, S. G., & Gray, J. D. 2008, "Natural and TGF-beta-induced Foxp3(+)CD4(+) CD25(+) regulatory T cells are not mirror images of each other", Trends Immunol., vol. 29, no. 9, pp. 429-435.
Horwitz, D. A., Zheng, S. G., Wang, J., & Gray, J. D. 2008, "Critical role of IL-2 and TGF-beta in generation, function and stabilization of Foxp3+CD4+ Treg", Eur.J.Immunol., vol. 38, no. 4, pp. 912-915.
Houman, H., Hamzaoui, A., Ben, G., I, Khanfir, M. S., Feki, M., & Hamzaoui, K. 2004, "Tc1/Tc2 ratio in the inflammatory process in patients with Behcet's disease", Mediators.Inflamm., vol. 13, no. 4, pp. 247-253.
Houman, M. H. & Hamzaoui, K. 2006, "Promising new therapies for Behcet's disease", Eur.J.Intern.Med., vol. 17, no. 3, pp. 163-169.
Hu, H., Djuretic, I., Sundrud, M. S., & Rao, A. 2007, "Transcriptional partners in regulatory T cells: Foxp3, Runx and NFAT", Trends Immunol., vol. 28, no. 8, pp. 329-332.
344
Hu, X. & Ivashkiv, L. B. 2009, "Cross-regulation of signaling pathways by interferon-gamma: implications for immune responses and autoimmune diseases", Immunity., vol. 31, no. 4, pp. 539-550.
Huan, J., Culbertson, N., Spencer, L., Bartholomew, R., Burrows, G. G., Chou, Y. K., Bourdette, D., Ziegler, S. F., Offner, H., & Vandenbark, A. A. 2005, "Decreased FOXP3 levels in multiple sclerosis patients", J.Neurosci.Res., vol. 81, no. 1, pp. 45-52.
Hue, S., Ahern, P., Buonocore, S., Kullberg, M. C., Cua, D. J., McKenzie, B. S., Powrie, F., & Maloy, K. J. 2006, "Interleukin-23 drives innate and T cell-mediated intestinal inflammation", J.Exp.Med., vol. 203, no. 11, pp. 2473-2483.
Hwang, E. S., White, I. A., & Ho, I. C. 2002, "An IL-4-independent and CD25-mediated function of c-maf in promoting the production of Th2 cytokines", Proc.Natl.Acad.Sci.U.S.A, vol. 99, no. 20, pp. 13026-13030.
Hymowitz, S. G., Filvaroff, E. H., Yin, J. P., Lee, J., Cai, L., Risser, P., Maruoka, M., Mao, W., Foster, J., Kelley, R. F., Pan, G., Gurney, A. L., de Vos, A. M., & Starovasnik, M. A. 2001, "IL-17s adopt a cystine knot fold: structure and activity of a novel cytokine, IL-17F, and implications for receptor binding", EMBO J., vol. 20, no. 19, pp. 5332-5341.
Imamura, Y., Kurokawa, M. S., Yoshikawa, H., Nara, K., Takada, E., Masuda, C., Tsukikawa, S., Ozaki, S., Matsuda, T., & Suzuki, N. 2005, "Involvement of Th1 cells and heat shock protein 60 in the pathogenesis of intestinal Behcet's disease", Clin.Exp.Immunol., vol. 139, no. 2, pp. 371-378.
Imrie, F. R. & Dick, A. D. 2007, "Biologics in the treatment of uveitis", Curr.Opin.Ophthalmol., vol. 18, no. 6, pp. 481-486.
International Study Group for Behcet's Disease 1990, "Criteria for diagnosis of Behcet's disease.", Lancet, vol. 335, no. 8697, pp. 1078-1080.
Isaacs, A. & Lindenmann, J. 1957, "Virus interference. I. The interferon", Proc.R.Soc.Lond B Biol.Sci., vol. 147, no. 927, pp. 258-267.
Ito, T., Amakawa, R., Inaba, M., Ikehara, S., Inaba, K., & Fukuhara, S. 2001, "Differential regulation of human blood dendritic cell subsets by IFNs", J.Immunol., vol. 166, no. 5, pp. 2961-2969.
Ivanov, I. I., McKenzie, B. S., Zhou, L., Tadokoro, C. E., Lepelley, A., Lafaille, J. J., Cua, D. J., & Littman, D. R. 2006, "The orphan nuclear receptor RORgammat directs the differentiation program of proinflammatory IL-17+ T helper cells", Cell, vol. 126, no. 6, pp. 1121-1133.
Izeradjene, K., Quemeneur, L., Michallet, M. C., Bonnefoy-Berard, N., & Revillard, J. P. 2001, "Mycophenolate mofetil interferes with interferon gamma production in T-cell activation models", Transplant.Proc., vol. 33, no. 3, pp. 2110-2111.

345
Jager, A. & Kuchroo, V. K. 2010, "Effector and regulatory T-cell subsets in autoimmunity and tissue inflammation", Scand.J.Immunol., vol. 72, no. 3, pp. 173-184.
Janeway, C., Travers, P., Walport, M., & Shlomchik, M. 2005, Immunobiology: the immune system in health and disease, 6th edn, Garland Science Publishing, New York.
Jang, W. C., Nam, Y. H., Ahn, Y. C., Lee, S. H., Park, S. H., Choe, J. Y., Lee, S. S., & Kim, S. K. 2008, "Interleukin-17F gene polymorphisms in Korean patients with Behcet's disease", Rheumatol.Int.
Jankovic, D., Kullberg, M. C., Feng, C. G., Goldszmid, R. S., Collazo, C. M., Wilson, M., Wynn, T. A., Kamanaka, M., Flavell, R. A., & Sher, A. 2007, "Conventional T-bet(+)Foxp3(-) Th1 cells are the major source of host-protective regulatory IL-10 during intracellular protozoan infection", J.Exp.Med., vol. 204, no. 2, pp. 273-283.
Jankovic, D. & Trinchieri, G. 2007, "IL-10 or not IL-10: that is the question", Nat Immunol., vol. 8, no. 12, pp. 1281-1283.
Jen, J. F., Glue, P., Ezzet, F., Chung, C., Gupta, S. K., Jacobs, S., & Hajian, G. 2001, "Population pharmacokinetic analysis of pegylated interferon alfa-2b and interferon alfa-2b in patients with chronic hepatitis C", Clin.Pharmacol.Ther., vol. 69, no. 6, pp. 407-421.
Joachims, M. L., Chain, J. L., Hooker, S. W., Knott-Craig, C. J., & Thompson, L. F. 2006, "Human alpha beta and gamma delta thymocyte development: TCR gene rearrangements, intracellular TCR beta expression, and gamma delta developmental potential--differences between men and mice", J.Immunol., vol. 176, no. 3, pp. 1543-1552.
Jonuleit, H., Schmitt, E., Kakirman, H., Stassen, M., Knop, J., & Enk, A. H. 2002, "Infectious tolerance: human CD25(+) regulatory T cells convey suppressor activity to conventional CD4(+) T helper cells", J.Exp.Med., vol. 196, no. 2, pp. 255-260.
Joosten, S., van Meijgaarden, K., Savage, N., et al. 2007, "Identification of a human CD8+ regulatory T cell subset that mediates suppression through the chemokine CC chemokine ligand 4", Proc Natl Acad Sci; vol. 104, no.19, pp.8029-34.
Jordan, M. S., Boesteanu, A., Reed, A. J., Petrone, A. L., Holenbeck, A. E., Lerman, M. A., Naji, A., & Caton, A. J. 2001, "Thymic selection of CD4+CD25+ regulatory T cells induced by an agonist self-peptide", Nat.Immunol., vol. 2, no. 4, pp. 301-306.
Junqueira, L. C., Carneiro, J., & Kelley, R. O. 1992, Basic Histology, 7th edn, Appleton & Lange, East Norwalk.
Kaech, S. M. & Wherry, E. J. 2007, "Heterogeneity and cell-fate decisions in effector and memory CD8+ T cell differentiation during viral infection", Immunity., vol. 27, no. 3, pp. 393-405.

346
Kahan, A., Hamzaoui, K., & Ayed, K. 1992, "Abnormalities of T lymphocyte subsets in Behcet's disease demonstrated with anti-CD45RA and anti-CD29 monoclonal antibodies", J.Rheumatol., vol. 19, no. 5, pp. 742-746.
Kalayciyan, A. & Zouboulis, C. 2007, "An update on Behcet's disease", J.Eur.Acad.Dermatol.Venereol., vol. 21, no. 1, pp. 1-10.
Kaneko, F., Takahashi, Y., Muramatsu, R., Adachi, K., Miura, Y., Nakane, A., & Minagawa, T. 1985, "Natural killer cell numbers and function in peripheral lymphoid cells in Behcet's disease", Br.J.Dermatol., vol. 113, no. 3, pp. 313-318.
Kaneko, S., Suzuki, N., Yamashita, N., Nagafuchi, H., Nakajima, T., Wakisaka, S., Yamamoto, S., & Sakane, T. 1997, "Characterization of T cells specific for an epitope of human 60-kD heat shock protein (hsp) in patients with Behcet's disease (BD) in Japan", Clin.Exp.Immunol., vol. 108, no. 2, pp. 204-212.
Karagiannidis, C., Akdis, M., Holopainen, P., Woolley, N. J., Hense, G., Ruckert, B., Mantel, P. Y., Menz, G., Akdis, C. A., Blaser, K., & Schmidt-Weber, C. B. 2004, "Glucocorticoids upregulate FOXP3 expression and regulatory T cells in asthma", J.Allergy Clin.Immunol., vol. 114, no. 6, pp. 1425-1433.
Kaser, A., Molnar, C., & Tilg, H. 1998, "Differential regulation of interleukin 4 and interleukin 13 production by interferon alpha", Cytokine, vol. 10, no. 2, pp. 75-81.
Kattah, M. G., Wong, M. T., Yocum, M. D., & Utz, P. J. 2008, "Cytokines secreted in response to Toll-like receptor ligand stimulation modulate differentiation of human Th17 cells", Arthritis Rheum., vol. 58, no. 6, pp. 1619-1629.
Kaufmann, S. H. 1996, "gamma/delta and other unconventional T lymphocytes: what do they see and what do they do?", Proc.Natl.Acad.Sci.U.S.A, vol. 93, no. 6, pp. 2272-2279.
Kawano, T., Nakayama, T., Kamada, N., Kaneko, Y., Harada, M., Ogura, N., Akutsu, Y., Motohashi, S., Iizasa, T., Endo, H., Fujisawa, T., Shinkai, H., & Taniguchi, M. 1999, "Antitumor cytotoxicity mediated by ligand-activated human V alpha24 NKT cells", Cancer Res., vol. 59, no. 20, pp. 5102-5105.
Kelchtermans, H., Billiau, A., & Matthys, P. 2008, "How interferon-gamma keeps autoimmune diseases in check", Trends Immunol., vol. 29, no. 10, pp. 479-486.
Kim, B. & LeBoit, P. E. 2000, "Histopathologic features of erythema nodosum--like lesions in Behcet disease: a comparison with erythema nodosum focusing on the role of vasculitis", Am.J.Dermatopathol., vol. 22, no. 5, pp. 379-390.
King, C. 2009, "New insights into the differentiation and function of T follicular helper cells", Nat Rev.Immunol., vol. 9, no. 11, pp. 757-766.
Kitani, A., Chua, K., Nakamura, K., & Strober, W. 2000, "Activated self-MHC-reactive T cells have the cytokine phenotype of Th3/T regulatory cell 1 T cells", J.Immunol., vol. 165, no. 2, pp. 691-702.

347
Kitani, A., Fuss, I., Nakamura, K., Kumaki, F., Usui, T., & Strober, W. 2003, "Transforming growth factor (TGF)-beta1-producing regulatory T cells induce Smad-mediated interleukin 10 secretion that facilitates coordinated immunoregulatory activity and amelioration of TGF-beta1-mediated fibrosis", J.Exp.Med., vol. 198, no. 8, pp. 1179-1188.
Klunker, S., Chong, M. M., Mantel, P. Y., Palomares, O., Bassin, C., Ziegler, M., Ruckert, B., Meiler, F., Akdis, M., Littman, D. R., & Akdis, C. A. 2009, "Transcription factors RUNX1 and RUNX3 in the induction and suppressive function of Foxp3+ inducible regulatory T cells", J.Exp.Med., vol. 206, no. 12, pp. 2701-2715.
Koarada, S., Haruta, Y., Tada, Y., Ushiyama, O., Morito, F., Ohta, A., & Nagasawa, K. 2004, "Increased entry of CD4+ T cells into the Th1 cytokine effector pathway during T-cell division following stimulation in Behcet's disease", Rheumatology.(Oxford), vol. 43, no. 7, pp. 843-851.
Koenders, M. I. & van den Berg, W. B. 2010, "Translational mini-review series on Th17 cells: are T helper 17 cells really pathogenic in autoimmunity?", Clin.Exp.Immunol., vol. 159, no. 2, pp. 131-136.
Koenen, H. J., Smeets, R. L., Vink, P. M., van Rijssen, E., Boots, A. M., & Joosten, I. 2008, "Human CD25highFoxp3pos regulatory T cells differentiate into IL-17-producing cells", Blood, vol. 112, no. 6, pp. 2340-2352.
Kolls, J. K. & Linden, A. 2004, "Interleukin-17 family members and inflammation", Immunity., vol. 21, no. 4, pp. 467-476.
Kondo, T., Takata, H., Matsuki, F., & Takiguchi, M. 2009, "Cutting edge: Phenotypic characterization and differentiation of human CD8+ T cells producing IL-17", J.Immunol., vol. 182, no. 4, pp. 1794-1798.
Konigshofer, Y. & Chien, Y. H. 2006, "Gammadelta T cells - innate immune lymphocytes?", Curr.Opin.Immunol., vol. 18, no. 5, pp. 527-533.
Kontsek, P. 1994, "Human type I interferons: structure and function", Acta Virol., vol. 38, no. 6, pp. 345-360.
Korn, T., Bettelli, E., Gao, W., Awasthi, A., Jager, A., Strom, T. B., Oukka, M., & Kuchroo, V. K. 2007, "IL-21 initiates an alternative pathway to induce proinflammatory T(H)17 cells", Nature, vol. 448, no. 7152, pp. 484-487.
Kosar, A., Haznedaroglu, S., Karaaslan, Y., Buyukasik, Y., Haznedaroglu, I. C., Ozath, D., Sayinalp, N., Ozcebe, O., Kirazli, S., & Dundar, S. 1999, "Effects of interferon-alpha2a treatment on serum levels of tumor necrosis factor-alpha, tumor necrosis factor-alpha2 receptor, interleukin-2, interleukin-2 receptor, and E-selectin in Behcet's disease", Rheumatol.Int., vol. 19, no. 1-2, pp. 11-14.
Kotter, I., Gunaydin, I., Zierhut, M., & Stubiger, N. 2004a, "The use of interferon alpha in Behcet disease: review of the literature", Semin.Arthritis Rheum., vol. 33, no. 5, pp. 320-335.
348
Kotter, I., Koch, S., Vonthein, R., Ruckwaldt, U., Amberger, M., Gunaydin, I., Zierhut, M., & Stubiger, N. 2005, "Cytokines, cytokine antagonists and soluble adhesion molecules in patients with ocular Behcet's disease treated with human recombinant interferon-alpha2a. Results of an open study and review of the literature", Clin.Exp.Rheumatol., vol. 23, no. 4 Suppl 38, p. S20-S26.
Kotter, I., Vonthein, R., Zierhut, M., Eckstein, A. K., Ness, T., Gunaydin, I., Grimbacher, B., Blaschke, S., Peter, H. H., & Stubiger, N. 2004b, "Differential efficacy of human recombinant interferon-alpha2a on ocular and extraocular manifestations of Behcet disease: results of an open 4-center trial", Semin.Arthritis Rheum., vol. 33, no. 5, pp. 311-319.
Kovanen, P. E. & Leonard, W. J. 2004, "Cytokines and immunodeficiency diseases: critical roles of the gamma(c)-dependent cytokines interleukins 2, 4, 7, 9, 15, and 21, and their signaling pathways", Immunol.Rev., vol. 202, pp. 67-83.
Krause, L., Altenburg, A., Pleyer, U., Kohler, A. K., Zouboulis, C. C., & Foerster, M. H. 2008, "Longterm visual prognosis of patients with ocular Adamantiades-Behcet's disease treated with interferon-alpha-2a", J.Rheumatol., vol. 35, no. 5, pp. 896-903.
Kreslavsky, T., Gleimer, M., & von Boehmer, H. 2010, "Alphabeta versus gammadelta lineage choice at the first TCR-controlled checkpoint", Curr.Opin.Immunol., vol. 22, no. 2, pp. 185-192.
Krishnaswamy, G., Smith, J. K., Srikanth, S., Chi, D. S., Kalbfleisch, J. H., & Huang, S. K. 1996, "Lymphoblastoid interferon-alpha inhibits T cell proliferation and expression of eosinophil-activating cytokines", J.Interferon Cytokine Res., vol. 16, no. 10, pp. 819-827.
Kryczek, I., Wei, S., Vatan, L., Escara-Wilke, J., Szeliga, W., Keller, E. T., & Zou, W. 2007, "Cutting edge: opposite effects of IL-1 and IL-2 on the regulation of IL-17+ T cell pool IL-1 subverts IL-2-mediated suppression", J.Immunol., vol. 179, no. 3, pp. 1423-1426.
Kuhl, A. A., Pawlowski, N. N., Grollich, K., Blessenohl, M., Westermann, J., Zeitz, M., Loddenkemper, C., & Hoffmann, J. C. 2009, "Human peripheral gammadelta T cells possess regulatory potential", Immunology.
Kunz, M. & Ibrahim, S. M. 2009, "Cytokines and cytokine profiles in human autoimmune diseases and animal models of autoimmunity", Mediators.Inflamm., vol. 2009, p. 979258.
Kunzmann, V., Kimmel, B., Herrmann, T., Einsele, H., & Wilhelm, M. 2009, "Inhibition of phosphoantigen-mediated gammadelta T-cell proliferation by CD4+ CD25+ FoxP3+ regulatory T cells", Immunology, vol. 126, no. 2, pp. 256-267.
Kurokawa, M. S. & Suzuki, N. 2004, "Behcet's disease", Clinical and Experimental Medicine, vol. 4, no. 1, pp. 10-20.
La Cava, A., Van Kaer, L., & Fu, D. S. 2006, "CD4+CD25+ Tregs and NKT cells: regulators regulating regulators", Trends Immunol., vol. 27, no. 7, pp. 322-327.
349
Lamoreaux, L., Roederer, M., & Koup, R. 2006, "Intracellular cytokine optimization and standard operating procedure", Nat.Protoc., vol. 1, no. 3, pp. 1507-1516.
Langrish, C. L., Chen, Y., Blumenschein, W. M., Mattson, J., Basham, B., Sedgwick, J. D., McClanahan, T., Kastelein, R. A., & Cua, D. J. 2005, "IL-23 drives a pathogenic T cell population that induces autoimmune inflammation", J.Exp.Med., vol. 201, no. 2, pp. 233-240.
Larrea, E., Garcia, N., Qian, C., Civeira, M. P., & Prieto, J. 1996, "Tumor necrosis factor alpha gene expression and the response to interferon in chronic hepatitis C", Hepatology, vol. 23, no. 2, pp. 210-217.
Laurence, A., Tato, C. M., Davidson, T. S., Kanno, Y., Chen, Z., Yao, Z., Blank, R. B., Meylan, F., Siegel, R., Hennighausen, L., Shevach, E. M., & O'shea, J. J. 2007, "Interleukin-2 signaling via STAT5 constrains T helper 17 cell generation", Immunity., vol. 26, no. 3, pp. 371-381.
Lawson, C. A., Brown, A. K., Bejarano, V., Douglas, S. H., Burgoyne, C. H., Greenstein, A. S., Boylston, A. W., Emery, P., Ponchel, F., & Isaacs, J. D. 2006, "Early rheumatoid arthritis is associated with a deficit in the CD4+CD25high regulatory T cell population in peripheral blood", Rheumatology.(Oxford), vol. 45, no. 10, pp. 1210-1217.
Lee, K. H., Chung, H. S., Kim, H. S., Oh, S. H., Ha, M. K., Baik, J. H., Lee, S., & Bang, D. 2003, "Human alpha-enolase from endothelial cells as a target antigen of anti-endothelial cell antibody in Behcet's disease", Arthritis Rheum., vol. 48, no. 7, pp. 2025-2035.
Letourneau, S., Krieg, C., Pantaleo, G., & Boyman, O. 2009, "IL-2- and CD25-dependent immunoregulatory mechanisms in the homeostasis of T-cell subsets", J.Allergy Clin.Immunol., vol. 123, no. 4, pp. 758-762.
Levings, M. K., Bacchetta, R., Schulz, U., & Roncarolo, M. G. 2002, "The role of IL-10 and TGF-beta in the differentiation and effector function of T regulatory cells", Int.Arch.Allergy Immunol., vol. 129, no. 4, pp. 263-276.
Levings, M. K., Sangregorio, R., Galbiati, F., Squadrone, S., de Waal, M. R., & Roncarolo, M. G. 2001, "IFN-alpha and IL-10 induce the differentiation of human type 1 T regulatory cells", J.Immunol., vol. 166, no. 9, pp. 5530-5539.
Levinsky, R. J., Paganelli, R., & Lehner, T. 1979, "Immune complexes and their characterization in Behcet's syndrome and recurrent oral ulcers," in Behcet's syndrome, T. Lehner & C. G. Barnes, eds., Academic Press, London, pp. 33-43.
Lexberg, M. H., Taubner, A., Forster, A., Albrecht, I., Richter, A., Kamradt, T., Radbruch, A., & Chang, H. D. 2008, "Th memory for interleukin-17 expression is stable in vivo", Eur.J.Immunol., vol. 38, no. 10, pp. 2654-2664.
Li, B., Samanta, A., Song, X., Iacono, K. T., Bembas, K., Tao, R., Basu, S., Riley, J. L., Hancock, W. W., Shen, Y., Saouaf, S. J., & Greene, M. I. 2007, "FOXP3 interactions with histone acetyltransferase and class II histone deacetylases are required for repression", Proc.Natl.Acad.Sci.U.S.A, vol. 104, no. 11, pp. 4571-4576.
350
Li, B., Yang, P., Zhou, H., Zhang, Z., Xie, C., Lin, X., Huang, X., & Kijlstra, A. 2003, "T-bet expression is upregulated in active Behcet's disease", Br.J.Ophthalmol., vol. 87, no. 10, pp. 1264-1267.
Li, M. O. & Flavell, R. A. 2008, "TGF-beta: a master of all T cell trades", Cell, vol. 134, no. 3, pp. 392-404.
Li, M. O., Sanjabi, S., & Flavell, R. A. 2006, "Transforming growth factor-beta controls development, homeostasis, and tolerance of T cells by regulatory T cell-dependent and -independent mechanisms", Immunity., vol. 25, no. 3, pp. 455-471.
Li, M. O., Wan, Y. Y., Sanjabi, S., Robertson, A. K., & Flavell, R. A. 2006, "Transforming growth factor-beta regulation of immune responses", Annu.Rev.Immunol., vol. 24, pp. 99-146.
Liang, B., Workman, C., Lee, J., Chew, C., Dale, B. M., Colonna, L., Flores, M., Li, N., Schweighoffer, E., Greenberg, S., Tybulewicz, V., Vignali, D., & Clynes, R. 2008, "Regulatory T cells inhibit dendritic cells by lymphocyte activation gene-3 engagement of MHC class II", J.Immunol., vol. 180, no. 9, pp. 5916-5926.
Liang, S. C., Long, A. J., Bennett, F., Whitters, M. J., Karim, R., Collins, M., Goldman, S. J., Dunussi-Joannopoulos, K., Williams, C. M., Wright, J. F., & Fouser, L. A. 2007, "An IL-17F/A heterodimer protein is produced by mouse Th17 cells and induces airway neutrophil recruitment", J.Immunol., vol. 179, no. 11, pp. 7791-7799.
Liblau, R. S., Wong, F. S., Mars, L. T., & Santamaria, P. 2002, "Autoreactive CD8 T cells in organ-specific autoimmunity: emerging targets for therapeutic intervention", Immunity., vol. 17, no. 1, pp. 1-6.
Lighvani, A. A., Frucht, D. M., Jankovic, D., Yamane, H., Aliberti, J., Hissong, B. D., Nguyen, B. V., Gadina, M., Sher, A., Paul, W. E., & O'shea, J. J. 2001, "T-bet is rapidly induced by interferon-gamma in lymphoid and myeloid cells", Proc.Natl.Acad.Sci.U.S.A, vol. 98, no. 26, pp. 15137-15142.
Lim, H. W., Hillsamer, P., Banham, A. H., & Kim, C. H. 2005, "Cutting edge: direct suppression of B cells by CD4+ CD25+ regulatory T cells", J.Immunol., vol. 175, no. 7, pp. 4180-4183.
Littman, D. R. & Rudensky, A. Y. 2010, "Th17 and regulatory T cells in mediating and restraining inflammation", Cell, vol. 140, no. 6, pp. 845-858.
Liu, W., Putnam, A. L., Xu-Yu, Z., Szot, G. L., Lee, M. R., Zhu, S., Gottlieb, P. A., Kapranov, P., Gingeras, T. R., Fazekas de St, G. B., Clayberger, C., Soper, D. M., Ziegler, S. F., & Bluestone, J. A. 2006, "CD127 expression inversely correlates with FoxP3 and suppressive function of human CD4+ T reg cells", J.Exp.Med., vol. 203, no. 7, pp. 1701-1711.
Liu, X., Yang, P., Wang, C., Li, F., & Kijlstra, A. IFN-alpha blocks IL-17 production by peripheral blood mononuclear cells in Behcet's disease. Rheumatology.(Oxford) . 2011. Ref Type: Journal (Full)
351
Liu, Y., Wei, S. H., Ho, A. S., de Waal, M. R., & Moore, K. W. 1994, "Expression cloning and characterization of a human IL-10 receptor", J.Immunol., vol. 152, no. 4, pp. 1821-1829.
Lockhart, E., Green, A. M., & Flynn, J. L. 2006, "IL-17 production is dominated by gammadelta T cells rather than CD4 T cells during Mycobacterium tuberculosis infection", J.Immunol., vol. 177, no. 7, pp. 4662-4669.
Lohr, J., Knoechel, B., Wang, J. J., Villarino, A. V., & Abbas, A. K. 2006, "Role of IL-17 and regulatory T lymphocytes in a systemic autoimmune disease", J.Exp.Med., vol. 203, no. 13, pp. 2785-2791.
Lu, N., Wang, Y. H., Wang, Y. H., Arima, K., Hanabuchi, S., & Liu, Y. J. 2009, "TSLP and IL-7 use two different mechanisms to regulate human CD4+ T cell homeostasis", J.Exp.Med., vol. 206, no. 10, pp. 2111-2119.
Lu, Y., Ye, P., Chen, S. L., Tan, E. M., & Chan, E. K. 2005, "Identification of kinectin as a novel Behcet's disease autoantigen", Arthritis Res.Ther., vol. 7, no. 5, p. R1133-R1139.
Luger, D., Silver, P. B., Tang, J., Cua, D., Chen, Z., Iwakura, Y., Bowman, E. P., Sgambellone, N. M., Chan, C. C., & Caspi, R. R. 2008, "Either a Th17 or a Th1 effector response can drive autoimmunity: conditions of disease induction affect dominant effector category", J.Exp.Med., vol. 205, no. 4, pp. 799-810.
Lutfalla, G., Gardiner, K., Proudhon, D., Vielh, E., & Uze, G. 1992, "The structure of the human interferon alpha/beta receptor gene", J.Biol.Chem., vol. 267, no. 4, pp. 2802-2809.
Lyssuk, E. Y., Torgashina, A. V., Soloviev, S. K., Nassonov, E. L., & Bykovskaia, S. N. 2007, "Reduced number and function of CD4+CD25highFoxP3+ regulatory T cells in patients with systemic lupus erythematosus", Adv.Exp.Med.Biol., vol. 601, pp. 113-119.
Ma, X. 2001, "TNF-alpha and IL-12: a balancing act in macrophage functioning", Microbes.Infect., vol. 3, no. 2, pp. 121-129.
Ma, X., Sun, J., Papasavvas, E., Riemann, H., Robertson, S., Marshall, J., Bailer, R. T., Moore, A., Donnelly, R. P., Trinchieri, G., & Montaner, L. J. 2000, "Inhibition of IL-12 production in human monocyte-derived macrophages by TNF", J.Immunol., vol. 164, no. 4, pp. 1722-1729.
Macian, F. 2005, "NFAT proteins: key regulators of T-cell development and function", Nat.Rev.Immunol., vol. 5, no. 6, pp. 472-484.
Mackensen, F., Max, R., & Becker, M. D. 2006, "Interferon therapy for ocular disease", Curr.Opin.Ophthalmol., vol. 17, no. 6, pp. 567-573.
Mahan, C. S., Thomas, J. J., Boom, W. H., & Rojas, R. E. 2009, "CD4+ CD25(high) Foxp3+ regulatory T cells downregulate human Vdelta2+ T-lymphocyte function triggered by anti-CD3 or phosphoantigen", Immunology, vol. 127, no. 3, pp. 398-407.
352
Mahesh, S. P., Li, Z., Buggage, R., Mor, F., Cohen, I. R., Chew, E. Y., & Nussenblatt, R. B. 2005, "Alpha tropomyosin as a self-antigen in patients with Behcet's disease", Clin.Exp.Immunol., vol. 140, no. 2, pp. 368-375.
Mahic, M., Henjum, K., Yaqub, S., Bjornbeth, B. A., Torgersen, K. M., Tasken, K., & Aandahl, E. M. 2008, "Generation of highly suppressive adaptive CD8(+)CD25(+)FOXP3(+) regulatory T cells by continuous antigen stimulation", Eur.J.Immunol., vol. 38, no. 3, pp. 640-646.
Manavalan, J., Kim-Schulze, S., Scotto, L., Naiyer, A., et al. 2004, "Alloantigen specific CD8+CD28-FOXP3+ T suppressor cells induce ILT3+ILT4+ tolerogenic endothelial cells, inhibiting alloreactivity", Int Immunol, vol.16, pp. 1055–68.
Manel, N., Unutmaz, D., & Littman, D. R. 2008, "The differentiation of human T(H)-17 cells requires transforming growth factor-beta and induction of the nuclear receptor RORgammat", Nat.Immunol., vol. 9, no. 6, pp. 641-649.
Marshall, S. E. 2004, "Behcet's disease", Best.Pract.Res.Clin.Rheumatol., vol. 18, no. 3, pp. 291-311.
Martin, B., Hirota, K., Cua, D. J., Stockinger, B., & Veldhoen, M. 2009, "Interleukin-17-producing gammadelta T cells selectively expand in response to pathogen products and environmental signals", Immunity., vol. 31, no. 2, pp. 321-330.
Mascher, B., Schlenke, P., & Seyfarth, M. 1999, "Expression and kinetics of cytokines determined by intracellular staining using flow cytometry", J.Immunol.Methods, vol. 223, no. 1, pp. 115-121.
Mat, M. C., Goksugur, N., Engin, B., Yurdakul, S., & Yazici, H. 2006, "The frequency of scarring after genital ulcers in Behcet's syndrome: a prospective study", Int.J.Dermatol., vol. 45, no. 5, pp. 554-556.
Mathur, A. N., Chang, H. C., Zisoulis, D. G., Stritesky, G. L., Yu, Q., O'Malley, J. T., Kapur, R., Levy, D. E., Kansas, G. S., & Kaplan, M. H. 2007, "Stat3 and Stat4 direct development of IL-17-secreting Th cells", J.Immunol., vol. 178, no. 8, pp. 4901-4907.
Matthys, P., Vermeire, K., Mitera, T., Heremans, H., Huang, S., & Billiau, A. 1998, "Anti-IL-12 antibody prevents the development and progression of collagen-induced arthritis in IFN-gamma receptor-deficient mice", Eur.J Immunol., vol. 28, no. 7, pp. 2143-2151.
McGeachy, M. J., Bak-Jensen, K. S., Chen, Y., Tato, C. M., Blumenschein, W., McClanahan, T., & Cua, D. J. 2007, "TGF-beta and IL-6 drive the production of IL-17 and IL-10 by T cells and restrain T(H)-17 cell-mediated pathology", Nat.Immunol., vol. 8, no. 12, pp. 1390-1397.
Mege, J. L., Dilsen, N., Sanguedolce, V., Gul, A., Bongrand, P., Roux, H., Ocal, L., Inanc, M., & Capo, C. 1993, "Overproduction of monocyte derived tumor necrosis factor alpha, interleukin (IL) 6, IL-8 and increased neutrophil superoxide generation in Behcet's disease. A comparative study with familial Mediterranean fever and healthy subjects", J.Rheumatol., vol. 20, no. 9, pp. 1544-1549.

353
Meguro, A., Inoko, H., Ota, M. et al. 2010, "Genetics of Behcet disease inside and outside the MHC", Ann Rheum Dis, vol. 69, pp. 747-54.
Melikoglu, M., Fresko, I., Mat, C., Ozyazgan, Y., Gogus, F., Yurdakul, S., Hamuryudan, V., & Yazici, H. 2005, "Short-term trial of etanercept in Behcet's disease: a double blind, placebo controlled study", J.Rheumatol., vol. 32, no. 1, pp. 98-105.
Mendes, D., Correia, M., Barbedo, M., Vaio, T., Mota, M., Goncalves, O., & Valente, J. 2009, "Behcet's disease--a contemporary review", J.Autoimmun., vol. 32, no. 3-4, pp. 178-188.
Meyers, J. A., Mangini, A. J., Nagai, T., Roff, C. F., Sehy, D., van Seventer, G. A., & van Seventer, J. M. 2006, "Blockade of TLR9 agonist-induced type I interferons promotes inflammatory cytokine IFN-gamma and IL-17 secretion by activated human PBMC", Cytokine, vol. 35, no. 5-6, pp. 235-246.
Michel, M. L., Keller, A. C., Paget, C., Fujio, M., Trottein, F., Savage, P. B., Wong, C. H., Schneider, E., Dy, M., & Leite-de-Moraes, M. C. 2007, "Identification of an IL-17-producing NK1.1(neg) iNKT cell population involved in airway neutrophilia", J.Exp.Med., vol. 204, no. 5, pp. 995-1001.
Min, B. 2010, "Th2 immunity: a step closer to completion", Immunol.Cell Biol., vol. 88, no. 3, p. 235.
Miner, K. T. & Croft, M. 1998, "Generation, persistence, and modulation of Th0 effector cells: role of autocrine IL-4 and IFN-gamma", J.Immunol., vol. 160, no. 11, pp. 5280-5287.
Misumi, M., Hagiwara, E., Takeno, M., Takeda, Y., Inoue, Y., Tsuji, T., Ueda, A., Nakamura, S., Ohno, S., & Ishigatsubo, Y. 2003, "Cytokine production profile in patients with Behcet's disease treated with infliximab", Cytokine, vol. 24, no. 5, pp. 210-218.
Miyara, M., Yoshioka, Y., Kitoh, A., Shima, T., Wing, K., Niwa, A., Parizot, C., Taflin, C., Heike, T., Valeyre, D., Mathian, A., Nakahata, T., Yamaguchi, T., Nomura, T., Ono, M., Amoura, Z., Gorochov, G., & Sakaguchi, S. 2009, "Functional Delineation and Differentiation Dynamics of Human CD4(+) T Cells Expressing the FoxP3 Transcription Factor", Immunity.
Mizuki, N., Meguro, A., Ota, M. et al. 2010, "Genome-wide association studies identify IL23R-IL12RB2 and IL10 as Behcet's disease susceptibility loci", Nat Genet, vol. 42, pp. 703-6.
Mizuki, N., Ota, M., Yabuki, K., Katsuyama, Y., Ando, H., Palimeris, G. D., Kaklamani, E., Accorinti, M., Pivetti-Pezzi, P., Ohno, S., & Inoko, H. 2000, "Localization of the pathogenic gene of Behcet's disease by microsatellite analysis of three different populations", Invest Ophthalmol.Vis.Sci., vol. 41, no. 12, pp. 3702-3708.
Mochizuki, M., Suzuki, N., Takeno, M., Nagafuchi, H., Harada, T., Kaneoka, H., Yamashita, N., Hirayama, K., Nakajima, T., Mizushima, Y., & . 1994, "Fine antigen
354
specificity of human gamma delta T cell lines (V gamma 9+) established by repetitive stimulation with a serotype (KTH-1) of a gram-positive bacterium, Streptococcus sanguis", Eur.J.Immunol., vol. 24, no. 7, pp. 1536-1543.
Momcilovic, M., Miljkovic, Z., Popadic, D., Markovic, M., Savic, E., Ramic, Z., Miljkovic, D., & Mostarica-Stojkovic, M. 2008, "Methylprednisolone inhibits interleukin-17 and interferon-gamma expression by both naive and primed T cells", BMC.Immunol., vol. 9, p. 47.
Monti, P., Scirpoli, M., Maffi, P., Piemonti, L., Secchi, A., Bonifacio, E., Roncarolo, M. G., & Battaglia, M. 2008, "Rapamycin monotherapy in patients with type 1 diabetes modifies CD4+CD25+FOXP3+ regulatory T-cells", Diabetes, vol. 57, no. 9, pp. 2341-2347.
Moore, K. W., de Waal, M. R., Coffman, R. L., & O'Garra, A. 2001, "Interleukin-10 and the interleukin-10 receptor", Annu.Rev.Immunol., vol. 19, pp. 683-765.
Moore, K. W., O'Garra, A., de Waal, M. R., Vieira, P., & Mosmann, T. R. 1993, "Interleukin-10", Annu.Rev.Immunol., vol. 11, pp. 165-190.
Moore, K. W., Vieira, P., Fiorentino, D. F., Trounstine, M. L., Khan, T. A., & Mosmann, T. R. 1990, "Homology of cytokine synthesis inhibitory factor (IL-10) to the Epstein-Barr virus gene BCRFI", Science, vol. 248, no. 4960, pp. 1230-1234.
Morgan, M. E., van Bilsen, J. H., Bakker, A. M., Heemskerk, B., Schilham, M. W., Hartgers, F. C., Elferink, B. G., van der, Z. L., de Vries, R. R., Huizinga, T. W., Ottenhoff, T. H., & Toes, R. E. 2005, "Expression of FOXP3 mRNA is not confined to CD4+CD25+ T regulatory cells in humans", Hum.Immunol., vol. 66, no. 1, pp. 13-20.
Moschen, A. R., Geiger, S., Krehan, I., Kaser, A., & Tilg, H. 2008, "Interferon-alpha controls IL-17 expression in vitro and in vivo", Immunobiology, vol. 213, no. 9-10, pp. 779-787.
Mosmann, T. R., Cherwinski, H., Bond, M. W., Giedlin, M. A., & Coffman, R. L. 1986, "Two types of murine helper T cell clone. I. Definition according to profiles of lymphokine activities and secreted proteins", J.Immunol., vol. 136, no. 7, pp. 2348-2357.
Mosmann, T. R. & Coffman, R. L. 1989, "TH1 and TH2 cells: different patterns of lymphokine secretion lead to different functional properties", Annu.Rev.Immunol., vol. 7, pp. 145-173.
Mosser, D. M. & Edwards, J. P. 2008, "Exploring the full spectrum of macrophage activation", Nat Rev.Immunol., vol. 8, no. 12, pp. 958-969.
Mosser, D. M. & Zhang, X. 2008, "Interleukin-10: new perspectives on an old cytokine", Immunol.Rev., vol. 226, pp. 205-218.
Mucida, D., Park, Y., Kim, G., Turovskaya, O., Scott, I., Kronenberg, M., & Cheroutre, H. 2007, "Reciprocal TH17 and regulatory T cell differentiation mediated by retinoic acid", Science, vol. 317, no. 5835, pp. 256-260.
355
Murphy, K. M. & Reiner, S. L. 2002, "The lineage decisions of helper T cells", Nat.Rev.Immunol., vol. 2, no. 12, pp. 933-944.
Murray, P. J. 2007, "The JAK-STAT signaling pathway: input and output integration", J.Immunol., vol. 178, no. 5, pp. 2623-2629.
Nadkarni, S., Mauri, C., & Ehrenstein, M. R. 2007, "Anti-TNF-alpha therapy induces a distinct regulatory T cell population in patients with rheumatoid arthritis via TGF-beta", J Exp.Med., vol. 204, no. 1, pp. 33-39.
Nagar, M., Jacob-Hirsch, J., Vernitsky, H., Berkun, Y., Ben Horin, S., Amariglio, N., Bank, I., Kloog, Y., Rechavi, G., & Goldstein, I. 2010, "TNF activates a NF-kappaB-regulated cellular program in human CD45RA- regulatory T cells that modulates their suppressive function", J.Immunol., vol. 184, no. 7, pp. 3570-3581.
Nanke, Y., Kotake, S., Goto, M., Ujihara, H., Matsubara, M., & Kamatani, N. 2008, "Decreased percentages of regulatory T cells in peripheral blood of patients with Behcet's disease before ocular attack: a possible predictive marker of ocular attack", Mod.Rheumatol., vol. 18, no. 4, pp. 354-358.
Napolitani, G., Acosta-Rodriguez, E. V., Lanzavecchia, A., & Sallusto, F. 2009, "Prostaglandin E2 enhances Th17 responses via modulation of IL-17 and IFN-gamma production by memory CD4+ T cells", Eur.J.Immunol., vol. 39, no. 5, pp. 1301-1312.
Nara, K., Kurokawa, M. S., Chiba, S., Yoshikawa, H., Tsukikawa, S., Matsuda, T., & Suzuki, N. 2008, "Involvement of innate immunity in the pathogenesis of intestinal Behcet's disease", Clin.Exp.Immunol., vol. 152, no. 2, pp. 245-251.
Narazaki, H., Watari, E., Shimizu, M., Owaki, A., Das, H., Fukunaga, Y., Takahashi, H., & Sugita, M. 2003, "Perforin-dependent killing of tumor cells by Vgamma1Vdelta1-bearing T-cells", Immunol.Lett., vol. 86, no. 1, pp. 113-119.
Nedellec, S., Bonneville, M., & Scotet, E. 2010, "Human Vgamma9Vdelta2 T cells: from signals to functions", Semin.Immunol., vol. 22, no. 4, pp. 199-206.
Nedwin, G. E., Svedersky, L. P., Bringman, T. S., Palladino, M. A., Jr., & Goeddel, D. V. 1985, "Effect of interleukin 2, interferon-gamma, and mitogens on the production of tumor necrosis factors alpha and beta", J.Immunol., vol. 135, no. 4, pp. 2492-2497.
Nelms, K., Keegan, A. D., Zamorano, J., Ryan, J. J., & Paul, W. E. 1999, "The IL-4 receptor: signaling mechanisms and biologic functions", Annu.Rev.Immunol., vol. 17, pp. 701-738.
Ness-Schwickerath, K. J., Jin, C., & Morita, C. T. 2010, "Cytokine requirements for the differentiation and expansion of IL-17A- and IL-22-producing human Vgamma2Vdelta2 T cells", J.Immunol., vol. 184, no. 12, pp. 7268-7280.
Nishida, T., Hirayama, K., Nakamura, S., & Ohno, S. 1998, "Proliferative response of CD8+ gamma delta+ T cells to Streptococcus sanguis in patients with Behcet's disease", Ocul.Immunol.Inflamm., vol. 6, no. 3, pp. 139-144.
356
Nurieva, R., Yang, X. O., Martinez, G., Zhang, Y., Panopoulos, A. D., Ma, L., Schluns, K., Tian, Q., Watowich, S. S., Jetten, A. M., & Dong, C. 2007, "Essential autocrine regulation by IL-21 in the generation of inflammatory T cells", Nature, vol. 448, no. 7152, pp. 480-483.
O'Brien, R., Jin, N., Huang, Y., Aydintug, M. K., Roark, C., & Born, W. 2010, "Characteristics of IL-17-producing gammadelta T cells", Immunity., vol. 32, no. 1, pp. 1-4.
O'Connor, R. A., Taams, L. S., & Anderton, S. M. CD4+ T helper cells: functional plasticity and differential sensitivity to regulatory T cell-mediated regulation. Clinical and Experimental Immunology . 2009. Ref Type: Journal (Full)
O'Garra, A. & Vieira, P. 2007, "T(H)1 cells control themselves by producing interleukin-10", Nat.Rev.Immunol., vol. 7, no. 6, pp. 425-428.
O'shea, J. J., Ma, A., & Lipsky, P. 2002, "Cytokines and autoimmunity", Nat.Rev.Immunol., vol. 2, no. 1, pp. 37-45.
O'shea, J. J. & Murray, P. J. 2008, "Cytokine signaling modules in inflammatory responses", Immunity., vol. 28, no. 4, pp. 477-487.
Ohno, S., Kato, F., Matsuda, H., Fujii, N., & Minagawa, T. 1982, "Detection of gamma interferon in the sera of patients with Behcet's disease", Infect.Immun., vol. 36, no. 1, pp. 202-208.
Okunuki, Y., Usui, Y., Takeuchi, M., Kezuka, T., Hattori, T., Masuko, K., Nakamura, H., Yudoh, K., Usui, M., Nishioka, K., & Kato, T. 2007, "Proteomic surveillance of autoimmunity in Behcet's disease with uveitis: selenium binding protein is a novel autoantigen in Behcet's disease", Exp.Eye Res., vol. 84, no. 5, pp. 823-831.
Onal, S., Kazokoglu, H., Direskeneli, H., & Yavuz, S. 2009, "Low-dose interferon alfa-2a therapy in severe uveitis associated with Behcet disease", Am.J.Ophthalmol., vol. 147, no. 6, pp. 1109-1110.
Onder, M. & Gurer, M. A. 1999, "Behcet's disease: an enigmatic vasculitis", Clin.Dermatol., vol. 17, no. 5, pp. 571-576.
Onder, M. & Gurer, M. A. 2001, "The multiple faces of Behcet's disease and its aetiological factors", J.Eur.Acad.Dermatol.Venereol., vol. 15, no. 2, pp. 126-136.
Onishi, R. M. & Gaffen, S. L. 2010, "Interleukin-17 and its target genes: mechanisms of interleukin-17 function in disease", Immunology, vol. 129, no. 3, pp. 311-321.
Ono, M., Yaguchi, H., Ohkura, N., Kitabayashi, I., Nagamura, Y., Nomura, T., Miyachi, Y., Tsukada, T., & Sakaguchi, S. 2007, "Foxp3 controls regulatory T-cell function by interacting with AML1/Runx1", Nature, vol. 446, no. 7136, pp. 685-689.
Oppmann, B., Lesley, R., Blom, B., Timans, J. C., Xu, Y., Hunte, B., Vega, F., Yu, N., Wang, J., Singh, K., Zonin, F., Vaisberg, E., Churakova, T., Liu, M., Gorman, D., Wagner, J., Zurawski, S., Liu, Y., Abrams, J. S., Moore, K. W., Rennick, D., Waal-
357
Malefyt, R., Hannum, C., Bazan, J. F., & Kastelein, R. A. 2000, "Novel p19 protein engages IL-12p40 to form a cytokine, IL-23, with biological activities similar as well as distinct from IL-12", Immunity., vol. 13, no. 5, pp. 715-725.
Ortega, C., Fernandez, A., Carrillo, J. M., Romero, P., Molina, I. J., Moreno, J. C., & Santamaria, M. 2009, "IL-17-producing CD8+ T lymphocytes from psoriasis skin plaques are cytotoxic effector cells that secrete Th17-related cytokines", J.Leukoc.Biol., vol. 86, no. 2, pp. 435-443.
Oswald-Richter, K., Grill, S. M., Shariat, N., Leelawong, M., Sundrud, M. S., Haas, D. W., & Unutmaz, D. 2004, "HIV infection of naturally occurring and genetically reprogrammed human regulatory T-cells", PLoS.Biol., vol. 2, no. 7, p. E198.
Ouyang, W., Beckett, O., Ma, Q., & Li, M. O. 2010, "Transforming growth factor-beta signaling curbs thymic negative selection promoting regulatory T cell development", Immunity., vol. 32, no. 5, pp. 642-653.
Owen, R. E., Sinclair, E., Emu, B., Heitman, J. W., Hirschkorn, D. F., Epling, C. L., Tan, Q. X., Custer, B., Harris, J. M., Jacobson, M. A., McCune, J. M., Martin, J. N., Hecht, F. M., Deeks, S. G., & Norris, P. J. 2007, "Loss of T cell responses following long-term cryopreservation", J.Immunol.Methods, vol. 326, no. 1-2, pp. 93-115.
Oztas, M. O., Onder, M., Gurer, M. A., Bukan, N., & Sancak, B. 2005, "Serum interleukin 18 and tumour necrosis factor-alpha levels are increased in Behcet's disease", Clin.Exp.Dermatol., vol. 30, no. 1, pp. 61-63.
Palmer, C., Diehn, M., Alizadeh, A. A., & Brown, P. O. 2006, "Cell-type specific gene expression profiles of leukocytes in human peripheral blood", BMC.Genomics, vol. 7, p. 115.
Palmer, M. T. & Weaver, C. T. 2010, "Autoimmunity: increasing suspects in the CD4+ T cell lineup", Nat.Immunol., vol. 11, no. 1, pp. 36-40.
Parham, C., Chirica, M., Timans, J., Vaisberg, E., Travis, M., Cheung, J., Pflanz, S., Zhang, R., Singh, K. P., Vega, F., To, W., Wagner, J., O'Farrell, A. M., McClanahan, T., Zurawski, S., Hannum, C., Gorman, D., Rennick, D. M., Kastelein, R. A., de Waal, M. R., & Moore, K. W. 2002, "A receptor for the heterodimeric cytokine IL-23 is composed of IL-12Rbeta1 and a novel cytokine receptor subunit, IL-23R", J.Immunol., vol. 168, no. 11, pp. 5699-5708.
Park, H., Li, Z., Yang, X. O., Chang, S. H., Nurieva, R., Wang, Y. H., Wang, Y., Hood, L., Zhu, Z., Tian, Q., & Dong, C. 2005, "A distinct lineage of CD4 T cells regulates tissue inflammation by producing interleukin 17", Nat.Immunol., vol. 6, no. 11, pp. 1133-1141.
Park, I. K., Letterio, J. J., & Gorham, J. D. 2007, "TGF-beta 1 inhibition of IFN-gamma-induced signaling and Th1 gene expression in CD4+ T cells is Smad3 independent but MAP kinase dependent", Mol.Immunol., vol. 44, no. 13, pp. 3283-3290.
358
Patel, D. D. 2001, "Escape from tolerance in the human X-linked autoimmunity-allergic disregulation syndrome and the Scurfy mouse", J.Clin.Invest, vol. 107, no. 2, pp. 155-157.
Paul, W. E. & Zhu, J. 2010, "How are T(H)2-type immune responses initiated and amplified?", Nat.Rev.Immunol., vol. 10, no. 4, pp. 225-235.
Pay, S., Musabak, U., Cobankara, V., Sagkan, R. I., Simsek, I., Keskin, F., Erdem, H., Kose, O., & Dinc, A. 2009, "IFNAR1 and IFNAR2 polymorphisms in patients with Behcet's disease", Clin.Exp.Rheumatol., vol. 27, no. 2 Suppl 53, p. S110-S111.
Pay, S., Simsek, I., Erdem, H., Pekel, A., Musabak, U., Sengul, A., & Dinc, A. 2007, "Dendritic cell subsets and type I interferon system in Behcet's disease: does functional abnormality in plasmacytoid dendritic cells contribute to Th1 polarization?", Clin.Exp.Rheumatol., vol. 25, no. 4 Suppl 45, p. S34-S40.
Pearce, E. L., Mullen, A. C., Martins, G. A., Krawczyk, C. M., Hutchins, A. S., Zediak, V. P., Banica, M., DiCioccio, C. B., Gross, D. A., Mao, C. A., Shen, H., Cereb, N., Yang, S. Y., Lindsten, T., Rossant, J., Hunter, C. A., & Reiner, S. L. 2003, "Control of effector CD8+ T cell function by the transcription factor Eomesodermin", Science, vol. 302, no. 5647, pp. 1041-1043.
Pellicano, R., Smedile, A., Peyre, S., Astegiano, M., Saracco, G., Bonardi, R., & Rizzetto, M. 2005, "Autoimmune manifestations during interferon therapy in patients with chronic hepatitis C: the hepatologist's view", Minerva Gastroenterol.Dietol., vol. 51, no. 1, pp. 55-61.
Peng, M. Y., Wang, Z. H., Yao, C. Y., Jiang, L. N., Jin, Q. L., Wang, J., & Li, B. Q. 2008, "Interleukin 17-producing gamma delta T cells increased in patients with active pulmonary tuberculosis", Cell Mol.Immunol., vol. 5, no. 3, pp. 203-208.
Penton-Rol, G., Cervantes-Llanos, M., Cabrera-Gomez, J. A., Alonso-Ramirez, R., Valenzuela-Silva, C., Rodriguez-Lara, R., Montero-Casimiro, E., Bello-Rivero, I., & Lopez-Saura, P. 2008, "Treatment with type I interferons induces a regulatory T cell subset in peripheral blood mononuclear cells from multiple sclerosis patients", Int.Immunopharmacol., vol. 8, no. 6, pp. 881-886.
Perry, C. M. & Jarvis, B. 2001, "Peginterferon-alpha-2a (40 kD): a review of its use in the management of chronic hepatitis C", Drugs, vol. 61, no. 15, pp. 2263-2288.
Pestka, S. 1997a, "The human interferon-alpha species and hybrid proteins", Semin.Oncol., vol. 24, no. 3 Suppl 9, p. S9.
Pestka, S. 1997b, "The interferon receptors", Semin.Oncol., vol. 24, no. 3 Suppl 9, p. S9.
Pestka, S., Krause, C. D., & Walter, M. R. 2004, "Interferons, interferon-like cytokines, and their receptors", Immunol.Rev., vol. 202, pp. 8-32.
Petersen, C. M., Christensen, E. I., Andresen, B. S., & Moller, B. K. 1992, "Internalization, lysosomal degradation and new synthesis of surface membrane

359
CD4 in phorbol ester-activated T-lymphocytes and U-937 cells", Exp.Cell Res., vol. 201, no. 1, pp. 160-173.
Pfeffer, L. M., Dinarello, C. A., Herberman, R. B., Williams, B. R. G., Borden, E. C., Bordens, R., Walter, M. R., Nagabhushan, T. L., Trotta, P. P., & Pestka, S. 1998, "Biological properties of recombinant alpha-interferons: 40th anniversary of the discovery of interferons", Cancer Research, vol. 58, no. 12, pp. 2489-2499.
Piazzolla, G., Giannelli, G., Antonelli, G., Tortorella, C., Jirillo, E., Schiraldi, O., & Antonaci, S. 1996, "Effects of interferon-alpha treatment on neutrophil oxidative metabolism, lymphocyte proliferation and monocyte HLA class I antigen expression in patients with chronic hepatitis C", Immunopharmacol.Immunotoxicol., vol. 18, no. 4, pp. 529-548.
Pickering, M. C. & Haskard, D. O. 2000, "Behcet's syndrome", J.R.Coll.Physicians Lond, vol. 34, no. 2, pp. 169-177.
Pillai, V., Ortega, S. B., Wang, C. K., & Karandikar, N. J. 2007, "Transient regulatory T-cells: a state attained by all activated human T-cells", Clin.Immunol., vol. 123, no. 1, pp. 18-29.
Platanias, L. C. 2005, "Mechanisms of type-I- and type-II-interferon-mediated signalling", Nat.Rev.Immunol., vol. 5, no. 5, pp. 375-386.
Plskova, J., Greiner, K., Muckersie, E., Duncan, L., & Forrester, J. V. 2006, "Interferon-alpha: a key factor in autoimmune disease?", Invest Ophthalmol.Vis.Sci., vol. 47, no. 9, pp. 3946-3950.
Prinz, M., Schmidt, H., Mildner, A., Knobeloch, K. P., Hanisch, U. K., Raasch, J., Merkler, D., Detje, C., Gutcher, I., Mages, J., Lang, R., Martin, R., Gold, R., Becher, B., Bruck, W., & Kalinke, U. 2008, "Distinct and nonredundant in vivo functions of IFNAR on myeloid cells limit autoimmunity in the central nervous system", Immunity., vol. 28, no. 5, pp. 675-686.
Qi, Q., Xia, M., Hu, J., Hicks, E., Iyer, A., Xiong, N., & August, A. 2009, "Enhanced development of CD4+ gammadelta T cells in the absence of Itk results in elevated IgE production", Blood, vol. 114, no. 3, pp. 564-571.
Rachitskaya, A. V., Hansen, A. M., Horai, R., Li, Z., Villasmil, R., Luger, D., Nussenblatt, R. B., & Caspi, R. R. 2008, "Cutting edge: NKT cells constitutively express IL-23 receptor and RORgammat and rapidly produce IL-17 upon receptor ligation in an IL-6-independent fashion", J.Immunol., vol. 180, no. 8, pp. 5167-5171.
Ramgolam, V. S., Sha, Y., Jin, J., Zhang, X., & Markovic-Plese, S. 2009, "IFN-beta inhibits human Th17 cell differentiation", J Immunol., vol. 183, no. 8, pp. 5418-5427.
Reddy, K. R. 2004, "Development and pharmacokinetics and pharmacodynamics of pegylated interferon alfa-2a (40 kD)", Seminars in Liver Disease, vol. 24, pp. 33-38.
Reinhardt, R. L., Liang, H. E., & Locksley, R. M. 2009, "Cytokine-secreting follicular T cells shape the antibody repertoire", Nat.Immunol., vol. 10, no. 4, pp. 385-393.
360
Remmers, E., Csan, F., Kirino, Y., et al. 2010, "Genome-wide association study identifies variants in the MHC class I, IL-10, and IL23R-IL12RB2 regions associated with Behcet's disease", Nat Genet, vol. 42, pp. 698-702.
Renno, T., Krakowski, M., Piccirillo, C., Lin, J. Y., & Owens, T. 1995, "TNF-alpha expression by resident microglia and infiltrating leukocytes in the central nervous system of mice with experimental allergic encephalomyelitis. Regulation by Th1 cytokines", J Immunol., vol. 154, no. 2, pp. 944-953.
Reynolds, J. M., Pappu, B. P., Peng, J., Martinez, G. J., Zhang, Y., Chung, Y., Ma, L., Yang, X. O., Nurieva, R. I., Tian, Q., & Dong, C. 2010, "Toll-like receptor 2 signaling in CD4(+) T lymphocytes promotes T helper 17 responses and regulates the pathogenesis of autoimmune disease", Immunity., vol. 32, no. 5, pp. 692-702.
Richaud-Patin, Y., Alcocer-Varela, J., & Llorente, L. 1995, "High levels of TH2 cytokine gene expression in systemic lupus erythematosus", Rev.Invest Clin., vol. 47, no. 4, pp. 267-272.
Roark, C. L., Simonian, P. L., Fontenot, A. P., Born, W. K., & O'Brien, R. L. 2008, "gammadelta T cells: an important source of IL-17", Curr.Opin.Immunol., vol. 20, no. 3, pp. 353-357.
Roncarolo, M. G., Bacchetta, R., Bordignon, C., Narula, S., & Levings, M. K. 2001, "Type 1 T regulatory cells", Immunol.Rev., vol. 182, pp. 68-79.
Roncarolo, M. G. & Gregori, S. 2008, "Is FOXP3 a bona fide marker for human regulatory T cells?", Eur.J.Immunol., vol. 38, no. 4, pp. 925-927.
Roncarolo, M. G., Gregori, S., Battaglia, M., Bacchetta, R., Fleischhauer, K., & Levings, M. K. 2006, "Interleukin-10-secreting type 1 regulatory T cells in rodents and humans", Immunol.Rev., vol. 212, pp. 28-50.
Roncarolo, M. G., Levings, M. K., & Traversari, C. 2001, "Differentiation of T regulatory cells by immature dendritic cells", J.Exp.Med., vol. 193, no. 2, p. F5-F9.
Rutishauser, R. L. & Kaech, S. M. 2010, "Generating diversity: transcriptional regulation of effector and memory CD8 T-cell differentiation", Immunol.Rev., vol. 235, no. 1, pp. 219-233.
Sad, S. & Mosmann, T. R. 1994, "Single IL-2-secreting precursor CD4 T cell can develop into either Th1 or Th2 cytokine secretion phenotype", J.Immunol., vol. 153, no. 8, pp. 3514-3522.
Saha, B., Jyothi, P. S., Chandrasekar, B., & Nandi, D. 2010, "Gene modulation and immunoregulatory roles of interferon gamma", Cytokine, vol. 50, no. 1, pp. 1-14.
Sakaguchi, S. 2004, "Naturally arising CD4+ regulatory t cells for immunologic self-tolerance and negative control of immune responses", Annu.Rev.Immunol., vol. 22, pp. 531-562.
361
Sakaguchi, S., Miyara, M., Costantino, C. M., & Hafler, D. A. 2010, "FOXP3+ regulatory T cells in the human immune system", Nat.Rev.Immunol., vol. 10, no. 7, pp. 490-500.
Sakaguchi, S., Sakaguchi, N., Asano, M., Itoh, M., & Toda, M. 1995, "Immunologic self-tolerance maintained by activated T cells expressing IL-2 receptor alpha-chains (CD25). Breakdown of a single mechanism of self-tolerance causes various autoimmune diseases", J.Immunol., vol. 155, no. 3, pp. 1151-1164.
Sakane, T., Takeno, M., Suzuki, N., & Inaba, G. 1999, "Behcet's disease", N.Engl.J.Med., vol. 341, no. 17, pp. 1284-1291.
San Segundo, D., Fabrega, E., Lopez-Hoyos, M., & Pons, F. 2007, "Reduced numbers of blood natural regulatory T cells in stable liver transplant recipients with high levels of calcineurin inhibitors", Transplant.Proc., vol. 39, no. 7, pp. 2290-2292.
Santarlasci, V., Maggi, L., Capone, M., Frosali, F., Querci, V., De Palma, R., Liotta, F., Cosmi, L., Maggi, E., Romagnani, S., & Annunziato, F. 2009, "TGF-beta indirectly favors the development of human Th17 cells by inhibiting Th1 cells", Eur.J.Immunol., vol. 39, no. 1, pp. 207-215.
Santos, L. M., Marcos, M. C., Gallardo Galera, J. M., Gomez Vidal, M. A., Collantes, E. E., Ramirez, C. R., & Omar, M. 2001, "Aqueous humor and serum tumor necrosis factor-alpha in clinical uveitis", Ophthalmic Res., vol. 33, no. 5, pp. 251-255.
Sayinalp, N., Ozcebe, O. I., Ozdemir, O., Haznedaroglu, I. C., Dundar, S., & Kirazli, S. 1996, "Cytokines in Behcet's disease", J.Rheumatol., vol. 23, no. 2, pp. 321-322.
Schaerli, P., Willimann, K., Lang, A. B., Lipp, M., Loetscher, P., & Moser, B. 2000, "CXC chemokine receptor 5 expression defines follicular homing T cells with B cell helper function", J Exp.Med., vol. 192, no. 11, pp. 1553-1562.
Schandene, L., Cogan, E., Crusiaux, A., & Goldman, M. 1997, "Interferon-alpha upregulates both interleukin-10 and interferon-gamma production by human CD4+ T cells", Blood, vol. 89, no. 3, pp. 1110-1111.
Schandene, L., Del Prete, G. F., Cogan, E., Stordeur, P., Crusiaux, A., Kennes, B., Romagnani, S., & Goldman, M. 1996, "Recombinant interferon-alpha selectively inhibits the production of interleukin-5 by human CD4+ T cells", J.Clin.Invest, vol. 97, no. 2, pp. 309-315.
Schering-Plough. Peginterferon alfa-2b product information. 2007. Kenilworth, NJ, USA, Schering Corporation. Schindler, R., Ghezzi, P., & Dinarello, C. A. 1990, "IL-1 induces IL-1. IV. IFN-gamma suppresses IL-1 but not lipopolysaccharide-induced transcription of IL-1", J.Immunol., vol. 144, no. 6, pp. 2216-2222. Scholz, C., Patton, K. T., Anderson, D. E., Freeman, G. J., & Hafler, D. A. 1998, "Expansion of autoreactive T cells in multiple sclerosis is independent of exogenous B7 costimulation", J.Immunol., vol. 160, no. 3, pp. 1532-1538.

362
Schraml, B. U., Hildner, K., Ise, W., Lee, W. L., Smith, W. A., Solomon, B., Sahota, G., Sim, J., Mukasa, R., Cemerski, S., Hatton, R. D., Stormo, G. D., Weaver, C. T., Russell, J. H., Murphy, T. L., & Murphy, K. M. 2009, "The AP-1 transcription factor Batf controls T(H)17 differentiation", Nature, vol. 460, no. 7253, pp. 405-409.
Schulze-Koops, H. & Kalden, J. R. 2001, "The balance of Th1/Th2 cytokines in rheumatoid arthritis", Best.Pract.Res.Clin.Rheumatol., vol. 15, no. 5, pp. 677-691.
Schwandner, R., Yamaguchi, K., & Cao, Z. 2000, "Requirement of tumor necrosis factor receptor-associated factor (TRAF)6 in interleukin 17 signal transduction", J.Exp.Med., vol. 191, no. 7, pp. 1233-1240.
Scotto, L., Naiyer, A. J., Galluzzo, S., Rossi, P., Manavalan, J. S., Kim-Schulze, S., Fang, J., Favera, R. D., Cortesini, R., & Suciu-Foca, N. 2004, "Overlap between molecular markers expressed by naturally occurring CD4+CD25+ regulatory T cells and antigen specific CD4+CD25+ and CD8+CD28- T suppressor cells", Hum.Immunol., vol. 65, no. 11, pp. 1297-1306.
Seddiki, N., Santner-Nanan, B., Tangye, S. G., Alexander, S. I., Solomon, M., Lee, S., Nanan, R., & Fazekas de Saint, G. B. 2006, "Persistence of naive CD45RA+ regulatory T cells in adult life", Blood, vol. 107, no. 7, pp. 2830-2838.
Seder, R. A. & Ahmed, R. 2003, "Similarities and differences in CD4+ and CD8+ effector and memory T cell generation", Nat.Immunol., vol. 4, no. 9, pp. 835-842.
Seder, R. A., Marth, T., Sieve, M. C., Strober, W., Letterio, J. J., Roberts, A. B., & Kelsall, B. 1998, "Factors involved in the differentiation of TGF-beta-producing cells from naive CD4+ T cells: IL-4 and IFN-gamma have opposing effects, while TGF-beta positively regulates its own production", J.Immunol., vol. 160, no. 12, pp. 5719-5728.
Selmi, C., Lleo, A., Zuin, M., Podda, M., Rossaro, L., & Gershwin, M. E. 2006, "Interferon alpha and its contribution to autoimmunity", Curr.Opin.Investig.Drugs, vol. 7, no. 5, pp. 451-456.
Senturk, M. U., Senturk, U. K., Basak, P. Y., Kuru, O., & Yesilkaya, A. 2003, "Serum and skin nitrite levels in patients with Behcet's disease", J.Eur.Acad.Dermatol.Venereol., vol. 17, no. 5, pp. 614-615.
Sfikakis, P. P., Kaklamanis, P. H., Elezoglou, A., Katsilambros, N., Theodossiadis, P. G., Papaefthimiou, S., & Markomichelakis, N. 2004, "Infliximab for recurrent, sight-threatening ocular inflammation in Adamantiades-Behcet disease", Ann.Intern.Med., vol. 140, no. 5, pp. 404-406.
Sfikakis, P. P., Markomichelakis, N., Alpsoy, E., Assaad-Khalil, S., Bodaghi, B., Gul, A., Ohno, S., Pipitone, N., Schirmer, M., Stanford, M., Wechsler, B., Zouboulis, C., Kaklamanis, P., & Yazici, H. 2007, "Anti-TNF therapy in the management of Behcet's disease--review and basis for recommendations", Rheumatology.(Oxford), vol. 46, no. 5, pp. 736-741.
363
Shahrara, S., Pickens, S. R., Dorfleutner, A., & Pope, R. M. 2009, "IL-17 induces monocyte migration in rheumatoid arthritis", J.Immunol., vol. 182, no. 6, pp. 3884-3891.
Shalom-Barak, T., Quach, J., & Lotz, M. 1998, "Interleukin-17-induced gene expression in articular chondrocytes is associated with activation of mitogen-activated protein kinases and NF-kappaB", J.Biol.Chem., vol. 273, no. 42, pp. 27467-27473.
Shevach, E. M. 2000, "Regulatory T cells in autoimmmunity*", Annu.Rev.Immunol., vol. 18, pp. 423-449.
Shevach, E. M. 2004, "Regulatory/suppressor T cells in health and disease", Arthritis Rheum., vol. 50, no. 9, pp. 2721-2724.
Shevach, E. M. 2006, "From vanilla to 28 flavors: multiple varieties of T regulatory cells", Immunity., vol. 25, no. 2, pp. 195-201.
Shevach, E. M. 2009, "Mechanisms of foxp3+ T regulatory cell-mediated suppression", Immunity., vol. 30, no. 5, pp. 636-645.
Shevach, E. M., DiPaolo, R. A., Andersson, J., Zhao, D. M., Stephens, G. L., & Thornton, A. M. 2006, "The lifestyle of naturally occurring CD4+ CD25+ Foxp3+ regulatory T cells", Immunol.Rev., vol. 212, pp. 60-73.
Shi, Z., Okuno, Y., Rifa'i, M., Endharti, A. T., Akane, K., Isobe, K., & Suzuki, H. 2009, "Human CD8+CXCR3+ T cells have the same function as murine CD8+CD122+ Treg", Eur.J.Immunol., vol. 39, no. 8, pp. 2106-2119.
Shin, H. C., Benbernou, N., Esnault, S., & Guenounou, M. 1999, "Expression of IL-17 in human memory CD45RO+ T lymphocytes and its regulation by protein kinase A pathway", Cytokine, vol. 11, no. 4, pp. 257-266.
Shoenfeld, Y., Selmi, C., Zimlichman, E., & Gershwin, M. E. 2008, "The autoimmunologist: geoepidemiology, a new center of gravity, and prime time for autoimmunity", J Autoimmun., vol. 31, no. 4, pp. 325-330.
Simon, H. U., Seelbach, H., Ehmann, R., & Schmitz, M. 2003, "Clinical and immunological effects of low-dose IFN-alpha treatment in patients with corticosteroid-resistant asthma", Allergy, vol. 58, no. 12, pp. 1250-1255.
Singh, S. P., Zhang, H. H., Foley, J. F., Hedrick, M. N., & Farber, J. M. 2008, "Human T cells that are able to produce IL-17 express the chemokine receptor CCR6", J.Immunol., vol. 180, no. 1, pp. 214-221.
Sireci, G., Espinosa, E., Di, S. C., Dieli, F., Fournie, J. J., & Salerno, A. 2001, "Differential activation of human gammadelta cells by nonpeptide phosphoantigens", Eur.J.Immunol., vol. 31, no. 5, pp. 1628-1635.
Skapenko, A., Kalden, J. R., Lipsky, P. E., & Schulze-Koops, H. 2005, "The IL-4 receptor alpha-chain-binding cytokines, IL-4 and IL-13, induce forkhead box P3-
364
expressing CD25+CD4+ regulatory T cells from CD25-CD4+ precursors", J.Immunol., vol. 175, no. 9, pp. 6107-6116.
Sobaci, G., Erdem, U., Durukan, A. H., Erdurman, C., Bayer, A., Koksal, S., Karagul, S., & Bayraktar, M. Z. 2010, "Safety and effectiveness of interferon alpha-2a in treatment of patients with Behcet's uveitis refractory to conventional treatments", Ophthalmology, vol. 117, no. 7, pp. 1430-1435.
Sonmez, M., Sonmez, B., Eren, N., Yilmaz, M., Karti, S. S., & Ovali, E. 2004, "Effects of interferon-alpha-2a on Th3 cytokine response in multiple myeloma patients", Tumori, vol. 90, no. 4, pp. 387-389.
Staples, K. J., Smallie, T., Williams, L. M., Foey, A., Burke, B., Foxwell, B. M., & Ziegler-Heitbrock, L. 2007, "IL-10 induces IL-10 in primary human monocyte-derived macrophages via the transcription factor Stat3", J.Immunol., vol. 178, no. 8, pp. 4779-4785.
Stark, G. R., Kerr, I. M., Williams, B. R., Silverman, R. H., & Schreiber, R. D. 1998, "How cells respond to interferons", Annu.Rev.Biochem., vol. 67, pp. 227-264.
Steinbrink, K., Graulich, E., Kubsch, S., Knop, J., & Enk, A. H. 2002, "CD4(+) and CD8(+) anergic T cells induced by interleukin-10-treated human dendritic cells display antigen-specific suppressor activity", Blood, vol. 99, no. 7, pp. 2468-2476.
Stow, J. L., Low, P. C., Offenhauser, C., & Sangermani, D. 2009, "Cytokine secretion in macrophages and other cells: pathways and mediators", Immunobiology, vol. 214, no. 7, pp. 601-612.
Strauss, L., Bergmann, C., & Whiteside, T. L. 2009, "Human circulating CD4+CD25highFoxp3+ regulatory T cells kill autologous CD8+ but not CD4+ responder cells by Fas-mediated apoptosis", J.Immunol., vol. 182, no. 3, pp. 1469-1480.
Su, L. & David, M. 2000, "Distinct mechanisms of STAT phosphorylation via the interferon-alpha/beta receptor. Selective inhibition of STAT3 and STAT5 by piceatannol", J.Biol.Chem., vol. 275, no. 17, pp. 12661-12666.
Sugi-Ikai, N., Nakazawa, M., Nakamura, S., Ohno, S., & Minami, M. 1998, "Increased frequencies of interleukin-2- and interferon-gamma-producing T cells in patients with active Behcet's disease", Invest Ophthalmol.Vis.Sci., vol. 39, no. 6, pp. 996-1004.
Sugiyama, H., Gyulai, R., Toichi, E., Garaczi, E., Shimada, S., Stevens, S. R., McCormick, T. S., & Cooper, K. D. 2005, "Dysfunctional blood and target tissue CD4+CD25high regulatory T cells in psoriasis: mechanism underlying unrestrained pathogenic effector T cell proliferation", J.Immunol., vol. 174, no. 1, pp. 164-173.
Szabo, S. J., Dighe, A. S., Gubler, U., & Murphy, K. M. 1997, "Regulation of the interleukin (IL)-12R beta 2 subunit expression in developing T helper 1 (Th1) and Th2 cells", J.Exp.Med., vol. 185, no. 5, pp. 817-824.
365
Szabo, S. J., Kim, S. T., Costa, G. L., Zhang, X., Fathman, C. G., & Glimcher, L. H. 2000, "A novel transcription factor, T-bet, directs Th1 lineage commitment", Cell, vol. 100, no. 6, pp. 655-669.
Szabo, S. J., Sullivan, B. M., Peng, S. L., & Glimcher, L. H. 2003, "Molecular mechanisms regulating Th1 immune responses", Annu.Rev.Immunol., vol. 21, pp. 713-758.
Szabo, S. J., Sullivan, B. M., Stemmann, C., Satoskar, A. R., Sleckman, B. P., & Glimcher, L. H. 2002, "Distinct effects of T-bet in TH1 lineage commitment and IFN-gamma production in CD4 and CD8 T cells", Science, vol. 295, no. 5553, pp. 338-342.
Takaoka, A., Mitani, Y., Suemori, H., Sato, M., Yokochi, T., Noguchi, S., Tanaka, N., & Taniguchi, T. 2000, "Cross talk between interferon-gamma and -alpha/beta signaling components in caveolar membrane domains", Science, vol. 288, no. 5475, pp. 2357-2360.
Takeno, M., Shimoyama, Y., Kashiwakura, J., Nagafuchi, H., Sakane, T., & Suzuki, N. 2004, "Abnormal killer inhibitory receptor expression on natural killer cells in patients with Behcet's disease", Rheumatol.Int., vol. 24, no. 4, pp. 212-216.
Takeuchi, M., Usui, Y., Okunuki, Y., Zhang, L., Ma, J., Yamakawa, N., Hattori, T., Kezuka, T., Sakai, J., & Goto, H. 2010, "Immune responses to interphotoreceptor retinoid-binding protein and S-antigen in Behcet's patients with uveitis", Invest Ophthalmol.Vis.Sci., vol. 51, no. 6, pp. 3067-3075.
Tamir, A., Jordan, W. J., Ritter, M., Habib, N., Lechler, R. I., Foster, G. R., & Lombardi, G. 2005, "Interferon-alpha2a is sufficient for promoting dendritic cell immunogenicity", Clin.Exp.Immunol., vol. 142, no. 3, pp. 471-480.
Tan, W. P., Mai, X. D., Wu, B. Q., Li, X. Y., Li, J., Wei, J., Huang, H. R., & Huang, S. L. 2007, "[Expression of transcription factors T-bet/GATA-3 mRNA and its effect on Tc1/Tc2 balance in asthmatic children]", Zhonghua Er.Ke.Za Zhi., vol. 45, no. 4, pp. 284-287.
Tang, Q. & Bluestone, J. A. 2006, "Regulatory T-cell physiology and application to treat autoimmunity", Immunol.Rev., vol. 212, pp. 217-237.
Tang, Q. & Bluestone, J. A. 2008, "The Foxp3+ regulatory T cell: a jack of all trades, master of regulation", Nat.Immunol., vol. 9, no. 3, pp. 239-244.
Taylor, A. L. & Llewelyn, M. J. 2010, "Superantigen-induced proliferation of human CD4(+)CD25(-) T cells is followed by a switch to a functional regulatory phenotype", J.Immunol., vol. 185, no. 11, pp. 6591-6598.
Thornton, A. M., Korty, P. E., Tran, D. Q., Wohlfert, E. A., Murray, P. E., Belkaid, Y., & Shevach, E. M. 2010, "Expression of Helios, an Ikaros transcription factor family member, differentiates thymic-derived from peripherally induced Foxp3+ T regulatory cells", J.Immunol., vol. 184, no. 7, pp. 3433-3441.
366
Thornton, A. M. & Shevach, E. M. 1998, "CD4+CD25+ immunoregulatory T cells suppress polyclonal T cell activation in vitro by inhibiting interleukin 2 production", J.Exp.Med., vol. 188, no. 2, pp. 287-296.
Thornton, A. M. & Shevach, E. M. 2000, "Suppressor effector function of CD4+CD25+ immunoregulatory T cells is antigen nonspecific", J.Immunol., vol. 164, no. 1, pp. 183-190.
Thunberg, S., Akdis, M., Akdis, C. A., Gronneberg, R., Malmstrom, V., Trollmo, C., van Hage, M., & Gafvelin, G. 2007, "Immune regulation by CD4+CD25+ T cells and interleukin-10 in birch pollen-allergic patients and non-allergic controls", Clin.Exp.Allergy, vol. 37, no. 8, pp. 1127-1136.
Tilg, H., Mier, J. W., Vogel, W., Aulitzky, W. E., Wiedermann, C. J., Vannier, E., Huber, C., & Dinarello, C. A. 1993, "Induction of circulating IL-1 receptor antagonist by IFN treatment", J.Immunol., vol. 150, no. 10, pp. 4687-4692.
Tilg, H., Vogel, W., & Dinarello, C. A. 1995, "Interferon-alpha induces circulating tumor necrosis factor receptor p55 in humans", Blood, vol. 85, no. 2, pp. 433-435.
Tone, Y., Furuuchi, K., Kojima, Y., Tykocinski, M. L., Greene, M. I., & Tone, M. 2008, "Smad3 and NFAT cooperate to induce Foxp3 expression through its enhancer", Nat.Immunol., vol. 9, no. 2, pp. 194-202.
Tran, D. Q., Ramsey, H., & Shevach, E. M. 2007, "Induction of FOXP3 expression in naive human CD4+FOXP3 T cells by T-cell receptor stimulation is transforming growth factor-beta dependent but does not confer a regulatory phenotype", Blood, vol. 110, no. 8, pp. 2983-2990.
Treusch, M., Vonthein, R., Baur, M., Gunaydin, I., Koch, S., Stubiger, N., Eckstein, A. K., Peter, H. H., Ness, T., Zierhut, M., & Kotter, I. 2004, "Influence of human recombinant interferon-alpha2a (rhIFN-alpha2a) on altered lymphocyte subpopulations and monocytes in Behcet's disease", Rheumatology.(Oxford), vol. 43, no. 10, pp. 1275-1282.
Trifari, S., Kaplan, C. D., Tran, E. H., Crellin, N. K., & Spits, H. 2009, "Identification of a human helper T cell population that has abundant production of interleukin 22 and is distinct from T(H)-17, T(H)1 and T(H)2 cells", Nat Immunol., vol. 10, no. 8, pp. 864-871.
Tsambaos, D., Eichelberg, D., & Goos, M. 1986, "Behcets-Syndrome - Treatment with Recombinant Leukocyte Alpha-Interferon", Archives of Dermatological Research, vol. 278, no. 4, pp. 335-336.
Tugal-Tutkun, I., Guney-Tefekli, E., & Urgancioglu, M. 2006, "Results of interferon-alfa therapy in patients with Behcet uveitis", Graefes Arch.Clin.Exp.Ophthalmol., vol. 244, no. 12, pp. 1692-1695.
Tugal-Tutkun, I., Onal, S., Altan-Yaycioglu, R., Kir, N., & Urgancioglu, M. 2006, "Neovascularization of the optic disc in Behcet's disease", Jpn.J.Ophthalmol., vol. 50, no. 3, pp. 256-265.
367
Usui, T., Nishikomori, R., Kitani, A., & Strober, W. 2003, "GATA-3 suppresses Th1 development by downregulation of Stat4 and not through effects on IL-12Rbeta2 chain or T-bet", Immunity., vol. 18, no. 3, pp. 415-428.
Usui, T., Preiss, J. C., Kanno, Y., Yao, Z. J., Bream, J. H., O'shea, J. J., & Strober, W. 2006, "T-bet regulates Th1 responses through essential effects on GATA-3 function rather than on IFNG gene acetylation and transcription", J.Exp.Med., vol. 203, no. 3, pp. 755-766.
Valencia, X., Stephens, G., Goldbach-Mansky, R., Wilson, M., Shevach, E. M., & Lipsky, P. E. 2006, "TNF downmodulates the function of human CD4+CD25hi T-regulatory cells", Blood, vol. 108, no. 1, pp. 253-261.
van Amelsfort, J. M., Jacobs, K. M., Bijlsma, J. W., Lafeber, F. P., & Taams, L. S. 2004, "CD4(+)CD25(+) regulatory T cells in rheumatoid arthritis: differences in the presence, phenotype, and function between peripheral blood and synovial fluid", Arthritis Rheum., vol. 50, no. 9, pp. 2775-2785.
van de Berg, P. J., van Leeuwen, E. M., ten Berge, I. J., & van Lier, R. 2008, "Cytotoxic human CD4(+) T cells", Curr.Opin.Immunol., vol. 20, no. 3, pp. 339-343.
van Winsen, L. M., Polman, C. H., Dijkstra, C. D., Tilders, F. J., & Uitdehaag, B. M. 2010, "Suppressive effect of glucocorticoids on TNF-alpha production is associated with their clinical effect in multiple sclerosis", Mult.Scler., vol. 16, no. 4, pp. 500-502.
Vandenbark, A. A., Huan, J., Agotsch, M., La Tocha, D., Goelz, S., Offner, H., Lanker, S., & Bourdette, D. 2009, "Interferon-beta-1a treatment increases CD56bright natural killer cells and CD4+CD25+ Foxp3 expression in subjects with multiple sclerosis", J Neuroimmunol., vol. 215, no. 1-2, pp. 125-128.
Veldhoen, M. 2009, "The role of T helper subsets in autoimmunity and allergy", Curr.Opin.Immunol.
Veldhoen, M., Hirota, K., Christensen, J., O'Garra, A., & Stockinger, B. 2009, "Natural agonists for aryl hydrocarbon receptor in culture medium are essential for optimal differentiation of Th17 T cells", J Exp.Med., vol. 206, no. 1, pp. 43-49.
Veldhoen, M., Hirota, K., Westendorf, A. M., Buer, J., Dumoutier, L., Renauld, J. C., & Stockinger, B. 2008a, "The aryl hydrocarbon receptor links TH17-cell-mediated autoimmunity to environmental toxins", Nature, vol. 453, no. 7191, pp. 106-109.
Veldhoen, M., Uyttenhove, C., van Snick, J., Helmby, H., Westendorf, A., Buer, J., Martin, B., Wilhelm, C., & Stockinger, B. 2008b, "Transforming growth factor-beta 'reprograms' the differentiation of T helper 2 cells and promotes an interleukin 9-producing subset", Nat Immunol., vol. 9, no. 12, pp. 1341-1346.
Verity, D. H., Marr, J. E., Ohno, S., Wallace, G. R., & Stanford, M. R. 1999, "Behcet's disease, the Silk Road and HLA-B51: historical and geographical perspectives", Tissue Antigens, vol. 54, no. 3, pp. 213-220.
368
Verity, D. H., Wallace, G. R., Vaughan, R. W., & Stanford, M. R. 2003, "Behcet's disease: from Hippocrates to the third millennium", Br.J.Ophthalmol., vol. 87, no. 9, pp. 1175-1183.
Verjans, G. M., van Hagen, P. M., van der, K. A., Osterhaus, A. D., & Baarsma, G. S. 2002, "Vgamma9Vdelta2 T cells recovered from eyes of patients with Behcet's disease recognize non-peptide prenyl pyrophosphate antigens", J.Neuroimmunol., vol. 130, no. 1-2, pp. 46-54.
Viola, A., Contento, R. L., & Molon, B. 2006, "T cells and their partners: The chemokine dating agency", Trends Immunol., vol. 27, no. 9, pp. 421-427.
Vogelzang, A., McGuire, H. M., Yu, D., Sprent, J., Mackay, C. R., & King, C. 2008, "A fundamental role for interleukin-21 in the generation of T follicular helper cells", Immunity., vol. 29, no. 1, pp. 127-137.
Volpe, E., Servant, N., Zollinger, R., Bogiatzi, S. I., Hupe, P., Barillot, E., & Soumelis, V. 2008, "A critical function for transforming growth factor-beta, interleukin 23 and proinflammatory cytokines in driving and modulating human T(H)-17 responses", Nat.Immunol., vol. 9, no. 6, pp. 650-657.
Voo, K. S., Wang, Y. H., Santori, F. R., Boggiano, C., Wang, Y. H., Arima, K., Bover, L., Hanabuchi, S., Khalili, J., Marinova, E., Zheng, B., Littman, D. R., & Liu, Y. J. 2009, "Identification of IL-17-producing FOXP3+ regulatory T cells in humans", Proc.Natl.Acad.Sci.U.S.A, vol. 106, no. 12, pp. 4793-4798.
Vukmanovic-Stejic, M., Vyas, B., Gorak-Stolinska, P., Noble, A., & Kemeny, D. M. 2000, "Human Tc1 and Tc2/Tc0 CD8 T-cell clones display distinct cell surface and functional phenotypes", Blood, vol. 95, no. 1, pp. 231-240.
Vyas, B. & Noble, A. 2008, "Short-term culture of CD8 cells and intracellular cytokine staining", Methods Mol.Med., vol. 138, pp. 73-83.
Wahl, S. M., McCartney-Francis, N., & Mergenhagen, S. E. 1989, "Inflammatory and immunomodulatory roles of TGF-beta", Immunol.Today, vol. 10, no. 8, pp. 258-261.
Walker, M. R., Carson, B. D., Nepom, G. T., Ziegler, S. F., & Buckner, J. H. 2005, "De novo generation of antigen-specific CD4+CD25+ regulatory T cells from human CD4+CD25- cells", Proc.Natl.Acad.Sci.U.S.A, vol. 102, no. 11, pp. 4103-4108.
Walker, M. R., Kasprowicz, D. J., Gersuk, V. H., Benard, A., Van Landeghen, M., Buckner, J. H., & Ziegler, S. F. 2003, "Induction of FoxP3 and acquisition of T regulatory activity by stimulated human CD4+CD25- T cells", J.Clin.Invest, vol. 112, no. 9, pp. 1437-1443.
Wan, Y. Y. 2010, "Multi-tasking of helper T cells", Immunology, vol. 130, no. 2, pp. 166-171.
Wan, Y. Y. & Flavell, R. A. 2007, "Regulatory T-cell functions are subverted and converted owing to attenuated Foxp3 expression", Nature, vol. 445, no. 7129, pp. 766-770.
369
Wan, Y. Y. & Flavell, R. A. 2008, "TGF-beta and regulatory T cell in immunity and autoimmunity", J.Clin.Immunol., vol. 28, no. 6, pp. 647-659.
Wang, W., Edington, H. D., Rao, U. N., Jukic, D. M., Radfar, A., Wang, H., & Kirkwood, J. M. 2008, "Effects of high-dose IFNalpha2b on regional lymph node metastases of human melanoma: modulation of STAT5, FOXP3, and IL-17", Clin.Cancer Res., vol. 14, no. 24, pp. 8314-8320.
Wang, Y. H., Angkasekwinai, P., Lu, N., Voo, K. S., Arima, K., Hanabuchi, S., Hippe, A., Corrigan, C. J., Dong, C., Homey, B., Yao, Z., Ying, S., Huston, D. P., & Liu, Y. J. 2007, "IL-25 augments type 2 immune responses by enhancing the expansion and functions of TSLP-DC-activated Th2 memory cells", J.Exp.Med., vol. 204, no. 8, pp. 1837-1847.
Wang, Z. J., Hong, J., Sun, W., Xu, G. W., Li, N. L., Chen, X., Liu, A., Xu, L. Y., Sun, B., & Zhang, J. W. Z. 2006, "Role of IFN-gamma in induction of Foxp3 and conversion of CD4(+)CD25(-) T cells to CD4(+) Tregs", Journal of Clinical Investigation, vol. 116, no. 9, pp. 2434-2441.
Weaver, C. T., Harrington, L. E., Mangan, P. R., Gavrieli, M., & Murphy, K. M. 2006, "Th17: an effector CD4 T cell lineage with regulatory T cell ties", Immunity., vol. 24, no. 6, pp. 677-688.
Weaver, C. T., Hatton, R. D., Mangan, P. R., & Harrington, L. E. 2007, "IL-17 family cytokines and the expanding diversity of effector T cell lineages", Annu.Rev.Immunol., vol. 25, pp. 821-852.
Weiner, H. L. 2001, "Induction and mechanism of action of transforming growth factor-beta-secreting Th3 regulatory cells", Immunol.Rev., vol. 182, pp. 207-214.
Wejstal, R., Norkrans, G., Lenkei, R., Weiland, O., Schvarcz, R., & Fryden, A. 1992, "Peripheral blood lymphocyte subsets in patients with chronic hepatitis C--effects of interferon treatment", Liver, vol. 12, no. 4 Pt 1, pp. 161-167.
Wenner, C. A., Guler, M. L., Macatonia, S. E., O'Garra, A., & Murphy, K. M. 1996, "Roles of IFN-gamma and IFN-alpha in IL-12-induced T helper cell-1 development", J.Immunol., vol. 156, no. 4, pp. 1442-1447.
Wesch, D., Glatzel, A., & Kabelitz, D. 2001, "Differentiation of resting human peripheral blood gamma delta T cells toward Th1- or Th2-phenotype", Cell Immunol., vol. 212, no. 2, pp. 110-117.
Wills, R. J. 1990, "Clinical Pharmacokinetics of Interferons", Clinical Pharmacokinetics, vol. 19, no. 5, pp. 390-399.
Wilson, N. J., Boniface, K., Chan, J. R., McKenzie, B. S., Blumenschein, W. M., Mattson, J. D., Basham, B., Smith, K., Chen, T., Morel, F., Lecron, J. C., Kastelein, R. A., Cua, D. J., McClanahan, T. K., Bowman, E. P., & de Waal, M. R. 2007, "Development, cytokine profile and function of human interleukin 17-producing helper T cells", Nat.Immunol., vol. 8, no. 9, pp. 950-957.
370
Witowski, J., Ksiazek, K., & Jorres, A. 2004, "Interleukin-17: a mediator of inflammatory responses", Cell Mol.Life Sci., vol. 61, no. 5, pp. 567-579.
Wu, Y., Borde, M., Heissmeyer, V., Feuerer, M., Lapan, A. D., Stroud, J. C., Bates, D. L., Guo, L., Han, A., Ziegler, S. F., Mathis, D., Benoist, C., Chen, L., & Rao, A. 2006, "FOXP3 controls regulatory T cell function through cooperation with NFAT", Cell, vol. 126, no. 2, pp. 375-387.
Xu, W. & Zhang, J. J. 2005, "Stat1-dependent synergistic activation of T-bet for IgG2a production during early stage of B cell activation", J.Immunol., vol. 175, no. 11, pp. 7419-7424.
Xystrakis, E., Dejean, A., Bernard, I., Druet, P, et al. 2004, "Identification of a novel natural regulatory CD8 T-cell subset and analysis of its mechanism of regulation", Blood, vol. 104, pp. 3294–301.
Yagi, H., Nomura, T., Nakamura, K., Yamazaki, S., Kitawaki, T., Hori, S., Maeda, M., Onodera, M., Uchiyama, T., Fujii, S., & Sakaguchi, S. 2004, "Crucial role of FOXP3 in the development and function of human CD25+CD4+ regulatory T cells", Int.Immunol., vol. 16, no. 11, pp. 1643-1656.
Yamamoto, J., Adachi, Y., Onoue, Y., Adachi, Y. S., Okabe, Y., Itazawa, T., Toyoda, M., Seki, T., Morohashi, M., Matsushima, K., & Miyawaki, T. 2000, "Differential expression of the chemokine receptors by the Th1- and Th2-type effector populations within circulating CD4+ T cells", J.Leukoc.Biol., vol. 68, no. 4, pp. 568-574.
Yamamoto, J. H., Minami, M., Inaba, G., Masuda, K., & Mochizuki, M. 1993, "Cellular autoimmunity to retinal specific antigens in patients with Behcet's disease", Br.J.Ophthalmol., vol. 77, no. 9, pp. 584-589.
Yamashita, N., Kaneoka, H., Kaneko, S., Takeno, M., Oneda, K., Koizumi, H., Kogure, M., Inaba, G., & Sakane, T. 1997, "Role of gammadelta T lymphocytes in the development of Behcet's disease", Clin.Exp.Immunol., vol. 107, no. 2, pp. 241-247.
Yang, L., Anderson, D. E., Baecher-Allan, C., Hastings, W. D., Bettelli, E., Oukka, M., Kuchroo, V. K., & Hafler, D. A. 2008a, "IL-21 and TGF-beta are required for differentiation of human T(H)17 cells", Nature, vol. 454, no. 7202, pp. 350-352.
Yang, X. O., Nurieva, R., Martinez, G. J., Kang, H. S., Chung, Y., Pappu, B. P., Shah, B., Chang, S. H., Schluns, K. S., Watowich, S. S., Feng, X. H., Jetten, A. M., & Dong, C. 2008b, "Molecular antagonism and plasticity of regulatory and inflammatory T cell programs", Immunity., vol. 29, no. 1, pp. 44-56.
Yang, X. O., Pappu, B. P., Nurieva, R., Akimzhanov, A., Kang, H. S., Chung, Y., Ma, L., Shah, B., Panopoulos, A. D., Schluns, K. S., Watowich, S. S., Tian, Q., Jetten, A. M., & Dong, C. 2008c, "T helper 17 lineage differentiation is programmed by orphan nuclear receptors ROR alpha and ROR gamma", Immunity., vol. 28, no. 1, pp. 29-39.
Yasuoka, H., Yamaguchi, Y., Mizuki, N., Nishida, T., Kawakami, Y., & Kuwana, M. 2008, "Preferential activation of circulating CD8+ and gammadelta T cells in patients
371
with active Behcet's disease and HLA-B51", Clin.Exp.Rheumatol., vol. 26, no. 4 Suppl 50, p. S59-S63.
Yates, J., Rovis, F., Mitchell, P., Afzali, B., Tsang, J. Y., Garin, M., Lechler, R. I., Lombardi, G., & Garden, O. A. 2007, "The maintenance of human CD4+ CD25+ regulatory T cell function: IL-2, IL-4, IL-7 and IL-15 preserve optimal suppressive potency in vitro", Int.Immunol., vol. 19, no. 6, pp. 785-799.
Yates, P. A. & Michelson, J. B. 2006, "Behcet disease", Int.Ophthalmol.Clin., vol. 46, no. 2, pp. 209-233.
Yazici, H. 1997, "The place of Behcet's syndrome among the autoimmune diseases", Int.Rev.Immunol., vol. 14, no. 1, pp. 1-10.
Yen, D., Cheung, J., Scheerens, H., Poulet, F., McClanahan, T., McKenzie, B., Kleinschek, M. A., Owyang, A., Mattson, J., Blumenschein, W., Murphy, E., Sathe, M., Cua, D. J., Kastelein, R. A., & Rennick, D. 2006, "IL-23 is essential for T cell-mediated colitis and promotes inflammation via IL-17 and IL-6", J.Clin.Invest, vol. 116, no. 5, pp. 1310-1316.
Yoshida, H., Nakaya, M., & Miyazaki, Y. 2009, "Interleukin 27: a double-edged sword for offense and defense", J.Leukoc.Biol., vol. 86, no. 6, pp. 1295-1303.
Yoshikawa, K., Kotake, S., Kubota, T., Kimura, K., Isogai, E., & Fujii, N. 1998, "Cloning and sequencing of BeS-1 gene encoding the immunogenic antigen of Streptococcus sanguis KTH-1 isolated from the patients with Behcet's disease", Zentralbl.Bakteriol., vol. 287, no. 4, pp. 449-460.
Yosipovitch, G., Shohat, B., Bshara, J., Wysenbeek, A., & Weinberger, A. 1995, "Elevated serum interleukin 1 receptors and interleukin 1B in patients with Behcet's disease: correlations with disease activity and severity", Isr.J.Med.Sci., vol. 31, no. 6, pp. 345-348.
Yu, H. G., Lee, D. S., Seo, J. M., Ahn, J. K., Yu, Y. S., Lee, W. J., & Chung, H. 2004, "The number of CD8+ T cells and NKT cells increases in the aqueous humor of patients with Behcet's uveitis", Clin.Exp.Immunol., vol. 137, no. 2, pp. 437-443.
Yurdakul, S. & Yazici, H. 2008, "Behcet's syndrome", Best.Pract.Res.Clin.Rheumatol., vol. 22, no. 5, pp. 793-809.
Zakka, F. R., Chang, P. Y., Giuliari, G. P., & Foster, C. S. 2009, "Current trends in the management of ocular symptoms in Adamantiades-Behcet's disease", Clin.Ophthalmol, vol. 3, pp. 567-579.
Zanin-Zhorov, A., Cahalon, L., Tal, G., Margalit, R., Lider, O., & Cohen, I. R. 2006, "Heat shock protein 60 enhances CD4+ CD25+ regulatory T cell function via innate TLR2 signaling", J.Clin.Invest, vol. 116, no. 7, pp. 2022-2032.
Zhang, C., Zhang, J., Yang, B., & Wu, C. 2008, "Cyclosporin A inhibits the production of IL-17 by memory Th17 cells from healthy individuals and patients with rheumatoid arthritis", Cytokine, vol. 42, no. 3, pp. 345-352.
372
Zhang, F., Meng, G., & Strober, W. 2008, "Interactions among the transcription factors Runx1, RORgammat and Foxp3 regulate the differentiation of interleukin 17-producing T cells", Nat.Immunol., vol. 9, no. 11, pp. 1297-1306.
Zhang, H., Chua, K. S., Guimond, M., Kapoor, V., Brown, M. V., Fleisher, T. A., Long, L. M., Bernstein, D., Hill, B. J., Douek, D. C., Berzofsky, J. A., Carter, C. S., Read, E. J., Helman, L. J., & Mackall, C. L. 2005, "Lymphopenia and interleukin-2 therapy alter homeostasis of CD4+CD25+ regulatory T cells", Nat.Med., vol. 11, no. 11, pp. 1238-1243.
Zhao, C., Yang, P., He, H., Lin, X., Li, B., Zhou, H., Huang, X., & Kijlstra, A. 2008, "S-antigen specific T helper type 1 response is present in Behcet's disease", Mol.Vis., vol. 14, pp. 1456-1464.
Zheng, J., Liu, Y., Qin, G., Lam, K. T., Guan, J., Xiang, Z., Lewis, D. B., Lau, Y. L., & Tu, W. 2010, "Generation of human Th1-like regulatory CD4(+) T cells by an intrinsic IFN-gamma- and T-bet-dependent pathway", Eur.J.Immunol.
Zheng, S. G., Gray, J. D., Ohtsuka, K., Yamagiwa, S., & Horwitz, D. A. 2002, "Generation ex vivo of TGF-beta-producing regulatory T cells from CD4+CD25- precursors", J.Immunol., vol. 169, no. 8, pp. 4183-4189.
Zhu, J., Cote-Sierra, J., Guo, L., & Paul, W. E. 2003, "Stat5 activation plays a critical role in Th2 differentiation", Immunity., vol. 19, no. 5, pp. 739-748.
Zhu, J. & Paul, W. E. 2008, "CD4 T cells: fates, functions, and faults", Blood, vol. 112, no. 5, pp. 1557-1569.
Zhu, J. & Paul, W. E. 2010, "Peripheral CD4+ T-cell differentiation regulated by networks of cytokines and transcription factors", Immunol.Rev., vol. 238, no. 1, pp. 247-262.
Zhu, J., Yamane, H., & Paul, W. E. 2010, "Differentiation of effector CD4 T cell populations (*)", Annu.Rev.Immunol., vol. 28, pp. 445-489.
Zidek, Z., Anzenbacher, P., & Kmonickova, E. 2009, "Current status and challenges of cytokine pharmacology", Br.J.Pharmacol., vol. 157, no. 3, pp. 342-361.
Ziegler-Heitbrock, L., Lotzerich, M., Schaefer, A., Werner, T., Frankenberger, M., & Benkhart, E. 2003, "IFN-alpha induces the human IL-10 gene by recruiting both IFN regulatory factor 1 and Stat3", J.Immunol., vol. 171, no. 1, pp. 285-290.
Zierhut, M., Mizuki, N., Ohno, S., Inoko, H., Gul, A., Onoe, K., & Isogai, E. 2003, "Immunology and functional genomics of Behcet's disease", Cell Mol.Life Sci., vol. 60, no. 9, pp. 1903-1922.
Ziolkowska, M., Koc, A., Luszczykiewicz, G., Ksiezopolska-Pietrzak, K., Klimczak, E., Chwalinska-Sadowska, H., & Maslinski, W. 2000, "High levels of IL-17 in rheumatoid arthritis patients: IL-15 triggers in vitro IL-17 production via cyclosporin A-sensitive mechanism", J.Immunol., vol. 164, no. 5, pp. 2832-2838.

373
Zouboulis, C. C. & Orfanos, C. E. 1998, "Treatment of Adamantiades-Behcet disease with systemic interferon alfa", Arch.Dermatol., vol. 134, no. 8, pp. 1010-1016.
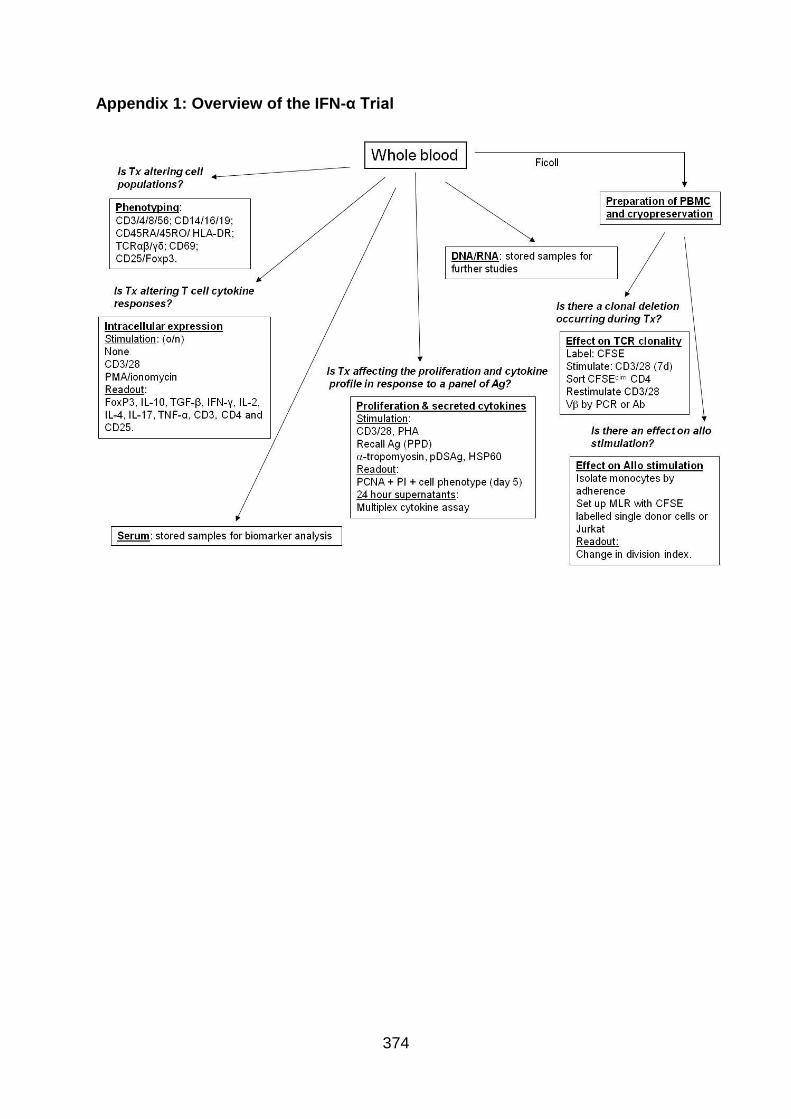
374
Appendix 1: Overview of the IFN-α Trial
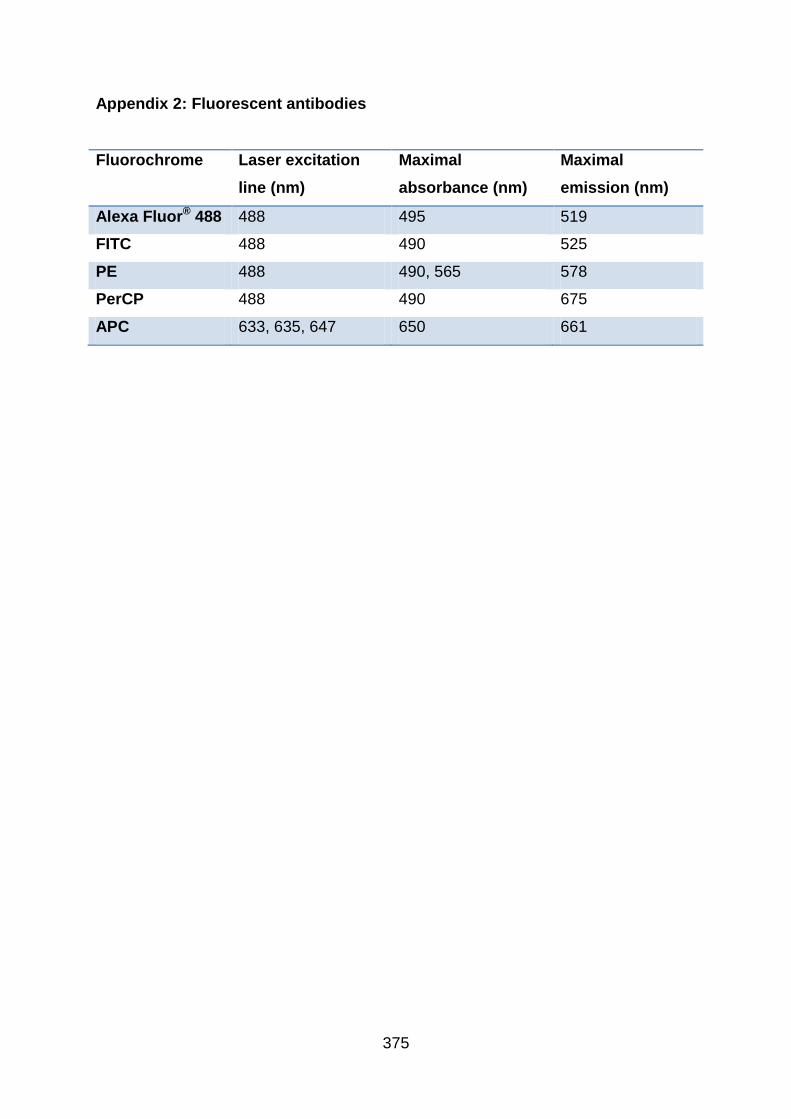
375
Appendix 2: Fluorescent antibodies
Fluorochrome Laser excitation
line (nm)
Maximal
absorbance (nm)
Maximal
emission (nm)
Alexa Fluor® 488 488 495 519
FITC 488 490 525
PE 488 490, 565 578
PerCP 488 490 675
APC 633, 635, 647 650 661
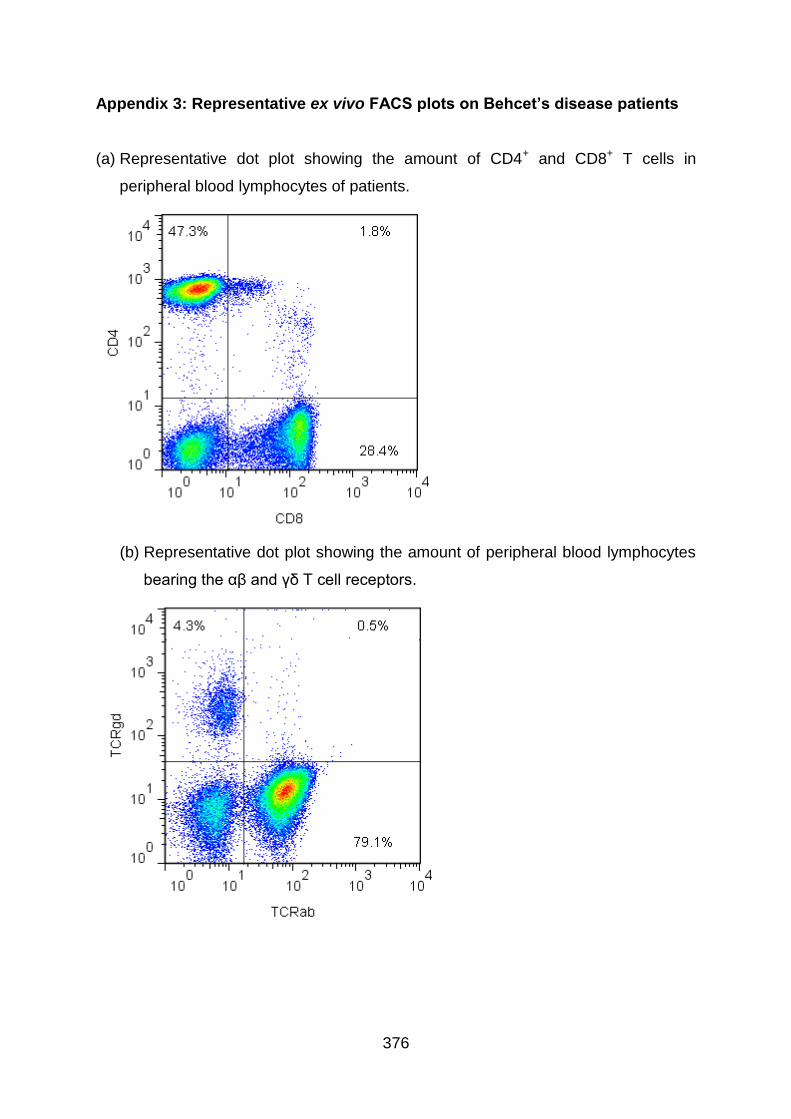
376
Appendix 3: Representative ex vivo FACS plots on Behcet’s disease patients
(a) Representative dot plot showing the amount of CD4+ and CD8+ T cells in
peripheral blood lymphocytes of patients.
(b) Representative dot plot showing the amount of peripheral blood lymphocytes
bearing the αβ and γδ T cell receptors.
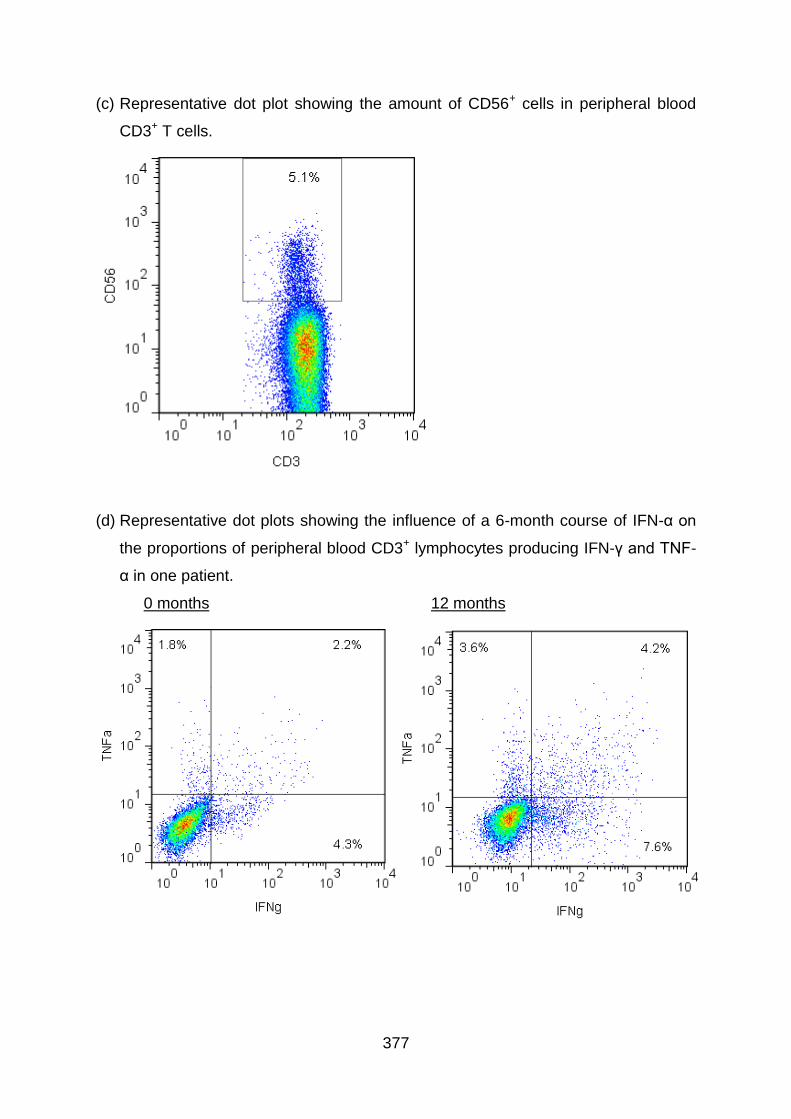
377
(c) Representative dot plot showing the amount of CD56+ cells in peripheral blood
CD3+ T cells.
(d) Representative dot plots showing the influence of a 6-month course of IFN-α on
the proportions of peripheral blood CD3+ lymphocytes producing IFN-γ and TNF-
α in one patient.
0 months 12 months
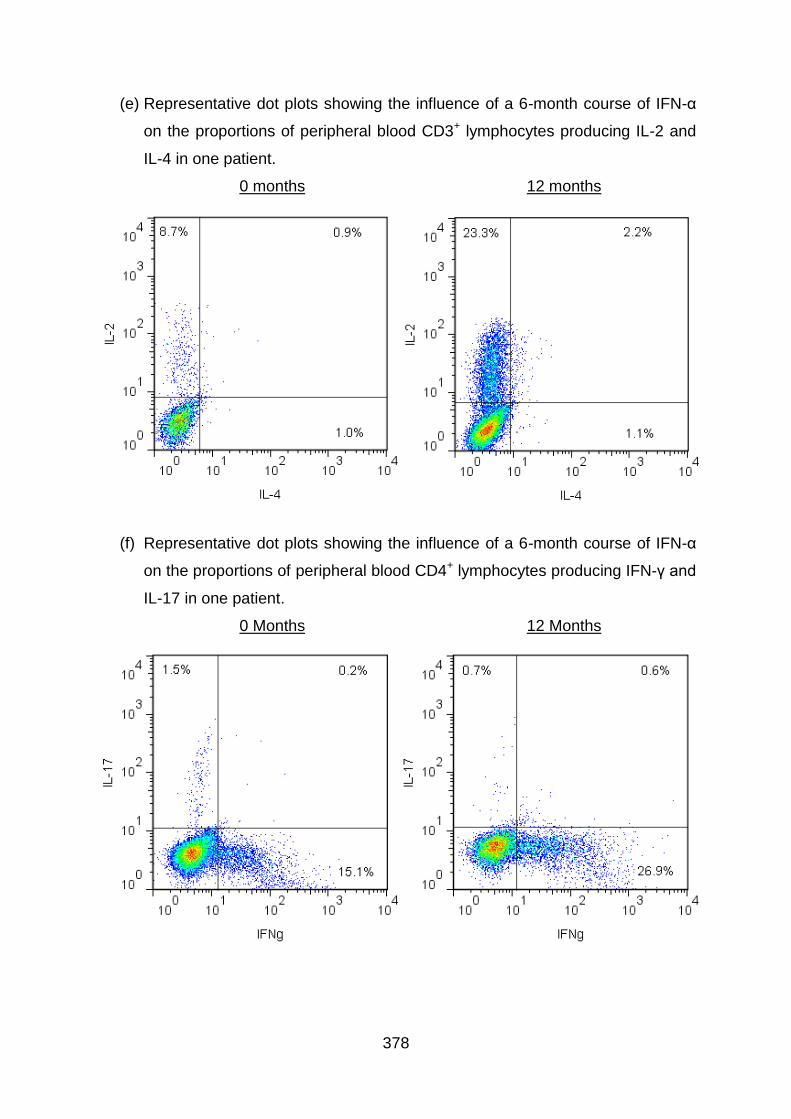
378
(e) Representative dot plots showing the influence of a 6-month course of IFN-α
on the proportions of peripheral blood CD3+ lymphocytes producing IL-2 and
IL-4 in one patient.
0 months 12 months
(f) Representative dot plots showing the influence of a 6-month course of IFN-α
on the proportions of peripheral blood CD4+ lymphocytes producing IFN-γ and
IL-17 in one patient.
0 Months 12 Months
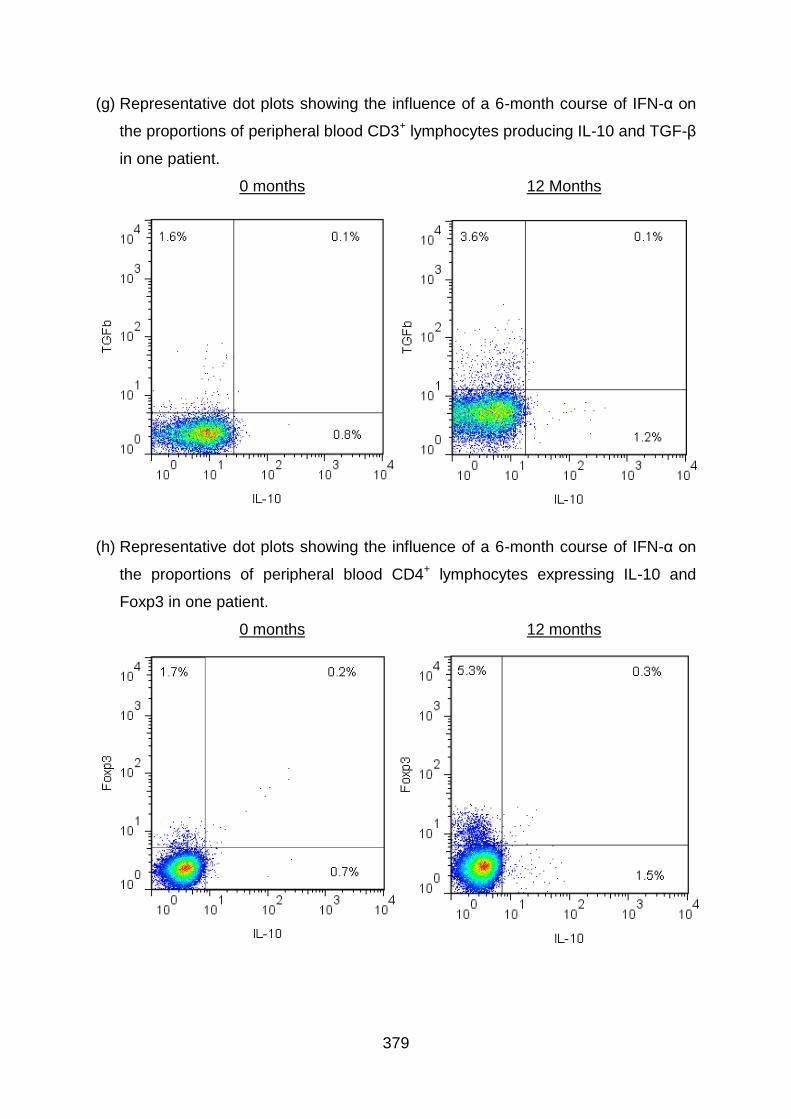
379
(g) Representative dot plots showing the influence of a 6-month course of IFN-α on
the proportions of peripheral blood CD3+ lymphocytes producing IL-10 and TGF-β
in one patient.
0 months 12 Months
(h) Representative dot plots showing the influence of a 6-month course of IFN-α on
the proportions of peripheral blood CD4+ lymphocytes expressing IL-10 and
Foxp3 in one patient.
0 months 12 months
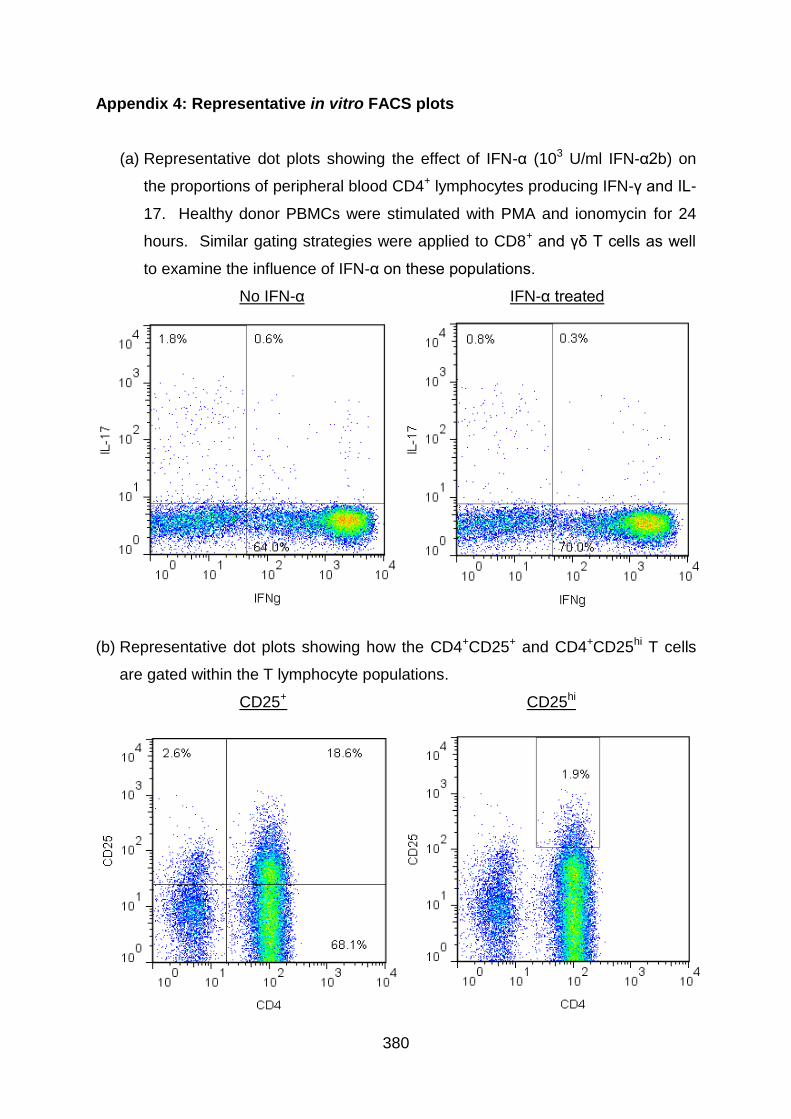
380
Appendix 4: Representative in vitro FACS plots
(a) Representative dot plots showing the effect of IFN-α (103 U/ml IFN-α2b) on
the proportions of peripheral blood CD4+ lymphocytes producing IFN-γ and IL-
17. Healthy donor PBMCs were stimulated with PMA and ionomycin for 24
hours. Similar gating strategies were applied to CD8+ and γδ T cells as well
to examine the influence of IFN-α on these populations.
No IFN-α IFN-α treated
(b) Representative dot plots showing how the CD4+CD25+ and CD4+CD25hi T cells
are gated within the T lymphocyte populations.
CD25+ CD25hi
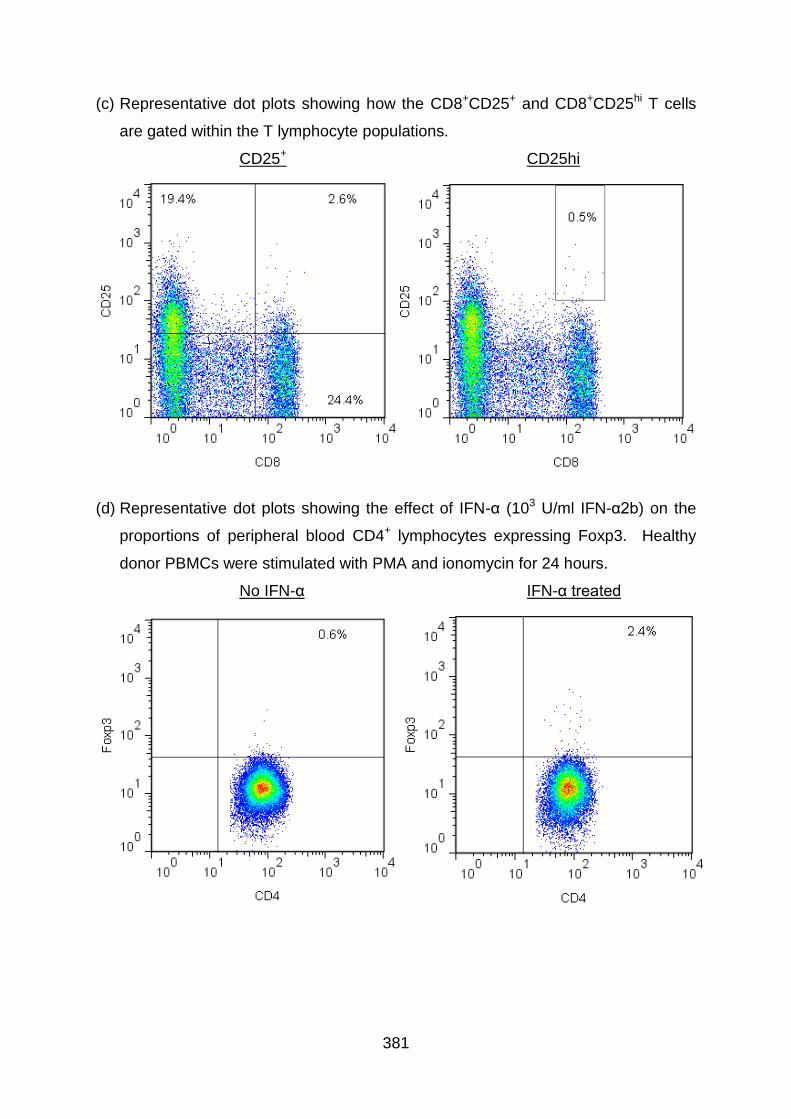
381
(c) Representative dot plots showing how the CD8+CD25+ and CD8+CD25hi T cells
are gated within the T lymphocyte populations.
CD25+ CD25hi
(d) Representative dot plots showing the effect of IFN-α (103 U/ml IFN-α2b) on the
proportions of peripheral blood CD4+ lymphocytes expressing Foxp3. Healthy
donor PBMCs were stimulated with PMA and ionomycin for 24 hours.
No IFN-α IFN-α treated
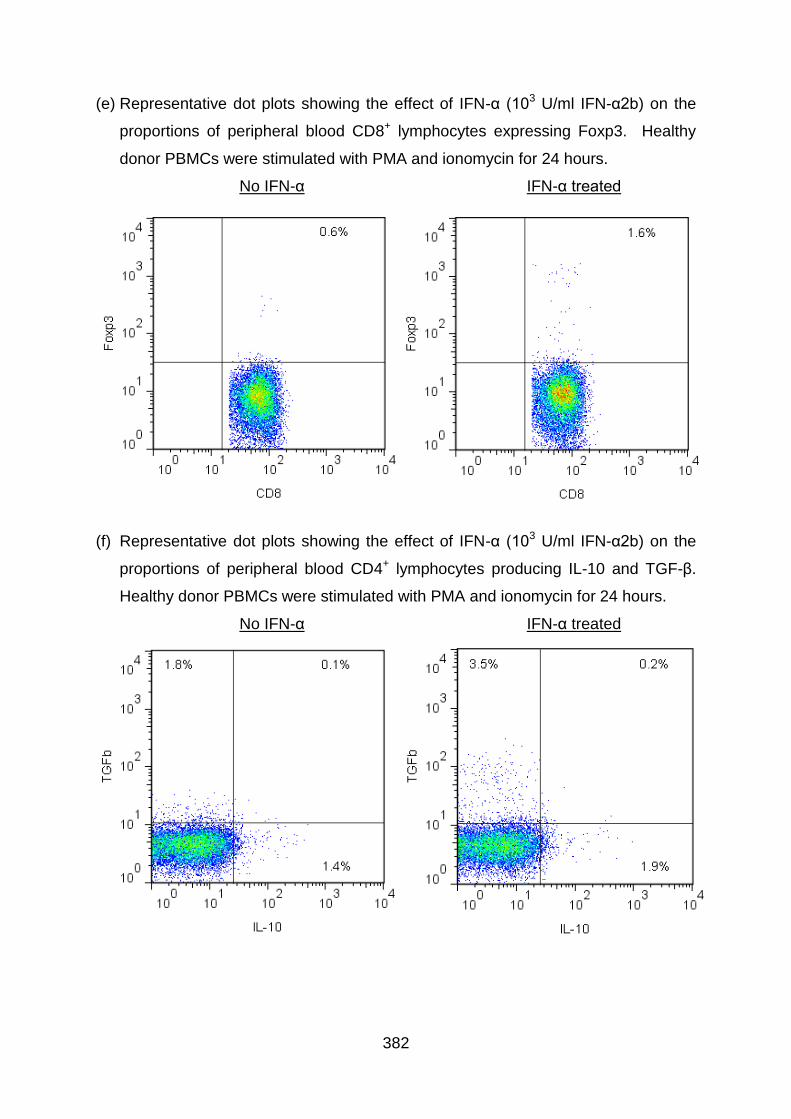
382
(e) Representative dot plots showing the effect of IFN-α (103 U/ml IFN-α2b) on the
proportions of peripheral blood CD8+ lymphocytes expressing Foxp3. Healthy
donor PBMCs were stimulated with PMA and ionomycin for 24 hours.
No IFN-α IFN-α treated
(f) Representative dot plots showing the effect of IFN-α (103 U/ml IFN-α2b) on the
proportions of peripheral blood CD4+ lymphocytes producing IL-10 and TGF-β.
Healthy donor PBMCs were stimulated with PMA and ionomycin for 24 hours.
No IFN-α IFN-α treated
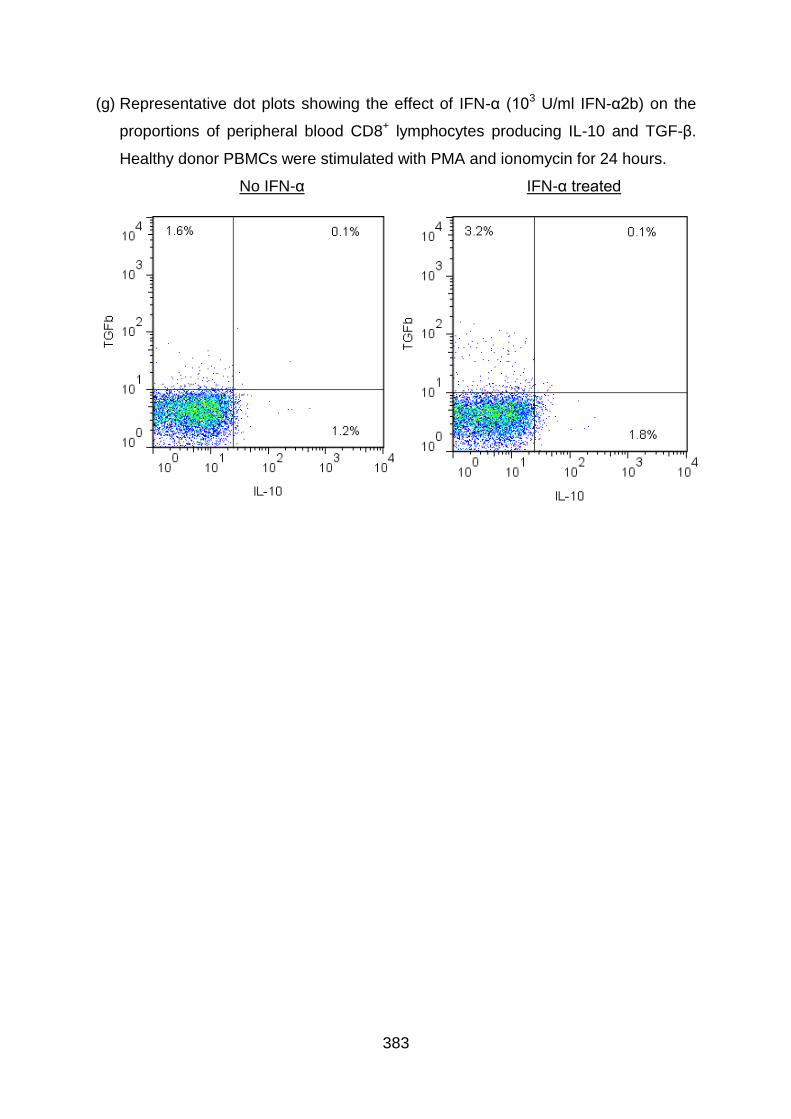
383
(g) Representative dot plots showing the effect of IFN-α (103 U/ml IFN-α2b) on the
proportions of peripheral blood CD8+ lymphocytes producing IL-10 and TGF-β.
Healthy donor PBMCs were stimulated with PMA and ionomycin for 24 hours.
No IFN-α IFN-α treated