iii. multicolor data near the south galactic pole
TRANSCRIPT
Astron. Astrophys. 345, 448–460 (1999) ASTRONOMYAND
ASTROPHYSICS
ESO imaging survey
III. Multicolor data near the South Galactic Pole
I. Prandoni1,2, R. Wichmann1,3, L. da Costa1, C. Benoist1,4, R. Mendez1,5, M. Nonino1,6, L.F. Olsen1,7, A. Wicenec1,S. Zaggia1,8, E. Bertin1,9,10, E. Deul1,9, T. Erben1,11, M.D. Guarnieri 1,12, I. Hook1, R. Hook13, M. Scodeggio1, andR. Slijkhuis1,9
1 European Southern Observatory, Karl-Schwarzschild-Strasse 2, D-85748 Garching bei Munchen, Germany2 Istituto di Radioastronomia del CNR, Via Gobetti 101, I-40129 Bologna, Italy3 IUCAA, Post Bag 4, Ganeshkhind, Pune 411007, India4 DAEC, Observatoire de Paris-Meudon, 5 Pl. J. Janssen, F-92195 Meudon Cedex, France5 Cerro Tololo Inter-American Observatory, Casilla 603, La Serena, Chile6 Osservatorio Astronomico di Trieste, Via G.B. Tiepolo 11, I-31144 Trieste, Italy7 Astronomisk Observatorium, Juliane Maries Vej 30, DK-2100 Copenhagen, Denmark8 Osservatorio Astronomico di Capodimonte, Via Moiariello 15, I-80131 Napoli, Italy9 Leiden Observatory, P.O. Box 9513, 2300 RA Leiden, The Netherlands
10 Institut d’Astrophysique de Paris, 98bis Bd Arago, F-75014 Paris, France11 Max-Planck-Institut fur Astrophysik, Postfach 1523, D-85748 Garching bei Munchen, Germany12 Osservatorio Astronomico di Pino Torinese, Strada Osservatorio 20, I-10025 Torino, Italy13 Space Telescope – European Coordinating Facility, Karl-Schwarzschild-Strasse 2, D-85748 Garching bei Munchen, Germany
Received 17 July 1998 / Accepted 16 December 1998
Abstract. This paper presents multicolor data obtained for a1.7 square degree region near the South Galactic Pole (patch B)as part of the ESO Imaging Survey (EIS). So far the observa-tions have been conducted inB, V andI, but are expected tobe complemented by observations in the U-band later in 1998.Object catalogs extracted from single exposure images are 80%complete down toB ∼ 24, V ∼ 23.5 andI ∼ 22.5, and onceco-added should reach about 0.5 mag deeper. The data are be-ing made public in the form of catalogs, pixel maps, target listsand image “postage stamps”, which can be retrieved from theWeb. Counts of stars and galaxies and the angular two-pointcorrelation function of galaxies are computed and compared toother available data to evaluate the depth and uniformity of theextracted object catalogs. In addition, color distributions of stel-lar objects are presented and compared to model predictions toexamine the reliability of the colors. The results suggest thatthe overall quality of the catalogs extracted from the images isgood and suitable for the science goals of the survey.
Key words: catalogs – surveys – stars: statistics – galaxies:statistics
1. Introduction
The present paper is part of a series presenting the data accumu-lated by the public ESO Imaging Survey (EIS) being carried outin preparation for the first year of regular operation of the VLT.
Send offprint requests to: L. da Costa
As described in previous papers (Renzini & da Costa 1997, Non-ino et al. 1999, hereafter paper I) the main science goal of EIS isthe search for rare objects such as clusters of galaxies, spanning abroad redshift range, quasars at intermediate and high redshifts,high-redshift galaxies and stars with special characteristics (e.g.,white dwarfs, very low mass stars, brown dwarfs). These goalshave guided the adopted survey strategy which, for EIS-wide,envisioned observations inV andI to search for clusters andin four passbands (U, B, V, I) over∼ 1.7 square degrees in aregion near the South Galactic Pole (EIS-wide patch B). Theobservations inB, V andI have already been completed, whileobservations in theU -band are expected to be carried out in thefall of 1999.
One of the main motivations for the multicolor survey hasbeen the identification of a large number of close line-of-sight,intermediate redshift QSOs to study the three-dimensional dis-tribution of absorbers, using medium and high-resolution spec-trographs (e.g., UVES) at the VLT. For this reason, a regionnear the SGP, where several QSOs are known from previousstudies, has been selected. However, the data are also useful forgalactic studies and for the identification of rare stellar popu-lations, with the survey having a unique combination of depthand area coverage. The additionalV -band images, which alto-gether overlap theI images over∼ 70% of the surveyed area inpatches A and B (15% of the whole EIS-wide), are also useful inthe search of galaxy clusters (e.g., Olsen et al. 1999, paper V).Finally, it is important to emphasize that the present data offeran excellent opportunity to assess the complexity of efficientlyhandling large volumes of multicolor data and extracting useful

I. Prandoni et al.: ESO imaging survey. III 449
0
10
20
30
0
10
20
30
0.5 1 1.5 2 2.5 30
10
20
30
Fig. 1. Histogram of the seeing distribution for patch B obtained fromall observed frames and from the frames actually accepted for the sur-vey (shaded area). Vertical lines refer to 25, 50 and 75 percentiles ofthe accepted frames distribution. The three panels refer to the threeobserved bands (B, V, I), as indicated in each panel.
target lists. This is a key element for the exploration of the fullrange of science offered by the multicolor surveys envisionedfor the new wide-field camera ([email protected]) at the ESO/MPIA2.2m telescope at La Silla.
In Sect. 2, the observations are described and the charac-teristics of the multicolor data are presented. This section alsopresents the extracted object catalogs and discusses their com-pleteness and reliability. In Sect. 3 the catalogs are evaluated bycomparison with models and other data. Concluding remarksare presented in Sect. 4.
2. Observations and data reduction
2.1. Observations
The observations of patch B were carried out over severalmonths in the period July 1997 to December 1997, using thered channel of the EMMI camera on the 3.5m New Technol-ogy Telescope (NTT) at La Silla. The red channel of EMMI isequipped with a Tektronix 2046× 2046 chip with a pixel sizeof 0.266 arcsec and a useful field-of-view of about9′ × 8.5′.EIS uses a special set ofBV I filters and the response functionof the system can be found in paper I.
As described in paper I, the observations were carried outby a sequence of overlapping exposures (hereafter referred to aseven/odd frames) 150 sec each, with each position on the sky be-ing sampled at least twice. A total of 701 frames were obtainedin the area with 200 inB, 282 inV and 219 inI bands. Only 150frames in each band were required to cover the field but poorweather conditions required several frames to be re-observed.The strong variations in the observing conditions can be seen inFig. 1 which shows, for each band, the seeing distribution of allobserved frames. For comparison the shaded histograms showthe seeing distribution of the frames finally accepted, with thesolid vertical line in each panel indicating the median seeing foreach band. TheB-band is the worst overall with a median see-ing of 1.2 arcsec and with a few frames extending to very largeseeing (∼ 2.5 arcsec). The upper and lower quartiles are, as can
0
10
20
30
40
0
20
40
60
24 25 26 270
10
20
30
40
Fig. 2. Limiting isophote distributions from patch B frames actuallyaccepted for the survey. Vertical lines refer to 25, 50 and 75 percentilesof the distributions. The three panels refer to the three observed bands(B, V, I).
be seen in Fig. 1∼1.0 and∼1.3 inB, ∼ 0.8 and∼1.2 forV and∼0.9 and∼1.2 inI. In the analysis below 9 frames with seeing>∼1.8 arcsec were discarded because of their incompleteness atfaint magnitudes. Fig. 2 shows, again for each band, the1σ lim-iting isophote within 1 arcsec. The transparency of the nightsalso showed significant variations especially for theI-band im-ages, with one frame reaching 21 mag/arcsec2 (not shown in thefigure). For this frame, which was removed from the analysis,the depth reached is considerably shallower than the remain-ing frames leading not only to a bright limiting magnitude butalso to the detection of a significant number of spurious objects.Other frames with bright limiting isophotes have no significantimpact in the analysis presented in Sect. 3.
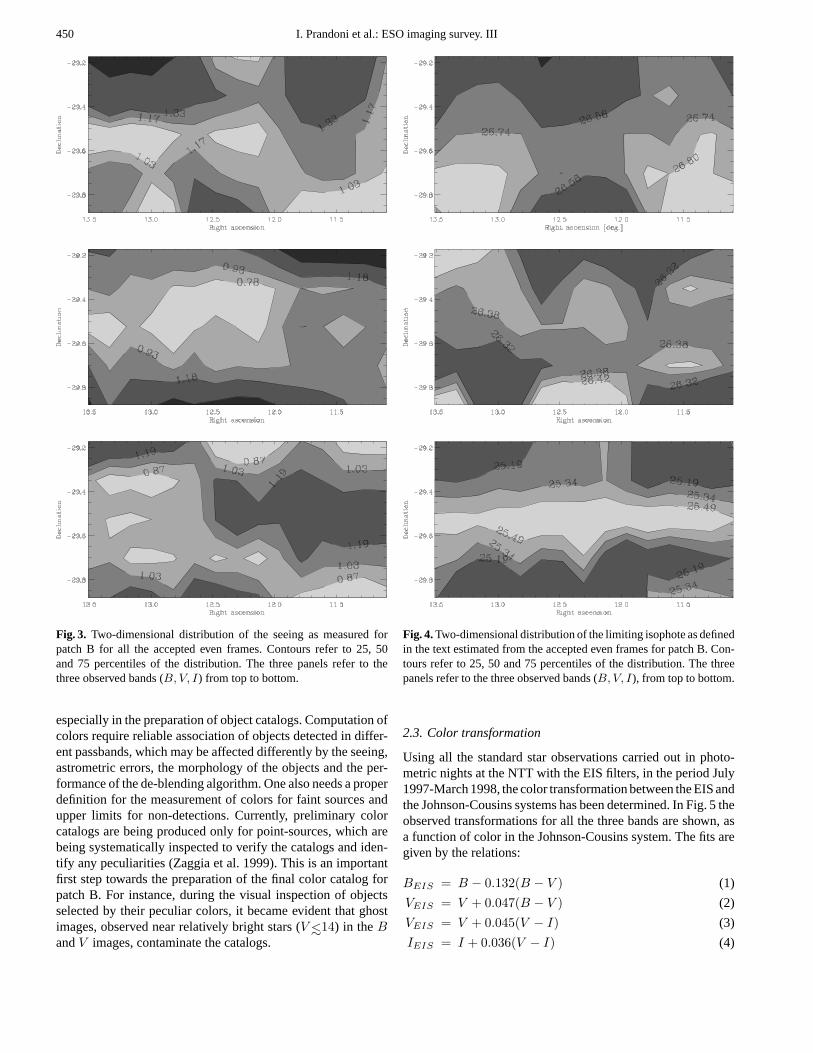
Figs. 3 and 4 show, for each band, the two-dimensional dis-tribution of the seeing and limiting isophote as determined fromthe even frames. Similar results are obtained for the odd frameswhich alternate with the even ones. Such maps allow the poten-tial user of the derived catalogs to evaluate their reliability. Thefinal data are reasonably homogeneous with the median seeingin all bands< 1.2 arcsec. However, some poor images do existand for some applications must be removed, as discussed above.The area that is affected is<∼0.1 square degree.
Finally, it is worth mentioning that since the completion ofpaper I, theV images for patch A over an area∼ 1.1 squaredegrees have also been reduced and are being made availabletogether with the catalogs extracted from them which are usedbelow.
2.2. Data reduction
The data were processed by the EIS pipeline being developedto handle large imaging programs and described in detail in pa-per I. The software development is still in progress with newfunctionalities being constantly added to the pipeline as wellas enhanced features in Skycat driven by the survey needs, inparticular to facilitate the visual inspection of the target listsbeing produced. In addition, new tools are being developed tohandle color information, which adds a new level of complexity
450 I. Prandoni et al.: ESO imaging survey. III
Fig. 3. Two-dimensional distribution of the seeing as measured forpatch B for all the accepted even frames. Contours refer to 25, 50and 75 percentiles of the distribution. The three panels refer to thethree observed bands (B, V, I) from top to bottom.
especially in the preparation of object catalogs. Computation ofcolors require reliable association of objects detected in differ-ent passbands, which may be affected differently by the seeing,astrometric errors, the morphology of the objects and the per-formance of the de-blending algorithm. One also needs a properdefinition for the measurement of colors for faint sources andupper limits for non-detections. Currently, preliminary colorcatalogs are being produced only for point-sources, which arebeing systematically inspected to verify the catalogs and iden-tify any peculiarities (Zaggia et al. 1999). This is an importantfirst step towards the preparation of the final color catalog forpatch B. For instance, during the visual inspection of objectsselected by their peculiar colors, it became evident that ghostimages, observed near relatively bright stars (V <∼14) in theBandV images, contaminate the catalogs.
Fig. 4.Two-dimensional distribution of the limiting isophote as definedin the text estimated from the accepted even frames for patch B. Con-tours refer to 25, 50 and 75 percentiles of the distribution. The threepanels refer to the three observed bands (B, V, I), from top to bottom.
2.3. Color transformation
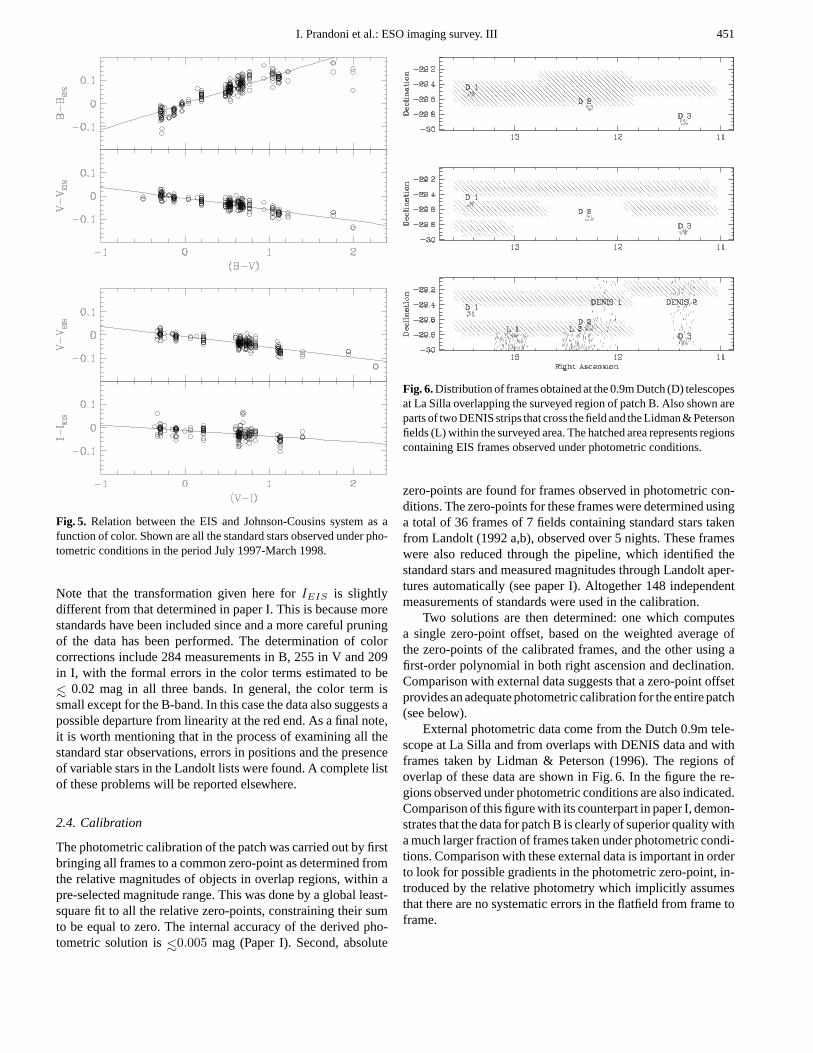
Using all the standard star observations carried out in photo-metric nights at the NTT with the EIS filters, in the period July1997-March 1998, the color transformation between the EIS andthe Johnson-Cousins systems has been determined. In Fig. 5 theobserved transformations for all the three bands are shown, asa function of color in the Johnson-Cousins system. The fits aregiven by the relations:
BEIS = B − 0.132(B − V ) (1)
VEIS = V + 0.047(B − V ) (2)
VEIS = V + 0.045(V − I) (3)
IEIS = I + 0.036(V − I) (4)
I. Prandoni et al.: ESO imaging survey. III 451
Fig. 5. Relation between the EIS and Johnson-Cousins system as afunction of color. Shown are all the standard stars observed under pho-tometric conditions in the period July 1997-March 1998.
Note that the transformation given here forIEIS is slightlydifferent from that determined in paper I. This is because morestandards have been included since and a more careful pruningof the data has been performed. The determination of colorcorrections include 284 measurements in B, 255 in V and 209in I, with the formal errors in the color terms estimated to be<∼ 0.02 mag in all three bands. In general, the color term issmall except for the B-band. In this case the data also suggests apossible departure from linearity at the red end. As a final note,it is worth mentioning that in the process of examining all thestandard star observations, errors in positions and the presenceof variable stars in the Landolt lists were found. A complete listof these problems will be reported elsewhere.
2.4. Calibration
The photometric calibration of the patch was carried out by firstbringing all frames to a common zero-point as determined fromthe relative magnitudes of objects in overlap regions, within apre-selected magnitude range. This was done by a global least-square fit to all the relative zero-points, constraining their sumto be equal to zero. The internal accuracy of the derived pho-tometric solution is<∼0.005 mag (Paper I). Second, absolute
Fig. 6.Distribution of frames obtained at the 0.9m Dutch (D) telescopesat La Silla overlapping the surveyed region of patch B. Also shown areparts of two DENIS strips that cross the field and the Lidman & Petersonfields (L) within the surveyed area. The hatched area represents regionscontaining EIS frames observed under photometric conditions.
zero-points are found for frames observed in photometric con-ditions. The zero-points for these frames were determined usinga total of 36 frames of 7 fields containing standard stars takenfrom Landolt (1992 a,b), observed over 5 nights. These frameswere also reduced through the pipeline, which identified thestandard stars and measured magnitudes through Landolt aper-tures automatically (see paper I). Altogether 148 independentmeasurements of standards were used in the calibration.
Two solutions are then determined: one which computesa single zero-point offset, based on the weighted average ofthe zero-points of the calibrated frames, and the other using afirst-order polynomial in both right ascension and declination.Comparison with external data suggests that a zero-point offsetprovides an adequate photometric calibration for the entire patch(see below).
External photometric data come from the Dutch 0.9m tele-scope at La Silla and from overlaps with DENIS data and withframes taken by Lidman & Peterson (1996). The regions ofoverlap of these data are shown in Fig. 6. In the figure the re-gions observed under photometric conditions are also indicated.Comparison of this figure with its counterpart in paper I, demon-strates that the data for patch B is clearly of superior quality witha much larger fraction of frames taken under photometric condi-tions. Comparison with these external data is important in orderto look for possible gradients in the photometric zero-point, in-troduced by the relative photometry which implicitly assumesthat there are no systematic errors in the flatfield from frame toframe.
452 I. Prandoni et al.: ESO imaging survey. III
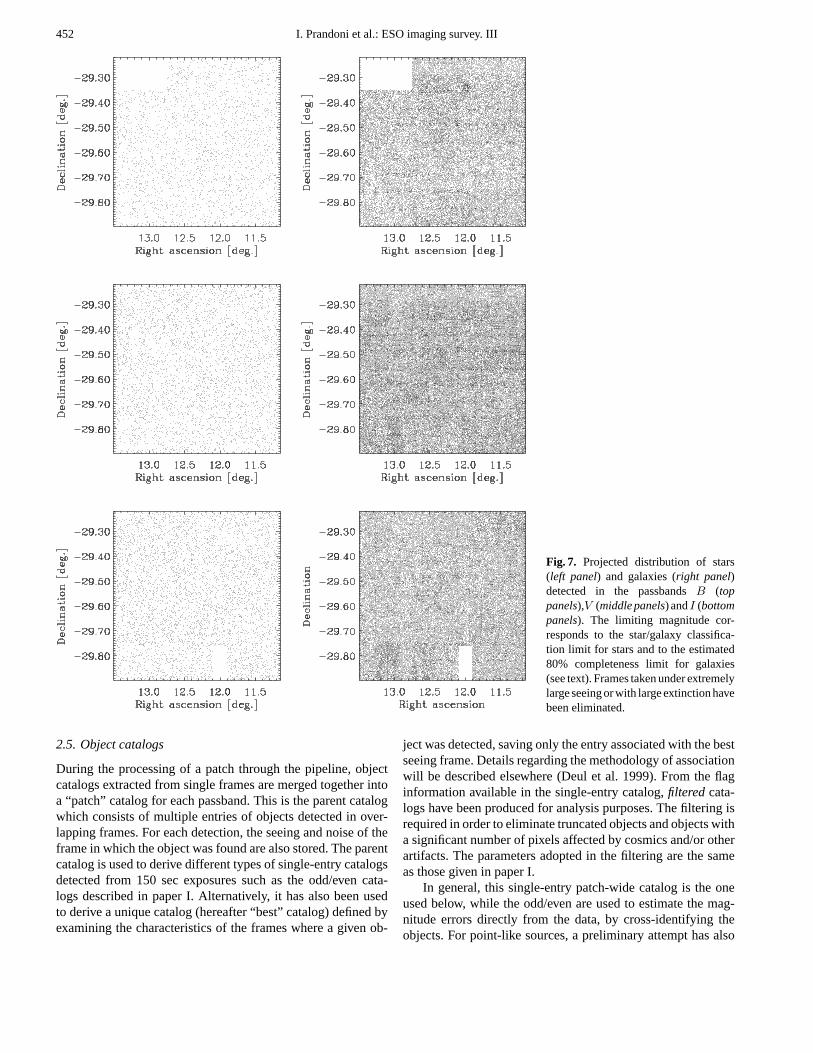
Fig. 7. Projected distribution of stars(left panel) and galaxies (right panel)detected in the passbandsB (toppanels),V (middle panels) andI (bottompanels). The limiting magnitude cor-responds to the star/galaxy classifica-tion limit for stars and to the estimated80% completeness limit for galaxies(see text). Frames taken under extremelylarge seeing or with large extinction havebeen eliminated.
2.5. Object catalogs
During the processing of a patch through the pipeline, objectcatalogs extracted from single frames are merged together intoa “patch” catalog for each passband. This is the parent catalogwhich consists of multiple entries of objects detected in over-lapping frames. For each detection, the seeing and noise of theframe in which the object was found are also stored. The parentcatalog is used to derive different types of single-entry catalogsdetected from 150 sec exposures such as the odd/even cata-logs described in paper I. Alternatively, it has also been usedto derive a unique catalog (hereafter “best” catalog) defined byexamining the characteristics of the frames where a given ob-
ject was detected, saving only the entry associated with the bestseeing frame. Details regarding the methodology of associationwill be described elsewhere (Deul et al. 1999). From the flaginformation available in the single-entry catalog,filtered cata-logs have been produced for analysis purposes. The filtering isrequired in order to eliminate truncated objects and objects witha significant number of pixels affected by cosmics and/or otherartifacts. The parameters adopted in the filtering are the sameas those given in paper I.
In general, this single-entry patch-wide catalog is the oneused below, while the odd/even are used to estimate the mag-nitude errors directly from the data, by cross-identifying theobjects. For point-like sources, a preliminary attempt has also
I. Prandoni et al.: ESO imaging survey. III 453
been made to produce a color catalog combining the informa-tion of the catalogs derived from each passband. Using the sameassociation scheme mentioned above, a cross-identification ofobjects is made and colors are computed using the magauto es-timator of SExtractor (e.g., Paper I) which should be adequatefor point sources. For non-detections in a given band, 1σ limitingmagnitudes are computed from the seeing and noise propertiesof the best seeing frame available at the expected position ofthe object. Even though still rudimentary, this derived catalogserves for verification purposes and for a first cut analysis of thedata. The final color catalog will only be derived from the co-added images. In this case, colors will be computed using thedetection area determined from a reference image (one band,e.g.,I, or the summed images of different bands,e.g.,V + I),but measuring the flux in the respective images. Even thoughthe required software is available it is only now being integratedinto the pipeline.
It is important to emphasize the complexity of handling andmerging information extracted from different passbands. Forinstance, each object may have a different SExtractor stellarity-index which may impact the galaxy/star classification, closepairs may be de-blended in one passband and not in another,depending on the seeing. Clearly a complete description of allthe possible pitfalls and the overall performance of the softwareis beyond the scope of the present paper, and will instead bediscussed in Deul et al. (1999). The current work also showsthe shortcomings of handling catalogs and points out the needfor the implementation of an object database with a flexible userinterface to allow for the full exploration of the data by differentgroups.
For the purposes of the present paper galaxies are objectswith stellarity index< 0.75 if brighter than the star/galaxy clas-sification limit (B=22, V =22, I=21) or any object, regardlessof the stellarity index, fainter than this limit. Stars are objectswith stellarity index≥ 0.75. Note that this definition leads tosome cross-contamination but it has no significant impact onthe conclusions. In evaluating the data in Sect. 3 the derived starand galaxy catalogs were, for simplicity, trimmed at the edgesand the bad frames discussed above were removed. After trim-ming the covered areas are: 1.3, 1.4 and 1.37 square degrees inB, V, I, respectively. The corresponding two-dimensional dis-tributions of stars, down to the star/galaxy classification limits,and galaxies, down to estimated 80% completeness limits (dis-cussed below), are shown in Fig. 7. The total number of objectsin these plots are: 2290 stars brighter thanB = 22 and 33133galaxies brighter thanB = 24; 3378 stars brighter thanV = 22and 58590 galaxies brighter thanV = 24; and 4297 stars and44546 galaxies brighter thanI = 21 andI = 22.5, respectively.Recall that the distribution shown is for the “best” catalog. Ifone wishes to work with the odd/even catalogs their distributionhave to be examined in the same way. In order to avoid extra-neous colors due to bad data in one or more bands, the colorcatalog examined in Sect. 3 corresponds to the common areascovered in the different passbands and has a total area of 1.27square degrees.
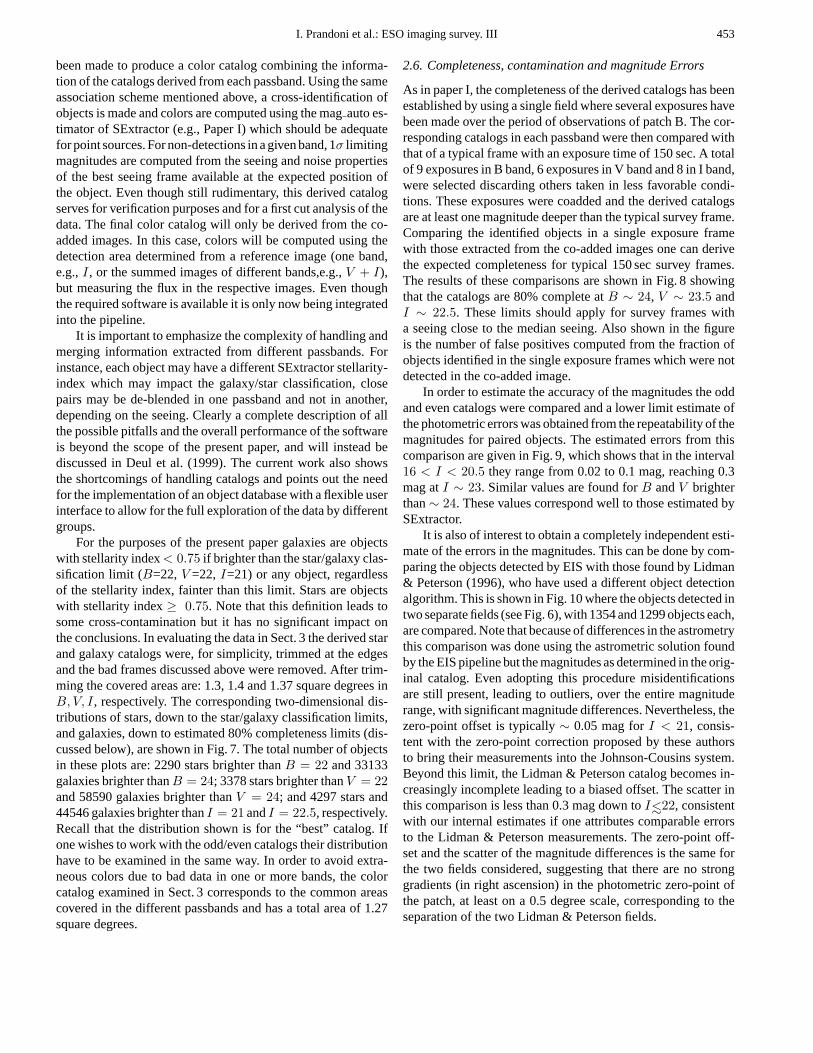
2.6. Completeness, contamination and magnitude Errors
As in paper I, the completeness of the derived catalogs has beenestablished by using a single field where several exposures havebeen made over the period of observations of patch B. The cor-responding catalogs in each passband were then compared withthat of a typical frame with an exposure time of 150 sec. A totalof 9 exposures in B band, 6 exposures in V band and 8 in I band,were selected discarding others taken in less favorable condi-tions. These exposures were coadded and the derived catalogsare at least one magnitude deeper than the typical survey frame.Comparing the identified objects in a single exposure framewith those extracted from the co-added images one can derivethe expected completeness for typical 150 sec survey frames.The results of these comparisons are shown in Fig. 8 showingthat the catalogs are 80% complete atB ∼ 24, V ∼ 23.5 andI ∼ 22.5. These limits should apply for survey frames witha seeing close to the median seeing. Also shown in the figureis the number of false positives computed from the fraction ofobjects identified in the single exposure frames which were notdetected in the co-added image.
In order to estimate the accuracy of the magnitudes the oddand even catalogs were compared and a lower limit estimate ofthe photometric errors was obtained from the repeatability of themagnitudes for paired objects. The estimated errors from thiscomparison are given in Fig. 9, which shows that in the interval16 < I < 20.5 they range from 0.02 to 0.1 mag, reaching 0.3mag atI ∼ 23. Similar values are found forB andV brighterthan∼ 24. These values correspond well to those estimated bySExtractor.
It is also of interest to obtain a completely independent esti-mate of the errors in the magnitudes. This can be done by com-paring the objects detected by EIS with those found by Lidman& Peterson (1996), who have used a different object detectionalgorithm. This is shown in Fig. 10 where the objects detected intwo separate fields (see Fig. 6), with 1354 and 1299 objects each,are compared. Note that because of differences in the astrometrythis comparison was done using the astrometric solution foundby the EIS pipeline but the magnitudes as determined in the orig-inal catalog. Even adopting this procedure misidentificationsare still present, leading to outliers, over the entire magnituderange, with significant magnitude differences. Nevertheless, thezero-point offset is typically∼ 0.05 mag forI < 21, consis-tent with the zero-point correction proposed by these authorsto bring their measurements into the Johnson-Cousins system.Beyond this limit, the Lidman & Peterson catalog becomes in-creasingly incomplete leading to a biased offset. The scatter inthis comparison is less than 0.3 mag down toI<∼22, consistentwith our internal estimates if one attributes comparable errorsto the Lidman & Peterson measurements. The zero-point off-set and the scatter of the magnitude differences is the same forthe two fields considered, suggesting that there are no stronggradients (in right ascension) in the photometric zero-point ofthe patch, at least on a 0.5 degree scale, corresponding to theseparation of the two Lidman & Peterson fields.
454 I. Prandoni et al.: ESO imaging survey. III
Fig. 8.Completeness (solid line) and expected contamination by spuri-ous objects (dashed line) in the EIS catalogs for the different passbandsconsidered. The computation of these quantities are described in thetext.
In order to further investigate possible systematic errors inthe photometric zero-point over the scale of the patch, the EIScatalogs were also compared with object catalogs extracted fromthe two DENIS strips that cross the survey region (see Fig. 6).This allows one to investigate the variation of the zero-pointas a function of right ascension and, especially, of declination.The results are shown in Fig. 11. The domain in which the com-parison can be made is relatively small because of saturation ofobjects in EIS at the bright end (I ∼ 16) and the shallow magni-tude limit of DENIS (I ∼ 18). Still, within the two magnitudeswhere comparison is possible one finds a roughly constant zero-point offset of less than 0.02 mag for both strips and a scatterthat can be attributed to the errors in the DENIS magnitudes(Deul 1998).
Fig. 9.Comparison between the estimated error in the magnitudes fromthe odd/even comparison (solid squares) and the SExtractor estimates(open squares).
Finally, similar comparisons can be made between the EISmagnitudes and those measured from the images obtained atthe 0.9m Dutch telescope at La Silla, in this case, for all threepassbands. Fig. 12 shows these comparisons, combining all thethree fields that overlap patch B. Even though the total numberof objects is relatively small (112 inB, 180 inV and 204 inI) preventing an accurate comparison, one finds a reasonableagreement in the zero-point and a scatter that can be accountedfor by magnitude errors in the Dutch data (∼ 0.2 at B = 21.5,V = 21.5 andI = 20). The observed zero-point offset betweenthe Dutch and EIS data (∼ 0.04 in B, <∼ 0.1 inV , <∼0.02 in I)can be explained by the color term corrections required for theEIS and Dutch measurements to bring both measurements intothe Cousins system. As the fields are well separated in rightascension, this result gives further evidence that there are no

I. Prandoni et al.: ESO imaging survey. III 455
16 18 20-1
-0.5
0
0.5
1
I
16 18 20-1
-0.5
0
0.5
1
I
Fig. 10. Comparison of the EIS data inI-bandwith Lidman & Peterson (1996) catalog for thetwo fields in common. Also shown are the meanand the rms in 0.5 mag bins.
15 16 17 18-1
-0.5
0
0.5
1
I
15 16 17 18-1
-0.5
0
0.5
1
I
Fig. 11. Comparison of the EISI-band magni-tudes with those measured by DENIS for the twostrips that overlap patch B. Also shown are themean and the rms in 0.5 mag bins.
Fig. 12. Comparison of the EIS magnitudes inB, V and I (top tobottom) with those measured from observations of the Dutch 0.9mtelescope. Objects in the three fields available have been combined.
significant gradients in the photometric zero-point in any of thepassbands.
In summary, comparison of the EIS magnitudes with avail-able external data shows no indication of gradients in the pho-
tometric zero-point of the patch. However, the external data aremainly overlapping the EIS data at low declination (δ<∼−29.5),especially for theB− andV −band, giving weaker constraintsin that direction for these bands. Instead, the consistency of thezeropoints for these bands were investigated using the(V − I)for halo stars in the turn-off region around(V − I) ' 0.7. Itwas found that the(V −I) of these stars showed a gradient withdeclination. To localize the problem the(B − V ) and(B − I)were also checked for gradients in the direction of declinationand the former was found to have gradient. Therefore, a linearrelation (Eq. 5) was fitted to remove this gradient.
Vcorr = Vold + 0.24 ∗ (30 + dec) (5)
This correction has been applied to the catalogs and a secondversion of the data will be released in 1999, to take this correc-tion into account.
3. Data evaluation
Although this paper does not intend to interpret the data, somebasic statistics are computed to evaluate the overall performanceof the EIS pipeline in translating images into useful scientificproducts. For this purpose, the stellar and galaxy samples ex-tracted in each passband and the preliminary color catalog forpoint-sources are compared below with other available data andmodel predictions.
456 I. Prandoni et al.: ESO imaging survey. III
Fig. 13. The EIS differential star counts versus magnitude comparedto the galactic model predictions (solid line), as described in the text.The model includes an old disk population (dashed line), a thick diskcomponent (long-dashed line) and a halo (dotted line).
3.1. Point-like sources
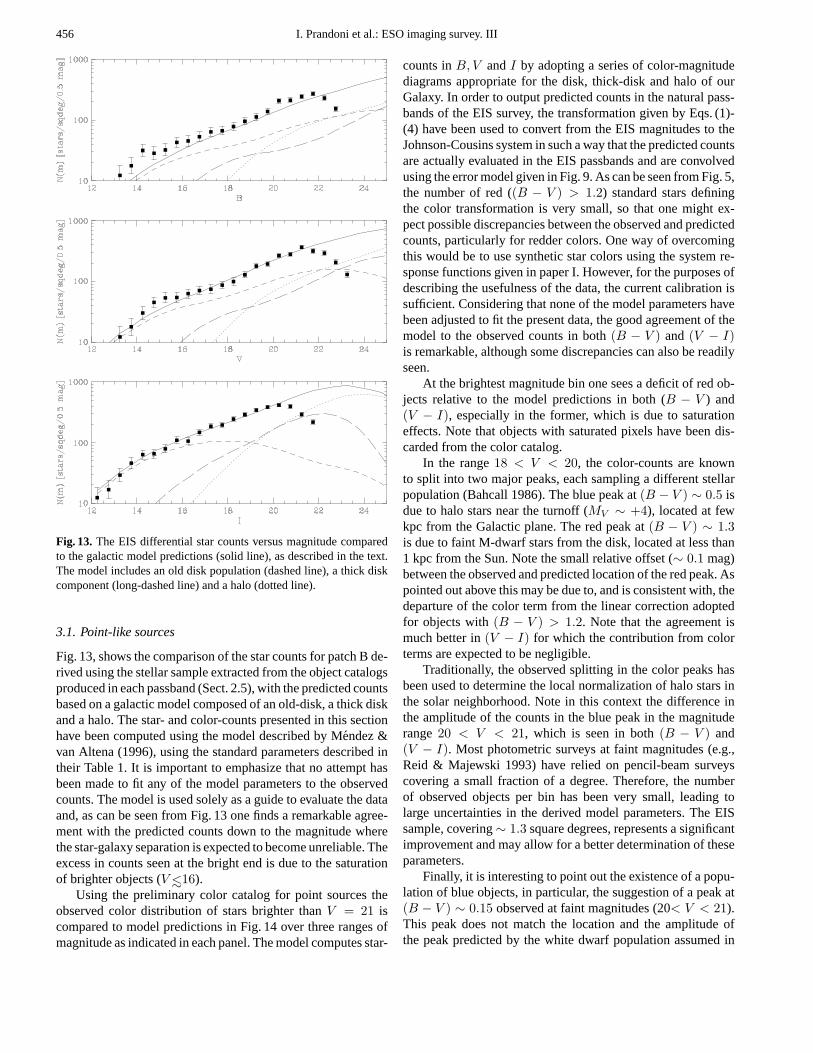
Fig. 13, shows the comparison of the star counts for patch B de-rived using the stellar sample extracted from the object catalogsproduced in each passband (Sect. 2.5), with the predicted countsbased on a galactic model composed of an old-disk, a thick diskand a halo. The star- and color-counts presented in this sectionhave been computed using the model described by Mendez &van Altena (1996), using the standard parameters described intheir Table 1. It is important to emphasize that no attempt hasbeen made to fit any of the model parameters to the observedcounts. The model is used solely as a guide to evaluate the dataand, as can be seen from Fig. 13 one finds a remarkable agree-ment with the predicted counts down to the magnitude wherethe star-galaxy separation is expected to become unreliable. Theexcess in counts seen at the bright end is due to the saturationof brighter objects (V <∼16).
Using the preliminary color catalog for point sources theobserved color distribution of stars brighter thanV = 21 iscompared to model predictions in Fig. 14 over three ranges ofmagnitude as indicated in each panel. The model computes star-
counts inB, V andI by adopting a series of color-magnitudediagrams appropriate for the disk, thick-disk and halo of ourGalaxy. In order to output predicted counts in the natural pass-bands of the EIS survey, the transformation given by Eqs. (1)-(4) have been used to convert from the EIS magnitudes to theJohnson-Cousins system in such a way that the predicted countsare actually evaluated in the EIS passbands and are convolvedusing the error model given in Fig. 9. As can be seen from Fig. 5,the number of red ((B − V ) > 1.2) standard stars definingthe color transformation is very small, so that one might ex-pect possible discrepancies between the observed and predictedcounts, particularly for redder colors. One way of overcomingthis would be to use synthetic star colors using the system re-sponse functions given in paper I. However, for the purposes ofdescribing the usefulness of the data, the current calibration issufficient. Considering that none of the model parameters havebeen adjusted to fit the present data, the good agreement of themodel to the observed counts in both(B − V ) and (V − I)is remarkable, although some discrepancies can also be readilyseen.
At the brightest magnitude bin one sees a deficit of red ob-jects relative to the model predictions in both (B − V ) and(V − I), especially in the former, which is due to saturationeffects. Note that objects with saturated pixels have been dis-carded from the color catalog.
In the range18 < V < 20, the color-counts are knownto split into two major peaks, each sampling a different stellarpopulation (Bahcall 1986). The blue peak at(B − V ) ∼ 0.5 isdue to halo stars near the turnoff (MV ∼ +4), located at fewkpc from the Galactic plane. The red peak at(B − V ) ∼ 1.3is due to faint M-dwarf stars from the disk, located at less than1 kpc from the Sun. Note the small relative offset (∼ 0.1 mag)between the observed and predicted location of the red peak. Aspointed out above this may be due to, and is consistent with, thedeparture of the color term from the linear correction adoptedfor objects with(B − V ) > 1.2. Note that the agreement ismuch better in(V − I) for which the contribution from colorterms are expected to be negligible.
Traditionally, the observed splitting in the color peaks hasbeen used to determine the local normalization of halo stars inthe solar neighborhood. Note in this context the difference inthe amplitude of the counts in the blue peak in the magnituderange20 < V < 21, which is seen in both(B − V ) and(V − I). Most photometric surveys at faint magnitudes (e.g.,Reid & Majewski 1993) have relied on pencil-beam surveyscovering a small fraction of a degree. Therefore, the numberof observed objects per bin has been very small, leading tolarge uncertainties in the derived model parameters. The EISsample, covering∼ 1.3 square degrees, represents a significantimprovement and may allow for a better determination of theseparameters.
Finally, it is interesting to point out the existence of a popu-lation of blue objects, in particular, the suggestion of a peak at(B − V ) ∼ 0.15 observed at faint magnitudes (20< V < 21).This peak does not match the location and the amplitude ofthe peak predicted by the white dwarf population assumed in
I. Prandoni et al.: ESO imaging survey. III 457
Fig. 14. Color distribution for point-sourcesfor different magnitude intervals as indi-cated in each panel. Also shown are predic-tions for the galactic model of Mendez &van Altena (1996).
the model. Instead the observed blue objects could consist ofa mix of white dwarfs, blue horizontal branch stars or perhapshalo field blue stragglers. Further investigation on the nature ofthese objects seems worthwhile.
The results demonstrate that the stellar color catalog beingproduced is by and large consistent with model predictions andthe observed differences may possibly point to deficiencies inthe model which should be further investigated by interestedgroups. Although primarily driven by other goals, the abovediscussion shows that the EIS data is also useful for galaticstudies.
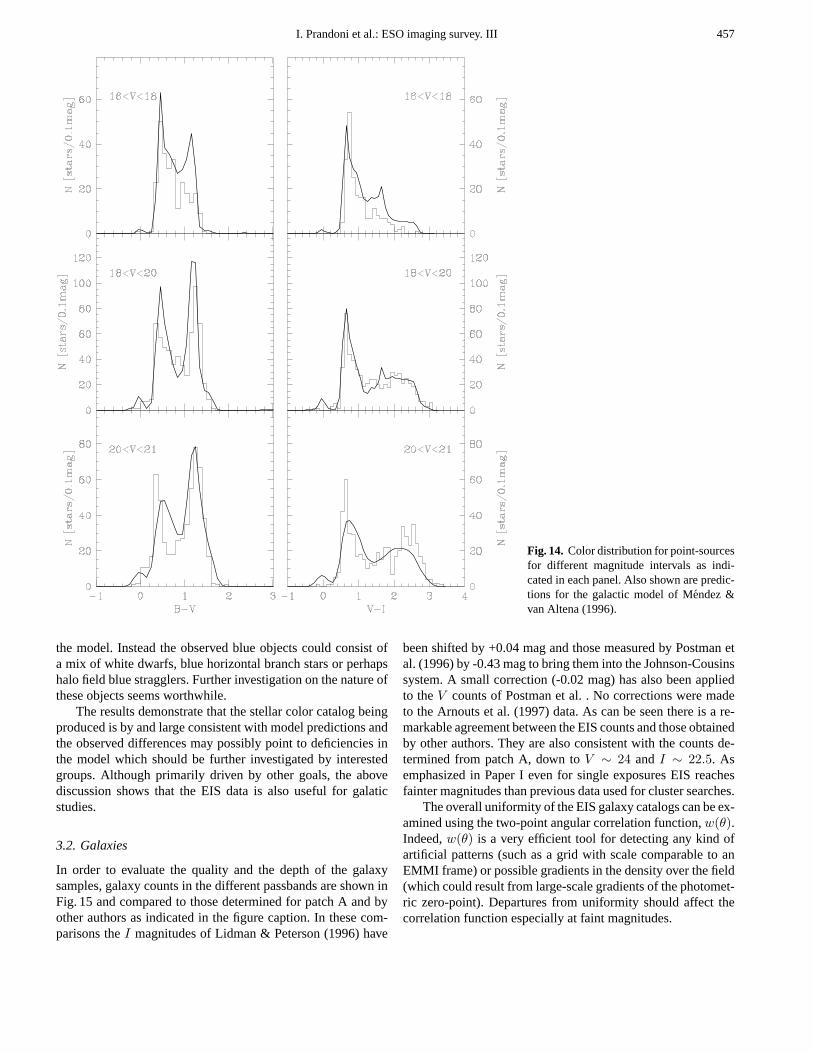
3.2. Galaxies
In order to evaluate the quality and the depth of the galaxysamples, galaxy counts in the different passbands are shown inFig. 15 and compared to those determined for patch A and byother authors as indicated in the figure caption. In these com-parisons theI magnitudes of Lidman & Peterson (1996) have
been shifted by +0.04 mag and those measured by Postman etal. (1996) by -0.43 mag to bring them into the Johnson-Cousinssystem. A small correction (-0.02 mag) has also been appliedto theV counts of Postman et al. . No corrections were madeto the Arnouts et al. (1997) data. As can be seen there is a re-markable agreement between the EIS counts and those obtainedby other authors. They are also consistent with the counts de-termined from patch A, down toV ∼ 24 andI ∼ 22.5. Asemphasized in Paper I even for single exposures EIS reachesfainter magnitudes than previous data used for cluster searches.
The overall uniformity of the EIS galaxy catalogs can be ex-amined using the two-point angular correlation function,w(θ).Indeed,w(θ) is a very efficient tool for detecting any kind ofartificial patterns (such as a grid with scale comparable to anEMMI frame) or possible gradients in the density over the field(which could result from large-scale gradients of the photomet-ric zero-point). Departures from uniformity should affect thecorrelation function especially at faint magnitudes.
458 I. Prandoni et al.: ESO imaging survey. III
Fig. 15. EIS patch B galaxy counts (filled squares) in different pass-bands (B, V, I, from top to bottom) compared to the counts obtainedby: Lidman & Peterson (1996, triangles), Postman et al. (1996, dia-monds) and Arnouts et al. (1997) (open squares), as provided by theauthors. Also shown are the counts obtained in patch A (stars) for theV andI-band. The counts from other authors have been converted tothe Johnson-Cousins system, as described in the text.
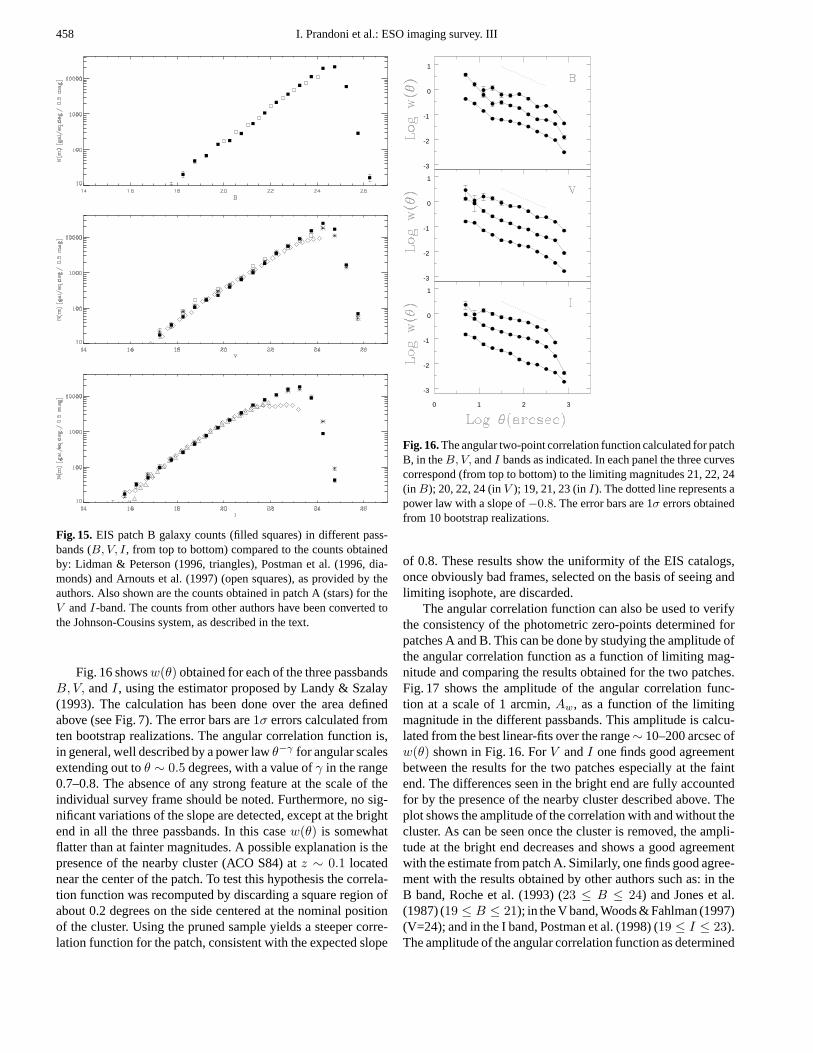
Fig. 16 showsw(θ) obtained for each of the three passbandsB, V, andI, using the estimator proposed by Landy & Szalay(1993). The calculation has been done over the area definedabove (see Fig. 7). The error bars are1σ errors calculated fromten bootstrap realizations. The angular correlation function is,in general, well described by a power lawθ−γ for angular scalesextending out toθ ∼ 0.5 degrees, with a value ofγ in the range0.7–0.8. The absence of any strong feature at the scale of theindividual survey frame should be noted. Furthermore, no sig-nificant variations of the slope are detected, except at the brightend in all the three passbands. In this casew(θ) is somewhatflatter than at fainter magnitudes. A possible explanation is thepresence of the nearby cluster (ACO S84) atz ∼ 0.1 locatednear the center of the patch. To test this hypothesis the correla-tion function was recomputed by discarding a square region ofabout 0.2 degrees on the side centered at the nominal positionof the cluster. Using the pruned sample yields a steeper corre-lation function for the patch, consistent with the expected slope
0 1 2 3
-3
-2
-1
0
1
-3
-2
-1
0
1
-3
-2
-1
0
1
Fig. 16.The angular two-point correlation function calculated for patchB, in theB, V, andI bands as indicated. In each panel the three curvescorrespond (from top to bottom) to the limiting magnitudes 21, 22, 24(in B); 20, 22, 24 (inV ); 19, 21, 23 (inI). The dotted line represents apower law with a slope of−0.8. The error bars are 1σ errors obtainedfrom 10 bootstrap realizations.
of 0.8. These results show the uniformity of the EIS catalogs,once obviously bad frames, selected on the basis of seeing andlimiting isophote, are discarded.
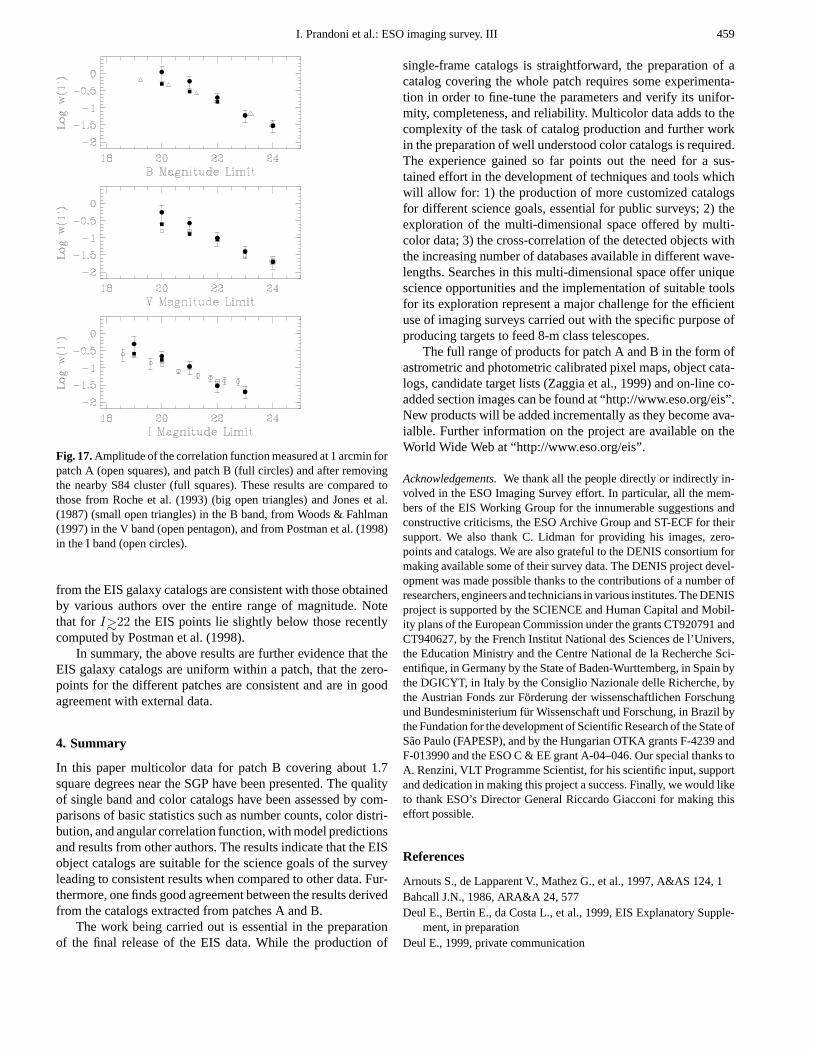
The angular correlation function can also be used to verifythe consistency of the photometric zero-points determined forpatches A and B. This can be done by studying the amplitude ofthe angular correlation function as a function of limiting mag-nitude and comparing the results obtained for the two patches.Fig. 17 shows the amplitude of the angular correlation func-tion at a scale of 1 arcmin,Aw, as a function of the limitingmagnitude in the different passbands. This amplitude is calcu-lated from the best linear-fits over the range∼ 10–200 arcsec ofw(θ) shown in Fig. 16. ForV andI one finds good agreementbetween the results for the two patches especially at the faintend. The differences seen in the bright end are fully accountedfor by the presence of the nearby cluster described above. Theplot shows the amplitude of the correlation with and without thecluster. As can be seen once the cluster is removed, the ampli-tude at the bright end decreases and shows a good agreementwith the estimate from patch A. Similarly, one finds good agree-ment with the results obtained by other authors such as: in theB band, Roche et al. (1993) (23 ≤ B ≤ 24) and Jones et al.(1987) (19 ≤ B ≤ 21); in the V band, Woods & Fahlman (1997)(V=24); and in the I band, Postman et al. (1998) (19 ≤ I ≤ 23).The amplitude of the angular correlation function as determined
I. Prandoni et al.: ESO imaging survey. III 459
Fig. 17.Amplitude of the correlation function measured at 1 arcmin forpatch A (open squares), and patch B (full circles) and after removingthe nearby S84 cluster (full squares). These results are compared tothose from Roche et al. (1993) (big open triangles) and Jones et al.(1987) (small open triangles) in the B band, from Woods & Fahlman(1997) in the V band (open pentagon), and from Postman et al. (1998)in the I band (open circles).
from the EIS galaxy catalogs are consistent with those obtainedby various authors over the entire range of magnitude. Notethat for I>∼22 the EIS points lie slightly below those recentlycomputed by Postman et al. (1998).
In summary, the above results are further evidence that theEIS galaxy catalogs are uniform within a patch, that the zero-points for the different patches are consistent and are in goodagreement with external data.
4. Summary
In this paper multicolor data for patch B covering about 1.7square degrees near the SGP have been presented. The qualityof single band and color catalogs have been assessed by com-parisons of basic statistics such as number counts, color distri-bution, and angular correlation function, with model predictionsand results from other authors. The results indicate that the EISobject catalogs are suitable for the science goals of the surveyleading to consistent results when compared to other data. Fur-thermore, one finds good agreement between the results derivedfrom the catalogs extracted from patches A and B.
The work being carried out is essential in the preparationof the final release of the EIS data. While the production of
single-frame catalogs is straightforward, the preparation of acatalog covering the whole patch requires some experimenta-tion in order to fine-tune the parameters and verify its unifor-mity, completeness, and reliability. Multicolor data adds to thecomplexity of the task of catalog production and further workin the preparation of well understood color catalogs is required.The experience gained so far points out the need for a sus-tained effort in the development of techniques and tools whichwill allow for: 1) the production of more customized catalogsfor different science goals, essential for public surveys; 2) theexploration of the multi-dimensional space offered by multi-color data; 3) the cross-correlation of the detected objects withthe increasing number of databases available in different wave-lengths. Searches in this multi-dimensional space offer uniquescience opportunities and the implementation of suitable toolsfor its exploration represent a major challenge for the efficientuse of imaging surveys carried out with the specific purpose ofproducing targets to feed 8-m class telescopes.
The full range of products for patch A and B in the form ofastrometric and photometric calibrated pixel maps, object cata-logs, candidate target lists (Zaggia et al., 1999) and on-line co-added section images can be found at “http://www.eso.org/eis”.New products will be added incrementally as they become ava-ialble. Further information on the project are available on theWorld Wide Web at “http://www.eso.org/eis”.
Acknowledgements.We thank all the people directly or indirectly in-volved in the ESO Imaging Survey effort. In particular, all the mem-bers of the EIS Working Group for the innumerable suggestions andconstructive criticisms, the ESO Archive Group and ST-ECF for theirsupport. We also thank C. Lidman for providing his images, zero-points and catalogs. We are also grateful to the DENIS consortium formaking available some of their survey data. The DENIS project devel-opment was made possible thanks to the contributions of a number ofresearchers, engineers and technicians in various institutes. The DENISproject is supported by the SCIENCE and Human Capital and Mobil-ity plans of the European Commission under the grants CT920791 andCT940627, by the French Institut National des Sciences de l’Univers,the Education Ministry and the Centre National de la Recherche Sci-entifique, in Germany by the State of Baden-Wurttemberg, in Spain bythe DGICYT, in Italy by the Consiglio Nazionale delle Richerche, bythe Austrian Fonds zur Forderung der wissenschaftlichen Forschungund Bundesministerium fur Wissenschaft und Forschung, in Brazil bythe Fundation for the development of Scientific Research of the State ofSao Paulo (FAPESP), and by the Hungarian OTKA grants F-4239 andF-013990 and the ESO C & EEgrant A-04–046. Our special thanks toA. Renzini, VLT Programme Scientist, for his scientific input, supportand dedication in making this project a success. Finally, we would liketo thank ESO’s Director General Riccardo Giacconi for making thiseffort possible.
References
Arnouts S., de Lapparent V., Mathez G., et al., 1997, A&AS 124, 1Bahcall J.N., 1986, ARA&A 24, 577Deul E., Bertin E., da Costa L., et al., 1999, EIS Explanatory Supple-
ment, in preparationDeul E., 1999, private communication

460 I. Prandoni et al.: ESO imaging survey. III
Jones L.R., Shanks T., Fong R., 1987, In: Bergeron J., Kunth D.,Rocca-Volmerange B., Tran Thanh Van J. (eds.) High Redshiftand Primeval Galaxies. Editions Frontiere, Gif-sur-Yvette, p. 29
Landolt A.U., 1992a, AJ 104, 340Landolt A.U., 1992b, AJ 104, 372Landy S.D., Szalay A., 1993, ApJ 494, 1Lidman C., Peterson B., 1996, MNRAS 279, 1357Mendez R.A., and van Altena W.F., 1996, AJ 112, 655Nonino M., Bertin E., da Costa L.N., et al., 1999, A&AS, in press
(paper I)
Olsen L.F., Scodeggio M., da Costa L.N., et al., 1999, A&A, astro-ph/9807156 (paper V)
Postman M., Lubin L.M., Gunn J.E., et al., 1996, AJ 111, 615Postman M., Lauer T.R., Szapudi I., Oegerle W., 1998, ApJ, in pressReid N., Majewski S.R., 1993, ApJ 409, 635Renzini A., da Costa L.N., 1997, The ESO Messenger, No 87, p. 23Roche N., Shanks T., Metcalfe N., Fong R., 1993, MNRAS 263, 360Woods D., Fahlman G., 1997, ApJ 490, 11Zaggia S.R., Hook I., Mendez R.H., et al., 1999, A&AS, astro-
ph/9807152 (paper IV)