igcse biology 0610/53 paper 5 practical test oct/nov 2020
TRANSCRIPT
Cambridge IGCSE™
This document has 12 pages. Blank pages are indicated.
DC (TC/CB) 191100/3© UCLES 2020 [Turn over
*5351173329*
BIOLOGY 0610/53
Paper 5 Practical Test October/November 2020
1 hour 15 minutes
You must answer on the question paper.
You will need: The materials and apparatus listed in the confidential instructions
INSTRUCTIONS● Answerall questions.
● Use a black or dark blue pen. You may use an HB pencil for any diagrams or graphs. ● Write your name, centre number and candidate number in the boxes at the top of the page. ● Write your answer to each question in the space provided. ● Do not use an erasable pen or correction fluid. ● Do not write on any bar codes. ● You may use a calculator. ● You should show all your working and use appropriate units.
INFORMATION ● The total mark for this paper is 40. ● The number of marks for each question or part question is shown in brackets [ ].
For Examiner’s Use
1
2
Total

2
0610/53/O/N/20© UCLES 2020
1 Amylaseisanenzymethatcatalysesthebreak-downofstarchintoreducingsugars.
Amylaseisproducedbyseedsduringgermination.
You are provided with extract U, which is made from germinating seeds.
You are going to estimate the concentration of amylase in seed extract U by comparing it to known concentrations of amylase.
Read all the instructions but DO NOT CARRY THEM OUT until you have drawn a table for your results in the space provided in 1(a)(ii).
You should use the gloves and eye protection provided while you are carrying out the practical work.
Step 1 Label four small beakers A, B, C, and D.
Step 2 Use the syringes to add the volumes of 2% amylase and distilled water shown in Table 1.1 to each labelled beaker.
Table 1.1
beakervolume of 2%
amylase solution / cm3
volume of distilled water / cm3
final percentage concentration of amylase solution
A 10.0 0.0 2.0
B 7.5 2.5 1.5
C 5.0 5.0 1.0
D 2.5 7.5
(a) (i) Complete Table 1.1 by calculating the final percentage concentration of amylase solution for beaker D.
.......................................................% [1]
Step3 Labelfivetest-tubesA, B, C, D and U.
Step 4 Use a syringe to add 2 cm3 of starchsuspensiontoeachofthelabelledtest-tubes.

3
0610/53/O/N/20© UCLES 2020 [Turn over
Step 5 Prepare a white tile by using a pipette to put drops of iodine solution in five columns labelled A, B, C, D and U, as shown in Fig. 1.1. There should be 8 drops of iodine solution in each column.
A
12345678
drop of iodine solutionB C D U
white tile
time/ minutes
Fig. 1.1
Step 6 Use a clean syringe to add 2 cm3 of amylase solution from beaker Atotest-tubeA and shake gently to mix.
Step 7 Repeat step 6 using beakers B, C, D and Uandtest-tubesB, C, D and U.
Step8 Startthestop-clock.
Step9 Afteroneminuteuseacleanpipette to removeonedropofsolution from test-tubeA and add it to the first drop of iodine solution, A1, on the white tile. Observe any colour change.
Step 10 Repeat step 9 using:
• thecontentsoftest-tubeB and iodine solution drop B1• thecontentsoftest-tubeC and iodine solution drop C1• thecontentsoftest-tubeD and iodine solution drop D1• thecontentsoftest-tubeU and iodine solution drop U1.
Step 11 Repeat steps 9 and 10 after two minutes using iodine solution drop A2, B2, C2, D2 and U2.
Step12 Continuetotestthecontentsofthetest-tubesatoneminuteintervalsuntiladropofthemixtures in the beakers has been added to all eight rows of iodine solution drops on the white tile.
4
0610/53/O/N/20© UCLES 2020
Step 13 Observe the colour of each drop of iodine solution on the white tile and determine the timeatwhichthestarchineachtest-tubewasbrokendown.
In your table in 1(a)(ii), record the time taken for the starch to be broken down.
If starch was still present in row 8 record the time taken as >8.
(ii) Prepare a table to record your results.
[4]
(iii) Explain how you decided when all of the starch had been broken down in step 13.
...........................................................................................................................................
...........................................................................................................................................
..................................................................................................................................... [1]
(iv) Estimate the concentration of amylase in seed extract U using your results in 1(a)(ii).
State the evidence that supports your choice.
estimated amylase concentration of U ..............................................................................
evidence ............................................................................................................................
...........................................................................................................................................
........................................................................................................................................... [1]

5
0610/53/O/N/20© UCLES 2020 [Turn over
(v) Describe how you would test for the presence of reducing sugars.
State the result for a positive test.
method ..............................................................................................................................
...........................................................................................................................................
...........................................................................................................................................
positive test result ............................................................................................................. [3]
(b) Seedscontainstarchasastoreofenergy.Amylaseintheseedscatalysesthebreak-downofthe stored starch into reducing sugars. Seeds use the reducing sugars to provide some of the energy required for germination.
Plan an investigation to find out how temperature affects the activity of amylase in germinating seeds.
...................................................................................................................................................
...................................................................................................................................................
...................................................................................................................................................
...................................................................................................................................................
...................................................................................................................................................
...................................................................................................................................................
...................................................................................................................................................
...................................................................................................................................................
...................................................................................................................................................
...................................................................................................................................................
...................................................................................................................................................
...................................................................................................................................................
............................................................................................................................................. [6]
6
0610/53/O/N/20© UCLES 2020
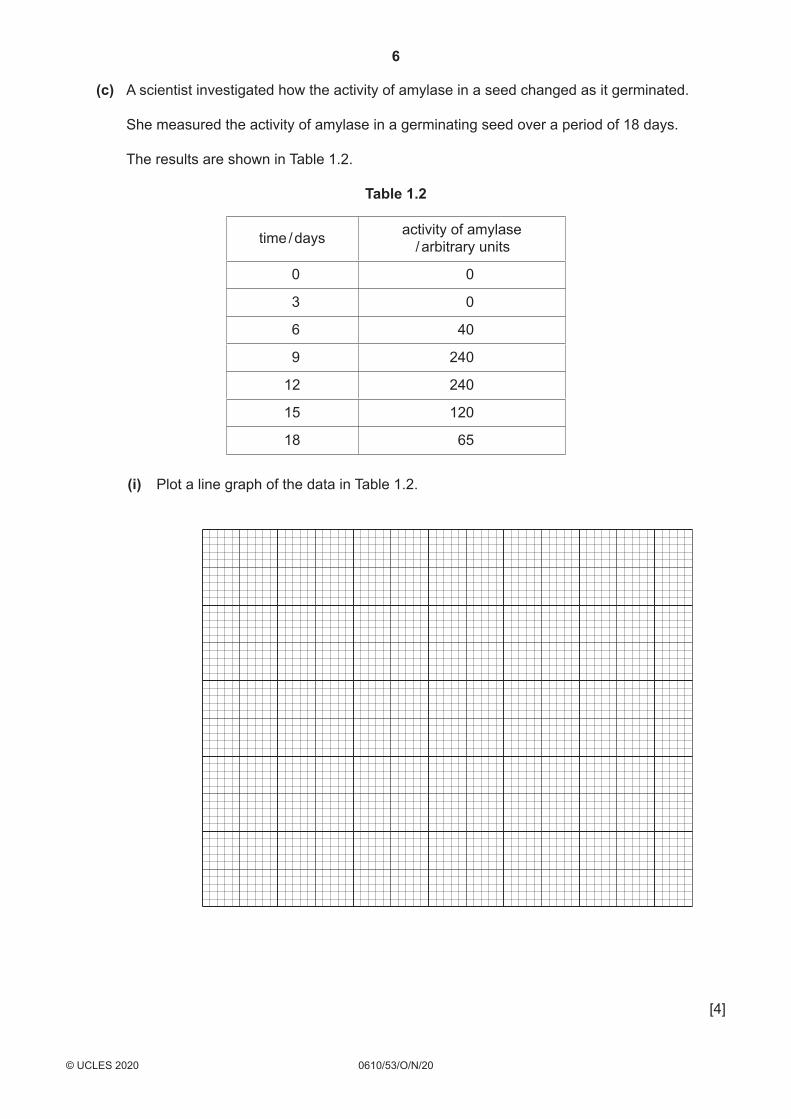
(c) Ascientistinvestigatedhowtheactivityofamylaseinaseedchangedasitgerminated.
She measured the activity of amylase in a germinating seed over a period of 18 days.
The results are shown in Table 1.2.
Table 1.2
time / days activity of amylase / arbitrary units
0 0
3 0
6 40
9 240
12 240
15 120
18 65
(i) Plot a line graph of the data in Table 1.2.
[4]
7
0610/53/O/N/20© UCLES 2020 [Turn over
(ii) Describe the pattern shown by the data in your graph.
...........................................................................................................................................
...........................................................................................................................................
...........................................................................................................................................
...........................................................................................................................................
..................................................................................................................................... [2]
(d) (i) The data in Table 1.2 did not enable the scientist to determine precisely when the amylase was most active.
Explain why.
...........................................................................................................................................
...........................................................................................................................................
..................................................................................................................................... [1]
(ii) Suggest what further data is needed to be able to determine exactly when amylase was most active.
...........................................................................................................................................
...........................................................................................................................................
..................................................................................................................................... [1]
[Total: 24]

8
0610/53/O/N/20© UCLES 2020
2 Fig. 2.1 shows a photograph of two winged seeds from a sycamore tree.
seed
seed
magnification ×4
wing
A B
Fig. 2.1
(a) (i) Make a large drawing of the two winged seeds shown in Fig. 2.1.
Do not label your drawing.
[4]

9
0610/53/O/N/20© UCLES 2020 [Turn over
(ii) Measure the length of line AB on the winged seed on Fig. 2.1.
length of line AB ............................ mm
Calculate the actual seed length using the equation and your measurement. Include the unit.
magnification = length of line AB
actual seed length
................................................................ [3]
(b) Fig. 2.2 is a photograph of a seed from another type of tree.
wing
seed
magnification ×1.5
Fig. 2.2
Describe one similarity and one difference between the seeds in Fig. 2.1 and the seed in Fig. 2.2.
similarity ....................................................................................................................................
...................................................................................................................................................
difference ..................................................................................................................................
................................................................................................................................................... [2]

10
0610/53/O/N/20© UCLES 2020
(c) Seeds such as those in Fig. 2.1 and in Fig. 2.2 can rotate when they fall, moving them further away from the parent tree.
Astudentcollectedsycamoreseedswithwingsofdifferentlengths.Theydroppedtheseedsfrom the same height and measured the distance travelled by each seed.
The results are shown in Fig. 2.3.
80
90
100
110
distancetravelled
by the seed/ cm
120
130
140
8seed wing length / mm
10 12 14 16 18 20
Fig. 2.3
(i) Estimate, using the graph, the distance travelled by a seed with a wing length of 15 mm.
Show on your graph how you estimated this value.
........................................................... cm [2]
(ii) Calculate the percentage increase in the distance travelled by a seed with a wing length of 18 mm compared to a seed with a wing length of 10 mm.
Give your answer to two significant figures.
Space for working.
............................................................ % [3]

11
0610/53/O/N/20© UCLES 2020
(iii) State two variables that should be kept constant in the investigation described in 2(c).
1 ........................................................................................................................................
...........................................................................................................................................
2 ........................................................................................................................................
........................................................................................................................................... [2]
[Total: 16]

12
0610/53/O/N/20© UCLES 2020
Permission to reproduce items where third-party owned material protected by copyright is included has been sought and cleared where possible. Everyreasonable effort has been made by the publisher (UCLES) to trace copyright holders, but if any items requiring clearance have unwittingly been included, the publisher will be pleased to make amends at the earliest possible opportunity.
To avoid the issue of disclosure of answer-related information to candidates, all copyright acknowledgements are reproduced online in the CambridgeAssessmentInternationalEducationCopyrightAcknowledgementsBooklet.Thisisproducedforeachseriesofexaminationsandisfreelyavailabletodownloadat www.cambridgeinternational.org after the live examination series.
CambridgeAssessment InternationalEducation ispartof theCambridgeAssessmentGroup.CambridgeAssessment is thebrandnameof theUniversityofCambridge Local Examinations Syndicate (UCLES), which itself is a department of the University of Cambridge.
BLANK PAGE