ifad annual report 2019
TRANSCRIPT
IFAD ANNUAL REPORT 2019
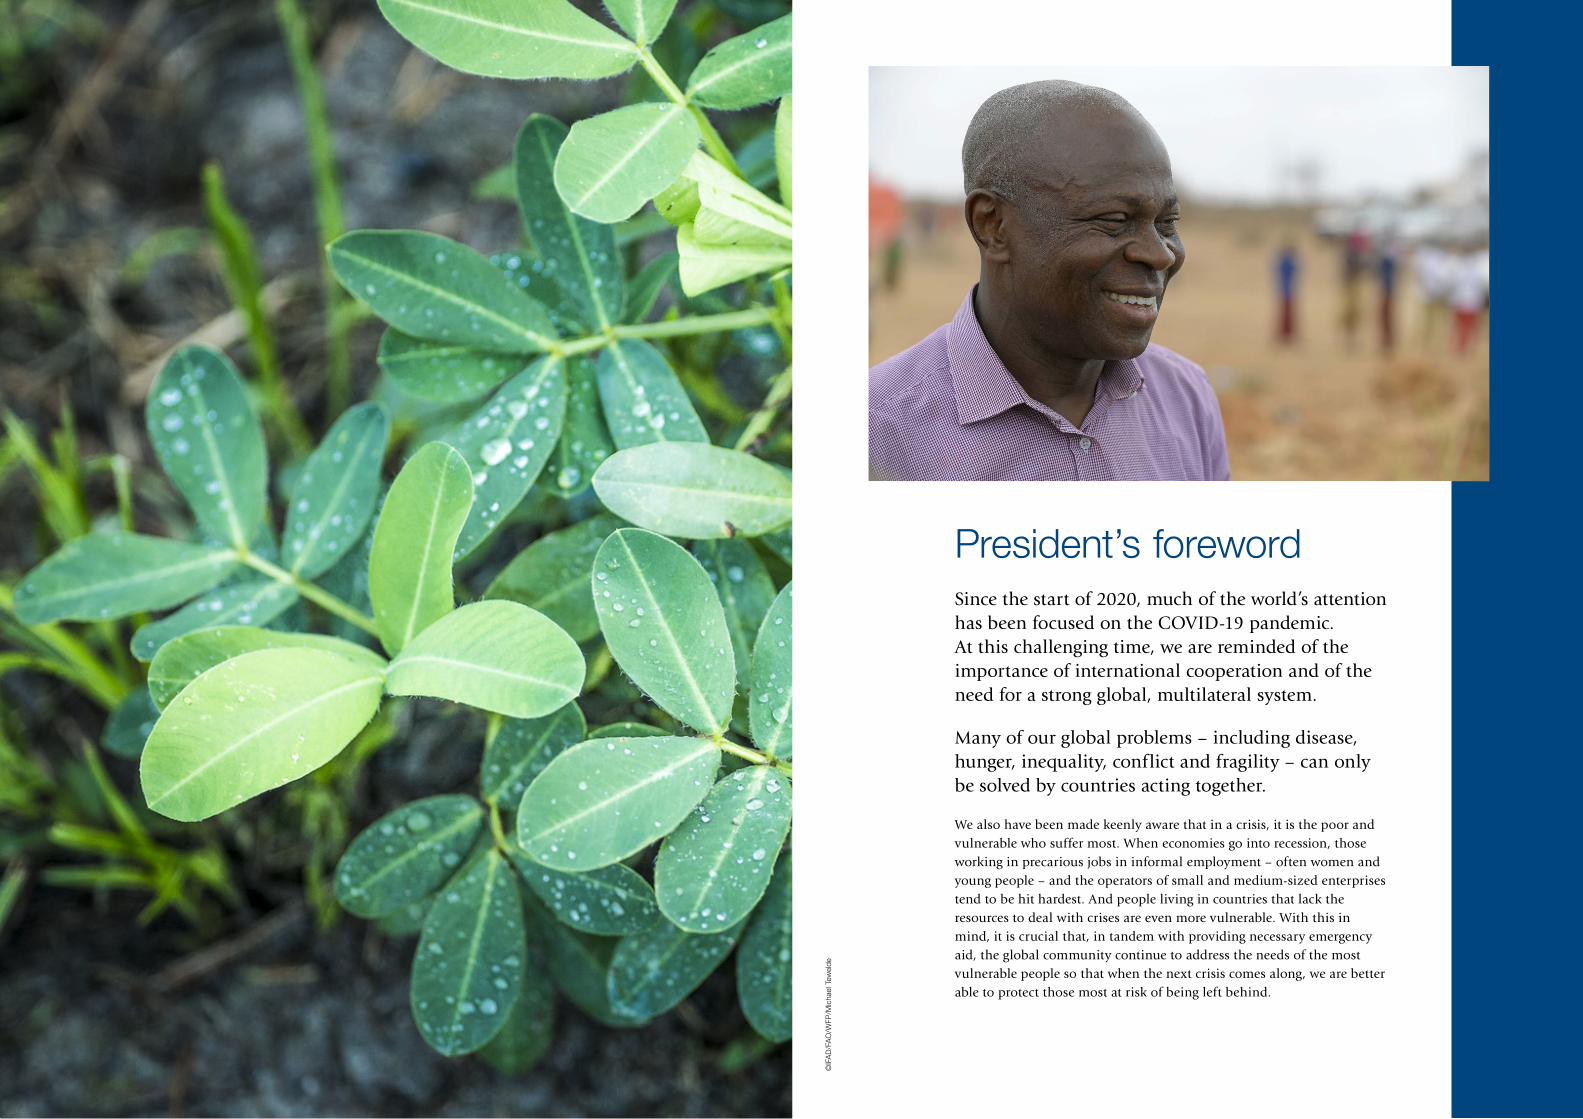
Since the start of 2020, much of the world’s attention has been focused on the COVID-19 pandemic. At this challenging time, we are reminded of the importance of international cooperation and of the need for a strong global, multilateral system.
Many of our global problems – including disease, hunger, inequality, conflict and fragility – can only be solved by countries acting together.
We also have been made keenly aware that in a crisis, it is the poor and vulnerable who suffer most. When economies go into recession, those working in precarious jobs in informal employment – often women and young people – and the operators of small and medium-sized enterprises tend to be hit hardest. And people living in countries that lack the resources to deal with crises are even more vulnerable. With this in mind, it is crucial that, in tandem with providing necessary emergency aid, the global community continue to address the needs of the most vulnerable people so that when the next crisis comes along, we are better able to protect those most at risk of being left behind.
President’s foreword
©IF
AD
/FA
O/W
FP/M
icha
el T
ewel
de
1
32
It has been gratifying to see that our investments in activities towards better livelihoods and greater resilience for rural people have made them more able to cope with the COVID-19 pandemic.
In 2019, new approvals for IFAD projects and programmes increased to
a record US$1.67 billion, enabling us to do more in improving the lives
of rural people now, as well as building a sustainable future for their
families and communities.
At the same time, the pandemic – especially its socio-economic consequences – is threatening past development gains. We have responded with a coordinated package of measures, as part of the overarching United Nations framework for response, to protect rural livelihoods from the impacts of the crisis, including a dedicated Rural Poor Stimulus Facility that addresses short-term disruptions in rural activities, with a focus on food systems. While it is true that IFAD’s core business is mid- and long-term sustainable development, not emergency humanitarian aid, we have a critical role to play in building the resilience of rural people to the impacts of crises in both the short and the long term.
How IFAD is adapting to the challenges of todayGlobally, 79 per cent of the world’s poorest people live in rural areas, most depending on small-scale agriculture for their income. Many are net buyers of food. Rural areas are also where most of the world’s hungriest people live.
These structural issues need to be addressed in our response to the COVID-19 pandemic and in the post-COVID-19 recovery. We cannot afford to move from one emergency to the other. We need to prioritize investments and policies to ensure that the next time crisis strikes – be it a global pandemic or a local weather event – people, economies and the environment are resilient enough and in a position to avert the worst outcomes.
IFAD’s mandate has proven to be very relevant in a rapidly changing world. Progress made in 2019 builds on recent institutional reforms aimed at maximizing IFAD’s contribution to ending poverty and hunger. We continued to pursue decentralization, and to move beyond single project interventions to more holistic approaches to address systemic issues.
A number of steps were taken to strengthen key areas in preparation for IFAD’s Twelfth Replenishment (IFAD12). To enable us to do more, we are also continuing to develop a financial framework that blends replenishment contributions with debt financing. While replenishment contributions will remain the bedrock of IFAD’s financial model, the new framework will allow us to expand our programme of loans and grants and reach more rural people around the world. At the same time, we are strengthening IFAD’s overall Enterprise Risk Management approach, and especially our financial risk framework, to ensure the financial sustainability of our new model.
In 2019, we established a robust Capital Adequacy Policy that strengthens the management of our assets and liabilities to protect our balance sheet and mitigate the financial risks of borrowing. In addition, the IFAD Private Sector Engagement Strategy 2019-2024 was approved. The Strategy will help us to mobilize additional funding by reaching out to private sector partners who are in a position to invest in rural areas. Another initiative aimed at assembling investment in rural areas, with a focus on job creation for young people, is the Agri-Business Capital Fund (ABC Fund), launched at IFAD’s Governing Council 2019 by IFAD, the European Union, the African, Caribbean and Pacific Group of States, the Alliance for a Green Revolution in Africa, and the Government of Luxembourg.
We also need to continue to enhance the quality of our programme of loans and grants. In 2019, there was an intense corporate focus on design quality. We have strengthened our quality assurance processes to improve the quality at entry of country strategies, loan-funded projects and grant-financed activities. We have further streamlined our design and review processes, ensuring that lessons learned are widely disseminated to inform future designs.
Improving the quality of our work also necessarily means developing the skills and capacities of staff in the context of our adaptation to a decentralized operating model and to deliver not only more, but better. Throughout 2019, we supported staff in developing skills to adapt to the
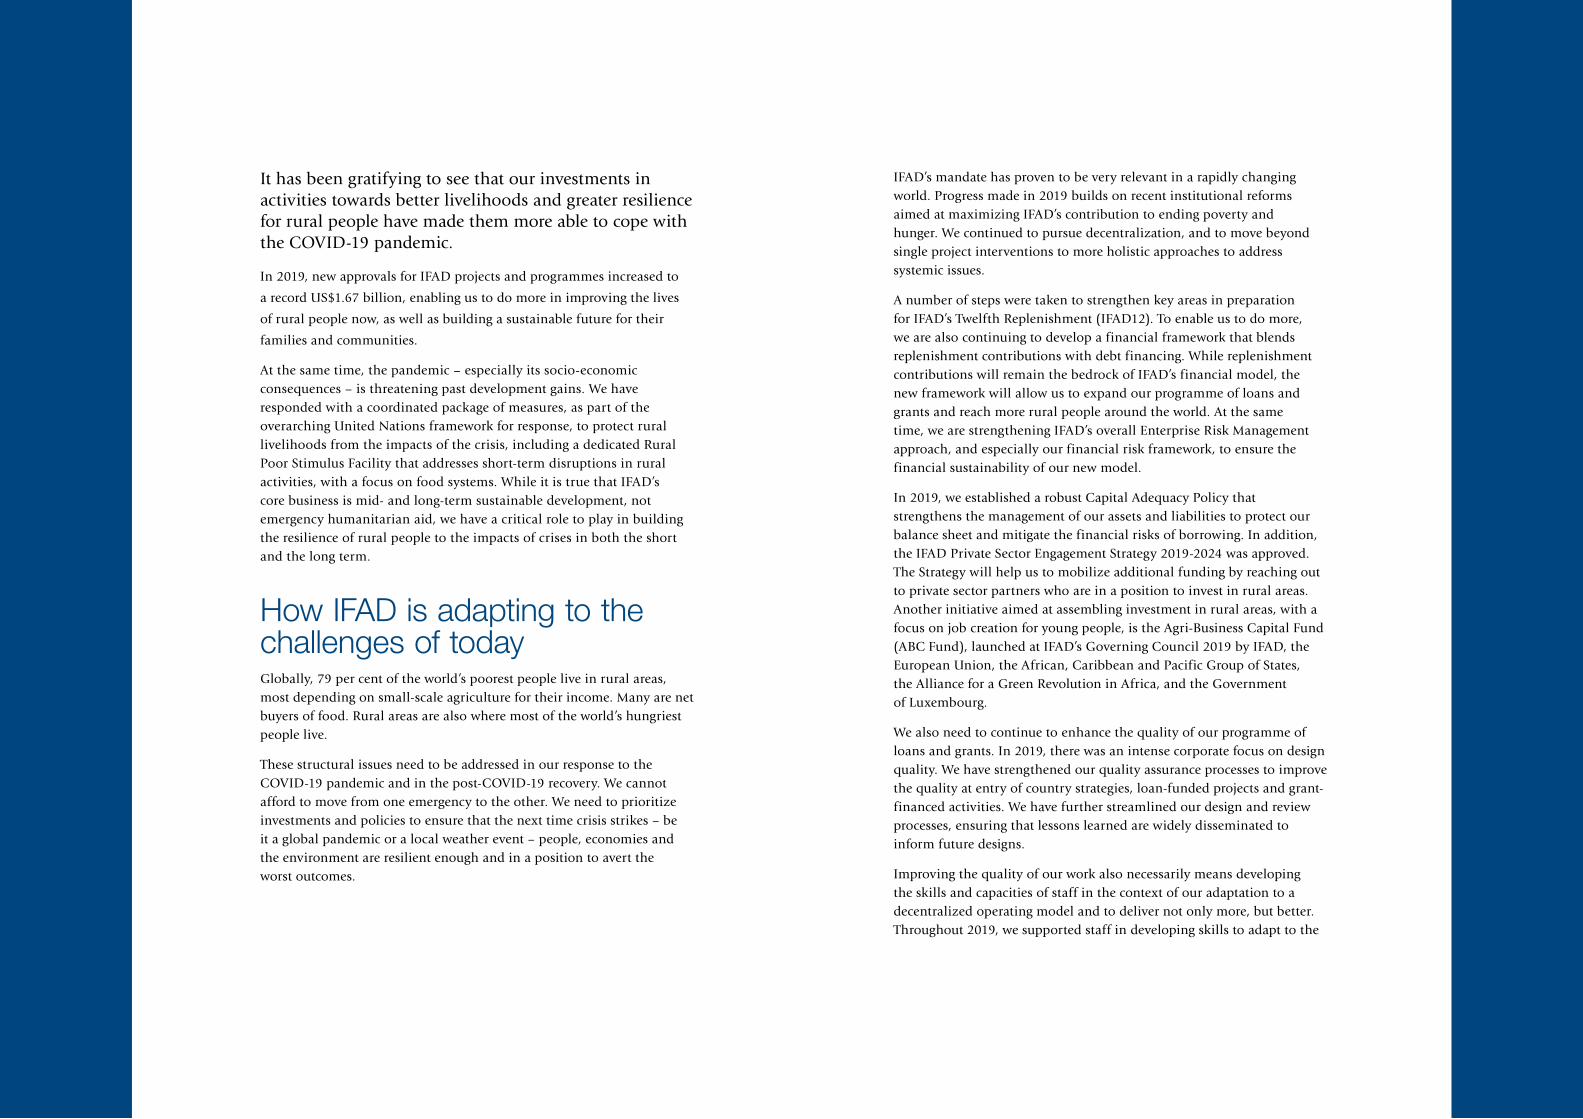
GILBERT F. HOUNGBOPresident of IFAD
5
bureaucracy and promote an efficient and positive working environment. A new bottom-up approach was taken for budget preparation in support of IFAD’s shift towards a more decentralized operating environment, and we successfully implemented a new budget planning tool, Oracle Hyperion, refining the budgeting process and making it less prone to error.
These and other efficiency improvements have allowed us to plan an increased US$1.67 billion programme of loans and grants within a zero-growth administrative budget.
As we move ahead to IFAD12, we are acutely aware that the world – and the challenges facing rural people – have changed profoundly.
The COVID-19 pandemic threatens past development gains and it calls for targeted investments to prevent the health crisis from becoming a food and poverty crisis. IFAD has responded quickly, in coordination with the United Nations system, in the context of our existing work and mandate, building on our experience of working in situations of fragility, crisis and post-crisis. We are determined to do what is needed to ensure that the rural people we serve do not fall back into a situation of poverty and hunger.
Key steps taken in 2019 ensure we are in a solid position to drive recovery efforts in rural economies in a post-COVID-19 world, as well as being able to step in to address the short-term impacts of the crisis. Having enhanced our country presence, boosted our work to mainstream key themes, reformed our financial framework and improved overall efficiency, we are well placed to continue to step up our efforts to end poverty and hunger in a changing world. And we remain convinced that the rural women and men we work with are key actors in driving us all to achieve these goals.
changing needs of IFAD, for example through a new leadership development programme for supervisors, an executive coaching programme for directors, professional qualification programmes such as International Coach Federation certification, and an expanded e-learning platform.
In addition, to step up efforts to empower rural people through our operations, we gave precedence to initiatives to support our priority themes – climate change and environment, gender, youth, and nutrition. New tools and approaches include:
• Enhanced Social, Environmental and Climate Assessment Procedures (SECAP)
• Revised targeting guidelines • A new transformation framework • Adaptation of the household methodologies to integrate youth,
nutrition, and environment and climate change issues • A new Rural Youth Action Plan
I am pleased that the 2019 results indicate we are ahead of our IFAD11 targets set under all four priority themes.
The year also saw the creation of the Change, Delivery and Innovation Unit, which has spearheaded a business process re-engineering exercise to reduce
©IF
AD
/Sus
an B
ecci
o
6
Brasilia
Addis Ababa
Nairobi
Hanoi
Beijing
PanamaCity
Dakar
Jakarta
New Delhi
Johannesburg
Rome
Cairo
Istanbul
Abidjan
Yaoundé
Lima
Regional hubIFAD country of�ceIFAD headquarters Regional South-South and TriangularCooperation and knowledge centre
Satellite office
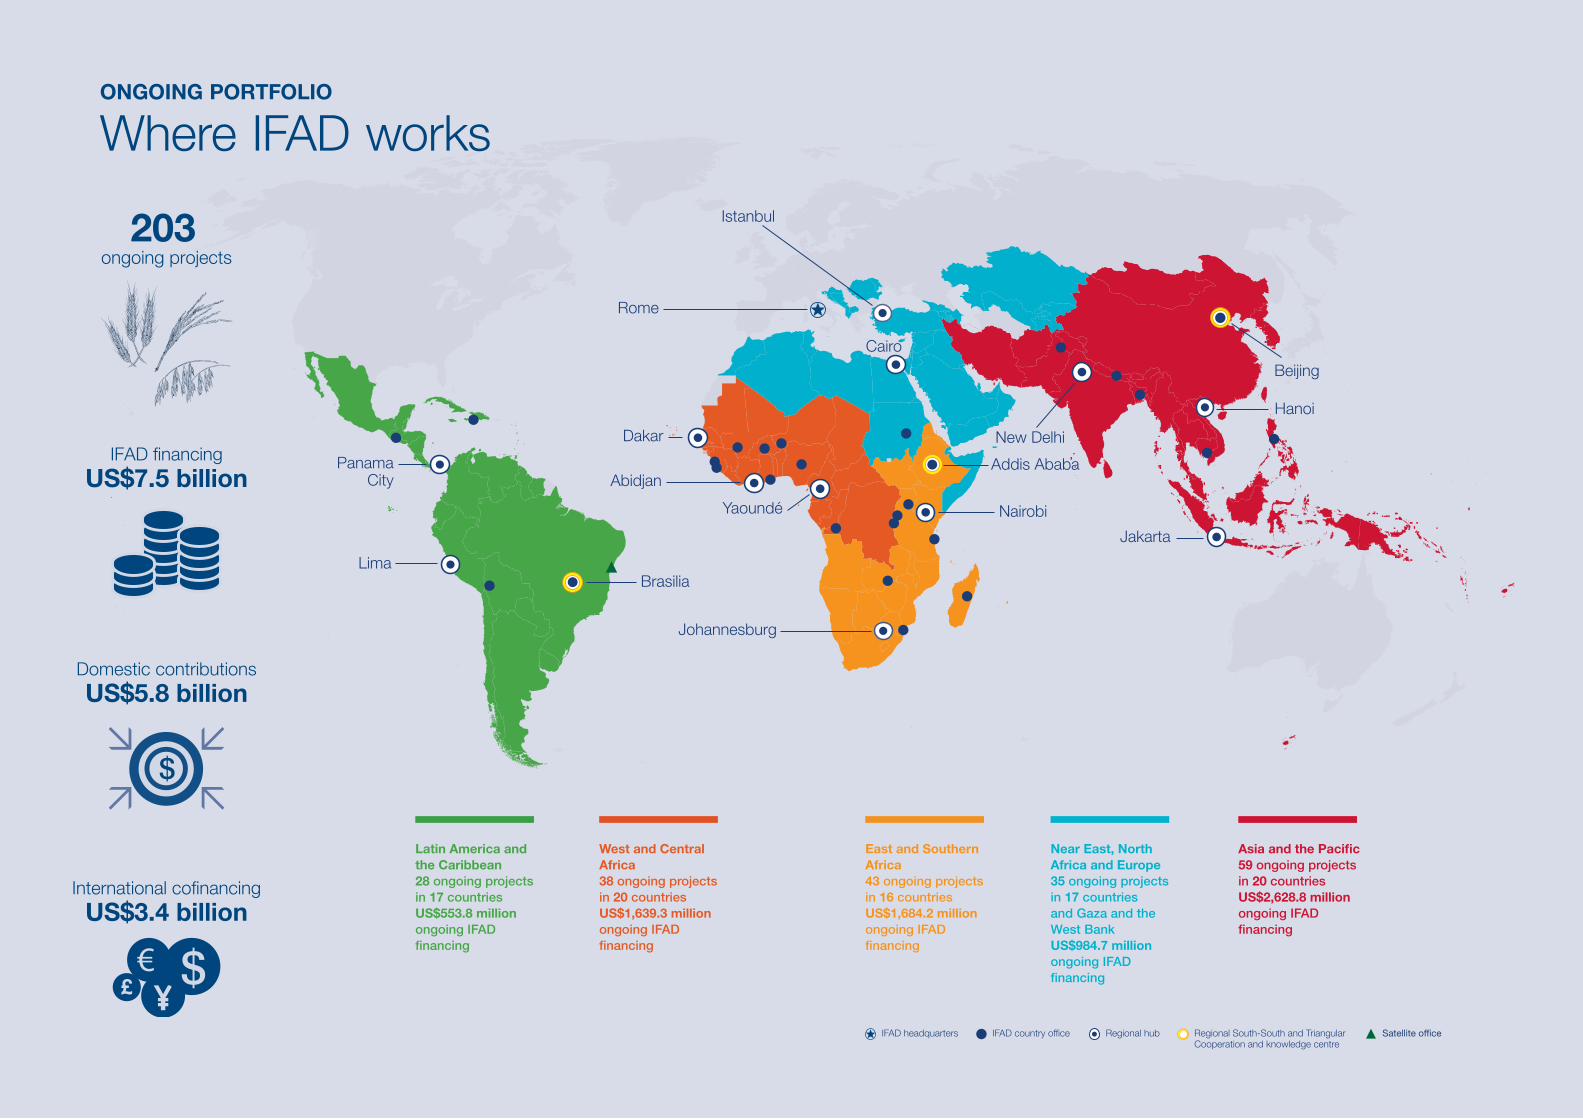
ONGOING PORTFOLIO
Where IFAD works
Asia and the Paci�c59 ongoing projectsin 20 countries US$2,628.8 million ongoing IFAD �nancing
East and Southern Africa 43 ongoing projectsin 16 countriesUS$1,684.2 million ongoing IFAD �nancing
Latin America andthe Caribbean 28 ongoing projects in 17 countriesUS$553.8 million ongoing IFAD �nancing
Near East, North Africa and Europe 35 ongoing projectsin 17 countries and Gaza and the West Bank US$984.7 million ongoing IFAD �nancing
West and Central Africa 38 ongoing projectsin 20 countriesUS$1,639.3 million ongoing IFAD �nancing
IFAD �nancingUS$7.5 billion
Domestic contributionsUS$5.8 billion
$
International co�nancingUS$3.4 billion
$
203 ongoing projects
By 2019:PAKISTAN
The Southern Punjab Poverty Alleviation Project has almost eliminated extreme poverty in its target area. It combines social protection, skills training and infrastructure development, and emphasizes women’s empowerment.
2,472 solar homes had been delivered
9,857 toilets had been built
80% of trainees were employed
Poverty had been cut from
58% to4%
US$million
2016 2017 2018 2019
50
100
150
200
250
300
2015
US$225.5
million
US$252.9
million
US$258.1
million
US$223.9
millionUS$
244.4million
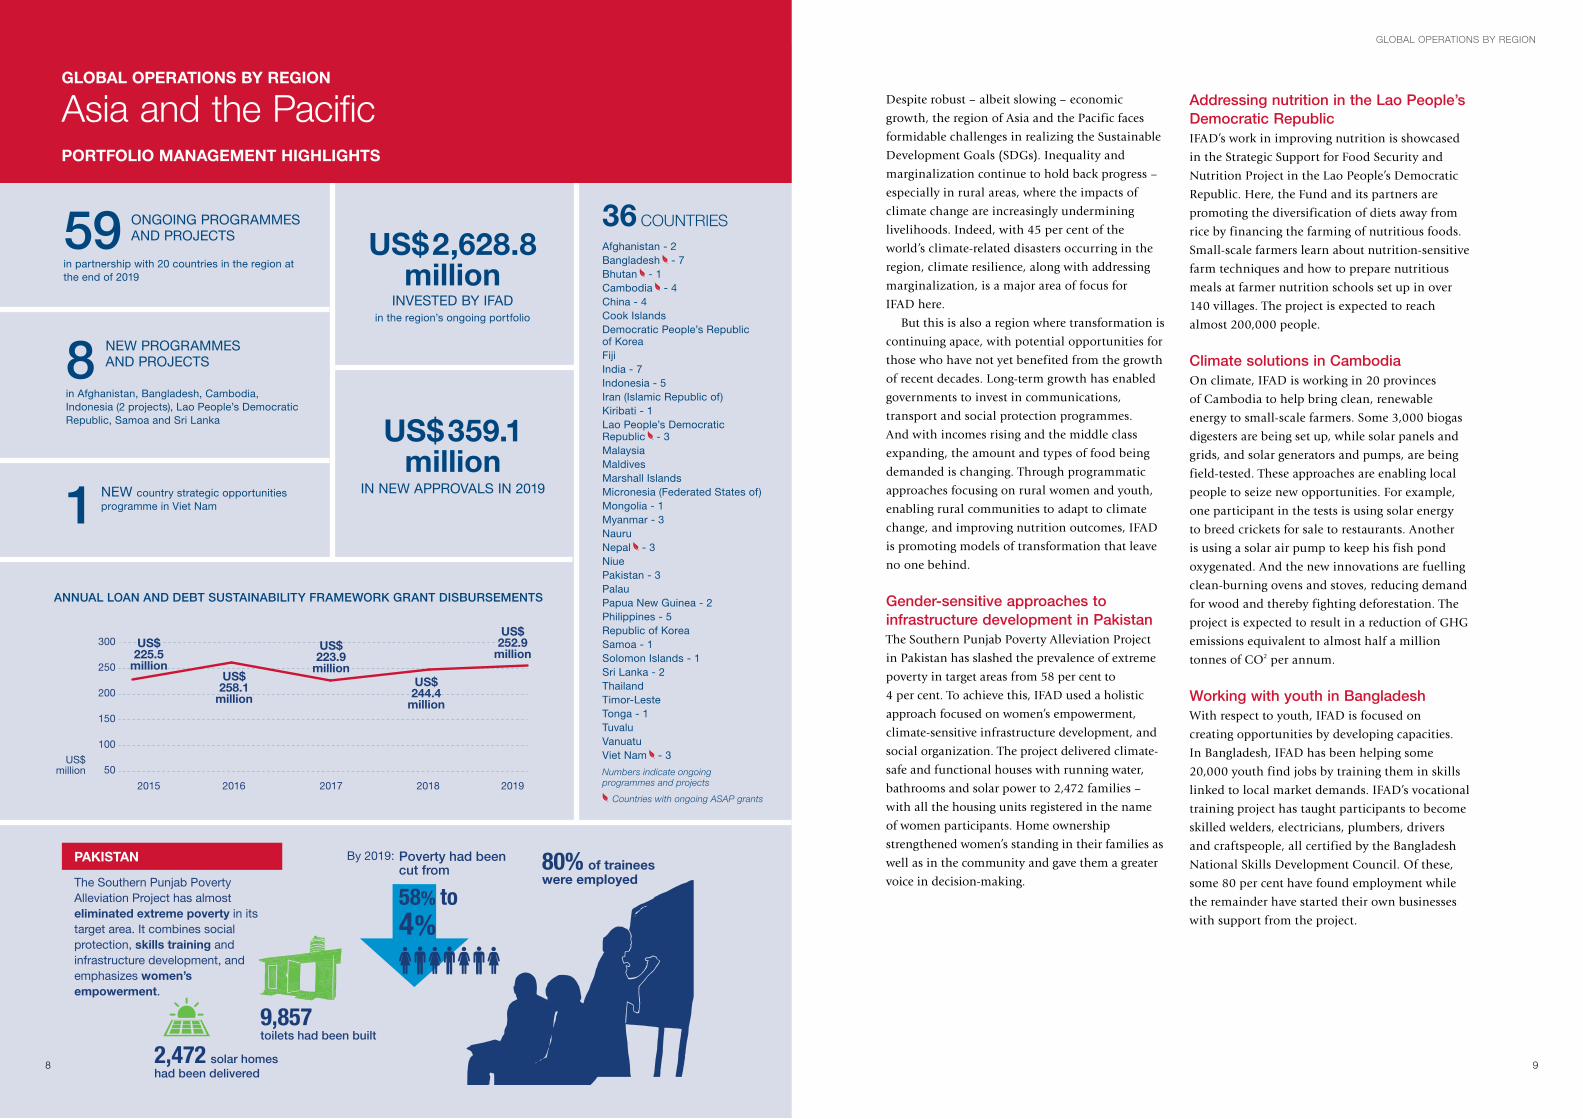
US$359.1 million
IN NEW APPROVALS IN 2019
59 ONGOING PROGRAMMES AND PROJECTS
in partnership with 20 countries in the region at the end of 2019
8 NEW PROGRAMMES AND PROJECTS
in Afghanistan, Bangladesh, Cambodia, Indonesia (2 projects), Lao People’s Democratic Republic, Samoa and Sri Lanka
1 NEW country strategic opportunities programme in Viet Nam
Afghanistan - 2Bangladesh - 7Bhutan - 1Cambodia - 4China - 4Cook IslandsDemocratic People’s Republic of KoreaFijiIndia - 7Indonesia - 5Iran (Islamic Republic of)Kiribati - 1Lao People’s Democratic Republic - 3MalaysiaMaldivesMarshall IslandsMicronesia (Federated States of)Mongolia - 1Myanmar - 3NauruNepal - 3NiuePakistan - 3PalauPapua New Guinea - 2Philippines - 5Republic of KoreaSamoa - 1Solomon Islands - 1Sri Lanka - 2ThailandTimor-LesteTonga - 1TuvaluVanuatuViet Nam - 3
Numbers indicate ongoing programmes and projects
Countries with ongoing ASAP grants
ANNUAL LOAN AND DEBT SUSTAINABILITY FRAMEWORK GRANT DISBURSEMENTS
US$2,628.8 million
INVESTED BY IFADin the region’s ongoing portfolio
36 COUNTRIES
8 9
Despite robust – albeit slowing – economic
growth, the region of Asia and the Pacific faces
formidable challenges in realizing the Sustainable
Development Goals (SDGs). Inequality and
marginalization continue to hold back progress –
especially in rural areas, where the impacts of
climate change are increasingly undermining
livelihoods. Indeed, with 45 per cent of the
world’s climate-related disasters occurring in the
region, climate resilience, along with addressing
marginalization, is a major area of focus for
IFAD here.
But this is also a region where transformation is
continuing apace, with potential opportunities for
those who have not yet benefited from the growth
of recent decades. Long-term growth has enabled
governments to invest in communications,
transport and social protection programmes.
And with incomes rising and the middle class
expanding, the amount and types of food being
demanded is changing. Through programmatic
approaches focusing on rural women and youth,
enabling rural communities to adapt to climate
change, and improving nutrition outcomes, IFAD
is promoting models of transformation that leave
no one behind.
Gender-sensitive approaches to infrastructure development in PakistanThe Southern Punjab Poverty Alleviation Project
in Pakistan has slashed the prevalence of extreme
poverty in target areas from 58 per cent to
4 per cent. To achieve this, IFAD used a holistic
approach focused on women’s empowerment,
climate-sensitive infrastructure development, and
social organization. The project delivered climate-
safe and functional houses with running water,
bathrooms and solar power to 2,472 families –
with all the housing units registered in the name
of women participants. Home ownership
strengthened women’s standing in their families as
well as in the community and gave them a greater
voice in decision-making.
Addressing nutrition in the Lao People’s Democratic RepublicIFAD’s work in improving nutrition is showcased
in the Strategic Support for Food Security and
Nutrition Project in the Lao People’s Democratic
Republic. Here, the Fund and its partners are
promoting the diversification of diets away from
rice by financing the farming of nutritious foods.
Small-scale farmers learn about nutrition-sensitive
farm techniques and how to prepare nutritious
meals at farmer nutrition schools set up in over
140 villages. The project is expected to reach
almost 200,000 people.
Climate solutions in CambodiaOn climate, IFAD is working in 20 provinces
of Cambodia to help bring clean, renewable
energy to small-scale farmers. Some 3,000 biogas
digesters are being set up, while solar panels and
grids, and solar generators and pumps, are being
field-tested. These approaches are enabling local
people to seize new opportunities. For example,
one participant in the tests is using solar energy
to breed crickets for sale to restaurants. Another
is using a solar air pump to keep his fish pond
oxygenated. And the new innovations are fuelling
clean-burning ovens and stoves, reducing demand
for wood and thereby fighting deforestation. The
project is expected to result in a reduction of GHG
emissions equivalent to almost half a million
tonnes of CO2 per annum.
Working with youth in BangladeshWith respect to youth, IFAD is focused on
creating opportunities by developing capacities.
In Bangladesh, IFAD has been helping some
20,000 youth find jobs by training them in skills
linked to local market demands. IFAD’s vocational
training project has taught participants to become
skilled welders, electricians, plumbers, drivers
and craftspeople, all certified by the Bangladesh
National Skills Development Council. Of these,
some 80 per cent have found employment while
the remainder have started their own businesses
with support from the project.
GLOBAL OPERATIONS BY REGION
PORTFOLIO MANAGEMENT HIGHLIGHTS
GLOBAL OPERATIONS BY REGION
Asia and the Pacific
Of whom
69% were women
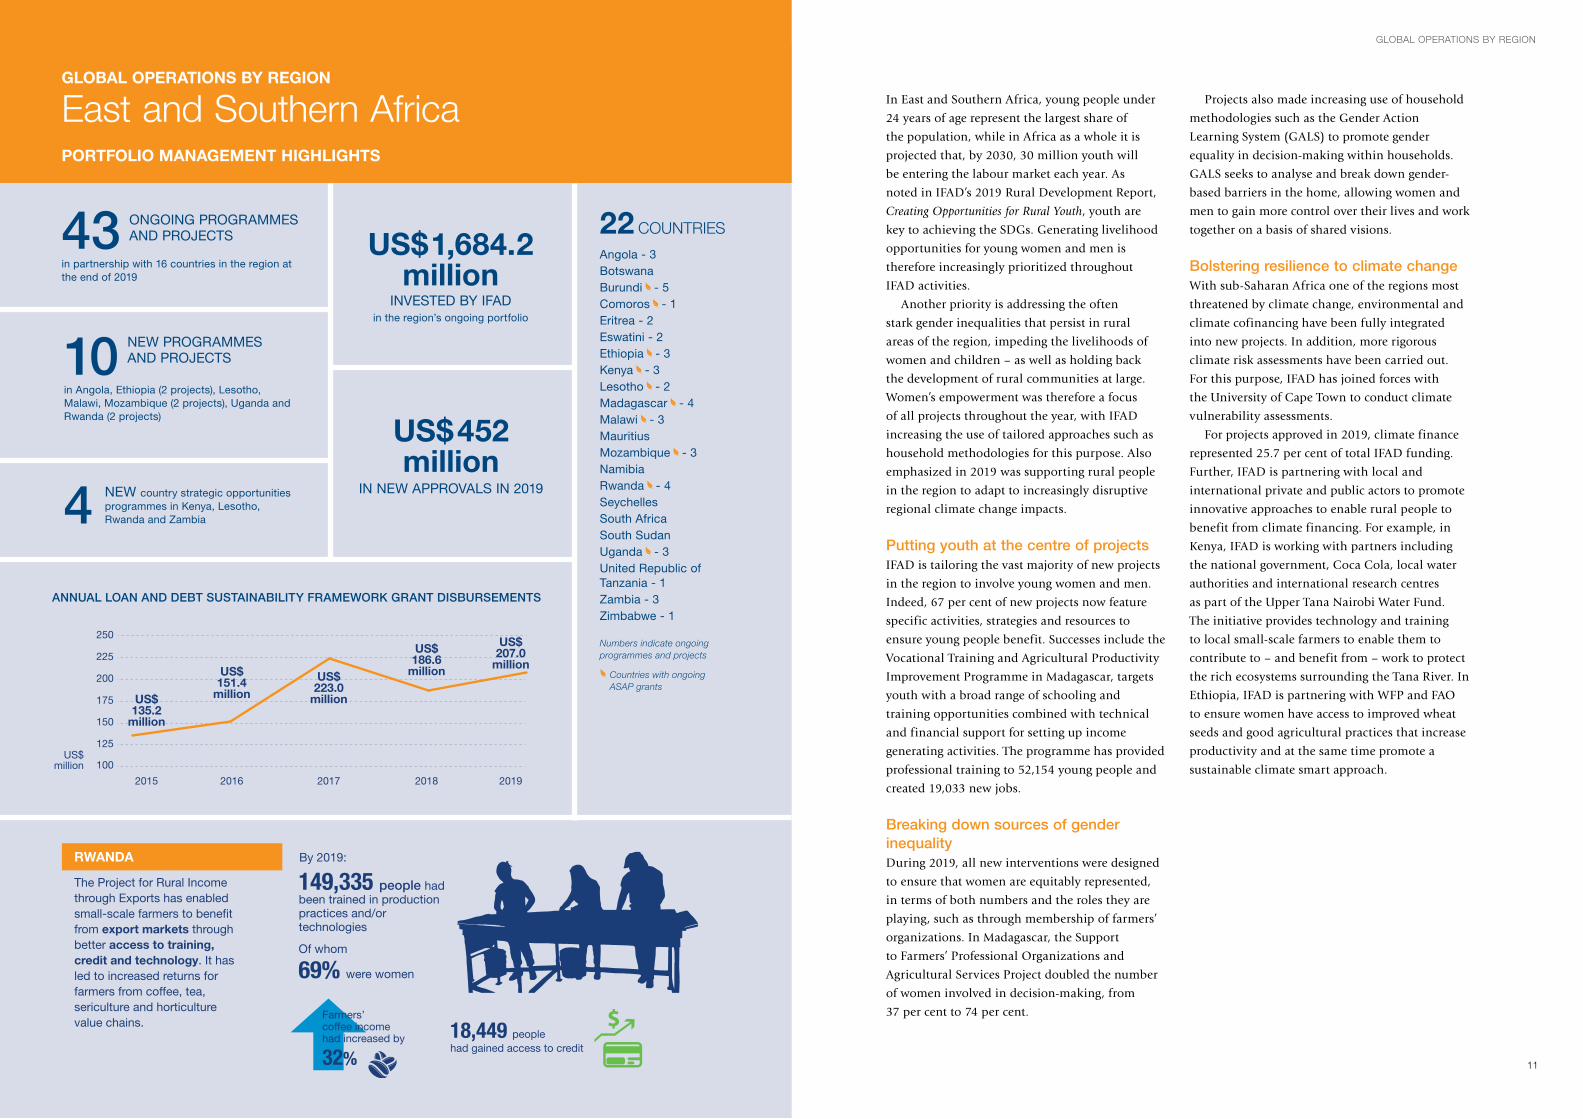
RWANDA
The Project for Rural Income through Exports has enabled small-scale farmers to benefit from export markets through better access to training, credit and technology. It has led to increased returns for farmers from coffee, tea, sericulture and horticulture value chains.
149,335 people had been trained in production practices and/or technologies
18,449 people had gained access to credit
Farmers’ coffee incomehad increased by
32%
By 2019:
PORTFOLIO MANAGEMENT HIGHLIGHTS
20172016
US$million
2019
100
125
175
200
225
250
150
US$207.0
million
2015
US$135.2
million
US$151.4
millionUS$
223.0million
2018
US$186.6
million
US$452 million
IN NEW APPROVALS IN 2019
43 ONGOING PROGRAMMES AND PROJECTS
in partnership with 16 countries in the region at the end of 2019
10 NEW PROGRAMMES AND PROJECTS
in Angola, Ethiopia (2 projects), Lesotho, Malawi, Mozambique (2 projects), Uganda and Rwanda (2 projects)
4 NEW country strategic opportunities programmes in Kenya, Lesotho, Rwanda and Zambia
22 COUNTRIES
Angola - 3BotswanaBurundi - 5Comoros - 1Eritrea - 2Eswatini - 2Ethiopia - 3Kenya - 3Lesotho - 2Madagascar - 4Malawi - 3MauritiusMozambique - 3NamibiaRwanda - 4SeychellesSouth AfricaSouth SudanUganda - 3United Republic of Tanzania - 1Zambia - 3Zimbabwe - 1
Numbers indicate ongoing programmes and projects
Countries with ongoing ASAP grants
ANNUAL LOAN AND DEBT SUSTAINABILITY FRAMEWORK GRANT DISBURSEMENTS
US$1,684.2 million
INVESTED BY IFADin the region’s ongoing portfolio
PORTFOLIO MANAGEMENT HIGHLIGHTS
GLOBAL OPERATIONS BY REGION
East and Southern Africa
GLOBAL OPERATIONS BY REGION
11
In East and Southern Africa, young people under
24 years of age represent the largest share of
the population, while in Africa as a whole it is
projected that, by 2030, 30 million youth will
be entering the labour market each year. As
noted in IFAD’s 2019 Rural Development Report,
Creating Opportunities for Rural Youth, youth are
key to achieving the SDGs. Generating livelihood
opportunities for young women and men is
therefore increasingly prioritized throughout
IFAD activities.
Another priority is addressing the often
stark gender inequalities that persist in rural
areas of the region, impeding the livelihoods of
women and children – as well as holding back
the development of rural communities at large.
Women’s empowerment was therefore a focus
of all projects throughout the year, with IFAD
increasing the use of tailored approaches such as
household methodologies for this purpose. Also
emphasized in 2019 was supporting rural people
in the region to adapt to increasingly disruptive
regional climate change impacts.
Putting youth at the centre of projectsIFAD is tailoring the vast majority of new projects
in the region to involve young women and men.
Indeed, 67 per cent of new projects now feature
specific activities, strategies and resources to
ensure young people benefit. Successes include the
Vocational Training and Agricultural Productivity
Improvement Programme in Madagascar, targets
youth with a broad range of schooling and
training opportunities combined with technical
and financial support for setting up income
generating activities. The programme has provided
professional training to 52,154 young people and
created 19,033 new jobs.
Breaking down sources of gender inequalityDuring 2019, all new interventions were designed
to ensure that women are equitably represented,
in terms of both numbers and the roles they are
playing, such as through membership of farmers’
organizations. In Madagascar, the Support
to Farmers’ Professional Organizations and
Agricultural Services Project doubled the number
of women involved in decision-making, from
37 per cent to 74 per cent.
Projects also made increasing use of household
methodologies such as the Gender Action
Learning System (GALS) to promote gender
equality in decision-making within households.
GALS seeks to analyse and break down gender-
based barriers in the home, allowing women and
men to gain more control over their lives and work
together on a basis of shared visions.
Bolstering resilience to climate changeWith sub-Saharan Africa one of the regions most
threatened by climate change, environmental and
climate cofinancing have been fully integrated
into new projects. In addition, more rigorous
climate risk assessments have been carried out.
For this purpose, IFAD has joined forces with
the University of Cape Town to conduct climate
vulnerability assessments.
For projects approved in 2019, climate finance
represented 25.7 per cent of total IFAD funding.
Further, IFAD is partnering with local and
international private and public actors to promote
innovative approaches to enable rural people to
benefit from climate financing. For example, in
Kenya, IFAD is working with partners including
the national government, Coca Cola, local water
authorities and international research centres
as part of the Upper Tana Nairobi Water Fund.
The initiative provides technology and training
to local small-scale farmers to enable them to
contribute to – and benefit from – work to protect
the rich ecosystems surrounding the Tana River. In
Ethiopia, IFAD is partnering with WFP and FAO
to ensure women have access to improved wheat
seeds and good agricultural practices that increase
productivity and at the same time promote a
sustainable climate smart approach.
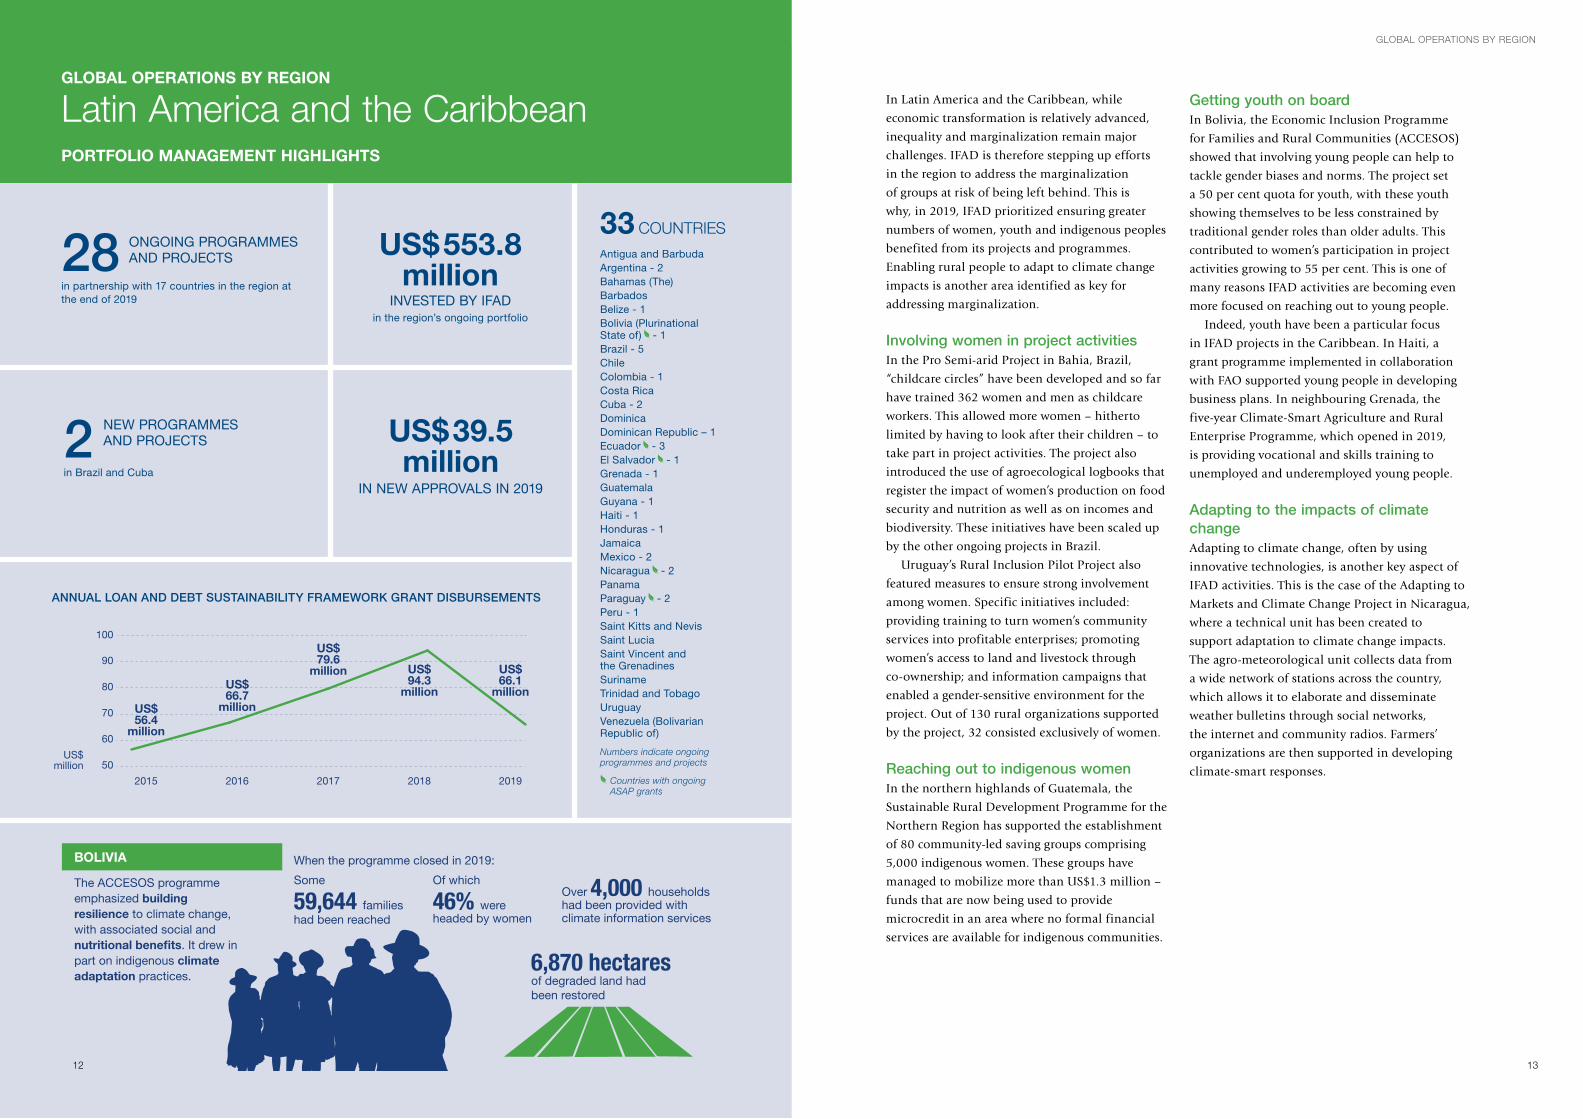
Of which
46% were headed by women
Over 4,000 households had been provided with climate information services
Some
59,644 families had been reached
When the programme closed in 2019:
6,870 hectares of degraded land had been restored
BOLIVIA
The ACCESOS programme emphasized building resilience to climate change, with associated social and nutritional bene�ts. It drew in part on indigenous climate adaptation practices.
US$million 50
60
70
80
90
100
2019
US$66.1
million
2015
US$56.4
million
2016
US$66.7
million
2017
US$79.6
million
2018
US$94.3
million
US$39.5 million
IN NEW APPROVALS IN 2019
28 ONGOING PROGRAMMES AND PROJECTS
in partnership with 17 countries in the region at the end of 2019
2 NEW PROGRAMMES AND PROJECTS
in Brazil and Cuba
Antigua and BarbudaArgentina - 2Bahamas (The)BarbadosBelize - 1Bolivia (Plurinational State of) - 1Brazil - 5ChileColombia - 1Costa RicaCuba - 2DominicaDominican Republic – 1Ecuador - 3El Salvador - 1 Grenada - 1GuatemalaGuyana - 1Haiti - 1Honduras - 1JamaicaMexico - 2Nicaragua - 2PanamaParaguay - 2Peru - 1Saint Kitts and NevisSaint LuciaSaint Vincent and the GrenadinesSurinameTrinidad and TobagoUruguay Venezuela (Bolivarian Republic of)
Numbers indicate ongoing programmes and projects
Countries with ongoing ASAP grants
ANNUAL LOAN AND DEBT SUSTAINABILITY FRAMEWORK GRANT DISBURSEMENTS
US$553.8 million
INVESTED BY IFADin the region’s ongoing portfolio
33 COUNTRIES
PORTFOLIO MANAGEMENT HIGHLIGHTS
GLOBAL OPERATIONS BY REGION
Latin America and the Caribbean
12
In Latin America and the Caribbean, while
economic transformation is relatively advanced,
inequality and marginalization remain major
challenges. IFAD is therefore stepping up efforts
in the region to address the marginalization
of groups at risk of being left behind. This is
why, in 2019, IFAD prioritized ensuring greater
numbers of women, youth and indigenous peoples
benefited from its projects and programmes.
Enabling rural people to adapt to climate change
impacts is another area identified as key for
addressing marginalization.
Involving women in project activitiesIn the Pro Semi-arid Project in Bahia, Brazil,
“childcare circles” have been developed and so far
have trained 362 women and men as childcare
workers. This allowed more women – hitherto
limited by having to look after their children – to
take part in project activities. The project also
introduced the use of agroecological logbooks that
register the impact of women’s production on food
security and nutrition as well as on incomes and
biodiversity. These initiatives have been scaled up
by the other ongoing projects in Brazil.
Uruguay’s Rural Inclusion Pilot Project also
featured measures to ensure strong involvement
among women. Specific initiatives included:
providing training to turn women’s community
services into profitable enterprises; promoting
women’s access to land and livestock through
co-ownership; and information campaigns that
enabled a gender-sensitive environment for the
project. Out of 130 rural organizations supported
by the project, 32 consisted exclusively of women.
Reaching out to indigenous womenIn the northern highlands of Guatemala, the
Sustainable Rural Development Programme for the
Northern Region has supported the establishment
of 80 community-led saving groups comprising
5,000 indigenous women. These groups have
managed to mobilize more than US$1.3 million –
funds that are now being used to provide
microcredit in an area where no formal financial
services are available for indigenous communities.
Getting youth on boardIn Bolivia, the Economic Inclusion Programme
for Families and Rural Communities (ACCESOS)
showed that involving young people can help to
tackle gender biases and norms. The project set
a 50 per cent quota for youth, with these youth
showing themselves to be less constrained by
traditional gender roles than older adults. This
contributed to women’s participation in project
activities growing to 55 per cent. This is one of
many reasons IFAD activities are becoming even
more focused on reaching out to young people.
Indeed, youth have been a particular focus
in IFAD projects in the Caribbean. In Haiti, a
grant programme implemented in collaboration
with FAO supported young people in developing
business plans. In neighbouring Grenada, the
five-year Climate-Smart Agriculture and Rural
Enterprise Programme, which opened in 2019,
is providing vocational and skills training to
unemployed and underemployed young people.
Adapting to the impacts of climate changeAdapting to climate change, often by using
innovative technologies, is another key aspect of
IFAD activities. This is the case of the Adapting to
Markets and Climate Change Project in Nicaragua,
where a technical unit has been created to
support adaptation to climate change impacts.
The agro-meteorological unit collects data from
a wide network of stations across the country,
which allows it to elaborate and disseminate
weather bulletins through social networks,
the internet and community radios. Farmers’
organizations are then supported in developing
climate-smart responses.
GLOBAL OPERATIONS BY REGION
13
GLOBAL OPERATIONS BY REGION
14 15
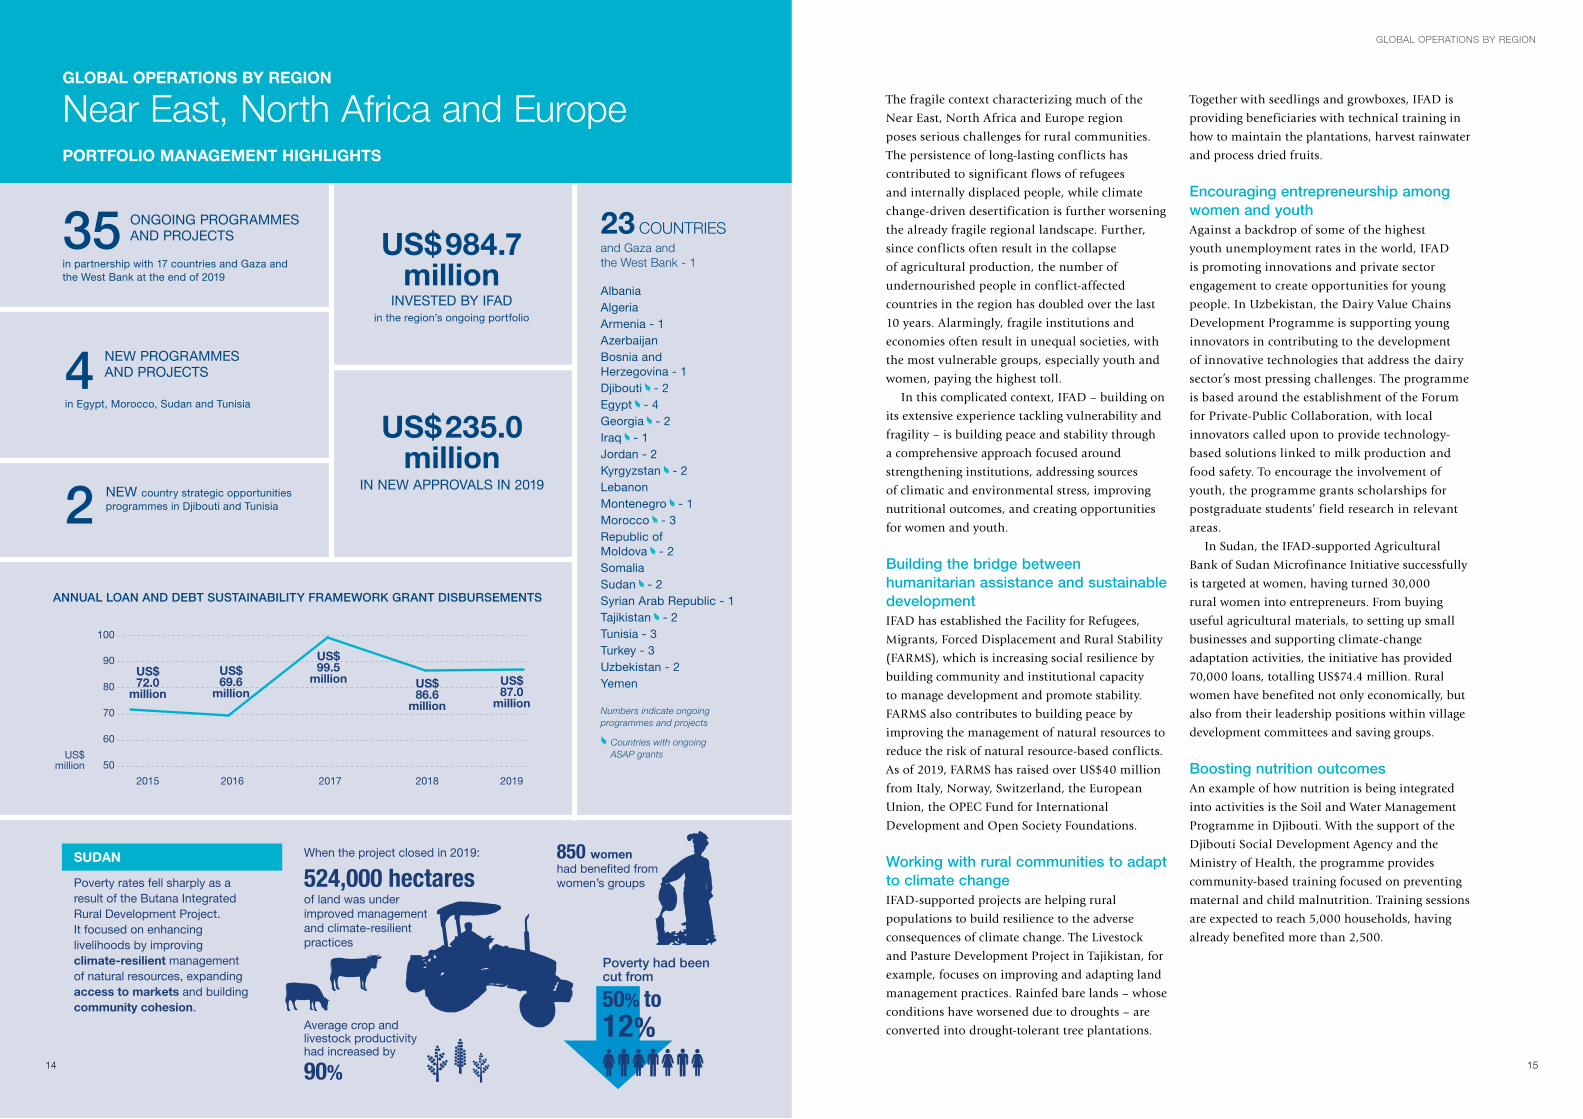
The fragile context characterizing much of the
Near East, North Africa and Europe region
poses serious challenges for rural communities.
The persistence of long-lasting conflicts has
contributed to significant flows of refugees
and internally displaced people, while climate
change-driven desertification is further worsening
the already fragile regional landscape. Further,
since conflicts often result in the collapse
of agricultural production, the number of
undernourished people in conflict-affected
countries in the region has doubled over the last
10 years. Alarmingly, fragile institutions and
economies often result in unequal societies, with
the most vulnerable groups, especially youth and
women, paying the highest toll.
In this complicated context, IFAD – building on
its extensive experience tackling vulnerability and
fragility – is building peace and stability through
a comprehensive approach focused around
strengthening institutions, addressing sources
of climatic and environmental stress, improving
nutritional outcomes, and creating opportunities
for women and youth.
Building the bridge between humanitarian assistance and sustainable developmentIFAD has established the Facility for Refugees,
Migrants, Forced Displacement and Rural Stability
(FARMS), which is increasing social resilience by
building community and institutional capacity
to manage development and promote stability.
FARMS also contributes to building peace by
improving the management of natural resources to
reduce the risk of natural resource-based conflicts.
As of 2019, FARMS has raised over US$40 million
from Italy, Norway, Switzerland, the European
Union, the OPEC Fund for International
Development and Open Society Foundations.
Working with rural communities to adapt to climate changeIFAD-supported projects are helping rural
populations to build resilience to the adverse
consequences of climate change. The Livestock
and Pasture Development Project in Tajikistan, for
example, focuses on improving and adapting land
management practices. Rainfed bare lands – whose
conditions have worsened due to droughts – are
converted into drought-tolerant tree plantations.
Together with seedlings and growboxes, IFAD is
providing beneficiaries with technical training in
how to maintain the plantations, harvest rainwater
and process dried fruits.
Encouraging entrepreneurship among women and youthAgainst a backdrop of some of the highest
youth unemployment rates in the world, IFAD
is promoting innovations and private sector
engagement to create opportunities for young
people. In Uzbekistan, the Dairy Value Chains
Development Programme is supporting young
innovators in contributing to the development
of innovative technologies that address the dairy
sector’s most pressing challenges. The programme
is based around the establishment of the Forum
for Private-Public Collaboration, with local
innovators called upon to provide technology-
based solutions linked to milk production and
food safety. To encourage the involvement of
youth, the programme grants scholarships for
postgraduate students’ field research in relevant
areas.
In Sudan, the IFAD-supported Agricultural
Bank of Sudan Microfinance Initiative successfully
is targeted at women, having turned 30,000
rural women into entrepreneurs. From buying
useful agricultural materials, to setting up small
businesses and supporting climate-change
adaptation activities, the initiative has provided
70,000 loans, totalling US$74.4 million. Rural
women have benefited not only economically, but
also from their leadership positions within village
development committees and saving groups.
Boosting nutrition outcomesAn example of how nutrition is being integrated
into activities is the Soil and Water Management
Programme in Djibouti. With the support of the
Djibouti Social Development Agency and the
Ministry of Health, the programme provides
community-based training focused on preventing
maternal and child malnutrition. Training sessions
are expected to reach 5,000 households, having
already benefited more than 2,500.
US$million
2015 2016 2017 2018 2019
50
60
70
80
90
100
US$72.0
million
US$69.6
million
US$99.5
million US$87.0
million
US$86.6
million
US$235.0 million
IN NEW APPROVALS IN 2019
35 ONGOING PROGRAMMES AND PROJECTS
in partnership with 17 countries and Gaza and the West Bank at the end of 2019
4 NEW PROGRAMMES AND PROJECTS
in Egypt, Morocco, Sudan and Tunisia
2 NEW country strategic opportunities programmes in Djibouti and Tunisia
23 COUNTRIESand Gaza and the West Bank - 1
AlbaniaAlgeriaArmenia - 1AzerbaijanBosnia and Herzegovina - 1Djibouti - 2Egypt - 4Georgia - 2Iraq - 1Jordan - 2Kyrgyzstan - 2LebanonMontenegro - 1Morocco - 3Republic of Moldova - 2SomaliaSudan - 2Syrian Arab Republic - 1Tajikistan - 2Tunisia - 3Turkey - 3Uzbekistan - 2Yemen
Numbers indicate ongoing programmes and projects
Countries with ongoing ASAP grants
ANNUAL LOAN AND DEBT SUSTAINABILITY FRAMEWORK GRANT DISBURSEMENTS
US$984.7 million
INVESTED BY IFADin the region’s ongoing portfolio
PORTFOLIO MANAGEMENT HIGHLIGHTS
GLOBAL OPERATIONS BY REGION
Near East, North Africa and Europe
When the project closed in 2019:
Average crop and livestock productivity had increased by
90%
850 women had benefited from women’s groups
SUDAN
Poverty rates fell sharply as a result of the Butana Integrated Rural Development Project. It focused on enhancing livelihoods by improving climate-resilient management of natural resources, expanding access to markets and building community cohesion.
524,000 hectares of land was under improved management and climate-resilient practices
Poverty had beencut from
50% to12%
US$million
2019
US$187.6
million
2015 2016 2017
US$123.1
millionUS$
117.0million
US$132.7
million
2018
US$153.5
million
110
120
130
140
150
160
170
180
190
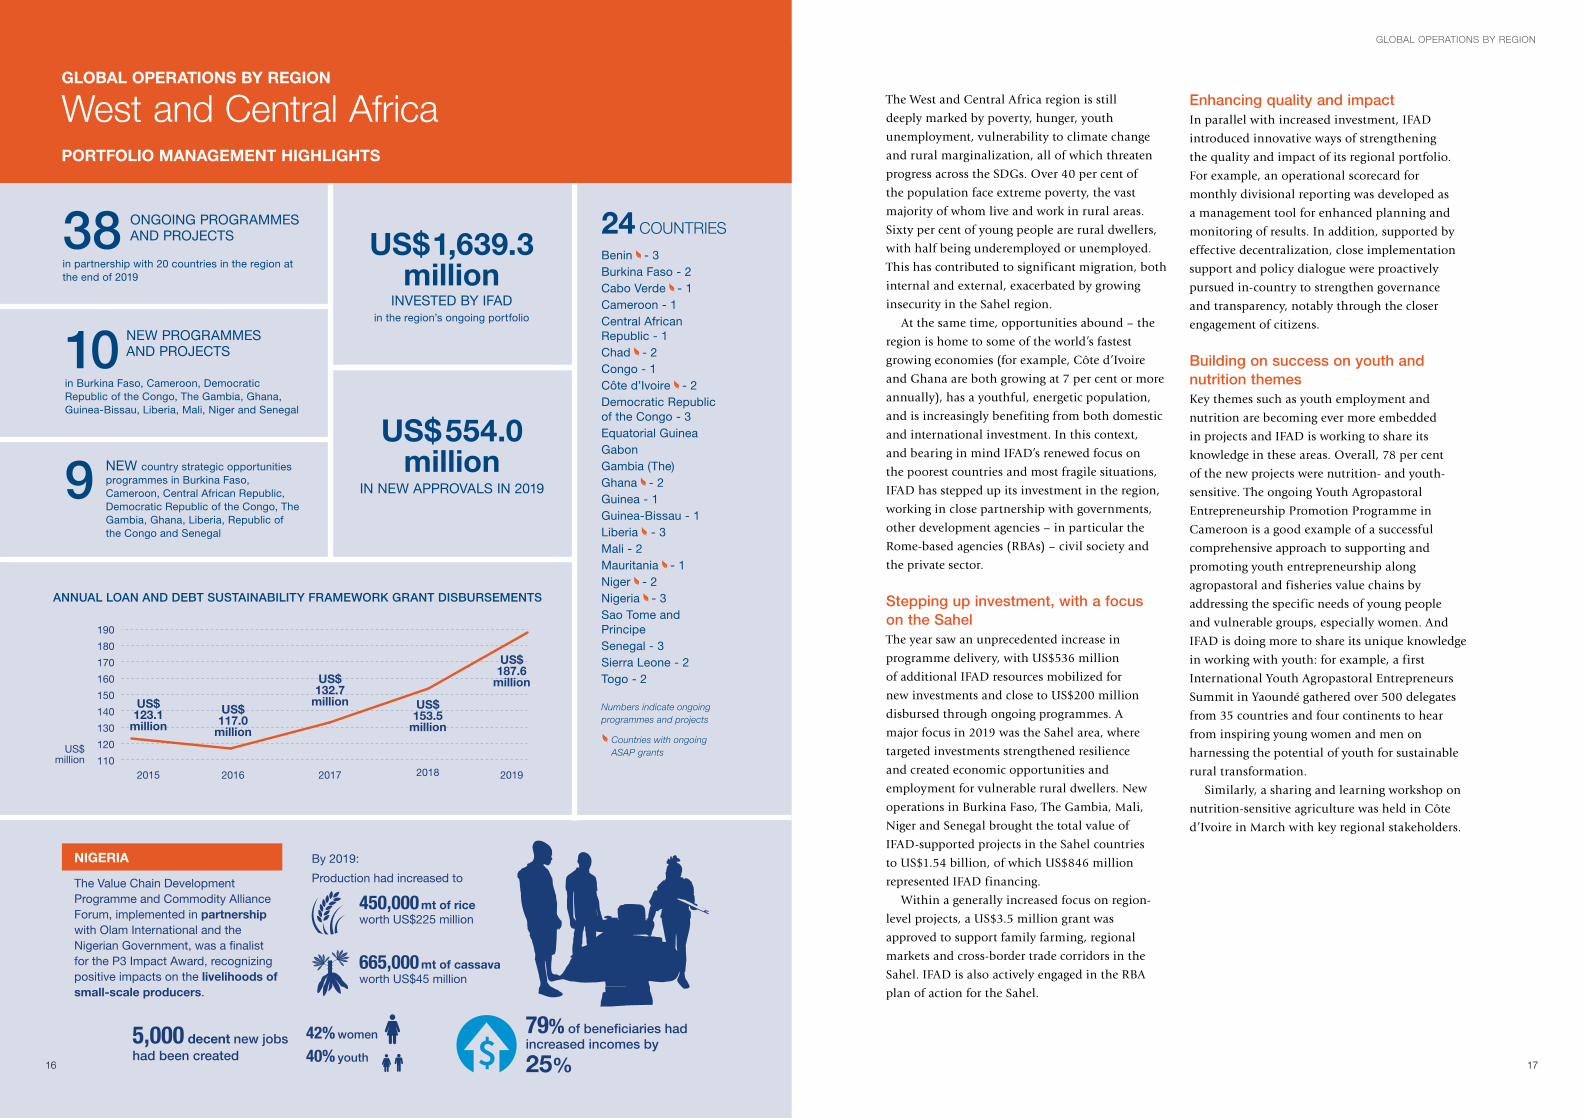
US$554.0 million
IN NEW APPROVALS IN 2019
38 ONGOING PROGRAMMES AND PROJECTS
in partnership with 20 countries in the region at the end of 2019
10 NEW PROGRAMMES AND PROJECTS
in Burkina Faso, Cameroon, Democratic Republic of the Congo, The Gambia, Ghana, Guinea-Bissau, Liberia, Mali, Niger and Senegal
9 NEW country strategic opportunities programmes in Burkina Faso, Cameroon, Central African Republic, Democratic Republic of the Congo, The Gambia, Ghana, Liberia, Republic of the Congo and Senegal
Benin - 3Burkina Faso - 2Cabo Verde - 1Cameroon - 1Central African Republic - 1Chad - 2Congo - 1Côte d’Ivoire - 2Democratic Republic of the Congo - 3Equatorial GuineaGabonGambia (The)Ghana - 2Guinea - 1Guinea-Bissau - 1Liberia - 3Mali - 2Mauritania - 1Niger - 2Nigeria - 3Sao Tome and PrincipeSenegal - 3Sierra Leone - 2Togo - 2
Numbers indicate ongoing programmes and projects
Countries with ongoing ASAP grants
ANNUAL LOAN AND DEBT SUSTAINABILITY FRAMEWORK GRANT DISBURSEMENTS
US$1,639.3 million
INVESTED BY IFADin the region’s ongoing portfolio
24 COUNTRIES
GLOBAL OPERATIONS BY REGION
17
The West and Central Africa region is still
deeply marked by poverty, hunger, youth
unemployment, vulnerability to climate change
and rural marginalization, all of which threaten
progress across the SDGs. Over 40 per cent of
the population face extreme poverty, the vast
majority of whom live and work in rural areas.
Sixty per cent of young people are rural dwellers,
with half being underemployed or unemployed.
This has contributed to significant migration, both
internal and external, exacerbated by growing
insecurity in the Sahel region.
At the same time, opportunities abound – the
region is home to some of the world’s fastest
growing economies (for example, Côte d’Ivoire
and Ghana are both growing at 7 per cent or more
annually), has a youthful, energetic population,
and is increasingly benefiting from both domestic
and international investment. In this context,
and bearing in mind IFAD’s renewed focus on
the poorest countries and most fragile situations,
IFAD has stepped up its investment in the region,
working in close partnership with governments,
other development agencies – in particular the
Rome-based agencies (RBAs) – civil society and
the private sector.
Stepping up investment, with a focus on the SahelThe year saw an unprecedented increase in
programme delivery, with US$536 million
of additional IFAD resources mobilized for
new investments and close to US$200 million
disbursed through ongoing programmes. A
major focus in 2019 was the Sahel area, where
targeted investments strengthened resilience
and created economic opportunities and
employment for vulnerable rural dwellers. New
operations in Burkina Faso, The Gambia, Mali,
Niger and Senegal brought the total value of
IFAD-supported projects in the Sahel countries
to US$1.54 billion, of which US$846 million
represented IFAD financing.
Within a generally increased focus on region-
level projects, a US$3.5 million grant was
approved to support family farming, regional
markets and cross-border trade corridors in the
Sahel. IFAD is also actively engaged in the RBA
plan of action for the Sahel.
Enhancing quality and impactIn parallel with increased investment, IFAD
introduced innovative ways of strengthening
the quality and impact of its regional portfolio.
For example, an operational scorecard for
monthly divisional reporting was developed as
a management tool for enhanced planning and
monitoring of results. In addition, supported by
effective decentralization, close implementation
support and policy dialogue were proactively
pursued in-country to strengthen governance
and transparency, notably through the closer
engagement of citizens.
Building on success on youth and nutrition themesKey themes such as youth employment and
nutrition are becoming ever more embedded
in projects and IFAD is working to share its
knowledge in these areas. Overall, 78 per cent
of the new projects were nutrition- and youth-
sensitive. The ongoing Youth Agropastoral
Entrepreneurship Promotion Programme in
Cameroon is a good example of a successful
comprehensive approach to supporting and
promoting youth entrepreneurship along
agropastoral and fisheries value chains by
addressing the specific needs of young people
and vulnerable groups, especially women. And
IFAD is doing more to share its unique knowledge
in working with youth: for example, a first
International Youth Agropastoral Entrepreneurs
Summit in Yaoundé gathered over 500 delegates
from 35 countries and four continents to hear
from inspiring young women and men on
harnessing the potential of youth for sustainable
rural transformation.
Similarly, a sharing and learning workshop on
nutrition-sensitive agriculture was held in Côte
d’Ivoire in March with key regional stakeholders.
16
NIGERIA
The Value Chain Development Programme and Commodity Alliance Forum, implemented in partnership with Olam International and the Nigerian Government, was a finalist for the P3 Impact Award, recognizing positive impacts on the livelihoods of small-scale producers.
5,000 decent new jobs had been created
42% women
40% youth
79% of beneficiaries had increased incomes by
25%
Production had increased to
665,000 mt of cassavaworth US$45 million
450,000 mt of rice worth US$225 million
By 2019:
PORTFOLIO MANAGEMENT HIGHLIGHTS
GLOBAL OPERATIONS BY REGION
West and Central Africa
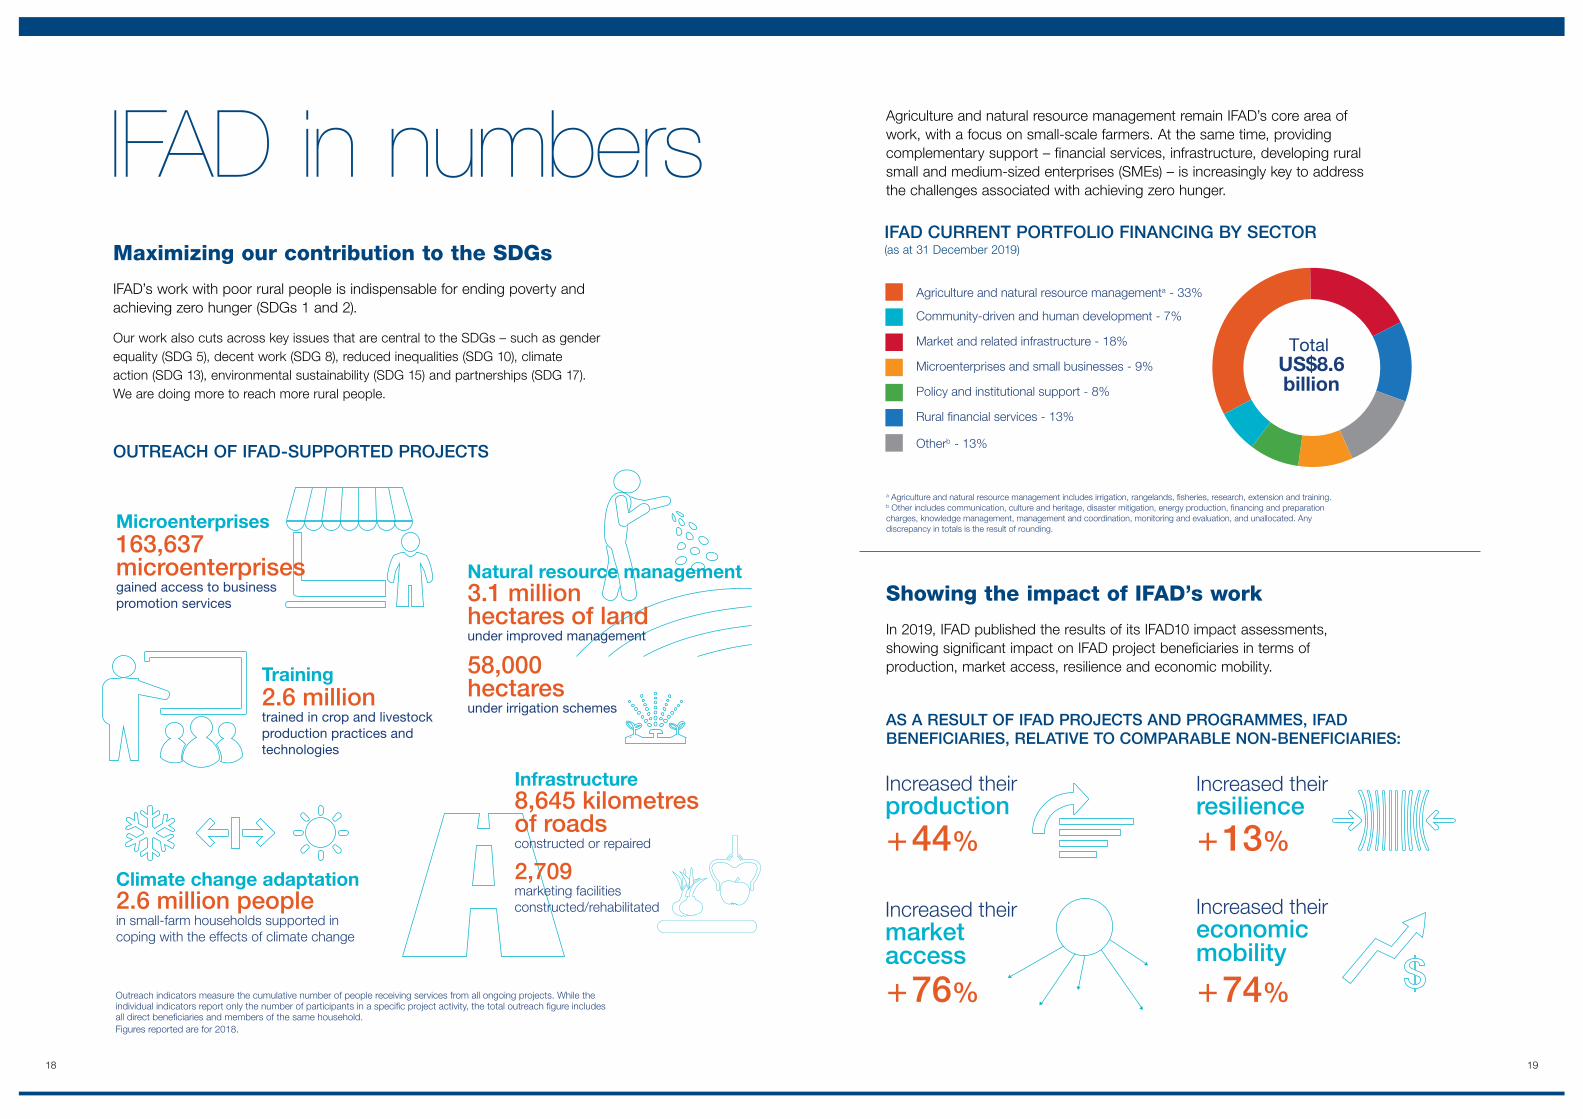
Increased their production
Increased their economic mobility
$
Increased their market access
Increased their resilience
+ 44% + 13%
+ 76% + 74%
IFAD in numbers
18 19
Outreach indicators measure the cumulative number of people receiving services from all ongoing projects. While the individual indicators report only the number of participants in a speci�c project activity, the total outreach �gure includes all direct bene�ciaries and members of the same household.Figures reported are for 2018.
Climate change adaptation2.6 million people in small-farm households supported in coping with the effects of climate change
Microenterprises163,637 microenterprises gained access to business promotion services
Training2.6 million trained in crop and livestock production practices and technologies
Infrastructure8,645 kilometres of roads constructed or repaired
2,709 marketing facilities constructed/rehabilitated
Natural resource management3.1 million hectares of land under improved management
58,000hectares under irrigation schemes
Maximizing our contribution to the SDGs
IFAD’s work with poor rural people is indispensable for ending poverty and achieving zero hunger (SDGs 1 and 2).
Our work also cuts across key issues that are central to the SDGs – such as gender equality (SDG 5), decent work (SDG 8), reduced inequalities (SDG 10), climate action (SDG 13), environmental sustainability (SDG 15) and partnerships (SDG 17). We are doing more to reach more rural people.
Showing the impact of IFAD’s work
In 2019, IFAD published the results of its IFAD10 impact assessments, showing significant impact on IFAD project beneficiaries in terms of production, market access, resilience and economic mobility.
OUTREACH OF IFAD-SUPPORTED PROJECTS
AS A RESULT OF IFAD PROJECTS AND PROGRAMMES, IFAD BENEFICIARIES, RELATIVE TO COMPARABLE NON-BENEFICIARIES:
Agriculture and natural resource management remain IFAD’s core area of work, with a focus on small-scale farmers. At the same time, providing complementary support – financial services, infrastructure, developing rural small and medium-sized enterprises (SMEs) – is increasingly key to address the challenges associated with achieving zero hunger.
Total US$8.6billion
a Agriculture and natural resource management includes irrigation, rangelands, �sheries, research, extension and training.b Other includes communication, culture and heritage, disaster mitigation, energy production, �nancing and preparation charges, knowledge management, management and coordination, monitoring and evaluation, and unallocated. Any discrepancy in totals is the result of rounding.
Community-driven and human development - 7%
Market and related infrastructure - 18%
Policy and institutional support - 8%
Rural �nancial services - 13%
Microenterprises and small businesses - 9%
Otherb - 13%
Agriculture and natural resource managementa - 33%
IFAD CURRENT PORTFOLIO FINANCING BY SECTOR (as at 31 December 2019)
20
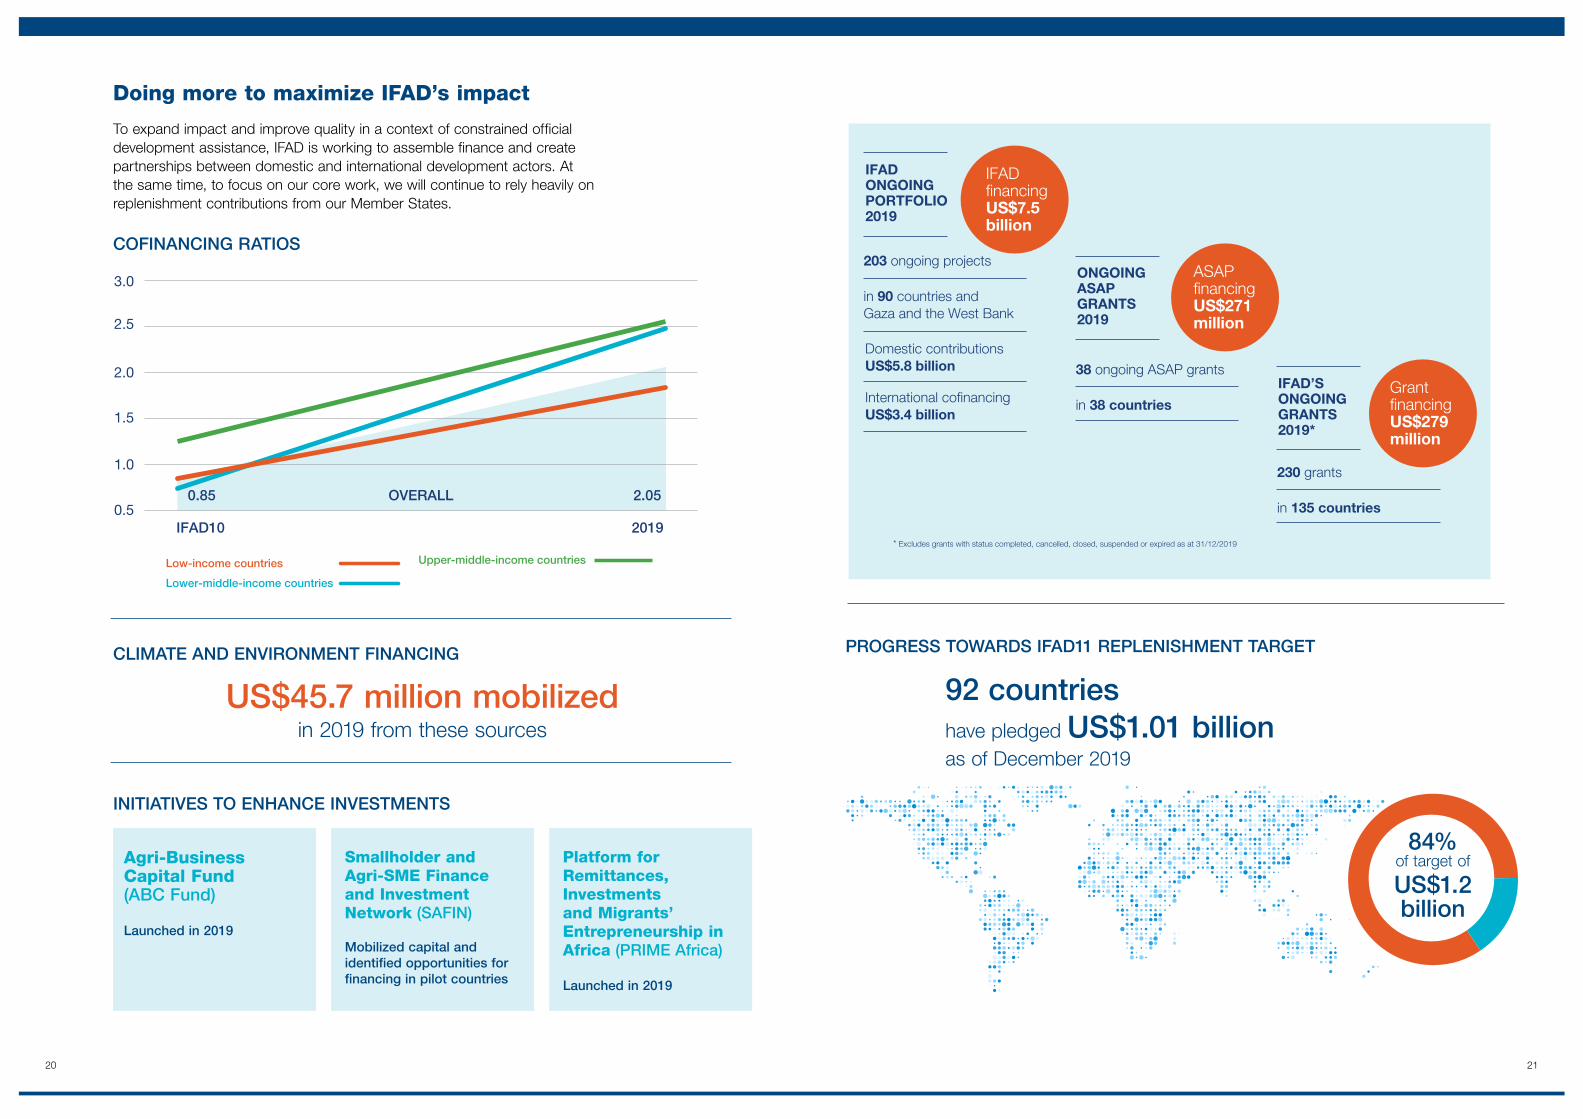
Lower-middle-income countries
Upper-middle-income countries
IFAD10
OVERALL
20190.5
1.0
1.5
2.0
2.5
3.0
0.85 2.05
Low-income countries
Agri-Business Capital Fund (ABC Fund) Launched in 2019
Smallholder and Agri-SME Finance and Investment Network (SAFIN) Mobilized capital and identified opportunities for financing in pilot countries
Platform for Remittances, Investments and Migrants’ Entrepreneurship in Africa (PRIME Africa) Launched in 2019
PROGRESS TOWARDS IFAD11 REPLENISHMENT TARGETCLIMATE AND ENVIRONMENT FINANCING
INITIATIVES TO ENHANCE INVESTMENTS
Total US$1,069.1
million
US$45.7 million mobilizedin 2019 from these sources
92 countries have pledged US$1.01 billionas of December 2019
84%of target of
US$1.2billion
IFAD�nancingUS$7.5 billion
in 90 countries and Gaza and the West Bank
203 ongoing projects
Domestic contributionsUS$5.8 billion
International co�nancingUS$3.4 billion
IFADONGOINGPORTFOLIO2019
in 135 countries
230 grants
Grant�nancingUS$279million
IFAD’SONGOINGGRANTS2019*
ASAP�nancingUS$271 million
in 38 countries
38 ongoing ASAP grants
ONGOINGASAPGRANTS2019
* Excludes grants with status completed, cancelled, closed, suspended or expired as at 31/12/2019
Doing more to maximize IFAD’s impact
To expand impact and improve quality in a context of constrained official development assistance, IFAD is working to assemble finance and create partnerships between domestic and international development actors. At the same time, to focus on our core work, we will continue to rely heavily on replenishment contributions from our Member States.
COFINANCING RATIOS
21
22 23
US$million
2015 2016 2017
600
650
700
750
800
850
900
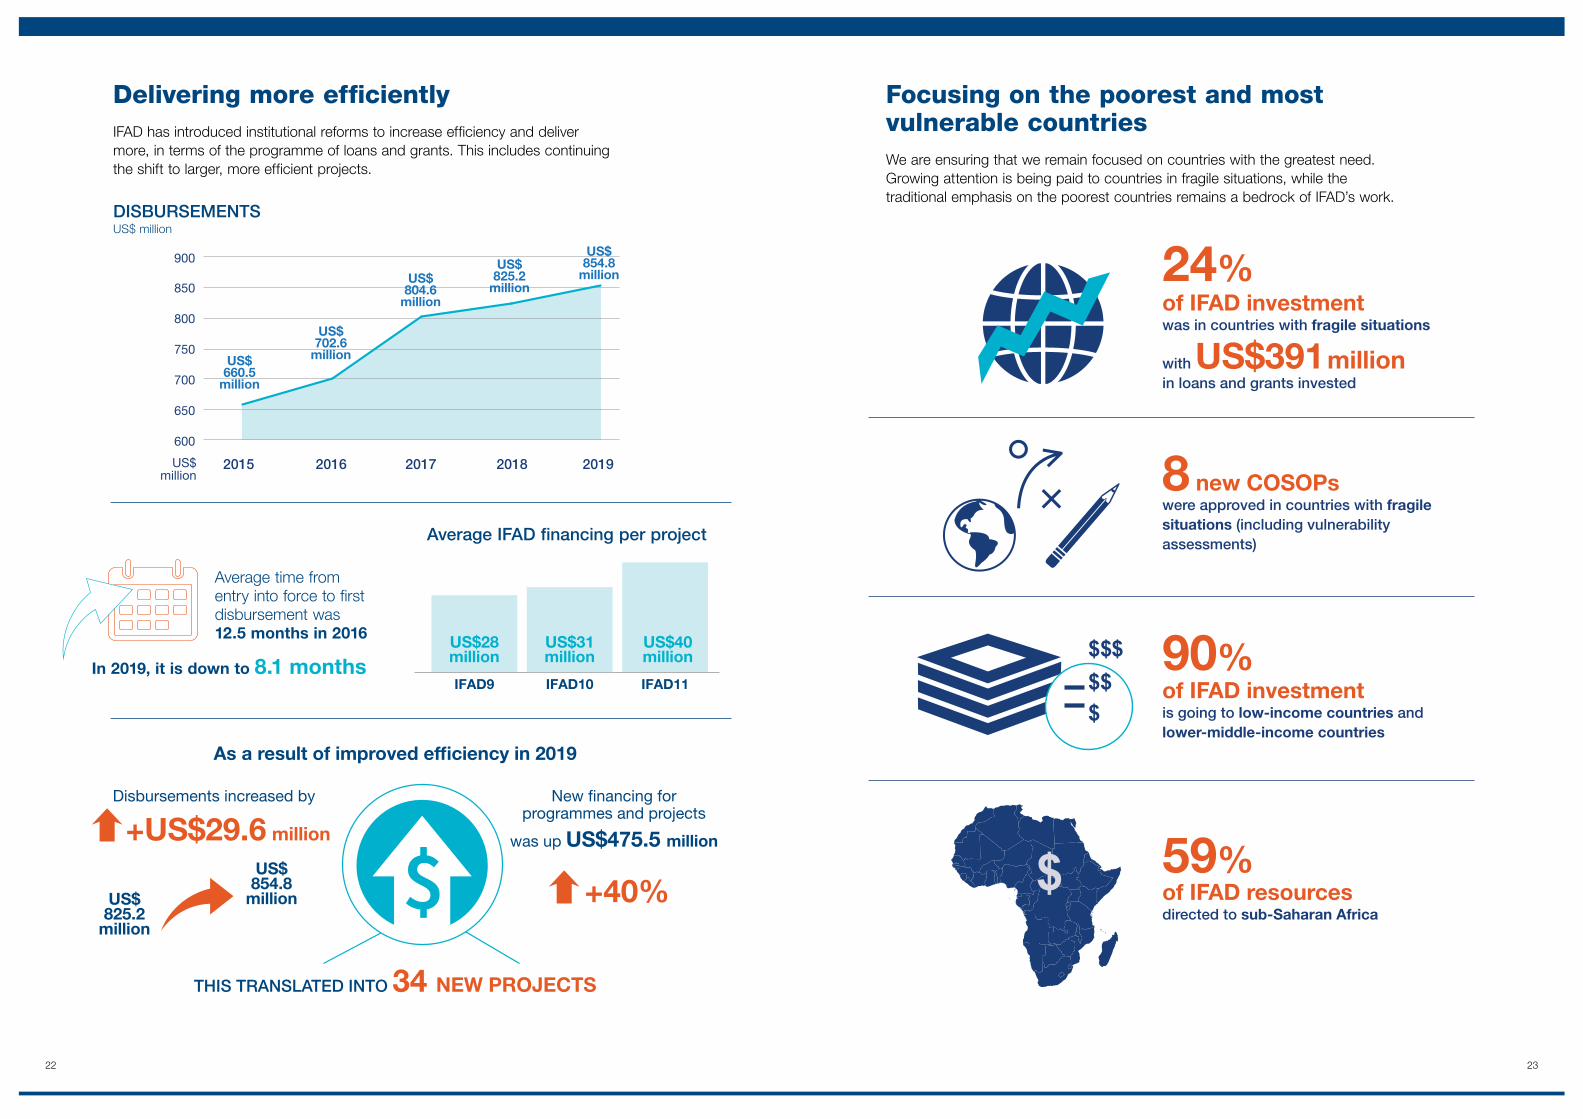
US$660.5
million
US$702.6
million
US$804.6
million
2018 2019
US$825.2
million
US$854.8
million
DISBURSEMENTS US$ million
Delivering more efficientlyIFAD has introduced institutional reforms to increase efficiency and deliver more, in terms of the programme of loans and grants. This includes continuing the shift to larger, more efficient projects.
Focusing on the poorest and most vulnerable countriesWe are ensuring that we remain focused on countries with the greatest need. Growing attention is being paid to countries in fragile situations, while the traditional emphasis on the poorest countries remains a bedrock of IFAD’s work.
Average time from entry into force to first disbursement was 12.5 months in 2016
In 2019, it is down to 8.1 months
Average IFAD financing per project
As a result of improved ef�ciency in 2019
New financing for programmes and projects
was up US$475.5 million
Disbursements increased by
+US$29.6 million
+40%
THIS TRANSLATED INTO 34 NEW PROJECTS
US$825.2
million
US$854.8
million
IFAD9 IFAD10 IFAD11
US$28million
US$31million
US$40million
with US$391 million in loans and grants invested
24% of IFAD investment was in countries with fragile situations
8 new COSOPs were approved in countries with fragile situations (including vulnerability assessments)
90%of IFAD investment is going to low-income countries and lower-middle-income countries
of IFAD resourcesdirected to sub-Saharan Africa
59%
2524
0
5
10
15
20
25
30
35
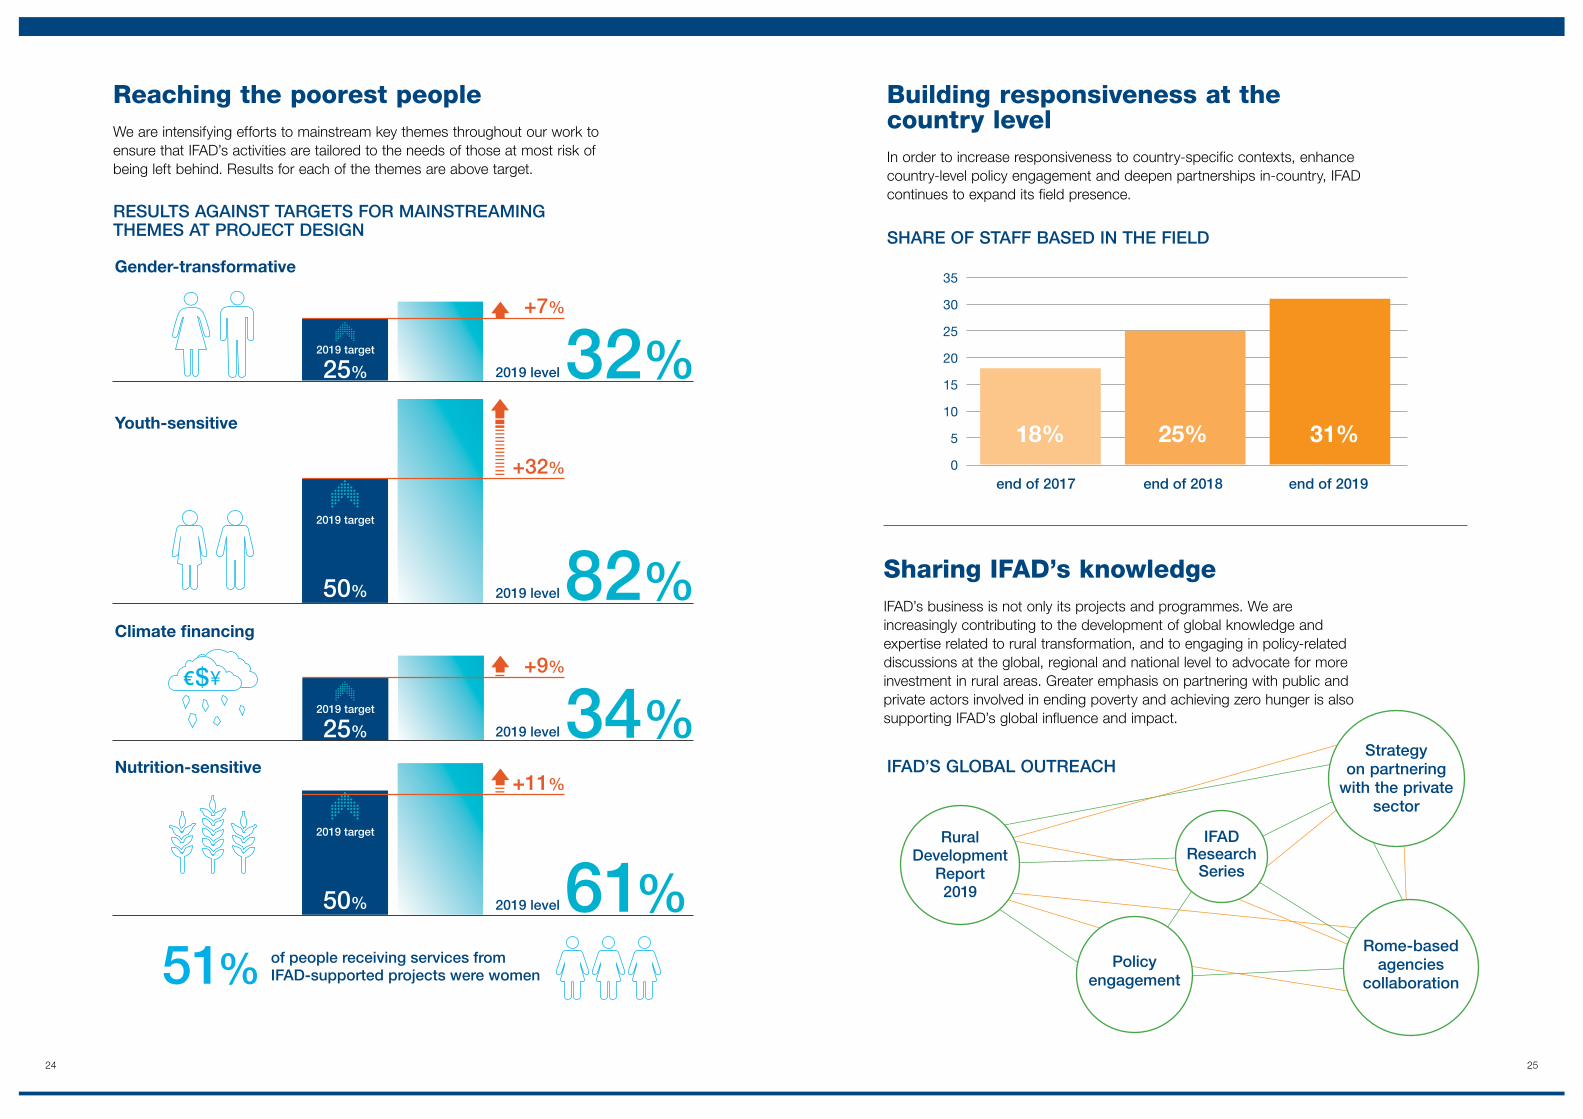
18% 25% 31%
end of 2017 end of 2018 end of 2019
Bilateral US$25.3 million – 2.4%
Reaching the poorest peopleWe are intensifying efforts to mainstream key themes throughout our work to ensure that IFAD’s activities are tailored to the needs of those at most risk of being left behind. Results for each of the themes are above target.
Building responsiveness at the country levelIn order to increase responsiveness to country-specific contexts, enhance country-level policy engagement and deepen partnerships in-country, IFAD continues to expand its field presence.
Sharing IFAD’s knowledge IFAD’s business is not only its projects and programmes. We are increasingly contributing to the development of global knowledge and expertise related to rural transformation, and to engaging in policy-related discussions at the global, regional and national level to advocate for more investment in rural areas. Greater emphasis on partnering with public and private actors involved in ending poverty and achieving zero hunger is also supporting IFAD’s global influence and impact.
IFAD’S GLOBAL OUTREACH
Rural Development
Report 2019
Rome-based agencies
collaborationPolicy
engagement
Strategy on partnering
with the private sector
IFADResearch
Series
SHARE OF STAFF BASED IN THE FIELD
Gender-transformative
2019 level
2019 level
32%Youth-sensitive
82%2019 target
2019 target
Climate �nancing
Nutrition-sensitive
of people receiving services from IFAD-supported projects were women51%
25%
50%
2019 level
+11%
61%2019 target
50%
2019 level34%2019 target
25%
+9%
+32%
+7%
RESULTS AGAINST TARGETS FOR MAINSTREAMING THEMES AT PROJECT DESIGN
2726
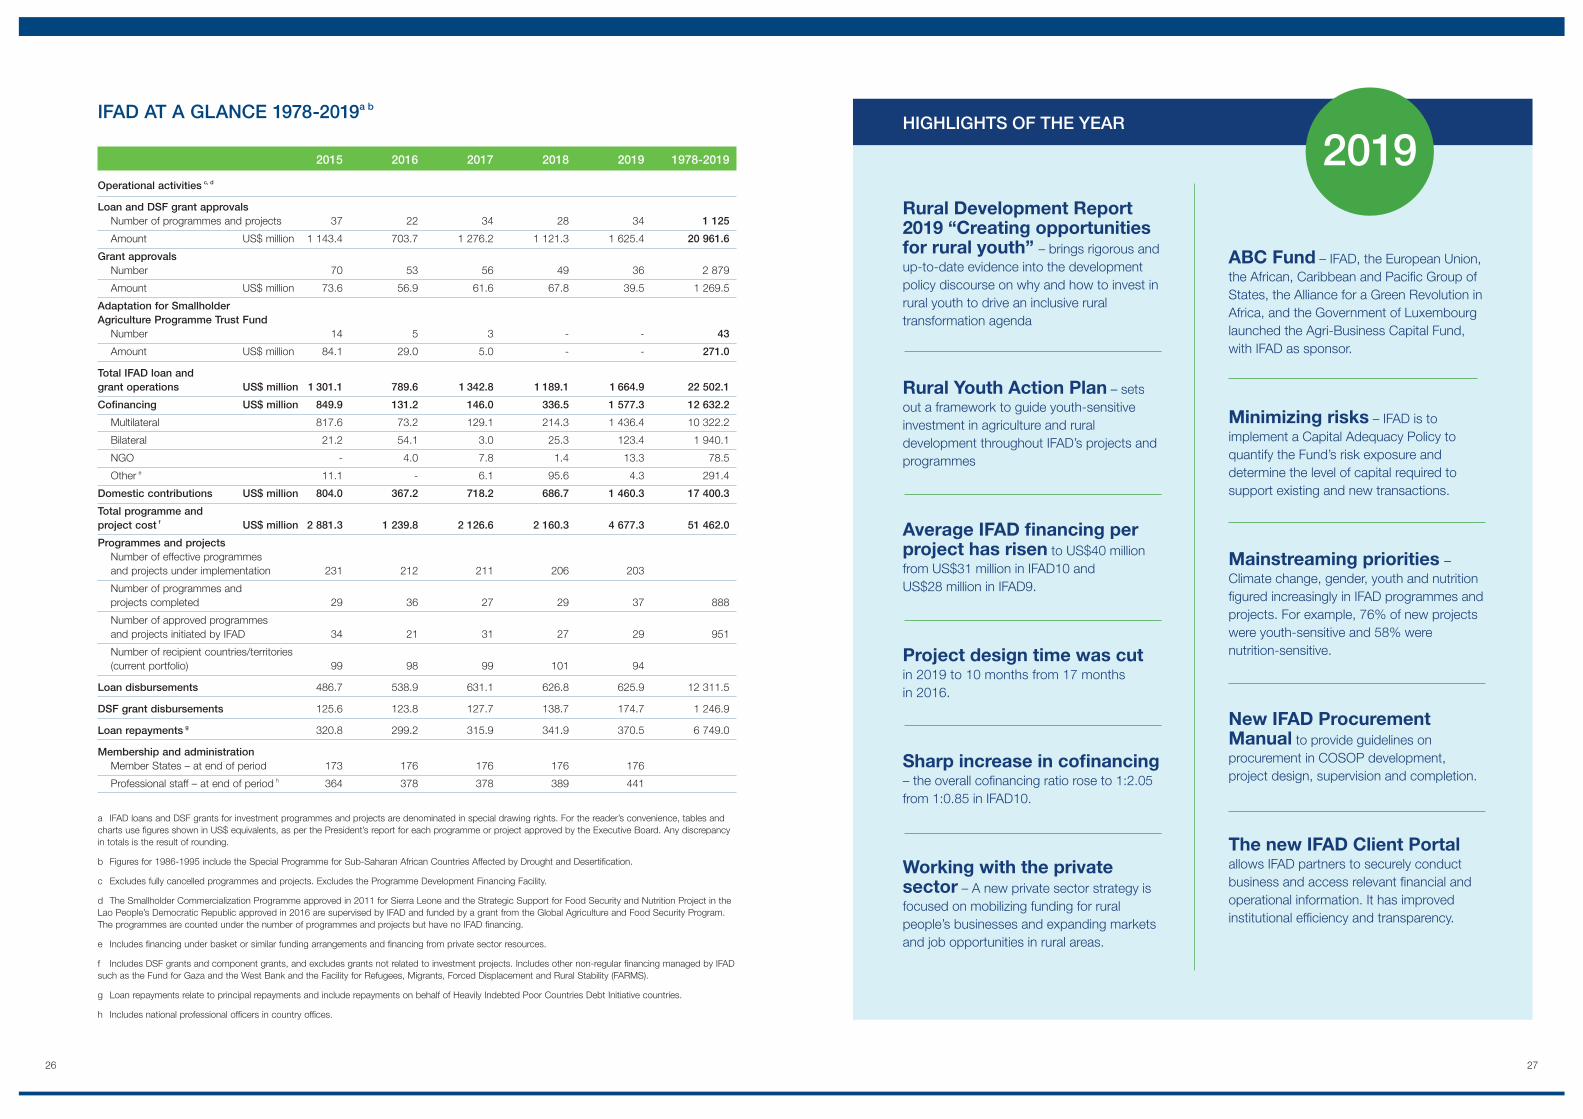
Rural Development Report 2019 “Creating opportunities for rural youth” – brings rigorous and up-to-date evidence into the development policy discourse on why and how to invest in rural youth to drive an inclusive rural transformation agenda
Rural Youth Action Plan – sets out a framework to guide youth-sensitive investment in agriculture and rural development throughout IFAD’s projects and programmes
Average IFAD �nancing per project has risen to US$40 million from US$31 million in IFAD10 and US$28 million in IFAD9.
Project design time was cut in 2019 to 10 months from 17 months in 2016.
Sharp increase in co�nancing – the overall co�nancing ratio rose to 1:2.05 from 1:0.85 in IFAD10.
Working with the private sector – A new private sector strategy is focused on mobilizing funding for rural people’s businesses and expanding markets and job opportunities in rural areas.
ABC Fund – IFAD, the European Union, the African, Caribbean and Paci�c Group of States, the Alliance for a Green Revolution in Africa, and the Government of Luxembourg launched the Agri-Business Capital Fund, with IFAD as sponsor.
Minimizing risks – IFAD is to implement a Capital Adequacy Policy to quantify the Fund’s risk exposure and determine the level of capital required to support existing and new transactions.
Mainstreaming priorities – Climate change, gender, youth and nutrition �gured increasingly in IFAD programmes and projects. For example, 76% of new projects were youth-sensitive and 58% were nutrition-sensitive.
New IFAD Procurement Manual to provide guidelines on procurement in COSOP development, project design, supervision and completion.
The new IFAD Client Portal allows IFAD partners to securely conduct business and access relevant �nancial and operational information. It has improved institutional ef�ciency and transparency.
2019HIGHLIGHTS OF THE YEAR
2015 2016 2017 2018 2019 1978-2019
Operational activities c, d
Loan and DSF grant approvals Number of programmes and projects 37 22 34 28 34 1 125
Amount US$ million 1 143.4 703.7 1 276.2 1 121.3 1 625.4 20 961.6
Grant approvals Number 70 53 56 49 36 2 879
Amount US$ million 73.6 56.9 61.6 67.8 39.5 1 269.5
Adaptation for Smallholder Agriculture Programme Trust Fund Number 14 5 3 - - 43
Amount US$ million 84.1 29.0 5.0 - - 271.0
Total IFAD loan and grant operations US$ million 1 301.1 789.6 1 342.8 1 189.1 1 664.9 22 502.1
Cofinancing US$ million 849.9 131.2 146.0 336.5 1 577.3 12 632.2
Multilateral 817.6 73.2 129.1 214.3 1 436.4 10 322.2
Bilateral 21.2 54.1 3.0 25.3 123.4 1 940.1
NGO - 4.0 7.8 1.4 13.3 78.5
Other e 11.1 - 6.1 95.6 4.3 291.4
Domestic contributions US$ million 804.0 367.2 718.2 686.7 1 460.3 17 400.3
Total programme and project cost f US$ million 2 881.3 1 239.8 2 126.6 2 160.3 4 677.3 51 462.0
Programmes and projects Number of effective programmes and projects under implementation 231 212 211 206 203
Number of programmes and projects completed 29 36 27 29 37 888
Number of approved programmes and projects initiated by IFAD 34 21 31 27 29 951
Number of recipient countries/territories (current portfolio) 99 98 99 101 94
Loan disbursements 486.7 538.9 631.1 626.8 625.9 12 311.5
DSF grant disbursements 125.6 123.8 127.7 138.7 174.7 1 246.9
Loan repayments g 320.8 299.2 315.9 341.9 370.5 6 749.0
Membership and administration Member States – at end of period 173 176 176 176 176
Professional staff – at end of period h 364 378 378 389 441
a IFAD loans and DSF grants for investment programmes and projects are denominated in special drawing rights. For the reader’s convenience, tables and charts use figures shown in US$ equivalents, as per the President’s report for each programme or project approved by the Executive Board. Any discrepancy in totals is the result of rounding.
b Figures for 1986-1995 include the Special Programme for Sub-Saharan African Countries Affected by Drought and Desertification.
c Excludes fully cancelled programmes and projects. Excludes the Programme Development Financing Facility.
d The Smallholder Commercialization Programme approved in 2011 for Sierra Leone and the Strategic Support for Food Security and Nutrition Project in the Lao People’s Democratic Republic approved in 2016 are supervised by IFAD and funded by a grant from the Global Agriculture and Food Security Program. The programmes are counted under the number of programmes and projects but have no IFAD financing.
e Includes financing under basket or similar funding arrangements and financing from private sector resources.
f Includes DSF grants and component grants, and excludes grants not related to investment projects. Includes other non-regular financing managed by IFAD such as the Fund for Gaza and the West Bank and the Facility for Refugees, Migrants, Forced Displacement and Rural Stability (FARMS).
g Loan repayments relate to principal repayments and include repayments on behalf of Heavily Indebted Poor Countries Debt Initiative countries.
h Includes national professional officers in country offices.
IFAD AT A GLANCE 1978-2019a b
28 29
SPOTLIGHT ON QUALITY ASSURANCE
guidelines prioritize: tailoring COSOPs to a
country’s particular context; consulting and
involving partner governments; and ensuring
that IFAD’s internal processes are efficient,
focused and cost-effective. The new COSOPs,
based upon a more robust analytical and strategic
underpinning, are already showing marked
improvements, in particular in enhancing clarity,
focus and relevance. Additionally, supporting the
strengthening of results frameworks, improved
alignment with relevant SDGs, government
policies and strategies, as well as alignment with
IFAD’s own corporate strategies, have also been
identified as benefits from the revised guidelines.
Building knowledge and sharing lessonsIn 2019, IFAD’s Quality Assurance Group (QAG)
used its unique vantage point to generate lessons
and suggest good practices for IFAD operations
and country strategies. QAG became more
proactive in sharing such lessons and driving
conversations about quality. In the second part
of the year, QAG organized three learning events
(including a QAG Learning Series event on
COSOP design quality) and launched the QAG
VIEW – a tri-annual insights pamphlet based on
lessons taken from quality-at-entry design reviews.
QAG staff participated in regional divisional
workshops in Brazil, the Republic of Korea and
Turkey – holding sessions on quality at entry, and
QAG’s reviews and role. The aim was to bring
QAG’s viewpoint to bear on improving the quality
of project, grant and strategy design, strengthening
knowledge dissemination, and providing
guidance and clarity on QAG’s methodology
and procedures.
Enhancing quality is clearly central to IFAD’s
ambitions in and around its contribution to
ending poverty and achieving zero hunger. This
means we must continue to adapt and improve
the way we tailor our work to addressing the
challenges rural communities are facing.
Improved quality means greater impact.
Essential for achieving impact on the ground are
three elements: strong country ownership, sound
project management and sufficient flexibility
to make design adjustments during a project.
These and other elements were emphasized in
the context of an intense corporate focus in 2019
on design quality. Consequently, IFAD further
strengthened its quality assurance apparatus
to improve the quality “at entry” – that is,
before approval by the Executive Board – of its
country strategies, loan-funded projects and
grant-financed activities.
We have also streamlined our design and review
processes, ensuring that any lessons learned are
widely disseminated to inform future designs.
In addition, IFAD’s final ratings methodology
was made more consistent, enabling the Fund to
guarantee accountability, identify systemic issues,
and allow comparison between quality at entry
and during implementation.
Focusing on improving qualityAs part of IFAD’s push to streamline its processes
and improve the quality of its operations, IFAD
Management committed the Fund to “front-
loading” project approval in the first year of
IFAD11. That made 2019 a bumper year in
terms of the quantity of projects being designed
and destined for Executive Board approval,
with 42 loans and 13 proposals for additional
financing passing through the quality assurance
review process.
The year 2019 was one of record approvals
(US$1.67 billion) for IFAD. At the same time, we
also fully rolled out the recalibrated project design
process. In all, 54 projects went through the new
process, which adopts a risk-based approach to
determine the appropriate review and approval
process. Of the 54 projects approved, 13 were
considered “track 1” projects, requiring high
corporate attention and presenting higher risks.
A comprehensive analysis of ratings revealed
that the projects approved in 2019 had the
highest average rating for overall quality of
design since 2013. Areas of strength in design
included alignment with IFAD and government
policies, mobilization of cofinancing, assimilation
of lessons from the past, and analysis of
project context.
Likewise, the grant programme was also
sizeable, with 53 concept notes for grants being
presented for internal approval throughout the
year. By the end of 2019, global/regional grants
for a total value of US$25.3 million had been
approved. In addition, loan-component grants
worth US$14.2 million had been agreed as part
of investment projects. In 2019, we conducted
an overall assessment of projects funded under
the regular grants programme, to identify
opportunities, challenges and lessons learned to
strengthen the effectiveness and efficiency of the
programme. This assessment will also provide
the foundations for the preparation of a revised
corporate regular grants policy for consideration
by the Board in 2020.
Enhancing country strategiesA large number of country strategic opportunities
programmes (COSOPs) came up for review in
2019. The 16 strategies were the first batch to
be reviewed under the new guidelines approved
by the Board in December 2018. The new
IFAD’s Quality Assurance Group became more proactive in sharing lessons and driving conversations about quality
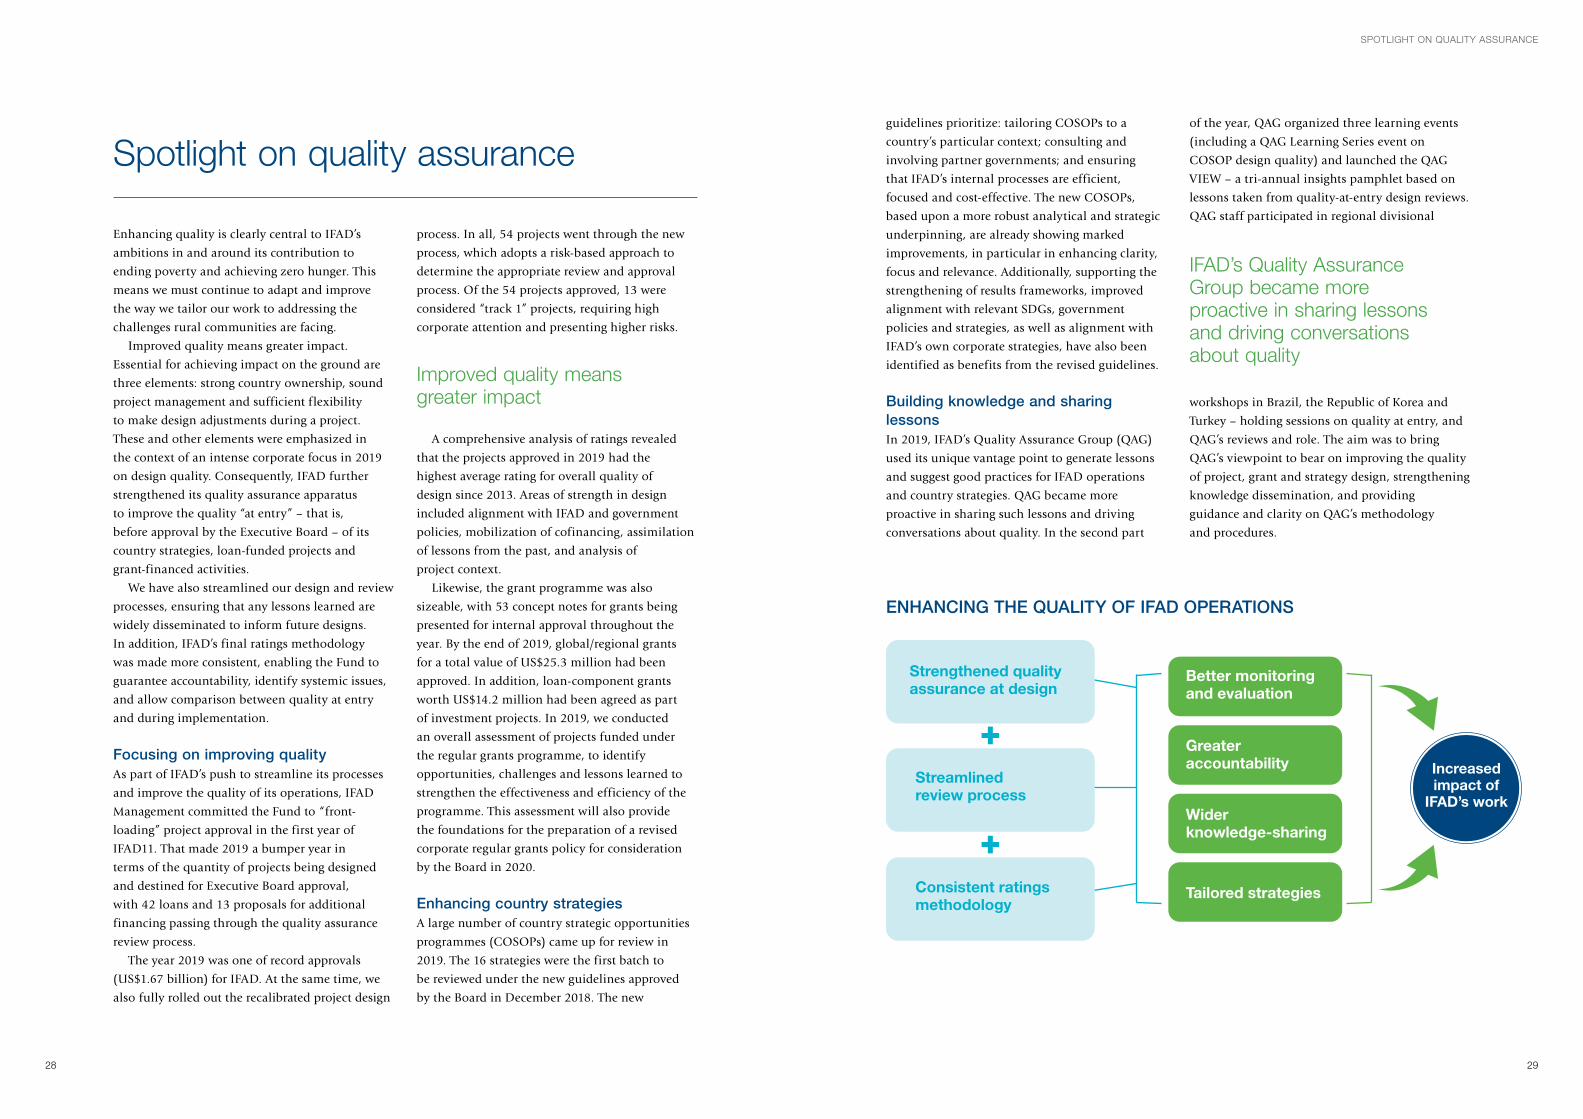
ENHANCING THE QUALITY OF IFAD OPERATIONS
Strengthened quality assurance at design
Better monitoring and evaluation
Greater accountability
Wider knowledge-sharing
Tailored strategies
Streamlined review process
Consistent ratings methodology
Increased impact of
IFAD’s work
Spotlight on quality assurance
Improved quality means greater impact
30 31
As stated in its Strategic Framework 2016-2025,
the overarching goal for IFAD is to invest in rural
people to enable them to overcome poverty and
achieve food security through remunerative,
sustainable and resilient livelihoods. IFAD pursues
this goal through three closely interlinked and
mutually reinforcing strategic objectives:
• Increasing poor rural people’s productive
capacities
• Increasing poor rural people’s benefits from
market participation
• Strengthening the environmental
sustainability and climate resilience of poor
rural people’s economic activities.
To hold itself accountable on progress made
in achieving this goal and these three strategic
objectives, IFAD has adopted a unique approach
to reporting impact at the corporate level, building
on rigorous project-level evaluations.
This initiative is a key element of our drive to
improve the quality of the Fund’s operations, and
to ensure alignment with corporate strategies and
with the SDGs.
The Development Effectiveness Framework,
which stipulates that approximately 15 per cent
of IFAD’s portfolio of projects should undergo
rigorous impact assessment, provided the overall
guidelines for carrying out the impact assessments.
Value chain approach. To achieve the best
impacts from market participation, linked
and coordinated approaches need to be taken
into account to address all constraints along
value chains – for example in credit, market
access, market information and links with
consumers. This was demonstrated by projects in
Bangladesh, Nepal, the Philippines, and Sao Tome
and Principe.
Integrated risk management. Sustained impacts
are much more likely when precautionary
measures to manage the risks associated with
extreme events are integrated into projects.
For example, in a project in the highlands of
Ethiopia, small-scale irrigation proved to be an
effective risk mitigation strategy against drought,
with project impacts in production and market
access (51 per cent and 175 per cent, respectively)
significantly higher than comparison groups.
The results of the assessments completed as part
of the IFAD10 Impact Assessment Initiative were
presented to the Executive Board in September
2019. The analysis showed significant impacts on
the lives of project beneficiaries relative to the
corporate goal of greater economic mobility and
its three supporting strategic objectives. In line
with these findings, the preliminary results of the
corporate impact assessment show that IFAD10 has
exceeded its targets for its overall goal of fostering
economic mobility and for two of the three
strategic objectives.
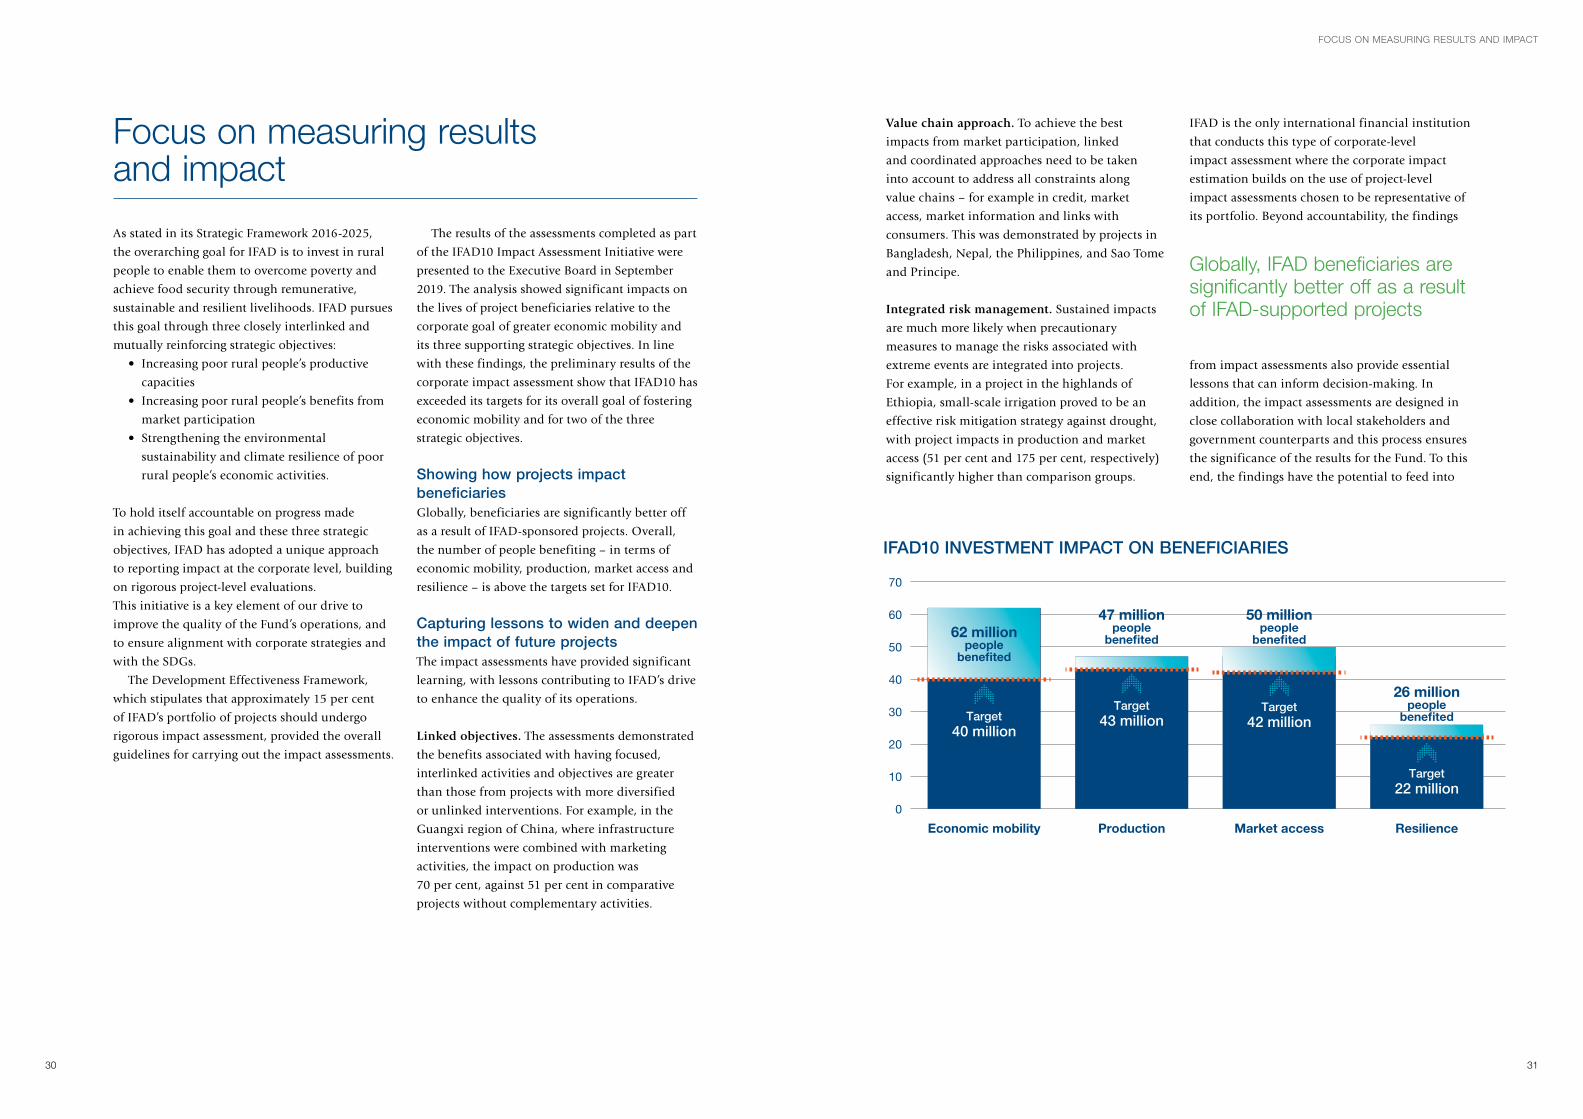
Showing how projects impact beneficiaries Globally, beneficiaries are significantly better off
as a result of IFAD-sponsored projects. Overall,
the number of people benefiting – in terms of
economic mobility, production, market access and
resilience – is above the targets set for IFAD10.
Capturing lessons to widen and deepen the impact of future projectsThe impact assessments have provided significant
learning, with lessons contributing to IFAD’s drive
to enhance the quality of its operations.
Linked objectives. The assessments demonstrated
the benefits associated with having focused,
interlinked activities and objectives are greater
than those from projects with more diversified
or unlinked interventions. For example, in the
Guangxi region of China, where infrastructure
interventions were combined with marketing
activities, the impact on production was
70 per cent, against 51 per cent in comparative
projects without complementary activities.
IFAD is the only international financial institution
that conducts this type of corporate-level
impact assessment where the corporate impact
estimation builds on the use of project-level
impact assessments chosen to be representative of
its portfolio. Beyond accountability, the findings
from impact assessments also provide essential
lessons that can inform decision-making. In
addition, the impact assessments are designed in
close collaboration with local stakeholders and
government counterparts and this process ensures
the significance of the results for the Fund. To this
end, the findings have the potential to feed into
Globally, IFAD beneficiaries are significantly better off as a result of IFAD-supported projects
IFAD10 INVESTMENT IMPACT ON BENEFICIARIES
0
10
20
30
40
50
60
70
Economic mobility
62 millionpeople
bene�ted
Target40 million
Production
47 millionpeople
bene�ted
Target43 million
Market access
50 millionpeople
bene�ted
Target42 million
Resilience
26 millionpeople
bene�ted
Target22 million
FOCUS ON MEASURING RESULTS AND IMPACT
Focus on measuring results and impact
32 33
STAFF DEVELOPMENT
improvements in the effectiveness, efficiency and
overall relevance of IFAD operations for the SDGs.
In addition, IFAD’s Independent Office of
Evaluation (IOE) contributes to the extraction of
valuable lessons from projects and programmes.
For example:
• A 2019 corporate-level evaluation on pro-
poor value chains found that our project
design is improving in this area and provided
recommendations on partnerships, outreach
to poor people and gender analysis that
will support us in making further quality
improvements in future operations.
• An evaluation synthesis on inclusive
financial services provided lessons on
transitioning to new types of financial
services that will inform future designs.
• A second evaluation synthesis focused on
technical innovations for rural poverty
reduction, offering important insights into
how partnerships can help manage the risks
associated with innovations.
Also, with respect to evaluations and their
role in encouraging learning and positive
change, in 2019 IOE jointly launched a new
prize recognizing outstanding evaluations
of development interventions that promote
transformational change and are linked to the
SDGs. The biennial competition, “Evaluating
Development Interventions for Transformational
Change Award” was developed jointly by IOE,
the Independent Evaluation Group of the World
Bank Group and the International Development
Evaluation Association. The role of learning
was also a theme during IFAD’s hosting of the
launch of the book Information and Communication
Technologies for Development Evaluation, which
examines the implications of new and emerging
technologies in development evaluation and
in particular the added challenges of charting
progress towards the 2030 Agenda.
The impact assessments have provided significant learning
As IFAD addresses an increasingly complex set
of global challenges and adapts its operational
model to maximize contribution to the SDGs,
complementary approaches are needed to support
staff to further develop their skills and knowledge.
Supporting enhanced presence in the fieldIn order to support a fit-for-purpose reform
process and increase IFAD’s in-country presence
to improve responsiveness and in-country
partnerships, IFAD’s Human Resources Division
conducted four ad hoc reassignment exercises
between January 2018 and July 2019. Each
exercise had a specific scope and objectives, with a
varying level of complexity related to the number
of positions and staff involved. These exercises,
affecting more than 35 per cent of staff, allowed
IFAD to implement the necessary structural
changes for its decentralized model in order to
reach the target of basing 33 per cent of positions
in the field. At the end of 2019, 31 per cent of
fixed-term staff were field-based.
As part of the IFAD Accelerated
Decentralization Plan, in 2019 the Field Support
Unit (FSU) coordinated with relevant divisions
the outposting and/or onboarding of 96 staff
to IFAD country offices (49 international
staff and 47 national staff). In 2019, FSU also
coordinated the establishment of four host country
agreements between IFAD and the Governments
of Bangladesh, the Philippines, Saudi Arabia
and South Africa to facilitate operations at the
country level from a juridical point of view. To
date, IFAD has a total of 37 such agreements
signed. FSU further coordinated and ensured the
establishment of 15 service-level agreements and/
or memorandums of understanding and/or direct/
indirect lease agreements with hosting agencies
and/or other service providers to facilitate the
running of operations at the country level.
Developing skills and capacitiesThroughout 2019, initiatives were taken to
support staff in developing the skills they need
to adapt to the changing needs of the Fund
in the context of decentralization, and for
delivering results that contribute to the SDGs.
These included a new leadership development
programme for supervisors, an executive
coaching programme for directors, professional
qualification programmes such as International
Coach Federation certification, and an expanded
e-learning platform. In the framework of a
decentralized working environment, the learning
approach, in most cases, is a blend of e-learning,
virtual workshops and personal interactions. Key
initiatives included capacity-building for staff
through participation in regional workshops and
retreats, delivery of country office-focused training
sessions, extensive training in travel processes and
in safety and security, organization of briefings
for staff relocated to the field, and coordination
of security activities related to decentralization.
In terms of numbers, 68 training sessions took
place and more than 1,000 e-learning modules
covering a wide array of topics were introduced.
Staff development
34 35
Capacity development of staff is also important
to ensure the success of reforms in IFAD’s financial
architecture. In this context, the Accounting and
Controller’s Division continues to support staff
to register and complete the joint Chartered
Institute of Public Finance and Accountancy-IFAD
Corporate Finance Qualification Programme.
As of 2019, over 30 staff had registered from
11 divisions, with seven candidates having
successfully achieved the international
certification and more to follow.
Ensuring an ethical working environmentPart of ensuring IFAD is able to attract and
retain world-class staff is ensuring a positive and
respectful work environment. In this respect, the
Ethics Office promotes IFAD’s Code of Conduct
and core values, provides confidential guidance
to staff and managers, and reviews allegations of
unethical behaviour. IFAD has given high priority
to combating all forms of sexual harassment
and sexual exploitation and abuse. Following
the Secretary-General’s request to all United
Nations bodies, the Ethics Office led an IFAD
multidivisional task force to strengthen rules and
procedures and to oversee full implementation
of IFAD’s policy on preventing and responding
to sexual harassment, exploitation and abuse.
In June 2019, IFAD launched its first awareness
campaign on this policy entitled “Speak up,
Report, Support”. To support these efforts, the
Ethics Office and Communications Division
worked together to produce a video that is
available on the IFAD website in all of IFAD’s
official languages.
0
2
4
6
8
10
12
14
16
18
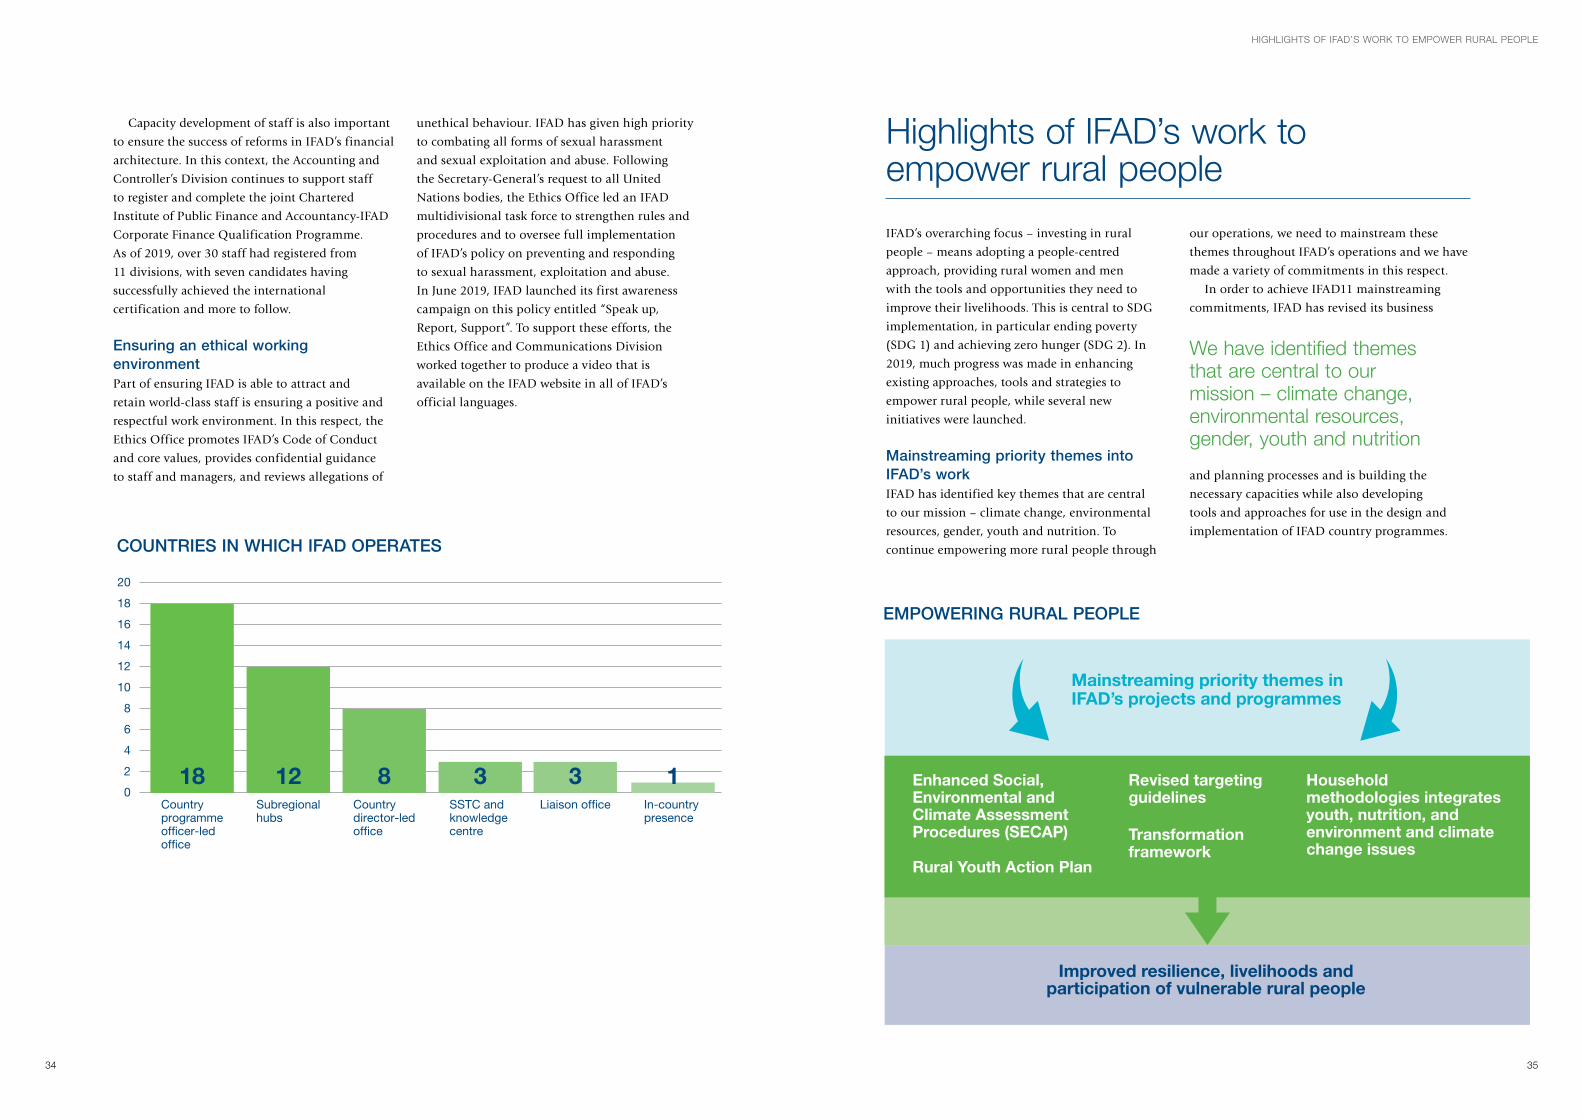
20
Countryprogrammeofficer-ledoffice
Subregionalhubs
Liaison office In-country presence
Countrydirector-ledoffice
SSTC and knowledge centre
18 12 8 3 3 1
COUNTRIES IN WHICH IFAD OPERATES
HIGHLIGHTS OF IFAD’S WORK TO EMPOWER RURAL PEOPLE
IFAD’s overarching focus – investing in rural
people – means adopting a people-centred
approach, providing rural women and men
with the tools and opportunities they need to
improve their livelihoods. This is central to SDG
implementation, in particular ending poverty
(SDG 1) and achieving zero hunger (SDG 2). In
2019, much progress was made in enhancing
existing approaches, tools and strategies to
empower rural people, while several new
initiatives were launched.
Mainstreaming priority themes into IFAD’s workIFAD has identified key themes that are central
to our mission – climate change, environmental
resources, gender, youth and nutrition. To
continue empowering more rural people through
our operations, we need to mainstream these
themes throughout IFAD’s operations and we have
made a variety of commitments in this respect.
In order to achieve IFAD11 mainstreaming
commitments, IFAD has revised its business
and planning processes and is building the
necessary capacities while also developing
tools and approaches for use in the design and
implementation of IFAD country programmes.
Highlights of IFAD’s work to empower rural people
We have identified themes that are central to our mission – climate change, environmental resources, gender, youth and nutrition
EMPOWERING RURAL PEOPLE
Mainstreaming priority themes in IFAD’s projects and programmes
Improved resilience, livelihoods and participation of vulnerable rural people
Revised targeting guidelines
Transformation framework
Household methodologies integrates youth, nutrition, and environment and climate change issues
Enhanced Social, Environmental and Climate Assessment Procedures (SECAP)
Rural Youth Action Plan
36 37
Another initiative to attract financing to
benefit the business activities of rural people
is the Smallholder and Agri-SME Finance and
Investment Network (SAFIN). In 2019, SAFIN
focused on mobilizing capital to strengthen the
financial base of institutions serving smallholders
and agri-SMEs, as well as on aligning partners’
investments through inclusive business models.
Activities to support these workstreams included
collecting evidence on the use of blended
finance in agriculture through a study with the
Organisation for Economic Co-operation and
Development and other partners, identifying
investment opportunities in pilot countries, and
sharing knowledge and new developments related
to agri-SME and smallholder finance.
In addition, we launched the IFAD Private
Sector Engagement Strategy 2019-2024 with two
main goals: first, to mobilize private investment
in rural MSMEs and small-scale agriculture, and
second, to expand markets and job opportunities
for rural people. The strategy will contribute
to closing the finance gap with respect to
SDG 2 implementation by reaching out to private
partners who can take advantage of untapped
business opportunities in rural areas.
Working with and for rural peopleEmpowering rural people and promoting
sustainable change requires working together with
rural people and their organizations, listening
to their perspectives and advice, and supporting
their agency around decisions at the global,
national and local level. IFAD continues to engage
extensively with rural people’s organizations,
especially farmers’ organizations – in 2019,
we introduced a new programme, Farmers’
Organizations for Africa, Caribbean and
Pacific. The programme will build on existing
collaboration between IFAD and farmers’
organizations to extend the geographic coverage
of past work, especially economic services and
integration into value chains.
IFAD is also supporting the International
Land Coalition, hosted at IFAD, in its important
work in changing policies and modifying the way
policies are implemented for the benefit of rural
communities across the world. Highlights for
2019 included policy changes in Cameroon that
bring greater transparency around land concession
contracts, and the adoption of forest laws in
Albania that support the interests of rural people.
HIGHLIGHTS OF IFAD’S WORK TO EMPOWER RURAL PEOPLE
For example:
• Enhanced Social, Environmental and Climate
Assessment Procedures (SECAP)
• Revised targeting guidelines
• A new transformation framework
• Adaptation of the household methodologies
to integrate youth, nutrition, and
environment and climate change issues
• A new Rural Youth Action Plan
Results for 2019 indicate IFAD is well ahead of
targets in all four priority areas. On climate, all
34 new projects approved in 2019 were screened
for climate risk using the SECAP procedures, with
US$568 million total investment constituting
climate finance, equivalent to 34 per cent of total
investment, compared with a target of 25 per cent.
On youth, 82 per cent of the 34 projects at
design were youth-sensitive, exceeding IFAD11
targets. For gender, 34 per cent of approved
project designs were rated gender-transformative
and 58 per cent of projects were rated as fully
gender mainstreamed or better at completion,
against targets of 25 per cent and 60 per cent,
respectively. Progress has also been encouraging
for nutrition – 61 per cent were validated as
nutrition-sensitive, against a target of 50 per cent.
Attracting investment into rural communitiesAssembling investment to develop entrepreneurial
activities that benefit rural people is key to
creating jobs – especially for young people – and
driving growth in rural economies. With this in
mind, at IFAD’s Governing Council 2019, IFAD,
the European Union, the African, Caribbean and
Pacific Group of States, the Alliance for a Green
Revolution in Africa, and the Government of
Luxembourg launched the Agri-Business Capital
Fund (ABC Fund), with IFAD as sponsor.
The purpose of the ABC Fund is to boost
investments in small agribusinesses across
developing markets, primarily in developing,
low-income and middle-income countries. The
ABC Fund targets micro, small and medium-sized
agribusinesses (MSMEs), cooperatives and farmers’
organizations that struggle to access the capital
they need to grow their business. The investment
strategy of the ABC Fund focuses on four themes:
• Integrating MSMEs and smallholder farmers
into value chains
• Addressing bottlenecks in specific value
chains
• Propelling technology and innovation
• Enhancing certification, traceability and
value added for exports.
Promoting sustainable change requires working with rural people and their organizations
The IFAD Private Sector Engagement Strategy 2019-2024 will contribute to closing the finance gap with respect to SDG 2
38 39
The drive for greater efficiency has enabled us to
plan an increased US$1.67 billion programme of
loans and grants – crucial to widen our impact in
the context of the SDGs – within a zero-growth
administrative budget.
Streamlining budgeting processesIFAD’s ongoing operational realignment is aimed
at achieving excellence through greater efficiency
and impact. For example, a comprehensive
bottom-up approach was taken for budget
preparation in support of IFAD’s shift towards a
more decentralized operating environment. The
Fund’s recently revised Delegation of Authority
framework gives greater responsibility to lower
levels of management and field officers. In
addition, the Office of Strategic Budgeting
successfully implemented a new budget-planning
tool, Oracle Hyperion, streamlining the budgeting
process and making it less prone to errors. This
laid the foundation for more improvements
planned in 2020 to further automate and simplify
the budgeting process, and upgrade institutional
reporting capabilities.
Also in 2019, IFAD began moving to full
robotic process automation and launched a
fully automated, paperless payment process for
consultants.
Innovation is not just coming up with new ideas, it is also about driving change
IN FOCUS: INSTITUTIONAL EFFICIENCY
Catalysing innovationWe consider that innovation is a key aspect of
delivering better, quicker results. This is why, in
2019, the Change, Delivery and Innovation Unit
(CDI) was established. One of CDI’s first moves
was to launch the Innovation Challenge – a
global, in-house competition for bold new ideas
on how IFAD can bring innovation to its
operations and business practices. Ten ideas were
eventually selected for implementation with some
US$700,000 of IFAD funding. Projects included
applications of blockchain, virtual reality,
crowdfunding and even a board game.
But innovation is not just a matter of coming up
with new ideas, it is also about driving change. For
example, in 2019 CDI coordinated a response to
IFAD’s Global Staff Survey with measures aimed
at reducing bureaucracy and supporting a positive
working climate. This involved leading the first
phase of a business process re-engineering exercise
to reduce staff workload and drive efficiency.
Stepping up the use of ICT Harnessing new technology is enabling us
to respond to partners’ needs more rapidly
and efficiently. One example is the continued
development of the IFAD Client Portal (ICP).
As the one-stop shop for clients to securely
conduct business with IFAD and to obtain
real-time information, in 2019 the ICP evolved
from simply focusing on the submission of
withdrawal applications to include the processing
of no-objections, contract monitoring, financial
statements submission and detailed reporting.
By end of the year, it covered 76 per cent of IFAD
countries with disbursable projects, processing
over US$600 million of transactions and accessing
reports and dashboards on a daily basis.
Harnessing new technology is enabling us to respond to partners’ needs more rapidly and efficiently
Aligning with IFAD’s evolving business modelSignificant work was undertaken in adjusting
IFAD’s administrative processes to institutional
changes, especially the more decentralized
operating model. For example, we implemented
decentralized travel agency services for all IFAD
country offices and reformed delegations of
authority to conduct low-value procurement
with an adequate internal control framework.
The security function was enhanced through:
security awareness campaigns; monitoring of
IFAD staff compliance with mandatory security
requirements; monitoring of physical security of
IFAD premises worldwide; and delivery of safety
and security training.
We also upgraded our electronic records
management system to promote knowledge-
sharing. And we have widened partnerships with
the other RBAs, achieving significant savings
through the hosting of the IFAD Governing
Council at FAO, implementing common
procurement activities, negotiating corporate fares
with airlines for discounts, providing printing
services to WFP and Bioversity International, and
coordinating privileges and immunities activities.
In focus: Institutional efficiency
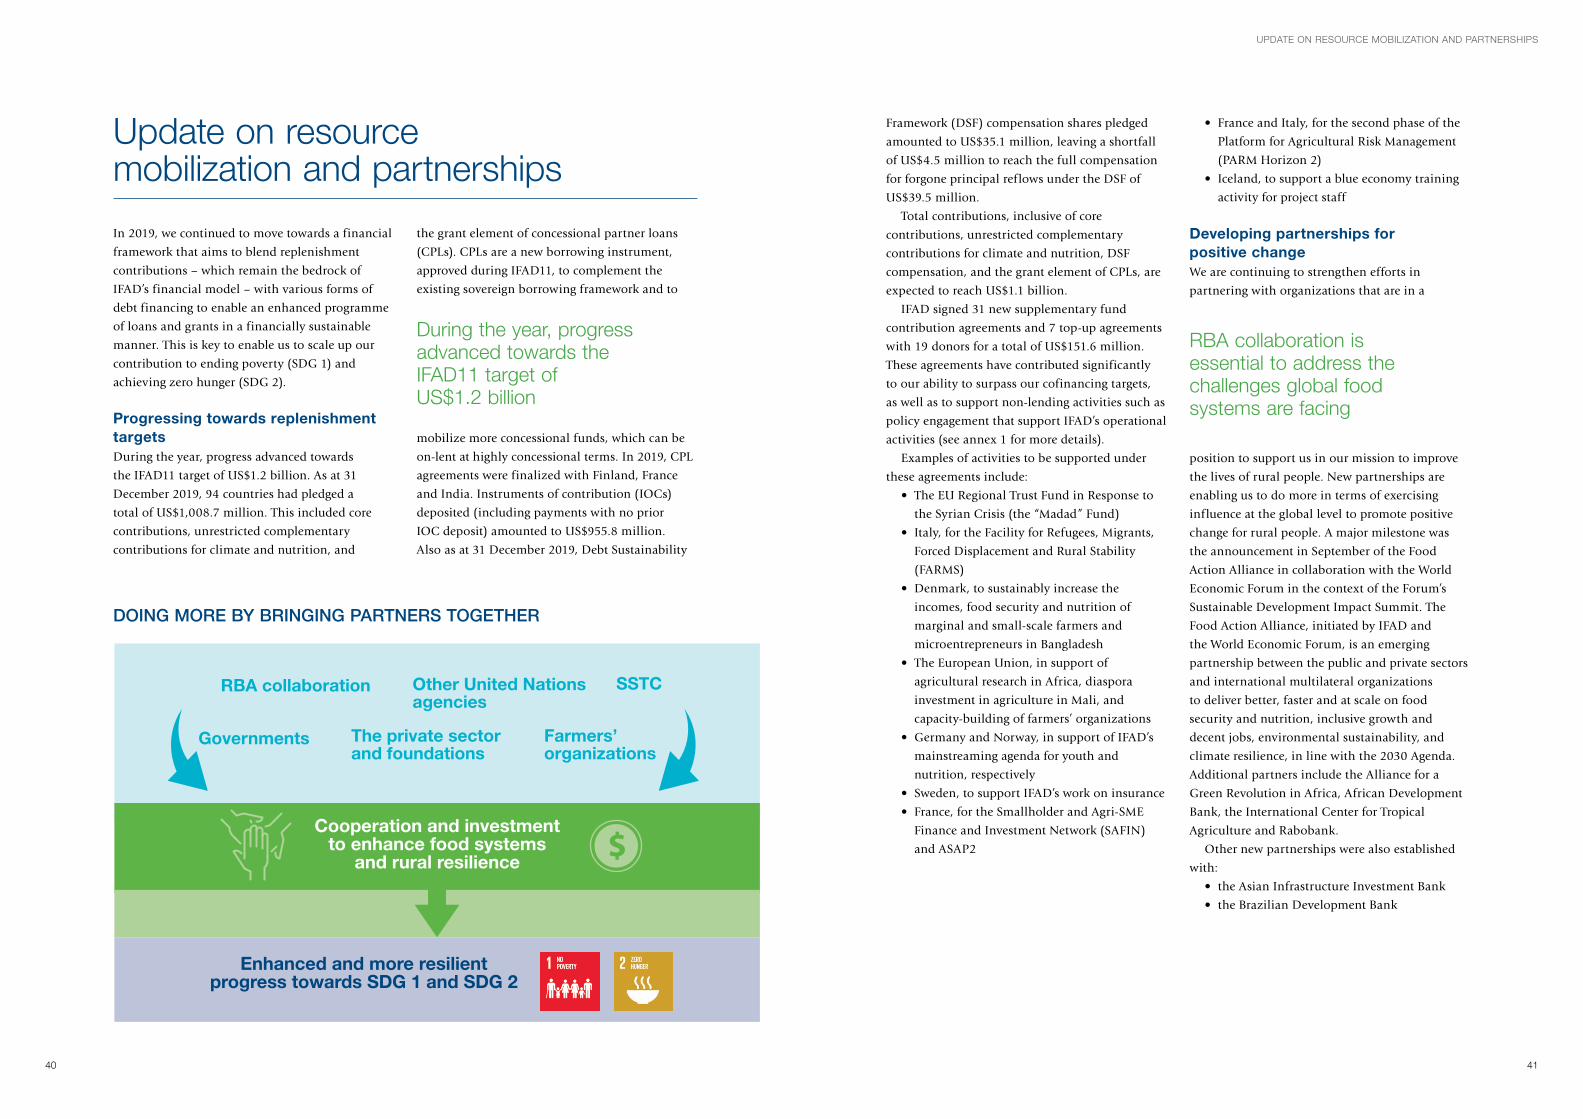
40 41
RBA collaboration Other United Nations agencies
SSTC
Governments The private sector and foundations
Farmers’ organizations
Enhanced and more resilient progress towards SDG 1 and SDG 2
Cooperation and investment to enhance food systems
and rural resilience
UPDATE ON RESOURCE MOBILIZATION AND PARTNERSHIPS
Framework (DSF) compensation shares pledged
amounted to US$35.1 million, leaving a shortfall
of US$4.5 million to reach the full compensation
for forgone principal reflows under the DSF of
US$39.5 million.
Total contributions, inclusive of core
contributions, unrestricted complementary
contributions for climate and nutrition, DSF
compensation, and the grant element of CPLs, are
expected to reach US$1.1 billion.
IFAD signed 31 new supplementary fund
contribution agreements and 7 top-up agreements
with 19 donors for a total of US$151.6 million.
These agreements have contributed significantly
to our ability to surpass our cofinancing targets,
as well as to support non-lending activities such as
policy engagement that support IFAD’s operational
activities (see annex 1 for more details).
Examples of activities to be supported under
these agreements include:
• The EU Regional Trust Fund in Response to
the Syrian Crisis (the “Madad” Fund)
• Italy, for the Facility for Refugees, Migrants,
Forced Displacement and Rural Stability
(FARMS)
• Denmark, to sustainably increase the
incomes, food security and nutrition of
marginal and small-scale farmers and
microentrepreneurs in Bangladesh
• The European Union, in support of
agricultural research in Africa, diaspora
investment in agriculture in Mali, and
capacity-building of farmers’ organizations
• Germany and Norway, in support of IFAD’s
mainstreaming agenda for youth and
nutrition, respectively
• Sweden, to support IFAD’s work on insurance
• France, for the Smallholder and Agri-SME
Finance and Investment Network (SAFIN)
and ASAP2
• France and Italy, for the second phase of the
Platform for Agricultural Risk Management
(PARM Horizon 2)
• Iceland, to support a blue economy training
activity for project staff
Developing partnerships for positive changeWe are continuing to strengthen efforts in
partnering with organizations that are in a
position to support us in our mission to improve
the lives of rural people. New partnerships are
enabling us to do more in terms of exercising
influence at the global level to promote positive
change for rural people. A major milestone was
the announcement in September of the Food
Action Alliance in collaboration with the World
Economic Forum in the context of the Forum’s
Sustainable Development Impact Summit. The
Food Action Alliance, initiated by IFAD and
the World Economic Forum, is an emerging
partnership between the public and private sectors
and international multilateral organizations
to deliver better, faster and at scale on food
security and nutrition, inclusive growth and
decent jobs, environmental sustainability, and
climate resilience, in line with the 2030 Agenda.
Additional partners include the Alliance for a
Green Revolution in Africa, African Development
Bank, the International Center for Tropical
Agriculture and Rabobank.
Other new partnerships were also established
with:
• the Asian Infrastructure Investment Bank
• the Brazilian Development Bank
RBA collaboration is essential to address the challenges global food systems are facing
In 2019, we continued to move towards a financial
framework that aims to blend replenishment
contributions – which remain the bedrock of
IFAD’s financial model – with various forms of
debt financing to enable an enhanced programme
of loans and grants in a financially sustainable
manner. This is key to enable us to scale up our
contribution to ending poverty (SDG 1) and
achieving zero hunger (SDG 2).
Progressing towards replenishment targetsDuring the year, progress advanced towards
the IFAD11 target of US$1.2 billion. As at 31
December 2019, 94 countries had pledged a
total of US$1,008.7 million. This included core
contributions, unrestricted complementary
contributions for climate and nutrition, and
the grant element of concessional partner loans
(CPLs). CPLs are a new borrowing instrument,
approved during IFAD11, to complement the
existing sovereign borrowing framework and to
mobilize more concessional funds, which can be
on-lent at highly concessional terms. In 2019, CPL
agreements were finalized with Finland, France
and India. Instruments of contribution (IOCs)
deposited (including payments with no prior
IOC deposit) amounted to US$955.8 million.
Also as at 31 December 2019, Debt Sustainability
Update on resource mobilization and partnerships
During the year, progress advanced towards the IFAD11 target of US$1.2 billion
DOING MORE BY BRINGING PARTNERS TOGETHER
42 43
FINANCIAL MANAGEMENT AND TRANSPARENCY
• the International Livestock Research Institute
• the International Social Security Association
• the Korea Rural Economic Institute
• the Kingdom of Saudi Arabia
We are well aware that continuing to deepen
collaboration with our Rome-based sister agencies
is essential to ensure complementary approaches
to address the challenges global food systems
are facing. In May, along with FAO and WFP, we
endorsed a joint RBA Action Plan. The RBAs are
placing emphasis on enhancing existing country-
level collaboration – FAO, WFP and IFAD have
conducted joint field visits, which have led to
joint action to develop each agency’s work in a
complementary way. Following the joint visit to
Niger in 2018, the three agencies presented a plan
of action for the Sahel during the 2019 informal
meeting of the RBA governing bodies.
Sharing knowledge through South-South and triangular cooperationSouth-South and triangular cooperation (SSTC)
is a key development cooperation approach that
is being embedded in IFAD’s business model to
complement the Regular Programme. To this end,
we established three SSTC and knowledge centres
in Addis Ababa, Beijing and Brasilia, with the aim
of furthering the SSTC agenda.
In 2019, the China-IFAD SSTC Facility began
implementing the eight projects approved
following its first call for proposals in 2018.
A second call for proposals in 2019 resulted in a
further seven projects being selected. The total
amount of both calls is US$6.7 million. The
projects cover topics such as technical assistance,
knowledge exchange, RBA cooperation and value
chain development in all five regions.
New partnerships are enabling us to do more in terms of exercising influence at the global level to promote positive change for rural people
As IFAD’s financial architecture evolves to
support its contribution to the SDGs, ongoing
corporate innovation in the areas of technical
and development finance, risk management and
in expanding transparency and anti-corruption
safeguards has been receiving increasing
attention. The transformation of IFAD’s financial
architecture will also help to position IFAD
positively with credit rating agencies, building on
the existing strong foundation and converging
with best practices from other development
financial institutions.
Building on recent innovationsIn 2018, the groundwork was laid for key
initiatives, including arrangements around
concessional partner loans, the ABC Fund and
IFAD’s prudent leveraging strategy. These began
to bear fruit in 2019. Among new developments
have been:
• Decentralization of financial management
staff to five regional hubs
• Establishment of a quality assurance group
to maintain the highest level of financial
management inputs
• Piloting of new financing tools, including
results-based lending and diversified pre-
financing options.
Tailoring financial support to countries’ needsA major new initiative has been the application
of the IFAD Transition Framework to ensure
that countries obtain the best form of financial
support as they move up the ladder of economic
development. Phasing-out and phasing-in periods
are designed to allow borrowers to transition
from one credit category to another in order
to adjust smoothly to new, less concessionary
lending terms. All this requires that IFAD both
upgrade and expand its existing lending and
non-lending products.
Managing financial risksIFAD continues to strengthen its overall financial
risk management and internal control framework.
Initiatives in this area included the monitoring
and reporting on credit and market risks, as well
as the management of risks relating to the lending,
funding, treasury and any other financial risks
affecting IFAD’s balance sheet.
In 2019, IFAD established a robust Capital
Adequacy Policy. This is a natural response to the
evolution of IFAD. It entails the transformation
of IFAD’s financial structure from pure liquidity
management to a solvency and liquidity
management approach. We also updated our Asset
Liability Management Framework. The Framework
enables IFAD to continue to strengthen the
management of its assets and liabilities to protect
its balance sheet and mitigate the financial risks
ensuing borrowing.
A strengthened, second line of defence
controllership function was also put in place in
2019 to protect the Fund against operational,
financial and reputational risks, particularly in an
increasingly decentralized environment featuring
wider delegation of authority.
Financial management and transparency
A major new initiative hasbeen the application of theIFAD Transition Framework
44
Enhancing transparency andanti-corruption approachesFinancial transparency has also been enhanced
at IFAD. Financial statements regarding audited
projects are disclosed systematically, as are
statistical data and information on IFAD’s
financial operations. And IFAD’s new
anticorruption policy, which establishes zero-
tolerance towards prohibited practices in
operations and activities funded or managed
by IFAD, was rolled out in 2019. As well as
revising legal and operational instruments
and communicating with IFAD stakeholders –
especially project staff and vendors – much focus
has been on activities to train IFAD staff
and consultants, for example through: an
anticorruption e-learning course; training on
techniques and tools to identify and report
prohibited practices; and staff induction training.
IFAD’s new anticorruption policy, which establishes zero-tolerance towards prohibited practices in operations and activities funded or managed by IFAD, was rolled out in 2019
Annex 1. Programme of loans and grants in tables
Table 1 – Supplementary funds received in 2019
Table 2 – IFAD financing by region, 1978-2019
Table 3 – Summary of IFAD loans by region and lending terms, and DSF grants, 1978-2019
Table 4 – Annual loan disbursements under the Regular Programme, by region, 1979-2019
Table 5 – Annual DSF disbursements by region, 2009-2019
Table 6 – Loan disbursements by region and lending terms under the Regular Programme,
1979-2019
Table 7 – Summary of grant financing, 2015-2019
Table 8 – Cofinancing of IFAD-initiated programmes and projects by donor Member States
(Bilateral), 1978-2019
Table 9 – Cofinancing of IFAD-initiated programmes and projects by multilateral donors, 1978-2019
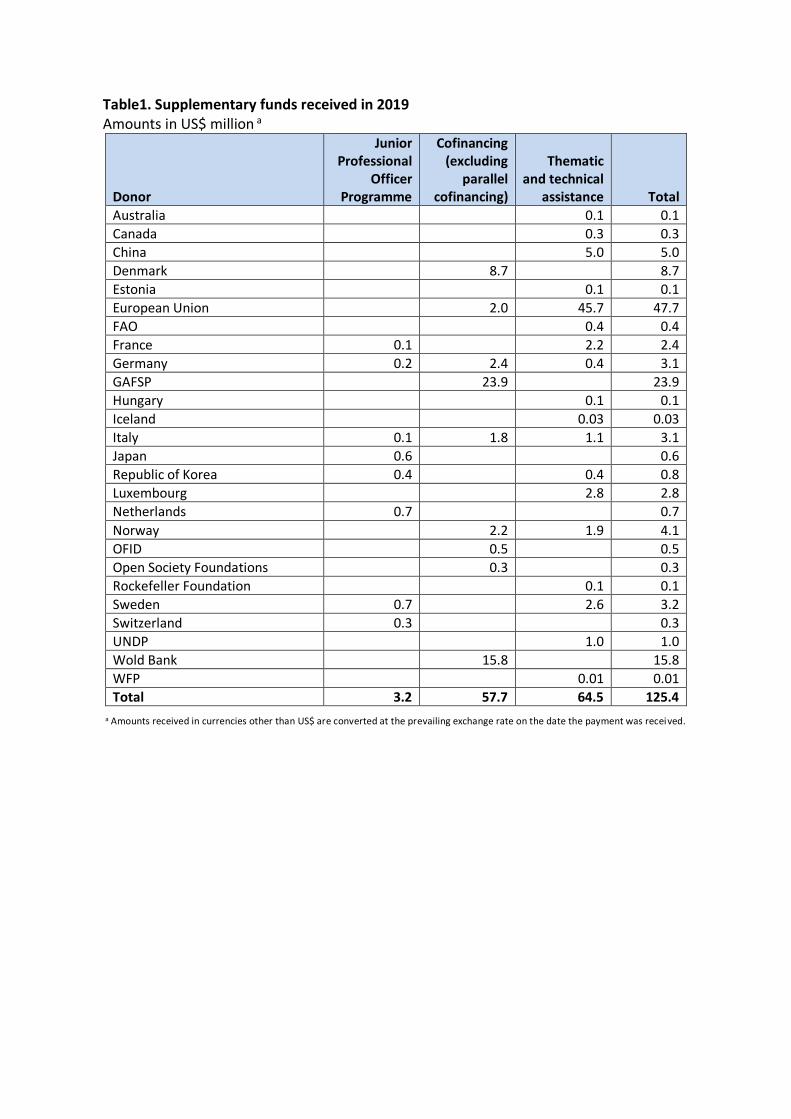
Table1. Supplementary funds received in 2019 Amounts in US$ million a
Donor
Junior Professional
Officer Programme
Cofinancing (excluding
parallel cofinancing)
Thematic and technical
assistance Total
Australia 0.1 0.1
Canada 0.3 0.3
China 5.0 5.0
Denmark 8.7 8.7
Estonia 0.1 0.1
European Union 2.0 45.7 47.7
FAO 0.4 0.4
France 0.1 2.2 2.4
Germany 0.2 2.4 0.4 3.1
GAFSP 23.9 23.9
Hungary 0.1 0.1
Iceland 0.03 0.03
Italy 0.1 1.8 1.1 3.1
Japan 0.6 0.6
Republic of Korea 0.4 0.4 0.8
Luxembourg 2.8 2.8
Netherlands 0.7 0.7
Norway 2.2 1.9 4.1
OFID 0.5 0.5
Open Society Foundations 0.3 0.3
Rockefeller Foundation 0.1 0.1
Sweden 0.7 2.6 3.2
Switzerland 0.3 0.3
UNDP 1.0 1.0
Wold Bank 15.8 15.8
WFP 0.01 0.01
Total 3.2 57.7 64.5 125.4
a Amounts received in currencies other than US$ are converted at the prevailing exchange rate on the date the payment was received.
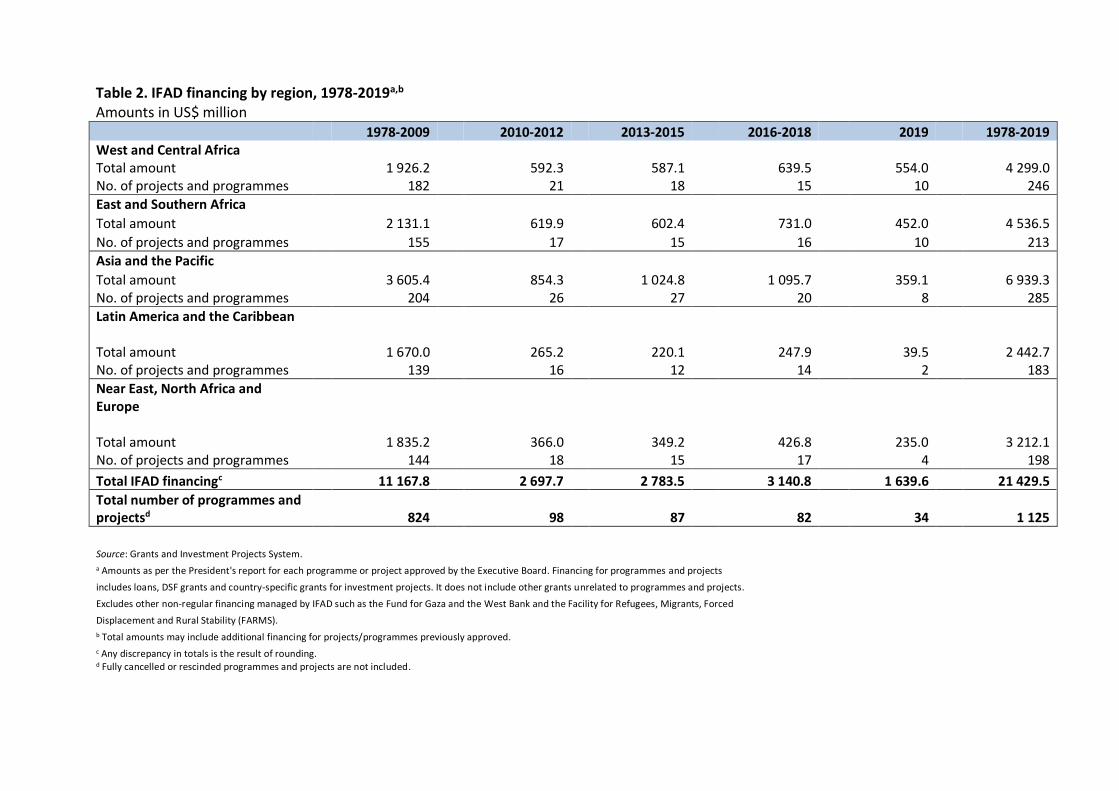
Table 2. IFAD financing by region, 1978-2019a,b
Amounts in US$ million 1978-2009 2010-2012 2013-2015 2016-2018 2019 1978-2019 West and Central Africa Total amount 1 926.2 592.3 587.1 639.5 554.0 4 299.0 No. of projects and programmes 182 21 18 15 10 246
East and Southern Africa Total amount 2 131.1 619.9 602.4 731.0 452.0 4 536.5
No. of projects and programmes 155 17 15 16 10 213
Asia and the Pacific Total amount 3 605.4 854.3 1 024.8 1 095.7 359.1 6 939.3 No. of projects and programmes 204 26 27 20 8 285
Latin America and the Caribbean Total amount 1 670.0 265.2 220.1 247.9 39.5 2 442.7 No. of projects and programmes 139 16 12 14 2 183
Near East, North Africa and Europe Total amount 1 835.2 366.0 349.2 426.8 235.0 3 212.1 No. of projects and programmes 144 18 15 17 4 198
Total IFAD financingc 11 167.8 2 697.7 2 783.5 3 140.8 1 639.6 21 429.5
Total number of programmes and projectsd 824 98 87 82 34 1 125
Source: Grants and Investment Projects System.
a Amounts as per the President's report for each programme or project approved by the Executive Board. Financing for programmes and projects
includes loans, DSF grants and country-specific grants for investment projects. It does not include other grants unrelated to programmes and projects.
Excludes other non-regular financing managed by IFAD such as the Fund for Gaza and the West Bank and the Facility for Refugees, Migrants, Forced
Displacement and Rural Stability (FARMS). b Total amounts may include additional financing for projects/programmes previously approved.
c Any discrepancy in totals is the result of rounding. d Fully cancelled or rescinded programmes and projects are not included.
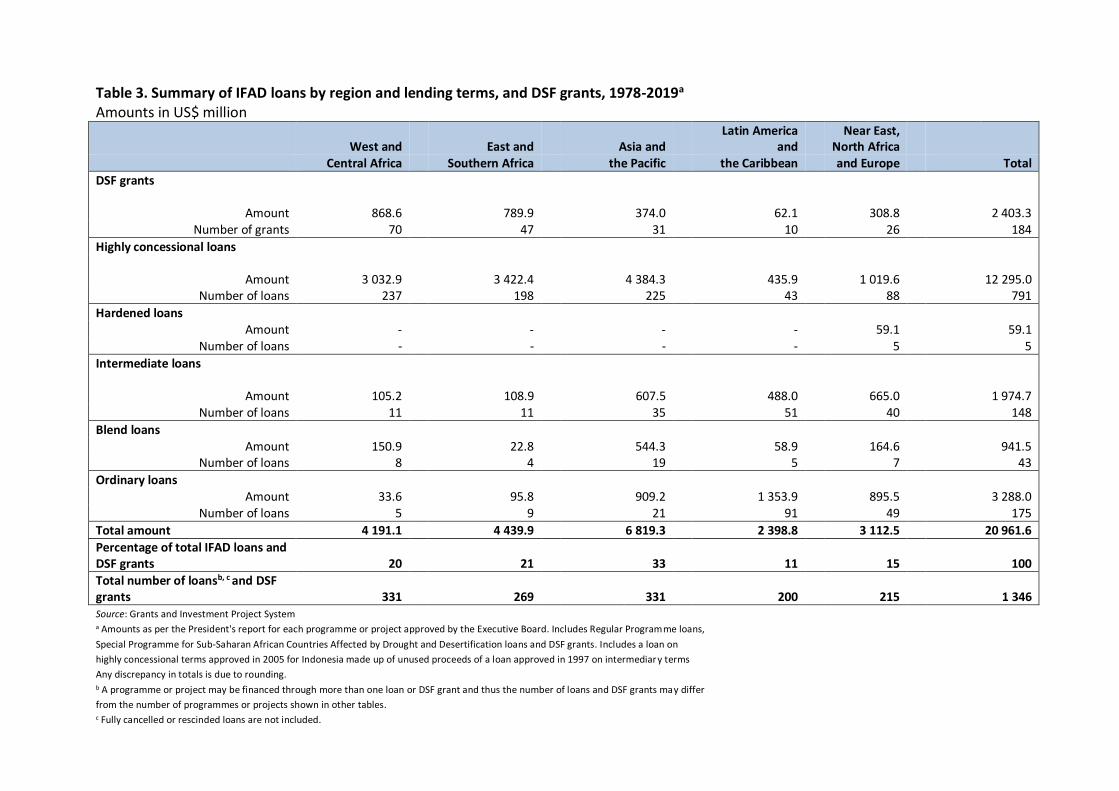
Table 3. Summary of IFAD loans by region and lending terms, and DSF grants, 1978-2019a
Amounts in US$ million
West and East and Asia and Latin America
and Near East,
North Africa Central Africa Southern Africa the Pacific the Caribbean and Europe Total
DSF grants
Amount 868.6 789.9 374.0
62.1 308.8 2 403.3
Number of grants 70 47 31 10 26 184
Highly concessional loans
Amount 3 032.9 3 422.4 4 384.3
435.9 1 019.6 12 295.0
Number of loans 237 198 225 43 88 791
Hardened loans Amount - - - - 59.1 59.1
Number of loans - - - - 5 5
Intermediate loans
Amount
105.2 108.9 607.5
488.0
665.0 1 974.7
Number of loans 11 11 35 51 40 148
Blend loans Amount 150.9 22.8 544.3 58.9 164.6 941.5
Number of loans 8 4 19 5 7 43
Ordinary loans Amount 33.6 95.8 909.2 1 353.9 895.5 3 288.0
Number of loans 5 9 21 91 49 175
Total amount 4 191.1 4 439.9 6 819.3 2 398.8 3 112.5 20 961.6
Percentage of total IFAD loans and DSF grants 20 21 33 11 15 100
Total number of loansb, c and DSF grants 331 269 331 200 215 1 346 Source: Grants and Investment Project System a Amounts as per the President's report for each programme or project approved by the Executive Board. Includes Regular Programme loans,
Special Programme for Sub-Saharan African Countries Affected by Drought and Desertification loans and DSF grants. Includes a loan on
highly concessional terms approved in 2005 for Indonesia made up of unused proceeds of a loan approved in 1997 on intermediary terms
Any discrepancy in totals is due to rounding. b A programme or project may be financed through more than one loan or DSF grant and thus the number of loans and DSF grants may differ
from the number of programmes or projects shown in other tables. c Fully cancelled or rescinded loans are not included.
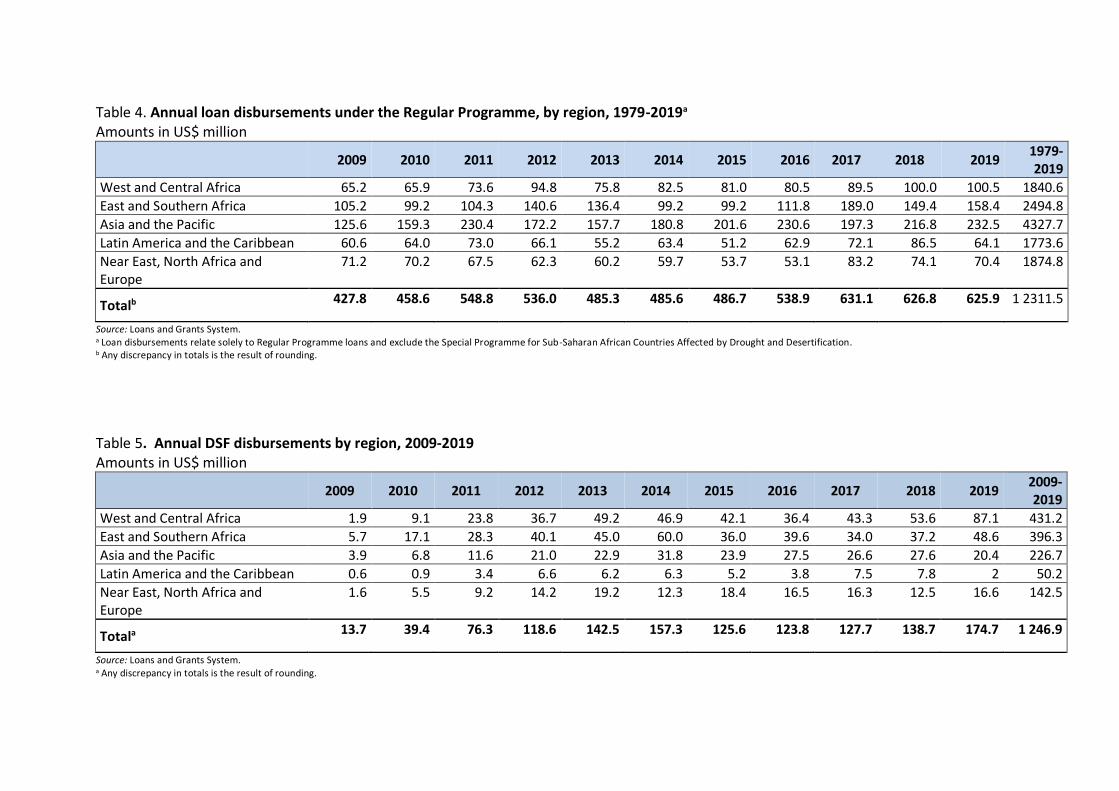
Table 4. Annual loan disbursements under the Regular Programme, by region, 1979-2019a
Amounts in US$ million
2009 2010 2011 2012 2013 2014 2015 2016 2017 2018 2019 1979-2019
West and Central Africa 65.2 65.9 73.6 94.8 75.8 82.5 81.0 80.5 89.5 100.0 100.5 1840.6
East and Southern Africa 105.2 99.2 104.3 140.6 136.4 99.2 99.2 111.8 189.0 149.4 158.4 2494.8
Asia and the Pacific 125.6 159.3 230.4 172.2 157.7 180.8 201.6 230.6 197.3 216.8 232.5 4327.7
Latin America and the Caribbean 60.6 64.0 73.0 66.1 55.2 63.4 51.2 62.9 72.1 86.5 64.1 1773.6
Near East, North Africa and Europe
71.2 70.2 67.5 62.3 60.2 59.7 53.7 53.1 83.2 74.1 70.4 1874.8
Totalb 427.8 458.6 548.8 536.0 485.3 485.6 486.7 538.9 631.1 626.8 625.9 1 2311.5
Source: Loans and Grants System. a Loan disbursements relate solely to Regular Programme loans and exclude the Special Programme for Sub-Saharan African Countries Affected by Drought and Desertification. b Any discrepancy in totals is the result of rounding.
Table 5. Annual DSF disbursements by region, 2009-2019 Amounts in US$ million
2009 2010 2011 2012 2013 2014 2015 2016 2017 2018 2019 2009-2019
West and Central Africa 1.9 9.1 23.8 36.7 49.2 46.9 42.1 36.4 43.3 53.6 87.1 431.2
East and Southern Africa 5.7 17.1 28.3 40.1 45.0 60.0 36.0 39.6 34.0 37.2 48.6 396.3
Asia and the Pacific 3.9 6.8 11.6 21.0 22.9 31.8 23.9 27.5 26.6 27.6 20.4 226.7
Latin America and the Caribbean 0.6 0.9 3.4 6.6 6.2 6.3 5.2 3.8 7.5 7.8 2 50.2
Near East, North Africa and Europe
1.6 5.5 9.2 14.2 19.2 12.3 18.4 16.5 16.3 12.5 16.6 142.5
Totala 13.7 39.4 76.3 118.6 142.5 157.3 125.6 123.8 127.7 138.7 174.7 1 246.9
Source: Loans and Grants System. a Any discrepancy in totals is the result of rounding.
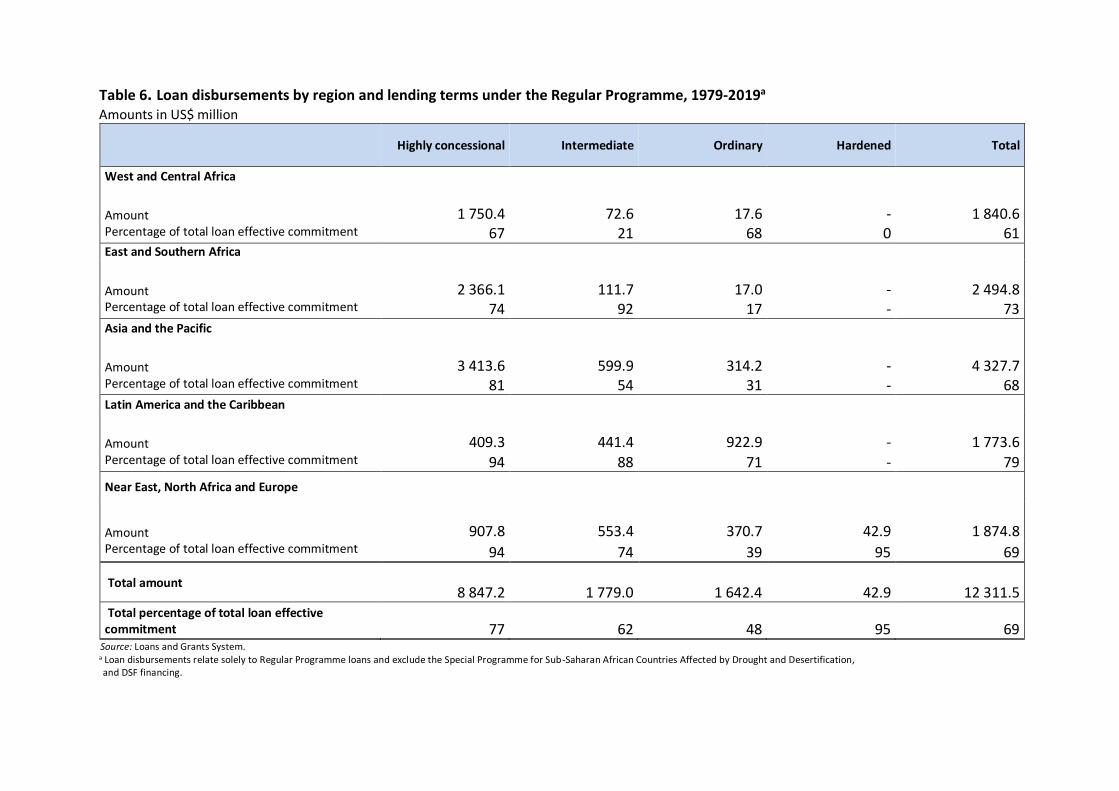
Table 6. Loan disbursements by region and lending terms under the Regular Programme, 1979-2019a Amounts in US$ million
Highly concessional Intermediate Ordinary Hardened Total
West and Central Africa
Amount
1 750.4
72.6
17.6
- 1 840.6
Percentage of total loan effective commitment 67 21 68 0 61
East and Southern Africa
Amount
2 366.1
111.7
17.0
- 2 494.8
Percentage of total loan effective commitment 74 92 17 - 73
Asia and the Pacific
Amount
3 413.6
599.9
314.2
- 4 327.7
Percentage of total loan effective commitment 81 54 31 - 68
Latin America and the Caribbean
Amount
409.3
441.4
922.9
- 1 773.6
Percentage of total loan effective commitment 94 88 71 - 79
Near East, North Africa and Europe
Amount
907.8
553.4
370.7
42.9 1 874.8
Percentage of total loan effective commitment 94 74 39 95 69
Total amount
8 847.2 1 779.0 1 642.4
42.9 12 311.5
Total percentage of total loan effective commitment 77 62 48 95 69
Source: Loans and Grants System. a Loan disbursements relate solely to Regular Programme loans and exclude the Special Programme for Sub-Saharan African Countries Affected by Drought and Desertification, and DSF financing.
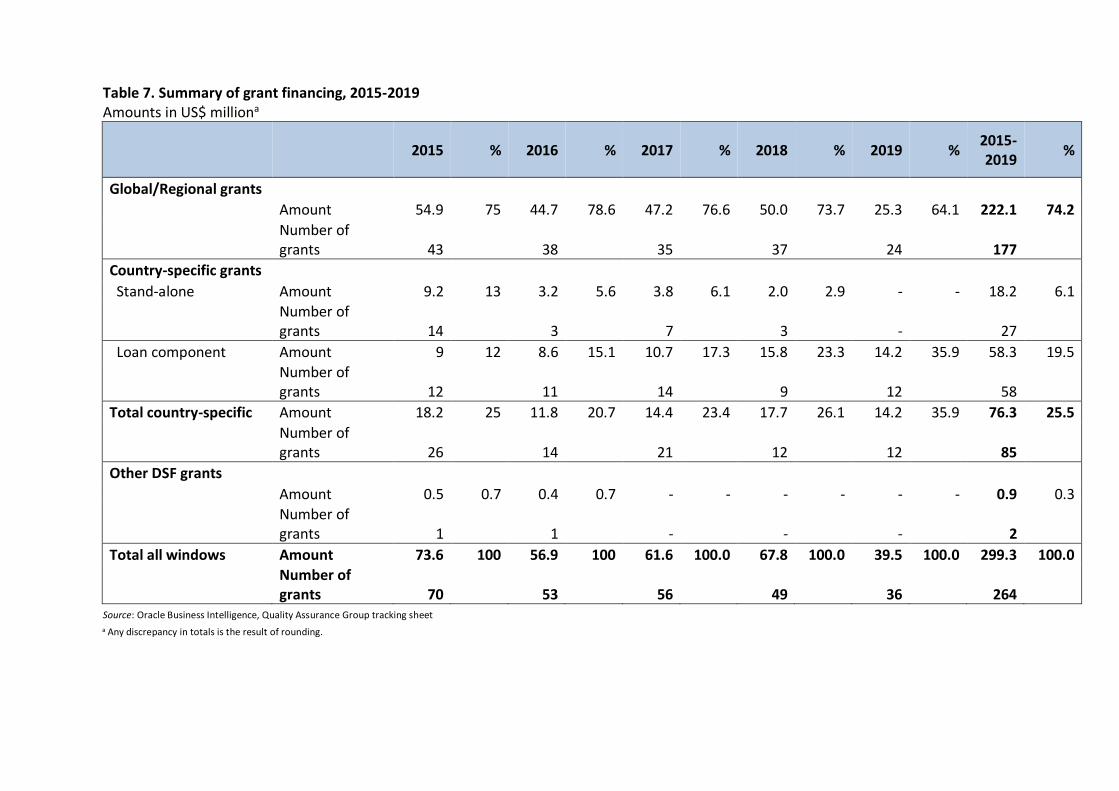
Table 7. Summary of grant financing, 2015-2019 Amounts in US$ milliona
2015 % 2016 % 2017 % 2018 % 2019 % 2015-2019
%
Global/Regional grants
Amount 54.9 75 44.7 78.6 47.2 76.6 50.0 73.7 25.3 64.1 222.1 74.2
Number of grants 43 38 35 37 24 177
Country-specific grants
Stand-alone Amount 9.2 13 3.2 5.6 3.8 6.1 2.0 2.9 - - 18.2 6.1
Number of grants 14 3 7 3 - 27
Loan component Amount 9 12 8.6 15.1 10.7 17.3 15.8 23.3 14.2 35.9 58.3 19.5
Number of grants 12 11 14 9 12 58
Total country-specific Amount 18.2 25 11.8 20.7 14.4 23.4 17.7 26.1 14.2 35.9 76.3 25.5
Number of grants 26 14 21 12 12 85
Other DSF grants
Amount 0.5 0.7 0.4 0.7 - - - - - - 0.9 0.3
Number of grants 1 1 - - - 2
Total all windows Amount 73.6 100 56.9 100 61.6 100.0 67.8 100.0 39.5 100.0 299.3 100.0
Number of grants 70 53 56 49 36 264
Source: Oracle Business Intelligence, Quality Assurance Group tracking sheet
a Any discrepancy in totals is the result of rounding.
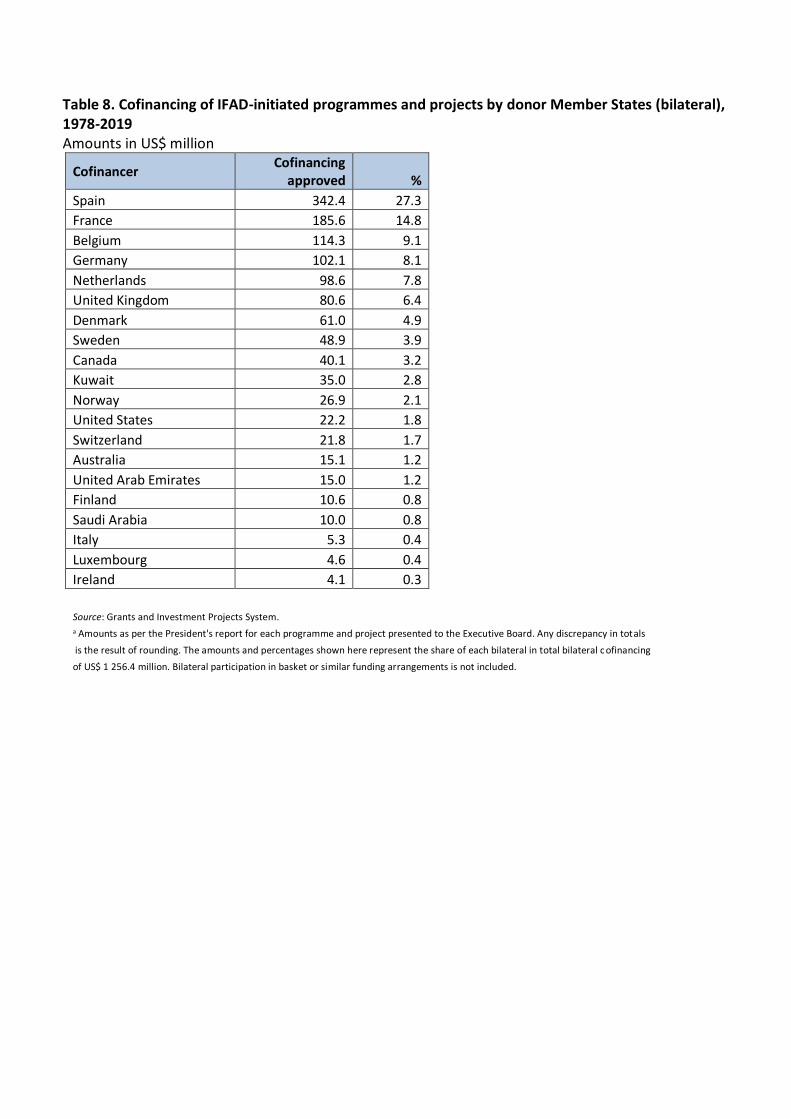
Table 8. Cofinancing of IFAD-initiated programmes and projects by donor Member States (bilateral), 1978-2019 Amounts in US$ million
Cofinancer Cofinancing
approved % Spain 342.4 27.3 France 185.6 14.8 Belgium 114.3 9.1 Germany 102.1 8.1 Netherlands 98.6 7.8 United Kingdom 80.6 6.4 Denmark 61.0 4.9 Sweden 48.9 3.9 Canada 40.1 3.2 Kuwait 35.0 2.8 Norway 26.9 2.1 United States 22.2 1.8 Switzerland 21.8 1.7 Australia 15.1 1.2 United Arab Emirates 15.0 1.2 Finland 10.6 0.8 Saudi Arabia 10.0 0.8 Italy 5.3 0.4 Luxembourg 4.6 0.4 Ireland 4.1 0.3 Source: Grants and Investment Projects System. a Amounts as per the President's report for each programme and project presented to the Executive Board. Any discrepancy in totals
is the result of rounding. The amounts and percentages shown here represent the share of each bilateral in total bilateral c ofinancing
of US$ 1 256.4 million. Bilateral participation in basket or similar funding arrangements is not included.
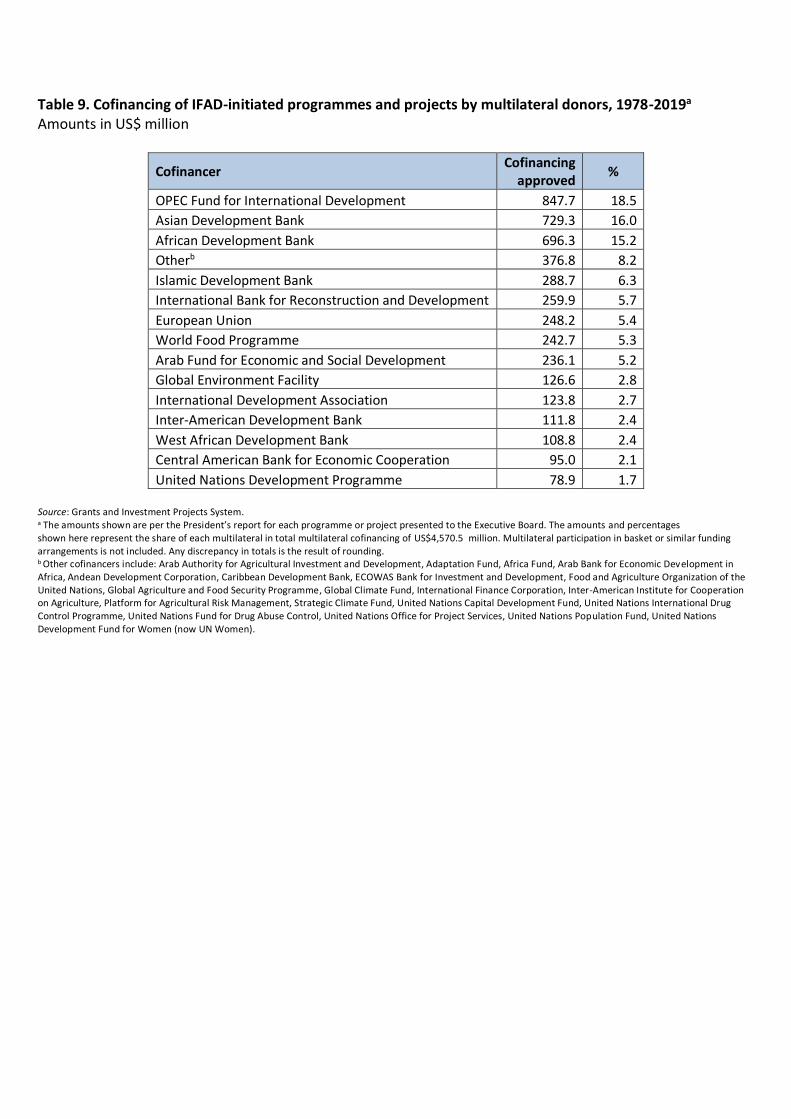
Table 9. Cofinancing of IFAD-initiated programmes and projects by multilateral donors, 1978-2019a Amounts in US$ million
Source: Grants and Investment Projects System. a The amounts shown are per the President’s report for each programme or project presented to the Executive Board. The amounts and percentages shown here represent the share of each multilateral in total multilateral cofinancing of US$4,570.5 million. Multilateral participation in basket or similar funding arrangements is not included. Any discrepancy in totals is the result of rounding. b Other cofinancers include: Arab Authority for Agricultural Investment and Development, Adaptation Fund, Africa Fund, Arab Bank for Economic Development in Africa, Andean Development Corporation, Caribbean Development Bank, ECOWAS Bank for Investment and Development, Food and Agriculture Organization of the United Nations, Global Agriculture and Food Security Programme, Global Climate Fund, International Finance Corporation, Inter-American Institute for Cooperation on Agriculture, Platform for Agricultural Risk Management, Strategic Climate Fund, United Nations Capital Development Fund, United Nations International Drug Control Programme, United Nations Fund for Drug Abuse Control, United Nations Office for Project Services, United Nations Population Fund, United Nations Development Fund for Women (now UN Women).
Cofinancer Cofinancing
approved %
OPEC Fund for International Development 847.7 18.5
Asian Development Bank 729.3 16.0
African Development Bank 696.3 15.2
Otherb 376.8 8.2
Islamic Development Bank 288.7 6.3
International Bank for Reconstruction and Development 259.9 5.7
European Union 248.2 5.4
World Food Programme 242.7 5.3
Arab Fund for Economic and Social Development 236.1 5.2
Global Environment Facility 126.6 2.8
International Development Association 123.8 2.7
Inter-American Development Bank 111.8 2.4
West African Development Bank 108.8 2.4
Central American Bank for Economic Cooperation 95.0 2.1
United Nations Development Programme 78.9 1.7
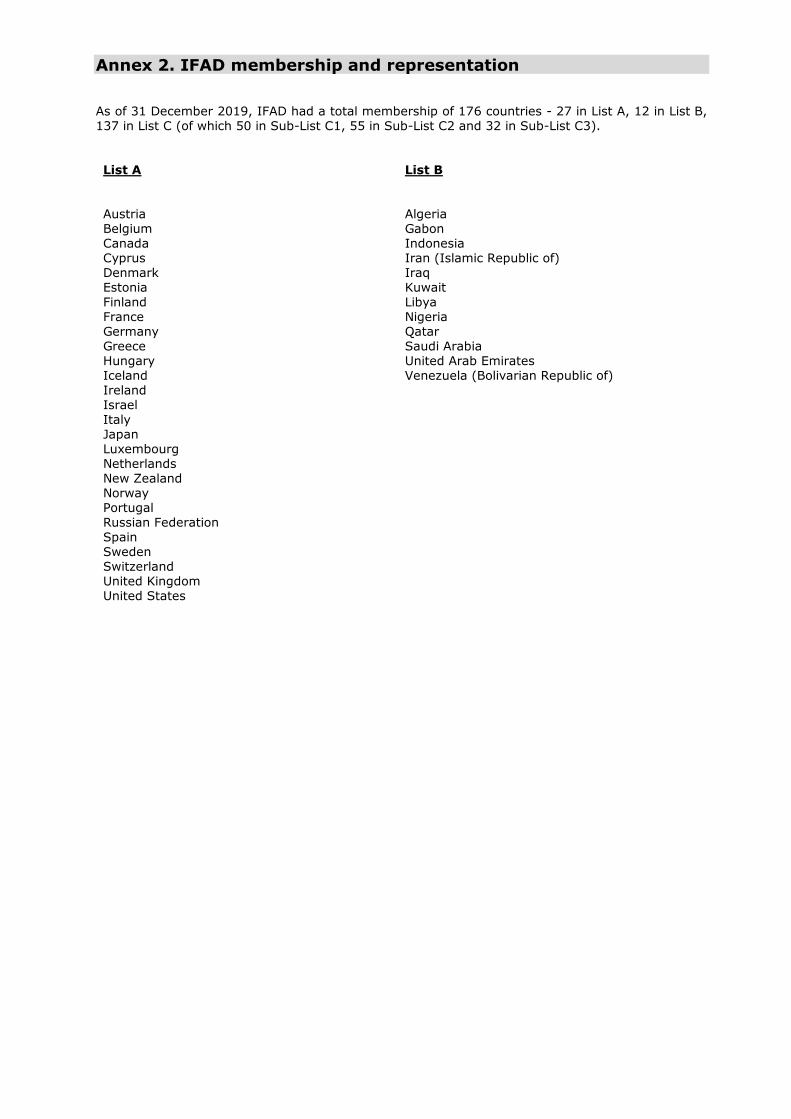
Annex 2. IFAD membership and representation As of 31 December 2019, IFAD had a total membership of 176 countries - 27 in List A, 12 in List B, 137 in List C (of which 50 in Sub-List C1, 55 in Sub-List C2 and 32 in Sub-List C3). List A
List B
Austria Belgium Canada Cyprus Denmark Estonia Finland France Germany Greece Hungary Iceland Ireland Israel Italy Japan Luxembourg Netherlands New Zealand Norway Portugal Russian Federation Spain Sweden Switzerland United Kingdom United States
Algeria Gabon Indonesia Iran (Islamic Republic of) Iraq Kuwait Libya Nigeria Qatar Saudi Arabia United Arab Emirates Venezuela (Bolivarian Republic of)
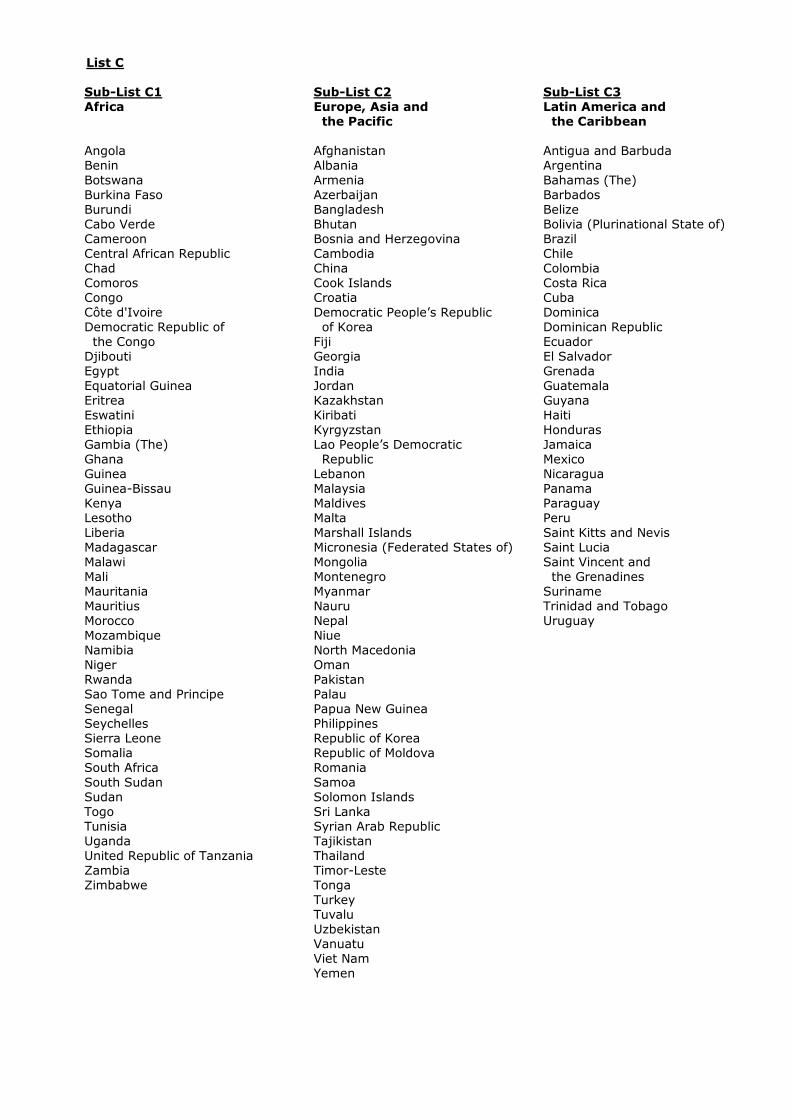
List C
Sub-List C1 Africa
Sub-List C2 Europe, Asia and the Pacific
Sub-List C3 Latin America and the Caribbean
Angola Benin Botswana Burkina Faso Burundi Cabo Verde Cameroon Central African Republic Chad Comoros Congo Côte d'Ivoire Democratic Republic of the Congo Djibouti Egypt Equatorial Guinea Eritrea Eswatini Ethiopia Gambia (The) Ghana Guinea Guinea-Bissau Kenya Lesotho Liberia Madagascar Malawi Mali Mauritania Mauritius Morocco Mozambique Namibia Niger Rwanda Sao Tome and Principe Senegal Seychelles Sierra Leone Somalia South Africa South Sudan Sudan Togo Tunisia Uganda United Republic of Tanzania Zambia Zimbabwe
Afghanistan Albania Armenia Azerbaijan Bangladesh Bhutan Bosnia and Herzegovina Cambodia China Cook Islands Croatia Democratic People’s Republic of Korea Fiji Georgia India Jordan Kazakhstan Kiribati Kyrgyzstan Lao People’s Democratic Republic Lebanon Malaysia Maldives Malta Marshall Islands Micronesia (Federated States of) Mongolia Montenegro Myanmar Nauru Nepal Niue North Macedonia Oman Pakistan Palau Papua New Guinea Philippines Republic of Korea Republic of Moldova Romania Samoa Solomon Islands Sri Lanka Syrian Arab Republic Tajikistan Thailand Timor-Leste Tonga Turkey Tuvalu Uzbekistan Vanuatu Viet Nam Yemen
Antigua and Barbuda Argentina Bahamas (The) Barbados Belize Bolivia (Plurinational State of) Brazil Chile Colombia Costa Rica Cuba Dominica Dominican Republic Ecuador El Salvador Grenada Guatemala Guyana Haiti Honduras Jamaica Mexico Nicaragua Panama Paraguay Peru Saint Kitts and Nevis Saint Lucia Saint Vincent and the Grenadines Suriname Trinidad and Tobago Uruguay
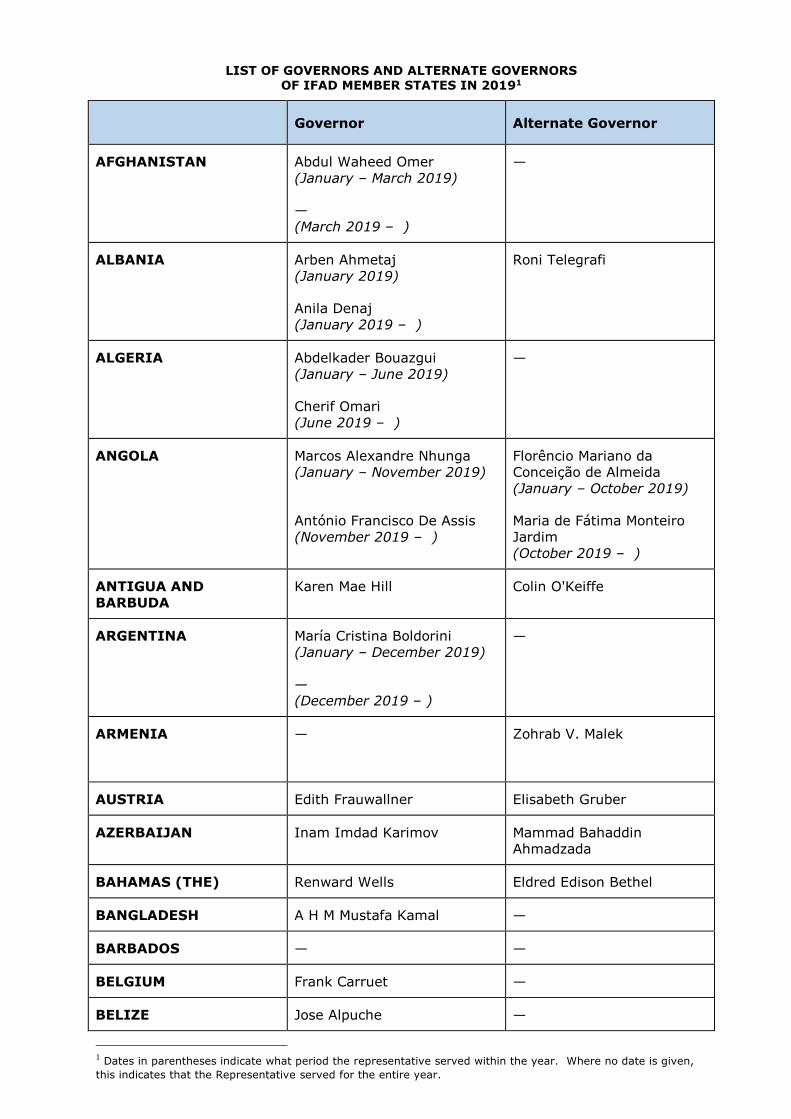
LIST OF GOVERNORS AND ALTERNATE GOVERNORS OF IFAD MEMBER STATES IN 20191
Governor Alternate Governor
AFGHANISTAN Abdul Waheed Omer
(January – March 2019)
— (March 2019 – )
—
ALBANIA Arben Ahmetaj (January 2019)
Anila Denaj (January 2019 – )
Roni Telegrafi
ALGERIA Abdelkader Bouazgui (January – June 2019)
Cherif Omari
(June 2019 – )
—
ANGOLA Marcos Alexandre Nhunga (January – November 2019)
António Francisco De Assis
(November 2019 – )
Florêncio Mariano da Conceição de Almeida (January – October 2019)
Maria de Fátima Monteiro
Jardim (October 2019 – )
ANTIGUA AND BARBUDA
Karen Mae Hill Colin O'Keiffe
ARGENTINA María Cristina Boldorini
(January – December 2019)
— (December 2019 – )
—
ARMENIA —
Zohrab V. Malek
AUSTRIA Edith Frauwallner Elisabeth Gruber
AZERBAIJAN Inam Imdad Karimov Mammad Bahaddin Ahmadzada
BAHAMAS (THE) Renward Wells Eldred Edison Bethel
BANGLADESH A H M Mustafa Kamal —
BARBADOS — —
BELGIUM Frank Carruet —
BELIZE Jose Alpuche —
1 Dates in parentheses indicate what period the representative served within the year. Where no date is given,
this indicates that the Representative served for the entire year.
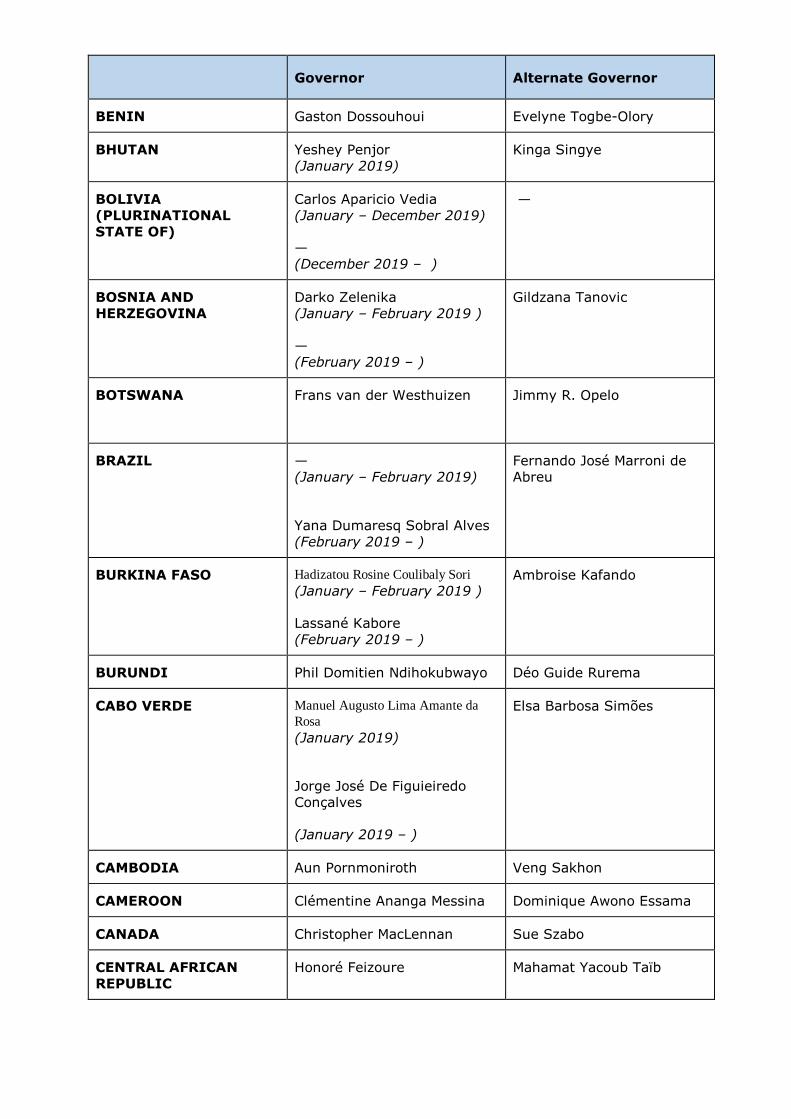
Governor Alternate Governor
BENIN Gaston Dossouhoui Evelyne Togbe-Olory
BHUTAN Yeshey Penjor (January 2019)
Kinga Singye
BOLIVIA (PLURINATIONAL STATE OF)
Carlos Aparicio Vedia (January – December 2019)
— (December 2019 – )
—
BOSNIA AND HERZEGOVINA
Darko Zelenika (January – February 2019 )
— (February 2019 – )
Gildzana Tanovic
BOTSWANA Frans van der Westhuizen
Jimmy R. Opelo
BRAZIL — (January – February 2019)
Yana Dumaresq Sobral Alves
(February 2019 – )
Fernando José Marroni de Abreu
BURKINA FASO Hadizatou Rosine Coulibaly Sori
(January – February 2019 )
Lassané Kabore (February 2019 – )
Ambroise Kafando
BURUNDI Phil Domitien Ndihokubwayo Déo Guide Rurema
CABO VERDE Manuel Augusto Lima Amante da
Rosa
(January 2019)
Jorge José De Figuieiredo Conçalves
(January 2019 – )
Elsa Barbosa Simões
CAMBODIA Aun Pornmoniroth Veng Sakhon
CAMEROON Clémentine Ananga Messina Dominique Awono Essama
CANADA Christopher MacLennan Sue Szabo
CENTRAL AFRICAN REPUBLIC
Honoré Feizoure Mahamat Yacoub Taïb
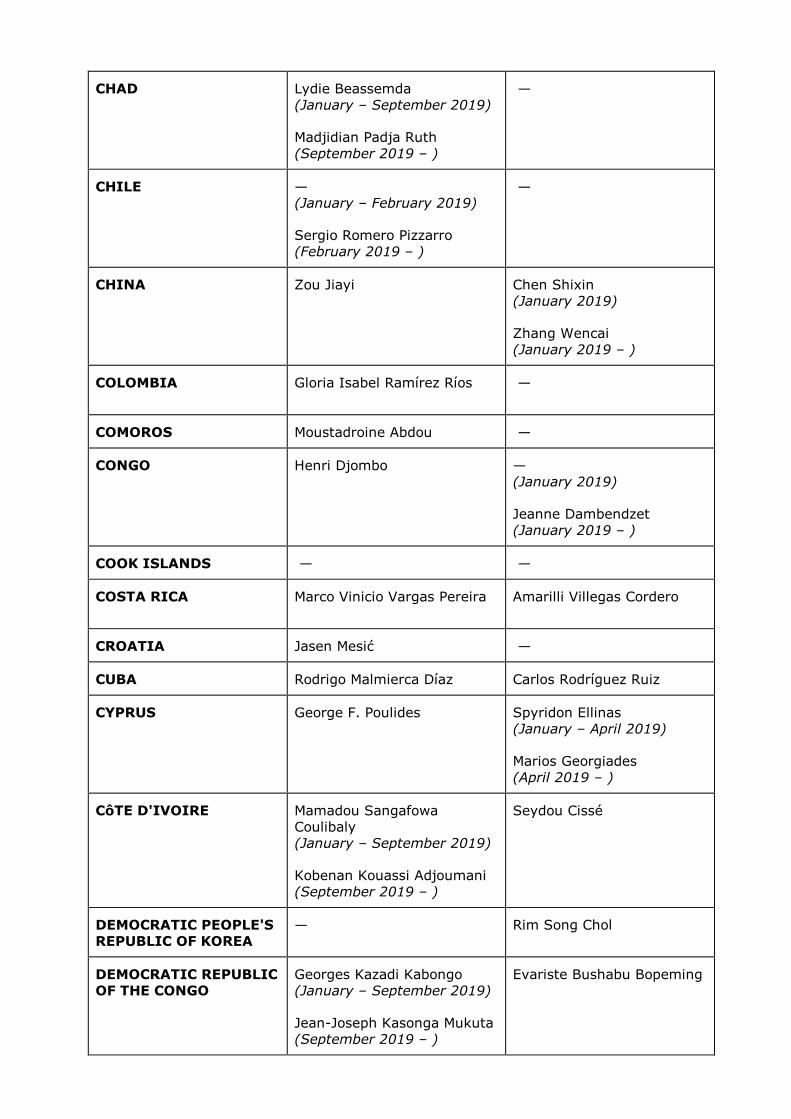
CHAD Lydie Beassemda (January – September 2019)
Madjidian Padja Ruth (September 2019 – )
—
CHILE — (January – February 2019)
Sergio Romero Pizzarro (February 2019 – )
—
CHINA Zou Jiayi
Chen Shixin
(January 2019)
Zhang Wencai (January 2019 – )
COLOMBIA Gloria Isabel Ramírez Ríos
—
COMOROS Moustadroine Abdou —
CONGO Henri Djombo — (January 2019)
Jeanne Dambendzet
(January 2019 – )
COOK ISLANDS — —
COSTA RICA Marco Vinicio Vargas Pereira Amarilli Villegas Cordero
CROATIA Jasen Mesić —
CUBA Rodrigo Malmierca Díaz Carlos Rodríguez Ruiz
CYPRUS George F. Poulides Spyridon Ellinas (January – April 2019)
Marios Georgiades
(April 2019 – )
CôTE D'IVOIRE Mamadou Sangafowa Coulibaly (January – September 2019)
Kobenan Kouassi Adjoumani
(September 2019 – )
Seydou Cissé
DEMOCRATIC PEOPLE'S REPUBLIC OF KOREA
— Rim Song Chol
DEMOCRATIC REPUBLIC OF THE CONGO
Georges Kazadi Kabongo (January – September 2019)
Jean-Joseph Kasonga Mukuta (September 2019 – )
Evariste Bushabu Bopeming
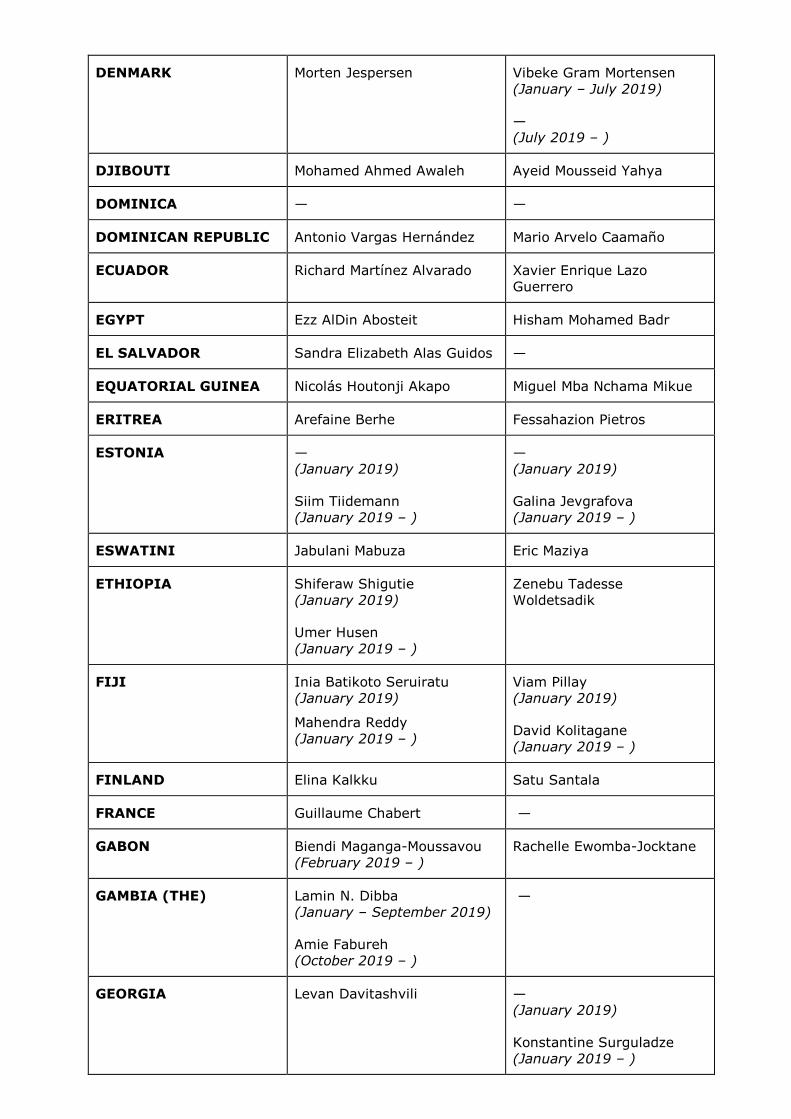
DENMARK Morten Jespersen Vibeke Gram Mortensen (January – July 2019)
— (July 2019 – )
DJIBOUTI Mohamed Ahmed Awaleh Ayeid Mousseid Yahya
DOMINICA — —
DOMINICAN REPUBLIC Antonio Vargas Hernández Mario Arvelo Caamaño
ECUADOR Richard Martínez Alvarado
Xavier Enrique Lazo Guerrero
EGYPT Ezz AlDin Abosteit Hisham Mohamed Badr
EL SALVADOR Sandra Elizabeth Alas Guidos —
EQUATORIAL GUINEA Nicolás Houtonji Akapo Miguel Mba Nchama Mikue
ERITREA Arefaine Berhe Fessahazion Pietros
ESTONIA — (January 2019)
Siim Tiidemann (January 2019 – )
— (January 2019)
Galina Jevgrafova (January 2019 – )
ESWATINI Jabulani Mabuza Eric Maziya
ETHIOPIA Shiferaw Shigutie (January 2019)
Umer Husen
(January 2019 – )
Zenebu Tadesse Woldetsadik
FIJI Inia Batikoto Seruiratu (January 2019)
Mahendra Reddy (January 2019 – )
Viam Pillay (January 2019)
David Kolitagane (January 2019 – )
FINLAND Elina Kalkku Satu Santala
FRANCE Guillaume Chabert —
GABON Biendi Maganga-Moussavou (February 2019 – )
Rachelle Ewomba-Jocktane
GAMBIA (THE) Lamin N. Dibba (January – September 2019)
Amie Fabureh (October 2019 – )
—
GEORGIA Levan Davitashvili —
(January 2019)
Konstantine Surguladze (January 2019 – )
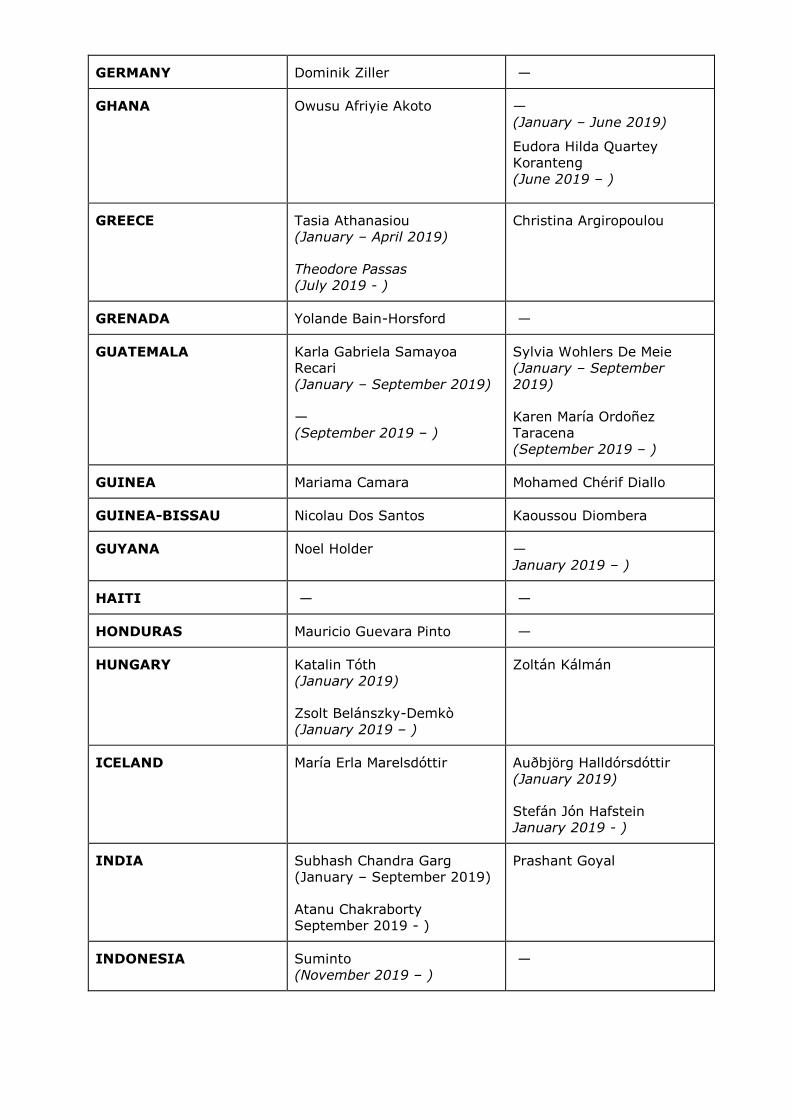
GERMANY Dominik Ziller —
GHANA Owusu Afriyie Akoto — (January – June 2019)
Eudora Hilda Quartey Koranteng
(June 2019 – )
GREECE Tasia Athanasiou (January – April 2019)
Theodore Passas (July 2019 - )
Christina Argiropoulou
GRENADA Yolande Bain-Horsford —
GUATEMALA Karla Gabriela Samayoa Recari (January – September 2019)
— (September 2019 – )
Sylvia Wohlers De Meie (January – September 2019)
Karen María Ordoñez Taracena (September 2019 – )
GUINEA Mariama Camara Mohamed Chérif Diallo
GUINEA-BISSAU Nicolau Dos Santos Kaoussou Diombera
GUYANA Noel Holder — January 2019 – )
HAITI — —
HONDURAS Mauricio Guevara Pinto —
HUNGARY Katalin Tóth (January 2019)
Zsolt Belánszky-Demkò (January 2019 – )
Zoltán Kálmán
ICELAND María Erla Marelsdóttir Auðbjörg Halldórsdóttir
(January 2019)
Stefán Jón Hafstein January 2019 - )
INDIA Subhash Chandra Garg (January – September 2019)
Atanu Chakraborty September 2019 - )
Prashant Goyal
INDONESIA Suminto (November 2019 – )
—
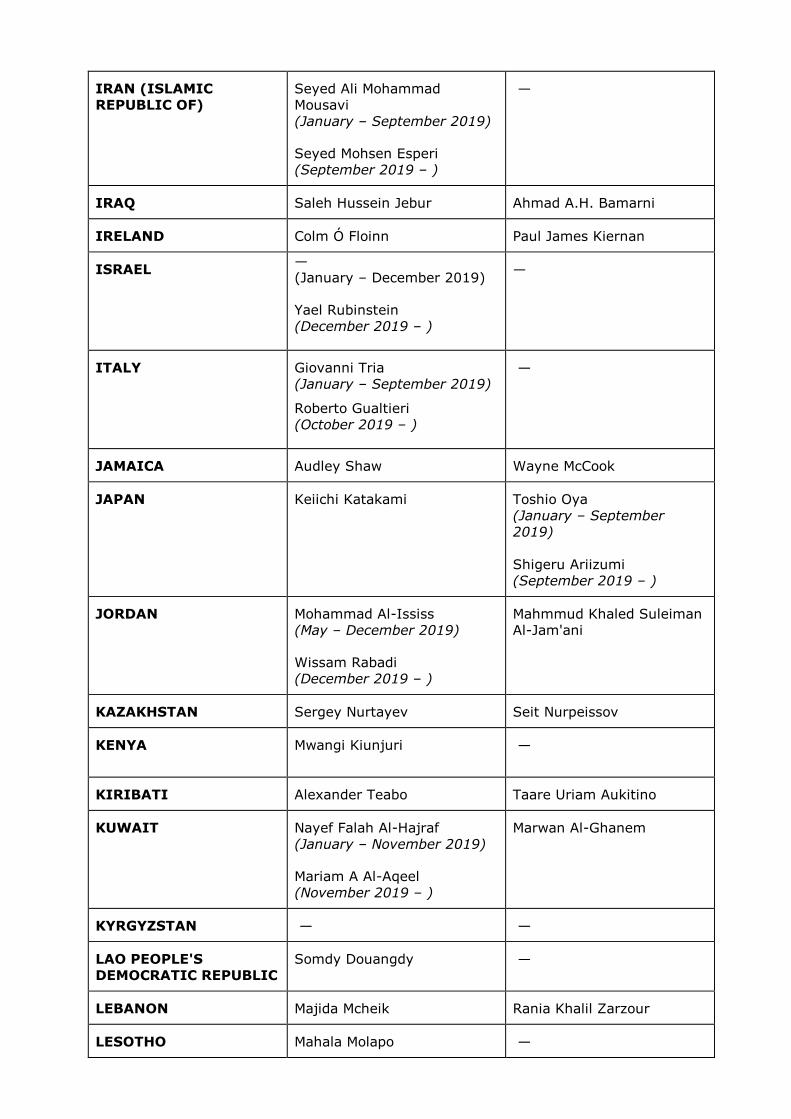
IRAN (ISLAMIC REPUBLIC OF)
Seyed Ali Mohammad Mousavi (January – September 2019)
Seyed Mohsen Esperi (September 2019 – )
—
IRAQ Saleh Hussein Jebur Ahmad A.H. Bamarni
IRELAND Colm Ó Floinn Paul James Kiernan
ISRAEL — (January – December 2019)
Yael Rubinstein (December 2019 – )
—
ITALY Giovanni Tria (January – September 2019)
Roberto Gualtieri (October 2019 – )
—
JAMAICA Audley Shaw Wayne McCook
JAPAN Keiichi Katakami Toshio Oya (January – September
2019) Shigeru Ariizumi (September 2019 – )
JORDAN Mohammad Al-Ississ (May – December 2019)
Wissam Rabadi (December 2019 – )
Mahmmud Khaled Suleiman Al-Jam'ani
KAZAKHSTAN Sergey Nurtayev Seit Nurpeissov
KENYA Mwangi Kiunjuri
—
KIRIBATI Alexander Teabo Taare Uriam Aukitino
KUWAIT Nayef Falah Al-Hajraf (January – November 2019)
Mariam A Al-Aqeel
(November 2019 – )
Marwan Al-Ghanem
KYRGYZSTAN — —
LAO PEOPLE'S DEMOCRATIC REPUBLIC
Somdy Douangdy —
LEBANON Majida Mcheik Rania Khalil Zarzour
LESOTHO Mahala Molapo —
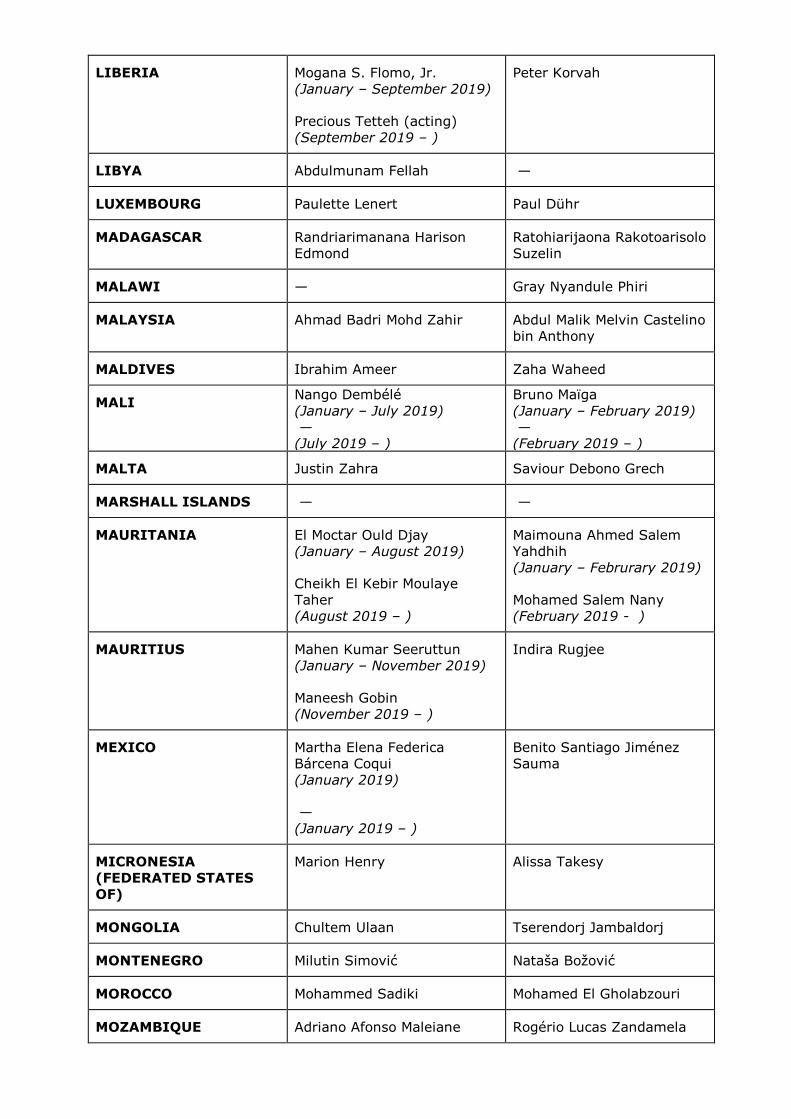
LIBERIA Mogana S. Flomo, Jr. (January – September 2019)
Precious Tetteh (acting) (September 2019 – )
Peter Korvah
LIBYA Abdulmunam Fellah —
LUXEMBOURG Paulette Lenert Paul Dühr
MADAGASCAR Randriarimanana Harison Edmond
Ratohiarijaona Rakotoarisolo Suzelin
MALAWI — Gray Nyandule Phiri
MALAYSIA Ahmad Badri Mohd Zahir Abdul Malik Melvin Castelino bin Anthony
MALDIVES Ibrahim Ameer Zaha Waheed
MALI Nango Dembélé
(January – July 2019) — (July 2019 – )
Bruno Maïga
(January – February 2019) — (February 2019 – )
MALTA Justin Zahra Saviour Debono Grech
MARSHALL ISLANDS — —
MAURITANIA El Moctar Ould Djay (January – August 2019)
Cheikh El Kebir Moulaye Taher (August 2019 – )
Maimouna Ahmed Salem Yahdhih (January – Februrary 2019)
Mohamed Salem Nany (February 2019 - )
MAURITIUS Mahen Kumar Seeruttun (January – November 2019)
Maneesh Gobin (November 2019 – )
Indira Rugjee
MEXICO Martha Elena Federica Bárcena Coqui
(January 2019)
— (January 2019 – )
Benito Santiago Jiménez Sauma
MICRONESIA (FEDERATED STATES
OF)
Marion Henry Alissa Takesy
MONGOLIA Chultem Ulaan Tserendorj Jambaldorj
MONTENEGRO Milutin Simović Nataša Božović
MOROCCO Mohammed Sadiki Mohamed El Gholabzouri
MOZAMBIQUE Adriano Afonso Maleiane Rogério Lucas Zandamela
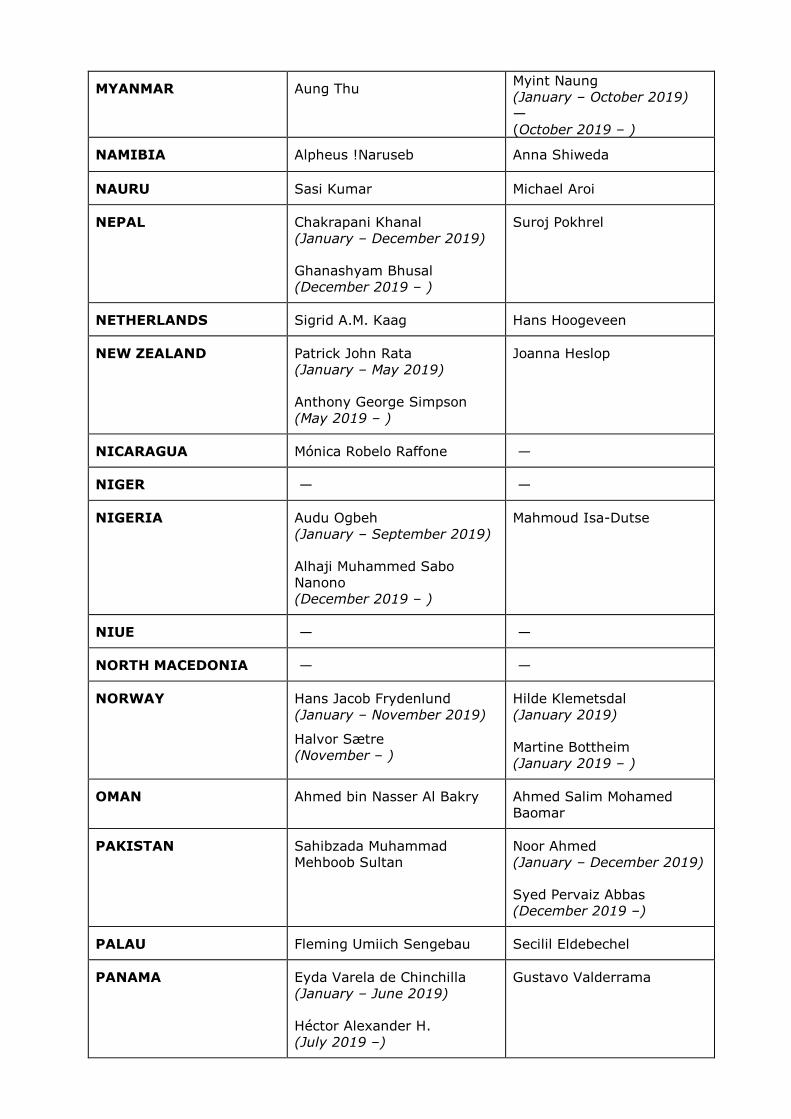
MYANMAR Aung Thu Myint Naung (January – October 2019) — (October 2019 – )
NAMIBIA Alpheus !Naruseb Anna Shiweda
NAURU Sasi Kumar Michael Aroi
NEPAL Chakrapani Khanal (January – December 2019)
Ghanashyam Bhusal (December 2019 – )
Suroj Pokhrel
NETHERLANDS Sigrid A.M. Kaag Hans Hoogeveen
NEW ZEALAND Patrick John Rata (January – May 2019)
Anthony George Simpson
(May 2019 – )
Joanna Heslop
NICARAGUA Mónica Robelo Raffone —
NIGER — —
NIGERIA Audu Ogbeh
(January – September 2019)
Alhaji Muhammed Sabo Nanono (December 2019 – )
Mahmoud Isa-Dutse
NIUE — —
NORTH MACEDONIA — —
NORWAY Hans Jacob Frydenlund (January – November 2019)
Halvor Sætre (November – )
Hilde Klemetsdal (January 2019)
Martine Bottheim (January 2019 – )
OMAN Ahmed bin Nasser Al Bakry Ahmed Salim Mohamed Baomar
PAKISTAN Sahibzada Muhammad Mehboob Sultan
Noor Ahmed (January – December 2019)
Syed Pervaiz Abbas (December 2019 –)
PALAU Fleming Umiich Sengebau Secilil Eldebechel
PANAMA Eyda Varela de Chinchilla (January – June 2019)
Héctor Alexander H. (July 2019 –)
Gustavo Valderrama
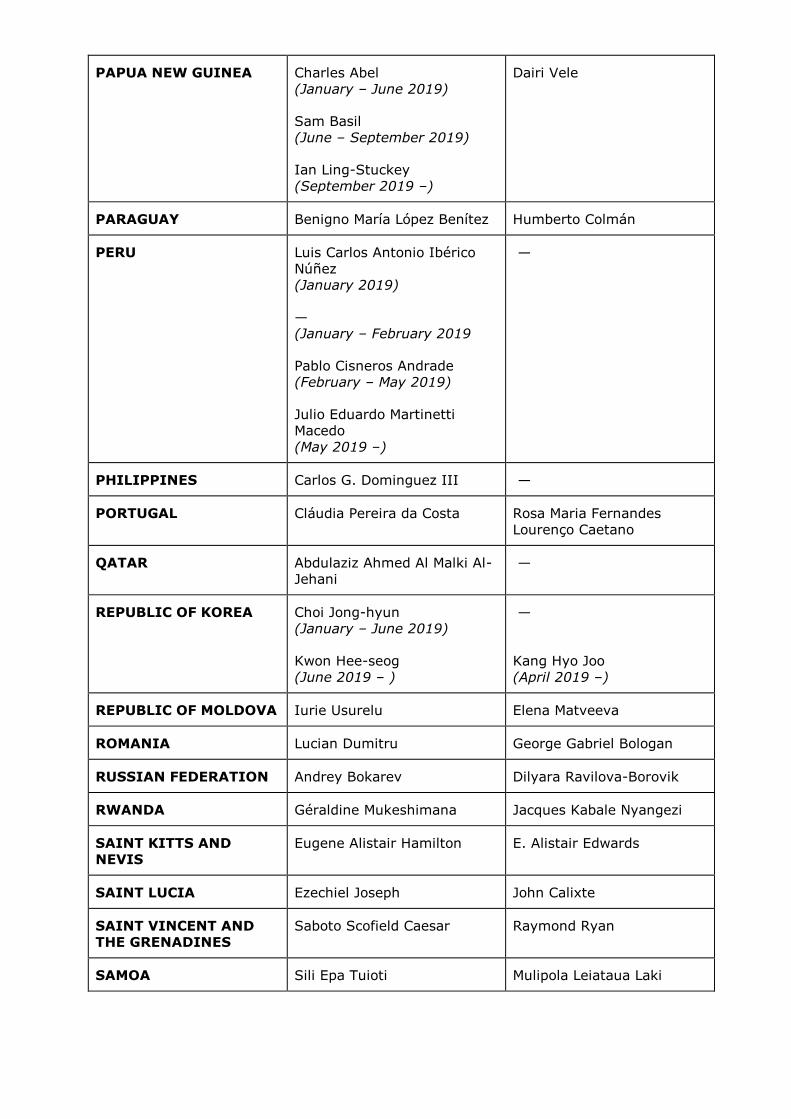
PAPUA NEW GUINEA Charles Abel (January – June 2019)
Sam Basil (June – September 2019)
Ian Ling-Stuckey
(September 2019 –)
Dairi Vele
PARAGUAY Benigno María López Benítez Humberto Colmán
PERU Luis Carlos Antonio Ibérico Núñez (January 2019)
— (January – February 2019
Pablo Cisneros Andrade (February – May 2019)
Julio Eduardo Martinetti Macedo (May 2019 –)
—
PHILIPPINES Carlos G. Dominguez III —
PORTUGAL Cláudia Pereira da Costa Rosa Maria Fernandes
Lourenço Caetano
QATAR Abdulaziz Ahmed Al Malki Al-Jehani
—
REPUBLIC OF KOREA Choi Jong-hyun (January – June 2019)
Kwon Hee-seog (June 2019 – )
—
Kang Hyo Joo (April 2019 –)
REPUBLIC OF MOLDOVA Iurie Usurelu Elena Matveeva
ROMANIA Lucian Dumitru George Gabriel Bologan
RUSSIAN FEDERATION Andrey Bokarev Dilyara Ravilova-Borovik
RWANDA Géraldine Mukeshimana Jacques Kabale Nyangezi
SAINT KITTS AND NEVIS
Eugene Alistair Hamilton E. Alistair Edwards
SAINT LUCIA Ezechiel Joseph John Calixte
SAINT VINCENT AND THE GRENADINES
Saboto Scofield Caesar Raymond Ryan
SAMOA Sili Epa Tuioti Mulipola Leiataua Laki
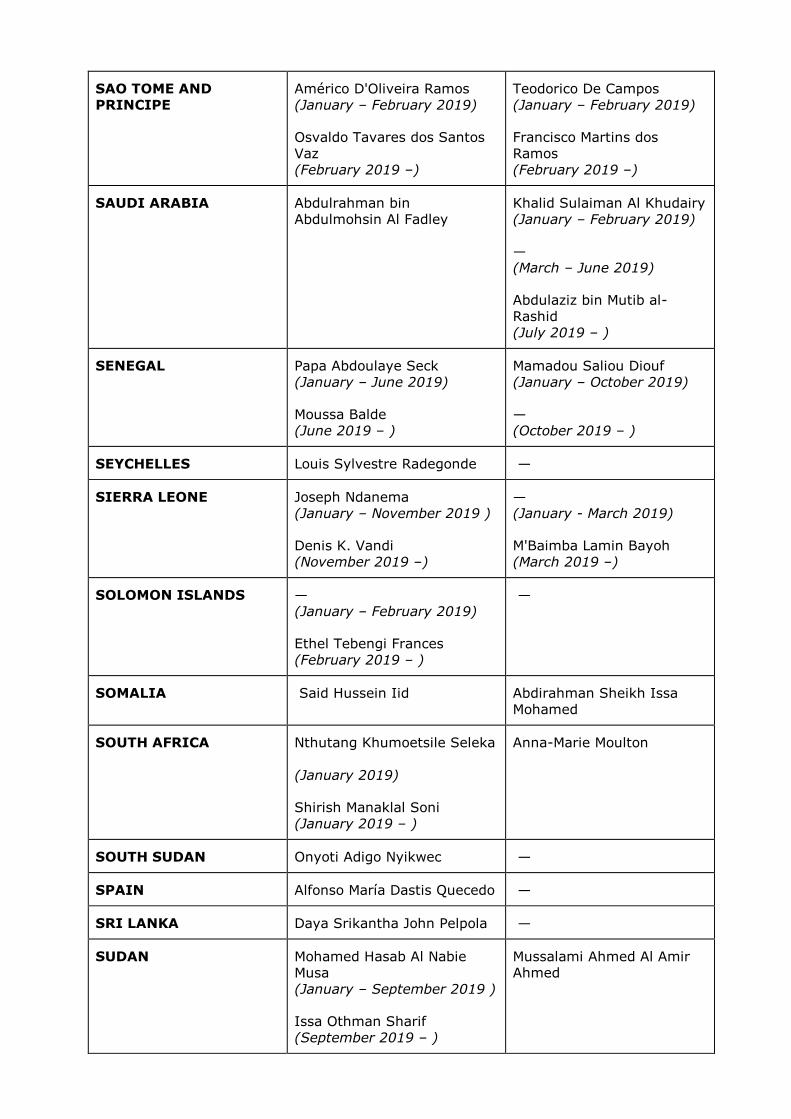
SAO TOME AND PRINCIPE
Américo D'Oliveira Ramos (January – February 2019)
Osvaldo Tavares dos Santos Vaz (February 2019 –)
Teodorico De Campos (January – February 2019)
Francisco Martins dos Ramos (February 2019 –)
SAUDI ARABIA Abdulrahman bin Abdulmohsin Al Fadley
Khalid Sulaiman Al Khudairy (January – February 2019)
— (March – June 2019)
Abdulaziz bin Mutib al-Rashid (July 2019 – )
SENEGAL Papa Abdoulaye Seck (January – June 2019)
Moussa Balde (June 2019 – )
Mamadou Saliou Diouf (January – October 2019)
— (October 2019 – )
SEYCHELLES Louis Sylvestre Radegonde —
SIERRA LEONE Joseph Ndanema (January – November 2019 )
Denis K. Vandi (November 2019 –)
— (January - March 2019)
M'Baimba Lamin Bayoh (March 2019 –)
SOLOMON ISLANDS — (January – February 2019)
Ethel Tebengi Frances
(February 2019 – )
—
SOMALIA Said Hussein Iid Abdirahman Sheikh Issa Mohamed
SOUTH AFRICA Nthutang Khumoetsile Seleka
(January 2019)
Shirish Manaklal Soni (January 2019 – )
Anna-Marie Moulton
SOUTH SUDAN Onyoti Adigo Nyikwec —
SPAIN Alfonso María Dastis Quecedo —
SRI LANKA Daya Srikantha John Pelpola —
SUDAN Mohamed Hasab Al Nabie Musa (January – September 2019 )
Issa Othman Sharif (September 2019 – )
Mussalami Ahmed Al Amir Ahmed
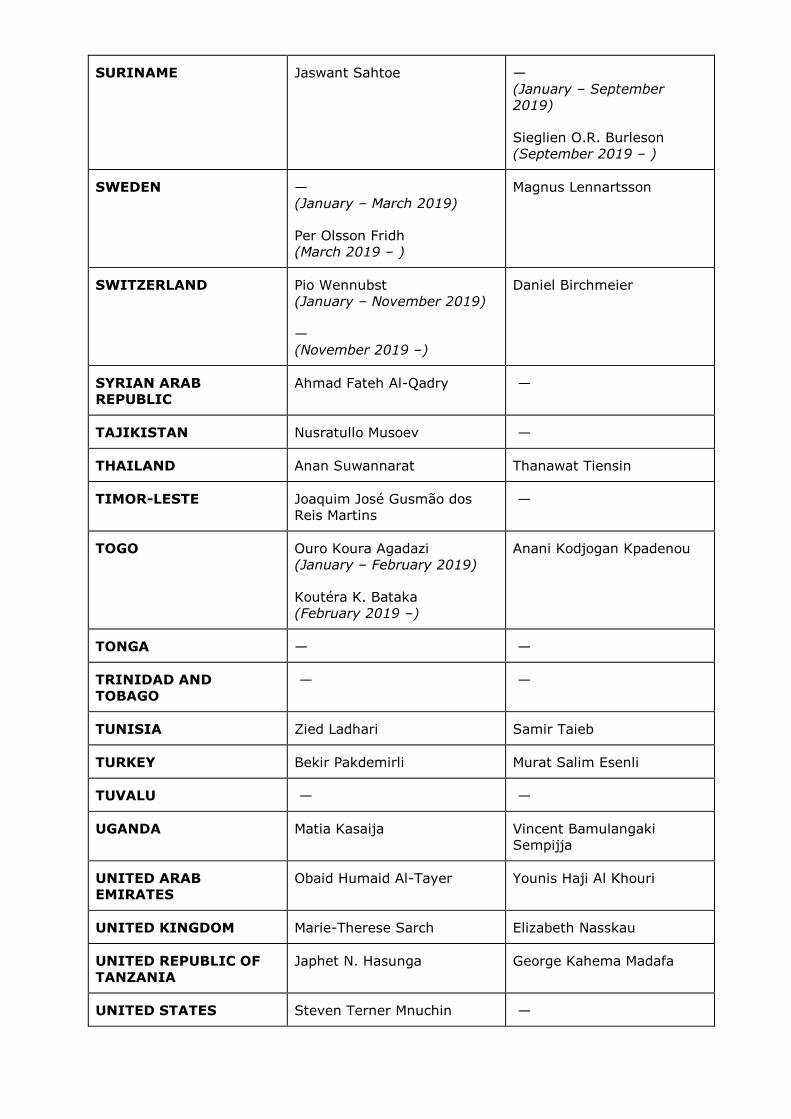
SURINAME Jaswant Sahtoe — (January – September 2019)
Sieglien O.R. Burleson (September 2019 – )
SWEDEN — (January – March 2019)
Per Olsson Fridh (March 2019 – )
Magnus Lennartsson
SWITZERLAND Pio Wennubst
(January – November 2019)
— (November 2019 –)
Daniel Birchmeier
SYRIAN ARAB REPUBLIC
Ahmad Fateh Al-Qadry —
TAJIKISTAN Nusratullo Musoev —
THAILAND Anan Suwannarat Thanawat Tiensin
TIMOR-LESTE Joaquim José Gusmão dos Reis Martins
—
TOGO Ouro Koura Agadazi (January – February 2019)
Koutéra K. Bataka (February 2019 –)
Anani Kodjogan Kpadenou
TONGA — —
TRINIDAD AND TOBAGO
— —
TUNISIA Zied Ladhari Samir Taieb
TURKEY Bekir Pakdemirli Murat Salim Esenli
TUVALU — —
UGANDA Matia Kasaija Vincent Bamulangaki Sempijja
UNITED ARAB
EMIRATES
Obaid Humaid Al-Tayer Younis Haji Al Khouri
UNITED KINGDOM Marie-Therese Sarch Elizabeth Nasskau
UNITED REPUBLIC OF TANZANIA
Japhet N. Hasunga George Kahema Madafa
UNITED STATES Steven Terner Mnuchin —
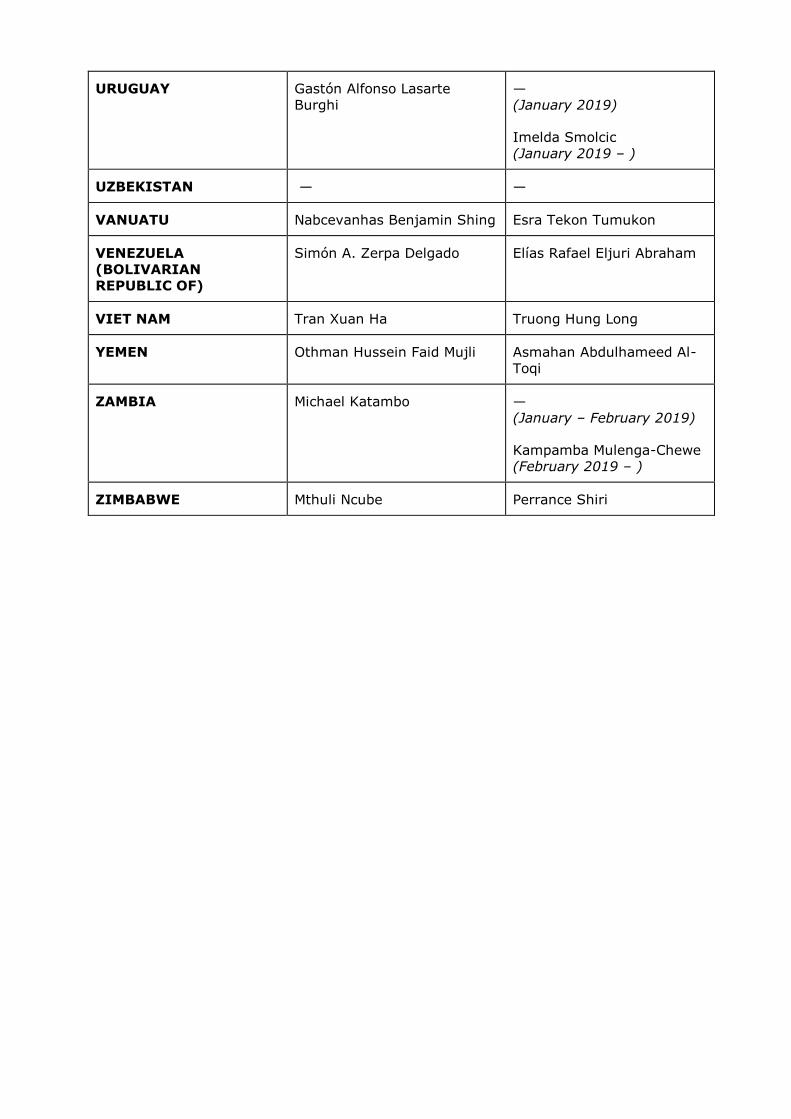
URUGUAY Gastón Alfonso Lasarte Burghi
— (January 2019)
Imelda Smolcic (January 2019 – )
UZBEKISTAN — —
VANUATU Nabcevanhas Benjamin Shing Esra Tekon Tumukon
VENEZUELA (BOLIVARIAN REPUBLIC OF)
Simón A. Zerpa Delgado Elías Rafael Eljuri Abraham
VIET NAM Tran Xuan Ha Truong Hung Long
YEMEN Othman Hussein Faid Mujli Asmahan Abdulhameed Al-Toqi
ZAMBIA Michael Katambo —
(January – February 2019)
Kampamba Mulenga-Chewe (February 2019 – )
ZIMBABWE Mthuli Ncube Perrance Shiri
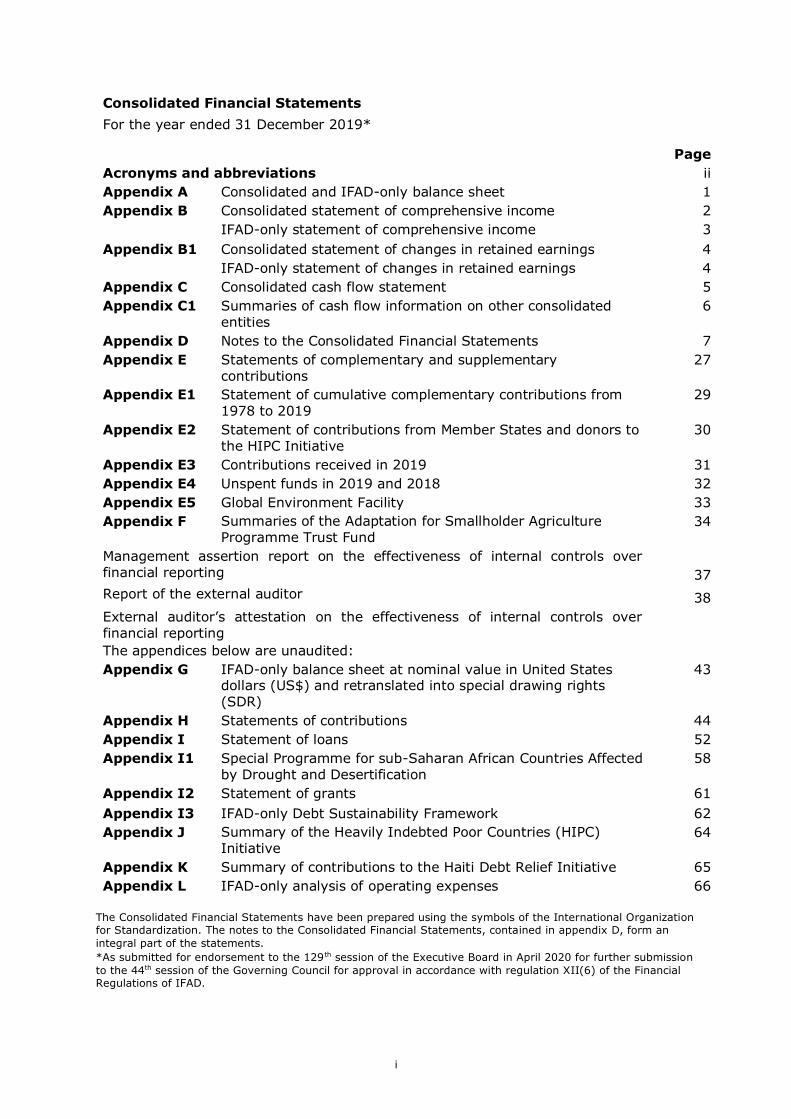
i
Consolidated Financial Statements
For the year ended 31 December 2019*
Page
Acronyms and abbreviations ii
Appendix A Consolidated and IFAD-only balance sheet 1
Appendix B Consolidated statement of comprehensive income 2
IFAD-only statement of comprehensive income 3
Appendix B1 Consolidated statement of changes in retained earnings 4
IFAD-only statement of changes in retained earnings 4
Appendix C Consolidated cash flow statement 5
Appendix C1 Summaries of cash flow information on other consolidated entities
6
Appendix D Notes to the Consolidated Financial Statements 7
Appendix E Statements of complementary and supplementary contributions
27
Appendix E1 Statement of cumulative complementary contributions from 1978 to 2019
29
Appendix E2 Statement of contributions from Member States and donors to the HIPC Initiative
30
Appendix E3 Contributions received in 2019 31
Appendix E4 Unspent funds in 2019 and 2018 32
Appendix E5 Global Environment Facility 33
Appendix F Summaries of the Adaptation for Smallholder Agriculture Programme Trust Fund
34
Management assertion report on the effectiveness of internal controls over financial reporting 37
Report of the external auditor 38
External auditor’s attestation on the effectiveness of internal controls over financial reporting
The appendices below are unaudited:
Appendix G IFAD-only balance sheet at nominal value in United States dollars (US$) and retranslated into special drawing rights (SDR)
43
Appendix H Statements of contributions 44
Appendix I Statement of loans 52
Appendix I1 Special Programme for sub-Saharan African Countries Affected by Drought and Desertification
58
Appendix I2 Statement of grants 61
Appendix I3 IFAD-only Debt Sustainability Framework 62
Appendix J Summary of the Heavily Indebted Poor Countries (HIPC) Initiative
64
Appendix K Summary of contributions to the Haiti Debt Relief Initiative 65
Appendix L IFAD-only analysis of operating expenses 66
The Consolidated Financial Statements have been prepared using the symbols of the International Organization for Standardization. The notes to the Consolidated Financial Statements, contained in appendix D, form an
integral part of the statements.
*As submitted for endorsement to the 129th session of the Executive Board in April 2020 for further submission
to the 44th session of the Governing Council for approval in accordance with regulation XII(6) of the Financial Regulations of IFAD.
ii
Acronyms and abbreviations
APO associate professional officer ASMCS After-Service Medical Coverage Scheme
ASAP Adaptation for Smallholder Agriculture Programme
BFFS.JP Belgian Fund for Food Security Joint Programme CPL concessional partner loan
DSF Debt Sustainability Framework EAD exposure at default
ECL expected credit loss
FVTPL fair value through profit and loss FGWB IFAD Fund for Gaza and the West Bank FAO Food and Agriculture Organization of the United Nations
GEF Global Environment Facility
IOE Independent Office of Evaluation of IFAD IAS International Accounting Standard (superseded by IFRS) IFRS International Financial Reporting Standards HIPC Heavily Indebted Poor Countries Initiative LGD loss given default
MLR minimum liquidity requirement OPEC Organization of the Petroleum Exporting Countries PCS preferred creditor status
PD probability of default
PIT point-in-time
RAMP Reserves Advisory and Management Program
Spanish Trust Fund Spanish Food Security Cofinancing Facility Trust Fund SPA Special Programme for sub-Saharan African Countries Affected
by Drought and Desertification SDR special drawing rights S&P Standard & Poor’s TTC through-the-cycle
UNJSPF United Nations Joint Staff Pension Fund
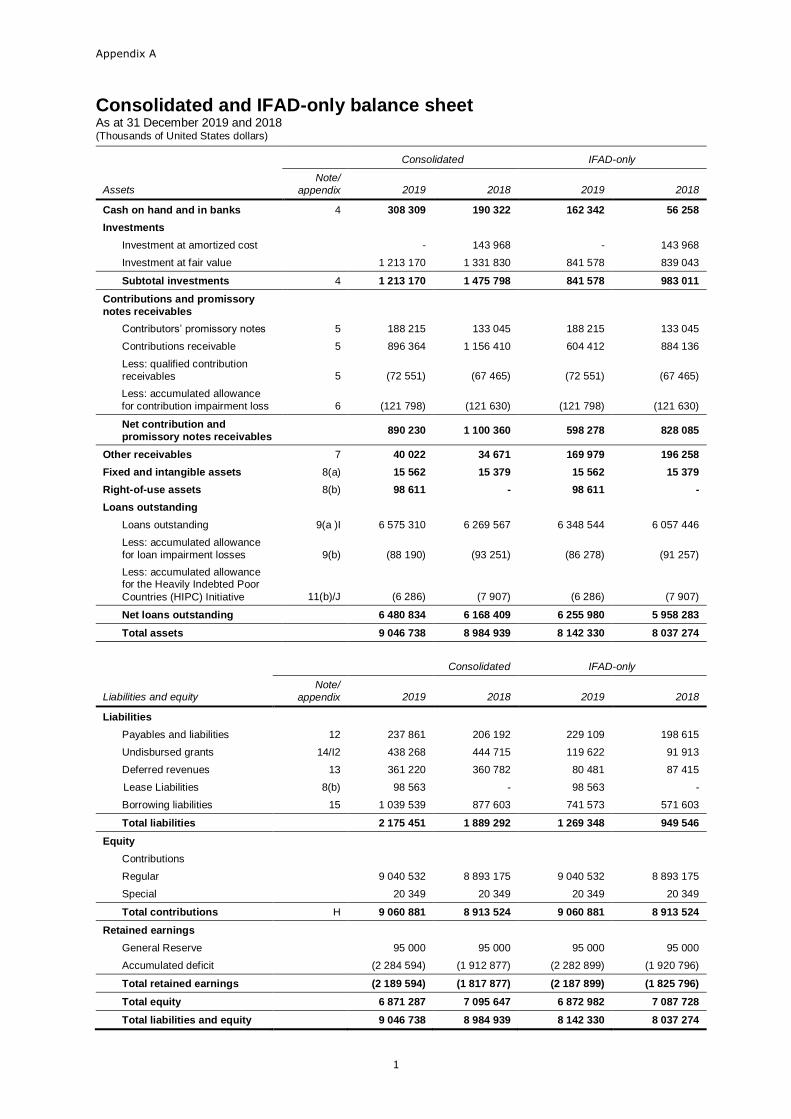
Appendix A
1
Consolidated and IFAD-only balance sheet As at 31 December 2019 and 2018 (Thousands of United States dollars)
Consolidated IFAD-only
Assets Note/
appendix 2019 2018 2019 2018
Cash on hand and in banks 4 308 309 190 322 162 342 56 258
Investments
Investment at amortized cost - 143 968 - 143 968
Investment at fair value 1 213 170 1 331 830 841 578 839 043
Subtotal investments 4 1 213 170 1 475 798 841 578 983 011
Contributions and promissory
notes receivables
Contributors’ promissory notes 5 188 215 133 045 188 215 133 045
Contributions receivable 5 896 364 1 156 410 604 412 884 136
Less: qualified contribution
receivables 5 (72 551) (67 465) (72 551) (67 465)
Less: accumulated allowance
for contribution impairment loss 6 (121 798) (121 630) (121 798) (121 630)
Net contribution and
promissory notes receivables 890 230 1 100 360 598 278 828 085
Other receivables 7 40 022 34 671 169 979 196 258
Fixed and intangible assets 8(a) 15 562 15 379 15 562 15 379
Right-of-use assets 8(b) 98 611 - 98 611 -
Loans outstanding
Loans outstanding 9(a )I 6 575 310 6 269 567 6 348 544 6 057 446
Less: accumulated allowance
for loan impairment losses 9(b) (88 190) (93 251) (86 278) (91 257)
Less: accumulated allowance for the Heavily Indebted Poor
Countries (HIPC) Initiative 11(b)/J (6 286) (7 907) (6 286) (7 907)
Net loans outstanding 6 480 834 6 168 409 6 255 980 5 958 283
Total assets 9 046 738 8 984 939 8 142 330 8 037 274
Consolidated IFAD-only
Liabilities and equity Note/
appendix 2019 2018 2019 2018
Liabilities
Payables and liabilities 12 237 861 206 192 229 109 198 615
Undisbursed grants 14/I2 438 268 444 715 119 622 91 913
Deferred revenues 13 361 220 360 782 80 481 87 415
Lease Liabilities 8(b) 98 563 - 98 563 -
Borrowing liabilities 15 1 039 539 877 603 741 573 571 603
Total liabilities 2 175 451 1 889 292 1 269 348 949 546
Equity
Contributions
Regular 9 040 532 8 893 175 9 040 532 8 893 175
Special 20 349 20 349 20 349 20 349
Total contributions H 9 060 881 8 913 524 9 060 881 8 913 524
Retained earnings
General Reserve 95 000 95 000 95 000 95 000
Accumulated deficit (2 284 594) (1 912 877) (2 282 899) (1 920 796)
Total retained earnings (2 189 594) (1 817 877) (2 187 899) (1 825 796)
Total equity 6 871 287 7 095 647 6 872 982 7 087 728
Total liabilities and equity 9 046 738 8 984 939 8 142 330 8 037 274
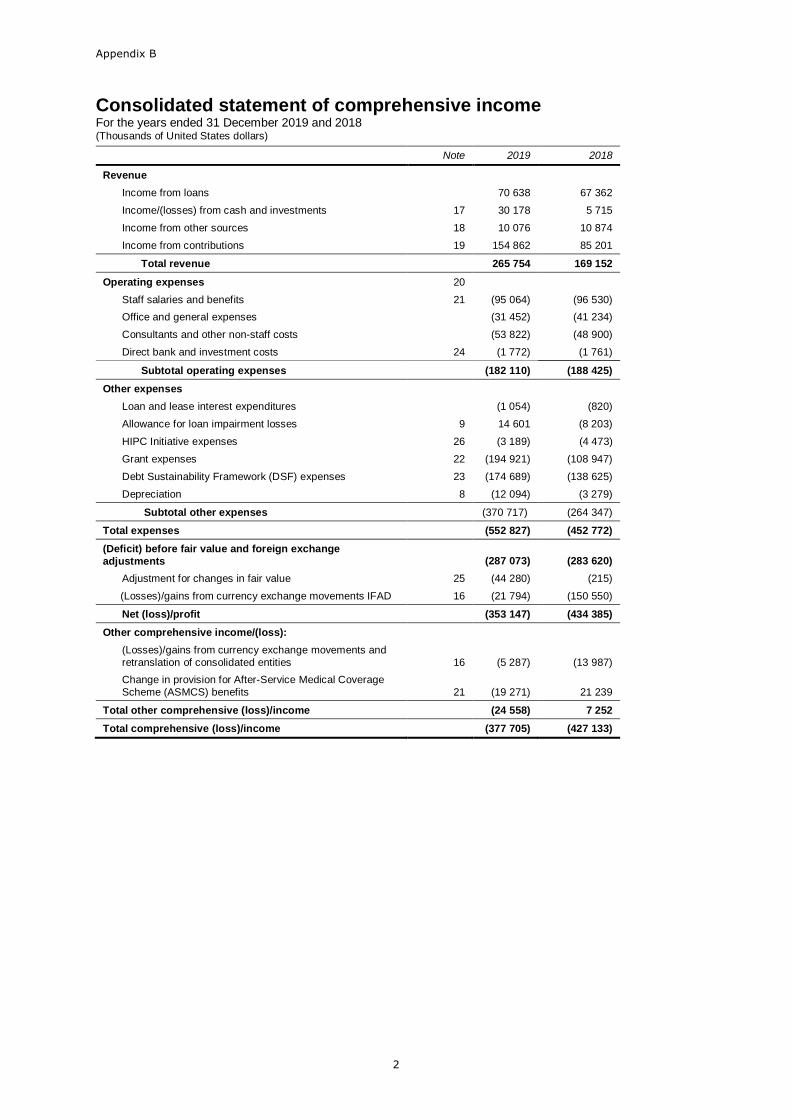
Appendix B
2
Consolidated statement of comprehensive income For the years ended 31 December 2019 and 2018 (Thousands of United States dollars)
Note 2019 2018
Revenue
Income from loans 70 638 67 362
Income/(losses) from cash and investments 17 30 178 5 715
Income from other sources 18 10 076 10 874
Income from contributions 19 154 862 85 201
Total revenue 265 754 169 152
Operating expenses 20
Staff salaries and benefits 21 (95 064) (96 530)
Office and general expenses (31 452) (41 234)
Consultants and other non-staff costs (53 822) (48 900)
Direct bank and investment costs 24 (1 772) (1 761)
Subtotal operating expenses (182 110) (188 425)
Other expenses
Loan and lease interest expenditures (1 054) (820)
Allowance for loan impairment losses 9 14 601 (8 203)
HIPC Initiative expenses 26 (3 189) (4 473)
Grant expenses 22 (194 921) (108 947)
Debt Sustainability Framework (DSF) expenses 23 (174 689) (138 625)
Depreciation 8 (12 094) (3 279)
Subtotal other expenses (370 717) (264 347)
Total expenses (552 827) (452 772)
(Deficit) before fair value and foreign exchange
adjustments (287 073) (283 620)
Adjustment for changes in fair value 25 (44 280) (215)
(Losses)/gains from currency exchange movements IFAD 16 (21 794) (150 550)
Net (loss)/profit (353 147) (434 385)
Other comprehensive income/(loss):
(Losses)/gains from currency exchange movements and
retranslation of consolidated entities 16 (5 287) (13 987)
Change in provision for After-Service Medical Coverage
Scheme (ASMCS) benefits 21 (19 271) 21 239
Total other comprehensive (loss)/income (24 558) 7 252
Total comprehensive (loss)/income (377 705) (427 133)
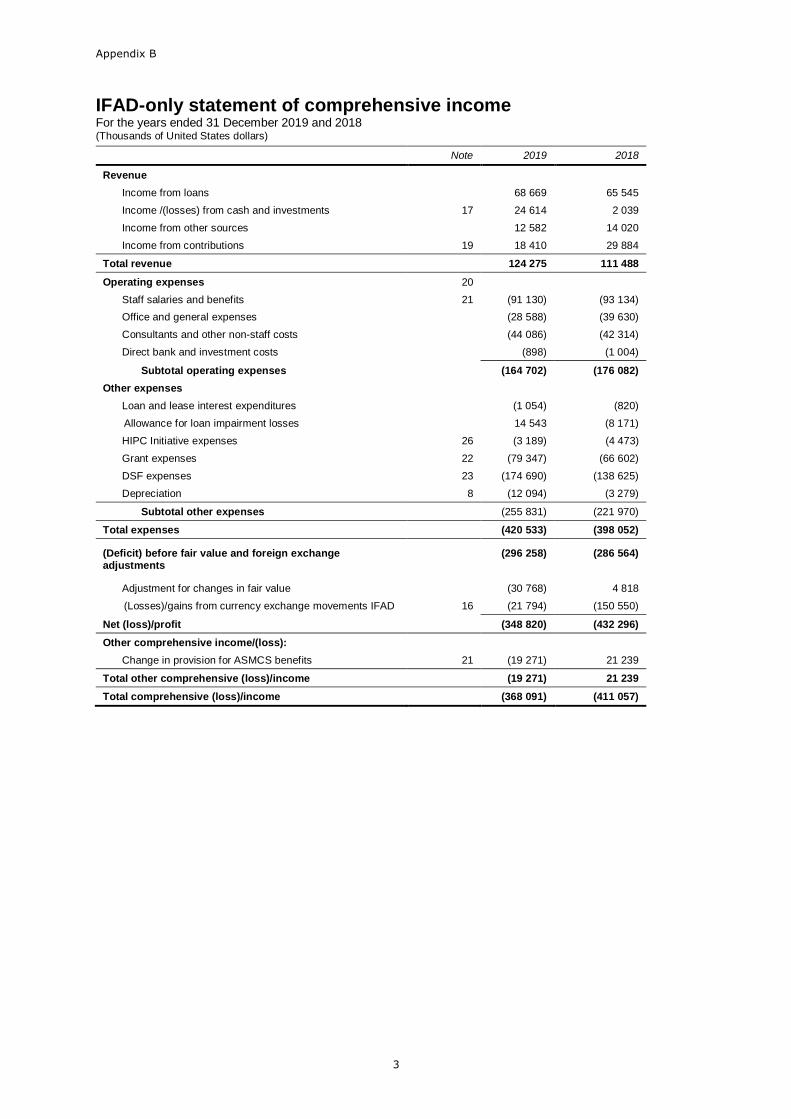
Appendix B
3
IFAD-only statement of comprehensive income For the years ended 31 December 2019 and 2018 (Thousands of United States dollars)
Note 2019 2018
Revenue
Income from loans 68 669 65 545
Income /(losses) from cash and investments 17 24 614 2 039
Income from other sources 12 582 14 020
Income from contributions 19 18 410 29 884
Total revenue 124 275 111 488
Operating expenses 20
Staff salaries and benefits 21 (91 130) (93 134)
Office and general expenses (28 588) (39 630)
Consultants and other non-staff costs (44 086) (42 314)
Direct bank and investment costs (898) (1 004)
Subtotal operating expenses (164 702) (176 082)
Other expenses
Loan and lease interest expenditures (1 054) (820)
Allowance for loan impairment losses 14 543 (8 171)
HIPC Initiative expenses 26 (3 189) (4 473)
Grant expenses 22 (79 347) (66 602)
DSF expenses 23 (174 690) (138 625)
Depreciation 8 (12 094) (3 279)
Subtotal other expenses (255 831) (221 970)
Total expenses (420 533) (398 052)
(Deficit) before fair value and foreign exchange adjustments
(296 258) (286 564)
Adjustment for changes in fair value (30 768) 4 818
(Losses)/gains from currency exchange movements IFAD 16 (21 794) (150 550)
Net (loss)/profit (348 820) (432 296)
Other comprehensive income/(loss):
Change in provision for ASMCS benefits 21 (19 271) 21 239
Total other comprehensive (loss)/income (19 271) 21 239
Total comprehensive (loss)/income (368 091) (411 057)
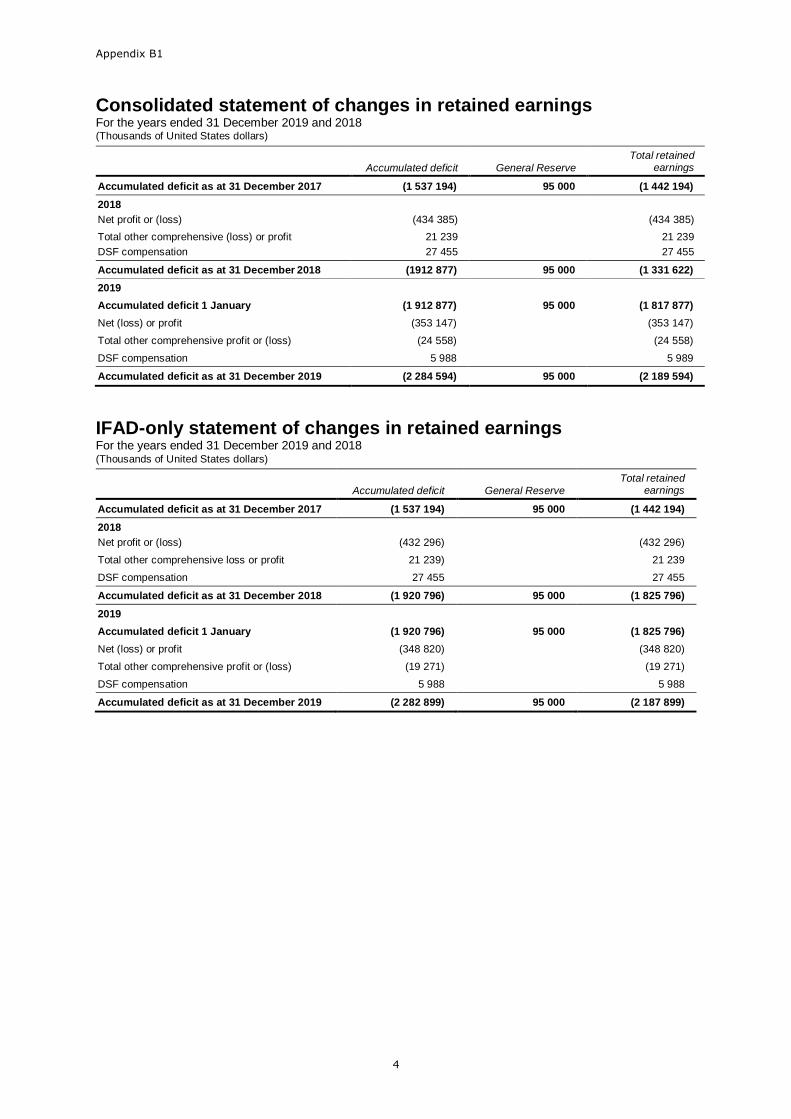
Appendix B1
4
Consolidated statement of changes in retained earnings For the years ended 31 December 2019 and 2018 (Thousands of United States dollars)
IFAD-only statement of changes in retained earnings For the years ended 31 December 2019 and 2018 (Thousands of United States dollars)
Accumulated deficit General Reserve
Total retained earnings
Accumulated deficit as at 31 December 2017 (1 537 194) 95 000 (1 442 194)
2018
Net profit or (loss)
(432 296)
(432 296)
Total other comprehensive loss or profit 21 239) 21 239
DSF compensation 27 455 27 455
Accumulated deficit as at 31 December 2018 (1 920 796) 95 000 (1 825 796)
2019
Accumulated deficit 1 January (1 920 796) 95 000 (1 825 796)
Net (loss) or profit (348 820) (348 820)
Total other comprehensive profit or (loss) (19 271) (19 271)
DSF compensation 5 988 5 988
Accumulated deficit as at 31 December 2019 (2 282 899) 95 000 (2 187 899)
Accumulated deficit General Reserve
Total retained earnings
Accumulated deficit as at 31 December 2017 (1 537 194) 95 000 (1 442 194)
2018
Net profit or (loss)
(434 385)
(434 385)
Total other comprehensive (loss) or profit
DSF compensation
21 239
27 455
21 239
27 455
Accumulated deficit as at 31 December 2018 (1912 877) 95 000 (1 331 622)
2019
Accumulated deficit 1 January (1 912 877) 95 000 (1 817 877)
Net (loss) or profit (353 147) (353 147)
Total other comprehensive profit or (loss) (24 558) (24 558)
DSF compensation 5 988 5 989
Accumulated deficit as at 31 December 2019 (2 284 594) 95 000 (2 189 594)
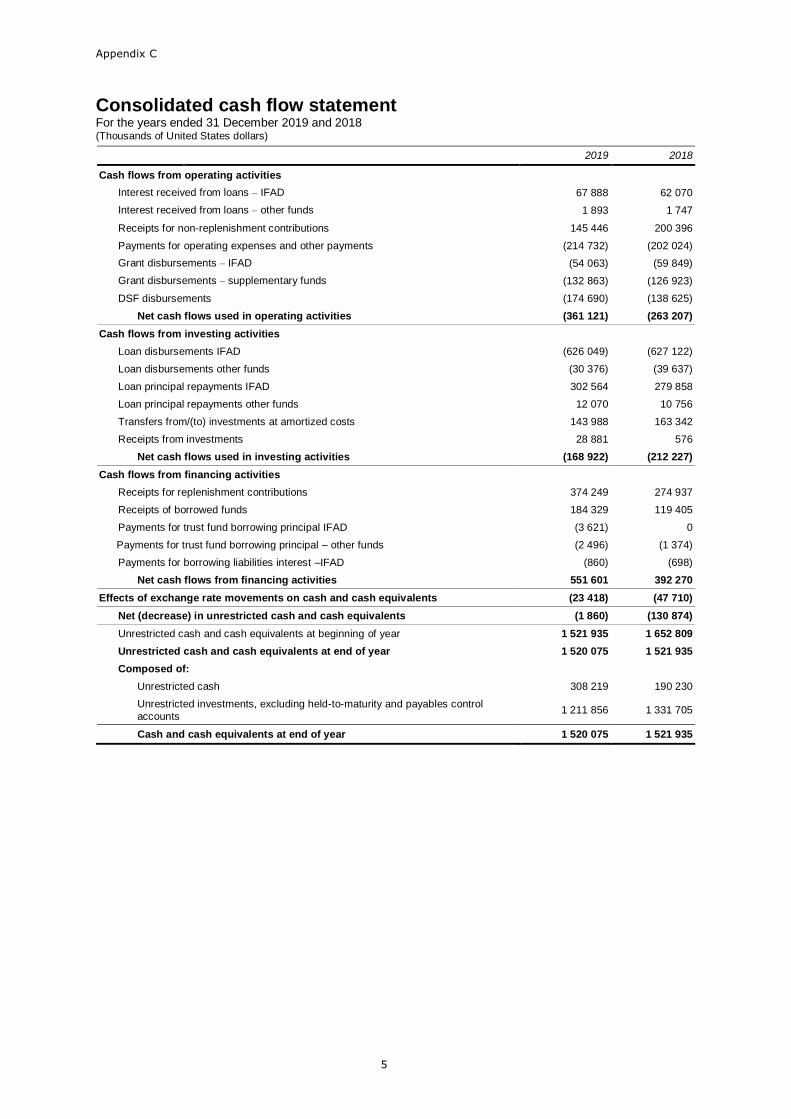
Appendix C
5
Consolidated cash flow statement For the years ended 31 December 2019 and 2018 (Thousands of United States dollars)
2019 2018
Cash flows from operating activities
Interest received from loans – IFAD 67 888 62 070
Interest received from loans – other funds 1 893 1 747
Receipts for non-replenishment contributions 145 446 200 396
Payments for operating expenses and other payments (214 732) (202 024)
Grant disbursements – IFAD (54 063) (59 849)
Grant disbursements – supplementary funds (132 863) (126 923)
DSF disbursements (174 690) (138 625)
Net cash flows used in operating activities (361 121) (263 207)
Cash flows from investing activities
Loan disbursements IFAD (626 049) (627 122)
Loan disbursements other funds (30 376) (39 637)
Loan principal repayments IFAD 302 564 279 858
Loan principal repayments other funds 12 070 10 756
Transfers from/(to) investments at amortized costs 143 988 163 342
Receipts from investments 28 881 576
Net cash flows used in investing activities (168 922) (212 227)
Cash flows from financing activities
Receipts for replenishment contributions 374 249 274 937
Receipts of borrowed funds 184 329 119 405
Payments for trust fund borrowing principal IFAD (3 621) 0
Payments for trust fund borrowing principal – other funds (2 496) (1 374)
Payments for borrowing liabilities interest –IFAD (860) (698)
Net cash flows from financing activities 551 601 392 270
Effects of exchange rate movements on cash and cash equivalents (23 418) (47 710)
Net (decrease) in unrestricted cash and cash equivalents (1 860) (130 874)
Unrestricted cash and cash equivalents at beginning of year 1 521 935 1 652 809
Unrestricted cash and cash equivalents at end of year 1 520 075 1 521 935
Composed of:
Unrestricted cash 308 219 190 230
Unrestricted investments, excluding held-to-maturity and payables control
accounts 1 211 856 1 331 705
Cash and cash equivalents at end of year 1 520 075 1 521 935
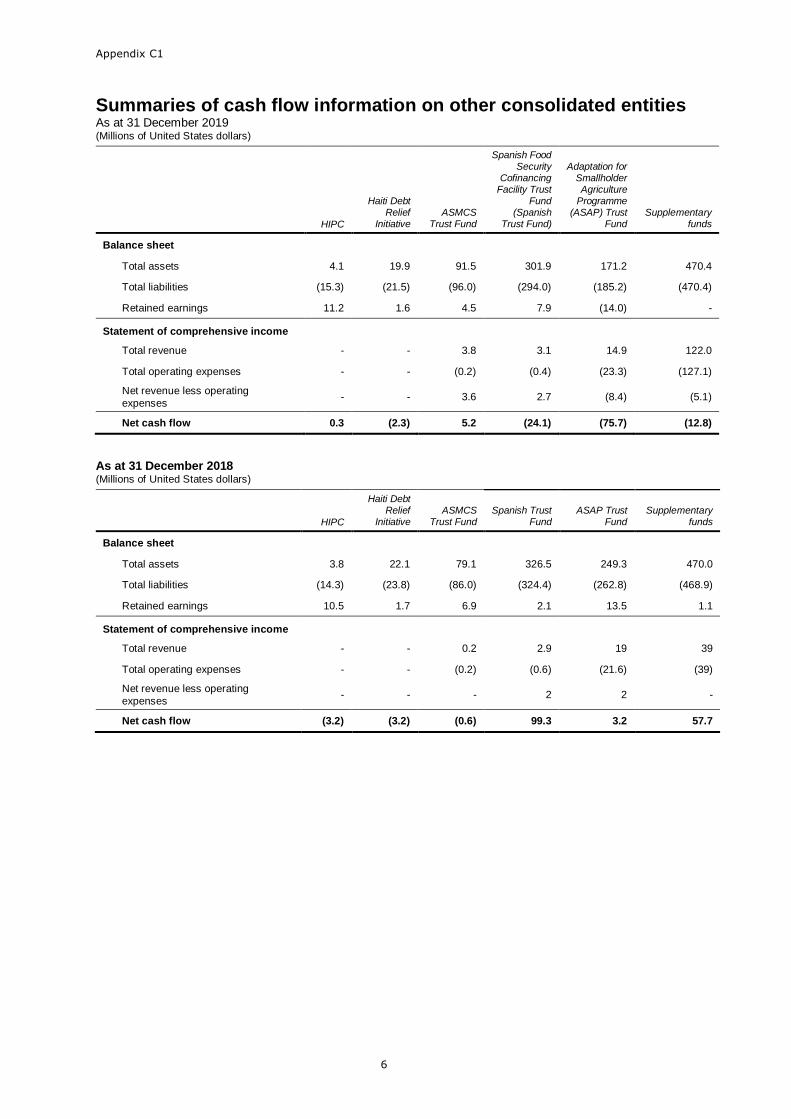
Appendix C1
6
Summaries of cash flow information on other consolidated entities
As at 31 December 2019 (Millions of United States dollars)
HIPC
Haiti Debt Relief
Initiative ASMCS
Trust Fund
Spanish Food Security
Cofinancing Facility Trust
Fund (Spanish
Trust Fund)
Adaptation for Smallholder Agriculture
Programme (ASAP) Trust
Fund Supplementary
funds
Balance sheet
Total assets 4.1 19.9 91.5 301.9 171.2 470.4
Total liabilities (15.3) (21.5) (96.0) (294.0) (185.2) (470.4)
Retained earnings 11.2 1.6 4.5 7.9 (14.0) -
Statement of comprehensive income
Total revenue - - 3.8 3.1 14.9 122.0
Total operating expenses - - (0.2) (0.4) (23.3) (127.1)
Net revenue less operating
expenses - - 3.6 2.7 (8.4) (5.1)
Net cash flow 0.3 (2.3) 5.2 (24.1) (75.7) (12.8)
As at 31 December 2018 (Millions of United States dollars)
HIPC
Haiti Debt Relief
Initiative ASMCS
Trust Fund Spanish Trust
Fund ASAP Trust
Fund Supplementary
funds
Balance sheet
Total assets 3.8 22.1 79.1 326.5 249.3 470.0
Total liabilities (14.3) (23.8) (86.0) (324.4) (262.8) (468.9)
Retained earnings 10.5 1.7 6.9 2.1 13.5 1.1
Statement of comprehensive income
Total revenue - - 0.2 2.9 19 39
Total operating expenses - - (0.2) (0.6) (21.6) (39)
Net revenue less operating
expenses - - - 2 2 -
Net cash flow (3.2) (3.2) (0.6) 99.3 3.2 57.7
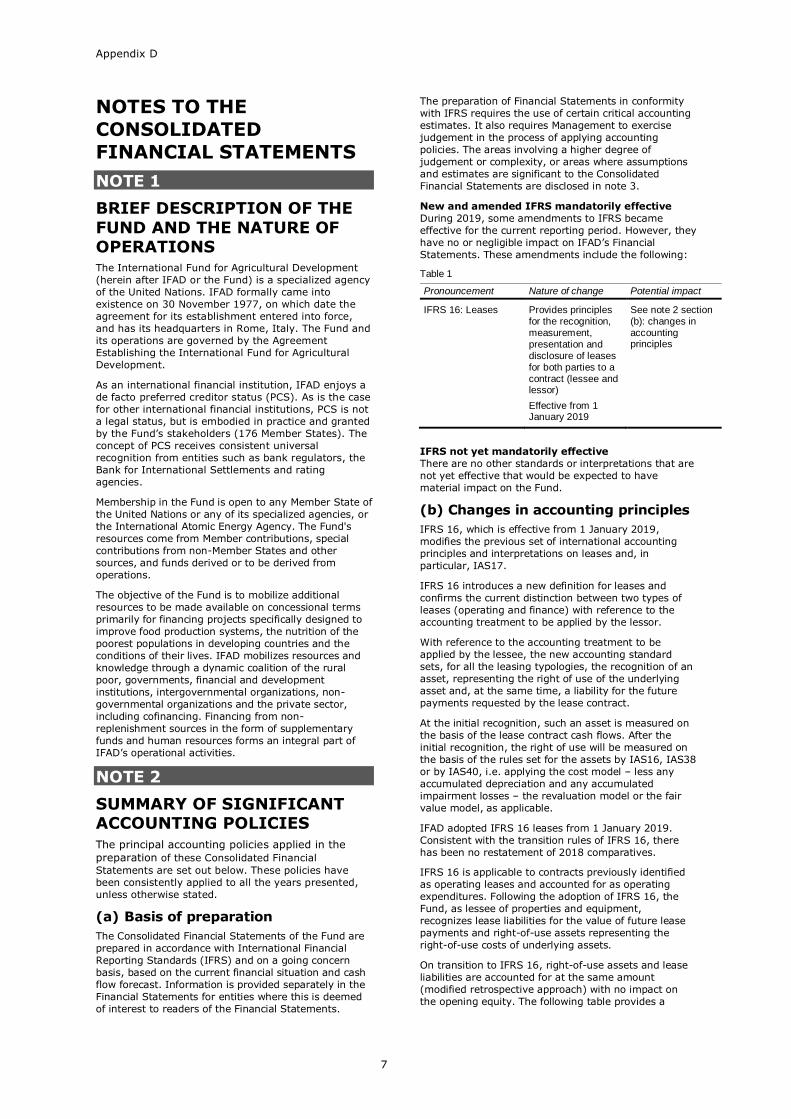
Appendix D
7
NOTES TO THE
CONSOLIDATED
FINANCIAL STATEMENTS
NOTE 1
BRIEF DESCRIPTION OF THE
FUND AND THE NATURE OF OPERATIONS
The International Fund for Agricultural Development
(herein after IFAD or the Fund) is a specialized agency
of the United Nations. IFAD formally came into
existence on 30 November 1977, on which date the
agreement for its establishment entered into force,
and has its headquarters in Rome, Italy. The Fund and
its operations are governed by the Agreement
Establishing the International Fund for Agricultural
Development.
As an international financial institution, IFAD enjoys a
de facto preferred creditor status (PCS). As is the case
for other international financial institutions, PCS is not
a legal status, but is embodied in practice and granted
by the Fund’s stakeholders (176 Member States). The
concept of PCS receives consistent universal
recognition from entities such as bank regulators, the
Bank for International Settlements and rating
agencies.
Membership in the Fund is open to any Member State of
the United Nations or any of its specialized agencies, or
the International Atomic Energy Agency. The Fund's
resources come from Member contributions, special
contributions from non-Member States and other
sources, and funds derived or to be derived from
operations.
The objective of the Fund is to mobilize additional
resources to be made available on concessional terms
primarily for financing projects specifically designed to
improve food production systems, the nutrition of the
poorest populations in developing countries and the
conditions of their lives. IFAD mobilizes resources and
knowledge through a dynamic coalition of the rural
poor, governments, financial and development
institutions, intergovernmental organizations, non-
governmental organizations and the private sector,
including cofinancing. Financing from non-
replenishment sources in the form of supplementary
funds and human resources forms an integral part of
IFAD’s operational activities.
NOTE 2
SUMMARY OF SIGNIFICANT ACCOUNTING POLICIES
The principal accounting policies applied in the
preparation of these Consolidated Financial
Statements are set out below. These policies have
been consistently applied to all the years presented,
unless otherwise stated.
(a) Basis of preparation
The Consolidated Financial Statements of the Fund are
prepared in accordance with International Financial
Reporting Standards (IFRS) and on a going concern
basis, based on the current financial situation and cash
flow forecast. Information is provided separately in the
Financial Statements for entities where this is deemed
of interest to readers of the Financial Statements.
The preparation of Financial Statements in conformity
with IFRS requires the use of certain critical accounting
estimates. It also requires Management to exercise
judgement in the process of applying accounting
policies. The areas involving a higher degree of
judgement or complexity, or areas where assumptions
and estimates are significant to the Consolidated
Financial Statements are disclosed in note 3.
New and amended IFRS mandatorily effective
During 2019, some amendments to IFRS became
effective for the current reporting period. However, they
have no or negligible impact on IFAD’s Financial
Statements. These amendments include the following:
Table 1
Pronouncement Nature of change Potential impact
IFRS 16: Leases Provides principles for the recognition, measurement, presentation and disclosure of leases for both parties to a contract (lessee and lessor)
Effective from 1 January 2019
See note 2 section (b): changes in accounting principles
IFRS not yet mandatorily effective
There are no other standards or interpretations that are
not yet effective that would be expected to have
material impact on the Fund.
(b) Changes in accounting principles
IFRS 16, which is effective from 1 January 2019,
modifies the previous set of international accounting
principles and interpretations on leases and, in
particular, IAS17.
IFRS 16 introduces a new definition for leases and
confirms the current distinction between two types of
leases (operating and finance) with reference to the
accounting treatment to be applied by the lessor.
With reference to the accounting treatment to be
applied by the lessee, the new accounting standard
sets, for all the leasing typologies, the recognition of an
asset, representing the right of use of the underlying
asset and, at the same time, a liability for the future
payments requested by the lease contract.
At the initial recognition, such an asset is measured on
the basis of the lease contract cash flows. After the
initial recognition, the right of use will be measured on
the basis of the rules set for the assets by IAS16, IAS38
or by IAS40, i.e. applying the cost model – less any
accumulated depreciation and any accumulated
impairment losses – the revaluation model or the fair
value model, as applicable.
IFAD adopted IFRS 16 leases from 1 January 2019.
Consistent with the transition rules of IFRS 16, there
has been no restatement of 2018 comparatives.
IFRS 16 is applicable to contracts previously identified
as operating leases and accounted for as operating
expenditures. Following the adoption of IFRS 16, the
Fund, as lessee of properties and equipment,
recognizes lease liabilities for the value of future lease
payments and right-of-use assets representing the
right-of-use costs of underlying assets.
On transition to IFRS 16, right-of-use assets and lease
liabilities are accounted for at the same amount
(modified retrospective approach) with no impact on
the opening equity. The following table provides a
Appendix D
8
summary of the impact of implementing IFRS 16 on the
opening balances:
US$ million Carrying
1 Jan 2019
Changes Restated 1 Jan 2019
Right-of-use assets
-
109.2
109.2
Lease liabilities - (109.2) (109.2)
(c) Area of consolidation
Financing in the form of supplementary funds and other
non-core funding forms an integral part of IFAD’s
operations. The Fund prepares consolidated accounts
that include the transactions and balances for the
following entities:
Special Programme for sub-Saharan African
Countries Affected by Drought and Desertification
(SPA);
IFAD Fund for Gaza and the West Bank (FGWB);
Other supplementary funds including technical
assistance grants, cofinancing, associate
professional officers (APOs), programmatic and
thematic supplementary funds, the Belgian Fund for
Food Security Joint Programme (BFFS.JP) and the
Global Environment Facility (GEF);
IFAD’s Trust Fund for the HIPC Initiative;
IFAD’s ASMCS Trust Fund;
Administrative account for Haiti Debt Relief
Initiative;
Spanish Trust Fund; and
ASAP Trust Fund.
These entities have a direct link with IFAD’s core
activities and are substantially controlled by IFAD. In
line with the underlying agreements and
recommendations establishing these entities, IFAD has
the power to govern the related financial and operating
policies. IFAD is exposed or has rights to the results of
its involvement with these entities, and has the ability
to affect those results through its power over the
components. Accordingly, these entities are
consolidated in IFAD’s Financial Statements. All
transactions and balances among these entities have
been eliminated. Additional financial data for the funds
are provided upon request to meet specific donor
requirements. All entities included in the consolidation
area have a fiscal period corresponding to the solar
year.
Entities housed in IFAD
These entities do not form part of the core activities of
the Fund and IFAD does not have power to govern the
related financial and operating policies. As such, they
are not consolidated as they are not substantially
controlled. As at 31 December 2019, the only entity
hosted by IFAD is the International Land Coalition
(formerly known as the Popular Coalition to Eradicate
Hunger and Poverty).
(d) Investments in private sector initiatives
Since 2018, IFAD has partnered with the European
Union, the Government of Luxembourg and the Alliance
for the Green Revolution in Africa to establish the
Agribusiness Capital Fund (ABC Fund), a private sector
fund that aims to boost investments in small rural
agribusinesses across emerging markets. IFAD
currently has a sponsorship role with no control or
exposure to the results of its sponsorship activity.
(e) Translation and conversion of currencies
Items included in the Consolidated Financial Statements
are measured using the currency of the primary
economic environment in which the entity operates (the
“functional currency”). The Consolidated Financial
Statements are presented in United States dollars,
which is IFAD’s functional and presentation currency.
Foreign currency transactions are translated into the
functional currency using the exchange rates prevailing
at the dates of the transactions. Foreign exchange gains
and losses resulting from the settlement of such
transactions and from the translation at year-end
exchange rates of monetary assets and liabilities
denominated in foreign currencies are recognized in the
net profit or loss of the period in which they arise.
The results and financial position of the entities/funds
consolidated that have a functional currency different
from the presentation currency are translated into the
presentation currency and are reported under other
comprehensive income/loss as follows:
Assets and liabilities expenditures are translated at
the closing rate and revenue and expenditures are
translated at the yearly average rate; and
All resulting exchange differences are recognized as
a separate component of other comprehensive
income.
(f) Measurement of financial assets and liabilities
Financial assets at amortized cost:
A financial asset is classified at “amortized cost” only if
both of the following criteria are met: the objective of
the F’s business model is to hold the asset in order to
collect the contractual cash flows, and the contractual
terms of the financial asset must give rise on specified
dates to cash flows that are only payments of principal
and interest on the principal amount outstanding.
Financial assets at fair value
If either of the two above criteria is not met, the asset
cannot be classified in the amortized cost category and
must be classified at fair value through profit and loss
(FVTPL) or fair value through other comprehensive
income (FVOCI). The FVOCI category is not used by the
Fund. All other financial assets not classified at
amortized cost are classified as FVTPL.
Financial liabilities measured at amortized cost
Financial liabilities measured at amortized cost comprise
financial instruments (other than liabilities held for
trading or those designated at fair value) representing
the various forms of third-party funding.
These financial liabilities are recognized at settlement
date initially at fair value, which is normally the
consideration received less transaction costs directly
attributable to the financial liability. Subsequently these
instruments are measured at amortized cost using the
effective interest method.
(g) Equity
This comprises the following three elements:
(i) contributions (equity); (ii) General Reserve; and
(iii) retained earnings.
(i) Contributions (equity)
Background to contributions
The contributions to the Fund by each Member when
due are payable in freely convertible currencies, except
in the case of Category III Members up to the end of
the Third Replenishment period, which were permitted
Appendix D
9
to pay contributions in their own currency whether or
not it was freely convertible. Each contribution is to be
made in cash or, to the extent that any part of the
contribution is not needed immediately by the Fund in
its operations, may be paid in the form of non-
negotiable, irrevocable, non-interest-bearing
promissory notes or obligations payable on demand.
A contribution to IFAD replenishment resources is
recorded in full as equity and as receivable when a
Member deposits an instrument of contribution, except
for qualified instruments of contribution, which are
subject to national appropriation measures and which
will be proportionally reduced upon fulfilment of those
conditions. Amounts receivable from Member States as
contributions and other receivables including
promissory notes, have been initially recognized in the
balance sheet at their FVTPL in accordance with IFRS 9.
Concessional partner loans (CPLs) have been introduced
with the adoption of the IFAD11 resolution. Borrowing
terms of CPLs are concessional: the maturities are either
25 or 40 years with a grace period of 5 years for a 25-year
loan and 10 years for a 40-year loan. Voting rights are
allocated to Member States that provide CPLs in an amount proportionate to the grant element embedded in such
loans. Proceeds received as CPLs consists of two
components: a borrowing component and an equity
component. The equity component is the derived grant
element, computed on the basis of the loan terms and the
discount rate agreed over the replenishment consultations.
The grant element is recorded as equity.
Allowance for contribution impairment losses
The Fund has established a policy on provisions against
overdue Member States’ contributions while still
maintaining PCS as follows:
If there is evidence that an identified loan or receivable
asset is impaired, a specific provision for impairment is
recognized. Impairment is quantified as the difference
between the carrying amount and the collectable
amount. The criteria used to determine whether there is
objective evidence of an impairment loss include:
Delinquency in contractual payments of principal
and interest;
Cash flow difficulties experienced by the borrower;
Breach in contracts or conditions; and
Initiation of bankruptcy proceeding.
In such cases, provisions will be set up:
Whenever a payment of an instalment against an
instrument of contribution or a payment of a
drawdown against a promissory note becomes
overdue by 24 months, a provision will be made
equal to the value of all overdue contribution
payments or the value of all unpaid drawdowns on
the promissory note(s) outstanding.
Whenever a payment of an instalment against an
instrument of contribution or a payment of a
drawdown against a promissory note becomes
overdue by 48 months or more, a provision will be
made against the total value of the unpaid
contributions of the Member or the total value of
the promissory note(s) of that Member related to
the particular funding period (i.e. a replenishment
period).
The end of the financial year is currently used for
determining the 24- and 48-month periods.
(ii) General Reserve
The General Reserve may only be used for the purposes
authorized by the Governing Council and was
established in recognition of the need to cover the
Fund's potential over-commitment risk as a result of
exchange rate fluctuations, possible delinquencies in
loan service payments or in the recovery of amounts
due to the Fund from the investment of its liquid assets.
It is also intended to cover the risk of over-commitment
as a result of a decrease in the value of assets caused
by fluctuations in the market value of investments.
As per Financial Regulation XIII, “annual transfers from
the accumulated surplus to the General Reserve shall
be determined by the Executive Board after taking into
account the Fund’s financial position in the context of
the review/approval of yearly audited financial
statements of the Fund”.
(iii) Retained earnings
Retained earnings represent the cumulative excess of
revenue over expenses inclusive of the effects of
changes in foreign exchange rates.
(h) Loans
(i) Background to loans
IFAD loans are made only to developing states that are
Members of the Fund or to intergovernmental
organizations in which such Members participate. In the
latter case, the Fund may require governmental or
other guarantees. A loan enters into force on the date
that both the Fund and the borrower have signed it, unless the financing agreement states that it is subject
to ratification. In this case, the financing agreement
shall enter into force on the date the Fund receives an
instrument of ratification. All IFAD loans are approved
and loan repayments and interest are payable in the
currency specified in the loan agreement. Loans
approved are disbursed to borrowers in accordance with
the provisions of the loan agreement.
Currently, the lending terms of the Fund are as follows:
(a) Special loans on highly concessional terms shall be
free of interest but bear a service charge of
0.75 per cent per annum and have a maturity period
of 40 years, including a grace period of 10 years;
(b) loans on hardened terms shall be free of interest
but bear a service charge of 0.75 per cent per annum
and have a maturity period of 20 years, including a
grace period of 10 years; (c) loans on blend terms
shall be free of interest but bear a service charge of
0.75 per cent per annum plus a spread and have a
maturity period of 20 years, including a grace period
of 10 years (these are applicable from 2013 onwards);
(d) loans on intermediate terms shall have a rate of
interest per annum equivalent to 50 per cent of the
variable reference interest rate, as determined
annually by the Executive Board, and a maturity
period of 20 years, including a grace period of
5 years; (e) loans on ordinary terms shall have a rate
of interest per annum equivalent to 100 per cent of
the variable reference interest rate, as determined
annually by the Executive Board, and a maturity
period of 15 to 18 years, including a grace period of
3 years; and (f) no commitment charge shall be levied
on any loan.
(ii) Loans to non-Member States
At its twenty-first session in February 1998, the
Governing Council adopted resolution 107/XXI
approving the establishment of a fund for the specific
purpose of lending to Gaza and the West Bank (FGWB).
The application of article 7, section 1(b), of the
Agreement Establishing IFAD was waived for this
purpose. Financial assistance, including loans, is
transferred to the FGWB by decision of the Executive Board and the repayment thereof, if applicable, is made
directly to IFAD’s regular resources.
Appendix D
10
(iii) Heavily Indebted Poor Countries (HIPC)
Initiative
IFAD participates in the International Monetary
Fund/World Bank original and enhanced HIPC Initiative
as an element of IFAD’s broader policy framework for
managing operational partnerships with countries that
face the risk of having arrears with IFAD in the future
because of their debt-service burden. Accordingly, IFAD
provides debt relief by forgiving a portion of an eligible
country’s debt-service obligations as they become due.
In 1998, IFAD established a Trust Fund for the HIPC
Initiative. This fund receives resources from IFAD and
from other sources, specifically dedicated as
compensation to the loan-fund account(s) for agreed
reductions in loan repayments under the Initiative.
Amounts of debt service forgiven are expected to be
reimbursed by the Trust Fund on a pay-as-you-go basis
(i.e. relief is when debt-service obligations become due)
to the extent that resources are available in the fund.
The Executive Board approves each country’s debt relief
in net present value terms. The estimated nominal
equivalent of the principal components of the debt relief
is recorded under the accumulated allowance for the
HIPC Initiative, and as a charge to the HIPC Initiative
expenses in the statement of comprehensive income.
The assumptions underlying these estimates are
subject to periodic revision. Significant judgement has
been used in the computation of the estimated value of
allowances for the HIPC Initiative.
The charge is offset and the accumulated allowance
reduced by income received from external donors to the
extent that such resources are available. The
accumulated allowance for the HIPC Initiative is
reduced when debt relief is provided by the Trust Fund.
In November 2006, IFAD was granted access to the
core resources of the World Bank HIPC Trust Fund, in
order to assist in financing the outstanding debt relief
once countries reach completion point. Financing is
provided based on net present value calculation of their
future debt relief flows.
(iv) Measurement of loans
Loans are initially recognized at fair value on day one
(based on disbursement to the borrower) and
subsequently measured at amortized cost using the
effective interest method. The fair value is calculated
using an enhanced fair value tool by applying discount
rates to the estimated future cash flows on a loan-by-
loan basis in the currency in which the loans are
denominated.
(v) Accumulated allowance for impairment
losses
IFAD has established the forward-looking expected
credit loss (ECL) methodology to calculate an allowance
for loan impairment. The methodology embeds PCS
features. It is applied to financial assets recorded at amortized cost such as loans and debt securities. The
Fund is required to recognize an allowance for either 12
months or lifetime ECLs, depending on whether there
has been a significant increase in credit risk since initial
recognition.
ECL reflects a probability-weighted outcome, time value
of money and the best available forward-looking
information through the inclusion of macroeconomic
factors.
ECL comprises a three-stage model based on changes
in credit quality since initial recognition/origination of
the financial instrument. Origination is the date on
which disbursement conditions have been met.
Impairments are reported based on either 12-month or
lifetime ECLs, depending on the stage allocation of the
financial instrument. The stage allocation also
determines if interest income for the financial
instrument is reported on the gross carrying amount, as
for stage 1 and 2, or the net of impairment allowance,
as for stage 3.
The staging model relies on a relative assessment of
credit risk (i.e. a loan with the same characteristics
could be included in stage 1 or stage 2, depending on
its credit risk at origination). As a result, the same
counterpart could have loans classified in different
stages.
Stage 1 includes “performing” financial instruments
that have not had a significant deterioration in credit
quality since initial recognition or have a low credit risk
at reporting date. For these instruments, the ECL is a
probability-weighted result of default events that are
possible within the next 12 months after the reporting
date. Low-risk assets (investment grade) are classified
as stage 1.
Stage 2 includes “under-performing” financial
instruments that have had a significant increase in
credit risk since initial recognition, but for which there is
no objective evidence of impairment. For these assets, the lifetime ECL results from all possible default events
over the expected lifetime, weighted with the
probability of default (PD). Interest income is computed
on the gross carrying amount.
Stage 3 includes “non-performing” financial
instruments when there is objective evidence of
impairment/default at the reporting date. For these
instruments, lifetime ECLs are recognized. According to
IFRS 9, interest is computed on the net carrying
amount. Considering that the Fund fully provides for the
interest accrued, the calculation is determined on the
gross basis.
Movements between stages depend on the evolution of
the financial instrument’s credit risk from initial
recognition to reporting date. Movements, whether
improvements or deterioration, may therefore cause
volatility in the impairment allowance balances.
IFAD has adopted some rebuttable presumptions
associated with days past due. In line with the debt
servicing procedures, financial instruments overdue by
more than 75 days are classified at stage 2 while
financial instruments overdue by more than 180 days
are classified at stage 3.
The carrying amount of the financial instrument is
reduced through an allowance account and the loss
amount is recognized in the income statement.
Interest and service charges for financial instruments
classified at stages 1 and 2 are recognized following the
accrual basis, while for financial instruments classified
at stage 3, interest and service charges are recognized
as income only when actually received.
(i) Investments
(i) Classification and Measurement
The Fund’s investments are classified at FVTPL or at
amortized cost. Investments are classified at amortized
cost when they belong to a portfolio managed by the
Fund based on a business model to hold those
securities until their maturity, by collecting solely
maturing interest and principal in line with the
contractual characteristics. If the above conditions are
not met, the Fund carries investments at FVTPL. Fair
value is determined in accordance with the hierarchy
set in note 3. For securities at FVTPL, both realized and
unrealized security gains and losses are included in
income from investments as they arise. Both realized
and unrealized exchange gains and losses are included
in the account for movements in foreign exchange rates
Appendix D
11
as they arise. All purchases and sales of investments
are recognized on the trade date. Derivatives are
initially recognized at fair value on the date a derivative
contract is entered into and are subsequently
remeasured at their FVTPL. The majority of derivatives
are used as hedging instruments (although they do not
qualify for hedge accounting) and therefore changes in
the fair value of these derivative instruments are
recognized immediately in the statement of
comprehensive income.
(ii) Accumulated allowance for securities held
at amortized cost
Securities held at amortized cost are subject to an
impairment allowance calculated based on an ECL
methodology similar to the accounting policy
established for loans. A three-stage model for
impairment is applied based on changes in the credit
quality of the financial instrument since origination. The
origination of the financial instrument is the date on
which the instrument was purchased by the Fund.
Considering the Investment Policy requirements
adopted by the Fund, the investment portfolio held at
amortized cost is classified at stage 1 since the financial
instruments are investment grade, and therefore low
credit risk instruments.
(j) Cash and cash equivalents
Cash and cash equivalents comprise cash in hand and
deposits held at call with banks. They also include
investments that are readily convertible at the balance
sheet date. Net investment payables and investments
at amortized cost are excluded from readily convertible
investments for cash flow purposes.
(k) Contributions (non-equity)
Contributions to non-replenishment resources are
recorded as revenues in the period in which the
related expenses occur. For project cofinancing
activities, contributions received are recorded as
revenues in the period in which the related grant
becomes effective. Contributions relating to
programmatic grants, APOs, BFFS.JP and other
supplementary funds are recorded in the balance
sheet as deferred revenues and are recorded as
revenue by the amount of project-related expenses in
the statement of comprehensive income. Where
specified in the donor agreements, contributions
received (including management fees) and interest
earned thereon, for which no direct expenses have yet
been incurred, are deferred until future periods to be
matched against the related costs. This is consistent
with the accounting principle adopted with regard to
IFAD’s combined supplementary funds and serves to
present the underlying nature of these balances more
clearly. A list of such contributions can be found in
appendix E.
Individual donors provided human resources (in the
form of APOs) to assist IFAD in its activities. The
contributions received from donors are recorded as
revenues and the related costs are included in staff
costs.
(l) Grants
The Agreement Establishing IFAD empowers the Fund
to provide grants to its Member States, or to
intergovernmental organizations in which its Members
participate, on such terms as the Fund deems
appropriate.
Grants are recorded as expenses on disbursable date
for the approved amount and as a liability for
undisbursed amounts at fair value in accordance with
IFRS 9. Following the approval by the Executive Board
of the revisions to the General Conditions for
Agricultural Development Financing (April 2009), grants
become disbursable when a recipient has the right to
incur eligible expenditure.
Cancellations of undisbursed balances are recognized as
an offset to the expense in the period in which they
occur.
(m) Debt Sustainability Framework
Under the DSF, countries eligible for highly concessional
lending receive financial assistance on a grant rather
than a loan basis. Principal amounts forgone by IFAD
are expected to be compensated on a pay-as-you-go
basis (according to the underlying loan amortization
schedule) by the Member States, while the service
charge is not meant to be compensated. In line with the
accounting policy on contributions-equity DSF principal
compensation, contributions will be recorded in full as
equity and as receivable when a Member deposits an
instrument of contribution, except for qualified
instruments of contribution, which are subject to
national appropriation measures that will be
proportionally reduced upon fulfilment of those
conditions. Amounts receivable from Member States as
contributions and other receivables, including
promissory notes, have been initially recognized in the
balance sheet at their FVTPL in accordance with IFRS 9.
Principal compensation will be negotiated during future
replenishment consultations (see note 28(b),
Contingent assets). DSF financing is subject to IFAD’s
General Conditions for Agricultural Development
Financing. DSF financing is implemented over an
extended time-horizon and recognized as expenditure
in the statement of comprehensive income in the period
in which conditions for the release of funds to the
recipient are met.
(n) Borrowing
Financial liabilities are accounted for at amortized cost.
IFAD has signed several borrowing agreements with
sovereign institutions at variable rate debt. Maturity could
vary from 20 years to 40 years. IFAD may not prepay
loans outstanding without incurring penalties. Interest
rates are variable (linked to EURIBOR plus a spread).
Borrowing activities are subject to the Sovereign Borrowing
Framework as approved by the Executive Board in April
2015 (EB 2015/114/R.17/Rev.1). Borrowed funds are
deployed in accordance with IFAD’s policies and
procedures (with the exception of DSF countries).
The Fund’s borrowings include loans from Member States
in the form of CPLs. These borrowings are carried and
reported at amortized cost.
(o) Employee schemes
Pension obligations
IFAD participates in the United Nations Joint Staff
Pension Fund (UNJSPF), which was established by the
United Nations General Assembly to provide retirement,
death, disability and related benefits. The Pension Fund
is a funded, defined benefit plan. The financial
obligation of the Fund to the UNJSPF consists of its
mandated contribution, at the rate established by the
United Nations General Assembly, together with any
share of any actuarial deficiency payments under article
26 of the regulations of the Pension Fund. Such
deficiency payments are only payable if and when the
United Nations General Assembly has invoked the provision of article 26, following determination that
there is a requirement for deficiency payments based
on an assessment of the actuarial sufficiency of the
Pension Fund as of the valuation date. At the time of
this report, the United Nations General Assembly has
not invoked this provision.
Appendix D
12
The actuarial method adopted for the UNJSPF is the
Open Group Aggregate method. The cost of providing
pensions is charged to the statement of comprehensive
income so as to spread the regular cost over the service
lives of employees, in accordance with the advice of the
actuaries, who carry out a full valuation of the period
plan every two years. The plan exposes participating
organizations to actuarial risks associated with the
current and former employees of other organizations,
with the result that there is no consistent and reliable
basis for allocating the obligation, plan assets and costs
to individual organizations participating in the plan.
IFAD, like other participating organizations, is not in a
position to identify its share of the underlying financial
position and performance of the plan with sufficient
reliability for accounting purposes.
After-Service Medical Coverage Scheme
IFAD participates in a multi-employer ASMCS
administered by the Food and Agriculture Organization
of the United Nations (FAO) for staff receiving a United
Nations pension and eligible former staff on a shared-
cost basis. The ASMCS operates on a pay-as-you-go
basis, meeting annual costs out of annual budgets and
staff contributions. Since 2006, an independent
valuation is performed on an annual basis.
In accordance with IAS 19R, IFAD has set up a trust
fund into which it transfers the funding necessary to
cover the actuarial liability. Service costs are recognized
as operating expenditure. The net balance between
interest costs and expected return on plan assets is
recognized in net profit or loss, while remeasurements
on assets and liabilities are recognized as the net
position in other comprehensive income.
(p) Accruals for long-service entitlements
Employee entitlements to annual leave and long-service
entitlements are recognized when they accrue to
employees. An accrual is made for the estimated
liability for annual leave and long-service separation
entitlements as a result of services rendered by
employees up to the balance sheet date.
(q) Taxation As a specialized agency of the United Nations, IFAD
enjoys privileged tax-exemption status under the
Convention on Privileges and Immunities of Specialized
United Nations Agencies of 1947 and the Agreement
between the Italian Republic and IFAD regarding the
provisional headquarters of IFAD. Taxation levied where
this exemption has not yet been obtained is deducted
directly from related investment income.
(r) Revenue recognition Service charge income and income from other sources
are recognized as revenue in the period in which the
related expenses are incurred (goods delivered or
services provided).
(s) Tangible and intangible assets
Fixed assets
Major purchases of property, furniture and equipment
are capitalized. Depreciation is charged on a straight-
line basis over the estimated useful economic life of
each item purchased as set out below:
Permanent equipment fixtures
and fittings 10 years
Furniture 5 years
Office equipment 4 years
Vehicles 5 years
Right-of-use assets
The Fund recognizes right-of-use assets at the
commencement date of the lease (i.e. the date the
underlying asset is available for use). Right-of-use
assets are measured at cost, less any accumulated
depreciation and impairment losses, and adjusted for
any remeasurement of lease liabilities. The cost of
right-of-use assets includes the amount of lease
liabilities recognized, initial direct costs incurred, and
lease payments made at, or before, the commencement
date less any lease incentives received. Right-of-use
assets are depreciated on a straight-line basis over the
lease term. In order to determine the lease term, the
Fund considers the non-cancellable period established
in the contract, in which the lessee is entitled to use the
underlying asset taking also into account potential
renewal options if the lessee is reasonably certain to renew. In particular, with reference to those contracts
that allow the lessee to tacitly renew the lease contract
after a first set of years, the lease term is determined
taking into account factors such as the length of the
first period, the existence of dismissal plans for the
asset leased and any other circumstance indicating a
reasonable certainty of the renewal. It should be noted
that, as allowed by the standard, IFAD has decided not
to recognize any right-of-use asset or lease liability with
reference to the following lease contracts:
short-term leases, lower than 12 months; and
low-value assets leases. For this purpose an asset
is considered as “low value” when its fair value as
new is equal to or lower than US$5000.
Lease liabilities
At the commencement date of the lease, lease liabilities
are measured at the present value of the remaining
lease payments, discounted at IFAD’s average cost of
funding.
Intangible assets
Software development costs are capitalized as
intangible assets where future economic benefits are
expected to flow to the organization. Depreciation is
calculated on a straight-line basis over the estimated
useful life of the software (four to 10 years). Leasehold
improvements are capitalized as assets. Depreciation is
calculated on a straight-line basis over their estimated
useful life (not exceeding rental period of IFAD
headquarters).
Appendix D
13
NOTE 3
CRITICAL ACCOUNTING ESTIMATES AND JUDGEMENTS
(a) Critical accounting estimates and assumptions
Estimates and judgements are continually evaluated
and are based on historical experience and other
factors, including expectations of future events that are
believed to be reasonable under the circumstances. The
resulting accounting estimates will, by definition, rarely
equal the related actual results. The estimates and
assumptions that have a significant risk of causing a
material adjustment to the carrying amounts of assets
and liabilities within the next financial year are outlined
below:
Fair value and amortized costs of loans,
undisbursed grants, deferred revenues, promissory notes and contributions
receivable.
For the details about the models applied for fair value
calculation of loans, reference should be made to
note 2.
The fair value of financial instruments that are not
traded in an active market is determined by considering
quoted prices for similar assets in active markets,
quoted prices for identical assets in non-active markets
or valuation techniques.
Financial assets and liabilities measured at
fair value on the balance sheet are
categorized as follows:
Level 1. Financial assets and liabilities whose values
are based on unadjusted quoted prices for identical
assets or liabilities in active markets.
Level 2. Financial assets and liabilities whose values
are based on quoted prices for similar assets or
liabilities, or pricing models for which all significant
inputs are observable, either directly or indirectly, for
substantially the full term of the asset or liability.
Level 3. Financial assets or liabilities whose values are
based on prices or valuation techniques requiring inputs
that are both unobservable and significant to the overall
fair value measurement.
(b) Critical judgement in applying accounting policies
Fair value accounting
Fair value accounting is required in order for IFAD to
comply with IFRS. Reconciliations between
measurement at fair value and amortized cost using
the effective interest method and nominal values have
been provided with respect to loans, receivables,
undisbursed grants and deferred revenues.
Allowance for impairment losses: Impairment
Methodology
Governance
IFAD calculates and reports its impairments based on
ECL. The ECL framework is based on the requirements
of IFRS 9’s financial instruments section and validated
by IFAD's Accounting and Controller's Division and Risk
Management Unit. The impairment allowances and ECL
methodology have been approved by the Associate
Vice-President Chief Financial Officer and Chief
Controller, Financial Operations Department.
Three-stage model
IFAD recognizes a loss allowance for ECL on financial
instruments measured at amortized cost and for loan
commitments. The ECL comprises a three-stage model
based on changes in the credit quality since initial
recognition as described in note 2h(v) above.
Impairments are reported based on either 12-month or
lifetime ECL, depending on the stage allocation of the
financial instrument. The stage allocation also
determines if interest income for the financial
instrument is reported on the gross carrying amount or
the net of impairment allowance.
In order to determine whether there has been a significant increase in the credit risk since origination –
and therefore transition to or from stage 2 – a
combination of quantitative and qualitative risk metrics
are employed.
The Fund has established an internal rating
methodology by leveraging public ratings available in
the market and by calculating proxies derived from
macroeconomic conditions (income level and level of
debt distress) and geographical area.
A loan’s migration across the Fund's internal credit
rating scale is monitored from the instrument’s
origination date to the reporting date. Following a significant deterioration in its counterparty's
creditworthiness, the loan is classified at stage 2.
Depending on qualitative assessments, loans may be
placed on a watch list and transitioned to stage 2.
Inputs
The ECL calculation is performed at the level of
individual financial instruments. The main components
comprise PD, loss given default, exposure at default
and discount factor. The model is forward-looking:
current and future macroeconomic conditions are
incorporated into the model through macro-financial
scenarios. A number of critical accounting estimates
and judgements are also factored into the model.
Probability of default (PD)
The Fund uses forward-looking point-in-time (PIT) PD
rates to calculate ECL. The PIT PD rates are derived
from through-the-cycle (TTC) PD rates adjusted for
projected macroeconomic conditions.
TTC PD rates express the likelihood of a default based
on long-term credit risk trend rates. TTC PD rates are
based on PDs associated to external ratings and are
calibrated to reflect IFAD's default experience and PCS.
On a yearly basis, TTC PD is reviewed based on IFAD's
loss experience.
The cumulative TTC PD rates used in 2019 are set out
by internal rating grade according to the methodology
detailed below:
Each instrument in the Fund’s portfolio has an internal
PD associated with it. To calculate ECLs for both stage 1
and stage 2 instruments, a default probability has been
retrieved from the PD embedded in the official
observable ratings calibrated to the Fund’s experience
based on IFAD-specific historical default data.
For unrated exposures, a methodology has been
developed starting from the rated portfolio and
calculating proxies based on indicators such as income
level, region and level of debt distress. For financial
instruments at stage 3, the PD has been set at 100 per
cent.
Loss given default (LGD) is the magnitude of the
likely loss if a default would occur. An LGD is assigned
to individual instruments, indicating how much the Fund
expects to lose on each facility if the borrower defaults.
For financial instruments at stages 1 and 2 the LGD has
Appendix D
14
been determined in relation to the sovereign sector and
calibrated in order to benefit from the Fund’s recovery
experience and PCS. For financial instruments at stage
3, the LGD has been informed by IFAD’s historical data
as well as the experience of other multilateral
development institutions.
Exposure at default (EAD) represents the expected
exposure in the event of a default. It is measured from
discounted contractual cash flows. The discount factor is
the contractual effective interest rate of the financial
instrument since IFAD’s lending terms currently do not
foresee any additional charge (i.e. commitment fee).
Since EAD is modelled at an individual instrument level,
all future expected cash flows, including disbursements,
cancellations, prepayments and interest, are
considered. EAD combines actual and contractual cash
flows, and models future disbursements and
repayments based on the Fund’s own experience.
Macroeconomic scenarios. Unlike the incurred loss
model, the IFRS 9 impairment methodology is forward-
looking. The starting point is IFAD’s view of current and
future macroeconomic conditions, and the credit
environment. IFAD considers a range of outcomes in a probability-weighted manner. The purpose is to capture
possible non-linear behaviour in the dependence of the
ECL on economic conditions. Forward-looking
macroeconomic simulations consist of neutral, positive
and pessimistic scenarios. Each scenario is assigned a
probability of occurrence based on expert judgement
and best practices. The probabilities assigned to the
pessimistic and optimistic scenarios indicate either a
balance or skew in either direction in order to capture
the perceived distribution of risks in a forward-looking
manner.
Based on expert judgement, Management may adopt
temporary adjustments to the model-based ECL
impairment allowance in order to reflect additional
factors that are not explicitly incorporated into the
modelling of ECL or the credit risk ratings
(e.g. significant scenarios or events representative of
the Fund’s peculiar experience).
NOTE 4
CASH AND INVESTMENT BALANCES
Analysis of balances (consolidated)
Table 1 As at 31 December
US$ thousands
2019 2018
Unrestricted cash 308 219 190 230
Cash subject to restriction 90 92
Subtotal cash 308 309 190 322
Unrestricted investments at fair value
1 212 921 1 331 552
Investments at amortized cost - 143 998
Investments subject to restriction 249 278
Subtotal investments 1 213 170 1 475 828
Subtotal cash and investments 1 521 479 1 666 150
Investments impairment allowance - (30)
Total cash and investments 1 521 479 1 666 120
The composition of the portfolio by entity was as
follows:
Table 2 As at 31 December
US$ thousands
Entity 2019 2018
IFAD 1 003 921 1 039 298
ASMCS Trust Fund 81 381 76 172
HIPC Trust Fund 4 139 3 790
Supplementary funds 174 944 187 749
Spanish Trust Fund 77 025 101 091
Haiti Debt Relief Initiative 18 787 21 063
ASAP Trust Fund 161 282 236 987
Total cash and investments 1 521 479 1 666 150
(a) Cash and investments subject to restriction
In accordance with the Agreement Establishing IFAD,
the amounts paid into the Fund by the then-
Category III Member States in their respective
currencies on account of their initial or additional
contributions are subject to restriction in usage.
(b) Composition of the investment portfolio by instrument (consolidated)
As at 31 December 2019, cash and investments,
including payables for investment purchased and
receivables, amounted to US$1,521.5 million
(2018 – US$1,661.3 million) comprised of the following
instruments:
Table 3
US$ thousands
2019 2018
Cash 308 309 190 322
Fixed-income instruments 1 208 819 1 400 298
Unrealized (loss)/gain on forward contracts
1 624 (198)
Time deposits and other obligations of banks
4 449 76 525
Unrealized (loss)/gain on futures 399 (201)
Unrealized (loss)/gain on swaps (2 121) (596)
Total cash and investments 1 521 479 1 666 150
Receivables for investments sold and taxes receivable 14 585 16 052
Payables for investments purchased (18 137) (20 900)
Total investment portfolio 1 517 927 1 661 302
As at 31 December 2019 the Fund did not hold any
investment portfolios at amortized cost (US$144 million
as at 31 December 2018 ).
Appendix D
15
(c) Composition of the investment portfolio by currency (consolidated)
The currency composition of cash and investments as at
31 December was as follows:
Table 4
US$ thousands
Currency 2019 2018
Chinese renminbi 18 132 32 093
Euro 814 955 840 402
Japanese yen* (7 107) 21 003
Pound sterling* (64 264) 29 749
United States dollar 756 211 738 055
Total cash and investment portfolio 1 517 927 1 661 302
* This balance includes open positions on foreign exchange forward
contracts offset by open positions in United States dollars for the equivalent amount.
(d) Composition of the investment portfolio by maturity (consolidated)
The composition of cash and investments by maturity
as at 31 December was as follows:
Table 5
US$ thousands
2019 2018
Due in one year or less 622 426 624 405
Due after one year
through five years 820 817 906 660
Due from five to 10 years 74 684 123 123
Due after 10 years - 7 114
Total cash and investment portfolio 1 517 927 1 661 302
The average life to maturity of the fixed-income
investments included in the consolidated investment
portfolio at 31 December 2019 was 22 months
(2018 – 27 months).
(e) Financial risk management
IFAD’s investment activities are exposed to a variety of financial risks: market risk, credit risk, currency risk,
custodial risk and liquidity risk, as well as capital risk as
a going concern which, however, is limited to the
investment portfolio.
(f) Market risk
The actual weights and amounts of each asset class
within the overall portfolio, together with the asset
allocation weights as of 31 December 2019 and 2018,
are shown in tables 6 and 7. Disclosures relate to
IFAD-only accounts for the net asset value.
Table 6
2019 Actual allocation
Asset class % US$
millions
Cash 16.4 165.0
Swaps (0.2) (1.8)
Time deposit - -
Global government bonds/agencies
49.0 492.0
Global credit bonds 34.8 348.7
Total 100.0 1 003.9
Table 7
2018 Actual allocation
Asset class % US$
millions
Cash 5.5 57.2
Swaps - (0.5)
Time deposit - -
Global government bonds/agencies
43.6 452.3
Global credit bonds 50.9 527.8
Total 100.0 1 036.8
The IFAD investment portfolio is split into four
tranches, as follows:
1. Liquidity tranche: Used for immediate cash
disbursements.
2. Buffer tranche: Should the liquidity tranche be
temporarily depleted due to an unforeseen spike in
disbursements, funds in the buffer tranche will be
used to fund these outflows. The size of the
tranche is determined by the parameters of IFAD’s
minimum liquidity requirement (MLR).
3. Surplus tranche: These are funds in addition to
what is required by the MLR and are used to
provide return enhancement.
4. Funding tranche: Borrowed funds, managed
according to an asset liability management
framework.
Table 8 shows IFAD’s investment portfolio net asset
values reclassified based on the tranching approach.
Table 8 2019
Tranche % US$ millions
Liquidity portfolio 13.5 135.4
Buffer portfolio 32.4 324.9
Funding portfolio 54.1 544.1
Hedge portfolio* (0.0) (0.5)
Total 100.0 1 003.9
* The hedge portfolio is shown separately since its derivative positions are established to immunize the entire portfolio for interest rate risk and foreign exchange rate risk.
Asset classes are managed according to investment
guidelines that address a variety of market risks
through restrictions on the eligibility of instruments and
other limitations:
1. Benchmarks and limits on deviations from
benchmarks in terms of tacking error limits;
2. Credit floors (refer to note 4[g], credit risk);
3. Conditional value at risk limitation, which
measures the potential average probable loss
under extreme conditions, providing an indication
of how much value a portfolio could lose over a
forward-looking period; and
4. Duration, which measures the sensitivity of the
market price of a fixed-income investment to a
change in interest rates.
The benchmark indices used for the respective
portfolios are shown in table 9.
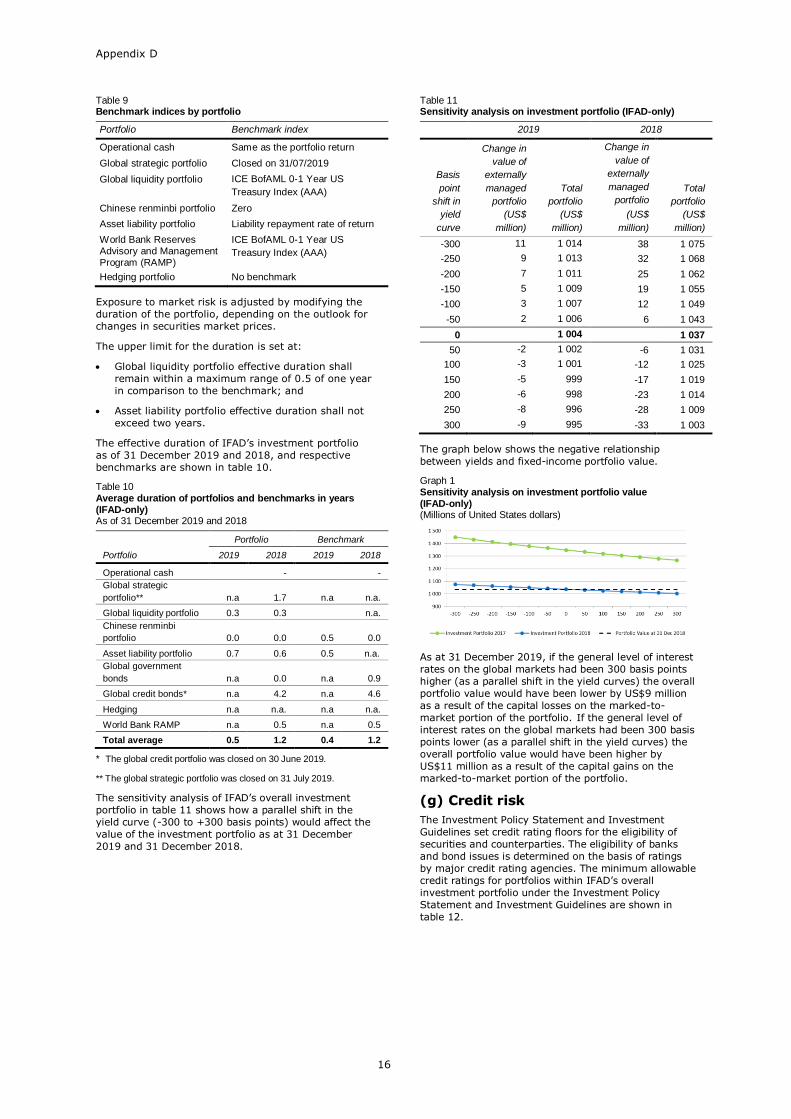
Appendix D
16
Table 9 Benchmark indices by portfolio
Portfolio Benchmark index
Operational cash Same as the portfolio return
Global strategic portfolio Closed on 31/07/2019
Global liquidity portfolio ICE BofAML 0-1 Year US
Treasury Index (AAA)
Chinese renminbi portfolio Zero
Asset liability portfolio Liability repayment rate of return
World Bank Reserves Advisory and Management Program (RAMP)
ICE BofAML 0-1 Year US
Treasury Index (AAA)
Hedging portfolio No benchmark
Exposure to market risk is adjusted by modifying the
duration of the portfolio, depending on the outlook for
changes in securities market prices.
The upper limit for the duration is set at:
Global liquidity portfolio effective duration shall
remain within a maximum range of 0.5 of one year
in comparison to the benchmark; and
Asset liability portfolio effective duration shall not
exceed two years.
The effective duration of IFAD’s investment portfolio
as of 31 December 2019 and 2018, and respective
benchmarks are shown in table 10.
Table 10 Average duration of portfolios and benchmarks in years (IFAD-only) As of 31 December 2019 and 2018
Portfolio Benchmark
Portfolio 2019 2018 2019 2018
Operational cash - -
Global strategic
portfolio** n.a 1.7 n.a n.a.
Global liquidity portfolio 0.3 0.3 n.a.
Chinese renminbi
portfolio 0.0 0.0 0.5 0.0
Asset liability portfolio 0.7 0.6 0.5 n.a.
Global government
bonds n.a 0.0 n.a 0.9
Global credit bonds* n.a 4.2 n.a 4.6
Hedging n.a n.a. n.a n.a.
World Bank RAMP n.a 0.5 n.a 0.5
Total average 0.5 1.2 0.4 1.2
* The global credit portfolio was closed on 30 June 2019.
** The global strategic portfolio was closed on 31 July 2019.
The sensitivity analysis of IFAD’s overall investment
portfolio in table 11 shows how a parallel shift in the
yield curve (-300 to +300 basis points) would affect the
value of the investment portfolio as at 31 December
2019 and 31 December 2018.
Table 11 Sensitivity analysis on investment portfolio (IFAD-only)
2019 2018
Basis
point
shift in
yield
curve
Change in
value of
externally
managed
portfolio
(US$
million)
Total
portfolio
(US$
million)
Change in
value of
externally
managed
portfolio
(US$
million)
Total
portfolio
(US$
million)
-300 11 1 014 38 1 075
-250 9 1 013 32 1 068
-200 7 1 011 25 1 062
-150 5 1 009 19 1 055
-100 3 1 007 12 1 049
-50 2 1 006 6 1 043
0 1 004 1 037
50 -2 1 002 -6 1 031
100 -3 1 001 -12 1 025
150 -5 999 -17 1 019
200 -6 998 -23 1 014
250 -8 996 -28 1 009
300 -9 995 -33 1 003
The graph below shows the negative relationship
between yields and fixed-income portfolio value.
Graph 1 Sensitivity analysis on investment portfolio value (IFAD-only) (Millions of United States dollars)
As at 31 December 2019, if the general level of interest
rates on the global markets had been 300 basis points
higher (as a parallel shift in the yield curves) the overall
portfolio value would have been lower by US$9 million
as a result of the capital losses on the marked-to-
market portion of the portfolio. If the general level of
interest rates on the global markets had been 300 basis
points lower (as a parallel shift in the yield curves) the
overall portfolio value would have been higher by
US$11 million as a result of the capital gains on the
marked-to-market portion of the portfolio.
(g) Credit risk
The Investment Policy Statement and Investment
Guidelines set credit rating floors for the eligibility of
securities and counterparties. The eligibility of banks
and bond issues is determined on the basis of ratings
by major credit rating agencies. The minimum allowable
credit ratings for portfolios within IFAD’s overall
investment portfolio under the Investment Policy
Statement and Investment Guidelines are shown in
table 12.
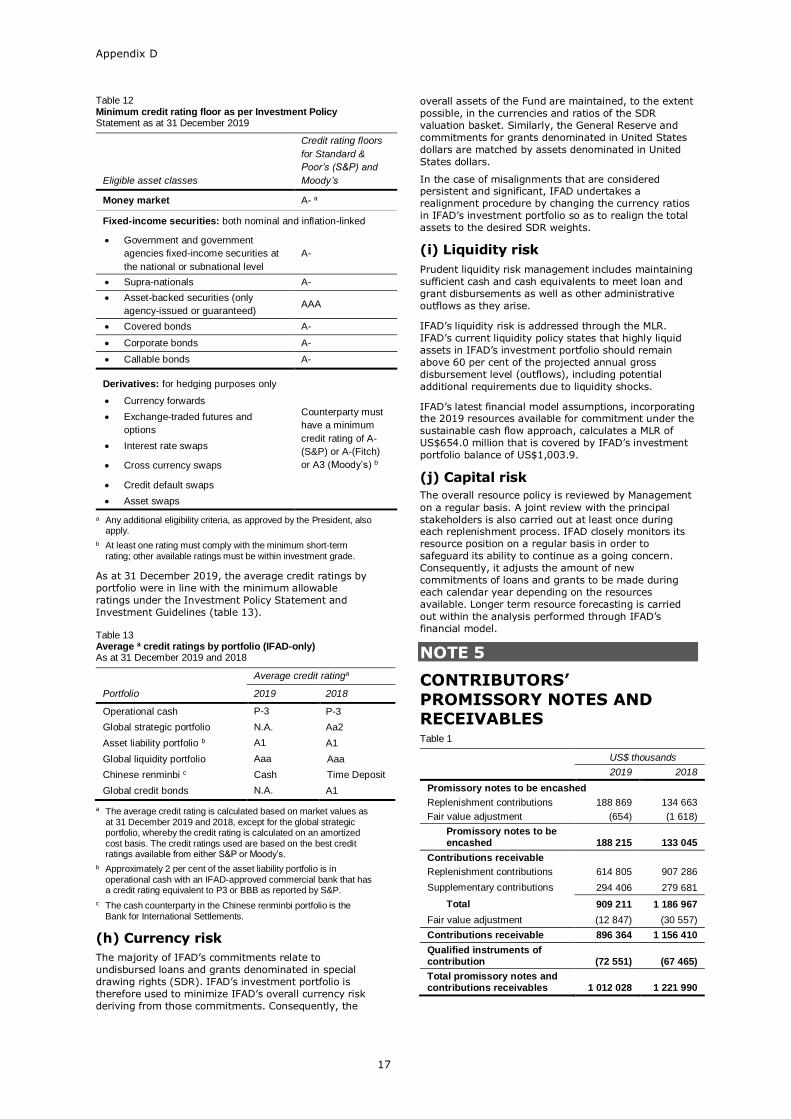
Appendix D
17
Table 12 Minimum credit rating floor as per Investment Policy Statement as at 31 December 2019
Eligible asset classes
Credit rating floors
for Standard &
Poor’s (S&P) and
Moody’s
Money market A- a
Fixed-income securities: both nominal and inflation-linked
Government and government
agencies fixed-income securities at
the national or subnational level
A-
Supra-nationals A-
Asset-backed securities (only
agency-issued or guaranteed) AAA
Covered bonds A-
Corporate bonds A-
Callable bonds A-
Derivatives: for hedging purposes only
Counterparty must
have a minimum
credit rating of A-
(S&P) or A-(Fitch)
or A3 (Moody’s) b
Currency forwards
Exchange-traded futures and
options
Interest rate swaps
Cross currency swaps
Credit default swaps
Asset swaps
a Any additional eligibility criteria, as approved by the President, also apply.
b At least one rating must comply with the minimum short-term rating; other available ratings must be within investment grade.
As at 31 December 2019, the average credit ratings by
portfolio were in line with the minimum allowable
ratings under the Investment Policy Statement and
Investment Guidelines (table 13). Table 13 Average a credit ratings by portfolio (IFAD-only) As at 31 December 2019 and 2018
Portfolio
Average credit ratinga
2019 2018
Operational cash P-3 P-3
Global strategic portfolio N.A. Aa2
Asset liability portfolio b A1 A1
Global liquidity portfolio Aaa Aaa
Chinese renminbi c Cash Time Deposit
Global credit bonds N.A. A1
a The average credit rating is calculated based on market values as at 31 December 2019 and 2018, except for the global strategic portfolio, whereby the credit rating is calculated on an amortized cost basis. The credit ratings used are based on the best credit ratings available from either S&P or Moody’s.
b Approximately 2 per cent of the asset liability portfolio is in operational cash with an IFAD-approved commercial bank that has a credit rating equivalent to P3 or BBB as reported by S&P.
c The cash counterparty in the Chinese renminbi portfolio is the Bank for International Settlements.
(h) Currency risk
The majority of IFAD’s commitments relate to
undisbursed loans and grants denominated in special
drawing rights (SDR). IFAD’s investment portfolio is
therefore used to minimize IFAD’s overall currency risk
deriving from those commitments. Consequently, the
overall assets of the Fund are maintained, to the extent
possible, in the currencies and ratios of the SDR
valuation basket. Similarly, the General Reserve and
commitments for grants denominated in United States
dollars are matched by assets denominated in United
States dollars.
In the case of misalignments that are considered persistent and significant, IFAD undertakes a
realignment procedure by changing the currency ratios
in IFAD’s investment portfolio so as to realign the total
assets to the desired SDR weights.
(i) Liquidity risk
Prudent liquidity risk management includes maintaining
sufficient cash and cash equivalents to meet loan and
grant disbursements as well as other administrative
outflows as they arise.
IFAD’s liquidity risk is addressed through the MLR.
IFAD’s current liquidity policy states that highly liquid
assets in IFAD’s investment portfolio should remain
above 60 per cent of the projected annual gross
disbursement level (outflows), including potential
additional requirements due to liquidity shocks.
IFAD’s latest financial model assumptions, incorporating the 2019 resources available for commitment under the
sustainable cash flow approach, calculates a MLR of
US$654.0 million that is covered by IFAD’s investment
portfolio balance of US$1,003.9.
(j) Capital risk The overall resource policy is reviewed by Management
on a regular basis. A joint review with the principal
stakeholders is also carried out at least once during each replenishment process. IFAD closely monitors its
resource position on a regular basis in order to
safeguard its ability to continue as a going concern.
Consequently, it adjusts the amount of new
commitments of loans and grants to be made during
each calendar year depending on the resources
available. Longer term resource forecasting is carried
out within the analysis performed through IFAD’s
financial model.
NOTE 5
CONTRIBUTORS’
PROMISSORY NOTES AND RECEIVABLES Table 1
US$ thousands
2019 2018
Promissory notes to be encashed
Replenishment contributions 188 869 134 663
Fair value adjustment (654) (1 618)
Promissory notes to be encashed 188 215 133 045
Contributions receivable
Replenishment contributions 614 805 907 286
Supplementary contributions 294 406 279 681
Total 909 211 1 186 967
Fair value adjustment (12 847) (30 557)
Contributions receivable 896 364 1 156 410
Qualified instruments of contribution (72 551) (67 465)
Total promissory notes and contributions receivables 1 012 028 1 221 990
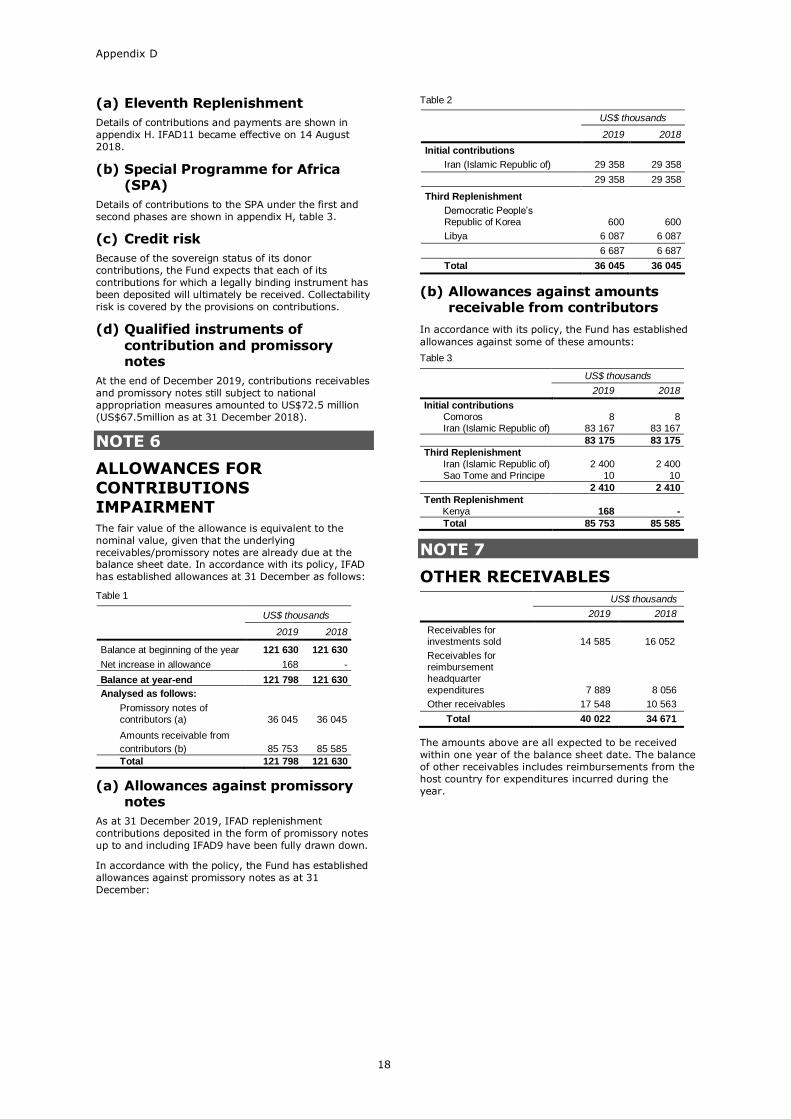
Appendix D
18
(a) Eleventh Replenishment
Details of contributions and payments are shown in
appendix H. IFAD11 became effective on 14 August
2018.
(b) Special Programme for Africa (SPA)
Details of contributions to the SPA under the first and
second phases are shown in appendix H, table 3.
(c) Credit risk
Because of the sovereign status of its donor
contributions, the Fund expects that each of its
contributions for which a legally binding instrument has
been deposited will ultimately be received. Collectability
risk is covered by the provisions on contributions.
(d) Qualified instruments of contribution and promissory notes
At the end of December 2019, contributions receivables
and promissory notes still subject to national
appropriation measures amounted to US$72.5 million
(US$67.5million as at 31 December 2018).
NOTE 6
ALLOWANCES FOR
CONTRIBUTIONS IMPAIRMENT The fair value of the allowance is equivalent to the
nominal value, given that the underlying
receivables/promissory notes are already due at the balance sheet date. In accordance with its policy, IFAD
has established allowances at 31 December as follows:
Table 1
US$ thousands
2019 2018
Balance at beginning of the year 121 630 121 630
Net increase in allowance 168 -
Balance at year-end 121 798 121 630
Analysed as follows:
Promissory notes of contributors (a) 36 045 36 045
Amounts receivable from
contributors (b) 85 753 85 585
Total 121 798 121 630
(a) Allowances against promissory notes
As at 31 December 2019, IFAD replenishment
contributions deposited in the form of promissory notes
up to and including IFAD9 have been fully drawn down.
In accordance with the policy, the Fund has established
allowances against promissory notes as at 31
December:
Table 2
US$ thousands
2019 2018
Initial contributions
Iran (Islamic Republic of) 29 358 29 358
29 358 29 358
Third Replenishment Democratic People’s Republic of Korea 600 600
Libya 6 087 6 087
6 687 6 687
Total 36 045 36 045
(b) Allowances against amounts receivable from contributors
In accordance with its policy, the Fund has established
allowances against some of these amounts: Table 3
US$ thousands
2019 2018
Initial contributions Comoros 8 8 Iran (Islamic Republic of) 83 167 83 167
83 175 83 175
Third Replenishment Iran (Islamic Republic of) 2 400 2 400 Sao Tome and Principe 10 10
2 410 2 410
Tenth Replenishment Kenya 168 -
Total 85 753 85 585
NOTE 7
OTHER RECEIVABLES
US$ thousands
2019 2018
Receivables for investments sold 14 585 16 052
Receivables for reimbursement headquarter expenditures 7 889 8 056
Other receivables 17 548 10 563
Total 40 022 34 671
The amounts above are all expected to be received
within one year of the balance sheet date. The balance
of other receivables includes reimbursements from the
host country for expenditures incurred during the
year.
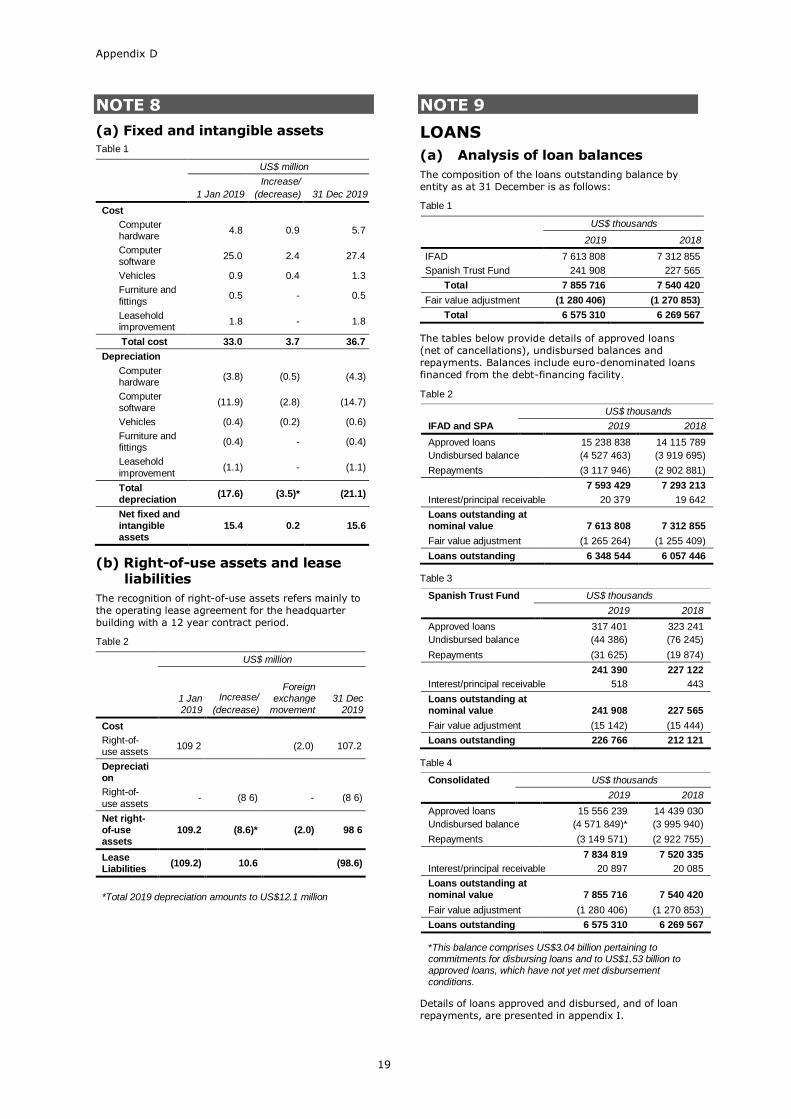
Appendix D
19
NOTE 8
(a) Fixed and intangible assets
Table 1
US$ million
1 Jan 2019
Increase/
(decrease) 31 Dec 2019
Cost
Computer hardware
4.8 0.9 5.7
Computer software
25.0 2.4 27.4
Vehicles 0.9 0.4 1.3
Furniture and
fittings 0.5 - 0.5
Leasehold improvement
1.8 - 1.8
Total cost 33.0 3.7 36.7
Depreciation
Computer hardware
(3.8) (0.5) (4.3)
Computer software
(11.9) (2.8) (14.7)
Vehicles (0.4) (0.2) (0.6)
Furniture and fittings
(0.4) - (0.4)
Leasehold
improvement (1.1) - (1.1)
Total depreciation
(17.6) (3.5)* (21.1)
Net fixed and intangible assets
15.4 0.2 15.6
(b) Right-of-use assets and lease liabilities
The recognition of right-of-use assets refers mainly to
the operating lease agreement for the headquarter
building with a 12 year contract period.
Table 2
US$ million
1 Jan 2019
Increase/
(decrease)
Foreign exchange
movement 31 Dec
2019
Cost
Right-of-use assets
109 2 (2.0) 107.2
Depreciation
Right-of-
use assets - (8 6) - (8 6)
Net right-of-use assets
109.2 (8.6)* (2.0) 98 6
Lease Liabilities
(109.2) 10.6 (98.6)
*Total 2019 depreciation amounts to US$12.1 million
NOTE 9
LOANS
(a) Analysis of loan balances
The composition of the loans outstanding balance by
entity as at 31 December is as follows:
Table 1
US$ thousands
2019 2018
IFAD 7 613 808 7 312 855
Spanish Trust Fund 241 908 227 565
Total 7 855 716 7 540 420
Fair value adjustment (1 280 406) (1 270 853)
Total 6 575 310 6 269 567
The tables below provide details of approved loans
(net of cancellations), undisbursed balances and
repayments. Balances include euro-denominated loans
financed from the debt-financing facility.
Table 2
IFAD and SPA
US$ thousands
2019 2018
Approved loans 15 238 838 14 115 789
Undisbursed balance (4 527 463) (3 919 695)
Repayments (3 117 946) (2 902 881)
7 593 429 7 293 213
Interest/principal receivable 20 379 19 642
Loans outstanding at nominal value 7 613 808 7 312 855
Fair value adjustment (1 265 264) (1 255 409)
Loans outstanding 6 348 544 6 057 446
Table 3
Spanish Trust Fund US$ thousands
2019 2018
Approved loans 317 401 323 241
(76 245) Undisbursed balance (44 386) (76 245)
Repayments (31 625) (19 874)
241 390 227 122
Interest/principal receivable 518 443
Loans outstanding at nominal value 241 908 227 565
Fair value adjustment (15 142) (15 444)
Loans outstanding 226 766 212 121
Table 4
Consolidated US$ thousands
2019 2018
Approved loans 15 556 239 14 439 030
Undisbursed balance (4 571 849)* (3 995 940)
Repayments (3 149 571) (2 922 755)
7 834 819 7 520 335
Interest/principal receivable 20 897 20 085
Loans outstanding at nominal value 7 855 716 7 540 420
Fair value adjustment (1 280 406) (1 270 853)
Loans outstanding 6 575 310 6 269 567
*This balance comprises US$3.04 billion pertaining to commitments for disbursing loans and to US$1.53 billion to approved loans, which have not yet met disbursement conditions.
Details of loans approved and disbursed, and of loan
repayments, are presented in appendix I.
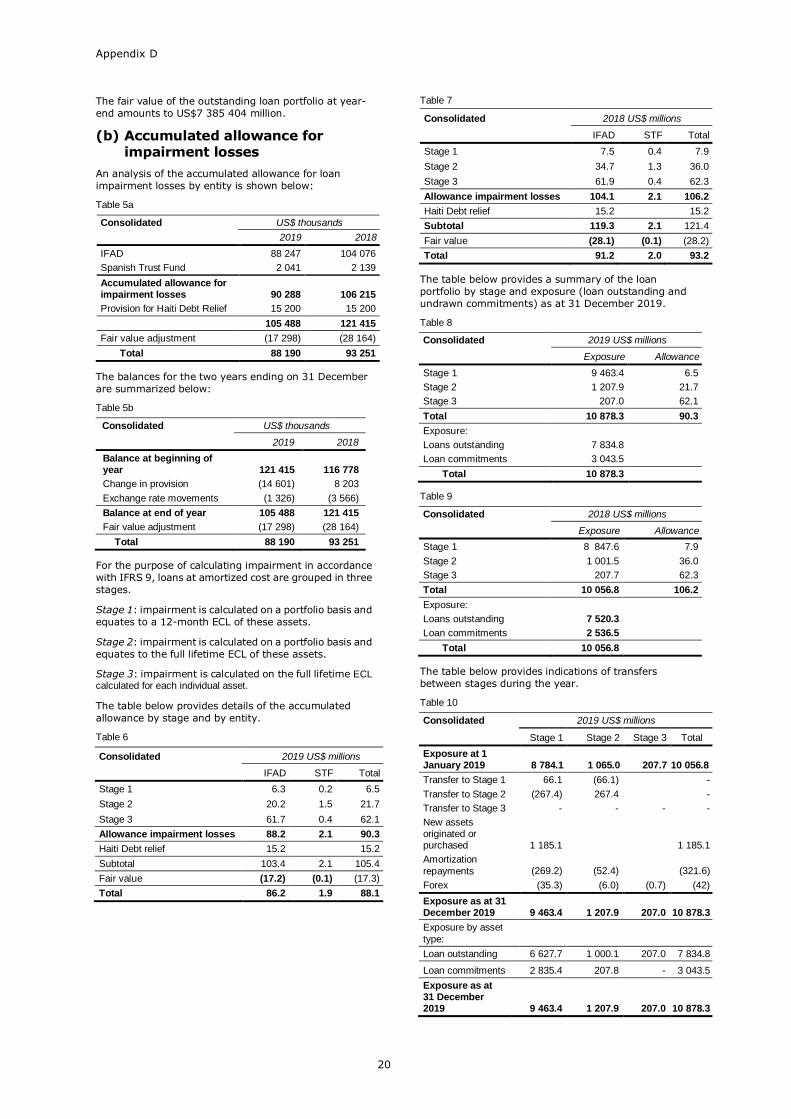
Appendix D
20
The fair value of the outstanding loan portfolio at year-
end amounts to US$7 385 404 million.
(b) Accumulated allowance for impairment losses
An analysis of the accumulated allowance for loan
impairment losses by entity is shown below:
Table 5a
Consolidated US$ thousands
2019 2018
IFAD 88 247 104 076
Spanish Trust Fund 2 041 2 139
Accumulated allowance for impairment losses 90 288 106 215
Provision for Haiti Debt Relief 15 200 15 200
105 488 121 415
Fair value adjustment (17 298) (28 164)
Total 88 190 93 251
The balances for the two years ending on 31 December
are summarized below:
Table 5b
Consolidated US$ thousands
2019 2018
Balance at beginning of year 121 415 116 778
Change in provision (14 601) 8 203
Exchange rate movements (1 326) (3 566)
Balance at end of year 105 488 121 415
Fair value adjustment (17 298) (28 164)
Total 88 190 93 251
For the purpose of calculating impairment in accordance
with IFRS 9, loans at amortized cost are grouped in three
stages.
Stage 1: impairment is calculated on a portfolio basis and
equates to a 12-month ECL of these assets.
Stage 2: impairment is calculated on a portfolio basis and
equates to the full lifetime ECL of these assets.
Stage 3: impairment is calculated on the full lifetime ECL calculated for each individual asset.
The table below provides details of the accumulated
allowance by stage and by entity.
Table 6
Consolidated 2019 US$ millions
IFAD STF Total
Stage 1 6.3 0.2 6.5
Stage 2 20.2 1.5 21.7
Stage 3 61.7 0.4 62.1
Allowance impairment losses 88.2 2.1 90.3
Haiti Debt relief 15.2 15.2
Subtotal 103.4 2.1 105.4
Fair value (17.2) (0.1) (17.3)
Total 86.2 1.9 88.1
Table 7
Consolidated 2018 US$ millions
IFAD STF Total
Stage 1 7.5 0.4 7.9
Stage 2 34.7 1.3 36.0
Stage 3 61.9 0.4 62.3
Allowance impairment losses 104.1 2.1 106.2
Haiti Debt relief 15.2 15.2
Subtotal 119.3 2.1 121.4
Fair value (28.1) (0.1) (28.2)
Total 91.2 2.0 93.2
The table below provides a summary of the loan
portfolio by stage and exposure (loan outstanding and
undrawn commitments) as at 31 December 2019.
Table 8
Consolidated 2019 US$ millions
Exposure Allowance
Stage 1 9 463.4 6.5
Stage 2 1 207.9 21.7
Stage 3 207.0 62.1
Total 10 878.3 90.3
Exposure:
Loans outstanding 7 834.8
Loan commitments 3 043.5
Total 10 878.3
Table 9
Consolidated 2018 US$ millions
Exposure Allowance
Stage 1 8 847.6 7.9
Stage 2 1 001.5 36.0
Stage 3 207.7 62.3
Total 10 056.8 106.2
Exposure:
Loans outstanding 7 520.3
Loan commitments 2 536.5
Total 10 056.8
The table below provides indications of transfers
between stages during the year.
Table 10
Consolidated 2019 US$ millions
Stage 1 Stage 2 Stage 3 Total
Exposure at 1 January 2019 8 784.1 1 065.0 207.7 10 056.8
Transfer to Stage 1 66.1 (66.1) -
Transfer to Stage 2 (267.4) 267.4 -
Transfer to Stage 3 - - - -
New assets originated or purchased 1 185.1 1 185.1
Amortization
repayments (269.2) (52.4) (321.6)
Forex (35.3) (6.0) (0.7) (42)
Exposure as at 31 December 2019 9 463.4 1 207.9 207.0 10 878.3
Exposure by asset
type:
Loan outstanding 6 627.7 1 000.1 207.0 7 834.8
Loan commitments 2 835.4 207.8 - 3 043.5
Exposure as at 31 December 2019 9 463.4 1 207.9 207.0 10 878.3
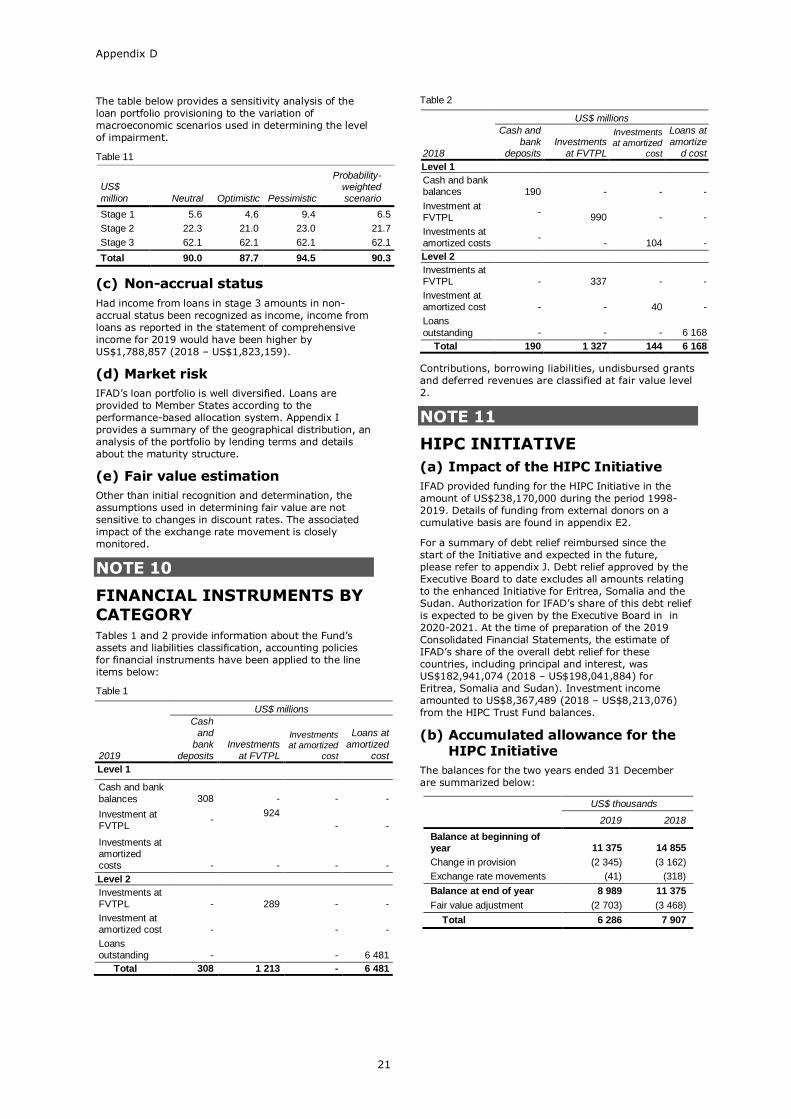
Appendix D
21
The table below provides a sensitivity analysis of the
loan portfolio provisioning to the variation of
macroeconomic scenarios used in determining the level
of impairment.
Table 11
US$
million
Neutral
Optimistic
Pessimistic
Probability-weighted scenario
Stage 1 5.6 4.6 9.4 6.5
Stage 2 22.3 21.0 23.0 21.7
Stage 3 62.1 62.1 62.1 62.1
Total 90.0 87.7 94.5 90.3
(c) Non-accrual status
Had income from loans in stage 3 amounts in non-
accrual status been recognized as income, income from
loans as reported in the statement of comprehensive
income for 2019 would have been higher by
US$1,788,857 (2018 – US$1,823,159).
(d) Market risk
IFAD’s loan portfolio is well diversified. Loans are
provided to Member States according to the
performance-based allocation system. Appendix I
provides a summary of the geographical distribution, an
analysis of the portfolio by lending terms and details
about the maturity structure.
(e) Fair value estimation
Other than initial recognition and determination, the
assumptions used in determining fair value are not
sensitive to changes in discount rates. The associated
impact of the exchange rate movement is closely
monitored.
NOTE 10
FINANCIAL INSTRUMENTS BY CATEGORY Tables 1 and 2 provide information about the Fund’s
assets and liabilities classification, accounting policies
for financial instruments have been applied to the line
items below:
Table 1
2019
US$ millions
Cash and
bank deposits
Investments at FVTPL
Investments at amortized
cost
Loans at amortized
cost
Level 1
Cash and bank
balances 308 - - -
Investment at FVTPL
- 924
- -
Investments at amortized costs
- - - -
Level 2
Investments at FVTPL - 289 - -
Investment at amortized cost - - -
Loans outstanding - - 6 481
Total 308 1 213 - 6 481
Table 2
2018
US$ millions
Cash and bank
deposits Investments
at FVTPL
Investments
at amortized cost
Loans at amortize
d cost
Level 1
Cash and bank balances 190 - - -
Investment at FVTPL
- 990 - -
Investments at amortized costs
- - 104 -
Level 2
Investments at FVTPL - 337 - -
Investment at amortized cost - - 40 -
Loans
outstanding - - - 6 168
Total 190 1 327 144 6 168
Contributions, borrowing liabilities, undisbursed grants
and deferred revenues are classified at fair value level
2.
NOTE 11
HIPC INITIATIVE
(a) Impact of the HIPC Initiative
IFAD provided funding for the HIPC Initiative in the
amount of US$238,170,000 during the period 1998-
2019. Details of funding from external donors on a
cumulative basis are found in appendix E2.
For a summary of debt relief reimbursed since the
start of the Initiative and expected in the future,
please refer to appendix J. Debt relief approved by the
Executive Board to date excludes all amounts relating
to the enhanced Initiative for Eritrea, Somalia and the
Sudan. Authorization for IFAD’s share of this debt relief
is expected to be given by the Executive Board in in
2020-2021. At the time of preparation of the 2019
Consolidated Financial Statements, the estimate of
IFAD’s share of the overall debt relief for these
countries, including principal and interest, was
US$182,941,074 (2018 – US$198,041,884) for
Eritrea, Somalia and Sudan). Investment income
amounted to US$8,367,489 (2018 – US$8,213,076)
from the HIPC Trust Fund balances.
(b) Accumulated allowance for the HIPC Initiative
The balances for the two years ended 31 December
are summarized below:
US$ thousands
2019 2018
Balance at beginning of year 11 375 14 855
Change in provision (2 345) (3 162)
Exchange rate movements (41) (318)
Balance at end of year 8 989 11 375
Fair value adjustment (2 703) (3 468)
Total 6 286 7 907
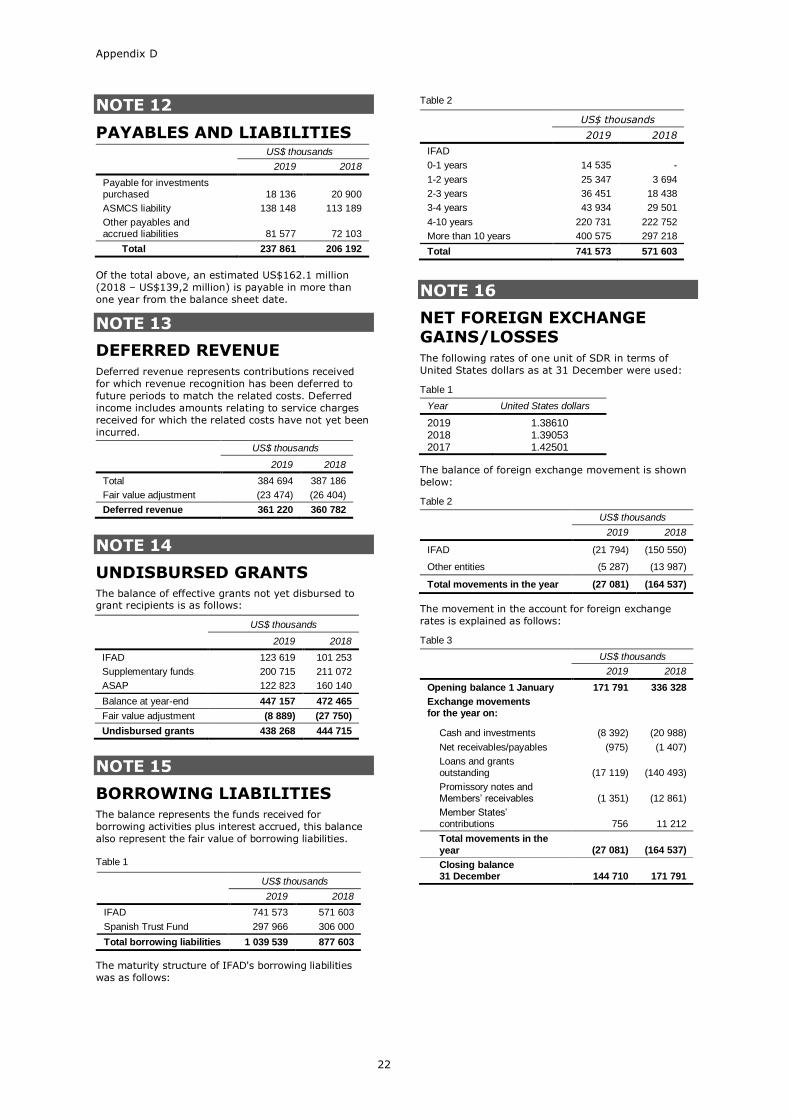
Appendix D
22
NOTE 12
PAYABLES AND LIABILITIES
US$ thousands
2019 2018
Payable for investments purchased 18 136 20 900
ASMCS liability 138 148 113 189
Other payables and accrued liabilities 81 577 72 103
Total 237 861 206 192
Of the total above, an estimated US$162.1 million
(2018 – US$139,2 million) is payable in more than
one year from the balance sheet date.
NOTE 13
DEFERRED REVENUE Deferred revenue represents contributions received
for which revenue recognition has been deferred to
future periods to match the related costs. Deferred
income includes amounts relating to service charges
received for which the related costs have not yet been
incurred.
US$ thousands
2019 2018
Total 384 694 387 186
Fair value adjustment (23 474) (26 404)
Deferred revenue 361 220 360 782
NOTE 14
UNDISBURSED GRANTS The balance of effective grants not yet disbursed to grant recipients is as follows:
US$ thousands
2019 2018
IFAD 123 619 101 253
Supplementary funds 200 715 211 072
ASAP 122 823 160 140
Balance at year-end 447 157 472 465
Fair value adjustment (8 889) (27 750)
Undisbursed grants 438 268 444 715
NOTE 15
BORROWING LIABILITIES The balance represents the funds received for
borrowing activities plus interest accrued, this balance
also represent the fair value of borrowing liabilities.
Table 1
US$ thousands 2019 2018
IFAD 741 573 571 603
Spanish Trust Fund 297 966 306 000
Total borrowing liabilities 1 039 539 877 603
The maturity structure of IFAD's borrowing liabilities
was as follows:
Table 2
US$ thousands 2019 2018
IFAD
0-1 years 14 535 -
1-2 years 25 347 3 694
2-3 years 36 451 18 438
3-4 years 43 934 29 501
4-10 years 220 731 222 752
More than 10 years 400 575 297 218
Total 741 573 571 603
NOTE 16
NET FOREIGN EXCHANGE GAINS/LOSSES The following rates of one unit of SDR in terms of
United States dollars as at 31 December were used:
Table 1
Year United States dollars
2019 1.38610 2018 1.39053 2017 1.42501
The balance of foreign exchange movement is shown
below:
Table 2
US$ thousands
2019 2018
IFAD (21 794) (150 550)
Other entities (5 287) (13 987)
Total movements in the year (27 081) (164 537)
The movement in the account for foreign exchange
rates is explained as follows:
Table 3 US$ thousands
2019 2018
Opening balance 1 January 171 791 336 328
Exchange movements for the year on:
Cash and investments (8 392) (20 988)
Net receivables/payables (975) (1 407)
Loans and grants outstanding (17 119) (140 493)
Promissory notes and Members’ receivables (1 351) (12 861)
Member States’ contributions 756 11 212
Total movements in the
year (27 081) (164 537)
Closing balance 31 December 144 710 171 791
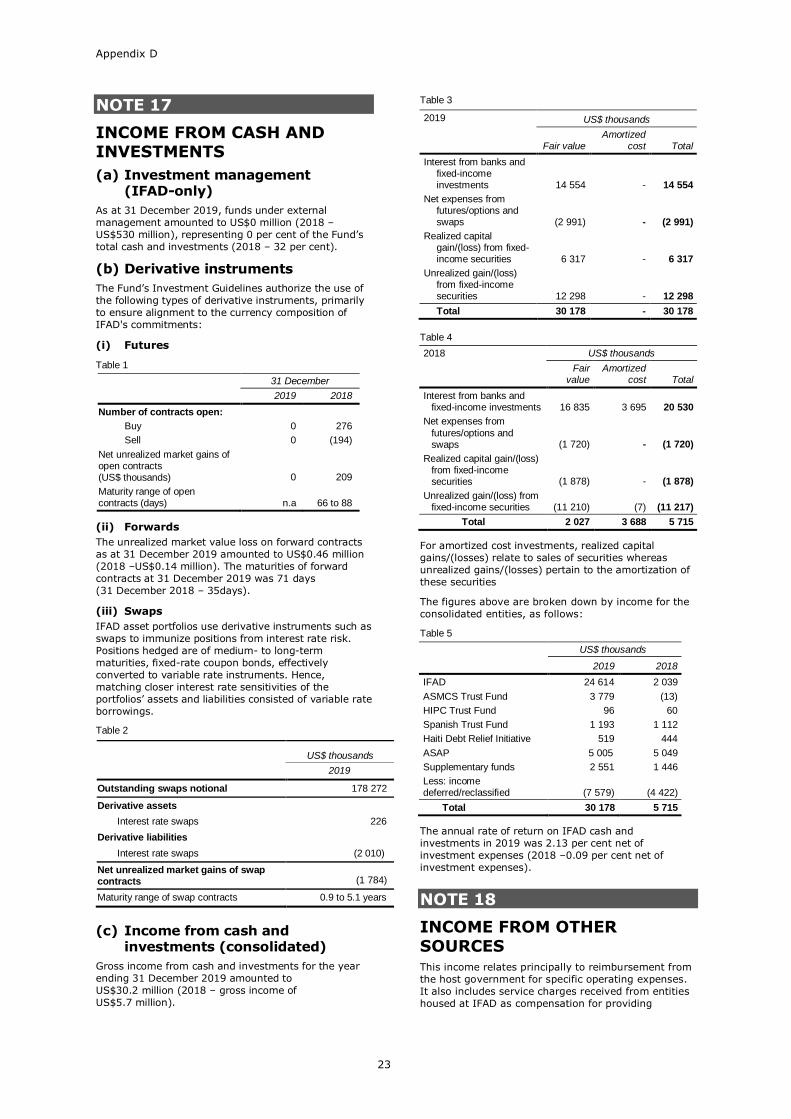
Appendix D
23
NOTE 17
INCOME FROM CASH AND INVESTMENTS
(a) Investment management (IFAD-only)
As at 31 December 2019, funds under external
management amounted to US$0 million (2018 –
US$530 million), representing 0 per cent of the Fund’s
total cash and investments (2018 – 32 per cent).
(b) Derivative instruments
The Fund’s Investment Guidelines authorize the use of
the following types of derivative instruments, primarily
to ensure alignment to the currency composition of
IFAD's commitments:
(i) Futures
Table 1
31 December
2019 2018
Number of contracts open:
Buy 0 276
Sell 0 (194)
Net unrealized market gains of open contracts (US$ thousands) 0 209
Maturity range of open contracts (days) n.a 66 to 88
(ii) Forwards
The unrealized market value loss on forward contracts
as at 31 December 2019 amounted to US$0.46 million
(2018 –US$0.14 million). The maturities of forward
contracts at 31 December 2019 was 71 days
(31 December 2018 – 35days).
(iii) Swaps
IFAD asset portfolios use derivative instruments such as
swaps to immunize positions from interest rate risk.
Positions hedged are of medium- to long-term
maturities, fixed-rate coupon bonds, effectively
converted to variable rate instruments. Hence,
matching closer interest rate sensitivities of the
portfolios’ assets and liabilities consisted of variable rate
borrowings.
Table 2
US$ thousands
2019
Outstanding swaps notional 178 272
Derivative assets
Interest rate swaps 226
Derivative liabilities
Interest rate swaps (2 010)
Net unrealized market gains of swap contracts (1 784)
Maturity range of swap contracts 0.9 to 5.1 years
(c) Income from cash and investments (consolidated)
Gross income from cash and investments for the year
ending 31 December 2019 amounted to
US$30.2 million (2018 – gross income of
US$5.7 million).
Table 3
2019 US$ thousands
Fair value Amortized
cost Total
Interest from banks and fixed-income investments 14 554 - 14 554
Net expenses from futures/options and swaps (2 991) - (2 991)
Realized capital gain/(loss) from fixed-income securities 6 317 - 6 317
Unrealized gain/(loss) from fixed-income securities 12 298 - 12 298
Total 30 178 - 30 178
Table 4
2018 US$ thousands
Fair value
Amortized cost Total
Interest from banks and fixed-income investments 16 835 3 695 20 530
Net expenses from
futures/options and swaps (1 720) - (1 720)
Realized capital gain/(loss) from fixed-income securities (1 878) - (1 878)
Unrealized gain/(loss) from fixed-income securities (11 210) (7) (11 217)
Total 2 027 3 688 5 715
For amortized cost investments, realized capital
gains/(losses) relate to sales of securities whereas
unrealized gains/(losses) pertain to the amortization of
these securities
The figures above are broken down by income for the
consolidated entities, as follows:
Table 5
US$ thousands
2019 2018
IFAD 24 614 2 039
ASMCS Trust Fund 3 779 (13)
HIPC Trust Fund 96 60
Spanish Trust Fund 1 193 1 112
Haiti Debt Relief Initiative 519 444
ASAP 5 005 5 049
Supplementary funds 2 551 1 446
Less: income deferred/reclassified (7 579) (4 422)
Total 30 178 5 715
The annual rate of return on IFAD cash and
investments in 2019 was 2.13 per cent net of
investment expenses (2018 –0.09 per cent net of
investment expenses).
NOTE 18
INCOME FROM OTHER SOURCES This income relates principally to reimbursement from
the host government for specific operating expenses.
It also includes service charges received from entities
housed at IFAD as compensation for providing
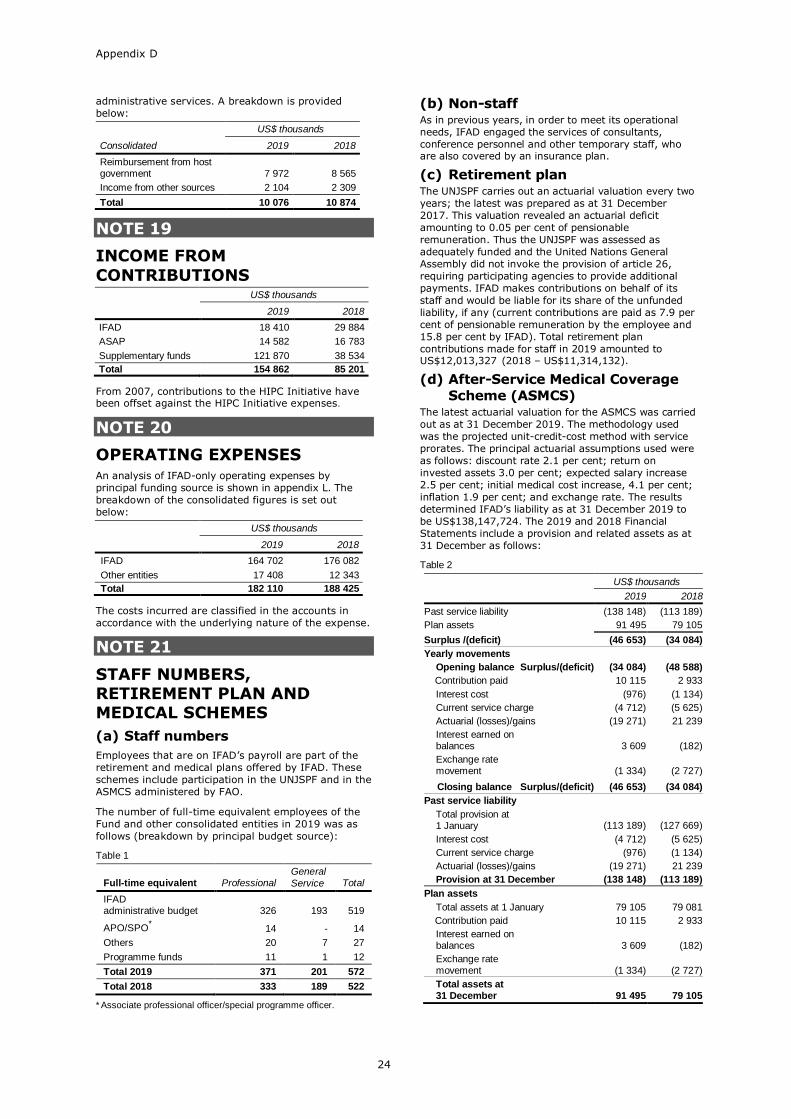
Appendix D
24
administrative services. A breakdown is provided
below:
US$ thousands
Consolidated 2019 2018
Reimbursement from host government 7 972 8 565
Income from other sources 2 104 2 309
Total 10 076 10 874
NOTE 19
INCOME FROM
CONTRIBUTIONS
US$ thousands
2019 2018
IFAD 18 410 29 884
ASAP 14 582 16 783
Supplementary funds 121 870 38 534
Total 154 862 85 201
From 2007, contributions to the HIPC Initiative have been offset against the HIPC Initiative expenses.
NOTE 20
OPERATING EXPENSES An analysis of IFAD-only operating expenses by
principal funding source is shown in appendix L. The
breakdown of the consolidated figures is set out
below:
US$ thousands
2019 2018
IFAD 164 702 176 082
Other entities 17 408 12 343
Total 182 110 188 425
The costs incurred are classified in the accounts in
accordance with the underlying nature of the expense.
NOTE 21
STAFF NUMBERS, RETIREMENT PLAN AND MEDICAL SCHEMES
(a) Staff numbers
Employees that are on IFAD’s payroll are part of the
retirement and medical plans offered by IFAD. These
schemes include participation in the UNJSPF and in the
ASMCS administered by FAO.
The number of full-time equivalent employees of the
Fund and other consolidated entities in 2019 was as
follows (breakdown by principal budget source):
Table 1
Full-time equivalent Professional General
Service Total
IFAD administrative budget 326 193 519
APO/SPO* 14 - 14
Others 20 7 27
Programme funds 11 1 12
Total 2019 371 201 572
Total 2018 333 189 522
* Associate professional officer/special programme officer.
(b) Non-staff As in previous years, in order to meet its operational
needs, IFAD engaged the services of consultants,
conference personnel and other temporary staff, who are also covered by an insurance plan.
(c) Retirement plan The UNJSPF carries out an actuarial valuation every two
years; the latest was prepared as at 31 December
2017. This valuation revealed an actuarial deficit
amounting to 0.05 per cent of pensionable
remuneration. Thus the UNJSPF was assessed as
adequately funded and the United Nations General
Assembly did not invoke the provision of article 26,
requiring participating agencies to provide additional
payments. IFAD makes contributions on behalf of its
staff and would be liable for its share of the unfunded
liability, if any (current contributions are paid as 7.9 per
cent of pensionable remuneration by the employee and
15.8 per cent by IFAD). Total retirement plan
contributions made for staff in 2019 amounted to US$12,013,327 (2018 – US$11,314,132).
(d) After-Service Medical Coverage
Scheme (ASMCS) The latest actuarial valuation for the ASMCS was carried
out as at 31 December 2019. The methodology used
was the projected unit-credit-cost method with service
prorates. The principal actuarial assumptions used were
as follows: discount rate 2.1 per cent; return on
invested assets 3.0 per cent; expected salary increase
2.5 per cent; initial medical cost increase, 4.1 per cent;
inflation 1.9 per cent; and exchange rate. The results
determined IFAD’s liability as at 31 December 2019 to
be US$138,147,724. The 2019 and 2018 Financial
Statements include a provision and related assets as at
31 December as follows:
Table 2
US$ thousands
2019 2018
Past service liability (138 148) (113 189)
Plan assets 91 495 79 105
Surplus /(deficit) (46 653) (34 084)
Yearly movements
Opening balance Surplus/(deficit) (34 084) (48 588)
Contribution paid 10 115 2 933
Interest cost (976) (1 134)
Current service charge (4 712) (5 625)
Actuarial (losses)/gains (19 271) 21 239
Interest earned on balances 3 609 (182)
Exchange rate movement (1 334) (2 727)
Closing balance Surplus/(deficit) (46 653) (34 084)
Past service liability
Total provision at 1 January (113 189) (127 669)
Interest cost (4 712) (5 625)
Current service charge (976) (1 134)
Actuarial (losses)/gains (19 271) 21 239
Provision at 31 December (138 148) (113 189)
Plan assets
Total assets at 1 January 79 105 79 081
Contribution paid 10 115 2 933
Interest earned on balances 3 609 (182)
Exchange rate movement (1 334) (2 727)
Total assets at 31 December 91 495 79 105
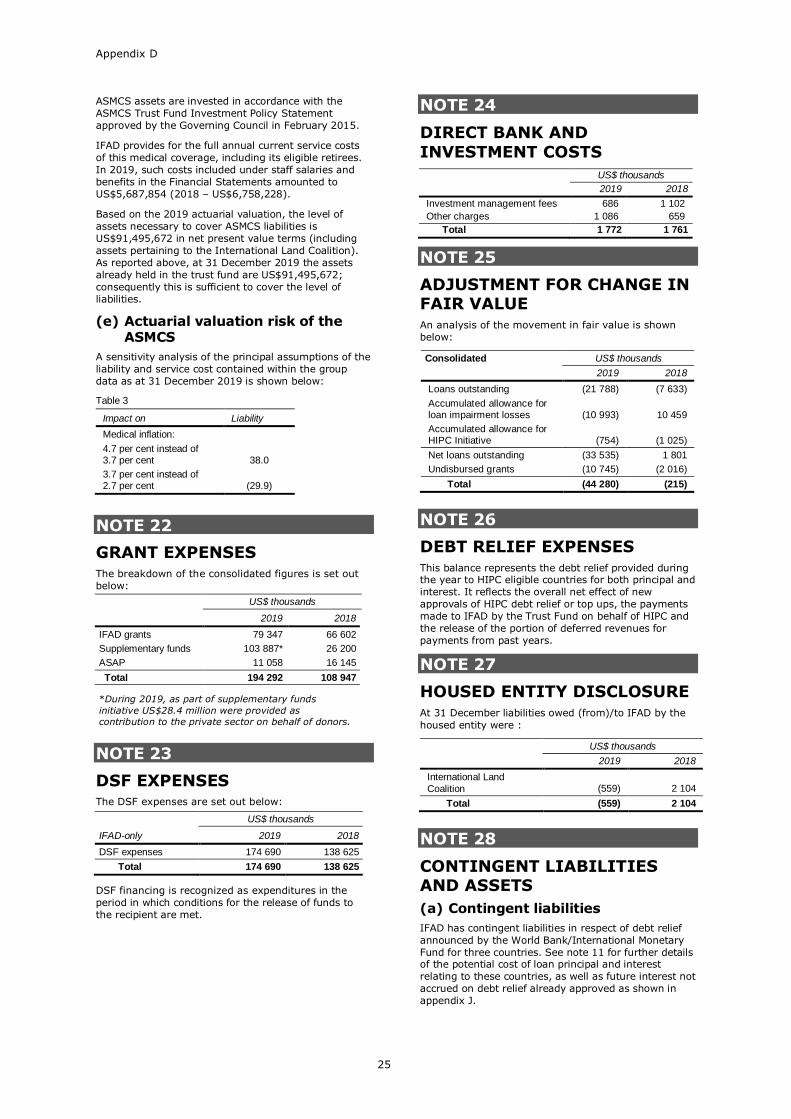
Appendix D
25
ASMCS assets are invested in accordance with the
ASMCS Trust Fund Investment Policy Statement
approved by the Governing Council in February 2015.
IFAD provides for the full annual current service costs
of this medical coverage, including its eligible retirees.
In 2019, such costs included under staff salaries and
benefits in the Financial Statements amounted to
US$5,687,854 (2018 – US$6,758,228).
Based on the 2019 actuarial valuation, the level of
assets necessary to cover ASMCS liabilities is
US$91,495,672 in net present value terms (including
assets pertaining to the International Land Coalition).
As reported above, at 31 December 2019 the assets
already held in the trust fund are US$91,495,672;
consequently this is sufficient to cover the level of
liabilities.
(e) Actuarial valuation risk of the ASMCS
A sensitivity analysis of the principal assumptions of the
liability and service cost contained within the group
data as at 31 December 2019 is shown below:
Table 3
Impact on Liability
Medical inflation:
4.7 per cent instead of 3.7 per cent 38.0
3.7 per cent instead of 2.7 per cent (29.9)
NOTE 22
GRANT EXPENSES The breakdown of the consolidated figures is set out
below:
US$ thousands
2019 2018
IFAD grants 79 347 66 602
Supplementary funds 103 887* 26 200
ASAP 11 058 16 145
Total 194 292 108 947
*During 2019, as part of supplementary funds
initiative US$28.4 million were provided as contribution to the private sector on behalf of donors.
NOTE 23
DSF EXPENSES The DSF expenses are set out below:
US$ thousands
IFAD-only 2019 2018
DSF expenses 174 690 138 625
Total 174 690 138 625
DSF financing is recognized as expenditures in the
period in which conditions for the release of funds to
the recipient are met.
NOTE 24
DIRECT BANK AND
INVESTMENT COSTS
US$ thousands
2019 2018
Investment management fees 686 1 102
Other charges 1 086 659
Total 1 772 1 761
NOTE 25
ADJUSTMENT FOR CHANGE IN FAIR VALUE
An analysis of the movement in fair value is shown
below:
Consolidated US$ thousands
2019 2018
Loans outstanding (21 788) (7 633)
Accumulated allowance for loan impairment losses (10 993) 10 459
Accumulated allowance for HIPC Initiative (754) (1 025)
Net loans outstanding (33 535) 1 801
Undisbursed grants (10 745) (2 016)
Total (44 280) (215)
NOTE 26
DEBT RELIEF EXPENSES This balance represents the debt relief provided during the year to HIPC eligible countries for both principal and
interest. It reflects the overall net effect of new
approvals of HIPC debt relief or top ups, the payments
made to IFAD by the Trust Fund on behalf of HIPC and
the release of the portion of deferred revenues for
payments from past years.
NOTE 27
HOUSED ENTITY DISCLOSURE At 31 December liabilities owed (from)/to IFAD by the
housed entity were :
US$ thousands
2019 2018
International Land
Coalition (559) 2 104
Total (559) 2 104
NOTE 28
CONTINGENT LIABILITIES AND ASSETS
(a) Contingent liabilities
IFAD has contingent liabilities in respect of debt relief
announced by the World Bank/International Monetary
Fund for three countries. See note 11 for further details of the potential cost of loan principal and interest
relating to these countries, as well as future interest not
accrued on debt relief already approved as shown in
appendix J.
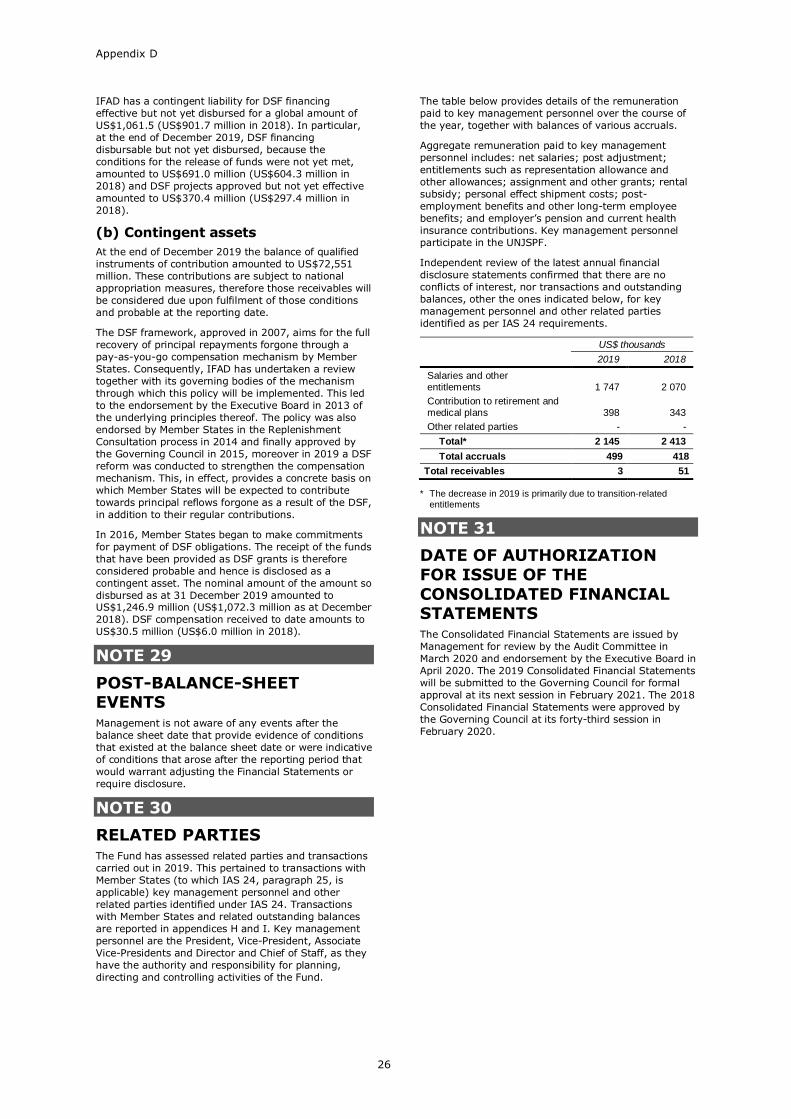
Appendix D
26
IFAD has a contingent liability for DSF financing
effective but not yet disbursed for a global amount of
US$1,061.5 (US$901.7 million in 2018). In particular,
at the end of December 2019, DSF financing
disbursable but not yet disbursed, because the
conditions for the release of funds were not yet met,
amounted to US$691.0 million (US$604.3 million in
2018) and DSF projects approved but not yet effective
amounted to US$370.4 million (US$297.4 million in
2018).
(b) Contingent assets
At the end of December 2019 the balance of qualified
instruments of contribution amounted to US$72,551
million. These contributions are subject to national
appropriation measures, therefore those receivables will
be considered due upon fulfilment of those conditions
and probable at the reporting date.
The DSF framework, approved in 2007, aims for the full
recovery of principal repayments forgone through a
pay-as-you-go compensation mechanism by Member
States. Consequently, IFAD has undertaken a review
together with its governing bodies of the mechanism
through which this policy will be implemented. This led
to the endorsement by the Executive Board in 2013 of
the underlying principles thereof. The policy was also
endorsed by Member States in the Replenishment
Consultation process in 2014 and finally approved by
the Governing Council in 2015, moreover in 2019 a DSF
reform was conducted to strengthen the compensation
mechanism. This, in effect, provides a concrete basis on
which Member States will be expected to contribute
towards principal reflows forgone as a result of the DSF,
in addition to their regular contributions.
In 2016, Member States began to make commitments
for payment of DSF obligations. The receipt of the funds
that have been provided as DSF grants is therefore
considered probable and hence is disclosed as a
contingent asset. The nominal amount of the amount so
disbursed as at 31 December 2019 amounted to US$1,246.9 million (US$1,072.3 million as at December
2018). DSF compensation received to date amounts to
US$30.5 million (US$6.0 million in 2018).
NOTE 29
POST-BALANCE-SHEET EVENTS Management is not aware of any events after the
balance sheet date that provide evidence of conditions
that existed at the balance sheet date or were indicative
of conditions that arose after the reporting period that
would warrant adjusting the Financial Statements or
require disclosure.
NOTE 30
RELATED PARTIES The Fund has assessed related parties and transactions
carried out in 2019. This pertained to transactions with
Member States (to which IAS 24, paragraph 25, is
applicable) key management personnel and other
related parties identified under IAS 24. Transactions
with Member States and related outstanding balances
are reported in appendices H and I. Key management
personnel are the President, Vice-President, Associate
Vice-Presidents and Director and Chief of Staff, as they
have the authority and responsibility for planning,
directing and controlling activities of the Fund.
The table below provides details of the remuneration
paid to key management personnel over the course of
the year, together with balances of various accruals.
Aggregate remuneration paid to key management
personnel includes: net salaries; post adjustment;
entitlements such as representation allowance and
other allowances; assignment and other grants; rental
subsidy; personal effect shipment costs; post-
employment benefits and other long-term employee
benefits; and employer’s pension and current health
insurance contributions. Key management personnel
participate in the UNJSPF.
Independent review of the latest annual financial
disclosure statements confirmed that there are no
conflicts of interest, nor transactions and outstanding
balances, other the ones indicated below, for key
management personnel and other related parties
identified as per IAS 24 requirements.
US$ thousands
2019 2018
Salaries and other entitlements 1 747 2 070
Contribution to retirement and medical plans 398 343
Other related parties - -
Total* 2 145 2 413
Total accruals 499 418
Total receivables 3 51
* The decrease in 2019 is primarily due to transition-related
entitlements
NOTE 31
DATE OF AUTHORIZATION
FOR ISSUE OF THE
CONSOLIDATED FINANCIAL STATEMENTS The Consolidated Financial Statements are issued by
Management for review by the Audit Committee in
March 2020 and endorsement by the Executive Board in
April 2020. The 2019 Consolidated Financial Statements
will be submitted to the Governing Council for formal
approval at its next session in February 2021. The 2018
Consolidated Financial Statements were approved by
the Governing Council at its forty-third session in
February 2020.
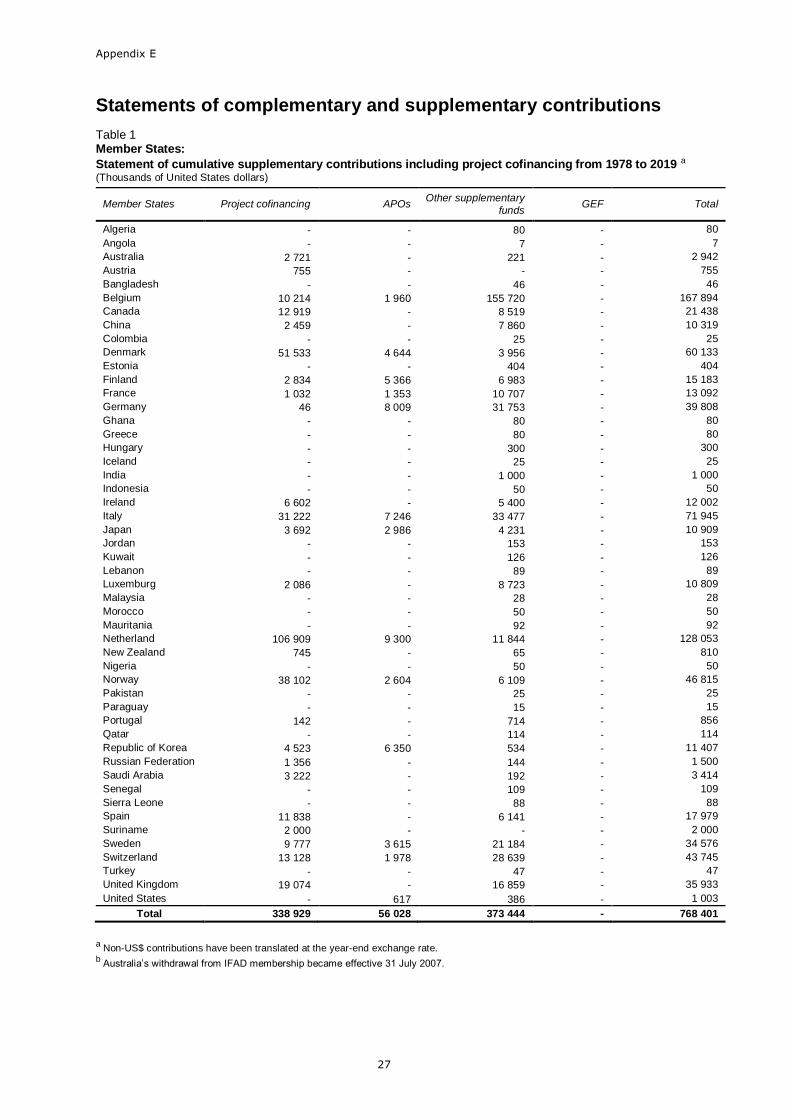
Appendix E
27
Statements of complementary and supplementary contributions
Table 1 Member States:
Statement of cumulative supplementary contributions including project cofinancing from 1978 to 2019 a (Thousands of United States dollars)
Member States Project cofinancing APOs Other supplementary
funds GEF Total
Algeria - - 80 - 80
Angola - - 7 - 7
Australia 2 721 - 221 - 2 942
Austria 755 - - - 755
Bangladesh - - 46 - 46
Belgium 10 214 1 960 155 720 - 167 894
Canada 12 919 - 8 519 - 21 438
China 2 459 - 7 860 - 10 319
Colombia - - 25 - 25
Denmark 51 533 4 644 3 956 - 60 133
Estonia - - 404 - 404
Finland 2 834 5 366 6 983 - 15 183
France 1 032 1 353 10 707 - 13 092
Germany 46 8 009 31 753 - 39 808
Ghana - - 80 - 80
Greece - - 80 - 80
Hungary - - 300 - 300
Iceland - - 25 - 25
India - - 1 000 - 1 000
Indonesia - - 50 - 50
Ireland 6 602 - 5 400 - 12 002
Italy 31 222 7 246 33 477 - 71 945
Japan 3 692 2 986 4 231 - 10 909
Jordan - - 153 - 153
Kuwait - - 126 - 126
Lebanon - - 89 - 89
Luxemburg 2 086 - 8 723 - 10 809
Malaysia - - 28 - 28
Morocco - - 50 - 50
Mauritania - - 92 - 92
Netherland 106 909 9 300 11 844 - 128 053
New Zealand 745 - 65 - 810
Nigeria - - 50 - 50
Norway 38 102 2 604 6 109 - 46 815
Pakistan - - 25 - 25
Paraguay - - 15 - 15
Portugal 142 - 714 - 856
Qatar - - 114 - 114
Republic of Korea 4 523 6 350 534 - 11 407
Russian Federation 1 356 - 144 - 1 500
Saudi Arabia 3 222 - 192 - 3 414
Senegal - - 109 - 109
Sierra Leone - - 88 - 88
Spain 11 838 - 6 141 - 17 979
Suriname 2 000 - - - 2 000
Sweden 9 777 3 615 21 184 - 34 576
Switzerland 13 128 1 978 28 639 - 43 745
Turkey - - 47 - 47
United Kingdom 19 074 - 16 859 - 35 933
United States - 617 386 - 1 003
Total 338 929 56 028 373 444 - 768 401
a Non-US$ contributions have been translated at the year-end exchange rate.
b Australia’s withdrawal from IFAD membership became effective 31 July 2007.
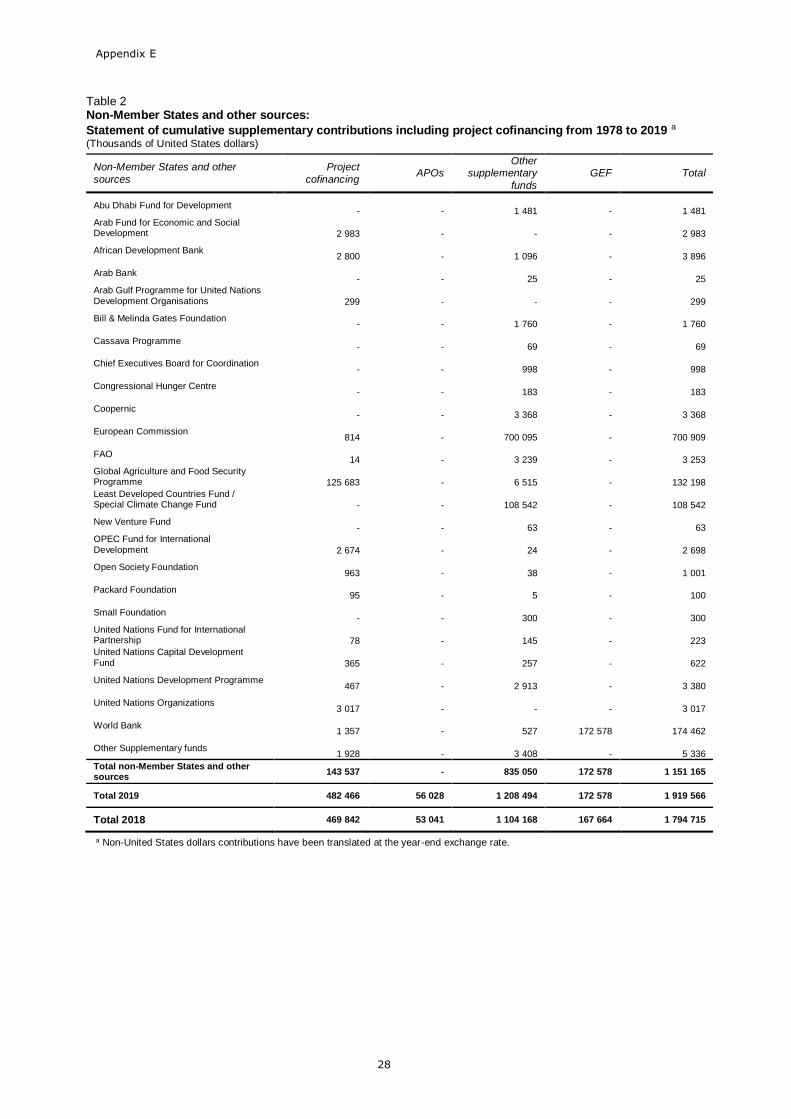
Appendix E
28
Table 2 Non-Member States and other sources:
Statement of cumulative supplementary contributions including project cofinancing from 1978 to 2019 a (Thousands of United States dollars)
Non-Member States and other
sources
Project
cofinancing APOs
Other supplementary
funds
GEF Total
Abu Dhabi Fund for Development - - 1 481 - 1 481
Arab Fund for Economic and Social Development 2 983 - - - 2 983
African Development Bank 2 800 - 1 096 - 3 896
Arab Bank - - 25 - 25
Arab Gulf Programme for United Nations Development Organisations 299 - - - 299
Bill & Melinda Gates Foundation - - 1 760 - 1 760
Cassava Programme - - 69 - 69
Chief Executives Board for Coordination - - 998 - 998
Congressional Hunger Centre - - 183 - 183
Coopernic - - 3 368 - 3 368
European Commission 814 - 700 095 - 700 909
FAO 14 - 3 239 - 3 253
Global Agriculture and Food Security Programme 125 683 - 6 515 - 132 198
Least Developed Countries Fund / Special Climate Change Fund - - 108 542 - 108 542
New Venture Fund - - 63 - 63
OPEC Fund for International Development 2 674 - 24 - 2 698
Open Society Foundation 963 - 38 - 1 001
Packard Foundation 95 - 5 - 100
Small Foundation - - 300 - 300
United Nations Fund for International Partnership 78 - 145 - 223
United Nations Capital Development Fund 365 - 257 - 622
United Nations Development Programme 467 - 2 913 - 3 380
United Nations Organizations 3 017 - - - 3 017
World Bank 1 357 - 527 172 578 174 462
Other Supplementary funds 1 928 - 3 408 - 5 336
Total non-Member States and other sources
143 537 - 835 050 172 578 1 151 165
Total 2019 482 466 56 028 1 208 494 172 578 1 919 566
Total 2018 469 842 53 041 1 104 168 167 664 1 794 715
a Non-United States dollars contributions have been translated at the year-end exchange rate.
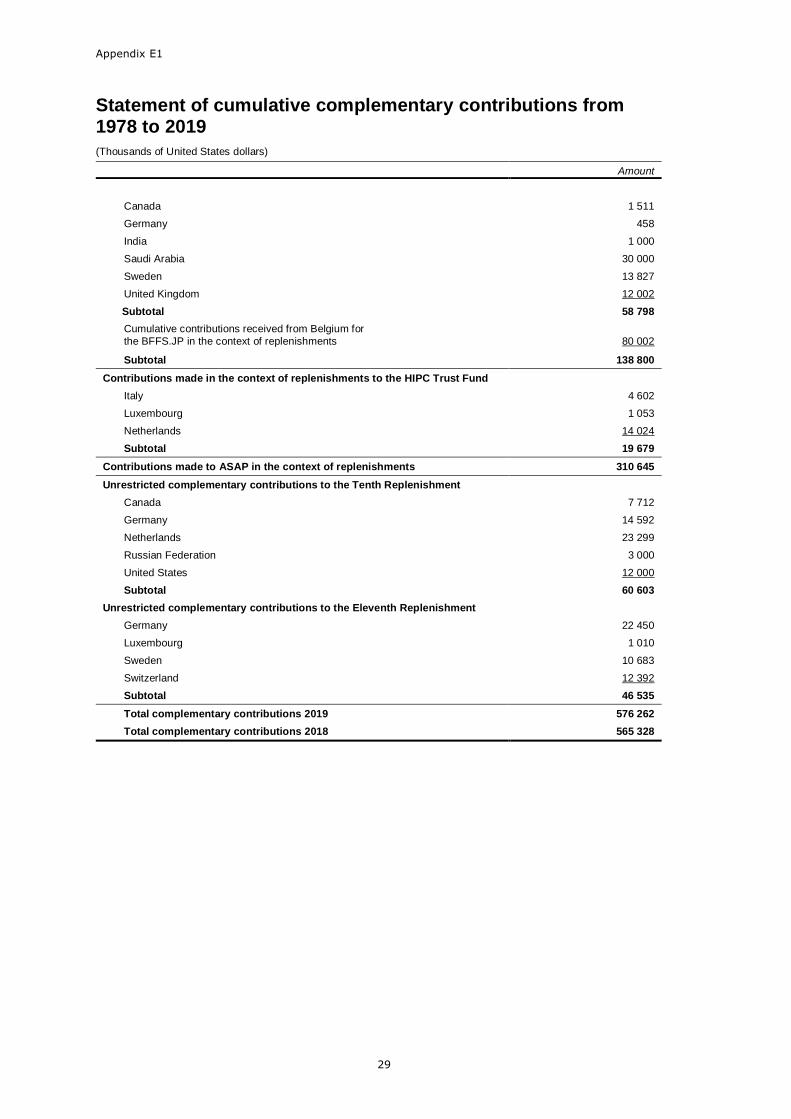
Appendix E1
29
Statement of cumulative complementary contributions from 1978 to 2019
(Thousands of United States dollars)
Amount
Canada 1 511
Germany 458
India 1 000
Saudi Arabia 30 000
Sweden 13 827
United Kingdom 12 002
Subtotal 58 798
Cumulative contributions received from Belgium for
the BFFS.JP in the context of replenishments 80 002
Subtotal 138 800
Contributions made in the context of replenishments to the HIPC Trust Fund
Italy 4 602
Luxembourg 1 053
Netherlands 14 024
Subtotal 19 679
Contributions made to ASAP in the context of replenishments 310 645
Unrestricted complementary contributions to the Tenth Replenishment
Canada 7 712
Germany 14 592
Netherlands 23 299
Russian Federation 3 000
United States 12 000
Subtotal 60 603
Unrestricted complementary contributions to the Eleventh Replenishment
Germany 22 450
Luxembourg 1 010
Sweden 10 683
Switzerland 12 392
Subtotal 46 535
Total complementary contributions 2019 576 262
Total complementary contributions 2018 565 328
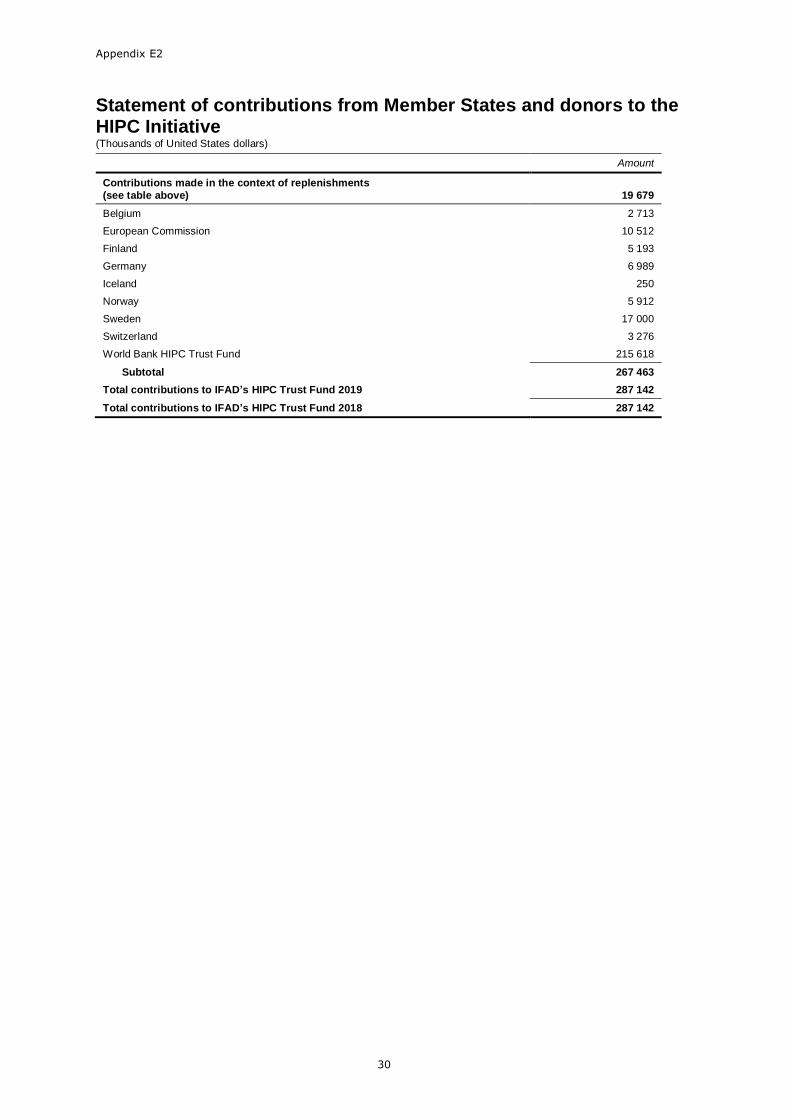
Appendix E2
30
Statement of contributions from Member States and donors to the HIPC Initiative (Thousands of United States dollars)
Amount
Contributions made in the context of replenishments
(see table above) 19 679
Belgium 2 713
European Commission 10 512
Finland 5 193
Germany 6 989
Iceland 250
Norway 5 912
Sweden 17 000
Switzerland 3 276
World Bank HIPC Trust Fund 215 618
Subtotal 267 463
Total contributions to IFAD’s HIPC Trust Fund 2019 287 142
Total contributions to IFAD’s HIPC Trust Fund 2018 287 142
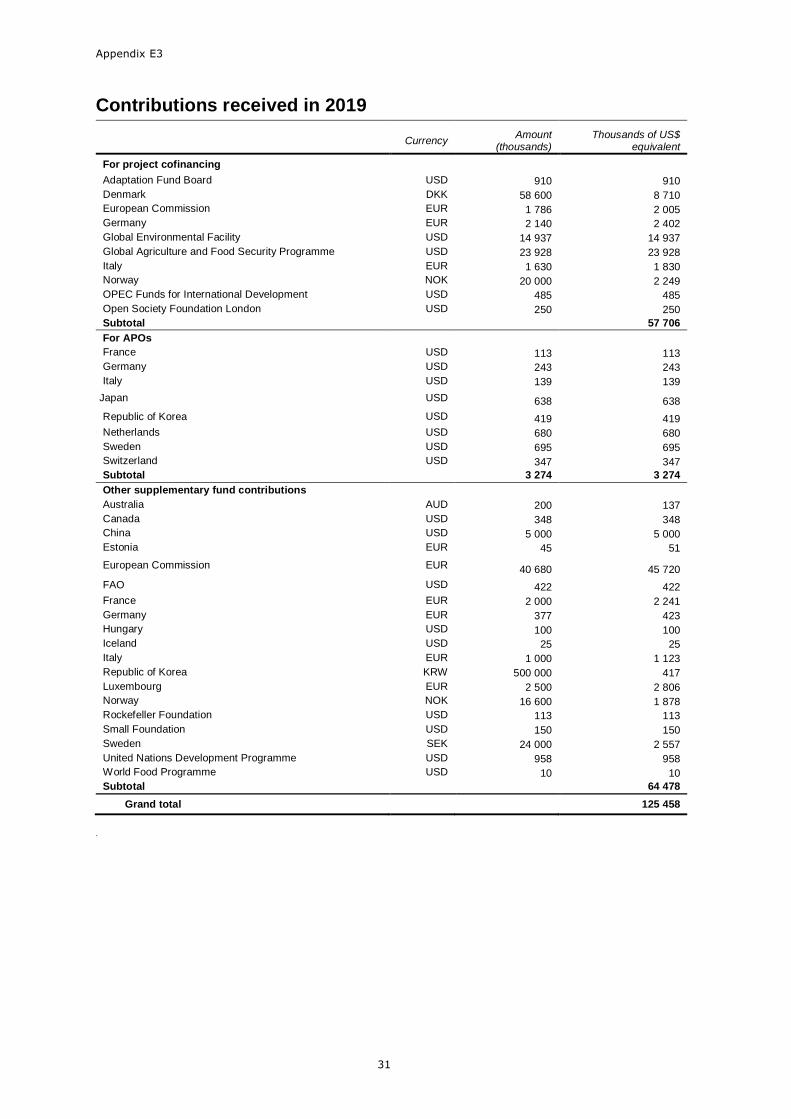
Appendix E3
31
Contributions received in 2019
Currency Amount
(thousands) Thousands of US$
equivalent
For project cofinancing
Adaptation Fund Board USD 910 910
Denmark DKK 58 600 8 710
European Commission EUR 1 786 2 005
Germany EUR 2 140 2 402
Global Environmental Facility USD 14 937 14 937
Global Agriculture and Food Security Programme USD 23 928 23 928
Italy EUR 1 630 1 830
Norway NOK 20 000 2 249
OPEC Funds for International Development USD 485 485
Open Society Foundation London USD 250 250
Subtotal 57 706
For APOs
France USD 113 113
Germany USD 243 243
Italy USD 139 139
Japan USD 638 638
Republic of Korea USD 419 419
Netherlands USD 680 680
Sweden USD 695 695
Switzerland USD 347 347
Subtotal 3 274 3 274
Other supplementary fund contributions
Australia AUD 200 137
Canada USD 348 348
China USD 5 000 5 000
Estonia EUR 45 51
European Commission EUR 40 680 45 720
FAO USD 422 422
France EUR 2 000 2 241
Germany EUR 377 423
Hungary USD 100 100
Iceland USD 25 25
Italy EUR 1 000 1 123
Republic of Korea KRW 500 000 417
Luxembourg EUR 2 500 2 806
Norway NOK 16 600 1 878
Rockefeller Foundation USD 113 113
Small Foundation USD 150 150
Sweden SEK 24 000 2 557
United Nations Development Programme USD 958 958
World Food Programme USD 10 10
Subtotal 64 478
Grand total 125 458
.
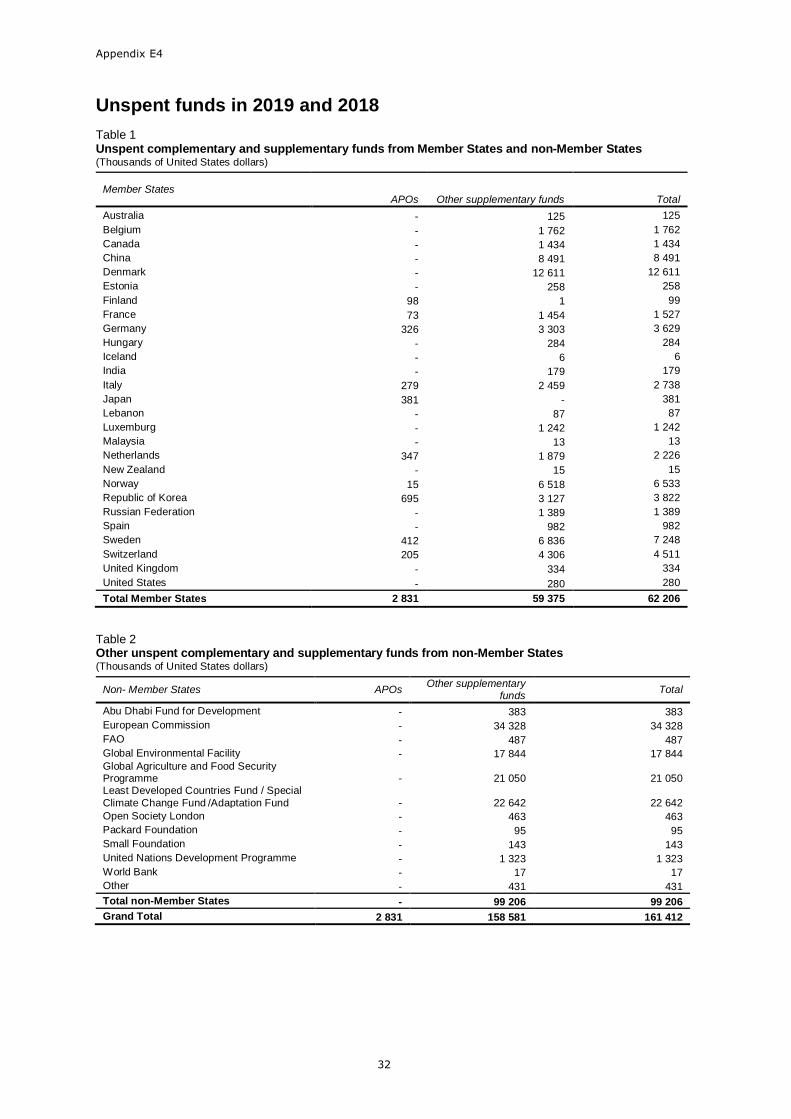
Appendix E4
32
Unspent funds in 2019 and 2018
Table 1 Unspent complementary and supplementary funds from Member States and non-Member States (Thousands of United States dollars)
Member States APOs Other supplementary funds Total
Australia - 125 125
Belgium - 1 762 1 762
Canada - 1 434 1 434
China - 8 491 8 491
Denmark - 12 611 12 611
Estonia - 258 258
Finland 98 1 99
France 73 1 454 1 527
Germany 326 3 303 3 629
Hungary - 284 284
Iceland - 6 6
India - 179 179
Italy 279 2 459 2 738
Japan 381 - 381
Lebanon - 87 87
Luxemburg - 1 242 1 242
Malaysia - 13 13
Netherlands 347 1 879 2 226
New Zealand - 15 15
Norway 15 6 518 6 533
Republic of Korea 695 3 127 3 822
Russian Federation - 1 389 1 389
Spain - 982 982
Sweden 412 6 836 7 248
Switzerland 205 4 306 4 511
United Kingdom - 334 334
United States - 280 280
Total Member States 2 831 59 375 62 206
Table 2 Other unspent complementary and supplementary funds from non-Member States (Thousands of United States dollars)
Non- Member States APOs Other supplementary
funds Total
Abu Dhabi Fund for Development - 383 383
European Commission - 34 328 34 328
FAO - 487 487
Global Environmental Facility - 17 844 17 844
Global Agriculture and Food Security Programme - 21 050 21 050 Least Developed Countries Fund / Special
Climate Change Fund /Adaptation Fund - 22 642 22 642
Open Society London - 463 463
Packard Foundation - 95 95
Small Foundation - 143 143
United Nations Development Programme - 1 323 1 323
World Bank - 17 17
Other - 431 431
Total non-Member States - 99 206 99 206
Grand Total 2 831 158 581 161 412
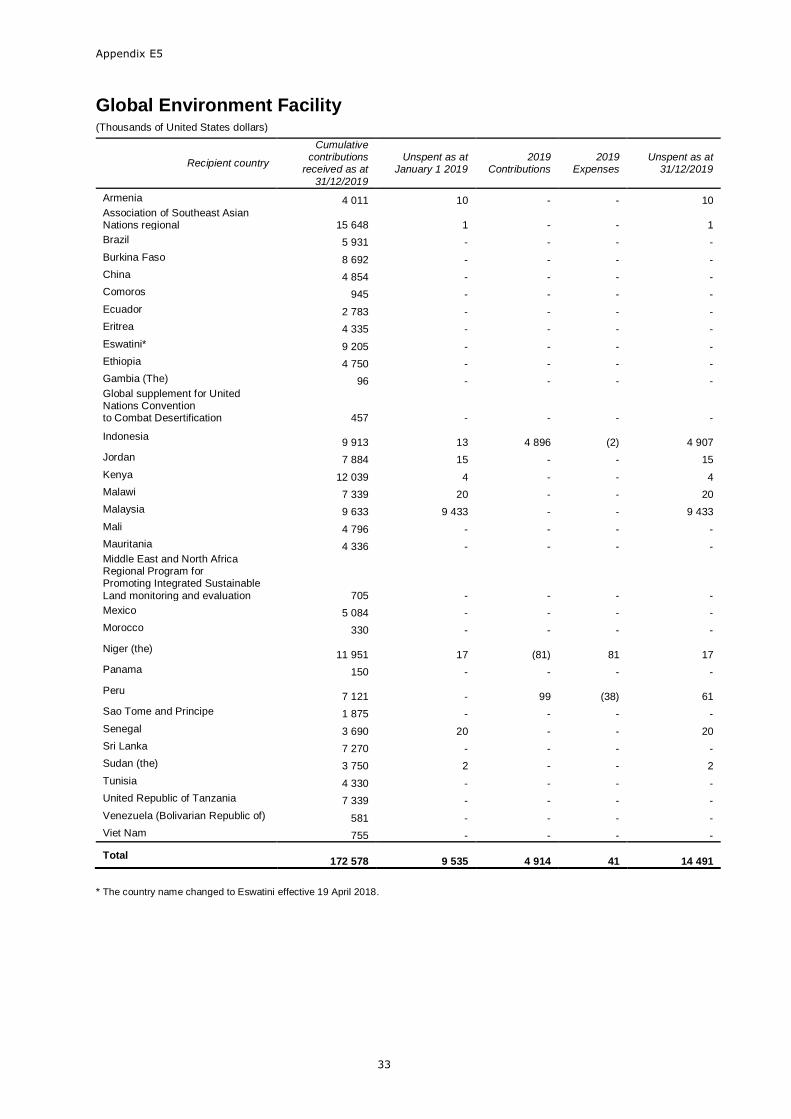
Appendix E5
33
Global Environment Facility (Thousands of United States dollars)
Recipient country
Cumulative contributions
received as at
31/12/2019
Unspent as at January 1 2019
2019 Contributions
2019 Expenses
Unspent as at 31/12/2019
Armenia 4 011 10 - - 10
Association of Southeast Asian Nations regional 15 648 1 - - 1
Brazil 5 931 - - - -
Burkina Faso 8 692 - - - -
China 4 854 - - - -
Comoros 945 - - - -
Ecuador 2 783 - - - -
Eritrea 4 335 - - - -
Eswatini* 9 205 - - - -
Ethiopia 4 750 - - - -
Gambia (The) 96 - - - -
Global supplement for United Nations Convention to Combat Desertification 457 - - - -
Indonesia 9 913 13 4 896
(2) 4 907
Jordan 7 884 15 - - 15
Kenya 12 039 4 - - 4
Malawi 7 339 20 - - 20
Malaysia 9 633 9 433 - - 9 433
Mali 4 796 - - - -
Mauritania 4 336 - - - -
Middle East and North Africa Regional Program for Promoting Integrated Sustainable
Land monitoring and evaluation 705 - - - -
Mexico 5 084 - - - -
Morocco 330 - - - -
Niger (the) 11 951 17
(81)
81 17
Panama 150 - - - -
Peru 7 121 - 99
(38) 61
Sao Tome and Principe 1 875 - - - -
Senegal 3 690 20 - - 20
Sri Lanka 7 270 - - - -
Sudan (the) 3 750 2 - - 2
Tunisia 4 330 - - - -
United Republic of Tanzania 7 339 - - - -
Venezuela (Bolivarian Republic of) 581 - - - -
Viet Nam 755 - - - -
Total 172 578 9 535 4 914
41 14 491
* The country name changed to Eswatini effective 19 April 2018.
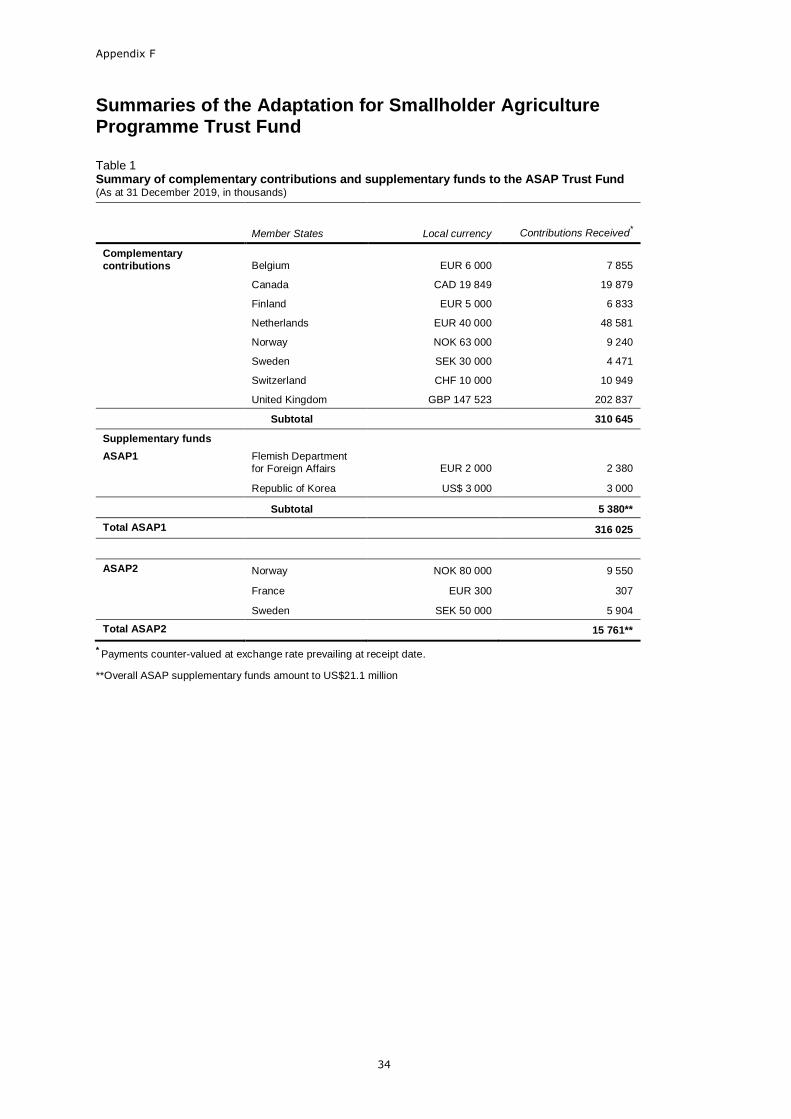
Appendix F
34
Summaries of the Adaptation for Smallholder Agriculture Programme Trust Fund Table 1 Summary of complementary contributions and supplementary funds to the ASAP Trust Fund (As at 31 December 2019, in thousands)
Member States Local currency Contributions Received*
Complementary
contributions Belgium EUR 6 000 7 855
Canada CAD 19 849 19 879
Finland EUR 5 000 6 833
Netherlands EUR 40 000 48 581
Norway NOK 63 000 9 240
Sweden SEK 30 000 4 471
Switzerland CHF 10 000 10 949
United Kingdom GBP 147 523 202 837
Subtotal 310 645
Supplementary funds
ASAP1 Flemish Department
for Foreign Affairs EUR 2 000 2 380
Republic of Korea US$ 3 000 3 000
Subtotal 5 380**
Total ASAP1 316 025
ASAP2 Norway NOK 80 000 9 550
France EUR 300 307
Sweden SEK 50 000 5 904
Total ASAP2 15 761**
* Payments counter-valued at exchange rate prevailing at receipt date.
**Overall ASAP supplementary funds amount to US$21.1 million
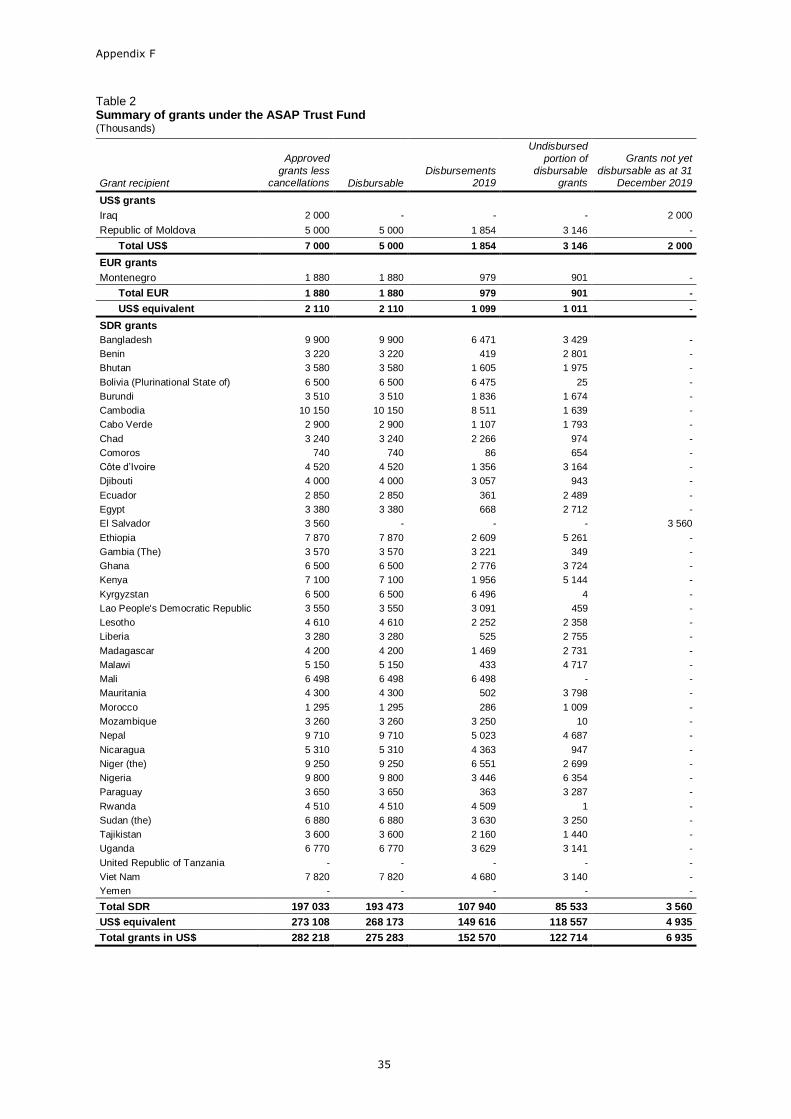
Appendix F
35
Table 2 Summary of grants under the ASAP Trust Fund (Thousands)
Grant recipient
Approved
grants less cancellations Disbursable
Disbursements 2019
Undisbursed
portion of disbursable
grants
Grants not yet
disbursable as at 31 December 2019
US$ grants
Iraq 2 000 - - - 2 000
Republic of Moldova 5 000 5 000 1 854 3 146 -
Total US$ 7 000 5 000 1 854 3 146 2 000
EUR grants
Montenegro 1 880 1 880 979 901 -
Total EUR 1 880 1 880 979 901 -
US$ equivalent 2 110 2 110 1 099 1 011 -
SDR grants
Bangladesh 9 900 9 900 6 471 3 429 -
Benin 3 220 3 220 419 2 801 -
Bhutan 3 580 3 580 1 605 1 975 -
Bolivia (Plurinational State of) 6 500 6 500 6 475 25 -
Burundi 3 510 3 510 1 836 1 674 -
Cambodia 10 150 10 150 8 511 1 639 -
Cabo Verde 2 900 2 900 1 107 1 793 -
Chad 3 240 3 240 2 266 974 -
Comoros 740 740 86 654 -
Côte d’Ivoire 4 520 4 520 1 356 3 164 -
Djibouti 4 000 4 000 3 057 943 -
Ecuador 2 850 2 850 361 2 489 -
Egypt 3 380 3 380 668 2 712 -
El Salvador 3 560 - - - 3 560
Ethiopia 7 870 7 870 2 609 5 261 -
Gambia (The) 3 570 3 570 3 221 349 -
Ghana 6 500 6 500 2 776 3 724 -
Kenya 7 100 7 100 1 956 5 144 -
Kyrgyzstan 6 500 6 500 6 496 4 -
Lao People's Democratic Republic 3 550 3 550 3 091 459 -
Lesotho 4 610 4 610 2 252 2 358 -
Liberia 3 280 3 280 525 2 755 -
Madagascar 4 200 4 200 1 469 2 731 -
Malawi 5 150 5 150 433 4 717 -
Mali 6 498 6 498 6 498 - -
Mauritania 4 300 4 300 502 3 798 -
Morocco 1 295 1 295 286 1 009 -
Mozambique 3 260 3 260 3 250 10 -
Nepal 9 710 9 710 5 023 4 687 -
Nicaragua 5 310 5 310 4 363 947 -
Niger (the) 9 250 9 250 6 551 2 699 -
Nigeria 9 800 9 800 3 446 6 354 -
Paraguay 3 650 3 650 363 3 287 -
Rwanda 4 510 4 510 4 509 1 -
Sudan (the) 6 880 6 880 3 630 3 250 -
Tajikistan 3 600 3 600 2 160 1 440 -
Uganda 6 770 6 770 3 629 3 141 -
United Republic of Tanzania - - - - -
Viet Nam 7 820 7 820 4 680 3 140 -
Yemen - - - - -
Total SDR 197 033 193 473 107 940 85 533 3 560
US$ equivalent 273 108 268 173 149 616 118 557 4 935
Total grants in US$ 282 218 275 283 152 570 122 714 6 935
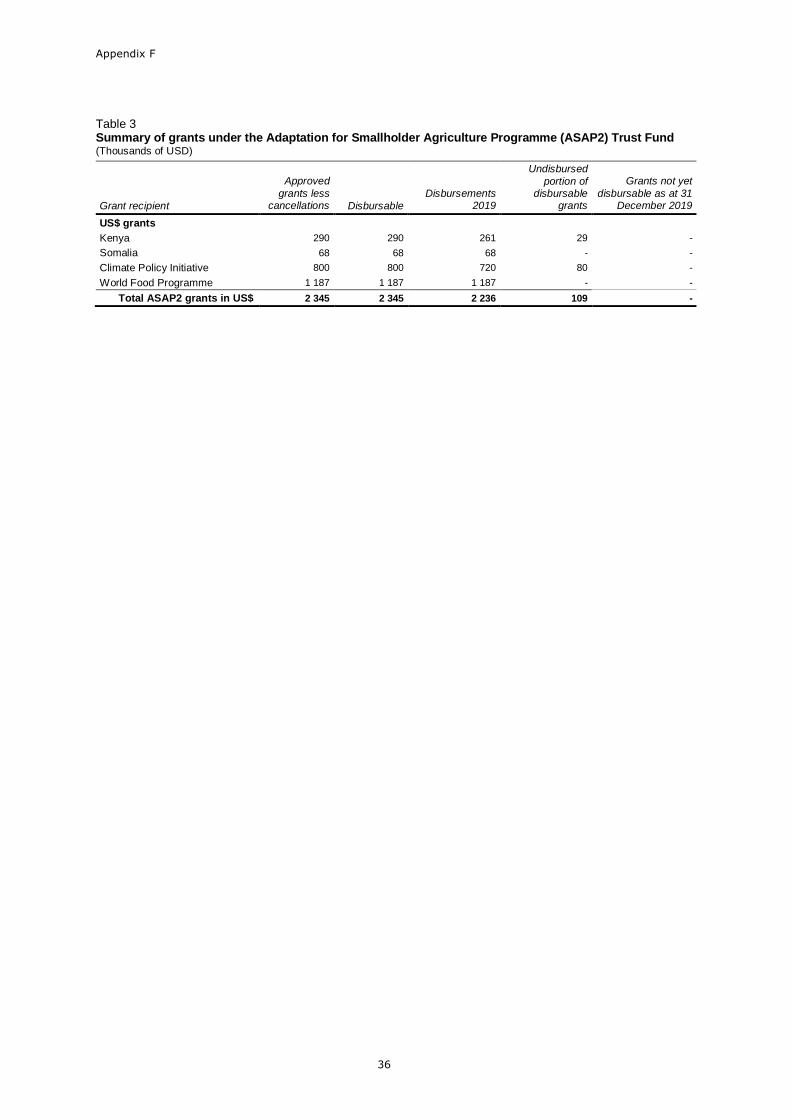
Appendix F
36
Table 3 Summary of grants under the Adaptation for Smallholder Agriculture Programme (ASAP2) Trust Fund (Thousands of USD)
Grant recipient
Approved
grants less cancellations Disbursable
Disbursements 2019
Undisbursed
portion of disbursable
grants
Grants not yet
disbursable as at 31 December 2019
US$ grants
Kenya 290 290 261 29 -
Somalia 68 68 68 - -
Climate Policy Initiative 800 800 720 80 -
World Food Programme 1 187 1 187 1 187 - -
Total ASAP2 grants in US$ 2 345 2 345 2 236 109 -
37
Management and external auditor’s reports
38
39
40
41
42
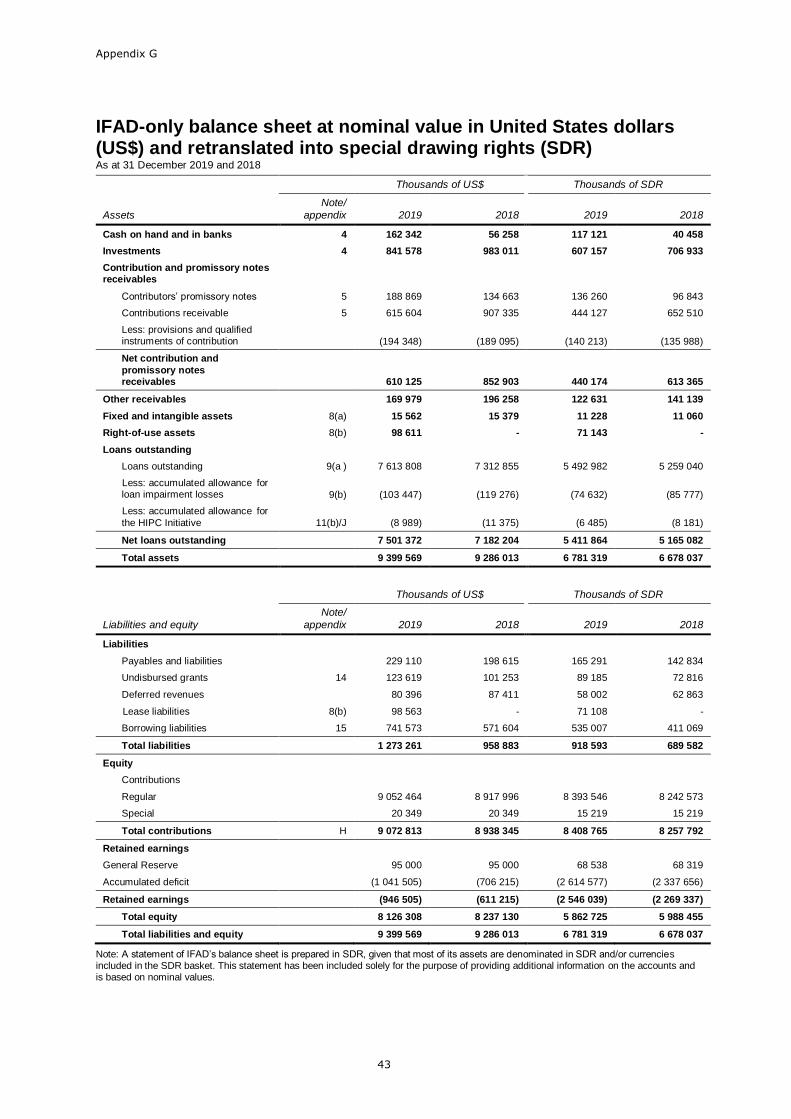
Appendix G
43
IFAD-only balance sheet at nominal value in United States dollars (US$) and retranslated into special drawing rights (SDR) As at 31 December 2019 and 2018
Thousands of US$ Thousands of SDR
Assets
Note/
appendix 2019 2018 2019 2018
Cash on hand and in banks 4 162 342 56 258 117 121 40 458
Investments 4 841 578 983 011 607 157 706 933
Contribution and promissory notes receivables
Contributors’ promissory notes 5 188 869 134 663 136 260 96 843
Contributions receivable 5 615 604 907 335 444 127 652 510
Less: provisions and qualified instruments of contribution (194 348) (189 095) (140 213) (135 988)
Net contribution and
promissory notes receivables 610 125 852 903 440 174 613 365
Other receivables 169 979 196 258 122 631 141 139
Fixed and intangible assets 8(a) 15 562 15 379 11 228 11 060
Right-of-use assets 8(b) 98 611 - 71 143 -
Loans outstanding
Loans outstanding 9(a ) 7 613 808 7 312 855 5 492 982 5 259 040
Less: accumulated allowance for loan impairment losses 9(b) (103 447) (119 276) (74 632) (85 777)
Less: accumulated allowance for
the HIPC Initiative 11(b)/J (8 989) (11 375) (6 485) (8 181)
Net loans outstanding 7 501 372 7 182 204 5 411 864 5 165 082
Total assets 9 399 569 9 286 013 6 781 319 6 678 037
Thousands of US$ Thousands of SDR
Liabilities and equity
Note/
appendix 2019 2018 2019 2018
Liabilities
Payables and liabilities 229 110 198 615 165 291 142 834
Undisbursed grants 14 123 619 101 253 89 185 72 816
Deferred revenues 80 396 87 411 58 002 62 863
Lease liabilities 8(b) 98 563 - 71 108 -
Borrowing liabilities 15 741 573 571 604 535 007 411 069
Total liabilities 1 273 261 958 883 918 593 689 582
Equity
Contributions
Regular 9 052 464 8 917 996 8 393 546 8 242 573
Special 20 349 20 349 15 219 15 219
Total contributions H 9 072 813 8 938 345 8 408 765 8 257 792
Retained earnings
General Reserve 95 000 95 000 68 538 68 319
Accumulated deficit (1 041 505) (706 215) (2 614 577) (2 337 656)
Retained earnings (946 505) (611 215) (2 546 039) (2 269 337)
Total equity 8 126 308 8 237 130 5 862 725 5 988 455
Total liabilities and equity 9 399 569 9 286 013 6 781 319 6 678 037
Note: A statement of IFAD’s balance sheet is prepared in SDR, given that most of its assets are denominated in SDR and/or currencies included in the SDR basket. This statement has been included solely for the purpose of providing additional information on the accounts and is based on nominal values.
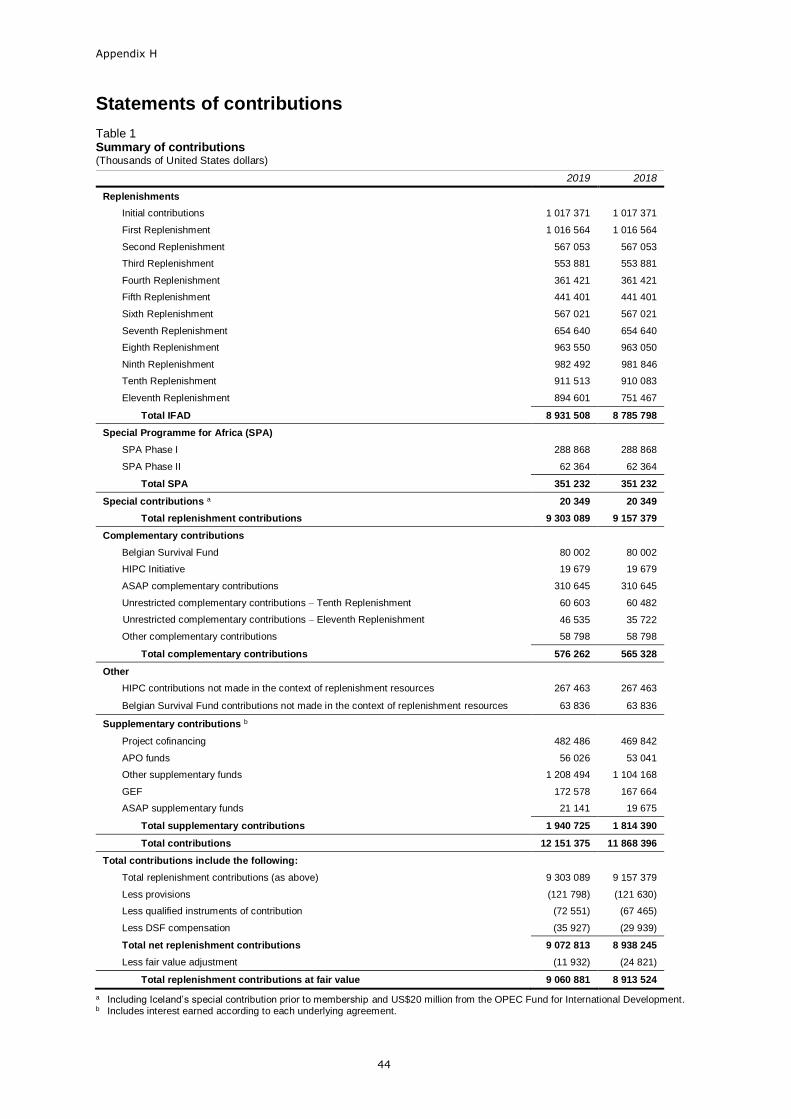
Appendix H
44
Statements of contributions
Table 1 Summary of contributions (Thousands of United States dollars)
2019 2018
Replenishments
Initial contributions 1 017 371 1 017 371
First Replenishment 1 016 564 1 016 564
Second Replenishment 567 053 567 053
Third Replenishment 553 881 553 881
Fourth Replenishment 361 421 361 421
Fifth Replenishment 441 401 441 401
Sixth Replenishment 567 021 567 021
Seventh Replenishment 654 640 654 640
Eighth Replenishment 963 550 963 050
Ninth Replenishment 982 492 981 846
Tenth Replenishment 911 513 910 083
Eleventh Replenishment 894 601 751 467
Total IFAD 8 931 508 8 785 798
Special Programme for Africa (SPA)
SPA Phase I 288 868 288 868
SPA Phase II 62 364 62 364
Total SPA 351 232 351 232
Special contributions a 20 349 20 349
Total replenishment contributions 9 303 089 9 157 379
Complementary contributions
Belgian Survival Fund 80 002 80 002
HIPC Initiative 19 679 19 679
ASAP complementary contributions 310 645 310 645
Unrestricted complementary contributions – Tenth Replenishment 60 603 60 482
Unrestricted complementary contributions – Eleventh Replenishment 46 535 35 722
Other complementary contributions 58 798 58 798
Total complementary contributions 576 262 565 328
Other
HIPC contributions not made in the context of replenishment resources 267 463 267 463
Belgian Survival Fund contributions not made in the context of replenishment resources 63 836 63 836
Supplementary contributions b
Project cofinancing 482 486 469 842
APO funds 56 026 53 041
Other supplementary funds 1 208 494 1 104 168
GEF 172 578 167 664
ASAP supplementary funds 21 141 19 675
Total supplementary contributions 1 940 725 1 814 390
Total contributions 12 151 375 11 868 396
Total contributions include the following:
Total replenishment contributions (as above) 9 303 089 9 157 379
Less provisions (121 798) (121 630)
Less qualified instruments of contribution (72 551) (67 465)
Less DSF compensation (35 927) (29 939)
Total net replenishment contributions 9 072 813 8 938 245
Less fair value adjustment (11 932) (24 821)
Total replenishment contributions at fair value 9 060 881 8 913 524
a Including Iceland’s special contribution prior to membership and US$20 million from the OPEC Fund for International Development. b Includes interest earned according to each underlying agreement.
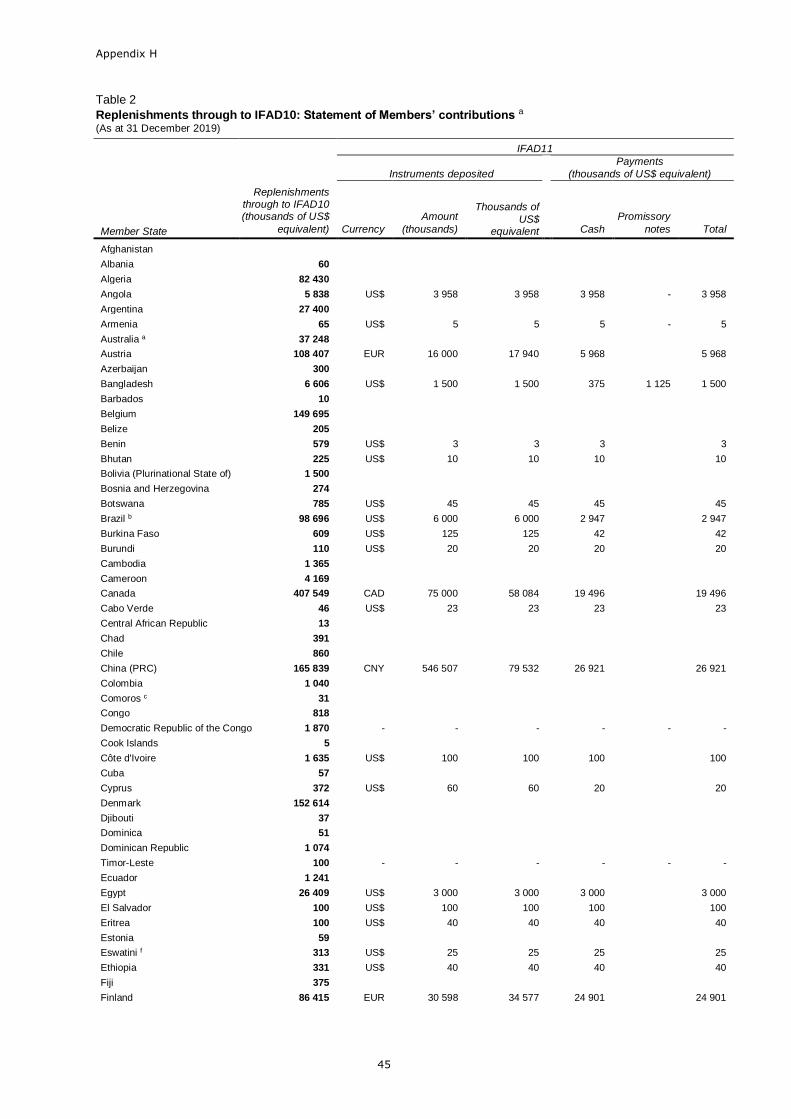
Appendix H
45
Table 2
Replenishments through to IFAD10: Statement of Members’ contributions a (As at 31 December 2019)
Member State
Replenishments through to IFAD10 (thousands of US$
equivalent)
IFAD11
Instruments deposited
Payments
(thousands of US$ equivalent)
Currency
Amount
(thousands)
Thousands of
US$ equivalent Cash
Promissory
notes Total
Afghanistan
Albania 60
Algeria 82 430
Angola 5 838 US$ 3 958 3 958 3 958 - 3 958
Argentina 27 400
Armenia 65 US$ 5 5 5 - 5
Australia a 37 248
Austria 108 407 EUR 16 000 17 940 5 968 5 968
Azerbaijan 300
Bangladesh 6 606 US$ 1 500 1 500 375 1 125 1 500
Barbados 10
Belgium 149 695
Belize 205
Benin 579 US$ 3 3 3 3
Bhutan 225 US$ 10 10 10 10
Bolivia (Plurinational State of) 1 500
Bosnia and Herzegovina 274
Botswana 785 US$ 45 45 45 45
Brazil b 98 696 US$ 6 000 6 000 2 947 2 947
Burkina Faso 609 US$ 125 125 42 42
Burundi 110 US$ 20 20 20 20
Cambodia 1 365
Cameroon 4 169
Canada 407 549 CAD 75 000 58 084 19 496 19 496
Cabo Verde 46 US$ 23 23 23 23
Central African Republic 13
Chad 391
Chile 860
China (PRC) 165 839 CNY 546 507 79 532 26 921 26 921
Colombia 1 040
Comoros c 31
Congo 818
Democratic Republic of the Congo 1 870 - - - - - -
Cook Islands 5
Côte d'Ivoire 1 635 US$ 100 100 100 100
Cuba 57
Cyprus 372 US$ 60 60 20 20
Denmark 152 614
Djibouti 37
Dominica 51
Dominican Republic 1 074
Timor-Leste 100 - - - - - -
Ecuador 1 241
Egypt 26 409 US$ 3 000 3 000 3 000 3 000
El Salvador 100 US$ 100 100 100 100
Eritrea 100 US$ 40 40 40 40
Estonia 59
Eswatini f 313 US$ 25 25 25 25
Ethiopia 331 US$ 40 40 40 40
Fiji 375
Finland 86 415 EUR 30 598 34 577 24 901 24 901
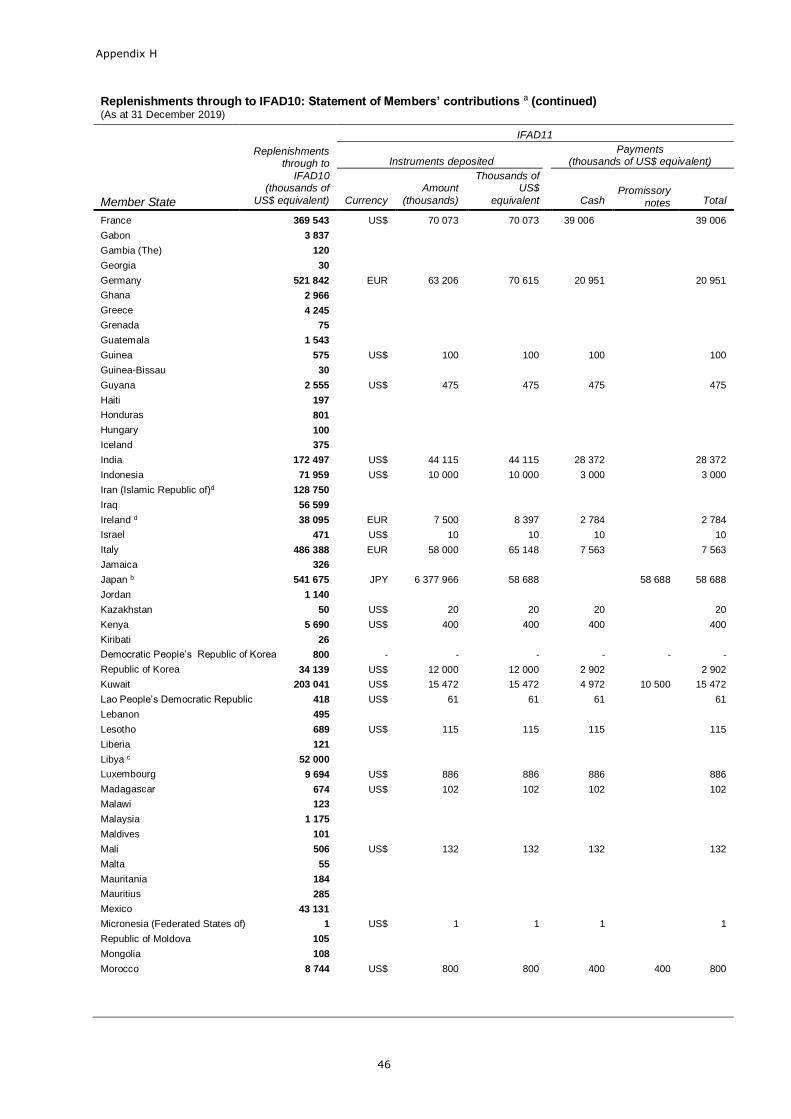
Appendix H
46
Replenishments through to IFAD10: Statement of Members’ contributions a (continued) (As at 31 December 2019)
Member State
Replenishments through to
IFAD10 (thousands of
US$ equivalent)
IFAD11
Instruments deposited Payments
(thousands of US$ equivalent)
Currency
Amount
(thousands)
Thousands of US$
equivalent Cash Promissory
notes Total
France 369 543 US$ 70 073 70 073 39 006 39 006
Gabon 3 837
Gambia (The) 120
Georgia 30
Germany 521 842 EUR 63 206 70 615 20 951 20 951
Ghana 2 966
Greece 4 245
Grenada 75
Guatemala 1 543
Guinea 575 US$ 100 100 100 100
Guinea-Bissau 30
Guyana 2 555 US$ 475 475 475 475
Haiti 197
Honduras 801
Hungary 100
Iceland 375
India 172 497 US$ 44 115 44 115 28 372 28 372
Indonesia 71 959 US$ 10 000 10 000 3 000 3 000
Iran (Islamic Republic of)d 128 750
Iraq 56 599
Ireland d 38 095 EUR 7 500 8 397 2 784 2 784
Israel 471 US$ 10 10 10 10
Italy 486 388 EUR 58 000 65 148 7 563 7 563
Jamaica 326
Japan b 541 675 JPY 6 377 966 58 688 58 688 58 688
Jordan 1 140
Kazakhstan 50 US$ 20 20 20 20
Kenya 5 690 US$ 400 400 400 400
Kiribati 26
Democratic People’s Republic of Korea 800 - - - - - -
Republic of Korea 34 139 US$ 12 000 12 000 2 902 2 902
Kuwait 203 041 US$ 15 472 15 472 4 972 10 500 15 472
Lao People’s Democratic Republic 418 US$ 61 61 61 61
Lebanon 495
Lesotho 689 US$ 115 115 115 115
Liberia 121
Libya c 52 000
Luxembourg 9 694 US$ 886 886 886 886
Madagascar 674 US$ 102 102 102 102
Malawi 123
Malaysia 1 175
Maldives 101
Mali 506 US$ 132 132 132 132
Malta 55
Mauritania 184
Mauritius 285
Mexico 43 131
Micronesia (Federated States of) 1 US$ 1 1 1 1
Republic of Moldova 105
Mongolia 108
Morocco 8 744 US$ 800 800 400 400 800
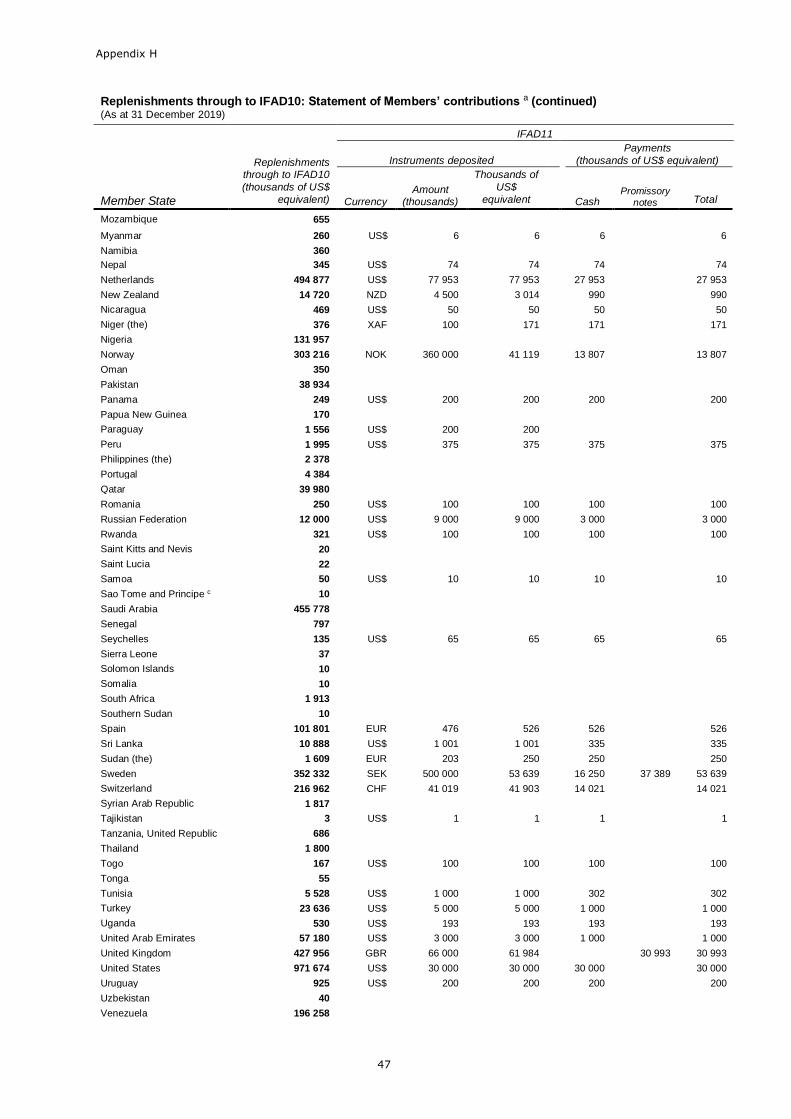
Appendix H
47
Replenishments through to IFAD10: Statement of Members’ contributions a (continued) (As at 31 December 2019)
Member State
Replenishments through to IFAD10
(thousands of US$
equivalent)
IFAD11
Instruments deposited
Payments
(thousands of US$ equivalent)
Currency Amount
(thousands)
Thousands of
US$
equivalent Cash Promissory
notes Total
Mozambique 655
Myanmar 260 US$ 6 6 6 6
Namibia 360
Nepal 345 US$ 74 74 74 74
Netherlands 494 877 US$ 77 953 77 953 27 953 27 953
New Zealand 14 720 NZD 4 500 3 014 990 990
Nicaragua 469 US$ 50 50 50 50
Niger (the) 376 XAF 100 171 171 171
Nigeria 131 957
Norway 303 216 NOK 360 000 41 119 13 807 13 807
Oman 350
Pakistan 38 934
Panama 249 US$ 200 200 200 200
Papua New Guinea 170
Paraguay 1 556 US$ 200 200
Peru 1 995 US$ 375 375 375 375
Philippines (the) 2 378
Portugal 4 384
Qatar 39 980
Romania 250 US$ 100 100 100 100
Russian Federation 12 000 US$ 9 000 9 000 3 000 3 000
Rwanda 321 US$ 100 100 100 100
Saint Kitts and Nevis 20
Saint Lucia 22
Samoa 50 US$ 10 10 10 10
Sao Tome and Principe c 10
Saudi Arabia 455 778
Senegal 797
Seychelles 135 US$ 65 65 65 65
Sierra Leone 37
Solomon Islands 10
Somalia 10
South Africa 1 913
Southern Sudan 10
Spain 101 801 EUR 476 526 526 526
Sri Lanka 10 888 US$ 1 001 1 001 335 335
Sudan (the) 1 609 EUR 203 250 250 250
Sweden 352 332 SEK 500 000 53 639 16 250 37 389 53 639
Switzerland 216 962 CHF 41 019 41 903 14 021 14 021
Syrian Arab Republic 1 817
Tajikistan 3 US$ 1 1 1 1
Tanzania, United Republic 686
Thailand 1 800
Togo 167 US$ 100 100 100 100
Tonga 55
Tunisia 5 528 US$ 1 000 1 000 302 302
Turkey 23 636 US$ 5 000 5 000 1 000 1 000
Uganda 530 US$ 193 193 193 193
United Arab Emirates 57 180 US$ 3 000 3 000 1 000 1 000
United Kingdom 427 956 GBR 66 000 61 984 30 993 30 993
United States 971 674 US$ 30 000 30 000 30 000 30 000
Uruguay 925 US$ 200 200 200 200
Uzbekistan 40
Venezuela 196 258
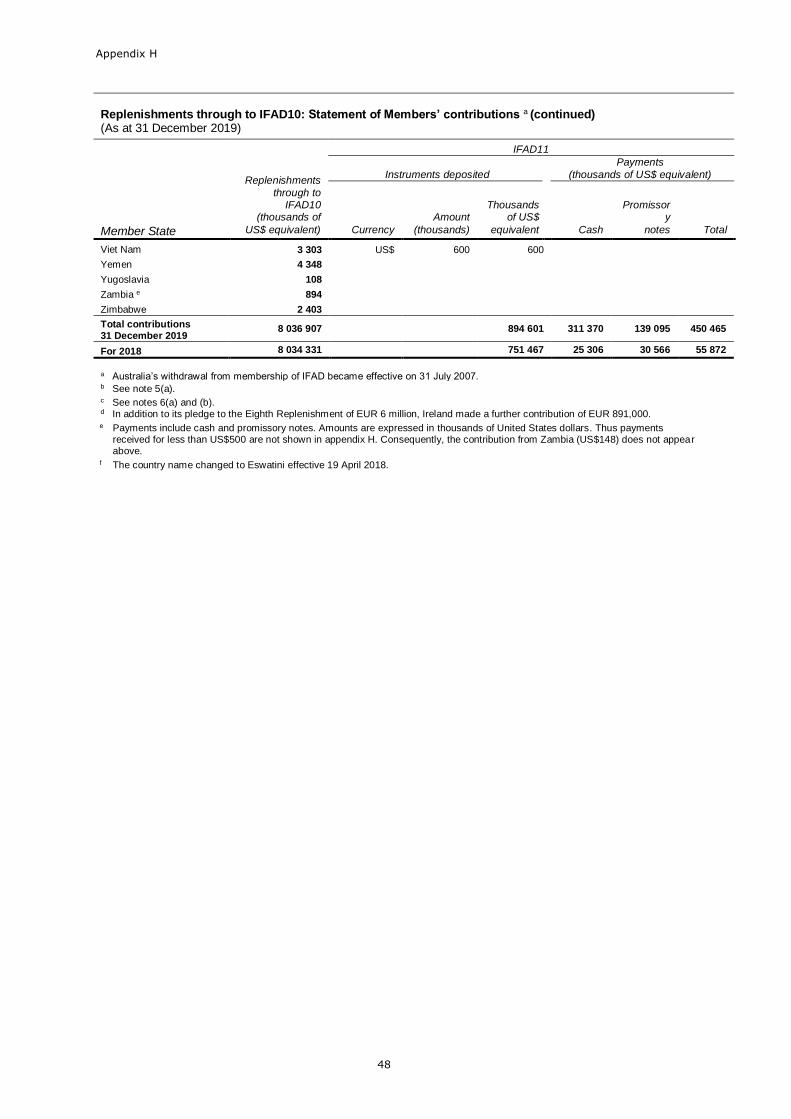
Appendix H
48
Replenishments through to IFAD10: Statement of Members’ contributions a (continued) (As at 31 December 2019)
Member State
Replenishments
through to IFAD10
(thousands of
US$ equivalent)
IFAD11
Instruments deposited
Payments
(thousands of US$ equivalent)
Currency
Amount
(thousands)
Thousands of US$
equivalent Cash
Promissory
notes Total
Viet Nam 3 303 US$ 600 600
Yemen 4 348
Yugoslavia 108
Zambia e 894
Zimbabwe 2 403
Total contributions 31 December 2019
8 036 907 894 601 311 370 139 095 450 465
For 2018 8 034 331 751 467 25 306 30 566 55 872
a Australia’s withdrawal from membership of IFAD became effective on 31 July 2007.
b See note 5(a).
c See notes 6(a) and (b).
d In addition to its pledge to the Eighth Replenishment of EUR 6 million, Ireland made a further contribution of EUR 891,000.
e Payments include cash and promissory notes. Amounts are expressed in thousands of United States dollars. Thus payments received for less than US$500 are not shown in appendix H. Consequently, the contribution from Zambia (US$148) does not appear above. f The country name changed to Eswatini effective 19 April 2018.
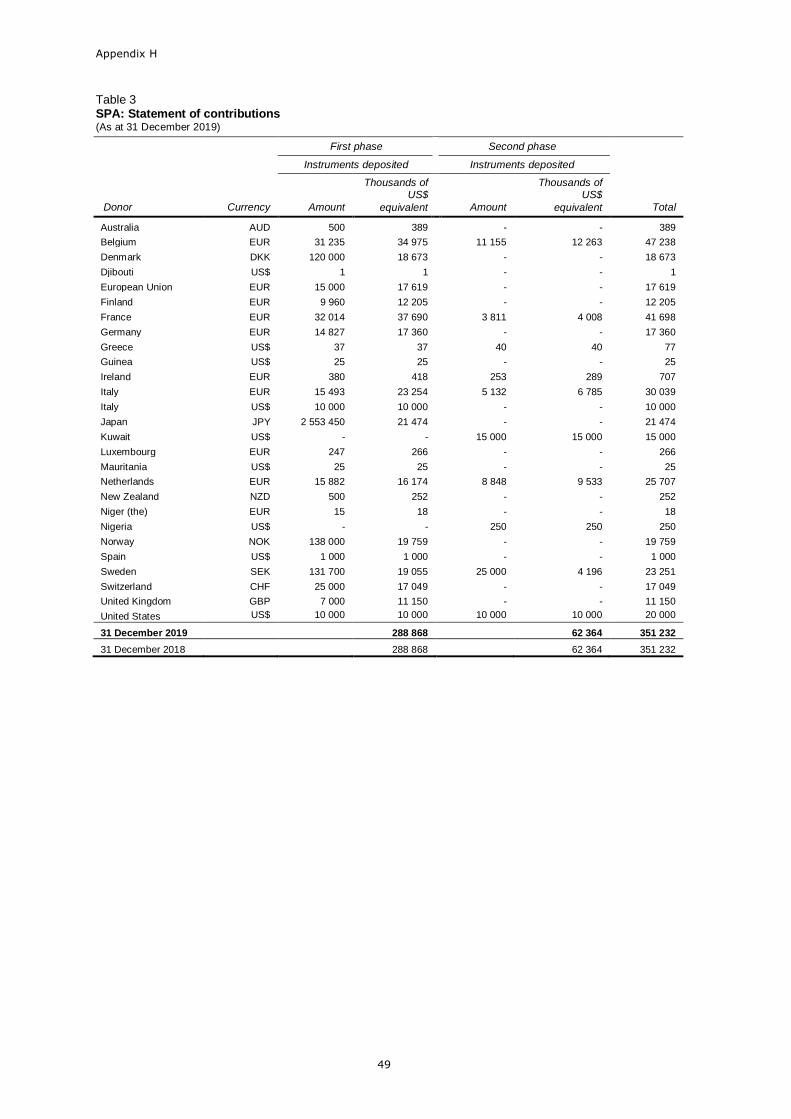
Appendix H
49
Table 3 SPA: Statement of contributions (As at 31 December 2019)
First phase Second phase
Instruments deposited Instruments deposited
Donor Currency Amount
Thousands of US$
equivalent Amount
Thousands of US$
equivalent Total
Australia AUD 500 389 - - 389
Belgium EUR 31 235 34 975 11 155 12 263 47 238
Denmark DKK 120 000 18 673 - - 18 673
Djibouti US$ 1 1 - - 1
European Union EUR 15 000 17 619 - - 17 619
Finland EUR 9 960 12 205 - - 12 205
France EUR 32 014 37 690 3 811 4 008 41 698
Germany EUR 14 827 17 360 - - 17 360
Greece US$ 37 37 40 40 77
Guinea US$ 25 25 - - 25
Ireland EUR 380 418 253 289 707
Italy EUR 15 493 23 254 5 132 6 785 30 039
Italy US$ 10 000 10 000 - - 10 000
Japan JPY 2 553 450 21 474 - - 21 474
Kuwait US$ - - 15 000 15 000 15 000
Luxembourg EUR 247 266 - - 266
Mauritania US$ 25 25 - - 25
Netherlands EUR 15 882 16 174 8 848 9 533 25 707
New Zealand NZD 500 252 - - 252
Niger (the) EUR 15 18 - - 18
Nigeria US$ - - 250 250 250
Norway NOK 138 000 19 759 - - 19 759
Spain US$ 1 000 1 000 - - 1 000
Sweden SEK 131 700 19 055 25 000 4 196 23 251
Switzerland CHF 25 000 17 049 - - 17 049
United Kingdom GBP 7 000 11 150 - - 11 150
United States US$ 10 000 10 000 10 000 10 000 20 000
31 December 2019 288 868 62 364 351 232
31 December 2018 288 868 62 364 351 232
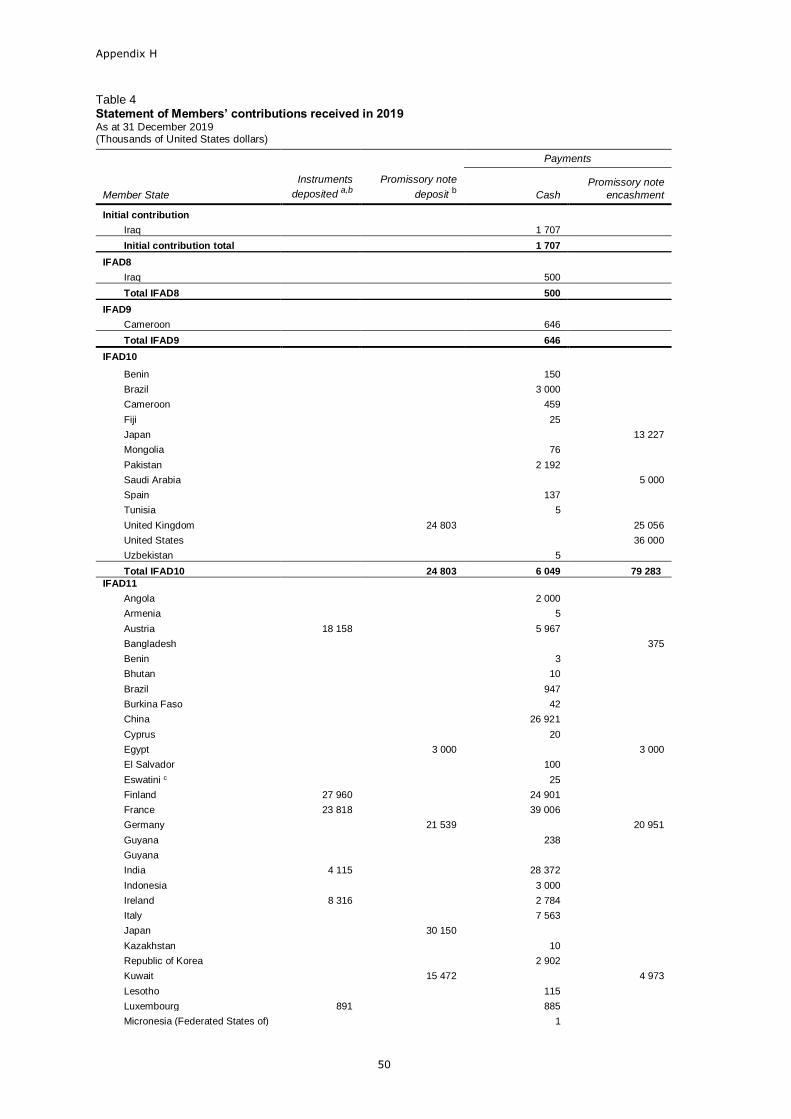
Appendix H
50
Table 4 Statement of Members’ contributions received in 2019 As at 31 December 2019 (Thousands of United States dollars)
Payments
Member State
Instruments
deposited a,b
Promissory note
deposit b Cash
Promissory note
encashment
Initial contribution
Iraq 1 707
Initial contribution total 1 707
IFAD8
Iraq 500
Total IFAD8 500
IFAD9
Cameroon 646
Total IFAD9 646
IFAD10
Benin 150
Brazil 3 000
Cameroon 459
Fiji 25
Japan 13 227
Mongolia 76
Pakistan 2 192
Saudi Arabia 5 000
Spain 137
Tunisia 5
United Kingdom 24 803 25 056
United States 36 000
Uzbekistan 5
Total IFAD10 24 803 6 049 79 283
IFAD11
Angola 2 000
Armenia 5
Austria 18 158 5 967
Bangladesh 375
Benin 3
Bhutan 10
Brazil 947
Burkina Faso 42
China 26 921
Cyprus 20
Egypt 3 000 3 000
El Salvador 100
Eswatini c 25
Finland 27 960 24 901
France 23 818 39 006
Germany 21 539 20 951
Guyana 238
Guyana
India 4 115 28 372
Indonesia 3 000
Ireland 8 316 2 784
Italy 7 563
Japan 30 150
Kazakhstan 10
Republic of Korea 2 902
Kuwait 15 472 4 973
Lesotho 115
Luxembourg 891 885
Micronesia (Federated States of) 1
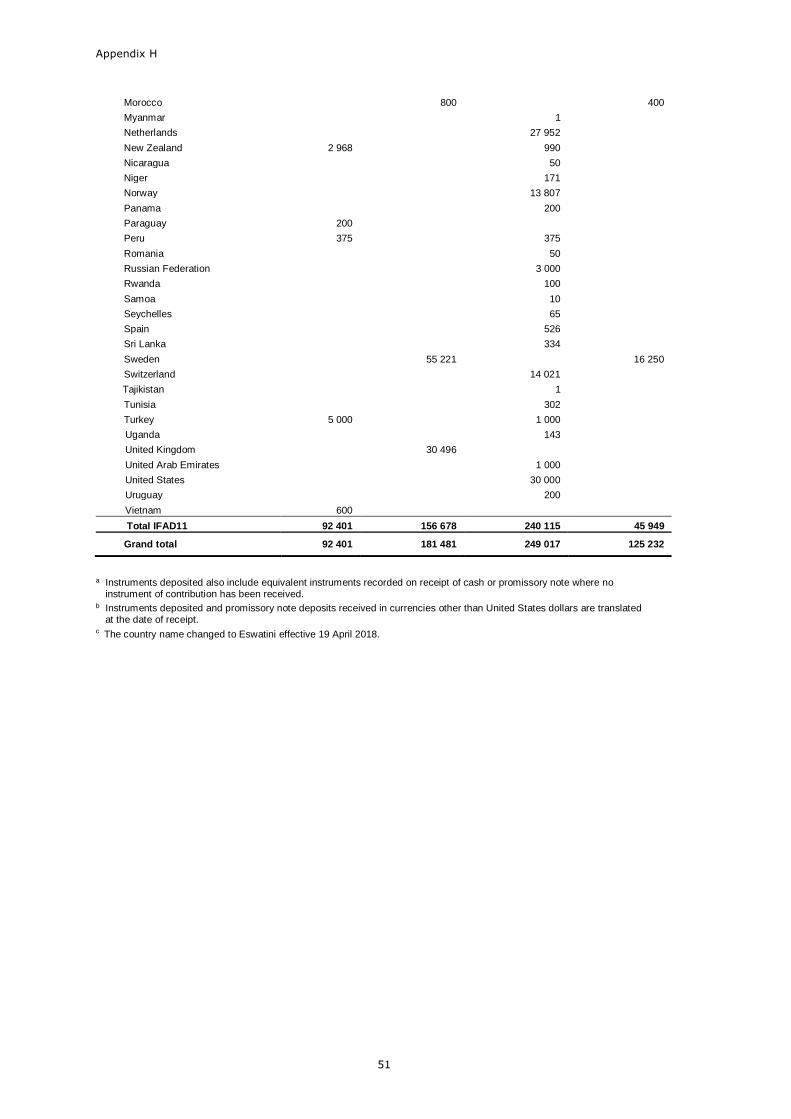
Appendix H
51
Morocco 800 400
Myanmar 1
Netherlands 27 952
New Zealand 2 968 990
Nicaragua 50
Niger 171
Norway 13 807
Panama 200
Paraguay 200
Peru 375 375
Romania 50
Russian Federation 3 000
Rwanda 100
Samoa 10
Seychelles 65
Spain 526
Sri Lanka 334
Sweden 55 221 16 250
Switzerland 14 021
Tajikistan 1
Tunisia 302
Turkey 5 000 1 000
Uganda 143
United Kingdom 30 496
United Arab Emirates 1 000
United States 30 000
Uruguay 200
Vietnam 600
Total IFAD11 92 401 156 678 240 115 45 949
Grand total 92 401 181 481 249 017 125 232
a Instruments deposited also include equivalent instruments recorded on receipt of cash or promissory note where no instrument of contribution has been received. b Instruments deposited and promissory note deposits received in currencies other than United States dollars are translated at the date of receipt. c The country name changed to Eswatini effective 19 April 2018.
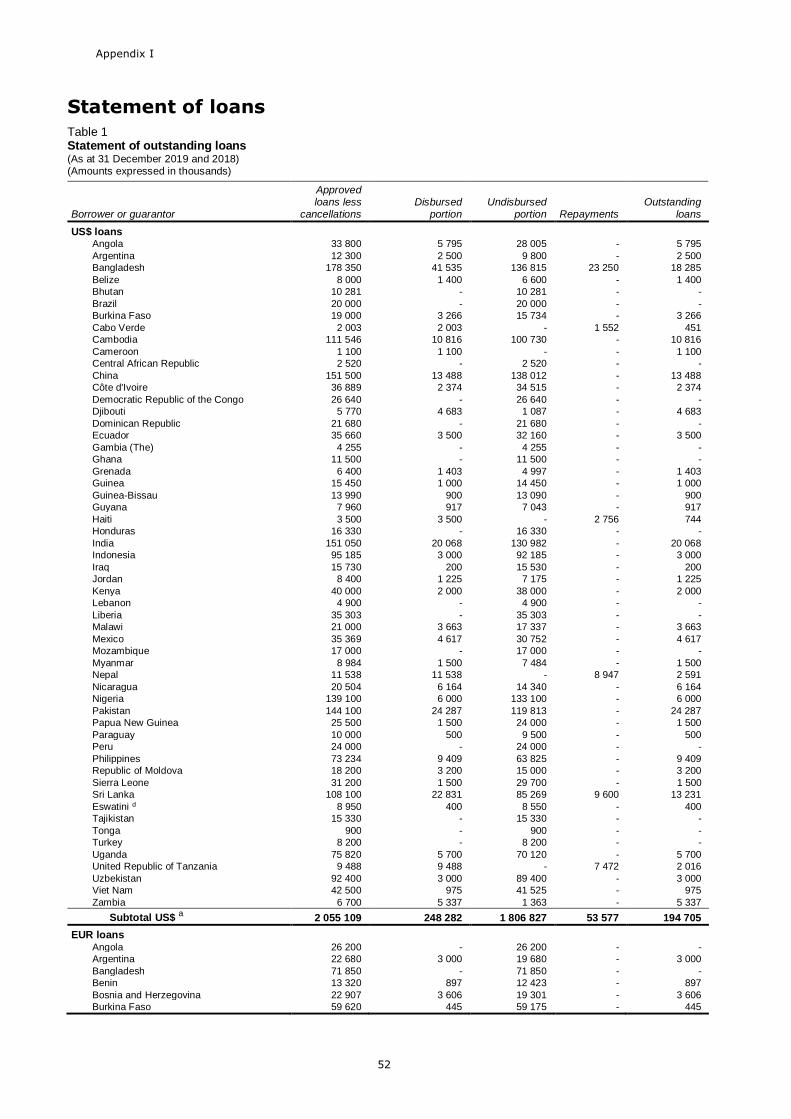
Appendix I
52
Statement of loans
Table 1 Statement of outstanding loans (As at 31 December 2019 and 2018) (Amounts expressed in thousands)
Borrower or guarantor
Approved loans less
cancellations
Disbursed portion
Undisbursed portion Repayments
Outstanding loans
US$ loans Angola 33 800 5 795 28 005 - 5 795
Argentina 12 300 2 500 9 800 - 2 500
Bangladesh 178 350 41 535 136 815 23 250 18 285
Belize 8 000 1 400 6 600 - 1 400
Bhutan 10 281 - 10 281 - -
Brazil 20 000 - 20 000 - -
Burkina Faso 19 000 3 266 15 734 - 3 266
Cabo Verde 2 003 2 003 - 1 552 451
Cambodia 111 546 10 816 100 730 - 10 816
Cameroon 1 100 1 100 - - 1 100
Central African Republic 2 520 - 2 520 - -
China 151 500 13 488 138 012 - 13 488
Côte d'Ivoire 36 889 2 374 34 515 - 2 374
Democratic Republic of the Congo 26 640 - 26 640 - -
Djibouti 5 770 4 683 1 087 - 4 683
Dominican Republic 21 680 - 21 680 - -
Ecuador 35 660 3 500 32 160 - 3 500
Gambia (The) 4 255 - 4 255 - -
Ghana 11 500 - 11 500 - -
Grenada 6 400 1 403 4 997 - 1 403
Guinea 15 450 1 000 14 450 - 1 000
Guinea-Bissau 13 990 900 13 090 - 900
Guyana 7 960 917 7 043 - 917
Haiti 3 500 3 500 - 2 756 744
Honduras 16 330 - 16 330 - -
India 151 050 20 068 130 982 - 20 068
Indonesia 95 185 3 000 92 185 - 3 000
Iraq 15 730 200 15 530 - 200
Jordan 8 400 1 225 7 175 - 1 225
Kenya 40 000 2 000 38 000 - 2 000
Lebanon 4 900 - 4 900 - -
Liberia 35 303 - 35 303 - -
Malawi 21 000 3 663 17 337 - 3 663
Mexico 35 369 4 617 30 752 - 4 617
Mozambique 17 000 - 17 000 - -
Myanmar 8 984 1 500 7 484 - 1 500
Nepal 11 538 11 538 - 8 947 2 591
Nicaragua 20 504 6 164 14 340 - 6 164
Nigeria 139 100 6 000 133 100 - 6 000
Pakistan 144 100 24 287 119 813 - 24 287
Papua New Guinea 25 500 1 500 24 000 - 1 500
Paraguay 10 000 500 9 500 - 500
Peru 24 000 - 24 000 - -
Philippines 73 234 9 409 63 825 - 9 409
Republic of Moldova 18 200 3 200 15 000 - 3 200
Sierra Leone 31 200 1 500 29 700 - 1 500
Sri Lanka 108 100 22 831 85 269 9 600 13 231
Eswatini d 8 950 400 8 550 - 400
Tajikistan 15 330 - 15 330 - -
Tonga 900 - 900 - -
Turkey 8 200 - 8 200 - -
Uganda 75 820 5 700 70 120 - 5 700
United Republic of Tanzania 9 488 9 488 - 7 472 2 016
Uzbekistan 92 400 3 000 89 400 - 3 000
Viet Nam 42 500 975 41 525 - 975
Zambia 6 700 5 337 1 363 - 5 337
Subtotal US$ a 2 055 109 248 282 1 806 827 53 577 194 705
EUR loans Angola 26 200 - 26 200 - -
Argentina 22 680 3 000 19 680 - 3 000
Bangladesh 71 850 - 71 850 - -
Benin 13 320 897 12 423 - 897
Bosnia and Herzegovina 22 907 3 606 19 301 - 3 606
Burkina Faso 59 620 445 59 175 - 445
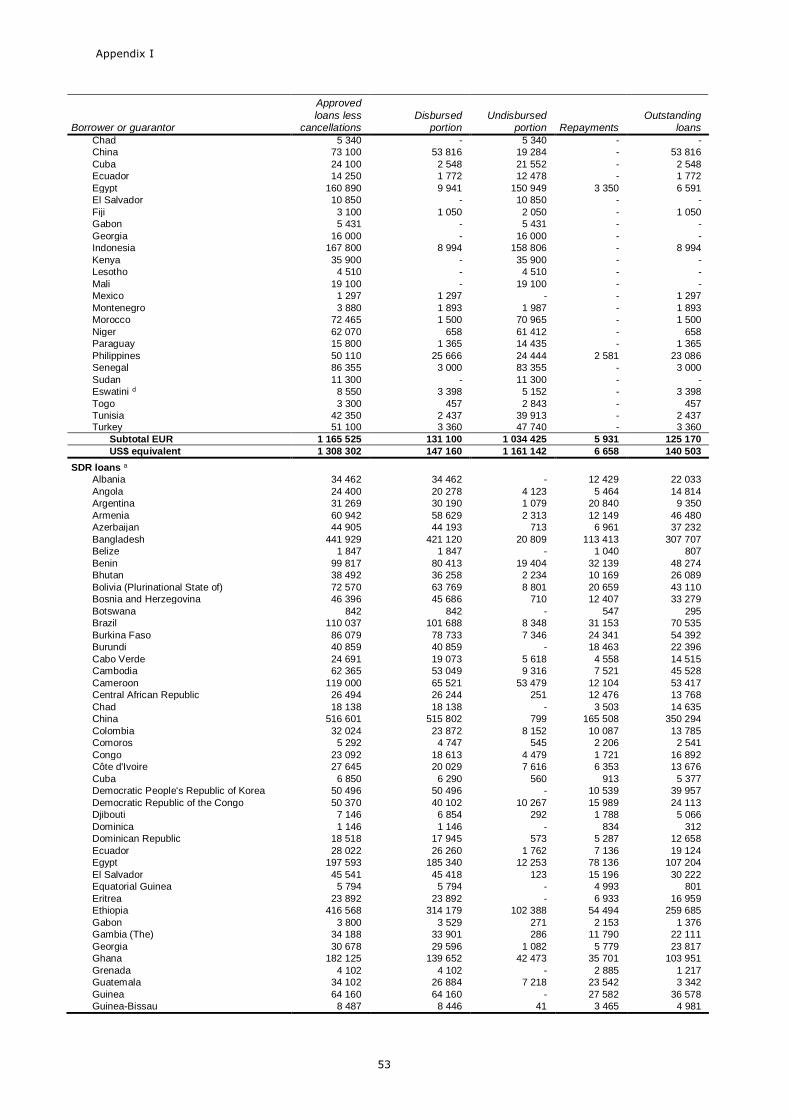
Appendix I
53
Borrower or guarantor
Approved
loans less cancellations
Disbursed portion
Undisbursed portion Repayments
Outstanding loans
Chad 5 340 - 5 340 - -
China 73 100 53 816 19 284 - 53 816
Cuba 24 100 2 548 21 552 - 2 548
Ecuador 14 250 1 772 12 478 - 1 772
Egypt 160 890 9 941 150 949 3 350 6 591
El Salvador 10 850 - 10 850 - -
Fiji 3 100 1 050 2 050 - 1 050
Gabon 5 431 - 5 431 - -
Georgia 16 000 - 16 000 - -
Indonesia 167 800 8 994 158 806 - 8 994
Kenya 35 900 - 35 900 - -
Lesotho 4 510 - 4 510 - -
Mali 19 100 - 19 100 - -
Mexico 1 297 1 297 - - 1 297
Montenegro 3 880 1 893 1 987 - 1 893
Morocco 72 465 1 500 70 965 - 1 500
Niger 62 070 658 61 412 - 658
Paraguay 15 800 1 365 14 435 - 1 365
Philippines 50 110 25 666 24 444 2 581 23 086
Senegal 86 355 3 000 83 355 - 3 000
Sudan 11 300 - 11 300 - -
Eswatini d 8 550 3 398 5 152 - 3 398
Togo 3 300 457 2 843 - 457
Tunisia 42 350 2 437 39 913 - 2 437 Turkey 51 100 3 360 47 740 - 3 360
Subtotal EUR 1 165 525 131 100 1 034 425 5 931 125 170
US$ equivalent 1 308 302 147 160 1 161 142 6 658 140 503
SDR loans a
Albania 34 462 34 462 - 12 429 22 033
Angola 24 400 20 278 4 123 5 464 14 814
Argentina 31 269 30 190 1 079 20 840 9 350
Armenia 60 942 58 629 2 313 12 149 46 480
Azerbaijan 44 905 44 193 713 6 961 37 232
Bangladesh 441 929 421 120 20 809 113 413 307 707
Belize 1 847 1 847 - 1 040 807
Benin 99 817 80 413 19 404 32 139 48 274
Bhutan 38 492 36 258 2 234 10 169 26 089
Bolivia (Plurinational State of) 72 570 63 769 8 801 20 659 43 110
Bosnia and Herzegovina 46 396 45 686 710 12 407 33 279
Botswana 842 842 - 547 295
Brazil 110 037 101 688 8 348 31 153 70 535
Burkina Faso 86 079 78 733 7 346 24 341 54 392
Burundi 40 859 40 859 - 18 463 22 396
Cabo Verde 24 691 19 073 5 618 4 558 14 515
Cambodia 62 365 53 049 9 316 7 521 45 528
Cameroon 119 000 65 521 53 479 12 104 53 417
Central African Republic 26 494 26 244 251 12 476 13 768
Chad 18 138 18 138 - 3 503 14 635
China 516 601 515 802 799 165 508 350 294
Colombia 32 024 23 872 8 152 10 087 13 785
Comoros 5 292 4 747 545 2 206 2 541
Congo 23 092 18 613 4 479 1 721 16 892
Côte d'Ivoire 27 645 20 029 7 616 6 353 13 676
Cuba 6 850 6 290 560 913 5 377
Democratic People's Republic of Korea 50 496 50 496 - 10 539 39 957
Democratic Republic of the Congo 50 370 40 102 10 267 15 989 24 113
Djibouti 7 146 6 854 292 1 788 5 066
Dominica 1 146 1 146 - 834 312
Dominican Republic 18 518 17 945 573 5 287 12 658
Ecuador 28 022 26 260 1 762 7 136 19 124
Egypt 197 593 185 340 12 253 78 136 107 204
El Salvador 45 541 45 418 123 15 196 30 222
Equatorial Guinea 5 794 5 794 - 4 993 801
Eritrea 23 892 23 892 - 6 933 16 959
Ethiopia 416 568 314 179 102 388 54 494 259 685
Gabon 3 800 3 529 271 2 153 1 376
Gambia (The) 34 188 33 901 286 11 790 22 111
Georgia 30 678 29 596 1 082 5 779 23 817
Ghana 182 125 139 652 42 473 35 701 103 951
Grenada 4 102 4 102 - 2 885 1 217
Guatemala 34 102 26 884 7 218 23 542 3 342
Guinea 64 160 64 160 - 27 582 36 578
Guinea-Bissau 8 487 8 446 41 3 465 4 981
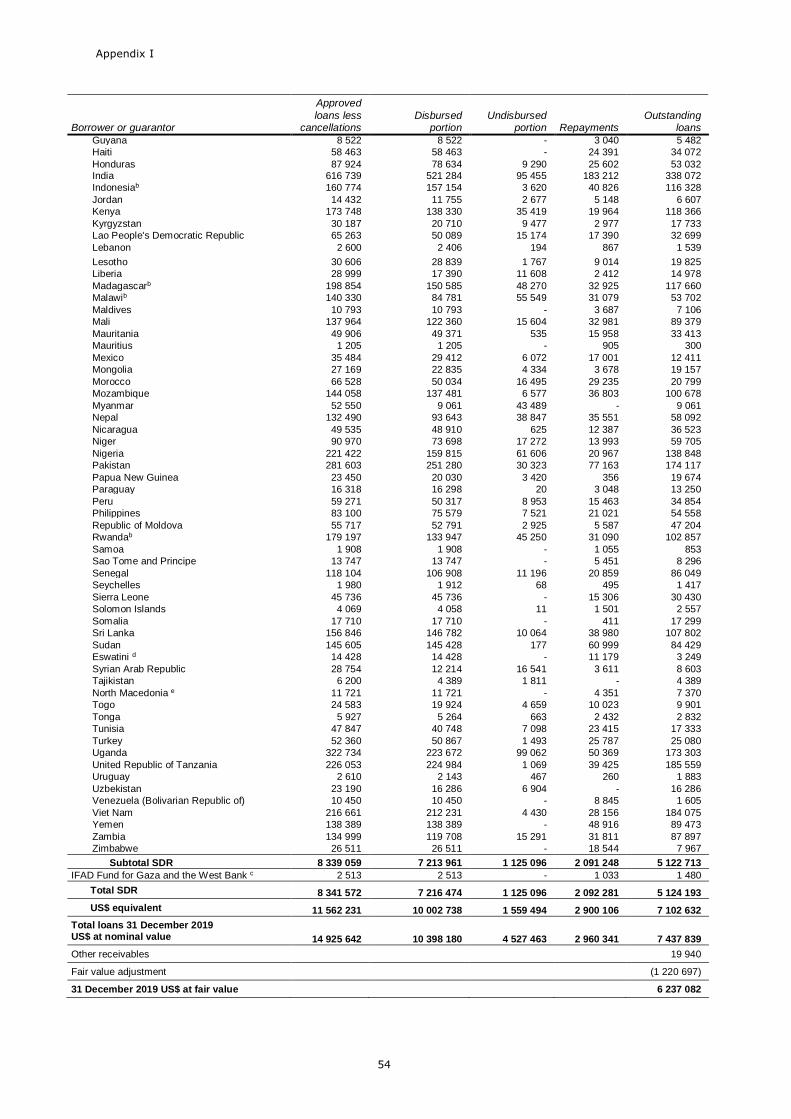
Appendix I
54
Borrower or guarantor
Approved
loans less cancellations
Disbursed portion
Undisbursed portion Repayments
Outstanding loans
Guyana 8 522 8 522 - 3 040 5 482
Haiti 58 463 58 463 - 24 391 34 072
Honduras 87 924 78 634 9 290 25 602 53 032 India 616 739 521 284 95 455 183 212 338 072
Indonesiab 160 774 157 154 3 620 40 826 116 328
Jordan 14 432 11 755 2 677 5 148 6 607
Kenya 173 748 138 330 35 419 19 964 118 366
Kyrgyzstan 30 187 20 710 9 477 2 977 17 733
Lao People's Democratic Republic 65 263 50 089 15 174 17 390 32 699
Lebanon 2 600 2 406 194 867 1 539
Lesotho 30 606 28 839 1 767 9 014 19 825
Liberia 28 999 17 390 11 608 2 412 14 978
Madagascarb 198 854 150 585 48 270 32 925 117 660
Malawib 140 330 84 781 55 549 31 079 53 702
Maldives 10 793 10 793 - 3 687 7 106
Mali 137 964 122 360 15 604 32 981 89 379
Mauritania 49 906 49 371 535 15 958 33 413
Mauritius 1 205 1 205 - 905 300
Mexico 35 484 29 412 6 072 17 001 12 411
Mongolia 27 169 22 835 4 334 3 678 19 157
Morocco 66 528 50 034 16 495 29 235 20 799
Mozambique 144 058 137 481 6 577 36 803 100 678
Myanmar 52 550 9 061 43 489 - 9 061
Nepal 132 490 93 643 38 847 35 551 58 092
Nicaragua 49 535 48 910 625 12 387 36 523
Niger 90 970 73 698 17 272 13 993 59 705
Nigeria 221 422 159 815 61 606 20 967 138 848
Pakistan 281 603 251 280 30 323 77 163 174 117
Papua New Guinea 23 450 20 030 3 420 356 19 674
Paraguay 16 318 16 298 20 3 048 13 250
Peru 59 271 50 317 8 953 15 463 34 854
Philippines 83 100 75 579 7 521 21 021 54 558
Republic of Moldova 55 717 52 791 2 925 5 587 47 204
Rwandab 179 197 133 947 45 250 31 090 102 857
Samoa 1 908 1 908 - 1 055 853
Sao Tome and Principe 13 747 13 747 - 5 451 8 296
Senegal 118 104 106 908 11 196 20 859 86 049
Seychelles 1 980 1 912 68 495 1 417
Sierra Leone 45 736 45 736 - 15 306 30 430
Solomon Islands 4 069 4 058 11 1 501 2 557
Somalia 17 710 17 710 - 411 17 299
Sri Lanka 156 846 146 782 10 064 38 980 107 802
Sudan 145 605 145 428 177 60 999 84 429
Eswatini d 14 428 14 428 - 11 179 3 249
Syrian Arab Republic 28 754 12 214 16 541 3 611 8 603
Tajikistan 6 200 4 389 1 811 - 4 389
North Macedonia e 11 721 11 721 - 4 351 7 370
Togo 24 583 19 924 4 659 10 023 9 901
Tonga 5 927 5 264 663 2 432 2 832
Tunisia 47 847 40 748 7 098 23 415 17 333
Turkey 52 360 50 867 1 493 25 787 25 080
Uganda 322 734 223 672 99 062 50 369 173 303
United Republic of Tanzania 226 053 224 984 1 069 39 425 185 559
Uruguay 2 610 2 143 467 260 1 883
Uzbekistan 23 190 16 286 6 904 - 16 286
Venezuela (Bolivarian Republic of) 10 450 10 450 - 8 845 1 605
Viet Nam 216 661 212 231 4 430 28 156 184 075
Yemen 138 389 138 389 - 48 916 89 473
Zambia 134 999 119 708 15 291 31 811 87 897
Zimbabwe 26 511 26 511 - 18 544 7 967
Subtotal SDR 8 339 059 7 213 961 1 125 096 2 091 248 5 122 713
IFAD Fund for Gaza and the West Bank c 2 513 2 513 - 1 033 1 480
Total SDR 8 341 572 7 216 474 1 125 096 2 092 281 5 124 193
US$ equivalent 11 562 231 10 002 738 1 559 494 2 900 106 7 102 632
Total loans 31 December 2019 US$ at nominal value 14 925 642 10 398 180 4 527 463 2 960 341 7 437 839
Other receivables 19 940
Fair value adjustment (1 220 697)
31 December 2019 US$ at fair value 6 237 082
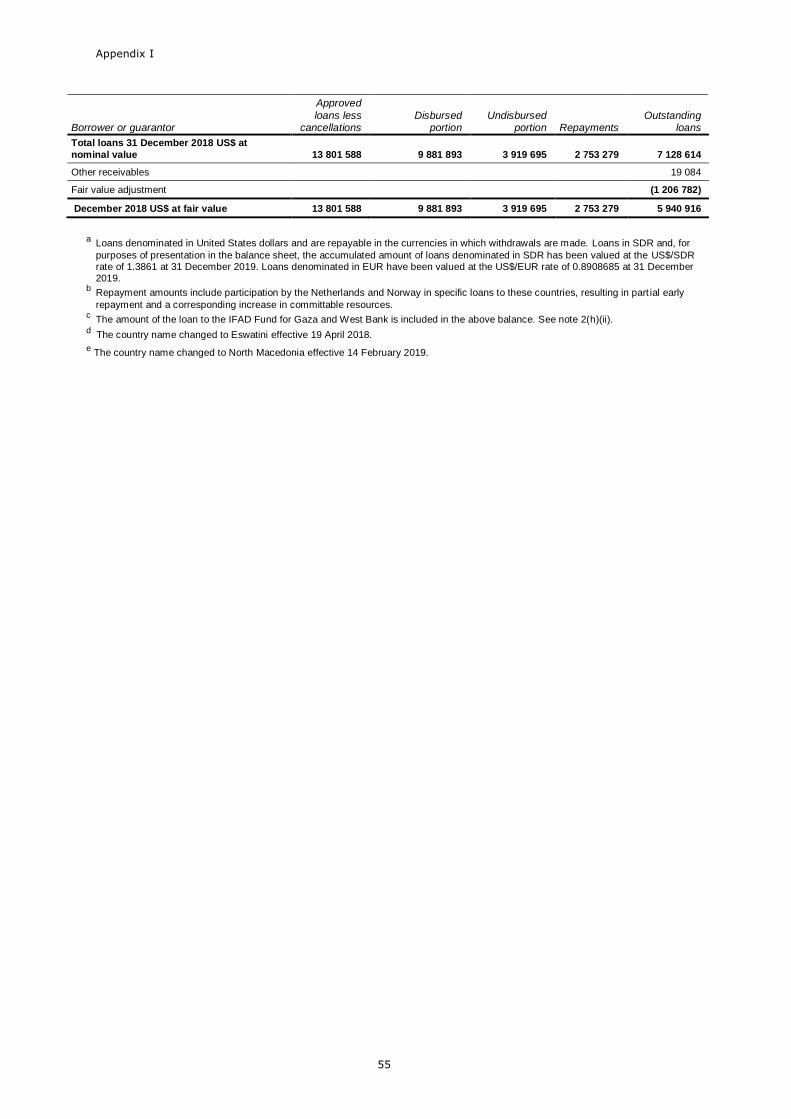
Appendix I
55
Borrower or guarantor
Approved
loans less cancellations
Disbursed portion
Undisbursed portion Repayments
Outstanding loans
Total loans 31 December 2018 US$ at
nominal value 13 801 588 9 881 893 3 919 695 2 753 279 7 128 614
Other receivables 19 084
Fair value adjustment (1 206 782)
December 2018 US$ at fair value 13 801 588 9 881 893 3 919 695 2 753 279 5 940 916
a Loans denominated in United States dollars and are repayable in the currencies in which withdrawals are made. Loans in SDR and, for
purposes of presentation in the balance sheet, the accumulated amount of loans denominated in SDR has been valued at the US$/SDR rate of 1.3861 at 31 December 2019. Loans denominated in EUR have been valued at the US$/EUR rate of 0.8908685 at 31 December 2019.
b Repayment amounts include participation by the Netherlands and Norway in specific loans to these countries, resulting in part ial early
repayment and a corresponding increase in committable resources. c The amount of the loan to the IFAD Fund for Gaza and West Bank is included in the above balance. See note 2(h)(ii).
d The country name changed to Eswatini effective 19 April 2018.
e The country name changed to North Macedonia effective 14 February 2019.
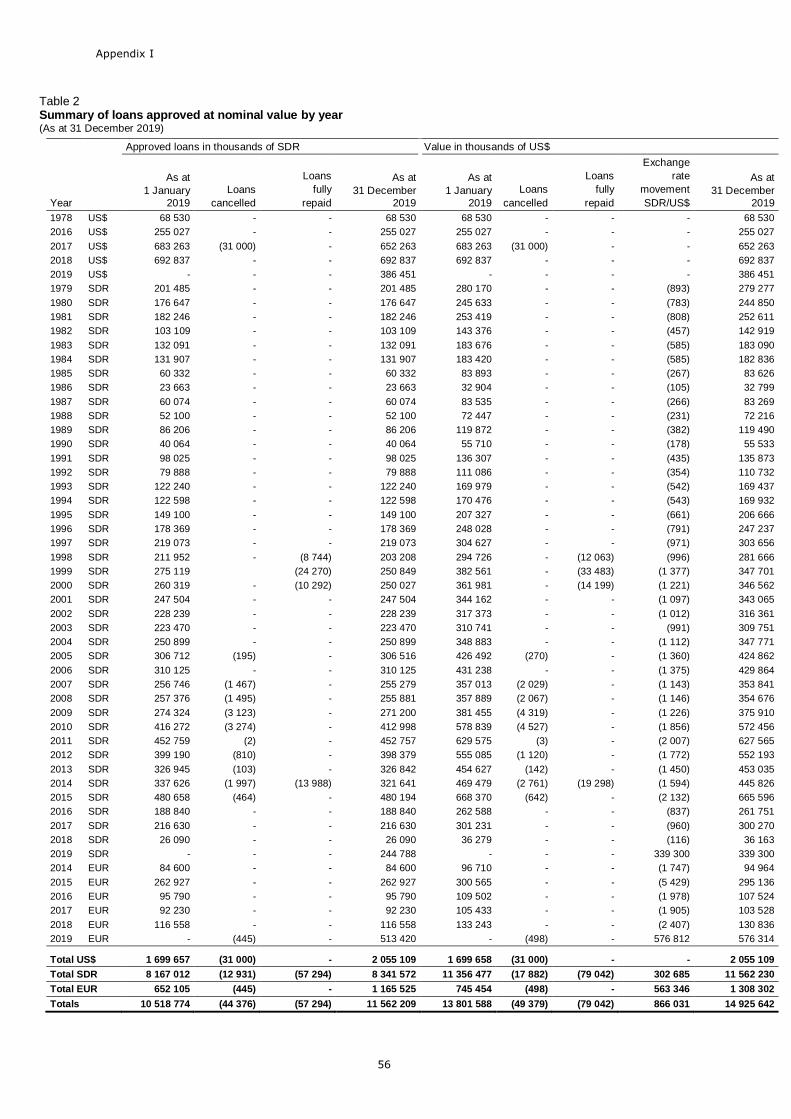
Appendix I
56
Table 2 Summary of loans approved at nominal value by year
(As at 31 December 2019)
Year
Approved loans in thousands of SDR Value in thousands of US$
As at
1 January
2019
Loans
cancelled
Loans
fully
repaid
As at
31 December
2019
As at
1 January
2019
Loans
cancelled
Loans
fully
repaid
Exchange
rate
movement
SDR/US$
As at
31 December
2019
1978 US$ 68 530 - - 68 530 68 530 - - - 68 530
2016 US$ 255 027 - - 255 027 255 027 - - - 255 027
2017 US$ 683 263 (31 000) - 652 263 683 263 (31 000) - - 652 263
2018 US$ 692 837 - - 692 837 692 837 - - - 692 837
2019 US$ - - - 386 451 - - - - 386 451
1979 SDR 201 485 - - 201 485 280 170 - - (893) 279 277
1980 SDR 176 647 - - 176 647 245 633 - - (783) 244 850
1981 SDR 182 246 - - 182 246 253 419 - - (808) 252 611
1982 SDR 103 109 - - 103 109 143 376 - - (457) 142 919
1983 SDR 132 091 - - 132 091 183 676 - - (585) 183 090
1984 SDR 131 907 - - 131 907 183 420 - - (585) 182 836
1985 SDR 60 332 - - 60 332 83 893 - - (267) 83 626
1986 SDR 23 663 - - 23 663 32 904 - - (105) 32 799
1987 SDR 60 074 - - 60 074 83 535 - - (266) 83 269
1988 SDR 52 100 - - 52 100 72 447 - - (231) 72 216
1989 SDR 86 206 - - 86 206 119 872 - - (382) 119 490
1990 SDR 40 064 - - 40 064 55 710 - - (178) 55 533
1991 SDR 98 025 - - 98 025 136 307 - - (435) 135 873
1992 SDR 79 888 - - 79 888 111 086 - - (354) 110 732
1993 SDR 122 240 - - 122 240 169 979 - - (542) 169 437
1994 SDR 122 598 - - 122 598 170 476 - - (543) 169 932
1995 SDR 149 100 - - 149 100 207 327 - - (661) 206 666
1996 SDR 178 369 - - 178 369 248 028 - - (791) 247 237
1997 SDR 219 073 - - 219 073 304 627 - - (971) 303 656
1998 SDR 211 952 - (8 744) 203 208 294 726 - (12 063) (996) 281 666
1999 SDR 275 119 (24 270) 250 849 382 561 - (33 483) (1 377) 347 701
2000 SDR 260 319 - (10 292) 250 027 361 981 - (14 199) (1 221) 346 562
2001 SDR 247 504 - - 247 504 344 162 - - (1 097) 343 065
2002 SDR 228 239 - - 228 239 317 373 - - (1 012) 316 361
2003 SDR 223 470 - - 223 470 310 741 - - (991) 309 751
2004 SDR 250 899 - - 250 899 348 883 - - (1 112) 347 771
2005 SDR 306 712 (195) - 306 516 426 492 (270) - (1 360) 424 862
2006 SDR 310 125 - - 310 125 431 238 - - (1 375) 429 864
2007 SDR 256 746 (1 467) - 255 279 357 013 (2 029) - (1 143) 353 841
2008 SDR 257 376 (1 495) - 255 881 357 889 (2 067) - (1 146) 354 676
2009 SDR 274 324 (3 123) - 271 200 381 455 (4 319) - (1 226) 375 910
2010 SDR 416 272 (3 274) - 412 998 578 839 (4 527) - (1 856) 572 456
2011 SDR 452 759 (2) - 452 757 629 575 (3) - (2 007) 627 565
2012 SDR 399 190 (810) - 398 379 555 085 (1 120) - (1 772) 552 193
2013 SDR 326 945 (103) - 326 842 454 627 (142) - (1 450) 453 035
2014 SDR 337 626 (1 997) (13 988) 321 641 469 479 (2 761) (19 298) (1 594) 445 826
2015 SDR 480 658 (464) - 480 194 668 370 (642) - (2 132) 665 596
2016 SDR 188 840 - - 188 840 262 588 - - (837) 261 751
2017 SDR 216 630 - - 216 630 301 231 - - (960) 300 270
2018 SDR 26 090 - - 26 090 36 279 - - (116) 36 163
2019 SDR - - - 244 788 - - - 339 300 339 300
2014 EUR 84 600 - - 84 600 96 710 - - (1 747) 94 964
2015 EUR 262 927 - - 262 927 300 565 - - (5 429) 295 136
2016 EUR 95 790 - - 95 790 109 502 - - (1 978) 107 524
2017 EUR 92 230 - - 92 230 105 433 - - (1 905) 103 528
2018 EUR 116 558 - - 116 558 133 243 - - (2 407) 130 836
2019 EUR - (445) - 513 420 - (498) - 576 812 576 314
Total US$ 1 699 657 (31 000) - 2 055 109 1 699 658 (31 000) - - 2 055 109
Total SDR 8 167 012 (12 931) (57 294) 8 341 572 11 356 477 (17 882) (79 042) 302 685 11 562 230
Total EUR 652 105 (445) - 1 165 525 745 454 (498) - 563 346 1 308 302
Totals 10 518 774 (44 376) (57 294) 11 562 209 13 801 588 (49 379) (79 042) 866 031 14 925 642
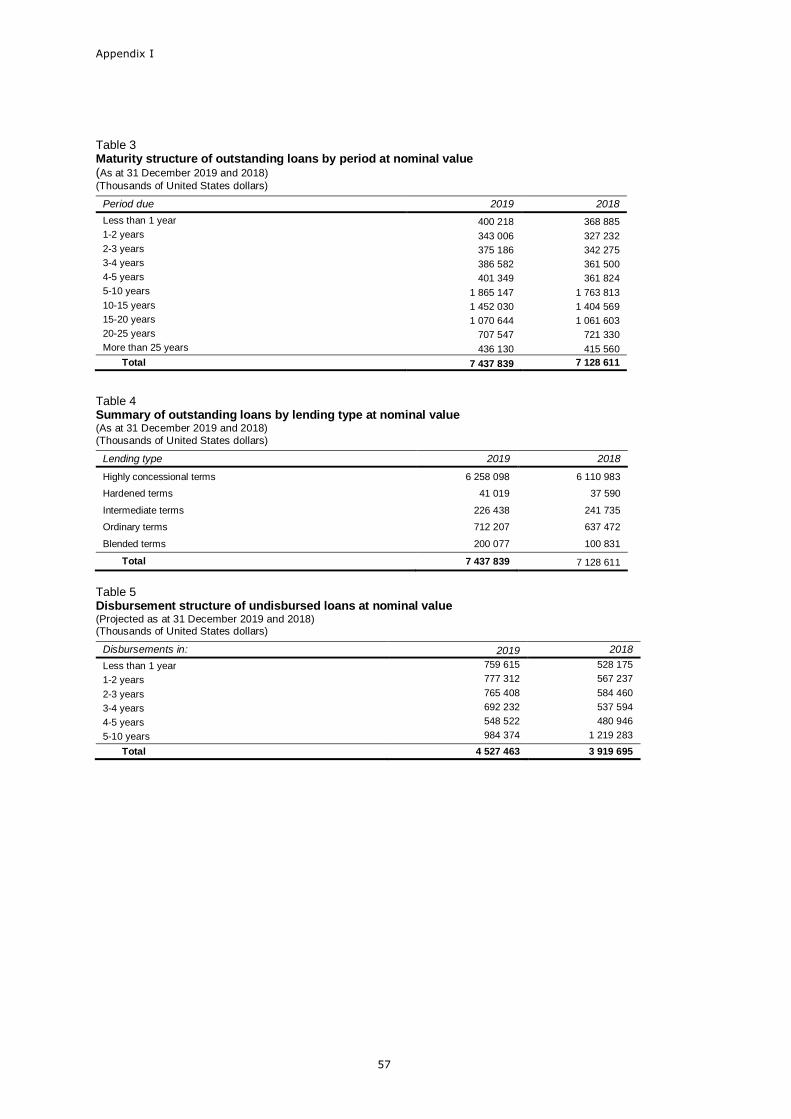
Appendix I
57
Table 3 Maturity structure of outstanding loans by period at nominal value (As at 31 December 2019 and 2018)
(Thousands of United States dollars)
Period due 2019 2018
Less than 1 year 400 218 368 885
1-2 years 343 006 327 232
2-3 years 375 186 342 275
3-4 years 386 582 361 500
4-5 years 401 349 361 824
5-10 years 1 865 147 1 763 813
10-15 years 1 452 030 1 404 569
15-20 years 1 070 644 1 061 603
20-25 years 707 547 721 330
More than 25 years 436 130 415 560
Total 7 437 839 7 128 611
Table 4 Summary of outstanding loans by lending type at nominal value (As at 31 December 2019 and 2018)
(Thousands of United States dollars)
Lending type 2019 2018
Highly concessional terms 6 258 098 6 110 983
Hardened terms 41 019 37 590
Intermediate terms 226 438 241 735
Ordinary terms 712 207 637 472
Blended terms 200 077 100 831
Total 7 437 839 7 128 611
Table 5 Disbursement structure of undisbursed loans at nominal value (Projected as at 31 December 2019 and 2018) (Thousands of United States dollars)
Disbursements in: 2019 2018
Less than 1 year 759 615 528 175
1-2 years 777 312 567 237
2-3 years 765 408 584 460
3-4 years 692 232 537 594
4-5 years 548 522 480 946
5-10 years 984 374 1 219 283
Total 4 527 463 3 919 695
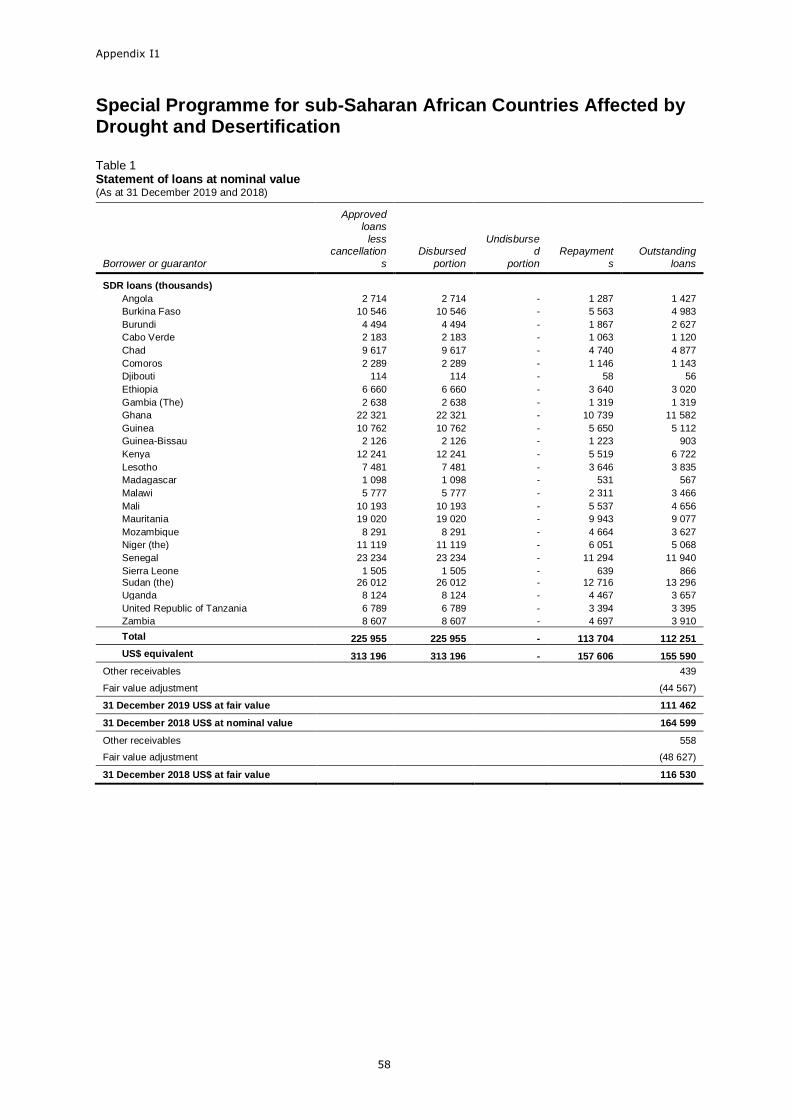
Appendix I1
58
Special Programme for sub-Saharan African Countries Affected by Drought and Desertification
Table 1 Statement of loans at nominal value (As at 31 December 2019 and 2018)
Borrower or guarantor
Approved loans
less cancellation
s
Disbursed
portion
Undisbursed
portion
Repayment
s
Outstanding
loans
SDR loans (thousands)
Angola 2 714 2 714 - 1 287 1 427
Burkina Faso 10 546 10 546 - 5 563 4 983
Burundi 4 494 4 494 - 1 867 2 627
Cabo Verde 2 183 2 183 - 1 063 1 120
Chad 9 617 9 617 - 4 740 4 877
Comoros 2 289 2 289 - 1 146 1 143
Djibouti 114 114 - 58 56
Ethiopia 6 660 6 660 - 3 640 3 020
Gambia (The) 2 638 2 638 - 1 319 1 319
Ghana 22 321 22 321 - 10 739 11 582
Guinea 10 762 10 762 - 5 650 5 112
Guinea-Bissau 2 126 2 126 - 1 223 903
Kenya 12 241 12 241 - 5 519 6 722
Lesotho 7 481 7 481 - 3 646 3 835
Madagascar 1 098 1 098 - 531 567
Malawi 5 777 5 777 - 2 311 3 466
Mali 10 193 10 193 - 5 537 4 656
Mauritania 19 020 19 020 - 9 943 9 077
Mozambique 8 291 8 291 - 4 664 3 627
Niger (the) 11 119 11 119 - 6 051 5 068
Senegal 23 234 23 234 - 11 294 11 940
Sierra Leone 1 505 1 505 - 639 866 Sudan (the) 26 012 26 012 - 12 716 13 296
Uganda 8 124 8 124 - 4 467 3 657
United Republic of Tanzania 6 789 6 789 - 3 394 3 395
Zambia 8 607 8 607 - 4 697 3 910
Total 225 955 225 955 - 113 704 112 251
US$ equivalent 313 196 313 196 - 157 606 155 590
Other receivables 439
Fair value adjustment (44 567)
31 December 2019 US$ at fair value 111 462
31 December 2018 US$ at nominal value 164 599
Other receivables 558
Fair value adjustment (48 627)
31 December 2018 US$ at fair value 116 530
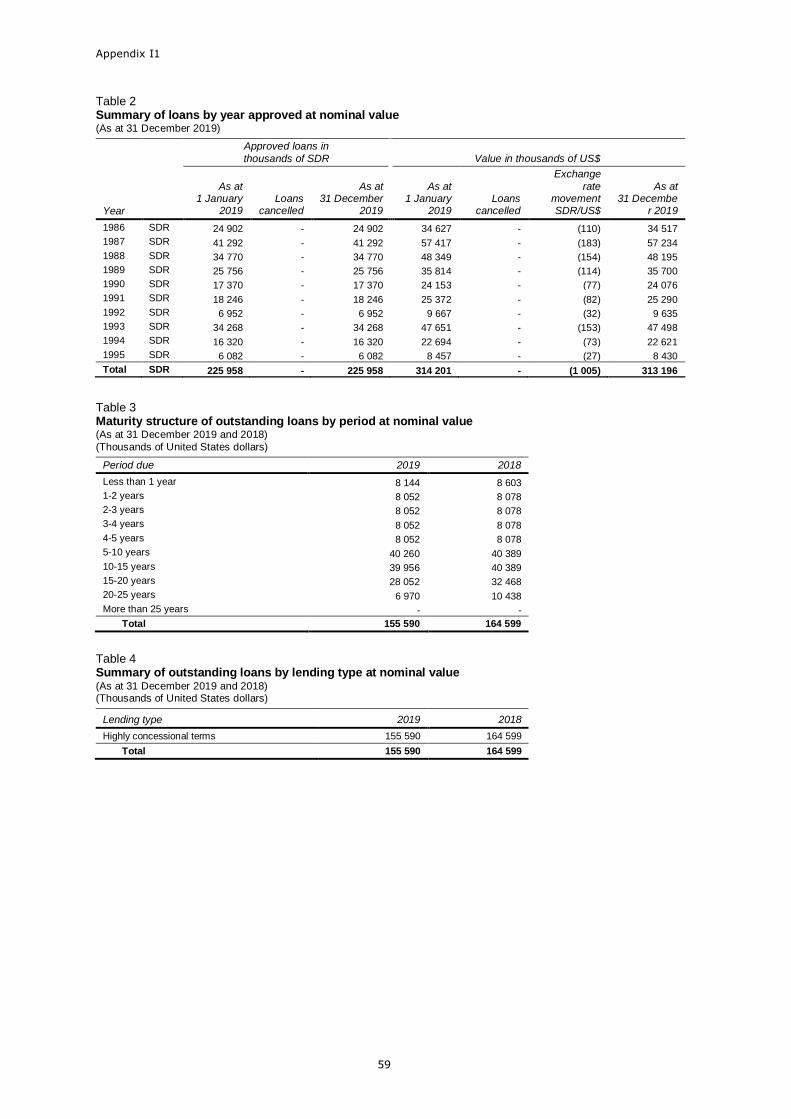
Appendix I1
59
Table 2 Summary of loans by year approved at nominal value (As at 31 December 2019)
Approved loans in
thousands of SDR
Value in thousands of US$
Year
As at 1 January
2019 Loans
cancelled
As at 31 December
2019
As at 1 January
2019 Loans
cancelled
Exchange
rate movement SDR/US$
As at 31 Decembe
r 2019
1986 SDR 24 902 - 24 902 34 627 - (110) 34 517
1987 SDR 41 292 - 41 292 57 417 - (183) 57 234
1988 SDR 34 770 - 34 770 48 349 - (154) 48 195
1989 SDR 25 756 - 25 756 35 814 - (114) 35 700
1990 SDR 17 370 - 17 370 24 153 - (77) 24 076
1991 SDR 18 246 - 18 246 25 372 - (82) 25 290
1992 SDR 6 952 - 6 952 9 667 - (32) 9 635
1993 SDR 34 268 - 34 268 47 651 - (153) 47 498
1994 SDR 16 320 - 16 320 22 694 - (73) 22 621
1995 SDR 6 082 - 6 082 8 457 - (27) 8 430
Total SDR 225 958 - 225 958 314 201 - (1 005) 313 196
Table 3 Maturity structure of outstanding loans by period at nominal value (As at 31 December 2019 and 2018)
(Thousands of United States dollars)
Period due 2019 2018
Less than 1 year 8 144 8 603
1-2 years 8 052 8 078
2-3 years 8 052 8 078
3-4 years 8 052 8 078
4-5 years 8 052 8 078
5-10 years 40 260 40 389
10-15 years 39 956 40 389
15-20 years 28 052 32 468
20-25 years 6 970 10 438
More than 25 years - -
Total 155 590 164 599
Table 4 Summary of outstanding loans by lending type at nominal value (As at 31 December 2019 and 2018) (Thousands of United States dollars)
Lending type 2019 2018
Highly concessional terms 155 590 164 599
Total 155 590 164 599
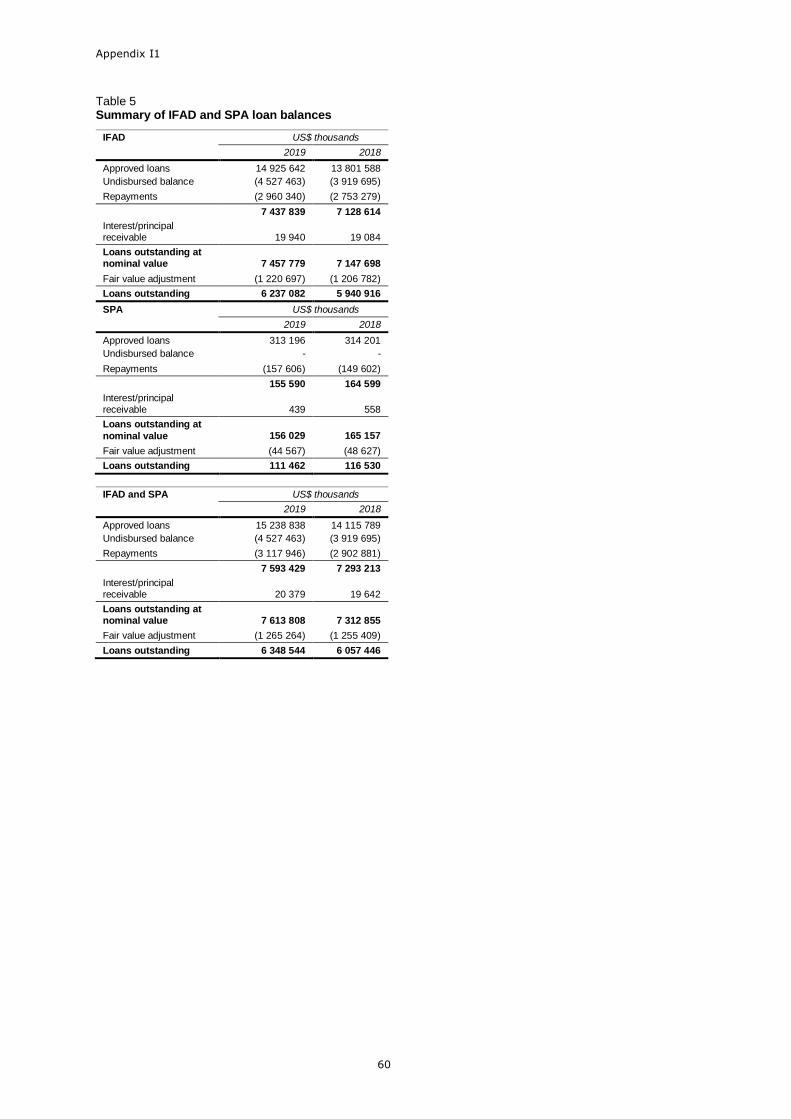
Appendix I1
60
Table 5 Summary of IFAD and SPA loan balances
IFAD US$ thousands
2019 2018
Approved loans 14 925 642 13 801 588
Undisbursed balance (4 527 463) (3 919 695)
Repayments (2 960 340) (2 753 279)
7 437 839 7 128 614
Interest/principal receivable 19 940 19 084
Loans outstanding at nominal value 7 457 779 7 147 698
Fair value adjustment (1 220 697) (1 206 782)
Loans outstanding 6 237 082 5 940 916
SPA US$ thousands
2019 2018
Approved loans 313 196 314 201
Undisbursed balance - -
Repayments (157 606) (149 602)
155 590 164 599
Interest/principal receivable 439 558
Loans outstanding at
nominal value 156 029 165 157
Fair value adjustment (44 567) (48 627)
Loans outstanding 111 462 116 530
IFAD and SPA US$ thousands
2019 2018
Approved loans 15 238 838 14 115 789
Undisbursed balance (4 527 463) (3 919 695)
Repayments (3 117 946) (2 902 881)
7 593 429 7 293 213
Interest/principal receivable 20 379 19 642
Loans outstanding at nominal value 7 613 808 7 312 855
Fair value adjustment (1 265 264) (1 255 409)
Loans outstanding 6 348 544 6 057 446
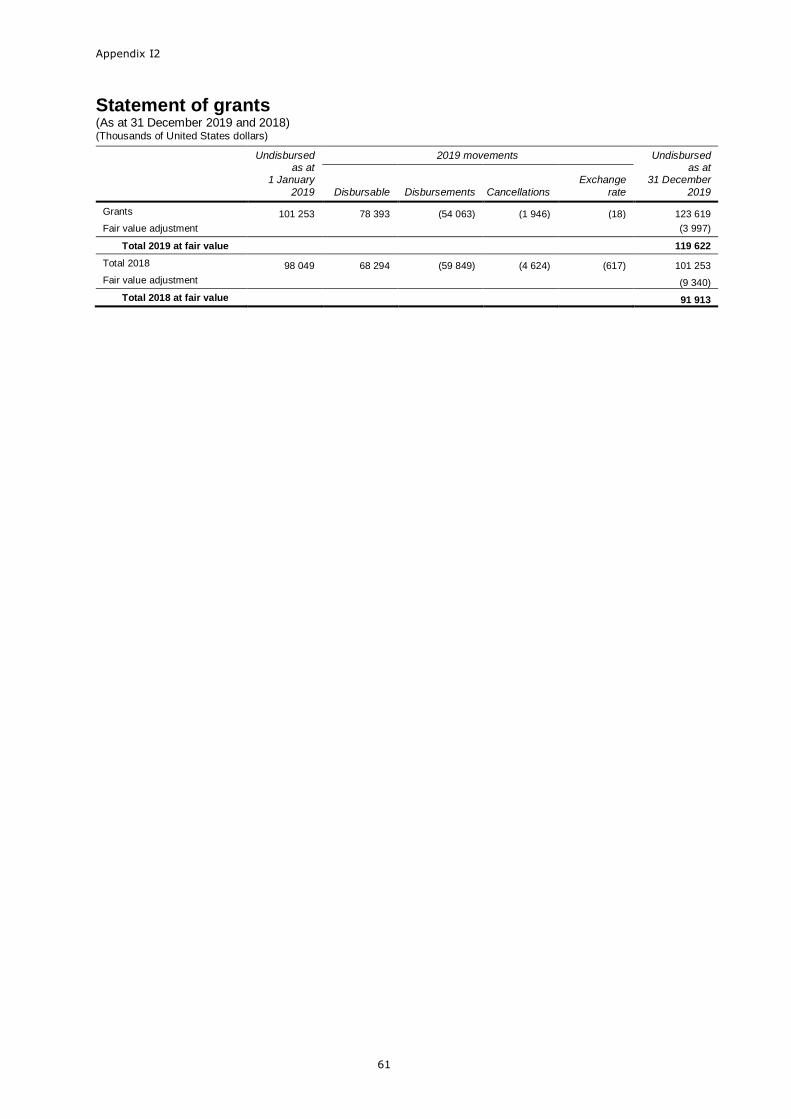
Appendix I2
61
Statement of grants (As at 31 December 2019 and 2018) (Thousands of United States dollars)
Undisbursed as at
1 January
2019
2019 movements Undisbursed as at
31 December
2019 Disbursable Disbursements Cancellations
Exchange
rate
Grants 101 253 78 393 (54 063) (1 946) (18) 123 619
Fair value adjustment (3 997)
Total 2019 at fair value 119 622
Total 2018 98 049 68 294 (59 849) (4 624) (617) 101 253
Fair value adjustment (9 340)
Total 2018 at fair value 91 913
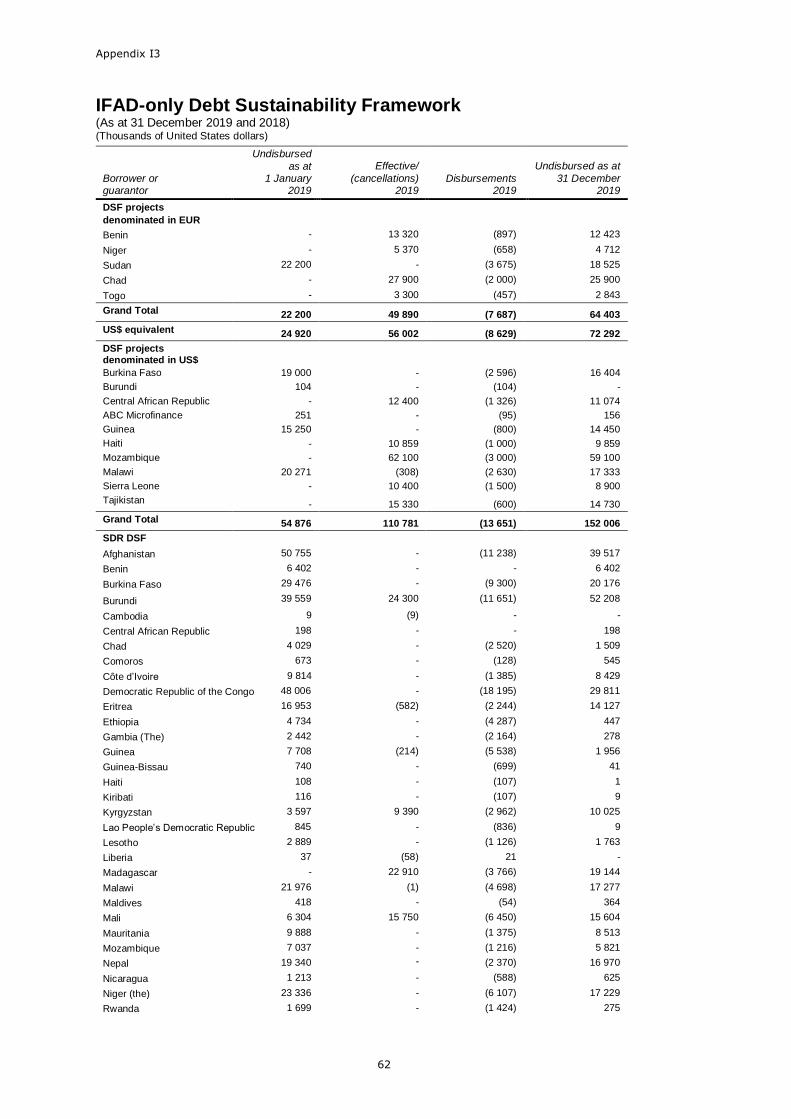
Appendix I3
62
IFAD-only Debt Sustainability Framework (As at 31 December 2019 and 2018) (Thousands of United States dollars)
Borrower or guarantor
Undisbursed
as at 1 January
2019
Effective/
(cancellations) 2019
Disbursements 2019
Undisbursed as at
31 December 2019
DSF projects
denominated in EUR
Benin - 13 320 (897) 12 423
Niger - 5 370 (658) 4 712
Sudan 22 200 - (3 675) 18 525
Chad - 27 900 (2 000) 25 900
Togo - 3 300 (457) 2 843
Grand Total 22 200 49 890 (7 687) 64 403
US$ equivalent 24 920 56 002 (8 629) 72 292
DSF projects denominated in US$
Burkina Faso 19 000 - (2 596) 16 404
Burundi 104 - (104) -
Central African Republic - 12 400 (1 326) 11 074
ABC Microfinance 251 - (95) 156
Guinea 15 250 - (800) 14 450
Haiti - 10 859 (1 000) 9 859
Mozambique - 62 100 (3 000) 59 100
Malawi 20 271 (308) (2 630) 17 333
Sierra Leone - 10 400 (1 500) 8 900
Tajikistan - 15 330 (600) 14 730
Grand Total 54 876 110 781 (13 651) 152 006
SDR DSF
Afghanistan 50 755 - (11 238) 39 517
Benin 6 402 - - 6 402
Burkina Faso 29 476 - (9 300) 20 176
Burundi 39 559 24 300 (11 651) 52 208
Cambodia 9 (9) - -
Central African Republic 198 - - 198
Chad 4 029 - (2 520) 1 509
Comoros 673 - (128) 545
Côte d’Ivoire 9 814 - (1 385) 8 429
Democratic Republic of the Congo 48 006 - (18 195) 29 811
Eritrea 16 953 (582) (2 244) 14 127
Ethiopia 4 734 - (4 287) 447
Gambia (The) 2 442 - (2 164) 278
Guinea 7 708 (214) (5 538) 1 956
Guinea-Bissau 740 - (699) 41
Haiti 108 - (107) 1
Kiribati 116 - (107) 9
Kyrgyzstan 3 597 9 390 (2 962) 10 025
Lao People’s Democratic Republic 845 - (836) 9
Lesotho 2 889 - (1 126) 1 763
Liberia 37 (58) 21 -
Madagascar - 22 910 (3 766) 19 144
Malawi 21 976 (1) (4 698) 17 277
Maldives 418 - (54) 364
Mali 6 304 15 750 (6 450) 15 604
Mauritania 9 888 - (1 375) 8 513
Mozambique 7 037 - (1 216) 5 821
Nepal 19 340 - (2 370) 16 970
Nicaragua 1 213 - (588) 625
Niger (the) 23 336 - (6 107) 17 229
Rwanda 1 699 - (1 424) 275
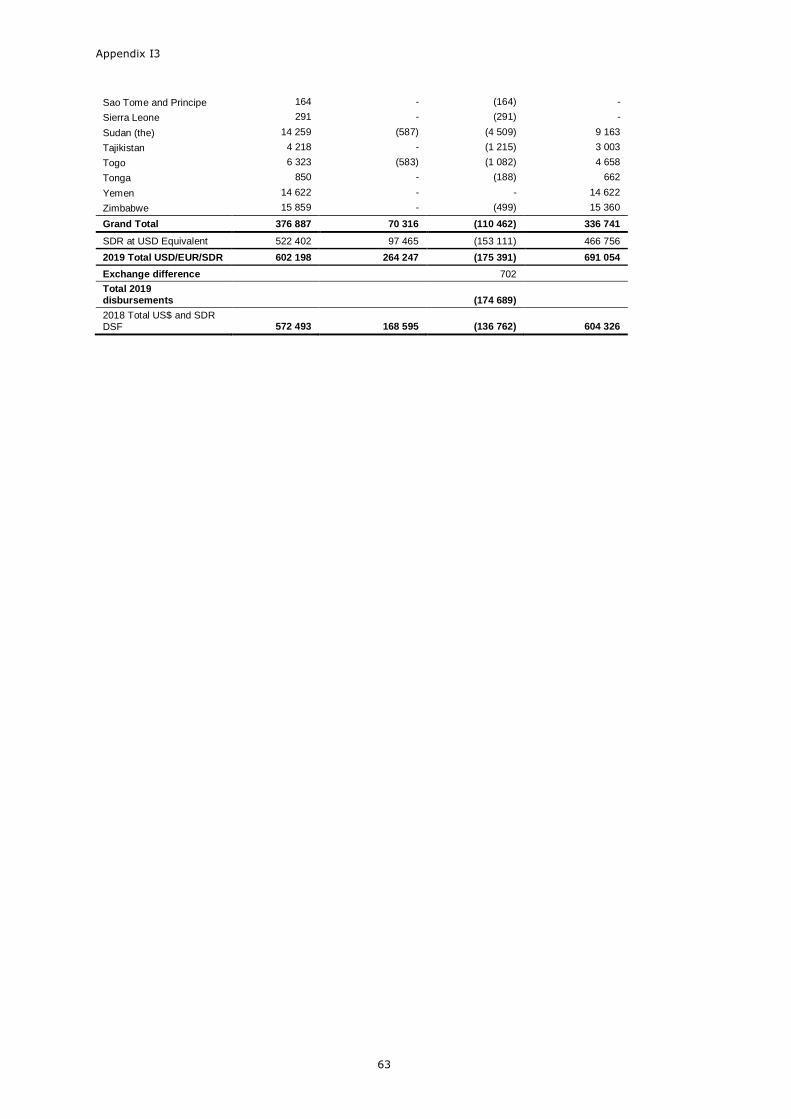
Appendix I3
63
Sao Tome and Principe 164 - (164) -
Sierra Leone 291 - (291) -
Sudan (the) 14 259 (587) (4 509) 9 163
Tajikistan 4 218 - (1 215) 3 003
Togo 6 323 (583) (1 082) 4 658
Tonga 850 - (188) 662
Yemen 14 622 - - 14 622
Zimbabwe 15 859 - (499) 15 360
Grand Total 376 887 70 316 (110 462) 336 741
SDR at USD Equivalent 522 402 97 465 (153 111) 466 756
2019 Total USD/EUR/SDR 602 198 264 247 (175 391) 691 054
Exchange difference 702
Total 2019 disbursements (174 689)
2018 Total US$ and SDR DSF 572 493 168 595 (136 762) 604 326
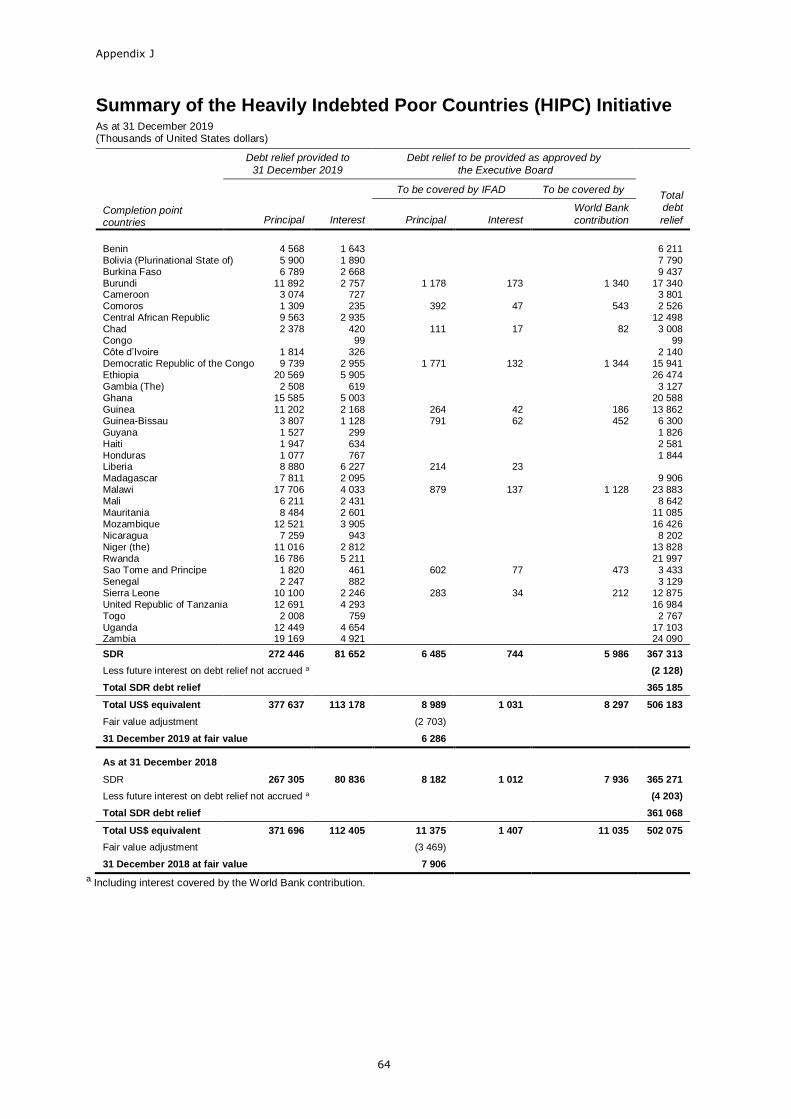
Appendix J
64
Summary of the Heavily Indebted Poor Countries (HIPC) Initiative As at 31 December 2019 (Thousands of United States dollars)
Debt relief provided to
31 December 2019
Debt relief to be provided as approved by
the Executive Board
To be covered by IFAD To be covered by Total debt
relief Completion point countries Principal Interest Principal Interest
World Bank
contribution
Benin 4 568 1 643 6 211 Bolivia (Plurinational State of) 5 900 1 890 7 790 Burkina Faso 6 789 2 668 9 437 Burundi 11 892 2 757 1 178 173 1 340 17 340 Cameroon 3 074 727 3 801 Comoros 1 309 235 392 47 543 2 526 Central African Republic 9 563 2 935 12 498 Chad 2 378 420 111 17 82 3 008 Congo 99 99 Côte d’Ivoire 1 814 326 2 140 Democratic Republic of the Congo 9 739 2 955 1 771 132 1 344 15 941 Ethiopia 20 569 5 905 26 474 Gambia (The) 2 508 619 3 127 Ghana 15 585 5 003 20 588 Guinea 11 202 2 168 264 42 186 13 862 Guinea-Bissau 3 807 1 128 791 62 452 6 300 Guyana 1 527 299 1 826 Haiti 1 947 634 2 581 Honduras 1 077 767 1 844 Liberia 8 880 6 227 214 23 Madagascar 7 811 2 095 9 906 Malawi 17 706 4 033 879 137 1 128 23 883 Mali 6 211 2 431 8 642 Mauritania 8 484 2 601 11 085 Mozambique 12 521 3 905 16 426 Nicaragua 7 259 943 8 202 Niger (the) 11 016 2 812 13 828 Rwanda 16 786 5 211 21 997 Sao Tome and Principe 1 820 461 602 77 473 3 433 Senegal 2 247 882 3 129 Sierra Leone 10 100 2 246 283 34 212 12 875 United Republic of Tanzania 12 691 4 293 16 984 Togo 2 008 759 2 767 Uganda 12 449 4 654 17 103 Zambia 19 169 4 921 24 090
SDR 272 446 81 652 6 485 744 5 986 367 313
Less future interest on debt relief not accrued a (2 128)
Total SDR debt relief 365 185
Total US$ equivalent 377 637 113 178 8 989 1 031 8 297 506 183
Fair value adjustment (2 703)
31 December 2019 at fair value 6 286
As at 31 December 2018
SDR 267 305 80 836 8 182 1 012 7 936 365 271
Less future interest on debt relief not accrued a (4 203)
Total SDR debt relief 361 068
Total US$ equivalent 371 696 112 405 11 375 1 407 11 035 502 075
Fair value adjustment (3 469)
31 December 2018 at fair value 7 906
a Including interest covered by the World Bank contribution.
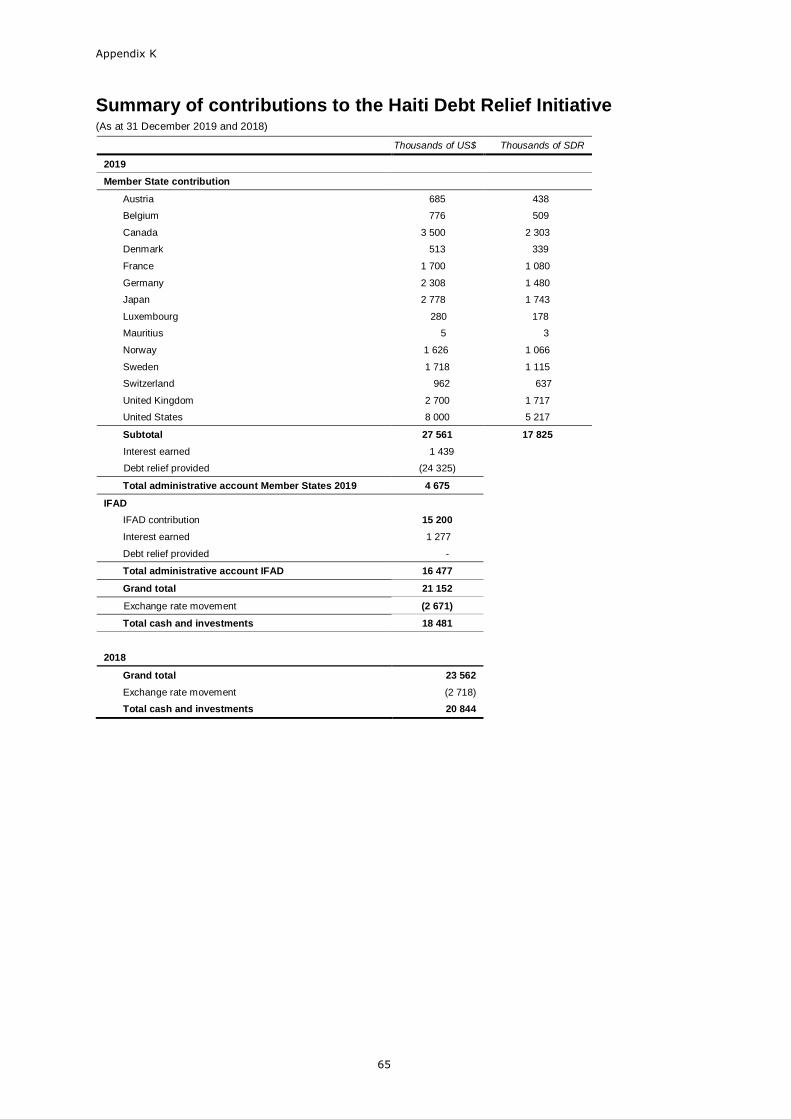
Appendix K
65
Summary of contributions to the Haiti Debt Relief Initiative (As at 31 December 2019 and 2018)
Thousands of US$ Thousands of SDR
2019
Member State contribution
Austria 685 438
Belgium 776 509
Canada 3 500 2 303
Denmark 513 339
France 1 700 1 080
Germany 2 308 1 480
Japan 2 778 1 743
Luxembourg 280 178
Mauritius 5 3
Norway 1 626 1 066
Sweden 1 718 1 115
Switzerland 962 637
United Kingdom 2 700 1 717
United States 8 000 5 217
Subtotal 27 561 17 825
Interest earned 1 439
Debt relief provided (24 325)
Total administrative account Member States 2019 4 675
IFAD
IFAD contribution 15 200
Interest earned 1 277
Debt relief provided -
Total administrative account IFAD 16 477
Grand total 21 152
Exchange rate movement (2 671)
Total cash and investments 18 481
2018
Grand total 23 562
Exchange rate movement (2 718)
Total cash and investments 20 844
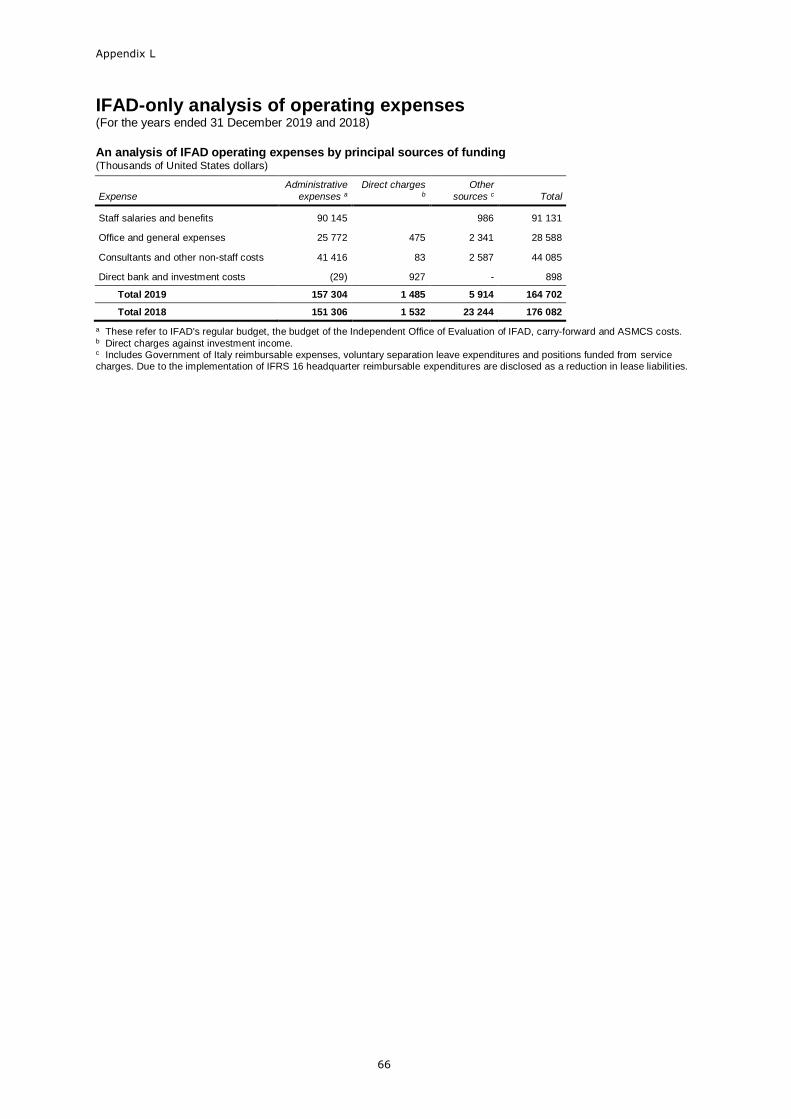
Appendix L
66
IFAD-only analysis of operating expenses (For the years ended 31 December 2019 and 2018)
An analysis of IFAD operating expenses by principal sources of funding (Thousands of United States dollars)
Expense
Administrative
expenses a
Direct charges b
Other
sources c Total
Staff salaries and benefits 90 145 986 91 131
Office and general expenses 25 772 475 2 341 28 588
Consultants and other non-staff costs 41 416 83 2 587 44 085
Direct bank and investment costs (29) 927 - 898
Total 2019 157 304 1 485 5 914 164 702
Total 2018 151 306 1 532 23 244 176 082
a These refer to IFAD's regular budget, the budget of the Independent Office of Evaluation of IFAD, carry-forward and ASMCS costs. b Direct charges against investment income. c Includes Government of Italy reimbursable expenses, voluntary separation leave expenditures and positions funded from service charges. Due to the implementation of IFRS 16 headquarter reimbursable expenditures are disclosed as a reduction in lease liabilit ies.
Contents President’s foreword
Ongoing portfolio: Where IFAD works
Global operations by region
IFAD in numbers
Spotlight on quality assurance
Focus on measuring results and impact
Staff development
Highlights of IFAD’s work to empower rural people
In focus: Institutional efficiency
Update on resource mobilization and partnerships
Financial management and transparency
Annex 1: Programme of loans and grants in tables
Annex 2: IFAD Member States and Governors
Annex 3: Consolidated financial statements
Complete contents of the Annual Report in Arabic, English, French and Spanish at:
www.ifad.org/ar2019
The designations employed and the presentation of material in this publication do not imply the expression of any opinion whatsoever on the part of the International Fund for Agricultural Development of the United Nations concerning the legal status of any country, territory, city or area or of its authorities, or concerning the delimitation of its frontiers or boundaries. The designations “developed” and “developing” economies are intended for statistical convenience and do not necessarily express a judgement about the stage reached by a particular country or area in the development process.
This publication or any part thereof may be reproduced without prior permission from IFAD, provided that the publication or extract therefrom reproduced is attributed to IFAD and the title of this publication is stated in any publication and that a copy thereof is sent to IFAD.
Cover photos: ©IFAD/Francesco Cabras, @IFAD/Edward Echwalu
© 2020 by the International Fund for Agricultural Development (IFAD)
IFAD ANNUAL REPORT 2019
International Fund for Agricultural Development
Via Paolo di Dono, 44 - 00142 Rome, Italy
Tel: +39 06 54591 - Fax: +39 06 5043463
Email: [email protected]
www.ifad.org
facebook.com/ifad
instagram.com/ifadnews
linkedin.com/company/ifad
twitter.com/ifad
youtube.com/user/ifadTV
IFAD invests in rural people, empowering them to reduce poverty, increase food security, improve nutrition and strengthen resilience. Since 1978, we have provided US$22.6 billion in grants and low-interest loans to projects that have reached an estimated 513 million people. IFAD is an international financial institution and a United Nations specialized agency based in Rome – the United Nations food and agriculture hub.