identification of new genes associated with breast cancer progression by gene expression analysis of...
TRANSCRIPT
Identification of new genes associated with breast cancer progression by gene
expression analysis of predefined sets of neoplastic tissues
Daniela Cimino1*, Luca Fuso1,2, Christian Sfiligoi1, Nicoletta Biglia1,2, Riccardo Ponzone1,2, Furio Maggiorotto1,2,Giandomenico Russo3, Luigi Cicatiello4, Alessandro Weisz4,5, Daniela Taverna1,6,7, Piero Sismondi1,2 and Michele De Bortoli6,7
1Institute for Cancer Research and Treatment, Unit of Gynecological Oncology, University of Turin Medical School,Candiolo, Turin, Italy2Department of Gynecology and Obstetrics, University of Turin, Turin, Italy3Istituto Dermopatico dell’Immacolata-Istituto di Ricovero e Cura a Carattere Scientifico, Rome, Italy4Dipartimento di Patologia Generale, Seconda Universita Degli Studi di Napoli, Naples, Italy5AIRC Naples Oncogenomic Center, Naples, Italy6Department of Oncological Sciences, University of Turin, Turin, Italy7Center for Complex Systems in Molecular Biology and Medicine, University of Turin, Turin, Italy
Gene expression profiles were studied by microarray analysis in 2sets of archival breast cancer tissues from patients with distinctclinical outcome. Seventy-seven differentially expressed geneswere identified when comparing 30 cases with relapse and 30 caseswithout relapse within 72 months from surgery. These genes had aspecific ontological distribution and some of them have beenlinked to breast cancer in previous studies: AIB1, the two keratingenes KRT5 and KRT15, RAF1, WIF1 and MSH6. Seven out of 77differentially expressed genes were selected and analyzed by qRT-PCR in 127 cases of breast cancer. The expression levels of6 upregulated genes (CKMT1B, DDX21, PRKDC, PTPN1, SLPI,YWHAE) showed a significant association to both disease-free andoverall survival. Multivariate analysis using the significant factors(i.e., estrogen receptor and lymph node status) as covariates con-firmed the association with survival. There was no correlationbetween the expression level of these genes and other clinical pa-rameters. In contrast, SERPINA3, the only downregulated geneexamined, was not associated with survival, but correlated withsteroid receptor status. An indirect validation of our genes wasprovided by calculating their association with survival in 3 pub-licly available microarray datasets. CKMT1B expression was anindependent prognostic marker in all 3 datasets, whereas othergenes confirmed their association with disease-free survival in atleast 1 dataset. This work provides a novel set of genes that couldbe used as independent prognostic markers and potential drugtargets for breast cancer.' 2008 Wiley-Liss, Inc.
Key words: breast cancer; gene expression; microarray analysis;prognostic
The heterogeneous nature of breast cancer reflects the complex-ity of the molecular alterations that underlie the development andprogression of this disease and poses serious problems to clinicalmanagement, also due to the lack of reliable pathological ormolecular markers.
There are a number of major open questions, such as the evalua-tion of risk of distant metastasis in cases characterized by the pres-ence of favorable indicators (negative axillary lymph nodes and/orpositive estrogen receptors), the prediction of response to chemo-therapy and/or antiestrogenic therapy and the prediction of metasta-ses sites for high-risk cancers. Moreover, the principal molecularalterations leading to aggressive clinical behavior, representingpotential therapeutic targets, still need to be identified in addition tothe well-known factor ERBB2 and the estrogen receptor pathways.
Molecular profiling using DNA microarrays have providedsound advancements in this field. The expression profile of geneclusters were useful in classifying breast tumors in biological sub-groups with clinical relevance,1 or in low- versus high-risk classesfor relapse,2–5 or to predict responsiveness to either hormonal- orchemo-therapy.6,7 In a well-known study, van’t Veer et al.addressed the risk of relapse in node-negative patients,2 one of themost clinically relevant problems in breast cancer. One-third of
these cases will progress and have poor outcome, but they cannotbe distinguished on the basis of the most classical clinicopatholog-ical criteria. Microarray analysis of archival frozen tissues pro-vided a 70-gene profile able to identify relapsing cases, outper-forming traditional clinical prognostic factors. This signaturemaintained its prognostic power in larger cohorts of patients,including node-positive cases as well.3 van de Vijver et al. data-set3 is today largely used for data analysis and a published meta-nalysis reported that other gene signatures, such as the wound-response model,8 the intrinsic subtype model1,9,10 and the rationalerecurrence score model proposed by Paik et al.,11 worked accept-ably well in estimating the risk of relapse in this dataset.12
The first remarkable conclusion from these and other studies isthat the primary tumor already possesses the hardwiring requiredto invade and metastasize.13 The second, unexpected, conclusionis that the ‘‘signatures’’ obtained by other studies have impressivelittle overlap, still showing good power in other’s datasets. Sets ofgenes identified in hierarchical cluster analysis showing the high-est grade of internal coherence within the experiment are not nec-essary correlated in terms of biological significance. It has beenrecently demonstrated that the expression profile of any randomlyselected set of genes with a sufficient width (around 100) can cor-rectly identify the kind of human tissue or organ from which theRNA was extracted.14
Another unexpected conclusion is that these prognostic signa-tures very rarely include known progression-associated genes orclearly point to novel pathways or molecules associated with can-cer progression. Therefore their exceptional prognostic and pre-dictive value does not parallel an equal power to identify newpotential targets for therapy and drug development.
Taking into account these results, we undertook a differentapproach, by directly comparing gene expression of high-risk ver-
Christian Sfiligoi’s current address is: Laboratorio Ematologia I, Az.Ospedaliera S. Giovanni Battista, Turin, Italy.Daniela Cimino and Daniela Taverna’s current address is: Molecular
Biotechnology Center, Via Nizza 52 Turin, Italy.Grant sponsor: Ministero della Salute; Grant number: RF.PE.2005.
147663; Grant sponsor: ABO Project; Grant number: TO47; Grant spon-sor: MIUR; Grant number: PRIN 2006069030 003; Grant sponsor: UE(CRESCENDO IP); Grant number: LSHM-CT2005-018652; Grant spon-sors: Regione Piemonte Ricerca Sanitaria; Ricerca Scientifica Applicata;AIRC (Italian Association for Cancer Research).*Correspondence to: Department of Oncological Sciences, University
of Turin, Molecular Biotechnology Center, Via Nizza 52, Turin, Italy.E-mail: [email protected]
This article contains supplementary material available via the Internet athttp://www.interscience.wiley.com/jpages/0020-7136/suppmat
Received 27 November 2007; Accepted after revision 19 March 2008DOI 10.1002/ijc.23660Published online 17 June 2008 in Wiley InterScience (www.interscience.
wiley.com).
Int. J. Cancer: 123, 1327–1338 (2008)' 2008 Wiley-Liss, Inc.
Publication of the International Union Against Cancer

sus low-risk patients from a cohort of archival breast cancer tis-sues, by microarray analysis of pooled samples, in order to mini-mize small and infrequent variations. These differentiallyexpressed genes were found to associate individually with risk,when analyzed using quantitative fluorogenic RT-PCR (qRT-PCR) in a larger cohort, indicating new genes and pathways poten-tially associated with breast cancer progression.
Material and methods
Patients and samples
130 frozen tumor samples were selected from the Tumor Bankof the Department of Obstetrics and Gynecology, University ofTurin. They were obtained from patients who underwent primarysurgical treatment between 1988 and 2001 at a median age of53 years (25–79). Eligibility criteria were the following: diagnosisof invasive breast cancer, all T and N stages, no distant metastasisat diagnosis (M0), complete clinical-pathological data and updatedfollow up. All patients were treated with radical modified mastec-tomy or quadrantectomy and axillary dissection plus breast irradi-ation. High-risk node-negative and node-positive patients receivedadjuvant treatments (generally 6 cycles of CMF, 600 mg/m2 cy-clophosphamide, 40 mg/m2 Metotrexate, 600 mg/m2 5-Fluoroura-cil) and/or 20 mg tamoxifen daily for 5 years in ER1 cases. ERand PgR status were determined by immunohistochemical stain-ing, patient stage distribution was assessed as prescribed by theUICC clinical staging guidelines and tumor grading was per-formed according to Elston and Ellis. Study design was approvedby our medical ethical committee.
RNA isolation
After surgical removal, samples were macro-dissected by path-ologists, quickly frozen and stored at 280�C. RNA was isolatedwith Concert Cytoplasmic RNA Reagent (Invitrogen, Carlsbad,CA) from 20 to 50 mg tumor tissues, according to the manufac-turer’s guidelines. Frozen tumors were placed in this reagent andhomogenized using a ball mill (MM200, Retsch, D€usseldorf, Ger-many). The suspension was centrifuged at 14,000g for 5 min at4�C, then lysed with 0.1 ml of 10% SDS followed by 0.3 ml of 5M sodium chloride and 0.2 ml of chloroform per ml of reagent.The lysate was centrifuged at 14,000g for 15 min at 4�C and theupper aqueous phase was removed and combined with 0.8 vol ofisopropyl alcohol for 10 min at room temperature. The RNA wasrecovered by centrifugation, washed with 75% ethanol and finallydissolved in RNase-free water. Ten-microgram aliquots of totalRNA was treated with DNase I, using the ‘‘DNA free’’ kit(Ambion, Austin, TX) to eliminate genomic DNA contamination.The quantity and quality of the RNA samples were determinedusing the Agilent 2100 Bioanalyzer and the RNA 6000 NanoAssay kit (Agilent Technologies, Palo Alto, CA). Only high-qual-ity RNA, having a 28S/18S rRNA band intensity ratio of 1.5–2and an A260/280 absorbance ratio of 1.8–2, was used for subse-quent analysis. RNA of optimal quality and quantity was recov-ered from 127 samples. The clinical characteristics of the respec-tive patient set are summarized in Table I.
Microarray analysis of pooled samples
Thirty cases of ductal invasive carcinoma with recurrencewithin 72 months from surgery (high-risk) and 30 without recur-rence (low-risk) were selected for microarray analysis. From eachgroup, 6 RNA pools of 5 samples each were prepared and ana-lyzed on GeneChip Human Genome U133A oligonucleotidemicroarrays (HG-U133A, Affymetrix, Santa Clara, CA). Detailedinformation about the clinical characteristics of samples in thecomposed pools, including ER or lymph node status, are providedin the Supplementary Information, Table SI. Labeling was per-formed using 8 lg of total RNA with the One-Cycle Target Label-ing Assay kit (Affymetrix), according to manufacturer’s instruc-tions. Double-stranded cDNA was purified and biotin-labeled byin vitro transcription. The biotinylated cRNA targets were then
purified and fragmented to a length of 35–200 bases. The qualityof in vitro transcription and fragmentation products was assessedusing the Agilent 2100 Bioanalyzer. Hybridization to HG-U133AGeneChips (Affymetrix) and arrays scanning was carried outaccording to Affymetrix protocols. Hybridizations were performedin technical duplicates in 2 experimental sessions.
Microarray data analysis
Data analysis was performed using the R statistical package(http://www.bioconductor.org). Array quality control was carriedout using the affy library and the affyPLM package of R. Expres-sion values were calculated from the raw.CEL files as GC RobustMultichip Analysis (gcRMA). Filtering procedure was doneemploying IQR filtering function using as cut an interquantilerange within the various samples lower than 0.25. The first selec-tion step of differentially expressed genes was done using aBayesian t-test, implemented for DNA microarray data with a lowreplicate number.15 The second step was made by the SignificanceAnalysis of Microarrays program16 and a two-dimensional unsu-pervised hierarchical clustering based on a centered Pearson corre-lation coefficient algorithm (TIGR MeV, www.tigr.org). The foldchange threshold for SAM plot calculator was 2 and the medianfalse discovery rate was lower than 5.0%. Statistical analyses ofgene ontology (GO) terms was performed using the web-basedtool DAVID Resource (http://david.abcc.ncifcrf.gov/); this toolprovides GO terms and their significant probabilities of enrich-ment (p-values from Fisher Exact test) compared to the referencegene list (HG-U133A GeneChip Affymetrix list). Raw data andGCRMA intensity values are available in GEO (http://www.ncbi.nlm.nih.gov/geo/, accession number GSE9662).
Comparison among discrimination power of different genelists4,17–20 was performed using support vector machine (SVM)and partial decision trees, used to train and classify pooled sam-ples (Weka software Version 3.4.821).
Quantitative real time RT-PCR assays
The RNA expression levels of individual genes (CKMT1B,DDX21, PRKDC, PTPN1, SERPINA3, SLPI and YWHAE) were
TABLE I – CLINICAL CHARACTERISTICS OF PATIENTS
CharacteristicsAll patients Array set
No. % No. %
No. of patients 127 60Age (years)
Median 54 53Menopausal status
Premenopausal 53 42 30 50Postmenopausal 74 58 30 50
T stage1 35 28 13 222 80 63 42 703/4 12 9 5 8
GradePoor 58 45 32 53Good to moderate 63 50 26 43Unknown 6 5 2 3
ER1
Positive 78 61 40 67Negative 49 39 20 33
PgR1
Positive 66 52 32 53Negative 61 48 28 47
LNPositive 86 68 41 68Negative 41 32 19 32
ER, estrogen receptor; PgR, progesterone receptor; LN, lymph nodestatus.
1ER and PgR are defined as positive when tumors contain morethan 10 fmol/mg protein or less than 10% positive tumor cells.
1328 CIMINO ET AL.

assayed using qRT-PCR with TaqMan1 gene expression assays(Applied Biosystems, Foster City, CA) on the total set of 127 sam-ples, including the 60 samples used for pooled microarray analy-sis. One microgram of total RNA was retrotranscribed in a 20 llfinal reaction volume, using random decamer primers and the M-MLV Reverse Transcriptase (Ambion). Reaction conditions wererecommended by the manufacturer. The amount of cDNA corre-sponding to 10 ng of RNA was used in 10 ll reactions with theTaqMan Universal PCR Master Mix (Applied Biosystems) andthe corresponding sequence-specific primers/probes assay mix(Applied Biosystems). Six independent cDNA syntheses for eachsample were made and each of them PCR amplified in single;analysis was performed on average values after filtering for out-liers. Fluorescence detection was measured using an ABI Prism7900 platform (Applied Biosystems) on 384-well plates. As refer-ence sample we used human breast total RNA (Stratagene, LaJolla, CA) and, after the assessment of several constitutivelyexpressed genes (Table SII), we chose the 18s ribosomal RNA asendogenous normalizer (Eukaryotic 18S rRNA Endogenous Con-trol, VIC/TAMRA Probe, Primer Limited, Applied Biosystems).TaqMan gene expression assays are listed in the SupplementaryInformation, Table SII. Fold difference between samples was cal-culated for each gene by means of the Comparative CT Method(DDCt), using the median normalized value as calibrator.
Statistics
Statistical analysis was performed using the SPSS 13.0 statisti-cal software (SPSS, Chicago, IL). The rank nonparametric statisti-cal tests of Mann–Whitney and Kruskal–Wallis were used toexamine associations between gene expression and clinicopatho-logical data because no evidence of normal distribution was avail-able (Kolmogorov–Smirnov p < 0.0001).
To compare mRNA expression level distribution among high-riskand low-risk samples in qRT-PCR, the Mann–Whitney nonparamet-ric statistical test was used. Kaplan–Meier survival curves were usedto estimate time-to-event models in the presence of censored cases.Risk differences between the 2 groups were assessed using the Man-tel–Haenszel Log-rank test. Survival analysis was carried out in bothunivariate and multivariate setting using Cox’s proportional hazardmodel. Variables that were significant at univariate level (p < 0.05)were considered to build multivariate model.
Analysis of published microarray datasets
Genes analyzed by qRT-PCR were evaluated in 3 independentdatasets available on line. Miller et al. dataset18 and Sotiriou et al.dataset20 were downloaded from Gene Expression Omnibusdatabase (http://www.ncbi.nlm.nih.gov/geo/; accession numbersGSE3494 and GSE2990). For these datasets expression valueswere calculated from the raw.CEL files with gcRMA bioconductorfunction and intensities were scaled on median values for eachgene; results were divided in 2 categories according to a cut-offvalue obtained from the Sensibility-Specificity ROC curve. van deVijver et al. dataset3 was downloaded from http://www.rii.com/publications/2002/nejm.html and, for each analyzed gene, the val-ues of the column entitled ‘‘Log Ratio’’ in the array data file weredivided in 2 categories according to a cut-off value obtained fromthe sensibility–specificity ROC curve.
Results
Identification of genes potentially associated withbreast cancer relapse
Genes and pathways responsible for a more invasive andaggressive phenotype should be consistently activated in breasttumors which relapse within a few years from surgical treatment.
As a first step, we wanted to identify a group of genes showingconsistently altered expression in tumors from patients relapsingwithin 72 months, as compared to tumors from relapse-freepatients. With this aim we performed a gene expression analysis
with a subpooling approach. We reasoned that genes showing avery wide range of expression or genes that are overexpressedonly in rare cases should be ‘‘masked’’ by combining the samplesin pools. The size of the pools was fixed in 5 because larger poolsize will possibly completely smooth the differences amonggroups. This choice was also supported by literature evidence. Byrecalculating data from microarray analysis, it was shown thatpooling samples by 5 gave similar sensitivity with the analysis ofsingle samples.22
From a cohort of 127 cases of primary breast carcinomas with amedian follow-up of 87 months, 2 groups of 30 samples each,showing or not disease recurrence within 72 months (high-riskand low-risk), with similar distribution of relevant prognostic fac-tors, were selected (Supplementary Information, Table SI). Aslobular carcinomas show a very distinctive expression profile1 thatcould be prevalent and confounding, only carcinomas of the ductalhistological type were included. Pools of 5 samples each wereused for gene expression analysis by Affymetrix HG-U133A Gen-eChips. Detailed information about the clinical characteristics ofsamples in the composed pools, including ER or lymph node sta-tus, are provided in the Supplementary Information, Table SI. Dif-ferential expression was assessed by comparing pools from high-risk versus low-risk patients. Expression data from 2 analyticalsessions were treated separately using a modified t test15 and 2gene sets were identified with a p-value cut-off of 0.05. A list ofgenes common to these 2 sets was then obtained and analyzed byapplying a two-dimensional unsupervised hierarchical clusteringand the Significance Analysis of Microarrays program,16 80 Affy-metrix probe-sets representing 77 genes, whose expression pat-terns best distinguished high-risk from low-risk pools, with a falsediscovery rate <5% and a fold change threshold of 2.0, were iden-tified. Unsupervised hierarchical clustering is shown in Figure 1and the complete probe list is shown in Figure 2, together withfold changes and Affymetrix IDs.
As expected, in this set only 6 downregulated genes in high-riskpools were present. More advanced tumors showed ranges of geneexpression wider than less advanced tumors or normal tissues. Thecomparison of arithmetical averages, intrinsic to the poolingapproach, is expected to enhance detection of upregulated genes.
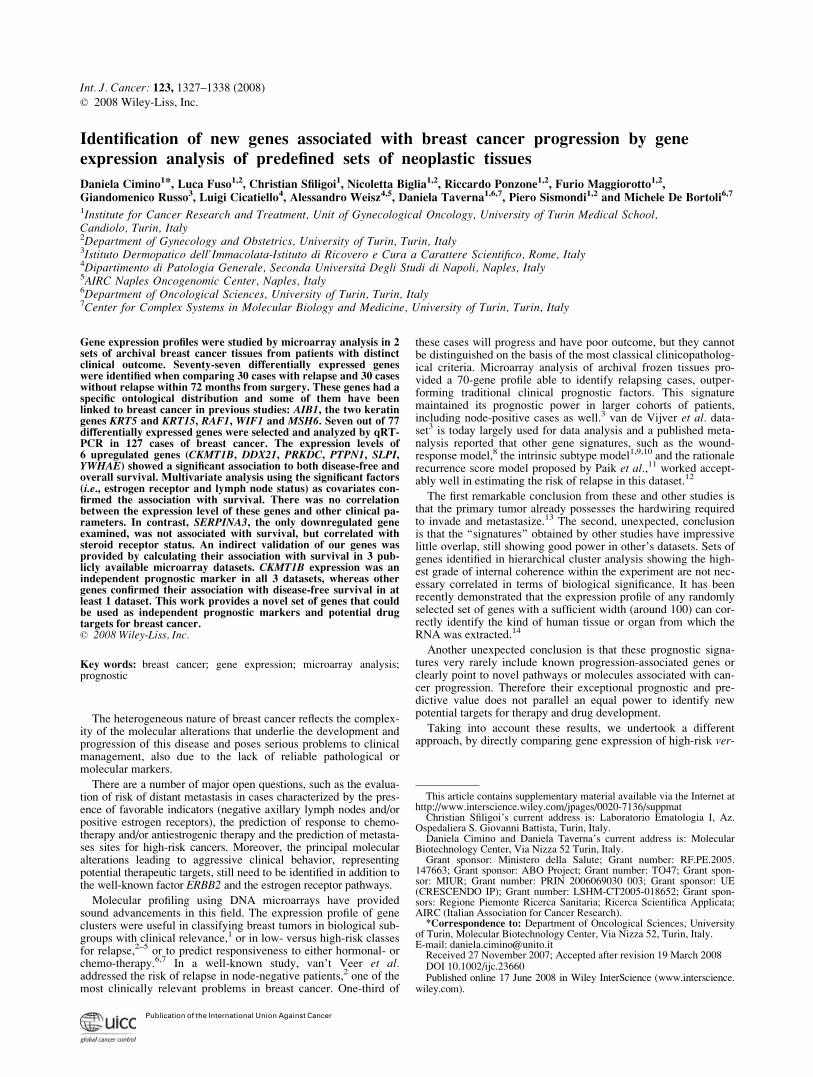
We looked for evidence of association with breast cancer in theliterature. As shown in Figure 2 (column 5), 21 genes had somereported link to breast cancer, in agreement with their differentialexpression in high-risk versus low-risk tumors.23–43 Some of themhad also previously demonstrated to be independent prognosticfactors, i.e., RAF1,24 KRT15,25 WIF1,26 KRT5,40 MSH631 andNCOA3/AIB-1.42 A GO analysis demonstrated significant proba-bility of enrichment in biosynthetic and metabolic processes withan overrepresentation of amine metabolism classes, while pathwayanalysis showed significant enrichment in the urea cycle and inthe amino group or proline metabolisms, in agreement with classrepresentation (Table II). A borderline level of significance wasalso attained by cell cycle and insulin signaling pathways.
The function of some of these genes could be found to play apart in novel pathways involved in cancer. Several genes are infact related to Acetyl-CoA and NAD1 metabolism (ACLY,ACACA, KYNU) and others to methyl group metabolism (AHCY),including the AOF2 gene, also known as LSD1, the first discov-ered histone demethylase enzyme, whose function is strictlylinked to chromatin remodeling as well as steroid receptor func-tion.44
As recently reported by other authors, there is a very low con-cordance among gene-expression-based predictors for breast can-cer.12 Therefore we examined the presence of our genes in severalpublished signatures, including the 231 prognostic reporter genesof van de Vijver et al.2,3 the wound response signature of 677genes,45 the Oncotype DX assay list of 21 genes,11 the intrinsicsubtype gene group of 552 genes1,9,10 and 2 signatures related tometastases sites, obtained from tumor cell lines with increasedmetastatic ability.17,19 Twenty-six/77 genes were present in at
1329IDENTIFICATION OF BREAST CANCER RELATED GENES

FIGURE 1 – Expression pattern ofthe 80-gene signature obtained byunsupervised two-dimensional hier-archical clustering using TIGR MeVsoftware and Pearson correlation. Thedata are shown in a table format inwhich each row represents a gene andeach column corresponds to a pooledsample. The color in each cell reflectsthe expression level of the correspond-ing gene in the corresponding pooledsample; red color indicates a transcrip-tion level above the median expressionof genes across all samples, greencolor indicates a transcription levelbelow the median expression. PoolIDs are those provided in Table SI andeach pool is represented by the 2 ex-perimental replicates (a) and (b).
1330 CIMINO ET AL.
least 1 expression profile. Only 1 gene (SLPI) is shared by 3 pub-lished signatures9,45,46 (Fig. 2). The general overlap was very lowand proportional to the number of genes of each signature. Despite
this little overlap, the combination of functional annotation andavailable literature is congruent with the involvement of the genesin our selection in breast cancer progression.
FIGURE 2 – List of genes differentiallyexpressed between high-risk and low-risk sam-ples. For each gene, Affymetrix IDs and foldchanges are shown. Gene symbols shown arethose provided by Affymetrix. Breast cancerrelated column represents results of literaturesearching for correlation with breast cancer;each finding is indicated by a blue cell with therespective reference number. Breast cancerrelated signature overlap columns representintersection with the published breast cancersignatures indicated by the column headers;shared genes are labeled as orange cells. Genenames are available in the Supplementary In-formation, Table SIII.
1331IDENTIFICATION OF BREAST CANCER RELATED GENES

To investigate whether the gene signatures identified by otherauthors discriminate between high-risk and low-risk pools as doesour gene list, we performed a classification analysis using theSVMs, a set of related supervised learning methods used for clas-sification and regression. We analyzed only signatures obtainedusing Affymetrix microarrays in order not to alter their composi-tion, due to an imperfect platform overlap. Sotiriou grading signa-ture,20 Miller gene list,18 Minn genes associated to lung metasta-sis19 and Kann bone signature17 correctly classified each pool ofours, while Wang gene list4 misclassified 1 pool out of 12. Con-cluding 4 out of the 5 analyzed signatures classified our samplescorrectly.
Individual prognostic value of selected genes
Next, we set out to ascertain if some of the selected genes couldhave the characteristics of individual prognostic markers. Afterexclusion of genes that were previously studied for associationwith survival in breast cancer, as discussed earlier, 6 upregulatedgenes were randomly selected: CKMT1B (CKMT1B creatine ki-nase, mitochondrial 1B), SLPI (secretory leukocyte peptidase in-hibitor), DDX21 (DEAD box polypeptide 21), YWHAE (tyrosine3-monooxygenase/tryptophan 5-monooxygenase activation pro-tein, epsilon polypeptide), PTPN1 (protein tyrosine phosphatase,non-receptor type 1) and PRKDC (protein kinase, DNA-activated,catalytic polypeptide). Among the small group of downregulatedgenes in high-risk samples, the SERPINA3 (serpin peptidase in-hibitor, clade A, alpha-1 antiproteinase, antitrypsin, member 3)gene was chosen because of conflicting literature data regardingbreast cancer association.43,47 mRNA expression level of thesegenes was analyzed by qRT-PCR in all 127 individual tumor sam-ples (Table I). Six independent cDNA preparations were used foreach sample and the values averaged.
qRT-PCR results related to the 60 samples employed for micro-array analysis gave an indirect validation of microarray data. Foldchanges among high- and low-risk samples was calculated andcompared to those obtained from microarray data. In all case,comparable values were found, although qRT-PCR derived foldchanges were generally wider (data not shown).
Next, we investigated whether these genes were also differen-tially expressed in the whole set of 127 samples, of which 55 wereclassified as low-risk (disease-free at 72 months) and 72 as high-risk (relapsing within 72 months). Distribution analysis of mRNAexpression levels was performed with the Mann–Whitney non-parametric statistical test, and gave significant results for the 6upregulated genes, as shown in Figure 3. Comparable results wereobtained limiting the analysis to the 60 samples used for microar-rays. Contrarily, the downregulated gene SERPINA3 was not sig-nificant in both groups.
Next, the possible association of gene expression with survivalwas studied by the Kaplan–Meier estimate and Log-rank test. Foreach gene, ‘‘low’’ and ‘‘high’’ expression was defined by using themedian as cut-off value.
For all 6 upregulated genes, high gene expression was signifi-cantly associated with early death (Fig. 4a) and a shorter disease-free survival (Fig. 4b), in keeping with microarray results. On theother hand, in both analyses, SERPINA3 did not show any signifi-cant association with survival, in contrast with its lower expres-sion found in poor prognosis pools by microarray analysis.
The 7 gene expression values were then subjected to statisticalanalysis to reveal significant associations with other clinicopatho-logical data, using the Mann-Whitney and Kruskal–Wallis non-parametric statistics. No significant correlation with any parameterwas observed, with the exception of SLPI and SERPINA3 expres-sion that correlated with steroid receptor status (SLPI: negativecorrelation, p5 0.02; SERPINA3: positive correlation, p5 0.02).
The association of gene expression with survival was furtherstudied using Cox’s proportional hazard model. In univariate anal-ysis, expression values for each gene were significantly associatedwith survival (Table III), with the exception of SERPINA3. In amultivariate model that included as covariates the variables thatwere significant at univariate level (ER and lymph node status), allpreviously significant genes kept their statistical significance(Table III). This result confirmed that the analyzed genes are novelindependent prognostic markers.
In conclusion, the analysis of association with survival showedthat all upregulated genes examined correlated with progression,
TABLE II – GO ENRICHMENT ANALYSIS OF DIFFERENTIALLY EXPRESSED GENES
Count1 %2 p-value3
Biological processBiosynthesis 13 18.06 0.007Amino acid and derivative metabolism 6 8.33 0.010Carboxylic acid metabolism 7 9.72 0.018Organic acid metabolism 7 9.72 0.019Amine metabolism 6 8.33 0.022Biogenic amine metabolism 3 4.17 0.023Cellular biosynthesis 11 15.28 0.024Nitrogen compound metabolism 6 8.33 0.029Amino acid derivative metabolism 3 4.17 0.031Polyamine biosynthesis 2 2.78 0.037Amine biosynthesis 3 4.17 0.043Nitrogen compound biosynthesis 3 4.17 0.043Polyamine metabolism 2 2.78 0.052Primary metabolism 36 50.00 0.070Aromatic compound metabolism 3 4.17 0.092Amino acid metabolism 4 5.56 0.098
Molecular functionCatalytic activity 32 44.44 0.015Prenylated protein tyrosine phosphatase activity 3 4.17 0.039Protein tyrosine phosphatase activity 3 4.17 0.068Structural constituent of cytoskeleton 3 4.17 0.091
PathwaysArginine and proline metabolism 4 5.56 0.005Urea cycle and metabolism of amino groups 3 4.17 0.011Cell cycle 4 5.56 0.043Insulin signaling pathway 4 5.56 0.078
1Observed number of gene with a given GO annotation.–2Percentage of gene with a given GO annota-tion.–3p value for significance of GO term enrichment.
1332 CIMINO ET AL.

and in particular DDX21 and PRKDC which displayed a very sig-nificant value also in Cox’s multivariate analysis.
Validation of selected genes on independent data sets
One drawback of our study is that the 60 samples used for dif-ferential expression analysis were included in the 127-samplecohort used for validation. To reduce this problem, the prognosticsignificance of the genes studied by qRT-PCR was addressed ondifferent patient cohorts. Three publicly available datasets wereconsidered.3,18,20 Expression data of each gene were obtainedfrom these datasets and subjected to Kaplan–Meier and Coxanalysis.
As shown in Figure 5a, in van de Vijver dataset results,3 anassociation between poor prognosis and high expression ofCKMT1B and PRKDC was revealed. Notably, only SERPINA3was found to be associated with long-term survival, as expectedfrom our microarray results. By Cox univariate analysis, these 3genes were significantly associated with survival (CKMT1B, p 50.004; PRKDC, p 5 0.000; SERPINA3, p 5 0.000) and main-tained the association in multivariate analysis adding as covariatethe ER status (CKMT1B, p 5 0.037; PRKDC, p 5 0.000; SER-PINA3, p 5 0.001). We did not use lymph node status as covariateas it was not significant in univariate analysis (p 5 0.561). AKaplan Meier analysis was carried out sorting samples for estro-gen receptor expression or lymph node invasion. PTPN1 exhibitedassociation with poor prognosis in node-positive samples (p 50.010), while SLPI associated with shorter disease-free survival innode-negative samples (p 5 0.041).
A Kaplan–Meier analysis of dataset from Sotirou et al.20 (Fig.5b) revealed significant correlation with a short disease-free sur-vival for CKMT1B expression and PRKDC expression and thiswas confirmed by univariate Cox analysis (CKMT1B, p 5 0.002;PRKDC, p 5 0.033). Noteworthy, a high expression of SLPI wasassociated to long-term survival by both Kaplan–Meier and uni-variate Cox’s models, contrary to our findings. Furthermore node-positive samples showed a correlation with short disease-free sur-vival for YWHAE expression (p 5 0.005).
Finally, the entire dataset of Miller18 showed an associationbetween an increased risk of relapse and CKMT1B expression(Fig. 5c), also confirmed by Cox’s univariate model (p 5 0.022)and multivariate analysis, with nodal status and p53 mutation ascovariates (p5 0.059). According to Kaplan–Meier, the risk of re-currence was associated with PTPN1 expression in node-positivecases (p5 0.016).
In conclusion, CKMT1B was identified as a prognostic factor in3 independent cohorts of breast cancer patients for the first time inour study.
Discussion
A direct comparison of gene expression in 2 balanced groups ofbreast tumors with different risk of relapse identified a novelgroup of genes that showed significant association with both dis-ease-free and overall survival, when tested individually by a quan-titative method. Some of these genes are novel independent prog-nostic markers and they represent novel genes linked to breastcancer as well, indicating pathways and targets that can be furtherstudied and exploited for therapy.
To identify a set of genes differentially expressed in low- ver-sus high-risk tumors by microarray analysis, the pooling strategywas preferred, for several reasons. First, since our goal was toidentify novel genes rather than a prognostic signature, moreresources were spent to guarantee high accuracy for the quantita-tive evaluation than for microarray detection step. Second, pool-ing RNAs will shield and reduce detection of genes showingsmall variations between groups but high variation between indi-vidual samples, as in the case of genes that are activated orrepressed only in a small percentage of tumors (e.g. the ERBB2gene). Conversely, this will enhance detection of genes that areconsistently upregulated or downregulated in 1 group. Thirdly,by measuring gene expression in pools, the average of individualvalues is measured. Since distribution of gene expression in tu-mor samples is often not Gaussian but follows a Poisson’ distri-bution, this will possibly favor detection of upregulated genes inhigh-risk tumors.
It has been predicted that this approach would produce quitedifferent results from those obtained by profiling a series of con-secutive, unselected breast cancer cases individually.22 Indeed, inour study, most of the genes are associated with the risk of relapseper se, rather than being part of a signature, as is often found inother studies.
This conclusion was justified not only by the fact that 6 out ofthe 7 genes individually tested by qRT-PCR displayed significantassociation with survival in our cohort of patients, but alsobecause additional genes in this group had already been associatedto prognosis. By inference, it is most likely that, within the77-gene set, a number of other genes with similar characteristicswill be found.
FIGURE 3 – Distribution analysis of mRNA expression levels analyzed by box-and-whiskers plot. DDCts obtained from the 2 risk categoriesof samples (LR, low risk; HR, high risk) are compared for each gene analyzed by qRT-PCR (lower DDCts value means higher expression).Circles label outliers (cases with values between 1.5 and 3 interquartile range) and asterisks mark extreme values (cases with values more than 3interquartile range). Shown p-values were obtained applying the Mann–Whitney nonparametric statistical test.
1333IDENTIFICATION OF BREAST CANCER RELATED GENES

FIGURE 4 – Kaplan–Meier analysis ofthe probability of overall survival (a) andof the probability that patients wouldremain free of disease (b) among allpatients, as calculated on the expressionof genes analyzed by qRT-PCR. Lowexpression and high expression aredefined using the median value as cut-off.
1334 CIMINO ET AL.

A critical point in our study regards the 60 samples used for thedetection step by microarray analysis, also part of the overallcohort where individual associations with survival were calcu-lated. The association with survival, however, was clear when theexpression of these genes was extrapolated from 3 very popularpublicly available datasets, i.e., the Amsterdam study,3 Milleret al. study18 and the Sotiriou et al. study.20 This was true in spiteof these facts, e.g., (i) microarray expression data of single genesare definitely less quantitative than real-time RT-PCR data, (ii)regions targeted by microrray probes in different platforms and inTaqMan assays do not always correspond, (iii) patient cohorts dif-fer in many regards, including N2/N1 ratio, age, treatment andother. Indeed it is noteworthy that at least 2 genes discovered byour study still show a significant association with both relapse-freeand overall survival in at least 2 out of 3 studies, even in multivar-iate analysis, definitely confirming that these genes are novel inde-pendent prognostic markers for breast cancer.
The function of the 7 individually studied genes also suggeststhat they deserve further studies. The CKMT1B gene, which gavethe most consistent results also in metanalysis, encodes a proteinthat transfers high energy phosphate from mitochondria to cyto-solic creatine. It was overexpressed in cancers with poor prognosisand correlated to the high energy turnover that characterizes grow-ing tumor tissue.48 Moreover, in the octameric state, CKMT1Binteracts with porin of mitochondrial membrane pore, reducing theprobability of pore opening, thus interfering with the induction ofapoptosis dependent on cytochrome c release.49
DDX21 is a putative nucleolar ATP-dependent RNA helicasewhich plays an important role in ribosomal RNA biogenesis, RNAediting and RNA transport.50 When it moves to the nuclear com-
partment, it interacts with the c-jun oncogene and acts as a tran-scriptional coactivator.51
The 14-3-3e protein encoded by the YWHAE gene binds tophosphoserine-containing proteins and mediates signal transduc-tion. For example, 14-3-3 binding is required for the stabilizationof active RAF-152 and CDC25-mediated cell cycle control,53
whereas its interaction with BAD and BAX prevents their proa-poptotic release to mitochondrial membrane.54,55
The PRKDC protein belongs to the PI3-K related kinase familyand represents a key complex for DNA repair. It is involved in thenonhomologous end-joining process corresponding to the majoractivity responsible for cell survival when double strand breaks inthe DNA are produced, after ionizing radiation or chemotherapeu-tic treatments.56
PTPN1 is a nonreceptor protein-tyrosine phosphatase that mod-ulates protein phosphorylation in cell signaling networks. It isinvolved in leptin and insulin signaling and in several other signal-ing pathways such as growth factor and integrin mediated pro-cesses.57 Several studies demonstrated that changes in abundanceand distribution of PTPases could impair insulin signal transduc-tion, causing insulin resistance.58 Aberrant insulin signaling,which leads to insulin resistance, hyperinsulinaemia and increasedconcentrations of endogenous estrogen and androgen, was linkedto high breast cancer risk by clinical and experimental evidence.59
The above mentioned functions confirmed the expressionbehavior of selected genes, in tumor samples of our study and inmetanalysis results. A quite different situation was observed forthe remaining upregulated gene, SLPI. SLPI is a secreted serineproteinase inhibitor that protects epithelial tissues from inflamma-tion-induced damage caused by endogenous proteolytic enzymesand it exerts its activity against neutrophil elastase, cathepsin G,trypsin and chymotrypsin.60 SLPI also exhibits proliferativeeffects, although its mechanism remains unknown.61 Several stud-ies demonstrated that SLPI is altered in cancer; it was found upre-gulated in ovarian and in lung carcinomas, and its serum level cor-related with tumor stage and response to therapy.62,63 The exactmechanism by which SLPI promotes malignancy is not yetknown: in addition to tumor growth support, the enhancement ofmalignancy could be due to its effects on angiogenesis. In fact,SLPI prevents the formation of the antiangiogenic factor endosta-tin, by inhibiting elastase, its activator.64
In our cohort, qRT-PCR clearly indicated that high SLPIexpression was correlated with high-risk of relapse and death.However, in the Sotiriou dataset, we observed a positive correla-tion of SLPI expression with low-risk patients and, in anotherstudy, a protective effect against liver metastasis was reported,explained through a reduced inflammatory response.65 The SLPIeffect in reducing the inflammatory response could also explainthe results obtained in Sotiriou dataset. In fact, in this study theonly adjuvant treatment used was tamoxifen and it is known thatinflammation is linked to resistance to endocrine treatments.66
The only downregulated gene found by microarrays in high-riskpatients studied by qRT-PCR was SERPINA3, because of uncer-tain results in the literature.43,47 SERPINA3 or Alpha-1-antichy-motrypsin (ACT) is a well-known serine protease inhibitorthat regulates the activity of cathepsin G in neutrophils67 and isan estrogen-induced gene.43 In breast cancer, SERPINA3 mRNAexpression was reported as an indicator of good prognosis,but only in ER-positive tumors,43 while SERPINA3 proteinexpression was reported as unfavorable factor.47 Our qRT-PCRresults did not confirm a prognostic role for SERPINA3, con-trary to pooled microarray results, whereas metanalysis of thevan de Vijver dataset confirmed a positive correlation with favor-able prognosis. Nevertheless, our qRT-PCR data confirmed apositive correlation with steroid receptor status. Certainly, differ-ences in the cohorts studied, as well as in the adjuvant treat-ments used in different studies could account for the observed dis-crepancies.
TABLE III – UNIVARIATE AND MULTIVARIATE ANALYSISOF ANALYZED GENE EXPRESSION, LYMPH NODE STATUS AND
ESTROGEN RECEPTOR STATUS (N 5 127)
Characteristic HR1 CI2 p-value3
Univariate analysisDDX21 1.8 1.4–4.2 0.019CKMT1 2.4 1.1–3.1 0.001SLPI 1.9 1.1–3.2 0.010YWHAE 2.0 1.2–3.5 0.007PTPN1 1.7 1.0–2.8 0.050PRKDC 2.3 1.3–4.0 0.002SERPINA3 1.2 0.7–1.9 0.517
LN 2.0 1.1–3.7 0.019ER 1.7 1.0–2.8 0.045
Multivariate analysisDDX21 2.2 1.2–3.8 0.004
LN 2.0 1.1–3.7 0.018ER 1.7 1.0–2.8 0.036
CKMT1 1.8 1.0–3.1 0.022LN 2.1 1.2–4.0 0.010ER 1.8 1.1–3.0 0.017
SLPI 1.6 0.9–2.7 0.072LN 2.0 1.1–3.7 0.022ER 1.6 0.9–2.7 0.056
YWHAE 1.9 1.1–3.3 0.012LN 2.1 1.1–3.9 0.011ER 1.8 1.1–3.0 0.021
PTPN1 1.6 0.9–3.8 0.055LN 2.1 1.1–3.9 0.011ER 1.8 1.1–3.1 0.014
PRKDC 2.0 1.2–3.6 0.007LN 2.1 1.1–3.8 0.015ER 1.6 1.0–2.7 0.049
SERPINA3 1.0 0.6–1.8 0.755LN 2.1 1.1–4.0 0.012ER 1.8 1.1–3.0 0.017
LN5 positive lymph node risk; ER 5 negative receptor status risk.1Variable hazard ratio in the model.–295% confidence inter-
val.–3Based on Cox regression.
1335IDENTIFICATION OF BREAST CANCER RELATED GENES

In conclusion, we have performed a profiling experimentwith some unusual characteristics, as compared to publishedbreast cancer profiling studies. As expected, our approachallowed for the discovery of a number of verified or potential
new prognostic markers and biological targets, rather than pre-dictive signatures. Many of the genes found are novel, and asinferred from the results obtained on some of them, deservefurther studies.
FIGURE 5 – The association with survival of the 7 risk-associated genes was evaluated by Kaplan–Meier method in 3 datasets available online.Only genes showing significant or borderline association are shown. Panel (a) shows results from van de Vijver et al. dataset.3 Panel (b) illus-trates results of Sotiriou et al. dataset.20 Panel (c) shows results obtained from Miller et al. dataset.18
1336 CIMINO ET AL.

Acknowledgements
The authors thank Mr. GianMario Milano, Dr. Barbara Martino-glio, Dr. Mauro Helmer Citterich and Dr. Olivier Friard for techni-cal assistance, the surgeons, pathologists, and internists of the
Saint Anna Hospital (Turin) and of the IRCC Hospital in Candiolo(Turin), for the supply of tumor tissues, for their assistance in thecollection of the clinical follow-up data, or both, and Prof. Raf-faele Calogero for microarray data analysis suggestions.
References
1. Perou CM, Sorlie T, Eisen MB, van de Rijn M, Jeffrey SS, Rees CA,Pollack JR, Ross DT, Johnsen H, Akslen LA, Fluge O, Pergamenschi-kov A, et al. Molecular portraits of human breast tumours. Nature2000;406:747–52.
2. van ’t Veer LJ, Dai H, van de Vijver MJ, He YD, Hart AA, Mao M,Peterse HL, van der Kooy K, Marton MJ, Witteveen AT, SchreiberGJ, Kerkhoven RM, et al. Gene expression profiling predicts clinicaloutcome of breast cancer. Nature 2002;415:530–6.
3. van de Vijver MJ, He YD, van’t Veer LJ, Dai H, Hart AA, VoskuilDW, Schreiber GJ, Peterse JL, Roberts C, Marton MJ, Parrish M,Atsma D, et al. A gene-expression signature as a predictor of survivalin breast cancer. New Engl J Med 2002;347:1999–2009.
4. Wang Y, Klijn JG, Zhang Y, Sieuwerts AM, Look MP, Yang F,Talantov D, Timmermans M, Meijer-van Gelder ME, Yu J, Jatkoe T,Berns EM, et al. Gene-expression profiles to predict distant metastasisof lymph-node-negative primary breast cancer. Lancet 2005;365:671–9.
5. Sotiriou C, Neo SY, McShane LM, Korn EL, Long PM, Jazaeri A,Martiat P, Fox SB, Harris AL, Liu ET. Breast cancer classificationand prognosis based on gene expression profiles from a population-based study. Proc Natl Acad Sci USA 2003;100:10393–8.
6. Sotiriou C, Powles TJ, Dowsett M, Jazaeri AA, Feldman AL, Asser-sohn L, Gadisetti C, Libutti SK, Liu ET. Gene expression profilesderived from fine needle aspiration correlate with response to sys-temic chemotherapy in breast cancer. Breast Cancer Res 2002;4:R3.
7. Jansen MP, Foekens JA, van Staveren IL, Dirkzwager-Kiel MM,Ritstier K, Look MP, Meijer-van Gelder ME, Sieuwerts AM, Porten-gen H, Dorssers LC, Klijn JG, Berns EM. Molecular classificationof tamoxifen-resistant breast carcinomas by gene expression profiling.J Clin Oncol 2005;23:732–40.
8. Chang HY, Nuyten DS, Sneddon JB, Hastie T, Tibshirani R, Sorlie T,Dai H, He YD, van’t Veer LJ, Bartelink H, van de Rijn M, Brown PO,et al. Robustness, scalability, and integration of a wound-responsegene expression signature in predicting breast cancer survival. ProcNatl Acad Sci USA 2005;102:3738–43.
9. Sorlie T, Tibshirani R, Parker J, Hastie T, Marron JS, Nobel A, DengS, Johnsen H, Pesich R, Geisler S, Demeter J, Perou CM, et al.Repeated observation of breast tumor subtypes in independent geneexpression data sets. Proc Natl Acad Sci USA 2003;100:8418–23.
10. Sorlie T, Perou CM, Tibshirani R, Aas T, Geisler S, Johnsen H, HastieT, Eisen MB, van de Rijn M, Jeffrey SS, Thorsen T, Quist H, et al.Gene expression patterns of breast carcinomas distinguish tumor sub-classes with clinical implications. Proc Natl Acad Sci USA2001;98:10869–74.
11. Paik S, Shak S, Tang G, Kim C, Baker J, Cronin M, Baehner FL,Walker MG, Watson D, Park T, Hiller W, Fisher ER, et al. A multi-gene assay to predict recurrence of tamoxifen-treated, node-negativebreast cancer. New Engl J Med 2004;351:2817–26.
12. Fan C, Oh DS, Wessels L, Weigelt B, Nuyten DS, Nobel AB, van’tVeer LJ, Perou CM. Concordance among gene-expression-based pre-dictors for breast cancer. New Engl J Med 2006;355:560–9.
13. Miller LD, Liu ET. Expression genomics in breast cancer research:microarrays at the crossroads of biology and medicine. Breast CancerRes 2007;9:206.
14. Son CG, Bilke S, Davis S, Greer BT, Wei JS, Whiteford CC, ChenQR, Cenacchi N, Khan J. Database of mRNA gene expression profilesof multiple human organs. Genome Res 2005;15:443–50.
15. Baldi P, Long AD. A Bayesian framework for the analysis of microar-ray expression data: regularized t -test and statistical inferences ofgene changes. Bioinformatics 2001;17:509–19.
16. Tusher VG, Tibshirani R, Chu G. Significance analysis of microarraysapplied to the ionizing radiation response. Proc Natl Acad Sci USA2001;98:5116–21.
17. Kang Y, Siegel PM, Shu W, Drobnjak M, Kakonen SM, Cordon-Cardo C, Guise TA, Massague J. A multigenic program mediatingbreast cancer metastasis to bone. Cancer Cell 2003;3:537–49.
18. Miller LD, Smeds J, George J, Vega VB, Vergara L, Ploner A, Pawi-tan Y, Hall P, Klaar S, Liu ET, Bergh J. An expression signature forp53 status in human breast cancer predicts mutation status, transcrip-tional effects, and patient survival. Proc Natl Acad Sci USA2005;102:13550–5.
19. Minn AJ, Gupta GP, Siegel PM, Bos PD, Shu W, Giri DD, Viale A,Olshen AB, Gerald WL, Massague J. Genes that mediate breast can-cer metastasis to lung. Nature 2005;436:518–24.
20. Sotiriou C, Wirapati P, Loi S, Harris A, Fox S, Smeds J, Nordgren H,Farmer P, Praz V, Haibe-Kains B, Desmedt C, Larsimont D, et al.Gene expression profiling in breast cancer: understanding the molecu-lar basis of histologic grade to improve prognosis. J Natl Cancer Inst2006;98:262–72.
21. Frank E, Hall M, Trigg L, Holmes G, Witten IH. Data mining in bio-informatics using Weka. Bioinformatics 2004;20:2479–81.
22. Peng X, Wood CL, Blalock EM, Chen KC, Landfield PW, StrombergAJ. Statistical implications of pooling RNA samples for microarrayexperiments. BMC Bioinformatics 2003;4:26.
23. Cross SS, Hamdy FC, Deloulme JC, Rehman I. Expression of S100proteins in normal human tissues and common cancers using tissuemicroarrays: S100A6. S100A8, S100A9 and. S100A11 are all overex-pressed in common cancers. Histopathology 2005;46:256–69.
24. Koster A, Landgraf S, Leipold A, Sachse R, Gebhart E, Tulusan AH,Ronay G, Schmidt C, Dingermann T. Expression of oncogenes inhuman breast cancer specimens. Anticancer Res 1991;11:193–201.
25. Folgueira MA, Brentani H, Katayama ML, Patrao DF, Carraro DM,Mourao Netto M, Barbosa EM, Caldeira JR, Abreu AP, Lyra EC,Kaiano JH, Mota LD, et al. Gene expression profiling of clinicalstages II and III breast cancer. Braz J Med Biol Res 2006;39:1101–13.
26. Ai L, Tao Q, Zhong S, Fields CR, Kim WJ, Lee MW, Cui Y, BrownKD, Robertson KD. Inactivation of Wnt inhibitory factor-1 (WIF1)expression by epigenetic silencing is a common event in breast can-cer. Carcinogenesis 2006;27:1341–8.
27. Debniak T, Scott R, Masojc B, Serrano-Fernandez P, Huzarski T,Byrski T, Debniak B, Gorski B, Cybulski C, Medrek K, Kurzawski G,van de Wetering T, et al. MC1R common variants. CDKN2A andtheir association with melanoma and breast cancer risk. Int J Cancer2006;119:2597–602.
28. Redondo M, Villar E, Torres-Munoz J, Tellez T, Morell M, PetitoCK. Overexpression of clusterin in human breast carcinoma. Am JPathol 2000;157:393–9.
29. Manni A, Astrow SH, Gammon S, Thompson J, Mauger D, Washing-ton S. Immunohistochemical detection of ornithine-decarboxylase inprimary and metastatic human breast cancer specimens. Breast CancerRes Treat 2001;67:147–56.
30. King JA, Ofori-Acquah SF, Stevens T, Al-Mehdi AB, Fodstad O,Jiang WG. Activated leukocyte cell adhesion molecule in breast can-cer: prognostic indicator. Breast Cancer Res 2004;6:R478–87.
31. Chintamani Jha BP, Bhandari V, Bansal A, Saxena S, Bhatnagar D.The expression of mismatched repair genes and their correlation withclinicopathological parameters and response to neo-adjuvant chemo-therapy in breast cancer. Int Semin Surg Oncol 2007;4:5.
32. Wirtenberger M, Tchatchou S, Hemminki K, Klaes R, SchmutzlerRK, Bermejo JL, Chen B, Wappenschmidt B, Meindl A, Bartram CR,Burwinkel B. Association of genetic variants in the Rho guanine nu-cleotide exchange factor AKAP13 with familial breast cancer. Carci-nogenesis 2006;27:593–8.
33. Simins AB, Weighardt H, Weidner KM, Weidle UH, Holzmann B.Functional cloning of ARM-1, an adhesion-regulating molecule upre-gulated in metastatic tumor cells. Clin Exp Metastasis 1999;17:641–8.
34. Suefuji Y, Sasatomi T, Shichijo S, Nakagawa S, Deguchi H, Koga T,Kameyama T, Itoh K. Expression of SART3 antigen and induction ofCTLs by SART3-derived peptides in breast cancer patients. Br J Can-cer 2001;84:915–9.
35. Ito Y, Yoshida H, Uruno T, Takamura Y, Miya A, Kuma K, MiyauchiA. Expression of cdc25A and cdc25B phosphatase in breast carci-noma. Breast Cancer 2004;11:295–300.
36. Suh KS, Crutchley JM, Koochek A, Ryscavage A, Bhat K, Tanaka T,Oshima A, Fitzgerald P, Yuspa SH. Reciprocal modifications ofCLIC4 in tumor epithelium and stroma mark malignant progressionof multiple human cancers. Clin Cancer Res 2007;13:121–31.
37. Luftner D, Mesterharm J, Akrivakis C, Geppert R, Petrides PE, Wer-necke KD, Possinger K. Tumor type M2 pyruvate kinase expressionin advanced breast cancer. Anticancer Res 2000;20:5077–82.
38. Ugolini F, Charafe-Jauffret E, Bardou VJ, Geneix J, Adelaide J, Labat-Moleur F, Penault-Llorca F, Longy M, Jacquemier J, Birnbaum D,Pebusque MJ. WNT pathway and mammary carcinogenesis: loss ofexpression of candidate tumor suppressor gene SFRP1 in most invasivecarcinomas except of the medullary type. Oncogene 2001;20:5810–7.
39. Li X, Cowell JK, Sossey-Alaoui K. CLCA2 tumour suppressor genein 1p31 is epigenetically regulated in breast cancer. Oncogene2004;23:1474–80.
1337IDENTIFICATION OF BREAST CANCER RELATED GENES

40. Turashvili G, Bouchal J, Baumforth K, Wei W, Dziechciarkova M,Ehrmann J, Klein J, Fridman E, Skarda J, Srovnal J, Hajduch M, Mur-ray P, et al. Novel markers for differentiation of lobular and ductalinvasive breast carcinomas by laser microdissection and microarrayanalysis. BMC Cancer 2007;7:55.
41. Chin K, DeVries S, Fridlyand J, Spellman PT, Roydasgupta R, KuoWL, Lapuk A, Neve RM, Qian Z, Ryder T, Chen F, Feiler H, et al.Genomic and transcriptional aberrations linked to breast cancer patho-physiologies. Cancer Cell 2006;10:529–41.
42. Zhao C, Yasui K, Lee CJ, Kurioka H, Hosokawa Y, Oka T, InazawaJ. Elevated expression levels of NCOA3. TOP1, and TFAP2C inbreast tumors as predictors of poor prognosis. Cancer 2003;98:18–23.
43. Yamamura J, Miyoshi Y, Tamaki Y, Taguchi T, Iwao K, Monden M,Kato K, Noguchi S. mRNA expression level of estrogen-induciblegene, a1-antichymotrypsin, is a predictor of early tumor recurrence inpatients with invasive breast cancers. Cancer sci 2004;95:887–92.
44. Garcia-Bassets I, Kwon YS, Telese F, Prefontaine GG, Hutt KR,Cheng CS, Ju BG, Ohgi KA, Wang J, Escoubet-Lozach L, Rose DW,Glass CK, et al. Histone methylation-dependent mechanisms imposeligand dependency for gene activation by nuclear receptors. Cell2007;128:505–18.
45. Chang HY, Sneddon JB, Alizadeh AA, Sood R, West RB, Montgom-ery K, Chi JT, van de Rijn M, Botstein D, Brown PO. Gene expres-sion signature of fibroblast serum response predicts human cancerprogression: similarities between tumors and wounds. PLoS Biol2004;2:E7.
46. West M, Blanchette C, Dressman H, Huang E, Ishida S, Spang R,Zuzan H, Olson JA, Jr, Marks JR, Nevins JR. Predicting the clinicalstatus of human breast cancer by using gene expression profiles. ProcNatl Acad Sci USA 2001;98:11462–7.
47. Hurlimann J, van Melle G. Prognostic value of serum proteins synthe-sized by breast carcinoma cells. Am J Clin Pathol 1991;95:835–43.
48. Joseph J, Cardesa A, Carreras J. Creatine kinase activity and isoen-zymes in lung, colon and liver carcinomas. Br J Cancer 1997;76:600–5.
49. Vyssokikh MY, Brdiczka D. The function of complexes between theouter mitochondrial membrane pore (VDAC) and the adenine nucleo-tide translocase in regulation of energy metabolism and apoptosis.Acta Biochim Pol 2003;50:389–404.
50. Valdez BC, Wang W. Mouse RNA helicase II/Gu: cDNA andgenomic sequences, chromosomal localization, and regulation ofexpression. Genomics 2000;66:184–94.
51. Westermarck J, Weiss C, Saffrich R, Kast J, Musti AM, Wessely M,Ansorge W, Seraphin B, Wilm M, Valdez BC, Bohmann D. TheDEXD/H-box RNA helicase RHII/Gu is a co-factor for c-Jun-acti-vated transcription. EMBO J 2002;21:451–60.
52. Roy S, McPherson RA, Apolloni A, Yan J, Lane A, Clyde-Smith J,Hancock JF. 14–3–3 facilitates Ras-dependent Raf-1 activation invitro and in vivo. Mol Cell Biol 1998;18:3947–55.
53. Thorson JA, Yu LW, Hsu AL, Shih NY, Graves PR, Tanner JW,Allen PM, Piwnica-Worms H, Shaw AS. 14–3–3 proteins are requiredfor maintenance of Raf-1 phosphorylation and kinase activity. MolCell Biol 1998;18:5229–38.
54. Won J, Kim DY, La M, Kim D, Meadows GG, Joe CO. Cleavage of14–3–3 protein by caspase-3 facilitates bad interaction with Bcl-x(L)during apoptosis. J Biol Chem 2003;278:19347–51.
55. Nomura M, Shimizu S, Sugiyama T, Narita M, Ito T, Matsuda H, Tsu-jimoto Y. 14–3–3 Interacts directly with and negatively regulates pro-apoptotic Bax. J Biol Chem 2003;278:2058–65.
56. Salles B, Calsou P, Frit P, Muller C. The DNA repair complex DNA-PK, a pharmacological target in cancer chemotherapy and radiother-apy. Pathol Biol 2006;54:185–93.
57. Liang F, Lee SY, Liang J, Lawrence DS, Zhang ZY. The role of pro-tein-tyrosine phosphatase 1B in integrin signaling. J Biol Chem2005;280:24857–63.
58. Byon JC, Kusari AB, Kusari J. Protein-tyrosine phosphatase-1B actsas a negative regulator of insulin signal transduction. Mol Cell Bio-chem 1998;182:101–8.
59. Stoll BA. Upper abdominal obesity, insulin resistance and breast can-cer risk. Int J Obes Relat Metab Disord 2002;26:747–53.
60. Boudier C, Cadene M, Bieth JG. Inhibition of neutrophil cathepsin Gby oxidized mucus proteinase inhibitor. Effect of heparin. Biochemis-try 1999;38:8451–7.
61. Zhang D, Simmen RC, Michel FJ, Zhao G, Vale-Cruz D, SimmenFA. Secretory leukocyte protease inhibitor mediates proliferation ofhuman endometrial epithelial cells by positive and negative regulationof growth-associated genes. J Biol Chem 2002;277:29999–30009.
62. Devoogdt N, Hassanzadeh Ghassabeh G, Zhang J, Brys L, De Baetse-lier P, Revets H. Secretory leukocyte protease inhibitor promotes thetumorigenic and metastatic potential of cancer cells. Proc Natl AcadSci USA 2003;100:5778–82.
63. Tsukishiro S, Suzumori N, Nishikawa H, Arakawa A, Suzumori K.Use of serum secretory leukocyte protease inhibitor levels in patientsto improve specificity of ovarian cancer diagnosis. Gynecol Oncol2005;96:516–9.
64. O’Reilly MS, Boehm T, Shing Y, Fukai N, Vasios G, Lane WS, FlynnE, Birkhead JR, Olsen BR, Folkman J. Endostatin: an endogenous in-hibitor of angiogenesis and tumor growth. Cell 1997;88:277–85.
65. Wang N, Thuraisingam T, Fallavollita L, Ding A, Radzioch D, BrodtP. The secretory leukocyte protease inhibitor is a type 1 insulin-likegrowth factor receptor-regulated protein that protects against liver me-tastasis by attenuating the host proinflammatory response. Cancer Res2006;66:3062–70.
66. Riggins RB, Schrecengost RS, Guerrero MS, Bouton AH. Pathwaysto tamoxifen resistance. Cancer lett 2007;256:1–24.
67. Laine A, Davril M, Hayem A. Interaction between human serumalpha 1-antichymotrypsin and human leukocyte cathepsin G. complexformation and production of a modified inhibitor. Biochem BiophysRes Commun 1982;105:186–93.
1338 CIMINO ET AL.