identification of metabolites, clinical chemistry markers and transcripts associated with...
TRANSCRIPT

Identification of Metabolites, Clinical Chemistry Markersand Transcripts Associated with HepatotoxicityAndreas Buness1*, Adrian Roth1, Annika Herrmann1, Oliver Schmitz2, Hennicke Kamp4, Kristina Busch3¤a,
Laura Suter1¤b
1 F. Hoffmann-La Roche, Basel, Switzerland, 2 Metanomics GmbH, Berlin, Germany, 3 Metanomics Health GmbH, Berlin, Germany, 4 BASF SE, Ludwigshafen, Germany
Abstract
Early and accurate pre-clinical and clinical biomarkers of hepatotoxicity facilitate the drug development process and thesafety monitoring in clinical studies. We selected eight known model compounds to be administered to male Wistar rats toidentify biomarkers of drug induced liver injury (DILI) using transcriptomics, metabolite profiling (metabolomics) andconventional endpoints. We specifically explored early biomarkers in serum and liver tissue associated withhistopathologically evident acute hepatotoxicity. A tailored data analysis strategy was implemented to better differentiateanimals with no treatment-related findings in the liver from animals showing evident hepatotoxicity as assessed byhistopathological analysis. From the large number of assessed parameters, our data analysis strategy allowed us to identifyfive metabolites in serum and five in liver tissue, 58 transcripts in liver tissue and seven clinical chemistry markers in serumthat were significantly associated with acute hepatotoxicity. The identified markers comprised metabolites such astaurocholic acid and putrescine (measured as sum parameter together with agmatine), classical clinical chemistry markerslike AST (aspartate aminotransferase), ALT (alanine aminotransferase), and bilirubin, as well as gene transcripts like Igfbp1(insulin-like growth factor-binding protein 1) and Egr1 (early growth response protein 1). The response pattern of theidentified biomarkers was concordant across all types of parameters and sample matrices. Our results suggest that acombination of several of these biomarkers could significantly improve the robustness and accuracy of an early diagnosis ofhepatotoxicity.
Citation: Buness A, Roth A, Herrmann A, Schmitz O, Kamp H, et al. (2014) Identification of Metabolites, Clinical Chemistry Markers and Transcripts Associated withHepatotoxicity. PLoS ONE 9(5): e97249. doi:10.1371/journal.pone.0097249
Editor: Tobias Eckle, University of Colorado Denver, United States of America
Received January 13, 2014; Accepted April 16, 2014; Published May 16, 2014
Copyright: � 2014 Buness et al. This is an open-access article distributed under the terms of the Creative Commons Attribution License, which permitsunrestricted use, distribution, and reproduction in any medium, provided the original author and source are credited.
Funding: This work was funded by Non-Clinical Safety, F. Hoffmann-La Roche Ltd, and Metanomics Health GmbH. The funders had no role in study design, datacollection and analysis, decision to publish, or preparation of the manuscript.
Competing Interests: AB, AR, AH and LS are or were employees of F. Hoffmann-La Roche. OS, HK and KB are or were employed by Metanomics Health GmbH orMetanomics GmbH or BASF SE. This does not alter the authors’ adherence to PLOS ONE policies on sharing data and materials.
* E-mail: [email protected]
¤a Current address: BASF SE, Ludwigshafen, Germany¤b Current address: Fachhochschule Nordwestschweiz, Muttenz, Switzerland
Introduction
Drug-induced liver injury (DILI) is a major concern during drug
development and beyond. Pre-clinical candidate drug molecules
frequently fail in development due to induced organ toxicities,
often hepatotoxicity. Likewise, a common reason of withdrawal of
approved drugs is toxicity. Although the incidence of drug-related
hepatotoxicity is only 1 in 10000 to 100000, DILI is the leading
cause of acute liver failure among patients referred to liver
transplantation in the United States [1]. Despite the efforts from
the last years in this field, appropriate biomarkers for monitoring
liver function and to identify onset, progression and reversibility of
DILI remain a major need in pharmaceutical research and in the
clinic.
In this context, we define biomarkers as measurable character-
istics that reflect physiological, pharmacological, or disease
processes in animals or humans. They are indicative of certain
biological processes or responses like adverse drug effects or
treatment efficacy. Preferably, biomarkers should be measurable in
body fluids, non-invasive and sensitive to be applied in clinical
monitoring of potential toxicities of investigational drugs. Trans-
lational biomarkers are such for which research based on pre-
clinical models can provide novel biomarkers which then may be
used in clinical practice. Evolving technologies continuously
improve the capabilities to measure smaller amounts of various
types of biomolecules and parameters rapidly, more accurately,
and in parallel in several biological matrices. These technologies
include, for example, real time quantitative polymerase chain
reaction (RT-PCR) and microarrays for gene expression profiling,
multiplex enzyme-linked immunosorbent assay (ELISA) for the
detection of proteins, and chromatography separation methods
combined with mass spectroscopy for the quantification of
peptides and small metabolites. These technological advancements
enhance our means to systematically identify and establish
biomarkers. For example in the field of nephrotoxicity, the
combined analysis of gene and protein expression, metabolite
concentration and in-situ hybridization and immunohistochemis-
try was successful in identifying putative biomarkers such as the
kidney injury molecule-1 (Kim-1) that has been shown to
outperform traditional markers [2,3,4]. Interestingly, these pre-
clinical results were not only translated from the pre-clinic to the
clinic and from tissue to urine, but also from the transcriptome to
the proteome. In addition, the application of liquid and gas
PLOS ONE | www.plosone.org 1 May 2014 | Volume 9 | Issue 5 | e97249

chromatography followed by mass spectrometry discovered
metabolites as further potential biomarkers for the early detection
of drug-induced nephrotoxicity [5]. The use of specific metabolite
profiles determined using different measurement platforms for the
toxicological assessment has also been published by several groups
either on its own or with concomitant transcriptomic data [6,7,8].
In these examples, metabolite profiling is useful to identify putative
biomarkers that can be readily measured in body fluids.
Given these promising published results we set out to identify
biomarkers that were indicative of hepatotoxicity after acute
exposure to a number of known hepatotoxicants. In order to gain
granularity and mechanistic understanding, we decided to base
our biomarker research not only on a single analytical technology
or a single sample type, but on multiple technologies and two
relevant matrices, serum and liver tissue. Therein we measured
transcripts, enzymatic activities and metabolites while aiming to a
more comprehensive view on the molecular changes associated
with hepatotoxicity. We also aimed at combining established
parameters (e.g. enzymatic activities) with less standard ones (e.g.
transcriptional changes in the tissue and the small metabolite
composition). In addition, appropriate phenotypic anchoring was
obtained by thorough histopathological assessment of the liver
tissue.
Materials and Methods
Study DesignMale Han Wistar rats (11–14 weeks old) were housed
individually and randomly assigned to groups of 5. Animals were
given water and chow ad libitum at all times. Regarding selection of
compounds, doses and times for sample collection, studies were
designed based on the known effect of the compounds, with the
aim of eliciting subtle to marked hepatotoxicity. All animals were
dosed either with one of following compounds (ANIT, Aminep-
tine, Cyclosporine A, Erythromycin, Glibenclamide, Methylene
Dianiline, Phalloidin, Tetracycline) or the corresponding vehicle
(Table 1). Immediately preceding sacrifice, terminal blood samples
for clinical chemistry investigations and determination of en-
dogene metabolites (metabolite profiling) were collected from the
retroorbital sinus. Liver samples were collected for further analysis,
including gene expression measurements (transcriptomics), en-
dogene metabolite determination (metabolite profiling) and
histopathological examination. Experiments were conducted with
authorization from the Swiss Federal Veterinary Office and the
Association for Assessment and Accreditation of Laboratory
Animal Care International.
Clinical ChemistryA panel of up to 23 clinical chemistry parameters was assessed
for 274 samples. The following determinations were made in
serum: alanine aminotransferase (ALT), albumin (ALB), alkaline
phosphatase (ALP), alpha globulins (AGLOB), aspartate amino-
transferase (AST), beta globulins (BGLOB), bilirubin, bile acids
(BA), calcium (Ca2+), chloride (Cl–), cholesterol, creatinine, gamma
globulins (GGLOB), gamma-glutamyltransferase (GGT), glucose,
inorganic phosphate (PI)), lactate dehydrogenase (LDH), potassi-
um (K+), sodium (Na+), sorbitol dehydrogenase (SDH), total
protein, triglycerides, and urea.
Gene Expression Analysis (Transcriptomics)A portion of liver tissue from the left medial lobe was stored at
necropsy into RNALater (Ambion, Austin, TX) for RNA
preservation. RNA isolation, processing and hybridization were
essentially carried out as recommended by Affymetrix (www.
affymetrix.com, Affymetrix, Santa Clara, CA) with minor mod-
ifications. RNA was extracted from 274 liver tissues, processed and
hybridized onto Affymetrix rat genome microarray U34A. This
microarray quantifies 8799 different sequences of transcripts
(probe sets). The resulting gene expression intensity data were
quality controlled and normalized.
Metabolite Profiling (Metabolomics)Two types of mass spectrometry analyses were applied: GC-MS
(gas chromatography-mass spectrometry) and LC-MS/MS (liquid
chromatography-MS/MS) were used for broad profiling, as
described elsewhere [9]. Proteins were removed from serum
samples by precipitation. Subsequently polar and non-polar
fractions were separated by adding water and a mixture of
ethanol and dichloromethane. Liver tissue samples were homog-
enized and extracted with a mixture of water, ethanol and
dichloromethane. After filtration and centrifugation polar and
non-polar fractions were separated. For GC-MS analysis, the non-
polar fraction was treated with methanol under acidic conditions
to yield the fatty acid methyl esters derived from both free fatty
acids and hydrolyzed complex lipids. The non-polar and polar
fractions were further derivatized with O-methyl-hydroxylamine
hydrochloride and pyridine to convert oxo-groups to O-methyl-
oximes and subsequently with a silylating agent before analysis
[10]. For LC-MS/MS analysis, both fractions were reconstituted
Table 1. Overview of treatments.
Treatment Dose Route Time N
ANIT 30; 150 mg/kg p.o. 24 h 10
Amineptine 0.125 mM/kg / 0.25; 0.5 mM/kg i.p. 24 h / 3; 6; 24 h 35
Cyclosporine A 5*; 15; 30 mg/kg i.v. 1,5*; 3*; 6 h 42
Erythromycin 734 mg/kg i.p. 1.5; 3; 6 h 13
Glibenclamide 2.5; 25 mg/kg i.v. 24 h 10
Methylene Dianiline 20; 100 mg/kg p.o. 3; 6; 24 h 30
Phalloidin 0.2; 0.8 mg/kg i.v. 3*; 6*; 24 h 30
Tetracycline 0.2 mM/kg i.p. 3; 6 h 10
Vehicle (Control) 0 mg/kg several 1.5; 3; 6; 24 h 100
The total number of samples is 280. Samples marked with * were not used for metabolite profiling analyses.doi:10.1371/journal.pone.0097249.t001
Metabolites, Markers and Transcripts Associated with Hepatotoxicity
PLOS ONE | www.plosone.org 2 May 2014 | Volume 9 | Issue 5 | e97249

in appropriate solvent mixtures. High-performance liquid chro-
matography (HPLC) was performed by gradient elution using
methanol/water/formic acid on reversed phase separation
columns. Mass spectrometric detection technology was applied
which allows target and high sensitivity MRM (multiple reaction
monitoring) profiling in parallel to a full screen analysis (patent
application: WO2003073464). For GC-MS and LC-MS/MS
profiling, data were normalized to the median of reference
samples which were derived from a pool formed from aliquots of
all samples to account for inter- and intra-instrumental variation.
Metabolite profiling of liver and serum samples was performed by
Metanomics Health (Berlin). In serum, we identified 200
metabolites at concentration levels above the limit of quantifica-
tion allowing semi-quantitative (SQ) analysis. In liver tissue, 545
SQ metabolites were measured.
HistopathologyRepresentative liver samples were fixed in 10% neutral buffered
formalin. One additional liver sample from top half of the left
lateral lobe was placed in Carnoy fixative. All samples were
processed using routine procedures and embedded in Paraplast.
Tissue sections approximately 2–3 microns were cut and stained as
follows for histopathological evaluation: hematoxylin-eosin, peri-
odic acid-Schiff for glycogen, and Oil Red-O for lipid. Hematox-
ylin-eosin and Oil Red O stained liver slides were evaluated
histopathologically. The histopathological assessment was the basis
for the classification of the samples into positive and negative for
liver toxicity. Any of following findings was considered to indicate
liver toxicity and drove the classification of the samples: apoptosis
or single cell necrosis, hemorrhage, hepatocellular cytoplasmic
vacuolation different from fat droplets (Oil Red O slides), necrosis
and inflammation. All other observations noted in the histology
evaluation like glycogen content were not considered to reflect
hepatotoxicity and were thus not used for the classification.
Data AnalysisWe transformed the measurements of all parameters (gene
expression, metabolite profiling and clinical chemistry) to the log2-
scale. The mean of the time matched control group (vehicle
treatment) was subtracted from each data point. Hence, the
control groups were centered at zero. The histopathological
classification of the samples was refined and the samples were
divided into three classes: negative, positive and increased. The
negative class comprised all samples which neither showed any
relevant histopathological alteration nor any substantial changes in
ALT or AST measurements. None of the measurements of the
control samples, i.e. vehicle treated samples, deviated from the
average of their group and thus all control samples were classified
negative. The positive class encompassed all samples with
histopathological findings as described above, irrespective of
ALT and AST changes. The third class, termed ‘increased’,
contained all samples which were classified as negative by means
of the histopathological descriptors mentioned above, but showed
at least a two-fold increase in either ALT or AST compared to the
mean of the corresponding control group. Following this
partitioning a two-tailed t-test with equal variance assumption
was applied to identify parameters with significant differences
between the positive and the negative class. To account for
multiple testing and to reduce and control the number of false
positive parameters, we calculated the false discovery rate (FDR,
Benjamini and Hochberg method) for each type of measurement
separately. All calculations were performed with the statistic
software R, Bioconductor and in-house tools (www.r-project.org,
www.bioconductor.org). The interpretation of obtained results
Ta
ble
2.
His
top
ath
olo
gic
alfi
nd
ing
sin
the
live
r(p
osi
tive
sam
ple
s/to
tal
of
sam
ple
s).
His
top
ath
olo
gic
fin
din
gs
Tre
atm
en
t,d
ose
lev
el,
tim
ep
oin
ts
AN
ITE
ryth
rom
yci
nM
eth
yle
ne
Dia
nil
ine
Ph
all
oid
in
30
mg
/kg
24
h1
50
mg
/kg
24
h7
34
mg
/kg
3h
73
4m
g/k
g6
h1
00
mg
/kg
3h
10
0m
g/k
g6
h1
00
mg
/kg
24
h0
.8m
g/k
g3
h0
.8m
g/k
g6
h0
.8m
g/k
g2
4h
Ap
op
tosi
s/si
ng
lece
lln
ecr
osi
s–
3/5
1/5
2/5
4/5
5/5
5/5
5/5
5/5
5/5
Infl
am
ma
tio
n1
/52
/5–
––
5/5
5/5
––
–
He
pa
toce
llu
lar
va
cuo
lati
on
––
1/5
1/5
––
––
––
He
mo
rrh
ag
e–
––
––
––
5/5
5/5
5/5
Ne
cro
sis
––
––
––
–5
/54
/5
Co
mp
ou
nd
sn
ot
liste
dd
idn
ot
cau
sean
yre
leva
nt
chan
ge
sin
the
live
r.d
oi:1
0.1
37
1/j
ou
rnal
.po
ne
.00
97
24
9.t
00
2
Metabolites, Markers and Transcripts Associated with Hepatotoxicity
PLOS ONE | www.plosone.org 3 May 2014 | Volume 9 | Issue 5 | e97249

primarily focused on parameters which were significantly dereg-
ulated (FDR value ,0.05) and in addition exhibited fold-changes
of at least twofold (FC .2).
Results
Eight independent animal studies performed in male Wistar rats
were used to identify early biomarkers associated with histopath-
ologically evident hepatotoxicity. The inclusion of measurements
within 24 hours of dosing allowed us to monitor potential changes
in biomarker concentration before toxic injuries were detectable at
the microscopic level. Details on all studies, treatments and time
points are summarized in Table 1.
Histopathologically positive samples were found in animals
treated with ANIT, Erythromycin, Methylene Dianiline or
Phalloidin (Table 2). ANIT, Erythromycin, Methylene Dianiline
and Phalloidin caused hepatocellular damage characterized by
single cell necrosis/apoptosis, inflammation and vacuolation.
Phalloidin in addition caused hepatic hemorrhage. The results,
with the observed incidence are summarized in Table 2. The other
tested compounds did not cause histopathological changes in the
liver. Clinical chemistry results showed increase in liver param-
eters in the animals showing histopathological findings in the
livers, but also in treated animals without microscopic indications
of liver damage (Figures S1 and S2).
Based on the histopathological findings and on the ALT and
AST measurements, individual animals were assigned to one of
the three classes defined in materials and methods, e.g. negative,
positive and increased (Table 3). The statistical analysis aimed at
identifying differences while enhancing the contrast between the
negative and positive class. For this purpose, a two-tailed t-test was
applied to determine parameters which were significantly dereg-
ulated between the negative class (no histopathological finding in
the liver) and the positive class (histopathological evident
hepatotoxicity). Samples with increased ALT or AST but without
concomitant histopathological manifestation (classified as ‘‘in-
creased’’) were left out in this step. This approach was motivated
by the following considerations. Firstly, we wanted to base our
analysis on confirmed toxicities, i.e. the positive class, rather than
on expectations on the effects of the treatment. Therefore, we only
classified as positive samples that had a clear phenotypic anchoring
(histopathology) [11]. Secondly, we expected that molecular
responses indicative of hepatotoxicity would arise prior to the
morphological evidence (e.g. in animals without histopathological
findings that were treated with known toxicants). Hence, a direct
comparison based solely on histopathologically detected hepato-
toxicity (negative versus the positive class) may bias the results in
the direction of late stages molecular changes since early molecular
alterations are presumably already present before histopatholog-
ical correlate. Thirdly, ALT and AST are well known, sensitive
serum markers of hepatotoxicity [12]. Thus, while aiming at an
enhanced contrast between the positive and negative class we
decided to remove samples which potentially represent early stages
of hepatotoxicity from the negative class. This was achieved by
leaving out all samples with increased ALT or AST. An overview
of the sample numbers for each parameter type and each class is
given in Table 4. As indicated in Table 2 fewer treatment groups
were used for metabolite profiling, particularly reducing the larger
sample numbers of the negative class. For the clinical chemistry
parameter gamma-glutamyltransferase (GGT) substantially less
sample measurements were available (see Figure S1 for the details
of all clinical chemistry parameters).
As a first step we quantified the sensitivity and specificity of the
ALT and AST serum measurements in detecting histopatholog-
ically evident hepatotoxicity based on our criteria. Serum ALT
and AST data were available for 30 out of the 35 samples in the
Table 3. Subdivision of samples into three classes split by treatment.
Treatment Negative Increased Positive N (total)
ANIT 6 0 4 10
Amineptine 15 20 0 35
Cyclosporine A 41 1 0 42
Erythromycin 2 8 3 13
Glibenclamide 10 0 0 10
Methylene Dianiline 16 0 14 30
Phalloidin 15 1 14 30
Tetracycline 1 9 0 10
Vehicle (Control) 100 0 0 100
Sum 206 39 35 280
doi:10.1371/journal.pone.0097249.t003
Table 4. Overview of samples per class and parameter type (highest numbers are shown).
Parameter Negative Increased Positive N (total)
Clinical Chemistry 202 39 30 271
Metabolites in Liver 131 37 25 193
Metabolites in Serum 130 31 20 181
Transcripts in Liver 202 39 33 274
doi:10.1371/journal.pone.0097249.t004
Metabolites, Markers and Transcripts Associated with Hepatotoxicity
PLOS ONE | www.plosone.org 4 May 2014 | Volume 9 | Issue 5 | e97249

positive class. From these samples, 16 showed a two-fold increase
in at least one enzyme and 14 did not exceed this cut-off value. In
addition, the class termed ‘increased’ contained further 39 samples
above the two-fold cut-off in either ALT or AST. This corresponds
to a sensitivity of 53% and specificity of 84% in our data set (200
true negative samples).
Regarding other putative biomarkers, our tailored approach
identified 75 parameters in serum and liver tissue which were
found to be significantly associated with acute hepatotoxicity (FDR
smaller than 0.05) and which were changed at a fold-change larger
than two. They are listed in separate tables for each type of
parameters and consist of 7 clinical chemistry markers in serum, 5
metabolites in liver tissue, 5 metabolites in serum and 58
transcripts, mapping to 45 distinct genes, in liver tissue
(Tables 5–8, respectively, Figures S3–S6 and Tables S1–S3).
The multiple occurrences of some probe sets in the result list
underlined the reproducibility of their measurement, e.g. we
identified four times Egr1 (early growth response protein 1) and
three times Btg2 (B-cell translocation gene 2) and Jun (jun proto-
oncogene).
The magnitude of deregulation varied across these 75 param-
eters. The distribution is visualized in Figure 1. The average fold-
change when compared to the matching control group is shown as
a colored line for each class separately. As a consequence of the
selection criteria, the changes of the mean of the class of the
negative samples for the 75 parameters are centered on zero (no
change) when compared to the matching control group. Likewise,
as a consequence of the selection criteria the changes in mean of
the positive class discriminate well from those of the negative class
for the 75 identified parameters. The number of parameters with
an increased level in the positive class by far exceeded those which
were down-regulated. Most interestingly to note is that, the
distribution of the class termed ‘increased’ lies between the
negative and positive classes, thus reassuring us of the validity of
our tailored approach. Hence, samples with no evident histopath-
ological finding, but two-fold increase in either ALT or AST,
clearly show further alterations on the molecular level in serum
and liver tissue.
A detailed graphical visualization of the measurements is given
for the best ranked parameters in Figure 2 and all other
parameters in Figures S3–S6. The parameters were ranked by
significance level (p-value) followed by amplitude of change (fold-
change), see Tables 5–8 and Tables S1–S3. The best ranked
parameters for each type of measurement were selected, i.e.
bilirubin for clinical chemistry, putrescine and taurocholic acid
from the metabolite profiling measurements and Igfbp1 (insulin-
like growth factor-binding protein 1) and Egr1 from the gene
expression data. The graphical representation depicts the variation
from the controls since all measurements were calibrated including
the vehicle treated control groups which were centered at zero.
These variations of the controls tend to be within the two-fold
range, but some extreme cases show changes up to four-fold. This
outcome appears to be irrespective of the type of measurement
and sample type, i.e. serum or tissue. Moreover, this outcome
appears to be unrelated to the matrix (serum or tissue) or the
technology of measurement. In addition, the data shows a
dynamic response in time, as seen in the graphical representation.
For example, bilirubin levels increase in a time-dependent manner
in animals treated with Methylene Dianiline and histopatholog-
ically positive scored samples. In addition to these detailed graphs,
a combined view of all 75 parameters is presented as a heatmap-
like representation (Figure S2).
A closer inspection of the detailed graphical visualization
revealed two individuals that clearly deviated from the rest of
the animals in the negative class (Figure 2). These two animals
were treated with a high dose of ANIT or Methylene Dianiline,
respectively. In particular, they showed increases in taurocholic
acid of approximately 16- and 32-fold at 24 h and 3 h,
respectively. Moreover they also showed increase in bilirubin
(16x, 2x), in Igfbp (11x, 4x), in Egr1 (2x, 4x) and in putrescine (3x,
Table 5. Significantly changed (FDR ,0.05) clinical chemistry markers in serum exhibiting absolute fold changes (FC) .2.
Name FDR logFC FC
Bilirubin 0.00 3.18 9.06
BA 0.00 2.94 7.70
ALT 0.00 2.75 6.72
GGT 0.00 2.61 6.09
AST 0.00 2.38 5.19
SDH 0.00 2.12 4.34
LDH 0.00 1.74 3.35
doi:10.1371/journal.pone.0097249.t005
Table 6. Significantly changed (FDR ,0.05) metabolites in liver tissue exhibiting absolute fold changes (FC) .2.
Name FDR logFC FC
Putrescine (additional: agmatine) 0.00 2.02 4.04
Glycochenodeoxycholic Acid 0.01 21.34 0.39
Taurocholic Acid 0.00 1.15 2.21
Unknown 0.00 1.12 2.17
Maltotriose 0.03 21.06 0.48
doi:10.1371/journal.pone.0097249.t006
Metabolites, Markers and Transcripts Associated with Hepatotoxicity
PLOS ONE | www.plosone.org 5 May 2014 | Volume 9 | Issue 5 | e97249
none). Given the consistent deviation of these individual animals
from the negative class, we decided to re-evaluate the histopath-
ological classification. In the case of the animals at the early time
point of 3h treated with Methylene Dianiline we could not detect
any histopathological changes upon re-evaluation. However, re-
assessment of the liver tissue of the rat treated with ANIT showed
single cell necrosis of grade one, which had been overlooked in the
first evaluation. These observations suggest the relevance of our
results, indicating that objective quantitative measurements can at
times outperform histopathological evaluation and suggesting a
higher sensitivity of analyte measurements compared to morpho-
logical assessment.
Taking into account treatment effects with fold changes ,2, a
large number of additional metabolites exhibiting significant
changes could be identified both in serum (n = 97) and liver
(n = 144). The total number of significantly changed metabolites
with known structure ID was 63 and 85 for liver and serum,
respectively (Tables S1 and S2; metabolites are sorted according to
their ontology classes). Metabolite concentration changes in serum
were largely observed for amino acids and related (including
tryptophan, metabolites of the tryptophan metabolism and
metabolites of the creatine metabolism) as well as lipids, e.g.
several (lyso)phospho- and sphingolipids and other complex lipids
(e.g. triacylglycerols) and fatty acids derived from complex lipids.
In addition to the already discussed bile acids, increases were
observed in particular for complex lipids and fatty acids that are
components of cell membranes. The metabolite classes amino
acids (and related) as well as lipids (again different lipid classes)
exhibited major changes also in liver (Table S1). It is noteworthy
to mention that particularly for amino acids and related we
observed quite some overlap of metabolites being significantly
changed in the same direction both in serum and liver (see Tables
S1 and S2, respectively). This applied to glutamate, alanine and
trans-4-Hydroxyproline (decreased by up to 27%) as well as
leucine, valine, creatine, creatinine and ornithine (increased by up
to 70%). In contrast, lysine and arginine are examples exhibiting
opposite changes in both matrices, the latter one being decreased
in serum by 58% and increased in liver by 30%).
The observed gene expression changes were summarized with
regard to gene ontology (GO) classes. To this end, all measured
transcripts were annotated and mapped to GO classes. We focused
on the most significant 500 deregulated transcripts irrespective
their fold change (p-value ,10–7). Those GO classes were selected
which were enriched in our list of 500 deregulated transcripts by
means of the Fisher exact test. The following 9 GO classes were
found overrepresented in our data set with a p-value ,10–5:
response to stimulus, external stimulus, chemical stimulus, stress,
wounding, hormone stimulus, organic substance and endogenous
stimulus; and regulation of angiogenesis.
Discussion
The aim of this investigation was to identify putative early
biomarkers for hepatotoxicity. With this purpose in mind, we
utilized clinical chemistry parameters, metabolite profiling (LC-
MS/MS and GC-MS) and gene expression in serum and/or liver.
We identified parameters which were associated with histopath-
ological findings in the rat liver. Most of these parameters were
elevated with an overall concordant pattern across the different
types of measurements and matrices (e.g. tissue transcripts and
serum metabolites). Here, we present the results of our study which
offer a repertoire of potential biomarkers to assess and monitor
DILI.
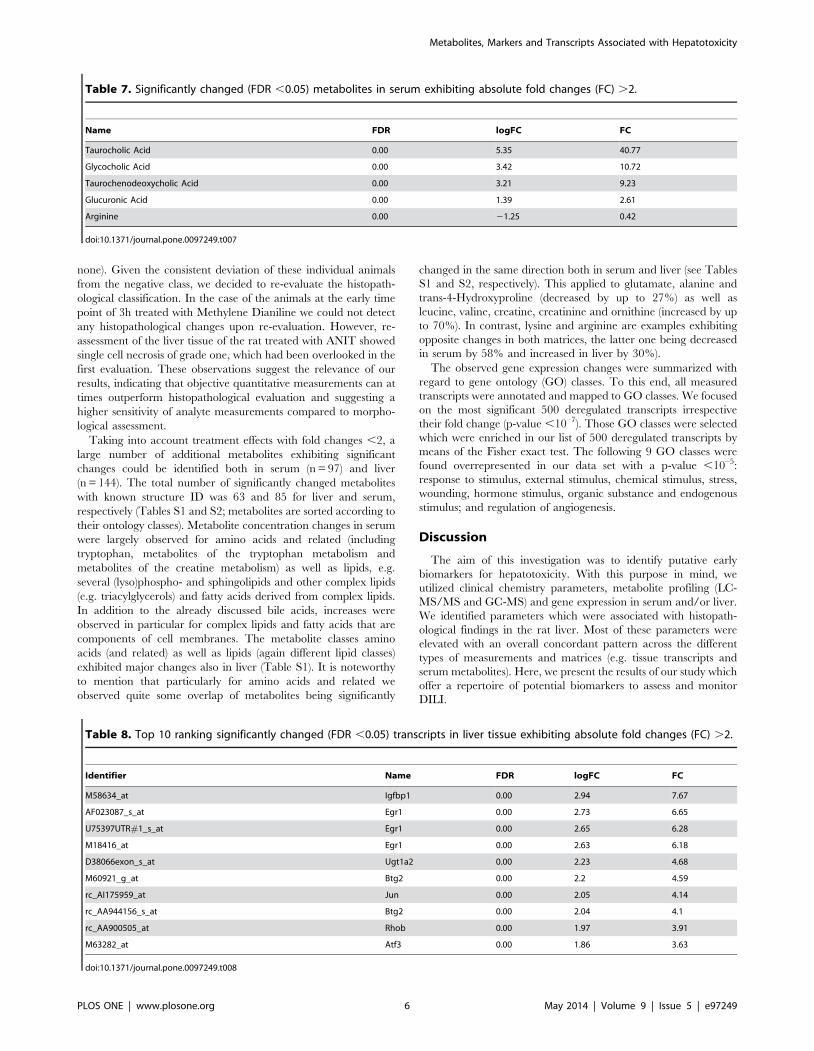
Table 7. Significantly changed (FDR ,0.05) metabolites in serum exhibiting absolute fold changes (FC) .2.
Name FDR logFC FC
Taurocholic Acid 0.00 5.35 40.77
Glycocholic Acid 0.00 3.42 10.72
Taurochenodeoxycholic Acid 0.00 3.21 9.23
Glucuronic Acid 0.00 1.39 2.61
Arginine 0.00 21.25 0.42
doi:10.1371/journal.pone.0097249.t007
Table 8. Top 10 ranking significantly changed (FDR ,0.05) transcripts in liver tissue exhibiting absolute fold changes (FC) .2.
Identifier Name FDR logFC FC
M58634_at Igfbp1 0.00 2.94 7.67
AF023087_s_at Egr1 0.00 2.73 6.65
U75397UTR#1_s_at Egr1 0.00 2.65 6.28
M18416_at Egr1 0.00 2.63 6.18
D38066exon_s_at Ugt1a2 0.00 2.23 4.68
M60921_g_at Btg2 0.00 2.2 4.59
rc_AI175959_at Jun 0.00 2.05 4.14
rc_AA944156_s_at Btg2 0.00 2.04 4.1
rc_AA900505_at Rhob 0.00 1.97 3.91
M63282_at Atf3 0.00 1.86 3.63
doi:10.1371/journal.pone.0097249.t008
Metabolites, Markers and Transcripts Associated with Hepatotoxicity
PLOS ONE | www.plosone.org 6 May 2014 | Volume 9 | Issue 5 | e97249

Our approach compares samples with treatment-related histo-
pathological findings in the liver (called ‘positive’) with those which
do not show any substantial alterations neither histopathologically
nor with regards to the their serum levels of ALT or AST (called
‘negative’). The approach implicitly aims to identify universal
biomarkers, i.e. biomarkers which are indicative for DILI
irrespective of the type of the toxic injury or its underlying
molecular mechanism. However, a single, universal marker
associated with any kind of hepatotoxicity may not exist, since
early toxic events may differ among different mechanisms of
toxicity. A biomarker discovery strategy that initially stratifies
hepatotoxicity based on the type of finding or mechanism could be
used to identify mechanism-specific markers [13]. Here, we did
not attempt to do so, but rather focused on histopathologically
positive samples, irrespective of the mode of action. Biological
understanding of the roles of the detected putative biomarkers
provided additional evidence of the true (rather than spurious)
association between the detected markers and the underlying
cellular processes.
Thus, we assessed the set of parameters identified as significantly
changed upon toxic insult to the liver considering their biological
function. The parameters included in the clinical chemistry panel
and that were elevated in the positive samples are known to be
associated with hepatotoxicity (Table 5 and Figure S3). For
example, Hy’s law, defined as elevations of circulating transam-
inases (ALT or AST) and bilirubin has become the standard of
practice to determine the severity of liver damage in the clinic.
This combination of parameters, however, will only indicate
serious cases of liver damage in patients [14]. Gamma-glutamyl-
transferase (GGT) is localized to bile ducts, so that elevations in
circulating levels are indicative of hepatobiliary damage. Sorbitol
dehydrogenase (SDH) elevations were found to be specific for liver
damage, but much less sensitive than the transaminases. Lactate
dehydrogenase (LDH) is considered a general marker of tissue
damage, although certain isoforms (LDH-4 and LDH-5) are more
specific to liver or muscle disease.
In association with hepatotoxicity, we detected increased bile
acids in serum (total bile acids, glycocholic and taurochenodeoxy-
cholic acids) and in liver tissue either by clinical chemistry or by
metabolite profiling. The fact that this metabolite family can be
detected in both matrices, irrespective of the analytical method
confirms that bile acids are robust and informative markers of liver
damage. These organic anions are synthesized in hepatocytes from
cholesterol, conjugated, and excreted into the canaliculus [15].
Measurement of serum bile acid concentrations is a more specific
indicator of functional hepatic excretory capacity than is serum
bilirubin [16]. Our data suggest that differential determination of
total and/or specific bile acids may add information on subtle
excretory abnormalities and improve sensitivity by employing of
more accurate analytical methods such as GC/MS or LC/MS.
Further indication of detoxification processes triggered in the liver
by the treatments is the increase in circulating glucuronic acid.
Metabolite profiling has proven high reliability and reproduc-
ibility in the past. In many cases rather small yet physiologically
meaningful changes observed in a highly controlled matrix like
serum or plasma could be assigned to specific toxicological mode
of actions. In particular, it has been shown that plasma
metabolome changes, e.g. for amino acids, fatty acids and
complex lipids, below a fold change of 2 can be indicative for
liver toxicity [17,18,9]. Furthermore, increased values of creati-
nine in rat urine have been reported to be related to treatment
with the hepatotoxicant hydrazine [19] and increases of urinary
bile acids have been associated with ANIT treatment [20]. These
results are in line with highly significant metabolome changes
observed in this study, such as increases of creatinine and creatine
levels both in liver and in serum. Recently it was reported that
changes in circulating bile acids as well as amino acids are
associated with acetaminophen-induced hepatotoxicity in rats
[21]. In particular, elevated blood bile acids have been observed,
with increases in cholic acid, deoxycholic acid and glycocholic acid
being statistically significant. Strong correlations with the hepato-
toxic outcome of acetaminophen were also observed for e.g.
arginine and derivatives [21]. In line with this observation, in the
current study serum arginine levels decreased while serum
ornithine levels increased (Table S2). The corresponding urea
cycle enzyme arginase I, catalyzing the conversion of arginine to
ornithine and urea, exhibited a significant increase in transcript
levels by ,20% in liver tissue as well (not shown). Remarkably, the
metabolites arginine, ornithine, citrulline and urea exhibited
significant increases in liver (Table S1), confirming deregulation
of the urea cycle as seen in the transcriptomics analysis in the
current study: in addition to the increase of arginase I, an increase
of argininosuccinate dehydrogenase by ,30% and a decrease of
ornithine carbamoyltransferase by ,13% was observed (not
shown).
Serum metabolite profiling revealed changes in tryptophan
metabolism: tryptophan decrease by 30% was accompanied by
decreases of indole-3-propionic acid and indole-3-lactic acid by
28% and 13%, respectively, whereas kynurenic acid was
considerably increased by a factor of ,1.5 (Table S2). Remark-
ably, expression of tryptophan-2,3-dioxygenase (TDO), catalyzing
the first and rate-limiting step of tryptophan degradation in liver,
thereby producing formylkynurenine, was significantly increased
Figure 1. Changes in Mean. In total 75 parameters were found to besignificantly changed between histopathologically negative and posi-tive scored samples (false discovery rate ,0.05) and exhibiting fold-changes .2 or ,0.5. The average fold-changes of all 75 parameterswere calculated with respect to the matching control group and theirsmoothed distribution is shown for each class. Control group meanscentered at zero are not shown. Samples which are scored negative andshow increased ALT or AST were omitted in the statistical comparisonand are shown as separate line in yellow. Their intermediate distributionreassures the validity of this approach and the relevance of theidentified parameters.doi:10.1371/journal.pone.0097249.g001
Metabolites, Markers and Transcripts Associated with Hepatotoxicity
PLOS ONE | www.plosone.org 7 May 2014 | Volume 9 | Issue 5 | e97249

Metabolites, Markers and Transcripts Associated with Hepatotoxicity
PLOS ONE | www.plosone.org 8 May 2014 | Volume 9 | Issue 5 | e97249

by 15% whereas expression levels of kynurenine 3-monooxygenase
(converting kynurenine to 3-hydroxykynurenine) and kynureni-
nase (catalyzing the following enzymatic step converting 3-
hydroxykynurenine further to 3-hydroxyanthranilic acid) were
decreased by 30% and 26%, respectively (not shown). This is in
line with the observed increase of kynurenic acid indicating that
tryptophan degradation to NAD was shifted towards synthesis of
kynurenic acid.
The most prominent candidate marker identified based on
metabolite profiling is putrescine (measured as sum parameter
together with agmatine), a simple polyamine, which showed an
increase of more than four-fold (Table 6, Figure 2 and Figure S4).
Although our analytical methods, based on full tissue homoge-
nates, do not allow for cellular localization of the changes, it is
interesting to note that the increase of putrescine may be linked to
activation of macrophages. The clearance of debris of necrotic
cells containing danger signals makes macrophages one of the
primary sensors of danger present in the host. Alternatively
activated macrophages primary role appears to be related to
wound healing, decreased inflammation and tissue repair. These
macrophages contribute to the production of polyamines and
collagen. Remarkably, major components of collagen, i.e. proline,
trans-4-hydroxyproline, glycine and others, are decreased in the
current study, primarily in serum (Table S2). Interleukin-4 (IL-4) is
known to induce wound healing macrophages and to stimulate
their arginase activity [22]. The latter may be related to the
observed arginine levels (Table 7 and Figure S5). Our measure-
ments of the Methylene Dianiline treatment support the hypoth-
esis which links putrescine to macrophages. Samples with
histopathologically verified inflammation are all those at the time
points 6 h and 24 h. These samples coincide with those showing an
increase of putrescine (Figure 2). In support of this theory, the
increase of polyamines and amino acids in urine has already been
associated with nephrotoxicity prior to observable histological
kidney damage [5].
In any case, polyamines are known to induce cell proliferation,
which is in agreement with some of the observed gene expression
modulations in the liver indicative of cell cycle regulation and
tissue repair. Among the top 10 most significantly regulated genes
(Table 8 and Figure S6), the zinc finger transcription factor Egr1
(early growth response 1 or Krox-24) represents an important
activator of target genes involved in a variety of pathophysiological
processes, including hepatocyte injury while Atf3 and Jun have
also been associated with liver injury. Egr1 is among the common
genes induced after a hepatocellular challenge leading to toxicity
[23] and is known as immediate early growth response activated
by cellular stimuli such as irradiation and small molecules [24].
Moreover, hypoxia induced up-regulation has been found in
macrophages [25]. Igfbp1 (insulin-like growth factor-binding
protein-1) listed as best ranked gene in Table 8 has been linked
to liver regeneration [26]. It is also known to antagonize the
proapoptotic effect of p53 while possibly allowing time for repair
of damage or resolution of metabolic distress [27].
The results of this study show the expected response in well-
known markers of DILI (AST, ALT and bilirubin) in many, but
not all the treated animals. In addition, we have also identified
putative biomarkers with biological anchoring such as putrescine,
bile acids, and genes such as Igfbp1 and Egr1. Among the most
interesting markers, bilirubin and taurocholic acid seem to
strongly correlate with the occurrence of histopathological liver
damage, while putrescine in serum and Igfbp1 and Egr1 in tissue
were also elevated in animals showing transaminase increases or
no changes. These results reinforce the usefulness of standard
clinical chemistry parameters, but also show that additional
parameters may improve the performance in terms of sensitivity.
Further data should be collected to determine if these additional
biomarkers may be also able to provide additional evidence with
regards of onset, relevance, and progression of DILI in cases where
ALT or AST are elevated but no tissue damage is evident
microscopically.
Translational biomarkers that allow the monitoring of patients
with regards of onset, progression and reversibility of toxicity
would offer means to design better and safer clinical trials. In
particular, sensitive, non-invasive and translational biomarkers are
useful for the clinical testing of compounds which show toxicity in
animals but may be safe in patients due to species differences of
different dose regimens. Our set of best ranked parameters based
on different technologies and different sample matrices is
biologically meaningful, in agreement with previous results and
shows an overall concordant measurement pattern across all
samples. Also, our tailored analysis demonstrated that the
identified biomarkers outperform histopathology evaluation in
terms of sensitivity. Hence, this set of biomarkers can be
implemented for the identification of early events leading to
hepatotoxicity. Future studies increasing the number of tested
compounds would improve the coverage of mechanisms causing
toxicity and hence the universal validity of our findings, as the
generalization power of our biomarkers may be constrained by the
limited number of toxicity mechanisms which were included in the
study.
Supporting Information
Figure S1 Clinical chemistry.
(PDF)
Figure S2 Significantly changed parameters exhibiting absolute
fold changes .2. Fold-changes are visualized for all samples and
all significantly changed parameters (FDR ,0.05) exhibiting
absolute fold changes .2. The fold-changes are calculated for
each sample with respect to the mean of the matching control
group (vehicle treatment). Red (blue) indicate up (down)-regulation
and yellow missing measurements. The samples are grouped by
class as shown on the top(green: vehicle control of class negative,
blue: class negative without vehicle controls, orange: increased in
ALT or AST, red: class positive). The parameters are grouped by
type as shown on the left(green: transcripts in liver tissue, red:
metabolites in serum, gray: metabolites in liver tissue, blue: clinical
chemistry in serum).
(PDF)
Figure S3 Clinical Chemistry Markers in Serum as Listed in
Table 5. The fold-change of each sample is calculated with respect
to the matching control group (vehicle treatment). The mean of
each class is shown as horizontal line (black: negative including
controls, yellow: increased in ALT or AST, red: positive). The size
Figure 2. Top Markers. All measurements are visualized in detail for the 1–2 best ranked markers for each type of parameter (subfigure A: clinicalchemistry in serum, B: metabolite in liver tissue, C: metabolite in serum, D/E: transcript in liver tissue). The fold-change of each sample is calculatedwith respect to the matching control group (vehicle treatment). The mean of each class is shown as horizontal line (black: negative including controls,yellow: increased in ALT or AST, red: positive). The size of the treatment symbols increase with dose. The time points are resolved by aligning thesymbols in columns.doi:10.1371/journal.pone.0097249.g002
Metabolites, Markers and Transcripts Associated with Hepatotoxicity
PLOS ONE | www.plosone.org 9 May 2014 | Volume 9 | Issue 5 | e97249

of the treatment symbols increase with dose. The time points are
resolved by aligning the symbols in columns.
(PDF)
Figure S4 Metabolites in Liver Tissue as Listed in Table 6. The
fold-change of each sample is calculated with respect to the
matching control group (vehicle treatment). The mean of each
class is shown as horizontal line (black: negative including controls,
yellow: increased in ALT or AST, red: positive). The size of the
treatment symbols increase with dose. The time points are
resolved by aligning the symbols in columns.
(PDF)
Figure S5 Metabolites in Serum as Listed in Table 7. The fold-
change of each sample is calculated with respect to the matching
control group (vehicle treatment). The mean of each class is shown
as horizontal line (black: negative including controls, yellow:
increased in ALT or AST, red: positive). The size of the treatment
symbols increase with dose. The time points are resolved by
aligning the symbols in columns.
(PDF)
Figure S6 Transcripts in Liver Tissue as Listed in Table 8. The
fold-change of each sample is calculated with respect to the
matching control group (vehicle treatment). The mean of each
class is shown as horizontal line (black: negative including controls,
yellow: increased in ALT or AST, red: positive). The size of the
treatment symbols increase with dose. The time points are
resolved by aligning the symbols in columns.
(PDF)
Table S1 Significantly changed metabolites in liver tissue. All 63
liver metabolites for which a structure ID was identified or
proposed and which were significantly changed (FDR ,0.05) are
listed.
(XLSX)
Table S2 Significantly changed metabolites in serum. All 85
serum metabolites for which a structure ID was identified or
proposed and which were significantly changed (FDR ,0.05) are
listed.
(XLSX)
Table S3 Significantly changed transcripts in liver tissue. All 45
genes exhibiting absolute fold changes .2 and being significantly
changed (FDR ,0.05) are listed.
(XLSX)
Author Contributions
Conceived and designed the experiments: LS AR. Performed the
experiments: LS OS. Analyzed the data: AB AH LS OS. Contributed
reagents/materials/analysis tools: AH OS. Wrote the paper: AB LS AR
AH OS HK KB.
References
1. Navarro VJ, Senior JR (2006) Drug-related hepatotoxicity. N Engl J Med 354:
731–739.2. Goodsaid FM, Blank M, Dieterle F, Harlow P, Hausner E, et al. (2009) Novel
biomarkers of acute kidney toxicity. Clin Pharmacol Ther 86: 490–496.
3. Dieterle F, Perentes E, Cordier A, Roth DR, Verdes P, et al. (2010) Urinaryclusterin, cystatin c, beta2-microglobulin and total protein as markers to detect
drug-induced kidney injury. Nat Biotechnol 28: 463–469.4. Vaidya VS, Ozer JS, Dieterle F, Collings FB, Ramirez V, et al. (2010) Kidney
injury molecule-1 outperforms traditional biomarkers of kidney injury inpreclinical biomarker qualification studies. Nat Biotechnol 28: 478–485.
5. Boudonck KJ, Mitchell MW, Nemet L, Keresztes L, Nyska A, et al. (2009)
Discovery of metabolomics biomarkers for early detection of nephrotoxicity.Toxicol Pathol 37: 280–292.
6. Strauss V, Wiemer J, Leibold E, Kamp H, Walk T, et al. (2009) Influence ofstrain and sex on the metabolic profile of rats in repeated dose toxicological
studies. Toxicol Lett 191: 88–95.
7. Robertson DG, Watkins PB, Reily MD (2011) Metabolomics in toxicology:preclinical and clinical applications. Toxicol Sci 120 Suppl 1: S146–S170.
8. Zhang A, Sun H, Wang P, Han Y, Wang X (2012) Metabonomics fordiscovering biomarkers of hepatotoxicity and nephrotoxicity. Pharmazie 67: 99–
105.
9. Kamp H, Fabian E, Groeters S, Herold M, Krennrich G, et al. (2012)Application of in vivo metabolomics to preclinical/toxicological studies: case
study on phenytoin-induced systemic toxicity. Bioanalysis 4: 2291–2301.10. Roessner U, Wagner C, Kopka J, Trethewey RN, Willmitzer L (2000) Technical
advance: simultaneous analysis of metabolites in potato tuber by gaschromatography-mass spectrometry. Plant J 23: 131–142.
11. Huang J, Shi W, Zhang J, Chou JW, Paules RS, et al. (2010) Genomic indicators
in the blood predict drug-induced liver injury. Pharmacogenomics J 10: 267–277.
12. Ozer J, Ratner M, Shaw M, Bailey W, Schomaker S (2008) The current state ofserum biomarkers of hepatotoxicity. Toxicology 245: 194–205.
13. Ennulat D, Magid-Slav M, Rehm S, Tatsuoka KS (2010) Diagnostic
performance of traditional hepatobiliary biomarkers of drug-induced liverinjury in the rat. Toxicol Sci 116: 397–412.
14. Temple R (2006) Hy’s law: predicting serious hepatotoxicity. Pharmacoepide-miol Drug Saf 15: 241–243.
15. Friedman SL (1996) Hepatic stellate cells. Prog Liver Dis 14: 101–130.16. Berk PD, Javitt NB (1978) Hyperbilirubinemia and cholestasis. Am J Med 64:
311–326.
17. van Ravenzwaay B, Cunha GCP, Leibold E, Looser R, Mellert W, et al. (2007)
The use of metabolomics for the discovery of new biomarkers of effect. Toxicol
Lett 172: 21–28.
18. Ravenzwaay B, Cunha GC, Fabian E, Herold M, Kamp H, et al. (2010) The
Use of Metabolomics in Cancer Research. Springer-Verlag, 141–166 pp. DOI:
10.1007/978–90–481–2675–0_8.
19. Bollard ME, Holmes E, Lindon JC, Mitchell SC, Branstetter D, et al. (2001)
Investigations into biochemical changes due to diurnal variation and estrus cycle
in female rats using high-resolution (1)h nmr spectroscopy of urine and pattern
recognition. Anal Biochem 295: 194–202.
20. Azmi J, Griffin JL, Shore RF, Holmes E, Nicholson JK (2005) Chemometric
analysis of biofluids following toxicant induced hepatotoxicity: a metabonomic
approach to distinguish the effects of 1-naphthylisothiocyanate from its products.
Xenobiotica 35: 839–852.
21. Sun J, Ando Y, Ahlbory-Dieker D, Schnackenberg L, Yang X, et al. (2013)
Systems biology investigation to discover metabolic biomarkers of acetamino-
phen-induced hepatic injury using integrated transcriptomics and metabolomics.
Journal of Molecular Biomarkers & Diagnosis S1. Available: http://omicsonline.
org/systems-biology-investigation-to-discover-metabolic-biomarkers-of-
acetaminophen-induced-hepatic-injury-using-integrated-transcriptomics-and-
metabolomics-2155-9929.S1-002.pdf. Accessed 28 April 2014.
22. Mosser DM, Edwards JP (2008) Exploring the full spectrum of macrophage
activation. Nat Rev Immunol 8: 958–969.
23. Pritchard MT, Nagy LE (2005) Ethanol-induced liver injury: potential roles for
egr-1. Alcohol Clin Exp Res 29: 146S–150S.
24. DeLigio JT, Zorio DAR (2009) Early growth response 1 (egr1): a gene with as
many names as biological functions. Cancer Biol Ther 8: 1889–1892.
25. Xu Y, Toure F, Qu W, Lin L, Song F, et al. (2010) Advanced glycation end
product (age)-receptor for age (rage) signaling and up-regulation of egr-1 in
hypoxic macrophages. J Biol Chem 285: 23233–23240.
26. Leu JI, Crissey MAS, Craig LE, Taub R (2003) Impaired hepatocyte dna
synthetic response posthepatectomy in insulin-like growth factor binding protein
1-deficient mice with defects in c/ebp beta and mitogen-activated protein
kinase/extracellular signal-regulated kinase regulation. Mol Cell Biol 23: 1251–
1259.
27. Leu JIJ, George DL (2007) Hepatic igfbp1 is a prosurvival factor that binds to
bak, protects the liver from apoptosis, and antagonizes the proapoptotic actions
of p53 at mitochondria. Genes Dev 21: 3095–3109.
Metabolites, Markers and Transcripts Associated with Hepatotoxicity
PLOS ONE | www.plosone.org 10 May 2014 | Volume 9 | Issue 5 | e97249